Enzymatic Biobleaching of Recalcitrant Paper Dyes - CiteSeerX
345
Enzymatic Biobleaching of Recalcitrant Paper Dyes A Dissertation Submitted by Kristina Parks Knutson B.A. Carthage College, Kenosha, Wisconsin M.S. 2000, Institute of Paper Science and Technology This Thesis is in Partial Fulfillment of the Requirements from the Institute of Paper Science and Technology For the Degree of Doctor of Philosophy Atlanta, Georgia Publication rights reserved by the Institute of Paper Science and Technology at Georgia Institute of Technology December 7, 2004
-
Upload
khangminh22 -
Category
Documents
-
view
0 -
download
0
Transcript of Enzymatic Biobleaching of Recalcitrant Paper Dyes - CiteSeerX

Enzymatic Biobleaching of Recalcitrant Paper Dyes
A Dissertation Submitted by
Kristina Parks Knutson
B.A. Carthage College, Kenosha, Wisconsin
M.S. 2000, Institute of Paper Science and Technology
This Thesis is in Partial Fulfillment of the Requirements from the
Institute of Paper Science and Technology
For the Degree of Doctor of Philosophy
Atlanta, Georgia
Publication rights reserved by the
Institute of Paper Science and Technology at
Georgia Institute of Technology
December 7, 2004

TABLE OF CONTENTS
1 ABSTRACT............................................................................................................... 1
2 INTRODUCTION..................................................................................................... 3
3 LITERATURE REVIEW ........................................................................................ 5
3.1 Overview of Wastepaper Recycling.............................................................................................. 5 3.1.1 Methods....................................................................................................................................... 5 3.1.2 Types of Furnish.......................................................................................................................... 6
3.2 Recycling of Colored WastePaper ................................................................................................ 7 3.2.1 Process of Color Stripping and Bleaching................................................................................... 7 3.2.2 Current Bleaching Methods in Wastepaper Recycling................................................................ 7
3.3 Problems With Recycling Colored Wastepaper ........................................................................ 12 3.3.1 Measurement of Color............................................................................................................... 12 3.3.2 Measurement of Dye Removal .................................................................................................. 13 3.3.3 Recycling Studies of Telephone Directories ............................................................................. 14
3.3.3.1 Study of recycling complete telephone directories by Sutman ........................................ 15 3.3.3.2 Study of dyes to allow recycling of directory paper by Dumont ..................................... 15 3.3.3.3 Study of bleaching yellow directory paper with FAS by Marchildon.............................. 16 3.3.3.4 Study of recycling telephone directories with floatation cell by Cao .............................. 17
3.3.4 Recycling of Mixed Office Waste ............................................................................................. 18
3.4 Chemical Requirements for Dyes ............................................................................................... 20 3.4.1 Electronic Requirements For Color........................................................................................... 20 3.4.2 Chemical Structure of Dye Molecules....................................................................................... 22 3.4.3 Fluorescence and Phosphorescence........................................................................................... 27 3.4.4 Classification of Dyes ............................................................................................................... 28 3.4.5 Acid (Anionic) Dyes ................................................................................................................. 29 3.4.6 Basic (Cationic) Dyes................................................................................................................ 29 3.4.7 Direct Dyes................................................................................................................................ 30
3.5 Dyes Used for Coloration of Paper ............................................................................................. 34 3.5.1 Dye Characteristics.................................................................................................................... 34 3.5.2 Fluorescent Whitening agents ................................................................................................... 35 3.5.3 Recyclablity............................................................................................................................... 36 3.5.4 Paper Dyes Selected for Study .................................................................................................. 36 3.5.5 Summary of Dye Chemistry...................................................................................................... 38
3.6 Decolorization of Dyes.................................................................................................................. 39 3.6.1 Definition of Decolorization and Related Terms....................................................................... 39 3.6.2 Chemical Decolorization ........................................................................................................... 39
3.6.2.1 Decolorization agents applied during paper recycling..................................................... 39 3.6.2.2 Decolorization of C.I. Direct Yellow 11.......................................................................... 41 3.6.2.3 Decolorization of Basazol Yellow 46L (C.I. Basic Yellow 96)....................................... 42
3.7 Enzymes ........................................................................................................................................ 43 3.7.1 an overview of Enzymes ........................................................................................................... 43 3.7.2 Naming of Enzymes .................................................................................................................. 44

3.7.3 Enzymatic Reactions ................................................................................................................. 44 3.7.4 Factors Affecting Enzymatic Reactions .................................................................................... 47 3.7.5 Enzyme Activity........................................................................................................................ 47 3.7.6 Oxidoreductases ........................................................................................................................ 48 3.7.7 Laccase Enzymes ...................................................................................................................... 49
3.7.7.1 Laccase mediators............................................................................................................ 51 3.7.7.2 HBT - hydroxy benzotriazole as mediator ....................................................................... 54 3.7.7.3 ABTS - 2,2'azinobis-3-ethyl benzthiazoline-5-sulfonate as mediator.............................. 56
3.7.8 Peroxidase Enzymes.................................................................................................................. 58 3.7.8.1 Lignin peroxidase ............................................................................................................ 61 3.7.8.2 Manganese peroxidase ..................................................................................................... 63 3.7.8.3 Horseradish peroxidase.................................................................................................... 64 3.7.8.4 Soybean peroxidase ......................................................................................................... 64
3.8 Biological Degradation and Decolorization................................................................................ 65 3.8.1 Summary of Effluent Dye Decolorization Research ................................................................. 65 3.8.2 Azo Reductases in Mammals and Intestinal Microflora............................................................ 66 3.8.3 Microbial Treatment of Textile Effluents.................................................................................. 66
3.8.3.1 Dye decolorization by inoculated soil microorganisms ................................................... 66 3.8.3.2 Decolorization of reactive azo dyes by methanogenic bacteria ....................................... 67 3.8.3.3 Decolorization of 3 azo dyes by Pseudomonas luteola .................................................... 67 3.8.3.4 Dye decolorization by microbial consortium................................................................... 68 3.8.3.5 Summary of Microbial Treatments of Textile Effluents .................................................. 69
3.8.4 Decolorization of Dyes by Intact Fungi .................................................................................... 70 3.8.4.1 Decolorization of azo dyes by Phanerochaete chrysosporium......................................... 70 3.8.4.2 Dye decolorization by P. chrysosporium and S. chromofuscus ....................................... 71 3.8.4.3 Decolorization of14C-ring-labeled azo dyes by P. chrysosporium ................................... 73 3.8.4.4 Dye decolorization of 3 varied dyes by Trametes versicolor ........................................... 75 3.8.4.5 Effect of aromatic substitution pattern on decolorization ................................................ 76 3.8.4.6 Summary of treatments of textile effluents with intact fungi........................................... 78
3.9 Degradative Redox Systems of White-Rot Fungi ...................................................................... 78 3.9.1 Degradation of Recalcitrant Pollutants...................................................................................... 78 3.9.2 Decolorization of Dyes by Fungal Enzymes ............................................................................. 79
3.9.2.1 Lignin peroxidase treatment of 10 varied dyes ................................................................ 79 3.9.2.2 Lignin and manganese peroxidase treatment of 8 varied dyes......................................... 80 3.9.2.3 Manganese peroxidase treatment of 4 azo dyes ............................................................... 82 3.9.2.4 Laccase treatment of 3 varied dyes .................................................................................. 84 3.9.2.5 Relationship between redox potential and decolorization by laccase .............................. 84 3.9.2.6 Summary of dye decolorization by fungal enzymes ........................................................ 85
3.10 Summary of Literature Review................................................................................................... 87
4 DISSERTATION OBJECTIVES.......................................................................... 90
5 THESIS FORMAT ................................................................................................. 91
6 EXPERIMENTAL PROCEDURES ..................................................................... 93
6.1 Materials and Reaction Equipment............................................................................................ 93 6.1.1 Chemicals .................................................................................................................................. 93 6.1.2 Reaction Equipment .................................................................................................................. 93 6.1.3 Analysis Equipment .................................................................................................................. 94

6.2 Enzyme Activity Assays ............................................................................................................... 95 6.2.1 Laccase Activity Assay ............................................................................................................. 95 6.2.2 Soybean Peroxidase Activity Assay .......................................................................................... 95
6.3 Peroxide Concentration Assay .................................................................................................... 95
6.4 Selection of Dye Concentration................................................................................................... 96 6.4.1 Dye manufacturers’ Sample and Stock Concentrations ............................................................ 96 6.4.2 Working Concentration for Dye solutions................................................................................. 96
6.5 Pulp Related Procedures ............................................................................................................. 97 6.5.1 Pulp Preparation ........................................................................................................................ 97 6.5.2 Dyeing Procedure ...................................................................................................................... 97 6.5.3 Determination of Concentration of Dye in Dyed Pulp .............................................................. 98 6.5.4 Handsheet Preparation............................................................................................................... 98
6.6 Solution Sample Treatments ....................................................................................................... 98 6.6.1 Laccase/ABTS Treatment of Direct Yellow 11 in Solution ...................................................... 98 6.6.2 Laccase/ABTS Treatment of Basazol 46L in Solution.............................................................. 99 6.6.3 Horseradish Peroxidase Treatments ........................................................................................ 100 6.6.4 Soybean Peroxidase Treatments.............................................................................................. 100
6.7 Pulp Sample Treatments ........................................................................................................... 101 6.7.1 Laccase-Mediator Treatment of Colored Pulps ....................................................................... 101 6.7.2 Alkaline Extraction of Laccase-Treated Pulp.......................................................................... 101 6.7.3 Oxygen Bleaching of Colored Pulps ....................................................................................... 101 6.7.4 Peroxide Bleaching of Colored Pulps...................................................................................... 102 6.7.5 Dithionite Treatment of Colored Pulps ................................................................................... 102
6.8 Analysis of Results...................................................................................................................... 103 6.8.1 Measurement of Color (Tristimulus Values)........................................................................... 103 6.8.2 Determination of Dye Removal Index..................................................................................... 103 6.8.3 Analysis of Spectral Data ........................................................................................................ 104
7 RESULTS AND DISCUSSION ........................................................................... 106
7.1 Publication 1 ............................................................................................................................... 106 7.1.1 Abstract ................................................................................................................................... 106 7.1.2 Introduction ............................................................................................................................. 106 7.1.3 Methods and Materials ............................................................................................................ 107
7.1.3.1 Enzyme activity assays .................................................................................................. 107 7.1.3.2 Dyeing pulp with Direct Yellow 11............................................................................... 107 7.1.3.3 LMS treatment of dyed pulp .......................................................................................... 108 7.1.3.4 Calculation of Dye Removal Index (DRI) ..................................................................... 108 7.1.3.5 Soybean peroxidase treatment ....................................................................................... 108 7.1.3.6 Horseradish peroxidase treatment .................................................................................. 109 7.1.3.7 Evaluation of pH and PEG effects on SBP .................................................................... 109
7.1.4 Results and Discussion............................................................................................................ 109 7.1.4.1 LMS treatment of Direct Yellow 11 .............................................................................. 110 7.1.4.2 Peroxidase treatments .................................................................................................... 112 7.1.4.3 Effects of pH and PEG on SBP treatment...................................................................... 113
7.1.5 Conclusions ............................................................................................................................. 114 7.1.6 Acknowledgments ................................................................................................................... 114
7.2 Publication 2 ............................................................................................................................... 115

7.2.1 Abstract: .................................................................................................................................. 115 7.2.2 Introduction ............................................................................................................................. 115 7.2.3 Methods and Materials ............................................................................................................ 117
7.2.3.1 Enzyme activity assays .................................................................................................. 117 7.2.3.2 Dyeing pulp with Direct Yellow 11............................................................................... 117 7.2.3.3 LMS treatment of dyed pulp .......................................................................................... 118 7.2.3.4 Measurement of color and calculation of Dye Removal Index (DRI) ........................... 118
7.2.4 Results and Discussion............................................................................................................ 119 7.2.4.1 Comparison of ABTS, HBT, and VA as laccase mediators........................................... 119 7.2.4.2 Determination of optimal ABTS concentration. ............................................................ 120
7.2.5 Acknowledgments ................................................................................................................... 121
7.3 Publication 3 ............................................................................................................................... 122 7.3.1 Abstract ................................................................................................................................... 122 7.3.2 Introduction ............................................................................................................................. 122 7.3.3 Materials and methods............................................................................................................. 123
7.3.3.1 Dyes and enzymes ......................................................................................................... 123 7.3.3.2 Enzyme assays ............................................................................................................... 123 7.3.3.3 Horseradish peroxidase treatments ................................................................................ 124 7.3.3.4 Soybean peroxidase treatments...................................................................................... 124 7.3.3.5 Laccase-mediator system treatment of Basazol 46L dye ............................................... 125 7.3.3.6 Reaction rate study of laccase/ABTS decolorization of Direct Yellow 11 .................... 125 7.3.3.7 Reaction rate study of SBP/H2O2 decolorization of dyes............................................... 125 7.3.3.8 Data collection and analysis........................................................................................... 126
7.3.4 Results and Discussion............................................................................................................ 126 7.3.5 Acknowledgements ................................................................................................................. 131
7.4 Publication 4 ............................................................................................................................... 132 7.4.1 Abstract ................................................................................................................................... 132 7.4.2 Introduction ............................................................................................................................. 132 7.4.3 Methods and materials............................................................................................................. 133
7.4.3.1 Materials ........................................................................................................................ 133 7.4.3.2 Enzyme activity assays .................................................................................................. 133 7.4.3.3 Peroxide concentration assay......................................................................................... 133 7.4.3.4 Dyeing pulp with Direct Yellow 11............................................................................... 134 7.4.3.5 Preparation of commercial dyed pulp ............................................................................ 134 7.4.3.6 LMS treatment of dyed pulp .......................................................................................... 134 7.4.3.7 Alkaline extraction of laccase-treated pulp.................................................................... 135 7.4.3.8 Oxygen bleaching of colored pulps ............................................................................... 135 7.4.3.9 Peroxide bleaching of colored pulps.............................................................................. 135 7.4.3.10 Dithionite treatment of colored pulps ............................................................................ 136 7.4.3.11 Calculation of Dye Removal Index (DRI) ..................................................................... 136
7.4.4 Results and discussion............................................................................................................. 137 7.4.4.1 Reaction rate study for oxygen bleaching...................................................................... 137 7.4.4.2 Comparison between bleaching treatments.................................................................... 139 7.4.4.3 Summary........................................................................................................................ 144
7.4.5 Acknowledgements ................................................................................................................. 144
8 SUMMARY OF RESULTS ................................................................................. 145
9 THESIS CONCLUSIONS.................................................................................... 153
10 RECOMMENDATION FOR FUTURE WORK........................................... 154

11 ACKNOWLEDGMENTS ................................................................................ 155
12 REFERENCES.................................................................................................. 157

TABLE OF FIGURES
Figure 1 L, a, b Color Space Based on Sharpe------------------------------------------------ 14 Figure 2 Single Stage Bleaching Results According to Ferguson--------------------------- 19 Figure 3 Molecular Orbitals Schematic as per Marcus ------------------------------------- 21 Figure 4 Designations for Wavelength Shifts and Absorptivity Changes as per Marcus 22 Figure 5 Bathochromic Shift with Electron-Withdrawing Groups as per Waring-------- 24 Figure 6 Structure of Dye Molecule as Described by Rivlin--------------------------------- 26 Figure 7 Energy Absorption, Fluorescence and Phosphorescence ------------------------- 27 Figure 8 Example of Fluorescence Due to Structure Stiffness From Zollinger ----------- 28 Figure 9 Acid Dye Binding to Wool Protein as Visualized by Rivlin ----------------------- 29 Figure 10 Cationic Dye Attached to Anionic Fiber as Visualized by Rivlin--------------- 30 Figure 11 Examples of Cationic Dyes From Rivlin------------------------------------------- 30 Figure 12 C.I. Direct Yellow 11 as Published by Cheek ------------------------------------- 31 Figure 13 Direct Dye Planarity Necessary for Substantivity as per Johnson ------------- 31 Figure 14 Proposed Model for Binding of Direct Dye to Cellulose as per Fessenden--- 32 Figure 15 Yoshida Bonds between Aromatic Dye and Cellulose as Described by Lewis 33 Figure 16 Direct Dyes Based on Benzdine From Cegarra ---------------------------------- 34 Figure 17 General Structure of Benzidine-based Direct Dyes ------------------------------ 34 Figure 18 Stilbene Fluorescent Whitening Agents as per Coulston ------------------------ 35 Figure 19 Stilbene Dye Direct Yellow 11 as Published by Cheek--------------------------- 37 Figure 20 Patent Information Relevant to Basazol Yellow 46L Basic Yellow Dye ------- 37 Figure 21 C.I. Direct Yellow 11 and Possible Cleavage Products ------------------------- 42 Figure 22 Enzyme Accelerates Reaction by Lowering Activation Energy ----------------- 45 Figure 23 Enzyme Substrate Complex Theory as per Ma and Jiang ---------------------- 45 Figure 24 Lock and Key Model of Enzyme-Substrate Interaction as per Ma and Jiang - 46 Figure 25 Redox Cycle for Mediated Substrate Oxidation by an Oxidoreductase-------- 49 Figure 26 Laccase Catalytic Cycle as per Wesenberg --------------------------------------- 51 Figure 27 Products From β-1 Dimer Produced by HBT and ABTS as Mediators-------- 53 Figure 28 Amounts of Products from Laccase Oxidation Depends on Mediator --------- 54 Figure 29 Laccase/HBT Oxidation of β-O-4 Lignin Dimer---------------------------------- 54 Figure 30 Formation of Benzylic and Aryl Cation Radicals from β-O-4 Lignin Dimer - 55 Figure 31 Products of Laccase Degradation of Lignin through Phenoxy Radicals ------ 56 Figure 32 ABTS and HBT and Their Intermediates------------------------------------------- 58 Figure 33 The Peroxidase Catalytic Cycle as Visualized by Barr and Aust -------------- 59 Figure 34 Mechanism of Mediated Lignin Peroxidase Oxidation -------------------------- 62 Figure 35 Veratryl Alcohol as Mediator for Peroxidase Reactions------------------------ 63 Figure 36 Manganese Peroxidase Mechanism ------------------------------------------------ 63 Figure 37 Reactive Azo Dye Substrates Decolorized by Methanogenic Bacteria--------- 67 Figure 38 Reactive Azo Dye Substrates Decolorized by Pseudomonas luteola ----------- 68 Figure 39 Direct Fast Scarlet 4BS as per He-------------------------------------------------- 69 Figure 40 Azo Dyes Degraded by Phanerochaete chrysosporium as per Cripps--------- 70 Figure 41 14C-Labeled Azo Dyes Degraded by P. chrysosporium and S. chromofuscus 72 Figure 42 Three Synthetic Dye Substrates Decolorized by Trametes versicolor---------- 75 Figure 43 Dye Degradation by Mycelium Plus Enzymes as Measured by Wang --------- 76

Figure 44 Monosulfonated Azo Dyes Degraded by Intact Fungi --------------------------- 77 Figure 45 Diverse Synthetic Dye Substrates Decolorized by Lignin Peroxidase --------- 82 Figure 46 Azo Dye Substrates Decolorized by Manganese Peroxidase-------------------- 83 Figure 47 Dye Structures with Different Redox Potentials Decolorized by Laccase----- 85 Figure 48 Photograph of a 1000-mL-Capacity Parr Reactor with Components---------- 94 Figure 49 Distance in Color Space from an Ideal Bleach ----------------------------------104 Figure 50 Chromophore in Direct Yellow 11-------------------------------------------------110 Figure 51 Bleaching Effectiveness of Different Mediators ---------------------------------111 Figure 52 Dye Removal From Direct Yellow 11-Dyed Pulp -------------------------------111 Figure 53 Effluents (Post-Reaction Solutions) -----------------------------------------------112 Figure 54 Results from Treating Dyes with Horseradish Peroxidase ---------------------113 Figure 55 Major Chromophore in Direct Yellow 11-----------------------------------------116 Figure 56 Bleaching Effectiveness of Different Mediators ---------------------------------119 Figure 57 Bleaching Effectiveness with Varying ABTS Concentrations ------------------120 Figure 58 Soybean Peroxidase Treatment of Dyes at pH 3.8-------------------------------126 Figure 59 Comparison Between Horseradish and Soybean Peroxidases-----------------127 Figure 60 Effect of pH and PEG on SBP Decolorization -----------------------------------128 Figure 61 Decolorization of Direct Yellow 11 by Laccase/1 mM ABTS ------------------129 Figure 62 Decolorization of Direct Yellow 11 by SBP/Veratryl Alcohol -----------------130 Figure 63 Decolorization of Basazol 46L by SBP/Veratryl Alcohol-----------------------131 Figure 64 Improvements in Brightness during Oxygen Bleaching-------------------------138 Figure 65 Improvements in Dye Removal Index Values during Oxygen Bleaching -----138 Figure 66 Brightness Values for Bleached Blue Commercial Pulp------------------------140 Figure 67 Brightness Values for Bleached Cherry Pink Commercial Pulp --------------140 Figure 68 Brightness Values for Bleached Goldenrod Commercial Pulp ----------------141 Figure 69 Brightness Values for Bleached Direct Yellow 11-Dyed Pulp -----------------141 Figure 70 Dye Removal Index Values for Bleached Blue Commercial Pulp -------------142 Figure 71 Dye Removal Index Values for Bleached Cherry Pink Commercial Pulp ----142 Figure 72 Dye Removal Index Values for Bleached Goldenrod Commercial Pulp------143 Figure 73 Dye Removal Index Values for Bleached Direct Yellow 11 Dyed-Pulp-------143

TABLE OF TABLES
Table 3-1 Actions Performed During Paper Recycling ----------------------------------------5 Table 3-2 Wastepaper Grade Information According to Garbutt-----------------------------6 Table 3-3 Major Wastepaper Categories According to Garbutt -----------------------------6 Table 3-4 Market Value Factors for Wastepaper According to Garbutt --------------------6 Table 3-5 Dye Removal Processes ----------------------------------------------------------------7 Table 3-6 Bleaching Agents for Recycled Fiber-------------------------------------------------8 Table 3-7 Oxidation Potentials of Bleaching Agents as per Bierman and Kronis ----------8 Table 3-8 Reactions of Bleaching Agents as per Bierman and Kronis a ---------------------9 Table 3-9 Comparison of Published Yellow Directory Bleachability Studies ------------- 18 Table 3-10 Bleaching of Unmixed Office Wastes Results According to Ferguson-------- 19 Table 3-11 Results from Bleaching of Direct Dyes as Reported by Cheek ---------------- 20 Table 3-12 Relationship of Conjugated Double Bonds and Absorption-------------------- 22 Table 3-13 Examples of Dye Chromophores From Rivlin and Burstone, ------------------ 23 Table 3-14 Examples of Dye Auxochromes From Rivlin and Burstone,-------------------- 23 Table 3-15 Enhancing Color by Group Additions as per Fessenden ----------------------- 23 Table 3-16 Auxochrome and Chromophore Addition Effects as per Rivlin---------------- 24 Table 3-17 Alteration of Color by Modifiers as Described by Burstone ------------------- 25 Table 3-18 Solubilizing Groups From Johnson ----------------------------------------------- 26 Table 3-19 Dye Classifications According to Rivlin ------------------------------------------ 28 Table 3-20 Characteristics of Dyes ------------------------------------------------------------- 35 Table 3-21 Molar Absorptivity of Chromogens as Described by Rivlin-------------------- 39 Table 3-22 Approaches to Decolorize Dyes or Color-Strip Dyed Fibers ------------------ 40 Table 3-23 Four Types of Enzyme Affinities as per Ma and Jiang-------------------------- 43 Table 3-24 Classification of Enzymes By Reaction Type as Decribed by Voet------------ 44 Table 3-25 Mediator Criteria for Oxidoreductase Reactions ------------------------------- 49 Table 3-26 Comparison of Redox Potentials of the T1 Cu From Palmer ------------------ 50 Table 3-27 Structure and Properties of Laccase Mediators According to Paice --------- 52 Table 3-28 Oxidation of Methoxybenzenes by SBP, HRP, and LiP as per McEldoona, -- 59 Table 3-29 Redox potential of Several Heme Proteins as per Millis and Cai , ------------ 61 Table 3-30Radioactivity Recovered from 14C Labeled Dyes as per Paszczynski---------- 73 Table 3-31 14C- Labeled Azo Dyes Degraded by P. chrysosporium as per Spadro------- 74 Table 3-32 Redox Systems of White-Rot Fungi ------------------------------------------------ 78 Table 3-33 Decolorization (%) of Dyes by Fungi and Lignin Peroxidase as per Young- 81 Table 3-34 Redox Potentials for Delignification Enzymes and Chemicals as per Call -- 86 Table 6-1 Concentrations of Dye Samples and Stock Solutions----------------------------- 96 Table 7-1 Comparison of Peroxidases---------------------------------------------------------113 Table 7-2 % Decrease in Absorbance Area at Various pHs --------------------------------114 Table 7-3 Reduction in Signal Intensity Following Treatment with Lac/ABTS or SBP -129 Table 7-4 Bleaching Treatments Applied to Colored Pulps --------------------------------139

TABLE OF EQUATIONS
Equation 1 Calculation of Tristimulus Values as per Marcus------------------------------- 13 Equation 2 Calculation of CIE L*, a*, b* Coordinates from Sharpe45--------------------- 13 Equation 3 Conversion Between IU and Kat -------------------------------------------------- 48 Equation 4 Conversion Between IU and Kat -------------------------------------------------- 95 Equation 5 Calculation of Hydrogen Peroxide Concentration------------------------------ 96 Equation 6 Dye Removal Index Calculation --------------------------------------------------104 Equation 7 Distance from Ideal Bleach Point ------------------------------------------------108 Equation 8 Amount of Color Removal --------------------------------------------------------108 Equation 9 Dye Removal Index (DRI) ---------------------------------------------------------108 Equation 10 Calculation of Hydrogen Peroxide Concentration ---------------------------134 Equation 11 Dye Removal Index Calculation ------------------------------------------------136
LIST OF ABBREVIATIONS
ABTS 2-2´ azinobis (3-ethylbenzthiazoline-6-sulfonate)
cs Consistency (wt% pulp in slurry)
FAS Formamidine sulfinic acid
HBT 1-Hydroxybenzotriazole
HRP Horseradish Peroxidase
LMS Laccase-mediator system
o.d. Oven-Dried
VA Violuric acid
VtA Veratryl Alcohol
SBP Soybean Peroxidase

KRISTINA KNUTSON PHD THESIS 2/22/2006 PAGE 1
1 ABSTRACT
Modern manufacturing processes assume efficient utilization and recycling of
natural resources whenever possible. Over the past decade paper recycling has progressed
from 33.5% in 1990 to just above 48% in 2002.1 Indeed, for certain select grades,
(newspaper and old corrugated containers) greater than 70% is currently being recycled.
In contrast, mixed office waste and colored directory papers are often underutilized. A
major difficulty in recycling these grades of paper is the problems associated with
decolorizing the dyes present in the paper.2 Of the commonly used paper dyes, the
stilbene dye Direct Yellow 113 and methine dye Basazol 46L are notorious4 for poor
bleachability with the commonly used chemical bleaching agents including chlorine
dioxide, oxygen, hydrogen peroxide and sodium dithionite.
The ability of white-rot fungi to decolorize colored effluents containing textile
dyes is currently the subject of intensive research efforts. The secreted enzymes involved
in dye decolorization include manganese peroxidase, lignin peroxidase and laccase.
Laccase, a lignolytic enzyme, has also been studied for many years for the biobleaching
of wood pulps. The ability of laccase to delignify pulp is greatly enhanced by the addition
of small molecule mediators such as 2-2´ azinobis (3-ethylbenzthiazoline-6-sulfonate)
(ABTS) and 1-hydroxybenzotriazole (HBT).
This research project focused on applying laccase combined with a mediator to
decolorize C.I. Direct Yellow 11 and Basazol 46L. Three mediators were tested: ABTS,
HBT and violuric acid. Laccase/ABTS was most effective with 60% of the color being
removed. The level of color removal was maintained at 60% even when ABTS
concentration was lowered from 5 mM to 0.01 mM. When laccase/1 mM ABTS was
applied to Direct Yellow 11 in solution, the majority of color loss occurred within 60
minutes.
The ability of soybean (SBP) and horseradish (HRP) peroxidases and laccase to
decolorize Direct Yellow 11 and Basazol 46L in solution was also examined. The results
demonstrated that these two recalcitrant dyes could be effectively decolorized by
enzymatic treatments by horseradish peroxidase, soybean peroxidase, and laccase with

KRISTINA KNUTSON PHD THESIS 2/22/2006 PAGE 2
ABTS as mediator. SBP is effective from pH 4.5 to 8.5. The stilbene dye Direct Yellow
11 responded to both SBP and laccase/ABTS. For the methine dye Basazol 46L, SBP was
a more effective treatment than HRP or laccase/ABTS. Basazol 46L responded quickly to
SBP treatment with 74% reduction in signal intensity within 5 minutes.
To evaluate the effectiveness of laccase/ABTS treatment, pulp dyed with Direct
Yellow 11 and three commercial colored pulps were subjected to seven different
bleaching treatments. These treatments consisted of 1)laccase/ABTS; 2)laccase/ABTS
followed by alkaline extraction; 3)laccase/ABTS followed by bleaching with sodium
dithionite; 4)oxygen bleaching; 5)oxygen bleaching followed by dithionite treatment;
6)alkaline hydrogen peroxide bleaching; and 7)alkaline peroxide bleaching followed by
dithionite treatment. The best results were obtained by including reductive bleaching with
sodium dithionite. For Direct Yellow 11 dyed pulp, laccase/ABTS followed by dithionite
yield comparable reduction in color to oxygen or peroxide followed by dithionite.

KRISTINA KNUTSON PHD THESIS 2/22/2006 PAGE 3
2 INTRODUCTION
Many factors converge to spur increases in the recycling of paper. Managers of
municipal solid waste systems5 prefer recycling because recycling reduces the volume of
material they must handle. Paper mills prefer to lower their fiber cost by incorporating as
much low cost fiber as the desired product quality will allow. Many consumers set aside
their newspapers, magazines and loose papers to be recycled because they wish to help
the environment. However, the different types of wastepaper are not equally valuable,
From the viewpoint of wastepaper recyclers, colored ledger paper and mixed
office waste contain desirable high-quality chemical pulp fibers. For environmental,
landfill management and public policy reasons, the large number of telephone directories
printed each year warrant the collection and recycling of outdated directories. However,
the dyes in these types of wastepaper complicate their recycling and limit both the
recycling of these types of wastepaper and the quality of fiber that can be produced from
them.
Paper dyes are highly colored and have a strong affinity to cellulose. Recycling
mills often use both oxidative and reductive bleaching stages to remove or reduce the
color of wastepaper fibers. Some dyes respond very poorly to the bleaching chemicals.
This project focused on two dyes that are considered unbleachable by current methods.
One of these dyes is C.I. Direct Yellow 11, which is applied to fine papers with chemical
pulps. The other dye is Basazol Yellow 46L (C.I. Basic Yellow 96), which the dye most-
commonly used to produce yellow directory paper.
White-rot fungi and their lignolytic enzymes such as manganese peroxidase,
lignin peroxidase and laccase have been studied for their ability to decolorize textile
dyes.6 These same enzymes have been scrutinized for delignifying wood pulp. When the
ability of laccase to bleach kraft pulps was examined, a minimal delignification response
resulted due to the size of the enzyme and its inability to diffuse into the secondary wall
of a pulp fiber.7 The addition of a small molecule mediator has been found to greatly
enhance the ability of laccase to delignify wood pulp. Bourbonnais and Paice8 introduced
the first mediator, ABTS (2-2′ azinobis-(3-ethyl benzthiazodine) in 1990. Their studies

KRISTINA KNUTSON PHD THESIS 2/22/2006 PAGE 4
found that a laccase-ABTS system could selectively remove as much as 32% of the
residual lignin in both softwood and hardwood kraft pulps. Later, a new class of
mediators containing the N-OH moiety was introduced. Call found 1-
hydroxybenzatriazole (HBT) to be the most effective one.9 With HBT as mediator,
delignification levels as high as 60% were obtained for both softwood and hardwood
kraft pulps in a single stage.
The goal of this project was to determine whether the laccase-mediator system or
peroxidases similar to the peroxidases in lignolytic fungi could effectively decolorize the
recalcitrant dyes Direct Yellow 11 and Basazol 46L.

KRISTINA KNUTSON PHD THESIS 2/22/2006 PAGE 5
3 LITERATURE REVIEW
First, wastepaper recycling and problems due to color from dyed papers will be
discussed. Next, the basics of color and dye chemistry will be examined. Enzymes, their
types and requirements will then be discussed. Peroxidase and laccase enzymes will be
described followed by a brief review of the laccase-mediator system applied to bleaching
virgin pulps. Finally, decolorization of dyes by intact fungi and isolated enzymes will be
discussed.
3.1 OVERVIEW OF WASTEPAPER RECYCLING
3.1.1 METHODS
A number of processes are used during paper recycling to remove undesirable
material and produce clean fibers. The necessary actions are listed in Table 3-1. To
remove large and/or dense contaminants, mechanical screens and centrifugal cleaners are
used.
The removal of ink and other small particles can be done by washing and/or
floatation deinking. Washing removes hydrophilic particles around 1-100 microns in
size.10 Floatation removes larger, hydrophobic particles, around 10-1000 microns in size.
The washing and floatation deinking processes may also be combined.
Table 3-1 Actions Performed During Paper Recycling
Removal of contaminants (ex: sand, plastic, styrofoam) Repulping/swelling of cellulose fibers Deinking Bleaching to remove color (for fine paper products)
In addition to washing and floatation, ink may also be removed enzymatically.
Low concentrations of cellulases are used to attack the fiber and release attached ink11
Other enzymes have also been used.12 Xylanases attack hemicellulose that may be on the
fiber surface. Lipases attack fats and can release vegetable oil-based ink from fibers.

KRISTINA KNUTSON PHD THESIS 2/22/2006 PAGE 6
To reduce the size of remaining visible ink specks after deinking, a hot dispersion
system is also commonly used. To obtain high quality fiber, deinking may be followed by
bleaching. To benefit from bleaching, the furnish must contain a low percentage of
mechanical pulp.13
3.1.2 TYPES OF FURNISH
Wastepaper for recycling is divided into many different grades.14 The grade
classification information (Table 3-2) can include the original use, fiber type, quality,
source and materials applied. The numerous grades of wastepaper can be classified into
two broad groups: News Grades and High or Ledger Grades (Table 3-3).
Table 3-2 Wastepaper Grade Information According to Garbutt14
The original use of the wastepaper (News, Computer Printout). The fiber type contained in the wastepaper (Mixed Groundwood Shavings, Printed Bleached Sulfate Cuttings). The quality of the wastepaper (Special News, Deink Quality, Sorted White Ledger). Materials applied to the wastepaper (Coated Groundwood Sections, Coated Book Stock). The source of the wastepaper (Over-issue News, Hard White Envelope Cuttings).
Table 3-3 Major Wastepaper Categories According to Garbutt 14
1.News Grades – wastepaper grades typically consumed in deinking plants producing deinked pulp for newsprint manufacture – usually high percentage of groundwood 2.High Grade or Ledger Grades – wastepaper grades typically consumed in deinking plants producing deinked pulp for manufacture of printing and writing papers or tissue products – varies considerably in quality but usually has high percentage chemical pulp
Each grade also has a specified maximum percentage of outthrows and
prohibitive materials. Prohibitive materials include high-density contaminants, (e.g.
rocks, tin cans, glass), wood (e.g. wood chips, plywood pieces, studs) low density
contaminants (e.g. styrofoam, rubber bands) and adhesives (e.g. pressure sensitive, hot
melt and plastic adhesives). The market value of different wastepaper grades depends on
a number of factors including the amount of contaminant materials and the fiber quality.
Table 3-4 Market Value Factors for Wastepaper According to Garbutt 14
The optical properties of the fibers in the wastepaper (brightness, color, etc.) The types of fiber contained in the wastepaper (mechanical fibers, chemical fibers) The types of materials applied to the fibers contained in the wastepaper
KRISTINA KNUTSON PHD THESIS 2/22/2006 PAGE 7
(clay-based coatings, laser inks, etc.) The presence and amount of various other types of wastepaper. The presence and amount of contaminant materials in the wastepaper.
3.2 RECYCLING OF COLORED WASTEPAPER
The demand for recycled paper continues to grow. However, a significant amount
of high quality wastepaper is contaminated with colored dyes that are difficult to
remove.15 In a 1998 survey of industrial professionals, bleaching and color stripping was
identified as the most problematical area.16
3.2.1 PROCESS OF COLOR STRIPPING AND BLEACHING
Removing colored dyes from wastepaper consists of two processes. (Table 3-5)
Table 3-5 Dye Removal Processes
1. Color stripping – release of attached colored material from the fibers into the solution 2. Bleaching or decolorization – destruction of the dye’s ability to absorb visible light
Color stripping allows dyes to be washed away. However, color-stripping alone is
usually not enough. Most paper dyes have a high tinctorial strength (high molar
absorptivity). Removal by simple dilution and washing would require an excessive
amount of water.
Bleaching and decolorization both refer to the destruction of light-absorption
capacity. This process is commonly called bleaching when dealing with pulp
suspensions. In effluent treatment, the destruction of light-absorption capacity is referred
to as decolorization. Decolorization can occur while dye molecules are still associated
with the fiber. The fragmentation of large dye molecules can result in the formation of
smaller compounds that do not absorb visible light but which are still attached to fiber.
Chemicals that improve the brightness of recycled pulp can color-strip, bleach or both.
3.2.2 CURRENT BLEACHING METHODS IN WASTEPAPER RECYCLING
A number of different bleaching agents are commonly used in recycling mills to
remove color. (The oxidative potentials for bleaching agents are given in Table 3-6 and
the reactions are shown in Table 3-8, page 9). The majority of recycle mills process old

KRISTINA KNUTSON PHD THESIS 2/22/2006 PAGE 8
corrugated containers and newsprint so their major color source is chromophores
generated from lignin. The color from dyed papers cause problems for recycle mills
producing high brightness papers from furnishes that include mixed office waste and
directory papers.
Table 3-6 Bleaching Agents for Recycled Fiber
Oxidizing Agents D Chlorine dioxide H Sodium hypochlorite O Oxygen bleaching P Hydrogen peroxide bleaching Z Ozone bleaching
Reducing Agents FAS Formamidine sulfinic acid
(thiourea dioxide) Y Sodium hydrosulfite (dithionite)
Table 3-7 Oxidation Potentials of Bleaching Agents as per Bierman and Kronis17
Species Structure Standard Oxidation Potential (Volts)
Potential Relative to Chlorine (Cl2 = 1.00)
Acidic solution (or pH is not relevant) Ozone O3 2.07 1.52 Permanganate MnO4
- 1.77 1.30 Hypochlorous acid HOCl 1.63 1.20 Chlorine dioxide ClO2 1.57 1.15 Peroxymonosulfate HSO5
- 1.44 1.06 Chlorine Cl2 1.36 1.00 Peracetic acid CH3CO3H 1.06 0.78 Basic solution Hypochlorite ClO- 0.89 0.65 Hydrogen peroxide H2O2 0.88 0.65 Oxygen O2 0.41 0.30 Reducing agent Hydrosulfite S2O4
2- -1.12 --- Hypochlorite has been the major bleaching agent in recycling mills using
chemical pulps. Sodium hypochlorite is relatively effective and inexpensive. However,
the use of hypochlorite is being phased out because hypochlorite bleaching creates
chloroform. Chlorine dioxide can replace sodium hypochlorite,18 but chlorine dioxide

KRISTINA KNUTSON PHD THESIS 2/22/2006 PAGE 9
generators are expensive and the pulp can not be labeled ‘environmentally friendly’ or
‘chlorine-free.4
Table 3-8 Reactions of Bleaching Agents as per Bierman and Kronis17 a
Oxidizing Agents
Chlorine Cl2 + 2e- → 2Cl- Eo = 1.36 V
Chlorine Dioxide ClO2 + 4H+ + 5e- → Cl- + 2H2O Eo = 1.57 V
pH 4 b c Eo = 1.38 V
(Na) Hypochlorite ClO- + H2O + 2e- → Cl- + 2OH- Eo = 0.89 V
Oxygen (basic) b O2 + 2H2O + 4e- → 4OH- Eo = 0.41 V
Oxygen (acidic) O2 + 4H++ 4e- → 2H2O Eo = 1.230 V
Ozone (acidic) b O3 + 2H+ + 2e- + O2 → H2O Eo = 2.07 V
Ozone (basic) O2 + H2O + 2e- → O2 + 2OH- Eo = 1.24 V
Hydrogen peroxide
(acidic) b H2O2 + 2H+ + 2e- → 2H2O Eo = 1.78 V
(basic) H2O2 + 2 e- → 2OH- Eo = 0.88 V
Peroxymonosulfuric acid (Caro's Acid)
HSO5- + 2H+ + 2e- → HSO4
- + H2O Eo = 1.44 V
Peracetic acid
CH3COOOH + 2H+ + 2e- → CH3COOH + H2O Eo = 1.06 V
K Permanganate
MnO4- + 8H+ + 5e- → Mn2+ + 4H2O Eo = 1.77 V
Reducing Agents
Hydrosulfite (Dithionite)
2SO32- + 2H2O + 2e- → S2O4
2- + 4OH- Eo = -1.12 V
pH 5-6b → Eo = -0.88 V
Formamidine Sulfinic Acid (FAS or thiourea dioxide)
NH2CONH2 + H2O + HSO3- + 2e- → NH2C(=NH)SO2H + 3 OH-
At pH 10, 20°C, vs. Pt//Ag/AgCl, v = -0.80 a Eo is standard reduction potential relative to hydrogen

KRISTINA KNUTSON PHD THESIS 2/22/2006 PAGE 10
b Reaction conditions normally used c Cell potential depends on relative concentrations of Cl species, which varies with pH
In theory, oxygen bleaching can produce a bright ‘chlorine-free’ pulp. However, a
pressure vessel capable of 25-115 psig is required. High concentrations of groundwood
result in 10-20% yield loss and insufficient bleaching.19 Air Products and Chemicals2 is
marketing the technology under the trade name OXYPRO OR.
Ozone continues to be explored for bleaching recycled fibers.20,21,22,23,24 In some
applications, ozone is desirable because it can both bleach and disinfect recycled
(secondary) pulps.25,26 Ozone bleaching has been limited by the prohibitive cost of the
ozone generator and other ancillary equipment. The poor selectivity of ozone bleaching is
another limiting factor. Ozone reacts with many compounds present in recycled furnish
such as kraft lignin, uncooked lignin, dyes and other oxidizable material. Since ozone
reacts with lignin and reduces yield, it is not used to treat wastepaper furnishes with high
mechanical fiber content.13 Yamamoto et al.27 found that bleaching waste copy paper
with ozone reduced the halogen content of the pulp when compared to pulp deinked by
standard methods. However, they also report a significant decrease in the pulp viscosity
during ozone treatment. Economou28 applied ozone based TCF bleaching sequences to a
recycled wastepaper mixture containing about 12% mechanical pulp. He did obtain a
color stripped high brightness pulp, but he also limited ozone consumption to less than
1.3% to limit fiber damage. Ozone has been reported to be effective29 for decolorizing
spent whitewaters from papermachines producing strongly colored papers. However,
Archibald and Roy-Arcand did also note that of the 15 direct dyes they tested, 29 “a few
of the yellow stilbene and azo dyes were quite resistant.”
Hydrogen peroxide is widely used, especially when recycling wastepaper
containing mechanical pulp. Peroxide can be added at the pulping stage, in the disperser
after deinking,30 or later, in a bleaching tower. Peroxide will brighten pulp, but it is poor
at dye stripping.4 To remove color, a reductive bleaching stage is often added. Any
residual peroxide present will consume reducing agents. Sulfur dioxide or sulfuric acid is
often added between bleaching stages to destroy residual peroxide.4

KRISTINA KNUTSON PHD THESIS 2/22/2006 PAGE 11
Most dyes do not react with oxidative reagents.13 Consequently furnishes with
significant amounts of colored ledger paper or yellow directory paper require the addition
of a reductive bleaching stage. The most common reducing agent is sodium hydrosulfite
(sodium dithionite). This compound easily reduces oxygen. Appreciable amounts of
oxygen must be absent for effective application.31 Hydrosulfite bleaching is reasonably
flexible and can be used with or without prior peroxide addition.4
Another common reducing agent is FAS. Formamidine sulfinic acid (FAS) is also
called thiourea dioxide. It requires the presence of caustic. FAS bleaching can replace
hydrosulfite bleaching or be used in addition to it. FAS is a relatively powerful reducing
agent. It is capable of disrupting and decolorizing the chromogens in most dyes. It should
be noted that bleaching with FAS or sodium dithionite alone has been reported32 to
increase the yellowness of the pulp even as it improved the lightness. In a direct
comparison, based on optical properties, Ackerman33 et al. report ozone and oxygen
treatments offered no additional benefits when compared to peroxide combined with
sodium dithionite or FAS.
New bleaching methods continue to be developed and tested such as direct
borohydride injection.34,35 In this process, solutions of sodium bisulfite and sodium
borohydride are added sequentially and directly into a recycled paper pulp stream in
medium or high consistency mixing equipment at high temp. Tests at recycle mills have
been positive36 or inconclusive37 Other bleaching processes recently patented include
reductive bleaching with hydroxymethanesulfinic acid, 38 and bleaching with a
peroxyacid39 followed by treatment with a reducing agent such as sodium dithionite. The
peroxyacid is generated in situ by reaction of a peroxygen bleaching agent, such as
hydrogen peroxide, with a bleach activator, such as an acylated amine, (e.g..
tetraacetylethylenediamine). Recently developed improvements for peroxide bleaching
include adding aldehyde donors,40 metal substituted xerogels41 or polymers.42 The
continued development of new bleaching technologies suggests that color removal
continues to be a problem for recycling paper.

KRISTINA KNUTSON PHD THESIS 2/22/2006 PAGE 12
3.3 PROBLEMS WITH RECYCLING COLORED WASTEPAPER
Yellow directory and colored ledger (office) paper are two high-quality fiber
grades that are difficult to recycle.15 The major difficulty with these grades is not the
removal of ink but the removal of dye. Generally, basic dyes are used for mechanical and
unbleached pulp. Acid, cationic, and direct dyes are used for bleached chemical pulps.15
In terms of one specific color, yellow directory is probably the most studied grade.43
3.3.1 MEASUREMENT OF COLOR
The perception of color is a human phenomenon. It depends on the brain’s
interpretation of signals received from the eyes. To enable quantitative comparison
between samples, quantitative testing methods had to be developed. Absorption,
reflection, transmission and scattering of light are physical phenomena that can be
measured quantitatively. To relate the physical measurements to the human perception of
color, the International Commission on Illumination (Commission Internationale de
l’Eclairage, CIE) developed the tristimulus system. Individuals were shown light of a
specific wavelength and asked to mix red, blue and green light to match the color. The
results of these tests were averaged and became the basis for CIE 10° Standard Observer
color matching functions.
The CIE color matching functions relate the human perception of color to the
spectral reflectance curve of objects. The reflectance or transmittance spectrum of a
sample are combined with emission spectrum of a standard illuminant and the CIE
Standard Observer color matching functions to calculate the tristimulus values X, Y, and
Z (Equation 1). P (λ) is the value of the spectral power distribution of the light source at
wavelength λ. R (λ) is the reflectance factor of the sample at wavelength λ.⎯x (λ),⎯y
(λ),⎯z (λ) are the CIE color matching functions for the Standard Observer at wavelength
λ. The factor κ normalizes the tristimulus value so that Y will have a value of 100 for the
perfect white diffuser (a theoretical material that reflects or transmits 100% of the
incident light). Most modern colorimeters automatically calculate the tristimulus values
X, Y, and Z.

KRISTINA KNUTSON PHD THESIS 2/22/2006 PAGE 13
Equation 1 Calculation of Tristimulus Values as per Marcus44
X = κ ΣP (λ)⎯x (λ) R (λ) Y = κ ΣP (λ)⎯y (λ) R (λ)
Z = κ ΣP (λ) ⎯z (λ) R (λ) κ = 100 / ΣP (λ) ⎯y (λ)
The CIE color space is complex and hard to understand. Consequently, other,
more easily understood color spaces have been developed based on transformations of
CIE tristimulus values. Richard Hunter developed the L, a, b color space (Figure 1, page
14). This system has been improved to produce the CIE L*, a*, b* system. The
calculation of CIE L*, a*, b* values are shown in Equation 2.
Equation 2 Calculation of CIE L*, a*, b* Coordinates from Sharpe45
L* = 116 (Y/100) 1/3 –16 ΔE = {(ΔL) 2 + (Δa) 2+ (Δb) 2] 1/2
a* = 500 [(X/98.04) 1/3 – (Y/100) 1/3] b* = 200 [(Y/100) 1/3 – (Z/118.1) 1/3]
When testing a sample, a colorimeter will measure the sample reflectance,
determine the tristimulus values and calculate the CIE L*, a*, b* values. The CIE L*, a*,
b* values quantitatively describe the appearance of a reflecting surface. However, the
observed color is the result of absorbance of all materials in the surface. Identical CIE
L*, a*, b* values may result from different combinations of absorbing chemicals.
3.3.2 MEASUREMENT OF DYE REMOVAL
The TAPPI brightness measurement (commonly used to test virgin fibers) does
not measure color because it depends on the blue portion of the visible spectrum. To
accurately characterize colored fibers and sheets, a colorimeter that determines the
tristimulus values should be used. Color measurements in the paper industry are usually
based on the CIE L*, a*, b* system (Figure 1). L* is a measure of the lightness/darkness
of a paper sheet (L*=100 = maximum lightness). The a* value quantifies how red/green
the sheet is while b* describes the relative blue/yellowness of the sheet. The geometric
distance, R, between the L*a*b* values for a sheet and the ideal bleach point (where
L*=a*=b*=0) is measure of the intensity of color in the sheet. The dye removal index45
(DRI) for a bleaching process is based on the change in R that occurs during the
bleaching process. The dye removal index is expressed as a percentage of the original

KRISTINA KNUTSON PHD THESIS 2/22/2006 PAGE 14
-b
-a
+a
Yellow
+b
+L
-L
Lighter
Green
Blue
Darker
Red
distance from the ideal bleach point. The DRI does not give the direction of the color
change, but rather measures how much color was removed. Calculation of the dye
removal index is discussed more fully in the experimental procedure section.
Figure 1 L, a, b Color Space Based on Sharpe45
3.3.3 RECYCLING STUDIES OF TELEPHONE DIRECTORIES
About 750,000 tons of old telephone directories are available each year for
collection and recycling.46 Directory paper is a specialty lightweight uncoated paper. The
majority of the pulp furnish is mechanical pulp, but clay (for opacity) and chemical pulp
(for strength) are included. The yellow color is achieved either by adding dyestuff in pulp
during production, or by using color ink to tint white paper yellow during printing.46
Although other dyestuffs are available that are more bleachable,15 the dyestuff most
commonly used is Basazol Yellow 46L47 The commonly used dye dosage is 0.2 to 0.4%
wt (4 to 8 lb. /ton.)48 Sutman in 1992,48 Dumont et al. in 1994,15 and Marchildon et al. in
1996,49 report moderately effective color removal from yellow directory paper by
reductive bleaching with sodium hydrosulfite (Sutman, Dumont) or with formamidine
sulfinic acid (Marchildon). However, Cao et al. reported at the TAPPI 2000 Recycling
Symposium46 that they were unable to bleach old telephone directories with FAS or
hydrosulfite. The reaction conditions and results from these papers are summarized in
Table 3-9.

KRISTINA KNUTSON PHD THESIS 2/22/2006 PAGE 15
3.3.3.1 Study of recycling complete telephone directories by Sutman48
Sutman’s48 experiments were designed to examine the quality of recovered pulp
from recycling complete old telephone directories. In addition to bleachability, Sutman
assessed stock deinking, binder glue repulpability, and cover stock repulpability. Wash
deinking and combination flotation/wash deinking were investigated on the laboratory
and pilot plant scale, using the directory white pages.
Sutman’s bleachability study was performed at the laboratory scale only. Sodium
hydrosulfite at 1% wt (20 lb. /ton) was added to 1% consistency pulp at pH 5, 60° C
(140° F) and allowed to react for 60 minutes. Most color stripping happened within the
first 15 minutes. Both printed and unprinted yellow pages were treated. Sutman reported
“excellent removal of the yellow tint.” The Hunter “b” value is a measure of ‘yellowness’
of paper. For unprinted yellow pages, Sutman reported that hydrosulfite bleaching
reduced the Hunter b value from +26.2 to +11.4. The Hunter “b” value for unbleached
groundwood stock is normally about +10. Sutman reported that yellow directory samples
from several sources were tested and produced similar results. Based on his laboratory
tests with unspecified yellow directory samples, Sutman concluded, “Color removal from
deinked yellow pages stock should not be a concern, as long as a properly designed
reductive bleaching system is used.”
3.3.3.2 Study of dyes to allow recycling of directory paper by Dumont15
The publication by Dumont15 and her colleagues at Hoechst Celanese was based
on work performed at the request of three different paper mills. The work was focused on
using sodium hydrosulfite to remove dyes during recycling yellow directory broke (Mill
1 and 2) and colored ledger paper (Mill 3). Unlike Sutman’s study, the dyes were
specified.
Mill 1 wanted to be able to easily color-strip their yellow directory broke and
asked Hoechst Celanese for help. Two dyes were under consideration: Basazol Yellow
46L and Calcozine Yellow 9G. Bleaching tests were performed under laboratory
conditions. Enough colorant was added to 2.5% consistency pulp to produce a b* value

KRISTINA KNUTSON PHD THESIS 2/22/2006 PAGE 16
close to 35 points. The hydrosulfite dosage, retention time, temperature and pH were
varied. Under the mill’s conditions, (pH 4.6, 38°C), 1% dosage of hydrosulfite reduced
b* only 5 points, (from b* 35 to 30), in 30 minutes for Basazol dyed pulp. To reduce b*
values from 35 to 15 with 1% hydrosulfite required 120 minutes at 70°C if Basazol
Yellow 46L was used and less than 30 minutes at 60°C if Calcozine 9GL was used.
The second mill used Astra Yellow 4GN dye for producing a yellow directory
paper. They wished to reduce changeover time when switching from the yellow grade to
newsprint. Dumont et al. report how mixed pulp, broke and whitewater responded to
different dosages of hydrosulfite at 50°C and 60°C. With 1.2% sodium hydrosulfite at pH
5.0, the b* value could be reduced from 33 to 15 in 120 minutes. The consistency of the
blended pulp was 2.8% and the temperature 60°C. Dumont’s results indicate that, when
optimized, reductive bleaching can remove the color from yellow directory. However, of
the three dyes mentioned, the one hardest to bleach, Basazol Yellow 46L, is also the most
commonly used dye for yellow directory.47
3.3.3.3 Study of bleaching yellow directory paper with FAS by Marchildon49
Sutman and Dumont both used sodium hydrosulfite at acidic pHs. Marchildon et
al.49 used formamidine sulfinic acid (FAS) in alkaline solution to remove color. The pulp
was 8% consistency and the bleaching equipment was laboratory scale. The publication
date and location of the yellow telephone directories are specified, but the dye in the
furnish is not. Marchildon et al. performed a statistical experiment where FAS
concentration and the sodium hydroxide charge were independently varied. The data was
used to generate three dimensional response surfaces and to calculate coefficients for
second order regression equations. Four response variables were tested: change in ISO
brightness, change in b* value, burst index and breaking length. Since only the changes
in b* values are reported, it unknown whether Marchildon's initial deinked unbleached
pulp was as strongly colored as the furnishes used by Sutman and Dumont. Sutman and
Dumont report conditions where b* values about 35 were reduced to b* 15, a decrease of
20 points. Marchildon’s maximum reported change in b* values was a decrease of 8
points.
KRISTINA KNUTSON PHD THESIS 2/22/2006 PAGE 17
3.3.3.4 Study of recycling telephone directories with floatation cell by Cao46
To gain operational experience with a new generation laboratory flotation cell,
Cao et al.46 investigated the properties of old telephone directories from three different
printings. The telephone directories were separated into white pages, yellow pages, cover,
inserts, and binder. The weight percent, ash content, and fiber quality were determined
for each type. Since the basis weight of directory paper is lower than newsprint, Cao
calculated that directories would contain 20% more ink per weight than newsprint. The
new flotation cell was able to removal ink, but the higher ink concentration required more
calcium ions (harder water) than newsprint requires.
The brightness and color of unprinted white and yellow pages were determined
for each of the three printings. The b* values found ranged from 24.65 to 30.27 for the
yellow pages and 7.52 to 8.50 for the white pages. When complete telephone directories
were pulped, the calculated weight-averaged b* value for the feed furnish was 19.7. Cao
calculated that 90% of the ink was removed by flotation deinking. The deinking process
decreased the b* value from 19.7 to 9.7. The deinked pulp was then reductively bleached
with hydrosulfite or FAS For the hydrosulfite bleaching, a 1% dosage was added to 12%
consistency pulp at pH 6.6, 140°F (60°C), and allowed to react 45 minutes. For FAS
bleaching, the initial pH was 10, temperature 177-188°F (80-87°C) and reaction time 30
minutes. Dosages of 1% or 2% FAS were applied to 15% consistency pulp. No brightness
gain was observed after bleaching. Cao et al. concluded that the yellow color in old
telephone directories “cannot be stripped with current bleaching chemicals.”46 According
to the 1996 environmental council action plan of the Yellow Pages Publishers’
Association, publishers throughout the industry have been switching from dyed yellow
pages to printed yellow pages. Printing inks are often based on insoluble pigments rather
than soluble dyes. Cao et al. suggest that they observed no effect from reductive
bleaching because the 1998 telephone directories they used may have been printed yellow
rather than dyed.
Table 3-9 summarizes the bleaching conditions used and the results obtained for
Sutman, Dumont et al., Marchildon et al. and Cao et al. The extent of bleachability of
yellow directory paper is not clear. Dumont’s work shows that the basic yellow dyes

KRISTINA KNUTSON PHD THESIS 2/22/2006 PAGE 18
differ in bleachability. It appears that reductive bleaching has worked in the past when
optimized, but the dyes in the paper are unspecified. Basazol Yellow 46L is considered
unbleachable.50 Since this dye is cheap and tinctorially strong, it is still the most common
dye for directory paper.47 Therefore, bleaching directory paper remains problematic.
Whether the trend towards publishers printing the yellow color will ease or complicate
the recycling of yellow directories remains to be determined.
Table 3-9 Comparison of Published Yellow Directory Bleachability Studies
Author Reducing Agent, pH Temperature, °C, °F
Retention Time
Pulp Consistency
Change in b*
Sutman Hydrosulfite, 1 wt%, pH 5 60°C, 140°F 60 min 1% 14.8 Dumont Mill 1
Hydrosulfite, 1 wt%, pH 4.6 (Basazol) pH 4.9 (Calcozine)
70°C, 158°F 60°C, 140°F
120 min 30 min
2.5% 20 25
Dumont Mill 2
Hydrosulfite, pH 5, 1.2 wt%, (Astra)
60°C, 140°F 30 min 2.8% 20
Marchildon FAS, 0.25-0.75%, NaOH, 0.15-1.05%
25-75°C, 77-167°F
20 min 8% Up to 8
Cao Hydrosulfite, 1 wt%, pH 6.6 start, 6.9 end
60°C, 140°F 45 min 12% < 1
Cao FAS, 1 and 2 wt% pH 10 start, 7 end
80-86°C, 177-188°F
30 min 15% Increase ≈ 1
3.3.4 RECYCLING OF MIXED OFFICE WASTE
Recycling colored ledger or mixed office waste containing color continues to be
difficult. Figure 2 compares the effectiveness of different bleaching agents used as single
stages on a mixed office waste pack. In Figure 2 high brightness values were obtained but
the furnishes contained only 8.5% colored ledger paper.
Table 3-10 shows that the final pulp brightness is much lower when ‘pure’
unmixed colored furnishes are used.

KRISTINA KNUTSON PHD THESIS 2/22/2006 PAGE 19
60 65 70 75 80
Original
Z 1%
P 2%
FAS 8.4%
Y 1%
H 1%
Brightness %
Figure 2 Single Stage Bleaching Results According to Ferguson4
Table 3-10 Bleaching of Unmixed Office Wastes Results According to Ferguson4 % Brightness After Treatment
Raw Material Type Original Deinked FAS 0.5% P 1% H 2% Mixed Office Waste 62.1 81.5 66.7 81.8 Colored Ledger 65.5 80.7 69.0 79.7 File Stock 54.3 72.3 61.5 71.0 Goldenrod 15.0 40.5 22.8 20.2
Bleaching goldenrod wastepaper with FAS did produce significantly brighter pulp
than did bleaching with hypochlorite or peroxide. However, even after bleaching, the
pulp from goldenrod paper was still darker than unbleached pulp from mixed office
waste. Goldenrod office paper is dyed with a stilbene yellow dye which is “one of the
notorious dyes in office wastepaper recycling.”4 Although all dyes vary in their
bleachability, yellow dyes are particularly troublesome. Stilbene dyes such as C.I. Direct
Yellow 11 and Direct Orange 15 are considered “unbleachable under normal bleaching
conditions”.51 To increase recycling of mixed office waste, a way to bleach these dyes
must be developed.
In 1991, Michael Cheek52 tested common bleaching agents for the ability to
removal color from a number of dissolved pure direct dyes. He bleached 24 dyes with 2
and 4% chlorine, at pH 4 and 8. Only two dyes out of 24 did not have 90% or greater
color removal under at least one of the four conditions tested. He also bleached dyes with
sodium hydrosulfite, FAS, and hydrogen peroxide. Hydrogen peroxide bleaching was not
very effective. Color removal was less than 60% for 8 out of 12 dyes when hydrosulfite
Furnish = 91.5 % Office Waste + 8.5 % Colored Ledger H=hypochlorite Y=hydrosulfite (dithionite) FAS = formamidine sulfinic acid P=peroxide Z=ozone

KRISTINA KNUTSON PHD THESIS 2/22/2006 PAGE 20
was used and 4 out of 15 dyes when FAS was used.52 Table 3-11 summarizes his data.
Only dyes with less than 90% color removal are listed.
Table 3-11 Results from Bleaching of Direct Dyes as Reported by Cheek 52 % Color Removal by Treatment (Dyes with removal >90% omitted)
Direct Dye H2O2 FAS Hydro sulfite
2% Avail. Cl pH 4
2% Avail. Cl pH 8
4% Avail. Cl pH 4
4% Avail. Cl pH 8
Ozone
Yellow 11 4 50(Red) 60(Red) 48 10 84 33 99 Yellow 147 16 NA 60 89 99 89 97 NA Yellow 166 42% Inc. 20 10 95 25 95 35 NA Red 236/239 6 98 80 98(Dull) 97 99(Dull) 99 NA Violet 9 0 98(Dull) 80 96(Dull) 80 98(Dull) 88 NA Blue 218 22 92(Dull) 50 97(Dull) 82(Redder) 99 96(Redder) NA Blue 86 0, Cons.
Redder 30 37 73 55(Redder) 98 92(Redder) NA
Blue 199 20% Inc., Redder
35 34 90 97 90 98 NA
To increase the utilization of wastepaper, the bleaching of dyed office and
directory papers must be improved. Examination of Table 3-11 shows that the hardest
direct dye to bleach is C.I. Direct Yellow 11. This project will focus on
bleaching/decolorization of C.I. Direct Yellow 11 (used in goldenrod office paper) and
Basazol Yellow 46L (used in telephone directories). Before examining possible
decolorization methods, the properties and characteristics of color and of dyes will be
discussed.
3.4 CHEMICAL REQUIREMENTS FOR DYES
3.4.1 ELECTRONIC REQUIREMENTS FOR COLOR
This project focused on two specific dyes. Dyes are organic compounds. Like all
organic compounds, their atomic orbitals combine to form molecular orbitals. When a
group with π orbitals (e.g. NO2 or COOH) is attached to an aromatic compound,
overlapping of the two π orbitals normally occurs, leading to new bonding and anti-
bonding states. Orbital overlapping and combination also occurs when aromatic carbons
carry substituents that have lone pair of electrons (e.g. OH, NR2, etc.)
Figure 3 shows the essential types of energy levels in two compounds. Compound
A has a pair each of σ, π and n electrons and compound B has one pair of σ and n
electrons, but two pairs of conjugated π electrons.

KRISTINA KNUTSON PHD THESIS 2/22/2006 PAGE 21
Color is produced when light is absorbed. The absorbed energy promotes one of
the electrons inhabiting the molecular orbitals to a level of higher energy. The spacing
between available bonding orbitals determines the amount of energy that can be accepted
and thus the wavelength of light absorbed. In Figure 3, the transition from the non-
bonding orbital n to the anti-bonding orbital π* requires the least energy. The n→ π
transition results in an absorption band at a longer wavelength than the π→ π* transition.
In compound B, the π orbitals are non-degenerate and the π→ π* transition corresponds
to the longest wavelength absorption band.
Figure 3 Molecular Orbitals Schematic as per Marcus 44
The degree of conjugation (number of π orbitals and electrons) determines
whether the electromagnetic radiation absorbed is within the range of visible
wavelengths. Table 3-12 demonstrates how color changes with the amount of
conjugation. The additional carbon-carbon double bonds increase the number of
delocalized π electrons and decrease the energy required for excitation. The shifting of
absorption from the ultraviolet range to the range of visible wavelengths is described as a
bathochromic shift (Figure 4).
Orbital (Symbol) Energy levels (schematic) A B Anti-bonding σ(σ*) σ* σ* π2* Anti-bonding π(π*) π* π1* π2 Non-bonding p(n) n n Bonding π(π) π π1 Bonding σ(σ) σ σ Schematic representation of energy levels. Molecule A has one σ, one π and one n electron pairs. Molecule B has one σ, one n and two conjugated π electron pairs. (Number of s electrons not specified)

KRISTINA KNUTSON PHD THESIS 2/22/2006 PAGE 22
Table 3-12 Relationship of Conjugated Double Bonds and Absorption
as Described by Rivlin53
Color of Diphenylpolyenes C6H5(CH=CH)NC6H5 (N defines the number of conjugated double bonds)
Value of N Color Value of N Color 1 None 6 Brownish orange 2 None 7 Copper-bronze 3 Pale yellow 11 Violet-black 4 Greenish yellow 15 Greenish black 5 Orange
Figure 4 Designations for Wavelength Shifts and Absorptivity Changes as per Marcus44
4 8 12 16
Wavelength
Abs
orpt
ion
3.4.2 CHEMICAL STRUCTURE OF DYE MOLECULES
All dyes are organic aromatic compounds with a conjugated double bond system,
to which chromophores and auxochromes are attached. These functional groups reduce
the number of conjugated double bonds needed for light absorption and result in
molecules that are small enough to diffuse into fibers.
Chromophores (Table 3-13) are unsaturated functional groups (except for –
NR3+). Alone, they absorb visible or near ultraviolet radiation. In a dye molecule, they
function as electron acceptors. Auxochromes (Figure 14) are saturated functional groups.
Hypochromic
Bathochromic Hypsochromic
Hyperchromic

KRISTINA KNUTSON PHD THESIS 2/22/2006 PAGE 23
Auxochromes act as electron donors because the atom attached to the conjugated system
has nonbonding electrons.
Table 3-13 Examples of Dye Chromophores From Rivlin and Burstone54,53
-NO2 Nitro group -N=N- Azo group -C=O Carbonyl group -NR3
+ Alkyl ammonium derivatives -C=C- Methylene group -C=N- Cyano group
O
O
Quinoid rings
Table 3-14 Examples of Dye Auxochromes From Rivlin and Burstone53,54
-NH2 Amino group -NHR Mono alkyl amino group-NR2 Dialkyl amino group -OH Hydroxy group -OR Ether group -NH3 Ammonium group -COOH Acetyl group -HSO3 Sulfonic acid group
Dye chromogens can be described as electron acceptor(s) (chromophores)
interacting with electron donor(s) (auxochromes) through a conjugated double bond
system. The effect of adding an auxochrome and chromophore is qualitatively discussed
in Table 3-15.
Table 3-15 Enhancing Color by Group Additions as per Fessenden55
To the left is naphthalene, a colorless compound
OH
The addition of a single hydroxyl group to naphthalene produces 1-naphthol which is also a colorless compound, but one which can ionize.
NO2
NO2
If instead of a hydroxyl group we add the nitro group, which is a chromophore, we get the compound 2, 4-dinitronaphthalene. The addition of this chromophore has caused it to become pale yellow.
NO2
NO2
OH
If instead of a hydroxyl or nitro groups, both a hydroxyl and nitro groups are added, we get the deep yellow dye, Martius yellow
The addition of both an auxochrome and a chromophore results in a much stronger alteration of the absorption maximum of the compound. The hydroxyl group must have deepened the color, showing that auxochromes are also chromophores.

KRISTINA KNUTSON PHD THESIS 2/22/2006 PAGE 24
The quantitative effects of adding an auxochromes and chromophore are
illustrated in Table 3-16. The addition of a dimethyl amino auxochrome to azobenzene
shifts the absorption to longer wavelength (bathochromic shift) and increases the molar
absorptivity (hyperchromic shift). The addition of a nitro chromophore causes both a
bathochromic shift and a hyperchromic increase in absorption.
Table 3-16 Auxochrome and Chromophore Addition Effects as per Rivlin53
Absorption Spectra of Azo Compounds λMax
nm ε Max
L mol-1 cm-1
N NAzobenzene
330 17,000
N N
C.I. Solvent Yellow 2
NCH3
CH3
408 27,500
N N
4-Nitro-4-dimethylamino-azobenzene
NCH3
CH3
O2N 478 33,100
For any chromogen, changing the electron density can cause a bathochromic shift
in absorption. In Figure 5 a typical yellow styryl dye is shown at the top. Addition of a
second cyano group shifts the absorption to produce greenish-yellow color. The addition
of a third cyano group shifts the absorption yet further to produce red color. At the
bottom of Figure 5 is shown a bright blue dye that is created if an even more powerful
electron-withdrawing group is used.
Figure 5 Bathochromic Shift with Electron-Withdrawing Groups as per Waring56
NBu
C2H4Cl
CO2EtHCHN
CI Disperse Yellow 31
NR2
R'
NCCN
NR2
R'
NCCN
Greenish-yellow color
NCBright red color
N
MeS
NC CN
O OBright blue color

KRISTINA KNUTSON PHD THESIS 2/22/2006 PAGE 25
This principle of altering dye color by adding modifying groups is shown more
clearly in Table 3-17 where a series of differently colored homologues can be produced
by the addition of methyl groups.
Table 3-17 Alteration of Color by Modifiers as Described by Burstone54
NH2H2N
NH2+
C
Without any methyl groups the parent dye is called Pararosanilin and is red
NN
NH2+
CCH3
CH3
H3C
H3C
When four methyl groups are added the result is the reddish purple dye Methyl violet.
NN
N+
CCH3
CH3
H3C
H3C
H3C CH3
As more methyl groups are added the result is the purple blue dye Crystal violet which has six such groups.
N+N
N+
C
CH3
CH3
H3C
H3C
H3C CH3
CH3
If a seventh methyl group is added, the resulting dye is Methyl green.
Dye molecules may also contain other groups in addition to chromophores and
auxochromes. Reactive dyes contain groups that form covalent bonds with cellulose.

KRISTINA KNUTSON PHD THESIS 2/22/2006 PAGE 26
Saturated hydrocarbon chain(s) may be added to increase the hydrophobicity or
molecular size. Soluble dyes will contain solubilizing groups, usually sulfonic acid
groups (-SO3-Na+). (Table 3-18)
Table 3-18 Solubilizing Groups From Johnson 57
Permanent Temporary -SO3Na -O-Na+ -COONa -OSO3-Na+ -N+H2HCl- -N+R3Cl- -OH -NH2 -SO2NH2
Onium groups e.g.
CH2SC
NR2
NR2
The important parts of a dye molecule are summarized in Figure 6.
Figure 6 Structure of Dye Molecule as Described by Rivlin53
SO3-Na++Na-O3S
HN CO
CH3OH
NN
solubilizing groupsA Soluble Azo Dye
C.I. Acid Red 1
chromophore(electron acceptor)
auxochromes (electron donors)
chromogen

KRISTINA KNUTSON PHD THESIS 2/22/2006 PAGE 27
3.4.3 FLUORESCENCE AND PHOSPHORESCENCE
An excited molecule or ion can lose the absorbed energy by 1) radiationless
transitions, such as internal conversion or intersystem crossing (observable as heat
formation) 2) emission of radiation (fluorescence and phosphorescence) and 3)
photochemical reactions. Processes 1) and 2) are represented schematically in Figure 7
Most fluorescent organic compounds are characterized by stiffness in their
structure. The stiffness prevents energy loss by torsional vibrations in the molecule. This
principle is illustrated in Figure 8. Phenolphthalein shows no fluorescence because the
excited state loses energy by internal conversion (vibrations of the benzene rings). The
ether linkage in fluorescein prevents the benzene rings from twisting. Consequently,
fluorescein is highly fluorescent.
Figure 7 Energy Absorption, Fluorescence and Phosphorescence
Schematic from Peters58
Vibration – relaxation
S1
S2
T2
T1
Intersystem crossing
Absorption hυA
Excitating light
Fluo
resc
ence
–hυ
F
Interconversion
-hυP Phosphorescence
T-T transitions
S0
Singlet states Sj
Triplet states Tj
-hυRadiating transitions Non-radiating transitions Vibrational states Electron states

KRISTINA KNUTSON PHD THESIS 2/22/2006 PAGE 28
Figure 8 Example of Fluorescence Due to Structure Stiffness From Zollinger59
C
OHO O
COO
FluoresceinStiff
Fluorescent
C
COO
OHO
PhenophthaleinFlexible
Non-fluorescent
3.4.4 CLASSIFICATION OF DYES
Dyes can be class ified by solubility, application method or by chemical
composition (Table 3-19). Only the revelant dye types will be discussed. These include
acid/anionic dyes, basic/cationic dyes and direct dyes.
Table 3-19 Dye Classifications According to Rivlin53
1. By Solubility 3. By Chemical Constitution Soluble dyes (anionic or cationic) Azo dyes and pigments (mono azo, diazo, etc.)
Anthraquinone Dyes Disperse dyes (non-ionic, very slightly water soluble) Benzodifuranone Dyes Pigments (insoluble) Polycyclic Aromatic Carbonyl Dyes 2. By Method of Application Indigoid Dyes Acid dyes (anionic) Polymethine and Related Dyes Basic dyes (cationic) Styryl Dyes Direct dyes Di- and Tri-Aryl Carbonium and Related Dyes Azoic dyes Phthalocyanines Vat dyes Quinophthalones Sulfur dyes Sulfur Dyes Reactive dyes Nitro and Nitroso Dyes Disperse dyes Miscellaneous Dyes (Stilbene and Formazan Dyes)
Of the major dye classifications, only basic and direct dyes are routinely applied
to paper. Direct dyes are substantive to cellulose and are used to color fine papers with
low-lignin-content chemical pulps. Basic dyes are cheap and have some affinity for

KRISTINA KNUTSON PHD THESIS 2/22/2006 PAGE 29
lignin. Consequently, basic dyes are preferred for directory and newsprint papers with
high-lignin-content mechanical pulps.
3.4.5 ACID (ANIONIC) DYES
Acid dyes were the first synthetic dyes for wool. This type of dye is called ‘acid’
because the dye bath must be acidic for the dye to attach to the fiber. These dyes are also
referred to as ‘anionic’ because they are negatively charged when dissolved. All acid dye
molecules possess at least one group of atoms that impart water solubility, usually the
sodium salt of a sulfonic acid group. The sulfonic or carboxylic acid group reacts with a
basic group on the fiber to form a salt bridge. For wool, the basic groups are amines or
amide groups present in the protein fiber. ()Since acid dyes require basic groups on the
fiber, acid dyes are not used to color cellulose.
Figure 9 Acid Dye Binding to Wool Protein as Visualized by Rivlin53
O N N SO3
HO NH3ionic bond
hydrogen bond Van der Waals forces
wool
3.4.6 BASIC (CATIONIC) DYES
Like acid dyes, basic dyes are soluble ionic compounds. Unlike acid dyes, in basic
dyes the color is contained within the cationic portion of the molecule. These dyes are
often preferred over other dyes because most cationic dyes are characterized by intense
and brilliant colors, and a complete range of colors is available.53 Cationic dyes bound to
acrylic fibers (Figure 10) are durable to washing and sunlight. When applied to cellulose,
cationic dyes are not light fast and have limited wash-fastness. Consequently, they are

KRISTINA KNUTSON PHD THESIS 2/22/2006 PAGE 30
little used for cotton textiles. However, due to their intense color and low cost, basic dyes
are often used for paper. Basic dyes are favored for mechanical pulps because the dye has
affinity for both cellulose and for lignin.47 Basazol 46L is a basic dye. Examples of
typical basic dyes are shown in Figure 11.
Figure 10 Cationic Dye Attached to Anionic Fiber as Visualized by Rivlin53
NN
Cl
O2N NC2H5
H2C
H2C N
CH3
CH3
H3C
SO3IonicBond
Weak
Acrylic Fiber
Figure 11 Examples of Cationic Dyes From Rivlin53
O
N
N(CH2CH3)2(H3CH2C)2N
Cl
C.I. Basic Blue 3
CH
CH
N(CH2CH3)2N
CH3H3C
CH3 Cl
C.I. Basic Violet 16
NN
Cl
O2N NC2H5
H2C
H2C N
CH3
CH3
H3C
Cl
C.I. Basic Red 18
3.4.7 DIRECT DYES
These dyes are called ‘direct’ because of the directness and simplicity of their
application to cellulosic fibers such as cotton, flax, and viscose rayon.60 They are
moderate in cost and easy to apply. During dye application, common salt (sodium
chloride) or Glauber’s salt (sodium sulfate)61 is added to overcome repulsion between
anionic cellulose and the charged dye molecules. Their poor wet-fastness limits the use of
direct dyes for coloring textiles.
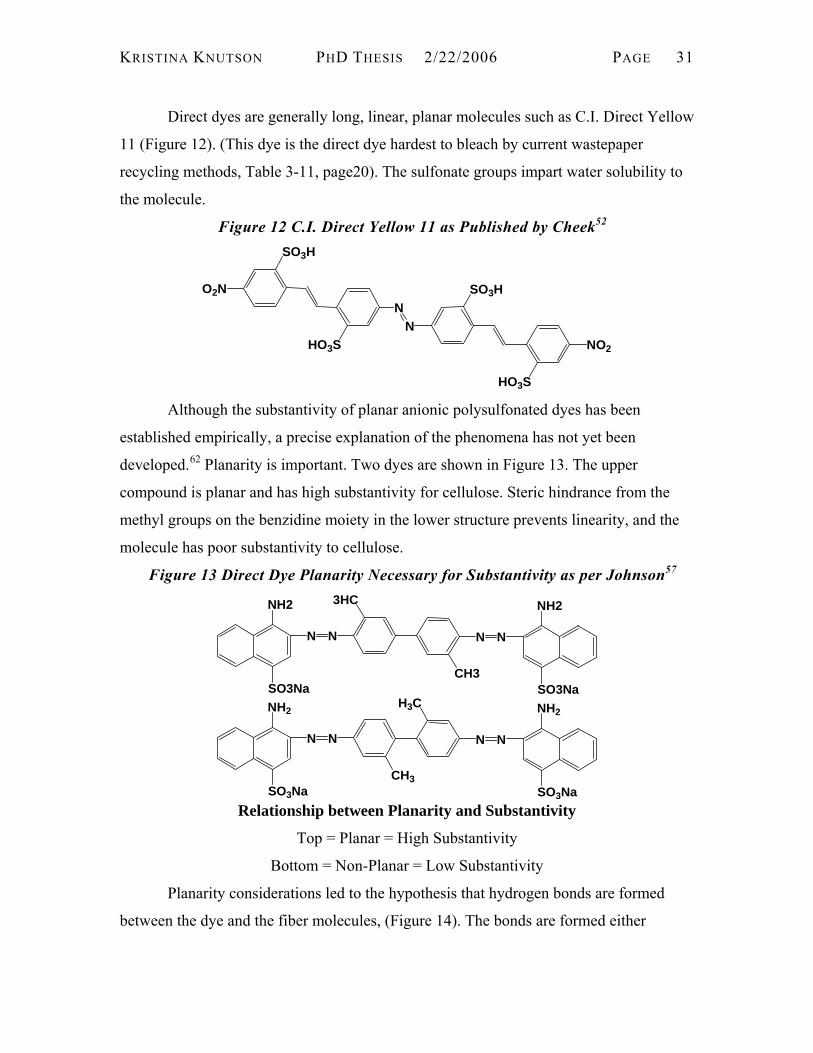
KRISTINA KNUTSON PHD THESIS 2/22/2006 PAGE 31
Direct dyes are generally long, linear, planar molecules such as C.I. Direct Yellow
11 (Figure 12). (This dye is the direct dye hardest to bleach by current wastepaper
recycling methods, Table 3-11, page20). The sulfonate groups impart water solubility to
the molecule.
Figure 12 C.I. Direct Yellow 11 as Published by Cheek52
NO2
HO3S
SO3H
N
O2N
SO3H
HO3S
N
Although the substantivity of planar anionic polysulfonated dyes has been
established empirically, a precise explanation of the phenomena has not yet been
developed.62 Planarity is important. Two dyes are shown in Figure 13. The upper
compound is planar and has high substantivity for cellulose. Steric hindrance from the
methyl groups on the benzidine moiety in the lower structure prevents linearity, and the
molecule has poor substantivity to cellulose.
Figure 13 Direct Dye Planarity Necessary for Substantivity as per Johnson57
NN N N
NH2
SO3Na
NH2
SO3NaCH3
3HC
NN N N
NH2
SO3Na
NH2
SO3Na
H3C
CH3
Relationship between Planarity and Substantivity
Top = Planar = High Substantivity
Bottom = Non-Planar = Low Substantivity
Planarity considerations led to the hypothesis that hydrogen bonds are formed
between the dye and the fiber molecules, (Figure 14). The bonds are formed either

KRISTINA KNUTSON PHD THESIS 2/22/2006 PAGE 32
directly or after strong van der Waals forces cause the fiber and dye molecules to
approach closely.63
Figure 14 Proposed Model for Binding of Direct Dye to Cellulose as per Fessenden55
N NNN
N
O3S
N
SO3
OH OH
HH
HH
Union between cellulose and a direct dye Direct Red 28 (Congo Red)
However, later evidence suggested that hydrogen bonds are not formed.57 The
cellulose hydroxyl groups are firmly attached to water and may not bind to polar groups
in a dye. A monolayer experiment supported this suggestion. A surface-active benzidine
diazo dye was spread as a monolayer on water containing cellobiose. The measured area
per dye molecule matched the value expected for a single layer of water molecules
between each dye and cellobiose molecule.57 The water would prevent the formation of
hydrogen bonds. When the cellobiose was replaced with mannitol, no such water layer
was detected. Unlike cellobiose, mannitol in water does form hydrogen bonds with other
solutes, including dyes.
Formation of hydrogen-π bonds has been suggested as a source of dye-fiber
attraction. (Figure 15) Yoshida et al.63 had found that sucrose, glucose, and cellobiose
form 1:1 complexes in water with simple aromatic sulfonate anions, but not with an
aliphatic anion. Yoshida inferred that the bond involves the aromatic group. However,
hydrogen-π bonds can not be important in cellulose dyeing. Typical sulfonated azo direct
dyes do not form any complexes with sucrose or with methyl-β-D-glycopyranoside (a
water-soluble model of cellulose). It is not known why the presence of an azo group in an
aromatic structure would prevent the formation of the π-bond complex. These models

KRISTINA KNUTSON PHD THESIS 2/22/2006 PAGE 33
and theories had been advanced and ruled out by 1989. In 1998, the mechanism for
substantivity of direct dyes for cellulose was still unknown.62
Figure 15 Yoshida Bonds between Aromatic Dye and Cellulose as Described by Lewis62
OH
More recently, FT-IR spectroscopy was used to detect the places at which 8
experimental direct dyes interacted with cotton cellulose.64 Pielesz et al. found that direct
dye-cellulose interactions involved hydroxyl groups on the cellulose fibers. They also
postulate that intermolecular interactions also occur between the dye molecules and
glycosdic groups on the fibers. The concept that direct dyes bind at specific sites is
compatible with other published studies. Data on the sorption of direct dyes onto
cellulose substrates correlate better with the Langmuir equation than with the Freundlich
equation.65,66 Since Langmuir postulates that absorption occurs on specific sites or
surface area while Freundlich proposes diffuse binding, the sorption results collaborate
the FT-IR results.
In Figure 16 are shown dyes based on benzidine, a carcinogen. The production of
these dyes has been discontinued in the United States. However, once benzidine is
incorporated into a direct dye it is no longer toxic. Therefore, some benzidine dyes are
imported. The general structure of benzidine-based direct dyes is shown in Figure 17.
Dye – π electron system
Cellulose substrate

KRISTINA KNUTSON PHD THESIS 2/22/2006 PAGE 34
Figure 16 Direct Dyes Based on Benzdine From Cegarra67
NH2H2N
XX = -CH2-, -NH-, -SO2-
Figure 17 General Structure of Benzidine-based Direct Dyes
NH2H2N X
RR X can be:HN-NH- (aryldiamine)simple link (benzidine)CH=CH- (Stilbenes)NH-O-S-CONH-NH-CO-NH-
R can be-H-SO3Na-CL-NO2-OH-CH3-OCH3-OCH2-COONa
3.5 DYES USED FOR COLORATION OF PAPER
3.5.1 DYE CHARACTERISTICS
The desired characteristics for dyes are summarized in Table 3-20. For paper,
water fastness is not needed, but high substantivity is necessary. Papermachine headbox
solutions are low consistency (0.3 to 0.6% fiber in water). To exhaust dyes from the
solution, the dye must have high substantivity to cellulose and/or other materials, such as
lignin, that are present in pulp fibers. High molar absorptivity reduces cost by requiring
less dye to achieve the desired color intensity. However, when recycling dyed paper
fibers, the high molar absorptivity of the dyes requires fiber decolorization to be very
efficient.

KRISTINA KNUTSON PHD THESIS 2/22/2006 PAGE 35
Table 3-20 Characteristics of Dyes A. Intense color (molar absorptivity ε >10,000)
B. Solubility in water (fibers adsorb individual dye molecules from solution regardless whether bulk of dye is soluble aggregates or dispersed in micelles) C. Substantivity to the fiber in question (dyeing is dynamic and reversible so dye must have greater affinity for fiber than for water) D. Durability to wet treatments (may require chemical fixation of dye to fiber or altering dye chemical structure to become insoluble after dye has diffused into fiber) E. Durability to further treatments in production and normal use (Normal use includes sunlight, bleaching, perspiration, dry-cleaning. For cellulosic fabrics, production includes low pH and high temperatures when adding durable press finish) F. Safe, easy to handle and reasonably priced (Derivatives of carcinogenic benzidine are no longer produced in the US. Mordanting of acid dyes with chromium salts has become very limited because of disposal difficulties for chromium polluted effluents)
3.5.2 FLUORESCENT WHITENING AGENTS
Fluorescent whitening agents are often applied to fine papers. About 80% of all68
commercial fluorescent whitening agents are stilbene derivatives (Figure 18). The generic
formula is 4, 4’-diaminostilbene-2, 2’-disulfonic acid structures acylated by cyanuric acid
derivatives.68 As mentioned in section 3.4.3 on page 27, compounds need to have a rigid
structure to exhibit fluorescence. The triazine rings increase the fluorescent efficiency of
these compounds. Fluorescent whitening agents are significantly different from stilbene
dyes because of the triazine rings.
Figure 18 Stilbene Fluorescent Whitening Agents as per Coulston68
N
NN
NN
NCH
HC NH
HN
R'
RR
R'
SO3H
HO3S
R R’ R R’
-NHC6H5 -OCH3 -NHC6H5 NCH3
CH2CH2OH -NHC6H5 -NHCH3 -NHC6H5 -N(CH2CH2OH)2 -NHC6H5 ON
-NHC6H5 -NHC6H5 HN SO3H
-N(CH2CH2OH)2
HN
SO3H -N(CH2CH2OH)2
HN
SO3H
HO3S
-N(CH2CH3)2
R and R’ are substituted or unsubstituted amino groups, substiututed hydroxyl groups, etc

KRISTINA KNUTSON PHD THESIS 2/22/2006 PAGE 36
3.5.3 RECYCLABLITY
Concern about recyclablity has become more important. Pressure sensitive
adhesives were recently redesigned to be repulpable.69,70,71 The successful72,73,74,75,76
redesign occurred because the United States Post Office had decided that postage stamps
should be repulpable. The Post Office convinced adhesive manufacturers and paper
recyclers to work together on creating repulpable pressure sensitive adhesives.77,78
In Europe, ink manufacturers are cooperating with paper researchers to develop
more recycling friendly inks for telephone book directories.79 Dye manufacturers are
giving some consideration to recyclablity. In 199880 and 1999,81 paper dyes were
patented that are readily bleached when the paper is recycled. In 200382 another dye was
patented that claims to yield a colorless wastewater that avoids effluent treatment
problems. However, other paper dyes were also recently patented83,84,85,86,87 that do not
claim to be bleachable. Dye manufacturers have other concerns such as improving the
water- and light- fastness of textile dyes. In addition, the manufacturing process must be
safe and the finished dye product must meet regulatory requirements. As long as
regulations allow the profitable production and application of existing dyes, little motive
exists to replace current paper dyes with bleachable alternatives.
3.5.4 PAPER DYES SELECTED FOR STUDY
Most dyes for bleached chemical pulp fine papers are direct dyes such as C.I.
Direct Yellow 11. Basic dyes such as Basazol Yellow 46L are applied to high-yield pulps
that contain a significant amount of lignin. Dyes were selected for this research project
because they are known to be recalcitrant to existing chemical bleaches.
The structure for Direct Yellow 11 has been published and is shown below.

KRISTINA KNUTSON PHD THESIS 2/22/2006 PAGE 37
Figure 19 Stilbene Dye Direct Yellow 11 as Published by Cheek52
NO2
HO3S
SO3H
N
O2N
SO3H
HO3S
N
Basazol Yellow 46L, used for yellow directory paper, is classified as a methine
dye. Unlike C.I. Direct Yellow 11, Basazol Yellow 46L (C.I. Basic Yellow 96), is
manufactured by only one company. According to Dwight Pakan of BASF, the exact
structure of Basazol Yellow 46L is proprietary. However, the general structure of Basazol
Yellow 46L is covered in US Patent #4,256,458 (March 17, 1981) Basazol Yellow 46L is
a cyanine-type dye. The patent information for this dye is summarized in Figure 20.
Figure 20 Patent Information Relevant to Basazol Yellow 46L Basic Yellow Dye United States Patent Number 4,256,458 March 17, 1981
Methine Dyes for Paper and Amonically-Modified Fibers
Inventors: Hans-Juergen Degen, Franz Feichtmayr, and Klaus Grychtol
Assignee: BASF Aktiengellschaft, Ludwigshafen, Fed. Rep. of Germany
Patent applies to methine dyes of the formula
N N
RR
CH
CH
CHCH QQ
X 2A

KRISTINA KNUTSON PHD THESIS 2/22/2006 PAGE 38
A is an organic or inorganic ion R is hydrogen, methyl or ethyl
Q groups are the same or different substituted or unsubstituted aryl or hetaryl radicals or selected
from the group consisting of N, N-disubstituted aminophenyl, indolyl and carbazolyl radicals which are
substituted or unsubstituted by chlorine, methoxy, ethoxy, methyl or ethyl groups.
X represents a bridge member selected from the group consisting of aliphatic, aromatic and
heteroaromatic radicals such as the group below.
H2C
CH2
H2C
H2C
H2C
n
n = 2-10
H2C H CH2
CH2C
CH3
CH3
H2C
The synthesis of numerous dyes is described, and the resultant colors include yellow, orange and red. An
example structure of an orange dye is shown below.
N N
H2C CH2
H2C CH2
CH
CH
CHHC
NN
CH3
CH3
CH3
CH3
2 Br
3.5.5 SUMMARY OF DYE CHEMISTRY
The possibility of organic compounds to absorb light and produce color is created
by the overlap of π-orbitals. Dye chromogens consist of electron-donor(s) and electron-
acceptor(s) interacting through a conjugated double bond system. Molar absorptivity and
wavelength(s) of absorption are controlled by the electronic structure of the molecule and
the amount of energy required for electron excitation. The molar absorptivities of major
commercial dye chromogens are listed in Table 3-21.

KRISTINA KNUTSON PHD THESIS 2/22/2006 PAGE 39
Table 3-21 Molar Absorptivity of Chromogens as Described by Rivlin53
Dye Type Molar Absorptivity (ε) Anthraquinone 5,00-15,000 Azo 20,000-40,000 Basic cyanine 40,00-80,000 Basic triarylmethane 40,000-160,000
3.6 DECOLORIZATION OF DYES
3.6.1 DEFINITION OF DECOLORIZATION AND RELATED TERMS
A number of different terms are used when discussing dyes. Color-stripping
refers to the removal of dye molecules from the fiber. Reduction in absorbance or visible
color is referred to as bleaching or as decolorization. Decolorization implies degradation
or destruction of the dye chromogen, but decolorization can result from destruction of
only a small portion of a large dye molecule. Mineralization refers to degradation of dye
molecule to carbon dioxide and water. Biological systems may be able to decolorize dyes
without mineralizing the dyes. If this occurs, intermediate byproducts will accumulate. In
a process called biosorption, biomass may also remove dyes from liquid solutions by
physical adsorption of the dyes to the cell membranes. Dead cells often exhibit greater
biosorption than living material.88
3.6.2 CHEMICAL DECOLORIZATION
The basic ‘components’ of dye molecules are listed in Table 3-22. Decolorization
and/or color-stripping methods can be classified by how the method interacts with the
dye components. Since light absorption is characteristic of the electronic structure of dye
molecules, all of these approaches involve redox reactions that alter the available electron
density.
3.6.2.1 Decolorization agents applied during paper recycling
Because of chemical differences, it is understood that no single chemical
treatment is capable of handling all the various dyes present in wastepaper.89 The
treatments listed in the TAPPI database of dye-breaking agents90 include chlorine,

KRISTINA KNUTSON PHD THESIS 2/22/2006 PAGE 40
hypochlorite, chlorine dioxide, hydrosulfite (dithionite), formamidine sulfinic acid (FAS),
hydrogen peroxide, oxygen, and ozone at various concentrations, pHs, and temperatures.
Chlorine, chlorine dioxide, sodium hypochlorite, oxygen and ozone can be
considered as degrading agents because they adversely affect pulping yield.31 They all
destroy phenolic groups and carbon-carbon double bonds. With the exception of
hypochlorite, these degrading agents do not have any affect on carbonyl bonds.
Hydrogen peroxide, sodium hydrosulfite, and formamidine sulfinic acid are
nondegrading reagents. Their action is limited to the destruction of carbonyl groups, and
thus pulp yield is not affected. FAS and hydrosulfite reduce just quinone structures, but
peroxide can oxidize virtually all carbonyl groups. FAS is effective in treating many
colored furnishes because FAS strips the dye from fiber in addition to reducing colored
quinones and carbonyls to less colored phenols and hydroxyls.91
These bleaching agents can be compared to the decolorization approaches
outlined in Table 3-22.
Table 3-22 Approaches to Decolorize Dyes or Color-Strip Dyed Fibers
Component Examples Approaches for Decolorization/Color-Strip
Electron-donating group (Auxochrome)
-NH2, -NHR, -NR2 -OH -OR
Oxidize to lower electron density Split from molecule
Electron-accepting group (Chromophore)
-C=O -N=N- -NO2 -NR3
+
Reduce to add electron density Split from molecule
Conjugated double bonds -C=C- -N=N- -C=N-
Cleave double bonds by redox rxns Oxidize: C→ C=O N→ N=O Reduce: C→ CH2 N→ NHs Add to bond(s): convert π bonds to σ bonds C=C → ClC-CCl or C-Cepoxide
Solubilizing groups -SO3Na, -COONa -N+H2HCl-, -N+R3Cl-
Change pH to change solubility, fiber affinity
Reactive groups Covalent bonds to fiber Cleave dye-fiber bonds The alkali that is added during wastepaper processing helps color-strip the dyed
fibers. The cellulose fibers swell and dye molecules detach from the fibers. Chlorine,
chlorine dioxide, and hypochlorite (oxidizing agents) are usually not very effective in
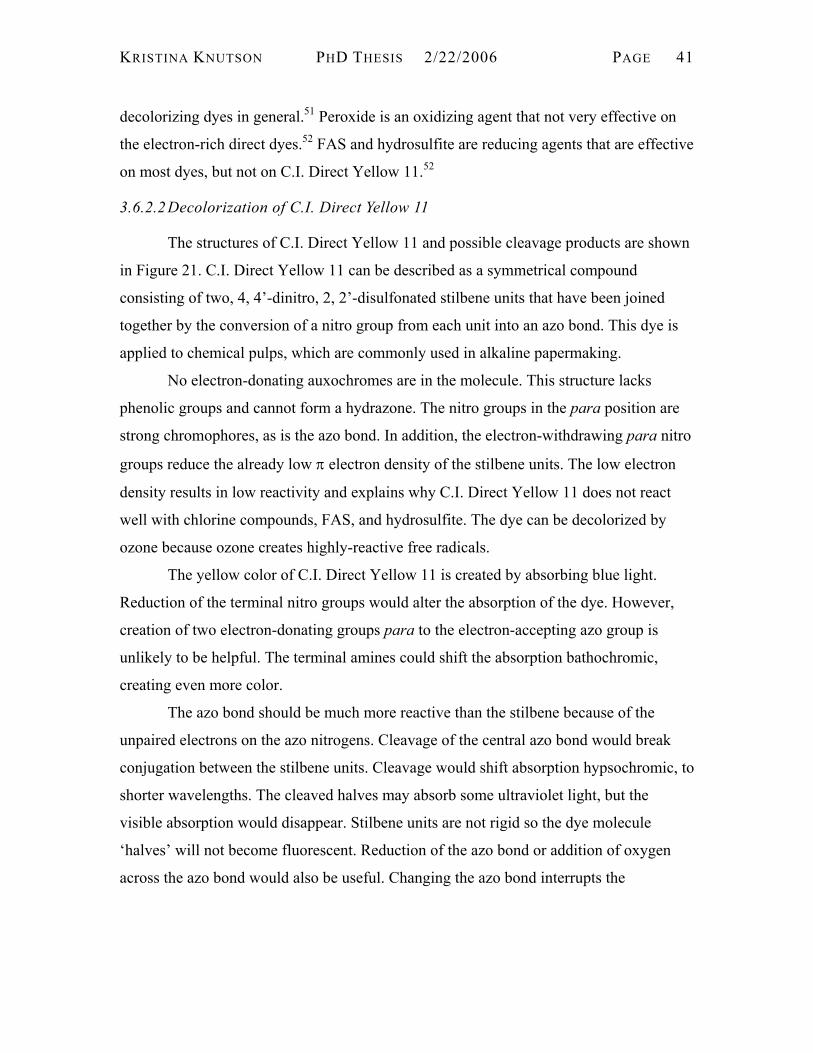
KRISTINA KNUTSON PHD THESIS 2/22/2006 PAGE 41
decolorizing dyes in general.51 Peroxide is an oxidizing agent that not very effective on
the electron-rich direct dyes.52 FAS and hydrosulfite are reducing agents that are effective
on most dyes, but not on C.I. Direct Yellow 11.52
3.6.2.2 Decolorization of C.I. Direct Yellow 11
The structures of C.I. Direct Yellow 11 and possible cleavage products are shown
in Figure 21. C.I. Direct Yellow 11 can be described as a symmetrical compound
consisting of two, 4, 4’-dinitro, 2, 2’-disulfonated stilbene units that have been joined
together by the conversion of a nitro group from each unit into an azo bond. This dye is
applied to chemical pulps, which are commonly used in alkaline papermaking.
No electron-donating auxochromes are in the molecule. This structure lacks
phenolic groups and cannot form a hydrazone. The nitro groups in the para position are
strong chromophores, as is the azo bond. In addition, the electron-withdrawing para nitro
groups reduce the already low π electron density of the stilbene units. The low electron
density results in low reactivity and explains why C.I. Direct Yellow 11 does not react
well with chlorine compounds, FAS, and hydrosulfite. The dye can be decolorized by
ozone because ozone creates highly-reactive free radicals.
The yellow color of C.I. Direct Yellow 11 is created by absorbing blue light.
Reduction of the terminal nitro groups would alter the absorption of the dye. However,
creation of two electron-donating groups para to the electron-accepting azo group is
unlikely to be helpful. The terminal amines could shift the absorption bathochromic,
creating even more color.
The azo bond should be much more reactive than the stilbene because of the
unpaired electrons on the azo nitrogens. Cleavage of the central azo bond would break
conjugation between the stilbene units. Cleavage would shift absorption hypsochromic, to
shorter wavelengths. The cleaved halves may absorb some ultraviolet light, but the
visible absorption would disappear. Stilbene units are not rigid so the dye molecule
‘halves’ will not become fluorescent. Reduction of the azo bond or addition of oxygen
across the azo bond would also be useful. Changing the azo bond interrupts the
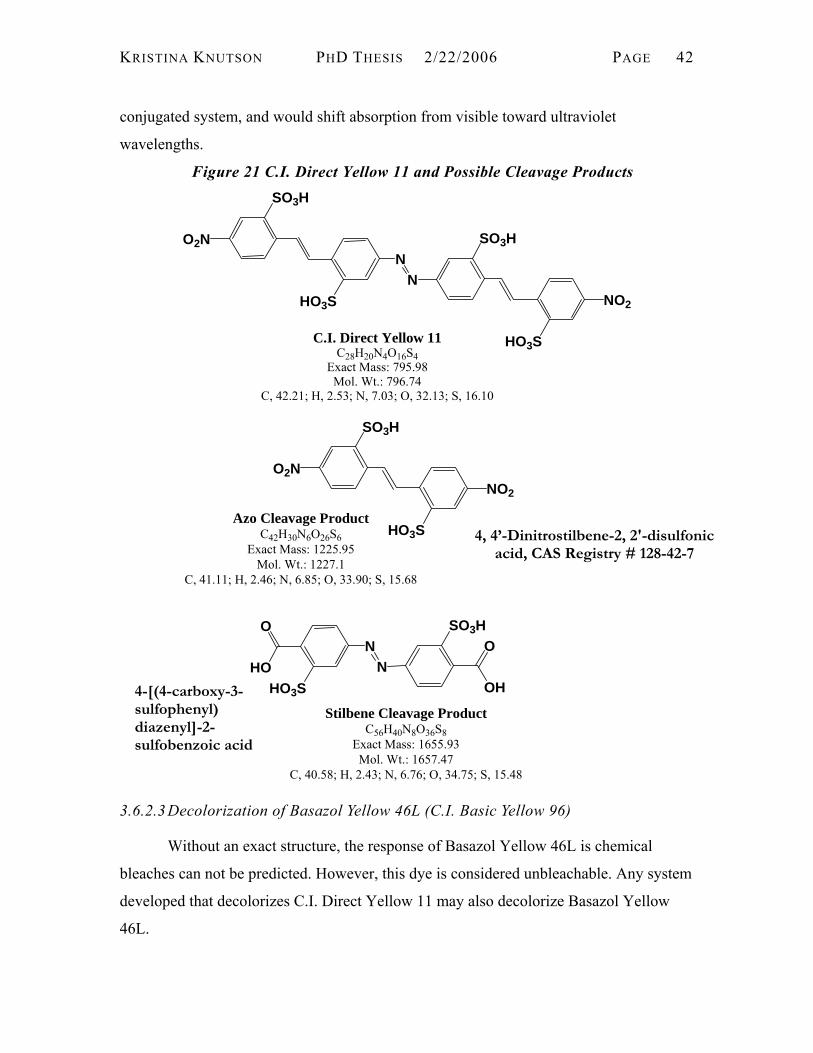
KRISTINA KNUTSON PHD THESIS 2/22/2006 PAGE 42
conjugated system, and would shift absorption from visible toward ultraviolet
wavelengths.
Figure 21 C.I. Direct Yellow 11 and Possible Cleavage Products
NO2
HO3S
SO3H
N
O2N
SO3H
HO3S
N
C.I. Direct Yellow 11C28H20N4O16S4
Exact Mass: 795.98Mol. Wt.: 796.74
C, 42.21; H, 2.53; N, 7.03; O, 32.13; S, 16.10
NO2
HO3S
SO3H
O2N
Azo Cleavage ProductC42H30N6O26S6
Exact Mass: 1225.95Mol. Wt.: 1227.1
C, 41.11; H, 2.46; N, 6.85; O, 33.90; S, 15.68
SO3H
NHO3S
N
OH
OO
HO
Stilbene Cleavage ProductC56H40N8O36S8
Exact Mass: 1655.93Mol. Wt.: 1657.47
C, 40.58; H, 2.43; N, 6.76; O, 34.75; S, 15.48
3.6.2.3 Decolorization of Basazol Yellow 46L (C.I. Basic Yellow 96)
Without an exact structure, the response of Basazol Yellow 46L is chemical
bleaches can not be predicted. However, this dye is considered unbleachable. Any system
developed that decolorizes C.I. Direct Yellow 11 may also decolorize Basazol Yellow
46L.
4, 4’-Dinitrostilbene-2, 2'-disulfonic acid, CAS Registry # 128-42-7
4-[(4-carboxy-3-sulfophenyl) diazenyl]-2-sulfobenzoic acid

KRISTINA KNUTSON PHD THESIS 2/22/2006 PAGE 43
3.7 ENZYMES
3.7.1 AN OVERVIEW OF ENZYMES
All living cells depend on enzymes. They produce enzymes to catalyze the
reactions necessary to life. Although some catalytic RNAs have been found,92 the
enzymes that regulate cellular metabolism are proteins. Each enzyme has a specific
function, or biochemical reaction in which it participates. Enzymes vary greatly in the
number of substrates. Some enzymes bind to only one specific molecule or a set of
closely related molecules. Others will bind to a class of compounds such as all phenols
small enough to enter the active site. In general, there are four kinds of enzyme affinities
(Table 3-23).
Table 3-23 Four Types of Enzyme Affinities as per Ma and Jiang93
Type of Affinity Definition Absolute Enzyme has one and only one function Group Enzyme acts on molecules that have specific
functional groups, such as amino group Linkage Enzyme acts on particular type of bond Sterochemical Enzyme acts on a particular stero or optical isomer
The rates of enzymatically catalyzed reactions are much greater than the
corresponding uncatalyzed reactions (by a factor of 106-1012) (94). Enzymatic reactions
generally occur under mild conditions of pH (4-8), temperature (<100°C) and pressure
(atmospheric). Not only are enzymatic reactions many times faster than uncatalyzed
reactions, in many cases extreme conditions are required to chemically produce the same
reactions. Some enzymes are so specific – a single enantiomer is recognized and a single
product is produced – that the reaction can not be reproduced chemically.
Some enzymes require metal ions to function – most commonly, iron, zinc,
copper and/or calcium. Enzymes may also require small molecules (coenzymes) that
participate in the catalytic reaction. Cofactors range from dietary-based molecules such as
pyridoxal-5-phosphate (from vitamin B6) to synthesized molecules like heme. Cofactors
may be consumed/altered during the enzymatic reaction. Examples include the electron
transport carriers NADPH (nicotinamide adenine dinucleotide phosphate) and NADH

KRISTINA KNUTSON PHD THESIS 2/22/2006 PAGE 44
(nicotinamide adenine dinucleotide) which cycle between oxidized and reduced forms as
they participate in biosynthetic and energy generation reactions. The oxidation and
reduction are generally performed by separate enzymes. Another example is the
conversion of essential energy metabolism compounds ATP (adenosine triphosphate) to
ADP (adenosine diphosphate) and. In the conversion of ATP to ADP, a high-energy
phosphate bond is broken to provide energy the enzyme captures to drive an endothermic
reaction.
3.7.2 NAMING OF ENZYMES
The International Union of Biochemistry and Molecular Biology (IUBMB) has
adopted a systematic protocol for the classification and nomenclature of enzymes based
on the nature of chemical reactions they catalyze. There are six main classes of reactions
that enzymes catalyze. (Table 3-24). Within these major classes there are subclasses and
sub-subclasses. Each enzyme is assigned two names and a four-digit classification.
Table 3-24 Classification of Enzymes By Reaction Type as Decribed by Voet(94)
Classification Type of reaction catalyzed 1. Oxidoreductase Oxidation-reduction reactions – adding or removing hydrogen atoms 2. Transferases Transfer of functional groups between donor and acceptor molecules 3. Hydrolases Hydrolysis reactions 4. Lyases Group elimination to form double bonds or addition of water,
ammonia or carbon dioxide across double bonds5. Isomerases Isomerization (such as L to D) 6. Ligases Bond formation coupled with ATP hydrolysis
3.7.3 ENZYMATIC REACTIONS
As catalysts, enzymes greatly accelerate reactions without being consumed.
Chemical reactions may not proceed, even if energy would be released, because a large
activation energy is required to initiate the reaction. Enzymes lower the activation energy
of reactions by many means including stabilizing transition states, controlling relative
orientations of reactants in SN2 reactions, and serving as electron transfer agents in multi-
step redox reactions. The enzyme alters the reaction rate. The enzyme does not affect the
change in free energy between reactants and products.
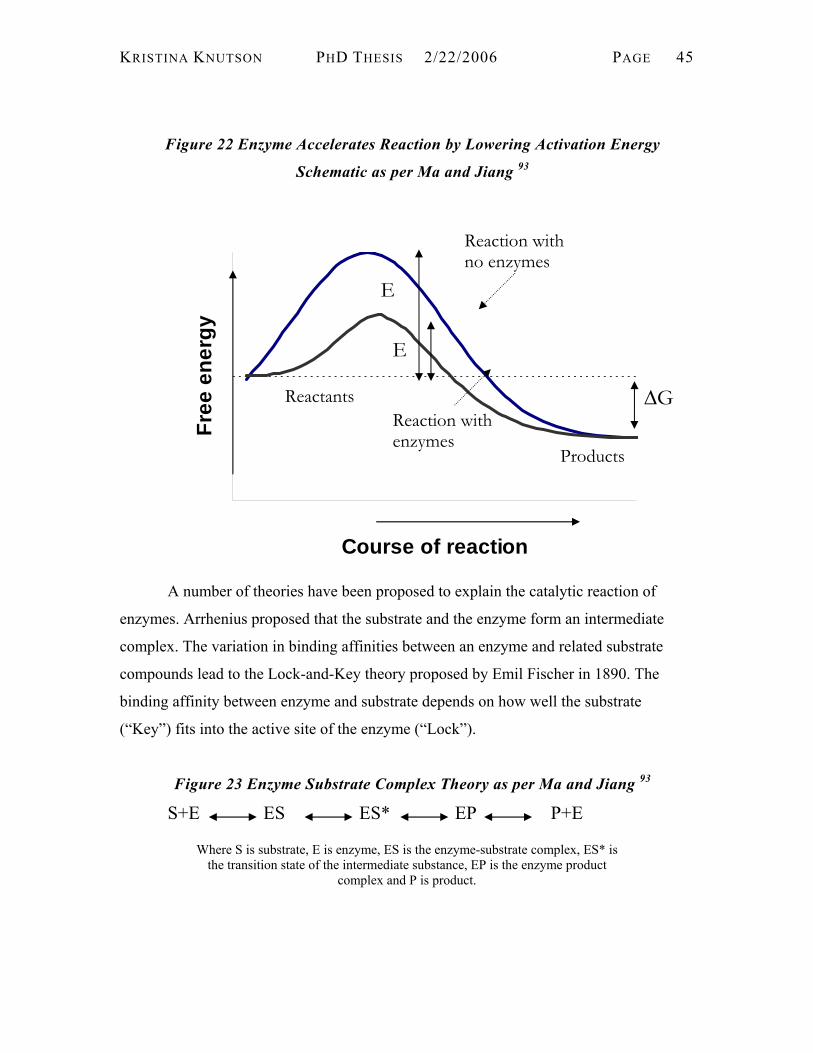
KRISTINA KNUTSON PHD THESIS 2/22/2006 PAGE 45
0 5 10 15 20 25 30
Course of reaction
Free
ene
rgy
Figure 22 Enzyme Accelerates Reaction by Lowering Activation Energy
Schematic as per Ma and Jiang 93
A number of theories have been proposed to explain the catalytic reaction of
enzymes. Arrhenius proposed that the substrate and the enzyme form an intermediate
complex. The variation in binding affinities between an enzyme and related substrate
compounds lead to the Lock-and-Key theory proposed by Emil Fischer in 1890. The
binding affinity between enzyme and substrate depends on how well the substrate
(“Key”) fits into the active site of the enzyme (“Lock”).
Figure 23 Enzyme Substrate Complex Theory as per Ma and Jiang 93
S+E ES ES* EP P+E
Where S is substrate, E is enzyme, ES is the enzyme-substrate complex, ES* is the transition state of the intermediate substance, EP is the enzyme product
complex and P is product.
E
E
∆G
Products
Reaction with no enzymes
ReactantsReaction with enzymes

KRISTINA KNUTSON PHD THESIS 2/22/2006 PAGE 46
Although the theories have been refined in detail for many enzymes, they still
serve as simplified yet adequate models of enzyme catalysis. They explain why the same
enzyme from two related fungi or plant species can exhibit differences in substrate
specificity. Each enzyme is made from unique sequence of amino acids that is specified
by the cell that produces it. Although portions of a sequence may be conserved during
evolution, enzymes serving the same function for two different species will exhibit slight
changes in the protein sequence. The changes in protein sequence result in changes in the
active site. Changes in the active site result in changes in the binding affinity between the
enzyme and its substrates. Because of structural variations, an enzyme’s binding affinity
depends on the specific substrate. Different substrates also vary in reactivity. It is
possible for a substrate to exhibit both strong binding affinity and poor reactivity.
Binding affinity varies with how well the substrate fits in the enzyme’s active site, while
reactivity is dependent on electronic and steric factors.
Figure 24 Lock and Key Model of Enzyme-Substrate Interaction as per Ma and Jiang93
Enzyme
ES Complex ES* Transition state
+
Active Site
Enzyme
Active Site
+
Substrate

KRISTINA KNUTSON PHD THESIS 2/22/2006 PAGE 47
3.7.4 FACTORS AFFECTING ENZYMATIC REACTIONS
Enzymes can be applied over a wide range of pH, temperature and solution
conditions. However, enzyme activity is dependent on reaction conditions such as pH,
temperature, and solution conditions such as ionic strength, presence/absence of metal
ions and presence of inhibitory compounds. These factors must be controlled during
enzymatic reactions.
Temperature is an important factor – both when the enzyme is applied and during
storage. Like all chemical reactions, the rate of an enzyme-catalyzed reaction increases
when reaction temperature is raised. All enzymes have optimum working temperatures at
which optimum activity is observed. Often, an enzyme is maximally active at high
temperatures that also lead to quick denaturation (irreversible inactivation) of the
enzyme. Optimal conditions may depend on the length of the desired reaction period.
Storage conditions are also important. Storage at 4ºC or below is generally safe while
storage at room temperature usually leads to loss of enzyme activity.
Since proteins are comprised of amino acid groups, the pH of a solution will
affect the net charge on the enzyme. Thus changes in pH (concentration of [H+]) alter the
shape of the enzyme active site. Each enzyme has an optimum pH and a working pH
range; extremes of pH outside the working pH range can denture the enzymes.
Concentrations of reaction components are also important and interrelated.
Increasing either the substrate concentration or the enzyme concentration will increase
the reaction rate until the enzyme active site is saturated and a maximum reaction rate is
reached. The products from an enzyme reaction inhibit the reaction. Inhibition of an
enzyme can be reversible (such as two substrates competing for the same enzyme active
site) or irreversible (such as removal of a metal ion from the active site). All these factors
have to be controlled to utilize an enzyme effectively.
3.7.5 ENZYME ACTIVITY
Since totally pure enzymes are difficult to prepare from living cells, and some
activity is lost every time a solution is thawed or frozen, enzymes are usually quantified
in terms of their activity. Enzyme activity is determined by measuring the rate of product

KRISTINA KNUTSON PHD THESIS 2/22/2006 PAGE 48
released from an enzyme-catalyzed reaction. The International Union of Biochemistry
and Molecular Biology define an international unit (IU) as the amount of enzyme that
catalyzes the conversion of 1 micromole of substrate to a product in 1 minute under the
conditions of the assay. The International System Unit for enzyme activity is Katal
(symbol: kat) which is the amount of enzyme converting 1 mole of substrate to product in
1 second under the assay conditions.
Equation 3 Conversion Between IU and Kat
1 kat = 1 mole/second = 60 mole/minute
1 IU = 1/60 µ kat = 16.67 x 10⁻⁹ kat
Because binding affinity and reactivity are substrate dependent, when an amount
of an enzyme is given, the assay (either the substrate or the product) is also specified. As
long as the same substrate and assay are used, enzymatic activities are comparable.
However, the same enzyme preparation can have different IU or kat values if the
substrate or assay conditions are altered.
3.7.6 OXIDOREDUCTASES
The ability of white rot fungi to digest trees and breakdown recalcitrant
pollutants197 has prompted research into the secreted enzymes of these fungi. Enzymes
identified as participating in dye decolorization include laccase, manganese peroxidase
and lignin peroxidase. These enzymes are oxidoreductases, which means they participate
in redox reaction where one compound is reduced and another is oxidized. These
enzymes contain metal ion(s). The metal center(s) and the enzyme itself undergo a redox
cycle between at least one reduced and one oxidized form. Additional forms of the
enzyme can exist for an enzyme like laccase that performs the four electron conversion of
dioxygen to water using electrons collected one-at-a-time during the oxidation of four
substrate molecules.
The addition of a mediator compound extends the range of compounds that can be
oxidized by an oxidoreductase. The compounds that serve to mediate electron transfer
reactions must meet a number of limiting criteria95 outlined below (Table 3-25).

KRISTINA KNUTSON PHD THESIS 2/22/2006 PAGE 49
Table 3-25 Mediator Criteria for Oxidoreductase Reactions
1) Mediator functions as substrate of oxidoreductase enzyme 2) Both oxidized and reduced forms of the mediator are stable and do not inhibit enzyme activity 3) The mediator exhibits reversible electrochemical behavior
A general redox cycle is outlined below Figure 25.
Figure 25 Redox Cycle for Mediated Substrate Oxidation by an Oxidoreductase
Enzyme
EnzymeoxMediator
Mediatorox
O2
H2O
H2O2
H2O
Substrate
Substrateox
(peroxidase)
(laccase)
3.7.7 LACCASE ENZYMES
Laccase belongs to a family of multi-copper oxidases that couple four one-
electron substrate oxidations with the four-electron reduction dioxygen to water.96
Spectroscopic studies, sequence alignments and crystal structures reveal that all
multicopper oxidases contain at least one type 1 (T1), one type 2 (T2) and one type 3
(T3) Cu center.96 Each type is defined by spectroscopic properties in the oxidized (Cu2+)
state. The T1 site accepts electrons from the substrate. Type 3 is a binuclear site of two
coupled Cu atoms. Type 2 and type 3 copper form a trinuclear copper cluster site that
binds oxygen. The type 2/type 3 center distinguishes laccase from coupled binuclear
copper proteins (such as tyrosinase) which are not able to produce water from
dioxygen.97
Laccase is the simplest of the multicopper oxidases, with one of each type of Cu
center for a total of four Cu atoms. Other members of this family include plastocyanin,

KRISTINA KNUTSON PHD THESIS 2/22/2006 PAGE 50
human ceruloplasmin, ascorbate oxidase, and tree laccases. The type 2 and type 3 copper
centers are very similar among these enzymes. However, the T1 Cu ligation for fungal
laccase differs significantly. The change in protein structure alters the pH responsiveness
and the redox potential. Redox potentials for some laccases are shown in Table 3-26.
Table 3-26 Comparison of Redox Potentials of the T1 Cu From Palmer96
Enzyme E° a
Myceliophtora thermophilia laccase 450-480
Rhizoctonia solani laccase 630-680
Polyporus pinsitus (Trametes villosa) laccase 750-790
Spinach plastocyanin 370
Coprinus cinereus laccase98 550 Trametes versicolor laccase99 770
a Units of mV vs NHE
Laccase is classified as p-diphenol: dioxygen oxidoreductase, EC 1.10.3.2, where
EC stands for the Enzyme Commission.100 Laccases have a broad specificity that enables
them to catalyze the one electron oxidation of a range of substrates. These substrates,
usually phenols, provide electrons for the concomitant four electron reduction of
atmospheric O2 to water. This catalytic reaction depends on the four copper atoms101
found in the active sites. The molecular mass of the monomer102 ranges from 50 to 100
kDa. In trees, laccases participate in the biosynthesis of lignin. White-rot fungi secrete
laccase and peroxidase enzymes to degrade lignin and enable digestion of cellulose from
trees.
Enzymes such as poplar plastocyanin and zucchini ascorbate oxidase have redox
potentials between 0.3 to 0.4 V. Laccases have higher redox potentials. They also fall into
two groups. The 'low' redox potential laccases have Eo values of 0.5-0.6 V. The 'high'
potential laccases have Eo values of 0.7-0.8 V.103
Laccase can directly oxidize phenolic compounds. The reaction conditions would
be as per McCarthy et al.104 Since laccases have low redox potentials, to react with non-
phenolic compounds, (like C.I. Direct Yellow 11); a low redox mediator is necessary.
Also, since the enzyme is too large to enter cellulose fibers, mediator compounds are

KRISTINA KNUTSON PHD THESIS 2/22/2006 PAGE 51
added when biobleaching virgin pulp.8 The general redox cycle involving laccase and a
mediator would be as in Figure 25 page49 with oxygen being converted to water. A
schematic outline showing the oxidation state of the copper atoms during the reaction is
shown below (Figure 26).
Figure 26 Laccase Catalytic Cycle as per Wesenberg105
HHCuCu
Cu
Cu
O2
H
CuCu
Cu
Cu
22O
O
OHO
H2O
H
CuCu
Cu
Cu
22O
OH
2
2
H
CuCu
Cu
Cu
22O
OH
2
24 AH AH = Substrate
4 A*A* = Oxidized substrate
H2O
native intermediate
resting enzyme
peroxide-levelintermediate
reduced laccase
3.7.7.1 Laccase mediators
The production and the redox potential of laccases vary between fungal species.
Likewise, the ability to bind to any particular mediator and to oxidize the mediator varies
between laccases. Binding affinity is not directly correlated with speed of oxidation.
Consequently, laccase effectiveness will change if the mediator compound is changed. In

KRISTINA KNUTSON PHD THESIS 2/22/2006 PAGE 52
addition, the optimum pH for dye decolorization depends on the enzyme, the dye, and the
mediator.180,174 Different mediators are compared in Table 3-27.
Table 3-27 Structure and Properties of Laccase Mediators According to Paice106
Mediator Name Mediator Structure
Redox Potential
vs SHEa V
Relative O2 uptake
rate
% Pulpb delign-
ification
HBT 1-Hydroxy benzotriazole
N
N
N
OH
1.04* 1 45
NHA N-hydroxy acetanilide
NHO CO
CH3
0.83*; 1.01* 42 42
Violuric acid HN NH
O
OONOH
0.91 14 42
ABTS 2,2'azinobis-3-ethyl-benzthiazoline-5-sulfonate
S
N
S
NH2C CH3 CH2H3C
N NSO3
HO3S
0.67; 1.09 100 37
HNNS 2-nitroso-1-naphthol- 4-sulfonic acid OH
N O
SO3H
0.91*; 1.10* 46 34
NNDS 1-nitroso-2-naphthol- 3,6-disulfonic acid
HO3S
OH
SO3H
NO
0.82 46 29
Promazine N
S
H2CH2C
H2C N
CH3
CH3
0.77; 1.06* 59 18
*Electrochemically irreversible, redox potentials are lower than the values shown a SHE: Standard Hydrogen Electrode b Softwood oxygen delignified kraft pulp; initial Kappa = 15. Mediator applied at 1% on pulp, followed by alkaline extraction.
The first mediator introduced for biobleaching of virgin pulp with laccase was ABTS
(2-2′ azinobis-(3-ethyl benzthiazodine) in 1990.8 A new class of mediators containing the N-
OH moiety was introduced in 1993.9 This class includes the mediators HBT (1-

KRISTINA KNUTSON PHD THESIS 2/22/2006 PAGE 53
hydroxybenzotriazole) and VA (violuric acid) used in this research as well as NHA, HNNS
and NNDS as shown above in Table 3-27.
Changing from one mediator to another can change the products of the reaction.
For example, when Bourbonnias et al.209 tested the reactivities of various mediators and
laccase with lignin model compound they found that when β-1 dimer II (D II on left in
Figure 27 ) was oxidized with Trametes versicolor laccase II, the products were veratraldehyde
and benzaldehyde if ABTS was the mediator, but if HBT was the mediator, an α-carbonyl
derivative of β-1 dimer II was also produced. The structures of the products are shown in
Figure 27 and the relative amounts produced are shown in Figure 28.
Figure 27 Products From β-1 Dimer Produced by HBT and ABTS as Mediators
Schematic From Bourbonnais209
OCH3
OCH3
HC OH
HC
OH
DII
CH O
Benzaldehyde
OCH3
OCH3
CVeratraldehyde
H O
OCH3
OCH3
C O
HC
OH
α-cabonyl of DII
HBT
HBT or ABTS

KRISTINA KNUTSON PHD THESIS 2/22/2006 PAGE 54
Figure 28 Amounts of Products from Laccase Oxidation Depends on Mediator
Results from Bourbonnais209
0
20
40
60
80
100
DII + Laccase/HBT DII + Laccase/ABTSOxi
datio
n pr
oduc
ts, %
of i
nitia
l DII
Benzaldehyde Veratraldehyde α-carbonyl of DII
3.7.7.2 HBT - hydroxy benzotriazole as mediator
During the course of the reaction, the mediator abstracts an electron from the
substrate which is then transferred to the enzyme. Figure 29 shows the HBT is reversibly
reduced and oxidized by the formation of a nitroxyl radical. HBT, (1-hydroxy
benzotriazole) is not fully catalytic because an inactive side product is occasionally
formed.
Figure 29 Laccase/HBT Oxidation of β-O-4 Lignin Dimer
As Described by Bourbonnais209
N
N
N
OH
N
N
N
O
N
N
N
H
1-HBT
HBT radical
Inactive Sideproduct
OCH3
OCH3
OCH3
O
HO
HO
OCH3
OCH3
OCH3
O
HO
O
β−Ο−4 lignin dimer ILaccase
Laccaseox
O2
H2O
When treated with the laccase-mediator system, the substrate forms radicals
which can lead to the formation of many different products. A thorough study of the

KRISTINA KNUTSON PHD THESIS 2/22/2006 PAGE 55
substrate degradation mechanisms has been made by Kawai et al. 107 They examined the
incorporation of 18O from H218O and 18O2. Treatment of a nonphenolic β-O-4 lignin
dimmer with Trametes versicolor laccase plus HBT has been reported to lead to Cα-Cβ
cleavage, Cα-oxidation, β-ether cleavage, and aromatic ring cleavage products.107 The
proposed initial radical formation mechanisms are shown in Figure 30. Most of the
products they observed were formed from the aryl cation radical. They did find a novel
Cα-Cβ cleavage that proceeded from the benzylic radical.
Figure 30 Formation of Benzylic and Aryl Cation Radicals from β-O-4 Lignin Dimer
As Described by Kawai107
OC2H5
H3CO
OCH3
O
HO
HO
H3CO
OC2H5
H3CO
OCH3O
HO
HO
H3CO
OC2H5
H3CO
OCH3O
HO
HO
H3CO
. .O O..
OC2H5
OCH3
OCH3O
OH
OH
H3CO
.. ...
O HH
. .
Aryl cation radical Benzylic radical
Laccase/HBTLaccase/HBT
The kinds of products that result from laccase-mediated oxidation of lignin are
exemplified from the products shown in Figure 31 for the degradation of β-1 lignin
model compounds. The degradation products shown were generated through three types
of cleavages via phenoxy radicals. These were: Cα-Cβ cleavage, alkyl-aryl cleavage, and
Cα oxidation.

KRISTINA KNUTSON PHD THESIS 2/22/2006 PAGE 56
Figure 31 Products of Laccase Degradation of Lignin through Phenoxy Radicals
As Per Higuchi108
OCH3
OH
OCH3
OC2H5
OCH3
OH
HO
H3CO
OCH3
OH
OCH3
OC2H5
OCH3
O
HO
H3CO
OCH3
OHH3CO OCH3
OHH3CO
H O OOH
OCH3
OHH3CO OCH3
OHH3CO
OH
OCH3
OH3CO
OH H
O
O
Cα oxidation
Cα−Cβ cleavage
alkyl-aryl cleavageα
βγ
3.7.7.3 ABTS - 2,2'azinobis-3-ethyl benzthiazoline-5-sulfonate as mediator
The mechanism and kinetics of the reaction of ABTS with laccase are different
than for HBT is able to transport one electron. ABTS however can abstract two electrons.
The structures and intermediates formed are shown in Figure 32. Potthast et al.109
explored the kinetics of the laccase-mediator oxidation of 2,4-dimethoxybenzyl alcohol
to 2,4-dimethoxybenzaldehyde. Two distinguishable stages were observed in the
consumption of dioxygen if ABTS was the mediator. In the first phase, a rapid decrease
in oxygen occurred and no reaction product could be detected. In the second stage,
oxygen consumption was slower and followed second-order kinetics while the
benzaldehyde product was produced according to a zero-order rate law. In the first stage,
ABTS was being converted to the oxidized species. In the second stage, the oxidized
ABTS acts as the oxidant for the substrate. The formation of the ABTS radical cation is
fast; the slower conversion of ABTS radical cation to the dication is the rate-limiting step
in the oxidation of substrate. Increasing the ABTS/substrate ratio lead to less oxygen

KRISTINA KNUTSON PHD THESIS 2/22/2006 PAGE 57
consumption in the second stage indicating that the oxidized ABTS formed in the first
stage acts as an oxidant reservoir.
The LMS reaction with HBT as mediator was different. No distinguishable phases
could be observed. The reaction was characterized by comparatively slow uptake with
zero-order kinetics throughout. The enzymatic oxidation of HBT to the HBT radical was
the rate limiting step. Product formation also followed a zero-order rate law. Increasing
the HBT/substrate ratio lowered the amount of oxygen consumed per equivalent of
benzaldehyde formed, indicating that a different reaction pathway occurs at higher
mediator concentrations. At low HBT/substrate concentrations, the HBT radical serves as
a one-electron oxidant and is reduced to HBT in a reversible process. At higher
HBT/substrate levels, the HBT radical acts as a three-electron oxidant and is irreversibly
reduced to benzotriazole (the inactive side product shown in Figure 29). Potthast et al.109
note that both mechanisms occur simultaneously when HBT is added at commonly
applied concentrations.
The differences in mechanism between HBT and ABTS suggest that ABTS
should be tested as well as the commonly applied nitroxyl mediators such as HBT. A
poor result obtained with laccase/HBT system does not mean the laccase/ABTS system
would also produce poor results.

KRISTINA KNUTSON PHD THESIS 2/22/2006 PAGE 58
Figure 32 ABTS and HBT and Their Intermediates
N
N
N
OHHBT
N
N
N
OHBT radical.
-e-
S
N
S
NN
NSO3H
HO3S
ABTS
-e-S
N
S
NNH
NSO3H
HO3S
ABTS cation radical
.
-e-S
N
S
NN
NSO3H
HO3S
ABTS dication
2,2'azinobis-3-ethyl-benzthiazoline-5-sulfonate 1-Hydroxy benzotriazole
3.7.8 PEROXIDASE ENZYMES
Peroxidases110 are heme (haem) containing enzymes that use hydrogen peroxide
(H2O2) as the electron acceptor to catalyze a number of oxidative reactions.111 In the
resting state, the iron ion in the heme is in the +3 oxidation state. The catalytic process is
a multistep reaction as outlined in Figure 33. The first step is the reaction of the active
site with hydrogen peroxide. The peroxide is reduced to water. The protein has been
oxidized by two electrons. This form of the enzyme is called Compound I and contains an
oxyferryl (Fe [IV] =O) center and an organic cation radical.112 Next, Compound I
oxidizes one substrate molecule (R) to give a substrate radical (R•) and Compound II,
where the organic cation radical is reduced to its resting state. Finally, Compound II is
reduced by a second substrate molecule to the resting Fe [III] state. In the absence of an

KRISTINA KNUTSON PHD THESIS 2/22/2006 PAGE 59
electron donor, Compound II will react with hydrogen peroxide to form the inactive
intermediate Compound III.113
Figure 33 The Peroxidase Catalytic Cycle as Visualized by Barr and Aust 197
NNN
N FeO 4
compound I
.
NNN
N Fe3
native peroxidase
H2O[R-OOH]
H2O2
NNN
N FeO 4
NNN
N FeO 4
.substrate(RH or Mn2+)
product, radical(R* + H+ or Mn3+)
compound IIH2O2H2Ocompound III
H
O2-.
substrate(RH or Mn2+)
product, radical(R* + H+ or Mn3+)
[R-OH]H2O
Heme peroxidases include fungal lignin peroxidase, fungal manganese
peroxidase, soybean peroxidase and horseradish peroxidase. Peroxidases are more
reactive than copper oxidases like laccase. The relative reactivities of laccase (Lac),
soybean peroxidase (SBP), horseradish peroxidase (HRP) and fungal lignin peroxidase
(LiP) are illustrated in Table 3-28. The E1/2 values are oxidation potentials for substrate
molecules. Laccase is obviously much less reactive than the peroxidases. Although dye
decolorization studies have focused on lignin and manganese peroxidases, the similarities
between the fungal peroxidases, which have to be isolated from fungi, and the
commercially available soybean and horseradish peroxidases suggest that soybean and
horseradish peroxidases may also be able to decolorize dyes.
Table 3-28 Oxidation of Methoxybenzenes by SBP, HRP, and LiP as per McEldoona,114
Compound E1/2 Vc SBP/H2O2 HRP/H2O2 LiP/H2O2 Lac/O2115

KRISTINA KNUTSON PHD THESIS 2/22/2006 PAGE 60
Methoxybenzene 1.76 - - - - 1,3,5-Trimethoxybenzene 1.49 - - ± - 1,2-Dimethoxybenzene 1.45 - - + - 1,2,3-Trimethoxybenzene 1.42 ± - + - 1,4-Dimethoxybenzene 1.34 + +b + - Hexamethoxybenzene 1.24 + +b + - 1,2,4-Trimethoxybenzene 1.12 + + + - 1,2,3,5-Tetramethoxybenzene 1.09 + + + - Pentamethoxybenzene 1.07 + + + - 1,2,4,5-Tetramethoxybenzene 0.81 + + + +
+ strongly reactive ± slightly reactive - unreactive Reactions at pH 2.4 a SBP=soybean peroxidase HRP=horseradish peroxidase LiP=Phanerochaete chrysosporium lignin peroxidase b HRP was active with these compounds at pH 2.4 only if initiated by enzyme addition. Initiation by peroxide addition produced no reactivity c E1/2 relative to saturated calomel electrode Peroxidases (donor: H2O2 oxidoreductase) are classified as EC 1.11.1.X - where
X is the digit that represents the particular type of peroxidase in question.
The overall reaction is as follows: donor + H2O2 <=> oxidized donor + 2 H2O
Peroxidases are found in bacteria, fungi, plants and animals. Fourteen subclasses
of peroxidases have been defined. On the basis of sequence similarity, fungal, plant and
bacterial peroxidases can be viewed as members of a superfamily consisting of three
major classes.110
Class I, the intracellular peroxidases, include yeast cytochrome c peroxidase,
ascorbate peroxidase and bacterial catalaseperoxidases, which exhibit both peroxidase
and catalase activities.
Class II consists of secretory fungal peroxidases: ligninases, or lignin peroxidases
(LiPs), and manganese dependent peroxidases (MnPs). These are monomeric
glycoproteins involved in the degradation of lignin. The peroxidases most commonly
studied for dye decolorization are fungal lignin peroxidase and manganese peroxidase.
Class III consists of the secretory plant peroxidases, which have multiple tissue
specific functions: e.g., removal of hydrogen peroxide from chloroplasts and cytosol;
oxidation of toxic compounds; biosynthesis of the cell wall; defense responses towards
wounding; indole3acetic acid (IAA) catabolism; ethylene biosynthesis; and so on.116
Class III peroxidases are also monomeric glycoproteins, containing four conserved
disulphide bridges and two calcium ions. The peroxidases used in this project are

KRISTINA KNUTSON PHD THESIS 2/22/2006 PAGE 61
horseradish peroxidase and soybean seed coat peroxidase. Both are classified as
peroxidase E.C.1.11.1.7 and are included in the class III superfamily.
3.7.8.1 Lignin peroxidase
Lignin peroxidase has an unusually high redox potential. A particular question has
been how Lip could catalyze the oxidation of compounds having a higher redox potential
than those estimated for LiPI (Compound I) and LiPII (Compound II). It has been
inferred117 from kinetic studies that LiPI and veratryl alcohol (VA) react to form a LiPII-
VA•+ that has a higher redox potential than uncomplexed LiPI and LiPII. The redox
potentials for the Fe3+/Fe2+ couple in some peroxidases are shown in Table 3-29.
The crystal structure for lignin peroxidase has been defined to 1.70 Å.118 Lignin
peroxidase shows the "typical peroxidase fold" and the heme has a close environment as
found in other peroxidases.118 The bond between the heme iron and the N atom of the
proximal histidine residue is longer than in cytochrome c peroxidase.118 The weaker Fe-N
bond would make the heme more electron-deficient and may explain the higher redox
potential. In addition, a surface residue tryptophan is stereospecifically hydroxylated by
an autocatalytic process. A transient radical may form during the catalytic cycle that is
different from the type of radical expected for this type of peroxidase.118
Table 3-29 Redox potential of Several Heme Proteins as per Millis and Cai 119,120
LiP Lignin peroxidase -130 mV MnP Manganese peroxidase -90 mV HRP Horseradish peroxidase -278 mV CcP Cyctochrome c peroxidase -194 mV Turnip peroxidase (P1) -223 mV Turnip peroxidase (P7) -100 mV Chloroperoxidase -140 mV Lignin peroxidase H1 -142 mV Lignin peroxidase H8 -137 mV Lignin peroxidase H2 -135 mV Lignin peroxidase H10 -127 mV Mn-dependent peroxidase H4 -93 mV Mn-dependent peroxidase H3 -88 mV
It is not clear what roles laccase, lignin peroxidase and manganese peroxidase
have during delignification. Fungi have been found that produce only one of these three

KRISTINA KNUTSON PHD THESIS 2/22/2006 PAGE 62
enzymes yet are still capable of delignification. Many ligninolytic fungi produce veratryl
alcohol (VA, 3,4-dimethoxybenzyl alcohol) that serves as cofactor in lignin peroxidase
degradation of lignin121 Veratryl alcohol may function as a redox mediator in the indirect
oxidation of compounds by LiP121 (Figure 34), protect lignin peroxidase from
inactivation by excess hydrogen peroxide122 or serve to complete the catalytic cycle.
Figure 34 Mechanism of Mediated Lignin Peroxidase Oxidation CH2OH
OCH3
OCH3 OCH3
OCH3
CH2OH
LiP/H2O2
Cation radical
Veratryl alcohol
Organic acidOrganic acid radical Decarboxylated
organic acid
Electron acceptor
Reduced electron acceptor
+ CO2
Organis acids shown to be electron donors include EDTA and oxalate(which is secrated by the fungus)Electron acceptors studied include cytochrome c, nitroblue tetrazolium, tetranitromethane, molecular oxygen, carbon tetrachloride and ferric iron.
Lignin peroxidase (LiP) catalyzes the H2O2-dependent oxidation of veratryl
alcohol (VA) to veratraldehyde, with the enzyme-bound veratryl alcohol cation radical
(VA•+) as an intermediate.117 Subsequently VA+* undergoes Cα-H protonation123 to form
a carbon centered radical which is eventually converted to veratryl aldehyde.124 (Figure
35) From kinetic studies of the deuterium isotope effect, it appears that the veratryl
alcohol radical cation, once generated by the lignin peroxidase/hydrogen peroxide
system, is released from the enzyme and is deprotonated by the medium.124

KRISTINA KNUTSON PHD THESIS 2/22/2006 PAGE 63
Figure 35 Veratryl Alcohol as Mediator for Peroxidase Reactions
As Published by Basiocchi125
RO
O CHOH
RRO
O CH
OHR
RO
O CHO
.
+ R.
-H+
O2
R O O.
oxygenated products
OCH3
OCH3
CH2OH
OCH3
OCH3
CH2OH
.
LiP, H2O2
3.7.8.2 Manganese peroxidase
Both lignin peroxidase and manganese peroxidase can oxidize substrates by
mediated reactions. For manganese peroxidase, the mediator is Mn2+/Mn3+ chelated by an
organic acid like malonate or oxalate. The mechanism for mediated oxidation of lignin by
manganese peroxidase is shown below. Chelated Mn2+ binds to MnP and is oxidized to
Mn3+. The Mn3+-complex diffuses to the media where it oxidizes the final substrate.
Figure 36 Manganese Peroxidase Mechanism
H2O2
H2O
MnP
MnPOX
Mn(III)malonate
malonate
Mn(II)
Lignin
LigninOX
The chelation of Mn2+ appears to be necessary. In the presence of succinate, a
weak chelator, most of the Mn2+ is present as free Mn2+ and the reduction of MnP-II is

KRISTINA KNUTSON PHD THESIS 2/22/2006 PAGE 64
slow.122 If oxalate or malonate are present, most of the Mn2+ is complexed and the rate of
MnP-II reduction is increased.
3.7.8.3 Horseradish peroxidase
Horseradish peroxidase (HRP) is an important enzyme that has been studied for
more than a century.126 Fifteen peroxidase isozymes have been isolated from horseradish
root. Of these, horseradish peroxidase C (HRP C) is the most studied. Most reactions
catalyzed by HRP C can be expressed as
H2O2 + 2AH2 →→→2H2O + 2AH* Where AH2 and AH* represent a reducing substrate and its radical product, respectively.
Typical reducing substrates include aromatic phenols, phenolic acids, indoles,
amines and sulfonates. The mechanism of catalysis has been investigated extensively (for
reviews see Veitch 2001,127 Dunford 1999128) HRP has many applications and has been
used as a reagent for organic synthesis and biotransformation. It is used in coupled
enzyme assays, chemiluminescent assays and immunoassays (for reviews of applications
see Veitch 2001,127 Kreig 2003129 and Ryan 1994130). HRP has also been investigated for
the treatment of waste waters and color removal from effluent from paper mill bleach
plant.131
3.7.8.4 Soybean peroxidase
Soybean peroxidase (SBP) is noteworthy for its stability. It exhibits high heat
stability with 66% of the enzymatic activity remaining after 90 minutes at 80ºC and pH
5.0132 It is also stable over a wide pH range250,251 (pH 2.4-8.0). Inclusion of polyethylene
glycol (PEG) has been reported to stabilize the enzyme.252 One major application for
soybean peroxidase is the polymerization of phenols, biphenols, anthraquinones and
anilines133,134 SBP has also been used for enantioselective sulfoxidations135 and for
brominations.136 SBP can be used to catalyze reactions in ionic liquids137 and in organic
solvents138 Other applications include bioremediation of phenolic wastes139 and of soils
contaminated with chlorophenols.140 Dye decolorization with soybean peroxidase has
also been reported.141 The reaction mechanism for soybean peroxidase is similar to other
HRP C

KRISTINA KNUTSON PHD THESIS 2/22/2006 PAGE 65
the peroxidases. Like the other peroxidases, inclusion of a mediator such as veratryl
alcohol extends the range of compounds that the enzyme can oxidize.
3.8 BIOLOGICAL DEGRADATION AND DECOLORIZATION
Removal of color from textile plant effluents is currently a major problem.142,143
Overall decolorization of dyes is being heavily researched and a number of reviews
articles144,145,6,146,147,148,149 about biological effluent treatments have been published. After
a brief discussion of the current status, some papers involving azo dyes will be discussed
to illustrate the chemistry involved. The discussion of biological degradation will focus
on azo dyes since C.I. Direct Yellow 11 contains an azo bond and azo dyes are
commonly studied. However, many of these studies did also include other dyes.
3.8.1 SUMMARY OF EFFLUENT DYE DECOLORIZATION RESEARCH
Effluents containing textile dyes can be subjected to chemical, physical or
biological treatments. Chemical treatments are usually oxidative processes and include
ozonation, photochemical treatment, addition of sodium hypochloride (NaOCl),
electrochemical destruction and addition of Fenton’s reagent (H2O2-Fe (II) salts).148
Physical methods are based on adsorption of dyes to solid materials. Although activated
carbon is most commonly used, cost considerations have promoted application many
other cheap adsorbents such as peat, wood chips, fly ash corn cobs, rice hulls, etc. Dead
biomass (fungal or microbial) may also be utilized in this fashion.
Concerns about cost and possible toxicity of dyes continue to prompt research
into biological treatments. Standard municipal aerobic treatments that rely on biological
activity are inefficient in dye removal.148 The biological treatments consist of four basic
types: physical adsorption to dead biomass; treatment by anaerobic bacteria; treatment
with aerobic fungi; and treatment with enzymes from white-rot fungi. Research into
biological degradation of dyes also includes the reductive degradation to which ingested
dyes are subjected.

KRISTINA KNUTSON PHD THESIS 2/22/2006 PAGE 66
3.8.2 AZO REDUCTASES IN MAMMALS AND INTESTINAL MICROFLORA
At least 3000 azo dyes are used commercially.150 Five azo dyes are used as food
colorants: Citrus Red No. 2, Allura Red, Tartrazine, Sunset Yellow and Orange B. More
than 2 million kilograms of these dyes are consumed yearly. Consequently, the
metabolism of these dyes has been well studied.
Many of the early azo dyes were benzidine derivatives. Aromatic amines, such as
benzidine, induce urinary bladder cancer in man and tumors in some experimental
animals.151,152,153 Many times intact dyes, like Trypan Blue, are not mutagenic but an
intestinal anaerobe reduces the dye to products that are mutagenic. The many different
intestinal microflora capable of reducing azo dyes. are anaerobes or facultative
anaerobes. Hepatic enzymes can also metabolize a variety of azo dyes. While the
reduction of azo dyes by intestinal microflora and hepatic enzymes is important to the
toxicity of the dye, neither method is applicable the decolorizing colored fibers.
3.8.3 MICROBIAL TREATMENT OF TEXTILE EFFLUENTS
Conventional wastewater-treatment methods are biological oxidation (by bacteria)
and chemical precipitation.154,155 However, in the case of textile dyes, biomass often
appears to remove color by absorption,156,157,158 not metabolism. Even dead mushrooms
have been used to remove color,142,159 and biosorption is generally more effective with
dead microbes than live ones.88,160,156 Some azo dyes have been identified as the most
problematic compounds in textile effluents as they are difficult to remove due to their
high water solubility and low exhaustion.161
3.8.3.1 Dye decolorization by inoculated soil microorganisms
In an attempt to find bacteria that could degrade textile dyes, Nigam162 isolated
bacteria from columns of soil samples inoculated with textile effluent over a year earlier.
He found five aerobic organisms that could grow on media containing textile dyes.
However, no decolorization was observed. From an anaerobic system, he isolated two
bacterial strains and one fungus. The fungus grew well but produced no visual
decolorization. The bacteria could grow aerobically, but decolored the test dyes only
when grown anaerobically.

KRISTINA KNUTSON PHD THESIS 2/22/2006 PAGE 67
3.8.3.2 Decolorization of reactive azo dyes by methanogenic bacteria
Beydilli et al.163 have been able to decolorize reactive azo dyes (Figure 37) with
bacteria under methanogenic (low redox potential) conditions. They are trying to develop
a fixed-film anaerobic reactor to treat textile dyebaths. Supplementing the cultures with
an additional carbon source (dextrin and peptone) increased the production of methane
and the extent of color removal.
Figure 37 Reactive Azo Dye Substrates Decolorized by Methanogenic Bacteria
As Published by Beydilli163
HO
SO3Na
SO3Na
H2N
N
N
N
NSO
ONaO3SOH2CH2C
SO
ONaO3SOH2CH2C
Reactive Black 5
HN
SO3NaNaO3S
NN
Reactive Red 22
N
NN
Cl
Cl
OH
Reactive Yellow 17
N NNN
HO
CH3
SO3KOCH3
OCH3
KO3SOH2CH2CO2S
H2N
SO3NaNaO3S
NN
Reactive Yellow 3
N
NN
Cl
NHCOCH3HN
HN
SO3HHO3S
N
SO3H
N
Reactive Red 120
N
NN
HN
Cl
OH NH
HO3S SO3H
N
HO3S
N
N
NN
NH
Cl
OH
3.8.3.3 Decolorization of 3 azo dyes by Pseudomonas luteola
Hu164 reported that the facultative anaerobe Pseudomonas luteola could decolor
three azo dyes when grown 5 days through shaking-static incubation. Of the three dyes
tested (Figure 38), all were chlorinated and one did not have any oxygen atoms attached
to an aromatic ring. P. luteola produced an inducible azoreductase. HPLC analysis of the
culture supernatant did detect 2-aminobezene sulfonic acid (or orthanilic acid), the

KRISTINA KNUTSON PHD THESIS 2/22/2006 PAGE 68
metabolite expected from azo bond cleavage. However, the amount of reduction
metabolite detected was lower (30%) than the amount of dye decolored. Hu did not
determine the cause. The low amount of orthanilic acid detected may have been due to
difficulty in extracting the metabolite from the culture supernatant. The low amount of
orthanilic acid could also indicate that the main degradation mechanism is the reduction
of the azo double bond to a single bond (with no cleavage).
Figure 38 Reactive Azo Dye Substrates Decolorized by Pseudomonas luteola
As Published by Hu164
HN
NaO3S
N
OCuO
N
Reactive Violet 2
N
NN
R
Cl
SO3Na(C6H5 and NH3 mixture)
HN
SO3NaNaO3S
N
SO3Na
N
Reactive Red 22
N
NN
Cl
Cl
N N
NNHHO3S
HN
Reactive Yellow 2ClSO3H
N NNN
HO
CH3
Cl
Cl
SO3H
3.8.3.4 Dye decolorization by microbial consortium
Using samples from the wastewater treatment facilities of a local dyeing house,
He et al.165 isolated four fungi and four bacterial strains that were highly effective at
decolorizing Direct Fast Scarlet 4BS (4BS), a model azo dye substrate. An optimal
microbial consortium was determined through combination decolorization experiments.
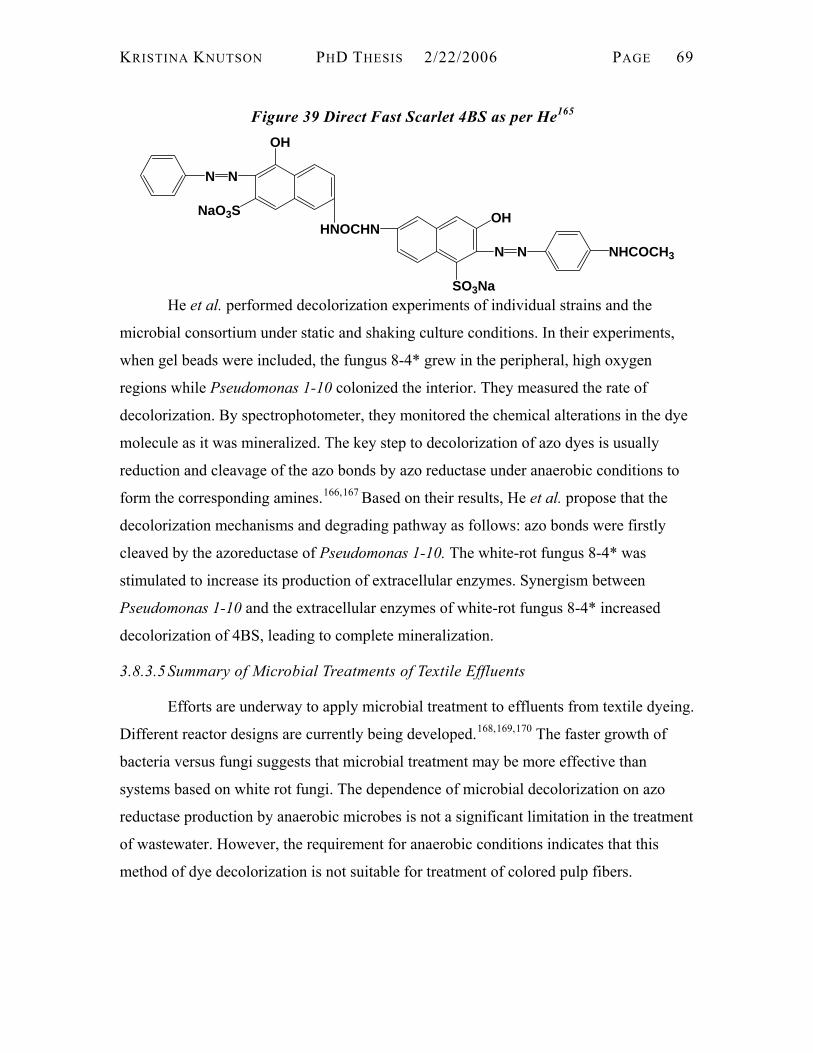
KRISTINA KNUTSON PHD THESIS 2/22/2006 PAGE 69
Figure 39 Direct Fast Scarlet 4BS as per He165 OH
NaO3S OH
SO3Na
N N
NN
NHCOCH3
HNOCHN
He et al. performed decolorization experiments of individual strains and the
microbial consortium under static and shaking culture conditions. In their experiments,
when gel beads were included, the fungus 8-4* grew in the peripheral, high oxygen
regions while Pseudomonas 1-10 colonized the interior. They measured the rate of
decolorization. By spectrophotometer, they monitored the chemical alterations in the dye
molecule as it was mineralized. The key step to decolorization of azo dyes is usually
reduction and cleavage of the azo bonds by azo reductase under anaerobic conditions to
form the corresponding amines.166,167 Based on their results, He et al. propose that the
decolorization mechanisms and degrading pathway as follows: azo bonds were firstly
cleaved by the azoreductase of Pseudomonas 1-10. The white-rot fungus 8-4* was
stimulated to increase its production of extracellular enzymes. Synergism between
Pseudomonas 1-10 and the extracellular enzymes of white-rot fungus 8-4* increased
decolorization of 4BS, leading to complete mineralization.
3.8.3.5 Summary of Microbial Treatments of Textile Effluents
Efforts are underway to apply microbial treatment to effluents from textile dyeing.
Different reactor designs are currently being developed.168,169,170 The faster growth of
bacteria versus fungi suggests that microbial treatment may be more effective than
systems based on white rot fungi. The dependence of microbial decolorization on azo
reductase production by anaerobic microbes is not a significant limitation in the treatment
of wastewater. However, the requirement for anaerobic conditions indicates that this
method of dye decolorization is not suitable for treatment of colored pulp fibers.

KRISTINA KNUTSON PHD THESIS 2/22/2006 PAGE 70
3.8.4 DECOLORIZATION OF DYES BY INTACT FUNGI
A number of white-rot fungi have been reported to degrade textile dyes. The
anthraquinone dyes are structurally similar to the phenolic units in lignin. To develop an
easier assay for lignolytic activity, in 1983 Glenn and Gold171 tested Phanerochaete
chrysosporium for the ability to degrade three polycyclic aromatic carbonyl dyes. The
fungus decolorized the dyes, but only during secondary metabolism, when lignolytic
activity appears in this fungus. Chemical inhibitors of lignin degradation also inhibited
dye degradation. Likewise, a mutant lacking lignolytic activity was unable to decolorize
the polymeric dyes.
3.8.4.1 Decolorization of azo dyes by Phanerochaete chrysosporium
Cripps et al.172 grew Phanerochaete chrysosporium cultures for six days, then
added azo dyes to the media. (The dyes are shown in Figure 40) To determine the extent
of decolorization, the absorbance of the culture media was measured at the λMax for each
dye. Extensive loss of color occurred during five days of culture, with most color loss
occurring within the first six hours. To determine whether the dye was degraded or
absorbed to the mycelium, Cripps extracted the mycelial mat with methanol. After five
days, Azure B, Tropaeolin O and Orange II contained no dye. For Congo Red, 6% of the
applied amount could be extracted after five days of growth and allowing the cultures to
grow 12 days still did not result in complete decolorization of Congo Red.
Figure 40 Azo Dyes Degraded by Phanerochaete chrysosporium as per Cripps172
NNNaO3S
HO
Orange II
NN N N
NH2
SO3Na
NH2
SO3Na Direct Red 28 (Congo Red)
NNNaO3S
HO
Tropaeolin O
OH
S
N
NH
CH3NCH3
H3C
ClAzure B

KRISTINA KNUTSON PHD THESIS 2/22/2006 PAGE 71
Lignolytic activity is induced by nitrogen-limiting conditions. In nitrogen
sufficient cultures, substantial amounts of dye (11 to 49%) were bound to the mycelia and
not degraded. Using crude lignin peroxidase from nitrogen-limited cultures of P.
chrysosporium, three of the four dyes were partially decolorized within 20 minutes. The
absorbance of Congo Red did not decrease. It should be noted that orange II, tropaeolin O
and Congo Red are all azo dyes, but only Congo Red lacks phenolic groups.
The enzyme reaction was initiated by the addition of hydrogen peroxide. The
crude lignin peroxidase was dialyzed during preparation. Cripps did not add veratryl
alcohol. Cripps’s crude lignin peroxidase may have decolorized if veratryl alcohol had
been present to serves as an electron shuttle. Cripps did demonstrate that Phanerochaete
chrysosporium could decolorize azo dyes when grown under lignolytic conditions.
3.8.4.2 Dye decolorization by P. chrysosporium and S. chromofuscus
Paszczynski et al.173,176 examined the ability of both Phanerochaete
chrysosporium and Streptomyces chromofuscus to mineralize sulfonated azo dyes and
sulfanilic acid. Structures of the radiolabeled substrates used are shown in Figure 41, and
the amount of radioactivity recovered is shown in Table 3-30. Phanerochaete
chrysosporium was tested because it is most-studied white-rot fungus. Streptomyces
chromofuscus, a ligninocellulolytic microorganism, belongs to an actinomycete group
abundant in soil. When tested with xenobiotic compounds, actinomycetes can catalyze
hydroxylations; O, N, and S oxidations; and O- and N-dealkylations. Paszczynski
radiolabeled the dyes in the most recalcitrant portion of the molecule, the benzene ring
attached directly to the azo bond and containing a sulfonate group in the para position.
S. chromofuscus showed mineralization only when the lignin-like guaiacol
structure was attached to the sulfonated aromatic ring. P. chrysosporium mineralized all
the dyes tested. Paszczynski measured the rate of dye mineralization during the 21-day
incubation period. The mineralization of dye 3 (with hydroxy and methoxy substituents)
was twice the rate of degradation of dyes 17 and 19 for the first 10 days. By the end of
the incubation, dyes 3, 17, and 19 had been mineralized to similar extents.

KRISTINA KNUTSON PHD THESIS 2/22/2006 PAGE 72
Hydroxynaphthol dyes 31 and 32 differ in the position of the hydroxyl group.
Paszczynski et al. report that the degradation rate of dye 31 was 2½ times greater than
dye 32. The degradation of dye 31 also started two days earlier. Paszczynski did not
speculate why the degradation rates for dyes 31 and 32 were so different. The position of
the hydroxyl group may have some effect. However, dye 32 is in the sulfonic acid form
while dye 31 is the sodium salt. Differences in water solubility could account for the
slower mineralization of dye 31.
Figure 41 14C-Labeled Azo Dyes Degraded by P. chrysosporium and S. chromofuscus
As Published by Paszczynski173
OHNNHO3S
NNHO3S
HO
NNHO3S
HON
NOH
SO3NaOCH3
NNHO3S
OH
OCH3
*
*
*
*
*
NNHO3S
NH2
SO3H*
NH2HO3S
Structures of radiolabeled compounds used. * aromatic rings uniformly labeled with 14C
(1)
(32)
(31)
(19)
(3)
(17)

KRISTINA KNUTSON PHD THESIS 2/22/2006 PAGE 73
Table 3-30Radioactivity Recovered from 14C Labeled Dyes as per Paszczynski173
3.8.4.3 Decolorization of14C-ring-labeled azo dyes by P. chrysosporium
Spadro et al.174 examined the ability of Phanerochaete chrysosporium to
mineralize specifically 14C-ring-labeled azo dyes. (Table 3-31) P. chrysosporium had
been reported to decolorize a number of azo dyes,172,175,176 but decolorization of the
chromophore is not the same as mineralization of the compound. All of the dyes tested
were degraded much more rapidly under nitrogen limiting (lignolytic) conditions than
under nitrogen-sufficient conditions. Phenolic ring-labeled compounds Ia and IIa were
also significantly degraded under nitrogen-sufficient conditions suggesting these phenolic
compounds are susceptible to enzymes other than lignin-degrading enzymes. Comparison
of the degradation of compounds Ia and IIa suggests that the addition of a methoxy group
to the phenolic ring enhanced degradation. For Disperse Orange 3, (compound VI), the
amino-substituted and the nitro-substituted ring were about equally degraded. Although
the nitro group would be expected to retard degradation, the degradation of 2, 4-
dinitrotoulene by P. chrysosporium has been shown to be initiated with reduction of a
nitro group to an amine.177 Addition of a phenolic, amino or acetamide group to the
aromatic ring increased the degradation. Spadro demonstrated that P. chrysosporium
mineralizes as well as decolorizes azo dyes and that the degradation rate was affected by
the substitution pattern.
Percentage of radioactivity incorporated into CO2 and biomass and Removed from medium after 21 days of growth by Phanerochaete
Chrysosporium and Streptomyces chromofucus % Radioactivity in:
P. chrysosporium S. chromofuscus Azo dye Mediuma CO2
b Cells Medium CO2 Cells 32 (Orange I) 29.6 19.7 4.0 22.0 1.1 7.0 1 Sulfanilic acid 25.0 17.2 1.3 0.0 0.0 0.0 31 (Orange II) 41.6 34.8 2.3 0.0 0.0 0.0 19 28.0 23.2 3.6 17.9 1.3 3.9 3 31.7 25.7 5.2 19.0 3.6 4.6 17 (Acid Yellow 9) 33.0 26.9 2.3 0.0 0.0 0.0 a 14C not accounted for as CO2 or biomass was lost by absorption to cell material and could be removed by washing with distilled water b In addition to CO2, a small amount (0.1 to 0.5%) of organic volatiles was detected
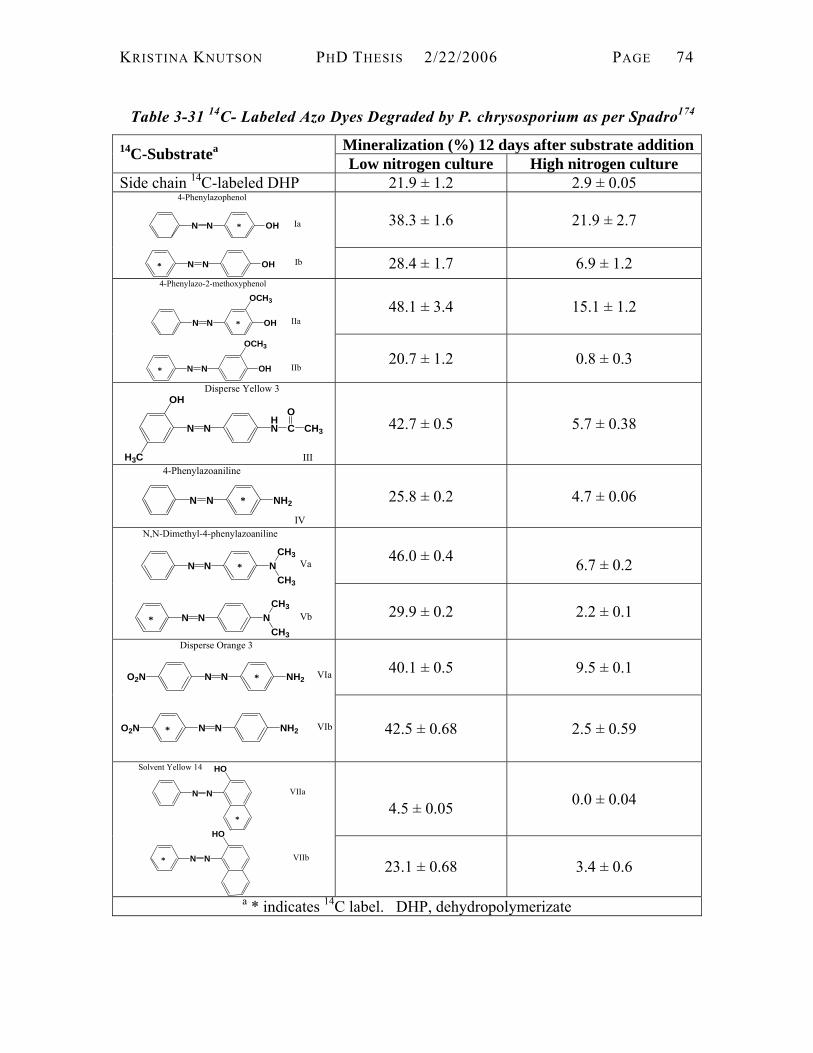
KRISTINA KNUTSON PHD THESIS 2/22/2006 PAGE 74
Table 3-31 14C- Labeled Azo Dyes Degraded by P. chrysosporium as per Spadro174
Mineralization (%) 12 days after substrate addition14C-Substratea Low nitrogen culture High nitrogen culture Side chain 14C-labeled DHP 21.9 ± 1.2 2.9 ± 0.05
38.3 ± 1.6
21.9 ± 2.7 NN OH
4-Phenylazophenol
*
NN OH*
Ia
Ib 28.4 ± 1.7 6.9 ± 1.2
48.1 ± 3.4
15.1 ± 1.2
NN OH
4-Phenylazo-2-methoxyphenol
*
NN OH*
IIa
IIb
OCH3
OCH3
20.7 ± 1.2 0.8 ± 0.3
NNHN
OH
H3C
CO
CH3
III
Disperse Yellow 3
42.7 ± 0.5 5.7 ± 0.38
NN NH2
4-Phenylazoaniline
*
IV 25.8 ± 0.2 4.7 ± 0.06
46.0 ± 0.4
6.7 ± 0.2 NN N
N,N-Dimethyl-4-phenylazoaniline
*
NN N*
Va
VbCH3
CH3
CH3
CH3
29.9 ± 0.2 2.2 ± 0.1
40.1 ± 0.5
9.5 ± 0.1
NN NH2
Disperse Orange 3
*
NN NH2*
VIa
VIb
O2N
O2N
42.5 ± 0.68 2.5 ± 0.59
4.5 ± 0.05
0.0 ± 0.04 NN
Solvent Yellow 14
*
NN*
VIIa
VIIb
HO
HO
23.1 ± 0.68 3.4 ± 0.6
a * indicates 14C label. DHP, dehydropolymerizate

KRISTINA KNUTSON PHD THESIS 2/22/2006 PAGE 75
3.8.4.4 Dye decolorization of 3 varied dyes by Trametes versicolor
Wang and Yu178 investigated the ability of Trametes versicolor to adsorb and
degrade three dyes: an indigoid, an anthraquinone and an azo dye. (The azo dye used has
a phenolic group on the aromatic ring attached to the azo bond. Figure 42)
To ascertain the importance of physical adsorption and enzymatic degradation,
dye adsorption was determined under four conditions. (Figure 43) 1.) Dead mycelium +
autoclaved spent broth. This control had minimal adsorption of the three dyes. 2.) Dead
mycelium + intracellular enzymes. A solution of intracellular enzymes prepared by
homogenization of mycelium in broth followed by removal of debris. 3.) Dead mycelium
+ extracellular enzymes. A solution of extracellular enzymes was prepared by removing
the mycelium from a 10-day old culture broth. The solution contained 78 U/L of
peroxidase activity and 16,000 U/L of laccase activity. 4.) Living mycelium +
extracellular enzymes. In general, the adsorbed dyes were removed and degraded fastest
by the living mycelium plus extra cellular enzymes. The anthraquinone dye was degraded
faster by the extracellular enzymes. The indigo dye was degraded faster by the
intracellular enzymes. The azo dye was degraded at the same rate with the enzymes. For
these dyes, degradation by live fungal cells was more important that biosorption by dead
cells.
Figure 42 Three Synthetic Dye Substrates Decolorized by Trametes versicolor
As Published by Wang and Yu179
O
O
HN
HN
NaO3S
NaO3S
CH2CH2CH2CH3
CH2CH2CH2CH3
Acid Green 27
SO3Na
SO3Na
HN
HO
N
CO
H3C
NNHCO
H3C
Acid violet 7
HN
NH
SO3NaO
ONaO3S
Indigo carmine

KRISTINA KNUTSON PHD THESIS 2/22/2006 PAGE 76
Figure 43 Dye Degradation by Mycelium Plus Enzymes as Measured by Wang178
0
5
10
15
20
DM+No DM+InE DM+ExE LM+ExE
Mycelium and enzymes
Dye
des
orpt
ion
and
degr
adat
ion
(mg
dye/
g bi
omas
s/h) Acid Violet 7
Acid Green 27Indigo carmine
Physical desorption and enzymatic degradation of adsorbed dyes with four types of fungal biomass and enzymes. DM+No: dye-saturated dead mycelium in an autoclaved spent broth without enzyme; DM+InE: dye-saturated dead mycelium in a supernatant of intracellular enzymes; DM+ExE: dye-saturated dead mycelium in a broth containing ligninolytic extracellular enzymes; LM+ExE: dye-saturated living mycelium in a broth with the extracellular enzymes
3.8.4.5 Effect of aromatic substitution pattern on decolorization
Pasti-Grigsby, Paszynski, et al180. continued research with Phanerochaete
chrysosporium and Streptomyces chromofuscus and examined the effect of different
aromatic substitution patterns on azo dye degradability.180 The substrate dye structures
are shown in Figure 44. Streptomyces chromofuscus A11 decolorized azo dyes that had a
hydroxyl group in the para position and at least one methoxy and/or alkyl group ortho to
the hydroxyl group. The rate of dye decolorization by intact Streptomyces chromofuscus
correlated with the decolorization rate by isolated Phanerochaete chrysosporium
manganese peroxidase and commercial horseradish peroxidase. Isolated Phanerochaete
chrysosporium lignin peroxidase showed a different dye specificity. LiP was the only
enzyme tested that could decolorize compound [11], an azo compound with two strongly
electron-withdrawing fluorine groups attached to the aromatic ring. Their work
demonstrates that the aromatic substitution pattern of the substrate is important and that
manganese peroxidase and lignin peroxidase differ in specificity.

KRISTINA KNUTSON PHD THESIS 2/22/2006 PAGE 77
Figure 44 Monosulfonated Azo Dyes Degraded by Intact Fungi
From Publication by Pasti-Grigsby180
NaO3S NNH
= (R)
R
CH3
OH
CH3(1)
R
HC
(9)
CH2CH3
CH3
OH
R
(17)
NH2
SO3Na
R
OCH3
OH
OCH3(2)
R
CH3
(10)
HO OCH3
R
OCH3
OH(3)
R
F
(11)
OH
F
HO
SO3Na
N
N
(18)
R
CH3
OH(4)
R
(12)
OH
Cl
R OH(5)
R(13)
NCH3
CH3
OCH3
(19)
OHN
N
SO3Na
R
R
CH3
CH3
(6)HO
R(14)
NCH2CH3
CH2CH3
R(30)
NH2
R
CH3
(7)HO
R(15)
OCH3
HO
R
(31)
R
CH2CH3
(8)HO R
OCH3
(16)OCH3
R
(32)
OH

KRISTINA KNUTSON PHD THESIS 2/22/2006 PAGE 78
3.8.4.6 Summary of treatments of textile effluents with intact fungi
Research efforts continue in this area ranging from screening new fungal isolates
for the ability to decolorize dyes,181,182,183 examining the effect of culture conditions on
decolorizing effectiveness184,185,186 and exploring potential methods for industrial
application.187,188 Treatment with intact fungi may be appropriate for wastewater
treatment. However, days of treatment are usually needed. Decolorization with intact
fungi is not appropriate for removing color from cellulose fibers.
3.9 DEGRADATIVE REDOX SYSTEMS OF WHITE-ROT FUNGI
White-rot fungi have been studied for dye decolorization because they are able to
degrade a large variety of substrates. White-rot fungi break down both hydrophilic
cellulose and hydrophobic lignin. Fungi can degrade a greater variety of substrates than
bacteria because fungi excrete enzymes that can attack compounds too large or insoluble
to enter a cell. The redox mechanisms of white-rot fungi are listed in Table 3-32. These
same pathways have also been studied for biobleaching189,190,191,192,193 and for treatment
of papermill and bleach plant effluents.194,195,196
Table 3-32 Redox Systems of White-Rot Fungi
System Mediator Electron Source Lignin Peroxidase Veratryl Alcohol H2O2 Manganese Peroxidase + Chelator Mn+2/+3 H2O2 Laccase Various Small Molecules O2 Organic Chelators Fe+2/+3, Mn+2/+3 H2O2
3.9.1 DEGRADATION OF RECALCITRANT POLLUTANTS
White-rot fungi are able to degrade pollutants like polychlorinated phenols and
dinitrotoulene that persist in the environment.197 The degradation mechanisms used by
white-rot fungi are outlined in an excellent review by Barr and Aust.197 These compounds

KRISTINA KNUTSON PHD THESIS 2/22/2006 PAGE 79
are already highly oxidized. The initial step in mineralization is a reduction. Published
reports of compound degradation should be evaluated carefully. In some cases, a fungus
can perform the initial reduction, but the breakdown products accumulate. Fungi have
been incorrectly assumed to mineralize compounds when only the disappearance of the
initial compound was monitored.
3.9.2 DECOLORIZATION OF DYES BY FUNGAL ENZYMES
White-rot fungi contain at least three redox systems: lignin peroxidase (LiP or
ligninase), manganese peroxidase (MnP) and laccase (Lac). Each of these systems has
been evaluated for ability to decolorize synthetic dyes.
3.9.2.1 Lignin peroxidase treatment of 10 varied dyes
Ollikka et al.198 isolated lignin peroxidase isoenzymes from carbon-limited
cultures of Phanerochaete chrysosporium. The fungus produces a number of veratryl
alcohol-oxidizing proteins that could be expect to vary in specificities and/or efficiencies.
Ten different dyes were treated with a crude enzyme preparation. These dyes included
azo, triphenyl methane, heterocyclic and polymeric dyes.
The color removal was greater than 75% for seven of the dyes. Poly R-478 and
Poly T-128, (polycyclic aromatic carbonyl dyes), were decolorized 46% and 48%,
respectively. Congo Red (an azo dye, structure given in Figure 40), was decolorized 54%.
Three lignin peroxidase isoenzymes were isolated by preparative isoelectric
focusing, followed by chromatofocusing with an exchange column. The purified
isoenzymes were used to decolorize five dyes. When 2-mM veratryl alcohol was added,
the decolorization activity of the purified isoenzymes was similar to the activity of the
crude enzyme preparation. In the absence of veratryl alcohol, decolorization was greatly
reduced.
Ollikka determined the kinetic constants, kCAT, Km, for the purified isoenzymes.
The three isoenzymes did not exhibit significant kinetic differences. For some dyes, the

KRISTINA KNUTSON PHD THESIS 2/22/2006 PAGE 80
pH range for effective decolorization was very narrow. The enzymes function in the pH
range of 3-5.
The addition of veratryl alcohol to the crude enzyme preparation did not affect
decolorization. Veratryl alcohol is added to the fungal culture media to activate enzyme
production. To determine if veratryl alcohol had carried over into the crude enzyme
preparation, Ollikka removed low-molecular weight compounds from the crude enzyme
preparation by diafiltration. After diafiltration, the activity of the crude LiP preparation
decreased to the level of the purified isoenzymes. The presence of veratryl alcohol in the
crude enzyme preparation was verified and its concentration was determined by two
independent methods. The crude enzyme preparation was found to contain 150 μM
veratryl alcohol by capillary electropherograms and by measurement of veratraldehyde
production at 310 nm.
Cripps172 had not observed decolorization of Congo Red by crude lignin
peroxidase from nitrogen-limited Phanerochaete chrysosporium. Ollikka198 found
significant decolorization of crude lignin peroxidase from carbon-limited Phanerochaete
chrysosporium. The discrepancy could be due to the difference in the fungal culture
conditions. However, the lack of veratryl alcohol in Cripps’s dialyzed enzyme
preparation is the most likely cause for the difference.
3.9.2.2 Lignin and manganese peroxidase treatment of 8 varied dyes
Young and Yu199 selected 8 dyes of very diverse structures as substrates. (Figure
45) They obtained partially purified ligninase (lignin peroxidase) and Mn-dependent
peroxidase (manganese peroxidase) from Tienzyme. Fungal cultures of P. chrysosporium
and T. versicolor were also tested. The results are shown in Table 3-33. No results are
shown for manganese peroxidase because MnP had negligible ability to decolorize the
dyes. Both the manganese and hydrogen peroxide concentrations were varied.
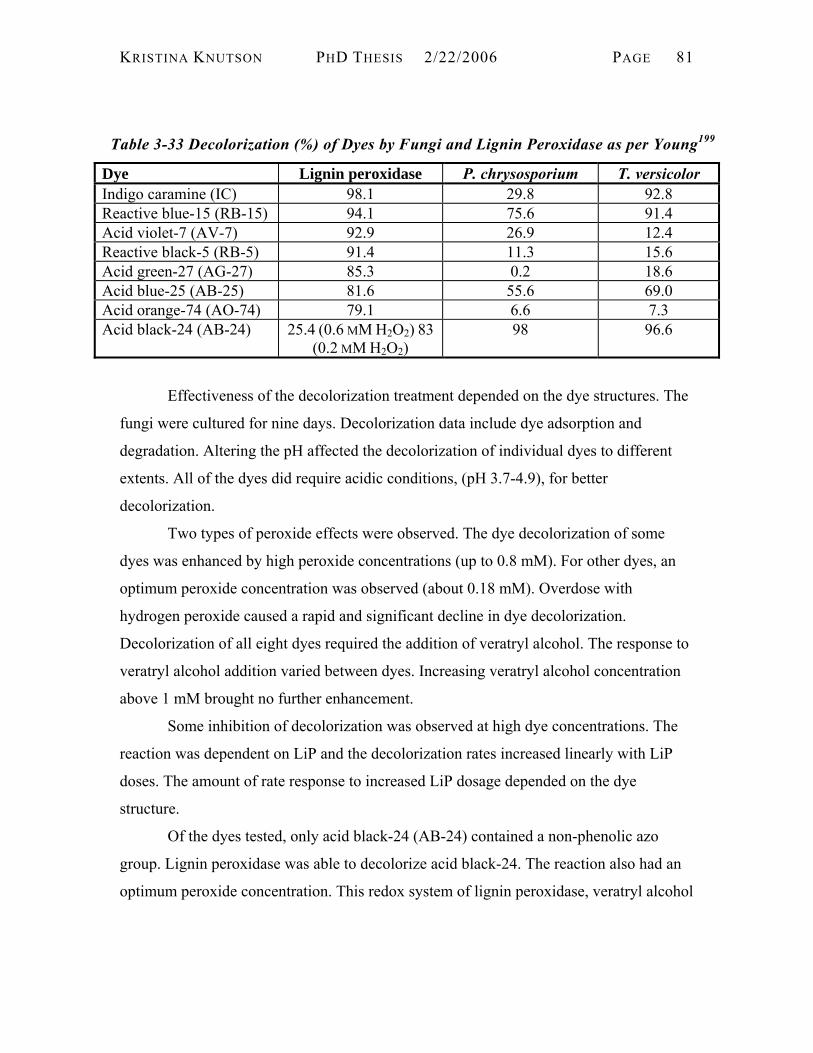
KRISTINA KNUTSON PHD THESIS 2/22/2006 PAGE 81
Table 3-33 Decolorization (%) of Dyes by Fungi and Lignin Peroxidase as per Young199
Dye Lignin peroxidase P. chrysosporium T. versicolor Indigo caramine (IC) 98.1 29.8 92.8 Reactive blue-15 (RB-15) 94.1 75.6 91.4 Acid violet-7 (AV-7) 92.9 26.9 12.4 Reactive black-5 (RB-5) 91.4 11.3 15.6 Acid green-27 (AG-27) 85.3 0.2 18.6 Acid blue-25 (AB-25) 81.6 55.6 69.0 Acid orange-74 (AO-74) 79.1 6.6 7.3 Acid black-24 (AB-24) 25.4 (0.6 MM H2O2) 83
(0.2 MM H2O2) 98 96.6
Effectiveness of the decolorization treatment depended on the dye structures. The
fungi were cultured for nine days. Decolorization data include dye adsorption and
degradation. Altering the pH affected the decolorization of individual dyes to different
extents. All of the dyes did require acidic conditions, (pH 3.7-4.9), for better
decolorization.
Two types of peroxide effects were observed. The dye decolorization of some
dyes was enhanced by high peroxide concentrations (up to 0.8 mM). For other dyes, an
optimum peroxide concentration was observed (about 0.18 mM). Overdose with
hydrogen peroxide caused a rapid and significant decline in dye decolorization.
Decolorization of all eight dyes required the addition of veratryl alcohol. The response to
veratryl alcohol addition varied between dyes. Increasing veratryl alcohol concentration
above 1 mM brought no further enhancement.
Some inhibition of decolorization was observed at high dye concentrations. The
reaction was dependent on LiP and the decolorization rates increased linearly with LiP
doses. The amount of rate response to increased LiP dosage depended on the dye
structure.
Of the dyes tested, only acid black-24 (AB-24) contained a non-phenolic azo
group. Lignin peroxidase was able to decolorize acid black-24. The reaction also had an
optimum peroxide concentration. This redox system of lignin peroxidase, veratryl alcohol

KRISTINA KNUTSON PHD THESIS 2/22/2006 PAGE 82
and ‘low dosage’ hydrogen peroxide might be effective in decolorizing non-phenolic C.I.
Direct Yellow 11.
Figure 45 Diverse Synthetic Dye Substrates Decolorized by Lignin Peroxidase
As Published by Young and Yu199
HN
NH
SO3NaO
ONaO3S
Indigo carmine
N
N
N
N
N
N
N
NCu
SS
S
S
O
OONa
O
ONaO
O
O
NaO
O
ONH
NaO3S
NH
N
N
N
NH2Cl
Reactive Blue 15
HO
SO3Na
SO3Na
H2N
N
N
N
NSO
ONaO3SOH2CH2C
SO
ONaO3SOH2CH2C
Reactive Black 5
O
O
HN
HN
NaO3S
NaO3S
CH2CH2CH2CH3
CH2CH2CH2CH3
Acid Green 27
O
O
NH2
SO3H
HNAcid Blue 25
HN
O2N
OHNaO3S
NH
NN
CH3
HO
*Cr
Acid Orange 74
SO3Na
SO3Na
HN
HO
N
CO
H3C
NNHCO
H3C
Acid Violet 7
N N N NNN
NaO3S
Acid Blue 24
SO3Na
3.9.2.3 Manganese peroxidase treatment of 4 azo dyes
Heinfling et al.200 selected one phthalocyanine dye and four azo dyes for
substrates (Figure 46) One of the dyes has a non-phenolic azo linkage. The selected

KRISTINA KNUTSON PHD THESIS 2/22/2006 PAGE 83
enzymes were manganese peroxidases from Phanerochaete chrysosporium, Pleurotus
eryngii and Bjerkandera adusta. MnP from P. chrysosporium did not decolorize the dyes.
The MnPs from P. eryngii and B. adusta did decolor the dyes, but the reaction was Mn2+
independent. The reaction rates with the dyes could not be increased by adding 1 mM
Mn2+.
Manganese peroxidase degrades xenobiotic compounds by converting Mn2+ to
Mn3+. The Mn3+ then reacts with the substrate. To determine if Mn3+ was involved,
Heinfling also treated the dyes with a Mn3+-lactate complex. The Mn3+ complex did not
decolorize the dyes. Lignin peroxidase from B. adusta was able to decolor the dyes when
veratryl alcohol was added. The addition of veratryl alcohol to MnP did not stimulate dye
decolorization. So the dyes were decolorized by lignin peroxidase plus veratryl alcohol
and by manganese peroxidases without additional manganese.
Figure 46 Azo Dye Substrates Decolorized by Manganese Peroxidase
As Published by Heinling200
HN
SO3NaNaO3S
NO
OCuO
N
HO3SOH2CH2CO2S
Reactive Violet 5
HO
SO3Na
SO3Na
H2N
N
N
N
NSO
ONaO3SOH2CH2C
SO
ONaO3SOH2CH2C
Reactive Black 5
HNOH
HO3S SO3H
NN
N
N
N
NH
SO3H
Cl
HO3SOH2CH2CO2S
Reactive Red 198
N
Cl
NNaO3SOH2CH2C
NaO3SOH2CH2C
N SO2CH2CH2OSO3Na
Reactive Orange 96

KRISTINA KNUTSON PHD THESIS 2/22/2006 PAGE 84
3.9.2.4 Laccase treatment of 3 varied dyes
Wong and Yu179 isolated the decolorizing enzyme from Trametes versicolor. The
same substrates were used as in previous work with the intact fungus. (Figure 42, page
75) These compounds include an anthraquinone dye, an indigo dye and an azo dye with
phenol group attached to the azo bond. Lignin peroxidase and manganese peroxidase
activities were not detected in carbon-limited cultures of T. versicolor. Laccase activity
was present in these cultures.
The initial decolorization rates were determined for each dye by adding an aliquot
of culture supernatant to a dye solution. For the anthraquinone dye, the initial
decolorization rate increased in proportion to the laccase activity. The linear response
indicates that the anthraquinone dye was a substrate for laccase. The azo and indigo dyes
were decolorized, but the rate was not proportional to the laccase activity. Decolorization
of these dyes may involve a low molecular weight mediator.
The crude media preparation was checked for the presence of a mediator by
membrane filtration. The filtered high molecular weight fraction could decolor the
anthraquinone dye, but not the azo or indigo dyes. In a designed experiment, the crude
laccase solution was enclosed in a dialysis membrane that allowed free diffusion of small
molecules but prohibited the release of the enzyme. When the known laccase mediator
ABTS (2, 2´-azino-bis (3-ethylthiazoline-6-sulfonate) was added to a dye solution with
the confined laccase, the azo and indigo dyes were decolorized. Subsequent experiments
determined that the anthraquinone dye could serve as a mediator for the decolorization of
the azo and indigo dyes. This work indicates that a laccase-mediator redox system may
be able to decolorize C.I. Direct Yellow 11.
3.9.2.5 Relationship between redox potential and decolorization by laccase
The ability of microbes, fungi and enzymes to degrade azo dyes depends on the
structural characteristics of the dye, the temperature and pH of treatment, the presence of
intermediates, and the difference between redox potentials of the bioagent and the dye.
Zille et al.201. explored the biodegradation of some azo dyes under aerobic conditions by
the ascomycete yeast Issatchenkia occidentalis and by laccase with or without mediator.

KRISTINA KNUTSON PHD THESIS 2/22/2006 PAGE 85
The dyes and mediator are shown in Figure 47. They compared these two approaches on
the basis of the electrochemical properties of the dyes and bioagents.
Zille found a linear relationship during the initial period of decolorization with
laccase and a laccase/mediator system between the percentage decolorization of each dye
and the respective anodic peak potential. Contrarily to the laccase system, I. occidentalis
decolorizes azo dyes through a reductive mechanism, but also in this system a linear
relationship between the cathodic peak potentials and the time of maximum
decolorization of the azo compounds was observed.
Figure 47 Dye Structures with Different Redox Potentials Decolorized by Laccase
From Publication by Zille201
N
3-(4-dimethylamino-phenylazo)-benzene sulfonic acid sodium salt
N
NaO3S
NCH3
CH3
N N N
Acid Orange 52
CH3
CH3NaO3S
N
HO
3-(2-hydroxy-naphthalen-1-phenylazo)-benzene sulfonic acid sodium salt
N
NaO3S
N
HO
Acid Orange 7
NNaO3S
N
SO3Na
SO3NaHO
Acid Red 27
NNaO3S
HO
SO3Na
SO3Na
H2N
N
N
N
NSO
ONaO3SOH2CH2C
SO
ONaO3SOH2CH2C
Reactive Black 5
HN
HN
SO3Na
N NNN
SO3Na
SO3Na OH
NaO3S NH2
Direct Blue 71 3.9.2.6 Summary of dye decolorization by fungal enzymes
Decolorization with fungal enzymes offers a number of advantages over using
intact fungi. To produce the necessary enzymes, fungi may require very precise culture
conditions. The reaction is slower and the amount of waste material (sludge) increases

KRISTINA KNUTSON PHD THESIS 2/22/2006 PAGE 86
due to fungal growth. Consequently, dye decolorization with fungal enzymes offers great
potential. In addition to screening new sources, research efforts include creating enzyme
membrane bioreactors202 and enzyme production under solid state fermentation
conditions.203
Table 3-34 Redox Potentials for Delignification Enzymes and Chemicals as per Call204 Redox potential Compound
E0 (mV)a E1/2 (mV)b Literature
Laccase (fungal; type 1/type 3) pH 5.5 +780/+785 Reinhammar 1984 Laccase (plant; type 1/type 3) pH 7.5 +394/+434 Reinhammar 1984 Ceruloplasmin pH 5.5 +490/+580 Reinhammar 1984 Stellamycin pH 7.1 +184 Reinhammar 1984 Mavicyanin pH 7.0 +285 Reinhammar 1984 Rusticyanin pH 2.0 +680 Reinhammar 1984 Plastocyanin pH 7.0 +370 Reinhammar 1984 Azurin pH 7.0 +300 Reinhammar 1984 HRP-I/HRP-II +920 Hayashi and Yamazaki 1979 LiP-I/LiP-II +1000-+1100 Shoemaker et al. 1994 O2 + e- → O2
- -330 Lippard and Berg 1994 O2 + H+ + e- → HO2 -130 Lippard and Berg 1994 O2 + 2H+ + 2e- → H2O2 (aq) +1500 Lippard and Berg 1994 O2 + 4H+ + 4e- → 2H2O +815 Ishihara and Nishida 1983;
Lippard and Berg 1994 O2
*- + 2H+ + e- → H2O2 +890 Lippard and Berg 1994
O2*-
(reductant/oxidant) -330/+950 Henry et al. 1981 OH + e- → OH- +1400 CRC 1982 OH2 + H+ + e- → H2O2 +1500 CRC 1982 OH*
+ H+ + e- → H2O +2180/+2310 Wood 1994; Lippard and Berg 1994
CO2*- +1100 Henry et al. 1981
Cu2+ + e- → Cu+ +153 Lippard and Berg 1994 Fe3+ + e- → Fe2+ +771 Lippard and Berg 1994 Mn3+ (chelated) +900 - +1200 Demmber et al. 1980; Cui
and Dolphin 1990 Mn3+ + e- → Mn2+ +1510 Lippard and Berg 1994 (Fe(CN)6)3-/(Fe(CN)6)4- +420 Morpurgo et al. 1993 Dehydroascorbate + 2H+ + 2e- → ascorbate
+0.06 Dawson et al. 1986
Veratryl alcohol (3,4-dimethoxybenzyl alcohol)
+1450 (pH 3, water)
+1220 Fawer et al. 1991
Several tetra-, tri-, di- and methoxybenzene(s)
Increasing from +810 - +1760
De Jong et al.; Popp and Kirk 1991
Benzotriazole (4N HCl) -1000d Lund and Kwee 1968 N-hydroxybenzotriazole (pH 0) ≈ -800d Lund and Kwee 1968 N-hydroxybenzotriazole (pH 7) +760 Aurich et al. 1977 aE0 is the potential; vs. normal hydrogen electrode (NHE, pH 7, 25ºC) bE1/2 (have-wave potential-polargraphy vs. saturated calomel electrode (SCE) is the potential where the ratio of oxidized/reduced state is valid, i.e. in this case E0=E1/2 according to Nernst equation (for correction E0,SCE = +240 mV)

KRISTINA KNUTSON PHD THESIS 2/22/2006 PAGE 87
cSolvent acetonitrile dControlled polarographical reductions of benzotriazole to o-aminophenylhydrazine can be obtained at -1.0 V (SCE) with a consumption of 4 electrons per molecule under acidic conditions (up to pH 3)
3.10 SUMMARY OF LITERATURE REVIEW
To increase the value of recycled fiber, dyes present in wastepaper have to be
bleached/decolorized. For fine papers from chemical pulp, the hardest dye to bleach is a
stilbene yellow dye. This dye, C.I. Direct Yellow 11, responds poorly to current chemical
bleaching agents. Ozone can destroy the dye, but ozone also damages cellulose fibers and
requires investment in an expensive ozone generator. In directory paper from high-yield
(mechanical) pulps, a major problem is the dye in telephone directory yellow pages. The
most commonly applied dye for directory paper is the methine dye, Basazol Yellow 46L
(C.I. Basic Yellow 96).
Dyes produce color by absorbing different wavelengths of light. Human
perception responds to all wavelengths of visible light received. Visually identically
material may not absorb light identically. Spectrophotometric analysis of absorbed or
reflected light is necessary to distinguish whether visually identical materials contain the
same dye.
Visible and ultraviolet electromagnetic radiation is absorbed by a compound if the
energy of the radiation matches the energy required to promote an electron in the
compound to a higher energy level. Many compounds absorb only high-energy ultraviolet
light. Dyes consist of planar conjugated systems. Many dyes also contain nitrogen or
sulfur. Because π→π* and η→π* transitions require less energy in conjugated systems,
dyes absorb lower-energy visible light. If reduction, oxidation, or cleavage interrupts the
conjugated double bonds in a dye, the absorption will be shifted toward higher-energy
shorter wavelengths. For yellow dyes (which absorb blue light), this hypsochromic shift
can result in the disappearance of visible color.
C.I. Direct Yellow 11 contains an azo bond. Azo dyes are the most-commonly
used textile dyes. Environmental considerations have prompted studies of biological
degradation of azo and other dyes. Bacteria are not very effective in degrading these large
molecules. However, treatments with white-rot fungi or isolated fungal enzymes have

KRISTINA KNUTSON PHD THESIS 2/22/2006 PAGE 88
been successful in degrading many dyes, including azo dyes. Non-phenolic azo dyes have
been harder to degrade than phenolic azo dyes. However, degradation of non-phenolic
azo dyes has been reported.
There are some published reports that are of particular relevance to this project.
Beginning with yellow pulp produced from yellow colored recycled paper sorted out
from mixed office paper at a recycling mill, Li et al.205 compared treatments with
oxygen, alkaline hydrogen peroxide, sodium dithionite in the presence of detergent, and
laccase with violuric acid as mediator. Bleaching effectiveness was evaluated by
measuring TAPPI brightness206 which is based on absolute reflectance of blue light of
457 nm. The laccase/violuric acid treatment was for 18 hours and yielded pulp with lower
brightness than pulp treated for one hour with alkaline hydrogen peroxide. Sodium
dithionite treatment, nearly equal to alkaline hydrogen peroxide treatment in bleaching
effectiveness, provided higher brightness than alkaline hydrogen peroxide when a
detergent was added during treatment. Their pulp contained a mixture of unidentified
dyes and the laccase reaction time was long (18 hours). This report suggests that results
from laboratory experiments with one dye may be difficult to apply to the mixed dyes in
commercial operations.
One German recycle mill investigated whether laccase mediator system would be
suitable for deinking processes (such as ink detachment and dirt speck reduction) that are
run in neutral conditions under atmospheric pressure.207 They tested two laccases (from
Trametes villosa and Myceliophtora thermophila) and three mediators: ABTS, HBT and
violuric acid. Treatment with laccase or laccase with mediator lowered the brightness of
artificially aged prints, deinked pulp, and unprinted recycling papers. Subsequent tests
indicated that laccase treatment resulted in yellowing of lignin in groundwood and
thermomechanical pulp. This yellowing could not be reversed by subsequent alkaline
extraction, peroxide bleaching or FAS bleaching. These results suggest that laccase-
mediator bleaching would not benefit a mill recycling lightly colored papers containing a
high percentage of groundwood or thermomechanical pulp. A recycle mill treating highly
colored papers with a low percentage of groundwood and thermomechanical pulp may
KRISTINA KNUTSON PHD THESIS 2/22/2006 PAGE 89
still benefit. Also, the neutral pH and/or atmospheric oxygen conditions may have
affected laccase selectivity.
Finally, according to a Japanese report,208 the white rot fungus Coriolus
versicolor was effective at decolorizing 5 of 7 different groups of dye tested, including
stilbene. They obtained a maximum decolorization of >80% after 7 days. They examined
cell-free extracts and found laccase, peroxidase, and catalase activities. Cell-free
decolorizing of stilbene dye is not mentioned. This fungus may be useful for effluent
treatment, but short reaction times with cell-free extracts are necessary for bleaching
cellulose fibers dyed with stilbene dyes.

KRISTINA KNUTSON PHD THESIS 2/22/2006 PAGE 90
4 DISSERTATION OBJECTIVES
The goal of this research proposal was to determine whether treatment with the
laccase-mediator system and/or with peroxidase-hydrogen peroxide could effectively
decolorize recalcitrant dyes Direct Yellow 11 and Basazol 46L. This research was novel
in two aspects. First, at the inception of this research program, there were no reported
investigations of the ability of lignolytic fungal enzymes to decolorize stilbene dyes.
Second, the reported decolorization studies applied fungal enzymes to dissolved dyes. It
was unknown whether the enzymes could decolorize dyes while the dye was attached to
cellulose fibers. On this basis, the findings reported in this thesis were important
contributions to the field of biobleaching of cellulose fibers and to the potential
applications of lignolytic enzymes.
The main objectives of this research proposal were to:
1. Determine the effectiveness of laccase-mediator system on decolorizing Direct
Yellow 11 and Basazol 46L.
2. Develop an efficient LMS to decolorize pulp dyed with Direct Yellow 11
3. Propose potential mechanism for LMS decolorization
4. Compare effectiveness of developed LMS system to conventional treatments.
5. Investigate whether peroxidase enzymes are capable of decolorizing Direct Yellow
11 and Basazol 46L
6. Examine the reaction rates of LMS and peroxidase treatments
7. Investigate potential mechanisms for peroxidase decolorization

KRISTINA KNUTSON PHD THESIS 2/22/2006 PAGE 91
5 THESIS FORMAT
The author has elected to present the research results in the format of publications,
conference proceedings and manuscripts submitted for publication. Because of this
format, there will be some duplication of the introduction and experimental sections. The
results and discussion section of this thesis is divided into four chapters. The four
sections comprising the core of this thesis are titled:
1. An Auspicious Application of Laccase and Hydrogen Peroxidases for
Biobleaching of Recalcitrant Paper Dyes, Proceedings International Society of
Wood Pulping and Chemistry, Madison, Wisconsin, June 2003.
2. Laccase-Mediator Biobleaching Applied to a Direct Yellow Dyed Paper,
Biotechnology Progress (in press)
3. Enzymatic biobleaching of two recalcitrant paper dyes with horseradish
peroxidase, soybean peroxidase and laccase-mediator system (submitted to
Biotechnology Letters)
4. Decolorization of Colored Paper by Laccase-Mediator System and Conventional
Treatments (in preparation)
Publication1 describes a preliminary study on the ability of the laccase-mediator
system to decolorize Direct Yellow 11. This report demonstrates that LMS can decolorize
pulp dyed with Direct Yellow 11.
In Publication 2, ABTS is shown to be more effective as laccase-mediator than
either HBT or violuric acid. In addition, the dye removal of 60% can be maintained as the
ABTS concentration is lowered from 5 mM to 0.01 mM.

KRISTINA KNUTSON PHD THESIS 2/22/2006 PAGE 92
For Publication 3, the laccase/ABTS system, soybean peroxidase and horseradish
peroxidase were applied to Direct Yellow 11 and Basazol 46L. All three treatments were
able to reduce the signal intensity of Direct Yellow 11 and Basazol 46L. Direct Yellow
11 responded slowly to both soybean peroxidase and laccase/ABTS. Basazol 46L
responded quickly, with 74% reduction in signal within 5 minutes.
The last section describes the results from a comparative study between the
laccase/ABTS system and conventional bleaching treatments. The best results were
obtained for bleaching regimes that included reductive bleaching with sodium dithionite.
For pulp dyed with Direct Yellow 11, laccase/ABTS followed by dithionite removed as
much color as when the pulp was treated with oxygen or hydrogen peroxide followed by
dithionite.
KRISTINA KNUTSON PHD THESIS 2/22/2006 PAGE 93
6 EXPERIMENTAL PROCEDURES
6.1 MATERIALS AND REACTION EQUIPMENT
6.1.1 CHEMICALS
A sample of C.I. Direct Yellow 11 (Pergasol) has been provided by Ciba-Geigy.
Samples of Direct Yellow 11 (Fastusol) and Basazol Yellow 46L were donated by
Dwight Paean of BASF. Bleached hardwood kraft dry lap pulp was obtained from an
IPST member company. Laccase, NOVO 51002, from Trametes villosa, was donated by
Novozyme.
Laccase mediators 1-Hydroxy benzotriazole (HBT), violuric acid, and 2,
2’azinobis-3-ethyl-benzthiazoline-5-sulfonate (ABTS) were purchased from Sigma.
Polyethylene glycol of 10,000 and 35,000 molecular weight were purchased from Fluka.
Soybean peroxidase, veratryl alcohol and 4-aminoantipyrine (4-AAP) were purchased
from Sigma.
6.1.2 REACTION EQUIPMENT
A water-jacketed Parr High-Pressure system (Figure 48) was used for heated
pressurized reactions such as laccase-mediator reactions (45 ºC, 10 bar oxygen) and
oxygen pulp bleaching (90 ºC, 90 psi (6 bar) oxygen). A thermostat-controlled water bath
was used for heated ambient pressure reactions such as soybean peroxidase (45 ºC),
alkaline hydrogen peroxide pulp bleaching (75 ºC), sodium dithionite pulp bleaching (75
ºC), and alkaline extraction of bleached pulp (60 ºC). For water batch reactions involving
pulp, the pulp and bleaching solutions were sealed in heat-sealable Kapak bags 2.5 mils
thick.

KRISTINA KNUTSON PHD THESIS 2/22/2006 PAGE 94
Figure 48 Photograph of a 1000-mL-Capacity Parr Reactor with Components
Safety rupture disc, gas release valve, bomb cylinder, and other internal bomb fittings are not
visible in this photograph.
6.1.3 ANALYSIS EQUIPMENT
Spectra were obtained on a Perkin-Elmer Lambda 900 UV/Vis/NIR
Spectrophotometer. The color of the handsheets were measured following TAPPI
Standard Method T422 om-88, "Spectral reflectance factor transmittance, and color of
paper and pulp polychromatic illumination" CIELAB values for handsheets were
obtained on a Technibrite Micro TB-1C machine (Technidyne Corp., New Albany,
Indiana, USA) which measures light reflected at 0º from the surface. For the comparison
among laccase/ABTS, hydrogen peroxide and oxygen bleaching treatments, CIELAB
Temperature controller
Heating mantle
Pressure gauge Stirring system
Gas inlet valve
Thermocouple
Split ring pair with cap screws + drop ring
Magnetic drive
Outlet cooling water hose
Inlet cooling water hose
Pressure hose, Teflon lined, braided stainless steel

KRISTINA KNUTSON PHD THESIS 2/22/2006 PAGE 95
values for handsheets were obtained on a Brightmeter Micro S-5 (Technidyne Corp.,
New Albany, Indiana, USA) which measures light reflected at 45º from the surface.
6.2 ENZYME ACTIVITY ASSAYS
6.2.1 LACCASE ACTIVITY ASSAY
Laccase activity was measured by monitoring the rate of oxidation of ABTS209 in
a 100.0 mM pH 5.0 sodium acetate buffer. . The reaction was followed at 420 nm (ε420 =
36,000) One International Unit (IU) of activity is defined as the conversion of 1 μmole of
substrate/minute. One Katal (kat) of activity is defined as 1 mole/second of substrate
converted. For laccase-mediator treatment of dyed pulp, 10.3 U or 50 μkat was added for
each mL of reaction.
Equation 4 Conversion Between IU and Kat
1 kat = 1 mole/second = 60 mole/minute
1 IU = 1/60 µ kat = 16.67 x 10⁻⁹ kat
6.2.2 SOYBEAN PEROXIDASE ACTIVITY ASSAY
Soybean peroxidase (SBP) activity was measured by monitoring the production of
a red quinoneimine dye at 510 nm. In the presence of hydrogen peroxide, phenol and 4-
aminoantipyrine (4-AAP), SBP catalyzes the formation of phenol free radicals which
then react with 4-AAP to form the quinoneimine dye. (ε510 = 97,210 a.u. /M/cm)210 The
standard reaction conditions were 10.0 mM phenol, 2.40 mM 4-AAP and 0.20 mM H2O2
at 25 °C, pH 7.0.
6.3 PEROXIDE CONCENTRATION ASSAY
For reactions involving hydrogen peroxide, the concentration of the stored stock
solution (nominally 30%) must be determined. The assay procedure211 involves titration
of an acidic solution of hydrogen peroxide with sodium dithionite in the presence of an
indicator. Two (2.0) mL of peroxide solution is mixed with 100 mL distilled water, 10-15
mL of 25% sulfuric acid, 5.0 mL of 10% potassium iodide (KI) solution and 3 drops of

KRISTINA KNUTSON PHD THESIS 2/22/2006 PAGE 96
saturated ammonium molybdate solution. This mixture is titrated with 0.10 N sodium
thiosulfate (Na2S2O3) until a pale yellow color appears. Then 10.0 mL of soluble starch
solution is added and the thiosulfate titration continues until the blue color disappears.
The calculation of hydrogen peroxide concentration is shown in Equation 5.
Equation 5 Calculation of Hydrogen Peroxide Concentration
Grams/Liter = 0.1(norm. thio.) x 34 (equiv. H2O2 - 50%) x (mL. thio used) 2 mL (sample size)
6.4 SELECTION OF DYE CONCENTRATION
6.4.1 DYE MANUFACTURERS’ SAMPLE AND STOCK CONCENTRATIONS
The donated dye samples are commercial preparations that, in addition to the dye
chromophore, include fillers, salts and other materials. For instance, according to the
MSDS sheet, the Basazol 46L sample contains 40% acetic acid. The first step was to
obtain a solution concentration of g/mL of non-volatile solids.
One mL of each dye was dried down using a rotary evaporator. In Table 6-1
below are listed the concentration of non-volatile solids/mL for each dye and the final
solution volumes when 1.0 mL of dye was diluted to prepare a 10.0 mg/mL solution. For
the basic dye Basazol 46L, it was necessary to include 10% acetic acid when preparing a
10 mg/mL solution
Table 6-1 Concentrations of Dye Samples and Stock Solutions
Commercial Dye g/mL non-volatile solids
Final volume for stock solutions from 1mL of dye
Stock solution concentration g/L
Pergasol (Direct Yellow 11)
0.613 61.0 10.05
Fastusol (Direct Yellow 11)
0.266 26.5 10.03
Basazol 46L 0.555 55.0 10.09
6.4.2 WORKING CONCENTRATION FOR DYE SOLUTIONS
The dye concentration used for the enzyme reactions was a concentration whose
absorbance is at least 0.5 AU and less than 1 AU. For both Direct Yellow 11 and Basazol

KRISTINA KNUTSON PHD THESIS 2/22/2006 PAGE 97
46L, that concentration was 10 ppm (10 mg/L). For Direct Yellow 11, the absorption
peak is broad and λMax is 405-411 nm. For Basazol 46L, λMax is 436-438 nm.
6.5 PULP RELATED PROCEDURES
6.5.1 PULP PREPARATION
Dry lap pulp sheets were used to prepare virgin fully bleached kraft hardwood
pulp for dyeing with Direct Yellow 11. Sheets of dry pulp were ripped into small pieces
and allowed to soak in distilled water for 4-16 hours. The soaked pulp was then
transferred to a laboratory-scale pulper (Catep by Kādant Lamort, Vitry Le Francois) and
pulped for at least five minutes. The resultant pulp was then drained to thicken it and
transferred to a 5-gallon pail for storage at 4ºC until used.
Commercial dyed office papers were used for some bleaching experiments.
Reams of RepliCopyColors™ paper designed for high-speed copying, laser and offset
printing were purchased. The colors selected for use were blue, cherry (pink) and
goldenrod (orange). 80 sheets (8 ½ x 11”, about 4.2 g each) of each color were ripped
into small pieces and soaked in 3 L of distilled water. The paper was processed in batches
in a Waring blender (with 4 additional L of distilled water) to produce pulp. The pulp was
thickened and stored at 4ºC until used.
6.5.2 DYEING PROCEDURE
Analysis of spectra containing Direct Yellow 11, laccase and mediators was
complicated because absorbance by laccase mediators overlaps with absorption by Direct
Yellow 11. Therefore most experiments were performed on pulp dyed with Direct
Yellow 11. The applied dye dosage was based on the commercial dosage recommended
by BASF. In a large Hobart mixer, 1200 g of fully bleached hardwood chemical pulp was
mixed with 3.0 g of liquid dye concentrate and 24 g alum. This 5% slurry, (24 kg total
volume), was mixed for one hour at room temperature. The dyed pulp was then subjected
to extensive washing until a mixture of yellow pulp in clear water was obtained.

KRISTINA KNUTSON PHD THESIS 2/22/2006 PAGE 98
6.5.3 DETERMINATION OF CONCENTRATION OF DYE IN DYED PULP
Determining the amount of dye on the fiber is difficult; however, it is possible to
determine how much remains in the liquid phase after the dyeing process. After dyeing, a
sample of dyed pulp was filtered to obtain effluent from the dyeing reaction. A spectrum
was then obtained of the effluent sample. To prepare a standard curve, dye concentrate
and alum were mixed at the concentrations used for pulp dyeing. This “100%” solution
was measured by spectrophotometer then used to prepare a series of dilutions (“50%”,
“25%”, “10%”, etc) that were also measured by spectrophotometer. Comparison between
the effluent sample and the standard curve allows determination of the amount of dye
associated with the fiber. Spectrophotometric measurement of dye remaining in pulp
filtrate indicated that more than 90% of the applied dose of Direct Yellow 11 was
attached to the pulp.
6.5.4 HANDSHEET PREPARATION
Handsheets were prepared following TAPPI Method T218 (the Büchner Funnel
Method).212 For this process, 4.0 o.d.g. of pulp in about 12000mL solution were
subjected to 15,000 revolutions on a disintegrator. This slurry is then pH adjusted to be
pH 6.5 ± 0.5. The slurry is then continuously poured into a 15.0 cm Büchner funnel.
After inversion onto a metal plate, the filter paper is removed. The metal plate and
formed handsheet are then stacked between sheets of blotter paper on a press, and pressed
at 50 psi for 90 seconds. Each metal plate and handsheets are then placed on a restrained
drying ring and dried under conditions as defined in TAPPI Standard Method 402 om-93,
"Standard conditioning and testing atmosphere for paper, board, pulp handsheets and
related products". After drying for 12-20 hours, the CIELAB color values were then
measured following TAPPI Standard Method T442-om88.213
6.6 SOLUTION SAMPLE TREATMENTS
6.6.1 LACCASE/ABTS TREATMENT OF DIRECT YELLOW 11 IN SOLUTION
For kinetic studies of laccase/ABTS treatment of Direct Yellow 11, 20.0 mg/L
Direct Yellow 11 was treated with 1.0 mM ABTS and 10.3 Units laccase/mL in 100 mM

KRISTINA KNUTSON PHD THESIS 2/22/2006 PAGE 99
sodium acetate buffer pH 4.5. The reaction was allowed to continue for 24 hours under
10 bar oxygen. During the course of the reaction, aliquots of at least 10 mL were
removed for analysis.
The reaction solution with Direct Yellow 11, buffer, mediator and water were
mixed and preheated to 45ºC. Laccase was added. After purging with oxygen for 60
seconds, the Parr reactor was sealed and the reaction timing began. At each time point,
the sampling valve was opened and the sample collected. The first 3-5 mL of sample was
discarded since the volume of the sampling tube was about 3 mL.
Since absorbance by ABTS would interfere with quantifying the dye peak, a
control reaction was performed in the same way, containing laccase and ABTS but no
dye. For each time point, the spectrum from the control was subtracted from the spectrum
of the dye reaction. To calculate the absorbance area, a baseline was first drawn from the
lowest point between 450 and 550 nm. The area under the curve was then summed from
285 – 550 nm.
Similar experiments were performed with 1-hydroxybenzotriazole and violuric
acid. However, after subtracting the matching control, the difference spectra obtained
showed both a peak with maxima around 410 nm (the λMax for Direct Yellow 11) and an
overlapping peak with maxima around 305 nm. Although efforts were made to model the
Direct Yellow 11 and other components of these complex spectra using Unscrambler
Chemometric software, Principal Component Analysis software and Multiple Linear
Regression software, consistent models of the Direct Yellow 11 absorbance as it changed
over time were not found.
6.6.2 LACCASE/ABTS TREATMENT OF BASAZOL 46L IN SOLUTION
The concentration of Basazol 46L was set at 10.0 mg/L of non-volatile dye solids.
The reaction mixture included 100 mM sodium acetate buffer, pH 4.5 and 1.0 mM
ABTS. After preheating the reaction mixture to 45°C, laccase was added (10.3 units/mL
reaction solution) and a time zero sample was taken. The system was flushed with
oxygen for 60 seconds, sealed, pressurized to 10 bar and reaction timing started. After

KRISTINA KNUTSON PHD THESIS 2/22/2006 PAGE 100
two hours the pressure was released and the treated sample was collected. A control of
laccase plus mediator was also run.
6.6.3 HORSERADISH PEROXIDASE TREATMENTS
The ability of horseradish peroxidase (HRP) to decolorize Basazol 46L and Direct
Yellow 11 was examined by treating the dyes with HRP for two hours at 45°C. The dye
concentration was set at 10.0 mg/L of non-volatile dye solids. The reaction mixture
included 100 mM sodium acetate buffer, pH 3.8 and 1.0 mM veratryl alcohol. Five units
(5.0) of horseradish peroxidase (activity 116 PPU/mg, assay based on the production of
purpurogallin from pyrogallol) was added per mL reaction volume. After preheating this
mixture to 45ºC, the reaction was initiated by adding hydrogen peroxide (0.10 mM final
concentration).
6.6.4 SOYBEAN PEROXIDASE TREATMENTS
Treatment conditions for soybean peroxidase (SBP) were virtually the same as for
HRP treatment. The dye concentrations were the same, 10.0 mg/L, and the reaction
proceeded for two hours at 45ºC. In this case, the reaction mixture included 0.10 M
calcium chloride as well as 100 mM sodium acetate buffer, pH 3.8 and 1.0 mM veratryl
alcohol. 1.0 unit of SBP was added for every mL of reaction mix. After preheating the
reaction mixture to 45ºC, the reaction was initiated by adding hydrogen peroxide (0.10
mM final concentration). In studies where the pH was varied, the buffers (100 mM) used
included glycine-HCl (pH 2.4), sodium acetate (pH 2.8 and pH 4.5), sodium citrate,
phosphate (pH 6.5) and glycine-NaOH (pH 8.5 and pH 10.5). To obtain an estimate of
experimental error, 8 identical samples at pH 4.5 were treated with SBP. The standard
deviation of the measured absorbance area divided by the average absorbance area yields
a variation of 6%. For tests to determine if a free radical mediator was involved, pH 6.5
samples were prepared with and without 5.0 mM dimethyl sulfoxide.

KRISTINA KNUTSON PHD THESIS 2/22/2006 PAGE 101
6.7 PULP SAMPLE TREATMENTS
6.7.1 LACCASE-MEDIATOR TREATMENT OF COLORED PULPS
The laccase-mediator treatments were carried out in a 1000-mL-capacity
temperature-controlled stirred pressure reactor. Mediator type and amount varied in
experiments, but was added as an aqueous solution. The selected reaction conditions,
based on optimal LMS biobleaching conditions for biodelignification of chemical
pulps238 were as follows: 45ºC, pH 4.5, 10 bar oxygen, stirred for 2-hour reaction
followed by extensive washing. The basic procedure was as follows: The pulp (3% final
consistency), mediator, sodium acetate buffer, pH 4.5, (final concentration 20 mM) and
water were preheated to 45°C. Laccase (4.365 kats for 27 g o.d. pulp) was added and
stirred. The reactor was closed and pressurized with oxygen to 10 bar. After mixing two
hours, the pulp was filtered and washed thoroughly with distilled water until the filtrate
contained no visible color. Reaction conditions such as pH, temperature and time were
not altered since previous work214 had established that these conditions were optimum
for this laccase.
6.7.2 ALKALINE EXTRACTION OF LACCASE-TREATED PULP
A major effect of xylanase treatment is to improve the efficacy of subsequent
deinking treatments.215 To determine if laccase/ABTS treatment would also improve
subsequent steps, colored pulps were subjected to laccase-1.0 mM ABTS treatment,
followed by alkaline extraction. Colored pulp (25g, o.d.) in a heat-sealable bag was
placed in a 60ºC water bath and preheated for at least five minutes. Sodium hydroxide
(0.10 g, or 0.4%) and water (final volume 250 mL, consistency 10%) were added. The
bag was then heat sealed, mixed thoroughly, and placed in the 60ºC water bath for 60
minutes. The bag was then opened; the pulp was suction-filtered and washed with 1 L of
distilled water.
6.7.3 OXYGEN BLEACHING OF COLORED PULPS
Alkaline oxygen bleaching of colored pulps was performed in the Parr pressure
reactor. The reaction conditions216 include 90ºC, 90 psi (6 bar) oxygen pressure and 0.8%

KRISTINA KNUTSON PHD THESIS 2/22/2006 PAGE 102
charge of sodium hydroxide (0.216 g NaOH for 27 g o.d. pulp). Water, sodium hydroxide
and the reaction vessel were preheated to 90ºC. The pulp was rapidly heated to 90ºC in a
microwave and added to the pressure reactor. For the time course studies, the pulp
consistency was 10%. For the bleaching comparison studies, a consistency of 5% was
used.
6.7.4 PEROXIDE BLEACHING OF COLORED PULPS
Bleaching of colored pulp with alkaline hydrogen peroxide was performed
following the procedure of Li et al.217 Colored pulp (53 g, o.d.) was mixed with water
(final volume 1060 mL, 5% consistency) and DTPA (diethylene triamine pentaacetate,
0.11 g or 0.2%) in a heat-sealable bag and preheated in 75ºC water bath for at least 10
minutes. (The DTPA is a metal chelator that stabilizes hydrogen peroxide.) Sodium
hydroxide (0.53 g or 1%) and hydrogen peroxide (0.53 g or 1%) were added. After heat-
sealing, the pulp slurry was mixed thoroughly and placed in 75ºC water bath for 60
minutes. The bag was then opened; the pulp was suction-filtered and washed with 1 L of
distilled water.
6.7.5 DITHIONITE TREATMENT OF COLORED PULPS
Reductive bleaching of colored pulp was performed following the procedure of Li
et al.217 Sodium dithionite (0.50 g, 2% on o.d. pulp) was dissolved in 50 mL of distilled
water that had been boiled and then cooled while a stream of nitrogen gas bubbled
through it. The colored pulp (25 g, o.d.) was mixed with water (final reaction volume 750
mL, consistency 3.33%) and placed in a heat-sealable Kapak bag. The pulp slurry was
then placed in a 75ºC water bath and allowed to preheat for 10 minutes as nitrogen gas
was bubbled through the pulp slurry. Nitrogen bubbling continued as the pulp slurry was
removed from the water bath, the dithionite solution was added and the contents were
mixed for 60 seconds. After measuring pH, the bag was then heat sealed and the pulp
slurry was placed in the water bath. After reacting for 60 minutes, the bag was opened
and the pH was measured. The pulp was suction filtered and washed with 1 L of distilled
water.

KRISTINA KNUTSON PHD THESIS 2/22/2006 PAGE 103
6.8 ANALYSIS OF RESULTS
6.8.1 MEASUREMENT OF COLOR (TRISTIMULUS VALUES)
The TAPPI brightness measurement (commonly used to test virgin fibers) does
not measure color because it depends on the blue portion of the visible spectrum. To
accurately characterize colored fibers and sheets, a three number colorimetric
measurement must be used. The color of the handsheets were measured following TAPPI
Standard Method T422 om-88, "Spectral reflectance factor transmittance, and color of
paper and pulp (polychromatic illumination)" A Technidyne Corporation Technibrite
Micro TB-k located in the Paper Testing Laboratory of IPST was used to perform this
measurement. This machine illuminates the sample with diffuse light, measures the
reflected light, and calculates the CIE L*, a*, b* values. For the comparison among
laccase/ABTS, hydrogen peroxide and oxygen bleaching treatments, CIELAB values for
handsheets were obtained on a Brightmeter Micro S-5 (Technidyne Corp., New Albany,
Indiana, USA) which measures light reflected at 45º from the surface.
6.8.2 DETERMINATION OF DYE REMOVAL INDEX
For any one sheet, the ‘difference’ from a white sheet can be reduced to a single
number that represent the distance in color space from an ideal bleach. (Figure 49) The
ideal bleach is pure white. The CIE L*a*b* coordinates for the ideal bleach point are
a*=b*=0, L*=100. The first step is to determine the tristimulus values for the sheet. Then
the geometric distance (R) from the measured location in L*, a*, b* color space to pure
white is calculated. The distance in color space from a point P1 with coordinates a1, b1,
L1, to the ideal bleach point is calculated from the formula R2 = a2 + b2 + (100-L) 2.
After bleaching, the material is now at point P2 in color space with coordinates a2,
b2, L2. The reduction in distance from the ideal bleach point in moving from point P1 to
P2 is -ΔR2. The formulas for calculating ΔR2 are given in Equation 6. The dye removal
index (DRI) for a bleaching process is based on the change in R that occurs during that
process. The dye removal index is expressed as a percentage of the original distance from

KRISTINA KNUTSON PHD THESIS 2/22/2006 PAGE 104
the ideal bleach point. The DRI does not give the direction of the color change, but rather
measures how much color was removed.
Figure 49 Distance in Color Space from an Ideal Bleach45
Equation 6 Dye Removal Index Calculation45
Distance from Ideal Bleach Point = R2
R2 = a2 + b2 + (100-L) 2
Amount of Color Removal = -ΔR2
ΔR2 = R22 – R1
2
ΔR2 = (a22 – a1
2) + (b22 – b1
2) + [(100-L2) 2 – (100-L1) 2]
Dye Removal Index (DRI) = -100 [ΔR2 / R12]
DRI = Percent Color Removal by Bleaching Process
6.8.3 ANALYSIS OF SPECTRAL DATA
To determine the amount of color removed during treatment of dissolved dyes,
the areas under the peak were determined. Because the absorption peaks from
laccase/ABTS overlap with the absorption peaks of the dyes, the spectra of the
R2
R1
Black
Grey
White
a*=0,b*=0, L*=0
a*=0,b*=0, L*=100
P2
P1
L1
L2
a1*
b1*
a2*
b2*

KRISTINA KNUTSON PHD THESIS 2/22/2006 PAGE 105
appropriate laccase/ABTS control was subtracted from the spectra of the
dye/laccase/ABTS spectra before quantifying. For laccase-mediator treatments, a straight
baseline was drawn from the lowest point between 380 and 550 nm. Examination of the
absorbance curves from HRP and SBP treatments outside the area of the dye peak
showed that a sloping baseline was needed. To this purpose, a small Excel Macro
program was written to take the absorbance data, draw the sloping baseline and sum the
area between the baseline and the observed absorbance. The wavelengths used for
summation were 285-550 nm for Direct Yellow 11 and 335-498 nm for Basazol 46L.
Extent of decolorization was determined by calculating the percentage decrease in signal
intensity (i.e., 100% would equal no dye peak remaining).

KRISTINA KNUTSON PHD THESIS 2/22/2006 PAGE 106
7 RESULTS AND DISCUSSION
7.1 PUBLICATION 1
An Auspicious Application of Laccase and Hydrogen Peroxidases for Biobleaching
of Recalcitrant Paper Dyes.
Kristina Knutson and Arthur Ragauskas
Proceedings International Society of Wood Pulping and Chemistry, Madison WI, June
2003.
7.1.1 ABSTRACT
Two commonly applied paper dyes, Direct Yellow 11 and Basazol 46L, are
known to cause color problems in recycling paper. Biobleaching of these dyes was
explored by treating the dyes with hydrogen peroxidases and laccase-mediator systems
(LMS). Treatment with soybean peroxidase achieved a 90% reduction in the absorption
of Basazol 46L. For Direct Yellow 11-dyed pulp, 60% of the color could be removed by
LMS treatment.
7.1.2 INTRODUCTION
Mixed office waste and colored directory paper are underutilized for generation of
recycled fibers. A major difficulty in using these furnishes is the problems associated
with decolorizing the dyes present in the paper.3,2 Of the commonly used paper dyes, the
stilbene dye Direct Yellow 11 (goldenrod yellow office paper)3 and methine dye Basazol
46L (yellow directory paper) are notorious4 for poor bleachability. When the
bleachability of a number of common paper dyes was examined,52 Direct Yellow 11 was
found to respond poorly to treatment with hydrogen peroxide, FAS, hydrosulfite,
chlorine, and hypochlorite. Only ozone treatment could remove more than 90% of the
color. Removing dye from yellow directory paper is also problematical.43

KRISTINA KNUTSON PHD THESIS 2/22/2006 PAGE 107
Laccase-mediator systems (LMS) have been extensively studied for the
biobleaching of wood pulps (for reviews, see Paice et al.218 Call and Mücke97) Laccases
(EC 1.10.3.2) are oxidoreductases that combine single-electron oxidization of many
aromatic substrates with the reduction of oxygen to water.254 Bourbonnais and Paice
demonstrated that the substrate range of laccase can be extended to nonphenolic
compounds by the addition of mediator compounds such as 2, 2’-azinobis (3-
ethylbenzthiazoline-6-sulfonate) (ABTS)219 Peroxidases also oxidize many aromatic
substrates but obtain electrons from hydrogen peroxide rather than oxygen. Horseradish
peroxidase (HRP) is the most widely used peroxidase, but soybean peroxidase (SBP) is
more stable.
Since these dyes respond poorly to chemical bleaching, peroxidases and the LMS
biobleaching system were tested for the ability to decolorize the dyes.
7.1.3 METHODS AND MATERIALS
7.1.3.1 Enzyme activity assays
Laccase activity was measured by the oxidation of ABTS209 at 420 nm, pH 5.0
(ε420 = 36,000). For these experiments, 50 μkats of laccase (NOVO 51002, from Trametes
villosa) were added per mL of liquid reaction volume. Soybean peroxidase activity was
determined by the oxidation of phenol in the presence of 4-aminoantipyrine at 510 nm
(ε420 = 36,000).210 One unit of SBP was used per mL of solution.
7.1.3.2 Dyeing pulp with Direct Yellow 11
To obtain a reproducible defined substrate for biobleaching, pulp dyed with Direct
Yellow 11 was prepared. Fully bleached hardwood kraft pulp (1200 o.d.g) was mixed at
room temperature for one hour (5% cs) with the equivalent of the common commercial
dosage: 3 g of liquid dye concentrate and 24 g alum (to attach the dye to the pulp). After
extensive washing, a mixture of yellow pulp in clear water was obtained.

KRISTINA KNUTSON PHD THESIS 2/22/2006 PAGE 108
7.1.3.3 LMS treatment of dyed pulp
Laccase-mediator treatments were carried out in a 1000-mL-capacity temperature-
controlled stirred pressure reactor. Direct Yellow 11-dyed pulp (27 o.d.g), sodium acetate
buffer, pH 4.5, (final concentration 20 mM), and distilled water (to dilute pulp slurry to
7.5% final consistency) were preheated to 45°C. Three mediators were tested (5.0 mM
each): ABTS, 1-hydroxybenzotriazole (HBT), and violuric acid (VA). After mixing
mediator with the pulp, 50 μkats of laccase per mL of liquid reaction volume was added
and mixed again. The reactor was closed and pressurized with oxygen to 10 bar. After
two hours, the pulp was filtered and washed thoroughly with distilled water until the
filtrate contained no visible color.
7.1.3.4 Calculation of Dye Removal Index (DRI)
The LMS decolorization of pulp dyed Direct Yellow 11 was quantified by
measuring the CIELAB color values for handsheets prepared following TAPPI Standard
Method T218.212 The DRI measures the percent change in geometric distance from the
ideal bleach point. It is calculated following the equations shown below.45
Equation 7 Distance from Ideal Bleach Point
R2 = a*2 + b*2 + (100-L*) 2
Equation 8 Amount of Color Removal
-ΔR2 = R22 – R1
2
ΔR2 = (*a22 – a*1
2) + (b*22 – b*1
2) +
Equation 9 Dye Removal Index (DRI)
Dye Removal Index (DRI) = -100 [ΔR2 / R12]
7.1.3.5 Soybean peroxidase treatment
Both the stilbene dye Direct Yellow 11 and the methine dye Basazol 46L were
treated with SBP. To obtain accurate spectra, 10 ppm of nonvolatile dye solids was used.
The 40-mL reaction solution contained 2 mM veratryl alcohol and 0.1 M CaCl2 in 0.1 M

KRISTINA KNUTSON PHD THESIS 2/22/2006 PAGE 109
glycine-HCl buffer, pH 2.4.210 One unit of SBP was added per mL solution. Reaction was
initiated by the rapid addition of 0.5 μL of 27% hydrogen peroxide (final concentration
0.1 mM). After inversion, reaction solutions were placed for 2 hours in a 45°C water
bath.
The effectiveness of SBP was evaluated by recording spectra, measuring the
major peak area, and calculating the percent reduction in peak area from untreated dye.
7.1.3.6 Horseradish peroxidase treatment
Treatment with HRP was conducted in the same way as the SBP treatment. The
dye (10 ppm) and H2O2 (0.1 mM) concentrations were the same. The buffer system was
0.1 M sodium acetate, pH 3.8 containing 1 mM veratryl alcohol (no CaCl2). Five units of
horseradish peroxidase (stated activity 116 PPU/mg based on a purpurogallin assay) was
added per mL reaction volume.
7.1.3.7 Evaluation of pH and PEG effects on SBP
The effectiveness of SBP treatment of Basazol 46L was evaluated at several
different pH values by changing the composition of the 0.1-M buffer system. The buffers
used included glycine-HCl (pH 2.4), sodium acetate (pH 3.8), potassium acetate (pH 4.5),
and glycine-NaOH (pH 8.5). SBP stabilization by polyethylene glycol (PEG) was also
examined by including none or 500 mg/mL of either 10,000 or 35,000 molecular weight
PEG.
7.1.4 RESULTS AND DISCUSSION
The major chromophore in Direct Yellow 11 is shown in Figure 50.52 This
stilbene dye is more unreactive than most dyes with azo bonds because the lack of
phenolic groups eliminates the formation of azo/hydrazone tautomers.

KRISTINA KNUTSON PHD THESIS 2/22/2006 PAGE 110
Figure 50 Chromophore in Direct Yellow 11
7.1.4.1 LMS treatment of Direct Yellow 11
Initial work focused on testing the effectiveness of LMS to bleach Direct Yellow
11. Since laccase alone did not decolorize the dye, three mediators were tested: ABTS,
HBT, and VA. In solution, dye decolorization is difficult to quantify because laccase and
the mediators also absorb near the λMax for Direct Yellow 11 (411nm).
To avoid the spectral interference, LMS was applied to pulp that had been dyed
with Direct Yellow 11. The biphasic system allows laccase and mediator compounds to
be washed away. In this system, ABTS was much more effective than HBT or VA in
bleaching pulp dyed with Direct Yellow 11 (Figure 51).
LMS-ABTS retained effectiveness even when the concentration of ABTS was cut
500-fold from 5 mM to 0.01 mM (Figure 52). These results were completely unexpected.
For delignifying virgin pulp, both violuric acid and 1-hydroxy benzotriazole (HBT) are
more effective than ABTS.209,220

KRISTINA KNUTSON PHD THESIS 2/22/2006 PAGE 111
Figure 51 Bleaching Effectiveness of Different Mediators
at 5 mM in the LMS Treatment of Pulp Dyed with Direct Yellow 11.
Mediator Comparison
0
10
20
30
40
50
60
70
Lac+HBT Lac+VA Lac+ABTS
DR
I (D
ye R
emov
al In
dex)
Figure 52 Dye Removal From Direct Yellow 11-Dyed Pulp
as ABTS Dose is Altered
010203040506070
0.0 0.005 0.01 0.05 0.50 5.0mM ABTS
DR
I
Although LMS treatment does reduce the color of dyed pulp, it is unclear whether
Direct Yellow 11 is being stripped from the pulp or chemically altered while remaining
attached to the pulp. Since significant electron delocalization is required for the

KRISTINA KNUTSON PHD THESIS 2/22/2006 PAGE 112
absorption of light in the visible range, interruption of conjugated double bonds would
reduce visible color. If absorption shifts to the ultraviolet range, the pulp color would
decrease even though the dye is still attached to the fiber.
When the effluent from the treated dyed pulp was compared with the effluent
from the treatment of the starting (undyed) white pulp, little difference can be noticed
(Figure 53). No dye peak at 411nm is observed which indicates that simple stripping of
the intact dye is not occurring. The observed spectra can be attributed to absorption by
laccase and the ABTS mediator. If any breakdown products from the dye are present in
the effluent, these putative products do not absorb visible light.
Figure 53 Effluents (Post-Reaction Solutions)
From the Treatment of Bleached and Dyed Pulps with Laccase and 0.1mM ABTS
0
0.2
0.4
0.6
0.8
1
200 400 600 800Wavelength (nm)
Abs
orba
nce
White Pulp + Lac +0.10mM ABTSDyed Pulp + Lac +0.10mM ABTS
7.1.4.2 Peroxidase treatments
Stilbene dye Direct Yellow 11 responds poorly to treatment with peroxidases
(Table 7-1). In fact, HRP slightly increased the area of absorbance for Direct Yellow 11
(Figure 54).
Table 7-1 and Figure 54 also show that the methine dye Basazol 46L (U.S. Patent
# 4,256,458 1981) responds well to treatment with peroxidases. Given that SBP is less
expensive, more effective, and stable through a broader pH range than HRP, soybean
peroxidase treatment was explored further.

KRISTINA KNUTSON PHD THESIS 2/22/2006 PAGE 113
Table 7-1 Comparison of Peroxidases
% Reduction in Absorbance Area Dye Direct Yellow 11 Basazol 46L SBP 19.5 88.9 HRP -14.6 73.5
7.1.4.3 Effects of pH and PEG on SBP treatment
Because polyethylene glycol (PEG) has been reported to stabilize SBP,210 500
mg/mL of different PEGs (Table 2) were included while examining the effect of pH on
SBP bleaching. Table 7-2 shows that SBP biobleaching is most effective between pH 3.8
and 8.5. The inclusion of 10,000 or 35,000 molecular weight PEG has little effect on
decolorization.
Figure 54 Results from Treating Dyes with Horseradish Peroxidase
HRP Treatment
0
0.1
0.2
0.3
0.4
0.5
0.6
0.7
280 330 380 430 480 530 580
Wavelength (nm)
Abs
orba
nce
Basazol 46L
Treated Basl 46L
Direct Yellow 11
Treated Yellow11

KRISTINA KNUTSON PHD THESIS 2/22/2006 PAGE 114
Table 7-2 % Decrease in Absorbance Area at Various pHs
in Presence of Different PEGs
SBP Treat pH PEG % Dec. PEG %
Dec. PEG % Dec.
Basazol 46L 2.4 None 69.2 10,000MW 60.2 35,000
MW 67.3
3.8 85.1 85.3 86.9 4.5 89.7 87.4 90.6 8.5 89.0 89.7 89.4
7.1.5 CONCLUSIONS
This research reports one of the first successful applications of laccase and
peroxidase to bleach these recalcitrant paper dyes. For the methine dye Basazol 46L,
soybean peroxidase showed the most promise particularly for near neutral pH systems.
The stilbene dye Direct Yellow 11 did not respond to peroxidases but could be bleached
by LMS. Of the mediators tested, ABTS provided the most decolorization.
7.1.6 ACKNOWLEDGMENTS
We would like to thank Novozyme for the donation of the laccase and BASF for
the donation of Direct Yellow 11. This work was supported by the member companies of
the Institute of Paper Science and Technology.
KRISTINA KNUTSON PHD THESIS 2/22/2006 PAGE 115
7.2 PUBLICATION 2
Laccase-Mediator Biobleaching Applied to a Direct Yellow Dyed Paper
Kristina Knutson and Arthur Ragauskas
Biotechnology Progress (2004) 20(6): 1893-1896
7.2.1 ABSTRACT:
Laccase-Mediator System (LMS) for biobleaching was applied to a bleached
chemical pulp dyed with stilbene dye Direct Yellow 11. Of mediators tested, 2, 2’-
azinobis (3-ethylbenzthiazoline-6-sulfonate) (ABTS) was found to be more effective than
either violuric acid (VA) and N-hydroxybenzotriazole (HBT), which had been shown to
be superior to ABTS when bleaching virgin chemical pulp. The laccase-ABTS system
removed more than 60% of the color.
7.2.2 INTRODUCTION
The ability to use enzymatic systems to convert waste materials into value added
products in an environmentally friendly manner and cost-effective manner is a hallmark
of modern biotechnology. The use of biotechnology in the pulp and paper industry,
especially for recycling applications is now a well established process. The use of
cellulases to deink newspaper221,222,223 is a commercially accepted practice and the use of
amylase for deinking xerographic office waste paper is nearing routine commercial
applications.224,225
Mixed office waste paper (MOW) is defined as wastepapers collected from
business offices, consisting of various coated and uncoated printing and writing
papers.226 It contains both chemical and mechanical pulp fibers, various types of printing
inks, and a wide assortment of mineral fillers and sizing materials. This source of waste
paper is frequently underutilized because it includes dyed copy papers and dyed file
folders that are difficult to bleach.19,227 Many different bleaching approaches have been

KRISTINA KNUTSON PHD THESIS 2/22/2006 PAGE 116
studied including ozone,228 oxygen,227 hydrogen peroxide229,230 and various
combinations216,231, 227 of commonly used chemical treatments including chlorine dioxide,
hypochlorite, hydrosulfite, formamidine sulfinic acid (FAS), as well as ozone, oxygen,
and hydrogen peroxide. When dealing with colored papers, some dyes are particularly
difficult to bleach. Goldenrod yellow copy paper is one of the most difficult papers to
bleach19 and detrimentally impacts the value of the wastepaper resource.89 This paper is
dyed with a yellow stilbene dye that is notorious4 for poor bleachability and has been
referred to as “unbleachable under normal bleaching conditions.”51 When the
bleachability of a number of common paper dyes was examined,52 Direct Yellow 11 (see
Figure 55) was found to respond poorly to treatment with hydrogen peroxide, FAS,
hydrosulfite, chlorine, and hypochlorite.
Figure 55 Major Chromophore in Direct Yellow 11
SO3H
SO3H
NO2 SO3H
SO3H
NO2
NN
In principal, laccase-mediator systems are a promising biotreatment to oxidatively
decolorize MOW since it has been already established that they can bleach several textile
dyes including: triarylmethane, indigoid, azo, and anthraquinone dyes.179,232 In addition,
the application of LMS for biobleaching chemical pulps has been extensively studied (see
Paice et al.218; Call and Mücke97; Kleen et al.233; Chandra et al.234; and Crestini, et al.235).
These biobleaching studies are dependent upon the application of the chemical mediator
which is attributed to the fact that the enzyme is too large to enter a fiber and oxidize the
lignin.7 Bourbonnais and Paice were the first to demonstrate that substantial oxidative
removal of lignin from a fiber could be accomplished in the presence of ABTS.219
Extensive screening efforts236,9,209 have found several suitable laccase mediators
including 1-hydroxybenzotriazole (HBT) and violuric acid (VA) which can significantly
outperform ABTS with respect to lignin removal.237 Although the use of laccase-

KRISTINA KNUTSON PHD THESIS 2/22/2006 PAGE 117
mediated bleaching has been mentioned205 as a possible method to remove dyes from
recycled paper, little207 has been published. Perhaps the most notable was a recent report
by Li et al.205 indicating that a LMS treatment, employing violuric acid as a mediator,
was able to increase the brightness of an unspecified yellowed dyed recycled paper from
TAPPI Brightness 43.5 to 55.0 after biobleaching. This paper examines the viability of
biobleaching the problematical stilbene dye, Direct Yellow 11 with LMS employing
ABTS, HBT and VA as mediators.
7.2.3 METHODS AND MATERIALS
Violuric acid and N-hydroxybenzotriazole were obtained from Aldrich. ABTS, (2,
2’-azinobis (3-ethylbenzthiazoline-6-sulfonate)) was purchased from Sigma. Direct
Yellow 11 was acquired from BASF. Laccase (NOVO 51002, from Trametes villosa)
was a gift from Novozymes. A commercial hardwood fully bleached chemical pulp was
employed for all test sheet studies.
7.2.3.1 Enzyme activity assays
Laccase activity was measured by the oxidation of ABTS209 at 420 nm, pH 5.0
(ε420 = 36,000). For decolorization experiments, 48.5 μkats of laccase were added per mL
of reaction solution.
7.2.3.2 Dyeing pulp with Direct Yellow 11
To obtain a reproducible defined substrate for biobleaching, pulp dyed with Direct
Yellow 11 was prepared. Fully bleached hardwood chemical pulp 5% slurry (24 kg
containing 1200 g fiber) was mixed at room temperature for one hour with the equivalent
of the common commercial dosage: 3 g of liquid dye concentrate and 24 g alum. After
extensive washing, a mixture of yellow pulp in clear water was obtained.
Spectrophotometric measurement of dye remaining in pulp filtrate indicated that more
than 90% of the applied dose of Direct Yellow 11 was attached to the pulp. All UV/Vis

KRISTINA KNUTSON PHD THESIS 2/22/2006 PAGE 118
measurements were accomplished using a Perkin Elmer UV/Vis/NIR Lambda 900
Spectrometer.
7.2.3.3 LMS treatment of dyed pulp
The selected reaction conditions, based on optimal LMS biobleaching conditions
for biodelignification of chemical pulps238 were as follows: 45ºC, pH 4.5, 10 bar oxygen,
stirred for 2-hour reaction followed by extensive washing. The laccase-mediator
treatments were carried out in a 1000-mL-capacity temperature-controlled stirred
pressure reactor. Direct Yellow 11-dyed pulp (27 g fiber), sodium acetate buffer, pH 4.5,
(final concentration 20 mM), and distilled water (873mL) were preheated to 45°C. Three
mediators were tested (5 mM each): ABTS, HBT, and VA. After mixing mediator with
the pulp, 4.365 kats of laccase was added and stirred. The reactor was closed and
pressurized with oxygen to 10 bar. After mixing two hours, the pulp was filtered and
washed thoroughly with distilled water until the filtrate contained no visible color.
7.2.3.4 Measurement of color and calculation of Dye Removal Index (DRI)
Following TAPPI Standard Method T218 (the Büchner Funnel Method),212 five to
seven 4 g fiber testsheets were prepared from the washed pulps. CIELAB color values
(TAPPI Standard Method T442-om88213) were then measured with a Technibrite Micro
TB-1C machine (Technidyne Corp., New Albany, Indiana, USA). Five measurements
were made on each testsheet and the values were statistically treated to obtain average
CIELAB color values with error bars for each treatment. These values were then used to
calculate the dye removal index (DRI) which measures the percent of color removed by
each treatment.45 The Lac+ABTS experiment was repeated to obtain an estimate of
experimental error. Variation due to experimental error (included in error bar calculation)
was significantly less (p<.001) than variation due to choice of mediator.

KRISTINA KNUTSON PHD THESIS 2/22/2006 PAGE 119
7.2.4 RESULTS AND DISCUSSION
7.2.4.1 Comparison of ABTS, HBT, and VA as laccase mediators.
To evaluate the biobleaching potential for MOW, a synthetic recycled furnish of
Direct Yellow 11-dyed hardwood chemical pulp was treated with laccase-mediator
systems. In the absence of enzyme and mediators, 13.6% of the color was removed as
determined by dye removal index. Laccase treatment, without mediators, resulted in
22.0% color removal.
Subsequently, the laccase biobleaching studies were performed in the presence of
a chemical mediator. Three mediators HBT, VA, and ABTS were employed with laccase
to biobleach the dyed paper. The treated pulp was washed, filtered and converted into
testsheets. The testsheets were subsequently evaluated employing standard CIELAB
optical methods. DRI values were calculated based on optical measurements of treated
and untreated pulps. The results of this analysis are summarized in Figure 56.
Figure 56 Bleaching Effectiveness of Different Mediators
at 5 mM in the Laccase-Mediator Treatment of Pulp Dyed with Direct Yellow11
Mediator Comparison
0
10
20
30
40
50
60
70
Heat +O2
Lac Lac +ABTS
Lac+HBT
Lac+VA
DR
I (D
ye R
emov
al In
dex)

KRISTINA KNUTSON PHD THESIS 2/22/2006 PAGE 120
Whereas the DRI values for pulps treated solely with laccase were 22.0% the
values of the pulps treated with the laccase mediator system varied between 22.0-59.6%.
These results indicated that ABTS was the most effect laccase mediator for removal of
Dye 11 under the conditions employed. This was unexpected in-light of the previously
reported efficiency of VA and HBT at lignin removal from chemical pulps over
ABTS.237,220,238 In this system, ABTS was much more effective than HBT in decolorizing
pulp dyed with Direct Yellow 11 (Figure 56). To determine that this biobleaching effect
was not due the mediator and oxygen, a control experiment with ABTS alone was
preformed. CIELAB analysis of the treated sheets indicated dye removal of 22.2%. In
summary, these initial results demonstrate the potential for an LMS treatment to remove
dye Direct Yellow 11 from paper.
7.2.4.2 Determination of optimal ABTS concentration.
To determine the effectiveness of LMS biobleaching with ABTS a second series
of experiments were performed in which the amount of dyed pulp and laccase were held
constant while the concentration of ABTS was varied. The treated pulps were washed and
subsequently converted into testsheets and analyzed by CIELAB. The results of this
analysis are summarized in Figure 57. The optimal ABTS concentration was determined
to be 0.01 mM for this system where 27 g of dyed pulp is treated with 4.365 kats of
laccase. Even with the five-hundredfold reduction of ABTS concentration, the DRI value
for 0.01 mM ABTS is still twice the values for treatment with 5 mM VA.
Figure 57 Bleaching Effectiveness with Varying ABTS Concentrations
in the Laccase-Mediator Treatment of Pulp Dyed with Direct Yellow11
010203040506070
0.0 0.005 0.01 0.05 0.50 5.0
mM ABTS
DR
I

KRISTINA KNUTSON PHD THESIS 2/22/2006 PAGE 121
Although laccase-mediator systems have been used to bleach chemical pulp and
to decolorize dyes in synthetic textile effluents, this study demonstrates the dependency
of the LMS system on mediator employed for efficient oxidative removal of direct dye
Yellow 11 from paper. In this study, the most effective mediator was ABTS and the least
effective was VA. This was unexpected since VA has been shown to substantially
outperform ABTS as a mediator for LMS bleaching of virgin chemical pulps.
This unexpected result must be related to the fact that oxidations with ABTS and
with N-hydroxyl mediators (HBT and VA) occur by different mechanisms.239,240 In the
laccase-mediator system, HBT forms benzotriazolyl-1-oxide radical241 while ABTS
forms both the radical cation and a dication.242 Further experimental work is under way
to determine the nature of the reaction between the dyed pulp and the ABTS-laccase
system. The ability to enzymatically bleach a difficult stilbene dye has significant
practical application during the recycling of mixed office waste and these applications are
currently under review.
7.2.5 ACKNOWLEDGMENTS
We would like to thank Novozymes for the donation of the laccase and BASF for
the donation of Direct Yellow 11. This work was supported by the member companies of
the Institute of Paper Science and Technology.

KRISTINA KNUTSON PHD THESIS 2/22/2006 PAGE 122
7.3 PUBLICATION 3
Enzymatic biobleaching of two recalcitrant paper dyes with horseradish and
soybean peroxidase
Authors: Kristina Knutson, Sylva Kirzan and Arthur Ragauskas
Accepted for publication by Biotechnology Letters
7.3.1 ABSTRACT
A stilbene and a methine dye known to be recalcitrant to common chemical
bleaches were treated with horseradish and soybean peroxidases and both oxoreductive
enzymes were shown to be effective at chromophore removal. On a comparative basis,
soybean peroxidase was found to be more effective at bleaching these dyes. When
compared to laccase in combination with ABTS as mediator, soybean peroxidase was
found to be more effective at oxidative dye removal, especially for the methine dye
Basazol 46L.
7.3.2 INTRODUCTION
Efficient utilization and recycling of natural resources is a hallmark of modern
industrial manufacturing processes. Over the past decade paper recycling in America has
progressed to about 45% in 1999.243 Indeed, for certain select grades, (newspaper and old
packaging containers) greater than 68% is currently being recycled. In contrast, mixed
office waste and colored directory papers are often underutilized (38% for
printing/writing paper). A major difficulty in recycling these grades of paper is the
problems associated with decolorizing the dyes present in the paper.2 Of the commonly
used paper dyes, the stilbene dye Direct Yellow 11 and methine dye Basazol 46L are
notorious4 for poor bleachability with the commonly used chemical bleaching agents
including chlorine dioxide, oxygen, hydrogen peroxide and sodium dithionite.

KRISTINA KNUTSON PHD THESIS 2/22/2006 PAGE 123
A number of enzymes from lignolytic fungi have been isolated and tested for the
ability to bleach wood pulps including manganese peroxidase244,245 lignin peroxidase246
and laccase.238 Fungi producing these enzymes are capable of decolorizing a number of
dyes including Malachite Green, Azure B, Poly R-478, Anthraquinone Blue, Congo Red
and Xylidine.181 Dye decolorization by other peroxidases has also been described247,248
The purpose of this study was to determine the ability of peroxidases to
decolorize Direct Yellow 11 and Basazol 46L and to compare peroxidase bleaching to
laccase-mediator bleaching. The development of a laccase mediator system utilizing 2,
2’-azinobis- (3-ethylbenzthiazoline-6-sulfonate), known as ABTS, as mediator to
decolorize pulp dyed with Direct Yellow 11 has been recently reported.249 This study
examines the relative reaction rates for laccase/ABTS and soybean peroxidase
biobleaching.
7.3.3 MATERIALS AND METHODS
7.3.3.1 Dyes and enzymes
Basazol 46L (B46) and Direct Yellow 11 dyes were donated by BASF. Soybean
peroxidase, horseradish peroxidase and laccase mediator 2, 2’-azinobis (3-
ethylbenzthiazoline-6-sulfonate) (ABTS) were purchased from Aldrich. Polyethylene
glycol 10,000 MW and 35,000 MW were purchased from Fluka. Laccase (NOVO 51002,
from Trametes villosa) was provided by Novozyme.
7.3.3.2 Enzyme assays
Soybean peroxidase activity was measured by the oxidation of phenol in the
presence of 4-aminoantipyrine at 510 nm (ε420 = 36,000)210 (Kinsley and Nicell 2000).
One unit was defined as µmole peroxide consumed per min. One unit of SBP was used
per mL of solution. Laccase activity was measured by the oxidation of ABTS209 at 420
nm (ε420 = 36,000) in pH 5.0 acetate buffer. One unit of laccase was defined as µmol
ABTS oxidized per min. 10.3 units of laccase were added per mL of reaction.

KRISTINA KNUTSON PHD THESIS 2/22/2006 PAGE 124
7.3.3.3 Horseradish peroxidase treatments
The ability of horseradish peroxidase (HRP) to decolorize Basazol 46L and Direct
Yellow 11 was examined by treating the dyes with HRP for two hours at 45°C. The dye
concentration was set at 10.0 mg/L of non-volatile dye solids. The reaction mixture
included 100 mM sodium acetate buffer, pH 3.8 and 1.0 mM veratryl alcohol. Five units
(5.0) of horseradish peroxidase (activity 116 PPU/mg based on a purpurogallin assay)
was added per mL reaction volume. After preheating this mixture to 45ºC, the reaction
was initiated by adding hydrogen peroxide (0.10 mM final concentration).
7.3.3.4 Soybean peroxidase treatments
Treatment conditions for soybean peroxidase (SBP) were virtually the same as for
HRP treatment. The dye concentrations were the same, 10 mg/L, and the reaction
proceeded for two hours at 45ºC. In this case, the reaction mixture included 0.10 M
calcium chloride as well as 100 mM sodium acetate buffer, pH 3.8 and 1.0 mM veratryl
alcohol. 1.0 unit of SBP was added for every mL of reaction mix. After preheating the
reaction mixture to 45ºC, the reaction was initiated by adding hydrogen peroxide (0.10
mM final concentration). In studies where the pH was varied, the buffers (100 mM) used
included glycine-HCl (pH 2.4), sodium acetate (pH 2.8 and pH 4.5), sodium citrate,
phosphate (pH 6.5) and glycine-NaOH (pH 8.5 and pH 10.5). To obtain an estimate of
experimental error, 8 identical samples at pH 4.5 were treated with SBP to yield average
signal intensity of 7.95 with standard deviation of 0.49 (6% variation)
For tests to determine if a free radical mediator was involved, pH 6.5 samples of
Basazol 46L (10.0 mg/L) were prepared with and without 5.0 mM dimethyl sulfoxide.
These samples were then reacted with soybean peroxidase (1.0 U/mL) as described
above.

KRISTINA KNUTSON PHD THESIS 2/22/2006 PAGE 125
7.3.3.5 Laccase-mediator system treatment of Basazol 46L dye
The laccase/ABTS system developed for treatment of Direct Yellow 11249 was
tested for its ability to decolorize Basazol 46L dye. Since laccase uses oxygen as an
electron source, the solution concentration of oxygen was increased by performing the
reaction with stirring under 1000 kPa of oxygen pressure. As in the peroxidase reactions,
the dye concentration was set at 10 mg/L of non-volatile dye solids. The reaction mixture
included 100 mM sodium acetate buffer, pH 4.5 and 1.0 mM ABTS. After preheating the
reaction mixture to 45°C, laccase was added (10.3 units/mL reaction solution) and a time
zero sample was taken. The system was flushed with oxygen for 60 seconds, sealed,
pressurized to 1000 kPa and stirred. After stirring for two hours, the pressure was
released and the treated sample was collected. A control of laccase plus ABTS (no dye)
was also performed.
7.3.3.6 Reaction rate study of laccase/ABTS decolorization of Direct Yellow 11
For reaction rate studies of the laccase/ABTS treatment of Direct Yellow 11, a
reaction mixture of 20.0 mg/L Direct Yellow 11, 1.0 mM ABTS and 10.3 Units
laccase/mL was prepared in 100 mM sodium acetate buffer pH 4.5 as described above.
The reaction was allowed to continue for 24 hours under 10 bar oxygen. During the
course of the reaction, 10 mL aliquots were removed for analysis. Samples were also
obtained for the same time points from a pressurized control reaction containing laccase
and ABTS, performed under analogous reaction conditions.
7.3.3.7 Reaction rate study of SBP/H2O2 decolorization of dyes
SBP treatment was performed as described above using individual aliquots of a
large master solution of 10.0 mg/L of dye, 100 mM acetate buffer, pH 4.5, 1.0 mM
veratryl alcohol and 1.0 unit of SBP/mL. Reaction was halted by removing from 45ºC
water bath. After chilling for one minute in an ice bath, the spectra were obtained.

KRISTINA KNUTSON PHD THESIS 2/22/2006 PAGE 126
7.3.3.8 Data collection and analysis
Spectra were obtained from all the samples prepared as described above using a
Perkin Elmer Lambda 900 UV/Vis/NIR spectrophotometer. The areas under the peak
curves (λ: 285-550 nm for Direct Yellow 11, 335-498 nm for Basazol 46L) were
determined. Because the absorption peaks from laccase/ABTS overlap with the
absorption peaks of the dyes, the spectra of the appropriate laccase/ABTS control was
subtracted from the spectra of the dye/laccase/ABTS spectra before quantifying. Extent
of decolorization was determined calculating the percentage decrease in signal intensity
(i.e., 100% would equal no dye peak remaining).
7.3.4 RESULTS AND DISCUSSION
Spectra of stilbene dye Direct Yellow 11 and methine dye Basazol 46L before and
after treatment with soybean peroxidase are shown in Figure 58. SBP treatment of
Basazol 46L resulted in a substantial decrease in the signal intensity and in a shifting of
the dye maxima suggesting a chemical alteration in the dye.
Figure 58 Soybean Peroxidase Treatment of Dyes at pH 3.8
0
0.2
0.4
0.6
0.8
1
320 360 400 440 480 520 560
Wavelength
Abs
orba
nce
Treatment of 10 mg/L Basazol 46L ( ) and 10 mg/L Direct Yellow 11 ( ) with soybean peroxidase (1.0 U/mL) and hydrogen peroxide (0.10 mM) for two hours at 45 ºC. Corresponding solid symbols are the untreated dyes. No dye control ( ) is included for comparison.

KRISTINA KNUTSON PHD THESIS 2/22/2006 PAGE 127
When both dyes were subjected to treatment by HRP and SBP, measurement of
the dye UV/Vis absorption intensity showed that both SBP and HRP significantly reduce
signal intensity of methine dye Basazol 46L, as summarized in Figure 59. The signal
intensity of Direct Yellow 11 UV/Vis spectrum also decreased with peroxidase treatment
but the effect was not as great. The difference in effectiveness between SBP and HRP for
biobleaching these dyes is greater for the stilbene dye Direct Yellow 11 than for the
methine dye Basazol 46L.
Figure 59 Comparison Between Horseradish and Soybean Peroxidases
0
20
40
60
80
100
Basazol 46L Direct Yellow 11
% R
educ
tion
in S
igna
l Int
ensi
ty
SBPHRP
Previous published reports had indicated that soybean peroxidase is stable over a
wide pH range250,251 and that inclusion of polyethylene glycol (PEG) could further
stabilize the enzyme.252 Thus a study was undertaken treating both dyes at a variety of
pHs, in the absence and presence PEG. Based on the work by Kinsley and Nicell,210 two
high molecular weight PEGs (10,000 MW and 35,000 MW), were chosen with an
application concentration of 500 mg/L. The results of these studies are shown in Figure
60.
Reduction in signal intensity due to treatment of dyes (10.0 mg/mL) with soybean (SBP) (1.0 U/mL) or horseradish (HRP) peroxidase (5.0 U/mL) in presence of 0.10 mM hydrogen peroxide (Initial signals 25.1 and 36.8 for Basazol 46L with SBP and HRP respectively, 5.5 and 15.5 for Direct Yellow 11 with SBP and HRP)

KRISTINA KNUTSON PHD THESIS 2/22/2006 PAGE 128
Figure 60 Effect of pH and PEG on SBP Decolorization
Basazol 46L
0
20
40
60
80
100
2.4 3.8 4.5 6.5 8.5 10.5
pH
% R
educ
tion
in S
igna
l Int
ensi
ty No PEG10K PEG35K PEG
Direct Yellow 11
0
20
40
60
2.4 3.8 4.5 8.5 10.5
pH
% R
educ
tion
in S
igna
l Int
ensi
ty
No PEG10K PEG35K PEG
Reduction in signal intensity due to treatment of dyes (10 mg/mL) with soybean (SBP) (1.0 U/mL) at various pHs in presence of 0.10 mM hydrogen peroxide (plus 0.10 M calcium chloride and 1.0 mM veratryl alcohol) for 2 h at 45 ºC with and without 10,000 (10K) and 35,000 (35K) MW PEG. (Average signal before treatment: 49.1 Basazol 46L, 31.0 Direct Yellow 11)
The inclusion of PEG appeared to inhibit decolorization of Direct Yellow 11 at
pH 3.8. At pH 10.5, inclusion of 10,000 MW PEG appeared to enhance the
decolorization of Basazol 46L. Otherwise, the presence of PEG had relatively little effect.
SBP appears to be effective at biobleaching from pH 4 to pH 8.

KRISTINA KNUTSON PHD THESIS 2/22/2006 PAGE 129
To determine if a free radical reaction was responsible for the biobleaching effect,
peroxidase activity was measured in the presence and absence of 5.0 mM dimethyl
sulfoxide (DMSO), a hydroxyl radical quencher.253 The amount of dye decolorization
was unaffected by the inclusion of DMSO, suggesting that the mechanism of dye
decolorization by soybean peroxidase does not involve a free radical. This was true for
reactions that included PEG as well as in the absence of PEG
The relative effectiveness of enzymatic bleaching by SBP and by laccase/ABTS
can be seen in Table 7-3. Soybean peroxidase appears to be more effective than
laccase/ABTS, especially for decolorization of Basazol 46L. Reaction rate study of the
decolorization of Direct Yellow 11 by laccase/ABTS is shown in Figure 61.
Table 7-3 Reduction in Signal Intensity Following Treatment with Lac/ABTS or SBP
Lac/ABTS SBP Direct Yellow 11 46% 49% Basazol 46L 34% 87%
Reduction in signal intensity at 285-550nm (Direct Yellow 11, initial signal 29) and 334-508nm (Basazol 46L, initial signal 49) due to treatment of dyes (10 mg/L) with laccase (10.3 U/mL plus 1.0 mM ABTS and 10 bar O2) and with soybean peroxidase (1.0 U/mL plus 0.10 mM hydrogen peroxide, 0.10 M calcium chloride and 1.0 mM veratryl alcohol) at pH 4.50 for two hours at 45 ºC
Figure 61 Decolorization of Direct Yellow 11 by Laccase/1 mM ABTS
0
10
20
30
40
0 8 16 24 32 40 48
Hours
Sign
al In
tens
ity
Time study of reduction in signal intensity (285-550nm) by Direct Yellow 11 (10.0 mg/L) during treatment with laccase (1.0 U/mL) and 1.0 mM ABTS (10 bar O2, 45ºC) show actual data points

KRISTINA KNUTSON PHD THESIS 2/22/2006 PAGE 130
After 90 minutes of biobleaching with the laccase system, 51% of the dye signal
has disappeared. As shown in Figure 62, decolorization of Direct Yellow 11 by SBP
follows similar kinetics with 48% dye decolorization in 90 minutes. Stilbene dyes, such
as Direct Yellow 11, are considered to be relatively unreactive to bleaching chemicals.
This is consistent with the relatively slow decolorization of Direct Yellow 11.
Figure 62 Decolorization of Direct Yellow 11 by SBP/Veratryl Alcohol
02468
1012141618
0 4 8 12 16 20 24
Hours
Sig
nal I
nten
sity
The methine dye Basazol 46L responds more rapidly to soybean peroxidase.
Within five minutes, the measured signal intensity decreases 74% (Figure 63). Longer
incubation times result in a slight additional decrease in signal intensity (data not shown).
Reduction in signal intensity (285-550 nm) during treatment of Direct Yellow 11 (10.0 mg/L) with SBP (1.0 U/mL plus 0.10 mM hydrogen peroxide, 0.10 M calcium chloride and 1.0 mM veratryl alcohol) at pH 4.5 for two hours at 45ºC
shows actual data points 5, 30, 120 minute measurements were performed in triplicate
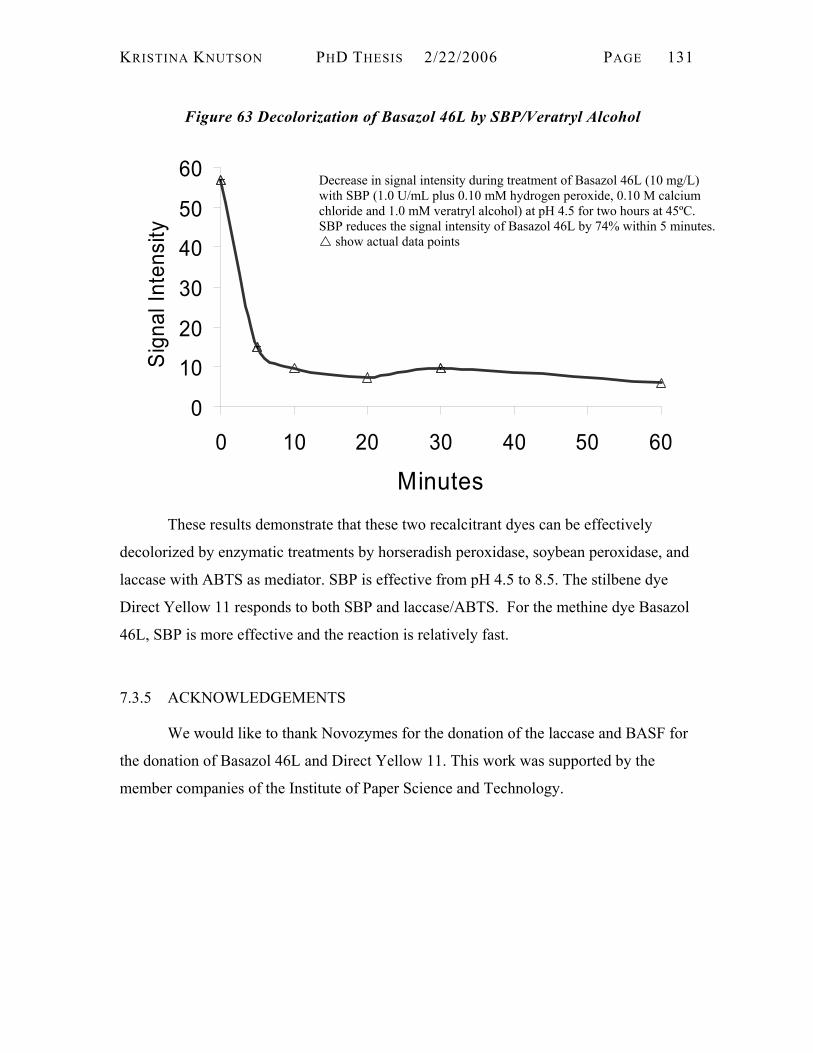
KRISTINA KNUTSON PHD THESIS 2/22/2006 PAGE 131
Figure 63 Decolorization of Basazol 46L by SBP/Veratryl Alcohol
0
10
20
30
40
50
60
0 10 20 30 40 50 60
Minutes
Sig
nal I
nten
sity
These results demonstrate that these two recalcitrant dyes can be effectively
decolorized by enzymatic treatments by horseradish peroxidase, soybean peroxidase, and
laccase with ABTS as mediator. SBP is effective from pH 4.5 to 8.5. The stilbene dye
Direct Yellow 11 responds to both SBP and laccase/ABTS. For the methine dye Basazol
46L, SBP is more effective and the reaction is relatively fast.
7.3.5 ACKNOWLEDGEMENTS
We would like to thank Novozymes for the donation of the laccase and BASF for
the donation of Basazol 46L and Direct Yellow 11. This work was supported by the
member companies of the Institute of Paper Science and Technology.
Decrease in signal intensity during treatment of Basazol 46L (10 mg/L) with SBP (1.0 U/mL plus 0.10 mM hydrogen peroxide, 0.10 M calcium chloride and 1.0 mM veratryl alcohol) at pH 4.5 for two hours at 45ºC. SBP reduces the signal intensity of Basazol 46L by 74% within 5 minutes.
show actual data points

KRISTINA KNUTSON PHD THESIS 2/22/2006 PAGE 132
7.4 PUBLICATION 4
Decolorization of Colored Paper by Laccase-Mediator System and Conventional
Treatments
Kristina Knutson and Arthur Ragauskas
Manuscript in preparation
7.4.1 ABSTRACT
A laccase-mediator has been developed for the decolorization of pulp dyed with
recalcitrant stilbene dye Direct Yellow 11 using 2, 2’-azinobis (3-ethylbenzthiazoline-6-
sulfonate) (ABTS) as the mediator. To compare the bleaching effectiveness of this
system to existing bleaching methods, three commercial colored pulps and pulp dyed
with Direct Yellow 11 were subjected to bleaching with the laccase-ABTS system,
alkaline oxygen and alkaline hydrogen peroxide. Pulp subjected to these treatments was
also further bleached with sodium dithionite. For pulp dyed with Direct Yellow 11,
treatment with laccase/ABTS followed by sodium dithionite was as effective as alkaline
hydrogen peroxide followed by sodium dithionite. For the commercial colored pulps,
hydrogen peroxide followed by sodium dithionite was the most effective bleaching
method.
7.4.2 INTRODUCTION
Mixed office waste and colored directory paper are underutilized for generation of
recycled fibers. A major difficulty in using these furnishes is the problems associated
with decolorizing the dyes present in the paper.3,2 Of the commonly used paper dyes, the
stilbene dye Direct Yellow 11 is notorious4 for poor bleachability. When the bleachability
of a number of common paper dyes was examined,52 Direct Yellow 11 was found to
respond poorly to treatment with hydrogen peroxide, FAS, hydrosulfite, chlorine, and
hypochlorite.

KRISTINA KNUTSON PHD THESIS 2/22/2006 PAGE 133
Laccase-mediator systems (LMS) have been extensively studied for the
biobleaching of wood pulps (for reviews, see Paice et al.,218 Call and Mücke97). Laccases
(EC 1.10.3.2) are oxidoreductases that combine single-electron oxidization of many
aromatic substrates with the reduction of oxygen to water. 254 Bourbonnais and Paice
demonstrated that the substrate range of laccase can be extended to nonphenolic
compounds by the addition of mediator compounds such as 2, 2’-azinobis (3-
ethylbenzthiazoline-6-sulfonate), as known as ABTS.219
A laccase-mediator system249 has been recently developed for bleaching pulp
dyed with Direct Yellow 11 using ABTS as the mediator. The purpose of this study was
to compare the effectiveness of laccase/ABTS treatment with existing chemical bleaching
treatments.
7.4.3 METHODS AND MATERIALS
7.4.3.1 Materials
Direct Yellow 11 dye was donated by BASF. Laccase (NOVO 51002, from
Trametes villosa) was provided by Novozyme. Laccase mediator 2, 2’azinobis-3-ethyl-
benzthiazoline-5-sulfonate (ABTS) was purchased from Sigma.
7.4.3.2 Enzyme activity assays
Laccase activity was measured by monitoring the rate of oxidation of ABTS209 in
a 100mM pH 5 sodium acetate buffer. One International Unit (IU) of activity is defined
as the conversion of 1 μmole of substrate/ minute. One Katal (kat) of activity is defined
as 1 mole/second of substrate converted. The reaction was followed at 420nm (ε420 =
36,000)
7.4.3.3 Peroxide concentration assay
For reactions involving hydrogen peroxide, the concentration of the stored stock
solution (nominally 30%) must be determined. The assay procedure211 involves titration
of an acidic solution of hydrogen peroxide with sodium dithionite in the presence of
starch indicator. Two (2) mL of peroxide solution is mixed with 100 mL distilled water,

KRISTINA KNUTSON PHD THESIS 2/22/2006 PAGE 134
10-15 mL of 25% sulfuric acid, 5 mL of 10% potassium iodide (KI) solution and 3 drops
of saturated ammonium molybdate solution. This mixture is titrated with 0.1N sodium
thiosulfate (Na2S2O3) until a pale yellow color appears. Then 10mL of soluble starch
solution is added and the thiosulfate titration continues until the blue color disappears.
The calculation of hydrogen peroxide concentration is shown below.
Equation 10 Calculation of Hydrogen Peroxide Concentration
Grams/Liter = 0.1(norm. thio.) x 34 (equiv. H2O2 - 50%) x (mL. thio used) 2 mL (sample size)
7.4.3.4 Dyeing pulp with Direct Yellow 11
To obtain a reproducible defined substrate for biobleaching, pulp dyed with Direct
Yellow 11 was prepared. Fully bleached hardwood kraft pulp (1200 o.d.g) was mixed at
room temperature for one hour (5% cs) with the equivalent of the common commercial
dosage: 3 g of liquid dye concentrate and 24 g alum (to attach the dye to the pulp). After
extensive washing, a mixture of yellow pulp in clear water was obtained.
7.4.3.5 Preparation of commercial dyed pulp
Reams of RepliCopyColors™ paper designed for high-speed copying, laser and
offset printing were purchased. The colors selected for use were blue, cherry (pink) and
goldenrod (orange). 80 sheets (8 ½ x 11”, about 4.2 g each) of each color were ripped
into small pieces and soaked in 3 L of distilled water. The paper was processed in batches
in a Waring blender (total of 7 L of distilled water used) to produce pulp. The pulp was
thickened, and stored at 4ºC until used.
7.4.3.6 LMS treatment of dyed pulp
The selected reaction conditions, based on optimal LMS biobleaching conditions
for biodelignification of chemical pulps238 were as follows: 45ºC, pH 4.5, 10 bar oxygen,
stirred for 2-hour reaction followed by extensive washing. The laccase-mediator
treatments were carried out in a 1000-mL-capacity temperature-controlled stirred
pressure reactor. Colored pulp (27 g, o.d. final consistency 3%), sodium acetate buffer,
pH 4.5, (final concentration 20 mM), ABTS (10mM), and distilled water (873mL) were
mixed and preheated to 45°C. Laccase (4.365 kats) was then added. The reactor was

KRISTINA KNUTSON PHD THESIS 2/22/2006 PAGE 135
closed and pressurized with oxygen to 10 bar. After mixing two hours, the pulp was
filtered and washed with a liter of distilled water.
7.4.3.7 Alkaline extraction of laccase-treated pulp
Xylanase treatment improves the efficacy of subsequent deinking treatment.215 To
determine if laccase/ABTS treatment would also improve subsequent steps, colored pulps
were subjected to laccase-1mM ABTS treatment, followed by alkaline extraction.
Colored pulp (25g, o.d.) in a heat-sealable bag was placed in a 60ºC water bath and
preheated for at least five minutes. Sodium hydroxide (0.1g, or 0.4%) and water (final
volume 250 mL, consistency 10%) were added. The bag was then heat sealed, mixed
thoroughly, and placed in the 60ºC water bath for 60 minutes. The bag was then opened;
the pulp was suction-filtered and washed with 1 L of distilled water.
7.4.3.8 Oxygen bleaching of colored pulps
Alkaline oxygen bleaching of colored pulps was performed in the Parr pressure
reactor. The reaction conditions216 include 90ºC, 90 psi (6 bar) oxygen pressure and 0.8%
charge of sodium hydroxide (0.216g NaOH for 27g o.d. pulp). Water, sodium hydroxide
and the reaction vessel were preheated to 90ºC. The pulp was rapidly heated to 90ºC in a
microwave and added to the pressure reactor. For the time course studies, the pulp
consistency was 10%. For the bleaching comparison studies, the pulp consistency was
5%. As a control, the time course studies included pulp samples that were also mixed
with alkali but which were allowed to react for 2 hours at room temperature under
ambient pressure.
7.4.3.9 Peroxide bleaching of colored pulps
Bleaching of colored pulp with alkaline hydrogen peroxide was performed
following the procedure of Li et al.217 Colored pulp (53g, o.d.) was mixed with water
(final volume 1060 mL, 5% consistency) and DTPA (diethylene triamine pentaacetate,
0.11g or 0.2%) in a heat-sealable bag and preheated in 75ºC water bath for at least 10
minutes. (DTPA is a metal chelator that stabilizes hydrogen peroxide.) Sodium hydroxide
(0.53g or 1%) and hydrogen peroxide (0.53g or 1%) were added. After heat-sealing, the

KRISTINA KNUTSON PHD THESIS 2/22/2006 PAGE 136
pulp slurry was mixed thoroughly and placed in 75ºC water bath for 60 minutes. The bag
was then opened; the pulp was suction-filtered and washed with 1 L of distilled water.
7.4.3.10 Dithionite treatment of colored pulps
Reductive bleaching of colored pulp was performed following the procedure of Li
et al.217 Sodium dithionite (0.5g, 2% on o.d. pulp) was dissolved in 50 mL of distilled
water that had been boiled and then cooled while a stream of nitrogen gas bubbled
through it. The colored pulp (25g, o.d.) was mixed with water (final reaction volume 750
mL, consistency 3.33%) and placed in a heat-sealable Kapak bag. The pulp slurry was
then placed in a 75ºC water bath and allowed to preheat for 10 minutes as nitrogen gas
was bubbled through the pulp slurry. Nitrogen bubbling continued as the pulp slurry was
removed from the water bath, the dithionite solution was added and the contents were
mixed for 60 seconds. After measuring pH, the bag was then heat sealed and the pulp
slurry was placed in the water bath. After reacting for 60 minutes, the bag was opened
and the pH was measured. The pulp was suction filtered and washed with 1 L of distilled
water.
7.4.3.11 Calculation of Dye Removal Index (DRI)
The LMS decolorization of pulp dyed Direct Yellow 11 was quantified by
measuring the CIELAB color values for handsheets prepared following TAPPI Standard
Method T218. The DRI measures the percent change in geometric distance from the ideal
bleach point. It is calculated following the equations shown below.45
Equation 11 Dye Removal Index Calculation45
Distance from Ideal Bleach Point = R2
R2 = a2 + b2 + (100-L) 2
Amount of Color Removal = -ΔR2
ΔR2 = R22 – R1
2
ΔR2 = (a22 – a1
2) + (b22 – b1
2) + [(100-L2) 2 – (100-L1) 2]
Dye Removal Index (DRI) = -100 [ΔR2 / R12]
DRI = Percent Color Removal by Bleaching Process
KRISTINA KNUTSON PHD THESIS 2/22/2006 PAGE 137
7.4.4 RESULTS AND DISCUSSION
7.4.4.1 Reaction rate study for oxygen bleaching
To determine how quickly oxygen bleaching can remove color, samples of each
of the three commercial colored pulps were subjected to oxygen bleaching for different
amounts of time. Brightness and L*a*b* values were then obtained for handsheets made
from the treated pulps. The brightness values are shown in Figure 64 below. Base values
(shown in Figure 64 as open circles on vertical axis) are measurements from handsheets
made directly from the colored pulps. Zero time brightness values are higher because the
pulp was diluted and washed in the same manner as the pulps exposed to oxygen
pressure. Controls (RT, points at 2 hour in graphs below) were also prepared: pulp mixed
with caustic and reacted for 2 hours at room temperature and ambient pressure. The
brightness of the blue and cherry pink pulp increases quickly (within 10 minutes) and
further incubation does not yield further improvement. The brightness of the goldenrod
orange paper was low and extending bleaching time to 120 minutes did not improve
brightness. Room temperature treatment with sodium hydroxide for an extended time (2
hours) lead to brightness improvements achievable with 10 minutes of oxygen bleaching.
Figure 65 shows why evaluation of L*a*b* values are necessary when evaluating
bleaching treatments for colored materials. Little change in brightness was observed for
pink and blue pulps between 10 minutes and 60 minutes of oxygen bleaching. Also, little
difference in brightness was observed between pulps bleached for 60 minutes with
oxygen at 90º and pulps bleached with caustic for 120 minutes at room temperature and
pressure. However, when the dye removal index values are compared (calculations based
on color in time zero handsheets), it can be seen that extending bleaching time from 10
minutes to 60 minutes did lead to a distinct improvement in the amount of color removed.
Also, the dye removal index showed more color was removed by oxygen bleaching at
90ºC for 60 minutes than was removed by 120 minutes at room temperature and
pressure.Despite the nearly unchanged brightness values, even the color in goldenrod
orange decreased when the L*a*b* values are measured.

KRISTINA KNUTSON PHD THESIS 2/22/2006 PAGE 138
Figure 64 Improvements in Brightness during Oxygen Bleaching
0
10
20
30
40
50
60
70
80
90
0 20 40 60 80 100 120
Minutes
Bri
ghtn
ess
PinkBlueGoldPink RTBlue RTGold RTPink BaseBlue BaseGold Base
Figure 65 Improvements in Dye Removal Index Values during Oxygen Bleaching
0
10
20
30
40
50
60
70
80
90
0 20 40 60 80 100 120 140
DRI
PinkBlueGoldPink RTBlue RTGold RT

KRISTINA KNUTSON PHD THESIS 2/22/2006 PAGE 139
7.4.4.2 Comparison between bleaching treatments
To evaluate bleaching effectiveness of the laccase/ABTS system, four colored
pulps were subjected to a series of bleaching treatments as outlined below in Table 7-4.
The bleaching treatments are defined in the right column of Table 40. The left column
lists associated abbreviation applied to the results of that treatment as shown in the
succeeding figures.
Table 7-4 Bleaching Treatments Applied to Colored Pulps
L 1. Laccase/ABTS bleaching: 2hrs, 10bar O2, 45ºC, pH 4.5, 0.01mM ABTS, 3% cs* LAE 2. Laccase/ABTS bleaching as above; followed by Alkaline Extraction: 1 hr, 60ºC,
10% cs, 0.4% NaOH or 0.1g NaOH/ 25g o.d. pulp LDT 3. Laccase/ABTS bleaching as above; followed by Dithionite Bleaching: 1 hr, 75ºC,
cs 3.33%, 2% Na2S2O4 or 0.5 g Na2S2O4/ 25g o.d. pulp O 4.Oxygen bleaching: 2 hr, 90ºC, cs 5%, 0.8% NaOH or 0.2g NaOH/ 25g o.d. pulp
ODT 5.Oxygen bleaching as above, followed by Dithionite Bleaching: 1 hr, 75ºC, cs 3.33%, 2% Na2S2O4 or 0.5 g Na2S2O4/ 25g o.d. pulp
P 6. Alkaline hydrogen peroxide bleaching: 1 hr, 75ºC, cs 5%, 1.0 % NaOH or 0.5g NaOH/ 50g o.d. pulp, 0.2% DTPA or 0.1g DTPA/ 50g o.d. pulp
PDT 7.Alkaline hydrogen peroxide as above followed by Dithionite Bleaching: 1 hr, 75ºC, cs 3.33%, 2% Na2S2O4 or 0.5 g Na2S2O4/ 25g o.d. pulp
*cs = consistency = wt% pulp in slurry The brightness values are plotted in Figure 66 through Figure 69. Bleaching
treatments increased the already high brightness values for the pink and blue pulps. The
largest brightness gain was 10 brightness points for the blue pulp and 22 points for the
pink pulp. For both goldenrod and Direct Yellow 11 pulps, treatments including
dithionite bleaching yielded the best results. The Direct Yellow 11-dyed pulp did respond
to bleaching treatments with the largest gain being 37 points in brightness. The goldenrod
pulp has a low brightness of 23 and the maximum brightness gain observed was 19
points.

KRISTINA KNUTSON PHD THESIS 2/22/2006 PAGE 140
Figure 66 Brightness Values for Bleached Blue Commercial Pulp
Blue
0
20
40
60
80
100
Base L LAE LDT O ODT P PDT
Brig
htne
ss
Figure 67 Brightness Values for Bleached Cherry Pink Commercial Pulp
Pink
0
20
40
60
80
100
Base L LAE LDT O ODT P PDT
Brig
htne
ss

KRISTINA KNUTSON PHD THESIS 2/22/2006 PAGE 141
Figure 68 Brightness Values for Bleached Goldenrod Commercial Pulp
Goldenrod
0
20
40
60
80
100
Base L LAE LDT O ODT P PDT
Brig
htne
ss
Figure 69 Brightness Values for Bleached Direct Yellow 11-Dyed Pulp
Direct Yellow 11
0
20
40
60
80
100
Base L LAE LDT O ODT P PDT
Brig
htne
ss
Examination of the dye removal index values (Figure 70 through Figure 73)
shows that dithionite bleaching yields the best result. LDT treatment results are
comparable to PDT treatment results for the pink pulp, but not for the blue pulp.

KRISTINA KNUTSON PHD THESIS 2/22/2006 PAGE 142
Figure 70 Dye Removal Index Values for Bleached Blue Commercial Pulp
Blue
0
20
40
60
80
100
L LAE LDT O ODT P PDT
DR
I
Figure 71 Dye Removal Index Values for Bleached Cherry Pink Commercial Pulp
Pink
0
20
40
60
80
100
L LAE LDT O ODT P PDT
DR
I

KRISTINA KNUTSON PHD THESIS 2/22/2006 PAGE 143
Figure 72 Dye Removal Index Values for Bleached Goldenrod Commercial Pulp
Goldenrod
-50
-40
-30
-20
-10
0
10
20
30
40
50
L LAE LDT O ODT P PDT
DR
I
Figure 73 Dye Removal Index Values for Bleached Direct Yellow 11 Dyed-Pulp
Direct Yellow 11
0
20
40
60
80
100
L LAE LDT O ODT P PDT
DR
I
For Direct Yellow 11, the dye removal index values of laccase/ABTS treatment
followed by dithionite bleaching are comparable to the results obtained with oxygen or
peroxide bleaching followed by dithionite treatment. When brightness values are

KRISTINA KNUTSON PHD THESIS 2/22/2006 PAGE 144
compared, the final brightness for LDT treatment of Direct Yellow 11 pulp is not quite as
high as for ODT or PDT. This may be related to the observation that Direct Yellow 11
pulp treated with oxygen or peroxide remains yellow, while Direct Yellow 11 pulp
treated with laccase/ABTS changes hue to cream/yellow-brown. The change in hue
suggests a chemical alteration occurred.
The results obtained for treatment of goldenrod pulp were unexpected. The large
negative dye removal index values were obtained for treatments that involve heating the
pulp at elevated temperatures (60-75ºC) in strongly alkaline treatments. It is unlikely to
be due to residual alkalinity as all pulps were washed at the end of the treatment. In
addition, during the preparation of handsheets, the pH of the pulp slurry is adjusted to
6.5±0.5.Whatever the cause for the increase in color during alkaline treatment, the color
increase was reversed by reduction with sodium dithionite.
7.4.4.3 Summary
Examination of oxygen bleaching of colored pulps show that L*a*b* color values
are better than brightness values for evaluating the effectiveness of a bleaching treatment.
When followed by sodium dithionite treatment, the results of the laccase/ABTS system
designed for bleaching Direct Yellow 11 dyed pulp is comparable to the results from
oxygen or hydrogen peroxide bleaching followed by sodium dithionite. For the
commercial colored pulps containing dyes of unknown composition, the laccase/ABTS
treatment had some effect, but was not as effective as alkaline hydrogen peroxide
followed by sodium dithionite.
7.4.5 ACKNOWLEDGEMENTS
We would like to thank Novozymes for the donation of the laccase and BASF for
the donation of Basazol 46L and Direct Yellow 11. This work was supported by the
member companies of the Institute of Paper Science and Technology.

KRISTINA KNUTSON PHD THESIS 2/22/2006 PAGE 145
8 SUMMARY OF RESULTS
The first issue this research project addressed was whether laccase-mediator
system could decolorize Direct Yellow 11. An affirmative answer could not be assumed.
As of 2004, the only reports of cell-free decolorization of a stilbene dye are the
publications from this research project. As mentioned in Section 3.8.4.1, page 70, when 4
different azo dyes were added to cultures of Phanerochaete chrysosporium,172 the one
dye the fungi did not completely decolorize was Congo Red - a direct dye that contains
azo bonds between two phenyl groups that do not have hydroxyl groups. Like Direct
Yellow 11, Congo Red is unable to form azo/hydrazone tautomers. When Cripps et al.
prepared a crude extract of lignin peroxidase from P. chrysosporium, the three other dyes
were partially decolorized, but not Congo Red.
The addition of a mediator compound could be necessary for decolorization of
Direct Yellow 11. Laccase can degrade phenolic units of lignin, but a mediator is
necessary to degrade nonphenolic lignin.8 During degradation of wood, white-rot fungi
secrete low molecular weight compounds that function as mediators.255 Decolorization of
a phenolic azo dye with the laccase from Trametes versicolor179 (discussed in section
3.9.2.4 on page 84), appeared to involve a small molecular weight mediator. In the
experiments reported here, it was found in control experiments under standard conditions
of 45ºC for 2 hours at pH 4.5 under 10 bar oxygen pressure followed by suction filtration
and washing, the amount of color removed was similar (~22% DRI) whether mediator
alone, laccase alone or nothing was added to the Direct Yellow 11-dyed pulp. Laccase
alone does not decolorize Direct Yellow 11.
Another possibility was that laccase with mediator could decolorize dissolved
Direct Yellow 11 in solution, but not when the dye was attached to fiber. A slurry of fiber
in water is a biphasic solution. The presence of solid material inhibits diffusion and can
result in uneven distribution of dissolved material within the solution.
In addition, cellulose fibers are negatively charged. At the interface between a
charged solid and a liquid, a separation of electrical charges occurs. Positive ions would
be attracted to the surface and attach, forming the rigid zone known as the Stern layer.

KRISTINA KNUTSON PHD THESIS 2/22/2006 PAGE 146
Additional positive ions are attracted by the negative fiber but also repelled by the other
positive ions in the Stern layer. These additional positive ions form a diffuse layer. The
diffuse layer and the Stern layer together form the double layer that exists surrounding
cellulose fibers in water. The thickness of the double layer depends on pH and ionic
strength of the solution. For some dyes, salt must be added during the dyeing process to
shrink the size of this double layer to enable the dye molecules to reach and attach to the
fibers. Not only are the cellulose fibers charged, the enzyme is also charged. The charge
on an enzyme varies with the pH since the amino acids of proteins are amphoteric.
Proteins contain both carboxylic acid groups that can ionize and amino groups that can be
protonated. Since a double layer would exist around cellulose fibers and around enzymes
in solution, it is probable that the ability of the enzyme to directly approach the fiber is
limited. These limitations would be much less for low molecular weight mediators. The
mediators have very little charge or surface area compared an enzyme (about 60,000 in
molecular weight) or the micron-sized cellulose fibers.
This research determined that laccase with mediator could decolorize both Direct
Yellow 11 in solution and pulp dyed with Direct Yellow 11.
One explanation for the decolorization of Direct Yellow 11 dyed pulp is that
laccase with mediator could be stripping the intact dye from the fiber. However
spectrophotometric measurement of the post-reaction effluent from laccase/ABTS
treatment (Figure 53, page 112) shows no dye peak around 400 nm and little difference is
discernable between post-reaction solutions of laccase/ABTS treatment of white and of
Direct Yellow 11-dyed pulp. The pulp color changes from yellow to cream/yellowish
brown, suggesting that an alteration in the dye chromophore has occurred. The
decolorization observed when Direct Yellow 11 in solution (no pulp, Figure 61, page
129) was treated with laccase with mediator proves that laccase with mediator is reacting
with the dye chromophore.
Another issue was which of the available mediators would be the most effective.
Although the first mediator introduced for biobleaching of virgin pulp with laccase was
ABTS (2-2′ azinobis-(3-ethyl benzthiazodine),8 most research has focused on the class of
mediators containing the N-OH moiety.9 This class includes the mediators HBT (1-

KRISTINA KNUTSON PHD THESIS 2/22/2006 PAGE 147
hydroxybenzotriazole) and VA (violuric acid) used in this research as well as NHA (N-
hydroxy acetanilide), HNNS (2-nitroso-1-naphthol-4-sulfonic acid) and (NNDS) 1-
nitroso-2-naphthol-3,6-disulfonic acid) (see Table 3-27, page 52). Previous research had
found that for biobleaching virgin pulp HBT was more effective than ABTS9. Later work
showed that mediators NHA and VA outperform HBT.256
For the decolorization of Direct Yellow 11 however, ABTS was found to a better
mediator than either HBT or violuric acid (Figure 56 page 119). Laccase/ABTS remained
effective even when the ABTS concentration was decreased to 10 nM (Figure 57 page
120). The differences in mediator effectiveness could be due to a difference in redox
potentials (redox potentials are 1.04 for HBT; 0.91 for violuric acid and 0.67 and 1.09 for
the two electron transfers to ABTS). It is also possible that some other mechanism is
occurring. There is some structure similarity between Direct Yellow 11, with an azo bond
between phenyl groups bearing sulfonic acid groups (Figure 55 page 116), and the ABTS
dication (Figure 32 page 58) which has an azo bond between heterocycles attached to
phenyl groups bearing sulfonic acid groups. The greater similarity between Direct Yellow
11 and ABTS intermediates than between Direct Yellow 11 and HBT and VA
intermediates may facilitate closer association and/or better sterochemical orientation
during the electron transfer from activated mediator to dye chromophore. For example,
the positive charges on the heterocyclic nitrogens of the ABTS dication (Figure 32 page
58) may draw the ABTS dication closer to Direct Yellow 11 which is negatively charged
from four ionized sulfonic acid groups.
Experiments with dissolved dye suggest that Direct Yellow 11 reacts slowly.
About one hour was needed for maximal decolorization to occur regardless of whether
the decolorization agent was the laccase/ABTS system (Figure 61 page 129) or soybean
peroxidase/veratryl alcohol (Figure 62 page 130). For laccase/ABTS, previous kinetic
studies had indicated that the radical cation formed quickly while the dication formation
was slow,109 and limited the reaction rate. It could be that the slow formation of ABTS
dication limited the rate of Direct Yellow 11 decolorization. However, the reaction of
soybean peroxidase/veratryl alcohol with Basazol 46L was rapid (Figure 63 page 131)
while the reaction of soybean peroxidase/veratryl alcohol with Direct Yellow 11 was

KRISTINA KNUTSON PHD THESIS 2/22/2006 PAGE 148
slow, even though both reactions were performed at same concentrations of nonvolatile
dye solids, enzyme, mediator and hydrogen peroxide. The slow rate of reaction of Direct
Yellow 11 with soybean peroxidase/veratryl alcohol together with the slow reaction with
laccase/ABTS suggests that the observed slow decolorization reaction is due to the dye,
not the mediator transferring the electron or the enzyme activating the mediator. The
reaction rate studies were performed on dissolved Direct Yellow 11 so the factors that
could limit the reaction rate of a dye attached to a solid fiber are not relevant.
Possible explanations for the observed slow decolorization include a) difficulties
in electron transfer between mediator and dye chromophore and b) slow transformation
of the activated dye chromophore to a stable chemical form with less molar absorptivity.
Direct Yellow 11 is a long planar molecule with four ionized sulfonic acid groups.
Being long and planar reduces the likelihood of random collisions with the necessary
sterochemical orientation between the dye chromophore and the activated mediator. The
four charged sulfonic acid groups would tend to repel the close approach of other
molecules. Since ABTS dication is positively charged (Figure 32 page 58) direct
repulsion may not be a problem. However, the charged sulfonic acid groups are bulky
and would further attract sodium ions (from the buffer solution), and hydronium ions
(solution pH 4.5 for laccase and pH 3.8 for reaction rate study of soybean peroxidase
with Direct Yellow 11). Even though the sulfonic acid groups are in the plane of the
aromatic ring, the bulk of the associated ions around these charged groups would reduce
close collisions between mediator and the dye chromophore. It is also possible that
electron transfer occurs only when the dye chromophore enters a rare resonance state or
conformation and the rate of decolorization is limited by the rare appearance of that
resonance state or conformation.
Stilbene compounds are very stable. The oxygens in Direct Yellow 11 (Figure 55
page 116) are in nitro and sulfonic acid groups and are already fully oxidized. Direct
Yellow 11 could form a radical that is moderately stable and continues to absorb light.
Eventually the dye radical could decay into a more stable form that has a shifted λMax
(resulting in the hue change from yellow to cream) and a lower molar absorptivity
(resulting in lower absorbance in solution and decolorization of dyed pulp). This

KRISTINA KNUTSON PHD THESIS 2/22/2006 PAGE 149
prolonged decay is similar to the process of phosphorescence in that time passes between
the initial activation and formation of the final stable structure. In this case, the reason for
the slow decolorization of Direct Yellow 11 would be difficulty in formation of the
oxidized dye products. The difficulty could be related to necessary intramolecular
rearrangements and/or to a requirement for a second intermolecular reaction such as
extraction of a hydrogen atom from the medium or even a second electron transfer with
the activated mediator. The slow decolorization of Direct Yellow 11 observed in these
enzymatic redox systems collaborates the reputation of Direct Yellow 11 as a stable dye
that is recalcitrant to chemical bleaching.
When Direct Yellow 11-dyed-pulp was subjected to a series of bleaching
treatments, it was found that single stage oxidative bleaching was not as effective as two-
stage oxidative bleaching followed by reductive treatment. Single stage laccase/ABTS
treatment was also not as effective as single stage oxygen or alkaline hydrogen peroxide.
That result was not expected. However, it should be noted that after single stage
treatments, the color of laccase/ABTS pulp has changed from yellow to cream while
oxygen and hydrogen peroxide treated pulps are still yellow. Oxygen and hydrogen
peroxide may be color stripping the dye off the fiber rather than altering the dye
chromophore.
Since the Direct Yellow 11-dyed pulp did respond to chemical bleaches, it may
appear that the dye’s reputation as recalcitrant is unwarranted. However, it must be noted
that in commercial production, the dye fixative applied would be a compound designed
for that purpose. The dye fixative applied to the pulp in this research (alum) is a readily
available chemical that has many uses in papermaking. It was suggested by JC Cantrell at
BASF because he knew our laboratory would already have this chemical on hand. If the
color reduction by oxygen and by hydrogen peroxide bleaching is by color stripping, then
the choice of dye fixative could be important. Oxygen and hydrogen peroxide did reduce
the color of Direct Yellow 11-dye pulp. However, unlike treatment with laccase/ABTS,
in treatment with oxygen or with alkaline hydrogen peroxide there is no evidence
indicative of chemical alteration of the dye chromophore.

KRISTINA KNUTSON PHD THESIS 2/22/2006 PAGE 150
The two stage treatment including laccase/ABTS was as effective as two stage
treatment with oxygen or alkaline hydrogen peroxide, whether judged by brightness
values (Figure 69 page141, maximum gain 37 points) or by dye removal index values
(Figure 73 page 143). Although the two stage treated pulps vary slightly in their a* and
b* values, the handsheets for all of the two stage treatments are visibly white. Whatever
the chemical alteration is that occurs in the Direct Yellow 11 dye chromophore during
laccase/ABTS treatment, that alteration does not prevent reductive bleaching by sodium
dithionite.
The results of bleaching the commercial colored pulps demonstrate why
brightness values are not conclusive when evaluating bleaching treatments of colored
pulps. For the blue pulp, the initial brightness is high and bleaching treatments did not
alter the brightness greatly (Figure 66 page 140, maximum gain 10 points). Brightness
value changes for the pink pulp were similar (Figure 67 page 140, maximum gain 22
points). The brightness values show little distinction among the bleaching treatments. The
dye removal index values were more informative. The blue pulp responded well to
bleaching with alkaline hydrogen peroxide, experiencing only a slight improvement by
secondary bleaching with sodium dithionite. The blue pulp did not respond well to
laccase/ABTS treatment, even if followed by alkaline extraction or dithionite bleaching.
For the pink pulp, a two stage treatment including laccase/ABTS achieved results
comparable to two stage bleaching with oxygen or alkaline hydrogen peroxide.
As for the Direct Yellow 11-dyed pulp, the most effective bleaching treatments
for commercial goldenrod pulp were treatments that included reductive bleaching by
sodium dithionite. The goldenrod pulp has a low brightness of 23 and the maximum
brightness gain observed was 19 points (Figure 68 page 141) For the goldenrod pulp,
very different information is conveyed by the dye removal index values (Figure 72 page
143) when compared with the brightness values. Treatments that result in only slight
differences in brightness values, exhibited major differences in dye removal index values.
An increase in color was observed for bleaching treatments that include heating strongly
alkaline solutions (alkaline extraction, oxygen bleaching, and hydrogen peroxide

KRISTINA KNUTSON PHD THESIS 2/22/2006 PAGE 151
bleaching). The poor results obtained for the goldenrod pulp demonstrate how the
bleaching response can vary greatly among dyes.
The methine dye Basazol 46L responded to laccase/ABTS, horseradish
peroxidase/veratryl alcohol and soybean peroxidase/veratryl alcohol treatments.
Decolorization results were 71% for treatment with horseradish peroxidase/veratryl
alcohol (Figure 59 page 127) and 33% for treatment with laccase/ABTS (Table 7-3 page
129). However the rapid rate of decolorization of Basazol 46L when treated with soybean
peroxidase/veratryl alcohol (74% reduction within 5 minutes, Figure 63 page 131)
suggests that decolorization by soybean peroxidase/veratryl alcohol may be the best
route. Soybean peroxidase is inexpensive and readily available. The acceptable range of
solution pH is also very broad including both acidic (pH 3.8) and mildly alkaline (pH 8)
conditions (Figure 60 page 128). Although polyethylene glycol (PEG) has been reported
to stabilize soybean peroxidase,210 the inclusion of 500 mg/L of PEG with 10,000 or
35,000 molecular weight had little effect on the decolorization of Basazol 46L.
Addition of 5 mM dimethyl sulfoxide (a free radical scavenger) had negligible
effect on the decolorization of the dye. Since inclusion of a radical scavenger had no
effect, it appears that the reaction mechanism may not include a free radical. However,
the dye decolorization is nearly instanteous. The reaction solution with soybean
peroxidase, veratryl alcohol and Basazol 46L dye was prepared and allowed to
equilibrate. Dye decolorization occurs immediately upon addition of the hydrogen
peroxide. There was not much time for the radical scavenger to affect the reaction.
The experiments with Basazol 46L were performed in solution. It is possible that
soybean peroxidase/veratryl alcohol may not decolorize the dye when it is attached to
cellulose fibers. However, the veratryl alcohol in the solution functions a mediator, in the
same manner that ABTS mediates in laccase reactions. Since ABTS is able to overcome
mass transfer limitations in the laccase-mediated decolorization of Direct Yellow 11, it is
probable that the mediated soybean peroxidase reaction could decolorize Basazol 46L
attached to fibers. One complication is relevant. Direct Yellow 11 is applied to bleached
kraft fibers. Basic dye Basazol 46L is designed for application to lignin-containing pulps.

KRISTINA KNUTSON PHD THESIS 2/22/2006 PAGE 152
The lignin present could consume the mediator and greatly reduce the ability of the
soybean peroxidase to decolorize Basazol 46L.
In summary, the results reported in this research project demonstrated the
potential benefits of biotechnology for solving existing problems. This research program
has also shown that a recalcitrant stilbene dye can be decolorized by the lignolytic
enzyme laccase combined with a mediator. This dye and a recalcitrant methine dye can
also be decolorized by soybean peroxidase, suggesting that the extensive existing
research on dye decolorization by lignin and manganese peroxidases may also apply to
this inexpensive commercially available enzyme.

KRISTINA KNUTSON PHD THESIS 2/22/2006 PAGE 153
9 THESIS CONCLUSIONS
Laccase-mediator treatment reduced the color of pulp dyed with Direct Yellow
11. For this purpose, ABTS was a better mediator than either HBT or violuric acid.
Laccase/ABTS remained effective even when the ABTS concentration was decreased to
10 nM. The pulp color changes from yellow to cream/yellowish brown, suggesting that
the dye molecule has been chemically altered.
Experiments with dissolved dye suggest that Direct Yellow 11 reacts slowly.
About one hour was needed for maximal decolorization to occur regardless of whether
the decolorization agent was the laccase/ABTS system or soybean peroxidase/hydrogen
peroxide. When compared with conventional bleaching treatments, laccase/ABTS
treatment followed by dithionite bleaching removed as much color as oxygen or
hydrogen peroxide treatment followed by dithionite treatment.
Both laccase/ABTS and horseradish peroxidase/hydrogen peroxide treatments
could reduce the signal intensity of Basazol 46L. However, soybean peroxidase achieved
74% reduction within 5 minutes. Soybean peroxidase was able to reduce the signal from
Basazol 46L under both acidic (pH 3.8) and mildly alkaline (pH 8) conditions.
In summary, the results reported in this research project demonstrated the potential
benefits of biotechnology for solving existing problems. This research program has also
shown that a recalcitrant stilbene dye can be decolorized by the lignolytic enzyme laccase
combined with a mediator. This dye and a recalcitrant methane dye can be decolorized by
soybean peroxidase, suggesting that the extensive existing research on dye decolorization by
lignin and manganese peroxidases may also apply to this commercially available enzyme.

KRISTINA KNUTSON PHD THESIS 2/22/2006 PAGE 154
10 RECOMMENDATION FOR FUTURE WORK
The research described in this thesis could be continued in a number of ways.
First, the chemistry of the reaction between laccase/ABTS and Direct Yellow 11
remains to be elucidated. The data suggest that laccase/ABTS causes a chemical change
in the dye molecule. The laccase/ABTS treatment of pulp dyed with Direct Yellow 11
changes the pulp color from yellow to cream/yellow-brown.
Another question is whether the laccase/ABTS system can be used to break down
other dyes? In addition, testing laccase with other mediators against a variety of dyes
could yield some useful information. Data suggests a correlation between the redox
potential of a dye and the mediator used
Finally, possible industrial application of this system raises issues to be explored.
It is possible that when treating mixed office waste that includes a variety of colored
paper, dyes from some colored papers could act as laccase mediators to allow laccase to
attack the recalcitrant dyes. Another issue concerns where in the recycling process should
laccase or laccase and mediator be added? For a recycle mill that is already adding
cellulases and/or xylanses before deinking, would there be any value to also adding
laccase or laccase and mediator? Or alternatively, must the treatment with the laccase-
mediator system come as part of the bleach cycles after deinking?

KRISTINA KNUTSON PHD THESIS 2/22/2006 PAGE 155
11 ACKNOWLEDGMENTS
Foremost I would like to thank Dr. A.J. Ragauskas, my immediate advisor. His guidance, support and faith in me allowed me to begin and to complete this project. I am indebted to my committee members including Dr. Deng who suggested the project and Dr. Gisela B. Buschle-Diller who offered advice on experimental methods.
I would like to also personally thank my former and present colleagues. Their assistance was much appreciated. In Wood Chemistry this includes Dr. L. Lucia, Dr. D. Dimmel, Dr. Richard Chandra, Dr. Lorraine Vander Wielen, Dr. Thomas Dyer, Dr. Yunqiao Pu, Dr. Dong-Ho Kim, Dr. Jian-guo Zhang, Dr. Rallming Yang, Dr. Anna Retzlaff, and Mrs. Lenong Allison. Of the IPST staff, my thanks go out to many people who provided help along the way: Ms. Kathleen Poll, Mr. Mike Buchanan and Miranda Bliss of Analytical and Testing Services Ms. Donna Jernigan of Editorial Services Mr. Charles Courchene of Pulping and Bleaching Mr. Charles Andry, Mr. Charles Brookshire, Mr. Bob Davies, Mr. Steve Gilbreath, Mr. Stan Hearn and Mr. Tom Miller of Computer/Audio visual support Ms. Clara Williams, Ms. Karen Smith and Ms. Susan Wells from the Library Ms. Joi Dogan, Dr. Jeff Empie, Mrs. Dana Carter, Dr. Barry Crouse, Ms. Starri Glenn, Mrs. Kathleen Krupp, and Ms. Janice Thomas from Academic Office Ms. Dorothy Farina, our Safety Officer Ms. Cindy Bowden and Ms. Teri Williams from the Papermaking Museum Ms. Durinda Dickson, Jasmin Frett and Mr. Tom Merchant of Purchasing Mr. Robert Hall and Mr. Mike Schaepe of Container Research Ted Jackson of Sensors Measurement and Control Dr. Tom McDonough of the Center for Paper Business and Industry Studies Mr. Ray Cunningham, Mr. Jerry Kloth, Mr. Jerry Nunn, Mr. Juan Chevere, Ms. Shirley Whitfield and Major Henry Hank White Williams Jr. P. the 3rd of various support services. For their friendly encouragement I would like to thank Dr. Lorraine Vander Wielen, Dr. Daniel Lane, Dr. Michelyn McNeal, Dr. Richard Chandra, Dr. Nour-Eddine Djerdjouri, Dr. Brian Weseman, Dr. Shaobo Pan and Dr. Hiroki Nanko. I am endlessly grateful for the people who encouraged and prodded me when I bogged down and was tempted to quit. My thanks go to my loving and supporting husband Chris Parks and my friend Teresa Vales who encouraged me to get the help I needed. However, special recognition must be made of the friend who stopped by or called every single weekday to see whether my day was productive, Brent Martin. More than anyone else, Brent knows the days I barely achieved anything yet he kept on encouraging me to persist

KRISTINA KNUTSON PHD THESIS 2/22/2006 PAGE 156
and to finish. Thanks Brent for being such a persistent friend. I want to thank Laura Ellen Ayres for believing in me. She has always been a bedrock of support for me. I thank Cathy Patrykus for encouraging me to begin this journey and for all the support and frank advice over the years. Above all, I want to acknowledge and thank my Lord Jesus Christ. Without His transforming power, I would never have begun this journey. Without the strength, courage, blessing and favor He bestowed, I would never have finished. Very few people are given a second opportunity to obtain a PhD. He is faithful as He promised in Jeremiah 29:11 to give us “a hope and a future” and in Joel 2:25 to “restore for the years the locusts have ravaged”.

KRISTINA KNUTSON PHD THESIS 2/22/2006 PAGE 157
12 REFERENCES
1 American Forest & Paper Association (AFPA) (2004) Recovered Paper Statistical
Highlights, 2004 Edition. 2 Darlington B, Jezerc G, Magnotta V, Naddeo R, Waller F, White-Gaebe K (1992)
“Secondary-fiber color stripping: Evaluation of alternatives” TAPPI Pulping Conference Proceedings Bk 1:67-74
3 Sharpe PE, Lowe RW (1993) “The bleaching of colored recycled fibers” TAPPI Pulping Conference Proceedings 1205-1217
4 Ferguson, L.D. (1997) “Bleaching wastepaper” in TAPPI Deinking Short Course, TAPPI Press, Atlanta, GA pp.447-485
5 Lober, Douglas J. (1996) “Informing the process and outcomes of recycling in the United States: the National Municipal Solid Waste Recycling Symposium” Journal of Solid Waste Technology and Management 23(4):181-195
6 Fu Y, Viraraghavan T (2001) “Fungal decolorization of dye wastewaters: a review” Bioresource Technology 79(3):251-262
7 Jurasek L (1995) “Toward a three dimensional model of lignin structure” Journal of Pulp and Paper Science 21:J274-J279
8 Bourbonnais R, Paice M (1992) Applied Microbiology and Biotechnology 36: 823-827 “Demethylation and delignification of kraft pulp by Trametes versicolor laccase in the presence of 2-2’-azinobis-(3-ethylbenzthiazoline-6-sulphonate)”
9 Call H-P (1994) World Patent WO 9429425 A2 19941222 “Multicomponent bleaching system containing an amine with an oxo or hydroxy group”
10 Shrinath A, Szewczak JT, Bowen IJ (1991) “A Review of ink-removal techniques in current deinking technology” TAPPI Journal 74(7): 85-93
11 Welt T, Dinus RJ (1995) “Enzymatic deinking-Review” Progress in Paper Recycling 4(2):36-47
12 Mørkbak A, Zimmermann W (1998) “Deinking of mixed office paper: Old newspaper and vegetable oil-based ink printed paper using cellulases, xylanases, and lipases” Progress in Paper Recycling 7(2):14-21
13 Hanchett GD (1994) “Bleaching and color stripping recycled fibers: Overview” Progress in Paper Recycling 3(2):24-31
14 Garbutt T (1996) “Wastepaper grades” in TAPPI Deinking Short Course, TAPPI Press, Atlanta, GA pp.1-6

KRISTINA KNUTSON PHD THESIS 2/22/2006 PAGE 158
15 Dumont I, Fluet A, Giasson J, Shepperd P (1994) “Two applications of hydrosulfite
dye-stripping in paper recycling; Yellow directory and colored ledger” Pulp & Paper Canada 95(12):136-141
16 Progress in Paper Recycling 7, no. 4, August 1998, page 61. 17 Biermann CJ, Kronis JD (1997) “Bleaching chemistry: Oxidation potentials of
bleaching agents” Progress in Paper Recycling 6(3):65-70. 18 Quinnett PE (1995) “Decolorization of colored paper using chlorine dioxide to
replace sodium hypochlorite” AIChE Symposium Series 307:92-106 19 Naddeo R, Magnotta V, Kulikowski T, Ayala V, Jezerc G (1992) “Oxidative methods
offer alternative to chlorine bleaching of waste paper” Pulp & Paper 18(11):71-81 20 Colodette JL, Ventorim G, Costa MM (2002) “Environmentally friendly processes
for bleaching of secondary fibers.” TAPPI Fall Technical Conference and Trade Fair, San Diego, CA, United States, Sept. 8-11, 2002 pp.536-564
21 Briois L, Fraisse L, Rabion A PCT Int. Appl. (2001) WO 2001057309 A2 20010809 “Method for bleaching deinked and/or recycled pulps.”
22 Huber AM Ger. Offen. (2001) DE 10005355 A1 20010809 “Ozone bleaching of natural fibers”
23 Han Q, Li C (2000) “Ozone bleaching process of heavily printed magazine waste paper” Zhongguo Zaozhi 19(1):45-47
24 Fernandes JC, Floccia L (2000) “The use of ozone in deinking and bleaching of secondary fibers.” TAPPI Recycling Symposium, Washington, DC, United States, Mar. 5-8, 2000 1:191-198.
25 Arai Y, Toda M, Ide T Jpn. Kokai Tokkyo Koho (2001) JP 2001049588 A2 20010220 “Apparatus and method for deinking and disinfecting pulp in wastepaper recycling”
26 Floccia L, Defosse G, Rauscher C, Fernandes J-C Eur. Pat. Appl. (2001): EP 1101859 A1 20010523 “Process for deinking, decoloring, disinfecting and bleaching wastepaper”
27 Yamamoto S, Koga G, Hosomura H, Okayama T (2001) “Ozone treatments of bleached kraft pulp and wastepaper” Kami Pa Gikyoshi 55(4):506-513
28 Economou AM (2000) “Effect of ozone based TCF bleaching sequences on the optical and mechanical properties of secondary fibres of low mechanical pulp content.” Appita Journal 53(4):312-317
29 Archibald F, Roy-Arcand L (1997) “The use of ozone to decolorize residual direct paper dyes in kraft paper machine whitewater” Ozone: Science & Engineering 19(6):549-565
30 Seccombe R, Brackenbury K, Vandenberg D (2003) “Disperser bleaching with hydrogen peroxide - a tool for brightening recycled fibers” Appita Journal 56(3):184-189

KRISTINA KNUTSON PHD THESIS 2/22/2006 PAGE 159
31 Lachenal D (1994) “Bleaching of secondary fibers – Basic principles” Progress in
Paper Recycling 3(4):37-43 32 Hache MJA, Joachimides T (1992) Tappi Journal 75(7):187-91. “The influence of
bleaching on color in deinked pulps.” 33 Ackermann C, Putz HJ, Goettsching L (1996) “Do alternative chlorine-free bleaching
agents revolutionize the bleaching of wood-containing deinking pulps?” Papier (Darmstadt) 50(6):320-327:
34 Meyers P, Wang D, Hache M (1999) “DBI, a novel bleaching process for recycled fibers.” Conference Proceedings - TAPPI 99, Preparing for the Next Millennium, Atlanta, Mar. 1-4, 1999 2:373-385
35 Crowley TR, Rangamannar G, Reynoso A (2002) “Case studies of applied new technologies: borohydride-based bleaching in US and Latin American recycle mills.” Congresso e Exposicao Anual de Celulose e Papel, 35th, Sao Paulo, Brazil, Oct. 14-17, 2002:660-668
36 Hache M, Fetterly N, Crowley T (2001) “North American mill experiences with direct borohydride injection” Preprint - PAPTAC Annual Meeting, 87th, Montreal, QC, Canada, Jan. 30-Feb. 1, 2001 A89-A94
37 Knoke T, Griffin A (2002) “One deinking plant's experience with direct borohydride injection for the reductive bleaching of mixed office papers.” TAPPI Fall Technical Conference and Trade Fair, San Diego, CA, United States, Sept. 8-11, 2002:587-598
38 Naddeo RC (2003) U.S. Pat. Appl. Publ. US 2003155085 A1 “Process for bleaching lignin-free pulp or paper in a single-stage or multi-stage bleaching process”
39 Coles B, Turner NA, Mathews AJ, Baum C, Chadwick IE (2003) PCT Int. Appl. WO 2003048450 A1 20030612 “Process for bleaching recycled cellulose pulp. “
40 Ney B, Sinden R, Sweeny PG, Lutz PJ, Borokhov O (2001) PCT Int. Appl.WO 2001094692 A2 20011213 “Aldehyde donors for stabilizing peroxides in papermaking applications.”
41 Ragauskas AJ, Kim DH (2003) U.S. Pat. Appl. Publ. US 2003019596 A1 20030130 “Metal substituted xerogels for improved peroxide bleaching of kraft pulps.”
42 Ahlgren J, Paren A, Jaekaerae J, Haermae T, Renvall I (2004) PCT Int. Appl. WO 2004063276 A1 20040729 “Polymer compositions for peroxide bleaching cellulosic fiber materials and processes for peroxide bleaching.”
43 Fluet A, Shepperd P (1997) “Color stripping of mixed office papers with hydrosulfite-based bleaching products” Progress in Paper Recycling 6(2):74-79
44 Marcus RT (1998) “The Measurement of color ” in Color for Science, Art and Technology, K. Nassau, Ed. Elsevier, Pubs. New York
45 Sharpe PE (1996) “Optical testing” in TAPPI Deinking Short Course

KRISTINA KNUTSON PHD THESIS 2/22/2006 PAGE 160
46 Cao B, Heise O, Tschirner U, Ramaswamy S (2000) TAPPI Recycling Symposium
Proceedings pp:667-676 “Recycling old telephone directories - Deinking with a new generation laboratory flotation cell”
47 Tom Kelly, Ciba-Geigy, Paper Chemicals Division, personal communication Bazasol dyes, used in yellow directory, are produced by BASF corporation. C.I. Direct Yellow 11, used with bleached pulps, is produced by both BASF and Ciba-Geigy.
48 Sutman FJ (1992) “Recycling and deinking of old telephone directories” Progress in Paper Recycling 2(4):10-19
49 Marchildon L, Daneault C, Ledu C, Sain M (1996) “Deinking conditions for yellow directory using formamidine sulfinic acid as a repulping chemical” Cellulose Chemistry and Technology 30(5/6):473-482
50 Dwight Pakan, BASF, personal correspondence 51 Kool IPL, Wolford TL (1991) “Decolorizing dyed paper” TAPPI Papermakers
Conference Proceedings: 79-83 52 Cheek MC (1991) “Practical review of paper decolorizing methods - present and
future” TAPPI Papermakers Conference Proceedings: 71-78 53 Rivlin J (1992) The Dyeing of Textile Fibers (THEORY AND PRACTICE), Philadelphia
College of Textiles and Science 54 Burstone MS (1962) Enzyme Histochemistry and its application to the study of
neoplasms Academic Press, New York, NY 55 Fessenden RJ, Fessenden JS (1990) Organic Chemistry, 4th ed., Brooks/Cole
Publishing Company, Pacific Grove, California 56 The Chemistry and Application of Dyes, Waring, D.R. and Hallas, G., eds. 1990
Topics in Applied Chemistry Series, Plenum Press, New York 57 The Theory of Coloration of Textiles, 2nd Ed, (1989) Johnson A, Ed. Society of Dyers
and Colourists, West Yorkshire, England. 58 Physicochemical Principles of Color Chemistry (1996) Peters AT, Freeman HS, Eds.,
Advances in Color Chemistry Series, Vol. 4, Blackie Academie & Professional, Bishopbriggs, Glasgow, UK
59 Zollinger, H. 1991 Color Chemistry, 2nd Ed.SYNTHESES, PROPERTIES AND APPLICATIONS OF ORGANIC DYES AND PIGMENTS, VCH Publishers, New York
60 Aspland JR (1998) “Colorants:Dyes” in Color for Science, Art and Technology, K Nassau, Ed, Elsevier, Pubs. New York
61 Ingamells W (1993) Colour For Textles: A User’s Handbook, Pub:Society of Dyers and Colourists, West Yorkshire, England
62 Lewis DM (1998) “Dyestuff-fibre interactions” Review of Progress in Coloration and Related Topics 28:12-17

KRISTINA KNUTSON PHD THESIS 2/22/2006 PAGE 161
63 Giles CH (1989) “Dye-fibre bonds and their investigation” in The Theory of
Coloration of Textiles, 2nd Ed, A Johnson, Ed. Society of Dyers and Colourists, West Yorkshire, England
64 Pielesz A, Freeman HS, Wysocki M, Weselucha-Birczynska A, Wlochowicz A (2003) “Characterisation of direct dye interactions with cotton via IR and Raman spectroscopies” Advances in Colour Science and Technology 6(4):111-115
65 Porter JJ (2002) “Dyeing equilibria: interaction of direct dyes with cellulose substrates” Coloration Technology 118(5):238-243
66 Porter JJ (2003) “Understanding the sorption of direct dyes on cellulose substrates” AATCC Review 3(6):20-24
67 Cegarra, J.; Puente, P.; and Valldeperas, J. 1992 The Dyeing of Textile Materials THE SCIENTIFIC BASES AND THE TECHNIQUES OF APPLICATION, Istituto per la Texilia, Tradizione e la Tecnologia Tesile S.p.A.., Italy (Trans. From Italian)
68 Fluorescent Whitening Agents, Coulston F, Korte F, Eds, (1975) Environmental Quality and Safety, Supplement Volume IV, Georg Theime, Pub., Stuttgart
69 Bentley DJ Jr (2000) “Environmentally benign PSAs featured at recycling symposium” TAPPI Journal 83(2):47-50
70 Sasaki H, Shibano T, Yamakage M (1998) “Repulpable pressure-sensitive adhesive tapes and labels” Packaging Technology & Science 11(5): 205-215.
71 Sutherland N, Shilts R, Spielvogel S (1998) “Pilot-scale evaluation of environmentally benign PSA stamps” Proceedings 1998 Recycling Symposium (TAPPI, AF&PA, and USDA) 453-468
72 Seiter DF, Pikulin MA, Meese RG, Abubakr S, Bormett D, Ross-Sutherland N (1998) “Environmentally benign USPS stamps: Baseline pilot recycling results” Proceedings of the TAPPI 1998 Pulping Conference 1:193-203
73 Donermeyer D, Bennett L (1998) “Laboratory recycling of benign pressure-Sensitive adhesive stamp materials” Proceedings 1998 Recycling Symposium (TAPPI, AF&PA, and USDA) 417-452
74 Tsujimoto K, Abubakr S, Donermeyer D, LaBrosse P, Stagg T (1998) “Environmentally benign linerless self-adhesive foil stamps; R&D and recycling studies” Proceedings 1998 Recycling Symposium (TAPPI, AF&PA, and USDA) 525-536
75 Crossley B, Abubakr S, Grimes D, Kumar R (1998) “Pilot-plant study of the recyclability of Pressure-Sensitive Adhesives (PSA)” Proceedings 1998 Recycling Symposium (TAPPI, AF&PA, and USDA) 469-474
76 Thoma L (1998) “Environmentally benign pressure-sensitive adhesive (PSA) for postage applications; Development of the laboratory recycling protocol” Proceedings 1998 Recycling Symposium (TAPPI, AF&PA, and USDA) 355-388

KRISTINA KNUTSON PHD THESIS 2/22/2006 PAGE 162
77 Kumar R (1998) Development of pressure-sensitive adhesive stamps requirements”
Proceedings 1998 Recycling Symposium (TAPPI, AF&PA, and USDA) 333-338 “ 78 Pennington T (1998) “Development of a recyclable water-based pressure-sensitive
adhesive for postage-stamp applications” Proceedings 1998 Recycling Symposium (TAPPI, AF&PA, and USDA) 537-544.”
79 Carre B, Magin L, Galland G (2004) “Printing processes and deinkability” Vortraege der 98. Hauptversammlung des Vereins ZELLCHEMING und Cellulose-Chemiker-Rundgespraech, Baden-Baden, Germany, June 17-19, 2003 pp.28-44.
80 Wurthner F, Sens R, Seybold G, Etzbach K-H (BASF A.-G, Germany). PCT Int. Appl. (1998) WO 9841583 A1 19980924 “Dye salts and their use.”
81 Pedrazzi R (Clariant Finance (BVI) Ltd., Virgin I. (Brit.)). (1999), US 5929215 A 19990727 “Basic monoazo dyes, their preparation and use.”
82 Taniguchi K (Nippon Chemical Works Co., Ltd., Japan) (2003) Jpn. Kokai Tokkyo Koho JP 2003301120 A2 20031021 “Water-soluble azo dye involving triazine structure for dyeing or printing of paper”
83 Catlin JC, Kokel RH (Bayer Corporation, USA) (1999) US 5883233 A 19990316 “Diazo stilbene dye and its use on paper”
84 Lehr F, Hasemann L (Clariant International Ltd., Switz.) PCT Int. Appl. (2002) WO 2002046316 A1 20020613 “Disazo dyes, their production and their use.”
85 Tresch R, Etzbach K-H, Sens R, Kraeh C (BASF A.-G., Germany) Ger. Offen. (2000) DE 19911267 A1 20000914 “Azoxy dyes and their copper complexes, their preparation and use.”
86 Lennartz M, Weiss S (Ciba Specialty Chemicals Holding Inc., Switz.) PCT Int. Appl. (2004) WO 2004013233 A1 20040212 “Anionic monoazo dyes, their production and their use.”
87 Etzbach K-H, Freund T, Tresch R (BASF A.-G., Germany) Ger. Offen. (2000) DE 19851026 A1 20000511 “Cationic azo dyes, their preparation and use”
88 Swamy J, Ramsay JA (1999) “Evaluation of white rot fungi in the decoloration of textile dyes” Enzyme and Microbial Technology 24(3-4):130-137
89 Walsh PB, Hill RT, Dutton DB (1993) “Secondary fiber processing: Color destruction in woodfree furnishes” Progress in Paper Recycling 1:9-16
90 Dye-Breaking Agents Database, (1996), TAPPI Press, Atlanta 91 Taylor RC, Morrison CR (1999) “The effects of various chelating agents on FAS
bleaching efficiency, for brightening of secondary fiber in a flotation deinking process” Conference Proceedings - TAPPI 99, Preparing for the Next Millennium, Atlanta, Mar. 1-4, 1999 (2)357-372

KRISTINA KNUTSON PHD THESIS 2/22/2006 PAGE 163
92 von Ahsen U, Schroeder R (1993) “RNA as a catalyst: natural and designed
ribozymes” BioEssays 15(5):299-307 93 Ma JH, Jiang C (2002) “Enzyme applications in the pulp and paper industry”
Progress in Paper Recycling 11(3):36-47 94 Voet D, Voet J (1995) Biochemistry,2nd ed, John Wiley and Sons, New York, chapter
12 95 Gelo-Pujic M, Kim H-H, Butlin NG, Palmore GTR (1999) “Electrochemical studies
of a truncated laccase produced in Pichia pastoris” Applied and Environmental Microbiology 65(12):5515-5521
96 Palmer AE, Randall DW, Xu F, Solomon EI (1999) “Spectroscopic studies and electronic structure description of the high potential type 1 copper site in fungal laccase: insight into the effect of the axial ligand” Journal American Chemical Society 121(30):7138-7149
97 Call HP, Mücke I (1997) “History, overview and applications of mediated lignolytic systems, especially laccase-mediator-systems (Lignozym®-process)” Journal of Biotechnology 53(2-3):161-202
98 Schneider P, Caspersen MB, Mondorf K, Halkier T, Skov LK, Oestergaard PR, Brown KM, Brown SH, Xu F (1999) “Characterization of a Coprinus cinereus laccase” Enzyme and Microbial Technology 25(7):502-508.
99 Fee JA, Malmström BG (1968) “The redox potential of fungal laccase” Biochimica et Biophysica Acta 153(1):299-302
100 Eriksson K, Blanchette R, Ander P (1990) “Biodegradation of lignin” in Microbial and Enzymatic Degradation of Wood and Wood Components, Springer Verlag, New York, page 255
101 Claus H (2003) “Laccases and their occurrence in prokaryotes” Archives of Microbiology 179(3):145-150
102 Claus, Harald. (2004) Micron 35(1-2):93-96. “Laccases: structure, reactions, distribution.”
103 Xu F, Shin W, Brown SH, Wahleithner JA, Sundaram UM, Solomon EI (1996) “A study of a series of recombinant fungal laccases and bilirubin oxidase that exhibit significant differences in redox potential, substrate specificity, and stability” Biochimica et Biophysica Acta 1292:303-11
104 McCarthy JT, Levy VC, Lonergan GT, Fecondo JV (1999) “Development of optimal conditions for the decolourization of a range of industrial dyes using Pycnoporus cinnabarinus laccase” Hazardous and Industrial Wastes 31st: 489-498
105 Wesenberg D, Kyriakides I, Agathos SN (2003) “White-rot fungi and their enzymes for the treatment of industrial dye effluents” Biotechnology Advances 22(1-2):161-187

KRISTINA KNUTSON PHD THESIS 2/22/2006 PAGE 164
106 Paice MG, Bourbonnais R, Archibald FS, Reid ID, Renaud S, Rochefort D (1998)
“Bleaching of kraft pulps with the enzymes laccase and manganese peroxidase” 107 Kawai S, Nakagawa M, Ohashi H (2002) “Degradation mechanisms of a
nonphenolic β-O-4 lignin model dimmer by Trametes versicolor laccase in the presence of 1-hydroxybenzotriazole” Enzyme and Microbial Technology 30:482-489
108 Higuchi K (1990) “Lignin Biochemistry: Biosynthesis and Biodegradation” Wood Science and Technology 24:23-63
109 Potthast A, Rosenau T, Fischer K (2001) “Oxidation of benzyl alcohols by the Laccase-Mediator System (LMS) – a comprehensive kinetic description” Holzforschung 55:47-56
110 Welinder KG (1992) “Superfamily of plant, fungal and bacterial peroxidases” Current Opinions in Structural Biology 2:388-393
111 Li H, Poulos TL (1994) “Structural variation in heme enzymes: a comparative analysis of peroxidase and P450 crystal structures” Structure 2, 461-464
112 Banci L (1997) “Structural properties of peroxidases” Journal of Biotechnology 53(2-3):253-263
113 Harvey PJ, Gilardi GF, Goble ML, Palmer JM (1993) “Charge transfer reactions and feedback control of lignin peroxidase by phenolic compounds: Significance in lignin degradation” Journal of Biotechnology 30:57-69
114 McEldoon JP, Pokora AR, Dordick JS (1995) “Lignin peroxidase-type activity of soybean peroxidase” Enzyme and Microbial Technology 17(4):359-365
115 Kersten PJ, Kalyanaraman B, Hammel KE, Reinhammer B, Kirk TK (1990) “Comparison of lignin peroxidase, horseperoxidase and laccase in the oxidation of methoxybenzenes” Biochemical Journal 268:475-480
116 Campa A (1991) “Biological roles of plant peroxidases: known and potential function.” in Peroxidases in Chemistry and Biology. Everse, J., Everse, K.E. and Grisham, M.B., Eds. CRC Press, Boca Raton, vol. II, pp. 25-50.
117 Khindaria A, Yamazaki I, Aust SD (1995) “Veratryl alcohol oxidation by lignin peroxidase” Biochemistry 34(51):16860-16869
118 Choinowski T, Blodig W, Winterhalter KH, Piontek K (1999) “The crystal structure of lignin peroxidase at 1.70 aa resolution reveals a hydroxy group on the C of tryptophan 171: A novel radical site formed during the redox cycle” Journal of Molecular Biology 286(3):809-827
119 Cai D, Tien M (1993) “Lignin-degrading peroxidases of Phanerochaete chrysosporium” Journal of Biotechnology 30(1):79-90
120 Millis CD, Cai D, Stankovich MT, Tien M (1989) “Oxidation-reduction potentials and ionization states of extracellular peroxidases from the lignin-degrading fungus Phanerochaete chrysosporium” Biochemistry 28(21):8484-8489
KRISTINA KNUTSON PHD THESIS 2/22/2006 PAGE 165
121 Goodwin DC, Aust SD, Grover TA (1995) “Evidence for varatryl alcohol as a redox
mediator in lignin peroxidase-catalyzed oxidation” Biochemistry 34:5060-5065 122 Zapanta LS, Tien M (1997) “The roles of veratryl alcohol and oxalate in fungal
lignin degradation” Journal of Biotechnology 53:93-102 123 Bietti M, Baciocchi E, Steenken S (1998) “Lifetime, reduction potential and base-
induced fragmentation of the veratryl alcohol radical cation in aqueous solution. Pulse radiolysis studies on a ligninase mediator” Journal of Physical Chemistry A 102(38):7337-7342
124 Baciocchi E, Gerini MF, Harvey PJ, Lanzalunga O, Prosperi A (2001) “Kinetic deuterium isotope effect in the oxidation of veratryl alcohol promoted by lignin peroxidase and chemical oxidants” Journal of the Chemical Society, Perkin Transactions 2(9):1512-1515
125 Baciocchi E, Bietti M, Gerini MF, Lanzalunga O (2002) “The mediation of veratryl alcohol in oxidations promoted by lignin peroxidase: the lifetime of veratryl alcohol radical cation” Biochemical and Biophysical Research Communications 293(2):832-835
126 Veitch NC (2004) “Horseradish peroxidase: a modern view of a classic enzyme” Phytochemistry 65:249-259
127 Veitch NC, Smith AT (2001) “Horseradish peroxidase” Advances in Inorganic Chemistry 51:107-162)
128 Dunford HB (1999) Heme peroxidases Wiley-VCH Pub., Neww York 129 Krieg R, Halbhuber K-J (2003) “Recent advances in catalytic peroxidase
histochemistry” Cellular and Molecular Biology 49:547-563 130 Ryan O, Smyth MR, O’Fágáin C (1994) “Horseradish peroxidase: the analyst’s
friend” in: Essays in Biochemistry, Vol 28, Ballou DK (Ed.) Portland Press, London pp129-146
131 Paice MG, Jurasek L (1984) “Peroxidase-catalyzed color removal from bleach plant effluent” Biotechnology and Bioengineering 26(5):477-480
132 Montgomery R (2004) “Development of biobased products” Bioresource Technology 19:1-29
133 Xue X-T, Chen Z-C, Shi C-N, Lu D-S, Lin X-F (2002) “Progress on oxidoreductase-catalyzed polymerization of aromatic compounds” Gongneng Gaofenzi Xuebao 15(1):82-86
134 Prane JW (1994) “Coatings and adhesives” Polymer News 19(7):203-4 135 Colonna S (1994) “Enantioselective sulfoxidations catalyzed by heme-dependent
monooxygenases” in Stereocontrolled Organic Synthesis, Trost BM Ed. Publisher: Blackwell, Oxford, UK pp. 435-451

KRISTINA KNUTSON PHD THESIS 2/22/2006 PAGE 166
136 Munir IZ, Dordick JS (2000) “Soybean peroxidase as an effective bromination
catalyst” Enzyme and Microbial Technology 26(5-6):337-341 137 Hinckley G, Mozhaev VV, Budde C, Khmelnitsky YL (2002) “Oxidative enzymes
possess catalytic activity in systems with ionic liquids” Biotechnology Letters 24(24):2083-2087
138 Xie Y, Das PK, Klibanov AM (2001) “Excipients activate peroxidases in specific but not in non-specific reactions in organic solvents” Biotechnology Letters 23(18):1451-1454
139 Bassi A, Geng Z, Gijzen M (2004) “Enzymatic removal of phenol and chlorophenols using soybean seed hulls” Engineering in Life Sciences 4(2):125-130
140 Geng Z, Bassi AS, Gijzen M (2004) “Enzymatic Treatment of Soils Contaminated with Phenol and Chlorophenols Using Soybean Seed Hulls” Water, Air, and Soil Pollution 154(1-4):151-166
141 Morita M, Morisaki M, Iwata K, Ito K (2004) “Kinetics of Orange II decoloration catalyzed by rice hull peroxidase” Journal of Oleo Science 53(4):177-181
142 Mittal AK, Gupta SK (1996) “Biosorption of cationic dyes by dead macro fungus Fomitopsis carnea: Batch studies” Water Science & Technology 34(10):81-87
143 Mou D-G, Lim KK, Shen HP (1991) “Microbial agents for decolorization of dye wastewater” Biotechnology Advances 9(4):613-622
144 Schliephake K, Baker WL, Lonergan GT (2004) “Decoloration of industrial wastes and degradation of dye water” Mycology Series 21(Fungal Biotechnology in Agricultural, Food, and Environmental Applications):419-429
145 Shah V, Nerud F (2002) “Lignin degrading system of white-rot fungi and its exploitation for dye decolorization” Canadian Journal of Microbiology 48(10):857-870
146 Knapp JS, Vantoch-Wood EJ, Zhang F (2001) “Use of wood-rotting fungi for the decolorization of dyes and industrial effluents” Symposium of the British Mycological Society 23(Fungi in Bioremediation):242-304
147 McMullan G, Meehan C, Conneely A, Kirby N, Robinson T, Nigam P, Banat IM, Marchant R, Smyth WF (2001) “Microbial decolorization and degradation of textile dyes” Applied Microbiology and Biotechnology 56(1-2):81-87
148 Robinson T, McMullan G, Marchant R, Nigam P (2001) “Remediation of dyes in textile effluent: a critical review on current treatment technologies with a proposed alternative” Bioresource Technology 77(3):247-255
149 Banat IM, Nigam P, Singh D, Marchant R (1996) “Microbial decolorization of textile-dye-containing effluents: a review” Bioresource Technology 58(3):217-227
150 Chung K-T, Stevens SE, Cerniglia CE (1992) “The reduction of azo dyes by the intestinal microflora” Critical Reviews in Microbiology 18(3):175-190

KRISTINA KNUTSON PHD THESIS 2/22/2006 PAGE 167
151 Walker R (1970) “The metabolism of azo compounds: a review of the literature”
Food and Cosmetics Toxicology 8(6):659-676 152 Combes RD, Haveland-Smith RB (1982) “A review of the genotoxicity of food,
drug and cosmetic cotours and other azo, triphenylmethane and xanthrene dyes” Mutation Research 98(2):101
153 Chung K-T (1983) “The significance of azo-reduction in the mutagenesis and carcinogenesis of azo dyes” Mutation Research 114(3):269-81
154 Naumczyk J, Szpyrkowicz L, Zilio-Grandi F (1996) “Electrochemical treatment of textile wastewater” Water Science & Technology 34(11):17-24
155 Krull R, Hemmi M, Otto P, Hempel DC (1998) “Combined biological and chemical treatment of highly concentrated residual dyehouse liquors” Water Science & Technology 38(4-5):339-346
156 Hu T-L (1996) “Removal of reactive dyes from aqueous solution by different bacterial genera” Water Science & Technology 34(10):89-95
157 Sumathi S, Manju BS (2000) “Uptake of reactive textile dyes by Aspergillus foetidus” Enzyme and Microbial Technology 27:347-355
158 Azmi W, Sani RK, Banerjee UC (1998) “Biodegradation of triphenylmethane dyes” Enzyme and Microbial Technology 22(3):185-191
159 Palma C, Moreira MT; Mielgo I, Feijoo G, Lema JM (1999) “Use of a fungal bioreactor as a pretreatment or post-treatment step for continuous decolorisation of dyes Water Science & Technology 40(8):131-136
160 Polman JK, Breckenridge CR (1996) “Biomass-mediated binding and recovery of textile dyes from waste effluents” Textile Chemist and Colorist 28(4):31-35.
161 Carliell CM, Barclay SJ, Naidoo N, Buckley CA, Muholland A, Senior E (1994) “Anaerobic decolorization of reactive azo dyes in conventional sewage treatment process” Water SA 20(4):341-4.
162 Nigam P, Singh D, Marchant R (1995) “An investigation of the biodegradation of textile dyes by aerobic and anaerobic microorganisms” in Environmental Biotechnology: Principles and Applications, Moo-Young M, Anderson WA, Chakrabarty AM, Eds. Kluwer Academic Pub., Boston pp.278-292
163 Beydilli MI, Pavlostathis SG, Tincher WC (1998) “Decolorization and toxicity screening of selected reactive azo dyes under methanogenic conditions” Water Science & Technology 38(4-5):225-232
164 Hu TL (1998) “Decolorization of azo dye RP2B by Pseudomonas luteola” Water Science & Technology 38(4-5):299-306
165 He F, Hu W, Li Y (2004) “Investigation of isolation and immobilization of a microbial consortium for decoloring of azo dye 4BS” Water Research 38(16):3596-3604

KRISTINA KNUTSON PHD THESIS 2/22/2006 PAGE 168
166 O’Neill C, Haekes FR, Hawkes DL, Esteves S, Wilcox SJ (2000) “Azo-dye
degradation in an anaerobic–aerobic treatment system operating on simulated textile effluent.” Applied Microbiology and Biotechnology 53(2):249–254.
167 Tan NCG, Prenafest-Bolud FX, Opsteeg JL, Lettinga G, Field JA (1999) “Biodegradation of azo dyes in cocultures of anaerobic granular sludge with aerobic aromatic amines degrading enrichment cultures” Applied Microbiology and Biotechnology 51(6):865–871.
168 Sandhya S, Padmavathy S, Swaminathan K, Subrahmanyam YV, Kaul SN (2005) “Microaerophilic-aerobic sequential batch reactor for treatment of azo dyes containing simulated wastewater” Process Biochemistry (Oxford, United Kingdom) 40(2): 885-890
169 Maas R, Chaudhari S (2005) “Adsorption and biological decolourization of azo dye Reactive Red 2 in semicontinuous anaerobic reactors.” Process Biochemistry (Oxford, United Kingdom) 40(2):699-705
170 Supaka N, Juntongjin K, Damronglerd S, Delia M-L, Strehaiano P (2004) “Microbial decolorization of reactive azo dyes in a sequential anaerobic-aerobic system” Chemical Engineering Journal 99(2):169-176
171 Glenn JK, Gold MH (1983) “Decolorization of several polymeric dyes by the lignin-degrading basidiomycete Phanerochaete chrysosporium” Applied and Environmental Microbiology 45(6):1741-1747
172 Cripps C, Bumpus JA, Aust SD (1990) “Biodegradation of azo and heterocyclic dyes by Phanerochaete chrysosporium” Applied and Environmental Microbiology 56(4):1114-1118
173 Paszczynski A, Pasti-Grigsby MB, Goszczynski S, Crawford RL, Crawford DL (1992) “Mineralization of sulfonated azo dyes and sulfanilic acid by Phanerochaete chrysosporium and Streptomyces chromofuscus” Applied and Environmental Microbiology 58(11):3598-3604
174 Spadaro JY, Gold MH, Renganathan V (1992) “Degradation of azo dyes by the lignin-degrading fungus Phanerochaete chrysosporium” Applied and Environmental Microbiology 58(8):2397-2401
175 Paszczynski A, Crawford RL (1991) “Degradation of azo compounds by ligninase from Phanerochaete chrysosporium: involvement of veratryl alcohol” Biochemical and Biophysical Research Communications 178:1056-1063
176 Paszczynski A, Pasti MB, Goszczynski S, Crawford DL, Crawford RL (1991) “New approach to improve degradation of recalcitrant azo dyes by Streptomyces spp. and Phanerochaete chrysosporium” Enzyme and Microbial Technology 13:378-384
177 Valli K, Brock BJ, Joshi D, Gold MH (1992) “Degradation of 2,4-dinitrotoulene by the lignin-degrading fungus Phanerochaete chrysosporium” Applied and Environmental Microbiology 58:221-228

KRISTINA KNUTSON PHD THESIS 2/22/2006 PAGE 169
178 Wang Y, Yu J (1998) “Adsorption and degradation of synthetic dyes on the
mycelium of Trametes versicolor” Water Science & Technology 38(4-5):233-238 179 Wong Y, Yu J (1999) “Laccase-catalyzed decolorization of synthetic dyes” Water
Research 33(16):3512-3520 180 Pasti-Grigsby MB, Paszczynski A, Goszczynski S, Crawford RL, Crawford DL
(1992) “Influence of aromatic substitution patterns on azo dye degradability by Streptomyces spp. and Phanerochaete chrysosporium” Applied and Environmental Microbiology 58(11):3598-3604
181 Levin L, Papinutti L, Forchiassin F (2004) “Evaluation of Argentinean white rot fungi for their ability to produce lignin-modifying enzymes and decolorize industrial dyes”Bioresource Technology 94(2):169-176
182 Grover R, Kumar S, Soni P, Sharma KP (2004) “Ecology and decolorizing potential of fungi in the textile dye wastewater polluted habitats of Sanganer (Jaipur) and biological effluent treatment plant” Nature, Environment and Pollution Technology 3(2):225-238
183 Toh Y-C, Yen JJL, Ting Y-P, Obbard JP (2003) “Decolorization of azo dyes by white-rot fungi (WRF) isolated in Singapore” Enzyme and Microbial Technology 33(5):569-575.
184 Ge Y, Yan L, Kong Q (2004) “Effect of environment factors on dye decolorization by P. sordida ATCC90872 in an aerated reactor” Process Biochemistry (Oxford, United Kingdom) 39(11):1401-1405
185 Tychanowicz GK, Zilly A, Marques S, Cristina G, Peralta RM (2004) “Decolorization of industrial dyes by solid-state cultures of Pleurotus pulmonarius” Process Biochemistry (Oxford, United Kingdom) 39(7):855-859
186 Omori AK, Santos AZ, Tavares CRG, Gomes-Da-Costa SM (2004) “Selection of liquid medium for biodegradation of RBB-R by white-rot fungi” Proceedings of European Symposium on Environmental Biotechnology, ESEB 2004, Oostende, Belgium, Apr. 25-28, 2004 pp.713-716
187 Moreira MT, Viacava C, Vidal G (2004) “Fed-batch decolorization of poly R-478 by Trametes versicolor” Brazilian Archives of Biology and Technology 47(2):179-183
188 Rodriguez Couto S, Sanroman MA, Hofer D, Gubitz GM (2004) “Stainless steel sponge: a novel carrier for the immobilization of the white-rot fungus Trametes hirsuta for decolorization of textile dyes” Bioresource Technology 95(1):67-72.
189 Paice M, Archibald F, Bourbonnais R, Reid I, Renaud S (1997) “Manganese peroxidase-catalyzed bleaching of kraft pulps” Proceedings of TAPPI Biological Science Symposium pp.343-348
190 Moreira M, Feijoo G, Sierra Álvarez R, Lema J, Field J (1997) “Manganese is not required for biobleaching of oxygen-delignified kraft pulp by the white-rot fungus

KRISTINA KNUTSON PHD THESIS 2/22/2006 PAGE 170
Bjerkandera sp. Strain BOS55” Applied and Environmental Microbiology 63(5):1749-1755
191 Viikari L, Suurnakki A, Buchert J (1996) “Enzyme-aided bleaching of kraft pulps: fundamental mechanisms and practical applications” ACS Symposium Series 655(Enzymes for Pulp and Paper Processing) pp.15-24
192 Kondo R, Harazono K, Tsuchikawa K, Saki K (1996) “Biological bleaching of kraft pulp with lignin-degrading enzymes” ACS Symposium Series 655(Enzymes for Pulp and Paper Processing) pp.228-240
193 Jurasek L, Archibald FS, Bourbonnais R, Paice MG, Reid ID (1994) “Prospects for redox enzymes to enhance kraft pulp bleaching” Proceedings of TAPPI Biological Science Symposium pp.239-244
194 Luisa M, Goncalves FC, Steiner W (1996) “Use of laccase for bleaching of pulps and treatment of effluents” ACS Symposium Series 655(Enzymes for Pulp and Paper Processing) pp.197-207
195 Paice MG, Jurasek L (1984) “Peroxidase catalyzed color removal from bleach plant effluent” Biotechnology and Bioengineering 26:477-480
196 Pellinen J, Joyce TW (1990) “White-rot fungi for treatment of pulp- and paper-industry waste water” Proceedings TAPPI Environmental Conference Book 1:1-13
197 Barr DP, Aust SD (1994) “Pollutant degradation by white rot fungi” Reviews of environmental contamination and toxicology 138:49-72
198 Ollikka P, Alhonnaki K, Leppaen V, Glumoff T, Raijola T, Suonimene L (1993) “Decolorization of azo, triphenyl methane, heterocyclic, and polymeric dyes by lignin peroxidase isoenzymes from Phanerochaete chrysosporium” Applied and Environmental Microbiology 59(12):4010-4016
199 Young L, Yu J (1997) “Ligninase-catalyzed decolorization of synthetic dyes” Water Research 31(5):1187-1193
200 Heinfling A, Martinez MJ, Martinez AT, Bergbauer M, Szewzyk U (1998) “Transformation of industrial dyes by manganese peroxidases from Bjerkandera adusta and Pleurotus eryngii in a manganese-independent reaction” Applied and Environmental Microbiology 64(8):2788-2793
201 Zille A, Ramalho P, Tzanov T, Millward R, Aires V, Cardoso MH, Ramalho MT, Guebitz GM, Cavaco-Paulo A (2004) “Predicting dye biodegradation from redox potentials.” Biotechnology Progress 20(5):1588-1592
202 Lopez C, Moreira MT, Feijoo G, Lema JM (2004) “Dye decolorization by manganese peroxidase in an enzymatic membrane bioreactor” Biotechnology Progress 20(1):74-81.
203 Verma P, Madamwar D (2002) “Production of ligninolytic enzymes for dye decolorization by cocultivation of white-rot fungi Pleurotus ostreatus and Phanerochaete
KRISTINA KNUTSON PHD THESIS 2/22/2006 PAGE 171
chrysosporium under solid-state fermentation” Applied Biochemistry and Biotechnology 102-103:109-118.
204 Call HP, Mücke I (1997) “History, overview and applications of mediated lignolytic systems, especially laccase-mediator-systems (Lignozym®-process)” Journal of Biotechnology 53(2-3):161-202
205 Li K, Collins R, Eriksson K-E (2000) “Removal of dyes from recycled paper” Progress in Paper Recycling 10:37-43
206 Diffuse brightness of pulp (d/0º) T525 Om-86 TAPPI Test Methods, 1992-1993. Tappi Press, Atlanta.
207 Hager A, Nellessen B, Puls J (2002) “On the applicability of laccases for deinking” Proceedings of PTS-CTP-Deinking-Symposium 34/1-34/10
208 Itoh K (2002) “Decolorization and degradation of synethic dyes by a white rot fungus” Nagoya-shi Kogyo Kenkyusho Kenkyu Hokoku 87:10-13
209 Bourbonnais R, Paice MG, Freiermuth B, Bodie E, Borneman S (1997) “Reactivities of various mediators and laccases with model compounds” Applied and Environmental Microbiology 63(12):4627-4632
210 Kinsley C, Nicell JA (2000) “Treatment of aqueous phenol with soybean peroxidase in the presence of polethylene glycol.” Bioresource Technology 73:139-146
211 Procedure for assaying the concentration of hydrogen peroxide was provided by Interox America, a subdivision of Solvay Chemicals.
212 Forming handsheets for reflectance testing of pulp: Büchner funnel method. Om-218. TAPPI Test Methods, 1998-1999. Tappi Press, Atlanta.
213 Spectral Reflectance factor, transmittance, and color of paper and pulp (polychromatic illumination) T 442 Om-88 TAPPI Test Methods, 1992-1993. Tappi Press, Atlanta.
214 Data from Lenong – find where Art published 215 Tausche JG (2002) “Mill-scale benefits in enzymatic deinking.” Proceedings 7th
Recycling Technology Conference, Pira International, Brussels, Belgium, Paper 7, 1-3. 216 Sharpe PE, Rangamannar G (1997) “Stretching the fiber supply with improved
bleaching technology” Proceedings 1997 TAPPI Pulping Conference San Francisco, Oct. 19-23, 1997 2:1163-1189.
217 Li K, Collins R, Eriksson K-EL (2000) “Removal of dyes from recycled paper” Progress in Paper Recycling 3:37-43
218 Paice MG, Bourbonnais R, Reid ID, Archibald FS, Jurasek L (1995) “Oxidative bleaching enzymes: A review” Journal of Pulp and Paper Science 21(8):J280-284
219 Bourbonnais R, Paice MG (1990) “Oxidation of non-phenolic substrates. An expanded role for laccase in lignin biodegradation” FEBS Letters 267:99-102

KRISTINA KNUTSON PHD THESIS 2/22/2006 PAGE 172
220 Poppius-Levlin K, Wang W, Ranua M, Niku-Paavola M, Viikari L (1997)
“Biobleaching of chemical pulps by laccase/mediator systems” Biological Science Symposium, San Francisco, CA, TAPPI Press, Atlanta, GA 327-334
221 Park JW, Park KN (1999) “Biological deinking of wastepaper using modified cellulase with polyoxyethylene” Biotechnology Techniques 13(1):49-53 222 Moerkbak AL, Zimmermann W (1998) “Applications of enzymes in paper deinking processes” ACS Symposium Series 687(Enzyme Applications in Fiber Processing) pp.133-141
223 Viesturs U, Leite M, Eisimonte M, Eremeeva T, Treimanis A (1998) “Biological deinking technology for the recycling of office wastepapers” Bioresource Technology
67(3):255-265 224 Magnin L, Delpech P, Lantto R (2002) “Potential of enzymatic deinking” Progress
in Biotechnology 21 (Biotechnology in the Pulp and Paper Industry) 323-332 225 Elegir G, Panizza E, Canetti M (2000) “Neutral enzyme-assisted deinking of xerographic office waste with a cellulase/amylase mixture” Tappi Journal 83(11):71
226 Lavigne JR (1998) Pulp Paper Dictionary, Miller Freeman Books, San Francisco, CA.
227 Rangamannar G, Sharpe PE (1998) “Recycled fiber bleaching processes overview” Paper Recycling Challenge 3:150-165
228 Patt R, Gehr V, Matzke W, Kordsachia O (1996) “New approaches in bleaching of recycled fibers” Tappi Journal 79(12):143-151
229 Lunabba P, Granfeldt P, Grunström P, Lary E (1998) “Top quality deinked pulp from mixed office waste by high temperature peroxide bleaching” Pulp & Paper Canada 99(10):36-39
230 Grundstrom P, Granfeldt T (1997) “High temperature peroxide: a bleaching process for mixed office waste” Paper Technology (Bury, United Kingdom) 38(9):29-33
231 Kim SH, Ahn BJ, Paik KH (2002) “Sequential oxidative and reductive bleaching of mixed office wastepaper (MOW) by the addition of thiourea”Polpu, Chongi Gisul 34(3):38-45
232 Abadulla E, Tzanov T, Costs S, Robra K-H, Cavaco-Paulo A, Gübitz GM (2000) “Decolorization and detoxification of textile dyes with a laccase from Trametes hirsute”Applied and Environmental Microbiology 66:3357-3362
233 Kleen M, Ohra-aho T, Tamminen T (2003) “On the interaction of HBT with pulp lignin during mediated laccase delignification-a study using fractionated pyrolysis-GC/MS” Journal of Analytical and Applied Pyrolysis 70(2):589-600
234 Chandra RP, Chakar FS, Allison L, Kim DH, Ragauskas AJ, Elder TJ (2002) “Delving into the fundamental LMS delignification of high-kappa kraft pulps” Progress in Biotechnology 21 (Biotechnology in the Pulp and Paper Industry) 151-164

KRISTINA KNUTSON PHD THESIS 2/22/2006 PAGE 173
235 Crestini C, Jurasek L, Argyropoulos DS (2003) “On the mechanism of the laccase-
mediator system in the oxidation of lignin” Chemistry--A European Journal 9(21):5371-5378
236 Call HP (1994) World Patent WO 9429510 A1 19941222 “Process for modifying, breaking down or bleaching lignin, materials containing lignin or like substances.”
237 Sealey J, Ragauskas AJ (1998) “Residual lignin studies of laccase-delignified kraft pulps” Enzyme and Microbial Technology 23(7/8):422-426
238 Chakar FS, Ragauskas AJ (2004) “Biobleaching chemistry of laccase-mediator systems on high-lignin-content kraft pulps” Canadian Journal of Chemistry 82(2):344-352
239 Bourbonnais R, Leech D, Paice MG (1998) “Electrochemical analysis of the interactions of laccase mediators with lignin model compounds” Biochimica et Biophysica Acta 1379(3):381-390.
240 Sealey J, Ragauskas AJ, Elder TJ (1999) “Investigations into laccase-mediator delignification of kraft pulps” Holzforschung 53(5):498-502
241 Aurich HG, Bach G, Hahn K, Küettner G, Weiss W (1977) “Aminyloxides (nitroxides). Part XXV. Reactions of benzotriazolyl oxide radicals with aromatic compounds” Journal of Chemical Research, Synopses (5):122-3
242 Maruthamuthu P, Venkatasubramanian L, Dharmalingam P (1987) “A fast kinetic study of formation of 2, 2’-azionbis (3-ethyl-benzothiazole-6-sulfonate) radical cation in aqueous solution” Bulletin of the Chemical Society of Japan 60:1113-1117
243 Carr A (2001) “Recycling: from niche market to core business” Solutions! for People, Processes and Paper (Oct.):34-36
244 Moreira MT, Feijoo G, Canaval J, Lema JM (2003) “Semipilot-scale bleaching of Kraft pulp with manganese peroxide” Wood Science and Technology 37(2):117-123
245 Li X., Kondo R, Sakai K (2002) “In vivo and in vitro biobleaching of unbleached hardwood kraft pulp by a marine fungus, Phlebia sp. MG-60” Progress in Biotechnology 21(Biotechnology in the Pulp and Paper Industry) 185-191
246 Machii Y, Hirai H, Nishida T (2004) “Lignin peroxidase is involved in the biobleaching of manganese-less oxygen-delignified hardwood kraft pulp by white-rot fungi in the solid-fermentation system” FEMS Microbiology Letters 233(2):283-287
247 Woo S-W, Cho J-S, Hur B-K, Shin D-H, Ryu K-G, Kim E-K (2003) “Hydrogen peroxide, its measurement and effect during enzymatic decoloring of Congo red.” Journal of Microbiology and Biotechnology 13(5):773-777
248 Shaffiqu TS, Roy JJ, Nair RA, Abraham TE (2002) “Degradation of textile dyes mediated by plant peroxidases” Applied Biochemistry and Biotechnology 102-103(1-6):315-26

KRISTINA KNUTSON PHD THESIS 2/22/2006 PAGE 174
249 Knutson K, Ragauskas AJ (2004) “Laccase-mediator biobleaching applied to a
Direct Yellow dyed paper” Biotechnology Progress 20: 1893 -1896 250 Nissum M, Schiødt C, Welinder K (2001) “Reactions of soybean peroxidase and
hydrogen peroxide pH 2.4-12.0, and veratryl alcohol at pH 2.4” Biochimica et Biophysica Acta 1545(1-2):339-348
251 Wright H, Nicell J (1999) “Characterization of soybean peroxidase for the treatment of aqueous phenols” Bioresource Technology 70:69-79
252 Caza N, Bewtra J, Biswas N, Taylor K (1999) “Removal of phenolic compounds from synthetic wastewater using soybean peroxidase” Water Research 33(13):3012-3018
253 Mohammadi M, Karr AL (2001) “Superoxide anion generation in effective and ineffective soybean root nodules” Journal of Plant Physiology 158(8):1023-1029
254 Reinhammar, B. Laccase in copper proteins and copper enzymes, vol. 3. R. Lontie, Ed. (CRC Press, Boca Raton, FL. 1984) pp. 1-35
255 ten Have R, Teunissen PJM (2001) “Oxidative mechanisms involved in lignin degradation by white-rot fungi” Chemical Reviews (Washington, D. C.) 101(11): 3397-3413
256 Amann M (1997) “The Lignozym process coming closer to the mill” 9th International Symposium on Wood and Pulping Chemistry Conference Proceedings, Montreal, Canada, pp. F4-1-F4-F4-5

Knutson direct yellow 11 (CHCA)5-OCT-2004 15:12:43 Laser Power: 20/80Georgia Tech Mass Spectrometry Laboratory Pulse Voltage: 1050
450 500 550 600 650 700 750 800 850 900 950 1000 1050 1100m/z0
100
%
ar1005ma 9 (0.740) Sm (SG, 2x2.00); Sb (15,30.00 ); Cm (9:27) TOF LD+ 1.69e3591.6
590.6
537.8
592.7
447.1
792.8776.0 797.9

Knutson direct yellow 11 (DHB)5-OCT-2004 16:57:29 Laser Power: 50/80Georgia Tech Mass Spectrometry Laboratory Pulse Voltage: 1050
300 400 500 600 700 800 900 1000 1100 1200 1300 1400 1500 1600 1700 1800 1900 2000 2100 2200 2300m/z0
100
%
ar1005ma2 22 (1.805) Sm (SG, 2x2.00); Sb (15,30.00 ); Cm (9:28) TOF LD+ 1.22e4341.4
340.4
335.3
287.2
347.5
353.5489.8
355.6
507.9
674.6514.0
520.0
841.4
1008.5
363.6
399.8

Knutson direct yellow 11 (CHCA)4-OCT-2004 18:29:51 Laser Power: 20/80Georgia Tech Mass Spectrometry Laboratory Pulse Voltage: 1100
400 500 600 700 800 900 1000 1100 1200 1300 1400 1500 1600 1700m/z0
100
%
ar1005man 10 (0.805) Sm (SG, 2x2.00); Sb (15,30.00 ); Cm (1:36) TOF LD- 1.95e4382.9
383.9
785.4
779.3
791.4
389.0
797.5
578.1395.1 763.3798.5
586.2 807.5
439.1 572.2 817.5

Knutson direct yellow 11 (DHB)4-OCT-2004 18:03:57 Laser Power: 50/80Georgia Tech Mass Spectrometry Laboratory Pulse Voltage: 1100
400 500 600 700 800 900 1000 1100 1200 1300 1400 1500 1600 1700m/z0
100
%
ar1005ma2n 28 (2.323) Sm (SG, 2x2.00); Sb (15,30.00 ); Cm (1:36) TOF LD- 2.69e3376.6
492.5
491.5
473.7
395.7
405.8
439.8
658.7
657.7
493.5659.7
824.6
661.7 990.8
1157.01008.4
651.4494.7640.1551.8
610.0670.0
1326.51171.51149.8

Knutson laccase (CHCA)5-OCT-2004 18:20:38 Laser Power: 50/80Georgia Tech Mass Spectrometry Laboratory Pulse Voltage: 1700
5000 10000 15000 20000 25000 30000 35000 40000 45000 50000 55000 60000 65000 70000 75000 80000m/z0
100
%
ar1005mc 17 (1.667) Sm (SG, 2x25.00); Sb (15,30.00 ); Cm (8:28) TOF LD+ 87.75819.1
5978.6
6069.35600.2
6158.9
6186.4
6259.7
11161.16354.4
10392.9
8855.7
11818.0
12535.817872.0

Knutson laccase (DHB)5-OCT-2004 17:34:48 Laser Power: 50/80Georgia Tech Mass Spectrometry Laboratory Pulse Voltage: 1700
5000 10000 15000 20000 25000 30000 35000 40000 45000 50000 55000 60000 65000 70000 75000 80000m/z0
100
%
ar1005mc2 14 (1.383) Sm (SG, 2x25.00); Sb (15,30.00 ); Cm (14:28) TOF LD+ 2952687.2
2735.4
2787.2
2826.0
2872.4
2955.0
3036.8
3115.2
3205.2
3278.6
3344.53372.4
3449.5
3519.1

Knutson laccase (CHCA)4-OCT-2004 19:51:31 Laser Power: 50/80Georgia Tech Mass Spectrometry Laboratory Pulse Voltage: 2200
5000 10000 15000 20000 25000 30000 35000 40000 45000 50000 55000 60000 65000 70000 75000 80000m/z0
100
%
ar1005mcn 26 (2.477) Sm (SG, 2x50.00); Sb (15,30.00 ); Cm (9:28) TOF LD- 62.13987.7 5486.7
5984.8
6063.7
6150.5
6245.1
6332.9
8633.6
11048.6
11312.2
64909.562830.515966.1 68817.4 77272.0

Knutson laccase (DHB)4-OCT-2004 19:06:50 Laser Power: 50/80Georgia Tech Mass Spectrometry Laboratory Pulse Voltage: 2200
5000 10000 15000 20000 25000 30000 35000 40000 45000 50000 55000 60000 65000 70000 75000 80000m/z0
100
%
ar1005mc2n 14 (1.326) Sm (SG, 2x50.00); Sb (15,30.00 ); Cm (1:36) TOF LD- 1382959.2
3217.3
3262.0
3587.217967.413979.4
13360.1 20747.2 25921.2 29183.136690.3
40186.3 43654.2 48075.7
8741.7

Knutson ABTS (CHCA)5-OCT-2004 15:25:38 Laser Power: 20/80Georgia Tech Mass Spectrometry Laboratory Pulse Voltage: 1050
400 500 600 700 800 900 1000 1100 1200 1300 1400 1500 1600 1700m/z0
100
%
ar1005mb 9 (0.722) Sm (SG, 2x2.00); Sb (15,30.00 ); Cm (8:32) TOF LD+ 3.75e3379.2
515.0
513.9
380.2
494.0381.4441.0
516.0
517.1
518.1

Knutson ABTS (DHB)5-OCT-2004 17:20:04 Laser Power: 50/80Georgia Tech Mass Spectrometry Laboratory Pulse Voltage: 1050
400 500 600 700 800 900 1000 1100 1200 1300 1400 1500 1600 1700m/z0
100
%
ar1005mb2 26 (2.151) Sm (SG, 2x2.00); Sb (15,30.00 ); Cm (8:27) TOF LD+ 3.46e3516.7
440.7
410.6
372.5
515.7
465.7
518.6
617.0576.8
670.4

Knutson ABTS (CHCA)4-OCT-2004 18:42:46 Laser Power: 20/80Georgia Tech Mass Spectrometry Laboratory Pulse Voltage: 1100
400 500 600 700 800 900 1000 1100 1200 1300 1400 1500 1600 1700m/z0
100
%
ar1005mbn 28 (2.306) Sm (SG, 2x2.00); Sb (15,30.00 ); Cm (1:36) TOF LD- 2.50e4513.5
514.6
515.6
516.6
529.8375.7

Knutson ABTS (DHB)4-OCT-2004 18:16:56 Laser Power: 50/80Georgia Tech Mass Spectrometry Laboratory Pulse Voltage: 1100
400 500 600 700 800 900 1000 1100 1200 1300 1400 1500 1600 1700m/z0
100
%
ar1005mb2n 17 (1.405) Sm (SG, 2x2.00); Sb (15,30.00 ); Cm (1:36) TOF LD- 2.47e4514.7
485.6
456.7
515.6
516.7
537.0
537.9
538.9
576.9 1071.81050.7

Knutson laccase + ABTS (CHCA)5-OCT-2004 18:32:06 Laser Power: 50/80Georgia Tech Mass Spectrometry Laboratory Pulse Voltage: 1700
5000 10000 15000 20000 25000 30000 35000 40000 45000 50000 55000 60000 65000 70000 75000 80000m/z0
100
%
ar1005md 15 (1.466) Sm (SG, 2x25.00); Sb (15,30.00 ); Cm (9:29) TOF LD+ 1062519.7
2583.0
5188.7
5442.95796.0
5850.3
11926.16032.3
10771.9 12118.3
12958.917955.3

Knutson laccase + ABTS (DHB)5-OCT-2004 17:50:05 Laser Power: 50/80Georgia Tech Mass Spectrometry Laboratory Pulse Voltage: 1700
5000 10000 15000 20000 25000 30000 35000 40000 45000 50000 55000 60000 65000 70000 75000 80000m/z0
100
%
ar1005md2 23 (2.268) Sm (SG, 2x25.00); Sb (15,30.00 ); Cm (14:32) TOF LD+ 2132557.0
2623.9
2781.0
2953.3
3023.3
3073.2
3093.13130.7
3164.0
3202.7
3307.4
3397.8

Knutson laccase + ABTS (CHCA)4-OCT-2004 20:02:43 Laser Power: 50/80Georgia Tech Mass Spectrometry Laboratory Pulse Voltage: 2200
5000 10000 15000 20000 25000 30000 35000 40000 45000 50000 55000 60000 65000 70000 75000 80000m/z0
100
%
ar1005mdn 22 (2.145) Sm (SG, 2x50.00); Sb (15,30.00 ); Cm (9:29) TOF LD- 1722518.0
2701.4
2785.6
3036.5
3123.9
3164.8
3290.1
3409.3
3536.6
11343.75765.212458.6

Knutson laccase + ABTS (DHB)4-OCT-2004 19:21:43 Laser Power: 50/80Georgia Tech Mass Spectrometry Laboratory Pulse Voltage: 2200
5000 10000 15000 20000 25000 30000 35000 40000 45000 50000 55000 60000 65000 70000 75000 80000m/z0
100
%
ar1005md2n 23 (2.212) Sm (SG, 2x50.00); Sb (15,30.00 ); Cm (1:36) TOF LD- 1063822.7 5569.2
8739.3 16368.811212.125815.120288.9
29334.9 37333.730343.4 39942.9 45587.9
50753.6 59451.7

Knutson laccase + ABTS + DY11 (CHCA)5-OCT-2004 18:39:44 Laser Power: 50/80Georgia Tech Mass Spectrometry Laboratory Pulse Voltage: 1700
5000 10000 15000 20000 25000 30000 35000 40000 45000 50000 55000 60000 65000 70000 75000 80000m/z0
100
%
ar1005me 14 (1.384) Sm (SG, 2x25.00); Sb (15,30.00 ); Cm (9:28) TOF LD+ 88.05698.9
5640.75743.3
5855.4
5212.0
6064.6
8963.1
6237.4 10550.4
11596.611799.3
18022.011950.8 18182.4

Knutson laccase + ABTS + DY11 (DHB)5-OCT-2004 18:01:32 Laser Power: 50/80Georgia Tech Mass Spectrometry Laboratory Pulse Voltage: 1700
5000 10000 15000 20000 25000 30000 35000 40000 45000 50000 55000 60000 65000 70000 75000 80000m/z0
100
%
ar1005me2 10 (0.964) Sm (SG, 2x25.00); Sb (15,30.00 ); Cm (9:29) TOF LD+ 1552831.5
2940.4
2963.8
3412.5
5916.6
6394.5
11760.18642.817925.012596.2
18580.919324.5

Knutson laccase + ABTS + DY11 (CHCA)4-OCT-2004 20:10:16 Laser Power: 50/80Georgia Tech Mass Spectrometry Laboratory Pulse Voltage: 2200
5000 10000 15000 20000 25000 30000 35000 40000 45000 50000 55000 60000 65000 70000 75000 80000m/z0
100
%
ar1005men 14 (1.311) Sm (SG, 2x50.00); Sb (15,30.00 ); Cm (9:28) TOF LD- 59.35822.7
5998.46059.2
6171.7
6255.0
8671.59808.5
11160.511618.2
79130.012063.9

Knutson laccase + ABTS + DY11 (DHB)4-OCT-2004 19:32:57 Laser Power: 50/80Georgia Tech Mass Spectrometry Laboratory Pulse Voltage: 2200
5000 10000 15000 20000 25000 30000 35000 40000 45000 50000 55000 60000 65000 70000 75000 80000m/z0
100
%
ar1005me2n 9 (0.843) Sm (SG, 2x50.00); Sb (15,30.00 ); Cm (1:36) TOF LD- 1058655.8
3608.9 9836.6
8194.013260.1
13586.118390.614306.9 18573.0
20004.4 25313.027540.6 37409.036307.0 49864.947791.844746.928703.3 63429.1

APPENDIX TABLE OF CONTENTS
A APPENDIX................................................................................................................ 1
A.1 Purification and Characterization ................................................................................................ 1 A.1.1 Purification by Solid Phase Extraction (SPE) ............................................................................. 1 A.1.2 Purification by HPLC.................................................................................................................. 4
A.1.2.1 Overview of HPLC Theory and Definitions ...................................................................... 4 A.1.2.2 Experimental HPLC Systems............................................................................................. 7 A.1.2.3 HPLC Results .................................................................................................................... 8 A.1.2.4 Model Compound ............................................................................................................ 10
A.1.3 Purification by TLC................................................................................................................... 10 A.1.4 Characterization of Dyes by UV/Vis Spectrophotometry ......................................................... 16
A.1.4.1 Effect of Changes in Solution pH on Dye Spectra........................................................... 18 A.1.4.2 Effect of Alum on Dye Spectra........................................................................................ 21 A.1.4.3 Effect of Mixing Laccase with ABTS.............................................................................. 21
A.1.5 Characterization of Reaction Mixtures by UV/Vis.................................................................... 22 A.1.6 Characterization of Pulp Reaction Effluents by UV/Vis ........................................................... 26 A.1.7 Characterization by NMR.......................................................................................................... 26
A.2 Necessary Supporting Procedures .............................................................................................. 30 A.2.1 Determination of Extent of Pulp Dyeing................................................................................... 30 A.2.2 Laccase Activity Assays............................................................................................................ 33 A.2.3 Soybean Peroxidase Activity Assays ........................................................................................ 34 A.2.4 Assay of Hydrogen Peroxide “30%” Stock Solution................................................................. 36
A.3 Data For Publication Tables and Bar Graphs ........................................................................... 36 A.3.1 Comparison Between Laccase Mediators.................................................................................. 36 A.3.2 Bleaching Response to ABTS Concentrations .......................................................................... 37 A.3.3 Comparison Between Enzymatic Treatments............................................................................ 38 A.3.4 Effect of pH on Soybean Peroxidase Decolorization ................................................................. 38 A.3.5 Effect of DMSO on SBP Decolorization of Basazol 46L ......................................................... 40 A.3.6 Reaction Rate Data.................................................................................................................... 41 A.3.7 Comparison Among Bleaching Treatments............................................................................... 43
A.4 Alternatives/Variations of Laccase-Mediator System............................................................... 44 A.4.1 Grafting ..................................................................................................................................... 44 A.4.2 Laccase Treatment Using Inorganic Laccase Mediators ........................................................... 46 A.4.3 Borohydride Reduction of Direct Yellow 11-Dyed Pulp .......................................................... 48
A.5 Optimization of Laccase/ABTS Decolorization ......................................................................... 48 A.5.1 Selected Experimental Design................................................................................................... 49 A.5.2 Calculating Variable Values for Each Coded Level.................................................................. 50 A.5.3 ExperimentAL Results .............................................................................................................. 52 A.5.4 Statistical Analysis of Optimization Experiment Results.......................................................... 57
A.5.4.1 Discussion of Statistical Models ...................................................................................... 58 A.5.4.2 Response-Surface Regression Report .............................................................................. 61 A.5.4.3 Multiple Regression Report ............................................................................................. 65 A.5.4.4 Multivariate Ratio of Polynomials Report ....................................................................... 74 A.5.4.5 Robust Regression Report................................................................................................ 77 A.5.4.6 All Possible Regression Report........................................................................................ 80

A.6 Reaction Rate Studies .................................................................................................................. 81 A.6.1 Reaction Conditions .................................................................................................................. 81 A.6.2 Calculation of Difference Spectra ............................................................................................. 82 A.6.3 Difference Spectra Results for Reaction Rate Studies............................................................... 84
A.6.3.1 ABTS Data....................................................................................................................... 85 A.6.3.2 Violuric Acid Data........................................................................................................... 87 A.6.3.3 HBT Data......................................................................................................................... 90
A.7 CHEMO METRIC Analysis of Reaction Rate Spectra ............................................................ 92 A.7.1 Manual Modeling of Gaussian and Lorentzian Peakshapes ...................................................... 93 A.7.2 Modeling by Multivariate Techniques ...................................................................................... 96 A.7.3 Application of Principal Components Regression..................................................................... 99
A.7.3.1 Calculation of C and S Matrices ...................................................................................... 99
A.8 Analysis of Soybean Peroxidase Spectra .................................................................................. 100 A.8.1 Excel Macro Program for Subtracting Sloping Baseline......................................................... 102
A.9 TOF-SIMS Experiments............................................................................................................ 104 A.9.1 Report of ToF SIMS Analysis Results .................................................................................... 104
A.9.1.1 Aim ................................................................................................................................ 104 A.9.1.2 Experimental.................................................................................................................. 104 A.9.1.3 Results and discussion ................................................................................................... 105
A.10 MALDI Experiments ................................................................................................................. 112 A.10.1 Results of MALDI Analysis ............................................................................................... 113
B APPENDIX REFERENCES................................................................................ 134

TABLE OF FIGURES
Figure A-1 Removal of Dye from Solution by NH2, SAX and C8 SPE Columns------------3 Figure A-2 Elution of Adsorbed Dye from C8 SPE Column -----------------------------------4 Figure A-3 Example of HPLC Peak Resolution -------------------------------------------------5 Figure A-4 Simulated HPLC Chromatogram----------------------------------------------------7 Figure A-5 Example of HPLC Separation of Direct Yellow 11 -------------------------------9 Figure A-6 Spectra of Direct Yellow 11 Peak from HPLC Chromatogram -----------------9 Figure A-7 Model Compound 4,4’-diamino-2,2’-stilbenedisulfonic acid------------------ 10 Figure A-8 Analytical TLC (No Water) Applied to Samples in Table A-5 ----------------- 12 Figure A-9 Analytical TLC (10 mL Water) Applied to Samples in Table A-5 ------------- 13 Figure A-10 Analytical TLC (15 mL Water) Applied to Samples from Table A-5 -------- 13 Figure A-11 Analytical TLC (25 mL Water) Applied to Samples in Table A-5------------ 14 Figure A-12 Analytical TLC (No Water, Altered) Applied to Samples in Table A-5 ----- 14 Figure A-13 Scan of Preparative TLC Applied to Direct Yellow 11 ----------------------- 16 Figure A-14 Absorbance of Four Dilutions of Direct Yellow 11---------------------------- 17 Figure A-15 Characteristic Spectra of Dye Samples ----------------------------------------- 17 Figure A-16 Absorbance of Different pH Buffers --------------------------------------------- 18 Figure A-17 Effect of pH on Light Absorbance of Fastusol --------------------------------- 19 Figure A-18 Effect of pH on Light Absorbance of Pergasol --------------------------------- 19 Figure A-19 Effect of pH on Light Absorbance of Basazol 46l------------------------------ 20 Figure A-20 Effect of pH on Light Absorbance of Basazol 40------------------------------- 20 Figure A-21 Alum Shifts λMax of Direct Yellow 11 -------------------------------------------- 21 Figure A-22 Formation of ABTS Dication by Addition of Laccase ------------------------- 22 Figure A-23 Heating Direct Yellow 11 under Oxygen has no Effect ----------------------- 23 Figure A-24 Laccase Treatment of Direct Yellow 11 has no Effect------------------------- 23 Figure A-25 Direct Yellow Treated with HBT ------------------------------------------------- 24 Figure A-26 Direct Yellow 11 + Laccase + 2.0 mM Violuric Acid------------------------- 24 Figure A-27 Direct Yellow 11 + Laccase + 0.01 mM ABTS--------------------------------- 25 Figure A-28 Direct Yellow 11 + Laccase + 1.0 mM ABTS ---------------------------------- 25 Figure A-29 Spectra from Effluents (Post-Reaction) for Laccase/ABTS Treated Pulps - 26 Figure A-30 NMR Spectrum of Direct Yellow 11 as Supplied------------------------------- 27 Figure A-31 NMR Spectrum of Direct Yellow 11 Purified by TLC ------------------------- 27 Figure A-32 NMR Spectrum of Direct Yellow 11 Purified by Paper Chromatography -- 28 Figure A-33 NMR Spectrum of Direct Yellow 11 Purified by NH2-SPE ------------------- 28 Figure A-34 NMR Spectrum of 10.3 µL/mL Laccase + 5.0 mM ABTS --------------------- 29 Figure A-35 NMR Spectrum of Direct Yellow 11 Treated with Laccase + ABTS--------- 29 Figure A-36 Spectra of Direct Yellow 11 + Alum--------------------------------------------- 31 Figure A-37 Linear Models of Signals of Different Dilutions of Dye + Alum------------- 32 Figure A-38 Spectra of Diluted Dye + Alum and Dyeing Reaction Filtrate--------------- 33 Figure A-39 Laccase Activity Assay ------------------------------------------------------------ 34 Figure A-40 Soybean Peroxidase (SBP) Activity Assay -------------------------------------- 35 Figure A-41 Effect of DMSO on SBP Decolorization of Basazol 46L---------------------- 41 Figure A-42 Brightness after Grafting Treatments ------------------------------------------- 45
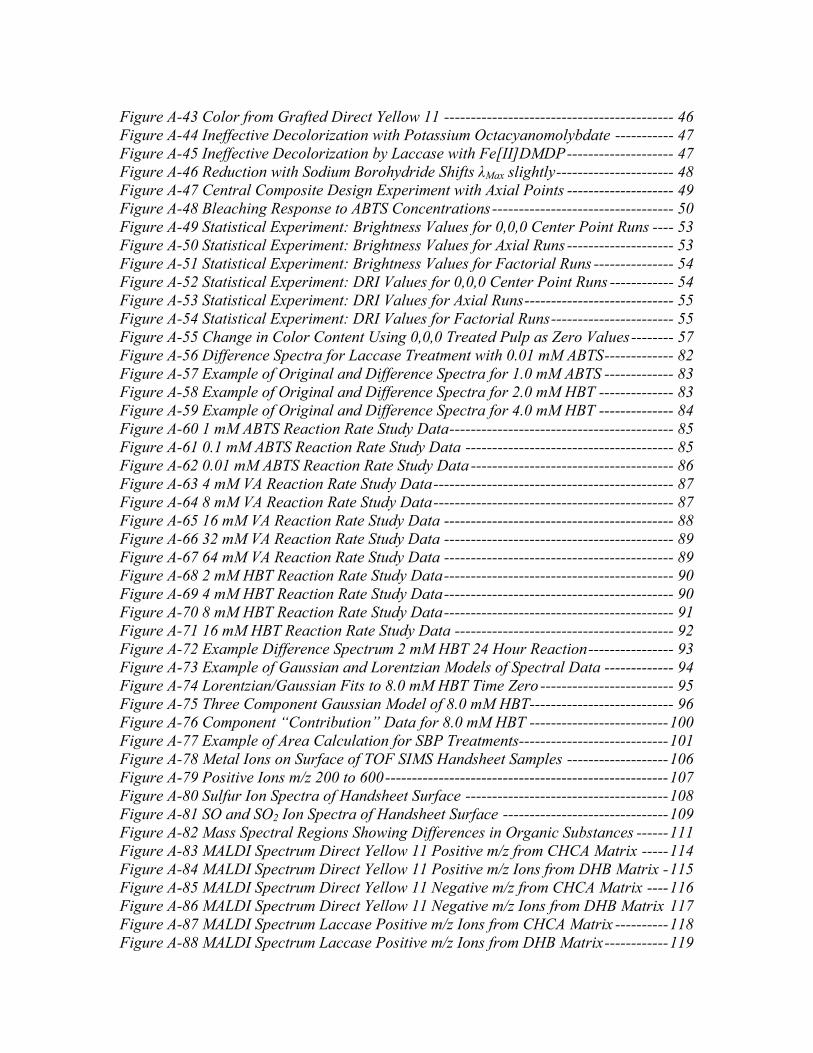
Figure A-43 Color from Grafted Direct Yellow 11 ------------------------------------------- 46 Figure A-44 Ineffective Decolorization with Potassium Octacyanomolybdate ----------- 47 Figure A-45 Ineffective Decolorization by Laccase with Fe[II]DMDP-------------------- 47 Figure A-46 Reduction with Sodium Borohydride Shifts λMax slightly---------------------- 48 Figure A-47 Central Composite Design Experiment with Axial Points -------------------- 49 Figure A-48 Bleaching Response to ABTS Concentrations---------------------------------- 50 Figure A-49 Statistical Experiment: Brightness Values for 0,0,0 Center Point Runs ---- 53 Figure A-50 Statistical Experiment: Brightness Values for Axial Runs -------------------- 53 Figure A-51 Statistical Experiment: Brightness Values for Factorial Runs --------------- 54 Figure A-52 Statistical Experiment: DRI Values for 0,0,0 Center Point Runs ------------ 54 Figure A-53 Statistical Experiment: DRI Values for Axial Runs---------------------------- 55 Figure A-54 Statistical Experiment: DRI Values for Factorial Runs----------------------- 55 Figure A-55 Change in Color Content Using 0,0,0 Treated Pulp as Zero Values-------- 57 Figure A-56 Difference Spectra for Laccase Treatment with 0.01 mM ABTS------------- 82 Figure A-57 Example of Original and Difference Spectra for 1.0 mM ABTS ------------- 83 Figure A-58 Example of Original and Difference Spectra for 2.0 mM HBT -------------- 83 Figure A-59 Example of Original and Difference Spectra for 4.0 mM HBT -------------- 84 Figure A-60 1 mM ABTS Reaction Rate Study Data------------------------------------------ 85 Figure A-61 0.1 mM ABTS Reaction Rate Study Data --------------------------------------- 85 Figure A-62 0.01 mM ABTS Reaction Rate Study Data -------------------------------------- 86 Figure A-63 4 mM VA Reaction Rate Study Data--------------------------------------------- 87 Figure A-64 8 mM VA Reaction Rate Study Data--------------------------------------------- 87 Figure A-65 16 mM VA Reaction Rate Study Data ------------------------------------------- 88 Figure A-66 32 mM VA Reaction Rate Study Data ------------------------------------------- 89 Figure A-67 64 mM VA Reaction Rate Study Data ------------------------------------------- 89 Figure A-68 2 mM HBT Reaction Rate Study Data------------------------------------------- 90 Figure A-69 4 mM HBT Reaction Rate Study Data------------------------------------------- 90 Figure A-70 8 mM HBT Reaction Rate Study Data------------------------------------------- 91 Figure A-71 16 mM HBT Reaction Rate Study Data ----------------------------------------- 92 Figure A-72 Example Difference Spectrum 2 mM HBT 24 Hour Reaction---------------- 93 Figure A-73 Example of Gaussian and Lorentzian Models of Spectral Data ------------- 94 Figure A-74 Lorentzian/Gaussian Fits to 8.0 mM HBT Time Zero------------------------- 95 Figure A-75 Three Component Gaussian Model of 8.0 mM HBT--------------------------- 96 Figure A-76 Component “Contribution” Data for 8.0 mM HBT --------------------------100 Figure A-77 Example of Area Calculation for SBP Treatments----------------------------101 Figure A-78 Metal Ions on Surface of TOF SIMS Handsheet Samples -------------------106 Figure A-79 Positive Ions m/z 200 to 600-----------------------------------------------------107 Figure A-80 Sulfur Ion Spectra of Handsheet Surface --------------------------------------108 Figure A-81 SO and SO2 Ion Spectra of Handsheet Surface -------------------------------109 Figure A-82 Mass Spectral Regions Showing Differences in Organic Substances ------111 Figure A-83 MALDI Spectrum Direct Yellow 11 Positive m/z from CHCA Matrix -----114 Figure A-84 MALDI Spectrum Direct Yellow 11 Positive m/z Ions from DHB Matrix -115 Figure A-85 MALDI Spectrum Direct Yellow 11 Negative m/z from CHCA Matrix ----116 Figure A-86 MALDI Spectrum Direct Yellow 11 Negative m/z Ions from DHB Matrix 117 Figure A-87 MALDI Spectrum Laccase Positive m/z Ions from CHCA Matrix ----------118 Figure A-88 MALDI Spectrum Laccase Positive m/z Ions from DHB Matrix------------119

Figure A-89 MALDI Spectrum Laccase Negative m/z Ions from CHCA Matrix ---------120 Figure A-90 MALDI Spectrum Laccase Negative m/z Ions from DHB Matrix-----------121 Figure A-91 MALDI Spectrum ABTS Positive m/z Ions from CHCA Matrix -------------122 Figure A-92 MALDI Spectrum ABTS Positive m/z Ions from DHB Matrix---------------123 Figure A-93 MALDI Spectrum ABTS Negative m/z Ions from CHCA Matrix ------------124 Figure A-94 MALDI Spectrum ABTS Negative m/z Ions from DHB Matrix--------------125 Figure A-95 MALDI Spectrum Laccase+ABTS Positive m/z Ions from CHCA Matrix -126 Figure A-96 MALDI Spectrum Laccase+ABTS Positive m/z Ions from DHB Matrix ---127 Figure A-97 MALDI Spectrum Laccase+ABTS Negative m/z Ions from CHCA Matrix 128 Figure A-98 MALDI Spectrum Laccase+ABTS Negative m/z Ions from DHB Matrix --129 Figure A-99 MALDI: Dye11 + Laccase+ABTS Positive m/z Ions from CHCA Matrix -130 Figure A-100 MALDI: Dye11+Laccase+ABTS Positive m/z Ions from DHB Matrix---131 Figure A-101 MALDI: Dye11+Laccase+ABTS Negative m/z Ions from CHCA Matrix 132 Figure A-102 MALDI: Dye11+Laccase+ABTS Negative m/z Ions from DHB Matrix--133

TABLE OF TABLES
Table A-1 Samples Subjected to SPE Extraction ------------------------------------------------1 Table A-2 Results of SPE Extraction of 75 µg/mL Direct Yellow 11 -------------------------2 Table A-3 Results of SPE Extractions of Reaction Filtrates -----------------------------------2 Table A-4 Parameters Affecting HPLC Peak Resolution --------------------------------------6 Table A-5 Samples Subjected to TLC Analysis ------------------------------------------------ 11 Table A-6 Mobile Phases Tested for Analytical TLC ----------------------------------------- 12 Table A-7 Dye Dilutions for Relating Absorbance to Concentration----------------------- 16 Table A-8 Dye λMax (nm) in Different pH Solutions ------------------------------------------- 21 Table A-9 NMR Peaks ---------------------------------------------------------------------------- 30 Table A-10 DRI Values for Pulps Treated with Different ABTS Concentrations --------- 37 Table A-11 DRI Values for Pulps Treated with Different ABTS Concentrations --------- 37 Table A-12 Comparisons between Enzymatic Treatments ----------------------------------- 38 Table A-13 Effect of pH on SBP Decolorization of Basazol 46L---------------------------- 39 Table A-14 Effect of pH on SBP Decolorization of Direct Yellow 11 ---------------------- 40 Table A-15 Signal Intensity for pH 6.5 --------------------------------------------------------- 41 Table A-16 Reaction Rate Study of SBP Decolorization of Basazol 46L------------------- 42 Table A-17 Reaction Rate Study of SBP Decolorization of Direct Yellow 11 ------------- 42 Table A-18 Reaction Rate Study of Direct Yellow 11 with Laccase+1.0 mM ABTS------ 42 Table A-19 Results of Grafting Direct Yellow 11 onto Pulp --------------------------------- 45 Table A-20 Coded Values for Central Composite Experiment ------------------------------ 49 Table A-21 Calculation of Variable Values for Statistical Designed Experiment -------- 51 Table A-22 Results from Statistical Design Experiment for Lac/ABTS Decolorization -- 52 Table A-23 Importance of Factors in Response Surface Regression ----------------------- 59 Table A-24 Correlation of Factors with DRI in Multiple Regression Analysis ----------- 60 Table A-25 Oxygen Level NOT Significant in Multiple Regression------------------------- 60 Table A-26 Oxygen Level NOT Significant in Robust Regression -------------------------- 61 Table A-27 Summary of Statistical Models ---------------------------------------------------- 61 Table A-28 Laccase Mediator Concentrations for Decolorization Reaction Rates------- 81 Table A-29 Time Points for Sample Collection Reaction Rate Studies--------------------- 82 Table A-30 Types of Chemometric Matrices Discussed -------------------------------------- 98 Table A-31 Relationships between Chemometric Matrices ---------------------------------- 99 Table A-32 Macro Program for Processing Spectral Data ---------------------------------102 Table A-33 Macro for Generating Spectra from Translated Spectral Files --------------103 Table A-34 Samples for TOF-SIMS Analysis -------------------------------------------------104 Table A-35 Ion Quantification Based on One Analyzed Spot/Sample ---------------------110 Table A-36 ToF-SIMS Identified Fatty Acids and Their Characteristic Peaks-----------112 Table A-37 Samples Subjected to MALDI Analysis ------------------------------------------113

TABLE OF EQUATIONS
Equation A-1 Definition of Resolution between Two HPLC Peaks ---------------------------5 Equation A-2 Resolution Depends on Selectivity, Efficiency and Retention-----------------5 Equation A-3 Definition of Retention Factor k --------------------------------------------------6 Equation A-4 Definition of Column Dead Time -------------------------------------------------6 Equation A-5 Calculation of Dead Volume Vm --------------------------------------------------7 Equation A-6 Calculation of Vm for 0.46cm ID Column----------------------------------------7 Equation A-7 Conversion of Coded Variables to Actual Values ---------------------------- 58 Equation A-8 Conversion of Coded Variable to Log (Actual Value) ----------------------- 58 Equation A-9 Conversion of Actual Values to Coded Variables ---------------------------- 58 Equation A-10 Conversion of Log (Actual Value) to Coded Variable---------------------- 58 Equation A-11 Model From Response Surface Regression (R2 0.941) --------------------- 59 Equation A-12 Regression Equation from Multiple Regression (R2 0.805)---------------- 60 Equation A-13 Format for Multivariate Ratio of Polynomials Model---------------------- 60 Equation A-14 Ratio of Polynomials Model (R2 0.989) -------------------------------------- 60 Equation A-15 Regression Equation from Robust Regression (R2 0.886)------------------ 61 Equation A-16 Equation to Calculate Gaussian Peakshape--------------------------------- 94 Equation A-17 Equation to Calculate Lorentzian Peakshape ------------------------------- 94 Equation A-18 Definitions for Peakshape Calculations-------------------------------------- 94 Equation A-19 Data Matrix = Component Concentration * Spectral Response---------- 97 Equation A-20 Data Matrix = Score x Loadings---------------------------------------------- 97 Equation A-21 Relationship between Data Matrices ----------------------------------------- 98 Equation A-22 Relationship between C and S Matrices and PCA Scores and Loadings 98 Equation A-23 Definition of R-1 Matrix Relating C,S to T,P--------------------------------- 98
LIST OF ABBREVIATIONS
ABTS 2-2´ azinobis (3-ethylbenzthiazoline-6-sulfonate)
cs Consistency (wt% pulp in slurry)
CHCA α-Cyano-4-hydroxycinnamic acid
DHB 2,5-dihydroxybenzoic acid
FAS Formamidine sulfinic acid
HBT 1-Hydroxybenzotriazole
HRP Horseradish Peroxidase
o.d. Oven-Dried
VA Violuric acid
SBP Soybean Peroxidase

PAGE 1
A APPENDIX
A.1 PURIFICATION AND CHARACTERIZATION
Since the samples of Direct Yellow 11 supplied were from commercial
preparations, they contained salts, fillers and other compounds in addition to the dye
chromophore(s). Attempts were made to purify the dye chromophore.
A.1.1 PURIFICATION BY SOLID PHASE EXTRACTION (SPE)
In solid phase extraction, a sample is applied to a bed of modified silica beads.
Ideally, the dye chromophore would initially adhere to the silica, (forming a visible
yellow band) while other ingredients would pass through. The column could then be
washed to remove any other ingredients that had bound to the beads. Finally, the dye
chromophore would be eluted from modified silica with a stronger solvent.
Table A-1 Samples Subjected to SPE Extraction
Available Samples (* marks samples selected) *Filtrate from treated Direct Yellow 11 dyed pulp*Filtrate from treated white pulp ABTS Laccase *Laccase + ABTS *Direct Yellow 11 *Direct Yellow 11 + Alum Solution of Direct Yellow 11 + laccase + ABTS Solution from treating Direct Yellow 11 with laccase/ABTS for 2 hrs at 45ºC, 10 bar O2
A method development kit with 5 each of 10 different types of solid phase
extraction cartridges was obtained. Five samples were selected from available solutions.
(Table A-1). The concentrations of Direct Yellow 11 and alum were those applied to pulp
during the dyeing process. It should be noted that Fastusol is the brand name for the
Direct Yellow 11 used for most experiments.

PAGE 2
Application conditions were as follows:
1) Room temperature 2) 3 mL of each sample 3) Applied to column; collected and reapplied two times for total of applying each 3
mL sample three times to maximize removal of dye from sample 4) Obtained spectra of each filtrate to examine decrease in absorbance
The results obtained using 3 mL of 75 µg/mL Direct Yellow 11 are shown below.
All columns were white before sample was applied. SPE Column refers to the group
attached to the silica beads to modify it. SAX stands for strong anion exchange; SCX for
strong cation exchange.
Table A-2 Results of SPE Extraction of 75 µg/mL Direct Yellow 11 SPE Column Filtrate Color Column Color NH2 Colorless Yellow band concentrated at very top SAX Colorless Dark yellow throughout with darker yellow at top C8 Slightly yellow Faint yellow with darker band at top C18 Slightly yellow Light yellow throughout CH Slightly yellow Light yellow throughout Diol Faint yellow Light yellow throughout CN Faint yellow Light yellow throughout Silica Faint yellow Light yellow throughout C2 Yellow White SCX Yellow White
Conclusion: the NH2 modified silica column gave the best results in binding.
However, SAX and C8 also appeared potentially useful. These three columns, NH2, SAX
and C8 were applied to the remaining samples: A)75 µg/mL Direct Yellow 11 + 600
µg/mL alum B)filtrate from laccase-ABTS treatment of Direct Yellow 11-dyed pulp
C)filtrate from laccase-ABTS treatment of white pulp The results are shown below in
Table A-3.
Table A-3 Results of SPE Extractions of Reaction Filtrates Sample SPE Column Filtrate Color Column Color
NH2 Colorless Thin dark yellow band concentrated at top SAX Colorless Yellow throughout
Direct Yellow 11 75 µg/mL + Alum 600 µg/mL C8 Slightly yellow Dark yellow at top and yellow throughout
NH2 Colorless Thin brown band concentrated at top SAX Colorless Slight yellow color throughout
Filtrate from dyed pulp treated with laccase-ABTS C8 Faint yellow tinge Faint cream color throughout
NH2 Colorless Concentrated brown band at top SAX Colorless Light tan throughout
Filtrate from white pulp treated with laccase-ABTS C8 Faint cream tinge Faint cream color throughout

PAGE 3
The results indicate that the NH2-modified SPE column was able to effectively
extract Direct Yellow 11 from solution. The SAX column was also very good at
removing Direct Yellow 11 from solution. All 3 SPE column types did appear to be able
to remove from solution and concentrate Direct Yellow 11.
Figure A-1 Removal of Dye from Solution by NH2, SAX and C8 SPE Columns
0
0.1
0.2
0.3
0.4
0.5
200 400 600 800Wavelength, nm
Abs
orba
nce
75 ug/mL DirectYellow 11Eluent from NH2SPE ColumnEluent from SAXSPE ColumnEluent from C8SPE Column
However, elution of absorbed dye was problematical. Changes in solution pH or
ionic strength were unable to elute dye. As shown in Figure A-2, some dye could be
removed from the C8 column by applying methanol (MeOH) or acetonitrile (ACN) as
eluent. However, visible dye color remained on column after elution. The absorption of
Direct Yellow 11 by the C8 column appears to non-specific. The binding of Direct
Yellow 11 to NH2 and SAX (strong anion exchange) was more specific and also
stronger. Although a number of solvents were tested as eluents, the binding between
Direct Yellow 11 and NH2 and SAX SPE columns was too strong to be disrupted. SPE
can not be easily used to separate Direct Yellow 11 and products from laccase-mediator
solutions.

PAGE 4
Figure A-2 Elution of Adsorbed Dye from C8 SPE Column
Samples Eluted from C8 Column After Application of 75ug/mL Direct Yellow 11
0
0.2
0.4
0.6
0.8
1
200 400 600 800
Wavelength, nm
Abs
orba
nce
A.1.2 PURIFICATION BY HPLC
Considerable effect was expended trying to develop a high-pressure liquid
chromatography (HPLC) system to separate Direct Yellow 11 from laccase, ABTS and
breakdown products. These efforts were guided by Practical HPLC Method
Development, 2nd Ed, by Synder, Kirkland and Glajch.1
A.1.2.1 Overview of HPLC Theory and Definitions
HPLC is used to separate components in a mixture so that the individual
components can be analyzed and/or quantitated. For analytical HPLC, the separation
achieved depends on solution components having some affinity for the column.
Component partitioning between the mobile phase and the column retards elution of the
components. Differences in component affinity and partitioning create the component
separation.
The quality of a separation is often determined by the resolution between the
component peaks. Resolution is based on peak widths and retention times. (Equation
A-1).
Eluent pH 4.5 0.1 M KAc Buff C8 Column Fastusol Sample Eluent pH 2.5 0.1 M PO4 C8 Column Fastusol Sample Eluent 0.1 M HOAc C8 Column Fastusol Sample Eluent 0.1 M NH4Ac C8 Column Fastusol Sample Eluent MeOH C8 Column Fastusol Sample Eluent ACN C8 Column Fastusol Sample (Peak at 240 due to extraction of material during overnight storage of acetonitrile sample in plastic vial)

PAGE 5
Equation A-1 Definition of Resolution between Two HPLC Peaks
Rs = 21
12 )(2WWtt
+−
Where W1 and W2 are the widths at the peak base of peaks 1 and 2,
t1 and t2 are the retention times for peaks 1 and 2. (Figure A-3).
Figure A-3 Example of HPLC Peak Resolution
The separation between any two bands in a chromatogram can be altered
systemically by changing the experimental conditions. The resolution Rs can be described
in terms of three parameters (k, α, and N) which are directly related to experimental
conditions.
Equation A-2 Resolution Depends on Selectivity, Efficiency and Retention
Rs = ¼ (α -1) N1/2 k
k+1
(selectivity) (efficiency) (retention)
Here k is the average retention factor for the two bands, N is the column plate
number and α is the separation factor: α = k1/k2, where k1 and k2 are values of k for
adjacent bands 1 and 2. Equation A-2 is useful in method development because it
t→
t2 t1
W1 W2

PAGE 6
classifies the many experimental variables into three categories: retention (k), column
efficiency (N) and selectivity (α). This classification simplifies the systematic variation of
conditions to improve resolution between bands.
If conditions are changed so k becomes smaller (earlier elution), resolution
usually becomes worse. If α is increased, the two peaks will move apart, increasing Rs.
When column efficiency N is increased, the bands become narrower and better separated,
but their relative positions do not change.
The parameters k and α are determined by conditions that affect retention
or component partitioning between the mobile phase and the column packing. The
column plate number N primarily depends on column quality and is affected by changing
column conditions.
Table A-4 Parameters Affecting HPLC Peak Resolution
Conditions that Affect k (retention factor) and α (selectivity) 1. Composition of the mobile phase 2. Column composition (stationary phase) 3. Temperature
Conditions the Affect N (column efficiency) 1. Flow rate 2. Column length 3. Particle size
The retention factor k is based on retention times.
Equation A-3 Definition of Retention Factor k
k = 0
0
tttR −
Where tR is the band retention time and t0 is the column dead time. The column
dead time is related to the column dead volume Vm (volume of mobile phase inside the
column) and the flow rate F.
Equation A-4 Definition of Column Dead Time
t0 = FVm
An estimate of the value of t0 can be obtained by the retention time of the first
significant baseline disturbance, use of a very strong solvent as the mobile phase,

PAGE 7
injection of an unretained sample or calculation from column dimensions. Equation A-4
allows the calculation of t0 from estimated Vm.
Equation A-5 Calculation of Dead Volume Vm
Vm ≈ 0.5 L dc2
Where Vm (dead volume, in mL), L (cm) is column length and dc (cm) is internal
diameter of the column. For the commonly used 0.46 cm ID columns, Equation A-5
reduces to Equation A-6.
Equation A-6 Calculation of Vm for 0.46cm ID Column
Vm ≈ 0.1 L
A simulated chromatogram is shown in Figure A-4. The resolution is poor
between peaks b and c and between e and f. For this system, t0 is 1. The values of
retention factor k are shown at the top.
Figure A-4 Simulated HPLC Chromatogram
A.1.2.2 Experimental HPLC Systems
Two different hardware systems were used. One was a Hewlett Packard (Agilient)
1090 LC system that included 3 mobile phase reservoirs, an autosampler and an 8-
channel photodiode array detector based on a xenon lamp, range 200-600 nm. This
integrated system was computer controlled, using Chem Station software, version 5. The
second hardware system consisted of Gilson equipment: Model 305 (master,
0 2 4 6 8 10
Time (min)
a
d
0 1 2 3 4 5 6 7 8
cb
e
f
k =

PAGE 8
programmable) pump, Model 306 (slave pump) Model 805 Manometric Module
(measures system pressure), Model 811B Dynamic Mixer, column oven, Model 116 UV
Detector (range 200-350 nm) and Model FC 204 Fraction Collector. A second detector,
SpectroPhotometric Model 8450 UV/Vis detector was also included after the Gilson UV
detector. Injections were made through a Rheodyne manual injector. Analog data from
the two detectors were collected and analyzed utilizing Pyramid Chromatography
Manager Software by Axxiom Chromatography.
A.1.2.3 HPLC Results
Two different reversed-phase silica-based columns were tested: Discovery C-18
and Discovery C-16 Amide, both from Supleco Company. A number of combinations of
water, acetonitrile and methanol were tested. Although laccase, ABTS and reaction
mixtures were also subjected to HPLC, the method development focused on the major
chromophore for Direct Yellow 11
Peaks broaden as components move through the column so that late eluting peaks
are much broader and shallower than early eluting peaks. At the same time, some
retention is necessary to separate desired component peaks from the initial baseline
disturbance and from early-eluting/nonretained impurity bands. For a good separation,
the HPLC method should result in retention factor 0.5<k<20. To lower high values of k
(late-eluting peaks), the solvent strength of the mobile phase can be increased or the
method can be changed from isocratic to a gradient system.
. The major problem observed with Direct Yellow 11 was a low value for k. Since
the pKa for sulfonic acid groups is very low (~1.0 pH), changing mobile phase pH had
little effect. High pressure problems experienced with the columns prevented the addition
of ion-pair reagents since these reagents significantly increase column pressures in
normal separations.
All the various combinations tested, (10, 20, 40, 60% acetonitrile in water; 20, 40,
60 % methanol in water; gradients from 5-100% acetonitrile in water or buffers; gradient
5-100% methanol in water) did not improve retention of Direct Yellow 11 on the C-18 or
Amide columns. Figure A-5 illustrates a typical HPLC separation of the manufacturer’s
sample of Direct Yellow 11. The chromatogram was obtained at 415 nm, near the dye

PAGE 9
maxima observed on spectra of the Direct Yellow 11 manufacturer’s sample. Fillers and
buffer salts added to the manufacturer’s sample should not be observed at this
wavelength. A number of peaks can be observed in Figure A-5. These various peaks
correspond to different isomers of the major chromophore.
Figure A-5 Example of HPLC Separation of Direct Yellow 11
This chromatograph was obtained on the Agilient HPLC system. The photodiode
array detector in the system obtains spectra for each observed peak. One such spectrum is
shown below (peak corresponds to the dotted line in Figure A-5). This spectrum for the
3.677 min peak matches the spectrum obtained for the unfractionated manufacturer’s
sample. Similar spectra were also obtained for peaks eluting at 2.927, 3.470, 3.958,
4.386, and 4.713 minutes. The HPLC method did sufficiently separate the different
chromophore isomers to produce the distinct peaks in Figure A-5, but baseline resolution
was not obtained for any method tested.
Figure A-6 Spectra of Direct Yellow 11 Peak from HPLC Chromatogram

PAGE 10
The earliest peak with spectrum corresponding to Direct Yellow 11 eluted at
2.927 minutes. For this system that included a 25 cm x 0.46 id. reverse phase C-18
column, the observed t0 was 2.6 min. The retention factor k = (2.9-2.6)/2.6 = 0.11.
(Equation A-3). A k of at least 0.5 (3.9 min for this separation) is considered necessary to
separate desired peaks from unretained components and contaminants. The combination
of poor peak retention and multiple isomers of the major chromophore limited application
of HPLC in this research project.
A.1.2.4 Model Compound
A simpler, single chromophore model compound was obtained to test for
decolorization by the laccase/mediator system. However the compound, 4,4’-diamino-
2,2’-stilbenedisulfonic acid (Figure A-7) was not water soluble. Treating the insoluble
dye with laccase in water would require the addition of alcohol, which in turn would
decrease the ability of laccase to function and could alter reaction mechanisms.
Consequently, experiments with the model compound were not pursued.
Figure A-7 Model Compound 4,4’-diamino-2,2’-stilbenedisulfonic acid
S
SNH2
H2NO
O
OH
O
O
HO
C14H14N2O6S2Exact Mass: 370.03
Mol. Wt.: 370.40C, 45.40; H, 3.81; N, 7.56; O, 25.92; S, 17.31
A.1.3 PURIFICATION BY TLC
Attempts were made to purify Direct Yellow 11 by thin-layer chromatography
(TLC). With four sulfonic acid groups on the major chromophore, Direct Yellow 11 is
very hydrophilic. Direct Yellow 11 (as supplied) was applied to Whatman
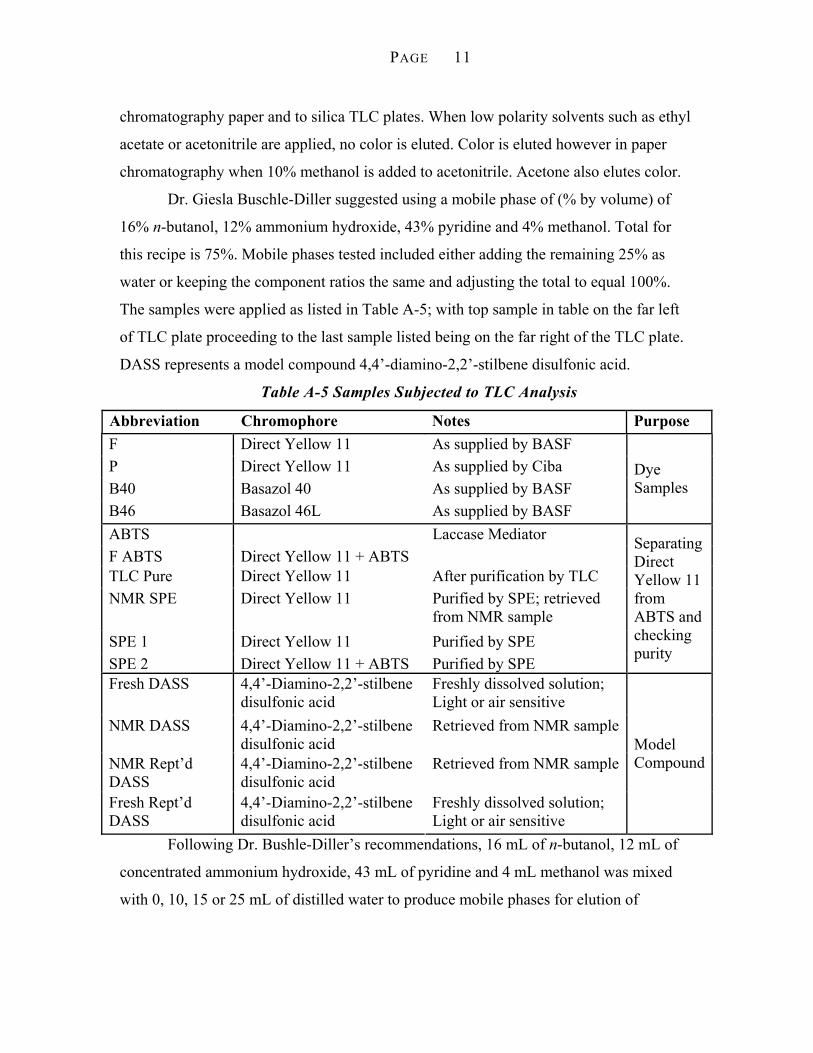
PAGE 11
chromatography paper and to silica TLC plates. When low polarity solvents such as ethyl
acetate or acetonitrile are applied, no color is eluted. Color is eluted however in paper
chromatography when 10% methanol is added to acetonitrile. Acetone also elutes color.
Dr. Giesla Buschle-Diller suggested using a mobile phase of (% by volume) of
16% n-butanol, 12% ammonium hydroxide, 43% pyridine and 4% methanol. Total for
this recipe is 75%. Mobile phases tested included either adding the remaining 25% as
water or keeping the component ratios the same and adjusting the total to equal 100%.
The samples were applied as listed in Table A-5; with top sample in table on the far left
of TLC plate proceeding to the last sample listed being on the far right of the TLC plate.
DASS represents a model compound 4,4’-diamino-2,2’-stilbene disulfonic acid.
Table A-5 Samples Subjected to TLC Analysis
Abbreviation Chromophore Notes Purpose F Direct Yellow 11 As supplied by BASF P Direct Yellow 11 As supplied by Ciba B40 Basazol 40 As supplied by BASF B46 Basazol 46L As supplied by BASF
Dye Samples
ABTS Laccase Mediator F ABTS Direct Yellow 11 + ABTS TLC Pure Direct Yellow 11 After purification by TLC NMR SPE Direct Yellow 11 Purified by SPE; retrieved
from NMR sample SPE 1 Direct Yellow 11 Purified by SPE SPE 2 Direct Yellow 11 + ABTS Purified by SPE
Separating Direct Yellow 11 from ABTS and checking purity
Fresh DASS 4,4’-Diamino-2,2’-stilbene disulfonic acid
Freshly dissolved solution; Light or air sensitive
NMR DASS 4,4’-Diamino-2,2’-stilbene disulfonic acid
Retrieved from NMR sample
NMR Rept’d DASS
4,4’-Diamino-2,2’-stilbene disulfonic acid
Retrieved from NMR sample
Fresh Rept’d DASS
4,4’-Diamino-2,2’-stilbene disulfonic acid
Freshly dissolved solution; Light or air sensitive
Model Compound
Following Dr. Bushle-Diller’s recommendations, 16 mL of n-butanol, 12 mL of
concentrated ammonium hydroxide, 43 mL of pyridine and 4 mL methanol was mixed
with 0, 10, 15 or 25 mL of distilled water to produce mobile phases for elution of

PAGE 12
analytical TLC plates. The volumes and percentages of each component in the mobile
phases tested are shown in Table A-6.
For the dyes, 10 µL of 10 mg/L stock solutions were applied to the plate by
adding 2.5 µL four times in same spot, allowing drying between applications. The ABTS
samples also contained 10 µL from 1 mg/mL solution. The results are shown in Figure
A-8 through Figure A-12. The areas outlined in pencil exhibited fluorescence under
ultraviolet illumination.
Table A-6 Mobile Phases Tested for Analytical TLC
Chemical mL % mL % mL % mL % mL % n-Butanol 16 21.3% 16 18.8% 16 17.8% 16 16.0% 40 40.0%NH4OH 12 16.0% 12 14.1% 12 13.3% 12 12.0% 30 30.0%Pyridine 43 57.3% 43 50.6% 43 47.8% 43 43.0% 20 20.0%MeOH 4 5.3% 4 4.7% 4 4.4% 4 4.0% 10 10.0%Water 0 0.0% 10 11.8% 15 16.7% 25 25.0% 0 0.0% Total 75 85 90 100 100
Figure A-8 Analytical TLC (No Water) Applied to Samples in Table A-5
Elution for 60 Minutes Mobile Phase by Volume: n-Butanol 16 mL: Ammonium
Hydroxide 12 mL: Pyridine 43 mL: Methanol 4.0 mL

PAGE 13
Figure A-9 Analytical TLC (10 mL Water) Applied to Samples in Table A-5
Elution for 95 Minutes Mobile Phase by Volume: n-Butanol 16 mL: Ammonium
Hydroxide 12 mL: Pyridine 43 mL: Methanol 4.0 mL: Water 10 mL
Figure A-10 Analytical TLC (15 mL Water) Applied to Samples from Table A-5
Elution for 05 Minutes Mobile Phase by Volume: n-Butanol 16 mL: Ammonium
Hydroxide 12 mL: Pyridine 43 mL: Methanol 4 mL: Water 15 mL

PAGE 14
Figure A-11 Analytical TLC (25 mL Water) Applied to Samples in Table A-5
Elution for 60 Minutes Mobile Phase by Volume: n-Butanol 16 mL: Ammonium
Hydroxide 12 mL: Pyridine 43 mL: Methanol 4 mL: Water 25 mL
Figure A-12 Analytical TLC (No Water, Altered) Applied to Samples in Table A-5
Elution for 60 Minutes Mobile Phase by Volume: n-Butanol 40 mL: Ammonium
Hydroxide 30 mL: Pyridine 20 mL: Methanol 10 mL:

PAGE 15
The best separation appears to be with the inclusion of 25 mL of water in the
mobile phase (Figure A-11). Preparative TLC plates were obtained and used to obtain
“TLC Pure” Direct Yellow 11. To improve separation of the dye chromophore(s) from
uncolored fillers and salts in manufacturer’s sample, two additional “wash” steps were
added. After application of Direct Yellow 11, the plates were subjected to elution first
with methylene chloride, then with ethyl acetate. The dye chromophore does not elute
with either solvent. These “wash” steps were included to move eluting uncolored
components to the top of the TLC plates, away from the desired chromophore(s). A scan
on one preparative TLC plate after elution is shown in Figure A-13 It can be seen that
the manufacturer’s sample consists of multiple chromophores. The chromophores in the
upper bands may be closely related, while the lower band may be different.
It is known that commercial dye preparations can contain multiple components
such as a major dye chromophore, contaminants from the manufacturing processes, acids
or buffer salts (to control pH and solubility), fillers, viscosity modifiers, and even
additional unrelated dye chromophores. For Direct Yellow 11 manufacturer’s sample, in
addition to the published structure that contains four sulfonic acid groups, manufacturer’s
sample may include chromophores with only 2 or 3 sulfonic acid groups. Also, stilbene
structures readily undergo cis-trans isomerizations in the presence of light. The wide
upper bands are probably geometric isomers. If chromophores are present that have less
than 4 sulfonic acid groups, the molecule would not be as soluble and would more
slowly, possibly creating the observed lower band.
The dark “orange” regions of the upper bands were collected and eluted with
water. Enough material was obtained that a NMR scan was run of the sample. However,
too little “TLC pure” dye was obtained to be used for further experiments.

PAGE 16
Figure A-13 Scan of Preparative TLC Applied to Direct Yellow 11
Step 1: Wash with Methylene Chloride Step 2: Wash with Ethyl Acetate
Step 3: Elution for 90 Minutes Mobile Phase by Volume %: n-Butanol 16%: Ammonium Hydroxide 12%: Pyridine 43%: Methanol 4%: Water 25%
A.1.4 CHARACTERIZATION OF DYES BY UV/VIS SPECTROPHOTOMETRY
Concentration curves were prepared to enable determination of amount of non-
volatile solids/mL necessary to produce absorbance between 0.2 and 0.8 AU. The
dilutions selected were 1:103, 1:104, 1:105 and 1:106. The dilutions were prepared as
described in Table A-7 below. The spectra for four dilutions made for Direct Yellow 11
dye sample from Ciba Corporation is shown in Figure A-14. Similar results were
obtained for the other dye samples (Direct Yellow 11 Fastusol, Basazol 46L and Basazol
40, all from BASF).
Table A-7 Dye Dilutions for Relating Absorbance to Concentration
Dilution Concentrate Amount of Concentrate Final Volume 1:103 Dye Sample 0.10 mL 100 mL 1:104 1:103 5.0 mL 50 mL 1:105 1:103 0.5 50 mL 1:106 1:103 0.10 mL 100 mL

PAGE 17
Figure A-14 Absorbance of Four Dilutions of Direct Yellow 11
CI Direct Yellow 11 (Pergasol Yellow S, Ciba Corp.)
0
0.5
1
1.5
2
2.5
200 300 400 500 600 700 800
Absorbance
Wav
elen
gth
(nm
)
1:1,000,0001:100,0001:10,0001:1,000
Four different dye samples were received from CIBA and BASF, including a
sample of C.I. Direct Yellow 11 from both Ciba and BASF. Fastusol, the Direct Yellow
11 sample from BASF, was used for virtually all the research in this project. The spectra
of these dyes are shown in Figure A-15. The absorbance spectra of both Direct Yellow 11
samples are very similar with the Fastusol sample having a higher concentration of dye
chromophore.
Figure A-15 Characteristic Spectra of Dye Samples
200.0 300 400 500 600 700 800 900.0
-0.02
0.2
0.4
0.6
0.8
1.0
1.2
1.41
NANOMETERS
A
Pergasol 10e4 (Ciba, CI Direct Yellow 11) Fastusol 10e4 (BASF, CI Direct Yellow 11) Basazol 46 10e4 (BASF, “unbleachable” dye) Basazol 40 10e4 (BASF, “bleachable” dye)

PAGE 18
A.1.4.1 Effect of Changes in Solution pH on Dye Spectra
Since pH can affect dye spectra, each dye sample was dissolved in pH 2.5; pH 4.5
and pH 9.0 buffers in addition to water and the spectra were obtained for all samples. The
effect of pH on dye absorbance is shown below, beginning with spectra of the buffers
used to dissolve the dyes. Full spectrums (200-900 nm) were obtained. The graphs below
show only 200-600 nm because only baseline absorbance was observed in the 600-900
nm range. It can be seen that 25 mM sodium phosphate buffer pH 2.5 did not exhibit
significant absorbance. However the more concentrated 100 mM sodium acetate buffer
pH 4.5 and the 100 mM sodium phosphate pH 9 buffer did show significant absorbance
below 220 nm (pH 9 buffer) and 240 nm (pH 4.5 buffer)
Figure A-16 Absorbance of Different pH Buffers
Buffers for Determining Effect of pH on Dyes
0
0.1
0.2
0.3
0.4
0.5
0.6
0.7
0.8
0.9
1
200 250 300 350 400 450 500 550 600
Wavelength (nm)
Abs
orba
nce
pH 2.5 NaPO4 25 mM vs water
pH 4.5 NaAcetate buffer 100 mM vs water
100 mM dibasic NaPO4 pH 9 vs water

PAGE 19
Figure A-17 Effect of pH on Light Absorbance of Fastusol
Fastusol Direct Yellow 11
0
0.1
0.2
0.3
0.4
0.5
0.6
0.7
0.8
0.9
1
200 250 300 350 400 450 500 550 600
Wavelength (nm)
Abs
orba
nce
Fastsol in WaterFastsol in pH 2.5Fastsol in pH 4.5Fastsol in pH 9
Figure A-18 Effect of pH on Light Absorbance of Pergasol
Pergasol Direct Yellow 11
0
0.1
0.2
0.3
0.4
0.5
0.6
0.7
0.8
0.9
1
200 250 300 350 400 450 500 550 600
Wavelength (nm)
Abs
orba
nce
Pergasol in waterPergasol in pH 2.5Pergasol in pH 4.5Pergasol in pH 9

PAGE 20
Figure A-19 Effect of pH on Light Absorbance of Basazol 46l
Basazol 46L
0
0.1
0.2
0.3
0.4
0.5
0.6
0.7
0.8
0.9
1
200 250 300 350 400 450 500 550 600
Wavelength (nm)
Abs
orba
nce
Baszol 46L vs waterBaszol 46L vs pH 2.5Baszol 46L vs pH 4.5Baszol 46L vs pH 9
Figure A-20 Effect of pH on Light Absorbance of Basazol 40
Basazol 40
0
0.1
0.2
0.3
0.4
0.5
0.6
0.7
0.8
0.9
1
200 250 300 350 400 450 500 550 600
Wavelength (nm)
Abs
orba
nce
Baszol 40 vs waterBaszol 40 vs pH 2.5Baszol 40 vs pH 4.5Baszol 40 vs pH 9

PAGE 21
Basic pH 9 solution did shift the absorbance maxima to longer wavelengths for
Direct Yellow 11 samples. The absorbance spectra of basic dyes Basazol 40 and Basazol
46L were not altered by changing solution pH.
Table A-8 Dye λMax (nm) in Different pH Solutions
Pergasol Fastusol B46L B40 Water 408 408 435 443 pH 2.5 410 410 434 443 pH 4.5 410 411 435 443 pH 9.0 419 416 435 443
A.1.4.2 Effect of Alum on Dye Spectra
The alum (aluminum sulfate 18-hydrate) applied as dye fixative may form
complexes with Direct Yellow 11 that alter its absorption spectra. When tested, alum did
slightly shift the λMax as can be seen in Figure A-21.
Figure A-21 Alum Shifts λMax of Direct Yellow 11
0
0.1
0.2
0.3
0.4
0.5
200 400 600 800Wavelength, nm
Abs
orba
nce
75ug/mL Dye +600 ug/mL alum75 ug/mL DirectYellow 11
A.1.4.3 Effect of Mixing Laccase with ABTS
When ABTS is dissolved in solution, the blue powder forms a blue solution.
When laccase is added, the solution immediately becomes much darker. Laccase reacts

PAGE 22
with ABTS and converts it to the dication. This change can also be observed by
spectrophotometer as in Figure A-22.
Figure A-22 Formation of ABTS Dication by Addition of Laccase
0
0.1
0.2
0.3
0.4
0.5
0.6
200 400 600 800
Wavelength, nm
Abs
orba
nce
Laccase
ABTSLaccase + ABTS
A.1.5 CHARACTERIZATION OF REACTION MIXTURES BY UV/VIS
The initial experiments with Direct Yellow 11 in solution showed that
laccase/HBT did react with the dye but quantization would be difficult. Complications
from overlapping absorbances forced the research focus to turn to dyed pulp. What are
shown below are spectra showing how the mediator absorbance overlaps the Direct
Yellow 11 (FS for Fastusol) spectra for ABTS, HBT and VA.
The first spectra (Figure A-23) show the reaction control of Direct Yellow 11 (Fs)
heated at 45ºC for 2 hours under 10 bar oxygen pressure. No change in dye absorbance
can be observed. The succeeding spectra (Figure A-24) are for Direct Yellow 11 treated
with laccase and oxygen, but in the absence of any mediator. No reaction can be observed
which is expected since laccase generally reacts with phenols and Direct Yellow 11 lacks
phenolic groups.

PAGE 23
Figure A-23 Heating Direct Yellow 11 under Oxygen has no Effect
Figure A-24 Laccase Treatment of Direct Yellow 11 has no Effect
Treatment with laccase and mediator for two hours at 45ºC 10 bar oxygen
pressure could decrease dye absorbance but quantization would be difficult due to
overlap between dye absorbance and enzyme/mediator absorbances. (Figure A-25)
200.0 250 300 350 400 450 500 550 600.00.03
0.5
1.0
1.5
2.0
2.5
3.00
NM
A
200.0 250 300 350 400 450 500 550 600.00.00
0.5
1.0
1.5
2.0
2.5
3.00
NM
A
20 ppm Fs 50 mM KOAc pH 4.5 - Initial Same - after 2 hours at 45°C, 10bar O2
20 ppm Fs 50mM KOAc pH 4.5 Lac 5ul/mL - Initial Same - after 2 hours at 45°C, 10 bar O2

PAGE 24
Figure A-25 Direct Yellow Treated with HBT
Direct Yellow 11 + LMS
00.5
11.5
22.5
3
200 400 600
Wavelength, nm
Abs
orba
nce 20ppm Drt Ylw +
Lac + 1mM HBT,t020ppm Drt Ylw +Lac + 1mM HBT,2hr 45C 10br O220ppm DirectYellow 11
When Direct Yellow 11 (1:10,000 dilution) is treated with laccase in combination
with 2.0 mM violuric acid, no decrease in dye absorbance can be discerned in the
presence of the large absorbances of enzyme and mediator.
Figure A-26 Direct Yellow 11 + Laccase + 2.0 mM Violuric Acid
200.0 300 400 500 600 700 800 900.0
0.04
0.5
1.0
1.5
2.0
2.5
3.00
NM
A
2 mM Violuric Acid + KOAc pH 4.5 2 mM ViolAc KOAc 10e4 Fs 2 mM ViolAc KOAc + 5 ul/mL Laccase 2 mM ViolAc 5 ul/mL Lac 2 hrs 45°C 10 bar O2 2 mM ViolAc KOAc 10e4 Fs + 5 ul/mL Laccase 2 mM ViolAc 10e4 Fs 5 ul/mL Lac 2 hrs 45°C 10 bar O2 100 mM potassium acetate (KOAc) buffer pH 4.5 1:10,000 dilution of Direct Yellow 11 5.0 µL/mL Lac = 10.3 Units laccase/mL reaction volume

PAGE 25
At low ABTS concentration, a slight decrease in absorbance near dye maxima
(394-415 nm) can be observed when reaction solution with Direct Yellow 11, laccase and
ABTS after two hours at 45ºC 10 bar oxygen (Figure A-27, green line) is compared with
the same solution before reaction (Figure A-27, blue line). The decrease after treatment is
more noticeable at higher ABTS concentration.
Figure A-27 Direct Yellow 11 + Laccase + 0.01 mM ABTS
0
0.25
0.5
0.75
1
1.25
1.5
200 300 400 500 600nm
Abs
orba
nce
20 ppm Direct Yellow 11 + ABTS + 50 ukat/mL Laccase
20 ppm Direct Yellow 11 + 0.01 mM ABTS
20 ppm Direct Yellow 11 in 20 mM sodium acetate buffer pH 4.5
Direct Yellow 11 + ABTS + Laccase after 2 hrs at 45C 10 bar O2
Figure A-28 Direct Yellow 11 + Laccase + 1.0 mM ABTS
200.0 300 400 500 600 700 800 900.0
0.00
0.2
0.4
0.6
0.8
1.0
1.2
1.4
1.6
1.8
2.0
2.2
2.4
2.6
2.8
3.00
NM
A
1 mM ABTS + KOAc + 5 µl/mL Laccase 1 mM ABTS + KOAc + 10e4 Direct Yellow 11 (Fs) 1 mM ABTS + KOAc + 5 µl/mL Lac for 2 hrs at 45°C, 10 bar O2 1 mM ABTS KOAc 10e4 Fs 5 µl/mL Lac 2 hrs at 45°C, 10 bar O2 100 mM potassium acetate (KOAc) buffer pH 4.5 5.0 µL/mL Lac = 10.3 Units laccase/mL reaction volume

PAGE 26
A.1.6 CHARACTERIZATION OF PULP REACTION EFFLUENTS BY UV/VIS
Switching from dye in solution to dyed pulp allows washing of pulp and removal
of laccase and mediator. One question is whether laccase treatment is stripping intact
Direct Yellow 11 dye chromophores off the fiber. Consequently post-reaction effluents
were obtained by filtration of dyed and white pulp samples treated with laccase and 0.10
mM ABTS. Spectrophotometric examination of these post reaction effluents showed little
difference resulting from treatment of dyed pulp versus treatment of white pulp.
Figure A-29 Spectra from Effluents (Post-Reaction) for Laccase/ABTS Treated Pulps
0
0.2
0.4
0.6
0.8
1
200 400 600 800Wavelength (nm)
Abs
orba
nce
White Pulp + Lac +0.10mM ABTSDyed Pulp + Lac +0.10mM ABTS
A.1.7 CHARACTERIZATION BY NMR
A number of NMR spectra were obtained. Commercial dyes are mixtures that
include fillers in addition to one – or more- chromophores. Attempts were made to purify
Direct Yellow 11. Direct Yellow 11, as supplied, purified Direct Yellow 11 and
ABTS/Laccase combinations were all subjected to NMR. The spectra are complex and
difficult to interpret.

PAGE 27
Figure A-30 NMR Spectrum of Direct Yellow 11 as Supplied
Figure A-31 NMR Spectrum of Direct Yellow 11 Purified by TLC
Direct Yellow 11
TLC-Purified Direct Yellow 11

PAGE 28
Figure A-32 NMR Spectrum of Direct Yellow 11 Purified by Paper Chromatography
Figure A-33 NMR Spectrum of Direct Yellow 11 Purified by NH2-SPE

PAGE 29
Figure A-34 NMR Spectrum of 10.3 µL/mL Laccase + 5.0 mM ABTS
Figure A-35 NMR Spectrum of Direct Yellow 11 Treated with Laccase + ABTS
Laccase + ABTS
Direct Yellow 11 + Laccase + ABTS After 2hr at 10 bar O2, 45 ºC

PAGE 30
Table A-9 NMR Peaks
Sample Peak ppm 96..24 Direct Yellow 11 81-53
146-121 Lac + ABTS 23.6
144-111 37.9
Dye Rxn w/ Lac + ABTS
11-10
A.2 NECESSARY SUPPORTING PROCEDURES
A.2.1 DETERMINATION OF EXTENT OF PULP DYEING
As mentioned in the Experimental Procedures section of the Thesis, the amount of
Direct Yellow 11 attached to dyed pulp was determined by spectrophotometric
examination of the filtrate of the dyeing reaction. The filtrate spectrum was compared to
spectra from serial dilutions of a mixture of Direct Yellow 11 and alum prepared at the
concentrations present at the beginning of the dyeing reaction. Figure A-36 shows the
spectrum of the “100%” solution of Direct Yellow 11 + alum. It also shows the spectrum
of the “5%” diluted dye+alum mixture plotted on a separate axis. The spectra show that
the λMax of Direct Yellow 11 remains around 400 nm but the secondary peak around 270
nm becomes more pronounced as the dye/alum solution is diluted.

PAGE 31
Figure A-36 Spectra of Direct Yellow 11 + Alum
Direct Yellow 11 + Alum at Conc. Equiv. to Start of Dyeing
397306238
-0.2
0
0.2
0.4
0.6
0.8
1
1.2
1.4
1.6
200 300 400 500 600
Wavelength
Abs
orba
nce
-0.06
-0.04
-0.02
0
0.02
0.04
0.06
0.08
0.1
0.12
Abs
orba
nce
100%5%
The serial dilutions measured include 100%; 75%; 50%; 25%; 10%; 7.5%; 5%;
2.5% and 1%. To see if a linear relationship existed between dye concentration and
absorbance, the signal (baseline to spectral line) was measured for each dilution at the
wavelengths of inflection (shown as dotted lines in Figure A-36: 397 nm; 306 nm; 238
nm; and 200 nm). These signal intensity values were then plotted and fitted with linear
trend lines. The results are shown in Figure A-37. Although the rate of change in signal
depends on the wavelength being measured, the measured signal decreases linearly as the
dye + alum mixture is diluted.

PAGE 32
Figure A-37 Linear Models of Signals of Different Dilutions of Dye + Alum
Direct Yellow 11+Alum
y = 0.735x - 0.013R2 = 0.996
y = 1.22x + 0.015R2 = 0.996
y = 2.12x + 0.014R2 = 0.995
y = 2.75x + 0.046R2 = 0.994
0.00%
20.00%
40.00%
60.00%
80.00%
100.00%
120.00%
0 0.5 1 1.5
Absorbance
% o
f Sta
rting
Dye
Con
c 200nm306nm238nm397nmLinear (200nm)Linear (397nm)Linear (238nm)Linear (306nm)
Comparison of the spectrum of the filtrate from the completed dyeing reaction
with the spectra of the diluted Direct Yellow 11 + alum standards revealed that a change
occurred during the dyeing reaction. As can be seen in Figure A-38, the spectrum of the
dyeing reaction filtrate is not the same shape as the diluted Direct Yellow 11 + alum
mixture. Since the uptake of Direct Yellow 11 and of alum are dependent of their affinity
for cellulose fiber, it is likely that the uptake of dye and of alum would differ, resulting in
a changed ratio of dye to alum in the filtrate from the completed dyeing reaction. In
addition, alum (aluminum sulfate) demonstrates complex behavior in water such as
changing the number of water molecules bound depending on solution pH2. Examination
of the spectrum at λMax around 400 nm does show that the filtrate signal at 400 nm is less
than the signal from dye + alum diluted to 5%. The shape difference between filtrate
spectrum and diluted dye + alum mixtures complicates analysis. However, it does appear
that less than 10% of the applied amount of Direct Yellow 11 (0.25% or 3.0 g dye

PAGE 33
concentrate/1200 g. o.d. pulp) remains in the filtrate. During the dyeing process, greater
than 90% of the dye was attached to the pulp.
Figure A-38 Spectra of Diluted Dye + Alum and Dyeing Reaction Filtrate
-0.1
0
0.1
0.2
0.3
0.4
0.5
0.6
0.7
0.8
0.9
200 300 400 500 600
Wavelength
Abs
orba
nce
100%75%50%25%10%7.50%5%2.50%1%Filtrate
A.2.2 LACCASE ACTIVITY ASSAYS
Laccase activity was measured by monitoring the rate of oxidation of ABTS3 in a
100 mM pH 5.0 sodium acetate buffer. The course of the reaction was followed by using
a Perkin-Elmer Lambda 900 UV/Vis/NIR Spectrophotometer set to continuously collect
absorbance values at 420 nm.
One mL solutions with ABTS and buffer were prepared. The reaction was started
by the addition of laccase, followed by immediate placement in spectrophotometer and
start of data collection. The reaction of an enzyme with substrate is linear as long as
substrate is in excess. As the reaction nears completion, it slows down and is no longer
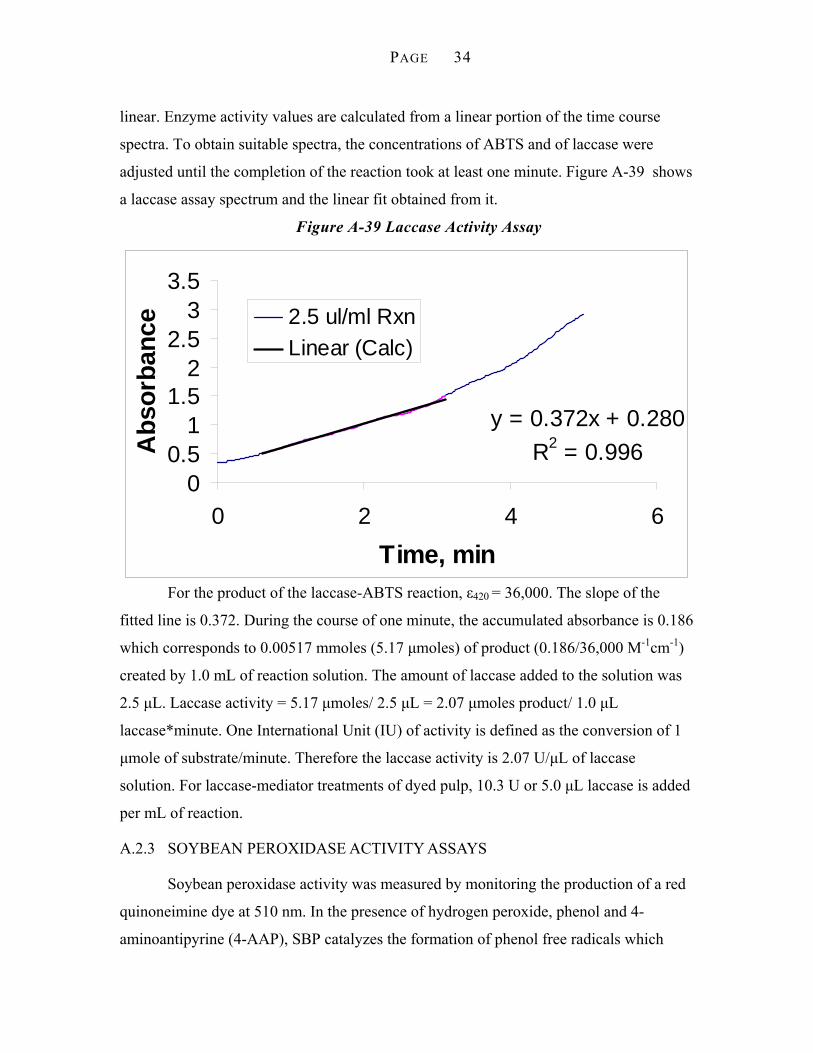
PAGE 34
linear. Enzyme activity values are calculated from a linear portion of the time course
spectra. To obtain suitable spectra, the concentrations of ABTS and of laccase were
adjusted until the completion of the reaction took at least one minute. Figure A-39 shows
a laccase assay spectrum and the linear fit obtained from it.
Figure A-39 Laccase Activity Assay
y = 0.372x + 0.280R2 = 0.996
00.5
11.5
22.5
33.5
0 2 4 6
Time, min
Abs
orba
nce 2.5 ul/ml Rxn
Linear (Calc)
For the product of the laccase-ABTS reaction, ε420 = 36,000. The slope of the
fitted line is 0.372. During the course of one minute, the accumulated absorbance is 0.186
which corresponds to 0.00517 mmoles (5.17 μmoles) of product (0.186/36,000 M-1cm-1)
created by 1.0 mL of reaction solution. The amount of laccase added to the solution was
2.5 μL. Laccase activity = 5.17 μmoles/ 2.5 μL = 2.07 μmoles product/ 1.0 μL
laccase*minute. One International Unit (IU) of activity is defined as the conversion of 1
μmole of substrate/minute. Therefore the laccase activity is 2.07 U/μL of laccase
solution. For laccase-mediator treatments of dyed pulp, 10.3 U or 5.0 μL laccase is added
per mL of reaction.
A.2.3 SOYBEAN PEROXIDASE ACTIVITY ASSAYS
Soybean peroxidase activity was measured by monitoring the production of a red
quinoneimine dye at 510 nm. In the presence of hydrogen peroxide, phenol and 4-
aminoantipyrine (4-AAP), SBP catalyzes the formation of phenol free radicals which

PAGE 35
then react with 4-AAP to form the quinoneimine dye. (ε510 = 7,210 a.u./M/cm)4 The
standard reaction conditions are 10 mM phenol, 2.4 mM 4-AAP and 0.2 mM H2O2 at
25°C, pH 7.0.
The reaction mixture was prepared and absorption at 510 nm was monitored. For
this enzyme, the reaction is started by the addition of hydrogen peroxide. As with the
laccase activity assay, determination of enzyme activity is done by fitting a trend line to
the linear portion of the time course spectra.
Figure A-40 Soybean Peroxidase (SBP) Activity Assay
y = 0.229x + 0.043R2 = 0.999
00.10.20.30.40.50.60.7
0 2 4 6Time, min
Abs
orba
nce
2 ug SBP PowderLinear (Calc)
For the original SBP activity assay performed in the summer of 2001, the
calculated activity was 7.95 Units/mg SBP powder. When additional soybean peroxidase
experiments were run in the summer of 2004, the same frozen powder preparation of SBP
was used, but the activity was reassayed. The same assay reaction conditions were used,
but the amount of enzyme was varied. A solution of 1 mg SBP powder/mL was prepared.
Activities for 1, 2, 5 and 10 μL aliquots were determined and linear trend lines were
obtained for each concentration. The results from enzyme activity assays can vary with
concentration of the reaction solution. When concentration-corrected enzyme activity
values were calculated, the activity calculated from the 1 µL aliquot was low (4 U/mL),
and the activity calculated from the 10 µL aliquot was high (8 U/mL). Consequently, the

PAGE 36
similar activities (~6U/mL) obtained from the 2 and the 5 μL aliquots were averaged. The
activity value calculated in August 2004 was 6.3 Units/mL. This slight decrease in
enzyme activity is reasonable for powdered enzyme stored at -4ºC.
A.2.4 ASSAY OF HYDROGEN PEROXIDE “30%” STOCK SOLUTION
For accurate concentration, hydrogen peroxide stock must be titrated before
application. The method was supplied by Interox America. A mixture of 100 mL distilled
water, 10-15 mL 4N sulfuric acid, 5.0 mL 1N potassium iodide and 3 drops of saturated
ammonium molybdate is prepared and 2.0 mL of “30%” hydrogen peroxide stock is
added. This mixture is then titrated with a 0.2 N sodium thiosulfate solution. Near the
end, as the yellow color becomes pale, 10 mL of starch indicator solution is added.
Titration endpoint is then readily visible as the dark blue color disappears.
An example calculation is outlined below.
(thio = sodium thiosulfate)
176.0 mL of 0.2 N thiosulfate was used in the first titration (173.0 in second)
Weight of 2 mL H2O2 sample was 2.226 g
0.2 N thio x 17g/mole (equiv thio/H2O2) x 176.0 mL (from titration) / 2 mL sample = 299.2 g/l
2.226 g / 2 mL H2O2 solution (density) * 1000 mL = 1113 g (for 1 L volume of H2O2 sln)
299.2 g/l / 1113 g = 26.88% wgt/wgt H202 (from first titration)
For second titration, 173.0 mL thio yields 294.1 g/L result: 26.42%
Average of 26.88 & 26.42 (from first and second titrations) = 26.65% wgt/wgt
A.3 DATA FOR PUBLICATION TABLES AND BAR GRAPHS
A.3.1 COMPARISON BETWEEN LACCASE MEDIATORS
These experiments were performed by treating Direct Yellow 11 dyed pulp with
laccase in the presence of 5.0 mM of violuric acid (VA), 1-hydroxybenzotriazole (HBT),
or 2-2´ azinobis (3-ethyl benzthiazoline-6-sulfonate) (ABTS). After the laccase-mediator
treatment, the treated pulps were washed and made into handsheets. The CIELAB values
were then measured. For dye removal index value (DRI) calculations, CIELAB values for

PAGE 37
handsheets made from untreated Direct Yellow 11 dyed pulps were used for the reference
starting point.
Error bars for these treatments were calculated. For each treated pulp, 5 to 7
handsheets were prepared and 5 CIELAB were obtained per handsheet. The resultant 25-
35 CIELAB readings were used to calculate average CIELAB values for the treated pulp.
Standard deviations were also calculated. DRI values are a single number derived from
calculations based on L*, a* and b* for the reference pulp and the treated pulp. The
calculated standard deviation for L*, a* and b* were added and subtracted from the
average L*a*b* values of the treated pulp. DRI values were calculated for the average
L*a*b* values, the “low” and the “high” L*a*b* values. The DRI values calculated from
the “low” and “high” L*a*b* were used to produce the error bars for the DRI value
calculated from the average L*a*b* values.
Table A-10 DRI Values for Pulps Treated with Different ABTS Concentrations
Mediator Brightness L* a* b* DRI (avg)
DRI (hi)
DRI (low) L* SD a* SD b* SD
Lac 56.3 94.1 -3.41 24.8 22.0 23.1 20.9 0.09 0.14 0.23 Lac + ABTS 54.6 87.4 -0.57 15.0 57.9 61.8 54.9 0.18 0.08 0.18 Lac + HBT 56.6 94.0 -3.76 24.4 23.9 26.1 21.6 0.21 0.08 0.46 Lac + VA 55.9 93.2 -3.04 23.7 27.6 28.4 26.7 0.12 0.06 0.20
A.3.2 BLEACHING RESPONSE TO ABTS CONCENTRATIONS
Pulp dyed with Direct Yellow 11 was treated with laccase in the presence of
different amounts of ABTS. As mentioned above, standard deviations in L*, a* and b*
values were used to calculate “low” and “high” DRI error bars.
Table A-11 DRI Values for Pulps Treated with Different ABTS Concentrations
mM ABTS Brightness L* a* b* DRI (avg)
DRI (hi)
DRI (low) L* SD a* SD b* SD
0 56.3 94.1 -3.41 24.8 22.0 23.1 20.9 0.09 0.14 0.23 0.005 58.5 93.3 -3.24 21.1 41.0 42.5 39.4 0.16 0.11 0.38 0.01 60.4 91.2 -1.85 15.8 61.1 61.3 60.8 0.14 0.10 0.16 0.05 57.5 86.3 0.97 10.1 65.8 65.3 66.2 0.28 0.13 0.19 0.50 53.5 82.6 2.37 7.7 56.8 55.8 57.8 0.37 0.13 0.27 5.0 54.8 83.5 2.31 7.9 59.9 59.3 60.6 0.23 0.11 0.12

PAGE 38
A.3.3 COMPARISON BETWEEN ENZYMATIC TREATMENTS
Both dyes, Direct Yellow 11 and Basazol 46L, were treated with soybean
peroxidase, horseradish peroxidase and laccase with 1.0 mM ABTS. The results from
soybean peroxidase treatment of Direct Yellow 11 varied with dye concentration. When
the absorption area was low, as for 10 ppm (mg/L) Direct Yellow 11, the calculated
reduction was lower (39%) than when the area was higher (49%) due to higher (20 ppm)
dye concentration.
Table A-12 Comparisons between Enzymatic Treatments
Basazol 46L Direct Yellow 11
Area
BeforeArea After
% Reduction
Area Before
Area After
% Reduction
Dye Conc.
Soybean Peroxidase (pH 3.8) 25.1 1.55 93.8% 5.47 3.31 39.4% 10 ppm Horseradish Peroxidase (pH 3.8) 36.8 10.7 70.8% 15.5 12.2 21.4% 20 ppm Laccase + 1.0 mM ABTS (pH 4.5) 41.8 27.8 33.6% 29.0 15.7 45.8% 20 ppm Soybean Peroxidase (pH 3.8) 62.0 7.95 87.2% 15.5 7.99 48.5% 20 ppm
A.3.4 EFFECT OF PH ON SOYBEAN PEROXIDASE DECOLORIZATION
The data for the published bar graphs are listed in Table A-13 and Figure A-14. In
these tables, the molecular weight (10,000 or 35,000) of the poly ethylene glycol (PEG)
included in the reaction is listed in the PEG column. The published bar graphs for SBP
treatment of Direct Yellow 11 did not include pH 6.5, but that data is included here.
Soybean peroxidase is inhibited by the presence of phosphate, which was present since
sodium phosphate buffer was used for the pH 6.5 reactions. The inhibition was
significant for the decolorization of Direct Yellow 11, but had only minor effect on SBP
decolorization of Basazol 46L. The decolorization reaction was attempted using
potassium citrate buffer for pH 6.5. However, the reaction mixture also includes calcium
chloride and the calcium citrate precipitated.

PAGE 39
Table A-13 Effect of pH on SBP Decolorization of Basazol 46L
Peak Area
Dye PEG pH Before After%
Reduction 2.4 55.6 17.1 69.2% 3.8 48.6 7.3 85.1% 4.5 41.4 4.3 89.7% 6.5 44.8 7.9 82.4% 8.5 53.6 5.9 89.0%
Basazol 46L None
10.5 36.0 20.7 42.4% 2.4 45.8 18.2 60.2% 3.8 49.2 7.3 85.3% 4.5 49.0 6.2 87.4% 6.5 48.4 6.3 87.0% 8.5 63.2 6.5 89.7%
Basazol 46L 10K
10.5 45.4 19.6 56.9% 2.4 56.0 18.3 67.3% 3.8 50.4 6.6 86.9% 4.5 51.9 4.9 90.6% 6.5 50.6 8.1 83.9% 8.5 61.4 6.5 89.4%
Basazol 46L 35K
10.5 34.0 20.4 39.9%

PAGE 40
Table A-14 Effect of pH on SBP Decolorization of Direct Yellow 11
Peak Area
Dye PEG pH Before After%
Reduction 2.4 43.1 20.8 51.8% 3.8 28.7 12.2 57.5% 4.5 24.1 12.5 48.1% 6.5 25.4 22.9 9.6% 8.5 34.2 17.3 49.5%
Direct Yellow 11 None
10.5 23.5 24.7 -5.3% 2.4 41.5 20.4 50.8% 3.8 28.6 19.2 32.9% 4.5 28.2 17.9 36.5% 6.5 26.0 19.9 23.7% 8.5 32.5 18.1 44.3%
Direct Yellow 11 10K
10.5 24.7 24.7 0.2% 2.4 41.8 20.3 51.3% 3.8 28.9 19.4 32.9% 4.5 29.4 16.9 42.5% 6.5 25.3 21.7 14.2% 8.5 32.3 17.7 45.1%
Direct Yellow 11 35K
10.5 23.9 24.0 -0.5%
A.3.5 EFFECT OF DMSO ON SBP DECOLORIZATION OF BASAZOL 46L
Peroxidase enzymes can create hydroxyl radicals. To examine whether free
radicals were involved in the decolorization of Basazol 46L by soybean peroxidase, a set
of experiments were performed at pH 6.5, with and without 5.0 mM dimethyl sulfoxide
(DMSO). DMSO is a free radical quencher5. If the soybean peroxidase enzyme releases
into the solution free radicals that are necessary for the decolorization reaction, the
inclusion of DMSO would significantly inhibit the decolorization reaction. However,
inclusion of 5.0 mM DMSO had little effect on the dye decolorization.

PAGE 41
Figure A-41 Effect of DMSO on SBP Decolorization of Basazol 46L
SBP Decolorization of Basazol 46L
0
2
4
6
8
10
12
14
No PEG 10K PEG 35K PEG
Sign
al A
rea
No DMSOW/ DMSO
Table A-15 Signal Intensity for pH 6.5
Before After % Reduction No PEG 40.2 11.8 70.5% 10K PEG 40.8 12.3 69.8% 35K PEG 39.3 12.5 68.3% No PEG w/ DMSO 40.5 11.8 70.8% 10K PEG w/ DMSO 39.8 12.2 69.3% 35K PEG w/ DMSO 41.0 12.5 69.5%
A.3.6 REACTION RATE DATA
In the dissertation, it is noted that when Basazol 46L is decolorized with soybean
peroxidase, 74% of the color is removed within 5 minutes. To clarify, the numerical data
for the reaction rate graphs are given below.

PAGE 42
Table A-16 Reaction Rate Study of SBP Decolorization of Basazol 46L
Time, min Area
Time, min
Time, Hour Area
% Reduced
Time, Hour Area
% Reduced
0 56.1 5 0.08 15.02 73.6% 2 5.99 89.5% 0 56.8 5 0.08 14.84 73.9% 2 7.76 86.3% 0 56.9 5 0.08 14.77 74.0% 2 9.52 83.2% 0 57.0 10 0.17 9.79 82.8% 4 10.24 82.0% 0 57.0 20 0.33 6.65 88.3% 6 6.93 87.8% 0 56.8 30 0.5 9.77 82.8% 8 8.11 85.7% 0 56.9 30 0.5 9.38 83.5% 10 5.55 90.2% 0 56.8 30 0.5 9.54 83.2% 12 8.99 84.2% 0 57.0 60 1 7.34 87.1% 24 7.05 87.6% 0 56.9 90 1.5 6.35 88.8%
Avg, 0 56.8
Table A-17 Reaction Rate Study of SBP Decolorization of Direct Yellow 11
Time, min Area
Time, min
Time, Hour Area
% Reduced
Time, Hour Area
% Reduced
0 15.8 5 0.08 12.53 19.3% 2 7.78 49.9% 0 15.5 5 0.08 12.47 19.7% 2 8.22 47.0% 0 15.9 5 0.08 12.42 20.0% 2 7.96 48.7% 0 15.6 10 0.17 12.25 21.1% 4 7.08 54.4% 0 15.8 20 0.33 11.13 28.3% 6 6.37 59.0% 0 15.6 30 0.5 10.31 33.6% 8 8.19 47.3% 0 15.2 30 0.5 10.46 32.6% 10 6.93 55.3% 0 15.2 30 0.5 10.14 34.7% 12 6.44 58.5% 0 15.1 60 1 9.22 40.6% 24 5.18 66.6%
Avg, 0 15.5 90 1.5 8.12 47.7%
Table A-18 Reaction Rate Study of Direct Yellow 11 with Laccase+1.0 mM ABTS
Time, Minutes
Time, Hour Area
Time, Hour Area
0 0 29.0 2 15.7 5 0.08 33.0 3 13.7 10 0.17 31.9 4 12.2 15 0.25 32.9 6 11.4 20 0.33 29.2 8 8.6 30 0.5 26.0 10 8.0 45 0.75 19.2 12 7.3 60 1 19.0 24 5.4 75 1.25 14.9 48 4.7 90 1.5 16.2

PAGE 43
A.3.7 COMPARISON AMONG BLEACHING TREATMENTS
Averages: Change in
Sample Treatment Brightness Brightness L* a* b* R^2 dR2 (Ref)
DRI (Ref)
2Blue Base (Peroxy) Base 2 76.83494 86.12714 -6.8727 -6.38169 280.4161 Blue Base Base 1 77.0955 86.675 -6.63713 -5.60575 253.0315 Blue 1 Lac/ABTS 76.49214 76.49214 88.35179 -4.58857 -2.35107 162.2634 -90.7681 35.87224 2 Lac + Alk Ext 80.84208 80.84208 92.2825 -2.79938 1.023958 68.4448 -184.587 72.95009 3 Lac + DiThio 79.50417 79.50417 90.57417 -5.04271 -0.70521 114.7726 -138.259 54.641 4 O2 82.64479 82.64479 92.92354 -3.65979 0.777083 64.0742 -188.957 74.67738 5 O2 + DiThio 86.02045 86.02045 95.46682 -1.30386 2.644545 29.24342 -223.788 88.44277 6 Peroxide 86.59268 86.59268 94.75036 -2.60607 0.916071 35.18955 -245.227 96.91544 7 P + DiThio 86.70021 86.70021 95.85042 -1.27771 2.764583 26.4945 -253.922 100.3518Cherry Pink Base 64.43236 83.74778 18.34639 -0.60806 601.0944 Cherry Pink 1 Lac/ABTS 67.92732 67.92732 86.40125 11.55214 1.257321 319.9589 -281.136 46.77062 2 Lac + Alk Ext 74.93313 74.93313 89.47958 8.330625 0.70625 180.5773 -420.517 69.95859 3 Lac + DiThio 77.78688 77.78688 92.51396 2.089375 3.776042 74.6648 -526.43 87.57852 4 O2 76.25964 76.25964 90.94357 7.383929 2.105536 140.9746 -460.12 76.54702 5 O2 + DiThio 84.65042 84.65042 95.31354 0.2075 3.400208 33.56736 -567.527 94.41563 6 Peroxide 78.54909 78.54909 90.412 9.728182 -0.61345 186.9436 -414.151 68.89946 7 P + DiThio 86.22839 86.22839 95.65839 0.290179 2.761786 26.56122 -574.533 95.58119Gold Base Base 23.54075 86.72463 1.81775 53.42525 3033.797 Goldenrod 1 Lac/ABTS 23.66688 23.66688 86.42354 -2.07396 52.58563 2953.869 -79.9277 2.634575 2 Lac + Alk Ext 18.50854 18.50854 87.97333 -2.71875 64.63417 4329.608 1295.811 -42.7125 3 Lac + DiThio 25.99833 25.99833 89.80875 -5.47938 54.57146 3111.929 78.13206 -2.57539 4 O2 19.75175 19.75175 88.5185 -1.9005 63.16525 4125.286 1091.488 -35.9776 5 O2 + DiThio 36.48255 36.48255 93.03255 -8.67809 44.84021 2134.499 -899.298 29.64265 6 Peroxide 21.07563 21.07563 88.71688 -1.15333 61.03583 3854.012 820.2149 -27.0359 7 P + DiThio 42.3675 42.3675 93.78917 -8.38729 39.01604 1631.173 -1402.62 46.2333Direct Yellow Base 51.56963 93.585 -2.88 28.8275 880.4714 Direct Yellow 1 Lac/ABTS 56.2055 56.2055 91.138 -1.82125 20.228 491.024 -389.447 44.23169 2 Lac + Alk Ext 55.241 55.241 91.8055 2.439 21.73125 545.3458 -335.126 38.06207 3 Lac + DiThio 82.84104 82.84104 95.57167 1.081042 4.96375 45.4176 -835.054 94.84167 4 O2 72.65688 72.65688 95.87146 -2.26833 13.35583 200.5685 -679.903 77.22033 5 O2 + DiThio 88.47667 88.47667 96.81625 -0.22896 3.158125 20.16244 -860.309 97.71004 6 Peroxide B 71.46438 71.46438 95.90344 -2.52969 14.355 229.2472 -651.224 73.96313 7 P + DiThio 89.00982 89.00982 96.80589 -0.21429 2.72625 17.68068 -862.791 97.99191

PAGE 44
A.4 ALTERNATIVES/VARIATIONS OF LACCASE-MEDIATOR SYSTEM
A.4.1 GRAFTING
For the first attempt to dye bleached hardwood kraft pulp with Direct Yellow 11,
the pulp was simply mixed with the dye. After filtration, a yellow solution and nearly
white pulp was obtained. A dye fixative is necessary to attach Direct Yellow 11 to pulp.
Dyed pulp was later prepared using alum (aluminum sulfate 18-hydrate) as fixative. The
need for a fixative led to a set of experiments to determine if laccase could graft Direct
Yellow 11 onto pulp. Direct Yellow 11 (75 mg) was mixed with (30 g) of white bleached
hardwood kraft pulp then subjected to one of three treatments: 1) [“laccase’] treatment
with 10.3 units of laccase in 100 mM sodium acetate buffer pH 4.5, at 45ºC for 2 hours
under 10 bar oxygen pressure 2) [“oxygen”] treatment with 10 bar oxygen pressure in
100 mM sodium acetate buffer pH 4.5, at 45ºC for 2 hours and 3) [“alum”] treatment by
adding (0.60 g) alum to Direct Yellow 11/pulp mixture and stirring for one hour at room
temperature. The results are shown below in Table A-19. “Wh Pulp” refers to the starting
white pulp. D2 is the calculated distance for the measured Lab* values from the ideal
bleach point (where a=b=0, L=100). The difference in D2 between the treated and starting
white pulps is shown as ∆D2. These results are shown graphically in Figure A-42 and
Figure A-43. Figure A-42 shows the TAPPI brightness values for handsheets made from
the white and each treated pulp. The calculated distance from the ideal bleach point, D2,
measures the amount of color present. As can be seen in Figure A-43, laccase treatment
under oxygen pressure was less effective in attaching Direct Yellow 11 to the pulp than
was oxygen treatment alone. The addition of alum greatly increased the attachment of
Direct Yellow 11 to the bleached pulp. Conclusion: laccase is not effective in grafting
Direct Yellow 11 to pulp. Laccase, which is known to react with phenols, may not
directly interact with the dye Direct Yellow 11 since it lacks phenolic groups.
Anecdotally, laccase does appear to be able to graft ABTS to pulp. In later
experiments, a set of sheets were prepared for TOF-SIMS experiments. For a control,
white pulp was treated with laccase plus 1.0 mM ABTS. Handsheets made from the
treated white pulp were faintly blue/purple. Since ABTS does bind to laccase and forms

PAGE 45
the dication, in the absence of reactive compounds to complete the redox cycle, some of
the ABTS (a blue compound) may attach to the pulp and impact some blue color.
Table A-19 Results of Grafting Direct Yellow 11 onto Pulp
Treatment Brightness L* a* b* D2 ∆D2 Oxygen 66.11 95.71 -3.37 18.37 367.0 344.1 Laccase 68.88 95.79 -2.83 16.13 285.9 262.9 Alum 53.08 94.30 -3.39 28.4 850.6 827.6 Wh Pulp 87.39 96.85 -0.43 3.59 23.0 0
Figure A-42 Brightness after Grafting Treatments
Treatments to Attach Dye to Pulp
0
20
40
60
80
100
Oxygen Laccase Alum Wh Pulp
Grafting Agent
Brig
htne
ss

PAGE 46
Figure A-43 Color from Grafted Direct Yellow 11
0100200300400500600700800900
Oxygen Laccase Alum Wh Pulp
Grafting Agent
Dis
tanc
e Fr
om Id
eal B
leac
h (w
here
a*=
b*=0
, L*=
100)
A.4.2 LACCASE TREATMENT USING INORGANIC LACCASE MEDIATORS
Inorganic mediators have been discovered for laccase.6,7 Two commercially
available inorganic laccase mediators were obtained for testing. Potassium
octacyanomolybdate (IV) hydrate (CNMo) was purchased from Sigma. The second was
produced by mixing 3 moles of 4,4’-dimethyl-2,2’-dipypridyl with 1 mole of ferrous
chloride, 4-hydrate to produce Fe[II]DMDP. Spectra were obtained for both compounds
and both mediators were applied to the decolorization of 20 ppm Direct Yellow 11.
However, strong spectral absorbance by the mediators limited application. For
Fe[II]DMDP, the mediator concentration was reduced to 0.01 mM to allow spectral
measurement. For decolorization with CNMo, 1 mM concentration was applied, but the
t0 and 2 hour reaction samples were diluted 1:10 to improve spectral measurement.
Neither mediator appeared to be effective at the concentrations tested.

PAGE 47
Figure A-44 Ineffective Decolorization with Potassium Octacyanomolybdate
00.10.20.30.40.50.60.70.80.9
1
200 300 400 500 600
Wavelength (nm)
Abs
orba
nce
1:10 Dil t0 1mM CNMo+20ppm DY11+1ul/mL Lac
1:10 Dil 2hr Rxn 45C 10bar O2 CNMo+DY11+Lac
0.1mM CNMo (K-octa-cyano-Mo)0.1mM CNMo + 1uL/mL Laccase
Figure A-45 Ineffective Decolorization by Laccase with Fe[II]DMDP
0
0.5
1
1.5
2
2.5
3
200 300 400 500 600Wavelength (nm)
Abs
orba
nce
t0 0.01mM Fe[II]DMDP+20ppm DY11+Lac
2hr Rxn 45C 10bar O2 Fe[II]DMDP+DY11+Lac
0.01 mM Fe[II]DMDP (Di-Methyl-Di-Pypridyl)
0.01 mM Fe[II]DMDP+1uL/mL Laccase

PAGE 48
A.4.3 BOROHYDRIDE REDUCTION OF DIRECT YELLOW 11-DYED PULP
Because of the electronic requirements for light absorption and the creation of
color, Direct Yellow 11 could be decolorized by either oxidation or reduction. Laccase-
mediated reactions oxidize substrates. It was relevant to determine whether Direct Yellow
11 could be decolorized by reduction. To do this, Direct Yellow 11 (Fastusol) was
reacted with sodium borohydride for a week at room temperature (RT). Dye solution was
diluted 1:10,000 and the pH was adjusted to pH 10.65. Some of the diluted dye was
transferred to a flask and stored in the dark for one week. To the remaining portion
sodium borohydride was added and mixed. The borohydride-Direct Yellow 11 solution
was then also placed in the dark for one week at room temperature. Spectra were obtained
from both samples after one week.
Figure A-46 Reduction with Sodium Borohydride Shifts λMax slightly
A.5 OPTIMIZATION OF LACCASE/ABTS DECOLORIZATION
A statistical design experiment was performed to determine the optimum
combination of laccase, ABTS, and oxygen pressure. The selected format was a central
composite design with additional axial points. The designed structure was a three variable
version of the two dimension design shown below. Each level of an experimental variable
was assigned a coded value between -2 and +2. In a central composite experiment, the
200.0 250 300 350 400 450 500 550 600.00.00
0.1
0.2
0.3
0.4
0.5
0.6
0.72
NM
A
10e4 Dil Fastusol pH 10.65 1 week RT 10e4 Dil Fastusol pH 10.65 + 4% wt/wt NaBH4

PAGE 49
interval between each value is fixed – that is the difference between 0 and + 1 is the same
as between 0 and -1. That is true also for the added axial values. To obtain an estimate of
experimental error, a number of 0,0,0 points were also included.
Figure A-47 Central Composite Design Experiment with Axial Points
-2
-1
0
1
2
-2 -1 0 1 2
A.5.1 SELECTED EXPERIMENTAL DESIGN
The experimental design was based on Design and Analysis of Experiments by
Douglas Montgomery.8 An orthogonal rotatable experiment with k=3 variables was
designed. The number of factorial runs (all combinations of 1,1,1 to -1,-1,-1) needed was
8. Axial runs (0,0,2 to -2,0,0) totaled 6. Six center point runs (0,0,0) were included to
obtain an estimate of experimental error. The coded variable values for the 20
experimental runs performed are shown in Table A-20
Table A-20 Coded Values for Central Composite Experiment
2^3 Factorial 8 runs Axial Runs 6 Runs Center Points 6 Runs Run a b c Run a b c Run a b c
1 1 1 1 1 0 0 2 1 0 0 0 2 1 1 -1 2 0 0 -2 2 0 0 0 3 1 -1 1 3 0 2 0 3 0 0 0 4 1 -1 -1 4 0 -2 0 4 0 0 0 5 -1 1 1 5 2 0 0 5 0 0 0 6 -1 1 -1 6 -2 0 0 6 0 0 0 7 -1 -1 1 8 -1 -1 -1

PAGE 50
A.5.2 CALCULATING VARIABLE VALUES FOR EACH CODED LEVEL
From what is known about the reaction mechanism, increasing the concentrations
of oxygen, (consumed during the reaction), ABTS and laccase would each increase the
reaction rate until a constraint is reached and no further improvement occurs. The
bleaching response for different ABTS concentrations at constant laccase and oxygen
concentration shows this logarithmic behavior. (Figure A-48) Based on this, Dr. Mc
Donough suggested that rather than plotting the variable concentrations on a linear scale
and then selecting fixed intervals between values, the variable concentrations should be
plotted on a logarithmic scale and a fixed “logarithmic” interval selected. Based on the
sketch shown in Figure A-48, Dr. McDonough suggested that for the concentrations of
ABTS, the “0” level should be between 0.005 and 0.01 mM ABTS, the “-1” value below
0.005, and the “+1” value above 0.05 mM.
Figure A-48 Bleaching Response to ABTS Concentrations
Following Montrogenomery,8 the alpha value between levels was kept at 1.6818
and a was adjusted to limit variables to achievable concentrations. As per Dr.
McDonough’s recommendation, the “0” value for ABTS was set at 0.075 mM. The “0”
values selected for laccase and oxygen pressure were the amounts applied in the
“standard” decolorization reaction 10.3 Units or 5 μL of laccase/mL reaction and 10 bar
oxygen pressure.
The calculations of variable values are shown in Table A-21. The calculations
were performed as follows:
.01.05
.005
ABTS Conc.
DRI

PAGE 51
The “0” variable values were set (5, 0.0075 and 10).
The log was obtained for those values (0.699, -2.125 and 1.0).
For each level, the coded value was multiplied by the a value and added to the “0”
log value to obtain the level log value. For example, for the -2 laccase log value, -3.3636
multiplied by 0.3 (a) and added to “0” log value (0.699) yielded the log value -0.310.
The inverse logarithm is then calculated to obtain the actual values of variables
that were applied during the experiment. For example, the inverse logarithm of -0.310
yields 0.490 as the value for the μL of laccase to add/mL reaction solution for the -2,0,0
axial run. If necessary, the value of a was adjusted to yield achievable values for the
variables. The variable values used in the experiment were equally spaced on the
logarithmic scale. The actual values and calculations are shown in Table A-21. From the
assay of laccase activity, 5 µL laccase stock/mL of solution equals 5 Units laccase/mL.
Table A-21 Calculation of Variable Values for Statistical Designed Experiment
Variables: Laccase, µL/mL
ABTS, mM
Oxygen Pressure
Laccase, Units
Actual Values Level -2 0.49 0.0011 5 1.0094 Level -1 1.57 0.0028 7 3.2342 Level 0 5 0.0075 10 10.3 Level 1 16.0 0.020 14 32.96 Level 2 51.1 0.052 20 105.266
Calculation Factor a 0.3 0.25 0.09 alpha = 1.6818
Variable Values Level Coded Level -2 0.490 0.0011 4.981 -2 -3.3636 Level -1 1.565 0.0028 7.057 -1 -1.6818 Level 0 5 0.0075 10 0 0 Level 1 15.978 0.0197 14.170 1 1.6818 Level 2 51.056 0.0520 20.078 2 3.3636
Log Variable Values Level -2 -0.310 -2.966 0.697 Level -1 0.194 -2.545 0.849 Level 0 0.699 -2.125 1.000 Level 1 1.204 -1.704 1.151 Level 2 1.708 -1.284 1.303

PAGE 52
A.5.3 EXPERIMENTAL RESULTS
Since these experimental points took several weeks to perform, to prevent a
blocking effect, points from the various levels were interspersed. Every week, one of the
center points (0,0,0) was run as well as one of the axial points. The numerical results are
shown in Table A-22. Maximum and minimum DRI values are in bold.
Table A-22 Results from Statistical Design Experiment for Lac/ABTS Decolorization
DRI Error
Values Std Dev Sample Date Brightness L* a* b* DRI Hi Low L* a* b* Lac ABTS O2Yellow Base Sheet 52.3 93.8 -2.74 28.4 0.17 0.16 0.55 0,0,0 27-Jan 54.7 89.8 -1.48 19.1 44.6 44.0 45.2 0.34 0.07 0.32 0 0 0 0,0,0 7-Feb 56.3 91.2 -1.73 19.9 43.9 42.3 45.4 0.12 0.06 0.39 0 0 0 0,0,0 17-Apr 56.1 90.7 -1.79 19.3 45.6 44.7 46.5 0.14 0.06 0.27 0 0 0 0,0,0 23-Apr 56.7 90.7 -1.58 18.7 48.4 47.6 49.1 0.22 0.07 0.28 0 0 0 0,0,0 1-May 56.5 91.1 -1.69 19.5 45.6 44.8 46.4 0.12 0.07 0.24 0 0 0 0,0,0 7-May 56.0 90.6 -1.63 19.3 45.8 44.9 46.8 0.14 0.05 0.28 0 0 0 Avg 0,0,0 56.1 90.7 -1.65 19.3 45.7 44.7 46.6 +2,0,0 Hi Lac 6-May 62.9 93.0 -1.92 16.8 60.5 59.8 61.1 0.23 0.09 0.28 2 0 0 -2,0,0 Low Lac 2-May 54.6 90.4 -1.69 20.2 40.9 40.2 41.6 0.20 0.21 0.27 -2 0 0 0,+2,0 Hi ABTS 24-Apr 54.3 84.7 1.26 10.6 58.8 59.1 58.5 0.18 0.08 0.12 0 2 0 0,-2,0 Low ABTS 16-Apr 56.5 93.0 -2.28 22.8 32.6 30.1 35.0 0.24 0.13 0.54 0 -2 0 0,0,+2 Hi O2 28-Jan 58.7 91.9 -1.83 18.8 50.2 49.1 51.2 0.22 0.20 0.35 0 0 2 0,0,-2 Low O2 6-Feb 56.9 91.5 -1.75 19.8 44.9 43.9 45.9 0.13 0.05 0.27 0 0 -2 +1,+1,+1 5-May 58.8 91.0 -1.40 16.9 56.5 54.8 58.0 0.35 0.07 0.59 1 1 1 +1,+1,-1 10-Feb 56.0 89.6 -1.11 17.5 51.1 50.5 51.8 0.17 0.06 0.26 1 1 -1 +1,-1,+1 18-Apr 60.1 93.2 -1.92 19.8 48.2 47.5 49.0 0.15 0.09 0.22 1 -1 1 +1,-1,-1 11-Feb 59.4 92.9 -1.82 20.0 46.9 45.9 47.9 0.15 0.09 0.28 1 -1 -1 -1,+1,+1 29-Apr 57.8 89.3 -1.09 15.2 59.2 58.9 59.5 0.18 0.07 0.21 -1 1 1 -1,+1,-1 21-Apr 55.3 88.5 -0.84 16.3 53.3 53.1 53.5 0.19 0.08 0.19 -1 1 -1 -1,-1,+1 30-Apr 56.2 92.2 -2.22 21.7 37.0 35.9 38.1 0.18 0.08 0.28 -1 -1 1 -1,-1,-1 29-Jan 57.0 92.5 -2.21 21.4 38.9 37.9 39.8 0.15 0.07 0.24 -1 -1 -1

PAGE 53
The results obtained showed small differences. To magnify the differences, the
brightness values are plotted for the range of 45-65. Of the six center point values, the
brightness values were 56.0 to 56.7 for five points; 54.7 for the remaining point.
Figure A-49 Statistical Experiment: Brightness Values for 0,0,0 Center Point Runs
Center PointsBrightness
45
50
55
60
65
0,0,0 0,0,0 0,0,0 0,0,0 0,0,0 0,0,0
Brig
htne
ss
Figure A-50 Statistical Experiment: Brightness Values for Axial Runs
Axis PointsBrightness
45
50
55
60
65
+2,0,0 Hi Lac
-2,0,0 Low Lac
0,+2,0 Hi ABTS
0,-2,0 Low ABTS
0,0,+2 Hi O2
0,0,-2 Low O2
Brig
htne
ss

PAGE 54
Figure A-51 Statistical Experiment: Brightness Values for Factorial Runs
Factorial PointsBrightness
45
50
55
60
65
+L,+A,+O +L,+A,-O +L,-A,+O +L,-A,-O -L,+A,+O -L,+A,-O -L,-A,+O -L,-A,-O
Brig
htne
ss
One way to examine the data is to examine by comparison to the center point
data. The dye removal index values all appeared high – above 90 % when initially
calculated. However, that was due to miscalculating the distance from ideal bleach point
(“color content”) of the initial base sheets. The final correct dye removal index values are
32 to 60%. All the DRI values are plotted below.
Figure A-52 Statistical Experiment: DRI Values for 0,0,0 Center Point Runs
Center Points DRI
414243444546474849
0,0,0 0,0,0 0,0,0 0,0,0 0,0,0 0,0,0
DRI

PAGE 55
Figure A-53 Statistical Experiment: DRI Values for Axial Runs
Axis Points DRI
010203040506070
+2,0,0 Hi Lac
-2,0,0 Low Lac
0,+2,0 Hi ABTS
0,-2,0 Low ABTS
0,0,+2 Hi O2
0,0,-2 Low O2
DRI
Figure A-54 Statistical Experiment: DRI Values for Factorial Runs
Factorial Points DRI
0
10
20
30
40
50
60
70
+1,+1,+1 +1,+1,-1 +1,-1,+1 +1,-1,-1 -1,+1,+1 -1,+1,-1 -1,-1,+1 -1,-1,-1
DRI
There are many ways to examine this data. One method is to set the amount of
color (distance from ideal bleach point) of the center point data as zero and look at the
percent change between in color content between pulp subjected to the (0,0,0) treatment
and the other treatments. The results are shown in Figure A-55. As expected for the axial
experiments (one variable ± 2 while others stay at 0), increasing just one variable
increased the removal of color while decreasing it decreased color removal. The variable
levels were actually spaced logarithmically equidistant. The relatively large increase in

PAGE 56
oxygen pressure from 10 bars to 20 only increased color removal 8 %. Decreasing
oxygen level from 10 bars to 5 bars caused a 36% decrease in the amount of color
removed during standard (0,0,0) treatment. For laccase mediator ABTS, equal size
logarithmic changes in concentration (0.0075 down to 0.0011 or up to 0.052 mM)
resulted in equal size changes in amount of color removed (± 24). Decreasing from 5
µL/mL of laccase to 0.49 µL/mL (10 fold decrease) decreased color removal by 9%.
Increasing laccase from 5 µL/mL to 51.1 (10 fold increase) increased color removal by
27%.
The factorial points (all variables either +1 or -1 level) also yield interesting
results. In the presence of higher concentration of ABTS (0.02 mM), dropping the laccase
concentration from 16.0 µL/mL to 1.6 µL/mL, actually increased the amount of color
removal (25% vs. 20% if O2 = +1, 14% vs. 10% if O2 = -1). In the presence of the lower
concentration (0.003 mM) of ABTS, dropping the laccase concentration decreased the
amount of color removal (-16% vs. 5% if O2 = +1, 13% vs. 2% if O2 = -1). If both the
laccase and ABTS concentrations are dropped, the amount of color removal is less than
for standard conditions. For the same combinations of laccase and ABTS, decreasing the
oxygen pressure (+1 = 14 bar, -1 = 7 bar) does lower the amount of color removed. As
expected, decreasing the amount of ABTS (+1 = 0.02 mM, -1 = 0.003 mM) decreases the
amount of color removed.
The difference in response to laccase concentration at higher ABTS
concentrations does suggest some interaction may be occurring between the enzyme and
the mediator that does not involve decolorization of the dye. At the higher enzyme
concentration, the putative interaction occurs more often, and maybe reducing the
availability of mediator to participate in the dye decolorization reaction.

PAGE 57
Figure A-55 Change in Color Content Using 0,0,0 Treated Pulp as Zero Values
%Change in Distance from Ideal Bleach Point Average of 6 Center Points = 0
24.2%
-24.0%
8.4%
-35.7%
19.9%
10.1%
4.7%2.3%
24.9%
14.1%
27.2%
-15.9%-12.5%
-8.7%
-40%
-30%
-20%
-10%
0%
10%
20%
30%
40%
Hi Lac
Low Lac
Hi AB
TS
Low AB
TS
Hi O
2
Low O
2
+Lac+AB
TS+O
2
+Lac+AB
TS-O
2
+Lac-AB
TS+O
2
+Lac-AB
TS-O
2
-Lac+ABTS+O
2
-Lac+ABTS-O
2
-Lac-ABTS
+O2
-Lac-ABTS
-O2
A.5.4 STATISTICAL ANALYSIS OF OPTIMIZATION EXPERIMENT RESULTS
To analyze the results, NCSS statistical analysis software was applied to the data.
The types of analysis applied include response surface regression analysis, multiple
regression, robust regression, multivariate ratio of polynomials, and all possible
regression. The complete report results from the software application are included,
following the discussion of significance.
The goal is a statistical model of the experimental data. As explained above, the
coded variable levels (-2 to +2) are derived from the logarithms of the actual values. For
the statistical analysis, the coded variable values were used. To apply any derived
statistical model, conversion functions are needed. The conversion equations are given
below. Coded variables were numbers -2 to +2. The actual values are given in Table
A-21, page 51 and range from 5-20 bar oxygen pressure, 0.0011 to 0.052 mM ABTS,
0.49 to 51.1 µL Laccase/mL solution or 1.009 to 105.3 Units of laccase/mL solution. For
this experiment, the amount of laccase added was calculated as µL of enzyme concentrate

PAGE 58
/ mL of reaction solution. Assay of the enzyme concentrate sows that 5 µL/mL is the
equivalent of 10.3 Units/mL
Equation A-7 Conversion of Coded Variables to Actual Values
Oxygen: bar = 10exp[0.3485* (Coded Value)] ABTS: mM = 0.0075exp[0.9663*(Coded Value)]
Laccase: µL/mL = 5.0009exp [1.1616*(Coded Value)] Laccase: Units = 10.302exp[1.1616*(Coded Value)]
Equation A-8 Conversion of Coded Variable to Log (Actual Value)
Oxygen: Log[bar] = 0.1514* (Coded Value) + 1 ABTS: Log[mM] = 0.4205* (Coded Value) - 2.1248
Laccase: Log[µL/mL] = 0.5046*(Coded Value) + 0.699 Laccase: Log[Units] = 0.5045*(Coded Value) + 1.0134
Equation A-9 Conversion of Actual Values to Coded Variables
Oxygen: (Coded Value) = 2.8694Ln(bar) - 6.607 ABTS: Coded Value = 1.0348Ln(mM) + 5.0639
Laccase: Coded Value = 0.8609Ln(µL/mL) - 1.3857 Laccase: Coded Value = 0.8609Ln(Units) - 2.0079
Equation A-10 Conversion of Log (Actual Value) to Coded Variable
Oxygen: Coded Value = 6.605* [Ln(bar)] - 6.605 ABTS: Coded Value = 2.3781*[Ln(mM)] + 5.053
Laccase: Coded Value = 1.9818*[Log((µL/mL)] - 1.3853 Laccase: Coded Value = 1.9823*[Log(Units)] - 2.0088
A.5.4.1 Discussion of Statistical Models
Response surface regression yielded a model with R2 value of 0.941, which is a
fairly good fit. This analysis includes both ANOVA and ANOVA using pure error. The
estimated regression coefficients are the same: what differs are the calculated Probability
levels, F Ratios for factors and T Ratios for regression coefficients. The full results are
given in Section A.5.4.2, page 61. The relative importance of the three factors is shown
below. The ABTS level is clearly very important. The laccase level is also important. The
oxygen level however is only marginally significant.

PAGE 59
Table A-23 Importance of Factors in Response Surface Regression
Standard ANOVA ANOVA Using Pure Error Prob Prob
Factor df F-Ratio Level F-Ratio Level Lac 4 12.16 0.000743 32.09 0.000927 ABTS 4 29.68 0.000016 78.36 0.000107 O2 4 2.25 0.136064 5.94 0.038634 Total Error 10 Lack of Fit 5 4.28 0.068238 4.28 0.068238 Pure Error 5 The model determined by response surface regression is described below. The
residual differences between model and data are plotted below in Section A.5.4.2 and
show no significant trends. The probability levels for each regression coefficient are also
given in Section A.5.4.2 If probability level of 0.1 is used to determine which regression
terms are significant, based on the standard ANOVA, the terms ABTS(Level)2,
O2(Level)2, Lac(Level)*O2(Level) and ABTS(Level)*O2(Level) can be omitted from
the model.
Equation A-11 Model From Response Surface Regression (R2 0.941)
DRI = 45.92814 + Lac(Level)*3.338322 + ABTS(Level)*6.347024 + O2(Level)*1.328575
+ Lac(Level)2*1.3943 + ABTS(Level)2*0.1527651 + O2(Level)2*0.6083103 +
Lac(Level)*ABTS(Level)*3.025076 + Lac(Level)*O2(Level)*0.3339178 +
ABTS(Level)*O2(Level)*1.471562
The results from Multiple Regression Analysis (Section A.5.4.3, page 65) were
similar. In correlation matrix, the dependent variable DRI strongly correlated with ABTS
levels, significantly correlated with laccase levels but only marginally correlated with
oxygen levels. Based on the T Value and the probability level, the multiple regression
rejected oxygen levels as not being significant. A model was obtained but its R2 value
was only 0.805. The low R2 value is probably due to limiting regression to linear terms.
However, the predicted values in the report were based on all three terms, including
oxygen. The data did pass normality tests such as skewness, kurtosis and omnibus.

PAGE 60
Table A-24 Correlation of Factors with DRI in Multiple Regression Analysis
Correlation Matrix DRI Lac 0.410726 ABTS 0.780897 O2 0.163459
Equation A-12 Regression Equation from Multiple Regression (R2 0.805) DRI = 47.65244 + Lac(Level)* 3.338322 + ABTS(Level)* 6.347024 + O2(Level)* 1.328575
Table A-25 Oxygen Level NOT Significant in Multiple Regression
Independent Regression Standard T-Value Prob Decision Power Variable Coefficient Error (Ho: B=0) Level (5%) (5%) Intercept 47.65244 0.8021212 59.4080 0.000000 Reject Ho 1.000000 Lac 3.338322 0.8967987 3.7225 0.001852 Reject Ho 0.937140 ABTS 6.347024 0.8967987 7.0774 0.000003 Reject Ho 0.999998 O2 1.328575 0.8967987 1.4815 0.157908 Accept Ho 0.285829 R-Squared 0.805214
The Multivariate Ratio of Polynomials Analysis was run to see how well the
model would fit. An R2 value of 0.989 was obtained, indicating a good fit. The model
consists of the ratio of two polynomial equations. Although the fit is good, the
complicated equation limits the model to the range of variable levels tested.
Equation A-13 Format for Multivariate Ratio of Polynomials Model
Symbolic Model Y = P1 (U,V,W) / P2 (U,V,W)
P1 (U,V,W) = B0+B1*U+B2*U2+B3*V+B4*UV+B5*V2+B6*W+B7*UW+B8*VW+B9*W2 P2 (U,V,W) = 1+B10*U+B11*U2+B12*V+B13*UV+B14*V2+B15*W+B16*UW+B17*VW+B18*W2
where Y = DRI U = Lac V = ABTS W = O2
Equation A-14 Ratio of Polynomials Model (R2 0.989)
DRI = {45.65816 -16.05398*Lac + 15.72261*Lac2 + 2.330253*ABTS + 47.34002*Lac*ABTS + 9.275566*ABTS2 + 1.32302*O2 + 1.453849*Lac*O2 + 4.770414*ABTS*O2 + 0.473319*O22} / [1-0.5431627*Lac + 0.3376349*Lac2 - 0.2267051 *ABTS + 1.141829*Lac*ABTS + 0.2349017
*ABTS2 + 0*O2 + 0*Lac*O2 + 4.349544E-02*ABTS*O2 + 0*O22]
The results from applying the NCSS robust regression to the data were very
similar to the multiple regression results. A moderate R2 value of 0.886402 was obtained.

PAGE 61
The probability levels indicate that the oxygen pressure term could be omitted. However,
the predicted values produced by the program do include the oxygen term in the
calculation
Equation A-15 Regression Equation from Robust Regression (R2 0.886) DRI = 46.81763+ Lac(Level)*3.054206 + ABTS(Level)*6.066785 + O2(Level)*1.137815
Table A-26 Oxygen Level NOT Significant in Robust Regression
Independent Regression Standard T-Value Prob Decision Power Variable Coefficient Error (Ho: B=0) Level (5%) (5%) Intercept 46.81763 0.5791607 80.8370 0.000000 Reject Ho 1.000000 Lac 3.054206 0.7395132 4.1300 0.000786 Reject Ho 0.972030 ABTS 6.066785 0.6475289 9.3691 0.000000 Reject Ho 1.000000 O2 1.137815 0.6292678 1.8082 0.089415 Accept Ho 0.397471 R-Squared 0.886402
Analysis by All Possible Regressions Function was also performed but no
additional insight was gained. The data indicate that ABTS level is most important,
followed by the laccase level. Oxygen level is barely significant, but does improve fit
when included. The models and fits are summarized below. The best fit was obtained
with the ratio of polynomials. Both models with good fits (ratio of polynomials and
response surface regression) include quadratic terms (squared values and products of two
terms)
Table A-27 Summary of Statistical Models
Equation Page Model Type R2 A-11 59 Response Surface Regression 0.941 A-12 60 Multiple Regression 0.805 A-14 60 Ratio of Polynominals 0.989 A-15 61 Robust Regression 0.886
A.5.4.2 Response-Surface Regression Report
Page/Date/Time 1 04-13-2005 15:49:06 Database P:\Public Files\Kristina Knutson\DRI Data.S0 Response DRI
Descriptive Statistics Section Variable Count Mean Minimum Maximum Lac 20 0 -2 2 ABTS 20 0 -2 2 O2 20 0 -2 2 DRI 20 47.65244 32.63659 60.46495

PAGE 62
Hierarchical Model Summary Section
Number of Terms Removed 0 Number of Terms Remaining 9 R-Squared Cutoff Value 0.010000 R-Squared of Final Model 0.941378
Coded Hierarchical Model
A B C D E F A Lac 2 1 1 0 0 0 B ABTS 2 1 0 0 0 C O2 2 0 0 0 D 0 0 0 E 0 0 F 0
Notes: For off-diagonal entries: 1=u1w1, 2=u1w2, 3=u2w1, 4=u2w2, 5=u1w3, 6=u3w1, 7=u2w3, 8=u3w2, 9=u3w3. For diagonal entries: 1=u1, 2=u2, 3=u3. Where u1=u, u2=u^2=u*u, and u3=u^3=u*u*u.
Sequential ANOVA Section
Sequential Mean Prob Incremental Source df Sum-Squares Square F-Ratio Level R-Squared Regression 9 995.0316 110.5591 17.84 0.000050 0.941378 Linear 3 851.1075 283.7025 45.79 0.000004 0.805214 Quadratic 3 52.49934 17.49978 2.82 0.093026 0.049668 Lin x Lin 3 91.42462 30.47487 4.92 0.023698 0.086495 Total Error 10 61.9635 6.19635 0.058622 Lack of Fit 5 50.22861 10.04572 4.28 0.068238 0.047520 Pure Error 5 11.73489 2.346979 0.011102
Sequential ANOVA Section Using Pure Error Sequential Mean Prob Incremental Source df Sum-Squares Square F-Ratio Level R-Squared Regression 9 995.0316 110.5591 47.11 0.000265 0.941378 Linear 3 851.1075 283.7025 120.88 0.000044 0.805214 Quadratic 3 52.49934 17.49978 7.46 0.027092 0.049668 Lin x Lin 3 91.42462 30.47487 12.98 0.008521 0.086495 Total Error 10 61.9635 6.19635 0.058622 Lack of Fit 5 50.22861 10.04572 4.28 0.068238 0.047520 Pure Error 5 11.73489 2.346979 0.011102

PAGE 63
ANOVA Section Last Mean Prob Term Factor df Sum-Squares Square F-Ratio Level R-Squared Lac 4 301.2905 75.32262 12.16 0.000743 0.285044 ABTS 4 735.6749 183.9187 29.68 0.000016 0.696006 O2 4 55.76162 13.9404 2.25 0.136064 0.052755 Total Error 10 61.9635 6.19635 0.058622 Lack of Fit 5 50.22861 10.04572 4.28 0.068238 0.047520 Pure Error 5 11.73489 2.346979 0.011102
ANOVA Section Using Pure Error Last Mean Prob Term Factor df Sum-Squares Square F-Ratio Level R-Squared Lac 4 301.2905 75.32262 32.09 0.000927 0.285044 ABTS 4 735.6749 183.9187 78.36 0.000107 0.696006 O2 4 55.76162 13.9404 5.94 0.038634 0.052755 Total Error 10 61.9635 6.19635 0.058622 Lack of Fit 5 50.22861 10.04572 4.28 0.068238 0.047520 Pure Error 5 11.73489 2.346979 0.011102
Estimation Section Regression Standard Prob Last Parameter df Coefficient Error T-Ratio Level R-Squared Intercept 1 45.92814 Lac 1 3.338322 0.6223117 5.36 0.000317 0.168695 ABTS 1 6.347024 0.6223117 10.20 0.000001 0.609800 O2 1 1.328575 0.6223117 2.13 0.058536 0.026719 Lac^2 1 1.3943 0.496433 2.81 0.018518 0.046244 ABTS^2 1 0.1527651 0.496433 0.31 0.764605 0.000555 O2^2 1 0.6083103 0.496433 1.23 0.248516 0.008802 Lac*ABTS 1 -3.025076 0.8800817 -3.44 0.006360 0.069261 Lac*O2 1 0.3339178 0.8800817 0.38 0.712311 0.000844 ABTS*O2 1 1.471562 0.8800817 1.67 0.125459 0.016390
Estimation Section Using Pure Error Regression Standard Prob Last Parameter df Coefficient Error T-Ratio Level R-Squared Intercept 1 45.92814 Lac 1 3.338322 0.3829963 8.72 0.000329 0.168695 ABTS 1 6.347024 0.3829963 16.57 0.000015 0.609800 O2 1 1.328575 0.3829963 3.47 0.017871 0.026719 Lac^2 1 1.3943 0.3055254 4.56 0.006037 0.046244 ABTS^2 1 0.1527651 0.3055254 0.50 0.638294 0.000555 O2^2 1 0.6083103 0.3055254 1.99 0.103114 0.008802 Lac*ABTS 1 -3.025076 0.5416386 -5.59 0.002538 0.069261 Lac*O2 1 0.3339178 0.5416386 0.62 0.564551 0.000844 ABTS*O2 1 1.471562 0.5416386 2.72 0.041931 0.016390

PAGE 64
Optimum Solution Section
Maximum Optimum Parameter Exponent Value Lac 2 1253 ABTS 2 -6669 O2 2 6554 Function at optimum -1215539 Number of Function Evaluations 504 Maximum Functions Evaluations 500
Residual Section
Row DRI Predicted Residual 1 44.6439 45.92814 -1.284145 2 43.8597 45.92814 -2.068444 3 45.6145 45.92814 -0.313633 4 48.3866 45.92814 2.458475 5 45.6289 45.92814 -0.2992045 6 45.8151 45.92814 -0.1129449 7 60.4649 58.18198 2.282966 8 40.9258 44.82869 -3.902863 9 58.8219 59.23325 -0.411335 10 32.6365 33.84515 -1.208561 11 50.1974 51.01853 -0.8210567 12 44.9053 45.70423 -0.7988397 13 56.4857 57.87784 -1.392118 14 51.1302 51.60973 -0.4795131 15 48.2210 48.29082 -6.979143E-0216 46.9043 47.90895 -1.004614 17 59.2080 56.58351 2.62451 18 53.3407 51.65107 1.689688 19 36.9955 34.89619 2.09941 20 38.8620 35.84999 3.012015

PAGE 65
Plots Section
-4.0
-2.0
0.0
2.0
4.0
-2.000 -1.000 0.000 1.000 2.000
Normal Probability Plot of Residuals
Expected Normals
DR
I
-3
-2
0
2
3
-3 -2 0 2 3
Grid Plot of DRI
ABTS
Lac
DRI-133183348637893
-3
-2
0
2
3
-3 -2 0 2 3
Grid Plot of DRI
O2
Lac
DRI-14-1112436496174
-3
-2
0
2
3
-3 -2 0 2 3
Grid Plot of DRI
O2
AB
TS
DRI-133183348637893
A.5.4.3 Multiple Regression Report
Page/Date/Time 6 04-14-2005 22:31:30 Database P:\Public Files\Kristina Knutson\DRI Data.S0 Dependent DRI
Descriptive Statistics Section Standard Variable Count Mean Deviation Minimum Maximum Lac 20 -1.387779E-17 0.9176629 -2 2 ABTS 20 0 0.9176629 -2 2 O2 20 0 0.9176629 -2 2 DRI 20 47.65244 7.458641 32.63659 60.46495

PAGE 66
Correlation Matrix Section Lac ABTS O2 DRI Lac 1.000000 0.000000 0.000000 0.410726 ABTS 0.000000 1.000000 0.000000 0.780897 O2 0.000000 0.000000 1.000000 0.163459 DRI 0.410726 0.780897 0.163459 1.000000
Regression Equation Section Independent Regression Standard T-Value Prob Decision Power Variable Coefficient Error (Ho: B=0) Level (5%) (5%) Intercept 47.65244 0.8021212 59.4080 0.000000 Reject Ho 1.000000 Lac 3.338322 0.8967987 3.7225 0.001852 Reject Ho 0.937140 ABTS 6.347024 0.8967987 7.0774 0.000003 Reject Ho 0.999998 O2 1.328575 0.8967987 1.4815 0.157908 Accept Ho 0.285829 R-Squared 0.805214
Regression Coefficient Section Independent Regression Standard Lower Upper Standardized Variable Coefficient Error 95% C.L. 95% C.L. Coefficient Intercept 47.65244 0.8021212 45.95202 49.35286 0.0000 Lac 3.338322 0.8967987 1.437194 5.23945 0.4107 ABTS 6.347024 0.8967987 4.445896 8.248153 0.7809 O2 1.328575 0.8967987 -0.5725538 3.229703 0.1635 T-Critical 2.119905
Analysis of Variance Section Sum of Mean Prob Power Source DF Squares Square F-Ratio Level (5%) Intercept 1 45415.1 45415.1 Model 3 851.1075 283.7025 22.0472 0.000006 0.949548 Error 16 205.8875 12.86797 Total(Adjusted) 19 1056.995 55.63132
Root Mean Square Error 3.587195 R-Squared 0.8052 Mean of Dependent 47.65244 Adj R-Squared 0.7687 Coefficient of Variation 0.0752783 Press Value 346.8986 Sum |Press Residuals| 66.33203 Press R-Squared 0.6718
Normality Tests Section Assumption Value Probability Decision (5%) Skewness 1.5600 0.118760 Accepted Kurtosis 0.1222 0.902761 Accepted Omnibus 2.4485 0.293974 Accepted

PAGE 67
Serial-Correlation Section Lag Correlation Lag Correlation Lag Correlation 1 0.294452 9 0.157251 17 2 -0.067348 10 0.159457 18 3 -0.088960 11 0.101654 19 4 -0.054537 12 -0.063515 20 5 -0.027456 13 0.067477 21 6 -0.234963 14 -0.153368 22 7 -0.206917 15 -0.255146 23 8 0.098583 16 24
Above serial correlations significant if their absolute values are greater than 0.447214 Durbin-Watson Value 1.3431
R-Squared Section
Independent Cumulative Incremental Incremental Partial Variable Sequential Sequential Last Simple (Adj. for Rest) Lac 0.168695 0.168695 0.168695 0.168695 0.464111 ABTS 0.778495 0.609800 0.609800 0.609800 0.757906 O2 0.805214 0.026719 0.026719 0.026719 0.120625
Variable Omission Section Independent R-Squared MSE Mallow's Cp Prob R-Squared Variable When Omitted When Omitted When Omitted Level Vs Other X's Full Model 0.805214 12.86797 Lac 0.636519 22.59987 15.856914 0.001852 0.000000 ABTS 0.195414 50.02606 52.089928 0.000003 0.000000 O2 0.778495 13.77231 4.194734 0.157908 0.000000
Sum of Squares and Correlation Section Independent Sequential Incremental Last Simple Partial Variable Sum Squares Sum Squares Sum Squares Correlation Correlation Lac 178.3103 178.3103 178.3103 0.410726 0.681257 ABTS 822.8658 644.5555 644.5555 0.780897 0.870578 O2 851.1075 28.24176 28.24176 0.163459 0.347311
Sequential Models Section Independent Included Omitted Included Included Omitted Omitted Variable R-Squared R-Squared F-Ratio Prob>F F-Ratio Prob>F Lac 0.168695 0.636519 3.65 0.072035 26.14 0.000009 ABTS 0.778495 0.026719 29.87 0.000003 2.19 0.157908 O2 0.805214 0.000000 22.05 0.000006 Notes 1. INCLUDED variables are those listed from current row up (includes current row). 2. OMITTED variables are those listed below (but not including) this row.

PAGE 68
Predicted Values with Confidence Limits of Means Row Actual Predicted Std Error
of Predicted95% LCLof Mean
95% UCL of Mean
1 44.64399 47.65244 0.8021212 45.95202 49.35286 2 43.8597 47.65244 0.8021212 45.95202 49.35286 3 45.61451 47.65244 0.8021212 45.95202 49.35286 4 48.38661 47.65244 0.8021212 45.95202 49.35286 5 45.62893 47.65244 0.8021212 45.95202 49.35286 6 45.81519 47.65244 0.8021212 45.95202 49.35286 7 60.46495 54.32908 1.964787 50.16392 58.49425 8 40.92583 40.9758 1.964787 36.81063 45.14096 9 58.82191 60.34649 1.964787 56.18132 64.51165 10 32.63659 34.95839 1.964787 30.79323 39.12355 11 50.19747 50.30959 1.964787 46.14442 54.47475 12 44.90539 44.99529 1.964787 40.83013 49.16045 13 56.48572 58.66636 1.748183 54.96038 62.37234 14 51.13022 56.00921 1.748183 52.30323 59.71519 15 48.22103 45.97231 1.748183 42.26633 49.67829 16 46.90434 43.31516 1.748183 39.60918 47.02114 17 59.20802 51.98972 1.748183 48.28373 55.6957 18 53.34076 49.33257 1.748183 45.62659 53.03855 19 36.99559 39.29567 1.748183 35.58968 43.00165 20 38.86201 36.63852 1.748183 32.93254 40.3445
Predicted Values with Confidence Limits of Individuals
Row Actual Predicted Std Error of Predicted
95% LCL of Individua
95% UCL of Individua
1 44.64399 47.65244 3.675781 39.86013 55.44474 2 43.8597 47.65244 3.675781 39.86013 55.44474 3 45.61451 47.65244 3.675781 39.86013 55.44474 4 48.38661 47.65244 3.675781 39.86013 55.44474 5 45.62893 47.65244 3.675781 39.86013 55.44474 6 45.81519 47.65244 3.675781 39.86013 55.44474 7 60.46495 54.32908 4.090031 45.6586 62.99956 8 40.92583 40.9758 4.090031 32.30532 49.64627 9 58.82191 60.34649 4.090031 51.67601 69.01697 10 32.63659 34.95839 4.090031 26.28791 43.62887 11 50.19747 50.30959 4.090031 41.63911 58.98007 12 44.90539 44.99529 4.090031 36.32481 53.66577 13 56.48572 58.66636 3.990502 50.20687 67.12585 14 51.13022 56.00921 3.990502 47.54972 64.4687 15 48.22103 45.97231 3.990502 37.51283 54.4318 16 46.90434 43.31516 3.990502 34.85567 51.77465 17 59.20802 51.98972 3.990502 43.53023 60.4492 18 53.34076 49.33257 3.990502 40.87308 57.79205 19 36.99559 39.29567 3.990502 30.83618 47.75515 20 38.86201 36.63852 3.990502 28.17903 45.098

PAGE 69
Residual Report Row Actual Predicted Residual Percent
Error MSEi
1 44.64399 47.65244 -3.008446 6.74 13.09069 2 43.8597 47.65244 -3.792744 8.65 12.71636 3 45.61451 47.65244 -2.037933 4.47 13.43438 4 48.38661 47.65244 0.7341753 1.52 13.68801 5 45.62893 47.65244 -2.023505 4.43 13.43849 6 45.81519 47.65244 -1.837245 4.01 13.48896 7 60.46495 54.32908 6.135866 10.15 10.14023 8 40.92583 40.9758 -4.996345E-02 0.12 13.72559 9 58.82191 60.34649 -1.524575 2.59 13.50447 10 32.63659 34.95839 -2.321801 7.11 13.21243 11 50.19747 50.30959 -0.1121156 0.22 13.72463 12 44.90539 44.99529 -8.989861E-02 0.20 13.72506 13 56.48572 58.66636 -2.18064 3.86 13.31008 14 51.13022 56.00921 -4.878993 9.54 11.64456 15 48.22103 45.97231 2.248715 4.66 13.28371 16 46.90434 43.31516 3.589181 7.65 12.59952 17 59.20802 51.98972 7.218305 12.19 9.170297 18 53.34076 49.33257 4.008194 7.51 12.32119 19 36.99559 39.29567 -2.300071 6.22 13.26329 20 38.86201 36.63852 2.223493 5.72 13.29358
Regression Diagnostics Section
Row Studentized Residual
Rstudent Hat Diagonal
Cook's D Dffits Covratio
1 -0.860449 -0.853098 0.050000 0.009742 -0.195714 1.1274232 -1.084768 -1.091215 0.050000 0.015483 -0.250342 1.0038953 -0.582872 -0.570452 0.050000 0.004470 -0.130871 1.2505684 0.209982 0.203595 0.050000 0.000580 0.046708 1.3477135 -0.578745 -0.566327 0.050000 0.004407 -0.129924 1.2521006 -0.525473 -0.513235 0.050000 0.003633 -0.117744 1.2710137 2.044428 2.303048 0.300000 0.447824 1.507699 0.5508758 -0.016647 -0.016119 0.300000 0.000030 -0.010552 1.8492129 -0.507978 -0.495862 0.300000 0.027647 -0.324618 1.73289410 -0.773608 -0.763457 0.300000 0.064122 -0.499800 1.58778811 -0.037356 -0.036172 0.300000 0.000150 -0.023680 1.84869512 -0.029954 -0.029003 0.300000 0.000096 -0.018987 1.84892613 -0.696160 -0.684500 0.237500 0.037738 -0.382020 1.50121414 -1.557598 -1.637377 0.237500 0.188918 -0.913820 0.87945215 0.717893 0.706569 0.237500 0.040131 0.394336 1.48935616 1.145831 1.157973 0.237500 0.102236 0.646265 1.20541317 2.304413 2.729754 0.237500 0.413508 1.523475 0.33826318 1.279599 1.307683 0.237500 0.127500 0.729818 1.10237819 -0.734288 -0.723262 0.237500 0.041985 -0.403652 1.48021720 0.709841 0.698385 0.237500 0.039236 0.389769 1.493784

PAGE 70
Multicollinearity Section
Independent Variance R-Squared Diagonal of Variable Inflation Vs Other X's Tolerance X'X Inverse Lac 1.000000 0.000000 1.000000 0.0625 ABTS 1.000000 0.000000 1.000000 0.0625 O2 1.000000 0.000000 1.000000 0.0625
Eigenvalues of Centered Correlations Incremental Cumulative Condition No. Eigenvalue Percent Percent Number 1 1.000000 33.33 33.33 1.00 2 1.000000 33.33 66.67 1.00 3 1.000000 33.33 100.00 1.00
All Condition Numbers less than 100. Multicollinearity is NOT a problem.
Eigenvector Percent of Regression-Coefficient-Variance using Centered Correlations No. Eigenvalue Lac ABTS O2 1 1.000000 0.00 0.00 100.00 2 1.000000 100.00 0.00 0.00 3 1.000000 0.00 100.00 0.00
Eigenvalues of Uncentered Correlations No. Eigenvalue Incrementa
Percent CumulativePercent
ConditionNumber
1 1.000000 25.00 25.00 1.00 2 1.000000 25.00 50.00 1.00 3 1.000000 25.00 75.00 1.00 4 1.000000 25.00 100.00 1.00
All Condition Numbers less than 100. Multicollinearity is NOT a problem. Eigenvector Percent of Regression-Coefficient-Variance using Uncentered Correlations
No. Eigenvalue Lac ABTS O2 Intercept1 1.000000 0.00 0.00 0.00 100.00 2 1.000000 100.00 0.00 0.00 0.00 3 1.000000 0.00 100.00 0.00 0.00 4 1.000000 0.00 0.00 100.00 0.00

PAGE 71
DFBETAS Section Row Lac ABTS O2 Intercept 1 0.0000 0.0000 0.0000 -0.1957 2 0.0000 0.0000 0.0000 -0.2503 3 0.0000 0.0000 0.0000 -0.1309 4 0.0000 0.0000 0.0000 0.0467 5 0.0000 0.0000 0.0000 -0.1299 6 0.0000 0.0000 0.0000 -0.1177 7 1.3763 0.0000 0.0000 0.6155 8 0.0096 0.0000 0.0000 -0.0043 9 0.0000 -0.2963 0.0000 -0.1325 10 0.0000 0.4563 0.0000 -0.2040 11 0.0000 0.0000 -0.0216 -0.0097 12 0.0000 0.0000 0.0173 -0.0078 13 -0.1960 -0.1960 -0.1960 -0.1753 14 -0.4688 -0.4688 0.4688 -0.4193 15 0.2023 -0.2023 0.2023 0.1809 16 0.3315 -0.3315 -0.3315 0.2965 17 -0.7815 0.7815 0.7815 0.6990 18 -0.3744 0.3744 -0.3744 0.3349 19 0.2071 0.2071 -0.2071 -0.1852 20 -0.1999 -0.1999 -0.1999 0.1788
Plots Section
0.0
2.0
4.0
6.0
8.0
-6.0 -2.5 1.0 4.5 8.0
Histogram of Residuals of DRI
Residuals of DRI
Cou
nt
-6.0
-2.5
1.0
4.5
8.0
-2.0 -1.0 0.0 1.0 2.0
Normal Probability Plot of Residuals of DRI
Expected Normals
Res
idua
ls o
f DR
I

PAGE 72
-6.0
-2.5
1.0
4.5
8.0
-6.0 -2.5 1.0 4.5 8.0
Serial Correlation of Residuals
Residuals Lagged One
Res
idua
ls
-6.0
-2.5
1.0
4.5
8.0
0.0 6.3 12.5 18.8 25.0
Residuals vs Row
Row Number
Res
idua
ls
-2.0
-0.8
0.5
1.8
3.0
0.0 0.1 0.2 0.2 0.3
Rstudent vs Hat Diagonal
Hat Diagonal
Rst
uden
t
-6.0
-2.5
1.0
4.5
8.0
30.0 38.8 47.5 56.3 65.0
Residuals vs Predicted
Predicted
Res
idua
ls
-6.0
-2.5
1.0
4.5
8.0
-3.0 -1.5 0.0 1.5 3.0
Residuals vs Lac
Lac
Res
idua
ls
-6.0
-2.5
1.0
4.5
8.0
-3.0 -1.5 0.0 1.5 3.0
Residuals vs ABTS
ABTS
Res
idua
ls

PAGE 73
-6.0
-2.5
1.0
4.5
8.0
-3.0 -1.5 0.0 1.5 3.0
Residuals vs O2
O2
Res
idua
ls
-2.0
-0.8
0.5
1.8
3.0
-3.0 -1.5 0.0 1.5 3.0
Rstudent vs Lac
Lac
Rst
uden
t
-2.0
-0.8
0.5
1.8
3.0
-3.0 -1.5 0.0 1.5 3.0
Rstudent vs ABTS
ABTS
Rst
uden
t
-2.0
-0.8
0.5
1.8
3.0
-3.0 -1.5 0.0 1.5 3.0
Rstudent vs O2
O2
Rst
uden
t
-10.0
-3.8
2.5
8.8
15.0
-3.0 -1.5 0.0 1.5 3.0
Partial Residual vs Lac
Lac
Par
tial R
esid
uals
-20.0
-11.3
-2.5
6.3
15.0
-3.0 -1.5 0.0 1.5 3.0
Partial Residual vs ABTS
ABTS
Par
tial R
esid
uals
-10.0
-5.0
0.0
5.0
10.0
-3.0 -1.5 0.0 1.5 3.0
Partial Residual vs O2
O2
Par
tial R
esid
uals

PAGE 74
A.5.4.4 Multivariate Ratio of Polynomials Report
Page/Date/Time 4 04-18-2005 15:34:36 Database P:\Public Files\Kristina Knutson\DRI Data.S0 Dependent DRI
Minimization Phase Section Itn Error Sum No. Lambda Lambda B0 B1 B2 B3 0 11.73489 0.00004 45.65816 -16.05398 15.72261 2.330253 Convergence criterion met.
Model Estimation Section ParameteName
Term Terms ParameterEstimate
Asymptotic Standard Error
Lower 100% C.L.
Upper 100% C.L.
B0 Intercept 45.65816 0 45.65816 45.65816 B1 U -16.05398 0 -16.05398 -16.05398 B2 U2 Lac 15.72261 0 15.72261 15.72261 B3 V Lac^2 2.330253 0 2.330253 2.330253 B4 UV ABTS 47.34002 0 47.34002 47.34002 B5 V2 Lac*ABTS 9.275566 0 9.275566 9.275566 B6 W ABTS^2 1.32302 0 1.32302 1.32302 B7 UW O2 1.453849 0 1.453849 1.453849 B8 VW Lac*O2 4.770414 0 4.770414 4.770414 B9 W2 ABTS*O2 0.473319 0 0.473319 0.473319 B10 u O2^2 -0.5431627 0 -0.5431627 -0.5431627B11 u2 Lac 0.3376349 0 0.3376349 0.3376349 B12 v Lac^2 -0.2267051 0 -0.2267051 -0.2267051B13 uv ABTS 1.141829 0 1.141829 1.141829 B14 v2 Lac*ABTS 0.2349017 0 0.2349017 0.2349017 B15 w ABTS^2 0 0 0 0 B16 uw O2 0 0 0 0 B17 vw Lac*O2 4.349544E-0 0 4.349544E-04.349544E-0B18 w2 ABTS*O2 0 0 0 0 R-Squared 0.988898 Iterations 0
Symbolic Model
Y = P1 (U,V,W) / P2 (U,V,W) P1 (U,V,W) = B0+B1*U+B2*U2+B3*V+B4*UV+B5*V2+B6*W+B7*UW+B8*VW+B9*W2
P2 (U,V,W) = 1+B10*U+B11*U2+B12*V+B13*UV+B14*V2+B15*W+B16*UW+B17*VW+B18*W2 where
Y = DRI U = Lac V = ABTS W = O2

PAGE 75
Estimated Model DRI = ((45.65816) - (16.05398)*Lac + (15.72261)*Lac^2 + (2.330253)*ABTS + (47.34002)*Lac*ABTS + (9.275566)*ABTS^2 + (1.32302)*O2 + (1.453849)*Lac*O2 + (4.770414)*ABTS*O2 + (0.473319)*O2^2) / (1-(0.5431627)*Lac + (0.3376349)*Lac^2 - (0.2267051)*ABTS + (1.141829)*Lac*ABTS + (0.2349017)*ABTS^2+(0)*O2 + (0)*Lac*O2 + (4.349544E-02)*ABTS*O2 + (0)*O2^2)
Analysis of Variance Table Sum of Mean Source DF Squares Square Mean 1 45415.1 45415.1 Model 19 46460.36 2445.282 Model (Adjusted) 18 1045.26 58.07001 Error 1 11.73489 11.73489 Total (Adjusted) 19 1056.995 Total 20 46472.09
Asymptotic Correlation Matrix of Parameters B0 B1 B2 B3 B4 B5 B0 0.000000 0.000000 0.000000 0.000000 0.000000 0.000000B1 0.000000 0.000000 0.000000 0.000000 0.000000 0.000000B2 0.000000 0.000000 0.000000 0.000000 0.000000 0.000000B3 0.000000 0.000000 0.000000 0.000000 0.000000 0.000000B4 0.000000 0.000000 0.000000 0.000000 0.000000 0.000000B5 0.000000 0.000000 0.000000 0.000000 0.000000 0.000000B6 0.000000 0.000000 0.000000 0.000000 0.000000 0.000000B7 0.000000 0.000000 0.000000 0.000000 0.000000 0.000000B8 0.000000 0.000000 0.000000 0.000000 0.000000 0.000000B9 0.000000 0.000000 0.000000 0.000000 0.000000 0.000000B10 0.000000 0.000000 0.000000 0.000000 0.000000 0.000000B11 0.000000 0.000000 0.000000 0.000000 0.000000 0.000000B12 0.000000 0.000000 0.000000 0.000000 0.000000 0.000000B13 0.000000 0.000000 0.000000 0.000000 0.000000 0.000000B14 0.000000 0.000000 0.000000 0.000000 0.000000 0.000000B15 0.000000 0.000000 0.000000 0.000000 0.000000 0.000000B16 0.000000 0.000000 0.000000 0.000000 0.000000 0.000000B17 0.000000 0.000000 0.000000 0.000000 0.000000 0.000000B18 0.000000 0.000000 0.000000 0.000000 0.000000 0.000000

PAGE 76
Asymptotic Correlation Matrix of Parameters B6 B7 B8 B9 B10 B11 B0 0.000000 0.000000 0.000000 0.000000 0.000000 0.000000B1 0.000000 0.000000 0.000000 0.000000 0.000000 0.000000B2 0.000000 0.000000 0.000000 0.000000 0.000000 0.000000B3 0.000000 0.000000 0.000000 0.000000 0.000000 0.000000B4 0.000000 0.000000 0.000000 0.000000 0.000000 0.000000B5 0.000000 0.000000 0.000000 0.000000 0.000000 0.000000B6 0.000000 0.000000 0.000000 0.000000 0.000000 0.000000B7 0.000000 0.000000 0.000000 0.000000 0.000000 0.000000B8 0.000000 0.000000 0.000000 0.000000 0.000000 0.000000B9 0.000000 0.000000 0.000000 0.000000 0.000000 0.000000B10 0.000000 0.000000 0.000000 0.000000 0.000000 0.000000B11 0.000000 0.000000 0.000000 0.000000 0.000000 0.000000B12 0.000000 0.000000 0.000000 0.000000 0.000000 0.000000B13 0.000000 0.000000 0.000000 0.000000 0.000000 0.000000B14 0.000000 0.000000 0.000000 0.000000 0.000000 0.000000B15 0.000000 0.000000 0.000000 0.000000 0.000000 0.000000B16 0.000000 0.000000 0.000000 0.000000 0.000000 0.000000B17 0.000000 0.000000 0.000000 0.000000 0.000000 0.000000B18 0.000000 0.000000 0.000000 0.000000 0.000000 0.000000
Asymptotic Correlation Matrix of Parameters B12 B13 B14 B15 B16 B17 B18 B0 0.000000 0.000000 0.000000 0.000000 0.000000 0.000000 0.000000 B1 0.000000 0.000000 0.000000 0.000000 0.000000 0.000000 0.000000 B2 0.000000 0.000000 0.000000 0.000000 0.000000 0.000000 0.000000 B3 0.000000 0.000000 0.000000 0.000000 0.000000 0.000000 0.000000 B4 0.000000 0.000000 0.000000 0.000000 0.000000 0.000000 0.000000 B5 0.000000 0.000000 0.000000 0.000000 0.000000 0.000000 0.000000 B6 0.000000 0.000000 0.000000 0.000000 0.000000 0.000000 0.000000 B7 0.000000 0.000000 0.000000 0.000000 0.000000 0.000000 0.000000 B8 0.000000 0.000000 0.000000 0.000000 0.000000 0.000000 0.000000 B9 0.000000 0.000000 0.000000 0.000000 0.000000 0.000000 0.000000 B10 0.000000 0.000000 0.000000 0.000000 0.000000 0.000000 0.000000 B11 0.000000 0.000000 0.000000 0.000000 0.000000 0.000000 0.000000 B12 0.000000 0.000000 0.000000 0.000000 0.000000 0.000000 0.000000 B13 0.000000 0.000000 0.000000 0.000000 0.000000 0.000000 0.000000 B14 0.000000 0.000000 0.000000 0.000000 0.000000 0.000000 0.000000 B15 0.000000 0.000000 0.000000 0.000000 0.000000 0.000000 0.000000 B16 0.000000 0.000000 0.000000 0.000000 0.000000 0.000000 0.000000 B17 0.000000 0.000000 0.000000 0.000000 0.000000 0.000000 0.000000 B18 0.000000 0.000000 0.000000 0.000000 0.000000 0.000000 0.000000

PAGE 77
Plot Section
-3.0
-1.8
-0.5
0.8
2.0
-2.0 -1.0 0.0 1.0 2.0
Normal Probability Plot of Residuals of DRI
Expected Normals
Res
idua
ls o
f DR
I
-3.0
-1.8
-0.5
0.8
2.0
-3.0 -1.5 0.0 1.5 3.0
Residual vs Lac
Lac
Res
idua
ls o
f DR
I
-3.0
-1.8
-0.5
0.8
2.0
-3.0 -1.5 0.0 1.5 3.0
Residual vs ABTS
ABTS
Res
idua
ls o
f DR
I
-3.0
-1.8
-0.5
0.8
2.0
-3.0 -1.5 0.0 1.5 3.0
Residual vs O2
O2
Res
idua
ls o
f DR
I
A.5.4.5 Robust Regression Report
Page/Date/Time 2 04-18-2005 15:36:04 Database P:\Public Files\Kristina Knutson\DRI Data.S0 Dependent DRI
Regression Equation Section Independent Regression Standard T-Value Prob Decision Power Variable Coefficient Error (Ho: B=0) Level (5%) (5%) Intercept 46.81763 0.5791607 80.8370 0.000000 Reject Ho 1.000000 Lac 3.054206 0.7395132 4.1300 0.000786 Reject Ho 0.972030 ABTS 6.066785 0.6475289 9.3691 0.000000 Reject Ho 1.000000 O2 1.137815 0.6292678 1.8082 0.089415 Accept Ho 0.397471 R-Squared 0.886402
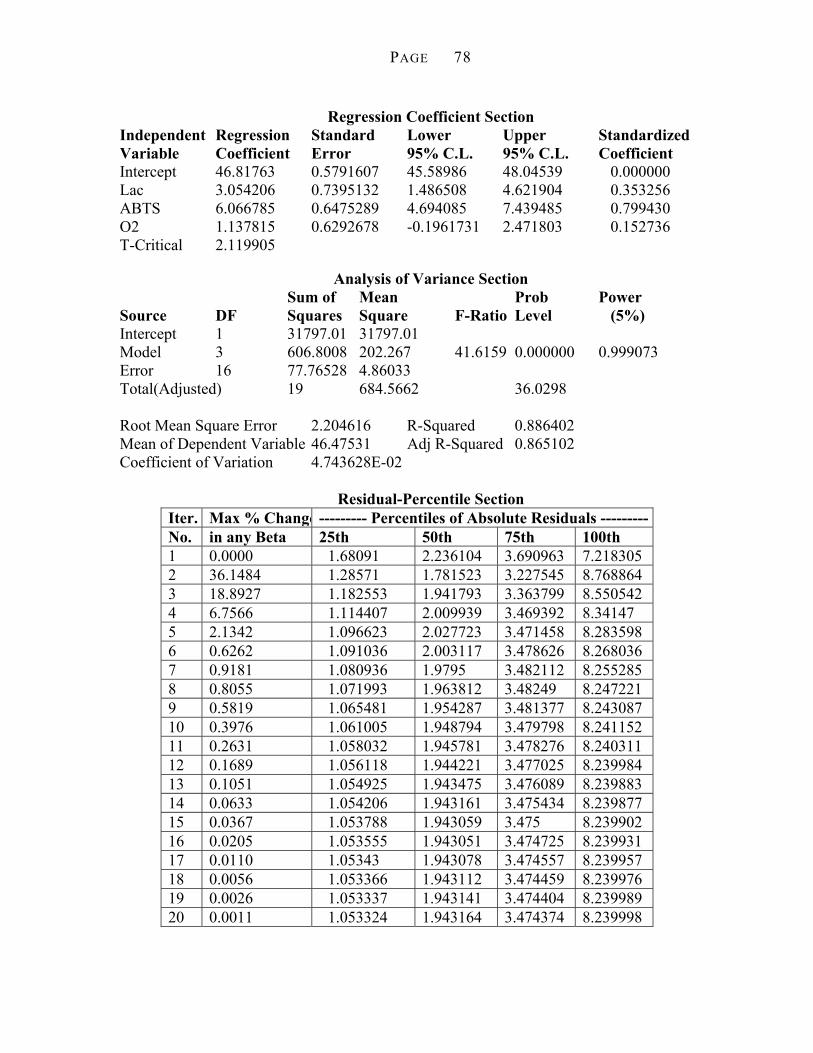
PAGE 78
Regression Coefficient Section Independent Regression Standard Lower Upper Standardized Variable Coefficient Error 95% C.L. 95% C.L. Coefficient Intercept 46.81763 0.5791607 45.58986 48.04539 0.000000 Lac 3.054206 0.7395132 1.486508 4.621904 0.353256 ABTS 6.066785 0.6475289 4.694085 7.439485 0.799430 O2 1.137815 0.6292678 -0.1961731 2.471803 0.152736 T-Critical 2.119905
Analysis of Variance Section Sum of Mean Prob Power Source DF Squares Square F-Ratio Level (5%) Intercept 1 31797.01 31797.01 Model 3 606.8008 202.267 41.6159 0.000000 0.999073 Error 16 77.76528 4.86033 Total(Adjusted) 19 684.5662 36.0298 Root Mean Square Error 2.204616 R-Squared 0.886402 Mean of Dependent Variable 46.47531 Adj R-Squared 0.865102 Coefficient of Variation 4.743628E-02
Residual-Percentile Section
Iter. Max % Change --------- Percentiles of Absolute Residuals --------- No. in any Beta 25th 50th 75th 100th 1 0.0000 1.68091 2.236104 3.690963 7.218305 2 36.1484 1.28571 1.781523 3.227545 8.768864 3 18.8927 1.182553 1.941793 3.363799 8.550542 4 6.7566 1.114407 2.009939 3.469392 8.34147 5 2.1342 1.096623 2.027723 3.471458 8.283598 6 0.6262 1.091036 2.003117 3.478626 8.268036 7 0.9181 1.080936 1.9795 3.482112 8.255285 8 0.8055 1.071993 1.963812 3.48249 8.247221 9 0.5819 1.065481 1.954287 3.481377 8.243087 10 0.3976 1.061005 1.948794 3.479798 8.241152 11 0.2631 1.058032 1.945781 3.478276 8.240311 12 0.1689 1.056118 1.944221 3.477025 8.239984 13 0.1051 1.054925 1.943475 3.476089 8.239883 14 0.0633 1.054206 1.943161 3.475434 8.239877 15 0.0367 1.053788 1.943059 3.475 8.239902 16 0.0205 1.053555 1.943051 3.474725 8.239931 17 0.0110 1.05343 1.943078 3.474557 8.239957 18 0.0056 1.053366 1.943112 3.474459 8.239976 19 0.0026 1.053337 1.943141 3.474404 8.239989 20 0.0011 1.053324 1.943164 3.474374 8.239998

PAGE 79
Robust Regression-Coefficient Section Iter. Intercept Lac ABTS O2 1 47.65244 3.338322 6.347024 1.328575 2 47.02871 3.349287 5.911412 0.848316 3 46.97453 3.29421 5.968573 1.008586 4 46.89972 3.110624 6.00072 1.076732 5 46.85357 3.044237 6.020569 1.094516 6 46.83173 3.025175 6.033324 1.100103 7 46.82609 3.030473 6.046911 1.110203 8 46.82393 3.038511 6.056231 1.119146 9 46.82235 3.044704 6.061631 1.125659 10 46.82101 3.048809 6.064528 1.130134 11 46.81995 3.051328 6.065979 1.133107 12 46.81916 3.052783 6.066642 1.135022 13 46.8186 3.053571 6.066899 1.136215 14 46.81821 3.053969 6.066963 1.136933 15 46.81797 3.05415 6.066947 1.137351 16 46.81782 3.05422 6.066905 1.137585 17 46.81773 3.054236 6.066863 1.13771 18 46.81767 3.05423 6.066827 1.137773 19 46.81764 3.054218 6.066802 1.137803 20 46.81763 3.054206 6.066785 1.137815
Robust Residuals and Weights Section
Row Actual Y Predicted Value Residual Robust Weight
1 44.64399 46.81763 -2.173635 0.804706 2 43.8597 46.81763 -2.957934 0.656632 3 45.61451 46.81763 -1.203123 0.938010 4 48.38661 46.81763 1.568985 0.895489 5 45.62893 46.81763 -1.188695 0.939478 6 45.81519 46.81763 -1.002435 0.956936 7 60.46495 52.92604 7.538908 0.173571 8 40.92583 40.70922 0.2166146 0.998667 9 58.82191 58.9512 -0.1292854 1.000000 10 32.63659 34.68406 -2.047471 0.825573 11 50.19747 49.09326 1.104213 0.947741 12 44.90539 44.542 0.3633926 0.994917 13 56.48572 57.07644 -0.5907142 0.985394 14 51.13022 54.8008 -3.670587 0.503165 15 48.22103 44.94286 3.278161 0.589188 16 46.90434 42.66724 4.237108 0.376240 17 59.20802 50.96802 8.239998 0.210207 18 53.34076 48.69239 4.648369 0.284977 19 36.99559 38.83445 -1.838857 0.857922 20 38.86201 36.55882 2.303188 0.782333

PAGE 80
A.5.4.6 All Possible Regression Report
Page/Date/Time 1 04-18-2005 15:30:31 Database P:\Public Files\Kristina Knutson\DRI Data.S0 Dependent DRI
All Possible Results Section
Model Root Size R-Squared MSE Cp Model 1 0.609800 4.786785 16.051648 B (ABTS) 1 0.168695 6.986832 52.284662 A (Lac) 1 0.026719 7.559958 63.946842 C (O2) 2 0.778495 3.711106 4.194734 AB 2 0.636519 4.753932 15.856914 BC 2 0.195414 7.07291 52.089928 AC 3 0.805214 3.587195 4.000000 ABC
Plots Section
0.00
0.25
0.50
0.75
1.00
0.5 1.3 2.0 2.8 3.5
R-Squared vs Variable Count
Variable Count
R-S
quar
ed
3.5
4.6
5.8
6.9
8.0
0.5 1.3 2.0 2.8 3.5
Root MSE vs Variable Count
Variable Count
Roo
t MS
E
-10.0
-6.5
-3.0
0.5
4.0
0.5 1.3 2.0 2.8 3.5
Cp vs Variable Count
Variable Count
Cp

PAGE 81
A.6 REACTION RATE STUDIES
A series of experiments were performed to examine the reaction rates of laccase-
mediator decolorization of Direct Yellow 11 in solution. Initial experiments have
indicated that results could be obtained by matching each dye decolorization reaction
with a control with the same laccase-mediator concentrations but containing no dye. The
Perkin-Elmer Lambda 900 UV/Vis/NIR spectrophotometer has the ability to subtract
spectra yielding a difference spectrum corresponding to small differences between large
absorbances.
A.6.1 REACTION CONDITIONS
Standard reaction conditions were used for these studies. The dye concentration
was fixed at 20 ppm Direct Yellow 11. Laccase addition was constant at 10.3 U or 5.0 μL
laccase is added per mL of reaction solution. Mediator concentrations did vary and the
concentrations selected for study are shown in Table A-28. Samples from each reaction
were collected at 18 time points as indicated in Table A-29. (Only one 48 hour time point
was collected for each mediator: the remaining 18 samples were collected for each
mediator concentration). In most cases, the absorbance of the reaction solution is too high
to read directly. Samples were diluted to obtain solutions with absorbances less than 1
AU in the region around 410 nm (λMax for Direct Yellow 11). The dilutions made varied
with the mediator concentration and ranged from 1:5 to 1:200. The same dilution was
applied to all samples and controls for a given mediator concentration.
Table A-28 Laccase Mediator Concentrations for Decolorization Reaction Rates
Mediator Concentrations:
Zero Mediator
ABTS 1.0 0.10 0.010 mM
VA 4.0 8.0 16 32 mM
HBT 2.0 4.0 8.0 16 mM

PAGE 82
Table A-29 Time Points for Sample Collection Reaction Rate Studies
Time Points:
0 5 10 15 20 30 45 60 75 90 Minutes
2 3 4 6 8 10 12 24 48 Hours
A.6.2 CALCULATION OF DIFFERENCE SPECTRA
As mentioned, difference spectra were calculated to show small differences in
large absorbances. For every spectrum obtained from laccase/mediator treatment of
Direct Yellow 11, a matching spectrum was obtained for the same time period from a
solution with the same amount of laccase and mediator, but no dye. Subtraction of the
spectrum of the no dye control from the spectrum of the dye/laccase/mediator solution
yields the difference spectrum for that time point for that mediator concentration.
For ABTS, difference spectra were obtained that showed a single dye peak that
could be quantified. For low concentration, the peak was clear (Figure A-56). At higher
concentrations the peak can be quantified, but the peak shape is distinctive in the
difference spectrum (Figure A-57).
Figure A-56 Difference Spectra for Laccase Treatment with 0.01 mM ABTS
0.01mM ABTS Kinetics t0
-0.1
0
0.1
0.2
0.3
0.4
0.5
0.6
200 300 400 500 600
Wavelength
Abs

PAGE 83
Figure A-57 Example of Original and Difference Spectra for 1.0 mM ABTS
Example Spectra t0 1.0 mM ABTS 1:10 Dilution
-0.20
0.20.40.60.8
1
200 400 600 800
Wavelength
Abs
orba
nce
Direct Yellow 11
Laccase-ABTS Control
Difference
The unusual peak shape in the difference spectra became more pronounced for the
selected concentrations of hydroxyl benzotriazole (HBT) and violuric acid (VA).
Figure A-58 Example of Original and Difference Spectra for 2.0 mM HBT
Example Spectra t0 2.0 mM HBT1:4 Dilution
-0.20
0.20.40.60.8
1
200 400 600 800Wavelength
Abs
orba
nce
Direct Yellow 11Lac + HBT ControlDifference

PAGE 84
Figure A-59 Example of Original and Difference Spectra for 4.0 mM HBT
Example Spectra t0 4.0 mM VA
-0.2
0
0.2
0.4
0.6
0.8
1
200 400 600 800
Wavelength
Abs
orba
nce
Direct Yellow 11Lac + VA ControlDifference
A.6.3 DIFFERENCE SPECTRA RESULTS FOR REACTION RATE STUDIES
The difference spectra obtained for each reaction rate study are shown in the
following figures. The ABTS spectra suggested that the wavelength range of concern is
285-550 nm, so only that range is plotted. The data were zeroed by subtracting the lowest
absorbance within that range.
For each mediator concentration, 18 time points were measured. For clarification
purposes, the data for each concentration was divided into three sets of six time points for
plotting. It can be observed that the time zero spectrum usually resembles the spectrum of
Direct Yellow 11 (broad peak with maximum absorbance 400-412 nm), while spectra
from the other time points are distinctly different with peaks in the 370-390 range.
The three graphs for a mediator concentration are followed by a graph showing
either the peak area (for ABTS graphs) or the peak height for the peak corresponding to
Direct Yellow 11. For ABTS, the area does appear to follow a recognizable pattern of
decreasing with time. For VA and HBT, no such pattern is evident.

PAGE 85
A.6.3.1 ABTS Data
Figure A-60 1 mM ABTS Reaction Rate Study Data
1 mM ABTS; 1:10 Dilution G1 of 3
0
0.1
0.2
0.3
0.4
0.5
0.6
0.7
0.8
0.9
250 300 350 400 450 500 550
Wavelength, nm
Abs
orba
nce
0 m5 m10 m15 m20 m30 m
1 mM ABTS; 1:10 Dilution G2 of 3
0
0.1
0.2
0.3
0.4
0.5
0.6
250 300 350 400 450 500 550
Wavelength, nm
Abs
orba
nce
45 m60 m75 m90 m2 h3 h
1 mM ABTS; 1:10 Dilution G3 of 3
0
0.05
0.1
0.15
0.2
0.25
0.3
0.35
250 300 350 400 450 500 550
Wavelength, nm
Abs
orba
nce
4 h6 h8 h10 h12 h24 h48 h
1 mM ABTS; 1:10 Dilution; Peak Area 285-550 nm
0
5
10
15
20
25
30
35
0 8 16 24 32 40 48
Hours
Abs
orba
nce
Are
a
Figure A-61 0.1 mM ABTS Reaction Rate Study Data
0.1 mM ABTS; No Dilution G1 of 3
0
0.1
0.2
0.3
0.4
0.5
0.6
0.7
250 300 350 400 450 500 550
Wavelength, nm
Abs
orba
nce
0 m5 m10 m15 m20 m30 m
0.1 mM ABTS; No Dilution G2 of 3
0
0.1
0.2
0.3
0.4
0.5
0.6
0.7
250 300 350 400 450 500 550
Wavelength, nm
Abs
orba
nce
45 m60 m75 m90 m2 h3 h

PAGE 86
0.1 mM ABTS; No Dilution G3 of 3
0
0.1
0.2
0.3
0.4
0.5
0.6
0.7
250 300 350 400 450 500 550
Wavelength, nm
Abs
orba
nce
4 h6 h8 h10 h12 h24 h
0.1 mM ABTS; No Dilution; Peak Area 285-550 nm
0102030405060708090
100
0 6 12 18 24
Hours
Abs
orba
nce
Are
a
Figure A-62 0.01 mM ABTS Reaction Rate Study Data
0.01 mM ABTS; No Dilution G1 of 3
0
0.1
0.2
0.3
0.4
0.5
0.6
250 300 350 400 450 500 550
Wavelength, nm
Abs
orba
nce
0 m10 m15 m20 m45 m
0.01 mM ABTS; No Dilution G2 of 3
0
0.1
0.2
0.3
0.4
0.5
0.6
250 300 350 400 450 500 550
Wavelength, nm
Abs
orba
nce
60 m90 m2 h3 h4 h
0.01 mM ABTS; No Dilution G3 of 3
0
0.1
0.2
0.3
0.4
0.5
0.6
0.7
0.8
0.9
1
250 300 350 400 450 500 550
Wavelength, nm
Abs
orba
nce
6 h8 h10 h12 h24 h
0.01 mM ABTS; No Dilution; Peak Area 285-550 nm
0102030405060708090
0 4 8 12 16 20 24
Hours
Abs
orba
nce
Are
a

PAGE 87
A.6.3.2 Violuric Acid Data
Figure A-63 4 mM VA Reaction Rate Study Data
4 mM VA; 1:20 Dilution G1 of 3
0
0.01
0.02
0.03
0.04
0.05
0.06
0.07
0.08
0.09
0.1
250 300 350 400 450 500 550
Wavelength, nm
Abs
orba
nce
0510152030
4 mM VA; 1:20 Dilution G2 of 3
0
0.01
0.02
0.03
0.04
0.05
0.06
0.07
0.08
0.09
0.1
250 300 350 400 450 500 550
Wavelength, nm
Abs
orba
nce
4660759023
4 mM VA; 1:20 Dilution G3 of 3
0
0.01
0.02
0.03
0.04
0.05
0.06
0.07
0.08
250 300 350 400 450 500 550
Wavelength, nm
Abs
orba
nce
468101224
4 mM VA; 1:20 Dilution; Peak Heights
0
0.01
0.02
0.03
0.04
0.05
0.06
0.07
0.08
0 4 8 12 16 20 24
Time, Hours
Abs
orba
nce
0
1
2
3
4
5
6
7
Abs
orba
nce
Are
a
405 410
415 Area Sum
Figure A-64 8 mM VA Reaction Rate Study Data
8 mM VA; 1:50 Dilution G1 of 3
0
0.01
0.02
0.03
0.04
0.05
0.06
0.07
0.08
0.09
0.1
250 300 350 400 450 500 550
Wavelength, nm
Abs
orba
nce
0 m5 m10 m15 m20 m30 m
8 mM VA; 1:50 Dilution G2 of 3
0
0.02
0.04
0.06
0.08
0.1
0.12
0.14
0.16
250 300 350 400 450 500 550
Wavelength, nm
Abs
orba
nce
45 m60 m75 m90 m125 m3 h

PAGE 88
8 mM VA; 1:50 Dilution G3 of 3
0
0.005
0.01
0.015
0.02
0.025
0.03
0.035
0.04
0.045
0.05
250 300 350 400 450 500 550
Wavelength, nm
Abs
orba
nce
4 h 3 m6 h8 h10 h12 h24 h
8 mM VA; 1:50 Dilution; Peak Heights
0
0.005
0.01
0.015
0.02
0.025
0.03
0.035
0 4 8 12 16 20 24
T ime, Hours
Abs
orba
nce
0
1
2
3
4
5
6
7
8
Abs
orba
nce
Are
a
405410415Area Sum
Figure A-65 16 mM VA Reaction Rate Study Data
16 mM VA; 1:50 Dilution G1 of 3
0
0.05
0.1
0.15
0.2
0.25
0.3
250 300 350 400 450 500 550
Wavelength, nm
Abs
orba
nce
0 m5 m10 m15 m20 m30 m
16 mM VA; 1:50 Dilution G2 of 3
0
0.01
0.02
0.03
0.04
0.05
0.06
0.07
0.08
0.09
0.1
250 300 350 400 450 500 550
Wavelength, nm
Abs
orba
nce
-0.1
0
0.1
0.2
0.3
0.4
0.5
0.6
0.7
0.8
0.9
Scal
e fo
r 75
m
45 m60 m90 m2 h3 h75 m
16 mM VA; 1:50 Dilution G3 of 3
0
0.02
0.04
0.06
0.08
0.1
0.12
250 300 350 400 450 500 550
Wavelength, nm
Abs
orba
nce
4 h6 h8 h10 h12 h24 h
32 mM VA; 1:100 Dilution; Peak Heights
0
0.1
0.2
0.3
0.4
0.5
0.6
0.7
0.8
0.9
0 4 8 12 16 20 24
Time, Hours
Abs
orba
nce
0
5
10
15
20
25
30
35
Abs
orba
nce
Are
a
405
410
415
Area Sum

PAGE 89
Figure A-66 32 mM VA Reaction Rate Study Data
32 mM VA; 1:100 Dilution G1 of 3
0
0.02
0.04
0.06
0.08
0.1
0.12
0.14
250 300 350 400 450 500 550
Wavelength, nm
Abs
orba
nce
0 m5 m10 m15 m20 m30 m
32 mM VA; 1:100 Dilution G2 of 3
0
0.02
0.04
0.06
0.08
0.1
0.12
250 300 350 400 450 500 550
Wavelength, nm
Abs
orba
nce
45 m60 m75 m90 m2 h3 h
32 mM VA; 1:100 Dilution G3 of 3
0
0.02
0.04
0.06
0.08
0.1
0.12
0.14
0.16
250 300 350 400 450 500 550
Wavelength, nm
Abs
orba
nce
4 h6 h8 h10 h12 h24 h
32 mM VA; 1:100 Dilution; Peak Heights
0
0.02
0.04
0.06
0.08
0.1
0.12
0.14
0.16
0 4 8 12 16 20 24
T ime, Hours
Abs
orba
nce
405
410
415
An experiment utilizing 64 mM violuric acid was also performed. However, no
peak around 400-415 nm due to Direct Yellow 11 can be distinguished in the difference
spectra of these dark solution which had to be highly diluted to be measured.
Figure A-67 64 mM VA Reaction Rate Study Data
64 mM VA; 1:200 Dilution
0
0.1
0.2
0.3
0.4
0.5
250 300 350 400 450 500 550
Wavelength, nm
Abs
orba
nce
0 m30 m45 m75 m90 m2 h6 h12 h24 h
64 mM VA; 1:200 Dilution; Peak Area 285-550 nm
0
5
10
15
20
25
30
0 4 8 12 16 20 24
Hours
Abs
orba
nce
Are
a

PAGE 90
A.6.3.3 HBT Data
Figure A-68 2 mM HBT Reaction Rate Study Data
2 mM HBT; 1:4 Dilution G1 of 3
0
0.05
0.1
0.15
0.2
0.25
0.3
250 300 350 400 450 500 550
Wavelength, nm
Abs
orba
nce
0 m5 m10 m15 m20 m30 m
2 mM HBT; 1:4 Dilution G2 of 3
0
0.05
0.1
0.15
0.2
0.25
0.3
0.35
250 300 350 400 450 500 550
Wavelength, nm
Abs
orba
nce
45 m60 m75 m90 m2 h3 h
2 mM HBT; 1:4 Dilution G3 of 3
0
0.05
0.1
0.15
0.2
0.25
0.3
0.35
250 300 350 400 450 500 550
Wavelength, nm
Abs
orba
nce
4 h6 h8 h10 h12 h24 h
2 mM HBT; 1:4 Dilution; Peak Heights
0
0.02
0.04
0.06
0.08
0.1
0.12
0.14
0.16
0.18
0 4 8 12 16 20 24
Time, Hours
Abs
orba
nce
Max Value between 380 & 450405410415
Figure A-69 4 mM HBT Reaction Rate Study Data
4 mM HBT; 1:10 Dilution G1 of 3
0
0.01
0.02
0.03
0.04
0.05
0.06
0.07
0.08
0.09
250 300 350 400 450 500 550
Wavelength, nm
Abs
orba
nce
0 m5 m10 m15 m20 m30 m
4 mM HBT; 1:10 Dilution G2 of 3
0
0.01
0.02
0.03
0.04
0.05
0.06
0.07
0.08
0.09
250 300 350 400 450 500 550
Wavelength, nm
Abs
orba
nce
45 m60 m75 m90 m2 h3 h

PAGE 91
4 mM HBT; 1:10 Dilution G2 of 3
0
0.02
0.04
0.06
0.08
0.1
0.12
0.14
250 300 350 400 450 500 550
Wavelength, nm
Abs
orba
nce
4 h6 h8 h10 h12 h24 h
4 mM HBT; 1:4 Dilution; Peak Heights
0
0.02
0.04
0.06
0.08
0.1
0.12
0.14
0 4 8 12 16 20 24
Time, Hours
Abs
orba
nce
Max Valuebetween380 & 450405
410
415
Figure A-70 8 mM HBT Reaction Rate Study Data
8 mM HBT 1:10 Dilution G1 of 3
0
0.05
0.1
0.15
0.2
0.25
250 300 350 400 450 500 550
Wavelength, nm
Abs
orba
nce
0m5m10m15m20m30m
8 mM HBT 1:10 Dilution G2 of 3
0
0.05
0.1
0.15
0.2
0.25
250 300 350 400 450 500 550
Wavelength, nm
Abs
orba
nce
45m60m75m90m2h3h
8 mM HBT 1:10 Dilution G3 of 3
0
0.05
0.1
0.15
0.2
0.25
250 300 350 400 450 500 550
Wavelength, nm
Abs
orba
nce
4h6h8h10h12h24h48h
8 mM HBT; 1:10 Dilution; Peak Heights
0
0.01
0.02
0.03
0.04
0.05
0.06
0 4 8 12 16 20 24
Time, Hours
Abs
orba
nce
Max Value between 380 & 450405410415

PAGE 92
Figure A-71 16 mM HBT Reaction Rate Study Data
16 mM HBT; 1:20 Dilution G1 of 3
0
0.05
0.1
0.15
0.2
0.25
0.3
250 300 350 400 450 500 550
Wavelength, nm
Abs
orba
nce
0 m5 m10 m15 m20 m30 m
16 mM HBT; 1:20 Dilution G2 of 3
0
0.05
0.1
0.15
0.2
0.25
250 300 350 400 450 500 550
Wavelength, nm
Abs
orba
nce
45 m 60 m 75 m
90 m 2 h 3 h
16 mM HBT; 1:20 Dilution G3 of 3
0
0.05
0.1
0.15
0.2
0.25
250 300 350 400 450 500 550
Wavelength, nm
Abs
orba
nce
4 h6 h8 h10 h12 h24 h
16 mM HBT; 1:20 Dilution; Peak Heights
0
0.02
0.04
0.06
0.08
0.1
0.12
0.14
0.16
0 4 8 12 16 20 24
Time, Hours
Abs
orba
nce
Max Value between 380 & 450405410415
A.7 CHEMO METRIC ANALYSIS OF REACTION RATE SPECTRA
The unusual peak shapes of the reaction rate experiments made quantification
difficult. Considerable time was spent on making mathematical models of these peaks.
For example, consider Figure A-72. Direct Yellow 11 absorbance is centered on 405 nm.
The peak around 300 nm does not need to be quantified. If a mathematical model could
be fit to the spectrum, the portion centered on 405 nm could be quantized and compared
to modeled areas from other time points from the same sample set.

PAGE 93
Figure A-72 Example Difference Spectrum 2 mM HBT 24 Hour Reaction
24hr 2.0 mM HBT
-0.05-0.03-0.010.010.030.050.070.090.110.130.15
200 300 400 500 600
Wavelength
Abs
orba
nce
A.7.1 MANUAL MODELING OF GAUSSIAN AND LORENTZIAN PEAKSHAPES
Modeling was guided by a textbook, Chemometrics (Data Analysis for the
Laboratory and Chemical Plant) by Richard Brereton.9 The initial efforts were
concentrated on using Gaussian and Lorentzian models of peaks. An example showing
the difference between the models is shown in Figure A-73. Lorentzian model is based on
the Cauchy distribution. While less common than the Gaussian (normal) distribution,
Lorentzian peakshape often arises in NMR spectra. Three parameters are necessary for
these models: x0, the position (wavelength) of the peak center, A the height at the center,
and s, related to peak width. The equations for calculating these models are shown below.

PAGE 94
Figure A-73 Example of Gaussian and Lorentzian Models of Spectral Data
0
0.02
0.04
0.06
0.08
0.1
0.12
0.14
0.16
300 350 400 450 500
Wavelength
Abs
orba
nce
GaussianLorentzian
Equation A-16 Equation to Calculate Gaussian Peakshape
xi = A exp[-(xi – x0)2 /s2]
Equation A-17 Equation to Calculate Lorentzian Peakshape
xi = A / [1 + (xi – x0)2 /s2]
Equation A-18 Definitions for Peakshape Calculations
xi = absorbance calculated for wavelength i x0 = position of peak center A = height of peak at center
s relates to peak width
One issue to consider is that it is possible for the front and back portions of a peak
to be of different kinds. For best fit of a peak, in addition to Gaussian and Lorentzian
peakshapes, a Lorentzian front and Gaussian back should be considered as well as

PAGE 95
Gaussian back and Lorentzian front. For modeling spectrums of two peaks, 16
combinations can be considered. For modeling, A and x0 are set, but s would have to be
adjusted as each of the 16 combinations are tried.
Examples of fitted models are shown in Figure A-74 where the two best
combinations are shown. Close comparison of the raw data with model 1 (Gauss fit of
peak 1 + Gauss fit of peak 2) and model 2 (Gauss fit of peak 1 + Lorentzian back and
Gaussian front of peak 2) show only a slightly better fit for model 1. However, when the
Gauss fit of peak 2 (dotted orange line, part of model 1) is compared with the
combination fit of peak 2 in model 2 (dotted blue line) it appears that these two models
that yield similar degrees of fit overall would yield significantly different areas for the
dye peak of Direct Yellow 11 around 400 nm. This procedure can yield models with
excellent fit to the data. However, it is tedious, and choosing between models is difficult.
Figure A-74 Lorentzian/Gaussian Fits to 8.0 mM HBT Time Zero
8.0 mM HBT to
0
0.02
0.04
0.06
0.08
0.1
0.12
0.14
300 350 400 450 500Wavelength, nm
Abs
orba
nce
Z'd DataaG1aG2aG1+G2cG1cL/G2cG1+L/G2
To automate the model fitting, chemometric software was applied to the data.
Both Unscrambler® software and software obtained from the Chemometric textbook

PAGE 96
were tried. Visually, the data for each time point appear to consist of two components. To
determine if this was correct, a matrix was compiled of the spectra for the complete set of
time points for each concentration. Principal Component Analysis (PCA) was then
applied to this matrix of data. PCA suggested that three components were represented in
the spectral data. The PCA analysis is discussed in detail below. For 8.0 mM HBT data,
the center of these three components appeared to be 306, 336, and 409 nm. Consequently,
an effort was made to model the data using just Gaussian fits, but with three peaks, at
306, 336 and 409 nm. An example is shown in Figure A-75.
Figure A-75 Three Component Gaussian Model of 8.0 mM HBT
8.0 mM HBT 15 minutes
00.020.040.060.08
0.10.120.140.16
250 300 350 400 450 500Wavelength
Abs
orba
nce
DataSUMGauss 1Gauss 2Gauss 3
A.7.2 MODELING BY MULTIVARIATE TECHNIQUES
To understand the difficulties experienced in processing these data, the steps
involved will be discussed. For easy reference, the different matrices discussed and their
relationships are summarized inTable A-31, page 98. To simplify the discussion, factor
analysis will be discussed as outlined by Brereton.9 The data set from HPLC-DAD (high

PAGE 97
pressure liquid chromatography coupled to photodiode array detector) chromatography
system consists of an elution profile (retention time for each individual compound) and a
spectrum (wavelength versus time) plus noise and instrumental error. This data set can be
written as a matrix that is the product of matrices C and S.
Equation A-19 Data Matrix = Component Concentration * Spectral Response
X = C.S + E
Where X is the original data matrix
C is a matrix of the elution profiles for each compound
S is a matrix consisting of spectra of each compound
E is an error matrix
For a chromatogram of two overlapping compounds recorded over 30 time points
and 28 wavelengths, X is a matrix of 30 rows and 28 columns. C is matrix of 30 rows and
2 columns, each corresponding to elution profile of one compound. S is a matrix of 2
rows and 28 columns, each row corresponding to the spectrum of a single compound. E
is a matrix the same size as X. Principal Component Analysis (PCA) performs an abstract
mathematical transformation of the data to yield
Equation A-20 Data Matrix = Score x Loadings
X = T.P + E
Where T, called the scores, has the same number of rows as original data and P,
the loadings, has as many columns as the original data. If the number of principal
components found is denoted by A, then for the example T = 30 x A and P = A x 28. In
this example, to estimate the absorbance value for the 10th wavelength at the 8th time
point, calculate the matrix sum for the values in the 8th row of the scores matrix (T) times
the 10th column of the loadings matrix (P) (If two components are assumed, this number
will be the sum of two multiplications).

PAGE 98
The components found by PCA are mathematical constructs that can but does not
necessarily correspond to physical factors (such as the number of compounds in a
mixture). PCA is designed for determining the number of important components. To
model the components, principal component regression can be used. Scores and loadings
can be related to the concentration profile and spectra.
Equation A-21 Relationship between Data Matrices
X ≈ C.S = T.R.R-1.P Where C corresponds to component concentration and
S to spectral response of each component.
Equation A-22 Relationship between C and S Matrices and PCA Scores and Loadings
C = T.R and S = R-1P If the number of components is known by PCA and pure spectra are available, the
matrix R-1 can be found by regression.
Equation A-23 Definition of R-1 Matrix Relating C,S to T,P
R-1 = S.P’
The different types of matrices are summarized in Table A-30.
Table A-30 Types of Chemometric Matrices Discussed
Symbol Name Example for Reaction Data from Laccase-Mediator Treatment of Direct Yellow 11 in Solution
X Raw Data Absorbance Values for Wavelength x Time Points 266 x 19
C Concentration/ Contribution for Components
266 x 3 Wavelength x Components
S Spectral Response 3 x 19 Components x Time Points
T PCA Scores 266 x 3 P PCA Loadings 2 x 19 R Regression Matrix

PAGE 99
Table A-31 Relationships between Chemometric Matrices
X = C.S + E = T.P + E X ≈ C.S = T.R.R-1.P
C = T.R S = R-1P
R-1 = S.P’
A.7.3 APPLICATION OF PRINCIPAL COMPONENTS REGRESSION
The data set analyzed most intensively was 8.0 mM HBT. The data set consisted
of 19 time points. For each time point a spectrum was available covering the range 200 to
900 nm. Omitting baseline portions of the spectra and the high absorbance near 200
resulted in useable spectra covering the range of 285 to 550 nm. Each spectrum analyzed
consists of a 1x266 (wavelength versus absorbance value).
For this case, the data set X = 266 rows and 19 columns. PCA indicated that there
were three principal components. T, the scores, was 266x3 and P, the loadings, was 3x19.
Principal Component Regression uses regression to convert Principal Component scores
into concentrations.
A.7.3.1 Calculation of C and S Matrices
The major problem with the laccase-mediator data is that pure spectra are not
available. The spectrum for Direct Yellow 11 is available, but not whatever components
absorb around 306 and 336. One way to handle this is to select a set of wavelengths
where only one component is available. That data region can then be used to calculate R-
1. For the 8 mM HBT data, wavelengths 297-319 nm, 331-358 nm, and 382-455 nm were
used to calculate S for Components 1, 2, and 3 respectively.
S, a 3x19 matrix, was transposed to create S’. The matrix S*S’ was calculated,
then inverted to create (S*S’)-1. Next S'*(S*S')-1 was calculated. C could then be
obtained because C = X*S'*(S*S')-1. X is the matrix of raw data (19 columns/timepoints
x 266 rows/wavelengths).
A C matrix was obtained that represents the relative presence of each component.
For 8.0 mM HBT, a C matrix of 266 columns and 3 columns was obtained. (Figure A-76)
It should be noted that each component curve includes regions of negative contributions.

PAGE 100
Figure A-76 Component “Contribution” Data for 8.0 mM HBT
8.0 mM HBT Components from 3PCA
-0.6-0.4-0.2
00.20.40.60.8
11.21.4
200 300 400 500 600
Wavelength
Inte
nsity
PC APC BPC C
Since the calculated model includes negative absorbance values, which cannot
occur physically, it was not possible to obtain a chemometric model that would allow the
absorbance area for Direct Yellow 11 to be isolated from the other peaks in the spectra.
A.8 ANALYSIS OF SOYBEAN PEROXIDASE SPECTRA
The soybean peroxidase experiments were performed with the help of a Summer
Undergraduate Research Experience (SURE) intern, Sylva Kirzan. Kristina Knutson
designed the experiments, trained and supervised Sylva Kirzan. To quantify the decrease
in dye absorbance, the absorbance area (area under the curve in the absorbance spectra)
needed to be measured. A difficulty was encountered in that the baseline for these
experiments was sloping. A simple approach for quantifying absorbance area is to correct
the absorbance data by subtracting the lowest point (so all absorbance values are

PAGE 101
positive), and sum the absorbance values for each wavelength within a specified peak
area. This simple approach was applied to the quantization of the spectra for laccase
treatments. However, because the baseline is sloping, for the soybean peroxidase
experiments an additional step was added. Standard points at the beginning and ending of
the dye absorbance peaks were selected. A sloping linear line was then drawn between
these two points. The triangular area between the zero axis, and the corrected absorbance
values for the selected beginning and ending points is then calculated and subtracted from
the total summed peak area to yield the final dye absorbance area values. (Figure A-77)
To facilitate these calculations, performed on each spectrum from each sample, Sylva
Kirzan wrote two Visual Basic Excel Macro Programs which Kristina Knutson applied to
analyze the data. These macro programs are listed in Table A-32and Table A-33.
These macros are designed for processing spectral data from Perkin Elmer
Lambda 900 UV/Vis/NIR machine which has been saved in ASCII format. The data files
can then be opened by Excel, but the listing of absorbance and wavelength data start in
row 89. To apply the macros, the spectral file is opened in Excel. Excel opens this file
type as a one page read-only file. The data is then copied into a workbook containing the
macro files. The data macro is run first, followed by the chart macro. The resultant Excel
Chart sheet and data sheet can then be copied and saved before processing further
spectral files.
Figure A-77 Example of Area Calculation for SBP Treatments
y = -0.0003x + 0.224
0
0.2
0.4
0.6
0.8
1
200 300 400 500 600
Wavelength, nm
Abs
orba
nce
Time Zero #5 B46L Baseline Points

PAGE 102
A.8.1 EXCEL MACRO PROGRAM FOR SUBTRACTING SLOPING BASELINE
Table A-32 Macro Program for Processing Spectral Data Sub Data() ' ' Data Macro ' Macro recorded 8/1/2002 by IPST ' ' Keyboard Shortcut: Ctrl+q ' Range("A1:F85").Select Application.CutCopyMode = False Selection.Cut Range("L1").Select ActiveSheet.Paste Range("A20").Select ActiveWindow.LargeScroll Down:=1 Range("A43").Select ActiveWindow.LargeScroll Down:=1 Range("A66").Select ActiveWindow.LargeScroll Down:=1 Range("A86:B868").Select Selection.Cut ActiveWindow.LargeScroll Down:=-1 Range("A63").Select ActiveWindow.LargeScroll Down:=-1 Range("A40").Select ActiveWindow.LargeScroll Down:=-1 Range("A17").Select ActiveWindow.LargeScroll Down:=-1 Range("A1").Select ActiveSheet.Paste Range("A2:B2551").Select Selection.Sort Key1:=Range("A2"), Order1:=xlAscending, Header:=xlGuess, _ OrderCustom:=1, MatchCase:=False, Orientation:=xlTopToBottom Range("C1").Select Sheets("Control 10KPEG+B40_DATA").Select Range("C1:K1283").Select Selection.Copy ActiveWindow.ScrollWorkbookTabs Sheets:=1 Sheets("Test").Select ActiveSheet.Paste Range("A1").Select Application.CutCopyMode = False ActiveCell.FormulaR1C1 = "Wavelength" Range("B1").Select ActiveCell.FormulaR1C1 = "Absorbance" Range("A1:B1").Select Selection.Font.Bold = True Range("B1").Select End Sub

PAGE 103
Table A-33 Macro for Generating Spectra from Translated Spectral Files Sub Chart() ' ' Chart Macro ' Macro recorded 8/1/2002 by IPST ' ' ActiveCell.Range("A1:B702").Select Charts.Add ActiveChart.ChartType = xlXYScatterSmoothNoMarkers ActiveChart.SetSourceData Source:=Sheets("Test").Range("A1:B702"), _ PlotBy:=xlColumns ActiveChart.Location Where:=xlLocationAsNewSheet, Name:="Chart change" With ActiveChart .HasTitle = True .ChartTitle.Characters.Text = "See Data" .Axes(xlCategory, xlPrimary).HasTitle = True .Axes(xlCategory, xlPrimary).AxisTitle.Characters.Text = "Absorbance" .Axes(xlValue, xlPrimary).HasTitle = True .Axes(xlValue, xlPrimary).AxisTitle.Characters.Text = "Wavelength" End With ActiveChart.PlotArea.Select With Selection.Border .ColorIndex = 16 .Weight = xlThin .LineStyle = xlContinuous End With Selection.Interior.ColorIndex = xlNone ActiveChart.Axes(xlCategory).Select With ActiveChart.Axes(xlCategory) .MinimumScale = 200 .MaximumScale = 600 .MinorUnitIsAuto = True .MajorUnitIsAuto = True .Crosses = xlAutomatic .ReversePlotOrder = False .ScaleType = xlLinear .DisplayUnit = xlNone End With ActiveChart.Axes(xlValue).Select With ActiveChart.Axes(xlValue) .MinimumScale = -1 .MaximumScale = 1 .MinorUnitIsAuto = True .MajorUnitIsAuto = True .Crosses = xlAutomatic .ReversePlotOrder = False .ScaleType = xlLinear .DisplayUnit = xlNone End With End Sub

PAGE 104
A.9 TOF-SIMS EXPERIMENTS
In an attempt to determine what chemical transformation(s) were occurring during
laccase/ABTS treatment, a set of handsheets were prepared from treated pulps and sent to
Marjatta Kleen for ToF SIMS analysis. Four sheets were prepared as outlined in Table
A-34. The laccase treatment conditions were the standard conditions of 10.3 Units of
laccase /mL reaction solution, 2 hour reaction at 45ºC, under 10 bar oxygen pressure. An
initial set of treated pulp sheets was prepared using 0.5 mM ABTS. However, at this
concentration the treated white pulp sheets exhibited a visible blue-purple tinge.
Consequently a second set of treated handsheets was prepared using 0.1 mM ABTS. The
sheets analyzed by ToF SIMS were treated with laccase and 0.1 mM ABTS. The analysis
report from Marjatta Kleen is shown below.
A.9.1 REPORT OF TOF SIMS ANALYSIS RESULTS
KCL Science and Consulting/Marjatta Kleen and Heli Kangas 23.9.2003 Report
Inked and deinked handsheets for ToF-SIMS testing
A report to IPST/ Kristina Parks Knutson
Table A-34 Samples for TOF-SIMS Analysis
1. the initial virgin bleached hardwood pulp (Wh) 2. the pulp dyed with Direct Yellow 11 (DY) 3. the laccase-mediator treated dyed pulp (TR DY) 4. the laccase-mediator treated virgin pulp (Tr Wh)
A.9.1.1 Aim
Try to see if any differences can be found between the sample sheets, particularly
any characteristics that are unique to the dyed pulp that was treated with laccase-ABTS
(TR DY 0.01).
A.9.1.2 Experimental
The instrument used in ToF-SIMS analyses was a PHI TRIFT II at Top Analytica
Oy. ToF SIMS spectra in positive and negative ion modes were acquired using Ga liquid

PAGE 105
metal ion gun with 15 keV primary ions in bunched mode over the mass range of 2-2000
Da. The primary ion current was 600 pA, time per channel 0.138 ns, pulse width 19 ns,
analysis area 200 x 200 µm2 and acquisition time 5 minutes. Analytical charge
compensation was used to neutralize charge in the insulating paper samples. The
calculated ion dose was 2.7·1011 /cm2 ensuring static conditions during the acquisition.
The marked side of each pulp sheet was analyzed. Three replicate runs were made
from each sample.
A.9.1.3 Results and discussion
In general, the three ToF-SIMS spectra from each sample were visually similar,
so the mass spectra in Figures and the numbers calculated and discussed are only based
on one of the runs. This was done, since the calculations are very time-consuming and in
this way we can get an idea how the results look like. Later, if needed, more exact
calculations for certain interesting features can be done.
Positive SIMS spectra
Figure A-78 shows spectra for some of the metal ions present on the sample
surfaces. It is evident that Wh and TR Wh samples contain some sodium (m/z 22.99) at
their surface, which is hardly visible on the other samples. Samples DY and TR DY
contain aluminum (m/z 26.98), the dyed sample more than the treated one. Samples DY
and TR DY contain also silica (m/z 27.98), the dyed sample more than the treated one.

PAGE 106
Figure A-78 Metal Ions on Surface of TOF SIMS Handsheet Samples
Figure A-79 shows the mass area from m/z 200 to 600. This area shows organic
ion information. The largest differences where found here. However, no exciting new
ions were observed for the DY sample compared to Wh sample. No clear differences
were observed between the samples TR DY and DY either. On the other hand, the
treatment changed slightly the relative abundance of some organic substances on pulp
surface (comparison between TR WH and Wh).

PAGE 107
Figure A-79 Positive Ions m/z 200 to 600
Negative SIMS spectra
Differences were further traced in negative SIMS spectra. The DY sample showed
relatively more of m/z 16 and 17, indicating more oxygen present on the dyed surface.
The percentage of O (15.99) of the total ion count was about 35% (DY), 33% (Tr DY)
and 31% for Wh and TR Wh.

PAGE 108
Marjatta Kleen tried to trace differences in the amount of sulfur on the surface of
samples. The positive SIMS spectra showed very low intensity for the sulfur ion (m/z
31.97), but the negative spectra showed some differences (Figure A-80).
Figure A-80 Sulfur Ion Spectra of Handsheet Surface

PAGE 109
Fig. 3 shows that there is slightly more sulfur on the DY sample compared to Wh
sample, but the largest difference is in fact between the TR DY and Wh. It seems that the
dye leaves some more sulfur on the surface, but also the laccase treatment. In similar way
SO at m/z 47.97 (Figure A-81) as well as SO2 at m/z 63.96, SO3 at m/z 79.96 and HSO3
at m/z 80.96 was observed to have highest abundances for TR DY sample (Table A-35).
Figure A-81 SO and SO2 Ion Spectra of Handsheet Surface

PAGE 110
Table A-35 Ion Quantification Based on One Analyzed Spot/Sample
m/z identity Wh DY TR DY TR Wh 15.99 O 0.308 0.351 0.328 0.314 26.00 CN 0.18 0.18 1.00 0.70 X 10⁻² 34.97 Cl 5.6 3.2 3.2 4.2 X 10⁻² 36.97 Cl 1.8 1.1 1.0 1.4 X 10⁻² 41.998 CNO 1.4 1.2 16.6 14.4 X 10⁻⁴ 45.99 NO2 1.1 1.0 1.1 1.0 X 10⁻² 47.97 SO 1.2 1.0 2.2 1.6 X 10⁻⁴ 50.94 V + + + + 52.94 Cr + + + + 62.96 PO2 1.2 3.9 2.6 1.6 X 10⁻⁵ 63.96 SO2 3.0 3.9 8.7 4.6 X 10⁻⁵ 69.93 Zn + + + + 79.96 SO3 6.8 6.9 20.1 10.0 X 10⁻⁵ 80.96 HSO3 3.4 4.8 7.9 5.0 X 10⁻⁵ 121.02 C6H3NO2 1.9 2.3 2.0 0.7 X 10⁻⁴
+ = observed, not quantified
Table A-35 indicates slight differences in the relative amount of the fragment ion
at m/z 121.02 (C6H3NO2), which could be formed from the ink. When normalized to the
total ion count for each sample, the figures become very low, but at this point Dr. Kleen
believes this is the best way for comparison. The ink fragment ion seems to be present
already on the Wh surface, which seems strange (maybe some other organic compound
gives the same fragment ion?), but there is about 20% more on the DY surface compared
to Wh. Also surprisingly, the enzymatic treatment decreases clearly the amount of this
ion on the Wh surface (about 60%), but much less on the TR DY surface (about 10%).
This might indicate that this ion may originate from two different surface compounds.
Dr. Kleen also tried to trace differences in the amount of nitrogen on the surface
of samples. Neither the positive nor the negative SIMS spectra showed any differences
when looking on the area at m/z 14.00 (N) or at m/z 45.00 (NO2) (Table A-35). Table
A-35 indicates that both treated samples (TR DY and TR Wh) have other nitrogen
residues on their surface (see e.g. 26.00 CN and 41.998 CNO). This indicates that these
fragment ions most probably originate from the enzyme.
Further it was noted that the sample Wh had relatively more chlorine (Cl at 34.97
and 36.97) on its surface compared to the other samples. In addition, zinc (Zn at 69.93) as

PAGE 111
well as some less common metals like vanadium (V at 50.94) and chromium (Cr at
52.94) were observed on all samples.
Figure A-82 shows the mass spectral area where some differences in the organic
substances can be noted.
Figure A-82 Mass Spectral Regions Showing Differences in Organic Substances

PAGE 112
Figure A-82 shows that the ion distribution is different between the Wh and the
DY samples, but same ions are found in both samples. No specific new ions were
observed for the DY sample compared to Wh sample. Differently to the positive ion
spectra, clear differences were observed between the samples TR DY and DY. The
enzymatic treatment seems to partly modify the surface compounds or at least change the
distribution pattern (compare TR Wh to Wh). However, the enzymatic treatment seems to
change Wh and DY surfaces in different ways. The main ions seen in Figure A-82
originate from fatty acid structures (Table A-36).
Table A-36 ToF-SIMS Identified Fatty Acids and Their Characteristic Peaks
Extractive Structure Neg. peaks (m/z) Saturated fatty acids
Palmitic C16H32O2 255 Anteiso heptadecanoic C17H34O2 269 Stearic C18H36O2 283 Arachidic C20H40O2 311 Behenic C22H44O2 339 Lignoceric C24H48O2 367
Unsaturated fatty acids Oleic C18H34O2 (9) 281 Linoleic C18H32O2 (9,12) 279 Pinolenic C18H30O2 (9,12,15) 277
A.10 MALDI EXPERIMENTS
Samples were submitted to Georgia Institute of Technology (GA Tech) Mass
Spectrophotometry Laboratory to see if MALDI (matrix-assisted laser
desorption/ionization mass spectroscopy) could detect any differences between liquid
samples of Direct Yellow 11, laccase, ABTS, laccase+ABTS and laccase/ABTS treated
Direct Yellow 11. It was hoped that the treated dye sample would exhibit new fragments
due to the putative breakdown product(s) of treated Direct Yellow. The sample
concentrations are outlined in Table A-37. Each sample was subjected to MALDI in two
different matrices: α-Cyano-4-hydroxycinnamic acid (CHCA) and 2,5-dihydroxybenzoic
acid (DHB). For each sample/matrix combination, spectra of both positive and negative
m/z ions were obtained.

PAGE 113
Table A-37 Samples Subjected to MALDI Analysis
Component Concentration Sample ID: Molecular Weight
1. Dye Direct Yellow 11 10g/L stock Dy11 796.7 2. Laccase 100% stock (semipure preparation) Lac ~60,000 3. ABTS 10 mM stock ABTS 548.7 4. Lac+ABTS 8.33 mM ABTS 16.7% Lac stock ABTS+LAC 5. Dye Treated with Lac/ABTS very dilute Dye: 20 ppm Direct Yellow 11
Lac: 5 µl/mL ABTS: 0.01 mM Dy11+Lac +ABTS
A.10.1 RESULTS OF MALDI ANALYSIS
The spectra obtained are shown on the following pages. Sharp clearly defined
spectra were obtained from moderately concentrated solutions of Direct Yellow 11 and
laccase mediator ABTS. The MALDI spectra of the high molecular weight (~60,000)
laccase enzyme did exhibit some peaks, but the signal-to-noise ratio is very small. The
same low sensitivity/noisy baseline was observed for ABTS combined with laccase and
the Direct Yellow 11, ABTS and laccase combination. No conclusions are easily drawn
from these data.

PAGE 114
Figure A-83 MALDI Spectrum Direct Yellow 11 Positive m/z from CHCA Matrix

PAGE 115
Figure A-84 MALDI Spectrum Direct Yellow 11 Positive m/z Ions from DHB Matrix

PAGE 116
Figure A-85 MALDI Spectrum Direct Yellow 11 Negative m/z from CHCA Matrix

PAGE 117
Figure A-86 MALDI Spectrum Direct Yellow 11 Negative m/z Ions from DHB Matrix

PAGE 118
Figure A-87 MALDI Spectrum Laccase Positive m/z Ions from CHCA Matrix

PAGE 119
Figure A-88 MALDI Spectrum Laccase Positive m/z Ions from DHB Matrix

PAGE 120
Figure A-89 MALDI Spectrum Laccase Negative m/z Ions from CHCA Matrix

PAGE 121
Figure A-90 MALDI Spectrum Laccase Negative m/z Ions from DHB Matrix

PAGE 122
Figure A-91 MALDI Spectrum ABTS Positive m/z Ions from CHCA Matrix

PAGE 123
Figure A-92 MALDI Spectrum ABTS Positive m/z Ions from DHB Matrix

PAGE 124
Figure A-93 MALDI Spectrum ABTS Negative m/z Ions from CHCA Matrix

PAGE 125
Figure A-94 MALDI Spectrum ABTS Negative m/z Ions from DHB Matrix

PAGE 126
Figure A-95 MALDI Spectrum Laccase+ABTS Positive m/z Ions from CHCA Matrix

PAGE 127
Figure A-96 MALDI Spectrum Laccase+ABTS Positive m/z Ions from DHB Matrix

PAGE 128
Figure A-97 MALDI Spectrum Laccase+ABTS Negative m/z Ions from CHCA Matrix

PAGE 129
Figure A-98 MALDI Spectrum Laccase+ABTS Negative m/z Ions from DHB Matrix

PAGE 130
Figure A-99 MALDI: Dye11 + Laccase+ABTS Positive m/z Ions from CHCA Matrix

PAGE 131
Figure A-100 MALDI: Dye11+Laccase+ABTS Positive m/z Ions from DHB Matrix

PAGE 132
Figure A-101 MALDI: Dye11+Laccase+ABTS Negative m/z Ions from CHCA Matrix

PAGE 133
Figure A-102 MALDI: Dye11+Laccase+ABTS Negative m/z Ions from DHB Matrix

PAGE 134
B APPENDIX REFERENCES
1 Lloyd Snyder, Joseph Kirkland, Joseph Glajch (1997) Practical HPLC Method
Development, 2nd Ed., Wiley & Sons, Pub. Chapters 1&2, “Getting Started” and “Basics of Separation” explain theory and outline the necessary factors for an adequate separation. Chapter 7, “Ionic Samples: Reversed-Phase, Ion-Pair and Ion Exchange HPLC” and Chapter 9 “Systematic Approach to the Reversed-Phase Separation of Regular Samples” guided the selection of mobile phases to test.
2 Moore, Gerald K. (1982) Wet End Chemistry and Runnability, Pira, Paper and Board division, Pub. Leatherhead, England
3 Bourbonnais R, Paice MG, Freiermuth B, Bodie E, Borneman S (1997) “Reactivities of various mediators and laccases with model compounds” Applied and Environmental Microbiology 63(12):4627-4632
4 Kinsley C, Nicell JA (2000) “Treatment of aqueous phenol with soybean peroxidase in the presence of polyethylene glycol.” Bioresource Techn. 73:139-146
5 Pochon A, Vaughan PP, Gan D, Vath P, Blough NV, Falvey DE. “Photochemical oxidation of water by 2-methyl-1,4-benzoquinone: Evidence against the formation of free hydroxyl radical.” J. Physical Chemistry A 106(12): 2889-2894.
6 Rochefort D, Bourbonnais R, Leech D, Paice MG. (2002) “Oxidation of lignin model compounds by organic and transition metal-based electron transfer mediators.” Chem. Comm. (Cambridge, United Kingdom) (11): 1182-1183.
7 Li K. (2003) “The role of enzymes and mediators in white-rot fungal degradation of lignocellulose.” ACS Symposium Series 845(Wood Deterioration and Preservation) pp. 196-209.
8 Douglas Montgomery (1997) Design and Analysis of Experiments, Wiley & Sons, Pub. Statistical experiment design was drawn from Chapter 14, “Response Surface Methods and Other Approaches to Process Optimization”, pp575-641.
9 Richard Brereton (2003) Chemometrics (Data Analysis for the Laboratory and Chemical Plant, Wiley & Sons, Pub. Information about Gaussian and Lorentzian curves to fit spectra on pages 122-125.Principal Component Analysis is in Chapter 4. {Principal Component Regression is in Chapter 5.