Synthesis, Characterisation and DFT Calculations of Azo ...
20
Özkınalı, Çavuş and Sakin, JOTCSA: 2018; 5(1): 159-178. RESEARCH ARTICLE 159 Synthesis, Characterisation and DFT Calculations of Azo-Imine Dyes Sevil Özkınalı 1* , Muhammet Serdar Çavuş 2 , Büşra Sakin 1 1 Hitit University, Faculty of Science and Literature, Department of Chemistry, 19040, Çorum, Turkey 2 Kastamonu University, Faculty of Engineering and Architecture, Biomedical Engineering Department, 37100, Kastamonu, Turkey Abstract: In this study, azo dyes containing an imine group were synthesised by coupling p- hydroxybenzylidene aniline with the diazonium salts of p-toluidine, 4-aminophenol, aniline, p- chloroaniline, p-fluoroaniline and p-nitroaniline. The compounds were characterised by melting point, elemental, UV-Vis and IR analyses as well as 1 H-NMR and 13 C-NMR spectroscopies. Moreover, the experimental data were supplemented with density functional theory (DFT) calculations. The experimental data on FT-IR and UV–Vis spectra of the compounds were compared with theoretical results. The DFT calculations were performed to obtain the ground state geometries of the compounds using the B3LYP hybrid functional level with 6-311++g(2d,2p) basis set. Frontier molecular orbital energies, band gap energies and some chemical reactivity parameters, such as chemical hardness and electronegativity, were calculated and compared with experimental values. A significant correlation was observed between the dipole moment and polarities of the solvents and the absorption wavelength of the compounds. Keywords: Azo-imine, Azo-Azomethine, Schiff Bases, DFT, Spectroscopy Submitted: October 24, 2017. Accepted: November 24, 2017. Cite this: Özkınalı S, Çavuş M, Sakin B. Synthesis, Characterisation and DFT Calculations of Azo- Imine Dyes. JOTCSA. 2018;5(1):159–76. DOI: http://dx.doi.org/10.18596/jotcsa.346278 *Corresponding Author: E-mail Address: [email protected]; T: 03642277000-1636 F: 03642277005
-
Upload
khangminh22 -
Category
Documents
-
view
1 -
download
0
Transcript of Synthesis, Characterisation and DFT Calculations of Azo ...

Özkınalı, Çavuş and Sakin, JOTCSA: 2018; 5(1): 159-178. RESEARCH ARTICLE
159
Synthesis, Characterisation and DFT Calculations of Azo-Imine Dyes
Sevil Özkınalı1*, Muhammet Serdar Çavuş2, Büşra Sakin1
1Hitit University, Faculty of Science and Literature, Department of Chemistry, 19040, Çorum, Turkey 2Kastamonu University, Faculty of Engineering and Architecture, Biomedical Engineering
Department, 37100, Kastamonu, Turkey
Abstract: In this study, azo dyes containing an imine group were synthesised by coupling p-
hydroxybenzylidene aniline with the diazonium salts of p-toluidine, 4-aminophenol, aniline, p-
chloroaniline, p-fluoroaniline and p-nitroaniline. The compounds were characterised by melting
point, elemental, UV-Vis and IR analyses as well as 1H-NMR and 13C-NMR spectroscopies. Moreover,
the experimental data were supplemented with density functional theory (DFT) calculations. The
experimental data on FT-IR and UV–Vis spectra of the compounds were compared with theoretical
results. The DFT calculations were performed to obtain the ground state geometries of the
compounds using the B3LYP hybrid functional level with 6-311++g(2d,2p) basis set. Frontier
molecular orbital energies, band gap energies and some chemical reactivity parameters, such as
chemical hardness and electronegativity, were calculated and compared with experimental values.
A significant correlation was observed between the dipole moment and polarities of the solvents
and the absorption wavelength of the compounds.
Keywords: Azo-imine, Azo-Azomethine, Schiff Bases, DFT, Spectroscopy
Submitted: October 24, 2017. Accepted: November 24, 2017.
Cite this: Özkınalı S, Çavuş M, Sakin B. Synthesis, Characterisation and DFT Calculations of Azo-
Imine Dyes. JOTCSA. 2018;5(1):159–76.
DOI: http://dx.doi.org/10.18596/jotcsa.346278
*Corresponding Author: E-mail Address: [email protected]; T: 03642277000-1636 F:
03642277005

Özkınalı, Çavuş and Sakin, JOTCSA: 2018; 5(1): 159-178. RESEARCH ARTICLE
160
INTRODUCTION
Azo dyes have been widely used in various areas, such as textile dyes (1-2), printing systems (2),
photoelectronics (3), coloring fibres (4) and optical storage technology. They are also commonly
utilised in many biological reactions (5, 6) and in analytical chemistry (7-8). Schiff bases are also
an important class of organic compounds that exhibit a broad range of biological activities, including
antibacterial (9), antifungal (9), antiproliferative (8), anti-inflammatory (4), antimalarial (8),
antipyretic (8) and antiviral (5) properties (6,10). Azo dyes and related Schiff bases containing both
imine (-HC=N-) and azo (-N=N-) groups have received much attention in both fundamental and
applied research areas. Azo-azomethine dyes containing hydroxyl groups are of particular interest
because of the proton tautomerism that exists between the enol-imine and keto-enamine forms
(11-14).
Because of the proton-transfer ability of azo-azomethine dyes, they play an important role in many
scientific fields; in addition, their tautomers exhibit different optical behaviours and possess different
electronic absorption spectra and dyeing properties (1,4,5). The extent to which a tautomer is
favoured under certain conditions can play a significant role in terms of its structural and optical
behaviours in different medium (6,15). Inter- and intramolecular proton transfer from the phenolic
oxygen to the imine nitrogen alters photophysical properties, such as electronic structure and
ground- and excited-state dipole moments (5-6). In addition to these solvent effects, substitutions
are also important in understanding many chemical and physical behaviours, such as hydrogen
bonding and tautomerism of Schiff bases in solutions (5,6). In this study, we examine the
relationship between the structural and spectroscopic behaviours of azo dyes containing Schiff bases
using density functional theory (DFT) analyses and estimation of singlet ground- and excited-state
dipole moments (6).
The literature contains many reports on the successful application of DFT to azo dyes (16-23). In
this study, a series of azo dyes containing an imine group were synthesised and characterised using
both spectroscopy and Kohn-Sham DFT (24) method. The molecular structures and FT-IR and UV–
Vis spectra of the azo-imine dyes synthesised in this study were obtained using the B3LYP method
with 6-311++g(2d,2p) basis set. Solvent effects on the absorbance characteristics of the dyes were
theoretically studied in solvents of different polarities, such as dichloromethane (DCM),
dimethylformamide (DMF) and ethanol (EtOH).

Özkınalı, Çavuş and Sakin, JOTCSA: 2018; 5(1): 159-178. RESEARCH ARTICLE
161
EXPERIMENTAL PROCESS
All reagents and solvents for synthesis and analysis were purchased from Merck (Germany) and
Sigma-Aldrich (US) and were used without further purification. p-Hydroxybenzylidene aniline were
synthesised and purified according to methods used in previous studies (11,25-27). In this study
compounds 2, 3 and 6 are new compounds and these are given here first time in the literature,
also theoretical calculations of all the compounds except 4 are studied for the first time. Azo-imine
compounds were obtained by coupling p-hydroxybenzylidene aniline with the diazonium salts of p-
toluidine, p-hydroxyaniline, p-chloroaniline, p-fluoroaniline and aniline in a 1:1 molar ratio at 0–
5°C. The crude products were purified by recrystallisation from EtOH–water. Elemental (C, H and
N) analyses were performed using a LECO CHNS-932 elemental analyser (LECO Corporation, US).
UV–Vis spectra were obtained using a Genesys 10S UV–Vıs spectrophotometer (Thermo Scientific,
UK) with a concentration of 5 × 10⁻⁵ mol/L of dye in various solvents, such as EtOH, DCM, and
DMF. Infrared spectra were obtained using a Class 1 Laser product FTIR (Thermo Scientific, US) in
the 400–4000 cm−1 range. 1H-NMR and 13C-NMR spectra were obtained using an AC 400 (400 MHz)
NMR spectrometer (Bruker, Germany) with deuterated dimethylsulphoxide (d6-DMSO) as a solvent
and tetramethylsilane as an internal standard.
General procedure for synthesising azo-imine dyes
p-Hydroxybenzylidene aniline was synthesised by a condensation reaction between p-
hydroxybenzaldehyde and aniline at a 1:1 molar ratio, as described previously (6,11,25-27), and
the reaction mixture was refluxed for 3 h. Azo derivatives were synthesised from the p-
hydroxybenzylidene aniline by reaction with diazonium salts at 0–5°C. The general synthetic method
is depicted in Figure 1.
Figure 1. Synthesis of azo-imine compounds (i) pH=4-5, methanol, reflux, 3 h, (ii) NaNO2, HCl,
0-5°C, r1: Ring ; r2: Ring 2; r3: Ring 3.
OH
N
O
H
OHNH2 +i
-+R
OH
N
ii
N
NR
1
R= -CH3 (2)
-OH (3)
-H (4)
-Cl (5)
-F (6)
-NO2 (7)
r1
r2
r3
N N Cl
Özkınalı, Çavuş and Sakin, JOTCSA: 2018; 5(1): 159-178. RESEARCH ARTICLE
162
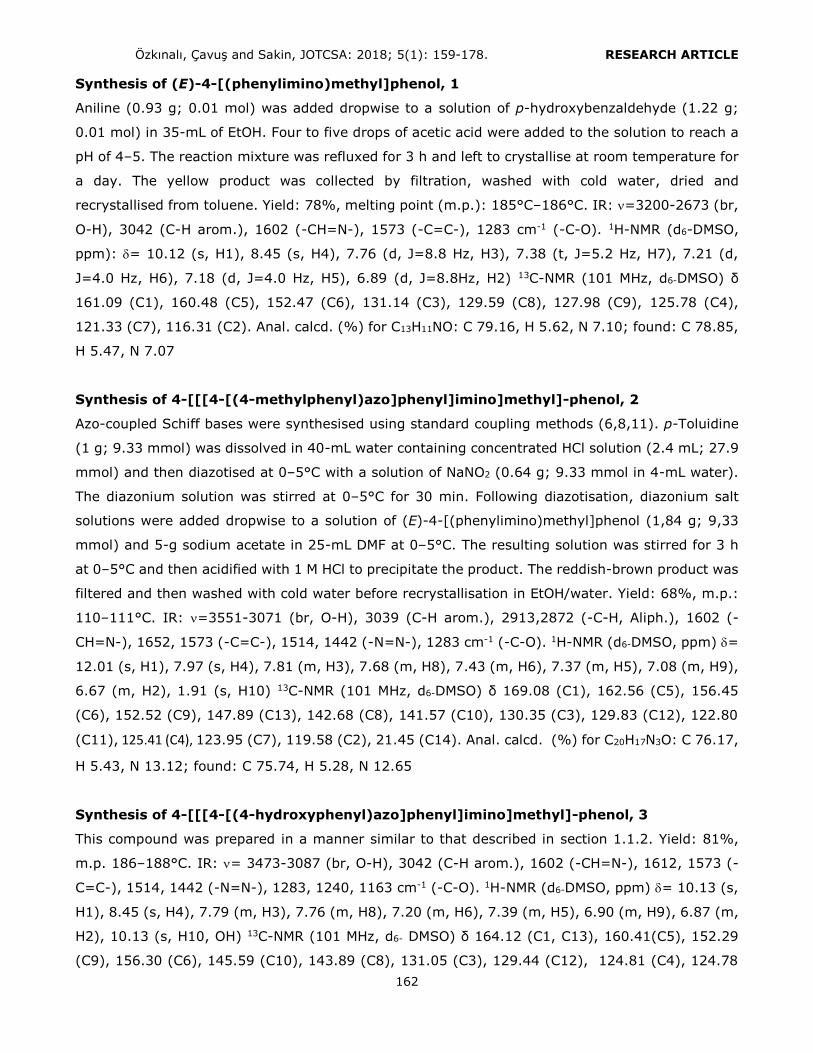
Synthesis of (E)-4-[(phenylimino)methyl]phenol, 1
Aniline (0.93 g; 0.01 mol) was added dropwise to a solution of p-hydroxybenzaldehyde (1.22 g;
0.01 mol) in 35-mL of EtOH. Four to five drops of acetic acid were added to the solution to reach a
pH of 4–5. The reaction mixture was refluxed for 3 h and left to crystallise at room temperature for
a day. The yellow product was collected by filtration, washed with cold water, dried and
recrystallised from toluene. Yield: 78%, melting point (m.p.): 185°C–186°C. IR: =3200-2673 (br,
O-H), 3042 (C-H arom.), 1602 (-CH=N-), 1573 (-C=C-), 1283 cm-1 (-C-O). 1H-NMR (d6-DMSO,
ppm): = 10.12 (s, H1), 8.45 (s, H4), 7.76 (d, J=8.8 Hz, H3), 7.38 (t, J=5.2 Hz, H7), 7.21 (d,
J=4.0 Hz, H6), 7.18 (d, J=4.0 Hz, H5), 6.89 (d, J=8.8Hz, H2) 13C-NMR (101 MHz, d6-DMSO) δ
161.09 (C1), 160.48 (C5), 152.47 (C6), 131.14 (C3), 129.59 (C8), 127.98 (C9), 125.78 (C4),
121.33 (C7), 116.31 (C2). Anal. calcd. (%) for C13H11NO: C 79.16, H 5.62, N 7.10; found: C 78.85,
H 5.47, N 7.07
Synthesis of 4-[[[4-[(4-methylphenyl)azo]phenyl]imino]methyl]-phenol, 2
Azo-coupled Schiff bases were synthesised using standard coupling methods (6,8,11). p-Toluidine
(1 g; 9.33 mmol) was dissolved in 40-mL water containing concentrated HCl solution (2.4 mL; 27.9
mmol) and then diazotised at 0–5°C with a solution of NaNO2 (0.64 g; 9.33 mmol in 4-mL water).
The diazonium solution was stirred at 0–5°C for 30 min. Following diazotisation, diazonium salt
solutions were added dropwise to a solution of (E)-4-[(phenylimino)methyl]phenol (1,84 g; 9,33
mmol) and 5-g sodium acetate in 25-mL DMF at 0–5°C. The resulting solution was stirred for 3 h
at 0–5°C and then acidified with 1 M HCl to precipitate the product. The reddish-brown product was
filtered and then washed with cold water before recrystallisation in EtOH/water. Yield: 68%, m.p.:
110–111°C. IR: =3551-3071 (br, O-H), 3039 (C-H arom.), 2913,2872 (-C-H, Aliph.), 1602 (-
CH=N-), 1652, 1573 (-C=C-), 1514, 1442 (-N=N-), 1283 cm-1 (-C-O). 1H-NMR (d6-DMSO, ppm) =
12.01 (s, H1), 7.97 (s, H4), 7.81 (m, H3), 7.68 (m, H8), 7.43 (m, H6), 7.37 (m, H5), 7.08 (m, H9),
6.67 (m, H2), 1.91 (s, H10) 13C-NMR (101 MHz, d6-DMSO) δ 169.08 (C1), 162.56 (C5), 156.45
(C6), 152.52 (C9), 147.89 (C13), 142.68 (C8), 141.57 (C10), 130.35 (C3), 129.83 (C12), 122.80
(C11), 125.41 (C4), 123.95 (C7), 119.58 (C2), 21.45 (C14). Anal. calcd. (%) for C20H17N3O: C 76.17,
H 5.43, N 13.12; found: C 75.74, H 5.28, N 12.65
Synthesis of 4-[[[4-[(4-hydroxyphenyl)azo]phenyl]imino]methyl]-phenol, 3
This compound was prepared in a manner similar to that described in section 1.1.2. Yield: 81%,
m.p. 186–188°C. IR: = 3473-3087 (br, O-H), 3042 (C-H arom.), 1602 (-CH=N-), 1612, 1573 (-
C=C-), 1514, 1442 (-N=N-), 1283, 1240, 1163 cm-1 (-C-O). 1H-NMR (d6-DMSO, ppm) = 10.13 (s,
H1), 8.45 (s, H4), 7.79 (m, H3), 7.76 (m, H8), 7.20 (m, H6), 7.39 (m, H5), 6.90 (m, H9), 6.87 (m,
H2), 10.13 (s, H10, OH) 13C-NMR (101 MHz, d6- DMSO) δ 164.12 (C1, C13), 160.41(C5), 152.29
(C9), 156.30 (C6), 145.59 (C10), 143.89 (C8), 131.05 (C3), 129.44 (C12), 124.81 (C4), 124.78
Özkınalı, Çavuş and Sakin, JOTCSA: 2018; 5(1): 159-178. RESEARCH ARTICLE
163
(C11), 121.34 (C7), 116.37 (C2). Anal. calcd. (%) for C20H17N3O: C 71.91, H 4.76, N 13.24; found:
C 71.25, H 4.58, N 13.04
Synthesis of 4-[[[4-phenylazo]phenyl]imino]methyl]-Phenol, 4
This compound was prepared in a manner similar to that described above. Yield: 75%, m.p.: 78–
80 °C. IR: =3483-3085 (br, O-H), 3041(C-H arom.), 1602 (-CH=N-), 1595 (-C=C-), 1504, 1478
(-N=N-), 1239, 1137 cm-1 (-C-O). 1H-NMR (d6-DMSO, ppm) = 6.10 (s, H1), 7.76 (s, H4), 7.69 (m,
H3), 7.49 (m, H8), 7.49 (m, H6), 7.41 (m, H5), 7.38 (m, H9), 6.69 (m, H2), 7.44 (m, H10) 13C-
NMR (101 MHz, d6-DMSO) δ 153.34 (C1,C6), 152.92 (C5, C9), 145.59 (C10), 143.26 (C8), 130.36
(C13), 129.85(C3), 129.65(C12), 125.65 (C4), 122.52 (C11) 122.16 (C7), 113.84(C2) Anal. calcd.
(%) for C19H15N3O: C 75.73, H 5.02, N 13.94; found: C 74.48, H 4.92, N 13.17
Synthesis of 4-[[[4-[(4-chlorophenyl)azo]phenyl]imino]methyl]-phenol, 5
This compound was prepared a in a manner similar to that described above. Yield: 73%, m.p.: 72–
74°C. IR: =3301-2648 (br, O-H), 3044(C-H arom.), 1602 (-CH=N-), 1670, 1574 (-C=C-), 1515,
1443 (-N=N-), 1285, 1164 cm-1 (-C-O), 840 (-C-Cl). 1H-NMR (d6-DMSO, ppm) = 12.58 (s, H1),
8.73 (s, H4), 7.75 (m, H3), 7.66 (m, H8), 7.28 (m, H6), 7.44 (m, H5), 7.04 (m, H9), 6.69 (m, H2).
13C-NMR (101 MHz, d6-DMSO) δ 153.73 (C1), 153.34 (C5), 152.92 (C6), 152.57 (C9), 151.12 (C13),
143.22 (C10), 131.52 (C8), 129.73 (C12), 128.96 (C3), 125.92, 125.57 (C4), 122.82 (C11), 122.17
(C7), 113.77 (C2). Anal. calcd. (%) for C19H14ClN3O: C 67.96, H 4.20, N 12.51; found: C 67.24, H
4.14, N 11.73
Synthesis of 4-[[[4-[(4-fluorophenyl)azo]phenyl]imino]methyl]-phenol, 6
This compound was prepared in a manner similar to that described above. Yield: 76%, m.p.: 71–
72 °C. IR: = 3386-2745 (br, O-H), 3042 (C-H arom.), 1602 (-CH=N-), 1572 (-C=C-), 1514, 1443
(-N=N-), 1283, 1163 cm-1 (-C-O), 1193 (-C-F). 1H-NMR (d6-DMSO, ppm) = 12.45 (s, H1), 8.45 (s,
H4), 7.79 (m, H3), 7.54 (m, H8), 7.24 (m, H6), 7.41 (m, H5), 7.03 (m, H9), 6.87 (m, H2) 13C-NMR
(101 MHz, d6-DMSO) δ 163.75 (C1), 160.43 (C13), 161.04 (C5), 152.46 (C9), 150.14 (C6), 146.84
(C10), 142.30 (C8), 131.14 (C3), 129.16 (C12), 125.71 (C4), 122.83 (C7), 121.33 (C11), 116.56
(C2), 114.56 (C12). Anal. calcd. (%) for C19H14FN3O: C 71.46, H 4.42, N 13.16; found: C 71.34, H
4.38, N 12.87
Synthesis of 4-[[[4-[(4-nitrophenyl)azo]phenyl]imino]methyl]-phenol, 7
This compound was prepared in a manner similar to that described above. Yield: 77%, m.p.: 128–
130°C. IR: =3544-3068 (br, O-H), 3047 (C-H arom.), 1602 (-CH=N-), 1572 (-C=C-), 1514, 1442
(-N=N-), 1484, 1388 (-NO2), 1283, 1163 cm-1 (-C-O). 1H-NMR (d6-DMSO, ppm) = 13.03 (s, H1),
8.29 (s, H4), 7.60 (m, H3), 7.58 (m, H8), 7.47 (m, H6), 7.50 (m, H5), 7.53 (m, H9), 7.34 (m, H2)
Özkınalı, Çavuş and Sakin, JOTCSA: 2018; 5(1): 159-178. RESEARCH ARTICLE
164
13C-NMR (101 MHz, d6-DMSO) 163.77 (C1), 158.41 (C5), 153.35 (C9), 152.04 (C6), 149.63 (C13),
142.00 (C10), 14167 (C8), 130.16 (C3), 126.39 (C11), 126.19 (C4), 123.95 (C12), 121.73 (C7),
114.25 (C2). Anal. calcd. (%) for C19H14N4O3: C 65.89, H 4.07, N 16.18; found: C 65.38, H 3.96, N
15.64
Computational details
Quantum chemical calculations of azo dyes containing an imine group were performed by the
Gaussian 09 software package (28) using Becke’s three-parameter exchange functional (B3) (29)
combined with the nonlocal correlation functional of Lee, Yang and Parr (LYP) (30) with 6-
311++G(2d,2p) basis set. Ground state geometries of the azo-imine dyes in gas and solvent phases
were optimised with the same method and basis set without any constraint on the geometry.
Vibrational analysis was used to verify whether the optimised structures corresponded to local
minima on the potential energy surface. The self-consistent reaction field method and the
conductor-polarizable continuum model (31) were used for UV calculations. The vertical excitation
energies and oscillator strengths at the optimised ground state equilibrium geometries were
calculated for DCM, DMF and EtOH phases using time-dependent DFT computations and the same
hybrid functional and basis set, and the UV–Vis absorption properties of the synthesised azo-imine
compounds were investigated for these solvents.
The highest occupied molecular orbital (HOMO), lowest unoccupied molecular orbital (LUMO) and
electrostatic potential (ESP) surfaces of the optimised forms of the molecules were obtained.
Electronegativity (χ) and chemical hardness (η) were also calculated. The theoretical results proved
invaluable in interpreting the experimental IR and UV–Vis spectra of the compounds.
RESULT AND DISCUSSION
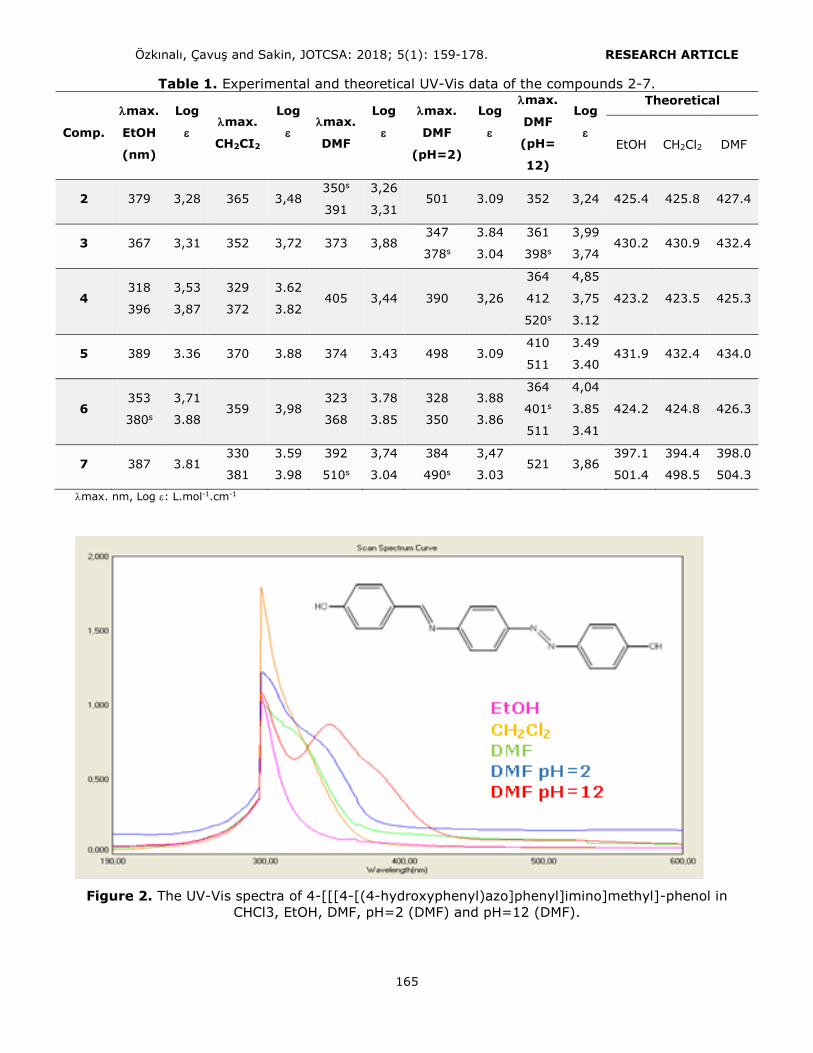
The UV–Vis spectra of the azo-imine compounds were obtained at a concentration of 1 x 10⁻⁵ mol/L
in EtOH, DCM, DMF and pH of 2 and 12 (in DMF). The UV–Vis spectral results of the compounds are
depicted in Table 1. The major absorption peaks with highest extinction coefficients are attributed
to ππ* and nπ* transitions at 318–389 nm and 372–521 nm, respectively. A weak nπ*
transition was observed as a shoulder peak in the spectra because it overlapped with the strong
ππ* transition. Figure 2 shows the UV–Vis spectrum of compound 3. Increasing the pH and polarity
produced a bathochromic shift. In acidic medium, the absorption bands for all compounds were
observed in the visible spectral region of 328–501 nm (Table 1).
Özkınalı, Çavuş and Sakin, JOTCSA: 2018; 5(1): 159-178. RESEARCH ARTICLE
165
Table 1. Experimental and theoretical UV-Vis data of the compounds 2-7.
Comp.
max.
EtOH
(nm)
Log
max.
CH2CI2
Log
max.
DMF
Log
max.
DMF
(pH=2)
Log
max.
DMF
(pH=
12)
Log
Theoretical
EtOH CH2Cl2 DMF
2 379 3,28 365 3,48 350s
391
3,26
3,31 501 3.09 352 3,24 425.4 425.8 427.4
3 367 3,31 352 3,72 373 3,88 347
378s
3.84
3.04
361
398s
3,99
3,74 430.2 430.9 432.4
4 318
396
3,53
3,87
329
372
3.62
3.82 405 3,44 390 3,26
364
412
520s
4,85
3,75
3.12
423.2 423.5 425.3
5 389 3.36 370 3.88 374 3.43 498 3.09 410
511
3.49
3.40 431.9 432.4 434.0
6 353
380s
3,71
3.88 359 3,98
323
368
3.78
3.85
328
350
3.88
3.86
364
401s
511
4,04
3.85
3.41
424.2 424.8 426.3
7 387 3.81 330
381
3.59
3.98
392
510s
3,74
3.04
384
490s
3,47
3.03 521 3,86
397.1
501.4
394.4
498.5
398.0
504.3
max. nm, Log : L.mol-1.cm-1
Figure 2. The UV-Vis spectra of 4-[[[4-[(4-hydroxyphenyl)azo]phenyl]imino]methyl]-phenol in
CHCl3, EtOH, DMF, pH=2 (DMF) and pH=12 (DMF).

Özkınalı, Çavuş and Sakin, JOTCSA: 2018; 5(1): 159-178. RESEARCH ARTICLE
166
Consistent with experimental measurements for the compounds, theoretical calculations of their
UV–Vis spectra showed that the absorption wavelengths obtained using DMF as a solvent were
generally longer than those obtained using other solvents. The absorption wavelengths of
compounds 2–7 in DCM and EtOH were found to be at around 425 nm, 430 nm, 423 nm, 432 nm
and 424 nm, respectively (Table 1), whereas they were 2 nm higher for the same compounds in
DMF. Compound 7, which bore the NO2 substituent, exhibited two large absorption peaks at 398
and 504 nm. Besides, for the compounds 2-6, the effects of CH3, OH, Cl and F substituents on the
absorption wavelengths were determined to be λ−Cl > λ−OH > λ−CH3> λ−F > λ−H. An increase in the
polarity of the solvent elicited a bathochromic shift in the absorption wavelengths of the compounds,
that is, the most polar solvent DMF produced a larger effect than the other solvents. A significant
correlation was also observed between the dipole moments of the solvents and the bathochromic
shifts they produced (mDMF≈3.86 D, mEtOH≈1.69 D, mDCM≈1.47 D, where D is Debye).
The IR absorption of the hydroxyl groups of the compounds occurred as a broad peak band in the
range of 3551–2672 cm−1 because of intramolecular hydrogen bonding, and the stretching of -
HC=N- was observed at 1602 cm−1 (5, 6). In addition, weak peak bands appeared in the ranges
3047–3039 cm−1 and 2925–2872 cm−1, which can be attributed to aromatic C-H and aliphatic =C-
H stretching, respectively (Figure 3 and Table 2). The asymmetric and symmetric stretching bands
of the azo group (-N=N-) were observed at both 1500 and 1450 cm−1. The exact position of these
bands varied according to the molecular structure of the compounds, and the strong bands that
appeared in the range of 1650–1572 cm−1 of the IR spectra can be attributed to aromatic stretching.
Figure 3. The IR spectrum for 4-[[[4-[(4-chlorophenyl)azo]phenyl]imino]methyl]-Phenol
Özkınalı, Çavuş and Sakin, JOTCSA: 2018; 5(1): 159-178. RESEARCH ARTICLE
167
Table 2. IR spectral results of compounds 1-7. Compound O-H C-H
Arom.
=C-H
Aliph.
C=N C=C N=N Ar-O Other functional
groups
1 3200-
2672
3042
2914
2863
1602 1573 - 1283 -
2 3551-
3071
3039 2913
2854
1602 1652
1573
1514
1442
1283 2913 and
2872 (CH3)
3 3473-
3087
3042 2923
2872
1602 1612
1573
1514
1442
1283
1240
1163
-
4 3483-
3085
3041 2918
2863
1602 1595 1504
1478
1239
1137
-
5 3301-
2648
3044 2913
2868
1602 1670
1574
1515
1443
1285
1164
840 (C-Cl)
6 3386-
2745
3042
2924
2874
1602 1573 1514
1443
1283
1163
1193 (C-F)
7 3544-
3068
3047 2925
2864
1602 1572 1514
1442
1283
1163
1484 and
1388 (NO2)
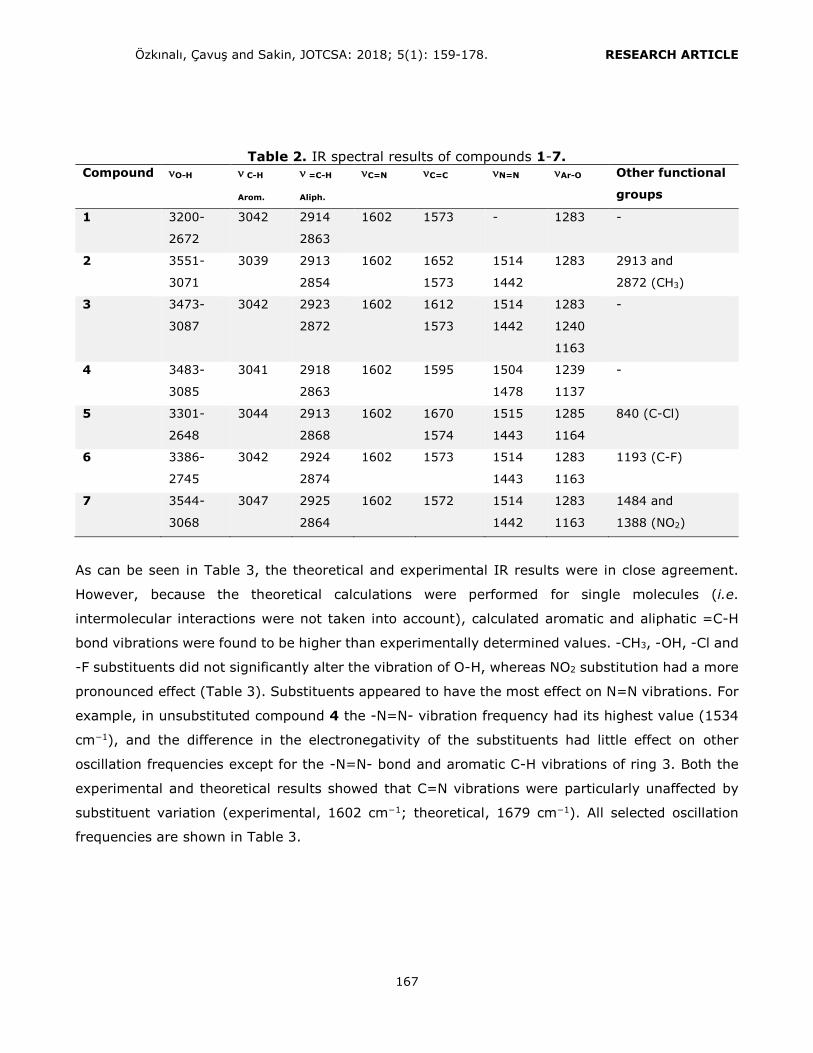
As can be seen in Table 3, the theoretical and experimental IR results were in close agreement.
However, because the theoretical calculations were performed for single molecules (i.e.
intermolecular interactions were not taken into account), calculated aromatic and aliphatic =C-H
bond vibrations were found to be higher than experimentally determined values. -CH3, -OH, -Cl and
-F substituents did not significantly alter the vibration of O-H, whereas NO2 substitution had a more
pronounced effect (Table 3). Substituents appeared to have the most effect on N=N vibrations. For
example, in unsubstituted compound 4 the -N=N- vibration frequency had its highest value (1534
cm−1), and the difference in the electronegativity of the substituents had little effect on other
oscillation frequencies except for the -N=N- bond and aromatic C-H vibrations of ring 3. Both the
experimental and theoretical results showed that C=N vibrations were particularly unaffected by
substituent variation (experimental, 1602 cm−1; theoretical, 1679 cm−1). All selected oscillation
frequencies are shown in Table 3.

Özkınalı, Çavuş and Sakin, JOTCSA: 2018; 5(1): 159-178. RESEARCH ARTICLE
168
Table 3. Theoretical IR spectral results of the compounds.
Compound O-H
C-H
Arom.
=C-H
Aliph. C=N C=C N=N Ar-O
Other
functional
groups
2 3832
3179 (r2)
3160 (r3)
3158 (r1)
3011 1680
1646
1618
1548
1490
1438 1286
3109
3076
3032 (CH3)
3 3833 (r3)
3831 (r1)
3178 (r2)
3159 (r1)
3153 (r3)
3009 1678
1642
1612
1527
1496
1466
1289 (r1)
1281 (r2) 3833 (O-H)
4 3831
3199 (r3)
3179 (r2)
3176 (r1)
3010 1679
1647
1612
1548
1534
1445 1290 -
5 3831
3218 (r3-
weak)
3180 (r2)
3160 (r1)
3010 1679
1647
1612
1548
1530
1492 1290 1095 (C-Cl)
6 3831
3210 (r3-
weak)
3179 (r2)
3160 (r1)
3010 1679
1647
1612
1527
1496
1439 1290 1238 (C-F)
7 3830
weak (r3)
3205 (r2)
3160 (r1)
3012 1679
1647
1611
1528
1528
1488 1292 1359 (NO2)
r1: ring 1, r2: ring 2, r3: ring 3
The 1H-NMR spectra of the compounds were produced using DMSO-d6, and the signals at 7.81 ppm
and 6.67 ppm were assigned to the aromatic protons. The signal stemmed from imine group
appeared as a singlet in the range of 8.45 and 7.76 ppm. Aromatic protons were observed as
doublets and, in a few cases, as overlapping doublets/multiplets. The singlet peak of the OH group
appeared at 13.03 and 10.12 ppm except for that of the OH group the compound 4, which appeared
at 6.10 ppm. An additional signal at 1.91 ppm, which was found in compound 2, was attributed to
the CH3 group. Hydroxyl and imine protons were observed as singlet peaks at 13.03 and 8.29 ppm
for the H1 and H4 protons in the spectrum of compound 7 (Figure 4). The peak at 7.34–7.60 ppm
was attributed to signals from aromatic protons (Table 4). Protons (H2-H7) on the benzene ring
adjacent to the nitro group shifted downfield, as expected, due to the unsubstituted benzene protons
(H2-H7) in the compound 7.

Özkınalı, Çavuş and Sakin, JOTCSA: 2018; 5(1): 159-178. RESEARCH ARTICLE
169
Figure 4. The 1H-NMR Spectrum of 4-[[[4-[(4-nitrophenyl)azo]phenyl]imino]methyl]-Phenol

Özkınalı, Çavuş and Sakin, JOTCSA: 2018; 5(1): 159-178. RESEARCH ARTICLE
170
Table 4. 1H-NMR spectral results of compounds 1-7.
HO
N
1
2
2 3
3
4
5
5 6
6
7
HO
N N
N X
1
2
2 3
3
4
5
5 6
6
8
8 9
9
10
7
Compound 1
X= CH3 (2), -OH (3), -H (4), -Cl (5), -F (6), NO2 (7)
H1 H2 H3 H4 H5 H6 H7 H8 H9 H10
1 10.12 (s) 6.89 (d) 7.76 (d) 8.45 (s) 7.18 (d) 7.21(d) 7.38 (t) - - -
2 12.01 (s) 6.67 (m) 7.81 (m) 7.97 (s) 7.37(m) 7.43(m) - 7.68(m) 7.08(m) 1.91(s)
3 10.13 (s) 6.87 (m) 7.79 (m) 8.45 (s) 7.39(m) 7.20(m) - 7.76(m) 6.90 (m) 10.13(s)
4 6.10 (s) 6.69 (m) 7.69 (m) 7.76 (s) 7.41(m) 7.49(m) - 7.49(m) 7.38(m) 7.44(m)
5 12.58 (s) 6.69 (m) 7.75 (m) 8.73 (s) 7.44(m) 7.28(m) - 7.66(m) 7.04(m) -
6 12.45(s) 6.87 (m) 7.79(m) 8.45 (s) 7.41(m) 7.24(m) - 7.54(m) 7.03(m) -
7 13.03(s) 7.34 (m) 7.60(m) 8.29 (s) 7.50(m) 7.47(m) - 7.58(m) 7.53(m) -

Özkınalı, Çavuş and Sakin, JOTCSA: 2018; 5(1): 159-178. RESEARCH ARTICLE
171
Theoretical calculations showed that the highest molecular energy among compounds 2–7 was
shown by the unsubstituted compound 4 (−972.776 au) and that there was no relationship between
the electronegativity of substituent groups and the molecular energies of the compounds.
Compound 5, bearing the -Cl substituent, had the lowest molecular energy (−1432.400 au). The
NO2 substituted compound 7 possessed the lowest HOMO-LUMO energy gap (∆E) and the highest
electronegativity (4.798 eV) and dipole moment (9.914 D). Therefore, compound 7 exhibited the
lowest chemical hardness (1.517 eV) and the highest reactivity. Conversely, unsubstituted
compound 4 exhibited the highest chemical hardness. Comparison between compounds 4 and 2
showed that the methyl substituent decreased the dipole moment of the compound 4 from 3.6 to
1.5 D.
Table 5. Electronic and chemical parameters calculated by B3lyp/6-311++g(2d,2p)
Compound E (au) 𝑬𝐡𝐨𝐦𝐨 (eV) 𝑬𝐥𝐮𝐦𝐨 (eV) ∆𝑬 𝜼 (eV) 𝜒 (eV) m (D)
2 -1012.105 -5.862 -2.455 3.406 1.703 4.158 1.501
3 -1048.026 -5.765 -2.417 3.348 1.674 4.091 2.469
4 -972.776 -5.954 -2.529 3.425 1.713 4.242 3.600
5 -1432.400 -6.022 -2.673 3.350 1.675 4.348 5.276
6 -1072.046 -5.992 -2.593 3.399 1.700 4.293 4.903
7 -1177.345 -6.315 -3.282 3.033 1.517 4.798 9.914
E: Energy, ∆𝑬: 𝐸𝐿𝑈𝑀𝑂 − 𝐸𝐻𝑂𝑀𝑂, 𝜼: Chemical Hardness, 𝝌: Electronegativity, m: Dipole moment D: Debye
As can be seen from Table 5, there is no obvious relationship between the electronegativity of the
substituents and that of the compounds 2–6. However, compound 7, which bore the highest
electronegative substituent (NO2), also showed the highest electronegative. However, these data
still suggest that a substituent’s electronegativity is not necessarily the only criterion that
determines the molecular electronegativity of the compound. The calculated electronic and chemical
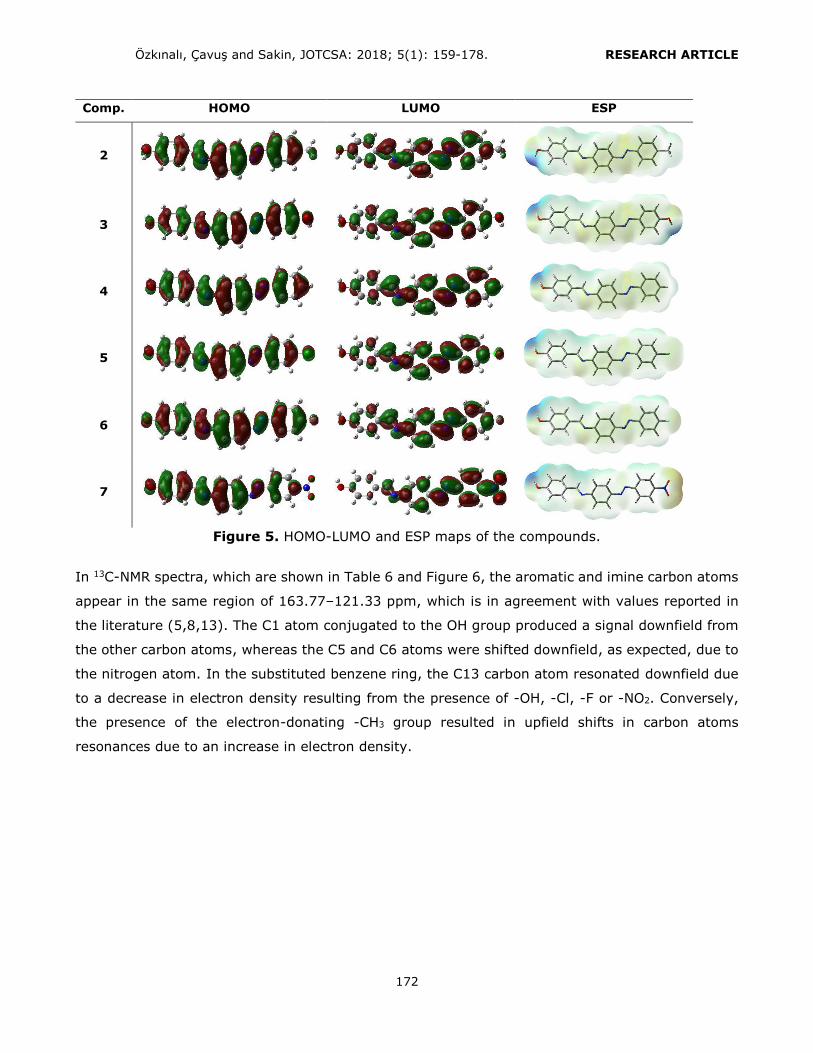
values of the compounds are shown in the Table 5. Furthermore, the calculated HOMO-LUMO and
ESP maps of the molecules are given in Figure 5.
Özkınalı, Çavuş and Sakin, JOTCSA: 2018; 5(1): 159-178. RESEARCH ARTICLE
172
Comp. HOMO LUMO ESP
2
3
4
5
6
7
Figure 5. HOMO-LUMO and ESP maps of the compounds.
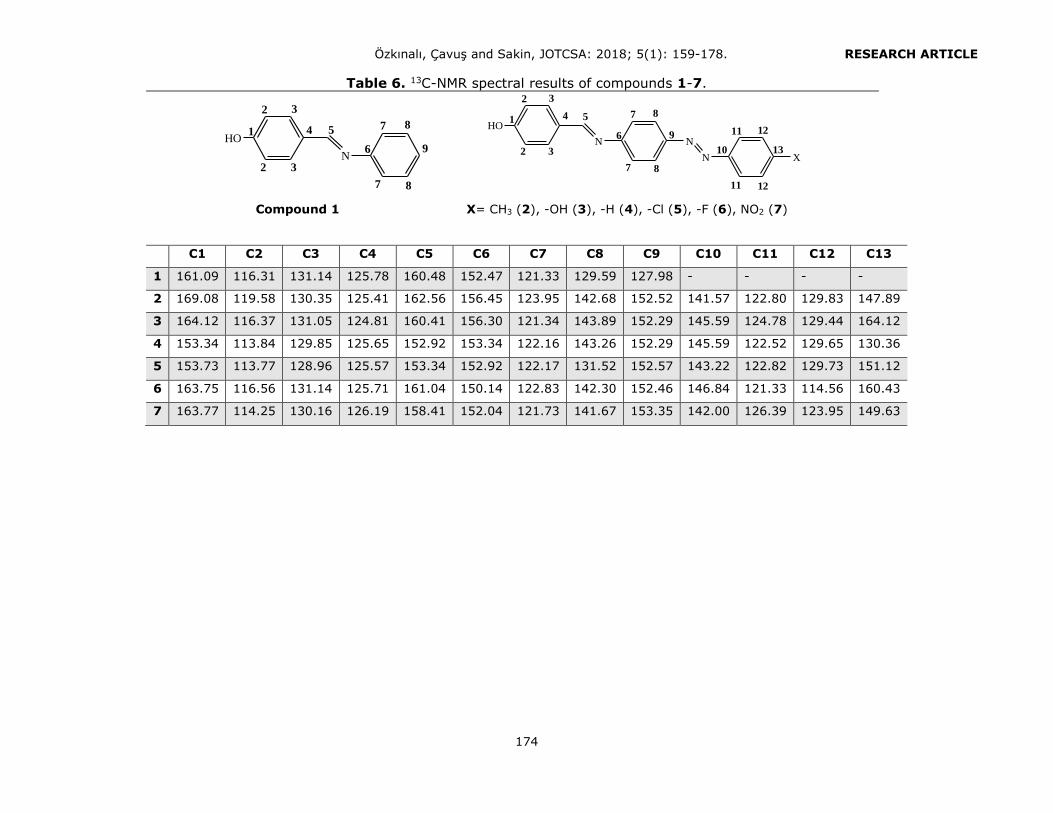
In 13C-NMR spectra, which are shown in Table 6 and Figure 6, the aromatic and imine carbon atoms
appear in the same region of 163.77–121.33 ppm, which is in agreement with values reported in
the literature (5,8,13). The C1 atom conjugated to the OH group produced a signal downfield from
the other carbon atoms, whereas the C5 and C6 atoms were shifted downfield, as expected, due to
the nitrogen atom. In the substituted benzene ring, the C13 carbon atom resonated downfield due
to a decrease in electron density resulting from the presence of -OH, -Cl, -F or -NO2. Conversely,
the presence of the electron-donating -CH3 group resulted in upfield shifts in carbon atoms
resonances due to an increase in electron density.

Özkınalı, Çavuş and Sakin, JOTCSA: 2018; 5(1): 159-178. RESEARCH ARTICLE
173
Figure 6. The 1H-NMR Spectrum of 4-[[[4-[(phenyl)azo]phenyl]imino]methyl]-phenol
Özkınalı, Çavuş and Sakin, JOTCSA: 2018; 5(1): 159-178. RESEARCH ARTICLE
174
Table 6. 13C-NMR spectral results of compounds 1-7.
HO
N
1
2
2 3
3
4 5
6
8
8
9
7
7
HO
N N
N X
1
2
2 3
3
4 5
6
8
8
9
10
7
11 12
13
7
11 12
Compound 1 X= CH3 (2), -OH (3), -H (4), -Cl (5), -F (6), NO2 (7)
C1 C2 C3 C4 C5 C6 C7 C8 C9 C10 C11 C12 C13
1 161.09 116.31 131.14 125.78 160.48 152.47 121.33 129.59 127.98 - - - -
2 169.08 119.58 130.35 125.41 162.56 156.45 123.95 142.68 152.52 141.57 122.80 129.83 147.89
3 164.12 116.37 131.05 124.81 160.41 156.30 121.34 143.89 152.29 145.59 124.78 129.44 164.12
4 153.34 113.84 129.85 125.65 152.92 153.34 122.16 143.26 152.29 145.59 122.52 129.65 130.36
5 153.73 113.77 128.96 125.57 153.34 152.92 122.17 131.52 152.57 143.22 122.82 129.73 151.12
6 163.75 116.56 131.14 125.71 161.04 150.14 122.83 142.30 152.46 146.84 121.33 114.56 160.43
7 163.77 114.25 130.16 126.19 158.41 152.04 121.73 141.67 153.35 142.00 126.39 123.95 149.63

Özkınalı, Çavuş and Sakin, JOTCSA: 2018; 5(1): 159-178. RESEARCH ARTICLE
175
CONCLUSION
The azo-imine compounds synthesised in this study were obtained in a high yield and were
characterised by UV–Vis, IR, NMR and elemental analyses. Spectroscopic and elemental analyses
revealed the expected results. The UV–Vis electronic absorption and IR spectra of the compounds
were determined both experimentally and also computationally using DFT. The UV–Vis spectra of
the compounds exhibited two absorption bands in the ranges of 318–389 and 372–521 nm, which
were assigned to * and n* transitions, respectively. 1H- and 13C NMR spectroscopy confirmed
the presence of the functional groups, particularly the -N=N- and -HC=N- imine groups, of the
compounds.
REFERENCES
1. Umape P.G, Patil V.S, Padalkar V.S, Phatangare K.R, Gupta V.D, Thate A.B, Sekar N, Synthesis and characterization of novel yellow azo dyes from 2-morpholin-4-yl-1,3-thiazol-(5H)-one and study of their azo-
hydrazone tautomerism. Dyes and Pigments. 2013;99: 291-298.
2. Gür M., Kocaokutgen H., M. Taş, Synthesis, spectral and thermal characterissation of some azo-ester derivatives containing a 4-acryloyloxy group, Dyes and Pigments, 2007, 72, 101-108.
3. Al-Hamdani A.A.S, Balkhi A.M, Falah A, Shaker S.A, Synthesis and investigation of thermal properties of vanadyl complexes with azo-containing Schiff-base dyes, Journal of Saudi Chemical Society, 2016; 20: 487-501 4. Bitmez Ş, Sayin K, Avar B, Köse M, Karayıldız A, Kurtoğlu M, Preparation, spectral, X-ray powder diffraction
and computational studies and genotoxic properties of new azo–azomethine metal chelates, Journal of Molecular Structure. 2014:1076; 213–226 5. Eren T, Köse M, Kurtoğlu N, Ceyhan G, McKee V, Kurtoğlu M, An azo-azomethine ligand and its copper(II) complex: Synthesis, X-ray crystal structure, spectral, thermal, electrochemical and photoluminescence properties. Inorganica Chimica Acta 2015; 430: 268–279
6. Köse M, Kurtoğlu N, Gümüşsu Ö, Tutak M, McKee V, Karakaş D, Kurtoğlu M, Synthesis, characterization and antimicrobial studies of 2-{(E)-[(2-hydroxy-5-methylphenyl)imino]methyl}-4-[(E)-phenyldiazenyl] phenol as a novel azo-azomethine dye. Journal of Molecular Structure. 2013; 1053: 89–99 7. Kantar C, Mavi, V, Baltas N¸ İslamoğlu F, Şaşmaz S, Novel zinc(II)phthalocyanines bearing azo-containing schiff base: Determination of pKa values, absorption, emission, enzyme inhibition and photochemical properties. Journal of Molecular Structure. 2016; 1122: 88-99
8. Purtas F, Sayin K, Ceyhan G, Kose M, Kurtoglu M, New fluorescent azo-Schiff base Cu(II) and Zn(II) metal chelates; spectral, structural, electrochemical, photoluminescence and computational studies. Journal of Molecular Structure. 2017; 1137: 461-475. 9. Alaghaz A.M.A, Zayed M. E, Alharbi S. A, Synthesis, spectral characterization, molecular modeling and
antimicrobial studies of tridentate azo-dye Schiff base metal complexes. Journal of Molecular Structure. 2015; 1084: 36–45 10. Zakerhamidi M.S, Nejati K, Sorkhabi S.G, Saati M, Substituent and solvent effects on the spectroscopic properties and dipole moments of hydroxyl benzaldehyde azo dye and related Schiff bases. Journal of Molecular Liquids. 2013; 180: 225–234
11. Anitha C, Sheela C.D, Tharmaraj P, Sumathi S, Spectroscopic studies and biological evaluation of some transition metal complexes of azo Schiff-base ligand derived from (1-phenyl-2,3-dimethyl-4-aminopyrazol-5-

Özkınalı, Çavuş and Sakin, JOTCSA: 2018; 5(1): 159-178. RESEARCH ARTICLE
176
one) and 5-((4-chlorophenyl)diazenyl)-2-hydroxybenzaldehyde. Spectrochimica Acta Part A: Molecular and
Biomolecular Spectroscopy. 2012; 96: 493–500
12. Nazır H, Yıldız M, Yılmaz H, Tahir M.N, Ülkü D, Intramolecular hydrogen bonding and tautomerism in Schiff bases. Structure of N-(2-pyridil)-2-oxo-1-naphthlidenemethylamine. Journal of Molecular Structure. 2000; 524: 241-250 13. Pal M.K, Kushwah N, Wadawale AP, Manna D, Sudarsan V, Ghanty T.K, Jain V.K, Synthesis,
characterization, photoluminescence and computational studies of mono- and diorgano-gallium complexes containing azo linked salicylaldimine Schiff bases. Journal of Organometallic Chemistry. 2015; 776: 98-106 14. Nagy P.I, Fabian W.M.F, Theoretical Study of the Enol Imine-Enaminone Tautomeric Equilibrium in Organic Solvents. J. Phys. Chem. B. 2006; 110: 25026-25032 15. Alaghaz A.M.A, Zayed M. E, Alharbi S. A, Synthesis, spectral characterization, molecular modeling and
antimicrobial studies of tridentate azo-dye Schiff base metal complexes. Journal of Molecular Structure. 2015; 1084: 36–45
16. Qian H.F, Tao T, Feng Y.N, Wang Y.G, Huang W, Crystal structures, solvatochromisms and DFT computations of three disperse azo dyes having the same azobenzene skeleton. Journal of Molecular Structure. 2016; 1123: 305-310
17. Atay Ç.K, Gökalp M, Kart S.Ö, Tilki T, Mono azo dyes derived from 5-nitroanthranilic acid: Synthesis, absorption properties and DFT calculations. Journal of Molecular Structure. 2017; 1141: 237-244. 18. Sreenath M.C, Mathew S, Joe H.I, Rastogi V.K, Z-scan measurements of the third-order optical nonlinearities and vibrational spectral studies by DFT computations on azo dye 1-(2-Methylphenylazo)-2-napthol. Optics and Laser Technology. 2017; 97: 390–399.
19 Deshmukh M.S, Sekar N, A combined experimental and TD-DFT investigation of three disperse azo dyes having the nitroterephthalate skeleton. Dyes and Pigments. 2014; 103: 25-33 20. Turkten N, Cinar Z, Photocatalytic decolorization of azo dyes on TiO2: Prediction ofmechanism via
conceptual DFT. Catalysis Today. 2017; 287: 169–175
21. Miraftab R, Ramezanzadeh B, Bahlakeh G, Mahdavian M, An advanced approach for fabricating a reduced graphene oxide-AZO dye/polyurethane composite with enhanced ultraviolet (UV) shielding. Chemical Engineering Journal. 2017; 321: 159–174 22. Erfantalab M, Khanmohammadi H, New 1,2,4-triazole-based azo–azomethine dye. Part III: Synthesis, characterization, thermal property, spectrophotometric and computational studies properties: Experimental and first-principles QM modeling. Spectrochimica Acta Part A: Molecular and Biomolecular Spectroscopy. 2014;
125: 345–352 23. Gür M, Muğlu H, Çavus M.S, Güder A, Sayıner H.S, Kandemirli F, Synthesis, characterization, quantum chemical calculations and evaluation of antioxidant properties of 1,3,4-thiadiazole derivatives including 2- and 3-methoxy cinnamic acids. Journal of Molecular Structure. 2017; 1134: 40-50
24. Kohn W, Sham L.J, Self-consistent equations including exchange and correlation effects. Phys. Rev. 1965;
140: A1133. 25. Shahab S, Sheikhi M, Filippovich L, Kumar R, Dikusar E, Yahyaei H, et al. Synthesis, geometry optimization, spectroscopic investigations (UV/Vis, excited states, FT-IR) and application of new azomethine dyes. Journal of Molecular Structure. 2017 Nov;1148:134–49.
26. Endre J, Tibor Z., Antimicrobial, ascaricidal, and molluscicidal activities of salicylanilide analogs. Virusforschung und Parasitologie. 1967; 202 (4): 547-62 27. Gogotov, A. F., 4-Hydroxybenzylidenaniline and 4-hydroxyazobenzene derivatives as alternatives to nitrobenzene in the selective decomposition of lignin to vanillin. Russian Journal of Applied Chemistry 2000; 73(2): 324-29

Özkınalı, Çavuş and Sakin, JOTCSA: 2018; 5(1): 159-178. RESEARCH ARTICLE
177
28. Gaussian 09, Revision B.01, Frisch M. J, Trucks G. W, Schlegel H. B, Scuseria G. E, Robb M. A, Cheeseman
J. R, Scalmani G., Barone V, Mennucci B, Petersson G. A, Nakatsuji H, Caricato M, Li X, Hratchian H. P, Izmaylov
A. F, Bloino J, Zheng G, Sonnenberg J. L, Hada M, Ehara M, Toyota K, Fukuda R, Hasegawa J, Ishida M, Nakajima T, Honda Y, Kitao O, Nakai H, Vreven T, Montgomery J. A, Peralta J. E, Ogliaro F, Bearpark M, Heyd J. J, Brothers E, Kudin K. N, Staroverov V. N, Keith T, Kobayashi R, Normand J, Raghavachari K, Rendell A, Burant J. C, Iyengar S. S, Tomasi J, Cossi M, Rega N, Millam J. M, Klene M, Knox J. E, Cross J. B, Bakken V, Adamo C, Jaramillo J, Gomperts R, Stratmann R. E, Yazyev O, Austin A. J, Cammi R, Pomelli C, Ochterski J.
W, Martin R. L, Morokuma K, Zakrzewski V. G, Voth G. A, Salvador P, Dannenberg J. J, Dapprich S, Daniels A. D, Farkas O, Foresman J. B, Ortiz J. V, Cioslowski J, Fox D. J, Gaussian, Inc., Wallingford CT, 2010. 29.Becke AD, A new mixing of HartreeeFock and local density-functional theories. J Chem Phys. 1993; 98:1372-7. 30. Lee C, Yang W, Parr RG. Development of the Colle-Salvetti correlation-energy formula into a functional of
the electron density. Phys Rev B 1988; 37: 785-9. 31. Cossi M, Barone V, Cammi R, Tomasi J., Ab initio study of solvated molecules: a new implementation of
the polarizable continuum model, Chem. Phys. Lett. 1996;255: 327-335.

Özkınalı, Çavuş and Sakin, JOTCSA: 2018; 5(1): 159-178. RESEARCH ARTICLE
178