Hybrid DFT calculations of the atomic and electronic structure for ABO3 perovskite (001) surfaces
14
Hybrid DFT calculations of the atomic and electronic structure for ABO 3 perovskite (0 0 1) surfaces S. Piskunov a,b, * , E.A. Kotomin b,c , E. Heifets d , J. Maier c , R.I. Eglitis a , G. Borstel a a Fachbereich Physik, Universita ¨ t Osnabru ¨ ck, D-49069 Osnabru ¨ ck, Germany b Institute of Solid State Physics, University of Latvia, Kengaraga 8, LV-1063 Riga, Latvia c Max-Planck-Institut fu ¨ r Festko ¨ rperforschung, Heisenbergstrasse 1, D-70569 Stuttgart, Germany d California Institute of Technology, MS 139-74, Pasadena, CA 91125, USA Received 15 June 2004; accepted for publication 4 November 2004 Available online 24 November 2004 Abstract We present the results of first-principles calculations on two possible terminations of the (0 0 1) surfaces of SrTiO 3 , BaTiO 3 , and PbTiO 3 perovskite crystals. Atomic structure and the electronic configurations were calculated for differ- ent 2D slabs, both stoichiometric and non-stoichiometric, using hybrid (B3PW) exchange-correlation technique and re-optimized basis sets of atomic (Gaussian) orbitals. Results are compared with previous calculations and available experimental data. The electronic density distribution near the surface and covalency effects are discussed in details for all three perovskites. Both SrTiO 3 and BaTiO 3 (0 0 1) surfaces demonstrate reduction of the optical gap with respect to the bulk, especially for the TiO 2 -terminated surfaces, whereas PbTiO 3 surfaces show a slight increase of the gap. The top of the PbTiO 3 valence band lies at X point of the Brillouin Zone, unlike the M point for SrTiO 3 and BaTiO 3 . Ó 2004 Elsevier B.V. All rights reserved. Keywords: Strontium titanate; Barium titanate; Lead titanate; Low index single crystal surfaces; Surface relaxation and reconstruction; Surface electronic phenomena; Density functional calculations 1. Introduction The ABO 3 perovskite surfaces are important for many technological applications, e.g. SrTiO 3 is widely used as a substrate for epitaxial growth of high-T c superconducting thin films, BaTiO 3 , PbTiO 3 and their solid solutions are promising 0039-6028/$ - see front matter Ó 2004 Elsevier B.V. All rights reserved. doi:10.1016/j.susc.2004.11.008 * Corresponding author. Address: Institute of Solid State Physics, University of Latvia, Kengaraga 8, LV-1063 Riga, Latvia. Tel.: +371 718 7480; fax: +371 713 2778. E-mail address: [email protected] (S. Piskunov). Surface Science 575 (2005) 75–88 www.elsevier.com/locate/susc
Transcript of Hybrid DFT calculations of the atomic and electronic structure for ABO3 perovskite (001) surfaces

Surface Science 575 (2005) 75–88
www.elsevier.com/locate/susc
Hybrid DFT calculations of the atomic and electronicstructure for ABO3 perovskite (001) surfaces
S. Piskunov a,b,*, E.A. Kotomin b,c, E. Heifets d, J. Maier c,R.I. Eglitis a, G. Borstel a
a Fachbereich Physik, Universitat Osnabruck, D-49069 Osnabruck, Germanyb Institute of Solid State Physics, University of Latvia, Kengaraga 8, LV-1063 Riga, Latvia
c Max-Planck-Institut fur Festkorperforschung, Heisenbergstrasse 1, D-70569 Stuttgart, Germanyd California Institute of Technology, MS 139-74, Pasadena, CA 91125, USA
Received 15 June 2004; accepted for publication 4 November 2004
Available online 24 November 2004
Abstract
We present the results of first-principles calculations on two possible terminations of the (001) surfaces of SrTiO3,
BaTiO3, and PbTiO3 perovskite crystals. Atomic structure and the electronic configurations were calculated for differ-
ent 2D slabs, both stoichiometric and non-stoichiometric, using hybrid (B3PW) exchange-correlation technique and
re-optimized basis sets of atomic (Gaussian) orbitals. Results are compared with previous calculations and available
experimental data. The electronic density distribution near the surface and covalency effects are discussed in details
for all three perovskites. Both SrTiO3 and BaTiO3 (001) surfaces demonstrate reduction of the optical gap with respect
to the bulk, especially for the TiO2-terminated surfaces, whereas PbTiO3 surfaces show a slight increase of the gap. The
top of the PbTiO3 valence band lies at X point of the Brillouin Zone, unlike the M point for SrTiO3 and BaTiO3.
� 2004 Elsevier B.V. All rights reserved.
Keywords: Strontium titanate; Barium titanate; Lead titanate; Low index single crystal surfaces; Surface relaxation and reconstruction;
Surface electronic phenomena; Density functional calculations
0039-6028/$ - see front matter � 2004 Elsevier B.V. All rights reserv
doi:10.1016/j.susc.2004.11.008
* Corresponding author. Address: Institute of Solid State
Physics, University of Latvia, Kengaraga 8, LV-1063 Riga,
Latvia. Tel.: +371 718 7480; fax: +371 713 2778.
E-mail address: [email protected] (S. Piskunov).
1. Introduction
The ABO3 perovskite surfaces are important for
many technological applications, e.g. SrTiO3 is
widely used as a substrate for epitaxial growth
of high-Tc superconducting thin films, BaTiO3,
PbTiO3 and their solid solutions are promising
ed.

76 S. Piskunov et al. / Surface Science 575 (2005) 75–88
for non-volatile memory cells, as electro-optical
materials, and for piezoelectrical devices [1–4].
Due to intensive development and progressive
miniaturization of electronic devices, the electronic
properties and atomic structure of the ABO3
perovskite thin films were extensively studied dur-
ing the last years. The SrTiO3(001) surface struc-
ture has been analyzed by means of low energy
electron diffraction (LEED) [5], reflection high
energy electron diffraction (RHEED), X-ray pho-
toelectron spectroscopy (XPS) and ultraviolet elec-
tron spectroscopy (UPS) [6], medium energy ion
scattering (MEIS) [7], and surface X-ray diffrac-tion (SXRD) [8]. The most recent experimental
studies on the SrTiO3(001) include a combination
of XPS, LEED, and time-of-flight scattering and
recoiling spectrometry (TOF-SARS) [9], and UPS
and metastable impact electron spectroscopy
(MIES) [10]. The BaTiO3 and PbTiO3 surfaces
are less studied.
The first ab initio calculations of the ABO3
perovskite surfaces has been presented by Kimura
et al. in 1995 [11]. Since then a number of calcula-
tions were performed, using different methods,
e.g. linearized augmented plane waves (LAPW)
[12,13], PW ultrasoft-pseudopotential [14–17],
and Hartree–Fock (HF) [18]. Recently, new studies
on the SrTiO3(001) surface relaxation were per-
formed using density functional theory (DFT) withplane wave (PW) basis set (DFT-PW method) [19],
and classical shell model (SM) [20,21]. It is well-
known that DFT considerably underestimate the
band gap. On the other hand, band gap obtained
through the HF calculations is usually overesti-
mated [22]. To solve this problem, the functionals
containing ‘‘hybrid’’ of the non-local HF exchange,
DFT exchange, and generalized gradient approxi-mation (GGA) correlation functionals, known as
B3LYP and B3PW could be used. These function-
als are quite popular in quantum chemistry of mol-
ecules [23,24]. Recently, periodic-structure hybrid
DFT calculations were carried out for a wide range
of crystalline materials [25], including perovskites
and their surfaces [26,27]. In all cases the hybrid
functional technique shows the best agreementwith experimental data for both bulk geometry
and optical properties of materials under investiga-
tion. In this paper, we continue our recent theoret-
ical studies of the surfaces of perovskite materials.
Our studies were carried out using both semi-
empirical SM [28] and ab initio HF and DFTmeth-
ods [27,29–31] and were dedicated mostly to the
SrTiO3(001) surfaces. We studied the effects of dif-ferent type of Hamiltonians (varied from DFT-
LDA to HF with a posteriori corrections) on
surface properties and atomic structure. This anal-
ysis allowed us to choose the B3PW functional for
calculations of bulk properties of all three perovsk-
ites under consideration [26] as well as of their sur-
face properties [27]. Therefore, B3PW is adopted in
present study to compare atomic structure andelectronic properties of the (001) surfaces of three
similar perovskites, SrTiO3, BaTiO3, and PbTiO3.
In our simulations, the (001) surfaces of perovsk-
ites are modelled using a single slab model.
The paper is organized as follows: in Section 2
we present the technical details of calculations.
In Section 3 we discuss the surface structure and
the electronic properties of the (001) surfaces.Our conclusions are summarized in Section 4.
2. Computational details
To perform the first-principles DFT-B3PW cal-
culations, we used the CRYSTAL-98 computer
code [22,32–34]. This code employs the Gauss-ian-type functions (GTF) localized at atoms as
the basis for an expansion of the crystalline orbi-
tals. Features of the CRYSTAL code, which are
most important for this study, are its ability to cal-
culate the electronic structure of materials within
both HF and Kohn–Sham (KS) Hamiltonians
and implementation of isolated 2D slab model
without its artificial repetition along the z-axis.However, in order to employ the LCAO-GTF
method, it is desirable to have optimized basis sets
(BS). Such BS�s optimization for all three perovsk-
ites was developed and discussed in Ref. [26]. In
this paper, we used this new BS which differs from
our previous calculations [27,29–31] by inclusion
of polarizable d-orbitals on O ions. We demon-
strated that this leads to better agreement of calcu-lated optical gaps with experimental data.
Our calculations were performed using the hy-
brid exchange-correlation B3PW functional involv-

S. Piskunov et al. / Surface Science 575 (2005) 75–88 77
ing a hybrid of non-local Fock exact exchange,
LDA exchange and Becke�s gradient corrected ex-
change functional [35], combined with the non-
local gradient corrected correlation potential by
Perdew and Wang [36–38]. The Hay–Wadt small-core effective core pseudopotentials (ECP) were
adopted for Ti, Sr, and Ba atoms [39–41]. The
‘‘small-core’’ ECP�s replace only inner core orbi-
tals, but orbitals for sub-valence electrons as
well as for valence electrons are calculated self-
consistently. Light oxygen atoms were treated with
the all-electron BS. The BSs were adopted in the
following forms: O—8-411(1d)G, Ti—411(311d)G,Sr and Ba—311(1d)G; see Ref. [26] for more
details.
The reciprocal space integration was performed
by the sampling the Brillouin zone of the unit cell
with the 8 · 8 · 1 Pack–Monkhorst net [42], that
provides the balanced summation in direct and re-
ciprocal spaces [43]. To achieve high accuracy,
large enough tolerances of 7, 8, 7, 7, 14, werechosen for the Coulomb overlap, Coulomb pene-
tration, exchange overlap, the first exchange
Fig. 1. On top: schematic view of the modelling for ABO3(001) surf
both sides, (c) asymmetrical termination (AO atop and TiO2 on botto
outermost surface layers relaxation: (d) SrTiO3, (e) BaTiO3, (f) PbTi
termination, right panels—TiO2. Dashed lines represent positions of
pseudo-overlap, and for the second exchange
pseudo-overlap, respectively [32].
The ABO3(001) surfaces were modelled with 2D
slabs, consisting several crystal planes perpendicu-
lar to (001) crystal direction. The slabs were ro-tated to make them perpendicular to Oz axis. The
CRYSTAL code allowed us to avoid artificial peri-
odicity along Oz direction and to perform simula-
tions for stand-alone 2D slabs. The symmetrical
(with respect to the mirror plane) 7-plane slabs
are either AO- or TiO2-terminated. These slabs
are non-stoichiometric, with unit cell formulas
A4B3O10 and A3B4O11, respectively. An alternativeasymmetrical slab is AO- and TiO2-terminated
(from each side, respectively) and stoichiometric
with unit cell formula A4B4O12, as shown schemat-
ically in Fig. 1(top). The slabs containing seven
planes (symmetrical) and eight planes (asymmetri-
cal) can be treated as thick enough since the conver-
gence of the calculated slab total energy per ABO3
unit is achieved. The total energies differ less than5 · 10�4 Hartree when 7- and 9-layered (or 8- and
10-layered for asymmetrical termination) slabs
aces: (a) AO-terminated on both sides, (b) TiO2-terminated on
m). On bottom: schematic illustration of the relaxation for two
O3. The view in the [010] direction. Left panels in d–f are AO
the same layers in unrelaxed slabs.

78 S. Piskunov et al. / Surface Science 575 (2005) 75–88
are considered. The symmetrical slabs have advan-
tage of no macroscopic dipole moment perpendicu-
lar to the slab. However, their non-stoichiometry
can potentially affect the electronic density distri-
butions and thus atomic displacements. On theother hand, since the effective atomic charges of
Ti and O ions differ from the ionic charges +4e,
�2e (due to the covalency contribution in Ti–O
chemical bonding), the alternating TiO2 and AO
planes are slightly charged, what produces in the
asymmetrical slab certain dipole moment perpen-
dicular to the slab. This dipole moment is cancelled
by the electronic density redistribution near the sur-face, which also can affect the optimized atomic dis-
placements. That is why a critical comparison of
these two slab models is important for making reli-
able conclusions.
In order to compare properties of three per-
ovskites under the same conditions and to reduce
Table 1
Atomic displacements with respect to atomic positions on unrelaxed
Termination N At. SrTiO3 Ba
This
study
SM
[28]
LDA
PW [15]
LDA
PW [19]
Th
stu
AO 1 A �4.84 �7.10 �5.7 �6.66 �1
O 0.84 1.15 0.1 1.02 �0
2 Ti 1.75 1.57 1.2 1.79 1
O2 0.77 0.87 0.0 0.26 1
3 A �1.42 �1.2 �1.54
O 0.7 �0.1 0.26
TiO2 1 Ti �2.25 �2.96 �3.4 �1.79 �3
O2 �0.13 �1.73 �1.6 �0.26 �0
2 A 3.55 3.46 2.5 4.61 2
O 0.57 �0.21 �0.5 0.77 0
3 Ti �0.6 �0.7 �0.26
O2 �0.29 �0.5 0.26
Asymmetrical 1 A �5.22 �2
O 0.39 �0
2 Ti 1.55 1
O2 0.61 1
– – – –
– – – –
– – – –
7 O �0.64 �0
A �3.74 �2
8 O2 0.15 0
Ti 2.27 3
Symbol A stands for Sr, Ba, or Pb atom. Positive displacements are ou
slab center.
computational efforts, we consider here only the
high-symmetry cubic (Pm3m) phases of these crys-
tals. The calculated bulk lattice constants (in A)
are: a = 3.90 for SrTiO3, a = 4.01 for BaTiO3,
and a = 3.93 for PbTiO3, which demonstrate quitegood agreement with experiment [44,45].
3. Results and discussions
3.1. Surface atomic structure
In present surface structure simulations we al-lowed atoms of the two outermost surface layers
to relax along the z-axis (surfaces of perfect cubic
crystals by symmetry have no forces along the
x- and y-axes). Displacements of the third layer
atoms were found negligibly small in our calcula-
tions and thus are not treated. The optimization
ABO3(001) surfaces (in percent of bulk lattice constant)
TiO3 PbTiO3
is
dy
SM
[28]
LDA
PW [14]
SM
[20]
LAPW
[13]
This
study
LDA
PW [16]
.99 �3.72 �2.79 �0.72 �3.82 �4.36
.63 1.00 �1.40 �1.09 �0.31 �0.46
.74 1.25 0.92 1.70 3.07 2.39
.40 0.76 0.48 2.75 2.30 1.21
�0.51 0.53 �0.69 �1.37
0.16 0.26 �0.28 �0.20
.08 �2.72 �3.89 �4.14 �2.81 �3.40
.35 �0.94 �1.63 �2.74 0.31 �0.34
.51 2.19 1.31 2.36 5.32 4.53
.38 �0.17 �0.62 �0.50 1.28 0.43
�0.33 �0.75 �0.81 �0.92
�0.01 �0.35 �0.72 �0.27
.09 �1.8 �4.28 �4.02
.69 �1.98 �3.26 �0.24
.70 3.01
.50 1.95
– – –
– – –
– – –
.37 �1.22
.54 �5.44
.34 3.52 2.68 �0.74
.03 4.72 4.79 2.84
twards (to the vacuum), negative displacements mean inward the
S. Piskunov et al. / Surface Science 575 (2005) 75–88 79
of atomic coordinates was done through the slab
total energy minimization using our own computer
code which implements conjugated gradients opti-
mization technique [46] with numerical computa-
tion of derivatives.Our calculated atomic displacements are pre-
sented in Table 1 and are schematically illustrated
in Fig. 1(bottom). A comparison with the surface
atomic displacements obtained by other theoretical
calculations is also done in Table 1. The relaxation
of surface metal atoms is much larger than that of
oxygen ions what leads to a considerable rumpling
of the outermost plane. Atoms of the first surfacelayer relax inwards, i.e. towards the bulk. The only
two exceptions are the top oxygen ions of SrTiO3
SrO-terminated and of PbTiO3 TiO2-terminated
surfaces. (At the latter point, our calculations dis-
agree with the DFT-PW-pseudopotential calcula-
tions [16], however the magnitudes of calculated
displacements are relative small, 0.31% and
�0.34% of lattice constant, respectively, which isclose to the limit of method accuracy.) The outward
relaxation of all atoms in the second layer is found
for all three perovskites and both terminations. The
displacements obtained for asymmetrically termi-
nated slabs are practically the same as for those
symmetrically terminated. This means that both
symmetrical and asymmetrical slabs are reliable
for the calculations of the (001) neutral surfaces.
Table 2
Calculated and experimental surface rumpling s, and relative displac
terminated surfaces Ddij (in percent of lattice constant)
AO-terminated
s Dd12 D
SrTiO3 This study 5.66 (5.61) �6.58 (�6.79) 1
LDA PW [15] 5.8 �6.9 2
LDA PW [19] 7.7 �8.6 3
SM [28] 8.2 �8.6 3
LEED expt. [5] 4.1 ± 2 �5 ± 1 2
RHEED expt. [6] 4.1 2.6 1
BaTiO3 This study 1.37 (1.40) �3.74 (�3.79) 1
LDA PW [14] 1.39 �3.71 0
SM [20] 0.37 �2.42 2
SM [28] 4.72 �4.97 1
PbTiO3 This study 3.51 (3.78) �6.89 (�7.03) 3
LDA PW [16] 3.9 �6.75 3
Results for asymmetric slabs are given in brackets.
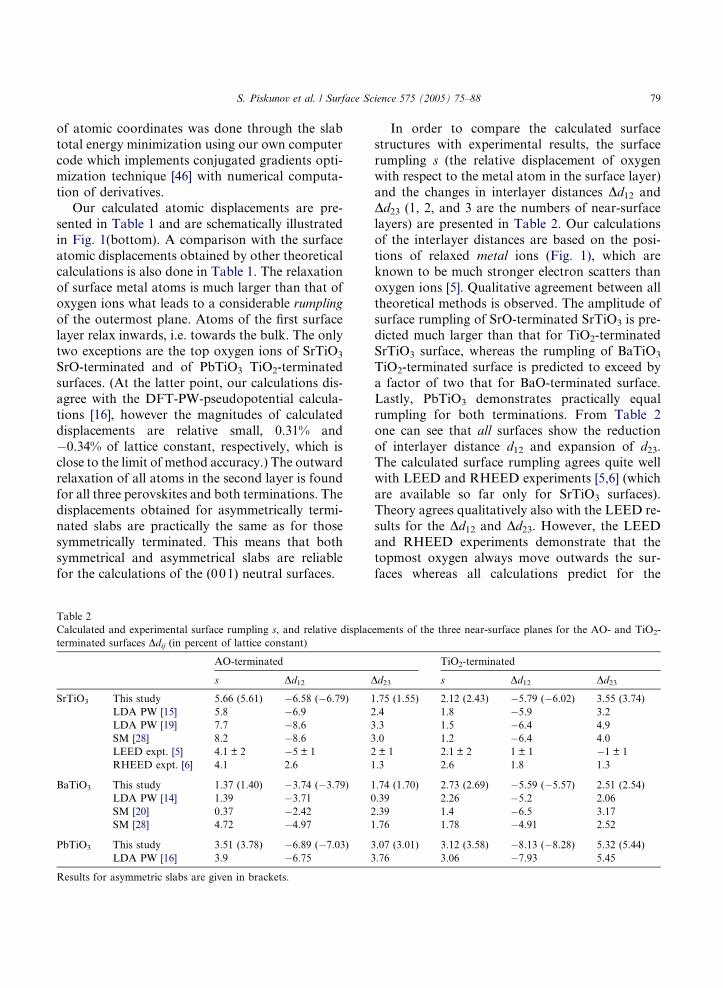
In order to compare the calculated surface
structures with experimental results, the surface
rumpling s (the relative displacement of oxygen
with respect to the metal atom in the surface layer)
and the changes in interlayer distances Dd12 andDd23 (1, 2, and 3 are the numbers of near-surface
layers) are presented in Table 2. Our calculations
of the interlayer distances are based on the posi-
tions of relaxed metal ions (Fig. 1), which are
known to be much stronger electron scatters than
oxygen ions [5]. Qualitative agreement between all
theoretical methods is observed. The amplitude of
surface rumpling of SrO-terminated SrTiO3 is pre-dicted much larger than that for TiO2-terminated
SrTiO3 surface, whereas the rumpling of BaTiO3
TiO2-terminated surface is predicted to exceed by
a factor of two that for BaO-terminated surface.
Lastly, PbTiO3 demonstrates practically equal
rumpling for both terminations. From Table 2
one can see that all surfaces show the reduction
of interlayer distance d12 and expansion of d23.The calculated surface rumpling agrees quite well
with LEED and RHEED experiments [5,6] (which
are available so far only for SrTiO3 surfaces).
Theory agrees qualitatively also with the LEED re-
sults for the Dd12 and Dd23. However, the LEED
and RHEED experiments demonstrate that the
topmost oxygen always move outwards the sur-
faces whereas all calculations predict for the
ements of the three near-surface planes for the AO- and TiO2-
TiO2-terminated
d23 s Dd12 Dd23
.75 (1.55) 2.12 (2.43) �5.79 (�6.02) 3.55 (3.74)
.4 1.8 �5.9 3.2
.3 1.5 �6.4 4.9
.0 1.2 �6.4 4.0
± 1 2.1 ± 2 1 ± 1 �1 ± 1
.3 2.6 1.8 1.3
.74 (1.70) 2.73 (2.69) �5.59 (�5.57) 2.51 (2.54)
.39 2.26 �5.2 2.06
.39 1.4 �6.5 3.17
.76 1.78 �4.91 2.52
.07 (3.01) 3.12 (3.58) �8.13 (�8.28) 5.32 (5.44)
.76 3.06 �7.93 5.45

Table 3
Calculated surface energies (in eV per surface cell)
SrTiO3 BaTiO3 PbTiO3
SrO TiO2 Asymmetrical BaO TiO2 Asymmetrical PbO TiO2 Asymmetrical
This study 1.15 1.23 1.19 1.19 1.07 1.13 0.83 0.74 0.85
SM [28] 1.32 1.36 1.45 1.40
LDA PW [19] 1.21 1.19
SM [21] 1.17
LDA PW [16] 1.26 1.24 0.97
Results for previous ab initio calculations [16,19,21] are averaged over AO- and TiO2-terminated surfaces.
80 S. Piskunov et al. / Surface Science 575 (2005) 75–88
TiO2-terminated SrTiO3 surface that oxygen goes
inwards. Moreover, Table 2 shows also that LEED
and RHEED experiments contradict each other in
the sign of Dd12 for SrO-terminated surface andDd23 of TiO2-terminated surface. Up to now the
reason for such discrepancies between the different
experimental data is not clear and still discussed
(e.g. see [15]). Thus, experimental check of our pre-
dictions at the moment is prevented by a conflict
between different experimental results. New de-
tailed experimental studies are important for
resolving this contradiction.The calculated surface energies of the relaxed
surfaces, presented in Table 3, were computed
using the method described in Ref. [29]. The ener-
gies calculated for AO- and TiO2-terminated sur-
faces demonstrate only a small difference, that
means both terminations could co-exist. Neverthe-
less, the energy computed for TiO2-terminated
SrTiO3 surface is a little bit larger than that forSrO-termination, in contrast to BaTiO3 and
PbTiO3 crystals where TiO2-terminated surface is
a little bit energetically more favorable.
3.2. Electronic charge redistribution
We begin discussion of the electronic structure
of surfaces with the analysis of charge redistribu-tion in near-surface planes. The effective atomic
charges (calculated using Mulliken population
analysis) and dipole atomic moments characteriz-
ing atomic deformation along the z-axis are pre-
sented for AO-, TiO2-surfaces in Table 4. The
differences in charge densities in the (001) planes
in ABO3 bulk crystals and on the (001) surfaces
are analyzed in Table 5.
First of all, note that the effective charges of Sr
and Ba are close to the +2e formal charges,
whereas that of Pb is considerably smaller. Ti
and O charges are also much smaller than formalcharges, similarly to the bulk [26], what results
from the Ti–O covalent bonding. The AO-termi-
nated surfaces of SrTiO3 and BaTiO3 show similar
behavior. The charges of top layer cations are
smaller with respect to the relevant bulk charges,
the oxygen ions attract an additional electron
charge and become more negative. Charges of
the titanium ions in the second layer are slightly in-creased. Oxygen ions in the same layer again be-
came more negative due to additional electron
charge transfer. Changes in atomic charges in dee-
per layers become very small and practically equal
zero in the center of the slabs. Unlike SrTiO3 and
BaTiO3, charges of the surface oxygen ions on
PbO-terminated surface becomes smaller, Ti in
the second layer shows practically no changes inthe effective charges.
The charge redistribution in the TiO2-termi-
nated surfaces (Table 4) of all three perovskites
demonstrates quite similar behavior. All cations
in both topmost layers demonstrate charge reduc-
tion. For surface Ti it is a little bit larger then for
A ions in subsurface layer. Changes of charges for
ions in the asymmetrically terminated slabs arepractically the same as for the symmetrically AO-
terminated and TiO2-terminated slabs, as it should
be when slabs are thick enough and its surfaces
do not interact. However, charge redistribution
makes the ABO3(001) surfaces to be polar with
the dipole moment perpendicular to the surface
[47]. Such surfaces are potentially unstable, be-
cause they bear infinite charges or dipole moments

Table 4
The calculated Mulliken effective charges and dipole moments for the AO and TiO2 terminations
N Ion SrTiO3 BaTiO3 PbTiO3
Q, e d, ea.u. Q, e d, ea.u. Q, e d, ea.u.
AO-terminated surfaces
1 A 1.84 �0.22 1.75 �0.46 1.28 �0.48
(�0.03) (�0.04) (�0.07)
O �1.52 �0.03 �1.47 �0.05 �1.13 0.02
(�0.12) (�0.09) (+0.09)
2 Ti 2.36 0.01 2.38 0.01 2.33 �0.02
(+0.01) (+0.01) (0.00)
O2 �1.45 �0.02 �1.42 0.02 �1.26 �0.01
(�0.04) (�0.03) (�0.03)
3 A 1.87 �0.02 1.8 �0.04 1.35 �0.05
(0.00) (+0.01) (+0.01)
O �1.43 0 �1.41 �0.01 �1.26 �0.01
(�0.02) (�0.03) (�0.03)
4 Ti 2.34 0 2.39 0 2.34 0
(�0.01) (0.00) (+0.01)
O2 �1.41 0 �1.39 0 �1.23 0
(0.00) (�0.01) (�0.01)
TiO2-terminated surfaces
1 Ti 2.31 0.08 2.3 0.08 2.28 0.1
(�0.04) (�0.06) (�0.06)
O2 �1.32 0.04 �1.28 0.02 �1.18 �0.03
(+0.08) (+0.11) (+0.04)
2 A 1.85 0.04 1.76 0.09 1.27 0.1
(�0.02) (�0.03) (�0.07)
O �1.36 �0.04 �1.34 �0.03 �1.17 �0.01
(+0.05) (+0.04) (+0.06)
3 Ti 2.37 0.01 2.36 0.01 2.33 0.02
(+0.04) (0.00) (0.00)
O2 �1.39 �0.02 �1.37 �0.01 �1.2 �0.02
(+0.02) (+0.02) (+0.02)
4 A 1.87 0 1.79 0 1.34 0
(0.00) (0.00) (�0.01)
O �1.4 0 �1.38 0 �1.22 0
(+0.01) (+0.01) (+0.01)
Numbers in brackets are deviations from bulk values. Bulk charges (in e); SrTiO3: Sr = 1.87, Ti = 2.35, O = �1.41, BaTiO3: Ba = 1.79,
Ti = 2.36, O = �1.39, PbTiO3: Pb = 1.34, Ti = 2.33, O = �1.23 [26].
S. Piskunov et al. / Surface Science 575 (2005) 75–88 81
what cause spurious electric field. As a result of
self-consistent calculations, the additional charge
densities (Table 5) localized mainly on two upper
layers whereas the central layers practically retain
the bulk charge density. Such the electron charge
density redistribution accompanied by atomic dis-
placements on the surfaces allows to compensate
the surface dipole moment even for the asymmetri-
cally terminated slabs. Indeed, as one can see, the
sum of changes in charge densities for three top-
most layers of the asymmetrically terminated slab
(on both sides) of all three perovskites approxi-
mately equals half the charge density of the corre-
sponding bulk plane, which is necessary condition
to remove the macroscopic dipole moment [47].
Both (001) surfaces of AIIBIVO3 perovskites

Table 5
Calculated charge densities in the (001) planes in the bulk perovskites (in e, per TiO2 or AO unit), data are taken from [26]) and in four
top planes of the AO-, TiO2-terminated and asymmetrical slabs
Termination N Unit SrTiO3 BaTiO3 PbTiO3
Bulk AO 0.46 0.41 0.18
TiO2 �0.46 �0.41 �0.18
AO 1 AO 0.32 0.28 0.15
(�0.14) (�0.13) (0.03)
2 TiO2 �0.53 �0.46 �0.18
(�0.07) (�0.05) (�0.06)
3 AO 0.45 0.39 0.1
(�0.02) (�0.02) (�0.02)
4 TiO2 �0.49 �0.4 �0.12
(�0.02) (0.01) (0.00)
TiO2 1 TiO2 �0.33 �0.25 �0.08
(0.13) (0.16) (0.03)
2 AO 0.49 0.42 0.1
(0.03) (0.01) (�0.01)
3 TiO2 �0.39 �0.38 �0.08
(0.07) (0.03) (0.04)
4 AO 0.47 0.41 0.12
(0.01) (0.00) (0.00)
Asymmetrical 1 AO 0.32 0.28 0.12
(�0.14) (�0.13) (0.01)
2 TiO2 �0.54 �0.46 �0.17
(�0.07) (�0.05) (�0.05)
3 AO 0.45 0.39 0.09
(�0.01) (�0.02) (�0.02)
4 TiO2 �0.46 �0.42 �0.12
(0.00) (0.00) (0.00)
5 AO 0.47 0.41 0.11
(0.00) (0.00) (0.00)
6 TiO2 �0.42 �0.38 �0.07
(0.05) (0.03) (0.04)
7 AO 0.48 0.42 0.11
(0.02) (0.01) (�0.01)
8 TiO2 �0.3 �0.25 �0.08
(0.16) (0.16) (0.04)
Deviations of charge density with respect to the bulk are given in brackets.
82 S. Piskunov et al. / Surface Science 575 (2005) 75–88
correspond to stable surfaces revealing the weak-
polarity [2,48] due to partly covalent nature of
perovskite chemical bonding discussed in the
next section.The atomic dipole moments (Table 4) character-
ize atomic deformation and polarization along the
z-axis perpendicular to the surface [32]. On the
AO-terminated surfaces of all three perovskites
the cations have the negative dipole moments, di-
rected inwards, to the slab center, whereas on the
TiO2 terminated surfaces polarization of cations
has a positive sign, as well as for the oxygen ions
in SrTiO3 and BaTiO3. In contrast, oxygen ions
on PbO surface have negative dipole moment. Cat-
ions of subsurface layers for all three perovskitesreveal the positive dipole moments whereas those
of oxygen ions are negative.
The Mulliken bond populations between atoms
in surface layers (which arise due to covalency)
exhibit the largest effect for PbTiO3 crystal: the
population of the Pb–O bond (54me) on the
top layer increases a factor of three, as compared

S. Piskunov et al. / Surface Science 575 (2005) 75–88 83
to the bulk (16me). The partly covalent nature of
Pb–O bond in lead titanate crystal due to hybrid-
ization of Pb 6s AO state with the O 2p AO is
already pronounced in the bulk [26], but due to
bond shortening (caused by the surface relaxa-tion) its covalency is increased. This effect is also
observed on the TiO2 surface, for the bond pop-
ulation between surface O and Pb in the second
plane. Unlike PbTiO3, in SrTiO3 and BaTiO3
there is no indication on the Sr-, Ba-bonding
with O atoms. The Ti–O bonds of all three per-
ovskites on the TiO2 terminated surfaces increase
their covalency due to bond shortening (causedby surface relaxation) and breaking O surface
bonds.
We calculated also the total and difference
electron density maps (with respect to the super-
position density of spherical A2+, Ti4+ and
O2� ions) for SrTiO3, BaTiO3 and PbTiO3 sur-
faces. Total density maps might be useful for
comparison with future experiments. In Fig. 2we present results for the PbTiO3, as an example.
The density maps demonstrate considerable elec-
Ti (4)
Ti (2)
O (3)
O (1)
Pb (3)
Pb (1)
PTO PbO
0
0
0
0
Ti (3)
Ti (1)
O (4)
O (2)
Pb (4)
Pb (2)
PTO TiO2
0
0
Pb (7)
Pb (5)
Pb (3)
Pb (1)
PTO
0
0
0
0
(a)
Fig. 2. The PbTiO3 difference electron density maps in the cross sec
PbO-, TiO2- and asymmetrical terminations (a). For asymmetrical term
curves are drawn from �0.05 to +0.05ea.u.�3 with an increment of 0
tron charge density redistribution near the perov-
skite surfaces and are entirely consistent with the
above-discussed Mulliken charges and bond pop-
ulation analysis. For all three perovskites the
excess of electron density (the solid isodensitycurves) is observed for the Ti–O bonds, which
corresponds to the bond covalency. For all termi-
nations nearest to the surface Ti–O bond becomes
stronger, while the next nearest bond becomes
weaker. The A cations on the AO-terminated sur-
faces demonstrate considerable polarization, as it
was predicted above from dipole moment calcula-
tions (Table 4). Nevertheless, the electron densitymaps demonstrate no clear trace of the covalent
bonding (zero dot-dashed curves in area between
A cations and Ti–O pairs) between A cations and
oxygen, even for PbTiO3, despite the Pb–O bond
population was calculated as 54me. This means,
in reality the covalent contribution in Pb–O bond
in PbTiO3 is quite weak. Our calculated Pb–O
bond population can be interpreted only as an in-crease of the electron attraction between Pb and
O ions.
O (7)
O (5)
O (3)
Ti (8)
Ti (6)
Ti (4)
O (1)
Ti (2)
asymmetrical termination
0
O (7)
O (5)
O (3)
Ti (8)
Ti (6)
Ti (4)
O (1)
Ti (2)
Pb (7)
Pb (5)
Pb (3)
Pb (1)
(b)
tion perpendicular to the (001) surface ((110) plane) with the
ination total electron density map is also shown (b). Isodensity
.0025ea.u.�3.

Fig. 3. The calculated electronic band structure for BaTiO3
bulk and surfaces.
84 S. Piskunov et al. / Surface Science 575 (2005) 75–88
3.3. Density of states and band structures
The calculated band structures for SrTiO3 and
BaTiO3 bulk and surfaces (Fig. 3) are quite simi-
lar. The band structures for the bulk perovskiteswere calculated using an unit cell which is fourfold
extended along the z-axis. Such a supercell is sim-
ilar to the eight-layer ‘‘slab’’ periodically repeated
in 3D space and provides also the most natural
comparison with the surface band structures. In
the bulk band structure the bands are plotted using
the C–X–M–C directions of the typical ‘‘surface’’
Brillouin zone. The highest valence bands (VB)for the SrTiO3 and BaTiO3 bulk are quite flat, with
the top at M point and also flat between M and X
points.
The main contribution into the highest VB
comes from O 2px and 2py as it is well seen from
the calculated density of states (DOS) projected
onto the corresponding atomic orbitals (AOs).
The bottom of lowest conduction band (CB) liesat the C point with quite flat fragment between
the C and X points and consist of Ti 3d threefold
degenerated T 2g level. The optical band gaps for
surfaces and bulk of all three perovskites as calcu-
lated by means of the hybrid DFT technique are
presented in Table 6. One can see good agreement
with experiment. We should stress here remarkable
agreement of the bulk gap with the experiment forSrTiO3 (3.6eV vs 3.3eV). This is in a sharp con-
trast with the typical HF overestimate of the gap
and DFT underestimate (e.g. 1.8eV for SrTiO3
and BaTiO3 [14,15]).
The optical band gap for the SrO-terminated
surface becomes smaller with respect to the band
gap of the bulk SrTiO3. The narrow indirect gap
between the C and M points is 3.3eV, whereasthe narrowest gap in the bulk is 3.63eV, i.e. surface
gap is reduced by 0.3eV (see Table 6 for details).
Analysis of the DOS calculated for the SrO-termi-
nated surface demonstrates no contribution of the
surface O 2p states into the top of VB which
mainly consists of 2p AOs of the oxygen ions from
the central plane. The main contribution into the
CB bottom comes from the Ti 3d which are inthe second layer.
The band structure calculated for another,
TiO2-terminated surface of SrTiO3 has not so flat

Table 6
The calculated optical gap (in eV) for the bulk [26] and surface-terminated perovskites
Optical gap SrTiO3 BaTiO3 PbTiO3
Bulk SrO TiO2 Asymmetrical Bulk BaO TiO2 Asymmetrical Bulk PbO TiO2 Asymmetrical
Direct
C–C 3.96 3.72 3.95 3.03 3.55 3.49 2.96 2.73 4.32 3.58 3.18 3.08
(4.43) (4.12) (3.78) (4.43) (3.61) (3.77)
X–X 4.53 4.37 4.04 4.09 4.39 4.22 3.63 3.72 3.02 3.79 3.10 3.28
(5.08) (4.70) (4.38) (3.21) (3.82) (3.12)
M–M 5.70 5.62 5.17 4.66 5.39 5.40 4.17 4.17 5.55 5.37 5.01 4.88
(6.45) (5.94) (5.04) (5.80) (6.02) (4.89)
R–R 6.47 6.12 5.98
(7.18)
Indirect
X–C 4.39 3.55 3.92 3.41 4.20 3.49 3.41 3.18 2.87 2.96 2.98 2.78
(3.18) (3.03) (3.12)
M–C 3.71 3.30 3.17 2.31 3.60 3.32 2.33 2.10 3.66 3.55 3.19 2.96
(4.23) (3.71) (3.09) (3.85) (4.05) (2.99)
R–C 3.63 3.50 3.66
(4.16)
LDA-DFT
PW (Ref. [16])
1.85 1.86 1.13 1.79 1.80 0.84 1.54 1.53 1.61
Experiment 3.75—Direct gap 3.2 3.4
3.25—Indirect gap Ref. [49] Ref. [50]
Ref. [51]
The numbers in brackets are from Ref. [27] for SrTiO3 and Ref. [52] for PbTiO3. Both these calculations had no d-orbitals on O, and
the later one is done with B3LYP functional. The last row contains experimental data.
S. Piskunov et al. / Surface Science 575 (2005) 75–88 85
VB top, as that for the the SrO-termination. The
indirect optical band gap (M–C) 3.17eV becomes
by �0.46eV narrower as compared with the bulk.
For the TiO2-terminated SrTiO3 surface the main
contribution into the top of VB is made by O
2px and 2py AOs which are perpendicular to Ti–
O–Ti bridge. The main contribution to the CB bot-
tom comes from the 3d AOs of Ti in the thirdlayer, energy levels of surface Ti lie a little bit high-
er in the energy. The calculated SrTiO3 DOS are in
a good agreement with MIES and UPS spectra
recently measured for the TiO2-terminated
SrTiO3(001) surface [10]. Moreover, our calcu-
lated position of the VB top for TiO2-terminated
SrTiO3 with respect to the vacuum (5.9eV) practi-
cally coincides with the experimentally observedvalue of 5.7 ± 0.2eV (Ref. [10]).
The band structure calculated for the asymmet-
rically terminated slab demonstrates the mixture of
band structures obtained for the two symmetri-
cally terminated slabs discussed above. The SrTiO3
band gap becomes narrower (2.31eV). The VB top
consists mainly of O 2p from TiO2-terminated slab
surface, and the CB bottom from 3d AOs of Ti
from a subsurface layer (II in top of Fig. 1(c)).
The split of the upper VB (�0.8eV) is well pro-
nounced in asymmetrical SrTiO3 slab. The band
structure of the BaTiO3(001) surfaces demon-strates practically the same behavior as SrTiO3
does (Table 6). Nevertheless, the split of the VB
upper band is pronounced more for the TiO2-ter-
minated BaTiO3, as compared with the SrTiO3
surface. Due to hybridization of Pb 6s and O 2p
orbitals in PbTiO3, the calculated PbTiO3 band
structure and DOS slightly differ from those calcu-
lated for SrTiO3 and BaTiO3 (see Fig. 4, and Table6). The narrowest gap of both, bulk and surface
band structures corresponds to the transition be-
tween C and X points of the Brillouin zone. In
the bulk, the VB top is formed significantly by

Fig. 4. The calculated electronic band structure for PbTiO3
bulk and surfaces.
86 S. Piskunov et al. / Surface Science 575 (2005) 75–88
Pb 6s AOs (which also make the main contribution
to the VB bottom). The bulk CB bottom consist of
Ti 3d AOs, as in two other perovskites. Surpris-
ingly, the optical band gaps in PbO-terminated
surfaces are not smaller, as in BaTiO3 and SrTiO3,but even a little bit increases (up to 2.96eV with re-
spect to 2.87 in the bulk). The VB top in the PbO-
terminated surface consists of a mixture of Pb 6s
and O 2p AOs from the third layer, whereas the
CB bottom is formed by Ti 3d AOs from the sub-
surface layer.
The VB top for the TiO2-terminated
PbTiO3(001) surface at the X point consists of amixture of the O 2p and Pb 6s AOs from both sur-
face and central layers. Moreover, the main contri-
bution comes from the orbitals of atoms from the
central layer. The CB bottom for the TiO2-termi-
nated PbTiO3 consists mainly of the Ti 3d AOs
from a third layer.
The band structure calculated for the asymmet-
rical PbTiO3 slab shows a mixture of the bandstructures of the two symmetrical slabs, as it was
observed for SrTiO3 and BaTiO3.
4. Conclusions
Using hybrid DFT approach, we calculated the
surface relaxation and the electronic structure ofthe two possible terminations of the (001) surfaces
for SrTiO3, BaTiO3 and PbTiO3 perovskite crys-
tals. The data obtained for the surface structure
are in good agreement with available results of the-
oretical ab initio calculations and with experimen-
tal data. Our study shows that the surfaces are
quite stable, in agreement with ideas of a ‘‘weak
polarity’’ [2,47,48] and existing experiments.The calculated difference electron density maps
and bond populations demonstrate an increase of
the Ti–O bond covalency near the surfaces, and
additionally a weak covalency (polarization) of
the Pb–O bond on the PbO terminated surface.
The bulk band gap calculated with our new ba-
sis set is very close to the experimental data, an
agreement is much better than for typical DFT cal-culations (Table 6). The observed absence of the
surface electronic states which would split off the
upper VB top for the AO-terminated (001) sur-

S. Piskunov et al. / Surface Science 575 (2005) 75–88 87
faces and considerable (0.5eV) reduction of the
gap for the TiO2-terminated SrTiO3 and BaTiO3
surfaces are important factor for the future treat-
ment of the electronic structure of surface defects
on perovskite surfaces, as well as adsorption andsurface diffusion of atoms and small molecules,
which is relevant for catalysis, fuel cells, and
microelectronics.
Acknowledgments
SP was partly supported by DFG whereas EKand EH by German- Israeli Foundation (GIF
grant No. G-703.41.10). Authors are indebted to
R. Evarestov for numerous discussions.
References
[1] M.E. Lines, A.M. Glass, Principles and Applications of
Ferroelectrics and Related Materials, Clarendon Press,
Oxford, 1977.
[2] C. Noguera, Physics and Chemistry at Oxide Surfaces,
Cambridge University Press, New York, 1996.
[3] V.E. Henrick, P.A. Cox, The Surface Science of Metal
Oxides, Cambridge University Press, New York, 1994.
[4] J.F. Scott, Ferroelectric Memories, Advanced Microelec-
tronics 3, Springer, Berlin, 2000.
[5] N. Bickel, G. Schmidt, K. Heinz, K. Muller, Phys. Rev.
Lett. 62 (17) (1989) 2009.
[6] T. Hikita, T. Hanada, M. Kudo, M. Kawai, Surf. Sci. 287/
288 (1993) 377.
[7] A. Ikeda, T. Nishimura, T. Morishita, Y. Kido, Surf. Sci.
433–435 (1999) 520.
[8] G. Charlton, S. Brennan, C.A. Muryn, R. McGrath, D.
Norman, T.S. Turner, G. Thorthon, Surf. Sci. 457 (2000)
L376.
[9] P.A.W. van der Heide, Q.D. Jiang, Y.S. Kim, J.W.
Rabalais, Surf. Sci. 473 (2001) 59.
[10] W. Maus-Friedrichs, M. Frerichs, A. Gunhold, S. Kris-
chok, V. Kempter, G. Bihlmayer, Surf. Sci. 515 (2002) 499.
[11] S. Kimura, J. Yamauchi, M. Tsukada, S. Watanabe, Phys.
Rev. B 51 (16) (1995) 11049.
[12] R.E. Cohen, J. Phys. Chem. Solids 57 (10) (1996) 1393.
[13] R.E. Cohen, Ferroelectrics 194 (1997) 323.
[14] J. Padilla, D. Vanderbilt, Phys. Rev. B 56 (3) (1997) 1625.
[15] J. Padilla, D. Vanderbilt, Surf. Sci. 418 (1998) 64.
[16] B. Meyer, J. Padilla, D. Vanderbilt, Faraday Discussions
114: The Surface Science of Metal Oxides, Royal Society of
Chemistry, London, 1999, Ch. Theory of PbTiO3, BaTiO3,
and SrTiO3 surfaces, p. 395.
[17] X.Y. Xue, C.L. Wang, W.L. Zhong, Surf. Sci. 550 (2004)
73.
[18] F. Cora, C.R.A. Catlow, Faraday Discussions 114: The
Surface Science of Metal Oxides, Royal Society of Chem-
istry, London, 1999, Ch. QM investigations on perovskite-
structured transition metal oxides: bulk, surfaces and
interfaces, p. 421.
[19] C. Cheng, K. Kunc, M.H. Lee, Phys. Rev. B 62 (15) (2000)
10409.
[20] S. Tinte, M.D. Stachiotti, AIP Conf. Proc. 535 (2000)
273.
[21] S. Tinte, M.D. Stachiotti, Phys. Rev. B 64 (2001) 235403.
[22] C. Pisani (Ed.), Quantum-Mechanical Ab-initio Calcu-
lations of the Properties of Crystalline Materials, Vol.
67 of Lecture Notes in Chemistry, Springer, Berlin,
1996.
[23] L.A. Curtiss, K. Raghavachari, P.C. Redfern, J.A. Pople,
J. Chem. Phys. 106 (3) (1997) 1063.
[24] L.A. Curtiss, P.C. Redfern, K. Raghavachari, J.A. Pople,
J. Chem. Phys. 109 (1) (1998) 42.
[25] J. Muscat, A. Wander, N.M. Harrison, Chem. Phys. Lett.
342 (2001) 397.
[26] S. Piskunov, E. Heifets, R.I. Eglitis, G. Borstel, Comp.
Mat. Sci. 29 (2004) 165.
[27] E. Heifets, R.I. Eglitis, E.A. Kotomin, J. Maier, G.
Borstel, Surf. Sci. 513 (2002) 211.
[28] E. Heifets, E.A. Kotomin, J. Maier, Surf. Sci. 462 (2000)
19.
[29] E. Heifets, R.I. Eglitis, E.A. Kotomin, J. Maier, G.
Borstel, Phys. Rev. B 64 (2001) 235417.
[30] E.A. Kotomin, R.I. Eglitis, J. Maier, E. Heifets, Thin
Solid Films 400 (2001) 76.
[31] G. Borstel, R.I. Eglitis, E.A. Kotomin, E. Heifets, Phys.
State Sol. (b) 236 (2) (2003) 253.
[32] V.R. Saunders, R. Dovesi, C. Roetti, M. Causa, N.M.
Harrison, R. Orlando, C.M. Zicovich-Wilson, CRYS-
TAL�98 User�s Manual, Universita di Torino, Torino,
1998.
[33] Available from: <http://www.chimifm.unito.it/teorica/crys-
tal/crystal.html>.
[34] Available from: <http://www.cse.clrc.ac.uk/cmg/crystal>.
[35] A.D. Becke, J. Chem. Phys. 98 (7) (1993) 5648.
[36] J.P. Perdew, Y. Wang, Phys. Rev. B 33 (12) (1986) 8800.
[37] J.P. Perdew, Y. Wang, Phys. Rev. B 40 (5) (1989) 3399.
[38] J.P. Perdew, Y. Wang, Phys. Rev. B 45 (23) (1992) 13244.
[39] P.J. Hay, W.R. Wadt, J. Chem. Phys. 82 (1) (1984) 270.
[40] P.J. Hay, W.R. Wadt, J. Chem. Phys. 82 (1) (1984) 284.
[41] P.J. Hay, W.R. Wadt, J. Chem. Phys. 82 (1) (1984) 299.
[42] H.J. Monkhorst, J.D. Pack, Phys. Rev. B 13 (12) (1976)
5188.
[43] T. Bredow, R.A. Evarestov, K. Jug, Phys. Stat. Solidi (b)
222 (2000) 495.
[44] K.H. Hellwege, A.M. Hellwege (Eds.), Ferroelectrics and
Related Substances, Vol. 3 of New Series, Landolt–
Bornstein, Springer Verlag, Berlin, 1969, group III.
[45] B.G. Shirane, R. Repinsky, B.C. Frazer, Acta Cryst. 9
(1956) 131.

88 S. Piskunov et al. / Surface Science 575 (2005) 75–88
[46] W.H. Press, S.A. Teukolsky, W.T. Vetterling, B.P. Flan-
nery, Numerical Recipies in Fortran77, second ed., Cam-
bridge University Press, Cambridge, MA, 1997.
[47] P.W. Tasker, J. Phys. C: Solid State Phys. 12 (1979) 4977.
[48] J. Goniakowski, C. Noguera, Surf. Sci. 365 (1996) L657.
[49] S.H. Wemple, Phys. Rev. B 2 (7) (1970) 2679.
[50] C.H. Peng, J.F. Chang, S. Desu, Mater. Res. Soc. Symp.
Proc. 243 (1992) 21.
[51] K. van Benthem, C. Elsaesser, R.H. French, J. Appl. Phys.
90 (12) (2001) 6156.
[52] S. de Lasaro, E. Longo, J.R. Sambrano, A. Beltran, Surf.
Sci. 552 (2004) 149.