TREATMENT OF SOFTDRINK INDUSTRY WASTEWATER ...
154
TREATMENT OF SOFTDRINK INDUSTRY WASTEWATER USING AN INTEGRATED ANAEROBIC/AEROBIC MEMBRANE BIOREACTOR by INNOCENTIA GUGULETHU ERDOGAN Thesis submitted in fulfilment of the requirements for the degree Master of Technologae: Chemical Engineering in the Faculty of Engineering at the CAPE PENINSULA UNIVERSITY OF TECHNOLOGY Supervisor: Ass. Prof. Marshall Sheldon CAPE TOWN October 2014 CPUT copyright information The thesis may not be published either in part (in scholarly, scientific or technical journals), or as a whole (as a monograph), unless permission has been obtained from the University
-
Upload
khangminh22 -
Category
Documents
-
view
1 -
download
0
Transcript of TREATMENT OF SOFTDRINK INDUSTRY WASTEWATER ...

TREATMENT OF SOFTDRINK INDUSTRY WASTEWATER USING AN
INTEGRATED ANAEROBIC/AEROBIC MEMBRANE BIOREACTOR
by
INNOCENTIA GUGULETHU ERDOGAN
Thesis submitted in fulfilment of the requirements for the degree
Master of Technologae: Chemical Engineering
in the Faculty of
Engineering
at the
CAPE PENINSULA UNIVERSITY OF TECHNOLOGY
Supervisor: Ass. Prof. Marshall Sheldon
CAPE TOWN
October 2014
CPUT copyright information
The thesis may not be published either in part (in scholarly, scientific or technical journals), or as a
whole (as a monograph), unless permission has been obtained from the University

ii
DECLARATION
I, Innocentia Gugulethu Erdogan, declare that the contents of this thesis represent my own
unaided work, and that this thesis has not previously been submitted for academic
examination towards any qualification. Furthermore, it represents my own opinions and not
necessarily those of the Cape Peninsula University of Technology.
Signed Date

iii
ABSTRACT
Most softdrink industries in developing countries are moving towards wastewater reuse or
recycling. Water and wastewater reutilization, costs of treatment and disposal guidelines,
remain the most critical factors for the development of sustainable water use for softdrink
industries. Wastewater reuse or recycle has potential in the softdrink industry, depending on
the wastewater characteristics’ concentration and volume.
During this study, an integrated laboratory scale anaerobic/aerobic sidestream membrane
bioreactor (MBR) system was used for treating softdrink industry wastewater (SDIW). The
aim was to evaluate the system’s performance, and identify potential opportunities to recycle
the water, and therefore reduce freshwater intake and minimise wastewater production. The
objectives were to: evaluate: 1) treatment efficiencies for the individual stages; 2) biogas
production in the anaerobic stage; and 3) the overall performance of the integrated system
under different operating conditions.
The SDIW used in this study was classified as medium to high strength wastewater with a
total chemical oxygen demand (CODt) ranging between 2 242 and 11 717 mg/L and a
biological oxygen demand (BOD) of up to 1 150 mg/L. The major pollutants in the SDIW
were caustic soda; dissolved sugars, namely fructose (1 071 mg/L) and sucrose
(6 900 mg/L); with the pH ranging between 6.1 and 12. The SDIW was characterized by total
suspended solids (TSS) of 66 mg/L, as well as fats, oils and greases (FOG) of 40 mg/L. The
maximum turbidity and colour was 65.3 NTU and 42 mg Pt/L, respectively. All the
physiochemical properties and inorganic parameters were within the within the City of Cape
Town’s (CCT’s) industrial wastewater quality discharge standards by-law (South Africa,
2006). Excluding the total dissolved solids (TDS) and electrical conductivity (EC) with
maximum values were 1 050 mg/L and 1 483 µS/cm, respectively.
Anaerobic pre-treatment of this SDIW was studied using a laboratory-scale expanded
granular sludge bed (EGSB) reactor maintained at mesophilic temperature of between 35 to
37˚C. An organic loading rate (OLR), upflow velocity (Vup) and hydraulic retention time (HRT)
of 10.9 kg COD/m3d, 0.85 m/h and ~11.8 h, respectively, resulting in COD treatment
efficiencies of up to 93% CODt. An increase in nitrate (NO3-) in the EGSB product stream
was an indication of an anaerobic ammonium (NH4+) oxidation (ANAMMOX) process.
Anaerobic digestion (AD) of SDIW in the EGSB resulted in biogas production with methane
(CH4), carbon dioxide (CO2), nitrogen (N2), and oxygen (O2), concentrations of up to 70%,
11%, 14.8%, and 4.1%, respectively. At the OLR and Vup of 10.9 kg COD/m3d and 0.85 m/h,
respectively, the EGSB produced 16.7 L/d of biogas. The EGSB anaerobic pre-treatment
iv
resulted in stable treatment efficiencies for the removal of organic constituents, as well as
biogas production without adding an external carbon source.
The MBR post-treatment satisfactorily operated at a feed flowrate of up to 33.7 L/d, OLR of
2.3 and 3.1 kg COD/m3d for the anoxic and aerobic zones, respectively, and an HRT of
approximately 0.41 h for both zones. The average CODt removal achieved was 86%. The
dissolved oxygen (DO) concentration of 2.1 mg/L in the anoxic zone combined with an
aeration rate and DO concentration of 11.8 L/min and 5.7 mg/L, in the aerobic zone resulted
in NH4+; NO3
-; and orthophosphate (PO43-), removal rates up to 90%; 55% and 39%,
respectively. However, the MBR post-treatment did not decrease the orthophosphate
concentration to within the SANS 241:2011 drinking water standards.
The integrated EGSB-MBR treatment for SDIW was able to achieve an overall CODt removal
efficiency of up to 94%. Although the MBR performance was successful the EC, TDS, PO43-,
and colour concentrations in the ultrafiltration (UF) permeate did not meet the CCT’s
industrial wastewater standards by-law (2006) as well as the SANS’ drinking water standards
241:2011 and required further treatment for reuse.

v
ACKNOWLEDGEMENTS
I wish to thank:
The Almighty, for blessing me and giving me strength to complete this study.
My sincere gratitude to my supervisor, Associate Professor Marshall Sheldon, for exceptional supervision on this project.
Dr. Debbie de Jager, for her assistance and support, which I appreciate. “Ngiyabonga kakhulu dadewethu”.
Our industrial partner, for agreeing to collaborate with us during this study. Without them this research would not have been possible.
CPUT Transport Department for helping me to make successful the trips to obtain wastewater samples from our industrial partner.
Biocatalysis and Technical Biology Research laboratory (BTB) at the Cape Peninsula University (CPUT), for allowing me to use their HPLC machine for fructose and sucrose analysis.
Mr Lukhanyo Mekuto and Mr Nkosikho Dlangamandla for their moral support and confidence.
Chemical Engineering: BTech students, Mr Jason August, and Luis de Sousa, for assisting me with analysis, running of the plant and collecting wastewater from the industrial partner; Ms Mantsha Maphoto and Ms Bianca Walbrugh, for assisting me with analysis and running of the plant.
Biotechnology: In-service training students for assisting me to collect wastewater, perform analysis, and for the biogas samples collection.
Chemical engineering staff; Mr Alwyn Bester, Mrs Hannelene Small and Mrs Elizma Alberts, for their contributions to this study.
CPUT and the Engineering Faculty, for their financial assistance towards this project.
I cannot begin to express my unfailing gratitude and love to my mother, Mrs Membry
Mkhize, who has supported me throughout this process and has constantly
encouraged me when the tasks seemed arduous and insurmountable.
To my husband, Mr Naci Erdogan, who brought me back to life; I am everything I am because you loved me. Your understanding, support and encouragement during this study are appreciated.

vi
DEDICATION
To my loving and caring daughter, Céline
All that I am or hope to be, I owe to you.
No one will ever know the strength of my love for you.

vii
TABLE OF CONTENTS
DECLARATION ..................................................................................................................... ii
ABSTRACT ........................................................................................................................... iii
ACKNOWLEDGEMENTS...................................................................................................... v
DEDICATION ....................................................................................................................... vi
TABLE OF CONTENTS ....................................................................................................... vii
LIST OF FIGURES ............................................................................................................... xi
LIST OF TABLES ................................................................................................................ xiii
GLOSSARY ........................................................................................................................ xiv
ABBREVIATIONS ............................................................................................................. xviii
LIST OF SYMBOLS ............................................................................................................ xxi
CHAPTER ONE ..................................................................................................................... 1
INTRODUCTION ................................................................................................................... 1
1.1 Background ............................................................................................................. 1
1.2 Research problem statement ................................................................................... 2
1.3 Hypotheses or research questions ........................................................................... 2
1.4 Aims and objectives ................................................................................................. 3
1.5 Significance of the research ..................................................................................... 3
1.6 Delineation of the research ...................................................................................... 3
CHAPTER TWO .................................................................................................................... 4
LITERATURE REVIEW ......................................................................................................... 4
2.1 Wastewater quality management and legislations.................................................... 4
2.1.1.1 Municipal wastewater .............................................................................................. 6
2.1.1.2 Industrial wastewater ............................................................................................... 6
2.1.1.3 The strength of industrial wastewater....................................................................... 6
2.2 Beverage industry wastewater ................................................................................. 7
2.2.1 Typical composition and the strength of beverage industry wastewater ................... 7
2.2.2 Alcoholic beverages industry wastewater composition ............................................. 9
2.2.2.1 Distillery wastewater background ............................................................................. 9
2.2.2.2 Winery wastewater background ............................................................................. 10
2.2.2.3 Brewery wastewater background ........................................................................... 10
2.2.3 Non-alcoholic beverages wastewater composition ................................................. 11
2.2.3.1 Fruit juice wastewater background ......................................................................... 11
2.2.3.2 Softdrink industry wastewater (SDIW) background ................................................ 12
2.3 Wastewater treatment methods ............................................................................. 12
2.3.1 Biological wastewater treatment methods .............................................................. 13
2.3.2 Anaerobic digestion treatment for wastewater and application ............................... 13
2.3.3 Advantages and disadvantages of anaerobic digestion ......................................... 13
viii
2.3.4 Highrate anaerobic reactor .................................................................................... 14
2.3.5 The relationship between the EGSB and UASB ..................................................... 15
2.3.6 Anaerobic degradation of organic matter ............................................................... 16
2.3.7 Factors that influence the operation of anaerobic digestion (AD) ........................... 18
2.3.7.1 Temperature .......................................................................................................... 19
2.3.7.2 Alkalinity and pH effect .......................................................................................... 19
2.3.7.3 Organic loading rate (OLR) and hydraulic retention time effect (HRT) ................... 19
2.3.7.4 Effect of nutrients ................................................................................................... 20
2.3.7.5 Upflow velocity (Vup) effect ..................................................................................... 21
2.4 Anaerobic digestion (AD) for the beverage industry’s wastewater .......................... 21
2.4.1 Application of anaerobic digestion (AD) for alcoholic beverage industry ................ 22
2.4.1.1 Anaerobic digestion (AD) of distillery wastewater .................................................. 22
2.4.1.2 Anaerobic digestion of winery wastewater ............................................................. 26
2.4.1.3 Anaerobic digestion for brewery wastewater .......................................................... 27
2.4.2 Application of anaerobic digestion (AD) for the non-alcoholic beverage industry ... 28
2.4.2.1 Anaerobic digestion for fruit juice industry wastewater ........................................... 30
2.4.2.2 Anaerobic digestion for softdrink industry wastewater (SDIW) ............................... 30
2.5 Anaerobic digestion and subsequent biogas production ........................................ 31
2.5.1 Biogas implementation and utilization in South Africa ............................................ 32
2.5.2 Anaerobic technology used for biogas production in the beverage industry ........... 33
2.5.3 Biogas utilization in beverage industry ................................................................... 36
2.6 Anoxic and aerobic wastewater treatment ............................................................. 37
2.6.1 Denitrification ......................................................................................................... 37
2.6.2 Nitrification ............................................................................................................. 38
2.6.3 Phosphorus removal .............................................................................................. 38
2.6.4 The modified Ludzack-Ettinger (MLE) treatment method ....................................... 38
2.6.5 UCT and modified UCT processes ........................................................................ 39
2.6.6 Comparison of anaerobic and aerobic wastewater treatment method .................... 40
2.7 Membrane bioreactors (MBRs) and configurations ................................................ 41
2.7.1 MBR for beverage industry wastewater ................................................................. 42
2.7.1.1 Membrane bioreactor (MBR) for alcoholic beverages’ wastewater treatment ......... 42
2.7.1.2 Membrane bioreactor for non-alcoholic beverages’ wastewater treatment ............. 46
2.7.2 Types of membranes and membranes filtration methods ....................................... 46
2.7.3 Membrane materials and filtration methods in beverage industry ........................... 47
2.8 Advantages and disadvantages of membrane bioreactors (MBRs) ........................ 49
2.9 Membrane fouling and the effect of air scouring .................................................... 49
2.10 Beverage industry wastewater recycling or reuse .................................................. 50
CHAPTER THREE .............................................................................................................. 52
MATERIALS AND METHODS ............................................................................................ 52
3.1 Background ........................................................................................................... 52
ix
3.2 Softdrink industry potable water ............................................................................. 52
3.3 Softdrink industry wastewater (SDIW) .................................................................... 52
3.4 Experimental setup ................................................................................................ 53
3.4.1 Anaerobic expanded granular sludge bed (EGSB) pre-treatment .......................... 53
3.4.1.1 EGSB inoculation .................................................................................................. 57
3.4.1.2 EGSB operation and operating conditions ............................................................. 57
3.4.2 Biogas production .................................................................................................. 58
3.4.3 UF-Membrane bioreactor (MBR) post-treatment for softdrink industry wastewater 60
3.4.3.1 UF-MBR operating conditions ................................................................................ 61
3.4.3.2 Cleaning-in-Place (CIP) of ultrafiltration (UF) membranes ..................................... 61
3.5 Analytical methods ................................................................................................. 63
3.5.1 Softdrink industry water and wastewater ................................................................ 64
3.5.2 Softdrink industry wastewater (SDIW) in the holding tank ...................................... 64
3.5.3 Sample analysis during EGSB pre-treatment phase .............................................. 64
3.5.2 EGSB biogas analysis ........................................................................................... 65
3.5.3 MBR post-treatment phase sample analysis .......................................................... 65
CHAPTER FOUR ................................................................................................................ 66
RESULTS AND DISCUSSIONS .......................................................................................... 66
4.1 Softdrink industry potable water (municipal water) ................................................. 66
4.1.1 Potable water characteristics for industrial partner ................................................. 67
4.1.2 Pre-treated water characteristics of the industrial partner ...................................... 69
4.1.3 Bottle-washing wastewater .................................................................................... 69
4.1.4 Softdrink industry wastewater (SDIW) on-site ........................................................ 71
4.2 Performance of the EGSB reactor ......................................................................... 72
4.2.1 EGSB initial start-up .............................................................................................. 73
4.2.2 EGSB stress period ............................................................................................... 79
4.2.3 EGSB re-inoculation and second start-up .............................................................. 79
4.2.4 EGSB treatment efficiency ..................................................................................... 80
4.2.5 EGSB treatment summary ..................................................................................... 81
4.3 EGSB biogas production and composition ............................................................. 82
4.3.1 Biogas composition during EGSB initial start-up .................................................... 82
4.3.2 Biogas composition during the EGSB stress period ............................................... 83
4.3.3 Biogas composition during EGSB second start-up ................................................ 84
4.3.4 Biogas summary .................................................................................................... 86
4.4 Performance of the Modified Ludzack-Ettinger (MLE) membrane bioreactor post- treatment ............................................................................................................... 87
4.4.1 MBR start-up ......................................................................................................... 87
4.4.2 MBRTreatment efficiency ....................................................................................... 87
4.4.3 Relationship between dissolved oxygen (DO) and nutrient removal during MBR post-treatment ....................................................................................................... 94

x
4.4.4 Membrane perfomance, air scouring and CIP ........................................................ 96
4.4.5 MBR post-treatment summary ............................................................................... 98
4.5 Overall EGSB and MBR treatment efficiency ......................................................... 99
4.6 Comparison of MBR permeate to potable water ................................................... 100
CHAPTER FIVE ................................................................................................................ 102
CONCLUSIONS AND RECOMEMNDATIONS .................................................................. 102
5.1 Conclusions .......................................................................................................... 102
5.2 Recommendations ................................................................................................ 103
REFERENCES .................................................................................................................. 104
APPENDICES ................................................................................................................... 121
APPENDIX A: Treatment methods ..................................................................................... 121
APPENDIX B: Preparation of dosing solution chemicals and cleaning-in-place (CIP) solution…………………………………………………………………………………………….123
APPENDIX C: Procedure for determining analytical parameters ........................................ 125
APPENDIX D: Composition of anoxic and aerobic zones in different operating conditions 131
APPENDIX E: Calculations ................................................................................................ 132

xi
LIST OF FIGURES
Figure 2.1: Schematic diagram for the EGSB [drawn using Microsoft Visio 2010] ................ 15
Figure 2.2: Microbial groups and metabolic pathway involved in anaerobic digestion .......... 18
Figure 2.3: Modified Ludzack - Ettinger (MLE) process ....................................................... 39
Figure 2.4: Schematic diagram for UCT process .................................................................. 40
Figure 2.5: Schematic diagram for modified UCT process ................................................... 40
Figure 2.6: Configurations of a membrane bioreactor: (a) sidestream and (b) immersed
Modified from (Judd, 2011) .................................................................................................. 42
Figure 3.1: Schematic diagram showing the laboratory integrated EGSB and UF-MBR
system used in the treatment of softdrink industry wastewater ............................................. 54
Figure 3.2: Diagram showing the laboratory integrated EGSB and UF-MBR system used in
the treatment of softdrink industry wastewater ..................................................................... 55
Figure 3.3: P&ID of anaerobic Expanded Granular Sludge Bed Reactor (EGSB) pre-
treatment [Drawn using Microsoft Visio 2010] ...................................................................... 56
Figure 3.4: Schematic representation of biogas measuring unit [Drawn using Microsoft Visio
2010] ................................................................................................................................... 60
Figure 3.5: P & ID of the Modified Ludzack-Ettinger (MLE)-MBR post-treatment phase
[Drawn using Microsoft Visio 2010] ...................................................................................... 62
Figure 4.1: Schematic diagram of softdrink manufacturing processes modified from
(Woodard, 2001). ................................................................................................................. 67
Figure 4.2: EGSB pre-treatment efficiency and CODt of softdrink industry wastewater ........ 74
Figure 4.3: EGSB pre-treatment efficiency and CODs of softdrink industry wastewater ........ 74
Figure 4.4: EGSB HRT and treatment efficiency in terms of CODt ....................................... 74
Figure 4.5: Foam formation in the holding tank .................................................................... 75
Figure 4.6: TSS during EGSB pre-treatment of softdrink industry wastewater ..................... 76
Figure 4.7: Turbidity during EGSB pre-treatment of softdrink industry wastewater ............... 76
Figure 4.8: EC during EGSB pre-treatment of softdrink industry wastewater ....................... 76
Figure 4.9: TDS during EGSB pre-treatment of softdrink industry wastewater ..................... 77
Figure 4.10: Ammonium concentration during EGSB pre-treatment for softdrink industry
wastewater .......................................................................................................................... 78
Figure 4.11: Nitrate concentration during EGSB pre-treatment for softdrink industry
wastewater .......................................................................................................................... 78
Figure 4.12: Ortho-phosphate concentration during EGSB pre-treatment for softdrink industry
wastewater .......................................................................................................................... 78
Figure 4.13: Biogas production in relation to CODt removal dung EGSB pre-treatment ........ 83
Figure 4.14: Biogas production in relation to OLR removal dung EGSB pre-treatment......... 83
Figure 4.15: Percentage CODt removed within the EGSB product and MBR system ........... 90

xii
Figure 4.16: EC concentrations for anoxic, aerobic and permeate during MBR treatment .... 90
Figure 4.17: TDS concentrations for anoxic, aerobic and permeate during MBR treatment.. 90
Figure 4.18: TSS concentration for anoxic, aerobic and permeate during MBR Treatment .. 91
Figure 4.19: Turbidity concentration for anoxic, aerobic and permeate during MBR Treatment
............................................................................................................................................ 91
Figure 4.20: Ammonium concentration during MBR treatment ............................................. 93
Figure 4.21: Nitrate concentration during MBR treatment .................................................... 93
Figure 4.22: Ortho-phosphate concentration during MBR treatment .................................... 93
Figure 4.23: Sludge permeation through the UF membranes ............................................... 97
Figure 4.24: Cracks on the membranes and epoxy becoming lose ...................................... 98
Figure 4. 25: Overall treatment efficiency for integrated during EGSB and MBR .................. 99
Figure 4.26: Colour comparison of the wastewater fed from the holding tank to the permeate
tank .................................................................................................................................... 100

xiii
LIST OF TABLES
Table 2.1 Industrial wastewater municipal discharged standards and by-laws ....................... 5
Table 2.2: The significant parameters used to determine the biological, chemical and
physical characteristics of municipal and industrial wastewater ............................................. 7
Table 2.3: Characteristics of various alcoholic and non-alcoholic beverage industries
wastewater ............................................................................................................................ 8
Table 2.4: Essential parameters for anaerobic digestion ...................................................... 18
Table 2.5: Treatment methods for alcoholic beverages industry wastewater ........................ 23
Table 2.6: Treatment methods for non-alcoholic beverages industry wastewater ................. 29
Table 2.7: Typical composition of biogas ............................................................................. 32
Table 2.8: Industrial barriers associated with biogas application and installation .................. 33
Table 2.9: Biogas production and technology used for alcoholic and non-alcoholic industries
............................................................................................................................................ 34
Table 2.10: Anaerobic treatment as compared to aerobic treatment .................................... 41
Table 3.1: EGSB pre-treatment planed operation conditions from literature. ........................ 57
Table 3.2: EGSB pre-treatment actual operation conditions measured ................................ 59
Table 3.3: MBR actual operating conditions ......................................................................... 63
Table 3.4: Softdrink industry wastewater (SDIW) analysis in the holding tank ...................... 64
Table 3.5: EGSB feed and product analysis ......................................................................... 65
Table 3.6: MBR post-treatment analysis .............................................................................. 65
Table 3.7: In-house analysis for EGSB pre-treatment and MBR post-treatment ................... 65
Table 4.1: Composition of potable water, reverse osmosis water for industrial partner, SANS
241 and EC 80/778/EEC ...................................................................................................... 68
Table 4.2: Physico-chemical properties of softdrink industry wastewaters and City of Cape
Town by-laws, 2006 ............................................................................................................. 70
Table 4.3: EGSB treatment efficiency for different operating conditions in relation to COD .. 81
Table 4.4: Biogas composition at different operation conditions during EGSB anaerobic
treatment for softdrink industry wastewater (SDIW) ............................................................. 85
Table 4.5: The comparison between EGSB treatment efficiency and MBR treatment
efficiency .............................................................................................................................. 89
Table 4.6: Composition of average MBR permeate and potable water, reverse osmosis water
for industrial partner ........................................................................................................... 101

xiv
GLOSSARY
TERM DEFINITION
Aerobic Conditions where oxygen acts as an electron acceptor for biochemical reactions (Judd, 2011).
Anaerobic Conditions where biochemical reactions occur in the absence of oxygen (Judd, 2011).
Anammox Defined as the biological process in which autotrophic bacteria convert ammonium directly into nitrogen gas under anaerobic conditions (Chen et al., 2013).
Anoxic Conditions where some species other than oxygen acts as the electron acceptor for biochemical reactions (Judd, 2011).
Activated Sludge Suspended solids in the wastewater that undergo digestion by high concentrations of aerobic bacteria (Maczulak, 2010).
Air pollution It is any change in the environment, which is caused by any substance emitted into the atmosphere from any activity, where that change has an adverse effect on human health or well-being or on the composition, resilience and productivity of natural or managed ecosystems, or on materials that are useful to people, or will have such an effect in the future (City of Cape Town, 2010).
Air scouring Defined as a cleaning practice by passing air through a filtration medium during filter backwash (Logsdon, 2011).
Alkalinity Refers to the capability of a solution to resist variations in pH (Turkdogan-Aydınol & Yetilmezsoy, 2010).
Beverage industry Enterprises that manufacture beverages with an alcohol content of less than 0.5% (Chen, 2013).
Biochemical oxygen demand (BOD5) The amount of dissolved oxygen, which is required by aerobic biological organisms in a body of water to break down organic material that is present in given water sample at a certain temperature over a specific period (Manyele et al., 2008).
Biodegradation Defined as the breakdown of compounds to its chemical components by means of living organisms (Madsen, 2011).
Biofilm A mixed deposit of microbes that attach to a surface that is generally immersed in moving liquor (Maczulak, 2010).

xv
Biomass Organic matter that can be used as fuel, which is derived from wastewater treatment, plants and animal waste (Maczulak, 2010).
Chemical oxygen demand (COD) Determines the amount of organic pollutants found in surface water (for examples, lakes and rivers) or wastewater, making COD a useful measure of water quality (Manyele et al., 2008).
Dissolved Oxygen (DO) Is a relative measure of the quantity of oxygen that is dissolved or carried within a given medium (Wang et al., 2009).
Fermentation Industry Enterprises that use some or all of the fermentation and distillation processes to manufacture alcoholic beverages, alcohol, or vinegar from raw materials such as wheat, rice, or other grains, starch, or molasses (Chen, 2013).
Filtration A process of purifying wastewater by passing it through a membrane with small pores (Maczulak, 2010).
Greenhouse gas Signifies gaseous elements of the atmosphere, both anthropogenic and environment, which attract and re-emits infrared radioactivity, and include nitrous oxide (N2O) CO2 and, CH4 (Peng et al., 2013).
Hydraulic retention time (HRT) A measure of the average length of time that a soluble compound remains within a system (Judd, 2011).
Industrial wastewater When any fluid, whether or not it is a restrain substance in solution as a result of any industrial operation such as agricultural activity, chemical process, manufacturing, mining, laboratories, research, service and material, is discharged from a waste crusher ( City of Cape Town, 2006).
Membrane A semi-permeable barrier (Judd, 2011).
Membrane bioreactor (MBR) Defined as a combination of membrane units, which is responsible for physical separation, and biological reactor systems for biodegradation of the waste compounds (Lin et al., 2012).
Membrane fouling A process where particles deposit onto a membrane surface area or into pores in a way that it reduces the performance of the membrane (Judd, 2011).
Membrane permeate flux Defined as the product of water flow, which is divided by the surface area of the membrane (Le-Clech et al., 2006).
Municipal sewer Any pipe under the power of the Council which, may be used for the transportation of wastewater (City of Cape Town, 2006).
xvi
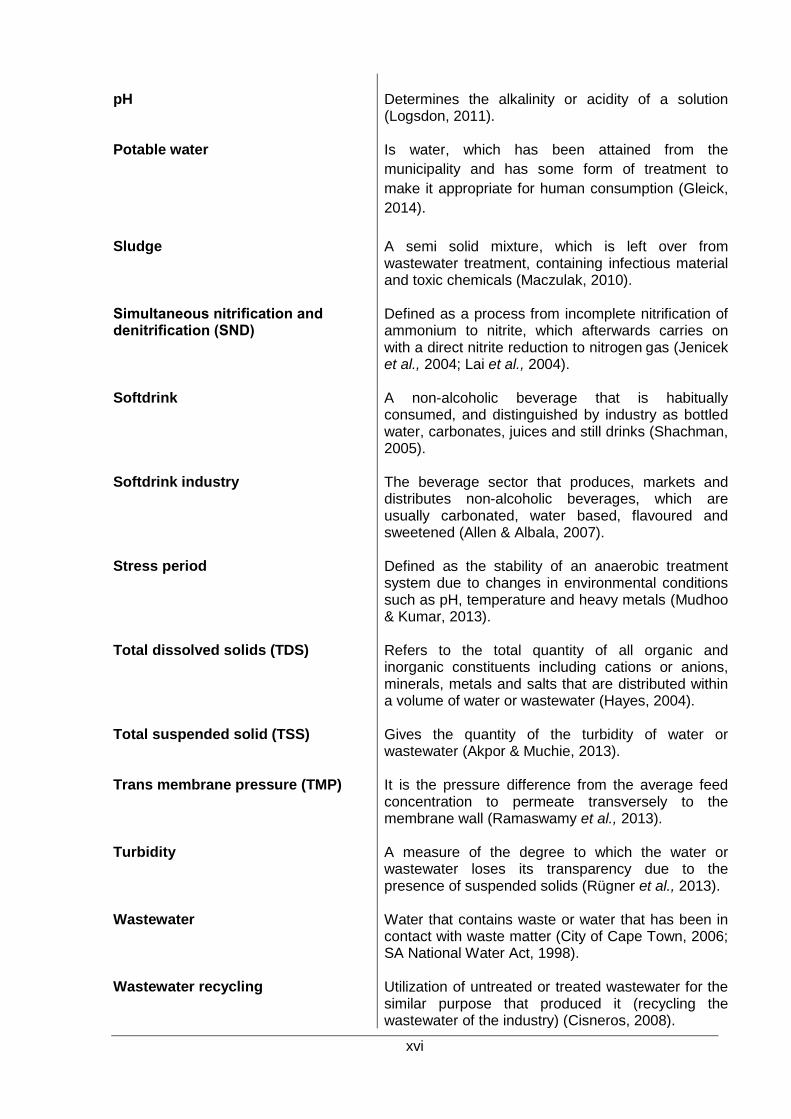
pH Determines the alkalinity or acidity of a solution
(Logsdon, 2011).
Potable water Is water, which has been attained from the
municipality and has some form of treatment to
make it appropriate for human consumption (Gleick,
2014).
Sludge A semi solid mixture, which is left over from wastewater treatment, containing infectious material and toxic chemicals (Maczulak, 2010).
Simultaneous nitrification and denitrification (SND)
Defined as a process from incomplete nitrification of ammonium to nitrite, which afterwards carries on with a direct nitrite reduction to nitrogen gas (Jenicek et al., 2004; Lai et al., 2004).
Softdrink A non-alcoholic beverage that is habitually consumed, and distinguished by industry as bottled water, carbonates, juices and still drinks (Shachman, 2005).
Softdrink industry The beverage sector that produces, markets and distributes non-alcoholic beverages, which are usually carbonated, water based, flavoured and sweetened (Allen & Albala, 2007).
Stress period Defined as the stability of an anaerobic treatment system due to changes in environmental conditions such as pH, temperature and heavy metals (Mudhoo & Kumar, 2013).
Total dissolved solids (TDS) Refers to the total quantity of all organic and inorganic constituents including cations or anions, minerals, metals and salts that are distributed within a volume of water or wastewater (Hayes, 2004).
Total suspended solid (TSS) Gives the quantity of the turbidity of water or wastewater (Akpor & Muchie, 2013).
Trans membrane pressure (TMP) It is the pressure difference from the average feed concentration to permeate transversely to the membrane wall (Ramaswamy et al., 2013).
Turbidity A measure of the degree to which the water or wastewater loses its transparency due to the presence of suspended solids (Rügner et al., 2013).
Wastewater Water that contains waste or water that has been in contact with waste matter (City of Cape Town, 2006; SA National Water Act, 1998).
Wastewater recycling Utilization of untreated or treated wastewater for the similar purpose that produced it (recycling the wastewater of the industry) (Cisneros, 2008).

xvii
Wastewater reuse Utilization of untreated or treated wastewater for a
different purpose than for what it was produced (agricultural irrigation) (Cisneros, 2008).
Water treatment plants Enterprises that employ physical, chemical, or biological methods to treat raw water, which is obtained from its source and supplied as public water (Chen, 2013).

xviii
ABBREVIATIONS
Abbreviation Explanation
AD Anaerobic digestion
AD-MBR Anaerobic digestion & membrane bioreactor
AD-MCAB Anaerobic digestion & membrane-coupled anaerobic bioreactor
AF Anaerobic filter
AH Anaerobic hybrid
AH-SBR Anaerobic hybrid sequence batch reactor
AJLR Aerobic jet-loop activated sludge reactor
AMBB Air micro-bubble bioreactor
AMBR Aerobic membrane bioreactor
AnCSBR Anaerobic contact sequence batch reactor
AnMBR Anaerobic membrane bioreactor
AnEMBR Anaerobic external membrane bioreactor
AnFBR Anaerobic fixed-bed reactor
AnIFBR Anaerobic inverse fluidized bed reactors
AnRBC Anaerobic rotating biological contactor
AnSBBR Anaerobic sequencing batch biofilm reactor
AnSBR Anaerobic sequencing batch reactor
AO&MBR Anoxic/aerobic membrane bioreactor
AS Activated sludge
ASBR Aerobic sequence batch reactor
BOD Biological oxygen demand
CA CO2 Absorber
CA-UASB CO2 Absorber & upflow anaerobic sludge bed
CF Cartridge filter
CF-RO Cartridge filter & reverse osmosis
CF-RO-IE Cartridge filter, reverse osmosis and ion exchange
CIP Cleaning in place
cm Centimetre
COD Chemical oxygen demand
CPUT Cape Peninsula University of Technology
CSIR Council for Scientific and Industrial Research
CSTR Continuous stirred zone reactor
CT Capillary tube
xix
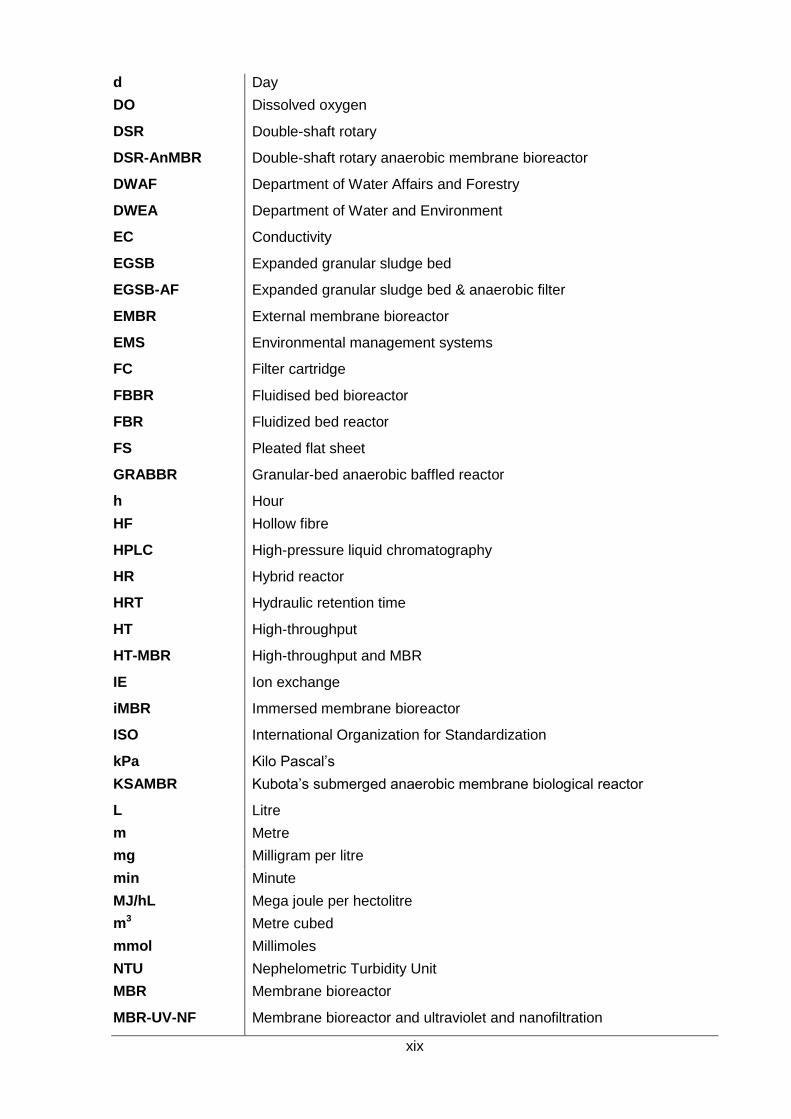
d Day
DO Dissolved oxygen
DSR Double-shaft rotary
DSR-AnMBR Double-shaft rotary anaerobic membrane bioreactor
DWAF Department of Water Affairs and Forestry
DWEA Department of Water and Environment
EC Conductivity
EGSB Expanded granular sludge bed
EGSB-AF Expanded granular sludge bed & anaerobic filter
EMBR External membrane bioreactor
EMS Environmental management systems
FC Filter cartridge
FBBR Fluidised bed bioreactor
FBR Fluidized bed reactor
FS Pleated flat sheet
GRABBR Granular-bed anaerobic baffled reactor
h Hour
HF Hollow fibre
HPLC High-pressure liquid chromatography
HR Hybrid reactor
HRT Hydraulic retention time
HT High-throughput
HT-MBR High-throughput and MBR
IE Ion exchange
iMBR Immersed membrane bioreactor
ISO International Organization for Standardization
kPa Kilo Pascal’s
KSAMBR Kubota’s submerged anaerobic membrane biological reactor
L Litre
m Metre
mg Milligram per litre
min Minute
MJ/hL Mega joule per hectolitre
m3 Metre cubed
mmol Millimoles
NTU Nephelometric Turbidity Unit
MBR Membrane bioreactor
MBR-UV-NF Membrane bioreactor and ultraviolet and nanofiltration

xx
MCAB Membrane-coupled anaerobic bioreactor
MF Microfiltration
MT Multi-tubular
NF Nanofiltration
NF-RO Nanofiltration and reverse osmosis
OLR Organic loading rate
PAC Powdered activated carbon
PBUAR Packed-bed upflow anaerobic reactor
pH Potential hydrogen
PFFR Polyurethane frickling filter reactor
ppm Parts per million
PTF Polyurethane trickling filter
PTF-AH Polyurethane trickling filter and anaerobic hybrid reactor
RBC Rotating biological contactor
RO Reverse osmosis
s Second
SA South Africa
SANAS South African National Accreditation System
SANS South African National Standard
SBR Sequence batch reactor
SMBR Submerged membrane bioreactor
SRT Solid retention time
SS Suspended solids
SW Spiral wound
TAnMBR Thermophilic anaerobic membrane bioreactor
TD Typical digester
TDS Total dissolved solids
TKN Total Kjeldahl nitrogen
TMP Transmembrane pressure
TN Total nitrogen
TOC Total organic carbon
TP Total phosphorus
TSS Total suspended solids
UAF Upflow anaerobic filter
UAFFR Anaerobic upflow fixed film glass column reactors
UASB Upflow aerobic sludge bed

xxi
UASB-AF Upflow anaerobic sludge bed and anaerobic filter
UASB-ASBR Upflow anaerobic sludge bed and aerobic sequence batch reactor
UASB-HR Upflow anaerobic sludge bed and hybrid reactor
UASB-SBR Upflow anaerobic sludge bed and sequence batch reactor
UASR Upflow anaerobic sponge reactor
UASR-AS Upflow anaerobic sponge reactor and activated sludge
UCT University of Cape Town
UF Ultrafiltration
UFFR Upflow fixed film reactor
VFA Volatile fatty acid
VOC Volatile organic compound
Vup Upflow velocity (m/h)
WWTP Wastewater treatment plants
LIST OF SYMBOLS
Unit Definition
A Cross sectional area (m2) ˚C Degrees Celsius
Gibbs free energy
H Height (m)
J Flux (L/h.m2)
Feed pressure (kPa)
Permeate pressure (kPa)
% Percentage (dimensionless)
Q Wastewater widrawal rate (m3/h)
V Fluid volume in reactor (m3)
Greek Symbols
Unit Definition
ᶮ Efficiency (%)
µS/cm Micro Siemens per centimetre

xxii
Chemical formulas
Element/Compound Description
Al2O3 Aluminium oxide
C Carbon
CH3COONH4 Ammonium acetate
CH4 Methane
CO2 Carbon dioxide
C:N:P Carbon:Nitrogen:Phosphate
H2 Hydrogen
HCO3- Hydrogen carbonate ion
H3PO4 Phosphoric acid
H2S Hydrogen sulphide
KH2PO4 Potassium dihydrogen phosphate
NaClO Sodium hypochlorite
NaOH Sodium hydroxide
Na2CO3 Sodium bicarbonate
N2 Nitrogen
NH4+ Ammonium
NO3- Nitrate
O2 Oxygen
PO43− Orthophosphate

Page 1 of 132
CHAPTER ONE INTRODUCTION
1.1 Background
In most industrial processes, water is the most extensively used raw material in the
production of high value products (Wijekoon et al., 2011; Melamane, 2007). Water quality
and its scarcity, has been identified as a future global threat to human health, marine
organisms, livestock and the environment (Skouteris et al., 2012; España-Gamboa et al.,
2011; Agarwal et al., 2010; Méndez-Acosta et al., 2010; Acharya et al., 2008; Alam et al.,
2007; Fritzmann et al., 2007; Fewtrell & Bartram, 2001). South Africa‘s (SA’s) water
resources are limited due to climate changes, population growth and a developing economy.
Hence, awareness campaigns for reasonable water consumption have increased (Haroon et
al., 2013; Hsine et al., 2010; Melamane, 2007; Van Schoor, 2005; DWAF, 2004). An increase
in industrial activities, along with the discharge of high strength wastewater from various
industries such as beverage industries (distilleries, wineries, breweries, and softdrink
manufactures), result in challenges with regard to methods that are used to remediate
contaminants in the water in order to limit its environmental impact (Wijekoon et al., 2011;
Melamane, 2007). A hindrance for developing countries is how to improve their wastewater
treatment capabilities, which at times are based on obsolete technology (Haroon et al.,
2013).
Water and wastewater reutilization, costs of treatment and disposal guidelines remain the
most critical factors for the development of sustainable water use for the food and beverage
industries (Alam et al., 2007; Fillaudeau et al., 2006; Blöcher et al., 2003). Regulatory bodies,
therefore, have imposed restrictions on the quality of the water to be discharged into natural
resources, In SA wastewater should have a potential hydrogen (pH) value between 5.5 and
7.5; and a total chemical oxygen demand (CODt) below 75 mg/L [SA, National Water Act,
1998-Act No. 36 of 1998]. Hence, due to these regulatory guidelines, process water usage
and wastewater management constitute a practical challenge for beverage industries in SA.
The beverage industry is a subdivision of the food industry (Guimarães et al., 2012), and
supplies a range of products from alcoholic (winery, vinasses, molasses and spirits) and
brewery to non-alcoholic (fruit juices, vegetable juice, mineral water, sparkling water,
flavoured water and softdrinks) beverages (Gonzalez‐Garcia et al., 2013; Haroon et al.,
2013; Satyawali, 2013; Guimarães et al., 2012). According to Haroon et al. (2013) and Hsine
et al. (2010), the beverage industry globally and in Africa requires large quantities (an
average 7 000 m3 to 25 000 m3 per month) of freshwater, and do not reuse or recycle
wastewater; hence they consume large volumes of freshwater. The beverage industry’s
Page 2 of 132
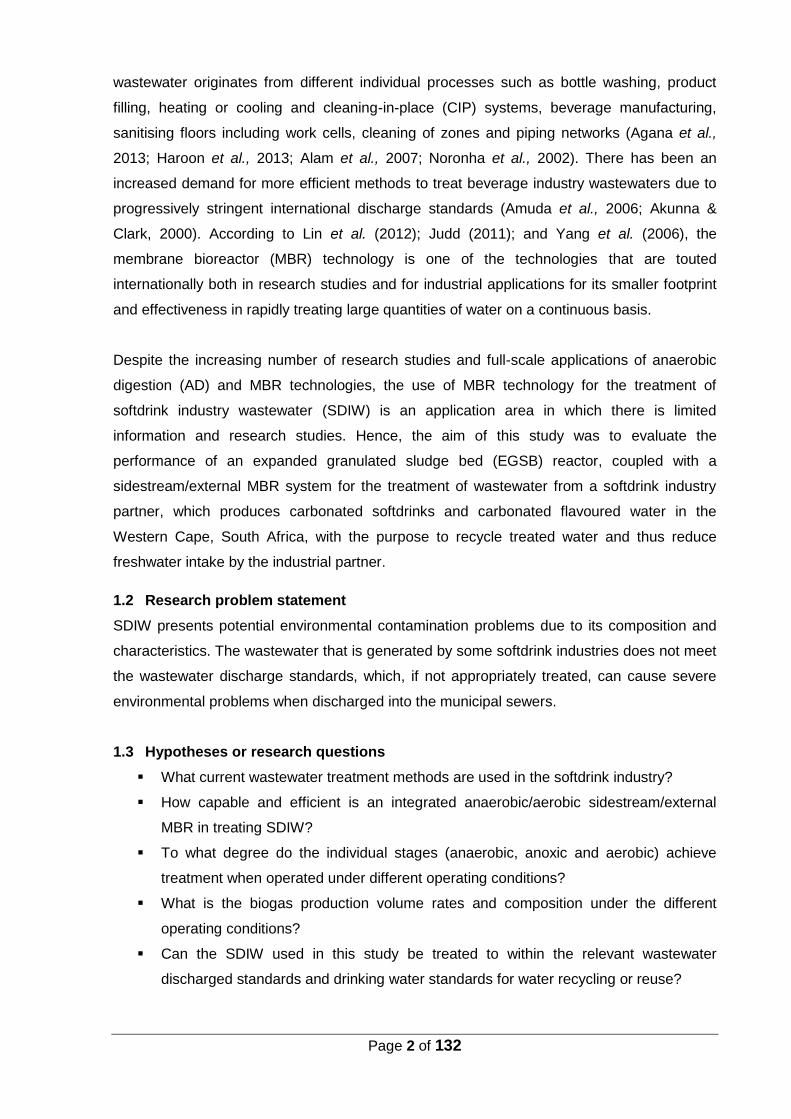
wastewater originates from different individual processes such as bottle washing, product
filling, heating or cooling and cleaning-in-place (CIP) systems, beverage manufacturing,
sanitising floors including work cells, cleaning of zones and piping networks (Agana et al.,
2013; Haroon et al., 2013; Alam et al., 2007; Noronha et al., 2002). There has been an
increased demand for more efficient methods to treat beverage industry wastewaters due to
progressively stringent international discharge standards (Amuda et al., 2006; Akunna &
Clark, 2000). According to Lin et al. (2012); Judd (2011); and Yang et al. (2006), the
membrane bioreactor (MBR) technology is one of the technologies that are touted
internationally both in research studies and for industrial applications for its smaller footprint
and effectiveness in rapidly treating large quantities of water on a continuous basis.
Despite the increasing number of research studies and full-scale applications of anaerobic
digestion (AD) and MBR technologies, the use of MBR technology for the treatment of
softdrink industry wastewater (SDIW) is an application area in which there is limited
information and research studies. Hence, the aim of this study was to evaluate the
performance of an expanded granulated sludge bed (EGSB) reactor, coupled with a
sidestream/external MBR system for the treatment of wastewater from a softdrink industry
partner, which produces carbonated softdrinks and carbonated flavoured water in the
Western Cape, South Africa, with the purpose to recycle treated water and thus reduce
freshwater intake by the industrial partner.
1.2 Research problem statement
SDIW presents potential environmental contamination problems due to its composition and
characteristics. The wastewater that is generated by some softdrink industries does not meet
the wastewater discharge standards, which, if not appropriately treated, can cause severe
environmental problems when discharged into the municipal sewers.
1.3 Hypotheses or research questions
What current wastewater treatment methods are used in the softdrink industry?
How capable and efficient is an integrated anaerobic/aerobic sidestream/external
MBR in treating SDIW?
To what degree do the individual stages (anaerobic, anoxic and aerobic) achieve
treatment when operated under different operating conditions?
What is the biogas production volume rates and composition under the different
operating conditions?
Can the SDIW used in this study be treated to within the relevant wastewater
discharged standards and drinking water standards for water recycling or reuse?

Page 3 of 132
What are the possibilities of reduction of potable water usage and wastewater
production?
1.4 Aims and objectives
The main purpose of this study was to render the SDIW safer for discharge into the municipal
sewer so that it does not cause environmental degradation and/or deterioration, and to treat
the water for the purpose of recycling.
The objectives of the study were to:
Evaluate the treatment efficiencies of the anaerobic, anoxic, aerobic and membrane
treatment stages under different operating conditions; and evaluate the extent of
contaminant removal in the individual stages, as well as the overall process;
Evaluate biogas production and composition under different hydraulic retention times
(HRT); and upflow velocities and organic loading rates (OLR) in the anaerobic stage;
Evaluate the performance of an integrated anaerobic EGSB pre-treatment combined with
an MBR post-treatment system to treat SDIW.
1.5 Significance of the research
The significance of performing the research project was to successfully treat the SDIW using
an EGSB-sidestream/external MBR technology design. The study aimed to assist softdrink
processors to meet the SA government industrial discharge standards, thus reducing
penalties and levies that are associated with discharging such wastewater into municipal
discharge points. Treated water could be available for recycle or reuse thereby: 1) reducing
their potable water consumption; 2) reducing their costs; 3) providing a solution to industry
specific needs; and 4) improving water and wastewater management.
1.6 Delineation of the research
The following were not included in this research project:
Isolation, comparison, and evaluation of the effects of different microbial consortia on
the treatment performance,
The scrubbing and heat generation of the biogas,
The study of any other food and beverages industries’ (distilleries, breweries, fruit
juices, vegetable juices, ciders) wastewater treatments,
Design and modelling of the MBR system hydrodynamics, and
Testing different membrane types, materials and sizes.

Page 4 of 132
CHAPTER TWO
LITERATURE REVIEW
2.1 Wastewater quality management and legislations
It is necessary to understand the importance of environmental impacts on the community,
and then to contemplate the advantages and disadvantages related to several ranks of
environmental control. Most wastewater treatment plants (WWTP) will have on-site specific
established requirements for the quality of wastewater that can be discharged into the natural
environment and municipal sewers. in South Africa (SA) the water quality requirements
stipulated in discharge permits/licenses are set and regulated by the Department of Water
and Environmental Affairs (DWEA), and are issued as General Authorisations in terms of
Section 39 of the National Water Act, 1998 (Act No. 36 of 1998). The General Authorisation
offers additional guidance in respect of wastewater management, requirements and quality.
The beverage industry should comply with several environmental protection acts and
regulations (Simate at al., 2011). Through environmental management systems (EMS) such
as: 1) Municipal discharged standards and by-laws; and 2) the International Organization for
Standardization (ISO) 14001. Therefore, the beverage industries have a duty to be able to
proactively manage their impacts on the environment. EMS assists the beverage industries
to pay attention to efficient and effective management of both existing and forthcoming
environmental impacts.
Wastewater standards are specifications of the biological, chemical and physical quality of
the wastewater that is produced by a treatment. These regularly comprise of allowable
chemical oxygen demand (COD), suspended solids (SS), nitrogen (N), phosphorus (P) and
other elements, which are expressed in concentrations as presented in Table 2.1, which
indicates the municipal and industrial discharged standards, as well as the by-laws. Table 2.1
shows that the eThekwini Municipality is much stricter in COD discharge standard, as
compared to the City of Cape Town (CCT) and Tshwane, and most of the other metros in
SA. The WWTP designer should refer to the local wastewater discharge standards, and by-
laws for the specific area in which the WWTP should be constructed and designed (DPW,
2012).

Page 5 of 132
Table 2.1 Industrial wastewater municipal discharged standards and by-laws (City of Cape Town, 2006; Tshwane 2001; eThekwini Municipality, 1999)
Section A: General City of Cape Town eThekwini Municipality Tshwane
Temperature at point of entry (°C) 0 – 40 <40°C -
Electrical Conductivity ( mS/m) 500 400 300
pH Value at 25 °C 5.5 – 12 6,5 – 10 6 - 10
Chemical Oxygen Demand (mg/L) 5 000 Charge 5 000
Section B: Chemical substances other than heavy metals – maximum concentrations
Settleable Solids (mg/L) 50 Charge
-
Suspended Solids (mg/L) 1 000 2 000 -
Total dissolved solids (mg/L) 4 000 1 000 -
Chloride as Cℓ (mg/L) 1 500 500 – 1 000 100
Total sulphates as SO4 (mg/L) 1 500 250 1 800
Total phosphates as P (mg/L) 25 - 10
Total cyanides as CN (mg/L) 20 10 – 20 20
Total sulphides as S (mg/L) 50 1 50
Total phenols as C6H5OH (mg/L) 50 5 1
Total sugars and starches as
glucose (mg/L) 1 500
1000 1 500
Oils, greases, waxes and fat (mg/L) 400 50 2 000
Sodium as Na (mg/L) 1 000 - -
Section C: Metals and inorganic content – maximum concentrations Group 1: Total collective concentration of all metals in Group 1 shall not exceed 50 mg/L
Iron as Fe (mg/L) 50 5 – 50 -
Chromium as Cr (mg/L) 10 - < 20
Copper as Cu (mg/L) 20 5 – 50 < 20
Zinc as Zn (mg/L) 30 5 – 50 < 20
Section C: Metals and inorganic content – maximum concentrations Group 2: Total collective concentration of all metals and
inorganic constituents in Group 2 shall not exceed 20 mg/L Arsenic as (mg/L) 5 5 – 20 20
Boron as B (mg/L) 5 5 – 50 20
Lead as Pb (mg/L) 5 5 – 20 -
Selenium as Se (mg/L) 5 5 – 50 -
Mercury as Hg (mg/L) 5 1 -
Titanium as Ti (mg/L) 5 5 – 20 -
Cadmium as Cd (mg/L) 5 5 – 20 -
Nickel as Ni (mg/L) 5 5 – 50 -

Page 6 of 132
2.1.1 The origin and constituents of wastewater
Wastewater is traditionally generated and largely classified as municipal wastewater and
industrial wastewater (Henze et al., 2008; Karia & Christian, 2006). Table 2.2 indicates the
most significant parameters to determine the strength of both municipal and industrial
wastewater. According to Adams (2004), the strength of industrial wastewater varies when
compared to domestic or municipal wastewater.
2.1.1.1 Municipal wastewater
Municipal wastewater is also known as domestic wastewater or sewage wastewater, which is
defined as “discharged used water from commercial, community institutions and residential
sectors that discard it via the sewage system”. Domestic wastewater contains
microorganisms, mainly bacteria, and inorganic and organic solids. However, its constituents
will depend on the sector from which it is generated. Municipal wastewater comprises about
0.1% solids and 99.9% water (Karia & Christian, 2006).
2.1.1.2 Industrial wastewater
Industrial wastewater, including agro-industrial wastewater, results from human activities,
which are associated with processing, manufacturing and raw material handlings, generated
from medium to large scale industries. This wastewater arises from cooling, heating,
extraction, reaction of by-products, washing and quality control as a result of specification
products being rejected (Feroz et al., 2012). The characteristic of wastewater depends on the
quality of water that is used by the different types of industries, as well as the community and
treatment of such wastewater (Karia & Christian, 2006). Industrial wastewater is difficult to
characterize as it varies according to the processes, season and products that are produced
(Henze et al., 2008; Karia & Christian, 2006). The main contaminants in industrial
wastewater are organic matter, which include microorganisms, biodegradable organic
material, metals, nutrients, odour, organic and inorganic materials (Karia & Christian, 2006).
2.1.1.3 The strength of industrial wastewater
Beverage industries produce wastewater with a diverse quantity of COD, which determines
the strength of the wastewater (Chmiel et al., 2003). Industrial manufactures usually
generate high strength wastewater [COD: <700 mg/L (low); 700 to 3 000 mg/L (medium) and
> 3000 mg/L (high)]. From mixing and equalizing tanks, COD ranges from: 2 500 to 6 500
mg/L; electrical conductivity (EC) from 2 300 to 4 700 µS/cm, which varies in constituents
depending on the type of industry and the products that are being manufactured (Feroz et al.,
2012; Karia & Christian, 2006; Chmiel et al., 2003). The strength of wastewater is generally
indicated by the contaminants load, which is determined by the concentration of major
biological, chemical and physical contents of the wastewater (Karia & Christian, 2006).

Page 7 of 132
Table 2.2: The significant parameters used to determine the biological, chemical and physical characteristics of municipal and industrial wastewater (Karia & Christian, 2006)
Biological Chemical Physical
Animal
Plants
Protista
Pathogenic Organisms
Viruses
Organic Contents
BOD, COD, phenols, oil and grease, surfactants and fats Inorganic Contents
Alkalinity, chlorides, nitrogen, sulphur, heavy metals, pH, phosphorus and carbohydrates Gases
Hydrogen sulphide, methane and oxygen
Colour
Fixed or volatile mineral solids
Odour
Temperature
Total suspended solids
Dissolved solids
2.2 Beverage industry wastewater
The beverage industry wastewater originates from different individual processes such as
bottle washing, product filling, heating or cooling and cleaning-in-place (CIP) systems,
beverage manufacturing, and sanitising floors, including work cells, cleaning of zones and
piping networks (Agana et al., 2013; Haroon et al., 2013; Alam et al., 2007; Noronha et al.,
2002).
2.2.1 Typical composition and the strength of beverage industry wastewater
Biodegradable industrial wastewater is wastewater, which contains organic waste that arise
from industrial activities, including manufacture and bottling of softdrinks, alcohol production
for alcoholic beverages in breweries, wineries and malting facilities (SA, National Water Act,
1998 (Act No. 36 of 1998)). The raw materials (phosphates, sugars and agricultural
products), which are used in the manufacture of the beverages enhance the organic load of
the wastewater (Haroon et al., 2013; Hsine et al., 2010; Amuda & Amoo, 2007; Amuda et al.,
2006). The concentration of beverage industry wastewater parameters such as EC, COD,
BOD, total suspended solids (TSS), total dissolved solids (TDS), and total Kjeldahl nitrogen
(TKN), are normally high (Agana et al., 2013; Sangave & Pandit, 2008; Shao et al., 2008;
Bustamate et al., 2005; Chmiel et al., 2003; Akunna & Clark, 2000). The amount of total
nitrogen (TN), total phosphorus (TP) and pH vary, depending on the chemicals that are used
(nitric acid, phosphoric acid and caustic soda) (Nyilimbabazi et al., 2011; Dai et al., 2010; El-
Kamah et al., 2010; Chmiel et al., 2003; Noronha et al., 2002). Table 2.3 shows some of the
typical composition of wastewater from various alcoholic and non-alcoholic beverage
production facilities.

Page 8 of 132
Table 2.3: Characteristics of various alcoholic and non-alcoholic beverage industries wastewater
Wastewater Type pH COD (mg/L)
BOD (mg/L)
TSS (mg/L)
TDS (mg/L)
TKN (mg/L)
TN (mg/L)
TP (mg/L)
References
Distillery: Sochu Sillage 3.60 - 4.76 57 000 - 182 400 - - - - 1 530 - 5 130 - Kanai et al., 2010.
Distillery 3.8 - 6.4 2 433 - 44 100 5 445 - 22 700 255 - - - - Agarwal et al., 2010; Zhang et al., 2009.
Distillery 4.01 - 8.2 54 000 - 125 000 18 600 - 11 600 - 38 140 - - - Murthy & Chaudhari, 2009; Venkata Mohan et al., 2008.
Distillery: Molasses 5.7 106 500 31 600 - 74 000 - 1 900 300 Sreethawong & Chavadej, 2008.
Distillery 3 - 4.5 110 000 - 190 000 50 000 - 60 000 13 000 - 15 000 90 000 - 150 000 - 5 000 - 7 000 2 500 - 2 700 Mohana et al., 2009; Acharya et al., 2008.
Distillery: Grain 3.3 - 4.3 16 500 - 22 520 - - - - 120 - 150 15 - 18 Gao et al., 2007.
Distillery 3 - 4 100 000 - 110 000 30 000 - 45 000 3000 - 5000 51 500 - 110 000 - - - Sangave & Pandit, 2008; Nataraj et al., 2006.
Distillery: Whisky 3.8 16 600 - 58 000 8 900 - 30 000 - 6 080 - 17 750 500 - 1 200 - 150 - 600 Akunna & Clark, 2000.
Winery: Vinasse 3.3 - 8.7 11 815 - 111 520 4 767 - 32 500 271 - 21.3 - 252.5 41 1.9 - 472.7 Valderrama et al., 2012; Bustamate et al., 2005.
Winery: White & Red 6 - 6.2 3 112 - 3 997 1 740 - 1 970 - - 67 - 71 - 7 - 8.5 Vlyssides et al., 2005.
Winery 3.6 - 11.8 738 - 296 119 125 - 130 000 - - 142.8 - 3.3 - 188.3 Bustamate et al., 2005.
Winery 4 - 11 3 100 - 27 200 2 100 - 8 000 150 - 490 - 21.3 - 64 - 16.6 - 65.7 Ganesh et al., 2010; Eusébio et al., 2004.
Winery - 800 - 11 000 500- 6 900 200 - 1 300 - - - 5 - 77 Petruccioli et al., 2002; Petruccioli et al., 2000.
Winery-Distillery 5 - 5.4 9 000 - 17 400 - 2 400 - 5000 - - - - Genovesi et al., 2000.
Brewery 6.5 1 250 - 2 250 1 350 480 - - 16 50 Wen et al., 2010; Wang et al., 2008.
Brewery 3.2 - 4.3 22 500 - 125 000 - 1 550 - 1 750 - 320 - 450 - 144 - 216 Shao et al., 2008; Baloch et al., 2007.
Brewery: Opaque Beer 3.3 - 6.3 8 240 - 20 000 - 2 901 - 3 000 - - 0.034 16 - 24 Parawira et al. 2005.
Brewery 6.3 - 7 500 - 1900 197 - 1 470 60 - 380 - 16.4 - 36.4 3 - 41.1 5.3 - 12.5 Nyilimbabazi et al., 2011; Dai et al., 2010; Ahn & Speece, 2004.
Brewery 3 - 12 2 000 - 6 000 1 200 - 3 600 200 - 3 000 2 020 - 5 940 25 - 116 25 - 80 10 - 50 Alvarado-Lassman et al., 2008; Rao et al., 2007; Driessen & Vereijken, 2003.
Fruit Juice 5.9 3 210 1 650 - 6 900 112 - 1 534 2 304 - 17 918 38 - 252 - 4.6 - 20.8 El-Kamah et al., 2010; Drogui et al., 2008.
Fruit Juice: Sour cherry - 1 000 - 8 000 - - - 3.5 - 55 - 0.104 - 10 Ozbas et al., 2006.
Fruit Juice: Apple - 1 600 - 2 500 - - - 73 - 114 - 0.63 - 0.98 Ozbas et al., 2006.
Fruit Juice - 3 650 1 581 - - - 12 2.4 Chmiel et al., 2003; Noronha et al., 2002.
Fruit Juice 7 - 9.5 620 - 6 600 729 - 1 745 367 - 2 940 - - - - Amuda & Amoo, 2007; Blöcher et al., 2002. Softdrink-Bottle-Washing 9 - 11 25 - 125 - 26 - 90 750 - 1 200 - - - Haroon et al., 2013.
Softdrink 5.3 - 9.9 228 - 2 990 130 - 350 - - - - - Matošić et al., 2009.
Softdrink-Energy Drink 5.4 33 000 - 250 - 54 - 2.5 Oktay et al., 2007.
Softdrink 3.4 - 3.5 72 900 - 145 000 - 5 700 - 38 000 - 0.05 - 31 20 - 1 180 130 - 250 Guven, 2001.
Page 9 of 132
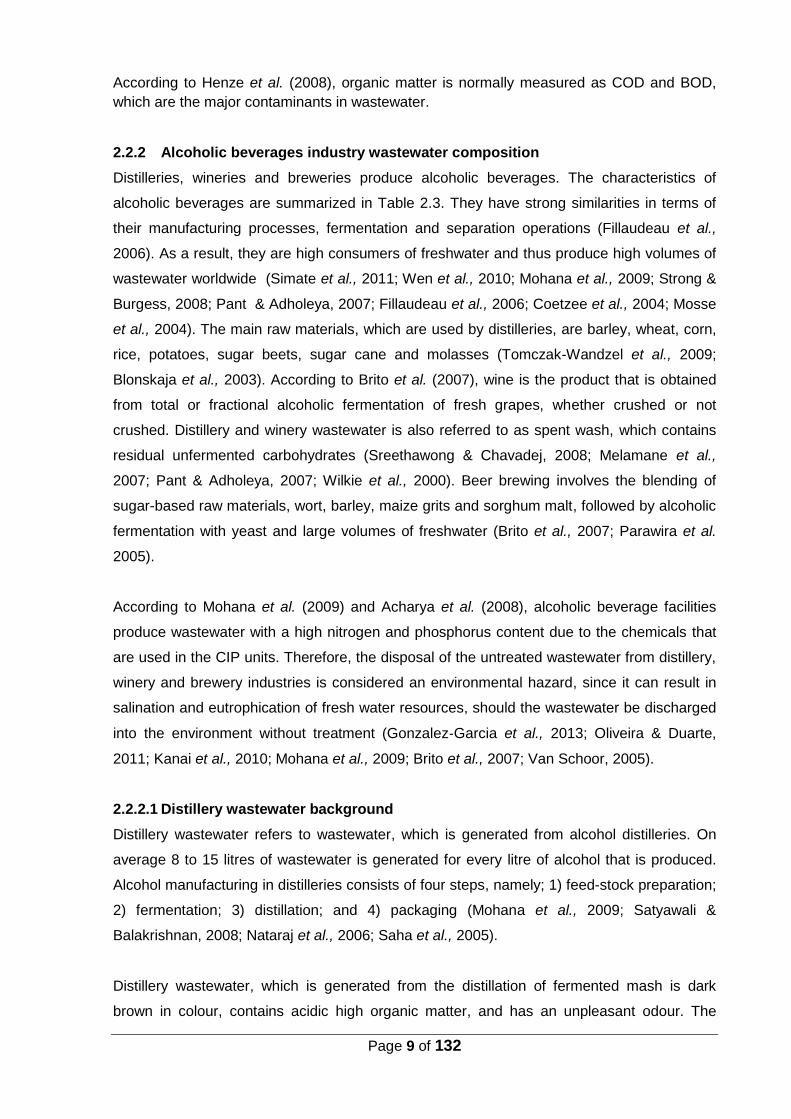
According to Henze et al. (2008), organic matter is normally measured as COD and BOD,
which are the major contaminants in wastewater.
2.2.2 Alcoholic beverages industry wastewater composition
Distilleries, wineries and breweries produce alcoholic beverages. The characteristics of
alcoholic beverages are summarized in Table 2.3. They have strong similarities in terms of
their manufacturing processes, fermentation and separation operations (Fillaudeau et al.,
2006). As a result, they are high consumers of freshwater and thus produce high volumes of
wastewater worldwide (Simate et al., 2011; Wen et al., 2010; Mohana et al., 2009; Strong &
Burgess, 2008; Pant & Adholeya, 2007; Fillaudeau et al., 2006; Coetzee et al., 2004; Mosse
et al., 2004). The main raw materials, which are used by distilleries, are barley, wheat, corn,
rice, potatoes, sugar beets, sugar cane and molasses (Tomczak-Wandzel et al., 2009;
Blonskaja et al., 2003). According to Brito et al. (2007), wine is the product that is obtained
from total or fractional alcoholic fermentation of fresh grapes, whether crushed or not
crushed. Distillery and winery wastewater is also referred to as spent wash, which contains
residual unfermented carbohydrates (Sreethawong & Chavadej, 2008; Melamane et al.,
2007; Pant & Adholeya, 2007; Wilkie et al., 2000). Beer brewing involves the blending of
sugar-based raw materials, wort, barley, maize grits and sorghum malt, followed by alcoholic
fermentation with yeast and large volumes of freshwater (Brito et al., 2007; Parawira et al.
2005).
According to Mohana et al. (2009) and Acharya et al. (2008), alcoholic beverage facilities
produce wastewater with a high nitrogen and phosphorus content due to the chemicals that
are used in the CIP units. Therefore, the disposal of the untreated wastewater from distillery,
winery and brewery industries is considered an environmental hazard, since it can result in
salination and eutrophication of fresh water resources, should the wastewater be discharged
into the environment without treatment (Gonzalez‐Garcia et al., 2013; Oliveira & Duarte,
2011; Kanai et al., 2010; Mohana et al., 2009; Brito et al., 2007; Van Schoor, 2005).
2.2.2.1 Distillery wastewater background
Distillery wastewater refers to wastewater, which is generated from alcohol distilleries. On
average 8 to 15 litres of wastewater is generated for every litre of alcohol that is produced.
Alcohol manufacturing in distilleries consists of four steps, namely; 1) feed-stock preparation;
2) fermentation; 3) distillation; and 4) packaging (Mohana et al., 2009; Satyawali &
Balakrishnan, 2008; Nataraj et al., 2006; Saha et al., 2005).
Distillery wastewater, which is generated from the distillation of fermented mash is dark
brown in colour, contains acidic high organic matter, and has an unpleasant odour. The

Page 10 of 132
amount of pollution that is produced from the distillery wastewater depends on the quality of
the molasses, feedstock, location, characteristics of the distillery manufacturing process and
the distillation process that is used to produce the ethanol (Mohana et al., 2009; Murthy &
Chaudhari, 2009; Sangave & Pandit, 2008; Pant & Adholeya, 2007; Nataraj et al., 2006;
Saha et al., 2005; Pandey et al., 2003).The BOD:COD ratio of distillery wastewater is
considered to be high at above 0.6 (Fillaudeau et al., 2006). Distillery wastewater is mildly
acidic, with a pH of 3 to 5.7; COD of 2 433 to 190 000 mg/L; BOD of 5 445 to 60 000 mg/L;
TSS of 255 to 15 000 mg/L; total organic carbon (TOC) of 2 500 to 56 000 mg/L; TDS of 11
600 to 150 000 mg/L; TN of 7000 mg/L; and TP of 2 700 mg/L (Agarwal et al., 2010; Mohana
et al., 2009; Acharya et al., 2008; Venkata Mohan et al., 2008; Sangave & Pandit, 2008;
Nataraj et al., 2006; Genovesi et al., 2000).
2.2.2.2 Winery wastewater background
The wine industry can be separated into two sub-divisions based on activity: 1) the
winemaking industry that creates winery wastewater and by-products; and 2) recycling of
winery by-products within wine distilleries (alcohol distillation, which results in the generation
of wastewater consist mostly of stillage that is normally non-toxic) (Fillaudeau et al., 2006).
Winery wastewater primarily originates from various washing operations during the crushing
and pressing of grapes, as well as rinsing of the fermentation zones, barrels, washing of
equipment, bottles and from the cooling processes (Strong & Burgess, 2008; Van Schoor,
2005; Petruccioli et al., 2002). The degree of pollution varies, depending on the wine making
process and the technology, which is applied for red and/or white wine production (Coetzee
et al., 2004; Euse´bio et al., 2004; Petruccioli et al., 2002).
Winery wastewater contains large amounts of biodegradable organics, polyphenols, organic
acids, salts and sugars with a BOD:COD ratio of less than 0.67 (Valderrama et al., 2012;
Fillaudeau et al., 2006; Mosse et al., 2004; Petruccioli et al., 2002). The quality of winery
wastewater varies due to the high organic loads; average COD of 296 119 mg/L; BOD of 125
to 130 000 mg/L; TKN of 142.8 mg/L, and TP of 188 mg/L. Cleaning chemicals, which
consist of caustic biocides results in high alkalinity of above 10 (Fillaudeau et al., 2006), and
low pH values of 3.3 to 6.2 (Bustamate et al., 2005; Vlyssides et al., 2005). A strong
relationship exists between ethanol and the COD of winery wastewater. However, the
generation of winery wastewater is seasonal (Fillaudeau et al., 2006).
2.2.2.3 Brewery wastewater background
Brewery wastewater is categorized as a medium to high strength organic wastewater (Huei,
2005; Fillaudeau et al., 2006). The beer manufacturing process, which is called brewing,
converts the sugars that are present in starch into ethanol through the fermentation by yeast

Page 11 of 132
(Guimarães et al., 2012). The composition of brewing wastewater also depends on the
various different processes that occur within the brewery (raw material handling, wort
preparation, fermentation filtration, CIP, and packing) (Brito et al., 2007; Fillaudeau et al.,
2006; Driessen & Vereijken, 2003).
Brewery wastewater consists of high strength biodegradable organic components and
primarily contains organic solids such as spent grains, soluble starch, sugars, waste yeast,
ethanol, and volatile fatty acids (VFA) with a BOD:COD ratio of 0.5 to 0.7 (Guimarães et al.,
2012; Simate et al., 2011; Wen et al., 2010; Alvarado-Lassman et al., 2008; Shao et al.,
2008; Brito et al., 2007; Fillaudeau et al., 2006). Brewery wastewater normally has a high
COD, ranging from 1 250 to 125 000 mg/L; TSS of 3 000 mg/L; TDS of 2 020 to 5 940 mg/L;
TOC of 970 mg/L; and TP of 216 mg/L (Simate et al., 2011; Wen et al., 2010; Shao et al.,
2008; Wang et al., 2008; Baloch et al., 2007; Rao et al., 2007; Parawira et al. 2005). The pH
values are irregular ranging from 3 to 12 depending on the types of chemicals used (Rao et
al., 2007; Driessen & Vereijken, 2003).
2.2.3 Non-alcoholic beverages wastewater composition
Table 2.3 summarises typical characteristics of non-alcoholic beverage wastewater. The
non-alcoholic beverage industry’s wastewater consists of pollutants including cleaning
chemicals, product mixes, concentrates, dirt, carbohydrates, sugars, pectin’s, flavourings and
colouring additives (Agana et al., 2013; Haroon, 2013; Hsine et al., 2010; Amuda et al., 2006;
Chmiel et al., 2003). According to Hsine et al. (2010), Matošić et al. (2009) and Noronha et
al. (2002), syrups are the largest pollutants in the non-alcoholic beverage industry
wastewater as it generates pollutants, which are rich in sucrose. In most non-alcoholic
beverage industry’s, wastewater arises from different operations (juice production, and
cleaning of zones and pipes), which are stored in equalizing mixing zones prior to municipal
discharge.
2.2.3.1 Fruit juice wastewater background
Wastewater from fruit juice manufacturing industries contains high concentrations of organic
materials, and an uneven amount of nutrients with low pH values (Ozbas et al., 2006). The
raw materials such as oranges, grapes, guavas, sugars and colorants that are used for
production of fruit juices may enhance the organic load of this wastewater (Amuda & Amoo,
2007). Fruit juice wastewater contains high biodegradable organic matter with a BOD:COD
ratio of 0.6 (El-Kamah et al., 2010).
Fruit juice wastewater also contains sugars (large non-polar organic molecules) and fine
colloidal particles, therefore, possessing lower conductivity when compared to other types of

Page 12 of 132
beverage wastewater (Drogui et al., 2008; Ozbas et al., 2006). Fruit juice wastewater is
characterized by high COD values of 8 000 mg/L; BOD of 6 900 mg/L; TSS of 2 940 mg/L,
indicating a high organic content and irregular pH values of 5.4 to 9.5 (El-Kamah et al., 2010;
Amuda & Amoo, 2007; Amuda et al., 2006; Blöcher et al., 2002).
2.2.3.2 Softdrink industry wastewater (SDIW) background
The wastewater from bottle washing constitutes almost 50% of the total wastewater, which is
generated by the softdrink industry (Hsine et al., 2010; Ramirez et al., 2004; Miyaki et al.,
2000). According to Hsine et al. (2010); Guven (2001) and Ghosh & Henry (1981),
wastewater from the softdrink industry is highly biodegradable and constitutes various blends
of chemicals, including fructose, glutose, sucrose, lactose, artificial sweetener, fruit juice
concentrates, flavouring agents, dissolved carbon dioxide/carbonic acid, bicarbonates,
colouring agents (caramel and synthetic dye-stuff), preservatives (phosphoric acid and
tartaric acid) and mineral salts that are used during production.
The BOD:COD ratio of wastewater from washing equipment during the manufacturing of
softdrinks is generally 0.05:1 (Hsine et al., 2010). Waste sugar is the main contributor to high
COD values of 25 to 145 000 mg/L, BOD of 130 to 350 mg/L, TSS of 26 to 38 000 mg/L,
TDS of 750 to 1 200 mg/L, TN of 20 to 1 180 mg/L, and TP of 130 to 250 mg/L. The pH could
be acidic or alkaline, ranging between 3.35 and 11 (Haroon et al., 2013; Hsine et al., 2010;
Matošić et al., 2009; Oktay et al., 2007; Guven, 2001). Wastewater from the production of
softdrinks is classified as high strength waste, since the BOD and SS concentrations are high
and, therefore; direct discharge into municipal sewers without treatment causes
environmental pollution (Matošić et al., 2009; Manyele, et al., 2008; Cheremisinoff, 2001).
The characteristics of SDIW have been reported by some researchers and are presented in
Table 2.3 (Haroon et al., 2013; Matošić et al., 2009; Oktay et al., 2007; Guven, 2001).
However, based on the available documented literature, there is little evidence and/or
research reports focusing on the treatment of SDIW.
2.3 Wastewater treatment methods
Wastewater treatment methods are essential for community development to remove
pollutants and to recover water for reuse (Libralato, 2013). There are four main types of
wastewater treatment systems, namely: 1) preliminary, which is selected for the removal of
large materials and coarse solids regularly found in the wastewater; 2) primary, which is
designed for the removal of inorganic and organic floating material and the physical
processes of sedimentation; 3) secondary, where biological processes are employed to
remove the remaining organic material and colloids (activated sludge, tickling filter and
secondary settling zone lagoons, ponds, expanded granular sludge bed (EGSB), rotating

Page 13 of 132
biological contactor (RBC), upflow anaerobic filter (UAF), and upflow anaerobic sludge bed
(UASB); and 4) tertiary or advanced to further treat secondary wastewater to eliminate or
decrease remaining contamination by utilizing different methods such as biological and
chemical processes, membrane filtration (MF), ion exchange (IE) and reverse osmosis (RO)
(Feroz et al., 2012; Bitton, 2011; Karia & Christian, 2006; Sonune & Ghate, 2004).
2.3.1 Biological wastewater treatment methods
Biological wastewater treatment can be separated into off-site treatment and on-site systems
(Okpor, 2011). Biological treatment is an essential and significant constituent of several
wastewater treatment plants that treat wastewater, either from industry or the municipality,
containing soluble organic materials (Mittal, 2011). The biological treatment methods for both
municipal and industrial wastewater are mostly carried out by activated sludge (AS) (Nielsen
et al., 2009). Wastewater, which is generated by agricultural and food-processing industries,
is primarily comprised of readily biodegradable organic materials; therefore, anaerobic
digestion (AD) is a suitable choice for wastewater treatment (Alvarado-Lassman et al., 2008)
2.3.2 Anaerobic digestion treatment for wastewater and application
AD of wastewater has been applied in full-scale and pilot-scale operation and its use is
increasing (Fillaudeau et al., 2006). AD or treatment is referred to as a fermentation process
during, which organic material is degraded and biogas is produced through a mixture of
microbial community in the absence of oxygen. This process is applied for the treatment of
industrial and domestic wastewater (Cioabla et al., 2012; Romaro et al., 2011; Wang &
Ivanov, 2010; Henze et al., 2008). AD is characterized by biological conversion of organic
compounds (COD) into biogas, primarily methane (CH4) and carbon dioxide (CO2) with odour
traces of hydrogen sulphide (H2S) (Driessen & Vereijken, 2003; Guven 2001). Equations 2-1
represent the overall equation for AD (Driessen & Vereijken, 2003).
Equation: 2-1
2.3.3 Advantages and disadvantages of anaerobic digestion
There are two major groups for AD, which are classified as conventional and high-rate
systems. The conventional systems are septic zones, anaerobic ponds and sludge reactors
(Von Sperling et al., 2005). Wastewater that contains high concentrations of soluble
constituents are presently treated successfully with a variety of high-rate anaerobic reactor
designs such as anaerobic filter (AF), anaerobic hybrid (AH), fluidised (FB), including EGSB
and UASB reactors. These high-rate reactors are able to separate solid retention time (SRT)
from hydraulic retention time (HRT), thus allowing the moderately slow growing anaerobic

Page 14 of 132
micro-organisms to remain within the reactor in parallel to the flow of wastewater. As a result,
higher volumetric loads and high removal efficiencies are achieved (Akunna & Clark, 2000).
2.3.4 Highrate anaerobic reactor
According to Lim and Kim (2014), full-scale high-rate anaerobic reactors such as the UASB
have been operating worldwide, which were developed by Lettinga (1995). Applications of
these reactors include those of the treatment of brewery industry wastewater (Brito et al.,
2007; Rao et al., 2007; Zupančič et al., 2007; Connaughton et al., 2006; Parawira et al.,
2005; Ahn & Speece, 2004); distillery wastewater (Blonskaja et al., 2003; Wolmarans & De
Villiers 2003); paper mill wastewater (Sheldon et al., 2012); winery wastewater (Gao et al.,
2007; Laubscher et al., 2001); fruit juice industry wastewater (El-Kamah et al., 2010; Ozbas
et al., 2006) and SDIW (Kalyuzhnyi et al., 1997). The EGSB reactor is operated by means of
granular anaerobic sludge, which is similar to the UASB reactor. The EGSB and UASB
reactors separate the biogas, biomass and wastewater in a one-step process by using a
three-phase separator that is situated at the top of the reactor (Sheldon et al., 2012; Brito et
al. 2007). EGSB has been mainly developed to enhance substrate-biomass interaction within
the treatment system by expanding the sludge bed and increasing hydraulic mixing, which
normally builds up to 16 m (Lim & Kim, 2014; Zhang et al., 2008). The EGSB reactor can be
operated at a higher upflow velocity (Vup) of up to 6 m/h with a higher recycle ratio.
Therefore, the EGSB reactor is capable of treating high strength organic wastewaters up to
an OLR of 30 kg COD/m3d. The EGSB can also treats low strength wastewaters where COD
concentrations are less than 1 000 mg/L (Lim & Kim, 2014; Lettinga, 1995). A modified
schematic diagram from Guo et al. (2008) and Zhang et al. (2008) for the EGSB reactor is
presented in Figure 2.1.
There have been minimal studies reported on the treatment of beverage industry wastewater
using the EGSB, especially SDIW. However, Connaughton et al. (2006) presented that there
was slight variation between psychrophilic and mesophilic conditions for brewery wastewater.
The wastewater was from a brewery industry, and the OLR was 4.5 kg COD/m3d, where both
reactor COD removal efficiencies ranged from 85 to 93%, and for methanogenic activities,
the biogas production rates were comparable.

Page 15 of 132
Figure 2.1: Schematic diagram for the EGSB [drawn using Microsoft Visio 2010] (Modified from Guo et al., 2008; Zhang et al., 2008)
2.3.5 The relationship between the EGSB and UASB
The Dutch sugar industry developed an UASB reactor, which was first utilized in the late
1970’s (Driessen & Vereijken, 2003). The EGSB reactor is a modified version of an UASB
(Zhang et al., 2008; Mutombo, 2004; Driessen & Vereijken, 2003). The EGSB has been
developed mainly to improve substrate-biomass contact within the treatment system by
escalating hydraulic mixing and expanding the sludge bed to allow for high organic loading
rates and COD removal efficiencies with a minimum of solids lost in the permeate. As a
result, the EGSB reactor has a more improved reactor performance and stability than the
UASB (Zhang et al., 2008; Liao et al., 2006; Dinsdale et al., 2000). Thus, the EGSB reactor
has a higher mixing capacity due to the higher Vup smaller footprint, increased biomass
activity and improved mass transfer than the UASB reactor (Mutombo, 2004; Dinsdale et al.,
2000). According to Zhang et al. (2008), Liao et al. (2006), Connaughton et al. (2006), and
Driessen & Vereijken (2003), several studies have been conducted on the EGSB to evaluate
the impact of flow patterns, kinetics, by-product inhibition, as well as start-ups and operation
characteristics on the overall efficiency of the bioreactor. In addition, EGSB reactors have
been successfully applied to treat various types of wastewater, including municipal
wastewater, molasses wastewater, brewery wastewater, starch wastewater and domestic
wastewater (Cervantes, 2009, Connaughton et al., 2006; Van Haandel et al., 2006).
Biogas
Hot Water Jacket
Recycling Feed Pump
EGSB ProductWastewater
Feed
EGSB Feed
Gas Bubble
Granules

Page 16 of 132
However, literature shows that EGSB has not been utilized or evaluated for the treatment of
softdrink industry wastewater.
2.3.6 Anaerobic degradation of organic matter
There are a number of microbiological phases that outline the pathway for organic matter
degradation in AD. The environment and the nutritional necessities of a huge quantity of
microorganisms have to be met in order for the biogas production process to be successful
(Cioabla et al., 2012; Schnurer & Jarvis, 2010; Weiland, 2010; Poh & Chong, 2009, Henze et
al., 2008; Fillaudeau et al., 2006). The different phases of the microorganisms and
decomposition that are active are (i) hydrolysis; (ii) acidogenesis; (iii) acetogenesis; and (iv)
methagenogenesis.
(i) Hydrolysis: Through hydrolysis, complex polymers such as carbohydrates, fats and
proteins are being degraded into amino acids, long chain fatty acids and sugars. This
degradation process occurs primarily through fermentative bacteria which excrete
enzymes that change complex undissolved matter into smaller units and dissolved
compounds that are capable of passing through the cell walls and membranes of the
fermentation bacteria. The hydrolysis process is affected by several factors such as
substrate composition, particle size, temperature, and residence time (Matovic, 2013;
Manyi-Loh et al., 2013; Song et al., 2005).
(ii) Acidogenesis: Acidogenesis is the second phase of AD, where the fermentation of
soluble substrate into more oxidized intermediates, mainly volatile fatty acids (VFAs),
which take place by hydrogen generating acidogens. Dissolved compounds present
in the cell fermenting bacteria are transformed into a number of simple compounds,
which are then excreted. The compounds produced during this phase includes new
cell material, hydrogen (H2), CO2, H2S, ammonium (NH4+), alcohol and lactic acid, as
well as trace amount of by-products, Equations: 2-2 to 2-4 demonstrates the
conversion of glucose to acetate, ethanol and propionate, respectively (Matovic,
2013; Manyi-Loh et al., 2013; Kangle et al., 2012).
Equation: 2-2
Equation: 2-3
Equation: 2-4
(iii) Acetogenesis: In general, acetogenesis is the generation of acetate, which is
derived from acetic acid and carbon with energy supplied by the acetogens.
Acetogens break down the biomass to a point where the methanogens can utilize
much of the remaining material to create methane as a biofuel and intermediary acid

Page 17 of 132
generation, where the digested product is transformed into new cells, acetic acid, H2
and CO2. Equation: 2-5 represents an acetogenesis reaction (Kangle et al., 2012).
Equation: 2-5
(iv) Methanogenesis: Methanogenesis represents the final phase of AD during, which
methanogens produce methane (CH4) from the ultimate products of acetogenesis, as
well as from the intermediary products from hydrolysis and acidogenesis. There are
two common pathways relating to the use of acetic acid and carbon dioxide; the two
main products from the first three phases of AD, and to generate the CH4 in
methanogenesis:
The three main reactions responsible for generating biogas during AD are: Represented
by Equations 2-6 to 2-8 (Matovic, 2013; Manyi-Loh et al., 2013; Kangle et al., 2012).
1) Acetotrophic methanogenesis:
Equation: 2-6
2) Hydrogenotrophic methanogenesis (CO2 reduction):
Equation: 2-7
3) Methylotrophic methanogenesis:
Equation: 2-8
While CO2 can be converted into CH4 and H2O through the reaction, the main mechanism to
create CH4 in methanogenesis is the path involving acetic acid. This path creates CH4 and
CO2, the two main products of AD, where H2, carbonate, acetate and ethanol are
transformed into new cell material (Matovic, 2013; Manyi-Loh et al., 2013; Song et al., 2005).
Figure 2.2 indicates the metabolic pathway involved in AD. Information on biogas generation
will be discussed in subsequent sections Section 2.5.

Page 18 of 132
Figure 2.2: Microbial groups and metabolic pathway involved in anaerobic digestion (modified from Matovic, 2013)
2.3.7 Factors that influence the operation of anaerobic digestion (AD)
The complexity of bioconversion processes may result in the performance of AD to be
affected by various aspects (Cioabla et al., 2012; Surroop et al., 2012; Ward et al., 2008).
These aspects can be divided in three major classes: 1) feedstock characteristics, 2) reactor
design and 3) operational conditions. The operational conditions include temperature, pH
and alkalinity, organic loading rate (OLR), inhibitory substances and inoculums to substance
ratio (Matovic, 2013; Trzcinski & Stuckey, 2009; Monson et al., 2007). The biological
processes are fundamental for successful operation of AD for optimal environmental
conditions. Operating parameters as indicated such as hydraulic retention time (HRT), and
OLR have been used to operate AD for beverage industries, as shown in Table 2.4.
Table 2.4: Essential parameters for anaerobic digestion (Deublein & Steinhauser 2011)
Parameter Hydrolysis/Acidogenesis Methanogenesis
pH
Temperature
C:N ratio
5.2 - 6.3 6.7 - 7.5
Psychophillic: 25 - 35°C Mesophilic: 30-40˚C
Thermophilic: 50 - 60˚C
10 – 45 20 - 30
C:N:P:S ratio 500:15:5:3 600:15:5:3
Trace elements No particular requirements crucial: Ni, Co, Mo, Se
1 = Hydrolysis 2 = Acidogenesis 3 = Acidogenesis 4 = Methanogenesis
Complex organic matter (Carbohydrates, proteins, fats
4 4
Soluble organic molecules Sugars, amino acids, fatty acids
Volatile fatty acids
Acetic acid H2 +CO2
CH4+ CO2
1
2
3

Page 19 of 132
2.3.7.1 Temperature
Most of the anaerobic reactors were operated either at around 35 to 37˚C in the mesophilic
range (Méndez-Acosta et al., 2010; Acharya et al., 2008; Akunna & Clark, 2000), or at
around 50 to 60˚C in the thermophilic range (Banerjee & Biswas, 2004). The psychrophilic
temperatures of around 21 and 25˚C were also tested (Bilad et al., 2010; Nataraj et al.,
2006). The temperature of the mixed-liquor affected the COD removal efficiencies; and
higher temperatures led to better COD removal efficiencies. Increasing the temperature level
to 37˚C, decreased the time required for AD (Cioabla et al., 2012; Cha et al., 2008; Choorit &
Wisarnwan, 2007). In general, mesophilic AD is favoured over thermophilic AD, since the
latter offers a smaller amount of CH4 production, and is susceptible to environmental
changes (Matovic, 2013; Manyi-Loh et al., 2013; Trzcinski & Stuckey, 2009; Monson et al.,
2007).
2.3.7.2 Alkalinity and pH effect
The buffering ability of AD is determined by the amount of bicarbonate ions (HCO3-) supplied
by the buffer that is used to maintain the system’s pH. The concentration of HCO3- in solution
is associated with the percentage of CO2 in the gas stage. Alkalinity generally supplies
sufficient buffering ability to survive reasonable shock loads of VFA. However, the optimum
pH range in an anaerobic reactor should be 6.8 to 7.2, although the process can tolerate a
pH range of 6.5 to 8.0 (Manyi-Loh et al., 2013; Cioabla et al., 2012; Labatut & Gooch, 2012:
Deublein & Steinhauser 2011; Romano & Zhang, 2011; Trzcinski & Stuckey, 2009; Monson
et al., 2007). Liu et al. (2008) report that the pH range is widespread in the plant-scale
operations and the optimal pH fluctuates with substrate quality and the biodegradability of the
contaminants in the system.
2.3.7.3 Organic loading rate (OLR) and hydraulic retention time effect (HRT)
HRT is defined as the average residence time of waste suspension within the reactor. As a
result, the high biogas production is obtained at higher rates, which is calculated according to
Equation: 2-9:
Equation: 2-9
Where, HRT = hydraulic retention time (h)
V = fluid volume in the reactor (m3)
Q = wastewater withdrawal rate (m3/h)
OLR is one of the significant parameters in the operation and design of the biological system
of wastewater treatments (Matovic, 2013; Monson et al., 2007). OLR is the quantity of

Page 20 of 132
organic matter (COD) that is loaded in one volumetric reactor per unit time, and it is
calculated by using Equations: 2-10 or 2-11:
Equation: 2-10
The ratio between HRT and the reactor volume is equivalent to the flowrate, hence Equation:
2-9 becomes Equation: 2-10:
Equation: 2-11
Where, OLR = organic loading rate (kg COD/m3d)
Organic matter removal efficiency measures the performance of the reactor and is
determined by Equation: 2-12:
[
] Equation: 2-12
The OLR value is generally coupled with HRT, as a result, the shorter the HRT, the higher
the OLR. However, the value of the OLR varies with the corresponding HRT as the organic
matter concentrations changes. There is a potential risk that rapidly increasing the OLR
would result in hydrolysis and acidogenic bacteria producing intermediate products quickly
(Matovic, 2013; Monson et al., 2007). As the replication time of the methanogenic bacteria
lowers, the bacteria will not be able to consume fatty acids at the same rate, and which
results in a drop in pH and causes the system to be unsuccessful (Grosser et al., 2013;
Manyi-Loh et al., 2013). An additional process parameter is retention time, which consists of
HRT and solid retention time (SRT), which refers to the time that any part of portion of a
solid, feed, water feed and microbial biomass remains in a digestion reactor.
2.3.7.4 Effect of nutrients
The microorganisms in the AD process requires micronutrients and trace elements such as
calcium, cobalt, copper, iron, magnesium, manganese, nitrogen, nickel, phosphorous,
sulphur, potassium and zinc for optimal growth. The existence of heavy minerals in the
wastewater is a crucial parameter, as this affects the reactor’s stability and granulation
process.

Page 21 of 132
However, it is essential that these elements are present in extremely low range
concentrations (Deublein & Steinhauser 2011; Monson et al., 2007; Rajeshwari et al., 2000).
The absence of these nutrients has an effect on AD and in such cases the wastewater
should be supplemented prior to treatment. According to Russel (2006) and Rajeshwari et al.
(2000), the vital optimal C:N:P ratio for enriched yield of CH4 should be 100:5:1 or
100:2.5:0.5 for ideal bacterial growth. The minimum concentration of micro and
macronutrients can be calculated from the wastewater COD biodegradable concentration
(Rajeshwari et al., 2000). Additionally, carbon and nitrogen are the two nutrients that require
attention for AD loading rates (Deublein & Steinhauser 2011; Monson et al., 2007).
2.3.7.5 Upflow velocity (Vup) effect
The other important parameter during AD is the upflow velocity, Vup. As Vup increases, the
turbulence in the reactor also increases, and hence the contact between the wastewater and
the granular sludge will improve (Cervantes, 2009). The relationship between the height of
the reactor (H) and Vup is described by Equations: 2-13; 2-14 and 2-15:
Equation: 2-13
Or
Equation: 2-14
Or
Equation: 2-15
Where,
A = cross sectional area (m2)
H= height (m)
In general, Vup ranges from 0.5 to 2 m/h for UASB, and up to 10 m/h for the EGSB
(Cervantes, 2009).
2.4 Anaerobic digestion (AD) for the beverage industry’s wastewater
Treatment of wastewater from the beverage industry typically comprises physical pre-
treatment for the removal of suspended matter, followed by biological treatment, either
anaerobic or aerobic (Hsine et al., 2010; Matošić et al., 2009; Guven, 2001). AD has been
utilized worldwide in the treatment of wastewater from the food and beverage industry,
including the alcohol industry, brewery industry, coffee industry, dairy industry, fish
processors, fruit and vegetable industries, softdrink industry and winery industry (Poh &
Chong , 2009; de Lemos Chernicharo, 2007). The brewery industry has been at the origin of
utilizing anaerobic technology (Fillaudeau et al., 2006). Wastewater that is generated by

Page 22 of 132
beverage industries is mainly composed of readily biodegradable organic matter, thus AD is
a recognized technology for the successful treatment and removal of organic matter removal
(Torres et al., 2011; Alvarado-Lassman et al., 2008; Connaughton et al., 2006; Fillaudeau et
al., 2006).
Tables 2.5 and Table 2.6 indicate several potential treatment methods that have been used
for wastewater from alcoholic and non-alcoholic beverage industries, respectively. According
to Kanai et al. (2010); Wijekoon et al. (2011); Satyawali & Balakrishnan (2009); Zhang et al.
(2006); Coetzee et al. (2004); Brito et al. (2007); Ganesh & Rajinikanth (2010); Melamane et
al. (2007); Wolmarans & De Villiers (2002); Yu et al. (2006); Parawira et al. (2005); Torres, et
al. (2011); Alvarado-Lassman et al. (2008); Zupančič et al. (2007) and Shao et al. (2008), in
the beverage industry, anaerobic wastewater treatment processes are generally adopted as
a pre-treatment method.
2.4.1 Application of anaerobic digestion (AD) for alcoholic beverage industry
As shown in Table 2.5, AD has been presented as being appropriate for treating distillery
wastewater from low strength 700 mg/L (Zhang et al., 2006) to high strength 190 000 mg/L
(Acharya et al., 2008); winery wastewater from 800 mg/L (Artiga et al., 2005) to 27 200 mg/L
(Eusébio et al., 2004) and brewery wastewater of 500 mg/L (Dai et al., 2010) to 62 300 mg/L
(Zupančič et al., 2007); since the C:N:P ratio is unstable for aerobic treatments, which
requires nitrogen and phosphorus addition. AD technology is acceptable for the
bioremediation of distillery, winery and brewery wastewater due to the low cost of operation,
and since the technology is considered to be environmentally friendly (Valderrama et al.,
2012; Torres et al., 2011; Wijekoon et al., 2011; Kanai et al., 2010; Ling et al., 2009;
Melamane, 2007; Moletta, 2005; Driessen & Vereijken, 2003; Wolmarans & de Villiers, 2002;
Cornelissen et al., 2001).
2.4.1.1 Anaerobic digestion (AD) of distillery wastewater
A number of AD technologies have been applied and investigated at full scale, pilot and
laboratory-scale to reduce the amount of pollution, which is present in distillery wastewater,
as shown in Table 2-5. Distillery wastewater is usually treated via either anaerobic or aerobic
biological methods, but in general, the integration of both methods has been applied
(Mohana et al., 2009). Distillery wastewater has a typical BOD:COD ratio of 0.5 to 0.6,
indicating the water’s suitability for biological treatment (Mohana et al., 2009).

Page 23 of 132
Table 2.5: Treatment methods for alcoholic beverages industry wastewater
Type of Wastewater
Application Treatment Method &
Type of Reactor
Configuration Characteristics of Membrane
T1
(˚C) HRT
2
(d) OLR
3
(kg COD/m3d)
CODFeed (mg/L)
TE4
(% COD) References
Distillery: Synthetic Molasses
Laboratory TAnMBR^ Sidestream MF Tubular Ceramic
(0.1 µm) 55 0.4 - 2 5 - 12 7 500 - 10 200 78 - 81 Wijekoon et al., 2011.
Distillery: Synthetic Molasses
Laboratory HT-MBR^ Submerged 6 x Flat Sheet Polymer
(0.1; 0.8;2 µm) 21 0.8 - 2 250 80 - 85 Bilad et al., 2011
Distillery Tequila Vinasse
Laboratory CSTR-TD^ - - 35 - 36 10 1 20 000 - 50 000 90 - 95 Méndez- Acosta, 2010.
Distillery: Sochu Full KSAMBR^ Submerged Kubota - - - 57 000 - 182 400 75 - 92 Kanai et al., 2010.
Distillery Laboratory AMBR-PAC^ Submerged Nylon Mesh Filter (30
µm)
21 - 26 7 3 - 5.71 - 53 Satyawali & Balakrishnan, 2008; Satyawali & Balakrishnan, 2009.
Distillery Pilot NF- RO^ - - 28 - 30 - - 4 000 91.3 - 96.8 Murthy & Chaudhari, 2009.
Distillery-Synthetic Laboratory AnSBBR - - 20 - 30 1 8.8 54 000 69.7 Mohan et al., 2009.
Distillery Laboratory UAFFR^ - - 37 8 23.25 110 000 - 190 000 64 Acharya et al., 2008.
Distillery: Synthetic Grain Sorghum
Laboratory AMBR^ Submerged Flat Stainless Steel
(0.2 µm) 30 - 45 0.4 - 1.3 0.6 - 2.8 700 - 1 500 94.7 Zhang et al., 2006.
Distillery Pilot NF - RO^ - - 27 - 29 - - 2 900 - 100 000 99.9 Nataraj et al., 2006.
Distillery Laboratory UASB-AF^ - - 35 10 - 19 2.5 - 5.1 13 600 54 - 93 Blonskaja et al., 2003.
Distillery Laboratory MCAB^ Sidestream Tubular
Hydrophobic Polypropylene ( 0.2 mm)
; Zirconia Skinned
0.14 mm. (0.2 µm)
55 13 3 - 3.5
38 400 >90 Kang et al., 2002
Distillery: Whisky Laboratory GRABBR^ - - 37 2 - 10 4.75 9 500 80 - 92.2 Akunna & Clark, 2000.
Winery Pilot AMBR^ - Kubota - - - 2 300 - 13 500 97 Valderrama et al., 2012.
Winery Laboratory AMBB^ - - 20 - 4 - 8 8 900 98.6 Oliveira & Duarte, 2011.
Winery: Synthetic Laboratory AnFBR^ - - 35 - 22 - 42 18 000 - 21 000 81 Ganesh & Rajinikanth, 2010.
Winery: Distillery Laboratory AnMBR^ Submerged UF Ceramic (0.2 µm) - 0.5 - 4 300 - 6 100 99.5 Wijekoon et al., 2011.
Distillery: Winery Grain
Laboratory UASB^ - - 37 0.04 - 3.4 5 - 48.3 16 500 - 22 520 80 - 97.3 Gao et al., 2007.
Winery Pilot AnSBR - - 15 - 25 3.7 - 7.4 - 5 000 90 Brito et al., 2007.
^: See Appendix A; 1.T: Temperature; 2. HRT: Hydraulic retention time; 3. OLR: Organic Loading Rate; 4. TE: Treatment Efficiency.

Page 24 of 132
Table 2.5 (cont.): Treatment methods for alcoholic beverages industry wastewater
Type of Wastewater
Application Treatment Method &
Type of Reactor
Configuration Characteristics of Membrane
T1
(˚C)
HRT2
(d) OLR
3
(kg COD/m3d)
CODFeed (mg/L)
TE4
(% COD) References
Winery Pilot AMBR^ Submerged Hollow Fibre - UF
Zenon ZW-10
- 1.8 0.5 - 2.2 1 000 - 4 000 97 Artiga et al., 2007.
Winery: Rice Laboratory UAF^ - - 19 -27 0.3 37.7 8 340 - 25 760 82 Yu et al., 2006)
Winery Laboratory AJLR^ - - 39 - 42.2 0.8 - 1 20 3 100 - 27 200 80 - 90 Eusébio et al., 2004.
Winery Pilot AnRBC^ Submerged Stainless Steel 26 - 30 1 6.3 3 240 23 Coetzee et al., 2004.
Winery Laboratory UASB^ - - 35 2.2 5.1 - 10.1 - 90 Keyser et al., 2003.
Winery: Distillery Full UASB
^ - - 34 - 36 - 2 -18 30 000 90 Wolmarans & de Villiers, 2002.
Winery Laboratory UASB^ - - 35 2 6.1 - 18 3 000 - 5 000 >90 Laubscher et al., 2001.
Winery Laboratory AMBB^ - - 30 0.8 8.8 800 - 11 000 >90 Petruccioli et al., 2000.
Winery Laboratory AJLR^ - - 25 - 30 2.1 - 4.4 0.4 - 5.9 800 - 12 800 >90 Petruccioli et al., 2002.
Brewery Laboratory AnMBR^ External Ceramic (0.2 µm) &
Polymeric (30nm)
30 - 12 21 000 97 Torres, et al., 2011.
Brewery Laboratory AO-MBR^ Submerged Hollow Fibre
Polyvinylidene Florde - 0.8 - 1 0.2 - 0.4 500 - 1 600 96.1 Dai et al., 2010.
Brewery: Synthetic Laboratory DSR-AnMBR^ Submerged - - - 5 - 12.5 2 900 - 5 200 95.15 Ling et al., 2009.
Brewery Pilot AnSBR^ - - 33 1 1.5 - 5 22 500 - 32 500 90 Shao et al., 2008.
Brewery Laboratory AnIFBR^ - - 35 4 70 2 100 >90 Alvarado-Lassman et al., 2008,
Brewery Laboratory AnSBR-UASB^ - - 55 13.5 - 26 3.2 - 8.6 56 600 - 62 300 79.6 - 88.9 Zupančič et al., 2007.
Brewery Laboratory ASBR^ - - 25 -2 7 - 3.5 - 88.7 - 91.6 Wang et al., 2007.
Brewery Laboratory UASB-CA^ - - 37 - 39 0.1 23.1 2 000 - 6 000 92 - 96 Rao et al., 2007.
Brewery Laboratory AO- UASB-SBR - - - - 15 - 30 13 200 70 - 80 Brito et al., 2007.
Brewery Laboratory GRABBR^ - - 35 0.8 - 2.3 2.2 - 13.4 5 000 93 - 96 Baloch et al., 2007.
Brewery Laboratory EGSB-AF^ - 37 0.8 - 2 1.6 - 4.5 2 900 - 3 400 85.5 - 92.6 Connaughton et al., 2006.
Brewery: Opaque Beer
Full UASB^ - - 37 - 39 1 6 12 540 57 Parawira et al., 2005.
Brewery Laboratory PBUAR & MBR^ submerged Polyethylene MF
(0.4 µm)
0.3 4.5 1 200 92 - 96 Huei, 2005.
Brewery Laboratory UASB^ - - - 0.04 28 1 300 93 Ahn & Speece, 2004.
Brewery Laboratory AnMBR^ Submerged - - - - 2 300 95 Cornelissen et al., 2001.
^: See Appendix A; 1.T: Temperature; 2. HRT: Hydraulic retention time; 3. OLR: Organic Loading Rate; 4. TE: Treatment Efficiency.

Page 25 of 132
Treatment methods include biological flocculation (Zhang et al., 2009) and anaerobic
fermentation (Wilkie et al., 2000) by using anaerobic upflow fixed film glass column reactors
(UAFFR) (Acharya et al., 2008); granular bed anaerobic baffled reactor (GRABBR) (Akunna
& Clark, 2000); anaerobic filters with upflow anaerobic sludge bed (UASB-AF) reactors
(Blonskaja et al., 2003); anaerobic digestion in a continuous stirred zone reactor with a
typical digester (CSTR-TD) (Méndez- Acosta, 2010); and anaerobic sequencing batch biofilm
reactor (AnSBBR) (Mohan et al., 2009). An anaerobic sequencing batch reactor (AnSBR)
was used for the treatment of cassava stillage with a high COD of 40 000 to 70 000 mg/L.
The reactor was maintained at 55°C by a circulating hot water bath at HRT of 5 d. The COD
removal efficiency was 90.8%. The COD:N:P ratio of 200:5:1 was maintained with minimal
nutrient supplementation (Luo et al., 2009).
AD of distillery industry wastewater, having a very high COD of 110 000 to 190 000 mg/L and
BOD of 50 000 to 60 000 mg/L, was studied in a continuously UAFFR at 37˚C and an
optimum operational pH, which ranged from 6.0 to 8.0 was reported by Acharya et al. (2008)
under HRT 8 d and OLR of 23.3 kg COD/m3d, leading to a 64% COD reduction. Akunna and
Clark (2000) investigated the performance of a GRABBR, which was used in the treatment of
a whisky distillery wastewater comprising 9 500 mg/L of COD at various values of HRT (10,
7, 4 and 2 days) corresponding to OLR of (1, 1.3, 2.4 and 4.8 kg COD/m3d). The pH values
remained reasonably constant at approximately 7 with up to 80% COD removal. Mohan et al.
(2008) studied the hydrogen (H2) production in an anaerobic sequencing batch biofilm
reactor (AnSBBR) by using distillery wastewater as substrate at two operating pH values of 3
and 6 for 24h at an ambient temperature of around 28°C. The performance of the reactor was
found to be reliant on the operating pH and favoured H2 of 26, 6.98, 7 and 1.6 mmol/d,
respectively. Nevertheless, COD removal efficiency was 69.7%; and was discovered to be
successful at a neutral pH of 7.
AD of distillery industry wastewater was studied in mesophilic temperatures of 36 to 37˚C in
a two-stage system comprising of an anaerobic filter (AF) and an UASB reactor. HRT ranged
from 10 to 19 d at OLR of 2.5 to 5.1 kg COD/m3d in the first stage and HRT of to 20 to 39 d,
corresponding to OLR of 0.6 to 2.5 kg COD/m3d in the second stage. The COD removal
treatment efficiency that was achieved was 54% in the first stage and 93% in the second
stage, respectively. The acidogenic reactor provided reasonable conversion of COD to
volatile fatty acids (VFAs), averaging 20.5% and a self-regulating pH in the methanogenic
reactor was in the range of 7.2 to 7.8 (Blonskaja et al., 2003). Conversely; Gao et al. (2007)
investigated the performance of an UASB reactor treating a distiller’s grains wastewater with
an acidic pH 3.3 to 4.3 at 37°C. Removal efficiencies of COD achieved was 80 to 97.3% at a
HRT of 2 to 11 h, and OLR of 5 to 48.3 kg COD/m3d.
Page 26 of 132
A model was developed by Turkdogan-Aydınol and Yetilmezsoy (2010) to predict biogas and
methane production rates in a mesophilic UASB reactor by treating molasses wastewater,
which was characterized by a moderate acidic pH of 4 to 5, high COD from 65 000 to
130 000 mg/L and the reactor showed a significant performance with an average COD
removal efficiency of 93%, and an average volumetric COD removal rate of 6.9 kg COD/m3d.
A study of biomethanation of distillery industry wastewater with COD of 71 544 mg/L was
also carried out by Banerjee and Biswas (2004) in a semi-batch digester at different OLRs of
(1.54, 2.12, 2.74, 3.28 and 4.5 kg COD/m3d) at different digestion temperatures in the range
of 35 to 55 °C for HRT of 14 d and under a controlled pH in the range of 6.8 to 7.2.
2.4.1.2 Anaerobic digestion of winery wastewater
A number of technologies are applied for winery wastewater treatment by using AD at lab
scale, pilot-scale and full-scale (Ganesh & Rajinikanth, 2010; Brito et al., 2007; Gao et al.,
2007; Yu et al., 2006; Moleta, 2005; Coetzee et al., 2004; Keyser et al., 2003; Wolmarans &
de Villiers, 2002; Laubscher et al., 2001;). As shown in Table 2.5, different anaerobic
treatment methods that were utilized includes an UASB (Gao et al., 2007; Keyser et al.,
2003; Wolmarans & de Villiers, 2002; Laubscher et al., 2001); an anaerobic fixed-bed reactor
(AnFBR)( Ganesh & Rajinikanth, 2010); an upflow anaerobic filter (UAF) (Yu et al., 2006); an
anaerobic sequencing batch reactor (AnSBR) (Brito et al., 2007); and a rotating biological
contactor (RBC) (Coetzee et al., 2004). COD removal efficiencies of above 90% were
achieved, which allowed the treated winery wastewater to be discharged into the municipal
sewer.
Molasses-based wastewater was added with nutrient sources to get a C:N:P ratio of 100:5:1,
and synthetic wastewater was used for separation of hydrolytic and methanogenic groups,
respectively (Wejekoon et al., 2011). The AD process was carried out in a CSTR type
digester, which was utilized by Méndez- Acosta et al. (2010) to treat a tequila vinasses
industry wastewater. The highly polluted wastewater with a temperature of around 90°C; pH
of 4 and COD, which ranged from 20 000 to 50 000 mg/L was treated with a digester
operated under mesophilic conditions, where the reactor temperature was regulated at 35
and 36°C. The COD removal ranged between 90 to 95% at a maintained OLR of
1 kg COD/m3d.
Ganesh et al. (2010) investigated three upflow anaerobic fixed-bed reactors (AnFBR) for
treatment of winery industry wastewater with COD of 18 000 to 21000 mg/L. The reactors
were maintained at a mesophilic temperature of 35°C by using a hot water jacket. The feed
wastewater with a liquid Vup between 0.8 and 0.9 m/h with a maximum OLR of
0.04 kg COD/m3d and up to 80.5% removal efficiency was attained. A rotating biological

Page 27 of 132
contactor (RBC) was evaluated for the treatment of winery wastewater, with COD from 2 910
to 3 828 mg/L and an increased pH from 5.6 to 6.1 at an average HRT of 1 h. The system
was able to achieve between 23 and 39% COD removal (Coetzee et al., 2004). Three
UASBs were evaluated for the treatment of winery wastewater by Keyser et al. (2003); the
Vup in the reactors was set at 2 m/h and operated at 35˚C. The first reactor reached a 90%
COD removal within 17 d at HRT of 24 h; the second reactor was seeded with brewery
granules and achieved 85% COD removal rate with a HRT of 50 d, and the third was seeded
with sludge, while there were problems encountered with conventional sludge seeding.
Conversely, Laubscher et al. (2001) investigated two UASB reactors that were maintained at
around 35°C and at a pH of 7 for treating synthetic winery wastewater with COD in the range
of 2 000 to 5 000 mg/L. The OLR was 18 kg COD/m3d and COD removal efficiency was
above 90%.
2.4.1.3 Anaerobic digestion for brewery wastewater
Table 2.5 represents treatment methods for brewery wastewater. High-rate anaerobic,
biological reactors such as: anaerobic filter and expanded granular sludge bed (EGSB-AF)
(Connaughton et al., 2006); UASB (Parawira et al., 2005; Ahn & Speece, 2004); addition of
carbon dioxide (CO2) absorber (CA) into an UASB (UASB-CA) (Rao et al., 2007); UASB
sequencing batch reactor (UASB-SBR) (Brito et al., 2007); GRABBR (Baloch et al., 2007);
anaerobic inverse fluidized bed reactors (AnIFBR) (Alvarado-Lassman et al., 2008); and
anaerobic sequencing batch reactors (AnSBR) (Shao et al., 2008) were reported to be
adequate for COD reduction of about 90% in the treatment of brewery wastewater.
An UASB reactor was utilized for treating brewery wastewater with COD of up to 1 290 mg/L
at an OLR up to 28 kg COD/m3d with a corresponding HRT of 1 h. The fluid Vup was
maintained at 0.6 to 2.5 m/h at a temperature around 35°C and the COD removal efficiency
achieved was up to 93% (Ahn & Speece, 2004). Conversely, Parawira et al. (2005)
evaluated an UASB reactor during anaerobic digestion to treat opaque beer brewery
wastewater with HRT of approximately 24 h. The brewery wastewater had a COD of 8 240 to
20 000 mg/L and temperature was maintained at 37°C, while the average COD reduction was
57% at OLR of 6 kg COD/m3d. Studies were also carried out by Rao et al. (2007) with a
carbon dioxide absorber (CA) to evaluate the usage of carbon dioxide (CO2) in the UASB
reactor to treat brewery wastewater with COD of 2 000 to 6 000 mg/L at an optimum OLR of
23.1 kg COD/m3d and HRT of 2 h. The reactor pH was controlled in the range of 7 to 5 with
COD reduction of 96%. The brewery wastewater was treated by an integrated system of
UASB as a pre-treatment, and SBR as post-treatment, while both reactors were operated
35˚C. The pH in the UASB ranged from 6.5 to 7.9 and COD of 400 to 2 000 mg/L with Vup of

Page 28 of 132
40 to 50 m/h .The average COD removal efficiencies of 70 to 80% was achieved in the
UASB process (Brito et al., 2007).
Brewery wastewater with COD of 22 500 to 32 500 mg/L was treated by utilizing an
anaerobic sequencing batch reactor (ASBR) in which an OLR was controlled between 1.5
and 5.0 kg COD/m3d, and HRT of 1 d. The COD removal efficiency was more than 90%
(Shao et al., 2008). The AnIFBR technology was investigated for the removal of organic
matter in the brewery wastewater with COD of 2 083 mg/L and removal efficiencies greater
than 90%. The reactor showed an excellent COD removal with OLR values of up to
0.07 kg COD/m3d, and the reactor temperature was kept at 35°C in a controlled pH of 7
(Alvarado-Lassman et al., 2008).
Baloch et al. (2007) studied the performance characteristics of a GRABBR treating brewery
wastewater with a high COD of 115 000 to 125 000 mg/L. The reactor achieved COD
removal of 93% to 96% with high methane production when operated at OLRs of 3.4, 5 and
13.4 kg COD/m3d, with corresponding HRTs of 36, 22 and 19.2 h, respectively. Two identical
expanded granular sludge bed-anaerobic filter (EGSB-AF) bioreactors were fed with brewery
wastewater COD discharged at a range between 1 000 to 6 000 mg/L. The average pH was
7.3 and the treatment experiments were separated into four different operational periods,
which were characterized either by the change in the HRT or Vup. The fluid Vup was 2.5, 3 and
5 m/h at a HRT of 18, 24 and 48 h. The reactors were maintained at 37°C and around 15˚C,
respectively. The OLR was up to 4.5 kg COD/m3d (Connaughton et al., 2006). The sequence
batch reactor (SBR) was utilized for treatment of brewery wastewater at HRT of 6 h and
temperature around 25°C. The aeration flowrate to reactor was 500 L/h and a stable removal
efficiencies of 88.7% COD was achieved (Wang et al., 2007). Treatment of brewery
wastewater with COD between 20 000 and 22 000 mg/L in a thermophilic anaerobic
sequencing batch reactor (ASBR) was studied under different OLR from 3.2 to
8.6 kg COD/m3d. The ASBR COD degradation removal efficiency was from 79.6 to 88.9%
(Zupančič et al., 2007).
2.4.2 Application of anaerobic digestion (AD) for the non-alcoholic beverage industry
Table 2.6 presents treatment methods for non-alcoholic beverages wastewater. AD
treatment technologies have been reported for laboratory scale application in the treatment
of non-alcoholic beverage industry wastewater (El-Kamah et al., 2010; Guven, 2001;
Kalyuzhnyi, et al., 1997).

Page 29 of 132
Table 2.6: Treatment methods for non-alcoholic beverages industry wastewater
Type of Wastewater
Application Treatment Method &
Type of Reactor
Configuration Characteristics of Membrane
T1
(˚C)
HTR2
(days) OLR
3
(kg COD/m3d)
CODFeed (mg/L)
TE4
(% COD) References
Fruit Juice Laboratory AH-SBR^ - - 26 0.5 5.3 - 11.8 - 67.4 Tawfik & El-Kamah, 2012.
Fruit Juice Laboratory UASR-AS^ - - 25 1 8.7 2 300 - 10 900 97.5 El-Kamah et al., 2010.
Fruit Juice-Sourcherry & Apple
Laboratory UASB-ASBR^
- - 35 - 37 2.3 - 5.7 5 1 000 - 8 000 95 Ozbas et al., 2006.
Fruit Juice Laboratory AMBR-UV-NF^ Submerged Tubular
(0.04 µm ) - - - 5 000 - 40 000 >95 Chmiel et al., 2003.
Fruit Juice Pilot
AMBR-UV-NF^ Submerged Hollow Fibre MF
polymer (0.4 µm)
20 - 35 0.42 - 1.4 4 -13 2 500 - 6500 95 - 97 Noronha et al., 2002.
Fruit Juice Laboratory AMBR-UV-NF^ Submerged Tubular
(0.04 µm ) 13 - 34 - - 1 800 - 6 600 >95 Blöcher et al., 2002.
Fruit Juice Laboratory AH-SBR^ - - 40 - 66 0.41 - 0.42 3.5 - 67.4 Tawfik & El-Kamah, 2012.
Softdrink: Bottle Washing
Pilot CF- RO- IE^ - - 40 - 50 - - - >99 Haroon et al., 2013.
Softdrink: Bottling Washing
Pilot AMBR^ Submerged Zenon: ZW-10 (0.4
µm) - 0.21 - 0.33 - 288 - 2 990 94 Matošić et al., 2009.
Softdrink Laboratory AnCSBR^ - - 35 - 37 0.004 - 0.09 72 900 - 145 000 74 - 98 Guven, 2001.
Softdrink: Bottling Washing
Full CF-NF^ - - - - - 33 70 Miyaki et al., 2000.
Softdrink Laboratory UASB-HR^ - - 35 <1 13 - 16.5 1 100 - 30 700 80 - 82 Kalyuzhnyi, et al., 1997.
^: See Appendix A; 1.T: Temperature; 2. HRT: Hydraulic retention time; 3. OLR: Organic Loading Rate; 4. TE: Treatment Efficiency.

Page 30 of 132
The selection of technology depends on the wastewater characteristics, the required
specification of the final product, and the simplicity of manufacturing and costs (Guimarães et
al., 2012; Hsine et al., 2010; Guven, 2001). Treatment of wastewater from fruit juice and
softdrink industries usually comprises some sort of physical pre-treatment method for the
removal of suspended matter, followed by biological treatment methods (Ozbas et al., 2006;
Blöcher et al., 2003; Chiemel et al., 2003; Noronha et al., 2002; Tawfik & El-Kamah, 2012).
2.4.2.1 Anaerobic digestion for fruit juice industry wastewater
The AD methods reported for fruit juice wastewater include: coagulation and flocculation
(Amuda & Amoo, 2007; Amuda et al., 2006); an UASB reactor and aerobic sequence batch
reactor (UASB-ASBR) (Ozbas et al., 2006); polyurethane trickling filter and anaerobic hybrid
reactor (PTF-AH) (Tawfik & El-Kamah, 2012); and an activated sludge with upflow anaerobic
sponge reactor (UASR-AS) (El-Kamah et al., 2010). El-Kamah et al. (2010) studied the
treatment of fruit juice industry wastewater with a maximum COD of 10 913 mg/L by utilizing
a three batch activated sludge (AS) system and operated at HRT of 48 h; a two-stage upflow
anaerobic sponge reactors (UASRs) were operated at HRT of 13 h, corresponding to an
OLR of 8.7 kg COD/m3d. The third treatment scheme consisted of a two-stage UASR
followed by an AS system, which was operated at three different HRTs, namely 10, 12, and
14 h. The combined system attained an overall removal efficiency of 97.5% for COD
producing wastewater suitable for reuse for agricultural purposes.
An integrated system, which comprised of AH–PTF was used to treat tomato processing
industry wastewater with fluctuating COD of approximately 795 to 1 000 mg/L and an OLR of
1 to 4.5 kg COD/m3.d. The results attained for the combined system was very successful for
the treatment of tomato industry wastewater at an HRT of not more than 10 h, while the COD
removal efficiency was 96% (Tawfik & El-Kamah, 2012). An UASB reactor was used as a
pre-treatment of tomato processing industry wastewater at a feed flowrate of 20 L/d and
COD of 5 000 to 7 000 mg/L at an Vup of 0.2 m/h. The reactor OLR was in the range of 2.9 to
7.7 kg COD/m3 d at HRT of 0.75 d. The average COD removal efficiency of 85 to 95.6% was
achieved (Gohil & Nakhla, 2006).
2.4.2.2 Anaerobic digestion for softdrink industry wastewater (SDIW)
The total soluble organic matter present in SDIW is high at about 62% (Matošić et al., 2009),
and hence cannot be removed by physical or mechanical means. SDIW are in concordance
with COD: total organic carbon (TOC) ratio of about 3.8, signifying the presence of an
oxidation phase for carbon, thus indicating that wastewater is suitable for biological
treatment. Therefore, chemical and biological oxidation becomes the key for SDIW treatment
(Hsine et al., 2010).

Page 31 of 132
Table 2.6 shows some of the studies that have been reported on the treatment of SDIW on a
lab, pilot and full-scale. Guven (2001) treated highly biodegradable SDIW with COD of
72 900 to 145 000 mg/L under anaerobic conditions by using two AnCSBRs. For an OLR
ranging from 0.004 to 0.09 kg COD/m3d the reactors were able to achieve up to 98% removal
efficiency. The SDIW was studied by utilizing anaerobic treatment of UASB and a hybrid
reactor (HR) (Kalyuzhnyi et al., 1997), with a fluctuating COD between 1 100 to 30 700 mg/L
and a varying pH between 4.3 and 13.0. Both reactors were maintained at 35°C and AH and
UASB attained OLR of 13 and 16.5 kg COD/m3d, respectively, with the treatment efficiency
of about 80% at HRT of 1 d. From Tables 2.5 and 2.6 it is clear that extensive research has
been published on the beverage industry in general, but limited studies have been reported
for the softdrink industry.
2.5 Anaerobic digestion and subsequent biogas production
As explained in section 2.3.6; a complex microbiological process lies behind the efficient
production of biogas. In biogas production large organic molecules such as fats, proteins and
sugars are sequentially broken down into CH4, CO2 and a gas mixture called biogas
(Schnurer & Jarvis, 2010), as previously presented in Figure 2-2. AD gained broader
recognition, as more information became available, governing conditions that permit more
consistent production of biogas, which can be used as an energy source (Strong et al.,
2008). Biogas typically refers to a gas, which is produced during anaerobic digestion of
biomass or wastes. It is classified as a renewable energy source such as solar and wind
energy. As previously indicated in Equations 2-2 to 2-7; the biogas composition is
determined by the operating conditions and waste material that are used during anaerobic
digestion. A guarantee of optimal generation of biogas depends on the C:N ratio of the input
(Ošlaj & Muršec, 2010). In addition to CH4 and CO2, biogas contains several trace elements
such as halogenated organic compounds, sulphur compounds, siloxanes, water (H2O),
ammonia (NH3), oxygen (O2), carbon monoxide (CO) and nitrogen (N2). All of these
compounds are harmful to human health, the environment, as well as equipment
(Monteleone et al., 2011). However, the most corrosive, harmful and toxic compound is
hydrogen sulphide (H2S) (Monteleone et al., 2011; Schomaker et al., 2000). In addition,
biogas recovery from AD guarantees renewable energy supply and decreases greenhouse
gas emissions (Wijekoon et al., 2011).
Table 2.7 shows the typical composition of biogas. According to Wilkie et al. (2000), AD
converts more than half of wastewater COD into biogas. Industrial biogas is normally
produced at mesophilic (35 - 37°C) and thermophilic (50 - 60°C) conditions from 1) landfills;
2) sewage treatment plants; 3) industrial processing plants; and 4) during agricultural organic
digestion (Ryckebosch et al., 2011; Rasi et al., 2007).

Page 32 of 132
Table 2.7: Typical composition of biogas (Monteleone et al., 2011; Ryckebosch et al., 2011; Rasi et al., 2007; Von Sperling, 2007; Krich et al., 2005; Wellinger & Lindberg, 2005; Schomaker et al., 2000)
Components Percentage (%)
Methane (CH4) 40 - 70
Carbon dioxide (CO2) 15 - 60
Water (H2O) moisture 5 - 10
Hydrogen sulphide (H2S) 0.005 - 2
Siloxanes 0 - 0.02
Halogenated hydrocarbons VOC < 0.6
Ammonia (NH3) < 1
Oxygen (O2) 0 - 1
Carbon monoxide (CO) < 0.6
Nitrogen (N2) 0 - 2
2.5.1 Biogas implementation and utilization in South Africa
Currently, biogas production technologies are mainly located in rural areas and consist of a
fixed dome plant that uses bio-digesters to produce biogas from waste material, which is
supplied to heating appliances in rural and peri-urban areas. These technologies assist in
addressing challenges of access to energy in SA. Societies utilize biogas technology to
produce energy, which is used for cooking, lighting, warmth and even electricity generation.
Biogas also subsidizes towards a cleaner environment as it reduces the necessity for wood
fires, hence there is a reduction in greenhouse gas emissions, deforestation, and prevents
the inhalation of smoke from wood fires, which can have a negative impact on human health
(Gas Act, 2001 (Act No. 48 of 2001)). Biogas has the big advantage that the energy it
generates is largely CH4 and can be used to meet specific demand. However, the raw plant
materials employed as the energy source must be sustainably grown and used efficiently in
order for this to hold true. Although there are barriers that are associated with biogas
utilization, some beverage industries have implemented this technology. According to Agama
Biogas (2010) and Boyd (2012), South African Breweries (SAB) utilize an on-site digester to
treat process wastewater and organic waste to produce biogas of 9 200 L/d.
Biogas technology is utilized worldwide, yet its application in SA is insignificant (Boyd, 2012).
Since 2011 biogas production operations in rural communities in KwaZulu-Natal, Limpopo,
as well as Pretoria were registered and approved by the National Energy Regulator of South
Africa (NERSA). According to the national legislation, the owners of biogas processes that
are not connected to the national gas pipeline are required to register with NERSA, but do
not have to be licensed. There are some barriers, which are associated with biogas
application in the agricultural, domestic and industrial sector, as presented in Table 2.8.

Page 33 of 132
Table 2.8: Industrial barriers associated with biogas application and installation (Boyd, 2012)
Implementation barriers Incentive options
Lack of knowledge and awareness Operationalize and build on global knowledge
Municipal by-law limits Adapt municipal by-laws to encourage industrial
participation
No incentives: no charges for CO2 tax and low
tipping charges
Implement environmental policies which increase
tipping cost and CO2 tax
Motivation for biogas digesters are for waste
management not energy generation
High capital cost and lack of feed-in tariff.
2.5.2 Anaerobic technology used for biogas production in the beverage industry
Treatment methods of wastewater from beverage industries are presented in Table 2.9.
Several anaerobic reactors were used and reported for the production of biogas in the
treatment of both alcoholic and non-alcoholic beverage industries. These reactors include:
anaerobic hybrid (AH) reactors (Tawfik & El-Kamah, 2012); continuous stirred zone reactor
(CSTR) digesters (Méndez-Acosta et al., (2010); anaerobic granular bed baffled reactors
(GRABBR) (Baloch et al., 2007; Akunna & Clark, 2000); semi continuous batch reactor
(SBR) (Banerjee & Biswas, 2004); anaerobic sequencing batch reactors (ASBR) (Shao et al.,
2008); UASB (Turkdogan-Aydinol & Yetilmezsoy, 2010; Gao et al., 2007; Rao et al., 2007;
Gohil & Nakhla, 2006; Moletta, 2005; Blonskaja et al., 2003; Kalyuzhnyi et al., 1997); upflow
anaerobic fixed film bioreactors (UAFFR) (Acharya et al., 2008); and expanded granular
sludge bed-anaerobic filter (EGSB-AF) (Connaughton et al., 2006).
Akunna and Clark (2000) utilized a GRABBR for the treatment of whisky distillery wastewater
with an OLR 1 to 4.8 kg.COD/m3 d. Biogas production increased with increasing loading rates
from 10 to 22 L/d and the CH4 content from 60 to 70%. GRABBR was utilized by Baloch et al.
(2007) for the treatment of brewery wastewater to produce biogas. It was reported that as the
OLR increased from 2.2 to 13.4 kg.COD/m3d, the biogas production rate also increased from
16 to 62 L/d with a high CH4 generation, which varied from 62% to 75%. Biogas containing
CO2 in the range of 30% to 40% and a methane yield in the range of 0.3 m3CH4/kg COD was
consumed. An upflow anaerobic fixed film bioreactor (UAFFR) was utilized for the treatment
of distillery wastewater, containing COD up to 230 300 mg/L leading to a biogas production
of 7.2 L/d (Acharya et al., 2008).

Page 34 of 132
Table 2.9: Biogas production and technology used for alcoholic and non-alcoholic industries
Wastewater Type Reactor Type pH Organic loading rate (OLR) (kg.COD/m
3d)
Biogas (L/d) Biogas composition (CH4 %)
References
Distillery UAFFR^ 8 - 8.5 23.25 7.2 - Acharya et al., 2008.
Molasses AnMBR^ 7.2 5 -12 5.5 55 - 65 Wijekoon et al., 2011.
Distillery: Shochu KSAMBR^ - - 1-10 60 Kanai et al., 2010.
Distillery grain UASB^ 7 33.3 1.6 - 11.51 57 - 60 Gao et al., 2007.
Distillery SBR^ 6.8 - 7.2 2.74 6.15 - 7.381 73.23 Banerjee & Biswas, 2004.
Distillery UASB+AF^ 7.2 - 7.8 0.6 - 5.1 1 - 6 55 - 75 Blonskaja et al., 2003.
Distillery GRABBR^ 0.99 - 4.75 10 - 22 60 - 70 Akunna & Clark, 2000.
Distillery: molasses vinasse UASB^ - 1.9 - 16.56 36 - 490 50 - 70 Turkdogan-Aydinol & Yetilmezsoy, 2010.
Disillery: molasses vinasse UASB^ 6.5 - 8 5-15 400 - 600 60 - 70 Moletta, 2005.
Brewery ASBR^ 6 -7 5.0 2.40 68 Shao et al., 2008.
Brewery GRABBR^ 7.1 - 7.2 2.16 - 13.38
16 - 62 62 - 75 Baloch et al. 2007.
Brewery EGSB-AF^ ~ 7.1 - 7.2 4.47 4.1 ~ 57.8 - 73.8 Connaughton et al., 2006.
Brewery UASB^ 7 - 7.5 23.1 4.62 - 5.2 - Rao et al., 2007.
Brewery ASBR^ 7.4 3.23 - 8.57 2.4 63 - 66 Zupančič et al., 2007.
Brewery UASB^ 7.3
6.3 23 - Keyser at al., 2003.
Tomato Juice AH^ - 2 – 4 0.48 Tawfik & El-Kamah, 2012.
Tomato Juice UASB^ - 0.43 78 - 82 Gohil & Nakhla, 2006.
Fruit Juice UASB^ - 0.8 - 11 Ozbas et al., 2006.
Softdrink UASB + HR^ 6 - 7 0.013 - 0.165 - 60 - 65 Kalyuzhnyi et al., 1997.
^ Refer to appendix A; 1: OLR: Organic loading rate; 2: CH4: methane

Page 35 of 132
An anaerobic sequencing batch reactor (ASBR) was utilized to treat brewery wastewater,
which effectively produced biogas of 2.4 L/d at a controlled OLR between 1.5 and
5 kg COD/m3d. The average CH4 composition in the biogas was 68% (Shao et al., 2008). An
ASBR was investigated for the treatment of brewery wastewater under different OLR,
ranging from 3.2 to 8.6 kg.COD/m3d, and resulting in a CH4 yield of 248 L/kg COD, which
was consumed. Conversely, Banerjee and Biswas (2004) designed a semi continuous batch
reactor (SBR) to investigate the biomethanation of distillery wastewater, while a total CH4
production of 73.2% occurred at an OLR of 2.7 kg.COD/m3d. Anaerobic treatment of tequila
vinasses in a CSTR digester was investigated by Méndez-Acosta et al. (2010), where the
biogas production rate was 1 to 14 L/d at an OLR of 0.01 kg.COD/m3d, leading to a CH4
production of greater than 65%.
The performance of an UASB reactor, which treats distiller’s grain wastewater, was
investigated by Gao et al. (2007) with an OLR of 33.3 kg.COD/m3d. The biogas mainly
consisted of 57 to 60% CH4 and 38 to 41% CO2. The biogas stillage treatment plants for
shochu generated 60% CH4; 40% CO2 and other trace elements, including H2S. Anaerobic
digestion of distillery wastewater was in a mesophilic two-stage system, consisting of an
anaerobic filter (AF) and an UASB reactor with an OLR of 0.6 and 5.1 kg.COD/m3d. Biogas
production of up to 6 L/d containing 55% to 75% of CH4 was recorded by Blonskaja et al.
(2003). Rao et al. (2007) studied the effect of a carbon dioxide absorber (CA) to evaluate the
usage of CO2 in the biogas UASB reactor using brewery wastewater. The biogas produced
was between 4.6 to 5.2 L/d at an optimal OLR of 23.1 kg.COD/m3d. An UASB reactor was
used for the treatment of diluted beet molasses vinasse wastewater. The OLR ranged from 2
to 16.6 kg.COD/m3d and the daily biogas production rates ranged between 36 to 490 L/d.
The biogas produced contained CH4 and CO2 between 50% and 70%, and of 16% and 44%,
respectively (Turkdogan-Aydinol & Yetilmezsoy, 2010). The treatment of winery wastewater
was investigated by Moletta (2005) using an UASB with an OLR of between 5 and 15
kg.COD/m3d. The biogas production was between 400 and 600 L/kg COD removed with a 60
to 70% CH4 content. An expanded granular sludge bed-anaerobic filter (EGSB-AF)
bioreactor was used for the treatment of brewery wastewater. A maximum OLR of 4.5 kg
COD/m3d was achieved at an applied liquid Vup of 2.5 m/h. In addition, the CH4 content of the
biogas was ~57.8 to ~73.8 % (Connaughton et al., 2006).
An UASB reactor was applied for the treatment of tomato processing wastewater with a
biogas yield of 0.43 m3/kg COD and CH4 content of 78 to 82% (Gohil & Nakhla, 2006). Ozbas
et al. (2006) treated fruit juice wastewater by utilizing an UASB. The biogas that was
produced was 0.8 to 11 L/d, which was produced with an average CO2 ratio of 20%. An AH
reactor was utilized for the treatment of tomato juice wastewater. The biogas production rate

Page 36 of 132
was 2.6 to 4 L/d, which was equivalent to 0.48 m3/kg COD that was consumed (Tawfik & El-
Kamah, 2012). The production of hydrogen (H2) from softdrink wastewater was evaluated by
Peixoto et al. (2011) for using two upflow anaerobic packed bed reactors. The results show
that softdrink wastewater is a good source for H2 generation. Data from both reactors
indicated that the reactor without nutrients provided a higher H2 yield of 3.5 H2/mol of sucrose
when compared to the reactor with nutrients containing 3.3 H2/mol of sucrose. Better H2 and
biogas production rates were observed in the reactor, which produced 0.4 to 1 L/d biogas
and contained 15.8% H2, compared to a second reactor, which produced 0.2 to 1 L/d biogas
with 2.6% H2. The anaerobic treatment of softdrink wastewater, which utilized an UASB
reactor and a hybrid sludge bed reactor was studied by Kalyuzhnyi et al. (1997). Both
reactors produced a satisfactorily stable CH4 content, ranging from 60 to 65% and CO2
content, ranging from 35% to 40%.
2.5.3 Biogas utilization in beverage industry
Biogas utilization covers a diverse group of markets, including electricity, heat and vehicle
fuels (AEBIOM, 2009). The biogas, which is recovered from anaerobic treatment guarantees
a renewable energy source supply and decreases greenhouse gas emissions, thus
contributing to sustainable waste and environmental impact management systems for a
beverage producing facility (Brito et al., 2007; Parawira et al., 2005). The produced CH4 can
be readily utilized as a fuel for the ethanol production process.
According to Driessen and Vereijken (2003), anaerobic wastewater treatment can subsidize
a brewery operation by saving up to 8% of a brewery’s energy requirements, which is
approximately 170 MJ/hL. Muster-Slawitsch et al. (2011) also reported that the energy that
was generated from the biogas produced during AD of brewery wastewater exceeds the
thermal process energy demand of 37 MJ/hL manufacture of beer. In breweries, direct
application of biogas in a boiler is regularly the favoured solution. However, due to the high
investment costs for a combined heat and power unit, extensive biogas generation system is
required (Ince et al., 2000).
The application of anaerobic membrane bioreactors (AnMBR) for the treatment of brewery
wastewater was studied by Torres et al. (2011), and biogas was injected inside the
membranes to stimulate a plug-flow regime. Kubota’s submerged anaerobic membrane
biological reactor (KSAMBR) has been successfully utilized in a number of full-scale food
and beverage industries. The biogas was collected in the factory that treats shochu distillery
wastewater and was utilized either for power generation or in the boiler, thus recovering
energy for the industry (Kanai et al., 2010). A winery industry in Wellington, SA, utilizes an
UASB reactor for wastewater pre-treatment and the biogas produced after purification is

Page 37 of 132
used on-site (Wolmarans & de Villiers, 2002). The biogas produced from a submerged
AnMBR system for pulp and paper wastewater treatment was used for scouring the
membrane surfaces to reduce membrane fouling (Liao et al., 2006).
2.6 Anoxic and aerobic wastewater treatment
According to Futselaar et al. (2013), the removal of TN and TP is usually required to meet
international discharge standards. However, an anaerobic system is not capable of
accomplishing these requirements when used as the sole and primary wastewater treatment
technology. Therefore, either intermittent aerobic or anoxic processes within the bioreactor
can be employed for TN and TP removal (Dai et al., 2010; Cicek, 2003). The removal of both
the nitrate formed through nitrification and phosphate present demands configuring the
process to produce zones which are depleted (anoxic or anaerobic) and/or enriched
(aerobic) with dissolved oxygen (DO) (Grady et al., 2011; Judd, 2011; Mutombo, 2004).
Grady et al. (2011) and Mutombo (2004) recommend that aerobic treatment should be used
for COD concentrations of lower than 1 500 mg/L and anaerobic treatment for higher COD
values of up to 50 000 mg/L. The supply of oxygen in the aerobic process is accomplished by
using mechanical equipment, principally mechanical aerators. To attain a DO level of 2 mg/L,
mixing and the maintenance of the biomass is essential (Mutombo, 2004).
2.6.1 Denitrification
Nitrogen removal or denitrification is the biological reduction of nitrate (NO3-N) to nitrogen
gas (N2) under anoxic conditions by heterotrophic bacteria, which utilizes organic matter as
food supply and NO3-N as a supply of oxygen (O2) (Fiss & Stein, 2002). Equation: 2-16
represents the reaction as follows:
Equation: 2-16
Denitrification takes place only under anoxic conditions in the absence of DO, but NO3-N is
accessible. Thus, denitrification will normally initiate at DO less than 0.5 mg/L. Anoxic
wastewater treatment methods are usually utilized for the reduction of nitrogen, and the
process of the biological removal of nitrogen is called denitrification. Organisms in the anoxic
treatment utilize the nitrate as an electron acceptor and discharge nitrogen in the form of
nitrogen oxides or nitrogen gas (Wang et al., 2009). Equation: 2-17 defines the denitrification
reaction:
Equation: 2-17

Page 38 of 132
Due to the anaerobic nature of anoxic wastewater treatment, the microorganism bed must
remain submerged (Wang et al., 2009). A minimal DO should be introduced into the system
recycle stream or wastewater, and DO should be between 0.2 to 0.5 mg/L to attain higher
denitrification rates (Wang et al., 2009). WWTP has to deal with tough wastewater discharge
standards, and nitrogen and phosphorus are one of the problems.
2.6.2 Nitrification
The biological transformation of ammonium to nitrate is known as nitrification. The
microorganisms, known as “nitrifies,” are strict “aerobes;” which means that, they must have
DO in order to carry out aerobic treatment of wastewater. The main species responsible for
nitrification are nitrobacteria and nitrosomonas (Fiss & Stein, 2002). Nitrification takes place
only under aerobic conditions at DO levels of 1.0 mg/L or more. The optimum pH is between
7.5 and 8.5. However, most treatment plants are able to effectively nitrify at a pH of 6.5 to
7.0. However, at a pH below 6 the nitrification process stops (Al-Hashimia et al., 2013). The
nitrification process is described by Equations: 2-18 and 2.19 (Fiss & Stein, 2002):
Equation: 2-18
Equation: 2-19
2.6.3 Phosphorus removal
Phosphorus removal can be achieved by chemical methods or biological methods. Factors
that affect the phosphate removal in the reactor are pH, temperature and sludge age. A
number of bench-scale studies have been reported on the effects of parameters, which affect
nitrogen and phosphorus removal such as carbon sources, hydraulic retention time (HRT),
recycling time, recycling rate, and SRT, which have influence on nitrogen and phosphorus
removal, directly or indirectly (Song et al., 2009). Presently, nutrient removal has attracted
huge awareness in wastewater treatment for recycle (Tatiana et al., 2011). Wastewater
recycling can equally decrease the demand of freshwater and reduce the discharge of
wastewater into the environment (Qadir et al, 2010).
2.6.4 The modified Ludzack-Ettinger (MLE) treatment method
There are two types of stages for the anoxic zone, namely the single stage zone and the
multistage zone. The single stage zones are classified according to their flow regime and the
staging of anoxic and aerobic arrangement. They rely on zones or compartments for
denitrification to occur. For denitrification to occur, it is essential for nitrate and carbon supply
to be present. The organic carbon can be supplied as BOD of the wastewater (Wang et al.,
2009).

Page 39 of 132
According to Wang et al. (2009), a single stage denitrification process was reported by
Wuhrmann for the treatment of domestic wastewater. Conversely, Ludzack and Ettinger
(1962) was also developed a similar system. The system used was designed by Ludzack
and Ettinger positioned the anoxic zone ahead of the aerobic zone. Conversely, Barnard
improved the Ludzack and Ettinger method, as shown in Figure 2.3; on condition that the
internal mixed liquor suspended solids (MLSS) are recycled from the aerobic stage to return
nitrified MLSS to the anoxic zone at a synchronized rate, thereby, increasing the system’s
efficiency. The recycle should be up to five times the feed flow rate (Sheldon et al., 2012;
Hatch Mott MacDonald, 2010).
Anoxic tank Aerobic tank
Figure 2.3: Modified Ludzack - Ettinger (MLE) process (Spellman & Drinan, 2012; Wang et al., 2009)
2.6.5 UCT and modified UCT processes
The UCT process was proposed by Rabinowitz and Marais in 1980, where the recycle
stream is taken from the anoxic instead of the aerobic zone and the introduction of nitrate in
the anaerobic zone is avoided as presented in Figure 2.4 (Wang et al., 2013; Monclús et al.,
2010). The modified UCT (MUCT) process was designed to make sure that the introduction
of nitrate in the anaerobic zone is impractical. The anoxic zone is divided into two portions,
introducing the return sludge in the upstream and using the downstream for denitrification of
the nitrate recycled with recirculation as shown Figure 2.5. Under these circumstances,
denitrification will be thorough in the anoxic zone and no nitrate will be returned to the
anaerobic zone. The disadvantage of this MUCT is that the anoxic zone is under-loaded with
nitrate (Wang et al., 2013; Vaiopoulou & Aivasidis, 2008).
Nitrified
Recycle
(5Q)
Permeate
Wastewater
(Denitrification
Zone)
(Nitrifying Zone)

Page 40 of 132
Figure 2.4: Schematic diagram for UCT process modified from (Monclús et al., 2010)
Figure 2.5: Schematic diagram for modified UCT process modified from (Vaiopoulou & Aivasidis, 2008).
2.6.6 Comparison of anaerobic and aerobic wastewater treatment method
Table 2.11 indicates a general comparison between anaerobic and conventional aerobic
biological treatment systems. When discharging into surface water bodies, anaerobic pre-
treatment, combined with subsequent aerobic post-treatment for organic or nutrient removal,
is considered to be an optimal solution (Wijekoon et al., 2011; Brito et al., 2007;
Connaughton et al., 2006; Parawira et al., 2005).
Anaerobic
Tank
Wastewater
Anoxic Aerobic
Nitrate Recycle
Se
co
nd
ary
Cla
rifi
er
Waste SludgeReturn Activated sludge
Mixed Liquor
Recycle
Anaerobic
Tank
Wastewater
Anoxic Anoxic Aerobic
Nitrate Recycle
Se
co
nd
ary
Cla
rifi
er
Waste SludgeReturn Activated sludge
Mixed Liquor
Recycle

Page 41 of 132
Table 2.10: Anaerobic treatment as compared to aerobic treatment (Torres et al., 2011; Simate et al., 2011; Wijekoon et al., 2011; Ganesh et al., 2010; Strong et al., 2008; Artiga et al.,2007; Melamane, 2007; Huei, 2005; Parawira et al., 2005; Driessen, Vereijken, T. 2003)
Operational parameters Anaerobic systems Aerobic Systems
Energy consumption Low
High
Energy production Yes
No
Biosolids production Low
High
COD removal 70% - 85%
90% - 98%
Nutrients (N/P) removal Low
High
Space requirement Low
High
Discontinuous operation Easy Difficult
2.7 Membrane bioreactors (MBRs) and configurations
MBRs are defined as systems, which integrate biological degradation of waste products with
membrane filtration (Lin et al., 2012; Singhania et al., 2012; Judd, 2011; Torres et al., 2011;
Cicek, 2003). MBR processes are designed to eradicate nitrogen and phosphorus
concurrently (Ahn et al., 2003). In the late 1960s Dorr-Oliver commercially established the
first MBRs. MBR treatment methods have been put into operation in more than 200 countries
and SA is one of the national key drivers when it comes to the utilization of membrane
technology. The way that the membrane reactor is mounted including geometry is crucial to
determine the overall process performance (Judd, 2011).
MBR systems were basically implemented based on two configurations: an immersed
configuration (iMBR) and a sidestream (sMBR) configuration, as shown in Figure 2.6.
Usually, the sidestream configuration provides more direct hydrodynamic control of fouling,
and offers the advantages of easier membrane replacement, and high fluxes, but with high
energy consumption and costs that are associated with frequent cleaning of the membranes.
Several distinct advantages of the submerged configuration are their much lower energy
consumption and fewer rigorous cleaning procedures, as well as milder operational
conditions due to the lower tangential velocities (Lin et al., 2012; Singhania et al., 2012;
Judd, 2011; Torres et al., 2011; Cicek, 2003).

Page 42 of 132
Figure 2.6: Configurations of a membrane bioreactor: (a) sidestream and (b) immersed Modified from (Judd, 2011)
2.7.1 MBR for beverage industry wastewater
MBRs are capable of treating high strength wastewater; hence efforts were made to evaluate
their effectiveness within the treatment of alcoholic beverage industry wastewater. However,
capital investment costs and high pressure requirements have resulted in the lack of full-
scale implementation of many such treatment methods (Liao et al., 2006; Dai et al., 2010;
Cicek, 2003). As shown in Table 2-6, several studies have reported that they utilized
sidestream/external membranes in the treatment of alcoholic beverage industry wastewater
(Bilad et al., 2011; Torres, et al., 2011; Kang et al., 2002). Sidestream/external membrane
configurations are considered to be more appropriate for high organic strength, high
temperatures, and difficult to filter, waste streams (Mutamim et al., 2012; Singhania et al.,
2012; Judd, 2011; Cicek, 2003). The application of the Kubota’s submerged anaerobic
membrane biological reactor (KSAMBR) process has been effectively developed in a number
of full-scale alcoholic industries (Valderrama et al., 2012; Kanai et al., 2010).
2.7.1.1 Membrane bioreactor (MBR) for alcoholic beverages’ wastewater treatment
The application of MBRs for the treatment of distillery wastewater has been studied at lab-
scale, pilot-scale and was also implemented at full-scale (Valderrama et al., 2012; Bilad et
al., 2011; Wijekoon et al., 2011; Kanai et al., 2010; Satyawali & Balakrishnan, 2009;
Satyawali & Balakrishnan, 2008; Artiga et al., 2007; Melamane et al., 2007; Zhang et al.,
2006, Kang et al., 2002). The effect of the OLR on VFA was examined in a two-stage
thermophilic anaerobic MBR (TAnMBR), which was used to treat high strength molasses-
based synthetic wastewater operated in a sidestream configuration. The COD removal
efficiency was between 78% and 81% (Wijekoon et al., 2011). COD removal of up to 53%
was obtained in the study of the effects of powdered activated carbon addition on the
operation of an MBR (AMBR-PAC), treating sugarcane molasses based distillery wastewater
(Satyawali & Balakrishnan, 2009; Satyawali & Balakrishnan, 2008).
Air
Bioreactor
(b) (a)
Sludge
Bioreactor
In
Sludge
Out
Air
In
Recirculation
Stream
Membrane
Out
Out

Page 43 of 132
The performance of a calefactive aerobic membrane bioreactor (AMBR) equipped with a
submerged stainless steel membrane, treating grain-sorghum based simulated distillery, was
investigated by Zhang et al. (2006); obtaining COD and TN removal efficiencies of 94.7%
and 84.4%, respectively. Bilad et al. (2011) also studied the influence of membrane pore size
during the treatment of molasses based distillery wastewater. Bilad et al. (2010) evaluated
the performance of an aerobic membrane bioreactor (AMBR), treating diluted synthetic
molasses wastewater containing COD of 2 250 mg/L. The aeration system was positioned
underneath the membrane modules to provide a distributed air flowrate of 0.6 m3/h. The
system was kept at a psychrophilic temperature of 21°C. The reactor operated at HRT of 18
to 20 h and a mixed liquor suspended solid (MLSS) of 800 to 1 200 mg/L. The COD removal
efficiencies that were obtained were between 80% and 85%. Satyawali and Balakrishnana
(2009) investigated the effect of powdered activated carbon (PAC) addition on the operation
of a MBR treating sugarcane molasses based distillery wastewater with COD, ranging from
30 to 40 000 mg/L. The reactor was equipped with a submerged 30µm nylon mesh filter with
0.05 m2 filtration area. OLR varied from 4.2 to 6.9 kg COD/m3d and at an enhanced critical
flux of around 23%. The transmembrane pressure (TMP) stayed constant at 0 to 0.1 kPa.
Similar studies were reported by Satyawali and Balakrishnana (2008) who used a similar
MBR at OLR ranging from 3 to 5.7 kg COD/m3d and COD removal and biomass growth in
the reactor, which was up to 41%.
In Japan, KSAMBRs are being utilized by 15 full-scale plants for the treatment of shochu
spirit wastewater. The recovered energy from the KSAMBR process was on average 12
GJ/d, which was used for steam production. The COD removal efficiencies were between
75% and 92% (Kanai et al., 2010). Additionally, Kang et al. (2002) compared the filtration
characteristics of organic and inorganic membranes by using a membrane coupled
anaerobic bioreactor (MCAB) for the treatment of distillery wastewater. Due to the seasonal
nature of winery wastewater and the irregular organic matter, the application of a MBR was a
suitable treatment method for winery wastewater as they efficiently combine the BOD, SS,
TN and TP removal and microbial sanitization (Valderrama et al., 2012; Artiga et al., 2007).
According to Ganesh and Rajinikanth (2010) and Moleta (2005), a number of technologies
are used for winery wastewater treatment. Different aerobic treatment methods have been
utilized, including an aerobic jet-loop activated sludge reactor (AJLR) (Eusébio et al., 2004;
Petruccioli et al., 2002); and an air micro-bubble bioreactor (AMBB) (Oliveira & Duarte, 2011;
Petruccioli et al., 2000). COD removal efficiencies of above 90% were achieved, allowing the
treated winery wastewater to be discharged into the municipal sewer. Table 2.5 shows
winery wastewater treatment methods, which use MBR. Artiga et al. (2007) utilized an MBR
to treat a synthetic winery wastewater under aerobic conditions and recorded COD removal
of above 97%. The MBR winery permeate was appropriate for agricultural, urban, and
Page 44 of 132
recreational reuse (Valderrama et al., 2012; Artiga et al., 2007; Melamane et al., 2007), and
meeting the quality stipulation defined by worldwide guidelines and regulations for water
reuse and reclamation (Valderrama et al., 2012). Winery wastewater was treated by
evaluating an ABBR with COD, which ranged from 800 to 11 00 mg/L at the maximum OLR
of 8.8 kg COD/m3d, and HRT was approximately 0.8 d. The bioreactor efficiency was above
90% (Petruccioli et al., 2000). An aerobic jet-loop activated sludge reactor (AJLR) was
utilized for the treatment of winery wastewater with COD that ranged between 800 and 12
800 mg/L and OLR from 0.4 to 5.9 kg COD/m3d with a varied HRT from 2.1 to 4.4 d.
A comparative study was carried out by Valderrama et al. (2012) for the winery wastewater in
order to evaluate MBR pilot plant and compared it to a full-scale conventional activated
sludge system in order to reach the quality determined international guidelines and
regulations for wastewater reuse and reclamation. The winery wastewater has a fluctuating
COD from 100 mg/L to more than 8 000 mg/L. The flat sheet Kubota membrane had a
surface area of 20 m2 permeation of 9 min and relaxation of 1 min, with a permeation flux of
12.5 L/m2h, and membrane fouling, which was prevented by trough air scouring. A
comparative evaluation of a conventional activated sludge (CAS) system with a MBR was
studied by Valderrama et al. (2012). The MBR successfully reduced the COD concentration
with a removal efficiency of close to 97%. In addition, the MBR performance showed a fairly
stable operation in terms of transmembrane pressure (TMP) and permeability regardless of
the high inconsistency of the treated wastewater. Artiga et al. (2007) utilized a MBR to treat a
synthetic winery wastewater under aerobic conditions and recorded COD removal of above
97%. A fungal pre-treatment step followed by a submerged MBR and a digester in series
was investigated by Melamane et al. (2007). High rate anaerobic digestion of the winery
distillery wastewater was achieved, as high polyphenols and COD removals of 99.5 and 87%
were recorded, respectively. The MBR winery permeate was appropriate for agricultural,
urban, and recreational reuse (Valderrama et al., 2012; Artiga et al., 2007; Melamane et al.,
2007), and met the quality stipulation defined by worldwide guidelines and regulations for
water reuse and reclamation (Valderrama et al., 2012).
A submerged ZW-10 hollow fibre ultrafiltration (UF) with a surface area of 0.9 m2 and AMBR
was fed with simulated white wine wastewaters of COD, ranging between 1 000 and
4 000 mg/L and OLR 0.5 to 2.2 kg COD/m3d. Dissolved oxygen (DO) concentration was
maintained in the range of 3 to 4 mg/L. The UF membrane module was operated in cycles of
15 min of permeation and 45 s of backwashing with permeate, and TMP was always kept
below 50 kPa. The system was able to achieve COD removal efficiency higher than 97%
(Artiga et al., 2005).

Page 45 of 132
The treatment of brewery wastewater, which used MBRs’ has been studied mostly at lab-
scale, as shown in Table 2.5. The application of a sidestream AnMBR was studied by Torres
et al. (2011) for the treatment of brewery wastewater, which contained high amounts of
organic SS. COD removal levels were above 97%. A submerged AnMBR was studied by
Cornelissen et al. (2001) for the treatment of brewery wastewater with a constant COD
removal of 95%, while Huei (2005) evaluated the performance of a packed-bed upflow
anaerobic reactor (PBUAR), coupled with a MBR. The COD reduction during the MBR stage
ranged between 92% and 96 %. COD removal efficiency of 95.15% was obtained in a
submerged double-shaft rotary DSR-AnMBR, which was used for the treatment of synthetic
brewery wastewater (Ling et al., 2009).
A multi-segment biochemical treatment (AO/MBR) process, which included an anoxic and
aerobic stage, was used in the integration of an UASB-MBR to treat beer brewing
wastewater (Dai et al., 2010). The average COD and TN removals were 96.1% and 92%,
respectively. Using the MBR technology to treat brewery wastewater accomplished high
removal rates for COD (96.1%) and NH4-N (92%). The permeate quality parameters that
were assessed were better than those that were set to treat wastewater for the purpose of
reuse (Dai et al., 2010). The SBR post-treatment was utilized for the treatment of brewery
wastewater with COD ranging from 400 to 2 000 mg/L, characterized by the use of aerobic
zone, followed by an anoxic zone. There was an oxygen limitation when DO was 3.7 mg/L
with HRT of 1.9 in the aerobic-anoxic sequence, characterized by a pre-denitrification step
and thereafter the aerated phase in the anoxic–aerobic–anoxic sequence and HRT of 1.2 d
with DO of 2.8 mg/L in the aerated period. The maximum observed specific nitrogen removal
rate was 0.04 kg/kg and NO3-N in the permeate was lower than 8 mg/L. The results attained
when acetate was used to increase the mass C:N ratio to 1.3 during the anoxic phase,
leading to a complete nitrate removal, confirmed the soluble carbon source. Conversely,
denitrification was inhibited throughout the aerated period when the DO was increased to 7
mg/L. The nitrogen removal efficiency was 50%, resulting in a wastewater NO3-N above 15
mg/L. An upflow anaerobic sludge bed and membrane bioreactor (UASB+MBR) was
investigated by using various operations to treat brewery wastewater of COD around 500 to
1 000 mg/L and pH of 7.7. The DO of the aerobic zone was controlled at a range of 2 to 4
mg/L. The system treatment efficiency was up to 96% (Dai et al., 2010).
The brewery wastewater of CODs, which ranged between 2 000 and 6 000 mg/L was treated
by an integrated system of packed bed upflow anaerobic reactor (PBUAR) and a three flat
shaped microfiltration (MF) membrane of 0.4 µm pore size and a surface area of 0.1 m2 were
submerged in a bioreactor, which operated at HRT of 2.12 and 18 h. The average OLR for
PBUAR was approximately 4.5 kg COD/m3d and for MBR was 1 kg COD/m3d with the air
Page 46 of 132
flow rate at 0.02 m3/h. The COD removal for PBUAR was 75% and the MBR was between
92% and 96% (Huei, 2005).
2.7.1.2 Membrane bioreactor for non-alcoholic beverages’ wastewater treatment
MBRs have also been evaluated for the treatment of fruit juice and softdrink industry
wastewater along with further membrane filtration (Blöcher et al., 2003; Chiemel et al., 2003;
Noronha et al., 2002) in order to facilitate water reuse (Haroon et al., 2013; Alam et al.,2007;
Miyaki et al., 2000;Tay & Jeyaseelan, 1995), and to meet the required discharged standards
(Drogui et al., 2008; Amuda & Amoo, 2007; Oktay et al., 2007; Amuda et al., 2006;
Kuyuzhnyi, et al., 1997). Table 2.4 indicates the treatment methods for non-alcoholic
beverage wastewater. Blöcher et al. (2003) implemented a system that comprised of MBR
and a combined NF/UV disinfection phase. During the MBR stage the COD removal
efficiencies were above 95%; with similar results obtained by Chiemel et al. (2003). These
integrated processes treated water to meet the legal bacteriological standards for drinking
water (Blöcher et al., 2003; Chiemel et al., 2003; Noronha et al., 2002).
The AMBR was used to treat a fluctuating softdrink industry wastewater with COD between
200 and 3 000 mg/L. The MBR accomplished constant organic compound removal from the
wastewater with removal efficiencies of 94% for both COD and TOC, and 98% for BOD.
Hence, these properties of MBR systems and the variations of flow and COD concentrations
of beverage industry wastewaters, the treatment of these wastewaters in a MBR is
motivating (Matošić et al., 2009). As a result, MBR post-treatment method could be utilized
for the treatment of softdrink industry wastewater. Aerobic conditions were also studied by
using iMBR under at pilot-scale for the treatment of softdrink wastewater from a bottling plant
for further filtration and water reuse (Matošić et al., 2009).
2.7.2 Types of membranes and membranes filtration methods
Membranes are classified according to the type of filtration and separation methods, which
will determine the membrane pore size. Membrane filtration occurs when force is applied to
water or wastewater through the membrane (Judd, 2011; Huei, 2005). According to Judd
(2011); Simate et al. (2011); and Huei (2005), there are four main pressure driven membrane
separation and filtration methods from which water and wastewater permeate:
1) Microfiltration (MF): Separation and filtration of SS from wastewater is achieved
by sieving through macropores (>50 nm);
2) Ultrafiltration (UF): Separation and filtration occur by sieving through mesopores
(2-50 nm);
3) Nanofiltration (NF): Separation and filtration are attained through a combination of
solubility-diffusion, sieving and charge rejection through micropores (<2 nm); and

Page 47 of 132
4) Reverse Osmosis (RO): Separation and filtration are achieved by the features of
different diffusion rates of wastewater, solutes and solubility through the
membrane.
2.7.3 Membrane materials and filtration methods in beverage industry
In general, there are two main different types of membrane materials that are utilized to form
membranes, namely ceramic and polymeric (Judd, 11). A number of configuration and
membrane types have been used in MBR applications for the treatment of beverage industry
wastewater treatment, which include tubular, rotary disk, hollow fibre, organic (polyethylene,
polyethersulfone, polysulfone and polyolefin), metallic, stainless steel, inorganic (for
example, zirconia, ceramic) MF and UF membranes (Valderrama et al., 2012; Bilad et al.,
2011; Torres, et al., 2011; Wijekoon et al., 2011; Kanai et al., 2010; Satyawali &
Balakrishnan, 2009; Matošić et al., 2009; Artiga et al., 2007; Melamane, 2007; Coetzee et al.,
2004; Chmiel et al., 2003; Noronha et al., 2002; Blöcher et al., 2002; Miyaki et al., 2000).
Most membrane modules used in AnMBRs were implemented by using MF or UF
membranes, with either hollow fibre, flat sheet (plate or frame) or tubular configurations due
to their high packing density and cost efficiency. Hollow fibre membrane modules are
popularly used in iMBRs. In recent years, wastewater pre-treatment in recent years have
shifted towards the use of low-pressure membrane processes such as UF and MF (Agana et
al., 2013; Judd, 2011; Kim et al., 2008).
The configuration of MBR is based on either cylindrical or planar geometry. There are six
main membrane configurations in practise: 1) flat sheet (FS); 2) hollow fibre (HF); 3) (multi)
tubular (MT); 4) capillary tube (CT); 5) pleated filter cartridge (FC); and 6) spiral-wound (SW)
(Judd, 2011; Henze et al., 2008). However, for MBR only, HF, FS and MT are appropriate
since they are easy to clean, and support a high amount of turbulence. HF modules operate
with the flow passing from outside to inside (Judd, 2011). Optimal membrane efficiency
should be arranged in the following style: 1) a design that allows modularisation that allows
easy cleaning; 2) a design that permits easy cleaning; 3) membrane area should be higher to
module volume ratio; 3) a high degree of turbulence on the feed side should promote mass
transfer; 4) volume of product water produced should require low energy requirements per
unit; and 5) membrane low costs (Judd, 2011; Henze et al., 2008).
The removal of TSS present in beverage production wastewater is a significant pre-treatment
step throughout water recovery. This guarantees that the effect of fouling on a primary
treatment method such as high-pressure membrane filtration (NF and RO) is reduced.
Processes that are normally used for the pre-treatment of beverage production wastewater
comprises of coagulation/flocculation (Amuda & Amoo, 2007; Amuda et al., 2006), and low-

Page 48 of 132
pressure membrane filtration (UF and MF) (Agana et al., 2013; Chmiel et al., 2003). The
decision on whether to utilize MF or UF as pre-treatment for a specific wastewater usually
depends on the nature and particle size range of contaminants that are present. Usually, UF
rejects large dissolved molecules and colloidal particles in the 0.01 to 0.1 μm size range, and
MF rejects suspended solids in the 0.1 to 1 μm size range (Agana et al., 2013). Although
both types of membranes can normally be used for the pre-treatment of wastewater, an UF
membrane is usually favoured in industrial surroundings (Vedavyasan, 2007). UF membrane
can successfully eliminate TSS and emulsified oils present in industrial wastewater (Zhang et
al., 2008; Karakulski & Morawski, 2000). UF filtrate water quality has been shown to be
higher than MF (Teng et al., 2003).
Ceramic membranes are the choice in the pre-treatment of highly polluted industrial
wastewater due to their thermal resistance and chemical stability (Lee & Cho, 2004). They
function well within a pH range of 1 to 14 and can be operated at temperatures as high as
500˚C (Van Gestel et al., 2002). One of the typical qualities of ceramic membranes is their
capability to tolerate high residual chlorine concentrations under alkaline pH (Agana et al.,
2013). Other advantages of ceramic membranes include a longer lifetime, lower cleaning
frequency and higher average flux (Agana et al., 2013). Although ceramic membranes may
offer a number of advantages in comparison to polymeric membranes, their use in industrial
wastewater treatment has been restricted due to their high initial cost and their intrinsic
brittleness. In addition, sudden temperature changes and pressure surges can cause thermal
and physical shocks, respectively, which may fracture the membranes (Agana et al., 2013).
A comparative study was performed by Kang et al. (2002) with regard to the filtration
characteristics of organic and inorganic membranes in a membrane-coupled anaerobic
bioreactor (MCAB). The reactor was maintained at a thermophilic temperature of 55°C. The
two tubular membranes that were chosen for comparison were: a zirconia skinned inorganic
membrane with a pore size of 0.14 μm and a hydrophobic polypropylene membrane with a
pore size of 0.2 μm; and treating distillery industry wastewater COD of 38 400 mg/L. With
acidic pH of 2.0 backflushing, the flux was approximately doubled for the organic membrane.
Three types of membranes were tested by Torres et al. (2011), namely ceramic membrane
of 0.2 µm and two polymeric membranes of 30 nm at different internal diameters of 5 and 8
mm for the treatment of brewery wastewater, which presented an average COD of 21 000
mg/L. Reactor and membrane modules were operated at a temperature of 30˚C and pH of
6.9. Membrane modules were operated with cycles consisting of 5 min of filtration, followed
by 30 s of backflush.

Page 49 of 132
2.8 Advantages and disadvantages of membrane bioreactors (MBRs)
The advantages offered by MBR methods over conventional anaerobic systems and aerobic
MBR are broadly acknowledged (Lin et al., 2012; Mutamim et al., 2012; Singhania et al.,
2012; Judd, 2011; Liao et al., 2006). MBR systems have proven relatively efficient in
eliminating organic and inorganic contaminants, as well as biological microorganisms from
wastewater. Advantages of the MBR include high quality permeate free of bacteria, good
management of biological activity and pathogens, higher organic loading rates and smaller
plant sizes (Lin et al., 2012; Mutamim et al., 2012; Singhania et al., 2012; Judd, 2011; Liao et
al., 2006; Cicek, 2003). A disadvantage related to MBRs are primarily high capital costs due
to fouling problems, which can result in the regular cleaning of membranes (Mutamim et al.,
2012; Singhania et al., 2012; Cicek, 2003).
2.9 Membrane fouling and the effect of air scouring
Membrane fouling is initiated by the deposition of colloidal, particulate, or soluble material on
the membrane surface or inside the pores. Hydrodynamic forces can be applied to remove
deposit on membrane surfaces. However, these forces do not only affect the deposition
layer, but might have negative effects on soluble microbial products and a reduction in
flocculant dosage. Due to the high costs associated with fouling, a substantial number of
studies have focused on the cause and control of fouling in MBRs over the past decade
(Böhm et al., 2012). The significance of the multi-phase fluid dynamics for controlling fouling
has been generally addressed with air scouring, which is also applied commercially to create
positive hydrodynamic flow on the surrounding area of the membrane surface. These flow
fields are induced by the complex interactions between flux, cross flows, as well as turbulent
eddies, which are created by the increasing the number of bubbles (Böhm et al., 2012;
Logsdon, 2011).
Membrane fouling is the main obstacle that holds back quicker commercialization of MBRs.
Membrane fouling results in a reduction of permeate flux or an increase of TMP, depending
on the operation mode. The permeate flux is defined by the product of water flow, which is
divided by the surface area of the membrane (Böhm et al., 2012; Logsdon, 2011; Le-Clech et
al., 2006). Permeate flux is calculated according to Equation: 2-20:
Equation: 2-20
Where, J = filtrate flux (L/h.m2)
Q = flowrate (L/h)
A = Membrane surface area (m2)
Page 50 of 132
TMP is transmembrane, which is the pressure difference from the average feed
concentration to the permeate transversely to the membrane wall. Operating parameters that
have been reported to affect membrane performance are TMP, cross flow velocity, pH, as
well as temperature (Ramaswamy et al., 2013). Equation: 2-21 represents transmembrane
pressure:
Equation: 2-21
Where, TMP = Transmembrane Pressure (kPa)
= feed pressure (kPa)
= permeate pressure (kPa)
2.10 Beverage industry wastewater recycling or reuse
A tertiary wastewater treatment gives attention to the disinfections of wastewater streams.
This is generally performed through oxidation methods such as ozonation, chlorination and
UV. Low-pressure membrane filtration is more recognized and has advantages over
conventional treatment methods. These advantages include: 1) compact modular
construction; 2) continuous operation under steady-state conditions; 3) an efficient
separation process even without a change of phase; and 4) reliable permeate water quality in
spite of differences in the quality of feed water (Agana et al., 2013; Chen, et al., 2006).
Membrane treatment methods have also been considered for their disinfectant characteristic,
while MF and RO membranes have been used to impart the disinfection of industrial
wastewater. One of the objectives and being part of the water-stressed world is to reduce the
amount of freshwater, which is utilized by increasing the volume of recycled water. The
benefits of recycling industrial wastewater is the reduction in freshwater intake and
wastewater disposal cost, as well as saving in chemical costs (Milne et al., 2009; Tamime,
2009).
Although recycling is possible in the food and beverage industry, it is important to consider all
regulations, standards and by-laws, including health and safety (Milne et al., 2009; Tamime,
2009). There are direct perceptions of industries that, regardless of the level of treatment
methods applied and the quantity of microbial infectivity in the recycled streams, direct
contact should be avoided merely because of this perception. Additionally, consumers are
reliant on confidence and trust (Tamime, 2009; Casani et al., 2005). Typical uses of recycled
water include in-house water replacements for cooling tower make-up and boiler feed, CIP
water rinse, floor cleaning, toilet flushing and irrigation. However, CIP, cooling tower make-up
and boiler feed are the most intensive water processes. Although mixed wastewater streams
may be recycled, most studies have been reported on the treatment and recycling of specific

Page 51 of 132
streams. NF permeate can produce treated wastewater that is suitable for boiler feed and
RO permeate for cooling towers. Beverage industries usually recycle their wastewater from
bottle washing streams (Milne et al., 2009; Tamime, 2009; Mavrov et al., 2001).
Treatment methods such as UF, RO, UV and ion exchange (IE) have been previously
investigated for beverage industry wastewater to facilitate reuse (Haroon et al., 2013; Murthy
& Chaudhari, 2009; Nataraj et al., 2006; Chmiel et al., 2003; Noronha et al., 2002; Blöcher et
al., 2002). Table 2-5 and Table 2-6 indicate that UF, MF, IE and RO units were utilized in
areas where discharge requirements were stringent, or direct reuse or recycling of the
wastewater was required for both alcoholic and non-alcoholic beverage industries (Haroon et
al., 2013; Acharya et al., 2008; Nataraj et al., 2006; Miyaki et al., 2000; Gao et al., 2007;
Artiga et al., 2007; Chmiel et al., 2003; Noronha et al., 2002). These methods have been
used for the treatment of distillery wastewater to remove the colour and contaminants, with
COD removal efficiencies of up to 99.9%. The treated wastewater was suitable to be reused
or recycled for both industrial and domestic purposes (Agarwal et al., 2010; Murthy &
Chaudhari, 2009; Acharya et al., 2008; Nataraj et al., 2006; Mohana et al., 2007). The
membrane based treatment method for beverage industry wastewater recycling are UF and
RO. In both cases the removal efficiencies were higher than 94%. However, salt reduction
was higher in RO systems than was predictable (Murthy & Chaudhari, 2009; Tamime, 2009;
Acharya et al., 2008; Nataraj et al., 2006; Mavrov & Bélières, 2000).
An integrated membrane filtration process comprised of an NF and ultraviolet (UV)
disinfection stage, which was developed to produce water of drinking quality out of polluted
fruit juice industry wastewater with an average COD of 4 030 mg/L. A membrane flux of 12-
15 L/m2h was achieved at a TMP of 60 to 100 mbar. The pH and temperature were
maintained at an average of 8.2 and 26˚C, respectively. The nutrients were adjusted in the
bioreactor with C:N and C:P at a ratio of 20:1 and 100:1, respectively, and the bioreactor
COD removal rates were above 95% (Blöcher et al., 2002). Similar studies were also
performed by Chmiel et al. (2003) for fruit juice industry wastewater with COD of 1 800 to
6 600 mg/L for reuse. The NF membrane flux was at 14 L/m2h and the reactor pH was 7.8 to
9. The COD removal rates achieved was also above 95%. A water recycling method was
developed and implemented by Miyaki et al. (2000) for reuse in a beverage industry that
produces both carbonated and non-carbonated softdrinks, while a floating media filtration
followed by NF, was used. The COD removal from NF was above 70%. A combination of
cartridge filter (CF), RO and IE pilot-scale system was used by Haroon et al. (2013) for the
treatment of wastewater from a softdrink facility. The integrated system was capable of
removing more than 99% of the contaminants.
Page 52 of 132
CHAPTER THREE MATERIALS AND METHODS
3.1 Background
The softdrink industry wastewater (SDIW) that was used was obtained from a continuous
softdrink processing industry (located in the Western Cape, SA), which produces carbonated
softdrinks and carbonated flavoured water. The SDIW was a combined stream that was
generated from different operations and comprises a blend of water from bottle-washing,
colorants, flavoring agents, lubricants from conveyor belts, syrup, cleaning of floors,
machinery, pipes and work zones. Water is an essential raw material, which is used in
softdrink production, with a consumption of 2.5 to 3.5 L of freshwater per litre of softdrink
production (Hsine et al., 2010). The wastewater from the industrial partner was directed into
an equalization tank located on-site before being discharged to the municipal sewer. The
wastewater that was used in this study was collected from the equalization tank. A
laboratory-scale plant comprising of an anaerobic EGSB pre-treatment and MBR post-
treatment was utilized for the treatment of this SDIW. The purpose of this study was to
perform a technology evaluation on the effectiveness and efficiency of the combined EGSB
and MBR technology for the treatment of SDIW, and to access the possibility of wastewater
recycling or reuse.
3.2 Softdrink industry potable water
Potable water samples before and after pre-treatment on-site were collected and analysed in
order to compare the composition of this water to the drinking water quality standards and
guidelines, as specified in SANS 241:2011. Eight 2L potable water samples were collected
from the tap every second week and four 2 L samples were collected from the pre-treatment
plant when operational. These samples were also taken to compare the treated water from
this study. Sample analysis methods will be covered in Section 3.5.1.
3.3 Softdrink industry wastewater (SDIW)
Eight 2 L bottle-washing wastewater samples were collected on-site every second week for
analysis. Eight batches of SDIW (500 L each) collected from the equalization tank on-site.
Initially it was planned to collect samples every third week, however, to stop the biological
activity in the holding tank the SDIW was collected every second week and used as the feed
for the EGSB pre-treatment system in this study. After pumping this wastewater into a 1000 L
holding tank on campus and circulating for 30 minutes by using a submersible pump a
sample was taken and analyzed. Sample analysis will be covered in Section 3.5.1.

Page 53 of 132
3.4 Experimental setup
A four-stage process consisting of a biological (anaerobic, anoxic and aerobic) treatment
stages followed by a membrane separation unit, as shown in Figures 3.1, 3.2, 3.3 and 3.4
was utilized for the treatment of the SDIW. The SDIW was fed from the holding tank and
passed through a (30 L) settling tank fitted with a 1 mm fine mesh filter, followed by a filter
(Effast 0.5 mm cartridge filter) in order to remove any fibrous and/or particulate matter, under
a vacuum of between -10 and -100 kPa before entering the anaerobic EGSB pre-treatment
phase (Li et al., 2008).
3.4.1 Anaerobic expanded granular sludge bed (EGSB) pre-treatment
The anaerobic EGSB reactor, made of polyvinylchloride (PVC) (ID of 104 mm, 2070 mm high
and a 24 L working volume) was incorporated to effectively reduce the organic load of the
SDIW prior to aerobic treatment. Refer to the piping and instrumentation diagram (P&ID) in
Figure 3.3 for a detailed design of the anaerobic EGSB system. The EGSB design, which
was also used in the study by Sheldon et al. (2012), was based on the design by Zhang et al.
(2008).
The discharge stream at the top of the EGSB reactor was divided into two, namely: (i)
recirculation stream; and (ii) EGSB product stream. The recirculation stream from the top of
the EGSB reactor was mixed with the filtered wastewater feed in a mixing tank to ensure a
consistent feed into the bottom of the EGSB reactor. The fluid upflow velocity (Vup) was
maintained by supplying a wastewater recirculation stream at the bottom of the EGSB to
improve mixing. The pH of the EGSB reactor was measured by means of a pH probe, which
was located in the stirred mixing tank. The mixing tank is an essential feature for pH control
and homogeneous environmental conditions. A dosing pump was installed to regulate the
pH, as shown in Figure 3.3. The flowrates from the EGSB feed and EGSB product were
measured three times daily. A gas-liquid-solids separator was utilized at the top of the
column to allow for separation of the solids and biogas from the liquid phase, as shown in
Figure 3.4.

Page 54 of 132
Figure 3.1: Block flow diagram showing the laboratory integrated EGSB and UF-MBR system used in the treatment of softdrink industry wastewater
Softdrink Wastewater Holding Tank
1000L
Settling Tank
30L
Gas Collection Chamber
AnoxicTank
35L
AerobicTank
35L
MembranesPermeate
Recycle Stream
EGSB

Page 55 of 132
Figure 3.2: Laboratory integrated EGSB and UF-MBR system used in the treatment of softdrink industry wastewater
Softdrink Industry Wastewater Holding Tank
(1000 L)
Settling Tank
Ultrafiltration Membranes
Anoxic Tank Aerobic Tank Permeate Tank EGSB
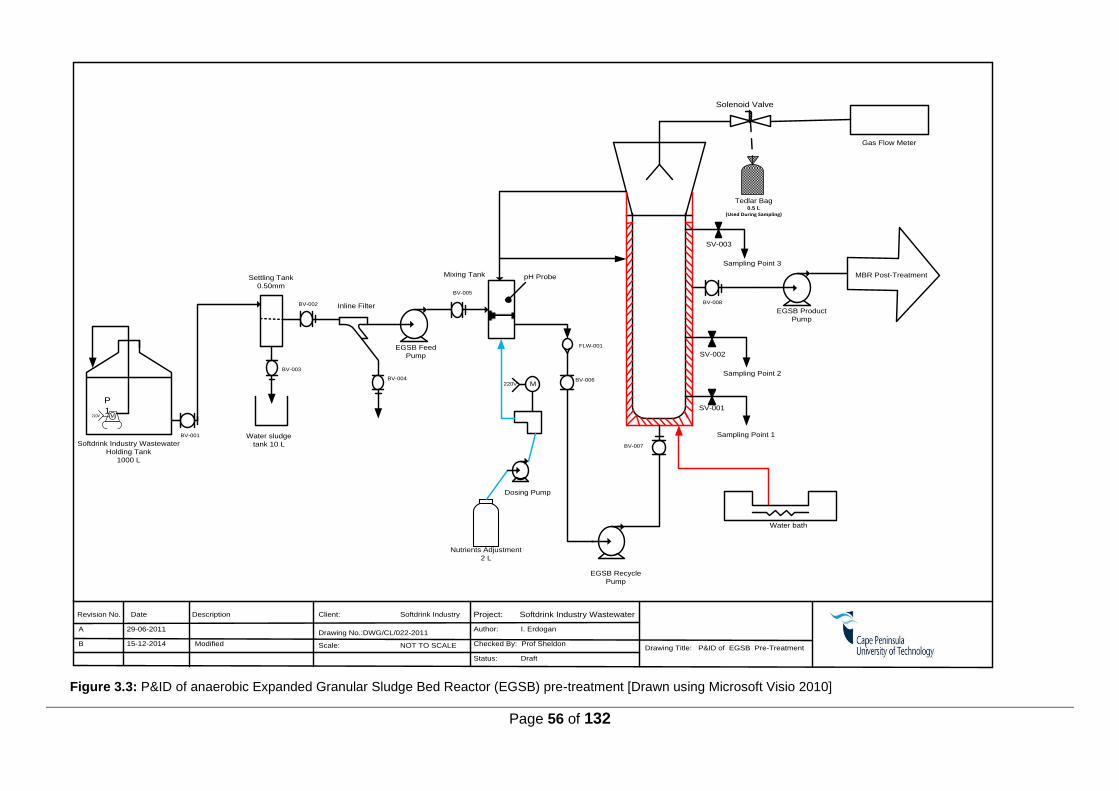
Page 56 of 132
SV-003
MBR Post-Treatment
Sampling Point 3
Sampling Point 2
Sampling Point 1
Water bath
M
M220V
P
1
Water sludge
tank 10 L
Revision No.
A
B
Date Description Client: Softdrink Industry
Settling Tank
0.50mm
BV-001
BV-002
BV-003
BV-005
BV-004
Inline Filter
pH Probe
Nutrients Adjustment
2 L
FLW-001
BV-006
BV-007
BV-008
Gas Flow Meter
220V
Mixing Tank
29-06-2011
15-12-2014
Drawing No.:DWG/CL/022-2011
Scale: NOT TO SCALE
Author: I. Erdogan
Checked By: Prof SheldonDrawing Title: P&ID of EGSB Pre-Treatment
Project: Softdrink Industry Wastewater
Modified
SV-002
SV-001
Status: Draft
Softdrink Industry Wastewater
Holding Tank
1000 L
Tedlar Bag 0.5 L
(Used During Sampling)
Solenoid Valve
EGSB Feed
Pump
EGSB Recycle
Pump
Dosing Pump
EGSB Product
Pump
Figure 3.3: P&ID of anaerobic Expanded Granular Sludge Bed Reactor (EGSB) pre-treatment [Drawn using Microsoft Visio 2010]

Page 57 of 132
3.4.1.1 EGSB inoculation
The EGSB was inoculated with granular anaerobic inoculum (9 L) with total suspended solids
(TSS) of 1 182 mg/L and volatile suspended solids (VSS) of 24.5%. The granular anaerobic
inoculum was collected from a full-scale UASB reactor treating brewery wastewater
(SABMiller plc, Newlands, South Africa). Activated sludge (AS) (3 L) with a TSS of 1 064
mg/L and VSS of 1.5 % was obtained from the Athlone Wastewater Treatment Works (City of
Cape Town, South Africa). This combined inoculum was used in order to reduce the start-up
time and acclimatisation period of the EGSB. The EGSB was allowed to stabilise by putting it
on a recycle operational mode for 24 h. Prior to inoculation, the SDIW was characterized in
terms of its organic matter biodegradability. The SDIW from the industrial partner had a COD
of 5 000 mg/L and a BOD of 1 150 mg/L. Due to the nature of the main ingredients used by
the softdrink industry during production, sugars are the major pollutant present in the SDIW
and can, therefore, readily biodegraded by micro-organisms. This wastewater had a
BOD:COD ratio of 0.23, which was a prediction of good biodegradability (Hsine et al., 2010;
Chmiel et al., 2003; Guven, 2001; Kalyuzhnyi et al., 1997).
3.4.1.2 EGSB operation and operating conditions
The reactor was equipped with a hot water jacket to maintain a mesophilic temperature of
between 35 to 37˚C, which is optimal for AD to occur (Matovic, 2013; Manyi-Loh et al., 2013;
Sheldon et al., 2012; Trzcinski & Stuckey, 2009; Monson et al., 2007). During the
acclimatization phase, phosphoric acid (H3PO4) was used for dosing in order to decrease the
feed pH. The EGSB was dosed with 0.5M H3PO4, which assisted in attaining the optimum
C:N:P ratio of 100:1.8:0.4 (Peixoto et al., 2011). An average CODt value of 4 197 mg/L
requires the ammonium and organically bound nitrogen, as well as the phosphorous
concentrations in the wastewater to be 75.6 and 16.8 mg/L, respectively. However, the actual
C:N:P ratio was 100:0.09:0.02. Refer to Appendix B1 for the preparation of a 0.5M H3PO4
dosing solution. The SDIW had a high pH value of ~ 10.1, which was due to the use of
sodium hydroxide (NaOH) solution that was used to clean the bottles. However, it was
discovered that the SDIW, without added nutrients can enhance hydrogen generation
(Peixoto et al., 2011). Gas chromatograph (GC) showed that the major constituents of the
organic matter in the EGSB reactor were acids, alcohols and esters.
In this study the EGSB was overdosed with H3PO4 which resulted in a stress period. A stress
period is defined as the stability of an anaerobic treatment system, which occurs due to
changes in environmental conditions such as pH, temperature and heavy metals (Mudhoo &
Kumar, 2013).The EGSB failed during this stress period and as a result, the dosing with
H3PO4 was stopped after 75 days. A second start-up was initiated.
Page 58 of 132
The C:N:P ratio of the SDIW was appropriate for bioconversion to methane (CH4), and it was
not essential to supplement the EGSB reactor with nutrients during the second start-up,
which was in agreement with observation made by Luo et al. (2009) and Yu et al. (2006) in
the treatment of cassava sillage and winery wastewater. The pH of the raw wastewater was
adjusted to between 6.5 and 7.2 by using 1M sodium hydrogen carbonate (NaHCO3) for
effective AD (Wijekoon et al., 2011; Turkdogan-Aydinol & Yetilmezsoy, 2010; Gohil & Nakhla,
2006). Following acclimatization, the operation of the EGSB was started immediately with the
actual SDIW as the carbon source containing feed.
The EGSB operating conditions were measured daily and are shown in Tables 3.1 and 3.2,
which were a modification to operational parameters used for the paper mill wastewater
treatment (Sheldon et al., 2012) and brewery wastewater treatment (Connaughton et al.,
2006). The EGSB was operated for 135 days and the treatment experiments were divided
into three different operational modes. Each mode was characterised by an adjustment in the
hydraulic retention time (HRT). With each HRT, the Vup was changed stepwise, up or down,
to determine the performance of the system. According to Sheldon et al. (2012), during the
treatment of paper mill wastewater, the EGSB had an Vup of 1.1 m/h; hence, this was used
during the start-up and acclimatization phase. However, on day 22 it was noticed that the
reactor bed had risen to the top of the column; and as a result, the Vup was decreased to
0.59 m/h to prevent system failure.
3.4.2 Biogas production
Biogas was produced during the anaerobic pre-treatment phase, as explained in Section
2.5.2 in the literature review. A custom made on-line biogas measuring unit, which was
obtained from the University of Cape Town (UCT) was installed at the top of the EGSB to
measure the flowrate of the biogas that was produced, as shown in Figure 3.4. Biogas
production was monitored and measured daily by using a water displacement technique. The
volume of water that was displaced from the biogas flow meter was equivalent to the volume
of gas that was produced. As soon as the EGSB reached a steady state for each specific
operating condition, biogas samples were collected in duplicate by using a 0.5 L Tedlar bag
(Méndez-Acosta et al., 2010) as shown in Figure 3.4, which was attached to the biogas exit
stream. Biogas samples were sent to J. Muller laboratories (SA) for analysis of the chemical
composition. An extraction fan was used to discharge the biogas from the laboratory to the
atmosphere.

Page 59 of 132
Table 3.1: EGSB pre-treatment planned operation conditions from literature (Sheldon et al., 2012; Connaughton et al., 2006).
Reactor Operational Conditions Start-up Mode-1a Mode-1b Mode-2a Mode-2b Mode3a Mode3b
HRT (d) 2.5 2 1 1 0.8 0.8 0.5 0.5
HRT (h) 58.7 48 24 24 18 18 12 12
Feed Rate (L/d) 10 12.2 24.5 24.5 32.6 32.6 48.9 48.9
Feed Rate (L/h) 0.5 0.5 1.0 1.0 1.4 1.4 2.0 2.0
Product Rate (L/d) 10 12.2 24.5 24.5 32.6 32.6 48.9 48.9
Product Rate L/h 0.4 0.5 1.0 1.0 1.4 1.4 2.0 2.0
Vup m/h) 1.1 1.1 1.1 0.85 0.85 1.1 1.1 0.85
Table 3.2: EGSB pre-treatment actual operation conditions measured
Reactor Operational Conditions
Acclimatisation Start-up 1 Stress period Start-up 2 Mode-1a Mode-1b Mode-2a Mode-2b Mode3a Mode3b
Days (d) 0 - 21 22 - 41 42 - 48 49 - 62
- 62
63 - 69 70 – 74
77 - 90 91 - 97 98 - 104 105 - 111 112 - 118 119 -125 126 - 135
HRT (d) 2.4 - 2.6 2.4 - 2.6 2 - 2.03 1.9 - 2.0 1 - 1.1 11.0 2.0 - 2.03 1.0 1.0 0.7 - 0.8 0.8 0.5 0.5
HRT (h) 57 - 62.1 58.4 - 61.3 48.2 - 48.6 46 - 48.4 24.1 - 25.1 24.4 – 25 47.6 - 48.8 23.7 - 24.6 24 - 24.1 17.7 - 18 18 - 18.3 12 - 12.5 12.0 - 12.3
Feed Rate (L/d) 9. 5 - 9.8 9.58 - 10.3 12.1 - 12.2 12.1 - 12.8
23.4- 24.4 23.5 - 24.1 12.0 - 12.3 23.8 - 24.9 24.4 - 25.4 32.6 - 34.8 32.2 - 34.6 48.0 – 49.0 48.3 – 49.0
Feed Rate (L/h) 0.4 - 0.4 0.4 - 0.4 0.5 - 0.5 0.5 - 0.5 1.0 1.0 0.5 1.0 1.0-1.1 1.4 - 1.5 1.3 - 1.4 2.0 2.0
Product Rate (L/d)
9.5 9.5 12.3 - 12.4 12.3 - 12.8 23.4 - 24.5 23.6 - 24.4 12.1 - 12.2 24.2 - 24.8 24.1- 24.9 32.3 - 35 33.2 - 33.9 48.0 - 48.8 48.0
Product Rate (L/h)
0.4 0.4 0.51 - 0.52 0.5 - 0.5 1.0 1.0 0.5 1.0 1.0 1.3 - 1.5 1.4 2.0 2.0
Vup (m/h) 1.1 0.59 0.85 1.1 1.1 0.85 1.1 1.1 0.85 0.85 1.1 1.1 0.85
OLR (kg COD/m
3d)
0.7 - 1.2 0.7 - 0.9 0.9 - 1 0.6 - 1.9 4.6 - 5.4 4.4 - 4.7 4.4 - 5.4 2.8 - 3.4 2.3 - 2.7 7.6 - 7.9 6.2 - 7.2 10.9 - 13.2 8.2 - 9.9

Page 60 of 132
Gas Flow Meter
Tedlar Bag - 0.5L
Used for Sampling
Solenoid Valve
EGSB
n
Gas Meter
Counter
Figure 3.4: Schematic representation of biogas measuring unit [Drawn using Microsoft Visio 2010]
3.4.3 UF-Membrane bioreactor (MBR) post-treatment for softdrink industry wastewater
A modified Ludzack-Ettinger (MLE) process configuration (Spellman, 2013) was adopted for
the biological as post-treatment phase, as shown in Figure 3.5. Denitrification and nitrification
were achieved with an anoxic zone (35 L), followed by an aerobic zone (35 L), respectively.
Both zones were inoculated with 10 L of sewage sludge, which were obtained from Athlone
Wastewater Treatment Works (City of Cape Town, South Africa), with a TSS concentration of
1 064 mg/L and VSS of 15%. The anoxic and aerobic zones both contained 30 plastic
bioballs of about 3 cm in diameter, which were used as biofilm carriers on which the biomass
was immobilised (Ng et al., 2011). The biomass in the anoxic zone was kept in suspension
by using a HP-6606 submersible pump. The flowrates (Q) from the anoxic and aerobic
zones, as well as from the ultrafiltration (UF) permeate, were measured thrice daily. Aeration
was accomplished by means of air diffusers, which were located at the bottom of the aerobic
zone. Aeration with specified dissolved oxygen (DO) concentrations in the aerobic zone was
monitored based on the operating conditions of 2, 2.8 and 3.7 mg/L DO (Sheldon et al.,
2012; Brito et al., 2007).
The product from the aerobic zone was fed through two airlift UF-membrane modules 0.058
m2 per module, with inner diameter of 0.065 m and active length of 0.47 m, each consisting of
six ceramic aluminium oxide (Al2O3) tubular membranes with pores of 0.2 and 0.4 µm,
respectively. Permeate was extracted on the shell side of the membrane modules, while the
retentate was recycled back to the anoxic and aerobic zones. The feedrate to the UF-
membranes was dependant on the operating conditions of the EGSB product flowrate. The

Page 61 of 132
average feed flowrate to the UF membranes was approximately 128.2 L/d for both modules,
of which the retentate had to be recycled back to the anoxic and aerobic zones to provide
ideal denitrification (Spellman, 2013). Correspondingly, membrane fouling was preventatively
controlled through continuous air scouring, which was gradually increased from 0.5 to 2.5
L/min per module (Sheldon et al., 2012; Zhang et al., 2006) on the lumen side of the
membranes. Further fouling prevention included a backflush system to the membrane
modules by using reverse permeate flow, controlled via a cyclic timer. Following 5 min of the
forward cycle, the backflush cycle would start for 7 s at a set flowrate, pumping UF permeate
back into the membranes.
3.4.3.1 UF-MBR operating conditions
The MBR phase was started 36 days after the EGSB phase to allow the EGSB to first
stabilize. The MBR was put on recycle for 24 h during this period with an average mixed
liquor suspended solid concentration (MLSS) in both anoxic and aerobic zones of 530 and
455 mg/L, respectively. The UF-MBR was operated for 95 days starting with 10 L/d EGSB
product as the carbon source with a CODt concentration of approximately 1 650 mg/L. The
system was allowed to acclimatize for 3 days. The MBR was operated for 13 days during
Mode-1a of operation without bioballs. The target operating conditions were adjusted from
Sheldon et al. (2012) and Brito et al. (2007), which were used for paper mill and brewery
wastewater treatment, respectively, and are presented in Table 3.2. The DO was measured
daily in both the anoxic and the aerobic zones by using the YSI Professional Plus (Pro Plus-
No.: 605596) handheld multiparameter analyser. The flowrates and HRTs for the different
operating modes are indicated in Table 3.3 and the flux through the membranes was
calculated using equation 2-20, as shown in Appendix E.
The overall MBR HRT was gradually decreased from 14.4 to 3.3 h, as shown in Table 3.3.
The MBR was operated in three sequential modes (Modes-1 to -3) with the feed flowrate,
ranging from 12.2 to 48.9 L/d and corresponding UF membrane flux gradually increasing
from 1.4 to 5.6 L/m2h for each mode, as shown in Table 3.3.
3.4.3.2 Cleaning-in-Place (CIP) of ultrafiltration (UF) membranes
The UF membranes were chemically cleaned-in-place (CIP) by using 400 mg/L sodium
hypochlorite (NaClO) solution to remove any bio-fouling and a 1% citric acid solution to
remove any chemical fouling and scaling, according to the Norit X-Flow manufacturer
specifications, every two weeks. CIP was performed on the UF-membrane modules initially
once every two weeks. However, when increased fouling of the membranes was noticed
when the backwash pressure reached 60 to 70 kPa, CIP was performed weekly.

Page 62 of 132
M220VM220V
Aerobic Feed Pump
Permeate Extraction Pump
EGSB Product
Air Blower
Compressor
220V M
Back Flush/CIP Pump
220V M
220V M
220V M
220V M
SLV-001
Overflow Tank
BV-014
BV-013
FLW-002
Anoxic Tank
SV-004
Aerobic Tank
FLW-003
BV-010
FLW-005
BV-011
Membrane
Modules
Air Relief
Valve
FLW-006 FLW-007
FLW-004
SLV-003
Permeate Tank
Revision No.
A
B
Date Description Client: Softdrink Industry
29-06-2011
20-12-2014
Drawing No.: DWG/CLI/022-2011_022
Scale: NOT TO SCALE
Author: I. Erdogan
Checked By: Prof Sheldon
Drawing Title: MBR P&ID Post-Treatment
Project: Softdrink Industry Wastewater
Modified
Status: DRAFT
DV-001
BV-012
Figure 3.5: P & ID of the Modified Ludzack-Ettinger (MLE)-MBR post-treatment phase [Drawn using Microsoft Visio 2010]

Page 63 of 132
During CIP the anoxic and aerobic zones were maintained in the recycle mode, while the UF
membranes were soaked with 400 mg/L NaOCl for 24 h, followed by a 1% citric acid for 4 h
to remove any inorganic matter, including scaling from the membranes. Refer to Appendix
B2 for the preparation of the CIP solutions.
Table 3.3: MBR actual operating conditions
Operating parameters Start-up Mode-1a Mode-1b Mode-2a Mode-2b Mode-3a Mode-3b
Days (d) 1- 3 4 -17 20 - 29 37 - 48 51 – 63 64 - 73 79 - 95
Overall MBR HRT( d) 0.6 0.5 0.3 0.5 0.3 0.2 0.1
Overall MBR HRT (h) 14.4 11.9 6.1 11.9 6.2 4.6 3.3
HRT Aerobic tank (35L) (d) 0.02 0.02 0.02 0.02 0.02 0.02 0.02
HRT Aerobic tank (35L) (h) 0.4 0.4 0.4 0.4 0.4 0.4 0.4
Feed to anoxic (L/d) 10 12.2 24.8 12.2 24.1 33.7 48.8
Feed to anoxic (L/h) 0.4 0.5 1.0 0.5 1.0 1.4 2.0
Recycle from membrane modules to anoxic tank (L/d) 50.0 61.0 123.8 61.0 120.7 168.6 243.8
Recycle from membrane modules to anoxic tank (L/h) 2.1 2.5 5.2 2.5 5.0 7.0 10.2
HRT Anoxic tank (35L) (d) 0.6 0.5 0.2 0.5 0.2 0.2 0.1
HRT Anoxic tank (35L) (h) 14.0 11.5 5.7 11.5 5.8 4.2 2.9
Feed to aerobic (L/d) 60.0 73.2 148.6 73.2 144.8 202.3 292.6
Feed to aerobic (L/h) 2.5 3.1 6.2 3.1 6.0 8.4 12.2
Recycle from membrane modules to aerobic tank (L/d) 198 1 966 1 892 1 968 1 898 1 841 1 752
Recycle from membrane modules to aerobic tank (L/h) 82.5 82.0 78.8 82.0 79.1 76.7 73.0
Feed to membrane modules (L/d) 2 040 2 040 2 041 2 042. 2 043 2 044 2 045
Feed to membrane modules (L/h) 85.0 85.0 85.0 85.1 85.1 85.2 85.2
Total recycle from membrane modules (L/d) 2 030 2 027 2 016 2 029 2 018 2 010 1 996
Total recycle from membrane modules (L/h) 84.6 84.5 84.0 84.6 84.1 83.7 83.2
Permeate flowrate (L/d) 10.0 12.2 24.8 12.2 24.1 33.7 48.8
Permeate flowrate (L/h) 0.4 0.5 1.0 0.5 1.0 1.4 2.0
Flux (J) (L/m2h) 3.4 4.3 8.6 4.3 8.6 12.1 17.2
3.5 Analytical methods
Four samples were collected from four different points at the softdrink industrial partner,
namely potable water (2L), pre-treated water (2L), bottle-washing water (2L), and 500 L of
wastewater from the equalizing tank every second week, and were analysed. HRT samples
were also taken for each biological treatment stage during the entire study and subsequently
labelled HRT1, HRT2, HRT3 and HRT4. For sugar analysis, the samples were filtered by
using a 45 µm filter unit, centrifuged at 13 000 rpm for 10 min to remove the supernatant and
stored at -80˚C before analysis with a high performance liquid chromatography (HPLC).

Page 64 of 132
3.5.1 Softdrink industry water and wastewater
The softdrink industry potable, pre-treated water and wastewater samples that were collected
were analysed for: total chemical oxygen demand (CODt); soluble chemical oxygen demand
(CODs); colour; electrical conductivity (EC); ammonium concentration (NH4+); nitrate
concentration (NO3-); pH; orthophosphate (PO4
3−); sugars, namely: fructose and sucrose;
temperature; total dissolved solids (TDS); total suspended solids (TSS); and turbidity. Refer
to Appendix C for COD, PO4-P, TSS and turbidity measurement methods. Selected samples
were also sent to independent South African National Accreditation System (SANAS)
accredited laboratories (Bemlab, South Africa and Scientific Services, City of Cape Town) for
full chemical water analysis. Biological oxygen demand (BOD5); fats oil and grease (FOG)
samples were sent to an independent accredited laboratory (Scientific Services, CCT) and
were analysed using EPA (1983 method 405.1), and for sugar analysis samples were sent to
the Biocatalysis and Technical Biology (BTB) Research laboratory (CPUT) and analysed
using HPLC method.
3.5.2 Softdrink industry wastewater (SDIW) in the holding tank
SDIW samples were collected weekly from the holding tank of the lab-scale treatment plant,
and analysed, as indicated in Table 3.4 The following parameters were analysed: CODt;
CODs; colour; EC; NH4+; NO3
-; pH; PO43−; sugars, namely: fructose and sucrose; temperature;
TDS; TSS and turbidity.
Table 3.4: Softdrink industry wastewater (SDIW) analysis in the holding tank
Parameters Monday Tuesday Wednesday Thursday Friday Saturday Sunday CODt (mg/L) √ √ √ CODs (mg/L) √ √ √ Colour (mg Pt/L) √ √ √ EC (µS/cm) √ √ √ √ √ √ √ NH4-H (mg/L) √ √ √ √ √ √ √ NO3-N (mg/L) √ √ √ √ √ √ √ pH √ √ √ √ √ √ √ PO4
3− (mg/L) √ √ √
Sugars (mg/L) √ √ √ TDS (mg/L) √ √ √ √ √ √ √ Temperature (
˚C) √ √ √ √ √ √ √
TSS (mg/L) √ √ √ Turbidity (NTU) √ √ √
3.5.3 Sample analysis during EGSB pre-treatment phase
Samples from the EGSB feed and product were collected and analysed, as indicated in
Table 3.5. The following parameters were analysed: CODt; CODs; colour; EC; NH4+; NO3
-;
pH; PO43−; sugars namely; fructose and sucrose; temperature; TDS; TSS and turbidity.
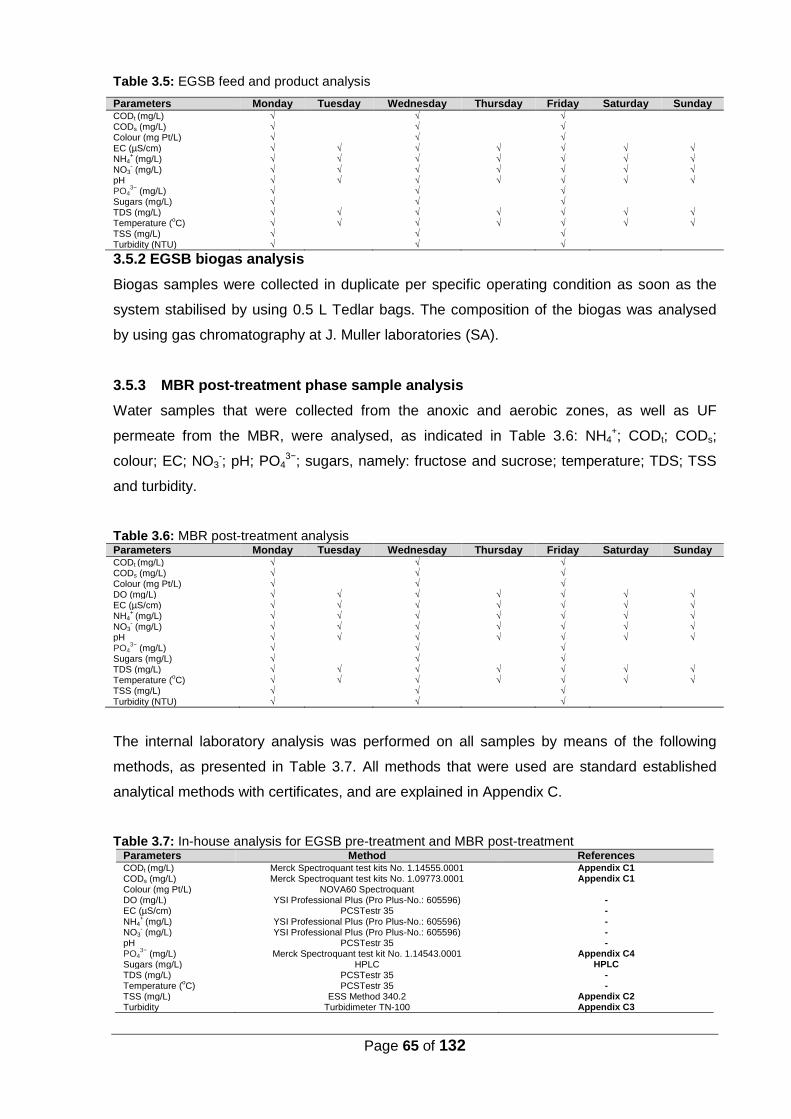
Page 65 of 132
Table 3.5: EGSB feed and product analysis
Parameters Monday Tuesday Wednesday Thursday Friday Saturday Sunday CODt (mg/L) √ √ √
CODs (mg/L) √ √ √ Colour (mg Pt/L) √ √ √
EC (µS/cm) √ √ √ √ √ √ √ NH4
+ (mg/L) √ √ √ √ √ √ √
NO3- (mg/L) √ √ √ √ √ √ √
pH √ √ √ √ √ √ √ PO4
3− (mg/L) √ √ √
Sugars (mg/L) √ √ √ TDS (mg/L) √ √ √ √ √ √ √ Temperature (
oC) √ √ √ √ √ √ √
TSS (mg/L) √ √ √ Turbidity (NTU) √ √ √
3.5.2 EGSB biogas analysis
Biogas samples were collected in duplicate per specific operating condition as soon as the
system stabilised by using 0.5 L Tedlar bags. The composition of the biogas was analysed
by using gas chromatography at J. Muller laboratories (SA).
3.5.3 MBR post-treatment phase sample analysis
Water samples that were collected from the anoxic and aerobic zones, as well as UF
permeate from the MBR, were analysed, as indicated in Table 3.6: NH4+; CODt; CODs;
colour; EC; NO3-; pH; PO4
3−; sugars, namely: fructose and sucrose; temperature; TDS; TSS
and turbidity.
Table 3.6: MBR post-treatment analysis Parameters Monday Tuesday Wednesday Thursday Friday Saturday Sunday CODt (mg/L) √ √ √ CODs (mg/L) √ √ √ Colour (mg Pt/L) √ √ √ DO (mg/L) √ √ √ √ √ √ √ EC (µS/cm) √ √ √ √ √ √ √ NH4
+ (mg/L) √ √ √ √ √ √ √
NO3- (mg/L) √ √ √ √ √ √ √
pH √ √ √ √ √ √ √ PO4
3− (mg/L) √ √ √
Sugars (mg/L) √ √ √ TDS (mg/L) √ √ √ √ √ √ √ Temperature (
oC) √ √ √ √ √ √ √
TSS (mg/L) √ √ √
Turbidity (NTU) √ √ √
The internal laboratory analysis was performed on all samples by means of the following
methods, as presented in Table 3.7. All methods that were used are standard established
analytical methods with certificates, and are explained in Appendix C.
Table 3.7: In-house analysis for EGSB pre-treatment and MBR post-treatment Parameters Method References CODt (mg/L) Merck Spectroquant test kits No. 1.14555.0001 Appendix C1
CODs (mg/L) Merck Spectroquant test kits No. 1.09773.0001 Appendix C1 Colour (mg Pt/L) NOVA60 Spectroquant DO (mg/L) YSI Professional Plus (Pro Plus-No.: 605596) - EC (µS/cm) PCSTestr 35 -
NH4+
(mg/L) YSI Professional Plus (Pro Plus-No.: 605596) - NO3
- (mg/L) YSI Professional Plus (Pro Plus-No.: 605596) -
pH PCSTestr 35 - PO4
3− (mg/L) Merck Spectroquant test kit No. 1.14543.0001 Appendix C4
Sugars (mg/L) HPLC HPLC TDS (mg/L) PCSTestr 35 - Temperature (
oC) PCSTestr 35 -
TSS (mg/L) ESS Method 340.2 Appendix C2 Turbidity Turbidimeter TN-100 Appendix C3

Page 66 of 132
CHAPTER FOUR
RESULTS AND DISCUSSIONS
4.1 Softdrink industry potable water (municipal water)
The softdrink industry uses potable water supplied by the municipality for various purposes
such as 1) the actual preparation of the product; 2) processing and equipment, including
bottle-washing, boilers and refrigeration; and 3) general tasks such as cleaning of walls,
surfaces, floors, trucks, gardening and sanitizing processing vessels. The purity and quality
of the potable water is of primary concern since it is used to produce products that will be
consumed.
Softdrink industry comprises about 87% to 92% of potable water, which makes up the
volume of a carbonated softdrink and 100% of bottled water (Shachman, 2004). Potable
water intake by the softdrink industry is 2.5 to 3.5 m3 H2O/m3 of softdrink that is produced
(Almukhtar, 2012; CSIR, 2010). This potable water often contains trace amounts of different
ions that can alter the taste of the final product. The potable water supplied by the
municipality, may vary in chemical and physical characteristics due to environmental and
seasonal changes, contamination in pipelines, and other problems encountered at municipal
treatment plants. Potable water supplied for human consumption in most cases meets
stringent health standards and quality as set by South African National Standard (SANS
241:2011).
The potable water is usually pre-treated further on-site before it is used in order to ensure
uniformity of the finished product. The potable water of the industrial partner that was used in
this study was pre-treated separately on-site before being used in the production process to
meet product quality specifications. Figure 4.1 presents a flow diagram of a typical softdrink
manufacturing process.

Page 67 of 132
Figure 4.1: Schematic diagram of softdrink manufacturing processes (modified from Woodard, 2001).
[Drawn using PowerPoint 2010]
4.1.1 Potable water characteristics for industrial partner
The composition of the industrial partner’s potable water and pre-treated water is presented
in Table 4.1, along with the SANS 241:2011 and (European Council drinking water standards
80/778/EEC:1980). The physical characteristics, which affect the potable water quality, are
pH, conductivity, colour, and turbidity. The potable water pH ranged from 7.7 to 10.5 with an
average of 9. The total dissolved solids (TDS) values varied from 52.8 to 80.7 mg/L, with an
average value of 62.3 mg/L. The average hardness, which includes copper, manganese,
iron, calcium and magnesium, was 0.02, 0.01, 0.04, 13.4 and 0.9 mg/L; respectively, and is
an additional concern for the softdrink industry (Haroon et al., 2013). The alkali earth ions,
which are sodium (Na+) and potassium (K+) values ranged from 3.9 to 13.1 mg/L and from 0
to 1.1 mg/L, respectively. The organic matter present in the form of COD varied from 59.2 to
157 mg/L, with an average of 105.6 mg/L, which was too high when compared to COD of 2
mg/L stipulated by the Council Directive 80/778/EEC:1980 in relation to the quality of water
intended for softdrink production. Turbidity ranged from 0.2 to 1.1 NTU, while TSS fluctuated
between 8 and 17 mg/L, and sugars in the form of fructose and sucrose were less than
1.7 mg/L and 6.3 mg/L, repetitively. Both physio-chemical properties and inorganic properties
were within the suitable limit stipulated by SANS 241:2011.
Pre-treatment
Potable Water from Municipality
Water Storage
Water Processing
Cooling
C arbonation
Bottle Filling (Softdrink Blending)
Bottle Washing (Sterilization)
Alkaline Detergent
Bottles
Carbon Dioxide Storage
Softdrink Preparation Water
Inspection
Wastewater
Plant
Washdown Wastewater

Page 68 of 132
Table 4.1: Composition of potable water, reverse osmosis water for industrial partner, SANS 241 and European Council 80/778/EEC
Parameters Potable Water Pre-treated Water SANS 241^^
European Council 80/778/EEC
^^ Minimum Maximum Average Minimum Maximum Average
Physio-chemical properties
pH 7.7 10.5 9.0 7.3 7.5 7.4 ≥5 ≤ 9.7 ≥6.5 ≤ 8.5
Temperature (oC) 13.8 25.0 20.9 19.0 23.3 21.2 - -
Alkalinity (mg/L) 11.0 30.1 22.8 4.0
5.0 4.5 - -
Conductivity (µS/cm) 51.3 92.9 79.0 1.0 2.8 1.6 ≤ 170 500
TDS (mg/L) 52.8 80.7 62.3 2.3 7.0 4.8 ≤1 200 500
CODt (mg/L) 59.2 157 105.6 2.0 2.7 2.4 - 2
CODs (mg/L) 46.5 145 92.7 1.5 2.5 2 - -
BOD5 (mg/L) - - - - - - - -
Turbidity (NTU) 0.2 1.1 0.8 0.01
0.2
0.1 ≤ 1 1
TSS (mg/L) 8.0 17.0 11.8 3.0 9.0 5.3 - -
FOG (mg/L) - - - - - - - -
Colour (mg Pt/L) <1 <1 <1 0.0 0.0 0.0 ≤ 15 20
Fructose (mg/L) - - - - - - - -
Sucrose(mg/L) <1.7 <1.7 <1.7 0.1 0.1 0.1 - -
Inorganic components
Sodium 3.9 13.1 7.1 3.7
5.3 4.5 ≤ 200 150
Boron (mg/L) 0.0 0.0 0.0 0.0 0.0 0.0 - -
CO3 (mg/L) 0.0 1.5 0.8 - - - - -
HCO3 (mg/L) 1.5 41.9 15.7 - - - - -
Calcium (mg/L) 7.7 17.3 13.4 0.4 13.5 7.0 - -
Chloride (mg/L) 11.1 14.5 12.4 3.4 6.8 5.1 ≤ 300 20
Fluoride (mg/L) 0.0 0.4 0.1 0.0 0.3 0.1 ≤ 1.5 1.5
Ammonium (mg/L) 0.0 0.8 0.4 0.0 0.6 0.4 ≤ 1.5 -
Nitrate (mg/L) 0.0 0.7 0.3 0.0 0.5 0.3 ≤ 11 1.5
Potassium (mg/L) 0.0 1.1 0.6 0.2 0.6 0.4 - -
Magnesium (mg/L) 0.5 1.4 0.9 0.0 0.8 0.4 - -
Sulphates (mg/L) 3.2 7.3 5.5 0.0 0.01 0.01 ≤ 250 10
Zinc (mg/L) 0.0 0.03 0.01 0.0 0.001 0.01 ≤ 5 5
Copper (mg/L) 0.0 0.02 0.01 - - - ≤ 2 3
Iron (mg/L) 0.0 0.1 0.04 0.0 0.0 0.0 ≤ 0.3 0.2
Manganese (mg/L) 0.0 0.01 0.01 0.0 0.0 0.0 ≤0.1 0.03
Phosphate (mg/L) 0.0 0.8 0.3 0.2 0.7 0.41 - 3
Orthophosphate (mg/L) 0.4 1.0 0.7 - - - - -
^^: SANS 241-1:2011 South African National Standard (SANS 241) (Department of Water Affairs, 2011)
^^: Council Directive 80/778/EEC relating to the quality of water intended for human consumption (European Union 1980)

Page 69 of 132
In Europe the minimum prerequisites of all potable water used in softdrink production must
meet the requirements in terms of drinking water standards European Council 80/778/EEC
(1980). However, according to Steen and Ashurst (2008), all softdrink manufacturers must
have their individual potable water standards.
4.1.2 Pre-treated water characteristics of the industrial partner
Softdrink producers have used pre-treatment plant for several years in addition to other
treatment steps to bring potable water to within ingredient quality (Almukhtar, 2012). Pre-
treated water treatment contributes a significant amount to the softdrink production. The
purifying plant is effective for the removal of water impurities, including salt forming ions,
microorganisms and any other pollutants (Ioannou et al., 2013; Zhou et al., 2012; Judd,
2011). It is observed from Table 4.1 that the physio-chemical parameters and inorganic
compounds present in the potable water decreased after pre-treatment. Pre-treatment is
used for the high rejection of the average organic matter [alkalinity from 22.8 to 4.5 mg/L;
CODt from 105.6 to 23.5 mg/L; sucrose from 6.3 to 1.9 mg/L; EC from 79 to 1.6 µS/cm; TSS
from 11.8 to 5.3 mg/L; TDS from 62.3 to 4.8 mg/L and ions (calcium of 13.5 mg/L; chloride of
6.8 mg/L; magnesium of 0.4 mg/L)]. However, the pre-treatment plant could be difficult to
maintain and operate, and as a result CODt was up to 2.7 mg/L. This could have been due to
fouling.
4.1.3 Bottle-washing wastewater
One of the most significant processes in softdrink production is bottle-washing. The quality of
the final product is subjected mainly to how thoroughly the bottles are washed instantly
before filling. The bottle-washing process begins with the passing of the returnable bottles
through a washer and rinser in sequence. Then, the washed bottles are inspected carefully
before they automatically go through sequential stages of filling, blending, capping, labelling,
packaging and wrapping (Almukhtar, 2012; Hsine et al., 2010; Miyaki et al., 2000). According
to Eckenfelder and Cleary (2013), Camperos et al. (2004) and Ramirez et al. ( 2004) water
from bottle-washing accounts for 50% of the total softdrink industry wastewater and the
consumption of water in the bottle-washing units reach 16 m3/d for cleaning processes
(Almukhtar, 2012). Therefore, this warrants a comprehensive investigation. A summary of
chemical analysis of the bottle-washing process wastewater, compared to the CCT industrial
wastewater by-laws is presented in Table 4.2. The pH ranged from neutral to slightly alkaline
at between 7 and 9.9 with an average of 8.5. The contaminating flow was between 99 to
1 065 mg/L CODt with an average of 453.8 mg/L, while BOD values of less than 1 mg/L were
recorded. The main contamination is in dissolved form CODs up to 997.5˚mg/L. TDS;
turbidity; TSS values varied up to 73.8 mg/L, 1.2 NTU; and 11 mg/L, respectively.

Page 70 of 132
Table 4.2: Physico-chemical properties of softdrink industry wastewaters and City of Cape Town by-laws, 2006 Parameters Bottle-washing wastewater Softdrink industry wastewater EGSB product City of Cape Town By-
Laws^^
Minimum Maximum Average Minimum Maximum Average Minimum Maximum Average
Physiochemical properties
pH 7.0 9.9 9.0 6.1 11.8 9.0 6.6 8.9 7.3 5.5 -12.0
Temperature (oC) 13.7 24.2 20.0 17.3 25.2 25.1 18.8 28.0 22.3 0 - 40
Alkalinity (mg/L) 20.1 35.1 28.0 160.6 589.9 348.1 - - - -
EC (µS/cm) 72.2 86.7 80.0 300.6 1 483 660.1 524.0 7 311 4 057 ≤ 500
TDS (mg/L) 52.0 73.8 59.0 226 1 050 461.9 356.0 4 674 2 725 1 000
CODt (mg/L) 99.0 1 065 453 2 242 11 717 5 533 240.0 4 373 2 245 ≤ 5 000 mg/L
CODs (mg/L) 84.5 997.5 404 2 217 11 345 5 220 187.0 4 163 2 051 -
BOD5 (mg/L) <1 <1 <1 400 1 150 640.0 - - - -
Turbidity (NTU) 0.6 1.2 0.9 12.0 65.3 26.4 12.1 137.0 50.7 -
TSS (mg/L) 8.0 11.0 9.5 28.0 66.0 39.0 20.0 274.0 99.0 4 000
FOG (mg/L) - - - 16.0 40.0 28.0 - - - 400
Colour (mg Pt/L) 0.8 12.0 4.7 21.0 42.0 32.4 - - - -
Fructose (mg/L) 3.9 72.3 37.0 10.3 1 071 518.0 3.3 461.6 189.0 1 500
Sucrose (mg/L) 133.3 696.6 421 1 346 6 901 3 983 46.6 1 505 631.0 1 500-
Inorganic parameters
Sodium 3.3 7.9 6.0 83.1 183.0 115.9 87.4 1 355 537.6 1 000
Boron (mg/L) 0.0 0.01 0.01 0.0 0.01 0.01 0.0 0.0 0.0 5
CO3 (mg/L) - - - 30.1 241 100 - - - -
HCO3 (mg/L) 35.1 43.5 39.0 137.8 421.1 228.1 367.5 2 787 1 623 -
Calcium (mg/L) 13.7 17.7 16.0 13 22.7 19.9 13.2 21.0 16.4 -
Chloride (mg/L) 13.6 14.0 14.0 19.8 44.2 28.7 22.1 44.2 32.3 1 500
Fluoride (mg/L) 0.0 0.0 0.2 0.5 1.4 1.1 0.0 0.5 0.2 -
Ammonium (mg/L) 0.1 0.42 0.3 0.5 1.8 0.8 0.1 38.7 4.2 -
Nitrate (mg/L) 0.1 1.1 0.6 0.1 2.2 0.7 0.01 9.4 2.6 -
Potassium (mg/L) 0.3 1.0 0.7 1.3 5.1 2.9 1.4 6.9 3.3 -
Magnesium (mg/L) 1.3 1.4 1.4 0.6 2.4 1.5 0.7 3.3 1.9 -
Sulphates (mg/L) 5.0 6.0 5.7 6.4 20.8 13.3 3.4 17.0 10.1 1 500
Zinc (mg/L) 0.0 0.0 0.0 0.02 0.1 0.0 0.0 0.1 0.0 30
Copper (mg/L) 0.0 0.02 0.01 0.02 0.01 0.03 0.0 0.0 0.0 20
Iron (mg/L) 0.0 0.04 0.02 0.3 0.7 0.5 0.1 1.6 1.0 50
Manganese (mg/L) 0.0 0.0 0.0 0.01 0.05 0.02 0.0 0.5 0.1 -
Phosphate (mg/L) 0.02 2.46 1.0 1.2 2.6 1.7 0.3 23.1 8.2 25
Orthophosphate (mg/L) 1.4 1.35 1.4 5.6 6.2 5.9 4.9 18.8 7.4 -
^^: City of Cape Town: Wastewater and industrial wastewater by-law (South Africa (Western Cape), 2006

Page 71 of 132
The sugar, namely fructose and sucrose concentrations, ranged from 3.9 to 72.3 mg/L with
an average of 37.3 mg/L and 133.3 to 696.6 mg/L with an average of 421.4 mg/L,
respectively. Both the physio-chemical properties and inorganic properties of the bottle-
washing wastewater were within the suitable limit stipulated by the CCT’s industrial by-laws.
However, it did not meet all the parameters stipulated by SANS 241:2011 for reuse or
recycling. It was reported by Hsine et al. (2010) that a bottling-washing plant generates
wastewater that is good for biological treatment. However, it varies significantly in quantity
and quality, depending on the production plans and products that are mixed. The quality of
wastewater is in turn often influenced by a reduced water intake, bottle-washing methods
and the unpredictable nature of the process.
4.1.4 Softdrink industry wastewater (SDIW) on-site
Results from the eight batches of SDIW from the on-site equalization tank are presented in
Table 4.2. SDIW consists of wasted softdrinks, syrups, sugars, and water from the
backwashing; washing of bottling machines, equipment floors and pipe work during flavour
changing; and operational performances, washing of bottles, which contains caustics,
detergents and lubricants that are used in the machinery and conveyor belts. Therefore, the
significant associated wastewater pollutants will include TSS, TDS, BOD5, COD and nitrate.
There are large variances in both the quality and quantity of SDIW.
The quantity and quality of the SDIW is proportional to potable water intake, but is greatly
influenced by the nature of the process and product. The data recorded in Table 4.2 clearly
shows wastewater with a high organic content and fluctuating pH, but it was mainly alkaline.
The pH values fluctuated from 6.1 to 11.8. The high pH of 11.8 was due to sodium hydroxide
(NaOH), which is indicative of the usage at the bottle-washing utilities. The alkalinity value
ranged from 160 to 589 mg/L. This could be attributed to the wastewater containing
components of detergents that were used in the bottle-washing plant, which made pH control
more difficult.
The temperature for SDIW fluctuated between 17.3 and 19.4˚C during the winter season,
and increased during the summer season to between 20.7 and 25.2°C. An increase in
temperature, together with an increase in the sugar concentrations in the wastewater
equalization tank, intensified the biological activities in the wastewater and thus accelerated
an excessive growth of micro-organisms. The SDIW had high BOD levels, which ranged from
400 to 1 150 mg/L due to the dissolved sugars, namely fructose from 10.3 to 1 071 mg/L and
sucrose from 1 346 to 6 900 mg/L. However, the fructose concentration for batches 6, 7 and
8 were lower than 36.3 mg/L due to the industrial partner discontinuing the use of fructose for
sweetening flavoured water.
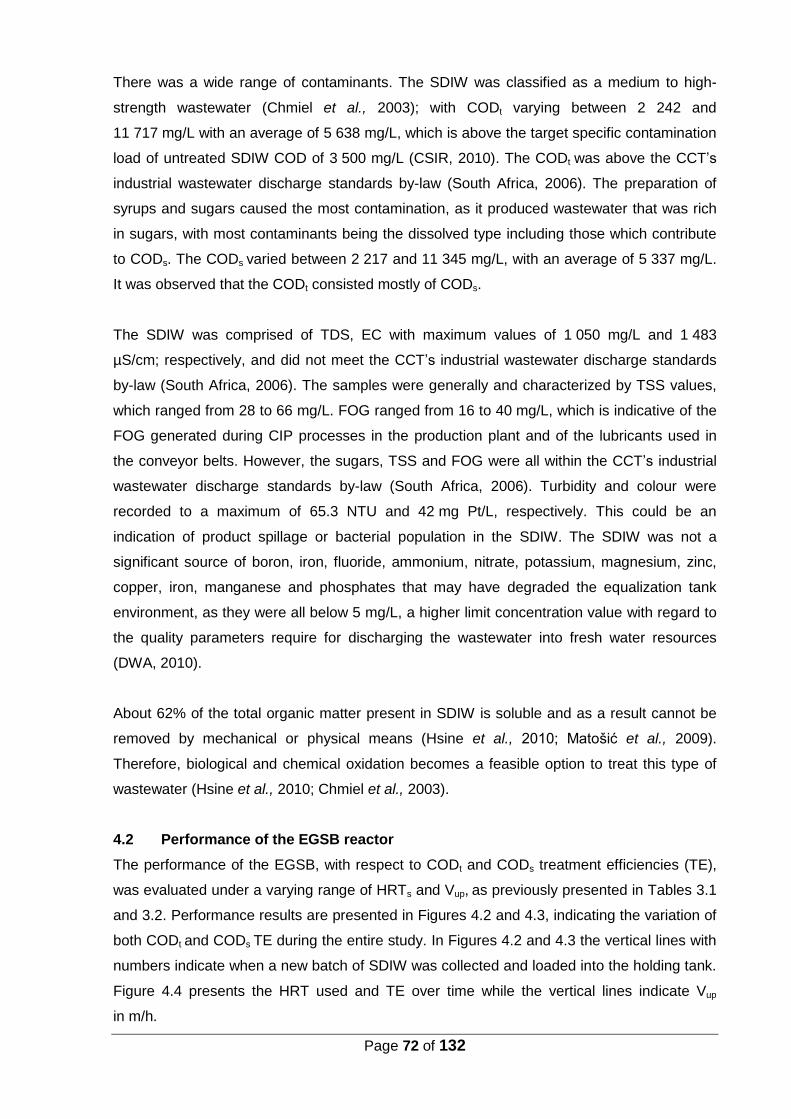
Page 72 of 132
There was a wide range of contaminants. The SDIW was classified as a medium to high-
strength wastewater (Chmiel et al., 2003); with CODt varying between 2 242 and
11 717 mg/L with an average of 5 638 mg/L, which is above the target specific contamination
load of untreated SDIW COD of 3 500 mg/L (CSIR, 2010). The CODt was above the CCT’s
industrial wastewater discharge standards by-law (South Africa, 2006). The preparation of
syrups and sugars caused the most contamination, as it produced wastewater that was rich
in sugars, with most contaminants being the dissolved type including those which contribute
to CODs. The CODs varied between 2 217 and 11 345 mg/L, with an average of 5 337 mg/L.
It was observed that the CODt consisted mostly of CODs.
The SDIW was comprised of TDS, EC with maximum values of 1 050 mg/L and 1 483
µS/cm; respectively, and did not meet the CCT’s industrial wastewater discharge standards
by-law (South Africa, 2006). The samples were generally and characterized by TSS values,
which ranged from 28 to 66 mg/L. FOG ranged from 16 to 40 mg/L, which is indicative of the
FOG generated during CIP processes in the production plant and of the lubricants used in
the conveyor belts. However, the sugars, TSS and FOG were all within the CCT’s industrial
wastewater discharge standards by-law (South Africa, 2006). Turbidity and colour were
recorded to a maximum of 65.3 NTU and 42 mg Pt/L, respectively. This could be an
indication of product spillage or bacterial population in the SDIW. The SDIW was not a
significant source of boron, iron, fluoride, ammonium, nitrate, potassium, magnesium, zinc,
copper, iron, manganese and phosphates that may have degraded the equalization tank
environment, as they were all below 5 mg/L, a higher limit concentration value with regard to
the quality parameters require for discharging the wastewater into fresh water resources
(DWA, 2010).
About 62% of the total organic matter present in SDIW is soluble and as a result cannot be
removed by mechanical or physical means (Hsine et al., 2010; Matošić et al., 2009).
Therefore, biological and chemical oxidation becomes a feasible option to treat this type of
wastewater (Hsine et al., 2010; Chmiel et al., 2003).
4.2 Performance of the EGSB reactor
The performance of the EGSB, with respect to CODt and CODs treatment efficiencies (TE),
was evaluated under a varying range of HRTs and Vup, as previously presented in Tables 3.1
and 3.2. Performance results are presented in Figures 4.2 and 4.3, indicating the variation of
both CODt and CODs TE during the entire study. In Figures 4.2 and 4.3 the vertical lines with
numbers indicate when a new batch of SDIW was collected and loaded into the holding tank.
Figure 4.4 presents the HRT used and TE over time while the vertical lines indicate Vup
in m/h.

Page 73 of 132
4.2.1 EGSB initial start-up
The acclimatization phase can be considered as the first 21 days of operation with the initial
of the SDIW being loaded into the holding tank with CODt, fructose and sucrose
concentration values of 3 267, 528.7 and 2 901 mg/L, respectively. During acclimatization the
EGSB feed CODt and CODs fluctuated between 1 691 to 3 277 mg/L and 1 515 to 2 255
mg/L, respectively, with fructose concentration of 580 mg/L while sucrose of 913 mg/L. CODt
and CODs TE of 66% and 67% were obtained, respectively, at an average OLR of
1.2 kg COD/m3d.
The holding tank developed a pungent odour and serious operating difficulties were
experienced with the occurrence of the foam as shown in Figure 4.5. Foam formation could
be associated with various issues such as low to high pH, toxic material, low dissolved
oxygen, anaerobic conditions, fermentation and change in ambient temperature. The SDIW
CODt and pH decreased from 3 267 to 2 233 mg/L and 6.1 to 5.4, respectively. This was an
indication that the holding tank was becoming anaerobic. Special attention was paid to
prevent anaerobic conditions of the holding tank by collecting fresh SDIW more frequently.
According to Bellmer and Hasan (2012), the dissolved waste’s sugar content provides the
potential for fermentation to occur. Thus, preliminary testing was conducted to determine
how easily softdrinks could be fermented. Using a gas chromatography (GC) unit,
unexpected acids, esters and ethanol-type fermentation was discovered at the top of the
EGSB. According to Isla et al. (2013), SDIW can be regarded as a medium for alcoholic
fermentation since this wastewater was comprised of a high sugar content of approximately 1
346 to 6 901 mg/L. The average EGSB feed concentration values for CODt was 1 890 mg/L
and for CODs was 1 777 mg/L. The CODt TE increased up to 90.4% at an OLR of
0.7 kg COD/m3d.

Page 74 of 132
Figure 4.2: EGSB pre-treatment efficiency and CODt of softdrink industry wastewater
Figure 4.3: EGSB pre-treatment efficiency and CODs of softdrink industry wastewater
Figure 4.4: EGSB HRT, Vup and CODt treatment efficiency
0
10
20
30
40
50
60
70
80
90
100
0100020003000400050006000700080009000
100001100012000
0 10 20 30 40 50 60 70 80 90 100 110 120 130
TE
(%
)
CO
Dt
(mg
/L)
Operating Time (days)
Feed CODt Product CODt CODt TE (%)
Start-up 1 Stress period Start-up 2 Mode -1 to Mode-3
1 2 3 4 5 6 7 8
0
10
20
30
40
50
60
70
80
90
100
0
1000
2000
3000
4000
5000
6000
7000
8000
9000
10000
0 10 20 30 40 50 60 70 80 90 100 110 120 130
TE
(%
)
CO
Ds (m
g/L
)
Operating Time (days)
Feed CODs Product CODs CODs TE (%)
1 6 7 8
Start-up 1 Stress period Start-up 2 Mode -1 to Mode-3
3 4 5 2
0102030405060708090100110120
0102030405060708090
100
0 10 20 30 40 50 60 70 80 90 100 110 120 130
HR
T (
hr)
TE
(%
)
Operating Time (days)
TE (%) HRT
1.1
1.1
0.5
9
0.8
5
0.8
5
1.1
0.8
5
1.1
0.8
5
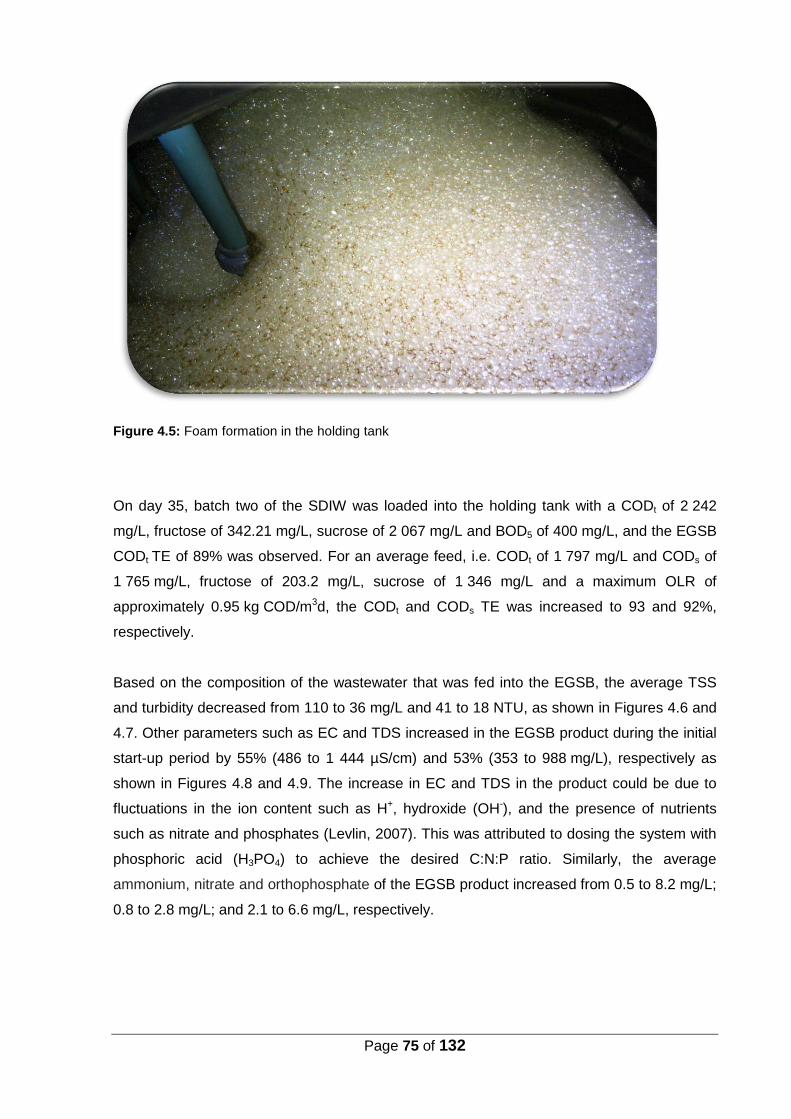
Page 75 of 132
Figure 4.5: Foam formation in the holding tank
On day 35, batch two of the SDIW was loaded into the holding tank with a CODt of 2 242
mg/L, fructose of 342.21 mg/L, sucrose of 2 067 mg/L and BOD5 of 400 mg/L, and the EGSB
CODt TE of 89% was observed. For an average feed, i.e. CODt of 1 797 mg/L and CODs of
1 765 mg/L, fructose of 203.2 mg/L, sucrose of 1 346 mg/L and a maximum OLR of
approximately 0.95 kg COD/m3d, the CODt and CODs TE was increased to 93 and 92%,
respectively.
Based on the composition of the wastewater that was fed into the EGSB, the average TSS
and turbidity decreased from 110 to 36 mg/L and 41 to 18 NTU, as shown in Figures 4.6 and
4.7. Other parameters such as EC and TDS increased in the EGSB product during the initial
start-up period by 55% (486 to 1 444 µS/cm) and 53% (353 to 988 mg/L), respectively as
shown in Figures 4.8 and 4.9. The increase in EC and TDS in the product could be due to
fluctuations in the ion content such as H+, hydroxide (OH-), and the presence of nutrients
such as nitrate and phosphates (Levlin, 2007). This was attributed to dosing the system with
phosphoric acid (H3PO4) to achieve the desired C:N:P ratio. Similarly, the average
ammonium, nitrate and orthophosphate of the EGSB product increased from 0.5 to 8.2 mg/L;
0.8 to 2.8 mg/L; and 2.1 to 6.6 mg/L, respectively.

Page 76 of 132
Figure 4.6: TSS during EGSB pre-treatment of softdrink industry wastewater
Figure 4.7: Turbidity during EGSB pre-treatment of softdrink industry wastewater
Figure 4.8: EC during EGSB pre-treatment of softdrink industry wastewater
0
50
100
150
200
250
300
0 10 20 30 40 50 60 70 80 90 100 110 120 130
TS
S (
mg
/L)
Operating Time (days)
Feed TSS Product TSS
0
20
40
60
80
100
120
140
0 10 20 30 40 50 60 70 80 90 100 110 120 130
Tu
rbid
ity (
NT
U)
Operating Time (days)
Feed Turbidity Product Turbidity
0500
100015002000250030003500400045005000550060006500700075008000
0 10 20 30 40 50 60 70 80 90 100 110 120 130
Co
nd
ucti
vit
y (
µS
/cm
)
Operating Time (days)
Feed Conductivity Product Conductivity
Limit

Page 77 of 132
Figure 4.9: TDS during EGSB pre-treatment of softdrink industry wastewater
During the initial-start-up it was noted that the ammonium concentration in the EGSB product
fluctuated from 2.9 to 39.5 mg/L, as shown in Figure 4.10. This wide range could be due to
changes in the characteristics of the SDIW, environmental conditions, acclimatisation periods
and inoculum quality (Rajagopal et al., 2013; Chen et al., 2008). According to González-
Fernández and García-Encina (2009) ammonium is the end-product of the AD of proteins,
nucleic acids and urea. Unlike the importance of ammonium for bacterial growth at lower
concentration, high concentration of ammonium may cause a severe disruption in the AD,
that is, cause decrease in microbial activities (Rajagopal et al., 2013; Zhang et al., 2011).
An increase in nitrate- from 0.5 to 4.5 mg/L was also recorded, as shown in Figure 4.11. This
could be an indication of an ANAMMOX process, which utilizes autotrophic bacteria that
converts ammonium directly into nitrogen gas under anaerobic conditions (Ahn, 2006; Van
Loosdrecht & Salem, 2005). An advantage of the ANAMMOX process is that because the
bacteria are autotrophic, there is no need for an external carbon source for denitrification
(Phillips et al., 2006). This also agrees with the pilot study conducted by Gut et al. (2006) on
a WWTP, which used a fixed film moving bed bioreactor (MBBR).
The average orthophosphate concentration increased in the EGSB product from 1.1 to
5.1 mg/L, when compared to the EGSB feed, according to Phillips et al. (2006) and during
AD, approximately 60% of the stored total phosphorus in the feed sludge is released as
orthophosphate, which may triple the phosphorus load that enters with the raw wastewater
(Figure 4.12).
0
500
1000
1500
2000
2500
3000
3500
4000
4500
5000
0 10 20 30 40 50 60 70 80 90 100 110 120 130
TD
S (
mg
/L)
Operating Time (days)
Feed TDS Product TDS
Limit

Page 78 of 132
Figure 4.10: Ammonium concentration during EGSB pre-treatment for softdrink industry wastewater
Figure 4.11: Nitrate concentration during EGSB pre-treatment for softdrink industry wastewater
Figure 4.12: Orthophosphate concentration during EGSB pre-treatment for softdrink industry wastewater
0
5
10
15
20
25
30
35
40
45
0 10 20 30 40 50 60 70 80 90 100 110 120 130
Am
mo
niu
m (m
g/L
)
Operating Time (days)
Feed Ammonium Product Ammonium
0
2
4
6
8
10
12
14
0 10 20 30 40 50 60 70 80 90 100 110 120 130
Nit
rate
(m
g/L
)
Operating Time (days)
Feed Nitrate Product Nitrate
0
2
4
6
8
10
12
14
16
18
20
0 10 20 30 40 50 60 70 80 90 100 110 120 130Ort
ho
-Ph
os
ph
ate
(m
g/L
)
Operating Time (days)
Feed Ortho-Phosphate Product Ortho-Phosphate

Page 79 of 132
4.2.2 EGSB stress period
On day 59 d, a third batch of SDIW was loaded to the holding tank with an average CODt of
5 495 mg/L, fructose of 63.6 mg/L and sucrose of 788 mg/L, and a low BOD5 of 76 mg/L. A
slight decrease in CODt and CODs TE to 76% and 77%, respectively was observed at an
OLR of 1.9 kg COD/m3d. After day 61 the EGSB was overdosed with H3PO4 resulting in a
drop in CODt and CODs TE down to 45 and 44%, respectively, at a Vup of 1.1 and HRT of
24h. The ammonium, nitrate and orthophosphate increased from 0.5 to 20.2 mg/L, 0.02 to
2.1 mg/L and 0.7 to 8.7 mg/L, respectively.
When the Vup was decreased to 0.85 m/h with an average CODt of 4 564 mg/L and CODs of
4 097 mg/L and an OLR of 4.6 kg COD/m3d a further decrease was observed in TE down to
24.7% and 27.5% for CODt and CODs, respectively. Methanogens and acidogens are
extremely sensitive to pH change. During this period, the pH in the EGSB decreased to 4.5,
resulting in severe toxicity. This correlated with the undissolved volatile fatty acids (VFA),
which were produced by the acidogenic microorganisms. Preferably the concentration of
VFA should be less than 200 mg/L, since VFA is being consumed by the methanogenic
bacteria. A pH or toxic load variation results in an increase in the VFA concentration (Gray,
2008; Paulsen, 2006). This resulted in system failure and the EGSB required re-inoculation.
It was also noted that during this period the ammonium varied from 0.1 to 38.7 mg/L as
shown in Figure 4.9, while it is reported that ammonium is one of the main causes of reactor
failure because of its inhibition of bacterial activity (Rajagopal et al., 2013; Chen et al., 2008).
4.2.3 EGSB re-inoculation and second start-up
The EGSB system was re-inoculated on day 76 with both anaerobic sludge and aerobic
granules with a TSS of 3 032 mg/L and TSS of 1 705 mg/L, respectively. The system was put
on recycle for two days to improve the granular sludge microbial interactions. A fourth batch
of the SDIW was loaded into the holding tank with a CODt concentration of 11 717 mg/L,
fructose of 34.7 mg/L, sucrose of 6 900 mg/L and BOD5 of 500 mg/L, with a BOD:COD ratio
of 0.043.. The CODt TE increased to 90% initially but subsequently decreased from 90% to
50%. The low TE could have been due to a high OLR between 4.4 and 5.4 kg COD/m3d,
which were higher than those suggested by Sheldon et al. (2012) during the start-up period,
namely 4.1 kg COD/m3d, for paper mill wastewater treatment using the EGSB. The EC and
TDS increased from 692.1 to 5 375 µS/cm and from 471 to 3 546 mg/L. Turbidity also
increased from 56 to 98 NTU and the maximum TSS removal that was achieved was only
87%. The average ammonium, nitrate and phosphate concentrations increased from 0.7 to
1.7 mg/L; 0.5 to 2.1 mg/L; and 1.0 to 5.7 mg/L, respectively.

Page 80 of 132
4.2.4 EGSB treatment efficiency
SDIW (batch 5) with a CODt of 2 662 mg/L, fructose of 54.3 mg/L, sucrose of 794.7 mg/L and
a low BOD5 of 30 mg/L, was introduced into the holding tank on day 90 prior to Mode-1a of
operation, with BOD:COD ratio of 0.023. The average CODt and CODs was 2 946 and 2 410
mg/L, respectively, with an OLR 3.4 kg COD/m3d. During days 91 to 94, the EGSB began to
achieve a certain level of stability, although the TE that were observed were low. However,
the process stabilised after day 95 with CODt and CODs TE increasing up to 61% and 53%,
respectively. The average EC of 1 926 µS/cm and TDS of 1 315 mg/L remained high in the
EGSB product when compared to the EGSB feed. The system stabilized after day 98 and the
TE of CODt and CODs stabilised at 65 and 62%, respectively, at an OLR of 2.7 kg COD/m3d.
The average ammonium, nitrate and phosphate concentrations increased in the product to
3.4, 4.9 and 6.7 mg/L, respectively.
SDIW (batch 6) was introduced into the holding tank on day 104 with CODt values of 6 962
mg/L, a low fructose of concentration 10.3 mg/L when compared to batches 1 to 5, sucrose
of 1346 mg/L and BOD5 of 650 mg/L. The HRT was decreased from 24 to 18 h. The CODt
and CODs removal efficiencies that were obtained at an OLR of 7.9 kg COD/m3d were 54%
and 55%, respectively. The average EC and TDS increased in the product to 4 038 µS/cm
and 2 666 mg/L, respectively. An increase in the average ammonium (2.4 mg/L) and nitrate
(3.6 mg/L) concentrations were observed with a slight decrease in the phosphate
concentration to 6.6 mg/L when compared to Mode-1b of operation.
On day 112 the Vup was increased to 1.1 m/h with a corresponding HRT of approximately 18
h. The CODt and CODs concentrations of the EGSB feed were 4 540 and 4 982 mg/L with an
OLR of 7.19 kg COD/m3d. The CODt removal decreased to 47%, while the CODs removal
rate increased to 55%. A decrease in CODt and increase in CODs could be due to the
microbial hydrolysis of insoluble organic matter such as carbohydrates, which are broken-
down to a soluble end-product that becomes accessible for other microorganisms.
Acidogenic microorganisms then convert the amino acids and sugars into organic acids,
CO2, H2 and N2. Finally, the methanogens microorganisms then convert these products to
CH4 and CO2 (Matovic, 2013; Manyi-Loh et al., 2013; Tabatabaei et al., 2010; Song et al.,
2005).
SDIW with CODt concentration values of 7 760 mg/L, fructose of 7.5 mg/L and sucrose of
4 514 mg/L, and BOD5 of 500 mg/L were loaded on day 118 with an OLR of
13.2 kg COD/m3d. The CODt and CODs TE that were attained were 56.8% and 68.3%,
respectively. On day 130 the Vup was decreased to 0.85 m/h and the SDIW (batch 7) with
CODt, fructose, sucrose, BOD5 values of 4 692 mg/L, 5.30 mg/L, 6 301 mg/L and 150 mg/L,

Page 81 of 132
respectively, were loaded into the holding tank. On day 135 the average CODt concentration
in the EGSB feed was 4 786 mg/L and the average was CODs of 4 641 mg/L at OLR of 9.9
kg COD/m3d. The CODt and CODs TE that were attained were 71% and 70.1%, respectively.
4.2.5 EGSB treatment summary
Table 4.3 represents operating conditions in relation to COD at various operating conditions.
The EGSB operation remained fairly consistent during 45 days of stable operation, as
presented in Figures 4.2 and 4.3. Throughout mode 1 to 3 of operations, the average amount
of CODt that was removed was 62.3% with a maximum of 93%; while the average CODs that
were removed amounted to 61% with a maximum of 94%. The average TSS and turbidity
removal was 8.2% and 22.4%, respectively.
The ammonium and nitrate concentrations increased from 0.57 to 2.04 mg/L, 0.1 to 0.7 mg/L,
respectively, during AD. This could be due to an amino acid such as alanine being
oxidatively decarboxylated and the hydrogen produced during the reaction that was used to
reductively transform an additional amino acid such as glycine, to acetate and ammonia, as
indicated in Equations 4.1 and 4.2 (Gallert, & Winter, 2005).
Equation 4.1
Equation 4.2
Table 4.3: EGSB treatment efficiency for different operating conditions
Operating Conditions CODt CODs
Operating Stages HRT Vup OLR Feed Product TE Feed Product TE
Days h m/h kg COD/m3d mg/L mg/L % mg/L mg/L %
Start-up 1 2 48.4 0.59 0.9 1 167 194.50 83.3 1 072 131 87.8
Stress period 1.1 25.1 1.1 5 4 622 3 397 26.5 4 115 3 095 24.8
Start-up 2 2 47.8 1.1 5 9 950 4 372 56.1 9 380 4 162 55.6
Mode-1a 1 23.7 1.1 2.8 2 212 775 65 1 955 745. 61.9
Mode-1b 1 23.6 0.85 2.7 5 582 2 547 54.4 5 365 2 360 56.0
Mode-2a 0.7 16.9 0.85 7.6 4 540 2 730 39.9 4 782 2 655 44.5
Mode-2b 0.8 18 1.1 6.2 5 103 2 205 56.8 5 004 2 078 58.5
Mode-3a 0.5 11.4 1.1 10.9 4 637 1 345 71 4 536 1 355 70.1
Mode-3b 0.5 11.8 0.85 9.9 4 007 1 104 72.4 3 975 1 173 70.5

Page 82 of 132
The nitrate increased from 0.5 to 2.6 mg/L in the EGSB product which agrees with Chen et
al.’s (2008) in the review of AD that showed significant variation in the toxicity/inhibition levels
and the main reason for these dissimilarities is the complexity of the AD process, where
mechanisms such as antagonism, synergism, acclimation, and complexing could significantly
affect the phenomenon of inhibition. Reduced levels of inhibition occurred with alcohol
derivatives and oxides (Amaral et al., 1998). Anaerobic ammonium oxidation (ANAMMOX) is
attained by a highly specialized group of microorganisms, which belongs to the
planctomycete group and, which oxidises ammonium to N2 gas by using ammonium as an
electron donor and nitrate simultaneously as an electron acceptor while producing alkalinity
(Yang et al., 2010), as presented in Equation 4.3:
Equation 4.3
According to Fiss and Stein (2002), an increase in the phosphate concentration from 0.48 to
5.48 mg/L during AD could be due to certain microbes named phosphate accumulating
organisms (PAOs) which generate phosphorus. PAOs utilize VFAs as a food source. If a
sugar solution or other alternative carbohydrates are added to the anaerobic phase as the
carbon source to enhance biological processes, the sugars are quickly fermented by
heterotrophic bacteria, which are called acid-forming bacteria to produce VFAs. The
carbohydrates themselves cannot be utilized by the PAOs. However, since the sugars are
quickly fermented to VFAs in a suspended growth process under anaerobic conditions, the
addition of sugar instead of acetic acid does not have an observable impact on the efficiency
of the enhanced biological process.
4.3 EGSB biogas production and composition
The biogas that was produced during the anaerobic treatment was primarily composed of
methane (CH4), carbon dioxide (CO2), nitrogen (N2), oxygen (O2) and traces elements of
hydrogen sulphide (H2S) and hydrogen (H2). The biogas production was monitored and
analysed at different operating conditions, as shown in Table 4.4. The biogas productions in
relation to COD TE and OLR throughout the study are shown in Figures 4.13 and 4.14.
4.3.1 Biogas composition during EGSB initial start-up
During the initial start-up the OLR was maintained at ~ 0.9 kg COD/m3d and the biogas
flowrate that was obtained was low at 2.5 L/d. The CH4, CO2, H2S, N2 and O2 content in the
biogas were 32.3%, 18%, 0.7%; 45.4% and 9.6 %, respectively, with H2, which was less than
1%.
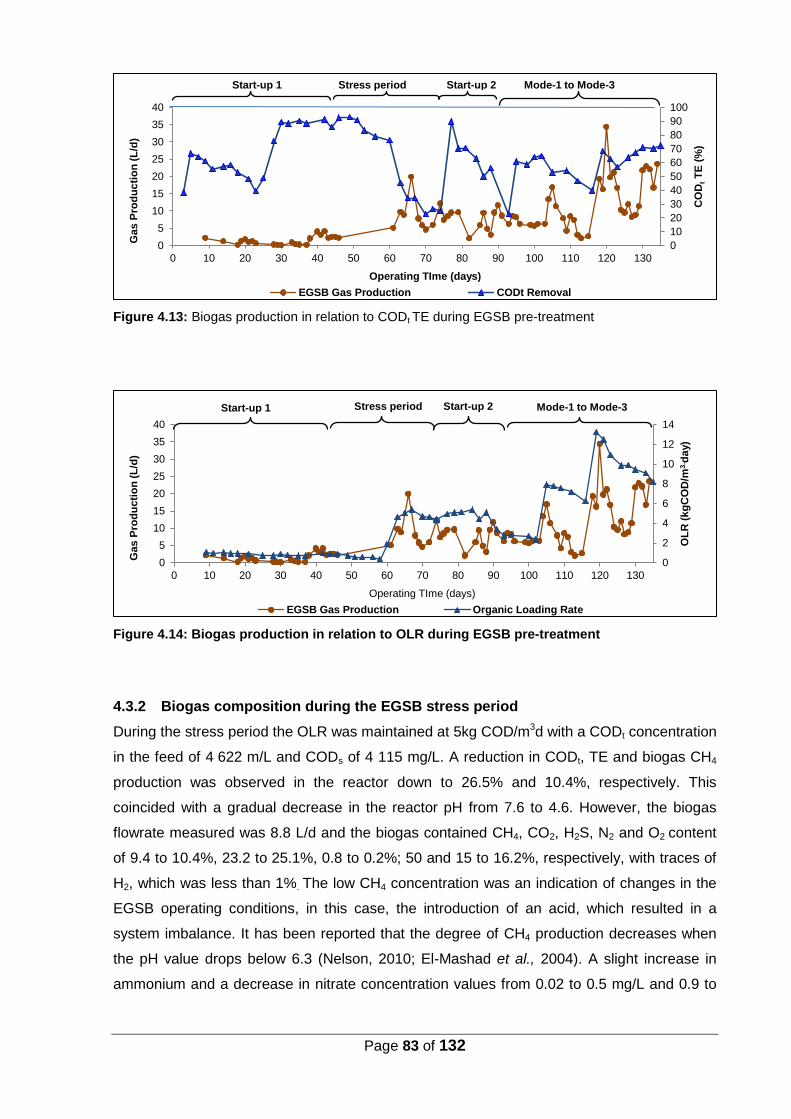
Page 83 of 132
Figure 4.13: Biogas production in relation to CODt TE during EGSB pre-treatment
Figure 4.14: Biogas production in relation to OLR during EGSB pre-treatment
4.3.2 Biogas composition during the EGSB stress period
During the stress period the OLR was maintained at 5kg COD/m3d with a CODt concentration
in the feed of 4 622 m/L and CODs of 4 115 mg/L. A reduction in CODt, TE and biogas CH4
production was observed in the reactor down to 26.5% and 10.4%, respectively. This
coincided with a gradual decrease in the reactor pH from 7.6 to 4.6. However, the biogas
flowrate measured was 8.8 L/d and the biogas contained CH4, CO2, H2S, N2 and O2 content
of 9.4 to 10.4%, 23.2 to 25.1%, 0.8 to 0.2%; 50 and 15 to 16.2%, respectively, with traces of
H2, which was less than 1%. The low CH4 concentration was an indication of changes in the
EGSB operating conditions, in this case, the introduction of an acid, which resulted in a
system imbalance. It has been reported that the degree of CH4 production decreases when
the pH value drops below 6.3 (Nelson, 2010; El-Mashad et al., 2004). A slight increase in
ammonium and a decrease in nitrate concentration values from 0.02 to 0.5 mg/L and 0.9 to
0
10
20
30
40
50
60
70
80
90
100
0
5
10
15
20
25
30
35
40
0 10 20 30 40 50 60 70 80 90 100 110 120 130
CO
Dt T
E (
%)
Gas P
rod
uc
tio
n (
L/d
)
Operating TIme (days)
EGSB Gas Production CODt Removal
Start-up 1 Stress period Start-up 2 Mode-1 to Mode-3
0
2
4
6
8
10
12
14
0
5
10
15
20
25
30
35
40
0 10 20 30 40 50 60 70 80 90 100 110 120 130
OL
R (
kg
CO
D/m
3. d
ay)
Gas P
rod
uc
tio
n (
L/d
)
Operating TIme (days)
EGSB Gas Production Organic Loading Rate
Start-up 1 Stress period Start-up 2 Mode-1 to Mode-3

Page 84 of 132
0.01 mg/L, respectively, were observed. According to Yang et al. (2010), the lower the
ammonium and the nitrate concentration in the reactor product, the lower the CH4 production.
4.3.3 Biogas composition during EGSB second start-up
As determined by gas chromatograph (GC), the major constituents of the organic matter
were acids, alcohols and esters in the EGSB reactor. The C:N:P ratio of the SDIW was
100:0.09:0.02, which was appropriate for bioconversion to CH4. It was not necessary to
supplement nutrients to the EGSB reactor during the second start-up period, which concurs
with Luo et al. (2009) and Yu et al. (2006) for the treatment of cassava sillage and winery
wastewater.
It was observed that there was a slight difference in biogas composition during the initial
start-up and the second start-up. The biogas content of the EGSB during the second start-up
was 26.2 to 30%, 17 to 18.1%, 0.15 to 0.2%, 41 to 41.3% and 11.7 to 14.1% for CH4, CO2,
H2S, N2 and O2, respectively, with traces H2, which was less than 1%. However, the feed
concentration values of CODt and CODs were high at 9 950 mg/L and 9 380 mg/L,
respectively. The OLR was maintained at 5.1 kg COD/m3d, higher than the initial start-up of
0.9 kg COD/m3d, and a higher biogas flowrate of 9.5 L/d was obtained, compared to 2.5 L/d.
The CODt TE was 56.1%, which was much lower than the initial start-up of 87.8%.
Conversely, ammonium and nitrate increased in the EGSB product from 0.64 to 2.1 mg/L
and from 1 to 3.1 mg/L, respectively; hence ammonium was partly oxidized to nitrite through
the ANAMMOX reaction (Lu et al., 2013).
During Mode-1a the EGSB demonstrated a recovery in process performance with the TE
CODt of 65%. The biogas flowrate was 8.6 L/d at an OLR of 2.8 kg COD/m3d with feed
concentrations of CODt of 2 212 mg/L and CODs of 1 955 mg/L. The biogas content for CH4,
CO2, N2 and O2 was 47%, 9.6%, 35.6%; and 7.9%, respectively, with traces of H2S and H2 of
less than 1%. Ammonium and nitrate concentration ranging from 1.99 to 2.31 mg/L and 0.6
to 5.5 mg/L, respectively. On day 112 at an OLR of approximately 2.7 kg COD/m3d the
biogas flowrate varied between 5.7 and 6.3 L/d. The HRT was maintained at 23.6 h with feed
CODt concentration of 5 582 mg/L. However, the CODt TE decreased to 54.4%. The biogas
composition increased in CH4 to between 60.4% and 70%, with a slight increase in CO2 from
10.4% to 11%. Ammonium and nitrate concentration values ranged from 0.27 to 2.4 mg/L
and from 0.05 to 4.3 mg/L, respectively.
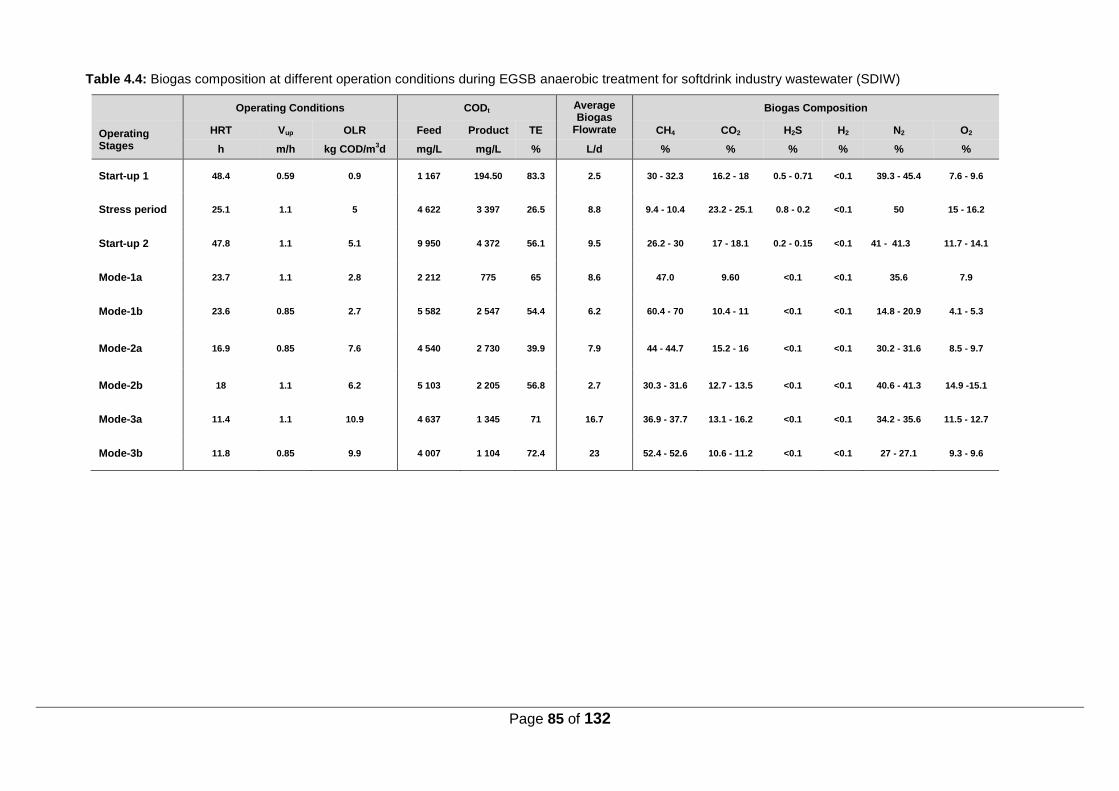
Page 85 of 132
Table 4.4: Biogas composition at different operation conditions during EGSB anaerobic treatment for softdrink industry wastewater (SDIW)
Operating Conditions CODt Average Biogas
Flowrate
Biogas Composition
Operating Stages
HRT Vup OLR Feed Product TE CH4 CO2 H2S H2 N2 O2
h m/h kg COD/m3d mg/L mg/L % L/d % % % % % %
Start-up 1 48.4 0.59 0.9 1 167 194.50 83.3 2.5 30 - 32.3 16.2 - 18 0.5 - 0.71 <0.1 39.3 - 45.4 7.6 - 9.6
Stress period 25.1 1.1 5 4 622 3 397 26.5 8.8 9.4 - 10.4 23.2 - 25.1 0.8 - 0.2 <0.1 50 15 - 16.2
Start-up 2 47.8 1.1 5.1 9 950 4 372 56.1 9.5 26.2 - 30 17 - 18.1 0.2 - 0.15 <0.1 41 - 41.3 11.7 - 14.1
Mode-1a 23.7 1.1 2.8 2 212 775 65 8.6 47.0 9.60 <0.1 <0.1 35.6 7.9
Mode-1b 23.6 0.85 2.7 5 582 2 547 54.4 6.2 60.4 - 70 10.4 - 11 <0.1 <0.1 14.8 - 20.9 4.1 - 5.3
Mode-2a 16.9 0.85 7.6 4 540 2 730 39.9 7.9 44 - 44.7 15.2 - 16 <0.1 <0.1 30.2 - 31.6 8.5 - 9.7
Mode-2b 18 1.1 6.2 5 103 2 205 56.8 2.7 30.3 - 31.6 12.7 - 13.5 <0.1 <0.1 40.6 - 41.3 14.9 -15.1
Mode-3a 11.4 1.1 10.9 4 637 1 345 71 16.7 36.9 - 37.7 13.1 - 16.2 <0.1 <0.1 34.2 - 35.6 11.5 - 12.7
Mode-3b 11.8 0.85 9.9 4 007 1 104 72.4 23 52.4 - 52.6 10.6 - 11.2 <0.1 <0.1 27 - 27.1 9.3 - 9.6

Page 86 of 132
During Mode-2a of operation the OLR was increased to approximately 7.9 kg COD/m3d and
the HRT was decreased to approximately 18 h. The varying feed CODt concentration of
4 540 to 4 982 mg/L at a Vup of 0.85 m/h. However, the reactor displayed a decrease in
performance with a TE of CODt of between 38.9% and 47%. The biogas flowrate varied from
7.9 to 11.4 L/d and the CH4 and CO2 concentrations were approximately 44 to 44.7% and
15.2 to 16%, respectively, while N2 and O2 concentration values varied from 30.2 to 31.6%
and from 8.5 to 9.7%, respectively. There was a slight increase in ammonium and nitrate
concentration values from 0.6 to 1.8 mg/L and 0.06 to 0.6 mg/L, respectively. At an OLR of
6.2 kg COD/m3d, and the feed concentration of CODt 5 103 mg/L, an Increasing TE that was
obtained was 56.8% and 58.5%, respectively. The biogas flowrate was low at 2.7 L/d with a
decrease in CH4 and CO2 from 30.3 to 31.6%, and from 12.7 to 13.5%, respectively. N2 and
O2 concentration values in the biogas increased from 40.6 to 41.3% and 14.9 to 15.1%,
respectively. The ammonium and nitrate increased from 0.64 to 2.12 mg/L and from 0.09 to
1.07 mg/L, respectively, in the EGSB product.
During Mode-3a with a high OLR of 10.9 kg COD/m3d and the Vup was maintained at 1.1 m/h,
the EGSB feed CODt concentration was 4 637 mg/L and the performance of the EGSB was
good with TE of 71 and 70.1%, respectively. The biogas flowrate was increased to 16.7 L/d
with a slight increase in CH4 and CO2 content from 36.9 to 37.7% and 13.1 to 16.2%,
respectively, and a slight decrease in N2 and O2 content from 34.2 to 35.6%, 11.5 to 12.7%,
respectively. Ammonium and nitrate concentrations increased from 0.66 to 2.39 mg/L and
0.03 to 2.03 mg/L, respectively. Subsequently, the Vup was decreased during Mode-3b to
0.85 m/h; the HRT was maintained at approximately 11.8 h, and the OLR decreased slightly
to 9.9 kg COD/m3d. The feed concentration was CODt of 4 007 mg/L and the TE was
approximately 72.4%. The biogas flowrate was almost double when compared to Mode-2a at
23 L/d, with an increase in CH4 content to 52.6%, and a slight decrease in CO2, N2 and O2
content of 10.6 to 11.2%, 27.1% and 9.3 to 9.6%, respectively.
4.3.4 Biogas summary
Biogas production was low at the beginning of the study due to the low OLR. The
performance of the EGSB was satisfactory during Mode-3a and Mode-3b of operation.
When, the Vup was decreased to 0.85 m/h and CH4 production increased to 52.6%. The
EGSB system showed a continuous increase in biogas production rate with increasing OLR,
as shown in Figure 4.14, which could be attributed to the continuous growth of methanogenic
microbial activity, allowing the EGSB to operate at even higher loading rates (Wijekoon et al.,
2011).
Page 87 of 132
CH4, CO2, H2S, N2 and O2, concentrations of up to 70%, 11%, 14.8%, and 4.1%, respectively.
This period, combined with the applied process changes, was further characterised by varied
EGSB feed CODt concentration, which ranged from 2 212 to 5 582 mg/L. This resulted in
unpredictable process performance as displayed by the EGSB CODt TE, varying from 44.5 to
70.5%, as shown in Figures 4.13 and 4.14. Specifically, CODt removal during Mode-3 was
greater than Mode-1 and Mode-2. However, the treatment efficiency during Mode-2 showed
more variations from 39.9 to 47% and 56.8% with an increasing Vup from 0.85 to 1.1 m/h at a
HRT of between 11.4 and 11.8 h.
Despite the difference in start-up times, an overall similarity in process performance was
observed throughout the study, which emphases, in this case the comparability of results that
were generated from the EGSB anaerobic treatment for SDIW. Towards the end of the study
the analogous performance of the reactor was particularly evident with respect to values for
COD removal, biogas volumes and CH4 content, as indicated in Figure 4.13. The process
stability in terms of wastewater treatment and CH4 production was apparent in the reactor at
this time. This difference was more pronounced during Mode-3, when the reactor was
exposed to the highest OLR of 10.9 kg COD/m3d. This can be an indication of two factors,
namely increased microbial activity and increased organic matter (Wijekoon et al., 2011). At
a Vup of 0.85 m/h the EGSB produced more biogas than at Vup of 1.1 m/h. The average CH4,
CO2, N2 and O2 content in the biogas during the study (Mode-1 to Mode-3) was 46.2%,
12.4%, 31.2% and 9.7%, respectively. However, the highest CH4 production content was
obtained at a Vup of 0.85 m/h, HRT of 24 h and OLR of 2.7 kg COD/m3d.
4.4 Performance of the Modified Ludzack-Ettinger (MLE) membrane bioreactor
post-treatment
Application of the membrane bioreactor (MBR) was investigated as a post-treatment phase
for SDIW. Refer to Table 3.3 for operating conditions in Section 3.4.3.1.
4.4.1 MBR start-up
The EGSB product with a CODt concentration of 1 092 mg/L was fed to the anoxic zone at
10 L/d for 5 days to allow the system to acclimatize to the SDIW. The EGSB product showed
significant variations in composition, as shown in Table 4.5.
4.4.2 MBRTreatment efficiency
Figure 4.15 represents the CODt TE for the MBR system. The composition of the wastewater
in both the anoxic and aerobic zones at different operating modes is presented in
Appendices D1 and D2. The average MLSS was 356.3 mg/L in the anoxic zone and 399.8

Page 88 of 132
mg/L in the aerobic zone, which was low for a typical MBR sludge retention time (SRT) of 14
days. However, this may be due to several electrical and mechanical problems, which
interrupted the MBR system during acclimatisation which resulted in sludge washout. The
MLSS should be higher to enhance the degradation process in order to get the best
performance in treating high strength wastewater (Mutamim et al., 2012). The average OLR
was approximately 0.14 kg COD/m3d for the anoxic zone and 0.9 kg COD/m3d for the aerobic
zone, with the average inlet CODt to the MBR of 158.4 mg/L. The average CODt TE was
approximately 64.7%. A CODt of 104.4 mg/L for the treated SDIW in the UF permeate was
within the CCT wastewater and industrial discharge standards, as shown in Table 4.5. The
EC, TDS, TSS and turbidity concentrations were 1 012 μS/cm, 729 mg/L, 98.7 mg/L and 13.6
NTU (Figures: 4.16, 4.17, 4.18 and 4.19).
On day 17 it was noted that the MLSS in both the anoxic and aerobic zones further
decreased to 70 mg/L and 180 mg/L, respectively. As a result, on day 18 the anoxic and
aerobic zones were re-inoculated with AS with TSS of 3 032 mg/L and VSS of 3.5%. Bioballs
were added to each zone and the system was put on recycle for 2 days so that
acclimatization could occur. On day 20 the MLSS for the anoxic zone increased to
712.1 mg/L and 3 488 mg/L for the aerobic zone. The OLR was 1.9 and 3.7 kg COD/m3d for
both the anoxic and aerobic zones, respectively, with an inlet CODt of 94.4 mg/L. The CODt
TE that was achieved was 79.7%, which is higher when compared to Mode-1a. The UF
permeate results indicate a slight decrease in turbidity levels 3.4 NTU and an increase in
TSS to 99.6 mg/L, EC to 1 530 μS/cm and TDS to 1 077 mg/L.

Page 89 of 132
Table 4.5: EGSB, MBR and overall treatment efficiencies
^: City of Cape Town: Wastewater and industrial wastewater by-law (South Africa (Western Cape), 2006
^^: SANS 241-1:2011 South African National Standard (SANS 241) (Department of Water Affairs, 2011)
Parameters EGSB Feed
EGSB Product
TE% MBR Permeate
MBR TE % Overall TE% CCT^ SANS 241^^
Physio-chemical properties
pH 5.2 7.3 - 9.2 - - 5.5 -12.0 ≥5 ≤ 9.7
Temperature (oC) 22.8 22.3 - 22.0 - - 0 - 40 -
Alkalinity (mg/L) 136.8 1 724 - 4 016 - - - -
Conductivity (µS/cm) 560.1 4 057 - 4 129 - - ≤ 500 ≤ 170
Total Dissolved Solids (mg/L) 361.9 2 725 - 2 753 - - 1 000 ≤1 200
CODt (mg/L) 5 433 2 245 58.7 253.5 88.7 95.3 ≤ 5 000 1 000 – 2 400
CODs (mg/L) 5 140 2 051 60.1 185.5 91.0 96.4 - -
Fructose (mg/L) 201.3 9.0 95.5 0.0 100 100 1 500 -
Sucrose (mg/L) 2 597 631.0 75.7 25.0 96.0 99.0 1 500 -
Turbidity (NTU) 22.4 50.7 - 79.1 - - - ≤ 1
TSS (mg/L) 33.4 99.0 - 211.0 - - 4 000 -
Colour (mg Pt/L) 19.0 18.8 0.9 34.3 - - - ≤ 15
Inorganic parameters
Sodium 122.2 537.6 - 756.0 - - 1 000 ≤ 200
Boron (mg/L) 0.0 0.0 - 0.0 - - 5 -
CO3 (mg/L) - - - - - - - -
HCO3 (mg/L) 76.5 1 623 - 1 856 - - - -
Calcium (mg/L) 19.0 16.4 13.3 16.0 2.4 15.8 - -
Chloride (mg/L) 77.9 32.3 58.6 44.1 - 43.4 1 500 ≤ 300
Fluoride (mg/L) 0.5 0.2 51.9 1.0 - - - ≤ 1.5
Ammonium (mg/L) 1.2 4.2 - 0.5 88.1 59.5 - ≤ 1.5
Nitrate (mg/L) 0.3 2.6 - 2.7 - - - ≤ 11
Potassium (mg/L) 1.4 3.3 - 8.1 - - - -
Magnesium (mg/L) 28.0 1.9 93.3 2.8 - 90.1 - -
Sulphates (mg/L) 15.1 10.1 33.4 8.6 14.9 43.4 1 500 ≤ 250
Zinc (mg/L) 23.9 0.0 99.9 0.3 - 98.8 30 ≤ 5
Copper (mg/L) 0.0 0.0 55.2 0.6 - - 20 ≤ 2
Iron (mg/L) 1.9 1.0 46.5 0.1 90.0 92.2 50 ≤ 0.3
Manganese (mg/L) 0.2 0.1 29.1 0.0 100 92.9 - ≤0.1
Phosphate (mg/L) 1.1 7.4 - 27.0 - - 25 -
Orthophosphate (mg/L) 0.9 6.4 - 7.0 - - - -

Page 90 of 132
Figure 4.15: MBR treatment efficiency
Figure 4.16: EC concentrations for anoxic, aerobic and permeate during MBR treatment
Figure 4.17: TDS concentrations for anoxic, aerobic and permeate during MBR treatment
0
10
20
30
40
50
60
70
80
90
100
0
500
1000
1500
2000
2500
3000
3500
4000
4500
0 5 10 15 20 25 30 35 40 45 50 55 60 65 70 75 80 85 90 95
TE
(%
)
CO
Dt
(mg
/L)
Operating Time (days)
EGSB Product CODt Permeate CODt MBR TE
Mode-1a Mode-1b Mode-2a Mode-2b Mode-3a Mode-3b Start-up
0
1000
2000
3000
4000
5000
6000
7000
8000
0 5 10 15 20 25 30 35 40 45 50 55 60 65 70 75 80 85 90 95
EC
(µ
S/c
m)
Operating Time (days)
Anoxic EC Aerobic EC Permeate EC
0
500
1000
1500
2000
2500
3000
3500
4000
4500
5000
5500
0 5 10 15 20 25 30 35 40 45 50 55 60 65 70 75 80 85 90 95
TD
S (
mg
/L)
Operating Time (days)
Anoxic TDS Aerobic TDS Permeate TDS

Page 91 of 132
Figure 4.18: TSS concentration for anoxic, aerobic and permeate during MBR Treatment
Figure 4.19: Turbidity concentration for anoxic, aerobic and permeate during MBR Treatment
While the EGSB system was being re-inoculated due to system failure resulting from the
stress period (Section 4.4.3), the MBR system was put on recycle and the UF membranes
were cleaned in place. The MBR was restarted on day 37 and the flowrate was decreased to
an average of 12.2 L/d during Mode-2a, the anoxic zone HRT was 11.5 h and aerobic zone
HRT was 0.41 h with corresponding OLR of 1.1 and 1.5 kg COD/m3d, respectively. The
average MLSS in both the anoxic and aerobic zones was 474 and 505 mg/L, respectively,
which decreased rapidly due to overflowing of the tanks with subsequent biomass loss. The
EGSB product to the anoxic zone had an average CODt of 3 251 mg/L, and the average
removal efficiency that was obtained was up to 73.5%. It can be noted that there was a slight
decrease in the CODt when compared to Mode-1b. The average UF permeate EC and TDS
increased to 4 428 μS/cm and 3 032 mg/L, respectively. The average BOD, TSS, CODt were
high in the UF permeate, 10; 193; 344.3 mg/L, respectively, and turbidity of 36.6 NTU; which
is usually considered high for recycling or re-use. High turbidity as a result of membrane
failure (refer to Section 4.4.4).
0
150
300
450
600
750
900
1050
1200
1350
1500
0 5 10 15 20 25 30 35 40 45 50 55 60 65 70 75 80 85 90 95
TS
S (
mg
/L)
Operating Time (days)
Anoxic TSS Aerobic TSS Permeate TSS
0
150
300
450
600
750
900
0 5 10 15 20 25 30 35 40 45 50 55 60 65 70 75 80 85 90 95
Tu
rbid
ity (
NT
U)
Operating Time (days)
Anoxic Turbidity Aerobic Turbidity Permeate Turbididty

Page 92 of 132
The average OLR was 2.8 and 1.1 kg COD/m3d with a HRT of 5.8 h and 0.41 h for the
anoxic and aerobic zones, respectively. The average CODt that was fed to the MBR system
was 1 707 mg/L, with an increasing average TE of 83.9% when compared to Mode-2a. The
average MLSS in the anoxic and aerobic zones were 439.5 and 531.5 mg/L, respectively.
Turbidity in the permeate decreased to 21.9 NTU and TSS to 124.5 mg/L. However, the
average EC and TDS concentrations increased to 5 882 µS/cm and 3 983 mg/L,
respectively, in the UF permeate, which was too high when compared to the CCT’s industrial
wastewater quality discharge by-laws (2006).
The feed flowrate to the MBR was increased to an average of 33.7 L/d for Mode-3a from day
64 to 73 with an OLR of 2.3 and 3.1 kg COD/m3d for both anoxic and aerobic zones,
respectively. The average MLSS decreased to 139.3 mg/L and 257.7 mg/L for the anoxic
and aerobic zones, respectively, with HRT decreasing to 4.2 h in the anoxic zone and to 0.41
h for the aerobic zone. A decrease was noted as the system failed to meet the required HRT,
and this increased membrane fouling and clogging. Despite the problems experienced with
membranes fouling, the MBR was able to achieve an average CODt TE of 86.4% at an
average CODt MBR feed concentrations of 2 239 mg/L. The average EC and TDS decreased
slightly in the UF permeate to 5 162 µS/cm; 3 408 mg/L, respectively; turbidity increased to
22.7 NTU and TSS to 137 mg/L when compared to Mode-2a.
On day 76, sewage sludge was added to the MBR and both tanks were re-inoculated as the
MLSS of 74.0 mg/L and 120.0 mg/L for the anoxic zone and the aerobic zones were too low
for SRT of 22 days. The system was put on recycle for 2 days so that acclimatization could
occur, and for the UF membranes to be cleaned. Mode-3b operated from day 79 to 97 when
the system was operated at an increased feed flowrate of 48.8 L/d and HRT of 2.9 h for the
anoxic zone, and at 0.41 h for the aerobic zone. Throughout this operating mode, the
average feed CODt concentration to the anoxic tank was 1 935 mg/L with an OLR of 3.1 kg
COD/m3d for the anoxic zone and 2.4 kg COD/m3d for the aerobic zone. However, CODt TE
decreased to 78.6% compared to Mode-3a. Lower CODt removal may be correlated to less
organic matter concentration in both the anoxic and aerobic zones. The average TSS, EC
and TDS of the UF permeate remained high at 155.4 mg/L, 4 937 µS/cm and 3 357 mg/L,
respectively.

Page 93 of 132
Figure 4.20: Ammonium concentration during MBR treatment
Figure 4.21: Nitrate concentration during MBR treatment
Figure 4.22: Orthophosphate concentration during MBR treatment
0
2
4
6
8
10
12
14
0 5 10 15 20 25 30 35 40 45 50 55 60 65 70 75 80 85 90 95
Am
mo
niu
m (m
g/L
)
Operating Time (days)
Anoxic Ammonium Aerobic Ammonium Permeate Ammonium
0
10
20
30
40
50
60
0 5 10 15 20 25 30 35 40 45 50 55 60 65 70 75 80 85 90 95
Nit
rate
(m
g/L
)
Operating Time (days)
Anoxic Nitrate Aerobic Nitrate Permeate Nitrate
0
5
10
15
20
25
0 5 10 15 20 25 30 35 40 45 50 55 60 65 70 75 80 85 90 95Ort
ho
ph
os
ph
ate
(m
g/L
)
Operating Time (days) Anoxic Orthophosphate Aerobic Orthophosphate Permeate Orthophosphate

Page 94 of 132
4.4.3 Relationship between dissolved oxygen (DO) and nutrient removal during MBR post-treatment
During this study, the aeration was adjusted to obtain suitable dissolved oxygen (DO) in the
anoxic and aerobic zones. As previously discussed in Chapter 2, Section 2.6 of the literature
review, wastewater can be comprised of nitrogen in the form of organic nitrogen, ammonium
(NH4+), nitrite (NO2-N) and nitrate (NO3-N). Biological treatment of wastewater for the
removal of nitrogen occurs in three stages: 1) ammonification (breakdown of organic N to
NH3-N); 2) nitrification (oxidation of NH3-N to NO3-N); and 3) denitrification (conversion of
NO3-N to N2) (Wang et al., 2009). The pH value is considered as an indication of alkalinity in
the mixed liquor. Most microorganisms, mainly the denitrifying and nitrifying microorganisms,
are sensitive to alkalinity (Meng et al., 2013).
The ammonium, nitrate and orthophosphate concentrations for anoxic, aerobic and UF
permeate are presented in Figures 4.20, 4.21 and 4.22. During Mode-1a, the average DO
was 1.2 mg/L in the anoxic zone. However, a higher DO is detrimental for anoxic conditions
to proceed, since DO must be less than 0.5 mg/L for denitrification to occur (Wang et al.,
2009). DO in the aerobic zone of 7.0 mg/L was suitable for nitrification to take place at a
corresponding aeration rate of 14.7 L/min. The anoxic and aerobic zones average
temperature and pH were 22.5˚C and 7.9; and 21.2˚C and 8.5, respectively. The NH4+
present in the anoxic zone was converted into nitrate in the aerobic zone. However, the
average concentration of ammonium, nitrate and orthophosphate in the UF permeate was
0.2, 1.7, and 7.2 mg/L, respectively. Therefore, the alternation to nitrification without any
external carbon source addition to the anoxic and aerobic zones resulted in ammonium,
nitrate and orthophosphate removal in the MBR of 85.4%, 53.5% and 14.2%, respectively.
Despite this, the average ammonium and nitrate concentration of the permeate was lower
than the limit 1.5 and 11 mg/L, which is stipulated in SANS 241:2011. The aeration supplied
to the aerobic zone was 11.78 L/min with an average DO of 5.7 mg/L during Mode-1b and
DO of 2.1 mg/L in the anoxic zone, which corresponded to Mode-1a of operation. The anoxic
and aerobic zones average temperature and pH were 22.1˚C and 8.3; and 21.5˚C and 8.8,
respectively, during Mode-1b. The average ammonium, nitrate and orthophosphate removal
increased to 89.9%; 55.3% and 38.6%, respectively, with the average concentration of
ammonium, nitrate and orthophosphate in the UF permeates being 0.6; 3.6, and 6.6 mg/L,
respectively. Decreased average ammonium, nitrate and orthophosphate concentrations in
the UF permeate were observed when compared to Mode-1a.
The average DO for the anoxic and the aerobic zones were decreased to 0.6 and 4.6 mg/L,
respectively, as compared to Mode-1b of operation in spite of an increase in the aeration rate
of the aerobic zone to 16.4 L/min during Mode-2a. The anoxic and aerobic zones average

Page 95 of 132
temperature and pH increased to 23.4˚C and 9.1; and 22.5˚C and 9.3, respectively. The
average concentrations of ammonium and nitrate in the UF permeate were 0.6 and 2.1 mg/L,
respectively, and the percentage removal increased to 90.9% and 75.1%, respectively. A
high average orthophosphate concentration value of 16.4 mg/L was recorded in the UF
permeate when compared to Mode-1b. A decrease in orthophosphate removal could be due
to the loss in orthophosphate biomass; hence, orthophosphate concentration levels did not
meet the SANS 241:2011 drinking water standards and CCT’s, industrial wastewater quality
by-laws (2006).
The average DO was 1.3 mg/L for the anoxic zone and 6.2 mg/L for the aerobic zone, with a
corresponding aeration of 17.1 L/min during Mode-2b. The average ammonium and nitrate
concentrations in the UF permeate were 0.14 and 2.1 mg/L, respectively, while the
ammonium removal increased to 94.7%. Conversely, nitrate removal decreased to 50%. A
decrease in the percentage removal of nitrate could be due to the problems experienced with
the nitrification cycle or with a process called simultaneous nitrification and denitrification
(SND) which suggested that SND occurred during MBR because of the coexistence of the
anoxic and aerobic zones (Zang et al., 2013). SND starts with an incomplete nitrification of
NH4+ to nitrite and afterwards carries on with a direct nitrite reduction to N2 gas (Jenicek et
al., 2004; Lai et al., 2004). SND nitrification and denitrification occur at the same time in the
same zone under identical operating conditions (Breisha & Winter, 2010). According to Dai et
al. (2010) and Gao et al. (2001), when the DO concentration is higher than 4 mg/L, bacterial
decomposition of carbohydrates increases, and the hydrophobic constituents would be
adsorbed on the membrane pore, which will be difficult to wipe off. Higher DO lead to a
gradual decrease in orthophosphate removal, which is triggered by nitrate influence. Also,
nitrate concentration levels gradually increased as increased oxygen hampers the degree of
SND in the MBR system. It was noted that an increasing DO increased the permeate
concentrations of orthophosphate to 7.3 mg/L. Overall, the degree of orthophosphate
removal is influenced by the nitrate concentration in the MBR (Nopens et al., 2007).
During Mode-3a the ammonium moved that was up to 97.4% and nitrate removal increased
to 53.2% when the DO was about 2.3 mg/L for the anoxic zone, and 6.5 mg/L for the aerobic
zone with a corresponding aeration of 11.4 L/min; which indicated that nitrification was a key
process equivalent to Mode-3. The average ammonium and nitrate concentration of feed
water was 0.2 and 4.4 mg/L, respectively. However, the orthophosphate concentration
increased to 9.2 mg/L. The temperature and pH recorded in the anoxic zone was 25.6˚C and
9.1; and 23.5˚C and 10 in the aerobic zone. It is reported that an increase in pH above 8.6
triggers a substantial increase in nitrite accumulation and a decrease in the nitrate removal
rate (Lee et al., 2003). Higher DO concentrations were maintained during Mode-3b in order

Page 96 of 132
to promote nitrification, DO of approximately 2.5 mg/L in the anoxic and DO of 6.1 mg/L in
the aerobic zone with a corresponding aeration rate of 13.7 L/min. The temperature and pH
recorded in the anoxic zone was 27.7°C and 8.6; and 24.9°C and 9.8 in the aerobic zone.
The average ammonium and nitrate concentration values were 0.4 mg/L and 3.6 mg/L,
respectively, with a decreasing ammonium removal to 89.7% and increasing nitrate to
60.8%, whereas the orthophosphate concentration increased to 10.7 mg/L when compared
to Mode-3a.
4.4.4 Membrane perfomance, air scouring and CIP
Over the entire period of this study, the membrane performance was monitored by the
development of backwash pressure as a function of membrane permeates flux and air
scouring intensities. It was noticed that physical backwashing, to some degree, improved
membrane permeability to its original values, but the reversible fouling and leakages was
found to gradually accumulate after repeated physical backwashing due to the accumulation
of the sludge that remained on the UF membranes.
CIP was performed twice during this operating Mode-3a since the backflush pressure went
above 70 kPa and sludge build-up was noticed on the UF membranes as shown in Figure
4.23. It is noticeable that backflush pressure increased due to the fouling of the UF
membrane. Backflush pressure reached 80 kPa on day 67, which was the quickest fouled UF
membrane. As a result, the air scouring rate was increased and maintained to 2.5 L/min and
the UF membrane flux to 3.9 L/m2h for both Mode-3a and 3b. In this phase biological,
colloidal, particle, and organic materials quickly accumulated onto the membranes, and
formed a sludge build-up, which led to a quick or rise in the backflush pressure. This could
be caused by two types of fouling: 1) irreversible fouling cause by solute and small colloids
that block membrane pores, and CIP cleaning may be required (Hosseinzadeh et al., 2013);
and 2) reversible fouling caused by deposition of large constituent and flocculants on the
surface of the membrane that can be achieved with effective physical cleaning (Stoller et al.,
2013).
The average TSS of the UF permeate was high at 152.9 mg/L. This was due to visible cracks
on the membranes as the epoxy became lose, as shown in Figure 4.24. During this period
CIP was conducted after manually removing the sludge that accumulated on the shell side of
the UF membrane modules. This tendency of sludge collecting on the shell side of
membrane modules indicated that membrane fouling was increased during operation of the
MBR. CIP was performed thrice during this period, since the backflush pressure went above
70 kPa and sludge build-up and leakages were noticed on the UF membranes

Page 97 of 132
Figure 4.23 (a) and (b: Sludge permeation through the UF membranes
During Mode-1 of operation the MBR system operated at a low flux of 1.4 L/m2h to limit
severe and rapid membrane fouling. It was noted that MBR fouling decreased with an
increasing air souring rate to 2 L/min and during Mode-2 of operation flux also increased
from 1.8 to 2.8 L/m2h. Furthermore increasing air scouring rates had little or no influence on
fouling reduction during Mode-3, since the membranes were CIPed frequently. During Mode-
3, membrane fouling was unavoidable in MBR permeate flux decline, as CIP helped to
reduce the amount of TMP, but did not restore the full capacity of the membrane. Initially the
cracks on the UF membranes were not visible. Towards the end of the study the cracks were

Page 98 of 132
noticed, which indicated that the UF membranes were near the end of its life as a result of
the experiments were discontinued. In general, the recovery of membrane permeability was
strongly governed by operating conditions, membrane materials and sludge characteristics.
Figure 4.24: Cracks on the membranes and epoxy becoming lose
4.4.5 MBR post-treatment summary
Despite the problems experienced with low MLSS and membrane cracks, the MBR was able
to achieve an average CODt removal of 86.4%. The study indicated that the air scouring of
2.5 L/min and UF flux of 3.85 L/m2h had influence on the membrane fouling. The UF
permeate showed high amounts of the EC and TDS. This could be the result of low biomass
concentration in the bioreactor, resulting in efficient biodegradation of the contaminants
present in the wastewater.
Mode-1b provided satisfactory nutrient removal at an aeration rate of 11.8 L/min in the
aerobic zone. DO was 5.7 mg/L and DO of 2.1 mg/L in the anoxic zone, although it was
higher than the required DO in the anoxic zone of 0.2 to 0.5 mg/L, as reported by Wang et al.
(2009). The average ammonium, nitrate and orthophosphate removal increased to 89.9%;
55.3% and 38.6%, respectively. However, increasing DO during Mode-2b and 3b was only
efficient for ammonium removal, while it had a negative influence on nitrate removal because
of the simultaneous nitrification and denitrification (SND). The orthophosphate concentrations
that entered the MBR system varied unpredictably. The MBR did not decrease the
orthophosphate concentration to within the SANS 241:2011 drinking water standards. This
result was rather unexpected, as the orthophosphate content is considered to be significant
in the biological treatment of wastewater. However, the ammonium and nitrate level
decreased to below that of the potable, which was used by the softdrink industrial partner, as
shown in Table 4.6, Section 4.1.
Crack on membrane
Epoxy becoming lose on membrane

Page 99 of 132
4.5 Overall EGSB and MBR treatment efficiency
The EGSB pre-treatment reactor was operational for 135 d during which the average CODt
removal efficiency was up to 58.7%, with a maximum of 92.9%. The EGSB pre-treatment
reactor successfully degraded organic material from SDIW and provided stable results for 94
days. The MBR reactor was highly efficient and the average removal of CODt with a
maximum of 89%. Figure 4:25 represents the overall TE for the integrated EGSB and MBR.
Membrane modules played a significant role in the permeate quality in terms of COD, to
make up for the variability of the biological treatment. The overall treatment efficiency
achieved was above 90%. Table 4.6 presents the comparison between EGSB TE, MBR TE,
and overall EGSB-MBR TE along with the CCT (2006) and SANS: 241 2011.
Figure 4. 25: Overall treatment efficiency for integrated during EGSB and MBR
0
10
20
30
40
50
60
70
80
90
100
0
1000
2000
3000
4000
5000
6000
7000
8000
9000
10000
11000
12000
0 5 10 15 20 25 30 35 40 45 50 55 60 65 70 75 80 85 90 95
Overr
ll T
E (
%)
CO
Dt
(mg
/L)
Operating Time (days) EGSB Feed CODt EGSB Product CODt Permeate CODt Overall (EGSB and MBR TE)

Page 100 of 132
The MBR post-treatment provided a satisfactory anoxic and aerobic environment, which was
favourable to the removal of ammonium and nitrate. The average UF permeate CODt and
CODs was below 250.5 and 218.8 mg/L, and ammonium and nitrate concentration was about
0.9 and 4.1 mg/L. The integrated processes EGSB-MBR SDIW treatment CODt and CODs
removal rates reached up to 94.1% and 81.6%, indicating that the biological process was
operated fairly stable, and was promising for future applications. The biological process
produced suitable removal of organic components and it was capable of achieving a high
removal of COD. Despite the satisfactory MBR performance, the orthophosphate
concentration values and colour in the UF permeate were high during the entire study, and
was not within the SANS 241:2011 drinking water standards.
Figure 4.26 represents colour difference. A consistent increase in the colour of the incoming
SDIW was evident, and unsatisfactory colour reduction was recorded in the UF permeate up
to 34.3 mg Pt/L. Due to the presence of colour, as well as high concentrations of EC and
TDS present after MBR treatment, the UF permeate will have to be further treated.
Figure 4.26: Colour comparison of the wastewater fed from the holding tank to the permeate tank
4.6 Comparison of MBR permeate to potable water
A summary of the average MBR permeate, potable water and pre-treated water quality that
was measured during the entire study, is provided in Table 4.6. The MBR permeate was still
within SANS 241:2011, although it was noted that the ammonium and nitrate levels did not
decrease below that of the potable and pre-treated water that was used by the softdrink
industrial partner. The water of pre-treated plant had a COD and TSS of 2.4 and 5.3 mg/L
and EC less than 1.6 µS/cm, respectively, as shown in Table 4.6. The MBR permeate can be
treated by methods such as NF, RO, UV and ion exchange (IE), which have been previously
investigated for beverage industry wastewater to facilitate re-use (Haroon et al., 2013;
Murthy & Chaudhari, 2009; Nataraj et al., 2006; Chmiel et al., 2003; Noronha et al., 2002;

Page 101 of 132
Blöcher et al., 2002). These methods have been used for the treatment of distillery
wastewater to remove the colour and contaminants, with COD TE of up to 99.9%. The
treated wastewater was suitable to be reused or recycled for both industrial and domestic
purposes (Agarwal et al., 2010; Murthy & Chaudhari, 2009; Acharya et al., 2008; Nataraj et
al., 2006; Mohana et al., 2007).
According to Côté and Mourato (2004), combining two membrane filtration processes,
namely UF and RO, allows industries to produce recycled water. The benefits of an MBR, as
a pre-treatment for the RO processes, are the improved wastewater and almost complete
rejection of TSS. The MBR and RO treatment processes can assist to save potable water
intake, and might influence sustainable water management.
Table 4.6: Composition of average MBR permeate and potable water, pre-treated water for industrial partner
Parameters Potable Water MBR Permeate Pre-treated Water
Physio-chemical properties
pH 8.99 9.2 7.4
Temperature (oC) 20.9 22.0 21.2
Alkalinity (mg/L) 22.8 4 016 4.5
Conductivity (µS/cm) 79 4 129 1.6
TDS (mg/L) 62.3 2 753 4.8
CODt (mg/L) 105.6 253.5 2.4
CODs (mg/L) 92.7 185.5 2
BOD5 (mg/L) - 0.0 -
Turbidity (NTU) 0.78 25.0 0.1
TSS (mg/L) 11.75 79.1 5.3
FOG (mg/L) - 211.0 -
Colour (mg Pt/L) <1 34.3 0
Fructose (mg/L) <1.7 9.2 -
Sucrose(mg/L) 5.5 22.0 1
Inorganic parameters
Sodium 7.1 756.0 4.5
Boron (mg/L) 0.0 0.0 0
CO3 (mg/L) 0.8 - -
HCO3 (mg/L) 15.7 1 856 -
Calcium (mg/L) 13.4 16.0 7.0
Chloride (mg/L) 12.4 44.1 5.1
Fluoride (mg/L) 0.1 1.0 0.14
Ammonium (mg/L) 0.4 0.5 0.4
Nitrate (mg/L) 0.3 2.7 0.3
Potassium (mg/L) 0.6 8.1 0.4
Magnesium (mg/L) 0.9 2.8 0.4
Sulphates (mg/L) 5.5 8.6 0.01
Zinc (mg/L) 0.01 0.3 0.01
Copper (mg/L) 0.01 0.6 -
Iron (mg/L) 0.04 0.1 0.0
Manganese (mg/L) 0.01 0.0 0.0
Phosphate (mg/L) 0.3 27.0 0.41
Orthophosphate (mg/L) 0.7 7.0 -

Page 102 of 132
CHAPTER FIVE
CONCLUSIONS AND RECOMEMNDATIONS
5.1 Conclusions
Objective 1: Evaluate the efficiencies of the anaerobic, anoxic, aerobic and membrane
treatment stages under different operating conditions and evaluate the extent of contaminant
removal in the individual stages, as well as the overall process.
For the EGSB technology, the capability to apply OLR of 10.9 kg COD/m3d and the CODt
removal was between 62.3% and 92.9% during 45 days of normal operation. The optimum
up flow velocity was 0.85 m/h, respectively. The reactor performed better at HRT of
approximately 11.8 h, and the TSS and turbidity reduction of 8.2% and 22.4%, respectively.
However, during this study all macronutrients (NH4+, NO3
- and PO43-) were below the
discharged standards, which are stipulated by the CCT’s industrial wastewater quality by-
laws (2006). The MBR showed that it could successfully operate with the feed flowrate up to
33.7 L/d at an OLR of 2.3 and 3.1 kg COD/m3d for both anoxic and aerobic zones,
respectively, with HRT of 4.2 h in the anoxic zone and 0.41 h for the aerobic zone. Despite
the problems experienced with the membranes, the MBR was able to achieve the average
CODt removal was up to 86.4%.
Objective 2: Evaluate the gas production and composition under different hydraulic retention
times (HRT); upflow velocities and organic loading rates (OLR) in the anaerobic stage.
Anaerobic digestion of SDIW in the EGSB showed high CODt removal and methane
production under different operational conditions. Besides CODt reduction during EGSB pre-
treatment it showed that it has the capability to produce energy. The biogas gas production
reached as high as 16.7 L/d. This research has shown that the anaerobic acetogenesis of
SDIW is an achievable alternative to biogas production. When the reactor was exposed to a
highest OLR of 10.9 kg COD/m3d and a Vup of 0.85 m/h the EGSB produced more biogas.
The CH4 and N2 content in the biogas reached up to 70% and 41.3%, respectively.
Objective 3: Evaluate the performance of an integrated anaerobic EGSB pre-treatment
combined with an MBR post-treatment system to treat SDIW.
The combination of the system EGSB-MBR represents a promising option for the treatment
of softdrink industry wastewater. The EGSB-MBR for SDIW treatment CODt and CODs
removal rates reached up to 94.1% and 81.6%, respectively. The nutrient removal at an

Page 103 of 132
aeration rate of 11.8 L/min in the aerobic zone and DO of 5.7 mg/L and DO of 2.1 mg/L in the
anoxic zone was with ammonium, nitrate and orthophosphate removal increasing to 89.9%;
55.3% and 38.6%, respectively. The MBR did not decrease the orthophosphate
concentration to within the SANS 241:2011 drinking water standards.
5.2 Recommendations
Further research should be conducted to collect additional data on the use of organic
acids, which are produced from the anaerobic digestion of SDIW treatment.
The challenges related to the EGSB operation at higher OLR and lower HRT should
be addressed, which include clogging and poor EGSB product and biogas quality.
The study also revealed that CH4 was available as a source of energy, and biogas
generated from the SDIW during anaerobic digestion can be effectively used in
production plant boilers.
Additional research should be conducted to gain more understanding of the stable
performance of the EGSB against various process inhibitors such as ammonia.
Fouling could be limited by optimising the operating conditions such as: air scouring
rates, low flux operation, chemical and physical cleaning and membrane relaxation
after backwash.
Subsequent treatment of the UF permeate with NF or RO for use in agriculture,
washing of trucks and cars, bottles, floors and walls and flushing of toilets. It can also
be used for firefighting purposes, cooling of power and industrial equipment.
In addition, financial and technical feasibility studies of the economic and
environmental aspects of the industrial application EGSB and MBR technology as an
alternative should be conducted.
All of the above views were suggested for the possible expansion of EGSB and MBR
technology in the future, both on a pilot-scale and full-scale.
Page 104 of 132
REFERENCES
Acharya, B. K., Mohana, S. & Madamwar, D. 2008. Anaerobic treatment of distillery spent wash-A study on upflow anaerobic fixed film bioreactor. Bioresource Technology, 99(11):4621-4626. Adams, G. M. 2004. Identifying and Controlling Odour in the Municipal Wastewater Environment: Phase I: Literature Search and Review. London. IWA Publishing. Agama Biogas, 2010. Sustainable Cities: Biogas Energy from Waste: A Feasibility Study and Guidelines for Implementing Biogas from Waste Projects in Municipalities. Cape Town. Agana, B. A., Reeve, D. & Orbell, J. D. 2013. Performance optimization of a 5nm TiO2 ceramic membrane with respect to beverage production wastewater. Desalination, 311:162-172. Agarwal, R., Lata, S., Gupta, M. & Singh, P. 2010. Removal of melanoidin present in distillery effluent as a major colorant: A review. Journal of Environmental Biology, 31(4):521-528. Ahn, K.- H., Song, K.- G., Cho, E., Cho, J., Yun, H., Lee, S. & Kim J. 2003. Enhanced biological phosphorus and nitrogen removal using a sequencing anoxic/anaerobic membrane bioreactor (SAM) process. Desalination, 157(1-3):345-352. Ahn, Y. H. & Speece, R. E. 2004. Settleability assessment protocol for anaerobic granular sludge and its application. Water SA, 29(4):419-426. Ahn, Y. H. 2006. Sustainable nitrogen elimination biotechnologies: A review. Process Biochemistry, 41(8):1709-1721. Akpor, O. B. & Muchie, B. 2013. Environmental and public health implications of wastewater quality. African Journal of Biotechnology, 10(13):2379-2387. Akpor, O. B. 2011. Wastewater effluent discharge: Effects and treatment processes. In 3rd International Conference on Chemical, Biological and Environmental Engineering, IACSIT Press, Singapore. Akunna, J.C. & Clark, M. 2000. Performance of a granular-bed anaerobic baffled reactor (GRABBR) treating whisky distillery wastewater. Bioresource Technology, 74:257-261. Alam, A. S. M. M., Hossain, K. M., Hossain, B., Ahmed, A. & Hoque, M. J. 2007. A Study on Industrial Waste Effluents and Their Management at Selected Food and Beverage Industries of Bangladesh. Journal of Applied Sciences and Environmental Management, 11(4):5-9. Al-Hashimia, M. A. I., Abbas, T. R. & Jasema, Y. I. 2013. Performance of sequencing anoxic/anaerobic membrane bioreactor (SAM) system in hospital wastewater treatment and reuse. European Scientific Journal, 9(15):169-180. Allen, G. J. & Albala, K. 2007. The business of food: Encyclopaedia of the food and drink industries. ABC-CLIO. Almukhtar, R. S. 2012. Water Recycling/Reuse in Factories Case Study Soft Drink Factory. Engineering and Technology Journal, 30(1):1-14.

Page 105 of 132
Alvarado-Lassman, A., Rustrian, E., Garcia-Alvarado, M. A., Rodriguez-Jimenez, G. C. & Houbron, E. 2008. Brewery wastewater treatment using anaerobic inverse fluidized bed reactors. Bioresource Technology, 99(8):3009-3015. Amaral, J. A., Ekins, A., Richards, S. R. & Knowles, R. 1998. Effect of selected monoterpenes on methane oxidation, denitrification, and aerobic metabolism by bacteria in pure culture. Applied and Environmental Microbiology, 64(2):520-525.
Amuda, O. S., Amoo, I. A. & Ajayi, O. O. 2006. Performance optimization of coagulant/flocculant in the treatment of wastewater from a beverage industry. Journal of Hazardous Materials, 129(1): 69-72.
Amuda, O.S. & Amoo, I.A. 2007. Coagulation/flocculation process and sludge conditioning in beverage industrial wastewater treatment. Journal of Hazardous Materials, 141:778-783. Artiga, P., Carballa, M., Garrido, J. M. & Mendez, R. 2007. Treatment of winery wastewaters in a membrane submerged bioreactor. Water Science and Technology, 56(2):63-69. Baloch, M. I., Akunna, J. C. & Collier, P. J. 2007. The performance of a phase separated granular bed bioreactor treating brewery wastewater. Bioresource Technology, 98(9):1849. Banerjee, S. & Biswas, G. K. 2004. Studies on biomethanation of distillery wastes and its mathematical analysis. Chemical Engineering Journal, 102(2):193-201. Bellmer, D. & Hasan A. 2012. Soft Drink Waste for Ethanol Production-Fermentation of numerous different soft drink products has been conducted at Oklahoma State University. Resource-Engineering and Technology for a Sustainable World, 19:2-10. Bilad, M. R., Declerck, P., Piasecka, A., Vanysacker, L., Yan, X. & Vankelecom, I. F. 2011. Treatment of molasses wastewater in a membrane bioreactor: Influence of membrane pore size. Separation and Purification Technology, 78(2):105-112. Bitton, G. 2011. Wastewater microbiology. New Jersey: John Wiley & Sons. Blöcher, C., Noronha, M., Fünfrocken, L., Dorda, J., Mavrov, V., Janke, H. D. & Chmiel, H. 2002. Recycling of spent process water in the food industry by an integrated process of biological treatment and membrane separation. Desalination, 144(1):143-150. Blonskaja, V., Menert, A. & Vilu, R. 2003. Use of two-stage anaerobic treatment for distillery waste. Advances in Environmental Research, 7(3):671-678. Böhm, L., Drews, A., Prieske, H., Bérubé, P. R. & Kraume, M. 2012. The importance of fluid dynamics for MBR fouling mitigation. Bioresource Technology, 122:50-61. Bolzonella, D., Fatone, F., Pavan, P. & Cecchi, F. 2010. Application of a membrane bioreactor for winery wastewater treatment. Water Science and Technology, 62(12):2754-2759. Boyd, A. 2012. Informing international UNFCCC technology mechanisms from the ground up: Using biogas technology in South Africa as a case study to evaluate the usefulness of potential elements of an international technology agreement in the UNFCCC negotiations process. Energy Policy, 51:301-311.
Breisha, G. Z. & Winter, J. 2010. Bio-removal of nitrogen from wastewaters: A review. Journal of American Science, 6(12):508-528.

Page 106 of 132
Brito, A. G., Peixoto, J., Oliveira, J. M., Oliveira, J. A., Costa, C., Nogueira, R. & Rodrigues, A. 2007. Brewery and winery wastewater treatment: some focal points of design and operation. In Utilization of by-products and treatment of waste in the food industry, 3:109-131. Bustamante, M. A., Paredes, C., Moral, R., Moreno-Caselles, J., Pérez-Espinosa, A. & Pérez-Murcia, M. D. 2005. Uses of winery and distillery effluents in agriculture: characterisation of nutrient and hazardous components. Water Science and Technology, 51(1):145-151. Camperos, E. R., Nacheva, P. M. & Diaz Tapia, E. 2004. Treatment techniques for the recycling of bottle washing water in the soft drinks industry. Water Science and Technology, 50(2): 107-112. Casani, S., Rouhany, M. & Knøchel, S. 2005. A discussion paper on challenges and limitations to water reuse and hygiene in the food industry. Water Research, 39(6):1134-1146. Cervantes, F. J. 2009. Environmental technologies to treat nitrogen pollution. London: IWA Publishing. Chae, K.J., Jang, A., Yim, S.K. & Kim, I. S. 2008: The effects of digestion temperature and temperature shock on the biogas yields from the mesophilic anaerobic digestion of swine manure. Bioresource Technology, 99:1-6. Chen, J. P., Mou, H., Wang, L. K. & Matsuura, T. 2006. Membrane filtration. In Advanced Physicochemical Treatment Processes, 4th Ed. Toronto: Humana Press. Chen, T. T., Zheng, P. & Shen, L. D. 2013. Growth and metabolism characteristics of anaerobic ammonium-oxidizing bacteria aggregates. Applied Microbiology and Biotechnology, 97(12):5575-5583. Chen, Y., Cheng, J. J. & Creamer, K. S. 2008. Inhibition of anaerobic digestion process: a review. Bioresource Technology, 99(10):4044-4064. Cheremisinoff, N. P. 2001. Handbook of water and wastewater treatment technologies. USA. Butterworth-Heinemann. Chmiel, H., Kaschek, M., Blocher, C., Noronha, M. & Mavrov, V. 2003. Concepts for the treatment of spent process water in the food and beverage industries. Desalination, 152(1):307-314. Choorit, W. & Wisarnwan, P. 2007: Effect of temperature on the anaerobic digestion of palm oil mill effluent. Electron Journal of Biotechnology, 10(3):376. Cicek, N. 2003. A review of membrane bioreactors and their potential application in the treatment of agricultural wastewater. Canadian Biosystems Engineering, 45:6-37. Cioabla, A. E., Ionel, I., Dumitrel, G. A. & Popescu, F. 2012. Comparative study on factors affecting anaerobic digestion of agricultural vegetal residues. Biotechnology for Biofuels, 5(1):1-9. Coetzee, G., Malandra, L., Wolfaardt, G. M. & Viljoen-Bloom, M. 2004. Dynamics of a microbial biofilm in a rotating biological contactor for the treatment of winery effluent. Water SA, 30(3):407-412.

Page 107 of 132
Connaughton, S., Collins, G. & O'Flaherty, V. 2006. Psychrophilic and mesophilic anaerobic digestion of brewery effluent: A comparative study. Water Research, 40(13): 2503-2510. Cornelissen, E. R., van Buggenhout, S., van Ermen, S., De Smedt, M., Van Impe, J. & Koning, J. 2001. Anaerobic treatment of brewery wastewater with an internal membrane bioreactor. Mededelingen (Rijksuniversiteit te Gent. Fakulteit van de Landbouwkundige en Toegepaste Biologische Wetenschappen), 66(3):135-138. Côté, P., Masini, M. & Mourato, D. 2004. Comparison of membrane options for water reuse and reclamation. Desalination, 167:1-11. CSIR, A. 2010. A CSIR Perspective on Water in South Africa. Council for Scientific and Industrial Research. Dai, H., Yang, X., Dong, T., Ke, Y. & Wang, T. 2010. Engineering application of MBR process to the treatment of beer brewing wastewater. Modern Applied Science, 4(9):103-109. De Lemos Chernicharo, C. A. 2007. Anaerobic Reactors. New York: IWA Publishing. Deublein, D. & Steinhauser, A. 2011. Biogas from waste and renewable resources: An introduction. Winheim: John Wiley & Sons. Dinamarca, C. 2014. Anaerobic expanded granular sludge bed (EGSB) reactor for the removal of sulphide by autotrophic denitrification. Journal homepage: www. International Journal of Energy and Environment. International Journal of Energy and Environment Foundation. Organization, 5(1):111-118. Dinsdale, R. M., Hawkes, F. R. & Hawkes, D. L. 2000. Anaerobic digestion of short chain organic acids in an expanded granular sludge bed reactor. Water Research, 34(9):2433-2438. Driessen, W. & Vereijken, T. 2003. Recent developments in biological treatment of brewery effluent. In Institute and Guide of Brewery Convention, Livingstone, Zambia. Drogui, P., Asselin, M., Brar, S. K., Benmoussa, H. & Blais, J. F. 2008. Electrochemical removal of pollutants from agro-industry wastewaters. Separation and Purification Technology, 61(3):301-310. Eckenfelder. W. W. & Cleary. J. G. 2013. Activated Sludge Technologies for Treating Industrial Wastewaters. Pennsylvaniaa: DEStech Publications. El-Kamah, H., Tawfik, A., Mahmoud, M. & Abdel-Halim, H. 2010. Treatment of high strength wastewater from fruit juice industry using integrated anaerobic/aerobic system. Desalination, 253(1):158-163. El-Mashad, H. M., Zeeman, G., van Loon, W. K., Bot, G. & Lettinga, G. 2004. Effect of temperature and temperature fluctuation on thermophilic anaerobic digestion of cattle manure. Bioresource Technology, 95(2):191-201. España-Gamboa, E., Mijangos-Cortes, J., Barahona-Perez, L., Dominguez-Maldonado, J., Hernández-Zarate, G. & Alzate-Gaviria, L. 2011. Vinasses: characterization and treatments. Waste Management and Research, 29(12):1235-1250.

Page 108 of 132
Eusébio, A., Petruccioli, M., Lageiro, M., Federici, F. & Duarte, J. C. 2004. Microbial characterisation of activated sludge in jet-loop bioreactors treating winery wastewaters. Journal of Industrial Microbiology and Biotechnology, 31(1):29-34. Feroz, S., Rao, D. G., Senthilkumar, R. & Byrne, J. A. 2012. Wastewater treatment: Advanced processes and technologies. New York: CRC Press. Fillaudeau, L., Blanpain-Avet, P. & Daufin, G. 2006. Water, wastewater and waste management in brewing industries. Journal of Cleaner Production, 14(5):463-471. Fiss, E. & Stein, R. 2002. Achieving Biological Nutrient Removal in a POTW Using a Soft-Drink Waste as a Supplemental Carbon Source. Water Environment Federation Annual Meeting. North Carolina. Forstmeier, M., Goers, B. & Wozny, G. 2005. Water network optimisation in the process industry-case study of a liquid detergent plant. Journal of Cleaner Production, 13(5):495-498. Fritzmann, C., Löwenberg, J., Wintgens, T. & Melin, T. 2007. State-of-the-art of reverse osmosis desalination. Desalination, 216(1):1-76. Futselaar, H., Rosink, R., Smith, G. & Koens, L. 2013. The anaerobic MBR for sustainable industrial wastewater management. Desalination and Water Treatment, 51(4-6):1070-1078. Gallert, C. & Winter, J. 2005. Bacterial metabolism in wastewater treatment systems. Environmental Biotechnology. Concepts and Applications, 1(15):1-48. Ganesh, R., Rajinikanth, R., Thanikal, J. V., Ramanujam, R. A. & Torrijos, M. 2010. Anaerobic treatment of winery wastewater in fixed bed reactors. Bioprocess and Biosystems Engineering, 33(5):619-628. Gao chun-di, Wang shu-ying & Yin bo. 2001. Influence of DO on Organic Matter Degradation Rate and Sludge Settling Property. China Water and Wastewater, 17(5):12-15. Gao, M., She, Z. & Jin, C. 2007. Performance evaluation of a mesophilic (37˚C) upflow anaerobic sludge blanket reactor in treating distiller's grains wastewater. Journal of Hazardous Materials, 141(3):808-813. Genovesi, A., Harmand, J. & Steyer, J. P. 2000. Integrated fault detection and isolation: application to a winery's wastewater treatment plant. Applied Intelligence, 13(1):59-76. Gerardi, M. H. 2003. The microbiology of anaerobic digesters. New Jersey: John Wiley & Sons. Ghosh, S. & Henry, M. P. 1981. Stabilization and gasification of soft-drink manufacturing waste by conventional and two-phase anaerobic digestion. (No. CONF-810577-1). Institute of Gas Technology, Chicago, IL. Gleick, P. H. 2014. The World's Water Volume 8: The Biennial Report on Freshwater Resources. Washington: Island Press. Gohil, A. & Nakhla, G. 2006. Treatment of tomato processing wastewater by an upflow anaerobic sludge blanket–anoxic–aerobic system. Bioresource Technology, 97(16):2141-2152. González-Fernández, C. & García-Encina, P. A. 2009. Impact of substrate to inoculum ratio in anaerobic digestion of swine slurry. Biomass and Bioenergy, 33(8):1065-1069. Gonzalez‐Garcia, Y., Hernandez, R., Zhang, G., Escalante, F. M., Holmes, W. & French, W. T. 2013. Lipids accumulation in Rhodotorula glutinis and Cryptococcus curvatus growing

Page 109 of 132
on distillery wastewater as culture medium. Environmental Progress and Sustainable Energy, 32(1):69-74. Grady Jr, C. L., Daigger, G. T., Love, N. G., Filipe, C. D. & Leslie Grady, C. P. 2011. Biological wastewater treatment. New York: IWA Publishing. Gray, M. 2008. The activity of immobilized anaerobic bacteria in the treatment of industrial wastewater. (Unpublished Doctoral dissertation, Worcester Polytechnic Institute, New York). Grosser, A., Worwag, M., Neczaj, E. & Kamizela, T. 2013. Co-digestion of Organic Fraction of Municipal Solid Waste with different organic wastes: A Review. Environmental Engineering IV. London: CRC Press. Guimarães, L., Klabjan, D. & Almada-Lobo, B. 2012. Annual production budget in the beverage industry. Engineering Applications of Artificial Intelligence, 25(2):229-241. Gut, L., Plaza, E., Trela, J., Hultman, B. & Bosander, J. 2006. Combined partial nitritation/Anammox system for treatment of digester supernatant. Water Science and Technology, 53(12):149-159. Guven, E. 2001. Soft drink and cookie industry wastewater treatment by anaerobic contact sequencing batch reactors. Unpublished Doctoral dissertation, Faculty of the Graduate School, Marquette University. Haroon, H., Waseem, A. & Mahmood, Q. 2013. Treatment and Reuse of Wastewater from Beverage Industry. Journal of Chemical Society of Pakistan, 35(1):5-11. Hayes, T. 2004. The electrodialysis alternative for produced water management. GasTIPS, Summer, 15-20. Henze, M. 2008. Biological wastewater treatment: Principles, modelling and design. London: IWA Publishing. Hosseinzadeh, M., Bidhendi, G. N., Torabian, A. & Mehrdadi, N. 2013. Evaluation of membrane bioreactor for advanced treatment of industrial wastewater and reverse osmosis pre-treatment. Journal of Environmental Health Science and Engineering, 11(1):34-42. Hsine, E., Benhammou, A. & Pons, M. N. 2010. Water resources management in soft drink industry-water use and wastewater generation. Environmental Technology, 26(12):1309-1316. Huei, L.C. 2005. Biodegration of brewery effluent using packed-bed upflow anaerobic reactor (PBUAR) and membrane bioreactor (MBR). Faculty of Civil Engineering, University Teknology Malaysia. Ince, B. K., Ince, O., Sallis, P. J. & Anderson, G. K. 2000. Inert COD production in a membrane anaerobic reactor treating brewery wastewater. Water Research, 34(16):3943-3948. Isla, M. A., Comelli, R. N. & Seluy, L. G. 2013. Wastewater from the soft drinks industry as a source for bioethanol production. Bioresource Technology, 136:140-147. ISO 14001. 2004. Environmental management systems: Requirements with guidance for use. Jenicek P, Svehla P, Zabranska J, & Dohanyos M. 2004 Factors affecting nitrogen removal by nitritation/denitritation. Water Science and Technology, 49:73-79.
Page 110 of 132
Judd, S. 2011. The MBR Book: Principles and Applications of Membrane Bioreactors for Water and Wastewater Treatment. Oxford: Butterworth-Heinemann. Kalyuzhnyi, S. V., Saucedo, J. V. & Martinez, J. R. 1997. The anaerobic treatment of soft drink wastewater in UASB and hybrid reactors. Applied Biochemistry and Biotechnology, 66(3):291-301. Kanai, M., Ferre, V., Wakahara, S., Yamamoto, T. & Moro, M. 2010. A novel combination of methane fermentation and MBR-Kubota Submerged Anaerobic Membrane Bioreactor process. Desalination, 250(3):964-967. Kang, I. J., Yoon, S. H. & Lee, C. H. 2002. Comparison of the filtration characteristics of organic and inorganic membranes in a membrane-coupled anaerobic bioreactor. Water Research, 36(7):1803-1813. Kangle, K. M., Kore, S. V., Kore, V. S. & Kulkarni, G. S. 2012. Recent trends in anaerobic codigestion: a review. Universal Journal of Environmental Research and Technology, 2(4):210-219. Kaparaju, P., Buendia, I., Ellegaard, L. & Angelidakia, I. 2008. Effects of mixing on methane production during thermophilic anaerobic digestion of manure: Lab-scale and pilot-scale studies. Bioresource Technology, 99(11):4919-4928. Karakulski, K. & Morawski, W. A. 2000. Purification of copper wire drawing emulsion by application of UF and RO. Desalination, 131(1):87-95. Karia G.L. & Christian, R.A. 2006. Wastewater Treatment: Concepts and Design Approach. London: PHI Learning. Keyser, M., Witthuhn, R. C., Ronquest, L. C. & Britz, T. J. 2003. Treatment of winery effluent with upflow anaerobic sludge blanket (UASB)-granular sludges enriched with Enterobacter sakazakii. Biotechnology Letters, 25(22):1893-1898. Kim, J., DiGiano, F. A. & Reardon, R. D. 2008. Autopsy of high-pressure membranes to compare effectiveness of MF and UF pretreatment in water reclamation. Water Research, 42(3):697-706. Krich K, Augenstein A, Batmale J, Benemann J, Rutledge B, & Salour D. 2005. Upgrading dairy biogas to biomethane and other fuels. In: Andrews K., Editor. Biomethane from Dairy Waste - A Sourcebook for the Production and Use of Renewable Natural Gas in California. California: Clear Concepts, 47-69. Labatut, R. A. & Gooch, C. A. 2012. Monitoring of Anaerobic Digestion Process to Optimize Performance and Prevent System Failure. Enhanced Environmental and Economic Sustainability Conference. Holiday Inn, Liverpool, New York, 28-29 March 28-29. Lai E, Senkpiel S, Solley D, & Keller J. 2004. Nitrogen removal of high strength wastewater via nitritation/denitritation using a sequencing batch reactor. Water Science and Technology, 50:27-33. Laubscher, A. C. J., Wentzel, M. C., Le Roux, J. M. W. & Ekama, G. A. 2001. Treatment of grain distillation wastewaters in an upflow anaerobic sludge bed (UASB) system. Water SA, 27(4):433-444. Le-Clech, P., Chen, V. & Fane, T. A. 2006. Fouling in membrane bioreactors used in wastewater treatment. Journal of Membrane Science, 284(1):17-53.

Page 111 of 132
Lee, K. C. & Rittmann, B. E. 2003. Effects of pH and precipitation on autohydrogenotrophic denitrification using the hollow-fiber membrane-biofilm reactor. Water Research, 37(7):1551-1556. Lee, S. & Cho, J. 2004. Comparison of ceramic and polymeric membranes for natural organic matter (NOM) removal. Desalination, 160(3):223-232. Lettinga, G. 1995. Anaerobic digestion and wastewater treatment systems. Antonie van Leeuwenhoek, 67(1):3-28. Levlin, E. 2007. Conductivity measurements for controlling municipal waste-water treatment. In Proceedings of a Polish-Swedish-Ukrainian Seminar (pp. 51-62). Levy, G., Fine, P., & Bar-Tal, A. 2011. Treated Wastewater in Agriculture: Use and impacts on the soil environments and crops. United Kingdom: Blackwell. Li, Y., Kang, J. H., Lau, S. L., Kayhanian, M., & Stenstrom, M. K. 2008. Optimization of settling zone design to remove particles and metals. Journal of Environmental Engineering, 134(11):885-894. Liao, B. Q., Kraemer, J. T. & Bagley, D. M. 2006. Anaerobic membrane bioreactors: applications and research directions. Critical Reviews in Environmental Science and Technology, 36(6):489-530. Libralato, G. 2013. The small-scale approach in wastewater treatment. In Wastewater Reuse and Management (pp. 195-224). Springer Netherlands. Lim, S. J. & Kim, T. H. 2014. Applicability and trends of anaerobic granular sludge treatment processes. Biomass and Bioenergy, 60:189-202. Lin, H., Gao, W., Meng, F., Liao, B. Q., Leung, K. T., Zhao, L. & Hong, H. 2012. Membrane bioreactors for industrial wastewater treatment: a critical review. Critical Reviews in Environmental Science and Technology, 42(7):677-740. Ling, B., Chao, L., Kan, H. & Shenxiang, W. 2009. Characteristics of membrane fouling in a submerged anaerobic double-shaft rotary membrane bioreactor. Industrial Water Treatment, 8:001-009. Liu, C. F., Yuan, X. Z., Zeng, G. M., Li, W. W. & Li, J. 2008. Prediction of methane yield at optimum pH for anaerobic digestion of organic fraction of municipal solid waste. Bioresource Technology, 99(4):882-888. loannou, L. A., Michael, C., Vakondios, N., Drosou, K., Xekoukoulotakis, N. P., Diamadopoulos, E. & Fatta-Kassinos, D. 2013. Winery wastewater purification by reverse osmosis and oxidation of the concentrate by solar photo-Fenton. Separation and Purification Technology, 118: 659-669. Logsdon, G. S. 2011. Water filtration practices: Including slow sand filters and pre-coat filtration. Washington: Water Works Association. Lu, J. C., Gao, D. W. & Sun, X. Y. 2013. A novel municipal wastewater treating process for energy production and autotrophic nitrogen removal based on ANAMMOX. Huan Jing ke Xue, 34(4):1435-1441. Luo, G., Xie, L. & Zhou, Q. 2009. Enhanced treatment efficiency of an anaerobic sequencing batch reactor (ASBR) for cassava stillage with high solids content. Journal of Bioscience and Bioengineering, 107(6):641-645.

Page 112 of 132
Maczulak, A. E. 2010. Waste treatment: reducing global waste. United Kingdom: InfoBase Publishing. Madsen, E. L. 2011. Environmental microbiology: from genomes to biogeochemistry. New York: John Wiley & Sons. Manyele, S. V., Peay, M., & Halfani, M. R. 2008. Treatment of beverage‐processing
wastewater in a three‐phase fluidised bed biological reactor. International Journal of Food Science and Technology, 43(6):1058-1065. Manyi-Loh, C. E., Mamphweli, S. N., Meyer, E. L., Okoh, A. I., Makaka, G. & Simon, M. 2013. Microbial Anaerobic Digestion (Bio-Digesters) as an Approach to the Decontamination of Animal Wastes in Pollution Control and the Generation of Renewable Energy. International Journal of Environmental Research and Public Health, 10(9):4390-4417. Mason, K.D., Esteves, S.R., Guwyn, A.J. & Dinsdale, R.M. 2007 Anaerobic digestion of biodegradable municipal solid wastes A Review. University of Glamorgan. Massoud, M. A., Fayad, R., Kamleh, R. & El-Fadel, M. 2010. Environmental Management System (ISO 14001) Certification in Developing Countries: Challenges and implementation strategies 1. Environmental Science and Technology, 44(6):1884-1887 Matošić, M., Prstec, I., Jakopović, H. K. & Mijatović, I. 2009. Treatment of beverage production wastewater by membrane bioreactor. Desalination, 246(1):285-293. Matovic, M. 2013. Biomass Now - Sustainable Growth and Use. Intech. Mavrov, V. & Bélières, E. 2000. Reduction of water consumption and wastewater quantities in the food industry by water recycling using membrane processes. Desalination, 131(1):75-86. Mavrov, V., Chmiel, H. & Bélières, E. 2001. Spent process water desalination and organic removal by membranes for water reuse in the food industry. Desalination, 138(1):65-74. Melamane, X. L. 2007. Treatment of wine distillery wastewaters by high rate anaerobic digestion and submerged membrane systems. Doctoral dissertation, Rhodes University, SA. Melamane, X. L., Strong, P. J. & Burgess, J. E. 2007. Treatment of wine distillery wastewater: A review with emphasis on anaerobic membrane reactors. South African Journal for Enology and Viticulture, 28(1):25. Méndez-Acosta, H. O., Snell-Castro, R., Alcatraz-González, V., González-Álvaro, V. & Playa-Ortiz, C. 2010. Anaerobic treatment of Tequila vinasses in a CSTR-type digester. Biodegradation, 21(3):357-363. Meng, F., Zhou, Z., Li, L., Li, R., Jian, X. & Li, S. 2013. A novel nearly plug‐flow membrane bioreactor for enhanced biological nutrient removal. Ache Journal, 59(1):46-54. Milne, N.A., Gray, S., Tjandaraatmadja, G., Diaper, C., Tailor, R., Zang, G. & Reeve., D. 2009. Guidance for the use of recycled water by industry. Victoria University. CSIRO and Smart water fund. Mittal, A. 2011. Biological Wastewater Treatment. Water Today, August, Fulltide, 32-44. Miyaki, H., Adachi, S., Suda, K. & Kojima, Y. 2000. Water recycling by floating media filtration and nanofiltration at a soft drink factory. Desalination, 131(1):47-53.

Page 113 of 132
Mohana, S. Acharya, B.K. Madamwar, D. 2009. Distillery spent wash: Treatment technologies and potential applications. Journal of Hazard Material, 163:12-25. Moletta, R. 2005. Winery and distillery wastewater treatment by anaerobic digestion. Water Science and Technology, 51(1):137-144. Monclús, H., Sipma, J., Ferrero, G., Comas, J. & Rodriguez-Roda, I. 2010. Optimization of biological nutrient removal in a pilot plant UCT-MBR treating municipal wastewater during start-up. Desalination, 250(2):592-597. Mosse, K. P. M., Patti, A. F., Christen, E. W. & Cavagnaro, T. R. 2011. Review: winery wastewater quality and treatment options in Australia. Australian Journal of Grape and Wine Research, 17(2):111-122. Mudhoo, A. & Kumar, S. 2013. Effects of heavy metals as stress factors on anaerobic
digestion processes and biogas production from biomass. International Journal of
Environmental Science and Technology, 10(6):1383-1398.
Murthy, Z. V. P. & Chaudhari, L. B. 2009. Treatment of distillery spent wash by combined UF and RO processes. Global NEST Journal, 11(2):235-240. Musee, N., Trerise, M. A. & Lorenzen, L. 2007. Post-treatment of distillery wastewater after UASB using aerobic techniques. South African Journal of Enology and Viticulture, 28:50-55. Muster-Slawitsch, B., Weiss, W., Schnitzer, H. & Brunner, C. 2011. The green brewery concept of energy efficiency and the use of renewable energy sources in breweries. Applied Thermal Engineering, 31(13):2123-2134. Mutombo, D. T. 2004. Internal circulation reactor: pushing the limits of anaerobic industrial effluents treatment technologies. In Proceedings of the 2004. Water Institute of Southern Africa (WISA) Bennial conference, Cape Town, South Africa. 608-616. Nataraj, S. K., Hosamani, K. M. & Aminabhavi, T. M. 2006. Distillery wastewater treatment by the membrane-based nanofiltration and reverse osmosis processes. Water Research, 40(12): 2349-2356. Nelson, R. 2010. Methane generation from anaerobic digesters: considering different substrates. Environmental Biotechnology,-Iowa State University, USA. NERSA, 2001. Registers biogas production activities in rural areas in terms of the Gas Act, 2001 (Act No. 48 of 2001). Ng, K. K., Lin, C. F., Panchangam, S. C., Andy Hong, P. K. & Yang, P. Y. 2011. Reduced membrane fouling in a novel bio-entrapped membrane reactor for treatment of food and beverage processing wastewater. Water Research, 45(14):4269-4278. Nielsen, P. H., Daims, H. & Lemmer, H. 2009. FISH handbook for biological wastewater treatment: identification and quantification of microorganisms in activated sludge and biofilms by FISH. London: IWA Publishing. Nopens, I., Sin, G., Jiang, T., d'Antonio, L., Stama, S., Zhao, J. & Vanrolleghem, P. A. 2007. Model-based optimisation of the biological performance of a sidestream MBR. Water Science and Technology, 56(6):135-146.

Page 114 of 132
Noronha, M., Britz, T., Mavrov, V., Janke, H. D. & Chmiel, H. 2002. Treatment of spent process water from a fruit juice company for purposes of reuse: hybrid process concept and on-site test operation of a pilot plant. Desalination, 143(2):183-196. Nyilimbabazi, N., Banadda, N., Nhapi, I. & Wali, U. G. 2011. Characterization of brewery wastewater for reuse in Kigali, Rwanda. Open Environmental Engineering Journal, 4:89-96. Oktay, S., Iskender, G., Germirli Babuna, F., Kutluay, G. & Orhon, D. 2007. Improving the wastewater management for a beverage industry with in-plant control. Desalination, 211(1):138-143. Ozbas, E. E., Tufekci, N., Yilmaz, G. & Ovez, S. 2006. Aerobic and anaerobic treatment of fruit juice industry effluents. Journal of Scientific and Industrial Research, 65(10):830-837. Pandey, R. A., Malhotra, S., Zonehiwale, A., Pande, S., Pathe, P. P. & Kaul, S. N. 2003. Treatment of biologically treated distillery effluent: A case study. International Journal of Environmental Studies, 60(3):263-275. Pant, D. & Adholeya, A. 2007.Biological approaches for treatment of distillery wastewater: A Review, Bioresource Technology, 98:2321-2334. Parawira, W., Kudita, I., Nyandoroh, M. G. & Zvauya, R. 2005. A study of industrial anaerobic treatment of opaque beer brewery wastewater in a tropical climate using a full-scale UASB reactor seeded with activated sludge. Process Biochemistry, 40(2):593-599. Paulsen, C. 2006. Determination of the methanogenic potential of an apple processing wastewater treatment system. Unpublished Doctoral dissertation, Stellenbosch: University of Stellenbosch, SA. Peixoto, G., Saavedra, N. K., Varesche, M. B. A. & Zaiat, M. 2011. Hydrogen production from soft-drink wastewater in an upflow anaerobic packed-bed reactor. International Journal of Hydrogen Energy, 36(15):8953-8966. Peng, J., Lu, L. & Yang, H. 2013. Review on life cycle assessment of energy payback and greenhouse gas emission of solar photovoltaic systems. Renewable and Sustainable Energy Reviews, 19:255-274. Petruccioli, M., Cardoso Duarte, J., Eusebio, A. & Federici, F. 2002. Aerobic treatment of winery wastewater using a jet-loop activated sludge reactor. Process Biochemistry, 37(8):821-829. Phillips, H. M., Kobylinski, E., Barnard, J. & Wallis-Lage, C. 2006. Nitrogen and Phosphorus-Rich Sidestreams: Managing the Nutrient Merry-Go-Round. Proceedings of the Water Environment Federation, 2006(7):5282-5304. Poh, P. E. & Chong, M. F. 2009. Development of anaerobic digestion methods for palm oil mill effluent (POME) treatment. Bioresource Technology, 100(1):1-9. Qadir, M., D., Wichelns, L., Raschid-Sally, P. G., McComick, P., Drechsel, A., Bahri & Minhas P. S. 2010. The challenges of wastewater irrigation in developing countries. Agricultural Water Management, 97(4):561-568. Rajagopal, R., Massé, D. I. & Singh, G. 2013. A critical review on inhibition of anaerobic digestion process by excess ammonia. Bioresource Technology, 143:632-641.

Page 115 of 132
Rajeshwari, K. V., Balakrishnan, M., Kansal, A., Lata, K. & Kishore, V. V. N. 2000. State-of the- art of anaerobic digestion technology for industrial wastewater treatment. Renewable and Sustainable Energy Reviews, 4:135-156. Ramaswamy, S., Huang, H. J. & Ramarao, B. V. 2013. Separation and purification technologies in biorefineries. New York: John Wiley & Sons. Ramírez Camperos, E., Mijaylova Nacheva, P. & Díaz Tapia, E. 2004. Treatment techniques for the recycling of bottle washing water in the soft drinks industry. Water Science and Technology, 50(2):107-12. Rao, A. G., Reddy, T., Prakash, S. S. Vanajakshi, J., Joseph, J. & Sarma, P. N. 2007. pH regulation of alkaline wastewater with carbon dioxide: A case study of treatment of brewery wastewater in UASB reactor coupled with absorber. Bioresource Technology, 98(11):2131-2136. Romano, R.T. & Zhang, R. 2011. Anaerobic digestion of onion residuals using a mesophilic anaerobic phased solids digester. Biomass Bioenergy, 35(10):4174-4179. Rügner, H., Schwientek, M., Beckingham, B., Kuch, B. & Grathwohl, P. 2013. Turbidity as a proxy for total suspended solids (TSS) and particle facilitated pollutant transport in catchments. Environmental Earth Sciences, 69(2): 373-380. Russell, D. L. 2006. Practical wastewater treatment. New Jersey: John Wiley & Sons. Ryckebosch, E., Drouillon, M. & Vervaeren, H. 2011. Techniques for transformation of biogas to biomethane. Biomass and Bioenergy, 35(5):1633-1645. Saha, N. K., Balakrishnan, M. & Batra, V. S. 2005. Improving industrial water use: case study for an Indian distillery. Resources, Conservation and Recycling, 43(2):163-174. Sangave, P. C. & Pandit, A. B. 2006. Enhancement in biodegradability of distillery wastewater using enzymatic pre-treatment. Journal of Environmental Management, 78(1):77-85. Satyawali, Y. & Balakrishnan, M. 2008. Treatment of distillery effluent in a membrane bioreactor (MBR) equipped with mesh filter. Separation and Purification Technology, 63(2):278-286. Schomaker, A. H. H. M., Boerboom, A. A. M., Visser, A. & Pfeifer, A. E. 2000. Anaerobic digestion of agro-industrial wastes: information networks: technical summary on gas treatment. AD-NETT Project FAIR-CT96-2083 (DG12-SSMI). Shachman, M. 2004. The soft drinks companion: A technical handbook for the beverage industry. Florida: CRC Press. Shachman. M. 2004. The soft drinks companion: A technical handbook for the beverage industry. Florida: Taylor and Francis. Shao, X., Peng, D., Teng, Z. & Ju, X. 2008. Treatment of brewery wastewater using anaerobic sequencing batch reactor (ASBR). Bioresource Technology, 99(8):3182-3186. Sheldon, M. S., Zeelie, P. J. & Edwards, W. 2012. Treatment of paper mill effluent using an anaerobic/aerobic hybrid side-stream Membrane Bioreactor. Water Science and Technology, 65(7):1265-1272.

Page 116 of 132
Simate, G. S., Cluett, J., Iyuke, S. E., Musapatika, E. T., Ndlovu, S., Walubita, L. F. & Alvarez, A. E. 2011. The treatment of brewery wastewater for reuse: State of the art. Desalination, 273(2):235-247. Singhania, R. R., Christophe, G., Perchet, G., Troquet, J. & Larroche, C. 2012. Immersed membrane bioreactors: An overview with special emphasis on anaerobic bioprocesses. Bioresource Technology, 122:171-180. Song, H., Clarke, W. P. & Blackall, L. L. 2005. Concurrent microscopic observations and activity measurements of cellulose hydrolyzing and methanogenic populations during the batch anaerobic digestion of crystalline cellulose. Biotechnology and Bioengineering, 91(3):369-378. Song, K. G., Cho J. & Ahn, K. H. 2009. Effects of internal recycling time mode and hydraulic retention time on biological nitrogen and phosphorus removal in a sequencing anoxic/anaerobic membrane bioreactor process. Bioprocess and Biosystems Engineering, 32(1):135-142. Sonune, A. & Ghate, R. 2004. Developments in wastewater treatment methods. Desalination, 167, 55-63. South Africa, Department of Public Works. 2012. Small wastewater treatment works, Design guidelines. South Africa, Department of Water Affairs and Forestry. 2004. Guidelines for Water Conservation and Water Demand Management: Volume 1: CMA Planning Framework, Pretoria. South Africa, The National Water Act. 1998. (Act No. 36 of 1998). Government Gazette, SA. South Africa. 2003. Department of Water Affairs and Forestry. 2003. Water Quality Management Series: Towards a Strategy for a Waste Discharge Charge System. Sub-Series No. MS 11. Pretoria: Government Printer. South Africa. 2006. City of Cape Town: Wastewater and industrial effluent by-law. Province of Western Cape Provincial Gazette, 6378:1562-1563, September 1. South Africa. Department of Water Affairs and Forestry. 2005. SANS 241:2005: A drinking water quality framework for South Africa. South Africa. Department of Water Affairs. 2011. SANS 241-1:2011: South African National Standard: Drinking Water. Part 1: Microbiological, physical, aesthetic and chemical determinants. Pretoria: SABS Standards Division. Spellman, F. R. & Drinan, J. E. 2012. The drinking water handbook. New York: CRC Press. Spellman, F. R. 2013. Handbook of water and wastewater treatment plant operations. New York: CRC Press. Sreethawong, T. & Chavadej, S. 2008. Colour removal of distillery wastewater by ozonation in the absence and presence of immobilized iron oxide catalyst. Journal of Hazardous Materials, 155(3):486-493. Stoller, M., De Caprariis, B., Cicci, A., Verdone, N., Bravi, M. & Chianese, A. 2013. About proper membrane process design affected by fouling by means of the analysis of measured threshold flux data. Separation and Purification Technology, 114: 83-89.

Page 117 of 132
Strong, P. J. & Burgess, J. E. 2008. Treatment methods for wine-related and distillery wastewaters: a review. Bioremediation Journal, 12(2):70-87. Sulaiman, A., Busu, Z., Tabatabaei, M., Yacob, S., Abd-Aziz, S., Hassan, M. A. & Shirai, Y. 2009. The effect of higher sludge recycling rate on anaerobic treatment of palm oil mill effluent in a semi-commercial closed digester for renewable energy. American Journal of Biochemistry and Biotechnology, 5(1):1-6. Surroop, D. & Mohee, R. 2011: Comparative assessment of anaerobic digestion of Municipal solid waste at mesophilic and thermophilic temperatures. International Journal of Environmental Technology Management, 14(1):238-251. Tabatabaei, M., Rahim, R. A., Abdullah, N., Wright, A. D. G., Shirai, Y., Sakai, K. & Hassan, M. A. 2010. Importance of the methanogenic archaea populations in anaerobic wastewater treatments. Process Biochemistry, 45(8):1214-1225. Tabatabaei, M., Sulaiman, A., Nikbakht, A. M., Yusof, N. & Najafpour, G. 2011. Influential parameters on biomethane generation in anaerobic wastewater treatment plants. Canada: Intech. Tamime, A. Y. 2009. Cleaning-in-place: dairy, food and beverage operations. London: John Wiley & Sons. Tawfik, A. & El-Kamah, H. 2012. Treatment of fruit-juice industry wastewater in a two-stage anaerobic hybrid (AH) reactor system followed by a sequencing batch reactor (SBR). Environmental Technology, 33(4):429-436. Tay, J. H. & Jeyaseelan, S. 1995. Membrane filtration for reuse of wastewater from beverage industry. Resources, Conservation and Recycling, 15(1): 33-40.
Teerasong. S. Chan-Eam. S. Sereenonchai. K. Amornthammarong. N. Ratanawimarnwong. N. & Nacapricha. D. 2010. A reagent-free SIA module for monitoring of sugar, color and dissolved CO< sub> 2</sub> content in soft drinks. Analytical Chemical, 668(1):47-53. Teng, C. K., Hawlader, M. N. A. & Malek, A. 2003. An experiment with different pretreatment methods. Desalination, 156(1):51-58. Torres, A., Hemmelmann, A., Vergara, C. & Jeison, D. 2011. Application of two-phase slug-flow regime to control flux reduction on anaerobic membrane bioreactors treating wastewaters with high suspended solids concentration. Separation and Purification Technology, 79(1):20-25. Trzcinski, A. P. & Stuckey, D. C. 2009. Continuous treatment of the organic fraction of municipal solid waste in an anaerobic two-stage membrane process with liquid recycle. Water Research, 43(9):2449-2462. Turkdogan-Aydınol, F. I. & Yetilmezsoy, K. 2010. A fuzzy-logic-based model to predict biogas and methane production rates in a pilot-scale mesophilic UASB reactor treating molasses wastewater. Journal of Hazardous Materials, 182(1):460-471. Vaiopoulou, E. & Aivasidis, A. 2008. A modified UCT method for biological nutrient removal: configuration and performance. Chemosphere, 72(7):1062-1068. Valderrama, C., Ribera, G., Bahi, N., Rovira, M., Gimenez, T., Nomen, R. & Martinez-Llado, X. 2012. Winery wastewater treatment for water reuse purpose: Conventional
Page 118 of 132
activated sludge versus membrane bioreactor (MBR): A comparative case study. Desalination, 306:1-7. Van Gestel, T., Vandecasteele, C., Buekenhoudt, A., Dotremont, C., Luyten, J., Leysen, R. & Maes, G. 2002. Salt retention in nanofiltration with multilayer ceramic TiO2 membranes. Journal of Membrane Science, 209(2):379-389. Van Haandel, A., Kato, M. T., Cavalcanti, P. F. & Florencio, L. 2006. Anaerobic reactor design concepts for the treatment of domestic wastewater. Reviews in Environmental Science and Biotechnology, 5(1):21-38. Van Schoor, L. H. 2005. Guidelines for the management of wastewater and solid waste at existing wineries. Winetech, South Africa. Vedavyasan, C. V. 2007. Pretreatment trends an overview. Desalination, 203(1):296-299. Venkata Mohan, S., Mohanakrishna, G., Ramanaiah, S. V. & Sarma, P. N. 2008. Simultaneous biohydrogen production and wastewater treatment in biofilm configured anaerobic periodic discontinuous batch reactor using distillery wastewater. International Journal of Hydrogen Energy, 33(2):550-558. Vlyssides, A. G., Barampouti, E. M. & Mai, S. 2005. Wastewater characteristics from Greek wineries and distilleries. Water Science and Technology, 51(1):53-60. Von Sperling, M. 2007. Basic principles of wastewater treatment. London: IWA publishing. Von Sperling, M., de Lemos Chernicharo, C. A., Andreoli, C. V. & Fernandes, F. 2005. Biological wastewater treatment in warm climate regions (Vol. 2). United Kingdom: IWA. Wang, L. K., & Ivanov, V. 2010. Environmental biotechnology. New York: Springer. Wang, L. K., Pereira, N. C. & Hung, Y. T. 2009. Biological treatment processes. New York: Springer. Wang, S. G., Liu, X. W., Gong, W. X., Gao, B. Y., Zhang, D. H. & Yu, H. Q. 2007. Aerobic granulation with brewery wastewater in a sequencing batch reactor. Bioresource Technology, 98(11):2142. Wang, X., Feng, Y. J. & Lee, H. 2008. Electricity production from beer brewery wastewater using single chamber microbial fuel cell. Water Science and Technology, 57(7):1117-1122. Wang, Z., Liu, B., Liu, Y. D. & Wan, F. 2013. Evaluation of biological removal efficiency in a
UCT process treating municipal wastewater during start-up stage. Journal of Environmental
Biology/Academy of Environmental Biology, 34:459-464.
Ward, A.J., Hobbs, P.J., Holliman P.J. & Jones, D.L. 2008: Optimisation of the anaerobic digestion of agricultural resources. Bioresource Technology, 99:7928-7940. Wen, Q., Wu, Y., Zhao, L. X., Sun, Q. & Kong, F. Y. 2010. Electricity generation and brewery wastewater treatment from sequential anode-cathode microbial fuel cell. Journal of Zhejiang University Science B, 11(2):87-93. Wijekoon, K. C., Visvanathan, C. & Abeynayaka, A. 2011. Effect of organic loading rate on VFA production, organic matter removal and microbial activity of a two-stage thermophilic anaerobic membrane bioreactor. Bioresource Technology, 102(9):5353-5360.

Page 119 of 132
Wilkie, A. C., Riedesel, K. J. & Owens, J. M. 2000. Stillage characterization and anaerobic treatment of ethanol stillage from conventional and cellulosic feedstock. Biomass and Bioenergy, 19(2):63-102. Wolmarans, B. & De Villiers, G. H. 2004. Start-up of a UASB effluent treatment plant on distillery wastewater. Water SA, 28(1):63-68. Yang, J., Zhang, L., Fukuzaki, Y., Hira, D. & Furukawa, K. 2010. High-rate nitrogen removal by the Anammox process with a sufficient inorganic carbon source. Bioresource Technology, 101(24):9471-9478.
Yang, W., Cicek, N. & Ilg, J. 2006. State-of-the-art of membrane bioreactors: Worldwide research and commercial applications in North America. Journal of Membrane Science, 270(1):201-211. Yu, H. Q., Zhao, Q. B. & Tang, Y. 2006. Anaerobic treatment of winery wastewater using laboratory-scale multi-and single-fed filters at ambient temperatures. Process Biochemistry, 41(12):2477-2481. Zhang, C., Wang, L., Yan, N., Zhang, Y. & Liu, R. 2013. Air-lift internal loop biofilm reactor for realized simultaneous nitrification and denitrification. Bioprocess and Biosystems Engineering, 36(5):597-602. Zhang, S., Yang, F., Liu, Y., Zhang, X., Yamada, Y. & Furukawa, K. 2006. Performance of a metallic membrane bioreactor treating simulated distillery wastewater at temperatures of 30 to 45 oC. Desalination, 194(1):146-155. Zhang, W., Xiong, R. & Wei, G. 2009. Biological flocculation treatment on distillery wastewater and recirculation of wastewater. Journal of Hazardous Materials, 172(2):1252-1257. Zhang, Y., Yan, L., Chi, L., Long, X., Mei, Z. & Zhang, Z. 2008. Start-up and operation of anaerobic EGSB reactor treating palm oil mill effluent. Journal of Environmental Sciences, 20(6):658-663. Zhang, Y., Zamudio Cañas, E. M., Zhu, Z., Linville, J. L., Chen, S. & He, Q. 2011. Robustness of archaeal populations in anaerobic co-digestion of dairy and poultry wastes. Bioresource Technology, 102(2):779-785. Zhou, M., Tan, Q., Wang, Q., Jiao, Y., Oturan, N. & Oturan, M. A. 2012. Degradation of organics in reverse osmosis concentrate by electro-Fenton process. Journal of Hazardous Materials, 215, 287-293. Zupančič, G. D., Stražiščar, M. & Roš, M. 2007. Treatment of brewery slurry in thermophilic anaerobic sequencing batch reactor. Bioresource Technology, 98(14):2714-2722. INTERNET REFERENCES
AEBIOM, A. 2009. Biogas road map for Europe. European Biomass Association. Council Directive 80/778/EEC of 15 July 1980 relating to the quality of water intended for human consumption - Repealed by Council Directive 98/83/European Council on the quality of water intended for human consumption. accessed [10 April 2014]. Fewtrell, L. & Bartram, J. 2001. Water Quality: Guidelines, Standards and Health: Assessment of Risk and Risk Management for Water-Related Infectious Disease. International Water Association.

Page 120 of 132
http://www.worldcat.org/title/water-quality-guidelines-standards-and-health-assessment-of-risk-and-risk-management-for-water-related-infectious-diseases/oclc/496991738 viewed [21 March 2014]. Oliveira, M. & Duarte, E. 2011. Winery wastewater treatment: evaluation of the air micro-bubble bioreactor performance. http://hdl.handle.net/10400.15/624 viewed [10 February 2014]. Softdrink 2014. In Encyclopædia Britannica. Inc. Encyclopaedia Britannica Online: http://www.britannica.com/EBchecked/topic/552397/soft-drink/66705/Carbon-dioxide-and-carbonation [Retrieved March 5. 2014]. South Africa (Western Cape). 2006. City of Cape Town: Wastewater and industrial effluent by-law. Province of Western Cape Provincial Gazette, 6378:1562-1563, September 1. https://www.capetown.gov.za/en/PublicParticipation/Documents/Draft_Wastewater_By_law_2011_Eng.pdf, viewed [15 January 2014]. Wellinger A. & Lindberg A. 2005. Biogas Upgrading and Utilisation. IEA Bioenergy Task 24: Energy from Biological Conversion of Organic Waste; 2005 [accessed 20 January 2014].

Page 121 of 132
APPENDICES
APPENDIX A: Treatment methods
Treatment method Type of reactor
AD Anaerobic digestion
AD-MBR Anaerobic digestion & membrane bioreactor
AD-MCAB Anaerobic digestion & membrane-coupled anaerobic bioreactor
AF Anaerobic filter
AH-SBR Anaerobic hybrid sequence batch reactor
AJLR Aerobic jet-loop activated sludge reactor
AMBB Air micro-bubble bioreactor
AMBR Aerobic membrane bioreactor
AMBR-CSTR Aerobic membrane bioreactor & continuous stirrer zone reactor
AMBR-PAC Aerobic MBR and powdered activated carbon
AnCSBR Anaerobic contact sequence batch reactor
AnMBR Anaerobic membrane bioreactor
AnEMBR Anaerobic external membrane bioreactor
AnFBR Anaerobic fixed-bed reactor
AnIFBR Anaerobic inverse fluidized bed reactors
AnRBC Anaerobic rotating biological contactor
AnSBBR Anaerobic sequencing batch biofilm reactor
AnSBR Anaerobic sequencing batch reactor
AO&MBR Anoxic/aerobic membrane bioreactor
CA-UASB CO2 Absorber & upflow anaerobic sludge bed
CF-RO Cartridge filter & reverse osmosis
CF-RO-IE Cartridge filter, reverse osmosis and ion exchange
CSTR Continuous stirred zone reactor and type digester
DSR-AnMBR Double-shaft rotary anaerobic membrane bioreactor
EGSB-AF Expanded granular sludge bed & anaerobic filter
FBBR Fluidised bed bioreactor
GRABBR Granular bed anaerobic baffled bed reactor
HT-MBR High-throughput and MBR
KSAMBR Kubota’s submerged anaerobic membrane biological reactor

Page 122 of 132
MBR-UV-NF Membrane bioreactor and ultraviolet and nanofiltration
MCAB Membrane-coupled anaerobic bioreactor
NF-RO Nanofiltration and reverse osmosis
PBUAR Packed-bed upflow anaerobic reactor
PTF-AH Polyurethane trickling filter and anaerobic hybrid reactor
RBC Rotating biological contactor
SBR Aerobic sequence batch reactor
sMBR Sidestream membrane bioreactor
TAnMBR Thermophilic anaerobic membrane bioreactor
UAF Upflow anaerobic filter
UAFFR Anaerobic upflow fixed film reactor
UASB Upflow anaerobic sludge bed
UASB-AF Upflow anaerobic sludge bed and anaerobic filter
UASR-AS Upflow anaerobic sponge reactor and activated sludge
UASB-ASBR Upflow anaerobic sludge bed and aerobic sequence batch reactor
UASB-HR Upflow anaerobic sludge bed and hybrid reactor
UASB-SBR Upflow anaerobic sludge bed and sequence batch reactor

Page 123 of 132
APPENDIX B: Preparation of dosing solution chemicals and cleaning-in-place (CIP) solution Appendix B1: Dosing solution
Preparation of 2L 0.5 M phosphoric acid from 80% phosphoric acid (H3PO4)
1. Molecular weight of phosphoric acid (Mw (H3PO4)) = 97.99 g/mol
2. 0.5 M = 0.5 mol/L x Mw (H3PO4)
= 0.5 x 97.95
= 48.98 g/L
Concentration of undiluted H3PO4 (C1) = 80%, therefore, C1 = 800 g/L and V1 = unknown volume
4. 2 L 0.5 M H3PO4 is required, therefore, C2 = 48.98 g/L and V2 = 2 L
5. C1V1 = C2V2
6. (800 g/L) x V1 = (48.98 g/L) x (2 L)
7. V1 = 0.122 L per 2 L water
Therefore, in order to prepare 2 L of 0.5 M H3PO4, 0.122 L (122 ml) of H3PO4 must be added to 2 L of distilled H2O and mixed well. Preparation of 2L 1M sodium hydrogen carbonate (NaHCO3)
1. Molecular weight of sodium hydrogen carbonate (Mw (NaHCO3)) = 84.007 g/mol
2. grams = (Mw (NaHCO3)x (2 L)x 1M
= 168.014 g
Therefore, in order to prepare a solution of 2L of 1M NaHCO3, 168.014 g must be added to
2L of distilled H2O and mixed well.
Appendix B2: CIP solution
Sodium Hypochlorite (NaOCl) 400ppm solution used to clean biological fouling off the
membranes, and citric acid 1% solution prepared to clean chemical fouling off the
membranes.
Preparation of 5 2Lof 400 ppm NaOCl from 12.5% NaOCl
1. Using the equation C1V1 = C2V2
2. Concentration of undiluted NaOCl (C1) = 12.5%, which is equivalent C1 = 125 g/L
3. 5 L 400 ppm NaOCl is required, equivalent C2 = 0.4 g/L and V2 = 2 L
4. C1V1 = C2V2 Equation B1
5. (125 g/L) x V1 = (0.4 g/L) x (2 L)
6. V1 = 0.0064 L per 2 L water
Therefore, 6.4 mL NaOCl is needed in 2L distilled H2O

Page 124 of 132
Preparation of 2L 1% citric acid solution
1% citric acid = 1 g/ 100 ml = 10 g /L
Therefore, 10g / 1L = x / 2L
x = (10 / 1) * 2
x = 20 g
Therefore, in order to prepare 2 L of 1% citric acid, 20 g (0.02 kg) of citric acid must be
added to 2 L of distilled H2O water and mixed well.

Page 125 of 132
APPENDIX C: Procedure for determining analytical parameters
APPENDIX C1: Chemical oxygen demand (COD)
Determines the amount of organic pollutants found in surface water (for example,
lakes and rivers) or wastewater, making COD a useful measure of water quality
(Manyele et al., 2008).
1.1.1) Method to determine total COD (CODt):
a) All samples must be tested in duplicate.
b) All apparatus should first be checked to confirm that all is operational
c) The test cells should not be scratched and must be cleaned.
d) Switch on the Spectroquant thermoreactor TR 420 to the present setting of 148˚C for
two hours and allow the thermoreactor to heat up to the desired temperature. This will
take approximately 10 minutes.
e) Place approximately 100 ml of distilled water in a 250 ml beaker.
1.1.2) When using COD solutions A and B for the 500 to 10 000 mg/L range:
a) Use Merck COD Solution A, Cat. No. 1.14679.0495 and Merck COD Solution B, Cat.
No. 14680.0495. Pipette 2.2 ml of COD solution A into the test cell.
b) Pipette 1.8 ml of COD solution B into the test cells into which COD solution A was
pipetted. Pipette 1 ml of the sample into the test cells.
c) Tightly attach the screw caps to the test cells. Vigorously mix the contents of the test
cells with a vortex mixer.
d) Heat the test cells in the Spectroquant thermoreactor TR 420 at 148˚C for 2 h.
Carefully remove the test cells after 2 h and place in a test tube rack to cool.
e) Wait 10 minutes and mix the contents of the test cells with the vortex mixer again.
Allow the test cells to cool down to room temperature for 30 minutes.
f) Clean the outside of the test cells and place in the Nova 60 Spectroquant.
g) Enter the code 024 for COD readings in the 500 to 10 000 mg/L range and the COD
concentration of the sample in the test cell will be indicated on the display screen in
mg/L.
1.1.3) When using COD solutions A and B for the 100 to 1500 mg/L range:
a) Use Merck COD Solution A, Cat. No. 1.14538.0065 and Merck COD Solution B, Cat.
No. 1.14539.0495. This procedure is exactly the same as for COD solutions A and B
for the 500 to 10000 mg/L range, with the exception of the following, which are
outlined below.
b) Pipette 0.3 ml of COD solution A into the test cell. Pipette 2.3 ml of COD solution B
into the test cell.

Page 126 of 132
c) Pipette 3 ml of sample into the test cell.
1.1.4) Method to determine soluble COD (CODs):
a) A Büchner funnel is attached to a 500 ml suction flask.
b) The suction flask is either connected to a water pump or to a vacuum pump.
c) Glass microfibre filter discs, 5.5 cm in diameter with a 0.45 μm pore size, without
organic binder (Whatman type GF/F (0.7 Fm)) is placed inside the Büchner funnel,
and 50ml of the raw sample is filtered.
d) The COD of the filtered sample is then determined by using the same procedure as
for total COD determination.
e) The insoluble COD (CODi) is measured by the difference between the total COD
(CODt) and the soluble COD (CODs), and is calculated by using Equation C1:
CODt (mg / L) - CODs (mg / L) = CODi (mg / L) Equation. C1
References
Merck COD Solution A, Cat. No. 1.14538.0065 and 1.14679.0495.
Merck COD Solution B, Cat. No. 1.14539.0495 and 1.14680.0495.

Page 127 of 132
APPENDIX C2: Procedure to determine Total Suspended Solids (TSS)
A total suspended solid (TSS) gives the quantity of the turbidity of water or
wastewater (Akpor & Muchie, 2013). TSS is defined as solids, which are retained by a
glass fibre filter and dried to constant weight at 103 to 105˚C.
a) Preparation of the glass fiber filter disk: Insert the filter disk onto the base and clamp
on funnel.
While the vacuum is applied, wash the disk with three successive 20 mL volumes of
Milli-Q water.
Remove all traces of water by continuing to apply the vacuum after water has passed
through.
Remove the funnel from the base and place the filter in the aluminium dish, and ignite
in the muffle furnace at 550˚C ± 50˚C for 30 minutes.
Rewash the filter with an additional three successive 20 mL volumes of Milli-Q water,
and dry in an oven at 103-105˚C for one hour.
When needed, remove dish from the oven, desiccate, and weigh.
b) Select a sample volume (max. of 50 mL) that will yield no more than 50 mg of total
suspended solids.
c) Place the filter on the base and clamp on the funnel and apply the vacuum.
d) Wet the filter with a small volume of Milli-Q water to seal the filter against the base.
e) Shake the sample vigorously and quantitatively transfer the sample to the filter by
using a large orifice, volumetric pipet.
f) Remove all traces of water by continuing to apply the vacuum after the sample has
passed through.
g) Rinse the pipet and funnel onto the filter with a small volume of Milli-Q water.
h) Remove all traces of water by continuing to apply the vacuum after water has passed
through.
i) Carefully remove the filter from the base and dry for at least one hour at 103-105˚C.
j) Cool in a desiccator and weigh.
Using equation C2 calculate Total Suspended Solids (TSS) as follows:
Total Suspended Solids, mg/L = (A-B) x 1000/C Equation C2
Where: A = weight of filter and dish + residue in mg
B = weight of filter and dish in mg
C = volume of sample filtered in mL
References
Methods for the Chemical Analysis of Water and Waste. 1979. U.S. Environmental Protection Agency, EPA 600/4-79-020:160.2.
Standard Methods for the Examination of Water and Wastewater. 1985. 16th Edition, p. 96, Method 209C.

Page 128 of 132
APPENDIX C3: Method to determine Turbidity
Turbidity is a measure of the degree to which the water or wastewater loses its
transparency due to the presence of suspended solids (Rügner et al., 2013).
Turbidity is measured by an instrument, which is called a nephelometer and its units
are called nephelometric turbidity units (NTU).
1.3.1) Calibration method:
a) Place TN-100 turbidimeter on a flat level surface.
b) Insert the CAL 1 (800 NTU) calibration standard into the sampling well, aligning the
mark on the vial with the mark on the meter.
c) Press the vial down until it snaps into the instrument.
d) Cover the vial with the light shield cap.
e) Press the ON/OFF key to switch on the meter. The meter will go into measuring mode
after the start up sequence.
f) Press the CAL key to switch to calibration mode. The meter will prompt for the CAL 1
standard to be inserted.
g) Press the READ/ENTER key.
h) The annunciator will blink for 12 seconds and then prompt for the CAL 2 (200 NTU)
calibration standard to be inserted.
i) Repeat steps a), b), d), g) and h) for CAL 2, CAL 3 (100 NTU) and CAL 4 (0.02 NTU)
calibration standards.
j) After the CAL 4 (0.02 NTU) calibration standard is calibrated, the display will show
STbY.
k) The nephelomete is now ready for measurement.
1.3.2) Turbidity measuring method:
Preparation of vial sample:
a) Clean dry sample vial.
b) Hold the vial sample vial by the cap.
c) Wash the vial sample with roughly 10 ml of the sample, capping the vial with a black
screw cap and inverting smoothly a number of times.
d) Dispose the used sample and repeat the washing method twice.
e) Fill the sample vial with approximately 10 ml of sample (up to the mark indicated on
the sample vial).
f) Cap the vial with a black screw cap.
g) Wipe the vial sample with a soft cloth.
h) Make sure that the external of the vial is dry and clean.
Page 129 of 132
1.3.3) Measurement method:
a) Place the vial sample inside the sample well of the TN-100 turbidimeter and align the
vial’s index mark with the meter’s index mark.
b) Push the vial sample until it is totally snapped in.
c) Cover the vial with the light protection cap.
d) Turn the meter on by pushing the ON/OFF key.
e) Following the power up sequence, the meter will go into measuring mode and the
display will flash “Rd” roughly 10 times.
f) The measured reading will appear on the display.
g) If necessary, place a second sample vial into the sample well, push down until it is
snapped into place and press the READ/ENTER key.
h) Wait for the measured reading to appear on the display screen.
i) Repeat steps a) to h) for all samples.
References
Standard Methods for the Examination of Water and Wastewater. 2012

Page 130 of 132
APPENDIX C4: Method to determine orthophosphate:
Use a Merck Spectroquant Phosphate cell test for orthophosphate. Cat. No.
1.14543.0001.
a) Check the pH of the sample; it should be in the specified range of pH 0 – 10.
b) Add 5.0 ml of the filtered sample to a barcoded test cell with a P1000 pipette.
c) Place a cap on the barcoded test cell, and mix vigorously with a vortex mixer.
d) Add 5 drops of P-2K to the barcoded test cell.
e) Add 1 dose of P-3K to the barcoded test cell by using the blue dose-metering cap.
f) Place the cap on the barcoded test cell, and mix vigorously with the vortex mixer.
g) Wait for 5 minutes for the reaction to occur.
h) Place the test cells into the Nova 60 Spectroquant to measure for
orthophosphate.
References
Merck Spectroquant Phosphate cell test for orthophosphate and total phosphorus, Cat. No. 1.14543.0001.

Page 131 of 132
APPENDIX D: Composition of anoxic and aerobic zones in different operating conditions Appendix D1: Characteristics of the anoxic zone for different modes of operation
Parameter Mode -1a Mode-1b Mode-2a Mode-2b Mode-3a Mode-3b
pH 7.9 8.3 9.1 8.8 9.1 8.6
CODt (mg/L) 385.8 896.4 1 061 1 181 1 331 1 375
CODs(mg/L) 109.8 755.3 822.5 939.6 1 262 981.3
DO (mg/L) 1.2 2.1 0.6 1.3 2.3 2.5
EC (µS/cm) 102 2 2 217 4 339 4 788 3 538 5 514
Fructose (mg/L) 2.9 60.5 63.4 97.7 33.9 3.9
Sucrose (mg/L) 46 680.2 2 392 1 271 958.4 771.4
TDS (mg/L) 708.3 1 567 2 916 3 163 2 299 3412
Temperature
(°C)
22.5 22.1 23.4 23.8 25.6 27.7
TSS (mg/L) 356.3 667.9 474.0 447.6 167.2 885.1
Turbidity (NTU) 82.4 204 182.9 196.3 106.9 314.6
Ammonium
(mg/L)
3.0 6.0 5.3 3.0 5.3 3.6
Nitrate (mg/L) 4.8 11.0 8.7 5.5 8.7 9.8
Phosphate 8.2 9.1 16.5 7.2 16.5 6.2
Appendix D2: Characteristics of the aerobic zone for different modes of operation
Parameter Mode -1a Mode-1b Mode-2a Mode-2b Mode-3a Mode-3b
pH 8.5 8.8 9.3 10.0 10.0 9.8
CODt (mg/L) 496.4 893.3 974.2 1 119 1 381 1 508
CODs(mg/L) 494.6 564.8 877.5 893.8 1 212 1 307
DO (mg/L) 7.0 5.7 4.6 6.2 6.5 6.1
EC (µS/cm) 1 327. 1 962. 3 884 6 229 5 442 5 318
Fructose (mg/L) 75.5 120.6 25.2 112.2 8.3 4.1
Sucrose (mg/L) 455.8 532.6 1 613 1 293 1 020 1 303
TDS (mg/L) 969.7 1 463 2 953 4 191 3 677 3 476
Temperature (°C) 21.2 21.5 22.5 23.0 23.5 24.9
TSS (mg/L) 515.6 596.0 505.0 547.6 309.2 801.6
Turbidity (NTU) 151.9 106.2 142.4 120.1 130.0 201.1
Ammonium
(mg/L)
1.8 2.0 1.1 0.6 0.1 0.9
Nitrate (mg/L) 28.4 30.5 23.1 17.0 16.2 20.1
Phosphate 9.8 10.4 17.1 9.0 9.9 13.2

Page 132 of 132
APPENDIX E: Calculations
Appendix E1: Membrane flux calculations
Appendix E2: Overall treatment efficiency calculations
%