
the second seminar on promoting community-based treatment ...
Upload
khangminh22Category
view
0download
0
BALTIC SEA ENVIRONMENT PROCEEDINGS
No. 30
SECOND SEMINAR ONWASTEWATER TREATMENT
IN URBAN AREAS
6-8 September 1987Visby, Sweden
BALTIC MARINE ENVIRONMENT PROTECTION COMMISSION- HELSINKI COMMISSION -

BALTIC SEA ENVIRONMENT PROCEEDINGS
No. 30
SECOND SEMINAR ONWASTEWATER TREATMENT
IN URBAN AREAS
6-8 September 1987Visby, Sweden
BALTIC MARINE ENVIRONMENT PROTECTION COMMISSION- HELSINKI COMMISSION -
April 1989
This publication has been technically edited by the host countryof the Seminar, Sweden.
For bibliographic purposes this document should be cited as:Baltic Marine Environment Protection Commission
- Helsinki Commission -1989
Second Seminar on Wastewater Treatment in Urban Areas6-8 September 1987, Visby, Sweden
Baltic Sea Environment Proceedings No. 30
Copyright by the Baltic Marine Environment ProtectionCommission - Helsinki Commission
ISSN 0357-2994
Helsinki 1989 - Government Printing Centre

CONTENTS
Page
Preface . . . . . . . . . . . . . . . . . . . . . . . . . . . . . . . . . . . . . . . . . .
Statement by Professor Harald Velner, ExecutiveSecretary of the Baltic Marine EnvironmentProtection Commission (Helsinki Commission) . . . . . .
The eutrophication status of the Baltic Sea:Input of nitrogen and phosphorus, their availa-bility for plant production, and some managementimplicationsR. Elmgren . . . . . . . . . . . . . . . . . . . . . . . . . . . . . . . . . . . . . . .
The quality of urban stormwater: A state-of-the-artreviewJ.B. Ellis . . . . . . . . . . . . . . . . . . . . . . . . . . . . . . . . . . . . . . .
COMBINED SEWERS
Quality aspects on and methods for reduction ofcombined sewer overflow dischargeW. Hogland . . . . . . . . . . . . . . . . . . . . . . . . . . . . . . . . . . . . . . .
Slide rule methods for estimation of combinedsewer overflow - volumes and pollution loadT. Farestveit . . . . . . . . . . . . . . . . . . . . . . . . . . . . . . . . . . . .
STORMWATER - SEPARATE SYSTEMS
Slide rule methods for estimation of pollutionload due to stormwaterJ. Falk . . . . . . . . . . . . . . . . . . . . . . . . . . . . . . . . . . . . . . . . . .
Measures at or close to source to prevent thedeterioration of stormwater qualityG. Svensson . . . . . . . . . . . . . . . . . . . . . . . . . . . . . . . . . . . . . .
1
2
12
32
46
65
75
79
492713H

Page
INDUSTRIAL DISCHARGES
Causes and effects of hazard from municipal -industrial agglomeration to the waters in thecatchment area of the Upper VistulaJ. Fiszer . . . . . . . . . . . . . . . . . . . . . . . . . . . . . . . . . . . . . . . . 85
Should locally pretreated industrial wastes bedischarged to the municipal sewage system or tothe stormwater system?J. Rennerfelt 97. . . . . . ..*...........................
PHOSPHORUS AND NITROGEN REMOVAL IN MUNICIPALWASTEWATER TREATMENT
Nutrient removal at low temperatures - DanishexperienceJ. la Cour Jansen . . . . . . . . . . . . . . . . . . . . . . . . . . .
Control of phosphorus and nitrogen discharges -present situation and trends in FinlandM. M&kelB . . . . . . . . . . . . . . . . . . . . . . . . . . . . . . . . . . .
Quality of stormwater - state of the art inSchleswig-HolsteinG. Leymann . . . . . . . . . . . . . . . . . . . . . . . . . . . . . . . . . .
Experiences and remarks to the advanced sewagetreatment in Schleswig-HolsteinG. Leymann . . . . . . . . . . . . . . . . . . . . . . . . . . . . . . . . . .
Research and development in Phosphorus andNitrogen removal from municipal wastewater inPolandJ. Kurbiel . . . . . . . . . . . . . . . . . . . . . . . . . . . . . . . . . .
Introduction into sequencing batch reactortechnologyP. Wilderer . . . . . . . . . . . . . . . . . . . . . . . . . . . . . . . . .
104
117
120
123
143
159
Effects of low temperature on nitrogen removalprocessesP. Wilderer ._............................... 170
Page
Modelling and improvements of single sludgeprocesses for biological nitrogen removalB. Hultman . . . . . . . . . . . . . . . . . . . . . . . . ..*............ 180
The state of advanced biological wastewatertreatment in the Federal Republic of Germany(presented at Visby Seminar in 1986)I. Sekoulov . . . . . . . . . . . . . . . . . . . . . . . . . . . . . . . . . . . . . . 196
List of participants . . . . . . . . . . . . . . . . . . . . . . . . . . . . . 207
Baltic Sea Environment Proceedings . . . . . . . . . . . . . . . 212
-l-
PREFACE
Within the framework of the Helsinki Commission, aSecond Seminar on Wastewater Treatment in Urban Areaswas held in Visby, Sweden, 6-8 September 1987.
The Seminar was hosted by Sweden and organized jointlyby the National Environmental Protection Board and theSwedish Water and Wastewater Works Association.
Experts of Contracting Parties to the HelsinkiCommission, both from the administrative and from thescientific fields participated in the seminar. In orderto broaden the base for the seminar, participants fromcountries bordering to the North Sea were also invited.
After the opening of the seminar by Mr. BertilHawerman, Sweden, a statement was made by ProfessorHarald Velner, Executive Secretary of the HelsinkiCommission.
Mr. Ragnar Elmgren held a general lecture on the issuenitrogen/phosphorus and Mr. J. Bryan Ellis presented astate-of-the-art document on Quality of Stormwater.
After these opening lectures, the seminar continued intwo different sub-groups.- Sub-group I - Combined Sewers; Stormwater - Separate
Systems and Industrial Discharges,- Sub-group II - Phosphorus and Nitrogen Removal inMunicipal Wastewater Treatment.
This report contains all documents presented at theSeminar as well as the paper by Prof. Dr. I. Sekoulov"The State of Advanced Biological Wastewater Treatmentin the Federal Republic of Germany" presented at theFirst Visby Seminar but not included in BSEP No. 25.
The authors are considered to be responsible for thecontents of their papers. The Helsinki Commission isnot responsible for any statements made or opinionsexpressed in this publication.

- 2 -
STATEMENT BY PROFESSOR HARALD VELNER, EXECUTIVE SECRETARY OFTHE BALTIC MARINE ENVIRONMENT PROTECTION COMMISSION (HELSINKICOMMISSION) - HELD AT THE SECOND SEMINAR ON WASTEWATER TREAT-MENT IN URBAN AREAS, VISBY, SWEDEN, 6-8 SEPTEMBER 1987 ANDIN KARLSKRONA, SWEDEN, 7 JUNE 1988
Mr. Chairman, Ladies and Gentlemen,
The Convention on the Protection of the Marine Environment of
the Baltic Sea Area was signed by all the seven Baltic Sea
States in 1974 and has been in force since 1980. It is the first
international instrument to deal with all different sources of
pollution in the Baltic Sea. The Convention has led to close
cooperation between the Baltic Sea States in the protection of
the Baltic Sea marine environment coordinated by the Helsinki
Commission and its executive body - the Secretariat. Close
cooperation was established at first with the Paris and Oslo
Commissions protecting the North Sea, and with ICES, UNEP and
some other intergovernmental organizations.
The principle of the Helsinki Convention is that the Contracting
Parties take all appropriate measures to prevent and abate the
pollution of the Baltic Sea (Article 3). The main task is to
reduce (or stop, if possible) discharges into the Baltic Sea of
toxic and other harmful substances (Paragraph 1 of Article 6).
The Contracting Parties agree to apply effective treatment of
municipal and industrial wastes aiming at the reduction of
discharges of harmful substances, organic matter and nutrients
to the marine environment (Paragraphs 1 and 3 of Annex III).
During 1980-88 the Helsinki Commission adopted 24
Recommendations prepared by its subsidiary bodies working in the
scientific and technological field with the aim of minimizing
the load of pollution entering the Baltic Sea from different
land-based sources.
The First Periodic Assessment of the State of the Marine
Environment of the Baltic Sea covering the five-year period from
1980 to 1985, published, in 1986 and adopted by the Commission,
showed that there had been progress in the state of the marine
environment compared with the state of the Baltic evaluated in
- 3-
1980. Concentrations of toxic substances like DDT, PCBs, and
mercury in living organisms and seawater were decreased.
Unfortunately it has not been possible to reduce remarkably the
load of phosphorus and nitrogen compounds discharged into the
marine environment from municipalities, industries and
agriculture. Increase of nitrogen and phosphorus compounds was
reported in the Baltic Sea Environment Proceedings No. 17,
1986,1987 (BSEP). The greatest increase of nutrients has been
found in the Gulf of Finland, Kattegat, Danish Sounds and Bay of
Gdansk. During the last years exceptional bloomings of plan:;ton
algae has been reported from the Southern Baltic. For the first
time in many years it was found that oxygen deficiency had
developed not only in the deep parts of the Baltic but also in
the shallow waters. Along the coast there are areas where the
larger benthic fauna has been distroyed by pollution.
The first Baltic Sea pollution load compilation was published by
the Commission in 1987 (BSEP No. 20). The pollution load is
considered in three categories according to the source:
municipalities, industry, rivers. The load carried via the
atmosphere is considered in this document only to give an
overall picture of the amount of pollutants (Figures 1 and 2).
The sources may not be strictly defined due to overlapping in
some cases. Considering that the values are often based on very
rough background data, especially pollution from atmosphere, the
document should be seen as a first step. The load of pollution
was calculated for 20 sub-areas of the Baltic Sea and the
results presented clearly indicated to the most affected areas
(Figures 3 and 4). The total load of phosphorus (P) and nitrogen
(NJ into the Baltic Sea is estimated to be ca. 50 000 tons and 1
000 000 tons respectively. The load of pollution of BOD make ca.
1 7000 000 tons. The consideration of the atmospheric fallout is
a task of an expert group (EGAP) which has given its first
estimations for the use of the Commission.
Investigations made revealed an urgent need to take all
appropriate measures to treat municipal sewage and industrial
wastewater with special emphasis on the reduction of discharges

-4-
of nutrients and a recommendation was adopted by the Commission
as a first step (HELCOM Recommendation 6/7).
During the seventh meeting of the Helsinki Commission in 1986
further steps were adopted by the Commission. According to
HELCOM Recommendation 7/3 the sewerage systems should be renewed
in such a way that infiltration and exfiltration be minimized, a
separated or a semi-separated sewerage system should be selected
for new developments. The Commission adopted also HELCOM
Recommendation 7/5 concerning reduction of discharges from urban
areas by the treatment of stormwater, where it was indicated
that measures should be taken already at the source and the
first flush of stormwater especially from heavily polluted
industrialized urban areas be purified.
Recommendation concerning measures aimed at the reduction of
discharges from urban areas by the use of effective methods in
wastewater treatment were discussed and adopted by the
Commission in two steps: in 1987 (HELCOM Recommendation 8/3) and
in 1988 (HELCOM Recommendation 9/2). It was declared that:
a) urban wastewater deriving from households or idustrial
enterprises should be collected and treated before being
discharged into water bodies; by-passes may only be used in
emergency cases
b) domestic sewage or wastewater of similar type which is
collected in a central sewerage system and treated in
wastewater treatment plants, loaded with more than 10 000
person equivalents, should be treated as soon as possible and
not later than 1998 by biological methods or other methods
giving equivalent results, so that the treatment should
result in:
- at least 90% reduction of BOD5; and
- at most a concentration of BOD 5 in the effluent of the
treatment plant of 15 mg/l;
- annual average values of total phosphorus below 1,5 mg P/l
- 5 -
It was also decided that each Contracting Party should start
research and evaluation projects as soon as possible with the
purpose to give a basis for further recommendations for nitrogen
removal within three years. The project should include studies
of process technology and costs for nitrogen removal to reach
the targets:
- as a first step 12 mg total nitrogen/l in the effluent water
or 50% reduction of total incoming nitrogen;
- as the second step 8 mg total nitrogen/l in the effluent water
or 75% reduction of total incoming nitrogen.
The results of these investigations could be discussed by
experts at the seminars organized annually within the auspices
of the Commissions. This Karlskrona seminar arranged in
cooperation with Paris Commission is an important step in the
necessary meetings of experts arranged for the purpose of
exchanging relevant information.
The reduction of discharges from agriculture as a source of
pollution of the marine environment was discussed during the
seventh and ninth meetings of HELCOM (HELCOM Recommendations 7/2
and 9/3).
This year 1988 the Commission decided inter alia that:
a) the farming practice with regard to manure should be in
accordance with the following principles:
- the capacity of the storage facilities should be large
enough to ensure that manure need only be brought out when
the plants can use the nutrients.
- the application of manure on frozen or bare soil should be
restricted
b) farming practice should be managed so as to favour the
efficient use of the nutrients that are available in the
agriculture system.
The Commission decided also to reduce drastically the industrial
discharges from land and by air where, inter alia, harmful

-6-
substances, nutrients or organic matter are the main pollution
problem. The discharges should be reduced as soon as possible
and not later than 1995 using the best available technology
(HELCOM Recommendation 9/8) At first restrictions of discharges
e.g. from the pulp and paper industry and minings should be
applied.
The great importance and need for further steps to reduce the
substances most harmful to the ecosystem of the Baltic Sea was
underlined in the Declaration on the Protection of the Marine
Environment of the Baltic Sea Area adopted and signed during the
ninth meeting of HELCOM in February 1988 by the Ministers of the
Baltic Sea States responsible for the environmental protection.
In this environmental-political declaration the ministers
declare, inter alia, their firm determination to reduce
radically heavy metals and toxic or persistent organic
substances and nutrients in the order of 50% out of the total
discharges of each of them as soon as possible but not later
than 1995. The best available technology should be used.
Therefore, the exchange of information and knowledge on
environmental technologies including preferential treatment is
of great importance.
During the second North Sea Conference in London 24-25 November
1987 the similar principles and ways to reduce the pollution
entering into the North Sea were adopted in the ministerial
declaration. A task was given to the Paris Commission to
elaborate possible measures to substantially reduce nutrient
inputs to the North Sea. I am sure that the present joint
symposium will thus speed up the elaboration of new effective
methods to protect the marine environment of the North Sea and
the Baltic Sea.
Some argue that we do not have enough proof of the harmful
effects of the discharges of nutrients into the sea. They say
that we must wait for science to provide that proof.

- 7 -
1 would like to finish my statement with the words expressed by
HRH the Prince of Wales at the Second North Sea Conference
"If science has taught us anything it is that the environment is
full of uncertainties. It makes no sense to test it to
destruction. While we wait for the doctor's diagnosis, the
patient may die."
Thank you.

- a - FIGURE 1
P O L L U T I O N L O A D C O M P I L A T I O NA r e a a b b r e v i a t i o n : TOTAL
THE BALTIC SEA AREA
PARAMETER FROM THROUGH FROM TOTALSUBSTANCE UNIT MUNICIPAL. RIVERS INDUST. SUM
NITROGEN TOFN T/A 67652 449150 11549 528351
PHOSPHORUS TOT-P T/A 11801 28321 8397 48519
B O D BOD T/A 196610 1212400 295440 1704450
MERCURY HG KG/A 1093 3707 268 5068
CADMIUM CD KG/A 3216 46340 9320 58876
ZINC ZN T/A 460 6709 1765 8934
LEAD PB T/A 18 239 8 265
COPPER CU T/A 133 3962 101 4196
OIL OIL T/A 8977 26021 576 35574
ARSENIC AS T/A 4 72 101 177
NICKEL NI T/A 10 0 96 LO6
VANADIUM v T/A 0 0 290 290
ICHROMIUM CR KG/A 127 78 205
Figure from Baltic Sea EnvironmentProceedings No. 20 ('1987)

- 9 -
THE TOTAL POLLUTION LOADFIGURE 2
I N P U T FROM LAN) ATMM’HERIC INPUT( EGAP 3/a 1
NITROGEN
PHOSPHORUS
BOO
MERCURY
CMIUt4
ZINC
LEAD
COPPER
OIL
ARSENIC
NICKEL
VANADIUM
CHROMIUM
TOT-N
TOT-P
Hg
Cd
Zn
Pb
cu
AS
Ni
V
Cl-
5 3 0 0 0 0 t/a 4 1 3 0 0 0 t / a
4 2 0 0 0 t / a 6 0 0 0 t / a
1 6 4 0 0 0 0 t / a
5 t / a (*
6 0 t / a 8 0 t / a
9 0 0 0 t / a 3 200 t / a
300 t / a (* 2 9 0 0 t / a
4 200 t / a 380 t/a
36000t/a (*
180 t / a (*
110 t / a (*
290 t / a (*
0 . 2 t / a (*
(* THE DATASET [w THESE SUBSTANCES IS NOT COMPLETE; THEREFORE, THE
GIVEN VALUES ARE VERY PRELIHINARY AND NOT REPRESENTATIVE.
Figure from Baltic Sea EnvironmentProceedings No. 20 (1987)
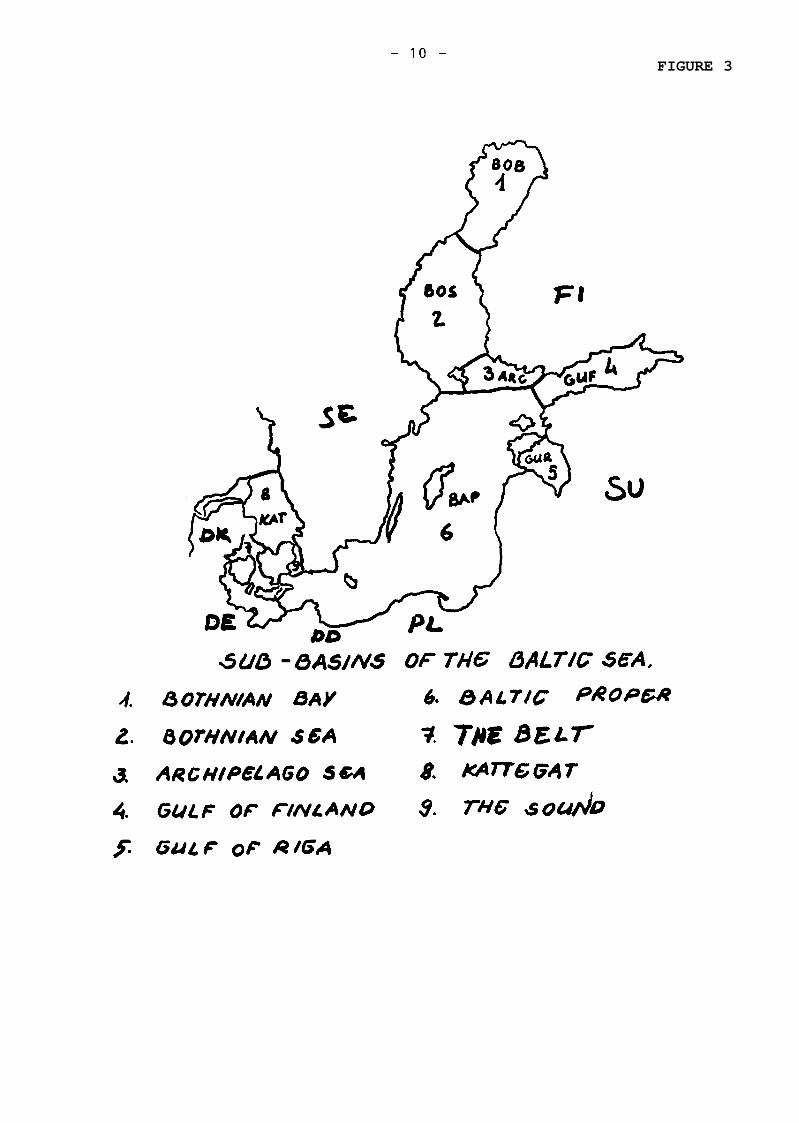
- 10 -FIGURE 3

-ll- FIGURE 4
*) Figure from Baltic Sea EnvironmentProceedings No. 20 (1987)
2 492713H

- 12 -
Ragnar ElmgrenDept Zoology andAskij LaboratoryUniv StockholmS-106 91 StockholmSweden
Baltic Marine EnvironmentProtection Commission,Second Seminar on WastewaterTreatment in Urban Areas,Visby, Sweden, Sep 6-8, 1987
THE EUTROPHICATION STATUS OF THE BALTIC SEA: INPUT OF NITROGEN
AND PHOSPHORUS, THEIR AVAILABILITY FOR PLANT PRODUCTION, AND SOME
MANAGEMENT IMPLICATIONS.
INTRODUCTION
The Baltic Sea has shown clear symptoms of nutrient enrichment in
recent decades. This has been discussed in a large number of
scientific publications, and in two international assessments,
within the framework of the Helsinki Convention on the protection
of the marine environment of the Baltic Sea (Melvasalo et al.
1981, HELCOM 1987a, Lassig 1987). What follows is a short summary
of this literature, focussed mainly on the Baltic Sea in a
restricted sense, inside the Belt Sea and the Sound (= the Danish
straits), with some preliminary consideration of likely future
developments and of the management options available.
BACKGROUND
The Dhvsical setting
The Baltic Sea is one of the world's largest brackish water
areas, and shows remarkably small variations in salinity at any
given point and depth. This is the result of a large volume
(Table l), a positive water balance (Table 2) and a semi-
enclosed topography (Fig 1). Surface salinity varies from a mere
2-3 o/ooS in the northernmost Bothnian Bay, via 5-6 o/ooS in the
Bothnian Sea, 6-8 o/ooS in most of the Baltic proper and rapidly
increasing values in the Danish sounds to about 15- 20 o/ooS at
the borderline to the Kattegatt. The Baltic Sea is shallow, with
an average depth less than 60 m.

- 13 -
km3/aRiver inflow -440
Seawater inflow -470
Precipitation lessevaporation -50
Seawater outflow -950
Table 1. Baltic water balance (after sources in Ehlin 1981).
Area, Volume1000 km '3
Maximum1000 km2 depth,
m
Bothnian Bay 36 1.5 147
Bothnian Sea 79 4.9 301
Gulf of Finland 29 1.1 123
Gulf of Riga 18 0.4 51
Baltic proper 210 13.0 459
Volumebelow loom,1000 km3
0.01
0.5
<O.OOl
0
1.2
Total Baltic Sea 373(inside Danish straits)
20.9 459 1.7
Table 2. Areas and volumes of the Baltic Sea. After Ehlin et al.
(1974) and U. Ehlin and G. Zachrisson, pers comm.
In the Baltic proper, a primary halocline at about 70 m depth
separates the low salinity surface layer (6-8 o/ooS), from a
semi-stagnant deep water of higher salinity (8-11 o/ooS), in
which secondary haloclines may further isolate the heaviest
bottom water (11-13 o/ooS). The surface layer is mixed in the
cold season, but develops a thermocline at 20-30 m depth in the
summer period. The formation and breakdown of the thermocline is
governed by the thermal balance and the wind mixing, since tidal
mixing is negligible.

- 14 -
The bottom water of the deep basins is replaced intermittently,
in connection with larger inflows of dense water through the
Danish sounds. Such exchanges are infrequent, and stagnation
periods as long as about a decade have been recorded in the
bottom water of the Eastern Gotland Basin (Fig 1). The Gulf of
Bothnia (= The Bothnian Bay + the Bothnian Sea) shows only weak
salinity stratification, but the stratification of the Baltic
proper extends into the Gulf of Finland.
Natural boundaries
Figure I. The Baltic and its subareas. In text computations for ‘Bothnlan Sea‘ Include the Aland and Archipelago Seas. and for‘Baltic Proper’ the Arkona Sea. Bornholm Sea, and Eastern and Webtern Gorhland Seas.

- 15 -
The Baltic Sea extends from 54ON to almost 66ON, nearly to the
polar circle. In the far north, the Bothnian Bay is ice-coveredfor five months each year, whereas in the south open-sea ice is
present at all only in harsh winters (Paluoso 1966).
The chemical and bioloaical conseauences
Respiratory processes during the long stagnation periods of the
Baltic proper deep waters lead to low oxygen concentration, a
feature noted already by the earliest investigators of the
chemistry of the Baltic Sea. During stagnation periods, nutrients
accumulate in the deep water, initially mainly as nitrate and
phosphate, but as the deep water turns anoxic, and hydrogen
sulphide starts to accumulate, nitrate is largely denitrified
and inorganic nitrogen begins to accumulate as ammonium, while
phosphate increases in concentration due to release from the now
anoxic sediments.
The low but stable salinity of the Baltic Sea has a profound
influence on its biological diversity. Only a few marine and
freshwater organisms, and a few forms specially adapted to
brackish water, are able to persist in those intermediate
salinities, leading to an extremely species-poor biota (Remane
1934, 1940, Segerstrale 1957). And already early in this century,
Ekman (1916) described how the oxygen-poor deep water in the
southwestern Baltic was avoided by fish, with important
consequences for the fishery.
The large, nutrient-poor freshwater input to the Gulf of Bothnia,
and the much shorter productive season in the north (4-5 months
V.S. 8-9 months in the south, Elmgren 1984) leads to a clear
north-south gradient of increasing primary production, benthic
secondary production (Elmgren 1978), zooplankton secondary
production (Ackefors et al. 1978) and fish production and yield
(Elmgren 1984).
The lona-term trends
The long-term data sets available from the Baltic show relatively
minor trends in the physical setting, such as a slight landsubsidence in the entrance area (Striggow, 1983), and some
- 16 -
changes in climatic forcing functions, such as precipitation and
dominant wind speed and direction (summarized by Kullenberg 1986,
Launiainen et al. 1987).
The chemical long-term data show many significant trends. These
trends are often made up not of slow gradual changes, but a few
rather sudden "events", separated by periods of relative
stability. Single events, such as the exceptionally large inflow
of high salinity water in 1951 (Wyrtki 1954), may influence the
situation for decades, adding a stochastic aspect to the long-
term trends.
The salinity of the Baltic surface water showed a statistically
significant increase from the 1920's into the mid 1970's
(Launiainen et al. 1987), but closer scrutiny shows that much of
the increase took place in short periods, during World War II,
and a few years after the 1951 salt water inflow. This salinity
increase has been correlated to a tendency of decreased average
precipitation in the Baltic drainage basin during the first half
of our century, and a cause-effect relationship inferred
(Launiainen et a1.1987). The mechanisms governing the salt water
inflows have been modelled by Stigebrandt (1983).
The oxygen concentration in the deep waters of the Baltic Sea
have deteriorated sharply in the last few decades. The current
stagnation period in the eastern Gotland Basin is the longest on
record (about 10 years), with hydrogen sulphide concentrations
higher than ever measured there before (Launiainen et al. 1987).
The length of the stagnation periods is not influenced by
eutrophication, but the almost continuous lack of oxygen in the
deep waters in recent decades can at present only be explained as
the result of an increased input of organic matter to the deep
waters, due to eutrophication (Shaffer 1979).
filternative exDlanatJons of the deep water oxygen deficiency
When the deterioration of oxygen conditions in the Baltic first
became an issue through the publications of Fonselius (e.g. 1969)
it was impossible to say whether the primary cause was cultural
eutrophication, or climatic fluctuations.
- 17 -
Fonselius (1969) showed that phosphate concentrations had
increased in parts of the Baltic since the 1930's. He suggested
that pollution of the Baltic with nutrients and oxygen consuming
wastes could be at least partly responsible for the oxygendecrease. But he also suggested that much of this decrease, and
of the increasing phosphate concentrations could be the end
result of natural climatic fluctuations. He noted evidence that
decreased precipitation in the Baltic drainage basin had led to
decreased freshwater input to the Baltic. Less freshwater, he
reasoned, could explain the raising of the level of the primary
halocline by about 20 m he estimated from his data.
Fonselius also calculated an increased density gradient across
the halocline, and suggested this meant less water exchange
through the halocline and therefore longer mean stagnation
periods in the deep water. A longer stagnation period should mean
lower oxygen concentration in the deep water, even if no change
occurred in the biological production. But as soon as the
stagnation resulted in real oxygen deficiency in the bottom
water, bound phosphate would be released from the sediments. When
later, following a water exchange, this phosphate-rich water was
mixed into the euphotic zone, increased production should follow.
This could conceivably start a positive feedback process, with
more production giving greater sedimentation of organic matter,
giving higher oxygen consumption rates in the deep water, giving
larger anoxic areas of sediment, giving further phosphate-
releases from the sediment, and so on.
In this primarily climate-driven scenario the increased phosphate
concentrations in the water could be explained as due to natural
events. This scenario gained in credibility when Hallberg (1973)
presented sedimentary evidence of earlier anoxic periods in the
eastern Gotland Basin.
The alternative interpretation, that anthropogenic eutrophication
was the major factor causing the Baltic anoxia was long
considered doubtful. There was never any doubt that anthropogenic
nutrient inputs to the Baltic area had increased, nor that this
had resulted in severe local eutrophication, e.g. off the cities
of Helsinki (Melvasalo and Viljamaa 1977) and Stockholm (Waern
and Pekkari 1973). But the magnitude of the nutrient load was

- 18 -
only vaguely known, and therefore its influence on the open sea
areas of the Baltic was doubted.
Today, the climate-driven scenario has lost much of its
credibility. The mean change in the halocline depth seems to be
much less than he calculated, only 5-6 m (MatthBus 1980), and the
stability across the halocline shows no consistent increase with
time (e.g. Kullenberg 1986). Rydberg (1983) argued, based on the
model of Stigebrandt (1983), that a decrease in precipitation and
run-off in the Baltic area should increase, not decrease, the
mixing across the halocline. Larsson et a1.(1985) showed that the
new estimates of the phosphorus load on the Baltic imply that the
sediments must act primarily as net sinks, not sources, of
phosphorus. Finally, it is now commonly accepted that nitrogen,not phosphorus, is generally the most limiting nutrient for
Baltic primary productivity (see below). In the light of this new
knowledge, the climate-driven scenario falls short in its
physics, its geochemistry and its biology.
Nevertheless, the physically driven stagnation periods clearly
decide the short-term dynamics of oxygen concentration in the
deep waters of the Baltic, and of salinity and to some extent
also nutrients in the surface water (Launiainen et al. 1987,
Nehring et al. 1987). It is therefore not surprising that it took
a decade to reach the conclusion that they cannot adequately
explain the long-term eutrophication trend in the Baltic (Shaffer
1979), and almost another decade for this conclusion to become
fairly generally accepted (Launiainen et al. 1987, Nehring et al.
1987). The increased nutrient load on the Baltic, no matter which
of the recent estimates you find more convincing, seems to
provide an explanation, if as yet only qualitative, of the long-
term eutrophication trend.
LIMITING NUTRIENTS IN THE BALTIC SEA
The available evidence on limiting nutrients in the Baltic Sea
has been reviewed by Larsson (1986), and further supporting
evidence is presented by Graneli & h;LL (in press). The evidence
derives from several types of measurements, and the conclusion is
clear: In most of the Baltic Sea, nitrogen is normally the most

- 19 -
limiting nutrient in the open sea area, and in coastal areasunaffected by local nutrient discharge. The Bothnian Bay differssharply in having phosphorus as the most limiting nutrient, and
the Bothnian Sea may be regarded as a transition area. There are
reports suggesting that phosphorus may also be the most limiting
nutrient in the Gulf of Riga (Nehring et al. 1987).
In coastal areas with large local nutrient loads, the situation
may differ. Near the effluent release from large sewage treatment
plants with efficient phosphorus removal, phosphorus is often the
most limiting nutrient, e.g. today in the innermost Stockholm
archipelago, where the runoff from Lake Malaren brings in a large
nitrogen surplus, in addition to that in the sewage from over a
million inhabitants, from which most of the phosphorus has been
removed (Brattberg 1986), and a similar situation is found in the
nearby Himmerfjard area, at the outfall from a modern sewage
treatment plant, treating the effluents from 240,000 people
(Elmgren and Larsson 1987).
The limiting nutrient is not always the same for all algal
species , and the relative availability of different nutrients
may lead to changes in the species composition of the flora, not
only to a limitation of the primary production (c.f. Tilman 1982,
Tilman et al. 1986). Studies in the northern Baltic proper
suggest, however, that the benthic macroalgal community as a
whole tends to be limited by the same nutrient as the
phytoplankton (I. Wallentinus, in press). An exception to the
general nitrogen limitation in most of the Baltic Sea is the
colonial heterocystous cyanobacteria, which are an important
component of the Baltic phytoplankton, at least in warm summers.
The ability of heterocystous cyanobacteria to fix atmospheric
nitrogen normally makes phosphorus their most limiting nutrient(Brattberg 1986).
The Baltic is naturally rich in silicate, and silicon has been
regarded as always present in surplus (Melvasalo et al. 1981,Nehring et al. 1987). However, silicate concentrations seem
recently to have decreased in some Baltic areas (Kiel Bight:
Babenerd and Zeitschel 1985; possibly the Tvarminne area:
Hgllfors et al. 1983), and may at times become almost depleted,especially in eutrophicated areas, such as the Himmerfjard

- 20 -
(Elmgren and Larsson 1987). A slow silicate depletion of theBaltic due to eutrophication, similar to that inferred for someof the Great Lakes of North America (Schelske and Stoermer 1971,
Schelske et al. 1986), may be suspected. This may have large
future consequences, if diatoms are replaced by otherphytoplankton groups, that do not require silicon for their
growth. As yet, silicon has, however, never been reported to bethe most limiting nutrient, even for diatoms, in the Baltic Sea.
Fig. 2. Drainage basin and subregions of the Baltic Sea and its transition area (Falken-mark and Mikulski, 1974). Boundaries between Baltic Sea subregions (dashed liner\.Boundaries between the corresponding drainage basins (thick lines).

- 21 -
NUTRIENT LOAD ON THE BALTIC SEA
Nutrient inout
The drainage basin of the Baltic Sea (Fig 2) has an area about
3.5 times larger than the Baltic itself. Based primarily on
documents submitted by the Baltic countries to a working group
under the Helsinki Commission, Larsson et al. (1985) presented an
estimate of the nutrient load on the Baltic Sea. The figures are
given in Tables 3 and 4 together with the estimates later
presented by the HELCOM Working Group itself (HELCOM 1987b). The
HELCOM total values are considerably lower, especially due to the
lower values for the Polish discharges. On the other hand Sweden,
Finland and Denmark have revised their release data upwards since
Larsson et a1.(1985) made their calculations. A major difference
between the two data sets is, that Larsson et al. tried to
estimate missing data if they could find a reasonable basis for
doing so, while in the HELCOM data set, it seems that a lack of
knowledge often became mathematically equivalent to zero
pollution load.
Trzosinska, in Nehring et al. (1987) quotes Polish multi-year
mean estimates of the load from the river Vistula alone of 94*103
t/a of nitrogen and 6.4*103 t/a of phosphorus. These figures
suggest that the original Polish report to HELCOM, used by
Larsson et al. (1985), may have been too high, especially for
phosphorus.They also indicate that the HELCOM (198713) estimate of
the nitrogen load from Polish rivers is too low, since it is
lower than the figure quoted above for the Vistula alone. Thus,
it is possible that the nutrient loads from Poland may have been
overestimated by Larsson et al. (1985), whereas both they and
HELCOM have almost certainly greatly underestimated the nutrient
load from the Soviet Union. Satellite images confirm the presence
of large phytoplankton blooms, not only off the Polish coast, but
also off the Soviet coastline in the southeastern Baltic proper
(Horstmann et al. 1986), an area for which HELCOM (1987b)
presents very low nutrient load estimates. That they are too low,
is clear from the extremely low area1 load (for nitrogen) and per
capita load (for phosphorus) from the Soviet Union, calculated in
the HELCOM (198713) compilation. Further support can be found in
the much higher estimates for the Soviet Union published by a
Soviet researcher (Maksimova 1982, see Table 4), who also

- 22 -
estimates loads from Poland, intermediate between Larsson et al.
(1985) and HELCOM (1987b).
Larsson et al. HELCOM1985 1987b
N P N P
Land discharge: Rivers 641 50 403 27Coastalmunicipal 87 18 60 10Coastalindustries 14 4 11 8
Atmospheric deposition 314 6 398l) 6- - - - - - - - - - - - - - - - -
External load subtotal 1056 78 872 51
Nitrogen fixation 134 - 1342) -
Total load 1190 78 1006 51
1) Estimated from Fig. page 41 in HELCOM 1987b.2) Estimate from Larsson et al. 1985. HELCOM gives no estimate.
Table 3. Total nutrient load on the Baltic, including the BeltSea and the Sound. Exchanges with the Kattegat are not taken intoaccount. Figures give lo3 t/a and are rounded to nearest integer.
Altogether this underscores the uncertainty of all load estimates
for the Baltic Sea. I will use the Larsson et al. (1985) estimate
as the basis for my discussion, since it is probably still the
best available estimate of the total Baltic nitrogen and
phosphorus loads. It may, in fact, still underestimate the real
load on the Baltic Sea, at least for nitrogen. Larsson et al.
(1985) also made rough estimates of how much the present
nutrient load had increased, compared to a background load,
representative of the end of the last century. They suggested
that the phosphorus load had increased about eightfold and the
nitrogen load fourfold. The increase must have been larger in the
south and smaller in the north. Most of the increase must have
taken place after the Second World War, probably accelerating
after about 1955-1960.
- 23 -
Maksimova1982
N P
Sweden 60 4
Finland 46 3
Soviet Union 236 19
Poland
GDR
FRG
Denmark
166 19
no estimate
no estimate
no estimate
77 5 94 6
51 3 70 4
149 9 130 6
386 43 110 19
6 2 4 (1
22 3 16 3
50 7 51 8
6
3
20
33
2
1
3
Total (599) (60) 741 72 475 45 70
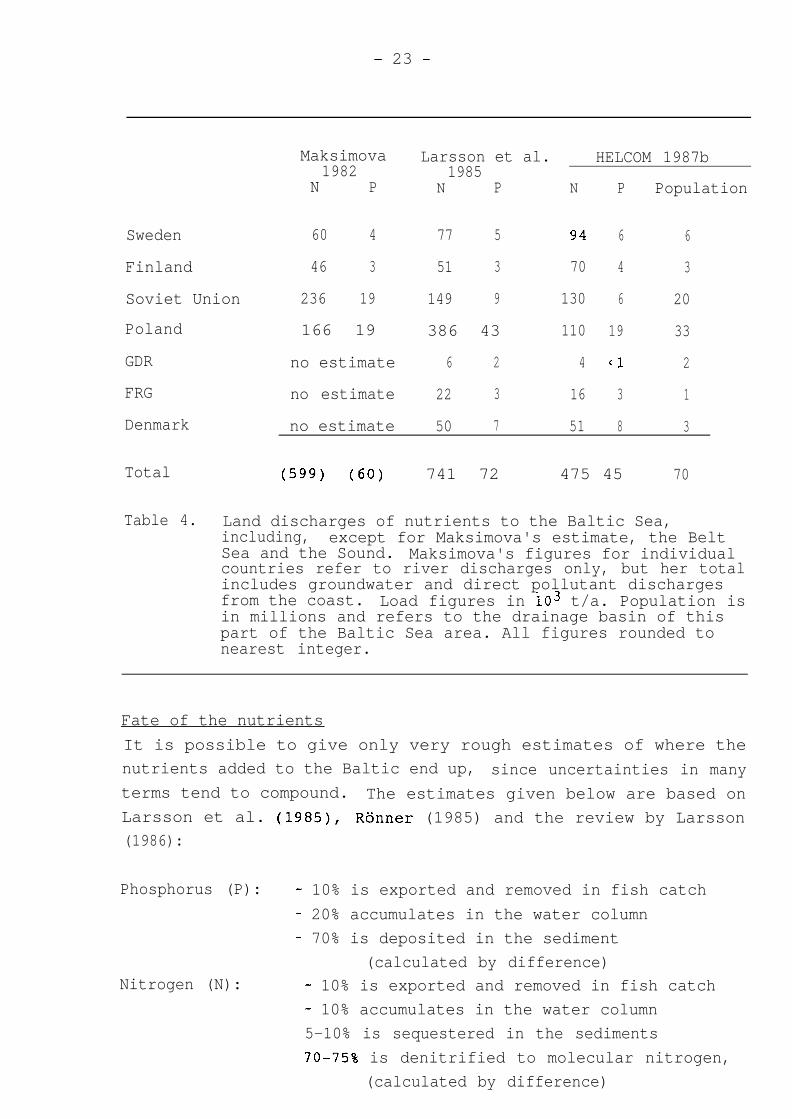
Table 4. Land discharges of nutrients to the Baltic Sea,including, except for Maksimova's estimate, the BeltSea and the Sound. Maksimova's figures for individualcountries refer to river discharges only, but her totalincludes groundwater and direct pollutant dischargesfrom the coast. Load figures in lo3 t/a. Population isin millions and refers to the drainage basin of thispart of the Baltic Sea area. All figures rounded tonearest integer.
Larsson et al. HELCOM 1987b1985
N P N P Population
Fate of the nutrients
It is possible to give only very rough estimates of where the
nutrients added to the Baltic end up, since uncertainties in many
terms tend to compound. The estimates given below are based on
Larsson et al. (1985), Rijnner (1985) and the review by Larsson
(1986):
Phosphorus (P): - 10% is exported and removed in fish catch
- 20% accumulates in the water column
- 70% is deposited in the sediment
(calculated by difference)Nitrogen (N): - 10% is exported and removed in fish catch
- 10% accumulates in the water column
5-10% is sequestered in the sediments
70-75% is denitrified to molecular nitrogen,
(calculated by difference)
- 24 -
The two main conclusions are:
1. Most of the phosphorus load ends up in the sediment.
2. Most of the nitrogen load is denitrified.
These conclusions emphasize the importance of sediment-water
interactions in water bodies with long hydraulic residence time,
such as the Baltic.
The phosphorus deposited in Baltic sediments is not permanently
removed from circulation, but may be mobilized into the water
column again, should the water above the sediment turn anoxic
(Fonselius 1969, Holm 1978), or if a layer of decomposing spring
bloom algae settles onto the sediment, making its former surface
anoxic (S. Blomqvist, pers comm.). It is not known how long the
sediments will be able to absorb such a high proportion of the
phosphorus inputs to the Baltic. Precipitating hydroxides of iron
and manganese are thought to scavenge phosphate from the water
column, but the stoichiometry of the process is not known, and
predictions on the ultimate absorptive capacity of Baltic
sediments cannot yet be made.
That denitrification, mostly in the sediments, is a major sink
for nitrogen is supported by calculations by Shaffer and Rijnner
(19841, who estimated that 470 x lo3 tons/year of combined
nitrogen were returned to molecular nitrogen in Baltic proper
below-halocline waters alone. A further 23 x lo3 tons/year were
supposedly lost as gaseous N20, also produced mostly during the
nitrification-denitrification process. Denitrification thus acts
as a "self-cleaning" mechanism in regard to the nitrogen load on
the Baltic (Ronner 1985).
The assimilative capacity of the Baltic for nitrogen has,
however, clearly been exceeded in recent years, as shown by the
increased nitrogen concentrations in the water column.
Furthermore, there are indications that the proportion of
supplied combined nitrogen that is denitrified in a marine
sediment may decline as the load increases (Seitzinger and Nixon
1985). This is probably due to to less efficient nitrification-
denitrification pathways in sediments devoid of bioturbation and
water-pumping macrofauna (Henriksen et al. 1980, Enoksson 1987),
but competition for nitrate from dissimilative reduction of
- 25 -
nitrate to ammonia may also be suspected in carbon-rich, oxygen-
poor environments (Koike and Hattori 1978). Thus the relative
assimilative capacity for nitrogen may actually decrease as the
nitrogen load increases.
OUTLOOK FOR THE FUTURE
Given the uncertainties in the nutrient load, the fate of the
nutrients and the mechanisms by which they are largely removed
from the water column, it is hard to say whether the Baltic today
is near a steady state in relation to its nutrient load, or
whether the eutrophication process will continue, even if the
nutrient load does not increase. We must suspect the latter,
especially as regards phosphorus.
Whether the nutrient load on the Baltic can be decreased , or
even prevented from increasing even further, depends on the
political priority given this effort. It is uncertain whether the
load is still increasing. Some data indicate an unchanged
atmospheric deposition of nitrogen over Sweden since the mid-
1970's (Rohde and Rood 1986, Granat 1986), and decisions already
taken in western Europe concerning catalytic conversion of car
exhausts give reason to believe the trend may even be reversed in
the next decade. Further such decisions are needed also in both
eastern and weatern Europe.
The other large source of nitrogen to the marine environment is
agriculture, both through ammonia emissions to the atmosphere
and through run-off from land. The nitrogen fertilizer use in
agriculture stagnated in many western countries after the 1979
oil price increases, but are likely to increase again, due to
recent oil price decreases, unless changes in agricultural policy
intervene. In Sweden and Denmark, political decisions to reduce
these emissions have been taken, and only the mere practical
details of how really to bring this about remain mostly to be
decided. Hopefully, within the next decade, these decisions will
begin to take effect.
A look at Table 3 shows, however, that what happens in Poland and
the USSR will largely decide whether the eutrophication of the

- 26 -
open Baltic can be halted. Both these countries have major
economic problems, making investment in environmental protection
technology difficult. The low productivity of the agricultural
sector is a major facet of the economic problems of both
countries, and increased use of fertilizer has long been an
important means whereby they have sought to increase agricultural
productivity (Soviet Union:Medvedev 1987). Poland also has
extremely urgent problems with heavy metal and other air
pollution in large parts of the country, problems thought
responsible for major acute health effects in the population
(Kabala 1985, Kramer 1987). Measures against such problems may
well be judged more urgent than protecting the Baltic from
eutrophication.
Concerning phosphorus, Andersen (1986) estimated that if all
Baltic countries removed 80% of the phosphorus from point
sources, a lower efficiency than normal in Sweden today, the
phosphorus load to the Baltic could be reduced by more than half.
The phosphorus load from Sweden to the Baltic has decreased in
recent years, due to improved municipal and industrial sewage
treatment (Anon. 1987). Measures against agricultural (erosion)
releases could decrease the load even further. If phosphorus
concentrations in the water of the open Baltic in summer are
allowed to increase further, the result may be even larger blooms
of nitrogen-fixing blue-green algae than today. Such blooms,
which at times are toxic (Edler et al. 1985), were a prominent
feature in the eutrophicated inner archipelago of Stockholm,
before phosphorus reduction was implemented in the local sewage
works, but disappeared when phosphorus discharges were reduced
(Brattberg 1986).
In partly enclosed coastal areas around the Baltic, local
discharges are normally the main water quality determinants, and
the fact that local discharges are only a small fraction of the
total load on the Baltic is not a valid argument against
discharge reductions. Such reductions will often, if carefully
calculated to suit the local area, result in considerable, and
rather rapid (a few years) local water quality improvement, as
demonstrated in the Stockholm Archipelago (Brattberg 1986). They
Will also be of some benefit for the open Baltic, and this shouldalways be considered in the planning.

- 27 -
Only in a longer perspective (decades) are improvements possible
also in the open Baltic Sea, given the necessary political will
in all Baltic countries. An improved scientific understanding of
marine eutrophication would be of great help in fostering such a
development. Careful scientific investigations of the effects of
the discharge reductions that are now being implemented will both
demonstrate the effectiveness of reductions, and help us better
predict the effects of further, future reductions. Improved basic
understanding of the origin of algal blooms, including why some
of them are toxic, and of the basic biogeochemical cycling of
nutrient are needed, to provide a better basis for managing the
Baltic Sea in the future.
REFERENCES
Ackefors, H., L. Hernroth, 0. Lindahl and F. Wulff 1978.Ecological production studies of the phytoplankton and
zooplankton in the Gulf of Bothnia. Finn. Mar. Res. 244:116-
126.
Andersen, J. M. 1986. Reversal of the eutrophication of the
Baltic Sea. Vatten 42:36-40.
Babenerd B. and B. Zeitschel 1985. Trends fur eintragsrelevante
Faktoren und fur die Nahrsalzkozentrationen im wasser der
Kieler Bucht. Ein Beitrag zur Erforschung der Eutrophierung
der Nord- und Ostsee. Ber. Inst. Meeresk. Kiel 148:1-45.
Brattberg, G. 1986. Decreased phosphorus loading changes
phytoplankton composition and biomass in the Stockholm
Archipelago. Vatten 42:141-153.
Edler, L., S. Fernli, M. G. Lind, R. Lundberg and P.O. Nilsson
1985. Mortality of dogs associated with a bloom of the
cyanobacterium Nodularia spumigena in the Baltic Sea.
Ophelia 24:103-109.
Ehlin, U. 1981. Hydrology of the Baltic Sea. In: A. Voipio(ed).The Baltic Sea. Elsevier, Amsterdam, 1981:123-134
Ehlin, U., I. Mattisson and G. Zachrisson 1974. Computer
calculations of volumes of the Baltic area. NinthBaltic Oceanogr., Kiel, April 1974, Paper 7. 14 pp.
.
based
Conf.
Ekman, G. 1916. Om tr&lfisket och dess inverkan p; fiskebestanden
(On trawling and its influence on the fish stocks). Sv.
Hydrografisk-Biol. Komm. Skr. 7(2):1-6. (In Swedish).7 1c17712u
- 28 -
Elmgren, R. 1984. Trophic dynamics in the enclosed, brackish
Baltic Sea. Rapp. P.-v. Reun. Cons. int. Explor. Mer
183:149-16.
Elmgren, R. 1987. Effects of increased nutrient loading on marine
ecosystems: The Baltic. Background paper GESAMP WG
"Nutrients and eutrophication in the marine environment",
Paris, Sept. 14-17, 1987.
Elmgren, R. & U. Larsson. 1987. Analys av ett kustomrades
eutrofiering med hjalp av forandringar i
n$ringsZmnesbelastningen: exemplet Himmerfjsrden. In: 22
Nordic symposium on Water Research. Eutrophication of seas
and coastal areas. Laugarvatn, Iceland, 1986-08-26--29.
PP* 297-319 (In Swedish).
Enoksson, V. 1987. Nitrogen flux between sediment and water and
its regulatory factors in coastal areas. Thesis, Dept.
Marine Microbiology, University of Gothenburgh, Sweden.
44PP*Fonselius, S.H. 1969. Hydrography of the Baltic deep basins III.
Fishery Bd. Sweden, Ser. Hydrogr. 23.
Granat, L. 1986. Luft- och nederbordskemiska stacionsngtet inom
PMK. Rapport frAn verksamheten 1985 (Station net for
atmospheric and precipitation chemistry within the programme
for surveillance of environmental quality. Report for 1985).
Nat. Swed. Environm. Prot. Board. Rep. 3232:1-61 (In
Swedish).
Graneli, E., S. Schulz, U. Schriewer, D. Gedziorowska, W. Kaiser
and M. Plinski. (in press). Is the same nutrient limiting
potential phytoplankton biomass formation in different
coastal areas of the southern Baltic? Kieler Meeresforsch.
Hallberg, R. 0. 1973. Paleoredox conditions in the eastern
Gotland basin during the last 400 years. Contrib. Askij
Lab., Univ. Stockholm 2:89-117.
HZllfors, G., E. Leskinen and A. Niemi 1983. Hydrography,
chlorophyll a and nutrients at Tvarminne Storfjard, Gulf of
Finland, in 1979/80. Walter and Andree de Nottbeck
Foundation Scientific Reports 4:1-19.
HELCOM 1987a. (Baltic Marine Environment Protection Commission-
Helsinki Commission). First periodic assessment of the state
of the environment of the Baltic Sea area, 1980-1985:
General conclusions. Baltic Sea Environm. Proc. 17A, l-54.
- 29 -
HELCOM 1987b. (Baltic Marine Environment Protection Commission -
Helsinki Commission). First Baltic pollution load
compilation. Baltic Sea Environm. Proc. 20:1-53.
Henriksen, K., J.I.Hansen, T.H.Blackburn 1980. The influence ofbenthic infauna on exchange rates of inorganic nitrogen
between sediment and water. Ophelia, Suppl. 1:249-256.
Holm, N.G. 1978. Phosphorus exchange through the sediment-water
interface. Mechanism studies of dynamic processes in the
Baltic Sea. Ph.D. Thesis. Dept. Geol. Univ. Stockholm,
Sweden. 149 pp.
Horstmann, U., H. van der Piepen and K. W. Barrot 1986. The
influence of river water on the sotheastern Baltic as
observed by Nimbus 7/CZCS imagery. Ambio 15:286-289.
Kabala, S. J. 1985. Poland: facing the hidden costs of
development. Environment, Nov 1985.
Koike, I. and A. Hattori 1978. Denitrification and ammonia
formation in anaerobic coastal sediments. Appl. Environ.
Microbial. 35:278-282.
Kramer, J. M. 1987. The environmental crisis in Poland. In:
Singleton, F. (ed). Environmental problems in the Soviet
Union and Eastern Europe. Lynne Riener Publ., Boulder and
London, pp. 149-167. I
Kullenberg, G. 1986. The Baltic Sea: Conditions and options of
management. In: Kullenberg G. (ed.). The role of the oceans
as a waste disposal option. D. Reidel Co., 325-345.
Larsen, B. in press. Phosphor accumulation in sediments from the
Baltic Sea and the Danish straits - A geological approach.
Proc. 15th Conf. Baltic Oceanogr. 15pp.
Larsson, U. 1986. The Baltic Sea. In: R. Rosenberg (ed).Eutrophication of marine waters surrounding Sweden. Nat.
Swed. Environm. Prot. Board Rep. 3054:16-70.
Larsson, U. 1988. Kvave och fosfor som biomassabegransande &nnen
i havet. Vatten 44:19-28.
Larsson, U., R. Elmgren and F. Wulff 1985. Eutrophication and the
Baltic Sea: Causes and consequences. Ambio 14:9-14.
Lassig, J. (ed). 1987. First periodic assessment of the state of
the marine environment of the Baltic Sea area, 1980-1985;
background document. Baltic Sea Environm. Proc. 17B, 351 pp.
ISSN 0357-2994.
- 30 -
Launiainen, J., W. Matthaus, S. Fonselius and E. Francke 1987.
Hydrography. In: Lassig, J. (ed). First periodic
assessment of the state of the marine environment of the
Baltic Sea area, 1980-1985; Background documents, 7-34.
Maksimova M. P., 1982.The balance of nutrients and organic matter
in the Baltic Sea during the period of intensive
anthropogenic action. Oceanology 22:555-559.
Matthaus, W. 1980. Is the Baltic halocline really rising?
Ophelia, Suppl. 1:157-163.
Medvedev, Z. A. 1987. Soviet agriculture. W. W. Norton & Co., New
York. 464 pp.
Melvasalo, T. and Viljamaa 1977. Planktonic blue-green algae in
polluted coastal waters of Helsinki. Publ. Water Res. Inst.
(Helsinki, Finland) 1:1-35.
Melvasalo, T., J. Pawlak, K. Grasshoff, L. Thorell & A. Tsiban
(eds). 1981. Assessment of the effects of pollution on the
natural resources of the Baltic Sea, 1980. Baltic Sea
Environm. Proc. 5B, l-426.
Nehring, D., G. Aertebjerg, P. Alenius, V. Astok, S. Fonselius,
M. Hannus, V. Tervo, A. Trzosinska, P. Tulkki and A.K.
Yurkovskis 1987. In: Lassig, J. (ed). First periodic
assessment of the state of the marine environment of the
Baltic Sea area, 1980-1985; Background documents. Pp.35-81.
Paluoso, E. 1966. Ice in the Baltic. Oceanogr. Mar. Biol. Ann.
Rev. 4:79-90.
Remane, A. 1934. Die Brackwasserfauna. Verh. dt. Zool. Ges. 34-
74.
Remane, A. 1940. Einfuhrung in die zoologische ijkologie der Nord
U . Ostsee. Tierw. Nord-u. Ostsee Ia, 238 pp.
Rohde, H. and M. J. Rood 1986. Temporal evolution of nitrogen
compounds in Swedish precipitation since 1955. Nature
321:762-764.
Ronner, U. 1985. Nitrogen transformations in the Baltic proper:
Denitrification counteracts eutrophication. Ambio 14:134-
138.
Rydberg, L. 1983. Vastkustens hydrografi och narsalttransporter.
Trender och klimatberoende i ijstersjijn och Vasterhavet.
Background document for evaluation of the eutrophication
status of Swedish marine waters, conducted by the National
Swedish Environment Protection Board. 41pp.

- 31 -
Schelske, C. L. and E. F. Stoermer 1971. Eutrophication, Silica
depletion, and predicted changes in algal quality in Lake
Michigan. Science 173:423-424..
Schelske, C. L., E. F. Stoermer, G. L. Fahnenstiel and M. Haibach1986. Phosphorus enrichment, silica utilization, and
biogeochemical silica depletion in the Great Lakes. Can. J.
Fish. Aquat. Sci. 43:407-415.
Seitzinger, S.P. and S.W. Nixon, 1985. Eutrophication and the
rate of denitrification and N20 production in coastal marine
sediments. Limnol. Oceanog. 30:1332-1339.
Segerstrile, S.G. 1957. Baltic Sea. Mem. Geol. sot. America
67:751-800.
Shaffer, G. 1979.0n the phosphorus and oxygen dynamics of the
Baltic Sea. Contrib. Askij Lab. Univ. Stockholm 26:1-150.
Shaffer, G. and U. Rijnner 1984. Denitrification in the Baltic
proper deep water. Deep Sea Res.31:197-202.
Stigebrandt, A. 1983. A model for the exchange of water and salt
between the Baltic and the Skagerrak. J. Phys. Oceanogr.
13:411-427.
Striggow, K. 1983. Die relative Landsenkung im Bereich des Sundes
und der Beltsee - eine weitere Ursache der rezenten
Salzgehaltszunahme der Ostsee. Gerlands Beitr. Geophysik,
Leipzig 92:228-240.
Tilman, D. 1982. Resource competition and community structure.
Monogr. Population Biol. 17. Princeton University Press,
Princeton, New Jersey, U.S.A., 296 pp.
Tilman, D., R. Kiesling, R. Sterner, S. S. Kilham and F. A.
Johnson 1986. Green, bluegreen and diatom algae: Taxonomic
differences in competitive ability for phosphorus, silicon
and nitrogen. Arch. Hydrobiol. 106:473-485.
Waern, M. & S. Pekkari. 1973. Outflow studies. Nutrients and
their influence on the algae in the Stockholm archipelago
during 1971. No. 1. Oikos Suppl. 15:155-163.
Wyrtki, K. 1954. Der grosse Salzeinbruch in die Ostsee im
November und Dezember 1951. Kieler Meeresforsch. 10:19-25.

- 32 -
THE QUALITY OF URBAN STORMWATER :A STATE-OF-THE-ART REVIEW
Professor J Bryan Ellis*
ABSTRACT
A review of pollutant sources and loadings discharged from both separate (SWO)and combined (CSO) sewers in urban catchments is made and scouring/resuspensionof contaminated in-pipe and in-stream sediments is identified as a significantfactor in the poor quality of urban sewer discharges. Receiving water impactsare discussed in terms of both acute and chronic timescale effects andexceedance criteria advocated as a basis for toxic bioassay analysis. Thesignificance of both exposure and recurrence time for the establishment of wetweather criteria is stressed as well as the speciation of the toxicant.
Keywords: Urban Runoff; Pollutant Sources and Loadings; receiving waterimpacts; wet weather criteria; bioassay toxicity.
*Urban Pollution Research Centre, Middlesex Polytechnic, UK.

- 33 -
1. INTRODUCTION
During the last decade most European countries have achieved an increasingcontrol over their point-source discharges from municipal treatment works andindustrial plants. However, despite the very large sums of money that have beeninvested in new or upgraded treatment plant as well as in sewer renovation andreplacement, many member states have not experienced as much correspondingreceiving water quality benefits as they might have expected. In the UK, over10% of all receiving waters (or 4210 km of river length) are currently in astate ranging from "polluted" to llgrossly polluted". The proportion fallinginto these two classes is now showing an increase for the first time sincenational river quality surveys began some thirty years ago. A major reason forthe persistence of these poor quality waters is the continued existence ofuncontrolled or poorly controlled discharges from separate stormwater seweroutfalls (SWO's) and combined storm sewer overflows (CSO's).
Water quality problems resulting from urban runoff are now a top priority inmost European countries. In the UK between 35 to 40% of CSO's are deemed to beunsatisfactory and causing serious short term, slug effects as well as longerterm chronic impacts. The transient, randomly distributed SW0 discharges fromnon-point urban sources also present a major control problem. Lack of hydrauliccapacity and transporting efficiency in the existing urban drainage system canfrequently lead to surcharging and local flooding as well as causing bothin-pipe and in-stream pollution problems. The consequent flood and pollutionalleviation works involve water authorities in major expenditure on seweragesystems which in the UK is estimated at being f100 M/year for flood avoidanceand 240 M/year for pollution prevention. The annual costs for urban sewermanagement in Norway are placed at 230 M/year, whilst in Sweden sewer investmentcurrently amounts to some 238 M/year with operating and maintenance costsestimated at about $40 M/year, which rises to nearly ES5 M/year in W. Germany.
2. SEWER SYSTEMS AND LOADS
Most European countries have a very high percentage of their populationconnected up to a main sewer system, although as 'indicated in Table 1, therelative percentage of separate and combined sewers does vary quite considerablyas does the age of the respective sewer systems.
TABLE 1 European sewer systems
UK
Sweden
Denmark
Netherlands
France
W Germany
Spain
USA
Country Percentage of Populatior PercentageConnected to Sewer Combined
96
94
87
86
91
90
52
77
)
70
14
37
90
85
60
02
25
(After Fiddes Cl]
Age
50% after 1945
50% after 1964
65% after 1955
48% after 1950
60% after 1963
50% after 1950
Most new residential developments in urban areas are now designed on theseparate principle, despite the proven poor quality of SW0 discharges and thefact that only 2-S% of wrong connections will entirely eliminate the waterquality benefits of such separation. Table 2 gives an indication of therelative pollutant concentrations and loadings associated with separate surfacewater and combined storm sewerage systems in W Europe.

- 34 -
TABLE 2 Mean Pollutant Concentrations and Unit Loads forSurface Water and Combined Sewer Discharges.
POLLUTANT
PARAMETER
surf-ace Water Sewers (SWO'S) Combined Sewers ('.X0's)
Load per Event Mean Load per Unit Event Mea"
Unit Area Co"ce"tratio"s Area Co"ce"tratio"s
(kallmo.halvr) (mgll) (kg/imp.ha/yr) (mgll)
Suspended 481 190 1260 425Solids (347 - 2340) (21 - 2582) (80 - 4900) (176 - 647)
Biological 59 11 826 90Oxygen Demand (35 - 172) (7 - 22) (500 - 1400) (43 - 225)
Chemical Oxygen 358 85 1600 380Demand (22 - 703) (20 - 365) (62 - 3800) (250 - 530)
AmmoniacalNitrogen
TotalNitrogen
TotalPhosohorus
1.76 1.45 68.0 6.0
(1.2 - 25.1) (0.2 - 4.6) (15 - 85) (3.1 - 8.0)
9.0 3.2 8.3(0.9 - 24.2) (0.4 - 20.0) (8 -'"40, (21 - 28.5)
1.8 0.34 10.0
(0.5 - 4.9) (0.02 - 4.30) (6.5 - 14.01
TotalLead
0.83 0.21 1.25 0.25
(0.09 - 1.91) (0.01 - 3.1) (0.83 - 1.84) (0.08 - 0.45)
TotalZinc
1.15 0.30 5.33 0.81(0.21 - 2.68) (0.01 - 3.68) I (4.06 - 6.61) (0.10 - 1.07)
Oil
I
0.4
(0.09 - 2.8) IFaecal 2.1 6430Coliforms (0.9 - 3.8) (400 - 50,000)(E.Coli) (xl09 counts/ha) (HPN/lOOml)
(Figures in parentheses give range of observed mean values)
(105 - lOBI
(MPN/lOOml)
(After Ellis, 2)
Uith the exception of solids and metals, CSO pollutant concentrations exceedthose of SWO's by about an order of magnitude although it should be noted thatthe COD:BOD ratio of stormwater runoff is much higher than that of combinedsewerage discharges.
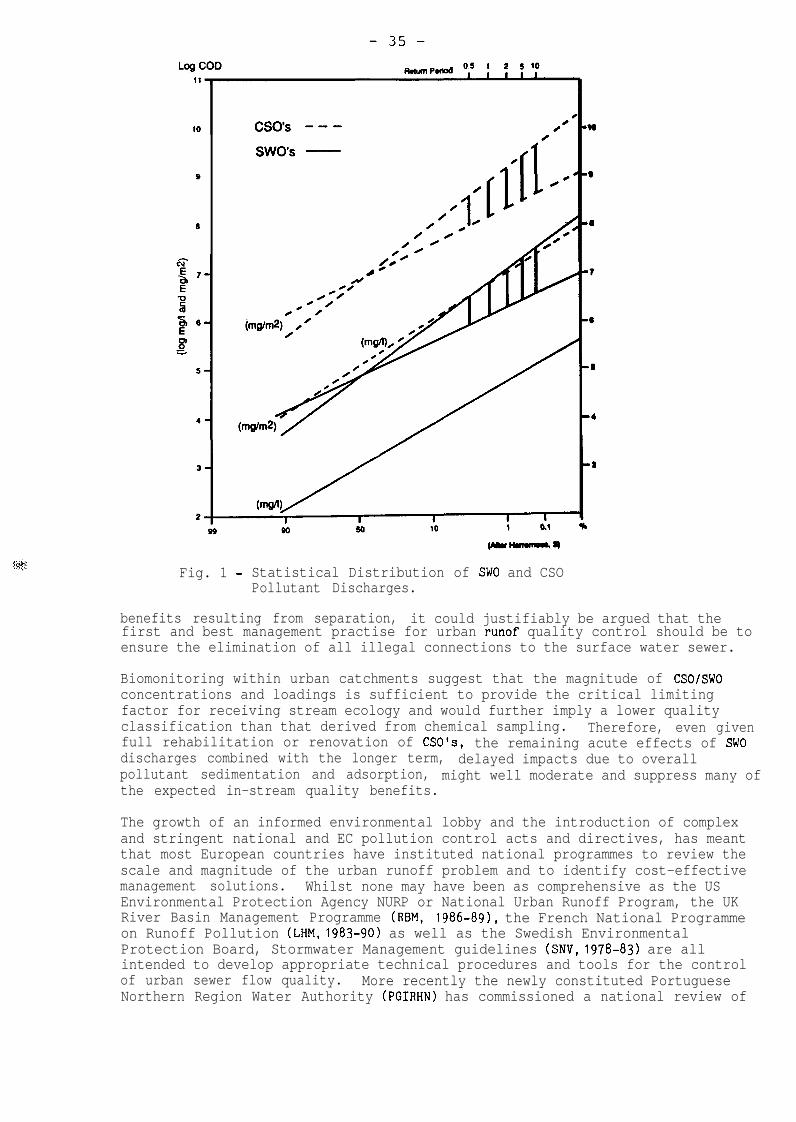
The event-mean concentration (EMC) values show considerable variability not onlybetween events but also from one site to another. Coefficients of variation(Cv) for most pollutant parameters typically range between 0.5 and 1.0increasing to 1.5 - 2.0 for solids and solid-associated parameters. Thereforewhilst acute impacts are best evaluated on the basis of extreme values for theindividual storm event, the accumulative, long term chronic effects are bestconsidered in terms of the annual loadings. EMC values appear to be typicallylog normally distributed as can be seen from inspection of Fig. 1 where thestatistical distribution of COD per storm event and unit catchment area isplotted for four Danish urban catchments. It should be noted however that a 3parameter log normal distribution using a 'maximum likelihood' fitting procedureappears to give the best SW0 data fit although an extreme value Frechet (EV2)distribution has also been shown to provide a good fit for organic demandparameters (Ellis, 2). Harremoes [3] has stressed the importance of taking intoconsideration the variability of the concentration in order to derive reliablepredictions of pollutant discharges. The distance between the curves on Fig.1can be used to determine the correction factors (which vary between 2 to 3) fordifferent return periods. However the similarity, and indeed overlap, of theSW0 pollutant distributions to those of CSO's would imply a widespread, even iflimited, degree of cross-connection between these systems. Given that only afew percent of such cross-connections are necessary to negate any water quality
cso’s ---
SW03 -
Fig. 1 - Statistical Distribution of SW0 and CSOPollutant Discharges.
benefits resulting from separation, it could justifiably be argued that thefirst and best management practise for urban runof quality control should be toensure the elimination of all illegal connections to the surface water sewer.
Biomonitoring within urban catchments suggest that the magnitude of CSOISWOconcentrations and loadings is sufficient to provide the critical limitingfactor for receiving stream ecology and would further imply a lower qualityclassification than that derived from chemical sampling. Therefore, even givenfull rehabilitation or renovation of CSO's, the remaining acute effects of SW0discharges combined with the longer term, delayed impacts due to overallpollutant sedimentation and adsorption, might well moderate and suppress many ofthe expected in-stream quality benefits.
The growth of an informed environmental lobby and the introduction of complexand stringent national and EC pollution control acts and directives, has meantthat most European countries have instituted national programmes to review thescale and magnitude of the urban runoff problem and to identify cost-effectivemanagement solutions. Whilst none may have been as comprehensive as the USEnvironmental Protection Agency NURP or National Urban Runoff Program, the UKRiver Basin Management Programme (RBM, 1986-891, the French National Programmeon Runoff Pollution (LHM, 1983-90) as well as the Swedish EnvironmentalProtection Board, Stormwater Management guidelines (SNV, 1978-83) are allintended to develop appropriate technical procedures and tools for the controlof urban sewer flow quality. More recently the newly constituted PortugueseNorthern Region Water Authority (PGIRHN) has commissioned a national review of
- 36 -
urban pollution abatement technology (PO-Rivers, 1988-92) and the ItalianNational Research Council is also conducting a review of the operational andlegislative aspects of urban sewer quality (IRSA, 1988-90). The targets forsewer upgrading would thus appear to be primarily quality based although in theUK and France avoidance of surcharging and flooding is perhaps more frequentlythe major consideration. This is largely because of the age of their sewersystems (Table 11, where some 5/10% of all 50m sewer lengths between manholesare categorised as being unsound with higher percentages (25/30%) occurring inthe older 1860/1920 brick-lined sewers of central urban districts.
3. POLLUTION SOURCES AND LEVELS
3.1 Atmospheric Deposits and Roof Runoff
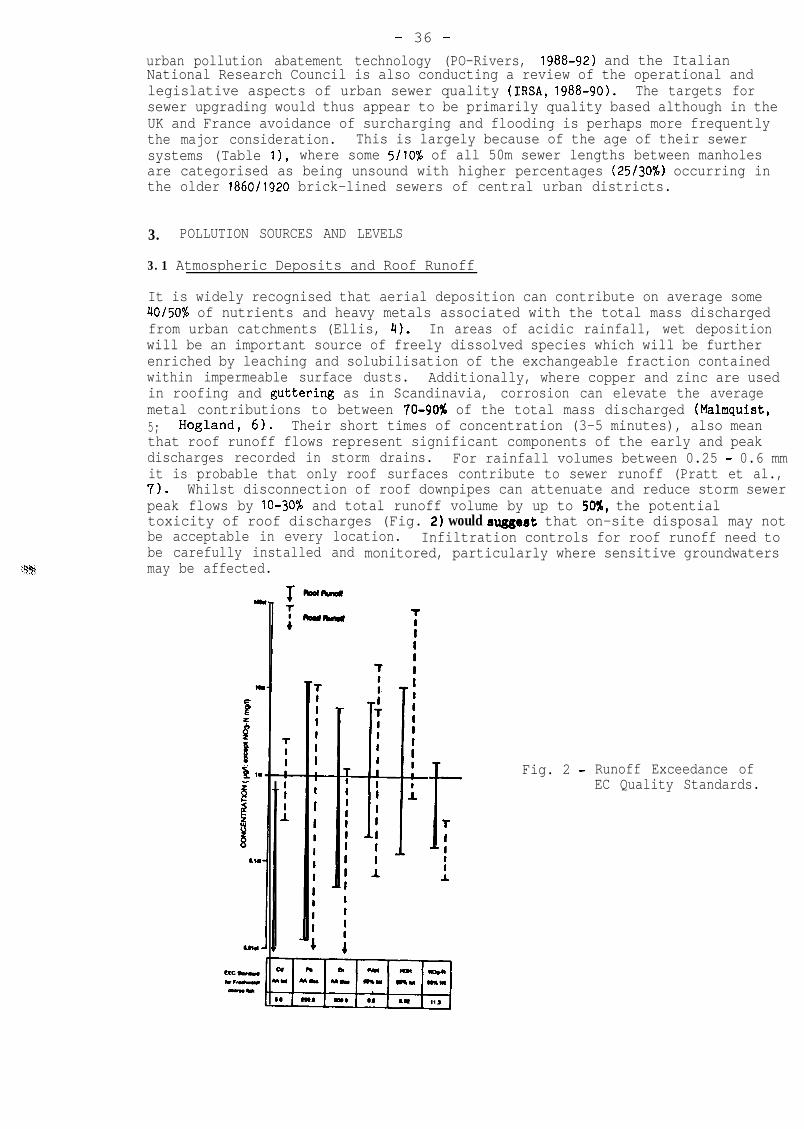
It is widely recognised that aerial deposition can contribute on average some40/50% of nutrients and heavy metals associated with the total mass dischargedfrom urban catchments (Ellis, 4). In areas of acidic rainfall, wet depositionwill be an important source of freely dissolved species which will be furtherenriched by leaching and solubilisation of the exchangeable fraction containedwithin impermeable surface dusts. Additionally, where copper and zinc are usedin roofing and guttering as in Scandinavia, corrosion can elevate the averagemetal contributions to between 70-90X of the total mass discharged (Malmquist,5; Hogland, 6). Their short times of concentration (3-5 minutes), also meanthat roof runoff flows represent significant components of the early and peakdischarges recorded in storm drains. For rainfall volumes between 0.25 - 0.6 mmit is probable that only roof surfaces contribute to sewer runoff (Pratt et al.,7). Whilst disconnection of roof downpipes can attenuate and reduce storm sewerpeak flows by IO-30% and total runoff volume by up to 50X, the potentialtoxicity of roof discharges (Fig. 2) would suggert that on-site disposal may notbe acceptable in every location. Infiltration controls for roof runoff need tobe carefully installed andmay be affected.
monitored, particularly where sensitive groundwaters
t
Fig. 2 - Runoff Exceedance ofEC Quality Standards.

- 37 -
3.2 Highway Runoff
Runoff from impermeable highway surfaces can also be highly contaminated (Fig.2) with accumulated mass rate of pollutant3 being a function of aerialdeposition rate, average daily traffic density and intensity-frequency of therainfall event (Ellis, 4). Speciation studies show that substantial proportionsof toxic metals in road runoff are in a potentially bioavailable form (Fig. 3)with as much as 50-60% of Pb being in the exchangeable fraction and 30-37% of Cdoccuring as a freely dissolved species.
Lead
8Cadmium
--Percentagemetal 60ineachfr*ctior?O
20
Road Gullypot Stormwater Road Gullypot Stonw~terrunoff butflow outfall runoff outflow outfall
m ElectrochemicallyAvailable
a Exchangeable
m Chelex Removable Carbonate 4 Hydrous Oxide
FZJ Strongly Bound organic(After Morrison et al.,181
Fbg. 3 - Stormwater Runoff Metal Speciation.
Modelling studies would suggest that impermeable urban surfaces virtuallyprovide an unlimited sediment store for washoff (Ellis et al., 81, such thatsurface accumulation can be adequately represented by a simple linear function:
PM = PO + K,.dt.
where PM = pollutant mass per unit highway surface at time t (g/km)
PO = residual on surface prior to time t (g/km)
K1 = accumulation rate (g/km/day)
dt = time of accumulation (day)
The value of K,, the accumulation rate, can be estimated from the average
daily traffic density (ADT) as being equivalent to 2ADT0.89 .
The high ionic strength and reduced pH of snowmelt runoff can liberate weaklyassociated species from the fine solids phase to elevate metal and dissolvedorganic fractions in the runoff by an order of magnitude. As much as half of theyearly pollutant mass transport can occur during intensive snow melting periods(Morrison et al., 9; Lygren and Gjessing, (10).
Although physically based simulation models based on sediment transport theoryare being developed for the prediction of surface washoff rates (Moys, 11;Svensson, 121, they do require verification, calibration and sensitivityanalysis to be reliably and widely applied as stormwater management tools.

- 38 -
Empirical first-order washoff equations still provide an appropriatemany operational modelling approaches and are of the general form:
dP/dt = PM (1 - e-K,.v
1
basis for
where dP/dt = pollutant mass discharged during runoff event (g/km)
K2 = washoff coefficient (hr/m), which varies between 5-12 for
highly impermeable and semi permeable rural areas respectively.
V = average runoff rate (m/hr)
The above formulation and its many variants have been fully discussed by Huber(13) and the exponential function has been adopted by many European workers.
3.3 Roadside Gullypots and Inlets
Roadside gullypots (or catchpits) have been identified as a significant sourceof the poor quality of SW0 discharges (Morrison et al., 14). Gullypot metaloutflows for example, show substantial (and often early) contributions from theanoxic supernatant liquors and interstitial gullypot waters (Fig. 41, reflecting
(b) DUzYzz!. rr d(0) puma4 Ndox potaatul-~t~- amw8uvi~mrsAtla= ia
ingull~tlieuor rrrvmw.
:; 0.m
%3
002
$
t
001
a 0nnwwufm
0 ma IQD mlbmlmkl (After Morrison et al., 14)
Fig. 4 - Variations in Cullypot Quality.
anaerobic degradation processes which act upon the trapped chamber sedimentsboth during and between storm events. The disturbance and mobilisation of theinterstitial sediment waters during road runoff are clearly indicated in Fig. 4bby the rapid changes that can be observed in the controlling parameters withinthe gullypot. Although these controlling factors can produce large changes inmetal speclation during specific storm events, the overall effect on dissolvedmetals for complete storms does not appear to be of major significance (Fig. 3).Increases in dissolved organic carbon within the gullypot can lead to enhancedmetal complexation as can be seen in the case of cadmium in Figure 3.

- 39 -
3.4 Sewer Deposits and Flushing
The greatest contributions to both total SW0 and CSO pollutant loadings (50-60%)are undoubtedly derived from the scour and release of in-pipe slimes andsediments. An increasing number of European studies are showing that pollutedsediments in the sewer pipe can be very considerable, amounting to some 20-44%of the in-line storage capacity. Not only do such sewer sediments restrict thehydraulic capacity and conveyance efficiency causing surcharging and prematureSSO spillage but they also have a considerable acute, shock-loading effect uponthe receiving water resulting from the 'first-foul' flush of contaminated solidsand oxidisable/soluble organics.
Table 3 provides a pooled estimation of the equivalent annual loads derived frompipe deposits within CSO catchments in Scandinavia and Switzerland whichcollectively amount to 50160% of the total mass loads discharged.
TABLE 3 In-pipe pollutant loads
The BOD strength (g/kg 0) of the cohesive, organic sludge layers found incombined sewers can reach lo-20 g/kg 0 with 4 hour BOD equivalents of aboutlo-15 g/kg per metre of pipe length and possessing critical shear strengthstypically in the range of 10 - 100 KN/m2 (Crabtree, 15).
The key criteria for the initiation of bed scour and mobilisation of thesurficial sewer sediment layer will therefore depend on rheologicalcharacteristics such as sediment bulk density, cohesion and plasticity.Consideration must therefore be given to the critical flow and shear velocitiesfor the various particle size ranges and sediment concentrations found in sewerdeposits as well as their interstitial ionic strength and degree of cohesion.The work of Stotz and Krauth (16) as well as Lindholm and Aaby (17) hasconfirmed that whilst a critical shear stress of 1.8 KN/m2 may be sufficient towashout recently deposited, unconsolidated sediment, residence times of 2-8 dayswill increase this value to 3 and 5 KN/m2 respectively for the same flushingrates and volumes. These shear strengths would suggest a minimum sewer velocityof about 1 m/s is needed to maintain a self-cleansing capability in smalldiameter pipes.
In the UK, current recommendations are for self-cleansing velocities of 0.7-O-9m/s at pipefull flows and assumed shear stress values of 6.2 KN/m2. InScandinavia and W Germany rather higher pipefull velocities of 1.5 m/s arerecommended but both assume shear values of only some 2-4 KN/m2 for this design.All quoted values fall well below the lo-100 KN/m2 required shear stressthreshold levels observed in the UK field studies referred to above and whichhave been independently confirmed by the French CERGRENE work being undertakenin Paris and Marseille. It would appear that for large pipe sizes above 1 mdiameter, a critical minimum flow velocity of at least 1.5 m/s is required tomaintain a reasonably satisfactory self-cleansing situation. Current sewertransport design is based on non-cohesive materials, with low sedimentconcentrations (< 100 mg/l) and for medium to coarse grain sizes (l-2 mm).Diameter-related velocity and shear design criteria need to be developed for the

- 40 -
cohesive, fine grained sediments and high concentrations typically found inurban sewer pipes. Other parameters of design and operational interest wouldinclude shear stress values for DWF loads as well as frequency function curves(FDC'S) for the distribution of shear stress along the sewer pipe length orperhaps for 10 and 50% of the length. Similar FDC's might also be plotted forslope as well as pipe diameter.
Both SW0 and CSO discharges tend to display a characteristic first-flush whichfrequently coincides with the time of concentration for the drainage system andwhich primarily reflects the re-entrainment and transport of in-pipecontaminants. The first-flush phenomena is undoubtedly less marked in largecatchments above 250/300ha in size and for storm events possessing low, uniformrunoff rates. Delayed subsidiary concentration peaks can also be frequentlydetected, which have been taken to reflect the input of fresh surface sedimentsand pollutants that have been washed into the sewer system. It should be notedhowever that there is considerable variation in the temporal distribution andmagnitude of pollutant concentrations depending upon catchment and sewerconditions, the antecedant dry period, the characteristics of the storm and flowevent as well as upon the nature, age and incidence of in-pipe sediments. Thenature of the chemical species involved and their solubility potentials alsohave a marked affect upon the magnitude and extent of the first-flush. Totallead and copper for example show a much more pronounced first-flush than theirdissolved or exchangeable species. Total lead and copper, both of which havestrong affinities for solid-associated phases (Fig. 31, also possess a greatertendency for first-flush than total zinc or cadmium (Morrison et al., 18).Cumulative mass loading curves indicate that on average only about 42% ofsolids, 35% of the organic demand, 24% of nutrients and 18% of metals aredischarged during the initial 30-35% of the cumulative storm volume (Ellis, 4;Geiger, 19). There is therefore considerable uncertainty and difference ofopinion as to the overall significance of first-flush as a sewer flow qualityphenomena as well as a lack of knowledge about its relative importance in termsof receiving water impacts.
4. RECEIVING WATER IMPACTS
4.1 Time Scale Effects
Urban drainage has conventionally been considered as an engineering problemessentially concerned with hydraulic sewer design, but the pollution problemsassociated with sewer discharges have shifted the objectives of many Europeanwater agencies to optimise operational performance in terms of receiving waterimpact. Water quality responses to SW0 and CSO discharges are measurable onboth short (acute) and long term (chronic) timescales. The accumulation ofsediments, containing elevated pollutant gradients, adjacent to and downstreamof the sewer outfall can result in localised acute effects following their scourand resuspension under storm flow conditions. In addition they impose severelonger term delays on stream recovery rates and the chronic bioaccumulation oftoxic materials induces permanent alterations in the aquatic biologicalcommunity and ecosystem.
These delayed impacts are associated with sediment-accumulated nutrients,metals, hydrocarbons and bacteria as well as being the result of benthalsediment oxygen demands. Typical undisturbed SOD levels vary between 0.15 -2.75 g/m2/day, which can account for a permanent deficit of about 1.5 - 2.5 mg/lin the DO regime of the receiving water. Bed disturbance during stormflowconditions can elevate the SOD levels into the range of 240 - 1500 g/m2/day anddepress normally near-saturation, in-stream DO levels to 2 mg/l or less. Thisdepressed DO balance is further exacerbated during storm event activity by theelevated in-stream COD and NH,-N concentrations which typically peak around
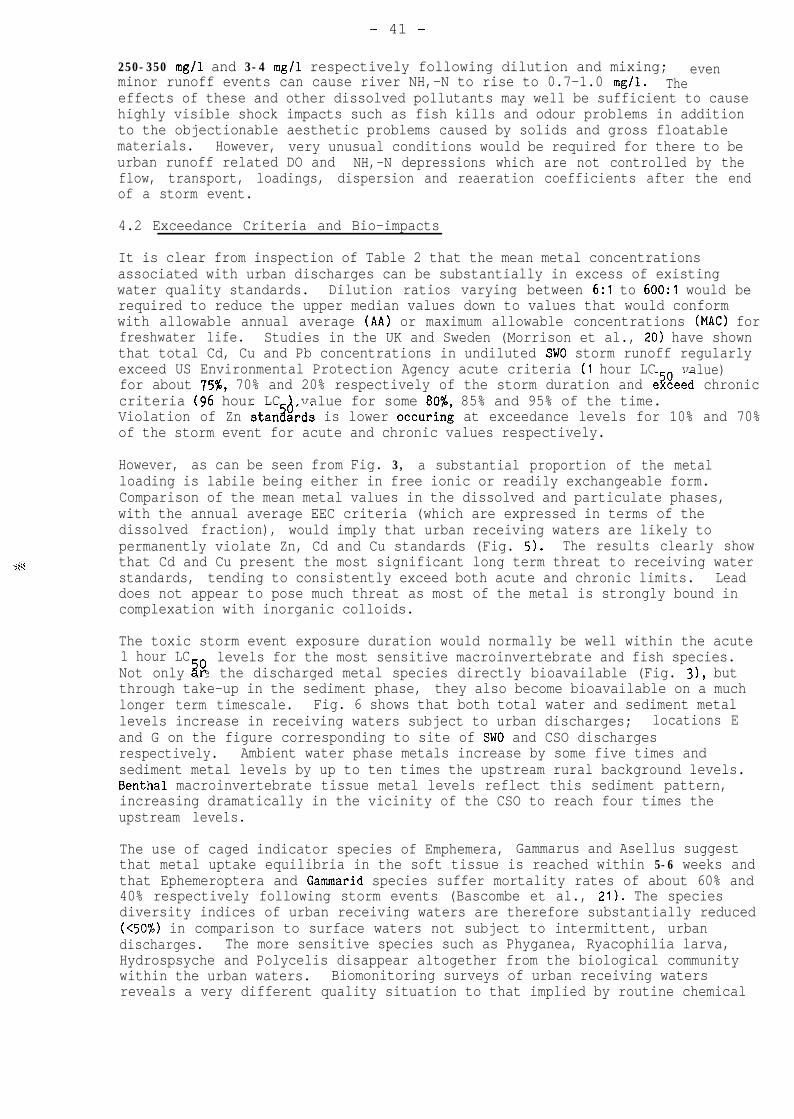
- 41 -
250-350 mg/l and 3-4 mg/l respectively following dilution and mixing; evenminor runoff events can cause river NH,-N to rise to 0.7-1.0 mg/l. Theeffects of these and other dissolved pollutants may well be sufficient to causehighly visible shock impacts such as fish kills and odour problems in additionto the objectionable aesthetic problems caused by solids and gross floatablematerials. However, very unusual conditions would be required for there to beurban runoff related DO and NH,-N depressions which are not controlled by theflow, transport, loadings, dispersion and reaeration coefficients after the endof a storm event.
4.2 Exceedance Criteria and Bio-impacts
It is clear from inspection of Table 2 that the mean metal concentrationsassociated with urban discharges can be substantially in excess of existingwater quality standards. Dilution ratios varying between 6:l to 6OO:l would berequired to reduce the upper median values down to values that would conformwith allowable annual average (AA) or maximum allowable concentrations (MAC) forfreshwater life. Studies in the UK and Sweden (Morrison et al., 20) have shownthat total Cd, Cu and Pb concentrations in undiluted SW0 storm runoff regularlyexceed US Environmental Protection Agency acute criteria (1 hour LC value)for about 75%, 70% and 20% respectively of the storm duration and e?!?eed chroniccriteria (96 hour LC 1 value for some 80%, 85% and 95% of the time.Violation of Zn sta&?rds is lower occuring at exceedance levels for 10% and 70%of the storm event for acute and chronic values respectively.
However, as can be seen from Fig. 3, a substantial proportion of the metalloading is labile being either in free ionic or readily exchangeable form.Comparison of the mean metal values in the dissolved and particulate phases,with the annual average EEC criteria (which are expressed in terms of thedissolved fraction), would imply that urban receiving waters are likely topermanently violate Zn, Cd and Cu standards (Fig. 5). The results clearly showthat Cd and Cu present the most significant long term threat to receiving waterstandards, tending to consistently exceed both acute and chronic limits. Leaddoes not appear to pose much threat as most of the metal is strongly bound incomplexation with inorganic colloids.
The toxic storm event exposure duration would normally be well within the acute1 hour LCNot only re the discharged metal species directly bioavailable (Fig. 31, butz"
levels for the most sensitive macroinvertebrate and fish species.
through take-up in the sediment phase, they also become bioavailable on a muchlonger term timescale. Fig. 6 shows that both total water and sediment metallevels increase in receiving waters subject to urban discharges; locations Eand G on the figure corresponding to site of SW0 and CSO dischargesrespectively. Ambient water phase metals increase by some five times andsediment metal levels by up to ten times the upstream rural background levels.Benthal macroinvertebrate tissue metal levels reflect this sediment pattern,increasing dramatically in the vicinity of the CSO to reach four times theupstream levels.
The use of caged indicator species of Emphemera, Gammarus and Asellus suggestthat metal uptake equilibria in the soft tissue is reached within 5-6 weeks andthat Ephemeroptera and Gammarid species suffer mortality rates of about 60% and40% respectively following storm events (Bascombe et al., 21). The speciesdiversity indices of urban receiving waters are therefore substantially reduced(<50%) in comparison to surface waters not subject to intermittent, urbandischarges. The more sensitive species such as Phyganea, Ryacophilia larva,Hydrospsyche and Polycelis disappear altogether from the biological communitywithin the urban waters. Biomonitoring surveys of urban receiving watersreveals a very different quality situation to that implied by routine chemical
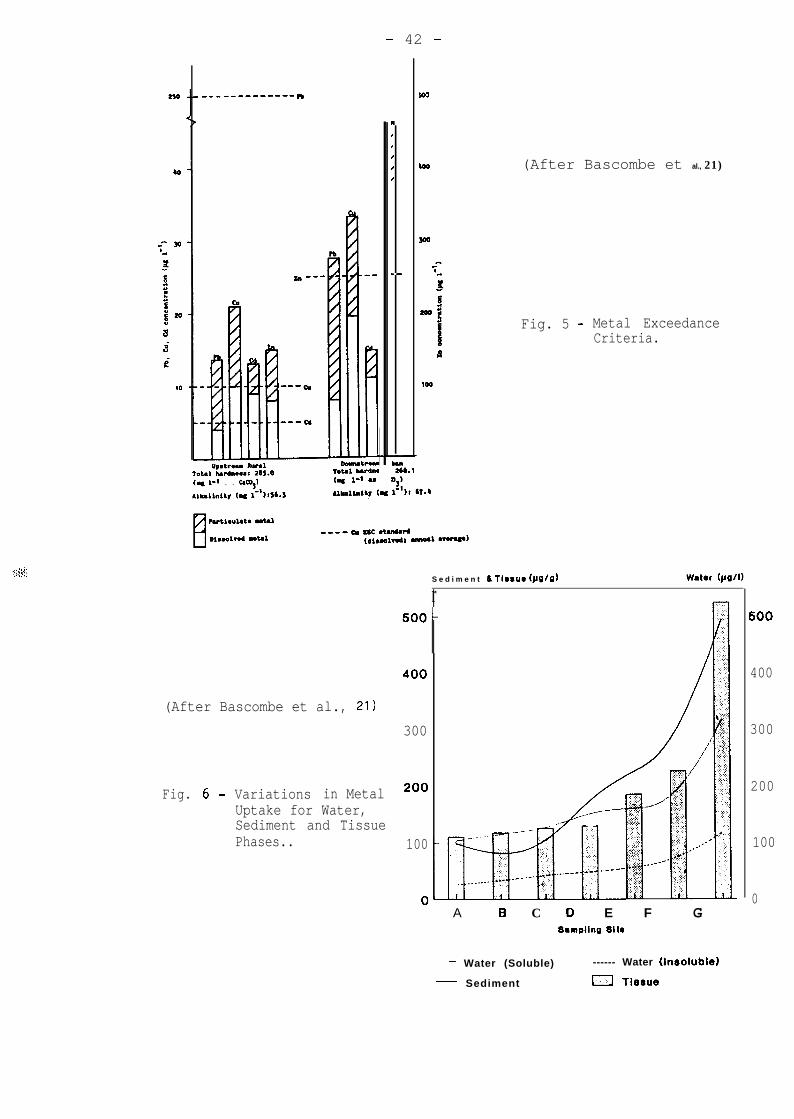
- 42 -
“p.tr.” Rut-*1 o0mutr.u
l.3l.l tmrdlm..: as.0 l&m, budm
bg 1-l . . c.mco3~ (- 1-g ”
II
I
I
I
I
,
__
(After Bascombe et al., 21)
300
Fig. 6 - Variations in Metal 2ooUptake for Water,Sediment and TissuePhases.. 100
(After Bascombe et al., 21)
Fig. 5 - Metal ExceedanceCriteria.
S e d i m e n t & Ti**UO (Fe/O) Wa1.r o&l/l)
rc
A B C D E F G
600
400
300
200
100
0
88mpllng 8110
~- Water (Soluble)
- Sediment
------ Water (Inroluble)
m Tierue
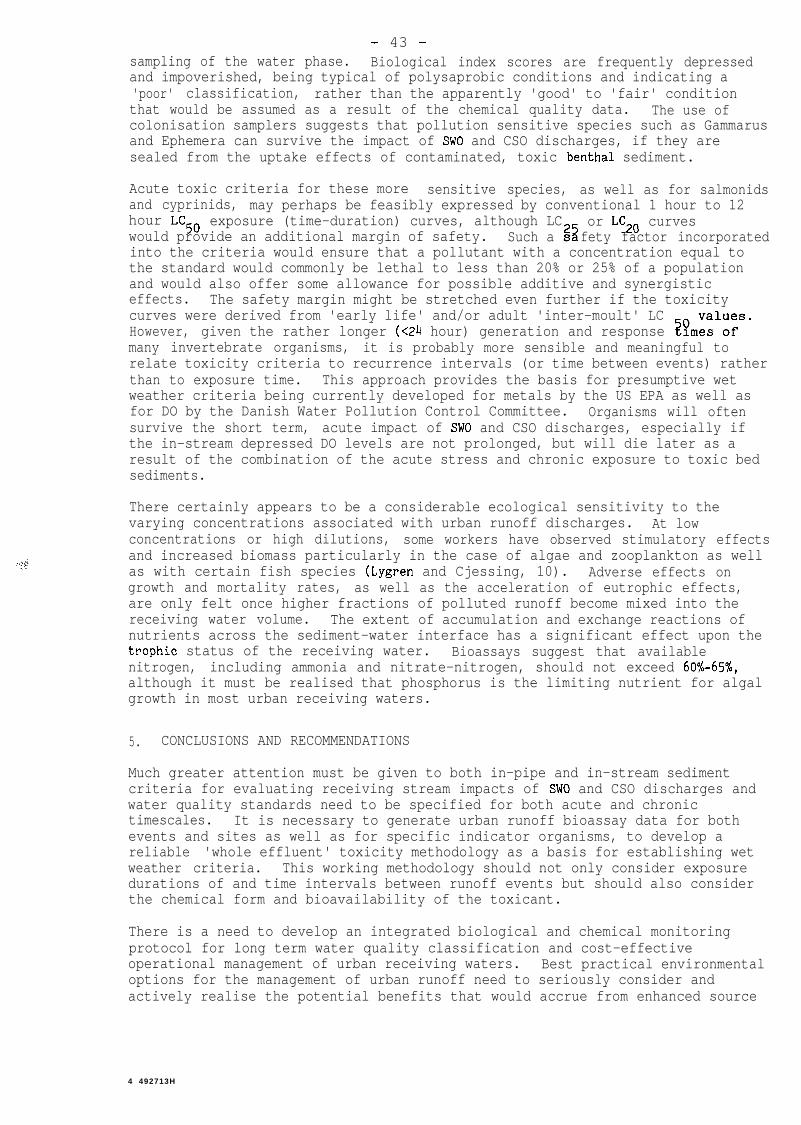
- 43 -sampling of the water phase. Biological index scores are frequently depressedand impoverished, being typical of polysaprobic conditions and indicating a'poor' classification, rather than the apparently 'good' to 'fair' conditionthat would be assumed as a result of the chemical quality data. The use ofcolonisation samplers suggests that pollution sensitive species such as Gammarusand Ephemera can survive the impact of SW0 and CSO discharges, if they aresealed from the uptake effects of contaminated, toxic benthal sediment.
Acute toxic criteria for these more sensitive species, as well as for salmonidsand cyprinids, may perhaps be feasibly expressed by conventional 1 hour to 12hour LC50 exposure (time-duration) curves, although LCwould provide an additional margin of safety. Such a s2z
or LC2C curvesfety factor incorporated
into the criteria would ensure that a pollutant with a concentration equal tothe standard would commonly be lethal to less than 20% or 25% of a populationand would also offer some allowance for possible additive and synergisticeffects. The safety margin might be stretched even further if the toxicitycurves were derived from 'early life' and/or adult 'inter-moult' LCHowever, given the rather longer (~24 hour) generation and response ??rnI~'",","'many invertebrate organisms, it is probably more sensible and meaningful torelate toxicity criteria to recurrence intervals (or time between events) ratherthan to exposure time. This approach provides the basis for presumptive wetweather criteria being currently developed for metals by the US EPA as well asfor DO by the Danish Water Pollution Control Committee. Organisms will oftensurvive the short term, acute impact of SW0 and CSO discharges, especially ifthe in-stream depressed DO levels are not prolonged, but will die later as aresult of the combination of the acute stress and chronic exposure to toxic bedsediments.
There certainly appears to be a considerable ecological sensitivity to thevarying concentrations associated with urban runoff discharges. At lowconcentrations or high dilutions, some workers have observed stimulatory effectsand increased biomass particularly in the case of algae and zooplankton as wellas with certain fish species (Lygren and Cjessing, 10). Adverse effects ongrowth and mortality rates, as well as the acceleration of eutrophic effects,are only felt once higher fractions of polluted runoff become mixed into thereceiving water volume. The extent of accumulation and exchange reactions ofnutrients across the sediment-water interface has a significant effect upon thetrophic status of the receiving water. Bioassays suggest that availablenitrogen, including ammonia and nitrate-nitrogen, should not exceed 60%-65%,although it must be realised that phosphorus is the limiting nutrient for algalgrowth in most urban receiving waters.
5. CONCLUSIONS AND RECOMMENDATIONS
Much greater attention must be given to both in-pipe and in-stream sedimentcriteria for evaluating receiving stream impacts of SW0 and CSO discharges andwater quality standards need to be specified for both acute and chronictimescales. It is necessary to generate urban runoff bioassay data for bothevents and sites as well as for specific indicator organisms, to develop areliable 'whole effluent' toxicity methodology as a basis for establishing wetweather criteria. This working methodology should not only consider exposuredurations of and time intervals between runoff events but should also considerthe chemical form and bioavailability of the toxicant.
There is a need to develop an integrated biological and chemical monitoringprotocol for long term water quality classification and cost-effectiveoperational management of urban receiving waters. Best practical environmentaloptions for the management of urban runoff need to seriously consider andactively realise the potential benefits that would accrue from enhanced source
4 492713H

- 44 -
control as well as from more effective and efficient design of in-pipe hydraulicand storage capacity as well as overflow operation.
REFERENCES
1. FIDDES, D. 1986. Overview of International Urban Drainage Practice.187-200 in BALMFORTH, D.J. (Ed): Developments in Storm Sewerage Management,Inst. Public Hlth. Eng., London.
2. ELLIS, J.B. (Ed). 1988. Urban Runoff Quality Data. Report to TechnicalSub-Committee, European Water Poll. Control Assoc., Copenhagen.
3. HARREMOES, P. 1986. Interaction between Quantity and Quality Models forUrban Storm Drainage. l-16 in MAKSIMOVIC, C. and RADOJKOVIK, M. (Eds): UrbanDrainage Modelling, Pergamon Press, Oxford.
4. ELLIS, J.B. 1986. Pollutional Aspects of Urban Runoff. l-38 in TORNO,H-C., MARSALEK, J. and DESBORDES, M. (Eds): Urban Runoff Pollution, SpringerVerlag, Berlin.
5. MALMQUIST, P.A. 1983. Urban Stormwater Pollutant Sources, ChalmersUniversity Technology, Gothenburg.
6. HOGLAND, W. 1986. Rural and Urban Water Budgets, Report No. 1001, LundUniversity, Lund.
7. PRATT, C.J., HARRISON, J.J. and ADAMS, J.R.W. 1984. Storm Runoff Simulationin Runoff Quality Investigations. 285-294 in BALMER, P., MALMQUIST, P.A. andSJOBERG, A. (Eds): Analysis and Design of Stormwater Systems, ChalmersUniversity Technology, Gothenburg.
8. ELLIS, J.B., HARROP, D.O. and REVITT, D.M. 1986. Hydrological Controls ofPollutant Removal from Highway Surfaces. Water Research, 20, 589-595.
9. MORRISON, G.M.P., REVITT, D-M., ELLIS, J-B., SVENSSON, G. and BALMER, P.1986. The Transport Mechanisms and Phase Interactions of Bioavailable HeavyMetals in Snowmelt Runoff. 399-406 in SLY, P.G. (Ed): Sediments and WaterInteractions., Springer-Verlag, New York.
10. LYGREN, E. and GJESSING, E. 1984. Highway Pollution in a Nordic Climate.Report No. o-79024, Norwegian Inst. Water Research, Oslo.
11. MOYS, G.D. 1987. Modelling of Stormwater Quality including Tanks andOverflows (MOSQITO), Report No. SR127, Hyd. Res. Ltd., Wallingford, Oxon.
12. SVENSSON, G. 1987. Modelling of Solids and Metal Transport from SmallUrban Watersheds, Chalmers University Technology, Gothenburg.
13. HUBER, W.C. 1986. Deterministic Modelling of Urban Runoff Quality.167-242 in TORNO, H.C. MARSALEK, J. AND DESBORDES, M. (Eds): Urban RunofffPollution, Springer Verlag, Berlin.
14. MORRISON, G.M.P., REVITT, D-M., ELLIS, J-B., SVENSSON, G. and BALMER, P.1988. Transport Mechanisms and Processes for Metal Species in a GullypotSystem. Water Research, 22, 1084-1095.
15. CRABTREE, R.W. 1987. Combined Sewer Sediment Types and Characteristics.Proc. Seminar Sewer Sediment, Hyd. Res. Ltd., Wallingford, Oxon.
16. STOTZ, G. and KRAUTH, K.H. 1986. Depositions in Combined Sewers and their
- 45 -
Flushing Behaviour. 443-453 in MAKSIMOVIC, C. and RADOJKOVIK, M. (Ed): UrbanDrainage Modelling, Pergamon Press, Oxford.
17. LINDHOLM, 0 and AABY, L. 1989. In-Pipe Flushing and their Implications forOverflow Quality. 14-24 in ELLIS, J.B. (Ed): Water Quality Impacts of StormSewage Overflows on Receiving Waters, Pergamon Press, Oxford.
18. MORRISON, G.M.P., REVITT, D-M., ELLIS, J-B., SVENSSON, G. and BALMER, P.1984. The Physico-Chemical Speciation of Zn, Cd, Pb and Cu in Urban Stormwater.989-1000 in BALMER, P., MALQUIST, P.A. AND SJOBERG, A. (Eds): Planning andControl of Urban Storm Drainage, Chalmers University Technology, Gothenburg.
19. GEIGER, W.F. 1986. Variation of Combined Runoff Quality and resultingPollutant Retention Strategies. 71-92 in VAN DE VEN, F.H.M. and HOOCHART, J.B.(Eds): Urban Stormwater Quality and Effects upon Receiving Waters, The Hague.
20. MORRISON, G.M.P., REVITT, D.M. AND ELLIS, J.B. 1987. Heavy MetalExceedance of Water Quality Standards during Storm Events. 91-96 in GUJER, W.AND KREJCI, V. (Eds): Topics in Urban Stormwater Quality, Planning andManagement, Ecole Polytechnique Federal, Lausanne.
21. BASCOMBE, A-D., ELLIS, J-B., REVITT, D.M. and SHUTES, R.B.E. 1988.Macroinvertebrate Biomonitoring and Water Quality Management within UrbanCatchments. 403-412 in HOOGHART, J.C. (Ed): Hydrological Processes and WaterManagement in Urban Areas, UNESCO/IHP, Zoetermeer, Netherlands.
- 46 -
QUALITY ASPECTS ON AND METHODS FOR REDUCTIONOF COMBINED SEWER OVERFLOW DISCHARGE
William Hogland, Ronny Bemdtsson, Magnus LarsonDepartment of Water Resources Engineering,Lund Institute of Technology/University of Lund,Box 118, S - 221 00 Lund, Sweden.
Abstract
Combined sewer overflow discharge is a pollution problem which
has been largely neglected in most of the world. However, during the
last five years extensive studies have been carried out in the Nordic
countries in order to clarify CSO-problems. A Nordic cooperation
project on the importance of sediment wash-out for the combined sewer
overflow quality is currently under way. After a short summing up of
combined sewer overflow pollution problems and a survey of the
research in this field this paper presents some methods of pollutant
reduction and discusses their effects.
- 47 -
Introduction
Combined sewer overflow (CSO) discharge means the flow from a combined
sewer which exceeds the interceptor capacity and is discharged into a
receiving water.
City areas in Sweden built before the 1950's are commonly drained by a
combined sewer system. The rapid urbanization meant that new areas
were connected to sewer nets with limited capacity leading to an
increase in in-flow volumes and in the CSO pollution load to the
receiving waters. This together with an extension and an improved
efficiency of the wastewater treatment plants means that the
relative effect of combined sewer overflow discharge has increased
compared to other urban pollutant discharges.
The knowledge of CSO is usually scant which leads to large uncertainties
when calculating both CSO volumes and mass transport. This lack of
knowledge is serious when rehabilitation plans are to be established.
Each municipality in Sweden is obliged to supply a rehabilitation plan
for its entire sewer system. Uncertainties in the basis material of
the rehabilitation plans implies that money allocated to rehabilita-
tion is not used in the most economical way. Thus may e.g. improvements of
the sewer systems be located at less effective sites, due to insufficient
knowledge.
In 1982 studies in order to clarify the CSO situation were initiated
at the Department of Water Resources Engineering, Lund. The project
has been presented in several reports and conference papers, see for
instance Hogland (19861, Hogland et al (19841, and Bemdtsson et al
(1986).
Mass transportation via CSO--------__ -__--__----__---
In order to calculate the CSO mass transport, it is necessary to know
both the water volumes and the pollutant concentration during the
CSO-event. There are five common ways of estimating the mass transporta-
tion from combined sewer overflow (see Hogland, 1986):

- 48 -
- the standard-value method
- the dilution method
- the CSO-wash-out model
- computer simulation
- measurements.
Usually the first four methods are combined with measurements in field.
The pollutants in the CSO discharge originate from three different
sources during the event:
- the waste water
- the storm water
- accumulated sediments in the sewer network.
The amount of pollutants accumulated on surfaces and in the sewer
network between CSO events seems to be the most important factor when
it comes to determining the mass transport during short periods of. .time. Field studies show that the mass transport can be underestimated
by a factor of 4-5; for single events when the sediment wash-out
is not taken into account in the calculations (see Figure 1). The
standard valve method gives reasonable results for longer periods
of time. For standard values.,of CSO representative for Sweden see
Figure 2.

- 49 -
Procentage
SS BOD, Ptot
Calculation method------_-----------
cw’qw seqs+cCB = qw + ps
1
i.ir
-2
qW= wastewater flow (l/St>
QS= storm water flow (l/St)
cB= concentration of pollutant in CSO (mg/l)
cS= 11 I, ,I in storm water (mg/l)
cw = II II II in wastewater (mg/l)
-
Figure 1 Pollutant transport according to the dilution calculationcompared to actual measurements at a CSO-weir in Malmij.

930
ss Img/O
i790
P TOT (mgj')190
N tOt Imgll)
9.0
COO,,Imgll)
C U (mgll)-
0.59
Z n (mglll
EXPLANATIONConcentration
1 1Min Interval in which Max
50% of the values falls
rrgure L atanaara values of CSO representative for Sweden(Hogland et al, 1984).
The pollutant concentration varies a lot from one CSO-event to another
but also during one single event. Field studies show that the concentra-
tionsof the constituents decrease with time during the CSO-event.
Normally, a distribution function of the log-normal type can describe
the average concentration (see Di Toro, 1983) during the CSO-event.
The differences in pollution coicentration between and during CSO events
can be explained by the characteristics of the rainfall, time elapsed
since the preceding event, characteristics of the sewer network, and
quality and quantity of the dry-weather flow.
Exceptional CSO-events with very high concentrations of pollutants
can occur when accumulated sludge banks are flushed away and when the
waste-water sewers are partly clogged during dry spells.

- 51 -
The rehabilitation plan-------_------W-W-- ---
In order to establish a rehabilitation plan knowledge of the CSO-
discharge and the function of the CSO weir is a necessity. Other-
wise the assignment of relative priority to measures necessary to
avoid inconveniences in connection with waste-water management cannot
be worked out. A complete CSO study consists of the following phases:
1) Definition of CSO problems and the use of receiving waters.
2) Selection of type and extent of CSO-control.
3) Detailed planning of CSO-control facilities.
Effects of the CSO discharge on the receiving water must also be
studied. Impacts of pollution loads have been presented by Driscoll
(1981), HarremoZs (1982), and Johansen et al (1984).
The present use of the receiving water as well as that planned for
the future determine the amount of pollutant discharge allowed. The
quality criteria for receiving waters of different size can be
exemplified by the schedule presented in Table 1.
Reduction of CSO-discharge____________________---- -
In urban areas the stormwater runoff increases with the growth of
impervious areas. This means that larger water volumes must be
transported to the treatment,plant and that the peak flow will be
higher as well. The three main methods of reduction of CSO are:
In
Source control of the stormwater runoff
Down-stream control of the stormwater runoff
Treatment of CSO
Sweden especially the first two methods have been practised. These
are based on the idea of reducing the stormwater volumes and the
peakflow. Until the beginning of 1970 the main goal of stormwater
management in this country was to lead the stormwater out of the urban
areas as fast as possible. The frequency of CSO-discharge has increased

Table 1. Quality criteria for different types of receiving waters (partly based on data from theCothenburg Waterworks, 1985).
Pollutant load
Yearly load (P, N, Susp)
Total load during thesummer period(6 months)(P, N, Susp)
Total load during thedriest summer month(I', N, Susp)
Total load during theCSO event, dim. 2-yearrainfall (BOD,, heavymetal)
Total load during theCSO event, dim. 2-yearrainfall (BOD,, heavy
metal, coli bacterial)
Sea
X
-
T y p e o f r e c i p i e n t
River Stream--I--XX
Brook
X
Fishingwater
X
X
Bathing
X
X
Drinkingwater
X
X
1
I
cnN
I

- 53 -
very much during this period as have other urban water problems as for
instance groundwater depletion. Hence, during the last decade alternative
methods for stormwater management have been developed. An overview
of these methods is given by Hogland (1984). Treatment of CSO in
Sweden has not been very common until just recently. The experiences
of CSO treatment presented in this paper are therefore based on a
survey of the current literature.
Source control-------------
The stormwater flow (i.e. the peakflow and the volumes transported
in the combined sewer system) can be reduced through different kinds
of source control. Source control means that the water volumes are
reduced and/or the runoff delayed before the water enters the sewer
system. Local deposition of stormwater and flow equalization through
inflow control are the two main principles of source control.
Local deposition means that-the water is infiltrated into the ground
close to the source. The most common methods are:
- Infiltration on pervious areas such as lawns
- Infiltration in open ditches
- Infiltration in pervious ponds
- Percolation directly into the soil
- Percolation storages for drainwater from roofs
- Percolation storages located in the road body.
A special interest has been directed towards a pervious road construc-
tion called "the unit superstructure" which infiltrates all the
rainwater (see Hogland et al, 1986). The stormwater runoff can more
ore less totally be reduced (see Figure 3). Flow equalization can also
be achieved through inflow control. Reduction of the flow is then made
on the impervious surfaces before the water enters the sewer system.
The concentration time can be lengthened by for instance increasing
the roughness of the impervious area, decreasing the slope of the
surface, increasing the distance between the gully pots,infiltration
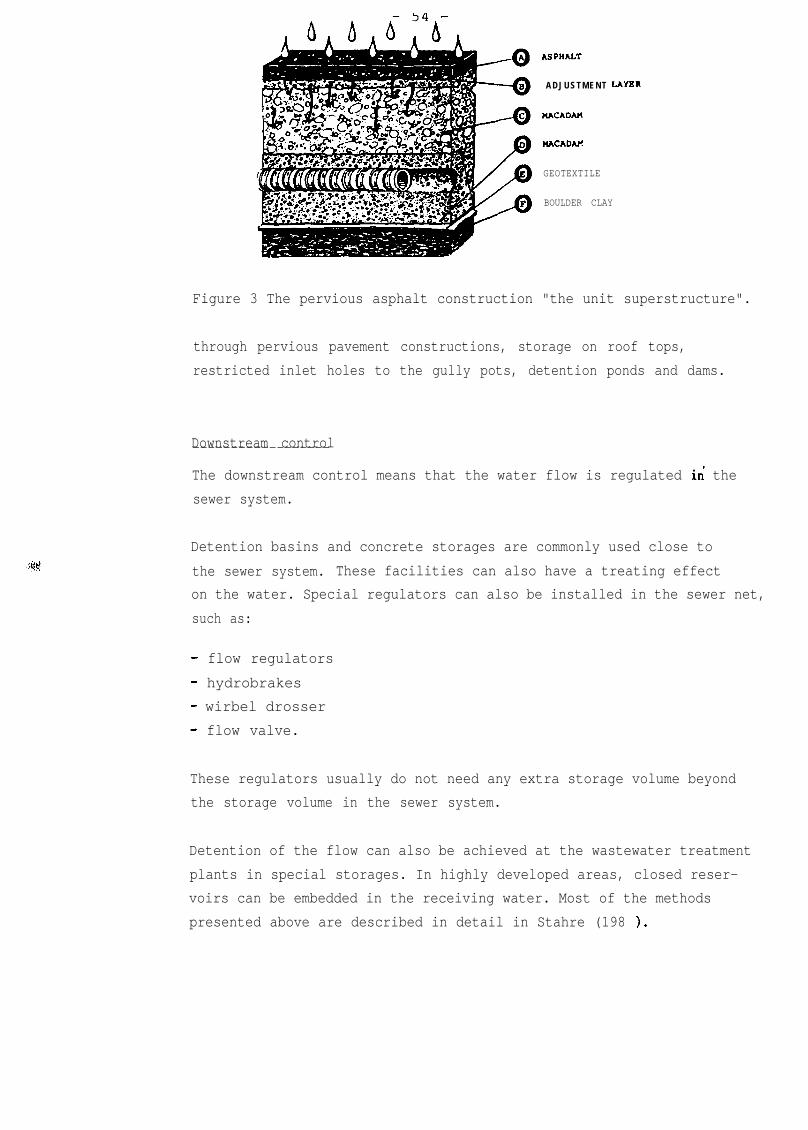
ADJUSTMENT UYER
MACADAYI
GEOTEXTILE
BOULDER CLAY
Figure 3 The pervious asphalt construction "the unit superstructure".
through pervious pavement constructions, storage on roof tops,
restricted inlet holes to the gully pots, detention ponds and dams.
Downstream control------------------
The downstream control means that the water flow is regulated in' the
sewer system.
Detention basins and concrete storages are commonly used close to
the sewer system. These facilities can also have a treating effect
on the water. Special regulators can also be installed in the sewer net,
such as:
- flow regulators
- hydrobrakes
- wirbel drosser
- flow valve.
These regulators usually do not need any extra storage volume beyond
the storage volume in the sewer system.
Detention of the flow can also be achieved at the wastewater treatment
plants in special storages. In highly developed areas, closed reser-
voirs can be embedded in the receiving water. Most of the methods
presented above are described in detail in Stahre (198 ).
- 55 -
The treatment of CSO---------------a----
Advanced treatment of CSO-discharge has no tradition in Sweden. The
reconstruction of combined sewer system into separated systems which
was carried out mainly during the period 1950-1975 has eventually
decreased the need for CSO-treatment.
Treatment of CSO-discharge can be an economically interesting alternative
when the cost of separation of the sewer net, construction of retention
basins etc is high.
CSO-treatment is usually only economically motivated where large
amounts of water can be treated at the same time. This means that the
CSO-discharge must be concentrated to a few closely located sites.
The most convenient location for CSO-treatment is close to the main
waste water treatment plant. Treatment of only CSO-discharge means
that the plant must be inactive for long periods of time. Badly
functioning treatment meth\dds and high costs due to a low utilization
rate, characterise a non-continuous treatment. According to Innerfeld
et al (1979) every method of treatment of CSO-discharge must include:
- Automatical activation at CSO-start
- Processes used must not be sensitive to quantitative and qualitative
fluctuations in CSO-discharge
- Authenticity according to operation and treatment result.
The most important part of the treatment of CSO is to take care of the
first most polluted discharge which is caused by washout of sediments
accumulated in the pipes and on the surfaces during dry periods.
The pollutants in CSO discharge can be divided according to the
processing methods as follows (Hultgren et al,1974):
- Settleable suspended materials
- Non-settleable suspended materials
- Dissolved biologically degradable materials

- 56 -
- Dissolved biologically non-degradable materials and toxic materials
- Nitrogen compounds
- Microorganisms.
The treatment methods are traditionally divided into:
a) Mechanical Processing Methods
b) Biological Processing Methods
c) Chemical Processing Methods.
The optimal effect of treatment is often reached with a combination of
the processes together with preventive measures such as street cleaning
and rinsing of pipes. A total overview of the pollutant situation and
function of the sewer net from the source to the receiving water is
a necessity.
Mechanical treatment------------------
The methods of mechanical treatment are usually simple constructions
with high efficiency and high adaptability to fluctuations in the flow.
No continuous operation of the plant is necessary. The plant can work
effectively directly after a long dry period. Through chemical additives
the efficiency of the mechanical treatment can be increased. Suspended
materials but also a considerable amount of other constituents such as
BOD7 and phosphorus can be sufficiently
The mechanical treatment can be divided
removed by mechanical treatment.
into the following methods:
- Grids, screens
- Sedimentation
- Filtering
- Flotation.
The separation rate of Grids and Screens varies a lot depending on
the CSO quality and the size of the screen. Lager et al (1974) present
removal rates for screens:

- 57 -
Separation rate Constituent
25-90% Suspended Solids (SS)
10-70x Biochemical Oxygen Demand (BOD7)
Screens can also beneficially be combined with other treatment processes
such as filtration and flotation. The efficiency of treatment can be
reduced by oil and lubricants in the water together with bacterial
growth on the screens.
The sedimentation process works through gravitational separation of
s.uspended materials. The method has also a flow equalization effect
which reduces the momentaneous load on the receiving water. ‘The
efficiency of different types of sedimentation basins and storages
in the sewer system is discussed by Koral and Saatci (1976).
A good reduction of suspended materials can be achieved but also a
lesser reduction of BOD7. Drehwing et al (1979) gives the reduction
rate 30-60X for suspended s:lids and 15-30% for BOD7
as normal values.
The sedimentation basins can easily be combined with other treatment
steps or with chemical dozing.
Different types of SWIRL-constructions (see Hogland et al, 1984) can
be used for removal of sediment. Sedimentation is also done in open
dams. In these dams the water is also biologically treated through
organical destruction by bacteria and algae.
Suspended materials can be removed more efficiently by filtering than
by the other methods mentioned. However, the incoming CSO must first
be pre-treated by a screen.
Innerfelt et al (1979) present removal rates by filtering.
Separation rate Constituent
60% ss
30% BOD7
40% COD
- 58 -
Murphy and Hrycyk (1979) state 40-60X reduction of suspended materials
as normal values for filtering. Lager et al (1974) summarize the
experiences of filtering CSO in the USA.
The flotation process separates the solids from the liquid phase
when air bubbles are added to the CSO. The bubbles are fastened on
the particles and float to the surface where they can be removed with
a scraper.
The flotation removes suspended materials but a good reduction of BOD7
can also be achieved. Small particles are removed more efficiently
as compared to conventional sedimentation.
Lager et al (1974) summarize the experiences of flotation.
Biological treatment----- -------------
Biological .treatment.methods are used for removal of non-sedimental
and dissolved organic materials. The organic material is transformed
biologically into cell substances, which can be removed by sedimenta-
tion. There are two methods of stabilisation of organic material:
- The aerobic method
- The anaerobic method.
The fuhction of the biological system and its removal efficiency
is dependent on the following factors (Lager et al, 1974):
- The inflow and the quality of the CSO (the availability of food)
- The growth speed of the organisms
- The total mass of organisms in the system
- The contact period between the organisms and the CSO
- Type of organisms
- The environmental condition (pH, temp. etc).
Graham et al (1979) give 70-92 as a reasonable removal rate for BOD7
and SS.

- 59 -
One main disadvantage with biological treatment is the fact that the
CSO-discharge has no continuous inflow. No dry weather flow exists.
Therefore the organisms are kept alive between the CSO-events or
developed again at the CSO-event. There are two possibilites of
solving this problem. The plant can be located near the conventional
waste water treatment plant and used for treatment of waste water
during dry periods. Another way is to store the CSO-water and let the
organisms grow so the wanted treatment can be achieved. The most common
methods of biological treatment of CSO as well as of waste water are:
- Activated sludge
- Biological beds
- Rotating biodiscs
- Biodams.
Normally the activated sludge method is inconvenient for treatment
of CSO as the BOD7 content is not always very high. Lubricants and
heavy metals in the CSO can disturb the biological process and the
removal of the sludge. lJnde;'normal conditions the method works
efficiently.
A biological bed consists of a bed of stone, carbon, plastic etc. through
which the CSO-water passes under destructive influence by the micro
organisms. The organisms adsorb the organic material.
Lager et al (1974) Fesent advantages and disadvantages with CSO
treatment by means of biological beds.
The rotating bio discs method is something in between the two
biological treatment methods just mentioned. The construction consists
of rotating discs sitting on an axis, where the organisms are growing,
toghether with a low contact tank.
When treating CSO in biodams the organic substances are removed through
sedimentation and through biological degradation. The degradation
can be anaerobic or aerobic. The anaerobic method is not convenient
for CSO as continuous inflow is necessary to keep the balance between
5 492713H

- 60 -
the organisms. The surplus of algae and the number of other micro-
organisms are the most important factors for the removal rate. To
keep aerobic conditions it can be necessary to instal special aerators.
Problems can also occur if the CSO water has a high sludge content.
Pre-sedimentation may then be necessary to avoid accumulation of
sludge in the biodams.
Lager et al (1974) discuss the convenience of treatment of CSO in
biodams.
Chemical treatment-----------------
CSO-water can be treated chemically when it consists of fine particles
which cannot be removed in a mechanical way.
The following chemical methods are common:
- Chemical dozing
- Carbon adsorption
- Disinfection.
The efficiency of most of the methods presented earlier can be increased
through chemical additives. Aluminium and iron salts and$ly-
electrolytes can be used. The removal rate is usually 65-75X for
organic materials.
The carbon adsorption method is used to remove dissolved materials in
CSO. The water passes up and down through
watersoluble pollutants can be adsorbed.
the carbon can be reused in big plants.
activated carbon where
The method is costly but
Graham et al (1979) state that 90% of the BOD7 can be removed by
carbon adsorption. The method can also be convenient for removal of
chemical components such as heavy metals and pesticides.
Disinfection is used for reduction of microorganisms in CSO, mostly
viruses and bacteria. The most common methods are:

- 61 -
- Mechanical methods
- Physical methods
- Chemical oxidation.
When the CSO is disinfected mechanically the microorganisms are
removed by a mechanical treatment method. Disinfection of CSO
demands a higher efficiency effect than when treating ordinary waste
water due to higher loading during short periods of time. Physical
disinfection is made by ultra-violet light or by heating methods.
The method consumes much energy and the suspended materials must be
removed from the CSO. The most common method of disinfection is
chemical oxidation with chlorine or ozone. Because of the temperature
fluctuations in the CSO, the dozing must be varied during the year.
Discussion----------
What method is selected among the existing control and treatment
alternatives depends on the*usefulness, at each special location, of
the method concerned and the costs that a realization of the CSO
control entails. The suggestion must be presented in relation to the
main goal of the entire rehabilitation plan for the sewer network.
Simple and sometimes less costly measures can also improve the CSO
situation. Examples of such methods, which can be satisfactory as
immediate rehabilitation work, are:
- Improvement and regular maintenance of the sewer system
- Repair and regulation of weir crests, screens and high-water gates
- Redistribution of the flow conditions in the sewer network
- Increasing the capacity of sewer under pressure, jets and pumping
stations
- Disconnection of storm water pipes from combined sewer systems
- Sludge pumping of storage and sediment traps.
It must always be kept in mind that the effect of the CSO discharge
also depends on the conditions in the receiving waters. A large discharge
to a harbour dock usually gives less negative effects than a small
discharge to a river. The CSO-discharge to the rivers in the south of

- 62 -
Sweden can during short periods in the summer be 8-10 times higher
than the riverflow itself.
Further research----------------
The current main research efforts in Sweden and in the other Nordic
countries are directed towards an estimation of the importance of
sediment build-up processes in combined sewers. A research co-opera-
tion between the Department of Water Resources Engineering and the
municipalities of Stockholm, Gothenburg and Oslo is currently under
way. The aim of this project is mainly to try to measure the pollution
build-up in sewers of different types and flows. With the knowledge
of the time-dependent pollution build-up processes, it will be possible
to establish a CSO-model which can be used to calculate the pollution
discharge on a single-event basis in a realistic way.
Acknowledgement------_-- -----
The authors would like to express their gratitude to the Swedish
Council for Buidling Research (BFR), the National Swedish Environmental
Protection Board (SNV), the Swedish Water and Sewage Works Association
(VAV), and to the municipalities of Lund, Malmij, Helsingborg,
Stockholm, Gateborg and Oslo which are funding the research project.

- 63 -
References
Berndtsson R, Hogland W, and Larson M (19861, Combined Sewer OverflowQuality - State of the Art in Sweden.'Proceedings of the NordicHydrological Conference August 11-13, 1986, Reykjavik, Iceland.
Bemdtsson R, Hogland W, and Larson, M (1986), Mathematical Modellingof Combined Sewer Overflow Quality. Urban Drainage Modelling. Pro-ceedings of Urban Drainage Models with Real Catchment Data UDM'86,Dubrovnik, Yugoslavia 8-11 April 1986, Pergamon Press, pp 305-315.
Ditoro, D M (1983), Probability of stream response to runoff. InternalMzsage from National Urban Runoff Program, NVRP, USA.
Drehwing et al (1979), Combined sewer overflow abatement program, Rochester,N.Y., Volume II, U.S. Environmental Protection Agency, USEPA-600/2-79-031 b. Cincinnati.
Driscoll E D and Associates (1981), Inc. Oakland, New Jersey, Combinedsewer overflow analysis handbook for use in 201 facility planning.
Graham P et al (1979), Cost methodology for control of combined seweroverflow and storm water discharge, US Environmental Protection Agency,Cincinnati.
HarremoEs P (1982), Urban Storm Drainage and Water Pollution. Pro-ceedings of Second International Conference on Urban Storm Drainage,Urbana, Illinois, USA, June 14-19, 1981, pp 469-494.
Hogland W (19841, SWMM for the selection of storm water managementmethods in semi-arid climate, Report No 3082, Dept. of Water ResourcesEngineering, Lund Institute of Technology/University of Lund, Lund,Sweden.
Hogland W (19863, Rural and Urban Water Budgets - Description andCharacterization of Different Parts of the Water Budgets with SpecialEmphasis on Combined Sewer Overflows. Report No 1006. Dept. of WaterResources Engineering. Lund University, Lund, Sweden.
Hogland W, Bemdtsson R, and Larson M, Estimation of Quality andPollution Load of Combined Sewer Overflow Discharge. Proceedings ofThird International Conference on Urban Storm Drainage, ChalmersUniversity of Technology, Gothenburg,Sweden.
Innerfeld M, Fomdran A, Ruggiero D, and Hartman T (19791, Dual processhigh-rate filtration of raw sanitary sewage and combined sewer over-flow, New York City, Dept. of Water Resources, USEPA-600/2-79-015,Cincinnati.
Johansen, N-B, Hvitved-Jacobsen T, and Harremogs P (1984), Simulationof the Impact of Combined Sewer Overflow on Rivers. Proceedings of theNordic Hydrological Conference, August 1984, Nyborg, Denmark.

- 64 -
Koral J, and Saatci A (19761, Regentiberlauf- und Regenrtickhalterbecken,WEMA-Facherlag CM-8804, Ziirich.
Lager J, and Smith W, Metcalf & Eddy Inc (19741, Urban Storm Waterand Technology: An Assessment, US Environmental Protection Agency,USEPA Report No 670/2-74-040. Cincinatti.
Murphy C, and Hrycyck 0.(1979), Chemical process treats combinedsewer overflows, water and waste water engineering.
Stahre P

- 65 -
Slide Rule Methods for Estimation of Combined Sewer Overflow-Volumes and Pollution Load.
Terje FarestveitState Pollution Control Authority - NorwayP.O. Box 8100 Dep.N-0032 OSLO 1
- 66 -
SLIDE RULE METHODS FOR ESTIMATION OF COMBINED SEWER OVERFLOW VOLUMESAND POLLUTION LOAD.
Introduction.
The relative effect of combined sewer overflow (CSO) discharge intoreceiving waters has increased during the last years due to improvedefficiency at treatment works. New pipelines are connected to oldsewerage systems with limited capacity and of not too good quality.In order to develop a responsible urban water quality managementpolicy we must be able to describe overflow discharges in terms ofquality and quantity. During the last lo-15 years big efforts hastaken place in order to develop the necessary tools.
Earlier it was presumed that CSO-discharges represents from lo-75%of the total pollution produced over a year and that 25 to 40% ofthe pipevolumes could be filled with deposits, depending onparameter and field conditions.
I would like to start this presentation on slide rule methods forestimation of combined sewer overflow, by giving an overview ofwhat kind of methods researchers have been using in predicting thepollution load and concentrations from overflow. So far no one hasbeen able to give any good equation or method for calculating pollu-tion load, and it would be useful to take a closer look into thenature of pollution deposits in combined sewers.
Methodology.
Oddvar Lindholm, Norwegian Institute of Water Research,(NIVA) in1974-75 studied 9 catchment areas out of which 4 were combinedsewers /l/.
He assumed that the concentration and load from the overflow systemwere high early in the rainfall in highly urbanised areas, at highrain-intensities and after long periods of drought. The load was alsoassumed to be closely connected to the slope of the pipes.
From September 1974 to july 1975, samples were taken manually fromthe time when the precipitation started. 5 to 20 samples were takenduring each precipitation event. The samples where analysed for SS,COD and total Phosphorous (TP). He calculated the pollution dischargevia overflows over a period of one year and for each precipitationevent, but did not try to make any equations for deposits. He onlystated some general rules for how the systems would act underdifferent conditions, assuming that slope and drought periods wouldbe the most important factors. His most important conclution wasthat the overflow discharges probably was greater than thedischarges from secondary treatment works over a year.
- 67 -
William C. Pisano, Gerald L. Aronson, Celso S. Queiroz, Frederic C.Blanc and James C. O'Shaughnessy did a two year study on dry weatherdeposition and flushing for combined sewers./2/Their aim was to findthumb rules for artificial flushing of sewers to avoid deposited pol-lution to enter recipients during rain events. In doing so they triedto develope an equation for dry-weather depositions, using both cleanwater and sewage for flushing. The research took place from 1976 to1978. The samples where taken manually from the front and in thetail of the wave. They made analysis on COD, BOD, TKN, NH TP, TSSand VSS. Based upon constants and variables they made det&ministicequations for deposits buildup and flushes. Geiger and Lager hadalso made such models in 1975 in two different studies.
In 1977 M.B. Sonnen, USA made a mathematical model connected to theSWMM which continually calculates the deposit in the pipes. This wasbased upon the works of Pisano et.al.
Wolfgang F. Geiger, Technische Universitat, Munchen, FederalRepublic of Germany, over a period of 4 years, from 1977 to 1981,made a study of the characteristics of combined sewer runoff. Hismethodology was similar to Pisano et.al., but he was only usingdrinking water, when flushing the sewers in his catchment areas.Samples were taken automaticly every 90 minute under dry-weatherconditions and the time lapse between every sample under precipi-tations events was 5 to 20 minutes. His conclusion was that: "Inspite of other and previous assumptions pollution buildup seems tobe of stochastic nature."/3/
William Hogland, Ronny Berndtsson and Magnus Larson made a study oncombined sewers in Malmo, Sweden in 1982; it was especiallyfocused on the time between the precipitation-events./4/ They statedthat the time for build up in the pipes could be up to at least 12days before a steady state occured, and that this fenomenon was of agreater importance, than the time since the last CSO event.
G.Stotz and Kh. Krauth, Institut fur Siedlungswasserbau, Universi-tat Stuttgart, made simular analasys as Geiger in Stuttgart in 1983.Their samples were taken on a manual basis, and the time betweeneach sample was down to 15 seconds, even then they found that thetime between samples taken were too long to measure pollution in thefront of the wave. The time between each precipitation-event variedfrom 12 to 288 hours (12 days). Taking into consideration the dryweather period and the slopes, they tried to make equations for thequantity of washed out materials. For SS the equation had a rela-tively high correlation coefficient, but not for other parameters./5/
From 1982 to 1986 the Norwegian Institute for Water Research madetheoretical analysis and mathematical models for calculation of dryweather deposits in combined sewers, and the amount of pollutiondischarged to the recipients /6/. They tried to make equations forthe discharges, based upon multiple correlations between parametersother authors had focused on. This work was to a great extent basedupon the works of Pisano et.al. and M.B. Sonnen. In addition theytook into account the deposit loads from surface areas during therain-event. They calculated the theoretical pollution productionfrom the area and the surface load. They then assumed that what wasmeasured as mass load to a sampling point downstream the overflow,

- 68 -
during the precipitation event, was the sum of produced pollutionminus the overflow discharge. This provides that you have a goodcontrol over the production. In 1985/86 NIVA found that the assumedpollution production had been overestimated, regarding phosphorous.In other words, the pollution deposits in the pipes had been over-estimated in these calculations.
In 1982-1984, the Norwegian Hydrotechnical Institute in Trondheim,did some research on selfcleaning pipes. This work concluded thatthe dry weather deposits only occured at very low flow or/and atvery gentle slopes. In other words: deposits seldom takes placeunless we have errors, like shallows or obstructions /ll/.
Today research is taking place on a large scale all over the world.In the nordic countries a cooperative work is taking place and hasby now been going on for 3 years. The project will measure the dryweather deposits after various drought periods. In addition theywill do a study of the mecanisms behind sedimentation- and erosion-processes in pipes.
Some of their findings are being published theese days, and furterreports will be published during 1988. In a new, not publishedreport from NIVA, they have studied a catchment area in Oslo for 5years, an area with steep slopes and high population-density. Theconclutions are that the overflow-masses were relatively small,compared with other and earlier findings, both in Norway and othercountries. This is assumed to be caused by steep slopes and a highpopulation density.
Water Research Center (WRC) has started a similar work in 4 catchmentareas in England.
The university of Hannover has started a project to make a mathemat-ical model for predicting deposits for the most commom pollution parameters. Also in other parts of the Federal Republic of Germany workare going on to optimize the management of the sewerage systems.
Slide rules.
Everyone who has tried to study combined sewer overflow discharges,has conluded that the variation in the discharges is great, itvaries with factors up to 10. It is also difficult to predict thesevariations in models. It is now general agreement among researchersthat the pipe deposits seems to be of a stochastic nature. Inaddition it is very hard to measure the discharge, because thefirst-flush wave is difficult to analyse correctly. The work ofStotz and Kraut shows that not even samples taken every 15 secondwas good enough to describe the variation in concentrations. What wecan conclude from these works over a period of 10 years, is that westill not are able to predict the deposits in pipes and that measur-ing the discharges will be difficult, even for skilled researchersHowever, we are much further down the road in order to understandthe nature of the deposits and will probably soon be able to givegood slide rules, even if we probably never will be able to giveaccurate equations for calculating pollution discharges.
- 69 -
Pisano et.al. measured on 75 different catchment areas and did re-gression analasys on their data. They based their models on thefollowing parameters;
- Total collection system pipe length (L') ft- Service area of collection system (A) acres- Average collection system pipe slope (S‘) ft/ft- Average collection system pipe diameter (D') inches- Length of pipe corresponding to 80% of the solids deposited
in the system (Lpd) ft.- Slope corresponding to Lpd (Spd) ft/ft- Slope corresponding to l/4 of the percentage of pipe
length (PLd) below which 80% of the solids deposit(Spd/4) ft
- Flow rate per capita, including allowance for infiltra-tion - q gpcd.
From these paramterts they made 4 different equations with differentcomplexity and different accuraty. The correlation-coefficient variedfrom 0.949 to 0.845.
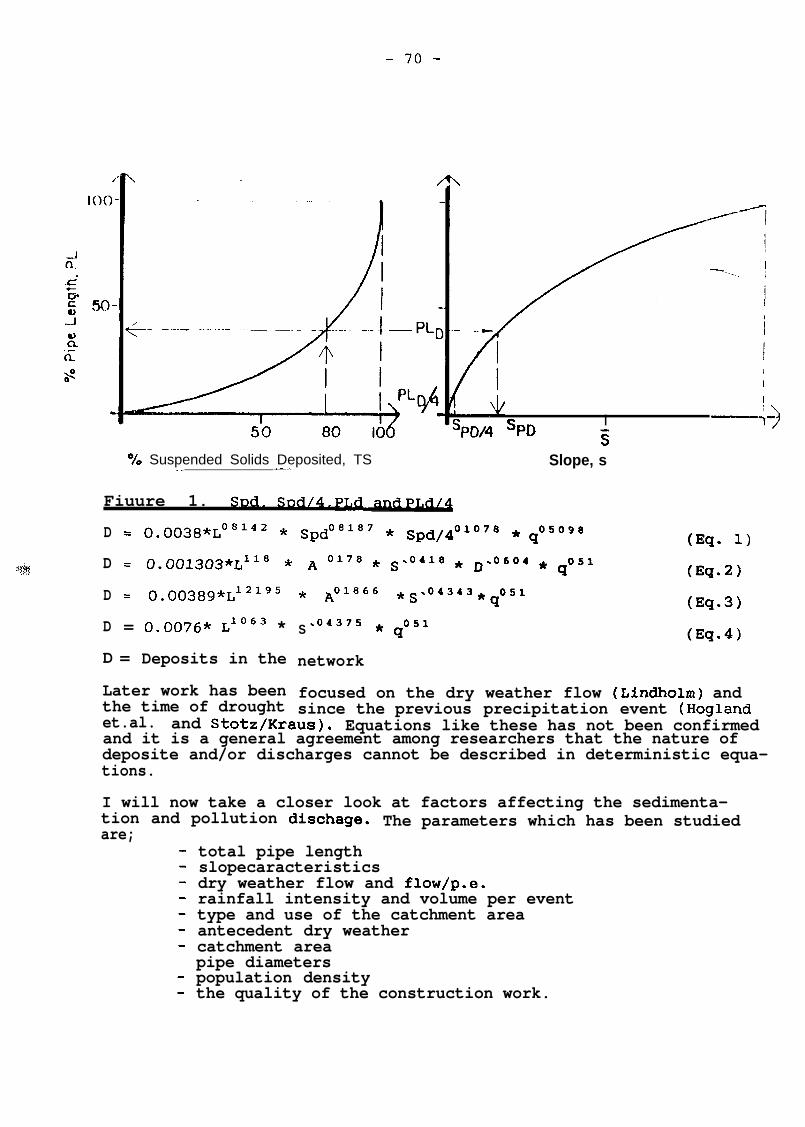
- 70 -
I(* II I
I
I
sPo/4 sPoI -4-3s
Slope, s% Suspended Solids Deposited, TS._ -~
Fiuure 1. Std. Snd/4. PJ,d pJ@4
D = ()0()38*~~*~~~ * C+d08187 * Spd,401078 * q05098($9. 1)
D = o.~o~303q11* * A 0178 * s‘041* * D‘0604 + q051(W-2)
D = 0.003Sg*L121g5 * ~~~~66 * s.04343 * q051(Q-3)
D = 0.0076* L1063 *
D = Deposits in the
Later work has beenthe time of drought
S .04375 * q051
network
focused on the dry weather flow (Lindholm) andsince the previous precipitation event (Hogland
et.al. and Stotz/Kraus). Equations like these has not been confirmedand it is a general agreement among researchers that the nature ofdeposite and/or discharges cannot be described in deterministic equa-tions.
I will now take a closer look at factors affecting the sedimenta-tion and pollution dischage. The parameters which has been studiedare;
total pipe lengthslopecaracteristicsdry weather flow and flow/p-e.rainfall intensity and volume per eventtype and use of the catchment areaantecedent dry weathercatchment areapipe diameterspopulation densitythe quality of the construction work.

- 71 -
It is obvious that most of these parameters will play a part in thebehaviour of the sedimentation and discharges, but it has been veryhard to find good correlations because the sedimentation in the pipesis of stochastic nature.
Total pipelength.
Both Pisano et.al. and Lindholm has studied this parameter withoutfinding good correlation between deposits and pipelength. This isprobably due to the fact that many of the parameters which has beenconsidered, interfere with each other. The pipelength is probably ofa great importance because the probability of having areas with anegative slope is increasing with the pipelength, but this istaken care of by other parameters.
Slopecharacteristics.
Since the shearing stress we need to keep the sewers selfcleaningis rather low, it should not be a good relationship between depositsand slope. However, since the deposits largely takes place in basinscaused by negative slopes, the volumes and the stability of these"stores" will depend on the slope (and the flow). Most findings con-cludes that we will have small deposits when the average slope inthe catchment is steeper than 15%. Pipes that steep will in mostcases keep the sewerage clean. Slopes between theoretical selfclean-ing conditions and lo- 15% will not correlate directly with deposits.
A thumb rule will then be, that if you have sewerage with slopes be-low 15% you may have deposits, but you will then have to considerother parameters for predicting how great the problem will be.
Dry weather flow, flow/p.e. and p.e./m.
The flow pr. p.e. and meters per p.e., are parameters interferingwith the total pipelength and dry weather flow. The flow pr. p.e.gives you a measure of the infiltration, and will obvious be ofimportance for the ability to keep the pipes clean, but the dryweather flow has so far been considered to be the best parameter fordescribing this ability. As earlier described, if the pipe lines isbuildt with smooth slopes, there should not be a problem withdeposits. But since this is not so, parts of the pipes will storesediments. The most important conteract against these stores seemsto be a high dry weather flow (and steep slopes).
Rainfall intensity and volum per event.
Different conclutions has been drawn here from different authors, buta majority of reports tell that the volume is not well correlatedto the discharge as the rainfall intensity is. Pisano et.al. concludethat small or medium rainfall intensity did not cause any dischargesor could clean the pipes. This corresponds with the findings of PaulLessard in Quebec, Canada and Hogland, Sweden. Geiger however foundno correlation between the rainfall intensity and the concentrationsin the discharges. The findings here will probably depend on thecontribution from the surface.

- 72 -
Type and use of catchment area.
How important is the type and use of the catchment area? Fullagreement has not been reached, but it seems obvious that erosion,street-sweeping practice will influence on the discharges from thesurface. Lindholm and Reinertsen, Norway, assume that the load fromthe surface washed out during a rain event, is proportional to theimpervious surface area and correlated to the intensity.
Considering nutrients and organic loads, there seems to a generalagreement amoung researchers that the sewage plays the major part inthe deposits, but not so for SS, metals and toxic compounds. BothLindholm and Hogland has pointed out that street sweeping practicewill be of great importance to the discharges during an rainfallevent.
Antecedent dry weather period.
Pisano et.al. and Geiger did not take the period of drought betweeneach overflow event into consideration in their works. Geiger con-cluded that this was not of any great importance.
Field, Hogland et.al. Lindholm and Stotz/Krauth however, found thatthis played an important role, because the sedimentation in the pipescould last for days and weeks before a steady state occured in thesystem. This is one of the most important factors the nordic projectis studying in the work now going on. The length of the dry weatherperiod will probably be of great importance calculating thepollution discharged to the recipient both for calculating thedischarge over a year and for finding the maximum loads for eachrain event.
Catchment area.
The total area will be of some importance for the total mass sedi-menting in the pipes. Other parameters will however overshadow inmost cases. Nobody has found a good correlation between catchment-area and the the quantity of deposits.
Pipe diameters.
The pipe diameter is of course of great importanse when we considerthe self cleaning ability for the sewerage. In addition a high flowin a small pipe will give better self cleaning conditions than thesame flow in a bigger pipe - obviously. But since the diameter corre-sponds well with other parameters mentioned above, this factor isalready taken care of. Parameters like population density and p.e.per meter pipe will tell more or less the same.
Population density.
The population density is of important because it should lead to ahigh dry weather flow compared to the area. We cannot use both thedensity and the dry weather flow, because they are expressions ofthe same physical factors - more or less.
- 73 -
The quality of the construction work.
As pointed out above, the sedimentation in the sewerage system isvery much a consequence of negative slopes causing shallows. Thisshould mean that the quality of the construction work and thegeotechnical conditions are important. This has not yet beenstudied, but will be analysed in the nordic project. The project aimat measuring the volumes in the pipes caused by shallows and see ifthere is any relationship between the volume which can storesediments and the discharges. This may be difficult to document,both because of the general problem in measuring and because thesurface of the local "stores" would be more directly linked to thepollution washed out from the pipes, than the volume. But anyhow,the quality of the construction and the geotechnical conditions mustbe of great importance, for deposits and overflow discharges.
Conclusions.
The nature of the sedimentation in pipes and the wash out, is com-plicated to describe and predict. Work has been going on for yearsand we still have a long way to go before we have a full under-standing of the influencing factors. We do know a lot of about fact-ors that plays a part here, but the problem is that we do not knowhow they interfere with each other and measuring during the dischargeevents is very difficult.
To predict the problem however it is possible to give some sliderules. I will point out 3 major factors which should be resonableto measure or determine:
- the quality of the construction of the pipes- the slopecaracteristics- the dry weather flow- geotechnical conditions.
If the construction job is well done, like in tunnels, and the slopeis steep enough to have self cleaning conditions, you should nothave any problems at all with sedimentation in the sewers.
If the slope is bigger than lo-15% you should not have too muchproblems with sedimentation. With lower slopes you must considerother parameters like the dry weather flow, the population densityand the meter of pipe per person.
If the dry weather flow is high, problems with deposits should notbe too great. When it is lower you must look into other parameterslike the slope and length of pipe and the length per person.

- 74 -
Litterature:
1. Lindholm 0. Forurensninger i Overvann. PRA 7.ISBN 82-90 180-05-5Prosjektkomiteen for rensing av avlopsvann 1975.
2. Pisano et.al.Dry weather deposition and flushing for combinedsewer overflow control. 1979. PB-80-118524; EPA/600/2-79/133
3. Geiger W.F. Characteristics of Combined Sewer Runoff. ThirdInternational Conferanse on Urban Storm Drainage GoteborgJune 4 - 8. 1984 p.851-861.
4. Lindholm, 0. Dry weather deposition in combined sewers overflow.Third International Conference on Urban Storm Drainage -Goteborg June 4-8.1984. p 861-869
5. Stotz G. Krauth Kh. Factors affecting first flushes in combinedsewers. Third International Conference on Urban Storm DrainagGoteborg June 4-8.1984 p.869-879.
6. Hogland W. et-al. Estimation of quality and pollution load of com-bined sewer overflow discharge. Third International Conferencon Urban Storm Drainage - Goteborg June 4-8.1984 - p.841-851.
7. Lindholm, 0. Konsekvenser av torrvarsavsetninger i avlopsledningerPTV 29 - 1984 ISBN 82-90328-33-8
8. Linholm,O. Torrvarsavsetninger i fellessystemror. Fase I. Problem-beskrivelse. NIVA rapport VA-10/82. 1982.
9. Hogland,W. et.al. Braddavlopp - Funktionsanalys, sanering ochdimensionering av braddavlopp. ByggforskningsrAdet T 13:1986
lO.Aaby,L. Forurensninger fra overlop. Samarbeidsprosjekt OVA/NIVA.Framdriftsrapport - 1987. Rapportutkast NIVA.(Upubl.)
ll.Berg, A. Undersoking av naturleg sjolvrensing i to avlopsleidningai Trondheim. STF60 A96048 NHL rapport,SINTEF-gruppen.1986.
- 75 -
SLIDE RULE METEIODS FOR ESTIMATION OF POLLUTION LOAD DUE
TO STORMWATER
Mr. Jan Falk
National Environmental Protection Board
Sweden
When making budget calculation for the pollution load due
to urban areas it is often easy to estimate the load from
sewage treatment plants. Much more difficult is the
calculation of pollutants from separate storm sewers. In
this case you could not in a realistic way measure all
the stormwater outlets, they are usually to many and the
technique of measuring continuously is difficult and
expensive. In other words you have to do calculations of
the pollutant load from information gathered at some few
locations and during a limited period of time.
A method for crude hand calculation of pollutant load was
presented at the Visby seminar 1986 (Falk, 1987). The
description of the methodology is repeated here:
The stormwater runoff volume during the year considered
may be calculated according to
Qyear = a . A . (Pr-b) . 10 -3 m3
where a = constant showing the portion of impermeable
surfaces that is drained via the stormsewer
network
6 492713H

- 76 -
a may be estimated according to
Land use a-Single family houses 0.5-0.6
Multi family houses 0.6-0.7
Downtown areas 0.8-1.0
A = total area of impermeable surfaces in the
catchment area (m2). Varies from 10 to 100 %
(single family houses sparsely distributed to
downtown areas)
Pr = total amount of precipitation during the
considered year (mm)
b = total loss of precipitation due to depression
storage (mm)
b may for a year be estimated to 50 mm for
steep areas and to 100 mm for flat areas.
The yearly outlet of pollutants may be derived by multi-
plying the volume calculated above with average pollution
concentrations according to Table 1.
COD Oil Ntot Ptot Pb Zn cu
mg/l mg/l mg/l mg/l pg/l pg/l pg/l
Single family houses 70 0.2 2.0 0.3 75 150 35
Multi family houses 100 0.4 2.0 0.3 150 200 50
Downtown areas 150 1.0 2.5 0.4 230 400 100Traffic areas 200 2.0 2.0 0.3 230 250 50
Industrial areas 110 2.0 3.0 0.4 140 500 130
Table 1. Average concentration of pollutants in storm-
water (Falk, 1987).

- 77 -
The method should give an accuracy of + 30-50 % as-regards volumes. For pollution load concentrations the
accuracy of course is smaller. It is strongly advised to
support the calculations by at least some measurements of
quantity and quality on location.
Some warnings when using the method must be given:
0 It should be stressed that the method is valid only
for calculating stormwater pollution from a
separate stormwater network.
0 Only direct runoff is considered i.e. the runoff
generated during a rainstorm. The baseflow from
inflow/infiltration is not taken into account.
Hogland et al, 1986 showed that the pollution load
due to inflow/infiltration is far from insignifi-
cant. For certain catchment areas this contribution
may be 50 % of the total load.
0 The method is difficult to use during winter
conditions.
0 Again it must be strongly advised to support the
calculations with measurements.
In spite of all the warnings the method has been used in
several cases since 1985. The Swedish action plan for the
eutrophication of the sea has used it when comparing
different sources of pollution. Different national task
groups for the protection of the Baltic Sea has used it
as well. When the county of 6stergBtland made their water
protection plan they also used the method. Several
municipalities have used it in their water planning,
among others NorrkGping, Linkijping, MiSnsterAs,
Oskarshamn, Motala and Falkenberg. Recently the method
was used when making budget calculations for the pollu-
tion load on lake Mglaren.

- 78 -
References:
Falk, 1987: Baltic Sea Environment Proceedings No. 25,
Seminar on Wastewater Treatment in Urban Areas, 7-9
September 1986, Visby Sweden.
Bogland, Berndtsson, Larson, 1986: Bergkning av uttrans-
porterad f8roreningsmgngd via dagvattensystem, (Calcula-
tion of mass transport of pollutants via storm water
discharge), Tidskriften Vatten, Arg. 42, 1986, pp 16-20.
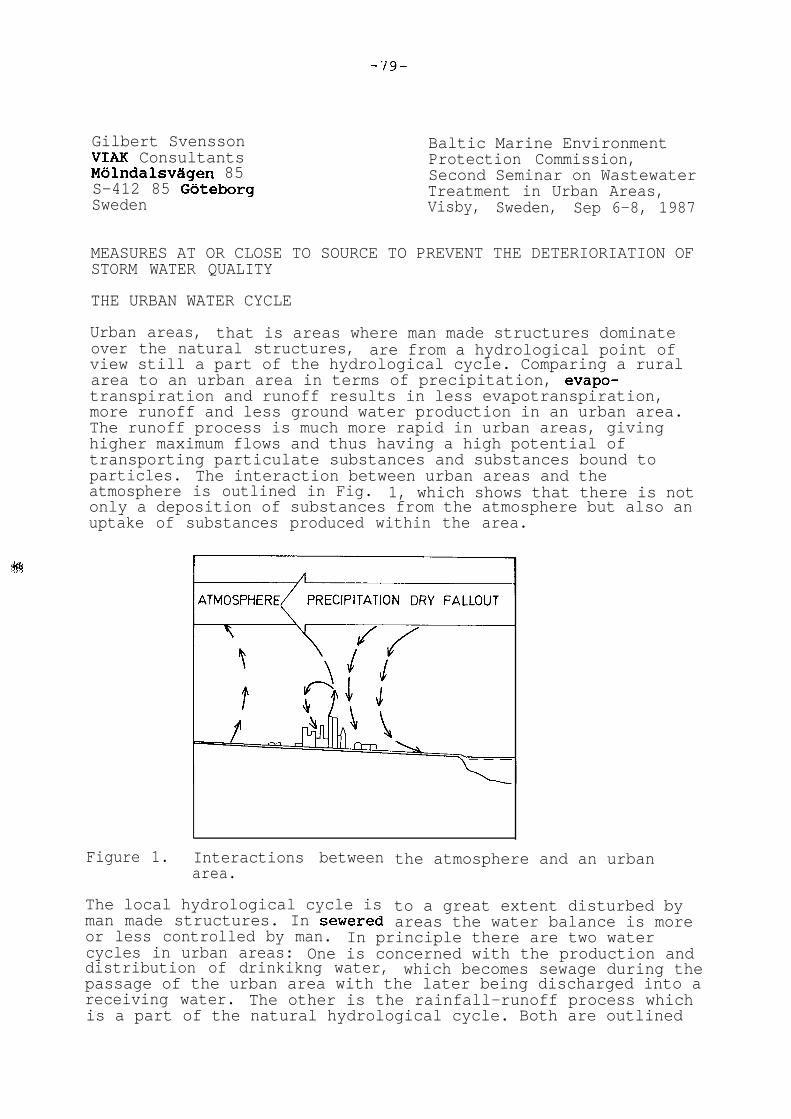
-‘19-
Gilbert SvenssonVIAE ConsultantsMolndalsvagen 85S-412 85 GoteborgSweden
Baltic Marine EnvironmentProtection Commission,Second Seminar on WastewaterTreatment in Urban Areas,Visby, Sweden, Sep 6-8, 1987
MEASURES AT OR CLOSE TO SOURCE TO PREVENT THE DETERIORIATION OFSTORM WATER QUALITY
THE URBAN WATER CYCLE
Urban areas, that is areas where man made structures dominateover the natural structures, are from a hydrological point ofview still a part of the hydrological cycle. Comparing a ruralarea to an urban area in terms of precipitation, evapo-transpiration and runoff results in less evapotranspiration,more runoff and less ground water production in an urban area.The runoff process is much more rapid in urban areas, givinghigher maximum flows and thus having a high potential oftransporting particulate substances and substances bound toparticles. The interaction between urban areas and theatmosphere is outlined in Fig. 1, which shows that there is notonly a deposition of substances from the atmosphere but also anuptake of substances produced within the area.
Figure 1. Interactions betweenarea.
the atmosphere and an urban
The local hydrological cycle is to a great extent disturbed byman made structures. In sewered areas the water balance is moreor less controlled by man. In principle there are two watercycles in urban areas: One is concerned with the production anddistribution of drinkikng water, which becomes sewage during thepassage of the urban area with the later being discharged into areceiving water. The other is the rainfall-runoff process whichis a part of the natural hydrological cycle. Both are outlined

-8O-
in Fig. 2, (Svensson (1987)), where some interactions betweenthe two systems are also marked. For example the yearly stormwater volume is of the same order of magnitude as the yearlyinfiltrated volume of ground water due to leaky sewers for manyurban areas in Sweden.
RESIOENIIAL B U S I N E S SA R E A
RESOURCE
Figure 2. Water cycles of urban areas.
To get some impression of the magnitudes of the mass flows inthe urban rainfall runoff process, an example from the City ofLund in the southern part of Sweden, (Hogland, 1986), is shownin Fig. 3.
Figure 3. Yearly mass balance of Pb for the City of Lund,Hogland (1986).
after

-81-
The major pollutant sources of storm water are:
- Atmospheric fallout- Exhausts from vehicles- Vehicle construction materials- Building construction materials- Road construction materials- Droppings from animals
A conclusion, which can be drawn from mass balances made fordifferent areas, (Malmqvist, 1983), is that there has to beparts of a catchment which act as sinks to the pollution. Forexample areas with vegetation, catch basins or parking areas.
THE RECOGNITION OF STORM WATER AS AN IMPORTANT TRANSPORT PATHFOR URBAN POLLUTION
The sources of the substances found in storm water can bedivided into atmospheric sources and surface bound sources. Bothcan be further subdivided, as by Malmqvist (1983). A repro-duction of this subdivision is made in Fig. 4.
P O L L U T E D A I R
+ pi++,
C I T Y P L A N N I N GT R A F F I CINDUSTRIALIZATIONT O P O G R A P H YGEOLOGYC L I M A T E
t
P O L L U T E D U R B A N S T O R M W A T E R
Figure 4. Factors influencing the quality of storm water,after Malmqvist (1983).
There are two main reasons why storm water is an importanttransport path of substances in the urban environment. The firstis the fact that rainfall or snow passes through the atmosphereover an urban area and hits every part of the area at least sometimes every year. As water is a good solvent for many substancesthis causes a transport of soluble substances from theatmosphere and from urban surfaces by the runoff. The secondreason is that raindrops, when hitting a surface, are a verygood erosive agent, thus creating the possibility oftransporting particulate substances. However, this cannot bedone without the runoff having a sufficient transport capacity,which will vary with the runoff intensity, the topology of thearea etc. Saying that the transport capacity varies within anarea, implies that a substance can be transported from one partof an area to another, not necessarily reaching the receivingwater during a single rainfall event.
An outline of the transport paths in a sewered urban catchment

-82-
is shown in Fig. 5. All parts of the area accumulate substancesbetween runoff events. During runoff, however, some parts willbe washed, thus having less accumulated substances afterthe runoff event and some parts will act as a sink, thus havingmore accumulatated substances after the event. An example of apart acting as a sink is a catch basin, which not onlyaccumulate substances, but also affects the composition of thestorm water through processes going on in between runoff events,(Morrison (1985)).
-+ Transport path
Figure 5. Transport paths and sinks for substances found instorm water.
Substances which are transported with storm water in relativelyhigh concentrations are:
Cadmium, Copper, Zink and LeadPhosphorous and NitrogenOrganics (COD)SolidsHydrocarbons
EFFECTS OF STORM WATER DISCHARGES
The physical, chemical and biological substances in storm watermay be harmful to the aquatic life in the recieving waters.Looking at background concentrations of receiving waters, stormwater most often increases these concentrations, thus stormwater can be regarded as a polluter. However, wether the stormwater is harmful or not depends on the concentration levels, andif they are critical for aquatic life or not.
When discussing concentration levels it is essential todistinguish between acute toxic effects and long term effects.The acute toxic effects are related to soluble or weakly boundsubstances, which are available for organisms and can be takenup rapidly. The long term effects are related to substances,which tends to accumulate in organisms and in plants.
The discussed effects of storm water on the aquatic life are theprimary effects of storm water discharges. A secondary effect onthe receiving water is the combined sewer overflow, where theflow increase during a storm event causes the overflow, and the
-83-
mixture of sewage and storm water overflowed causes the environ-mental effect. Similary storm water discharges to sewage treat-ment plants often disturb the treatment process, thus effectingthe quality of the outlet from the treatment plant.
MEASURES TO IMPROVE STORM WATER QUALITY OR TO REDUCE STORM WATERDISCHARGES
Source control will be effective to reduce pollutants in:
- Atmospheric fallout- Exhausts from vehicles- Construction materials
Reducing runoff volumes is effective in reducing the pollutionimpact on surface water bodies. However, the risk of pollutingthe ground water must be observed. Means of reducing runoffvolumes are:
- Surface infiltration- Percolation basins- Permeable asphalt
Surface maintenance is another effective way of reducing thepullution of storm water. This can be done by:
- Street cleaning on a regularly basis- Catch basin cleaning on a regularly basis- Snow transport
At present reducing storm water volumes and diverting somerunoff to the treatment plant will be the most realistic way ofhandling the storm water pollution.
Also, surface maintenance for industrial areas and restrictionsfor the handling of substances which could cause water pollutionare effective tools.
In the long run, source control may improve air quality, thusimproving storm water quality.
REFERENCES
Hogland, W. (1986). Rural and Urban Water Budgets. A Descriptionand Characterisation of Different Parts of the WaterBudgets with Special Emphasis on Combined Sewer Overflows.Ph. D. Thesis, Lund University, Dept. of Water Res. Eng.,Report No. 1006, Lund.
Malmqvist, P.A. (1983). Urban Storm Water Pollutant Sources. AnAnalysis of Inflows and Outflows of Nitrogen, Phosphorous,Lead, Zinc and Copper in Urban Areas. Ph. D Thesis,Chalmers University of Technology, Dept. of SanitaryEngineering, Giiteborg.

-54-
Morrison, G.M. (1985). Metal Speciation in Urban Areas. Ph. D.Thesis, Middlesex Polytechnic, London.
Svensson, G. (1987). Modelling of Solids an Metal Transport fromSmall Urban Watersheds. Ph. D. Thesis, Chalmers Universityof Technology, Dept. of Sanitary Engineering, Gbteborg.

-85-
CAUSES AND EFFECTS OF HAZARD FROM MUNICIPAL - INDUSTRIAL
AGGLOMERATION TO THE WATERS IN THE CATCHMENT AREA OF THE
UPPER VISTULA
Mr. Jozef Fiszer
Technical University of Cracow
Poland
1. Introduction
The catchment area of the Upper Vistula of 34 thousand
km* surface area constitutes 17 % of the total basin the
Vistula River.
Participation of the flow from the Upper Vistula reaches
about 30 % in relation to the total flow.
Five of the total number of 27 areas of ecological hazard
in Poland are located in the basin of the Upper Vistula.
(9)
2. Causes of ecological hazard
From among the mines, water of 7 Silesian coal mines are
discharged into the Vistula River. (2)
According to investigations carried out by the Institute
of the Technical University of Cracow the discharge from
these mines of highly brackish water was very irregular
in the course of a day and a week.
In consequence of activities of water management
authorities from the Voievodship Katowice a temporary
stabilization of this discharge took place.

-86-
The diagrams no. 4, 5 show the variability of mean
concentrations of chlorides in the years 1934 to 1986 and
mean concentrations of dissolved matter in the years 1968
to 1982 /3/.
From the territory of Silesia and the adjacent territory
polluted waste waters flow into the Vistula River from
textile, cellulose-paper mills, metallurgical works and
chemical industry.
These waste waters cause qualitative changes in the
waters of the Vistula River in the region of Cracow.
(Figure 6)
The list of concentrations corresponding to determined
frequence occuring in the years in question shown in
Table 1 gives evidence of the hazard to the waters of the
Vistula River in the region of Cracow. /Table l/. (8)
3. Effects of hazard to waters in the catchment area of
the Upper Vistula
Pollution of surface waters in the territory of the
Siliasian agglomeration made it necessary to look for
pure water resources beyond this territory. /Figure i'/
This was carried out by building a water reservoir on the
Small Vistula River at the locality Goczalkowice and by
using the water stored in the chain of water reservoirs
of the Sola River since local reservoirs on the Przemsza
River and Brynica proved not to be sufficient.
At present already the Silesian agglomeration suffers
from a serious water insufficiency and the conception of
transporting water from the Carpathian tributaries of the
Vistula River to Siliasia is discussed.

-87-
In consequence of water pollution in the Vistula River,
Cracow, counting at present 800 thousand inhabitants, had
to restrict water uptake from this river for its water
works.
Water pollution in the Vistula River, which appears in
the fifties and was caused mainly by phenol compounds
from chemical and coke industry made it necessary to
eliminate the water intake from the Vistula River,
working since the beginning of this century by means of
infiltration intakes.
Consequently it caused a necessity of building water
intakes on small tributaries of the Vistula River in the
vicinity of the city at the localities Rudawa and
Dlubnia.
These sources of water supply assured water for the town
in sufficient quantities only till the half of the
sixties and since that time marked deficit of water in
the town Cracow had been noticeable and made it inevit-
able for the municipal authorities to take water from the
Vistula River at Bielany in spite of poor quality
indices.
This water intake began to be supplied from the stream
Sanka dewatering an agricultural catchment area.
A melioration of water supply conditions for the town
took place by water intake from the Raba River a
Carpathian tributary of the River Vistula where a storage
reservoir of volume of about 130 mln m3 was built.
Salination of the Vistula River is especially troublesome
for industrial works which use water from the Vistula for
production and cooling purposes.

-88-
The Metallurgical Works of annual steel production of
about 5 mln ton, which take water from the Vistula River
must cope with serious difficulties because of poor water
quality.
This water used at present in the region of Cracow for
cooling purposes is highly aggressive and does not
satisfy the conditions which industrial water, used in
ferrous metallurgy and heat energetics, should satisfy.
In dependence on the kind of water circulation in the
metallurgical plant the rate of equipment corrosion is at
present from 0,l mm/year to 1,s mm/year and leads in
consequence to necessity of an exchange of pipe lines
every S-10 years.
In thermal power plants in the region of Cracow use of
brackish water for cooling purposes causes a decreasing
in work reliability of turbine condensers, steamboilers
and cooling water pipelines.
Representants of the energy-industry find that maintain-
ante or gravation of the existing water conditions in
cooling circuits will cause in consequence a decrease in
work reliability and life of the equipment.
It may also influence production of electric energy and
heat supply for Cracow.
4. Fields of activities aiming at decreasing the hazard
of industrial agglomeration pollution to the waters of
the Vistula River
After recognition of the state of hazard of municipal
industrial agglomeration pollutions in the catchment area
in the upper course of the river, the basic activity
consisted in defining a building plan of sewage treatment

-89-
plants in the main points of hazard. In the years 1970-
1980 a number of designs were elaborated the building of
which was begun and partly completed.
These were built in the region of Upper Silesia among
others at Tychy, Katowice, Czestochowa.
A sewage treatment plant for the Metallurgical Works in
Cracow was built and finished in 1985, a sewage treatment
plant in Nitrogen Works in Tarnow has also been built.
The general state of waste water treatment in the
catchment area of the Upper Vistula is however, still
unsatisfactory.
4.2 Limited pure water resources directed attention of a
number of research centers in Poland to the possibilities
of water recovery from waste waters and using it for
industrial purposes.
First investigations on this possibility were carried out
for the region of Upper Silesia, where a great water
demand for industrial purposes exists and moreover this
territory lies on the vidge between the Rivers Vistula
and Odra, and does not dispose of sufficient resources of
surface water.
The water drawn
are not useable
from coal mines are highly brackish and
for industrial purposes.
The population get water from a number of Carpathianrivers on which, as it was mentioned, storage reservoirs
were built.
Investigations indicate to the possibility of water
reclamation from waste water with destination for
industrial purposes. It was assumed that waste waters of

-9o-
hardly removable mineral pollutants not exceeding con-
centrations permissable for industrial water, admitted in
the given area, can be designed for recovery. /4/
Water recovered from waste waters can be used for cooling
purposes. Territories of the basin where waste waters are
designed for recovery must be protected against inflow of
substances complicating purification processes.
Waste waters, only after biological treatment in sewage
treatment plants of output higher than 20 thousand m3/day
will be subject to the reclamation processes.
After biological treatment in which nitrogen compounds
should be removed, waste waters designed for cooling
circuits in metallurgical or energo-industry are sub-
sequently subjected to further purification in coagula-
tion processes by use lime or aluminium or iron
sulphate. After the coagulation process, filtration and
desinfection of the waste water in forseen.
A schematic presentation of recovered water utilization
in the central part of Silesia is presented in figure 9.
/4/
Similar studies on utilization of recovered waste waters
as the source of industrial supply for Metallurgical
Works in Cracow have been recently carried out in Poland,
in the Technical University of Cracow, Institute of
Sanitary Engineering and Environment Protection.
Municipal sewage from Cracow often shows lower salinity
than the water in the Vistula River, since the
inhabitants use mainly waters taken in from the Rivers
Raba, Rudawa and Dlubnia which are not charged with
mineral pollutants.
-91-
4.3 Increase in salinity in the waters of the Vistula
River is caused by discharging brackish waters from coal
mines into it; further prognoses concerning this increase
have been an investigation and study problem since 1960.
In a successive conception chemical treatment of brackish
waters was forseen according to the proposition made by
Chief Institute of Mining. This conception led to the
establishment of an experimental plant at Debienska,
where brackish waters were subject to chemical thermal
treatment giving in consequence salt and water.
In this process, however, great amounts of wastes,
especially gypsism, are obtained and moreover, it is a
very energy-consuming process. According to the data of
the Chief Institute of Mining from the year 1967 heat
consumption in the heating period is 1047 kJ per 1 kg
H20- /6, 7/
A successive conception concerned storing brackish waters
in storage reservoirs and dosing them in proportion to
the occuring flow so as to obtain in the waters of the
Vistula River upper concentration values of 300 mg/dm3,
forseen by respective Polish regulations.
Increase in salinity of coal mine waters and their
amounts caused by opening of new coal mines where
exploatation reeched deeper and deeper layers caused the
situation that the Vistula River above Cracow is no more
able to receive chlorides. Simultaneously difficulties in
building storage reservoirs for storing brackish waters
occured. Another conception was, thus, forwarded it is to
transport brackish waters below Cracow and subsequently
below the estaury of the San River. /Figures 10, 11/
Studies in this line have been carried for.many years. In
1985 a group of specialists from the Oil and Gas Company
and a team of the Technical University of Cracow forward-
ed the suggestion of transporting brackish waters to the
7 492713H
-92-
region where Cenomane sandstone occurs and pressing them
into the sandstone strata. Preliminary investigation
showed that the total capacity of the Cenomane reservoir,
lying about 800 to 1000 m below the ground level, is
about 18 mld m3. The water quality in that reservoir is
similar to waters from coal mines, but these waters have
no contact with waters of higher levels.
The quantity of highly brackish waters of chloride
concentration of 42 000 mg/l is about 1 cm3/s, hence
annually about 31 mln m3/year. Annual amounts of brackish
waters pressed into that reservoir would then to 1,6 % of
the total capacity, of the Cenomane reservoir. Consider-
ing the life-time of the Silesian mines, which is 50
years, the amount to about 1,5 mld m3 i.e. about 8 % of
the total capacity of the Cenomane reservoir.
Investigations on the absorbtion ability of Cenomane
reservoir have recently started in Poland. In case of
positive results the waters of the Vistula River would be
greatly lightened from pollution with brackish waters
from Silesian coal mines.
4.4 Decrease in pollutions discharged is also the
consequence of building sewage treatment plants.
On the basic of a number of examples of waste waters
characteristics of the purification system of waste
waters in the Metallurgical Works in Cracow is given.
There are 3 sewage treatment plants in the Metallurgical
Works for treating industrial wastes and rainfall waters.
In the waste water treatment plant the so called A
/figure 12/ 420 thousand m3/day of industrial waste
waters and 6,4 m3/s rainfall waters are to be purified.
The purified waters from this plant supply the so called
port basin from which water is taken for production
purposes.
-93-
The quality of wastes should have achieved, according to
the design, following values determined in the water-
loyal permission COD 60 mg/dm3, oxidability 20 mg/dm3,
total suspension 40 mg/dm3, soluble matter 1000 mg/dm3.
The purification plant consists of mechanical grates,
longitudinal sedimentation tanks of retention time T = 3
hours earth sedimentation tanks for rainfall waters
flowing into the purification plant during heavy rains.
Control studies performed on the purification plant
corroborate the values adopted in the design.
Reduction of suspended solid by 50 %, oil and fats by
20 %, iron by 70 % is achieved in the sewage treatment
plant.
The second sewage treatment plant built in the Metallurg-
ical Works, plant "B" has a daily flow capacity of about
140 thousand m3/day for industrial wastes and about 1,6
m3/s for rainfall wastes. This plant is of mechanical
type and the reduction effect is 50 % as suspended solid
is concerned and 20 % as oil is concerned.
The Metallurgical Works have also built a biological
treatment plant for coke waste waters.
4.5 Waste waters from the region of Tarnow, discharged
into the Dunajec River, a right tributory of the Vistula
River, is a serious source of hazard for surface waters.
In the territory of Tarnow there are Nitrogen Works,
which have recently built their own sewage treatment
plant. These Works came into operation on the turn of
years 1920-1930 and have been greatly developed in the
post war period.
-94-
A part of the Works built in the center-war period has a
combined sewage system covering the area where production
of unorganic products: ammonia, nitric acid, semi
conductor silica is located.
From this part of the Works the wastes are discharged to
the mechanical-chemical treatment plant into which also
flow in wastes from production of acrylonitrile, where
hydrogen cyanido is the main product.
With regard to their high toxicity these wastes are
preliminary subjected to oxidation with active chlor so
that cyanides are reduced to a level which is absorbable
by active sludge in the local department purification
plant. There from the waste waters are discharges to the
mentioned mechanical-chemical treatment plant.
The above mentioned local purification plant is also
designed for selective biological removal of waste waters
from caprolaetan and formaldyhyde production. Activated
sludge tanks are aerated with compressed air.
The plant has a developed system of retarding reservoirs
what eliminates variations in pollutant concentration.
This splant aims at preliminary wastes treatment before
introducing them into the common sewage treatment plant
for Nitrogen Works and the city Tarnow, which has been in
operation since 1978. /l/
In this sewage treatment plant chemically contaminated
waste waters with many toxic substances and easily
decomposing sewage, carrying nutrients /phosphorus,
nitrogen/ necessary for activated sludge undergo
treatment and are discharged into the river.
In that plant a 58 % decrease of COD takes place, but no
investigations on nitrogen removing are carried out.

-95-
Simultanously with building waste water treatment plant
in Tarnow, technological production changes aiming at
decreasing the amount of water uptake and waste load were
introduced in the Nitrogen Works.
From the primary quantity 43 300 m3 waste waters/day, in
1985 the amount of discharged wastes was 34 500 m3
wastes/day and respectively decreased the following
pollutant charges:
CDD from 16 497 kg/day to 7 225 kg/day
NNH3 from 5 065 kg/day to 4 441 kg/day
and Nitrates NNC3 from 199 kg/day to 11,7 kg/day.
4.6 Apart from investigations on water recovery from
waste waters carried out in the Technical University of
Cracow investigations connected with hydraulics of equip-
ments for waste water purification are also performed.
Those are carried out in the Institute of Engineering and
Water Manaqement Laboratory of Hydraulics.
Kinetics of flow and pollution in nitrification and
denitrification chambers is investigated for one of the
big sewage treatment plants to be built on the coast of
the Baltic Sea.
Investigations are carried out on a model in the scale
1:17 aiming at checking the design version, determination
on dead areas and inner circulation.
Establishing of optimal maxing conditions tends at
decrease in energy consumption.
5. Summary
Hazard to the natural environment in Poland was caused
by excessive development of national economy, and
-96- -
specially mining and heavy industry at simultanous under-
estimation of water and air protection.
This may be accounted for by a rapid increase in popu-
lation which has grown in the recent 40 years by about
12-14 mln. This was connected with the necessity of
creating new work possibilities to assure work for people
from the overpopulated country regions.
Resources such as coal, zink and lead ore and sulfur
occur in the South of Poland in the basin of the Upper
Vistula where big municipal-industrial agglomerations
developed. This caused difficulties in a planned
protection of water against pollution at a lack of
respective means.
At present this problem is not only noticed by
professionalists but also by economical and political
authorities. There force inhibition of further degrad-
ation of the natural environment and gradual, though a
long term, a melioration of this state is to be expected.
-97-
Should locally pretreated industrial wastes bedischarged to the municipal sewage system or tothe stormwater system?
Professor Jan Rennerfelt,Department of Biotechnology, KTH and K-Konsult,Stockholm
1 Background
Waste water from industries in municipal areas aregenerally discharged to the municipal sewage sys-tem. The state or municipal authorities can re-quire that the water shall be&pretreated in orderto protect the sewerage system and the treatmentplant.
In Sweden, industrial wastes from
0
0
0
breweriesdairiesslaughterhouses and meat processingindustriescanneriestanneries and textile industriespharmaceutical industriesmetal/finishing industriesworkshopsphotographic laboratories
and some other industries in the city area aredischarged to the municipal sewage system andtreated together with the normal municipal waste.Guidelines with limit values have been prepared bythe Swedish Water and Sewage Works Association,VAV. (VAV 1983, Rennerfelt 1986)
In principle a well pretreated waste water mightalso be discharged to the stormwater system. Thiswas also discussed during the preparation of thefirst issue of the limit values.
In the following the advantages and disadvantageswith a treatment with the municipal sewage on adisharge to the stormwater system will bediscussed.
-98-
2 Composition of industrial wastes
Waste water from food industries contains carbo-hydrates, proteins and fats in suspended andsoluble form.
Waste water from pharmaceutical industries con-tains complicated organic substances and organicsolvents.
Waste water form workshops often contains heavymetals and oil (partly as emulsion) and water frommetal finishing contains heavy metals, partly incomplex form, cyanides etc.
Waste water from photographic laboratories con-tains toxic and carcinogenic substances.
Waste water from textile industries contains avariety of organic and inorganic compounds used inproduction and dyeing of textiles.
Waste water from laundries contains organic mate-rial and tensides and has a high pH.
Waste water from tanneries contain organic sub-stances, sulphide and sometimes chromium.
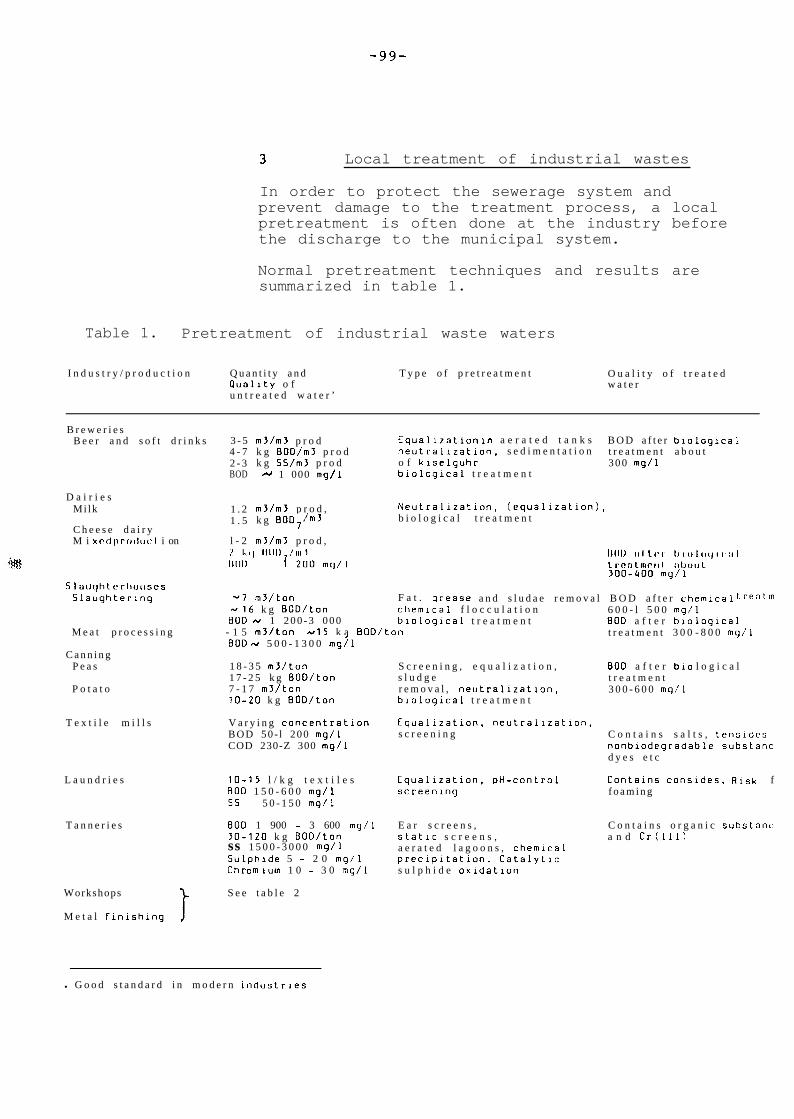
-99-
3 Local treatment of industrial wastes
In order to protect the sewerage system andprevent damage to the treatment process, a localpretreatment is often done at the industry beforethe discharge to the municipal system.
Normal pretreatment techniques and results aresummarized in table 1.
Table 1. Pretreatment of industrial waste waters
I n d u s t r y / p r o d u c t i o n Q u a n t i t y a n d T y p e o f p r e t r e a t m e n t O u a l i t y o f t r e a t e dPuality o f w a t e ru n t r e a t e d w a t e r ’
B r e w e r i e sB e e r a n d s o f t d r i n k s 3 - 5
4 - 72 - 3BOD
D a i r i e sMi lk
C h e e s e d a i r yM i xrd p rorillc t i on
SlauqhterhotlsesSlaughtering
M e a t p r o c e s s i n g
C a n n i n gP e a s
P o t a t o
T e x t i l e m i l l s
1 . 21 . 5
l - 2
m3/m3 p r o dk g BOD/m3 p r o dk g SS/m3 p r o d
M 1 000 mg/l
Equallzation In a e r a t e d t a n k s B O D a f t e r blologlcalneutrallzatlon, s e d i m e n t a t i o n t r e a t m e n t a b o u to f klselguhr 3 0 0 mg/lbiological t r e a t m e n t
m3/m3 p r o d ,k g EIOD/m3
mJ/m3 p r o d ,
Neutrallzation, (equalization),b i o l o g i c a l t r e a t m e n t
-7 m3/ton F a t . qrease a n d s l u d a e r e m o v a l B O D a f t e r chemical treatmd16 k g BOD/ton chemical f l o c c u l a t i o n
EOD N 1 2 0 0 - 3 0 0 0 bloloqlcal t r e a t m e n t- 1 5 m3/ton ~15 k a BOD/tonBOD ,+ 5 0 0 - 1 3 0 0 mgjl
1 8 - 3 5 m3/ton S c r e e n i n g , e q u a l i z a t i o n ,1 7 - 2 5 k g BOD/ton s l u d g e7 - 1 7 m3/ton r e m o v a l , neutralizatlon,lo-20 k g BOD/ton biological t r e a t m e n t
V a r y i n g concentrationB O D 5 0 - l 2 0 0 mg/lCOD 230-Z 300 mg/l
Equalization, neutralization,s c r e e n i n g
L a u n d r i e s
T a n n e r i e s
lo-15 l / k g t e x t i l e sBOD 1 5 0 - 6 0 0 mg/lSS 5 0 - 1 5 0 mg/l
BOD 1 900 - 3 600 mg/l30-120 k g BDD/tonss 1 5 0 0 - 3 0 0 0 mg/lSulphide 5 - 2 0 mg/lChromium 1 0 - 3 0 mg/l
Workshops
M e t a l finishing
S e e t a b l e 2
Equallzation, pH-control Contains consides. Risk fscreening f o a m i n g
E a r s c r e e n s ,static s c r e e n s ,a e r a t e d l a g o o n s , chemicalpreclpltation. Catalytics u l p h i d e oxldatlon
6 0 0 - l 5 0 0 mq/lEIOD a f t e r b;o logicalt r e a t m e n t 3 0 0 - 8 0 0 mgil
BOD a f t e r blot r e a t m e n t3 0 0 - 6 0 0 mg/l
l o g i c a l
C o n t a i n s s a l t s , tensldesnonblodegradable substanc,d y e s e t c
C o n t a i n s o r g a n i c substanca n d Cr (III)
l G o o d s t a n d a r d i n m o d e r n industries

-lOO-
Of special interest are the possibilities to treatwastes containing heavy metals.
The most important way to decrease the concentra-tions is to change the production processes, e.g.the washing.
The external treatment of the wastes isfacilitated and gives better results if wastewater of different character are separated beforethe treatment.
The following types of water should be separated
0 cooling waters or other clean waters(which can be discharged directly to the re-cieving stream or to the storm water system)
0 water containing cyanide
0 water containing chromates
The techniques of waste treatment and the expectedresults are summarized in table 2.
l a b 2 . Pretreatment o f waste waters f rom workshops and m e t a l f in ishing industr ies
Type of waste Type of treatment Qual i ty o f t reated wastes
Melal I’inrshing w a s t e pH-adjustment, p r e c i p i t a t i o n Al 2 mg/lwith heavy metals o f m e t a l h y d r o x i d e s (pH 8,S-10) Fe 2 ”
( f l o c c u l a t i o n a n d s e p a r a t i o n o f floes) Zn 2 ”complexing agents may disturb Pb 1 4,
the format ion o f hydroxides . cu 1 ,IC r - t o t 1 IINi 1 ,I
Destruction o f the complexing agents , Ag 1 I,p r e c i p i t a t i o n w i t h HZS etc may St? 1 1,
be u s e d . Cd 0,l ‘I
Cyanides Oxidat ion with chlor ine ors o d i u m hypochloritc st pH > 1 1 .
Free cyanide 0,l mg/l
Two stages, m i x i n g (> 15 min) anda f t e r - r e a c t i o n (> 45 min)
Total cyanide 1 mg/l
Chromates Reduction of chromates with C r IV11 0,l mg/ls o d i u m b i s u l f i t e a t pH < 2,s
(15 min). Chromium hydroxidei s precipitated w i t h pH-adjustment.
Oi l containing wastes
0 with f ree o i l and F l o t a t i o n ( g r a v i t a t i o n a l )suspended so l ids
Surface loading 1 m/hDetent ion t ime >2h Oil SO mg/lF l o t a t i o n + f i l t r a t i o n Oil 2 S mg/lFiltratron ( i f t h e o i l c o n c e n t r a t i o ni s l o w , < 5 mg/l) Oi l < 1 mg/l
0 w i t h emulsified o i l about 20 mg/lBreaking with acids, H g - i o n s (With Mg + separat ion lo-50 mg/!or chemical precipitation
(With the m.precipitation l - 10 mg/!
U l t r a f i l t r a t i o n S mg/l
Adsorpt ion 20 mg/:
Flltratlon with activated c a r b o n 5 mgi:

-lOl-
4 Advantages and disadvantages with dis-charge to a municipal treatment plant
4.1 Advantages
Even after a local pretreatment, waste waters fromfood industries, textile mills and tanneries con-tain a considerable amount of organic materialthat may consume oxygen in the recieving water. Ina municipal treatment plant (especially with bio-logical treatment) a larger or smaller part of thebiodegradable material is reduced. Nonbiodegrad-able organic material such as PAH and PCB may tocertain extent be adsorbed to the primary sludgeand is thus removed from the water. EPA:s in-vestigations showed however big differences in thereductions between different plants and differentgroups of organic substances.
4.2 Disadvantages
Pretreated water from workshops and metalfinishing plants contains small amounts of heavymetals and other toxic substances. If there aredisturbances in the operation of the pretreatmentplant, the concentration of mineral oil, heavymetals and other toxic material increases. Thismay upset the operation of the municipal plant andcause a loss both of the BOD and the toxic sub-stances to the recieving water.
If water from workshops, metal finishing plants,printers etc are discharged to a municipal treat-ment plant, the heavy metal concentration in thesludge increases. The removal of Cu, Zn, Cr, Pband Cd was on an average 40 % in the primary se-dimentation, 25 8 in the biological stage and 15 8in the chemical postprecipitation according tothe SWEP research (SNV PM 1942). Ni was hardlyremoved at all in the primary sedimentation andchemical precipitation but to some extent in thebiological step.
The increase of metals in the incoming municipalsewage due to the industrial wastes has been esti-mated to 40 - 80 % in the SWEP studies.

-102-
The main disadvantage with an industrial dischargeto the municipal system is the transport of heavymetals and nonbiodegradable organics to thesludge. If the sludge is used in agriculture theremay be a further transport of these substances tothe environment. Even if the sludge is taken to agarbage dump, there may be a leakage to the groundwater.
5 Advantages and disadvantages with adischarge to the stormwater system
5.1 Advantages
The advantage with a discharge of pretreated waterto the stormwater system is above all that thereis no risk to upset the operation of the municipaltreatment plant with toxic material. The con-centration of heavy metals and nonbiodegradableorganics in the sludge can be decreased, whichfacilitates the sludge disposal.
Another advantage is that the hydraulic load ofthe municipal treatment plant is decreased.
A pretreated industrial waste water with a con-siderable organic concentration must however inmost cases be treated in the municipal treatmentplant.
5.2 Disadvantages
The main disadvantage with discharge to the storm-water system is that the recieving waters may bepolluted in case of a breakdown of the industrialpretreatment system. The aquatic life may thus bedamaged. On the other hand, an accidental dis-charge to a municipal treatment plant may decreasethe treatment efficiency and cause more damageduring a longer period to the environment.
A practical disadvantage is the necessity ofchanging the connections from the stormwater sys-tem to the sewage system if the character of theindustrial production is changed.
-103-
6 RECOMMENDATIONS
Stormwater, cooling waters and well pretreatedindustrial wastes without biodegradable organicsubstances should be discharged to the stormwatersystem.
Industrial wastes containing biodegradable organicsubstances should be discharged to the sewage sys-tem and treated together with the municipalsewage.
REFERENCES
Rennerfelt, J (1986): Discharge of industrialwaste water to municipal sewerage systems -concentration limits from technical standpoint.Seminar on Wastewater Treatment in Urban Areas,Visby 7-9 September 1986. To be published.
Statens naturvirdsverk (1985): Vattenv2rd inomverkstads- och ytbehandlingsindustri.Allmanna rid 85:l.
Statens Naturvzrdsverk och Svenska Vatten- ochAvloppsverksforeningen. Author G. Ekedahl (1985):Specifika fororeningar vid kommunal avloppsrening.SNV PM 1964.
Statens naturv;rdsverk och Svenska Vatten- ochAvloppsverksforeningen. Author C. Berg (1985):Metaller i kommunalt avloppsvatten. SNV PM 1942.
VAV, (1983): Industriavlopp - Gransvarden. Villkorfor utslapp av skadliga amnen i kommunal avlopps-anlaggning. VAV M 20.
'104-
NUTRIENT REMOVALAT IOWTEMPERATURES
DANISH EXPERIENCE
Jes la Cour Jansen, Water Quality Institute, Denmark.
INTRODUCTION
Within five years nitrogen removal is required at all Danish
treatment plants above 15,000 PE, and phosphorus removal is
required at all plants above 5,000 PE.
These requirements will bring about construction or extension
of about 250 treatment plants of a size from 5,000 PE to 2
million PE.
Today >phosphorus removal takes place at about one tenth of
the plants above 5,000 PE and nitrogen removal takes place at
the 35 plants shown in figure 1.
It is seen that plants ranging from 800 to 200,000 PE are in
operation.
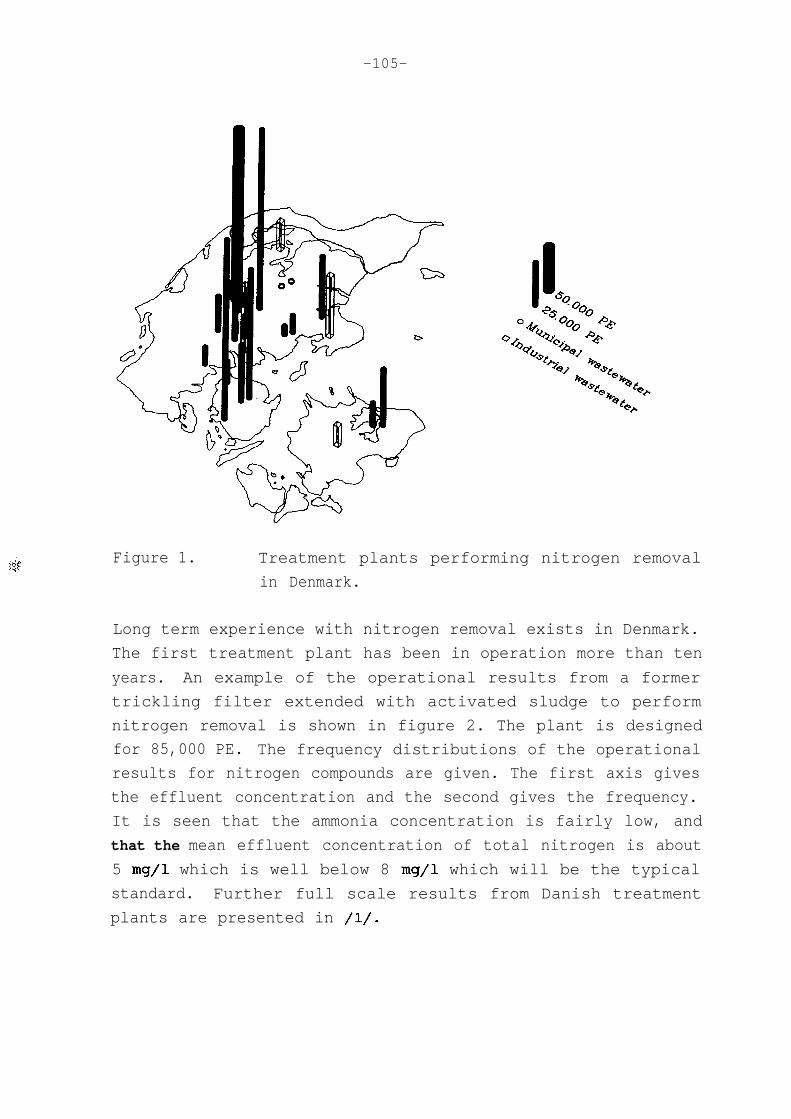
-105-
Figure 1. Treatment plants performing nitrogen removal
in Denmark.
Long term experience with nitrogen removal exists in Denmark.
The first treatment plant has been in operation more than ten
years. An example of the operational results from a former
trickling filter extended with activated sludge to perform
nitrogen removal is shown in figure 2. The plant is designed
for 85,000 PE. The frequency distributions of the operational
results for nitrogen compounds are given. The first axis gives
the effluent concentration and the second gives the frequency.
It is seen that the ammonia concentration is fairly low, and
that the mean effluent concentration of total nitrogen is about
5 mg/l which is well below 8 mg/l which will be the typical
standard. Further full scale results from Danish treatment
plants are presented in /l/.

-106-
A
100 :
8 0 :
Frequency%
** *
*
** A
AA
AhA
A
A
AA
AA
AAA * Ammonia
A A Total nitrogenbA
ttA
A
%
A
AAAAA Con;;$rition
. . .._.._............“‘.“...I l
0 5 10 15
Figure 2. Frequency distribution of effluent results for
nitrogen compounds from a trickling filter,
upgraded with activated sludge treatment for
nitrogen removal.
The nitrogen requirement makes it necessary for the plants
to maintain nitrification to a considerable extent throughout
the entire winter, and since nitrification is expected to be
highly influenced by temperature drop during winter operations,
special attention is necessary.
The principal factor determining nitrification is the sludge
age, i.e. the average "life time" of the bacteria in the treat-
ment plant and the temperature. Therefore, design of plants
in Denmark basically takes place according to a correlation
between the necessary sludge age and the temperature as shown
in figure 3.
Even at treatment plants designed on the safe side of the guide-
line in figure 3, problems with nitrification may occur.

-107-
tAerobic sludge age for nitrification.
30,
25
20
15
10
5
emperature ("C)
0 5 10 15 20
Figure 3. Design curve for nitrification.
The course is that the process depends on a number of things
of a very different nature whose influence may be difficult
to separate from each other.
The natural conditions of central importance are of course
primarily the special growth conditions of the nitrifying
bacteria and the temperature conditions, but also precipitation
conditions including the snow cover during thaw may have a
decisive influence on the course of the process.
The nlanninq conditions in connection with sewerage and treat-
ment plants play an important part in the influence of the
natural conditions on the process. By ensuring a reasonable
design of the plant in relation to the amount of pollution
in the catchment area and by preventing restrictive substances
in the wastewater, basic conditions can be established for a
satisfactory growth of nitrifying bacteria.
A suitable planning of the sewerage may prevent unfavourable
temperature conditions from acquiring a dominant influence, and
by forethought when choosing the constructive design of the
8 492713H
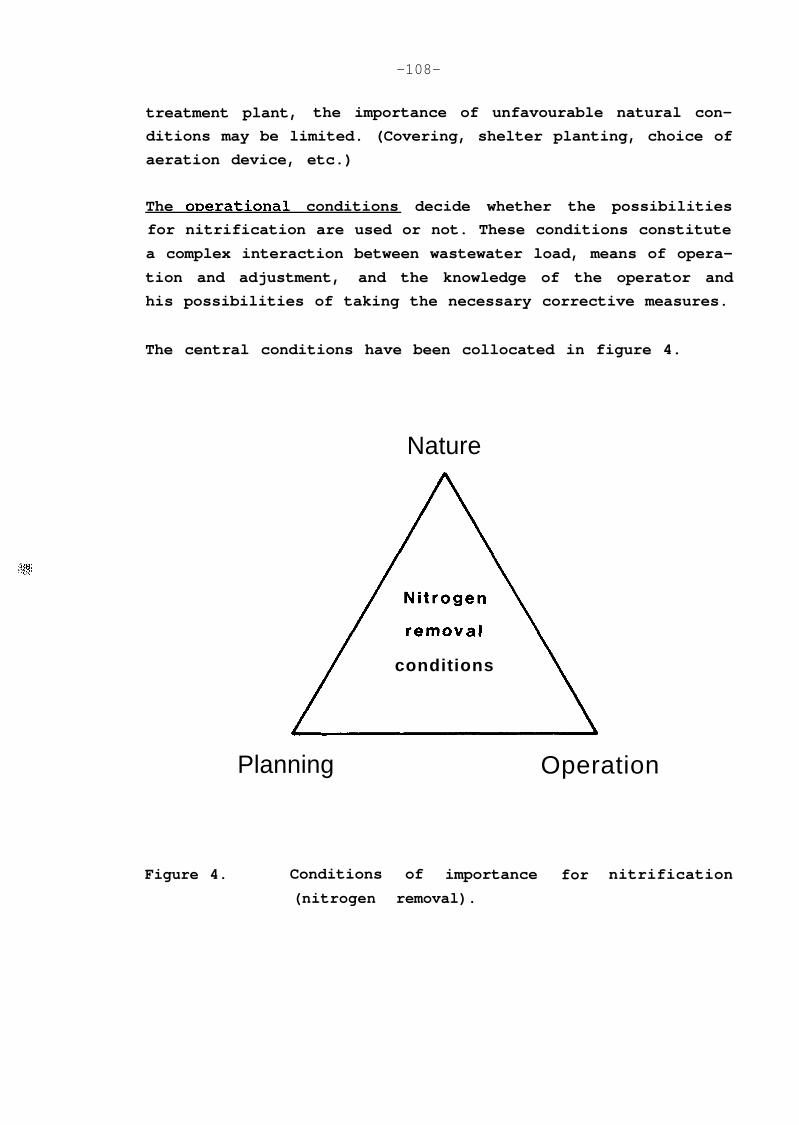
-108-
treatment plant, the importance of unfavourable natural con-
ditions may be limited. (Covering, shelter planting, choice of
aeration device, etc.)
The ooerational conditions decide whether the possibilities
for nitrification are used or not. These conditions constitute
a complex interaction between wastewater load, means of opera-
tion and adjustment, and the knowledge of the operator and
his possibilities of taking the necessary corrective measures.
The central conditions have been collocated in figure 4.
Nature
Figure 4.
conditions
Planning Operation
Conditions of importance for nitrification
(nitrogen removal).
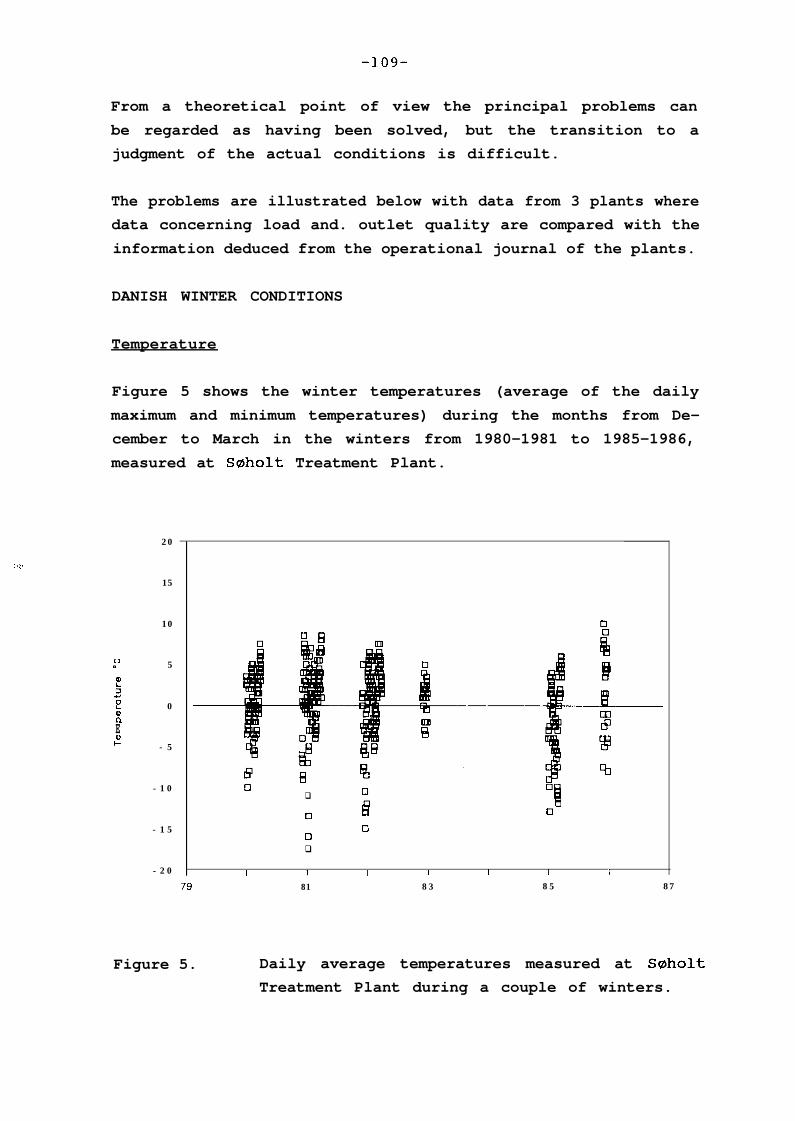
-109-
From a theoretical point of view the principal problems can
be regarded as having been solved, but the transition to a
judgment of the actual conditions is difficult.
The problems are illustrated below with data from 3 plants where
data concerning load and. outlet quality are compared with the
information deduced from the operational journal of the plants.
DANISH WINTER CONDITIONS
Temperature
Figure 5 shows the winter temperatures (average of the daily
maximum and minimum temperatures) during the months from De-
cember to March in the winters from 1980-1981 to 1985-1986,
measured at Soholt Treatment Plant.
20
15
10
o" 5
fIJe 0xE: - 5
-10
- 1 5
-20
0 0q
ifiB
Cl 0
00q
I I I I I I I
79 81 83 85 87
Figure 5. Daily average temperatures measured at Soholt
Treatment Plant during a couple of winters.
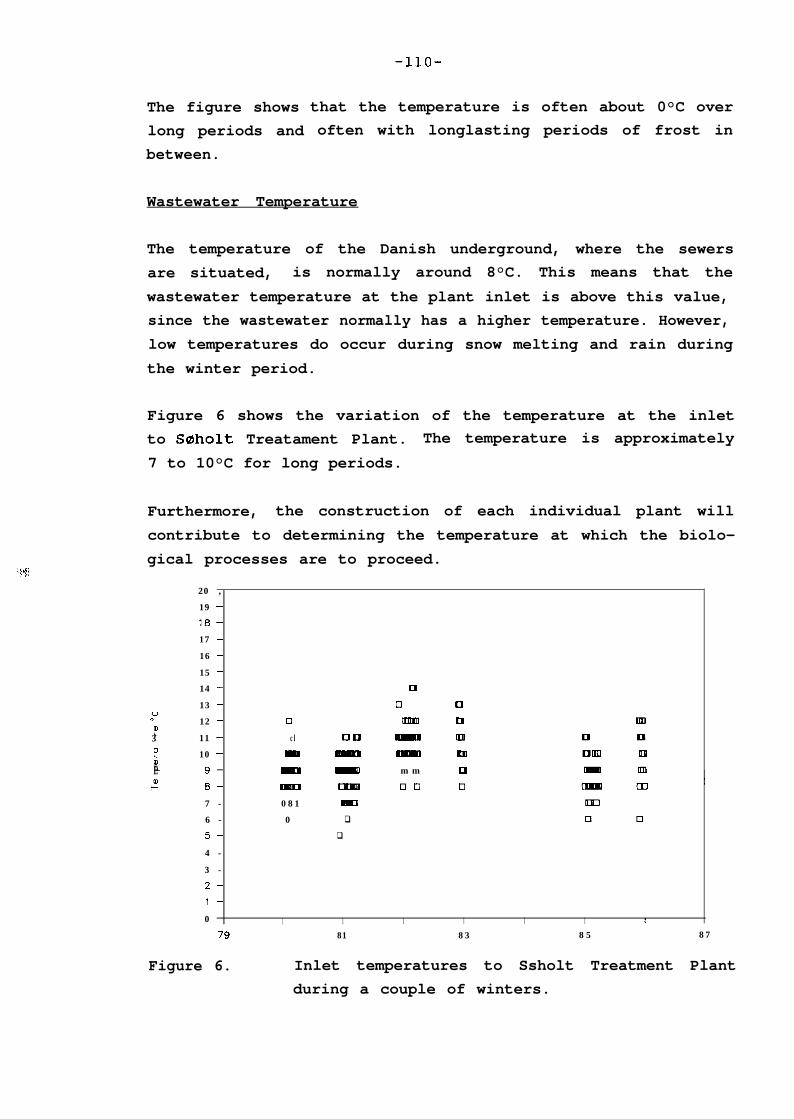
The figure shows
long periods and
between.
-llO-
that the temperature is often about 0°C over
often with longlasting periods of frost in
Wastewater Temperature
The temperature of the Danish underground, where the sewers
are situated, is normally around 8°C. This means that the
wastewater temperature at the plant inlet is above this value,
since the wastewater normally has a higher temperature. However,
low temperatures do occur during snow melting and rain during
the winter period.
Figure 6 shows the variation of the temperature at the inlet
to Soholt Treatament Plant. The temperature is approximately
7 to 10°C for long periods.
Furthermore, the construction of each individual plant will
contribute to determining the temperature at which the biolo-
gical processes are to proceed.
20 ,
19 -
18 -
17 -
16 -
15 -
14 - 0
13 - cl 00" 12 - 0 lmxn 0f3 11 - cl KID m un
P 10 - m 5 m mmxE 9- 01 m m m 0
r 8- omn mm Klo 0
7 - 081 m
6 - 0 q
5- q
4 -
3 -
2-
l-
0 I I I I I I I
79 81 83 85 87
Figure 6. Inlet temperatures to Ssholt Treatment Plant
during a couple of winters.

-111-
Soholt Treatment Plant. (105,000 PE)
Figure 7 shows the winter temperatures measured at Soholt
Treatment Plant during a number of years.
Figure 8 shows the ammonia concentration in the discharge
from 1985 to 1986 measured in 24-hour composit samples taken
at an interval of 2 weeks. It can be seen that nitrification
fails in part. Generally, the possibilities of the plant to
nitrify may be judged on the basis of the design curve in
figure 3, though the data basis for judging the sludge age is2
flimsy and inaccurate. In figure 9 the sludge age is shown
such as it can be calculated in the winter months on the basis
of the operational journal. It can be seen that the sludge
age of the plant is near/below the critical limit, so that a
securing of the nitrification will require favourable wastewater
conditions and optimum operation.
20 -.
19 -
18 -
17 -
16 -
15 -
14 - 013 -
QU 12 -f!
cl mum 0
3 11 - m on mmll 0
e 10 - - mnlmx
Ilpo 0
E 9- = m m 0
: 8- um mm 00 07- m Q6 - 0 05 -
4 -
3 -
2 -
l-
0 I I I I I I I
q
ml
0
un ml
-
mm mal q
-I79 81 83 85 87
Figure 7. Plant temperature at Soholt Treatment Plant
during a couple of winters.

-112-
20
19 -
18 -
17 -
16 -
15 -
14 -
13 -
i 12 -
8 11 -
4
$
10 -
9-
8- q n
7 - 06 -
5 - 00
4 -
3 - I3
Nov-84 Jun-85 Dee-85 Jul-86 Jan-87
Figure 8. Discharge concentrations of ammonia at Saholt
Treatment Plant from 1985 to 1986.
t
Aerobic sludge age for nitrification.
30
25-
20-
15-
lo-
5-
, I I0 5 10 15 20
Figure 9. Estimate of the sludge age and nitrifying con-
ditions at S@holt Treatment Plant during the
winter from 1985 to 1986.

-113-
Odense N.W. Plant. (85,000 PE)
Figure 10 shows the discharge quality from Odense N.W. Treat-
ment Plant of total inorganic nitrogen and ammmonia in 1986
till now (average 1.3 mg/l NH3, 5 mg/l inorganic N). On an
average the plant has been loaded with 70% of the design load.
The plant can be seen to nitrify excellently during both win-
ters, but at no time has the temperature been lower than 12°C.
The one high measurement in January 1987 was due to a heavy hy-
draulic and organic overloading, the organic substance loading
being 30% above
ammonia reduced
pended matter.
the design basis. Further to the discharge of
discharge quality was recorded for BOD and sus-
20 ,
19 -
18 -
17 -
16 -
15 -
14 -
13 -
12 -
11 -
10 -
9-
8-
7 -
6 - 00
5 -
4 -
3 -
2 -
l- +
cl INORGANIC NITROGEN
+ AMMONIA
o] + I I I I I
D e e - 8 5 J u l - 8 6 J a n - 8 7 Aug-87
Figure 10. Discharge quality for ammmonia and inorganic
nitrogen for Odense N.W. Treatment Plant.

-114-
. :!J’..!
Small Treatment Plant (8,500 PE)
Figure 11 shows the water temperature of a small treatment
plant and the corresponding discharge results for ammonia. It
can be seen that for long periods the nitrification runs at a
temperature well below 5°C. Reduced discharge quality can be
demonstrated when the temperature drops to 0°C due to snow
melt. However, the reduction is not predominant and only lasts
a short time. The plant is estimated to have a load of 60% of
the design load.
In figure 12 the calculated sludge age is compared with the
temperature and the typical curve for nitrification. It can
be seen that the plant nitrifies at considerably lower tem-
peratures than expected!
Therefore, figure 3 can only be used as a guideline.
2 0
19 -
18 -Cl Temperature%
17 - + A m m o n i a MG/L
16 -
15 -
14 -
13 -
12 -
11 -
10 - m9- 08- m7 - + 06 - 05- mo 0 q
4- q ~rnocdo
3 - 0 0 0 [1113m +
2 - 0 0 0l- + ++ ++ +I++* q + ++ +0 I I I I I I I - IM a r - 8 6 J u l - 8 6 O t t - 8 6 J a n - 8 7 M a y - 8 7
Figure 11. Water temperature and discharge of ammonia at
a small treatment plant during the winter 1986
to 1987.
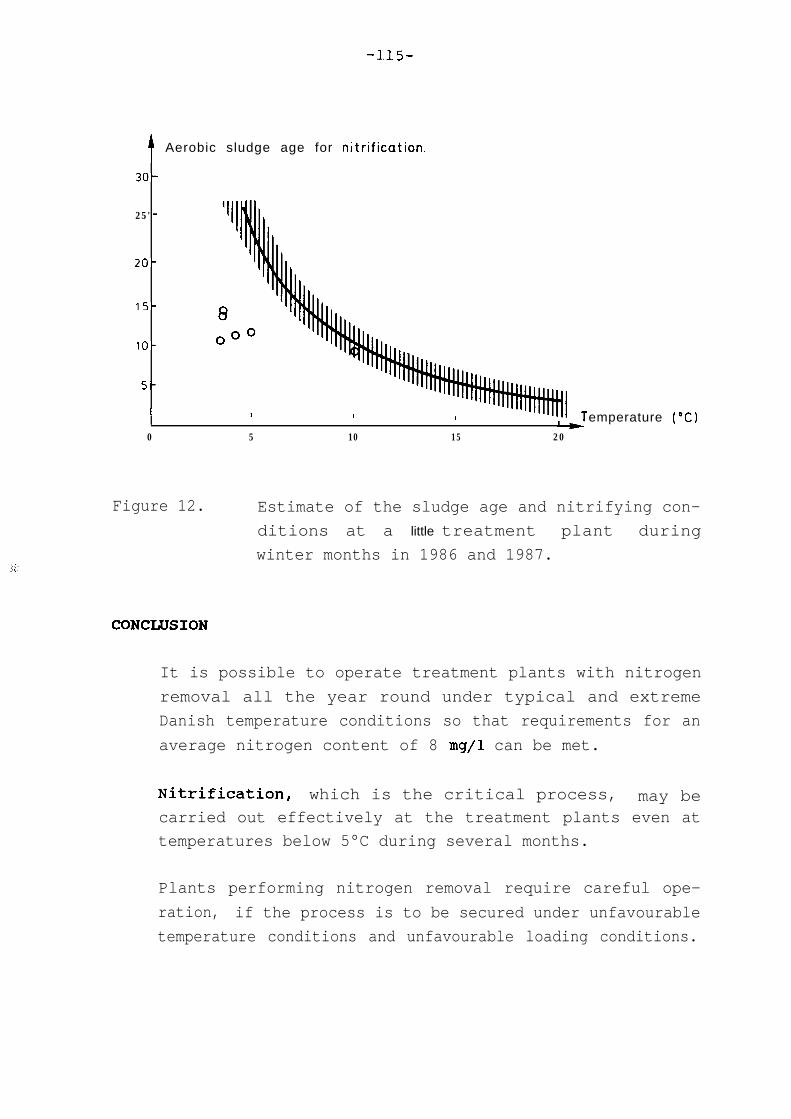
-115-
tAerobic sludge age for nitrification.
30,
25'
20,
15,
10.
5.
I
0
1
5
I
10
1
15
emperature ( “C 120
Figure 12. Estimate of the sludge age and nitrifying con-
ditions at a little treatment plant during
winter months in 1986 and 1987.
CONCIUSION
It is possible to operate treatment plants with nitrogen
removal all the year round under typical and extreme
Danish temperature conditions so that requirements for an
average nitrogen content of 8 mg/l can be met.
Nitrification, which is the critical process, may becarried out effectively at the treatment plants even at
temperatures below 5°C during several months.
Plants performing nitrogen removal require careful ope-
ration, if the process is to be secured under unfavourable
temperature conditions and unfavourable loading conditions.

-116-
RJZFERENCES
/l/ G. Holm Kristensen and Jes la Cour Jansen:
"Nutrient Removal - Danish PracticeI!,
7th European Sewage and Refuse Symposium EWPCA, Munich,
PP. 293-306, 1987.
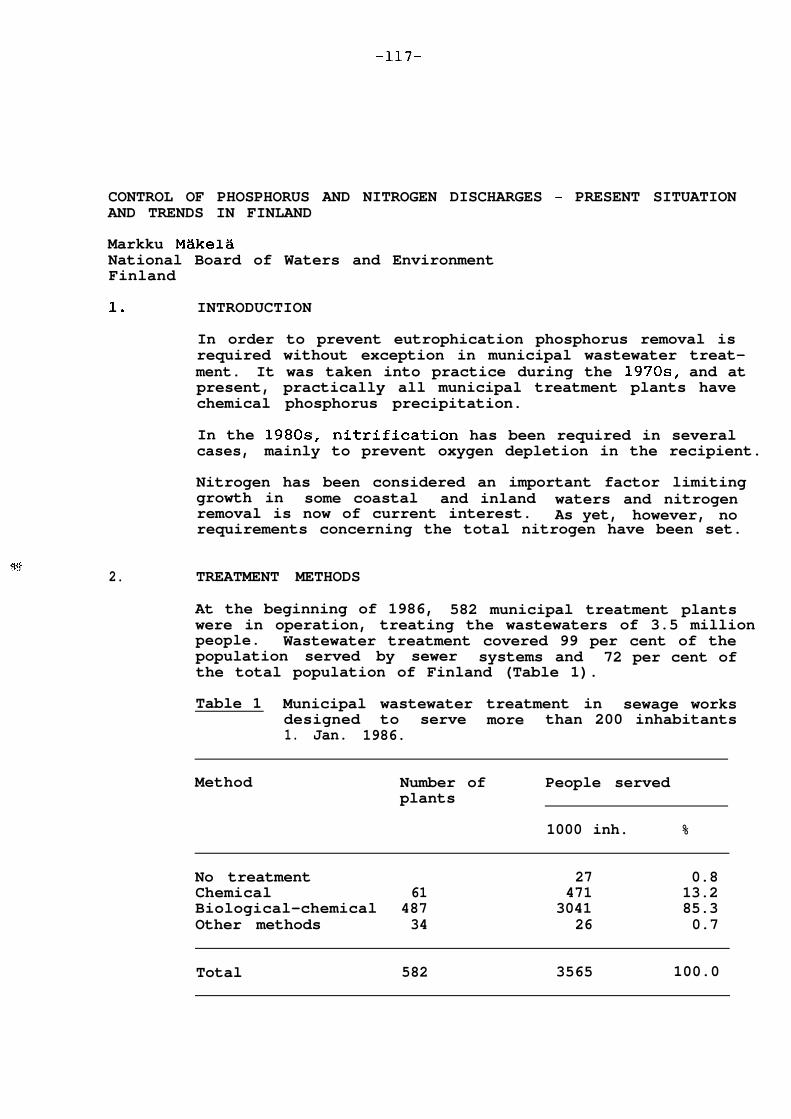
-117-
CONTROL OF PHOSPHORUS AND NITROGEN DISCHARGES - PRESENT SITUATIONAND TRENDS IN FINLAND
Markku MakelaNational Board of Waters and EnvironmentFinland
1. INTRODUCTION
In order to prevent eutrophication phosphorus removal isrequired without exception in municipal wastewater treat-ment. It was taken into practice during the 197Os, and atpresent, practically all municipal treatment plants havechemical phosphorus precipitation.
In the 198Os, nitrification has been required in severalcases, mainly to prevent oxygen depletion in the recipient.
Nitrogen has been considered an important factor limitinggrowth in some coastal and inland waters and nitrogenremoval is now of current interest. As yet, however, norequirements concerning the total nitrogen have been set.
2. TREATMENT METHODS
At the beginning of 1986, 582 municipal treatment plantswere in operation, treating the wastewaters of 3.5 millionpeople. Wastewater treatment covered 99 per cent of thepopulation served by sewer systems and 72 per cent ofthe total population of Finland (Table 1).
Table 1 Municipal wastewater treatment in sewage worksdesigned to serve more than 200 inhabitants1. Jan. 1986.
Method Number ofplants
People served
1000 inh. %
No treatment 27 0.8Chemical 61 471 13.2Biological-chemical 487 3041 85.3Other methods 34 26 0.7
Total 582 3565 100.0

-118-
3. TREATMENT REQUIREMENTS
The share of simultaneous precipitation and the combina-tions of simultaneous and pre or post precipitation isabout 80 per cent of the total plant capacity. Simul-taneous precipitation has been introduced in activatedsludge plants without significant costructional, opera-tional or economic disadvantages. Ferrous sulphate(FeSO4 .The usual
7 H20) is the most commonly used precipitant.dosage corresponds with the Fe to P molar ratio
of about 2. Many plants are operated with partial preprecipitation, with addition of ferrous sulphate at twopoints.
In most cases, nitrification has been carried out in oldsimultaneous precipitation plants which originally havebeen too heavily loaded for nitrification. Pre precipi-tation is often used for prolonging the sludge retentiontime. The design values of sludge load in combined carbonoxidation-nitrification processes have been 0.06 - 0.08kg BOD7/kg MLSS'd.
The alkalinity of waters in Fi9land is low and a limedosage of 50 - 100 g Ca(OH) /m
&or denitrification is
needed in connection with nit ification. Denitrification,which has been used for reducing the operating costs ofnew nitrification plants, has resulted in a 50 - 60 percent removal of total nitrogen as a yearly average.
Treatment requirements are expressed as maximum allowableconcentration values and minimum percentage reductionvalues of BOD
zand phosphorus (Table 2). The figures
refer to aver ge results during a specified time period(3, 6 or 12 months), including possible by-passes andprocess disturbances.
Table 2. Common requirements for municipal wastewatertreatment.
Methdd BoD7ATU Phosphorus
w/l red. % mg/l red. %
Direct precipitation 60-70 60-70 1.0 85-90Simultaneous prec. 15-20 85-90 O-5-1.5 80-90Post precipitation 15 90 0.5 90
When nitrification has been required, the maximum permittedconcentration of ammonia nitrogen has been 4 mg N/l andthe minimum reduction 80 - 90 per cent. The reductioncalculation is based on influent total nitrogen andeffluent ammonia nitrogen.
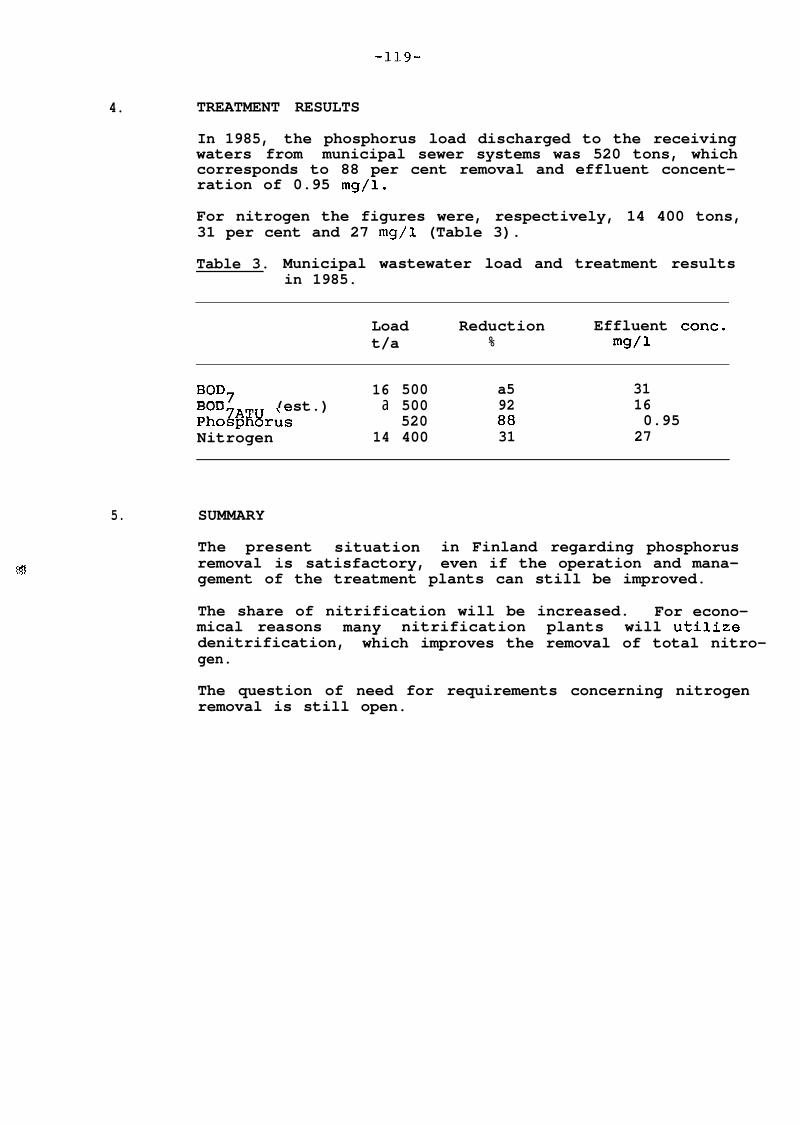
-119-
4. TREATMENT RESULTS
In 1985, the phosphorus load discharged to the receivingwaters from municipal sewer systems was 520 tons, whichcorresponds to 88 per cent removal and effluent concent-ration of 0.95 mg/l.
For nitrogen the figures were, respectively, 14 400 tons,31 per cent and 27 mg/l (Table 3).
Table 3. Municipal wastewater load and treatment resultsin 1985.
Load Reduction Effluent cont.t/a % mg/l
BOD7 16 500 a5 31BOD (est.)Phog$#rus
a 500 92 16520 88 0.95
Nitrogen 14 400 31 27
5. SUMMARY
The present situation in Finland regarding phosphorusremoval is satisfactory, even if the operation and mana-gement of the treatment plants can still be improved.
The share of nitrification will be increased. For econo-mical reasons many nitrification plants will utilizedenitrification, which improves the removal of total nitro-gen.
The question of need for requirements concerning nitrogenremoval is still open.
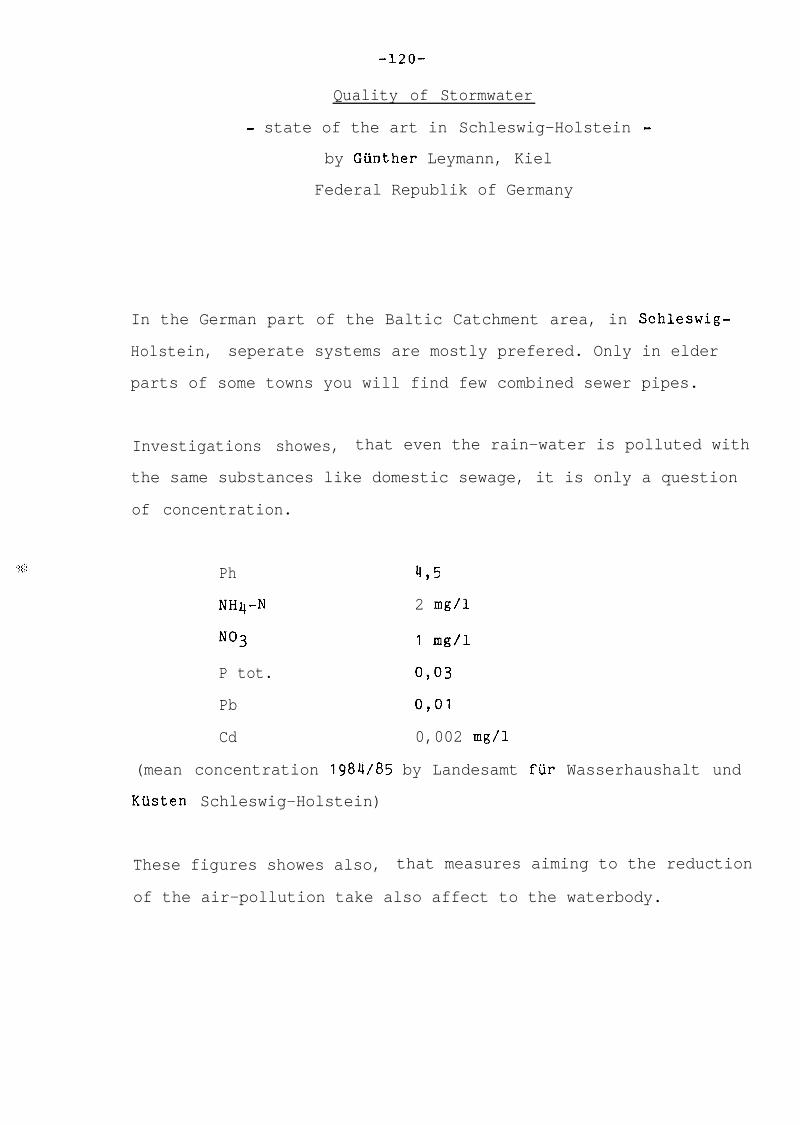
-120-
Quality of Stormwater
- state of the art in Schleswig-Holstein -
by GUnther Leymann, Kiel
Federal Republik of Germany
In the German part of the Baltic Catchment area, in Schleswig-
Holstein, seperate systems are mostly prefered. Only in elder
parts of some towns you will find few combined sewer pipes.
Investigations showes, that even the rain-water is polluted with
the same substances like domestic sewage, it is only a question
of concentration.
Ph 495
NH@ 2 mg/l
No3 1 mg/l
P tot. 0,03
Pb 0,Ol
Cd 0,002 mg/l
(mean concentration 1984/85 by Landesamt fur Wasserhaushalt und
Kiisten Schleswig-Holstein)
These figures showes also, that measures aiming to the reduction
of the air-pollution take also affect to the waterbody.
-121-
The pavement run off often is additional polluted by oil, rub-
ber and other carbon compounds.
The mean pollution load of storm water is for some parameters
general the tenth of the rain water load.
BOD 10 mg/l
COD 50 mg/l
N tot. 3 4,
P tot. 0 4)
Pb 091
Cd 0,001
(mean Concentration of pavement run off, Brunner 1977 and
Krauth 1978).
Normaly there is no treatment of storm-water in connection with
seperate systems, but beside of oil seperators at petrol stations
we run a lot of storm-water tanks to equalize the discharge.
These tanks, sometimes lagoons, additional fittet out with an oil
barrier in case of an accident,.work like an sedementation tank.
Beside these funktions they are often very nice biotops.
-122-
In some cases e.g. at Auto wrack places, uncovered industrial
areas or quays where fertilizer is handled we run overflow tanks
with the facility to discharge all sewage to a central treatment
plant, or in case of the quay only the first highly polluted
flush.
Beside these measures in my opinion roofs are the best method to
avoid highly polluted storm-water.
-123-
Experiences and remarks to the advanced_
s e w a g e treat;ment in Schleswig-Holsteiq
by GLinther Leymann, Kiel
Federal Republik of Germany
1. Introduct ion
Schleswig-Holste in , situated in the north,is one of the eleven
federal states in Germany. It borders in the west to the North
Sea in the north to Danmark and in the east to the Baltic .
Schleswig-Holstein has about 2.6 mill ions inhabitants, and about
1.0 mill ion of those l ive in the catchment area of the Baltic .
The specialyties for the water management are about 300 lakes,
slow floating short waters and more than 1.100 km coastline.
In 1971 the district government of Schleswig-Holstein defined and
publ ished the pro ject “Sewage treatment an protection of water,
general line”. One of the aims of these plan was a reduction of
phosphorus and BOD in order to stop the increasing eutrophication
in the lakes due to the nutrients, especially phosphorus.
The development of sewage treatment in Schleswig-Holstein can be
seen at f ig . 1. In the German catchment area of the Baltic to-
day near ly 90 % of all wastewater (urban areas and industry) is
being collected and treated at central sewage treatment plants at
least mechanical and b io log ica l ( inc luding s ludge treatment) .
9 492713H
-124-
In order of this fixed plan today we run about 53 t r e a t m e n t
plants with additional phosphorus precipitation, further 5 o f
those plants are under construction, 15 are designed and 10 are
p r o j e c t e d . Most of these plants with advanced treatment are in
operat ion in the East o f Schleswig-Holste in (see f ig . 2), that
means in the catchment area of the Baltic. In order to the plan I
mentioned, in the recent 15 years the investments for protection
of waters amount up to 1.9 billion German marks (DM).
2. The German water act
Before I try to explain the German point of view concerning
the advanced wastewater treatment especially the elemination of
nutrients I must explaine some definitions of our water act.
2.1 Wastewater and permission for discharging
Every wastewater discharging into a surface-water must be promit-
ted by the local water authority.
“Wastewater” means: “Water, which is polluted by human usage or
changed otherwise in his characteristic . Pavement run off is
w a s t e w a t e r too.1r All wastewater discharges must fulfi l special
minimum requirements concerning the concentration of the para-
meter BOD, COD, SS and after 1. 1. 1992 additional P and NH4-N.
The water authority is able, due to the quality of the receiving
body 9 to require a h igher d ischarging standard ( f ig . 39. To
-125-
fulfil these requirements the use of "Advanced Wastewater Treat-
ment" in our definition is necessary. The permission for discharge
contents max. concentration values for some parameters, which are
not allowed to ecxeed. These values are fulfilled if the arithme-
tic mean of the last five 2-h-samples doesn't exceed these values.
Each exceeding of these values result in a higher sewage tax and
can be punished as a crime. Dilution isn't allowed and no solu-
tion for pollution!
Due to these regulations it must be possible to fulfil these
requirements and to avoid a crime by mean of available waste wa-
ter technic,
2.2 Stages of technic
There are three or four stages of technical perfection:
1. General employed technic,
2. state of technic (best available economic acceptable
technic),
3. state of technical science,
4. state of technical scientific discussion.
Due to the remarks I made, the highest stage, which can be requi-
red by the authority is the stage "Best available technic". That
means, it must be able to buy these technic, the producer must be
able to guarantee the promised result - and the user must be able
to believe him!
-126-
3. Consequence to the “advanced wastewater treatment”.
3.1 Phosphorus
Today in Schleswig-Holstein about 53 treatment plants with phosho-
rus prec ip i tat ion are in operat ion . Due to the requirements of
the recipient and due to the joy for experiments of some engi-
neers we run a l l sorts o f prec ip i tat ion :
p r e - s imultan-combined-af ter -prec ip i tat ion etc .
3.1.1 Example 1: Simultan prec ip i tat ion
( f i g . 4).
The simultan-precipitation is the most applied method. Fig. 5
shows the results of P-precipitation at the treatment plant
K i e l .
The outlet concentration P tot. during the last year:
P tot . 1.87 mg/l
(mean value January 1985 to May 1987 unfiltred sample).
This treatment plant is the largest treatment plant in Schleswig-
Holste in . It is designed for about 500,000 population equi-
valents and at present a f i ltration stage is under construction.
3.1.2 Example 2: A f t e r - p r e c i p i t a t i o n
The treatment plant of the city Raisdorf is equipped with two

-127-
biological treatment stages and an after precipitation as a com-
bined flotation and filtration. The outlet concentration P tot.
during the last years:
0.37 mg/l (unfiltrated sample, mean value).
Figures 6 and 7 gives an overview about the efficiency of these
plant.
3.1.3 Consequence concerning llphosphorusft
The technic for phosphorus precipitation, without doubt, is an
available economic acceptable technic, which can be required by
the water authorities.
3.2 Nitrogen and nitrogen compounds
At present phosphorus but especially nitrogen are in the focus of
interest, because by human activities during the past decades
increasing amount of these two nutrients have been released to
the sea. These elements, which we call nutrients are available
only in limited quantities. They control plant growth according to
Liebig's law of the minimum factor, when other enviromental fac-
tors are optimal. What are the effects of these increasing inputs
of nutrients7 Since some years this question is discussed among
marine Scientists. It seemed to be, that nitrogen is the nutrient,
that generally limits growth in the Baltic Proper, the Sound, the
Kattegat and the Skagerrak. But there is also another question
discussed among the Scientists: The right method of nitrogen-

-128-
analysis. For example, when the Kjeldahl wet-oxydation method is
applied, more organic nitrogen compounds are included, which are
not easyly available to plants. Applying pyrolytic methods the
results are also problematic. I don't intend (and I'm not able) to
complete this theme, but we should be careful1 with nitrogen
budgets. Before going on the discussion about the advantages and
possibility of a requirement of nutrient removal, especially ni-
trogen oxydation (nitrification) and nitrogen removal (denitrifi-
cation), some remarks to the nutrient-sources.
3.2.1 Nutrient sources
Concerning phosphorus, wastewater from urban areas is the main
source of these nutrient. More than 55 % of the total load recei-
ving our waters result from domestic sewage. The calculated specf-
fications for nitrogen coming from domestic sewage differ from
10 % up to 22 %. Last calculations in Schleswig-Holstein resulted
in 16 8. Fig. 8 gives some details for nitrogen-sources, but
at the moment only such sources are of interest, which we can
influence by wastewater engeneering. In case of nitrogen we talk
about 16 %.
3.2.2 Example 3: Nitrification/Denitrification
Now I intend to present you the brandnew new wastewater treatment
plant of Husum, as an example for a modern plant with a controled
nitrification and since some month with denitrification.
Husum is a small village at the North Sea coast, but that doesn't

-129-
mind in this example, with about 25 000. inhabitants, important
tourism during summer and some industry. The main content of the
pollution is caused by a slaughter house, so that the plant had
to be designed to a seize of 110.000 populant equivalents (PE).
The requirements for discharge are shown in fig. 9.
Because the purif ied vastewater is disoharged into the harbour,
the discharge requirements specify not only the reduction of car-
bon compounds, but also a reduction of nitrogen compounds to an
a m m o n i u m (NHI+-NJ concentration of 5 mg/l at a water temperature
o f 150 c .
In accordance with the inlet conditions - the nitrogen oxydation
must be secured at any time - the arithmetical BOD sludge load
had been laid out to 0.12 kg/kg x d at max. load. (This correla-
tes to a sludge age of about 6 days). The plant has been designed
as an oxydation ditch. (Design parameters f ig. lO).Tankform and
aerator arrangement (f ig. 11) create best condi t ions for a si-
multan n i t r i f i c a t i o n / d e n i t r i f i c a t i o n . T h e r e t u r n s l u d g e a n d
mechanicaly pretreated wastewater are intermixed in a contact
tank and are discharged into the.anoxic area of the aeration ba-
s i n . The input of oxygen is done by the rotors 1 and 6 as con-
tinues runners. The NHQ-N concentration is continually measured
at the tank eff luent and with exeeding a certain concentration
the necessary additional oxygen input is done by the step-wise
shutt ing in o f the o ther rotors . These control and steering
equipment is additional controled by an oxygen regulation.
-130-
3.2 .2 .1 Discuss ion o f resul ts
Figure 12 shows the resul ts o f the f i rs t test december 1986 u n -
til january 1987. The reached purif ication effect was much better
than requested, but the plant works only with a capacity of 60 %
compared with the design data, Even under extrem conditions,
3.5O C water temperature, the required ammonium nitrogen concen-
trat ion o f 5 mg/l wasn ’ t exeed at any time (fig. 13). B u t t h e
nitrat-nitrogen value was higher than expected. A control of the
oxygen concentration along the slope results, that there was no
point with an oxygen concentration below 0,2 mg 02/l (picture
14). After changing the rotors for the basic load ( instead of the
rotors 1 and 6 now the rotors 3 a n d 4) for the basic load the
results o f the p lant change in a s igni f i cant way ( f ig . 15).
3.2.3 Consequence concerning “nitrogenl’
Well , these very simple treatment plant, beside of controling
equipment, could be a good argument for the general require of
n i trogen reduct ion . But please have a look to fig. 12. The
corresponding mean sludge load was about 0.075 kg/kg x d, and
t h e r e i s n o p o s s i b i l i t y f o r c a l c u l a t e t h e d e n i t r f f i c a t i o n effien-
cY9 becauie there i s no va lue for tota l n i trogen (TKN).
I think Husum is one of the necessary experiences and it shows,
that nitrification is feasible without operation problems. But
it is also an example for wasting energy and last not least mo-
ney. Investments in wastewater treatment must not be in any case
-131-
economical , but it ’s necessity must be explainable.
Today the decision to require and define a max. outlet concentra-
tions for nitrogen would halve our treatment capacity and result
in an enormous investment. As a subvention to the building trade,
- o . k . But as an argument resulting from
- the water situation,
- the expected e f f i c iency ,
- the state of science about the minimum factor,
- the consideration of the sources and
- the lack of available wastewater-technic
it should be very diff iculty to get the needed money.
3 .2 .3 .1 Avai lable technic for n i trogen removel?
The biological proceedings for the nitrogen removal are well
known and often practised by operation reasons. In this case
denitrif ication as an method for nitrogen removal is of interest.
P r e c o n d i t i o n f o r d e n i t r i f i c a t i o n i s t h e t o t a l n i t r i f i c a t i o n . T h e
only pract ica l des ign parameter for the n i tr i f i cat ion is the BOD-
s l u d g e l o a d (BTs 0.15 kg /kg x d ) be l iev ing , that at a certa in
sludge age the conditions for the Nitroso and other bacterial
spec ia l i s ts are good enough for l i fe . There are a lot of expe-
r i e n c e s , where this assumption seemed to fit not in any case.

-132-
Figure 16 gives a little overview about the different technical
ways for nitrogen removal. But there is none fixed rule for de-
signing and it is recommended to make tests in a large as possi-
b l e s c a l e , for getting the best f itting method. Methods for de-
nitrification t o d a y a r e o b j e c t o f t e c h n i c a l s c i e n t i f i c d i s c u s -
sion, but they are not ready for the general application1 Special
in Germany, due to our water act, we would criminalize all treat-
ment plant operators, if we would require a l imitation for.nitro-
gen tota l , because there is no “available technic” in the mean of
our water act. This is , beside economical questions, today our
main argument against the l imitation of nitrogen.
4. Final remarks
Beside th is , please allow following remarks. The removal of nitro-
gen needs the “high-tech” of wastewater engineering. It ’s pos-
s i b l e , but what is not possible? In my opinion in the whole catch-
ment area of the Baltic we first need thousands kilometer of
sewer-pipes and a lot of simple treatment plants with mechanical
and biological purification. After reaching that aim, we should
look further . I ’m a l i t t le b i t a fra id , that whi le d iscuss ing
high-tech of wastewater engineering, we don’t recognize that we
lost v i e w t o t h e r e a l i t y . I t ‘ s a fact that there are d i f ferences
in the econimical sources and poss ib i l i t ies within the Baltic-
s t a t e s . I think, we should wait a little and reduce the speed in
order to go the way together.

-133-
References
(1) P. Spies
C.F. Seyfried
Ammonia controlled activated sludge
process for nitrification-denitri-
fication,
IAWPRC Workshop, Sept. ‘87
Budapest
(2) Minister for Food,
Agiculture and
Forestry of
Schleswig-Holstein
(editor)
Generalplan Abwaser und Gewasser-
schutz in Schleswig-Holstein vom
15.01.1971
Eigenverlag
(3) Minister for Food,
Agiculture and
Forestry of
Schleswig-Holstein
(editor)
Generalplan Abwasser und Gewtisser-
schutz in Schleswig-Holstein
Fortschreibung 1986 vom 24.03.87
Eigenverlag
(4) Sebastian A. Gerlach Nutrients - An Overview
Int. conference on Enviromental
Protection of the North Sea
London 24 .-27. March 1987
Book of Reprints
-134-
(5) W. von der Emde
(6) National Swedisch
Enviroment Protection
Board (editor)
(7) Ministry for Food,
Agiculture and
Forestry of
Schleswig-Holstein
(editor)
Modifikation des Belebungsverfahrens
zur Stickstoffentfernung
Mitteilungen des. Inst. fUr Stadt-
bauwesen der TV Braunschweig j/87
Marine Eutrophication, June 1984
State of sewage treatment in
Schleswig-Holstein
8th WGS 1985, Inf. Paper
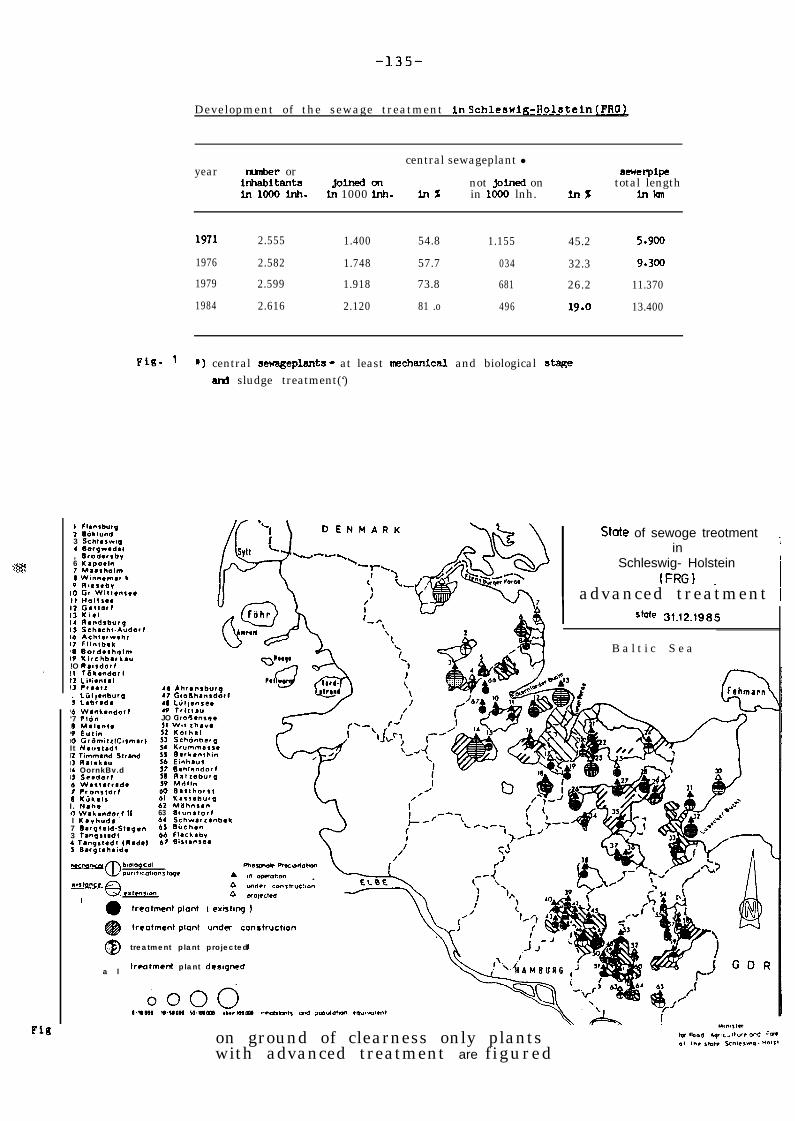
-135-
Development of the sewage treatment in SchleswiR-Holstein (FM_)_
central sewageplant lyear nmber or sewerpipe
l&abltants jomm not joined on total lengthin loo0 inh. in 1000 lnh. ln x in loo0 lnh. in% ltllall
1971 2.555 1.400 54.8 1.155 45.2 5.900
1976 2.582 1.748 57.7 034 32.3 9.300
1979 2.599 1.918 73.8 681 26.2 11.370
1984 2.616 2.120 81 .o 496 19.0 13.400
Fig. ’ a) central sewageplants = at least nrx.hanlcal and biological stegeand sludge treatment(‘)
State of sewoge treotmentin
;
Schleswig- Holstein I
IFRGI _ I
, F1ensburgI Bolllvnd3 Sckl*rrwJ1 (lor9.wd.l, Brodwrbv6 K.ooalnI M..tkolmI Wlnn.m.r kP Rns¶.bv
IO Gl.wltt.nr..II Holtt..1; p;.rt
I. R.nd.bur9IS Sch.cht.AudortI6 *Cht.rr.kr17 F1intb.k‘9 Bo~d..halmI9 Kirchb.rk.u!O R.l.d.rtIt llk.ndar,t3 Lili.nl*t!I PV..11. Lirl,.nb”rp‘3 L.br.d.!d W.nC.ndort‘7 Pldll‘I M.l.nl.!9 EutinIO Gr6mitrfCirm.r)It H.u.l.dtI1 Timm.nd SlrvldI3 R.l.k.”lb OornkBv.dI$ S..dartI6 W.,,.rr.d.8, Pro”,,.,,I9 Kirh.1.I. N.h.10 W.k.ndav,, III K.“h”d.7 S.r9l.ld-St.9.n3 T.n9*t*dt1 T.np.l.dt tA.d.tJ S.rpl*h.id.
advanced treatment 1
se xi2.1985
B a l t i c S e a
bb Ah,.n.burp1, Groak.n,dori48 Lti1i.n.a.19 Trill.”JO G1oa.n.a.SI WI1 II?.“.51 Ki$,h.l31 Schdnbsr93. Krummsrr.,, 8*rk.“tk,n56 Ei.lh.U¶,I e*hl.ndorlJI A.lr.bvr9SP MOll”60 B.llhot$~61 K.rl.b”r961 Mdhn..n63 Irunrtort6. Schw.rz.nb.td3 BJcll.n66 Fl.ck.bv6, 9i,,.n.c.
treatment plant projected
a ltreatment plant dcsqned
on ground of clearness only plantswith advanced treatment are figured
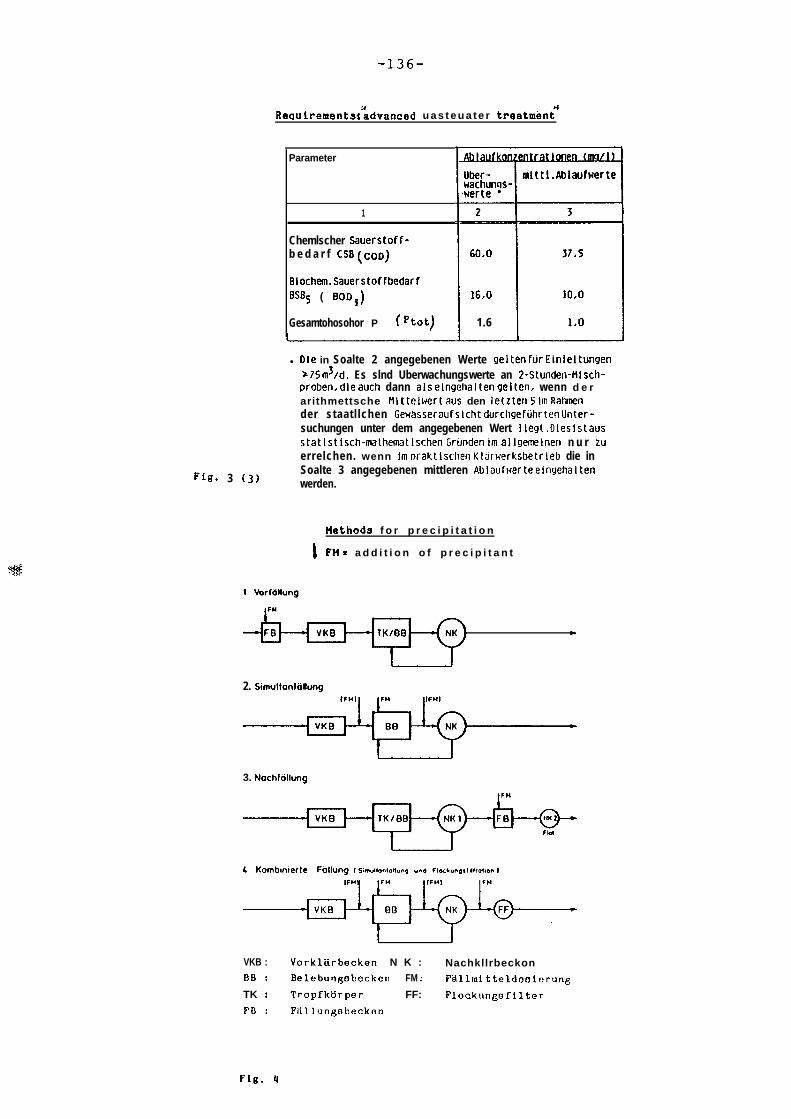
-136-
:,Requlrements!advanced u a s t e u a t e r treatmen;’
Parameter
1
Chemlscher Sauerstoff-b e d a r f CSE (COD)
Elochem.SauerstoffbedarfBSBrj ( BOOS)
Gesamtohosohor P (Ptot)
60,O
16,O
1.6
mlttl.Ablaufwerte
l Die in Soalte 2 angegebenen Werte gelten fiir Einleltungen3 75 m3/d. Es slnd Uberwachungswerte an 2-Stunden-Mlsch-oroben, die such dann als elngehalten Pelten, wenn d e rarithmettsche Mlttclwert aus den letzteri 5 Im Rahrnender staatl lchen Gew&seraufslcht durchgeftihrten Unter-suchungen unter dem angegebenen Wert Ilegt. Dies 1st ausstatlstlsch-mathematischen GrBnden Im allserrelnen n u r zuerrelchen. wenn Im oraktlschen Kl&werksbetrleb die inSoalte 3 angegebenen mittleren Ablaufwerte elngehaitenwerden.Fig. 3 (3)
IHethods f o r p r e c i p i t a t i o n
Fti = a d d i t i o n o f p r e c i p i t a n t
c
2. Stmultonliilung
3. Nochfcillung
VKB : Vorklkrbecken N K : NachkllrbeckonBB : Delebungobecken FM : F!4illmi tteldoolerungTK : Tropfktirper FF: FlockuneofilterFD : FPllungsbeckon
Fig. 4

-137-Treatment plant
u 500 000 PODUlatiOn e q u i v a l e n t
Ptot (mean oonaentrations)
1 9 8 5 : 1,4; 1,5; 1,2; 2.6; 1,3; 1,l; 1,7; 6 , 0 ; 1,6; 2,4;.2,0 u n d 4,5 mg/l
1 9 8 6 : 1,9; 1,7; 1,9; 1,4; l , O ; 1,2; 0,72; 1,7; 1,l; l , O ; 1,9 u n d 2,3 mg/l
1 9 8 7 : 3,l; 1,s; 1,3; 1,9 u n d 1,27 mg/l
i.M. = i,a7 mg/l
Fig. 5--------_--__---- - - - - - - - - - - - - - - -
Treatment plant Raisdorf - Phosphorusreduction
fP) nrp/l
4 0
I-J Zulruf VK8D Abl. TKINKBm Abl. FLO-Fill0
0
F i g . 6
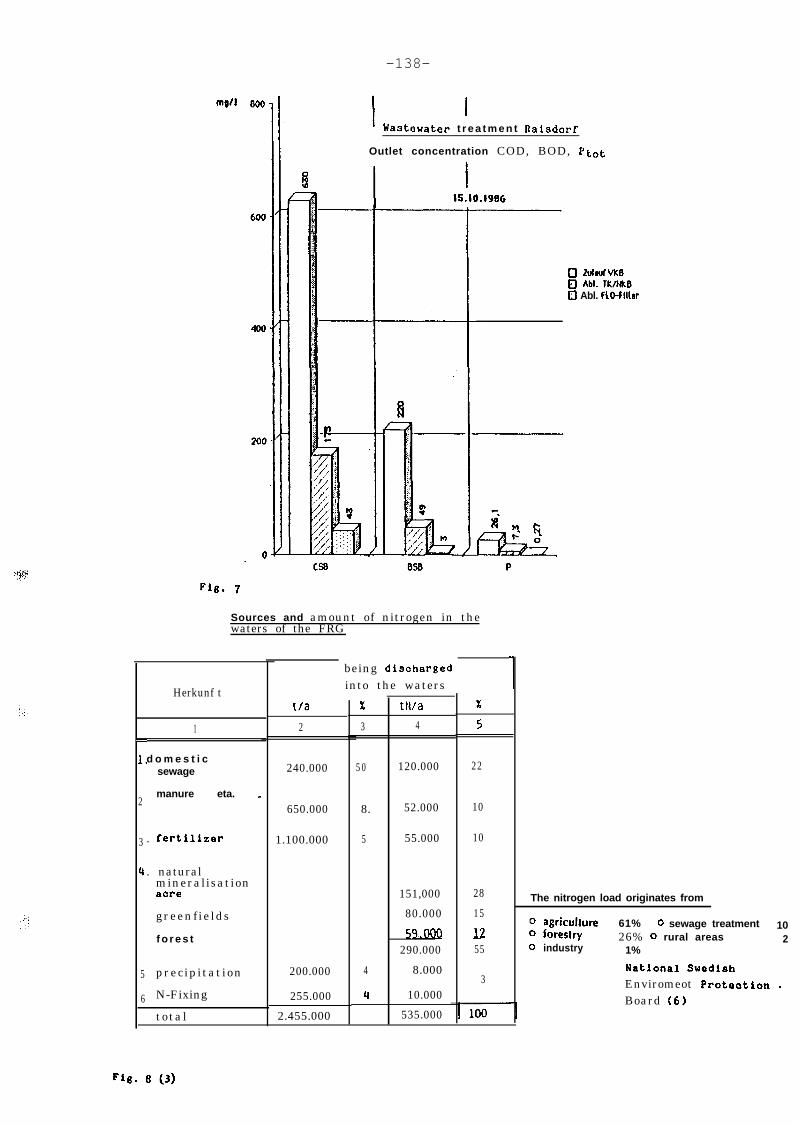
-138-
C
1.
2
3
cr
5
6
I IWaatcwater t r e a t m e n t Raisdorf
Outlet concentration COD, BOD, Ptot
0 ZulwfvK6E) Abl. WN&E0 Abl. FlO-flllsr
Sources and amount of nitrogen in thewaters of the FRG
Herkunf t
1
d o m e s t i csewage
manure eta. _
. fertillzer
. naturalmineralisationaare
greenfields
f o r e s t
precipitation 200.000
N-Fixing 255.000
total 2.455.000
being dischargedinto the waters
t/a
2
240.000
650.000
1.100.000
96 tH/a
3 4
50 120.000
8. 52.000
5 55.000
151,000
80.000
59.QQQ290.000
4 8.000
4 10.000
535.000
%
5
22
10
10
28
15
1255
3
1
The nitrogen load originates from
0 agriculktre 61%0 foreslry
0 sewage treatment 1026% 0 rural areas
0 industry2
1%
National Suedish
Enviromeot Proteotlon 0Board (6)
Fig. 8 (3)
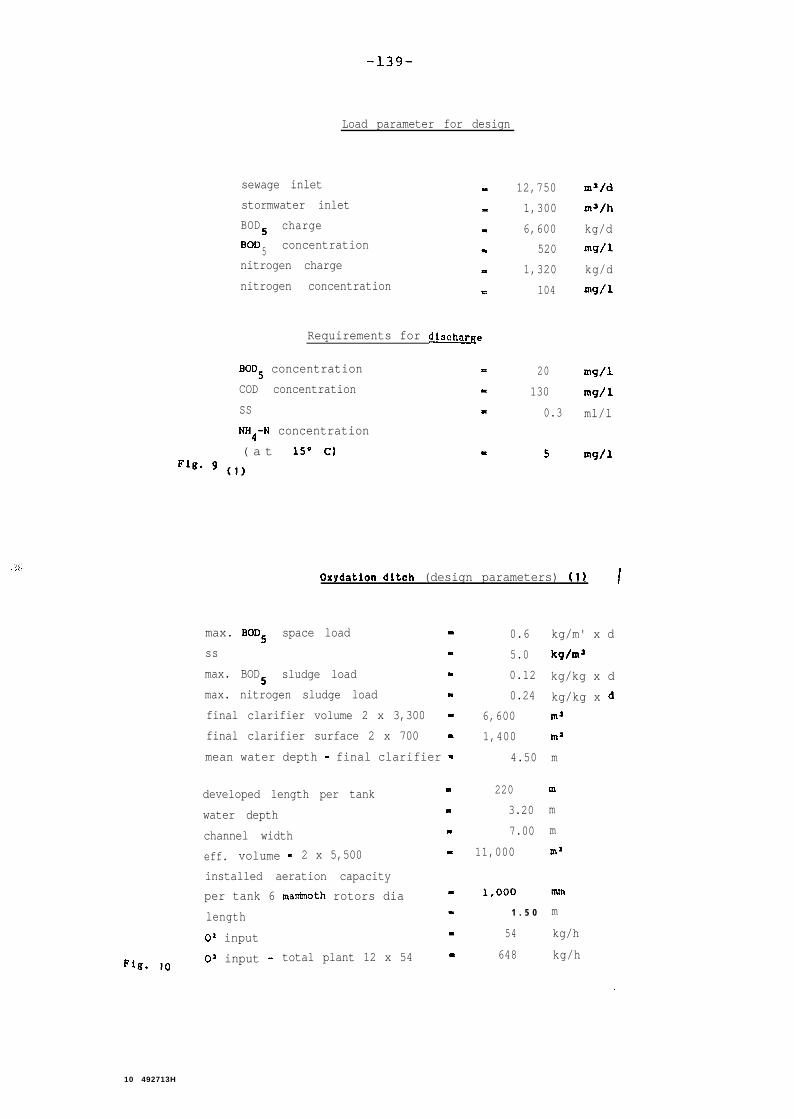
-139-
Load parameter for design
Fig. IO
sewage inlet
stormwater inlet
BOD5 charge
8005 concentration
nitrogen charge
nitrogen concentration
D 12,750 ma/d
- 1,300 m'/h
I 6,600 kg/d
I 520 mg/l
P 1,320 kg/d
- 104 mg/l
Requirements for discharge
BODS concentration P
COD concentration 1
SS I
NH4-N concentration
( a t lS" C) *Fig. 9 (,)
20 mg/l
130 mg/l
0.3 ml/l
5 mg/l
Oxydation ditch (design parameters) (1) I
max. SOD5 space load -
ss I
max. BOD I5 sludge load
max. nitrogen sludge load I
final clarifier volume 2 x 3,300 -
final clarifier surface 2 x 700 -
mean water depth - final clarifier -
developed length per tank I
water depth I
channel width I
eff. volume - 2 x 5,500 I
installed aeration capacity
per tank 6 matioth rotors dia -
length I
0' input I
0' input - total plant 12 x 54 -
0.6 kg/m' x d
5.0 kg/m'
0.12 kg/kg x d
0.24 kg/kg x d
6,600 mJ
1,400 ma
4.50 m
220 m
3.20 m
7.00 m
11,000 rn'
1,000 mm
1 . 5 0 m
54 kg/h
648 kg/h
10 492713H
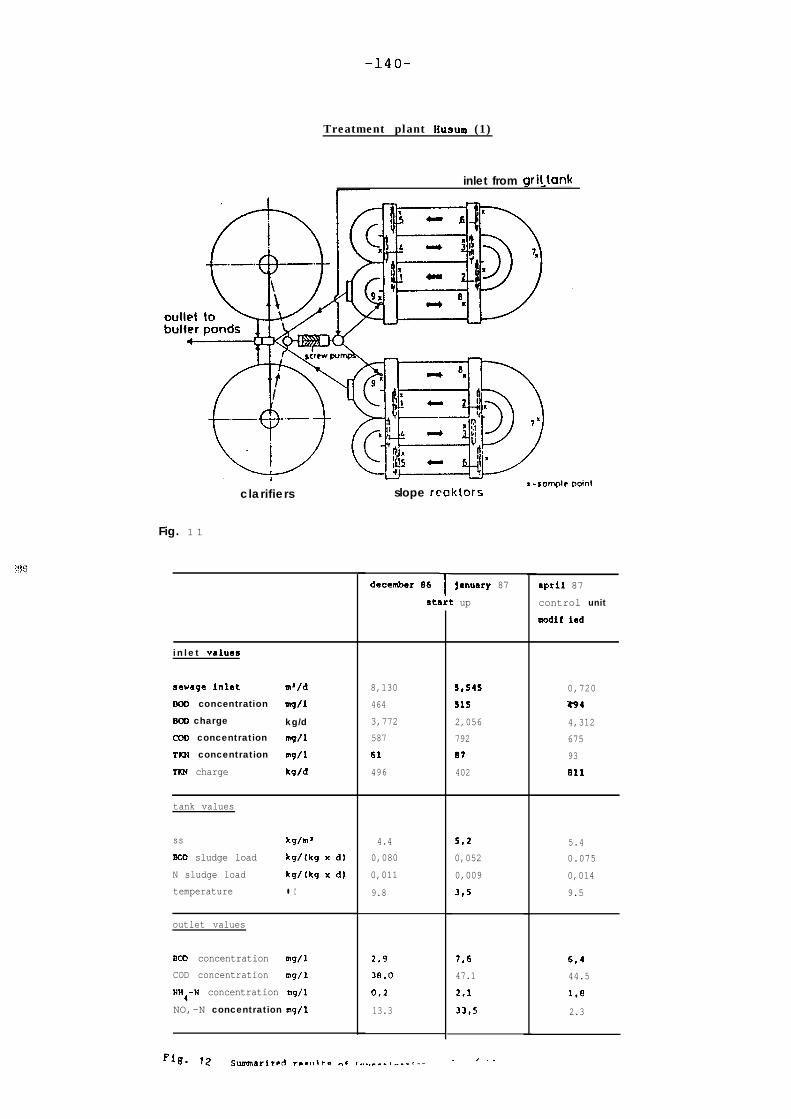
-140-
Treatment plant Husum (1)
inlet from qri\tank
clarifiers slope reaktors
Fig. 1 1
inlet values
sawage inlet d/d 8,130 3,545 0,720
BOO concentration w/l 464 115 x94
BOO charge kg/d 3,772 2,056 4,312
cob concentration mg/l 587 792 675
TiU4 concentration mg/l 61 87 93
TXN charge kg/d 496 402 a11
tank values
ss kg/m'
BOO sludge load kg/(kg x d)
N sludge load kg/(kq x dl
temperature l C
outlet values
4.4
0,080
0,011
9.8
BOO concentration mg/l 2.9
COD concentration mg/l 38,O
NH4-N concentration mg/l 0,2
NO,-N concentration mg/l 13.3
Fig. 12 swmnarixrn r.c,,lte "f in*.r.r‘_--r_-
dcccmbet 86 Tmt
jrnuary 87
: up
5,2 5.4
0,052 0.075
0,009 0,014
3,5 9.5
7,6
47.1
2,1
33,5
. ,..
6.4
44.5
1.0
2.3
april 87
control unit
modif fed

-
-- -25-
---
---
--1=3
--_
--
--
--
-
=I
-1
.-

Q-:
NachgcschaltetcOenitrtfikation
VorgcschalteteOcnitrifikation
SimultaneOcnitrifikation
AlterniercndcOcnitritikotian
lntermitticrendcDenitrifikotion
Kaskaden-Ocnitrifikation
Gctrennte Oenitrifikation+ Methanolrugabe
8 , KombinicrteOcnitrifikation
Vorgcschattete Pnaaob-u.Denitrifikationsstufe
,,.,, Simuitanc Oenitrifikat.mit vorgeschalteter
Anacrobstufe
20.. * I
04 40 1 2 1 4 I ORV
'ZO = Deni. E f f i c i e n c y
n I quantity of Den-stages
xv reafrculation ratio
QRS = R(icklaufmenge aus Nachkilrung
QRz = Rezfrkulationsmenqe Lnnerhalb einer aus O-und N-Stufe bestehenden Kaskade
Q = Zulaufmenge
Fig. 17 Max. denitriflcation efficiencydepending of the recirculationratlo and the number of Stages.

-143-
Jerry Xurbiel
Institute of Sariitary and Qwironnental
Cracow Technical University, Y:arszanska
?oland
Engineering
24, 31-155 Xra!&,
Nitrogen and phosphorus compounds are one of the clost
important constituents of nater contaM.nation. Their presence irr
waste:vaters discharged into the surface mters creates a danger
of recontamination by i2romoting acluatic grow-Ah and eutrophication.
,:,..’ t:t the sane time, both these substmces are the min nutrients
controlling biological gronth in the aquatic environment.
Phosnhorus has been corsidered the limiting nutrient in Poland.A.
*"rotection of receiving mtcrs, lakes and im>oundnents is only
one reason for cievcloping advanced xastcnater treatment technologies
presence of an escess nutrients results also in poor v:ater ciuality
making water unsuitable for the prospective nunici:)al and industrial
users. The latter becomes very significant in the highly.‘,
industrialixed resion of South ?oland Acre the deficit of lvater
resources is severe.
;?ster that has been ueccvcred from r.luuicipal sex-cage at nater
reclamation giants in Siicsia and Cracon regions is planned to be
reused in the cooling systems of rzetal and electric go\;er iszdustry.
Kitrogen is a liriiting nutrient for this application. !,Icximum
concentration of ammonia io9s allcwed in the cooling systems due to
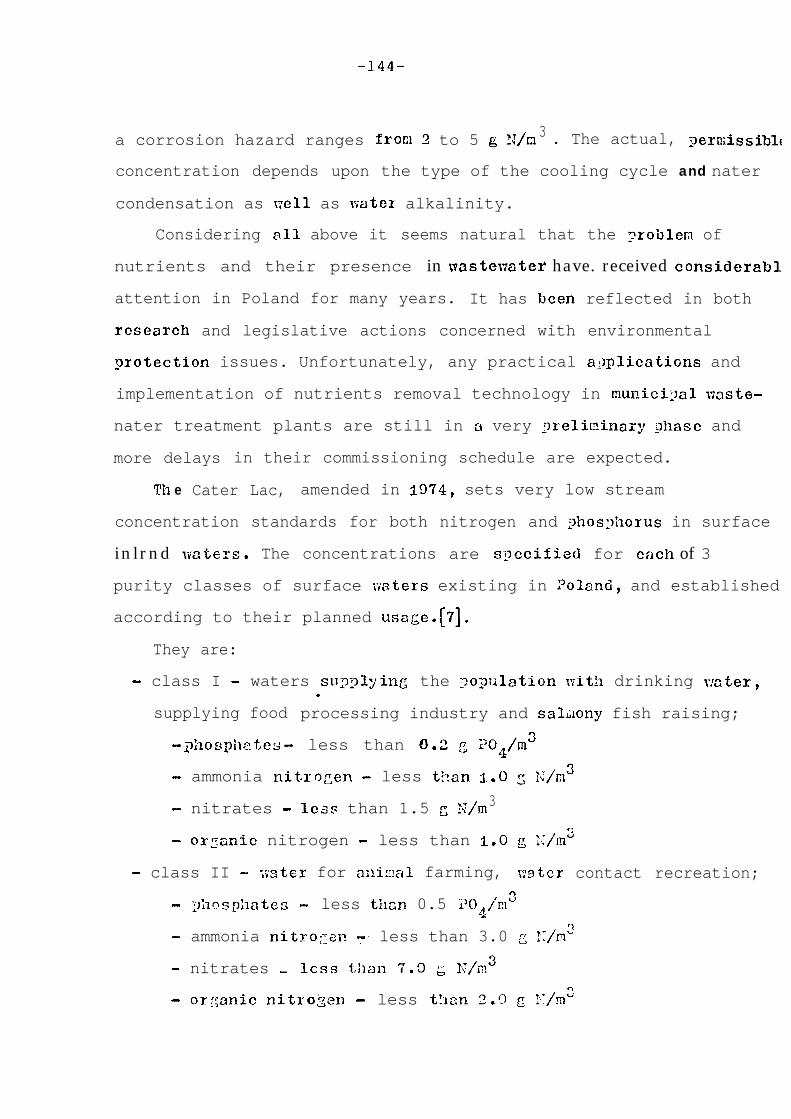
-144-
a corrosion hazard ranges from 2 to 5 g !:/n 3 . The actual, >ermissiblc
concentration depends upon the type of the cooling cycle and nater
condensation as sell as \vater alkalinity.
Considering all above it seems natural that the Troblen of
nutrients and their presence in aastemater have. received considerabl
attention in Poland for many years. It has been reflected in both
research and legislative actions concerned with environmental
protection issues. Unfortunately, any practical applications and
implementation of nutrients removal technology in munici:)al 17aste-
nater treatment plants are still in a very preliminary ghasc and
more delays in their commissioning schedule are expected.
Th e Cater Lac, amended in 1074, sets very low stream
concentration standards for both nitrogen and $ios:>horus in surface
inlrnd eaters. The concentrations are s;1ccified for CiiCh of 3
purity classes of surface naters existing in ?oland, and established
according to their planned usage.[7].
They are:
- class I - waters suT31yinG the :3o?ulation with drinking water,.
supplying food processing industry and salclony fish raising;
- $hOSpil2tCY - less than 0.2 g i'0q/m3
- ammonia nitrogen - less than 1.0 2 ;:/m3
- nitrates - less than 1.5 g 22/m3
- organic nitrogen - less than 1.0 g ;I/m'
- class II - xster for animal farming, aster contact recreation;
- ;>hos?hates - less than 0.5 ?i)o in"4.
- ammonia nitro;:2.n y‘ less than 3.0 2 Z:/n3
- nitrates - less tllall 7.9 6 K/m3
- orgnic nitrozen - less t!lcn 2.9 g IT/m3

- 145 -
- class III - cater supplying ipdustr:, and aq_ricultcrzl irrigation
Despite existing nater quality standards, local cater protection
authorities tended to overlook their esccution :~;i.t!t respect of
nutrients rccovc2 in t;le i073-ties even ;-,%cn it rTou2d bc adviscklc
due to an insufficient dilution ix receiving ;_.xters. Such 902icy
~2s a result of high costs znd tccImic.22 :~roblccc zs?ociat r?d l::itk.
n6;7 technologies of nutximts rel;;ovcl ts vie11 i;s the difficulties
with an accurate transfer of xaCcr stal?c!;;Y~?s into rx3simurr; ~;a s te:;,a ter
concc;ltzations. Axicipa2 ~tste,;:-atci trcatcicxt ~lmt design criteria
xei-e iLain15 i,a~ed o!: organic lc;c:ir,g c:;;)ressed 2s XE,..33xistiuz st,Ietfi crater c,uality staPd;rcls for :;urfacc Yxters
:,e r c difficult to enforce ix ccsc of lakes r:xd ii~:.,cundscnt rCs~lV@lis
2il.d tllat is nhy the 1I:stitute cf Lnvironcc~:tal I;rotcction i;? :;ci'sa:c
has recently Cevclopzd a set of !:c~; xcgu2zttions. Tkcy arc based on
the i;zstC\;atCr effluext iinits znd Jay ?z mcd ir, those lake
c?rzmace Sasins 5:lic;i arc co~~ecir:ll~~ cctro$~ication scusitive.
~ro;losb~-3 nea stanGerG:s inelude also ~??i:_os~>l~o~~~s considered as a
li;i:ftill~ i?ctYicnt. B lcgislativc action oii this issue is still
pending.
Lcke standc;rcis ai~ly to the sni::e f-class scclc of i*;ater .purity:
i’lass I - direct I-:a!stexater disckaL;;e to tiie Iafrc 2s not a22c-~26 ;
cry disci1arg.e to i_Ac rivers or siree~.z_is locaLed l%:itllin the IniLe
drain-n,,e basin canrlot cxceec! t.hc tota :;;l-os:~,horus level in
~;astc\;-atcr efflucr,t of I g ?/a'
Class II aud III - direct x~steccter Cisci:nr;;e to C!lo lnlre is
allomd; ixaxii:lun conGe?:tl-ation of total _>l!oa;;llorus ii-: :;;:ste-
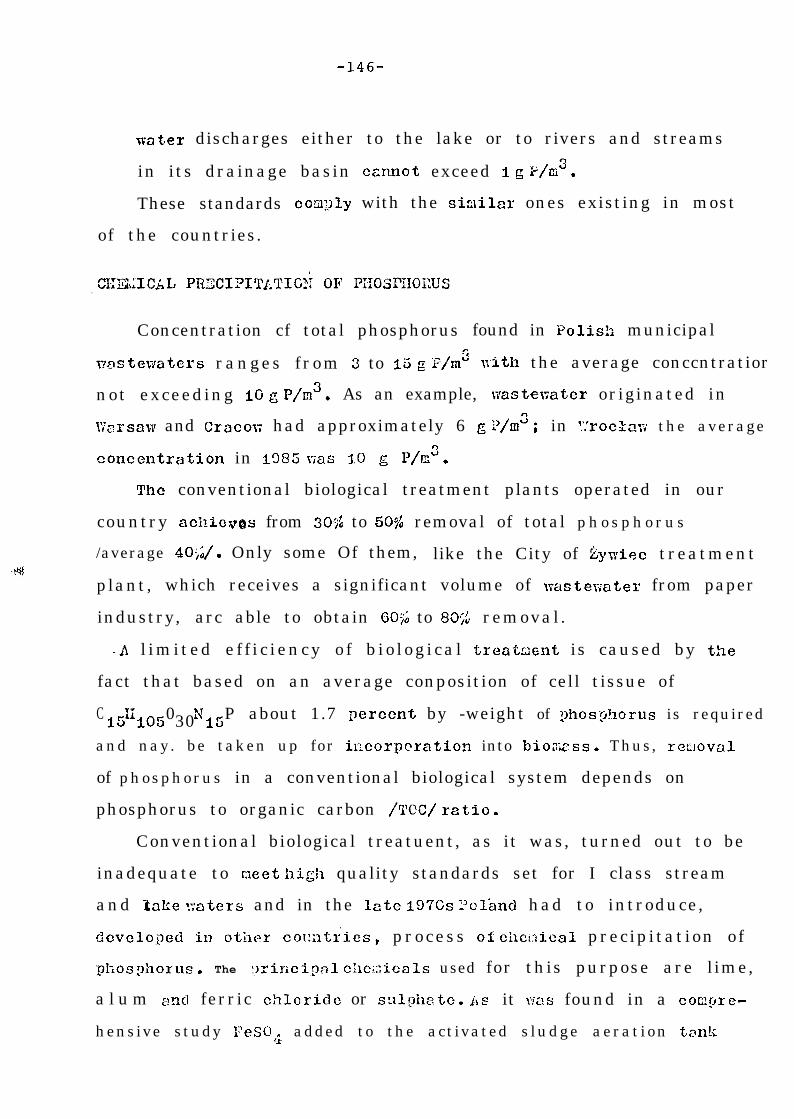
-146-
rater discharges either to the lake or to rivers and streams
in its drainage basin can-not exceed I g 2/m3.
These standards comply with the sirAlar ones existing in most
of the countries.
Concentration cf total phosphorus found in Polis!l municipal
VaSteVjaters ranges f rom 3 to 15 g F/m’ n-ith the average conccntratior
not exceeding IG g P/m3. As an example, wasteaater originated in
Karsam and Cracol; had approximately 6 g Z/m’; in YrocZa~-; the average
concentration in 1085 Vas 10 g P/Es.
The conventional biological treatment plants operated in our
country achieves from 30;;$ to 50% removal of total p h o s p h o r u s
/average 4OjJ. Only some Of them, like the City of kywiec treatment
plant, which receives a significant volume of wastenater from paper
industry, arc able to obtain 60~; to 80:: removal .
. A l imi ted e f f i c i ency o f b io log i ca l treatacnt is caused by t,he
fact that based on an average conposition of cell tissue of
C 15%05 30 150 N P about 1.7 percent by -weight of :jhosphorus is required
and nay. be taken up for il:corpcration into biomss. Thus, rel;loval
of phosphorus in a conventional biological system depends on
phosphorus to organic carbon /TN/ rat.io.
Conventional biological treatuent, as it was, turned out to be
inadequate to r;leet high quality standards set for I class stream
and lake ?;aters and in the late 1976s Yoljnd had to introduce,
dcvcloped in other countries, process of cilc0ical precipitation of
phOSphOrUS. The ;)rincinnl cileizicals used for this purpose are lime,
a l u m and ferric chlcridc or sulphate. ils it was found in a com:Pre-
hensive study FeSO 4 added to the activated s ludge aerat ion tank

-147-
appeared to be cptimal; i t r e s u l t e d i n t h e e f f e c t i v e ;1?hosphorus
removal, though 2I-I a d j u s t m e n t v.ith lime v3s necessary in some cases.
Po l i sh research - d e s i g n office CTK, together :vi th VEB Pro jelctierung
?Tasserwirtschaft IIalle /GIG?/ has deve loped a set o f s tandard
i n s t a l l a t i o n s f o r c;lenioal prepration a n d d o s i n g .
A l s o , tire Technical Univers i ty at l’oanan developed a deta i led
d e s i g n c r i t e r i a f o r c h e m i c a l p r e c i p i t a t i o n o f p!1os>horus in a n
a c t i v a t e d s l u d g e ty?e Tackage plant. T13ioblok’1 norking i n a n
extended aeration mode. T h e applied dosages of 2reci2itant vary
f r o m ri-0 to I50 g FeSC,*-2. ‘E20/m3 de>endin_g on the required degree
of ?hos:Giorus r e m o v a l . Yhe dosage has been expressed as a zolar
rat io Fe : F that y i e l d s t o t h e r a t i o o f ortho~~hosphates to tctal
phosphorus Port/Ptot; The latter becomes a convenient indicator of
p r o c e s s e f f e c t i v e n e s s ; f o r cxam?le, a d o s a g e Fe : P = 2 : I r e s u l t s
in an e f f luent orthophosphates c o n c e n t r a t i o n 0 . 2 g Port/m3, r;hich
a m o u n t s t o 1 g Ptot/m3, providing t h a t PortjPtot = C.2. [53.
If tert.iary t r e a t m e n t process i n c l u d e a l s o filtration, ndditio-
1X31 30;; phosphorus is removed. It has been f o u n d , Oat the cIle!:licols
introduced into the aerat ion tank do not inhib i t the nitrification,
and el?hanc e s e d i m e n t a t i o n md denaterins of mixed primary and
ectivatecl s l u d g e .
?hos~3l~orus removal in an activated sludLge a e r a t i o n tan!c cith
&SO,) 8s a main chezicsl, h a s b e e n r e c e n t l y i~:~~le:;:entecl in zany.I.rastenater treatment p lants in Folznd. They l-311 cover a tide
r a n g e o f ccyjacitics and some of thee e r e a l r e a d y i n t h e i r f i n 2 1
stacc o f c o n s t r u c t i o n . Some of these IJlznts a r e l o c a t e d a l o n g t h e
COBS t v;iith a d i r e c t Giscii3rge int.0 Scltic Sea. T h e y a r e :
i/ GC1 c? :k!‘--Y, ‘schjd t r e a t m e n t Flant /IS0 000 m’/d/ ; mechsnicel

-148-
treatneat Dlant aith nitrififacticn, denitrification and
cI!er.lical prccipitrtiop of phosphorus in an seration tank.
1.Iaxim.m dosage of ckenical /I50 g l?eSO$* 7E2O/a3/ resulted
in 2!4-)i, rcno~Ja1 of ghonphorus and final effluent conce~trztion
C.G 2 ?/RF. The slmt is scheduled to begin its ol)eration
in 1992.
2/ Gdynia-D$bog&ra tr eatnent pl,-nt /I20 053 u'/d/; activated
sludge treatmmt ,lznt /system A-3/ :Tith r?!lmicatl precipi-
tztion of y~,ilosphoxus. The i~lallt vi.11 come into 02eration in
froIJ ?uck. and '..-3~dys~awo~~o . T:re construction of biological
reactors llZioOl;.syblol;lf nitb chei'.lical grecigitation of
phosphorus is a12iost conplstcd.
&/I:artuz;, tIzztnf,nt giant /lL!W L13/d/; ex:jenc?ing of the
existing biological t.res;tizent ;)lr:nt v;ith c:xr;ical precipi-
tation of $:osp~orus wing PeSGC.b
The 0ti:cr 3rezs Acre tl;erc is a need for construction of
U2der Silesia i-cziom.
A vcfq' intexcsting, coL:;;reileilsivc study hz,s been done at a
:?ilGt-sCc? le treatment -plant in ::rocZw. ZheEiical prccigitation of
phosphorus Vjith alus-iixiun rrld iron salts iws been _xrformed on a
c;ixturc of rx!i~icigal on6 industri,?,l Fzstewtxrs, Ath an average
:A~os$iorus c0ncentration 4.3 g Ftot/xC. The c'le:Licals :.;ere added
i; t a vzriet: of difierent _2oints in the trest;ncnt. :)reccss. 6 .[ I

-149-
Conventional biological treatrncnt process itself /sludge organic
loading 0.2 - 0.38 g 2CC5/g XXVSS*d/ ;'ras able to achieve sevcrage
49.3;; rer=.oval of total ?hoa>horus and 405 rcnovbl of yhosr)hates.
The best effects -c-:ere observed for zrlm, though, for cconozic
reasons, the ~recigitation with ferjric sulphate was chosen ior
further a?glication.
?:losi1horus rez;ovals :vith FeS04 vaxicd with the point of
c!?,esical addition, md v:ere: in .grinary sedimntation - 94;;, ir:
biolo,riical treatncnt - 96.5,;;, in tertiary treatnent - 99.9;3.
In recent years tAcre has been a grwing interest in nutrients
~:e_r;lov~l 30th through an cxtermivc :)rocesses czrried out in natural
contiitions and through cdvonced intensive i:Jethods carried out in
a soghisticated mm-nacic instzllz.tions.
1. Kutrients rcr;loval ir?_ stabilization gonds
Accc,mlation 01 m1trient.s in zlgac pnd solids settle< on the
bottoa cas esti:wted in t;;o irinds oi stabilication :1or:da. !i!!lc
reses;_ch \-;as done in full-scnlc at Lo:;icz treCiti>C!llt p1Sll-t
/I5 009 &cl/. Percent of total cnnuzl nutrient loads sccmulated
in solids \:cre:
- F'c?,cLltativc r~ord l_ -0 total cilro:eli SfO
total ,::os;3:>orus 2.3;;
- Aerobic pond : total nitrogen 31 1. 5;;o
total jzl;osL~::orus 5.9&
1': s 1. gilificzr,t a;;lount of nutric:its INS also acccnulated in the
algae , r;hicll s:lould be il;;rvestcd 01: 3 xcgtilar bcsfs. .,nnucl

-150-
combined removal of total ghosyhorus observed in both pcnds was
55;';; total nitrogen 513 with a sumer high value 70;;. Eutrients
removal IWS accon2anied by COD5 reduction up to 90?;.[2].
2. TIiological nitrification and denitrification
Ziolc~icnl rmoval of nitrogen, as the only nutrient, is
recommended in case of industrial cnstey;aters conin: from fertilizer
industry; wnicipal aastei;aters trcatncnt combines usualI.: botll
nitrogen retnovnl and chcxical ~~~os~~hor23 :3reci_L2itation, as it is
designed at SdaZslr.-!;*sch6d ti-e2ti::ent pknt.
Construction of t.tl6.3 -giant followed a laboratory-scale research
conciucted Zt t2e Institute of Znvironnental Zrotec'tion ii: ?da:fs:r.
T h e systcn tested cox:~~i,sed of m o n e - s ludf~e activated sludcr,e
syster-; xit:? grclizicary denitrificztion. The 3xoceL;s 72ra:;lcters
~32 r e : hionzss concentxztion = 233? :/n2, rcclrculotion r a t e - 3OO,d,
tecqcrzture 1 7 ° C /SLl.?i?l’:rr/ z,nd 10°C /“idiYlt er/ ,. h;,cks:ulic d e t e n t i o n
t.ixc : E hotirs /deilitfIiicatior~/, 3.2 hocr3 /3;itriiication/, sludno0’
orzcliic lo&dig:> z 0.1:: c; yT+‘g.on*(j, C,ota1 :7iitIogeC concextrn tion
i n the influcnt CL) g TT/r:‘.
-151-
2. Integrated re!Aiov~l of c~r:~oll, nitrogen and ghos@!7^orus in the
acti.vGted sludge process
The very first rcsezrcil in Polar.d on the combified removal of
nutrients fro;: the munici:3al ~T_aste:~cters ~,as donc at ti1t-z Institute
O f Yivironmental Frotection in ::arsaw iq J. Dernzcka, in iSSO-1982.
The project combined dcnitrification and ;3hos:?horus removal in
multifunctional reactors nit11 activated sludge and ;;'cs conducted
on a laboratory scale. The model :;'a~ able to simulate anaerobic/
aerobic conditions sinilar to Tkrdenpho system in different
conf i~urations. The O;Jtimm $rOCCss i?araZCters, at the temperature
IG-2C°C, 37cre[l] :
- anaerobic tank - hydraulic detention tine - 2 h
- sludge recirculation rate - 20031
- dissolved osygcn - 0 g 02/m3
- aerobic tank - hydraulic detention time - G-7 h
- sludge organic loading - 0.1 - 0.2 2 DOD5jg
- dissolved oqpgen - 2 g 02/m3
During the experiments OO$ removal of 3CD5, total nitrogen and ammo
nia nitrogen xas observed; p!~os~horus reuovai r,7ngcC frorii GO to 89$
Phos-fihorusCA removal ~8s limited by 3C!D5: P ratio /optizun i30:1.3/
and a loi: sludge production, caused by lo\-; sludge organic loading
and high sludge age it3 - 31 daye.
It nas confirmed, that lo\7erinZ the temperature dovn to
iC-12°C resulted in a significant drag in nitrification and deni-
trification efficiencies; removal rates zcre reduced by 50;; and
SO& respectively..
On the basis of operating ex~eeicnce, a multifunctional package
treatment giant PS 150 for extensive integrated biological nutrient
-152-
re!noval h,-s beer, design by PO’iOCAZ in Zcencli. The first installation
4, Eez~oval of xitrogen aG.l gbos,horus in mstcmter reCl;i;lation
system
As it has been stated previously, nutrients removal appears
to 72e the xost urgent in the mste-mter reclsnation systms
suy:>lying T;ater to t::c industrinl users. The schmntic flo:y diaZroms
of water reclanation J3lailts /YIiP/ :3larmed to go into construction
iii the 2carest future in South Polcrrd 8rc shorn ir, Fizs 1 and 2.
They are: ';,X;i? in Lory supylying xatcr to the ccal mine /Fig. i/ and
:;'L? in Crpcov: /'Fiz. 2/ sug?plying water to these industries in the
Crnco9 zrea, ;Xlich cannot draw any rcloi-e cater fron the Yistula
Xver c!cc to 3-i@ saliizity. [3,4].
fls shorn in the diaga!x, the nutrients re:::ovzl process bczrs
its ol>n individual characteristic, l;-ith nitrosen end phosphorus
removal achieved in separate :2rocesses. Xitriiication and denitrifi-
cation arc conducted <as a :part of biologic,?1 trcatnent followd by
coegulation 2nd cllel;lical lmeciyitation of phosphorus Suring tertiar!
treatmxt. Coagulation i=! required in system providing water for
cooling cycles, because it rmoves also other undesired rzfrnctory
substances like COD, alkalinity, coloids.
The zter reclmation syrJtcn, recoAzmended for Cracon differs0
fron the others, alld ?hosphor1!s is ,~.QFoing to be reizoved in a nulti-
functioml biological reactor. It i;ill all05 for a looter coagulant
dosage in the pbos;3horus rrecipitstion *Jrocess.
Chmical grcci?itation of phosphorus will serve as a buffer in case
an estelxzivc biolo~iczl pilosilhorlls rer!ovcl iI? the reactor is
teaporarily inkibited.
-153-
kt present, t:xc castenatcl- rcc;pnl,-,tion process is 5ei:ig t.csted
at Crzccw! 3~. a smll scale r;odel. It con;)rises i2,11 :irocasses of
wter reclznation tosct!3er xAtir a rmltifwctionnl biologicc;l. reactor
The reactor Irorks iI? a closed cycle :::itD. the >reliT!inary active
gzooess KiliCh returns 8 si:j)em c7tw.t fro2 a prcliaimry sludge
thickener. T>e e:qeri:.:cnt Ixs I;;ecun in July IX7 znd it is still
too ecrly to r?rsl: alzy concltwions, though the cintn are ,rc::~isin~.
5. ~cnFtrific2tion of vitrified ::28te:;3tter usi: biological
fluidieed bed
k biological
re,-ctors
20s t significant advontn~es of the re;lctor of this' ty:?e cre:
- very large bicmss surface prca i?l c? reactor wit volme, aPoi;t
tric!ili!ig biofilters,
- !lich oonceqtration of bionass in fltli<izcd ~e~c*Uors - E! to 53 22

-154-
These val~les are hi$ler than the ones quoted by Jeris who
lour,cl Q.j.3 2 ?zr03/~ vsS*d aiicl n*dch higher Wan the ones found at
the 'activated sludge _rrroceas \O.OC - 0.12 2 x03/g VSS*d/.
The volunctric indicator of denltrificaiion rate, characterising
the degree of t!re reactor utilization ranged from 1.5 /:Tith no
methanol added/ to 9.2G .g ii-;:O, rem/m3*d for sU!MZcr time. The latterr)
value is 10 times hizhcr thakr the one found in conventional deni-
trification processes.
The kxlwriments shoced that the i7roccss poceeded T;;ith a ME:!;
kinetic removal rate - 0.4 g X-XC, removal yer s VSS*d.LJ
-6 high concentration of biomass in a fluidized-bed reatcr /20-30
1;~ VSS/n'/, ten times !rig.lier than in activated sludge, results
in a large value of the voWmetric rate of denitrification - up
to 9 !;g IT-220 removal/lm 33 l d .
- I?j_trates removal. efficiency was S&95:& at hydraulic detention
time 3-O min. and tem:~crature 15 - 200,v,
On the basis of es?erimental data the complex rw.thejmatical model
of denitrification kinetics ~i:as developed and verified.
1. ji great need to ixqlement tile optiixxr technologies of nutrient
removal from waste;;reter in Poland is associated with tl70 factors
- water quality standards for the Polish rivers, and the Daltic
Sea :vhich ultimately receives 955; of the wastewters Senerated
in our country ,
- reclaimed wastesatcr quality standards for the cestel:atcrs
that are to be used again in the industry as a source of
coolirq \;-aters.

-155-
technology of its rc:roval is rcceivinz tile :wiority.-,^,n extensive
l?ilot-scale study is J3chg coxirluctcd tkt conccntretes on the
develo;?:.:cr,t. of t:?e O~~tii:XX; nitrific2tion r.ncJ dcnitrification
,31-ocess :x,rnncters.
>Titrcser_ rcnovcl is cons:irYerccJ to be GE iqortant unit process in
the :75::i; t e r r e ;: 1. n I'*,...ztion t@C;illOlO~<y plumed fcx T.J;)_gcr Silcsia ~711~3
Crc?cw:. It is also pro~~3sccJ GS 3 tcrkicry t~eatnent for the
mcwly 3 C S i z J? t: Ci ~x.sterxthx trectncllt giants at the Zialtic Coast.
11 492713H
-156-
REFERENCES
1. Bernacka J.: The integration of carbon, nitrogen and phosphoru:removal from senage in the process of lom loaded activatedsludge. Dr habil.thesis, Institute of Environmental Protect:Warszawa 1984, pp.l-82.
2. Kalisz L., Salbut J.: Removal of nutrients in stabilization parUnpubl. report. Project No PR-7.03. Institute of Environmen:Protection, Varszama 1985.
3. Kurbiel J., Kucharska A., Uzaroaicz R.: Eater reclamation frommunicipal sewage of the city of Zory for coal mining indust:Proc. 4th Intern.Symp. on Advanced I',Tasteaater Treatment andReclamation, Krakow 1985 pp. 361~374.
4. Kurbiel J., geglin I(. and others: h!unicipal mastewater reclana.systems for industrial supply. Intern. report. CPBR ProjectMO 11.10. Krakow 1987.
5. Poznaliska I{.: Symultaneous phosphortjs precipitation in extendefactivated sludge process. Doctor s thesis. Poznari. TechnicalUniversity, Poznali 1983.
6, PrzewZocki,J.,, Lojewska C.t Efficienoy evaluation df differentchemical precipitation systems for phosphorus removal. Unpulinterim report, Project No, CPBR 13.1.6.4., Institute ofEnvironmental Protection. Wrockan Division 1987.
7. Stream standards for surface Tiaters quality. Decree of Ministr:Council dated Nov.29, 1975, Dz.Ustaa PRL ??o 41.
8. Styka !7., Kurbiel J,: Liathematical model of'denitrificationkinetics in fluidized bed reactor. Proc.Qth Intern.,Synp. 01Adva;;;diy7steaater Treatment and Reclamz,tion. Kra!ron 1985pp. - .
9. Teleiyliski A.: Research on effectiveness of \sastewater and sluttreatment at Gdaiisk-Vschjd treatment plant. Unpubl. report,Institute of Fnvironmental Protection, Gdatisk Division 1957

-157-
Nitrification-den i t r i f i co t ion
Chlor inat ion
Fl Pumping
t6000 m3/d Sto rage 3500 m3/d
T=2d CI,- A12(S04)3*18 H,Oinn n /-3
to coolw a s h e r s
I Upf low contact
f i l t r a t i o n I
1 A c t i v a t e d 1
I c a r b o n 1
1500 m3/d
+
ion
* exchangeD i s i n f e c t i o n -Cl2
I I2000 m3/d
to boilers + to cool excavation
Fig . 1 . D e s i g n c o n c e p t i o n f o r w a s t e w a t e r r e c l a m a t i o n p l a n t
a t iory ( 9 5 0 0 m3/d) .
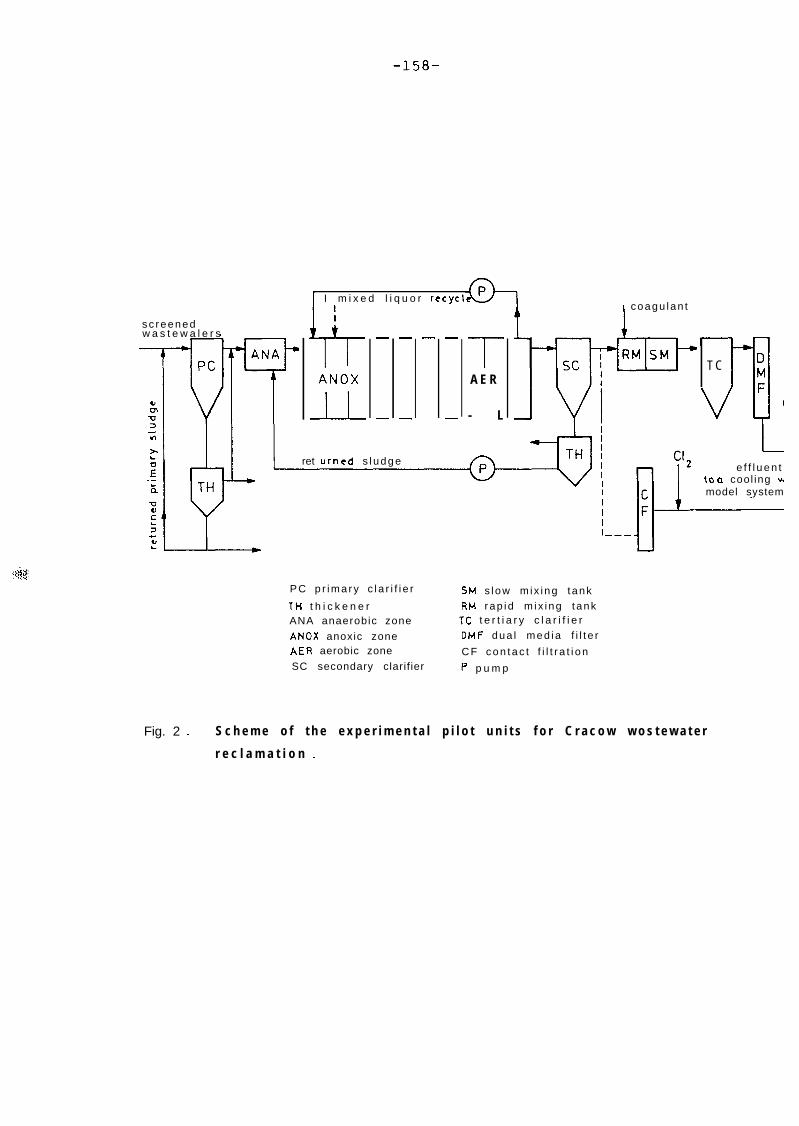
-158-
1 I m i x e d l i q u o r recyclIIvi
ANOX
-LL
-
-
-
-
- -
-
I coagu lan t
sc reenedw a s t e w a l e r s
-T-A E R
- L
DMF;’
e f f l u e n t
T C
to 0 cool ing Hmodel system
ret urned s l u d g e
P C p r i m a r y c l a r i f i e r SM s low m ix i ng t ank
TH t h i c k e n e r RM rap id m ix i ng t ankANA anaerobic zone TC t e r t i a r y c l a r i f i e r
ANOX anoxic zone DMF dua l med ia f i l t e r
AER aerobic zone C F c o n t a c t f i l t r a t i o nSC secondary clarif ier P p u m p
Fig. 2 . S c h e m e o f t h e e x p e r i m e n t a l p i l o t u n i t s f o r C r a c o w w o s t e w a t e r
r e c l a m a t i o n .

-159-
INTRODUCTION INTO SEQUENCING BATCH REACTOR TECHNOLOGY
Peter A. Wilderer
Technical University of Hamburg-Harburg
Eissendorferstr. 38
2100 Hamburg 90, West Germany
DESCRIPTION OF THE PROCESS
The Sequencing Batch Reactor (SBR) process is commonly understood to be a
modification of the continuous flow activated sludge process, although the SBR
principle can be and has been applied to biofilm systems as well.
In general, the SBR process is distinguished by three major characteristics:
(1) periodic repetition of a sequence of well defined process phases;
(2) planned duration of each process phase in accordance with the treatment
result to be met;
(3) progress of the various biological and physical reactions in time rather
than in space.
Applied to the activated sludge process, the typical sequence of process
phases is sketched in Figure 1 and 2.
At the beginning of each cycle, the SBR contains a certain volume of water,
and activated sludge settled at the bottom of the reactor. The cycle starts
with a fill phase of distinct duration. The fill phase may be short or long
depending on the effects which are desired to be achieved.
With the beginning of the fill phase, or some time later, the aerator is
turned on. The aeration phase which now begins may last until the biode-
gradable portion of the organic wastewater constituents has been degraded,
and/or nitrification has been completed.

-160-
Sequence of process phases & options
fill
-3lllli?J. ..A -...55..5................5.::::~::::::::::::::::::::::::::‘........f I.~.~.~.~.~.~.~.~.~.~.~.~
aeration
.:.:.:.:.:.:.:.:.:.: .:::::::::::::::::j;~:i:~:~:~:~:~~~~~~:~~~~;~~~~. ‘:i:~:~:~:~:~~~:~.:~:::::::::~:::. ..i.... i..... ..‘(
mixing &:.:.:.:.:::j::;::~ ~:.r:.:.:.:.~:::C~:iii_:.>:.:.:<<< . ...:.:.:, ~~,:’ii;;;~:;;;$;~;;; ‘:>$$~~~::;g~~,~,>-.-l........ . . . . . .ii .._,_...,..:~:g:;:~;:y >:.y,....:.; 3:.:.1):,:.:,:,..:.:.: . . . . . .._._........._..,.,.,_,. ,.,.,.,._._._.i:~:I:~:i::i~j;.:::::~::::::::::::::::
settle
drain
idle
ilIiI!x.~;.:.~~.~.~.~.;.;‘z A.. :.x.:.:........................ . . .:...:.:...:
..> ................................ ...
u’55........................-.....-..~:ff.:.:.:.:.:.....-.............-..
slow or fastwith or without aeration
until completion of- C-removal- nitrification
- denitrification
small or large portion
until needed again
Figure 1 Typical sequence of SBR process phases

-161-
aeration
mixing
settle
Figure 2 Representation of the SBR process phases as they are periodically
repeted.
To achieve denitrification it is necessary to add an anoxic phase during which
the reactor content is smoothly mixed.
Eventually, mixer and aerator are turned off. The sludge is allowed to settle
under entirely quiescent conditions. A clear water zone (supernatant) appears
which can be progressively withdrawn as the sludge blanket moves downwards.
Once the water level in the reactor has reached the lower setpoint the mixer
is turned on for a short period of time to distribute the sludge evenly, and
to allow controlled withdrawal of the surplus sludge. From now on the SBR
idles until a new batch of wastewater is available to be filled into the
reactor.

-162-
ADVANTAGES OF SBR OPERATION
Periodic repetition of process phases is not a unique feature of the SBR
process but of the activated sludge process in general. The periodic nature of
continuous flow activated sludge systems becomes obvious, when the activated
sludge is observed while recirculating through a cascade reactor system
(Figure 3).
In such a system the microorganisms may experience very different
environmental conditions as they flow from one to the other compartment of the
cascade. Some of the environmental conditions can be actively influenced by
the engineer. Among these are the mean concentration of the organic wastewater
constituents in the influent compartment, the occurance of starvation
conditions for the heterotrophic bacteria in the downstream compartments, the
oxygen concentration, and the turbulence.
waterin
reactor sett ler
water
biomass
Figure 3 Representation of a continuous flow activated sludge treatmentsystem. The micoorganisms circulating in the system experienceperiodically changing environmental factors as in the SBR

-163-
Periodic change of environmental conditions is a factor which has a signifi-
cant effect on the composition of the activated sludge and on it’s overall
metabolic potential. For instance, nitrifiers and denitrifiers can only be
forced to live together and form a biocommunity, when the activated sludge is
periodically exposed to aerobic and anoxic conditions. Chudoba (1985), van den
Eynde (1983) , Chiesa (1982) and many others demonstrated experimentally the
effects of periodic feast/famine conditions on sludge settleability. It isassumed that as long as the substrate concentration is high, floe forming
organisms become capable of outgrowing their filamentous competitors; starva-
tion conditions, on the other hand, favor synthesis of the slime material
(extracellular polymers) the floes are made of.
Of importance, however, is not only the existence of periodic changes of
environmental conditions but also the duration during which the microorganisms
are exposed to specific situations. The duration of the various process phases
controlls enrichment of particular groups of microorganisms. And of course,
the duration of the process phases determines which degree of treatment can be
obtained.
The great advantage of the S8R process is that the duration of the various
process phases can be chosen and maintained independently of any variations of
the treatment plant influent. Once the reactor has been filled the process is
executed according to it’s own rules. The resulting effluent values are low in
variability. The process is controlled by timer settings and, if required, by
the result of analytical parameters which can easily and continuously
measured, as for instance: dissoved oxygen concentration, pH, water level in
the reactor and turbidity. The SBR, inherently, is an automatically controlled
process (Wilderer et al., 1987), and requires only very limited operator
assistance.

-164-
DESIGN OF SBR SYSTEMS
Since wastewater is normally delivered to treatment plants on a regular basis
but is filled into the SBR only during distinct periods of time an SBR plant
must consist of several reactors to be operated in parallel, and must provide
holding capacity. Figure 4 contains the typical flow schematic of an SBR
treatment plant.
If the actual fill regime is not of concern, and the wastewater is allowed to
fill the available SBR by gravity (Irvine et al., 1985), the demand for
holding capacity shrinks to a minimum. A by far higher demand of holding tank
capacity exists, when the fill regime is strictly regulated (GBrg and
Wilderer, 1987), and the inflow to the treatment plant is highly variable. A
storm water standby tank is necessary, when the wastewater is received from a
combined sewer system.
storm waterstandby tank
4
SBR, --H
I,- sceen etc. 1 holding tank,
b primary settlerSBR, +4
,
t f
\ SBR3 -ba
t
t*
3
sludgetreament
Figure 4 Flow schematic of a Sequencing Batch Reactor wastewater treatmentplant

-165-
NITRIFICATION/DENITRIFICATION
As in continuous flow activated sludge systems, nitrification can be achieved,
when the SBR is operated at a sludge age of above 5 days. The possibilities to
enrich for nitrifiers, and to force nitifiers to express their metabolic
capabilities is especially favorable in SBRs. That is because organic
substrates are converted at the very beginning of the aeration phase so that
heterotrophic bacteria switch soon to endogenous respiration, and nitrifiers
have free access to oxygen, then.
Termination of the nitrification process is characterized by a significant
drop of the overall respiration rate (Figure 5), and can be easily and auto-
matically detected by examination of the profile for the concentration of
dissolved oxygen.
Denitrification can theoretically be accomplished during a mixing phase which
is added to the aeration phase but the time required would in this case be
extremely long. That is because organic substances required as electrone
donors were already converted during the intial phase of the cycle, and only
stored products are left to drive the denitrification process.
Various methods have been proposed to speed the denitrification process up
(Wilderer and Schroeder, 19BS). Most favorable results could be achieved by
application of quasi-simultaneous operation strategies (Wilderer et al.,
1986). The reactor used for the respective pilot studies is sketched in Figure
6. It consists of two interconnected cylindrical compartments, the inner
cylinder for denitrification and the outer tubular compartment for nitrifi-
cation. An adjustable pump allows control of the retention time of the mixed
liquor within the two compartment.
The results obtained from a comparison study are summarized in Table 1. To be
treated was septic tank supernatant. The efficiency of the SBR process was
comparable with the efficiency of a full scale continuous flow activated
sludge plant. However, only half of the reactor tank volume was required.

- 1 6 6 -
0
40
3 0
;:
0
0
aeration
2 3 4 5 6 7
time, h
Figure 5 Development of the concentration of filterable organics (FCOD),ammonia and nitrate nitrogen, and the development of the respirationrate during the react phase of an SBR cycle.
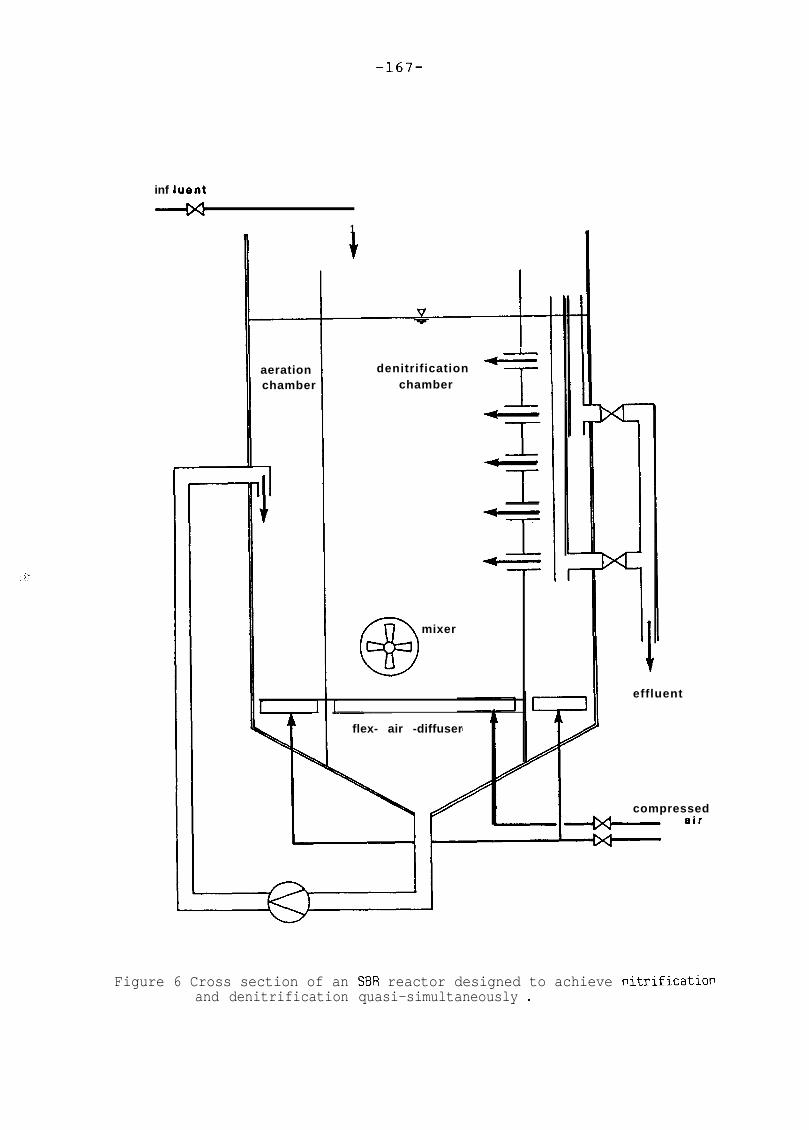
-167-
inf luent
1
aerationchamber
denitrification1
chamber
@
mixer
~~~flex- air -diffuser
effluent
compressed
Figure 6 Cross section of an SBR reactor designed to achieve nitrificationand denitrification quasi-simultaneously .
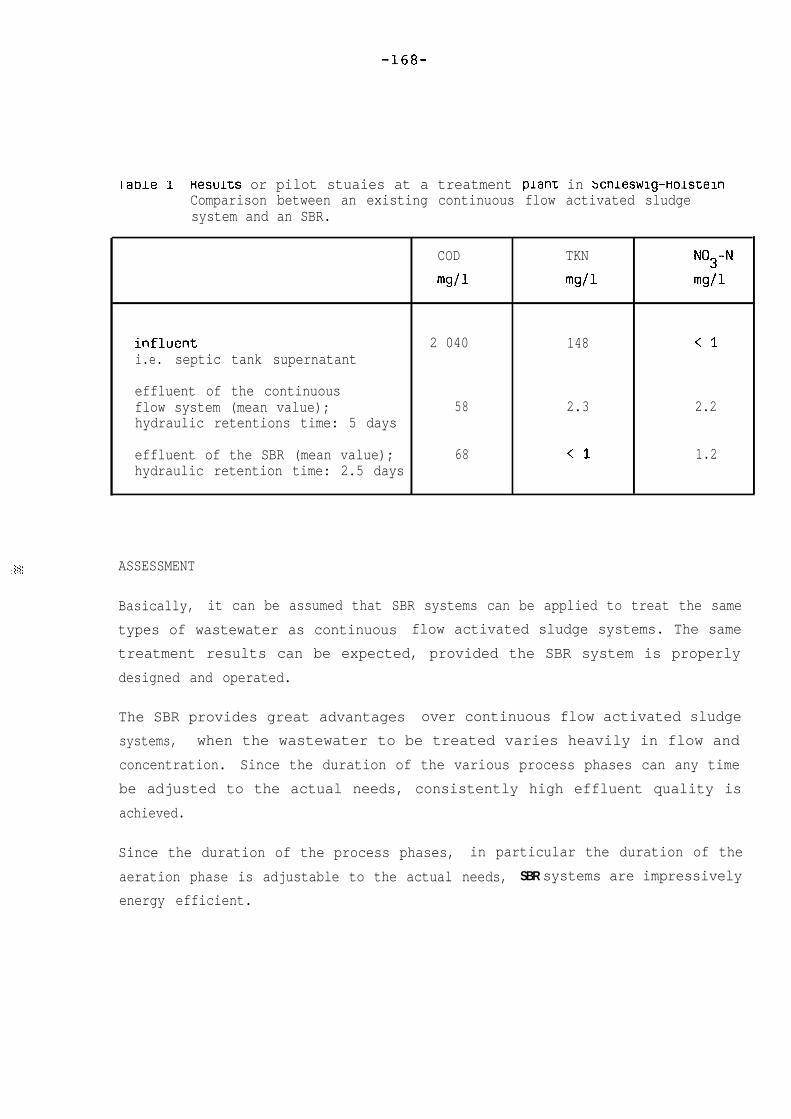
-168-
laole 1 Hesults or pilot stuaies at a treatment plant in Xnleswlg-HolsteinComparison between an existing continuous flow activated sludgesystem and an SBR.
COD TKN N03-N
mg/l mgll mg/l
influent 2 040 148 (1i.e. septic tank supernatant
effluent of the continuousflow system (mean value); 58 2.3 2.2hydraulic retentions time: 5 days
effluent of the SBR (mean value); 68 <l 1.2hydraulic retention time: 2.5 days
ASSESSMENT
Basically, it can be assumed that SBR systems can be applied to treat the same
types of wastewater as continuous flow activated sludge systems. The same
treatment results can be expected, provided the SBR system is properly
designed and operated.
The SBR provides great advantages over continuous flow activated sludge
systems, when the wastewater to be treated varies heavily in flow and
concentration. Since the duration of the various process phases can any time
be adjusted to the actual needs, consistently high effluent quality is
achieved.
Since the duration of the process phases, in particular the duration of the
aeration phase is adjustable to the actual needs, SBR systems are impressively
energy efficient.
-169-
The SBR can and must be operated automatically. Simple timers are the minimum
requirement to operate an SBR system. Higher sophistication of process control
and management can be achieved without the need for employment of complicated
analytical devices. As a result, SBR systems appear to be especially well
suitable at locations where only little or no operator skill is available.
REFERENCES
Chudoba, J., J.S. Czech, J. Farkac and P. Grau (1985): Control of ActivatedSludge Filamentous Bulking - Experimental Verification of a Kinetic SelectionTheory. Wat. Res. 19, 191-196
Van den Eynde, E., J. Geerts, B. Maes and H. Verachtert (1983): Influence ofthe Feeding Paterns on the Glucose Metabolism of Arthrobacter sp. andSpaerotilus natans, Growing in Chemostat Cultures, Simulating Activated SludgeBulking. Europ. J. Appl. Microbial. 17, 35-43
Chiesa, S.C. and R.L. Irvine (1982): Growth and Control of FilamentousMicrobes in Activated Sludge - An Integrated Hypothesis. Proc. 55th Ann. Conf.WPCF, St. Louis
Wilderer, P.A., S. Gorg and J. Dettmer (1987): Automatic Control of SequencingBatch Reactor Activated Sludge Treatment Systems. Proc. EWPCA-Symposium '87,Munich, West Germany, 141-154
Irvine, R.L., L.H. Ketchum, M.L. Arora and E.F. Barth (1985): An OrganicLoading Study of Full Scale Sequencing Batch Reactors. JWPCF 57, 847-853
Wilderer, P.A. und R.L. Irvine (1985): Sequencing Batch Reactor Verfahren zurbiologischen Abwasserreinigung - Konzept, Wirkmechanismen und Betriebs-erfahrungen. GWA, Aachen 69, 521-547
Gorg, S. and P.A. Wilderer (1987): Hydraulische Bemessung von SBR-Anlagen. Z.f. Abwassertechnik (in press)
Wilderer, P.A. und E.D. Schroeder (1986): Anwendung des Sequencing BatchReactor (SBR) Verfahrens zur biologisachen Abwasserreinigung. HamburgerBerichte zur Siedlungswasserwirtschaft 4
Wilderer, P.A., S. Gorg und K. Hempel (1986): Treatment of Domestic Wastewaterfrom Dwellings and Small Communities in a special Treatment Plant. 3rd German-Japanese Workshop on Wastewater and Sludge Treatment, Tsukuba, Japan

-170-
EFFECTS OF LOW TEMPERATURE ON NITROGEN REMOVAL PROCESSES
Peter A. Wilderer
Technical University of Hamburg-Harburg
Eissendorferstr. 38
2100 Hamburg 90, West Germany
ABSTRACT
Temperature must be understood to be an environmental factor which affects not
only the reaction rate but also the composition of the multi-species bio-
communities employed in biological wastewater treatment plants. Both effects
must be taken into account, when impacts of low temperature on the efficiency
of biological treatment systems are to be assessed.
Based on the results of pilot scale studies biofilm systems appear to be
superior over suspended growth systems. Nitrification could be maintained even
at a temperature of only 1 'C. Trickling filters employed for nitrification
proved to be reliable even at low temperatures but, nevertheless, limited in
capacity.
BACKGROUND
Temperature affects the microbial systems in wastewater treatment plants in
two different but interrelated ways. Short term and long term effects have to
be distinguished.
The immediate response of any temperature change is change of the rate of
metabolic reactions such as substrate uptake, respiration and growth. The de-
pendency of the reaction rates on the temperature can be modelled according to
the Arrhenius law:
In rmax = In k. - Ea R-l T-l
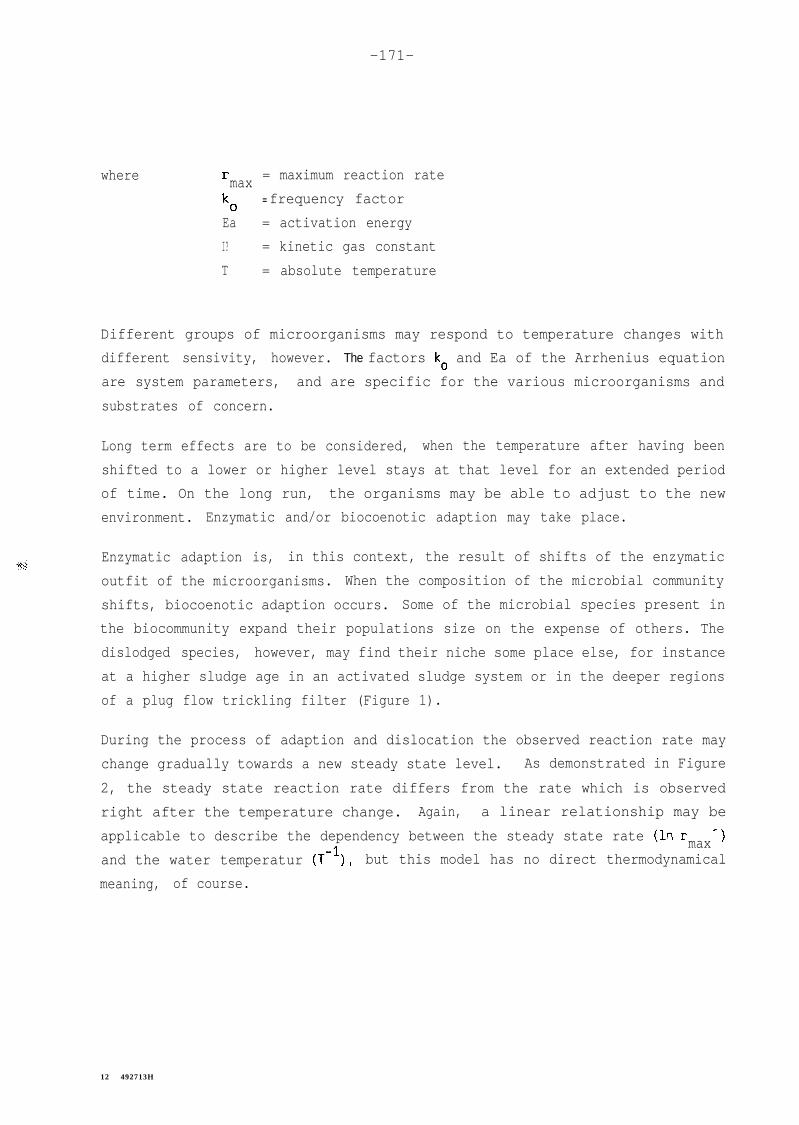
-171-
where rmax = maximum reaction rate
kO= frequency factor
Ea = activation energy
I? = kinetic gas constant
T = absolute temperature
Different groups of microorganisms may respond to temperature changes with
different sensivity, however. The factors k. and Ea of the Arrhenius equation
are system parameters, and are specific for the various microorganisms and
substrates of concern.
Long term effects are to be considered, when the temperature after having been
shifted to a lower or higher level stays at that level for an extended period
of time. On the long run, the organisms may be able to adjust to the new
environment. Enzymatic and/or biocoenotic adaption may take place.
Enzymatic adaption is, in this context, the result of shifts of the enzymatic
outfit of the microorganisms. When the composition of the microbial community
shifts, biocoenotic adaption occurs. Some of the microbial species present in
the biocommunity expand their populations size on the expense of others. The
dislodged species, however, may find their niche some place else, for instance
at a higher sludge age in an activated sludge system or in the deeper regions
of a plug flow trickling filter (Figure 1).
During the process of adaption and dislocation the observed reaction rate may
change gradually towards a new steady state level. As demonstrated in Figure
2, the steady state reaction rate differs from the rate which is observed
right after the temperature change. Again, a linear relationship may be
applicable to describe the dependency between the steady state rate (In rmax ')
and the water temperatur (T-l), but this model has no direct thermodynamical
meaning, of course.
12 492713H
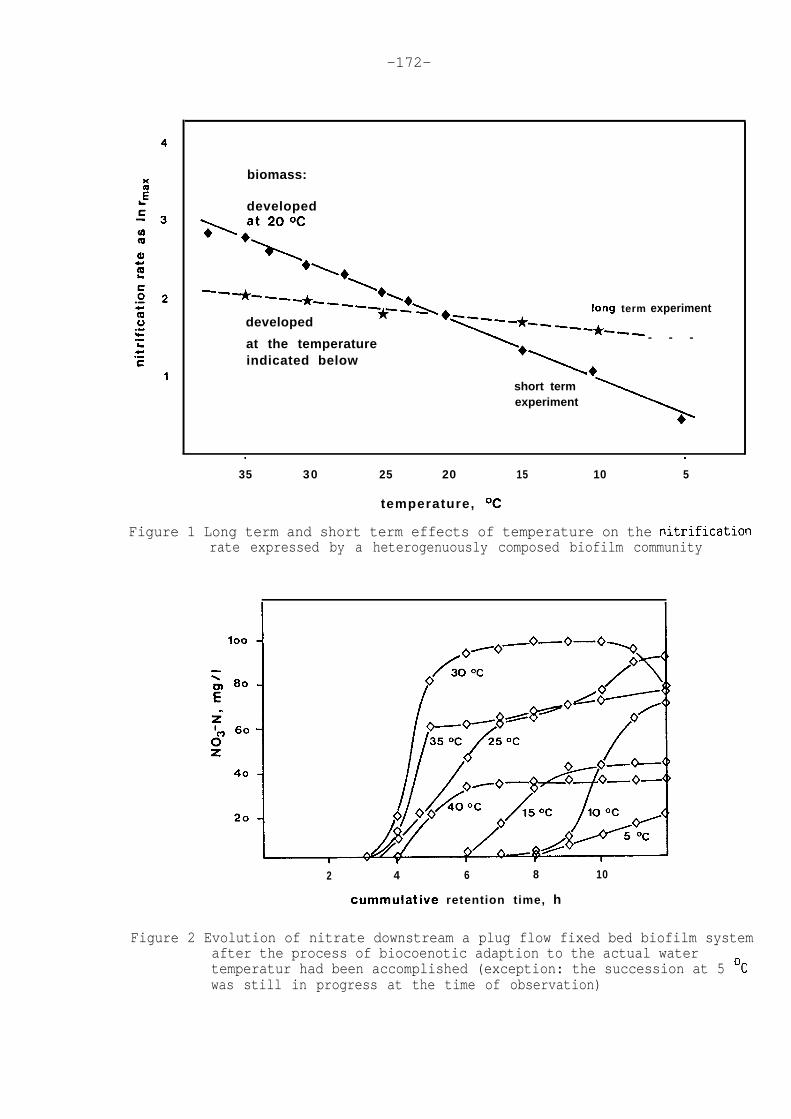
-172-
biomass:
developed
--%--- -_
developed *A
at the temperatureindicated below
term experiment
- - -
short termexperiment
. .
35 30 25 20 15 10 5
temperature, OC
Figure 1 Long term and short term effects of temperature on the nitrificationrate expressed by a heterogenuously composed biofilm community
2 4 6 8 10
cummulative retention time, h
Figure 2 Evolution of nitrate downstream a plug flow fixed bed biofilm systemafter the process of biocoenotic adaption to the actual watertemperatur had been accomplished (exception: the succession at 5 'Cwas still in progress at the time of observation)

-173-
As a conclusion, it appears to be necessary to take the duration of the
situations of high and low temperature into account in order to assess the
effects of temperature on microbial communities.
With reagard to biological wastewater treatment technologies in general it
appears to be necessary, although hardly practicable, to modify sludge age and
trickling filter depth respectively as the seasonal mean temperature of the
wastewater changes. Reduction of the temperature related fluctuations of the
effluent results would be achievable.
With respect to nitrification, biofilm reactor systems appear to be superior
over suspended growth systems. The loss of nitrifiers through sludge wasting
and washout of suspended cells over the weir of the clarifier is of particular
concern, when activated sludge systems are applied. Nitrifiers, on the other
hand, are retained in the background of biofilms, even when the organisms are
not able to grow for a long period of time.
PRACTICAL EXPERIENCES
Pilot scale experiments have been conducted to develop a method to treat the
run-off water from a dredged material landfill site at Hamburg, West Germany
(Sekoulov et al., 1985). A fixed bed biofilm reactor was applied to achieve
nitrification.
The observed nitrification rates over a one year period are shown in Figure 3,
together with the temperature graph. During the summer months, the water
temperature varied between 12 and 18 'C. The observed nitrification rate
varied roughly between 14 and 20 mg ammonia nitrogen per square meter of
support media surface and per hour. During the winter months the water
temperature dropped considerably, for several weeks even below the freezing
point. Actually, the entire reactor content froze two times during the
observation period. But, once the reactor content had been thawed
nitrification continued, although at a relatively low rate of about 5 to 8
mg/m2, h.
The nitrifications rates which were observed during a one year study period
are plotted in Figure 4 against the corresponding temperatur of the water. No

-174-
b
bb
b l 0b
l a a. nitrification
rate0 a
Sept. Nov. Jan. March May
20
00
15 !facz%
10 EQ)
5
Figure 3 Observed nitrification rate and water temperature. Results from afixed bed biofilm reactor for nitrification of dredged materialrunoff
25
2 0
15
10
5 .
.
. .
. ..
. .
. .0’ 0 .
.
.’ ‘b$ .
.
l l b 8.
a . . .. . l .. l . l ... ... l
.. . .
l
. ’ .:
0. .
l . .
I 1 I 1
5 10 15 2 0
temperature, T
Figure 4 Effect of temperature on the nitrification rate. Results of pilotscale experiments to nitrify dredged material runoff

-175-
distinction can be made between data referring to the temperature adapted and
non-adapted state of the biofilm community. Anyway, the results support the
conclusion that biofilm reactors provide significant advantages under low
temperature conditions. The nitrifiers being attached to the suport medium
were able to perform nitrification regardless the growth rate and the yield
which the nitrifiers could realize.
Severe sludge losses over the weir due to uncontrolled denitrification in the
clarifier were experienced at a pilot plant operated in Schleswig, West
Germany (Sekoulov and Wilderer, 1985; Wilderer, 1987). The pilot study was
conducted to collect information about the capacity of a single sludge
activated sludge system in comparison with a two stage activated sludge-
trickling filter system. The goal was to achieve advanced carbon removal and
nitrification. Denitrification was not directly required but recommended.
The flow schematic of the pilot plant is sketched in Figure 5. Since a full
scale plastic media trickling filter was already in operation and could not be
easily be bypassed, a plastic media filter had to be incorporated into the
flow schematic of the pilot plant as a first biological stage.
The partly unusual results which are summarized in Figure 6 can be explaind by
the fact that the first stage trickling filter removed, on the average, about
50 per cent of the soluble organic carbon. As a result, it was not possible to
establish controlled denitrification in the activated sludge tratment plant.
Denitrification occured, nevertheless, but uncontrollable in the clarifier.
Although the surface of the clarifier was regularly cleared from floating
sludge, it could not be avoided that large amounts of rising sludge got lost
over the weir. Because of this, and because of sludge wasting the nitrifier
population decreased steadily as the time went by, and was completely lost
during cold weather conditions.
In contrast, nitrification in the rock media trickling filter following the
intermediate activated sludge system improved steadily, and was not at all
affected by temperature drops down to as low as 6 'C during the winter season.
However, the mean concentration of ammonia nitrogen in the effluent of the
trickling filter could not be reduced to a level below 5 to 10 mg/l.

-176-
plasticmediatricklingfilter
.
rock mediatricklingfilter
i____________,
activated sludge denitrificationsystems reactor
Figure 5 Flow schematic of the pilot plant operated in Schleswig
10
>12OC
tertiary tricklingfilter activated sludge
observation time, d
Figure 6 Effluent ammonia concentration of the activated sludge system and ofthe trickling filter. Mean values for observation periods of severalweeks each.

-177-
Relatively high effluent concentrations were observed, although the mean
removal capacity of the trickling filter was remarkably high.
The quantity of ammonia nitrogen which was converted in the trickling filter
is plotted in Figure 7 against the frequency of occurance. Represented are the
results of a one year observation period. A linear relationship indicates
Gauss normal distribution of the observed removal values.
The slope of the regression line reflecting the variance of the observed data
appears to be high. Further investigation of that phenomenon revealed that the
variability of the effluent results was mostly due to the variations of the
influent ammonia concentration. The influent concentration was occasionally as
low as 22 m/l N. The mean influent value, however, was 45 mg/l. The highest
values were observed during the cold weather season with concentrations
between 60 and 72 mg/l. At the same time, the highest ammonia removal rates
were achieved so that the effluent ammonia concentration remained, on the
average, close to 7 mg/l even at a water temperatur of 10 'C and less.
Nevertheless, the capacity of the trickling filter to convert ammonia was
limited. On the average, 41 mg/l of ammonia nitrogen could be transformed into
nitrate. With reference to the influent concentrations this number is
impressive, but not really satisfying.
Advanced denitrification could be achievd by pumping surplus sludge from the
activated sludge system to the final clarifier, and distribute the sludge
evenly in that tank. The effluent nitrate nitrogen concentration varied
between 1 and 7 mg/l (Figure 8), and the concentration of suspended solids
between 10 and 20 mg/l. These results are remarkable. Despite the opinion of
many experts, denitrification can be accomplished in two stage, two sludge
treatment systems without the need to add external carbon sources.
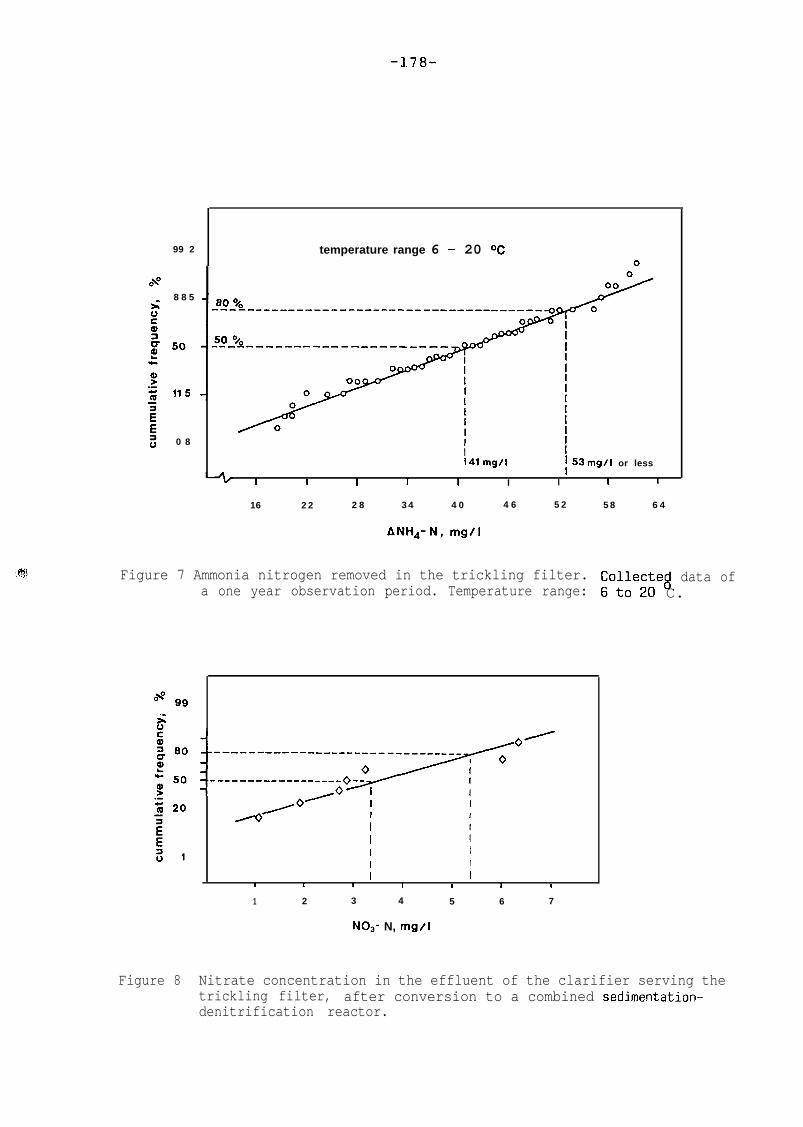
-178-
99 2 temperature range 6 - 20 OC
8 8 5
0 8
I41 mg/l I53 mg/l or lessI
1 I I I I I I I I
16 2 2 2 8 3 4 4 0 4 6 5 2
ANH,-N, mg/l
Figure 7 Ammonia nitrogen removed in the trickling filter.a one year observation period. Temperature range:
Figure 8
5 8 6 4
Collectegdata of
6to20 C.
;_-_--___________;~~’-._____------------^ --
H-0’o/O f I
I I
I II II I
I II I 1 I I I I
1 2 3 4 5 6 7
NO3- N, mg/l
Nitrate concentration in the effluent of the clarifier serving thetrickling filter, after conversion to a combined sedimentation-denitrification reactor.

-179-
CONCLUSIONS
The effects of low temperature on the nitrification rate should not be
overestimated. Biocoenotic adaption must be considered to take place, when the
temperature starts to decline, so that the decrease of the reaction rate is
eventually leved off to a considerable degree.
In general, biofilm processes provide under low temperature conditions a
significantly higher process stability as compared to suspended growth
systems. Trickling filters belong to the group of biofilm reactors, but cannot
be recommended without reservation. Trickling filters appear to be limited in
efficiency for a number of reasons, and they are susceptible to significant
variations of the effluent concentration. The latter is not primarily caused
by temperature but by the limited hydraulic buffer capacity the trickling
filter provides. For that very reason it is recommended to pay more attention
to other biofilm reactor systems such as rotating biological contactors and
fixed bed biofilm reactors.
Activated sludge treatment systems are susceptible to significant losses of
slow growing organisms such as nitrifiers through sludge wasting and hydraulic
washout. Special attention must be paid to perturbation of the flow regime,
and to biological reactions in the clarifier. Advanced denitrification must be
achieved in the biological reactor in order to minimize un-controlled
denitrification in the sedimentation tank, and subsequently washout during
cold weather conditions.
REFERENCES
Wolff, E. (1979): Oer Einfluf3 der Temperatur auf die Selbstreinigung und derenIndikatororganismen in einem Modellfliel3gewasser. Karlsruher Berichte zurIngenieurbiologie, 14
Sekoulov, I., J. van Assche and K. Rohbrecht-Buck (1985): Behandlung von Sptil-feldablaufwassern. Untersuchungsbericht. TU Hamburg-Harburg
Sekoulov, I. und P.A. Wilderer (1985): Gutachten zum weiteren Ausbau derKlaranlage Schleswig.
Wilderer, P.A. (1987): Vergleichsuntersuchungen zur Nitrifikation mit einemTropfkorper und einer Belebungsanlage in zweiter Stufe. Vercffentlichungen desInstituts fur Stadtbauwesen, TU Braunschweig 42, 251-263

-180-
MODELLING AND IMPROVEMENTS OF SINGLE SLUDGE PROCESSES FOR BIOLOGICAL
NITROGEN REMOVAL
Bengt Hultman Elzbieta P?aza
Swedish Water and Waste Water Department of Water Resources
Works Association Engineering
Regeringsgatan 86 Royal Institute of Technology (KTH)
S-111 39 STOCKHOLM, Sweden S-100 44 STOCKHOLM, Sweden
INTRODUCTION
Hultman and co-workers (1987) have reviewed possibilities to imple-
ment nitrogen removal at Swedish municipal wastewater treatment plants.
The interest has thereby mainly been focused on single sludge systems
for biological nitrogen removal. In this paper will be discussed:
0 Modelling of single sludge systems
0 Strategies for improving single sludge processes based on
the model
MODELLING SINGLE SLUDGE SYSTEMS
Parameter for determining of nitrogen removal
Nitrogen removal may be accomplished by two mechanisms:
0 Assimilative nitrogen removal, which depends on withdrawal of
sludge containing nitrogen. The removal may be described by
the formula:
(1)
in which Na = removed concentration of nitrogen due to assimila-
tion of nitrogen
S0
= influent concentration of organic material
'e = effluent concentration of organic material
Y obs = observed yield coefficient
bl = nitrogen content in sludge

-181-
0 Denitrification, which depends on reduction of nitrate to nitro-
gen gas according to the chemical formula:
5C (organic carbon) + 2H20 t 4NOi -> 2N2 t 40H- t 5C02
The denitrification process may be described by the formula:
Nd = (so - s,)a(l - b2)b3/b4 + b5 (2)
in which Nd =
a =
b2 =
b3 = oxidation velocity of organic material in the presenceof nitrate/oxidation of organic material in the presenceof oxygen
b4 =
b5 =
stoichiometric coefficient between oxidation of organic
material and reduction of nitratecoefficient describing initial rapid removal of nitrate
The total concentration of nitrogen that
as according to formulae 1 and 2:
removed concentration of nitrogencation
fraction of anoxic zone
fraction of organic material that
sludge, i.e. (1 - b2) is the oxid
organic material
is transferred to
ised fraction of the
due to denitrifi-
is removed may be calculated
Nr = (so - se)(ab3(1 - b2)/b4 + Yobsbl + b5) (3)
in which Nr = Na t Nd = total removed concentration of nitrogen
Two parameters, K1 and K2, will be defined, that are helpful in evalua-
tion of nitrogen processes. The parameters may be written, respectively:
NrK1=(l-a)s _s
0 e
in which Kl = (1 - a)(ab3(1 - b2)/b4 + vobsbl + b5)

-182-
NdKp=U-a), _s
0 e
in which K2 = (1 - a)(ab3(1 - b2)/b4 + b5)
Values of parameters K1 and K2
(5)
Based on an introductory literature study, typical values are of
different coefficients describing K1~986, and Hultman and co-workers, 1 4
and Kp (see for instance Matsche,87):
’ 'ohs = 0.3 g VSS/g COD
0 bl = 0.08 g N/g VSS
0 b2 = 0.4 (1 - b2 = 0.6)
0 b3 = 0.7 (pre- and simultaneous denitrification)
b3 = 0.4 (post-denitrification)
0 b4 = 2.86 g COD/g N
0 b5 = 0.03 g N/g COD (pre-denitrification)
b5 = 0 (simultaneous and post-denitrification)
For pre-,. simultaneous, and post-denitrification, respectively, K1
and K2 may be written:
Pre-denitrification:
K, = (1 - a)(O.l47a + 0,054)
K2 = (1 - a)(O.l47a t 0,03)
Simultaneous denitrification:
K, = (1 - a)(O.l47a t 0,024)
K2 = O.l47a(l - a)
Post-denitrification:
(6)
(7)
(8)
(9)
Kl = (1 - a)(O.O84a t 0,024)
K2 = O.O84a(l - a)
(10)
(11)
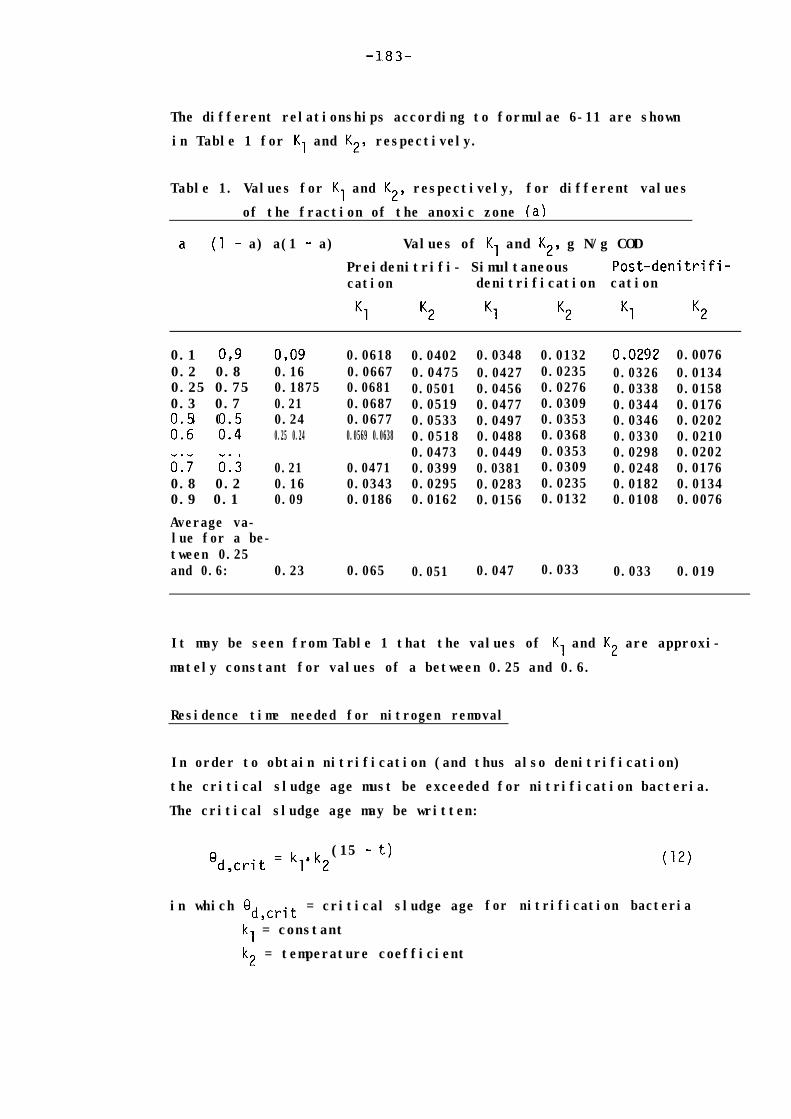
-183-
The different relationships according to formulae 6-11 are shown
in Table 1 for K1 and K2, respectively.
Table 1. Values for K1 and K2, respectively, for different values
of the fraction of the anoxic zone (a)
a (1 - a) a(1 - a) Values of K1 and K2, g N/g COD
Preidenitrifi- Simultaneous Post-denitrifi-cation denitrification cation
K2 K2
0.1 0,9 0,09 0.06180.2 0.8 0.16 0.06670.25 0.75 0.1875 0.06810.3 0.7 0.21 0.06870.4 0.6 0.24 0.0677i-6" E
0:7 0:3
0.25 0.24 0.0569 0.0638
0.21 0.04710.8 0.2 0.16 0.03430.9 0.1 0.09 0.0186
Average va-lue for a be-tween 0.25and 0.6: 0.23 0.065
0.0402 0.0348 0.0132 0.0292 0.00760.0475 0.0427 0.0235 0.0326 0.01340.0501 0.0456 0.0276 0.0338 0.01580.0519 0.0477 0.0309 0.0344 0.01760.0533 0.0497 0.0353 0.0346 0.02020.0518 0.0488 0.0368 0.0330 0.02100.0473 0.0449 0.0353 0.0298 0.02020.0399 0.0381 0.0309 0.0248 0.01760.0295 0.0283 0.0235 0.0182 0.01340.0162 0.0156 0.0132 0.0108 0.0076
0.051 0.047 0.033 0.033 0.019
It may be seen from Table 1 that the values of K1 and K2 are approxi-
mately constant for values of a between 0.25 and 0.6.
Residence time needed for nitrogen removal
In order to obtain nitrification (and thus also denitrification)
the critical sludge age must be exceeded for nitrification bacteria.
The critical sludge age may be written:
gd,crit = k,'k2 (15 - t) (12)
in which Bd,crit = critical sludge age for nitrification bacteria
kl = constant
k2 = temperature coefficient
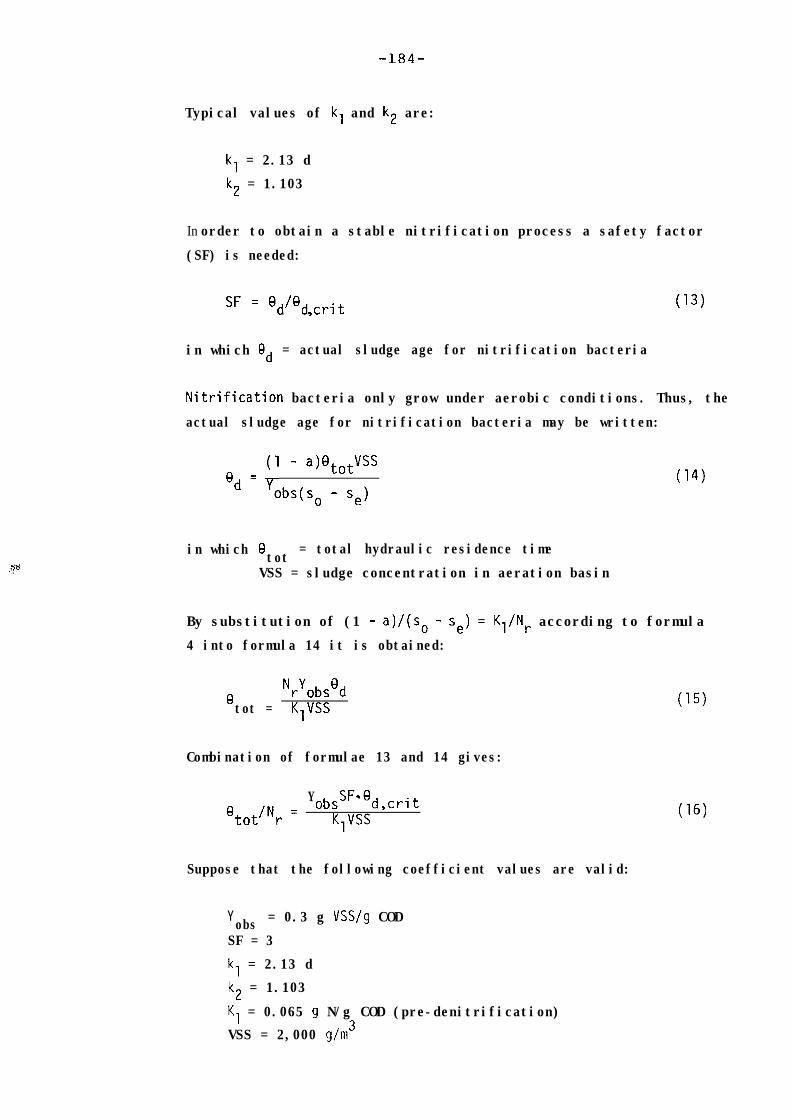
-184-
Typical values of k, and k2 are:
k, = 2.13 d
k2 = 1.103
In order to obtain a stable nitrification process a safety factor
(SF) is needed:
SF = ed/ed crit,
(13)
in which Bd = actual sludge age for nitrification bacteria
Nitrification bacteria only grow under aerobic conditions. Thus, the
actual sludge age for nitrification bacteria may be written:
g _(’ - a)BtotVSSd-V'obs(s, - se)
in which 0 tot = total hydraulic residence time
VSS = sludge concentration in aeration basin
(14)
By substitution of (1 - a)/(s, - se) = K,/N, according to formula
4 into formula 14 it is obtained:
8 NrYobsedtot = K,VSS
Combination of formulae 13 and 14 gives:
Y8 tot'Nr =
obssF"d critK,VSS ’
Suppose that the following coefficient values are valid:
Y obs = 0.3 g VSS/g COD
(15)
(‘6)
SF = 3
k, = 2.13 d
k2 = 1.103
K, = 0.065 g N/g COD (pre-denitrification)
VSS = 2,000 g/m3

-185-
If the temperature is 10 'C formula 16 gives:
OtotlNr =24*0.3*32.13'1.103(15 - t, = 0 50 h,g N,m3
065.2000 ..
According to the calculation example, a residence time of about 0.6 h
is needed for every g N/m3 that is removed. If it is necessary to re-
move 15 g N/m3 in the pre-denitrification step at 10 'C, a residence
time of about 9 h is needed at the sludge concentration 2000 g VSS/m3.
Fraction of anoxic zone
By use of formula 4 the fraction of the anoxic zone may be written:
a=l-K,(so - se)
Nr(17)
If, for example, so - se = 200 g COD/m3, Nr = 15 g N/m3, and K, =
0.05 g N/g COD the value of a may be calculated to 0.33. For a fixed
value of a = 0.25, so - se = 200 g COD/m3, and K = 0.05 g N/g COD
the value of Nr may be calculated to 13.3 g N/m3'.
Form,ula 4 may also be written:
Nr = K1 “f i ‘e)1 (‘8)
It is seen from the formula that Nr is increased by a decreased
value of (1 - a) for constant values of K,-and so - se. However,
(1 - a) must not be lower than a certain value for a stable nitri-
fication process. By use of instrumentation (for instance measurement
of the effluent ammonium concentration) and possibilities to
control the air supply, it may be possible to optimize the opera-
tion with respect to the fraction of the anoxic zone (a).
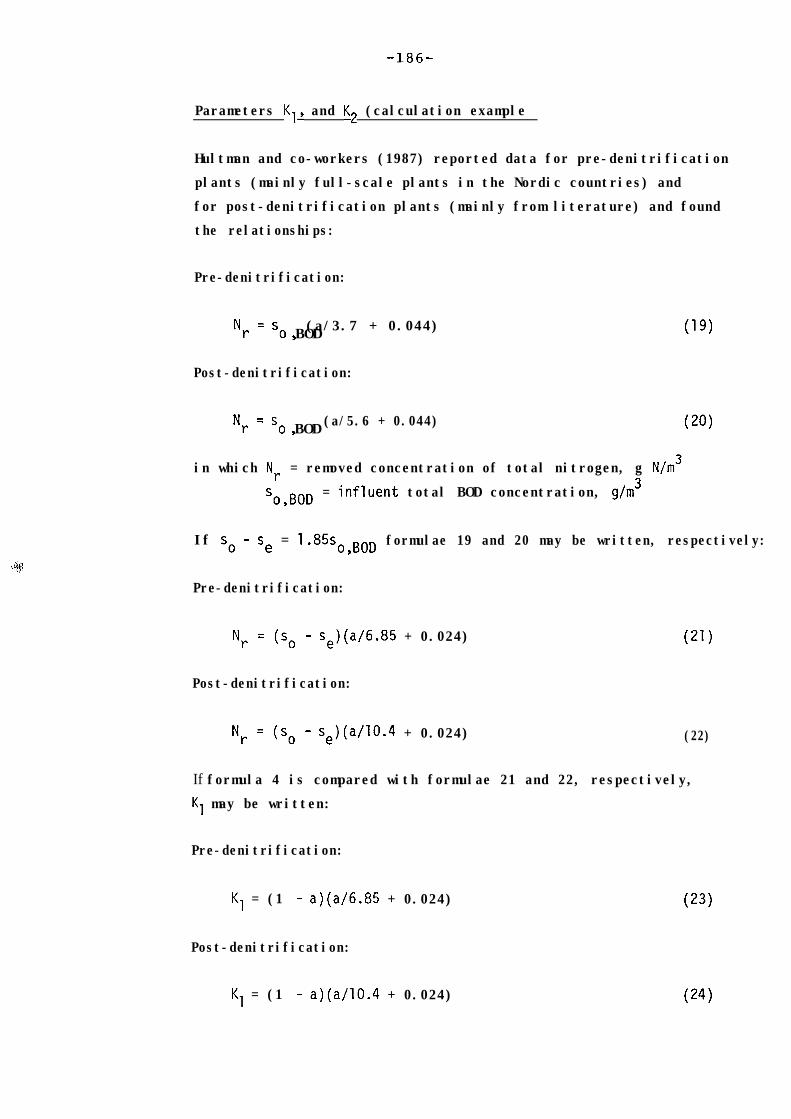
-186-
Parameters K,, and K2 (calculation example
Hultman and co-workers (1987) reported data for pre-denitrification
plants (mainly full-scale plants in the Nordic countries) and
for post-denitrification plants (mainly from literature) and found
the relationships:
Pre-denitrification:
Nr = 'o BOD, (a/3.7 + 0.044)
Post-denitrification:
Nr = 'o BOD (a/5.6 + 0.044)3
(19)
in which Nr = removed concentration of total nitrogen, g N/m'
'o,BOD = influent total BOD concentration, g/m3
If so - se = 1.85~~ BOD formulae 19 and 20 may be written, respectively:,
Pre-denitrification:
Nr = (‘0 - se)(a/6.85 + 0.024) (21)
Post-denitrification:
Nr = (‘0 - se)(a/10.4 + 0.024) (22)
If formula 4 is compared with formulae 21 and 22, respectively,
Kl may be written:
Pre-denitrification:
Kl = (1 - a)(a/6.85 + 0.024)
Post-denitrification:
(23)
K, = (1 - a)(a/10.4 + 0.024) (24)

-187-
By use of similar calculations as in Table 1, K, may be determined to
about 0.047 g N/g COD and K2 to about 0.036 g N/g COD for values of a
between 0.25 and 0.6.
If b, = 0, a comparison of formula 5 with formulae 21 and 22, respec-
tiveyy, shows that K2 may be written:
Pre-denitrification:
(25)K2 = a(1 - a)/6.85
Post-denitrification:
K2 = a(1 - a)/10.4 (26)
From calculations similar as in Table 1, K2 is approximately 0.034
g N/g COD for pre-denitrification and approximately 0.022 for Post-
denitrification for values of a between 0.25 and 0.6.
The calculated values of K, and K2 for post-denitrification is in
agreement with the values of Kl and K2 in Table 1. The calculated
values for pre-denitrification of Kl and K2 are approximately the
same as for simultaneous denitrification inTable 1. This may de-
pend on that large recirculation makes the pre-denitrification pro-
cess similar as the simultaneous denitrification process.
Design procedure
Based on the presented model, a design procedure may be for the
removal of nitrogen in single sludge systems:
0 Calculation of the necessary total residence. time, Btot, by use
of formula 16 and with values on:
the concentration of total nitrogen, Nr, that is needed to
remove in the activated sludge process
the critical sludge age, Qd crit, for nitrification (depen-9
dent on temperature)
13 492713H
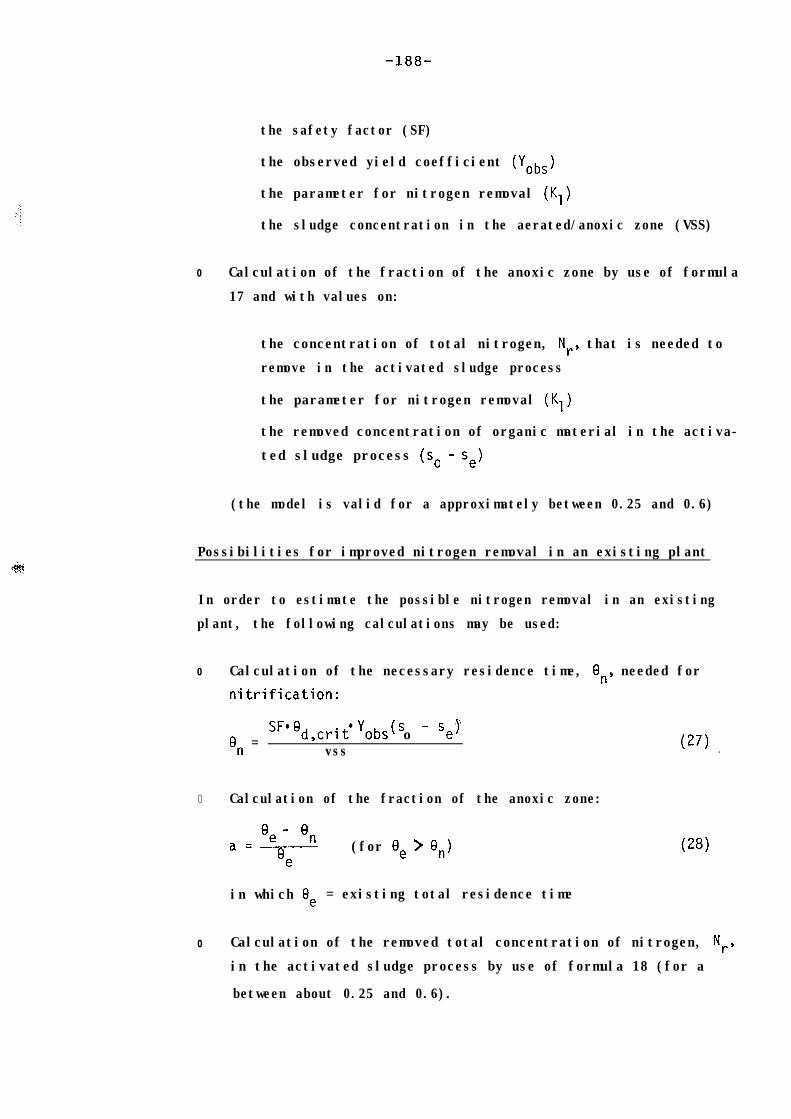
-188-
the safety factor (SF)
the observed yield coefficient (Yobs)
the parameter for nitrogen removal (K,)
the sludge concentration in the aerated/anoxic zone (VSS)
0 Calculation of the fraction of the anoxic zone by use of formula
17 and with values on:
the concentration of total nitrogen, Nr, that is needed to
remove in the activated sludge process
the parameter for nitrogen removal (K,)
the removed concentration of organic material in the activa-
ted sludge process (so - se)
(the model is valid for a approximately between 0.25 and 0.6)
Possibilities for improved nitrogen removal in an existing plant
In order to estimate the possible nitrogen removal in an existing
plant, the following calculations may be used:
0 Calculation of the necessary residence time, On, needed for
nitrification:
SF*8d,crit"obs o(sen =
- se)vss
0 Calculation of the fraction of the anoxic zone:
‘e - 'na=T (for ee > en)
in which ge = existing total residence time
(27) ,
(28)
0 Calculation of the removed total concentration of nitrogen, Nr,
in the activated sludge process by use of formula 18 (for a
between about 0.25 and 0.6).
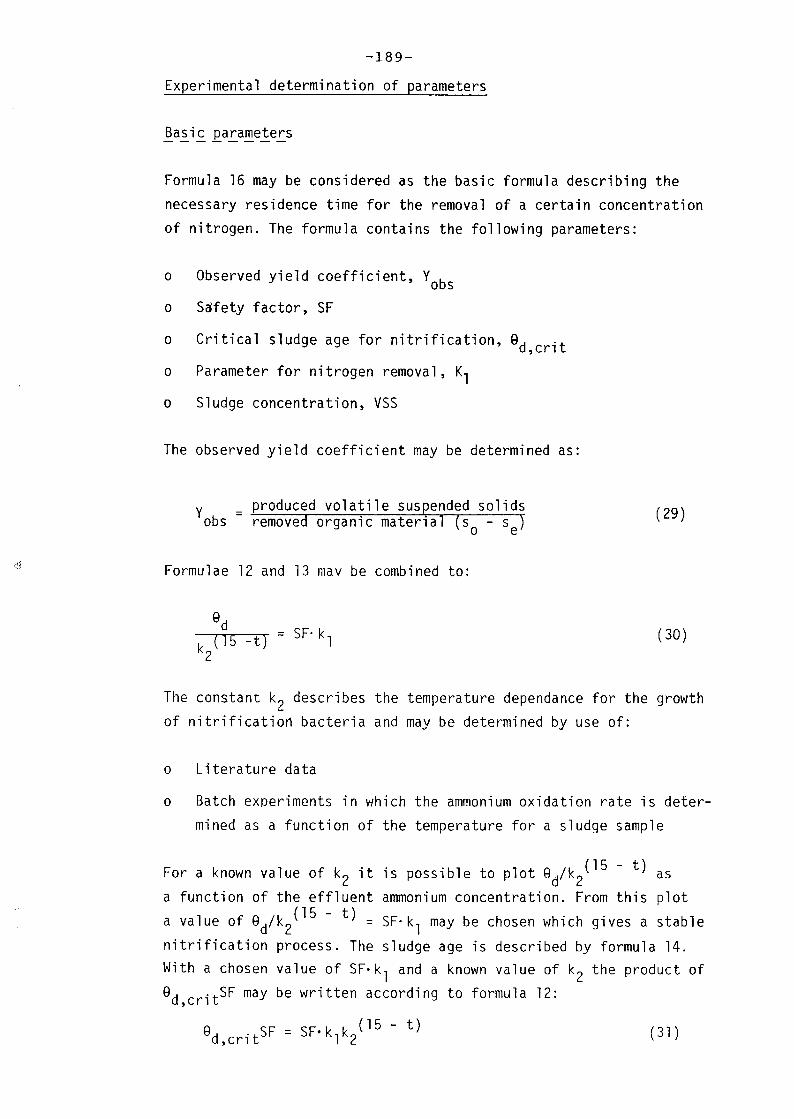

-190:
The parameter K, is determined by use of formula 4. From formula
16 it is seen that the basic processes influencing nitrogen remo-
val are:
0 Factors influencing sludge production and sludge properties descri-
bed by Yobs/VSS.
0 Factors influencing the nitrification process described by
8d critSF (Cf formula 31).9
0 Factors influencing the nitrogen removal process described by K,
(position and size of anoxic zone, type of organic material etc).
In order to determine basic parameters influencing the nitrogen re-
moval processes measurements should be made for the biological step:
0
0
0
0
0
0
0
0
0
0
0
0
0
0
0
Influent flow
Excess sludge flow
Sludge concentrations in aerobic and anoxic zones
Sludge concentration in excess sludge
Sludge concentration in the effluent
Volatile fraction of sludge
Influent organic concentration
Effluent organic concentration
Influent total nitrogen concentration
Effluent total organic concentration
Effluent ammonium concentration
Temperature
Temperature dependance for nitrification bacteria
Fraction of anoxic zone
Sludge volume after 30 min sedimentation
-191-
Assimilative nitrogen removal- - - - - - - - - ---__
The assimilative nitrogen removal is described by formula 1.
In addition to the measurements of the influent and effluent organic
concentration and the observed sludge yield, it is necessary to
measure the nitrogen content in the sludge (b,) in order to de-
termine N,.
Denitrification- - - - - - - -
By use of formulae 4 and 5, the parameter K2 may be written:
K2 = K, - (1 - a)Yobsbl (32)
With a known value of K2 it is possible to calculate the removed
nitrogen concentration by denitrification, Nd, by use of formula 5.
The denitrification rate, rN , in the anoxic zone may be calculatedd
rNd
Nd=etotaVSS
(33)
In the parameter K2, important coefficients are b2, b3, b4 and b5.
b2 may be determined as b6Yobs where b6 is g organic material per g
The value of b4 is 2.86 g COD/g N. Possible methods to determine b3ans b5 are:
vss.
0 According to the IAWPRC model of the activated sludge process
(Henze and co-workers, 1987) b3 is influenced by two factors.
The first is a correction factor which adjusts for either the
the change in maximum growth rate associated with anoxic condi-
tions, or for the fact that only a portion of the biomass can
denitrify. The second is a correction factor is a correction fac-
tor which adjusts for the observation that hydrolysis of slowly
biodegradable organic matter occurs more slowly under anoxic con-
ditions than under aerobic conditions.
as:
In the IAWPRC model is shown how these two factors may be de-
termined. The tests imply the measurements at the same time of
the oxygen and nitrate consumption rates in two batch reactors
which are equivalent in every respect except for the terminal
electron acceptor oxygen in one (aerobic) and nitrate in the other
(anoxic).
-192-
0 b5 may be determined by use of formula 2, which may be written:
Nds - s = a(10 e
- b2)b3/b4 + b5 (34)
If Nd/(So - se) is plotted against a the slope is (1 - b2)b3/b4
and the intercept is b5. In simultaneous or post-denitrification
the value of b5 seem to be approximately zero.
Nitrification- - - - - - -
The oxidised nitrogen, NoX, may be calculated as:
NOK = NKj,~ - 'obsbl - NKj,e (35)
in which NKj,o = influent Kjeldahl nitrogen concentration
NKj,e = effluent Kjeldahl nitrogen concentration
With a known value of No, it is possible to calculate the nitrifi-
cation rate, rN , as:ox
N oxrNox = Qtot(l - a)VSS (36)
Additional measurements- - - - - - - - - - - -
In addition to measurements necessary for determination of basic para-
meters the following parameters are of interest according to the pre-
sented model:
0 Nitrogen content of VSS
0 Organic content (for instance as COD) of VSS
0 Oxygen and nitrate consumption rate by use of batch reactors
0 Nd/(SO - se) = f(a)
0 Influent Kjeldahl nitrogen concentration
0 Effluent Kjeldahl nitrogen concentration

-193-
STRATEGIES FOR IMPROVING SINGLE SLUDGE PROCESSES FOR BIOLOGICAL
NITROGEN REMOVAL
Possibilities to improve the single sludge biological nitrogen pro-
cess will be discussed from formula 16, where important parameters are:
0 Observed yield coefficient (Yobs)
0 Safety factor for nitrification (SF)
0 Critical sludge age for nitrification (G, crit)
'0 Parameter for nitrogen removal (K,)
0 Sludge concentration (VSS)
Suppose that Yobs and SF could be diminished by 10 % and
20%, respectively, and that K, and VSS could be increased by
20% and 25X, respectively. In order to remove a certain concentra-
tion of nitrogen the volume need would then according to formula
16 be diminished by a factor of 1.2*1.25]0.9~0.8 = 2.1. This example
shows that the imorovement of different process factors may give
a combined effect to significantly diminish the volume need for
biological nitrogen removal.
Observed yield coefficient
A possible way to diminish the observed yield coefficient, except
for increasing the sludge age, is to substitute part of the organic
material in the influent by a soluble organic carbon source. In that
case the inert VSS fraction will be diminished.
Safety factor for nitrification
In order to reach below a certain value of the ammonium concentration
in the effluent a certain value is needed for the safety factor. By
use of instrumentation and possibilities to control the oxygen supply,
it is possible to use a lower value of the necessary safety factor.
Critical sludge age for nitrification
Two ways may be helpful in decreasing the critical sludge age:

-194-
The critical sludge age for nitrification is highly dependent
on temperature. Thus, partial nitrification of side-streams
from dewatering of digested sludge may be a suitable technique.
The critical sludge age may be diminished if external nitrifica-
tion bacteria are seeded into the activated sludge process
Parameter for nitrogen removal
The parameter, K1, for nitrogen removal seemsto be positively influ-
enced by:
0 Use of pre-denitrification
0 Use of a soluble carbon source
0 Use of plug flow conditions in the anoxic zone in pre-denitrifi-
cation
Sludge concentration
Several methods may be used to increase the sludge concentrat ion:
Improvement of sludge settleability by addition of weighting agents
Improvement of sludge settleability by use of concentration gra-
dients (plug flow etc)
Use of fixed bed material in the aeration basin
Nitrification in the return sludge (use of contact stabilisation)
Denitrification in the return sludge (addition of a carbon source
to the return sludge and use of a separate denitrification step
for the return sludge)
ACKNOWLEDGEMENT
This study is part of a research project on nitrogen removal with
support from the Swedish Board for Technical Development (STU), the
Swedish Water and Waste Water Works Association (VAV) and the National
Environmental Protection Board (SNV).
-195-
REFERENCES
Henze, M., Grady, C.P.L., Gujer, W., Marais, G.v.R. and Matsuo, T.
(1987): Activated sludge model No 1. IAWPRC, Scientific and
Technical Reports No 1.
Hultman, B., Plaza, E. and Tendaj-Xavier, M. (1987): Possibilities
of implementing nitrogen removal at Swedish wastewater treat-
ment plants. Baltic Sea Environment Proceedings, No 25, pp 130-148.
Matsche, N. (1986): Bemessung, Betrieb und Wirkung der simultanen
Denitrifikation. Stuttgarter Berichte zur Siedlungswasserwirt-
schaft, Band 90, pp. 177-199.
-196-
The State of Advanced Biological Wastewater Treatment
in the Federal Republic of Germanv
Ivan Sekoui.ov, Prof. Or.-Ing.
Technische Universitat Hamburg-Harburg
1. Introduction
Late in the 60s the need of new wastewater purification technology for the
protection of the environment became evident.
The start of a special research program SFB-82* (in 19721 supported by the
DFG** can be considered as the beginning of an intensive research in the field
of advanced wastewater treatment in the FRG.
:!;
The main research projects o f this program had the object to enlarge the
basic knowledge on:
- Nitrification (activated sludge systems and fixed bed reactors)
- Denitrification (activated sludge systems without extended H-donator)
- Suspended solids removal (microstraining, filtration, particle size dis-
tribution in biological treatment plants effluents)
- Phosphorus removal (chemical precipitation)
- Refractory CSB (identification of the single substances, activated car-
bon, the use of ozone)
- Trace elements in the effluents
- Treatment methods w;th algae
SFB-82* - Sonderforschungsbereich-82, at the Un'versity of Stuttgart
DFG** - Deutsche Forschungsgemeinschaft, Bonn
-197-
The importance of the advanced uastewater treatment was rapidly recog-
nized. The received results were influencing the requirements on the eff!uent
quality and the planning of treatment plants.
Parallel to the achievement of better results by the advanced wastewater
treatment and the rising consciousness of the people concerning the environmen-
tal protection, new more stringent laws and regulations were issued. This pro-
cess is still going on and cannot be assumed as finished.
This has to be considered by the planning of new treatment plants. That
means that we have to design treatment plants today, which must fulfil1 the
expected effluent requirements of tomorrow.
That is why, the engineers have to develop first of all a concept for a
full possible wastewater treatment, independent of lower current requirements.
This will allow a stepuise building of the treatment plants according to the
coming requirements in the future. Thus, unexpected difficulties by expanding
of an existing purification system can be easily avoided.
2. The State of the Biological Treatment
Because of the lacking of practical experience with advanced wastewater
treatment plants, their application was at the beginning very careful.
The first requirement to stop or prevent eutrophication was regulating
only the phosphorus concentration in the effluent of the treated wastewaters.
This was followed later by limiting also the ammonium-nitrogen (N-NH4+) con-
centration. After introducing the nitrification, the operation of these plants
was modified for carrying out a denitrification. Additional to some benefits
by protecting the recipient of eutrophication, the use of N03- as homolog to
O2 helps to save some energy costs. The denitrification is more or less op-
tional, but it finds a good acceptance and is very often planned together ;Jith
the nitrification.

-198-
The elimination of the eutrophication factors (P, NH4+, N03-) 'were o b l i -
gatory only for the protection of special surface waters. This did not belong
yet to the general requirements, but it is expected that this can occur in the
next few years.
The 5th novel of the law regulating the water resources in the FRG (WHG)
has its validity from January 1987. The new bylaws regulating the effluent
quality CAbwAG and VwV) are in discussion and will be introduced in 1989. The
application of advanced wastewater treatment to be required generally. That
means that besides the full BOO-removal, the treatment plants have to be
planned today for full nitrification, denitrification, phosphorus- and sus-
pended solids removal.
2.1 Preferred Treatment Systems
The investment- and operational costs for the upgrading of a conventionaL
treatment plant with stages of advanced wasteuater treatment are usually high.
To avoid erratic pLanning and disappointments the ATV*-organiration tried to
elaborate recommendations for the planning of treatment plants with advanced
wastewater stages.
The design methods are based on the existing experience with technical
plants. Basic research, theoretical models, results of Laboratory or pilot
scale only are not usually considered. The worked out recommendation from the
specialited groups (ATV-FA** 2.6 and 2.8) are published in the "Korrespondenz
Abwasser" 1987 (1).
In the FRG good practical experience is available for the foliowing ad-
vanced wastewater treatment processes:
- chemical removaL of phosphorus
- nitrification
- denitrification and
- suspended solids removal
ATV* - Abwassertechnischer Verband
FA** - Fachausschun
-199-
The proposed and accepted technical solutions for the above mentioned
processes depend to some extent on subjective decisions. It is not seldom that
the personal opinion of a responsible government officer, the special experi-
ence of the engineers and the research interests of the professors involved
in projects influence the decision of a treatment plant system.
That means that the wanted effluent quality can be achieved with differ-
ent techniques and systems.
A reliable comparison of costs, energy, efficiency, process stability
etc. of different systems is not available. The existing results (data) are
not sufficient for a critical review of the known plants.
2.1.1 Activated Sludge Plants
The best results for nitrification and denitrification up till now are
achieved with activated sludge plants.
In Fig. 1 prospective systems for full nitrification and denitrification
are summarized.
The interest
phorus removal is
of combining these systems (Fig. 1) with a biological phos-
very great. Research work is carried out now on such plants.
To reach high stability of a phosphorus removal is still considered as a prob-
lem. The results are promising and in spite of not sufficient safety such
treatment plants are now in planning.
The efficiency of these treatment systems is also depending on the sewer
system. Combined sewerage causes difficulties to the denitrification and bio-
logical phosphorus removal. The role of equaliting basins and primary sedi-
mentation tanks on the wanted biological purification processes has to be con-
sidered in each case very carefully.
There have been published several methods to design plants for nitrifi-
cation and denitrification. They will not be discussed in this paper. However,
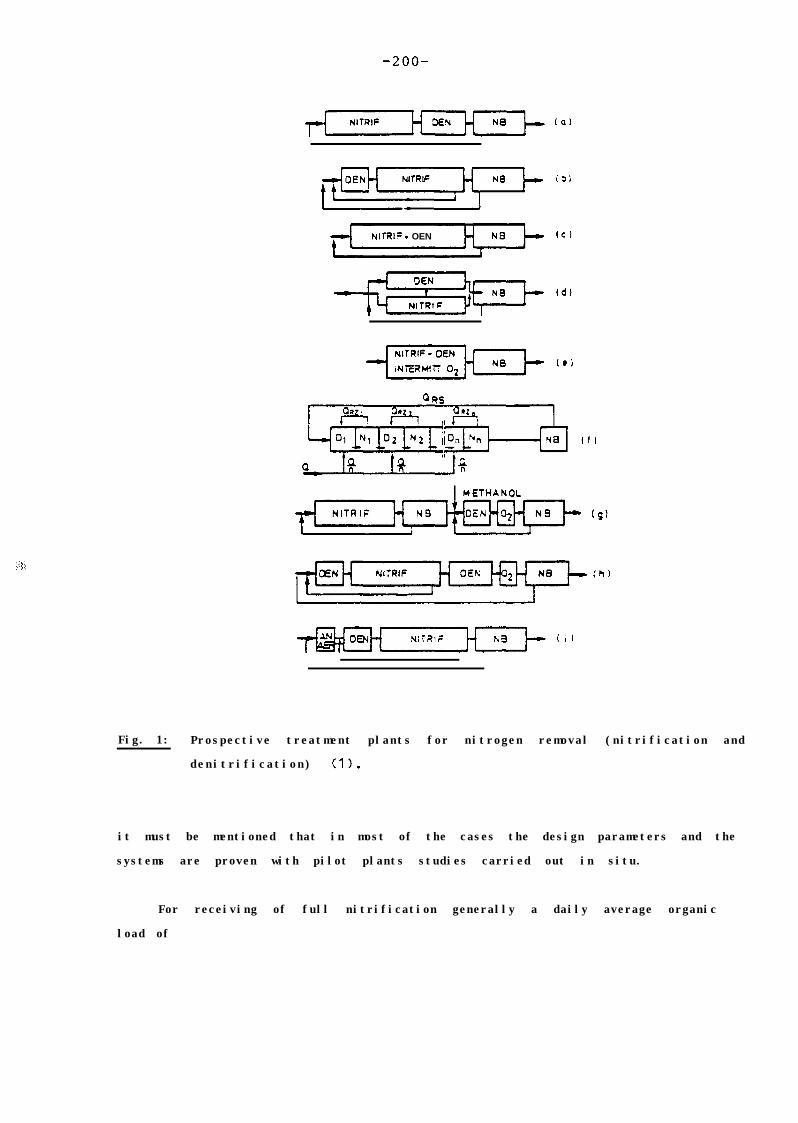
(a)
OEN NITRIF,TiHiHi Na I- i3i
NITRIte OEN (Cl
Fig. 1: Prospective treatment plants for nitrogen removal (nitrification and
denitrification) Cl>.
it must be mentioned that in most of the cases the design parameters and the
systems are proven with pilot plants studies carried out in situ.
For receiving of full nitrification generally a daily average organic
load of

-201-
'TS = 0.1 ./. 0.2 (kg BOO/kg SS l d)
is recommended.
2.1.2 9iofi lm Reactors
6iofil.m reactors have some advantage for full njtrification. Once the bio-
film has grown on the support material it can reach a very high sludge age.
This is of great benefit for growing of the nitrifying bacteria.
Good results in the practice are achieved with two-stage treatment plants
in which the first stage is an activated sludge system and the second stage a
biofi lm reactor e.g. a trickling filter unit.
On Fig. 2 can be seen the dependance between the organic load (BOO> and
the reached nitrification efficiency of a trickling filter (2).
ti 02 04 0.6 0.6 1.0
BOO,-organic load kq/(m’/d)
0 0.05 0.1 0.6 0.25NH‘-N- Load kg/(rn3
Fig. 2: Oependance of the nitrification efficiency fram the organic toad b y
trickling filters (2).

-202-
The profiles. of C30, NH‘+, and N03- measured in trickling iilrcrs by dii-
ferent organic loads are Given in Fig. 3 (3).
Concentration (mg/l)
50 lcx) 150
A
SO 100 150
s
1 0 20 3 0
r I. .
I. .
‘- \
. .
.
2.
3
+Fig. 3: Profi!os of C30, NH
4'and ti03- n9asured ir 21 Trick
Hydraulic load q = 0,7S (m'/m* l h).

- 2 0 3 -
For low ammonia concentrations in the effluent (Ne s 5 mg/l) by t L 10 Oc
a specific load of 15 ./. 20 (mg/m2*h) N-NH4+ can be recommended. The hydraulic
load of the trickling filter has a big influence on the nitrification rates.
Good results are received with a hydraulic load
qh I 1.5 (m3/m2*h) .
The recirculation rate can be chosen 100%.
To receive good results from a two-stage treatment plant it is necessary
to optimite the first stage-activated sludge together with the second-stage
trickling filter.
To use the equalizing efficiency of the activated sludge system it is
reasonable to design this stage for partial nitrification
BTS 6 0.2 ./. 0.3 (kg BCD/kg SS l d)
The second stage trickling filter is nitrifying with good success, inlet
concentration of ammonia (NH4+) not exceeding 20 ./. 30 mg/l (N-NH4+) (without
calculating the dilution due to recirculation).
The detention time in the trickling filter is too shcrt for equaliting
peak N-NH4' concentrations (Fig. 4).
for the enlargement of the treatment plant of town Flensburg (ca. 300000
inhabitants) are carried on pilot studies in situ.
A two-stage system consijting of first stage activated sludge for BOD
removal and partial nitrification , second stage trickling filter for full
nittification and denitrification in the final clarifiers was chosen.
14 492713H

-204-
Influent
I . -
R n I* 1 I. 1 t n 0 s n n n n
Oak
Fig. 4: Variation of the effluent concentration of the ammonia (NHCf) depend-
ing on the variation of the influent concentration.
On Fig. S can be seen the flow scheme. A biological. phosphorus removal is in-
tegrated to the first stage.
The research work will be finished at the end of May and the final report
will be available in July.
3. Conclusions
- The requirements on the effluent quality became more stringent. The treat-
ment plant today must be designed for the expected requirements of tomorrow.
- There are reliable techniques for achieving full nitrification and deni-
trification.
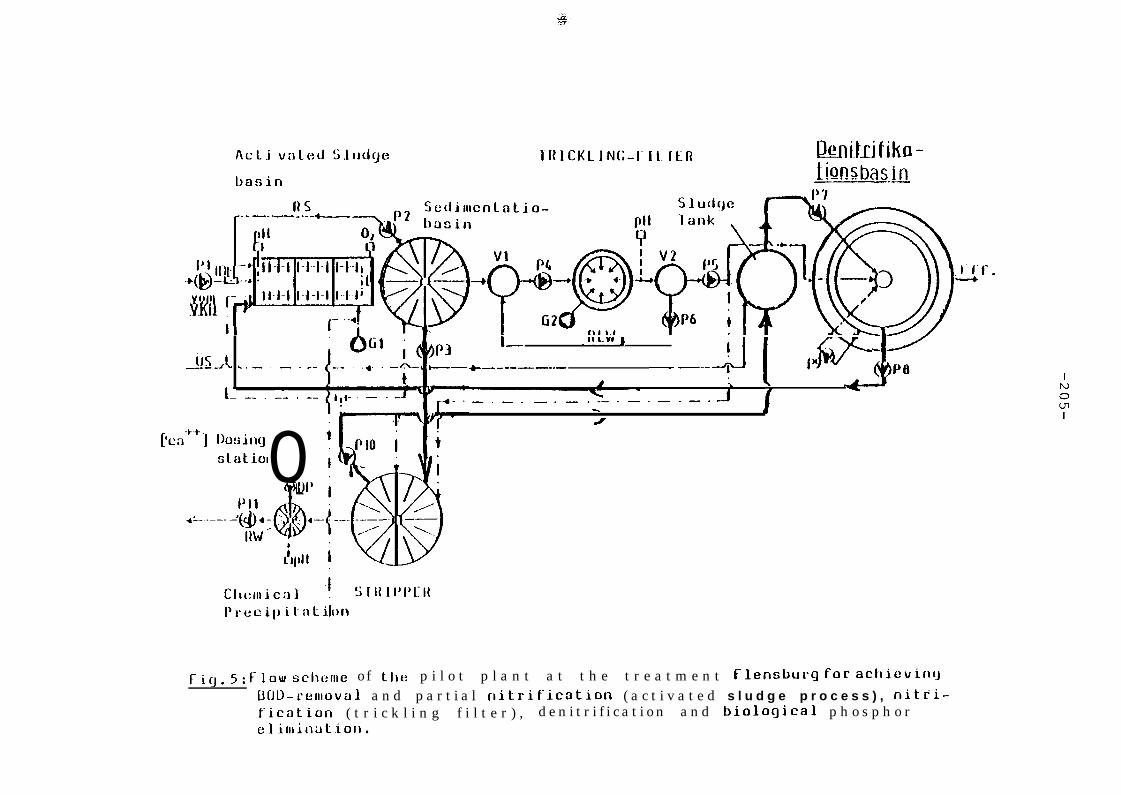
[‘c
Aclj vated Sl~rtlge
basin
lRICKLINI;-I-IL ItR tkni.trifiha-fionsb;pJc-
I- _IlLW )Iiis {,_-I c.-.-._- *--_-_----_.- - -..--‘I1 6J--IY
1 \
l- - . --- . -- _._._._‘._.l._._.-I-L
/
&a++] I)o!;ingsI.aLiolQ
T
01’
4L..____~~;$j&
;ll(bll
Fig. ~;flou, schl:me of tlbe p i l o t p l a n t a t t h e t r e a t m e n t Flensburg for acllicvingIJfJLI-ren~oval a n d p a r t i a l rlitrification ( a c t i v a t e d s l u d g e p r o c e s s ) , nitr;i-fication ( t r i c k l i n g f i l t e r ) , d e n i t r i f i c a t i o n a n d biological p h o s p h o relimi~Iut.ion.
-206-
- The activated sludge systems are the most reliable systems to reach high
requirements today. The integration of a biological phosphorus removal
to these systems can be considered as reasonable. The recommended organic
load is 8TS 5 0.1 ./. 0.2 (kg BSB/kg SS l d)
- The nitrification process is strongly temperature dependent. That is why
to the limits of ammonia in the effluent the temperature range must be
given also.
- The biofilm reactors e.g. trickling filters are suitable for nitrifica-
tion. The biofilm grown on the support material has usually high sludge
age benefitial for the growth of the nitrifyers.
- The two-stage treatment plants with first stage activated sludge system
and second stage nitrifying trickling filter can have some advantages
over the activated sludge systems.
- The nitrification rate of the trickling filter can be chosen VN = 15 ./.
20 (mg/m2*h) by t L 12 'C. The first stage activated sludge process must
be designed in this case with an organic load
'TS 4 0.2 .I. 0.3 (kg EIOD/kg SS l 6)
!Jith the nitrifying filters normally it can Se achieved a difference of
ammonia between the influent and effluent of ca. h = 20 ./. 30 mg/l
CN-NH4+)
For optimizing this system further research work is necessary.
Literature
1. ATV FH 2.6 Umwandlung und Elimination von Stickstoff in Abwas-and FH 2.8 ser. Arbeitsbericht.
Korrespondenz Abwasser Nr. 1, S. 77./.85 und Nr. 2,S. 167.1.171 (1987)
2. Wolf, P. Betriebserfahrung an Tropfkorpern, gwf-WasserlAbwas-ser, 125(1984) S. 186
3. Wilderer, P. and Erfahrung beim Setrieb der Klaranlage Lahr. Stutt-Hartmann, L. garter Berichts tur Siedlungswasserwirtschaft, 77(1982
s. 95.1. 115
-207-
SECOND SEMINAR ON WASTEWATER TREATMENT IN URBAN AREASVISBY, SWEDEN 6-8 SEPTEMBER 1987
LIST OF PARTICIPANTS
DENMARK
FINLAND
NORWAY
Ms; Stina Tielmann-IbsenStorstrams amtskommuneParkvej 37DK-4800 NYK$$BING F
Mr. Rolf KungerskovI. Kriiger ASGladsaxevej 363DK-2860 S@BORG
Mr. Janosz BielickiAgency of Environmental ProtectionStrandgade 29DK-1401 COPENHAGEN
Mr. Jes la Cour JansenVKI, VandkvalitetsinstitutetAgern All&DK-2970 HldRSHOLM
Mr. Antti JokelaNational Board of Waters andEnvironmentBox 250SF-00101 HELSINKI
Mr. Markku MZkelZNational Board of Waters andEnvironmentBox 250SF-00101 HELSINKI
Mr. Veikko PaloNational Board of Waters andEnvironmentBox 250SF-00101 HELSINKI
Mr. Matti AlavakeriSuunnittelukeskus OYOpastinsilta 6SF-00520 HELSINKI
Mr. Terje FahrestveitStatens forurensningstilsynBox 8100 Dep.N-0032 OSLO 1

-208-
POLAND
FEDERAL REPUBLICOF GERMANY
GERMAN DEMOCRATICREPUBLIC
THE NETHERLANDS
YUGOSLAVIA/UNEP
UNITED KINGDOM
Ms. Eugenia Koblak-KalinskaDepartment of Water ProtectionMinistry of Environment Protectionand Natural ResourcesWawelska 52/5400-922 WARSAW
Ms. Jadwiga BernackaInstitute of Environment Protection
Mr. Tomasz FalkowskiInstitute of Environment Protection
Mr. Jozef FiszerPolitechnika KrakowskaWarszawska str. 24KRAKOW
Mr. Jerzy KurbielPolitechnika KrakowskaWarszawska str. 24KRAKOW
Mr. Giinther LeymannMinistry of Food Agriculture and Forestry,Schleswig-HolsteinDtisternbrooker Weg 104D-2300 KIEL 1
Mr. P. WildererTechnische Universitst Hamburg-HarburgEissendorfer Strasse 38D-2100 HAMBURG 90
Mr. Horst HagenKombinat Wassertechnik und ProjektierungWasserwirtschaft
Mr. Hardy TemmikWagening Agricultural UniversityP.O. Box 81296700 EV Wagening
Mr. Margeta JurePriority Actions ProgrammeRegional Activity CentreKraj Sv. Ivana 1158000 SPLIT
Mr. Peter NewmanWater Research CentreTelex: 848632 WRC G

-209-
Mr. J. B. EllisMiddlesex PolytechnicCentre for Urban Pollution ResearchQueenswayEnfieldMIDDLESEX EN3 4SF
Mr. Ian CliffordWateer Research Centre, EngineeringP.O. Box 85Frankland Road, BlagroveSWINDON SN5 8YR
THE BALTIC MARINE Mr. Harald VelnerENVIRONMENT PROTECTION Baltic Marine Environment Protection CommissionCOMMISSION Mannerheimintie, 12 A
SF-00100 HELSINKI 10
Ms. Terttu MelvasaloBaltic Marine Environment Protection CommissionMannerheimintie 12 ASF-00100 HELSINKI 10
SWEDEN Mr. Peter BalmerInst. fiir VA-teknikChalmers TekniskaS-416 90 GCTEBORG
Hcgskola
Mr. Bengt BengtssonKgppala Sewage Works AssociationBox 815S-181 08 LIDINGa
Mr. Rolf BergstedtPublic WorksBox 120S-371 22 KARLSKRONA
Ms. Gunilla BrattbergStockholm Water and Sewerage WorksBox 6407S-113 82 STOCKHOLM
Mr. Lars EklundNational Environmental Protection BoardBox 1302S-171 25 SOLNA
Mr. Hans EliassonCounty AdministrationS-621 85 VISBY

-210-
Mr. Ragnar ElmgrenStockholm UniversityZoological Inst.S-106 91 STOCKHOLM
Mr. Jan FalkNational Environmental Protection BoardBox 1302S-171 25 SOLNA
Ms. Marta Fendaj-XavierStockholm Water and Sewerage WorksBox 6407S-113 82 STOCKHOLM
Ms. Carola GuthrieNational Environmental Protection BoardBox 1302S-171 25 SOLNA
Mr. Wke HaglundPublic WorksS-601 81 NORRKijPING
Mr. Christer HannerzNational Environmental Protection BoardBox 1302S-171 25 SOLNA
Mr. Bertil HawermanSwedish Water and Waste Water Works Association,VAVRegeringsgatan 86s-111 39 STOCKHOLM
Mr. William HoglandLunds naturvetenskapliga och tekniska hzgskolaInst. fiir teknisk vattenresurslgraBox 118S-221 00 LUND
Mr. Hans HolmstrBmSwedish Water and Waste Water Works Association,VAVRegeringsgatan 86s-111 39 STOCKHOLM
Mr. Bengt HultmanSwedish Water and Waste Water Works Association,VAVRegeringsgatan 86s-111 39 STOCKHOLM
Mr. Carl-Ivar HijijerCounty Administrations-291 86 KRISTIANSTAD
-211-
Mr. Lars JanssonSwedish Water and Waste Water Works Association, VAVRegeringsgatan 86S-111 39 STOCKHOLM
Mr. Jar1 JohanssonSwedish National Board for Technical DevelopmentBox 43200S-100 72 STOCKHOLM
Mr. Ingmar KarlssonBoliden vattenvardBox 45118S-104 30 STOCKHOLM
Mr. Fred NybergVAAT ConsultFlygarvggen 179S-175 63 JjiRFiLLA
Mr. Gustaf NylanderCounty AdministrationS-901 86 UMEir
Mr. Bernt PerssonGateborg Water and Sewerage WorksBox 1514S-401 50 GZjTEBORG
Ms. Elzbieta PlazaWater Resources EngineeringRoyal Institute of Technology (KTH)S-100 44 STOCKHOLM
Mr. Jan RennerfeltK-konsultS-117 80 STOCKHOLM
Mr. Bjijrn RosenVA-teknik ABSt. RGrS-386 00 FARJESTADEN
Mr. Gilbert SvenssonVIAK GijteborgMclndalsvZgen 85S-412 85 GijTEBORG
Mr. Lars G ThorellNational Environmental Protection BoardBox 1302S-171 25 SOLNA
Mr. Gunnar WassbergVIAKBox 519S-162 15 ViiLLINGBY

No. 1
No. 2
No. 3
No. 4
No. 5A
No. 5B
No. 6
No. 7
No. 8
No. 9
-212-
BALTIC SEA ENVIRONMENT PROCEEDINGS
JOINTACTMTlESOFTHf3 BALTICSEASTATESWITHINTHEEOFTHEcoNvENTIoNoNTHEPRWZTIoNOFTHENARINElWJIRUWEWTOFl'HEBAL,TIC SEA AREA 1974-1978(1979)*
REPORT OF THE INTERIM (ZCBMISSION (IC) 'ID THE BALTIC MARINEENvIRoNMENTPRoTEcTIoN~ssIoN(1981)
ACTIVITIES OF THE CXXWISSION 1980- Report on the activities of the Baltic Marine EnvironmmtProtection Camission during 1980
- HEZC(Xl Recamendations passed during 1980(1981)
BAT;TIC MARINE ENVIRONMENT BIBLIOGRAPHY 1970-1979(1981)
ASSFSSNHNTOFTHHEFFETS OFPOLJJJTI~cN~NXtWU4LREs(xTRcEsOF THE BALTIC SEA, 1980PART A-l: OVERAIL CONCLUs1oNs(1981)*
ASSESWEWTOFTHR HFFRCTSOFPOLLVl'IoNcNTHENATURALREsouIEcEsOF THE BALTIC SEA, 1980PART A-l: OVERALLcmCLUs1ONsPART A-2: WY OF RFSULTSPART B: SCI~IFIC MATERIAL(1981)
WORKSHOP ON THE ANAI.;YSIS OF HYDRO(XREON SINSEAWATERInstitut fti Meereskunde an der Universitat Kiel, Department ofMarine Chemistry, March 23 - April 3, 1981(1982)
ACTMTIES OF THE COMMISSION 1981- Report of the activities of the Baltic Marine EnvironmentProtection Cannission during 1981 including the Third &tingof the Camission held in Helsinki 16-19 February 1982
- HELCOM Recamumdations passed during 1981 and 1982(1982)
ACTIVITIES OFTHHCOMMISSICN1982- Report of the activities of the Baltic Marine EnvironmentProtection CamGssion during 1982 including the Fourth Wetingof the Catmission held in Helsinki l-3 FeWuary 1983
- HEXCW Recamendations passed during 1982 and 1983(1983)
SECOND BIOLOGICAL INTERCALJBRATIoNKX?KSHOPMarine Pollution Laboratory and Marine Division of the NationalAgency of Environmental Protection, Denmark, August 17-20, 1982,Ronne, Denmark(1983)
-_----__------__
l out of print
No. 10
No. 11
No. 12
No. 13
No. 14
No. 15
No. 16
No. 17A
No. 17B
No. 18
No. 19
-213-
TENYEARSAETERTHESIGNINGOFTHEHELSINKIcoNvENTIONNational Statements by the Contracting Parties on theAchievements in Implementing the Goals of the Convention on theProtection of the Marine Enviromkent of the Baltic Sea Area(1984)
STUDIES ON SHIP CASUALTIES IN THE BALTIC SEA 1979-1981Helsinki University of Technology, Ship Hydrodynamics Labora-tory, Otaniemi, FinlandP. Tuovinen, V. Kostilainen and A. HZmZlZinen(1984)
GUIDELINES FORTHEBAL,TICMoNI'IORINGP~ FORTHE SECCNBSTAGE(1984)
ACTMTIFS OF THE COMMISSION 1983- Report of the activities of the Baltic Marine EnvirommtProtection Cannission during 1983 including the Fifth bketingof the Carmission held in Helsinki 13-16 March 1984
-HELCC?JIReC amendations passed during 1983 and 1984(1984)
SIWINARoNFUWIEWOFPROGRESS MADEINWATERPR0I'JXTIONMDSURES17-21 October 1983, Espoo, Finland(1985)
ACTIVITIES OF THE COMMISSION 1984- Report on the activities of the Baltic Marine EnviromntProtection Catmission during 1984 including the Sixth Meetingof the Carmission held in Helsinki 12-15 March 1985
- HELCW Recammdations passed during 1984 and 1985(1985)
WATERBOFTHE BALTIC SEAA Regional Cooperation Project of the Baltic Sea States;International Sumnary Report(1986)
FIRSTPERIODICASSESSMIWl?OFTHE STATEOFTHEMARINE ElWImOF THE BALTIC SEA AREA, 1980-1985; GENERAL CONCLus1ONs(1986)
FIRSTPERICDICASSESSMENT OFTHE STATEOFTHEMARINE ENVIETONMENTOF THE BALTIC SEA AREA, 1980-1985; BAcKGRouND DOCUMENT(1987)
ACTIVITIES OF THE COI%lISSICN 1985- Report on the activities of the Baltic Marine EnvironmentProtection Cm-mission during 1985 including the Seventh Meetingof the &mission held in Helsinki 11-14 February 1986
- HEICCW Recannendations passed during 1986(1986)*
BALTIC SEA~I?DRING SYMPOSIUMTallinn, USSR, lo-15 March 1986(1986)
----------------
* out of print

-214-
No. 20
No. 21
No. 22
No. 23
No. 24
No. 25
No. 26h
No. 27A
No. 27B
No. 27C
No. 27D
No. 28
FIRSTBALTIC SEAPOLLUTION LOADC@4PILATIUU(1987)f
SEWNAR ON RJZGWATIONS CONTAINED IN ANNEX II OF MMFOL 73/78 ANDREGULATION 5OFANNEX IVOFTHEHELSINKICXNWWTICNNational Swedish Administration of Shippingand Navigation; 17-18 Novenbr 1986, NcrrkQ$ng,Sweden(1987)
smINARCN0ILPOLLuT1ONQuEST1aG19-20 November 1986, Norrkijping, Sweden(1987)
ACTIVITIES OF THE COIWISSION 1986- Report on the activities of the Baltic Marine EWbomnentProtection Cmmission during 1986 including the Eighth Wetingof the Camission held in Helsinki 24-27 F&xuaq 1987
- HELCXXlRecamendatims passed during 1987(1987)*
PRCGRESSREPORTScx!JCADMIuM#MmmRY# CCmzRANDzINC(1987)
SEMINARON wl4smwATER~~INuRBANAREAs7-9 September 1986, Vi&y, Sweden(1987)
ACTIVITIES OF THE CWMISSION 1987- Repcrt on the activities of the Baltic Marine EnvironmentProtection Carmission during 1987 including the Ninth Wetingof the Ccmnission held in Helsinki 15-19 February 1988
- HELCW Recamendations passed during 1988(1988)
GUIDELINESFoRTHEBALTICI'XWIlXXING~ EmTHElHIRDSTAGE; PARTA. INTRODWIQXYCHAPTEW(1988)
GUIDELINESEOR'IHEBALTICMoNI'I0RINGPRCGRAWE FORTHETHIRDSTAGE; PARTB. PHYSICALANDcHEMIcAtD~ INSEAWATER(1988)
GUIDELINES EOR'IWE BALTICM[rJITWUNGP~ FORTHETHIRDSTAGE; PARTC. HARMFDL SUBSTANCES INBIU'I'AANDSEDIMENTS(1988)
GUIDELINES FORTHE BALTICIKNITORINGP~ FORTHFTHIRDSTAGE;PARTD.BIOX_QGICALDETERMINANDS(1988)
RECEPTION OF WASTES FRC@l SHIPS IN THE BALTIC SEA AREA- A MARPOL 73/78 SPECIAL AREA(1989)
------_----------
* out of print

-215-
No. 29 ACI'MTIES OF TEE CObNISSION 1988- Report on the activities of the Baltic Marine EnviromntProtection Carmission during 1988 including the Tenth Meetingof the Carrnission held in Helsinki 14-17 Februaq 1989
- HELLD4 Recmndations passed during 1989(1989)
Copyright © 2022 FDOKUMEN