Advanced oxidative wastewater treatment using cavitational ...
240
Advanced oxidative wastewater treatment using cavitational reactors Rashmi Chand A thesis submitted in partial fulfilment of the requirements of the University of Abertay Dundee for the degree of Doctor of Philosophy May 2008 I certify that this is a true and accurate version of the thesis approved by the examiners Signed: Dated: Director of studies
-
Upload
khangminh22 -
Category
Documents
-
view
1 -
download
0
Transcript of Advanced oxidative wastewater treatment using cavitational ...

Advanced oxidative wastewater treatment using cavitational reactors
Rashmi Chand
A thesis submitted in partial fulfilment of therequirements of the
University of Abertay Dundeefor the degree of
Doctor of Philosophy May 2008
I certify that this is a true and accurate version of the thesis approved by the examiners
Signed: Dated:
Director of studies

Declaration
I hereby declare that the work presented in this thesis was carried out by me at the
University of Abertay Dundee, except where due acknowledgement is made, and
has not been submitted for any academic award at this or any other University.
Signed:Dated:
11
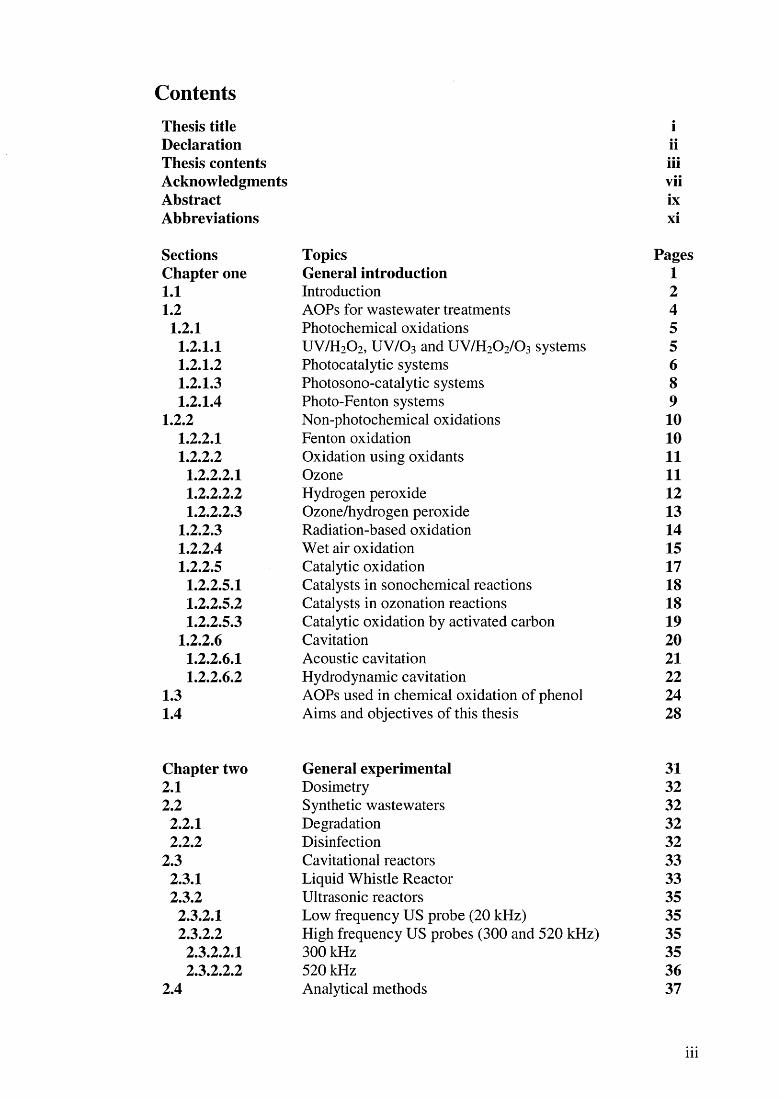
ContentsThesis title iDeclaration iiThesis contents iiiAcknowledgments viiAbstract ixAbbreviations xi
Sections Topics PagesChapter one General introduction 11.1 Introduction 21.2 AOPs for wastewater treatments 4
1.2.1 Photochemical oxidations 51.2.1.1 UV/H2 0 2, UV/O3 and UV/H2 O2 /O 3 systems 51.2.1.2 Photocatalytic systems 61.2.1.3 Photosono-catalytic systems 81.2.1.4 Photo-Fenton systems 9
1.2.2 Non-photochemical oxidations 101.2.2.1 Fenton oxidation 101.2.2.2 Oxidation using oxidants 11
1.2.2.2.1 Ozone 111.2.2.2.2 Hydrogen peroxide 121.2.2.2.3 Ozone/hydrogen peroxide 13
1.2.2.3 Radiation-based oxidation 141.2.2.4 Wet air oxidation 151.2.2.5 Catalytic oxidation 17
1.2.2.5.1 Catalysts in sonochemical reactions 181.2.2.5.2 Catalysts in ozonation reactions 181.2.2.5.3 Catalytic oxidation by activated carbon 19
1.2.2.6 Cavitation 201.2.2.6.1 Acoustic cavitation 211.2.2.6.2 Hydrodynamic cavitation 22
1.3 AOPs used in chemical oxidation of phenol 241.4 Aims and objectives of this thesis 28
Chapter two General experimental 312.1 Dosimetry 322.2 Synthetic wastewaters 32
2.2.1 Degradation 322.2.2 Disinfection 32
2.3 Cavitational reactors 332.3.1 Liquid Whistle Reactor 332.3.2 Ultrasonic reactors 35
2.3.2.1 Low frequency US probe (20 kHz) 3523,2.2 High frequency US probes (300 and 520 kHz) 35
2.3.2.2.1 300 kHz 3523.2.2.2 520 kHz 36
2.4 Analytical methods 37
m

2.4.1 Triiodide 372.4.2 Phenol 37
2.4.2.1 Qualitative analysis 372.4.2.1.1 Total organic carbon (TOC) 372.4.2.1.2 Gas Chromatography (GC) 38
2.4.2.2 Quantitative analysis (GC-MS) 392.4.3 Hydrogen peroxide 402.4.4 Ozone 412.4.5 Microorganism identification 422.4.6 Viable count 422.4.7 Power measurement 432.4.8 Toxicity analysis 442.4.9 Statistical analysis 442.4.10 Cost and energy analysis 44
Chapter three Dosimetry: Investigation of oxidation intensities 45in cavitational reactors
3.1 Introduction 463.2 Experimental 51
3.2.1 Hydrodynamic cavitation 513.2.1.1 Liquid Whistle reactor 51
3.2.2 Acoustic cavitation 513.2.2.1 Ultrasonic bath 513.2.2.2 Ultrasonic probe 52
3.3 Results and discussion 523.3.1 Liquid Whistle Reactor 543.3.2 The ultrasonic bath 583.3.3 The ultrasonic probe 60
3.3.3.1 Effect of US amplitudes 603.3.3.2 Effect of additive concentrations 643.3.3.3 Effect of additives 67
3.4 Hydrodynamic vs acoustic cavitation 693.5 Summary 70
Chapter four Degradation I: Phenol removal using multiple 71frequency US reactors
4.1 Introduction 724.2 Experimental 77
4.2.1 Chemicals 774.2.2 Hydrogen peroxide measurements 784.2.3 Power measurement 784.2.4 US/ZVC/H2 0 2 system 794.2.5 US/ZVC/O3 system 79
4.3 Results and discussion 804.3.1 Hydrogen peroxide formation 804.3.2 Preliminary experiments 83
4.3.2.1 Effect of pH 834.3.2.2 Effect of air 84
IV
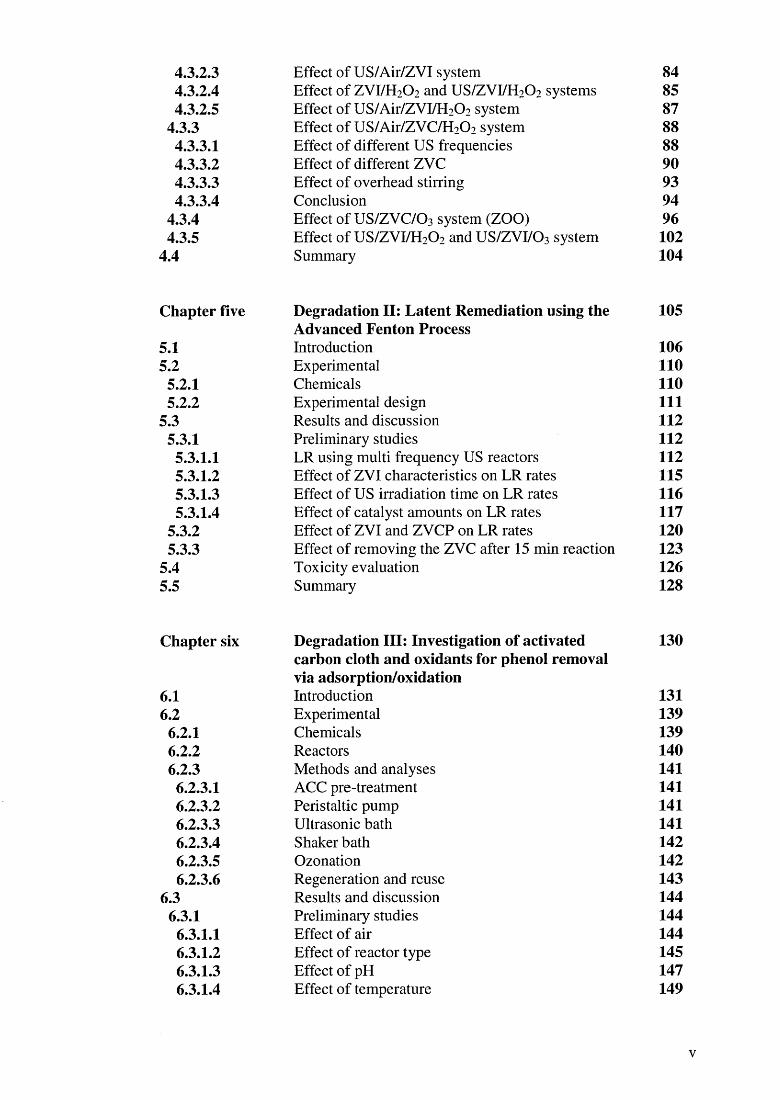
4.3.2.3 Effect of US/Air/ZVI system 844.3.2.4 Effect of ZVI/H2 0 2 and US/ZVI/H2 0 2 systems 854.3.2.5 Effect of US/Air/ZVI/H 2 0 2 system 87
4.3.3 Effect of US/Air/ZVC/H2 0 2 system 8 8
4.3.3.1 Effect of different US frequencies 8 8
4.3.3.2 Effect of different ZVC 904.3.3.3 Effect of overhead stirring 934.3.3.4 Conclusion 94
4.3.4 Effect of US/ZVC/O 3 system (ZOO) 964.3.5 Effect of US/ZVI/H 2 0 2 and US/ZVI/O 3 system 102
4.4 Summary 104
Chapter five Degradation II: Latent Remediation using the 105Advanced Fenton Process
5.1 Introduction 1065.2 Experimental 110
5.2.1 Chemicals 1105.2.2 Experimental design 111
5.3 Results and discussion 1125.3.1 Preliminary studies 112
5.3.1.1 LR using multi frequency US reactors 1125.3.1.2 Effect of ZYI characteristics on LR rates 1155.3.1.3 Effect of US irradiation time on LR rates 1165.3.1.4 Effect of catalyst amounts on LR rates 117
5.3.2 Effect of ZVI and ZVCP on LR rates 1205.3.3 Effect of removing the ZVC after 15 min reaction 123
5.4 Toxicity evaluation 1265.5 Summary 128
Chapter six Degradation III: Investigation of activated 130carbon cloth and oxidants for phenol removal via adsorption/oxidation
6.1 Introduction 1316.2 Experimental 139
6.2.1 Chemicals 1396.2.2 Reactors 1406.2.3 Methods and analyses 141
6.2.3.1 ACC pre-treatment 1416.2.3.2 Peristaltic pump 1416.2.3.3 Ultrasonic bath 1416.2.3.4 Shaker bath 1426.2.3.5 Ozonation 1426.2.3.6 Regeneration and reuse 143
6.3 Results and discussion 1446.3.1 Preliminary studies 144
6.3.1.1 Effect of air 1446.3.1.2 Effect of reactor type 1456.3.1.3 Effect of pH 1476.3.1.4 Effect of temperature 149
v

6.3.1.5 Effect of amount of catalyst 1526.3.1.6 Statistical analysis 154
6.3.2 Phenol removal with the ACC/H2 O2 system 1556.3.2.1 Effect of H2 O2 concentrations 1576.3.2.2 Effect of the ACC/H2 O2/US system 1596.3.2.3 Effect of ACC types/H2 0 2 160
6.3.3 Phenol removal with ACC/O3 system 1616.3.3.1 Effect of ACC types/ 0 3 system 1626.3.3.2 Effect of ACCozonised/ 0 3 system 1636.3.3.3 Effect of ACC/Direct ozonation systems 165
6.4 Regeneration and reuse of ACC 1686.5 Summary 169
Chapter seven Disinfection: Bacterial inactivation using cavitation and ozonation in a novel Liquid Whistle Reactor
171
7.1 Introduction 1727.2 Experimental 175
7.2.1 Microorganism 1757.2.2 Reaction suspension 1757.2.3 Liquid Whistle Reactor 1767.2.4 Ozone 177
7.2.4.1 Ozone generator 1777.2.4.2 Ozone measurements 177
7.2.5 Operational details: single/combined processes 1777.2.5.1 Hydrodynamic cavitation alone 1777.2.5.2 Ozonation alone 1777.2.5.3 Hydrodynamic cavitation and single ozonation 1787.2.5.4 Hydrodynamic cavitation and double ozonation 1787.2.5.5 Ozone decomposition in the LWR 178
7.3 Results and discussion 1797.3.1 Effect of hydrodynamic cavitation 1797.3.2 Effect of ozonation 1817.3.3 Effect of hydrodynamic cavitation and single O3 1837.3.4 Effect of hydrodynamic cavitation and double O3 185
7.4 Ozone decomposition in the LWR 1877.5 Summary 190
Conclusion Conclusions and suggestions for future work 191References 193Appendix A Cost and energy estimation of the Dosimetry,
Degradation and Disinfection processes in the cavitational reactors
A
Appendix B Published paper I BAppendix C Published paper II C
VI
Acknowledgements
I would like to express my gratitude to my Director of Studies, Prof. David H. Bremner, for
his extended support throughout my research period. It would never have been possible for
me to come to this stage without the motivation and knowledge that he has provided at
various stages of my study. It is a pleasure to thank him for introducing me to the field of
cavitation, hydroxyl radicals and wastewater treatment. David’s encouragement and trust
has played a great role in my attendance at different conferences and research visits, which
has boosted both my confidence in my work and my self-confidence. I much appreciate his
valuable time and suggestions on my different reports, papers and presentations. I am sure,
in my new job, while writing company reports I will always be reminded of using ‘a’ and
‘the’ in the right places, thanks for that too! It has been wonderful three years of good
work, great fun, achievements and Jack Daniels during lab outings. Thank you very much!
I am indebted for financial support from the University of Abertay Dundee, the European
Social Fund, the European Science Foundation (for a Short Term Scientific Mission,
STSM) and the Food Processing Faraday Partnership.
It was a great pleasure to work with my visiting reader, Dr. Arthur E. Burgess, and post
doctoral researcher, Dr. K.C. Namkung. I deeply thank them both for their inputs in
various scientific discussions and also their valuable guidance.
I am sincerely thankful to the chemical science support team, especially Mr Mike Black
and Ms Evelyn McPhee for helping me with different instrumentation and ordering
chemicals used during the research. Also, thanks to Ms Louise Milne, Mr Maurice Lindsey
and Mr William Meldrum for their help on several occasions. Also, my deep appreciation
to all the civil engineering technicians for their extended help in the construction of various
reactor set-ups and for this, I would particularly like to thank Gerry and Tony. They were a
great help. I much appreciate the administrative staff at the School of Contemporary
Science especially Mrs Carol Conway.
I am also thankful to different experts from all over the world, for their patience and time in
responding to my queries at several stages of my work. Thus, I would like to thank Prof.
Jurg Hoigne and Prof. Santiago Esplugas for their inputs on ozone estimation/studies in
aqueous medium and thanks to Dr. Parag R. Gogate for his valuable discussions on
cavitational reactions and reactors. I extend my warm thanks to Dr. Phillip J. Collier and
Dr. Jane S. White for introducing me to microbiology and for their critical assessment on
disinfection results. Special thanks to Dr. Andreas Tiehm and Dr. Raul Molina for their
vii
time in carrying out toxicity analysis and particle size distribution analysis on my zero
valent iron and copper samples.
I would like to express my warm thanks to Ms. Anna Hans and Mr Ian Johnson from
Carbon Filter Technology for preparing different activated carbon cloth samples used in
this study. It is also my pleasure to acknowledge Prof. Harry Staines and Dr. Simona
Hapca for their help while carrying out statistical analysis on my experimental data. Many
thanks to Alison Gordon and Nicola McBride for their assistance with Endnote and
formatting. I also express my gratitude to Kevin Coe for publishing my different work
articles on the UAD website. I also wish to thank the UAD campus security, who have
looked after me during my odd working hours, carrying out research and especially while
writing up this thesis.
Many thanks to Prof. Nilsun H. Ince for her fruitful discussions and guidance during my
STSM research visit at Bogazici University, Istanbul, Turkey. I also acknowledge the
research staff at Bogazici who were very helpful during my short stay. The support and
care of my friend and colleague Dr. Yonca Ercumen is also much appreciated especially for
help at work and excellent Turkey sightseeing.
I extend my heartfelt thanks to my family who have always stood by me in all my
individual decisions taken so far in my life. Their unending belief in my skills and talents
to excel has always given me a sense of confidence while facing difficult situations. Once
again, I praise the affection and motivation from my parents, brother, sister, brother-in-law
and my wonderful niece, with whom I have always enjoyed having delightful chats while I
was away from home. Thank you so much!
Great applause is also due to all my friends with whom I have lived most of my life since I
left home and started University (ten years now!). Thus, support from friends back home
in India are deeply acknowledged for all their lovely emails, phone calls and wishes which
have been a constant source of strength and encouragement. I would specially like to thank
my best friend Jagdeep Kaur and close friend Sneha KP for all their motivation, support,
love and care for me throughout my PhD. My amazing research mates, Raffaele Nicola,
Paola Bmno, Lekraj Amin, Anantha Shanmugam, Randa Haddadin, Anna Koza and Robert
Crow, with whom I have had some healthy scientific discussions and also enjoyed some
smashing night outs with lots of Jacks, are deeply appreciated.
They are just unforgettable moments and I have to say I have had great fun and an excellent
time during this research. Thank you all!
vm

Abstract
This thesis explores various novel ways of treatment of wastewater contaminated
by toxic organic pollutants using single and combined advanced oxidative
wastewater treatment technologies in conjunction with a variety of acoustic and
hydrodynamic cavitational reactors. There have been many reports in the literature
on the use of hydroxyl radicals as the core part of AOPs and hence, as the first
objective, the amount of hydroxyl radical generation from different acoustic and
hydrodynamic cavitational reactors was studied using the potassium iodide
dosimeter. The results reveal that optimum concentrations of less toxic
chloroalkanes (chloroform and dichloromethane) could be efficient alternatives to
carbon tetrachloride for enhancement of hydroxyl radical generation in cavitational
reactors. Increasing ultrasonic amplitudes and operating hydrodynamic cavitational
pressures lead to higher rates of hydroxyl radical production. Having explored the
efficiency of generation of hydroxyl radicals the capacity of the reactors to degrade
the model pollutant phenol, via a modified classic Fenton reaction which uses zero
valent iron catalysts (instead of iron salts) and hydrogen peroxide under acidic
conditions was studied. This process, named the advanced Fenton process (AFP),
is the main foundation of the phenolic wastewater treatment reported in this thesis.
Phenol degradation was assessed using different frequencies of ultrasound where a
comparison between 20, 300 and 520 kHz ultrasonic reactors showed that 300 kHz
was by far the most efficient US reactor resulting in 100% phenol removal and 37%
total organic carbon (TOC) mineralization in 25 min.
The concept of Latent Remediation (LR) was discovered during investigations into
innovative approaches towards development of cost/energy-effective methods to
treat phenolic wastewater. LR consists of inputting only 15 min of either
ultrasound or stirring to the reaction medium, which contains optimised amounts of
hydrogen peroxide and iron catalyst, and then the silent-dark AFP phenol
degradation was studied over 24 h. The excellent results revealed that >80% TOC
mineralization was achieved after this time. It was also found that zero valent
copper catalysts were effective for phenol degradation and offered an excellent
alternative to iron in the AFP, however toxicity analysis on the 24, 48 and 72 h
IX

samples showed that zero valent iron exhibited decreased toxicity when compared
to zero valent copper.
Conventional granular/powdered activated carbons were replaced with activated
carbon cloth and investigations on the potential use of this material for phenol
removal/decomposition was studied in detail at different operating pHs (3, 5.5 and
9), temperatures (20, 40 and 80 °C), oxidants (H2O2/O 3) in various reactors (pump,
shaker and US bath).
Another aspect of the AOP application, disinfection of natural waters, was studied
employing hydrodynamic cavitation and ozonation in a novel Liquid Whistle
Reactor system. Model markers of faecal coliforms, Escherichia coli, were chosen
for the study and the combined technologies of hydrodynamic cavitation and step
wise ozonation proved be highly beneficial, resulting in ~ 6 log bacterial reduction
revealing 99.9999% disinfection efficiency of the process.
x
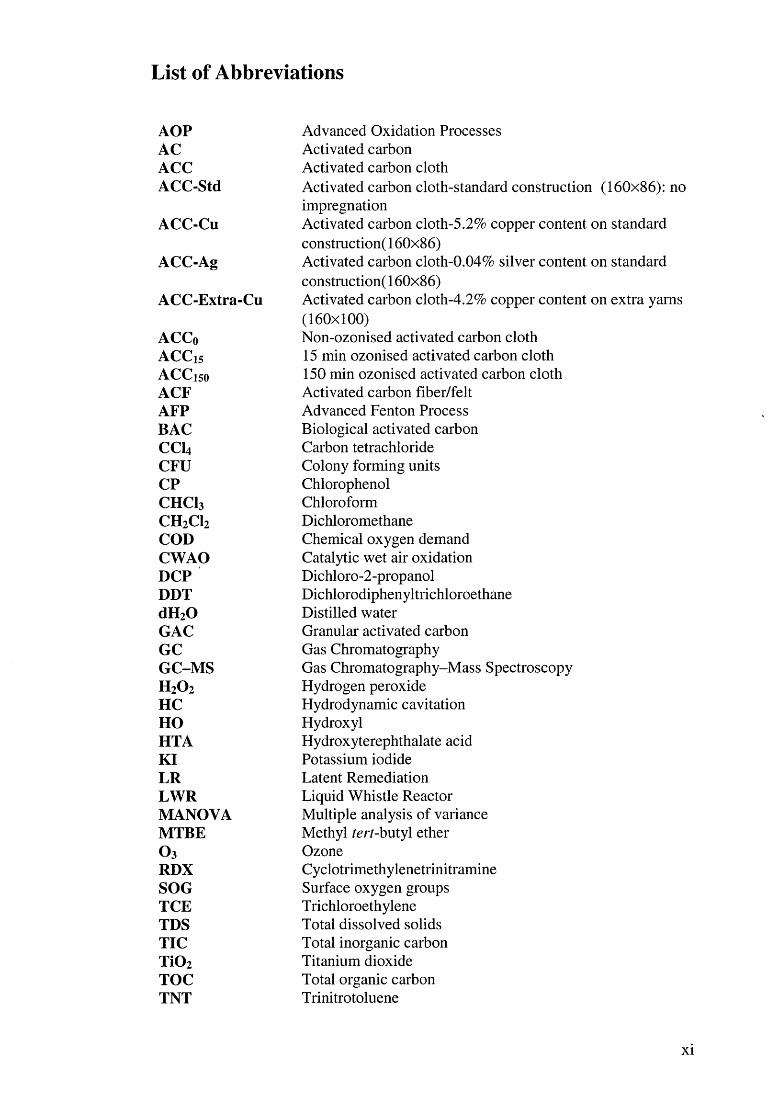
List of Abbreviations
AOP Advanced Oxidation ProcessesAC Activated carbonACC Activated carbon clothACC-Std Activated carbon cloth-standard construction (160x86): no
impregnationACC-Cu Activated carbon cloth-5.2% copper content on standard
construction( 160x86)ACC-Ag Activated carbon cloth-0.04 % silver content on standard
construction 160x86)ACC-Extra-Cu Activated carbon cloth-4.2% copper content on extra yarns
(160x100)ACC0 Non-ozonised activated carbon clothACCis 15 min ozonised activated carbon clothACCiso 150 min ozonised activated carbon clothACF Activated carbon fiber/feltAFP Advanced Fenton ProcessBAC Biological activated carbonCC14 Carbon tetrachlorideCFU Colony forming unitsCP ChlorophenolCHCI3 ChloroformCH2CI2 DichloromethaneCOD Chemical oxygen demandCWAO Catalytic wet air oxidationDCP Dichloro-2-propanolDDT DichlorodiphenyltrichloroethanedH20 Distilled waterGAC Granular activated carbonGC Gas ChromatographyGC-MS Gas Chromatography-Mass SpectroscopyH20 2 Hydrogen peroxideHC Hydrodynamic cavitationHO HydroxylHTA Hydroxyterephthalate acidKI Potassium iodideLR Latent RemediationLWR Liquid Whistle ReactorMANOVA Multiple analysis of varianceMTBE Methyl terr-butyl etherO3 OzoneRDX CyclotrimethylenetrinitramineSOG Surface oxygen groupsTCE T richloroethyleneTDS Total dissolved solidsTIC Total inorganic carbonT i0 2 Titanium dioxideTOC Total organic carbonTNT Trinitrotoluene
XI
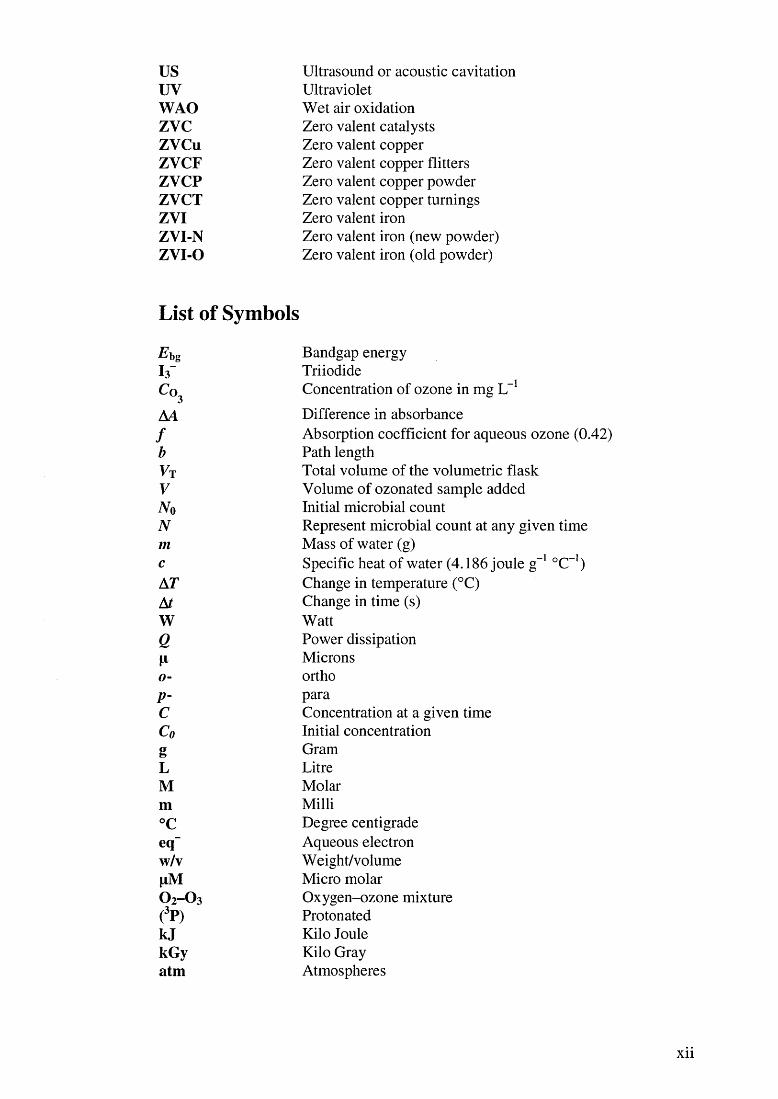
USuvWAOZVCZVCuZVCFZVCPZVCTZVIZVI-NZVI-O
Ultrasound or acoustic cavitationUltravioletWet air oxidationZero valent catalystsZero valent copperZero valent copper flittersZero valent copper powderZero valent copper turningsZero valent ironZero valent iron (new powder)Zero valent iron (old powder)
List of Symbols
F"bg
h~
AAfbVTVNoNmcATAtWQpo-p-CCogLMm°Ceq"w/v\iMO2-O 3
(3P)k jkGyatm
Bandgap energy TriiodideConcentration of ozone in mg L- 1
Difference in absorbanceAbsorption coefficient for aqueous ozone (0.42)Path lengthTotal volume of the volumetric flask Volume of ozonated sample added Initial microbial count Represent microbial count at any given time Mass of water (g)Specific heat of water (4.186 joule g- 1 °C_1) Change in temperature (°C)Change in time (s)WattPower dissipationMicronsorthoparaConcentration at a given timeInitial concentrationGramLitreMolarMilliDegree centigrade Aqueous electron Weight/volume Micro molar Oxygen-ozone mixture Protonated Kilo Joule Kilo Gray Atmospheres

Chapter 1
General introduction

G enera l in tro d u c tio n
1.1 IntroductionAccess to fresh, clean, uncontaminated water is recognised as a universal need for
all societies. This, combined with the global requirement to protect our
environment, continues to motivate a legislative drive toward more stringent limits
on the amount of pollutants present in industrial wastewater discharge. This new
legislation, is forcing de-pollution measures and in order to meet this challenge,
industrial demand has grown for innovative and improved water treatment solutions
for both, disinfection and pollutant removal. Advanced oxidative disinfection and
wastewater treatment technologies contribute a great deal in environmental
friendly-economic-efficient water treatment methodologies in order to achieve
complete mineralisation or convert highly toxic organic pollutants into less harmful
compounds.
In industrial effluents, phenol is one of the most common toxic pollutants in
wastewaters generated from petroleum refining, petrochemicals, pharmaceuticals,
pesticides, dyes/paints and organic chemical manufacturing industries (Benitez et
al., 1999). To all living creatures, phenol is a prototype poison, which can
coagulate protein and devitalise cells, especially the nervous system. It is believed
that in high concentration, phenol can even lead to death, whereas lower
concentrations could cause cumulative chronic intoxication. Therefore, this organic
compound has been researched over several decades and the United States
Environmental Protection Agency (US EPA) has listed it as one of the 129 priority
pollutants (Chen et al., 2003). Conventional treatment of phenolic wastewaters
include recycling, incineration, activated carbon (AC) adsorption (Dabrowski et al.,
2005), biological treatment (Calvosa et al., 1991) and chemical oxidation (Davis
and Huang, 1990; Joglekar et al., 1991; Weavers et al., 1998), however with each
methods are associated advantages and disadvantages. Therefore, the selection of
an efficient technology depends on the: concentration of phenolic compounds in
wastewaters, compositions of the wastewater and treatment cost.
2

G en era l in tro d u c tio n
Recent advances in science and technology have introduced a range of new
techniques, termed as Advanced Oxidation Processes (AOP). Thus, a number of
AOPs have been considered as an attractive way of treating phenolic compounds
from effluent streams. Since the 1970s, AOPs have shown considerable potential
for treating a variety of pollutants, with low to high concentrations of harmful to
toxic organic compounds and for drinking waters to industrial wastewaters. The
concept of ‘AOPs’ was described by Glaze et al. (1987) as a process which
“ involves the generation of HO* in sufficient quantity to effect water purification’’.
Table 1.1 lists AOPs and the area of opportunities for the variety of AOPs
developed, or are under investigation, that could have possible applications in
wastewater treatment technologies (Parsons, 2004).
Some of the widely used AOPs for phenol oxidation studies will be reviewed in
detail with special emphasis on the use of single and combined processes of the
Fenton reaction, cavitation (ultrasound and hydrodynamic), catalysis, peroxidation,
ozonation and use of activated carbon cloth as emerging AOPs in phenolic
wastewater and drinking water treatment.
AOPs
Catalysis Pulsed plasma Electrochemical Supercritical water oxidation Fenton’s reagent Cavitation Ferrate UV Ionising radiation UV/H2O2
Microwave UV/H2O2/O3
Photo-Fenton’s reagent Vacuum UV Photocatalysis Wet air oxidation
Opportunities for AOPs
Groundwater Industrial wastewater Odour and VOCs Industrial sludge’s Surface water Municipal wastewater Swimming pools Leachates Water recycling Municipal sludge’s Disinfection Ultra pure water
Table 1.1: List o f AOPs and its applications in w ater and w astew ater treatm ent (Parsons, 2004).
3
G enera l in tro d u c tio n
In AOPs, the main aim of oxidation of pollutants is to mineralise or convert the
reactants of the organic pollutants into relatively simpler inorganic molecules,
mainly CO2 , H2 O and mineral salts (Parsons, 2004). The conventional oxidants
such as hydrogen peroxide (H2 O2 ) and ozone (O3 ) have been focussed in this thesis
and the hydroxyl radicals (H O ) generated from these oxidants, through chain
reactions, give many AOPs its power to oxidise pollutants and enhance degradation
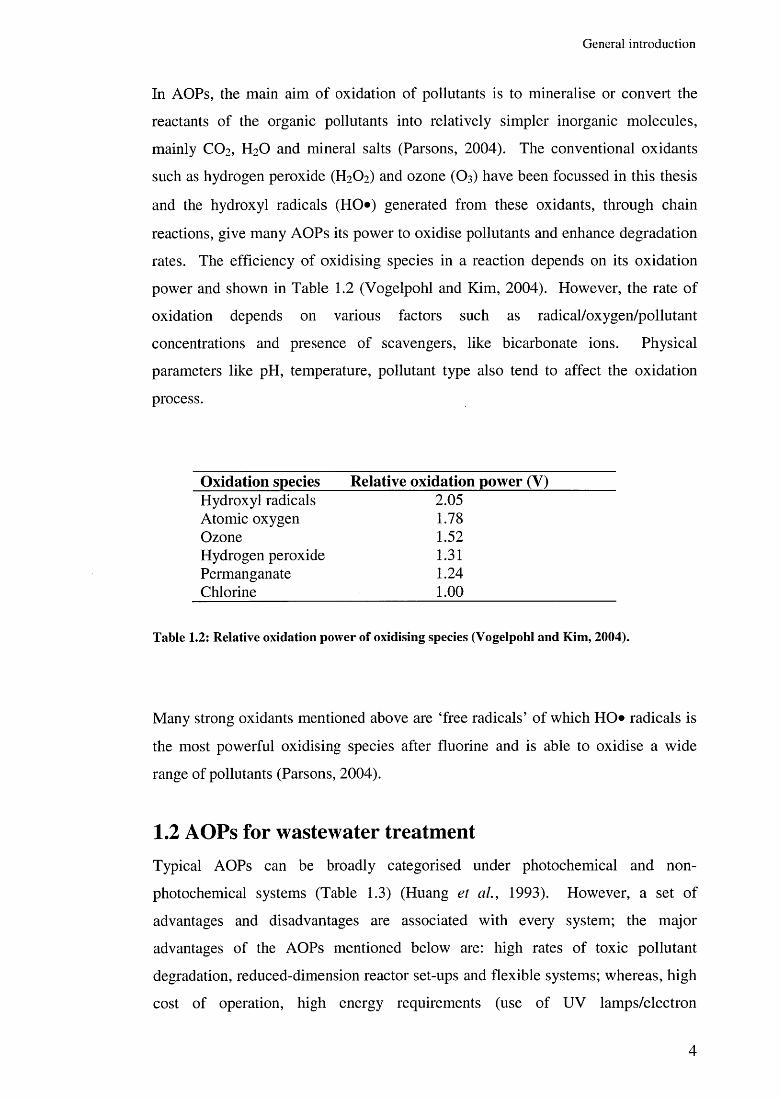
rates. The efficiency of oxidising species in a reaction depends on its oxidation
power and shown in Table 1.2 (Vogelpohl and Kim, 2004). However, the rate of
oxidation depends on various factors such as radical/oxygen/pollutant
concentrations and presence of scavengers, like bicarbonate ions. Physical
parameters like pH, temperature, pollutant type also tend to affect the oxidation
process.
Oxidation species Relative oxidation power (Y)Hydroxyl radicals 2.05Atomic oxygen 1.78Ozone 1.52Hydrogen peroxide 1.31Permanganate 1.24Chlorine 1 . 0 0
Table 1.2: Relative oxidation pow er o f oxidising species (V ogelpohl and Kim , 2004).
Many strong oxidants mentioned above are ‘free radicals’ of which HO* radicals is
the most powerful oxidising species after fluorine and is able to oxidise a wide
range of pollutants (Parsons, 2004).
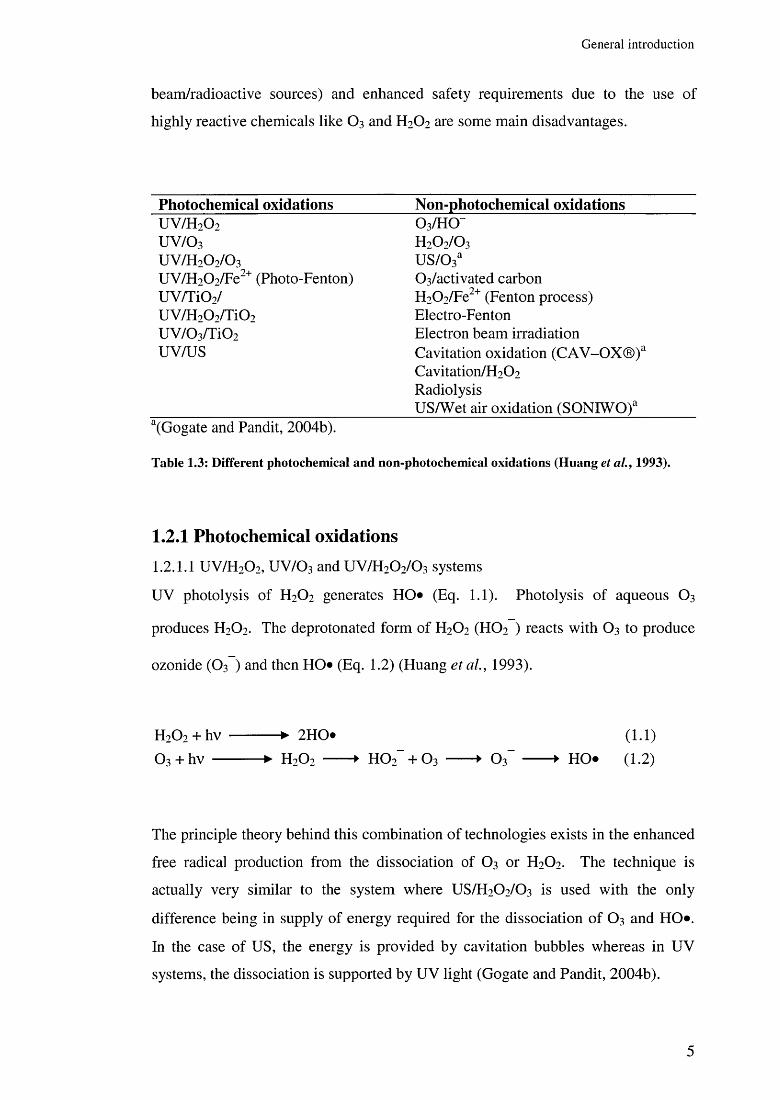
1.2 AOPs for wastewater treatmentTypical AOPs can be broadly categorised under photochemical and non-
photochemical systems (Table 1.3) (Huang et al., 1993). However, a set of
advantages and disadvantages are associated with every system; the major
advantages of the AOPs mentioned below are: high rates of toxic pollutant
degradation, reduced-dimension reactor set-ups and flexible systems; whereas, high
cost of operation, high energy requirements (use of UV lamps/electron
4
G enera l in tro d u c tio n
beam/radioactive sources) and enhanced safety requirements due to the use of
highly reactive chemicals like O3 and H2O2 are some main disadvantages.
Photochemical oxidations Non-photochemical oxidationsUV/H2O2 O3/HO"UV/O3 H2O2/O 3
UV/H2O2/O3 u s /o 3aUV/H20 2/Fe2+ (Photo-Fenton) 0 3 /activated carbonUV /Ti02/ H2 0 2 /Fe2+ (Fenton process)UV/H20 2/T i0 2 Electro-FentonU V /0 3/T i0 2 Electron beam irradiationu v /u s Cavitation oxidation (CAV-OX ® ) 3
Cavitation/H202RadiolysisUS/Wet air oxidation (SONIWO)a
a(Gogate and Pandit, 2004b).
Table 1.3: Different photochem ical and non-photochem ical oxidations (H uang et a l. , 1993).
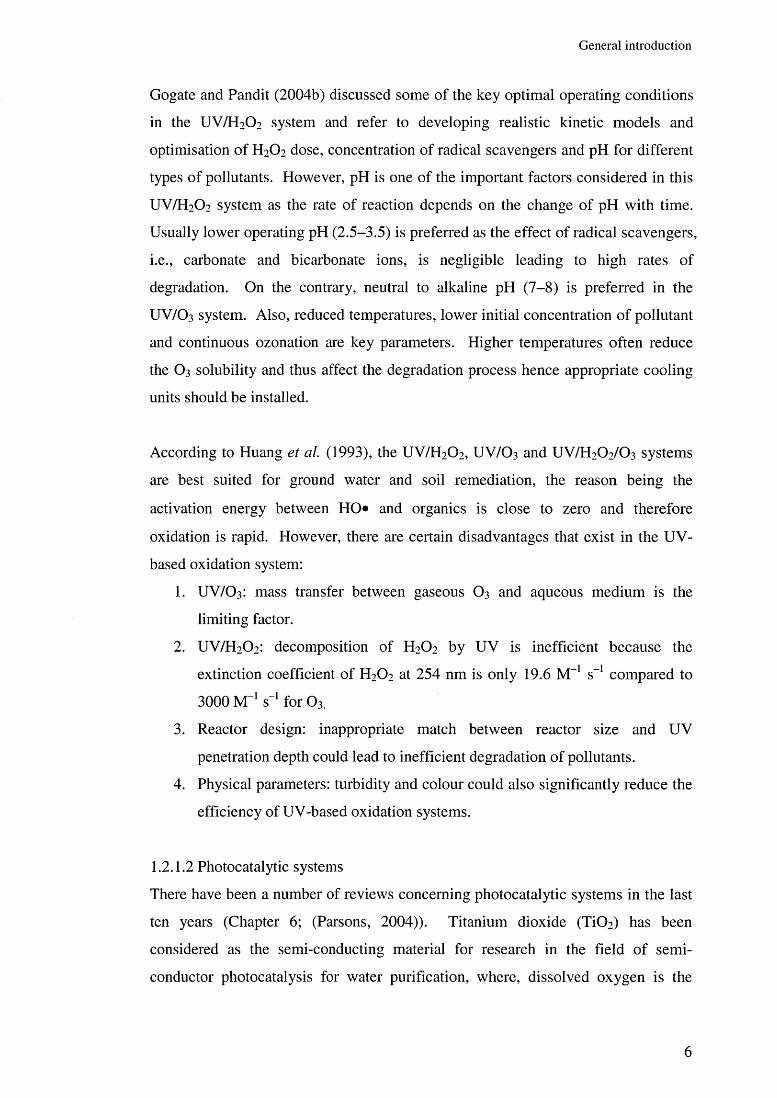
1.2.1 Photochemical oxidations1 .2 . 1 . 1 UV/H2O2, UV/O3 and UV/H20 2/ 0 3 systems
UV photolysis of H2O2 generates HO» (Eq. 1.1). Photolysis of aqueous O3
produces H2O2. The deprotonated form of H2O2 (HO2 ) reacts with O3 to produce
ozonide (O3 ) and then HO* (Eq. 1.2) (Huang et a l , 1993).
H20 2 + hv ---------- ► 2HO* ( 1 . 1 )O3 + hv ---------- ► H2O2 ------► HO2 + O3 ------► O3 ------ ► HO* (1.2)
The principle theory behind this combination of technologies exists in the enhanced
free radical production from the dissociation of O3 or H2O2 . The technique is
actually very similar to the system where US/H2O2/O 3 is used with the only
difference being in supply of energy required for the dissociation of O3 and HO*.
In the case of US, the energy is provided by cavitation bubbles whereas in UV
systems, the dissociation is supported by UV light (Gogate and Pandit, 2004b).
5
G enera l in tro d u c tio n
Gogate and Pandit (2004b) discussed some of the key optimal operating conditions
in the UV/H2 O2 system and refer to developing realistic kinetic models and
optimisation of H 2 O2 dose, concentration of radical scavengers and pH for different
types of pollutants. However, pH is one of the important factors considered in this
UV/H2 O2 system as the rate of reaction depends on the change of pH with time.
Usually lower operating pH (2.5-3.5) is preferred as the effect of radical scavengers,
i.e., carbonate and bicarbonate ions, is negligible leading to high rates of
degradation. On the contrary, neutral to alkaline pH (7-8) is preferred in the
UV/O3 system. Also, reduced temperatures, lower initial concentration of pollutant
and continuous ozonation are key parameters. Higher temperatures often reduce
the O3 solubility and thus affect the degradation process hence appropriate cooling
units should be installed.
According to Huang et cil (1993), the UV/H 2 O2 , UV/O 3 and UV/H 2 O2 /O 3 systems
are best suited for ground water and soil remediation, the reason being the
activation energy between HO» and organics is close to zero and therefore
oxidation is rapid. However, there are certain disadvantages that exist in the UV-
based oxidation system:
1. UV/O3 : mass transfer between gaseous O3 and aqueous medium is the
limiting factor.
2 . UV/H2 O2 : decomposition of H 2 O2 by UV is inefficient because the
extinction coefficient of H 2 O2 at 254 nm is only 19.6 M - 1 s- 1 compared to
3000 M~‘ s“‘ for 0 3.
3. Reactor design: inappropriate match between reactor size and UV
penetration depth could lead to inefficient degradation of pollutants.
4. Physical parameters: turbidity and colour could also significantly reduce the
efficiency of UV-based oxidation systems.
1.2.1.2 Photocatalytic systems
There have been a number of reviews concerning photocatalytic systems in the last
ten years (Chapter 6 ; (Parsons, 2004)). Titanium dioxide (T i02) has been
considered as the semi-conducting material for research in the field of semi
conductor photocatalysis for water purification, where, dissolved oxygen is the
6
G enera l in tro d u c tio n
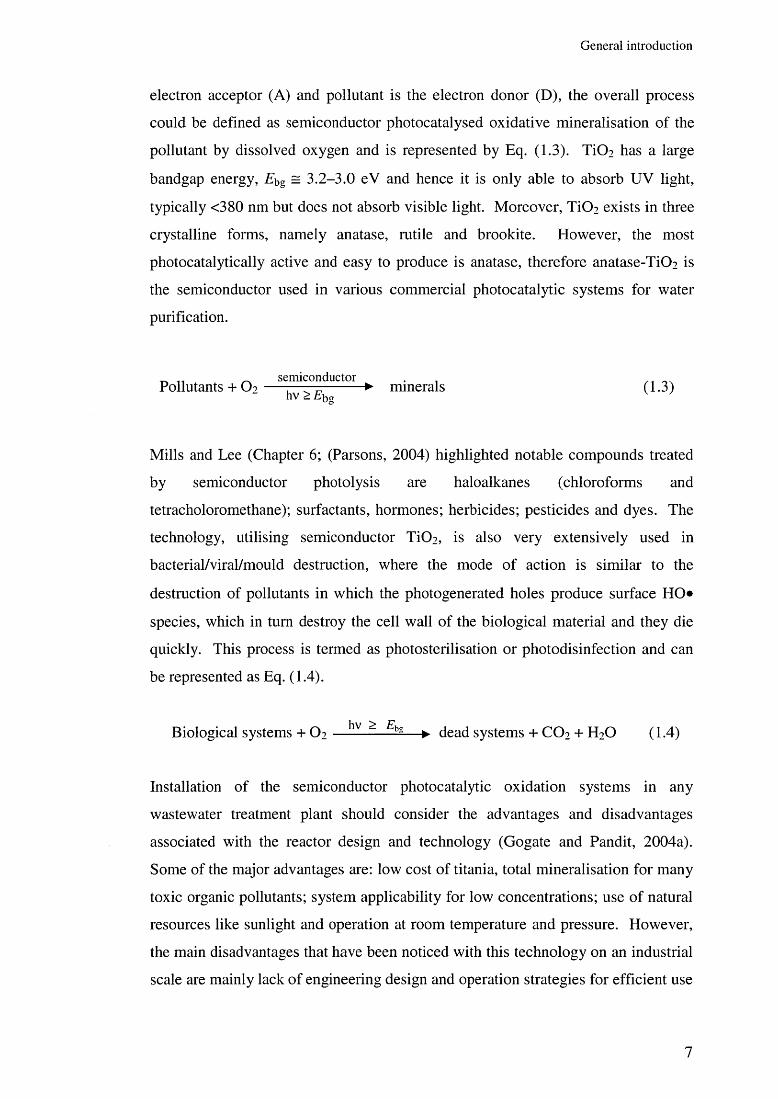
electron acceptor (A) and pollutant is the electron donor (D), the overall process
could be defined as semiconductor photocatalysed oxidative mineralisation of the
pollutant by dissolved oxygen and is represented by Eq. (1.3). Ti0 2 has a large
bandgap energy, £bg = 3.2 -3 .0 eV and hence it is only able to absorb UV light,
typically <380 nm but does not absorb visible light. Moreover, Ti0 2 exists in three
crystalline forms, namely anatase, rutile and brookite. However, the most
photocatalytically active and easy to produce is anatase, therefore anatase-TiC> 2 is
the semiconductor used in various commercial photocatalytic systems for water
purification.
Pollutants + O2semiconductor
hv > Eft g minerals (1.3)
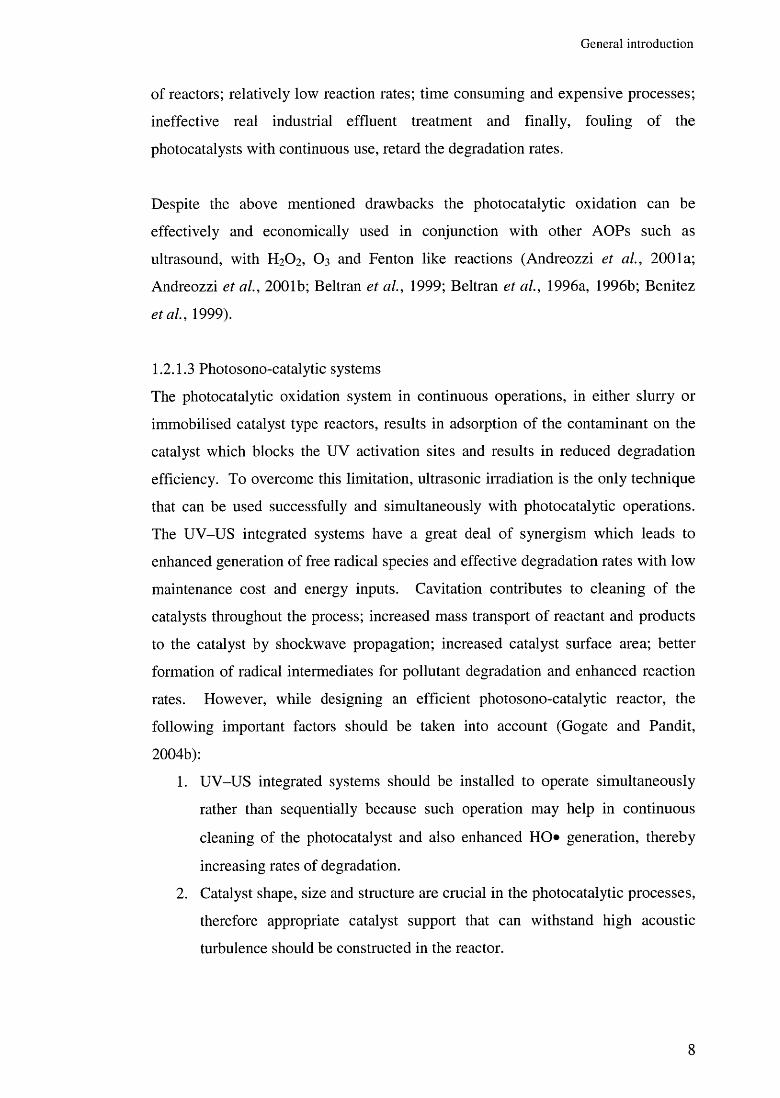
Mills and Lee (Chapter 6 ; (Parsons, 2004) highlighted notable compounds treated
by semiconductor photolysis are haloalkanes (chloroforms and
tetracholoromethane); surfactants, hormones; herbicides; pesticides and dyes. The
technology, utilising semiconductor TiCL, is also very extensively used in
bacterial/viral/mould destruction, where the mode of action is similar to the
destruction of pollutants in which the photogenerated holes produce surface HO*
species, which in turn destroy the cell wall of the biological material and they die
quickly. This process is termed as photosterilisation or photodisinfection and can
be represented as Eq. (1.4).
Biological systems + O 2 —hv ~ Ebg— ► dead systems + CO 2 + H 2 O (1.4)
Installation of the semiconductor photocatalytic oxidation systems in any
wastewater treatment plant should consider the advantages and disadvantages
associated with the reactor design and technology (Gogate and Pandit, 2004a).
Some of the major advantages are: low cost of titania, total mineralisation for many
toxic organic pollutants; system applicability for low concentrations; use of natural
resources like sunlight and operation at room temperature and pressure. However,
the main disadvantages that have been noticed with this technology on an industrial
scale are mainly lack of engineering design and operation strategies for efficient use
7
G enera l in tro d u c tio n
of reactors; relatively low reaction rates; time consuming and expensive processes;
ineffective real industrial effluent treatment and finally, fouling of the
photocatalysts with continuous use, retard the degradation rates.
Despite the above mentioned drawbacks the photocatalytic oxidation can be
effectively and economically used in conjunction with other AOPs such as
ultrasound, with H 2 O2 , O3 and Fenton like reactions (Andreozzi et a i, 2001a;
Andreozzi et al., 2001b; Beltran et al., 1999; Beltran et al., 1996a, 1996b; Benitez
etal., 1999).
1.2.1.3 Photosono-catalytic systems
The photocatalytic oxidation system in continuous operations, in either slurry or
immobilised catalyst type reactors, results in adsorption of the contaminant on the
catalyst which blocks the UV activation sites and results in reduced degradation
efficiency. To overcome this limitation, ultrasonic irradiation is the only technique
that can be used successfully and simultaneously with photocatalytic operations.
The UV-US integrated systems have a great deal of synergism which leads to
enhanced generation of free radical species and effective degradation rates with low
maintenance cost and energy inputs. Cavitation contributes to cleaning of the
catalysts throughout the process; increased mass transport of reactant and products
to the catalyst by shockwave propagation; increased catalyst surface area; better
formation of radical intermediates for pollutant degradation and enhanced reaction
rates. However, while designing an efficient photosono-catalytic reactor, the
following important factors should be taken into account (Gogate and Pandit,
2004b):
1 . UV-US integrated systems should be installed to operate simultaneously
rather than sequentially because such operation may help in continuous
cleaning of the photocatalyst and also enhanced HO* generation, thereby
increasing rates of degradation.
2. Catalyst shape, size and structure are crucial in the photocatalytic processes,
therefore appropriate catalyst support that can withstand high acoustic
turbulence should be constructed in the reactor.
8
General introduction
3. For wastewater treatment in photosono-catalytic reactors, it is suggested that
continuous reactors are better than batch reactors or those operating in re
circulating mode in order to treat huge quantities of effluents.
4. While combining, the photosono-catalytic reactors, uniformity in power
distribution by ultrasonic irradiation and uniformity in receiving the
irradiation by the photocatalysts, should always be taken in account to
achieve maximum pollutant degradation.
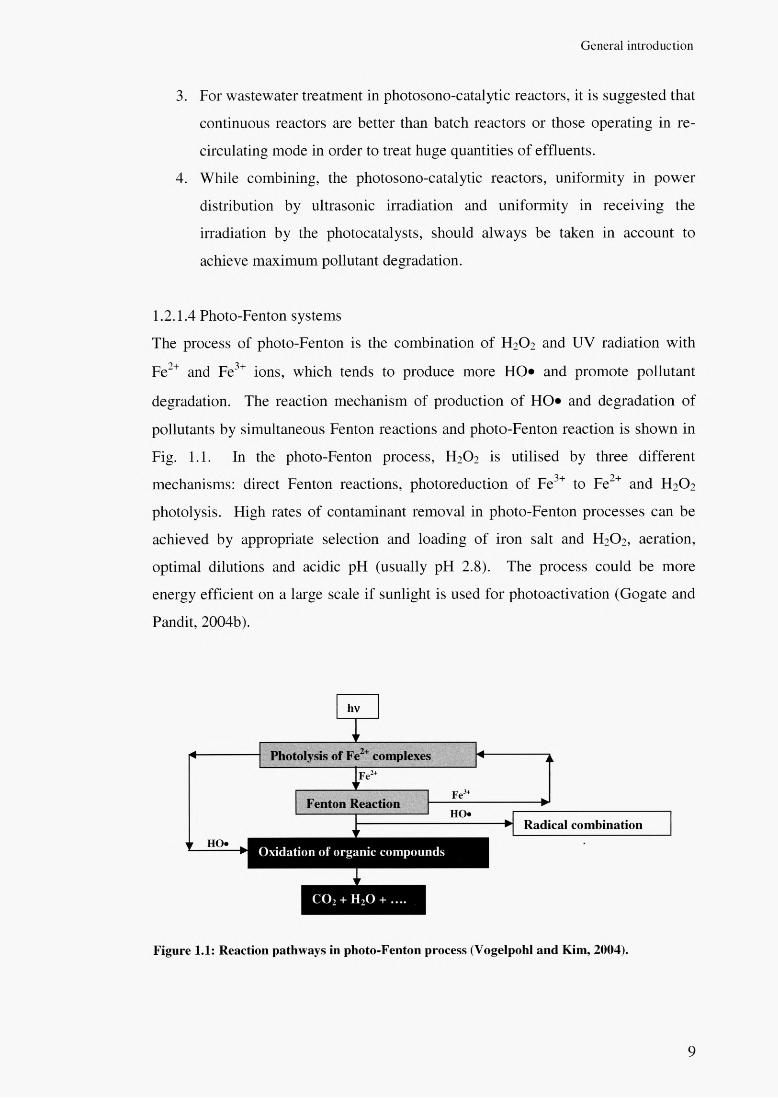
1.2.1.4 Photo-Fenton systems
The process of photo-Fenton is the combination of FFCF and UV radiation with
Fe2+ and Fe3+ ions, which tends to produce more HO« and promote pollutant
degradation. The reaction mechanism of production of HO» and degradation of
pollutants by simultaneous Fenton reactions and photo-Fenton reaction is shown in
Fig. 1.1. In the photo-Fenton process, FFCF is utilised by three different
mechanisms: direct Fenton reactions, photoreduction of Fe3+ to Fe2+ and FFCF
photolysis. High rates of contaminant removal in photo-Fenton processes can be
achieved by appropriate selection and loading of iron salt and H2O2, aeration,
optimal dilutions and acidic pH (usually pH 2.8). The process could be more
energy efficient on a large scale if sunlight is used for photoactivation (Gogate and
Pandit, 2004b).
F ig u re 1.1: R e a c tio n p a th w a y s in p h o to -F e n to n p ro c e ss (V o g e lp o h l a n d K im , 2004).
9

G enera l in tro d u c tio n
1.2.2 Non-photochemical oxidations1.2.2.1 Fenton oxidation
According to Wadely and Waite (Chapter 5; (Parsons, 2004)), the Fenton reaction
is used extensively in the treatment of contaminated water and soil and has been
categorised into light- and dark-Fenton processes. The light-Fenton process is often
termed as the photo-assisted Fenton process whereas, the dark-Fenton process
involves one or more oxidising agents, usually H2 O2 and/or oxygen and a catalyst
(usually iron metal salt or oxide). The contaminant degradation is normally
catalysed by the reduction of Fe3+ to Fe2+ and leads to the formation of a range of
free radical species, including highly reactive HO* which helps in efficient
pollutant removal. The Fenton reaction involves three main radical species, two of
which are HO* and the third is an aquo or organo complex of high valence iron,
called the ferryl ion (Sauer and Ollis, 1996). These coexisting radical species
predominate over each other depending on substrate nature, metal-peroxide ratio,
scavenger addition, etc. The Fenton oxidation system is highly applicable in
removing colour and odour from wastewater with good energy efficiency and can
be effectively used in treating toxic and non-biodegradable wastewaters making it
suitable for secondary biological treatment (Chen and Pignatello, 1997).
Optimum operating conditions in the Fenton oxidation system have been
summarised in a review by (Gogate and Pandit, 2004a):
1. pH: the optimum pH recommended for Fenton reactions is 3, however at pH
<3, the formation of [Fe(II).(H2 0 )]2+ occurs, which reduces HO* production
thereby decreasing the degradation rates, similarly, at pH >4, the
degradation rate often tends to fall mainly due to formation of Fe2+
complexes with the buffer which in turn inhibits the free radical formation
and enhances ferric oxyhydroxide precipitation.
2. Ferrous ions: the rate of pollutant degradation increases with increasing
ferrous ion concentration; however enormous quantities may remain
unutilised and may eventually increase the total dissolved solids load in the
effluent stream.
3. H2 O2 : the efficacy of Fenton oxidation greatly depends on the oxidant dose
and generally the pollutant degradation increases with the increased H 2 O 2
10
G enera l in tro d u c tio n
dosage. However, selecting an optimum oxidant concentration is important
as the residual H 2 O2 concentration influences the chemical oxygen demand
(COD) levels and therefore excess amount is not recommended.
4. Pollutant concentration: lower initial pollutant concentration is favoured.
5. Operating temperature: usually 1CM-0 °C have been reported to be the range
of temperatures that does not affect the degradation efficiency. Above this
range, cooling units should be installed in the reactor design.
Fenton oxidation systems can also be greatly enhanced by combination with other
AOPs, like UV, cavitation, catalysis and ozonation.
1.2.2.2 Oxidation using oxidants
The two most extensively used oxidants in AOPs are O3 and H 2 O2 . The
combination of the two oxidants (H2 O2 /O 3 ) leads to synergy in the treatment of
chemicals such as organophosphoric acid triesters, clofibric acid, ibuprofen,
tetrachloroethylene, which show less reactivity towards direct oxidation with O3
alone (Echigo et al., 1996; Glaze and Kang, 1989a, 1989b; Zwiener and Frimmel,
2000).
1.2.2.2.1 Ozone
O3 is an unstable gas and a highly powerful oxidising agent (E° = +2.07 V). The
main areas where O3 has been used extensively are:
i. Disinfection
ii. Oxidation of organic and inorganic compounds
iii. Particle and taste/colour/odour removal
O3 has a high potential to react with multiple bonds species, i.e., C=C, C=N, N=N,
etc., however it has a reduced potential to react with single-bonded species, i.e.,
C -C , C - 0 and O -H . 3
O3 transfer in the aqueous medium is one of the key factors controlling disinfection
and degradation rates. Literature supports the use of small size O3 diffusers such as
porous disks, porous glass diffusers, bubble columns, packed and plate columns,
static mixers, jet reactors and agitated vessels. These have all been shown to be
11
G enera l in tro d u c tio n
effective in increasing the interfacial area of contact of O3 in aqueous medium
(Glaze, 1987). Martin and Galey (1994) studied the use of static mixers in
oxidation and disinfection and reported that the mass transfer coefficient of O3
increases with a decreasing static mixer’s flowrate and increasing gas flowrate.
A list of operating conditions to achieve the maximum extent of degradation along
with high energy efficiency has been recommended (Beltran et a l , 1997; Beltran et
a l , 1994; Beltran et al, 1992; Glaze, 1987; Martin and Galey, 1994):
1. Higher pH values.
2. Increased O3 partial pressure.
3. Use of static mixers.
4. Temperatures 5-20 °C.
5. Presence of catalyst: TiCU, Fe (II), Mn (II), etc.
A major drawback of using ozonation technology on larger scale operations is the
high cost of generation and gas-liquid mass transfer. However, such difficulties
could be partially tackled with a combination of ozonation with other existing
AOPs such as ultrasound; UV; H2 O 2 and efficient reactor design, with lower cost of
treatment (Gogate and Pandit, 2004a).
1.2.2.2.2 Hydrogen peroxide
H2 O2 has been found to be effective in treating wastewater which require less
stringent oxidation conditions (Ayling and Castrantas, 1981). There are three
different concentrations normally recommended for the treatment of wastewater:
35%, 50% and 70%, of which, 35% is the safest to use while 70% may produce
detonable mixtures with many organic compounds. The reaction rate between
H 2 O2 and the pollutant often decides where H 2 O2 should be added in the pollutant
stream. According to Gogate and Pandit (2004a), the simplest, fastest and cheapest
method for injection of H 2 O2 is a gravity feed system.
No reports so far state the usage of H 2 O2 alone for effective wastewater treatment.
Moreover, stability of this oxidant is always a limitation in any reaction system.
Interestingly, H2 O2 could act as an additional pollutant if added in excess to the
12
G enera l in troduc tion
reaction system or if formed by recombination of dissociated H O . Either of the
above processes could result in decreased overall degradation rates.
However, the above limitations can be tackled by involving H 2 O2 in other hybrid
AOP systems such as ultrasound, UV, the Fenton reaction, catalysis and ozonation.
Such alternatives might also lead to enhanced oxidation rates at low cost and energy
consumption.
1.2.2.2.3 Ozone/hvdrogen peroxide
The addition of H2 O2 at a O 3/H 2 O2 ratio of 2 : 1 to ozonation processes, increases the
decomposition of O3 molecules thereby enhancing the formation of H O in the
reaction medium (Vogelpohl and Kim, 2004). The reaction mechanism has been
studied and is shown in Eq. 1.5-1.12 (Buhler et a l, 1984; Forni et al., 1982;
Sehested et al., 1982).
H 2 O2 can form the hydroperoxide ion HO 2 and an H+:
H 2 0 2 ---------- ► H 0 2- + H+ (1.5)
The hydroperoxide ion reacts with O3 to produce the ozonide ion (O3 ) and
hydroperoxide radical (HCb*):
H 0 2 + 0 3 ----------► 0 3" + H 0 2* ( 1 .6 )
Chain reactions of these products (Cb- and HCb*) form HO*:
H 0 2' ----------► H+ + 0 2' (1.7)0 2 + O3 ---------- ► O3 + O2 (1.8)o r + H+ --------- ► HO3 (1.9)HO3 --------- ►H0* + 0 2 (1.10)
Once HO* are formed, the following propagation steps generate HO* by an
autocatalytic mechanism:
0 3 + H0* ---------- ► 0 2 + H 0 2* (1.11)0 3“ + H 0 2* ---------- ► 2 0 2 + HO* (1.12)
The chain mechanism generates HO* by consuming H 2 O2 and O 3 and the sequence
is terminated by recombination of different radicals.
(Gogate and Pandit, 2004b) highlighted the following important considerations for
the use of the hybrid H2 O2 /O 3 technology in wastewater treatment:
13
G enera l in tro d u c tio n
1. The combined technology will be particularly helpful for pollutants showing
less reactivity towards molecular O3 attack and where radical chain
initiators are present in low concentrations.
2. The optimum operating conditions in order to achieve enhanced degradation
from this combined technology can be given as: optimum O3 and H2 O 2
dosage, neutral pH, low pollutant concentration and pre-treatment of
wastewaters.
3. Increasing the O3 utilisation in the reactions is another important factor that
should be taken into account in reactor design.
4. Instead of using reactors in series, multiple point injection of H 2 O 2 and
addition of O3 in steps is a promising technique rather than single point
injection/addition.
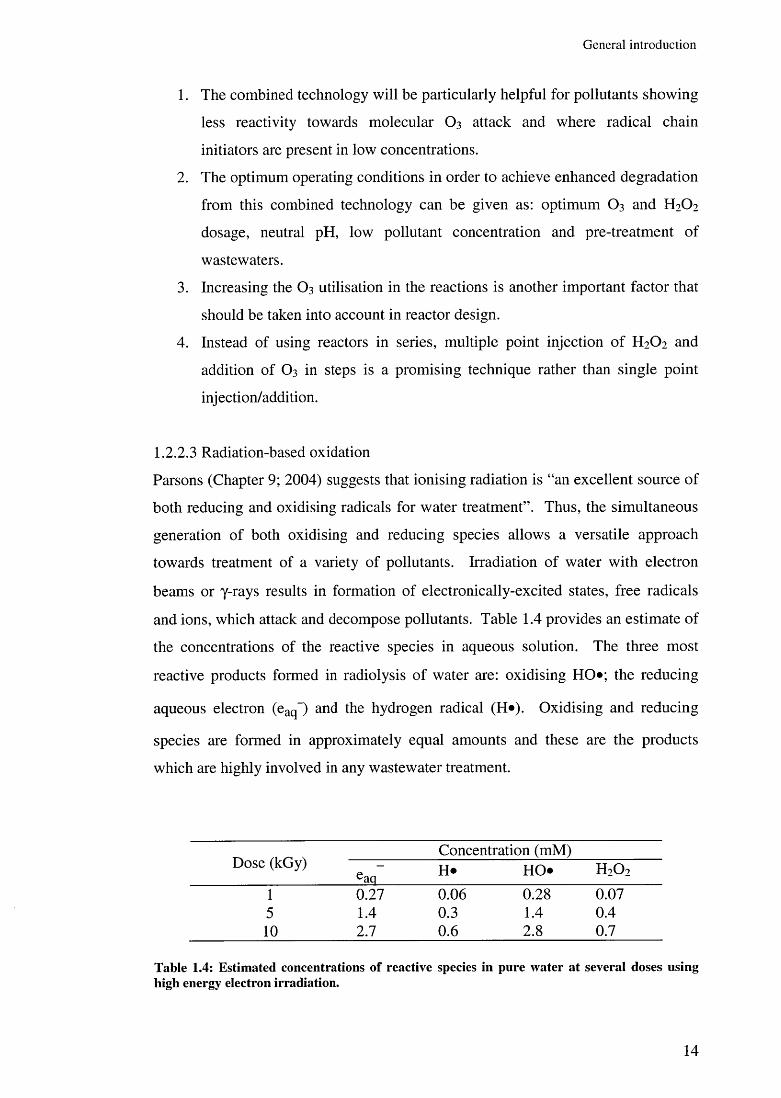
1.2.2.3 Radiation-based oxidation
Parsons (Chapter 9; 2004) suggests that ionising radiation is “an excellent source of
both reducing and oxidising radicals for water treatment”. Thus, the simultaneous
generation of both oxidising and reducing species allows a versatile approach
towards treatment of a variety of pollutants. Irradiation of water with electron
beams or y-rays results in formation of electronically-excited states, free radicals
and ions, which attack and decompose pollutants. Table 1.4 provides an estimate of
the concentrations of the reactive species in aqueous solution. The three most
reactive products formed in radiolysis of water are: oxidising HO*; the reducing
aqueous electron (eaq~) and the hydrogen radical (H*). Oxidising and reducing
species are formed in approximately equal amounts and these are the products
which are highly involved in any wastewater treatment.
Dose (kGy)Concentration (mM)
eaq H* HO* H 2 0 2
1 0.27 0.06 0.28 0.075 1.4 0.3 1.4 0.4
1 0 2.7 0 . 6 2 . 8 0.7
Table 1.4: Estim ated concentrations o f reactive species in pure w ater at several doses using high energy electron irradiation.
14
G enera l in tro d u c tio n
Although aqueous electron (eaq~) and HO* have similar G values, the former is less
available for reaction due to scavenging by hydronium ion (H3 0 +) in acidic water
and oxygen in aerated solutions. Likewise, though H* is less abundant than eaq~,
the former has a relatively small reaction rate with common radical scavengers
found in natural water which makes it important for some pollutant removal.
However, such limitations do not exist with the HO*, therefore it can participate in
several types of reactions (Parsons, 2004).
The rate of reaction in radiation processes is controlled by several factors, namely
ionising radiation (electron beam or y-radiation energy, absorbed dose and dose
rate), nature and concentration of pollutants and presence of scavengers and
additives. The effect on treatment efficiency is especially noticeable at low
pollutant concentrations. Irradiations of some systems have a dual impact on the
treatment system: on the one hand it degrades the pollutant whereas on the other it
changes the physico-chemical properties of the system which again contributes to
pollutant removal process. Highly concentrated pollutants require large absorbed
doses for their purification. Therefore, a cost-effective approach in irradiation
treatment would be to combine this technology with other conventional
technologies, such as ozonation, floatation, adsorption, coagulation or biological
treatment (Woods and Pikaev, 1994).
1.2.2.4 Wet air oxidation
The application of wet air oxidation (WAO) for the treatment of industrial
wastewaters began to be commercialised in the 1970s (Mishra et al., 1995). Nearly
100 WAO plants are operating commercially mostly to treat wastewaters generated
from petrochemical, chemical and pharmaceutical industries as well as residual
sludge from wastewater treatment plants. WAO is an aqueous phase process,
where water is an integral part of the reaction. The process is defined as ‘the
oxidation of organic and inorganic compounds in an aqueous media by means of
oxygen/air at elevated temperatures’ (Chapter 9; (Parsons, 2004)). Typical
operating temperature range for WAO varies from 100 °C to 372 °C (subdivided
into: lower, 100-200 °C; medium, 200-260 °C; higher, 260-320 °C; highest, 320-
15

G enera l in tro d u c tio n
372 °C) at elevated pressures to maintain water in the liquid phase and ensure
oxidation reactions take place in the liquid phase. However, due to high capital
cost, high temperature systems, i.e., 320-372 °C, are rarely used. Residence time
may vary between 15 and 120 min, leading to 75-90% COD removal. Insoluble
organic matter is converted to small organic compounds and eventually to carbon
dioxide and water without emission of NOx, SOx, HC1, dioxins, furans, fly ash, etc.
WAO plants either aim for complete oxidation or partial oxidation prior to
treatment by conventional biological processes.
WAO can be divided into two types:
1. Non-catalytic WAO
2. Catalytic WAO (CWAO)
i. Heterogeneous CWAO
ii. Homogeneous CWAO
In case of non-catalytic WAO, the free radical chain mechanism involves the
formation of hydroperoxides and oxyradicals. The two-step non-catalytic WAO
degradation mechanism is as follows:
Step 1: hydrogen abstraction from the a-, p- and Y-CH2 groups of carboxylic
acids by O2 results in the formation of free radicals which react immediately
with O2 to form peroxy radicals.
Step 2: the peroxy radicals can lead to the decarboxylation and formation of
CO2 by H abstraction from the —COOH group of another molecule of
carboxylic acid.
A generalised kinetic model based on a simplified reaction scheme with acetic acid
as the rate-limiting intermediate was proposed by (Li et a l, 1991). This kinetic
model is usually used to represent the WAO reactions and shows a reasonably good
fit with experimental data.
With the high thermal efficiency of WAO and utilisation of direct chemical
oxidation processes, it offers an economical alternative to liquid waste incineration.
Higher efficiencies have also been achieved by addition of a catalyst to WAO
1 6

G enera l in tro d u c tio n
which in turn reduces the energy consumption in the process and proves out to be a
cost-effective process for the treatment of organic sludge and refractory industrial
wastewater.
Furthermore, hybrid technologies like SONIWO (sonication followed by WAO)
have proved to be outstanding in achieving high degradation rates with enhanced
efficiency at comparatively milder temperature and pressure conditions as
compared to WAO alone (Dhale and Mahajani, 2001; Ingale and Mahajani, 1995).
The WAO has certain limitations with respect to treating complex materials, e.g.,
polychlorinated biphenyls and polyaromatics along with requirements of severe
conditions of temperature and pressure which may lead to high operating cost and
therefore affect the overall economic values of the treatment system. In such
situations SONIWO has a great advantage as the hybrid technology, involving
sonication, may first used to pre-treat the wastes and convert the toxic complex
mixtures to smaller fragmented molecules and further processing can easily be
carried out by WAO, thereby achieving efficient degradation at comparatively less
severe conditions of temperature and pressure.
Some laboratory scale studies suggest that hybrid technologies such as
membrane/sonication/WAO, can lead to 80-90% dye degradation in a residence
time of 120 min at neutral pH (Dhale and Mahajani, 1999). Also, catalysts like
CUSO4 and NiSOzu small amounts of phenol; acidic pH; pre-treatment such as
adsorption by activated carbon and membrane separation, could be other hybrid
alternative ways in treating toxic wastes along with WAO (Gogate and Pandit,
2004b).
1.2.2.5 Catalytic oxidation
Some of the catalytic oxidations such as photocatalytic oxidation and use of iron
salts and iron oxides in Fenton reactions have been discussed earlier. Solid
catalysts have also been reported to enhance the rate of degradation when combined
with other AOPs like, ozonation and cavitation. This part of the Introduction will
mainly concentrate on the use of catalysts in ozonation and cavitation processes and
their effect on the oxidation rates.
17
G enera l in tro d u c tio n
1.2.2.5.1 Catalysts in sonochemical reactions
The presence of solid catalysts in the form of the particles in sonochemical reactors
increases the collapse events, thereby increasing the number of free radical
formation. Also, by the action of ultrasound the solid catalysts are continuously
polished and reduction in particle size due to mechanical action provides large
surface areas for pollutants to react. Hung and co-workers discussed the enhanced
reductive degradation of C C I 4 and nitrobenzene by elemental iron during sonication
(Hung and Hoffmann, 1998; Hung et a l, 2000). The presence of solid catalysts in
sonochemical reactors also alters the physical properties of the liquid medium, viz.,
vapour pressure and surface tension, which results in greater cavity collapse and
intense radical species formation available for pollutants (Gogate and Pandit,
2004b). The use of NaCl as an additive for the enhanced degradation of aqueous
pollutants has been reported (Seymour and Gupta, 1997). The presence of NaCl
and NaN 0 2 alters the distribution of the aqueous and organic phases by changing
the partition coefficient due to which the concentration of organics increases at the
gas-liquid interfaces, subsequently increasing the degradation rates. Moreover,
salts are known to increase the surface tension of liquids and in doing so in the
presence of cavitational activity, much violent cavity collapse occurs (Mahamuni
and Pandit, 2006). However, the concentration of salts, the pollutant concentration,
power density and operating frequency should always be considered before
application (Gogate and Pandit, 2004a).
1.2.2.5.2 Catalysts in ozonation reactions
(Ma and Graham, 1997, 2000) discussed in detail the use of manganese ions in an
ozonation process as a promising catalyst for enhanced degradation rates. They
reported that in the presence of Mn ions, the O3 is utilised efficiently by the Mn(II)
ions and assist subsequent degradation and the catalyst may promote the formation
of free radicals from O3 since Mn(IV) acts as catalyst in O3 decomposition. A
small dose of Mn(II) is often recommended, however as the free radical attack is
the driving mechanism in catalytic ozonation, the naturally occurring material
present in effluents is always a deciding factor. In a similar study Andreozzi and
co-workers (Andreozzi et al., 2000a; Andreozzi et al., 1998; Andreozzi et a i,
2001b; Andreozzi et al., 1992; Andreozzi et al., 2000b) studied catalytic ozonation
in the presence of Mn catalyst for degradation of pyruvic and oxalic acid and
18
G enera l in troduc tion
reported that pH is the controlling factor in catalytic action. At pH 10, conversion
of Mn(II) to Mn(III) via Mn(IV), initiates free radical formation, whereas at pH 4.7,
the Mn(III)-oxalate complex is formed, which acts as a free radical chain initiator.
The above study could be adapted to provide guidelines in developing similar
kinetic models for different reaction systems involving catalysts and O3 in order to
achieve high degradation rates. Moreover, optimum conditions such as 0 3 /catalyst
loading and lower pH/temperatures/naturally occurring materials/radical scavengers
may also contribute towards efficient degradation. Also, the use of hybrid AOP
technologies like ultrasound, in conjunction with catalytic ozonation, offers an
attractive alternative in pollutant removal.
1.2.2.5.3 Catalytic oxidation by activated carbon
Granular activated carbon (GAC) has gained immense importance for removal of
organic pollutants, however use of activated carbon cloth (ACC) in removal
processes showed similar or higher adsorption capacities (Brasquet et a l , 1999).
Catalytic oxidation for wastewater treatment has also been extensively studied in
the integrated processes such as metal oxide catalyst/GAC/H 2 0 2 for dye wastewater
(Lin and Lai, 1999); GAC/H2 O2 treatment of 4-chlorophenol (Huang et a l, 2003);
AC/O3 treatment for gallic water (Beltran et a l, 2006) and bagasse ash and wood
charcoal ACs have been effectively used to remove phenol (Mukherjee et al., 2007).
Combined AOPs such as O3-BAC (biological AC), UV/O 3 -BAC, TiCb/UV/C^-
BAC (Li et al, 2005) and CWAO-Fe/AC (Quintanilla et a l, 2007) for removal of
organic pollutants from secondary effluents have also been reported in recent
literature.
Pre-treatment of AC by oxidants like, H2O2/HNO3 on pentachlorobenzene (P5CBz)
was studied and results suggest that certain functional groups such as carboxyl and
hydroxyl were formed on the surface of the AC. It was inferred that the hydroxyl
groups act on the dechlorination of P5CBz and the oxygen functional groups arising
from the HNO3 treatment helps in the destruction of P5CBz (Takaoka et a l, 2007).
Similarly, when AC is pre-treated with O3 the chemical and textural properties are
altered. Also, as a rule the O3 treatment, at room (25 °C) or even higher (100 °C)
19

G enera l in tro d u c tio n
temperatures give rise to the surface oxygen groups (SOG). However, at the same
time it is worth noting that at 25 °C, only primary carboxylic acids are formed on
the surface of AC but at higher temperatures (100 °C), a more homogeneous
distribution of carboxylic, lactonic, hydroxyl and carbonyl group formation, which
in turn increases the adsorptive capacity of AC at elevated temperatures, has been
reported (Alvarez et a l, 2005).
The complete reaction mechanism of action of H O formed on the surface of AC
by AC/H2 O2 for organic contaminant removal has been proposed (Georgi and
Kopinke, 2005). AC is known to decompose H 2 O2 and subsequent reactions lead to
formation of H O (Eq. 1.13 and 1.14).
AC-OH + H+OOH“ ---------- ► AC-OOH + H20 (1.13)AC-OOH + H 2 O2 ---------- ► AC-OH + H20 + 0 2 (1.14)
Apart from the decomposition reaction, H 2 O2 can be activated on the AC surface
involving the formation of free radicals (Eq. 1.15). Similar to the Haber-W eiss
reaction in the Fenton reaction, AC is considered to function as an electron-transfer
catalyst. In such a case, AC and AC+ act as the oxidised and reduced catalyst state
and catalyse the decomposition of organics (Eq. 1.16).
AC + H 2 0 2 ---------- ► AC+ + OH- + OH* (1.15)AC+ + H2 0 2 ---------- ► AC + H 0 2* + H+ (1.16)
1.2.2.6 Cavitation
Cavitation is the phenomenon of ‘formation-growth-implosive collapse of gas or
vapour-filled liquids’ occurring in milliseconds and releasing energy in small
pockets, called ‘hotspots’, at multiple locations within the liquid stream of
cavitational reactors (Doktycz and Suslick, 1990; Mason and Lorimer, 1988;
Suslick, 1988; Suslick, 1990; Suslick et a l, 1990). Although cavitation, has been
classified as: acoustic, hydrodynamic, optic and particle; only acoustic and
hydrodynamic cavitation have been reported for inducing effective chemical
20

G enera l in tro d u c tio n
changes in any reaction. In cavitational processes, chemical degradation of
pollutants occurs via two pathways:
1. Free radical attack
2. Pyrolysis
This thesis mainly concentrates on the utilisation of acoustic and hydrodynamic
cavitation, as one of the major AOPs, for degradation and disinfection studies,
respectively; therefore the two effective cavitation types only will be discussed in
great detail in the following sections. However, the work on phenol degradation
with different frequency acoustic cavitation reactors and the disinfection studies by
hydrodynamic cavitation and ozonation will be dealt as separate chapters.
1.2.2.6.1 Acoustic cavitation
Acoustic cavitation is the phenomenon where cavitation is generated by the action
of high frequency sound waves, usually ultrasound. The activity of compression
and rarefaction cycles of the sound waves leads to formation-growth-collapse of
cavitational bubbles, releasing large amounts of high temperature and high pressure
zones, termed as ‘hotspots’. In the literature, the range of frequencies reported for
ultrasound used in degradation studies is 16 kHz-100 MHz. Based on previous
research, if certain operating conditions are considered while designing a treatment
technology using ultrasound, the process can be highly effective and economical for
contaminant removal from wastewaters. The optimum operating conditions
suggested are:
1. High ultrasonic frequencies are best suited for effective pollutant destruction,
however continuous operation at high frequencies may lead to erosion of the
transducers and the power input may considerably increase which may act
as a limitation in large scale operations and make the process uneconomical
(Francony and Petrier, 1996; Hua and Hoffmann, 1997; Hung and
Hoffmann, 1999; Petrier et al., 1996; Petrier and Francony, 1997a, 1997b).
Multiple transducers attached on the opposite faces and irradiating with
multiple frequencies produces results in higher yields of transformation.
Also, dual or triple frequency US reactors minimise the problem of erosion
as the cavitational collapse occurs away from the transducer surface, hence
21
G enera l in tro d u c tio n
this way multiple transducers can be placed in large volume reactors which
can treat larger volumes of effluents (Sivakumar et a l, 2002).
2. Greater cavitational events can be achieved using ultrasonic probes with
higher irradiating surfaces (Gogate et a l, 2001).
3. The physico-chemical properties of the liquid medium should be adjusted in
such a way that the reactors produce cavitation easily and also generate
cavities with lower initial size (Gogate, 2002; Gogate and Pandit, 2000).
4. Large quantities of pollutants can easily be treated with high rates at lower
initial pollutant concentration, hence dilution factors should be considered
before subjecting the effluent to treatment (Sivakumar and Pandit, 2001).
5. The inclusion of catalysts: TiC>2 , NiSCL, C C I 4 , Fe2 +/Fe3+, CuSCL, NaCl and
presence of gases: air, O3, oxygen and Ar/ 0 3 mixtures, enhances the
cavitational events by providing additional nuclei and also blocks sound
wave propagation, thereby, reducing the energy dissipation into the system
(Hart and Henglein, 1985; Hung and Hoffmann, 1998; Ingale and Mahajani,
1995; Seymour and Gupta, 1997; Sivakumar and Pandit, 2002).
6 . Lower temperatures are often effective for cavitational events, therefore a
range of 10-15 °C is preferred (Suslick e ta l, 1997).
Although sonochemical reactors have been reported to be effective for degradation
of pollutants in laboratory scale studies, degradation of real effluents on
large/industrial scale by sonochemical reactors still needs a large amount of
research in terms of design strategies for scale up.
1.2.2.6.2 Hydrodynamic cavitation
Hydrodynamic cavitation is the phenomenon where cavities are generated by the
passage of liquid through a constriction/orifice, which creates large pressure
differentials within the moving liquid and is accompanied by a number of physical
effects (Gogate and Pandit, 2001; Suslick et a l, 1997).
Pandit, Gogate and co-workers (Gogate, 2001; Gogate, 2002; Gogate and Pandit,
2001; Gogate et al., 2001) have carried out in-depth research on hydrodynamic
cavitational reactors and reported that intensities generated by hydrodynamic
2 2

G enera l in tro d u c tio n
cavitation are lower than for acoustic cavitational reactors but the design offers
much more flexibility as compared to sonochemical reactors. A variety of orifice
plate configurations, differing in number/size/type of holes can be used to suit a
particular application of treatment. Recently, effective and economical degradation
and disinfection systems have been reported where hydrodynamic cavitation is used
in conjunction with other AOPs like Fenton reactions and ozonation (Chakinala et
al., 2007a; Chakinala et al., 2008a; Chand et al., 2007).
Some important optimisation parameters related to hydrodynamic cavitation are as
follows (Gogate, 2002; Gogate and Pandit, 2000, 2001; Vichare et al., 2000):
1. The inlet pressure into the system.
2. Geometry of the constriction/orifice.
3. Physico-chemical property of the aqueous medium.
There are not many reports regarding the use of hydrodynamic cavitation as a
technology in wastewater treatment, however these equipment offer higher energy
efficiencies; more flexibility in design and have higher potential for scale up
compared to acoustic cavitational reactors. Despite its high industrial value, only
one commercial plant, namely CAV-OX®, introducing hydrodynamic cavitation
along with UV/H 2 O 2 has been established by Magnum Water Technology Inc.,
California (http://www.epa.gov/QRD/SlTE/reports/540ar93520/54Qar93520.pdf)
(Gogate and Pandit, 2004a).
Researchers suggest that more theoretical and experimental work is needed in this
field in order to make the use of hydrodynamic cavitation a commercially feasible
technology (Gogate and Pandit, 2004a). The use of modem sophisticated
Computational Fluid Dynamics (CFD) to study the mean/fluctuating velocity
components, Reynolds stresses, turbulent pressure fluctuations, etc. need to be
investigated further. Such CFD simulations could then be used to understand the
role of the above mentioned parameters in altering the cavity dynamics in
hydrodynamic cavitational processes.
23
G en era l in tro d u c tio n
Overall, pilot scale case studies have shown that the process is effective enough in
treating a wide range of effluents containing pentachlorophenol, benzene, toluene,
ethyl benzene, xylenes, phenols and pesticides, like atrazine, but very few studies
report the use of hydrodynamic cavitation in treating complex mixtures of effluents
and/or real industrial wastewaters. Conclusively, it can be said that cavitation
technology on its own has great potential in treating toxic pollutants where the
majority of other conventional oxidation technologies fail to do so.
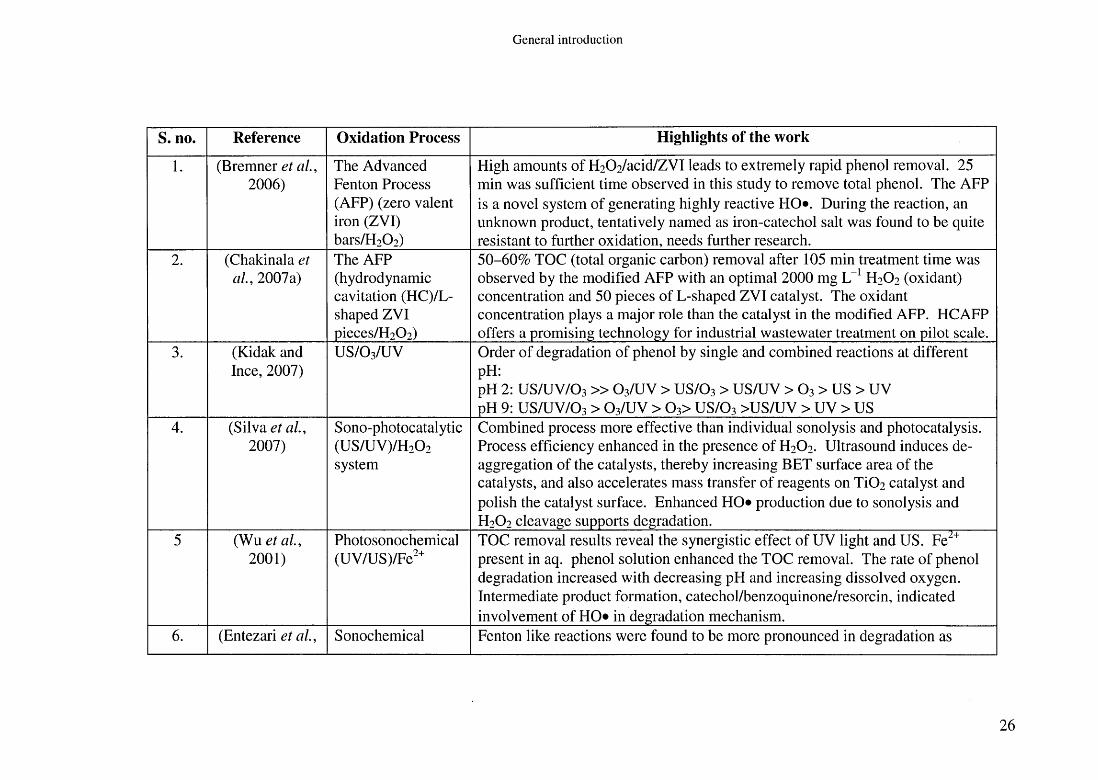
1.3 AOPs used in chemical oxidation of phenolThe major part of this thesis focuses on the phenol oxidation by single and
combined oxidation technologies. Henceforth, a review on phenol degradation by
varieties of AOP’s is presented in Table 1.5 to focus on the research carried out in
the past two decades and to lay the background for this novel research.
Furthermore, the detailed information on the innovative technologies for phenol
removal used in this study will be later discussed in separate chapter introductions.
Apart from the individual work mentioned in Table 1.5, there are some overall
conclusions derived from different studies related to phenol oxidation by single
and/or integrated approaches of AOPs. Photochemistry of phenol is pH dependant,
given the acid-base equilibria in which these compounds are involved. Among the
primary phenol photoproducts are tri-, tetra-dihydroxyphenyls, quinines and
diphenols. The literature suggests that phenol photolysis at pH 3-8 over a wide
light frequencies (Xe flashlamp), does not depend on the irradiation wavelength but
on pH (Ho et al, 1996). Recently, reported phenol degradation studies suggest that,
among various AOPs, UV/H2 O2 processes have highest rates and also phenol
removal depends on pH alone with low rates in alkaline media (Esplugas et a l,
2002). Recently, laser-based photocatalytic oxidation using a P-type NiO
semiconductor catalyst was reported for efficient fast phenol removal (0-60 min)
(Gondal et al., 2008). Almost complete sono-electrochemical destruction of phenol
can be achieved in an aqueous medium containing 0.5 g L-1 NaCl at pH 6 within 20
min at 25 °C. The reaction was shown to proceed via intermediate chlorinated
phenols (Parsons, 2004).
24
G enera l in tro d u c tio n
There are various other AOPs, which contribute towards effective phenol removal
from water. Some of the extensively used AOPs utilised in phenol oxidation in a
variety of reactor set-ups have been outlined in Table 1.5. Moreover, there have
been several other AOPs which have also been suggested in the literature for
effective phenol degradation: photocatalytic oxidation using titania-clay
composites (Menesi et al., 2008); enzyme catalysed conversion by using
immobilised horseradish in a membrane-less electrochemical reactor (Cho et al.,
2008); use of multiwalled carbon nanotubes in CWAO (Yang et al., 2007);
photodegradation by phthalocyanines (Kluson et al., 2008); electrochemical
degradation using Gd-doped Ti-based Sb-SnCL anodes (Feng et al., 2008); laser-
enhanced photocatalytic process using semiconductor catalysts (Fe2C>3, NiO, WO3 ,
TiCF) (Gondal et al., 2007); by adsorption (Ahmaruzzaman and Sharma, 2005;
Vazquez et al., 2007); wet H2O2 catalytic oxidation with Cu-zeolite and Cu-pillared
clay catalyst (Giordano et al., 2007); simultaneous use of O3 with silica gel and
zeolite (Sano et al., 2007); by electrocoagulation (Ugurlu et al., 2008); use of
combined biological and photocatalytic treatment (Suryaman et al., 2006);
microwave-enhanced catalytic degradation over nickel oxide (Lai et al., 2006);
oxidative decomposition by microwave irradiation in UV/H2O2 process (Han et al.,
2004); photo-Fenton oxidation in solar reactors (Will et al., 2004); solar-activated
ozonation (Sanchez et al., 2003); ultrasound-assisted CWPO (Nikolopoulos et al.,
2006); carbon-coated anatase adsorption and decomposition (Tryba et al., 2004);
catalytic oxidation under low temperature iron-modified cobalt oxide system
(Christoskova et al., 2001); by soybean peroxidase treatment (Wright and Nicell,
1999); photo-oxidation in oxygen saturated aqueous solutions by different
sensitisers (Gerdes et ah, 1997); by homogeneous photo-oxidation in the presence
of metals (Sykora et al., 1997); by high energy electron-beam irradiation (Lin et al.,
1995); H2 0 2 -mediated photodegradation studied by flash photolysis/HPLC
technique (Lipczynska-Kochany, 1993).
25
G enera l in troduc tion
S. no. Reference Oxidation Process Highlights of the work
1 . (Bremner et a l , 2006)
The Advanced Fenton Process (AFP) (zero valent iron (ZVI) bars/H2 0 2 )
High amounts of H2 0 2 /acid/ZVI leads to extremely rapid phenol removal. 25 min was sufficient time observed in this study to remove total phenol. The AFP is a novel system of generating highly reactive HO*. During the reaction, an unknown product, tentatively named as iron-catechol salt was found to be quite resistant to further oxidation, needs further research.
2 . (Chakinala et a l , 2007a)
The AFP (hydrodynamic cavitation (HC)/L- shaped ZVI pieces/H2 0 2 )
50-60% TOC (total organic carbon) removal after 105 min treatment time was observed by the modified AFP with an optimal 2000 mg L- 1 H2O2 (oxidant) concentration and 50 pieces of L-shaped ZVI catalyst. The oxidant concentration plays a major role than the catalyst in the modified AFP. HCAFP offers a promising technology for industrial wastewater treatment on pilot scale.
3. (Kidak and Ince, 2007)
US/O3/UV Order of degradation of phenol by single and combined reactions at different pH:pH 2: US/UV/O3 » O3/UV > US/O3 > US/UV > O3 > US > UV pH 9: US/UV/O3 > O3/UV > 0 3> US/O3 >US/UV > UV > US
4. (Silva et a l , 2007)
Sono-photocatalytic(US/UV)/H20 2
system
Combined process more effective than individual sonolysis and photocatalysis. Process efficiency enhanced in the presence of H2O2. Ultrasound induces deaggregation of the catalysts, thereby increasing BET surface area of the catalysts, and also accelerates mass transfer of reagents on Ti0 2 catalyst and polish the catalyst surface. Enhanced HO* production due to sonolysis and H2O2 cleavage supports degradation.
5 (Wu et a l , 2 0 0 1 )
Photosonochemical(UV/US)/Fe2+
TOC removal results reveal the synergistic effect of UV light and US. Fei+ present in aq. phenol solution enhanced the TOC removal. The rate of phenol degradation increased with decreasing pH and increasing dissolved oxygen. Intermediate product formation, catechol/benzoquinone/resorcin, indicated involvement of HO* in degradation mechanism.
6 . (Entezari et a l , Sonochemical Fenton like reactions were found to be more pronounced in degradation as
2 6

G enera l in troduc tion
2003) oxidation in new cylindrical reactor
compared to when H2O2 added alone. The order of reactivity for phenol oxidation by the combined method was 35>500>20 kHz. Thus, it can be seen that degradation rate is more by cylindrical reactor at lower frequency. Therefore, it is recommended that geometrical parameters in overall efficiency should be taken into account in general assessment of process. 20/500 kHz take 200-360 min and 35 kHz take 80-240 min time to completely degrade phenol and its by-products, respectively.
7. (Mahamuni and Pandit, 2006)
US/0 3 /additives (NaCl, CC14)
Additives like salts and CCI4 enhance rates of phenol degradation. Pollutants, phenol and CCI4, are degraded simultaneously with higher rate of overall COD reduction. Enhanced rates can be achieved when higher amounts of additives used. The additives break the phenol to easily degradable products. In US/O3
process, the degradation rate is much faster with ozonation alone.8 . (Beltran et al.,
2003)Heterogeneous catalytic ozonation
Fe, Ti and Co metal catalyst on alumina prepared by impregnation/calcination leads to complete TOC mineralisation in 5 h during catalytic phenol ozonation. C0 /AI2O3 led to fastest mineralisation rate. However, leaching of the metal is the biggest limitation in their use. In the AC-O 3 process, the rate of TOC mineralisation was same as Fe and Ti catalysts in 5 h. However, increase in temperature, gas concentration and mass of carbon may lead to increased TOC mineralisation. The reaction mechanism proceeds by the formation of HO* in solution, generated from adsorbed entities on the AC.
9. (Polaert et a l , 2 0 0 2 )
Adsorption- oxidation process on activated carbon
The activated carbon used in the study acts as adsorbants in the first step and as oxidants in the second step of the study at moderate temperatures for treating highly concentrated effluents. However, the integrated system offers great potentials in treating diluted phenolic wastewaters. Presented studies are relevant for moderate flowrates, therefore much optimisation is needed for the high flowrate when the adsorption is still in process. In order to make this process industrially feasible, economical aspects should be taken into account.
Table 1.5: Review o f current research on phenol oxidation studies with single and com bined AOPs.
27
G enera l in tro d u c tio n
1.4 Aims and objectives of this thesisThe aim of most AOPs is to produce HO» in water and the amount and types of
generation of these free radicals is mainly dependent on the single and combined
AOPs, e.g., the oxidation of wide range of organic compounds by HO* is 109 faster
than O3. Once the free radicals are introduced to the system by photolysis, O3, H2O2,
heat ultrasound, etc., a series of chain reactions is initiated which makes the system
more complex and prediction of all the products of oxidation becomes difficult.
Therefore, in order to understand the radical formation and associated chemistry in
sonochemical and hydrodynamic cavitational reactors, extensively studied in the work,
the first objective was to estimate the HO* production in these cavitational reactors.
Secondly, the potential use of zero valent metal powdered/solid catalysts (instead of
classical iron salts) in Fenton-type reactions, termed the Advanced Fenton Process
(AFP) (Bremner and Burgess, 2004; Namkung et a l , 2006), which has recently been
patented and reported in the literature for phenol oxidation, has been explored in this
work with the novel approach of usage of types of zero valent catalysts ZVC (i.e., iron
(ZVI) and copper (ZVCu)). Also, the use AFP has been extensively studied in
sonochemical and silent reactions and a number of novel reaction mechanisms and
hypotheses have been proposed.
Thirdly, the use of activated carbon cloth (ACC) in phenol adsorption-oxidation is
explored in conjunction with oxidants such as O3 and H2O2 and variety of reactor set
ups.
Finally, the use of hydrodynamic cavitation and ozonation were employed to study
natural water disinfection in a newly designed Liquid Whistle Reactor (LWR) set-up.
Thus, the presented thesis mainly focuses on three D ’s: Dosimetry (Chapter 3),
Degradation (Chapter 4-6) and Disinfection (Chapter 7). The research described
herein may be considered interdependent.
2 8

G enera l in tro d u c tio n
Specific contents/objectives of each Chapter are:
Chapter 2: General experimental
■ synthetic wastewaters for degradation and disinfection
■ laboratory scale cavitational reactor set-ups
■ analytical methods: triiodide; phenol; TOC; pH; GC-MS; UV-vis; H2O2 ; O3 ;
bacterial plate count
Chapter 3: Dosimetry: Investigation of oxidation intensities in cavitational
reactors
■ to study the oxidation capacity of different chloroalkanes (CH2CI2 , CHCI3,
CHCU; 5.25 g L_1), chloroalkane concentrations and different pressures (500,
1000, 1200, 1500 psi) in the LWR
■ to study the effect on oxidation rates of different concentrations of CH2CI2 in
US bath
■ to study the oxidation capacity of different chloroalkanes (CH2CI2 , CHCI3,
CHCU; 7 g L-1; 50% amplitude) and oxidation capacity of CH2CI2 (5.25 g L_1)
under different amplitudes (25%, 50%, 75%) in an US probe reactor
■ to carry out a comparative study between US and HC reactors for oxidation
capacities
Chapter 4: Degradation I: Phenol removal using multiple frequency US reactors
■ assess the H2O2 production in the chosen low-and high-frequency US reactors
■ optimisation of parameters for enhanced phenol degradation in the presence
and absence of air, H 2O2, US, ZVI
■ assess the efficacy of different ZVI and ZVCu catalysts in conjunction with
H2O2 and ultrasound (20, 300 and 520 kHz) in the process of phenol
degradation
■ compare the efficiency of oxidants, H2O2 and O3 with the AFP for phenol
degradation in high frequency US (300 and 520 kHz) reactors
29

G enera l in tro d u c tio n
Chapter 5: Degradation II: Latent Remediation using the Advanced Fenton
Process
■ to study the effect of low and high frequencies (20, 300 and 520 kHz)
■ to assess the presence and absence of oxidant (H2O2) and catalysts (ZVI and
ZVCu)
■ to compare the effects of ZVI and ZVCF, ZVCT, ZVCP catalysts
■ to study the effects of low (0.6 g L-1) and high (5 g L-1) catalysts amounts
■ to assess the US irradiation and stirring input time (15-30 min)
■ to assess the efficacy of filtered and unfiltered catalyst LR reactions
Chapter 6: Degradation III: Investigation of activated carbon cloth and oxidants
for phenol removal via adsorption/oxidation
■ to study the effect of reactor performances (peristaltic pumps, shaker bath and
US bath) for ACC/oxidant systems
■ to compare ACC types and amounts (ACC-Std, ACC-Cu, ACC-Ag, ACC-
extra)
■ to study the effect of different concentrations of hydrogen peroxide (H2O2 :
1.19,2.38 and 4.76 g L '1)
■ to explore the effect pH (3, 5.5 and 9) and temperature (20,40, 80 °C)
■ to investigate types and duration of ozone (O3) treatments (bulk and/or step
wise ozonation)
■ to examine thermal regeneration and reuse
Chapter 7: Disinfection: Bacterial inactivation using cavitation and ozonation in
a novel Liquid Whistle Reactor
■ to study the effect of the inlet pressure into the LWR (over a range 500-1500
psi)
■ to assess the effect of O3 dosages (time of ozonation and flowrates)
■ to study the effect of individual technology: HC and ozonation
■ to study the effect of combined technology: HC + (single/double) ozonation
■ to assess O3 decomposition in the LWR
30

G en era l ex p e rim en ta l
Chapter 2
General experimental
31
G enera l experim en ta l
2.1 DosimetryHydroxyl radical (HO*) generation in acoustic and hydrodynamic cavitational reactors
was measured by iodide dosimeter (Chapter 3). In a typical run, 20 g L- 1 KI solution
in distilled water (dH2 0 ) was prepared in different volumes for the various
experimental studies. Measurement of HO* in reactors was carried out with and
without addition of chloroalkanes, namely chloroform (CHCI3), dichloromethane
(CH2CI2) and carbon tetrachloride (CCI4), in various concentrations. The
effectiveness of different chloroalkanes in terms of degree of intensification achieved
was quantified by means of I7 I3- dosimeter. The temperature was maintained constant
at 35 ± 3 °C and 23 ± 2 °C in hydrodynamic and acoustic cavitational reactors,
respectively. An external cooling bath with ice was used in order to maintain the
temperatures.
2.2 Synthetic wastewaters2.2.1 DegradationThe model pollutant phenol was chosen to create synthetic wastewater for laboratory
scale degradation studies (Chapters 4-6). Throughout the study, concentration of the
phenol solution was 2.5 mM prepared in dH2 0 with analytical grade phenol (Fluka).
The degradation rates were measured by total organic carbon (TOC) analysis
(Chapters 4-6), gas chromatography (Chapter 4) and GC-M S (Chapter 6 ). Materials
and methods for different chapters have been discussed in detail in the experimental
section of individual chapters.
2.2.2 DisinfectionA dominant marker of faecal coliforms, Escherichia coli was chosen as the model
bacterium for the disinfection studies (Chapter 7). Stock cultures were maintained by
repeated subculturing on nutrient agar (CM3; Oxoid Basingstoke, UK) at 37 °C and
used for viable counts. It was observed that nutrient broth with a cell concentration 6
x 107 CFU mL- 1 (on inoculation) reached the stationary phase in 9 h as shown in
growth curve (Fig. 2.1). Therefore, standard experimental cultures were prepared by
loop inoculation of a colony from a source plate of the E. coli on 400 mL of sterile
nutrient broth (CM1; Oxoid Basingstoke, UK), in a 1 L conical flask and incubated
32
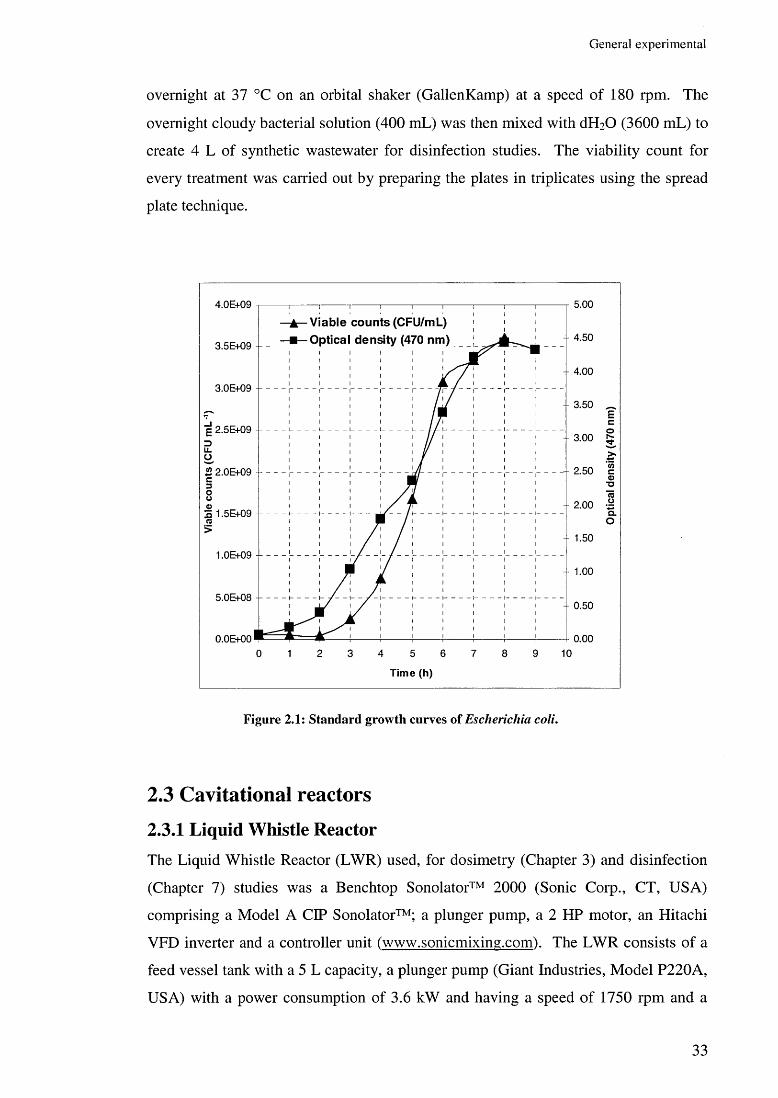
G enera l ex p e rim en ta l
overnight at 37 °C on an orbital shaker (GallenKamp) at a speed of 180 rpm. The
overnight cloudy bacterial solution (400 mL) was then mixed with dlLO (3600 mL) to
create 4 L of synthetic wastewater for disinfection studies. The viability count for
every treatment was carried out by preparing the plates in triplicates using the spread
plate technique.
Figure 2.1: Standard grow th curves o f Escherichia coli.
2.3 Cavitational reactors2.3.1 Liquid Whistle ReactorThe Liquid Whistle Reactor (LWR) used, for dosimetry (Chapter 3) and disinfection
(Chapter 7) studies was a Benchtop Sonolator™ 2000 (Sonic Corp., CT, USA)
comprising a Model A CIP Sonolator™; a plunger pump, a 2 HP motor, an Hitachi
VFD inverter and a controller unit (www.sonicmixing.com). The LWR consists of a
feed vessel tank with a 5 L capacity, a plunger pump (Giant Industries, Model P220A,
USA) with a power consumption of 3.6 kW and having a speed of 1750 rpm and a
33

General experimental
mixing chamber comprising of an orifice (orifice area, 0 . 0 0 1 2 sq. in.) and a blade
(length, 26.8 mm; width, 22.2 mm; thickness, 1.5 mm). The pump has a maximum
discharge pressure of up to 2000 psi. An acoustic intensity meter is connected to the
mixing chamber to give a measure of the level of cavitation inside the chamber. The
distance between the orifice and blade is adjustable and the backpressure valve
connected at the end of the mixing chamber influences the inlet pressure into the
system (Fig. 2.2).
The LWR is an in-line homogenizing device that employs high pressures and
ultrasonic cavitational energy generated within the liquid stream by a physical
phenomenon known as “jet-edge tone” (www.sonicmixing.com). A stream of process
liquid is subjected to extreme pressure and shear when forced to pass through a
specially engineered lip-shaped orifice and blade and the jet of liquid sheds vortices
perpendicular to the original flow vector which creates oscillations similar to that
generated due to ultrasound within the liquid, causing the fluid to cavitate.
F ig u re 2 .2 : S ch em a tic r e p re s e n ta t io n o f (a) th e L W R a n d (b ) a n e x p a n d e d v iew o f th e a r r a n g e m e n t o f o r if ic e a n d b la d e (w w w .so n ic m ix in g .co m ) : 1, P lu n g e r p u m p ; 2 , P L C b o a r d ; 3 , P re s s u re g u ag e (d ig ita l) ; 4 , P re s s u re g u a g e (a n a lo g ); 5, O rif ic e ; 5 a , O rif ic e h ig h p r e s s u r e z o n e (e x p a n d e d v iew ); 6 , B lad e ; 6 a , B lad e (e x p a n d e d v iew ); 7 , C a v ita t io n zo n e ; 8, C o o lin g b a th ; 9 , F e e d ta n k (5 L ).
34

G en era l ex p e rim en ta l
2.3.2 Ultrasonic reactors2.3.2.1 Low frequency ultrasonic probe (20 kHz)
There were two different kinds of low frequency 20 kHz US reactors were used in
various studies, Unit (i) was used at the Bogazici University, Turkey and (ii) was used
at the University of Abertay Dundee:
i. Sono-Fenton studies were carried out in the presence of zero valent
metal/powdered catalysts (Chapter 4) in a horn type sonicator (tip diameter 12
mm) connected to a 20 kHz Bandelin Sonoplus HD2200 generator with a
capacity of 180 W. The tip of the horn was submersed into the liquid from the
top of an 80 mL cylindrical glass reactor. The cell was equipped with a water
cooling jacket to maintain constant liquid temperature and the entire reactor
set-up was enclosed in a sound proof box (Fig. 2.3).
ii. Dosimetry (Chapter 3) and Latent Remediation (Chapter 5) were performed in
a commercial ultrasonic (US) processor (Cole Parmer, 400 W Model)
equipped with a titanium probe (1 cm diameter) capable of operating either
continuously or in a pulse mode at a fixed frequency of 20 kHz. Most of the
experiments were carried out with the probe working in pulses, 4 s on and 2 s
off, which allows the system to dissipate some of the heat generated by the US
waves. The experiments were carried out at variable US power amplitudes
(25%, 50% and 75%).
2.3.2.2 High frequency ultrasonic probes
The high frequency US reactors (300 and 520 kHz), used to study the phenol
degradation in the presence of zero valent metals (Chapter 4) were used at the
Bogazici University, Turkey.
2 3 2 .2 .1 300 kHz
A 300 kHz piezo-electric transducer located at the bottom of a 150 mL cell was
connected to a generator with a maximum capacity of 25 W (UNDATIM
ULTRASONICS). The cell was equipped with a water cooling jacket to maintain
constant liquid temperature (Fig. 2.4).
35
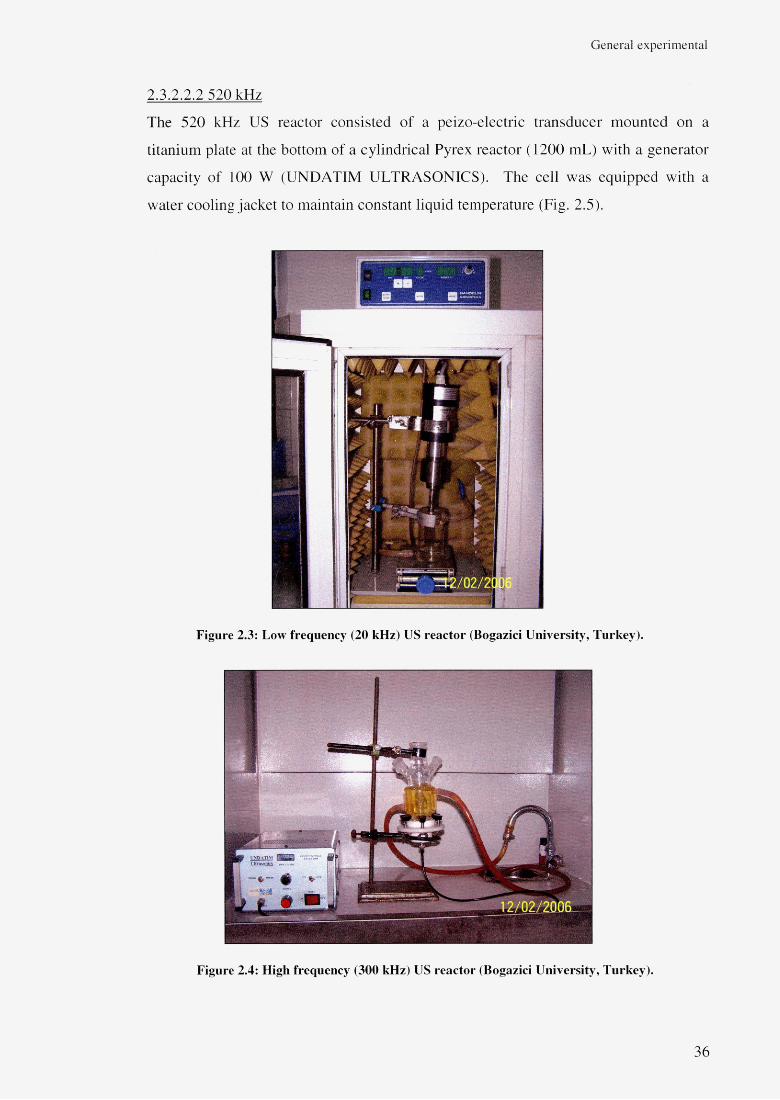
General experimental
2.3.2.2.2 520 kHz
The 520 kHz US reactor consisted of a peizo-electric transducer mounted on a
titanium plate at the bottom of a cylindrical Pyrex reactor (1200 mL) with a generator
capacity of 100 W (UNDATIM ULTRASONICS). The cell was equipped with a
water cooling jacket to maintain constant liquid temperature (Fig. 2.5).
F ig u re 2 .3 : L ow fre q u e n c y (20 k H z) U S r e a c to r (B ogaz ic i U n iv e rs ity , T u rk e y ) .
F ig u re 2 .4 : H ig h f re q u e n c y (300 k H z) U S r e a c to r (B ogaz ic i U n iv e rs ity , T u rk e y ) .
36
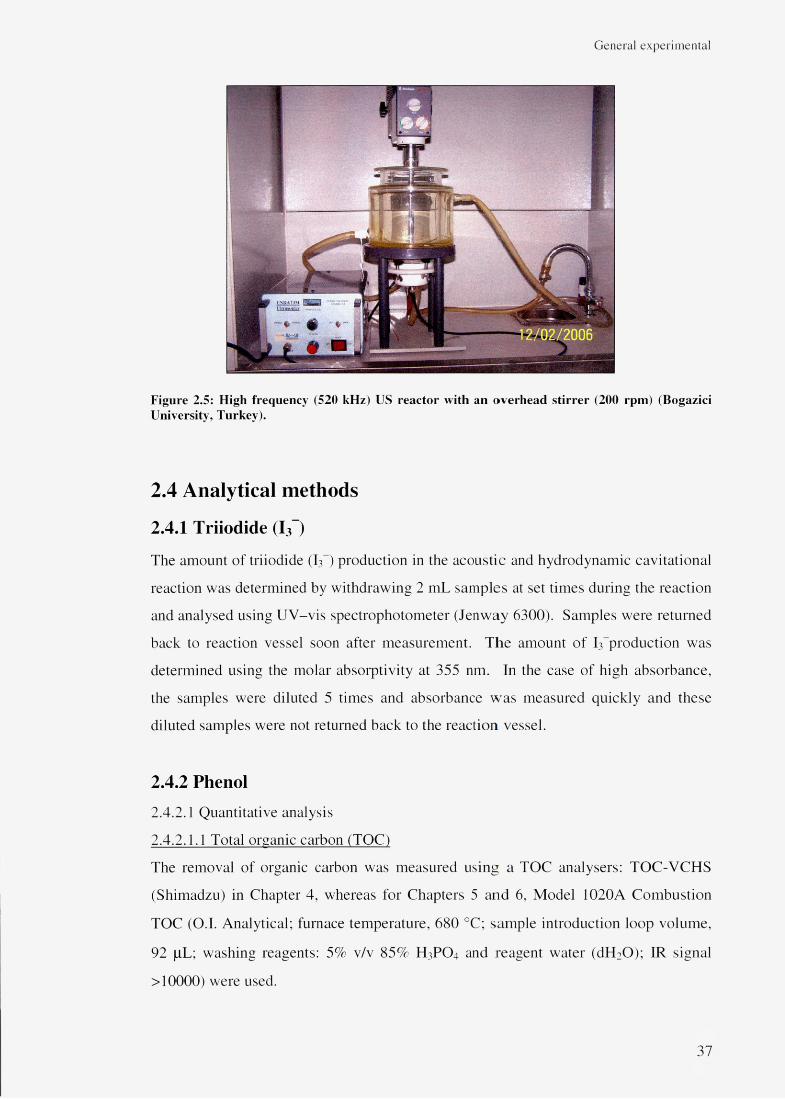
General experimental
F ig u re 2.5: H ig h f re q u e n c y (520 k H z) U S r e a c to r w ith a n o v e r h e a d s t i r r e r (200 rp m ) (B o g az ic i U n iv e rs ity , T u rk e y ) .
2.4 Analytical methods
2.4.1 Triiodide (I3“)
The amount of triiodide (ID production in the acoustic and hydrodynamic cavitational
reaction was determined by withdrawing 2 mL samples at set times during the reaction
and analysed using UV-vis spectrophotometer (Jenway 6300). Samples were returned
back to reaction vessel soon after measurement. The amount of reproduction was
determined using the molar absorptivity at 355 nm. In the case of high absorbance,
the samples were diluted 5 times and absorbance was measured quickly and these
diluted samples were not returned back to the reaction vessel.
2.4.2 Phenol2.4.2.1 Quantitative analysis
2.4.2.1.1 Total organic carbon (TOC)
The removal of organic carbon was measured using a TOC analysers: TOC-VCHS
(Shimadzu) in Chapter 4, whereas for Chapters 5 and 6 , Model 1020A Combustion
TOC (O.I. Analytical; furnace temperature, 680 °C; sample introduction loop volume,
92 pL; washing reagents: 5% v/v 85% H3PO4 and reagent water (dUGO); IR signal
> 1 0 0 0 0 ) were used.
37

General experimental
Prior to analysis, sample (5-10 mL) was withdrawn from the reaction vessel through a
10 mL syringe and filtered using Whatman cellulose nitrate membrane filters
(Schleicher and Schuell, CAT No. 7184-200; 25 mm diameter) fitted in filter holder
(Fig. 2.6).
F ig u re 2 .6 : (a) S am p le co llec tio n u s in g 10 m L sy r in g e ; s a m p le (b ) f i l t r a t io n u s in g W h a tm a n ce llu lo se m e m b ra n e f i l te rs a n d (c) f i t te d o n sy r in g e a n d f i l te r h o ld e r .
2.4.2.1.2 Gas Chromatography (GC)
Phenol degradation studies were also carried out using the GC analysis (Chapter 4)
(Agilent Technologies, Model 6890N). Column specification: HP-5 5% Phenyl
Methyl Siloxane (Aligent Cat No. 19091J-413); dimensions, 30 m (length) x 0.32 mm
(inner diameter) x 0.25 pm (film thickness). Back detector, flame ionisation detector
(FID); temperature, 300 °C; mode, splitless; hydrogen flow, 30 mL min-1; makeup gas
type, Helium.
Prior to analysis a sample (1 mL) was withdrawn from the reaction and mixed with
dichloromethane (50 pL) for 3 min in a 2 mL standard GC vial which was then placed
on the autosampler of the GC Machine. The extracted liquid, which settled at the
bottom of the vial, was subsequently taken up by 10 pL syringe for injection into the
38
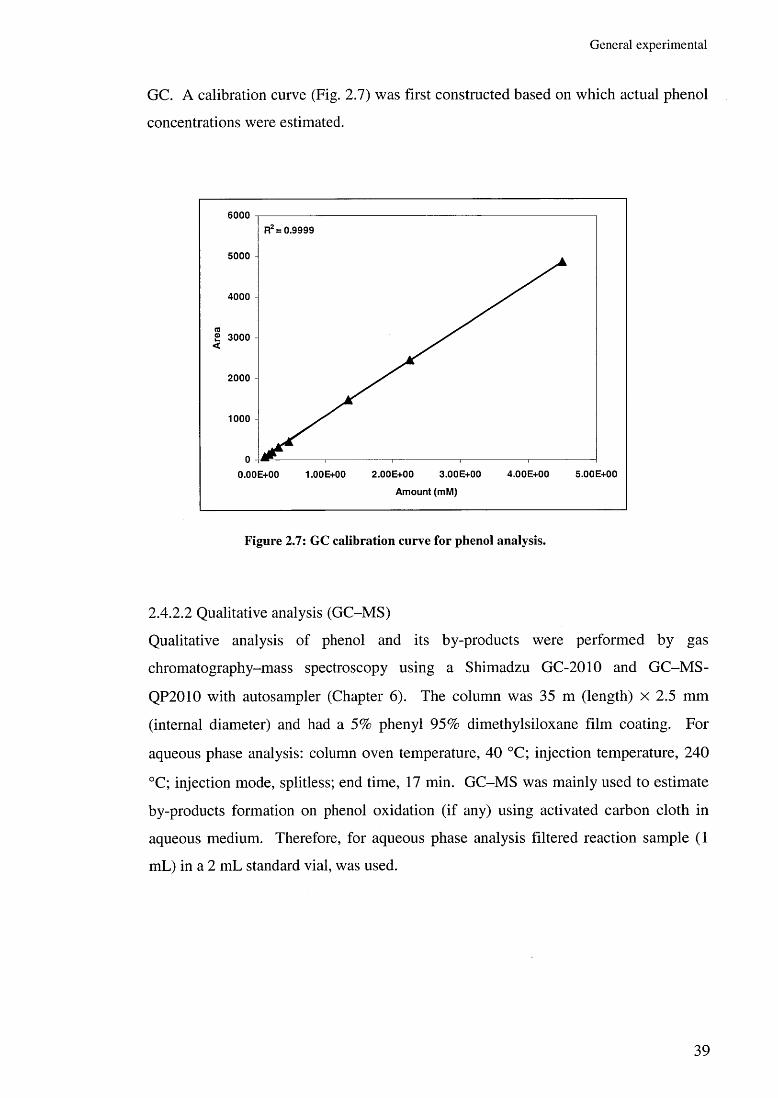
G enera l ex p e rim en ta l
GC. A calibration curve (Fig. 2.7) was first constructed based on which actual phenol
concentrations were estimated.
Figure 2.7: GC calibration curve for phenol analysis.
2.4.2.2 Qualitative analysis (GC-MS)
Qualitative analysis of phenol and its by-products were performed by gas
chromatography-mass spectroscopy using a Shimadzu GC-2010 and GC-M S-
QP2010 with autosampler (Chapter 6 ). The column was 35 m (length) x 2.5 mm
(internal diameter) and had a 5% phenyl 95% dimethylsiloxane film coating. For
aqueous phase analysis: column oven temperature, 40 °C; injection temperature, 240
°C; injection mode, splitless; end time, 17 min. GC-MS was mainly used to estimate
by-products formation on phenol oxidation (if any) using activated carbon cloth in
aqueous medium. Therefore, for aqueous phase analysis filtered reaction sample (1
mL) in a 2 mL standard vial, was used.
39

G enera l ex p e rim en ta l
2.4.3 Hydrogen peroxide
Hydrogen peroxide was spectrophotometrically determined by the I3 method at 351
nm (Klassen et al., 1994). For the I3 method, solutions A and B were prepared.
■ Solution A: KI (33 g), NaOH (1 g) and ammonium molybdate tetrahydrate (0.1
g) were diluted to 500 mL dH2 0 . The solution was stirred for 10 min to
dissolve the molybdate and was stored in the dark to avoid oxidation.
■ Solution B: this is an aqueous buffer prepared by 10 g of K2 H P0 4 per 500 mL.
The I3 method consists of mixing equal volumes of A and B, followed by addition of
the H2 O2 experimental solution. The absorbance of the resulting solution was
measured at 351 nm in a 1 cm cuvette. In this study, 2.5 mL of A and B each was
mixed in a 10 mL volumetric flask and 1 mL of H 2 O2 experimental solution was added
to the mixture and volume was made up to the mark with dH 2 0 . Hydrogen peroxide
concentration in mg L_ 1 was measured using the equation obtained from the
calibration curve (Fig. 2.8).
Figure 2.8: Calibration curve for hydrogen peroxide analysis.
40
G en era l ex p e rim en ta l
2.4.4 OzoneOzonator was used from Ozone Services (Yanco Industries Ltd.) at Bogazici
University (Chapter 4) and ozonator Lab2B Laboratory Ozone Generator (Ozone
Engineering CA, USA; http://www.ozone-engineering.com) at University of Abertay
(Chapters 6 and 7). In both the ozonators, ozone was generated by the corona
discharge method with pure oxygen as feed gas. Ozone concentrations were
determined by the user manuals provided by companies, whereas in different reactions,
ozone concentrations were determined by indigo method (details below).
The ozone concentration in the aqueous phase was measured using the indigo-
trisulfonate method (Bader and Hoigne, 1981, 1982). The proportionality constant,
which is the maximum absorbance of the indigo solution at 600 nm, is 0.42 ± 0.01 L
cm - 1 mg- 1 giving a range of application of this method of 0.05 to 0.6 mg L-1. The
indigo method is based on the principle that in acidic solution, potassium indigo-
trisulfonate (C 1 6H 7 N2 O 1 1 S3 K3 ) (Riedel-de Haen) is discoloured by aqueous ozone and
the degree of discoloration is compared to a blank solution of the dye. The decrease in
absorbance is linear with increasing ozone concentration.
Indigo stock solution was prepared by adding dlUO (500 mL), cone, phosphoric acid
(85%; 1 mL) and potassium indigo trisulfonate (0.770 g) to a volumetric flask and
diluting to 1 L with dtLO. A 1:100 dilution exhibits an absorbance of 0.20 ± 0.010
cm - 1 at 600 nm and this stock solution is stable for about 4 months when stored in the
dark (Bader and Hoigne, 1981, 1982).
The working solution was made up immediately before use by dilution of 25 mL of
the above indigo stock solution to 250 mL with dH2 0 containing 2.5 g of analytical
grade sodium phosphate monobasic monohydrate (ACS Reagent 98-102% ; Sigma-
Aldrich) and 1.75 mL of analytical grade 85% H 3PO4.
In the actual method of analysis, two volumetric flasks (50 mL) were taken and 5 mL
of working solution was introduced into each. One flask was then filled with ozone-
free water and the other with 3 mL of the ozone sample and then filled to the mark
with dH2 0 . The ozone sample was introduced by immersing the pipette to the bottom
41
G enera l ex p erim en ta l
of the flask and gently shaking so that no ozone degassing occurred. The difference in
absorption of light at 600 nm between the blank and sample was measured, within 4 h,
using a UV-vis spectrophotometer (Perkin-Elmer Lambda 2) and the ozone
concentration was then determined using Eq. 2.1:
Co3 = (AA-VT)/(f-b-V) (2 . 1)
where Co3 is concentration of ozone in mg L l; AA, the difference in absorbance;/ =
0.42 (corresponding to the absorption coefficient for aqueous ozone); b, path length (4
cm); Vt and V, the total volume (50 mL) and volume of sample added (3 mL),
respectively.
2.4.5 Microorganism identificationPrior to the disinfection studies, the bacteria to be used for all the experiments was
confirmed by carrying out the API 20 E test on the subcultures of E. coli NCIMB
10000 obtained from National Collection of Industrial, Food and Marine Bacteria
(Aberdeen, UK). Using the API 20 E Test, it was found the bacteria consisted E. coli.
2.4.6 Viable countThe bacterial numbers in this study were determined using the viable plate count
method and spectrophotometric (420 nm) (turbidimetric) analysis methods were
employed. Although the two methods are somewhat similar in the results they yield,
there are distinct differences. For example, the standard plate count method is an
indirect measurement of cell density and reveals information related only to live
bacteria. The spectrophotometric analysis is based on turbidity and indirectly
measures all bacteria (cell biomass), dead or alive. The standard plate count method
used in the study to estimate bacterial killing due to hydrodynamic cavitation and/or
ozonation (Chapter 7), employed diluting a sample with sterile saline diluent until the
bacteria are dilute enough to count accurately. That is, the final plates in the series
should have between 30 and 300 colonies. Fewer than 30 colonies are not acceptable
for statistical reasons and more than 300 colonies on a plate are likely to produce
42
G en era l ex p erim en ta l
colonies too close to each other to be distinguished as distinct colony-forming units
(CFUs). The assumption is that each viable bacterial cell is separate from all others
and will develop into a single discrete colony. Thus, the number of colonies should
give the number of bacteria that can grow under the incubation conditions (37 °C)
employed. A wide series of dilutions (e.g., 10- 2 to 10“10) were plated because the
exact number of bacteria was usually unknown. Greater accuracy was achieved by
plating duplicates or triplicates of each dilution. After 24 h incubation period, the 30-
300 CFU plates were separated and surviving bacterial colonies were carefully
counted by placing the plate on a colony counter. The percentage disinfection was
calculated as described in Eq. 2.2.
percentage disinfection = log ((No~N)/N) x 100 (2.2)
where, No represent initial microbial count and N represent microbial count at any
given time.
2.4.7 Power measurementApproximate power measurements in the US reactors were carried out without any
cooling system and measuring the temperature rise on irradiation for a specific time
period (AT/At). The slope of the graph (time vs temperature) was used in Eq. 2.3 to
calculate power (Watts) dissipation in US reactors. The power (Q) was calculated
using formula shown in Eq. 2.3:
Q = cm (AT/At) (2.3)
where, m is mass of water (g); c is specific heat of water (4.186 joule g- 1 °C_1); AT is
change in temperature (°C) and At change in time (s). Unit is Watt (W). The values
obtained in watts were divided by the volume of the reactant used, which finally gives
the final power output (heat dissipation) in Watt per millilitre (W mL_1).
43
G enera l ex p erim en ta l
2.4.8 Toxicity analysisToxicity evaluation was carried out on some samples (in Chapter 5) by Dr. Andreas
Tiehm’s team at Karlsruhe University, Germany. They determined the toxicity
through (i) the bioluminescence test and (ii) by monitoring biological oxygen
consumption of sonicated samples, (i) The bioluminescence test was performed with
Vibrio fisheri according to the European standard procedure EN ISO 11348. The
marine bacterium V. fisheri emits light during physiological activity. A decreasing
light intensity is correlated with an increasing toxicity of the sample tested, (ii) In
order to study the biodegradability of the sonicated samples, mineral salts suitable for
microbial growth were added and the pH was adjusted to 7.0. Inoculation was done
with activated sludge obtained from a municipal waste water treatment plant, and
biological degradation was monitored in a respirometer at 20 °C. Toxicity of the
sonicated samples was measured by diluting the samples. The dilution factor resulting
in a 20% and 50% reduction (EC20 and EC50) of bioluminescence was determined.
A higher EC20 or EC50 corresponds to a lower toxicity (Tiehm and Neis, 2005).
2.4.9 Statistical analysisAll experiments were performed in duplicates and/or triplicates and the average results
were recorded. Standard deviation of the data points from the mean was also
calculated. Multiple analysis of variance (MANOVA) was performed for multiple
comparisons. P-values <0.05 were considered significant. MANOVA was carried out
using MINITAB 15 software.
2.4.10 Cost and energy consumption analysisThis study is presented as an Appendix A and attached at the back of the thesis. This
includes the formula, calucations and estimated cost and energy used in the
cavitational reactors while carrying out Dosimetry, Degradation and Disinfection
studies. The cost is estimated in the form of cost per unit volume (£/L) and cost per
unit generation/reduction/Logio reduction presented as £/HO» generation, £/g TOC
reduction and £/Logio reduction, respectively.
44
D o sim etry
Chapter 3
Dosimetry: Investigation of oxidation
intensities in cavitational reactors
Published paper (Appendix B)
C hak ina la , A .G ., G ogate , P .R ., C hand , R ., B rem ner, D .H ., M o lina , R. and B u rg ess, A .E . 2008 .
In tensifica tion o f ox idation capacity u sin g ch lo ro a lk an es as add itives in h y d ro d y n am ic an d acoustic
cav ita tion reactors. U ltrasonics Sonocliem is try . 15(3): p p .164-170.
Platform presented paper: UK N ational C onference
C hand , R . (1 8 -2 0 th A pril 2007). E n h an ced o x ida tion using h a lo a lk an es a s add itiv es in h y d ro d y n am ic
and acoustic cav ita tiona l reactors. 8 th IW A U K Young W ater P ro fe ss io n a l C on ference . U n iv ersity o f
Surrey , G uild fo rd , England.
45

D o sim etry
3.1 IntroductionHydroxyl radicals (H O ) are the most potent oxidants that control virtually all AOPs
currently applied in wastewater technologies. HO* are produced in-processes such as:
■ photolysis of hydrogen peroxide (H2 O2 ), aqueous chlorine, nitrate, nitrite or
dissolved aqueous iron (III) ions
■ Fenton reactions or by ionising radiation
■ decomposition of aqueous ozone by radical type chain reactions
Aqueous HO* is non-selective and reacts with most organic and inorganic solutes with
very high rate constants. In natural water and wastewater, they are consumed mostly
through competitive reactions with a variety of natural organic matter, bicarbonate,
carbonate, bromide and, even by, H2 O2 (Hoigne, 1997). Organic radicals formed by
any of these reactions may add a dissolved oxygen molecule to form peroxy type
intermediates. These react further to form hydroperoxyl radicals, H2 O 2 and a series of
different peroxides, aldehydes, acids, etc., thereby enhancing the oxidation rates and
degradation of organic molecules (Von Sonntag and Schuchmann, 1991). In natural
waters and most drinking waters, HO* are consumed with a rate constant of about 105
s '1, i.e., the mean lifetime is only about 10 gs. Hoigne (1997) also explained the
reaction kinetics through which the HO* can oxidise inorganic or organic compounds
(Scheme 3.1), however the formation of the final oxidation products will depend on
many different parameters.
Schem e 3.1: H ydroxyl radical initiated chains of reactions (H oigne, 1997).
46

D o sim e try
Several methods such as iodimetry (Weissler et al., 1950); ESR spin trapping
(Christman et al., 1987); Fricke dosimeter (Miller, 1950; Price and Lenz, 1993),
terphthalic acid dosimeter (Anbar et al., 1966; Barreto et al., 1994; Brandenburg and
Moll, 1984; Mason et al., 1994; Mclean and Mortimer, 1988; Mishin and Thomas,
2004; Price et al., 1997), salicylic acid dosimeter (Blandini et al., 1999; Chakinala et
al., 2007b; Floyd et al., 1986; Luo and Lehotay, 1997; Teismann and Ferger, 2000),
electrochemical and fluorescence detection (Liu, 1993; Mccabe et al., 1997) have been
proposed in order to monitor the production of HO» in aqueous media. The most
generally used method for the estimation of H2 O2 is by iodimetry, whereas ESR Spin,
Fricke and terephthalate ion dosimeter is normally used for the estimation of the
radical species themselves (Mason et al., 1994). Moreover, in recent decades, a
number of fluorescent probes such as p-chlorobenzoic aci (pCBA) (Sanchez-Polo et
al., 2005b) and coumarin (Louit et al., 2005) have been used to monitor the HO* in
various reactions involving ozone, activated carbon and radiolysis. Other recent
techniques involves radical measurement by novel chemiluminescence method (Hu et
al., 2008).
Research has been carried on the use of various dosimeters in the measurement of
HO* generation in different sonochemical reactors and different reaction schemes had
been proposed in the literature and presented in this study with the help of schemes
taken from various research reports: terephthalic acid (Scheme 3.2) and Fricke
(Fe2 +/Fe3+) system (Scheme 3.3) (Mark et al., 1998; Mason et al., 1994; Price and
Lenz, 1993) and salicylic acid dosimeter in acoustic (US) and hydrodynamic
cavitational (HC) reactors (Arrojo et al., 2007; Chakinala et al., 2007b) (Scheme 3.4).
Schem e 3.2: M echanism o f the form ation o f 2-hydroxyterephthalic acid (H TA) from oxidation o f terephthalic acid (Price and Lenz, 1993).
47

D o sim etry
OH* + Fe2+ + H+-------- H20 + Fe3+H2 0 2 + Fe2+ + H+------ -► H20 + Fe3+ + H OH* + 0 2 --------► H 0 2*H 0 2» + Fe2+ + H+------—► H2 0 2 + Fe3+
Schem e 3.3: Reaction m echanism s in Fricke (Fe2+/F e3+) dosim eter (M ark e ta l ., 1998).
Schem e 3.4: M echanism o f the form ation o f 2,3- and 2,5-dihydroxybenzoic acid from oxidation o f salicylic acid (Chakinala e ta l . , 2007b).
Ultrasonic irradiation in water forms HO» and H* as a result of high energies
generated due to cavitational collapse and the number of these radicals depends on the
cavitational energy of the system (Eq. 3.1-3.4) (Weissler, 1948).
H ,0 -------- ►H* + HO* (3.1)H* + 0 2--------►H02* (3.2)h o 2* + h o 2*--------►h 2o 2 + 0 2 (3.3)HO* + HO*--------►H20 2 (3.4)
Cavities formed upon sonication of the liquid, oscillate in the sonic field and can reach
very high temperatures during the compression phase or cavitational collapse as a
result of which the dissolved gases, volatile material and water vapour may suffer
thermal decomposition, Eq. 3.1, 3.5 and 3.6.
H 2 0 - H* + H.O
-► O + H,H2 + H O
(3.5)(3.6)
48

D o sim e try
It has been observed that among the water radicals in the solution, i.e., H* and HO*,
HO* dominate over the H atoms (Hart and Henglein, 1985). This is attributed to the
reaction of the hot H atoms with water vapour in the gaseous phase, which is an
endothermic reaction. Due to cavitational activity, the water molecules in the
cavitating bubble reacts with the originally formed H atoms and assumed to be
converted to HO* (Eq. 3.6) (Hart and Henglein, 1986b) which participate in the
reacting medium.
Due to limitations on the use of ultrasound on an industrial scale, hydrodynamic
cavitation (HC) has been investigated as an alternative for organic pollutant
degradation in variety of wastewaters. In HC, a liquid (usually water) is forced to pass
through a small constriction with high velocities leading to HO* formation (Suslick et
al., 1997). Detailed information on the use of HC reactors and its ability to generate
HO* and simultaneously degrade/disinfect wastewaters has been studied by Arrojo,
Pandit, Bremner and co-workers (Arrojo et al., 2007a; Arrojo et al., 2007b; Bremner
et al., 2008; Chakinala et al., 2007a; Chakinala et al., 2008a; Chakinala et al., 2008b;
Gogate, 2001; Gogate, 2002; Gogate and Pandit, 2000; Gogate and Pandit, 2005;
Gogate et al., 2001; Jyoti and Pandit, 2003; Pandit et al., 2005; Save et al., 1997;
Senthil Kumar et al., 2000; Sivakumar and Pandit, 2002; Suslick et al., 1997; Vichare
et al., 2 0 0 0 )
Chloroalkanes, mainly carbon tetrachloride, have been found to enhance the efficacy
of both US and HC when the controlling mechanism is free radical attack (Chendke
and Fogler, 1983; Mahamuni and Pandit, 2006; Parke and Taylor, 1956; Wang et al.,
2007; Weissler et al., 1950; Zheng et al., 2005). Chendke and Fogler (1983)
discovered that the sonoluminescence intensity was found to increase linearly with
increasing percentage saturation of C C I4 in water. Similarly Mahamuni and Pandit
(2006) reported that the use of simple additives such as salt and C C I4 acted as process
intensifying parameters, thereby reducing operational time and cost. Reports also
addressed that oxidation due to ultrasonic waves increased linearly with time of
irradiation in the solutions: O2 -H2 O, O2 -KI-H2 O, air-K I-CCU -^O, Ar-H 2 0 , N 2 -H2 O,
while for the first three, the rate of oxidation increased linearly with both ultrasonic
power and the intensity of sonoluminescence (Parke and Taylor, 1956). Presence of
49
D o sim e try
C C I4 and perflurohexane as additives have also been found to be useful in improving
pollutant degradation efficiency or improving synthetic processes that rely on HO* as
a key intermediate (Zheng et al., 2005). However, considering the toxicity and
carcinogenicity of C C I4 , this study demonstrates the use of less toxic chloroalkanes
and its comparison with C C I4 in cavitational reactors.
As described above, over the decades various methods have been adapted to monitor
the HO* in aqueous media however iodimetry has gained the most interest in indirect
estimation of HO* by monitoring triiodide (I3 ) production from potassium iodide
oxidation. Likewise, in this study iodimetry and terephthalic acid dosimeter has been
adopted as tools to determine the oxidation intensities in cavitational reactors. The
effect of different chloroalkanes (chloroform (CHCI3), dichloromethane(CH2Cl2) and
carbon tetrachloride (CCI4)) on KI oxidation in cavitational reactors has been
investigated, and simultaneously a variety of reaction mechanisms have been proposed
with respect to KI oxidation due to the presence of chloroalkanes in US (ultrasonic
bath and probe) and HC (Liquid Whistle Reactor; LWR) reactors at different
amplitudes (25%, 50% and 75%) and pressures (500, 1000, 1200 and 1500 psi),
respectively. The scope of this study has been listed below.
Hence, the main objectives of the study were as follows:
■ to study the oxidation capacity of different chloroalkanes (CH2 CL, CHCI3 ,
CHCI4 ; 5.25 g L-1), chloroalkane concentrations and different pressures (500,
1000, 1200, 1500 psi) in the LWR
■ to study the effect on oxidation rates of different concentrations of CH 2 CL in
US bath
■ to study the oxidation capacity of different chloroalkanes (C H 2 C L , C H C I3 ,
C H C L ; 7 g L_1; 50% amplitude) and oxidation capacity of C H 2 C L (5.25 g L-1)
under different amplitudes (25%, 50%, 75%) in an US probe reactor
■ to carry out a comparative study between US and HC reactors for oxidation
capacities
50

D o sim etry
3.2 Experimental3.2.1 Hydrodynamic cavitation (HC)3.2.1.1 Liquid Whistle Reactor (LWR)
The LWR has a feed tank capacity of 5 L, therefore 4 L of KI solution (20 g L-1) was
prepared in distilled water (dtLO) and pumped through the orifice at selected
pressures. The pressures chosen for the study were 500, 1000, 1200 and 1500 psi.
The additives, CILCL, CHCI3 and CCI4 were used for the study in concentrations of
5.25 g L-1. However, for the comparative study at 1500 psi, high and low
concentrations of additives (CH2 CL, 7g L- 1 and CHCI3 , 1.75 g L_1) were selected. In
each 90 min reaction time, aliquots (2 mL) were withdrawn every 10 min and the rate
of I3 production was determined using a UV-vis spectrophotometer at 355 nm.
Temperatures of 35 ± 3 °C were maintained using an external cooling water/ice bath.
Reported results are average values of triplicates and the experimental error was in the
range of ±5%.
3.2.2 Acoustic cavitation (US)3.2.2.1 Ultrasonic bath
Experiments were carried out using a commercial US bath (Kerry Ultrasonics Ltd.,
England) capable of operating at a fixed frequency of 38 kHz. In the present work,
experiments were carried out in 300 mL glass beaker, immersed partially in the US
bath containing cold water and ice mixture as a cooling unit and maintaining a
constant temperature of 23 ± 2 °C. The reaction solution in the glass beaker contained
200 mL KI (20 g L-1) solution. Only dichloromethane (CH2 CI2 ) at different
concentrations (1.4-7 g L-1) was used as an additive for the study and results were
compared with reactions carried out without additives. In a reaction time of 70 min
for each experiment, aliquots of 2 mL were withdrawn every 10 min and I3-
concentrations were determined using UV-vis at 355 nm. Results produced are the
average values of experiments carried out in triplicates and the errors were in the
range of ±5%.
51
D o sim e try
3.2.2.2 Ultrasonic probe
Experiments were carried out using a commercial US probe (Cole Parmer) capable of
operating at a fixed frequency of 20 kHz. In the present work, experiments were
carried out in 300 mL glass beaker containing 200 mL KI (20 g L-1) solution. A
temperature of 23 ± 2 °C was maintained throughout the reaction with the help of ice.
Different chloroalkanes, i.e., dichloromethane (CH2 CI2 ); chloroform (CHCI3 ) and
carbon tetrachloride (CCI4 ) were used as additives in different concentrations (1.4-7 g
L-1) at three different amplitudes (25%, 50% and 75%) and results were compared
with reactions containing no additives. In a reaction time of 70 min, aliquots of 2 mL
were withdrawn every 10 min and 1 3 “ concentrations (jiM) were analysed using U V -
vis at 355 nm. Results reported are average values of triplicate experiments and the
errors were in the range of ±5%.
3.3 Results and discussionIn wastewater treatment the destruction of volatile organic compounds can be
considered to occur inside the cavitating bubble which acts as a micro-reactor. The
cavities may also be considered to be a source of H*, HO*, HOO* and H 2 O2 (Eq. 3 .1-
3.4), which further reacts with toxic pollutants and enhances degradation rates in the
bulk of the solution (Riesz et al., 1985; Riesz and Kondo, 1992; Sehgal and Wang,
1981). The process of pollutant degradation and oxidant generation is further
enhanced by the addition of chlorinated compounds, e.g., CCI4 and CHCI3 (Korn et al.,
2004); NaCl and CCI4 (Mahamuni and Pandit, 2006) and related reaction mechanisms
had been proposed showing pollutant (phenol) degradation (Eq. 3.1 and 3.7-3.13).
CC14 --------► Cl* + CC13* (3.7)CC13* + C l*--------► **CC12 + Cl2 (3.8)CC13* + CC13* --------► C2 C16 (3.9)•*CC12 + **CC12 --------► C2 CI4 (3.1 0 )Phenol + C l*--------► o-Chlorophenol and p-Chlorophenol (3.11)o-Chlorophenol and p-Chlorophenol + H O *-------► Dihydroxybenzenes (3.12)Dihydroxybenzenes + H O *--------► Small organic acids-------- ► CO2 + H20(3.13)
In a separate study the effect of CCI4 and other salts, like MgCL, have also been
studied using I3 production from aqueous Nal solution, instead of KI solution, in the
presence of high frequency ultrasonic reactors (1 MHz) (Gutierrez et al., 1995) and it
52

D o sim etry
was reported that in the absence of CCI4 , the yield was not affected upto 1 M,
however, with higher MgCL concentrations, the 1 3“ yields rapidly decreased owing to
the increased viscosity of the solution. The above studies reveal that much of the
research involves CCI4 as an additive for enhancing radical generation and pollutant
removal, however due to its toxicity, it is important to use an optimum concentration
which is degraded on reaction completion. Consequently, the use of other additives
such as CHCI3 and CH2 CI2 has been investigated in this study. Literature suggests
that addition of chloroalkanes (Hua and Hoffmann, 1996; Rajan et al., 1998) enhances
the radical generation through its own degradation under cavitating conditions to
generate Cl* which then participates in the process of pollutant removal. The Cl*
undergoes a series of recombination reactions as a result of which there are additional
oxidising agents such as CL and HOC1 produced which take part in the process of
oxidation (Rajan et al, 1998). These supplementary oxidising agents, are supposedly
more stable than the free radicals hence their contribution to the process of oxidation
is greater. Possible reaction mechanisms taking place due to the action of
chloroalkanes under cavitating conditions and responsible for KI oxidation has been
proposed as follows (Eq. 3.7, 3.14-3.21) (Chakinala et al., 2008b):
CC14 ------- > Cl* + *CC13 (3.7)CHC13 — —► Cl* + *CHC12 (3.14)CH2CL — — ► Cl* + CH2C1 (3.15)CC14 + Cl* --------► Cl2 + *CC13 (3.16)CL + H2 0 -------- ► HOC1 + HC1 (3.17)r + ci* —— ► I* + Cl" (3.18)c r+ c r - ----- ►CL (3.19)i* + i* — —► L (3.20)i2 + r — ► L (3.21)
The reactions in Eq. 3.7 and 3.14-3.17 are initiation reactions which contribute
additional oxidising agents to the system, however Rajan et al. (1998) discussed
detailed reactions mechanisms involving KI oxidation in the presence of CCI4 and
reported that the sonolysis of KI solution containing CCI4 acts as a separate phase
resulting in the formation of L, revealing characteristics different from those observed
when KI solution was sonicated alone. The reports also accounted that the addition of
CCI4, enhanced the rate by two orders of magnitude and the rate became independent
53

D o sim e try
of KI concentration, the effect of gas atmosphere was reported to be less pronounced
and the rate was time-dependent. Raj an also explained that the significant increase in
the oxidation rate was found to be due to release of CL, Cl and HOC1 which acted as
separate source of reactants to yield I2 and all these quantitatively reacted in the
reactor with KI, turning the rate independent of KI concentration. From the above
reactions, it was confirmed that ultrasonication of aqueous KI solution is known to
yield L due to reaction of iodide ions with H O , which in turn are generated due to
cavitation. Based on this conceptual framework, a model has also been developed to
predict the rate of iodine formation for KI solutions of various concentrations under
different gas atmospheres (Naidu et al., 1994). Naidu explained this with the help of
the model following the growth and collapse of a gas-vapour cavity using the
Rayleigh-Plesset bubble dynamics equation. His explanation suggests that the bubble
is assumed to behave isothermally during its growth phase and a part of the collapse
phase. Thereafter, it is assumed to collapse adiabatically, yielding high temperatures
and pressures. Thermodynamic equilibrium is assumed in the bubble at the end of
collapse phase. The contents of the bubble are assumed to mix with the liquid, and the
reactor contents are assumed to be well stirred. The model was verified by conducting
experiments with KI solutions of different concentrations and using different gas
atmospheres.
3.3.1 Liquid Whistle ReactorThe capacity of a LWR to generate oxidising radicals in the presence of CH 2 CI2 was
studied at different pressures (500, 1000, 1200 and 1500 psi), however initial studies
at the highest pressure of 1500 psi and no addition of chloroalkanes, showed no
oxidation of I~ to 1 3 ". This can be attributed to the fact that 1500 psi in the LWR is an
insufficient a pressure for generating enough HO* required for KI oxidation. Suslick
et al. (1997) reported that no liberation of iodine was observed below -2200 psi even
in CCI4 saturated bulk solution which means there has to be minimum intensity of
cavitation for the onset of oxidation. However, Pandit and co-workers reported a high
degree of cavitation at low pressures of 14.5-101.5 psi, using a multiple orifice plate
with an advanced by-pass flow system in their HC reactor set-up. They postulated that
the high flowrates induced increased cavitational activity leading to higher contact of
the bulk liquid with the cavitating bubbles and contributing towards enhanced
54
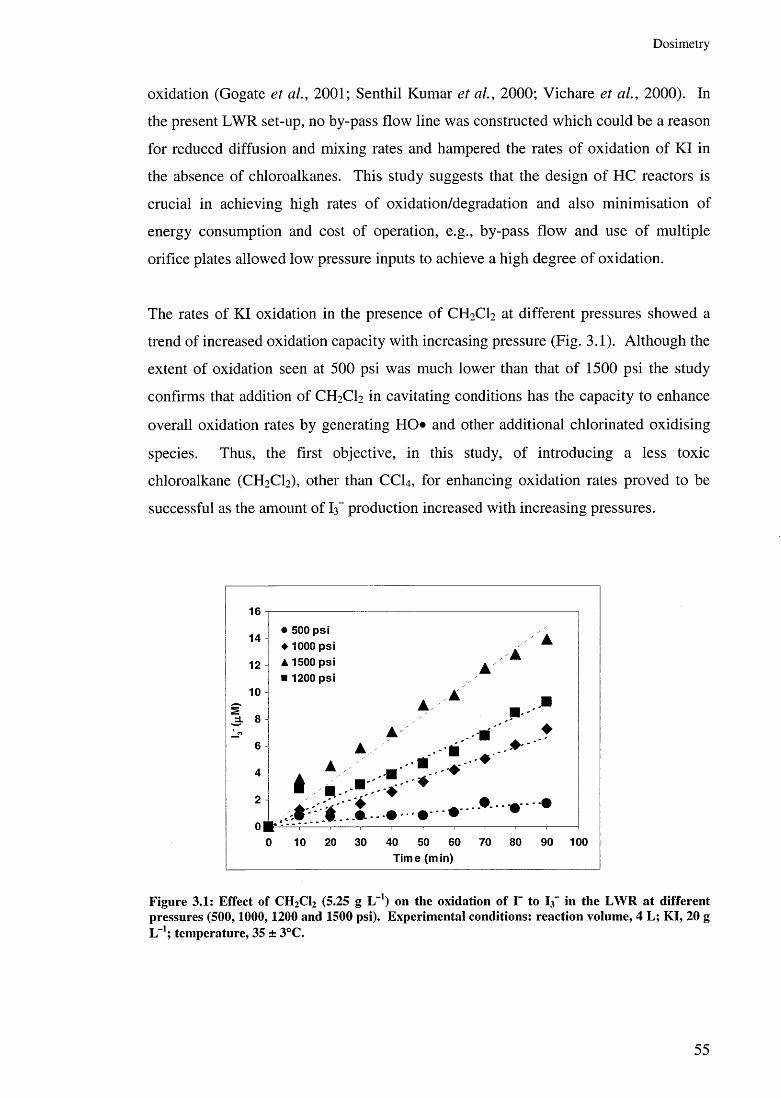
D osim etry
oxidation (Gogate et al., 2001; Senthil Kumar et al., 2000; Vichare et al., 2000). In
the present LWR set-up, no by-pass flow line was constructed which could be a reason
for reduced diffusion and mixing rates and hampered the rates of oxidation of KI in
the absence of chloroalkanes. This study suggests that the design of HC reactors is
crucial in achieving high rates of oxidation/degradation and also minimisation of
energy consumption and cost of operation, e.g., by-pass flow and use of multiple
orifice plates allowed low pressure inputs to achieve a high degree of oxidation.
The rates of KI oxidation in the presence of CH2 CI2 at different pressures showed a
trend of increased oxidation capacity with increasing pressure (Fig. 3.1). Although the
extent of oxidation seen at 500 psi was much lower than that of 1500 psi the study
confirms that addition of CH2 CI2 in cavitating conditions has the capacity to enhance
overall oxidation rates by generating HO» and other additional chlorinated oxidising
species. Thus, the first objective, in this study, of introducing a less toxic
chloroalkane (CH 2CI2), other than C C I4 , for enhancing oxidation rates proved to be
successful as the amount of I f production increased with increasing pressures.
Figure 3.1: Effect o f CH2C12 (5.25 g L x) on the oxidation o f I~ to I3 in the L W R at d ifferent pressures (5 0 0 ,1 0 0 0 ,1 2 0 0 and 1500 psi). Experim ental conditions: reaction volum e, 4 L; K I, 20 g L-1; tem perature, 35 ± 3°C.
55
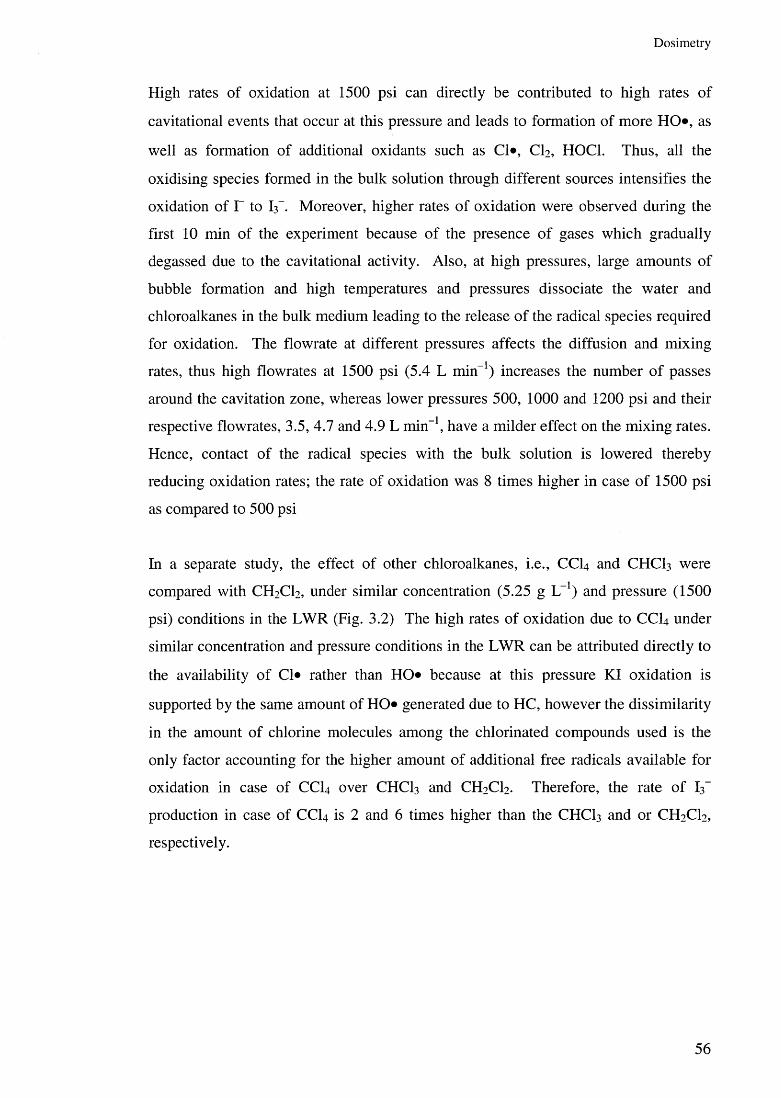
D o sim e try
High rates of oxidation at 1500 psi can directly be contributed to high rates of
cavitational events that occur at this pressure and leads to formation of more H O , as
well as formation of additional oxidants such as Cl*, CI2 , HOC1. Thus, all the
oxidising species formed in the bulk solution through different sources intensifies the
oxidation of T to I3- . Moreover, higher rates of oxidation were observed during the
first 1 0 min of the experiment because of the presence of gases which gradually
degassed due to the cavitational activity. Also, at high pressures, large amounts of
bubble formation and high temperatures and pressures dissociate the water and
chloroalkanes in the bulk medium leading to the release of the radical species required
for oxidation. The flowrate at different pressures affects the diffusion and mixing
rates, thus high flowrates at 1500 psi (5.4 L min-1) increases the number of passes
around the cavitation zone, whereas lower pressures 500, 1000 and 1200 psi and their
respective flowrates, 3.5, 4.7 and 4.9 L min-1, have a milder effect on the mixing rates.
Hence, contact of the radical species with the bulk solution is lowered thereby
reducing oxidation rates; the rate of oxidation was 8 times higher in case of 1500 psi
as compared to 500 psi
In a separate study, the effect of other chloroalkanes, i.e., C C I4 and C H C I3 were
compared with CH 2CI2, under similar concentration (5.25 g L-1) and pressure (1500
psi) conditions in the LWR (Fig. 3.2) The high rates of oxidation due to C C I4 under
similar concentration and pressure conditions in the LWR can be attributed directly to
the availability of Cl* rather than HO* because at this pressure KI oxidation is
supported by the same amount of HO* generated due to H C , however the dissimilarity
in the amount of chlorine molecules among the chlorinated compounds used is the
only factor accounting for the higher amount of additional free radicals available for
oxidation in case of C C I4 over C H C I3 and CH 2CI2. Therefore, the rate of I3-
production in case of C C I4 is 2 and 6 times higher than the C H C I3 and or C H 2C I2,
respectively.
56
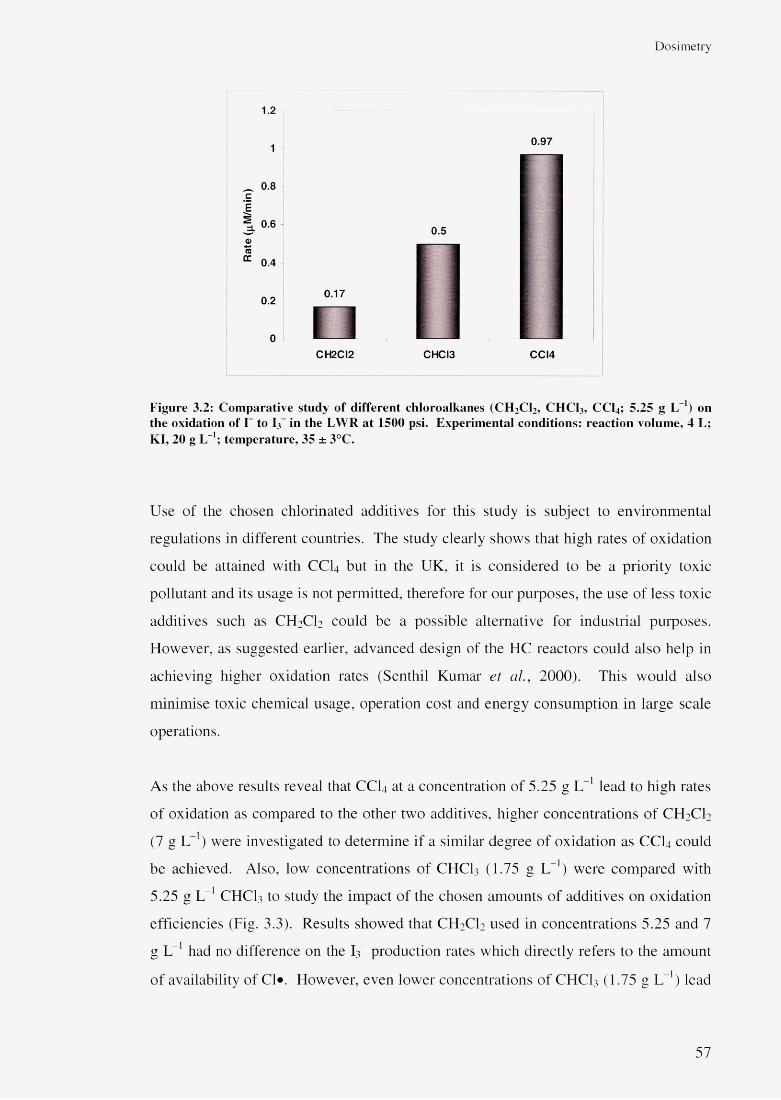
Dosimetry
1.2
0.97
_ 0.8C
CH2CI2 CHCI3 CCI4
F ig u re 3 .2: C o m p a ra tiv e s tu d y o f d if fe re n t c h lo ro a lk a n e s (C H 2C12, C H C I 3, CC14; 5 .25 g L 1) o n th e o x id a tio n o f I- to F f in th e L W R a t 1500 psi. E x p e r im e n ta l c o n d itio n s : r e a c t io n v o lu m e , 4 L ; K I , 20 g L _1; te m p e r a tu re , 35 ± 3°C .
Use of the chosen chlorinated additives for this study is subject to environmental
regulations in different countries. The study clearly shows that high rates of oxidation
could be attained with CCI4 but in the UK, it is considered to be a priority toxic
pollutant and its usage is not permitted, therefore for our purposes, the use of less toxic
additives such as CfUCT could be a possible alternative for industrial purposes.
However, as suggested earlier, advanced design of the HC reactors could also help in
achieving higher oxidation rates (Senthil Kumar et cil, 2000). This would also
minimise toxic chemical usage, operation cost and energy consumption in large scale
operations.
As the above results reveal that CCI4 at a concentration of 5.25 g L" 1 lead to high rates
of oxidation as compared to the other two additives, higher concentrations of CH2CI2
(7 g L_1) were investigated to determine if a similar degree of oxidation as CCI4 could
be achieved. Also, low concentrations of CHCT (1.75 g L_1) were compared with
5.25 g L 1 CHCI3 to study the impact of the chosen amounts of additives on oxidation
efficiencies (Fig. 3.3). Results showed that CH2CI2 used in concentrations 5.25 and 7
g L 1 had no difference on the I3 production rates which directly refers to the amount
of availability of Cl*. However, even lower concentrations of CHCI3 (1.75 g L 1) lead
57
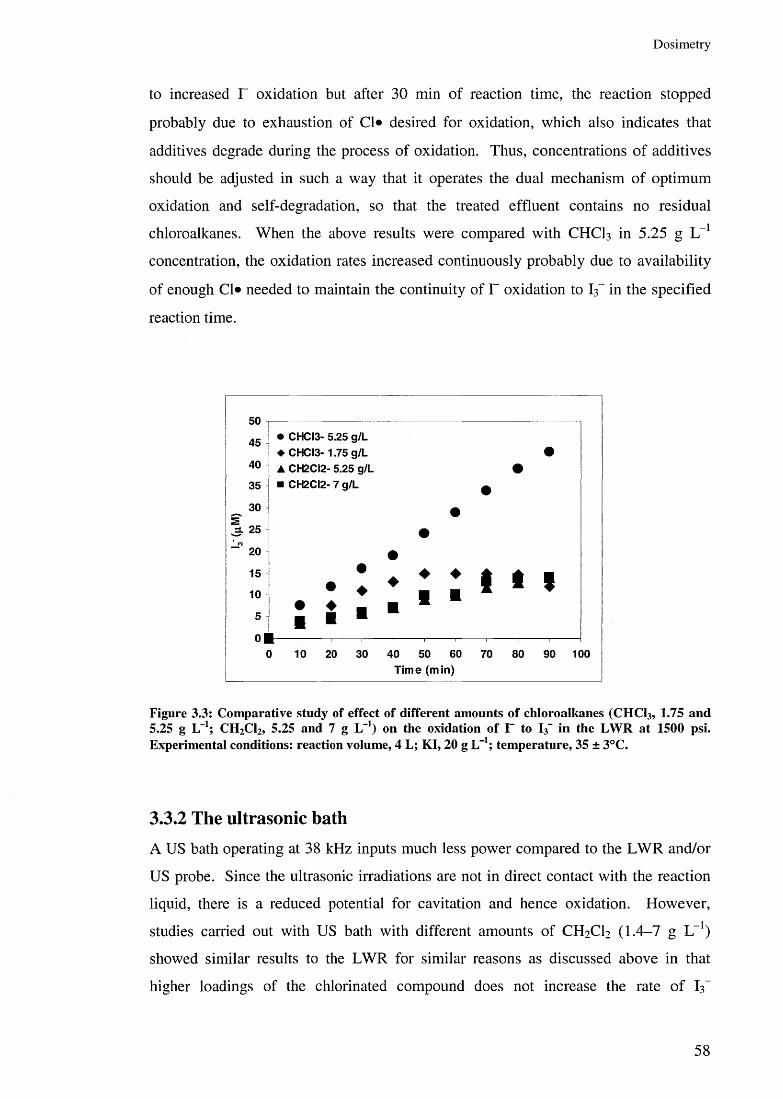
D o sim e try
to increased r oxidation but after 30 min of reaction time, the reaction stopped
probably due to exhaustion of Cl* desired for oxidation, which also indicates that
additives degrade during the process of oxidation. Thus, concentrations of additives
should be adjusted in such a way that it operates the dual mechanism of optimum
oxidation and self-degradation, so that the treated effluent contains no residual
chloroalkanes. When the above results were compared with C H C I3 in 5.25 g L- 1
concentration, the oxidation rates increased continuously probably due to availability
of enough Cl* needed to maintain the continuity of r oxidation to 1 3 “ in the specified
reaction time.
50
45
40
35
30s3r 25
CO
“ 20
15
10
5
0
0 10 20 30 40 50 60 70 80 90 100Time (min)
Figure 3.3: C om parative study of effect o f different am ounts o f chloroalkanes (CHCI3, 1.75 and 5.25 g Lf1; CH2C12, 5.25 and 7 g Lf1) on the oxidation o f I- to I3“ in the LW R at 1500 psi. Experim ental conditions: reaction volum e, 4 L; K I, 20 g LT1; tem perature, 35 ± 3°C.
3.3.2 The ultrasonic bathA US bath operating at 38 kHz inputs much less power compared to the LWR and/or
US probe. Since the ultrasonic irradiations are not in direct contact with the reaction
liquid, there is a reduced potential for cavitation and hence oxidation. However,
studies carried out with US bath with different amounts of CH 2 CI2 (1.4-7 g L-1)
showed similar results to the LWR for similar reasons as discussed above in that
higher loadings of the chlorinated compound does not increase the rate of I3-
58

Dosimetry
production (Fig. 3.4). Results also reveal that higher concentrations may lead to a
decrease in I f production; with increasing concentrations, the rate of FT production
decreased from 0.35 pM min 1 to 0.22 pM min-1.
0.40
0.35
0.30
I 0.25
3 r 0.20 otsCC 0.15
0.10
0.05
0.00
0.35
0.23
1.4 4.2CH2CI2 (g/L)
0.22
F ig u re 3 .4 : C o m p a ra tiv e s tu d y o f e ffec t o f d if fe re n t a m o u n ts o f C H 2C12 (1 .4 -7 g L -1) o n th e o x id a tio n o f I- to I 3~ in th e U S b a th . E x p e r im e n ta l co n d itio n s : r e a c t io n v o lu m e , 200 m L ; K I, 20 g L -1; te m p e r a tu re , 23 ± 2 °C.
Previous research in cavitational reactors reveals that other oxidants, e.g., FFCU, in
optimum concentrations (not necessarily the highest concentrations) lead to enhanced
degradation rates (Gogate and Pandit, 2004b). The reason proposed for the higher
concentration of oxidants not increasing the oxidation rates was that the higher amount
of unreacted FFCU itself acts as a free radical scavenger thereby reducing the reaction
rates. The cavitational activity in the US bath is very low, which could also be one of
the reasons of lower dissociation rates of CFFCT which contribute free radicals for F
oxidation. Therefore, the study suggests that CFFCT could be used as a potential
additive in oxidation reactions but its usage in optimum concentration could lead to
enhanced degradation rates.
59
D o sim e try
3.3.3 The ultrasonic probe3.3.3.1 Effect of US amplitudes
The US probe was operated at three different amplitudes (25%, 50% and 75%) and the
results show that the rate of I f production was directly proportional to the increasing
amplitudes of the US probe. Initial studies were carried out with CH2 CI2 at the chosen
concentrations and amplitudes and the results are shown in Fig. 3.5.
The results obtained with the US probe are very much in line with that of the LWR
which showed that as the pressure increased in the LWR, the rate of I3- was increased
simultaneously. Higher cavitational activities at higher frequencies and pressures
contribute higher amounts of free radicals in cavitational reactors (Gogate and Pandit,
2004a). Thus, higher rates of oxidation of r could be attributed to the same fact. The
greater rate of production of I3 - at higher amplitudes could also be the result of the
large amount of HO* production occurring due to dissociation of water molecules.
Simultaneously, higher temperatures and pressures occurring due to bubble collapse in
such conditions could lead to enhanced dissociation of CH2 CI2 and generation of
additional free radicals in the system which participates in the process of oxidation.
However, the results seen with three different concentrations (1.4-7 g L_1) showed
variable trends at different amplitudes, therefore all the results were compared at the
highest chosen concentration (7 g L-1) in order to estimate the effect of the chosen
amplitudes as shown in Fig. 3.6 which clearly shows the KI oxidation increased with
increasing amplitudes.
6 0

D o sim etry
125
100
75
23.> 50
25
0
0 10 20 30 40 50 60 70 80
Time (min)
♦ 1.4 g/L ■ 4.2 g/L A 7 g/LA No additives
Amplitude 25%
■ A
n— a — a — 4-
A A A A
2
125
100
75
50
25
00 10 20 30 40 50 60 70 80
♦ 1.4 g/L Amplitude 50% ■
■ 4.2 g/L AA 7 g/L ■ ♦A No additives
* A
9 A
m A
▲*▲
f t.___ A___ A A A A A A
Time (min)
200 n♦ 1.4 g/L Amplitude 75% g
175 ■ 4.2 g/L ■ A150 i79,L m tA No additives ■
125. A
2 1003 . * ACO
” 75i *
50 A A25
o|
i a A A A A A
1 A A ------- .-------- ,---------,-------- ,---------,--------0 10 20 30 40 50 60 70 80
Time (min)
Figure 3.5: Com parative study o f effect o f different am plitudes (25-75% ) and different concentration o f CH2CI2 (1 .4 -7 g LT1) on the oxidation o f 1“ to I3- using an U S probe. Experim ental conditions: reaction volum e, 200 mL; K I, 20 g L-1; tem perature, 23 ± 2 °C.
61

D o sim e try
200
175
150
12531 ." 100
75
50
25
0
0 10 20 30 40 50 60 70 80Time (min)
♦ 25% (7 g/L)
■ 50% (7 g/L)
A 75% (7 g/L)
I
2.5 m in-1
1.5 min-1
0.80 min-1
Figure 3.6: KI dosim eter using CH2CI2 as additive to study the effect o f d ifferent am plitudes o f the US probe (25-75% ) on I3~ production. Experim ental conditions: reaction volum e, 200 mL; K I, 20 g L-1; tem perature, 23 ± 2 °C.
The phenomenon of HO* production at different amplitudes was also assessed using
the terephthalic acid dosimeter (Scheme 3.2) and results obtained are in agreement
with those found with the KI dosimeter, i.e., the production of free radicals increased
with increasing amplitudes in the US probe. In this study, various other amplitudes
such as 10%, 25%, 50%, 60% and 75% were also studied. The experimental approach
was adapted from the publication by Mason et al. (1994) and a calibration curve was
constructed from which the concentration of hydroxyterephthalate acid (HTA) was
determined after measuring the fluorescence intensity. Reactions were carried out in a
300 mL glass beaker using 200 mL of terephthalic acid (0.5 x 10- 3 mol dm-3) and
results were obtained by measuring the fluorescence of HTA after every 10 min over
the 60 min reaction time and, using the calibration curve (Fig. 3.7).
6 2

D o sim etry
Figure 3.7: Calibration line for HTA m easurem ent using the terephthalic acid dosim eter.
F igure 3.8: The effect o f different am plitudes o f US energy (10-75% ) on H TA production corresponding to HO». Experim ental conditions: reaction volum e, 200 mL; terephthalic acid, 0.5 x 10⁻³ mol dm '3; tem perature, 23 ± 2 °C.
The increase in US power that is involved in a reaction is associated with the increased
cavitational effect in the system, which in turn produces more HO* and as a result
greater fluorescence as more HTA is produced, i.e., the yield of HO* is directly
proportional to the power input (Mason et al., 1994). Increasing amplitudes (10-75%)
of the US radiation showed increase in the HTA production at different amplitudes can
63
D o sim etry
be attributed to the increasing power dissipation at higher amplitudes (Fig. 3.8). Thus,
both the KI dosimeter and the terephthalic acid dosimeter, clearly demonstrate the
efficiency of the US probe at different amplitudes; increasing cavitational activities at
increasing amplitudes, with increasing power entering the reaction system, leads to
higher oxidation intensities in sonochemical reactors. Statistical analysis (MANOVA)
also revealed the significance of amplitudes on the intensity of oxidation in US probe
(P = 0.00-0.01).
3.3.3.2 Effect of additive concentrations
Three different concentrations of CFFCF, CHCI3, CCI4 (1.4-7 g L-1) were chosen for
the study and their effects on r oxidation were examined (Fig. 3.9a). The initial rate
of I3- production without any additive was 10 times less than the lowest concentration
(1.4 g L-1) of CH2CI2 but higher concentrations (4.2 and 7g L-1) did not increase the
rate of 13“ production. A similar explanation, as given in Section 3.3.2, can be
presented here. Also, addition of additives alters the physico-chemical properties of
the liquid thereby affecting the intensity of cavitation. In such cases, it could be a
possibility that the concentration of CH2CI2 is higher than that of FFO in the cavitating
bubble, which may alter the surface tension affecting the bubble cloud behaviour.
Such activities in turn affect the key processes like collapse and coalescence, resulting
in the overall oxidation efficiency. Because of the above reasons even higher
concentrations of CFFCU could not replace the oxidation capacity of CCI4. However,
previous reviews of research on similar oxidations (Gogate and Pandit, 2004a, 2004b)
suggest that if oxidants are added stepwise, the process of oxidation continues for
longer, since oxidants added at several stages of the reaction continuously generate
free radicals in the reaction system and the oxidation continues. In another experiment
in this study (not shown), addition of CH2CI2 was done in three steps without altering
the concentration of the additive and results showed that 13“ production was higher
(1.1 pM min-1) in the case of stepwise addition but lower (0.88 pM min-1) in case of
addition at the start of the experiment. This clearly indicates that continuous renewal
of Cl« required for oxidation takes place when the CH2CI2 is added in stepwise.
In the case of CHCI3, the three chosen concentrations ranging from 1.4 to 7 g L- 1 did
not have any effect on the I3- production and the rates were noted to be 2.83, 2.95 and
64

D osim etry
2.79 jiM min-1. A similar observation as CH 2CI2 was seen for C H C I3 in that lower
concentrations had a significant effect on r oxidation, however the rate of oxidation
was elevated as compared to CH 2 CI2 due to the higher amount of chlorine atoms
present in C H C I3 . Even if the cavitational activity at 25% amplitude was less, the
availability of Cl* in case of C H C I3 maintains the oxidation process at all the three
chosen concentrations.
However, with C C I4 , the observed results were completely different from the two
additives studied earlier. In this case, the increase in concentration from 1.4 to 7 g L - 1
lead to enhanced generation of I3 - which could be attributed to the increased amount
of Cl* present in oxidation reactions with CC I4. Fig. 3.9b shows the rates of I3 -
production three different concentrations (1.4-7 g L-1) of the different additives. It is
evident from the figure, that with higher concentrations of C C I4 the rate of r oxidation
increases, whereas the oxidation rates remain constant in case of C H C I3 and C H 2C I2.
65
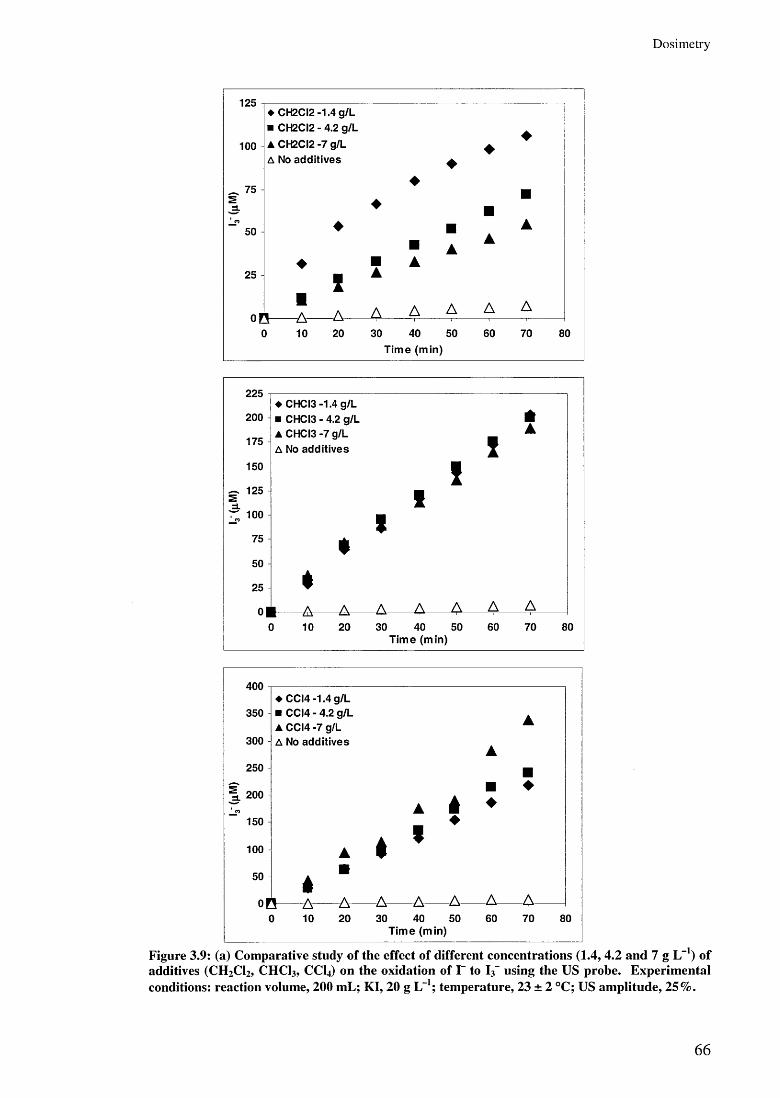
D o sim e try
125
100
75
50
25
♦ CH2CI2 -1.4 g/L ■ CH2CI2 - 4.2 g/L
▲ CH2CI2 -7 g/L A No additives
on— a -0 10
♦ ■ A■ A
A■ A
IA
A A A A A A
20 30 40 50 60 70 80
Time (min)
Figure 3.9: (a) Com parative study o f the effect o f different concentrations (1.4, 4 .2 and 7 g L -1) o f additives (CH2CI2, CHCI3, CC14) on the oxidation o f 1“ to I3- using the US probe. E xperim ental conditions: reaction volum e, 200 mL; K I, 20 g L f1; tem perature, 23 ± 2 °C; US am plitude, 25% .
6 6
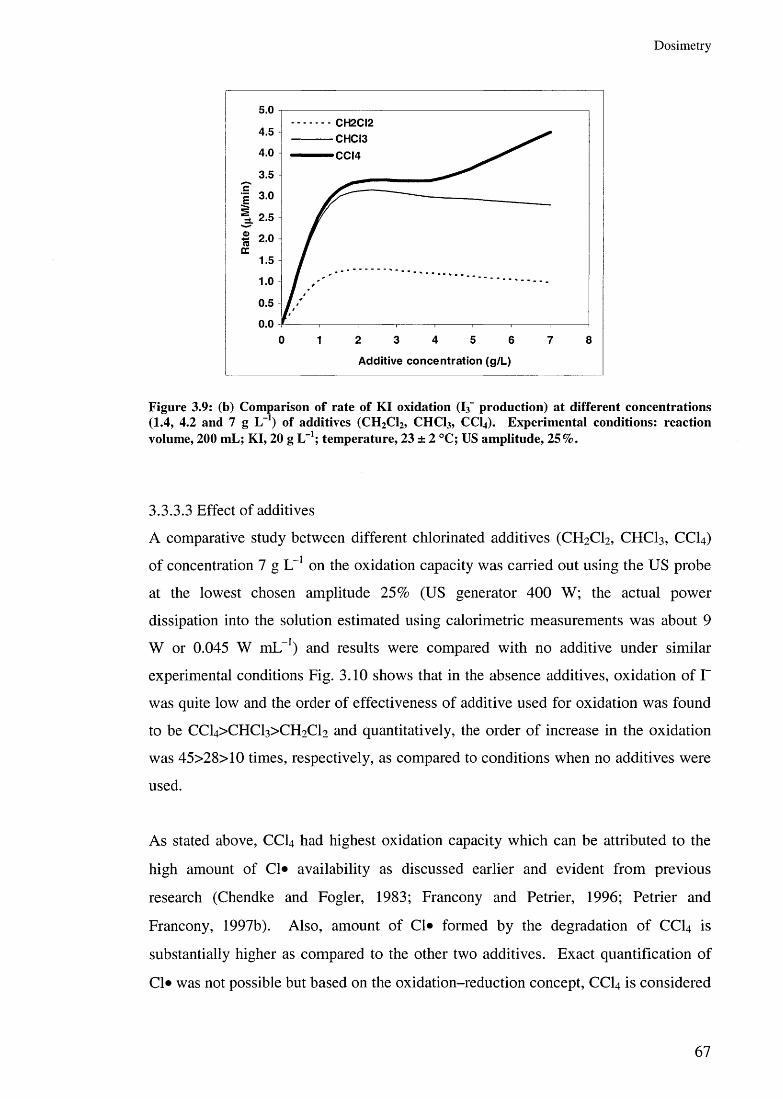
D o sim etry
Figure 3.9: (b) Com parison o f rate o f KI oxidation (I3“ production) at d ifferent concentrations (1.4, 4.2 and 7 g L-1) o f additives (CH 2C12, CHC13, CC14). E xperim ental conditions: reaction volum e, 200 mL; KI, 20 g L-1; tem perature, 23 ± 2 °C; US am plitude, 25% .
3.3.3.3 Effect of additives
A comparative study between different chlorinated additives (CFFCF, C H C I3 , C C I4 )
of concentration 7 g L_t on the oxidation capacity was carried out using the US probe
at the lowest chosen amplitude 25% (US generator 400 W; the actual power
dissipation into the solution estimated using calorimetric measurements was about 9
W or 0.045 W mL_I) and results were compared with no additive under similar
experimental conditions Fig. 3.10 shows that in the absence additives, oxidation of r
was quite low and the order of effectiveness of additive used for oxidation was found
to be CCl4 >CHCl3 >CH2 Cl2 and quantitatively, the order of increase in the oxidation
was 45>28>10 times, respectively, as compared to conditions when no additives were
used.
As stated above, C C I4 had highest oxidation capacity which can be attributed to the
high amount of Cl* availability as discussed earlier and evident from previous
research (Chendke and Fogler, 1983; Francony and Petrier, 1996; Petrier and
Francony, 1997b). Also, amount of Cl* formed by the degradation of C C I4 is
substantially higher as compared to the other two additives. Exact quantification of
Cl* was not possible but based on the oxidation-reduction concept, C C I4 is considered
67

D o sim etry
to be non-reactive with the HO* in which case the reaction proceeds through a
reductive process (Teel and Watts, 2002), thus the rate of I3 - formation with CCI4 is
directly proportional to the rate of Cl* formation which is formed upon degradation of
CC14.
400
300
♦ CH2CI2 (7 g/L)
■ CHCI3 (7 g/L)
A CCI4 (7 g/L)
A No additives
4.48 m in-1
A -'" '
3 ._r> 200
100
10
- A
20
' A
X ' . ■A ■■
♦
- A - ^ A
30 40 50
2.78 m in-1
0.98 min-1
0.10 min-1
60
=A-70 80
Time (min)
Figure 3.10: Com parative study o f the effect of: CH2CI2, CHCI3 and CCI4 (7 g L-1) on the oxidation o f 1“ to V using an US probe (20 kHz). Experim ental conditions: reaction volum e, 200 mL; KI, 20 g L-1; tem perature, 23 ± 2 °C; US probe am plitude, 25% .
The results of oxidation rates obtained with US probe with the three different
chlorinated compounds are similar to that of HC (LWR) which clearly indicates that
efficacy of chlorinated additives have no impact of cavitational activity in these
cavitational reactors. However, the concentration of the additives added have a great
role to play in the oxidation reactions, as discussed above and in studies carried out
previously (Rajan et al., 1998). Concentration of the additives is an important factor
as the activity of cavitation depends on this because the chloroalkanes do not dissolve
in the aqueous iodine solution but are dispersed throughout the solution as
microdroplets, which multiplies the number of nucleation sites available for cavitation.
Therefore, any increase or decrease in the concentration of the chloroalkanes, relative
to the bulk iodine solution, may interfere with the process of oxidation. Thus, an
optimum concentration is recommended for intensification of the process of oxidation
6 8

D o sim e try
using chloroalkanes. Also, optimum concentrations would positively work to produce
ideal outputs useful at laboratory or pilot scale processes:
Optimum chloroalkanes concentrations —> dissociate/degrade —> enhanced nucleation
—> generate free radicals —> oxidation —> leave no residues at final discharge.
3.4 Hydrodynamic vs acoustic cavitationPandit and co-workers carried out much work on HC reactors and reported that their
efficiency is more than that of US reactors (Save et al., 1994; Sivakumar and Pandit,
2002). However, in the present study, the results contradict these research findings,
maybe due to the use of a different type of HC reactor. Pandit used a by-pass flow
system which utilises low pressures and operates at relatively higher flowrates, which
increases the passes through the cavitational zone and hence the opportunity of the
pollutant/oxidant to interact with the cavities and other free radicals is also improved
which helps in the process of oxidation. Whereas in this study, the HC reactor utilised
high pressures and reduced flowrates resulting in lower degree of oxidation as
compared to the US probe, therefore the production was found to be 5 times more
effective in case of US probe than the LWR. However, since the volume and energy
utilised in the two reactors were different, a comparative study was carried out,
involving the measurement of oxidation rates per unit power density which is defined
as the electrical energy dissipated into the system per unit volume of the reactant and
results showed that US reactors were still 2.5 times effective as compared to the HC
(LWR) reactor (Pandit and Gogate, 2005).
69
D o sim etry
3.5 SummaryThe chloroalkanes could be termed as potential additives for enhancing oxidation
reactions. In general, the use of these chloroalkanes is beneficial for the oxidation of
non-volatile toxic compounds which are less susceptible to free radical attack,
however the concentration of the additives should be optimised in such a way that the
additive supports the degradation process and is utilised completely by the end of the
reaction, so that the effluent discharge does not transfer any toxic residues of the
additives to the natural environment.
Thus, from the above laboratory scale experimental study, in order achieve higher
oxidation intensities in cavitational reactors, the following conclusions can be drawn:
■ Advanced hydrodynamic cavitational reactor set-ups can be improved by
introducing multiple orifices and by-pass flow for onset of cavitation even in
the absence of chloralkanes.
■ Enhanced generation of radical species could be achieved with increasing
pressures in the LWR.
■ The order of effectiveness of chloroalkanes for oxidation is
CCl4 >CHCl3 >CH2 Cl2 .
■ Higher concentration of additives does not favour the oxidation reaction, thus
an optimum concentration, relative to the bulk solution, could achieve high
oxidation rates.
■ Stepwise addition of additive/oxidants could lead to higher oxidation
intensities rather than addition of additives initially.
■ Oxidation capacity of US probe type reactors is more effective than US bath
reactors.
■ Addition of C C I4 could achieve higher rates of oxidation intensities in
sonochemical and hydrodynamic cavitational reactors.
■ Acoustic cavitation reactors are 2.5 times more effective, for enhanced
oxidation, than the hydrodynamic cavitational reactors.
70

D eg rad a tio n I: U S reacto rs
Chapter 4
Degradation I: Phenol removal using
multiple frequency US reactors
Platform presented paper: U K N ational Conference
C hand, R. (2nd- 4 th A pril 2008). P heno lic w astew ater trea tm en t u sin g A F P in m ulti freq u en cy u ltra so n ic
reactors. 9 th IW A U K Young W ater P ro fe ss io n a l C onference. N ew castle U n iv ersity , N ew castle , E ng land .
Poster presented: SET, H ouse of C om m ons
C hand, R. (19th M arch 2007 , L unch tim e R ecep tion ). ‘N ovel g reen te ch n o lo g ies fo r w astew ater
trea tm en t’ at the S E T fo r B R IT A IN , E arly -stage Scien tist, E n g in eers and T ech n o lo g ists P o ste r
C om petition , H ouse o f C om m ons, L ondon .
71
D eg rad a tio n I: U S reac to rs
4.1 IntroductionPhenol and its chlorinated derivatives are used in the formulation of insecticides,
herbicides and fungicides and can be found as toxic pollutants in industrial wastes.
Also, phenolic compounds are common contaminants in wastewaters, being generated
from petroleum and petrochemical, coal conversion and phenol-producing industries.
Phenols are widely used for the commercial production of a wide variety of resins
including phenolic resins, which are used as construction materials for automobiles
and appliances, epoxy resins, adhesives and polyamides for various applications (Fang
and Chan, 1997). The use of these substances imposes severe risks to human health
and is, therefore a matter of public concern. Several cases of phenol pollution have
also been reported around the world since mid-1900s. In 1974, an accidental spillage
of phenol (carbolic acid) in Southern Wisconsin (USA) caused chemical
contamination of wells leading to severe human illness; although physical and
laboratory examinations 6 months after the exposure revealed no residual abnormality
in exposed persons, however water testing and geological evaluations indicated that
contamination of the underground water system may persist for many years (Baker et
al., 1978). Thus, phenols are considered as priority pollutants since they are harmful
to organisms at low concentrations and many of them have been classified as
hazardous pollutants because of their potential harm to human health. Stringent
Environmental Protection Agency (EPA) regulations call for lowering phenol content
in the wastewater to less than 1 mg L- 1 (Dutta et al., 1992). Similarly, the Doosan oil
spill, where 320 tonnes of phenol waste from the Doosan Electro-Materials Inc. when
illegally dumped in River Naktong, South Korea, affected more than 10 million homes
(www.american.edu/ted/doosan). In the UK, few serious incidences of phenol
contamination in major rivers, serving millions of peoples and aquatic flora and fauna,
have lead to enormous concerns regarding its pollution and toxicity. For example, in
1984 and 2000 the River Dee, one of the most closely monitored waterways in Europe,
was heavily contaminated by phenol due to a million gallons of toxic effluent being
discharged. This incident killed a number of fishes, affected more than 2 million
people in North Wales and left the water supply contaminated for several weeks
(www.bbc.co.uk/wales). Such atrocious events, on the one hand increase the risk of
severe environmental pollution but on the other lead to public participation and
72

D eg rad a tio n I: U S reac to rs
awareness toward environmental issues and demands effective treatment systems for
such toxic organic compounds.
The treatment processes for phenolic wastewater is classified into two principal
categories (Dutta et al., 1998):
■ a destructive process such as oxidation with ozone (O3 ) (Hoigne, 1985) or
hydrogen peroxide (H2 O 2 ) (Kochany and Bolton, 1992)
■ a recuperative processes such as adsorption onto porous solids (Danis et al.,
1998), membrane separation (Mccray and Ray, 1985), or solvent extraction
(Earhart etal., 1977)
However, it is believed that aromatic compounds are generally, refractory to chemical
and biological processes, which is why other alternative treatments have gained
enormous interest from researchers worldwide (Esplugas et al., 2002; Gogate and
Pandit, 2004b). Advanced Oxidation Processes (AOPs) are considered as alternative
technologies in order to treat such toxic wastewaters, as these processes have the
capacity to generate hydroxyl radicals (HO*) which are one of the most powerful
oxidising agents and, as discussed in Chapter 1, they have the highest oxidation
potential of any species used in wastewater treatment technologies.
Among the various AOPs discussed in detail in Chapter 1, sonochemistry has been
demonstrated as a promising method for the destruction of aqueous pollutants (Cheung
et al., 1991; De Visscher et al., 1997; Destaillats et al., 2000; Joseph et al., 2000;
Laughrey et al., 2001; Mckee et al., 1977; Peller et al., 2001; Taylor Jr et al., 1999;
Wheat and Tumeo, 1997). Ultrasonic irradiation generates cavitation bubbles which
oscillate between growth and collapse through compression and rarefaction (Joseph et
al., 2000; Peller et al., 2001). The temperatures and the pressures in these collapsing
bubbles are estimated to be 3000-5000 K and 500-10,000 atm, respectively (Flint and
Suslick, 1991; Suslick et al., 1993a; Suslick et al., 1993b). Under such extreme
conditions of temperature and pressure, water molecules dissociate to form highly
reactive HO* and hydrogen atoms (H*) as also discussed previously in Chapter 3
(Chen and Smirniotis, 2002; Makino et al., 1982; Misik et al., 1995; Suslick, 1990;
Suslick et al., 1986). Other oxidising radicals also tend to form depending upon the
73
D eg rad a tio n I: U S reacto rs
nature of gases and other solutes present in the medium (Kang et al., 1999a;
Thompson and Doraiswamy, 1999). Several mechanisms have been proposed for
sonochemical degradation of aqueous pollutants(Hoffmann et al., 1996; Laughrey et
al, 2 0 0 1 ):
■ oxidation by hydroxyl radicals (H O )
■ pyrolytic decomposition
■ supercritical water oxidation
■ combustion
The above mechanisms are likely to happen in the gas phase inside the collapsing
bubble, at the gas-liquid interface and in the reaction solution which surrounds the
bubble (Laughrey et al., 2001; Taylor Jr et al., 1999). However, the efficacy of the
sonochemical degradation process depends on many other factors such as irradiation
frequency, input energy, dissolved gases and aqueous additives (Beckett and Hua,
2001; Kang et al., 1999a; Laughrey et al., 2001; Peller et al., 2001; Taylor Jr et al.,
1999). Since the oxidation by HO* is an important reaction pathway in sonochemical
reactions, the degradation efficiency is directly proportional to the amount of HO*
generation. The following reaction pathways have been proposed, where HO* either
recombines, reacts with other gaseous species or diffuses into bulk solution to react
with solutes present in the reaction medium (Laughrey et al., 2001):
HO* + H * --------► H20 (4.1)HO* + H O *--------► H2 0 2 (4.2)HO* + other species--------► oxidised products (4.3)
Equations 4.1-4.3 are generally competitive in the sonochemical degradation process
and the second order rate constants of Eq. 4.1 and 4.2 are 7 x 10⁹ M - 1 s- 1 and 4.2 x 10⁹
M - 1 s- 1 and it is believed that under most circumstances Eq. 4.3 has a similar rate
constant. However, the local concentration of all the above mentioned species can
play a very important role in controlling the actual rate of each process. Moreover, as
discussed earlier in Chapter 3, the role of chlorinated additives, Fe2+ and Fe° have
been found to be very efficient in increasing the overall degradation rates in sonolytic
system (Hung et al., 2000).
74
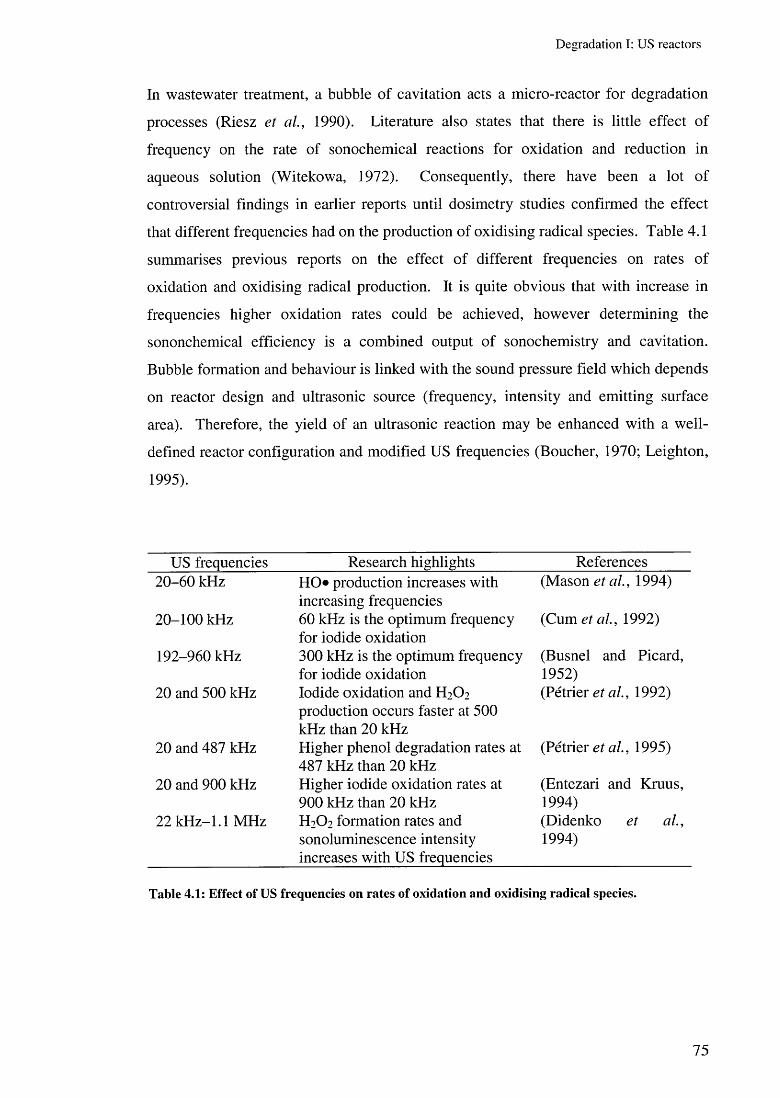
D eg rad a tio n I: U S reac to rs
In wastewater treatment, a bubble of cavitation acts a micro-reactor for degradation
processes (Riesz et al., 1990). Literature also states that there is little effect of
frequency on the rate of sonochemical reactions for oxidation and reduction in
aqueous solution (Witekowa, 1972). Consequently, there have been a lot of
controversial findings in earlier reports until dosimetry studies confirmed the effect
that different frequencies had on the production of oxidising radical species. Table 4.1
summarises previous reports on the effect of different frequencies on rates of
oxidation and oxidising radical production. It is quite obvious that with increase in
frequencies higher oxidation rates could be achieved, however determining the
sononchemical efficiency is a combined output of sonochemistry and cavitation.
Bubble formation and behaviour is linked with the sound pressure field which depends
on reactor design and ultrasonic source (frequency, intensity and emitting surface
area). Therefore, the yield of an ultrasonic reaction may be enhanced with a well-
defined reactor configuration and modified US frequencies (Boucher, 1970; Leighton,
1995).
US frequencies Research highlights References20-60 kHz HO* production increases with
increasing frequencies(Mason et al., 1994)
20-100 kHz 60 kHz is the optimum frequency for iodide oxidation
(Cum et al., 1992)
192-960 kHz 300 kHz is the optimum frequency for iodide oxidation
(Busnel and Picard, 1952)
20 and 500 kHz Iodide oxidation and H 2 O2
production occurs faster at 500 kHz than 20 kHz
(Petrier et al., 1992)
20 and 487 kHz Higher phenol degradation rates at 487 kHz than 20 kHz
(Petrier et al., 1995)
20 and 900 kHz Higher iodide oxidation rates at 900 kHz than 20 kHz
(Entezari and Kruus, 1994)
22 kHz-1.1 MHz H2 O2 formation rates and sonoluminescence intensity increases with US frequencies
(Didenko et al., 1994)
Table 4.1: Effect o f US frequencies on rates o f oxidation and oxidising radical species.
75
D eg rad a tio n I: U S reac to rs
However, total mineralisation of refractory organic pollutants by means of US alone
still remains a difficult task which makes its use impractical on industrial scale
processes. In order to overcome limitations of low degradation efficiency by
ultrasound alone, the method has been combined with various other processes in order
to achieve high total organic carbon (TOC) degradation and to reduce time of
treatment (Adewuyi, 2001). These methods include US treatment coupled with
oxidants (H2 O2 and O3 ) (Chemat et al., 2001; Lin et al., 1996; Weavers et al., 1998);
electrochemical methods (Trabelsi et al., 1996); Fenton reagent (De Visscher and Van
Langenhove, 1998; Guo et al., 2005; Lin and Ma, 2000; Manousaki et al., 2004;
Neppolian et al., 2002) and photocatalysis (Ragaini et al., 2001; Theron et al., 1999).
Among all the applications mentioned above, Fenton-like processes in conjunction
with ultrasound have been of most interest. The reaction between H 2 O2 and Fenton
like catalysts (either homogeneous or heterogeneous), referred to as Fenton-like
reactions, is known to produce additional HO* in the system, capable of oxidising
organic compounds and accelerating the rates of ultrasonic degradation. Literature
suggests that the degradation of chlorophenols (Nagata et al., 2000), 1,4-dioxane
(Beckett and Hua, 2003) and 4-/z-nonylphenol (Yim et al., 2003) is enhanced with the
combined reaction of US/Fe2+/H 2 0 2 compared to US alone. Also, it was reported (Lin
and Ma, 2000; Neppolian et al., 2002) that substantial increase in degradation rates of
MTBE and 2-chlorophenols were observed in the US/Fe2 +/H 2 0 2 system over the
Fe2 +/H 2 0 2 system (silent Fenton system). On the contrary, lower degradation
efficiencies of phenol and 2,4-dinitrophenols were reported with US/Fe2 +/H 2 0 2 and
US/Cu2 +/H 2 0 2, respectively, when compared with silent Fenton systems (Guo et al.,
2005; Papadaki et al., 2004). The controversy still exists as to whether ultrasound has
a beneficial role in the homogeneous system (Fe2 +/H 2 0 2 ) for treating organic
compounds. (The part of the study with silent Fenton-like reactions in conjunction
with various zero valent metal catalysts will be discussed in detail in Chapter 5).
This chapter mainly concentrates on a study of the efficacy of low- and high-
frequency US reactors in conjunction with Fenton-like reactions where the source of
Fe2+ and Cu2+ has been obtained from the use of zero valent iron (ZVI) and zero valent
copper (ZVCu) catalysts. Such a process using zero valent metals along with H 2 O 2
76

D eg rad a tio n I: U S reac to rs
under acidic conditions (pH 2.5-3) has recently been termed the Advanced Fenton
Process (AFP) (Bremner and Burgess, 2004; Namkung et al., 2006; Namkung et a l,
2005).
Hence, objectives of the current study were to:
■ assess the H 2 O2 production in the chosen low-and high-frequency US reactors
■ optimisation of parameters for enhanced phenol degradation in the presence
and absence of air, H 2 O2 , US, ZVI
■ assess the efficacy of different ZYI and ZVCu catalysts in conjunction with
H2 O2 and ultrasound (20, 300 and 520 kHz) in the process of phenol
degradation
■ compare the efficiency of oxidants, H 2 O2 and O3 with the AFP for phenol
degradation in high frequency US (300 and 520 kHz) reactors
This part of the study was carried out on a one month Short Term Scientific Mission
(STSM) at the Institute of Environmental Studies, Bogazici University, Istanbul,
Turkey. Therefore, the chemicals, US reactors, equipment for analysis (GC, TOC and
UV-vis) and also the experimental set-up for this part of the research may be different
from the remainder of the work described in this thesis, however the objectives,
experimental methodology, process optimisation, data interpretation and analysis is
my individual contribution to the study.
4.2 Experimental4.2.1 ChemicalsAqueous phenol solutions (2.5 mM, Fluka) were used as model synthetic wastewater
for all the US reactions in this study. Experimental results shown in this part of the
thesis were carried out at Bogazici University, Turkey, therefore the US reactors used
for the study (20, 300 and 520 kHz) are the same as described in Section 2.3.2. The
volumes of liquid used in the three US reactors; 20, 300 and 520 KHz were 80, 100
and 300 mL; respectively. The strength of the H2 O2 (35%) used for the study was
2.38 g L_ 1 and the concentration of H 2 O2 in individual experiments was obtained using
the calibration curve shown in Section 2.4.3. Three different kinds of zero valent
catalysts (ZVC) used for the study were: zero valent iron powder (ZVI), zero valent
77
D eg rad a tio n I: U S reac to rs
copper flitters (ZVCF) and zero valent copper turnings (ZVCT). The amounts chosen
for the two types of catalysts were: ZVI (0.120 g; 0.6 g L-1) and ZVCF and ZVCT (1
g; 5 g L-1). It is worth noting that the amounts used for the two types of catalysts were
different, since, ZVCu at 0.6 g L- 1 in Fenton-like conditions, did not initiate any
reactions within 60 min, therefore the amounts used were increased to 5 g L-1. The
pH for the US/ZVC/H2 O2 system was maintained at pH 3. However, O3 studies were
carried out under two different conditions: (i) at pH 3 with O3 concentration of 6 g O3
m - 3 flowrate 0.25 L min- 1 and (ii) at pH 9 with O3 concentrations of 2 g O3 m- 3 and
flowrate 0.75 L min-1. Thus, based on these conditions, the O3 studies have been
compared under two major systems: pH 3/6 g O3 m-3/0.25 L min- 1 and pH 9/2 g O3 m-
3 /0.75 L min-1.
4.2.2 Hydrogen peroxide measurementThe efficiency of the US reactors to produce H2 O2 was determined using the method
described in Section 2.4.3. In this study, H 2 O2 production in water and 2.5 mM
phenol solution, over 60 min, was measured spectrophotome trie ally, in each US
reactor (20, 300 and 520 kHz), at 355 nm. Specific volumes, as mentioned in Section
4.2.1, of aqueous solution were placed in the respective reactors and samples (1 mL)
were removed every 20 min during the 60 min reaction time. Phenol samples were
filtered prior to analysis with the method described in Section 2.4.2.1.
4.2.3 Power measurementApproximate power measurements in the US reactors were carried out by taking 80,
100 and 300 mL of water in 20, 300 and 520 kHz US reactors, with no cooling and
measuring the temperature rise on irradiation for a specific time period. The power
( 0 was calculated using formula shown in Eq. 4.4:
Q = cm (AT/At) (4.4)
where, m is mass of water (g); c is specific heat of water (4.186 joule g- 1 °C-1); AT is
change in temperature (°C) and At change in time. Unit is Watt (W). The values
obtained in watts were divided by the volume of the reactant used, which finally gives
the final power output (heat dissipation) in watts per millilitre (W mL-1).
78
D egrad a tio n I: U S reac to rs
4.2.4 US/ZVC/H2 O2 systemIn the US/ZVC/H2O2 system, the reactions were carried out using standard volumes of
2.5 mM phenol solution in the three chosen US reactors (20, 300 and 520 kHz).
Thereafter, the pH of the solution was set to pH 3 with 0.1 M H2SO4. After attaining
the desired pH for the reaction, zero minute reading was taken and followed by this
known amounts of catalysts and oxidants were introduced into the reaction solution
and the reactor was switched on immediately. Continuous air was purged into the
reaction solution with a glass diffuser at a flowrate of 1.5 L min-1. The temperature
was maintained (23 ± 2 °C) by a cooling jacket built around the glass reactor set-ups
(shown in Section 2.3.2). The reaction time chosen for each batch study was 60 min.
Samples (3 mL) were withdrawn every 10 min for GC (1 mL) and TOC (2 mL)
analysis in order to estimate phenol removal and TOC mineralisation, respectively.
For GC analysis, the sample (1 mL) was mixed with 50 pL dichloromethane (internal
standard) in a 2 mL amber vial (method described in detail in Section 2.4.2.1.2),
whereas for the TOC analysis, original samples were diluted five times to get the
desired volume required for the TOC analyser. In some reactions, the concentration of
H2O2 was also monitored throughout the reaction every 15 or 20 min as discussed in
Section 2.4.3.
4.2.5 US/ZVC/O3 systemSimilar experimental conditions were set-up for studies with the US/ZVC/O3 system,
with an only difference in the use of oxidant in this case, O3 was used as oxidant
instead of H2O2. Ozone generator (Ozone Service, Yanco Industries Ltd.) was used to
generate ozone-oxygen mixture using an oxygen cylinder. Ozone-oxygen mixture
was purged into the reaction solution using a single point glass diffuser. The study
was carried out at two different: pH 3 and 9 (using 0.1 M NaOH); concentrations, 2
and 6 g O3 m-3; flowrates, 0.75 and 0.25 L min- 1 described in Section 4.2.1. Ozone
concentrations were not monitored in any reactions with O3 as the scope of the study
was only to estimate the efficacy of oxidants, H2O2 and O3, for phenol
removal/mineralisation in Fenton-like reactions.
79
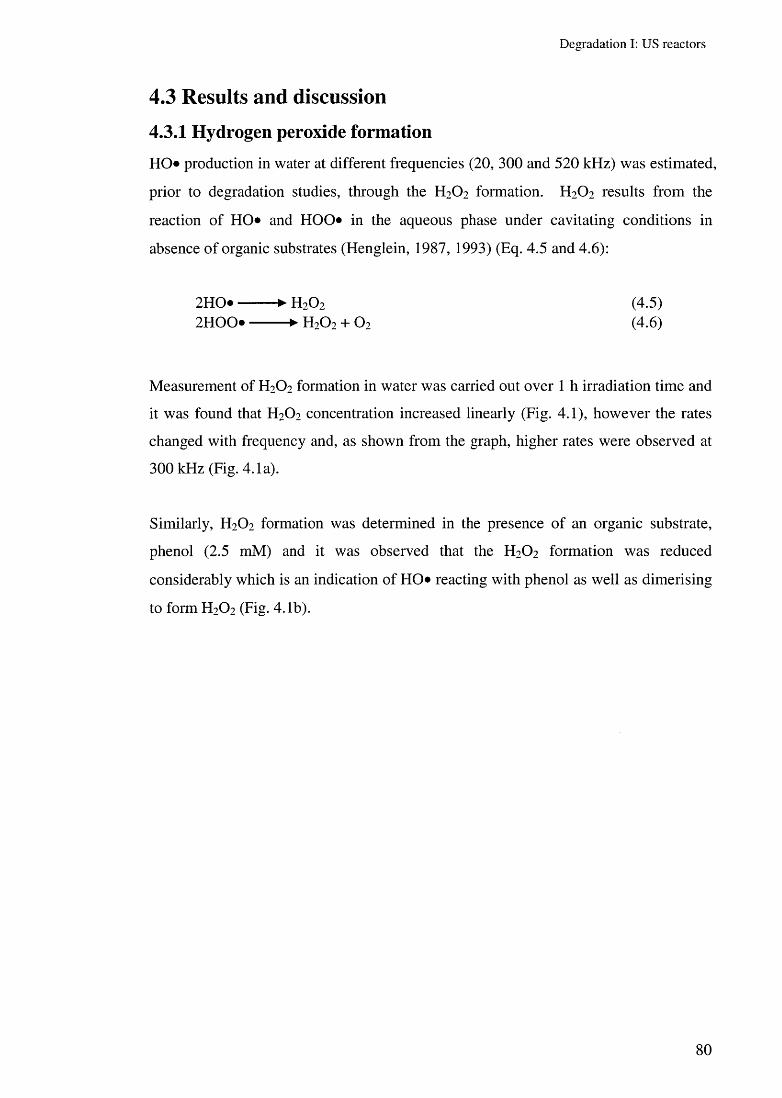
D eg rad a tio n I: U S reac to rs
4.3 Results and discussion4.3.1 Hydrogen peroxide formationHO* production in water at different frequencies (20, 300 and 520 kHz) was estimated,
prior to degradation studies, through the H 2 O2 formation. H 2 O2 results from the
reaction of HO* and HOO* in the aqueous phase under cavitating conditions in
absence of organic substrates (Henglein, 1987, 1993) (Eq. 4.5 and 4.6):
2HO*--------► H2 0 2 (4.5)2HOO*--------► H2 0 2 + 0 2 (4.6)
Measurement of H 2 O2 formation in water was carried out over 1 h irradiation time and
it was found that H 2 O2 concentration increased linearly (Fig. 4.1), however the rates
changed with frequency and, as shown from the graph, higher rates were observed at
300 kHz (Fig. 4.1a).
Similarly, H 2 O2 formation was determined in the presence of an organic substrate,
phenol (2.5 mM) and it was observed that the H 2 O2 formation was reduced
considerably which is an indication of HO* reacting with phenol as well as dimerising
to form H 2 O2 (Fig. 4.1b).
8 0
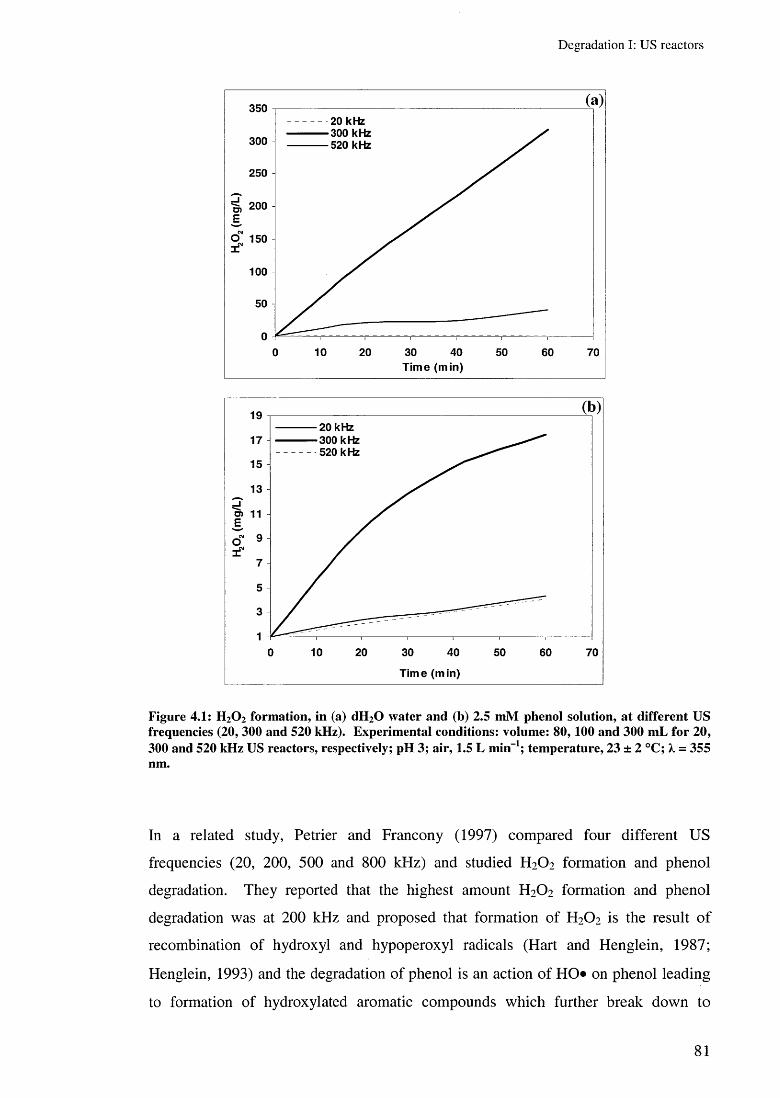
D egrad a tio n I: U S reac to rs
Figure 4.1: H 20 2 form ation, in (a) dH 20 w ater and (b) 2.5 m M phenol solution, at d ifferent U S frequencies (20, 300 and 520 kHz). Experim ental conditions: volum e: 8 0 ,1 0 0 and 300 m L for 20, 300 and 520 kHz US reactors, respectively; pH 3; air, 1.5 L m in-1; tem perature, 23 ± 2 °C; X = 355 nm.
In a related study, Petrier and Francony (1997) compared four different US
frequencies (20, 200, 500 and 800 kHz) and studied H 2 O 2 formation and phenol
degradation. They reported that the highest amount H 2 O 2 formation and phenol
degradation was at 200 kHz and proposed that formation of H 2 O 2 is the result of
recombination of hydroxyl and hypoperoxyl radicals (Hart and Henglein, 1987;
Henglein, 1993) and the degradation of phenol is an action of HO» on phenol leading
to formation of hydroxylated aromatic compounds which further break down to
81
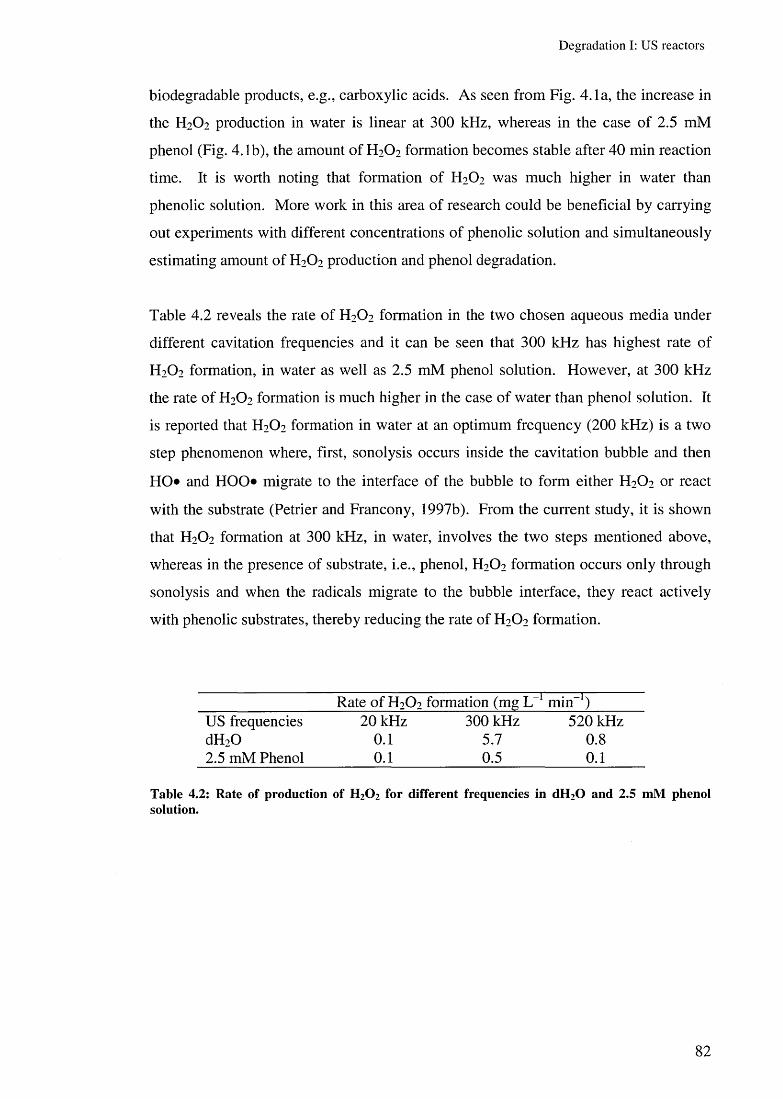
D eg rad a tio n I: U S reac to rs
biodegradable products, e.g., carboxylic acids. As seen from Fig. 4.1a, the increase in
the H2 O2 production in water is linear at 300 kHz, whereas in the case of 2.5 mM
phenol (Fig. 4.1b), the amount of H 2 O2 formation becomes stable after 40 min reaction
time. It is worth noting that formation of H2 O2 was much higher in water than
phenolic solution. More work in this area of research could be beneficial by carrying
out experiments with different concentrations of phenolic solution and simultaneously
estimating amount of H2 O2 production and phenol degradation.
Table 4.2 reveals the rate of H 2 O2 formation in the two chosen aqueous media under
different cavitation frequencies and it can be seen that 300 kHz has highest rate of
H 2 O2 formation, in water as well as 2.5 mM phenol solution. However, at 300 kHz
the rate of H2 O2 formation is much higher in the case of water than phenol solution. It
is reported that H2 O2 formation in water at an optimum frequency (200 kHz) is a two
step phenomenon where, first, sonolysis occurs inside the cavitation bubble and then
HO* and HOO* migrate to the interface of the bubble to form either H 2 O2 or react
with the substrate (Petrier and Francony, 1997b). From the current study, it is shown
that H 2 O2 formation at 300 kHz, in water, involves the two steps mentioned above,
whereas in the presence of substrate, i.e., phenol, H2 O2 formation occurs only through
sonolysis and when the radicals migrate to the bubble interface, they react actively
with phenolic substrates, thereby reducing the rate of H 2 O2 formation.
Rate of H 2 O2 formation (mg L 1 min *)US frequencies 20 kHz 300 kHz 520 kHzdH20 0 . 1 5.7 0 . 8
2.5 mM Phenol 0 . 1 0.5 0 . 1
Table 4.2: Rate of production of H2C>2 for different frequencies in dH 20 and 2.5 m M phenol solution.
8 2

D eg rad a tio n I: U S reac to rs
4.3.2 Preliminary experimentsIn order to decide the best experimental conditions for optimal phenol/TOC removal
using US/ZVC/H2 O2 system, preliminary experiments were carried out with ZVI at
300 kHz (Fig. 4.2) under acidic conditions (pH 3).
C IC 0
Figure 4.2: Effect o f operational param eters on phenol degradation over 60 min. E xperim ental conditions: phenol, 2.5 mM ; US, 300 kHz; ZVI (0.6 g L f1); reaction tim e, 60 min; air, 1.5 L m in-1; H20 2, 2.38 g L-1, tem perature 23 ± 2 °C; analysis: phenol rem oval, GC and TOC m ineralisation , TOC analyser.
4.3.2.1 Effect of pH
Sono-Fenton degradation studies on different organic compounds such as 2-
chlorophenol (Lin et al., 1996), aniline (Jiang et al., 2002) and 2,4 dinitrophenol (Guo
et al., 2005) indicate that the degradation efficiency decreases with increase of
solution pH, however higher phenol degradation at low pH, when large amount of
pollutant can penetrate into cavitational bubble and stimulate the process of
degradation. Also, Bremner and co-workers reported that the AFP proceeds faster at
lower pH values (Bremner et al., 2006; Bremner et al., 2008; Namkung et ah, 2005).
Therefore, for this study pH 3 was chosen as optimal pH.
83
D eg rad a tio n I: U S reac to rs
4.3.2.2 Effect of air
During the initial experiments, the effect of sparging was tested by continuously
injecting air (1.5 L min-1) into 2.5 mM phenol solution and sonicating the test solution
at 300 kHz. The literature suggest that monoatomic gases are more favourable than
diatomic gases in a sonicated liquid, for the generation of high temperatures upon
bubble collapse (Suslick, 1990). Also, its been reported that higher sonochemical
yields have been observed in the presence of air than in argon (Kidak and Ince, 2006).
In this study, air was used as a sparge gas and ~4-10% enhanced oxidation capacity
was observed, as compared to US alone, probably due to the reactions of nitrogen with
molecular oxygen to yield HNO3 and other radical species such as H O , •NC^, *N0 3
that may help in accelerating the oxidation process. The following chemical reactions
explain the mechanism that takes place during air injection into a sonoreactor
(Ullerstam et al., 2000):
2 N2 + 02 - > 2N20 (4.7)
2N20 + H20 ---- > 2H N 02 + 2N2 (4.8)
H* + N20 ----- - > N2 + HO* (4.9)
HO* + N20 — 2NO + H* (4.10)
HNO2 + H2O2 -— > h n o 3 + h 2o (4.11)
HNO3 + ))) — > h o + »n o 2 (4.12)
HNO3 + ))) — > H« + •NO, (4.13)
Formation of nitrous and nitric acids favours the process of decomposition of formic
acid via pH reduction, generation of excess HO* (&ho*> 10 “ L mol s ) and •NO*
(&no.v, 107 L mol- 1 s-1) radicals, which are strong oxidants and help in enhancing the
oxidation rates (Gogate et a l , 2003).
4.3.2.3 Effect of US/Air/ZVI system
The addition of ZVI relates to an enhanced solid-liquid interface in the bulk solution
which may tend to promote cavitation. The US/Air/ZVI system in the absence of
H2O2 leads to 10% higher phenol removal compared to the US/Air system, however it
is worth noting that the TOC values in both the systems remains the same (Fig. 4.2).
This shows that there is formation of more oxidised products in case of US/Air/ZVI
84
D egrada tion I: U S reac to rs
system but the mineralisation efficiency was not enhanced by the ZVI catalyst. This
phenomenon could be explained by another study on cresol degradation in the
presence of either Fe2+ or H2 O2 alone (Kavitha and Palanivelu, 2005) where results
reveal that cresols were not decomposed in conditions of Fe“ or FFCF alone because
the oxidation potentials of Fe2+ (0.77 V) or H 2 O2 (1.77 V) is much less than the
oxidising potential of HO* (2.80 V). However, in acidic media at room temperature, ̂,
the presence of Fe" ions and H 2 O2 generate HO*, which have high enough oxidation
potential to degrade organic pollutants.
During a number of experiments carried out in this study, it was observed that the
colour of the solution, upon addition of H2 O 2 to an acidic medium containing phenol
and ZVI, showed an immediate change from colourless to brown then to yellow after
1 0 min of reaction time and remained light yellow to colourless at the end of reaction
(60 min); this normally indicated completion of the reaction. So far, it has been
observed that H 2 O2 , Fe2+ and pH have been crucial factors in generating HO*, which
ultimately control the degradation efficiency of organic pollutants. Hence,
experiments shown later in this section were carried out in batch reactors involving
ZVI, H2 O2 and US and the effect of air was also assessed in combination with these
systems.
4.3.2.4 Effect of ZVI/H 2 O2 and U S/Z W H 2 O2 systems
A reaction mixture in which iron powder (ZVI) and H 2 O2 exist together in an aqueous
medium at acidic pH 3, is called a Fenton-like system (reactions) because its
behaviour is similar to the typical Fenton’s reagent. During the process optimisation
studies, the Fenton-like systems were studied for phenol degradation efficiencies in
the presence and absence of ultrasound.
Sonochemical degradation of 4-chlorophenol using Fenton-like systems reveals that
iron powder tends to dissolve smoothly under acidic conditions (pH 3), producing iron
ions and production of these ions increases tremendously in the presence of ultrasound
(Liang et al., 2007). Thus, a similar hypothesis was drawn for ZVI/H 2 O 2 system,
when ZVI in the presence of H2 O2 lead to 82% phenol removal and significantly
higher TOC mineralisation (35%). Therefore, not only production of biodegradable
85
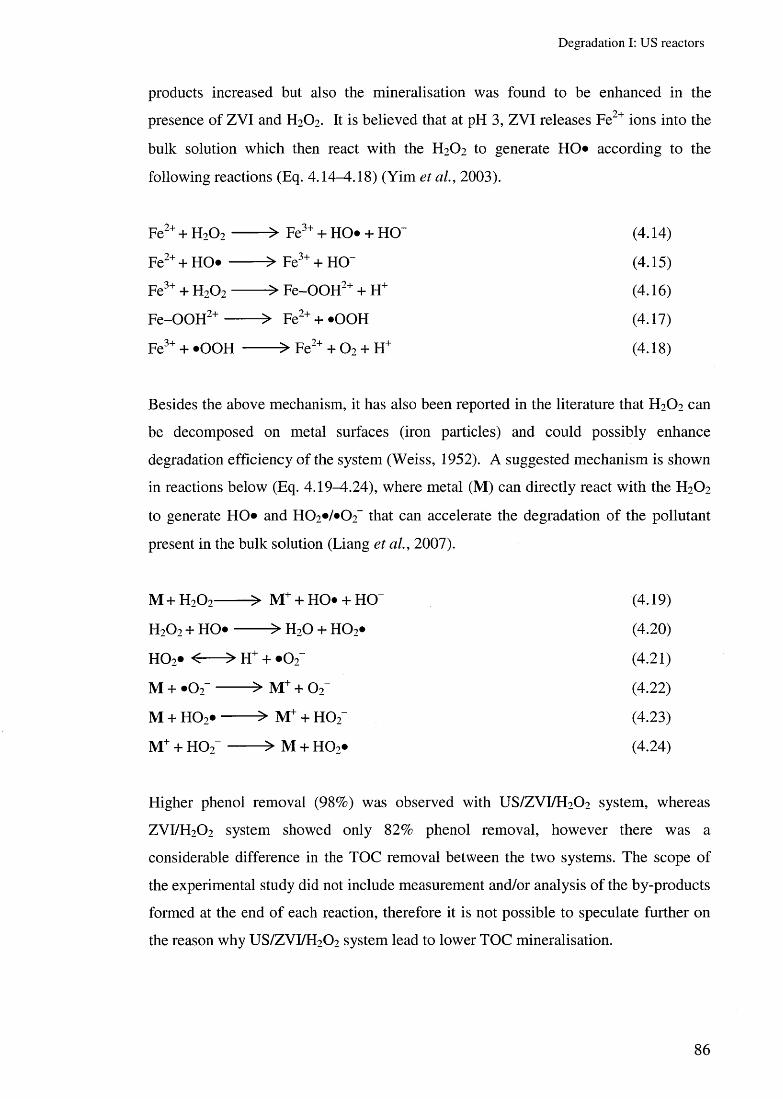
D eg rad a tio n I: U S reac to rs
products increased but also the mineralisation was found to be enhanced in the
presence of ZVI and H2 O2 . It is believed that at pH 3, ZVI releases Fe2+ ions into the
bulk solution which then react with the H 2 O2 to generate HO* according to the
following reactions (Eq. 4.14^1.18) (Yim et al., 2003).
Fe2+ + H2 0 2 — — > Fe3+ + HO* + HO" (4.14)
Fe2++ H O — — > Fe3+ + HO" (4.15)
Fe3+ + H2 0 2 — — > Fe-OOH2+ + H+ (4.16)
Fe-OOH2+ — —> Fe2+ + •OOH (4.17)
Fe3+ + «OOH ------- > Fe2+ + 0 2 + H+ (4.18)
Besides the above mechanism, it has also been reported in the literature that H 2 O 2 can
be decomposed on metal surfaces (iron particles) and could possibly enhance
degradation efficiency of the system (Weiss, 1952). A suggested mechanism is shown
in reactions below (Eq. 4.19^1.24), where metal (M) can directly react with the H 2 O 2
to generate HO* and H 0 2 */*0 2 ~ that can accelerate the degradation of the pollutant
present in the bulk solution (Liang et al., 2007).
M + H 2 O2 ----- > M + + HO» + HO” (4.19)
H2 O2 + HO'• ------- > h 2o + h o 2* (4.20)
h o 2* <— ■> H+ + * 0 2~ (4.21)
M + *02 ------> M + + 0 2" (4.22)
M + H 0 2* ■-------> M + + HO;f (4.23)
JVF + H 0 2" ------- > M + H 0 2* (4.24)
Higher phenol removal (98%) was observed with US/ZVI/H 2 O2 system, whereas
ZVI/H2 O2 system showed only 82% phenol removal, however there was a
considerable difference in the TOC removal between the two systems. The scope of
the experimental study did not include measurement and/or analysis of the by-products
formed at the end of each reaction, therefore it is not possible to speculate further on
the reason why US/ZVI/H2 O2 system lead to lower TOC mineralisation.
8 6
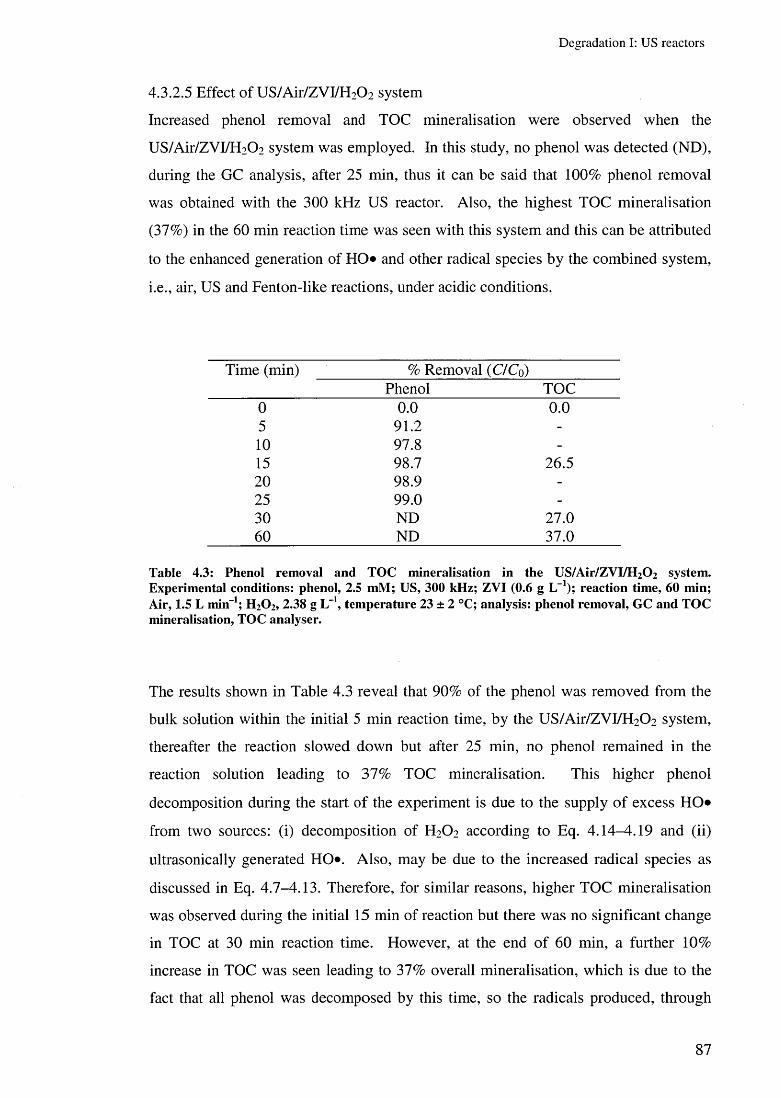
D eg rad a tio n I: U S reac to rs
4.3.2.5 Effect of US/Air/ZVI/EEC^ system
Increased phenol removal and TOC mineralisation were observed when the
US/Air/ZVI/H2 0 2 system was employed. In this study, no phenol was detected (ND),
during the GC analysis, after 25 min, thus it can be said that 100% phenol removal
was obtained with the 300 kHz US reactor. Also, the highest TOC mineralisation
(37%) in the 60 min reaction time was seen with this system and this can be attributed
to the enhanced generation of HO* and other radical species by the combined system,
i.e., air, US and Fenton-like reactions, under acidic conditions.
Time (min) % Removal {ClCo)Phenol TOC
0 0 . 0 0 . 0
5 91.2 -1 0 97.8 -15 98.7 26.52 0 98.9 -25 99.0 -30 ND 27.060 ND 37.0
Table 4.3: Phenol rem oval and TO C m ineralisation in the U S/A ir/Z V I/H 20 2 system . Experim ental conditions: phenol, 2.5 m M ; U S, 300 kHz; ZV I (0.6 g L-1); reaction tim e, 60 m in; Air, 1.5 L min-1; H 20 2, 2.38 g L-1, tem perature 23 ± 2 °C; analysis: phenol rem oval, GC and TOC m ineralisation, TOC analyser.
The results shown in Table 4.3 reveal that 90% of the phenol was removed from the
bulk solution within the initial 5 min reaction time, by the US/Air/ZVI/^CU system,
thereafter the reaction slowed down but after 25 min, no phenol remained in the
reaction solution leading to 37% TOC mineralisation. This higher phenol
decomposition during the start of the experiment is due to the supply of excess HO*
from two sources: (i) decomposition of H 2 O2 according to Eq. 4.14—4.19 and (ii)
ultrasonically generated HO*. Also, may be due to the increased radical species as
discussed in Eq. 4.7-4.13. Therefore, for similar reasons, higher TOC mineralisation
was observed during the initial 15 min of reaction but there was no significant change
in TOC at 30 min reaction time. However, at the end of 60 min, a further 10%
increase in TOC was seen leading to 37% overall mineralisation, which is due to the
fact that all phenol was decomposed by this time, so the radicals produced, through
87
D eg rad a tio n I: U S reac to rs
various mechanisms, were solely utilised in the mineralisation of the by-products
formed after phenol removal.
Since highest phenol decomposition and overall mineralisation were obtained with the
US/Air/ZVI/H2 0 2 system under acidic conditions (pH 3) at 300 kHz US these
conditions were considered to be optimal for carrying out batch experiments with 2 0
and 520 kHz reported in this study. Thereafter, 20, 300 and 520 kHz US frequencies
were compared for their degradation efficiencies under similar experimental
conditions. Also, in another comparative study, ZVC (ZVI, ZVCF and ZVCT) were
compared for their efficiencies for decomposition and mineralisation of phenol in the
chosen US reactors.
4.3.3 Degradation of phenol in the US/Air/ZVC/H20 2 system4.3.3.1 Effect of different US frequencies
Initial phenol removal studies were carried out using US/Air/ZVI/^CU system in
conjunction with zero valent iron (0.6 g L-1; ZVI) catalyst at different chosen US
frequencies (20, 300 and 520 kHz). The results shown in Fig. 4.3 reveal that high
phenol removal efficiency was observed with the 20 and 300 kHz US reactors as
phenol was undetectable after 45 and 25 min, respectively. However, in the 520 kHz
US reactor, only 70% phenol removal was observed at the end of the 60 min reaction
time. It was interesting to note that the TOC mineralisation at all the chosen
frequencies in the US/Air/ZVC/H2 0 2 system was between 37 and 40%. The reaction
was much faster during the initial 15 min reaction time leading to 60-90% phenol
removal and 25-30% TOC mineralisation at all the US frequencies. As evident from
results discussed above, the HO«/Fe2+ ion production and increased availability of
H 2 O2 in the bulk solution leads to high degradation during the start of the reaction.
Upon cavitational activity in the bulk solution, dissociation of the H 2 O2 initiates and
therefore, Fe2 +/Fe3+ and H2 O2 reaction decreases considerably (Eq. 4.14^1.16) thereby
reducing the radical concentration (H O »/H O O ) required for the conversion of Fe3+ to
Fe2+ in order to carry out effective Fenton-like reactions (Eq. 4.17-4.18).
8 8
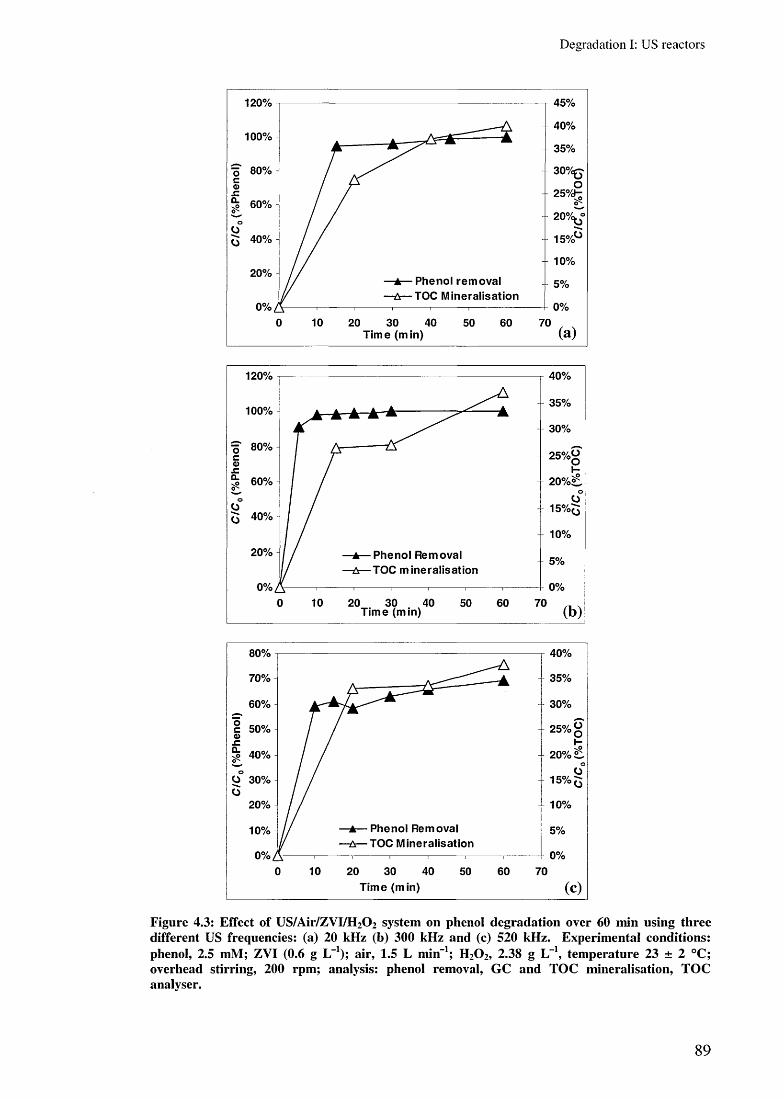
D egrad a tio n I: U S reac to rs
Figure 4.3: Effect o f US/A ir/ZV I/H 202 system on phenol degradation over 60 m in using three different US frequencies: (a) 20 kHz (b) 300 kHz and (c) 520 kH z. Experim ental conditions: phenol, 2.5 mM ; ZVI (0.6 g L f1); air, 1.5 L min-1; H20 2, 2.38 g L-1, tem perature 23 ± 2 °C; overhead stirring, 200 rpm; analysis: phenol rem oval, GC and TO C m ineralisation, TO C analyser.
89

D eg rad a tio n I: U S reac to rs
High phenol removal after 25 min of reaction time at 300 kHz in the
US/Air/ZVC/H 2 0 2 system is explained by the enhanced availability of radical species
generated in situ due to the action of ultrasound, Fenton-like reactions and also various
other combined reactions in the presence of ZVI catalysts. It is often thought that with
increasing frequency, degradation will be much higher, however there exists an
optimum frequency at which the rates of radical production and collapse is maximum
and this state is considered the best frequency for pollutant destruction (Petrier and
Francony, 1997b). Likewise, it has been discussed in a similar study, utilising 300 and
520 kHz US reactors, where 300 kHz was much more efficient for phenol destruction
than 520 kHz due to the fact that bubbles formed at 300 kHz are long lived and
collapse with higher energy compared to those formed in 520 kHz. Thus, with 300
kHz US more HO» are ejected into the bulk solution leading to more efficient
pollutant destruction (Kidak and Ince, 2006). At 300 kHz, higher rates of HO»
ejection into the solution (Fig. 4.1a) and higher phenol removal at this frequency (Fig.
4.3a) are consistent and therefore accounts for the dominance of aqueous phase
oxidation by HO» and enhanced efficiency of 300 kHz US reactor. At 20 kHz, the
lower volume of reaction solution (80 mL) leads to enhanced mixing within the
reactor and allows the pollutant, catalysts and the radicals to interact with each other
and therefore phenol disappearance was noticed after 45 min of reaction time. Also,
the reactor geometry and high vibrations at 20 kHz disperse the ZVI catalysts
throughout the solution, polish the catalysts and recharge the active sites for reaction,
however since the HO» production at this frequency (Fig. 4.1a) is the least, 100%
phenol removal within first 45 min is mostly attributed to the Fenton-like reactions.
Similar TOC mineralisation (37-40%) during the 60 min reaction time at the three
frequencies can be attributed to the conversion of the phenol into intermediate
compounds (Santos et al., 2002) which could not be further mineralised.
4.3.3.2 Effect of different ZVC
A comparative study between the zero valent iron (ZVI), copper flitters (ZVCF) and
copper turnings (ZVCT) catalysts was carried out to assess their efficiencies for
phenol removal and TOC mineralisation at three chosen US frequencies. Figs. 4.4a
and 4.4b shows comparison of ZVI, ZVCF and ZVCT for both, phenol removal and
TOC mineralisation, whereas Fig. 4.4c shows only TOC mineralisation at 520 kHz as
90

D egrad a tio n I: U S reac to rs
the phenol removal trend with the ZVCu catalysts was found to be highly variable.
From these results, it is obvious that, with 20 kHz, 1^1% and 10-30% of TOC
mineralisation and phenol removal, respectively, were achieved with ZVCu catalysts.
Whereas with the 300 kHz US reactor, the enhanced generation of HO* at this
frequency gives 56-97% and 10-26% of phenol removal and TOC mineralisation,
respectively, with ZVCu catalysts during 60 min reaction time. This phenomenal
result is probably due to the HO* oxidation in the bulk solution as discussed above
and also the Fenton-like reactions involving the copper ions in the presence of H2 O 2 at
pH 3 (Eq. 4.25 and 4.26) (Entezari et al., 2003).
H2 0 2 + Cu2+------- > Cu+ + H 0 2» + H+ (4.25)
H2 0 2 + Cu+------- > HO” + H O + Cu2+ (4.26)
Reports of copper catalysts for pollutant destruction are rare in the literature but there
are reports on generation of HO* from heterogeneous copper catalysts (Kim and
Metcalfe, 2007). Also, in a comparative study between 20 and 520 kHz US reactors
with the H2 O2 -CUSO4 system, the latter frequency was reported to eliminate phenol to
below the detection limit (concentration < 1 0 -6) in 2 1 0 min reaction time and any
remaining intermediates disappeared in 360 min. This was explained by the action of
HO* produced by two pathways: (i) cavitation and (ii) H 2 O2 decomposition catalysed
by CUSO4 (Entezari et al., 2003). Similarly, sonochemical destruction of o-
chlorophenol using a H2 O2 and CUSO4 combination has been reported to be the result
of both the ultrasound and chemical oxidation effect, whereas the trichloroethylene
degradation rates were only just significant under similar conditions (De Visscher and
Van Langenhove, 1998). Thus, it is seen that copper ions have a tendency to carry out
Fenton-like reactions in the presence of H 2 O2 under acidic conditions, however the
degradation of the organic pollutant may vary depending upon the US frequencies as
cavitation is the principle pathway of HO* generation in the bulk solution resulting in
oxidation.
91

Degradation I: US reactors
120%
100%
80%
60%
40%
20%
0%
100 .0%
►♦♦♦►♦♦♦•►♦♦♦►♦♦♦•►♦♦♦•►♦♦♦■►♦♦♦►♦♦♦■►♦♦♦►♦♦♦■►♦♦♦■39.9% ►♦♦♦■►♦♦♦•►♦♦♦•►♦♦♦•►♦♦♦•►♦♦♦•►♦♦♦■►♦♦♦•►♦♦♦•►♦♦♦•
□ Phenol Removal (%)□ TOC Mineralisation (%)
30.0%►♦♦♦►♦♦♦►♦♦♦►♦♦♦►♦♦♦►♦♦♦
3.8% ----- 1
10.7%►♦♦♦►♦♦♦ 1.3%
ZVI ZVCF ZVCT (a)
45%40%
c 35%| 30% w1 25%<D
■| 20% OO 15%35 10%
5%
0%
37.8%
8.0%
ZVI
4.0%
ZVCF ZVCT (c)
F ig u re 4 .4 : E ffec t o f Z V I a n d Z V C u c a ta ly ts ts in th e U S /A ir /Z V C /H 20 2 s y s te m , o n p h e n o l d e g ra d a t io n o v e r 60 m in u n d e r th r e e d if fe r e n t U S fre q u e n c ie s : (a ) 20 k H z (b ) 300 k H z a n d (c) 520 k H z. E x p e r im e n ta l co n d itio n s : p h e n o l, 2 .5 m M ; Z V I (0 .6 g L 1) a n d Z V C F /Z V C T (5 g L -1); r e a c tio n tim e , 60 m in ; a i r , 1.5 L m in -1; H 20 2, 2 .38 g L -1, te m p e r a tu re , 23 ± 2 °C ; o v e r h e a d s t i r r in g , 200 rp m ; a n a ly s is : p h en o l re m o v a l, G C a n d T O C m in e ra lis a tio n , T O C a n a ly s e r .
92
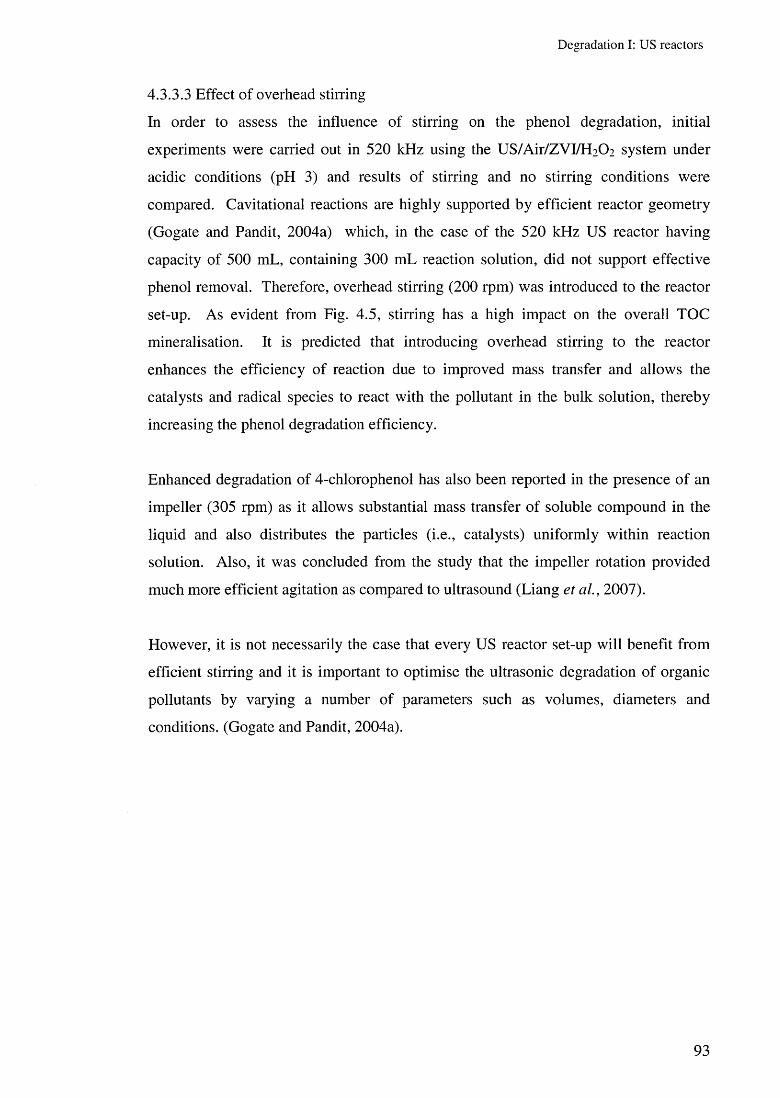
D egrad a tio n I: U S reac to rs
4.3.3.3 Effect of overhead stirring
In order to assess the influence of stirring on the phenol degradation, initial
experiments were carried out in 520 kHz using the US/Air/ZVLEECU system under
acidic conditions (pH 3) and results of stirring and no stirring conditions were
compared. Cavitational reactions are highly supported by efficient reactor geometry
(Gogate and Pandit, 2004a) which, in the case of the 520 kHz US reactor having
capacity of 500 mL, containing 300 mL reaction solution, did not support effective
phenol removal. Therefore, overhead stirring (200 rpm) was introduced to the reactor
set-up. As evident from Fig. 4.5, stirring has a high impact on the overall TOC
mineralisation. It is predicted that introducing overhead stirring to the reactor
enhances the efficiency of reaction due to improved mass transfer and allows the
catalysts and radical species to react with the pollutant in the bulk solution, thereby
increasing the phenol degradation efficiency.
Enhanced degradation of 4-chlorophenol has also been reported in the presence of an
impeller (305 rpm) as it allows substantial mass transfer of soluble compound in the
liquid and also distributes the particles (i.e., catalysts) uniformly within reaction
solution. Also, it was concluded from the study that the impeller rotation provided
much more efficient agitation as compared to ultrasound (Liang et aL, 2007).
However, it is not necessarily the case that every US reactor set-up will benefit from
efficient stirring and it is important to optimise the ultrasonic degradation of organic
pollutants by varying a number of parameters such as volumes, diameters and
conditions. (Gogate and Pandit, 2004a).
93
Degradation I: US reactors
80%
70%
60%
50%
40%
30%
20%
10%
0%
Stirring No Stirring
69.5%
37.8%
a Phenol Removal (%)□ TOC Mineralisation (%)
53.0%♦♦♦♦♦♦♦♦♦♦♦♦♦♦♦♦♦♦♦♦♦♦♦♦♦♦♦♦♦♦♦♦♦♦♦♦♦♦♦♦♦♦♦♦♦♦♦♦♦♦♦♦♦♦♦♦♦♦♦♦♦♦♦♦♦♦♦♦♦♦♦♦♦♦♦♦♦♦♦♦♦♦♦♦♦♦♦♦♦♦♦♦♦♦♦♦♦♦♦♦♦♦♦♦♦♦♦♦♦♦♦♦♦♦♦♦♦♦♦♦♦♦♦♦♦♦
17.9%
F ig u re 4 .5 : E ffe c t o f s t i r r in g on p h en o l d e g r a d a t io n o v e r 60 m in in 520 k H z U S r e a c to r . E x p e r im e n ta l c o n d itio n s : p h e n o l, 2.5 m M ; Z V I (0 .6 g L -1); a i r , 1.5 L m in -1; H 2O 2, 2 .38 g L -1, te m p e r a tu re , 23 ± 2 °C ; o v e rh e a d s t i r r in g , 200 r p m ; a n a ly s is : p h e n o l re m o v a l, G C a n d T O C m in e ra lis a tio n , T O C a n a ly s e r .
In Fig. 4.5, it is worth noting the substantial difference between the effect of stirring
on the TOC and phenol removal. There is an increase of 20% of TOC removal in the
presence of the overhead stirrer, whereas the phenol removal data shows that there is
marginal increase with stirring as compared to no stirring. Earlier figures with FFO2
production in the 520 kHz showed that the rate of HO* production at this frequency
was very low as compared to the 300 kHz. Thus, phenol oxidation at this frequency is
mainly the attributed to Fenton oxidation leading to 70% phenol removal and 38%
TOC mineralisation in the presence of overhead stirring. Therefore, overhead stirring
was used in all experiments with the 520 kHz US reactor and the results shown in Figs.
4.3c and 4.4c are with stirring at 200 rpm.
4.3.3.4 Conclusion
The above study on the effect of the three chosen frequencies, i.e., 20, 300 and 520
kHz and zero valent catalysts (iron, ZVI and copper, ZVCu), on phenol degradation
shows that ZVI catalysts and 300 kHz US are by far the most effective for carrying out
Fenton-like reactions or, as has been termed the Advanced Fenton Process, in this
study. A summary graph prepared from the available data on TOC mineralisation is
shown in Fig. 4.6 and gives the comparison of ZVI, ZVCF and ZVCT performance at
94

Degradation I: US reactors
20, 300 and 520 kHz US frequency. It can be seen that although the reaction
mechanism of iron and copper (shown above) in the AFP is similar iron is still much
more efficient in carrying out the Fenton reaction leading to 40% TOC mineralisation
at all three US frequencies. However, when compared, the performance of ZVCF and
ZVCT did not show substantial TOC mineralisation but ZVCF (flitters) still dominates
over ZVCT (turnings) because of large surface area available to react with the
pollutant leading to degradation and also proves to be a potential catalysts for phenol
removal in the AFP.
45%
40%
35%
~ 30%C01 25%
g 20%
O 15%10%
5%
0%
40%37% 38%
:G:
M H M
r"
a 300 kHz □ 520 kHz ■ 20 kHz
26%
10%8%
n -
4%1%
ZVI ZVCF ZVCT
F ig u re 4 .6 : C o m p a r is o n o f d if fe re n t U S f re q u e n c ie s (20 , 300 a n d 520 k H z) a n d z e ro v a le n t c a ta ly s ts (Z V I a n d Z V C u ) o n T O C m in e ra l is a t io n o v e r 60 m in re a c t io n tim e . E x p e r im e n ta l c o n d itio n s : p h e n o l, 2 .5 m M ; Z V I (0 .6 g IV1) a n d Z V C F /Z V C T (5 g L "1); a i r , 1.5 L m i n 1; H 20 2, 2 .38 g L f1, te m p e r a tu re , 23 ± 2 °C ; o v e rh e a d s t i r r in g in 520 k H z , 200 rp m ; a n a ly s is : p h e n o l re m o v a l, G C a n d T O C m in e ra lis a tio n , T O C a n a ly se r .
Thus, it can be said that, 300 kHz US frequency and ZVI is the most efficient, reactor
and catalyst, respectively, to carry out efficient phenol degradation using the AFP, in
the presence of 1.5 L min~' continuous aeration with a catalyst loading of 0.6 g L 1
and 2.38 g L_l of H2O2. Also, the best performance of the 520 kHz US reactor can be
achieved with overhead stirring as mixing enhances the mass transfer rates, thereby
increasing the degradation. High phenol degradation with ZVI at 20 kHz is accounted
95
D eg rad a tio n I: U S reac to rs
for by mixing, reactor geometry and regenerated/high surface area catalysts. Also,
power estimation in the three chosen US reactors (0.92, 0.12 and 0.03 W mL- 1 in 20,
300 and 520 kHz, respectively) suggests 300 kHz is by far the most economically
efficient US reactor for phenol degradation.
4.3.4 Degradation of phenol in the US/ZVC/O3 system (ZOO)Ozone is a known oxidant in the AOP wastewater treatment and Hoigne and co
workers have discussed the mechanism of attack of O3 on organic compounds and
reported the pH dependence on the organic pollutant oxidation. In acidic to neutral pH,
O3 acts as a direct oxidising agent, especially for aromatic compounds, whereas at
alkaline pH, O3 reacts with the hydroxide ions, giving rise to HO* which are
considered to be an AOP (Buhler et al., 1984; Hoigne, 1985; Hoigne and Bader, 1976,
1983a, 1983b; Staehelin et al., 1984; Staehelin and Hoigne, 1985; Staehelln and
Hoigne, 1982). Although the effect of pH is pronounced in deciding the reaction
pathways other factors such as catalysts, US, UV, Xe lamp light sources, etc. have
been shown to be beneficial in carrying out effective O3 oxidation of organic
pollutants (Sanchez et al., 2003). In recent years, catalytic ozonation has turned out to
be very helpful in the decomposition of organic pollutants. This is especially true with
the use of transition metal ions, e.g., Fe2+, which possess the tendency to decompose
O3 into HO* explained by the following mechanism proposed in the literature
(Lpgager et al., 1992):
Fe2+ + O3 ------- > F e02+ + 0 2 (4.27)
F e0 2+ + H20 ------- > Fe(HO)2++ H O (4.28)
Fe2+ also catalyses the reaction of O3 and H 0 2, which is one o f the products of O3
decomposition, producing H2O2 and accelerating the process of pollutant degradation
by the action of Fenton-like reactions under acidic conditions (Rush and Bielski, 1986).
Among the transition metals used for catalytic ozonation, iron is recommended
because of the abundance of this metal on earth and its relative lack of toxicity
therefore Fe-Cb catalytic ozonation processes have been used to remove various
different toxic organic compounds like, phenol, aniline, carboxylic acids
chlorobenzene, chlorophenols, dyes and other natural organic matter (Beltran et al.,
96

D egrada tion I: U S reac to rs
2005). Also, the use of ultrasound in conjunction with O 3 (sonozone) has become a
useful technology in the pollutant decomposition studies (Olson and Barbier, 1994).
Following reaction mechanisms of sonochemical decomposition of O 3 has been
explained by Hart and Henglein (1986):
0 3 ------- > 0 2 + 0* (4.29)
O* + 0 3 ------- > 2 0 2 (4.30)
Ozone photolysis leads to the formation of O* and 0 2 which further may combine
with water to form HO* and two molecules of HO* may recombine to form H 2 0 2:
0 * + H 20 ------- > HO* (4.31)
2H O *------- > H2 0 2 (4.32)
Several other reactions have been proposed when ozonated water is irradiated with U S
and overall an increase in HO* production is the most likely outcome (Kang and
Hoffmann, 1998; Weavers et al., 1998). Enhanced mass transfer of O3 in the solution
due to ultrasonic vibrations is an added advantage of this process (Weavers and
Hoffmann, 1998). The reaction pathway for HO* generation during the U S /O 3
treatment of water could be formulated as follows (Hart and Henglein, 1986a; Kang
and Hoffmann, 1998; Serpone et al., 1994; Weavers et al., 1998):
0 3* + H20 ------- >2HOO* (4.33)
0 3 + HOO*------- >2HO* + 2 0 2 (4.34)
H20 + ) ) ) ------> H* + HO* (4.35)
0 3 + )))------- > 0 2 (g) + 0 ( 3 P)(g) (4.36)
0 ( 3 P)(g) + H2 Q(g)------- > 2HO» (4.37)
Destruction of organic pollutants by the combined US/O 3 system is possible in
different ways: direct thermal decomposition, oxidation mediated by HO*, chemical
oxidation, ozonation and by combinations of these processes (Weavers and Hoffmann,
1998).
97

D eg rad a tio n I: U S reac to rs
'ZO O ’ or 'zero valent catalysts-assisted ozone oxidation’ is the name assigned to the
US/ZVC/O3 system. The main aim of this study was to evaluate the effectiveness of
US/ZVC/O3 system over US/ZVC/H2O2 system for carrying out the AFP in the
presence of ZVI catalyst. Initial experiments utilised the 300 kHz US reactor and then
optimised conditions were used to study phenol degradation in the 520 kHz US reactor
using the US/ZVC/O3 system.
Phenol degradation using US/ZVC/O3 system was carried out in the presence of ZVC
and US reactors under two different ozonating conditions: (i) at pH 3 with O3
concentration of 6 g O3 m-3 flowrate 0.25 L min- 1 and (ii) at pH 9 with O3
concentrations of 2 g O3 m-3 and flowrate 0.75 L min-1. These parameters are
represented as pH 3/6 g O3 m-3/0.25 L min- 1 and pH 9/2 g O3 m-3/0.75 L min - 1 in the
figures.
Phenol removal (%), shown in Fig. 4.7, reveals that a maximum of 45-67% of phenol
removal was achieved with pH 9/2 g O3 m-3/0.75 L min- 1 whereas, only 30% removal
was seen with pH 3/6 g O3 m 3/0.25 L min l. Usually higher pH values are
recommended for degradation of organic pollutants, however if the operating pH is
above the pK value of the pollutant, efficient degradation will not be achieved (Beltran
et al., 1994; Beltran et al., 1992). It has also been reported that under higher pH
values, O3 reacts with almost all the organic and inorganic compounds present in the
bulk solution (Staehelln and Hoigne, 1982). Probably, that is one of the reasons why
under pH 9/2 g O3 m-3/0.75 L min- 1 phenol removal was better than pH 3/6 g O3 m-
3/0.25 L min-1. Also at alkaline pHs, O3 tends to stay stable for longer durations,
hence available for the reactions for longer time period.
98
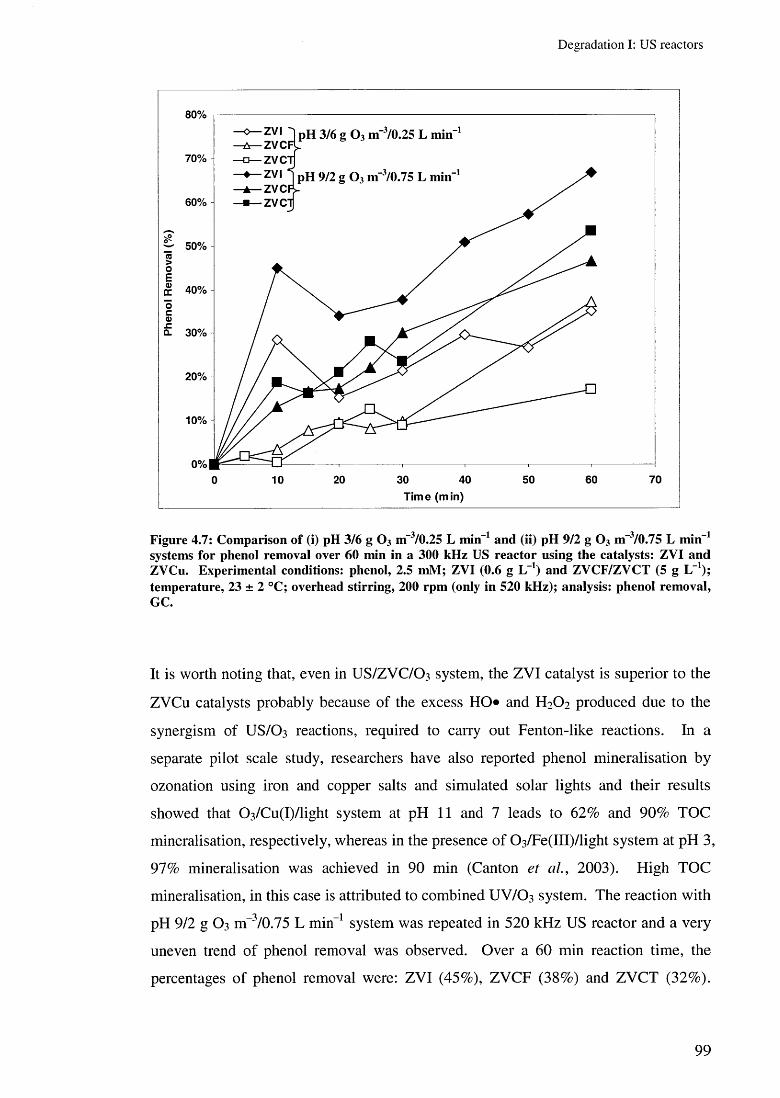
D egrada tion I: U S reac to rs
Figure 4.7: Com parison o f (i) pH 3/6 g O3 m-3/0.25 L min-1 and (ii) pH 9/2 g O3 m-3/0 .75 L m in-1 system s for phenol rem oval over 60 m in in a 300 kHz US reactor using the catalysts: ZV I and ZVCu. Experim ental conditions: phenol, 2.5 mM ; ZVI (0.6 g L-1) and ZV C F/Z V C T (5 g LT1); tem perature, 23 ± 2 °C; overhead stirring, 200 rpm (only in 520 kHz); analysis: phenol rem oval, GC.
It is worth noting that, even in US/ZVC/O 3 system, the ZVI catalyst is superior to the
ZVCu catalysts probably because of the excess HO* and H 2 O2 produced due to the
synergism of US/O 3 reactions, required to carry out Fenton-like reactions. In a
separate pilot scale study, researchers have also reported phenol mineralisation by
ozonation using iron and copper salts and simulated solar lights and their results
showed that 0 3 /Cu(I)/light system at pH 11 and 7 leads to 62% and 90% TOC
mineralisation, respectively, whereas in the presence of 0 3 /Fe(III)/light system at pH 3,
97% mineralisation was achieved in 90 min (Canton et a i , 2003). High TOC
mineralisation, in this case is attributed to combined UV/O 3 system. The reaction with
pH 9/2 g O3 m_3 /0.75 L min- 1 system was repeated in 520 kHz US reactor and a very
uneven trend of phenol removal was observed. Over a 60 min reaction time, the
percentages of phenol removal were: ZVI (45%), ZVCF (38%) and ZVCT (32%).
99

D eg rad a tio n I: U S reac to rs
The results of TOC mineralisation, at this frequency, are shown and discussed in the
section below.
The TOC mineralisation with US/ZVC/O3 system was very low as compared to
phenol removal and Fig. 4.8 illustrates a comparison between the 300 and 520 kHz.
Furthermore, the same figure shows comparison of US/ZVC/O3 system and
US/ZVC/H2O2 system for TOC mineralisation in 300 and 520 kHz US reactors.
Although the TOC mineralisation in the US/ZVC/O3 system were three times less than
that of US/ZVC/H2O2 system in 300 kHz US reactor in the presence of ZVI catalysts it
is worth noting that in the absence of catalysts, the US/O3 reaction shows 5% TOC
mineralisation which is greater than that shown with 520 kHz US reactor in the
presence of ZVI and ZVC catalysts. This phenomenon could be explained by the
strong action of US/O3 on phenol removal rather than presence of catalysts which may
be interfering with the ozonation process whereas catalysts play a major role in
carrying out Fenton-like reactions in the US/ZVC/H2O2 system. Within the
US/ZVC/O3 system it can be seen that 300 kHz reactor performs 4 -6 times better than
520 kHz, the reason being high rates of HO* production at this frequency. Also, the
differences in geometry the two US reactors, 300 (smaller diameter reactor) and 520
kHz (bigger diameter reactor) may also contribute to decreased amounts of TOC
mineralisation in case of 520 kHz. Kidak and Ince (2006) very well explained in their
report that higher phenol destruction was obtained at 300 kHz due to the longer lived
bubble advantages at 300 kHz over shorted lasting but less energetic cavity collapse at
520 kHz that allows larger spread of HO* into the solution. Also, it is well known that
there exists an optimum frequency at which the rate of radical generation and the
duration of cavity collapse provide the ‘best’ conditions for the destruction of
pollutants (Kidak and Ince, 2006).
100
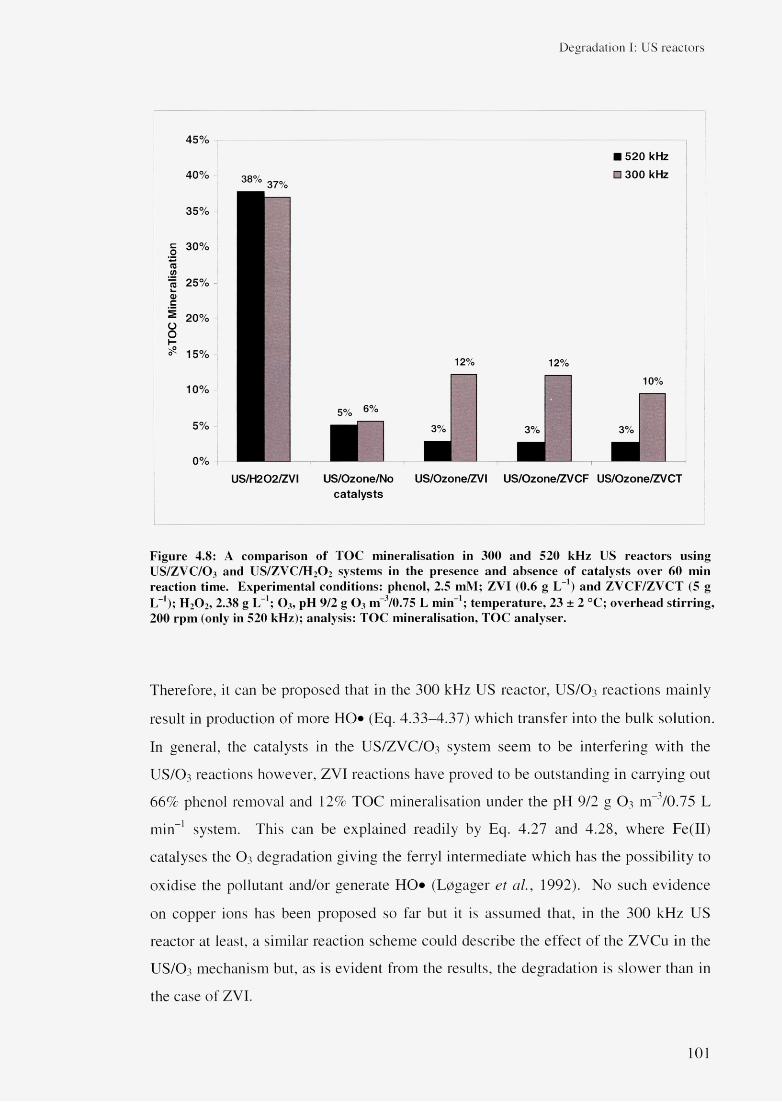
Degradation I: US reactors
45%
40%
35%
£ 30%
15 25%
O 20%
^ 15%
10%
5%
0%
38%37%
US/H202/ZVI
5% 6%
■
3%
■ 520 kHz □ 300 kHz
1 2 % 12%10%
3% 3%
US/Ozone/No US/Ozone/ZVI US/Ozone/ZVCF US/Ozone/ZVCT catalysts
F ig u re 4 .8 : A c o m p a r is o n o f T O C m in e ra lis a tio n in 300 a n d 520 k H z U S r e a c to r s u s in g U S /Z V C /O 3 a n d U S /Z V C /H 2O 2 sy s tem s in th e p re se n c e a n d a b s e n c e o f c a ta ly s ts o v e r 60 m in r e a c tio n tim e . E x p e r im e n ta l c o n d itio n s : p h e n o l, 2.5 m M ; Z V I (0 .6 g L -1) a n d Z Y C F /Z V C T (5 g L -1); H 2O 2, 2 .38 g LT1; O 3, p H 9 /2 g O 3 m “V0.75 L m in -1; te m p e r a tu r e , 23 ± 2 °C ; o v e rh e a d s t i r r in g , 200 r p m (on ly in 520 k H z); a n a ly s is : T O C m in e ra lis a tio n , T O C a n a ly s e r .
Therefore, it can be proposed that in the 300 kHz US reactor, US/O3 reactions mainly
result in production of more HO* (Eq. 4.33-4.37) which transfer into the bulk solution.
In general, the catalysts in the US/ZVC/O3 system seem to be interfering with the
US/O3 reactions however, ZVI reactions have proved to be outstanding in carrying out
66% phenol removal and 12% TOC mineralisation under the pH 9/2 g O3 m-?/0.75 L
min- system. This can be explained readily by Eq. 4.27 and 4.28, where Fe(II)
catalyses the O3 degradation giving the ferryl intermediate which has the possibility to
oxidise the pollutant and/or generate HO* (Lpgager et al, 1992). No such evidence
on copper ions has been proposed so far but it is assumed that, in the 300 kHz US
reactor at least, a similar reaction scheme could describe the effect of the ZVCu in the
US/O3 mechanism but, as is evident from the results, the degradation is slower than in
the case of ZVI.
101
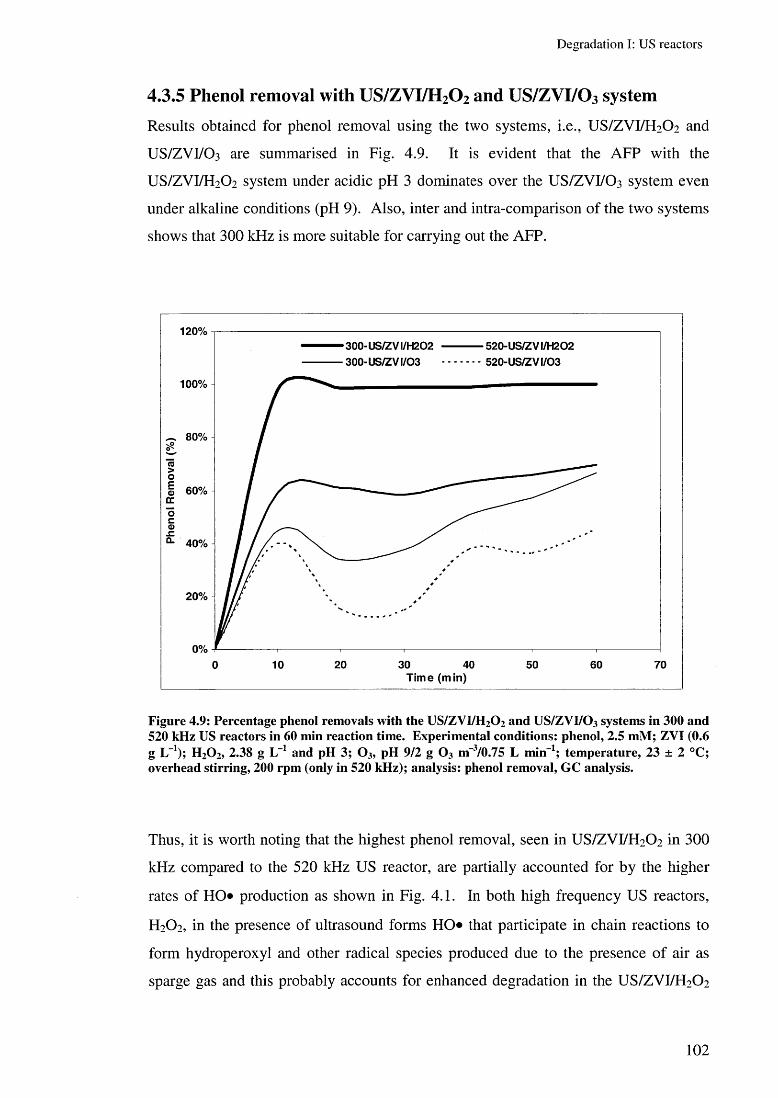
D eg rad a tio n I: U S reac to rs
4.3.5 Phenol removal with US/ZVI/H2O2 and US/ZVI/O3 systemResults obtained for phenol removal using the two systems, i.e., US/ZVI/H2O2 and
US/ZVI/O3 are summarised in Fig. 4.9. It is evident that the AFP with the
US/ZVI/H2O2 system under acidic pH 3 dominates over the US/ZVI/O3 system even
under alkaline conditions (pH 9). Also, inter and intra-comparison of the two systems
shows that 300 kHz is more suitable for carrying out the AFP.
Figure 4.9: Percentage phenol rem ovals w ith the U S/ZV I/H 20 2 and U S/Z V I/O 3 system s in 300 and 520 kHz US reactors in 60 m in reaction tim e. Experim ental conditions: phenol, 2.5 m M ; ZV I (0.6 g L-1); H 20 2, 2.38 g LT1 and pH 3; O 3, pH 9/2 g O3 m-3/0 .75 L m in-1; tem perature, 23 ± 2 °C; overhead stirring, 200 rpm (only in 520 kHz); analysis: phenol rem oval, GC analysis.
Thus, it is worth noting that the highest phenol removal, seen in US/ZVI/H2O2 in 300
kHz compared to the 520 kHz US reactor, are partially accounted for by the higher
rates of HO* production as shown in Fig. 4.1. In both high frequency US reactors,
H2O2, in the presence of ultrasound forms HO* that participate in chain reactions to
form hydroperoxyl and other radical species produced due to the presence of air as
sparge gas and this probably accounts for enhanced degradation in the US/ZVI/H2O2
102
D eg rad a tio n I: U S reac to rs
system. It is also proposed that O3 decomposition due to ultrasonic irradiation
influences the catalyst and oxidant concentration, which hinders direct pollutant
destruction whereas in the case of H2O2 , simultaneous decomposition and synthesis of
the oxidant occurs in the reaction system and/or additional free radicals/iron species
also react with the pollutant. Thus, H2O2 proves to be the most effective oxidant in
conjunction with ZVI in high frequency US reactors.
Gogate and Pandit (2004b) discussed a few crucial factors related to pollutant
destruction using the US/H2O2 and US/O3 systems which may be worth restating here
in support to this study. In ultrasonic reactions, HO» is the main driver and often it is
believed that oxidants such as H2O2 and O3 should enhance the rates of oxidation by
enhanced H O generation. However, along with the oxidant selection, rates of
oxidation also depend on the operating pH, ultrasonic intensity (turbulence), nature
and concentration of pollutant and all these parameters should be taken into account
before selecting an oxidant for the ultrasonic processes in order to achieve high rates
of degradation. However, selection of the optimum concentration of the oxidants is a
crucial factor as higher concentrations could lead to detrimental effects by acting as
scavengers of the generated free radicals. Thus, use of optimum catalyst
concentrations have been recommended to further enhance the degradation process
otherwise they may interfere with the ultrasonic activity by scattering the sound waves
leading to detrimental effects.
Based on the above discussion, it can said that high phenol removal obtained from the
US/ZVI/H2O2 system (60-100%) is the results of the use of optimum catalyst and
oxidant concentrations, whereas the US/ZVI/O3 system, resulting in only 40-60%
phenol removal, needs further optimisation. Synergism of the US/H2O2 also works
efficiently for phenol removal as free radical attack is the controlling mechanism.
103
D eg rad a tio n I: U S reac to rs
4.4 Summary■ The Advanced Fenton Process supports the US/Air/ZVC/FFCU system as the
optimum condition to carry out phenol degradation at pH 3.
■ Effective phenol removal and TOC mineralisation could be achieved in the 520
kHz US reactor by the introduction of overhead stirring.
■ Efficient reactor geometry of the 20 kHz US reactor supports high phenol and
TOC removal with ZVI catalyst.
■ Power input of 0.94, 0.13 and 0.03 W mL- 1 in 20, 300 and 520 kHz,
respectively, indicates that the 300 kHz US reactor is by far the most energy
efficient for phenol degradation.
■ The order of effectiveness of catalysts for phenol degradation:
ZVI>ZVCF>ZVCT.
■ The ZOO process works more efficiently with pH 9/2 g O3 m-3/0.75 L min- 1
than pH 3/6 g O3 m~3/0.25 L min- 1 system.
■ The ZOO process works best with 300 kHz US reactor using ZVI catalysts
■ A comparison between US/H2O2 and US/O3 synergism for phenol degradation
suggests that optimum catalysts and oxidant concentrations in the
US/Air/ZVC/H2 0 2 system proves it to be more effective for the AFP than the
US/ZVC/O3 or ZOO system.
104

D eg rad a tio n II: L R
Chapter 5
Degradation II: Latent Remediation using
the Advanced Fenton Process
Platform presentation: International W orld W ater Congress 2008
C hand, R. (7 th—12th S ep tem ber 2008). L a ten t rem ed ia tion u sing com b in a tio n o f u ltra so u n d and
advanced F en ton ox idation : an innova tive app roach . IW A -IO A W orld W a ter C ongress. V ienna , A ustria .
D eg rad a tio n II: L R
5.1 IntroductionIn the Fenton reaction, ferrous salts (usually FeSCU.lFO) are reacted with hydrogen
peroxide (H2 O2 ) to generate hydroxyl radicals (HO») according to the following
reaction first described by Henry John Hortsman Fenton in 1890s.
Fe2+ + H2 0 2 -------► Fe3+ + HO* + OH“ (5.1)Fe3+ + H2 0 2 -------► Fe2+ + HOO* + H+ (5.2)
In the above reactions, Fe2+ is oxidised by H2 O2 to Fe3+ producing a HO* and a
hydroxide anion. Thereafter, Fe3+ in the presence of H2 O2 reduces back to Fe2+
releasing the peroxide radical and a proton. These generated radicals participate in the
secondary reactions.
The Fenton system (Fe2 +/Fe3 +/H 2 C>2 ) has been extensively used in the treatment of
industrial wastewaters and/or landfill leachates, but the key parameters on which the
rate of reaction depends are:
1. Wastewater conditions, i.e., pH, concentration, temperature and
organic/inorganic constituents
2. Fenton reagent conditions, i.e., [Fe2+] [Fe3+] and [H2 O2 ]
These physical and chemical parameters determine the overall reaction pathways in
terms of HO» production and consumption (Yoon et a l , 2001)
The mechanism for the Fenton and related reactions was first proposed by Haber and
Weiss in 1934 and further extended by other researchers, who used low reagent
concentrations, i.e., Fe3+, Fe2+ and H 2 O2 at less than 1 mM. W alling’s work in 1975
used the addition of small known concentrations of H 2 O2 slowly to the solution,
containing excess of Fe2+ and organic substrates in O2 free conditions. He described
the reaction in terms of H O and other radical intermediates interacting with the
organic substrates. However, these conditions vary from those used frequently in real
wastewater treatment, where Fe2+ and H 2 O 2 is more than 1 mM and total organic
carbon (TOC) is several hundred ppm (Yoon et al., 1998). Later Yoon and co
workers described the Fenton system with high reagent concentrations ([Fe2+] > 1 mM
and [H2 O2 ] = 5 mM) and explained their results in terms of the known mechanisms of
106

D eg rad a tio n II: L R
the Fenton reaction and presented implications of the results for use of the Fenton
process in practical wastewater treatment (Yoon et al., 2001).
Degradation rates are often controlled by various physical and chemical parameters,
among which, pH has a significant role to play in Fenton-like reactions (Benitez et al.,
2001; Kang and Hwang, 2000; Lin and Lo, 1997; Nesheiwat and Swanson, 2000).
The optimum pH is 3 and therefore this pH is usually employed for Fenton-like
reactions (Benitez et al., 2001; Kwon et al., 1999; Tang and Huang, 1996). At lower
pH (<2.5), the formation of the complex [Fe(II).H2 0 ]2+ is favoured and this reacts
slowly with the H 2 O2 thereby reducing HO» production and hence the degradation
rates, also at very low pHs, hydrogen ions act as scavengers of H O (Tang and Huang,
1996) and the reaction of Fe3+ and H 2 O2 is inhibited (Pignatello, 1992). Higher pH
(>4) decreases the rate of degradation due to (i) precipitation of ferric hydroxides
which inhibit the regeneration of ferrous ions and (ii) lack of free iron species in the
solution since most of the Fe(II) forms complexes, inhibiting the production of free
radicals (Bigda, 1995; Lin and Lo, 1997; Nesheiwat and Swanson, 2000). Most
importantly, with increasing pH, the oxidation potential of HO» is known to decrease
(Kwon et al., 1999). Therefore, pH 3 was chosen to conduct Latent Remediation (LR)
studies.
Other operating parameters in the Fenton process are: the concentrations of the ferrous
ions, pollutant and H 2 O2 . It has been reported that rates of degradation increase with
higher ferrous ion concentrations (Benitez et al., 2001; Kwon et al., 1999; Lin and Lo,
1997) but stoichiometric amounts are recommended otherwise the levels of unused
iron in the effluent stream may lead to non-permissible levels of total dissolved solids
(TDS). Likewise, increasing H 2 O2 concentrations are beneficial in Fenton reactions
but care should be taken as high concentrations could lead to enhancement in the
chemical oxygen demand (COD) levels (Lin and Lo, 1997). Also, elevated H 2 O2
concentrations act as scavengers of HO», therefore the chosen concentrations should
just be high be enough to be used up entirely during the Fenton reaction. As far as
pollutant concentrations in Fenton reactions are concerned, usually lower
concentrations or diluted wastewaters are recommended (Benitez et al., 2001; Kwon et
al., 1999).
107

D eg rad a tio n II: L R
Fenton reactions have proved to be extremely useful in groundwater and/or
contaminated soil remediation because of the availability of ferrous ions which are
often found in groundwater (Miller and Valentine, 1995; Tyre et al., 1991). The
Fenton reaction has also been applied to the oxidation of pentachlorophenol-
contaminated soils using ferric ions as a catalysts instead of ferrous ions (Watts et al.,
1990) and also for diesel contaminated soils (Watts and Dilly, 1996). Over the last
decade, Fenton reactions have otherwise being extensively used in the treatment of a
wide range of organic compounds including herbicides (Miller et al., 1996), pesticides
(Chan and Chu, 2003), dyes (Barros et a l, 2006; Kuo, 1992; Park et al., 1999), 2,4,6-
dinitrotoluene (Li et al., 1997a; Li et al., 1997b; Li et al., 1997c), RDX (Hundal et al.,
1997), 2,4-dinitrophenol (Kang et al., 1999b; Wang et al., 1999), chlorobenzene
(Watts et al., 1997), tetrachloroethylene (Yoshida et al., 2000), halomethanes (Tang
and Tassos, 1997) and chlorophenols (Barbeni et al., 1987; Pera-Titus et al., 2004;
Potter and Roth, 1993; Watts et al., 1990). However, there are many other organic
compounds such as acetic acid, acetone, carbon tetrachloride, methylene chloride,
trichloroethane, /2-paraffins and maleic/malonic/oxalic acids, which are refractory
towards Fenton chemistry (Gogate and Pandit, 2004a).
Although the Fenton reagent has been applied in many successful oxidation reactions,
as mentioned above, there are still some limitations such as restricted oxidant/catalyst
dosage ratios and low pollutant concentrations. Therefore, successful application of
the Fenton reaction in wastewater treatment systems demands a combination of Fenton
oxidation with other AOP, like ozonation, cavitation, UV, chemical and catalytic
oxidation. Since one of the aims of this project includes the use of cavitational
reactors for phenol degradation, most of the discussion will be focussed on the
individual and combined usage of ultrasound (US) and Fenton chemistry. Ultrasound
has been efficiently used as hybrid method for treatments of various aliphatic,
aromatic, polycyclic aromatic, halogenated hydrocarbons, azo dyes and some
pesticides (loan et al., 2007). Also, as discussed in Chapter 4, various methods of
phenol degradation using different frequency US reactors, oxidants i.e., H 2 O2 and/or
ozone and zero valent catalysts (ZVC) (iron, ZVI and copper, ZVCu) have been
reported.
108
D eg rad a tio n II: L R
Zero valent iron (ZVI) was initially used by the researchers (Deng et al., 1999; Dries
et al., 2001a; Dries et al., 2001b; Gillham et al., 1998; Grittini et al., 1995; Matheson
and Tratnyek, 1994; Muftikian et al., 1995) to treat waters contaminated by
chlorinated compounds. In recent years, the use of ZVI in various forms has been
described for the treatment of TCE (Chen et al., 2001), phenol and aromatic
compounds (Sanchez et al., 2007), pentachlorophenol (Dai et al., 2006), azo dye Acid
Orange 7 (Liu et al., 2007), dinitrobenzene (Zhang et al., 2007), DDT, TNT and RDX
(Boussahel et al., 2007; Oh et al., 2003). Similarly, a few recent studies have also
reported the use of zero valent copper (ZVCu) catalysts in the degradation of carbon
tetrachloride (Lin et al., 2005), phenol (Canton et al., 2003), 2,4-dinitrophenol (Guo et
al., 2005) and;?-chlorophenol (Kim et al., 2007).
The Advanced Fenton Process (AFP), i.e., degradation of organic pollutants in the
presence of ZVI, hydrogen peroxide (FLCL) at fairly acidic pH 2.5-3, has been
patented and reported in many papers by Bremner and co-workers (Bremner and
Burgess, 2004; Bremner et al., 2008; Chakinala et al., 2007a; Chakinala et al., 2008a;
Molina et al., 2006; Namkung et al., 2006; Namkung et al., 2008). However, the
novel part of the current study is in the use of ZVCu catalysts as potential catalysts for
the AFP and duration of US energy input.
In the published papers reporting the AFP, usually, the cavitation treatment time is the
controlling factor in deciding the overall treatment costs. With an aim of increasing
the cost efficiency of the process so as to make the procedure more economically
viable, an innovative approach with overall low energy input and low cost operation,
named ‘Latent Remediation’ (LR) is now reported in this study. In this study, an
initial input of ultrasound (US) is applied for a short time and then the degradation of
the pollutant is allowed to continue silently afterwards. Different forms o f zero valent
copper catalysts (ZVCu): flitters (ZVCF), turnings (ZVCT) and powder (ZVCP) have
been used for the study and compared with zero valent iron powdered catalysts (ZVI)
for their degradation efficiencies. Degradation was measured with the help of total
organic carbon (TOC) analysis.
109
D eg rad a tio n II: L R
Hence, the main aims of the study were to assess degradation of phenol using LR with
the effect of the following operational parameters:
■ Low and high frequencies (20, 300 and 520 kHz)
■ Presence and absence of oxidant (H2 O 2 ) and catalysts (ZVI and ZVCu)
■ ZVI and ZVCF, ZVCT, ZVCP catalysts
■ Low (0.6 g L-1) and high (5 g L-1) catalysts amounts
■ US irradiation and stirring input time (15-30 min)
■ Filtered and unfiltered catalyst LR reactions
5.2 Experimental5.2.1 ChemicalsLatent Remediation studies using multiple (low- and high)-frequency US reactors is a
continuation of the work described in Chapter 4 but with the difference that US energy
was inputted for only 15 min instead of continuous US irradiation (60 min). Hence,
chemicals and their concentrations, i.e., phenol, H2 O2 and zero valent catalysts (ZVC)
and US reactors (20, 300 and 520 kHz) are the same as described in Chapter 4. This
study was partially carried out in the Institute of Environmental Studies, Bogazici
University, Turkey but additional reactions were performed in the University of
Abertay Dundee using the 20 kHz US reactor and a new batch of zero valent iron
powder (ZVI; Sigma Aldrich 325 (44 p) mesh 97%) and zero valent copper powder
(ZVCP; Sigma Aldrich 200 mesh (74 p), 99%) powdered catalysts. The LR
experiments were performed in a commercial ultrasonic processor (Cole-Parmer)
equipped with a titanium probe ( 1 cm diameter) capable of operating either
continuously or in a pulse mode at a fixed frequency of 20 kHz. The intensity o f the
irradiation was adjusted to 50% of ultrasonic power amplitude, which corresponds to a
calorimetric measurement of 18 W (0.09 W mL-1). LR experiments were carried out
with the probe working in pulses, 4.0 s on and 2 s off, which allows the system to
dissipate some of the heat generated by the ultrasonic waves.
In a typical experimental set-up with 20 kHz (Cole Parmer), the US probe was
immersed in a 300 mL cylindrical glass beaker containing aqueous phenol solution
(2.5 mM; 200 mL) and the pH was adjusted to 3.0 with 0.1 M H2SO4. The temperature
was kept constant at 23 ± 2 °C during all reactions by an external cooling bath. The
110
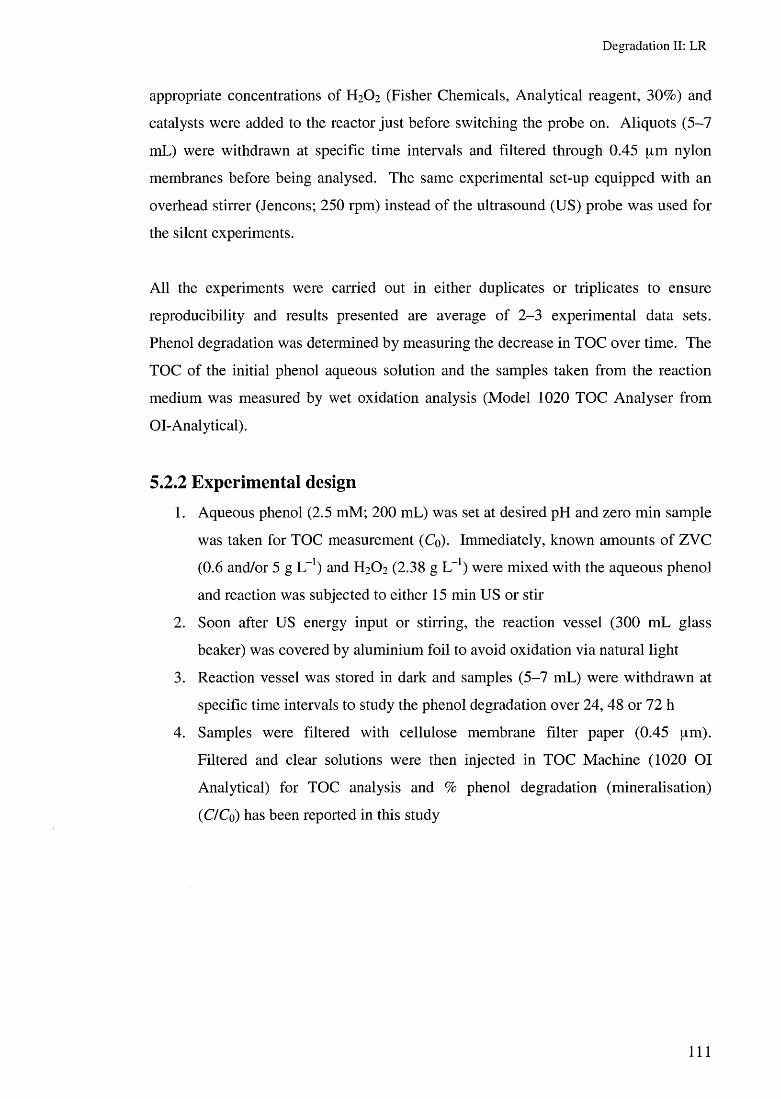
D eg rad a tio n II: L R
appropriate concentrations of H 2 O2 (Fisher Chemicals, Analytical reagent, 30%) and
catalysts were added to the reactor just before switching the probe on. Aliquots (5-7
mL) were withdrawn at specific time intervals and filtered through 0.45 pm nylon
membranes before being analysed. The same experimental set-up equipped with an
overhead stirrer (Jencons; 250 rpm) instead of the ultrasound (US) probe was used for
the silent experiments.
All the experiments were carried out in either duplicates or triplicates to ensure
reproducibility and results presented are average of 2-3 experimental data sets.
Phenol degradation was determined by measuring the decrease in TOC over time. The
TOC of the initial phenol aqueous solution and the samples taken from the reaction
medium was measured by wet oxidation analysis (Model 1020 TOC Analyser from
OI-Analytical).
5.2.2 Experimental design1. Aqueous phenol (2.5 mM; 200 mL) was set at desired pH and zero min sample
was taken for TOC measurement (Co). Immediately, known amounts of ZVC
(0.6 and/or 5 g L-1) and H2 O2 (2.38 g L-1) were mixed with the aqueous phenol
and reaction was subjected to either 15 min US or stir
2. Soon after US energy input or stirring, the reaction vessel (300 mL glass
beaker) was covered by aluminium foil to avoid oxidation via natural light
3. Reaction vessel was stored in dark and samples (5-7 mL) were withdrawn at
specific time intervals to study the phenol degradation over 24, 48 or 72 h
4. Samples were filtered with cellulose membrane filter paper (0.45 pm).
Filtered and clear solutions were then injected in TOC Machine (1020 OI
Analytical) for TOC analysis and % phenol degradation (mineralisation)
(C/Co) has been reported in this study
111
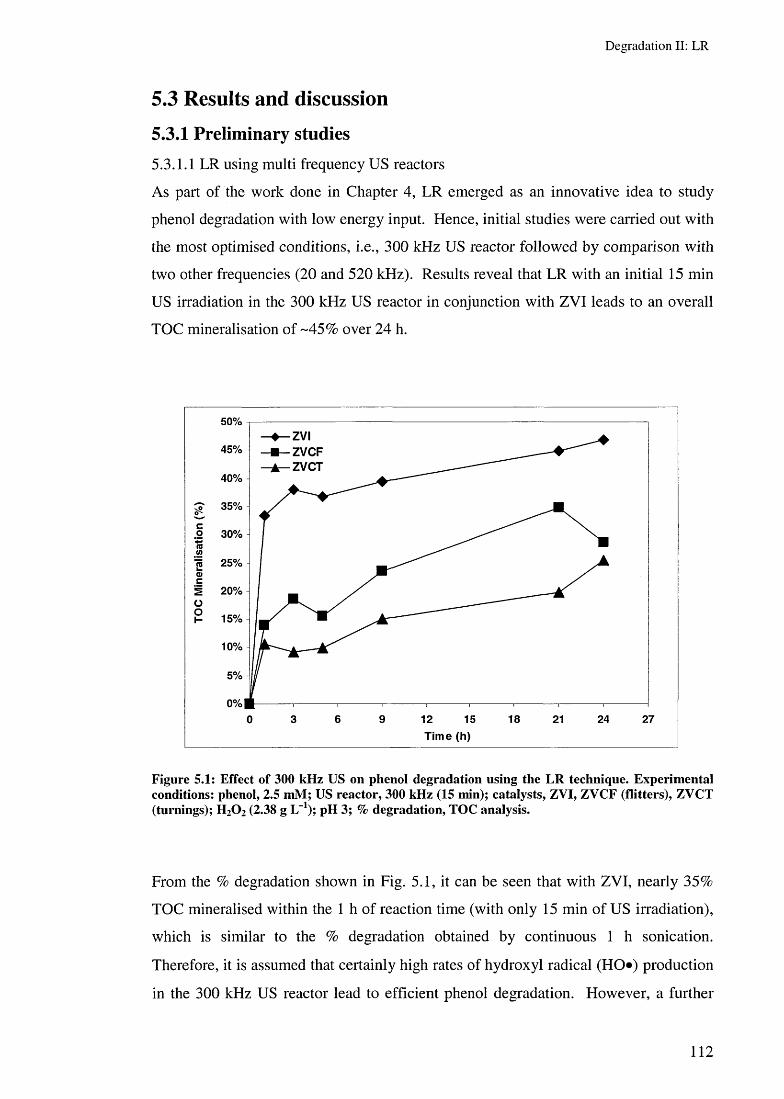
D eg rad a tio n II: L R
5.3 Results and discussion5.3.1 Preliminary studies5.3.1.1 LR using multi frequency US reactors
As part of the work done in Chapter 4, LR emerged as an innovative idea to study
phenol degradation with low energy input. Hence, initial studies were carried out with
the most optimised conditions, i.e., 300 kHz US reactor followed by comparison with
two other frequencies (20 and 520 kHz). Results reveal that LR with an initial 15 min
US irradiation in the 300 kHz US reactor in conjunction with ZVI leads to an overall
TOC mineralisation of -45% over 24 h.
Figure 5.1: Effect o f 300 kH z US on phenol degradation using the LR technique. E xperim ental conditions: phenol, 2.5 m M ; US reactor, 300 kHz (15 min); catalysts, ZVI, ZVCF (flitters), ZVCT (turnings); H 20 2 (2.38 g L"1); pH 3; % degradation, TOC analysis.
From the % degradation shown in Fig. 5.1, it can be seen that with ZVI, nearly 35%
TOC mineralised within the 1 h of reaction time (with only 15 min of US irradiation),
which is similar to the % degradation obtained by continuous 1 h sonication.
Therefore, it is assumed that certainly high rates of hydroxyl radical (HO») production
in the 300 kHz US reactor lead to efficient phenol degradation. However, a further
112
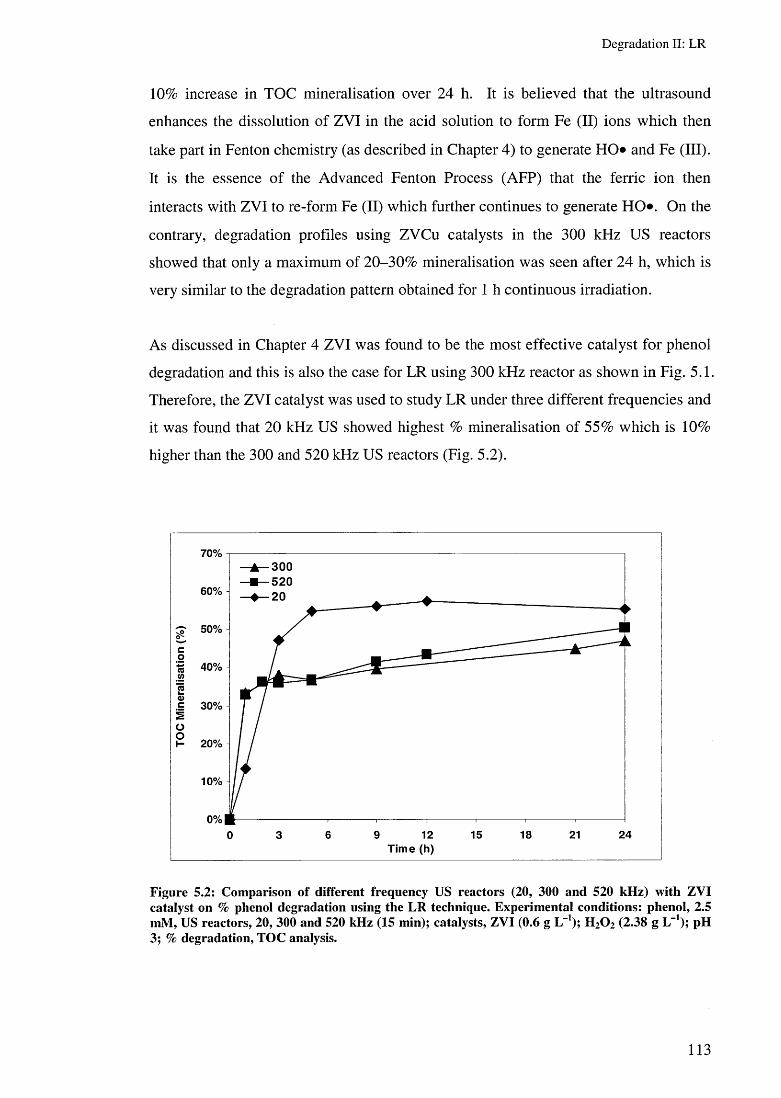
D eg rad a tio n II: L R
10% increase in TOC mineralisation over 24 h. It is believed that the ultrasound
enhances the dissolution of ZVI in the acid solution to form Fe (II) ions which then
take part in Fenton chemistry (as described in Chapter 4) to generate HO* and Fe (III).
It is the essence of the Advanced Fenton Process (AFP) that the ferric ion then
interacts with ZVI to re-form Fe (II) which further continues to generate HO*. On the
contrary, degradation profiles using ZVCu catalysts in the 300 kHz US reactors
showed that only a maximum of 20-30% mineralisation was seen after 24 h, which is
very similar to the degradation pattern obtained for 1 h continuous irradiation.
As discussed in Chapter 4 ZVI was found to be the most effective catalyst for phenol
degradation and this is also the case for LR using 300 kHz reactor as shown in Fig. 5.1.
Therefore, the ZVI catalyst was used to study LR under three different frequencies and
it was found that 20 kHz US showed highest % mineralisation of 55% which is 10%
higher than the 300 and 520 kHz US reactors (Fig. 5.2).
Figure 5.2: Com parison o f different frequency U S reactors (20, 300 and 520 kH z) w ith ZVI catalyst on % phenol degradation using the LR technique. Experim ental conditions: phenol, 2.5 m M , US reactors, 20, 300 and 520 kHz (15 min); catalysts, ZVI (0.6 g L_1); H 2O2 (2 .38 g L-1); pH 3; % degradation, TO C analysis.
113

D eg rad a tio n II: L R
The above results showed that along with highest overall mineralisation achieved after
24 h, the degradation was also quite high (after about 2 h) in case of the 20 kHz US.
This is attributed to the fact that high mechanical action during cavitation in 20 kHz
US leads to surface activation of the catalyst and therefore makes it more readily
available for reaction. Therefore, even though the rates of HO» production at this
frequency are low compared to the higher frequency US reactors (300 and 520 kHz),
the rate of reaction and overall mineralisation over 24 h in the LR with 20 kHz US is
quite high because of the high mechanical activity. It is interesting to note that
initially, i.e., during the first 90 min after US irradiation is switched off, the
degradation was faster with the 300 and 520 kHz US, possibly indicating that there has
been greater production of HO» at these frequencies. It is assumed that due to high
intensity of cavitation at 20 kHz, the iron particles are further broken down to finer
particles increasing the number and quality of available reactive sites, thus the
polished catalysts provide a larger surface area for catalyst/oxidant reactions in the
bulk solution over longer durations leading to high % degradation.
Table 5.1 shows a comparative study of phenol degradation, using ZVI in the AFP
with continuous sonication (data obtained from chapter 4) and the newly developed
LR technique after 1 h and 24. From the data, it is clear that 15 min US energy input
is sufficient to start the degradation which then continues over 24 h and this
hypothesis is further supported by data presented later in this chapter with a different
catalysts and 20 kHz US reactor set-up in a 200 mL reaction volume.
TOC mineralisation (%)US Irradiation time Continuous US Latent Remediation (15 min US)
US frequencies (kHz) After 1 h After 1 h After 24 h2 0 39.9 13.4 55.3
300 37.8 33.3 46.9520 37.0 32.7 50.3
Table 5.1: Com parison o f % TOC m ineralisation achieved through continuous sonication and LR using ZVI catalyst at three different frequencies. E xperim ental conditions: phenol 2.5 mM ; U S reactors, 20, 300 and 520 kHz; continuous sonication, 1 h; L R , in itial 15 m in sonication; catalyst, ZVI (0.6 g L-1); H 20 2 (2.38 g L-1); pH 3; % degradation, TO C analysis.
114
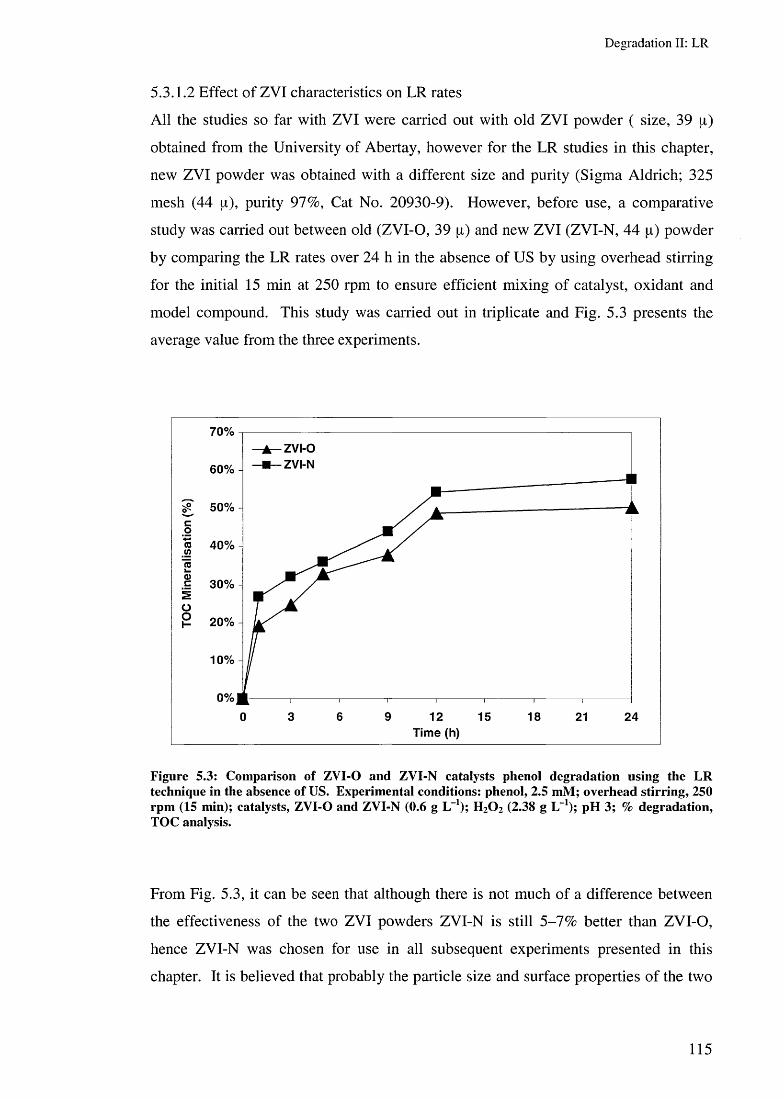
D eg rad a tio n II: L R
5.3.1.2 Effect of ZVI characteristics on LR rates
All the studies so far with ZVI were carried out with old ZVI powder ( size, 39 p)
obtained from the University of Abertay, however for the LR studies in this chapter,
new ZVI powder was obtained with a different size and purity (Sigma Aldrich; 325
mesh (44 p), purity 97%, Cat No. 20930-9). However, before use, a comparative
study was carried out between old (ZVI-O, 39 p) and new ZVI (ZVI-N, 44 p) powder
by comparing the LR rates over 24 h in the absence of US by using overhead stirring
for the initial 15 min at 250 rpm to ensure efficient mixing of catalyst, oxidant and
model compound. This study was carried out in triplicate and Fig. 5.3 presents the
average value from the three experiments.
Figure 5.3: Com parison o f ZVI-O and ZVI-N catalysts phenol degradation using the LR technique in the absence o f US. Experim ental conditions: phenol, 2.5 mM ; overhead stirring, 250 rpm (15 min); catalysts, ZVI-O and ZVI-N (0.6 g L-1); H20 2 (2.38 g L-1); pH 3; % degradation, TOC analysis.
From Fig. 5.3, it can be seen that although there is not much of a difference between
the effectiveness of the two ZVI powders ZVI-N is still 5-7% better than ZVI-O,
hence ZVI-N was chosen for use in all subsequent experiments presented in this
chapter. It is believed that probably the particle size and surface properties of the two
115

D egrada tion II: L R
powders contributes to the slight differences between the observed phenol
degradations.
5.3.1.3 Effect of US irradiation time on LR rates
Although preliminary LR studies were carried out by irradiating the phenol solution
for 15 min, the effect of increasing the initial irradiation time was investigated.
Therefore, phenol degradation using LR was compared with initial input of 15 and 30
min of US irradiation and the results are shown in Fig. 5.4 where it can be seen that
there is no significant difference between overall phenol degradation at the two chosen
US irradiation times. Hence, it was concluded that 15 min corresponds to a lower US
energy input and is sufficient to carry out effective mineralisation.
Figure 5.4: Com parison o f 20 kHz US irradiation tim es (15 and 30 m in) along w ith Z V I catalyst phenol degradation using the LR technique. Experim ental conditions: phenol, 2 .5 m M ; U S, 20 kHz (15 and 30 min); catalysts, ZVI (0.6 g L-1); H2O 2 (2.38 g L-1); pH 3; % degradation, TO C analysis.
116
D eg rad a tio n II: L R
From Fig. 5.4, it is understood that the initial 10-15 min of US irradiation is sufficient
enough to get the reaction started with respect to formation of radical species in the
bulk solution and also conversion of Fe° to Fe2+ and/or Fe3+, which further participates
in the reaction and carries out mineralisation, therefore more US input after 15 min is
not necessary. Hence, all the LR experiments were carried out with inputting either 15
min of US irradiation or 15 min of overhead stirring to facilitate efficient mixing and
enhanced mass transfer rates between catalysts, oxidants and organic compound.
5.3.1.4 Effect of catalyst amounts on LR rates
So far, phenol degradation using ZVI and ZVCu catalysts in combination with US had
been carried out with 0.6 g L- 1 and 5 g L_1, respectively, as discussed in Chapter 4 and
Fig. 5.1. ZVI and H 2 O2 concentrations for phenol degradation were optimised earlier
by Molina et al. (2006), hence the same was used for all the experiments reported in
this thesis. However, ZVCu catalysts, i.e., flitters, turnings and powder, were novel
catalysts especially chosen to assess their efficacies to carry out the AFP. Preliminary
studies with copper flitters (ZVCF) and turnings (ZVCT) reported in Chapter 4 were
carried out at 5 g L_1 catalyst amount, however for comparative work zero valent
copper powder (ZVCP), zero valent copper flitters (ZVCF; Plate 5.1) and zero valent
copper turnings (ZVCT; Plate 5.2) were compared at two different amounts, i.e., 0.6 g
L- 1 and 5 g L- 1 in the different 20 kHz US reactor set-up with 200 mL reaction volume
and results are presented in Fig. 5.5. However, to avoid the effect of US on this
reaction, aqueous phenolic solutions were only stirred for 15 min at 250 rpm at the
start of the experiment with ZVCP or ZVCF or ZVCT along with H 2 O2 and the
degradation was measured over 24 h.
117

Degradation II: LR
F ig u re 5 .5: C o m p a r iso n o f d if fe re n t a m o u n ts a n d ty p e s o f Z V C u c a ta ly s ts f o r p h e n o l d e g r a d a t io n u s in g th e s ilen t L R te c h n iq u e . E x p e r im e n ta l co n d itio n s : p h e n o l, 2 .5 m M ; o v e rh e a d s t i r r in g , 250 rp m (15 m in ); Z V C u c a ta ly s ts (0.6 a n d 5 g L " ') : Z V C P , Z V C F , Z V C T ; H 20 2 (2 .38 g L 1); p H 3 ; % d e g ra d a t io n , T O C an a ly s is .
P la te 5 .1: Z V C F (c o p p e r f litte r s ) P la te 5 .2 : Z V C T (c o p p e r tu rn in g s )

D eg rad a tio n II: L R
From Fig. 5.5, it is clear that ZVCP is the most efficient at degrading phenol.
However, the experimental data reveals that a low amount of ZVCP (0.6 g L-1) is
comparable to higher amounts of ZVCF/ZVCT (5 g L-1) for phenol degradation. The
extent of phenol degradation with ZVCP (0.6 g L- 1 and 5 g L"1) was found to be the
same (60%) until about 9 h of silent reaction, but TOC mineralisation with ZVCP (0.6
g L-1) increased to 83% after 24 h, whereas ZVCP (5 g L-1) remained constant, at 60%.
In contrast, ZVCT (0.6 g L-1) could only mineralise around 5% phenol over 9 h but
after 24 h the ZVCT (0.6 g L-1) mineralisation remained at 5% but ZVCF (0.6 g L-1)
had increased to 50%. Thus, the best mineralisation is achieved with ZVCP (0.6 g L~
*) and this is attributed to a suitable catalyst oxidant ratio required for efficient phenol
degradation. Higher amounts of catalyst inhibit the rates of reaction due to
decomposition of H2 O 2 required to carry out further mineralisation, hence any increase
in catalyst quantity does not enhance the overall degradation. However, higher
amounts of the catalysts like ZVCF and ZVCT (which have much larger particle size
initially) increase the surface area required for the reaction and therefore they are
better suited instead of lower amounts. It is noteworthy that silent reactions without
any initial US irradiation could efficiently carry out Fenton like reactions in the AFP
using ZVCu catalysts. Therefore, one of the main objectives of this study, i.e., to test
different ZVCu catalysts for carrying out the AFP has been successfully achieved and
reaction mechanisms will be discussed later in this chapter.
119

D eg rad a tio n II: L R
5.3.2 Effect of ZVI and ZYCP on LR ratesAfter optimising the type and amounts of catalysts, the rates of LR were compared for
0.6 g L' 1 ZVI and ZVCP catalysts with minimum energy input of 15 min either
overhead stirring (250 rpm) or US irradiation (20 kHz). LR rates with ZVI and ZVCP
in the AFP were also studied and compared in the presence and absence of catalyst
and oxidant conditions.
Figure 5.6: Com parison o f phenol degradation with the ZV I catalyst under different operating conditions using the LR technique. Experim ental conditions: phenol, 2.5 mM ; U S, 20 kH z (15 min); stirring, 250 rpm (15 min); catalysts, ZVI (0.6 g L-1); H 20 2 (2.38 g L_1); pH 3; % degradation, TOC analysis.
120

D eg rad a tio n II: L R
Fig. 5.6 shows a comparison of the different operating conditions for ZVI as the
catalyst. It can be easily seen from the figure that the presence of catalyst and H 2 O2 is
essential for a decrease in TOC. Thus, use of US/stirring in the initial 15 min time
acts as an initiator of series of reactions as indicated in Eq. 5.3-5.6. Use of US
facilitates a larger production of radicals as compared to the use of stirring alone as
indicated by higher TOC mineralisation for the case of ZVI as catalyst.
Fe° — — ► Fe2+ (5.3)Fe2+ + H 2 0 2 ------- ► Fe3+ + HO» + OH” (5.4)Fe° + 2Fe3+ ------- ► 3Fe2+ (5.5)HO* + Pollutant--------► CO2 + H 2 O + small organic acids (5.6)
From the above equations, it can be seen that the ZVI catalyst is capable of conversion
of Fe° to Fe2+ and also Fe3+ to Fe2+ which is essential for carrying out the classic
Fenton reaction expressed in Eq. 5.1 and 5.2. Therefore, it can be suggested that ZVI,
in the presence of H 2 O2 and at pH 3, provides an effective alternative to the
conventional Fenton chemistry.
From the above comparison graph, it can be noted that phenol degradation with initial
15 min US treatment has been quite effective right from the start o f the reaction and
between 12 and 24 h, pronounced phenol degradation were achieved when compared
with those of 15 min of stirring. With only 15 min of stirring, the % degradation did
not change between 12 and 24 h indicating that less HO* were produced.
Therefore, the hypothesis drawn from this study is that an input of US irradiation
could help in catalysing the reaction and a balanced stoichiometric ratio of catalyst and
oxidant is essential to achieve high phenol mineralisation. This hypothesis is in
agreement with various reports published in the literature where synergism of Fenton
with US, termed ‘sono-Fenton’ proves to be beneficial for increasing % degradation
(as discussed in Section 5.1). However, LR, with substantially lower energy inputs,
has capability to carry out degradation under silent conditions is being reported in this
research for the first time which makes this work novel and meets the scope of this
study.
121
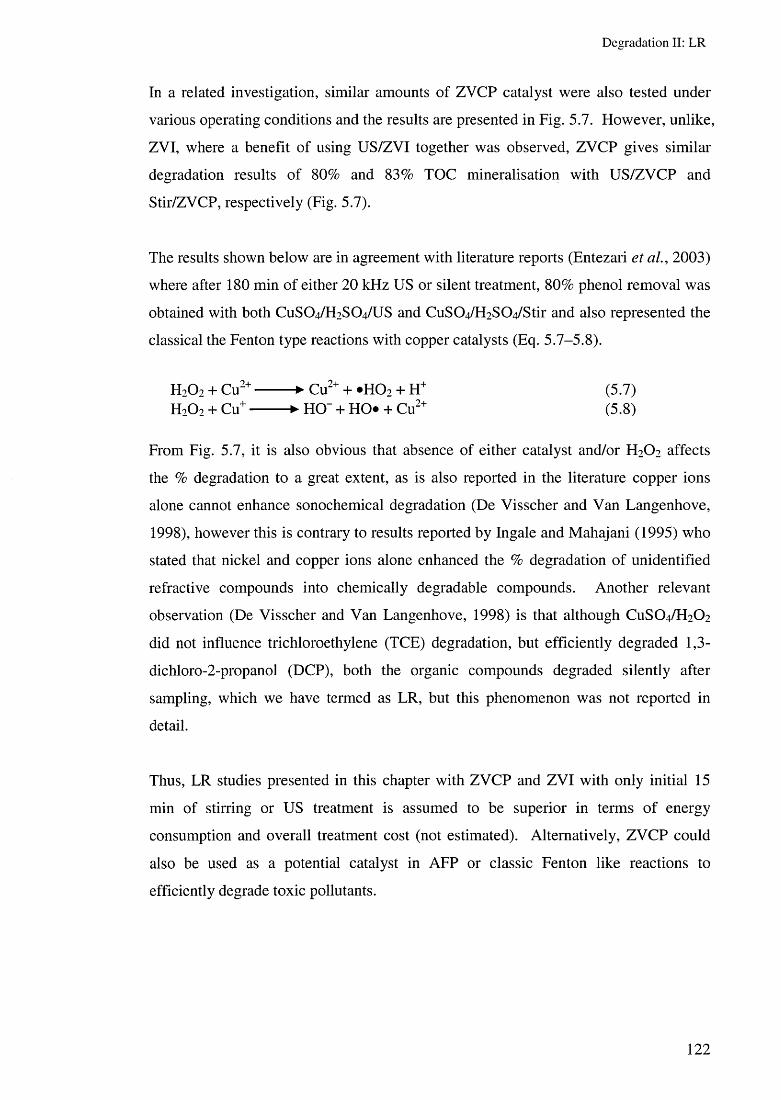
D eg rad a tio n II: L R
In a related investigation, similar amounts of ZVCP catalyst were also tested under
various operating conditions and the results are presented in Fig. 5.7. However, unlike,
ZVI, where a benefit of using US/ZVI together was observed, ZVCP gives similar
degradation results of 80% and 83% TOC mineralisation with US/ZVCP and
Stir/ZVCP, respectively (Fig. 5.7).
The results shown below are in agreement with literature reports (Entezari et al., 2003)
where after 180 min of either 20 kHz U S or silent treatment, 80% phenol removal was
obtained with both C U SO 4/H 2SO 4/U S and CuS0 4 /H 2 S0 4 /Stir and also represented the
classical the Fenton type reactions with copper catalysts (Eq. 5 .7-5.8 ).
From Fig. 5.7, it is also obvious that absence of either catalyst and/or H 2 O 2 affects
the % degradation to a great extent, as is also reported in the literature copper ions
alone cannot enhance sonochemical degradation (De Visscher and Van Langenhove,
1998), however this is contrary to results reported by Ingale and Mahajani (1995) who
stated that nickel and copper ions alone enhanced the % degradation of unidentified
refractive compounds into chemically degradable compounds. Another relevant
observation (De Visscher and Van Langenhove, 1998) is that although CUSO4 /H 2 O2
did not influence trichloroethylene (TCE) degradation, but efficiently degraded 1,3-
dichloro-2-propanol (DCP), both the organic compounds degraded silently after
sampling, which we have termed as LR, but this phenomenon was not reported in
detail.
Thus, LR studies presented in this chapter with ZVCP and ZVI with only initial 15
min of stirring or US treatment is assumed to be superior in terms of energy
consumption and overall treatment cost (not estimated). Alternatively, ZVCP could
also be used as a potential catalyst in AFP or classic Fenton like reactions to
efficiently degrade toxic pollutants.
H2 0 2 + Cu2+-------- ► Cu2+ + »H 0 2 + H+t r r\ , r-\,+_____ w 1 , urv. . r̂ ,,2+H2 0 2 + Cu+------- ► HO" + HO* + Cu2
(5.7)(5.8)
122
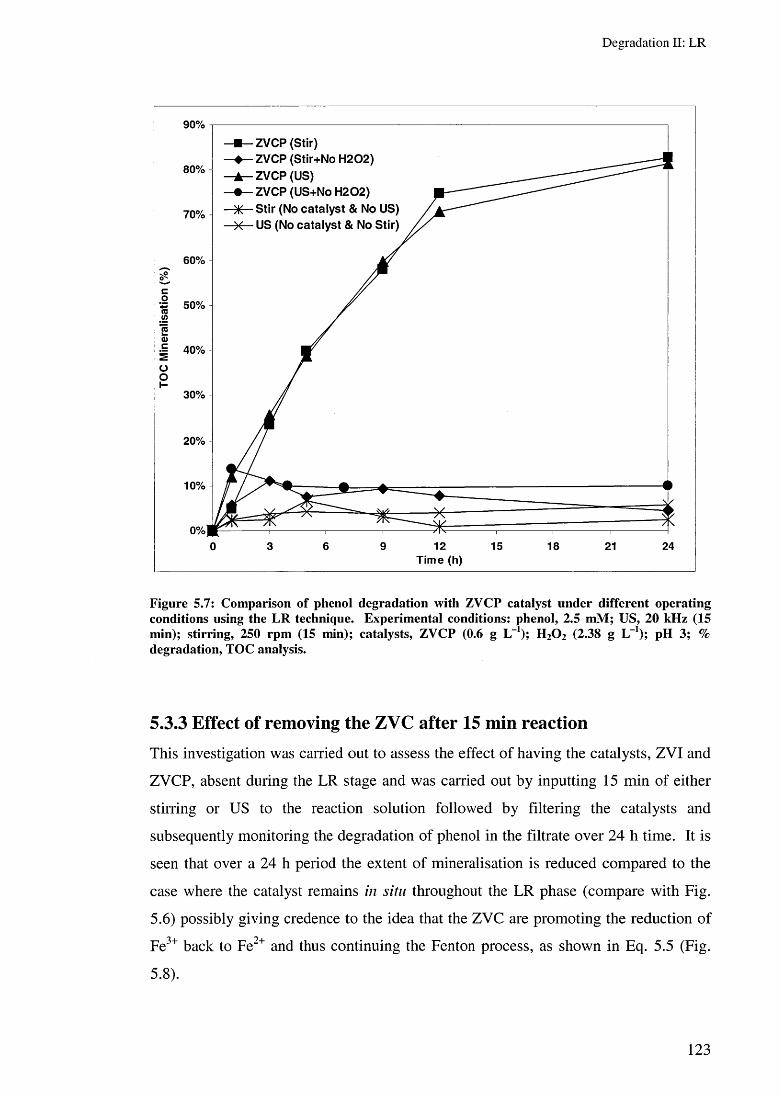
D eg rad a tio n II: L R
Figure 5.7: Com parison o f phenol degradation w ith ZVCP catalyst under different operating conditions using the LR technique. Experim ental conditions: phenol, 2.5 m M ; U S, 20 kHz (15 m in); stirring, 250 rpm (15 min); catalysts, ZVCP (0.6 g L-1); H 20 2 (2.38 g L-1); pH 3; % degradation, TOC analysis.
5.3.3 Effect of removing the ZVC after 15 min reactionThis investigation was carried out to assess the effect of having the catalysts, ZVI and
ZVCP, absent during the LR stage and was carried out by inputting 15 min of either
stirring or US to the reaction solution followed by filtering the catalysts and
subsequently monitoring the degradation of phenol in the filtrate over 24 h time. It is
seen that over a 24 h period the extent of mineralisation is reduced compared to the
case where the catalyst remains in situ throughout the LR phase (compare with Fig.
5.6) possibly giving credence to the idea that the ZVC are promoting the reduction of
Fe3+ back to Fe2+ and thus continuing the Fenton process, as shown in Eq. 5.5 (Fig.
5.8).
123
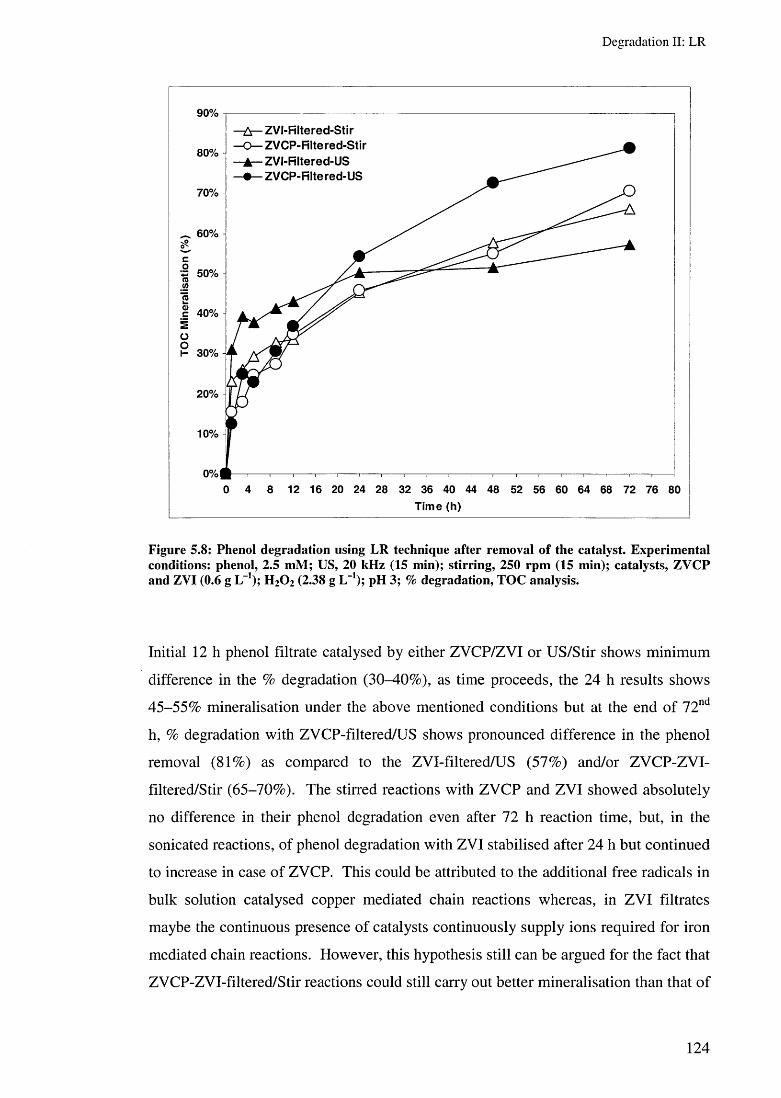
D eg rad a tio n II: L R
Figure 5.8: Phenol degradation using LR technique after rem oval o f the catalyst. E xperim ental conditions: phenol, 2.5 mM ; US, 20 kHz (15 min); stirring, 250 rpm (15 m in); catalysts, Z V C P and ZVI (0.6 g L_1); H 2O2 (2.38 g L-1); pH 3; % degradation, TO C analysis.
Initial 12 h phenol filtrate catalysed by either ZVCP/ZVI or US/Stir shows minimum
difference in the % degradation (3CM10%), as time proceeds, the 24 h results shows
45-55% mineralisation under the above mentioned conditions but at the end of 72nd
h, % degradation with ZVCP-filtered/US shows pronounced difference in the phenol
removal (81%) as compared to the ZVI-filtered/US (57%) and/or ZVCP-ZVI-
filtered/Stir (65-70%). The stirred reactions with ZVCP and ZVI showed absolutely
no difference in their phenol degradation even after 72 h reaction time, but, in the
sonicated reactions, of phenol degradation with ZVI stabilised after 24 h but continued
to increase in case of ZVCP. This could be attributed to the additional free radicals in
bulk solution catalysed copper mediated chain reactions whereas, in ZVI filtrates
maybe the continuous presence of catalysts continuously supply ions required for iron
mediated chain reactions. However, this hypothesis still can be argued for the fact that
ZVCP-ZVI-filtered/Stir reactions could still carry out better mineralisation than that of
124
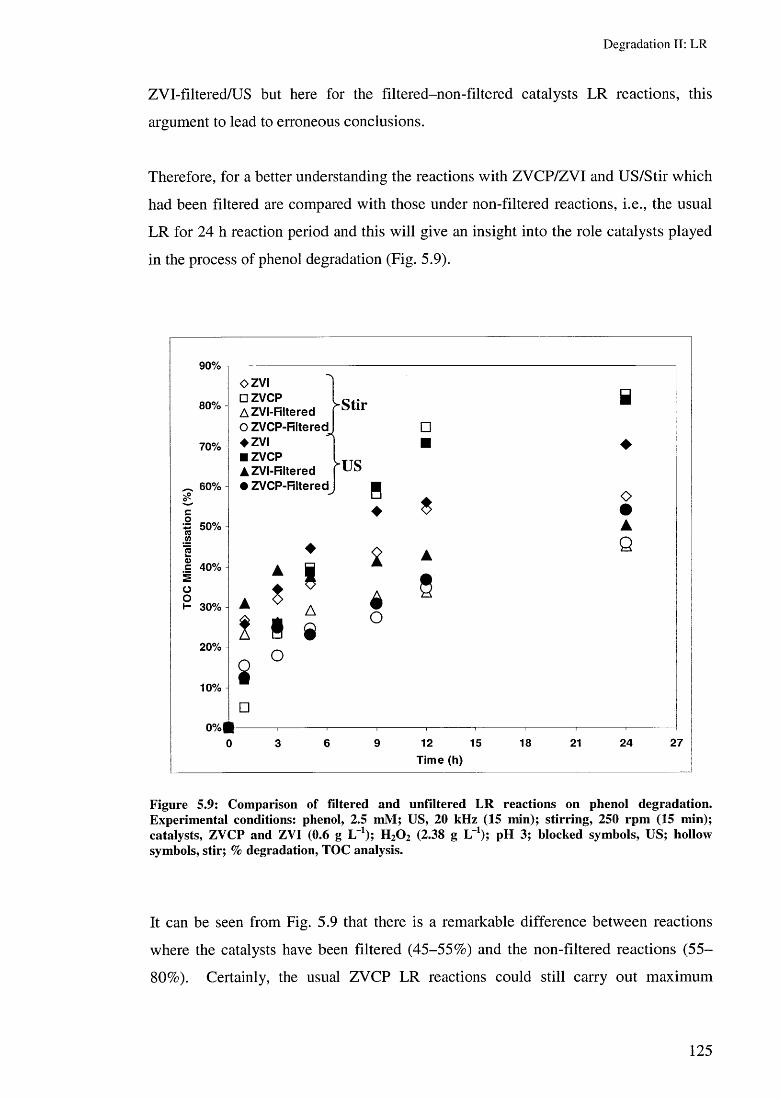
D eg rad a tio n II: L R
ZVI-flltered/US but here for the filtered-non-filtered catalysts LR reactions, this
argument to lead to erroneous conclusions.
Therefore, for a better understanding the reactions with ZVCP/ZVI and US/Stir which
had been filtered are compared with those under non-filtered reactions, i.e., the usual
LR for 24 h reaction period and this will give an insight into the role catalysts played
in the process of phenol degradation (Fig. 5.9).
90%
80%
70%
^ 60%
cI 50%
40%
30%
20%
10%
OZVI □ ZVCP A ZVI-Rltered O ZVCP-Rltered♦ ZVI■ ZVCP ▲ ZVI-Rltered• ZVCP-Rltered
^Stir
r u s
□o%#-
0
▲
* 4 I 8O
B♦
£o
□
▲
8
B
♦
oAQ
12 15
Time (h)
18 21 24 27
Figure 5.9: Com parison of filtered and unfiltered L R reactions on phenol degradation. E xperim ental conditions: phenol, 2.5 m M ; U S, 20 kHz (15 m in); stirring, 250 rpm (15 min); catalysts, ZVCP and ZVI (0.6 g L-1); H 2C>2 (2.38 g L"1); pH 3; blocked sym bols, U S; hollow sym bols, stir; % degradation, TOC analysis.
It can be seen from Fig. 5.9 that there is a remarkable difference between reactions
where the catalysts have been filtered (45-55%) and the non-filtered reactions (55-
80%). Certainly, the usual ZVCP LR reactions could still carry out maximum
125
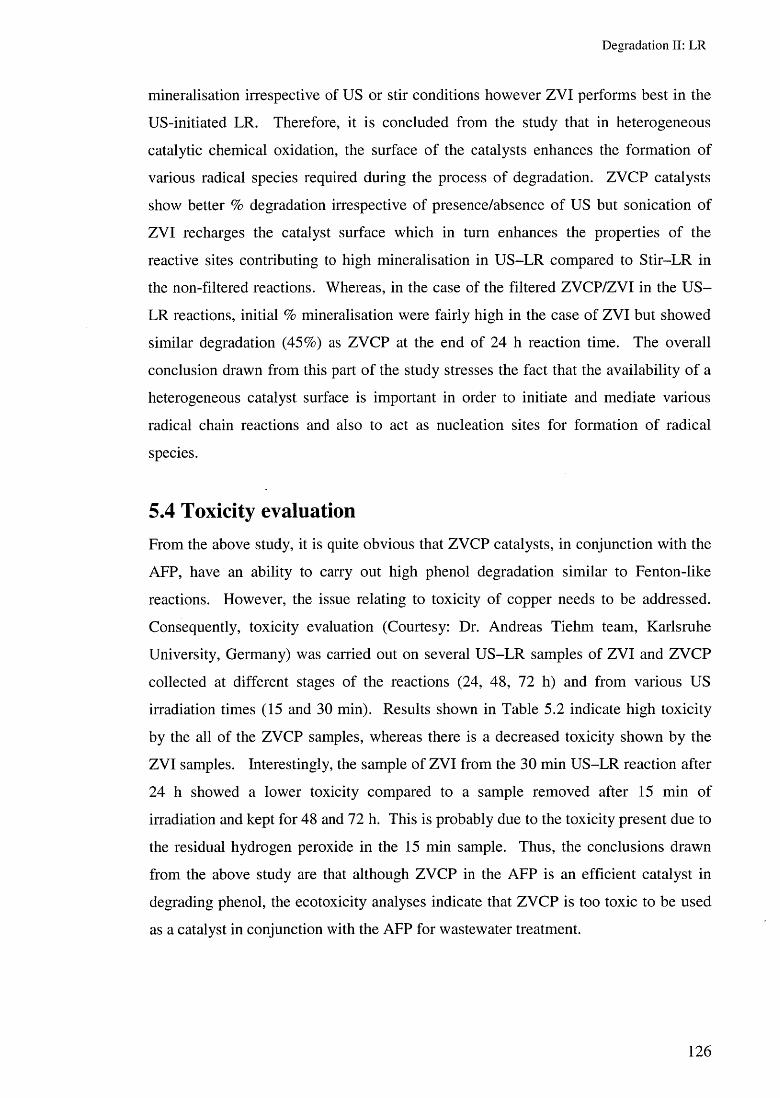
D eg rad a tio n II: L R
mineralisation irrespective of US or stir conditions however ZVI performs best in the
US-initiated LR. Therefore, it is concluded from the study that in heterogeneous
catalytic chemical oxidation, the surface of the catalysts enhances the formation of
various radical species required during the process of degradation. ZVCP catalysts
show better % degradation irrespective of presence/absence of US but sonication of
ZVI recharges the catalyst surface which in turn enhances the properties of the
reactive sites contributing to high mineralisation in US-LR compared to Stir-LR in
the non-filtered reactions. Whereas, in the case of the filtered ZVCP/ZVI in the U S -
LR reactions, initial % mineralisation were fairly high in the case of ZVI but showed
similar degradation (45%) as ZVCP at the end of 24 h reaction time. The overall
conclusion drawn from this part of the study stresses the fact that the availability of a
heterogeneous catalyst surface is important in order to initiate and mediate various
radical chain reactions and also to act as nucleation sites for formation of radical
species.
5.4 Toxicity evaluationFrom the above study, it is quite obvious that ZVCP catalysts, in conjunction with the
AFP, have an ability to carry out high phenol degradation similar to Fenton-like
reactions. However, the issue relating to toxicity of copper needs to be addressed.
Consequently, toxicity evaluation (Courtesy: Dr. Andreas Tiehm team, Karlsruhe
University, Germany) was carried out on several US-LR samples of ZVI and ZVCP
collected at different stages of the reactions (24, 48, 72 h) and from various US
irradiation times (15 and 30 min). Results shown in Table 5.2 indicate high toxicity
by the all of the ZVCP samples, whereas there is a decreased toxicity shown by the
ZVI samples. Interestingly, the sample of ZVI from the 30 min US-LR reaction after
24 h showed a lower toxicity compared to a sample removed after 15 min of
irradiation and kept for 48 and 72 h. This is probably due to the toxicity present due to
the residual hydrogen peroxide in the 15 min sample. Thus, the conclusions drawn
from the above study are that although ZVCP in the AFP is an efficient catalyst in
degrading phenol, the ecotoxicity analyses indicate that ZVCP is too toxic to be used
as a catalyst in conjunction with the AFP for wastewater treatment.
126
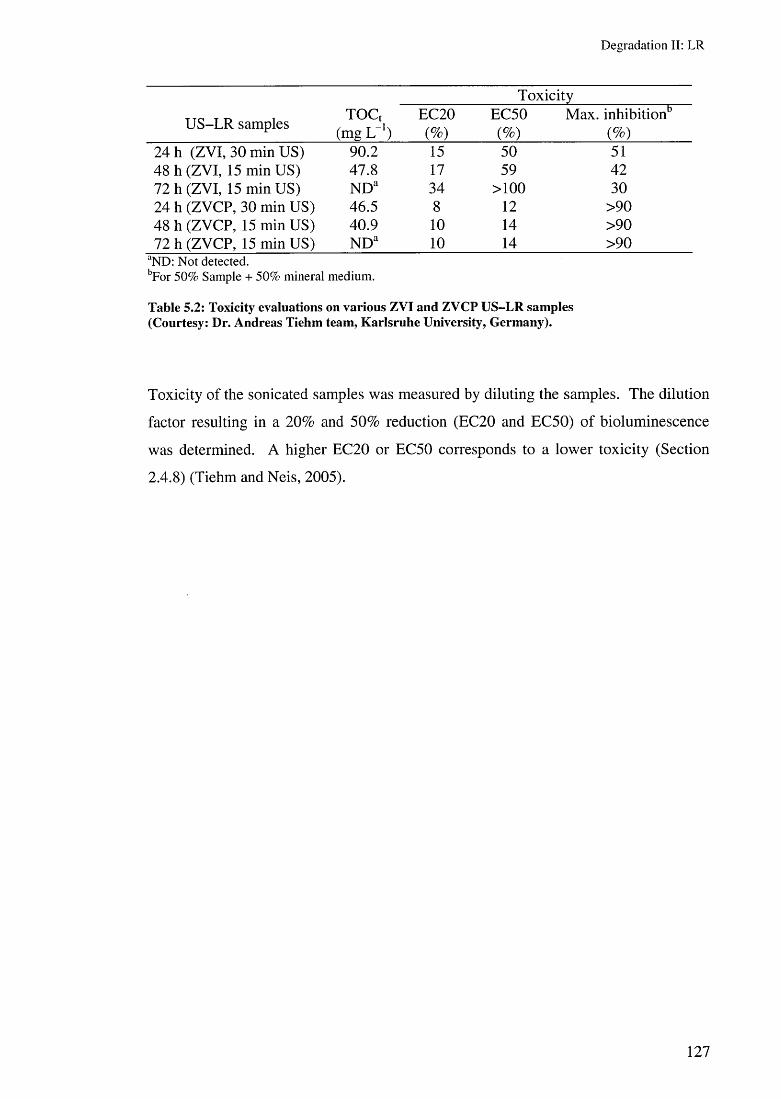
D eg rad a tio n II: L R
Toxicity
US-LR samples TOC, (mg L-')
EC20(%)
EC50(%)
Max. inhibition15
(%)24 h (ZVI, 30 min US) 90.2 15 50 5148 h (ZVI, 15 min US) 47.8 17 59 4272 h (ZVI, 15 min US) NDa 34 > 1 0 0 3024 h (ZVCP, 30 min US) 46.5 8 1 2 >9048 h (ZVCP, 15 min US) 40.9 1 0 14 >9072 h (ZVCP, 15 min US) NDa 1 0 14 >90
aN D : N o t detec ted .bF o r 50% S am ple + 50% m ineral m edium .
Table 5.2: Toxicity evaluations on various ZVI and ZVCP U S -L R sam ples (Courtesy: Dr. A ndreas Tiehm team , K arlsruhe U niversity, G erm any).
Toxicity of the sonicated samples was measured by diluting the samples. The dilution
factor resulting in a 20% and 50% reduction (EC20 and EC50) of bioluminescence
was determined. A higher EC20 or EC50 corresponds to a lower toxicity (Section
2.4.8) (Tiehm and Neis, 2005).
127
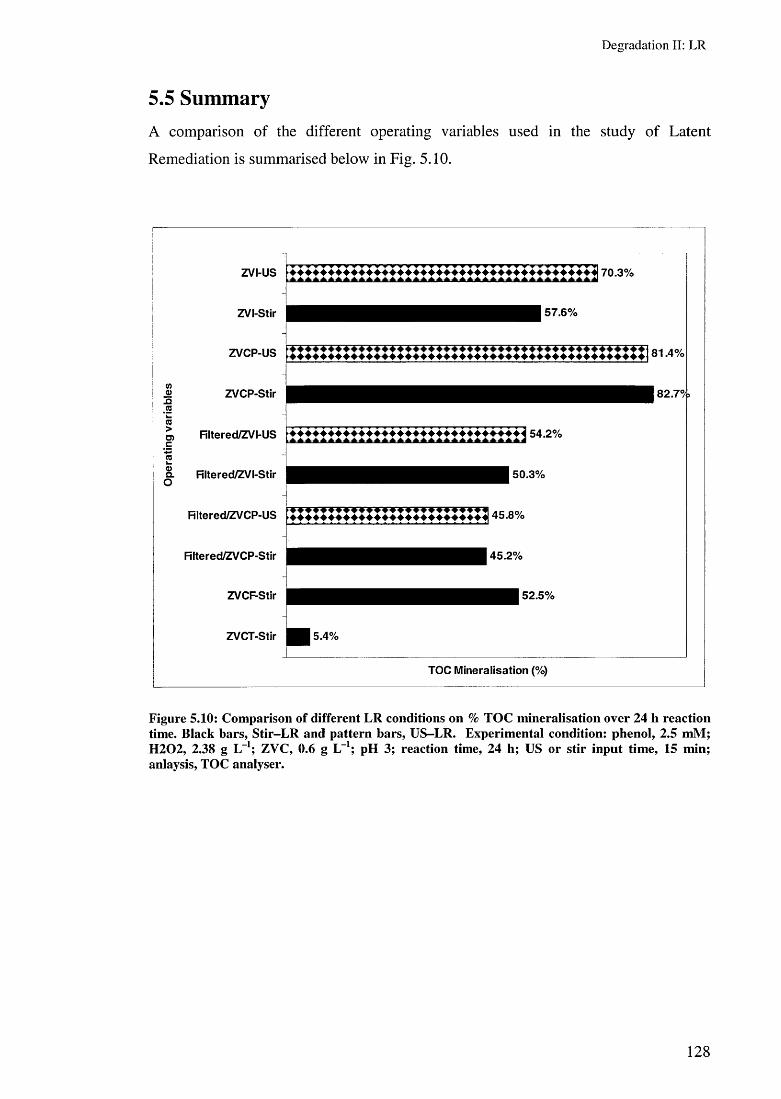
D eg rad a tio n II: L R
5.5 SummaryA comparison of the different operating variables used in the study of Latent
Remediation is summarised below in Fig. 5.10.
zvi-us
ZVI-Stir
ZVCP-US
ZVCP-Stir
V V TT f W W W W V W V W W W V W W W V V W W W W V W + W V W W '. .
***■ *****. '
57.6%
♦♦♦♦♦♦♦♦♦♦♦♦♦♦♦♦♦♦♦♦♦♦♦♦♦♦♦♦♦♦♦♦♦♦♦♦♦♦♦♦♦♦♦♦♦♦
o, Rltered/ZVI-US ♦ ♦ ♦ ♦ ♦ ♦ ♦ ♦ ♦ ♦ ♦ ♦ ♦ ♦ ♦ ♦ ♦ ♦ ♦ ♦ ♦ ♦ ♦ ♦ ♦ ♦ ♦ ♦ ♦ ♦ <54.2% '*****************************
o. Rltered/ZVI-Stir O
Rltered/ZVCP-US
Rltered/ZVCP-Stir
50.3%
wwwwwwwwwwwwwwwwwwwwwwwwwm Al. QO/
45.2%
ZVCFStir
ZVCT-Stir 5.4%
52.5%
TOC Mineralisation (%)
81.4%
82.7%
Figure 5.10: Com parison o f different LR conditions on % TO C m ineralisation over 24 h reaction time. B lack bars, S tir-L R and pattern bars, U S -L R . Experim ental condition: phenol, 2.5 m M ; H 2 0 2 , 2.38 g L-1; ZVC, 0.6 g L-1; pH 3; reaction tim e, 24 h; US or stir input tim e, 15 m in; anlaysis, TOC analyser.
1 2 8

D eg rad a tio n II: L R
The main aim of the study was focused on developing greener and cost-effective ways
to degrade toxic pollutants, therefore only initial 15 min sonication or stirring was
provided to the reaction medium in order to initiate HO» production from H 2 O2 and
ZVI or ZVCP. From the above study, the following conclusions may be drawn:
■ Mechanical activity and high intensity 20 kHz US-LR along with a ZVI
catalyst is more effective at mineralising phenol than 300 and 520 kHz.
■ Increased sonication time of 30 min, did not have any pronounced effect on the
LR rates.
■ Higher amounts of ZVCP (5 g L-1) did not prove to be beneficial in increasing
LR rates, whereas higher amounts of ZVCF and ZVCT showed a pronounced
increase in LR rates when compared to 0.6 g L- 1 attributed to the presence of
larger surface area.
■ The presence of oxidant and catalyst in the bulk solution was found to be
essential to carry out efficient LR using the Advanced Fenton Process.
■ ZVI-mediated LR performed best in US initiated reactions, whereas ZVCP
lead to equal % mineralisation with both US and/or stirred reactions.
■ The presence of a heterogeneous catalyst in bulk solution is beneficial and
leads to >80% TOC mineralisation.
■ ZVCP could be used as an alternative catalyst in Fenton-like reactions and/or
the AFP.
■ Toxicity evaluation prefers ZVI for integrated wastewater treatment systems.
■ Overall Latent Remediation provides an emerging technology to treat toxic
wastewaters at comparatively low costs and decreased energy inputs.
129
D eg rad a tio n III: A C C
Chapter 6
Degradation III: Investigation of activated
carbon cloth and oxidants for phenol
removal via adsorption/oxidation
Platform presented paper: International O zone Conference
C hand , R. (15 th- 1 6 th M ay 2008). R em ed ia tion o f pheno lic w astew aters u sin g ozone, h y d ro g en p e ro x id e
ca ta lysts and cav ita tion . In tern a tio n a l C on ference on O zone a n d R e la ted O xidan ts in A d v a n c e d
T rea tm en t o f W ater. B russe ls, B elgium . [Specia l p rize aw arded fo r bes t p resen ta tion ].
130

D eg rad a tio n III: A C C
6.1 IntroductionUntil recently, industrial effluents were treated by traditional techniques like filtration,
reverse osmosis, flocculation, coagulation, precipitation and finally incineration. In a
traditional approach, the pollutants were transferred from the liquid phase to a solid
phase and for years activated carbon (AC) has been known as the best for adsorption
of various toxic pollutants. Activated carbon is commercially produced and widely
used in various treatment methods to remove toxic pollutants from the environment,
i.e., packed towers with AC have been extensively utilised as air pollution control
devices. Likewise there are many reports on the adsorption of toxic pollutants on the
surface of the AC (Takaoka et a l , 2007). However, adsorption of toxic pollutants
from either gas or liquid phases onto a solid phase is not the final disposal method,
therefore secondary treatment or combined technologies are required to effectively
treat the adsorbed pollutant and also reuse the spent AC.
Individual and combined techniques utilising granular activated carbon (GAC) and
other Advanced Oxidation Processes (AOPs) have been commonly used in water and
wastewater treatment in order to remove toxic pollutants (Faria et a l, 2005; Lin and
Lai, 2000; Lin and Wang, 2003; Lopez-Lopez et a l, 2007; Quinlivan et a l, 2005;
Zhang et a l, 2006), however on the industrial scale, the use of fibrous activated
carbon in the form of cloth (ACF/ACC) or felt has received enormous attention as an
adsorbent for purifying water as well as air (Brasquet et a l, 1996; Delanghe et a l,
1996; Economy et a l, 1996; Le Cloirec et a l, 1996, 1997). ACC/ACFs are produced
from a natural or synthetic precursor by carbonisation and activation at 800/1000 °C in
the presence of CCL or steam (Suzuki, 1991). The ACFs, so produced have high
specific surface areas (800-2000 m 2 g-1) and micropores with diameters in the range
from 5 to 2 1 A, are directly connected to the external surface of the fibres ensuring
that the initial adsorption velocities are higher than that of granules (Ryu, 1990).
For over two decades, ACs have also been efficiently used as metal catalyst support
material but there are very few reports of the effects of AC on the decomposition of
toxic organic substances at low temperatures (Bozzi et a l, 2005; Carabineiro et a l,
1999; Shimada et a l, 1998). Bozzi et a l (2005) reported the decomposition of
industrial wastewaters on non-adsorbing Fe/C fabrics (combination of AC and Fenton-
131

D eg rad a tio n III: A C C
based systems) and addressed the pre-treatment of toxic and recalcitrant compounds
such as chlorinated aromatics and non-aromatics, anilines, phenols and methyl-tert-
butyl-ether (MTBE) found in industrial wastewaters. In that study, the main aim was
to reduce the TOC (the hydraulic load) for further bacterial processing during the
secondary effluent treatment and the degradation rates were studied as a function of
the amount of oxidant (H2 O2 ) used, recirculation rates, solution pH and temperature.
Results indicated the potential of Fe/C fabrics as Fenton immobilised catalysts in the
treatment of real wastewaters containing important families of toxic industrial
compounds. Fe/C fabrics have also successfully been reported for the degradation of
azo-dye Orange II (Yuranova et al., 2004) and Fe/Silica fabrics for degradation of
industrial wastewaters (Bozzi et al., 2003). Other researchers have attempted to
decompose toxic organic compounds, like trichloroethylene and pentachlorophenol,
by combined techniques of AC and microwave irradiation, however the relationship
between the nature of the carbon and the organic compounds decomposition have not
been discussed in detail (Jou, 1998; Liu et al., 2004).
Furthermore, it is believed that the characteristics of the surface of the AC such as the
number of active sites (free radicals) and the functional groups present both influence
the overall reaction and relationship between the organic compounds and the AC
(Gomez-Serrano et al., 1994; Otake and Jenkins, 1993; Strelko et al., 2002;
Szymanski et al., 2002). Carbon functionalisation with oxygen, nitrogen and sulphur
has been widely investigated and oxygen surface groups have been reported to be, by
far, the most important in influencing the properties of carbon (Boehm, 2002).
Recently, in a separate study, it was reported that a reducing treatment with H 2 could
also strongly modify the redox properties of an AC resulting in remarkable effects on
the catalytic properties towards decomposition of H 2 O 2 and oxidation of aqueous
organic pollutants (Oliveira et al., 2004).
Since the main objective of this current study was to assess the effect of different types
of activated carbon cloths (ACC), pH, temperature and different oxidising agents, i.e.,
H2 O2 and O3 in conjunction with ACCs on phenol removal via adsorption/oxidation,
previous findings and observations with H 2 O2 /O 3 /AC, in particular, have been taken
into account and are presented here to present a background for this study.
132

D eg rad a tio n III: A C C
As discussed above, adsorption on AC is one of the most commonly used treatments,
which are process based, for the concentration and immobilisation of pollutants on the
surfaces of granular/powdered AC, termed as ‘interface phenomenon’. However,
tertiary treatment by adsorption alone is not an environmentally complete system,
unless the immobilised pollutants on the spent or used carbon surface are removed as
well. Thus, adsorption alone cannot be compared as to the treatments via advanced
oxidation systems, where there is neither any accumulation nor transport o f the
pollutant from one medium to another (Ince and Apikyan, 2000). Thus, there have
been proposed advanced methods, termed phase transfer oxidation, to cope with this
problem involving two simultaneous operations: (i) fixed-bed adsorption of the
pollutant from the effluent and (ii) advanced oxidation for destructive regeneration of
the adsorbent (Liu et ah, 1996; Mourand et al., 1995; Notthakun et al., 1993). This
strategy has been reported to provide significant benefits as ‘on-site regeneration’ and
eliminate loading, transportation and repackaging of the adsorbent (Mourand et al.,
1995).
Hydrogen peroxide (H2 O2 ) in conjunction with AC tends to modify the catalytic
properties of AC for adsorption and/or degradation, however yet again, in this context
of granular activated carbons (GAC) have been discussed in detail with different view
points but there are very few reports describing ACCs/ACFs in conjunction with
O3 /H 2 O2 at room temperature (Lei et a l , 2007). The oxidation of organic compounds
in the aqueous medium using H 2 O2 catalysed by AC has been investigated and
reported an interesting feature emerges wherein the AC acts as adsorbent as well as
catalyst/promoter for the oxidation of organic contaminants (Ince and Apikyan, 2000;
Ince et al., 2002; Lucking et al., 1998). Catalytic decomposition of H2 O2 and 4-
chlorophenol (4-CP) was studied in the presence of AC and results revealed that the
combination of H2 O2 and GAC did not increase the total removal of 4-CP over single
GAC adsorption (Huang et al., 2003). Although, the decomposition mechanism of
H2 O2 is still not well understood several electron transfer processes have been
suggested to take place during the reaction. According to these mechanisms, it is
believed that reaction might be initiated by a reducing site transferring an electron to
H2 O2 to produce a HO* radical or by reaction of peroxide transferring an electron to
an oxidising site yielding a HOO* species (Biniak et al., 2002; Falcon et al., 2001;
133

D eg rad a tio n III: A C C
Grajek et aL, 2001; Heil and Sontheimer, 1972; Jans and Hoigne, 1998; Khalil et ah,
2001; Radeke et al., 1989; Yang and Mccreery, 2000).
Oliveira et al. (2004) proposed a competitive mechanism (Scheme 6.1) for the H 2 O2
reactions in the presence of AC and reported that both reactions, i.e., H 2 O2
decomposition and oxidation of organics by H 2 O2 were taking place via radicals as
suggested by the inhibition effect observed during the H 2 O2 decomposition by the
presence of organics such as phenol, hydroquinone and the Drimaren Red textile dye.
The author explained that the reactions were initiated by the activation of H 2 O 2 by a
reducing site in a Fenton like reaction (Ince and Apikyan, 2000; Ince et al., 2002;
Lucking et al., 1998) to produce an HO* radical intermediate, which could then react
according to the two competitive pathways: (i) reacting with another H 2 O2 molecule
leading to the decomposition to O2 and (ii) oxidation of organic molecules in aqueous
medium. This explanation could be helpful later while discussing
adsorption/oxidation interaction of different ACCs and H 2 O2 for phenol removal.
h + + o 2
h o 2* <
Activated carbon Reducing site (e~)
Activatedcarbon h 2 o 2
Oxidation of organics
h o 2*
Schem e 6.1: Proposed com petitive m echanism for the H 20 2 reactions in conjunction w ith AC (O liveira et a l., 2004).
134

D eg rad a tio n III: A C C
The above reactions could also be presented as follows Eq. 6.1 and 6.2 (Khalil et a l,
2001):
AC-OH + H+OOH------ ► AC-OOH + H20 (6.1)AC-OOH + H2 0 2 ------- ► AC-OH + H20 + 0 2 (6.2)
As discussed above, AC is considered to function as an electron transfer catalyst
similar to the Haber-Weiss mechanism known for the Fenton reaction with AC and
AC+ as the oxidised and reduced catalyst states (Kimura et a l, 1996) (Eq. 6.3 and
6.4):
AC + H2 0 2-------► AC+ + HO* + OH- (6.3)AC+ + H 2 0 2 --------► AC + H 0 2* + H+ (6.4)
The above equations have supported various studies showing that contaminant
removal in aqueous AC suspensions can be achieved (Huang et a l, 2003; Lucking et
al, 1998). Huang et al. (2003) compared several AC samples after treatment with
oxidising agents and studied their decomposition and catalytic activity and reported
that the decomposition activity of the modified AC sample towards H2 0 2 was lower;
on the contrary, the catalytic activity towards the decomposition of 4-chlorophenol
was slightly higher as compared to the virgin AC.
Likewise, based on findings by Jans and Hoigne (1998), the activity of AC for the
transformation of ozone (O3 ) into HO* radicals including various operational
parameters, i.e., carbon/ 0 3 dose, carbon type and treatment time was also quantified
(Sanchez-Polo et a l, 2005b). These authors presented a similar conclusion for O3 as
H2 0 2 that in conjunction in AC/O 3 system, AC does not really act as catalyst but
rather as a conventional initiator or promoter for the O3 transformation into HO*
radicals. They also reported that O 3 decomposition constant (Ap) increases with the
presence of AC in the system and also depending on the type of AC added, the ratio of
HO* and O3 , i.e., Rct value ([HO*]/[0 3 ]), increases by a factor 3-5. Their results also
revealed that the activity of the AC, as measured by the ability to transform O3 into
HO* radicals, depended on the surface chemical and textural properties and the most
efficient carbon materials were those with high basicity and large surface area. Their
results showed that interaction between the O3 and pyrrole groups present on the
135
D eg rad a tio n III: A C C
surface of the AC increases the concentration of CL*- radicals in the system, which in
turn enhances the transformation of O3 into HO* radicals. Additionally, it was
reported that the activity of AC decreases with prolonged exposure to O3, which
proves that AC really does not act as catalyst but as an initiator for the O3
transformation to HO* radicals.
Thus, O3 has also been extensively studied in conjunction with AC as it is believed
that the combined technology of ozonation with other catalysts i.e., catalytic ozonation
minimises its practical limits, including selective oxidation and low O3 utilisation
efficiency in wastewater treatment (Cannon et al, 1996; Croll, 1996; Fontanier et a l,
2006; Kainulainen et a l , 1995). In the presence of AC, O3 offers enhanced process
yields possibly due to catalytic effects provided by the active surface groups (Zaror,
1997). The Boehm titration’s and FTIR studies also indicated that the ACF/O 3
systems in water can significantly change the composition of the acidic surface
oxygen-containing groups of the ACF, leading to an increase in the carboxylic,
hydroxylic and carbonylic groups as well as a slight increase in the lactonic groups
(Qu et al., 2007). Likewise, the effect of temperatures (25 °C and 100 °C) was studied
with AC/O3 systems for their ability to adsorb, phenol, /?-nitrophenol and p-
chlorophenol from aqueous solutions and it was reported that as a rule, O 3 treatment at
either room temperature or 100 °C gave rise to acidic surface oxygen groups (SOG),
however at 25 °C primarily carboxylic acids were formed while a more homogeneous
distribution of carboxylic, lactonic, hydroxyl, carbonyl groups was formed at 100 °C
(Alvarez et a l, 2005). The study also showed that exposure of GAC to O 3 at room
temperature decreased the ability to adsorb phenols, whereas at 100 °C, the adsorption
was not restricted but, in fact, enhanced.
In the GAC-O 3 integrated process, pollutant removal is improved while the time
before the GAC is exhausted is prolonged and therefore this process has turned out to
be an attractive alternative in dye, textile and other organic wastewater treatment
(Faria et a l, 2005; Quinlivan et a l, 2005; Sanchez-Polo and Rivera-Utrilla, 2003).
This integrated technology in wastewater treatment presents strong synergistic effects,
especially in the mineralisation of organic compounds (Rivera-Utrilla and Sanchez-
Polo, 2002; Sanchez-Polo et a l, 2005a; Sanchez-Polo and Rivera-Utrilla, 2003, 2006).
136

D eg rad a tio n III: A C C
Adsorption-ozonation-regeneration (Faria et cil., 2005; Lin and Lai, 2000; Lin and
Wang, 2003) suggests that GAC possesses excellent adsorption ability, where the
pollutants get adsorbed onto the surface, gradually oxidise and in the meantime the
GAC gets regenerated. Whereas, in catalytic ozonation (Sanchez-Polo and Rivera-
Utrilla, 2003), GAC initiates the radical-type chain reactions in the aqueous media and
the oxidation process is catalysed by the GAC.
Detailed reaction mechanisms and kinetics of the integrated AC/O 3 process for both
single ozonation and AC-ozonation have been presented in a study for the ozonation
of aqueous gallic acid using AC at pH 5 and their positive synergism has also been
discussed (Beltran et al., 2006). Hydrogen peroxide, ketomalonic acid and oxalic
acids were identified as by-products (Eq. 6.5 and 6 .6 ; G = gallic acid; Int =
Intermediates; Ox = oxalic acid and Ket, = ketomalonic acid) and also possible
mechanisms of AC-ozonation-assisted degradation have been proposed in Eq. 6 .7-
6.12. The study revealed that this process involved two main periods of reactions: (i)
complete disappearance of gallic acids, during which ozonation rates were found to be
slightly improved due to the presence of AC and (ii) AC played an important role as a
promoter due to which the total mineralisation of the organic components in the water
was achieved. Thus, in this case, the organic matter removal was reported to be the
sum of contributions of direct O3 reactions and adsorption during the first period and a
free radical mechanism likely improving surface reactions of O3 and H 2 O2 on the
carbon surface, during the second period. Also, a third transition period was reported,
where by-products reached maximum values and ozonation was probably due to both
direct and free-radical mechanisms involving O3 and adsorption.
G + CL kp ̂Int + l̂nh 2 o 2 4 _____ ^H 0 2 + 0 3 ——A C + H2O2 A C + + 6 3 ◄— HO* + Ox — HO* + Ket —
Int + H2 O2
Ket + Ox + H 2 O2
HOC + H+ many steps-► h o 2* + 0 3 * ■— ► AC-H 2 0 2
—► A C -0 + Oo
many steps many steps
►HO*-►HO*-►H2 O2
► CO2 + H2O-► co2 + h 2o
or HO 2
(6.5)(6.6)(6.7)(6 .8)
(6.9)(6.10) (6.11) (6.12)
137
D eg rad a tio n III: A C C
From the presented literature, it can be seen that a lot of studies related to GACs in
conjunction with strong oxidants reveal the catalytic efficiency and industrial potential
of ACs to treat toxic wastewaters. Hence, the main idea of this research was to
investigate the potential usage of activated carbon cloth (ACC) for toxic phenol
removal from wastewaters via adsorption and chemical oxidation.
Following are main objectives of this research to assess the effect of the single and
combined systems on phenol removal:
■ to study the effect of reactor performances (peristaltic pumps, shaker bath and
US bath) for ACC/oxidant systems
■ to compare ACC types and amounts (ACC-Std, ACC-Cu, ACC-Ag, ACC-
extra)
■ to study the effect of different concentrations of hydrogen peroxide (H2 O2 :
1.19, 2.38 and 4.76 g L “‘)
■ to explore the effect pH (3, 5.5 and 9) and temperature (20,40, 80 °C)
■ to investigate types and duration of ozone (O3) treatments (bulk and/or step
wise ozonation)
■ to examine thermal regeneration and reuse
138
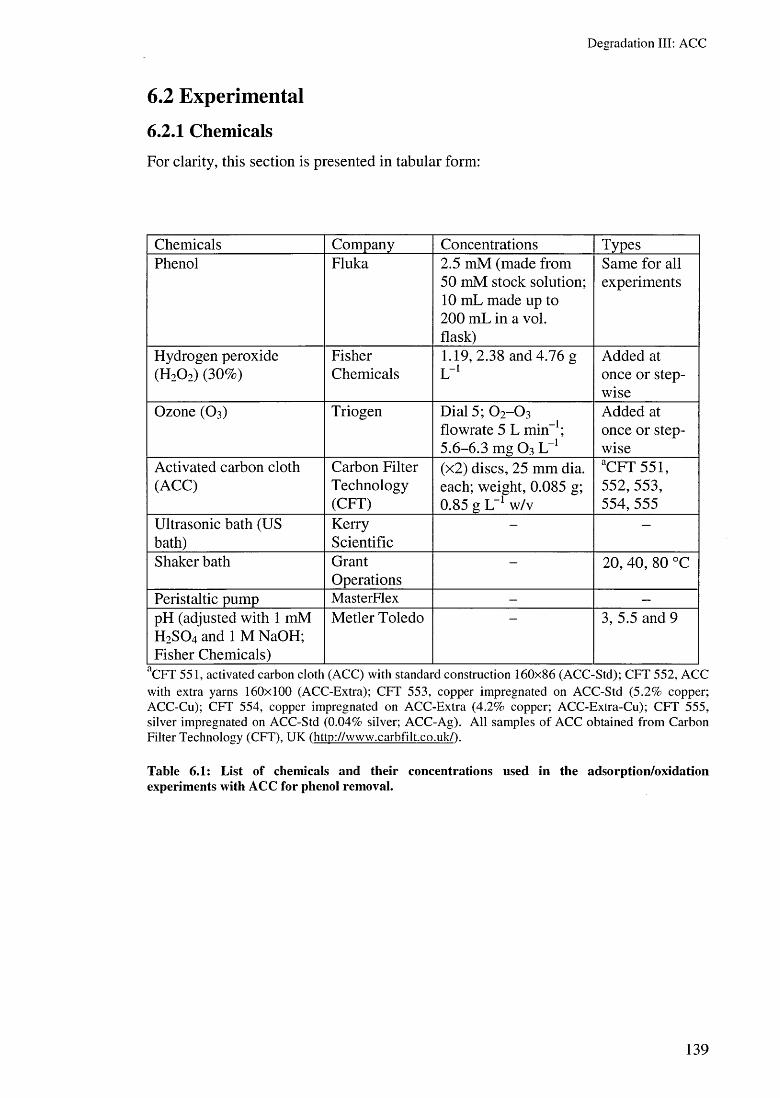
D eg rad a tio n III: A C C
6.2 Experimental6.2.1 ChemicalsFor clarity, this section is presented in tabular form:
Chemicals Company Concentrations TypesPhenol Fluka 2.5 mM (made from
50 mM stock solution; 10 mL made up to 200 mL in a vol. flask)
Same for all experiments
Hydrogen peroxide Fisher 1.19, 2.38 and 4.76 g Added at(H2 0 2) (30%) Chemicals L- 1 once or step
wiseOzone (O3) Triogen Dial 5; 0 2 -C>3
flowrate 5 L min-1; 5.6-6.3 mg O3 L- 1
Added at once or stepwise
Activated carbon cloth Carbon Filter (x2) discs, 25 mm dia. aCFT 551,(ACC) Technology
(CFT)each; weight, 0.085 g; 0.85 g L- 1 w/v
552, 553, 554, 555
Ultrasonic bath (US bath)
KerryScientific
— —
Shaker bath GrantOperations
— 20, 40, 80 °C
Peristaltic pump MasterFlex - —
pH (adjusted with 1 mM H2 S 0 4 and 1 M NaOH; Fisher Chemicals)
Metier Toledo 3, 5.5 and 9
aC F T 551, ac tiva ted carbon c lo th (A C C ) w ith s tandard co n s tru c tio n 160x86 (A C C -S td ); C F T 552 , A C C w ith ex tra yarns 160x100 (A C C -E xtra); C F T 553 , copper im pregna ted on A C C -S td (5 .2% copper; A C C -C u); C F T 554, copper im pregnated on A C C -E x tra (4 .2% copper; A C C -E x tra -C u ); C F T 555 , silver im pregnated on A C C -S td (0 .04% silver; A C C -A g ). A ll sam p les o f A C C ob ta in ed f ro m C arb o n F ilte r T echno logy (C F T ), U K (h ttp ://w w w .ca rb filt.co .u k /) .
Table 6.1: List o f chem icals and their concentrations used in the adsorption/oxidation experim ents with ACC for phenol rem oval.
139
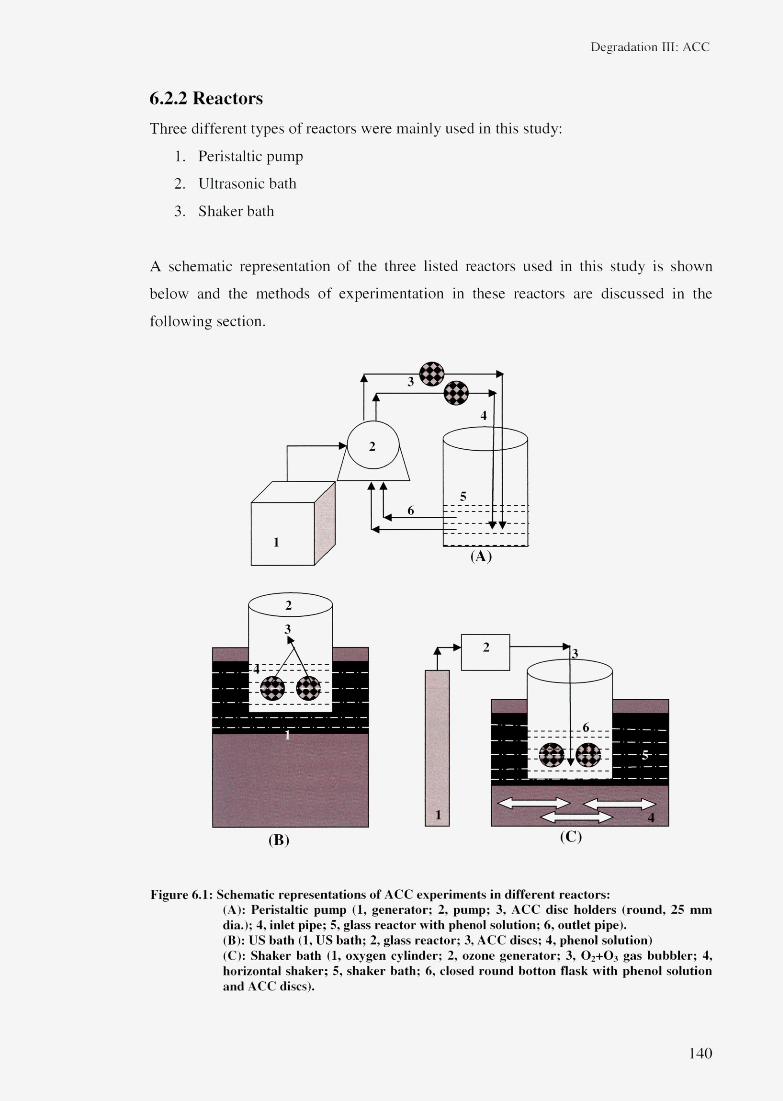
Degradation III: ACC
6.2.2 ReactorsThree different types of reactors were mainly used in this study:
1. Peristaltic pump
2. Ultrasonic bath
3. Shaker bath
A schematic representation of the three listed reactors used in this study is shown
below and the methods of experimentation in these reactors are discussed in the
following section.
F ig u re 6 .1 : S ch em a tic r e p re s e n ta t io n s o f A C C e x p e r im e n ts in d if fe r e n t r e a c to r s :(A ) : P e r is ta lt ic p u m p (1, g e n e r a to r ; 2 , p u m p ; 3, A C C d isc h o ld e rs ( ro u n d , 25 m m d ia .) ; 4 , in le t p ip e ; 5, g la ss r e a c to r w ith p h en o l s o lu t io n ; 6 , o u tle t p ip e ).(B ) : U S b a th (1, U S b a th ; 2 , g la ss r e a c to r ; 3, A C C d isc s ; 4 , p h e n o l s o lu tio n )(C ) : S h a k e r b a th (1, o x y g en c y l in d e r ; 2, o zo n e g e n e r a to r ; 3 , O 2+ O 3 g a s b u b b le r ; 4, h o r iz o n ta l s h a k e r ; 5, s h a k e r b a th ; 6 , c losed r o u n d b o tto n f la sk w ith p h e n o l so lu tio n a n d A C C discs).
140
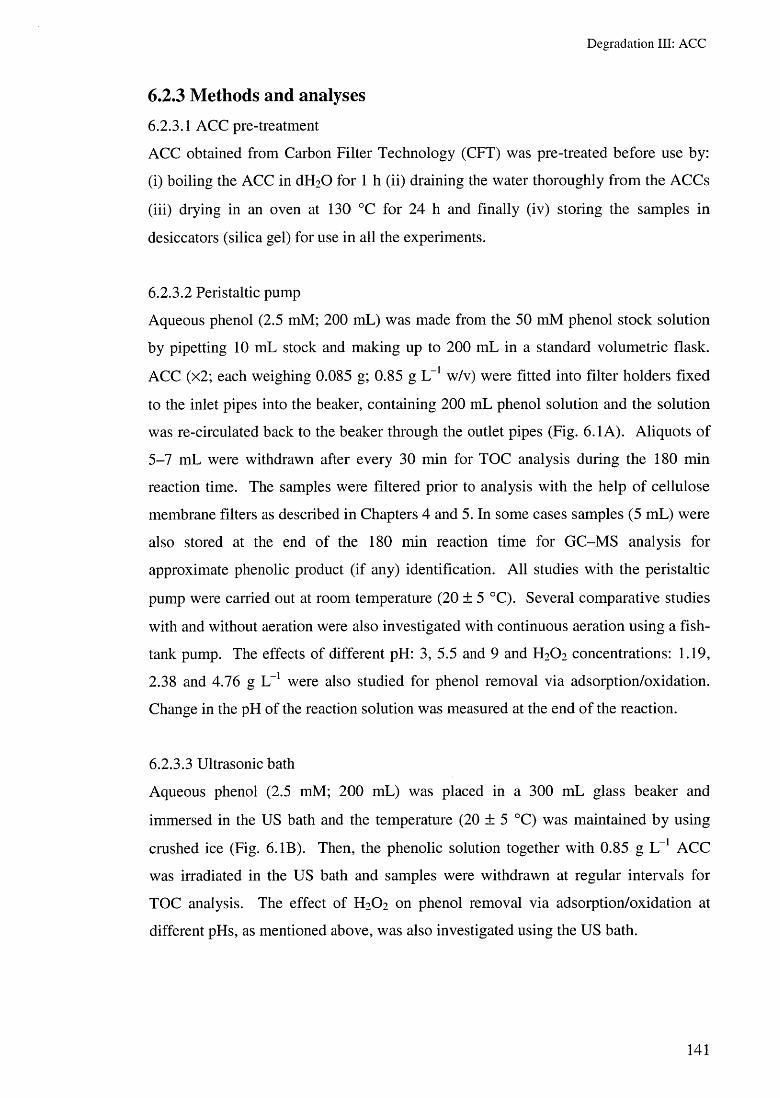
D eg rad a tio n III: A C C
6.2.3 Methods and analyses6.2.3.1 ACC pre-treatment
ACC obtained from Carbon Filter Technology (CFT) was pre-treated before use by:
(i) boiling the ACC in dH 2 0 for 1 h (ii) draining the water thoroughly from the ACCs
(iii) drying in an oven at 130 °C for 24 h and finally (iv) storing the samples in
desiccators (silica gel) for use in all the experiments.
6 .2.3.2 Peristaltic pump
Aqueous phenol (2.5 mM; 200 mL) was made from the 50 mM phenol stock solution
by pipetting 10 mL stock and making up to 200 mL in a standard volumetric flask.
ACC (x2; each weighing 0.085 g; 0.85 g L- 1 w/v) were fitted into filter holders fixed
to the inlet pipes into the beaker, containing 200 mL phenol solution and the solution
was re-circulated back to the beaker through the outlet pipes (Fig. 6.1 A). Aliquots of
5-7 mL were withdrawn after every 30 min for TOC analysis during the 180 min
reaction time. The samples were filtered prior to analysis with the help of cellulose
membrane filters as described in Chapters 4 and 5. In some cases samples (5 mL) were
also stored at the end of the 180 min reaction time for GC-M S analysis for
approximate phenolic product (if any) identification. All studies with the peristaltic
pump were carried out at room temperature (20 ± 5 °C). Several comparative studies
with and without aeration were also investigated with continuous aeration using a fish-
tank pump. The effects of different pH: 3, 5.5 and 9 and H 2 O2 concentrations: 1.19,
2.38 and 4.76 g L- 1 were also studied for phenol removal via adsorption/oxidation.
Change in the pH of the reaction solution was measured at the end of the reaction.
6 .2.3.3 Ultrasonic bath
Aqueous phenol (2.5 mM; 200 mL) was placed in a 300 mL glass beaker and
immersed in the US bath and the temperature (20 ± 5 °C) was maintained by using
crushed ice (Fig. 6 . IB). Then, the phenolic solution together with 0.85 g L- 1 ACC
was irradiated in the US bath and samples were withdrawn at regular intervals for
TOC analysis. The effect of H2 O2 on phenol removal via adsorption/oxidation at
different pHs, as mentioned above, was also investigated using the US bath.
141

D eg rad a tio n III: A C C
6.2.3.4 Shaker bath
The adsorption/oxidation of phenol (Fig. 6 .1C) was carried out in conical or round
bottom flasks as required in a shaker bath operating at 200 strokes min- 1 (SPM). The
effects of pH (3, 5.5 and 9), temperature (20, 40 and 80 °C) and bulk/step-wise
addition of ACC and O3 were also investigated.
6 .2.3.5 Ozonation
ACC-ozonation was studied in the shaker bath involving various methodologies.
Most of the ACC-ozonation experiments were designed on the basis of published
reports (Sanchez-Polo et al., 2005a; Sanchez-Polo and Rivera-Utrilla, 2003, 2006)
with the differences being the use of phenol and ACC instead of NTS acid and GAC:
1. Saturated O3 solution: the ozoniser was set to Dial 5, the O2-O 3 flowrate was 5
L min- 1 (5.6-6.3 mg O3 L-1) and dH2 0 (190 mL) was ozonated for 45 min
prior to any experiment. Then 50 mM phenol stock solution (10 mL) and x2
ACC discs were introduced to the reaction solution
2. A C C was saturated with O3 by subjecting A C C s to dH2 0 (200 mL) and
ozonating the solution for either 15 min or 150 min to get A C C saturated,
termed specifically as A C C 1 5 and A C C 15 0 in the study. The A C C 1 5 0 and
A C C 15 were further immersed in the 45 min ozonated water solution (190 mL)
with 10 mL phenol solution taken from 50 mM stock solution. Phenol removal
were studied with the help of TOC analysis
3. Direct ozonation (Dial 5; O2-O 3 flowrate 5 L min-1; 5.6-6.3 mg O3 L-1)
■ 15 min initial ozonation of phenol solution (No ACC)
■ x3 5 min ozonation of phenol solution at time 0, 60 and 120 min (No
ACC)
■ 15 min initial ozonation of ACC-Std + phenol solution
■ x2 15 min ozonation of ACC-Std + phenol solution after 240 min and
360 min
142

Degradation III: ACC
6 .2.3.6 Regeneration and reuse
Thermal regeneration of the catalyst (ACC-Std) was carried out by initially using the
catalyst (x5 ACC-Std) for 240 min in the phenol solution and then heating the same
catalyst in the oven at 130 °C for different periods: 1, 3, 5, 7 and 9 days (e.g., 1 day;
Fig. 6.2) and reusing it again for 4 more times by subjecting it every time to 2.5 mM
phenol solution in a 500 volumetric flask. Percentage adsorption/oxidation was
measured every time at 0 and 240 min of reaction by measuring TOC.
1 d ay /1 3 0 °C 1 d ay /1 3 0 ° C
3_A (g)x5 / 4 \1 d ay /1 3 0 °C 1 d ay /1 3 0 ° C
In it ia l ru ni _ A ® x 5 C j _ A• 1 < st1 st reu se 2 nd re u se 3rd re u se 4 lh re u se
F ig u re 6 .2 : S ch em a tic r e p re s e n ta t io n o f c a ta ly s t r e g e n e ra t io n a n d re u se s e t-u p .
143
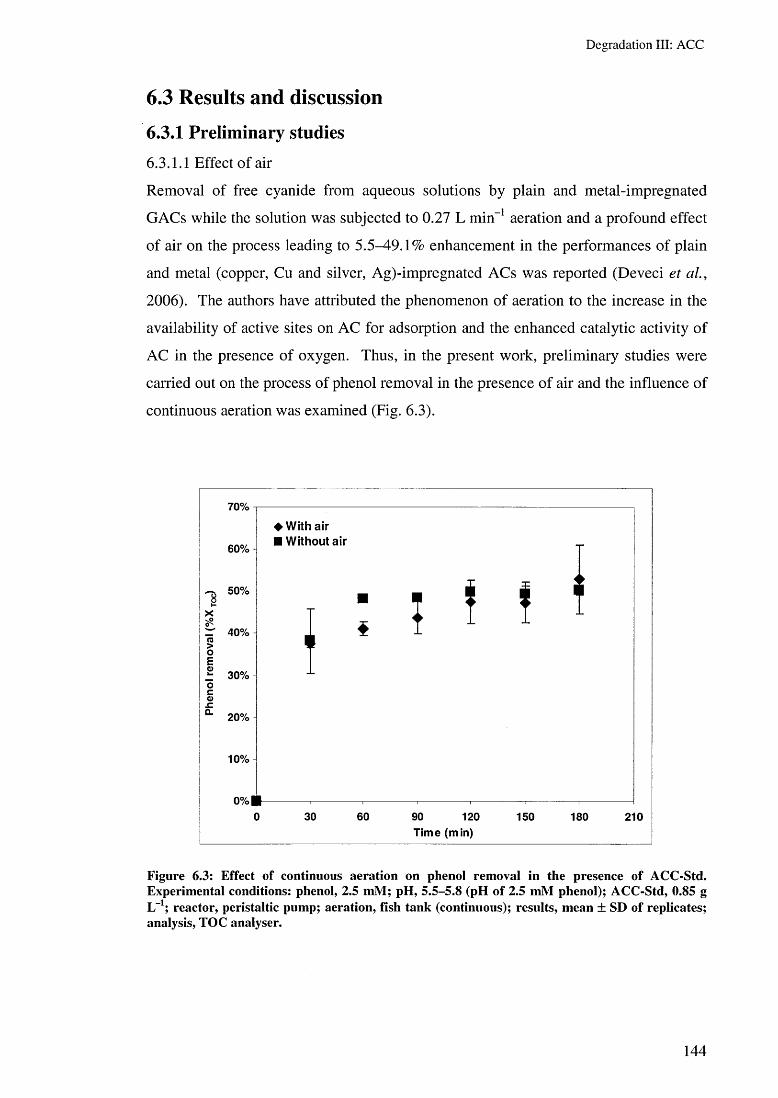
D egrad a tio n III: A C C
6.3 Results and discussion6.3.1 Preliminary studies6.3.1.1 Effect of air
Removal of free cyanide from aqueous solutions by plain and metal-impregnated
GACs while the solution was subjected to 0.27 L min- 1 aeration and a profound effect
of air on the process leading to 5.5^19.1% enhancement in the performances of plain
and metal (copper, Cu and silver, Ag)-impregnated ACs was reported (Deveci et a l ,
2006). The authors have attributed the phenomenon of aeration to the increase in the
availability of active sites on AC for adsorption and the enhanced catalytic activity of
AC in the presence of oxygen. Thus, in the present work, preliminary studies were
carried out on the process of phenol removal in the presence of air and the influence of
continuous aeration was examined (Fig. 6.3).
Figure 6.3: Effect o f continuous aeration on phenol rem oval in the presence o f A CC-Std. Experim ental conditions: phenol, 2.5 m M ; pH , 5 .5 -5 .8 (pH o f 2.5 mM phenol); A C C -Std, 0.85 g L-1; reactor, peristaltic pump; aeration, fish tank (continuous); results, m ean ± SD o f replicates; analysis, TOC analyser.
144
D eg rad a tio n III: A C C
Unlike the results reported by Deveci et al (2006), it can be easily noted that there is
no significant difference obtained with and without aeration in this study. It is
probable that the ACC-Std (0.85 g L- 1 w/v) was efficient enough to remove -50%
phenol and that is why aeration has no effect on the overall phenol removal. Also, no
change in the pH was observed at the end of 180 min reaction time. A similar
explanation was provided by Deveci et al. (2006) when low (0.2 g L-1) or high (4.5 g
L_I) concentrations of Ag- and/or Cu-impregnated AC were compared for cyanide
removal in the presence and absence of aeration. The authors noted that the
contribution of aeration to the removal of cyanide by Ag/Cu-impregnated AC tended
to decrease with increasing adsorbent dosage. Thus, it is presumed that the surface
properties and the amount of the ACC-Std used in this study remains unaffected by the
aeration. Hence, all the experiments in this study with ACC were carried out without
aeration.
6.3.1.2 Effect of reactor type
During the preliminary studies, the following three different types of reactors were
tested for adsorption/oxidation removal of phenol using ACC:
1. Re-circulatory type (peristaltic pump)
2. Horizontal shaker (shaker bath)
3. Cavitational reactor (US bath, 38 kHz)
All the comparisons were carried out without altering the pH, i.e., 2.5 mM phenol
solution pH = 5.5 and phenol removal was monitored over 180 min (Fig. 6.4).
145
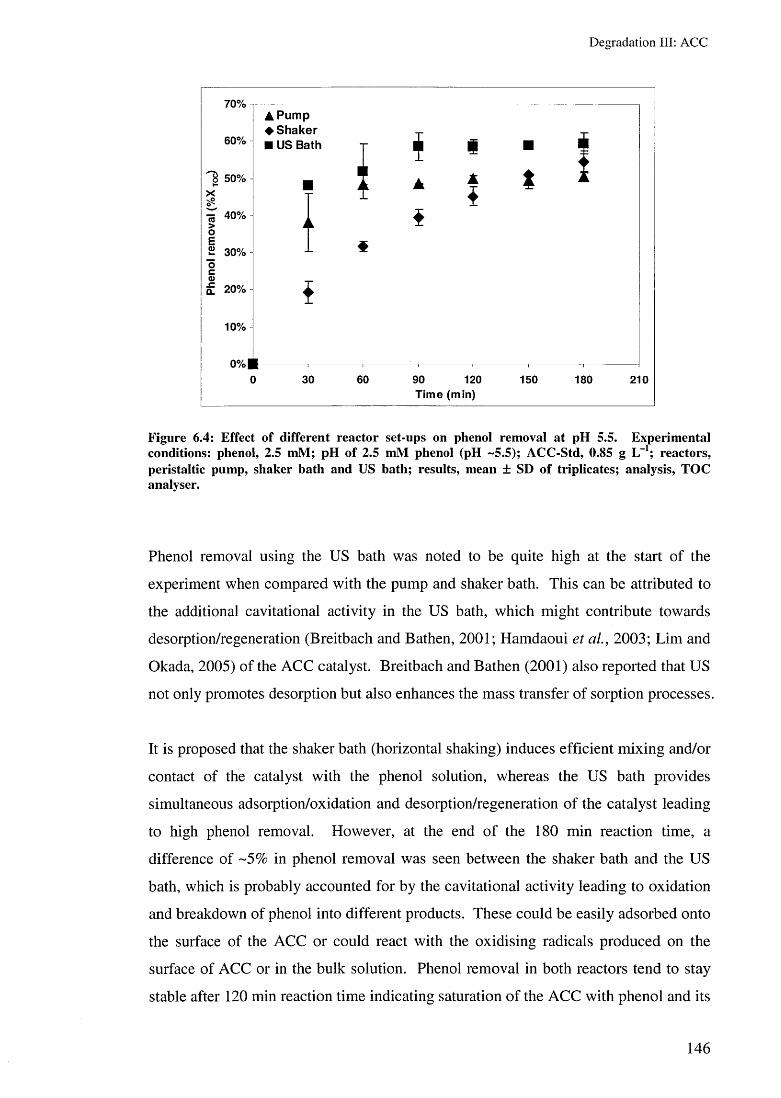
D eg rad a tio n III: A C C
Figure 6.4: Effect o f d ifferent reactor set-ups on phenol rem oval at pH 5.5. E xperim ental conditions: phenol, 2.5 mM ; pH o f 2.5 mM phenol (pH ~5.5); A C C -Std, 0.85 g LT1; reactors, peristaltic pum p, shaker bath and US bath; results, m ean ± SD o f triplicates; analysis, TO C analyser.
Phenol removal using the US bath was noted to be quite high at the start of the
experiment when compared with the pump and shaker bath. This can be attributed to
the additional cavitational activity in the US bath, which might contribute towards
desorption/regeneration (Breitbach and Bathen, 2001; Hamdaoui et ciL, 2003; Lim and
Okada, 2005) of the ACC catalyst. Breitbach and Bathen (2001) also reported that US
not only promotes desorption but also enhances the mass transfer of sorption processes.
It is proposed that the shaker bath (horizontal shaking) induces efficient mixing and/or
contact of the catalyst with the phenol solution, whereas the US bath provides
simultaneous adsorption/oxidation and desorption/regeneration of the catalyst leading
to high phenol removal. However, at the end of the 180 min reaction time, a
difference of ~5% in phenol removal was seen between the shaker bath and the US
bath, which is probably accounted for by the cavitational activity leading to oxidation
and breakdown of phenol into different products. These could be easily adsorbed onto
the surface of the ACC or could react with the oxidising radicals produced on the
surface of ACC or in the bulk solution. Phenol removal in both reactors tend to stay
stable after 120 min reaction time indicating saturation of the ACC with phenol and its
146
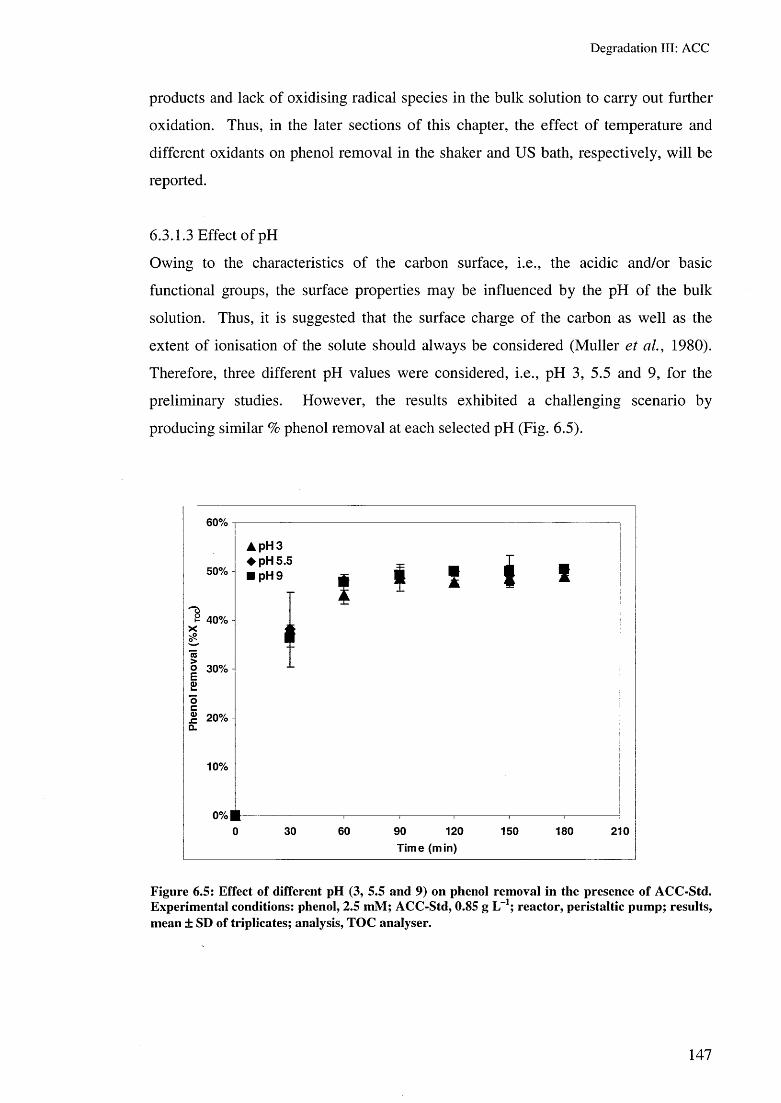
D eg rad a tio n III: A C C
products and lack of oxidising radical species in the bulk solution to carry out further
oxidation. Thus, in the later sections of this chapter, the effect of temperature and
different oxidants on phenol removal in the shaker and US bath, respectively, will be
reported.
6.3.1.3 Effect of pH
Owing to the characteristics of the carbon surface, i.e., the acidic and/or basic
functional groups, the surface properties may be influenced by the pH of the bulk
solution. Thus, it is suggested that the surface charge of the carbon as well as the
extent of ionisation of the solute should always be considered (Muller et al., 1980).
Therefore, three different pH values were considered, i.e., pH 3, 5.5 and 9, for the
preliminary studies. However, the results exhibited a challenging scenario by
producing similar % phenol removal at each selected pH (Fig. 6.5).
Figure 6.5: Effect o f different pH (3, 5.5 and 9) on phenol rem oval in the presence o f A C C -Std. Experim ental conditions: phenol, 2.5 m M ; A C C -Std, 0.85 g LT1; reactor, peristaltic pum p; results, m ean ± SD o f triplicates; analysis, TO C analyser.
147

D eg rad a tio n III: A C C
However, phenol removal at pH 3 showed a slight increase in the pH at the end of 180
min reaction time, i.e., from 3.0 to 3.4, no pH change was observed at pH 5.5, whereas
at the end of reaction time at pH 9, the pH of the bulk solution decreased from pH 9 to
8.5. Likewise there was slight increase in the total inorganic carbon (TIC) values
when the experiment was carried out at pH 9; the TIC increased up to 2.8 mg L-1,
whereas it remained unchanged (0.58 mg L-1) for pH 3 and 5.5. Rivera-Utrilla and
Sanchez-Polo (2002) accounted for dissolved inorganic carbon (ADIC = 2.37 mg L_1or
TIC in this case) at pH 7 as mineralisation of organic matter. Thus, the increase in the
TIC values in this study is accounted for by some phenol oxidation at pH 9.
In a separate study of adsorption of pentachlorophenol with ACF, it has been reported
that the solution pH always increased during the adsorption at pH < 7 but always
diminished slightly at pH > 8 (Diaz-Flores et al, 2006). They suggested that H 3 0 +
ions were adsorbed on the AC-felt at pH < 7, causing an increase in pH, whereas the
H 3 0 + ions were released from the AC-felt at pH > 8 causing decrease in pH and this
was due to the amphoteric character of the AC-felt, which had both acidic and basic
sites. Thus, it can be suggested that probably ACC-Std has both acidic and basic sites
which is why, similar % phenol removal was obtained at all the selected pHs.
Furthermore, different concentrations of oxidants and temperatures were studied at all
three selected pHs to see their combined effect on phenol removal and the results are
presented with statistical analysis later in this chapter.
148

D eg rad a tio n III: A C C
6.3.1.4 Effect of temperature
Preliminary studies with three different temperatures (20, 40 and 80 °C) were used to
investigate their effects on the phenol adsorption/oxidation in the shaker bath tested at
pH 5.5 (Fig. 6 .6 ).
Figure 6.6: Effect o f different tem peratures (20, 40 and 80 °C) on phenol rem oval in the presence o f ACC-Std at pH 5.5. Experim ental conditions: phenol, 2.5 m M ; A C C -Std, 0.85 g LT1; reactor, shaker bath; results, m ean ± SD of duplicates; analysis, TOC analyser.
The results reveal that highest percentage of phenol removal was obtained at elevated
temperatures. Similar results have been presented in the literature for adsorption of
phenolic compounds by ACs, where phenol was contacted for 10 days at temperatures:
25, 53 and 80 °C and the highest rates of phenol adsorption were noticed at 80 °C
(Grant and King, 1990). Therefore, similar experimental set-up was repeated by
altering the pH of the phenol solution to pH 3 and 9 and phenol removal was
monitored using TOC/TIC analysis. Phenol removal obtained in the shaker under
different temperatures have been compared with pump results obtained at room
temperature (20 ± 5 °C) (Fig. 6.7).
149
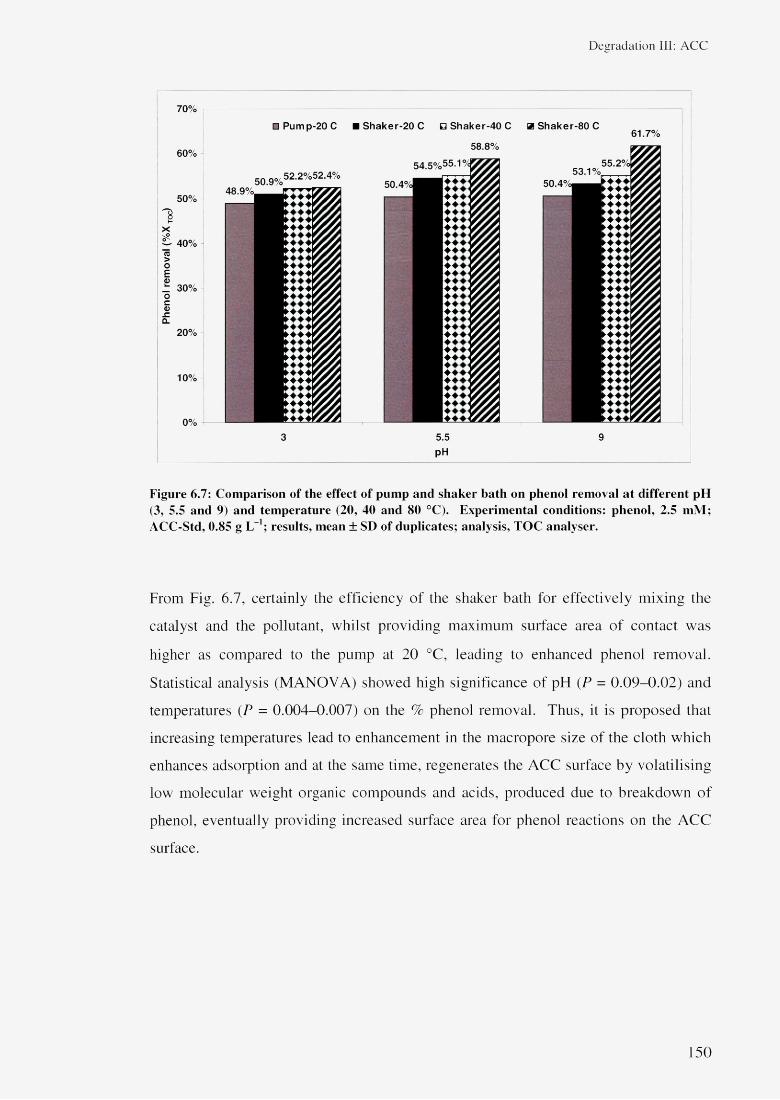
Degradation III: ACC
70%□ Pump-20 C ■ Shaker-20 C □ Shaker-40 C a Shaker-80 C
61.7%
60% 58.8%
r-r\ r\r>/ CO AO/54.5%55-1<>/
0%
a3 5.5 9
pH
F ig u re 6 .7 : C o m p a r is o n o f th e e ffec t o f p u m p a n d s h a k e r b a th o n p h e n o l r e m o v a l a t d i f f e r e n t p H (3, 5.5 a n d 9) a n d te m p e r a tu re (20 , 40 a n d 80 °C ). E x p e r im e n ta l c o n d itio n s : p h e n o l , 2 .5 m M ; A C C -S td , 0 .85 g L -1; re su lts , m e an ± SD o f d u p lic a te s ; an a ly s is , T O C a n a ly s e r .
From Fig. 6.7, certainly the efficiency of the shaker bath for effectively mixing the
catalyst and the pollutant, whilst providing maximum surface area of contact was
higher as compared to the pump at 20 °C, leading to enhanced phenol removal.
Statistical analysis (MANOVA) showed high significance of pH ( P = 0.09-0.02) and
temperatures ( P = 0.004-0.007) on the % phenol removal. Thus, it is proposed that
increasing temperatures lead to enhancement in the macropore size of the cloth which
enhances adsorption and at the same time, regenerates the ACC surface by volatilising
low molecular weight organic compounds and acids, produced due to breakdown of
phenol, eventually providing increased surface area for phenol reactions on the ACC
surface.
150

Degradation III: ACC
Lower temperatures suit the cavitational activity and that is why, pump, shaker bath
and US bath operated under room temperature conditions (20 ± 5 °C) were compared
for phenol removal at different pH 3, 5.5 and 9 (Fig. 6.8).
70% □ Pump
3 5.5 9pH
F ig u re 6 .8 : C o m p a r is o n o f th e effec t o f th e p u m p , s h a k e r a n d th e U S b a th o n p h e n o l re m o v a l a t d if fe re n t pH (3, 5 .5 a n d 9). E x p e r im e n ta l c o n d itio n s : p h e n o l, 2 .5 m M ; A C C -S td , 0 .85 g L _l; re su lts , m e an ± SD o f d u p lic a te s ; an a ly s is , T O C a n a ly se r .
The above figure clearly indicates that the effect of US is equivalent to the highest
temperature (80 °C) for effective phenol removal (-60%). As discussed in the
sections above, the effect of cavitation leads to enhancement of the active sites on the
ACC and also regenerates the catalytic activity and enhances removal of phenol and
degradation products (not known). Since, the GC-MS analysis on samples collected
from these experiments did not show any known peaks of phenolic degradation it can
be assumed that this phenomenon is mainly an activity of adsorption-desorption-
regeneration and not oxidation. This can be further proved by increasing the catalyst
amount as discussed in the following section.

D eg rad a tio n III: A C C
6.3.1.5 Effect of amount of catalyst
The effect of amount of catalyst on phenol removal was tested by introducing
increased amounts of catalyst into the reaction medium. In all the experiments so far 2
discs (0.085 g each; 0.85 g L- 1 w/v) of ACC-Std were used, whereas to study the
effect of an increased amount of catalyst, 5 discs (x5) (2.125 g L-1) ACC-Std was used.
The study was conducted using the shaker bath at room temperature, without altering
the pH of the 2.5 mM phenol solution (pH 5.5). Fig. 6.9 clearly indicates that
increasing amount of the catalyst leads to increased adsorption in the absence of any
effect from pH/temperatures/reactors. The results obtained from the GC-M S for
samples with 5 ACC discs, showed no peaks of any known degradation product of
phenol revealing no contribution from oxidation on % phenol removal.
100% 7
90%
80%
K 70%X■sPo'- 60%ra>oc 50%czu
oc0)szQ.
40%
30%
20%
10%
♦ ACC (x2 discs)
■ ACC (x5 discs)
0 %*0 30 60 90 120
Time (min)150 180 210
Figure 6.9: Effect o f am ount o f catalyst (0.85 and 2.125 g L-1) on phenol rem oval in the presence of x 2 and x5 A CC-Std discs at pH 5.5. Experim ental conditions: phenol, 2.5 mM ; tem perature 20 ± 5 °C (room); reactor, shaker bath; results, m ean ± SD of duplicates; analysis, TO C analyser.
Furthermore, as discussed in previous chapters, step-wise addition of catalyst leads to
enhancement in the rates of pollutant removal. Therefore, in this study, instead of one
bulk addition at the start of the experiment, ACC-Std disc(s) (0.085 g weight) were
152
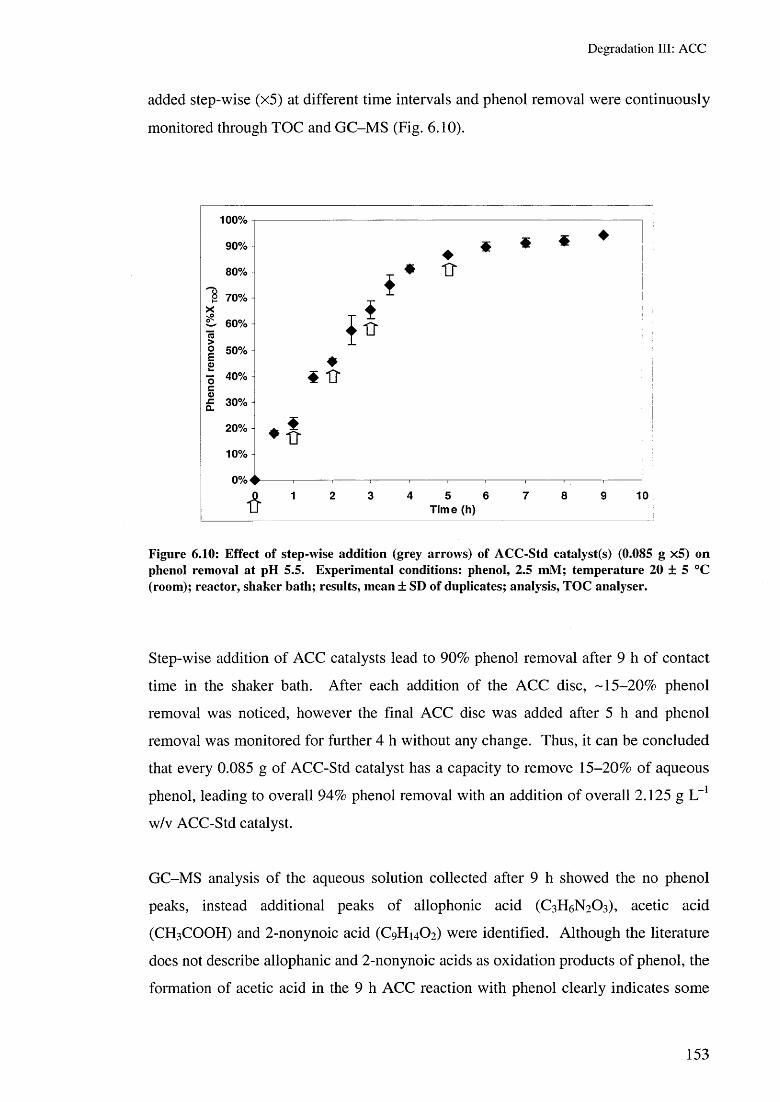
D egrada tion III: A C C
added step-wise (x5) at different time intervals and phenol removal were continuously
monitored through TOC and GC-MS (Fig. 6.10).
Figure 6.10: Effect o f step-w ise addition (grey arrows) o f A C C -Std catalyst(s) (0.085 g x5 ) on phenol rem oval at pH 5.5. E xperim ental conditions: phenol, 2.5 m M ; tem perature 20 ± 5 °C (room); reactor, shaker bath; results, m ean ± SD o f duplicates; analysis, TOC analyser.
Step-wise addition of ACC catalysts lead to 90% phenol removal after 9 h of contact
time in the shaker bath. After each addition of the ACC disc, -15-20% phenol
removal was noticed, however the final ACC disc was added after 5 h and phenol
removal was monitored for further 4 h without any change. Thus, it can be concluded
that every 0.085 g of ACC-Std catalyst has a capacity to remove 15-20% of aqueous
phenol, leading to overall 94% phenol removal with an addition of overall 2.125 g L- 1
w/v ACC-Std catalyst.
GC-MS analysis of the aqueous solution collected after 9 h showed the no phenol
peaks, instead additional peaks of allophonic acid (C3 H6 N 2 O3 ), acetic acid
(CH3 COOH) and 2-nonynoic acid (C9 H 1 4O2 ) were identified. Although the literature
does not describe allophanic and 2 -nonynoic acids as oxidation products of phenol, the
formation of acetic acid in the 9 h ACC reaction with phenol clearly indicates some
153

D eg rad a tio n III: A C C
oxidation of phenol in this study but higher phenol removal is mainly due to the
process of adsorption. Formation of higher molecular weight compounds, like 2-
nonynoic acids, are the oligomerisation oxidation products of phenol (Santos et al.,
2002).
Thus, from the above study, it can be concluded that higher amounts of ACC catalysts
over longer contact periods could lead to effective phenol removal as well as initiation
of phenol oxidation. Since the literature does not account for any specific routes of
phenol oxidation products in the presence of AC (granules/felt/fibre/cloth) prediction
of oxidation using ACC in this study is highly complex. Also, the formation of a
variety of acids (allophonic and 2 -nonynoic acids) does not give any clear indication if
they are formed as a result of phenol oxidation or complexes on surface of ACC.
Therefore, thus far only formation of acetic acid as a result of step-wise addition of the
catalyst into phenol solution over prolonged contact period (Fig. 6.10) definitely
indicates oxidation of phenol. Hence, further experiments on the effects of oxidants
such as H 2 O2 and O3 , were separately studied in conjunction with ACC to investigate
adsorption/oxidation or their combined effects on phenol removal.
6.3.1.6 Statistical analysis
Multivariate analysis (MANOVA) was carried out on the data obtained from the use
of the different variables: pH, reactors and temperatures. Significant effects are
reported with P-values. Also, the interaction of two variables has been shown in
Table 6.2. Results revealed independent significant effect of pH, temperatures and
reactors on phenol removal. The P-values which are less that 0.05 shows statistical
significance of the parameters. For better understanding the values have been
highlighted in bold. It can be clearly seen from the table that pH, temperatures and the
interaction of both the parameters showed high significance on the % phenol removal.
However, in case of pH and reactors, the reactors alone showed high significance
on % phenol removal but the interactions of the pH and reactors did not showed any
significance.
154
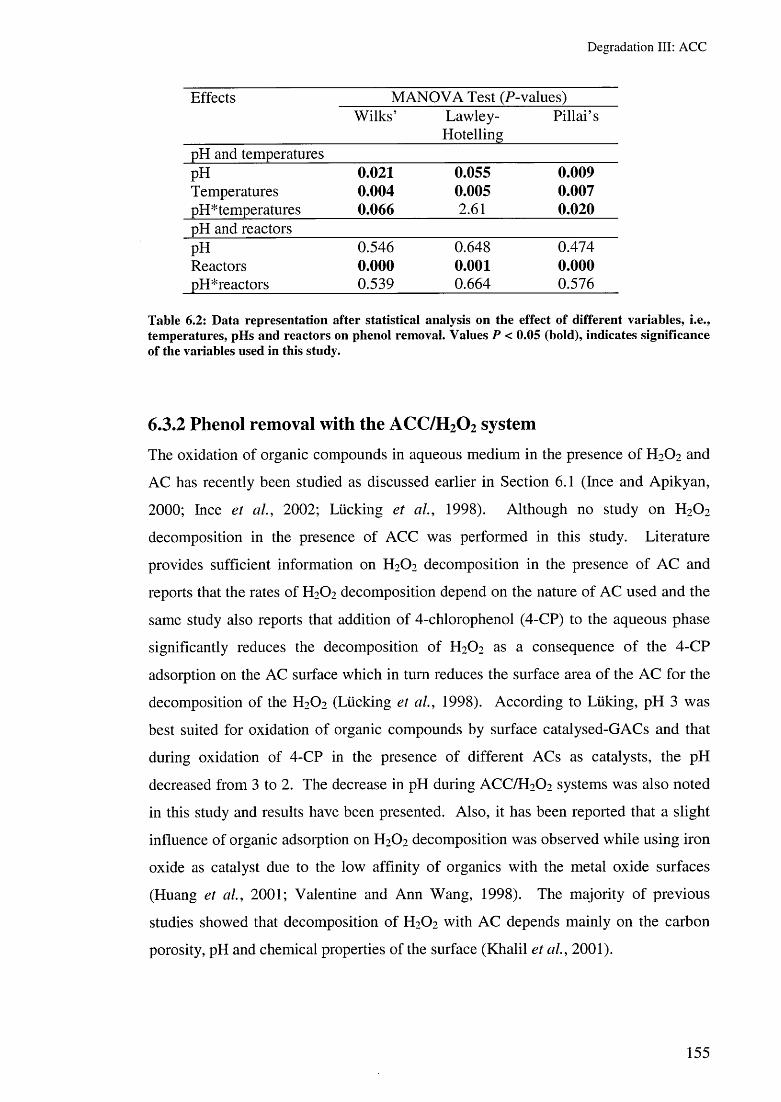
D egrad a tio n III: A C C
Effects MANOVA Test (P-values)W ilks’ Lawley-
HotellingPillai’s
pH and temperaturesPH 0.021 0.055 0.009Temperatures 0.004 0.005 0.007pH*temperatures 0.066 2.61 0.020pH and reactorspH 0.546 0.648 0.474Reactors 0 . 0 0 0 0 . 0 0 1 0 . 0 0 0
pH*reactors 0.539 0.664 0.576
Table 6.2: Data representation after statistical analysis on the effect o f different variables, i.e ., tem peratures, pH s and reactors on phenol rem oval. V alues P < 0.05 (bold), indicates sign ificance o f the variables used in this study.
6.3.2 Phenol removal with the ACC/H2 0 2 systemThe oxidation of organic compounds in aqueous medium in the presence of H 2 O 2 and
AC has recently been studied as discussed earlier in Section 6 .1 (Ince and Apikyan,
2000; Ince et a l, 2002; Lucking et a l, 1998). Although no study on H 2 O 2
decomposition in the presence of ACC was performed in this study. Literature
provides sufficient information on H 2 O2 decomposition in the presence of AC and
reports that the rates of H 2 O 2 decomposition depend on the nature of AC used and the
same study also reports that addition of 4-chlorophenol (4-CP) to the aqueous phase
significantly reduces the decomposition of H 2 O2 as a consequence of the 4-CP
adsorption on the AC surface which in turn reduces the surface area of the AC for the
decomposition of the H 2 O2 (Lucking et a l, 1998). According to Liiking, pH 3 was
best suited for oxidation of organic compounds by surface catalysed-GACs and that
during oxidation of 4-CP in the presence of different ACs as catalysts, the pH
decreased from 3 to 2 . The decrease in pH during ACC/H 2 O2 systems was also noted
in this study and results have been presented. Also, it has been reported that a slight
influence of organic adsorption on H 2 O2 decomposition was observed while using iron
oxide as catalyst due to the low affinity of organics with the metal oxide surfaces
(Huang et al., 2001; Valentine and Ann Wang, 1998). The majority of previous
studies showed that decomposition of H 2 O2 with AC depends mainly on the carbon
porosity, pH and chemical properties of the surface (Khalil et a l, 2001).
155

D eg rad a tio n III: A C C
Thus, the present study reports the effect of the ACC/H2 O2 system on phenol removal
under different pHs, ACC types and H 2 O2 concentrations. To study the effect of
cavitation, the ACC/H2 O2 system was tested in the US bath (ACC/H 2 O2 /US) along
with different concentrations of H 2 O2 . An approximate estimation of oxidation
products (if any) were also made with the help of GC-MS analysis but phenol removal
was mainly monitored with using TOC analysis. Liiking et al. (1998) described that
because of the adsorption properties of GAC, it was difficult to estimate the amount of
4-CP removed by oxidation in batch experiments, thus the DOC (dissolved organic
carbon) drop in the aqueous phase was reported as the result of adsorptive and
oxidative removal. It was also reported that during the oxidative degradation of
phenols, intermediate products with stronger adsorption properties can be formed
(Nakhla et al., 1994) but also produced are products such as organic acids which
adsorb less strongly. Therefore, the interpretation of the obtained DOC or TOC (in
this study) data is complex.
156

Degradation III: ACC
6.3.2.1 Effect of H2O2 concentrations
The effect of three different concentrations of EhCD: 1.19, 2.38 and 4.76 g L_l was
studied under the ACC/H2O2 system (Fig. 6.11).
50%
45%
40%
35%o1-X55 30%ro| 25%CD
g 20%
15%
1 0 %
5%
0%
□■0
1
i
30
□B▲
2
S
£♦
§&AA♦
pH 5.5
60 90 120Time (min)
150 180 210
F ig u re 6 .11 : E ffec t o f d if fe re n t c o n c e n tra t io n s o f H 20 2 (1 .19 , 2 .38 a n d 4 .76 g L ”1) a n d p H (3 , 5 .5 a n d 9) on th e A C C -S td /H ? 0 2 sy s tem o n p h e n o l re m o v a l. E x p e r im e n ta l c o n d itio n s : p h e n o l , 2 .5 m M ; te m p e r a tu re 20 ± 5 °C ( ro o m ); r e a c to r , p e r is ta l t ic p u m p ; r e s u lts , m e a n ± SD o f d u p lic a te s ; an a ly s is , T O C a n a ly se r .
The phenol removal trend shown in Fig. 6 .11 reveals that a lower concentration of
FFCH at pH 3 and 5.5 lead to enhanced phenol removal. Whereas, an alkaline pH of 9
at higher H2O2 concentrations (2.38 and 4.76 g L”1) leads to only 40% phenol removal
but in this case an increase in TIC values (3.2-4.5 mg L ’) was noted with increasing
concentrations of H2O2, attributing to the formation of CCF. For confirmation of
oxidation under different H2O2 concentrations and pH, GC-MS data was taken into
account and results showed formation of a variety of acids as phenol oxidation
products. A decrease in pH was also noted at different H2O2 concentrations under the
ACC/H2O2 system, indicating formation of acids and these results are summarised in
157
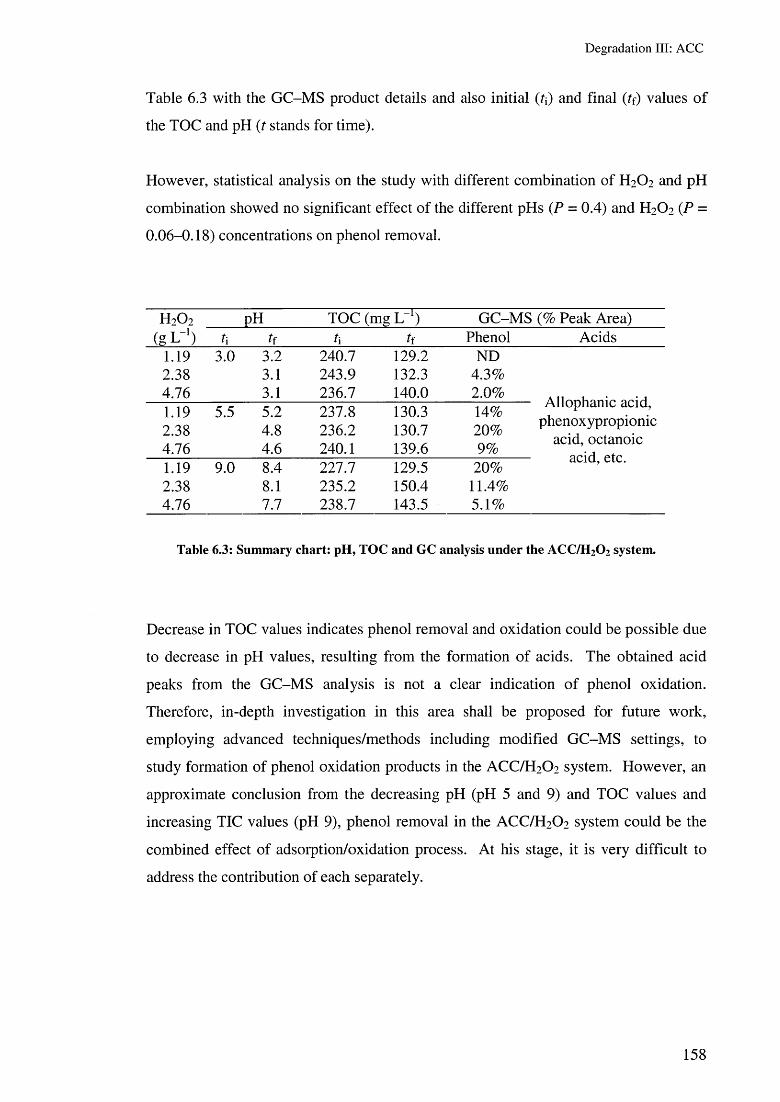
D eg rad a tio n III: A C C
Table 6.3 with the GC-MS product details and also initial (r*) and final (tf) values of
the TOC and pH (t stands for time).
However, statistical analysis on the study with different combination of H 2 O2 and pH
combination showed no significant effect of the different pHs (P = 0.4) and H2 O2 (P =
0.06-0.18) concentrations on phenol removal.
H 2 0 2 pH TOC (mg L-1) GC-MS (% Peak Area)feL "1) h k h k Phenol Acids
1.19 3.0 3.2 240.7 129.2 ND2.38 3.1 243.9 132.3 4.3%4.76 3.1 236.7 140.0 2 .0 %1.192.38
5.5 5.24.8
237.8236.2
130.3130.7
14%2 0 %
/vuopnamc acid, phenoxypropionic
acid, octanoic4.76 4.6 240.1 139.6 9%1.19 9.0 8.4 227.7 129.5 2 0 %
CIUIU., CIL.
2.38 8 . 1 235.2 150.4 11.4%4.76 7.7 238.7 143.5 5.1%
Table 6.3: Sum m ary chart: pH , TO C and GC analysis under the A C C /H 20 2 system .
Decrease in TOC values indicates phenol removal and oxidation could be possible due
to decrease in pH values, resulting from the formation of acids. The obtained acid
peaks from the GC-MS analysis is not a clear indication of phenol oxidation.
Therefore, in-depth investigation in this area shall be proposed for future work,
employing advanced techniques/methods including modified GC-MS settings, to
study formation of phenol oxidation products in the ACC/H 2 O2 system. However, an
approximate conclusion from the decreasing pH (pH 5 and 9) and TOC values and
increasing TIC values (pH 9), phenol removal in the ACC/H 2 O2 system could be the
combined effect of adsorption/oxidation process. At his stage, it is very difficult to
address the contribution of each separately.
158

D eg rad a tio n III: A C C
6.3.2.2 Effect of the ACC/H2 O2 /US system
Ultrasound has been used in conjunction with AC for adsorption-desorption studies
(Breitbach and Bathen, 2001; Hamoudi et al, 1998; Lim and Okada, 2005). The
current ACC/H2 O2 /US system study was conducted in a 38 kHz US bath (continuous
sonication) at pH 5.5 and the temperature was controlled (20 ± 5 °C) by using ice.
The effect of different concentrations of H 2 O2 , i.e., 1.19, 2.38 and 4.76 g L - 1 was also
studied to investigate if increasing concentrations of H 2 O2 in conjunction with US bath
have any enhanced effect on phenol removal (Fig. 6.12). To avoid the effect of pH in
these reactions, all experiments were carried out at pH 5.5.
Figure 6.12: Effect o f ACC-Std/H 20 2/U S system on phenol rem oval. E xperim ental conditions: phenol, 2.5 mM ; tem perature 20 ± 5 °C; pH 5.5; reactor, U S bath (continuous sonication); H 20 2: 1 .19 ,2 .38 and 4.76 g L f1; Results, m ean ± SD o f duplicates; analysis, TO C analyser.
Fig. 6.12 reveals that initially phenol removal is high with lower concentrations of
H 2 O2 (1.19 g L-1), however at the end of 180 min, all the peroxide concentrations gave
similar results (1.19, 2.38 and 4.76 g L- 1 showed 54, 52 and 50% TOC removal,
respectively). Thus, it is proved that increasing concentrations of H 2 O 2 have no
significant effect on phenol removal and this is attributed to the radical scavenging
activity of higher concentrations of H 2 O2 . MANOVA analysis showed only slight
159

D eg rad a tio n III: A C C
significance of using US bath in the ACC/H2O2 system as the obtained P-value was
0.08. GC-MS analysis on the 180 min sample showed formation of traces of formic
acid and /7-benzoquinone with 1.19 and 2.38 g L-1, respectively, revealing oxidation of
phenol in the ACC/H2O2/US system.
6 .3.2.3 Effect of ACC types/tEC^
Different types of ACCs were employed in the ACC/H2O2 system to investigate their
enhanced (if any) efficiencies to remove phenol from aqueous medium. Lucking et al.
(1998) found an optimum pH ~ 3 for the oxidation several organic compounds with
AC/H2O2, therefore ACC types/^C b were studied at this pH along with lower
concentrations of H2O2 (1.19 g L_1). Thus, comparative studies were carried out on
the shaker bath at room temperature, by addition of H 2O2 (1.19 g L”1) to the aqueous
medium after phenol and the ACCs had already been shaken together without H2O2 for
4 h. After H2O2 addition, phenol removal was monitored for the following 4 h (Fig.
6.13).
Figure 6.13: Effect o f different ACC types (ACC-Std, A C C -Std-C u (5.2% Cu), A C C -Std-A g (0.04% Ag), ACC-Extra-Cu (4.2% Cu)) on ACC types/H 20 2 system on phenol rem oval. ACC construction: ACC-Std (160 x 86) and A C C -Extra (160 x 100). E xperim ental conditions: phenol, 2.5 mM ; tem perature 20 + 5 °C (room ); pH 3; reactor, shaker bath; results, m ean ± SD o f triplicates; analysis, TOC analyser.
160

D eg rad a tio n III: A C C
With all the ACC types, 4 h of shaking lead to 42-52% phenol removal. The initial
phenol removal with ACC-Std and ACC-Std-Ag followed similar pattern, whereas the
phenol removal was relatively slow with ACC-Extra-Cu probably due to cloth
construction or unavailability of macropores. Thus, it can be addressed that cloth
construction has a significant role to play in the removal of organics and also that
presence of different amount of metals on the surface of ACC vary in the particle size
and therefore the adsorption tendencies differ for different ACC types. However,
H2O2 addition to the reaction solution resulted in nearly similar phenol removal (52-
55%) with all the chosen ACC types, indicating that 10-13% oxidation of phenol
present in the aqueous medium had occurred. Since, phenol adsorption on the cloth
reduces the surface area of the AC available for the H 2O2 decomposition (Lucking et
al., 1998) to radical species required to react with the phenolic compounds it is
proposed that the presence of H2O2 catalysed the oxidation of phenol in the presence
of ACC via an hydroxyl radical mechanism. Consequently, this enhancement could
be attributed to the adsorption and then catalytic oxidising activity in the presence of
H 2O2 and standard ACC or metal-impregnated ACC.
Statistics (MANOVA) on the effect of different types of ACCs showed slight
significance on phenol removal as the obtained P-values were in the range 0.03-0.17.
GC-MS analysis showed no peaks of phenol on the chromatogram which indicates
that even though only 52-55% TOC removal was obtained, the ACC/H2O2 system
showed complete removal of phenol after 8 h.
6.3.3 Phenol removal with ACC/O3 systemAll studies with ACC/O3 system were carried out on the shaker bath at room
temperature. The effects of phenol removal in ozonated water and direct ozonation
were studied at the natural pH of 2.5 mM aqueous phenol and at modified pHs,
respectively. Oxidation was evaluated based on the decreasing TOC/TIC and pH
values. Ozone was produced by using oxygen gas feed and all experiments were
conducted at Dial 5 settings, O2-O 3 flowrate of 5 L min- 1 (5.6 - 6 .3 mg O3 L-1). For
direct ozonation studies, both bulk and step-wise ozonation were investigated to
determine if enhanced phenol removal was seen.
161

Degradation III: ACC
6.3.3.1 Effect of ACC types/ 0 3 system
The experiments in this study were based on the work described by Sanchez-Polo and
co-workers for the treatment of 1,3,6-naphthalenetrisulphonic acid catalysed by AC
and the experimental set-up used has been discussed in Section 6 .2.3.5 (Sanchez-Polo
et a l , 2005a; Sanchez-Polo and Rivera-Utrilla, 2003, 2006). The effects of ACC-Std,
ACC-Std-Cu and ACC-Std-Ag and No ACC on ozonated water containing phenol
were compared and are presented in Fig. 6.14. The change in TOC and pH values
indicated the effect of adsorption/oxidation catalysed by the O3 decomposition on the
surface of AC (Sanchez-Polo et al., 2005b).
60%
50%
X40%
♦ No ACC A ACC-Std A ACC-Std-Cu A ACC-Std-Ag
cco 30% E0)01 20%CL
1 0 %
0% i30 60 90 120
Time (min)150 180
F ig u re 6 .14 : E ffe c t o f d if fe re n t A C C ty p e s (A C C -S td , A C C -S td -C u (5 .2 % C u ) , A C C -S td -A g (0 .0 4 % A g)) o n A C C ty p e s / 0 3 sy s tem on p h e n o l re m o v a l. E x p e r im e n ta l c o n d itio n s : p h e n o l, 2.5 m M ; A C C , 0 .85 g L - l (x2 A C C d iscs); t e m p e r a tu r e 20 ± 5 °C ( ro o m ); p H , 45 m in o z o n a te d w a te r (6 .8 —7.1); ozone , D ia l 5, 5 L m in -1, 45 m in in it ia l o z o n a tio n ; r e a c to r , s h a k e r b a th ; r e s u l ts , m e a n ± SD o f d u p lic a te s ; an a ly s is , T O C a n a ly se r .
The results obtained with the ACC types/ 0 3 system are very much in line with those
obtained from the ACC types/H^CE system as it was seen that ACC-Std-Ag was more
efficient that ACC-Std-Cu for phenol removal, which was also reported by Deveci et
al. (2006) for removal of cyanide by metal-impregnated GAC in the absence of O3.
162

D eg rad a tio n III: A C C
Even though the copper content on the cloth was higher (5.2%) than the silver content
(0.04%), to achieve 0.85 g LT1 amount, the ACC-Std-Ag disc used for the experiment
was slightly bigger in diameter (3 cm) than that of ACC-Std-Cu (2.5 cm). Probably
the increased surface area in the ACC-Std-Ag could be the reason for the higher
phenol removal which allowed more O3 reactions on the surface of the ACC for
oxidation and adsorption. However, naked ACC-Std was found to be the best for
phenol removal using ACC types/ 0 3 system.
Statistically, A C C types showed very slight significance (P = 0.03-0.1) on phenol
removal using A C C types/ 0 3 system. Furthermore, no change in TIC values were
seen for any of the A C C types used, however a notable decrease in the pH (Table 6.4)
was observed suggesting formation of acids as a result of oxidation during the
A C C / O 3 phenol treatment.
No ACC ACC-Std ACC-Std-Cu ACC-Std-AgpHi 7.1 6 . 8 7.1 6 . 8
pHf 3.7 4.1 4.2 3.9
Table 6.4: Sum m ary chart o f pH values before and after ACC/O3 treatm ent.
6 .3.3.2 Effect of ACCOZonised/ 0 3 system
It has been proposed in the literature that oxygenated surface groups of the basic
nature (chromene and pyrone) in ACs are mainly responsible for the O3 decomposition
in the aqueous phase (Sanchez-Polo and Rivera-Utrilla, 2003). Also, it has been well
documented that O3 reduction on the surface of AC generates radical species which
are responsible for initiating the decomposition of O3 in the aqueous phase into highly
oxidative species (Fomi et al., 1982; Gurol, 1982; Sotelo et cil, 1987). Thus, the aim
of the present work was to study the effect of O3-A CC reaction on the catalytic
activity of ACC during ozonation of phenol in the aqueous phase. Therefore, ACC-
Std samples were modified by exposing the catalyst to O3 for 15 min (ACC 15) and 150
min (ACC 150) and the effect on phenol removal was monitored and compared with
conditions of absence of ACC catalysts and no pre-ozone treated-ACC catalyst
referred to as ACCo (equivalent to ACC-Std) (Fig. 6.15).
163
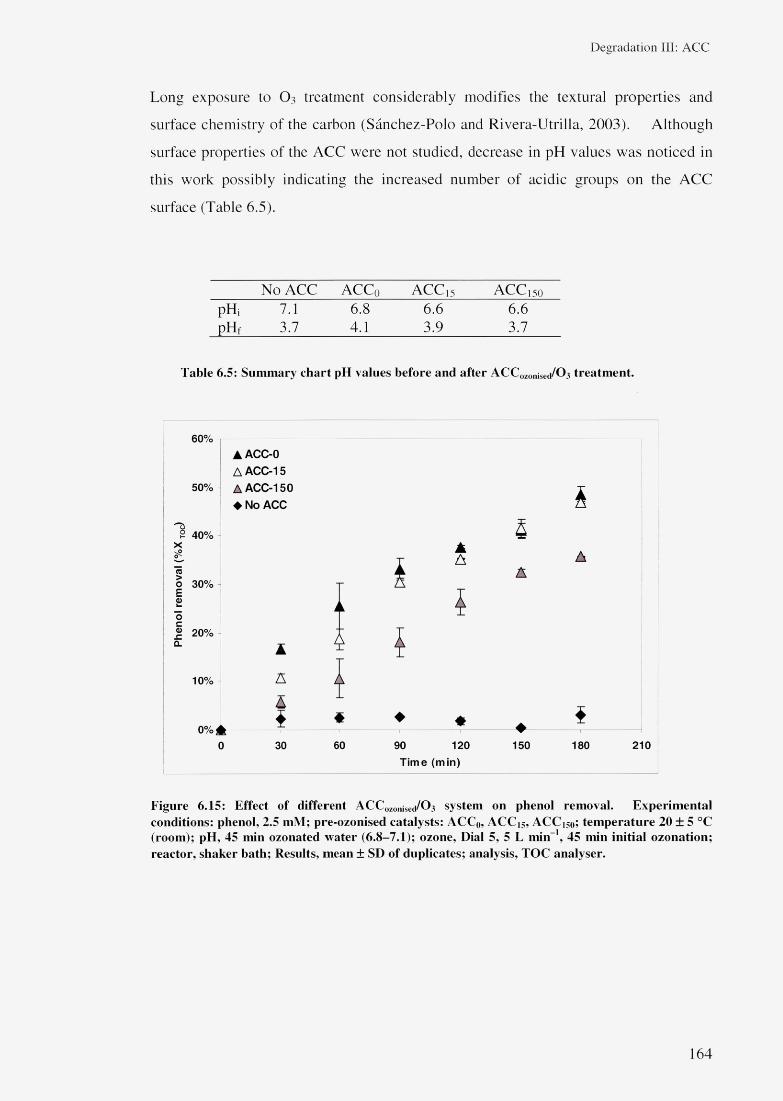
Degradation III: ACC
Long exposure to O3 treatment considerably modifies the textural properties and
surface chemistry of the carbon (Sanchez-Polo and Rivera-Utrilla, 2003). Although
surface properties of the ACC were not studied, decrease in pH values was noticed in
this work possibly indicating the increased number of acidic groups on the ACC
surface (Table 6.5).
No ACC ACC0 a c c 15 ACC 150
pH, 7.1 6 .8 6 .6 6 .6
pHf 3.7 4.1 3.9 3.7
T a b le 6 .5: S u m m a ry c h a r t p H v a lu e s b e fo re a n d a f te r A C C ozonise(1/C b t r e a tm e n t .
60%
50%
▲ ACC-0 A ACC-15 A ACC-150 ♦ No ACC
x40%
30%
20%
10%
0%i
A5
$30
i
▲A A
A
60 90 120Time (min)
150 180 210
F ig u re 6 .15 : E ffe c t o f d if fe re n t A C C 0Zonised/O 3 sy s tem on p h e n o l re m o v a l. E x p e r im e n ta l co n d itio n s : p h en o l, 2.5 m M ; p re -o z o n ise d c a ta ly s ts : A C C 0, A C C 15, A C C 150; t e m p e r a tu r e 20 + 5 °C ( ro o m ); p H , 45 m in o z o n a te d w a te r (6 .8 —7.1 ); o zo n e , D ia l 5 , 5 L m in \ 45 m in in i t ia l o z o n a tio n ; r e a c to r , s h a k e r b a th ; R esu lts , m e a n ± SD o f d u p lic a te s ; an a ly s is , T O C a n a ly s e r .
164
D eg rad a tio n III: A C C
From Fig. 6.15, it is seen that the catalytic activity of carbon diminishes in the order
ACCo>ACCi5>ACCi5o. The order is similar to the one proposed in the literature and
the authors proposed that the decrease in TOC with reaction time was due to the two
parallel phenomenon: (i) adsorption of the pollutant oxidation products on the AC and
(ii) mineralisation of the organic matter to CO2 due to O3 decomposition into highly
oxidising species (catalytic effect) (Sanchez-Polo and Rivera-Utrilla, 2003). A similar
hypothesis can be proposed for ACC in this study and it can be seen that ACC equally
offers a great opportunity to remove phenol in the presence of O3 via these optimised
treatment systems.
6.3.3.3 Effect of ACC/Direct ozonation systems
In Sections 6.3.3.1 and 6.3.3.2, initial experiments were designed based on published
reports by Sanchez-Polo and co-workers, where reactions were carried out in saturated
ozonated water conditions, however as a matter of interest direct ozonation was
studied for phenol removal in the presence of ACC. Bulk and step-wise direct
ozonation effects were also investigated in this study for their enhanced effect (if any).
From Table 6 .6 , it can be clearly seen that ozonation of phenol under alkaline pH
conditions leads to high phenol removal in the presence and absence of the ACC-Std
catalyst. More importantly, step-wise ozonation was found to be more beneficial than
bulk ozonation as it continuously provides oxidising radical species to the reaction
medium, which in-turn enhances the oxidation and this theory agrees with the
literature (Gogate and Pandit, 2004a, 2004b). The combined effect of ACC-ozonation
was observed in the ACC-Std/ 0 3 operating conditions proposing adsorption/oxidation
contribution on the high % phenol removal agreeing with discussions presented earlier
(Sanchez-Polo and Rivera-Utrilla, 2003). Also, increasing TIC values present
additional evidence of mineralisation in the ACC-Std/ 0 3 systems.
Furthermore, step-wise ozonation and a longer period of contact between the phenol,
ACC and O3 were studied for enhanced phenol removal and results are presented in
Fig. 6.16.
165

Degradation III: ACC
Treatments Time (h) pH TOC(mg LT1)t[ tf
ATIC (mg IT1)
Step-wise: 5 min ozonation (at 0 min and x2 after every 1 h) (No ACC)3 3 248.6 217.8
5.5 248.6 210.0 3.049 248.6 189.7
Bulk ozonation: 15 min at the start of the reaction (No ACC)3 3 239.6 224.1
5.5 239.6 198.8 3.799 239.6 192.4
Bulk ozonation: 15 min at the start of the reaction+( ACC-Std, 0.85 g L ')3 3 239.6 159.6
5.5 239.6 155.1 4.459 239.6 149.4
T a b le 6 .6 : S u m m a ry c h a r t o f p h en o l r e m o v a l v ia d ire c t (b u lk o r s te p -w ise ) o z o n a tio n in th e p re se n c e a n d a b se n c e o f A C C -S td c a ta ly s t.
80%
70%
60%
1
>< 50%
40%
30%
20%
10%
0%
■ pH 3 H pH 5.5 □ pH 9
46.3%
62.1%
53.5%50.1%
58.8%
tr
66 .6%68.4%
Time (h) tr
F ig u re 6 .16 : E ffe c t o f s te p -w ise d ire c t o z o n a tio n in th e p re se n c e o f A C C -S td c a ta ly s t a t d i f f e r e n t p H (3, 5.5 a n d 9) on p h en o l rem o v a l. E x p e r im e n ta l c o n d itio n s : p h e n o l, 2 .5 m M ; A C C -S td , 0 .85 g L - l (x2 A C C d isc s); te m p e r a tu re 20 ± 5 °C ( ro o m ); o zo n e , D ia l 5 , 5 L m in _1(x 2 , 15 m in ; g re y a r ro w s ) ; r e a c to r , s h a k e r b a th ; R e su lts , m e a n ± SD o f re p lic a te s ; a n a ly s is , T O C a n a ly s e r .
166

D eg rad a tio n III: A C C
Of all the systems studied so far utilising ACC catalysts, step-wise addition of O3 at
suitable time intervals over a longer contact period lead to the highest (-70% ) phenol
removal as a result of combined effect of adsorption/oxidation. Notable changes in
pH were observed (pH 3 decreased to 2.80; 5.5 to 3.04 and 9 to 3.20) indicating
formation of acids via oxidation of phenol by radicals produced due to O3
decomposition on the ACC surface. Considerable change in TIC values (2.27-6.33
mg L-1) were noticed indicating CO 2 formation due to mineralisation of the organic
compounds.
Therefore, from the ACC/O 3 system, it can be concluded that optimised conditions of
ozonation over a suitable period time with the ACC catalysts could lead to efficient
phenol removal. Moreover, the decrease of TOC during ozonation of phenol in the
presence of ACC is a result of the combined effect of two parallel systems: catalytic-
chemical oxidation and adsorption. Thus, the positive combined effects of treatments
for enhanced pollutant removal proposed through this study with ACC/H 2 O2 and
ACC/O 3 systems is in line with those suggested through combinations of various
AOPs in Chapters 4 and 5. Hence, it is seen that ACC is an emerging technology that
can be effectively used in conjunction with other AOPs to remove toxic pollutants via
adsorption/oxidation from the wastewater.
167
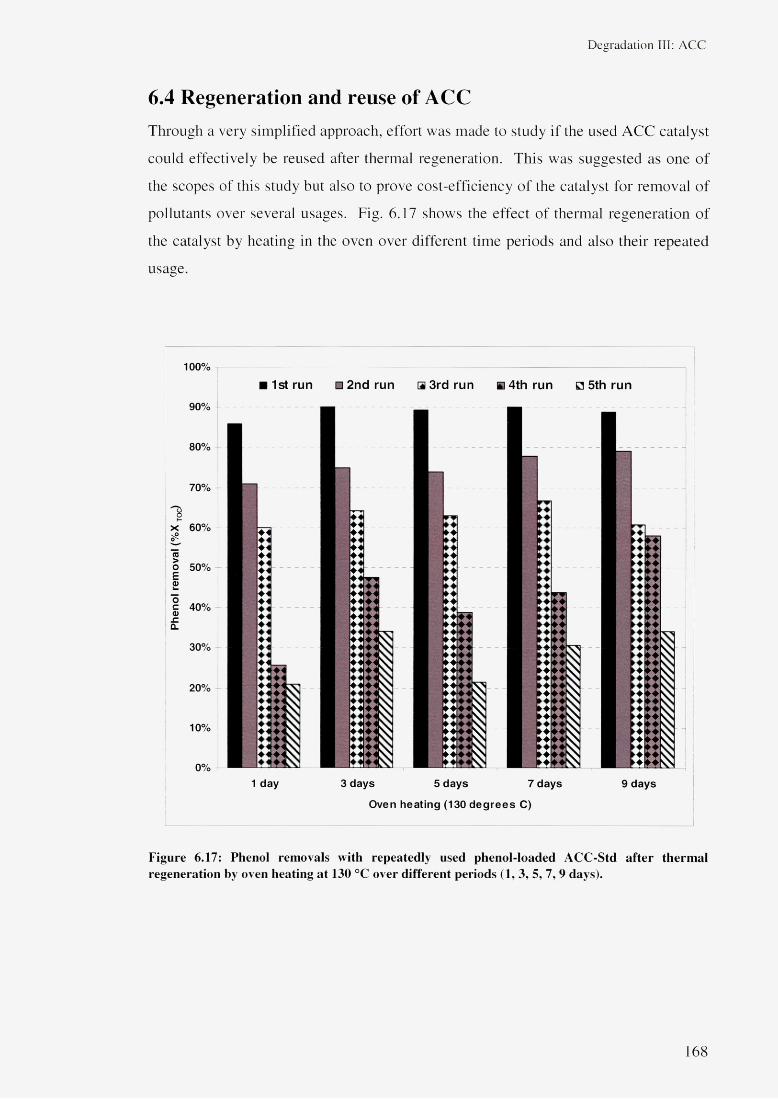
Degradation III: ACC
6.4 Regeneration and reuse of ACCThrough a very simplified approach, effort was made to study if the used ACC catalyst
could effectively be reused after thermal regeneration. This was suggested as one of
the scopes of this study but also to prove cost-efficiency of the catalyst for removal of
pollutants over several usages. Fig. 6.17 shows the effect of thermal regeneration of
the catalyst by heating in the oven over different time periods and also their repeated
usage.
10 0%
90%
1st run □ 2nd run a 3rd run a 4th run □ 5th run
80%
70%
1
X 60%
O 50% E<D
C 40% a).cCL
30%
20%
1 0 %
I
0%
44+4 444 ♦41 4 4 % ♦41 ♦41 4 4 % 444 444 4 4 4
a sa Sa si
1 day
i1
44444
I
I44444444444444444444
4 4 4 4 44 44 44 44 44 44 44 44
I44♦ ♦♦ *4 4a :|:a§asa sasasa s
3 days 5 days 7 days
Oven heating (130 degrees C)
9 days
F ig u re 6 .17 : P h en o l re m o v a ls w ith re p e a te d ly u se d p h e n o l- lo a d e d A C C -S td a f t e r th e rm a l r e g e n e ra tio n by o v en h e a tin g a t 130 °C o v e r d if fe re n t p e r io d s (1, 3 , 5, 7 , 9 d ay s ).
168
D egrada tion III: A C C
The novel part of this part of this study is the low temperatures (130 °C) used to
regenerate the catalyst and over 5 repeated reuses the ACC-Std catalysts (0.085 g x5)
could still remove 20-35% of TOC from the aqueous phenol solutions. Longer
heating time (9 days) after every reuse showed higher phenol removal, however even
consecutive 1 day heating periods for 5 times also resulted in 20% phenol removal,
which could be recommended for industrial scale applications as a cost- and energy-
efficient technology for catalyst regeneration and reuse.
6.5 SummaryThe investigation of activated carbon cloth as a benign catalyst for phenol removal
suggests that ACC can be viewed as an emerging catalyst in conjunction with other
AOPs producing combined effect of adsorption-oxidation-regeneration and
effectively decontaminating wastewaters containing phenolic compounds. From the
study the following key conclusions are drawn and suggestions have been made for
future work:
• Different reactors (US bath>Shaker bath>Peristaltic pump) and temperatures
(80>40>20 °C) and pH (5.5>9>3.3) showed significant effects on phenol
removal (P = 0.000-0.055).
• In the ACC/H2 O2 system:
1. The order of efficiencies of ACC catalysts was ACC-Std>ACC-Std-
Ag>ACC-Std-Cu>ACC-Extra-Cu.
2. The order of pH for % efficient phenol removal was 5.5>3>9.
3. The order of H 2 O2 concentrations beneficial for adsorption/oxidation
reactions was 1.19>2.38>4.76 g L-1. However, higher concentrations
showed radical scavenging activity leading to lower % phenol removal.
• In the ACC/O3 system:
1. The order of efficiency was ACC-Std>ACC-Std-Ag>ACC-Std-Cu.
2. The order of efficiency of ozonised ACC-Std was
ACCo> ACC 15 > ACC 1 5 0
3. The order of pH for efficient % phenol removal was 9>5.5>3.
169
D eg rad a tio n III: A C C
4. Step-wise ozonation was the most efficient for phenol adsorption-
oxidation-regeneration in the presence of ACC-Std leading to -70%
TOC removal.
• ACC catalysts can be thermally regenerated by oven heating at 130 °C and
reused over 5 consecutive times resulting in decreasing but effective phenol
removal after each usage.
In depth knowledge of the chemical/textural properties and behaviour of ACC in
oxidant-assisted phenol removal could lead to a better understanding and support of
the proposed hypothesis of adsorption/chemical oxidation via ACC/O 3/H 2 O2 systems.
Also, ultrasound could also be used for the purpose of regeneration and reuse ACC
catalyst. Hence, these objectives are recommended for future studies.
170
D isin fec tion : L W R
Chapter 7
Disinfection: Bacterial inactivation using
cavitation and ozonation in a novel Liquid
Whistle Reactor
Published paper (Appendix C)
C hand , R., B rem ner, D .H ., N am kung , K .C ., C o llier, P .J. and G ogate , P .R . 2007. W a te r d is in fec tio n
using the novel approach o f ozone and a liqu id w histle reacto r. B io c h em ica l E n g in eer in g Jo u rn a l.
35(3): pp .357-364 .
Platform presented paper: International C onference
C hand, R. (1 5 -1 8 O ctober 2006). T he an tim icrob ia l effec ts o f ozo n e and h yd rodynam ic cav ita tio n in a
liqu id w histle reacto r. 56 th C anadian C hem ica l E ng in eerin g C on ference . S herb rooke , Q uebec , C anada .
171

D isin fec tion : L W R
So far in the thesis, much has been discussed on pollutant degradation using single and
combined Advanced Oxidation Processes (AOPs) such as the Advanced Fenton
Process (AFP), cavitation, catalytic and chemical oxidation and also use of different
oxidants such as ozone and hydrogen peroxide. In this part of the work, another
application using the novel approach of hydrodynamic cavitation and/or ozonation as
individual and combined technology for disinfection is described.
7.1 IntroductionSince the early 1970s, the developed countries in the world have used ozone (O3) as a
disinfectant for treated wastewater effluent and the past literature suggested that 1 0 mg
O3 L - 1 dose is required to achieve an efficient level of disinfection. However,
increasing environmental regulations and lowered nutrient levels in the effluents have
lead to O3 dosages as low as 5 mg O3 L- 1 to meet high levels of disinfection (Burns et
al., 2007). Thus, the effective low dosages combined with other dissolution
technology have made O3 a disinfectant for wastewater cost-competitive with UV
treatment. The US EPA Wastewater Disinfection Manual summarises O3 dosages
required to disinfect a variety of effluents (Table 7.1). However, economic analysis of
disinfection systems indicated a 17% higher cost of O3 operation than UV,
Effluent quality Absorbed O3 dosages (mg O3 L *) for2.2 CFU 100 70 CFU 100 mL" 1 200 CFU 100
3 r-t- 0 p total coliform mL- 1 faecal
coliform coliformFiltered secondary 35-40 15-20 12-15Filtered and nitrified 15-20 5-10 3-5
Table 7.1: Sum m ary o f O3 dose required to treat various disinfection targets (Burns et a l 2007).
Recent published research indicates that water treated by biological nutrient removal
(BNR) in the presence of 3 mg O3 L- 1 gives greater than 90% removal of most
common pharmaceutical care products as well as reduction of total faecal coliforms to
below detection (Snyder et al., 2005). Combined AOPs have become very famous in
recent years mainly due to decreased cost of operations. Industries are focussing on
technologies which are effective enough for achieving multiple goals, i.e., disinfection
172
D isin fec tion : L W R
as well as micropollutant removal. Certainly O3 has gained popularity over the years
and is becoming more cost-competitive with UV, however considering its capability to
remove micropollutants, O3 is clearly a technology that will be considered
increasingly in the future (Burns et a l, 2007).
As discussed above, the cost of operations of technologies using O3 has always been a
barrier to widespread adoption by industry, therefore recent literature also reported a
combination of AOPs to disinfect and degrade wastewaters (Jyoti and Pandit, 2004;
Kim et a l , 1999; Mason et a l, 1996; Save et a l, 1997), which prove to be efficient
and cost effective. Enhanced disinfection has also been achieved by exposure of
bacteria to magnetic fields and ultrasonic irradiation (Kohno et a l, 2000; San Martin
et a l, 2001). Chemical oxidation using chlorine dioxide, thyme essential oil (Singh et
al, 2003); hypochlorite (Duckhouse et a l, 2004); chorine and monochloramine
(Baker et al, 2002) and titanium dioxide (Ireland et a l, 1993), have also been
successfully used as combined or individual systems in hybrid AOPs for effective
disinfection.
Ozone has been used extensively in food industries all over the world, especially with
increasing demand for packed/canned food products. For example, recently a
Japanese company invented a laboratory scale machine that can sterilise food
packaging films and preformed cups using ozonated water and O3 gas (Naitou and
Takahara, 2008). Although UV-rays can be used to support the disinfection process, it
is suggested by these authors that the process could be utilised to reduce the degree of
microbial contamination caused by inadequate disinfection against new resistant
strains, i.e., lactic acid bacteria, Gram-negative bacteria, mould, yeast. Other
advantages of using O3 in the food industry is that it increases the shelf life of the food
products, it decomposes rapidly and leaves behind no residues (Guzel-Seydim et a l,
2004; Khadre et a l, 2001). In particular, it has been found that cell lysis is dependent
on the extent of reaction of the O3 gas with the double bonds of lipids of the cell
membrane of Escherichia coli (Scott and Lesher, 1963).
Emerging technologies such as membrane filtration, ozone-membrane filtration and
catalytic (iron oxide)-ozonation-membrane filtration have recently been compared
and reported to be effective for Escherichia coli removal (Karnik et a l, 2007). Their
173
D isin fec tion : L W R
report suggested that highest log removal (7.45) was obtained from catalytic-
ozonation-membrane filtration due to the catalytic decomposition of O3 at the iron
oxide surface results in the formation of HO* and other radical species that inactivate
bacteria near the surface. Likewise, recent reports on hydrodynamic cavitation and
acoustic cavitation have also proved to be outstanding advanced disinfection
technologies in drinking water treatment and are deemed to be environmentally sound
systems without generating any toxic residual by-products (Jyoti and Pandit, 2003;
Piyasena et al, 2003). Burleson et a l (1975) reported individual treatment with O3
and ultrasound did not inactivate microorganisms, but simultaneous treatments with
both resulted in a synergistic effect.
In the previous chapters, the application of acoustic cavitation has been discussed in
detail in conjunction with the Advanced Fenton Process, ozonation and activated
carbon cloth for the removal of toxic phenols from wastewaters. However, the present
study focuses on the disinfection of water containing E. coli, as model markers o f the
faecal coliforms, using single and hybrid technologies of hydrodynamic cavitation
(HC) and ozonation in a novel Liquid Whistle Reactor (LWR).
As suggested by Burleson et al (1975), it is also expected that HC and ozonation
should give synergistic effects due to additional free radical production (Eq. 7.1 and
7.2) (Hart and Henglein, 1985), taking place in the cavitating bubble due to very high
temperatures and pressures, leading to enhanced disinfection.
The reaction products of Eq. 7.1 and 7.2 migrate to the interfacial sheath of the bubble
where they subsequently react in the bulk solution. Mass transfer limitations are often
believed to be associated with ozonation processes, but they are eliminated by the
turbulence created by the liquid circulation currents, induced by the cavitation. Thus,
due to the two positive facts, i.e., elimination of mass transfer limitations and
production of two free radicals per molecule of O3 consumed, even for compounds
that react fairly quickly with O 3 , the rate of degradation/disinfection will be enhanced
by the combined operation of cavitation and ozonation. The extent of these combined
O3 ------- ►CL + 0(3P) (7.1)(7.2)0 (3P) + H20 ------- ► 2HO*
174
D isin fec tion : L W R
effects, in case of HC, is also expected to be influenced by the intensity of cavitation
in the reactor which, in turn, depends on the inlet pressure as demonstrated by
theoretical bubble dynamic modelling (Gogate and Pandit, 2000). Therefore, it is
recommended that to attain maximum benefits of the combined systems, optimum
operating pressure should be selected and this will be discussed later in this chapter.
Hence, the main objectives of this study were to assess the following on the
effectiveness of disinfection:
■ Inlet pressure into the LWR (over a range 500-1500 psi)
■ O 3 dosages (time of ozonation and flowrates)
■ Individual technology: HC and ozonation
■ Combined technology: HC + (single/double) ozonation
■ O3 decomposition in the LWR
7.2 Experimental7.2.1 MicroorganismEscherichia coli (NCIMB 10000 obtained from the National Collection of Industrial
Food and Marine Bacteria, Aberdeen, UK), a Gram-negative model bacterium, was
chosen for all the experimental studies. Cells, medium and viable count methodology
are as described in Section 2.4.6.
7.2.2 Reaction suspensionSince the aim of this study was to develop a robust disinfection technology utilising
the combined approach of hydrodynamic cavitation (HC) and ozonation, for potential
utilisation in different industries, a contaminated suspension was created by
inoculating 400 mL of the overnight culture of E. coli ( 6 x 10⁷ CFU mL-1) into 3600
mL distilled water (dH2 0). The suspension pH (7-8) and temperature (20 ± 5 °C) was
noted at the start of every experiment.
175
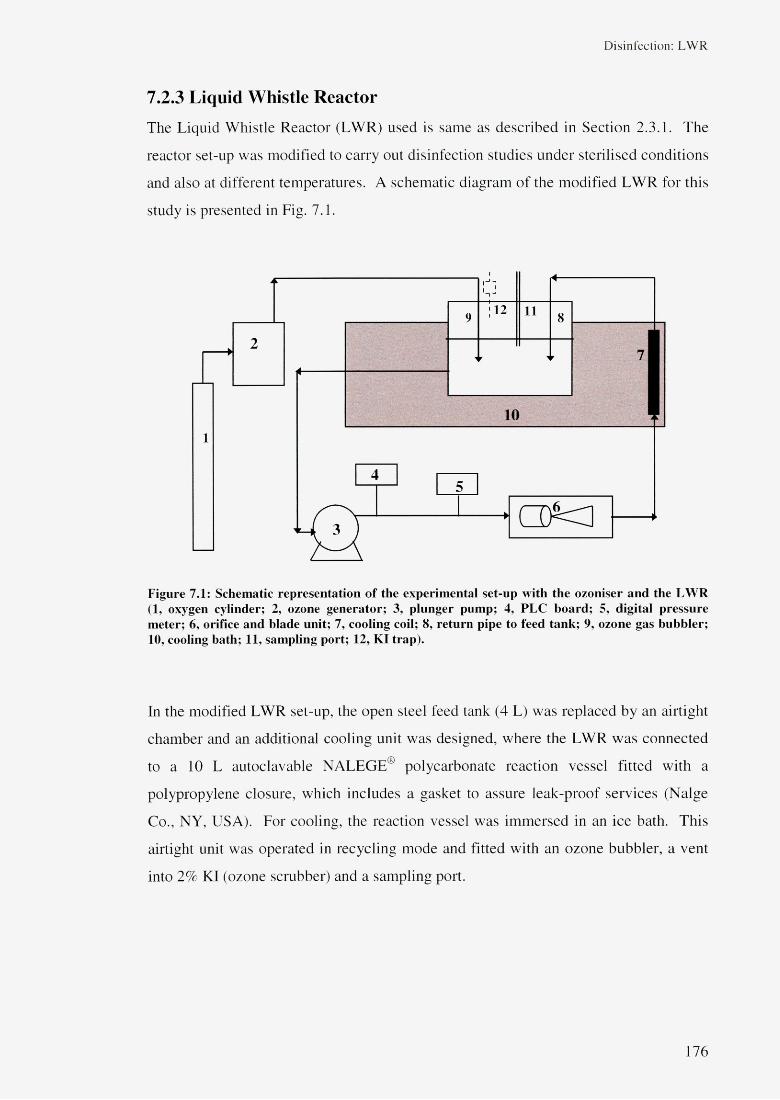
Disinfection: LWR
7.2.3 Liquid Whistle ReactorThe Liquid Whistle Reactor (LWR) used is same as described in Section 2.3.1. The
reactor set-up was modified to carry out disinfection studies under sterilised conditions
and also at different temperatures. A schematic diagram of the modified LWR for this
study is presented in Fig. 7.1.
F ig u re 7 .1 : S ch em a tic r e p re s e n ta t io n o f th e e x p e r im e n ta l s e t-u p w ith th e o z o n ise r a n d th e L W R (1, o x y g en c y l in d e r ; 2, ozone g e n e r a to r ; 3 , p lu n g e r p u m p ; 4, P L C b o a r d ; 5, d ig ita l p r e s s u r e m e te r ; 6 , o rifice a n d b la d e u n it ; 7 , co o lin g co il; 8 , r e tu r n p ip e to fe e d ta n k ; 9 , o zo n e g a s b u b b le r ; 10, coo ling b a th ; 11, s a m p lin g p o r t ; 12, K I t r a p ) .
In the modified LWR set-up, the open steel feed tank (4 L) was replaced by an airtight
chamber and an additional cooling unit was designed, where the LWR was connected
to a 10 L autoclavable NALEGE® polycarbonate reaction vessel fitted with a
polypropylene closure, which includes a gasket to assure leak-proof services (Nalge
Co., NY, USA). For cooling, the reaction vessel was immersed in an ice bath. This
airtight unit was operated in recycling mode and fitted with an ozone bubbler, a vent
into 2% KI (ozone scrubber) and a sampling port.
176
D isin fec tio n : L W R
7.2.4 Ozone7.2.4.1 Ozone generator
The ozone generator is the same as described in Section 2.4.4 with oxygen as a feed
gas.
7.2.4.2 Ozone measurements
Ozone was measured using the colorimetric Indigo method as described in detail in
Section 2.4.4 (Bader and Hoigne, 1981, 1982; Greenberg et cil., 1992)
7.2.5 Operational details: single and combined technologies7.2.5.1 Hydrodynamic cavitation alone
To estimate the % disinfection using HC alone, experiments were carried out with 4 L
of bacterial suspension having a concentration of approximately 108-1 0 9 CFU mL-1.
The % disinfection was compared at three different pressures: 500, 1000 and 1500 psi
with samples being withdrawn every 30 min. Experiments were carried out in
triplicates and average data is presented with reproducibility within ±5%.
12.5.2 Ozonation alone
To study the % disinfection with O3 alone, the LWR was operated without orifice and
blade, which consequently reduces the inlet pressure considerably and the reaction
suspension was circulated through the pipe to the feed tank and back to the LWR.
However, since there was no pressure in the LWR there was no resultant increase in
temperature as HC normally generates heat due to cavity collapse. Therefore, with
ozonation alone experiments, the temperature was maintained at 35 ± 5 °C by
immersing the feed tank in a water bath. In the absence of orifice and blade, the LWR
inlet pressure and flowrates were observed as 30 psi and 5.4 L min-1, respectively.
The O3 concentrations were monitored and samples were withdrawn every 30 min,
exactly as described above for analysis of the extent of disinfection. The effect of O3
concentration on the extent of disinfection was optimised by changing the dial settings
on the control dial on a scale of 1-10 as described by the equipment supplier. This
step is considered to be important in the optimisation process for maximising
combined/synergistic effects (if any).
177
D isin fec tio n : L W R
7.2.5.3 Hydrodynamic cavitation and single ozonation
Single ozonation is defined as a single dose of O3 at a flowrate of 5 L min- 1 of O3-O 2
mixture being applied for 15 min before the start of the experiment (3-3.5 mg O3 L-1).
Once ozonation was finished, the bacterial solution was mixed in the LWR at a very
low pressure (300 psi, 5 min) and then the first sample was withdrawn for serial
dilution in order to determine the base line bacterial count. Following the 5 min
mixing at 300 psi, the pressure in the LWR was then increase to the desired value and
the solution was circulated. During this process, the temperature was not controlled
and hence it increased from 20 ± 5 °C to 35 ± 5 °C as a result of cavitation. The
extent of bacterial killing at each pressure was determined using the heterotrophic
plate count technique after incubation overnight at 37 °C (Greenberg et a l , 1992).
7.2.5.4 Hydrodynamic cavitation and double ozonation
To determine the enhanced effect (if any) of adding the O3-O 2 mixture in two separate
doses, the experiments at different pressures were repeated with purging the gaseous
mixture at a flowrate of 5 L min- 1 for 15 min at the start of the experiment (3-3.5 mg
O3 L-1) and then again for 15 min after 90 min reaction time. Studies with HC and
double ozonation were carried out at controlled temperatures of, 15 ± 5 °C, 25 ± 5 °C,
35 ± 5 °C, for pressures, 500, 1000 and 1500 psi, respectively, to determine any
enhancement in process operation for disinfection.
7.2.5.5 Ozone decomposition in the LWR
Ozone was bubbled through sterile dH2 0 (4 L) and O3 decomposition over 180 min
reaction time was monitored in the LWR in the presence/absence of the orifice and
blade and also with single/double ozonation at different operating pressures (Section
7.4). Experimental conditions and set-up were the same for all the bacterial
disinfection measurements. For colorimetric measurements, the ozonised samples (3
mL) were withdrawn at specific time intervals and mixed gently with 5 mL Indigo
reagent and filled to mark in a 50 mL volumetric flask. To mix the solution, the
volumetric flask was turned upside down without formation of any air bubbles and the
colour change was read on the UV-vis spectrophotometer at 600 nm and
concentrations were measured in mg O3 L- 1 as described in Section 2.4.4.
178
D isin fec tion : L W R
7.3 Results and discussionThe % disinfection under different operational conditions have been represented in the
form of percentage disinfection (microbial inactivation %) and calculated using the
formula below:
percentage disinfection = log {(No~N)/N} x 100 (7.3)
where, No represents the initial microbial count and N represents the microbial count at
any give time.
7.3.1 Effect of hydrodynamic cavitationMicrobial inactivation at lower pressures, i.e., 500 and 1000 psi was almost negligible
(1-7%). However, 22% microbial inactivation was obtained by increasing the
pressure to 1500 psi, which could be explained by higher cavity formation at this
pressure, as discussed in Chapter 3. At 1500 psi, higher intensity cavitation leads to
the formation of higher number of free radicals and at this pressure, the elevated
intensity of turbulence causes cell disruption at the high pressure zone, i.e., orifice and
blade and also allows the free radicals to homogeneously react with the microbial cell
contents (Fig. 7.2).
179

D isin fec tion : L W R
Figure 7.2: Effect o f HC alone on m icrobial inactivation (% ) at d ifferent pressures in the L W R . Experim ental conditions: bacteria, E. coli; reaction suspension (4 L); reaction tim e, 180 m in, tem perature 20 ± 5 °C to 35 ± 5 °C; operating pressure, 5 0 0 ,1 0 0 0 and 1500 psi; results show n are an average o f triplicates.
During cavitational processes, extreme temperatures and pressure gradients occur
within the bubble during cavitational collapse and release oxidants, like HO* and
H 2 O2 into the solution (Suslick et a l, 1997), which participate in bacterial inactivation.
Different theories have been proposed where high pressures and cavitation leads to
cavity collapse which in turn leads to cell disruption (Shirgaonkar et al., 1998). Cell
disruption at high pressures has also been attributed to impingement and impact
(Moore et al., 1990). In this study, at 1500 psi, the highest reduction in bacterial
numbers is attributed to the significant cavitational effects beyond certain cavitation
inception conditions (e.g., 500 psi), resulting in generation of various free radicals and
also mechanical effects, i.e., turbulence and shear, which facilitates the de
agglomeration of microbial clusters, allowing effective interaction of the bulk liquid
oxidants with the microorganisms and its contents leading to enhanced disinfection at
this pressure.
180
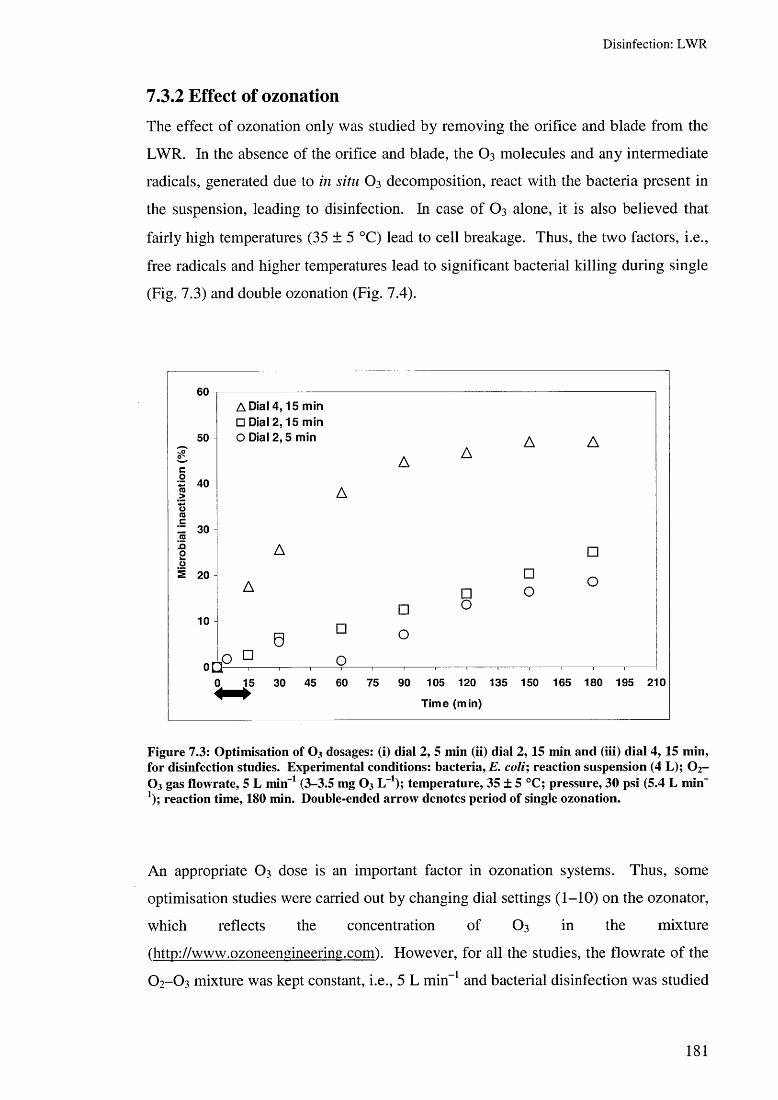
D isin fec tion : L W R
7.3.2 Effect of ozonationThe effect of ozonation only was studied by removing the orifice and blade from the
LWR. In the absence of the orifice and blade, the O3 molecules and any intermediate
radicals, generated due to in situ O3 decomposition, react with the bacteria present in
the suspension, leading to disinfection. In case of O3 alone, it is also believed that
fairly high temperatures (35 ± 5 °C) lead to cell breakage. Thus, the two factors, i.e.,
free radicals and higher temperatures lead to significant bacterial killing during single
(Fig. 7.3) and double ozonation (Fig. 7.4).
Figure 7.3: O ptim isation o f O3 dosages: (i) dial 2, 5 m in (ii) dial 2 ,1 5 m in and (iii) d ial 4, 15 m in, for disinfection studies. Experim ental conditions: bacteria, E. coli; reaction suspension (4 L); 0 2- O3 gas flow rate, 5 L min-1 (3 -3 .5 mg O3 L-1); tem perature, 35 ± 5 °C; pressure, 30 psi (5.4 L m in- *); reaction tim e, 180 min. Double-ended arrow denotes period o f single ozonation.
An appropriate O3 dose is an important factor in ozonation systems. Thus, some
optimisation studies were carried out by changing dial settings ( 1 - 1 0 ) on the ozonator,
which reflects the concentration of O3 in the mixture
(http://www.ozoneengineering.com). However, for all the studies, the flowrate of the
O2-O3 mixture was kept constant, i.e., 5 L min- 1 and bacterial disinfection was studied
181
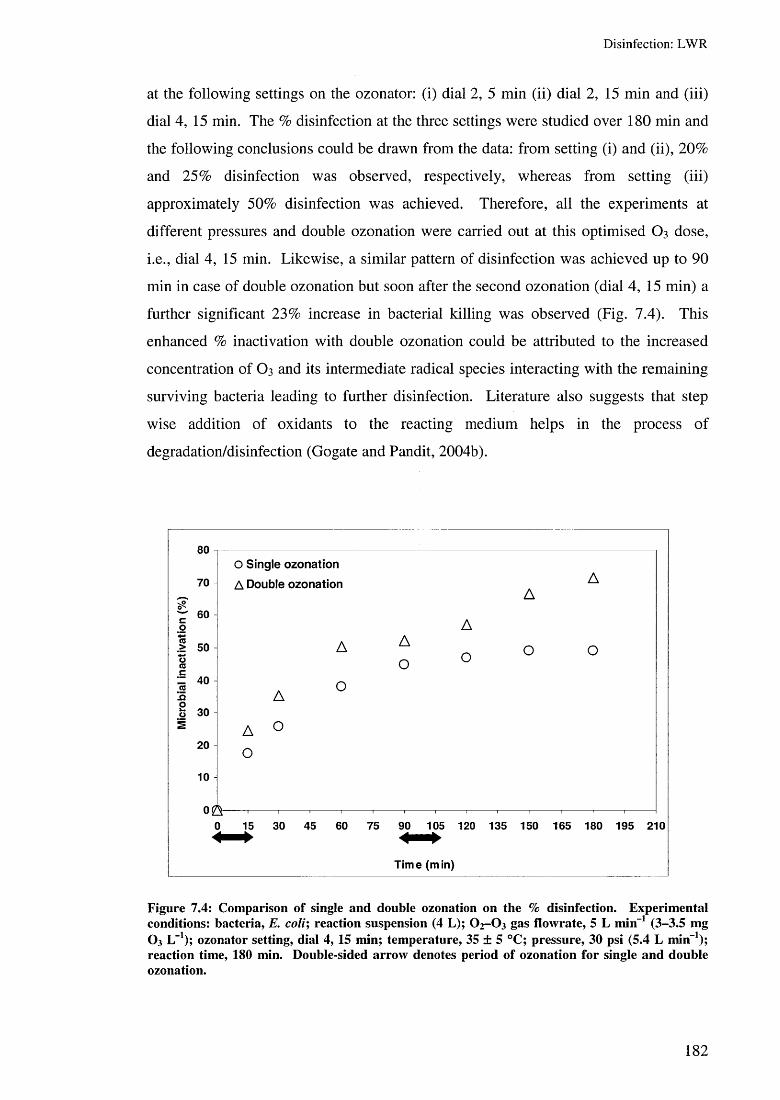
D isin fec tion : L W R
at the following settings on the ozonator: (i) dial 2, 5 min (ii) dial 2, 15 min and (iii)
dial 4, 15 min. The % disinfection at the three settings were studied over 180 min and
the following conclusions could be drawn from the data: from setting (i) and (ii), 2 0 %
and 25% disinfection was observed, respectively, whereas from setting (iii)
approximately 50% disinfection was achieved. Therefore, all the experiments at
different pressures and double ozonation were carried out at this optimised O3 dose,
i.e., dial 4, 15 min. Likewise, a similar pattern of disinfection was achieved up to 90
min in case of double ozonation but soon after the second ozonation (dial 4, 15 min) a
further significant 23% increase in bacterial killing was observed (Fig. 7.4). This
enhanced % inactivation with double ozonation could be attributed to the increased
concentration of O3 and its intermediate radical species interacting with the remaining
surviving bacteria leading to further disinfection. Literature also suggests that step
wise addition of oxidants to the reacting medium helps in the process of
degradation/disinfection (Gogate and Pandit, 2004b).
80
70
c 6 001 50oCOcZ 40CO!5otj 30
20
10
Ofi
O Single ozonation
A Double ozonationA
A
A
A °
AO
A
O O O
O >
O
15 30 45 60 75 90 105 120 135 150 165 180 195 210
Time (min)
Figure 7.4: Com parison o f single and double ozonation on the % disinfection. E xperim ental conditions: bacteria, E. co li; reaction suspension (4 L); O2- O 3 gas flow rate, 5 L m in-1 (3 -3 .5 mg O3 L-1); ozonator setting, dial 4, 15 min; tem perature, 35 ± 5 °C; pressure, 30 psi (5.4 L m in-1); reaction tim e, 180 min. Double-sided arrow denotes period o f ozonation for single and double ozonation.
182

D isin fec tio n : L W R
Bacterial disinfection with O3 occurs due to interaction between the oxidising radical
species and the bacterial cell, where the cell membrane is the first site of attack
through glycoproteins, glycolipids and amino acids and O3 tends to act upon the
sulfhydryl groups of certain enzyme (Rojas-Valencia et a l , 2004). The mass transfer
limitations of O3 sparging in the stirred or bubble column type reactors is overcome by
the re-circulatory flows in the LWR which, in turn, enhances mixing rates in the
system. The continuous re-circulation not only affects the mixing rates but also helps
in de-agglomeration of the microbial clusters and with the effect of high temperatures,
favours cell breakage and O3 dissociation into intermediate radicals, which have
higher potentials to break through individual microbial cells and enhance bacterial
inactivation. It should also be noted that O3 could have been used for a longer time
duration but the scope of the present study was to develop an optimum treatment
protocol based on the LWR with minimum usage of O3 to reduce the cost of treatment.
7.3.3 Effect of hydrodynamic cavitation and single ozonationA combination of HC (1500 psi) and single ozonation (15 min at the start of the
experiment, corresponding to 3-3.5 mg O3 L-1), lead to 48% microbial inactivation,
i.e., the bacterial numbers reduced from ~109 to 105 CFU mL_1. In Fig. 7.5a, a
comparison of the combined system of HC and single ozonation is shown and a
further magnified comparison graph is presented at 1500 psi, with and without
ozonation (Fig. 7.5b). However, the results shown here are in correlation with the O3
decomposition, discussed in Section 7.4, in the presence (1500 psi) and absence of
orifice (30 psi) which follows a similar pattern under both the conditions and this
could be the possible reason for similar % disinfection under the two conditions.
From Fig. 7.5a, it can be noticed that at lower pressures (500 and 1000 psi) with the
single ozonation, instant killing was observed within 15 min due to the direct reaction
of O3 and its intermediate radicals species with the bacteria in the bulk solution.
However, there was no further significant microbial reduction observed over the next
165 min and since the pressures were not high enough, no more disinfection occurred
via cavitation.
183

D isin fec tion : L W R
vV0s
60
50
co~ 40(0,>onZ 30 re5o01 20
10
0 A
A HC onlyA HC+Single ozonation
A
(b)
A
AA
15 30 45 60 75 90 105 120 135 150 165 180 195 210
Time (min)
Figure 7.5: (a) Effect o f HC and single ozonation on m icrobial inactivation (% ) at d ifferent pressures in the LW R and (b) Com parison o f m icrobial inactivation (% ) at 1500 psi (HC) and 1500 psi (HC) + single ozonation. E xperim ental conditions: bacteria, E. coli; reaction suspension (4 L); O2-O 3 gas flowrate, 5 L m in-1 (3 -3 .5 mg O3 L”1); ozonator setting, dial 4, 15 m in at the start; tem perature, 35 ± 5 °C; reaction tim e, 180 min. D ouble-sided arrow denotes period o f single ozonation.
184

D isin fec tio n : L W R
In Fig. 7.5b, the comparative study at 1500 psi with and without ozonation indicates
effect of the combination of the two AOPs, i.e., cavitation and ozonation. With an
initial 15 min ozonation under similar conditions and reactor set-up, a significant 28%
bacterial inactivation was observed and after a further 165 min of reaction at 1500 psi,
a further 20% increase in disinfection is achieved, giving a total of 48% killing.
However, in case of cavitation alone at 1500 psi, only 22% disinfection over 180 min
was achieved.
7.3.4 Effect of hydrodynamic cavitation and double ozonationThe effect of low pressure was insignificant in the case of HC coupled with single
ozonation, therefore to maximise disinfection, double ozonation (Section 7.4) was
investigated at all of the three chosen pressures. The results shown in Fig. 7.6 reveal
that the extent of disinfection obtained from this combined system of HC and double
ozonation was in the range 58 to 73%.
80
70
60
> 50
Z 40
30
10
A 1500 psi □ 1000 psi O 500 psi
9
W
□O
6□
2
□
9
15 30 45 60 75 90 105 120 135 150 165 180 195 210
Time (min)
Figure 7.6: Effect o f HC and double ozonation on m icrobial inactivation (% ) at d ifferent pressures in the LW R. Experim ental conditions: bacteria, E. co li; reaction suspension (4 L); O2- O3 gas flow rate, 5 L min-1; ozonator setting, dial 4, 15 m in at the start (3 -3 .5 m g O3 L-1); tem perature, 500 psi, 15 ± 5 °C, 1000 psi, 25 ± 5 °C , 1500 psi, 35 + 5 °C; reaction tim e, 180 m in. Double-sided arrow denotes period o f single and double ozonation.
185
D isin fec tion : L W R
As discussed above, the extent of disinfection was similar in case of 500 and 1500 psi,
whereas comparatively low with 1000 psi. The difference in the % disinfection can be
explained on the basis of two parallel mechanisms: (i) pressures and related
cavitational activity and (ii) operating temperature. In the literature, the concept of
variable temperature and activation energies with respect to microbial disinfection for
bacteria has been discussed in detail by Von Gunten (Von Gunten, 2003) who reported
that activation energies for bacteria are in a similar range to chemical reactions with
O3 (35-50 kJ mol-1). Thus, to assess disinfection for variable temperatures, these
activation energies have to be compared with the activation energies for the O3 decay,
which is 65-70 kJ mol- 1 (as determined in various water matrices). The above
explanation proves that for the same O3 dosage, the degree of microbial inactivation
would be higher at lower temperatures (Hunt and Marinas, 1997). Therefore, a
different set of temperatures were selected to operate with different pressures: 500 psi,
15 ± 5 °C; 1000 psi, 25 ± 5 °C and 1500 psi, 35 ± 5 °C, to achieve effective %
disinfection in the LWR.
At 500 psi operating pressure, the temperature was maintained at 15 ± 5 °C with the
help of the cooling bath and a high degree of disinfection was achieved with double
ozonation even though the contribution due to cavitation was negligible. The high %
disinfection at this pressure could be attributed to the higher activity of the O3 because
the single and double O3 decomposition profiles in the LWR (Section 7.4) reveals that
during single ozonation, O3 concentrations decreased from 3-3.5 mg O3 L - 1 to 0.9 mg
O3 L- 1 at the end of 90 min, but in case of double ozonation, O3 concentrations
increased to 3.4 mg O3 L- 1 after the second ozonation and remained 1.5 mg O3 L- 1
until the end of reaction time due to stability of O3 at lower temperatures. Thus, the
presence of O3 and its intermediate radical species until the end of the reaction time at
500 psi and 15 ± 5 °C temperature influences the % inactivation. However, at 1000
psi, with similar cooling but relatively high cavitational activity, the operating
temperature could only be maintained around 25 ± 5 °C. Thus, here both the
ineffective factors: low cavitational activity and low activity of ozone lead to only
58% microbial inactivation at this pressure. On the contrary, higher pressures of 1500
psi and 35 ± 5 °C shows lower O3 activity but substantially higher cavitational activity
186

D isin fec tio n : L W R
as seen from all the results so far, which overall results in the similar degree of
disinfection as seen in case of 500 psi, i.e., 73%.
This part of the study at different pressure and temperature combinations meets the
objectives of this research because literature suggests that natural water
microorganisms can be rapidly killed by the direct ozonation, whereas those in
secondary effluents from wastewater treatment plants require longer contact time for
inactivation which might increase the operational cost (Burleson et al., 1975). Hence,
simultaneous treatments by ozonation in the LWR at optimised temperature and
pressure conditions could prove to be beneficial for inactivating bacteria at
substantially reduced contact time of O3 , which may in turn, reduce the total cost of
operations.
Therefore, the overall conclusion is that the use of the hybrid technology of HC and
ozonation in the LWR offers great promise in treating wastewater with recalcitrant
bacteria, at unusually low cost and lower energy input.
7.4 Ozone decomposition in the LWRThe ozone decomposition studies were carried out in the presence (1500 psi) and
absence (30 psi) of the orifice and blade at 35 ± 5 °C and also at the different
temperature and pressure combinations during HC and double ozonation: 500 psi, 15 ±
5 °C; 1000 psi, 25 ± 5 °C and 1500 psi, 35 ± 5 °C over 180 min treatment time.
187
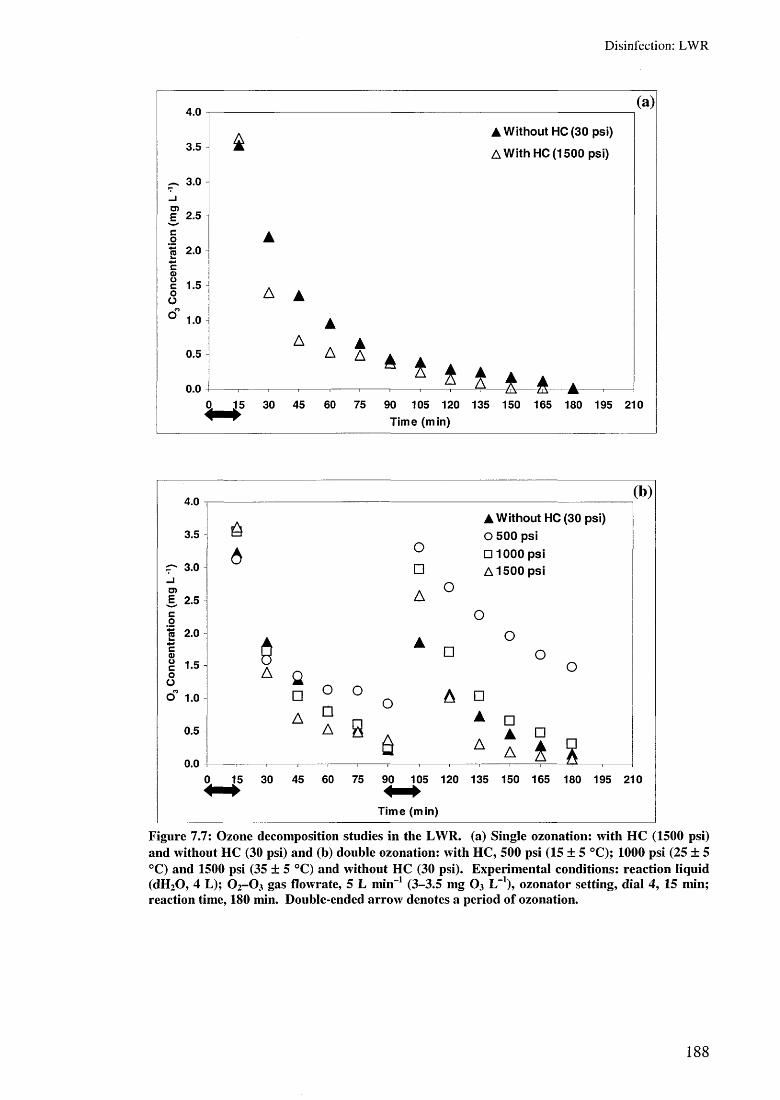
D isin fec tion : L W R
4.0
3.5
j-, 3.0
I 2-5c01 2.0cfl)c 1.5oo° 1.0
0.5
0.0
A A
A A
A Without HC (30 psi)
A With HC(1500 psi)
* * *
(a)
Q, J5 30 45 60 75 90 105 120 135 150 165 180 195 210
Time (min)
Figure 7.7: O zone decom position studies in the LW R. (a) S ingle ozonation: w ith H C (1500 psi) and without HC (30 psi) and (b) double ozonation: w ith H C , 500 psi (15 ± 5 °C); 1000 psi (25 ± 5 °C) and 1500 psi (35 ± 5 °C) and w ithout HC (30 psi). E xperim ental conditions: reaction liquid (dH20, 4 L); O2- O 3 gas flowrate, 5 L min-1 (3 -3 .5 m g O3 L-1), ozonator setting, d ial 4 , 15 min; reaction tim e, 180 min. Double-ended arrow denotes a period o f ozonation.
188
D isin fec tio n : L W R
Initial ozonation for 15 min (O2-O 3 mixture) resulted in concentrations of 3-3.5 mg
O3 L- 1 in the reaction medium but this had completely disappeared with or without
high levels of cavitation at the end of 180 min due to the high temperature (35 ± 5 °C)
(Fig. 7.7a). Not surprisingly, the rate of decomposition at this temperature was greater
at the higher pressure. Similarly, O3 decomposition studies in the case of combined
HC and double ozonation were compared for different experimental conditions and
set-ups (Fig. 7.7b). In this case, the initial O3 concentration was 3-3.5 mg O3 L- 1
which reduced to 0.2-1.00 mg O3 L- 1 depending on operating pressure and
temperature. After the second O3 purge (between 90 and 105 min), the concentration
increased to between 1.8 and 3.5 mg O3 L_ 1 depending on the residual O3
concentration at different pressures and temperature of the reaction solution. At 500
psi in the case of double ozonation, the residual concentration of O3 at 90 min was the
highest and therefore greater % disinfection was achieved at this pressure as discussed
previously. Due to continuous HC, the temperature of the reaction solution increases
and allows mixing of O3 and its dissociated radical species into the bulk solution.
Thus, the residual concentration of O3 is found to be highest at 500 psi, corresponding
to the minimum intensity of cavitation and is lowest in case of 1500 psi which
correlates to the maximum intensity of cavitation at this operating pressure. Likewise
the two pressures (500 and 1500 psi) and the related intensities of ozonation and
cavitation lead to highest degree of disinfection (73%).
189
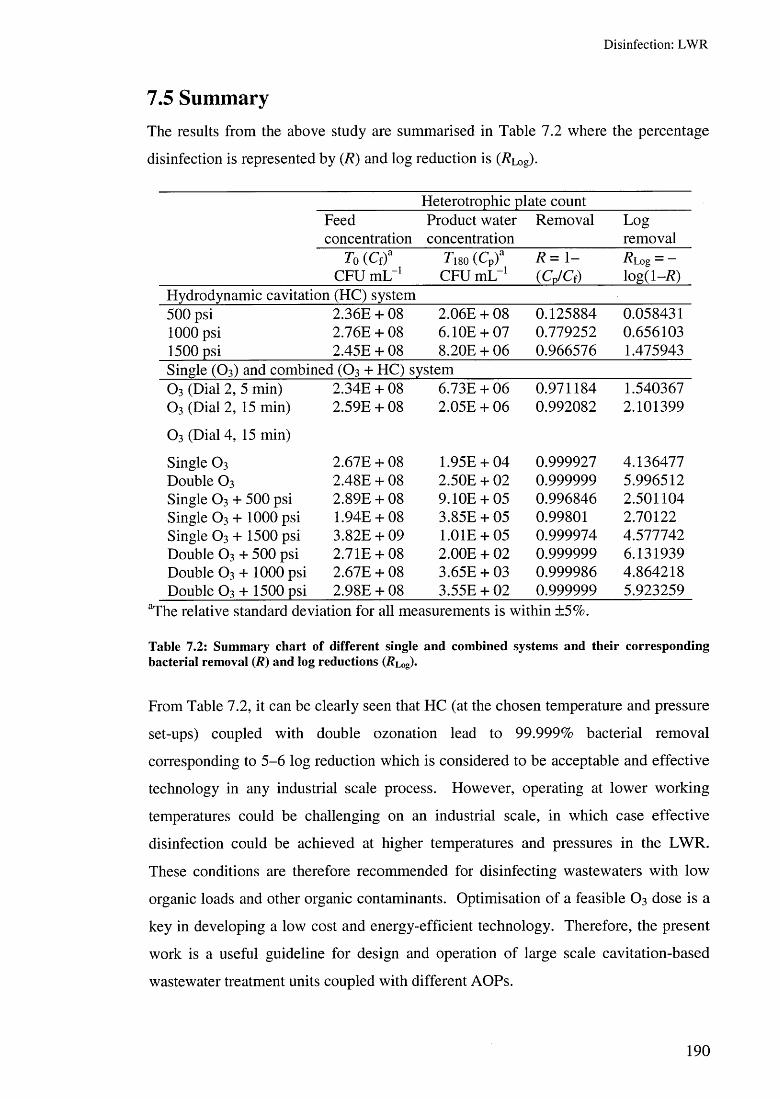
D isin fec tion : L W R
7.5 SummaryThe results from the above study are summarised in Table 7.2 where the percentage
disinfection is represented by (R) and log reduction is (/?Log).
Heterotrophic plate countFeed Product water Removal Logconcentration concentration removal
To (Cf)a ^180 (Cp) 3 R= 1- ^Log — —CFU mL_1 CFU mL-1 (Cp/Cf) log(l-R )
Hydrodynamic cavitation (HC) system500 psi 2.36E + 08 2.06E + 08 0.125884 0.0584311 0 0 0 psi 2.76E + 08 6.10E + 07 0.779252 0.6561031500 psi 2.45E + 08 8.20E + 06 0.966576 1.475943Single (O3 ) and combined (O3 + HC) systemO3 (Dial 2, 5 min) 2.34E + 08 6.73E + 06 0.971184 1.540367O3 (Dial 2, 15 min) 2.59E + 08 2.05E + 06 0.992082 2.101399
O3 (Dial 4, 15 min)
Single 0 3 2.67E + 08 1.95E + 04 0.999927 4.136477Double O3 2.48E + 08 2.50E + 02 0.999999 5.996512Single O3 + 500 psi 2.89E + 08 9.10E + 05 0.996846 2.501104Single O3 + 1000 psi 1.94E + 08 3.85E + 05 0.99801 2.70122Single O3 + 1500 psi 3.82E + 09 1.01E + 05 0.999974 4.577742Double O3 + 500 psi 2.7 IE + 08 2.00E + 02 0.999999 6.131939Double O3 + 1000 psi 2.67E + 08 3.65E + 03 0.999986 4.864218Double O3 + 1500 psi 2.98E + 08 3.55E + 02 0.999999 5.923259
aThe relative standard deviation for all measurements is within ±5%.
Table 7.2: Sum m ary chart o f different single and com bined system s and their corresponding bacterial rem oval (R ) and log reductions (/?Log)»
From Table 7.2, it can be clearly seen that HC (at the chosen temperature and pressure
set-ups) coupled with double ozonation lead to 99.999% bacterial removal
corresponding to 5-6 log reduction which is considered to be acceptable and effective
technology in any industrial scale process. However, operating at lower working
temperatures could be challenging on an industrial scale, in which case effective
disinfection could be achieved at higher temperatures and pressures in the LWR.
These conditions are therefore recommended for disinfecting wastewaters with low
organic loads and other organic contaminants. Optimisation of a feasible O3 dose is a
key in developing a low cost and energy-efficient technology. Therefore, the present
work is a useful guideline for design and operation of large scale cavitation-based
wastewater treatment units coupled with different AOPs.
190
C onc lu sions and su g g estio n s
Key Conclusions and Suggestions for Future WorkThis thesis describes the effective use of combined techniques of various advanced
oxidation processes with cavitational reactors for phenolic wastewater treatment and
water disinfection. The following are the key conclusions drawn from the above
study:
■ Dosimetry: Less toxic chloroalkanes are effective alternatives for enhanced
generation of hydroxyl radicals in cavitational reactors. Enhanced production
of hydroxyl radicals was seen at higher operational pressures in the Liquid
Whistle Reactor and at higher operating amplitudes in the ultrasonic reactor.
■ Degradation I: The 300 kHz ultrasonic transducer-type reactor and zero valent
iron catalysts showed 100% phenol removal and 37% TOC mineralisation in
just 25 min. Whereas 37-40% TOC mineralisation was observed with both the
20 (probe type) and 520 kHz (transducer type) but only in the presence of zero
valent iron catalysts and overhead stirring. The modified Advanced Fenton
Process, studied with ozonation did not seem to effectively enhance phenol
removal rates when compared to hydrogen peroxide.
■ Degradation II: The Latent Remediation approach significantly enhanced
phenol degradation rates in the presence of zero valent iron and a variety of
types of zero valent copper catalysts. Optimum concentrations of zero valent
copper catalysts lead to -80% TOC mineralisation. Toxicity analysis on 24,
48 and 72 h samples with zero valent iron and copper reactions revealed that
the latter is more toxic and iron is favoured as the catalysts of choice.
■ Degradation III: Activated carbon cloth (ACC) showed the best results for
high phenol removal; at high temperatures via the reactivation of adsorption
active sites on the cloth surface, in an ultrasonic bath via adsorption-
oxidation-regeneration and step-wise ozonation via adsorption-oxidation.
■ Disinfection: Higher operating pressures in conjunction with step-wise
ozonation resulted in 99.9999% disinfection efficiency of the LWR.
191
C onc lu sions and su g g estio n s
Hence, based on the overall findings of the work presented in this thesis, the following
suggestions for future works are proposed:
1. Investigations of oxidation products of phenol from the activated carbon cloth
are essential to confirm removal of organics via adsorption or oxidation or both
phenomena.
2. Iron impregnated activated carbon cloths are proposed for a study of Fenton
like reactions.
3. Installation of the optimised activated carbon cloth catalyst bed in conjunction
with advanced oxidation processes should be carried out on a pilot scale.
4. Latent Remediation process should be investigated with optimised ozonation
strategies in conjunction with the Advanced Fenton Process.
5. Use of zero valent copper catalysts should be further optimised for industrial
scale operations with toxicity considerations being taken into account.
6 . The combination of hydrogen peroxide + ozonation in conjunction with the
Advanced Fenton Process for industrial wastewater should be studied.
7. The AFP and related reactions should be investigated on a larger scale with
real industrial wastewater.
8 . The combination of acoustic and hydrodynamic cavitation should be assessed
for enhanced generation of hydroxyl radicals and simultaneous wastewater
treatment for industrial scale operations.
192

R efe ren ces
ReferencesAdewuyi, Y.G. 2001. Sonochemistry: Environmental science and engineering applications. Industrial and Engineering Chemistry Research. 40(22): pp.4681-4715.
Ahmaruzzaman, M. and Sharma, D.K. 2005. Adsorption of phenols from wastewater. Journal of Colloid and Interface Science. 287(1): pp. 14-24.
Alvarez, P.M., Garcia-Araya, J.F., Beltran, F.J., Masa, F.J. and Medina, F. 2005. Ozonation of activated carbons: Effect on the adsorption of selected phenolic compounds from aqueous solutions. Journal of Colloid and Interface Science. 283(2): pp.503-512.
Anbar, M., Meyerstein, D. and Neta, P. 1966. The reactivity of aromatic compounds toward hydroxyl radicals. Journal of Physical Chemistry. 70(8): pp.2660-2662.
Andreozzi, R., Caprio, V., Insola, A., Marotta, R. and Sanchirico, R. 2000a. Advanced oxidation processes for the treatment of mineral oil-contaminated wastewaters. Water Research. 34(2): pp.620-628.
Andreozzi, R., Caprio, V., Insola, A., Marotta, R. and Tufano, V. 1998. The ozonation of pyruvic acid in aqueous solutions catalyzed by suspended and dissolved manganese. Water Research. 32(5): pp. 1492-1496.
Andreozzi, R., Caprio, V. and Marotta, R. 2001a. Oxidation of benzothiazole, 2- mercaptobenzothiazole and 2 -hydroxybenzothiazole in aqueous solution by means of H202/UV or photoassisted Fenton systems. Journal of Chemical Technology and Biotechnology. 76(2): pp. 196-202.
Andreozzi, R., Caprio, V., Marotta, R. and Tufano, V. 2001b. Kinetic modeling of pyruvic acid ozonation in aqueous solutions catalyzed by Mn(II) and Mn(IV) ions. Water Research. 35(1): pp. 109-120.
Andreozzi, R., Insola, A., Caprio, V. and D'amore, M.G. 1992. The kinetics of Mn(II)-catalysed ozonation of oxalic acid in aqueous solution. Water Research. 26(7): pp.917-921.
Andreozzi, R., Marotta, R. and Sanchirico, R. 2000b. Manganese-catalysed ozonation of glyoxalic acid in aqueous solutions. Journal of Chemical Technology and Biotechnology. 75(1): pp.59-65.
Arrojo, S., Nerin, C. and Benito, Y. 2007. Application of salicylic acid dosimetry to evaluate hydrodynamic cavitation as an advanced oxidation process. Ultrasonics Sonochemistry. 14(3): pp.343-349.
Ayling, G.W. and Castrantas, H.M. 1981. WASTE TREATMENT WITH HYDROGEN PEROXIDE. Chemical Engineering (New York). 88(24): pp.79-82.
193

R efe ren ces
Bader, H. and Hoigne, J. 1981. Determination of ozone in water by the indigo method. Water Research. 15(4): pp.449-456.
Bader, H. and Hoigne, J. 1982. Determination of ozone in water by the indigo method: a submitted standard method ( Switzerland). Ozone: Science & Engineering. 4(4): pp. 169-176.
Baker, E.L., Landrigan, P.J. and Field, P.H. 1978. Phenol poisoning due to contaminated drinking water. Archives of Environmental Health. 33(2): pp.89-94.
Baker, K.H., Hegarty, J.P., Redmond, B., Reed, N.A. and Herson, D.S. 2002. Effect of oxidizing disinfectants (chlorine, monochloramine, and ozone) on Helicobacter prylori. Applied and Environmental Microbiology. 68(2): pp.981-984.
Barbeni, M., Minero, C., Pelizzetti, E., Borgarello, E. and Serpone, N. 1987. Chemical degradation of chlorophenols with Fenton's reagent (Fe2+ + H202). Chemosphere. 16(10-12): pp.2225-2237.
Barreto, J.C., Smith, G.S., Strobel, N.H.P., Mcquillin, P.A. and Miller, T.A. 1994. Terephthalic acid: A dosimeter for the detection of hydroxyl radicals in vitro. Life Sciences. 56(4): pp.PL89-PL96.
Barros, A.L., Pizzolato, T.M., Carissimi, E. and Schneider, I.A.H. 2006. Decolorizing dye wastewater from the agate industry with Fenton oxidation process. Minerals Engineering. 19(1): pp.87-90.
Beckett, M.A. and Hua, I. 2001. Impact of ultrasonic frequency on aqueous sonoluminescence and sonochemistry. Journal of Physical Chemistry’ A. 105(15): pp.3796-3802.
Beckett, M.A. and Hua, I. 2003. Enhanced sonochemical decomposition of 1,4- dioxane by ferrous iron. Water Research. 37(10): pp.2372-2376.
Beltran, F.J., Encinar, J.M. and Gonzalez, J.F. 1997. Industrial wastewater advanced oxidation. Part 2. Ozone combined with hydrogen peroxide or UV radiation. Water Research. 31(10): pp.2415-2428.
Beltran, F.J., Garcia-Araya, J.F. and Acedo, B. 1994. Advanced oxidation of atrazine in water - 1: Ozonation. Water Research. 28(10): pp.2153-2164.
Beltran, F.J., Garcia-Araya, J.F., Frades, J., Alvarez, P. and Gimeno, O. 1999. Effects of single and combined ozonation with hydrogen peroxide or UV radiation on the chemical degradation and biodegradability of debittering table olive industrial wastewaters. Water Research. 33(3): pp.723-732.
Beltran, F.J., Garcia-Araya, J.F. and Giraldez, I. 2006. Gallic acid water ozonation using activated carbon. Applied Catalysis B: Environmental. 63(3-4): pp.249-259.
Beltran, F.J., Gomez-Serrano, V. and Duran, A. 1992. Degradation kinetics of p- nitrophenol ozonation in water. Water Research. 26(1): pp.9-17.
194

R efe ren ces
Beltran, F.J., Ovejero, G. and Rivas, J . 1996a. Oxidation of polynuclear aromatic hydrocarbons in water. 3. UV radiation combined with hydrogen peroxide. Industrial and Engineering Chemistry Research. 35(3): pp.883-890.
Beltran, F.J., Ovejero, G. and Rivas, J . 1996b. Oxidation of polynuclear aromatic hydrocarbons in water. 4. Ozone combined with hydrogen peroxide. Industrial and Engineering Chemistry Research. 35(3): pp.891-898.
Beltran, F.J., Rivas, F.J. and Montero-De-Espinosa, R. 2003. Mineralization improvement of phenol aqueous solutions through heterogeneous catalytic ozonation. Journal of Chemical Technology and Biotechnology. 78(12): pp. 1225-1233.
Beltran, F.J., Rivas, F.J. and Montero-De-Espinosa, R. 2005. Iron type catalysts for the ozonation of oxalic acid in water. Water Research. 39(15): pp.3553-3564.
Benitez, F.J., Acero, J.L., Real, F.J., Rubio, F.J. and Leal, A.I. 2001. The role of hydroxyl radicals for the decomposition of p-hydroxy phenylacetic acid in aqueous solutions. Water Research. 35(5): pp. 1338-1343.
Benitez, F.J., Beltran-Heredia, J ., Acero, J.L . and Rubio, F.J. 1999. Chemical decomposition of 2,4,6-trichlorophenol by ozone, Fenton's reagent, and UV radiation. Industrial and Engineering Chemistry Research. 38(4): pp. 1341-1349.
Bigda, R .J. 1995. Consider Fenton's chemistry for wastewater treatment. Chemical Engineering Progress. 91(12): pp.62-66.
Biniak, S., Walczyk, M. and Szymanski, G.S. 2002. Modified porous carbon materials as catalytic support for cathodic reduction of dioxygen. Fuel Processing Technology. 79(3): pp.251-257.
Blandini, F., Martignoni, E., Ricotti, R., Di Jeso, F. and Nappi, G. 1999. Determination of hydroxyl free radical formation in human platelets using high- performance liquid chromatography with electrochemical detection. Journal of Chromatography B: Biomedical Sciences and Applications. 732(1): pp.213-220.
Boehm, H.P. 2002. Surface oxides on carbon and their analysis: a critical assessment. Carbon. 40(2): pp. 145-149.
Boucher, R.M.G. 1970. Sonochemistry at low and high frequencies. British Chemical Engineering. 14 p.263.
Boussahel, R., Harik, D., Mammar, M. and Lamara-Mohamed, S. 2007. Degradation of obsolete DDT by Fenton oxidation with zero-valent iron. Desalination. 206(1-3): pp.369-372.
Bozzi, A., Yuranova, T., Lais, P. and Kiwi, J. 2005. Degradation of industrial waste waters on Fe/C-fabrics. Optimization of the solution parameters during reactor operation. Water Research. 39(8): pp. 1441-1450.
195
R e fe ren ces
Bozzi, A., Yuranova, T., Mielczarski, E., Mielczarski, J., Buffat, P.A., Lais, P. and Kiwi, J. 2003. Superior biodegradability mediated by immobilized Fe-fabrics o f waste waters compared to Fenton homogeneous reactions. Applied Catalysis B: Environmental. 42(3): pp.289-303.
Brandenburg, K. and Moll, H. 1984. The terephthalate dosimeter for [gamma]-, X- and [beta]-radiation: dependence on dose and dose rate. Radiation Physics and Chemistry (1977). 23(4): pp.431-434.
Brasquet, C., Subrenat, E. and Le Cloirec, P. 1999. Removal of phenolic compounds from aqueous solution by activated carbon cloths. Water Science and Technology. 39(10-11): pp.201-205.
Breitbach, M. and Bathen, D. 2001. Influence of ultrasound on adsorption processes. Ultrasonics Sonochemistry. 8(3): pp.277-283.
Bremner, D.H. and Burgess, A.E. 2004. Method of producing hydroxyl radicals for chemical reactions. US Patent 6692632.
Bremner, D.H., Burgess, A.E., Houllemare, D. and Namkung, K.-C. 2006. Phenol degradation using hydroxyl radicals generated from zero-valent iron and hydrogen peroxide. Applied Catalysis B: Environmental. 63(1-2): pp. 15-19.
Bremner, D.H., Carlo, S.D., Chakinala, A.G. and Cravotto, G. 2008.Mineralisation of 2,4-dichlorophenoxyacetic acid by acoustic or hydrodynamic cavitation in conjunction with the advanced Fenton process. Ultrasonics Sonochemistry. 15 pp.416-419.
Buhler, R.E., Staehelin, J. and Hoigne, J. 1984. Ozone decomposition in water studied by pulse radiolysis. 1. H 02 /02 - and H 03/03- as intermediates. Journal o f Physical Chemistry. 88(12): pp.2560-2564.
Burleson, G.R., Murray, T.M. and Pollard, M. 1975. Inactivation of viruses and bacteria by ozone, with and without sonication. Journal o f Applied Microbiology. 29(3): pp.340-344.
Burns, N., Hunter, G., Jackman, A., Hulsey, B., Coughenour, J. and Walz, T.2007. The return of ozone and the hydroxyl radical to wastewater disinfection. Ozone: Science and Engineering. 29(4): pp.303-306.
Busnel, R.-G. and Picard, D. 1952. Rapports entre la longueur d'onde et l'oxydation de l'iodure de potassium par les ultrasons. C R Academie des Sciences. 235 p.1217.
Calvosa, L., Monteverdi, A., Rindone, B. and Riva, G. 1991. Ozone oxidation of compounds resistant to biological degradation. Water Research. 25(8): pp.985-993.
196

R efe ren ces
Cannon, F.S., Dusenbury, J.S., Paulsen, P.D., Singh, J., Mazyck, D.W. and Maurer, D.J. 1996. Advanced oxidant regeneration of granular activated carbon for controlling air-phase vocs. Ozone: Science and Engineering. 18(5): pp.417-441.
Canton, C., Esplugas, S. and Casado, J. 2003. Mineralization of phenol in aqueous solution by ozonation using iron or copper salts and light. Applied Catalysis B: Environmental. 43(2): pp. 139-149.
Carabineiro, S.A., Fernandes, F.B., Vital, J.S., Ramos, A.M. and Silva, I.F. 1999. Uncatalyzed and catalyzed NO and N 20 reaction using various catalysts and binary barium mixtures supported on activated carbon. Catalysis Today. 54(4): pp.559-567.
Chakinala, A.G., Bremner, D.H., Gogate, P.R., Namkung, K.-C. and Burgess,A.E. 2007a. Multivariate analysis of phenol mineralisation by combined hydrodynamic cavitation and heterogeneous advanced Fenton processing. Applied Catalysis B: Environmental. 78(1-2): pp. 11-18.
Chakinala, A.G., Gogate, P.R., Burgess, A.E. and Bremner, D.H. 2007b. Intensification of hydroxyl radical production in sonochemical reactors. Ultrasonics Sonochemistry. 14(5): pp.509-514.
Chakinala, A.G., Gogate, P.R., Burgess, A.E. and Bremner, D.H. 2008a.Treatment of industrial wastewater effluents using hydrodynamic cavitation and the advanced Fenton process. Ultrasonics Sonochemistry. 15(1): pp.49-54.
Chakinala, A.G., Gogate, P.R., Chand, R., Bremner, D.H., Molina, R. and Burgess, A.E. 2008b. Intensification of oxidation capacity using chloroalkanes as additives in hydrodynamic and acoustic cavitation reactors. Ultrasonics Sonochemistry. 15(3): pp. 164-170.
Chan, K.H. and Chu, W. 2003. The dose and ratio effects of Fe(II) and H 202 in Fenton's process on the removal of atrazine. Environmental Technology. 24(6): pp.703-710.
Chand, R., Bremner, D.H., Namkung, K.C., Collier, P.J. and Gogate, P.R. 2007. Water disinfection using the novel approach of ozone and a liquid whistle reactor. Biochemical Engineering Journal. 35(3): pp.357-364.
Chemat, F., Teunissen, P.G.M., Chemat, S. and Bartels, P.V. 2001. Sono-oxidation treatment of humic substances in drinking water. Ultrasonics Sonochemistry. 8(3): pp.247-250.
Chen, J.-L., Al-Abed, S.R., Ryan, J.A. and Li, Z. 2001. Effects of pH on dechlorination of trichloroethylene by zero-valent iron. Journal o f Hazardous Materials. 83(3): pp.243-254.
Chen, J.H., Hsu, Y.C., Yang, H.C. and Hsu, C.H. 2003. Ozonation treatment of 2- nitrophenolic wastewater using a new gas-inducing reactor. Chemical Engineering Communications. 190(11): pp.1541-1561.
197
R efe ren ces
Chen, R. and Pignatello, J.J. 1997. Role of quinone intermediates as electron shuttles in fenton and photoassisted fenton oxidations of aromatic compounds. Environmental Science and Technology. 31(8): pp.2399-2406.
Chen, Y.C. and Smirniotis, P. 2002. Enhancement of photocatalytic degradation of phenol and chlorophenols by ultrasound. Industrial and Engineering Chemistry Research. 41(24): pp.5958-5965.
Chendke, P.K. and Fogler, H.S. 1983. Sonoluminescence and sonochemical reactions of aqueous carbon tetrachloride solutions. Journal o f Physical Chemistry>. 87(8): pp. 1362-1369.
Cheung, H.M., Bhatnagar, A. and Jansen, G. 1991. Sonochemical destruction of chlorinated hydrocarbons in dilute aqueous solution. Environmental Science and Technology. 25(8): pp. 1510-1512.
Cho, S.-H., Shim, J., Yoon, S.-H. and Moon, S.-H. 2008. Enzyme-Catalyzed Conversion of Phenol by Using Immobilized Horseradish Peroxidase (HRP) in a Membraneless Electrochemical Reactor. Applied Catalysis A: General. 337(1): pp.6 6 - 72.
Christman, C.L., Carmichael, A.J., Mossoba, M.M. and Riesz, P. 1987. Evidence for free radicals produced in aqueous solutions by diagnostic ultrasound. Ultrasonics. 25(1): pp.31-34.
Christoskova, S.G., Stoyanova, M. and Georgieva, M. 2001. Low-temperature iron- modified cobalt oxide system: Part 2. Catalytic oxidation of phenol in aqueous phase. Applied Catalysis A: General. 208(1-2): pp.243-249.
Croll, B.T. 1996. The installation of GAC and ozone surface water treatment plants in Anglian Water, UK. Ozone: Science and Engineering. 18(1): pp. 19-40.
Cum, G., Galli, G., Gallo, R. and Spadaro, A. 1992. Role of frequency in the ultrasonic activation of chemical reactions. Ultrasonics. 30(4): pp.267-270.
Dabrowski, A., Podkoscielny, P., Hubicki, Z. and Barczak, M. 2005. Adsorption of phenolic compounds by activated carbon—a critical review. Chemosphere. 58(8): pp. 1049-1070.
Dai, Y., Li, F., Ge, F., Zhu, F., Wu, L. and Yang, X. 2006. Mechanism of the enhanced degradation of pentachlorophenol by ultrasound in the presence of elemental iron. Journal of Hazardous Materials. 137(3): pp. 1424-1429.
Danis, T.G., Albanis, T.A., Petrakis, D.E. and Pomonis, P.J. 1998. Removal of chlorinated phenols from aqueous solutions by adsorption on alumina pillared clays and mesoporous alumina aluminum phosphates. Water Research. 32(2): pp.295-302.
Davis, A.P. and Huang, C.P. 1990. The removal of substituted phenols by a photocatalytic oxidation process with cadmium sulfide. Water Research. 24(5): pp.543-550.
198
R efe ren ces
De Visscher, A. and Van Langenhove, H. 1998. Sonochemistry of organic compounds in homogeneous aqueous oxidising systems. Ultrasonics Sonochemistry. 5(3): pp.87-92.
De Visscher, A., Van Langenhove, H. and Van Eenoo, P. 1997. Sonochemical degradation of ethylbenzene in aqueous solution: A product study. Ultrasonics Sonochemistry. 4(2): pp. 145-151.
Delanghe, B., Le Cloirec, P. and Dagois, G. 1996. Removal of organic micropollutants by adsorption onto fibrous activated carbon (FAC) - Comparisons with GAC and PAC and application to UF-FAC process. Water Supply. 14(2): pp.177- 186.
Deng, B., Burris, D.R. and Campbell, T.J. 1999. Reduction of vinyl chloride in metallic iron-water systems. Environmental Science and Technology. 33(15): pp.2651- 2656.
Destaillats, H., Hung, H.M. and Hoffmann, M.R. 2000. Degradation of alkylphenol ethoxylate surfactants in water with ultrasonic irradiation. Environmental Science and Technology. 34(2): pp.311-317.
Deveci, H., Yazici, E.Y., Alp, I. and Uslu, T. 2006. Removal of cyanide from aqueous solutions by plain and metal-impregnated granular activated carbons. International Journal of Mineral Processing. 79(3): pp. 198-208.
Dhale, A.D. and Mahajani, V.V. 1999. Reactive dye house wastewater treatment.Use of hybrid technology: Membrane, sonication followed by wet oxidation.Industrial and Engineering Chemistry Research. 38(5): pp.2058-2064.
Dhale, A.D. and Mahajani, V.V. 2001. Subcritical mineralization of sodium salt of dodecyl benzene sulfonate using sonication-wet oxidation (SONIWO) technique. Water Research. 35(9): pp.2300-2306.
Diaz-Flores, P.E., Leyva-Ramos, R., Guerrero-Coronado, R.M. and Mendoza- Barron, J. 2006. Adsorption of pentachlorophenol from aqueous solution onto activated carbon fiber. Industrial and Engineering Chemistry Research. 45(1): pp.330- 336.
Didenko, Y.T., Nastich, D.N., Pugach, S.P., Polovinka, Y.A. and Kvochka, V.I.1994. The effect of bulk solution temperature on the intensity and spectra of water sonoluminescence. Ultrasonics. 32(1): pp.71-76.
Doktycz, S.J. and Suslick, K.S. 1990. Interparticle collisions driven by ultrasound. Science. 247(4946): pp.1067-1069.
Dries, J., Bastiaens, L., Springael, D., Agathos, S.N. and Diels, L. 2001a.Combined removal of chlorinated ethenes and heavy metals in zero valent iron systems. Proceedings of the 3rd International Conference on Groundwater Quality. pp.396-398.
199
R efe ren ces
Dries, J., Bastiaens, L., Springael, D. and Diels, L. 2001b. Kinetics of trichloroethene (TCE) reduction by zero-valent iron: Effect of medium composition. Groundwater Quality: Natural and Enhanced Restoration of Groundwater Pollution (Proceedings of the Goundwater Quality 2001 Conference Held at Sheffield, UK, June 2001). 275 pp.397-402.
Duckhouse, H., Mason, T.J., Phull, S.S. and Lorimer, J.P. 2004. The effect of sonication on microbial disinfection using hypochlorite. Ultrasonics Sonochemistry. 11(3-4): pp.173-176.
Dutta, N.N., Borthakur, S. and Baruah, R. 1998. A novel process for recovery of phenol from alkaline wastewater: Laboratory study and predesign cost estimate. Water Environment Research. 70(1): pp.4-9.
Dutta, N.N., Borthakur, S. and Patil, G.S. 1992. Phase Transfer Catalyzed Extraction of Phenolic Substances from Aqueous Alkaline Stream. Separation Science and Technology. 27(11): pp.1435 - 1448.
Earhart, J.P., Won, K.W. and Wong, H.Y. 1977. Recovery of organic pollutants via solvent extraction. Chemical Engineering Progress. 73(5): pp.67-73.
Echigo, S., Yamada, H., Matsui, S., Kawanishi, S. and Shishida, K. 1996. Comparison between o3/vuv, o3/h2o2, vuv and o3 processes for the decomposition of organophosphoric acid triesters. Water Science and Technology. 34(9): pp.81-88.
Economy, J., Daley, M. and Mangun, C. 1996. Activated carbon fibers - past, present, and future. ACS Division of Fuel Chemistry, Preprints. 41(1): pp.321-324.
Entezari, M.H. and Kruus, P. 1994. Effect of frequency on sonochemical reactions.I: oxidation of iodide. Ultrasonics Sonochemistry. 1(2): pp.S75-S79.
Entezari, M.H., Petrier, C. and Devidal, P. 2003. Sonochemical degradation of phenol in water: a comparison of classical equipment with a new cylindrical reactor. Ultrasonics Sonochemistry. 10(2): pp. 103-108.
Esplugas, S., Gimenez, J., Contreras, S., Pascual, E. and Rodriguez, M. 2002. Comparison of different advanced oxidation processes for phenol degradation. Water Research. 36(4): pp. 1034-1042.
Falcon, H., Carbonio, R.E. and Fierro, J.L.G. 2001. Correlation of oxidation states in LaFexNil-x03+? oxides with catalytic activity for H 202 decomposition. Journal of Catalysis. 203(2): pp.264-272.
Fang, H.H.P. and Chan, O.-C. 1997. Toxicity of phenol towards anaerobic biogranules. Water Research. 31(9): pp.2229-2242.
Faria, P.C.C., Orfao, JJ.M. and Pereira, M.F.R. 2005. Mineralisation of coloured aqueous solutions by ozonation in the presence of activated carbon. Water Research. 39(8): pp.1461-1470.
2 0 0
R efe ren ces
Feng, Y., Cui, Y., Logan, B. and Liu, Z. 2008. Performance of Gd-doped Ti-based Sb-Sn02 anodes for electrochemical destruction of phenol. Chemosphere. 7(9): pp.1629-1636.
Flint, E.B. and Suslick, K.S. 1991. The temperature of cavitation. Science.253(5026): pp. 1397-1399.
Floyd, R.A., Henderson, R., Watson, J.J. and Wong, P.K. 1986. Use of salicylate with high pressure liquid chromatography and electrochemical detection (LCE) as a sensitive measure of hydroxyl free radicals in adriamycin treated rats. Journal of Free Radicals in Biology & Medicine. 2(1): pp.13-18.
Fontanier, V., Farines, V., Albet, J., Baig, S. and Molinier, J. 2006. Study of catalyzed ozonation for advanced treatment of pulp and paper mill effluents. Water Research. 40(2): pp.303-310.
Forni, L., Bahnemann, D. and Hart, E.J. 1982. Mechanism of the hydroxide ion initiated decomposition of ozone in aqueous solution. Journal of Physical Chemistry. 86(2): pp.255-259.
Francony, A. and Petrier, C. 1996. Sonochemical degradation of carbon tetrachloride in aqueous solution at two frequencies: 20 kHz and 500 kHz. Ultrasonics Sonochemistry. 3(2): pp.S77-S82.
Georgi, A. and Kopinke, F.-D. 2005. Interaction of adsorption and catalytic reactions in water decontamination processes: Part I. Oxidation of organic contaminants with hydrogen peroxide catalyzed by activated carbon. Applied Catalysis B: Environmental. 58(1-2): pp.9-18.
Gerdes, R., Wohrle, D., Spiller, W., Schneider, G., Schnurpfeil, G. and Schulz- Ekloff, G. 1997. Photo-oxidation of phenol and monochlorophenols in oxygen- saturated aqueous solutions by different photosensitizers. Journal of Photochemistry and Photobiology A: Chemistry’. 111(1-3): pp.65-74.
Gillham, R.W., Major, L., Wadley, S.L.S. and Warren, J. 1998. Advances in the application of zero-valent iron for the treatment of groundwater containing VOCs. Groundwater Quality, pp.457-481.
Giordano, G., Perathoner, S., Centi, G., De Rosa, S., Granato, T., Katovic, A., Siciliano, A., Tagarelli, A. and Tripicchio, F. 2007. Wet hydrogen peroxide catalytic oxidation of olive oil mill wastewaters using Cu-zeolite and Cu-pillared clay catalysts. Catalysis Today. 124(3-4): pp.240-246.
Glaze, W.H. 1987. Drinking-water treatment with ozone: Ozone is a powerful disinfectant and oxidant, but its chemical byproducts need to be better understood. Environmental Science and Technology. 21(3): pp.224-230.
Glaze, W.H. and Kang, J.W. 1989a. Advanced oxidation processes. Description of a kinetic model for the oxidation of hazardous materials in aqueous media with ozone
201

R efe ren ces
and hydrogen peroxide in a semibatch reactor. Industrial and Engineering Chemistry Research®. 28(11): pp. 1573-1580.
Glaze, W.H. and Kang, J.W. 1989b. Advanced oxidation processes. Test of a kinetic model for the oxidation of organic compounds with ozone and hydrogen peroxide in a semibatch reactor. Industrial and Engineering Chemistry Research®. 28(11): pp.1580-1587.
Gogate, P.R. 2001. Wastewater treatment: Hydrodynamic cavitation. Chemical Engineering World. 36(5): pp.60-63.
Gogate, P.R. 2002. Cavitation: an auxiliary technique in wastewater treatment schemes. Advances in Environmental Research. 6(3): pp.335-358.
Gogate, P.R., Mujumdar, S. and Pandit, A.B. 2003. Sonochemical reactors for waste water treatment: comparison using formic acid degradation as a model reaction. Advances in Environmental Research. 7(2): pp.283-299.
Gogate, P.R. and Pandit, A.B. 2000. Engineering design methods for cavitation reactors II: Hydrodynamic cavitation. AIChE Journal. 46(8): pp.1641-1649.
Gogate, P.R. and Pandit, A.B. 2001. Hydrodynamic cavitation reactors: A state of the art review. Reviews in Chemical Engineering. 17(1): pp.1-85.
Gogate, P.R. and Pandit, A.B. 2004a. A review of imperative technologies for wastewater treatment I: oxidation technologies at ambient conditions. Advances in Environmental Research. 8(3-4): pp.501-551.
Gogate, P.R. and Pandit, A.B. 2004b. A review of imperative technologies for wastewater treatment II: hybrid methods. Advances in Environmental Research. 8(3-4): pp.553-597.
Gogate, P.R., Shirgaonkar, I.Z., Sivakumar, M., Senthilkumar, P., Vichare, N.P. and Pandit, A.B. 2001. Cavitation reactors: Efficiency assessment using a model reaction. AIChE Journal. 47(11): pp.2526-2538.
Gomez-Serrano, V., Acedo-Ramos, M., Lopez-Peinado, A.J. and Valenzuela- Calahorro, C. 1994. Oxidation of activated carbon by hydrogen peroxide. Study of surface functional groups by FT-i.r. Fuel. 73(3): pp.387-395.
Gondal, M.A., Sayeed, M.N. and Alarfaj, A. 2007. Activity comparison of Fe203, NiO, W 03, T i02 semiconductor catalysts in phenol degradation by laser enhanced photo-catalytic process. Chemical Physics Letters. 445(4-6): pp.325-330.
Gondal, M.A., Sayeed, M.N. and Seddigi, Z. 2008. Laser Enhanced Photo-Catalytic Removal Of Phenol From Water Using P -Type NiO Semiconductor Catalyst. Journal of Hazardous Materials. 155(1-2): pp.83-89.
Grajek, H., Swiatkowski, A., Witkiewicz, Z., Pakua, M. and Biniak, S. 2001. Changes in the surface chemistry and adsorptive properties of active carbon previously
2 0 2

R efe ren ces
oxidised and heat-treated at various temperatures. I. Physicochemical properties of the modified carbon surface. Adsorption Science and Technology. 19(7): pp.565-576.
Grant, T.M. and King, C.J. 1990. Mechanism of irreversible adsorption of phenolic compounds by activated carbons. Industrial and Engineering Chemistry Research. 29(2): pp.264-271.
Greenberg, A.E., Clesceri, L.S. and Eaton, A.D. 1992. APHA Standard Methods for the Examination of Water and Wastewater. Washingtom DC: APHA.
Grittini, C., Malcomson, M., Fernando, Q. and Korte, N. 1995. Rapid dechlorination of polychlorinated biphenyls on the surface of a Pd/Fe bimetallic system. Environmental Science and Technology. 29(11): pp.2898-2900.
Guo, Z., Zheng, Z., Zheng, S., Hu, W. and Feng, R. 2005. Effect of various sono- oxidation parameters on the removal of aqueous 2,4-dinitrophenol. Ultrasonics Sonochemistry. 12(6): pp.461-465.
Gurol, M.D. 1982. Kinetics of ozone decomposition: A dynamic approach. ES and T Contents. 16(7): pp.377-383.
Gutierrez, M., Henglein, A. and Mockel, H. 1995. Observations on the role of MgC12 in the Weissler reaction. Ultrasonics Sonochemistry. 2(2): pp.Sl 11-SI 13.
Guzel-Seydim, Z.B., Greene, A.K. and Seydim, A.C. 2004. Use of ozone in the food industry. LWT - Food Science and Technology. 37(4): pp.453-460.
Hamdaoui, O., Naffrechoux, E., Tifouti, L. and Petrier, C. 2003. Effects of ultrasound on adsorption-desorption of p-chlorophenol on granular activated carbon. Ultrasonics Sonochemistry. 10(2): pp. 109-114.
Hamoudi, S., Larachi, F., Cerrella, G. and Cassanello, M. 1998. Wet oxidation of phenol catalyzed by unpromoted and platinum-promoted manganese/cerium oxide. Industrial and Engineering Chemistry Research. 37(9): pp.3561-3566.
Han, D.-H., Cha, S.-Y. and Yang, H.-Y. 2004. Improvement of oxidative decomposition of aqueous phenol by microwave irradiation in UV/H202 process and kinetic study. Water Research. 38(11): pp.2782-2790.
Hart, E.J. and Henglein, A. 1985. Free radical and free atom reactions in the sonolysis of aqueous iodide and formate solutions. Journal of Physical Chemistry. 89(20): pp.4342-4347.
Hart, E.J. and Henglein, A. 1986a. Sonolysis of ozone in aqueous solution. Journal of Physical Chemistry. 90(14): pp.3061-3062.
Hart, E.J. and Henglein, A. 1986b. Sonolytic decomposition of nitrous oxide in aqueous solution. Journal o f Physical Chemistry. 90(22): pp.5992-5995.
203
R eferences
Hart, E.J. and Henglein, A. 1987. Sonochemistry of aqueous solutions: H 2-02 combustion in cavitation bubbles. Journal of Physical Chemistry. 91(13): pp.3654- 3656.
Heil, G. and Sontheimer, H. 1972. Determination of the amount of organic substances adsorbed on activated carbon by means of the rate of decomposition of hydrogen peroxide. Bestimminig der Beladung von Aktivkohle mit organischen Stojfen u?ber die Geschwindigkeit der Wasserstoffperoxidzersetzung. 261(2): pp. 117-123.
Henglein, A. 1987. Sonochemistry: Historical developments and modern aspects. Ultrasonics. 25(1): pp.6-16.
Henglein, A. 1993. Contributions to various aspects of cavitation chemistry. JAI Press Ltd.
Ho, T.-F.L., Bolton, J.R. and Lipczynska-Kochany, E. 1996. Quantum yields for the photodegradation of pollutants in dilute aqueous solution: phenol, 4-chlorophenol and N-nitrosodimethyl amine. Journal of Advanced Oxidation Technology. 1(2): pp.170-178.
Hoffmann, M.R., Hua, I. and Ho?Chemer, R. 1996. Application of ultrasonic irradiation for the degradation of chemical contaminants in water. Ultrasonics Sonochemistry. 3(3): pp.S163-S172.
Hoigne, J. 1985. Organic micropollutants and treatment processes: Kinetics and final effects of ozone and chlorine dioxide. Science of The Total Environment. A1 pp.169- 185.
Hoigne, J. 1997. Inter-calibration of the OH radical sources and water quality parameters. Water Science and Technology. 35(4): pp.1-8.
Hoigne, J. and Bader, H. 1976. The role of hydroxyl radical reactions in ozonation processes in aqueous solutions. Water Research. 10(5): pp.377-386.
Hoigne, J. and Bader, H. 1983a. Rate constants of reactions of ozone with organic and inorganic compounds in water—I : Non-dissociating organic compounds. Water Research. 17(2): pp. 173-183.
Hoigne, J. and Bader, H. 1983b. Rate constants of reactions of ozone with organic and inorganic compounds in water—I I : Dissociating organic compounds. Water Research. 17(2): pp.185-194.
Hu, Y., Zhang, Z. and Yang, C. 2008. Measurement of hydroxyl radical production in ultrasonic aqueous solutions by a novel chemiluminescence method. Ultrasonics Sonochemistry. 15(5): pp.665-672.
Hua, I. and Hoffmann, M.R. 1996. Kinetics and mechanism of the sonolytic degradation of CCL4: Intermediates and byproducts. Environmental Science and Technology. 30(3): pp.864-871.
204

R eferences
Hua, I. and Hoffmann, M.R. 1997. Optimization of ultrasonic irradiation as an advanced oxidation technology. Environmental Science and Technology. 31(8): pp.2237-2243.
Huang, C.P., Dong, C. and Tang, Z. 1993. Advanced chemical oxidation: Its present role and potential future in hazardous waste treatment. Waste Management. 13(5-7): pp.361-377.
Huang, H.-H., Lu, M.-C. and Chen, J.-N. 2001. Catalytic Decomposition of Hydrogen Peroxide and 2-chlorophenol with iron oxides. Water Research. 35(9): pp.2291-2299.
Huang, H.-H., Lu, M.-C., Chen, J.-N. and Lee, C.-T. 2003. Catalytic decomposition of hydrogen peroxide and 4-chlorophenol in the presence of modified activated carbons. Chemosphere. 51(9): pp.935-943.
Hundal, L.S., Singh, J., Bier, E.L., Shea, P.J., Comfort, S.D. and Powers, W.L.1997. Removal of TNT and RDX from water and soil using iron metal. Environmental Pollution. 97(1-2): pp.55-64.
Hung, H .M. and Hoffmann, M.R. 1998. Kinetics and mechanism of the enhanced reductive degradation of CC14 by elemental iron in the presence of ultrasound. Environmental Science and Technology. 32(19): pp.3011-3016.
Hung, H .M. and Hoffmann, M.R. 1999. Kinetics and Mechanism of the Sonolytic Degradation of Chlorinated Hydrocarbons: Frequency Effects. Journal of Physical Chemistry A. 103(15): pp.2734-2739.
Hung, H.M., Ling, F.H. and Hoffmann, M.R. 2000. Kinetics and mechanism of the enhanced reductive degradation of nitrobenzene by elemental iron in the presence of ultrasound. Environmental Science and Technology. 34(9): pp. 1758-1763.
Hunt, N.K. and Marinas, B.J. 1997. Kinetics of Escherichia coli inactivation with ozone. Water Research. 31(6): pp. 1355-1362.
Ince, N.H. and Apikyan, I.G. 2000. Combination of activated carbon adsorption with light-enhanced chemical oxidation via hydrogen peroxide. Water Research. 34(17): pp.4169-4176.
Ingale, M.N. and Mahajani, V.V. 1995. A novel way to treat refractory waste: Sonication followed by wet oxidation (SONIWO). Journal of Chemical Technology and Biotechnology. 64(1): pp.80-86.
loan, I., Wilson, S., Lundanes, E. and Neculai, A. 2007. Comparison of Fenton and sono-Fenton bisphenol A degradation. Journal of Hazardous Materials. 142(1-2): pp.559-563.
205
R efe ren ces
Ireland, J.C., Klostermann, P., Rice, E.W . and Clark, R.M. 1993. Inactivation of Escherichia coli by titanium dioxide photocatalytic oxidation. Applied and Environmental Microbiology. 59(5): pp. 1668-1670.
Jans, U. and Hoigne, J. 1998. Activated carbon and carbon black catalyzed transformation of aqueous ozone into OH-radicals. Ozone: Science and Engineering. 20(1): pp.67-90.
Jiang, Y., Petrier, C. and Waite, T.D. 2002. Effect of pH on the ultrasonic degradation of ionic aromatic compounds in aqueous solution. Ultrasonics Sonochemistry. 9(3): pp. 163-168.
Joglekar, H.S., Samant, S.D. and Joshi, J.B. 1991. Kinetics of wet air oxidation of phenol and substituted phenols. Water Research. 25(2): pp.135-145.
Joseph, J.M., Destaillats, H., Hung, H.M. and Hoffmann, M.R. 2000. The Sonochemical Degradation of Azobenzene and Related Azo Dyes: Rate Enhancements via Fenton's Reactions. Journal of Physical Chemistry A. 104(2): pp.301-307.
Jou, G.C.-J. 1998. Application of activated carbon in a microwave radiation field to treat trichloroethylene. Carbon. 36(11): pp. 1643-1648.
Jyoti, K.K. and Pandit, A.B. 2003. Hybrid cavitation methods for water disinfection. Biochemical Engineering Journal. 14(1): pp.9-17.
Jyoti, K.K. and Pandit, A.B. 2004. Ozone and cavitation for water disinfection. Biochemical Engineering Journal. 18(1): pp.9-19.
Kainulainen, T.K., Tuhkanen, T.A., Vartiainen, T.K. and Kalliokoski, P.J. 1995. Removal of residual organics from drinking water by ozonation and activated carbon filtration: A pilot plant study. Ozone: Science and Engineering. 17(4): pp.449-462.
Kang, J.W. and Hoffmann, M.R. 1998. Kinetics and mechanism of the sonolytic destruction of methyl tert- butyl ether by ultrasonic irradiation in the presence of ozone. Environmental Science and Technology. 32(20): pp.3194-3199.
Kang, J.W., Hung, H.M., Lin, A. and Hoffmann, M.R. 1999a. Sonolytic destruction of methyl tert-butyl ether by ultrasonic irradiation: The role of 0 3 , H 202, frequency, and power density. Environmental Science and Technology. 33(18): pp.3199-3205.
Kang, S.F., Wang, T.H. and Lin, Y.H. 1999b. Decolorization and degradation of 2,4-dinitrophenol by Fenton's reagent. Journal of Environmental Science and Health Part A-Toxic/Hazardous substances and Environmental Engineering. 34(4): pp.935- 950.
Kang, Y.W. and Hwang, K.-Y. 2000. Effects of reaction conditions on the oxidation efficiency in the Fenton process. Water Research. 34(10): pp.2786-2790.
206

R efe ren ces
Karnik, B.S., Davies, S.H., Baumann, M.J. and Masten, S.J. 2007. Removal of Escherichia coli after treatment using ozonation-ultrafiltration with iron oxide-coated membranes. Ozone: Science and Engineering. 29(2): pp.75-84.
Kavitha, V. and Palanivelu, K. 2005. Destruction of cresols by Fenton oxidation process. Water Research. 39(13): pp.3062-3072.
Khadre, M.A., Yousef, A.E. and Kim, J.G. 2001. Microbiological aspects of ozone applications in food: A review. Journal of Food Science. 66(9): pp. 1242-1252.
Khalil, L.B., Girgis, B.S. and Tawfik, T.A.M. 2001. Decomposition of H 202 on activated carbon obtained from olive stones. Journal of Chemical Technology and Biotechnology. 76(11): pp.1132-1140.
Kidak, R. and Ince, N.H. 2006. Effects of operating parameters on sonochemical decomposition of phenol. Journal of Hazardous Materials. 137(3): pp. 1453-1457.
Kidak, R. and Ince, N.H. 2007. Catalysis of advanced oxidation reactions by ultrasound: A case study with phenol. Journal of Hazardous Materials. 146(3): pp.630-635.
Kim, J.G., Yousef, A.E. and Dave, S. 1999. Application of ozone for enhancing the microbiological safety and quality of foods: A review. Journal of Food Protection. 62(9): pp.1071-1087.
Kim, J.K., Martinez, F. and Metcalfe, I.S. 2007. The beneficial role of use of ultrasound in heterogeneous Fenton-like system over supported copper catalysts for degradation of p-chlorophenol. Catalysis Today. 124(3-4): pp.224-231.
Kim, J.K. and Metcalfe, I.S. 2007. Investigation of the generation of hydroxyl radicals and their oxidative role in the presence of heterogeneous copper catalysts. Chemosphere. 69(5): pp.689-696.
Kimura, M., Miyamoto, I., Fujita, S. and Kumashiro, S. 1996. Difference in the kinetic behavior on the AC-catalyzed decomposition (AC=Activated Carbon) of [Co(C204)3]3- and Co(NH3)5(H20)J3+, and on the AC-catalyzed ligand-substitution reactions between each complex and EDTA in an aqueous solution. Bulletin o f the Chemical Society of Japan. 69(10): pp.2897-2900.
Klassen, N.V., Marchington, D. and Mcgowan, H.C.E. 1994. H 202 determination by the 13- method and by KM n04 titration. Analytical Chemistry. 66(18): pp.2921- 2925.
Kluson, P., Drobek, M., Krejcikova, S., Krysa, J., Kalaji, A., Cajthaml, T. and Rakusan, J. 2008. Molecular structure effects in photodegradation of phenol and its chlorinated derivatives with phthalocyanines. Applied Catalysis B: Environmental. 80(2-4): pp.321-326.
Kochany, J. and Bolton, J.R. 1992. Mechanism of photodegradation of aqueous organic pollutants. 2. Measurement of the primary rate constants for reaction of OH
207
R efe ren ces
radicals with benzene and some halobenzenes using an EPR spin-trapping method following the photolysis of H202. Environmental Science and Technology. 26(2): pp.262-265.
Kohno, M., Yamazaki, M., Kimura, I. and Wada, M. 2000. Effect of static magnetic fields on bacteria: Streptococcus mutans, Staphylococcus aureus, and Escherichia coli. Pathophysiology. 7(2): pp. 143-148.
Korn, M., Borges, S.S., Maia, P.R.M., Lima, J.L.F.C. and Lapa, R.A.S. 2004. Reagent generation for chemical analysis assisted by ultrasonic irradiation.Ultrasonics. 42(1-9): pp.585-590.
Kuo, W.G. 1992. Decolorizing dye wastewater with Fenton's reagent. Water Research. 26(7): pp.881-886.
Kwon, B.G., Lee, D.S., Kang, N. and Yoon, J. 1999. Characteristics of p- chlorophenol oxidation by Fenton's reagent. Water Research. 33(9): pp.2110-2118.
Lai, T.-L., Lee, C.-C., Wu, K.-S., Shu, Y.-Y. and Wang, C.-B. 2006. Microwave- enhanced catalytic degradation of phenol over nickel oxide. Applied Catalysis B: Environmental. 68(3-4): pp. 147-153.
Laughrey, Z., Bear, E., Jones, R. and Tarr, M.A. 2001. Aqueous sonolytic decomposition of polycyclic aromatic hydrocarbons in the presence of additional dissolved species. Ultrasonics Sonochemistry. 8(4): pp.353-357.
Le Cloirec, P., Brasquet, C. and Subrenat, E. 1996. The adsorption onto fibrous activated carbon applications to water and air treatments. ACS Division o f Fuel Chemistry\ Preprints. 41(1): pp.379-381.
Le Cloirec, P., Brasquet, C. and Subrenat, E. 1997. Adsorption onto fibrous activated carbon: Applications to water treatment. Energy and Fuels. 11(2): pp.331- 336.
Lei, L., Gu, L., Zhang, X. and Su, Y. 2007. Catalytic oxidation of highly concentrated real industrial wastewater by integrated ozone and activated carbon. Applied Catalysis A: General. 327(2): pp.287-294.
Leighton, T.G. 1995. Bubble population phenomena in acoustic cavitation. Ultrasonics Sonochemistry. 2(2): pp.S123-S136.
Li, L., Chen, P. and Gloyna, E.F. 1991. Generalized kinetic model for wet oxidation of organic compounds. AIChE Journal. 37(11): pp.1687-1697.
Li, L., Zhang, P., Zhu, W., Han, W. and Zhang, Z. 2005. Comparison of 03-BAC, UV/03-BAC and Ti02/UV/03-BAC processes for removing organic pollutants in secondary effluents. Journal o f Photochemistry and Photobiology A: Chemistry. 171(2): pp.145-151.
2 0 8

R efe ren ces
Li, Z.M., Comfort, S.D. and Shea, P.J. 1997a. Destruction of 2,4,6-trinitrotoluene by Fenton oxidation. Journal o f Environmental Quality. 26(2): pp.480-487.
Li, Z.M., Peterson, M.M., Comfort, S.D., Horst, G.L., Shea, P.J. and Oh, B.T.1997b. Remediating TNT-contaminated soil by soil washing and Fenton oxidation. Science of The Total Environment. 204(2): pp. 107-115.
Li, Z.M., Shea, P.J. and Comfort, S.D. 1997c. Fenton oxidation of 2,4,6- trinitrotoluene in contaminated soil slurries. Environmental Engineering Science.14(1): pp.55-66.
Liang, J., Komarov, S., Hayashi, N. and Kasai, E. 2007. Improvement in sonochemical degradation of 4-chlorophenol by combined use of Fenton-like reagents. Ultrasonics Sonochemistry. 14(2): pp.201-207.
Lim, J.-L. and Okada, M. 2005. Regeneration of granular activated carbon using ultrasound. Ultrasonics Sonochemistry. 12(4): pp.277-282.
Lin, C.J., Lo, S.-L. and Liou, Y.H. 2005. Degradation of aqueous carbon tetrachloride by nanoscale zerovalent copper on a cation resin. Chemosphere. 59(9): pp. 1299-1307.
Lin, J.G., Chang, C.N. and Wu, J.R. 1996. Decomposition of 2-chlorophenol in aqueous solution by ultrasoundth2o2 process. Water Science and Technology. 33(6): pp.75-81.
Lin, J.G. and Ma, Y.S. 2000. Oxidation of 2-chlorophenol in water by ultrasound/fenton method. Journal of Environmental Engineering. 126(2): pp. 130-137.
Lin, K., Cooper, W.J., Nickelsen, M.G., Kurucz, C.N. and Waite, T.D. 1995. Decomposition of aqueous solutions of phenol using high energy electron beam irradiation—A large scale study. Applied Radiation and Isotopes. 46(12): pp.1307- 1316.
Lin, S.H. and Lai, C.L. 1999. Catalytic oxidation of dye wastewater by metal oxide catalyst and granular activated carbon. Environment International. 25(4): pp.497-504.
Lin, S.H. and Lai, C.L. 2000. Kinetic characteristics of textile wastewater ozonation in fluidized and fixed activated carbon beds. Water Research. 34(3): pp.763-772.
Lin, S.H. and Lo, C.C. 1997. Fenton process for treatment of desizing wastewater. Water Research. 31(8): pp.2050-2056.
Lin, S.H. and Wang, C.H. 2003. Industrial wastewater treatment in a new gas- induced ozone reactor. Journal of Hazardous Materials. 98(1-3): pp.295-309.
Lipczynska-Kochany, E. 1993. Hydrogen peroxide mediated photodegradation of phenol as studied by a flash photolysis/HPLC technique. Environmental Pollution. 80(2): pp.147-152.
209

R efe ren ces
Liu, D. 1993. Generation and detection of hydroxyl radical in vivo in rat spinal cord by microdialysis administration sampling. Journal of Biochemical and Biophysical Methods. 27(4): pp.281-291.
Liu, H., Li, G., Qu, J. and Liu, H. 2007. Degradation of azo dye Acid Orange 7 in water by FeO/granular activated carbon system in the presence of ultrasound. Journal of Hazardous Materials. 144(1-2): pp. 180-186.
Liu, J., Crittenden, J.C., Hand, D.W. and Perram, D.L. 1996. Regeneration of adsorbents using heterogeneous photocatalytic oxidation. Journal of Environmental Engineering. 122(8): pp.707-713.
Liu, X., Quan, X., Bo, L., Chen, S. and Zhao, Y. 2004. Simultaneous pentachlorophenol decomposition and granular activated carbon regeneration assisted by microwave irradiation. Carbon. 42(2): pp.415-422.
L0gager, T., Holcman, J., Sehested, K. and Pedersen, T. 1992. Oxidation of ferrous ions by ozone in acidic solutions. Inorganic Chemistry. 31(17): pp.3523-3529.
Lopez-Lopez, A., Pic, J.S., Benbelkacem, H. and Debellefontaine, H. 2007. Influence of t-butanol and of pH on hydrodynamic and mass transfer parameters in an ozonation process. Chemical Engineering and Processing. 46(7): pp.649-655.
Louit, G., Foley, S., Cabillic, J., Coffigny, H., Taran, F., Valleix, A., Renault, J.P. and Pin, S. 2005. The reaction of coumarin with the OH radical revisited: hydroxylation product analysis determined by fluorescence and chromatography. Radiation Physics and Chemistry. 72(2-3): pp.l 19-124.
Lucking, F., Koser, H., Jank, M. and Ritter, A. 1998. Iron powder, graphite and activated carbon as catalysts for the oxidation of 4-chlorophenol with hydrogen peroxide in aqueous solution. Water Research. 32(9): pp.2607-2614.
Luo, X. and Lehotay, D.C. 1997. Determination of hydroxyl radicals using salicylate as a trapping agent by gas chromatography-mass spectrometry. Clinical Biochemistry. 30(1): pp.41-46.
Ma, J. and Graham, N.J.D. 1997. Preliminary investigation of manganese-catalyzed ozonation for the destruction of atrazine. Ozone: Science and Engineering. 19(3): pp.227-240.
Ma, J. and Graham, N.J.D. 2000. Degradation of atrazine by manganese-catalysed ozonation - Influence of radical scavengers. Water Research. 34(15): pp.3822-3828.
Mahamuni, N.N. and Pandit, A.B. 2006. Effect of additives on ultrasonic degradation of phenol. Ultrasonics Sonochemistry. 13(2): pp. 165-174.
Makino, K., Mossoba, M.M. and Riesz, P. 1982. Chemical effects of ultrasound on aqueous solutions. Evidence for -OH and H by spin trapping. Journal o f the American Chemical Society. 104(12): pp.3537-3539.
2 1 0
R efe ren ces
Manousaki, E., Psillakis, E., Kalogerakis, N. and Mantzavinos, D. 2004. Degradation of sodium dodecylbenzene sulfonate in water by ultrasonic irradiation. Water Research. 38(17): pp.3751-3759.
Mark, G., Tauber, A., Laupert, R., Schuchmann, H.-P., Schulz, D., Mues, A. and Von Sonntag, C. 1998. OH-radical formation by ultrasound in aqueous solution - Part II: Terephthalate and Fricke dosimetry and the influence of various conditions on the sonolytic yield. Ultrasonics Sonochemistry. 5(2): pp.41-52.
Martin, N. and Galey, C. 1994. Use of static mixer for oxidation and disinfection by ozone. Ozone: Science and Engineering. 16(6): pp.455-473.
Mason, T.J. and Lorimer, J.P. 1988. Sonochemistry: Theory, Applications and Uses of Ultrasound in Chemistry. John Wiley, New York.
Mason, T.J., Lorimer, J.P., Bates, D.M. and Zhao, Y. 1994. Dosimetry in sonochemistry: the use of aqueous terephthalate ion as a fluorescence monitor. Ultrasonics Sonochemistry. 1(2): pp.S91-S95.
Mason, T.J., Paniwnyk, L. and Lorimer, J.P. 1996. The uses of ultrasound in food technology. Ultrasonics Sonochemistry. 3(3): pp.S253-S260.
Matheson, L.J. and Tratnyek, P.G. 1994. Reductive dehalogenation of chlorinated methanes by iron metal. Environmental Science and Technology. 28(12): pp.2045- 2053.
Mccabe, D.R., Maher, T.J. and Acworth, I.N. 1997. Improved method for the estimation of hydroxyl free radical levels in vivo based on liquid chromatography with electrochemical detection. Journal of Chromatography B: Biomedical Sciences and Applications. 691(1): pp.23-32.
Mccray, S.B. and Ray, R.J. 1985. Concentration of synfuel process condensates by reverse osmosis. Separation Science and Technology. 22(2-3): pp.745-762.
Mckee, J.R., Christman, C.L., O’brien Jr, W.D. and Wang, S.Y. 1977. Effects of ultrasound on nucleic acid bases. Biochemistry. 16(21): pp.4651-4654.
Mclean, J.R. and Mortimer, A.J. 1988. A cavitation and free radical dosimeter for ultrasound. Ultrasound in Medicine & Biology. 14(1): pp.59-64.
Menesi, J., Korosi, L., Bazso, E., Zollmer, V., Richardt, A. and Dekany, I. 2008. Photocatalytic oxidation of organic pollutants on titania-clay composites.Chemosphere. 70(3): pp.538-542.
Miller, C.M. and Valentine, R.L. 1995. Hydrogen peroxide decomposition and quinoline degradation in the presence of aquifer material. Water Research. 29(10): pp.2353-2359.
211
R efe ren ces
Miller, C.M., Valentine, R.L., Roehl, M.E. and Alvarez, P.J.J. 1996. Chemical and microbiological assessment of pendimethalin-contaminated soil after treatment with Fenton's reagent. Water Research. 30(11): pp.2579-2586.
Miller, N. 1950. Chemical action of sound waves on aqueous solutions. Transactions of the Faraday Society. 46 pp.546-550.
Mishin, V.M. and Thomas, P.E. 2004. Characterization of hydroxyl radical formation by microsomal enzymes using a water-soluble trap, terephthalate. Biochemical Pharmacology. 68(4): pp.747-752.
Mishra, V.S., Mahajani, V.V. and Joshi, J.B. 1995. Wet air oxidation. Industrial and Engineering Chemistry Research. 34(1): pp.2-48.
Misik, V., Miyoshi, N. and Riesz, P. 1995. EPR spin-trapping study of the sonolysis of H 20/D 20 mixtures: Probing the temperatures of cavitation regions. Journal of Physical Chemistry. 99(11): pp.3605-3611.
Molina, R., Martinez, F., Melero, J.A., Bremner, D.H. and Chakinala, A.G. 2006. Mineralization of phenol by a heterogeneous ultrasound/Fe-SBA-15/H202 process: Multivariate study by factorial design of experiments. Applied Catalysis B: Environmental. 66(3-4): pp. 198-207.
Moore, E.K., Hoare, M. and Dunnill, P. 1990. Disruption of baker's yeast in a high- pressure homogenizer: New evidence on mechanism. Enzyme and Microbial Technology. 12(10): pp.764-770.
Mourand, J.T., Crittenden, J.C., Hand, D.W., Perram, D.L. and Notthakun, S.1995. Regeneration of spent adsorbents using homogeneous advanced oxidation. Water Environment Research. 67(3): pp.355-363.
Muftikian, R., Fernando, Q. and Korte, N. 1995. A method for the rapid dechlorination of low molecular weight chlorinated hydrocarbons in water. Water Research. 29(10): pp.2434-2439.
Mukherjee, S., Kumar, S., Misra, A.K. and Fan, M. 2007. Removal of phenols from water environment by activated carbon, bagasse ash and wood charcoal. Chemical Engineering Journal. 129(1-3): pp. 133-142.
Muller, G., Radke, C.J. and Prausnitz, J.M. 1980. Adsorption of weak organic electrolytes from aqueous solution on activated carbon. Effect of pH. Journal of Physical Chemistry. 84(4): pp.369-376.
Nagata, Y., Nakagawa, M., Okuno, H., Mizukoshi, Y., Yim, B. and Maeda, Y.2000. Sonochemical degradation of chlorophenols in water. Ultrasonics Sonochemistry. 7(3): pp. 115-120.
Naidu, D.V.P., Rajan, R., Kumar, R., Gandhi, K.S., Arakeri, V.H. and Chandrasekaran, S. 1994. Modelling of a batch sonochemical reactor. Chemical Engineering Science. 49(6): pp.877-888.
2 1 2
R efe ren ces
Naitou, S. and Takahara, H. 2008. Recent developments in food and agricultural uses of ozone as an antimicrobial agent-food packaging film sterilizing machine using ozone. Ozone: Science and Engineering. 30(1): pp.81-87.
Nakhla, G., Abuzaid, N. and Farooq, S. 1994. Activated carbon adsorption of phenolics in oxic systems: Effect of pH and temperature variations. Water Environment Research. 66(6): pp.842-850.
Namkung, K.C., Bremner, D.H. and Burgess, A.E. 2006. Method for Generating Hydroxyl Radicals Patent No. W02006109043, Dated: 2006-10-19, University of Abertay Dundee.
Namkung, K.C., Burgess, A.E. and Bremner, D.H. 2005. A fenton-like oxidation process using corrosion of iron metal sheet surfaces in the presence of hydrogen peroxide: A batch process study using model pollutants. Environmental Technology. 26(3): pp.341-352.
Namkung, K.C., Burgess, A.E., Bremner, D.H. and Staines, H. 2008. Advanced Fenton processing of aqueous phenol solutions: A continuous system study including sonication effects. Ultrasonics Sonochemistry. 15(3): pp. 171-176.
Neppolian, B., Jung, H., Choi, H., Lee, J.H. and Kang, J.W. 2002. Sonolytic degradation of methyl tert-butyl ether: The role of coupled fenton process and persulphate ion. Water Research. 36(19): pp.4699-4708.
Nesheiwat, F.K. and Swanson, A.G. 2000. Clean contaminated sites using Fenton's reagent. Chemical Engineering Progress. 96(4): pp.61-66.
Nikolopoulos, A.N., Igglessi-Markopoulou, O. and Papayannakos, N. 2006. Ultrasound assisted catalytic wet peroxide oxidation of phenol: kinetics and intraparticle diffusion effects. Ultrasonics Sonochemistry. 13(1): pp.92-97.
Notthakun, S., Crittenden, J.C., Hand, D.W., Perram, D.L. and Mullins, M.E.1993. Regeneration of adsorbents using heterogeneous advanced oxidation. Journal of Environmental Engineering. 119(4): pp.695-714.
Oh, S.-Y., Chiu, P.C., Kim, B.J. and Cha, D.K. 2003. Enhancing Fenton oxidation of TNT and RDX through pretreatment with zero-valent iron. Water Research. 37(17): pp.4275-4283.
Oliveira, L.C.A., Silva, C.N., Yoshida, M.I. and Lago, R.M. 2004. The effect of H2 treatment on the activity of activated carbon for the oxidation of organic contaminants in water and the H 202 decomposition. Carbon. 42(11): pp.2279-2284.
Olson, T.M. and Barbier, P.F. 1994. Oxidation kinetics of natural organic matter by sonolysis and ozone. Water Research. 28(6): pp. 1383-1391.
213
R efe ren ces
Otake, Y. and Jenkins, R.G. 1993. Characterization of oxygen-containing surface complexes created on a microporous carbon by air and nitric acid treatment. Carbon. 31(1): pp. 109-121.
Pandit, A.B. and Gogate, P.R. 2005. Process intensification using sonochemical reactors: Scale up aspects. 2005 AIChE Spring National Meeting, Conference Proceedings, p.3227.
Papadaki, M., Emery, R.J., Abu-Hassan, M.A., Diaz-Bustos, A., Metcalfe, I.S. and Mantzavinos, D. 2004. Sonocatalytic oxidation processes for the removal of contaminants containing aromatic rings from aqueous effluents. Separation and Purification Technology. 34(1-3): pp.35-42.
Park, T.J., Lee, K.H., Jung, E.J. and Kim, C.W. 1999. Removal of refractory organics and color in pigment wastewater with fenton oxidation. Water Science and Technology. 39(10-11): pp. 189-192.
Parke, A.V.M. and Taylor, D. 1956. The chemical action of ultrasonic waves. Journal of the Chemical Society (Resumed), pp.4428-4433.
Parsons, S. 2004. Advanced Oxidation for Water and Wastewater Treatment. London, UK: IWA Publishing.
Peller, J., Wiest, O. and Kamat, P.V. 2001. Sonolysis of 2,4-dichlorophenoxyacetic acid in aqueous solutions. Evidence for 'OH-radical-mediated degradation. Journal of Physical Chemistry A. 105(13): pp.3176-3181.
Pera-Titus, M., Garcia-Molina, V., Banos, M.A., Gimenez, J. and Esplugas, S.2004. Degradation of chlorophenols by means of advanced oxidation processes: a general review. Applied Catalysis B: Environmental. 47(4): pp.219-256.
Petrier, C., A., J., Luche, J.-L. and Reverdy, G. 1992. Unexpected frequency effects on the rate of oxidative processes induced by ultrasound. Journal o f the American Chemistry Society. 114 p.3148.
Petrier, C., David, B. and Laguian, S. 1996. Ultrasonic degradation at 20 kHz and 500 kHz of atrazine and pentachlorophenol in aqueous solution: Preliminary results. Chemosphere. 32(9): pp.1709-1718.
Petrier, C. and Francony, A. 1997a. Incidence of wave-frequency on the reaction rates during ultrasonic wastewater treatment. Water Science and Technology. 35(4): pp.175-180.
Petrier, C. and Francony, A. 1997b. Ultrasonic waste-water treatment: incidence of ultrasonic frequency on the rate of phenol and carbon tetrachloride degradation. Ultrasonics Sonochemistry. 4(4): pp.295-300.
Petrier, C., Lamy, M.-F., Francony, A., Renaudin, V., Gondrexon, N., Bremner,D. and Benahcene, A. 1995. Sonochemical degradation of phenol in dilute aqueous
214
R efe ren ces
solutions: comparison of the reaction rates at 20 and 487 kHz. Journal of Physics and Chemistry. 98 p. 10510.
Pignatello, J.J. 1992. Dark and photoassisted Fe3+-catalyzed degradation of chlorophenoxy herbicides by hydrogen peroxide. Environment Science and Technology. 26(5): pp.944-951.
Piyasena, P., Mohareb, E. and Mckellar, R.C. 2003. Inactivation of microbes using ultrasound: A review. International Journal of Food Microbiology. 87(3): pp.207-216.
Polaert, I., Wilhelm, A.M. and Delmas, H. 2002. Phenol wastewater treatment by a two-step adsorption-oxidation process on activated carbon. Chemical Engineering Science. 57(9): pp. 1585-1590.
Potter, F.J. and Roth, J.A. 1993. Oxidation of chlorinated phenols using Fenton's reagent. Hazardous Waste and Hazardous Materials. 10(2): pp. 151-170.
Price, G.J., Duck, F.A., Digby, M., Holland, W. and Berryman, T. 1997. Measurement of radical production as a result of cavitation in medical ultrasound fields. Ultrasonics Sonochemistiy. 4(2): pp. 165-171.
Price, G.J. and Lenz, E.J. 1993. The use of dosimeters to measure radical production in aqueous sonochemical systems. Ultrasonics. 31(6): pp.451-456.
Qu, X., Zheng, J. and Zhang, Y. 2007. Catalytic ozonation of phenolic wastewater with activated carbon fiber in a fluid bed reactor. Journal o f Colloid and Interface Science. 309(2): pp.429-434.
Quinlivan, P.A., Li, L. and Knappe, D.R.U. 2005. Effects of activated carbon characteristics on the simultaneous adsorption of aqueous organic micropollutants and natural organic matter. Water Research. 39(8): pp. 1663-1673.
Quintanilla, A., Fraile, A.F., Casas, J.A. and Rodriguez, J.J. 2007. Phenol oxidation by a sequential CWPO-CWAO treatment with a Fe/AC catalyst. Journal of Hazardous Materials. 146(3): pp.582-588.
Radeke, K.H., Jonas, S., Spitzer, P., Jung, R. and Neffe, S. 1989. On the characterization of activated carbon by the decomposition of hydrogen peroxide. ZUR CHARAKTERISIERUNG VONAKTIVKOHLEN DURCH DIE ZERSETZUNG VON WASSERSTOFFPEROXID. 17(3): pp.315-319.
Ragaini, V., Selli, E., Letizia Bianchi, C. and Pirola, C. 2001. Sono-photocatalytic degradation of 2-chlorophenol in water: Kinetic and energetic comparison with other techniques. Ultrasonics Sonochemistry. 8(3): pp.251-258.
Rajan, R., Kumar, R. and Gandhi, K.S. 1998. Modelling of sonochemical oxidation of the water-KI-CC14 system. Chemical Engineering Science. 53(2): pp.255-271.
215
R efe ren ces
Riesz, P., Berdahl, D. and Christman, C.L. 1985. Free radical generation by ultrasound in aqueous and nonaqueous solutions. Environmental Health Perspectives. VOL. 64 pp.233-252.
Riesz, P. and Kondo, T. 1992. Free radical formation induced by ultrasound and its biological implications. Free Radical Biology and Medicine. 13(3): pp.247-270.
Riesz, P., Kondo, T. and Krishna, C.M. 1990. Sonochemistry of volatile and nonvolatile solutes in aqueous solutions: e.p.r. and spin trapping studies. Ultrasonics. 28(5): pp.295-303.
Rivera-Utrilla, J. and Sanchez-Polo, M. 2002. Ozonation of 1,3,6- naphthalenetrisulphonic acid catalysed by activated carbon in aqueous phase. Applied Catalysis B: Environmental. 39(4): pp.319-329.
Rush, J.D. and Bielski, B.H.J. 1986. Pulse radiolysis studies of alkaline Fe(III) and Fe(VI) solutions. Observation of transient iron complexes with intermediate oxidation states. Journal of the American Chemical Society. 108(3): pp.523-525.
Ryu, S.-K. 1990. Porosity of activated carbon fibre. High Temperatures - High Pressures. 22(3): pp.345-354.
San Martin, M.F., Harte, F.M., Lelieveld, H., Barbosa-Ca?Novas, G.V. and Swanson, B.G. 2001. Inactivation effect of an 18-T pulsed magnetic field combined with other technologies on Escherichia coli. Innovative Food Science and Emerging Technologies. 2(4): pp.273-277.
Sanchez-Polo, M., Leyva-Ramos, R. and Rivera-Utrilla, J. 2005a. Kinetics of 1,3,6-naphthalenetrisulphonic acid ozonation in presence of activated carbon. Carbon. 43(5): pp.962-969.
Sanchez-Polo, M. and Rivera-Utrilla, J. 2003. Effect of the ozone-carbon reaction on the catalytic activity of activated carbon during the degradation of 1,3,6- naphthalenetrisulphonic acid with ozone. Carbon. 41(2): pp.303-307.
Sanchez-Polo, M. and Rivera-Utrilla, J. 2006. Ozonation of naphthalenetrisulphonic acid in the presence of activated carbons prepared from petroleum coke. Applied Catalysis B: Environmental. 67(1-2): pp. 113-120.
Sanchez-Polo, M., Von Gunten, U. and Rivera-Utrilla, J. 2005b. Efficiency of activated carbon to transform ozone into OH radicals: Influence of operational parameters. Water Research. 39(14): pp.3189-3198.
Sanchez, I., Stiiber, F., Font, J., Fortuny, A., Fabregat, A. and Bengoa, C. 2007. Elimination of phenol and aromatic compounds by zero valent iron and EDTA at low temperature and atmospheric pressure. Chemosphere. 68(2): pp.338-344.
216
R e fe ren ces
Sanchez, L., Domenech, X., Casado, J. and Peral, J. 2003. Solar activated ozonation of phenol and malic acid. Chemosphere. 50(8): pp. 1085-1093.
Sano, N., Yamamoto, T., Yamamoto, D., Kim, S.-I., Eiad-Ua, A., Shinomiya, H. and Nakaiwa, M. 2007. Degradation of aqueous phenol by simultaneous use of ozone with silica-gel and zeolite. Chemical Engineering and Processing. 46(6): pp.513-519.
Santos, A., Yustos, P., Quintanilla, A., Rodriguez, S. and Garcia-Ochoa, F. 2002. Route of the catalytic oxidation of phenol in aqueous phase. Applied Catalysis B: Environmental. 39(2): pp.97-113.
Sauer, M.L. and Ollis, D.F. 1996. Photocatalyzed Oxidation of Ethanol and Acetaldehyde in Humidified Air. Journal of Catalysis. 158(2): pp.570-582.
Save, S.S., Pandit, A.B. and Joshi, J.B. 1994. Microbial cell disruption: role of cavitation. The Chemical Engineering Journal and the Biochemical Engineering Journal. 55(3): pp.B67-B72.
Save, S.S., Pandit, A.B. and Joshi, J.B. 1997. Use of hydrodynamic cavitation for large scale microbial cell disruption. Food and Bioproducts Processing: Transactions of the Institution of of Chemical Engineers, Part C. 75(1): pp.41-49.
Scott, D.B.M. and Lesher, E.C. 1963. Effect of ozone on survival and permeability of Escherichia coli. Journal of Bacteriology. 85 pp.567-576.
Sehested, K., Holcman, J., Bjergbakke, E. and Hart, E.J. 1982. Ultraviolet spectrum and decay of the ozonide ion radical, 03-, in strong alkaline solution.Journal of Physical Chemistry. 86(11): pp.2066-2069.
Sehgal, C.M. and Wang, S.Y. 1981. Threshold intensities and kinetics of sonoreaction of thymine in aqueous solutions at low ultrasonic intensities. Journal of the American Chemical Society. 103(22): pp.6606-6611.
Senthil Kumar, P., Siva Kumar, M. and Pandit, A.B. 2000. Experimental quantification of chemical effects of hydrodynamic cavitation. Chemical Engineering Science. 55(9): pp. 1633-1639.
Serpone, N., Terzian, R., Hidaka, H. and Pelizzetti, E. 1994. Ultrasonic induced dehalogenation and oxidation of 2-, 3-, and 4-chlorophenol in air-equilibrated aqueous media. Similarities with irradiated semiconductor particulates. Journal o f Physical Chemistry. 98(10): pp.2634-2640.
Seymour, J.D. and Gupta, R.B. 1997. Oxidation of Aqueous Pollutants Using Ultrasound: Salt-Induced Enhancement. Industrial and Engineering Chemistry Research. 36(9): pp.3453-3457.
Shimada, H., Akazawa, T., Ikenaga, N.-O. and Suzuki, T. 1998. Dehydrogenation of isobutane to isobutene with iron-loaded activated carbon catalyst. Applied Catalysis A: General. 168(2): pp.243-250.
217
R efe ren ces
Shirgaonkar, I.Z., Lothe, R.R. and Pandit, A.B. 1998. Comments on the mechanism of microbial cell disruption in high-pressure and high-speed devices. Biotechnology Progress. 14(4): pp.657-660.
Silva, A.M.T., Nouli, E., Carmo-Apolinario, A.C., Xekoukoulotakis, N.P. and Mantzavinos, D. 2007. Sonophotocatalytic/H202 degradation of phenolic compounds in agro-industrial effluents. Catalysis Today. 124(3-4): pp.232-239.
Singh, N., Singh, R.K. and Bhunia, A.K. 2003. Sequential disinfection of Escherichia coli 0157:H7 inoculated alfalfa seeds before and during sprouting using aqueous chlorine dioxide, ozonated water, and thyme essential oil. LWT - Food Science and Technology. 36(2): pp.235-243.
Sivakumar, M. and Pandit, A.B. 2001. Ultrasound enhanced degradation of Rhodamine B: optimization with power density. Ultrasonics Sonochemistry. 8(3): pp.233-240.
Sivakumar, M. and Pandit, A.B. 2002. Wastewater treatment: a novel energy efficient hydrodynamic cavitational technique. Ultrasonics Sonochemistry. 9(3): pp.123-131.
Sivakumar, M., Tatake, P.A. and Pandit, A.B. 2002. Kinetics of p-nitrophenol degradation: effect of reaction conditions and cavitational parameters for a multiple frequency system. Chemical Engineering Journal. 85(2-3): pp.327-338.
Snyder, S., Wert, E., Westerhoff, P., Yoon, Y., Rexing, D. and Zegers, R. 2005. Occurrence and Treatment of Endocrine Disruptors and Pharmaceuticals. Proceedings Ozone World Congress, Strasbourg, France, Paper VI 1.1.
Sotelo, J.L., Beltran, F.J., Benitez, F.J. and Beltran-Heredia, J. 1987. Ozone decomposition in water: Kinetic study. Industrial and Engineering Chemistry Research. 26(1): pp.39-43.
Staehelin, J., Bu?Hler, R.E. and Hoigne, J. 1984. Ozone decomposition in water studied by pulse radiolysis. 2. OH and H 04 as chain intermediates. Journal o f Physical Chemistry. 88(24): pp.5999-6004.
Staehelin, J. and Hoigne, J. 1985. Decomposition of ozone in water in the presence of organic solutes acting as promoters and inhibitors of radical chain reactions. Environmental Science and Technology. 19(12): pp. 1206-1213.
Staehelln, J. and Hoigne, J. 1982. Decomposition of ozone in water: Rate of initiation of hydroxide ions and hydrogen peroxide: Rate of initiation by hydroxide ions and hydrogen peroxide. Environmental Science and Technology. 16(10): pp.676- 681.
Strelko, V., Malik, D.J. and Streat, M. 2002. Characterisation of the surface of oxidised carbon adsorbents. Carbon. 40(1): pp.95-104.
218
R efe ren ces
Suryaman, D., Hasegawa, K. and Kagaya, S. 2006. Combined biological and photocatalytic treatment for the mineralization of phenol in water. Chemosphere. 65(11): pp.2502-2506.
Suslick, K.S. 1988. Ultrasound: Its Chemical, Physical and Biological Effects. VCH Publishers, Inc., New York.
Suslick, K.S. 1990. Sonochemistry. Science. 247(4949): pp. 1439-1445.
Suslick, K.S., Doktycz, S.J. and Flint, E.B. 1990. On the origin of sonoluminescence and sonochemistry. Ultrasonics. 28(5): pp.280-290.
Suslick, K.S., Flint, E.B., Grinstaff, M.W. and Kemper, K.A. 1993a. Sonoluminescence from metal carbonyls. Journal of Physical Chemistry. 97(13): pp.3098-3099.
Suslick, K.S., Hammerton, D.A. and Cline Jr, R.E. 1986. The sonochemical hot spot. Journal of the American Chemical Society. 108(18): pp.5641-5642.
Suslick, K.S., Kemper, K.A. and Flint, E.B. 1993b. Spectrally resolved sonoluminescence as a probe of cavitation. Proceedings of the IEEE Ultrasonics Symposium. 2 pp.777-783.
Suslick, K.S., Mdleleni, M.M. and Ries, J.T. 1997. Chemistry induced by hydrodynamic cavitation. Journal of the American Chemical Society. 119(39): pp.9303-9304.
Suzuki, M. 1991. Application of fiber adsorbents in water treatment. Water Science and Technology. 23(7-9): pp. 1649-1658.
Sykora, J., Pado, M., Tatarko, M. and Izakovic, M. 1997. Homogeneous photooxidation of phenols: influence of metals. Journal of Photochemistry and Photobiology A: Chemistry. 110(2): pp. 167-175.
Szymanski, G.S., Karpinski, Z., Biniak, S. and Swiatkowski, A. 2002. The effect of the gradual thermal decomposition of surface oxygen species on the chemical and catalytic properties of oxidized activated carbon. Carbon. 40(14): pp.2627-2639.
Takaoka, M., Yokokawa, H. and Takeda, N. 2007. The effect of treatment of activated carbon by H202 or HN03 on the decomposition of pentachlorobenzene. Applied Catalysis B: Environmental. 74(3-4): pp. 179-186.
Tang, W.Z. and Huang, C.P. 1996. 2,4-dichlorophenol oxidation kinetics by Fenton's reagent. Environmental Technology. 17(12): pp. 1371-1378.
Tang, W.Z. and Tassos, S. 1997. Oxidation kinetics and mechanisms of trihalomethanes by Fenton's reagent. Water Research. 31(5): pp. 1117-1125.
219
R efe ren ces
Taylor Jr, E., Cook, B.B. and Tarr, M.A. 1999. Dissolved organic matter inhibition of sonochemical degradation of aqueous polycyclic aromatic hydrocarbons.Ultrasonics Sonochemistry. 6(4): pp. 175-183.
Teel, A.L. and Watts, R.J. 2002. Degradation of carbon tetrachloride by modified Fenton's reagent. Journal o f Hazardous Materials. 94(2): pp. 179-189.
Teismann, P. and Ferger, B. 2000. The salicylate hydroxylation assay to measure hydroxyl free radicals induced by local application of glutamate in vivo or induced by the Fenton reaction in vitro. Brain Research Protocols. 5(2): pp.204-210.
Theron, P., Pichat, P., Guillard, C., Petrier, C. and Chopin, T. 1999. Degradation of phenyltrifluoromethylketone in water by separate or simultaneous use of T i02 photocatalysis and 30 or 515 kHz ultrasound. Physical Chemistry Chemical Physics. 1(19): pp.4663-4668.
Thompson, L.H. and Doraiswamy, L.K. 1999. Sonochemistry: Science and engineering. Industrial and Engineering Chemistry Research. 38(4): pp. 1215-1249.
Tiehm, A. and Neis, U. 2005. Ultrasonic dehalogenation and toxicity reduction of trichlorophenol. Ultrasonics Sonochemistry. 12(1-2): pp. 121-125.
Trabelsi, F., Ai?T-Lyazidi, H., Ratsimba, B., Wilhelm, A.M., Delmas, H., Fab re, P.L. and Berlan, J. 1996. Oxidation of phenol in wastewater by sonoelectrochemistry. Chemical Engineering Science. 51(10): pp. 1857-1865.
Tryba, B., Tsumura, T., Janus, M., Morawski, A.W. and Inagaki, M. 2004. Carbon-coated anatase: adsorption and decomposition of phenol in water. Applied Catalysis B: Environmental. 50(3): pp. 177-183.
Tyre, B.W., Watts, R.J. and Miller, G.C. 1991. Treatment of four biorefractory contaminants in soils using catalyzed hydrogen peroxide. Journal o f Environmental Quality. 20(4): pp.832-838.
Ugurlu, M., Gurses, A., Dogar, C. and Yalcin, M. 2008. The removal of lignin and phenol from paper mill effluents by electrocoagulation. Journal of Environmental Management. 87(3): pp.420-428.
Ullerstam, M., Langer, S. and Ljungstro?M, E. 2000. Gas phase rate coefficients and activation energies for the reaction of butanal and 2-methyl-propanal with nitrate radicals. International Journal of Chemical Kinetics. 32(5): pp.294-303.
Valentine, R.L. and Ann Wang, H.C. 1998. Iron oxide surface catalyzed oxidation of quinoline by hydrogen peroxide. Journal of Environmental Engineering. 124(1): pp.31-38.
Vazquez, I., Rodriguez-Iglesias, J., Maranon, E., Castrillon, L. and Alvarez, M.2007. Removal of residual phenols from coke wastewater by adsorption. Journal of Hazardous Materials. 147(1-2): pp.395-400.
2 2 0

R efe rences
Vichare, N.P., Gogate, P.R. and Pandit, A.B. 2000. Optimization of hydrodynamic cavitation using a model reaction. Chemical Engineering and Technology. 23(8): pp.683-690.
Vogelpohl, A. and Kim, S.M. 2004. Advanced oxidation processes (AOPs) in wastewater treatment. J. Ind. Eng. Chem. 10(1): pp.33-40.
Von Gunten, U. 2003. Ozonation of drinking water: Part II. Disinfection and byproduct formation in presence of bromide, iodide or chlorine. Water Research. 37(7): pp. 1469-1487.
Von Sonntag, C. and Schuchmann, H.P. 1991. The elucidation of peroxyl radical reactions in aqueous solution with the help of radiation-chemical methods.Angewandte Chemie (International Edition in English). 30(10): pp. 1229-1253.
Wang, L., Zhu, L., Luo, W., Wu, Y. and Tang, H. 2007. Drastically enhanced ultrasonic decolorization of methyl orange by adding CC14. Ultrasonics Sonochemistry. 14(2): pp.253-258.
Wang, T.H., Kang, S.F. and Lin, Y.H. 1999. Comparison among Fenton-related processes to remove 2,4-dinitrophenol. Journal of Environmental Science and Health - Part A Toxic/Hazardous Substances and Environmental Engineering. 34(6): pp.1267- 1281.
Watts, R.J. and Dilly, S.E. 1996. Evaluation of iron catalysts for the Fenton-like remediation of diesel-contaminated soils. Journal of Hazardous Materials. 51(1-3): pp.209-224.
Watts, R.J., Jones, A.P., Chen, P.H. and Kenny, A. 1997. Mineral-catalyzed Fenton-like oxidation of sorbed chlorobenzenes. Water Environment Research. 69(3): pp.269-275.
Watts, R.J., Udell, M.D. and Rauch, P.A. 1990. Treatment of pentachlorophenol- contaminated soils using Fenton's reagent. Hazardous Waste and Hazardous Materials. 7(4): pp.335-345.
Weavers, L.K. and Hoffmann, M.R. 1998. Sonolytic decomposition of ozone in aqueous solution: Mass transfer effects. Environmental Science and Technology. 32(24): pp.3941-3947.
Weavers, L.K., Ling, F.H. and Hoffmann, M.R. 1998. Aromatic compound degradation in water using a combination of sonolysis and ozonolysis. Environmental Science and Technology. 32(18): pp.2727-2733.
Weiss, J. 1952. The free radical mechanism in the reactions of hydrogen peroxide.Adv. Catal. 4 pp.343-365.
Weissler, A. 1948. Ultrasonic investigation of molecular properties of liquids. II. The alcohols. Journal of the American Chemical Society. 70(4): pp. 1634-1640.
221

R efe ren ces
Weissler, A., Cooper, H.W. and Snyder, S. 1950. Chemical effect of ultrasonic waves: Oxidation of potassium iodide solution by carbon tetrachloride. Journal o f the American Chemical Society. 72(4): pp. 1769-1775.
Wheat, P.E. and Tumeo, M.A. 1997. Ultrasound induced aqueous polycyclic aromatic hydrocarbon reactivity. Ultrasonics Sonochemistiy. 4(1): pp.55-59.
Will, Moraes, J.E.F., Teixeira, A.C.S.C., Guardani, R. and Nascimento,C.A.O. 2004. Photo-Fenton degradation of wastewater containing organic compounds in solar reactors. Separation and Purification Technology. 34(1-3): pp.51-57.
Witekowa, S. 1972. Chemical effects of ultrasonic waves. XIII. Investigations of some sonochemical oxidation and reduction reactions. Acta Chim. 17 pp.97-104.
Woods, R.J. and Pikaev, A.K. 1994. Applied Radiation Chemistry: Radiation Processing. New York: Wiley.
Wright, H. and Nicell, J.A. 1999. Characterization of soybean peroxidase for the treatment of aqueous phenols. Bioresource Technology. 70(1): pp.69-79.
Wu, C., Liu, X., Wei, D., Fan, J. and Wang, L. 2001. Photosonochemical degradation of Phenol in water. Water Research. 35(16): pp.3927-3933.
Yang, H.H. and Mccreery, R.L. 2000. Elucidation of the mechanism of dioxygen reduction on metal-free carbon electrodes. Journal o f the Electrochemical Society. 147(9): pp.3420-3428.
Yang, S., Zhu, W., Li, X., Wang, J. and Zhou, Y. 2007. Multi-walled carbon nanotubes (MWNTs) as an efficient catalyst for catalytic wet air oxidation of phenol. Catalysis Communications. 8(12): pp.2059-2063.
Yim, B., Yoo, Y. and Maeda, Y. 2003. Sonolysis of alkylphenols in aqueous solution withFe(II) andFe(III). Chemosphere. 50(8): pp. 1015-1023.
Yoon, J., Cho, S., Cho, Y. and Kim, S. 1998. The characteristics of coagulation of Fenton reaction in the removal of landfill leachate organics. Water Science and Technology. 38(2 pt 2): pp.209-214.
Yoon, J., Lee, Y. and Kim, S. 2001. Investigation of the reaction pathway of OH radicals produced by Fenton oxidation in the conditions of wastewater treatment. Water Science and Technology. 44(5): pp. 15-21.
Yoshida, M., Lee, B.D. and Hosomi, M. 2000. Decomposition of aqueous tetrachloroethylene by Fenton oxidation treatment. Water Science and Technology. 42(1-2): pp.203-208.
Yuranova, T., Enea, O., Mielczarski, E., Mielczarski, J., Albers, P. and Kiwi, J.2004. Fenton immobilized photo-assisted catalysis through a Fe/C structured fabric. Applied Catalysis B: Environmental. 49(1): pp.39-50.
2 2 2
R efe rences
Zaror, C.A. 1997. Enhanced oxidation of toxic effluents using simultaneous ozonation and activated carbon treatment. Journal of Chemical Technology and Biotechnology. 70(1): pp.21-28.
Zhang, W., Chen, L., Chen, H. and Xia, S.-Q. 2007. The effect of Fe0/Fe2+/Fe3+ on nitrobenzene degradation in the anaerobic sludge. Journal o f Hazardous Materials. 143(1-2): pp.57-64.
Zhang, X., Chen, P., Wu, F., Deng, N., Liu, J. and Fang, T. 2006. Degradation of 17 [alpha]-ethinylestradiol in aqueous solution by ozonation. Journal of Hazardous Materials. 133(1-3): pp.291-298.
Zheng, W., Maurin, M. and Tarr, M.A. 2005. Enhancement of sonochemical degradation of phenol using hydrogen atom scavengers. Ultrasonics Sonochemistry. 12(4): pp.313-317.
Zwiener, C. and Frimmel, F.H. 2000. Oxidative treatment of pharmaceuticals in water. Water Research. 34(6): pp.1881-1885.
223

Appendix A
Cost and energy estim ation o f the D osim etry, Degradation and D isinfection processes in the
cavitational reactors.
A

Actual power (W)
Supplied power (W)
Time oftreatment(h)
Operationalpower(kWh)
Operational cost (GBP) (1 kWh = GBP 0.10)
Volume of £/Lreactants(L)
Experiment al results
Estimated cost (cost per unit product yield) £/pM HO»generation or £/g TOC reduction
Actual x (amplitude)
(Supplied power/1000 ) x Time of treatment
kWh x 0.10 = GBP
£/L
Ultrasonic reactors (acoustic cavitation)Dosimetry pM HO« £/pM HO»
generation generation20 kHz US reactor (amplitudes) [Dichloromethane, 7 g L *]25% 400 100 1.17 0.117 0.012 0.200 0.058 54.43 0.00150% 400 200 1.17 0.233 0.023 0.200 0.117 111.5 0.001
75% 400 300 1.17 0.350 0.035 0.200 0.175 171.01 0.001
Degradation g L”1 TOC £/g TOCremoved removed
US reactors (kHz)20 (50% amplitude) 180 90 1 0.09 0.009 0.080 0.113 0.0719 1.565300 25 25 1 0.03 0.003 0.100 0.025 0.0709 0.353520 kHz 100 100 1 0.10 0.010 0.300 0.033 0.0658 0.507Latent Remediation (24 h)____________US (20 kHz; 50%) 400 200 0.25 0.050 0.005 0.200 0.025 0.175 0.143Stir 100 100 0.25 0.025 0.003 0.200 0.013 0.138 0.091
1
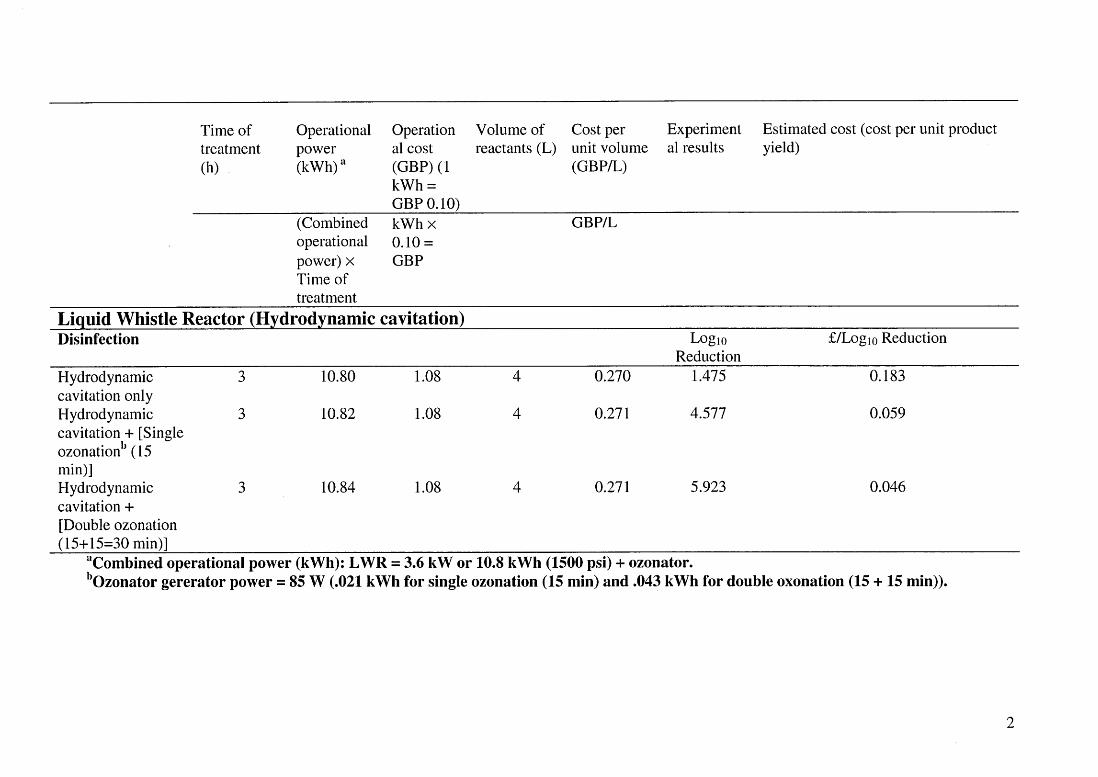
Time oftreatment(h)
Operational power (kW h)a
Operation al cost (GBP) (1 kWh = GBP 0.10)
Volume of reactants (L)
Cost per Experiment unit volume al results (GBP/L)
Estimated cost (cost per unit product yield)
(Combined kWh x GBP/Loperational 0.10 =power) x GBPTime oftreatment
Liquid Whistle Reactor (Hydrodynamic cavitation)Disinfection Logio
Reduction£/Logio Reduction
Hydrodynamic 3 10.80 1.08 4 0.270 1.475 0.183cavitation only Hydrodynamic cavitation + [Single ozonationb (15
3 10.82 1.08 4 0.271 4.577 0.059
min)]Hydrodynamic cavitation + [Double ozonation (15+15=30 min)]
3 10.84 1.08 4 0.271 5.923 0.046
aCombined operational power (kWh): LWR = 3.6 kW or 10.8 kWh (1500 psi) + ozonator.bOzonator gererator power = 85 W (.021 kWh for single ozonation (15 min) and .043 kWh for double oxonation (15 + 15 min)).
2
Appendix B
C hakinala, A .G ., G ogate, P.R ., Chand, R., Brem ner, D .H ., M olina, R. and B urgess, A.E. 2008.
Intensification o f oxidation capacity using chloroalkanes as additives in hydrodynam ic and
acoustic cavitation reactors. Ultrasonics Sonochem istry. 15(3): pp.164-170.
B

Appendix C
Chand, R ., Brem ner, D .H ., Nam kung, K .C., Collier, P.J. and G ogate, P.R . 2007. W ater
disinfection using the novel approach o f ozone and a liquid w histle reactor. B iochem ical
Engineering Journal. 35(3): pp.357-364.