Assessment of freezing desalination technologies. - Cronfa
316
Swansea University E-Theses _________________________________________________________________________ Assessment of freezing desalination technologies. Ahmad, Mansour M. M How to cite: _________________________________________________________________________ Ahmad, Mansour M. M (2012) Assessment of freezing desalination technologies.. thesis, Swansea University. http://cronfa.swan.ac.uk/Record/cronfa42635 Use policy: _________________________________________________________________________ This item is brought to you by Swansea University. Any person downloading material is agreeing to abide by the terms of the repository licence: copies of full text items may be used or reproduced in any format or medium, without prior permission for personal research or study, educational or non-commercial purposes only. The copyright for any work remains with the original author unless otherwise specified. The full-text must not be sold in any format or medium without the formal permission of the copyright holder. Permission for multiple reproductions should be obtained from the original author. Authors are personally responsible for adhering to copyright and publisher restrictions when uploading content to the repository. Please link to the metadata record in the Swansea University repository, Cronfa (link given in the citation reference above.) http://www.swansea.ac.uk/library/researchsupport/ris-support/
-
Upload
khangminh22 -
Category
Documents
-
view
0 -
download
0
Transcript of Assessment of freezing desalination technologies. - Cronfa
Swansea University E-Theses _________________________________________________________________________
Assessment of freezing desalination technologies.
Ahmad, Mansour M. M
How to cite: _________________________________________________________________________ Ahmad, Mansour M. M (2012) Assessment of freezing desalination technologies.. thesis, Swansea University.
http://cronfa.swan.ac.uk/Record/cronfa42635
Use policy: _________________________________________________________________________ This item is brought to you by Swansea University. Any person downloading material is agreeing to abide by the terms
of the repository licence: copies of full text items may be used or reproduced in any format or medium, without prior
permission for personal research or study, educational or non-commercial purposes only. The copyright for any work
remains with the original author unless otherwise specified. The full-text must not be sold in any format or medium
without the formal permission of the copyright holder. Permission for multiple reproductions should be obtained from
the original author.
Authors are personally responsible for adhering to copyright and publisher restrictions when uploading content to the
repository.
Please link to the metadata record in the Swansea University repository, Cronfa (link given in the citation reference
above.)
http://www.swansea.ac.uk/library/researchsupport/ris-support/
Swansea University Prifysgoi Abertawe
Department of Chemical and Biological Process Engineering
Swansea University
ASSESSMENT OF FREEZING DESALINATION
TECHNOLOGIES
by
Mansour AhmadM.Sc. with Distinction
A Thesis Submitted in Fulfilment of the Requirement for the Degree
DOCTOR OF PHILOSOPHYPhilosophiae Doctor (Ph.D.)
Mansour Ahmad 2012
August 2012
ProQuest Number: 10805411
All rights reserved
INFORMATION TO ALL USERS The quality of this reproduction is dependent upon the quality of the copy submitted.
In the unlikely event that the author did not send a com p le te manuscript and there are missing pages, these will be noted. Also, if material had to be removed,
a note will indicate the deletion.
uestProQuest 10805411
Published by ProQuest LLC(2018). Copyright of the Dissertation is held by the Author.
All rights reserved.This work is protected against unauthorized copying under Title 17, United States C ode
Microform Edition © ProQuest LLC.
ProQuest LLC.789 East Eisenhower Parkway
P.O. Box 1346 Ann Arbor, Ml 48106- 1346
Summary
The production of both fresh water and waste streams are progressively increasing over the
years due to ongoing population growth coupled with high levels of increase in water
consumption. The ongoing growth of human activities, such as industry, recreation, and
agriculture, are significantly contributing to the increase in both water demand and severity
of degradation of natural water resources. The majority of the industrial wastewaters have a
significant impact on the environment; some of which may pose a number of threats to
human health and the surrounding environment. Thus, discharge of such waste streams into a
surface water and/or groundwater presents a major source of water pollution in many
countries. Therefore, these waste streams must be disposed of in an environmentally
acceptable manner.
The primary concern of the PhD thesis is to seek the most feasible and applicable freezing
desalination technologies that are potentially capable to concentrate the dissolved ionic
content of the liquid streams, especially for those causing severe pollution problems.
Therefore, various forms of melt crystallisation processes, namely; agitated and static
crystallisation processes, ice maker machines, a Sulzer falling film crystallisation process,
the Sulzer suspension crystallisation process, and the Sulzer static crystallisation process,
were experimentally used and investigated. The experimental investigations were carried out
on the laboratory bench scale and/or straightforward pilot plant by using aqueous solutions
of sodium chloride and/or process brines as feed samples. The study was focused on a
number of important parameters influencing the separation performance of the investigated
treatment systems. In general, the resulting experimental data for each innovative process
were highly encouraging in minimising the volume of the waste stream, and substantially
increasing the amount of product water. The obtained product water was ready for immediate
use either as drinking water or as a saline water of near brackish water or seawater qualities.
Also, relationships between the influences and the separation performance, in terms of salt
rejection and water recovery ratios, were explored and determined for the investigated
technologies. Based on the experimental results, the Sulzer melt crystallisation processes
were scaled up and were combined into a commercial reverse osmosis membrane
desalination plant. As a result, three novel treatment option configurations were proposed for
minimising the waste stream, whilst increasing the production rate of drinking water and/or
preserving a substantial amount of natural water resource from the RO plant's exploitation.

Declaration
This work has not been previously accepted in substance for any degree and is not
being concurrently submitted in candidature for any degree.
Signed: ............................................................... (Candidate: Mansour Ahmad)
Date: ................
Statement 1
This thesis is the result of my own investigations, except where otherwise stated.
Other sources are acknowledged by footnotes giving explicit references. A
bibliography is appended.
Signed: ............................................................... (Candidate: Mansour Ahmad)
Date: ........ ......................................................
Statement 2
I hereby give my consent for my thesis, if accepted, to be available for photocopying
and for inter-library loan, and for the title and summary to be made available to
outside organisations.
Signed: ............................................................... (Candidate: Mansour Ahmad)
Date: ......... .....................................................
Acknowledgements
I am ever grateful to God, the Creator and the Guardian, and to whom I owe my very existence.
I would like to thank a number of people and institutions who have contributed in one way or another to this project and extended their valuable assistance in the completion of my thesis:
First and foremost, I would like to express my sincere gratitude to my supervisor Dr Paul Williams for his direction, guidance and support throughout my Ph.D research since without his encouragement and motivation I could not have completed this project. Despite his busy schedule at the university, he was always available to me, to discuss my ideas or answer any questions I had on various aspects of my Ph.D study.
I would like to thank Kuwait Institute for Scientific Research (KISR) and in particular the scholarship committee for their financial support and providing me with the opportunity to pursue my studies as well as giving me the chance to achieve my ultimate goal in life. Moreover, I owe special thanks to Dr Yousif Al-Wazzan, Department Manager of Water Technologies Department at KISR, for all his support and help toward obtaining the scholarship from KISR. I would also like to give sincere and many thanks to Dr Mahmoud Abdel-Jawad, Principal Research Scientist at KISR, since without his encouragement and enthusiasm I could have not completed the work (as scheduled in the work plan) on time.
During my Ph.D, I had the privilege to work with Sulzer Chemtech Ltd in Switzerland to conduct some of my research. The three months I spent there were exceptionally productive and the staff who were involved showed great interest and enthusiasm in the technical sessions, practical training programs, technical meetings, and oral presentations given by myself. Furthermore, I owe a great deal to Dr. Severine Dette, Sales Engineer Fractional Crystallization at Sulzer Chemtech Company, who has been so kind and generous with her time in offering me valuable information about Sulzer’s technologies through technical sessions. I really appreciate her help in discussing the experimental data with me, answering and addressing any questions that would assist me to think through my ideas for developing the existing Sulzer’s technologies.
Finally, I would like to express gratitude to all my friends, colleagues, family members and especially my loving wife Mrs. Zainab Ghareeb for all their faith, patience and moral support during the writing of this thesis.
List of Contents
Summary............................................................................................................................... i
List of Figures....................................................................................................................... ix
List of Tables......................................................................................................................... xiv
Nomenclature........................................................................................................................ xvii
Chapter 1: Introduction........................................................................................................ 1
1.1 Project Scope........................................................................................................ 3
1.2 Objectives............................................................................................................. 3
Chapter 2: Literature Review............................................................................................... 5
2.1 Introduction.......................................................................................................... 5
2.2 Principle of Current Desalination Technologies............................................... 13
2.2.1 Conventional Thermal Desalination....................................................... 14
2.2.2 Membranes Processes.............................................................................. 16
2.2.3 Chemical Processes................................................................................. 22
2.3 Freezing Desalination Technologies.................................................................. 26
2.3.1 Description of the Basic Freezing Desalination Processes................... 27
2.3.1.1 Indirect Freezing Process with a Secondary Refrigerant 28
2.3.1.2 Vacuum-Freezing Vapour Compression Process................... 29
2.3.1.3 Vacuum-Freezing Vapour Absorption Process...................... 31
2.3.1.4 Secondary Refrigerant Freezing Process................................ 32
2.3.1.5 Separation Unit - Washing System ......................................... 33
2.3.2 Advantages & Disadvantages of Freezing Desalination Technologies. 34
2.3.3 Present & Future Freezing-Melting Process.......................................... 36
2.3.4 Potential Technology Transfer of Melt Crystallisation Process to
Desalination........................................................................................... 39
2.4 Brine Treatment & Zero Liquid Discharge Approaches................................... 40
2.4.1 Thermal Technologies............................................................................. 41
2.4.1.1 Conventional Thermal Technologies...................................... 41
2.4.1.2 Thermal Solar Technologies.................................................... 43
2.4.2 Membrane Technologies......................................................................... 45
2.4.3 Comparison of Membrane & Conventional Thermal Technologies
for ZLD Systems................................................................................... 47
iv
2.4.4 Promising Technologies - Opportunities & Challenges...................... 50
2.5 Conclusions.......................................................................................................... 53
Chapter 3: Experimental Study of Agitation Systems Used for the Freeze-Thawing
Process............................................................................................................... 55
3.1 Introduction............................................................................................................ 55
3.2 Preparation of Feed Samples............................................................................... 56
3.3 Physicochemical Analysis & Measuring Instruments....................................... 56
3.4 Experimental Setup............................................................................................... 57
3.5 Experimental Procedure........................................................................................ 59
3.6 Results & Discussion............................................................................................ 62
3.6.1 Static Crystallisation Process.................................................................. 62
3.6.2 Crystallisation Process using Mechanically Stirred System............... 65
3.6.3 Crystallisation Process using Ultrasonic Process.................................. 68
3.6.4 Crystallisation using Bubbling Process.................................................. 70
3.7 Conclusions............................................................................................................ 70
Chapter 4: Assessment of Ice Maker Used for Saline Water Applications...................... 72
4.1 Introduction........................................................................................................... 72
4.1.1 Description of Ice Maker Machine & Basic Operation........................ 73
4.1.2 Mechanism of Ice Cubes Production...................................................... 77
4.1.3 Modifications to Ice Maker Machine..................................................... 82
4.2 Preparation of Feed Samples............................................................................... 85
4.3 Physiochemical Analysis & Measuring Instruments......................................... 86
4.4 Experimental Setup............................................................................................... 87
4.5 Experimental Procedure........................................................................................ 88
4.6 Results & Discussion............................................................................................ 91
4.6.1 Influence of Feed Salinity....................................................................... 92
4.6.2 Influence of Ice Thickness....................................................................... 94
4.6.3 Energy Consumption............................................................................... 96
4.6.4 Influence of the Feed Flow-Rate............................................................ 99
4.6.5 Multi-Stage Process (Rectification Stage)............................................. 101
4.6.6 Multi-Stage Process (Stripping stage).................................................... 106
4.7 Conclusions............................................................................................................ I l l
Chapter 5: Investigating the Feasibility of the Falling Film Crystallisation Process for
Treating Reverse Osmosis Brines..................................................................... 113
V

5.1 Introduction............................................................................................................ 113
5.6.1 Description of the Falling Film Crystallisation Process & Basic
Operation................................................................................................ 115
5.6.2 Multi-Stage Design & Basic Operation.................................................. 119
5.2 Preparation of Feed Samples............................................................................... 122
5.3 Physicochemical Analysis & Measuring Instruments....................................... 122
5.4 Experimental Setup............................................................................................... 123
5.5 Experimental Procedure....................................................................................... 128
5.5.1 Preparation & Activation of the SC R ..................................................... 129
5.5.2 Preparation & Activation of the Pilot P lant........................................... 130
5.6 Results & Discussion............................................................................................ 135
5.6.1 Crystallisation Experiments using Feed Stage (without the Sweating
Process).................................................................................................. 139
5.6.2 Multi-Stage Process (Feed & Rectification Stages) without the
Sweating Process.................................................................................... 146
5.6.3 Crystallisation & Sweating Experiments using Feed Stage................. 149
5.6.4 Multi-Stage Processing (Feed, Rectification, & Stripping Stages)
with a Sweating Procedure for Treating RO B rine............................ 153
5.6.5 Multi-Stage Processing (Feed & Rectification Stages) with a
Sweating Step for Desalting Arabian Gulf Seawater......................... 164
5.6.6 Scaling-up of the Sulzer Falling Film Crystallisation Technology 169
5.6.7 Energy Consumption & Production R ate............................................. 173
5.7 Conclusions............................................................................................................ 175
Chapter 6: Investigating the Feasibility of the Suspension Crystallisation Process for
Treating Reverse Osmosis Brines..................................................................... 177
6.1 Introduction............................................................................................................ 177
6.2 Description of Suspension Crystallisation & Basic Operation......................... 179
6.3 Preparation of Feed Samples............................................................................... 184
6.4 Physicochemical Analysis & Measuring Instruments........................................ 184
6.5 Experimental Setup............................................................................................... 184
6.6 Experimental Procedure........................................................................................ 189
6.7 Results & Discussion............................................................................................ 198
6.8 Power Requirement Analysis............................................................................... 214
6.9 Conclusions............................................................................................................ 224
Chapter 7: Investigating the Feasibility of the Static Crystallisation Process for
Treating Different Concentrations of Reverse Osmosis Brines................... 225
7.1 Introduction............................................................................................................ 225
7.1.1 Description of the Static Crystallisation Process & Basic Operation .. 227
7.1.2 Multi-Stage Design & Basic Operation................................................. 231
7.2 Preparation of Feed Samples............................................................................... 231
7.3 Physicochemical Analysis & Measuring Instruments........................................ 231
7.4 Experimental Setup............................................................................................... 232
7.5 Experimental Procedure........................................................................................ 236
7.6 Results & Discussion............................................................................................ 238
7.6.1 Parametric Study of Crystallisation & Sweating Processes................. 239
7.6.2 RO Brine Treatment - using a Pilot Plant with a Crystalliser
Capacity of 7 0 L ...................................................................................... 243
7.6.3 Process Brine Treatment - using the Laboratory Pilot Scale Setup
with a Crystalliser Capacity of 6L ........................................................ 245
7.6.4 Scaling-up of the Sulzer Static Crystallisation Technology................ 256
7.7 Conclusions............................................................................................................ 262
Chapter 8: Conclusions & Recommendations.......................................................... 264
8.1 Static & Agitated Crystallisation Processes........................................................ 267
8.2 Ice Maker Technology.......................................................................................... 269
8.3 Sulzer Falling Film Crystallisation Process........................................................ 272
8.4 Sulzer Suspension Crystallisation Process.......................................................... 276
8.5 Sulzer Static Crystallisation Process.................................................................... 279
Appendices (attached as C D )..................................................................................... 283
Appendix A3: A complete record of experimental data on static & agitated
crystallisation processes................................................................... 283
Appendix A4: A complete record of experimental data on ice maker machine ... 283
Appendix A5: A complete record of experimental data on Sulzer falling film
crystallisation pilot p lant.................................................................. 283
Appendix A6: A complete record of experimental data on Sulzer suspension
crystallisation pilot p lan t.................................................................. 283
Appendix A7: A complete record of process data, operating temperature profiles,
full physiochemical analysis, & crystalline impurity content
versus sweating tim es....................................................................... 283
vii

References
List of Figures
Figure (2.1): Dry Salts per Day versus Feed-Water Salinity...................................... 9
Figure (2.2): Feed Water Salinity & Process Applicability........................................ 14
Figure (2.3): Osmotic Pressure & Minimum Energy Consumption Predictions for
NaCl at 25 °C ..................................................................................................................... 18
Figure (2.4): Energy Requirement Predictions for Electrodialysis versus the
Salinity.............................................................................................................................. 20
Figure (2.5): A Schematic Illustration of the Ion Exchange Concept for Softening
Process............................................................................................................................ 22
Figure (2.6): A Schematic View of a Typical Example of an Ion Exchange U nit... 24
Figure (2.7): Flow Process Diagram of the Main Equipment of an Indirect
Freezing Process............................................................................................................ 29
Figure (2.8): Flow Process Diagram of the Main Equipment of a Vacuum
Freezing Vapour Compression Process....................................................................... 31
Figure (2.9): Flow process Diagram of the Main Equipment of a Vacuum-
Freezing Vapour Absorption Process.......................................................................... 32
Figure (2.10): Flow Process Diagram of the Main Equipment of a Secondary
Refrigerant Freezing Process........................................................................................ 33
Figure (2.11): Flow process Diagram of the Wash-Separation Column.................. 34
Figure (3.1): Scheme of Experimental Setups............................................................ 58
Figure (3.2): Simplified Block Diagram of the Operational Process for the
Experiments................................................................................................................... 60
Figure (3.3): Summary of the Phase Diagram & Relationships Between the Main
Key Parameters for the NaCl Solution, & Experimental Data for Static
Crystallisation Experiments.......................................................................................... 63
Figure (3.4): Experimental Data for Static & MSS Crystallisation Experiments .... 66
Figure (3.5): Undesired Ice Suspension in a Crystalliser.......................................... 67
Figure (3.6): Experimental Data for the Ultrasonic & Bubbled Crystallisation
Experiments................................................................................................................... 69
Figure (4.1): K40 Ice Maker & its Major Items of Equipment.................................. 74
Figure (4.2): Simplified Schematic Diagram of the Water Recirculation System of
the Laboratory Apparatus............................................................................................. 76
ix
Figure (4.3): Simplified Schematic Flow Diagram of Refrigeration Cycle.............. 79
Figure (4.4): Schematic Flow Diagram of Water Circulation Loop Existed in the
Laboratory Apparatus................................................................................................... 80
Figure (4.5): Feeding Process Used for Each Experiment......................................... 83
Figure (4.6): Top Interior View of Ice M aker............................................................. 84
Figure (4.7): Water Circulation Loop with a Flow Control Valve in the
Laboratory Apparatus................................................................................................... 84
Figure (4.8): Kilowatt Hours M eter............................................................................. 87
Figure (4.9): Stirring Hot Plate Device........................................................................ 87
Figure (4.10): Simplified Block Diagram of the Operational Process for the
Experimental Set-up....................................................................................................... 88
Figure (4.11): Product Concentration & Water Recovery Ratios versus Running
Tim e................................................................................................................................ 93
Figure (4.12): Influence of Ice Thickness on the Salt Concentration of Water
Samples, Salt Rejection Ratio & Water Recovery R atio ........................................... 95
Figure (4.13): Summary of the Experimental & Theoretical Results of the Energy
Consumption of the Ice M aker..................................................................................... 98
Figure (4.14): Influence of Circulation Pump Flow-Rate on Product Concentration
& Water Recovery......................................................................................................... 100
Figure (5.1): Typical Sulzer Falling Film Crystallisation P lant................................ 116
Figure (5.2): Typical Sulzer Falling Film Crystalliser................................................ 116
Figure (5.3): Mass Flows in a Three-Stage Process................................................... 120
Figure (5.4): Temperature-time Profile of the Falling Film Crystallisation............. 121
Figure (5.5): Process Phases......................................................................................... 121
Figure (5.6): Tested Sulzer Falling Film Crystallisation Pilot P lant........................ 124
Figure (5.7): Outside-view of the Tested Pilot P lant.................................................. 125
Figure (5.8): Apparatus for Controlling & Maintaining the Pilot P lant................... 126
Figure (5.9): Process Flow Diagram of the Pilot-Plant............................................... 127
Figure (5.10): Simplified Block Diagram of the Operational Process for the
Experimental Set-up....................................................................................................... 129
Figure (5.11): Screenshot of the Pilot Plant Software................................................ 131
Figure (5.12): Summary of the Phase Diagram & Relationships between the Main
Key Parameters for the Arabian Gulf Seawater & RO Brine.................................... 138
Figure (5.13): Performance of Feed Stage using Sulzer Falling Film
X
Crystallisation (without the Sweating Process) for Treating RO Brine.................... 141
Figure (5.14): Performance of Feed Stage using Sulzer Falling Film
Crystallisation (with sweating) Process for Treating RO Brine................................. 150
Figure (5.15): Performance of Feed, Rectification, & Stripping Stages, using
Falling Film Crystallisation & Sweating Processes, for Treating RO B rine 159
Figure (5.16): Summary of Several Eutectic Temperatures & Chemical
Composition of Binary Salt - Water Systems............................................................ 163
Figure (5.17): Performance of Feed & Rectification Stages, using Falling Film
Crystallisation & Sweating Processes, for Treating Arabian Gulf Seawater 170
Figure (5.18): Combination of a Commercial Seawater Reverse Osmosis (RO)
Membrane Desalination Plant Coupled with the Sulzer Falling Film
Crystallization Plant...................................................................................................... 172
Figure (5.19): Production Rate & Power Consumption versus End-point FITM
Temperature for the First Series of the Experiments................................................. 174
Figure (5.20): Production Rate & Power Consumption versus End-point HTM
Temperature................................................................................................................... 175
Figure (5.21): Feed Concentration versus Power Consumption................................ 175
Figure (6.1): A Typical Plant using Suspension-Based Melt Crystallisation 180
Figure (6.2): Flow Process Diagram of Main Equipment.......................................... 181
Figure (6.3): A Typical Tubular & Scraped Surface Heat Exchanger....................... 181
Figure (6.4): A Typical Sulzer Wash Column............................................................. 182
Figure (6.5): Four Stroke Cycles of the Piston Type Wash Column......................... 182
Figure (6.6): Skid Mounted Pilot P lant........................................................................ 185
Figure (6.7): Pilot Plant Apparatus.............................................................................. 186
Figure (6.8): Flow Process Diagram of the Pilot P lant............................................... 187
Figure (6.9): Apparatus for Controlling & Maintaining the Pilot P lant.................. 188
Figure (6.10): Cylindrical Glass of Wash Column..................................................... 188
Figure (6.11): Simplified Block Diagram of the Operational Procedure for the
Suspension Crystallisation Experiments...................................................................... 189
Figure (6.12): Preparation Phases before Operating the Pilot P lant......................... 190
Figure (6.13): Screen Shot of the Pilot Plant Software with a Dialog Window of
Feed Tank Setting........................................................................................................... 192
Figure (6.14): Screen Shot of the Pilot Plant Software with a Dialog Window of
Wash Column Settings.................................................................................................. 193
xi
Figure (6.15): Screen Shot of the Pilot Plant Software with a Dialog Window for
Setting the Heating System of Melting L oop............................................................. 194
Figure (6.16): Screen Shot of the Pilot Plant Software with a Dialog Window for
Setting the Scraper Motor in the Crystalliser.............................................................. 195
Figure (6.17): Collection of Final Product Water Samples for Run 1 ..................... 197
Figure (6.18): Final Product Water & Residue Samples for Runs 1 & 2 .................... 200
Figure (6.19): Experimental Data of Run 2 ................................................................ 202
Figure (6.20): Product Water Sample from Sub-Run (a- 2) in Comparison with
Feed Sample................................................................................................................... 203
Figure (6.21): Predicted & Experimental Data of Water Recovery Ratio Measured
at Different Residue Temperature for Different Types of Saline W ater.................... 211
Figure (6.22): Combination of Commercial Plant of Seawater Reverse Osmosis
(RO) Membrane Desalination Plant Coupled with Suspension Crystallization
P lant............................................................................................................................... 213
Figure (6.23): Plant Specific Power Consumption versus the Product Mass Flow-
R ate ................................................................................................................................ 222
Figure (7.1): Plate Type Heat Exchanger Used in the Commercial Sulzer Static
Crystalliser..................................................................................................................... 228
Figure (7.2): Sulzer Commercial Static Crystalliser.................................................. 229
Figure (7.3): Process Set-Point Temperature-Time Profile....................................... 229
Figure (7.4): Laboratory Pilot Scale Setup, & Main Equipment & Processes 233
Figure (7.5): Pilot Plant Apparatus & Main Equipment............................................ 234
Figure (7.6): Schematic of Laboratory Pilot Scale Setup.......................................... 235
Figure (7.7): Simplified Block Diagram of the Operational Process for the
Experiments................................................................................................................... 236
Figure (7.8): Preliminary Experimental Results for the Static Crystallisation &
Sweating Experiments using the Operating Conditions of Runs 4 -7 ....................... 242
Figure (7.9): Summary of Experimental Results for the Static Crystallisation Pilot
Plant Used for Treating RO B rine............................................................................... 244
Figure (7.10): Influence of Cooling Rate of the Crystallisation Process & Effect of
the Sweating Process on the Salt Concentration of the Crystal Layer & Permeate
Water Recovery R atio ................................................................................................... 246
Figure (7.11): Influence of Sweating Time on the Salt Concentration of the
Crystal Layer & Permeate Water Recovery R atio ...................................................... 249
xii
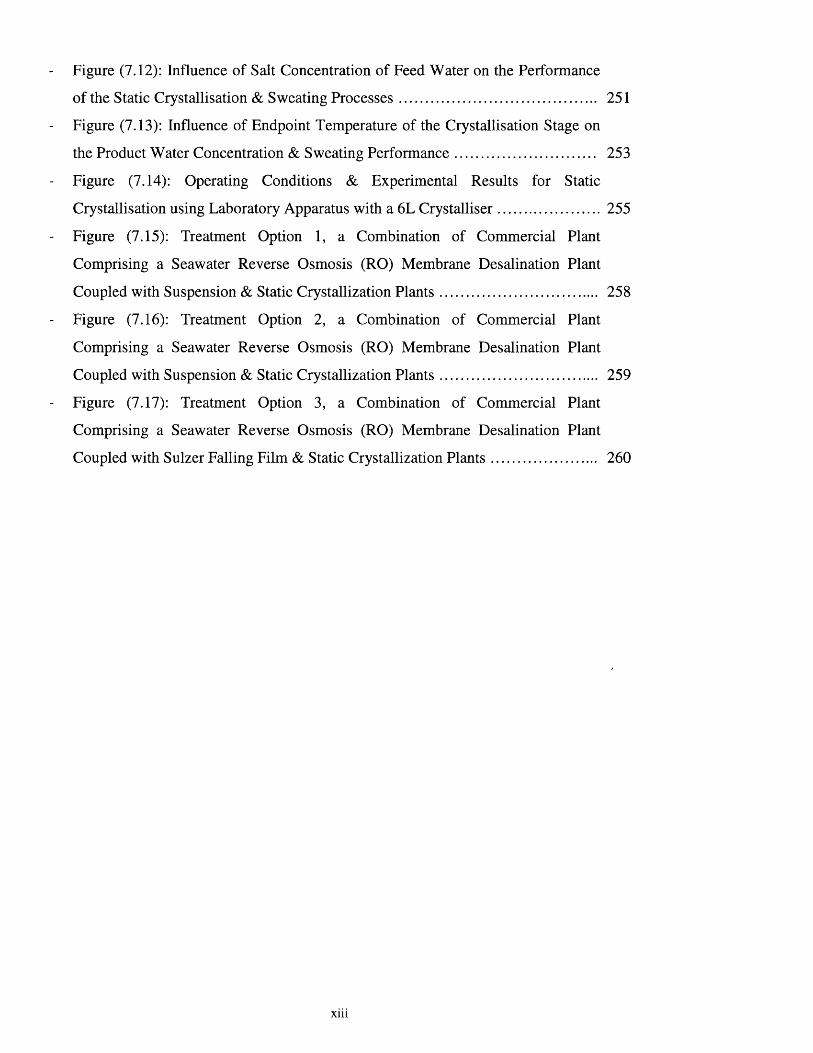
Figure (7.12): Influence of Salt Concentration of Feed Water on the Performance
of the Static Crystallisation & Sweating Processes.................................................... 251
Figure (7.13): Influence of Endpoint Temperature of the Crystallisation Stage on
the Product Water Concentration & Sweating Performance..................................... 253
Figure (7.14): Operating Conditions & Experimental Results for Static
Crystallisation using Laboratory Apparatus with a 6L Crystalliser.......................... 255
Figure (7.15): Treatment Option 1, a Combination of Commercial Plant
Comprising a Seawater Reverse Osmosis (RO) Membrane Desalination Plant
Coupled with Suspension & Static Crystallization Plants......................................... 258
Figure (7.16): Treatment Option 2, a Combination of Commercial Plant
Comprising a Seawater Reverse Osmosis (RO) Membrane Desalination Plant
Coupled with Suspension & Static Crystallization Plants......................................... 259
Figure (7.17): Treatment Option 3, a Combination of Commercial Plant
Comprising a Seawater Reverse Osmosis (RO) Membrane Desalination Plant
Coupled with Sulzer Falling Film & Static Crystallization Plants........................... 260
List of Tables
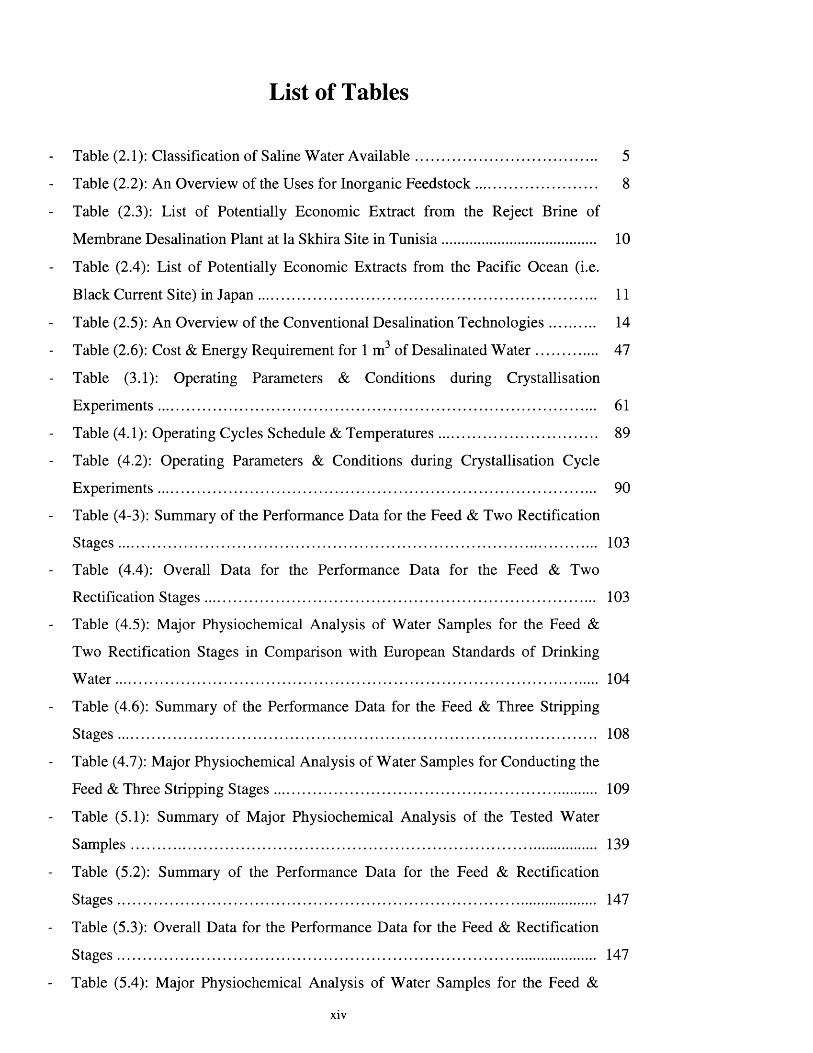
Table (2.1): Classification of Saline Water Available............................................... 5
Table (2.2): An Overview of the Uses for Inorganic Feedstock................................ 8
Table (2.3): List of Potentially Economic Extract from the Reject Brine of
Membrane Desalination Plant at la Skhira Site in Tunisia........................................ 10
Table (2.4): List of Potentially Economic Extracts from the Pacific Ocean (i.e.
Black Current Site) in Japan......................................................................................... 11
Table (2.5): An Overview of the Conventional Desalination Technologies 14
Table (2.6): Cost & Energy Requirement for 1 m3 of Desalinated W ater................ 47
Table (3.1): Operating Parameters & Conditions during Crystallisation
Experiments................................................................................................................... 61
Table (4.1): Operating Cycles Schedule & Temperatures......................................... 89
Table (4.2): Operating Parameters & Conditions during Crystallisation Cycle
Experiments................................................................................................................... 90
Table (4-3): Summary of the Performance Data for the Feed & Two Rectification
Stages.............................................................................................................................. 103
Table (4.4): Overall Data for the Performance Data for the Feed & Two
Rectification Stages...................................................................................................... 103
Table (4.5): Major Physiochemical Analysis of Water Samples for the Feed &
Two Rectification Stages in Comparison with European Standards of Drinking
W ater............................................................................................................................... 104
Table (4.6): Summary of the Performance Data for the Feed & Three Stripping
Stages.............................................................................................................................. 108
Table (4.7): Major Physiochemical Analysis of Water Samples for Conducting the
Feed & Three Stripping Stages..................................................................................... 109
Table (5.1): Summary of Major Physiochemical Analysis of the Tested Water
Samples.......................................................................................................................... 139
Table (5.2): Summary of the Performance Data for the Feed & Rectification
Stages.............................................................................................................................. 147
Table (5.3): Overall Data for the Performance Data for the Feed & Rectification
Stages.............................................................................................................................. 147
Table (5.4): Major Physiochemical Analysis of Water Samples for the Feed &
xiv
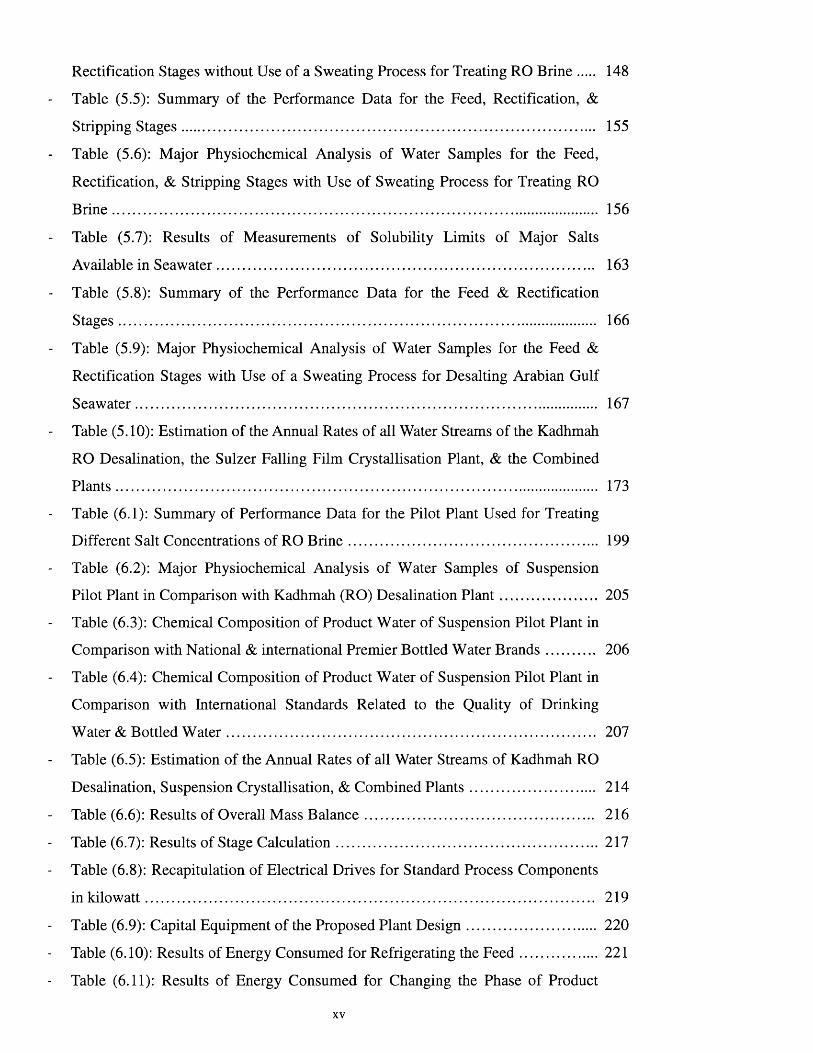
Rectification Stages without Use of a Sweating Process for Treating RO Brine 148
Table (5.5): Summary of the Performance Data for the Feed, Rectification, &
Stripping Stages............................................................................................................. 155
Table (5.6): Major Physiochemical Analysis of Water Samples for the Feed,
Rectification, & Stripping Stages with Use of Sweating Process for Treating RO
Brine................................................................................................................................ 156
Table (5.7): Results of Measurements of Solubility Limits of Major Salts
Available in Seawater................................................................................................... 163
Table (5.8): Summary of the Performance Data for the Feed & Rectification
Stages............................................................................................................................. 166
Table (5.9): Major Physiochemical Analysis of Water Samples for the Feed &
Rectification Stages with Use of a Sweating Process for Desalting Arabian Gulf
Seawater......................................................................................................................... 167
Table (5.10): Estimation of the Annual Rates of all Water Streams of the Kadhmah
RO Desalination, the Sulzer Falling Film Crystallisation Plant, & the Combined
Plants.............................................................................................................................. 173
Table (6.1): Summary of Performance Data for the Pilot Plant Used for Treating
Different Salt Concentrations of RO B rine................................................................. 199
Table (6.2): Major Physiochemical Analysis of Water Samples of Suspension
Pilot Plant in Comparison with Kadhmah (RO) Desalination P lan t......................... 205
Table (6.3): Chemical Composition of Product Water of Suspension Pilot Plant in
Comparison with National & international Premier Bottled Water Brands............. 206
Table (6.4): Chemical Composition of Product Water of Suspension Pilot Plant in
Comparison with International Standards Related to the Quality of Drinking
Water & Bottled W ater................................................................................................. 207
Table (6.5): Estimation of the Annual Rates of all Water Streams of Kadhmah RO
Desalination, Suspension Crystallisation, & Combined Plants................................. 214
Table (6.6): Results of Overall Mass Balance............................................................ 216
Table (6.7): Results of Stage Calculation.................................................................... 217
Table (6.8): Recapitulation of Electrical Drives for Standard Process Components
in kilowatt...................................................................................................................... 219
Table (6.9): Capital Equipment of the Proposed Plant Design.................................. 220
Table (6.10): Results of Energy Consumed for Refrigerating the F eed .................... 221
Table (6.11): Results of Energy Consumed for Changing the Phase of Product
XV
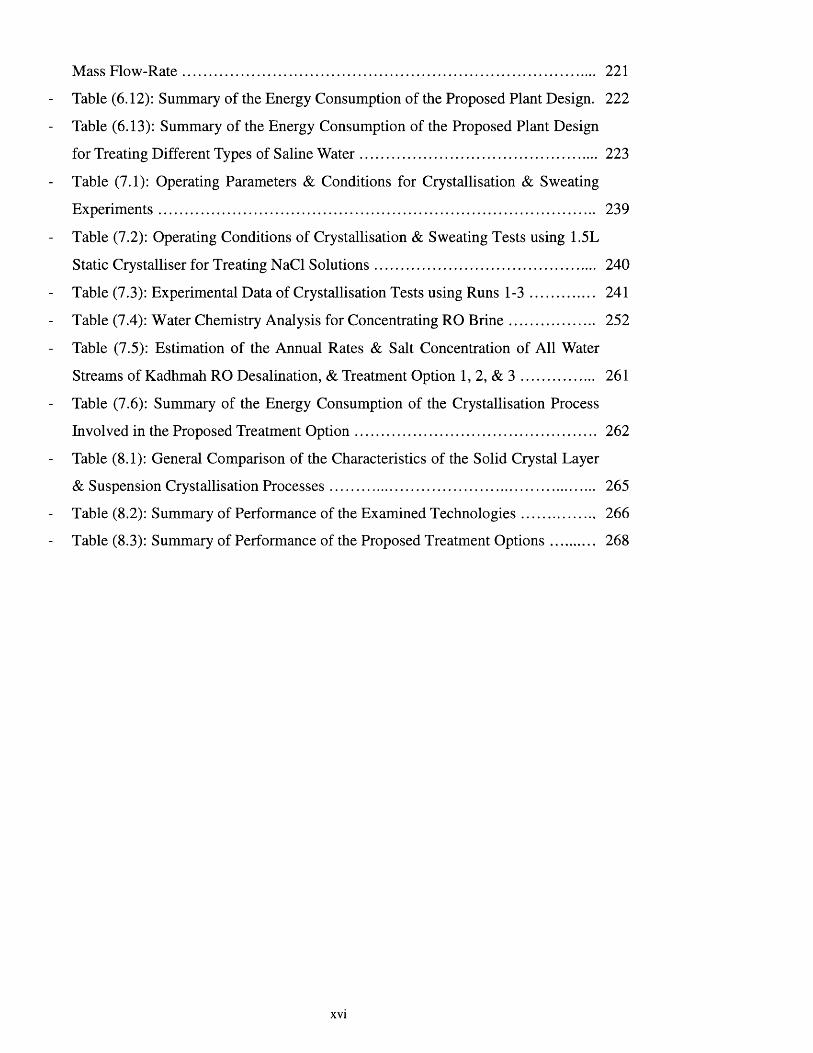
Mass Flow-Rate............................................................................................................ 221
Table (6.12): Summary of the Energy Consumption of the Proposed Plant Design. 222
Table (6.13): Summary of the Energy Consumption of the Proposed Plant Design
for Treating Different Types of Saline W ater.............................................................. 223
Table (7.1): Operating Parameters & Conditions for Crystallisation & Sweating
Experiments................................................................................................................... 239
Table (7.2): Operating Conditions of Crystallisation & Sweating Tests using 1.5L
Static Crystalliser for Treating NaCl Solutions.......................................................... 240
Table (7.3): Experimental Data of Crystallisation Tests using Runs 1-3 ................. 241
Table (7.4): Water Chemistry Analysis for Concentrating RO B rine...................... 252
Table (7.5): Estimation of the Annual Rates & Salt Concentration of All Water
Streams of Kadhmah RO Desalination, & Treatment Option 1, 2, & 3 .................. 261
Table (7.6): Summary of the Energy Consumption of the Crystallisation Process
Involved in the Proposed Treatment Option............................................................... 262
Table (8.1): General Comparison of the Characteristics of the Solid Crystal Layer
& Suspension Crystallisation Processes..................................................................... 265
Table (8.2): Summary of Performance of the Examined Technologies................... 266
Table (8.3): Summary of Performance of the Proposed Treatment Options 268
xvi

Nomenclature
Symbol Representing Units
AGR Average growth rate mm/h, mm/min
APFR Average product flow rate kg/h
A r Agitation rate rpm, L/min, amplitude
C, x Salt concentration of water sample wt%, mg/L, meq/m3
Cp Specific heat capacity of the feed kJ/(kg.K)
CR Cooling rate °C/min, °C/h
F Minimum energy requirement kWh/m3
FP Freezing point °C
m Mass kg
mb Mass flow-rates of brine kg/h
mf Mass flow-rate of feed water kg/h
mi Mass flow rate of ice slurry kg/h
mu Mass flow rate of the ice slurry out kg/h
mLo Mass flow rate of the liquid out kg/h
mp Mass flow-rates of product water kg/h
msait Mass of dissolved salts in the sampled solution g
mso Mass flow rate of liquid in kg/h
m Solution Mass of the sampled solution respectively g
Q Circulation pump flow-rate, Volume flow-rate L/min, m3/h
Qe, Experimental power consumption kWh/kg
Q f Heat transfer rate for cooling the feed water kW
Q P Heat transfer rate for changing the phase of the
liquid
kW
Qt Theoretical power consumption kWh/kg
R Universal gas constant J/(mole.K)
R2 Regression correlation coefficient Dimensionless
R i Weight ratio of crystal slurry %
Rr Weight ratio of the residue %
Rec Permeate water recovery %
RT Running time h
xvii
SR Salt rejection ratio %
Sr Sweating rate °C/min, °C/h
t Running time min
tc Running time of crystallisation process min, h
ts Running time of sweating process min, h
T Absolute temperature K
Th SPT Start-point temperature °C
t 2, e p t End-point temperature °C
TDS Total dissolved solids mg/L, ppm
U Energy available kWh
V Number of Ions per molecule of solute Dimensionless
V w Molar volume of the water m3/mole
V Volume 3m
w Weight N
WR Permeate water recovery ratio %
X f Feed concentration ppm, wt%
X s Salt mole-fraction Dimensionless
Greek Symbols
AHf Heat of fusion of ice kJ/kg
Ats Sweating time h
7i Osmotic pressure bar
Subscripts
1 First stage, feed stage, stage number, start-point
2 Second stage, rectification stage, stripping stage, stage number, end
point
b Brine or residue
C Crystallisation process
E Experimental
f Feed water
xviii
i Ice slurry
Min Minimum
P Product water, phase of the liquid
r Residue
s Saline solution
S Sweating process
T Theoretical
w Water
Abbreviations
AG Arabian Gulf
AGMD Air gap membrane distillation
BP Bubbling process
CAL Central analytical laboratories
CAC Codex Alimentarius Commission standards
DCMD Direct contact membrane distillation
DRP Doha research plant
DTB Draft tube and baffle
DTs Desalination technologies
DV Drain valve
ED Electrodialysis
EDR Electrodialysis reversal
EU European Union standards
f Feed water
FCV Flow control valve
FDA Food and Drug Administration standards
FM Freeze-melting
FO Forward osmosis
HSB Highly saline brines
HSIB High saline industrial brines
HSNB High saline natural brines
HTM Heat transfer medium
HTU Heat transfer unit
IBWA International Bottled Water Association standards
KBW Kadhmah bottled water
KISR Kuwait Institute for Scientific Research
kWh meter Kilowatt hours meter
LEBNOR Lebanese standards institution
LPS Laboratory pilot scale setup
MD Membrane distillation
MED Multiple effect distillation
MGD Millions of gallons per day
Min Minimum
MSF Multiple-stage flash distillation
MSS Mechanically stirred system
MVC Mechanical vapour compressor
n Number of sweat fractions
NF Nanofiltration
PP Pilot plant
PRO Pressure retarded osmosis
RED Reverse electrodialysis
RO Reverse osmosis
RO brines Reject brine of the reverse osmosis membrane plant or unit
S Source of feed
SGMD Sweeping gas membrane distillation
SCR Strip chart recorder
TI Temperature indicator
TR Temperature ramp
TVP Theoretical power consumption value for the tap water
TVC Thermal vapour compressor
t/y Ton per year
UF Ultrafiltration
UP Ultrasonic process
VC Vapour compression
VMD Vacuum membrane distillation
WHO World Health Organization standards
XX

WRD Water Resources Division
WTD Water Technologies Department
X Independent variable of the empirical equation
y Dependant variable of the empirical equation
ZLD Zero liquid discharge
xxi

C h a p t e r I: I n t r o d u c t i o n 1
C h a p t e r I:
In t r o d u c t io n
Primary environmental impacts from any industry are typically associated with the disposal
methods used for the waste streams. Industrial wastewaters are produced in large volumes
from various industrial sectors, particularly those that deal with the production of fresh
water, oil and gas, food, medical supplies, and chemical processing. Unfortunately, the
production of both fresh water and waste streams are progressively increasing over years as
ongoing population growth coupled with high levels of increase in water consumption
[Fritzmann et al., 2007]. The ongoing growth of human activities, such as industry,
recreation, and agriculture, are significantly contributing to the increase in both water
demand and severity of degradation of natural water resources. The majority of the industrial
wastewaters have a significant impact on environment; some of which may pose a number of
threats to human health and the surrounding environment. Thus, discharge of such waste
streams into a surface water and/or groundwater presents a major source of water pollution in
many countries. Therefore, these waste streams must be disposed of in an environmentally
acceptable manner.
Treatment and/or disposal of concentrated brines which have total dissolved solid content in
the region of 70,000 ppm up to full saturation, are a common and important problem around
the world. The success of any desalination technology for such an application depends on the
reliability of the process, product quality, capital cost, energy consumption, complexity of
the process and safe disposal. Unfortunately, the treatment of concentrated brines using
desalination technologies may be either expensive or technically unfeasible. Existing
conventional desalination technologies may also not be capable of concentrating the
polluting materials sufficiently for re-use or for their safe disposal. Hence, process
development and innovation in this area is of extreme importance for many countries,
especially countries such as Kuwait, where desalination and oil industries are considered
vital.
C h a p t e r I: In t r o d u c t i o n 2
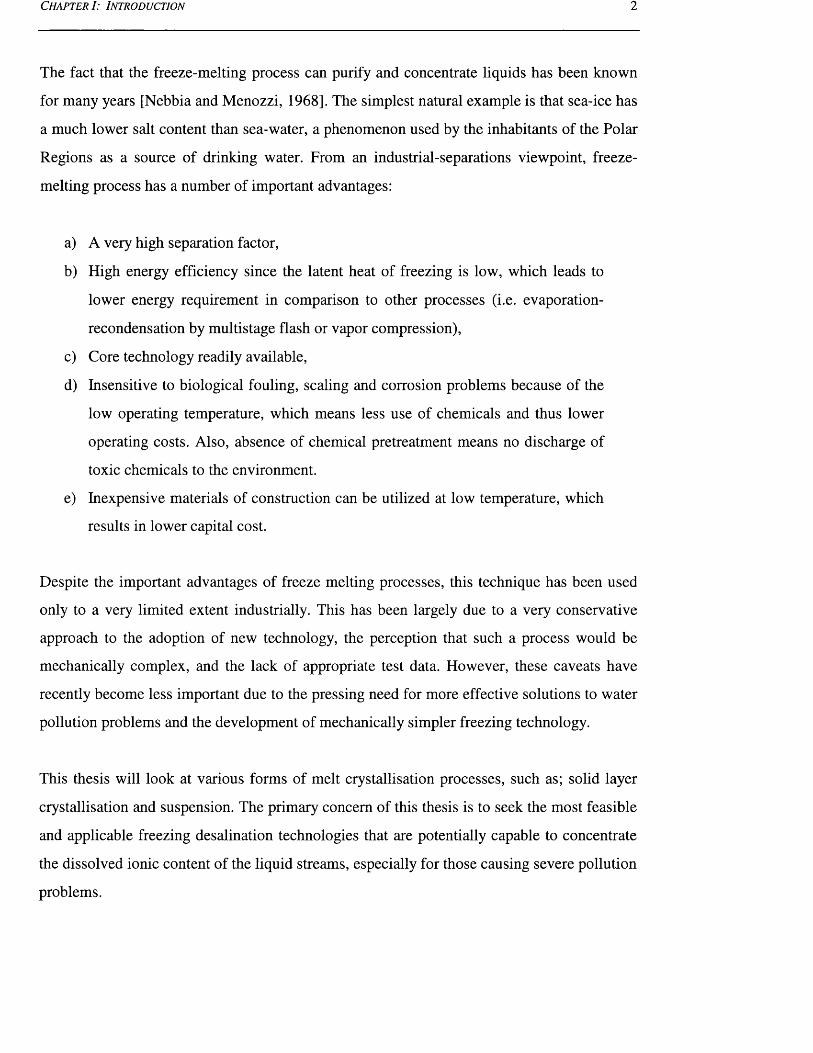
The fact that the freeze-melting process can purify and concentrate liquids has been known
for many years [Nebbia and Menozzi, 1968], The simplest natural example is that sea-ice has
a much lower salt content than sea-water, a phenomenon used by the inhabitants of the Polar
Regions as a source of drinking water. From an industrial-separations viewpoint, freeze-
melting process has a number of important advantages:
a) A very high separation factor,
b) High energy efficiency since the latent heat of freezing is low, which leads to
lower energy requirement in comparison to other processes (i.e. evaporation-
recondensation by multistage flash or vapor compression),
c) Core technology readily available,
d) Insensitive to biological fouling, scaling and corrosion problems because of the
low operating temperature, which means less use of chemicals and thus lower
operating costs. Also, absence of chemical pretreatment means no discharge of
toxic chemicals to the environment.
e) Inexpensive materials of construction can be utilized at low temperature, which
results in lower capital cost.
Despite the important advantages of freeze melting processes, this technique has been used
only to a very limited extent industrially. This has been largely due to a very conservative
approach to the adoption of new technology, the perception that such a process would be
mechanically complex, and the lack of appropriate test data. However, these caveats have
recently become less important due to the pressing need for more effective solutions to water
pollution problems and the development of mechanically simpler freezing technology.
This thesis will look at various forms of melt crystallisation processes, such as; solid layer
crystallisation and suspension. The primary concern of this thesis is to seek the most feasible
and applicable freezing desalination technologies that are potentially capable to concentrate
the dissolved ionic content of the liquid streams, especially for those causing severe pollution
problems.
C h a p t e r I: In t r o d u c t i o n 3
1.1 Project ScopeThe primary concern of this PhD study is to explore and to seek methods of improving
freeze-desalting technologies to fill some of the existing gaps of know-how in treating and
upgrading effluent waters of extreme salinity for reuse at a reasonable cost and reasonable
reliability with least harm to the environment.
The scope of this study involves acquisition of relevant test data using demonstration
equipment that incorporates the latest developments in process engineering. Several
innovative processes were used and examined to treat a range of liquid streams typical of
those causing the most severe pollution problems. The resulting experimental data for each
innovative process were assessed to provide state-of-the-art technical and economic
assessment of the potential of the proposed technology.
1.2 ObjectivesIn this thesis, attention was focused on two main themes:
a) Assessment of the conventional desalination and freezing desalination
technologies for brine applications based on theoretical studies.
b) Performance assessments of various forms of freezing desalination technologies
used for desalting/treating a wide range of salt concentrations of feed waters
through comprehensive experimental studies.
Therefore the main objectives of this project are as follows:
- To provide a useful thesis for professionals and technologists in all aspects of brine
treatment using desalination technologies.
- To present the reasons why conventional desalination technologies have a limited
scope in the treatment/disposal of the concentrated brines.
- To review and update the knowledge of recent developments in the various aspects
of brine disposal processes using desalination technologies.
- To review and update the knowledge of recent developments in the various aspects
of freezing desalination technologies.
C h a p t e r I: In t r o d u c t i o n 4
- To establish experimental studies based on the most feasible proposed technologies
and applied works in the literature.
- To design, prepare, manufacture, operate and examine the adopted approaches.
- To analyse and to evaluate the experimental data of the examined technologies.
- To assess the separation performances of various forms of freezing desalination
technologies for saline water applications.
- To establish reference background experimental data on various forms of freezing
desalination technologies with a wide range of salt concentrations of feed water
using synthetic waters and process brines.
- To investigate the influence of affecting parameters for the adopted technologies.
- To investigate the applicability of melt crystallisation technologies for treating RO
brine and concentrated solutions of RO brine.
- To examine and assess the performance of post treatments such as washing and
sweating processes.
- To recommend the most feasible technologies, which are potentially capable to treat
brine in a sustainable manner with least harm to the environment and at affordable
cost.
C h a p t e r II: L it e r a t u r e R e v i e w 5
C h a p t e r II:
L itera tu re r e v ie w
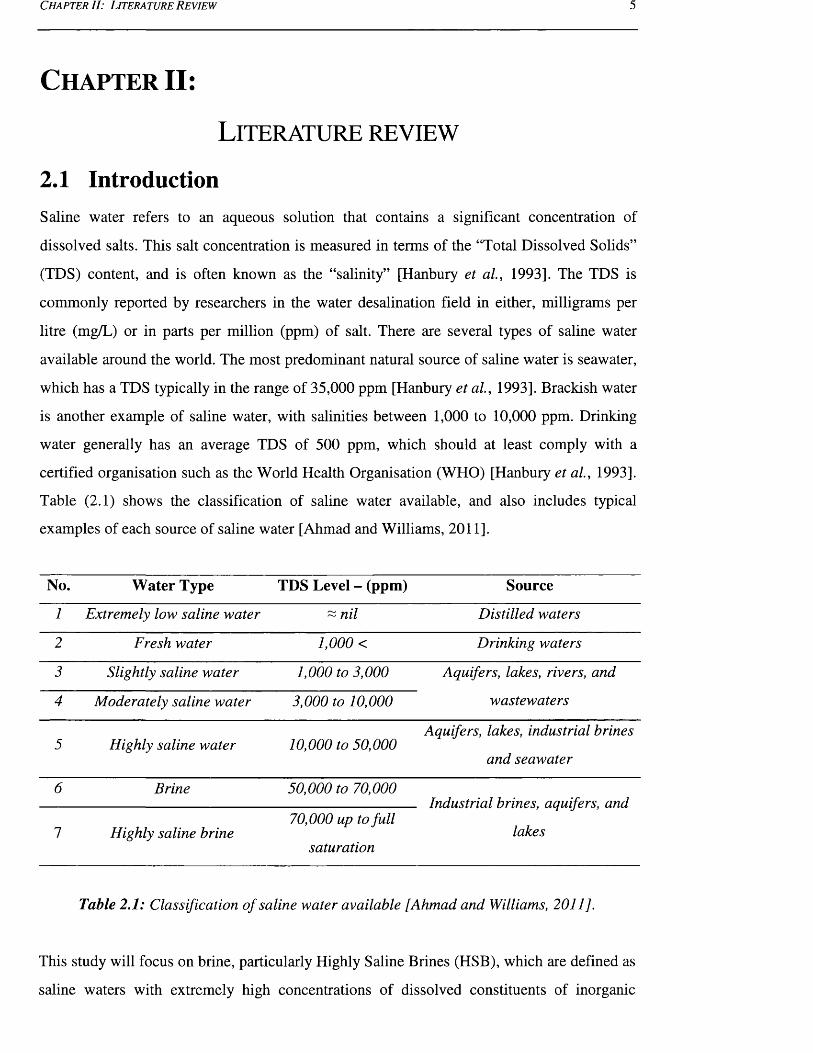
2.1 IntroductionSaline water refers to an aqueous solution that contains a significant concentration of
dissolved salts. This salt concentration is measured in terms of the “Total Dissolved Solids”
(TDS) content, and is often known as the “salinity” [Hanbury et al., 1993]. The TDS is
commonly reported by researchers in the water desalination field in either, milligrams per
litre (mg/L) or in parts per million (ppm) of salt. There are several types of saline water
available around the world. The most predominant natural source of saline water is seawater,
which has a TDS typically in the range of 35,000 ppm [Hanbury et a l , 1993]. Brackish water
is another example of saline water, with salinities between 1,000 to 10,000 ppm. Drinking
water generally has an average TDS of 500 ppm, which should at least comply with a
certified organisation such as the World Health Organisation (WHO) [Hanbury et a l, 1993].
Table (2.1) shows the classification of saline water available, and also includes typical
examples of each source of saline water [Ahmad and Williams, 2011].
No. Water Type TDS Level - (ppm) Source
1 Extremely low saline water ~ nil Distilled waters
2 Fresh water 1,000 < Drinking waters
3 Slightly saline water 1,000 to 3,000 Aquifers, lakes, rivers, and
4 Moderately saline water 3,000 to 10,000 wastewaters
5 Highly saline water 10,000 to 50,000Aquifers, lakes, industrial brines
and seawater
6 Brine 50,000 to 70,000Industrial brines, aquifers, and
lakes1 Highly saline brine70,000 up to full
saturation
Table 2.1: Classification of saline water available [Ahmad and Williams, 2011].
This study will focus on brine, particularly Highly Saline Brines (HSB), which are defined as
saline waters with extremely high concentrations of dissolved constituents of inorganic
C h a p t e r II : L i t e r a t u r e R e v i e w 6
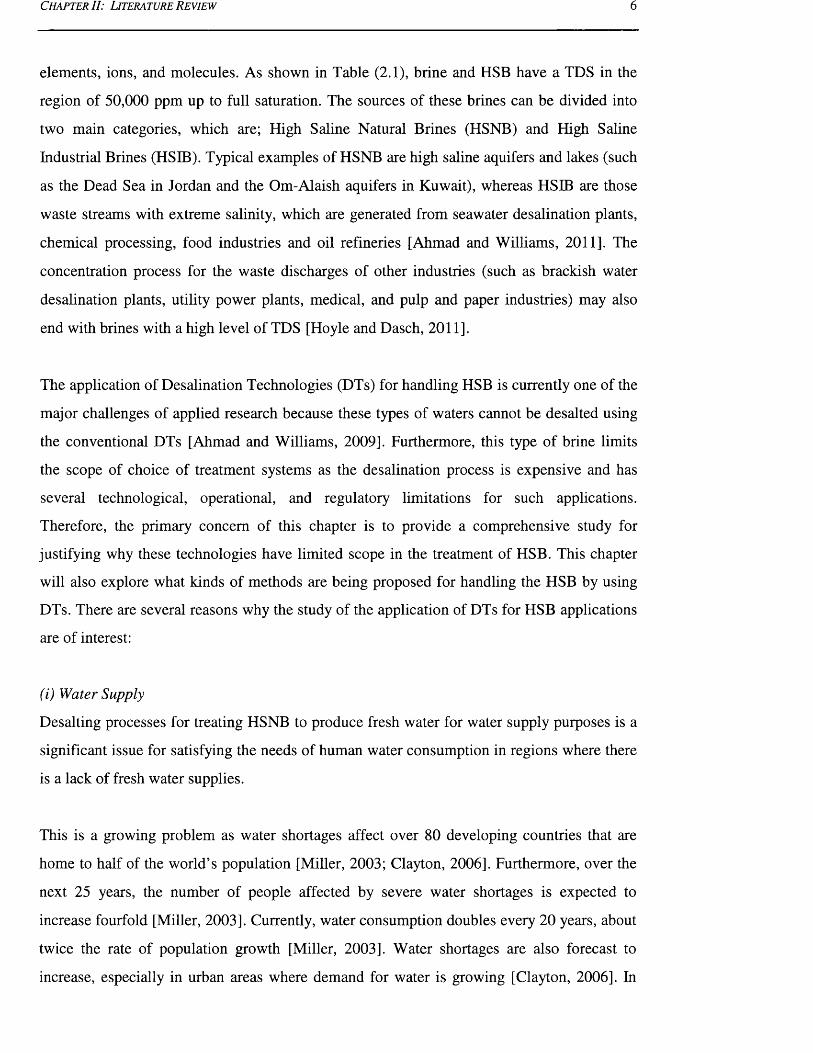
elements, ions, and molecules. As shown in Table (2.1), brine and HSB have a TDS in the
region of 50,000 ppm up to full saturation. The sources of these brines can be divided into
two main categories, which are; High Saline Natural Brines (HSNB) and High Saline
Industrial Brines (HSIB). Typical examples of HSNB are high saline aquifers and lakes (such
as the Dead Sea in Jordan and the Om-Alaish aquifers in Kuwait), whereas HSIB are those
waste streams with extreme salinity, which are generated from seawater desalination plants,
chemical processing, food industries and oil refineries [Ahmad and Williams, 2011]. The
concentration process for the waste discharges of other industries (such as brackish water
desalination plants, utility power plants, medical, and pulp and paper industries) may also
end with brines with a high level of TDS [Hoyle and Dasch, 2011].
The application of Desalination Technologies (DTs) for handling HSB is currently one of the
major challenges of applied research because these types of waters cannot be desalted using
the conventional DTs [Ahmad and Williams, 2009]. Furthermore, this type of brine limits
the scope of choice of treatment systems as the desalination process is expensive and has
several technological, operational, and regulatory limitations for such applications.
Therefore, the primary concern of this chapter is to provide a comprehensive study for
justifying why these technologies have limited scope in the treatment of HSB. This chapter
will also explore what kinds of methods are being proposed for handling the HSB by using
DTs. There are several reasons why the study of the application of DTs for HSB applications
are of interest:
(i) Water Supply
Desalting processes for treating HSNB to produce fresh water for water supply purposes is a
significant issue for satisfying the needs of human water consumption in regions where there
is a lack of fresh water supplies.
This is a growing problem as water shortages affect over 80 developing countries that are
home to half of the world’s population [Miller, 2003; Clayton, 2006]. Furthermore, over the
next 25 years, the number of people affected by severe water shortages is expected to
increase fourfold [Miller, 2003]. Currently, water consumption doubles every 20 years, about
twice the rate of population growth [Miller, 2003]. Water shortages are also forecast to
increase, especially in urban areas where demand for water is growing [Clayton, 2006]. In
C h a p t e r II : L i t e r a t u r e R e v i e w 1
many cases HSNB are usually the only available source of water. In addition, environmental
aspects must be considered for such applications because all DTs produce two streams; a
fresh water (product) stream and a concentrated salt (brine) stream that must be disposed of.
Hence, in inland desalination plants, the possibility for disposing the reject brine to a large
body of water (such as the sea) is not available.
(ii) Safe Disposal
As mentioned previously, the primary environmental impacts from any industry are typically
associated with the disposal method of the concentrated streams that have been produced
from the industrial plant [Ahmad and Williams, 2011]. These waste streams are
contaminated in some way by man's industrial or commercial activities prior to their release
into the environment [Ahmad and Williams, 2011]. Disposal of HSIB is a common and
important problem in many industrial plants, such as the oil and gas industries, because of
the extreme salinity and chemical composition of these brines and the fact that some of these
effluents may contain toxic substances [Brandt et al., 1997]. Furthermore, these brines are
generated in large volumes from many industrial plants and pose a threat to the surrounding
environment.
Two important examples of where HSIB occur and their problems are:
a) In inland desalination plants. By assuming that the operators decided to
minimise and concentrate the reject brine, then getting rid of the reject brine
(which has a high level of TDS) is a significant and important problem because,
the option of disposing of the brine to a large body of water (i.e. seawater) is not
available. Therefore, the use of small plants that use membrane technology, for
instance, is restricted in inland areas (in many countries such as Kuwait)
because of the concentrate disposal limitations and its consequences, which may
lead to contamination of aquifers with more concentrated waste.
b) In oil and gas industries. In drilling for petroleum there is usually a penetration
of porous rocks containing salt water with a much more highly concentrated salt
content than that of normal ocean seawater, and it may reach the full saturation
[Pols and Harmsen, 1994; Spiegler and El-Sayed, 1994; Brandt et a l, 1997].
This means that the brines may be produced in large quantities with extreme
C h a p t e r II: L i t e r a t u r e R e v i e w 8
salinity, especially in oil fields that have been producing for long periods of
time. Wells may produce hundreds of barrels of brine for every barrel of oil
[Hoyle and Dasch, 2011]. The chemical composition of a typical brine from
these systems makes it unfit for human consumption or for irrigation purposes,
which makes it pose a threat to the aqua-life. Therefore the federal effluent
limitation guidelines do not permit the discharge of the produced-brine into
surface water [Pols and Harmsen, 1994]. As a result, investors of a producing
well are usually faced with the problem of having to dispose of significant
quantities of brine in an environmentally acceptable manner at reasonable cost
and reasonable reliability.
(iii) Harvesting Salts and Other Useful Products
Harvesting valuable minerals from concentrated brines for beneficial uses must be
considered as an alternative method of disposal. The brine should really be dealt with as a
resource rather than a waste problem. There are many practical examples of salt production
from industrial waste concentrate, for instance, salt production plants using thermal
processes were established in Kuwait and the United Arab Emirates more than 17 years ago
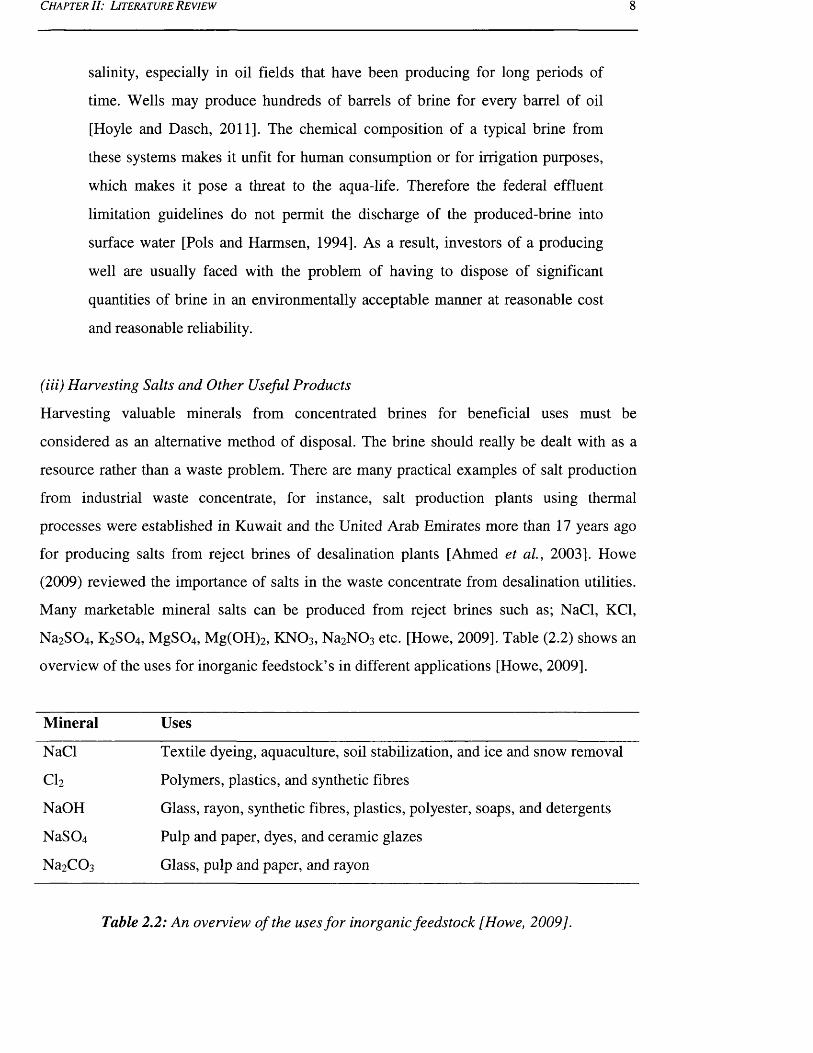
for producing salts from reject brines of desalination plants [Ahmed et a l , 2003]. Howe
(2009) reviewed the importance of salts in the waste concentrate from desalination utilities.
Many marketable mineral salts can be produced from reject brines such as; NaCl, KC1,
Na2S 04, K2S 04, MgS04, Mg(OH)2, KNO3, Na2N 0 3 etc. [Howe, 2009]. Table (2.2) shows an
overview of the uses for inorganic feedstock’s in different applications [Howe, 2009].
Mineral Uses
NaCl Textile dyeing, aquaculture, soil stabilization, and ice and snow removal
Cl2 Polymers, plastics, and synthetic fibres
NaOH Glass, rayon, synthetic fibres, plastics, polyester, soaps, and detergents
NaS04 Pulp and paper, dyes, and ceramic glazes
Na2C 03 Glass, pulp and paper, and rayon
Table 2.2: An overview o f the uses for inorganic feedstock [Howe, 2009].
C h a p t e r I I: L i t e r a t u r e R e v i e w 9
Heavy brines at different concentrations are used in several applications such as chemical
industries, brine shrimp production, electricity production by salinity gradient power,
irrigation of halophytes, and aquaculture [Howe, 2009], Howe (2009) also reviewed some
facts about the consumption of salt (NaCl) in the United States, for instance, 45,000,000 tons
of salt are produced annually, and about 70% of these salts are used by chemical industries,
where 21,000,000 tons are utilised for the production of chlorine, 4,000,000 tons are used for
the production of soda ash, and about 88% of these salts are used in a liquid form (i.e. heavy
brine).
C/51)Cc
a-3
8,000
7.000
6.000
5.000
4.000
3.000
2.000
1,000
050,000
Plant Capacity: I MGD
Plant Capacity: 2 MGD
Plant Capacity: 8 MGD
100,000 150,000 200,000
Feed-W ater Salinity (mg/L)
250,000
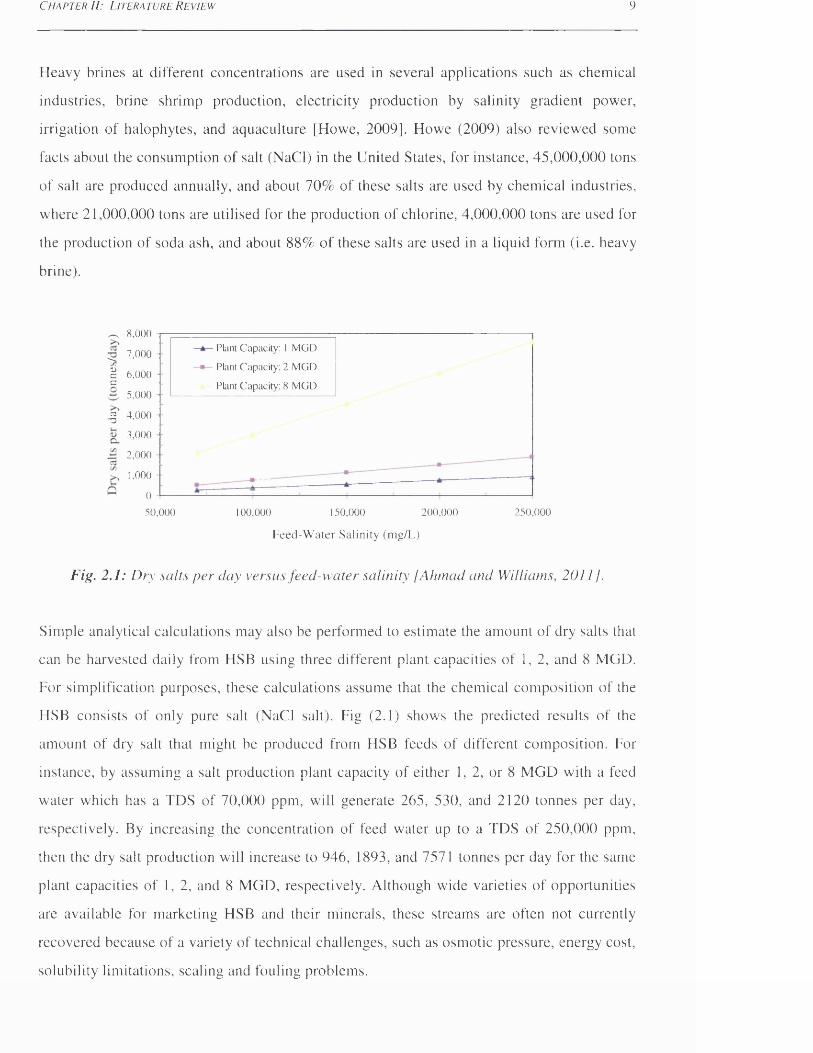
Fig. 2.1: Dry salts per clay versus feed-water salinity' [Ahmad and Williams, 2011 ].
Simple analytical calculations may also be performed to estimate the amount of dry salts that
can be harvested daily from HSB using three different plant capacities of 1, 2, and 8 MGD.
For simplification purposes, these calculations assume that the chemical composition of the
HSB consists of only pure salt (NaCl salt). Fig (2.1) shows the predicted results of the
amount of dry salt that might be produced from HSB feeds of different composition. For
instance, by assuming a salt production plant capacity of either 1, 2, or 8 MGD with a feed
water which has a TDS of 70,000 ppm, will generate 265, 530, and 2120 tonnes per day,
respectively. By increasing the concentration of feed water up to a TDS of 250,000 ppm,
then the dry salt production will increase to 946, 1893, and 7571 tonnes per day for the same
plant capacities of 1,2, and 8 MGD, respectively. Although wide varieties of opportunities
are available for marketing HSB and their minerals, these streams are often not currently
recovered because of a variety of technical challenges, such as osmotic pressure, energy cost,
solubility limitations, scaling and fouling problems.
C h a p t e r II: L it e r a t u r e R e v i e w 10
(iv) Harvesting Rare Elements
Rare earth elements are required for a wide range of applications [Kumar et a l, 2011].
Seawater represents an infinite source of rare metals since almost all elements in the periodic
table including vital trace elements, such as gold, silver, uranium, vanadium, strontium,
boron, magnesium, molybdenum, phosphates, silicon, etc. are contained in seawater. These
elements are often scarce on land or extraction costs are highly prohibitive [Sugo, 1999;
Ohya et al., 2001; Dirach et al., 2005; Jeppesen et al., 2009]. The concentrated brine from
desalination plants, on the other hand, represents a concentrate of all elements contained in
seawater [Dirach et a l, 2005]. Hence, extraction of these elements would be an advantage
for desalination plant, leading to them being more environmental friendly and cost effective.
Currently, four compounds are extracted from seawater via the conventional evaporation
processes [Jeppesen et al., 2009]. These compounds are principally table salt (i.e. sodium
chloride), and the by-products potassium chloride, magnesium and bromide salts [Jeppesen
et al., 2009]. Extraction of other compounds from seawater may be feasible, especially for
some elements that are highly prohibitive or rare on the land. Therefore, several authors
[Ohya et al., 2001; Dirach et al., 2005; Jeppesen et al., 2009] have proposed various
extraction schemes for a range of elements.
ElementSeawater
(mg/L)
Quantity
(t/y)Major Use
Selling Price
($/kg)
Value
(M$/y)
Na 10,500 1.5xl06 Fertilizers 0.13 180
Mg 1,350 1.9xl03 Alloys 2.80 525
K 380 5.3xl02 Fertilizers 0.15 8
Rb 0.12 17 Laser 79,700 1,300
P 0.07 10 Fertilizers 0.02 0
In 0.02 3 Metallic Protection 300 0.9
Cs 5.0X10"4 0.07 Aeronautics 63,000 4
Ge 7 .0x l0“5 0.01 Electronics 1,700 0.02
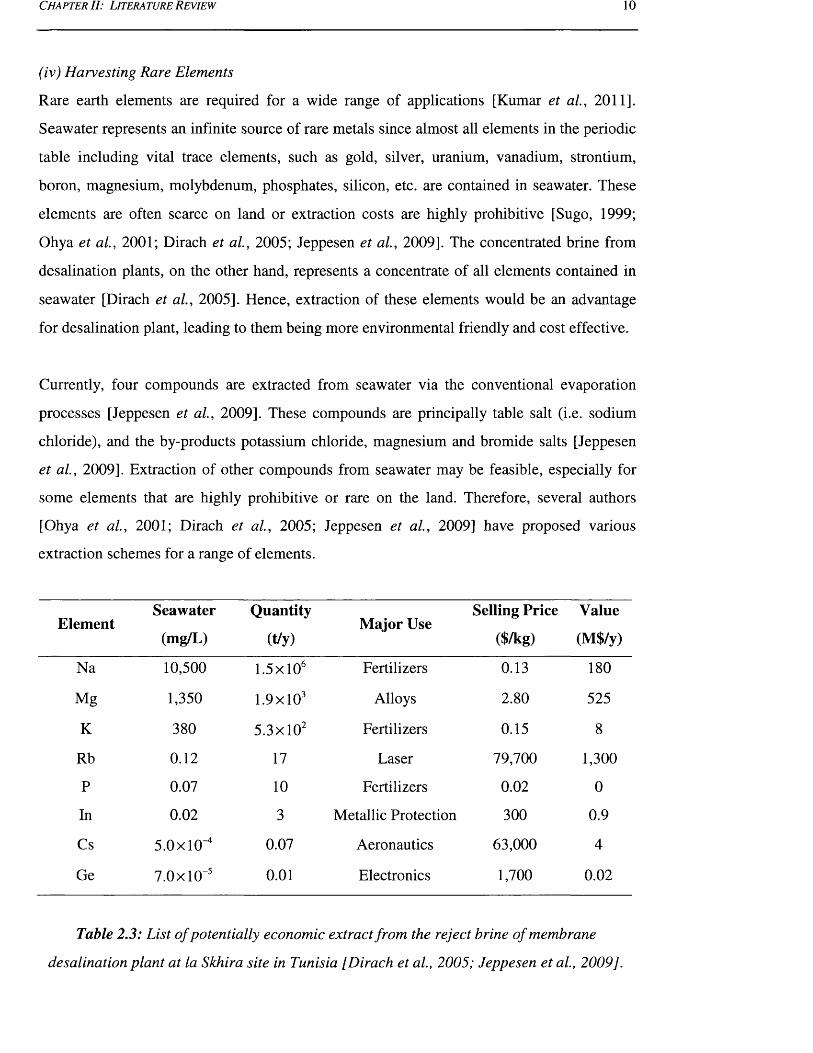
Table 2.3: List o f potentially economic extract from the reject brine of membrane
desalination plant at la Skhira site in Tunisia [Dirach et al., 2005; Jeppesen et al., 2009].
C h a p t e r II: L i t e r a t u r e R e v i e w 11
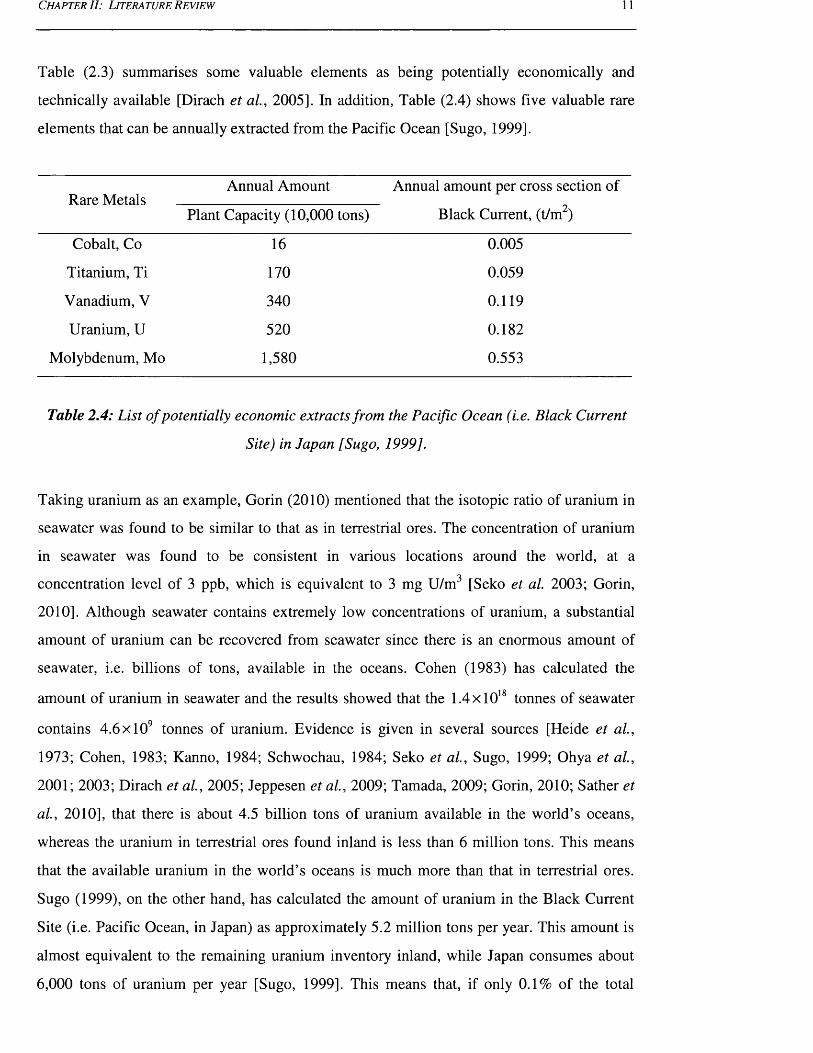
Table (2.3) summarises some valuable elements as being potentially economically and
technically available [Dirach et a l, 2005]. In addition, Table (2.4) shows five valuable rare
elements that can be annually extracted from the Pacific Ocean [Sugo, 1999].
Rare MetalsAnnual Amount
Plant Capacity (10,000 tons)
Annual amount per cross section of
Black Current, (t/m2)
Cobalt, Co 16 0.005
Titanium, Ti 170 0.059
Vanadium, V 340 0.119
Uranium, U 520 0.182
Molybdenum, Mo 1,580 0.553
Table 2.4: List o f potentially economic extracts from the Pacific Ocean (i.e. Black Current
Site) in Japan [Sugo, 1999].
Taking uranium as an example, Gorin (2010) mentioned that the isotopic ratio of uranium in
seawater was found to be similar to that as in terrestrial ores. The concentration of uranium
in seawater was found to be consistent in various locations around the world, at a
concentration level of 3 ppb, which is equivalent to 3 mg U/m [Seko et al. 2003; Gorin,
2010]. Although seawater contains extremely low concentrations of uranium, a substantial
amount of uranium can be recovered from seawater since there is an enormous amount of
seawater, i.e. billions of tons, available in the oceans. Cohen (1983) has calculated the
amount of uranium in seawater and the results showed that the 1.4xl018 tonnes of seawater
contains 4.6xlO9 tonnes of uranium. Evidence is given in several sources [Heide et al.,
1973; Cohen, 1983; Kanno, 1984; Schwochau, 1984; Seko et al., Sugo, 1999; Ohya et al.,
2001; 2003; Dirach et al., 2005; Jeppesen et al., 2009; Tamada, 2009; Gorin, 2010; Sather et
a l, 2010], that there is about 4.5 billion tons of uranium available in the world’s oceans,
whereas the uranium in terrestrial ores found inland is less than 6 million tons. This means
that the available uranium in the world’s oceans is much more than that in terrestrial ores.
Sugo (1999), on the other hand, has calculated the amount of uranium in the Black Current
Site (i.e. Pacific Ocean, in Japan) as approximately 5.2 million tons per year. This amount is
almost equivalent to the remaining uranium inventory inland, while Japan consumes about
6,000 tons of uranium per year [Sugo, 1999]. This means that, if only 0.1% of the total
C h a p t e r II: L i t e r a t u r e R e v i e w 12
amount of uranium in seawater can be recovered, then the domestic demand for uranium can
be supplied in Japan without taking anything from the remaining land based uranium.
Consequently, Japanese scientists are devoting their applied research for such applications to
take advantage of the appearance of uranium in seawater [Sugo, 1999]. Specific details of
various proposed methods for extracting uranium from seawater are available in the literature
[Sugo, 1999; Ohya et a l, 2001; Dirach et a l, 2005; Jeppesen et a l, 2009].
Previous studies have stated three important facts on uranium in seawater, which are; (i) the
concentration of uranium in one litre of seawater is potentially capable of providing enough
energy to power a delivery pump for raising that litre up to 17m uphill [Gorin, 2010], (ii) if
16,000 tonne of uranium per year can be extracted from seawater, then it would supply 25
times the world's electricity usage and twice the world total energy consumption in 1983
[Cohen, 1983], (iii) the estimated amount of uranium in seawater could supply the world's
electricity usage, generated from nuclear energy in 1983, for 7 million years [Cohen, 1983].
Currently, the uranium price is $51.98 (September 2011), while it hit $136.22 in June 2007
according to Index Mundi (2011). This means that the available amount of uranium in
seawater is worth trillions of dollars of fuel for nuclear power plants [Gorin, 2010].
Due to the fact that uranium metal represents an inevitable resource for nuclear power plants,
uranium recovery from seawater becomes one of the most important research areas,
especially for those countries, such as Japan, who deal with nuclear power plants. Hence,
several uranium extraction methods have been widely developed and tested for recovering
uranium metal [Tamada, 2009; Gorin, 2010]. The most promising process deals with
absorption of the uranyl ion through binding to a chemical ligand [Schwochau, 1984; Seko et
a l, 2003; Tamada, 2009; Gorin, 2010; Sather et a l, 2010]. Other uranium extraction
methods include the use of biological material, such as bacteria and algae, to concentrate the
uranium for simplifying the extraction process, and nanomembrane filtering techniques
[Heide etal., 1973; Kanno, 1984; Schwochau, 1984; Gorin, 2010;].
In Japan, the supply of electricity, generated from nuclear energy, is threatened by demand of
uranium which will exceed the supply in the near future [Sugo, 1999]. Accordingly, a
number of research studies on uranium recovery from seawater have been performed for two
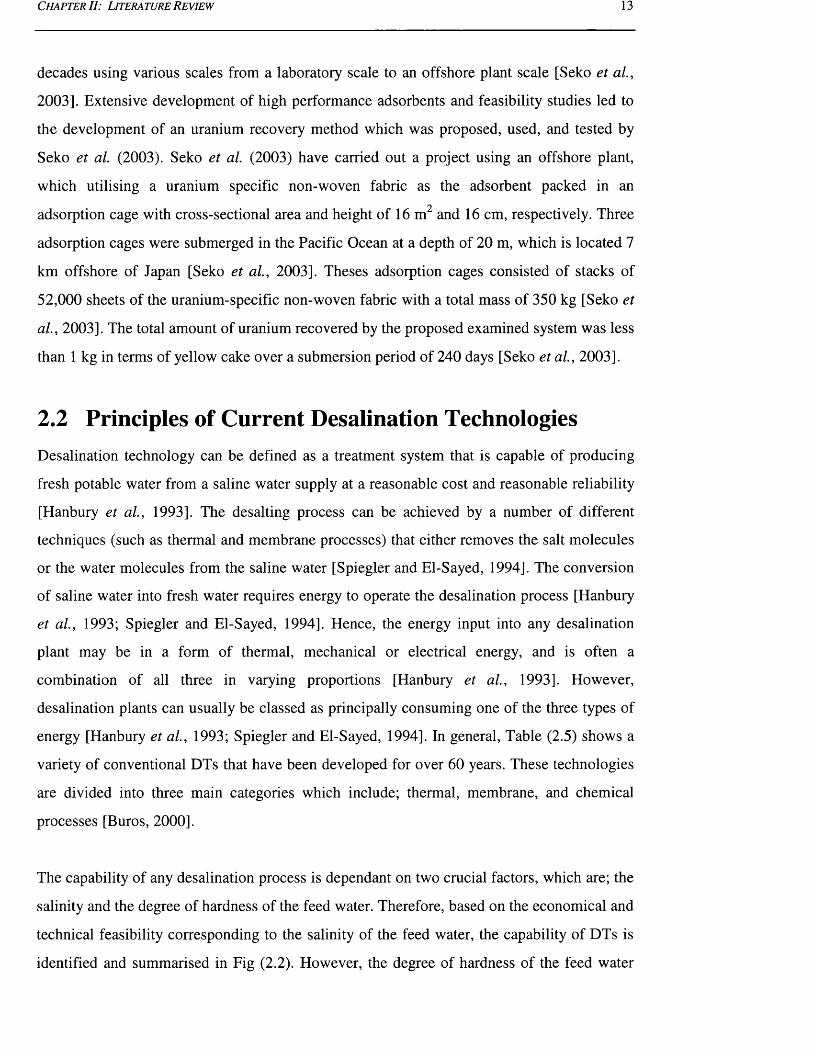
C h a p t e r II: L i t e r a t u r e R e v i e w 13
decades using various scales from a laboratory scale to an offshore plant scale [Seko et a l,
2003]. Extensive development of high performance adsorbents and feasibility studies led to
the development of an uranium recovery method which was proposed, used, and tested by
Seko et a l (2003). Seko et a l (2003) have carried out a project using an offshore plant,
which utilising a uranium specific non-woven fabric as the adsorbent packed in an
adsorption cage with cross-sectional area and height of 16 m and 16 cm, respectively. Three
adsorption cages were submerged in the Pacific Ocean at a depth of 20 m, which is located 7
km offshore of Japan [Seko et a l, 2003]. Theses adsorption cages consisted of stacks of
52,000 sheets of the uranium-specific non-woven fabric with a total mass of 350 kg [Seko et
a l, 2003]. The total amount of uranium recovered by the proposed examined system was less
than 1 kg in terms of yellow cake over a submersion period of 240 days [Seko et a l, 2003].
2.2 Principles of Current Desalination TechnologiesDesalination technology can be defined as a treatment system that is capable of producing
fresh potable water from a saline water supply at a reasonable cost and reasonable reliability
[Hanbury et a l, 1993]. The desalting process can be achieved by a number of different
techniques (such as thermal and membrane processes) that either removes the salt molecules
or the water molecules from the saline water [Spiegler and El-Sayed, 1994]. The conversion
of saline water into fresh water requires energy to operate the desalination process [Hanbury
et a l, 1993; Spiegler and El-Sayed, 1994]. Hence, the energy input into any desalination
plant may be in a form of thermal, mechanical or electrical energy, and is often a
combination of all three in varying proportions [Hanbury et a l, 1993]. However,
desalination plants can usually be classed as principally consuming one of the three types of
energy [Hanbury et a l, 1993; Spiegler and El-Sayed, 1994]. In general, Table (2.5) shows a
variety of conventional DTs that have been developed for over 60 years. These technologies
are divided into three main categories which include; thermal, membrane, and chemical
processes [Buros, 2000].
The capability of any desalination process is dependant on two crucial factors, which are; the
salinity and the degree of hardness of the feed water. Therefore, based on the economical and
technical feasibility corresponding to the salinity of the feed water, the capability of DTs is
identified and summarised in Fig (2.2). However, the degree of hardness of the feed water
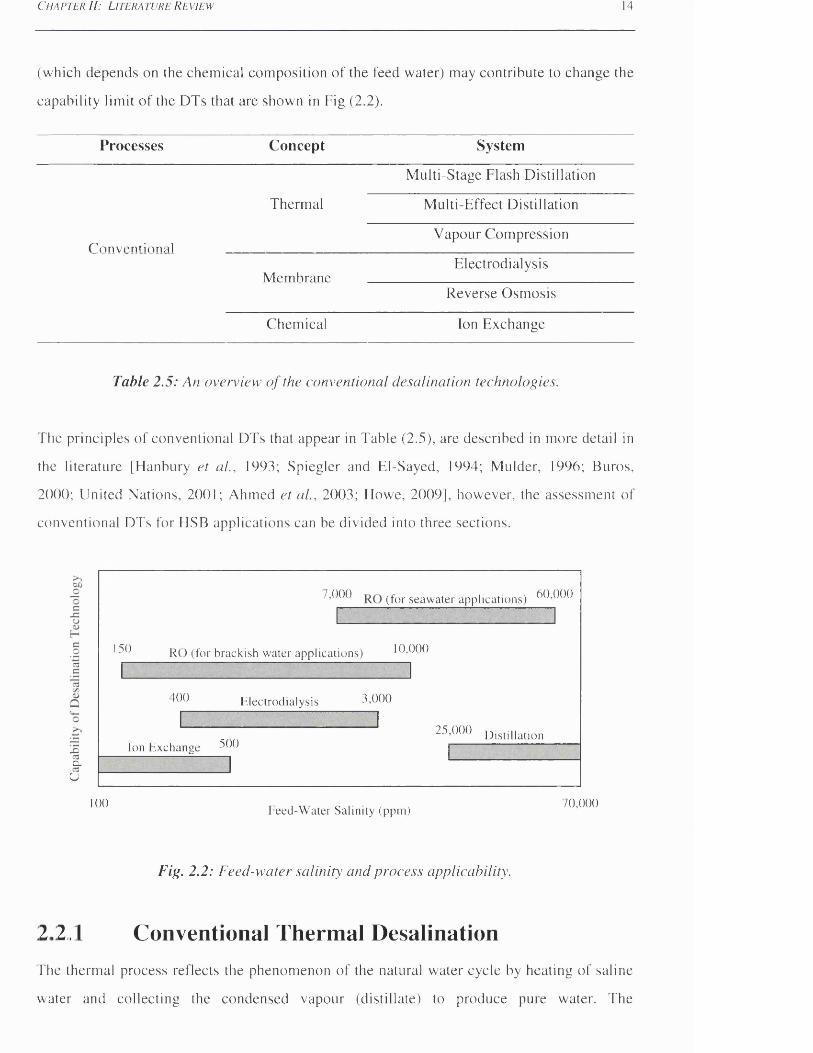
C h a p t e r I I: L i t e r a t u r e R e v i e w 14
(which depends on the chemical composition of the feed water) may contribute to change the
capability limit of the DTs that are shown in Fig (2.2).
Processes Concept System
Multi-Stage Flash Distillation
Thermal Multi-Effect Distillation
Convent ionalVapour Compression
MembraneElectrodialysis
Reverse Osmosis
Chemical Ion Exchange
Table 2.5: An overview o f the conventional desalination technologies.
The principles of conventional DTs that appear in Table (2.5), are described in more detail in
the literature |Hanbury et al., 1993; Spiegler and El-Sayed, 1994; Mulder, 1996; Buros,
2000; United Nations, 2001; Ahmed et al., 2003; Howe, 2009], however, the assessment of
conventional DTs for HSB applications can be divided into three sections.
Q.U
7,000 (for Seawater applications) 6(3,000
' 69 RO (for brackish water applications) 10,000
400 Electrodialysis 3,000
Ion Exchange 60025,000 f)istiUation
100 Feed-W ater Salinity (ppm) 70,000
Fig. 2.2 : Feed-water salinity and process applicability\
2 .2 .1 Conventional Thermal DesalinationThe thermal process reflects the phenomenon of the natural water cycle by heating of saline
water and collecting the condensed vapour (distillate) to produce pure water. The
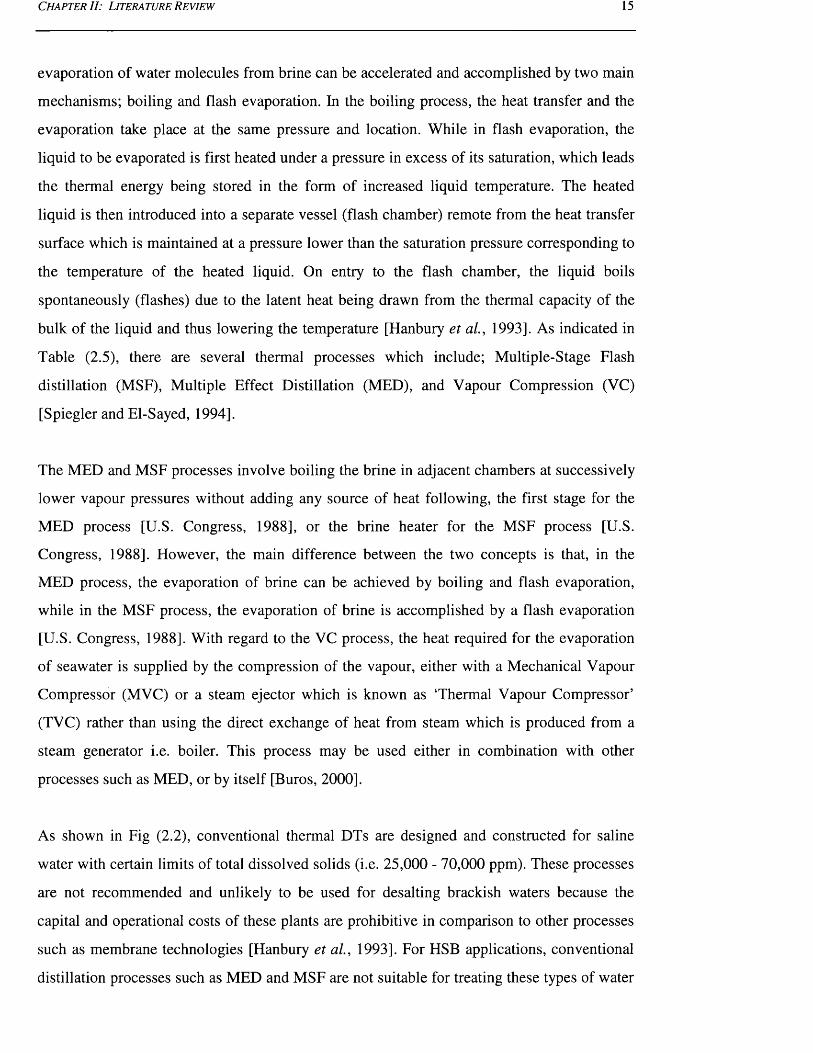
C h a p t e r II: L it e r a t u r e R e v i e w 15
evaporation of water molecules from brine can be accelerated and accomplished by two main
mechanisms; boiling and flash evaporation. In the boiling process, the heat transfer and the
evaporation take place at the same pressure and location. While in flash evaporation, the
liquid to be evaporated is first heated under a pressure in excess of its saturation, which leads
the thermal energy being stored in the form of increased liquid temperature. The heated
liquid is then introduced into a separate vessel (flash chamber) remote from the heat transfer
surface which is maintained at a pressure lower than the saturation pressure corresponding to
the temperature of the heated liquid. On entry to the flash chamber, the liquid boils
spontaneously (flashes) due to the latent heat being drawn from the thermal capacity of the
bulk of the liquid and thus lowering the temperature [Hanbury et a l, 1993]. As indicated in
Table (2.5), there are several thermal processes which include; Multiple-Stage Flash
distillation (MSF), Multiple Effect Distillation (MED), and Vapour Compression (VC)
[Spiegler and El-Sayed, 1994].
The MED and MSF processes involve boiling the brine in adjacent chambers at successively
lower vapour pressures without adding any source of heat following, the first stage for the
MED process [U.S. Congress, 1988], or the brine heater for the MSF process [U.S.
Congress, 1988]. However, the main difference between the two concepts is that, in the
MED process, the evaporation of brine can be achieved by boiling and flash evaporation,
while in the MSF process, the evaporation of brine is accomplished by a flash evaporation
[U.S. Congress, 1988]. With regard to the VC process, the heat required for the evaporation
of seawater is supplied by the compression of the vapour, either with a Mechanical Vapour
Compressor (MVC) or a steam ejector which is known as ‘Thermal Vapour Compressor’
(TVC) rather than using the direct exchange of heat from steam which is produced from a
steam generator i.e. boiler. This process may be used either in combination with other
processes such as MED, or by itself [Buros, 2000].
As shown in Fig (2.2), conventional thermal DTs are designed and constructed for saline
water with certain limits of total dissolved solids (i.e. 25,000 - 70,000 ppm). These processes
are not recommended and unlikely to be used for desalting brackish waters because the
capital and operational costs of these plants are prohibitive in comparison to other processes
such as membrane technologies [Hanbury et al., 1993]. For HSB applications, conventional
distillation processes such as MED and MSF are not suitable for treating these types of water
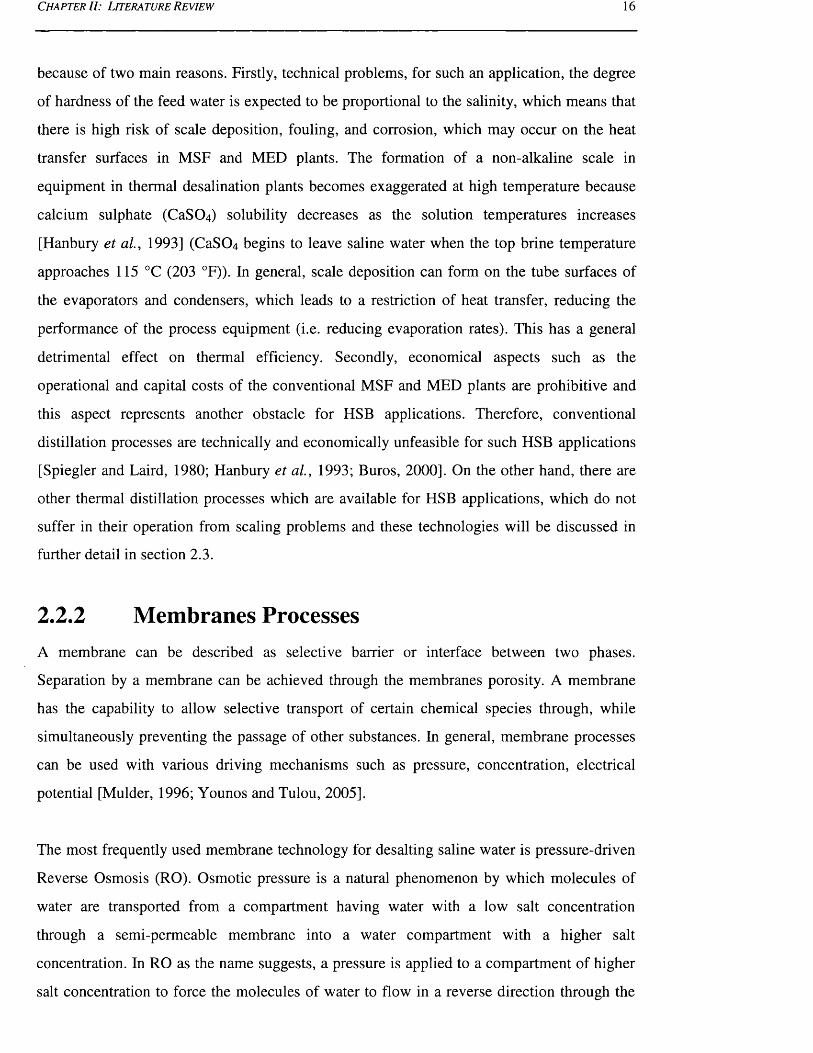
C h a p t e r II: L i t e r a t u r e R e v i e w 16
because of two main reasons. Firstly, technical problems, for such an application, the degree
of hardness of the feed water is expected to be proportional to the salinity, which means that
there is high risk of scale deposition, fouling, and corrosion, which may occur on the heat
transfer surfaces in MSF and MED plants. The formation of a non-alkaline scale in
equipment in thermal desalination plants becomes exaggerated at high temperature because
calcium sulphate (CaSO,*) solubility decreases as the solution temperatures increases
[Hanbury et al., 1993] (CaS(>4 begins to leave saline water when the top brine temperature
approaches 115 °C (203 °F)). In general, scale deposition can form on the tube surfaces of
the evaporators and condensers, which leads to a restriction of heat transfer, reducing the
performance of the process equipment (i.e. reducing evaporation rates). This has a general
detrimental effect on thermal efficiency. Secondly, economical aspects such as the
operational and capital costs of the conventional MSF and MED plants are prohibitive and
this aspect represents another obstacle for HSB applications. Therefore, conventional
distillation processes are technically and economically unfeasible for such HSB applications
[Spiegler and Laird, 1980; Hanbury et a l, 1993; Buros, 2000]. On the other hand, there are
other thermal distillation processes which are available for HSB applications, which do not
suffer in their operation from scaling problems and these technologies will be discussed in
further detail in section 2.3.
2.2.2 Membranes ProcessesA membrane can be described as selective barrier or interface between two phases.
Separation by a membrane can be achieved through the membranes porosity. A membrane
has the capability to allow selective transport of certain chemical species through, while
simultaneously preventing the passage of other substances. In general, membrane processes
can be used with various driving mechanisms such as pressure, concentration, electrical
potential [Mulder, 1996; Younos and Tulou, 2005].
The most frequently used membrane technology for desalting saline water is pressure-driven
Reverse Osmosis (RO). Osmotic pressure is a natural phenomenon by which molecules of
water are transported from a compartment having water with a low salt concentration
through a semi-permeable membrane into a water compartment with a higher salt
concentration. In RO as the name suggests, a pressure is applied to a compartment of higher
salt concentration to force the molecules of water to flow in a reverse direction through the
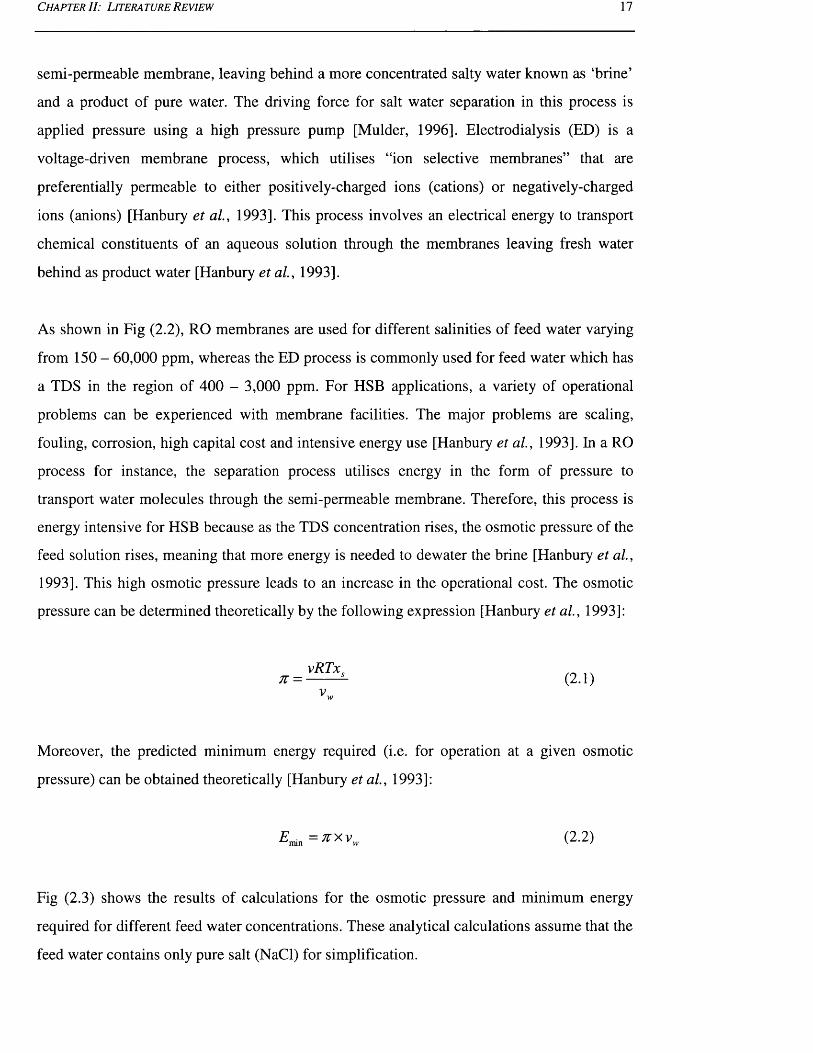
C h a p t e r II: L i t e r a t u r e R e v i e w 17
semi-permeable membrane, leaving behind a more concentrated salty water known as ‘brine’
and a product of pure water. The driving force for salt water separation in this process is
applied pressure using a high pressure pump [Mulder, 1996]. Electrodialysis (ED) is a
voltage-driven membrane process, which utilises “ion selective membranes” that are
preferentially permeable to either positively-charged ions (cations) or negatively-charged
ions (anions) [Hanbury et a l, 1993]. This process involves an electrical energy to transport
chemical constituents of an aqueous solution through the membranes leaving fresh water
behind as product water [Hanbury et a l, 1993].
As shown in Fig (2.2), RO membranes are used for different salinities of feed water varying
from 150 - 60,000 ppm, whereas the ED process is commonly used for feed water which has
a TDS in the region of 400 - 3,000 ppm. For HSB applications, a variety of operational
problems can be experienced with membrane facilities. The major problems are scaling,
fouling, corrosion, high capital cost and intensive energy use [Hanbury et a l, 1993]. In a RO
process for instance, the separation process utilises energy in the form of pressure to
transport water molecules through the semi-permeable membrane. Therefore, this process is
energy intensive for HSB because as the TDS concentration rises, the osmotic pressure of the
feed solution rises, meaning that more energy is needed to dewater the brine [Hanbury et a l,
1993]. This high osmotic pressure leads to an increase in the operational cost. The osmotic
pressure can be determined theoretically by the following expression [Hanbury et a l, 1993]:
Moreover, the predicted minimum energy required (i.e. for operation at a given osmotic
pressure) can be obtained theoretically [Hanbury et a l, 1993]:
Fig (2.3) shows the results of calculations for the osmotic pressure and minimum energy
required for different feed water concentrations. These analytical calculations assume that the
feed water contains only pure salt (NaCl) for simplification.

C h a p t e r I I: L i t e r a t u r e R e v i e w 1 8
VCL
300
250 Osmotic Pressure Minimum Energy
200
150
100
50
0 J----50,000 300,000100,000 150,000 200,000 250,000
£
w>,&0
£
Sodium Chloride Concentration - (ppm)
Fig. 2.3: Osmotic pressure and minimum energy consumption predictions fo r NaCl at 25°C.
Fig (2.3) shows that the osmotic pressure varies from 62.3 - 256 bar for the salinities of
70,000 - 250,000 ppm respectively. Furthermore, the osmotic pressure is found to be a
strong function of the salinity or more strictly the solute activity. With regard to energy
requirements, the energy consumption is proportional to the osmotic pressure of the feed
water (see Equation 2.2). As shown in Fig (2.3), the minimum energy consumption varies
from 1.73 - 7.1 1 kW/m3 for salinities of 70,000 - 250,000 ppm respectively. However, the
separation process consumes more energy than the minimum amount obtained through
analytical calculations. This is due to the excess of the applied pressure difference across the
membrane, AP, over the difference in osmotic pressure across the membrane, An. Hence, if
the RO plant operates at a pressure only just in excess of the osmotic pressure difference
which is the condition for the minimum energy consumption, then the water flow (treated
water-product) will be very small and salt flow will be finite, resulting in the product water
quality being relatively poor [Hanbury et al., 1993]. As the pressure of the operation is
increased, the water flow increases, but the salt flow will remain relatively constant and so
the quality of the product water will improve. Also, plants operating at pressures only just in
excess of the osmotic pressure of the brine will only produce very small fluxes and will
therefore require large membrane areas which will increase cost. Therefore, in practice RO
plants are operated at pressures which are well in excess of the osmotic pressure of the reject
brine [Hanbury et al., 1993]. These results demonstrate that RO is not promising for HSB
application because of the high operating pressure required. Current membranes and
membrane modules cannot be used under these osmotic pressures. However, by assuming

C h a p t e r II: L i t e r a t u r e R e v i e w 19
that there are a new generation of RO membranes that are capable of being used at high
operating pressures for HSB applications, then these membranes will be under high risk of
scaling deposition and fouling problems because of the degree of hardness accompanied with
the salinity of HSB. The scaling problem results in the deterioration of membrane
performance, poor efficiency and short membrane life because scale deposits formed at the
surfaces of the membranes, act as ionic sieves [Hanbury et a l, 1993]. They are usually
composed of different minerals such as sulphates, calcium carbonate, and magnesium
hydroxide. With regard to the fouling, the build-up of a layer of constituents on the surface of
a membrane will interfere drastically with the performance of the membrane in terms of its
primary separation function (e.g. removing ions), which means a reduction in product water
flux and an increase in salt passage. In the other words, the product water quality will be
relatively poor and the flow rate of the product water will decline [Hanbury et al., 1993]. In
addition to these technical problems, RO plants will encounter corrosion problems, which
lead to an increase in the maintenance costs. This process will also be equipped with
expensive pipelines, high pressure pumps and accessories which will eventually increase the
capital costs. Nevertheless, for such an application, the outlet reject brine of an RO plant,
will be much higher in salt concentration than the feed water, and must be disposed of with
the least harm to the environment. Therefore, the RO process is not potentially applicable for
HSB applications. On the other hand, in some cases where the brine concentration reaches
salinities with a TDS of less than 60,000 ppm, RO plant may play an important role in Zero
Liquid Discharge (ZLD) systems (this application is discussed in further detail in section
2.3.2).
In the ED process, the higher the salinity of the raw water, the more the electrical power that
is required [Hanbury et al., 1993]. This process is therefore relatively expensive in energy
costs for HSB application. This is due to the direct relation between required electrical
energy and feed salinity and also trends towards lower current efficiencies in HSB due to
increased water transport across the membranes and also to lower membrane selectivity’s.
Hence a rough estimate of the value of energy consumption of electrodialysis, for HSB
applications, can be predicted using [Hanbury et a l, 1993]:
Total energy — 0.7 . (of product water) + 0.7 (per 1,000 ppm salt removed) ( 2 . 3 )m m

C h a p t e r II: L i t e r a t u r e R e v i e w 20
Fig (2.4) summaries the predicted energy requirement to produce a product water of 500 ppm
from feed water salinities of 70,000 - 250,000 ppm. Again, this has been calculated under
the assumption that the salt composition of the brine is purely NaCl. For a feed water of
70,000 ppm the energy required is 49.7 kW/m3 whereas, for a feed of 250,000 ppm, the
energy requirement increases to 175.7 kW/m3. These figures are indicators only for the
energy requirement, as this will also depend upon the detailed design, operation and
production rates required from the plant. Although the electrodialysis process is, technically,
capable of treating HSB, the theoretical results of energy requirement show that this
technology is very energy intensive for such an application. On the other hand, with regard to
the scaling and fouling problems, the deposition of scales or other fouling agents (including
fine particulate matter) on an electrodialysis plant are not as critical as in RO membrane
plants [Buros, 2000]. However, such deposition, if allowed to occur in HSB applications,
will affect plant performance by causing a reduction in the amount of desalination achieved
(poor product water quality) and by decreasing the limiting current density by an order of
magnitude leading to eventual membrane failure. Furthermore, the deposition of scaling
plugs the membranes, increasing the electrical or hydraulic resistance and power
consumption which leads to deterioration in the electrodialysis performance and increases in
the operational costs. Therefore, the risk of scaling in ED process should be considered for
HSB applications.
" g 200 - -
I ISO
'SCD
§ 100 -
'3crPi 50 -
<DCW
50,000 100,000 150,000 200,000 250,000
Sodium Chloride Concentration - (ppm)
Fig. 2.4: Energy requirement predictions for electrodialysis versus the salinity.
One technology that has not been discussed so far is a cross-over technology between
thermal and membrane processes called membrane distillation (MD) [Lawson and Lloyd,
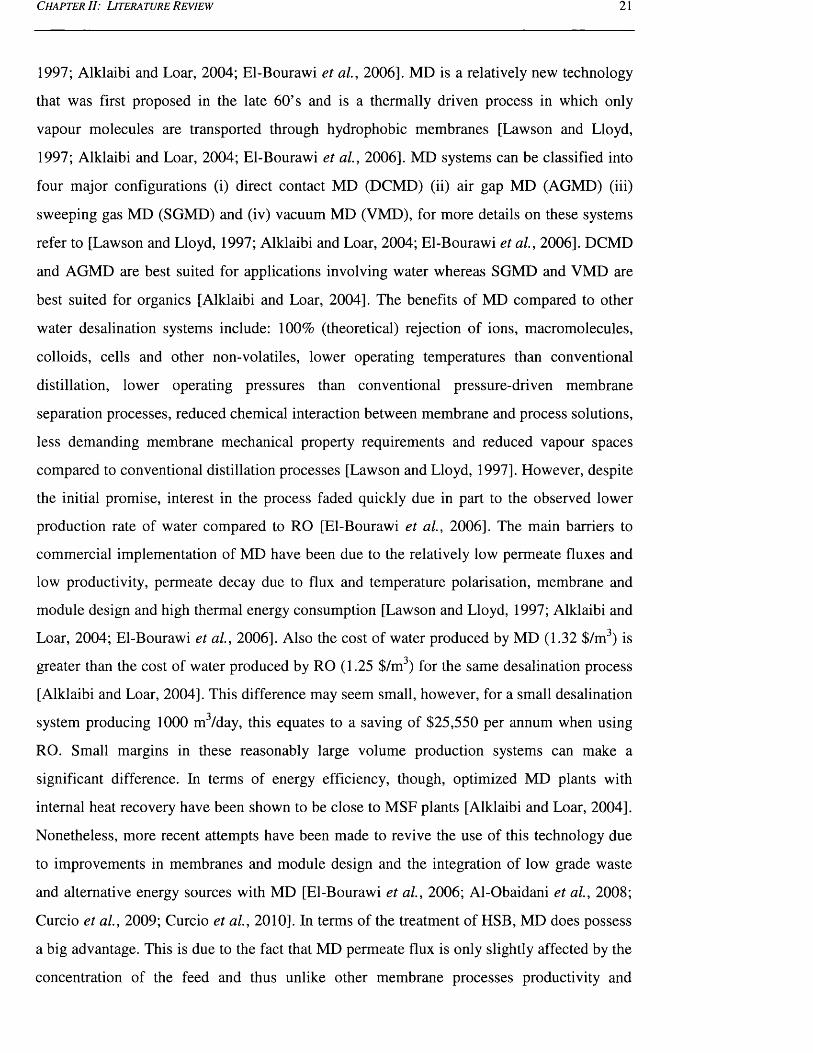
C h a p t e r II: L it e r a t u r e R e v i e w 21
1997; Alklaibi and Loar, 2004; El-Bourawi et al., 2006]. MD is a relatively new technology
that was first proposed in the late 60’s and is a thermally driven process in which only
vapour molecules are transported through hydrophobic membranes [Lawson and Lloyd,
1997; Alklaibi and Loar, 2004; El-Bourawi et al., 2006]. MD systems can be classified into
four major configurations (i) direct contact MD (DCMD) (ii) air gap MD (AGMD) (iii)
sweeping gas MD (SGMD) and (iv) vacuum MD (VMD), for more details on these systems
refer to [Lawson and Lloyd, 1997; Alklaibi and Loar, 2004; El-Bourawi et al., 2006]. DCMD
and AGMD are best suited for applications involving water whereas SGMD and VMD are
best suited for organics [Alklaibi and Loar, 2004]. The benefits of MD compared to other
water desalination systems include: 100% (theoretical) rejection of ions, macromolecules,
colloids, cells and other non-volatiles, lower operating temperatures than conventional
distillation, lower operating pressures than conventional pressure-driven membrane
separation processes, reduced chemical interaction between membrane and process solutions,
less demanding membrane mechanical property requirements and reduced vapour spaces
compared to conventional distillation processes [Lawson and Lloyd, 1997]. However, despite
the initial promise, interest in the process faded quickly due in part to the observed lower
production rate of water compared to RO [El-Bourawi et al., 2006]. The main barriers to
commercial implementation of MD have been due to the relatively low permeate fluxes and
low productivity, permeate decay due to flux and temperature polarisation, membrane and
module design and high thermal energy consumption [Lawson and Lloyd, 1997; Alklaibi and
Loar, 2004; El-Bourawi et al., 2006]. Also the cost of water produced by MD (1.32 $/m3) is
greater than the cost of water produced by RO (1.25 $/m3) for the same desalination process
[Alklaibi and Loar, 2004]. This difference may seem small, however, for a small desalination
system producing 1000 m3/day, this equates to a saving of $25,550 per annum when using
RO. Small margins in these reasonably large volume production systems can make a
significant difference. In terms of energy efficiency, though, optimized MD plants with
internal heat recovery have been shown to be close to MSF plants [Alklaibi and Loar, 2004].
Nonetheless, more recent attempts have been made to revive the use of this technology due
to improvements in membranes and module design and the integration of low grade waste
and alternative energy sources with MD [El-Bourawi et al., 2006; Al-Obaidani et al., 2008;
Curcio et a l, 2009; Curcio et al., 2010]. In terms of the treatment of HSB, MD does possess
a big advantage. This is due to the fact that MD permeate flux is only slightly affected by the
concentration of the feed and thus unlike other membrane processes productivity and
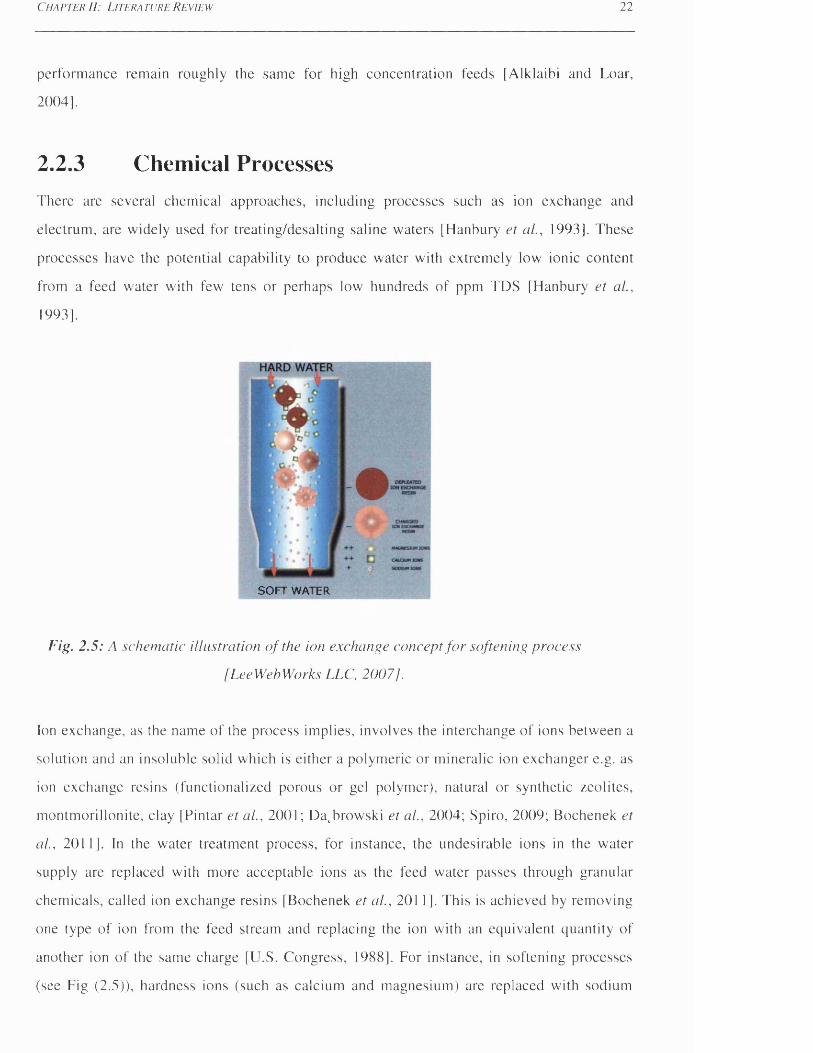
C h a p t e r 11: L i t e r a t u r e R e v i e w 22
performance remain roughly the same for high concentration feeds [Alklaibi and Loar,
2004].
2.2.3 Chemical ProcessesThere are several chemical approaches, including processes such as ion exchange and
electrum, are widely used for treating/desalting saline waters [Hanbury et al., 1993]. These
processes have the potential capability to produce water with extremely low ionic content
from a feed water with few tens or perhaps low hundreds of ppm TDS [Hanbury et al.,
1993].
SOFT WATER
Fig. 2.5: A schematic illustration o f the ion exchange concept fo r softening process
[LeeWebWorks LLC, 2007/.
Ion exchange, as the name of the process implies, involves the interchange of ions between a
solution and an insoluble solid which is either a polymeric or mineralic ion exchanger e.g. as
ion exchange resins (functionalized porous or gel polymer), natural or synthetic zeolites,
montmorillonite, clay [Pintar et al., 2001; Dacbrowski et al., 2004; Spiro, 2009; Bochenek et
al., 2011]. In the water treatment process, for instance, the undesirable ions in the water
supply are replaced with more acceptable ions as the feed water passes through granular
chemicals, called ion exchange resins [Bochenek et al., 201 1 ]. This is achieved by removing
one type of ion from the feed stream and replacing the ion with an equivalent quantity of
another ion of the same charge [U.S. Congress, 1988]. For instance, in softening processes
(see Fig (2.5)), hardness ions (such as calcium and magnesium) are replaced with sodium
C h a p t e r II : L i t e r a t u r e R e v i e w 23
ions, whereas, in de-alkalization processes, the ions that are contributing to alkalinity, such
as; carbonate, bicarbonate, etc..., are removed and replaced with chloride ions [NALCO,
1998]. Other de-alkalization processes utilise weak and strong acid cation resins in a split
stream process, where these cations exchange with hydrogen [NALCO, 1998]. This forms
carbonic acid which can be removed in a post-treatment system such as a de-carbonator
tower. Demineralization, on the other hand, is replacing all cations with hydrogen ions (H+)
and all anions with hydroxide ions (OH ) [NALCO, 1998].
Ion exchange is used in a wide range of industries such as production of various acids, bases,
salts, for industrial drying and treatment gases, in bio-molecular separations as well as food
industries [Bochenek et a l, 2011]. This technology is commonly used in water and
wastewater treatments in commercial and industrial applications such as water softening,
demineralisation, and decontamination [Spiro, 2009; Bochenek et al., 2011]. For example,
cation exchange resins are typically used for domestic purposes (i.e. homes) and municipal
wastewater treatment plants to remove the hardness ions such as; calcium and magnesium
from feed stream [Spiro, 2009; Bochenek et al., 2011]. The production of ultra-pure water
for industries is also achieved through this technology.
It is impossible to have a uniform scheme of ion exchange systems for different types of
applications. A typical example of an ion exchange unit is illustrated in Fig (2.6). The ion
exchange reservoir contains a bed of resin which is usually supported by another bed of
either graded gravel or anthracite filter media [NALCO, 1998]. Another type of ion exchange
system may have a different type of support method that does not include either a gravel or
anthracite [NALCO, 1998].
As explained by Bochenek et al. (2011), the operation cycle of ion exchange using a fixed-
bed column system, which is used for water and wastewater applications, contains two
subsequent operational stages: saturation and regeneration [Bochenek et al., 2011]. During
the operation process (i.e. saturation), the feed with the undesired ions is distributed over the
surface of the bed of ion exchange resin via the upper distribution system. The undesirable
ions in the distributed water are replaced with desired ions as the distributed water passes
through the bed of exchange resin. The treated water with the desired ions is then withdrawn
and collected via a pipe collector, installed below the bed of the ion exchange resin, leading

C h a p t e r I I: L i t e r a t u r e R e v i e w 24
to a product outlet pipeline [Bochenek et al., 201 1J. When the concentration of the undesired
ion exceeds the permissible limit, the ion exchange bed must be regenerated periodically to
restore its exchange capacity and return it back into the initial conditions [Bochenek et al.,
2011]. This step is known as regeneration [NALCO, 1998]. The regeneration method is
implemented either by the co-current flow regeneration, which is achieved by flowing the
regenerant in an opposite direction to the service flow feed-water, or vice versa i.e. co
current flow regeneration. The former has a lower leakage rate when compared to the latter.
The regeneration mode contains two subsequent operational stages: elution and re
equilibrium [Bochenek et al., 2011]. The former is achieved by replacing the retained ions
with ions of a regenerant and is then followed by column re-equilibration where the
regenerant is washed out in order to bring the fixed-bed column system back to the initial
conditions [Bochenek et al., 2011 ].
u w w u
Fig. 2.6: A schematic view o f a typical example o f an ion exchange unit, adopted from
[NALCO, 1998], where; (I) Ion exchange reservoir, (2) Upper distribution, backwash
outlet, and rinse inlet, (3) Chemical inlet and distribution, (4) Sub-surface washer
(optional), (5) Lower distributor with strainers, (6) Concrete sub-fill, (7) Free board
or rinsing space, (8) Exchange resin, and (9) Support.

C h a p t e r II: L i t e r a t u r e R e v i e w 25
Depending on several factors, such as feed quality, and proper design and running with
optimal operating conditions, the ion exchange process is capable of almost entirely
eliminating the undesired ion from the treated water, where in some cases the salt
concentration of the treated water is reduced to parts per million [NALCO, 1998].
Although other water treatment systems, such as chemical reactions, electro-flotation,
reverse osmosis and adsorption, are more effective than ion exchange in terms of ion
removal, ion exchange is an attractive process because of the processes relative simplicity
[Flores and Cabassud, 1999; Bochenek et a l, 2011]. In many cases, the ion exchange process
is found to be a more feasible economic option in terms of effective removal of ions from
diluted solutions and wastewaters [Pintar et al., 2001; Valverde et al., 2006; Bochenek et al.,
2011].
Unfortunately, in the softening processes, the separation performance of ion exchange is
seriously impaired and deteriorated when the treatment system deals with high levels of salt
concentration of feed [Brown and Sheedy, 2002]. Chen (1984) pointed out that the hardness
leakage level is directly proportional to two crucial factors, which are; salt concentration of
feed and the hardness concentration in the brine regenerant. This means high purity brine
regenerant must be used when the treatment system deals with a high level of salt
concentration of feed. Mommaerts (1999) performed analytical solutions to predict the
performance of ion exchange for treating saline waters with a TDS higher than 5,000 ppm,
the results showed that it is possible to obtain product water with a low hardness level by
treating feed with a strong acid cation resin [Brown and Sheedy, 2002]. To date, the ion
exchange process is usually used for treating feed streams with a low salt concentration
(<3,000 ppm) [U.S. Congress, 1988; Brown and Sheedy, 2002].
In general, it is expected that the higher the salt concentration of feed stream, the more
frequent the resins will need to be replaced or regenerated, therefore these processes are
considered impractical and not economically feasible for treating waters with high levels of
dissolved solids, hence, these technologies are not suitable for HSB applications [U.S.
Congress, 1988; Hanbury et a l, 1993; Tillberg, 2004].
C h a p t e r II: L i t e r a t u r e R e v i e w 26
2.3 Freezing Desalination TechnologiesThese processes are based on the fact that when saline water freezes, the individual ice
crystals consisting of pure water are formed, leaving dissolved organic and inorganic solids
behind. However, the ice crystals are usually impure due to inclusion of drops or pockets of
the reject brine. Therefore, the ice crystal are usually separated from mother liquor and then
washed and melted to obtain potable water.
The fact that freeze-melting can purify and concentrate liquids has been known for many
years, with the first recorded examples of the process being in the 1600’s [Nebbia and
Menozzi, 1968]. According to Nebbia and Menozzi (1968), the Danish physician Thomas
Bartholinus (1616-1680) was the first to report that drinking water can be obtained by
melting the ice crystals that are formed on the seawater. Robert Bolye (1627-1691) also
reported a similar observation at almost the same time, while Jesuit Athanasios Kircher
(1602-1680) discussed the reason behind this phenomenon [Nebbia and Menozzi 1968],
Over the past years, Samuel Reyher (1635-1714) described an experiment to analyse the salt
content of the sea-ice and found that drinking water can be achieved by melting the ice
[Nebbia and Menozzi 1968]. Therefore, the phenomenon was used by travellers and sailors
as a source of drinking water [Nebbia and Menozzi 1968]. The British physician Edward
Naime (d. 1806) reported the results of specific gravity of the water obtained by melting the
ice, and also measured the freezing point of seawater.
The first apparatus as well as the first publish paper for water desalination by freezing was
introduced by Anton Maria Lorgna (1735-1796) in 1786 [Nebbia and Menozzi 1968].
Lorgna carried out the first experiments on desalination by freezing, through producing a
block of fresh water ice from seawater. The laboratory apparatus was capable of reducing the
TDS of seawater from 36,200 ppm down to traces of salts over a series of successive
freezing stages [Nebbia and Menozzi 1968]. Several types of turbid waters were also
investigated [Nebbia and Menozzi 1968]. The apparatus was further developed in order to be
equipped with a washing process prior to conducting the melting operation. All experimental
results showed that the product waters were produced at high standard quality [Nebbia and
Menozzi 1968]. Before developing the refrigeration systems, the proposed treatment system
was not practical and was limited to the coldest regions and seasons [Nebbia and Menozzi
1968]. According to Nebbia and Menozzi (1968), the first experimental freezing desalination
C h a p t e r II: L i t e r a t u r e R e v i e w 27
plant was revived in the late 1930's in Italy by the Institute Superior di Sanita. This
desalination plant was operated using the indirect freezing process.
According to Johnson (1976), the first successful pilot plant was demonstrated by the Carrier
Corporation. This plant used a vacuum freeze process employing an absorption system.
Another company, known as the Structures Wells Corporation, was heavily involved in
developing a secondary refrigerant freeze technology. A plant with a capacity of 200,000 gpd
was built during the early 1960s [Johnson, 1976]. Colt industries, on the other hand,
continued the development of a primary vacuum freeze process, and successfully constructed
a pilot plant with a capacity of 100,000 gpd at Wrightville Beach, North Carolina (USA), in
the late 1960s. The plant was tested over 2000 h of operation, and the power consumption
was less than 47 kWh/1000 g (-10.34 kWh/m3), which was encouraging for a non-optimised
pilot plant [Johnson, 1976]. The United Kingdom Atomic Energy Authority (UKAEA) in
cooperation with Simon Carves, which is commercial organisation, developed a secondary
refrigerant process with a plant capacity of 10,000 gpd [Johnson, 1976]. The investigated
plant was successfully operated and the results were encouraging enough to scale up the
plant capacity up to 1 MGD, and was to be constructed at Ipswich (England), but was then
rejected [Johnson, 1976]. In addition to these plants, several freezing desalination plants
were built for the purpose of creating drinking water. A pilot plant using vacuum freezing
vapour compression technology was constructed in Eilat (Israel); while another plant,
utilising secondary refrigerant freezing, was built in Florida (USA); and a pilot plant, using
an indirect freezing process, was built in Yanbu (Saudia Arabia) [Rich et al., 2011].
2.3.1 Description of the basic freezing desalination
processesSeveral approaches using freezing desalination technologies were developed in the period
1950 - 1970 [Spiegler and El-Sayed, 1994]. The classification of the different Freeze-
Melting (FM) processes can be divided into three concepts based on contact of refrigerant
with the solution; direct contact freezing, indirect contact freezing, and vacuum freezing
[Spiegler and Laird, 1980; Spiegler and El-Sayed, 1994; Rahman et a l, 2007]. The most
commonly known technologies are indirect freezing process with a secondary refrigerant,
vacuum-freezing vapour compression process, vacuum-freezing vapour absorption process,

C h a p t e r II: L it e r a t u r e R e v i e w 28
and secondary refrigerant freezing process. In brief, the principle of each technology is
described in the following sections.
2.3.1.1 Indirect freezing process with a secondary
refrigerantFigure (2.7) shows the flow process diagram of the main equipment of a simple indirect-
refrigeration method. A separate conventional vapour compression refrigeration cycle
absorbs heat from the seawater in the freezing chamber, and then delivers heat to the
separated ice crystal in the melting unit. The freezer chamber and melting unit simply
represent the refrigeration cycle evaporator and condenser, respectively. Hence, the operation
of the compressor must be optimised in order to maintain the temperature of the refrigerant
below that required in the freezing chamber and higher than that required in the melting unit.
The incoming seawater is initially pumped through the heat exchanger to the freezing
chamber. Thus, the incoming seawater feed is initially pre-cooled by the heat exchanger
before entering the freezing chamber. The heat exchanger is designed to optimise the heat
available from the two different cold streams, i.e. rejected brine and melted ice crystal, while
reducing the temperature of the incoming seawater feed. The temperature of seawater is
further reduced until a critical temperature is reached. As a result, the ice crystals are formed
inside the freezing chamber. The ice slurry, including ice crystals and reject brine, is pumped
to the separation unit where the ice crystals and reject brine are split into two streams. The
separation unit will be discussed later in section 2.3.1.5. The reject brine is removed from the
system, while the ice stream is transferred to the melting unit where the ice absorbs heat from
the refrigerant through a heat transfer surface, leading to melting of the ice resulting in fresh
water, as the refrigerant is condensed. Prior to discharging the melted ice from the system, a
small amount of product water is taken to the separation unit as washing liquor. The desired
amount of wash liquor does not exceed 5% of the total product water [Johnson, 1976]. The
remaining product water is then taken from melting unit to the product discharge passing
through the heat exchanger. Thus, the temperature of the incoming feed is reduced.
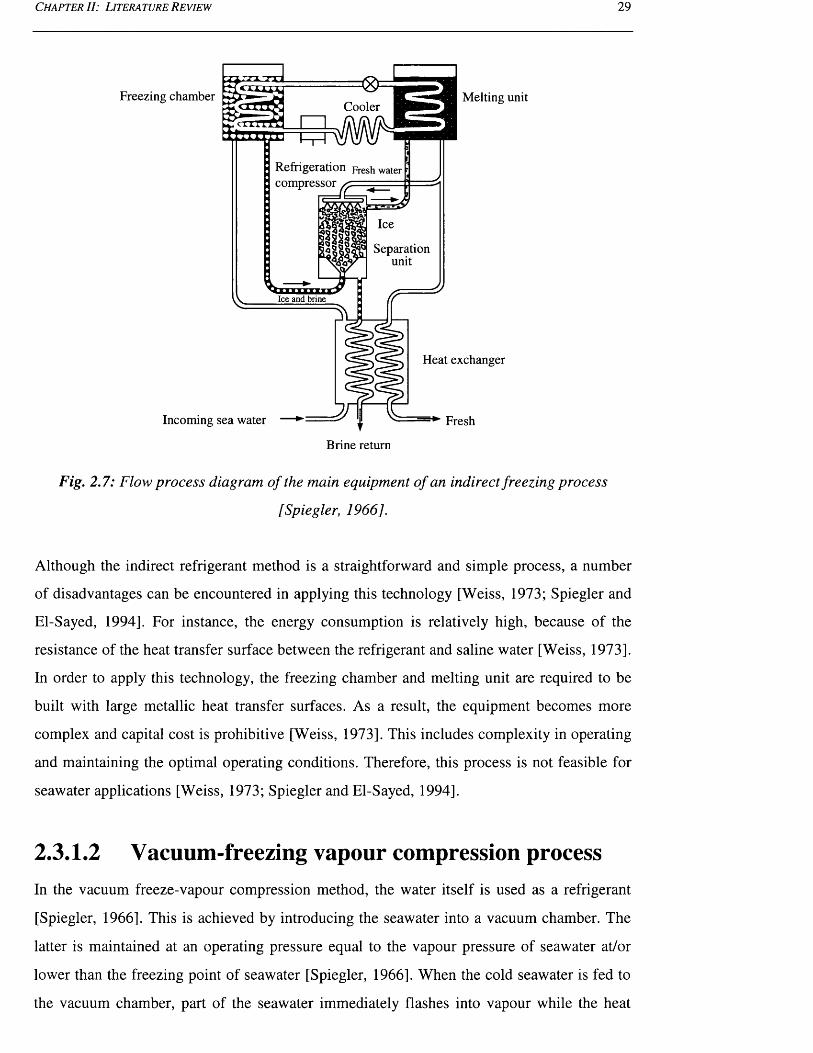
C h a p t e r II: L i t e r a t u r e R e v i e w 2 9
Freezing chamberCooler
CTTTT
Melting unit
Refrigeration Fresh water compressor
Incoming sea water
i mSeparation
unit
Ice and brine
Heat exchanger
Fresh
Brine return
Fig. 2.7: Flow process diagram of the main equipment o f an indirect freezing process
[Spiegler, 1966].
Although the indirect refrigerant method is a straightforward and simple process, a number
of disadvantages can be encountered in applying this technology [Weiss, 1973; Spiegler and
El-Sayed, 1994]. For instance, the energy consumption is relatively high, because of the
resistance of the heat transfer surface between the refrigerant and saline water [Weiss, 1973].
In order to apply this technology, the freezing chamber and melting unit are required to be
built with large metallic heat transfer surfaces. As a result, the equipment becomes more
complex and capital cost is prohibitive [Weiss, 1973]. This includes complexity in operating
and maintaining the optimal operating conditions. Therefore, this process is not feasible for
seawater applications [Weiss, 1973; Spiegler and El-Sayed, 1994].
2.3.1.2 Vacuum-freezing vapour compression processIn the vacuum freeze-vapour compression method, the water itself is used as a refrigerant
[Spiegler, 1966]. This is achieved by introducing the seawater into a vacuum chamber. The
latter is maintained at an operating pressure equal to the vapour pressure of seawater at/or
lower than the freezing point of seawater [Spiegler, 1966]. When the cold seawater is fed to
the vacuum chamber, part of the seawater immediately flashes into vapour while the heat
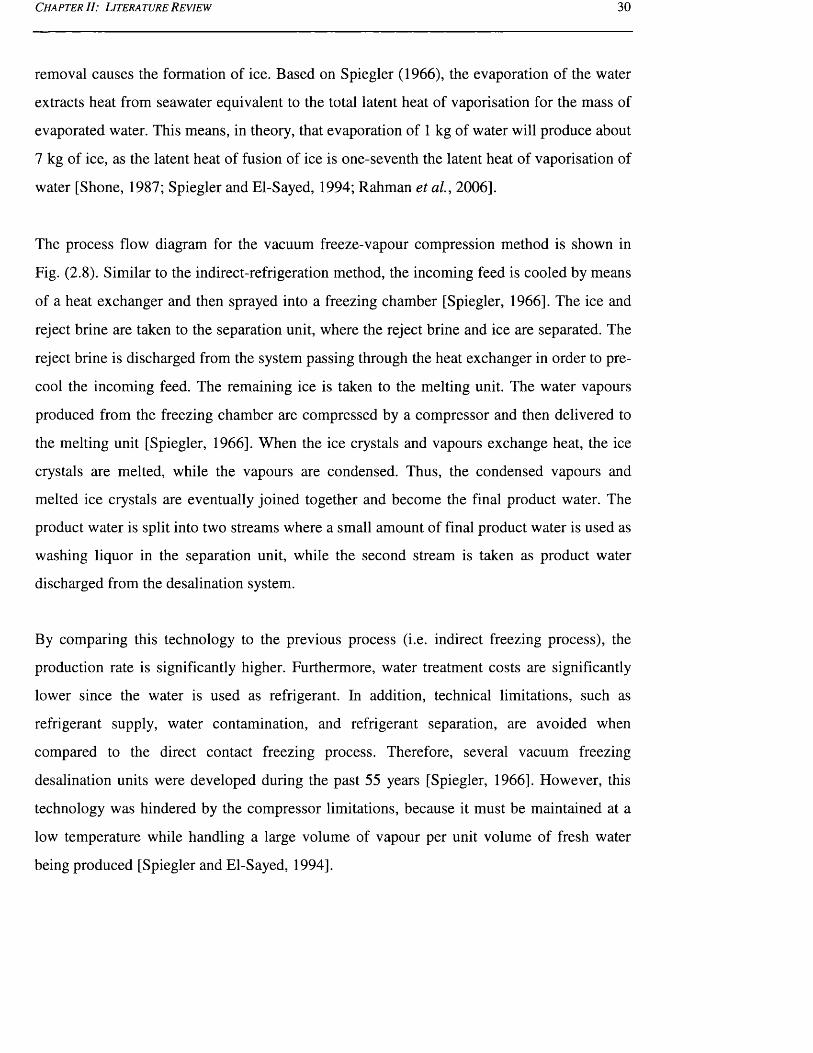
C h a p t e r II: L i t e r a t u r e R e v i e w 30
removal causes the formation of ice. Based on Spiegler (1966), the evaporation of the water
extracts heat from seawater equivalent to the total latent heat of vaporisation for the mass of
evaporated water. This means, in theory, that evaporation of 1 kg of water will produce about
7 kg of ice, as the latent heat of fusion of ice is one-seventh the latent heat of vaporisation of
water [Shone, 1987; Spiegler and El-Sayed, 1994; Rahman et al., 2006].
The process flow diagram for the vacuum freeze-vapour compression method is shown in
Fig. (2.8). Similar to the indirect-refrigeration method, the incoming feed is cooled by means
of a heat exchanger and then sprayed into a freezing chamber [Spiegler, 1966]. The ice and
reject brine are taken to the separation unit, where the reject brine and ice are separated. The
reject brine is discharged from the system passing through the heat exchanger in order to pre
cool the incoming feed. The remaining ice is taken to the melting unit. The water vapours
produced from the freezing chamber are compressed by a compressor and then delivered to
the melting unit [Spiegler, 1966]. When the ice crystals and vapours exchange heat, the ice
crystals are melted, while the vapours are condensed. Thus, the condensed vapours and
melted ice crystals are eventually joined together and become the final product water. The
product water is split into two streams where a small amount of final product water is used as
washing liquor in the separation unit, while the second stream is taken as product water
discharged from the desalination system.
By comparing this technology to the previous process (i.e. indirect freezing process), the
production rate is significantly higher. Furthermore, water treatment costs are significantly
lower since the water is used as refrigerant. In addition, technical limitations, such as
refrigerant supply, water contamination, and refrigerant separation, are avoided when
compared to the direct contact freezing process. Therefore, several vacuum freezing
desalination units were developed during the past 55 years [Spiegler, 1966]. However, this
technology was hindered by the compressor limitations, because it must be maintained at a
low temperature while handling a large volume of vapour per unit volume of fresh water
being produced [Spiegler and El-Sayed, 1994].
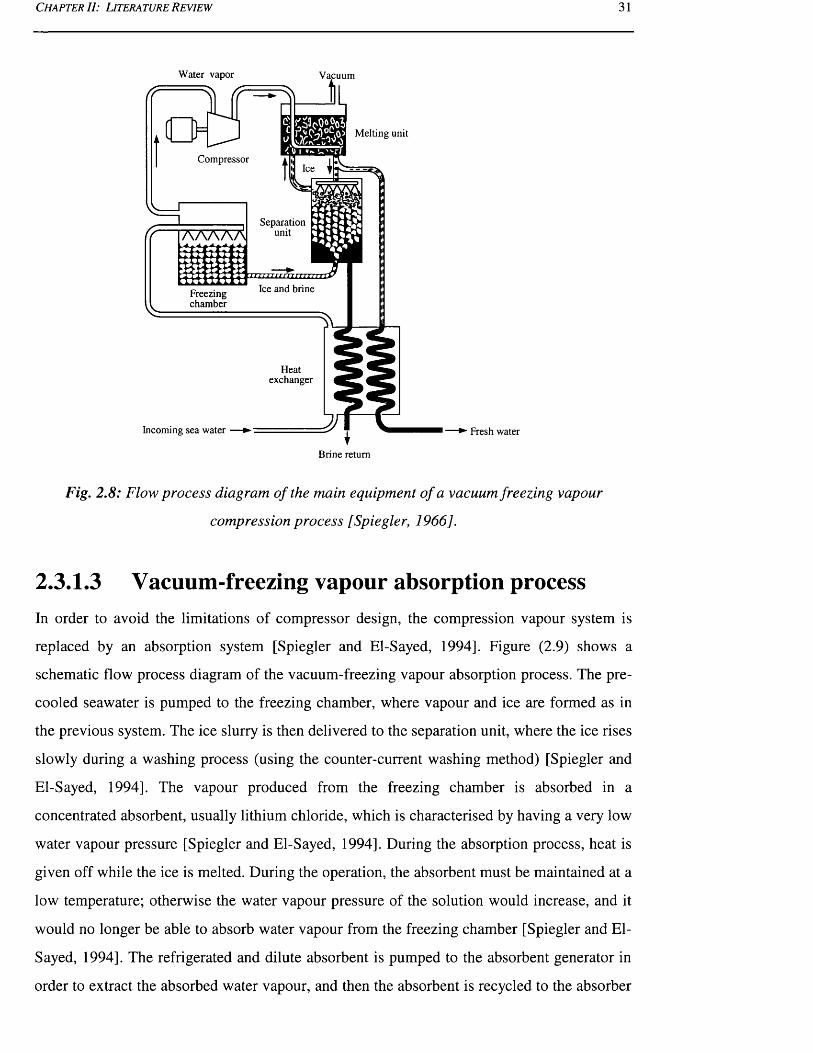
C h a p t e r II: L i t e r a t u r e R e v ie w 31
Water vapor Vacuum
Melting unit
Compressor
Separation unitCf 1 A A A A A
Ice and bnneFreezingchamber
Heat exchanger
Incoming sea water Fresh water
Brine return
Fig. 2.8: Flow process diagram of the main equipment o f a vacuum freezing vapour
compression process [Spiegler, 1966].
2.3.1.3 Vacuum-freezing vapour absorption processIn order to avoid the limitations of compressor design, the compression vapour system is
replaced by an absorption system [Spiegler and El-Sayed, 1994]. Figure (2.9) shows a
schematic flow process diagram of the vacuum-freezing vapour absorption process. The pre
cooled seawater is pumped to the freezing chamber, where vapour and ice are formed as in
the previous system. The ice slurry is then delivered to the separation unit, where the ice rises
slowly during a washing process (using the counter-current washing method) [Spiegler and
El-Sayed, 1994]. The vapour produced from the freezing chamber is absorbed in a
concentrated absorbent, usually lithium chloride, which is characterised by having a very low
water vapour pressure [Spiegler and El-Sayed, 1994]. During the absorption process, heat is
given off while the ice is melted. During the operation, the absorbent must be maintained at a
low temperature; otherwise the water vapour pressure of the solution would increase, and it
would no longer be able to absorb water vapour from the freezing chamber [Spiegler and El-
Sayed, 1994]. The refrigerated and dilute absorbent is pumped to the absorbent generator in
order to extract the absorbed water vapour, and then the absorbent is recycled to the absorber
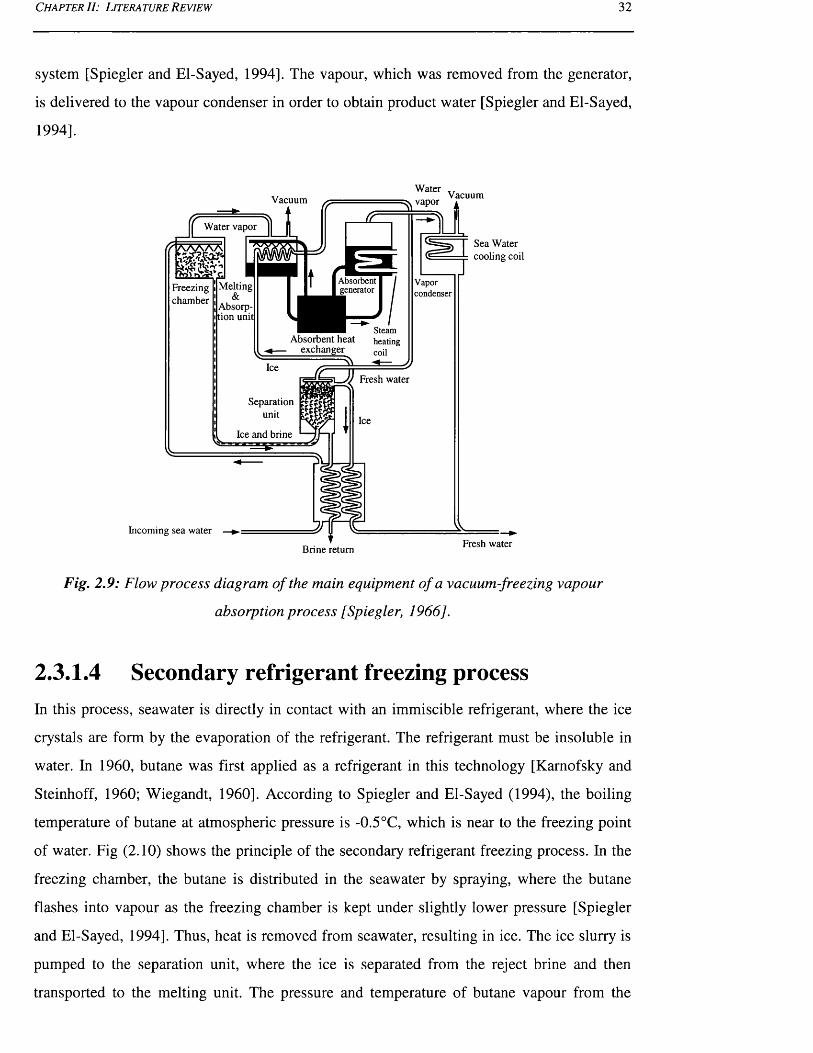
C h a p t e r I I: L i t e r a t u r e R e v ie w 32
system [Spiegler and El-Sayed, 1994]. The vapour, which was removed from the generator,
is delivered to the vapour condenser in order to obtain product water [Spiegler and El-Sayed,
1994].
Watervapor
VacuumVacuum
Water vapor
Sea Water cooling coil
AAAAX
r y ^ 3 '
Freezingchamber
Absorbentgenerator
Vaporcondenser
Melting&
Absorption unit
Steamheatingcoil
Absorbent heat exchanger
IceFresh water
Separationunit
IceIce and brine
Incoming sea waterFresh waterBrine return
Fig. 2.9: Flow process diagram of the main equipment o f a vacuum-freezing vapour
absorption process [Spiegler, 1966].
2.3.1.4 Secondary refrigerant freezing processIn this process, seawater is directly in contact with an immiscible refrigerant, where the ice
crystals are form by the evaporation of the refrigerant. The refrigerant must be insoluble in
water. In 1960, butane was first applied as a refrigerant in this technology [Kamofsky and
Steinhoff, 1960; Wiegandt, I960]. According to Spiegler and El-Sayed (1994), the boiling
temperature of butane at atmospheric pressure is -0.5°C, which is near to the freezing point
of water. Fig (2.10) shows the principle of the secondary refrigerant freezing process. In the
freezing chamber, the butane is distributed in the seawater by spraying, where the butane
flashes into vapour as the freezing chamber is kept under slightly lower pressure [Spiegler
and El-Sayed, 1994]. Thus, heat is removed from seawater, resulting in ice. The ice slurry is
pumped to the separation unit, where the ice is separated from the reject brine and then
transported to the melting unit. The pressure and temperature of butane vapour from the
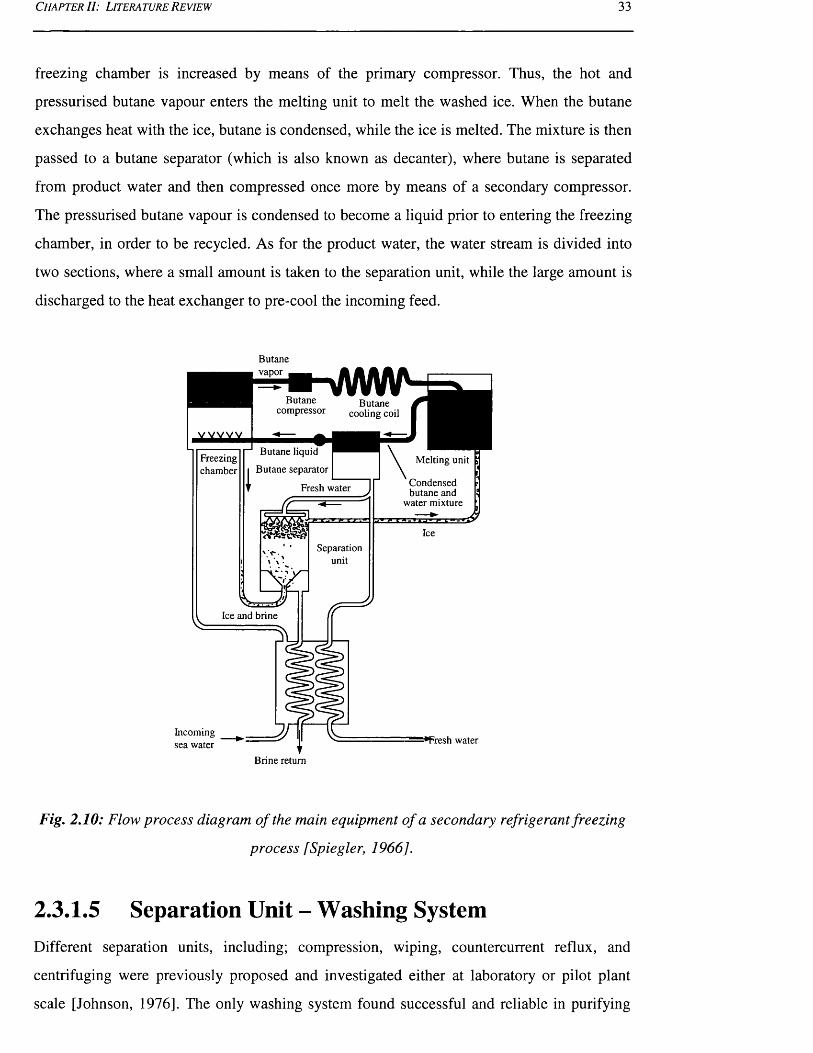
C h a p t e r II: L it e r a t u r e R e v ie w 33
freezing chamber is increased by means of the primary compressor. Thus, the hot and
pressurised butane vapour enters the melting unit to melt the washed ice. When the butane
exchanges heat with the ice, butane is condensed, while the ice is melted. The mixture is then
passed to a butane separator (which is also known as decanter), where butane is separated
from product water and then compressed once more by means of a secondary compressor.
The pressurised butane vapour is condensed to become a liquid prior to entering the freezing
chamber, in order to be recycled. As for the product water, the water stream is divided into
two sections, where a small amount is taken to the separation unit, while the large amount is
discharged to the heat exchanger to pre-cool the incoming feed.
Butanevapor
Butanecompressor
Butane cooling coil
V V
Butane liquid
Butane separatorFreezingchamber
Melting unit
Condensed butane and
water mixtureFresh water
iSeparation
unit
Ice and brine
Incoming sea water •Fresh water
Brine return
Fig. 2.10: Flow process diagram o f the main equipment o f a secondary refrigerant freezing
process [Spiegler, 1966].
2.3.1.5 Separation Unit - Washing SystemDifferent separation units, including; compression, wiping, countercurrent reflux, and
centrifuging were previously proposed and investigated either at laboratory or pilot plant
scale [Johnson, 1976]. The only washing system found successful and reliable in purifying
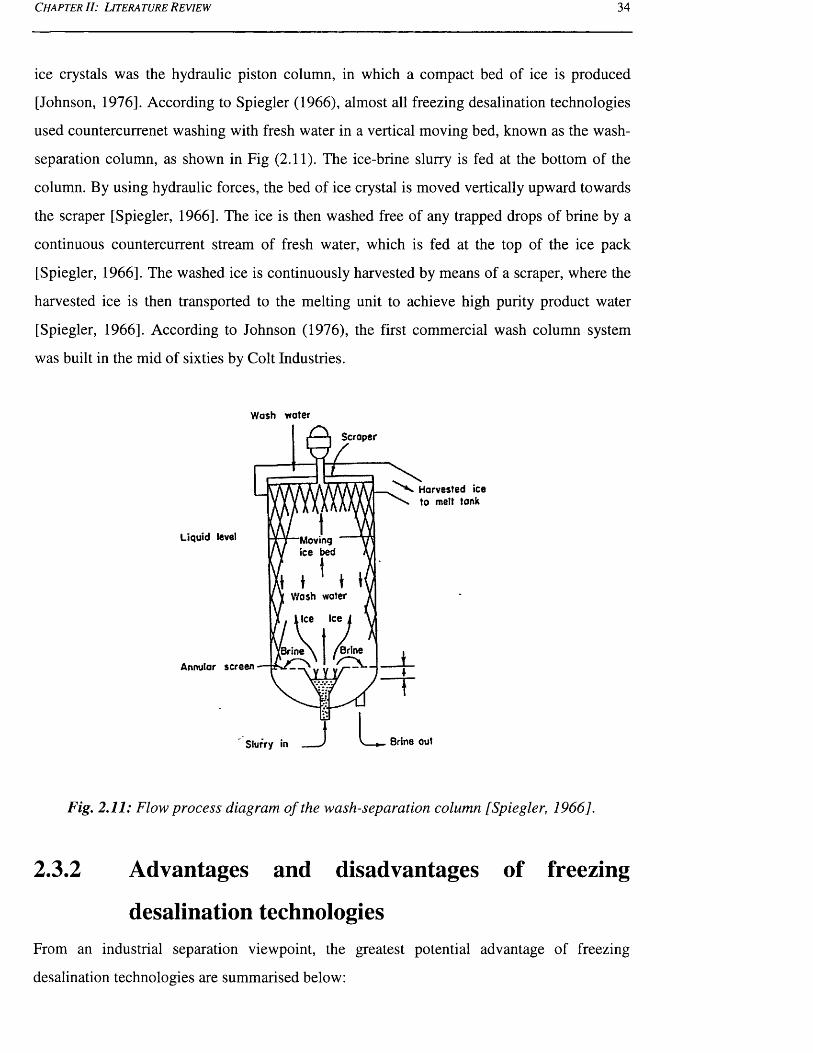
C h a p t e r II: L i t e r a t u r e R e v ie w 34
ice crystals was the hydraulic piston column, in which a compact bed of ice is produced
[Johnson, 1976]. According to Spiegler (1966), almost all freezing desalination technologies
used countercurrenet washing with fresh water in a vertical moving bed, known as the wash-
separation column, as shown in Fig (2.11). The ice-brine slurry is fed at the bottom of the
column. By using hydraulic forces, the bed of ice crystal is moved vertically upward towards
the scraper [Spiegler, 1966]. The ice is then washed free of any trapped drops of brine by a
continuous countercurrent stream of fresh water, which is fed at the top of the ice pack
[Spiegler, 1966]. The washed ice is continuously harvested by means of a scraper, where the
harvested ice is then transported to the melting unit to achieve high purity product water
[Spiegler, 1966]. According to Johnson (1976), the first commercial wash column system
was built in the mid of sixties by Colt Industries.
Wash water
Scraper
Harvested ice to melt tank
Liquid level 'Moving ice bed
Wash water
Brine[BrineAnnular screen
Brine outSlurry in
Fig. 2.11: Flow process diagram o f the wash-separation column [Spiegler, 1966].
2.3.2 Advantages and disadvantages of freezing
desalination technologiesFrom an industrial separation viewpoint, the greatest potential advantage of freezing
desalination technologies are summarised below:
C h a p t e r I I : L it e r a t u r e R e v ie w 35
i) Freezing desalination technologies, in theory, require less energy when
compared to the evaporation/distillation process, because the latent heat of
fusion of ice is only one-seventh the latent heat of vaporisation of water [Shone,
1987; Rahman et a l, 2006]. Therefore, theoretically, desalination by freezing
could achieve a 75 - 90% reduction in the energy required by a conventional
thermal process [Rahman et al., 2006].
ii) The energy cost of a freezing desalination process is theoretically almost similar
to that of a RO membrane plants; however, the investment and operational costs
for freezing technologies are less than RO membrane plants, because the
biological fouling is substantially reduced by low temperature operation
[Rahman et al., 2006; Rich et a l, 2011].
iii) The advantages of a low operating temperature minimises the major technical
problems, such as scaling and corrosion, that are usually encountered in thermal
desalination plants [Spiegler and Laird, 1980; Rahman et al., 2006].
iv) The low operating temperature can minimise the capital cost, because many
inexpensive plastics or low cost materials can be utilised at low temperature
[Spiegler and Laird, 1980; Spiegler and El-Sayed, 1994; Buros, 2000; Rahman
et al., 2007].
v) The freezing desalination technologies require very low chemical use due to the
absence of pretreatment systems, and therefore this process is environmentally-
friendly, because there is no discharge of toxic chemicals to the surrounding
environment [Rahman et al., 2006].
vi) By using direct contact freezing desalination technology, a very high surface
area and high heat transfer coefficient can be achieved [Rahman et al., 2006].
vii) Freezing desalination process is insensitive to the nature of feed stream in terms
of salinity or type of substances in the feed water [Spiegler and Laird, 1980;
Rahman et al., 2006].
Despite these advantages, the FM process has been used only to a very limited extent
industrially, especially for seawater applications. Commercially, the FM process has not
achieved the success of other conventional processes for seawater applications, because of
the process complexity and the prohibitive total cost compared to conventional membrane
and distillation technologies [Johnson, 1976; Rahman et al., 2007]. In general, the
C h a p t e r I I : L it e r a t u r e R e v ie w 36
disadvantages and main reasons behind restricting the application of freezing desalination
plants are as follows [Rahman et a l, 2007]:
i) Freezing desalination requires complicated equipment to deal with growing,
handling, washing, and melting ice crystals.
ii) The final product may be produced with undesirable flavour and aroma.
iii) The freezing technologies require mechanical vapour compressors.
iv) Large scale compressors consume energy intensively when used in desalination.
v) Difficulties in designing large scale plant using freezing desalination
technologies and optimising the operating conditions with confidence, because
of the process and operation units complexity in the main equipment of the
freezing desalination plants, such as freezing chamber, and separation and
melting units.
vi) Impure ice crystals are usually produced due to adherence of drops or pockets of
the reject brine. As a result, crushing and re-crystallisation of ice may be needed.
vii) Progressive increases in the salinity of reject brine and non-condensable gases,
viii) High quality energy is essential for freezing desalination technologies, while
many evaporation processes can be applied with low quality energy.
ix) Mass loss in product water due to certain amount of fresh water taken as wash
liquor for washing the ice crystal in the separation unit.
x) Lack of knowledge on ice crystallisation and growth in a slurry system, and
limited knowledge in handling ice slurries and separation of ice from brine.
2.3.3 Present and future freezing-melting processTo date, a commercial application of freezing desalination technology processes does not
exist. However, a similar concept, in terms of the freeze-melting process, is widely available
for use in many different industrial sectors, particularly in food processing [Miyawaki et a l,
2005; Hernandez et al., 2009; Hernandez et al., 2010; Auleda et al., 2011; Sanchez et al.,
2011]. Rahman et al., (2007) illustrated various commercial food applications that utilise
freeze-melting technologies, which are known as melt crystallisation processes [Rahman et
al, 2007]. The solid layer and suspension crystallisation processes are widely used, for such
applications. The crystallisers being used in these technologies are classified as indirect
contact crystallisers, where the food and refrigerant are fully separated by heat transfer walls
C h a p t e r II: L it e r a t u r e R e v ie w 37
and surfaces [Rahman et a l, 2007]. The most commonly used crystallisers are static
crystallisation, layer crystalliser growing on rotating drum, dynamic crystallisation, and
suspension crystallisation [Rahman et a l, 2007]. The food industries have adapted the
principles of the freezing desalination technologies, and applied them to take advantage of
the technology [Rahman et a l, 2007]. In fact, melt crystallisation processes in food
industries achieved great success due to the ability of producing high quality products
compared to other available technologies around the world [Rahman et a l, 2007].
Desalination however, is a massively important process due to the high water usage across
the globe, and the constant necessity for clean water [Miller, 2003; OECD, 2004; Rahman et
a l, 2007]. Therefore, many technologies have been developed for freeze concentration, but
some of the most widely used are the falling film principle [Ulrich and Glade, 2003;
Hernandez et a l, 2010; Sanchez et a l, 2011] and suspension crystallisation technology
[Lemmer et a l, 2001; Sulzer, 2004]. In falling-film crystallisation concentration, the fluid to
be concentrated flows down over a chilled surface, which causes the crystallization of ice
and the further growth of the ice crystals on the surface [Sanchez et a l, 2011]. Falling film
crystallisation technology will be described later in Chapter 5 in greater detail.
The separation of ice and concentrated solution occurs, because the ice adheres to the
surface, while the concentrated liquid flows down along the surface. The suspension
crystallisation process consists of a crystallisation section followed by a wash section
[Sulzer, 2004; Lemmer et a l, 2001]. In the first heat exchanger, tiny needle crystals form,
these are then fed into the re-crystaliser holding larger crystals in a slurry. The small crystals
then melt and reform on the larger crystals due to lower equilibrium temperatures. These new
spherical ice crystals of a larger size are then fed into a wash column and separated from the
concentrated solution. One advance in this system in the last decade is the implementation of
the batch wash column which uses a piston to compact the crystals into a filter bed. Wash
water then flows through the bed and washes out the concentrate before itself freezing on the
crystals. The bottom layer of ice is taken off by a scraper at the bottom of the column while
the concentrate flows through the top of the piston. The process is finished when all the ice
has been scraped away [Sulzer, 2004, Lemmer et a l, 2001], The piston then returns to the
start position for the next batch. Several wash columns in series can wash constantly without
C h a p t e r II: L it e r a t u r e R e v ie w 38
stopping so long as they work with corresponding holding times. This technology will be
described in detail later in Chapter 6.
Both batch and continuous freeze separation systems exist in industry. Batch separation units
are generally kept to the small scale due to higher energy use, while new designs of
continuous units are being brought into industries where higher throughput is required.
Rodriguez et al. (2000) discuss the key economic factors for the use of freeze separation as
an industrial process, and prove through calculation that the capital costs of a large freezing
system is much higher than that of a RO unit for a similar level of separation. Due to the RO
technology being more available and economically viable the outcome of the paper was that
it was the better method for desalination. Hence, it is obvious that freeze concentration
technology must be developed to a level, where it is more widely available and economical
for all levels of business.
Ice maker machines are extensively used in many commercial and residential areas for the
purpose of making ice cubes. They are a good example of the falling film freeze
concentration technique. There are a variety of ice maker machines with different production
rates of ice cubes (up to 200 tons per day) available nowadays in the market. Heat Transfer
Technology AG (2011) recently released a new design for a continuous chip ice machine for
use in industry. The BUCO industrial ice maker boasts that by creating chip ice rather than
flake ice it can drastically reduce freezing energy costs. Chip ice has an evaporation
temperature between -8 and -10 °C while flake ice must be cooled to -35 °C, giving
significant energy consumption advantages. The BUCO technology also makes the point that
no storage cooling silo is required for very similar separation, and that fragile products are
much safer due to no sharp edges like those in flake ice. Similar points are made by Ziegra
Ice Machines [Ziegra Ice Machines, 2011]. Heat Transfer Technology AG also discuss the
fact that the flexibility of ice thickness, hygienic process and product safety make their
process a very strong design for use in the food and pharmaceutical industries. There is good
scope for use of ice maker units in industry, where the ice can be collected and either melted
in place or taken off to a secondary process.
When the separation performance of thermal distillation becomes infeasible (in terms of
product quality and quantity, or energy intensive) in any application and there is no
C h a p t e r II: L it e r a t u r e R e v ie w 39
alternative process, melt crystallisation technologies become the alternative solutions for
such applications. Therefore, a number of applications in chemical industries, including:
concentration of harmful industrial wastewaters, were reported [Rahman et a l , 2007].
2.3.4 Potential technology transfer of melt
crystallisation process to desalinationIn principle, all melt crystallisation technologies used in either the food or chemical
industries could be transferred and applied to the desalination area, including concentrating
HSB applications [Rahman et a l, 2007]. All methods could lower the food product down to
100 ppm within a multistage process [Rahman et a l, 2007]. However, an important point
that must be taken into consideration is the economic analysis of the potential melt
crystallisation technologies for desalination applications. Suspension crystallisation might be
the technology with the most potential as a melt crystallisation process for producing high
purity product water from saline water. This is because the technology deals with an ice
suspension and washing process as applied in the conventional freezing desalination
technologies. However, solid layer crystallisation technologies, namely dynamic and static
crystallisation technologies might be feasible for concentrating HSB, since these
technologies take advantage of the conventional freezing desalination technologies, in terms
of minimising the technical limitations, such as scale and corrosion. In fact, when these
technologies are applied to concentrating HSB, then the process will be far simpler compared
to freezing desalination technologies. This is due to the elimination of the important
limitations, such as complicated ice slurry handling, ice separation and washing processes,
since the separation process in solid layer crystallisation depends mainly on the freezing and
melting process. Therefore, the melt crystallisation technologies, and more specifically
suspension and solid layer crystallisation processes, were adopted in this study and
investigated for saline water applications.
In the literature, ZLD systems have combined the FM process with other desalination
processes [Rahman et a l, 2007]. The most promising ZLD system is the combination of RO
and FM processes, while a ZLD system consisting of FM and solar evaporator is proposed as
an efficient system to reduce the environmental impact of the HSIB [Rahman et a l, 2007].
This method is aimed at producing fresh water and several useful minerals. Based on
C h a p t e r II: L it e r a t u r e R e v ie w 40
economic analysis, it was found that FM might be competitive with solar distillation in many
suitable places [Rahman et al., 2007]. In general, all studies show that the hybrid techniques
of combining the FM process and other desalination technologies have high potential for
future development [Rahman et a l, 2007], In addition, the literature shows that direct
contact freezing and eutectic FM processes are suitable for HSB applications [Spiegler and
Laird, 1980; Spiegler and El-Sayed, 1994; Rahman et al., 2007]. The disposal of effluents
and conversion to by-products can also be achieved by adopting a Freeze-Melting (FM)
process [Spiegler and Laird, 1980; Spiegler and El-Sayed, 1994; Rahman et al., 2007].
2.4 Brine Treatment and Zero Liquid Discharge
ApproachesIncreasing public awareness of the significant impact of industrial effluents on the
surrounding environment has contributed to the setting of more restrictive regulations for
governing disposal methods, which might restrict many conventional disposal methods (such
as, discharging the brines into open waters and inland surface waters, deep well injection and
aquifer re-injection) in the future. Moreover, increased demands for water supply coupled
with more stringent regulations are forcing desalination utilities to produce fresh water from
low quality supplies. These pressing demands are forcing engineers and investors to use a
desalination process that is potentially capable of increasing water recovery to the highest
level by minimizing the effluents (to the lowest level) with least harm to the environment.
These demands can be satisfied by utilising a treatment system known as Zero Liquid
Discharge (ZLD) [McKetta, 2002; Sethi et al., 2006; El-Sayed and El-Sayed, 2007].
As its name implies, Zero Liquid Discharge (ZLD) can be defined as a combination of
desalination processes, which are aimed at producing high purity of fresh water with the total
elimination of waste liquid from the plant [McKetta, 2002]. However, this treatment system
does not eliminate the total waste, but reduces the size of waste by converting the effluents
into a compact solid waste. Therefore, this technology offers economic advantages and
environmental benefits to any industrial plant because more fresh water per unit feed is
produced and a compact solid waste is discharged (instead of having large volumes of waste
liquid). The produced fresh water from ZLD can be used for different applications such as;
drinking water, irrigation, process re-use, boiler feed water, cooling water, environmental
discharge, and groundwater recharge [Ahmad and Williams, 2011]. While the compact waste
C h a p t e r II: L it e r a t u r e R e v i e w 41
solid discharge can be either disposed in a way friendly to the environment or transported for
additional processing in order to be prepared as useful products. Therefore, the ZLD system
is an attractive and powerful concept for disposing of the industrial effluent.
With regard to the description of ZLD systems, since there are many different industrial
plants using different types of saline waters, it is impossible to have a uniform scheme of
ZLD systems for all industrial plants. The design of this ZLD technology consequently
depends on several crucial factors, which include; feed water chemistry, purity demand of
fresh water and concentration of the waste liquid that is required for either safe disposal or
other beneficial uses. In general, there are numerous design, configurations and operation
variations in ZLD facilities, and each system is unique. Moreover, reducing the costs of ZLD
becomes one of the major goals of many scientific and commercial sectors around the world
in order to make this treatment system a viable option. Therefore, ZLD schemes may include
some or all of the processes discussed.
2.4.1 Thermal Technologies
2.4.1.1 Conventional Thermal TechnologiesThe trend toward ZLD systems requires energy to eliminate the solvent from the effluents.
This can be achieved by several thermal processes:
(i) Brine concentrators: These are also known as ‘evaporators’, and are
commercially available in different types based on the following main
designs; plate, falling film, rising film, horizontal tube, natural circulation,
forced circulation, and flash evaporators [GAE NIRO, 2003]. Hence, the
selection of the evaporator type depends on the water chemistry of feed
water, the feed temperature related behaviour, viscosity, the encrustation
properties of dissolved substances and the production capacity required. The
process concepts which might be employed for the brine concentrators are;
multi-effect evaporators, thermal vapour compression, mechanical vapour
compression, combined processes, and flash evaporation. The vapour
compression technique is the most commonly used as a process concept for
brine concentrators. However, the selection of process concept depends
C h a p t e r II: L it e r a t u r e R e v ie w 42
mainly on factors which include; water chemistry of the feed water, process
availability and economical aspects [GAE NIRO, 2003].
(ii) Crystallizers in ZLD systems are usually followed by an evaporator, which
is employed for converting the highly saturated waste liquid to a compact
solid waste [GAE NIRO, 2011]. Highly pure fresh water is produced in this
process. Crystallizers with longer retention times are operated with less
specific energy input, resulting in lower nucleation rates. The impacts
between crystals and the blades of the impeller pump are the most effective
source for the nuclei production. This is about 100 fold more effective than
other impacts (i.e. between the crystal and the wall, or crystal-crystal
impacts). Therefore, the types of crystallizers differ mainly in design and the
position of the impeller pump. In general, these types are; forced circulation,
turbulence (or Draft Tube and Baffle (DTB)) and OSLO (classified-
suspension) crystallizers [GAE NIRO, 2011].
(iii) Spray dryers: These are devices used for dewatering concentrated slurries
produced from brine concentrators [National Research Council, 2009]. They
are capable of separating the solute or suspension as a dry solid by
vaporizing the solvent (i.e. water). The advantage of this technology over the
crystallizers is that, for continuous production, the form of the dry solids
(such as powder, granulate or agglomerate form) can be controlled. This
means this technology is an ideal process for harvesting useful salts
according to quality standards regarding particle size distribution, residual
moisture content, bulk density, and particle shape.
As thermal technologies are well established and devolved, they are the most reliable
processes for HSB applications since they do not suffer in their operation from scaling
problems. These technologies are therefore, technically the most feasible methods for small
scale applications. However, these processes are infeasible for large scale applications
because their capital and operational costs are relatively high and may exceed the cost of
several industrial plants such as a desalination facility [National Research Council, 2009].
These technologies have only been used to a very limited extend industrially around the
world and may also be operated with some DTs to decrease the total cost of ZLD systems
[GAE NIRO, 2003].
C h a p t e r II: L it e r a t u r e R e v ie w 43
2.4.1.2 Thermal Solar TechnologiesSeveral technologies using solar energy have been introduced and used in thermal DTs [U.S.
Congress, 1988; Hanbury et a l 1993; Spiegler and El-Sayed, 1994; Lawson and Lloyd,
1997; Buros, 2000; Younos and Tulou, 2005; Howe, 2009]. The most commonly used are
solar humidification and evaporation and solar ponds (more detailed descriptions of these
processes are available in the literature [U.S. Congress, 1988; Hanbury et a l, 1993; Spiegler
and El-Sayed, 1994; Buros, 2000; Younos and Tulou, 2005; Howe, 2009]). There are
however differences between these technologies. The solar humidification technique is
devoted mainly to desalinating purposes [Hanbury et a l, 1993; Lawson and Lloyd, 1997;
Buros, 2000], This process imitates a part of the natural hydrologic cycle in which a
transparent cover allows the radiation of the sun to heat directly a layer of saline water so that
the production of water vapour (humidification) increases [Hanbury et a l, 1993; Spiegler
and El-Sayed, 1994; Buros, 2000; Younos and Tulou, 2005]. The water vapour is then
condensed on a cool surface, and the condensate collected as fresh water product [Hanbury et
a l, 1993; Spiegler and El-Sayed, 1994; Buros, 2000; Younos and Tulou, 2005]. The concept
of evaporation and solar ponds is similar to solar humidification except in the fact that they
are employed to concentrate waste effluents, while the production of water vapour is not
utilised. According to the literature, solar or evaporation ponds might be used as an
alternative option to using crystallizers or spray dryers in order to reduce the total costs of a
ZLD system [Ahmed et a l, 2000].
A solar pond technique can be described as an artificial shallow pond, which is used for
collecting and storing the solar thermal energy by heating and evaporating the water from the
surface layer of the pond through the radiation of sun [Szacsvay et a l, 1999; Curcio et a l,
2009]. The evaporation process on the surface causes a salinity gradient through the pond
depth which establishes three different zones, where salinity at the surface is lower than at
the bottom. These three zones consist of an upper convective zone (or surface zone) of
uniform relatively low salinity and temperature at the surface, a non-convective gradient
zone (or intermediate zone) in the middle of the pond where salinity and temperature are
proportional to the depth and a lower convective thermal storage zone (bottom zone) of
uniform high salinity and temperature at the bottom of the pond [Ahmed et a l, 2000;
Pankratz, 2008]. Therefore, the heat energy can be extracted from the bottom zone by using a
heat exchanger in order to transfer the thermal energy (at a level of 50 - 90°C) to a wide
C h a p t e r II: L it e r a t u r e R e v ie w 4 4
range of industrial and agricultural applications such as, heating, agricultural processes,
thermal desalination plants, electrical power generation plants and production of marine
chemicals [Lawson and Lloyd, 1997; Ahmed et a l, 2000; Pankratz, 2008].
With regard to evaporation ponds, this process is similar to the solar pond except that this
process has a number of successive ponds connected to each other [Ahmed et a l, 2000]. The
brine is introduced to the first pond and then flows slowly through a number of ponds
towards the final pond where salt precipitation occurs. The ponds become successively more
salty moving down the system. Evaporation ponds can be used for different applications such
as; concentrating effluents, salt production and mining processes [Ahmed et a l, 2000]. The
construction of evaporation ponds is relatively easy and they have low maintenance
requirements and low operation costs in comparison to the thermal technologies [Ahmed et
a l, 2000]. Moreover, evaporation ponds do not require mechanical equipment, except for
transfer pumps that convey the effluents to the different ponds. Evaporation ponds are the
least costly means of disposal, especially in areas where the evaporation rate is high and the
costs of flat land are inexpensive [Ahmed et a l, 2000].
The advantages of using solar thermal energy in comparison to thermal energy in ZLD
systems are that the energy is free, completely renewable, clean and green since no
significant effluents (such as CO2 emission) are emitted to the surrounding environment.
Furthermore, dependant on flat land and climate limitations, the total costs of ZLD systems
can be reduced by using thermal solar technologies as a final treatment rather than using
crystallizers or spray dryers [Ahmed et a l, 2000]. However, several factors may restrict the
use of these technologies for large scale applications as they require large solar collection
areas of low-cost, especially when the evaporation rate is low or the volume of effluent is
high. Also, the ponds should be located in warm climate areas, and which are dry, with a
high rate of evaporation without any risk of vulnerability to weather-related damage. The
pond must also be installed near to the location where the brines are available/generated. In
addition, these ponds must be isolated from the water table to protect the surface
water/aquifer from the contents of the ponds. In these systems, the water vapour is not
collected and condensed for producing fresh water (i.e. waste of fresh water) [Ahmed et a l,
2000]. There are some downsides however, as the application of solar ponds requires
expensive piping, insulation, armatures, pumps and controls which may have some
C h a p t e r II: L it e r a t u r e R e v ie w 45
maintenance and operational problems [Szacsvay et a l, 1999; Ahmed et a l, 2000]. In some
applications such as in oil-produced brines, the effluents must be well treated prior to being
transported to the ponds in order to remove some of the undesired organic substances from
the brine because of the negative impact on the environment and human health. One of the
main problems with this particular process is the rebirth of harmful gases.
2.4.2 Membrane TechnologiesAs explained in section 2.2.2 a variety of technical problems can be experienced with
membrane technologies, however, according to the water chemistry of feed-water, RO
membrane technology may be used as a pre-concentrator system for a ZLD process. This
means that the reject brine of RO will be delivered to the ZLD technique for final treatment.
The aim of this application is to reduce the total costs of ZLD by reducing the quantity of the
waste stream to a minimum. Membrane technologies such as Ultrafiltration (UF) and
Nanofiltration (NF) may also be used as a pretreatment system for ZLD technologies or for
the industrial plant in order to extract undesired species from feed water and to concentrate
the waste discharge (with undesired species) for further treatment through ZLD technologies
[Spiegler and Laird, 1980; Pols and Harmsen, 1994].
Forward Osmosis (FO) is another type of membrane based separation process. Unlike RO
technology, the FO process utilises osmotic pressure gradients rather than hydraulic pressure.
This osmotic pressure gradient can be established by feeding simultaneously a concentrated
solution (known as the draw solution) on one side of the membrane and saline water on the
other side [Cath and Childress, 2006]. Water molecules will be naturally and spontaneously
transported from the feed saline water to the draw solution across membrane, which leads to
dilution of the draw solution. Hence, by concentrating the diluted draw solution (by using
any desalting system such as distillation or membrane technology), fresh water and draw
solute are separated, with the latter being recycled to the FO module. The draw solution plays
the main role for establishing osmotic pressure gradients in the FO process, so the process is
dependant on the concentration of draw solution [Cath and Childress, 2006; Sethi et a l,
2006]. The driving force in FO can be significantly higher than in RO and leads to the FO
process having several advantages over the RO process, which include higher water
recovery, less operational and capital costs, low fouling potential, and process simplicity and
reliability [Spiegler and El-Sayed, 1994; Cath and Childress, 2006; Howe, 2009]. With
C h a p t e r II: L it e r a t u r e R e v ie w 46
regard to HSB applications, the advantages of the FO process show that the FO process
might be more feasible than RO for concentrating the industrial wastewater by using a draw
solution. In principle, by using a suitable draw solution and reliable process with a new
generation of semi-permeable FO membranes, the FO process (as a final treatment system)
can achieve the ZLD concept by producing fresh water and precipitating the salt. In general,
the literature showed that FO process has been used for industrial wastewaters (in small scale
applications), concentrating landfill leachate and seawater applications [Cath and Childress,
2006; Sethi et a l, 2006; Howe, 2009].
Membrane contactor processes such as FO and MD can potentially minimize brine volume at
lower energy expenditure and with less complexity [Martinetti et a l, 2009]. As MD can
potentially give 100% rejection of non-volatile solutes, MD’s use for ZLD systems has also
been investigated [Walton et a l, 2004; Martinetti et a l, 2009]. However, from the tests
conducted so far, the main uses of MD for zero liquid discharge will be on the small scale in
connection with other methods such as RO and solar ponds [Walton et a l, 2004; Martinetti
et a l, 2009]. Further research is required in order to develop this technology for large scale
operation.
With regard to voltage-driven membrane processes, Electrodialysis Reversal (EDR), which
operates on the same principle as an ED unit, except that the polarity of the electrodes is
reversed at intervals of several times an hour, causes ions to be attracted in the opposite
direction across the membranes [Mulder, 1996]. Hence, scale problems in EDR are not as
critical as in RO membranes because ions are removed and fresh water is left behind, while
in RO technology the opposite scenario occurs [Mulder, 1996; Tillberg, 2004]. Therefore,
technically, EDR technology may be more feasible than RO processes in increasing water
recovery from the effluents, resulting in more fresh water being produced, and a cost
reduction of the final discharge treatment systems because the reject brine from EDR is
reduced to a minimum without having a risk of scale problems. According to Shone (1987),
in some instances EDR technology is currently the most viable option for mining
applications. EDR technology can also treat water with a free chlorine residual, making this
technology more feasible than RO process to reclaim industrial wastewater, where chlorine
might be injected in the brine as a disinfectant [Tillberg, 2004]. However, EDR processes
consume high amounts of energy for high saline applications, and cannot remove silica and

C h a p t e r I I : L it e r a t u r e R e v ie w A l
dissolved organics from the water produced [Tillberg, 2004]. Therefore, RO and EDR
technologies might need an intensive pretreatment system in order to achieve reliable
operation for such applications.
2.4.3 Comparison of Membrane and Conventional
Thermal Technologies for ZLD SystemsComparison of desalination technologies is a difficult matter due to the different demands
required by different feed waters and different processes. The usual metrics which are used to
compare processes are the cost and energy required to produce one metre cubed of water.
The cost of desalination is very site-specific and is mostly based on the quality of the feed
water at the selected site. However, energy is the key to desalination. The fundamental limit
for the minimum work needed is equal to the difference in free energy between the incoming
feed (i.e. seawater) and outgoing streams (i.e. product water and discharge brine). For normal
seawater (3.45 per cent salt) at a temperature of 25 °C, the minimum work has been
calculated as equal to 0.86 kWh m'3 [DESWARE, 2011]. Table (2.6) shows a comparison of
water cost and required energy per cubic metre for a range of desalination technologies.
ParameterMSF
Seawater
MED
Seawater
VC
Seawater
RO
Seawater
RO
Brackish
Water
ED
Brackish
water
MD
Cost
($/m3)0.7-5.36 0.27-1.49 0.46-1.21 0.45-6.56 0.18-0.70 0.58 1.32
Energy
(kWh/m3)13.5-81 6.5-77 3.8-33.3 2.3-17 2-3.1 0.1-1.1 1.25
Table 2.6: Cost and energy requirement for 1 m3 o f desalinated water [Miller, 2003;
Alklaibi and Loar, 2004; DESWARE, 2011 ].
Table (2.6) illustrates the problem encountered when comparing different technologies. The
cost of desalting seawater has reduced in recent years, with the newest reverse osmosis plants
producing water for about 0.50 $/m3 [Dreizin, 2006]. The costs have dropped by a factor of
about three in the last 10 years. On average for RO systems, the current power consumption
C h a p t e r II: L it e r a t u r e R e v ie w 48
for seawater desalination is less than 3 kWh/m3, which is a 90% reduction in energy use over
the past 40 years. This is because of improvements in membrane technology and energy
recovery systems. However, the energy use is still about four times greater than the
thermodynamic minimum. For desalination of brackish waters and groundwaters, the energy
required is significantly less and the cost is usually less than 50% of that for seawater
desalination. This does however raise a problem when considering high saline brines as the
energy required, and thus the cost of processing, is going to be more substantial than the
values shown in Table (2.6), as the initial brine concentration will be higher than the
concentration of seawater. Another problem which also occurs when dealing with high saline
brines is that no one technology can accomplish the whole desalination process in one go i.e.
RO will become limited at higher brine concentrations as the pressure required to overcome
the osmotic pressure of the solution becomes prohibitive. Energy therefore constitutes a large
portion of the cost of processing high saline brines and is a prime driver of decisions about
which treatment method to use. Generally, the more advanced the treatment the more energy
is required.
The energy requirements of ZLD systems may vary according to several factors including
system configuration and plant design. Thermal evaporators are known to be a viable and
reliable technology for reducing the reject brines of RO plants to a slurry of approximately
20% solids, however, this process requires a large amount of energy, which has been
estimated to be more than 18.5 kWh/m3 of feed-water [Bostjancic and Ludlum, 1994; Bond
and Veerapaneni, 2007; Pankratz, 2008; National Research Council, 2009]. Crystallizer and
spray drying processes are more capital-cost and energy-intensive than brine concentrators
and the energy requirements of a thermal evaporator combined with a crystallizer may
exceed 32 kWh/m3 in order to accomplish the total elimination of waste liquid [Pankratz,
2008; National Research Council, 2009].
El-Sayed and El-Sayed (2007) have conducted mathematical modelling for two different
configurations of a thermal vapour compression process and of a ZLD process which
incorporates RO membrane technology for ZLD. The vapour compression processes
considered were (i) a single stage concentrator combined with a crystallizer and (ii)
multistage concentrators preceding a crystallizer [El-Sayed and El-Sayed, 2007]. Both
configurations are meant to be retrofits to existing seawater distillation plants [El-Sayed and
C h a p t e r II: L it e r a t u r e R e v i e w 49
El-Sayed, 2007]. The results showed that the single stage concentrator requires an estimated
work of 48.7 kWh/m feed and costs about 3.78 $/m distilled water, while a three-stage
configuration requires an estimated work of 46 kWh/m3 feed and costs about 3.44 $/m3 [El-
Sayed and El-Sayed, 2007]. Also, the authors stated that the multistage configuration is
better for handling large scale applications compared to single stage ones because the large
volume rate of vapour can be split into more than one compressor [El-Sayed and El-Sayed,
2007]. There are however unsolved problems and remaining challenges that may restrict the
application of this technology (for large scale applications), which include (a) the
development of strong light composite materials for the compressor rotor used for handling
large volumes at relatively high speeds efficiently and (b) effective methods for containing
salt to avoid clogging flow paths [El-Sayed and El-Sayed, 2007].
The RO membrane system considered consisted of 4 stages in series such that the end result
is product water and salt (process configuration and estimated operating parameters are in
reference [El-Sayed and El-Sayed, 2007]). The specific work of the pumps was computed at
11.1 kWh/ton initial feed or at 11.6 kWh/ton product [El-Sayed and El-Sayed, 2007]. For a
capacity of one million gallons per day the power required to drive the pumps was 1822 kW,
which is much lower than the ZLD system using a thermal process [El-Sayed and El-Sayed,
2007]. However, the application of RO membranes is restricted by several unsolved
problems including (a) concentration polarization which leads to scaling and fouling and (b)
the applied pressure for the last two stages may exceed 200 bar. To solve these problems the
authors have suggested doping and vibration to solve problem (a) and the use of ceramic
membranes for problem (b) [El-Sayed and El-Sayed, 2007].
According to the results of analytical calculations that have been conducted for ideal ZLD
process using NaCl aqueous solutions as feed-water theoretical work of ZLD desalting was
found to be 2.25 times that of conventional desalination [El-Sayed and El-Sayed, 2007]. This
value increased to about 3.6 times the work required for conventional desalination if
retrofitting of the existing desalination plants was considered [El-Sayed and El-Sayed, 2007].
C h a p t e r II: L it e r a t u r e R e v ie w 50
2.4.4 Promising Technologies - Opportunities and
ChallengesSo far existing methods for desalination and processing of high saline brines have been
discussed, however, there are also other systems which can be considered for future
development. These include freeze-melting processes and salinity gradient power.
(i) Freeze-melting processes
The disposal of effluents and conversion to by-products can also be achieved by adopting a
Freeze-Melting (FM) process [Spiegler and Laird, 1980; Spiegler and El-Sayed, 1994;
Rahman et a l, 2007]. This method depends on the fact that when saline water freezes, the
individual ice crystals consist of pure water, leaving dissolved organic and inorganic solids
in liquid pockets of high salinity brine. Since salt solution is trapped in the ice during the
crystallisation process the ice crystals require washing and then melting to get potable water.
In general, the classification of the different FM processes can be divided into three concepts
based on contact of refrigerant with the solution; direct contact freezing, indirect contact
freezing, and vacuum freezing [Spiegler and Laird, 1980; Spiegler and El-Sayed, 1994,
Rahman et al., 2007].
From an industrial separations viewpoint, the greatest potential advantage of FM is that less
energy is required when compared to the evaporation/distillation process because the latent
heat of fusion of ice is only one-seventh the latent heat of vaporisation of water. Therefore,
theoretically, desalination by freezing could achieve a 75 - 90% reduction of the energy
required by a conventional thermal process. Furthermore, the advantages of a low operating
temperature minimises technical problems such as scaling and corrosion, and also it
minimises the capital cost because many inexpensive plastics or low cost materials can be
utilised at low temperature [Spiegler and Laird, 1980; Spiegler and El-Sayed, 1994; Buros,
2000; Rahman et al., 2007]. The FM process also requires very low chemical use due to the
absence of pretreatment systems, and therefore this process is environmentally friendly
because there is no discharge of toxic chemicals to the surrounding environment. Biological
fouling is also reduced by low temperature operation. In addition, by using direct contact
freezing, a very high surface area and high heat transfer coefficient can be achieved [Rahman
et al., 2007]. Despite these advantages, the FM process has been used only to a very limited
C h a p t e r II: L it e r a t u r e R e v ie w 51
extent industrially especially for seawater applications. Commercially, the FM process has
not achieved the success of other conventional processes for seawater applications because
of the process complexity and the prohibitive total cost compared to the conventional
membrane and distillation technologies [Rahman et a l, 2007]. However, the literature shows
that direct contact freezing and eutectic FM processes are suitable for HSB applications
[Spiegler and Laird, 1980; Spiegler and El-Sayed, 1994; Rahman et a l, 2007].
In the literature, ZLD systems have combined the FM process with other desalination
processes [Rahman et a l, 2007]. The most promising ZLD system is the combination of RO
and FM processes, while a ZLD system consisting of FM and solar evaporator is proposed as
an efficient system to reduce the environmental impact of the HSIB [Rahman et a l, 2007].
This method aimed at producing fresh water and several useful minerals. Based on
economical analysis, it was found that FM might be competitive with solar distillation in
many suitable places [Rahman et a l, 2007]. In general, all studies show that the hybrid
techniques of combining the FM process and other desalination technologies have high
potential for future development [Rahman et a l, 2007].
(ii) Salinity gradient power
The principle behind the salinity gradient power is the exploitation of the entropy of mixing
two solutions with different salt gradients [Skilhagen et a l, 2008; Ahmad and Williams,
2009]. When incorporating a semi-permeable membrane between two compartments
containing diluted and concentrated solutions respectively, a net flow of diluted solution
towards the concentrated solution side will be observed because of the osmosis phenomenon.
If the compartment volume on the concentrated solution side is fixed, then the pressure will
increase towards a theoretical maximum of 26 bar for seawater applications [Skilhagen et a l,
2008]. This pressure is equivalent to a 270 metre high water column [Skilhagen et a l, 2008].
Therefore, a dual purpose plant which would generate power from waste brine before
disposal would be an attractive option. Various concepts on the exploitation of salinity
gradient power have been proposed [Post et a l, 2007; Skilhagen et a l, 2008]. Pressure
retarded osmosis (PRO) and reverse electrodialysis (RED) are the most frequently studied
membrane-based processes for energy conversion of salinity-gradient energy [Post et a l,
2007; Skilhagen et a l, 2008]. These technologies utilise an alternative energy source which
can generate a significant amount of energy which is completely renewable and sustainable,
C h a p t e r II: L it e r a t u r e R e v ie w 52
clean, and green since it does not produce CO2 or other significant effluents that may
interfere with the natural climate [Jones and Finley, 2003]. Technically PRO and RED are
not desalination technologies, but they can make use of high saline brines to generate power.
Power generation alongside desalination is a common phenomenon in the Middle East.
The main disadvantage of implementing ZLD systems using thermal DTs for treating brines
is correlated with the economical feasibility. When an industrial plant (which produces brine
effluents) is located in an area where disposal of the brine into a large body water is a
possibility (i.e. ecologically permissible), then several novel ideas for the application of PRO
plants can be proposed. For instance, the operational cost of ZLD systems can be decreased
by incorporating two technologies utilising alternative energy, which are an osmotic power
plant and a solar pond [Ahmad and Williams, 2009]. The main role of a solar pond is to
reduce the energy consumption (required by the ZLD system) and also to concentrate the
brines, while the role of osmotic power plant is to produce electrical power by mixing
concentrated brines with a diluted solution such as seawater. This idea may be useful for the
oil and gas industries because with the osmotic power plant, the concentrated solution (i.e.
high saline brine) can be diluted, and therefore the volume of the diluted brines will be
increased, hence, the diluted brine can be split into two streams. One stream can go to the
down-hole injection for enhanced oil recovery in the oil production offshore, which means
that this method will decrease the salinity of the well, in particular, in oil fields that have
been producing for long periods of time. The second stream can be used for the SP to take
advantage of the thermal energy available prior to being fed into the ZLD process. It is
however, important to point out that the application of salinity gradient power for HSB
applications is restricted by several crucial factors, which include; the availability of a large
volume of diluted water and the possibility for dumping the brines into the diluted waters
(i.e. ecologically, it should be permissible) [Ahmad and Williams, 2009]. Furthermore,
because of the concentration polarisation phenomenon in membrane separations, this process
is still being researched as the predicted membrane performance and efficiency (i.e. predicted
energy) is not achieved [Ahmad and Williams, 2009]. The process also suffers from scaling
and fouling problems. In addition, this process can be used only for producing energy prior to
disposal of the brine, which means that this technology does not treat the brine and only
dilutes it, prior to dumping into a diluted solution or into a solar pond.

Ch a p t e r II: L it e r a t u r e R e v ie w 53
2.5 ConclusionsProcessing of saline brines is required for several reasons; water supply and water
conservation, safe disposal, harvesting the residual salts as by-product and achieving the
requirements of the regulatory limitations. HSB must be considered as a resource rather than
a waste problem because as well as pure water production, many valuable minerals can be
harvested and reused.
There are a wide range of DTs which effectively remove salt from salty water, or extract
fresh water from saline water. Most of these technologies rely on either thermal or
membranes processes. At the moment there is no “best” method for desalination because
every desalination process has its own advantages and disadvantages. This study showed that
the success of any desalination system in any application depends on several important
factors such as, water chemistry of the feed water and careful study of the site conditions and
the application at hand. These factors need to be considered in any theoretical analysis and
evaluation of the desalination technologies to seek the most reliable treatment process at
reasonable cost with least harm to the environment. The water chemistry of the feed water
plays the main role for selecting the appropriate desalination process, for instance, the higher
the concentration of dissolved solids in the feed water, the more technical limitations, the
more process complicity and higher cost. Therefore, the application of DTs for treating the
HSB is currently one of the major challenges of applied research because this type of water
cannot be desalted by using the conventional DTs. A variety of technical problems can be
experienced with the conventional distillation processes including scaling, fouling, corrosion,
capital cost and high energy usage. RO membrane technologies are hindered by high osmotic
pressure, scale and fouling problems, while ED is unfeasible because of high operational
cost.
HSB also limit the scope of choice of treatment systems due to the fact that the desalination
process is either expensive and/or it has several technological, operational, and regulatory
limitations for such applications. For example, ZLD systems using thermal distillation
processes (such as vapour compression technologies) that do not suffer in their operation
from scaling problems are only feasible for small scale applications because these
technologies are relatively expensive in capital and operational costs for large scale
applications. Therefore, other processes such as membrane and thermal solar technologies
C h a p t e r II: L it e r a t u r e R e v ie w 54
are recommended to be incorporated in ZLD systems to reduce the total costs of whole
process. Finally, there are other technologies, such as FO, PRO and FM processes, which
need to be considered for future applications as these processes have great advantages that
must be appreciated for such applications, especially in energy requirements.
The literature survey was conducted on various forms of freezing desalination technologies,
as well as melt crystallisation processes. The developments in freezing desalination
technologies were active during the period 1950 - 1970. However, commercial plants using
freezing desalination technologies did not achieve success, because of process complexity,
difficulty in scaling-up, and the prohibitive total cost, when compared to conventional
membrane and distillation technologies. On the other hand, the study showed that the freeze
melting process offers a number of important advantages, including (a) a very high
separation factor, (b) high energy efficiency (the latent heat of freezing is low), (c) generic
applicability, (d) no additives, and (e) ready availability of core technology. Despite these
advantages, the freeze melting process has been used only to a very limited extent in
concentrating brines. Therefore, this study was devoted to experimentally investigating and
evaluating the separation performance of various forms of melt crystallisation technologies
for desalting and/or concentrating saline water and brine applications. The adopted and
investigated processes are namely dynamic crystallisation, static crystallisation, and
suspension crystallisation processes.
Ch a p t e r I I I : E x p e r im e n t a l s t u d y o f a g it a t io n s y s t e m s u s e d f o r f r e e z e -t h a w in g p r o c e s s 55
C h a p t e r III:
EXPERIMENTAL STUDY OF AGITATION
SYSTEMS USED FOR THE FREEZE-
THAWING PROCESS
3.1 IntroductionThe performance of a static crystallization technique with various forms of agitated
crystallisation processes was experimentally investigated and assessed for treating a range of
liquid streams, using aqueous solutions of sodium chloride. The investigated saline waters
ranged from low salinity simulating brackish water up to high concentration typical of those
causing the most severe pollution problems such as reject brine of desalination plants. Post
treatment processes, such as washing and sweating, were not considered in this study.
A laboratory bench scale experimental setup was used for investigating and verifying the
performance of a static crystallizer with different types of agitation systems for desalting
NaCl solutions at different salt concentrations ranging from 5,000 to 70,000 ppm. These
laboratory investigations were carried out using a thermo-stated double wall reaction vessel
with a capacity of 200 mL. The crystallization process was investigated in batch mode with
three agitation systems: a Bubbling Process (BP), a Mechanically Stirred System (MSS), and
an Ultrasonic Process (UP). These were examined individually, and the results were analysed
and compared to the results of the performance of the crystallizer when no agitation was
applied i.e. the static crystallization process.
The specific aims of this experimental investigation was to verify the influence of the initial
salt concentration of the feed, crystallisation temperature, crystallisation time, and agitation
rate (such as; air pressure for the BP, stir rate for the MSS, and amplitude rate for the UP),
upon the salt rejection and water recovery.
C h a p t e r II I : E x p e r im e n t a l s t u d y o f a g it a t io n s y s t e m s u s e d f o r f r e e z e - t h a w in g p r o c e s s 56
3.2 Preparation of Feed SamplesSince aqueous solutions of sodium chloride give results in the desalting process very close to
process brines [Barduhn, 1965], different salt concentrations of NaCl solutions were
prepared, used, and examined as feed material in this experimental investigation. The initial
salt concentration of the feed streams used ranged from 0.5 to 7% by weight of NaCl salt.
Sodium chloride solutions were made by dissolving a weighed amount of sodium chloride
(Fisher Scientific - Laboratory Reagent Grade) in a known weight of high purity water
(produced via an ultra-pure water purification system, Elix 3, Millipore).
3.3 Physicochemical Analysis and Measuring
InstrumentsPhysical and chemical analysis of all water samples included measurements of Total
Dissolved Solids (TDS), electrical conductivity, weight, volume, and temperature. All
experimental data including the results of these measurements were recorded and are
tabulated in Tables A3-1 - A3-13 in Appendix A3. The accuracy of the results of salt
concentration was also ensured through a simple mass balance equation.
The salt concentration of the feed sample was measured using a Russell RL105 conductivity
meter with a conductivity probe (CDC139/K) to ensure that the correct concentration had
been achieved.
The measurements of TDS were experimentally determined by evaporating a known weight
of a water sample to dryness and weighing the solid residue. This is known as the
gravimetric method. The equipment involved in obtaining gravimetric measurements are
oven, petri dish, and laboratory balance. The volume measurements, on the other hand, were
determined by scaled borosilicate glass cylinder. The running time for crystallization process
was measured by a stopwatch timer (HS-10W Stopwatch, Casio).
C h a p t e r I II: E x p e r im e n t a l s t u d y o f a g i t a t i o n s y s t e m s u s e d f o r f r e e z e - t h a w in g p r o c e s s 57
3.4 Experimental SetupFour experimental setups were prepared, constructed, and tested for investigating and
verifying the performance of a static crystallizer with different types of agitation systems for
treating aqueous solutions of sodium chloride at different salt concentrations. The principal
unit operations that have been considered for the laboratory study are; crystallization,
separation, and total melting. The applied crystallisation process is characterized as “the
secondary-refrigerant indirect freezing” method, and utilizes a solid layer crystallisation
concept.
Fig (3.1) shows the equipment for the crystallisation experiments using a static and agitated
crystallisation processes. The experimental setup for the static crystallisation process
comprises of a laboratory jacketed beaker (borosilicate glass jacketed reaction vessel with
hose connectors) with a capacity of 200 mL, refrigerated immersion cooler (Grant, C2G)
attached to the cooling coil (Grant, CW5), refrigerated thermostatic bath (Grant, W6),
circulator (Julabo, U3/7), and flexible tubing.
The refrigeration system used for all the laboratory setups was identical, which involves the
use of a refrigerated immersion cooler, connected to a cooling coil. The latter is immersed in
a Heat Transfer Medium (HTM) that is stored in a thermostatic bath. The circulator is
installed above the thermostatic bath, so the cooling coil and suction line of the circulator are
immersed in a HTM. The circulator and jacketed beaker are connected by means of flexible
tubes. The jacketed beaker was thermodynamically insulated by using foam pipe insulation,
while the top surface of the jacketed beaker was entirely open. The thermostatic bath
contains 4L of HTM. The HTM represents a mixture of an antifreeze solution (Super
Coldmaster antifreeze, Blue) and deionised water. The antifreeze solution was diluted at a
weight ratio of 2:1.
The experimental setups for the static and agitated crystallisation processes are identical
apart from the agitation system used. The experimental setup for the mechanically stirred
crystallisation process was provided with an overhead stirrer assembly, which include; an
overhead stirrer (IKA, Model: 2482000), and stirring paddle. The experimental setup for the
crystallisation process using a bubbling system, on the other hand, was provided with an air-
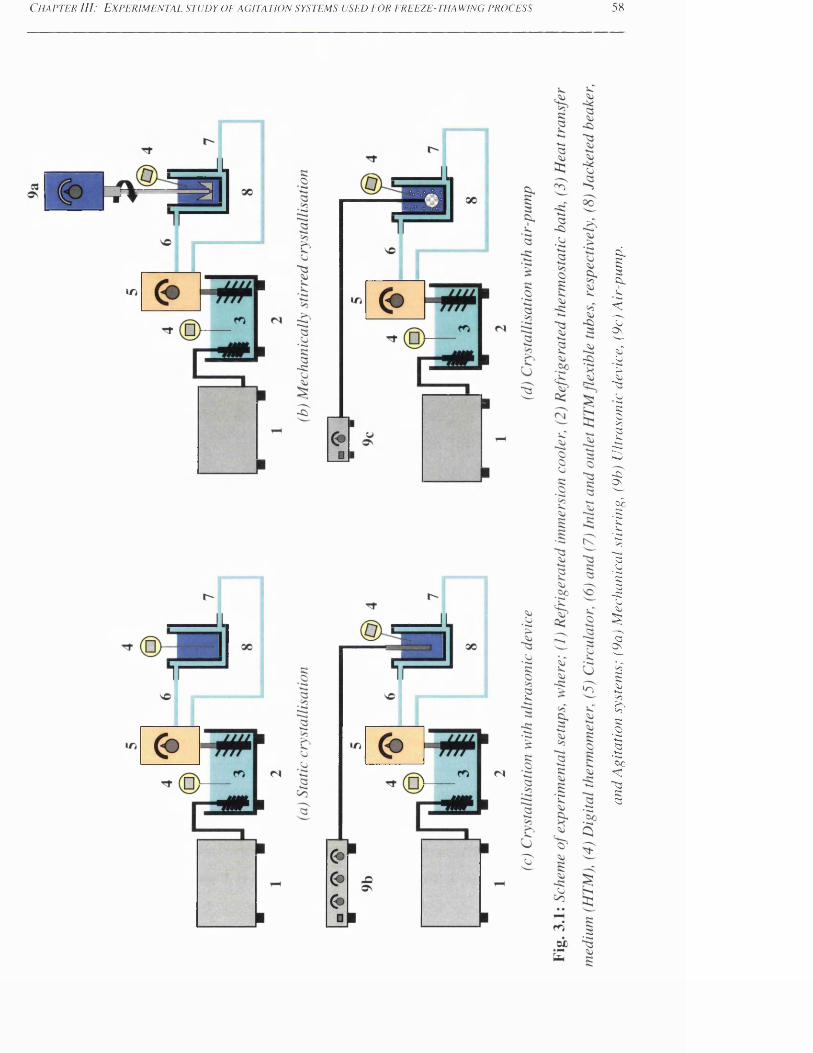
C h a p t e r I I I : E x p e r i m e n t a l s t u d y o f a g i t a t i o n s y s t e m s u s e d f o r f r e e z e - t h a w i n g p r o c e s s 58
and
Agita
tion
syste
ms;
(9a
) M
echa
nica
l st
irri
ng,
(9b)
U
ltras
onic
de
vice
, (9
c) A
ir-p
ump.

C h a p t e r III: E x p e r im e n t a l s t u d y o f a g it a t io n s y s t e m s u s e d f o r f r e e z e -t h a w in g p r o c e s s 5 9
pump assembly which includes an air-pump (Resun), flexible airline tubing, and one inch
ball type ceramic air-stone diffuser (Won Brothers, Model: AP-WB14514). The
experimental setup for the crystallisation process using an ultrasonic radiation system, on the
other hand, was provided with the ultrasonic radiation assembly that consisted of an
ultrasonic processor device (Ultrasonic Processor, Model: VC 130, Sonics, Vibra-cell), and
an ultrasonic probe (CV18, S&M 1101).
All experimental setups utilised two digital thermometers, where the first one (Checktemp,
Hanna Instruments) was used for monitoring the operating temperature of HTM, while the
second one (Digital Thermometer Instant, Model: 9847N, Taylor) was used to track the
temperature of feed/residue during the operational period of the experiment. This was
achieved by immersing the semiconductor measuring elements of the digital thermometers
into the mentioned solutions by means of supporting equipment.
All experimental setups were also monitored with a Kilowatt Hours Meter (kWh meter)
(Efergy smart wireless electricity meter) to measure the energy consumption of the
crystallisation operation.
3.5 Experimental ProcedureThe operating procedure for the experiments is presented in Fig (3.2). These experiments
were carried out in batch mode. Referring to the simplified block diagram in Fig (3.2), prior
conducting any experiment, the feed sample was prepared and then the physiochemical
analyses were performed on the feed sample. The jacketed beaker was filled with a constant
mass of feed material i.e. 200 g. For all experiments, the temperature of the HTM was
initially reduced via operation of the refrigerated immersion cooler. When the temperature of
HTM reached the desired crystallisation temperature, the circulator was manually turned on,
and then simultaneously the operational cycle of pre-cooling takes place to decrease the
temperature of the jacketed beaker which includes the feed sample. This is achieved by
pumping the HTM from the thermostatic bath to the jacketed beaker at flow rate of 0.8
L/min. The HTM temperature was controlled and set at a desired value through a
temperature control knob on the circulator.
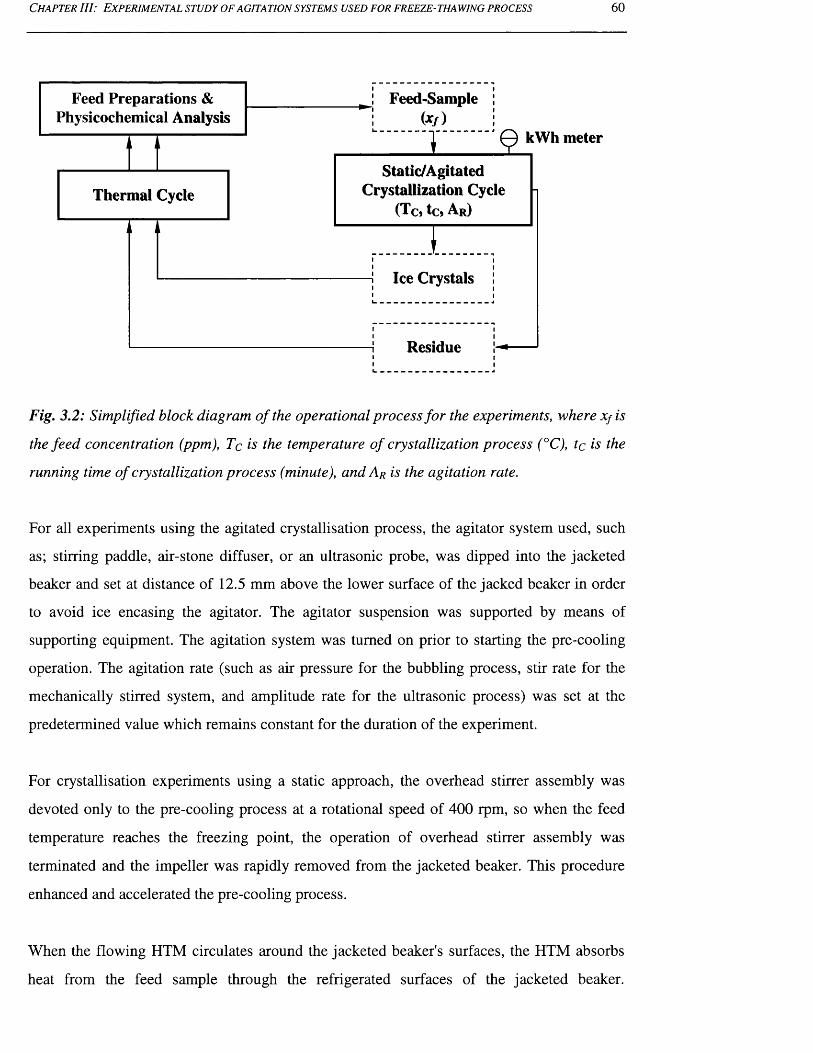
Ch a p t e r I II: E x p e r im e n t a l s t u d y o f a g it a t io n s y s t e m s u s e d f o r f r e e z e - t h a w in g p r o c e s s 60
Feed-Sample<*/)
' © kWh
Ice Crystals
Residue
Thermal Cycle
Feed Preparations & Physicochemical Analysis
Static/Agitated Crystallization Cycle
(Tc, tc, Ar)
Fig. 3.2: Simplified block diagram o f the operational process for the experiments, where Xf is
the feed concentration (ppm), Tc is the temperature o f crystallization process (°C), tc is the
running time of crystallization process (minute), and Ar is the agitation rate.
For all experiments using the agitated crystallisation process, the agitator system used, such
as; stirring paddle, air-stone diffuser, or an ultrasonic probe, was dipped into the jacketed
beaker and set at distance of 12.5 mm above the lower surface of the jacked beaker in order
to avoid ice encasing the agitator. The agitator suspension was supported by means of
supporting equipment. The agitation system was turned on prior to starting the pre-cooling
operation. The agitation rate (such as air pressure for the bubbling process, stir rate for the
mechanically stirred system, and amplitude rate for the ultrasonic process) was set at the
predetermined value which remains constant for the duration of the experiment.
For crystallisation experiments using a static approach, the overhead stirrer assembly was
devoted only to the pre-cooling process at a rotational speed of 400 rpm, so when the feed
temperature reaches the freezing point, the operation of overhead stirrer assembly was
terminated and the impeller was rapidly removed from the jacketed beaker. This procedure
enhanced and accelerated the pre-cooling process.
When the flowing HTM circulates around the jacketed beaker's surfaces, the HTM absorbs
heat from the feed sample through the refrigerated surfaces of the jacketed beaker.
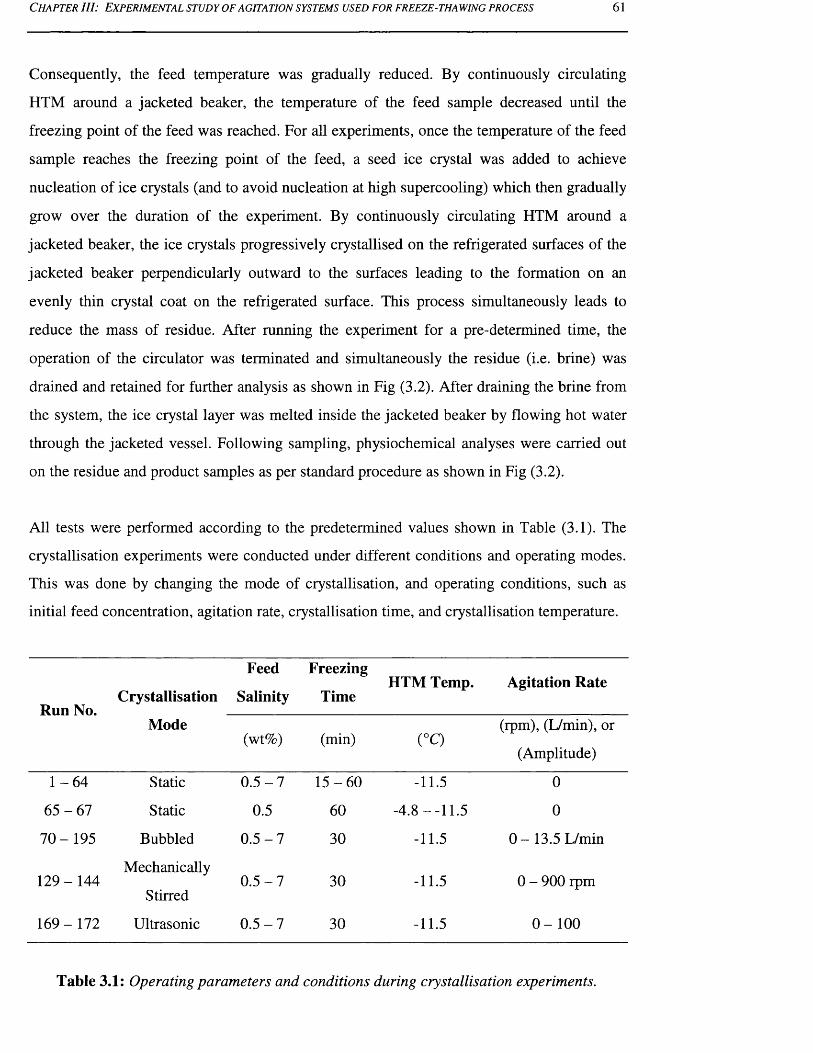
C h a p t e r I I I : E x p e r im e n t a l s t u d y o f a g it a t io n s y s t e m s u s e d f o r f r e e z e -t h a w in g p r o c e s s 61
Consequently, the feed temperature was gradually reduced. By continuously circulating
HTM around a jacketed beaker, the temperature of the feed sample decreased until the
freezing point of the feed was reached. For all experiments, once the temperature of the feed
sample reaches the freezing point of the feed, a seed ice crystal was added to achieve
nucleation of ice crystals (and to avoid nucleation at high supercooling) which then gradually
grow over the duration of the experiment. By continuously circulating HTM around a
jacketed beaker, the ice crystals progressively crystallised on the refrigerated surfaces of the
jacketed beaker perpendicularly outward to the surfaces leading to the formation on an
evenly thin crystal coat on the refrigerated surface. This process simultaneously leads to
reduce the mass of residue. After running the experiment for a pre-determined time, the
operation of the circulator was terminated and simultaneously the residue (i.e. brine) was
drained and retained for further analysis as shown in Fig (3.2). After draining the brine from
the system, the ice crystal layer was melted inside the jacketed beaker by flowing hot water
through the jacketed vessel. Following sampling, physiochemical analyses were carried out
on the residue and product samples as per standard procedure as shown in Fig (3.2).
All tests were performed according to the predetermined values shown in Table (3.1). The
crystallisation experiments were conducted under different conditions and operating modes.
This was done by changing the mode of crystallisation, and operating conditions, such as
initial feed concentration, agitation rate, crystallisation time, and crystallisation temperature.
Run No.Crystallisation
Feed
Salinity
Freezing
TimeHTM Temp. Agitation Rate
Mode(wt%) (min) (°Q
(rpm), (L/min), or
(Amplitude)
1 -6 4 Static 0 .5 -7 1 5 -6 0 -11.5 0
6 5 -6 7 Static 0.5 60 -4.8--11.5 0
7 0 -1 9 5 Bubbled 0 .5 -7 30 -11.5 0 - 13.5 L/min
129 - 144Mechanically
Stirred0 .5 -7 30 -11.5 0 - 900 rpm
169-172 Ultrasonic 0 .5 -7 30 -11.5 0 -1 0 0
Table 3.1: Operating parameters and conditions during crystallisation experiments.
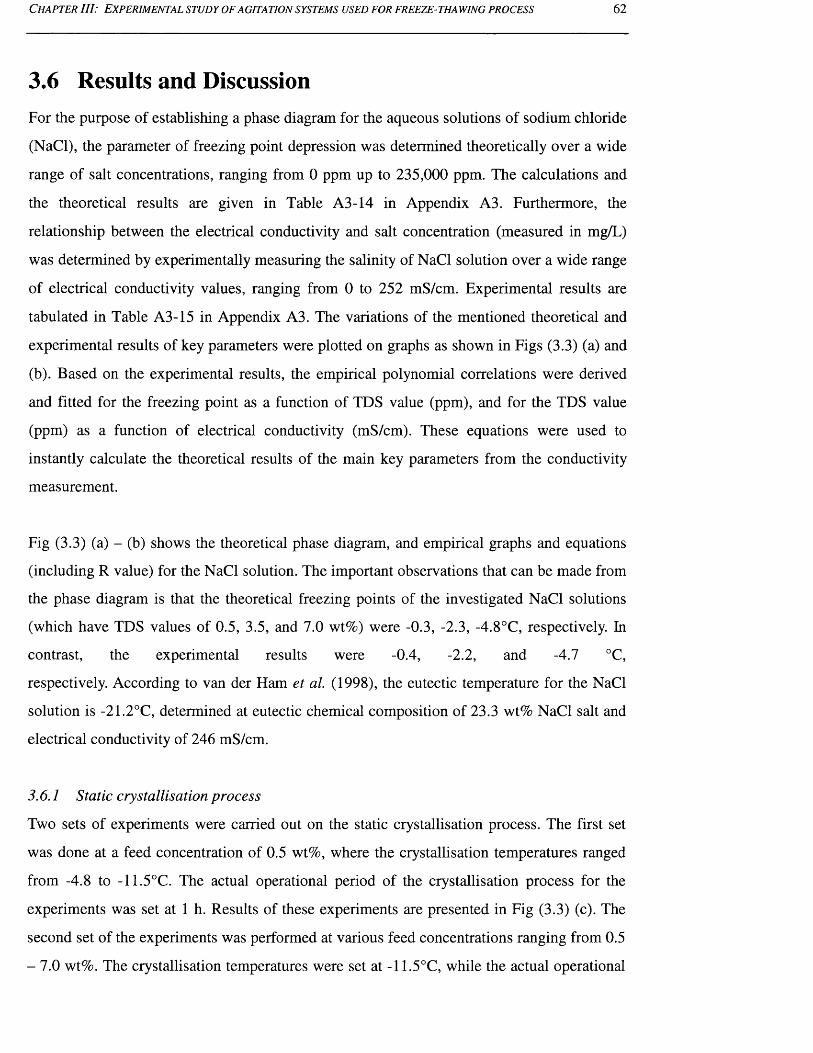
C h a p t e r II I : E x p e r im e n t a l s t u d y o f a g i t a t i o n s y s t e m s u s e d f o r f r e e z e -t h a w in g p r o c e s s 62
3.6 Results and DiscussionFor the purpose of establishing a phase diagram for the aqueous solutions of sodium chloride
(NaCl), the parameter of freezing point depression was determined theoretically over a wide
range of salt concentrations, ranging from 0 ppm up to 235,000 ppm. The calculations and
the theoretical results are given in Table A3-14 in Appendix A3. Furthermore, the
relationship between the electrical conductivity and salt concentration (measured in mg/L)
was determined by experimentally measuring the salinity of NaCl solution over a wide range
of electrical conductivity values, ranging from 0 to 252 mS/cm. Experimental results are
tabulated in Table A3-15 in Appendix A3. The variations of the mentioned theoretical and
experimental results of key parameters were plotted on graphs as shown in Figs (3.3) (a) and
(b). Based on the experimental results, the empirical polynomial correlations were derived
and fitted for the freezing point as a function of TDS value (ppm), and for the TDS value
(ppm) as a function of electrical conductivity (mS/cm). These equations were used to
instantly calculate the theoretical results of the main key parameters from the conductivity
measurement.
Fig (3.3) (a) - (b) shows the theoretical phase diagram, and empirical graphs and equations
(including R value) for the NaCl solution. The important observations that can be made from
the phase diagram is that the theoretical freezing points of the investigated NaCl solutions
(which have TDS values of 0.5, 3.5, and 7.0 wt%) were -0.3, -2.3, -4.8°C, respectively. In
contrast, the experimental results were -0.4, -2.2, and -4.7 °C,
respectively. According to van der Ham et al. (1998), the eutectic temperature for the NaCl
solution is -21.2°C, determined at eutectic chemical composition of 23.3 wt% NaCl salt and
electrical conductivity of 246 mS/cm.
3.6.1 Static crystallisation process
Two sets of experiments were carried out on the static crystallisation process. The first set
was done at a feed concentration of 0.5 wt%, where the crystallisation temperatures ranged
from -4.8 to -11.5°C. The actual operational period of the crystallisation process for the
experiments was set at 1 h. Results of these experiments are presented in Fig (3.3) (c). The
second set of the experiments was performed at various feed concentrations ranging from 0.5
- 7.0 wt%. The crystallisation temperatures were set at -11.5°C, while the actual operational
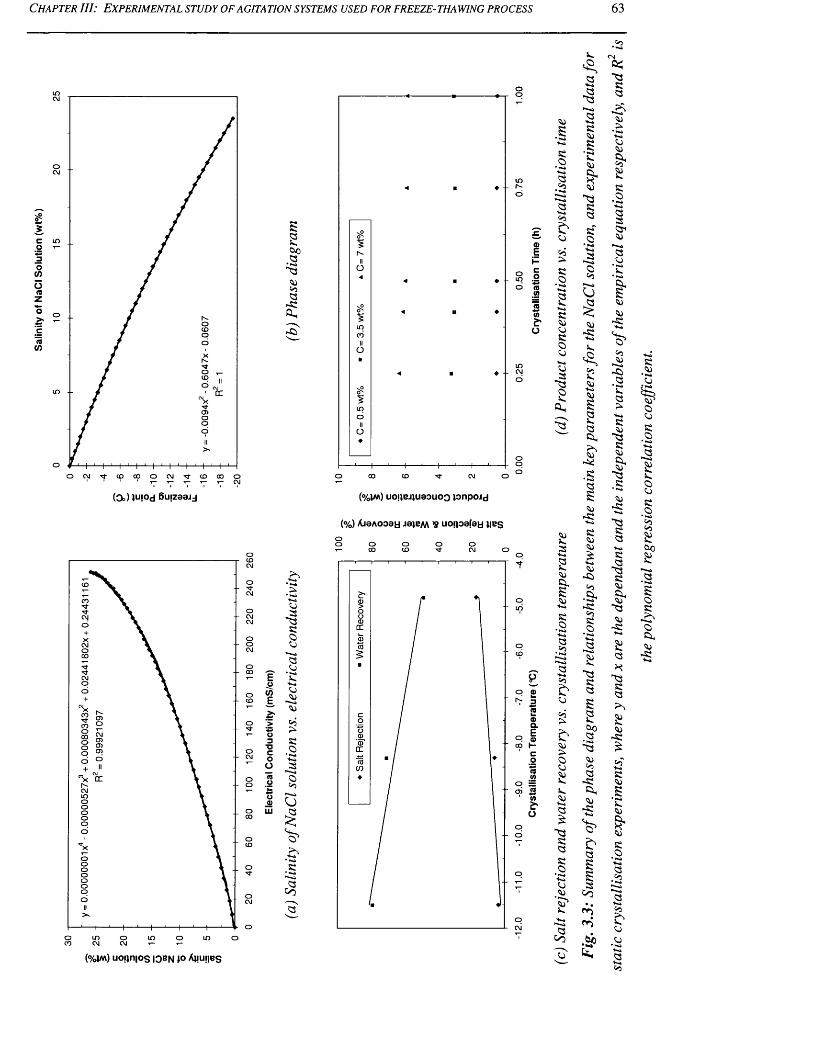
Salin
ity
of N
aCl
Solu
tion
(wt%
)
C h a p t e r III: E x p e r im e n t a l s t u d y o f a g it a t io n s y s t e m s u s e d f o r f r e e z e - t h a w in g p r o c e s s 63
(Ob)tujOd Bmzeajj (%IM) uojiejiuaouoo tonpojd
(%) AjaAOoau jbjbm ? uopoafaa MBS
(%IM) uojjnios iqbn jo Ajiunes static
cr
ysta
llisa
tion
expe
rimen
ts, w
here
y an
d x
are
the
depe
ndan
t an
d the
in
depe
nden
t va
riabl
es
of the
em
piric
al e
quat
ion
resp
ectiv
ely,
and
R
is
the p
olyn
omia
l re
gres
sion
corr
elatio
n co
effic
ient
.
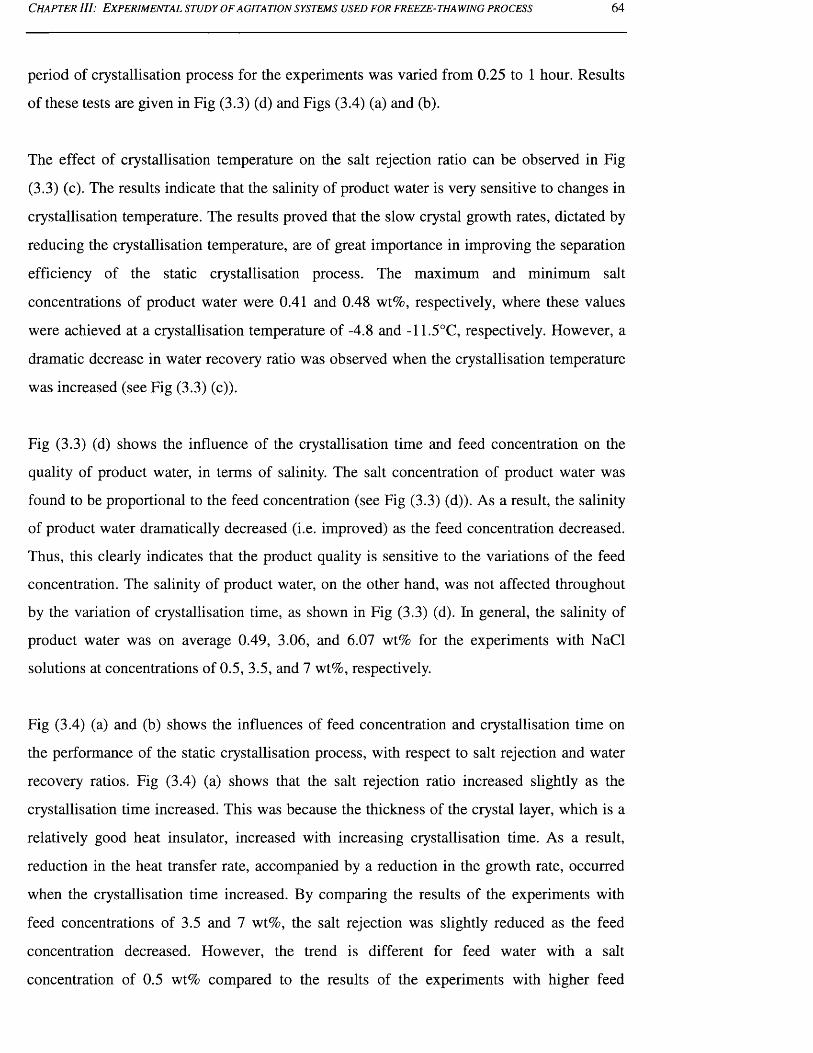
C h a p t e r I II: E x p e r im e n t a l s t u d y o f a g i t a t i o n s y s t e m s u s e d f o r f r e e z e - t h a w in g p r o c e s s 6 4
period of crystallisation process for the experiments was varied from 0.25 to 1 hour. Results
of these tests are given in Fig (3.3) (d) and Figs (3.4) (a) and (b).
The effect of crystallisation temperature on the salt rejection ratio can be observed in Fig
(3.3) (c). The results indicate that the salinity of product water is very sensitive to changes in
crystallisation temperature. The results proved that the slow crystal growth rates, dictated by
reducing the crystallisation temperature, are of great importance in improving the separation
efficiency of the static crystallisation process. The maximum and minimum salt
concentrations of product water were 0.41 and 0.48 wt%, respectively, where these values
were achieved at a crystallisation temperature of -4.8 and -11.5°C, respectively. However, a
dramatic decrease in water recovery ratio was observed when the crystallisation temperature
was increased (see Fig (3.3) (c)).
Fig (3.3) (d) shows the influence of the crystallisation time and feed concentration on the
quality of product water, in terms of salinity. The salt concentration of product water was
found to be proportional to the feed concentration (see Fig (3.3) (d)). As a result, the salinity
of product water dramatically decreased (i.e. improved) as the feed concentration decreased.
Thus, this clearly indicates that the product quality is sensitive to the variations of the feed
concentration. The salinity of product water, on the other hand, was not affected throughout
by the variation of crystallisation time, as shown in Fig (3.3) (d). In general, the salinity of
product water was on average 0.49, 3.06, and 6.07 wt% for the experiments with NaCl
solutions at concentrations of 0.5, 3.5, and 7 wt%, respectively.
Fig (3.4) (a) and (b) shows the influences of feed concentration and crystallisation time on
the performance of the static crystallisation process, with respect to salt rejection and water
recovery ratios. Fig (3.4) (a) shows that the salt rejection ratio increased slightly as the
crystallisation time increased. This was because the thickness of the crystal layer, which is a
relatively good heat insulator, increased with increasing crystallisation time. As a result,
reduction in the heat transfer rate, accompanied by a reduction in the growth rate, occurred
when the crystallisation time increased. By comparing the results of the experiments with
feed concentrations of 3.5 and 7 wt%, the salt rejection was slightly reduced as the feed
concentration decreased. However, the trend is different for feed water with a salt
concentration of 0.5 wt% compared to the results of the experiments with higher feed
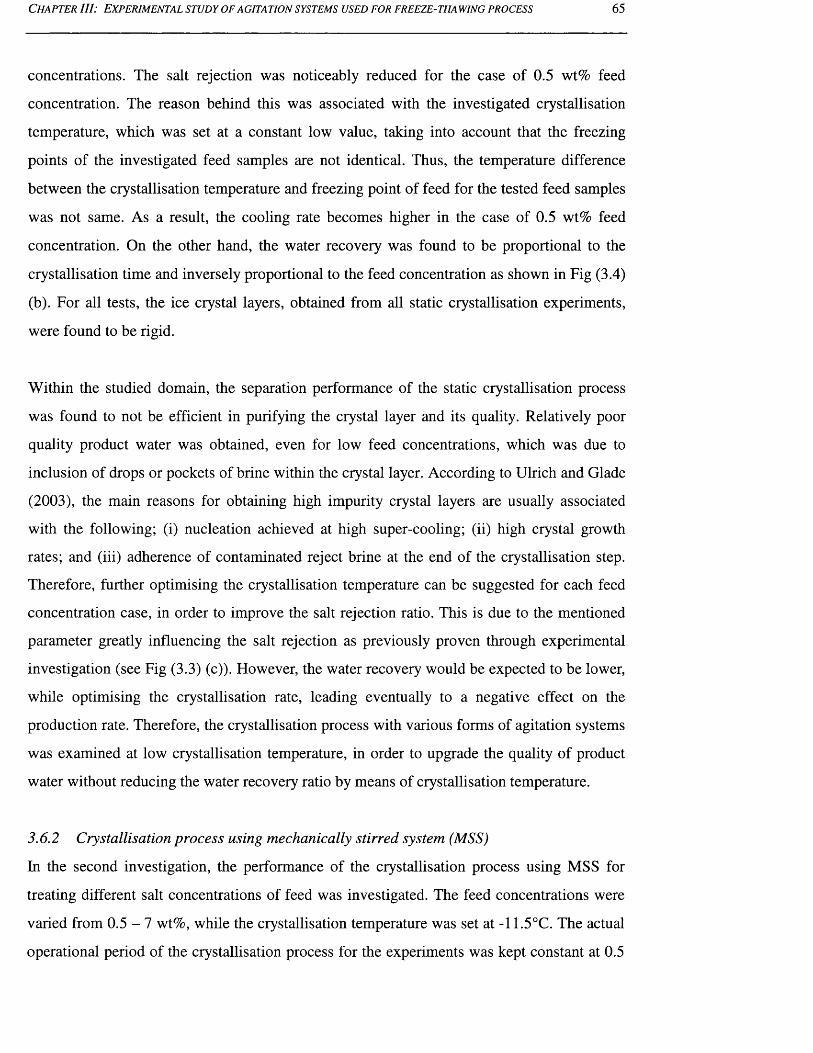
C h a p t e r I I I : E x p e r im e n t a l s t u d y o f a g it a t io n s y s t e m s u s e d f o r f r e e z e - t h a w in g p r o c e s s 65
concentrations. The salt rejection was noticeably reduced for the case of 0.5 wt% feed
concentration. The reason behind this was associated with the investigated crystallisation
temperature, which was set at a constant low value, taking into account that the freezing
points of the investigated feed samples are not identical. Thus, the temperature difference
between the crystallisation temperature and freezing point of feed for the tested feed samples
was not same. As a result, the cooling rate becomes higher in the case of 0.5 wt% feed
concentration. On the other hand, the water recovery was found to be proportional to the
crystallisation time and inversely proportional to the feed concentration as shown in Fig (3.4)
(b). For all tests, the ice crystal layers, obtained from all static crystallisation experiments,
were found to be rigid.
Within the studied domain, the separation performance of the static crystallisation process
was found to not be efficient in purifying the crystal layer and its quality. Relatively poor
quality product water was obtained, even for low feed concentrations, which was due to
inclusion of drops or pockets of brine within the crystal layer. According to Ulrich and Glade
(2003), the main reasons for obtaining high impurity crystal layers are usually associated
with the following; (i) nucleation achieved at high super-cooling; (ii) high crystal growth
rates; and (iii) adherence of contaminated reject brine at the end of the crystallisation step.
Therefore, further optimising the crystallisation temperature can be suggested for each feed
concentration case, in order to improve the salt rejection ratio. This is due to the mentioned
parameter greatly influencing the salt rejection as previously proven through experimental
investigation (see Fig (3.3) (c)). However, the water recovery would be expected to be lower,
while optimising the crystallisation rate, leading eventually to a negative effect on the
production rate. Therefore, the crystallisation process with various forms of agitation systems
was examined at low crystallisation temperature, in order to upgrade the quality of product
water without reducing the water recovery ratio by means of crystallisation temperature.
3.6.2 Crystallisation process using mechanically stirred system (MSS)
In the second investigation, the performance of the crystallisation process using MSS for
treating different salt concentrations of feed was investigated. The feed concentrations were
varied from 0.5 - 7 wt%, while the crystallisation temperature was set at -11.5°C. The actual
operational period of the crystallisation process for the experiments was kept constant at 0.5

100 -
I—
1 100
C h a p t e r III: E x p e r im e n t a l s t u d y o f a g i t a t i o n s y s t e m s u s e d f o r f r e e z e - t h a w in g p r o c e s s 66
OO o o o o
S'o
(%) AJ8A008U J81BM
o
S'o
a03£Cj03
o
2
£a£0303
oo
R•2■G<30 3
4-40 3
£
•2
co
<344CO£o05>R•24-4
a05
0505SUCj2
R•24-4a0 3
20 5
•2•G2CO
OCO
oCO
o'Cj- oCM
OOO
« ? a
o co
(%) Ajlqaoqbu -oibm
oo
oCO
oCO
o4J- oC\J
o
o CO
oCj2R2a£
Co?o
00• 5
0 330 303Cj2
R•24-4305
205o
a03Co
ICo
■S0330505CJOfc-Ci-R•24-4305
20 5
<o
(%) uojioefsy lies (%) uojpafay lies
~R<4)
cua0 5R
• 2■J32so
§ -R•2a0 5
a4-40 3
£Cj
•s.0 5R•2;t-4
RO0Co
•5R4
1 §
^4
R•24—4a05
05bo
COCO
^3R3
20 5
■ s.a3"3
i-
^4
M;co
.fcub
S-.3O
-R’" i34-4
*oCMO
£05
CoR2so
<34-405bSo~3Ra
CJo‘or-4
00t-‘
sa0 5so!>-.34-,
1 I•Ss
■ 3R
£OK
1*0
" o 5R•2■*32 4-4RsosjR3Co
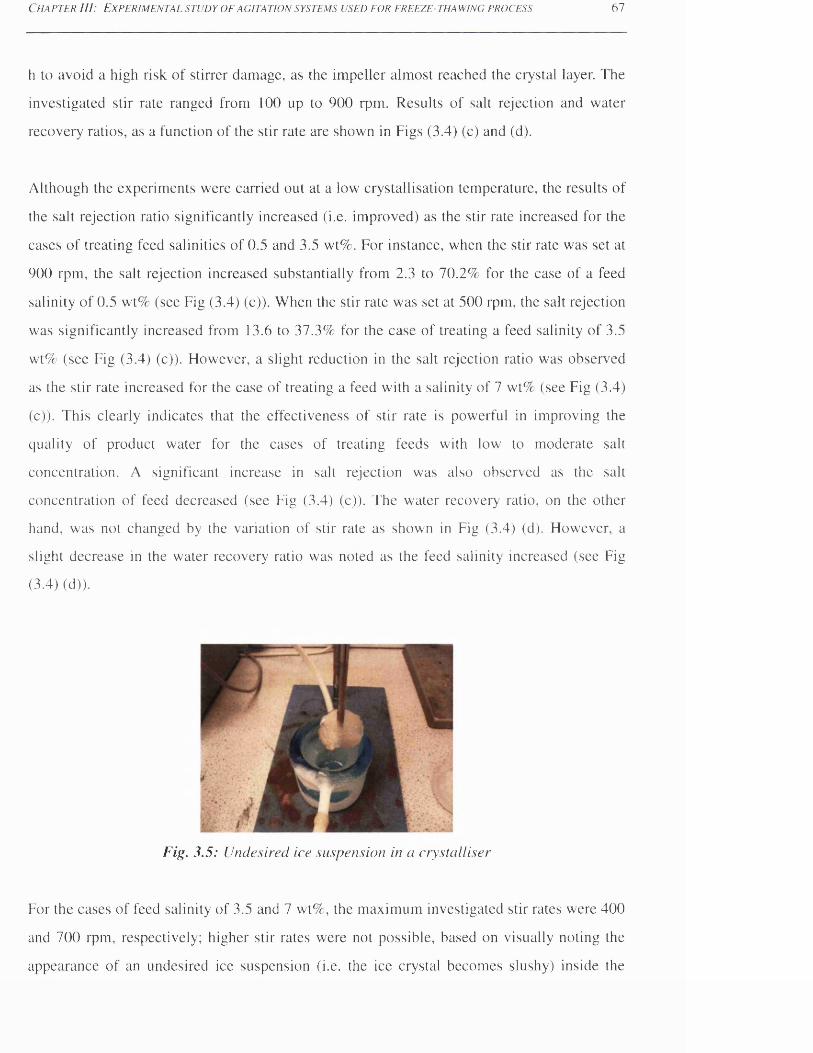
C h a p t e r H I: E x p e r i m e n t a l s t u d y o f a g i t a t i o n s y s t e m s u s e d f o r f r e e z e - t h a w i n g p r o c e s s 67
h to avoid a high risk of stirrer damage, as the impeller almost reached the crystal layer. The
investigated stir rate ranged from 100 up to 900 rpm. Results of salt rejection and water
recovery ratios, as a function of the stir rate are shown in Figs (3.4) (c) and (d).
Although the experiments were carried out at a low crystallisation temperature, the results of
the salt rejection ratio significantly increased (i.e. improved) as the stir rate increased for the
cases of treating feed salinities of 0.5 and 3.5 wt%. For instance, when the stir rate was set at
900 rpm, the salt rejection increased substantially from 2.3 to 70.2% for the case of a feed
salinity of 0.5 wt% (see Fig (3.4) (c)). When the stir rate was set at 500 rpm, the salt rejection
was significantly increased from 13.6 to 37.3% for the case of treating a feed salinity of 3.5
wt% (see Fig (3.4) (c)). However, a slight reduction in the salt rejection ratio was observed
as the stir rate increased for the case of treating a feed with a salinity of 7 wt% (see Fig (3.4)
(c)). This clearly indicates that the effectiveness of stir rate is powerful in improving the
quality of product water for the cases of treating feeds with low to moderate salt
concentration. A significant increase in salt rejection was also observed as the salt
concentration of feed decreased (see Fig (3.4) (c)). The water recovery ratio, on the other
hand, was not changed by the variation of stir rate as shown in Fig (3.4) (d). However, a
slight decrease in the water recovery ratio was noted as the feed salinity increased (see Fig
(3.4) (d)).
Fig. 3.5 : Undesired ice suspension in a crystalliser
For the cases of feed salinity of 3.5 and 7 wt%, the maximum investigated stir rates were 400
and 700 rpm, respectively; higher stir rates were not possible, based on visually noting the
appearance of an undesired ice suspension (i.e. the ice crystal becomes slushy) inside the
C h a p t e r III: E x p e r im e n t a l s t u d y o f a g it a t io n s y s t e m s u s e d f o r f r e e z e - t h a w in g p r o c e s s 68
crystalliser as shown in Fig (3.5). The ice suspensions formed in the crystalliser were not
considered in this study.
3.6.3 Crystallisation process using ultrasonic process
The third investigation was performed on the crystallisation process using an ultrasonic
process. The investigated feed concentrations, crystallisation temperature, and crystallisation
time are the same as given previously for the second investigation (see section 3.6.2). The
investigated amplitudes ranged from 20 up to 100.
Fig (3.6) (a) and (b) shows the salt rejection and water recovery ratios as a function of the
amplitude, measured at different feed concentrations. The results indicate that the ultrasonic
process positively enhanced the separation performance of the crystallisation process. In the
cases of treating feed salinities of 0.5 and 3.5 wt%, a significant increase in the salt rejection
ratio was observed as the amplitude value increased (see Fig (3.6) (a)). Fig (3.6) (a) shows
that the maximum salt rejection ratios were 84 and 34 % for feed salinities of 0.5 and 3.5
wt%, respectively. This means that the product water was at 0.08 and 2.32 wt%, respectively.
The salt rejection also improved for the case of a feed salinity of 7 wt%. For instance, the salt
rejection increased from 14 to 28% (see Fig (3.5) (a)). This clearly indicates that the
ultrasonic process is effective in lowering the salt concentration of product water for treating
low to high feed concentrations.
Throughout the tests, the crystal layer was not formed on the bottom heat transfer surface of
the crystalliser, in comparison to the previous experiments with other experimental setups.
The reason behind this was that the probe of the ultrasonic system was positioned above the
crystalliser. As a result, the ultrasonic waves prevented the formation of the ice crystal on the
bottom heat transfer surface of the crystalliser. Therefore, the water recovery ratio was
dramatically decreased as the amplitude increased (see Figs (3.6) (b)). This clearly indicates
that the water recovery ratio was inversely proportional to the amplitude. A noticeable
decrease in water recovery ratio was also observed as the salt concentration increased (see
Fig (3.6) (b)). For the case of a feed salinity of 7 wt%, no product water was obtained from
the experiment when the amplitude reached 60 and above (see Figs (3.6) (b)). A similar
situation occurred for the case of 3.5 wt% feed salinity, when the amplitude reached 100 (see
Fig (3.6) (b)). This was because higher agitation rate results in slushy ice rather than having a
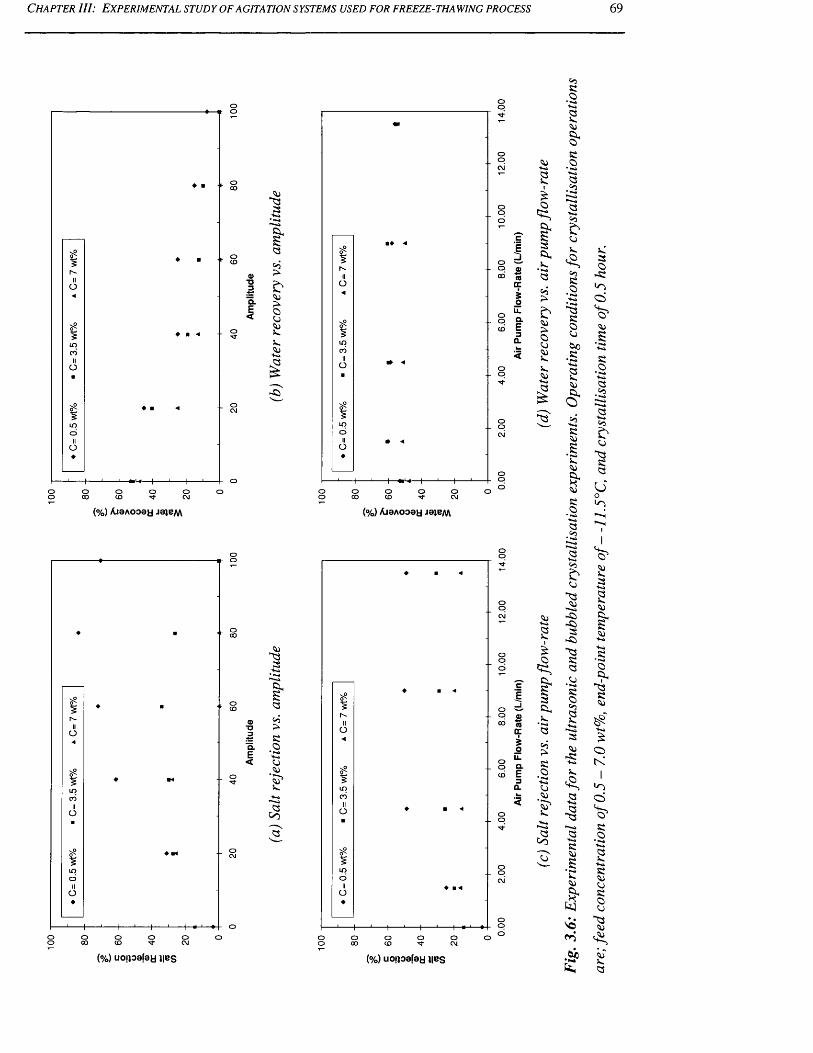
100 -I
1 100
C h a p t e r I I I : E x p e r im e n t a l s t u d y o f a g it a t io n s y s t e m s u s e d f o r f r e e z e -t h a w in g p r o c e s s 69
O00 oCD
OOJ O
Ia
1 £3>333333+«»
I^3
oo o o o o o
5ou.Q.E3Q.
3
5t£
I3Cin.3*3oj>£3>333333+«»
I
(%) AjaAooay jaje m (%) AjaAooay jbjbm
033■253§■3•2G303
203£33
•a,0 33•2s33Co•SGI
33
33•2G303
333
*3
O
*3*
203
3"3<3
L)o*ol"*'Hr''H
o
o
3"33
I303>3•2o33 s3+-i3
CO
oo o o o o o
3ou_a.E30.
22
Ǥ*
I3CX,
. 3303?»3•2G33
' ?
3CO
(%) uouoafay lies (%) uouoafay lies
203
b3"33
- 33
- 3"333.3*322
3-g3
- a .
■§’-—a233
33ex,
VOCo.§>St<
' o 4
23
23cx*23
.33*
"333
£oK
1• oo
'"o53•21-*2 +■«>333333
"33
23
C h a p t e r III: E x p e r im e n t a l s t u d y o f a g i t a t i o n s y s t e m s u s e d f o r f r e e z e - t h a w in g p r o c e s s 70
rigid crystal layer, where these crystals cannot stick to the heat transfer surface as the waves
produced by the ultrasonic system break these up.
3.6.4 Crystallisation using bubbling process
In the fourth series of experiments, the potential capability of the crystallisation step agitated
by a bubbling process was investigated. The investigated feed concentrations, crystallisation
temperature, and crystallisation time are as given previously for the second investigation (see
section 3.6.2). The investigated air pump flow-rates ranged from 1.5 up to 13.5 L/min.
Fig (3.6) (c) shows the variation of salt rejection as a function of the air pump flow-rate. The
air pump flow-rate also has a strong influence on the quality of product water, where this
parameter was found to be effective in removing significant amounts of dissolved salt from
the investigated feed concentrations, more specifically feed samples with salt concentrations
of 0.5 and 3.5 wt%. Fig (3.6) (c) shows that the salt rejection ratio was significantly
increased as the air pump flow-rate increased for the case of feed sample with concentration
of 0.5 wt%. However, the salt rejection was reduced with increasing salt concentration of
feed samples, which was noticeable for the experiments with feed concentrations of 7 wt%
(see Fig (3.6) (c)). In fact, the salt rejection ratio, for such feed concentrations, was not
affected by the variation in the air pump flow-rate. In general, the trend of salt rejection
results was found to be in agreement with the previous experimental results for the
crystallisation processes using mechanically stirred and ultrasonic systems.
As shown in Fig (3.6) (d), the water recovery ratio, on the other hand, increased slightly
when the air pump flow-rate reached 1.5 L/min and then the water recovery ratios were
stabilised until the air pump flow-rate reached the maximum value. A dramatic decrease in
the water recovery ratio was also observed as the feed salinity increased (see Fig (3.6) (d)).
3.7 ConclusionsThis chapter presented a series of laboratory investigations, performed on a static crystallizer
with different types of agitation systems, for desalting NaCl solutions at concentrations
ranging from 0.5 up to 7 wt%. The investigated agitation systems were a bubbling process, a
mechanically stirred system, and an ultrasonic process. Several influences, including:
C h a p t e r III: E x p e r im e n t a l s t u d y o f a g i t a t i o n s y s t e m s u s e d f o r f r e e z e - t h a w in g p r o c e s s 71
crystallisation temperature, time, and agitation rate, on the degree of desalination, in terms of
salt rejection and water recovery ratios, were investigated and assessed.
The results were gathered, analysed, and compared to the results of the performance of the
static crystallizer when no agitation was applied. The results of the laboratory experiments
showed that, in the case of feed salinities ranging from 0.5 up to 3.5 wt%, the product quality
achieved by the crystallizer was significantly improved through agitation, while the lowest
salt rejection was achieved when the static crystallisation process was applied. The most
effective processes, in terms of salt rejection and recovery, were the bubbling process and
mechanically stirred system. Although the ultrasonic process gave the highest salt rejection
ratio for the cases of low to high feed concentration, the water recovery ratio was relatively
poor when compared to the static crystallisation process, with and without agitation (i.e.
bubbling process and mechanically stirred system). Apart from the ultrasonic system, the
performance of the agitated and static crystallisation processes declined for high saline
applications (i.e. 7 wt%). In general, the results show that the application of agitation systems
within the solid layer crystallisation process is encouraging. For commercial applications, the
bubbling process might be the most feasible technique, since this method can be easily
designed and built for large-scale applications.
CHAPTER IV : ASSESSMENT OF ICE MAKER USED FOR SALINE WATER APPLICATIONS U
C h a p t e r IV:
ASSESSMENT OF ICE MAKER USED FOR
SALINE WATER APPLICATIONS
4.1 IntroductionThe brine treatment process compared to any form of saline water desalination process is by
far the most expensive and complicated. This is because brine contains high levels of a wide
range of dissolved salts, which result in severe technical problems to the treatment system
equipment, and a vast increase in capital and operational treatment costs. For instance, when
the TDS value of brine reaches a critical limit, exceeding 70,000 ppm, the majority of
desalination technologies, including all conventional membrane and thermal desalination
processes, are no longer economical and/or technically feasible to be used as a treatment
system [Ahmad and Williams, 2011]. For such applications, however, a unique situation has
arisen which paves the way for separation through a freezing process. The proposed
technology offers significant advantages over other desalination processes in respect to the
technical, economic, and environmental aspects.
Ice maker machines are used extensively in many commercial and residential areas for the
purpose of making ice cubes. There are a variety of ice maker machines with different
production rates of ice cubes (up to 200 tons per day) available nowadays in the market. In
principle, these ice making machines are potentially capable of producing ice cubes from
aqueous solutions, as long as the operating temperature of the refrigeration system is
considerably lower than the freezing point of the feed streams. When the produced ice cubes
are melted to yield product in liquid form, the quality of the product water is expected to be
higher than that of the feed water. A certain amount of dissolved salts will be rejected to the
remaining residual liquid during the growing crystal layer. However, the degree of separation
by freezing, in terms of the salt rejection and water recovery ratios, is dictated by several
factors and influences, such as operating conditions and feed quality. With the purpose of
verifying and assessing the major factors influencing the performance of the ice maker
machine, one commercial ice maker machine was tested for desalting a range of liquid
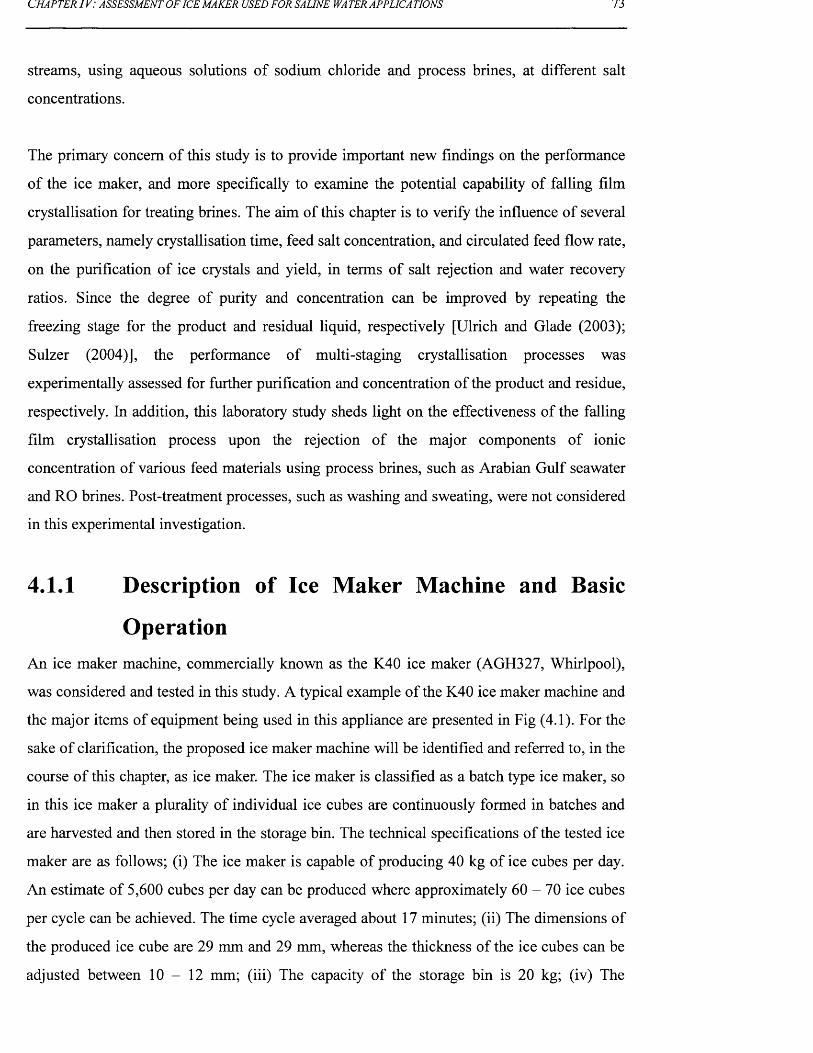
CHAPTER IV : ASSESSMENT OF ICE MAKER USED FOR SALINE WA TER APPLICA TIONS 73
streams, using aqueous solutions of sodium chloride and process brines, at different salt
concentrations.
The primary concern of this study is to provide important new findings on the performance
of the ice maker, and more specifically to examine the potential capability of falling film
crystallisation for treating brines. The aim of this chapter is to verify the influence of several
parameters, namely crystallisation time, feed salt concentration, and circulated feed flow rate,
on the purification of ice crystals and yield, in terms of salt rejection and water recovery
ratios. Since the degree of purity and concentration can be improved by repeating the
freezing stage for the product and residual liquid, respectively [Ulrich and Glade (2003);
Sulzer (2004)], the performance of multi-staging crystallisation processes was
experimentally assessed for further purification and concentration of the product and residue,
respectively. In addition, this laboratory study sheds light on the effectiveness of the falling
film crystallisation process upon the rejection of the major components of ionic
concentration of various feed materials using process brines, such as Arabian Gulf seawater
and RO brines. Post-treatment processes, such as washing and sweating, were not considered
in this experimental investigation.
4.1.1 Description of Ice Maker Machine and Basic
OperationAn ice maker machine, commercially known as the K40 ice maker (AGH327, Whirlpool),
was considered and tested in this study. A typical example of the K40 ice maker machine and
the major items of equipment being used in this appliance are presented in Fig (4.1). For the
sake of clarification, the proposed ice maker machine will be identified and referred to, in the
course of this chapter, as ice maker. The ice maker is classified as a batch type ice maker, so
in this ice maker a plurality of individual ice cubes are continuously formed in batches and
are harvested and then stored in the storage bin. The technical specifications of the tested ice
maker are as follows; (i) The ice maker is capable of producing 40 kg of ice cubes per day.
An estimate of 5,600 cubes per day can be produced where approximately 6 0 -7 0 ice cubes
per cycle can be achieved. The time cycle averaged about 17 minutes; (ii) The dimensions of
the produced ice cube are 29 mm and 29 mm, whereas the thickness of the ice cubes can be
adjusted between 1 0 - 1 2 mm; (iii) The capacity of the storage bin is 20 kg; (iv) The
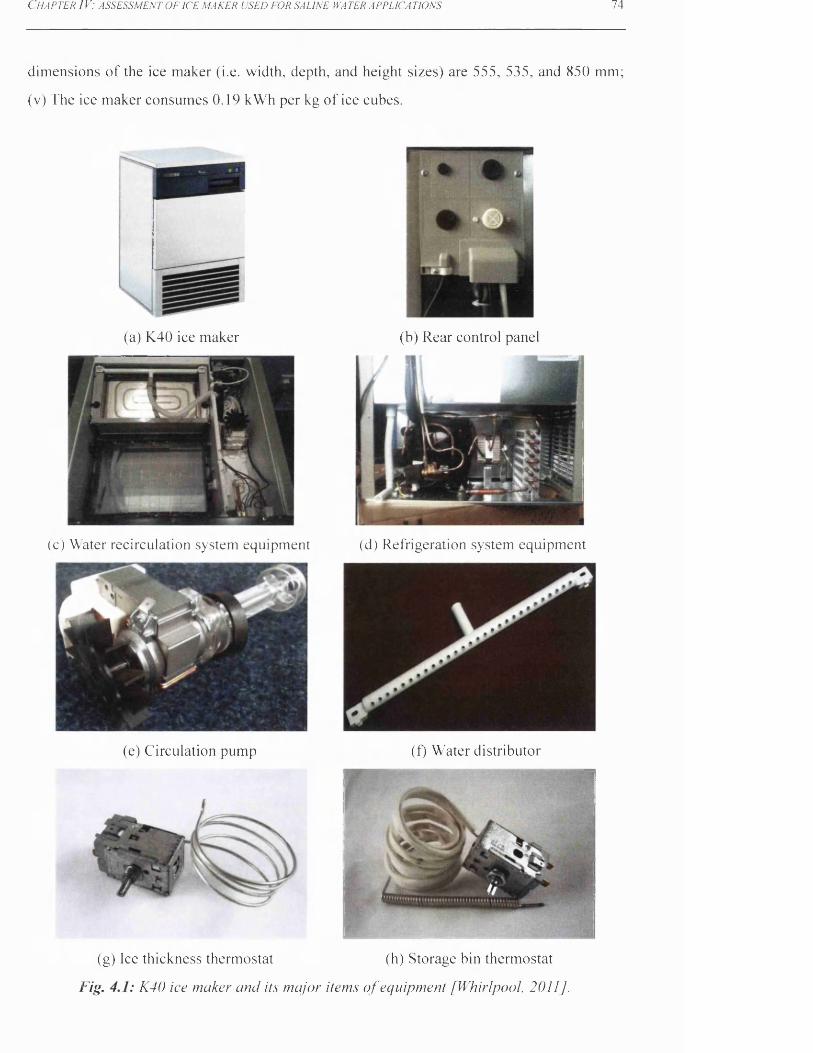
C h a p t e r IV : a s s e s s m e n t o f ic e m a k e r u s e d f o r s a l i n e w a t e r a p p l i c a t i o n s 74
dimensions o f the ice maker (i.e. width, depth, and height sizes) are 555, 535, and 850 mm;
(v) The ice maker consumes 0.19 kWh per kg o f ice cubes.
(b) Rear control panel(a) K40 ice maker
(c) Water recirculation system equipment (d) Refrigeration system equipment
(g) Ice thickness thermostat (h) Storage bin thermostat
Fig. : K40 ice maker and its major items o f equipment [Whirlpool, 2011].
(e) Circulation pump (f) Water distributor
C h a p t e r IV : a s s e s s m e n t o f ic e m a k e r u s e d f o r s a l in e wa t e r a p p l ic a t io n s 75
The main operating systems of the ice maker are; (a) electrical and control, (b) filling (c)
water recirculation, and (d) refrigeration and heating [Whirlpool, 2009].
(a) Electrical and control system
This system supplies electrical power for the operating systems. Moreover, this system leads
and controls the operational cycles of the ice maker by means of an electronic control board.
The ice maker is provided with two control panels, namely, front and rear control panels. The
front control panel (see Fig (4.1) (a)) contains two switches enable the user to control the
operation and cleaning of the ice maker. The rear control panel (see Fig (4.1) (b)) contains
two dials that enable the user to adjust the ice thickness and storage bin thermostats. The rear
control panel also includes the tubular inlet of the water supply, which is one of the main
parts of the filling system.
(b) Filling system
The filling system contains a tubular inlet for the water supply, pipelines, a restricted water
inlet valve, and float sensor. The main role of this system is to monitor and control the water
level of the collecting tank in order to keep the water level within the allowable limit for the
crystallisation process. A low water level within the collecting tank is detected by means of
float sensor (known as the float switch or liquid level sensor). The float sensor protects the
circulation pump from damage through running dry [Ayres et al., 1954; Whirlpool, 2010],
When the float sensor detects a low level of liquid within the collecting tank or if the tank is
empty, then the crystallisation process operation will automatically be terminated. The
crystallisation process operation is automatically resumed when the water reaches a
predetermined level. This is achieved through the float sensor, which actuates the restricted
water inlet valve to be set to a fully open position for filling the collecting tank with feed
water. The restricted water inlet valve is an automatic solenoid valve controlled by means of
a water level sensor. The ice maker, or more specifically the restricted water inlet valve must
be connected to a water supply with a pressure of 2 bar.
(c) Water recirculation system
The water recirculation system is responsible for circulating water and distributing the
flowing water evenly as a falling film over the upper surface of the inclined plate during the
crystallisation process.
L HAPTER I V: ASSESSM ENT OF ICE MAKER USED FOR SALINE WA TER APPLICA TIONS 76
Discharge Manifold
Inclined Plate
Hot Wires NetworkFlexible Hose
Insulated Body.Recirculation Pump
Collecting Tank Drain Overflow Tube
Drain Discharge
Fig. 4.2: Simplified schematic diagram o f the water recirculation system o f the laboratory
apparatus (adapted from Whirlpool (2009)).
As shown schematically in Fig (4.2), the water recirculation system contains a collecting
tank, a circulation pump, a flexible hose, a water distributor (i.e. discharge manifold), an
inclined plate, and a drain overflow tube. The inclined plate is installed and set downward at
angle o f 195 degrees above the collecting tank. The dimensions of the inclined plate are 190
mm and 295 mm. The collecting tank with a capacity o f 3.5 L is joined with a return
manifold, which is positioned above the tank. The return manifold is also joined with the
lower end o f the inclined plate in order to guide the flowing water coming from the inclined
plate to the collecting tank. A hinged deflector, which extends into the path o f water flow ing
in front o f the lower extremity o f inclined plate, is also used for directing the water flow into
a return manifold leading to the collecting tank. A tank rubber bung, which is fixed beneath
the collecting tank, is used for draining the remained residual liquid or undesired water from
the reservoir. As for the water distributor, this component extends transversely across the
upper surface o f the inclined plate. The water distributor is provided with 28 longitudinally
spaced apertures through which water may flow [Ayres et al., 1954]. The diameter o f each
aperture is 3.5 mm, while the longitudinal distance between the aperture centres is 10 mm.
The length and diameter o f the discharge manifold are 287 mm and 16 mm, respectively. The
water distributor is provided with a tubular inlet which is located at the centre o f the water
distributor and this tubular inlet is connected to the circulation pump by means o f a flexible
hose [Barnard et al., 1971], The water distributor, return manifolds, and collecting tank are
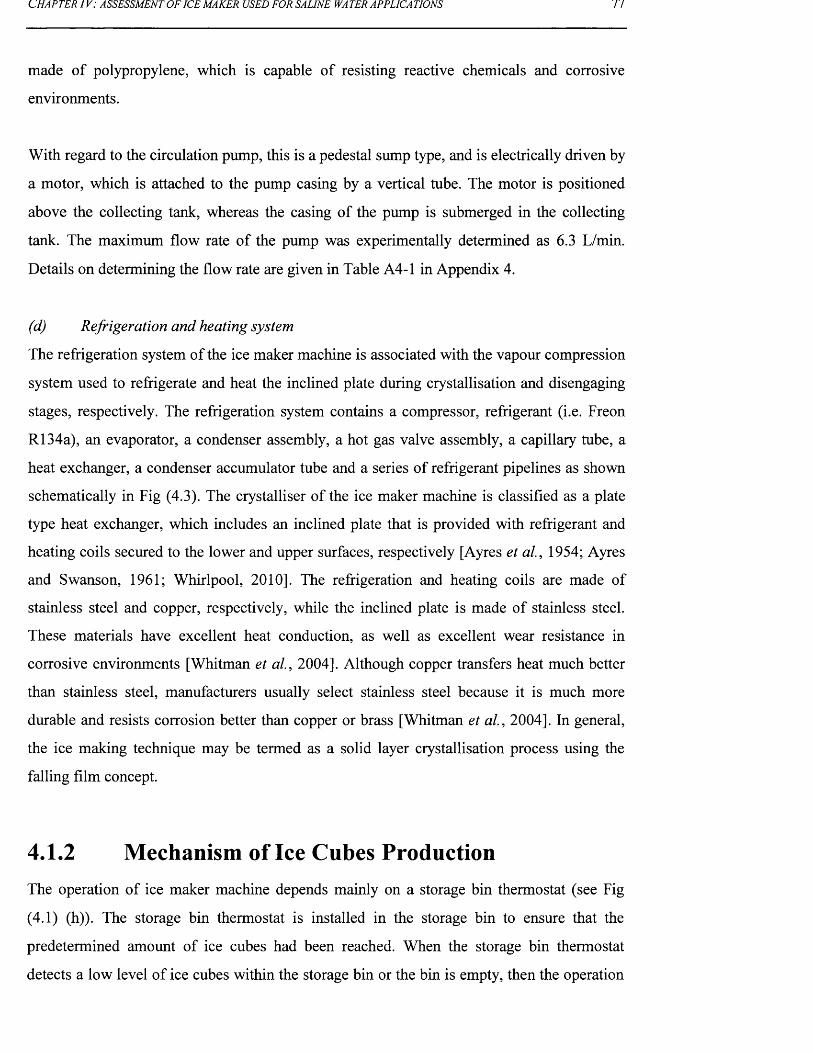
CHAPTER 1 V: ASSESSMENT OF ICE MAKER USED FOR SALINE WA TER APPLICA TIONS 77
made of polypropylene, which is capable of resisting reactive chemicals and corrosive
environments.
With regard to the circulation pump, this is a pedestal sump type, and is electrically driven by
a motor, which is attached to the pump casing by a vertical tube. The motor is positioned
above the collecting tank, whereas the casing of the pump is submerged in the collecting
tank. The maximum flow rate of the pump was experimentally determined as 6.3 L/min.
Details on determining the flow rate are given in Table A4-1 in Appendix 4.
(d) Refrigeration and heating system
The refrigeration system of the ice maker machine is associated with the vapour compression
system used to refrigerate and heat the inclined plate during crystallisation and disengaging
stages, respectively. The refrigeration system contains a compressor, refrigerant (i.e. Freon
R134a), an evaporator, a condenser assembly, a hot gas valve assembly, a capillary tube, a
heat exchanger, a condenser accumulator tube and a series of refrigerant pipelines as shown
schematically in Fig (4.3). The crystalliser of the ice maker machine is classified as a plate
type heat exchanger, which includes an inclined plate that is provided with refrigerant and
heating coils secured to the lower and upper surfaces, respectively [Ayres et al., 1954; Ayres
and Swanson, 1961; Whirlpool, 2010]. The refrigeration and heating coils are made of
stainless steel and copper, respectively, while the inclined plate is made of stainless steel.
These materials have excellent heat conduction, as well as excellent wear resistance in
corrosive environments [Whitman et a l , 2004]. Although copper transfers heat much better
than stainless steel, manufacturers usually select stainless steel because it is much more
durable and resists corrosion better than copper or brass [Whitman et al., 2004]. In general,
the ice making technique may be termed as a solid layer crystallisation process using the
falling film concept.
4.1.2 Mechanism of Ice Cubes ProductionThe operation of ice maker machine depends mainly on a storage bin thermostat (see Fig
(4.1) (h)). The storage bin thermostat is installed in the storage bin to ensure that the
predetermined amount of ice cubes had been reached. When the storage bin thermostat
detects a low level of ice cubes within the storage bin or the bin is empty, then the operation
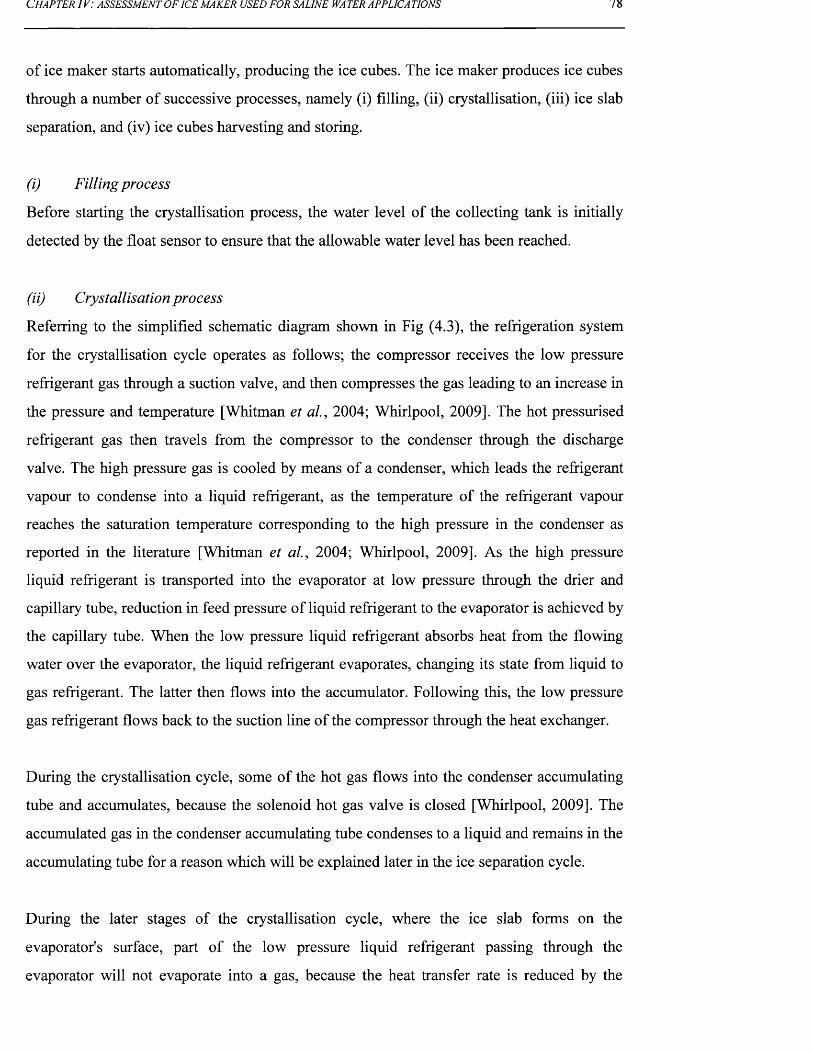
C h a p t e r l v : a s s e s s m e n t o f ic e m a k e r u s e d f o r s a l in e wa t e r a p p l ic a t io n s 78
of ice maker starts automatically, producing the ice cubes. The ice maker produces ice cubes
through a number of successive processes, namely (i) filling, (ii) crystallisation, (iii) ice slab
separation, and (iv) ice cubes harvesting and storing.
(i) Filling process
Before starting the crystallisation process, the water level of the collecting tank is initially
detected by the float sensor to ensure that the allowable water level has been reached.
(ii) Crystallisation process
Referring to the simplified schematic diagram shown in Fig (4.3), the refrigeration system
for the crystallisation cycle operates as follows; the compressor receives the low pressure
refrigerant gas through a suction valve, and then compresses the gas leading to an increase in
the pressure and temperature [Whitman et al., 2004; Whirlpool, 2009]. The hot pressurised
refrigerant gas then travels from the compressor to the condenser through the discharge
valve. The high pressure gas is cooled by means of a condenser, which leads the refrigerant
vapour to condense into a liquid refrigerant, as the temperature of the refrigerant vapour
reaches the saturation temperature corresponding to the high pressure in the condenser as
reported in the literature [Whitman et al., 2004; Whirlpool, 2009]. As the high pressure
liquid refrigerant is transported into the evaporator at low pressure through the drier and
capillary tube, reduction in feed pressure of liquid refrigerant to the evaporator is achieved by
the capillary tube. When the low pressure liquid refrigerant absorbs heat from the flowing
water over the evaporator, the liquid refrigerant evaporates, changing its state from liquid to
gas refrigerant. The latter then flows into the accumulator. Following this, the low pressure
gas refrigerant flows back to the suction line of the compressor through the heat exchanger.
During the crystallisation cycle, some of the hot gas flows into the condenser accumulating
tube and accumulates, because the solenoid hot gas valve is closed [Whirlpool, 2009]. The
accumulated gas in the condenser accumulating tube condenses to a liquid and remains in the
accumulating tube for a reason which will be explained later in the ice separation cycle.
During the later stages of the crystallisation cycle, where the ice slab forms on the
evaporator's surface, part of the low pressure liquid refrigerant passing through the
evaporator will not evaporate into a gas, because the heat transfer rate is reduced by the
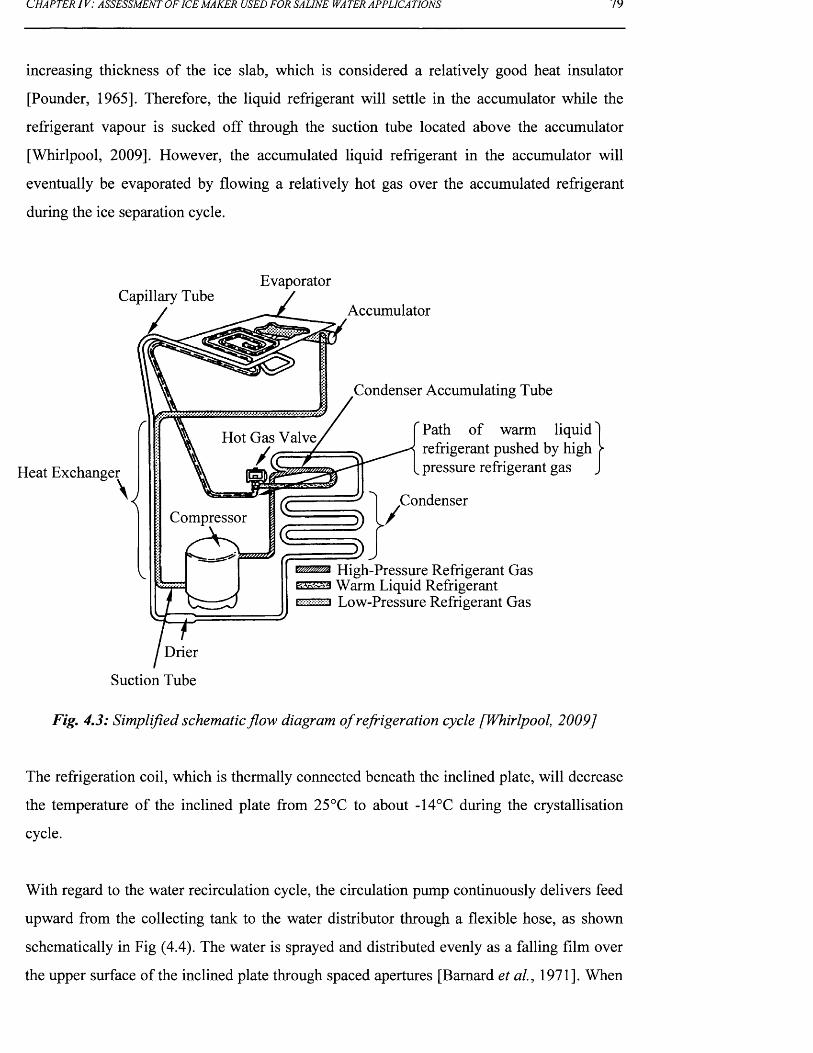
CHAPTER IV : ASSESSMENT OF ICE MAKER USED FOR SALINE WA TER APPLICATIONS 79
increasing thickness of the ice slab, which is considered a relatively good heat insulator
[Pounder, 1965]. Therefore, the liquid refrigerant will settle in the accumulator while the
refrigerant vapour is sucked off through the suction tube located above the accumulator
[Whirlpool, 2009]. However, the accumulated liquid refrigerant in the accumulator will
eventually be evaporated by flowing a relatively hot gas over the accumulated refrigerant
during the ice separation cycle.
Capillary Tube
/Evaporator
Accumulator
Heat Exchanger
Hot Gas Valve /,
Compressor
Condenser Accumulating Tube
Path of warm liquid refrigerant pushed by high pressure refrigerant gas
Condenser5) 1 /
vamma High-Pressure Refrigerant Gas Warm Liquid Refrigerant
EH23 Low-Pressure Refrigerant Gas
Drier
Suction Tube
Fig. 4.3: Simplified schematic flow diagram o f refrigeration cycle [Whirlpool, 2009]
The refrigeration coil, which is thermally connected beneath the inclined plate, will decrease
the temperature of the inclined plate from 25°C to about -14°C during the crystallisation
cycle.
With regard to the water recirculation cycle, the circulation pump continuously delivers feed
upward from the collecting tank to the water distributor through a flexible hose, as shown
schematically in Fig (4.4). The water is sprayed and distributed evenly as a falling film over
the upper surface of the inclined plate through spaced apertures [Barnard et al., 1971]. When
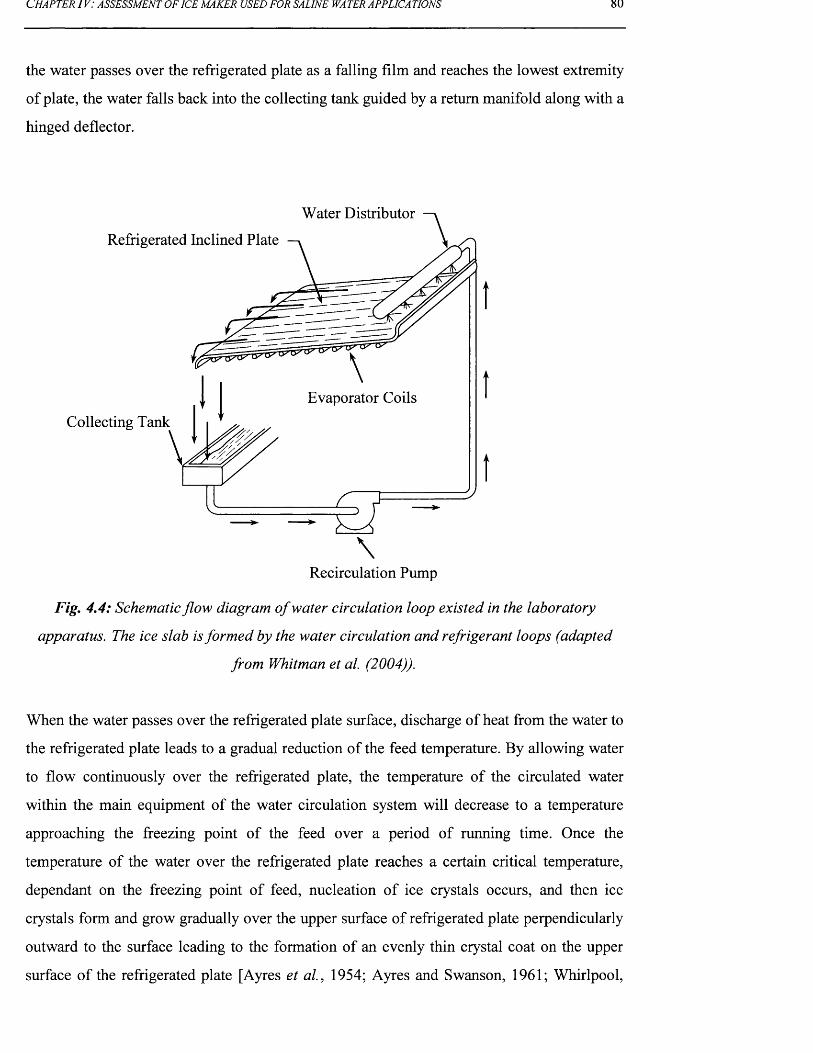
CHAPTER IV : ASSESSMENT OF ICE MAKER USED FOR SALINE WA TER APPLICA TIONS
the water passes over the refrigerated plate as a falling film and reaches the lowest extremity
of plate, the water falls back into the collecting tank guided by a return manifold along with a
hinged deflector.
Water Distributor
Refrigerated Inclined Plate
Evaporator CoilsCollecting Tank
\Recirculation Pump
Fig. 4.4: Schematic flow diagram o f water circulation loop existed in the laboratory
apparatus. The ice slab is formed by the water circulation and refrigerant loops (adapted
from Whitman et al. (2004)).
When the water passes over the refrigerated plate surface, discharge of heat from the water to
the refrigerated plate leads to a gradual reduction of the feed temperature. By allowing water
to flow continuously over the refrigerated plate, the temperature of the circulated water
within the main equipment of the water circulation system will decrease to a temperature
approaching the freezing point of the feed over a period of running time. Once the
temperature of the water over the refrigerated plate reaches a certain critical temperature,
dependant on the freezing point of feed, nucleation of ice crystals occurs, and then ice
crystals form and grow gradually over the upper surface of refrigerated plate perpendicularly
outward to the surface leading to the formation of an evenly thin crystal coat on the upper
surface of the refrigerated plate [Ayres et al., 1954; Ayres and Swanson, 1961; Whirlpool,

C h a p t e r IV : a s s e s s m e n t o f i c e m a k e r u s e d f o r s a l in e w a t e r a p p l ic a t io n s 81
2010]. By continuously re-circulating the cold water above the existing crystal coat, the
thickness of crystal coat on the refrigerated plate increases progressively over the operational
period, which simultaneously leads to a reduction in the water level within the collecting
tank.
The operational cycle of the crystallisation process is controlled by a predetermined
thickness of ice slab, which can be adjusted by means of a thermostat knob. This is achieved
by installing an ice thickness thermostat element at a certain distance located above the left
hand-side of the plate's surface. When the ice thickness thermostat element is contacted by
cold water (which is flowing over the surface of the ice slab), the temperature of the element
will decrease leading to actuation of the switch in the ice thickness thermostat which
terminates the ice making cycle (i.e. crystallisation) [Ayres et al., 1954; Ayres and Swanson,
1961]. However, the evaporator's thermistor terminates the power only to the condenser fan
and water circulation pump through an electronic control board, whereas the compressor is
still turned "On". Moreover, the electronic control board supplies power to the hot gas valve
solenoid to open the valve. This procedure leads to ending the operation of the crystallisation
cycle, and simultaneously the ice separation cycle commences.
(Hi) Ice slab separation process
The ice separation cycle takes place in order to disengage and release the ice slab from the
inclined plate. When the hot gas solenoid valve is open, high pressure refrigerant gas is
forced by a compressor to bypass the condenser and flow toward the condenser accumulating
tube where the condensed refrigerant gas remaining from the previous operational cycle (i.e.
crystallisation) is kept [Whirlpool, 2009]. As shown in Fig (4.3), the high pressure hot gas
warms and pushes the liquid refrigerant accumulated in the accumulator tube upward toward
the evaporator, which eventually leads to an increase in the temperature of the upper surface
of the inclined plate from -14°C up to 11°C during the ice separation cycle [Whirlpool,
2009]. The hot liquid refrigerant evenly heats the plate by means of heating coils, so the thin
ice slab is slightly and evenly defrosted and melted; the ice slab is easily and evenly
disengaged from the plate, sliding through gravitational force. As the inclined plate is
installed in front of the cutting grid, the ice slab then slides down toward the hot wires
network by pushing and passing the hinged deflector [Ayres and Swanson, 1961]. The
hinged deflector is designed to be swung out of the path of the ice slab by the weight of the
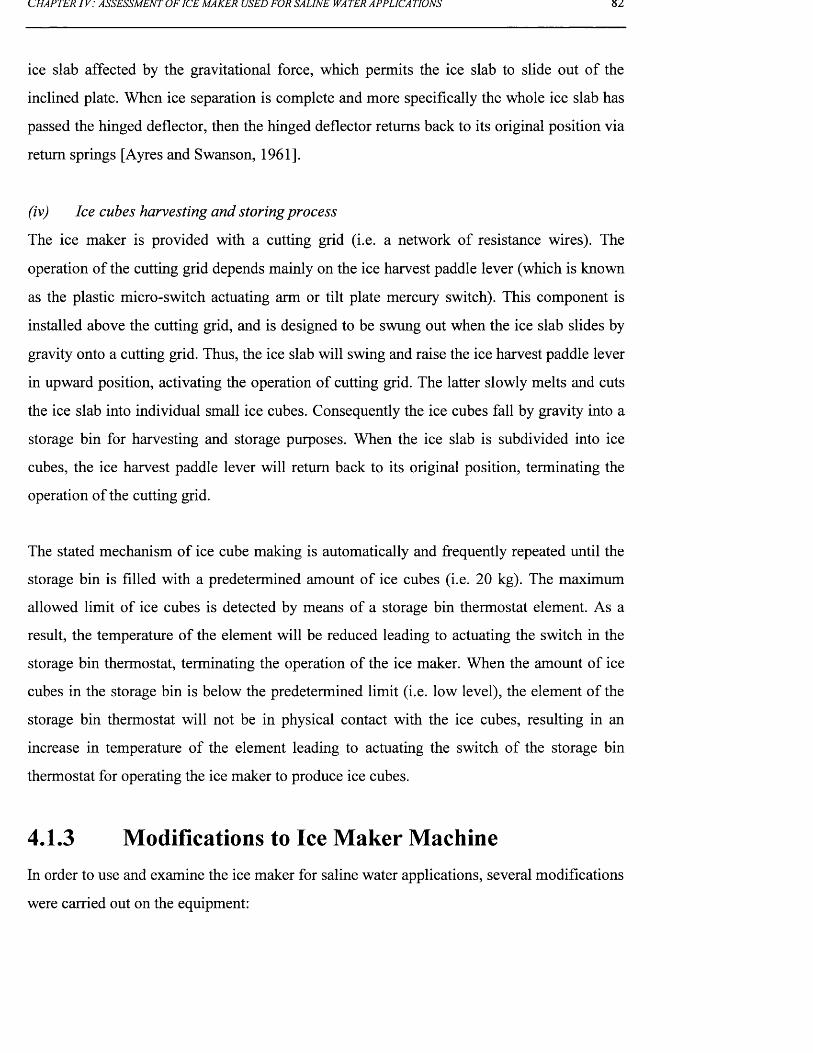
CHAPTER 1 V: ASSESSMENT OF ICE MAKER USED FOR SALINE WA TER APPLICA TIONS
ice slab affected by the gravitational force, which permits the ice slab to slide out of the
inclined plate. When ice separation is complete and more specifically the whole ice slab has
passed the hinged deflector, then the hinged deflector returns back to its original position via
return springs [Ayres and Swanson, 1961],
(iv) Ice cubes harvesting and storing process
The ice maker is provided with a cutting grid (i.e. a network of resistance wires). The
operation of the cutting grid depends mainly on the ice harvest paddle lever (which is known
as the plastic micro-switch actuating arm or tilt plate mercury switch). This component is
installed above the cutting grid, and is designed to be swung out when the ice slab slides by
gravity onto a cutting grid. Thus, the ice slab will swing and raise the ice harvest paddle lever
in upward position, activating the operation of cutting grid. The latter slowly melts and cuts
the ice slab into individual small ice cubes. Consequently the ice cubes fall by gravity into a
storage bin for harvesting and storage purposes. When the ice slab is subdivided into ice
cubes, the ice harvest paddle lever will return back to its original position, terminating the
operation of the cutting grid.
The stated mechanism of ice cube making is automatically and frequently repeated until the
storage bin is filled with a predetermined amount of ice cubes (i.e. 20 kg). The maximum
allowed limit of ice cubes is detected by means of a storage bin thermostat element. As a
result, the temperature of the element will be reduced leading to actuating the switch in the
storage bin thermostat, terminating the operation of the ice maker. When the amount of ice
cubes in the storage bin is below the predetermined limit (i.e. low level), the element of the
storage bin thermostat will not be in physical contact with the ice cubes, resulting in an
increase in temperature of the element leading to actuating the switch of the storage bin
thermostat for operating the ice maker to produce ice cubes.
4.1.3 Modifications to Ice Maker MachineIn order to use and examine the ice maker for saline water applications, several modifications
were carried out on the equipment:
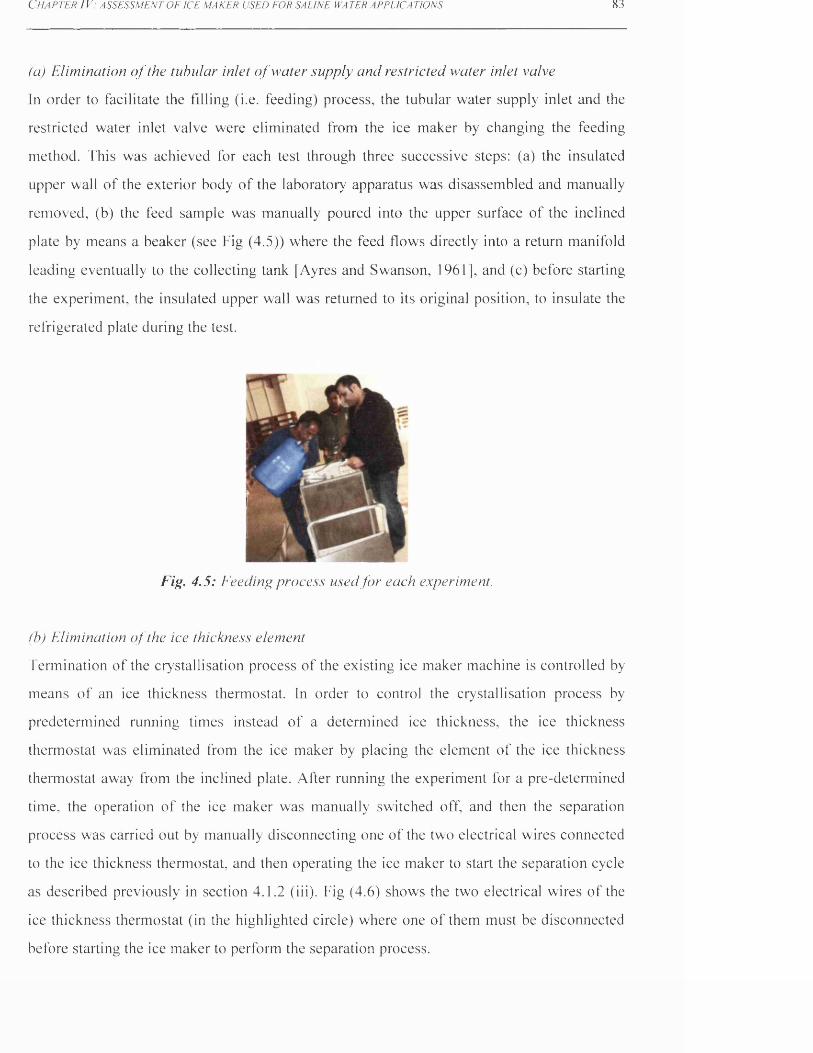
C h a p t e r IV : a s s e s s m e n t o f i c e m a k e r u s e d f o r s a l i n e w a t e r a p p l i c a t i o n s 83
(a) Elimination o f the tubular inlet o f water supply and restricted water inlet valve
In order to facilitate the filling (i.e. feeding) process, the tubular water supply inlet and the
restricted water inlet valve were eliminated from the ice maker by changing the feeding
method. This was achieved for each test through three successive steps: (a) the insulated
upper wall o f the exterior body o f the laboratory apparatus was disassembled and manually
removed, (b) the feed sample was manually poured into the upper surface o f the inclined
plate by means a beaker (see Fig (4.5)) where the feed flows directly into a return manifold
leading eventually to the collecting tank [Ayres and Swanson, 1961], and (c) before starting
the experiment, the insulated upper wall was returned to its original position, to insulate the
refrigerated plate during the test.
Fig. 4.5: Feeding process used fo r each experiment.
(b) Elimination o f the ice thickness element
Termination of the crystallisation process o f the existing ice maker machine is controlled by
means o f an ice thickness thermostat. In order to control the crystallisation process by
predetermined running times instead o f a determined ice thickness, the ice thickness
thermostat was eliminated from the ice maker by placing the element o f the ice thickness
thermostat away from the inclined plate. Alter running the experiment for a pre-determined
time, the operation o f the ice maker was manually switched off, and then the separation
process was carried out by manually disconnecting one o f the two electrical wires connected
to the ice thickness thermostat, and then operating the ice maker to start the separation cycle
as described previously in section 4.1.2 (iii). Fig (4.6) shows the two electrical wires o f the
ice thickness thermostat (in the highlighted circle) where one o f them must be disconnected
before starting the ice maker to perform the separation process.
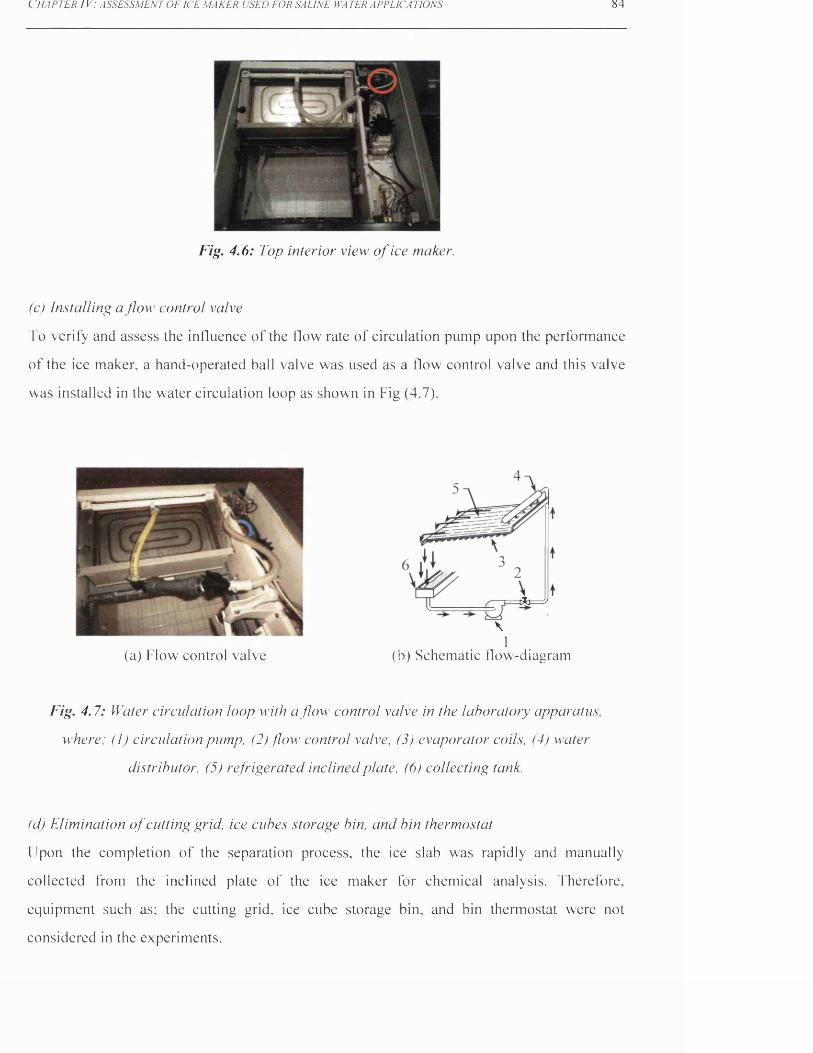
C HAPTER / V: ASSESSM ENT OF ICE MAKER USED FOR SALINE WA TER APPLICA TIONS 84
Fig. 4.6: Top interior view o f ice maker.
(c) Installing a flow control valve
To verify and assess the influence o f the flow rate of circulation pump upon the performance
o f the ice maker, a hand-operated ball valve was used as a flow control valve and this valve
was installed in the water circulation loop as shown in Fig (4.7).
$3=1
\1
(a) Flow control valve (b) Schematic flow-diagram
Fig. 4.7: Water circulation loop with a flow’ control valve in the laboratory apparatus,
where; (I) circulation pump, (2) flow control valve, (3) evaporator coils, (4) water
distributor, (5) refrigerated inclined plate, (6) collecting tank.
(d) Elimination o f cutting grid, ice cubes storage bin, and bin thermostat
Upon the completion o f the separation process, the ice slab was rapidly and manually
collected from the inclined plate o f the ice maker for chemical analysis. Therefore,
equipment such as; the cutting grid, ice cube storage bin, and bin thermostat were not
considered in the experiments.
CHAPTER 1 V: ASSESSMENT OF ICE MAKER USED FOR SALINE WA TER APPLICA TIONS
4.2 Preparation of Feed SamplesTwo different sources of saline water have been used and tested individually as feed-samples
in this experimental study. The feed materials are aqueous solutions of sodium chloride and
process brines.
Barduhn (1965) stated that prepared synthetic water using aqueous solutions of sodium
chloride (NaCl) gives results very similar to process brines. Therefore, synthetic water using
aqueous solutions of NaCl were prepared, used, and examined as feed, in order to validate
the potential capability of the falling film crystallisation process for treating a range of liquid
streams typical of those causing the most severe pollution problems. The initial salt
concentrations of the feed streams, using synthetic waters, ranged from 0.5 to 15 wt% by
weight of NaCl salt.
In addition to this, two different sources of process brine were used and tested individually as
feed-samples in the laboratory investigations. The examined process brines are: Arabian Gulf
(AG) seawater (4.9 wt% by weight of dissolved salt) and reject brine (6 wt% by weight of
dissolved salt), produced from a Reverse Osmosis (RO) membrane desalination plant.
As far as the water sample preparation is concerned, according to the mass fraction formula
(which was explained previously in Chapter 3), the feed samples, using synthetic water, were
prepared by dissolving a predetermined mass of NaCl salt (Sodium Chloride PA-ACS-ISO,
Order Number: 131659.1211, Panreac, Made in Spain) into a known mass of deionised water
(produced by UV water purification system, Direct-Q3, Trade Name: Direct-Q). With regard
to the preparation of process brines, water samples of RO brine were collected from a RO
unit, located at the Doha Research Plant (DRP), Kuwait. Arabian Gulf (AG) beach-well
seawater was used as feed-water for the mentioned RO plant. Tables (A4-12) and (A4-17)
illustrate the major components of ionic composition of these samples.
Process water, such as AG seawater and RO Brine, were collected from the feed stream and
reject brine discharge of the Kadhmah Bottled Water (KBW) plant. The KBW plant
represents one of the main research projects of the Water Technologies Department’s (WTD)
of the Water Resources Division (WRD) at the Kuwait Institute for Scientific Research
(KISR), located at the Doha Research Plant (DRP) in Kuwait. The KBW plant consists of
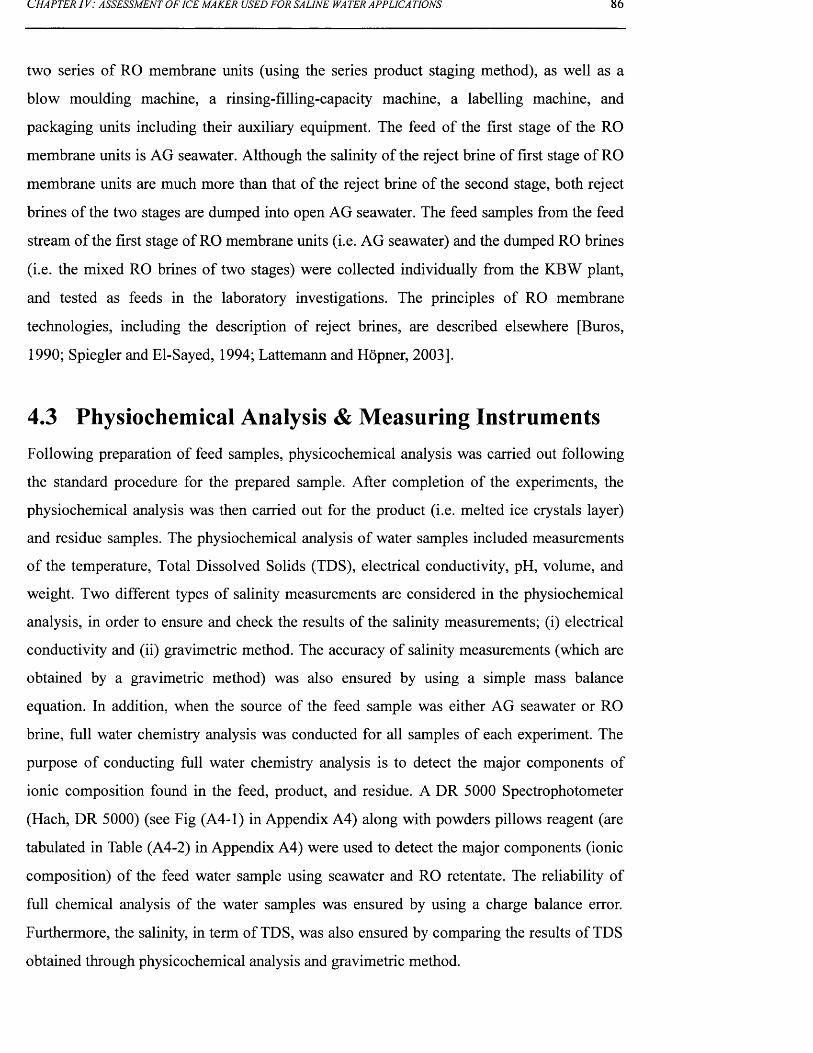
CHAPTER 1 V: ASSESSMENT OF ICE MAKER USED FOR SALINE WA TER APPLICA TIONS 8 6
two series of RO membrane units (using the series product staging method), as well as a
blow moulding machine, a rinsing-filling-capacity machine, a labelling machine, and
packaging units including their auxiliary equipment. The feed of the first stage of the RO
membrane units is AG seawater. Although the salinity of the reject brine of first stage of RO
membrane units are much more than that of the reject brine of the second stage, both reject
brines of the two stages are dumped into open AG seawater. The feed samples from the feed
stream of the first stage of RO membrane units (i.e. AG seawater) and the dumped RO brines
(i.e. the mixed RO brines of two stages) were collected individually from the KBW plant,
and tested as feeds in the laboratory investigations. The principles of RO membrane
technologies, including the description of reject brines, are described elsewhere [Buros,
1990; Spiegler and El-Sayed, 1994; Lattemann and Hopner, 2003].
4.3 Physiochemical Analysis & Measuring InstrumentsFollowing preparation of feed samples, physicochemical analysis was carried out following
the standard procedure for the prepared sample. After completion of the experiments, the
physiochemical analysis was then carried out for the product (i.e. melted ice crystals layer)
and residue samples. The physiochemical analysis of water samples included measurements
of the temperature, Total Dissolved Solids (TDS), electrical conductivity, pH, volume, and
weight. Two different types of salinity measurements are considered in the physiochemical
analysis, in order to ensure and check the results of the salinity measurements; (i) electrical
conductivity and (ii) gravimetric method. The accuracy of salinity measurements (which are
obtained by a gravimetric method) was also ensured by using a simple mass balance
equation. In addition, when the source of the feed sample was either AG seawater or RO
brine, full water chemistry analysis was conducted for all samples of each experiment. The
purpose of conducting full water chemistry analysis is to detect the major components of
ionic composition found in the feed, product, and residue. A DR 5000 Spectrophotometer
(Hach, DR 5000) (see Fig (A4-1) in Appendix A4) along with powders pillows reagent (are
tabulated in Table (A4-2) in Appendix A4) were used to detect the major components (ionic
composition) of the feed water sample using seawater and RO retentate. The reliability of
full chemical analysis of the water samples was ensured by using a charge balance error.
Furthermore, the salinity, in term of TDS, was also ensured by comparing the results of TDS
obtained through physicochemical analysis and gravimetric method.
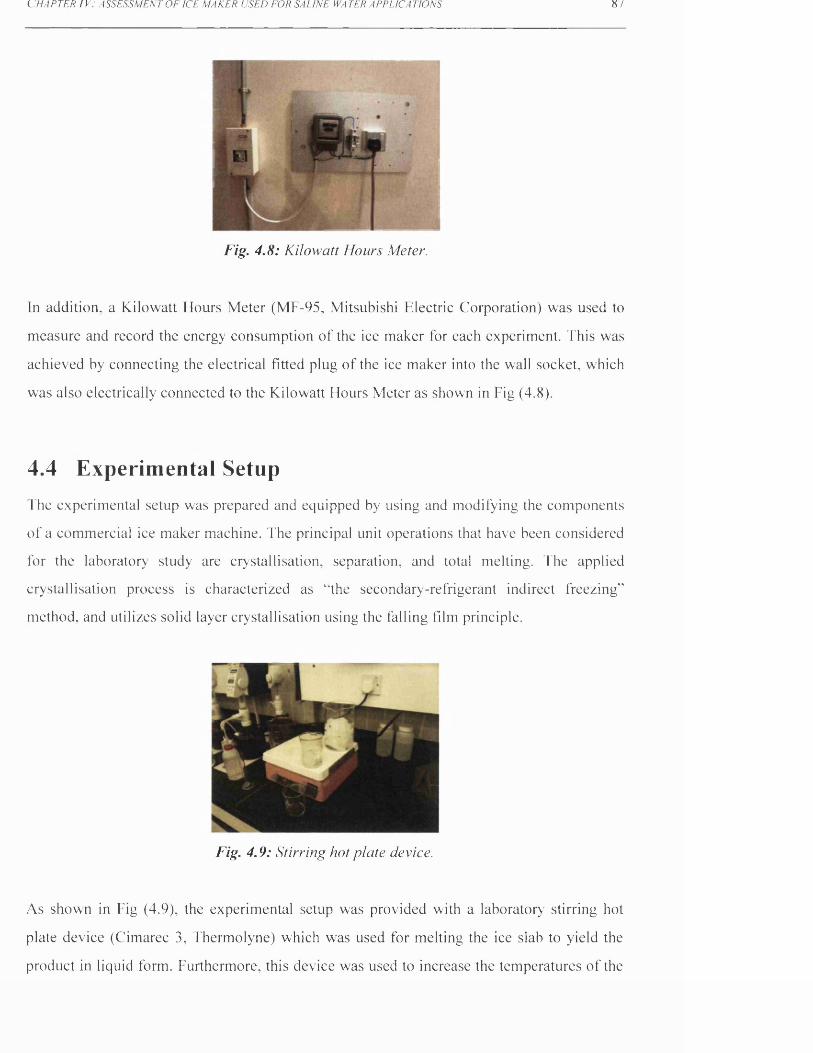
C HAPTER / V: ASSESSM ENT OF ICE MAKER USED FOR SALINE WA TER APPLICA TIONS 87
Fig. 4.8 : Kilowatt Hours Meter.
In addition, a Kilowatt Hours Meter (MF-95, Mitsubishi Electric Corporation) was used to
measure and record the energy consumption o f the ice maker for each experiment. This was
achieved by connecting the electrical fitted plug o f the ice maker into the wall socket, which
was also electrically connected to the Kilowatt Hours Meter as shown in Fig (4.8).
4.4 Experimental SetupThe experimental setup was prepared and equipped by using and modifying the components
o f a commercial ice maker machine. The principal unit operations that have been considered
for the laboratory study are crystallisation, separation, and total melting. The applied
crystallisation process is characterized as “the secondary-refrigerant indirect freezing”
method, and utilizes solid layer crystallisation using the falling film principle.
Fig. 4.9: Stirring hot plate device.
As shown in Fig (4.9), the experimental setup was provided with a laboratory' stirring hot
plate device (Cimarec 3, Thermolyne) which was used for melting the ice slab to yield the
product in liquid form. Furthermore, this device was used to increase the temperatures o f the
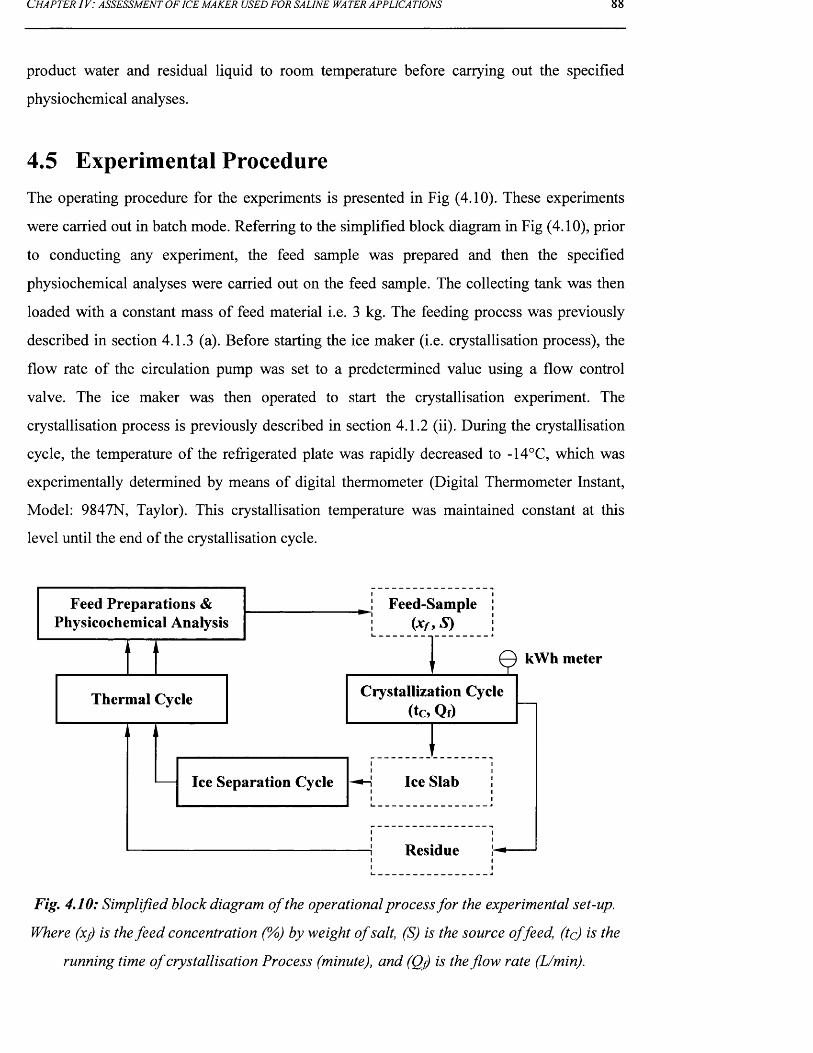
CHAPTER 1 V: ASSESSMENT OF ICE MAKER USED FOR SALINE WA TER APPLICA TIONS 8 8
product water and residual liquid to room temperature before carrying out the specified
physiochemical analyses.
4.5 Experimental ProcedureThe operating procedure for the experiments is presented in Fig (4.10). These experiments
were carried out in batch mode. Referring to the simplified block diagram in Fig (4.10), prior
to conducting any experiment, the feed sample was prepared and then the specified
physiochemical analyses were carried out on the feed sample. The collecting tank was then
loaded with a constant mass of feed material i.e. 3 kg. The feeding process was previously
described in section 4.1.3 (a). Before starting the ice maker (i.e. crystallisation process), the
flow rate of the circulation pump was set to a predetermined value using a flow control
valve. The ice maker was then operated to start the crystallisation experiment. The
crystallisation process is previously described in section 4.1.2 (ii). During the crystallisation
cycle, the temperature of the refrigerated plate was rapidly decreased to -14°C, which was
experimentally determined by means of digital thermometer (Digital Thermometer Instant,
Model: 9847N, Taylor). This crystallisation temperature was maintained constant at this
level until the end of the crystallisation cycle.
Feed-Sample (xf,S)
© kWh
Ice Slab
Residue
Crystallization Cycle (to Qf)
Thermal Cycle
Ice Separation Cycle
Feed Preparations & Physicochemical Analysis
Fig. 4.10: Simplified block diagram o f the operational process for the experimental set-up.
Where (xf is the feed concentration (%) by weight o f salt, (S) is the source offeed, (tc) is the
running time o f crystallisation Process (minute), and (Qf) is the flow rate (L/min).
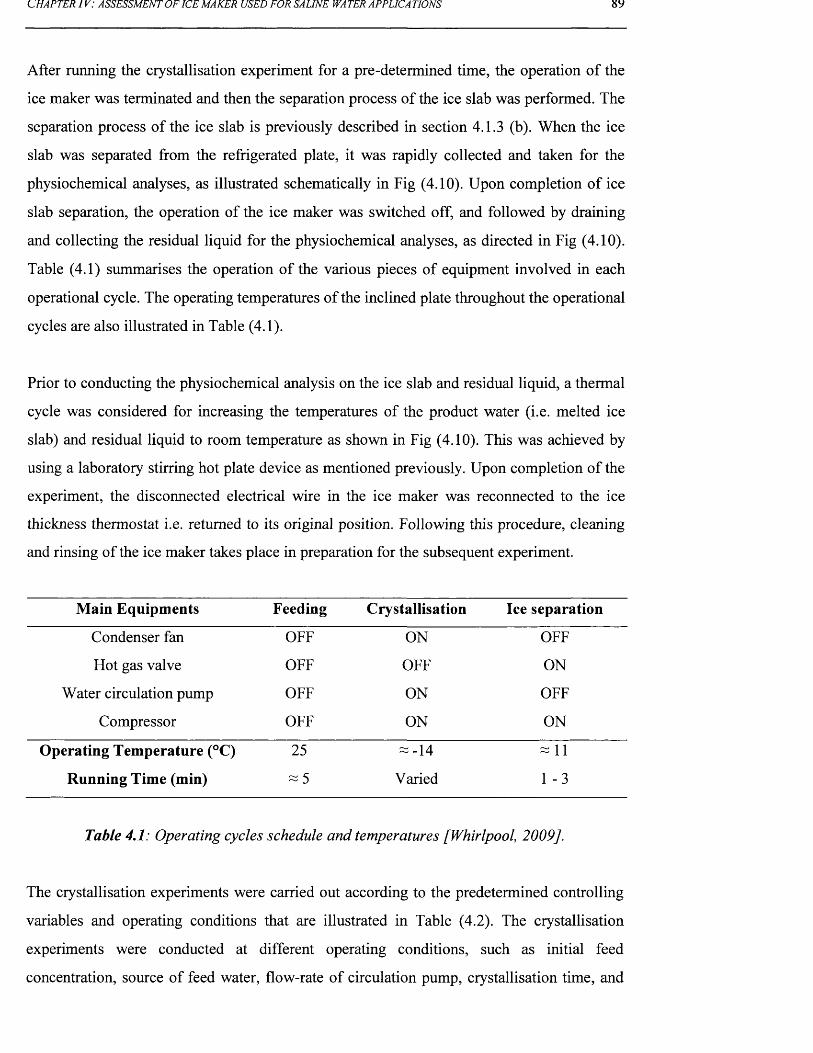
CHAPTER IV : ASSESSMENT OF ICE MAKER USED FOR SALINE WA TER APPLICA T10NS 89
After running the crystallisation experiment for a pre-determined time, the operation of the
ice maker was terminated and then the separation process of the ice slab was performed. The
separation process of the ice slab is previously described in section 4.1.3 (b). When the ice
slab was separated from the refrigerated plate, it was rapidly collected and taken for the
physiochemical analyses, as illustrated schematically in Fig (4.10). Upon completion of ice
slab separation, the operation of the ice maker was switched off, and followed by draining
and collecting the residual liquid for the physiochemical analyses, as directed in Fig (4.10).
Table (4.1) summarises the operation of the various pieces of equipment involved in each
operational cycle. The operating temperatures of the inclined plate throughout the operational
cycles are also illustrated in Table (4.1).
Prior to conducting the physiochemical analysis on the ice slab and residual liquid, a thermal
cycle was considered for increasing the temperatures of the product water (i.e. melted ice
slab) and residual liquid to room temperature as shown in Fig (4.10). This was achieved by
using a laboratory stirring hot plate device as mentioned previously. Upon completion of the
experiment, the disconnected electrical wire in the ice maker was reconnected to the ice
thickness thermostat i.e. returned to its original position. Following this procedure, cleaning
and rinsing of the ice maker takes place in preparation for the subsequent experiment.
Main Equipments Feeding Crystallisation Ice separation
Condenser fan OFF ON OFF
Hot gas valve OFF OFF ON
Water circulation pump OFF ON OFF
Compressor OFF ON ON
Operating Temperature (°C) 25 ~ -14 ~ 11
Running Time (min) ~ 5 Varied 1 -3
Table 4.1: Operating cycles schedule and temperatures [Whirlpool, 2009].
The crystallisation experiments were carried out according to the predetermined controlling
variables and operating conditions that are illustrated in Table (4.2). The crystallisation
experiments were conducted at different operating conditions, such as initial feed
concentration, source of feed water, flow-rate of circulation pump, crystallisation time, and

CHAPTER IV : ASSESSMENT OF ICE MAKER USED FOR SALINE WATER APPLICATIONS
number of freezing stages. As illustrated in Table (4.2), three and four successive freezing
stages were considered in this study for purifying and concentrating the product and residue,
respectively. The single or first stage is commonly known as the feed stage, whereas the
rectification and stripping stages represent the repeated stages for purifying the product and
concentrating the residual liquid, respectively [Ulrich and Glade (2003); Sulzer (2004)].
Run No. of Stage
(*f) (A) m (S)
(%) (min) (L/min)(Synthetic Water
/ Process Brine)
1 -6 4 1 0 .5 -7 15-120 6.3-3 .15 NaCl solution
6 5 -1 9 2 1 4.9 15-120 6.3 AGSW
129-144 1 7 15-120 6.3 RO Brine
145-160 3 4.9 90 6.3 AGSW
160-163 4 7 6 0 -1 2 0 6.3 RO Brine
Table 4.2: Operating parameters and conditions during crystallisation cycle experiments.
Where (xf is the feed concentration (%) by weight o f salt, (S) is the source offeed, (tc) is the
running time o f crystallisation process (minute), and (Qf) is the flow rate (L/min).
For the crystallisation experiment with multiple freezing stages, the preparation of feed
samples differs from the feed stage. This was due to the product and residual liquid of the
previous freezing stage becoming the feed for the subsequent rectification and stripping
stages, respectively. However, several limitations were encountered during these
experiments, which are as follows: (a) the capacity of the collecting tank is limited, (b) the
circulation pump is turned off automatically by a float sensor when the water level of the
collecting tank reaches 0.5 L, (c) a single crystalliser was available for this experimental
investigation, (d) the maximum mass of product water cannot exceed 1.2 kg in any freezing
stage, because the apertures of the water distributor were blocked by the ice slab thickness,
and (f) the experiments were handled on a batch basis. Therefore, for experiments with
rectification stages, the final product of the fourth freezing stage was reprocessed by
conducting four successive crystallisation processes where the liquid obtained by melting the
ice slab of the previous freezing stage becomes the feed for the following freezing stage, and
so on, until achieving the final product of the fourth freezing stage. This means that the first
three freezing stages might be individually repeated several times in order to collect the
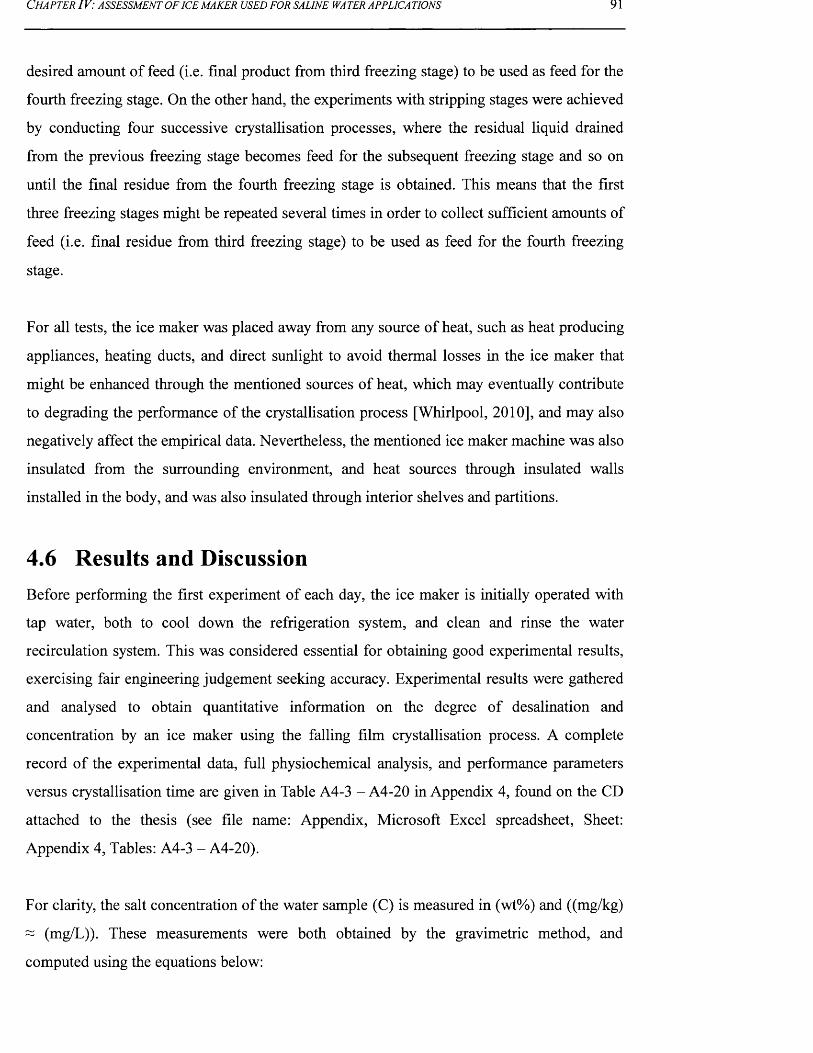
C h a p t e r IV : a s s e s s m e n t o f ic e m a k e r u s e d f o r s a l in e w a t e r a p p l ic a t io n s 91
desired amount of feed (i.e. final product from third freezing stage) to be used as feed for the
fourth freezing stage. On the other hand, the experiments with stripping stages were achieved
by conducting four successive crystallisation processes, where the residual liquid drained
from the previous freezing stage becomes feed for the subsequent freezing stage and so on
until the final residue from the fourth freezing stage is obtained. This means that the first
three freezing stages might be repeated several times in order to collect sufficient amounts of
feed (i.e. final residue from third freezing stage) to be used as feed for the fourth freezing
stage.
For all tests, the ice maker was placed away from any source of heat, such as heat producing
appliances, heating ducts, and direct sunlight to avoid thermal losses in the ice maker that
might be enhanced through the mentioned sources of heat, which may eventually contribute
to degrading the performance of the crystallisation process [Whirlpool, 2010], and may also
negatively affect the empirical data. Nevertheless, the mentioned ice maker machine was also
insulated from the surrounding environment, and heat sources through insulated walls
installed in the body, and was also insulated through interior shelves and partitions.
4.6 Results and DiscussionBefore performing the first experiment of each day, the ice maker is initially operated with
tap water, both to cool down the refrigeration system, and clean and rinse the water
recirculation system. This was considered essential for obtaining good experimental results,
exercising fair engineering judgement seeking accuracy. Experimental results were gathered
and analysed to obtain quantitative information on the degree of desalination and
concentration by an ice maker using the falling film crystallisation process. A complete
record of the experimental data, full physiochemical analysis, and performance parameters
versus crystallisation time are given in Table A4-3 - A4-20 in Appendix 4, found on the CD
attached to the thesis (see file name: Appendix, Microsoft Excel spreadsheet, Sheet:
Appendix 4, Tables: A4-3 - A4-20).
For clarity, the salt concentration of the water sample (C) is measured in (wt%) and ((mg/kg)
~ (mg/L)). These measurements were both obtained by the gravimetric method, and
computed using the equations below:
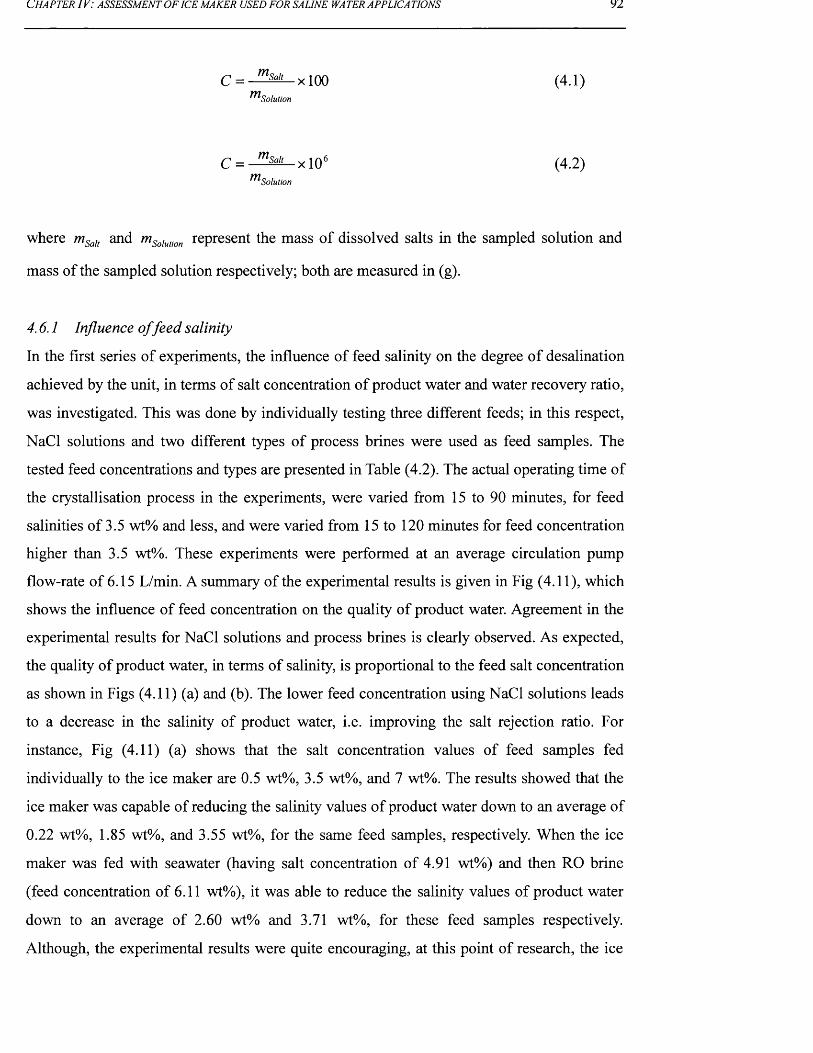
c h a p t e r IV : a s s e s s m e n t o f ic e m a k e r u s e d f o r s a l in e w a t e r a p p l ic a t io n s 92
C = . mSalt xlQQ'Solution
(4.1)
C = m sa " xlO6Solution
(4.2)
where mSalt and mSolutjon represent the mass of dissolved salts in the sampled solution and
mass of the sampled solution respectively; both are measured in (g).
4.6.1 Influence o f feed salinity
In the first series of experiments, the influence of feed salinity on the degree of desalination
achieved by the unit, in terms of salt concentration of product water and water recovery ratio,
was investigated. This was done by individually testing three different feeds; in this respect,
NaCl solutions and two different types of process brines were used as feed samples. The
tested feed concentrations and types are presented in Table (4.2). The actual operating time of
the crystallisation process in the experiments, were varied from 15 to 90 minutes, for feed
salinities of 3.5 wt% and less, and were varied from 15 to 120 minutes for feed concentration
higher than 3.5 wt%. These experiments were performed at an average circulation pump
flow-rate of 6.15 L/min. A summary of the experimental results is given in Fig (4.11), which
shows the influence of feed concentration on the quality of product water. Agreement in the
experimental results for NaCl solutions and process brines is clearly observed. As expected,
the quality of product water, in terms of salinity, is proportional to the feed salt concentration
as shown in Figs (4.11) (a) and (b). The lower feed concentration using NaCl solutions leads
to a decrease in the salinity of product water, i.e. improving the salt rejection ratio. For
instance, Fig (4.11) (a) shows that the salt concentration values of feed samples fed
individually to the ice maker are 0.5 wt%, 3.5 wt%, and 7 wt%. The results showed that the
ice maker was capable of reducing the salinity values of product water down to an average of
0.22 wt%, 1.85 wt%, and 3.55 wt%, for the same feed samples, respectively. When the ice
maker was fed with seawater (having salt concentration of 4.91 wt%) and then RO brine
(feed concentration of 6.11 wt%), it was able to reduce the salinity values of product water
down to an average of 2.60 wt% and 3.71 wt%, for these feed samples respectively.
Although, the experimental results were quite encouraging, at this point of research, the ice
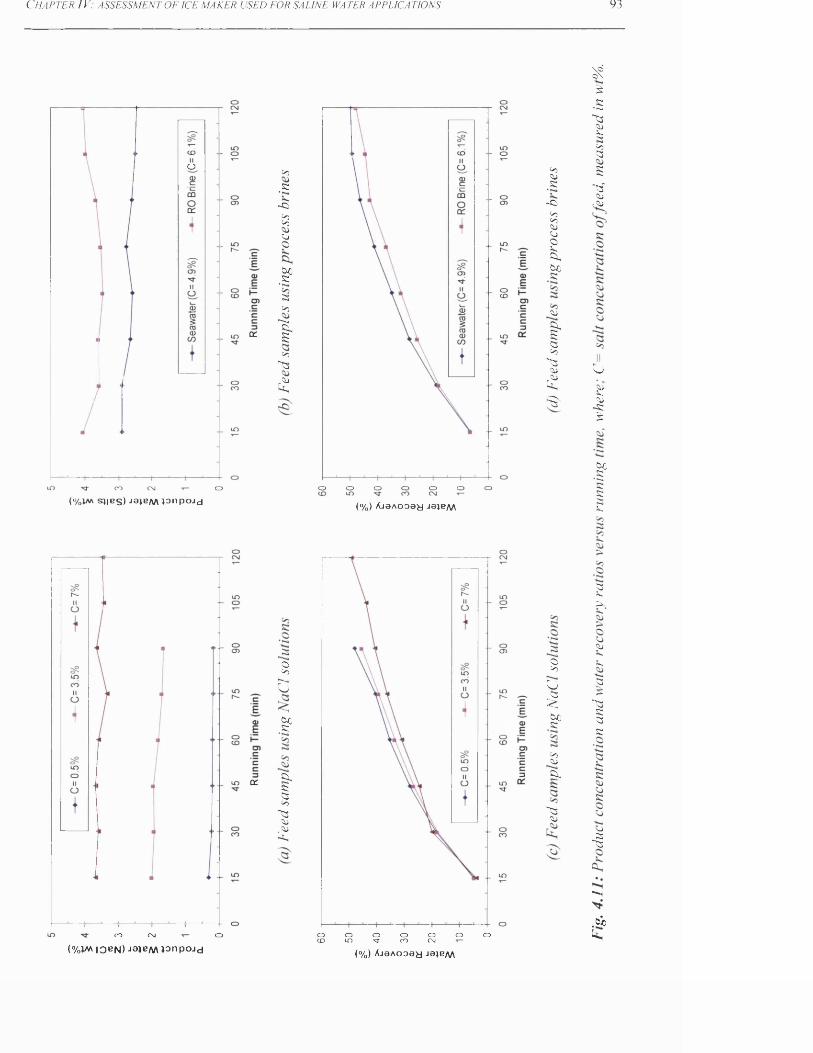
C h a p t e r IV : a s s e s s m e n t o f i c e m a k e r u s e d f o r s a l i n e w a t e r a p p l i c a t i o n s 93
o
CO CM CD
0£
CO.R
-RCOCO5j0
too,R
aco
~-~4
1Co"R>£
(%V\a sjibs) ja»e/\/\13npojdo o o CD CD CD CD
CO<Xi.R
-C>cococaooX ,CX,tooR
<X>I53Co
"53<X>£S'
( % ) X j a A o a a y j a j e / v v
N?o\£
.R
"52iRco535
"53"<X>c'XJ
rO2!CX>
-R£
fRRRx.
CO CNJ O
a:
oCo
G
<scR
I53co"53CXJ
£
(% V * I O B N ) J a i e / v \ l a n p o j y
oLO
oO '
oCO
oCNJ
o ooCD
oCo
o:§tooR
CoCXJ5,
~53CX>
535b
CX»
X .
53?
*53R53R
sJR~53
" - h
£(%) AjaAooay jaje/w

CHAPTER IV : ASSESSMENT OF ICE MAKER USED FOR SALINE WA TER APPLICA TIONS 94
maker did not produce a final, near potable quality product. However, for the case of
seawater treatment, the ice maker produced final water close to the brackish water quality
that can be further desalted by brackish RO membranes to produce potable water. In the case
of RO brine treatment, the ice maker produced final water of near seawater quality that could
be recycled and easily treated by seawater RO membranes to reach a final product water of
near drinking water quality. For example, Figs (4.11) (b) and (d) shows that the maximum
salt concentration of product water and water recovery ratio were about 4 wt% and 48%,
respectively. This gives a clear indication that the ice maker using falling film crystallisation
process might be a feasible process for concentrating RO brines in order to minimise the
volume of the waste streams of RO desalination plants, and more specifically, inland
desalination plants.
The water recovery ratios, on the other hand, were found to be inversely proportional to the
feed salt concentration as shown in Figs (4.11) (c) and (d). However, the water recovery
ratios were found proportional to the running time, as shown in Figs (4.11) (c) and (d).
Consequently, the experiments using feed samples with high salinities (such as NaCl
solutions with a salt concentration of 7 wt% and process brines) required longer
crystallisation time (i.e. 120 minutes) to reach the water recovery ratio of 50%, as shown in
Figs (4.11) (c) and (d). For each freezing stage, the maximum water recovery ratio could not
exceed 50%, because the thick ice slab started to block the apertures of the water distributor.
4.6.2 Influence o f ice thickness
The second group of experiments were carried out with feed samples using NaCl solutions
with salt concentration of 0.5, 3.5, and 7 wt%. The actual operational period of crystallisation
process for the experiments was varied from 15 to 90 minutes. These experiments were
carried out with an average flow-rate of 6.15 L/min. The ice thickness was analytically
determined by assuming the dimensions and shape of solid layer ice slab is a rectangular
block. Fig (4.12) shows the influence of ice thickness on the quality of product water and
residue, in terms of salinity, as well as the salt rejection and water recovery ratios.
For the experiments using feed samples with a salt concentration of 0.5 wt%, the quality of
product water, in terms of salinity, was found to be inversely proportional to the ice thickness
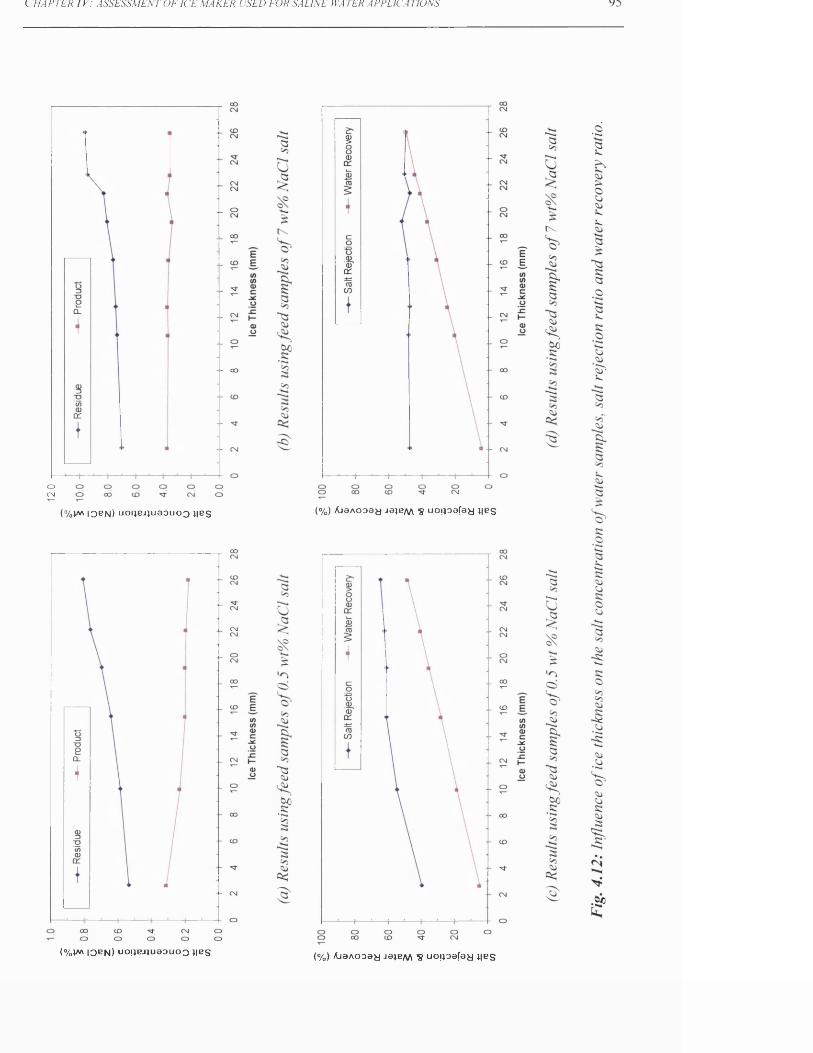
12.0
L HAPTER I V : ASSESSMENT OF ICE MAKER USED FOR SALINE WA TER APPLICA TIONS
(% ) A jaA O oay ja ie /\A >8 u o fjo a fa y j ib s(% V * IQ BN ) uo ijB J^uaouo o *|BS
(%V« IQBn) uojjBJiuaouoo jibs (% ) A ja A o o a y j b j b m ’S u o jjo a fa y j ib s
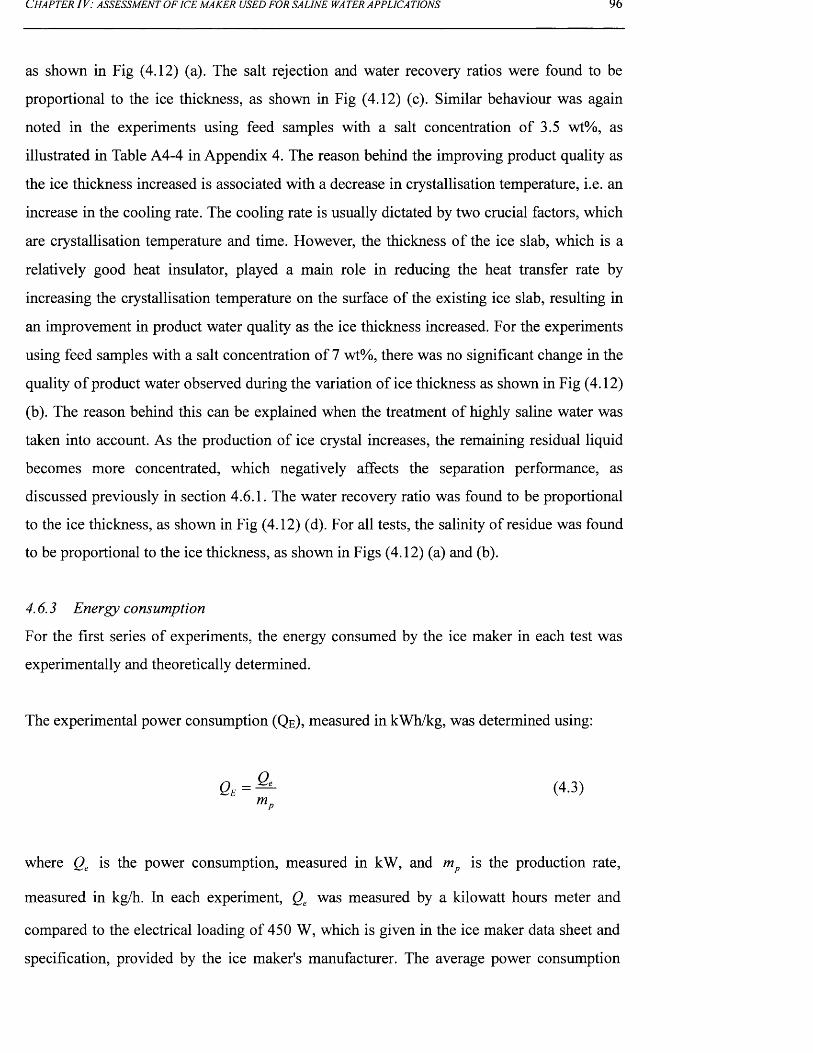
C h a p t e r 1 v : a s s e s s m e n t o f ic e m a k e r u s e d f o r s a l in e w a t e r a p p l ic a t io n s 96
as shown in Fig (4.12) (a). The salt rejection and water recovery ratios were found to be
proportional to the ice thickness, as shown in Fig (4.12) (c). Similar behaviour was again
noted in the experiments using feed samples with a salt concentration of 3.5 wt%, as
illustrated in Table A4-4 in Appendix 4. The reason behind the improving product quality as
the ice thickness increased is associated with a decrease in crystallisation temperature, i.e. an
increase in the cooling rate. The cooling rate is usually dictated by two crucial factors, which
are crystallisation temperature and time. However, the thickness of the ice slab, which is a
relatively good heat insulator, played a main role in reducing the heat transfer rate by
increasing the crystallisation temperature on the surface of the existing ice slab, resulting in
an improvement in product water quality as the ice thickness increased. For the experiments
using feed samples with a salt concentration of 7 wt%, there was no significant change in the
quality of product water observed during the variation of ice thickness as shown in Fig (4.12)
(b). The reason behind this can be explained when the treatment of highly saline water was
taken into account. As the production of ice crystal increases, the remaining residual liquid
becomes more concentrated, which negatively affects the separation performance, as
discussed previously in section 4.6.1. The water recovery ratio was found to be proportional
to the ice thickness, as shown in Fig (4.12) (d). For all tests, the salinity of residue was found
to be proportional to the ice thickness, as shown in Figs (4.12) (a) and (b).
4.6.3 Energy consumption
For the first series of experiments, the energy consumed by the ice maker in each test was
experimentally and theoretically determined.
The experimental power consumption (Qe), measured in kWh/kg, was determined using:
Qe = — (4.3)mp
where Qe is the power consumption, measured in kW, and mp is the production rate,
measured in kg/h. In each experiment, Qe was measured by a kilowatt hours meter and
compared to the electrical loading of 450 W, which is given in the ice maker data sheet and
specification, provided by the ice maker's manufacturer. The average power consumption
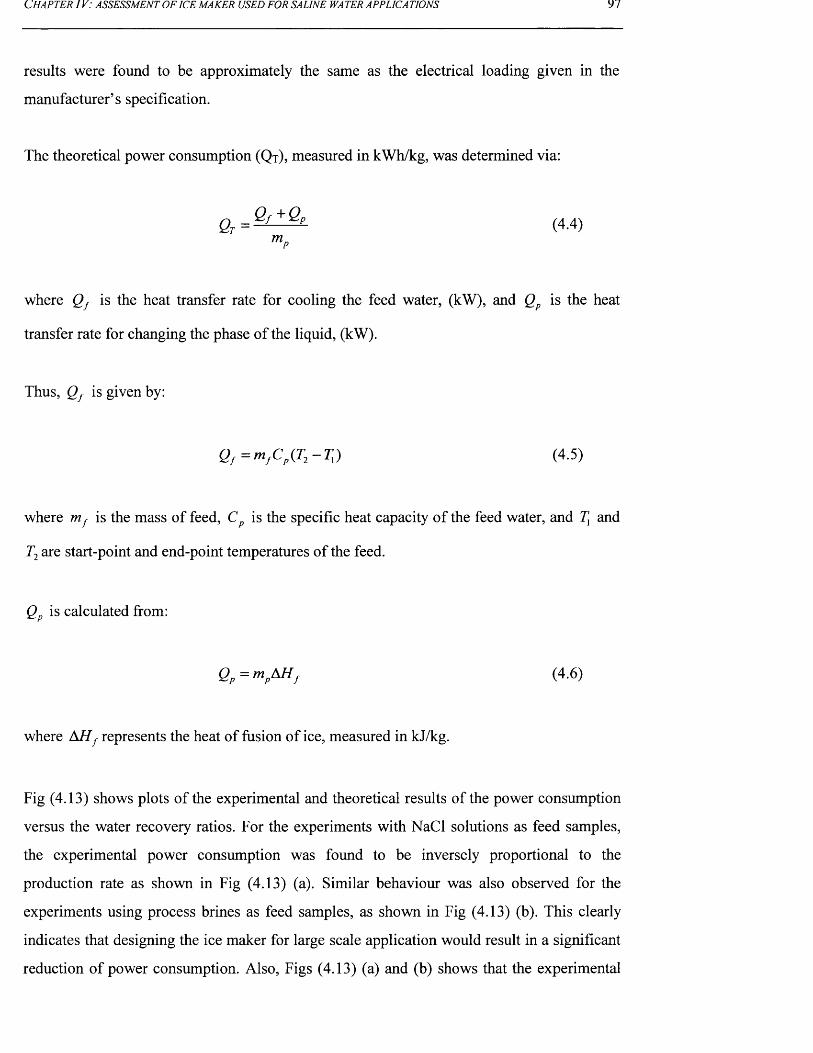
C h a p t e r IV : a s s e s s m e n t o f i c e m a k e r u s e d f o r s a l in e w a t e r a p p l ic a t io n s 97
results were found to be approximately the same as the electrical loading given in the
manufacturer’s specification.
The theoretical power consumption (Qt), measured in kWh/kg, was determined via:
Qr = Qf + QP ( 4 4 )
mp
where Qf is the heat transfer rate for cooling the feed water, (kW), and Qp is the heat
transfer rate for changing the phase of the liquid, (kW).
Thus, Qf is given by:
Qf =mf Cp(T2- T ]) (4.5)
where mf is the mass of feed, C is the specific heat capacity of the feed water, and Tx and
T2 are start-point and end-point temperatures of the feed.
Qp is calculated from:
Qp =mpAHf (4.6)
where AHf represents the heat of fusion of ice, measured in kJ/kg.
Fig (4.13) shows plots of the experimental and theoretical results of the power consumption
versus the water recovery ratios. For the experiments with NaCl solutions as feed samples,
the experimental power consumption was found to be inversely proportional to the
production rate as shown in Fig (4.13) (a). Similar behaviour was also observed for the
experiments using process brines as feed samples, as shown in Fig (4.13) (b). This clearly
indicates that designing the ice maker for large scale application would result in a significant
reduction of power consumption. Also, Figs (4.13) (a) and (b) shows that the experimental
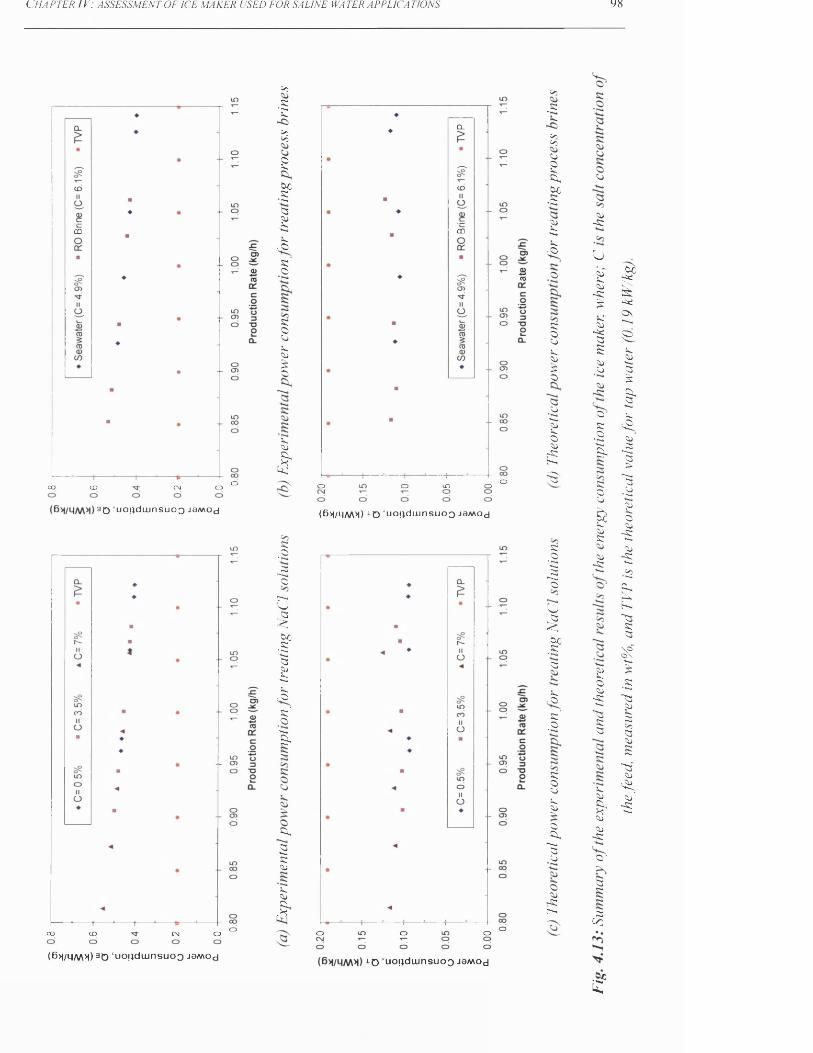
C HAPTER IV : ASSESSMENT OF ICE MAKER USED FOR SALINE WA TER APPLICA TIONS 98
co
o0° CD CNJ O
3D ‘uofjdiunsuoo ja/wod
oOO CD CNJ O
CO.R£CO<0
£so■Sa£■Ki5s.<©s '©
s©©5s©£©
5s.©
t
s.©
a~©1—* u:§So•S■Ss.©2i•ss5s.V©s'
.©<s£s
ccSs©
5s.©>
a.
CD
ooo o LO
(B /MM l) 1D ‘uo^diunsuoQ jaMOj
oo o o
<0.R
CoCoO5ccf
2iSs5s.,©
% ©
s©©is©£©
. ©•Ss©5s©©s£*
f-s,
S '
s. ©■Ssa
~ S s©01So.s©
5s•©s'
.©
s©©5s©
©Cc" si©©
©
g
©-s
o©5s©-s£S'©s<;©S©©
©*s.©■S.Ss
s©©
£©s©-s
(Bw m 5)) 3D ‘uoijdiunsuoo jawod i D ‘uojjdujnsuoo jaMOd
2!©©-s■*-a
©SS©
S©8-©©
~S
©•
©
aco
E?
the f
eed,
mea
sure
d in
wt%
, an
d TV
P is
the
theo
retic
al v
alue
for
tap
wa
ter
(0.19
kW
/kg)
.
80

CHAPTER IV : ASSESSMENT OF ICE MAKER USED FOR SALINE WA TER APPLICA TIONS
power consumption was slightly increased as the salt concentration of feed sample increased.
For example, the averaged values of experimental power consumption were 0.43, 0.45, and
0.51 kWh/kg in treating feed samples comprising NaCl solutions at salt concentrations of
0.5, 3.5, and 7 wt%, respectively, whereas the treatment of seawater and RO brine consumed
0.47 and 0.51 kWh/kg, respectively, taking into account that the ice maker consumes 0.19
kWh/kg for the cases of producing ice cubes from tap water as specified by the supplier. This
behaviour was found to agree with the results of the theoretical power consumption, as
shown in Figs (4.13) (c) and (d). This clearly confirms that the power consumption is the
proportional to the salt concentration of feed sample. In general, the values of the
experimental power consumption do not reflect the actual power consumption of the
treatment system. The reasons behind this are (i) the tested ice maker contains several items
of equipment not needed for desalination; (ii) the demonstrated results of the experimental
power consumption reflected the power consumption of the ice maker used for small scale
applications; (iii) the absence of pre-cooling unit (i.e. heat exchanger) to recover most of the
cold from the residual liquid and the melted ice by cooling the incoming feed water; and (iv)
depending on the operating conditions, the examined operating temperature and cooling rate
limits might be too low for the tested water samples. Hence, a full scale demonstration with
suitable items of equipment and optimal operating conditions must be examined to estimate
the actual power consumption.
4.6.4 Influence o f the feed flow-rate
In the third series of experiments, the influence of the feed flow-rate on the separation
performance of the ice maker was investigated. These experiments were performed with
NaCl solutions having salt concentrations of 0.5 wt% and 7 wt%. The actual operational
period of the crystallisation process for the experiments was varied from 15 to 90 minutes.
The laboratory investigation was carried out with an average feed flow-rate of 6.30 and 3.15
L/min. The flow-rate of 6.30 L/min represents the maximum flow-rate that can be obtained,
whereas the flow rate of 3.15 L/min was achieved by manual adjustment through the
installed flow control valve. The predetermined flow-rates of feed were experimentally
measured before starting the experiment. Fig (4.14) shows the influence of flow rate on the
product concentration, water recovery, and salt rejection ratios.
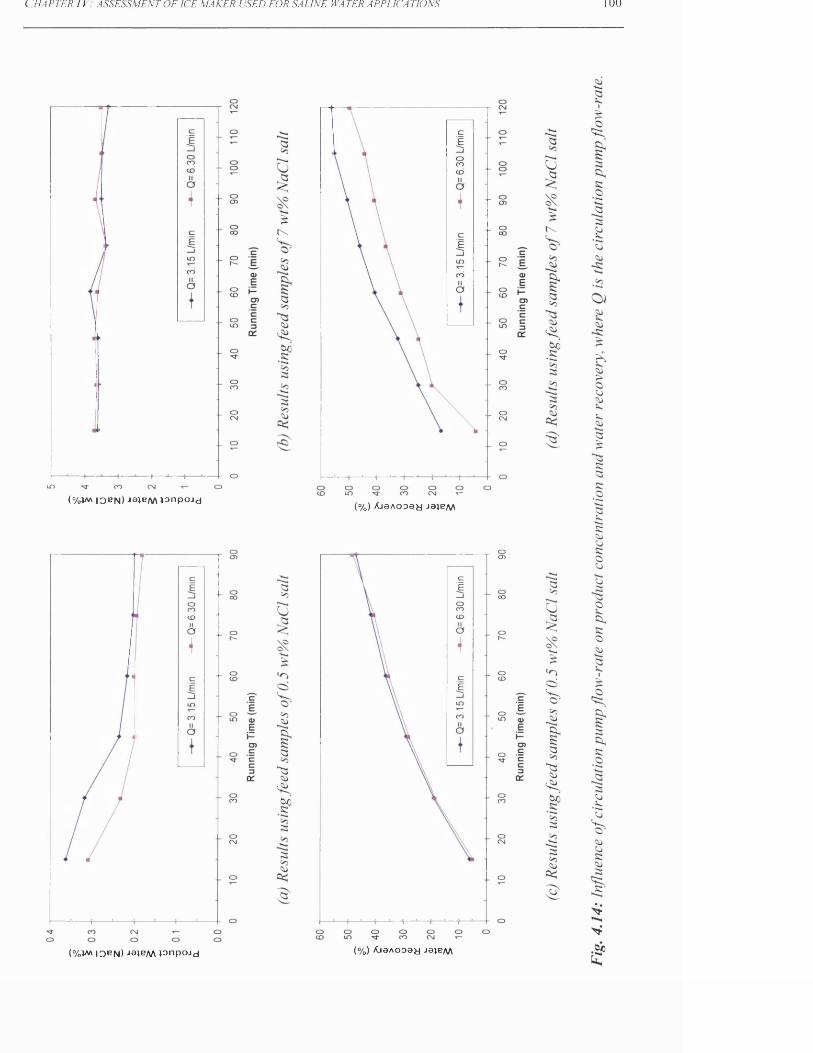
C H APTER I V : ASSESSMENT OF ICE MAKER USED FOR SALINE WATER APPLICATIONS I UU
(% V * IQ B N ) Ja;e/\A jo n p o jd( % ) A j a A O o e y J 0 j B / \ / \
(%) AjaAooay jajBM(% V « I 3 b n ) J a ie M lo n p o jd
CHAPTER 1 V: ASSESSMENT OF ICE MAKER USED FOR SALINE WA TER APPLICA TIONS 101
The experiments with a feed concentration of 0.5 wt% demonstrated that salinity was
inversely proportional to the feed flow-rate, as shown in Fig (4.14) (a). The amount of
impurity in the ice slab was significantly reduced by increasing the feed flow rate. This
indicates that the effectiveness of such a dynamic effect is helpful in improving the quality of
product water in cases of treating feeds with low salt concentration, as confirmed by Ulrich
and Glade (2003). As the solid ice layer is growing, the rejected liquid film adhering to the
surface of ice slab becomes more concentrated. This liquid film must be rapidly washed and
replaced with a lower concentration of incoming liquid film; otherwise the boundary layers
of ice slab will be formed with poor separation. Therefore, separation performance of the ice
maker was improved by increasing the feed flow-rate. This clearly indicates that the feed
flow-rate can improve the quality of product water for the case of feed solutions with low
salt concentrations. However, the water recovery ratio was not affected by the feed flow-rate
as shown in Fig (4.14) (c). This clearly indicates that the feed flow-rate cannot change the
water recovery ratio in the case of feed solutions with low salt concentrations, especially
when the experiments were carried out at low a crystallisation temperature, i.e. low cooling
rate.
For the cases of treating a feed with a salt concentration of 7 wt%, the product quality was
not affected by changing the feed flow-rate, as shown in Fig (4.14) (b). The water recovery
ratio is considerably increased by decreasing the flow-rate of the feed, as shown in Fig (4.14)
(d). The reason behind this was that the ice crystal layers were found to be quite slushy and
not rigid when compared to the experiments using feed samples with a low salt
concentration. Therefore, the flow rate of the feed must be reduced to obtain a rigid crystal
layer. Consequently, the rejected liquid film is allowed more residence time above the surface
of the ice slab, which helps the ice crystals to grow much faster, leading to an increased
production rate. Therefore, the water recovery ratio was found to be inversely proportional to
the feed flow-rate using higher salinity feeds.
4.6.5 Multi-stage process (rectification stage)
In the fourth series of experiments, the influence of a multi-stage ice maker (falling film
process) on the degree of desalination, in terms of product quality, water recovery, and ionic
rejection, was studied. This was achieved by treating Arabian Gulf beach-well seawater as
the initial feed sample. Continuous rectification stages were performed in three successiv
CHAPTER IV : ASSESSMENT OF ICE MAKER USED FOR SALINE WA TER APPLICA TIONS 102
freezing stages, namely a feed stage, and then first and second rectification stages, to
determine the degree of seawater desalination through the ice maker. The actual operational
period of the crystallisation process for these experiments was constant at 90 minutes. These
experiments were carried out with an average circulation pump flow-rate of 6.15 L/min. The
experiments for the feed and first rectification stages were individually repeated 9 and 3
times, respectively, to collect the water samples for physiochemical analysis and also to
collect final feed water for the second rectification stage (i.e. final stage), which was
performed only one time to produce the final product water. A summary of the experimental
data and physiochemical analysis for the water samples of each freezing stage is given in
Tables (4.3) - (4.5).
Table (4.3) shows that the average TDS value of seawater fed to the feed stage was 49,074
ppm, whereas the feed stage, and first and second rectification stages were able to output
product water with average TDS values of 26,047, 17,996, and 9,529 ppm, respectively.
Table (4.3) shows that the salt rejection ratios were 46.95, 30.91, and 47.05%, for the same
freezing stages, respectively. The overall salt rejection ratio was 80.59% (see Table (4.4)).
The overall results proved that the ice maker tested was capable of reducing the TDS value
of seawater from 49,074 ppm down to 9,529 ppm over three successive freezing stages (see
Table (4.3)). Table (4.3) shows that the water recovery ratios were 46.33, 65.83, and 65.23%,
for the same freezing stages, respectively. The water recovery ratios for the first and second
rectification stages are higher than that in the feed stage, because water recovery ratio is
inversely proportional to the salt concentration of feed water. Table (4.4) shows that the
overall product water recovery ratio was 19.89%. This investigation clearly indicates that the
number of rectification stages is proportional to the salt rejection ratio and inversely
proportional to the water recovery ratio. Although the results are quite encouraging in terms
of the salt rejection ratio, however the ice maker, over three successive freezing stages, did
not produce a final product reaching drinking water standards that is ready for immediate use
(see Table (4.5)). Table (4.5) compares the major ion composition of final product water to
drinking water standards. In this case, the ice maker produced a saline water of near brackish
water standards that can be further easily desalted either by increasing the number of
rectification stages or by using brackish water RO membranes to obtain a final product of
potable water. Table (4.5) shows that the TDS values of the residual liquid of the feed, and
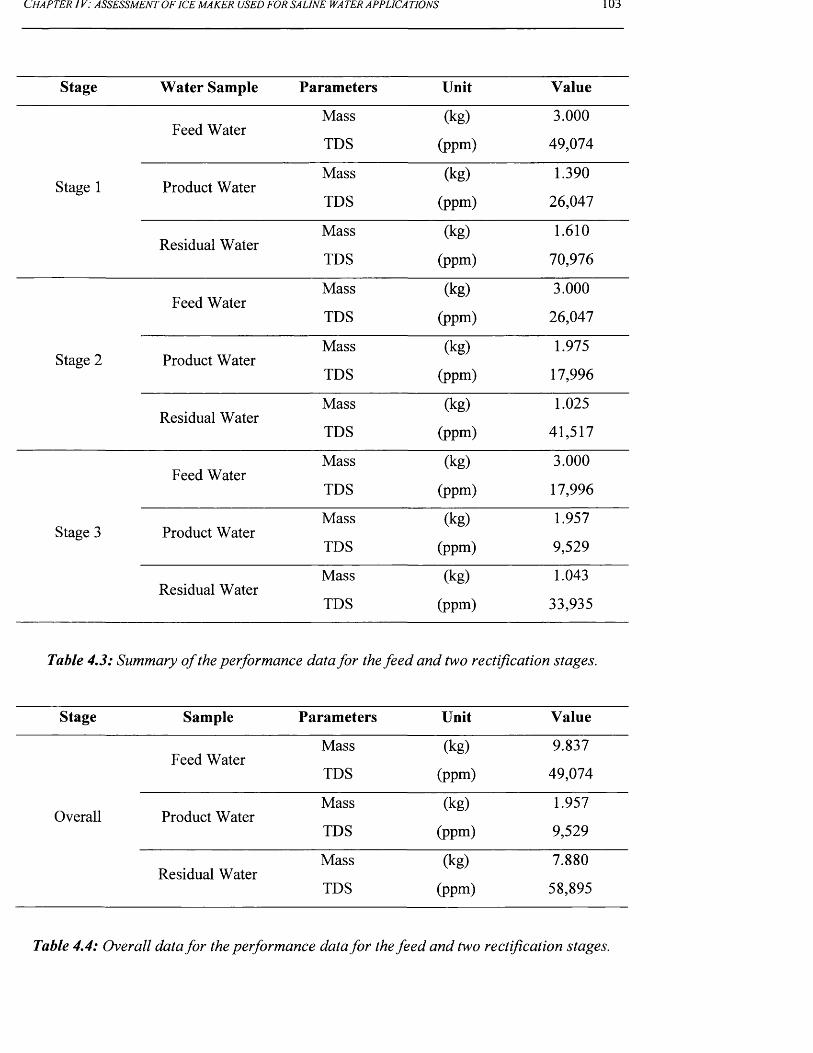
C h a p t e r IV : a s s e s s m e n t o f ic e m a k e r u s e d f o r s a l i n e wa t e r a p p l ic a t io n s 103
Stage Water Sample Parameters Unit Value
Feed WaterMass
TDS
(kg)
(ppm)
3.000
49,074
Stage 1 Product WaterMass
TDS
(kg)
(ppm)
1.390
26,047
Residual WaterMass
TDS
(kg)
(ppm)
1.610
70,976
Feed WaterMass
TDS
(kg)
(ppm)
3.000
26,047
Stage 2 Product WaterMass
TDS
(kg)
(ppm)
1.975
17,996
Residual WaterMass
TDS
(kg)
(ppm)
1.025
41,517
Feed WaterMass
TDS
(kg)
(ppm)
3.000
17,996
Stage 3 Product WaterMass
TDS
(kg)
(ppm)
1.957
9,529
Residual WaterMass
TDS
(kg)
(ppm)
1.043
33,935
Table 4.3: Summary o f the performance data for the feed and two rectification stages.
Stage Sample Parameters Unit Value
Feed WaterMass
TDS
(kg)
(ppm)
9.837
49,074
Overall Product WaterMass
TDS
(kg)
(ppm)
1.957
9,529
Residual WaterMass
TDS
(kg)
(ppm)
7.880
58,895
Table 4.4: Overall data for the performance data for the feed and two rectification stages.
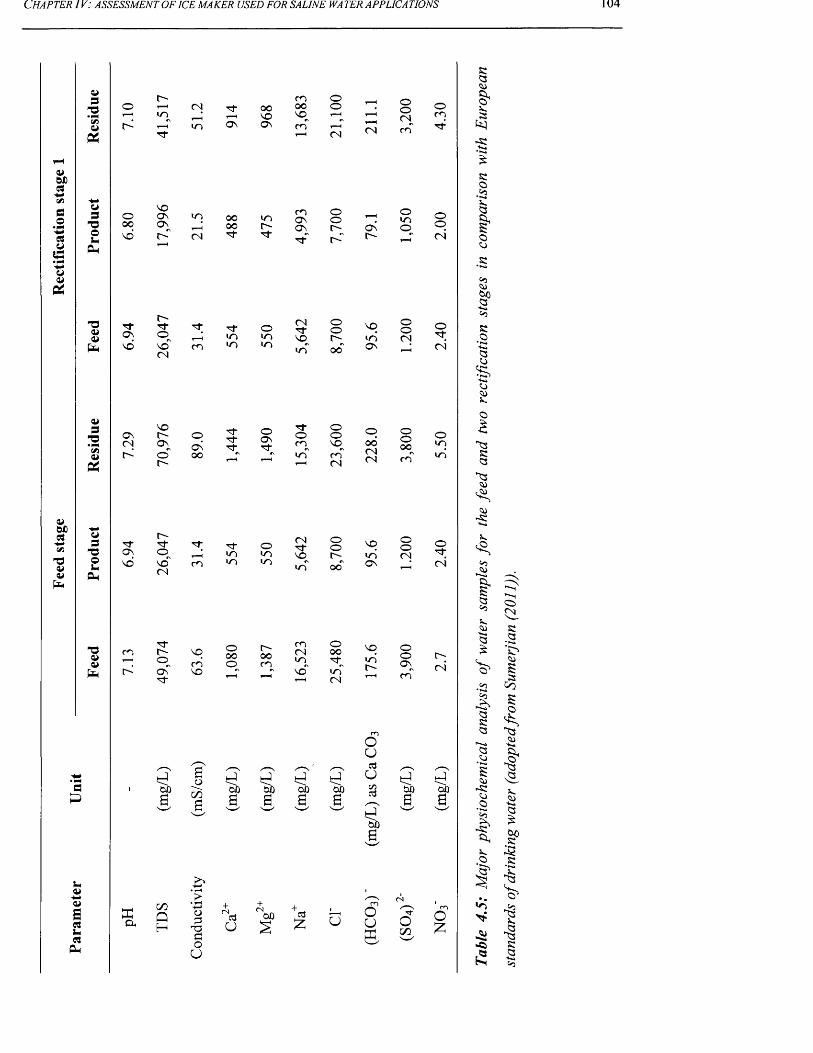
Feed
sta
ge
Rec
tific
atio
n sta
ge
1
C h a p t e r IV : a s s e s s m e n t o f ic e m a k e r u s e d f o r s a l in e w a t e r a p p l ic a t io n s 104
0o -
( N 3 " 0 0i p r“H N Ofa 1 0 O n O N
3 "
mo onom
oo
<N (N8 ^r n T t
R
§■is.
R
w3ouPm
N OO O n i n O O t o0 0
° \ 1—H O O 0
N O C "-" < N 3 " 3 "
mOnONOOr -
~ s?O N o
oo
(N
RO•S£a
oo
03S ’
-aa>a>fa
3 "O N
3 "C O
3 ;
T 13 "m
OI O
< N3 "N O
0Or -
N O
i n
OO< N
O3 -#
N O n o "( N
m I O I Oi n 0 0 "
O n 1—H < N
v33*G«u
O NN OO 0
3 "w^M
OO N3 ^
3 "O
OO
O O/*“ S O
< N O NO N
N3 ^
N O ^ O O( N( N
0 0 ^i n
f a 0 "r -
O O i n m< N
mi n
R•SQO
NjiN_
o£
R<33
R«3T9OuPm
3 "r -3 " 3 ^ 3 - 0
( N3 "
00
pO N P i n m p i nN O n o "
( Nm m i n
m " 0 0 "O N
oo(N
O3<N
-S.03<4>
T3Va>fam
3 -l > - N O
O0 0O
r -0 0m
m( N
O0 0
p c ni n 3 ^
O N3 -
N O n o " i n "C N
a£
'£i)S
aoc/5a
'OJDfa'oba
t j'Bba
tj'Bba
u<u<L>S3U3PM
ffiOhG O
QH
o333oou
3u
OJO 3£ u
N O
inr-
Ou3uC/33
~Bba
ouK
ooO N
ro(N
fa*Bba
fa'Bba
oC/5
O£
'o'
0 3
<3Ra
QJRNJ•S-R
jn..Ot<n
R
os iR.a
<4issCoo
£
t3Na_
C3£too
.R
•S
'o'
*§Ra
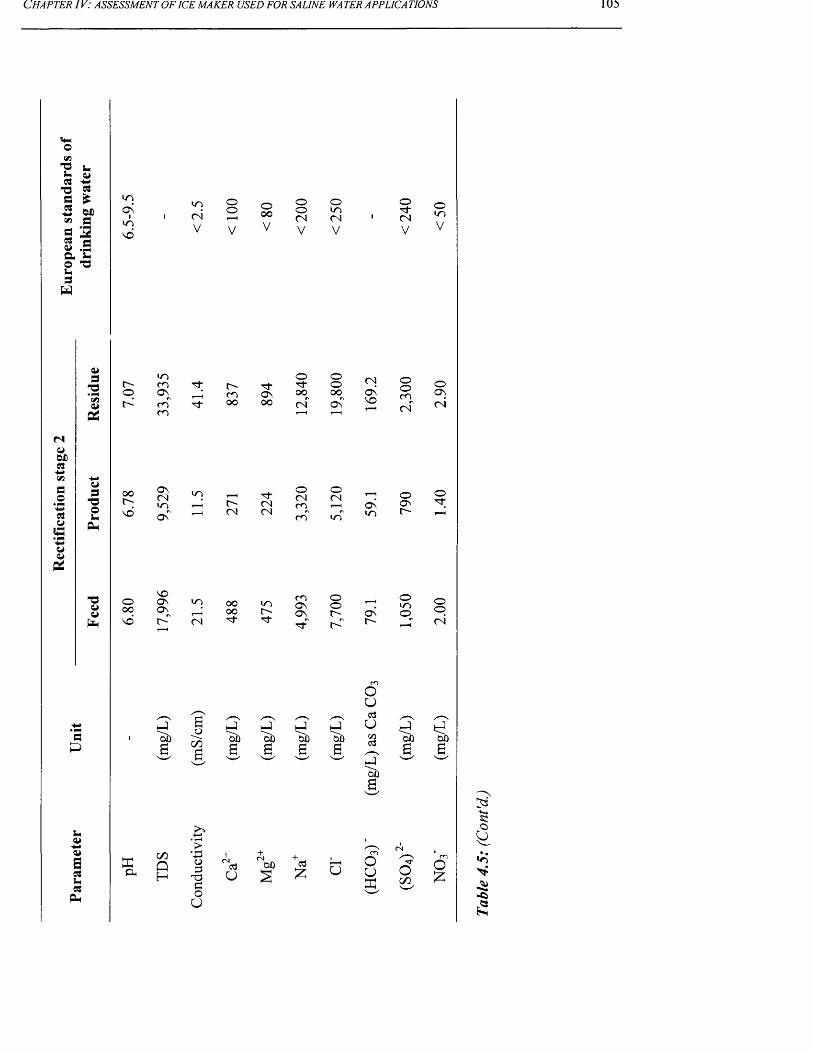
C h a p t e r IV : a s s e s s m e n t o f ic e m a k e r u s e d f o r s a l in e wa t e r a p p l ic a t io n s 105
ocnb
£ 3
a *£ wo5« a
a 3a a v .Sa iO T3 Lhs
w
idONiID
no
ID ©cm' 2
V V
oooV
ooCMV
oIDCMV
oCMV
oIDV
3'O• pN !» <W
P$
UO o oc - CO c - Tj- ^t" o© ON i—H r o ON 00^ o o
CO 3 - o o OO cm" On"CO 1 r“H
CMONNO
oo(Dcm"
o
CM
CM0» WDa
so
• pp+•»cswIS
u3
"Oou
a-
o o
NO
O nCM«DoC
r-CM
CMCM
OCMCO
oCM
ONIDoONr-
o-'3-
oo
'Oo>v
oo o
NOONON
ID OOo o
IDCOONON
oor -^ ON
NO c -" CM C-" C-
oIDo
ooCM
3P
'5b£
u<u
E3i-3
Plh
KOh
CDQH
ao
CDa
£*
o3
T33O
U
tJ"5b
tJ'Bba
dU
oo
tJ'oba 'oba
(3£ u
oud
UKfid
'5ba
oox
"cbahj'Bba
oCD
23■k»RO
L>
•o
CHAPTER IV : ASSESSMENT OF ICE MAKER USED FOR SALINE WA TER APPLICA TIONS 106
first and second rectification stages were 70,976, 41,517 and 33,935 ppm, respectively. The
residual liquids of the first and second rectification stages can be further easily treated and
concentrated by recycling these waste streams back into the feed stage, whereas the residual
liquids of feed stage can be further treated and concentrated through stripping stages. The
latter will be addressed for the case of concentrating RO brines in section 4.6.6.
With regard to ionic rejection, Table (4.5) shows that the average hardness ion values of2"b 2“b 2Ca , Mg , and (SO4) ' for the investigated seawater fed to the ice maker were 1,080, 1,387,
and 3,900 mg/L, respectively. The ice maker, over three successive freezing stages, was able
to reduce these ions down to 271, 224, and 790 mg/L, respectively. Table (4.5) also shows
that the investigated seawater contains monovalent ions, such as Na+ and Cl’, with ionic
concentrations of 16,523 and 25,480 ppm, respectively, whereas these ionic concentrations
were reduced to 3,320 and 5,120 ppm, for the same ions respectively, over the three
successive freezing stages.
In general, the ionic rejection ratios were found to be proportional to the number of
rectification stages. The ionic concentrations of the residual liquids, on the other hand, are
reduced as the number of rectification stages increased. This was due to the feed of the
subsequent stage being the product of the previous stage.
The calculations of the theoretical power consumption consumed by the feed stage, and first
and second rectification stages give about 0.105, 0.097, and 0.096 kWh/kg, respectively,
whereas the values of the experimental power consumption were 0.49, 0.34, and 0.34
kWh/kg, for the same freezing stages, respectively, as given in the Table A4-11 in Appendix
A4.
4.6.6 Multi-stage process (stripping stage)
In the fifth series of experiments, the influence of a multi-stage ice maker (falling film)
process on the degree of concentrating a RO brine, in terms of product quality, water
recovery, concentration ratio, and ionic rejections, was investigated. This was accomplished
by using RO brine as initial feed sample for the feed stage. A continuous multi-stage freezing
process was performed in four successive stages, namely a feed stage, and first, second, and
third stripping stages, to determine the potential capability of using the ice maker as a
CHAPTER IV : ASSESSMENT OF ICE MAKER USED FOR SALINE WA TER APPLICA TIONS 1U /
treatment system for concentrating RO brine. The actual operational period of the
crystallisation process for the feed, and first, second, and third stripping stages were 60, 90,
90 and 120 minutes respectively. The experimental investigation was carried out with an
average feed flow-rate of 6.15 L/min. The experiments for the feed, and first and second
stripping stages were individually repeated 4, 4, and 1 time(s), respectively, to collect the
water samples for physiochemical analysis and also to collect the final feed water for the
third stripping stage (i.e. final stage); this stage was carried out once to concentrate the
residual liquid as much as possible. A summary of the experimental data and physiochemical
analysis for the water samples of each freezing stage is given in Tables (4.6) - (4.7).
Table (4.6) shows that the average TDS value of the RO brine fed to the process was 61,104
ppm, whereas the residual liquid from the feed, and first, second, and third stripping stages
were concentrated with average TDS values of 73,178, 88,172, 97,786, and 114,102 ppm,
respectively. Table (4.6) shows that the TDS values of the product water were 34,247,
59,385, 59,541, and 70,490 ppm, for the same freezing stages respectively, while the salt
rejection ratios were 43.95, 18.85, 32.47 and 27.91 respectively. According to mass balance
calculations, the ice maker was able to produce final product water with an overall TDS
value of 51,393 ppm, which is close to the quality of Arabian Gulf beach-well seawater, with
respect to the salt concentration (see Table (4.6)). The overall water recovery and salt
rejection ratios were about 84.51 and 15.89%, respectively, where Table (4.6) shows that the
total concentration ratio was 15.49%. Table (4.6) shows that the overall results proved that
the ice maker tested was able to increase the TDS value of RO brine from 61,104 ppm up to
114,102 ppm over four successive freezing stages with concentration ratios of about 69, 48,
75, and 63% respectively. The concentration ratios for the first and third stripping stages are
less than in the feed and second stripping stages, respectively, which was mainly due to the
residual liquid remaining in the collecting tank from the previous freezing stages (i.e. feed
and second stripping stages) being used directly as feed water for the subsequent freezing
stages (i.e. first and third stripping stages).
This investigation clearly indicates that the overall concentration ratio was significantly
decreased as the number of the stripping stages increased. The results are highly
encouraging, in terms of the concentration ratio and treated water (i.e. product quality). The
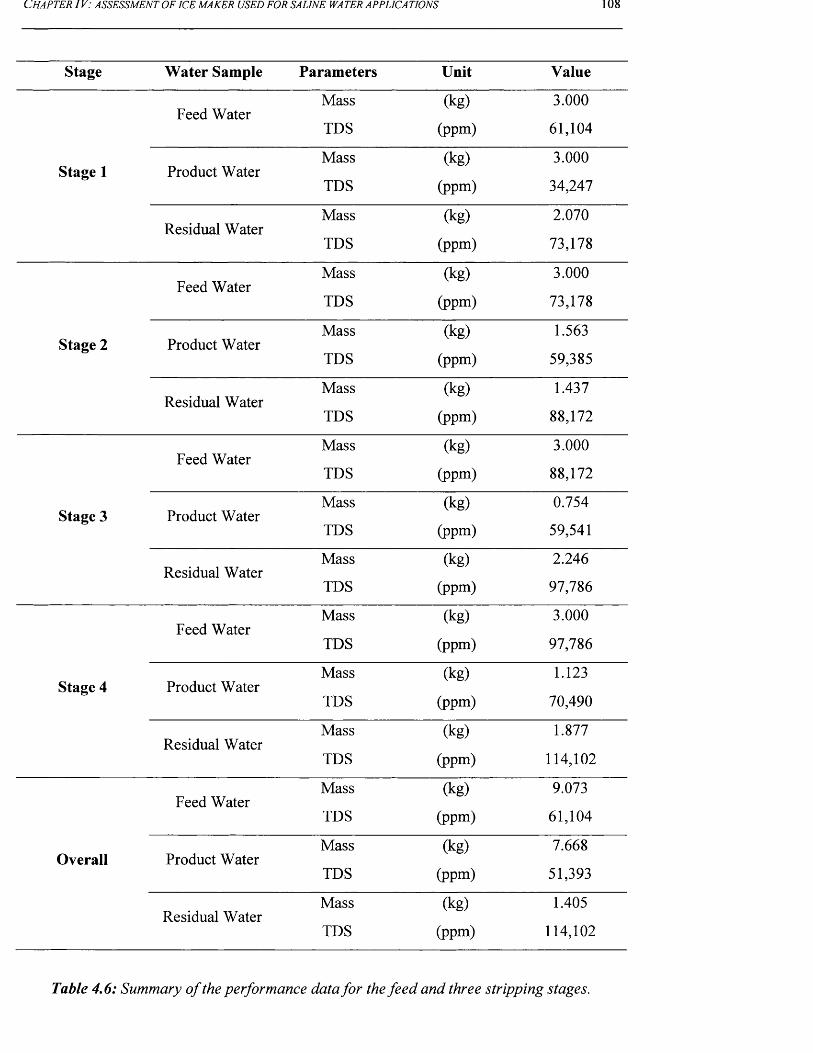
C h a p t e r 1 V: a s s e s s m e n t o f ic e m a k e r u s e d f o r s a l in e w a t e r a p p l ic a t io n s 108
Stage Water Sample Parameters Unit Value
Feed WaterMass
TDS
(kg)(ppm)
3.000
61,104
Stage 1 Product WaterMass
TDS
(kg)
(ppm)
3.000
34,247
Residual WaterMass
TDS
(kg)
(ppm)
2.070
73,178
Feed WaterMass
TDS
(kg)
(ppm)
3.000
73,178
Stage 2 Product WaterMass
TDS
(kg)
(ppm)
1.563
59,385
Residual WaterMass
TDS
(kg)
(ppm)
1.437
88,172
Feed WaterMass
TDS
(kg)
(ppm)
3.000
88,172
Stage 3 Product WaterMass
TDS
(kg)
(ppm)
0.754
59,541
Residual WaterMass
TDS
(kg)
(ppm)
2.246
97,786
Feed WaterMass
TDS
(kg)
(ppm)
3.000
97,786
Stage 4 Product WaterMass
TDS
(kg)
(ppm)
1.123
70,490
Residual WaterMass
TDS
(kg)
(ppm)
1.877
114,102
Feed WaterMass
TDS
(kg)
(ppm)
9.073
61,104
Overall Product WaterMass
TDS
(kg)
(ppm)
7.668
51,393
Residual WaterMass
TDS
(kg)
(ppm)
1.405
114,102
Table 4.6: Summary o f the performance data for the feed and three stripping stages.
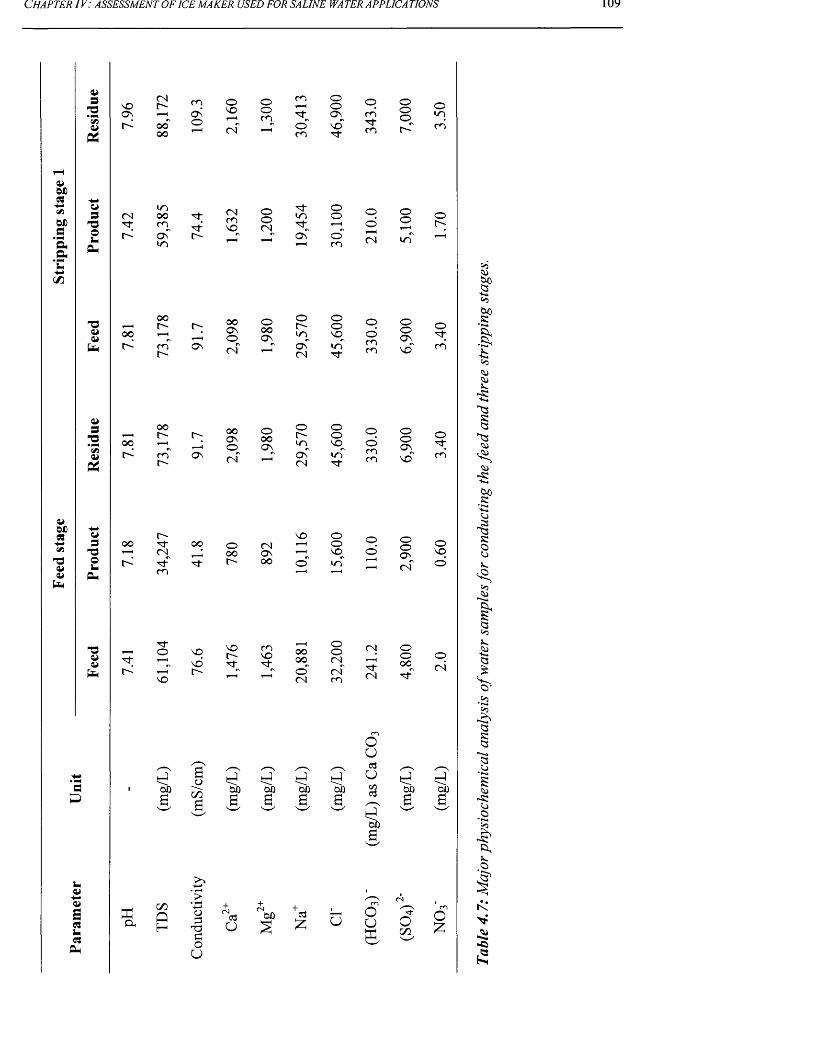
Feed
sta
ge
Stri
ppin
g sta
ge
1
C h a p t e r / V: a s s e s s m e n t o f ic e m a k e r u s e d f o r s a l in e w a t e r a p p l ic a t io n s 109
4>3'O•pm<3i&
NOON
<Nr-
oooo
ONOoNO
(N
oo 3^
o '
ooONno"3-
o o
5? §mo
u313OUffu
(N3;
moorn
3^3"
CNmNO
OO(N
3"
3^
Oo
t o O n"m
r- O n"^ t o
o"m
O©to(N
Oo or-"
! oor-" OO
ON©^
OOOON
Ol>
oo
OO to lo NOto m
t-~ON (N 1—H ON
(Nto3-
oomm
oo° \no"
o3;to
a>32*»3
, oo 00ON©^
oooON
or-
oo
00 1—to *r VOto m
r-ON <n" on"
(Nto3"
oomm
ooONNO
o3-
t<>3c>oR
&•S'1£:<4J<4>5
•s3RQ3
•R*•*boR
o3'OoI*
Ph
r-~ NO ooo 3" oo O (N i—i or—1 CN to OO ON ’—1 NOto 3-" 3" r-~ OO o" to"
m p—1 •—1
Oo
oo(N
oNOO
O'RROO
R03
13Qi3"
p— 1 O NO3- NOto ^ t o r-
NO
NOr-3-
mNO3"
ooooo'<N
oo<n "m
(N3"(N
OO00
o(N
3to
to'Bba
aoBoa
to to to to'Bb 'Bb3 'Bb3 'Bb35 C c
uouS3u3
to
XtoinOH
o0T33O
3o
oo +3£ u
ou3uoo3
to''5ba
ouffi
ooato'Bb
OmOZ
%QRaao<4J
-RO•S
.O
Ito>*■Si-O
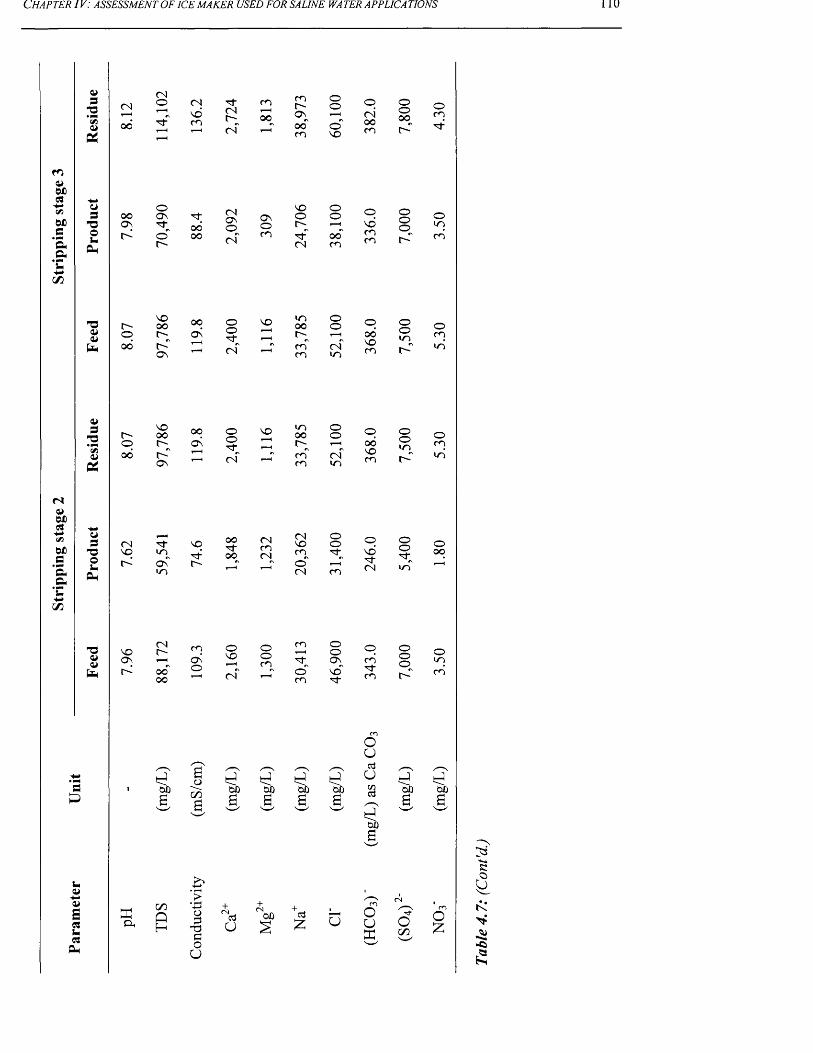
Strip
ping
sta
ge
2 St
rippi
ng
stage
3
C h a p t e r IV : a s s e s s m e n t o f ic e m a k e r u s e d f o r s a l in e wa t e r a p p l ic a t io n s 110
CHAPTER IV : ASSESSMENT OF ICE MAKER USED FOR SALINE WA TER APPLICA TIONS 111
results proved that the ice maker was able to concentrate the RO brine by a considerable
amount whilst simultaneously producing a final product of near seawater quality. This
product water can easily be further desalted by feeding it to seawater RO membranes to
obtain a final product water to drinking water standards.
• 2"b 2As for the ionic composition, the average hardness ion values of Ca , Mg , and (SO4) " for
the RO brine fed to the feed stage, were 1,476, 1,463, and 4,800 mg/L, respectively, as
illustrated in Table (4.7). The ice maker, over four successive freezing stages, was able to
significantly increase the hardness ions up to 2,724, 1,813, and 7,800 mg/L, for Ca , Mg ,
and (SO4) ', respectively. Table (4.7) also shows that the RO brine contains monovalent
ions, i.e. Na+ and CL, with ionic concentration of 20,881 and 32,200 ppm, respectively,
which were dramatically increased to 38,973 and 60,100 ppm, for the same ions,
respectively, over four successive freezing stages. In general, the ionic concentrations of the
feed and residual liquid were found to be proportional to the number of stripping stages. This
was due to the residual liquid of the previous freezing stage becoming the feed for the
subsequent freezing stage.
The calculations of the theoretical power consumption for the feed stage, and first, second,
and third stripping stages gave about 0.112, 0.107, 0.125, and 0.119 kWh/kg respectively.
The values of power consumption from experiments were 0.48, 0.66, 0.90 and 1.10 kWh/kg,
for the same freezing stages respectively, as given in the Table A4-16 in Appendix A4. In
comparison to the case of seawater desalination (see section 4.6.6), the power consumption
from experiments for concentrating RO brines is much higher than that in desalting seawater.
This is affected by the reduction in production rate since the value of the electrical loading
was constant for all experiments. This clearly indicates and confirms that the salt
concentration has a strong influence on the power consumption.
4.7 ConclusionsThe primary concern of this study was to assess the viability of desalting saline water by
means of an ice maker. The proposed treatment system was tested using NaCl solutions over
a wide range of salt concentrations. Alongside the NaCl solutions, process brines, including
Arabian Gulf seawater and RO brine, were considered in this laboratory investigation. In
addition, different parameters influencing the separation performance of the ice maker were
CHAPTER IV : ASSESSMENT OF ICE MAKER USED FOR SALINE WA TER APPLICA TIONS
studied. The process brines were also investigated over a number of freezing stages for the
purpose of water desalination and brine concentration.
The overall experimental results showed that the tested treatment system was not capable of
providing drinking water even from the low salt concentration feeds. In contrast, the
investigation showed that the ice maker was effective in concentrating high salinity feeds,
while producing saline water that could subsequently be easily desalted using any type of
conventional desalination technology. As a result, the volumes of waste streams, such as RO
brine, could be substantially reduced. For such an application, the experimental results were
highly encouraging, and proved that the investigated ice maker was technically feasible and
might be competitive with other available commercial brine concentration systems. In order
to further assess the actual separation efficiency of the falling film crystallisation technology
(which utilises similar technology as the ice maker) in the concentration of high salinity
feeds under a wider range of operating conditions (with and without use of sweating
operation), a full scale industrial pilot plant for the Sulzer falling film crystallisation process
was considered, used and investigated in the subsequent chapter.
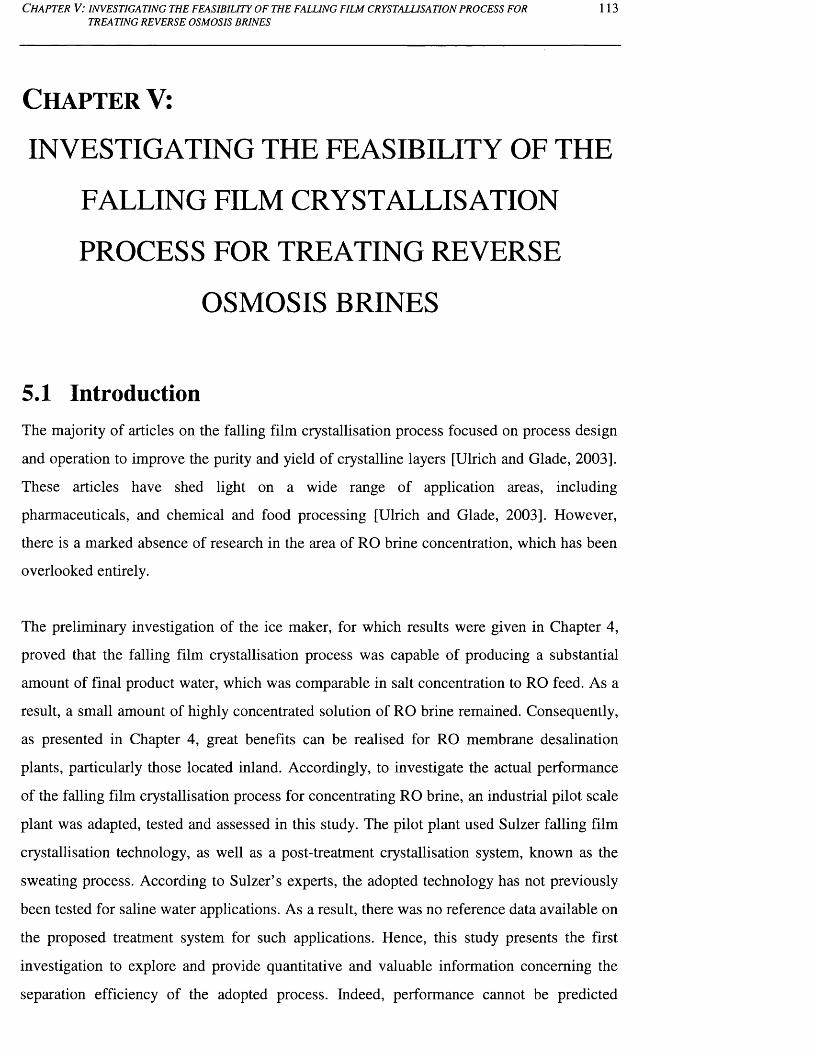
C h a p t e r V: in v e s t ig a t in g t h e f e a s ib il it y o f t h e f a l l in g f il m c r y s t a l l is a t io n p r o c e s s f o rTREATING REVERSE OSMOSIS BRINES
113
C h a p t e r V:
INVESTIGATING THE FEASIBILITY OF THE
FALLING FILM CRYSTALLISATION
PROCESS FOR TREATING REVERSE
OSMOSIS BRINES
5.1 IntroductionThe majority of articles on the falling film crystallisation process focused on process design
and operation to improve the purity and yield of crystalline layers [Ulrich and Glade, 2003].
These articles have shed light on a wide range of application areas, including
pharmaceuticals, and chemical and food processing [Ulrich and Glade, 2003]. However,
there is a marked absence of research in the area of RO brine concentration, which has been
overlooked entirely.
The preliminary investigation of the ice maker, for which results were given in Chapter 4,
proved that the falling film crystallisation process was capable of producing a substantial
amount of final product water, which was comparable in salt concentration to RO feed. As a
result, a small amount of highly concentrated solution of RO brine remained. Consequently,
as presented in Chapter 4, great benefits can be realised for RO membrane desalination
plants, particularly those located inland. Accordingly, to investigate the actual performance
of the falling film crystallisation process for concentrating RO brine, an industrial pilot scale
plant was adapted, tested and assessed in this study. The pilot plant used Sulzer falling film
crystallisation technology, as well as a post-treatment crystallisation system, known as the
sweating process. According to Sulzer’s experts, the adopted technology has not previously
been tested for saline water applications. As a result, there was no reference data available on
the proposed treatment system for such applications. Hence, this study presents the first
investigation to explore and provide quantitative and valuable information concerning the
separation efficiency of the adopted process. Indeed, performance cannot be predicted
C h a p t e r V: in v e s t ig a t in g t h e f e a s ib il it y o f t h e f a l l in g f il m c r y s t a l u s a t i o n p r o c e s s f o r
TREATING REVERSE OSMOSIS BRINES114
without carrying out experiments, since the actual performance of the process depends not
only on the physicochemical properties of RO brine (such as equilibrium diagrams), but also
on other factors concerning the process operation. Thus, this investigation provides useful
and important information on designing a complete commercial plant used as a pre
concentrator system for future application to RO brine concentration. In particular, the tested
pilot plant represents a straightforward scale up pilot plant.
The overall objective of this chapter is to assess and validate the actual technical feasibility
of using Sulzer's falling film crystallisation technology as a pre-concentration system for
concentrating RO retentate and producing final product water, which is comparable to
seawater in quality, and hence ready for immediate use as feed water for a RO membrane
plant. The specific aims of this study are:
i) To operate and test the pilot plant with use of the sweating process, and
collecting experimental data at different operating conditions.
ii) To validate and assess the influence of feed salt concentration, crystallisation
time, sweating time and operating temperatures, on the performance of the
Sulzer falling film crystallization technology and sweating process.
iii) To identify the optimal operating limits for key operating parameters in the
crystallisation and sweating operations.
iv) To investigate the performance of the rectification and stripping stages using
the adopted technology for achieving further purification and concentration
of the product and residue, respectively. Alongside the RO brine, Arabian
Gulf seawater was also used and tested as feed in this investigation.
v) To validate and assess the process’s technical merits for future application
on a commercial scale.
vi) To establish reference data on the performance of the Sulzer falling film
crystallisation processes for concentrating RO retentate. This includes a
reference physiochemical profile for water samples.
vii) To assess the separation effectiveness, under the influence of the falling film
crystallisation and sweating processes, in the rejection of the major
components of ionic concentration (e.g. Ca2+, Mg2+, (SO4)2’, (HCO3) , Cl' ,
Na+, etc) for the process brine samples.
C h a p t e r V: in v e s t ig a t in g t h e f e a s ib il it y o f t h e f a l l in g f il m c r y s t a l l is a t io n p r o c e s s f o r
TREATING REVERSE OSMOSIS BRINES115
5.1.1 Description of the Falling Film Crystallisation
Process and Basic OperationMelt crystallisation technologies are applied extensively in the purification of a wide range
of chemical substances in various application areas, such as chemical processing,
pharmaceuticals, and food processing. There are two main melt crystallisation process types,
namely suspension, and solid layer crystallisation [Ulrich and Glade, 2003; Sulzer, 2004].
Suspension crystallisation will be described later in Chapter 6. Solid layer crystallisation
technologies are classified, according to operating mode, into two main categories: batch and
continuous modes. The solid layer crystallisation in batch mode uses either a static (e.g.
stagnant melt with use of natural convection or forced convection principles) or dynamic
process (e.g. flowing melt with use of tube flow or falling film principles) [Ulrich and Glade,
2003; Sulzer, 2004]. The solid layer crystallisation with a continuous method is either a static
(e.g. stagnant melt with use of zone melting or drum crystalliser) or dynamic (e.g. flowing
melt with use of belt crystalliser) process [Ulrich and Glade, 2003; Sulzer, 2004].
The Sulzer falling film crystallisation process is characterised as a dynamic process, i.e.
flowing melt with use of the falling film principle, in batch operating mode. The Sulzer
falling film crystalliser differs from conventional falling film crystallisers and the ice maker
machine (which was tested and assessed in Chapter 4) in that it distributes the flowing melt
and Heat Transfer Medium (HTM) evenly as a falling film (via distribution systems) over the
inside and outside surfaces of the tubes, respectively, as illustrated in Figs (5.1) and (5.2).
This means that neither the shell side nor the inside of the tubes is filled with HTM or melt,
but in return, falling film principles are applied instead [Ulrich and Glade, 2003; Sulzer,
2004]. Ulrich and Glade (2003) mentioned that the refrigerant vapour condenses into a liquid
refrigerant, which is distributed on the outside tubes to wet them for refrigerating and
warming purposes. This technique enhances the refrigeration method by maintaining a
constant temperature distribution along the length of the inside and outside surfaces of
crystallizers, leading eventually to obtaining a more homogeneous thicknesses of ice [Ulrich
and Glade, 2003]. Furthermore, this method improves the efficiency of post-purification
processes, including the sweating step [Ulrich and Glade, 2003; Sulzer, 2004].
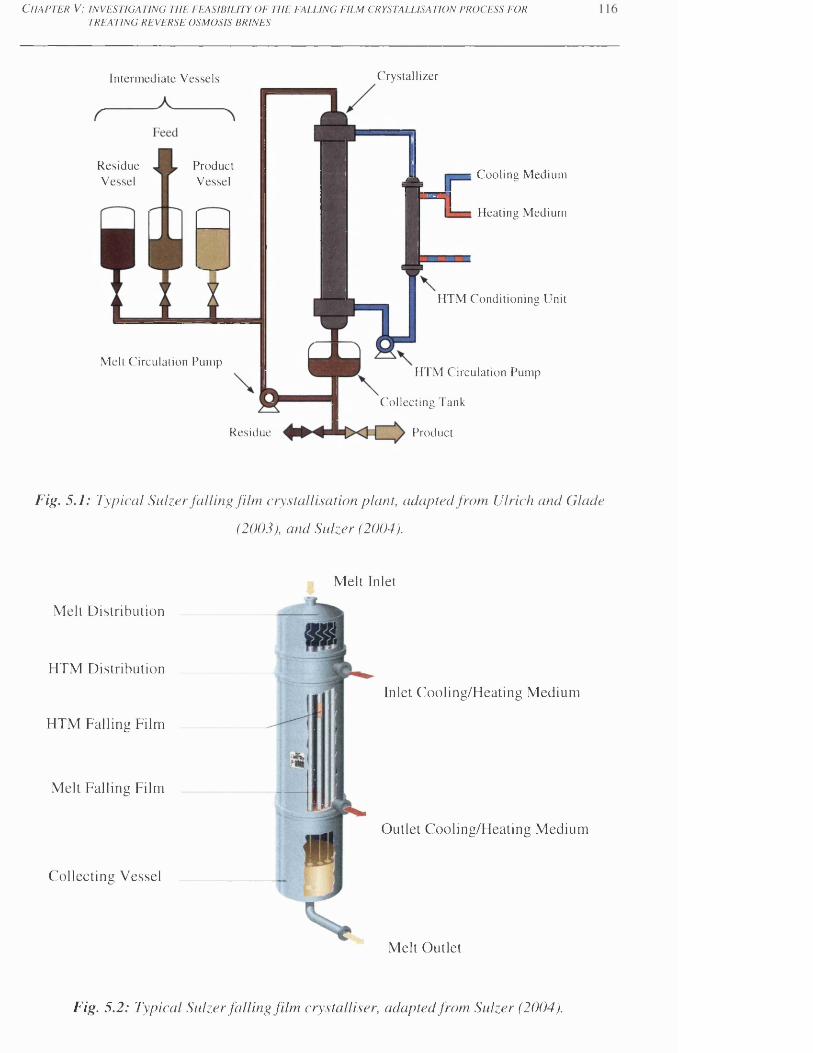
C h a p t e r V : i n v e s t i g a t i n g t h e f e a s i b i l i t y o f t h e f a l l i n g f i l m c r y s t a l l i s a t i o n p r o c e s s f o r
TREATING REVERSE OSMOSIS BRINES
Intermediate Vessels Crystallizer
ResidueVessel
ProductVessel
Melt Circulation Pump
.j. | • Cooling Medium
nHeating Medium
HTM Conditioning Unit
HTM Circulation Pump
Residue
Collecting Tank
Product
Fig. 5.1: Typical Sulzer falling film crystallisation plant, adapted from Ulrich and Glade
(2003), and Sulzer (2004).
Mcll Distribution
HTM Distribution
HTM Falling Film
Melt Falling Film
Collecting Vessel
Melt Inlet
Inlet Cooling/Heating Medium
Outlet Cooling/Heating Medium
Melt Outlet
Fig. 5.2: Typical Sulzer falling film crystalliser, adapted from Sulzer (2004).
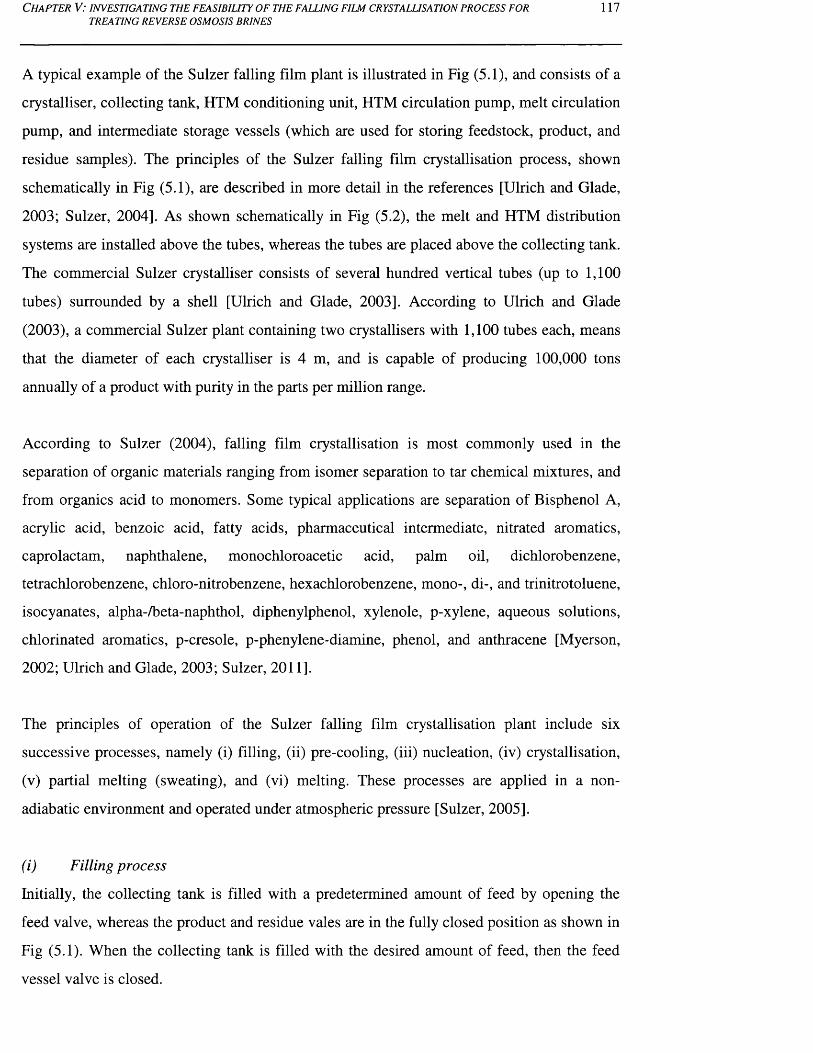
C h a p t e r V: in v e s t ig a t in g t h e f e a s ib il it y o f t h e f a l l in g f i l m c r y s t a l l is a t io n p r o c e s s f o r 117TREATING REVERSE OSMOSIS BRINES
A typical example of the Sulzer falling film plant is illustrated in Fig (5.1), and consists of a
crystalliser, collecting tank, HTM conditioning unit, HTM circulation pump, melt circulation
pump, and intermediate storage vessels (which are used for storing feedstock, product, and
residue samples). The principles of the Sulzer falling film crystallisation process, shown
schematically in Fig (5.1), are described in more detail in the references [Ulrich and Glade,
2003; Sulzer, 2004]. As shown schematically in Fig (5.2), the melt and HTM distribution
systems are installed above the tubes, whereas the tubes are placed above the collecting tank.
The commercial Sulzer crystalliser consists of several hundred vertical tubes (up to 1,100
tubes) surrounded by a shell [Ulrich and Glade, 2003]. According to Ulrich and Glade
(2003), a commercial Sulzer plant containing two crystallisers with 1,100 tubes each, means
that the diameter of each crystalliser is 4 m, and is capable of producing 100,000 tons
annually of a product with purity in the parts per million range.
According to Sulzer (2004), falling film crystallisation is most commonly used in the
separation of organic materials ranging from isomer separation to tar chemical mixtures, and
from organics acid to monomers. Some typical applications are separation of Bisphenol A,
acrylic acid, benzoic acid, fatty acids, pharmaceutical intermediate, nitrated aromatics,
caprolactam, naphthalene, monochloroacetic acid, palm oil, dichlorobenzene,
tetrachlorobenzene, chloro-nitrobenzene, hexachlorobenzene, mono-, di-, and trinitrotoluene,
isocyanates, alpha-/beta-naphthol, diphenylphenol, xylenole, p-xylene, aqueous solutions,
chlorinated aromatics, p-cresole, p-phenylene-diamine, phenol, and anthracene [Myerson,
2002; Ulrich and Glade, 2003; Sulzer, 2011].
The principles of operation of the Sulzer falling film crystallisation plant include six
successive processes, namely (i) filling, (ii) pre-cooling, (iii) nucleation, (iv) crystallisation,
(v) partial melting (sweating), and (vi) melting. These processes are applied in a non-
adiabatic environment and operated under atmospheric pressure [Sulzer, 2005].
(i) Filling process
Initially, the collecting tank is filled with a predetermined amount of feed by opening the
feed valve, whereas the product and residue vales are in the fully closed position as shown in
Fig (5.1). When the collecting tank is filled with the desired amount of feed, then the feed
vessel valve is closed.
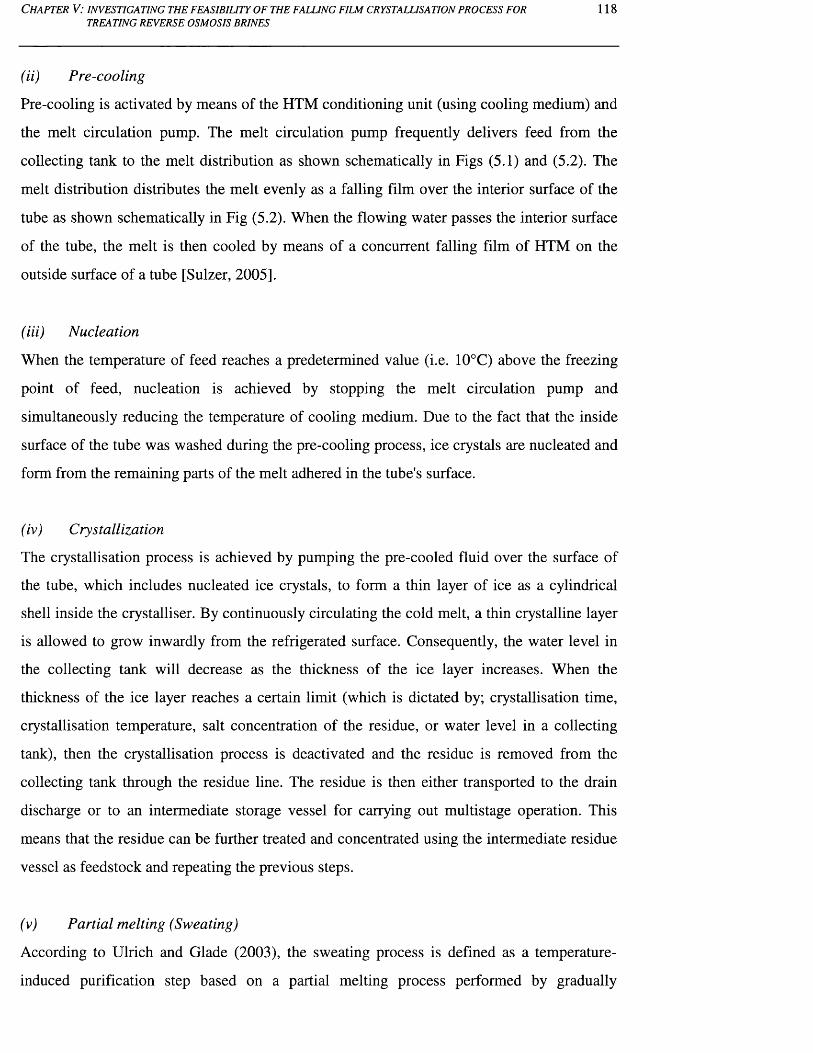
C h a p t e r V: in v e s t ig a t in g t h e f e a s ib il it y o f t h e f a l l in g f il m c r y s t a l l is a t io n p r o c e s s f o r
TREATING REVERSE OSMOSIS BRINES118
(ii) Pre-cooling
Pre-cooling is activated by means of the HTM conditioning unit (using cooling medium) and
the melt circulation pump. The melt circulation pump frequently delivers feed from the
collecting tank to the melt distribution as shown schematically in Figs (5.1) and (5.2). The
melt distribution distributes the melt evenly as a falling film over the interior surface of the
tube as shown schematically in Fig (5.2). When the flowing water passes the interior surface
of the tube, the melt is then cooled by means of a concurrent falling film of HTM on the
outside surface of a tube [Sulzer, 2005].
(iii) Nucleation
When the temperature of feed reaches a predetermined value (i.e. 10°C) above the freezing
point of feed, nucleation is achieved by stopping the melt circulation pump and
simultaneously reducing the temperature of cooling medium. Due to the fact that the inside
surface of the tube was washed during the pre-cooling process, ice crystals are nucleated and
form from the remaining parts of the melt adhered in the tube's surface.
(iv) Crystallization
The crystallisation process is achieved by pumping the pre-cooled fluid over the surface of
the tube, which includes nucleated ice crystals, to form a thin layer of ice as a cylindrical
shell inside the crystalliser. By continuously circulating the cold melt, a thin crystalline layer
is allowed to grow inwardly from the refrigerated surface. Consequently, the water level in
the collecting tank will decrease as the thickness of the ice layer increases. When the
thickness of the ice layer reaches a certain limit (which is dictated by; crystallisation time,
crystallisation temperature, salt concentration of the residue, or water level in a collecting
tank), then the crystallisation process is deactivated and the residue is removed from the
collecting tank through the residue line. The residue is then either transported to the drain
discharge or to an intermediate storage vessel for carrying out multistage operation. This
means that the residue can be further treated and concentrated using the intermediate residue
vessel as feedstock and repeating the previous steps.
(v) Partial melting (Sweating)
According to Ulrich and Glade (2003), the sweating process is defined as a temperature-
induced purification step based on a partial melting process performed by gradually
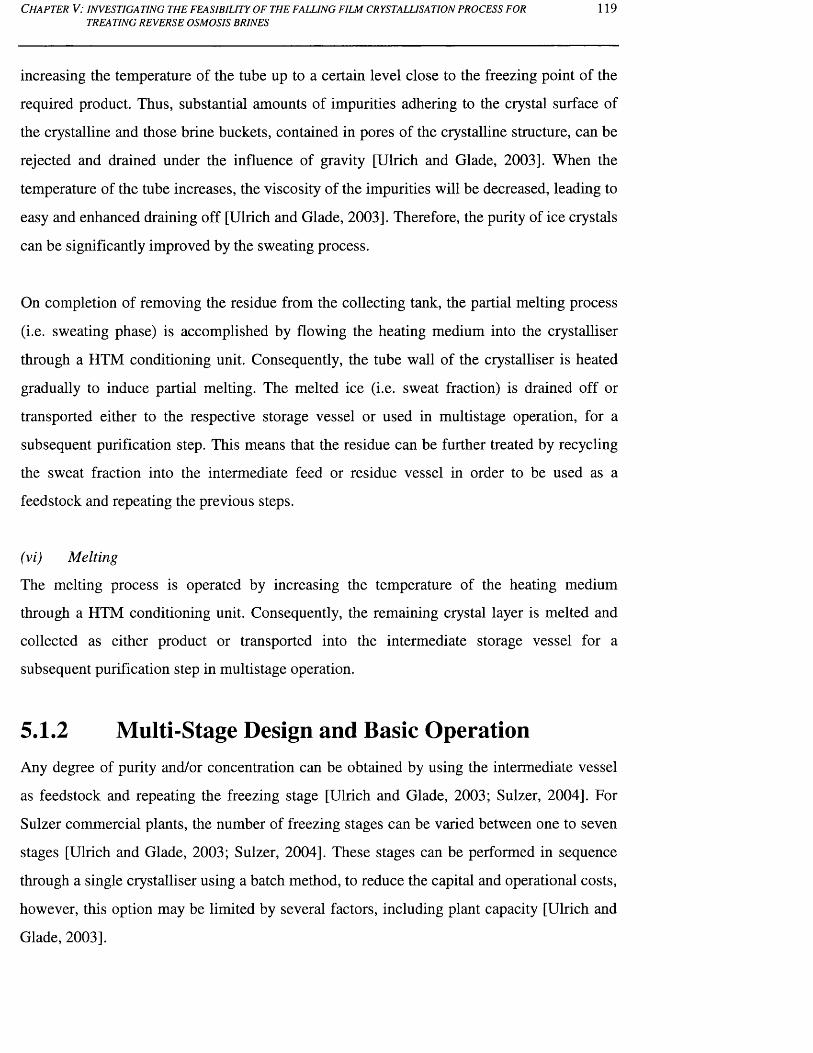
C h a p t e r V: in v e s t ig a t in g t h e f e a s ib il it y o f t h e f a l l in g f il m c r y s t a l u s a t io n p r o c e s s f o r 119TREATING REVERSE OSMOSIS BRINES
increasing the temperature of the tube up to a certain level close to the freezing point of the
required product. Thus, substantial amounts of impurities adhering to the crystal surface of
the crystalline and those brine buckets, contained in pores of the crystalline structure, can be
rejected and drained under the influence of gravity [Ulrich and Glade, 2003]. When the
temperature of the tube increases, the viscosity of the impurities will be decreased, leading to
easy and enhanced draining off [Ulrich and Glade, 2003]. Therefore, the purity of ice crystals
can be significantly improved by the sweating process.
On completion of removing the residue from the collecting tank, the partial melting process
(i.e. sweating phase) is accomplished by flowing the heating medium into the crystalliser
through a HTM conditioning unit. Consequently, the tube wall of the crystalliser is heated
gradually to induce partial melting. The melted ice (i.e. sweat fraction) is drained off or
transported either to the respective storage vessel or used in multistage operation, for a
subsequent purification step. This means that the residue can be further treated by recycling
the sweat fraction into the intermediate feed or residue vessel in order to be used as a
feedstock and repeating the previous steps.
(vi) Melting
The melting process is operated by increasing the temperature of the heating medium
through a HTM conditioning unit. Consequently, the remaining crystal layer is melted and
collected as either product or transported into the intermediate storage vessel for a
subsequent purification step in multistage operation.
5.1.2 Multi-Stage Design and Basic OperationAny degree of purity and/or concentration can be obtained by using the intermediate vessel
as feedstock and repeating the freezing stage [Ulrich and Glade, 2003; Sulzer, 2004]. For
Sulzer commercial plants, the number of freezing stages can be varied between one to seven
stages [Ulrich and Glade, 2003; Sulzer, 2004]. These stages can be performed in sequence
through a single crystalliser using a batch method, to reduce the capital and operational costs,
however, this option may be limited by several factors, including plant capacity [Ulrich and
Glade, 2003].
CHAPTER V: INVESTIGATING THE FEASIBILITY OF THE FALLING FILM CRYSTALLISATION PROCESS FOR 120TREATING REVERSE OSMOSIS BRINES
Fig (5.3) illustrates the mass flow in a three-stage process as an example of multi-stage
design. As mentioned previously, the three stages in the process are commonly known as
feed, rectification, and stripping stages [Ulrich and Glade, 2003; Sulzer, 2004]. The feed
stage represents the first freezing stage, which is mainly used for both purifying and
concentrating the product and residual liquid, respectively [Ulrich and Glade, 2003; Sulzer,
2004]. The rectification and stripping stages represent the repeated stages for purifying the
product and concentrating the residual liquid, respectively [Ulrich and Glade, 2003; Sulzer,
2004]. Fig (5.4) shows the HTM temperature profile for the feed, rectification, and stripping
stages. Fig (5.4) also shows the temperature profile of the main processes, i.e. crystallisation,
partial melting, and total melting for each freezing stage. The operating conditions of each
stage may differ from the other, as dictated by several factors, including the characteristics of
feed material, and achieving the desired quality and quantity of the product and/or residual
liquid. Therefore, the operating HTM temperatures of the main processes of the feed stage
are higher and lower than those in stripping and rectification stages respectively, as shown in
Fig (5.4). This is due to the salt concentration of the feed material fed to the rectification and
stripping stages being lower and higher, respectively, in comparison to that in the feed stage.
Fig (5.5) demonstrates the scheme of falling films of melt and HTM throughout the freezing
stage.
Product
Stripping Stage Rectification Stage
Residue
Fig. 5.3: Mass flows in a three-stage process [Ulrich and Glade, 2003; Sulzer, 2004],
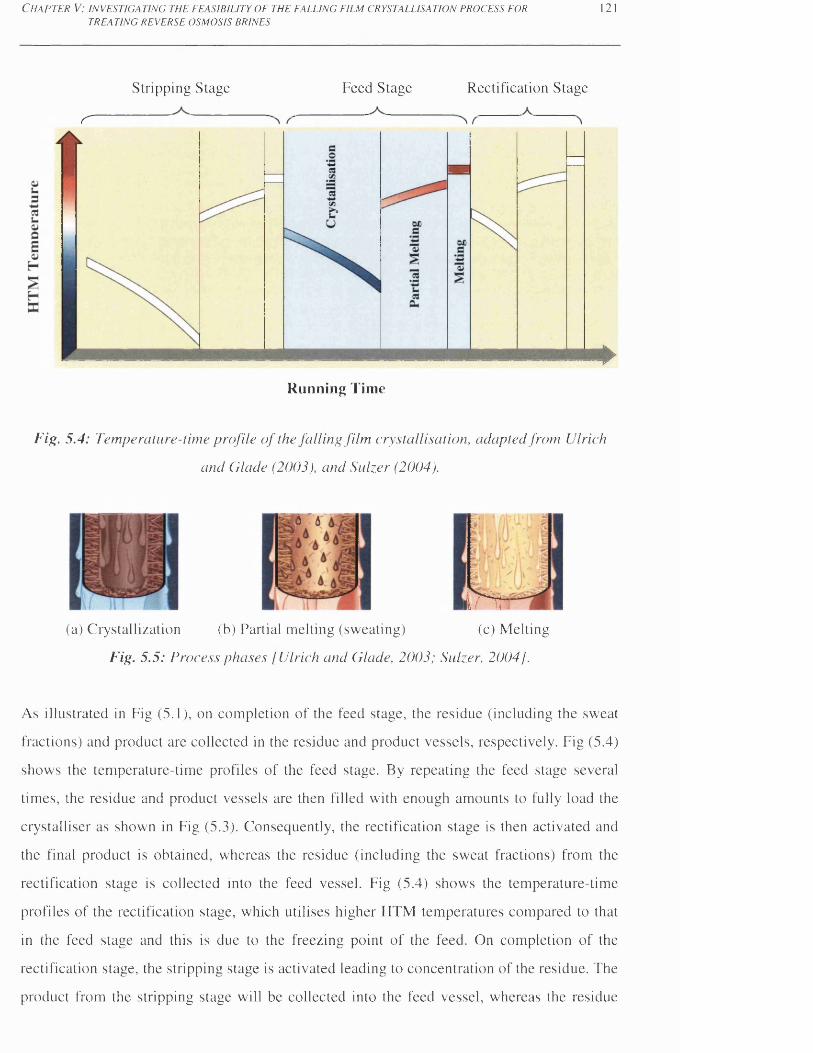
C h a p t e r V; i n v e s t i g a t i n g t h e f e a s i b i l i t y o f t h e f a l l i n g f i l m c r y s t a l l i s a t i o n p r o c e s s f o r
TREATING REVERSE OSMOSIS BRINES121
Stripping Stage
S '
Feed Stage Rectification Stage
►Running Time
Fig. 5.4: Temperature-time profile o f the falling film crystallisation, adapted from Ulrich
and Glade (2003), and Sulzer (2004).
i* 6
m i
(a) Crystallization (b) Partial melting (sweating) (c) Melting
Fig. 5.5: Process phases [Ulrich and Glade, 2003; Sulzer, 2004].
As illustrated in Fig (5.1), on completion of the feed stage, the residue (including the sweat
fractions) and product are collected in the residue and product vessels, respectively. Fig (5.4)
shows the temperature-time profiles of the feed stage. By repeating the feed stage several
times, the residue and product vessels are then filled with enough amounts to fully load the
crystalliser as shown in Fig (5.3). Consequently, the rectification stage is then activated and
the final product is obtained, whereas the residue (including the sweat fractions) from the
rectification stage is collected into the feed vessel. Fig (5.4) shows the temperature-time
profiles of the rectification stage, which utilises higher HTM temperatures compared to that
in the feed stage and this is due to the freezing point of the feed. On completion of the
rectification stage, the stripping stage is activated leading to concentration of the residue. The
product from the stripping stage will be collected into the feed vessel, whereas the residue
C h a p t e r V: in v e s t ig a t in g t h e f e a s ib il it y o f t h e f a l l in g f il m c r y s t a l l is a t io n p r o c e s s f o rTREATING REVERSE OSMOSIS BRINES
1 22
(including the sweat fractions) is drained off. Fig (5.4) shows the temperature-time profiles
of the stripping stage, which utilises lower HTM temperatures compared to that in the feed
stage.
5.2 Preparation of Feed SamplesTwo different sources of process brines were used and tested individually as a feed-sample in
this study. The examined process brines are: Arabian Gulf (AG) seawater (4.9% by weight of
dissolved salt) and reject brine (6% by weight of dissolved salt), produced from a Reverse
Osmosis (RO) membrane desalination plant. The majority of the experimental work was
carried out with RO brines as feed material. The feed water samples were collected from the
RO unit at the Doha Research Plant (DRP), Kuwait Institute for Scientific Research (KISR),
in Kuwait. These feed water samples were transported from KISR (Kuwait) to Buch SG
(Switzerland), where the laboratories of Sulzer Chemtech Ltd are located. The preparation of
feed materials was carried out as described in Chapter 4.
5.3 Physicochemical Analysis & Measuring InstrumentsThe physicochemical analysis of water samples was carried out as described in Chapter 4
(section 4.3). In addition, the measurements of freezing point were covered in this
investigation. Furthermore, the temperature profiles and running times of the pre-cooling,
crystallisation, partial melting, total melting, and freezing stage of each test were monitored
and recorded. However, the pH measurements were not considered in this study. The
physicochemical analysis of water samples was performed experimentally using the
measuring instruments, auxiliary equipment, tools, and laboratory facilities of Sulzer
Chemtech Ltd (Buchs SG, Switzerland). For further investigation, several sets of water
samples were sent to both the Doha Desalination Research Plant (DRP) laboratory and the
Central Analytical Laboratories (CAL) at KISR (Kuwait) for performing similar chemical
analysis and also carrying out full chemical analyses on water samples to detect the major
ionic composition. Results of these measurements are tabulated in Tables A5-4 - A5-9 in
Appendix A5.
The salt concentration of the feed sample was measured via a conductivity meter (Cond
3110, Tetra Cond 325) and a conductivity probe (Conductivity probe model: TetraCon 325,
C h a p t e r V: in v e s t ig a t in g t h e f e a s ib il it y o f t h e f a l l in g f il m c r y s t a l u s a t io n p r o c e s s f o r
TREATING REVERSE OSMOSIS BRINES123
Wissenschaftlich-Technische Werkstatten GmbH) to ensure that the correct concentration
was achieved. The measurements of TDS were experimentally determined, using the
gravimetric method, by evaporating a known weight of the water sample to dryness, and
weighing the solid residue. The equipment involved in obtaining gravimetric measurements
are an oven (Heraeus instruments, Type: UT 12P, D-63450 Hanau, Kendro Laboratory
Products), Petri dish, and laboratory balance (Mettler PM 460, Delta Range, CH-8606). The
accuracy of salt concentration results was assured through a simple mass balance equation.
The volume and weight measurements, on the other hand, were determined by a laboratory
beaker, scaled borosilicate glass cylinder (Barcode: CYL-350-020J, Fisher Scientific) and a
laboratory balance (Mettler Toledo, Model: PM30-K). The running time for the
crystallization process was measured by a stopwatch timer (HS-10W Stopwatch, Casio).
The freezing points were experimentally measured with an instant digital thermometer (P650
series, Serial No.: 65006040472) and a temperature sensor (PtlOO, IEC A 240119-1), while
the refrigeration system consisted of the following equipment; (a) thermostatic bath (Haake
C, Type: 001-0505, Nr: 840096), (b) PID temperature controller (Haake PG 40, Type: 000-
9030, Nr: 830264), (c) bath circulator (Haake F3, Type: 000-9601, Nr: 840117), and Heat
Transfer Medium (HTM), which is a mixture of ethylene glycol and deionised water.
The measuring instruments involved in the full water chemistry analysis, including their
measuring procedures, are described in Chapter 4.
5.4 Experimental SetupFigs (5.6) and (5.7) show the Sulzer falling film crystallisation pilot unit used by Sulzer for
investigating new fields of application. This pilot plant was used and tested in this study. The
description of the pilot plant and basic operation is available in section 5.1.1. Although
Sulzer Chemtech Ltd commercialises complete test units that are completely equipped with
all necessary equipment, including the cooling compressors [Ulrich and Glade, 2003; Sulzer,
20111, the examined pilot plant does not include a complete built-in refrigeration unit. The
pilot plant is connected to a Heat Transfer Medium (HTM) conditioning unit, which
represents the main refrigeration system (Elektroschema NR 1.054.692, Dowtherm-
Kiihlanlage-65°C, Fur Kristallisations-Labor, R 404a, Dowtherm, using organic heat transfer

C h a p t e r V: i n v e s t i g a t i n g t h e f e a s i b i l i t y o f t h e f a l l i n g f i l m c r y s t a l l i s a t i o n p r o c e s s f o r
TREATING REVERSE OSMOSIS BRINES124
Crystallizer's T uh
Sight Glas
Collecting Tan
Flow Control Valv
Drain Valv
Crystallizer'sTube
Funnel
Flexible Light
CirculationPump
Location
(a) Left-hand side view of pilot plant (b) Right-hand side view of pilot plant
(c) Funnel (d) Sight glass & water level Indicator
(e) Drain valve (i.e. sampling point) (f) Monitoring ice suspension
Fig. 5.6 : Tested Sulzer falling film crystallisation pilot plant.
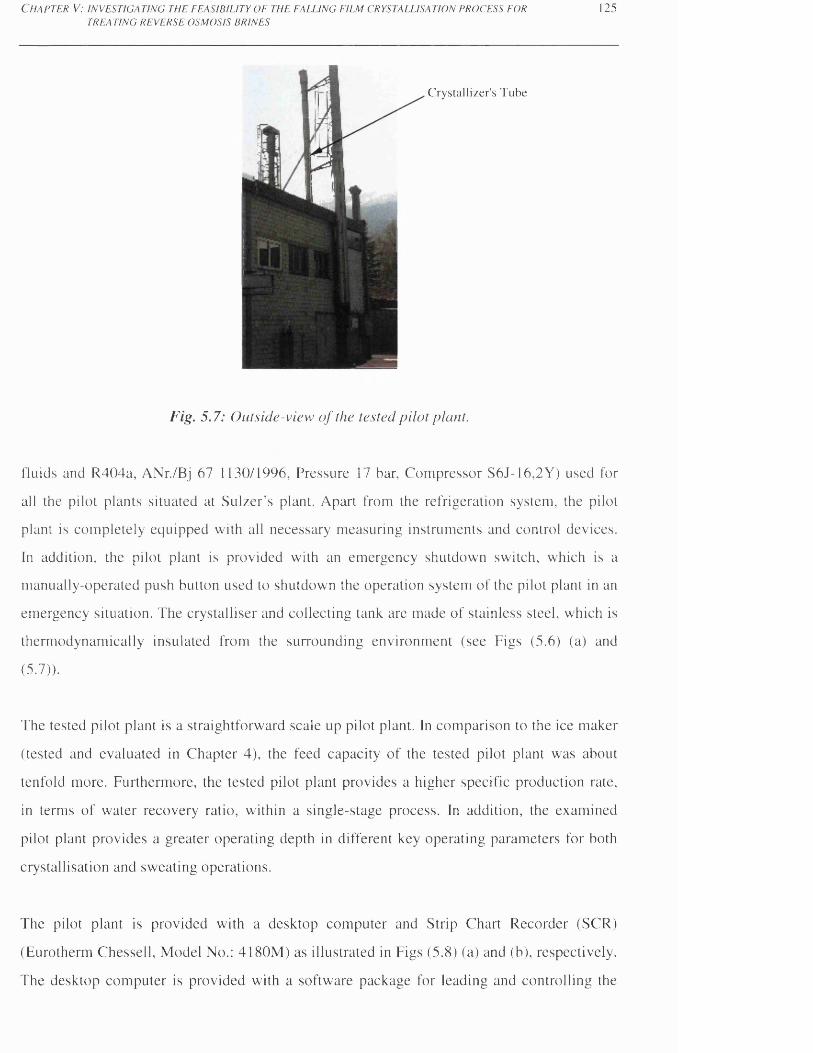
C h a p t e r V: i n v e s t i g a t i n g t h e f e a s i b i l i t y o f t h e f a l l i n g f i l m c r y s t a l l i s a t i o n p r o c e s s f o r
TREATING REVERSE OSMOSIS BRINES125
Crystallizer's Tube
Fig. 5.7: Outside-view o f the tested pdot plant.
fluids and R404a, ANr./Bj 67 1130/1996, Pressure 17 bar, Compressor S6J-16,2Y) used for
all the pilot plants situated at Sulzer’s plant. Apart from the refrigeration system, the pilot
plant is completely equipped with all necessary measuring instruments and control devices.
In addition, the pilot plant is provided with an emergency shutdown switch, which is a
manually-operated push button used to shutdown the operation system of the pilot plant in an
emergency situation. The crystalliser and collecting tank are made of stainless steel, which is
thermodynamically insulated from the surrounding environment (see Figs (5.6) (a) and
(5.7)).
The tested pilot plant is a straightforward scale up pilot plant. In comparison to the ice maker
(tested and evaluated in Chapter 4), the feed capacity of the tested pilot plant was about
tenfold more. Furthermore, the tested pilot plant provides a higher specific production rate,
in terms of water recovery ratio, within a single-stage process. In addition, the examined
pilot plant provides a greater operating depth in different key operating parameters for both
crystallisation and sweating operations.
The pilot plant is provided with a desktop computer and Strip Chart Recorder (SCR)
(Eurotherm Chessell, Model No.: 4180M) as illustrated in Figs (5.8) (a) and (b), respectively.
The desktop computer is provided with a software package for leading and controlling the
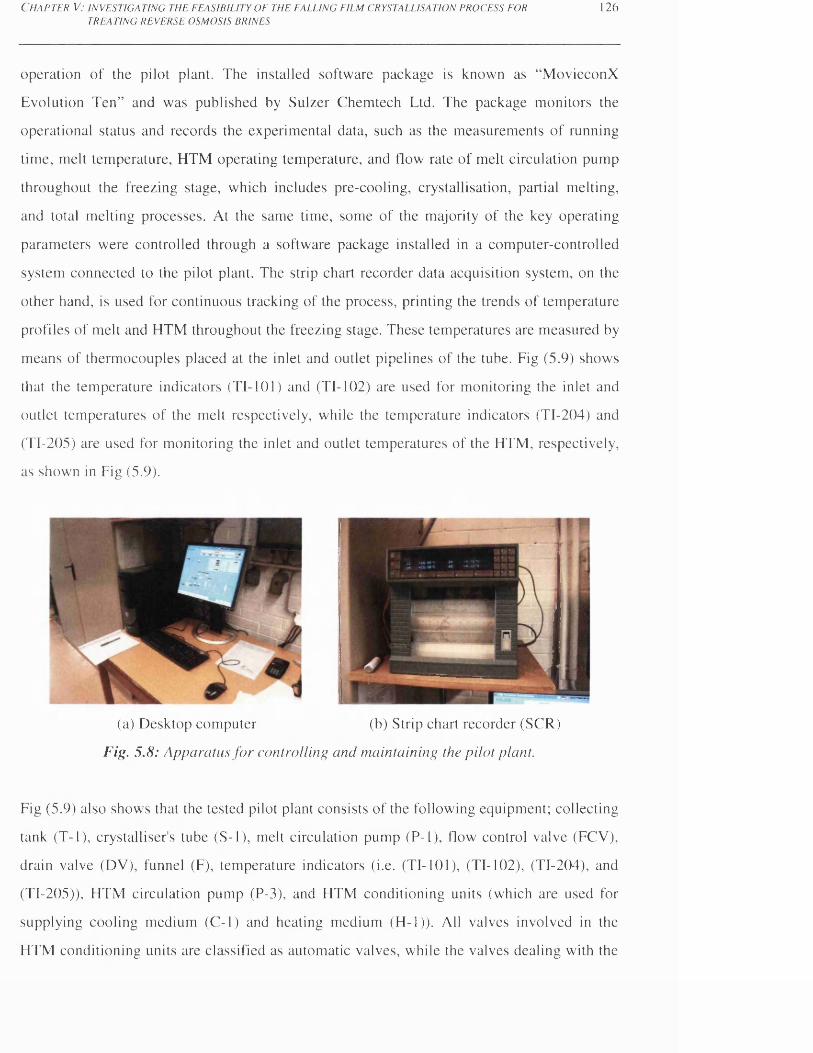
C h a p t e r V: i n v e s t i g a t i n g t h e f e a s i b i l i t y o f t h e f a l l i n g f i l m c r y s t a l l i s a t i o n p r o c e s s f o r
TREATING REVERSE OSMOSIS BRINES126
operation of the pilot plant. The installed software package is known as “MovieconX
Evolution Ten” and was published by Sulzer Chemtech Ltd. The package monitors the
operational status and records the experimental data, such as the measurements of running
time, melt temperature, HTM operating temperature, and flow rate of melt circulation pump
throughout the freezing stage, which includes pre-cooling, crystallisation, partial melting,
and total melting processes. At the same time, some of the majority of the key operating
parameters were controlled through a software package installed in a computer-controlled
system connected to the pilot plant. The strip chart recorder data acquisition system, on the
other hand, is used for continuous tracking of the process, printing the trends of temperature
profiles of melt and HTM throughout the freezing stage. These temperatures are measured by
means of thermocouples placed at the inlet and outlet pipelines of the tube. Fig (5.9) shows
that the temperature indicators (TI-101) and (TI-102) are used for monitoring the inlet and
outlet temperatures of the melt respectively, while the temperature indicators (TI-204) and
(TI-205) are used for monitoring the inlet and outlet temperatures of the HTM, respectively,
as shown in Fig (5.9).
(a) Desktop computer (b) Strip chart recorder (SCR)
Fig. 5.8: Apparatus fo r controlling and maintaining the pilot plant.
Fig (5.9) also shows that the tested pilot plant consists of the following equipment; collecting
tank (T-l), crystalliser's tube (S-l), melt circulation pump (P-l), flow control valve (FCV),
drain valve (DV), funnel (F), temperature indicators (i.e. (TI-101), (Tl-102), (TI-204), and
(TI-205)), HTM circulation pump (P-3), and HTM conditioning units (which are used for
supplying cooling medium (C-l) and heating medium (H-l)). All valves involved in the
HTM conditioning units are classified as automatic valves, while the valves dealing with the
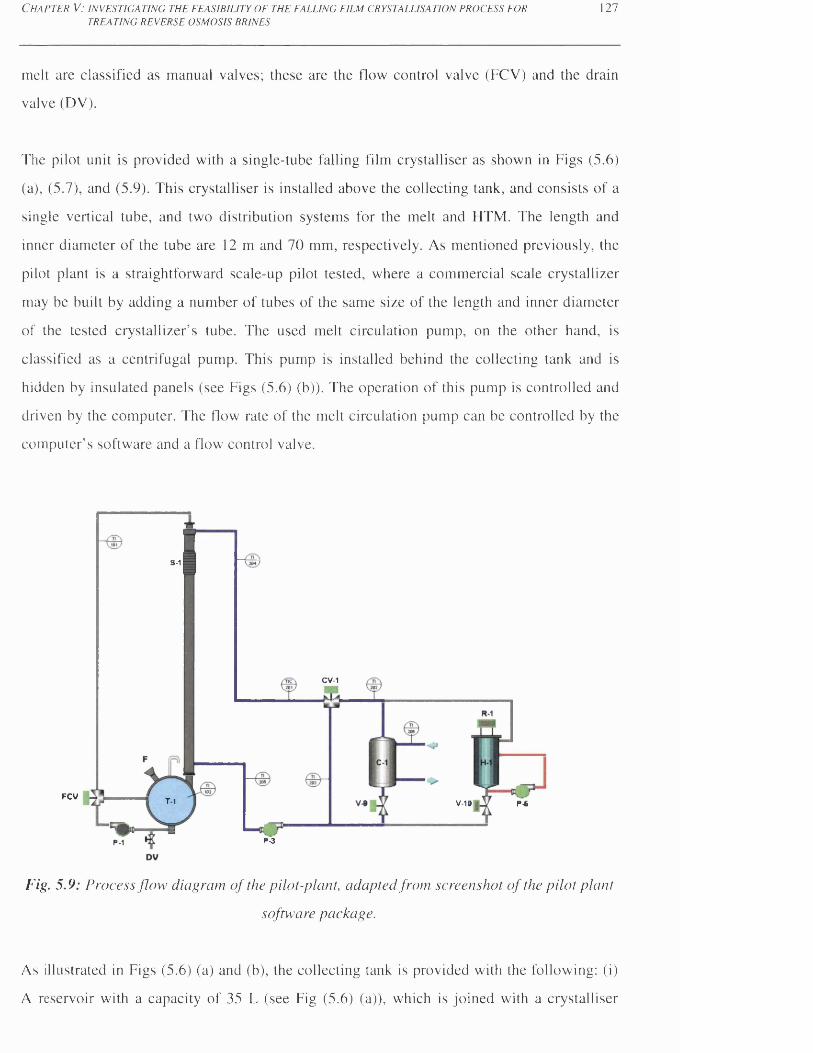
C h a p t e r V: i n v e s t i g a t i n g t h e f e a s i b i l i t y o f t h e f a l l i n g f i l m c r y s t a l l i s a t i o n p r o c e s s f o r
TREATING REVERSE OSMOSIS BRINES127
melt are classified as manual valves; these are the flow control valve (FCV) and the drain
valve (DV).
The pilot unit is provided with a single-tube falling film crystalliser as shown in Figs (5.6)
(a), (5.7), and (5.9). This crystalliser is installed above the collecting tank, and consists of a
single vertical tube, and two distribution systems for the melt and HTM. The length and
inner diameter of the tube are 12 m and 70 mm, respectively. As mentioned previously, the
pilot plant is a straightforward scale-up pilot tested, where a commercial scale crystallizer
may be built by adding a number of tubes of the same size of the length and inner diameter
of the tested crystallizer’s tube. The used melt circulation pump, on the other hand, is
classified as a centrifugal pump. This pump is installed behind the collecting tank and is
hidden by insulated panels (see Figs (5.6) (b)). The operation of this pump is controlled and
driven by the computer. The flow rate of the melt circulation pump can be controlled by the
computer’s software and a flow control valve.
S-1
CV-1
FCV T-1 V-10 P-6
P-1 P-3
Fig. 5.9: Process flow diagram o f the pilot-plant, adapted from screenshot o f the pilot plant
software package.
As illustrated in Figs (5.6) (a) and (b), the collecting tank is provided with the following: (i)
A reservoir with a capacity of 35 L (see Fig (5.6) (a)), which is joined with a crystalliser
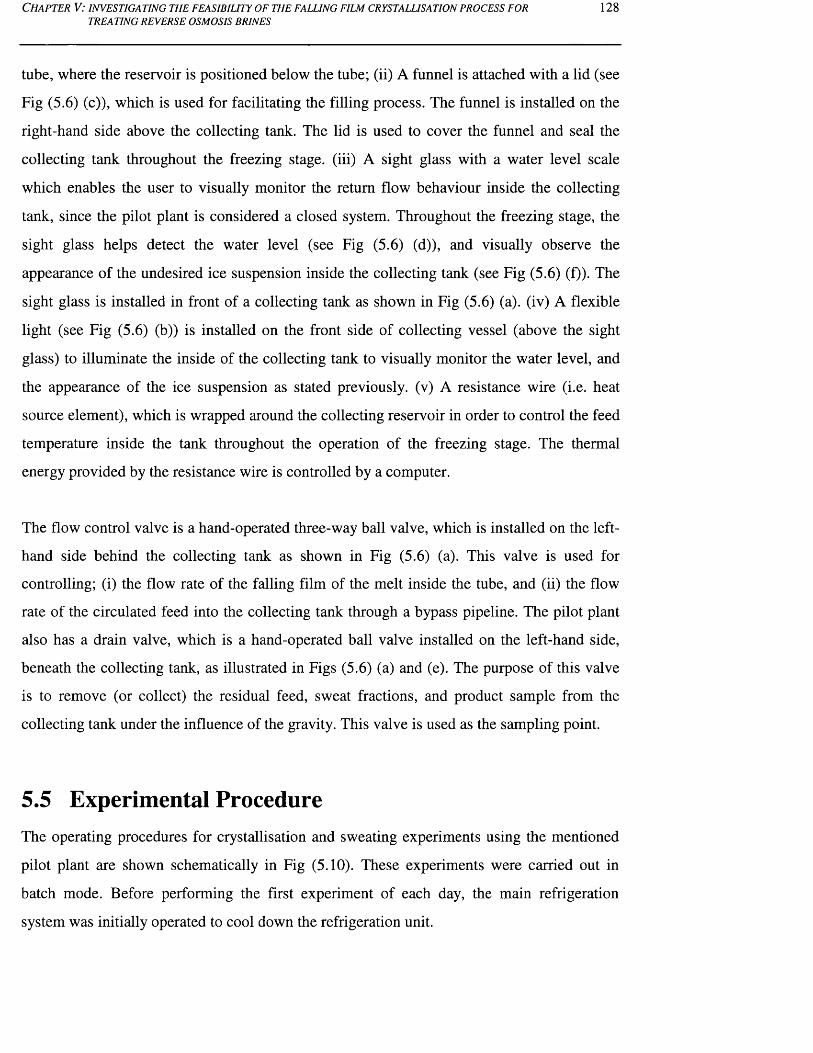
C h a p t e r V: in v e s t ig a t in g t h e f e a s ib il it y o f t h e f a l l in g f il m c r y s t a l l is a t io n p r o c e s s f o r 128TREATING REVERSE OSMOSIS BRINES
tube, where the reservoir is positioned below the tube; (ii) A funnel is attached with a lid (see
Fig (5.6) (c)), which is used for facilitating the filling process. The funnel is installed on the
right-hand side above the collecting tank. The lid is used to cover the funnel and seal the
collecting tank throughout the freezing stage, (iii) A sight glass with a water level scale
which enables the user to visually monitor the return flow behaviour inside the collecting
tank, since the pilot plant is considered a closed system. Throughout the freezing stage, the
sight glass helps detect the water level (see Fig (5.6) (d)), and visually observe the
appearance of the undesired ice suspension inside the collecting tank (see Fig (5.6) (f)). The
sight glass is installed in front of a collecting tank as shown in Fig (5.6) (a), (iv) A flexible
light (see Fig (5.6) (b)) is installed on the front side of collecting vessel (above the sight
glass) to illuminate the inside of the collecting tank to visually monitor the water level, and
the appearance of the ice suspension as stated previously, (v) A resistance wire (i.e. heat
source element), which is wrapped around the collecting reservoir in order to control the feed
temperature inside the tank throughout the operation of the freezing stage. The thermal
energy provided by the resistance wire is controlled by a computer.
The flow control valve is a hand-operated three-way ball valve, which is installed on the left-
hand side behind the collecting tank as shown in Fig (5.6) (a). This valve is used for
controlling; (i) the flow rate of the falling film of the melt inside the tube, and (ii) the flow
rate of the circulated feed into the collecting tank through a bypass pipeline. The pilot plant
also has a drain valve, which is a hand-operated ball valve installed on the left-hand side,
beneath the collecting tank, as illustrated in Figs (5.6) (a) and (e). The purpose of this valve
is to remove (or collect) the residual feed, sweat fractions, and product sample from the
collecting tank under the influence of the gravity. This valve is used as the sampling point.
5.5 Experimental ProcedureThe operating procedures for crystallisation and sweating experiments using the mentioned
pilot plant are shown schematically in Fig (5.10). These experiments were carried out in
batch mode. Before performing the first experiment of each day, the main refrigeration
system was initially operated to cool down the refrigeration unit.
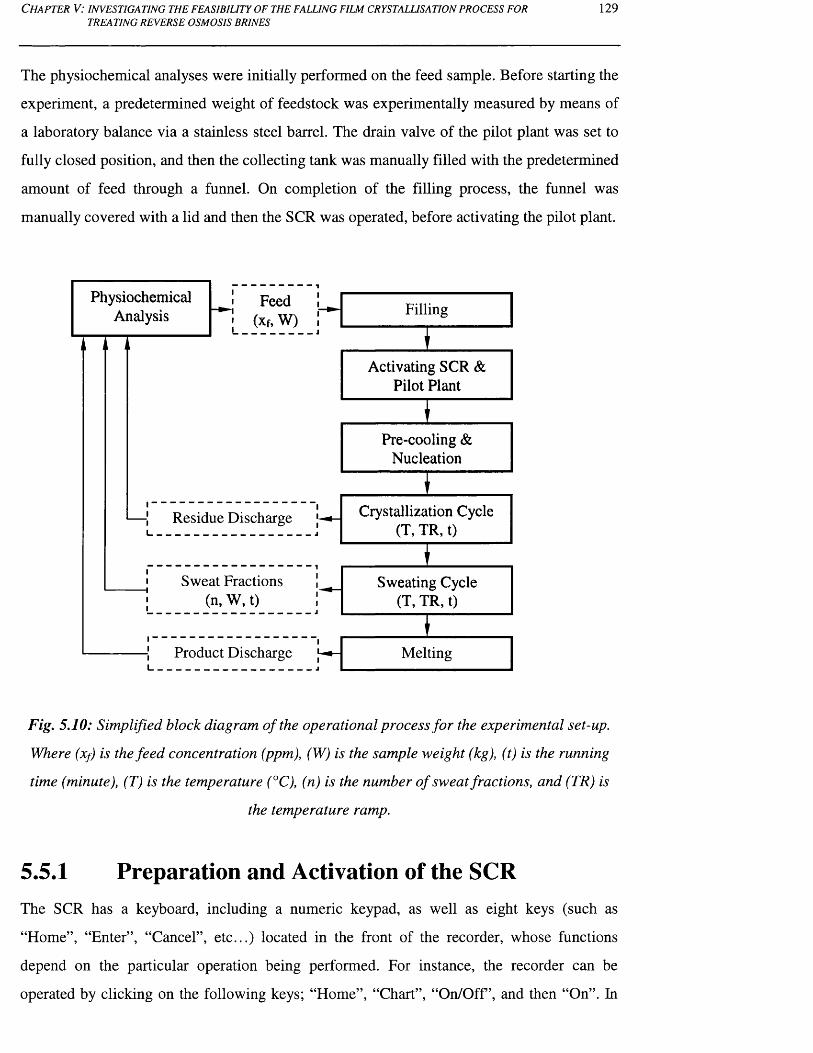
C h a p t e r V: in v e s t ig a t in g t h e f e a s ib il it y o f t h e f a l l in g f il m c r y s t a l u s a t io n p r o c e s s f o r
TREATING REVERSE OSMOSIS BRINES129
The physiochemical analyses were initially performed on the feed sample. Before starting the
experiment, a predetermined weight of feedstock was experimentally measured by means of
a laboratory balance via a stainless steel barrel. The drain valve of the pilot plant was set to
fully closed position, and then the collecting tank was manually filled with the predetermined
amount of feed through a funnel. On completion of the filling process, the funnel was
manually covered with a lid and then the SCR was operated, before activating the pilot plant.
Residue Discharge
Sweat Fractions (n, W, t)
Product Discharge Melting
FillingPhysiochemical
Analysis
Sweating Cycle (T, TR, t)
Crystallization Cycle (T, TR, t)
Pre-cooling & Nucleation
Activating SCR & Pilot Plant
Fig. 5.10: Simplified block diagram of the operational process for the experimental set-up.
Where (x/) is the feed concentration (ppm), (W) is the sample weight (kg), (t) is the running
time (minute), (T) is the temperature (°C), (n) is the number o f sweat fractions, and (TR) is
the temperature ramp.
5.5.1 Preparation and Activation of the SCRThe SCR has a keyboard, including a numeric keypad, as well as eight keys (such as
“Home”, “Enter”, “Cancel”, etc...) located in the front of the recorder, whose functions
depend on the particular operation being performed. For instance, the recorder can be
operated by clicking on the following keys; “Home”, “Chart”, “On/Off’, and then “On”. In
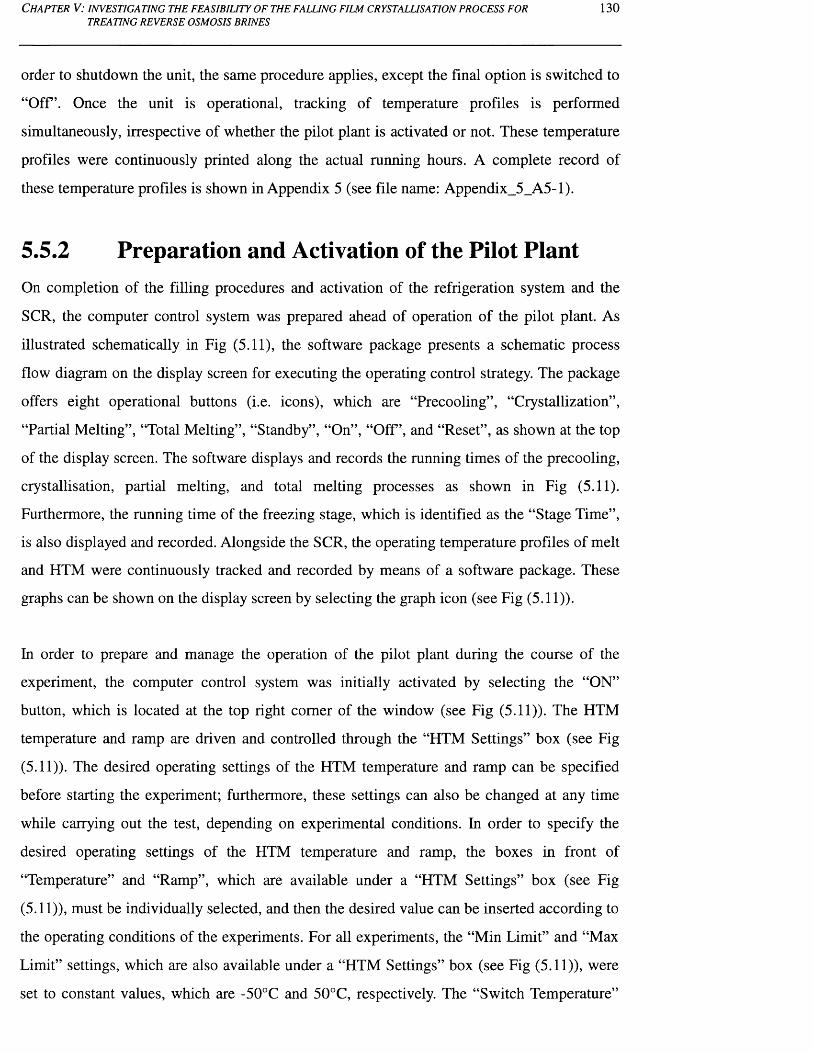
C h a p t e r V: in v e s t ig a t in g t h e f e a s ib il it y o f t h e f a l l in g f il m c r y s t a l l is a t io n p r o c e s s f o rTREATING REVERSE OSMOSIS BRINES
130
order to shutdown the unit, the same procedure applies, except the final option is switched to
“O ff’. Once the unit is operational, tracking of temperature profiles is performed
simultaneously, irrespective of whether the pilot plant is activated or not. These temperature
profiles were continuously printed along the actual running hours. A complete record of
these temperature profiles is shown in Appendix 5 (see file name: Appendix_5_A5-l).
5.5.2 Preparation and Activation of the Pilot PlantOn completion of the filling procedures and activation of the refrigeration system and the
SCR, the computer control system was prepared ahead of operation of the pilot plant. As
illustrated schematically in Fig (5.11), the software package presents a schematic process
flow diagram on the display screen for executing the operating control strategy. The package
offers eight operational buttons (i.e. icons), which are “Precooling”, “Crystallization”,
“Partial Melting”, “Total Melting”, “Standby”, “On”, “O ff’, and “Reset”, as shown at the top
of the display screen. The software displays and records the running times of the precooling,
crystallisation, partial melting, and total melting processes as shown in Fig (5.11).
Furthermore, the running time of the freezing stage, which is identified as the “Stage Time”,
is also displayed and recorded. Alongside the SCR, the operating temperature profiles of melt
and HTM were continuously tracked and recorded by means of a software package. These
graphs can be shown on the display screen by selecting the graph icon (see Fig (5.11)).
In order to prepare and manage the operation of the pilot plant during the course of the
experiment, the computer control system was initially activated by selecting the “ON”
button, which is located at the top right comer of the window (see Fig (5.11)). The HTM
temperature and ramp are driven and controlled through the “HTM Settings” box (see Fig
(5.11)). The desired operating settings of the HTM temperature and ramp can be specified
before starting the experiment; furthermore, these settings can also be changed at any time
while carrying out the test, depending on experimental conditions. In order to specify the
desired operating settings of the HTM temperature and ramp, the boxes in front of
“Temperature” and “Ramp”, which are available under a “HTM Settings” box (see Fig
(5.11)), must be individually selected, and then the desired value can be inserted according to
the operating conditions of the experiments. For all experiments, the “Min Limit” and “Max
Limit” settings, which are also available under a “HTM Settings” box (see Fig (5.11)), were
set to constant values, which are -50°C and 50°C, respectively. The “Switch Temperature”
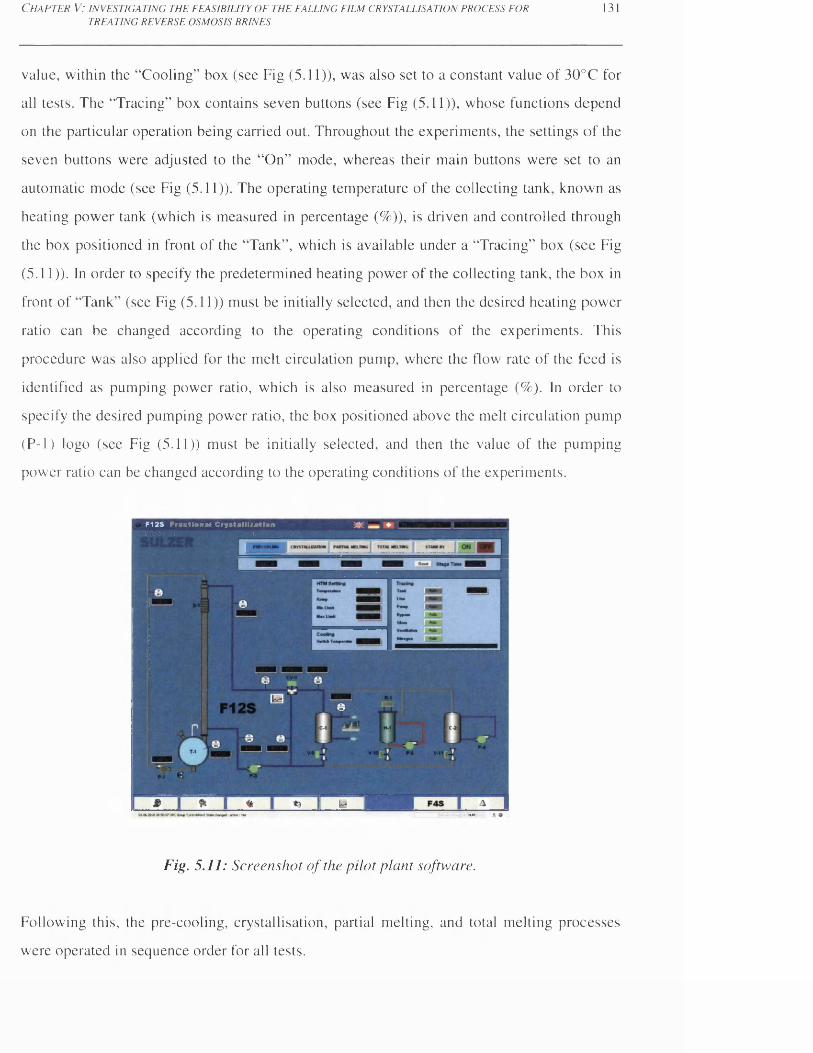
C h a p t e r V: i n v e s t i g a t i n g t h e f e a s i b i l i t y o f t h e f a l l i n g f i l m c r y s t a l l i s a t i o n p r o c e s s f o r 131TREATING REVERSE OSMOSIS BRINES
value, within the “Cooling” box (see Fig (5.11)), was also set to a constant value of 30°C for
all tests. The “Tracing” box contains seven buttons (see Fig (5.11)), whose functions depend
on the particular operation being carried out. Throughout the experiments, the settings of the
seven buttons were adjusted to the “On” mode, whereas their main buttons were set to an
automatic mode (see Fig (5.11)). The operating temperature of the collecting tank, known as
heating power tank (which is measured in percentage (%)), is driven and controlled through
the box positioned in front of the “Tank”, which is available under a “Tracing” box (see Fig
(5.11)). In order to specify the predetermined heating power of the collecting tank, the box in
front of “Tank” (see Fig (5.11)) must be initially selected, and then the desired heating power
ratio can be changed according to the operating conditions of the experiments. This
procedure was also applied for the melt circulation pump, where the flow rate of the feed is
identified as pumping power ratio, which is also measured in percentage (%). In order to
specify the desired pumping power ratio, the box positioned above the melt circulation pump
(P-l) logo (see Fig (5.11)) must be initially selected, and then the value of the pumping
power ratio can be changed according to the operating conditions of the experiments.
F 1 2 S F r a c t i o n a l C r y s t a l l i z a t i o n
iBihi iNi iiMainrirnT i irinnr hit
Fig. 5 .11: Screenshot o f the pilot plant software.
Following this, the pre-cooling, crystallisation, partial melting, and total melting processes
were operated in sequence order for all tests.
C h a p t e r V: in v e s t ig a t in g t h e f e a s ib il it y o f t h e f a l l in g f il m c r y s t a l l is a t io n p r o c e s s f o r
TREATING REVERSE OSMOSIS BRINES132
(i) Pre-Cooling Process
In practice, the pre-cooling process was operated by conducting three successive steps: (i) the
HTM conditioning units were operated by selecting the “PRECOOLING” button. This
procedure will simultaneously activate the internal circulation of the HTM distributed as a
falling film on the outside surface of the crystalliser tube by means of the HTM circulation
pump, (ii) The temperature and the ramp of the HTM were then reduced to 0°C and 0°C/min,
respectively, (iii) Prior to operating the melt circulation pump, the flow control valve was
manually adjusted to a position, where the no bypass option is available. The melt circulation
pump is then operated by selecting the “CRYSTALLIZATION” button, and the settings of
the pumping power ratio and heating power tank were rapidly set to 100% and 0%,
respectively.
(ii) Nucleation Process
According to Sulzer, the nucleation process must be started when the temperature difference
between the freezing point of the melt and temperature of the inlet feed reached 10°C. When
the temperature of the inlet feed, which is detected by means of a temperature indicator (TI-
101) (see Fig (5.11)), had decreased to 7°C, the nucleation process takes place by
deactivating the melt circulation pump through selecting the “PRECOOLING” button, and
then rapidly changing the HTM temperature from 0°C to the predetermined crystallisation
temperature (e.g. -12°C), whereas the ramp of HTM remained at a constant value of
0°C/min.
(iii) Crystallisation Process
When the temperature of the outlet HTM (which is detected by a temperature indicator (TI-
205) (see Fig (5.11)) reached the freezing point of the feed (i.e. -3°C), then the crystallisation
process was activated by selecting the “Crystallization” button, which simultaneously
activates the melt circulation pump. The pumping power ratio and heating power tank were
rapidly set to 85% and 20%, respectively, for the majority of the tests. The flow control valve
was then rapidly adjusted whereby the bypass mode is operational to reduce the flow of the
falling film, and so avoid the collapse of the nucleated ice from the crystalliser's tube;
otherwise, an undesired ice suspension will form inside the collecting tank (see Fig (5.6) (f)).
C h a p t e r V: in v e s t ig a t in g t h e f e a s ib il it y o f t h e f a l l in g f il m c r y s t a l l is a t io n p r o c e s s f o r 133TREATING REVERSE OSMOSIS BRINES
For the crystallisation experiments, where ramping was not considered, the ramp for the
HTM was kept at 0°C/min until the end of the crystallisation experiment. For the
crystallisation experiments where ramping was considered, the ramp for the HTM was not
adjusted to a predetermined value (e.g. -0.5 °C/min) until the nucleation phenomenon begins.
Otherwise, the feed would be supercooled, leading eventually to carrying out the experiment
with a very low HTM temperature and ramp. Therefore, the ramp for the HTM was adjusted
to the desired value as soon as a slight rise in the outlet HTM temperature (detected by a
temperature indicator (TI-205) see Fig (5.11)) was observed after the nucleation
phenomenon, which was monitored through a SCR. A slight rise in the outlet HTM
temperature after the nucleation phenomenon is caused by the liberation of the heat of
crystallisation at the rapidly moving freezing front [Turnbull, 1965]. Following this
procedure, the temperature and ramp of the HTM remained unchanged until the end of the
crystallisation experiment. For all tests, the operation of the crystallisation process was
deactivated based on the experimental conditions, which were dictated by either
crystallisation time or when the water level in the collecting tank reaches the minimum
allowed limit (i.e. achieving maximum water recovery ratio).
(iv) Partial Melting Process
Following completion of the crystallisation process, the partial melting process takes place
by selecting the “partial melting” button (which terminates the operation of the melt
circulation pump). At this point, the residual liquid was collected into a stainless steel barrel
through a drain valve (see Fig (5.6) (e)). The residual liquid was then taken for
physiochemical analysis. A sampling time of two minutes was set for collecting the residue
sample before activating the HTM temperature and ramp for carrying out the partial melting
process. On completion of the sampling procedures, the HTM temperature and ramp were
changed to the desired values corresponding to the operating conditions of the crystallisation
or sweating experiments, whereas the heating power tank were set to 100% for all tests.
For the crystallisation experiments, the values of the HTM temperature and ramp were
increased to 15°C and 0°C/min, respectively. The sweat fractions were not collected and
therefore the drain valve was then set to the fully closed position. The total melting process
cannot be operated directly, because the melt circulation pump will be simultaneously
activated, which will expose the pump to a high risk of damage due to running the pump dry,
C h a p t e r V: in v e s t ig a t in g t h e f e a s ib il it y o f t h e f a l l in g f i l m c r y s t a l l is a t io n p r o c e s s f o r
TREATING REVERSE OSMOSIS BRINES134
since the collecting tank is still empty. Therefore, the remaining ice crystals were initially
melted through the partial melting process to recover enough product water to be able to run
the pump during the final process, namely total melting, to yield the final product water.
For the sweating experiments, the values of the HTM temperature and ramp were adjusted to
the predetermined values dictated by the operating conditions of the sweating experiments
(e.g. -7°C and 0.5°C/min, respectively). Based on the mass and the sampling time, the sweat
fractions were collected into a number of vessels through a drain valve (see Fig (5.6) (e)).
The sweat fractions were then taken for physiochemical analysis. On collection of the
sweating fractions, the drain valve was set to the fully closed position, and then the HTM
temperature and ramp were increased to 15°C and 0°C/min, respectively, for performing the
partial melting process prior to conducting the final step, i.e. total melting.
(v) Total Melting Process
The total melting process takes place as soon as the water level in a collecting tank reached a
predetermined limit (i.e. 10L). At this water level, the melt circulation pump can be operated
without risk of pump damage, which might occur in running the pump dry. In practice, this
was achieved by selecting the “Total Melting” button, and rapidly adjusting the pumping
power ratio to 100%. However, the flow control valve was adjusted to reduce the flowing
film inside a tube for a period of three minutes. This was done to gently disengage the large
layers of ice crystals from the crystalliser's tube. This procedure prevents water leaking
through the gap between funnel and lid, which might occurred from big splashes of water
created by large chunks of ice falling from the tube into the collecting tank, when the
pumping power ratio is set to 100% with the no bypass option applied. Following this, the
flow control valve was adjusted to a position where the no bypass option is available, until
the end of the total melting. When the temperature of the inlet feed, which is detected by
means of a temperature indicator (TI-101) (see Fig (5.11))) had decreased to 15°C, the total
melting process was then terminated by selecting the “Stand By” button followed by the
“O ff’ button. The product, i.e. the melted ice crystals, was collected and taken for
physiochemical analysis.
C h a p t e r V: in v e s t ig a t in g t h e f e a s ib il it y o f t h e f a i l i n g f il m c r y s t a l l is a t io n p r o c e s s f o r
TREATING REVERSE OSMOSIS BRINES135
5.6 Results and DiscussionDue to the absence of design data in the literature, and the difficulty in predicting the
performance of the Sulzer falling film crystallisation process for desalting and/or
concentrating process brines, laboratory investigations were carried out. Experimental data
were gathered and analysed to provide quantitative information on the separation
performance of this technology for saline water applications, and more specifically for
concentrating RO brines. Throughout the experimental investigations, no pre-treatment
system or chemical additives were considered for use, either before or during the tests. For
clarity, the HTM temperature of the crystallisation process is identified, and referred to, in
the course of this chapter, as the crystallisation temperature.
A complete record of the phase diagram and the relationships between the key parameters,
process data, temperature profiles, full physiochemical analysis, and performance parameters
versus crystallisation and sweating times are given in Appendix 5, found on the CD attached
to the thesis (see file name: Appendix, Microsoft Excel spreadsheet, Sheet: Appendix 5,
Tables: A5-1 - A5-12).
The nucleation process for the experiments was explained previously in section 5.5.2.
However, the operating procedures for the crystallisation experiments were varied from one
experiment to another depending mainly on the crystallisation temperature. For instance, the
crystallisation process takes place when the temperature of the outlet HTM (see Fig (5.11))
reached the freezing point of the feed, i.e. -3°C. However, this procedure was applied to the
group of experiments where the crystallisation temperatures were above -10°C. For the group
of experiments with crystallisation temperature below -10°C, the crystallisation process was
rapidly started when the temperature of the outlet HTM reached -4°C. The reason was to
ensure enough residence time to allow adequate heat removal for nucleating and forming ice
on the surface of the crystalliser tube. This procedure also avoids damaging the ice formed at
the beginning of the crystallisation process, leading to formation of an undesired ice
suspension inside the collecting tank. For all tests, the duration of the nucleation process was
about three minutes on average, which was found to be enough to accomplish nucleation and
formation of ice crystals, before the crystallisation process was started. At the beginning of
the crystallisation process, the settings of the pumping power ratio and tank heating power
were adjusted to 85% and 20% respectively, for those experiments with a crystallisation
C h a p t e r V: in v e s t ig a t in g t h e f e a s ib il it y o f t h e f a l l in g f il m c r y s t a l l is a t io n p r o c e s s f o r
TREATING REVERSE OSMOSIS BRINES136
temperature above -10°C, whereas these settings were adjusted to 75% and 30% respectively,
for those experiments with a crystallisation temperature below -10°C.
Variations in pumping power ratio settings were considered, so as to reduce the feed flow
rate, and avoid dislodging the ice crystals formation on the crystalliser tube during the
crystallisation process. Variations in the tank heating power were also considered, with the
practical aim of eliminating ice suspension formation in the collecting tank during the
crystallisation process. According to the experimental operating conditions, the settings of
the melt circulation pump and flow control valve must be adjusted and optimised, in order to
reduce the flowing film inside the tube, and increase turbulence inside the collecting tank
(through a bypass pipeline), which helps eliminate the formation of ice suspension inside the
collecting tank. However, high turbulences may reduce the performance of the melt
circulation pump due to air bubbles, and makes monitoring the water level inside the
collecting tank more difficult. The pumping power ratio and tank heating power were rapidly
set to 85% and 20% respectively, for the majority of the tests. The flow control valve was
then rapidly adjusted, whereby the bypass mode is operational to reduce the flow of the
falling film, and so avoid dislodgment of the nucleated ice from the crystalliser tube;
otherwise, an undesired ice suspension will form inside the collecting tank (see Fig (5.6) (f)).
Throughout the experiments, the formation of an ice suspension inside the collecting tank
was eliminated by applying one of the following methods; (i) reducing the flow rate of the
flowing film inside the crystalliser tube via the pumping power ratio setting, (ii) Reducing
the flow rate of the flowing film inside the crystalliser tube by adjusting the flow control
valve, (iii) Increasing the setting of the tank heating power through a "Tracing" box. This
action helps warm the collecting tank in order to eliminate the formation of an ice suspension
by melting, (iv) Increasing turbulence inside the collecting tank through use of a bypass
valve (i.e. flow control valve). This can be accomplished by increasing the flow rate through
the pumping power ratio setting, and simultaneously adjusting the bypass valve, (v)
Decreasing the "Temperature" of "HTM Setting" box at low level; however, this procedure
may be limited by the operating conditions of the experiment.
For the purpose of establishing a phase diagram for the tested feed materials, and instantly
estimating the results of TDS and freezing point by means of electrical conductivity, the
C h a p t e r V: in v e s t ig a t in g t h e f e a s ib il it y o f t h e f a l l in g f il m c r y s t a l l is a t io n p r o c e s s f o rTREATING REVERSE OSMOSIS BRINES
137
parameters of salt concentration (measured in wt% and TDS), and freezing point, were
measured experimentally over a wide range of electrical conductivity, ranging from 424
pS/cm up to 220 mS/cm. The variations of the experimental results of key parameters were
plotted on graphs as shown in Fig (5.12). Based on the experimental results, the empirical
polynomial correlations were derived and fitted for the freezing point as a function of TDS
value (ppm), salt concentration (wt%), and electrical conductivity (mS/cm). Furthermore, the
empirical polynomial correlations were also derived and fitted for the electrical conductivity
(mS/cm) as a function of salt concentration (wt%). These equations were also used to
instantly determine the results of the main key parameters through the conductivity
measurement.
Fig (5.12) (a) - (b) show the experimental phase diagram, and empirical graphs and
equations (including R value) for the Arabian Gulf seawater and RO brine. The important
observations that can be revealed from the phase diagram are as follows: (i) the freezing
points of Arabian Gulf seawater and RO brine were -2.4°C and -3.1°C respectively, (ii) the
eutectic temperature for the Arabian Gulf seawater and RO brine was -20.45°C, which was
obtained at weight ratio, TDS value and electrical conductivity of 23.85 wt%, 238,560 ppm
and 220 mS/cm respectively.
Table (5.1) summarises the results of the major physiochemical characteristics of the tested
feed samples i.e. Arabian Gulf seawater and RO brine. When the salt concentration and
major ionic composition of Arabian Gulf seawater is compared to that in the RO brine (see
Table (5.1)), a number of important observations can be revealed:
a) There was a clear difference in the salt concentration and the major ionic
composition of the Arabian Gulf seawater when compared to RO brine.
b) RO brine was 1.25 times more highly concentrated than seawater. Thus, RO
brine was more complicated than seawater, in terms of the challenge and
difficulty for desalting this type of saline water.
c) The ions in RO brine were more highly concentrated than in the seawater.
However, the seawater and RO brine both contained NaCl salts, which is by far
the most dominant dissolved salt when compared to other salts. For instance, the
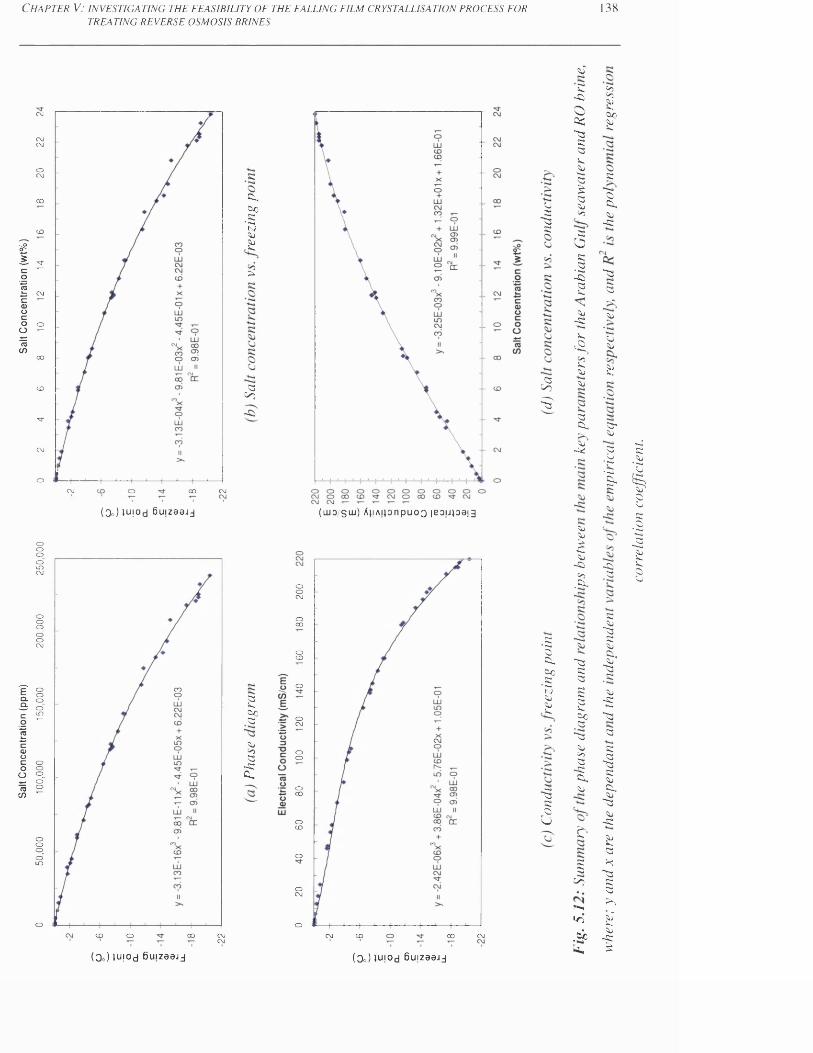
Salt C
oncen
tratio
n (pp
m)
Salt C
oncen
tratio
n (w
t%)
50,000
100
,000
150,00
0 200
,000
250,00
0 0
2 4
6 8
10 12
14
C h a p t e r V; i n v e s t i g a t i n g t h e f e a s i b i l i t y o f t h e f a l l i n g f i l m c r y s t a l l i s a t i o n p r o c e s s f o r
TREATING REVERSE OSMOSIS BRINES138
C\J
C\JC\J
oC\J
00
CD
CM 00O CM
(Do) tuiod Bmzaajj
OCD O 00 CM
CM
ex.Co•S
n )S i
£
>
aSo
SGoa
S>> 3a
-S ia .
cr
( o i o / s u j ) A t j A i j o n p u o o l e o u i o a i g
OOCM
O00
oCD
O
OCM
OO
Oco
oCD
O
OCM
OCM CD 00 CM
Sja"asS3
S3SoS'
• S
sasCo•S
n )S>s■ S.
sSiS3
u
S 3
£-43oac"C3S3S3! <S3t - .33£S3SO
3SO
S3•33S
5
S 3~gs.•a.>2s>S3
S3asS3-s*i
> 3> 3
S iC o .
£
s i
3 3a s
S3-si
~ S 3
3
s>+ » .SjS 3
S i
S 3 -S3
S3•3
' I
( Co ) tu|0d 6uizaaj j ( Do ) t u | 0 d B u j z a a j d
S iS i
SS 3
-43> 3
. e x .
^ ss;S3
s
5CoS3
^ 3
S 3OS3
- s ia s
Si
£
§
SO
* - <
• O
. s i
t t .
-43S3
SiS 3
" S 3s;S 3
S’~S3.S 3
S 3- g
■ a s
S3
s iS3
■ a sas>&"asS3
- g
a!a
K
a sg
a
r N
afS 3
-s:£
corr
elat
ion
coef
ficie
nt.
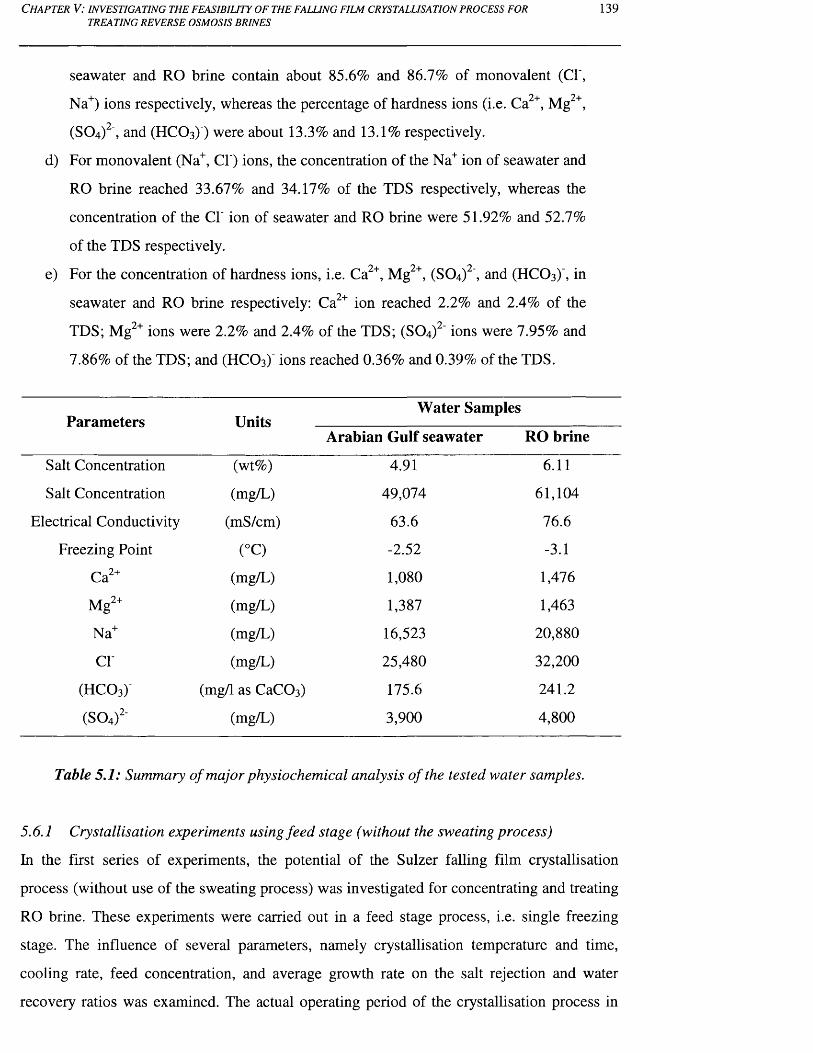
C h a p t e r V: in v e s t ig a t in g t h e f e a s ib il it y o f t h e f a l l in g f il m c r y s t a l l is a t io n p r o c e s s f o rTREATING REVERSE OSMOSIS BRINES
139
seawater and RO brine contain about 85.6% and 86.7% of monovalent (Cl',
Na+) ions respectively, whereas the percentage of hardness ions (i.e. Ca2+, Mg2+,
(SO4)2', and (HCO3)') were about 13.3% and 13.1% respectively.
d) For monovalent (Na+, Cl ) ions, the concentration of the Na+ ion of seawater and
RO brine reached 33.67% and 34.17% of the TDS respectively, whereas the
concentration of the Cl' ion of seawater and RO brine were 51.92% and 52.7%
of the TDS respectively.
e) For the concentration of hardness ions, i.e. Ca2+, Mg2+, (SO4)2', and (HCO3)', in0-i-seawater and RO brine respectively: Ca ion reached 2.2% and 2.4% of the
TDS; Mg2+ ions were 2.2% and 2.4% of the TDS; (SO4)2' ions were 7.95% and
7.86% of the TDS; and (HC03)' ions reached 0.36% and 0.39% of the TDS.
Water SamplesParameters Units ___________________________
Arabian Gulf seawater RO brine
Salt Concentration (wt%) 4.91 6.11
Salt Concentration (mg/L) 49,074 61,104
Electrical Conductivity (mS/cm) 63.6 76.6
Freezing Point (°C) -2.52 -3.1
Ca2+ (mg/L) 1,080 1,476
Mg2+ (mg/L) 1,387 1,463
Na+ (mg/L) 16,523 20,880
Cl' (mg/L) 25,480 32,200
(HCO3)- (mg/1 as CaCOs) 175.6 241.2
(SO4)2- (mg/L) 3,900 4,800
Table 5.1: Summary o f major physiochemical analysis o f the tested water samples.
5.6.1 Crystallisation experiments using feed stage (without the sweating process)
In the first series of experiments, the potential of the Sulzer falling film crystallisation
process (without use of the sweating process) was investigated for concentrating and treating
RO brine. These experiments were carried out in a feed stage process, i.e. single freezing
stage. The influence of several parameters, namely crystallisation temperature and time,
cooling rate, feed concentration, and average growth rate on the salt rejection and water
recovery ratios was examined. The actual operating period of the crystallisation process in
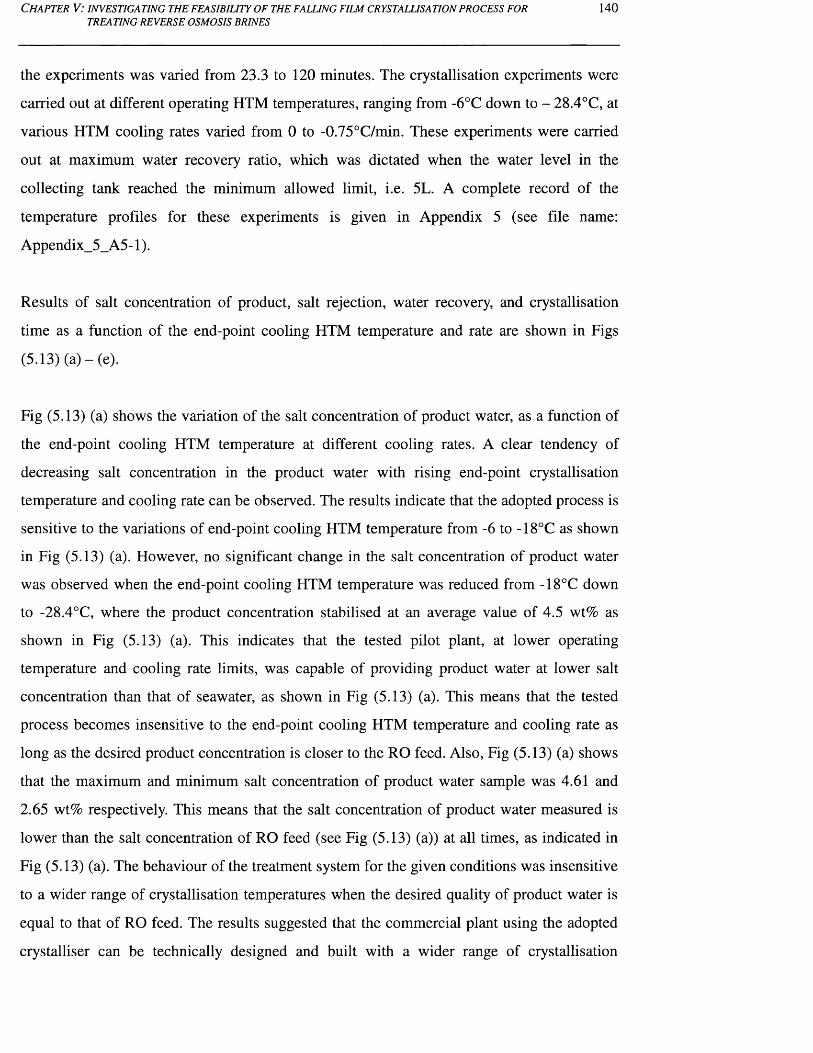
C h a p t e r V: in v e s t ig a t in g t h e f e a s ib il it y o f t h e f a l l in g f il m c r y s t a l l is a t io n p r o c e s s f o r
TREATING REVERSE OSMOSIS BRINES140
the experiments was varied from 23.3 to 120 minutes. The crystallisation experiments were
carried out at different operating HTM temperatures, ranging from -6°C down to - 28.4°C, at
various HTM cooling rates varied from 0 to -0.75°C/min. These experiments were carried
out at maximum water recovery ratio, which was dictated when the water level in the
collecting tank reached the minimum allowed limit, i.e. 5L. A complete record of the
temperature profiles for these experiments is given in Appendix 5 (see file name:
Appendix_5_A5-1).
Results of salt concentration of product, salt rejection, water recovery, and crystallisation
time as a function of the end-point cooling HTM temperature and rate are shown in Figs
(5.13) (a )-(e ).
Fig (5.13) (a) shows the variation of the salt concentration of product water, as a function of
the end-point cooling HTM temperature at different cooling rates. A clear tendency of
decreasing salt concentration in the product water with rising end-point crystallisation
temperature and cooling rate can be observed. The results indicate that the adopted process is
sensitive to the variations of end-point cooling HTM temperature from -6 to -18°C as shown
in Fig (5.13) (a). However, no significant change in the salt concentration of product water
was observed when the end-point cooling HTM temperature was reduced from -18°C down
to -28.4°C, where the product concentration stabilised at an average value of 4.5 wt% as
shown in Fig (5.13) (a). This indicates that the tested pilot plant, at lower operating
temperature and cooling rate limits, was capable of providing product water at lower salt
concentration than that of seawater, as shown in Fig (5.13) (a). This means that the tested
process becomes insensitive to the end-point cooling HTM temperature and cooling rate as
long as the desired product concentration is closer to the RO feed. Also, Fig (5.13) (a) shows
that the maximum and minimum salt concentration of product water sample was 4.61 and
2.65 wt% respectively. This means that the salt concentration of product water measured is
lower than the salt concentration of RO feed (see Fig (5.13) (a)) at all times, as indicated in
Fig (5.13) (a). The behaviour of the treatment system for the given conditions was insensitive
to a wider range of crystallisation temperatures when the desired quality of product water is
equal to that of RO feed. The results suggested that the commercial plant using the adopted
crystalliser can be technically designed and built with a wider range of crystallisation
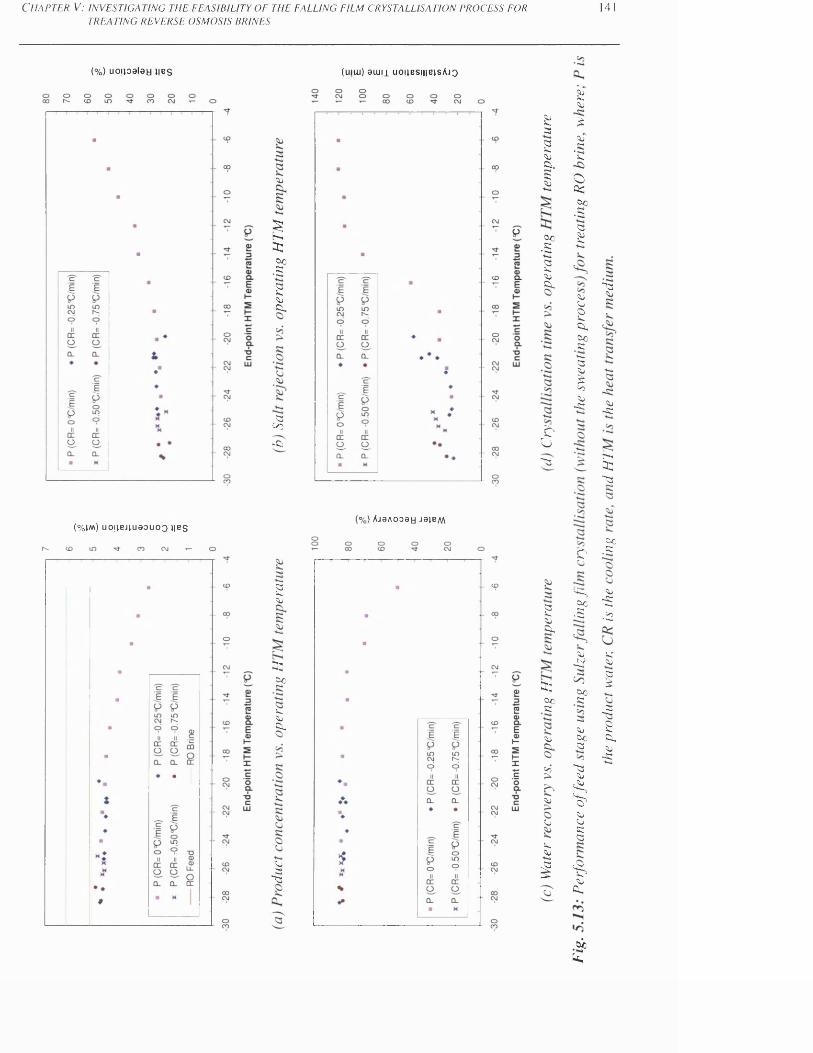
C h a p t e r V: i n v e s t i g a t i n g t h e f e a s i b i l i t y o f t h e f a l l i n g f i l m c r y s t a l l i s a t i o n p r o c e s s f o r
TREATING REVERSE OSMOSIS BRINES141
(%) uouoafay l ie s (mui) a u j j i u o jie s w e is A jo
so
sa :Co
• S
<30 .SoCo
ssc/3-C5
Si3
5SOs -3so
Co•Sa0 .soCo
£o
c-3
Siso£
<0• S' C
OQCCo
• S
aSi
sosoOo.COCo
. 3I-*S3so£Soso
- 3
^ 3o>
SO- 3
t-Ha :~C3
( % j m ) u o j j B J i u a o u o o n e s%) AjaAOoay J31bm
S33SO
a:Co
3soCo
Sj3
"S3
£
5soCO
a :CoS3
soCO
so
SO
So
3SO
I
COS3
031 so^ "S•S .52
so or-H f ^
co |Co 3
SuCoS3
" 3so
$O 'Su5051 S3
< 6SO
0 .
.cio£
3~S3
gCoso
■3
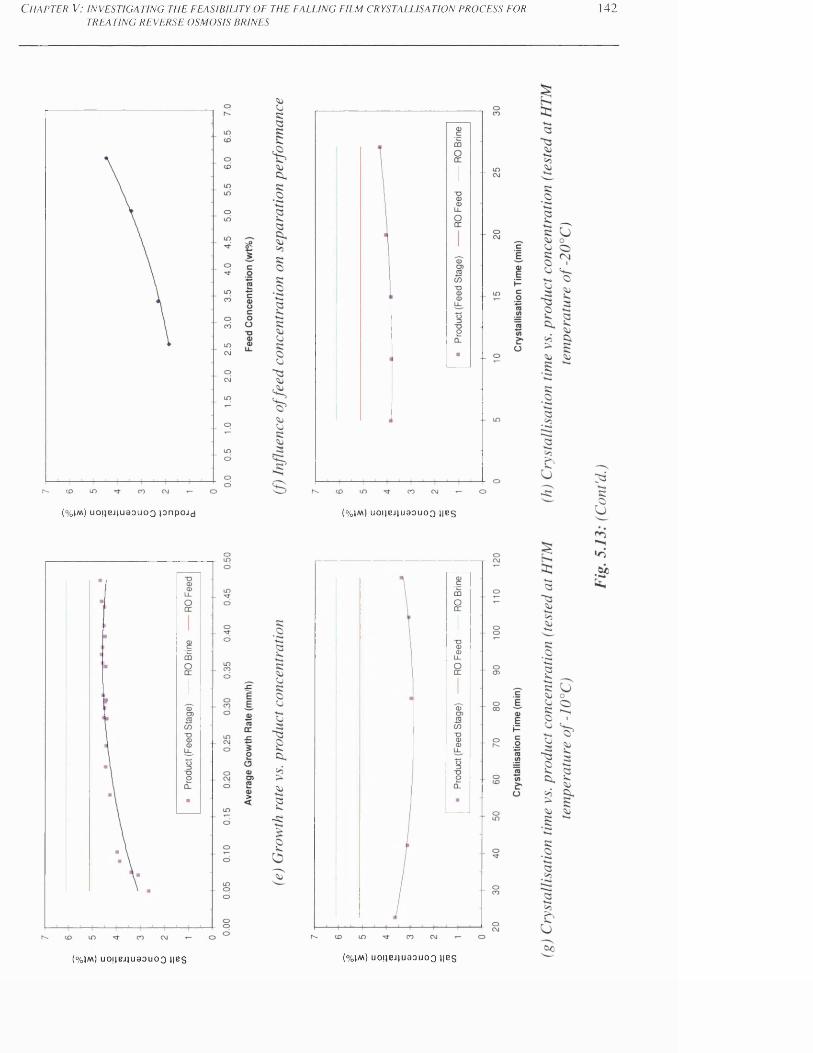
C h a p t e r V: i n v e s t i g a t i n g t h e f e a s i b i l i t y o f t h e f a l l i n g f i l m c r y s t a l l i s a t i o n p r o c e s s f o r
TREATING REVERSE OSMOSIS BRINES142
(%jm) uojieJiuaouoo pnpoJd (%jm) uouBjjuaouoo nes
( % J M ) U 0 I I B J J U 9 0 U 0 Q | | B S ( % J M ) U O j l B J J U a O U O O 11B s
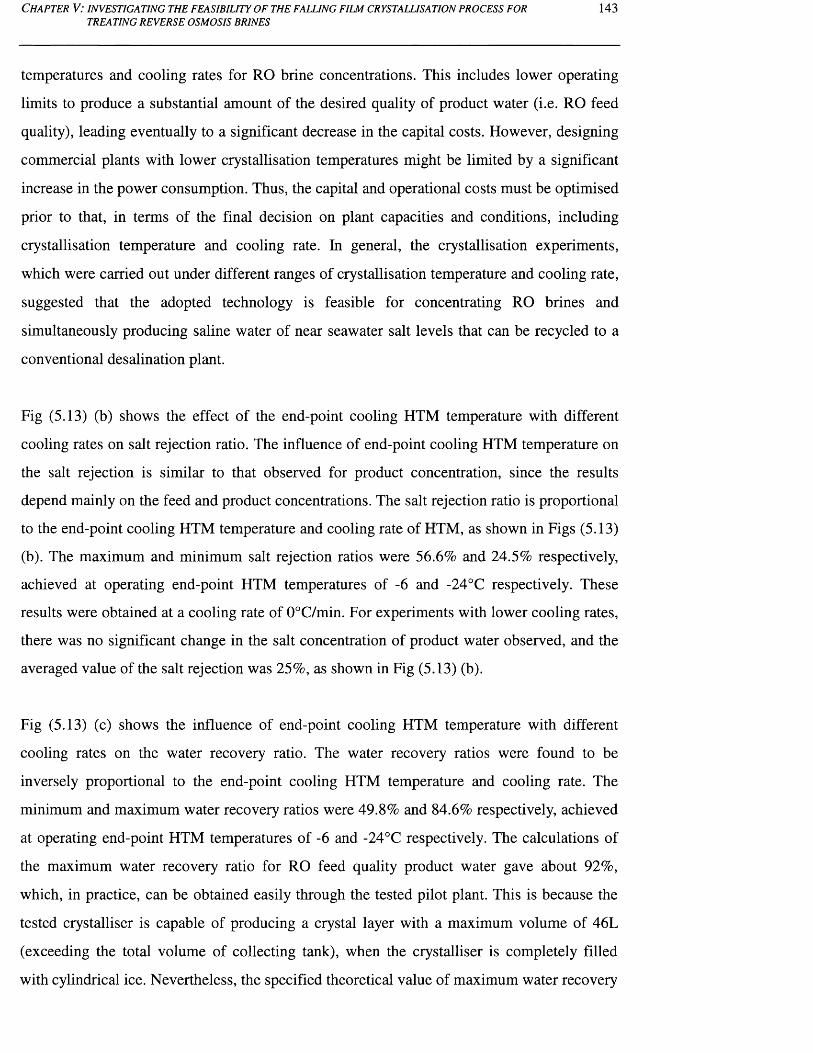
C h a p t e r V: in v e s t ig a t in g t h e f e a s ib il it y o f t h e f a l l in g f il m c r y s t a l l is a t io n p r o c e s s f o rTREATING REVERSE OSMOSIS BRINES
143
temperatures and cooling rates for RO brine concentrations. This includes lower operating
limits to produce a substantial amount of the desired quality of product water (i.e. RO feed
quality), leading eventually to a significant decrease in the capital costs. However, designing
commercial plants with lower crystallisation temperatures might be limited by a significant
increase in the power consumption. Thus, the capital and operational costs must be optimised
prior to that, in terms of the final decision on plant capacities and conditions, including
crystallisation temperature and cooling rate. In general, the crystallisation experiments,
which were carried out under different ranges of crystallisation temperature and cooling rate,
suggested that the adopted technology is feasible for concentrating RO brines and
simultaneously producing saline water of near seawater salt levels that can be recycled to a
conventional desalination plant.
Fig (5.13) (b) shows the effect of the end-point cooling HTM temperature with different
cooling rates on salt rejection ratio. The influence of end-point cooling HTM temperature on
the salt rejection is similar to that observed for product concentration, since the results
depend mainly on the feed and product concentrations. The salt rejection ratio is proportional
to the end-point cooling HTM temperature and cooling rate of HTM, as shown in Figs (5.13)
(b). The maximum and minimum salt rejection ratios were 56.6% and 24.5% respectively,
achieved at operating end-point HTM temperatures of -6 and -24°C respectively. These
results were obtained at a cooling rate of 0°C/min. For experiments with lower cooling rates,
there was no significant change in the salt concentration of product water observed, and the
averaged value of the salt rejection was 25%, as shown in Fig (5.13) (b).
Fig (5.13) (c) shows the influence of end-point cooling HTM temperature with different
cooling rates on the water recovery ratio. The water recovery ratios were found to be
inversely proportional to the end-point cooling HTM temperature and cooling rate. The
minimum and maximum water recovery ratios were 49.8% and 84.6% respectively, achieved
at operating end-point HTM temperatures of -6 and -24°C respectively. The calculations of
the maximum water recovery ratio for RO feed quality product water gave about 92%,
which, in practice, can be obtained easily through the tested pilot plant. This is because the
tested crystalliser is capable of producing a crystal layer with a maximum volume of 46L
(exceeding the total volume of collecting tank), when the crystalliser is completely filled
with cylindrical ice. Nevertheless, the specified theoretical value of maximum water recovery
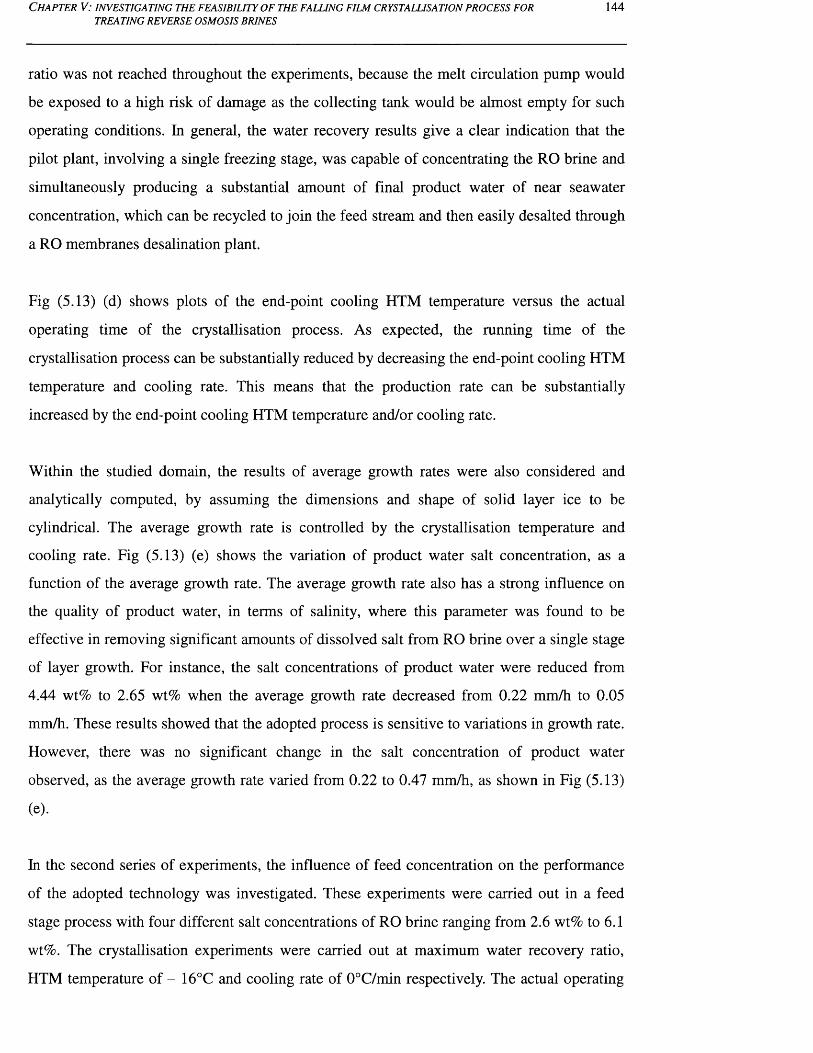
C h a p t e r V: in v e s t ig a t in g t h e f e a s ib il it y o f t h e f a l u n g f il m c r y s t a l l is a t io n p r o c e s s f o rTREATING REVERSE OSMOSIS BRINES
144
ratio was not reached throughout the experiments, because the melt circulation pump would
be exposed to a high risk of damage as the collecting tank would be almost empty for such
operating conditions. In general, the water recovery results give a clear indication that the
pilot plant, involving a single freezing stage, was capable of concentrating the RO brine and
simultaneously producing a substantial amount of final product water of near seawater
concentration, which can be recycled to join the feed stream and then easily desalted through
a RO membranes desalination plant.
Fig (5.13) (d) shows plots of the end-point cooling HTM temperature versus the actual
operating time of the crystallisation process. As expected, the running time of the
crystallisation process can be substantially reduced by decreasing the end-point cooling HTM
temperature and cooling rate. This means that the production rate can be substantially
increased by the end-point cooling HTM temperature and/or cooling rate.
Within the studied domain, the results of average growth rates were also considered and
analytically computed, by assuming the dimensions and shape of solid layer ice to be
cylindrical. The average growth rate is controlled by the crystallisation temperature and
cooling rate. Fig (5.13) (e) shows the variation of product water salt concentration, as a
function of the average growth rate. The average growth rate also has a strong influence on
the quality of product water, in terms of salinity, where this parameter was found to be
effective in removing significant amounts of dissolved salt from RO brine over a single stage
of layer growth. For instance, the salt concentrations of product water were reduced from
4.44 wt% to 2.65 wt% when the average growth rate decreased from 0.22 mm/h to 0.05
mm/h. These results showed that the adopted process is sensitive to variations in growth rate.
However, there was no significant change in the salt concentration of product water
observed, as the average growth rate varied from 0.22 to 0.47 mm/h, as shown in Fig (5.13)
(e).
In the second series of experiments, the influence of feed concentration on the performance
of the adopted technology was investigated. These experiments were carried out in a feed
stage process with four different salt concentrations of RO brine ranging from 2.6 wt% to 6.1
wt%. The crystallisation experiments were carried out at maximum water recovery ratio,
HTM temperature of - 16°C and cooling rate of 0°C/min respectively. The actual operating
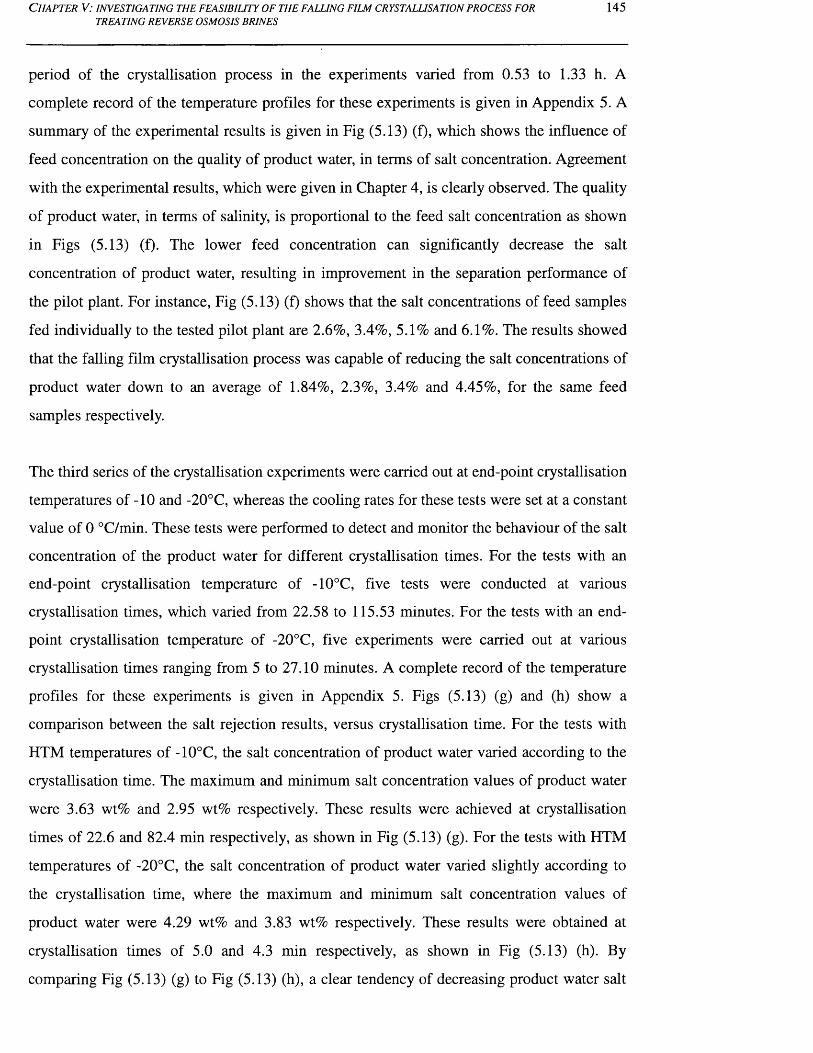
C h a p t e r V: in v e s t ig a t in g t h e f e a s ib il it y o f t h e f a l l in g f il m c r y s t a l l is a t io n p r o c e s s f o r
TREATING REVERSE OSMOSIS BRINES145
period of the crystallisation process in the experiments varied from 0.53 to 1.33 h. A
complete record of the temperature profiles for these experiments is given in Appendix 5. A
summary of the experimental results is given in Fig (5.13) (f), which shows the influence of
feed concentration on the quality of product water, in terms of salt concentration. Agreement
with the experimental results, which were given in Chapter 4, is clearly observed. The quality
of product water, in terms of salinity, is proportional to the feed salt concentration as shown
in Figs (5.13) (f). The lower feed concentration can significantly decrease the salt
concentration of product water, resulting in improvement in the separation performance of
the pilot plant. For instance, Fig (5.13) (f) shows that the salt concentrations of feed samples
fed individually to the tested pilot plant are 2.6%, 3.4%, 5.1% and 6.1%. The results showed
that the falling film crystallisation process was capable of reducing the salt concentrations of
product water down to an average of 1.84%, 2.3%, 3.4% and 4.45%, for the same feed
samples respectively.
The third series of the crystallisation experiments were carried out at end-point crystallisation
temperatures of -10 and -20°C, whereas the cooling rates for these tests were set at a constant
value of 0 °C/min. These tests were performed to detect and monitor the behaviour of the salt
concentration of the product water for different crystallisation times. For the tests with an
end-point crystallisation temperature of -10°C, five tests were conducted at various
crystallisation times, which varied from 22.58 to 115.53 minutes. For the tests with an end
point crystallisation temperature of -20°C, five experiments were carried out at various
crystallisation times ranging from 5 to 27.10 minutes. A complete record of the temperature
profiles for these experiments is given in Appendix 5. Figs (5.13) (g) and (h) show a
comparison between the salt rejection results, versus crystallisation time. For the tests with
HTM temperatures of -10°C, the salt concentration of product water varied according to the
crystallisation time. The maximum and minimum salt concentration values of product water
were 3.63 wt% and 2.95 wt% respectively. These results were achieved at crystallisation
times of 22.6 and 82.4 min respectively, as shown in Fig (5.13) (g). For the tests with HTM
temperatures of -20°C, the salt concentration of product water varied slightly according to
the crystallisation time, where the maximum and minimum salt concentration values of
product water were 4.29 wt% and 3.83 wt% respectively. These results were obtained at
crystallisation times of 5.0 and 4.3 min respectively, as shown in Fig (5.13) (h). By
comparing Fig (5.13) (g) to Fig (5.13) (h), a clear tendency of decreasing product water salt

C h a p t e r V: in v e s t ig a t in g t h e f e a s ib il it y o f t h e f a l u n g f il m c r y s t a l l is a t io n p r o c e s s f o r
TREATING REVERSE OSMOSIS BRINES146
concentration with lower end-point crystallisation temperature can be observed, which
confirmed the previous observations on the influence of crystallisation temperature on the
product quality presented in Fig (5.13) (a). Furthermore, the trend in the results for salt
concentration of the product water versus the average growth rate, as given in Appendix 5
(A5-10), is in agreement with the experimental data presented in Fig (5.13) (e).
For the design of commercial plants, the recommended crystallisation temperatures range
from -12°C to -16°C when the cooling rate is set to 0°C/min, whereas the recommended
crystallisation temperature should not be higher than -12°C when the cooling rate is set to
below 0°C/min. Commercial plants with higher crystallisation temperatures (i.e. > -12°C)
would require careful operation, and close monitoring to nucleate and form ice crystals that
can be adhered to the crystalliser at the beginning of the crystallisation operation. Otherwise,
several limitations might be encountered leading to an ice suspension forming inside the
collecting vessel, while plants with lower operating temperatures (i.e. < -16°C) would be
expected to be limited by operational cost.
5.6.2 Multi-stage process (feed and rectification stages) without the sweating process
In the fourth series of experiments, the influence of a multi-stage process, using the Sulzer
falling film crystallisation process, on the degree of water desalination, in terms of salt
rejection, water recovery, and ionic rejection, was investigated. A feed sample of RO brine
was treated using two successive freezing stages, namely feed and rectification stages. The
experiments were carried out at the maximum water recovery ratio. The crystallisation
temperature and ramp of the feed and rectification stages were set to -16°C and 0 °C/min
respectively. The actual operational periods of the feed and rectification stages were 0.83 h
and 0.37 h respectively. A summary of the experimental and water chemistry data for the
water samples of each freezing stage is given in Tables (5.2) - (5.4). A complete record of
the temperature profiles for these experiments is given in Appendix A5.
Table (5.2) shows that the feed and rectification stages were able to lower the TDS value of
the RO brine from 61,104 ppm to 32,451 ppm. Table (5.2) shows that the TDS value of the
product water from each stage was 44,512 and 32,451 ppm respectively. Thus the residual
liquids, which were rejected from the feed and rectification stages, were concentrated with
average TDS values of 147,840 and 95,258 ppm, respectively. The salt rejection ratios for
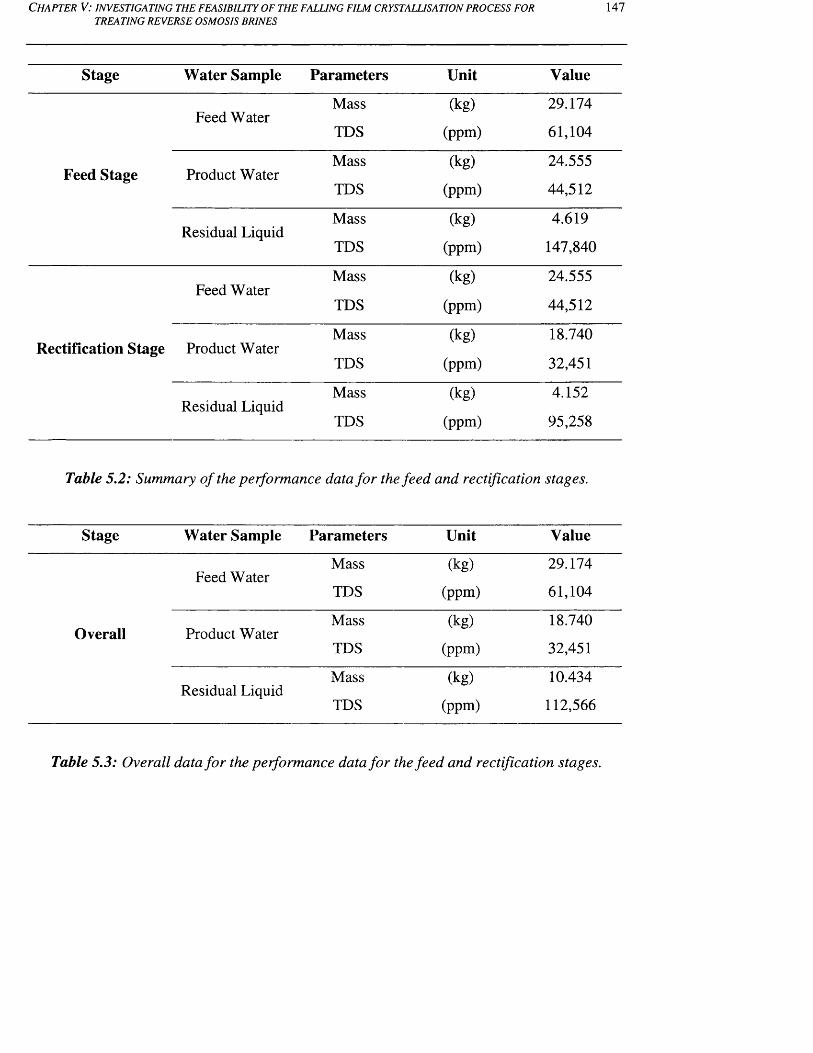
C h a p t e r V: in v e s t ig a t in g t h e f e a s ib il it y o f t h e f a l l in g f il m c r y s t a l l is a t io n p r o c e s s f o rTREATING REVERSE OSMOSIS BRINES
147
Stage Water Sample Parameters Unit Value
Feed WaterMass
TDS
(kg)
(ppm)
29.174
61,104
Feed Stage Product WaterMass
TDS
(kg)
(ppm)
24.555
44,512
Residual LiquidMass
TDS
(kg)
(ppm)
4.619
147,840
Feed WaterMass
TDS
(kg)
(ppm)
24.555
44,512
Rectification Stage Product WaterMass
TDS
(kg)
(ppm)
18.740
32,451
Residual LiquidMass
TDS
(kg)
(ppm)
4.152
95,258
Table 5.2: Summary of the performance data for the feed and rectification stages.
Stage Water Sample Parameters Unit Value
Feed WaterMass
TDS
(kg)
(ppm)
29.174
61,104
Overall Product WaterMass
TDS
(kg)
(ppm)
18.740
32,451
Residual LiquidMass
TDS
(kg)
(ppm)
10.434
112,566
Table 5.3: Overall data for the performance data for the feed and rectification stages.
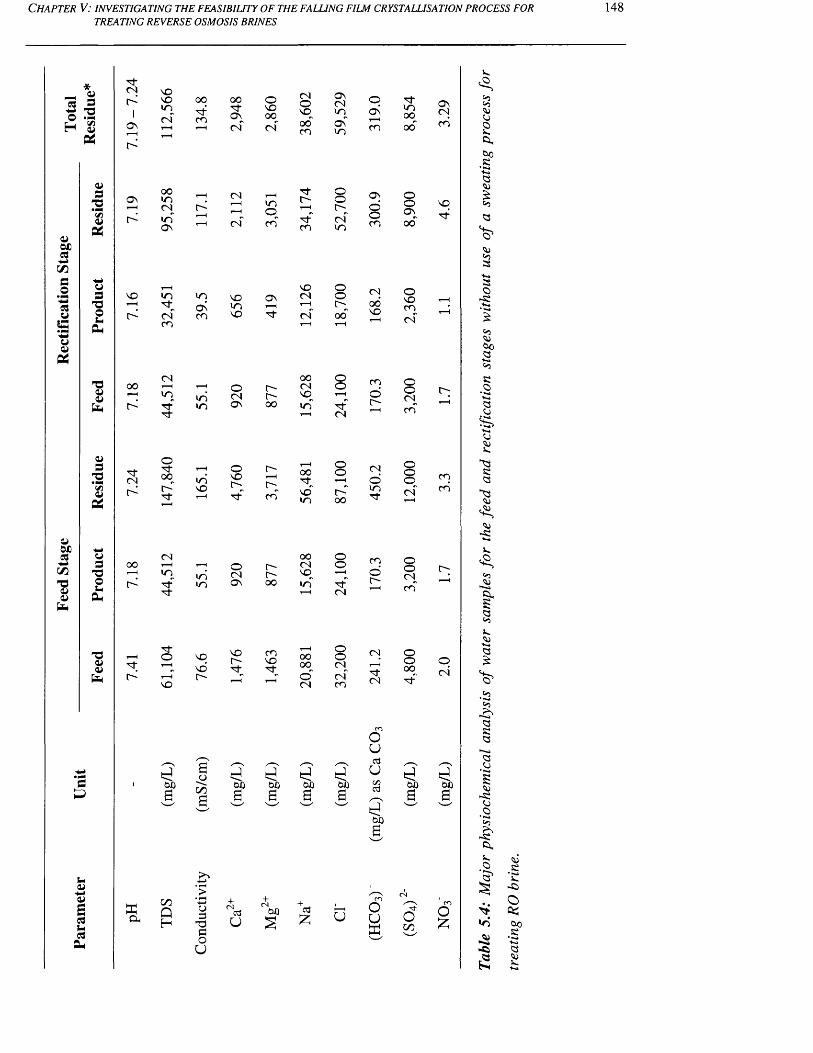
Feed
St
age
Rec
tific
atio
n St
age
C h a p t e r V: in v e s t ig a t in g t h e f e a s ib il it y o f t h e f a l l in g f il m c r y s t a l l is a t io n p r o c e s s f o r
TREATING REVERSE OSMOSIS BRINES148
*_ Qi3 S OH 8
a>3TJ
•
373OSh
a ,
a>
&>373V3QJ
&
V373OUh
a .
TJ4>0>fe
<N
lON1—H 11
2,56
6
134.
8
2,94
8
2,86
0
38,6
02
59,5
29
r~4
ON 00mCN1—H <N in
0^■'d-0 00C";
c4 inON i—H cn co" 'd'co CNin
NO 0NO in in NO On CN 0ON m r-H
r4 (N CO NO ^t CN 00"CO t-H
<N 00 O00 1—H T—( O r - CN Oin in CN r- p Hr4 in ON 00 in Tdr
'd- CN
7.24
147,
840
165.
1
4,7
60
3,71
7
56,4
81
87,1
00
CN 00 000 1—1 0 r - CN 0p in in CN r- p t - 1i> m ON 00 in 'd-'d' CN
1—H^t
"d-0H
NONO
NOr- CONO'd -
0000OOCN
HNO c- -4 <dCN CN
CO
OONi—HCO
O N
ooCO
<N00N O
COo
CNoi n'si-
or~-
(Ni—H"d-CN
i n00oo
ooO N
oo
oN OCOCN
OOCNCO
Oocn
ooCNco"
oO00
O N(NCO
N O
o
COCO
l>
ocn
-a.<>3>3SuOga ,Oo•Sa
£02
033
■t-43O
-Si
03
3
K•2■k-l<3cj
*S>+«»Nj
g733373
su-si
<2.03
303
SN.SU
■*-»C3£
*0*
3P
d00a
s*a>a>3aucda-
ffiCl
ooQH
aocnS
d dOX) 0 0a a 00
o3T3CO
u
cdu
oo +cd£
d00a
u
oua
UC/3cd
d00a
ouK
d00
d00a
oc n
o£
03- d333
3Sj
su- S i
S j
•2?!rS
- S i
a ,
7h• o
sS
• 5c-c>
O
0 0• 5i - j<3
C h a p t e r V: in v e s t ig a t in g t h e f e a s ib il it y o f t h e f a l l in g f il m c r y s t a l l is a t io n p r o c e s s f o r 149TREATING REVERSE OSMOSIS BRINES
the feed and rectification stages were 27.2 and 27.1%, respectively, whilst the water recovery
ratios were 84.17 and 81.86 %, for the same freezing stages respectively. Table (5.3) shows
that the overall salt rejection and product water recovery ratios were 46.89% and 64.24%,
respectively.
Table (5.4) shows the ionic composition of water samples of all the streams in the process.
The results showed that the multi-stage process using the crystallisation process did not
produce a final product reaching brackish water standards. Therefore, a post-treatment
crystallisation process must be considered, when a high purity product water is required.
5.6.3 Crystallisation and sweating experiments using feed stage
In the fifth group of experiments, the potential of the adopted technology, using
crystallisation and sweating processes, was investigated for desalting and concentrating RO
brine. These experiments were carried out in a feed stage process, and were performed at the
maximum water recovery ratio. The tested salt concentrations of feed ranged from 2.6 to 6.1
wt%. The crystallisation temperature and ramp for the experiments were -16°C and 0 °C/min
respectively, whereas the sweating experiments were carried out using a start-point HTM
temperature of -16°C and sweating ramp of 0.5°C/min. A complete record of the temperature
profiles for these experiments is given in Appendix A5. For clarity, the sweating time is
identified and referred to, in the course of this chapter, as time elapsed from increasing the
temperature of the crystalliser until the end of collecting the last sample of sweating
fractions. The crystal mass ratio is analytically computed by dividing the extracted mass of
sweating fraction to the original mass of the product water, i.e. the mass of product before
performing the sweating process.
In Figs (5.14) (a) and (b) the influence of salt concentration of feed water on the quality of
product water is shown. The crystalline impurities were found to increase with increasing
feed concentration, and to decrease with increasing crystal mass ratio and sweating times.
For instance, for desalting the RO brine, the concentration of crystals was reduced from 4.31
wt% to 3.32 wt% after carrying out the sweating process at a mass crystal ratio of 17.19%
and sweating time of 26.40 min. In the case of desalting Arabian Gulf seawater, Figs (5.14)
(a) and (b) show that the salt concentration of crystals was reduced from 3.33 wt% to 2.64
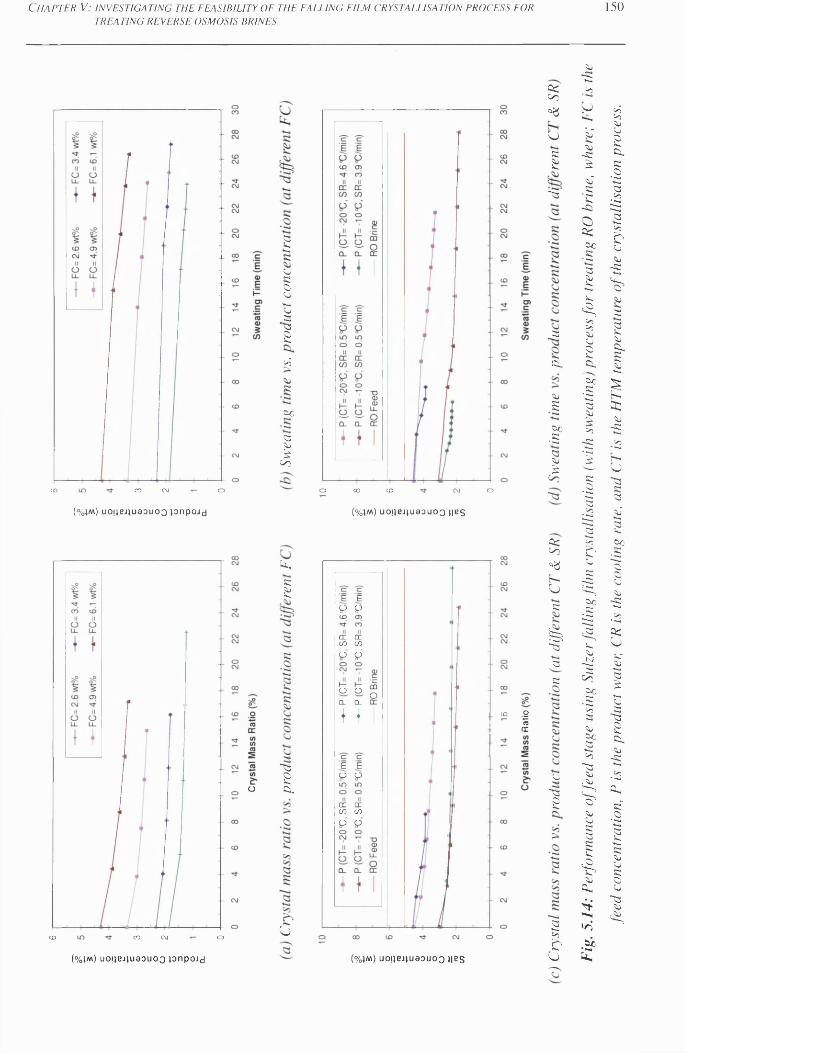
C h a p t e r V: i n v e s t i g a t i n g t h e f e a s i b i l i t y o f t h e f a l l i n g f i l m c r y s t a l l i s a t i o n p r o c e s s f o r
TREATING REVERSE OSMOSIS BRINES150
CO CMCO O
5*-»pcoCj■*—Cos"n3Soj
KOO
asu£co
o oo co CNJ O
k;Co*8
U
I“C3
2
»k
SoB<sc•SCoSo£
C o
( % j m ) u o j i e j j u a o u o o p n p o j d (% IM ) UOjlBJJUaOUO Q l |B S
CO CNJCO o
o
k«cg
~n3Bk.
o
E E P P
cn cnCO COp p
o aCL CL\ I
E EP P
cn ccCO COp p
Oco .2"5
cc
( % I m ) u o j j B J i u a o u o o p n p o J d (%l/w) u o iiB iju a o u o o h b s
acCo°8t-iUc
te3S3S
Co“s3s
2>3£
o Fig.
5.1
4: P
erfo
rman
ce
of fee
d sta
ge
using
Su
lzer
falli
ng f
ilm
crys
talli
satio
n (w
ith
swea
ting)
pro
cess
for
tre
atin
g RO
br
ine,
whe
re;
FC
is th
e
feed
conc
entr
atio
n, P
is the
pr
oduc
t wa
ter,
CR
is the
co
olin
g ra
te, a
nd
Cl
is the
HT
M te
mpe
ratu
re
of the
cr
ysta
llisa
tion
proc
ess.
C h a p t e r V: in v e s t ig a t in g t h e f e a s ib il it y o f t h e f a l u n g f il m c r y s t a l l is a t io n p r o c e s s f o r 151TREATING REVERSE OSMOSIS BRINES
wt% after carrying out the sweating process at a mass crystal ratio and sweating time of 15%
and 24.13 min respectively.
In general, the variation in the behaviour of the product concentration versus the mass crystal
ratio represents a reflection of the sweating efficiency. At the beginning of sweating
operation where the first sweat fraction was taken, a dramatic fall in the product
concentration can be observed as shown in Figs (5.14) (a) and (b). This was due to the
remaining impure melt, adhered to the surface of the crystal layer, being removed efficiently
by the initial sweating step. As the sweating continued, a slight decrease in the product
concentration was observed, because the impurities were further inside the crystalline slab,
and effectively trapped and occluded. Therefore, further sweating would be a progressive
melting process for the remaining crystalline mass, which corresponds to a poor sweating
efficiency. This procedure must also take into account that the product lost (i.e. mass crystal
ratio) should be within an average of 10% [Ulrich and Glade, 2003]. Although the sweating
time can be varied from 10 min to 30 h, the sweating operation should be performed at the
shortest retention time possible (about one-third of a crystallisation process); otherwise, the
production rate will dramatically decline [Ulrich and Glade, 2003]. The production rate is a
crucial factor for desalination applications. The production rate will be negatively affected by
the sweating process because of the product loss, and an increase in the time retention of the
freezing stage. From an economic point of view, the reduced amount of product water due to
the sweating step for the rise in purity was not worthwhile for the purpose of desalination, as
the pilot plant with sweating process did not produce a final product water suitable for
human consumption.
For the cases of operating the pilot plant without sweating, the HTM temperature and cooling
rate of the partial melting process were usually set to 15 °C and 0 °C/min. This procedure
was applied to accelerate the process of partially melting the crystalline mass in order to
recover enough product water, which enables the user to run the pump during the total
melting process, to yield the final product water. These operating conditions were also
considered in the subsequent sweating experiments, in order to carry out the sweating
process in the fastest possible way, and also determine the trend for crystalline impurity, as a
function of the crystal mass ratio and sweating times under these operating conditions.
C h a p t e r V: in v e s t ig a t in g t h e f e a s ib il it y o f t h e f a l l in g f il m c r y s t a l l is a t io n p r o c e s s f o r 152TREATING REVERSE OSMOSIS BRINES
Therefore, the sixth group of experiments was carried out with feed samples using RO brine
to investigate the affect of the sweating rate on the salt concentration of product water. The
experiments were carried out at maximum water recovery ratio. These experiments were also
performed in a feed stage process, which was examined at crystallisation temperatures of -10
and -20°C. The crystalline impurity content was measured at different sweating rates ranging
from 0.5 to 4.6 °C/min.
Figs (5.14) (c) and (d) show the variation of product water salt concentration, as a function of
the crystal mass ratio and sweating time at different crystallisation temperatures and sweating
rates. The salt concentration of product water increases with decreasing crystallisation
temperature, as observed previously in different experiments. For the experiments with a
crystallisation temperature of -20 °C and sweating rate of 0.5 °C/min, the salt concentration
of product water was reduced from 4.6 to 3.27 wt% when the crystal mass ratio increased
from 0 % to 17.85 % (see Figs (5.14) (c)). For the experiments with a crystallisation
temperature of -20 °C and sweating rate of 4.6 °C/min, the salt concentration of product
water was reduced from 4.6 to 3.83 wt%, when the crystal mass ratio increased from 0 % to
8.60% (see Figs (5.14) (c)). When the crystal mass ratio reached 8.60%, the sweating process
could not be continued, because the remaining crystal mass inside the crystalliser tube was
dislodged, and fell into the collecting vessel. This experiment was repeated several times and
the same behaviour was observed, indicating that the maximum crystal mass ratio could not
exceed 8.60%. For the experiments with a crystallisation temperature of -10 °C and sweating
rate of 0.5 °C/min, the salt concentration of product water was reduced from 2.89 to 1.86
wt%, when the crystal mass ratio increased from 0% to 24.41% (see Figs (5.14) (c)). For the
experiments with a crystallisation temperature of -10 °C and sweating rate of 3.9 °C/min, the
salt concentration of product water was deceased from 2.89 wt% to 2.38 wt%, when the
crystal mass ratio varied from 0 % to 27.50% (see Figs (5.14) (c)). The remaining crystal
mass was not dislodged from the crystalliser tube as seen in the previous experiments at -20
°C. The experimental results proved that lowering sweating rate can slightly reduce the
product concentration. This gives clear evidence that the performance of the adopted
technology cannot produce a final product of near drinking water at a reasonable production
rate. Figs (5.14) (d) shows that the sweating time was significantly reduced by increasing the
sweating rate. For instance, the sweating time was reduced from 21.73 min to 7.62 min when
the sweating rate was changed from 0.5 to 4.6 °C/min. From an economic point of view, the
C h a p t e r V: in v e s t ig a t in g t h e f e a s ib il it y o f t h e f a l l in g f il m c r y s t a l l is a t io n p r o c e s s f o rTREATING REVERSE OSMOSIS BRINES
153
product concentration was not significantly changed by changing the sweating rate,
indicating that the user can carry out the sweating process in the fastest possible way to
reduce the time retention of the freezing stage, if the sweating process is essential for such an
application.
5.6.4 Multi-stage processing (feed, rectification, and stripping stages) with a sweating
procedure for treating RO brine
The purpose of the seventh series of experiments was to evaluate the performance of a multi
stage process, using falling film crystallisation and sweating processes, for desalting and
concentrating RO brine. The multi-stage process consisted of three successive freezing
stages, i.e. feed, rectification, and stripping stages, and was operated at the maximum water
recovery ratio. The experiments determined the performance of each freezing stage, with
respect to the salt concentration of product water and ionic rejection. The crystallisation
temperature and ramp for the feed and rectification stages were -16°C and 0 °C/min
respectively, whereas the sweating steps were carried out at a start-point HTM temperature
and sweating ramp of -16°C and 0.5°C/min respectively. A complete record of the
temperature profiles for these experiments is given in Appendix A5. The stripping stage was
initially tested with a crystallisation temperature of -22°C (see run 80 in Table A5-3 in
Appendix 5); however, the test was terminated at the beginning of the crystallisation
operation, because of the collapse of the nucleated ice from the crystalliser tube, which led to
a substantial amount of undesired ice suspension inside the collecting tank. This is because
the initial crystal layer adhering like an encrustation on the cooled surfaces of the crystalliser
tends to be porous, with a sponge-like structure, since the crystal layer was contained
substantial amounts of impurities. This type of crystal layer tends to be weak in structure and
does not stick well to the cooled surface of crystalliser, and cannot resist the incoming flow
of circulated melt, which flows as a falling film. To prevent this problem, the stripping stage
requires a well-controlled driving force and flow rate. Therefore, the experiment for the
stripping stage was carried out with the crystallisation temperature and ramp at -26°C and 0
°C/min respectively; furthermore, the flow rate of melt circulation pump was reduced at the
beginning of the crystallisation operation for 5 min, and then increased to the optimum flow
rate. In general, the crystallisation operation of the stripping stage needs intensive monitoring
to avoid the appearance of an ice suspension inside the collecting vessel. The sweating steps
were carried out at a start-point HTM temperature of -26°C and sweating ramp of 0.5°C/min.
The actual operational period of the crystallisation process for the feed, rectification, and
C h a p t e r V: in v e s t ig a t in g t h e f e a s ib il it y o f t h e f a l u n g f il m c r y s t a l l is a t io n p r o c e s s f o r 154TREATING REVERSE OSMOSIS BRINES
stripping stages were 0.87, 0.75, and 0.56 h respectively, whereas the actual operational
periods of the sweating process were 0.6, 0.45, and 0.47 h, for the same freezing stages
respectively. The amount of feed used each time was approximately 30 kg, so the
experiments for the feed stage were individually repeated 6 times to collect the water
samples for physiochemical analysis, and also to collect enough feed water for the
rectification and stripping stages, which were performed only one time to produce the final
product water.
A summary of the performance data for the multi-stage process and physiochemical analysis
for the water samples of each freezing stage is given in Tables (5.5) and (5.6). Furthermore,
the salt concentration of product water, water recovery ratio, and salt rejection ratio for each
freezing stage is shown in Fig (5.15).
Table (5.5) shows that the average TDS value of the brine fed to the feed stage, rectification,
and stripping stages were 61,104, 33,701, and 141,974 ppm, whereas these freezing stages
were capable of lowering the feed waters down to 33,701, 17,913, and 113,787 ppm
respectively. The calculations of the salt rejection ratios give 44.84, 46.85, and 19.85%, for
the same freezing stages respectively. The overall results proved that the tested technology
was capable of reducing the TDS value of RO brine from 61,104 ppm down to 17,913 ppm
over two successive freezing stages (see Table (5.5)). The calculation of the overall salt
rejection ratio for these stages was 70.68%. The results clearly indicate that the salt rejection
ratio was improved by adding one more freezing stage (i.e. rectification stage); as a result,
the salt rejection ratio is proportional to the number of freezing stages. The calculations of
the water recovery ratios were 69.85, 71.79, and 69.72%, for the same freezing stages
respectively. The water recovery ratios for the freezing stages were approximately the same,
because the crystallisation processes for these freezing stages were performed at the same
and maximum ratios. The calculation of the overall water recovery ratio gives 50.15%. The
experimental results clearly indicate that the water recovery ratio declined from 69.85%
down to 50.15% by adding a rectification stage. This indicates that the water recovery ratio is
inversely proportional to the number of freezing stages.
Table (5.5) shows that the TDS values of the residual liquid of the feed, rectification and
stripping stages were 124,576, 73,886 and 218,033 ppm respectively. The residual liquid of

C h a p t e r V: in v e s t ig a t in g t h e f e a s ib il it y o f t h e f a l l in g f i l m c r y s t a l l is a t io n p r o c e s s f o rTREATING REVERSE OSMOSIS BRINES
155
Stage Water Sample Parameters Unit Value
Feed WaterMass
TDS
(kg)
(ppm)
30.931
61,104
Feed Stage Product WaterMass
TDS
(kg)
(ppm)
21.604
33,701
Residual Water*Mass
TDS
(kg)
(ppm)
9.327
124,576
Feed WaterMass
TDS
(kg)
(ppm)
30.827
33,701
Rectification Stage Product WaterMass
TDS
(kg)
(ppm)
22.132
17,913
Residual Water*Mass
TDS
(kg)
(ppm)
8.695
73,886
Feed WaterMass
TDS
(kg)
(ppm)
27.648
141,974
Stripping Stage Product WaterMass
TDS
(kg)
(ppm)
19.276
113,787
Residual Water*Mass
TDS
(kg)
(ppm)
8.372
218,033
Table 5.5: Summary o f the performance data for the feed, rectification, and stripping stages.
* Residual liquid includes the overall results o f the actual residual liquid and sweat
fractions.
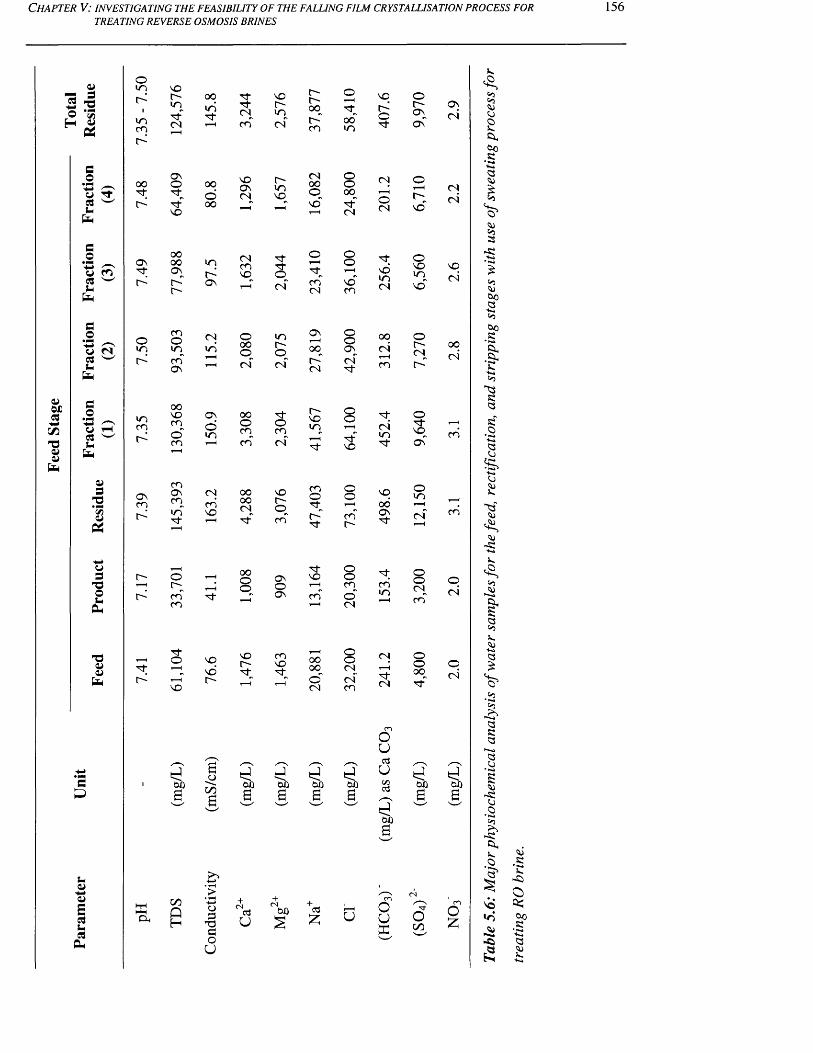
C h a p t e r V: in v e s t ig a t in g t h e f e a s ib il it y o f t h e f a l l in g f il m c r y s t a l l is a t io n p r o c e s s f o r
TREATING REVERSE OSMOSIS BRINES156
a^ 3
fa a>
<L>00cg
C/3
0>
fa
VAU
fa
u cn cs w u fa
aeoU M CS w Ufa
SO• PNWAufa
3*B«34>fa
Ws
'BOUi
fa
'B
fa
Sfa
u0>4>EcsuCS
fa
Oinl>
mcn
oini>
inrn
ONrn
faf a
NOr -in<N
mOinrnON
oonomo'm
mONrnin'rj-
*dooB
onQH
00in CN
r n
NOr-inCS"
<Sin
O N
oin
CSrnNO
ooocs
00ornrn
ooooC S
inr -o ,cs
orncs
NOr-o
Boc/5B
o3TJao
U
cSU
00
r -r -ooo "m
o ni—H
oo
cs
r-NOm
mO
o "
+c<3£
oom
00■"Sf
O NO 00
oN OO N<s
r-inp
cs00o
OO00
N O00 1—H l—H n o "
t—H cs
O N0 00 0O N
i nC SmN O
o1— 1
ooH
r - " O N _r cs" r n n o "r- cs m
oo
cs"
oor -H
NO
oorno
1—H 00oo
Tf oi> O O N N O ol—H
r—H o i—H m
r nm
O N r n o"( S
o N O
N O
N Or-
mN O
T—I 00 00
oo°i
t-H r- ^ o" cs"N O cs m
t d t d t d t dtU)cs
o oa
0 0CS
0 0C3
C
U
N O
o
CS
OCS
N Omcs
00csr -H
m
csm
NO00O Nxt-
min
c si—H
c s
OUcS
utn cS
d00
OuX
ot"-O N
O N
no"
ON Oinno"
of "<Nr-~"
oN O
O N
oincs"
oo° im
oooo
O n
C S
cscs
N O
cs
00cs’
m
ocs
ocs
*dooa
tdooa
oCO
o
K
oai>aCJgfa00•SOS
1*0*
&aS
Oi00«
0 oR
•S-+-»t>3"3R3R•S-t-d3O
Njsou
’3 '
-R•*«*
'S,03
' o '
>!&3ROS
3O
-R
•S>3?S
-Rfau3
IVOn
<R
£
<4i•SU■ROfa
O o
•S
g
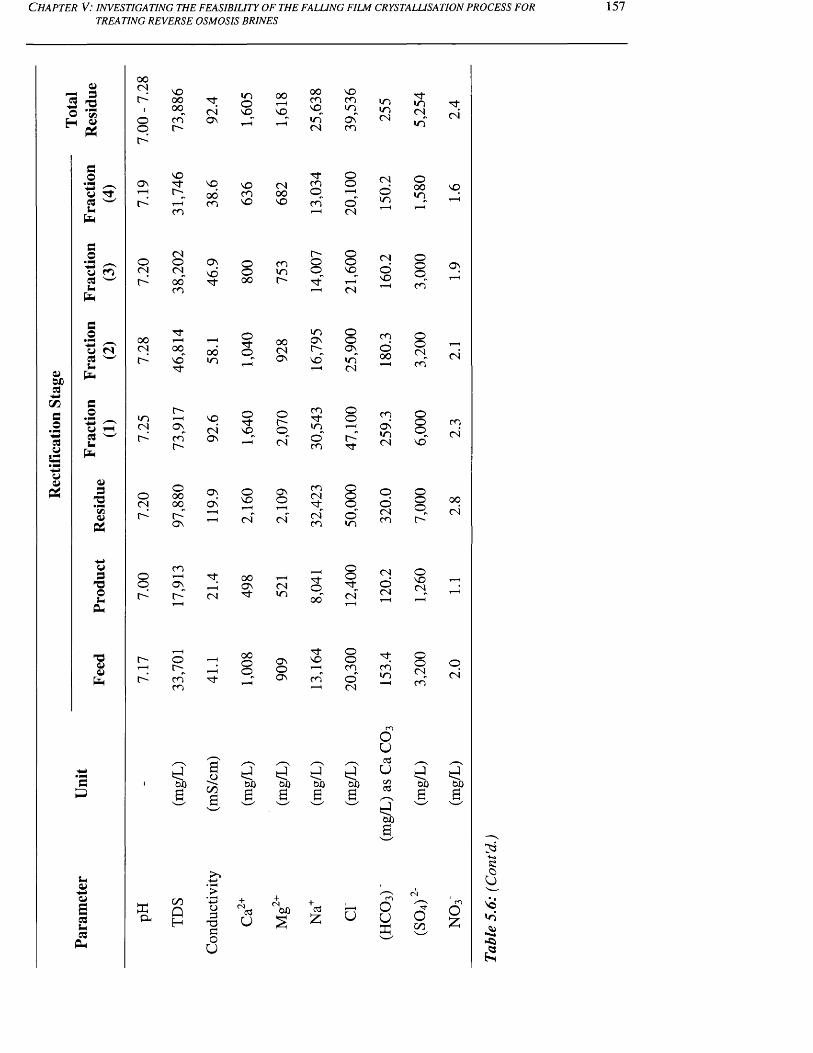
C h a p t e r V: in v e s t ig a t in g t h e f e a s ib il it y o f t h e f a l u n g f il m c r y s t a l u s a t i o n p r o c e s s f o r
TREATING REVERSE OSMOSIS BRINES157
O C/5
c©• pm
(J03U
<UOX)coC/5CS
’-MCO©G• ppoc*
co• Pp —^ /—“S« ro co w u P
ao•pp _
<y CN CO w u p
so• pp©COUiP
<u32*3?0)
w373Oucu
730)P
aP
UiOia>aCOSiCOeu
00C M
N Oi > 0 0
i 0 0C M
o C O O No o
N OO N 7f- pi—H
0 0r —-1 C Oc o
C Mo O O NC M C N
N Or - ‘ o o " 7t
C O
oC M
o0000r-"O N
d00a
XCLC O
QH
mONO00N O
N OCON O
oooo
CM00N O
COin
O N
O N
ON O
CN
O NOCN
C Oo 0 0 i—Ho O N O N C M
o "r* H
C M m
aoC O
d00ad00
o3733Ou
<3U
00
ooCOpinCN
7j-co<oCO
r-oo
coCN
CNCO
■"too"
d00a
+<3£
N OCOinO NCO
oOO<N
OoP1—H
CN
in o0 0 I- H H 0 0 O N oC M 0 0
0 0\ i
C M t> O N
n o " in O n n o " in"7j- *— 1 C M
i nr -
H p o oc-©
C O OO
C M O NCM* p
i n
c o "l>
O N t-H c m "o"C O
r - "7 l -
OOoo'm
ooCN
,— i0 0o© ^
Or - o i—H O N N O oi—H o t-H C O
c o "C O
O n c o " o"C M
d00a
u
mmCN
CNom
CNoN O
COo00
coO NinCN
ooCNCO
CNoCN
COm
ouc3u(Z)3d00
OUX
mCNin
o00m
ooco"
ooCNCO
OOON O "
oooc-"
oN OCN
OoCM
CN
N O
O N
CN
COCN
00CN
©CM*
d00 dooa
oon
73KOo
'NOin
a
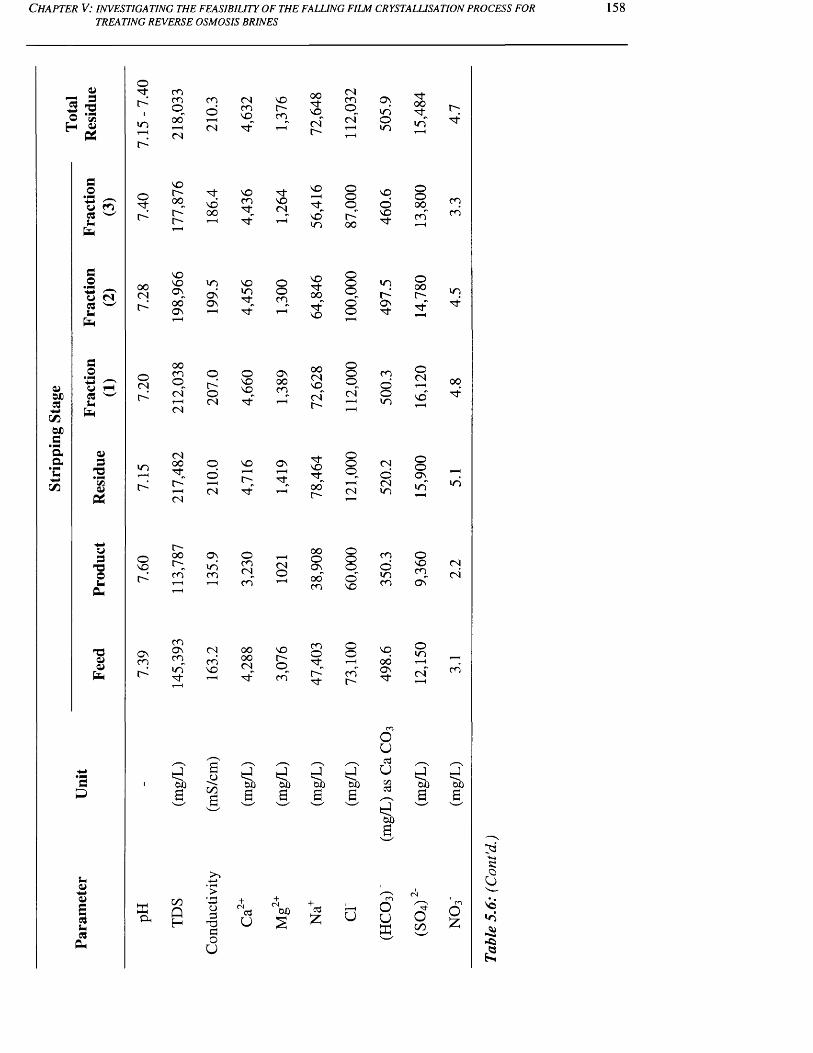
Strip
ping
St
age
C h a p t e r V: in v e s t ig a t in g t h e f e a s ib il it y o f t h e f a l l in g f il m c r y s t a l l is a t io n p r o c e s s f o r
TREATING REVERSE OSMOSIS BRINES158
0)"eS A© S H © fa
w m03 w Ufa
C#o /■“Su d
08 w Uifa
a©CJCtUfa
0>3T3• MPc/ifa
3T3Oufa
"OV4>fa
flfa
Ua>au03fa
O
tor-
o
ooCN
oCN
mH
ono
ONcn
mcno,oo"
CN
NOr-oor--"
NONOONoo"ON
00cn<qCNr—ICN
CN00nTo"H
CN
r"00t";cn
cnONcninnt-
tdOX)a
a&00QH
cnoCN
NO00
inONON
r -oCN
Odr"HCN
ONincn
CNcnNO
00
o3T33Ou
CNcnNO
NOcn
NOinnf
ONONOnt-"
NO
ocnCNcn
0000CNn |-
NOr-cn
NOCN
Oocn
ON00cn
ON
CNo
NOr-cn
0X)
00 NO CNc-~
NO
nfno"m
NOm-00nf-"NO
00CNNqCNc-~
nf-NO
oo"r-
00oONoo"cn
cnor-"n-
t d t d t d0X)a 0X)
C3OX)cj
B
+cS£
CNcn
cn"
OO<qo"oo
oooo"o
oo< 3
CN
OO<3CN
OOoo"NO
oocnr-
0X)a
u
ONinom
NOoNOn-
ini>ONn |-
cnooin
CN
oCNin
cnoincn
NO00ON
Ouuon3
OX)a
oux
oom"
oo00cn
Ooor-
oCN
no"
ooONin"
oNOcnOn"
Omcn"
cncn
inn f-
oo
in
CNCN
fed0X)a
fedOX)a
ocnO£
sofa
in
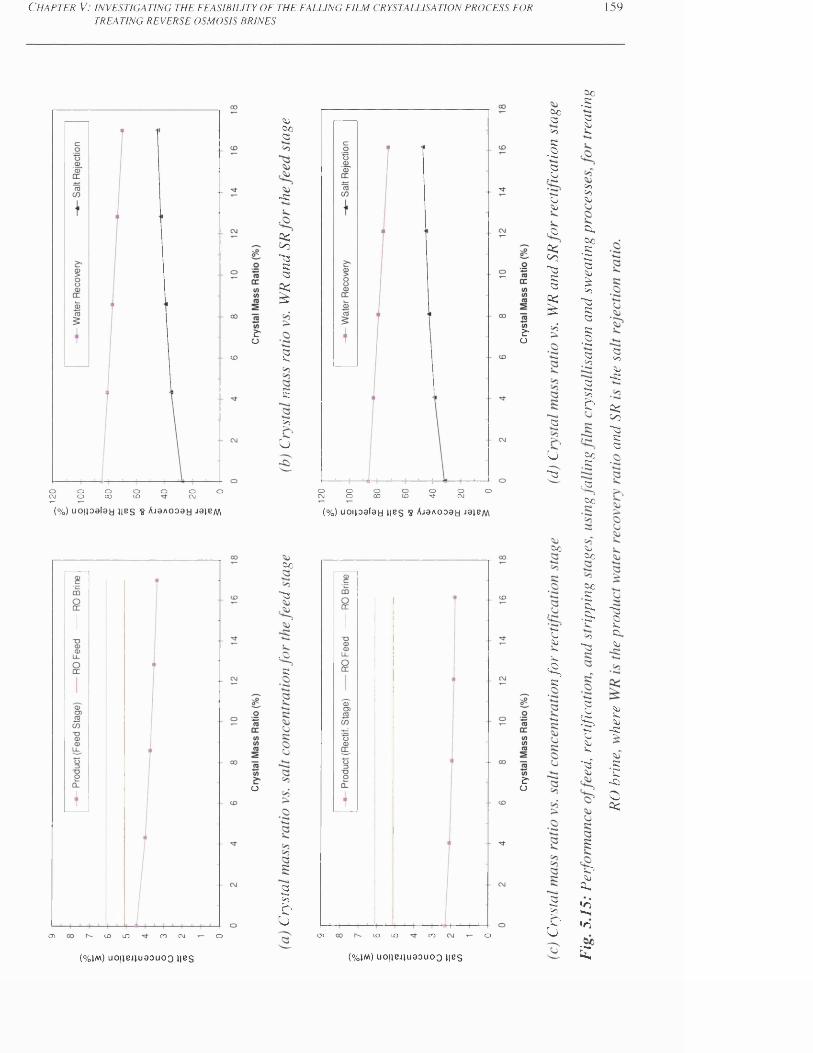
120
C h a p t e r V: i n v e s t i g a t i n g t h e f e a s i b i l i t y o f t h e f a l l i n g f i l m c r y s t a l l i s a t i o n p r o c e s s f o r
TREATING REVERSE OSMOSIS BRINES159
Oo
ooo oCD
o oCNJ
O
(% ) u o i jo a f a y n e s S A ja A o a a y Ja iB M
cn CD I D CO C\J o
£o
o
sosccs> 3
-c
a:CO■3
SCCS
I
5
r<»S:
>3u
Sc
s
. JO
sc
2»3£u
oCNJ
OCD
OTfoo o
cooCNJ
o
" T -
&o
(%) u o u o a f a y j i b s $ A-iaAooay j b j b m
CD CD ID CO O
£-o
Sccs>3SS•2csSj*—CjSo
-CS
C<CoSKcs
I<>5
<3
u2c
Sc
SjSoV.SO<£,e
21>3£u
(% jm ) u o j jB J ju a o u o o j ib s (% jm ) UOjJBJJUaOUOQ J|BS
Sc_2cssok.
> 3>3So
a,Sc.2■k-4cs50£>)
~cssccs51 .2 a6*3cst—> 3
c
ScSC
J3Sc
SoSc
Scsc
.1C!*>3s
2§
S jSOis.
■g
is?soa,>o-i•o
£
cs03So-si
a;Co■C3s:cs
~cscsV.a,<0
sois.so-sc
•S£!-csoa:
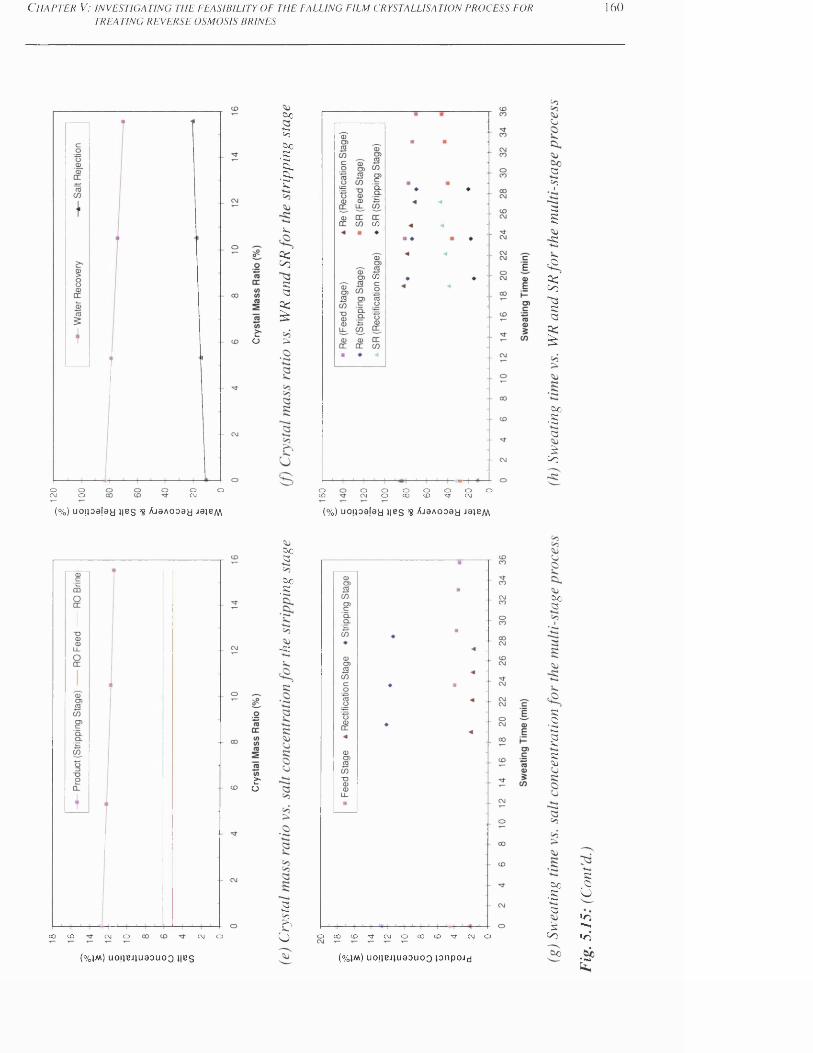
120
C h a p t e r V: i n v e s t i g a t i n g t h e f e a s i b i l i t y o f t h e f a l l i n g f i l m c r y s t a l l i s a t i o n p r o c e s s f o r
TREATING REVERSE OSMOSIS BRINES160
Oo o oCNJ
O
&o
OjJ*-4O00 <->
1 C
V.
QCtocos
I>
C/3
CO
oCD
Oeg oo o00 oCD oTf oeg
o
Co;J
CS<>3
35-s;.oasto3St3
I
Oo•Sa£
to
(%) U 0 !io a [3 a l i e s ’S A ja A o a a y Jaje/v\ (%) uoijoalau lie s S AjaAooaa J3jem
CO CD CNJ O eg o
S'o
(%jm) UOjlBJlUaOUOQ J|BS
Oo05Oo.K
- s ;
2oc
o OOOCO^frCNJOCOtO-stCVJO(%jm) uoiJBJjuaauoo jonpojd
Oo05
s•2♦—05V.
«So
Oo•Sa£
t o
S*Oo•o*-<•o *
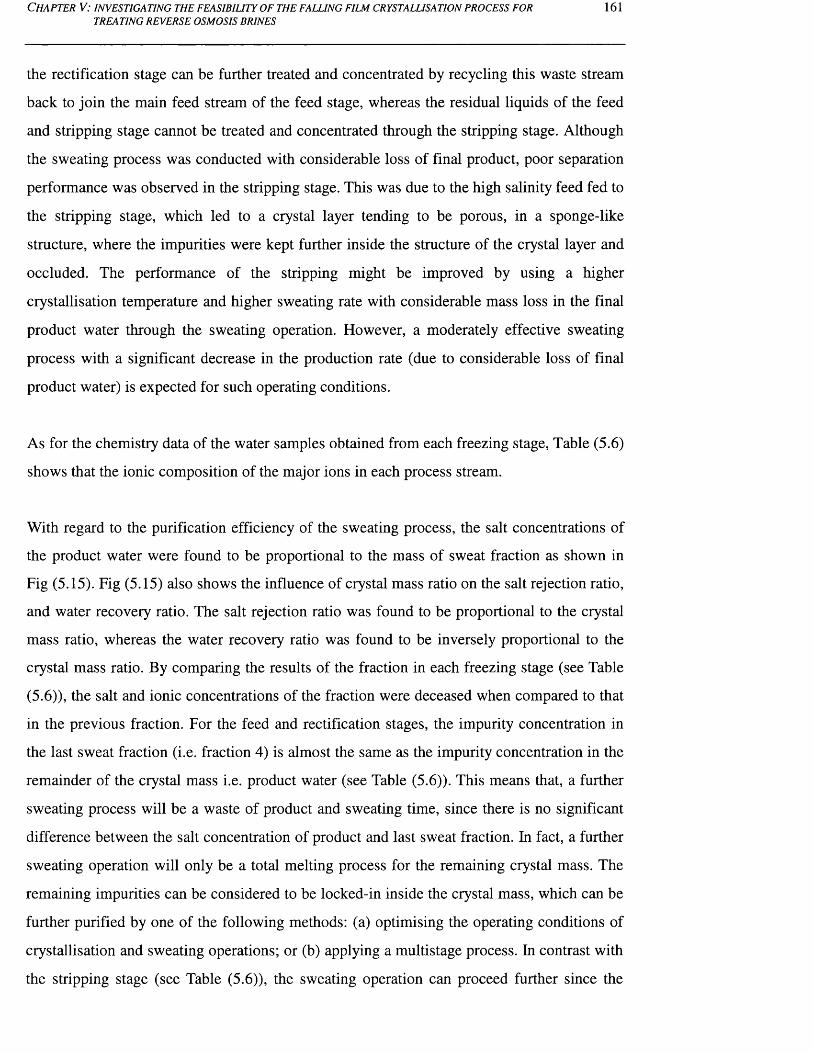
C h a p t e r V: in v e s t ig a t in g t h e f e a s ib il it y o f t h e f a l u n g f il m c r y s t a l l is a t io n p r o c e s s f o r 161TREATING REVERSE OSMOSIS BRINES
the rectification stage can be further treated and concentrated by recycling this waste stream
back to join the main feed stream of the feed stage, whereas the residual liquids of the feed
and stripping stage cannot be treated and concentrated through the stripping stage. Although
the sweating process was conducted with considerable loss of final product, poor separation
performance was observed in the stripping stage. This was due to the high salinity feed fed to
the stripping stage, which led to a crystal layer tending to be porous, in a sponge-like
structure, where the impurities were kept further inside the structure of the crystal layer and
occluded. The performance of the stripping might be improved by using a higher
crystallisation temperature and higher sweating rate with considerable mass loss in the final
product water through the sweating operation. However, a moderately effective sweating
process with a significant decrease in the production rate (due to considerable loss of final
product water) is expected for such operating conditions.
As for the chemistry data of the water samples obtained from each freezing stage, Table (5.6)
shows that the ionic composition of the major ions in each process stream.
With regard to the purification efficiency of the sweating process, the salt concentrations of
the product water were found to be proportional to the mass of sweat fraction as shown in
Fig (5.15). Fig (5.15) also shows the influence of crystal mass ratio on the salt rejection ratio,
and water recovery ratio. The salt rejection ratio was found to be proportional to the crystal
mass ratio, whereas the water recovery ratio was found to be inversely proportional to the
crystal mass ratio. By comparing the results of the fraction in each freezing stage (see Table
(5.6)), the salt and ionic concentrations of the fraction were deceased when compared to that
in the previous fraction. For the feed and rectification stages, the impurity concentration in
the last sweat fraction (i.e. fraction 4) is almost the same as the impurity concentration in the
remainder of the crystal mass i.e. product water (see Table (5.6)). This means that, a further
sweating process will be a waste of product and sweating time, since there is no significant
difference between the salt concentration of product and last sweat fraction. In fact, a further
sweating operation will only be a total melting process for the remaining crystal mass. The
remaining impurities can be considered to be locked-in inside the crystal mass, which can be
further purified by one of the following methods: (a) optimising the operating conditions of
crystallisation and sweating operations; or (b) applying a multistage process. In contrast with
the stripping stage (see Table (5.6)), the sweating operation can proceed further since the
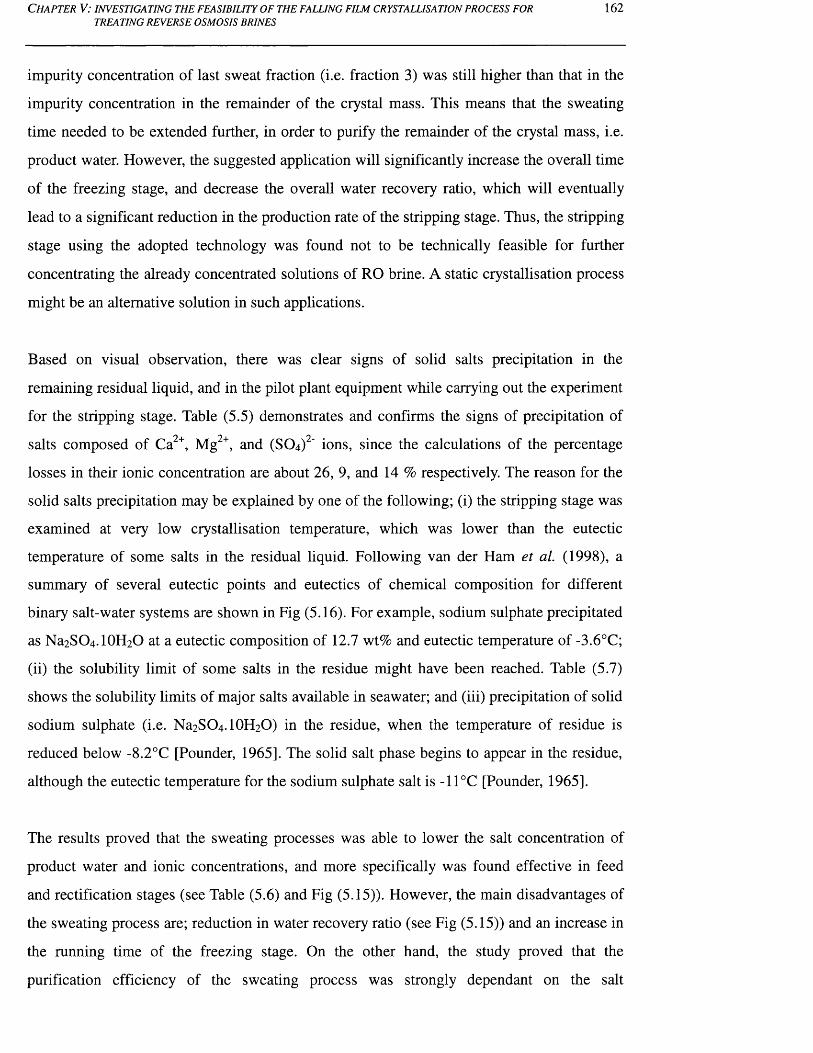
C h a p t e r V: in v e s t ig a t in g t h e f e a s ib il it y o f t h e f a l l in g f il m c r y s t a l l is a t io n p r o c e s s f o r 162TREATING REVERSE OSMOSIS BRINES
impurity concentration of last sweat fraction (i.e. fraction 3) was still higher than that in the
impurity concentration in the remainder of the crystal mass. This means that the sweating
time needed to be extended further, in order to purify the remainder of the crystal mass, i.e.
product water. However, the suggested application will significantly increase the overall time
of the freezing stage, and decrease the overall water recovery ratio, which will eventually
lead to a significant reduction in the production rate of the stripping stage. Thus, the stripping
stage using the adopted technology was found not to be technically feasible for further
concentrating the already concentrated solutions of RO brine. A static crystallisation process
might be an alternative solution in such applications.
Based on visual observation, there was clear signs of solid salts precipitation in the
remaining residual liquid, and in the pilot plant equipment while carrying out the experiment
for the stripping stage. Table (5.5) demonstrates and confirms the signs of precipitation of
salts composed of Ca2+, Mg2+, and (SO4)2' ions, since the calculations of the percentage
losses in their ionic concentration are about 26, 9, and 14 % respectively. The reason for the
solid salts precipitation may be explained by one of the following; (i) the stripping stage was
examined at very low crystallisation temperature, which was lower than the eutectic
temperature of some salts in the residual liquid. Following van der Ham et al. (1998), a
summary of several eutectic points and eutectics of chemical composition for different
binary salt-water systems are shown in Fig (5.16). For example, sodium sulphate precipitated
as Na2SO4.10H2O at a eutectic composition of 12.7 wt% and eutectic temperature of -3.6°C;
(ii) the solubility limit of some salts in the residue might have been reached. Table (5.7)
shows the solubility limits of major salts available in seawater; and (iii) precipitation of solid
sodium sulphate (i.e. Na2SO4.10H2O) in the residue, when the temperature of residue is
reduced below -8.2°C [Pounder, 1965]. The solid salt phase begins to appear in the residue,
although the eutectic temperature for the sodium sulphate salt is -11°C [Pounder, 1965].
The results proved that the sweating processes was able to lower the salt concentration of
product water and ionic concentrations, and more specifically was found effective in feed
and rectification stages (see Table (5.6) and Fig (5.15)). However, the main disadvantages of
the sweating process are; reduction in water recovery ratio (see Fig (5.15)) and an increase in
the running time of the freezing stage. On the other hand, the study proved that the
purification efficiency of the sweating process was strongly dependant on the salt
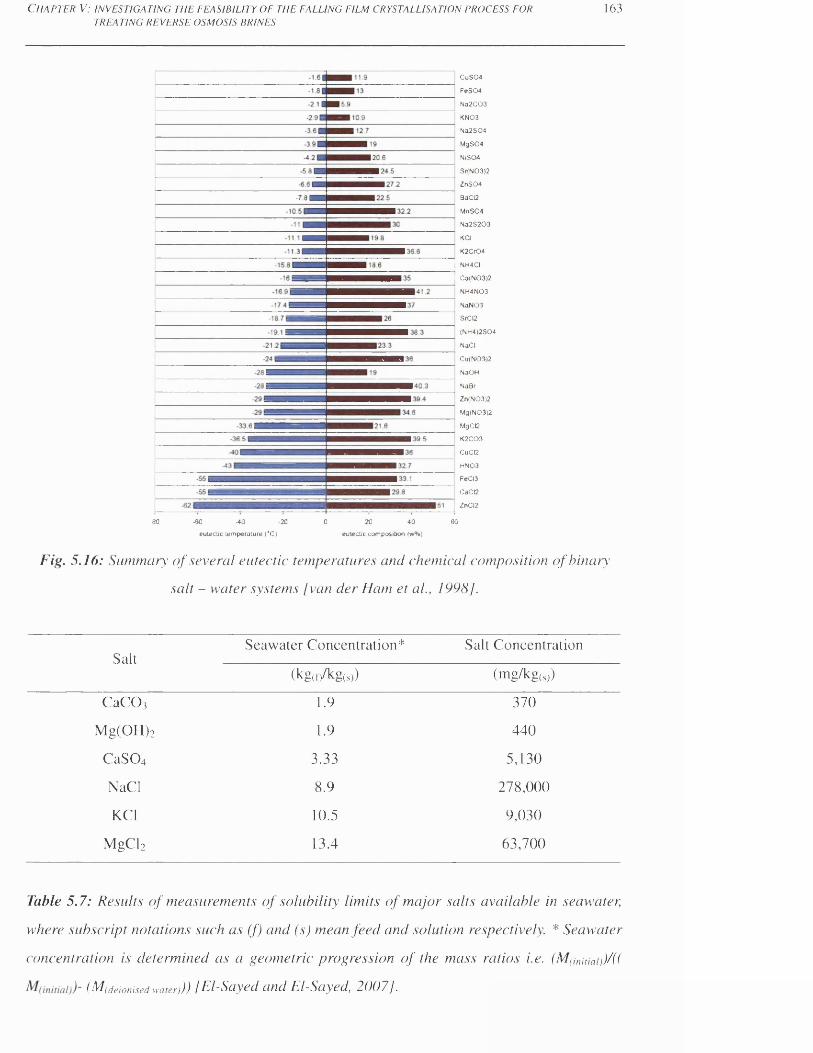
C h a p t e r V: i n v e s t i g a t i n g t h e f e a s i b i l i t y o f t h e f a l l i n g f i l m c r y s t a l l i s a t i o n p r o c e s s f o r
TREATING REVERSE OSMOSIS BRINES163
CuS04
FeS04
Na2C03
KN03
Na2S04
MgS04
NiS04
Sr(N03)2
ZnS04
BaC12
MnS04
Na2S203
KCI
K2Cr04
NH4CI
Ca(N03)2
NH4N03
NaN03
SrCI2
(NH4)2S04
NaCI
Cu(N03)2
NaOH
NaBr
Zn(N03)2
Mg(N03)2
MgCC
K2C03
CuCI2
HN03
FeCI3
CaCQ
ZnCI2
30 -60 -40 -20 0 20 40 60
eutecjc temperature (*C) eutectjc composition (w%)
Fig. 5.16: Summary o f several eutectic temperatures and chemical composition o f binary
salt - water systems [van der Ham et al., 1998].
SaltSeawater Concentration* Salt Concentration
(kg(f/kg(S)) (mg/kg(s})
C a C 0 3 1.9 370
Mg(OH)2 1.9 440
C aS 0 4 3.33 5,130
NaCI 8.9 278,000
KC1 10.5 9,030
MgCl2 13.4 63,700
Table 5.7: Results o f measurements o f solubility limits o f major salts available in seawater,
where subscript notations such as (f) and (s) mean feed and solution respectively. * Seawater
concentration is determined as a geometric progression o f the mass ratios i.e. (M(imtiai))/((
( (deionised water))) [Rl-Sayed and lil-Sayed, 2007].
C h a p t e r V: in v e s t ig a t in g t h e f e a s ib il it y o f t h e f a l l in g f il m c r y s t a l u s a t i o n p r o c e s s f o r 164TREATING REVERSE OSMOSIS BRINES
concentration of the original mass of crystal layer, as shown in Fig (5.15). Figs (5.15) (g) and
(h) showed that the purification efficiency of sweating processes declined considerably on
increasing the salt concentration of the original mass of the crystal layer.
Although the results are quite encouraging in terms of the separation performance, the
adopted technology, over two successive freezing stages, did not produce a final product
close to potable water standards, with respect to salt concentration and ionic compositions, as
illustrated in Table (5.6). However, the adopted technology produced a saline water of near
brackish water standards that can be further easily desalted by: (a) optimising the
crystallisation and sweating operations by compromising the purification efficiency and
product loss; (b) increasing the number of rectification stages; and (c) using one of the
conventional desalination technologies, such as brackish water RO membranes, to obtain a
final product of drinking water.
5.6.5 Multi-stage processing (feed and rectification stages) with a sweating step for
desalting Arabian Gulf seawater
In the eighth series of experiments, the purification efficiency of a multi-stage Sulzer falling
film process was examined and evaluated for seawater desalination application. The
experiments were carried out in a multi-stage process, using two successive freezing stages,
which are the feed and rectification stages. Arabian Gulf beach-well seawater was used as
the feed sample for the feed stage. The multistage process was examined at maximum water
recovery ratio. The experiments determine the purification efficiency of the crystallisation
and sweating processes in each freezing stage, in terms of the salt concentration of product
water and ionic rejection. The crystallisation temperature and ramp for the feed and
rectification stages were -16°C and 0 °C/min respectively, whereas the sweating steps were
carried out at a start-point HTM temperature of -16°C and sweating ramp of 0.5°C/min
respectively. The actual operational period of the crystallisation process for the feed and
rectification stages were 1.33, and 0.53 h respectively, whereas the actual operational period
of the sweating process were 0.4, and 0.47 h, for the same freezing stages respectively. A
complete record of the temperature profiles for these experiments is given in Appendix A5.
The amount of feed used each time was approximately 30 kg, so the experiments for the feed
stage were individually repeated twice to collect the water samples for physiochemical
C h a p t e r V: in v e s t ig a t in g t h e f e a s ib il it y o f t h e f a l l in g f il m c r y s t a l l is a t io n p r o c e s s f o rTREATING REVERSE OSMOSIS BRINES
165
analysis, and also to collect enough feed water for the rectification stage, which was
performed only once to produce the final product water.
A summary of the experimental data and physiochemical analysis for the water samples of
each freezing stage is given in Tables (5.8) and (5.9). Table (5.8) shows that the average TDS
value of Arabian Gulf seawater fed to the feed stage was 49,074 ppm, whereas the feed and
rectification stages were able to produce a final product water with average TDS values of
26,446, and 12,289 ppm respectively. Table (5.9) shows that the TDS values of the residual
liquid of the feed and rectification stages were 103,955 and 51,052 ppm respectively. The
residual liquids of the rectification stages can be further easily desalted by recycling this
residue back to join the main stream of the feed stage, whereas the residue of the feed stage
must be treated and concentrated through the stripping stage.
The calculation of the salt rejection ratios give 46.11 and 53.53%, for the feed and
rectification stages respectively, while calculation of the water recovery ratios give 70.81 and
63.48%, for the same freezing stages respectively. The overall salt rejection and water
recovery ratios, of the examined multi-stage process, were 74.96% and 44.95% respectively.
The performance results obtained provided clear evidence that the investigated multistage
process was capable of providing product water with a TDS value of 12,289 ppm from
Arabian Gulf seawater. Although the examined treatment system did not produce high
quality product water closer to drinking water standards, it produced saline water with almost
the same quality as brackish water, in terms of salinity and ionic composition, as indicated in
Table (5.9). In order to obtain potable water, this near brackish water can be further easily
desalted by one of the following methods; (i) optimising the crystallisation and sweating
process for the multistage process; (ii) adding one rectification stage or more; or (iii) using a
conventional brackish water desalination technology, such as membranes.
With regard to ionic rejection, Table (5.9) shows that the average hardness ion values of
Ca2+, Mg2+, and (SO4) 2‘ for the tested seawater fed to the feed stage were 1,080, 1,387, and
3,900 mg/L respectively. The examined multistage process was able to reduce these ions
down to 392, 402, and 980 mg/L respectively. Table (5.9) also shows that the tested seawater
contains monovalent ions, such as Na+ and Cl", with ionic concentrations of 16,523 and
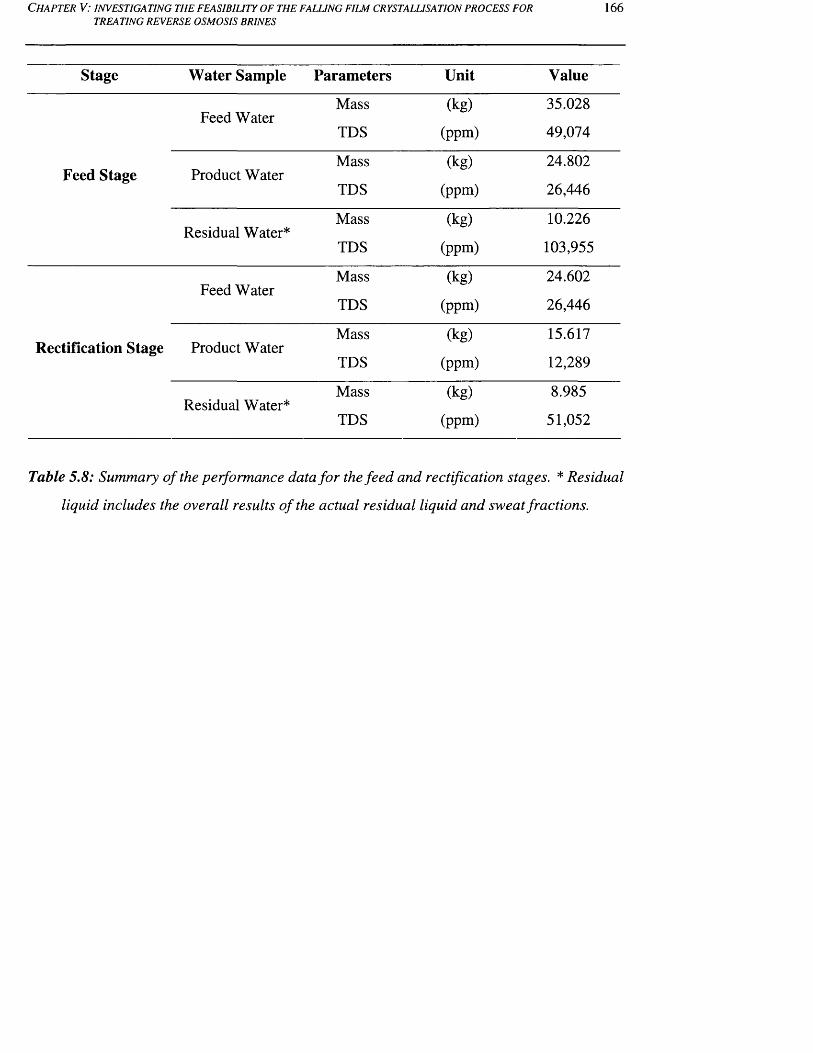
C h a p t e r V: in v e s t ig a t in g t h e f e a s ib il it y o f t h e f a l l in g f il m c r y s t a l l is a t io n p r o c e s s f o r 166TREATING REVERSE OSMOSIS BRINES
Stage Water Sample Parameters Unit Value
Feed WaterMass
TDS
(kg)
(ppm)
35.028
49,074
Feed Stage Product WaterMass
TDS
(kg)
(ppm)
24.802
26,446
Residual Water*Mass
TDS
(kg)
(ppm)
10.226
103,955
Feed WaterMass
TDS
(kg)
(ppm)
24.602
26,446
Rectification Stage Product WaterMass
TDS
(kg)
(ppm)
15.617
12,289
Residual Water*Mass
TDS
(kg)
(ppm)
8.985
51,052
Table 5.8: Summary of the performance data for the feed and rectification stages. * Residual
liquid includes the overall results o f the actual residual liquid and sweat fractions.
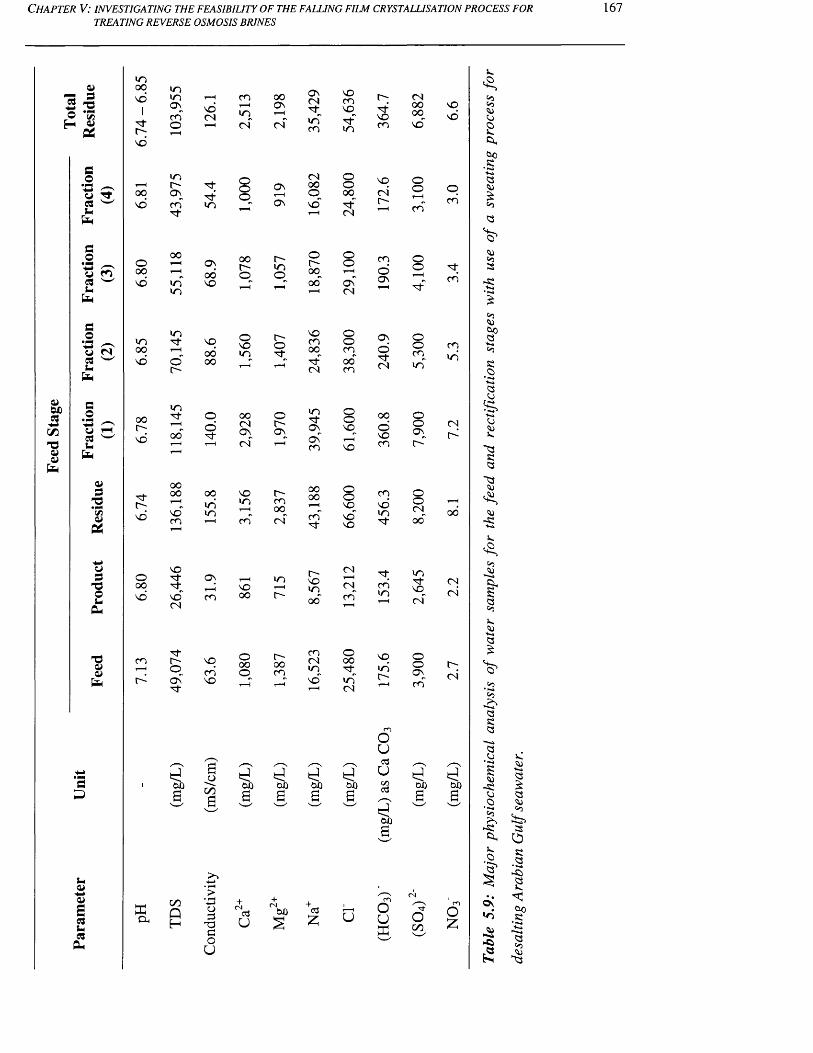
C h a p t e r V: in v e s t ig a t in g t h e f e a s ib il it y o f t h e f a l l in g f il m c r y s t a l l is a t io n p r o c e s s f o r
TREATING REVERSE OSMOSIS BRINES167
4)
H ©fa
so• PN
4>aufa
4)OjCcg
C/2
4)4)
fa
G©
fa rnC3 w Uifa
GO• pp —
(J CN CG w U
fa
G©•p^©CGU
fa
4>=3
• P«<V34>fa
oG
- 0©u
fa
©©
fa
Gfa
u©©acgucg
fa
mooVO
Id -r-v d
oovo
d -r -
f aCLi
inmO nrnO
ind"
oo
0000
vorn
00a
cnPH
vo(N
cnr-fainCN
ooO n
CN
Od"
00inm
ooCNO nCN
VOm
m
or-~O N
r-mooCN
aocna
oGT3GO
U
aU
oo
O nCN■dincn
ind -O N
O Ncn
0000
cnd -
+d£
V OcnV O
d -"m
m /*“N CN Oi—fa 0 d; f-S ON 00 O0 0 ON d- o, 0 00vd cn in ON vo" d"~
d- i—H CN
00 0
0 0fa 1—fa ON
OO0 0r-o,
r-~in0Oi>0 0
OO1—fa
vd inm VO 1—fa i-fa 0 0"fa O n"CN
in0 0
ind - q
0 0
0voinr-0d -
VOcn0 0^
OOcn
vd 0 " 0 0 _^ ^ d -" 00"t-' CN cn
oovqvo
ooqv dvo
vo r-VOin
CNO d- ON in fa00 d I-fa VO CNvd vo"
CNcn 00 r - 00" cn"
1—fa
cnd -r - q O
00 00cn
cnCN
O00
q 0 cn q d ^O n"d -
vo ^fa r-fa vo"^fa
in "CN
00d
OX)d
W )d
U )d
C C
U
d"vocn
qCNr -
cn©O N
O N
od -CN
00ov ocn
cnv dind -
cnin
qinr -
Oud
ucnd
td00a
ouf a
CN000 0
vo"
OOT“facn
Oo
oocnin
ooO N
l>"
ooCNoo"
md -qCN
OoO N
rn
v ov d
ocn
d ;cn
cnin
CN
oo
CNCN
CN
oo ooa
ocn
O£
033U3ufa0 0
•S+0<33
>3
*3*
s
033oo<3
3•S■*<133
u3
*333
"33
4)-3
>£,t>33
3oaU3■**>3£
' o 5
03• d333
3O
3-3
•S>3? s
->3fau3
On•n
£
33•*»*3£3303
3O3
.3
5
0 03
303
^3
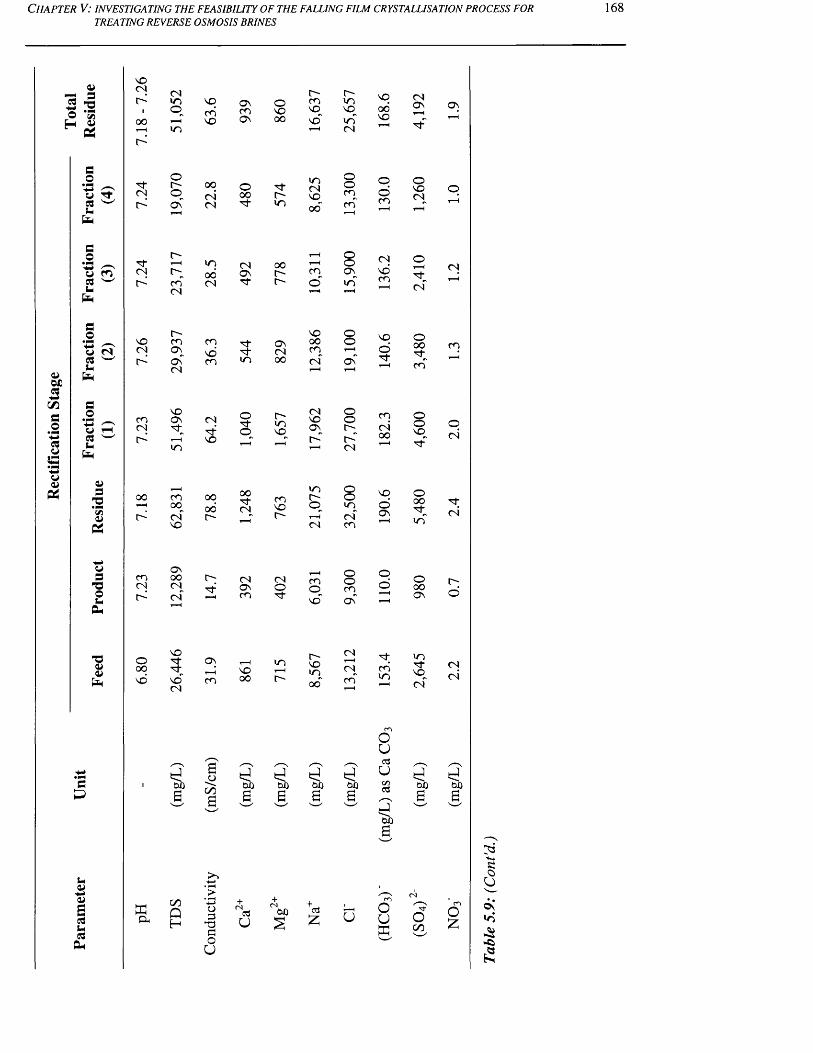
C h a p t e r V: in v e s t ig a t in g t h e f e a s ib il it y o f t h e f a l l in g f il m c r y s t a l l is a t io n p r o c e s s f o rTREATING REVERSE OSMOSIS BRINES
168
©$ 5 (2 '§
©OX03C/5flsOeg©a’-5©©fa
©egUfa
© Pi eg w u fa
fle© /"—Su N eg w u fa
flo• PN©egu
fa
©32*5©fa
©3-fl©ufa
'O©©fa
afa
©©"©seg©egfa
NOCN CNIN m noi cn00 i—fa NOfan
m
Og N 0 0(N o CNIN O n" CN
Ng i—fa inCN N 00n cn" CNCN
INNO cn cnCN ON NOin on" cnCN
NOcn ON CNCN g gIN fa NOm
i—fa00 cn 00fa 00IN cn" N
ffiOh
vo
ONcn 00 INCN CN gN CN 1 ■ <
d006
00QH
ONcnON
o00g
CNONg
ggm
ogo
00gCN
CNONcn
oNO00
gINin
00nin
ONCN00
inmNO
cnNON
CNOg
INcnNOno"
inCNMDoo"
cno"
NO00cncn"
CNNOONIN
inr-t—fa(N
cn©no"
aot/5a
o3T33Ou
egu
ox +eg£
r-m'Oin"CN
oocncn
ooONin"
oo1—fa
On"
Oonn"CN
ooincn"cn
oocnO n"
O NOg ON fa in NNOinCN1—fa
o o g r**fa NO fa CNNO no" cn 00 N oo" cn"CN T—fa
d d d do xeg
o xeg
o x3
o x3
3 3 3
U
NO00NO
oocn
CNNOcn
NOog
cnCN00
NOoON
oo
cnin
OUCgu
C/3eg
dOXa
oufa
CNOn On
ONOCN
CN
O00g^cn
OoNOg"
oOOg^in"
oooON
ingMDCN
CN
cn
oCN
gCN
n-o
<NCN
do xa
doxa
o00
O£
s ;oUOn
•n
a
C h a p t e r V: in v e s t ig a t in g t h e f e a s ib il it y o f t h e f a l l in g f il m c r y s t a l l is a t io n p r o c e s s f o r 169TREATING REVERSE OSMOSIS BRINES
25,480 ppm respectively. These ionic concentrations were lowered to 6,031 and 9,300 ppm,
for the same ions respectively, through the examined multistage process.
A summary of the important experimental data from field testing is shown in Fig (5.17). In
these plots the purity of the final product water, water recovery ratio and salt rejection ratio
are plotted against the crystal mass ratio. The purity of the final product waters (for the feed
and rectification stages respectively) was slightly reduced on increasing the crystal mass ratio
(see Fig (5.17) (a) and (c)). Similar behaviour was also observed with the water recovery
ratio, which decreased as the crystal mass ratio increased; this was due to the mass loss
during the sweating process, as shown in Fig (5.17) (b) and (d). The salt rejection was found
to be proportional to the crystal mass ratio, as shown in Fig (5.17) (b) and (d).
5.6.6 Scaling-up o f the Sulzer falling film crystallisation technology
The performance results obtained, provided evidence that the Sulzer falling film
crystallisation technology, using a single freezing stage without the need for a sweating
process, would be an ideal treatment system for concentrating RO brine. This technology
was capable of producing a substantial amount of final product water to near Arabian Gulf
seawater quality, whilst simultaneously reducing the waste stream as far as possible. The
scale-up for such an application is straightforward, since the commercial scale crystallizer
can be easily built by adding a number of crystallizer tubes similar in size to those tested.
The Kadhmah RO desalination plant was used as an example for scaling-up the integration
of the RO desalination plant with the Sulzer falling film crystallisation process under
continuous operation. The laboratory investigations were actually carried out with RO brine,
discharged from the mentioned RO desalination plant. The example for scaling-up will
present an estimation of the mass and salt concentration of the three liquid streams for each
treatment system, which are essential for the assessment of the water treatment costs.
The proposed treatment system was scaled-up according to the experimental results obtained
from run 72 (see Table A5-2 in Appendix A5). However, the salt concentration of product
water of the Sulzer falling film crystallisation plant was changed and balanced to the feed
concentration of Kadhmah (RO membrane) desalination plant. This means that the TDS
value of the product water of the Sulzer plant was equivalent to the feed salinity of the water
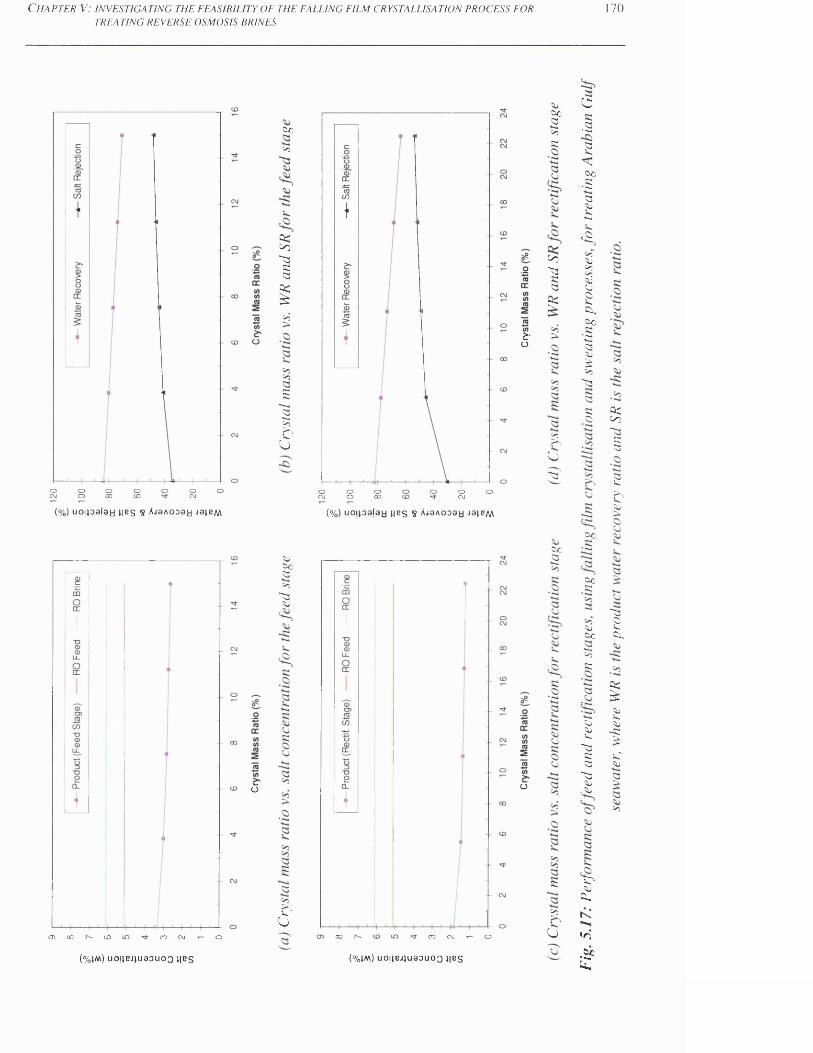
120
C h a p t e r V: i n v e s t i g a t i n g t h e f e a s i b i l i t y o f t h e f a l l i n g f i l m c r y s t a l l i s a t i o n p r o c e s s f o r
TREATING REVERSE OSMOSIS BRINESl 70
O oCNJ
OO
OCO
oCO
o
(%) u o j p a f a y \ \ e § $ A j a A o a a y j s i b m
07 00 CD CO CNJ O
S'o
o
Go> 3
03go"aS3a
I>3
>3s~s>3£u
GJGo3
73Gj
aco
CO
oCNJ
OO
o00
o oCNJ
o
(%) u c u i o a l a y h b s S A j a A o o a y j b i b m
00 CO CNJ O
S'o
o
SUGOa>>c
go7s
g
9?
>3Cu73s
Go35
( % | M ) u o j j e j j u a o u o o n e s ( % j m ) u o i i B j j u a o u o o h b s
>>o
o•22GO
. g
35<X3is .
♦ - 4
Js.
•a.<0<X3>3> 3<X3Cj0)is .
cx,GO•2■ S ,353£
7333K33
GO-
GOS3
iX3GO
'SjK
Xj<X3is.
73K337 33, > U
C13Gs
•O. t o o
£
osGO73S335
35is.
£Su
~5£cx.
IX3isG3
~S3£CGU

C h a p t e r V: in v e s t ig a t in g t h e f e a s ib il it y o f t h e f a l l in g f il m c r y s t a l u s a t io n p r o c e s s f o r
TREATING REVERSE OSMOSIS BRINES171
desalination plant. This was achieved simply by adding a predetermined mass of the residue
(according to the calculation of mass and salt balance) to the product water of the pilot plant.
Consequently, the total water recovery ratio of the freezing stage was changed, and slightly
increased from 84.2 to 87.8%. The TDS values of feed and residue streams of the Sulzer
plant were determined from the experiment (i.e. run 72). The volume flow-rate of the feed
stream of Sulzer plant was equivalent to that in the discharged RO retentate from the water
desalination plant. The volume flow-rate of the product of the Sulzer plant was theoretically
determined according to the adjusted water recovery ratio (i.e. 87.8%), whereas the volume
flow-rate of the residue was simply computed from the mass balance formula.
A novel treatment option configuration, involving integration of a RO plant and the Sulzer
falling film crystallisation plant, is shown schematically in Fig (5.18). According to Sulzer,
the proposed commercial plant can be built without any technical problem; however, such an
application might be limited by capital and/or operational costs. Fig (5.18) shows that the
volume flow-rate of RO retentate is significantly decreased from 21.9 to 2.67m /h by means
of a Sulzer plant. Besides, the product water of Sulzer plant, which is recycled to join the
main feed stream of RO plant, has significantly reduced the volume flow-rate of the intake
feed from 27.3 to 8.07m3/h as shown in Fig (5.18).
Table (5.10) shows the estimated annual rates of all liquid streams of the Kadhmah RO plant,
Sulzer commercial plant, and combined water desalination plant. The estimated annual rate
of feed water for the RO plant is 239.15 ton/year, whereas the RO plant produces drinking
water with an estimated annual production rate of 34.17 ton/year. As a result, a substantial
annual rate of highly concentrated process brine (i.e. 191.84 ton/year) will be discharged to
the receiving environment, i.e. into the Arabian Gulf, for the case of Kadhmah RO plant.
According to Lattemann and Hopner (2003), physiochemical characteristics and volume of
the waste stream of RO membrane desalination plants can cause severe impacts on the
marine environment. Thus, the question now arises; what is the available disposal option and
environmental impact of such a large volume of waste stream for the case of inland
desalination plants. The Sulzer falling film crystallisation plant can be considered as a great
solution for concentrating the waste streams of desalination technologies.
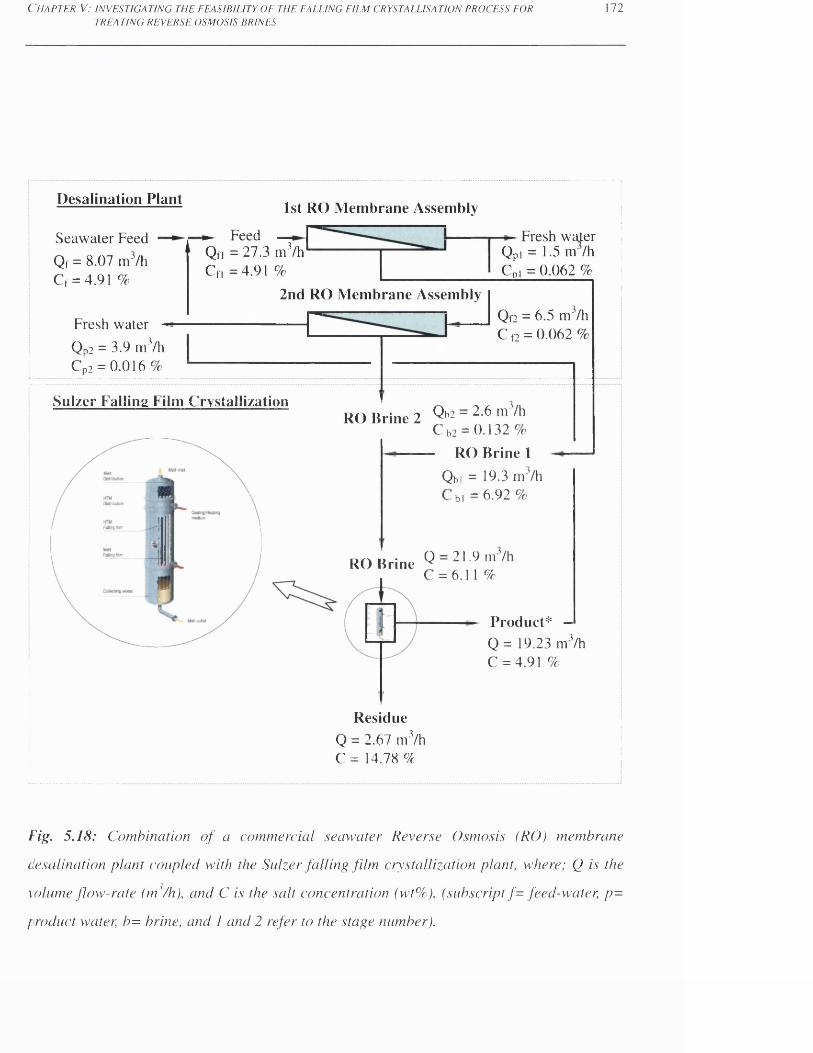
C h a p t e r V : i n v e s t i g a t i n g t h e f e a s i b i l i t y o f t h e f a l l i n g f i l m c r y s t a l l i s a t i o n p r o c e s s f o r
TREATING REVERSE OSMOSIS BRINES172
RO Brine Q ~ 21-9m /h C = 6.11 %
Product* —Q = 19.23 m7h C = 4.91 %
ResidueQ = 2.67 m’/h C = 14.78 %
Desalination Plant „ ,------------------------ 1st RO Membrane Assembly
Seawater FeedQf = 8.07 m7h Cf = 4.91 %
Fresh water -Qp2 = 3.9 nv’/h Cp2 = 0.016%
► Feed —■ Qn = 27.3 m'Vh Cf, =4.91 %
Fresh water Qpi = 1.5 m /h CPi= 0.062%
2nd RO Membrane AssemblyQf2 = 6.5 m3/h C o = 0.062 %
Sulzer Falling Film CrystallizationRO Brine 2 0 b2 - 2.6 m3/h
C b2 = 0.132% RO Brine 1
Qbi = 19.3 m3/h C m =6.92 %
Fig. 5.18: Combination o f a commercial seawater Reverse Osmosis (RO) membrane
desalination plant coupled with the Sulzer falling film crystallization plant, where; Q is the
\olume flow-rate (m'Vh), and C is the salt concentration (wt%), (subscript f - feed-water, p -
product water, b= brine, and I and 2 refer to the stage number).
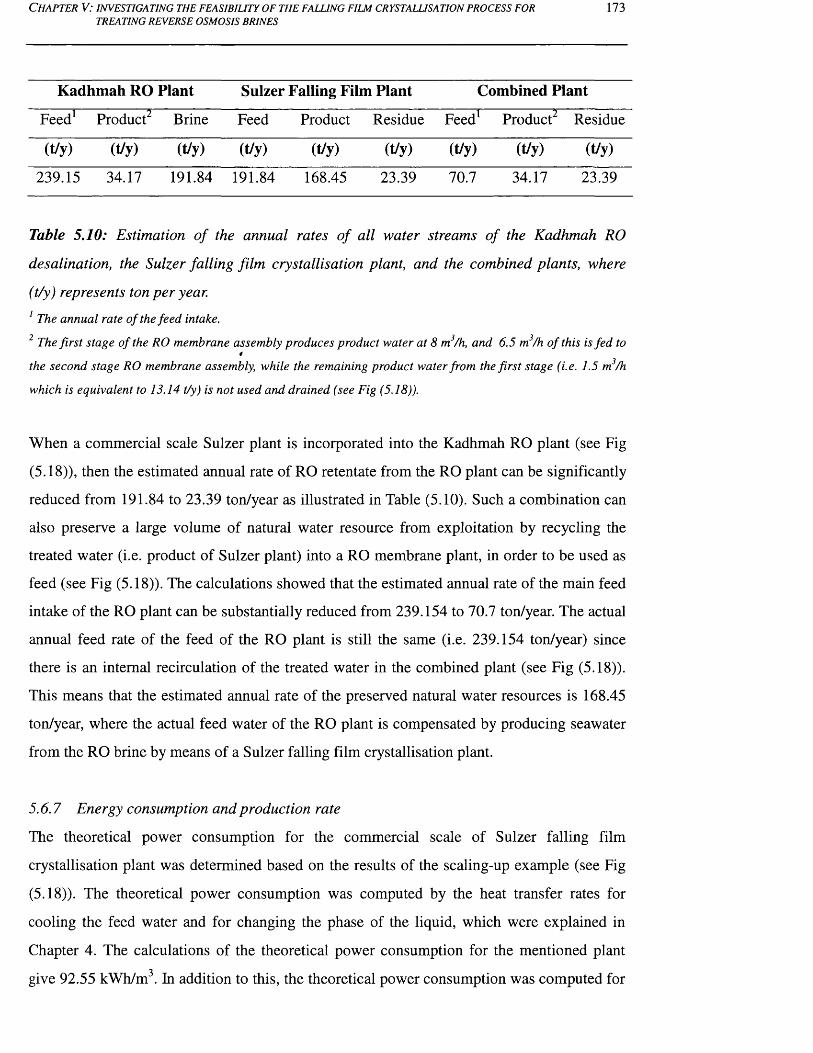
C h a p t e r V: in v e s t ig a t in g t h e f e a s ib il it y o f t h e f a l l in g f il m c r y s t a l l is a t io n p r o c e s s f o r 173TREATING REVERSE OSMOSIS BRINES
Kadhmah RO Plant Sulzer Falling Film Plant Combined Plant
Feed1 Product2 Brine Feed Product Residue Feed1 Product2 Residue
(t/y) (t/y) (t/y) (t/y) (t/y) (t/y) (t/y) 1 |
239.15 34.17 191.84 191.84 168.45 23.39 70.7 34.17 23.39
Table 5.10: Estimation o f the annual rates o f all water streams of the Kadhmah RO
desalination, the Sulzer falling film crystallisation plant, and the combined plants, where
(t/y) represents ton per year.
1 The annual rate o f the feed intake.
2 The f irs t stage o f the RO membrane assembly produces product w ater at 8 m3/h, and 6.5 m3/h o f this is fed to4
the second stage RO membrane assembly, while the remaining product water from the firs t stage (i.e. 1.5 m3/h
which is equivalent to 13.14 t/y) is not used and drained (see Fig (5.18)).
When a commercial scale Sulzer plant is incorporated into the Kadhmah RO plant (see Fig
(5.18)), then the estimated annual rate of RO retentate from the RO plant can be significantly
reduced from 191.84 to 23.39 ton/year as illustrated in Table (5.10). Such a combination can
also preserve a large volume of natural water resource from exploitation by recycling the
treated water (i.e. product of Sulzer plant) into a RO membrane plant, in order to be used as
feed (see Fig (5.18)). The calculations showed that the estimated annual rate of the main feed
intake of the RO plant can be substantially reduced from 239.154 to 70.7 ton/year. The actual
annual feed rate of the feed of the RO plant is still the same (i.e. 239.154 ton/year) since
there is an internal recirculation of the treated water in the combined plant (see Fig (5.18)).
This means that the estimated annual rate of the preserved natural water resources is 168.45
ton/year, where the actual feed water of the RO plant is compensated by producing seawater
from the RO brine by means of a Sulzer falling film crystallisation plant.
5.6.7 Energy consumption and production rate
The theoretical power consumption for the commercial scale of Sulzer falling film
crystallisation plant was determined based on the results of the scaling-up example (see Fig
(5.18)). The theoretical power consumption was computed by the heat transfer rates for
cooling the feed water and for changing the phase of the liquid, which were explained in
Chapter 4. The calculations of the theoretical power consumption for the mentioned plant
give 92.55 kWh/m3. In addition to this, the theoretical power consumption was computed for
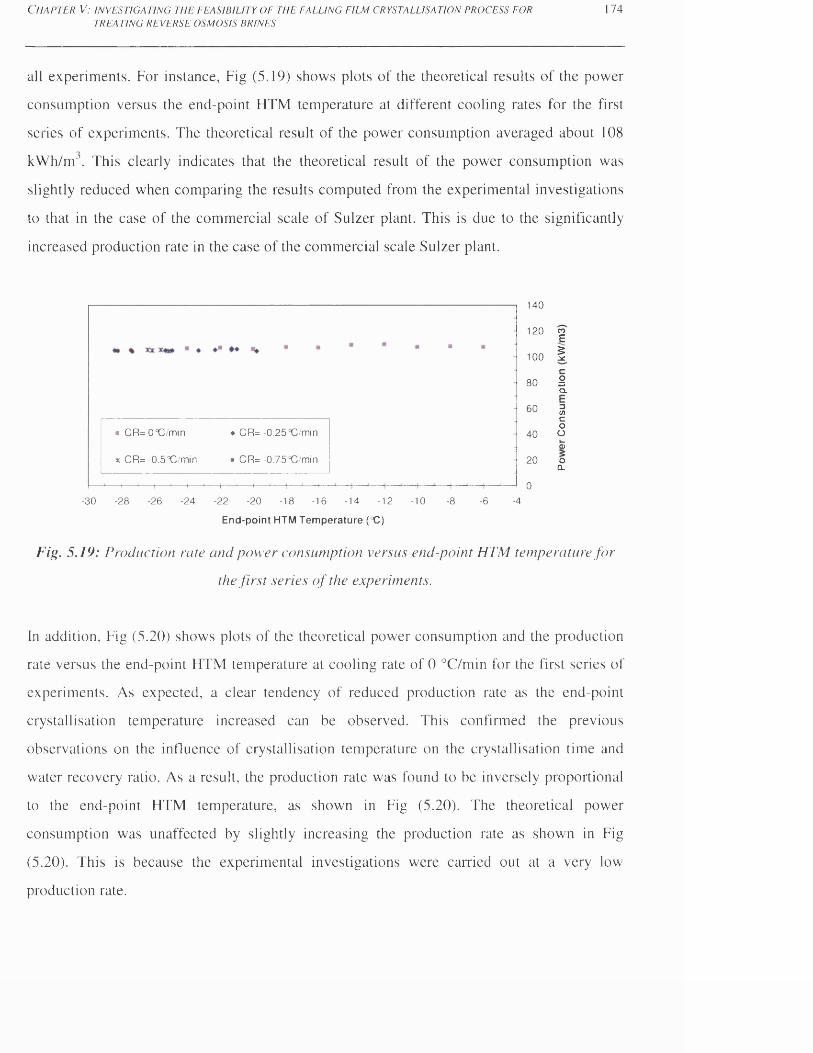
C h a p t e r V: i n v e s t i g a t i n g t h e f e a s i b i l i t y o f t h e f a l l i n g f i l m c r y s t a l l i s a t i o n p r o c e s s f o r
TREATING REVERSE OSMOSIS BRINES174
all experiments. For instance, Fig (5.19) shows plots of the theoretical results of the power
consumption versus the end-point HTM temperature at different cooling rates for the first
series of experiments. The theoretical result of the power consumption averaged about 108
kWh/m . This clearly indicates that the theoretical result of the power consumption was
slightly reduced when comparing the results computed from the experimental investigations
to that in the case of the commercial scale of Sulzer plant. This is due to the significantly
increased production rate in the case of the commercial scale Sulzer plant.
140
120 1
100 S
80 BGL
60 £ c o
40 O q5
20 oCL
0-30 -28 -26 -24 -22 -20 -18 -16 -14 -12 -10 -8 -6 -4
E nd-point HTM T em perature (“C)
Fig. 5.19: Production rate and power consumption versus end-point HTM temperature fo r
the first series o f the experimen ts.
■ CR= 0 qC/min ♦ CR= -0.25°C/min
* CR= -0.5'5C/min • CR= -0.75QC/min
-i—1—i—1—i—'—i—1—i—1—i—1—i-
In addition, Fig (5.20) shows plots of the theoretical power consumption and the production
rate versus the end-point HTM temperature at cooling rate of 0 °C/min for the first series of
experiments. As expected, a clear tendency of reduced production rate as the end-point
crystallisation temperature increased can be observed. This confirmed the previous
observations on the influence of crystallisation temperature on the crystallisation time and
water recovery ratio. As a result, the production rate was found to be inversely proportional
to the end-point HTM temperature, as shown in Fig (5.20). The theoretical power
consumption was unaffected by slightly increasing the production rate as shown in Fig
(5.20). This is because the experimental investigations were carried out at a very low
production rate.
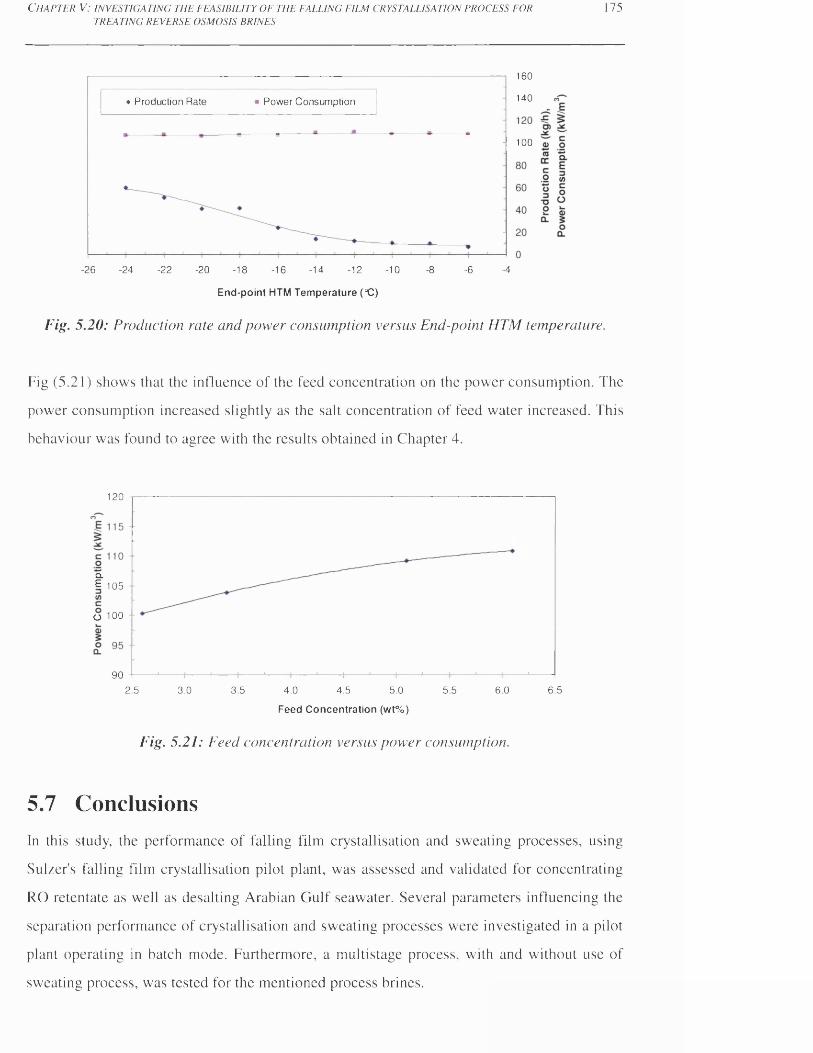
C h a p t e r V : i n v e s t i g a t i n g t h e f e a s i b i l i t y o f t h e f a l l i n g f i l m c r y s t a l l i s a t i o n p r o c e s s f o r
TREATING REVERSE OSMOSIS BRINES175
160
140Power Consumption♦ Production Rate
100
-26 -24 -22 -20 -18 16 12 10 -8 ■6 ■414
End-point HTM T em perature (°C)
Fig. 5.20: Production rate and power consumption versus End-point HTM temperature.
Fig (5.21) shows that the influence of the feed concentration on the power consumption. The
power consumption increased slightly as the salt concentration of feed water increased. This
behaviour was found to agree with the results obtained in Chapter 4.
120
CL
E 105
O 100
906.0 6.52.5 3.0 3.5 4.0 4.5 5.0 5.5
F eed C on cen tration (wt%)
Fig. 5.21: Feed concentration versus power consumption.
5.7 ConclusionsIn this study, the performance of falling film crystallisation and sweating processes, using
Sulzer's falling film crystallisation pilot plant, was assessed and validated for concentrating
RO retentate as well as desalting Arabian Gulf seawater. Several parameters influencing the
separation performance of crystallisation and sweating processes were investigated in a pilot
plant operating in batch mode. Furthermore, a multistage process, with and without use of
sweating process, was tested for the mentioned process brines.
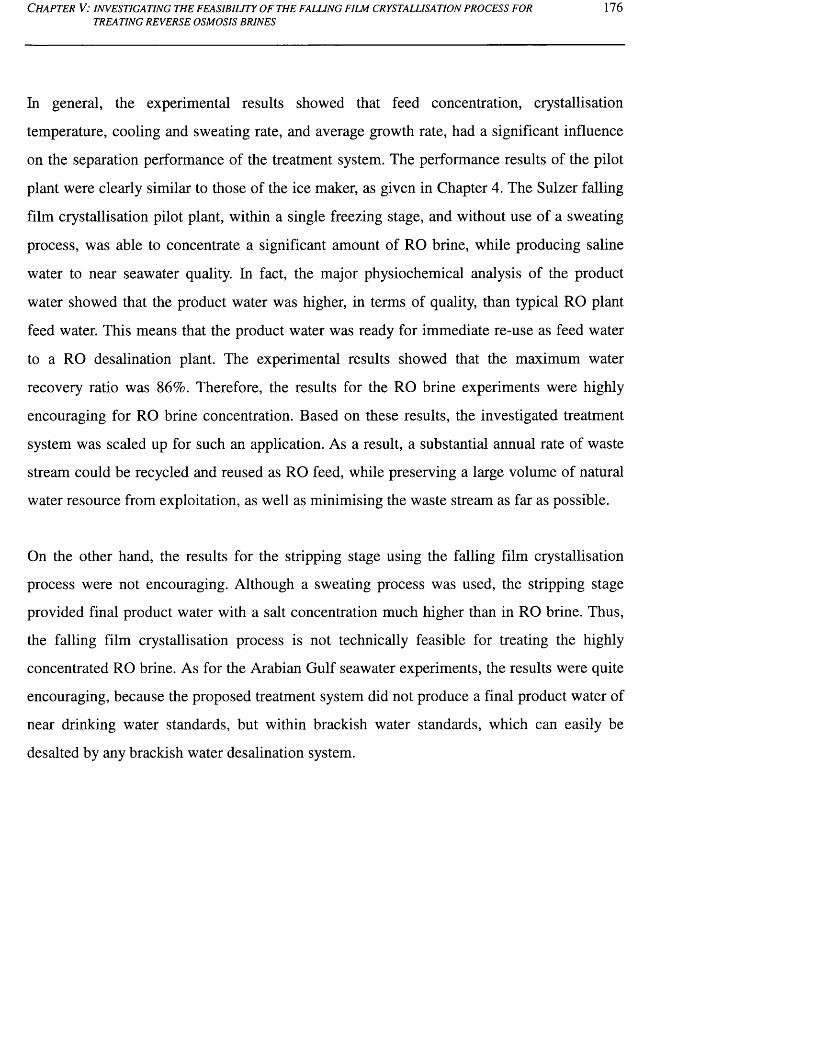
C h a p t e r V : i n v e s t i g a t i n g t h e f e a s i b i l i t y o f t h e f a l l i n g f i l m c r y s t a l l i s a t i o n p r o c e s s f o r
TREATING REVERSE OSMOSIS BRINES176
In general, the experimental results showed that feed concentration, crystallisation
temperature, cooling and sweating rate, and average growth rate, had a significant influence
on the separation performance of the treatment system. The performance results of the pilot
plant were clearly similar to those of the ice maker, as given in Chapter 4. The Sulzer falling
film crystallisation pilot plant, within a single freezing stage, and without use of a sweating
process, was able to concentrate a significant amount of RO brine, while producing saline
water to near seawater quality. In fact, the major physiochemical analysis of the product
water showed that the product water was higher, in terms of quality, than typical RO plant
feed water. This means that the product water was ready for immediate re-use as feed water
to a RO desalination plant. The experimental results showed that the maximum water
recovery ratio was 86%. Therefore, the results for the RO brine experiments were highly
encouraging for RO brine concentration. Based on these results, the investigated treatment
system was scaled up for such an application. As a result, a substantial annual rate of waste
stream could be recycled and reused as RO feed, while preserving a large volume of natural
water resource from exploitation, as well as minimising the waste stream as far as possible.
On the other hand, the results for the stripping stage using the falling film crystallisation
process were not encouraging. Although a sweating process was used, the stripping stage
provided final product water with a salt concentration much higher than in RO brine. Thus,
the falling film crystallisation process is not technically feasible for treating the highly
concentrated RO brine. As for the Arabian Gulf seawater experiments, the results were quite
encouraging, because the proposed treatment system did not produce a final product water of
near drinking water standards, but within brackish water standards, which can easily be
desalted by any brackish water desalination system.
C h a p t e r VI: i n v e s t i g a t i n g t h e f e a s i b i l i t y o f t h e s u s p e n s i o n c r y s t a l l i s a t i o n p r o c e s s f o rTREATING REVERSE OSMOSIS BRINES
177
C h a p t e r VI:
INVESTIGATING THE FEASIBILITY OF THE
SUSPENSION CRYSTALLISATION PROCESS
FOR TREATING REVERSE OSMOSIS BRINES
6.1 IntroductionThis chapter tackles an optimisation approach used to boost the production of drinking water
in inland desalination plants from brackish and surface water using RO membrane
technologies. This optimisation approach can be achieved by desalting and concentrating the
waste streams (RO retentate) through a suspension crystallisation technology. A hybrid
process which comprises of the existing melt crystallisation technologies in Sulzer's
portfolio (falling film or suspension crystallisation process, integrated with a static
crystallisation process), can be introduced as a pre-concentrator system for the water
desalination plant and ZLD process. Such a combination can increase the total permeate
water recovery (by using a suspension crystallisation system) or preserve natural water
resources from exploitation by recycling treated water into a RO plant as feed (using falling
film crystallisation system). The residual liquid of the suspension or falling film
crystallisation plants can be further concentrated and processed via a subsequent treatment
system involving a static crystallisation process (see Chapter (7)). As a result, a small
volume of highly concentrated solution of RO retentate will remain. This final residual
liquid can be further treated and processed via a ZLD process for producing more fresh water
and/or a discharging a compact solid waste in a way friendly to the environment.
Intensive studies on the suspension crystallisation process have investigated the influence of
operating parameters on the performance of the crystallisation and washing processes for the
separation of organic chemicals and metals [Ulrich and Glade, 2003]. According to Sulzer's
experts, the suspension-based melt crystallisation technology has not previously been tested
for saline water applications. As a result, there is no reference data available on the
application of suspension crystallisation technologies for RO retentate treatment. This
chapter presents the first experimental study to explore the potential capability of using
C h a p t e r V I: i n v e s t i g a t i n g t h e f e a s i b i l i t y o f t h e s u s p e n s i o n c r y s t a l l i s a t i o n p r o c e s s f o r 178TREATING REVERSE OSMOSIS BRINES
Sulzer's suspension-based melt crystallisation process to treat a range of liquid streams
causing the most severe pollution problems.
In an effort to help developing arid countries, such as Kuwait, to satisfy the water supply and
safe disposal demands, a combination of a commercial seawater desalination plant using RO
membrane and a suspension crystallisation pilot plant was investigated. This hybrid system is
aimed at increasing the overall permeate water recovery, and simultaneously concentrating
the RO retentate as much as possible. Such a combination of treatment systems will preserve
natural water resources from exploitation, especially in the case of brackish and inland
desalination plants.
The main objective of this chapter is to determine the viability and technical feasibility of
using suspension crystallisation technology as a pre-concentration system for concentrating
RO retentate and producing final product water of near potable quality, ready for immediate
use. The specific aims of this study are;
i) To operate the pilot plant and collect and maintain experimental data for
different process configurations in order to validate and assess the technical
viability of the suspension crystallisation process for treating different salt
concentrations of RO retentate, through initial trial tests and technology
refinement using pilot industrial scale plant.
ii) To validate and assess the proposed system's technical merits for future
application on a commercial scale.
iii) To establish reference data for estimating the performance of the suspension
crystallisation technology for treating RO retentate. This includes a reference
physiochemical profile for water samples.
iv) To assess the separation effectiveness of the suspension crystallisation
process with use of a piston type wash-column unit upon the rejection of the
major components of ionic concentration (e.g. Ca2+, Mg2+, (SO4)2', (HCO3)'
, Cf , Na+, etc) for the water samples.
v) To develop and identify the operating ranges for the main elements of the
suspension crystallisation pilot plant, e.g. crystallisation temperature, stroke,
C h a p t e r VI: i n v e s t i g a t i n g t h e f e a s i b i l i t y o f t h e s u s p e n s i o n c r y s t a l u s a t i o n p r o c e s s f o rTREATING REVERSE OSMOSIS BRINES
179
residue temperature, wash temperature, time cycle action, and tracing feed
temperature.
6.2 Description of Suspension Crystallisation and Basic
OperationSuspension-based melt crystallisation is a highly selective, low energy consuming and
solvent-free separation process used for the purification of organic chemicals [Ulrich and
Glade, 2003; Tahti, 2004; Sulzer, 2011]. This technology is capable ideally of achieving high
purity products and ecological production methods [Ulrich and Glade, 2003; Sulzer, 2011].
Suspension-based melt crystallisation has previously been used for purifying various
chemicals and concentrating waster water. Some typical applications are; acetic acid,
acetonitrile, adipic acid, benzene, caprolactam, durene, ethyl lactate, hexamethylendiamine
(HMD), ionic liquids, lactic acid, methylene diphenyl isocyanate (MDI), methacrylic acid, o-
phenylphenol, p-Diisopropylbenzene, p-Dichlorobenzene, p-Chlorotoluene, p-
Nitrochlorobenzene, p-Xylene, phenol, trioxane, and waster water [Ulrich and Glade, 2003;
Sulzer, 2011]. According to Ulrich and Glade [2003], the important advantages of the
suspension-based melt crystallisation approach are: (i) superior purification can be produced
from a single crystallisation stage, (ii) higher crystal production rate per unit volume of
equipment, (iii) suspension crystallisation process uses less energy to attain the same
separation as solid layer crystallisation, (iv) the suspension crystallisation process is often
carried out in a continuous mode, whereas solid layer crystallisation is usually carried out in
batch mode.
Fig (6.1) (a) shows a typical skid mounted pilot plant unit used for small commercial scale
applications or investigating new fields of application. Suspension crystallisation plants for
medium and large scale commercial applications with various capacity ranges are also
available at Sulzer Chemtech Ltd. Fig (6.1) (b) shows a commercial skid mounted unit,
using Sulzer's suspension-based melt crystallisation technology. This commercial unit, for
instance, was installed and used for Methylene diphenyl isocyanate (MDI) applications at
Huntsman in the Netherlands [Sulzer, 2011].
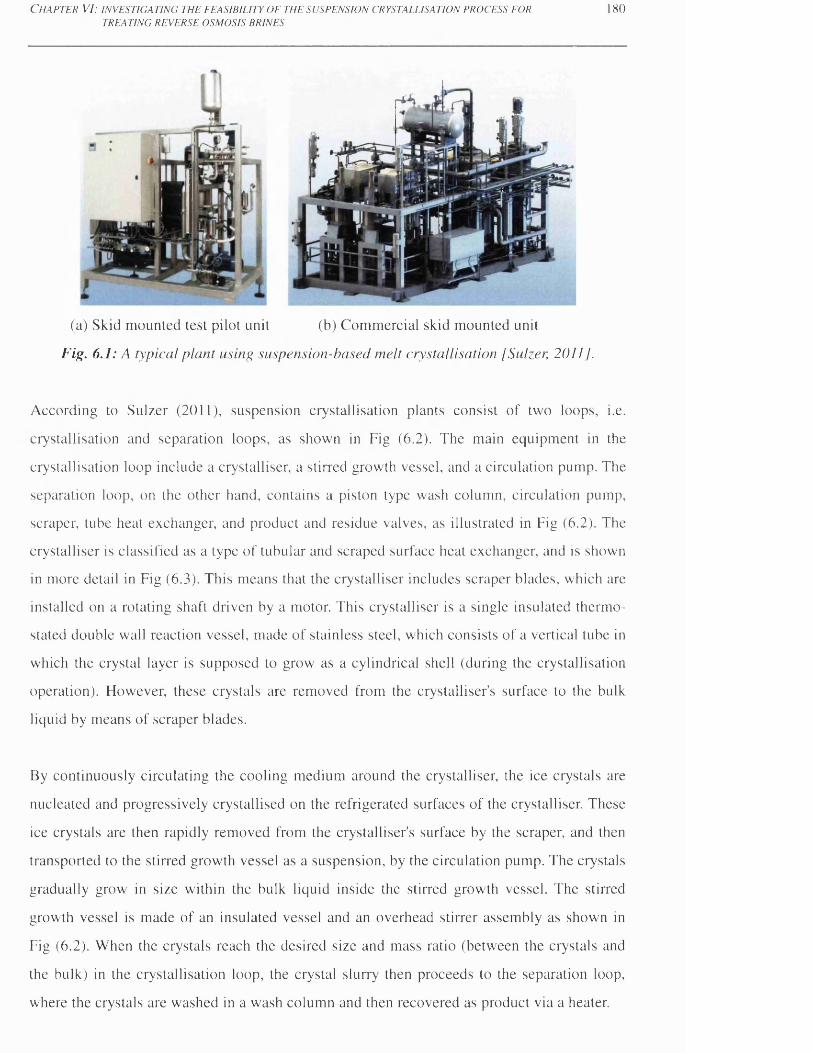
C h a p t e r V I: i n v e s t i g a t i n g t h e f e a s i b i l i t y o f t h e s u s p e n s i o n c r y s t a l l i s a t i o n p r o c e s s f o r
TREATING REVERSE OSMOSIS BRINES180
(a) Skid mounted test pilot unit (b) Commercial skid mounted unit
Fig. 6.1 : A typical plant using suspension-based melt crystallisation [Sulzer, 20111.
According to Sulzer (2011), suspension crystallisation plants consist of two loops, i.e.
crystallisation and separation loops, as shown in Fig (6.2). The main equipment in the
crystallisation loop include a crystalliser, a stirred growth vessel, and a circulation pump. The
separation loop, on the other hand, contains a piston type wash column, circulation pump,
scraper, tube heat exchanger, and product and residue valves, as illustrated in Fig (6.2). The
crystalliser is classified as a type of tubular and scraped surface heat exchanger, and is shown
in more detail in Fig (6.3). This means that the crystalliser includes scraper blades, which are
installed on a rotating shaft driven by a motor. This crystalliser is a single insulated thermo
stated double wall reaction vessel, made of stainless steel, which consists of a vertical tube in
which the crystal layer is supposed to grow as a cylindrical shell (during the crystallisation
operation). However, these crystals are removed from the crystalliser's surface to the bulk
liquid by means of scraper blades.
By continuously circulating the cooling medium around the crystalliser, the ice crystals are
nucleated and progressively crystallised on the refrigerated surfaces of the crystalliser. These
ice crystals are then rapidly removed from the crystalliser's surface by the scraper, and then
transported to the stirred growth vessel as a suspension, by the circulation pump. The crystals
gradually grow in size within the bulk liquid inside the stirred growth vessel. The stirred
growth vessel is made of an insulated vessel and an overhead stirrer assembly as shown in
Fig (6.2). When the crystals reach the desired size and mass ratio (between the crystals and
the bulk) in the crystallisation loop, the crystal slurry then proceeds to the separation loop,
where the crystals are washed in a wash column and then recovered as product via a heater.
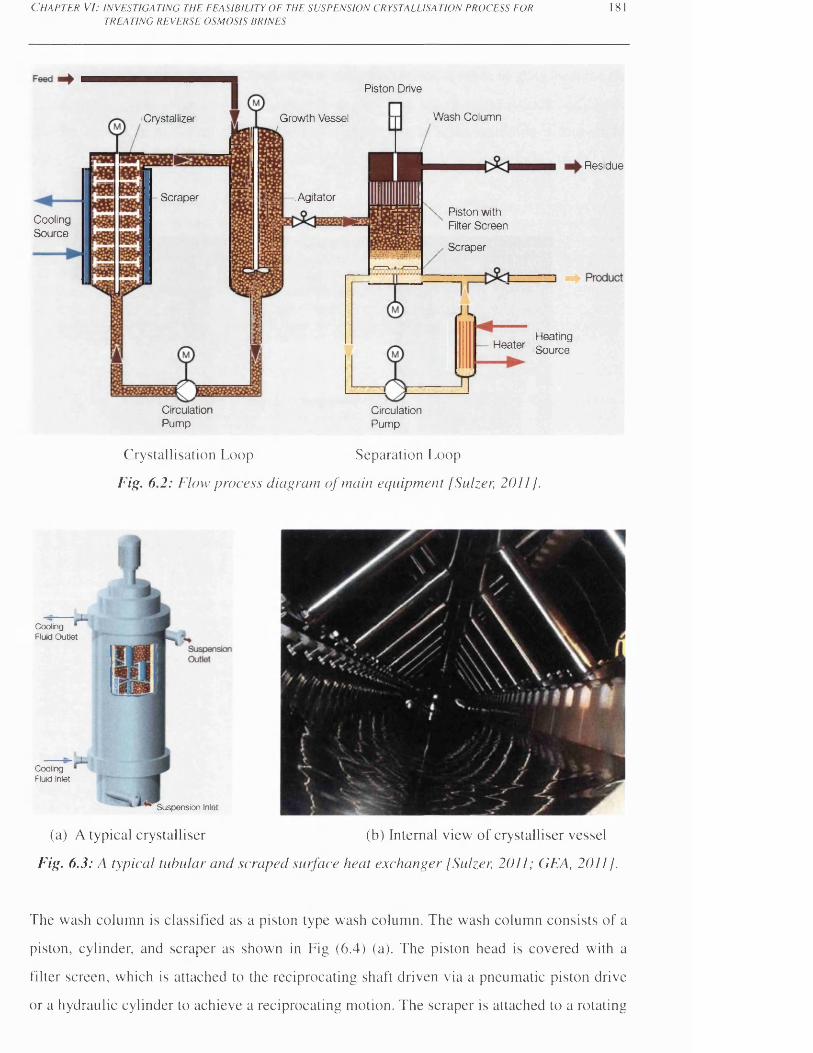
C h a p t e r V I: i n v e s t i g a t i n g t h e f e a s i b i l i t y o f t h e s u s p e n s i o n c r y s t a l l i s a t i o n p r o c e s s f o r
TREATING REVERSE OSMOSIS BRINES181
Growth VesselCrystaliizer
AgitatorScraper
Heating Heater Source
Circulation CirculationPump Pump
Crystallisation Loop Separation Loop
Fig. 6.2: Flow process diagram o f main equipment [Sulzer, 2011].
Residue
CoolingSource
Piston Drive
Wash Column
Piston with Rlter Screen
Scraper
C o o lin g Fluid Inlet
S u s p e n s io n Inlet
(a) A typical crystalliser (b) Internal view of crystalliser vessel
Fig. 6.3: A typical tubular and scraped surface heat exchanger [Sulzer, 2011; GEA, 2011J.
C o d in g Fluid O utlet
The wash column is classified as a piston type wash column. The wash column consists of a
piston, cylinder, and scraper as shown in Fig (6.4) (a). The piston head is covered with a
filter screen, which is attached to the reciprocating shaft driven via a pneumatic piston drive
or a hydraulic cylinder to achieve a reciprocating motion. The scraper is attached to a rotating
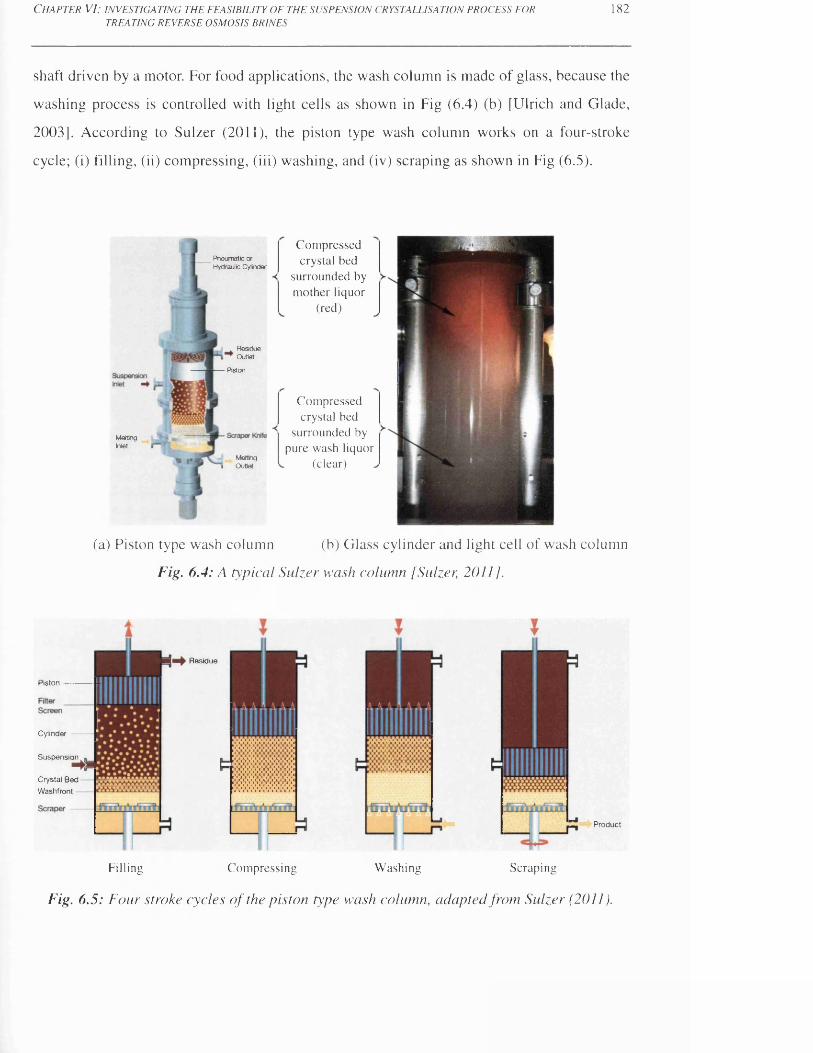
C h a p t e r V I: i n v e s t i g a t i n g t h e f e a s i b i l i t y o f t h e s u s p e n s i o n c r y s t a l l i s a t i o n p r o c e s s f o r
TREATING REVERSE OSMOSIS BRINES182
shaft driven by a motor. For food applications, the wash column is made of glass, because the
washing process is controlled with light cells as shown in Fig (6.4) (b) [Ulrich and Glade,
2003]. According to Sulzer (2011), the piston type wash column works on a four-stroke
cycle; (i) filling, (ii) compressing, (iii) washing, and (iv) scraping as shown in Fig (6.5).
Pneumatic or Hydraulic Cylinder
ResidueOutlet
Piston
MattingInlet
Melting 1 CXitlet
(a) Piston type wash column (b) Glass cylinder and light cell of wash column
Fig. 6.4: A typical Sulzer wash column fSulzer, 2011].
4
Piston
CylinderSuspensionCrystal Bed Washfront
Com pressed crystal bed
surrounded by m other liquor
(red)
Com pressed crystal bed
surrounded by pure wash liquor
(clear)
WWASW.V*vXvXwXvXXvXvXvXvX
Residue
v ;X XvX-X'Xv
Product
Filling Com pressing W ashing Scraping
Fig. 6.5 : Four stroke cycles o f the piston type wash column, adapted from Sulzer (2011).
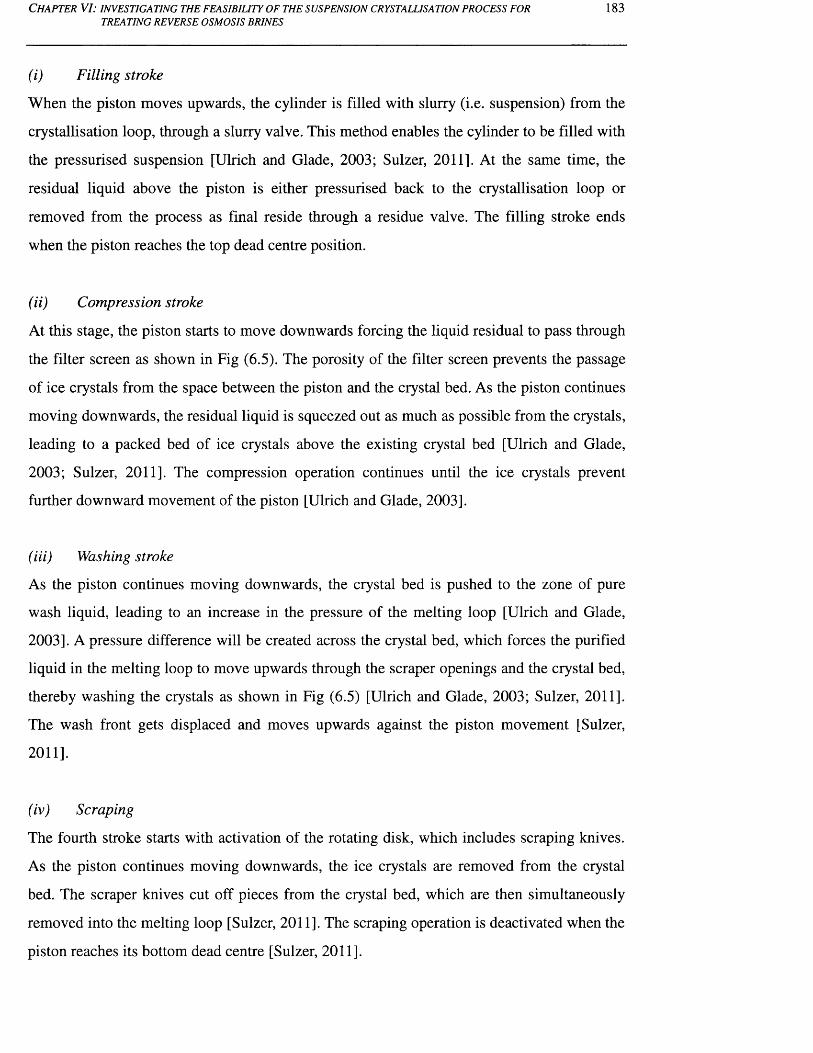
C h a p t e r V I: i n v e s t i g a t i n g t h e f e a s i b i l i t y o f t h e s u s p e n s i o n c r y s t a l l i s a t i o n p r o c e s s f o r
TREATING REVERSE OSM OSIS BRINES183
(i) Filling stroke
When the piston moves upwards, the cylinder is filled with slurry (i.e. suspension) from the
crystallisation loop, through a slurry valve. This method enables the cylinder to be filled with
the pressurised suspension [Ulrich and Glade, 2003; Sulzer, 2011]. At the same time, the
residual liquid above the piston is either pressurised back to the crystallisation loop or
removed from the process as final reside through a residue valve. The filling stroke ends
when the piston reaches the top dead centre position.
(ii) Compression stroke
At this stage, the piston starts to move downwards forcing the liquid residual to pass through
the filter screen as shown in Fig (6.5). The porosity of the filter screen prevents the passage
of ice crystals from the space between the piston and the crystal bed. As the piston continues
moving downwards, the residual liquid is squeezed out as much as possible from the crystals,
leading to a packed bed of ice crystals above the existing crystal bed [Ulrich and Glade,
2003; Sulzer, 2011]. The compression operation continues until the ice crystals prevent
further downward movement of the piston [Ulrich and Glade, 2003].
(Hi) Washing stroke
As the piston continues moving downwards, the crystal bed is pushed to the zone of pure
wash liquid, leading to an increase in the pressure of the melting loop [Ulrich and Glade,
2003]. A pressure difference will be created across the crystal bed, which forces the purified
liquid in the melting loop to move upwards through the scraper openings and the crystal bed,
thereby washing the crystals as shown in Fig (6.5) [Ulrich and Glade, 2003; Sulzer, 2011].
The wash front gets displaced and moves upwards against the piston movement [Sulzer,
2011].
(iv) Scraping
The fourth stroke starts with activation of the rotating disk, which includes scraping knives.
As the piston continues moving downwards, the ice crystals are removed from the crystal
bed. The scraper knives cut off pieces from the crystal bed, which are then simultaneously
removed into the melting loop [Sulzer, 2011]. The scraping operation is deactivated when the
piston reaches its bottom dead centre [Sulzer, 2011].
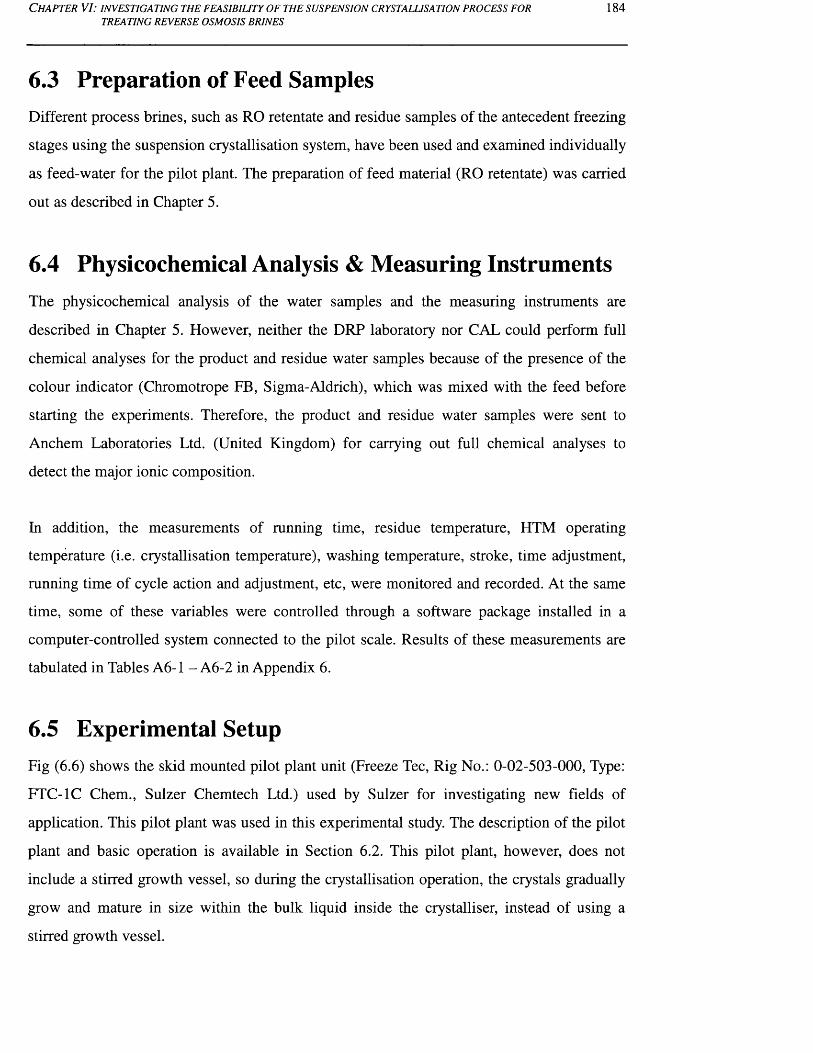
C h a p t e r V I: i n v e s t i g a t i n g t h e f e a s i b i l i t y o f t h e s u s p e n s i o n c r y s t a l u s a t i o n p r o c e s s f o r
TREATING REVERSE OSMOSIS BRINES184
6.3 Preparation of Feed SamplesDifferent process brines, such as RO retentate and residue samples of the antecedent freezing
stages using the suspension crystallisation system, have been used and examined individually
as feed-water for the pilot plant. The preparation of feed material (RO retentate) was carried
out as described in Chapter 5.
6.4 Physicochemical Analysis & Measuring InstrumentsThe physicochemical analysis of the water samples and the measuring instruments are
described in Chapter 5. However, neither the DRP laboratory nor CAL could perform full
chemical analyses for the product and residue water samples because of the presence of the
colour indicator (Chromotrope FB, Sigma-Aldrich), which was mixed with the feed before
starting the experiments. Therefore, the product and residue water samples were sent to
Anchem Laboratories Ltd. (United Kingdom) for carrying out full chemical analyses to
detect the major ionic composition.
In addition, the measurements of running time, residue temperature, HTM operating
temperature (i.e. crystallisation temperature), washing temperature, stroke, time adjustment,
running time of cycle action and adjustment, etc, were monitored and recorded. At the same
time, some of these variables were controlled through a software package installed in a
computer-controlled system connected to the pilot scale. Results of these measurements are
tabulated in Tables A6-1 - A6-2 in Appendix 6.
6.5 Experimental SetupFig (6.6) shows the skid mounted pilot plant unit (Freeze Tec, Rig No.: 0-02-503-000, Type:
FTC-1C Chem., Sulzer Chemtech Ltd.) used by Sulzer for investigating new fields of
application. This pilot plant was used in this experimental study. The description of the pilot
plant and basic operation is available in Section 6.2. This pilot plant, however, does not
include a stirred growth vessel, so during the crystallisation operation, the crystals gradually
grow and mature in size within the bulk liquid inside the crystalliser, instead of using a
stirred growth vessel.

C h a p t e r V I: i n v e s t i g a t i n g t h e f e a s i b i l i t y o f t h e s u s p e n s i o n c r y s t a l l i s a t i o n p r o c e s s f o r
TREATING REVERSE OSMOSIS BRINES185
Feed Tank
Scraper M otor (W ash Column)
Crystalliser
(a) Pilot plant left-hand view (b) Pilot plant right-hand view
Sight Glass
W ash column
HTM Circulation Pump
HTM Tubes
Fig. 6.6 : Skid mounted pilot plant.
Although Sulzer Chemtech Ltd commercialises complete test units that are completely
equipped with all necessary equipment, including the cooling compressors [Ulrich and
Glade, 2003; Sulzer, 2011], the examined skid mounted pilot plant does not include a
complete built-in refrigeration unit. The pilot plant is provided with a heat exchanger, which
is connected to a heat transfer unit (LAUDA, ITH Series, Type: W350/25kW) via tubes for
low temperature applications, as shown in Fig (6.7) (a). The heat transfer unit utilises
synthetic thermal oil as the HTM. Apart from the heat transfer unit, the skid is completely
equipped with all necessary measuring instruments and control devices. The crystalliser and
feed tank are made of stainless steel, which is thermodynamically insulated from the
surrounding environment (see Fig (6.7)). The pilot plant also contains a wash column with a
visible wash front, as shown in Fig (6.7) (c).

C h a p t e r V I: i n v e s t i g a t i n g t h e f e a s i b i l i t y o f t h e s u s p e n s i o n c r y s t a l l i s a t i o n p r o c e s s f o r
TREATING REVERSE OSMOSIS BRINES186
(a) Heat transfer unit (b) Crystalliser (c) Wash column
Fig. 6.7: Pilot plant apparatus.
Fig (6.8) shows the crystallisation loop (1), and the separation loop (2) within the pilot plant.
The crystallisation loop consists of a feed tank (3), a melt circulation pump (M-102) (4), a
crystalliser (5), an ice scraper motor (M-101) (6), a refrigerant circulation pump (M-104) (7),
a refrigerant heat exchanger (8), a heat transfer unit (9), and a slurry supply valve (YV-201)
(10). The separation loop consists of a piston type wash column (11), an ice scraper motor
(M-200) (12), a melting loop (13), a filtrate discharge valve (YV-202) (14), a filtrate recycle
valve (YSV-205) (15), a filtrate reject valve (YV-203) (16), and a product output valve (YV-
204) (17). The melting loop (13) contains a product circulation pump (known by Sulzer as a
Meltloop pump) (M-220) (18), meltloop pressure valve (YSV-206) (19), product heat
exchanger (20), and heating system (known by Sulzer as a Melter) (H-200) (21). The pilot
plant is also provided with a cabinet light (22), and air heating system (23). The purpose of
the cabinet light is mainly for illumination purposes. The air heating system comprises a
heater and fan. The air heating system is used to avoid ice encasing the main components and
pipelines of the pilot plant. The pilot plant also contains other equipment, such as a feed
pump (YSV-400) and an external wash pressure system (P-225); however, these items of
equipment were not used in the experiments. For identification purposes, codes were given
to equipment items in order to identify them in the software package (e.g. the code for the
melt circulation pump is M-102).
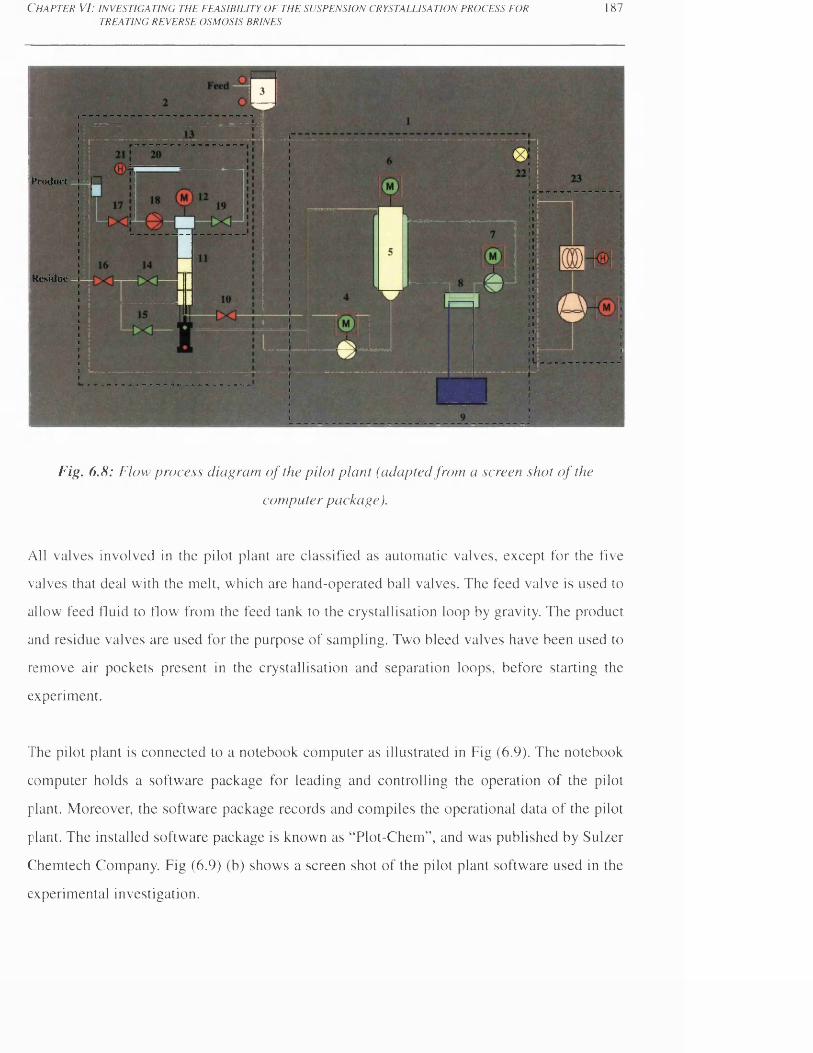
C h a p t e r V I: in v e s t i g a t i n g t h e f e a s i b i l i t y o f t h e s u s p e n s i o n c r y s t a l l i s a t i o n p r o c e s s f o r
TREATING REVERSE OSMOSIS BRINES187
P r o d u c t
R e s id u e
Fig. 6.8: Flow process diagram o f the pilot plant (adapted from a screen shot o f the
computer package).
All valves involved in the pilot plant are classified as automatic valves, except for the five
valves that deal with the melt, which are hand-operated ball valves. The feed valve is used to
allow feed fluid to How from the feed tank to the crystallisation loop by gravity. The product
and residue valves are used for the purpose of sampling. Two bleed valves have been used to
remove air pockets present in the crystallisation and separation loops, before starting the
experiment.
The pilot plant is connected to a notebook computer as illustrated in Fig (6.9). The notebook
computer holds a software package for leading and controlling the operation of the pilot
plant. Moreover, the software package records and compiles the operational data of the pilot
plant. The installed software package is known as “Plot-Chem”, and was published by Sulzer
Chemtech Company. Fig (6.9) (b) shows a screen shot of the pilot plant software used in the
experimental investigation.
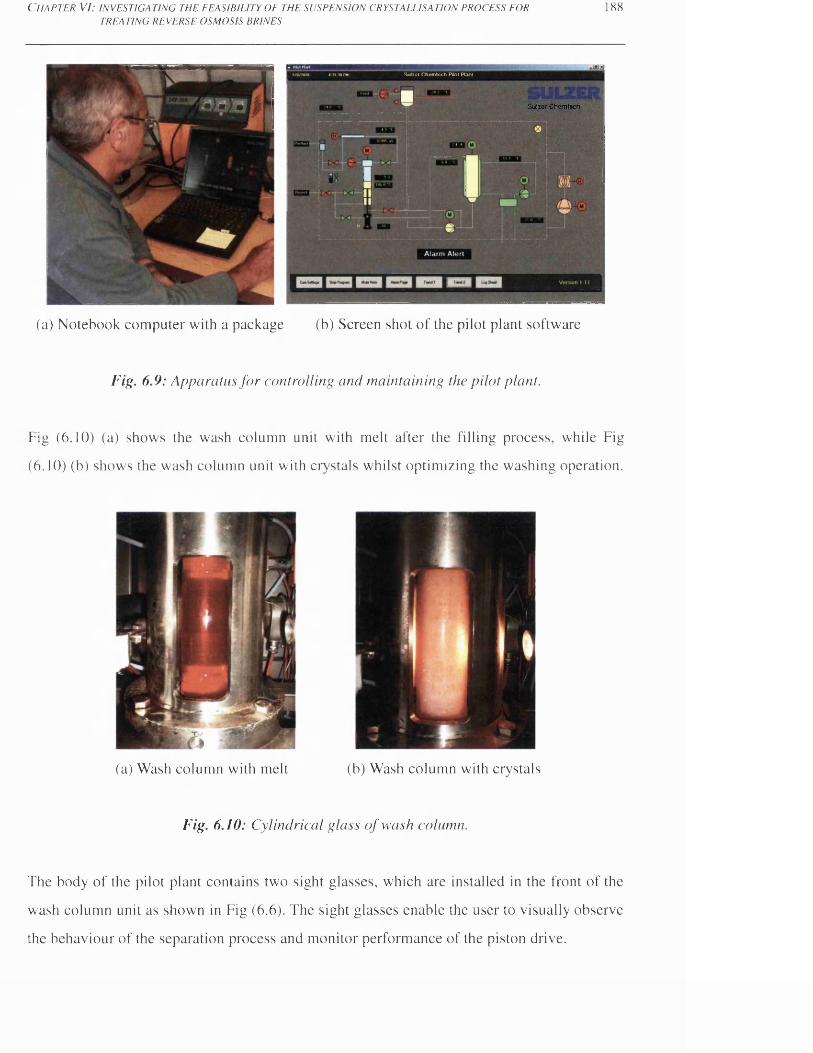
C h a p t e r V I: i n v e s t i g a t i n g t h e f e a s i b i l i t y o f t h e s u s p e n s i o n c r y s t a l l i s a t i o n p r o c e s s f o r
TREATING REVERSE OSMOSIS BRINES188
Sulzer Chemtech Pilot Plant
Sulzer Chemtech
(a) Notebook computer with a package (b) Screen shot of the pilot plant software
Fig. 6.9: Apparatus fo r controlling and maintaining the pilot plant.
Fig (6.10) (a) shows the wash column unit with melt after the filling process, while Fig
(6.10) (b) shows the wash column unit with crystals whilst optimizing the washing operation.
r
(a) Wash column with melt (b) Wash column with crystals
Fig. 6.10: Cylindrical glass o f wash column.
The body of the pilot plant contains two sight glasses, which are installed in the front of the
wash column unit as shown in Fig (6.6). The sight glasses enable the user to visually observe
the behaviour of the separation process and monitor performance of the piston drive.
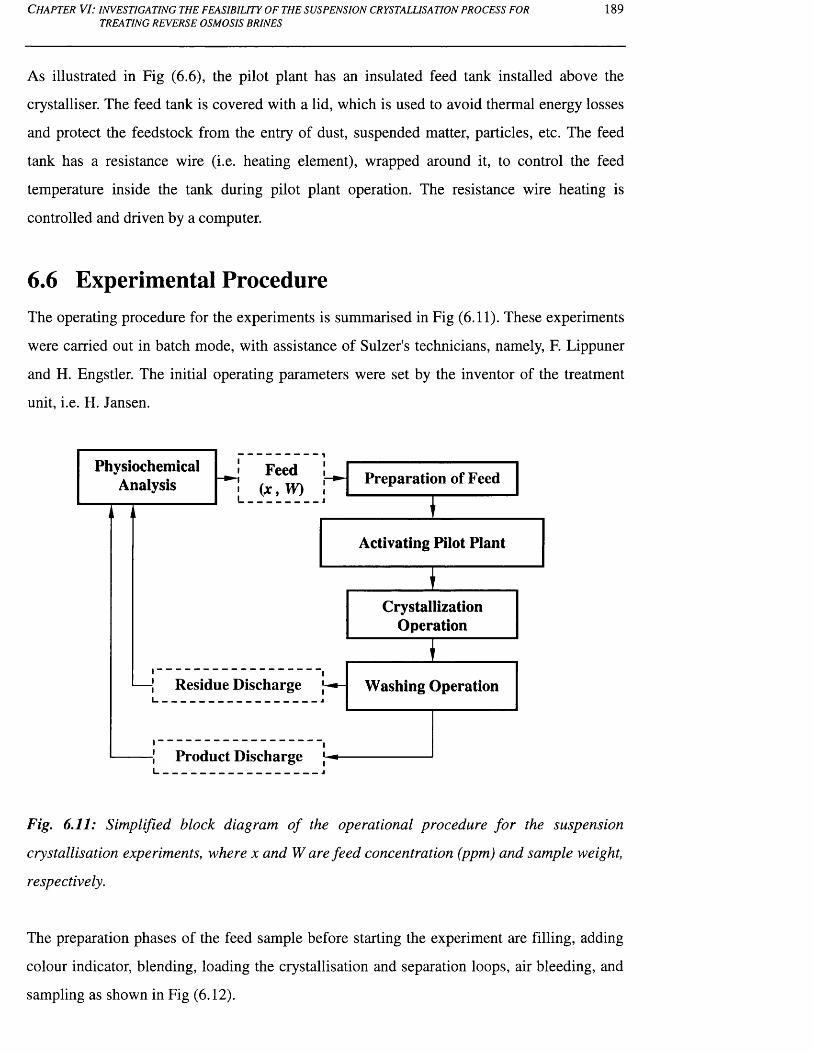
C h a p t e r V I: i n v e s t i g a t i n g t h e f e a s i b i l i t y o f t h e s u s p e n s i o n c r y s t a l l i s a t i o n p r o c e s s f o r
TREATING REVERSE OSMOSIS BRINES189
As illustrated in Fig (6.6), the pilot plant has an insulated feed tank installed above the
crystalliser. The feed tank is covered with a lid, which is used to avoid thermal energy losses
and protect the feedstock from the entry of dust, suspended matter, particles, etc. The feed
tank has a resistance wire (i.e. heating element), wrapped around it, to control the feed
temperature inside the tank during pilot plant operation. The resistance wire heating is
controlled and driven by a computer.
6.6 Experimental ProcedureThe operating procedure for the experiments is summarised in Fig (6.11). These experiments
were carried out in batch mode, with assistance of Sulzer's technicians, namely, F. Lippuner
and H. Engstler. The initial operating parameters were set by the inventor of the treatment
unit, i.e. FI. Jansen.
Residue Discharge
Product Discharge
Preparation of FeedPhysiochemical
Analysis
CrystallizationOperation
Washing Operation
Activating Pilot Plant
i_____________________ j
Fig. 6.11: Simplified block diagram o f the operational procedure for the suspension
crystallisation experiments, where x and W are feed concentration (ppm) and sample weight,
respectively.
The preparation phases of the feed sample before starting the experiment are filling, adding
colour indicator, blending, loading the crystallisation and separation loops, air bleeding, and
sampling as shown in Fig (6.12).

C h a p t e r V I: i n v e s t i g a t i n g t h e f e a s i b i l i t y o f t h e s u s p e n s i o n c r y s t a l l i s a t i o n p r o c e s s f o r
TREATING REVERSE OSMOSIS BRINES190
(a) Filling (b) Feed before adding colour indicator
(c) Adding colour indicator (d) Blending the mixture
(e) Final feed before loading the system (f) Bleeding air and sampling
Fig. 6.12: Preparation phases before operating the pilot plant.
Initially, the feed valve was set to a fully closed position, and the feed tank was loaded with a
predetermined amount of feed as shown in Fig (6.12) (a). Unfortunately, the separation
process of the wash column was controlled by means of light cells (this is due to the pilot
plant being designed for food applications), and since the RO retentate is colour-less, a
colour indicator (Chromotrope FB, MKBD4111, Sigma-Aldrich) needed to be added before
the experiments were carried out. Before starting the experiment, the final feed sample was
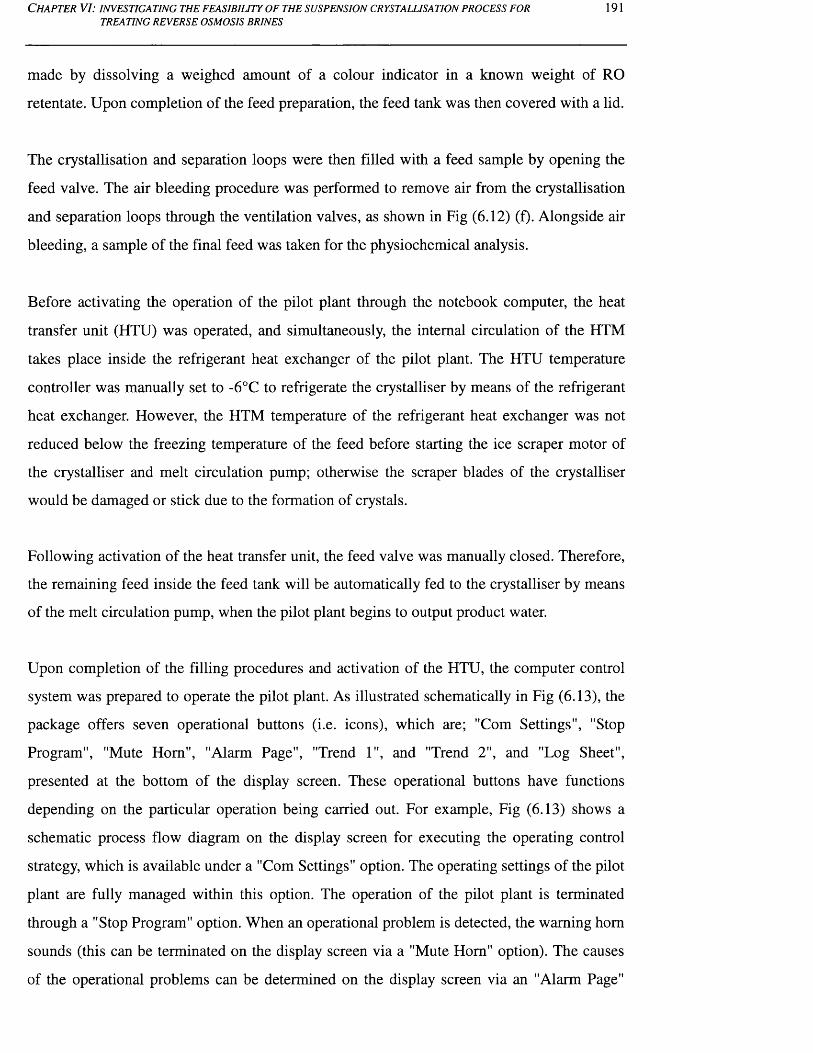
C h a p t e r V I: i n v e s t i g a t i n g t h e f e a s i b i l i t y o f t h e s u s p e n s i o n c r y s t a l l i s a t i o n p r o c e s s f o r
TREATING REVERSE OSMOSIS BRINES191
made by dissolving a weighed amount of a colour indicator in a known weight of RO
retentate. Upon completion of the feed preparation, the feed tank was then covered with a lid.
The crystallisation and separation loops were then filled with a feed sample by opening the
feed valve. The air bleeding procedure was performed to remove air from the crystallisation
and separation loops through the ventilation valves, as shown in Fig (6.12) (f). Alongside air
bleeding, a sample of the final feed was taken for the physiochemical analysis.
Before activating the operation of the pilot plant through the notebook computer, the heat
transfer unit (HTU) was operated, and simultaneously, the internal circulation of the HTM
takes place inside the refrigerant heat exchanger of the pilot plant. The HTU temperature
controller was manually set to -6°C to refrigerate the crystalliser by means of the refrigerant
heat exchanger. However, the HTM temperature of the refrigerant heat exchanger was not
reduced below the freezing temperature of the feed before starting the ice scraper motor of
the crystalliser and melt circulation pump; otherwise the scraper blades of the crystalliser
would be damaged or stick due to the formation of crystals.
Following activation of the heat transfer unit, the feed valve was manually closed. Therefore,
the remaining feed inside the feed tank will be automatically fed to the crystalliser by means
of the melt circulation pump, when the pilot plant begins to output product water.
Upon completion of the filling procedures and activation of the HTU, the computer control
system was prepared to operate the pilot plant. As illustrated schematically in Fig (6.13), the
package offers seven operational buttons (i.e. icons), which are; "Com Settings", "Stop
Program", "Mute Horn", "Alarm Page", "Trend 1", and "Trend 2", and "Log Sheet",
presented at the bottom of the display screen. These operational buttons have functions
depending on the particular operation being carried out. For example, Fig (6.13) shows a
schematic process flow diagram on the display screen for executing the operating control
strategy, which is available under a "Com Settings" option. The operating settings of the pilot
plant are fully managed within this option. The operation of the pilot plant is terminated
through a "Stop Program" option. When an operational problem is detected, the warning hom
sounds (this can be terminated on the display screen via a "Mute Hom" option). The causes
of the operational problems can be determined on the display screen via an "Alarm Page"
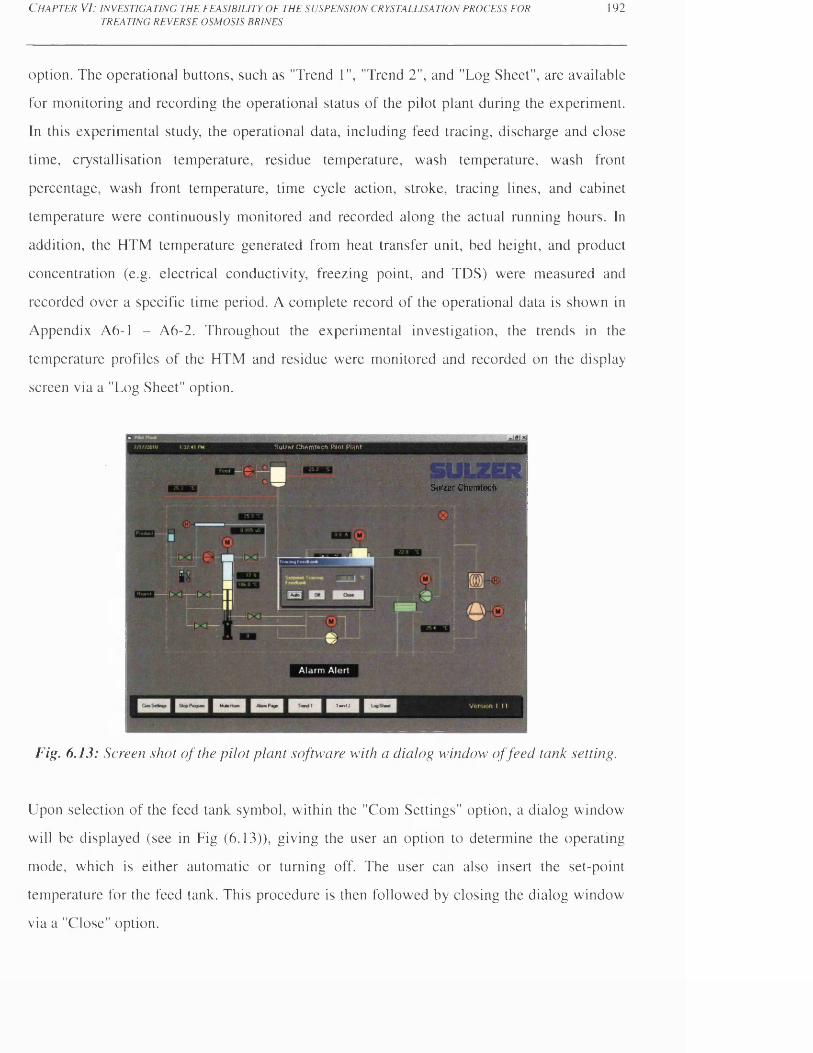
C h a p t e r V I: in v e s t i g a t i n g t h e f e a s i b i l i t y o f t h e s u s p e n s i o n c r y s t a l l i s a t i o n p r o c e s s f o r
TREATING REVERSE OSMOSIS BRINES192
option. The operational buttons, such as "Trend 1", "Trend 2", and "Log Sheet", are available
for monitoring and recording the operational status of the pilot plant during the experiment.
In this experimental study, the operational data, including feed tracing, discharge and close
time, crystallisation temperature, residue temperature, wash temperature, wash front
percentage, wash front temperature, time cycle action, stroke, tracing lines, and cabinet
temperature were continuously monitored and recorded along the actual running hours. In
addition, the HTM temperature generated from heat transfer unit, bed height, and product
concentration (e.g. electrical conductivity, freezing point, and TDS) were measured and
recorded over a specific time period. A complete record of the operational data is shown in
Appendix A6-1 - A6-2. Throughout the experimental investigation, the trends in the
temperature profiles of the HTM and residue were monitored and recorded on the display
screen via a "Log Sheet" option.
Fig. 6.13: Screen shot o f the pilot plant software with a dialog window o f feed tank setting.
Upon selection of the feed tank symbol, within the "Com Settings" option, a dialog window
will be displayed (see in Fig (6.13)), giving the user an option to determine the operating
mode, which is either automatic or turning off. The user can also insert the set-point
temperature for the feed tank. This procedure is then followed by closing the dialog window
via a "Close" option.
Sutte r Chem tech Riot Plant
Sulzer Chemtech
T(«rd2

C h a p t e r V I: i n v e s t i g a t i n g t h e f e a s i b i l i t y o f t h e s u s p e n s i o n c r y s t a l l i s a t i o n p r o c e s s f o r
TREATING REVERSE OSMOSIS BRINES193
In order to specify the desired operating settings of the wash column, the wash column logo
(symbol) must to be selected, leading to a dialog window as illustrated in Fig (6.14). This
dialog window enables the user to specify the desired operating settings for the wash column
system. For all experiments, the wash column settings were set to constant values. Details of
the wash column settings are given in Appendix 6, found in a CD attached to the thesis (see
file name: Appendix, Microsoft Excel spreadsheet, Sheet: Appendix 6, Tables A6-1 - A6-2).
However, the time cycle adjustment was initially set to 120 seconds at the beginning of the
experiment. For clarification, the time cycle adjustment is the total time for completing the
four stroke cycle for the piston drive in the wash column.
Sulzer Chemtech PHot Plant
Sulzer Chemtech
Fig. 6.14: Screen shot o f the pilot plant software with a dialog window o f wash column
settings.
The operating mode of some equipment in the pilot plant must be set to automatic. This was
achieved by selecting the desired equipment symbol button (which is available in the "Com
Settings" option), giving the user an option to select the operating mode, either automatic or
manual. An example for determining the operating mode of the ice scraper motor is
illustrated in Fig (6.15). This procedure was applied individually for the majority of
equipment in the pilot plant, including the product circulation pump (i.e. Meltloop pump)
(M-220), slurry supply valve (YV-201), product output valve (YV-204), feed pump (YSV-
400), filtrate discharge valve (YV-202), filtrate recycle valve (YSV-205), filtrate reject valve
(YV-203), heating system (i.e. Melter) (H-200), and meltloop pressure valve (YSV-206).
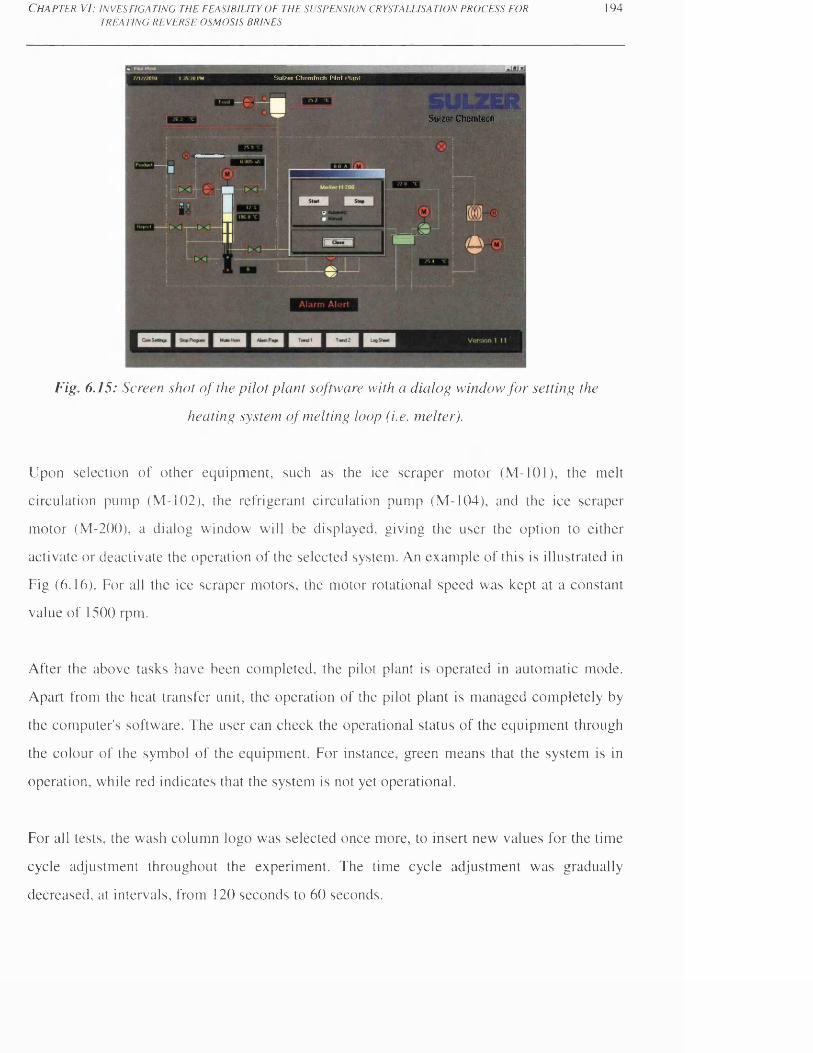
C h a p t e r V I: i n v e s t i g a t i n g t h e f e a s i b i l i t y o f t h e s u s p e n s i o n c r y s t a l l i s a t i o n p r o c e s s f o r
TREATING REVERSE OSMOSIS BRINES194
Sulzor Chomtoch Pilot Plan!
Sulzer Chemtech
Fig. 6.15: Screen shot o f the pilot plant software with a dialog window fo r setting the
heating system o f melting loop (i.e. melter).
Upon selection of other equipment, such as the ice scraper motor (M-101), the melt
circulation pump (M-102), the refrigerant circulation pump (M-104), and the ice scraper
motor (M-200), a dialog window will be displayed, giving the user the option to either
activate or deactivate the operation of the selected system. An example of this is illustrated in
Fig (6.16). For all the ice scraper motors, the motor rotational speed was kept at a constant
value of 1500 rpm.
After the above tasks have been completed, the pilot plant is operated in automatic mode.
Apart from the heat transfer unit, the operation of the pilot plant is managed completely by
the computer's software. The user can check the operational status of the equipment through
the colour of the symbol of the equipment. For instance, green means that the system is in
operation, while red indicates that the system is not yet operational.
For all tests, the wash column logo was selected once more, to insert new values for the time
cycle adjustment throughout the experiment. The time cycle adjustment was gradually
decreased, at intervals, from 120 seconds to 60 seconds.
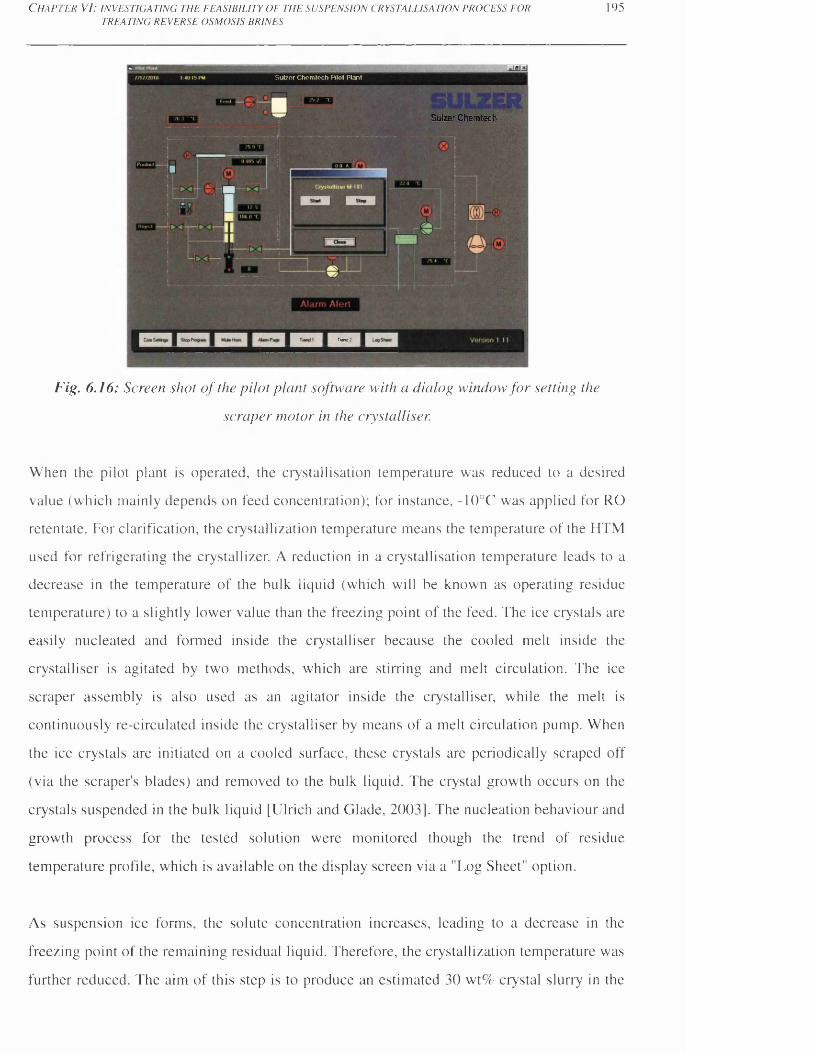
C h a p t e r V I: i n v e s t i g a t i n g t h e f e a s i b i l i t y o f t h e s u s p e n s i o n c r y s t a l l i s a t i o n p r o c e s s f o r
TREATING REVERSE OSMOSIS BRINES195
SulT’nr Chomtoch hlot Plant
Sulzer Chemtech
T«nd2
Fig. 6.16: Screen shot o f the pilot plant software with a dialog window fo r setting the
scraper motor in the crystalliser.
When the pilot plant is operated, the crystallisation temperature was reduced to a desired
value (which mainly depends on feed concentration); for instance, -10°C was applied for RO
retentate. For clarification, the crystallization temperature means the temperature of the HTM
used for refrigerating the crystallizer. A reduction in a crystallisation temperature leads to a
decrease in the temperature of the bulk liquid (which will be known as operating residue
temperature) to a slightly lower value than the freezing point of the feed. The ice crystals are
easily nucleated and formed inside the crystalliser because the cooled melt inside the
crystalliser is agitated by two methods, which are stirring and melt circulation. The ice
scraper assembly is also used as an agitator inside the crystalliser, while the melt is
continuously re-circulated inside the crystalliser by means of a melt circulation pump. When
the ice crystals are initiated on a cooled surface, these crystals are periodically scraped off
(via the scraper's blades) and removed to the bulk liquid. The crystal growth occurs on the
crystals suspended in the bulk liquid [Ulrich and Glade, 2003]. The nucleation behaviour and
growth process for the tested solution were monitored though the trend of residue
temperature profile, which is available on the display screen via a "Log Sheet" option.
As suspension ice forms, the solute concentration increases, leading to a decrease in the
freezing point of the remaining residual liquid. Therefore, the crystallization temperature was
further reduced. The aim of this step is to produce an estimated 30 wt% crystal slurry in the
C h a p t e r V I: i n v e s t i g a t i n g t h e f e a s i b i l i t y o f t h e s u s p e n s i o n c r y s t a l l i s a t i o n p r o c e s s f o r
TREATING REVERSE OSMOSIS BRINES196
crystallizer. For clarification, the weight ratio of crystal slurry inside the crystallisation loop
will be identified and referred to, in the course of this chapter, as crystal slurry ratio. The
crystal slurry ratio must be balanced in the crystalliser throughout the pilot plant operation.
The crystal suspension is then transported to the wash column. The washing steps for the
wash column unit then take place to purify the crystals and output product water.
When the crystals can be visually observed through the glass window of the wash column,
the wash column symbol was selected in order to reduce the time cycle adjustment from 60
to 35 seconds. Throughout the experiment, the key-parameter (i.e. time cycle adjustment)
was changed according to the separation performance of wash column unit, dictated by the
quality of product water.
In the wash column, the crystals are compressed to a firm crystal bed by means of a piston
drive. Above the piston head, the compressed crystal bed is surrounded by mother liquor,
including impurities. On the opposite side of the compressed crystal bed, the crystal bed is
scraped off (via a scraper) and becomes slurry (once more) in a melting loop. The crystals are
melted via a heating system (i.e. Melter) installed in a simple heat exchanger.
This pilot plant has never before been examined for treating RO retentate; so, there is no
reference data available for such an application. Although there are a number of operating
parameters that can be used to optimise and improve the performance of the pilot unit, only
two key-parameters, namely the time cycle adjustment and the crystallization temperature,
were periodically adjusted based on trial and error. When the desired quality of product water
was obtained, then the settings of these two parameters were kept constant until the quality
of product water started to decline slightly.
Therefore, product water samples were periodically (i.e. at specific time intervals throughout
the experiment) collected from the melting loop for physiochemical analysis of TDS,
electrical conductivity, and freezing point. The electrical conductivity gives an instant
reading to evaluate the quality of product water before collection of the final product water.
When the product water reaches a desired quality, the product valve was set to the fully open
position to collect the final product water from the melting loop as shown in Fig (6.17). If the

C h a p t e r V I: i n v e s t i g a t i n g t h e f e a s i b i l i t y o f t h e s u s p e n s i o n c r y s t a l l i s a t i o n p r o c e s s f o r
TREATING REVERSE OSMOSIS BRINES197
product water is of poor quality, the product valve was set to the fully closed position to carry
out further purification of the final product water through the separation loop.
Fig. 6.17: Collection o f final product water samples fo r run 1.
When the product water is collected, the solute concentrations will increase. Consequently
the freezing point of the remaining residual liquid is reduced. As mentioned previously, the
crystallisation temperature was reduced gradually over time, in order to maintain the crystal
slurry ratio at 30 wt%; otherwise, the performance of the pilot plant will deteriorate.
This experimental investigation dealt with two different types of residual liquids, which have
different physiochemical properties. The first will be known as the "operating residue", and
is re-circulated with ice slurry inside the crystallisation loop. When the experiment is
completed, the pilot plant must be shut down to collect the residual liquid for physiochemical
analysis. When the pilot plant is turned off, separation of the remaining ice slurry from the
operating residue inside the crystallisation and separation loops was impossible, and even so,
the remaining ice slurry would not be purified. Therefore, the remaining ice slurry inside
these loops was melted and mixed with the remaining residual liquid i.e. operating residue.
Therefore, the final residual liquid (which will be known as the "final residue") has
completely different physiochemical properties than that in the operating residue. For
instance, the salt concentration of the operating residue must be higher than that of the final
residue. However, the final residual liquid was separated from the crystallisation and melting
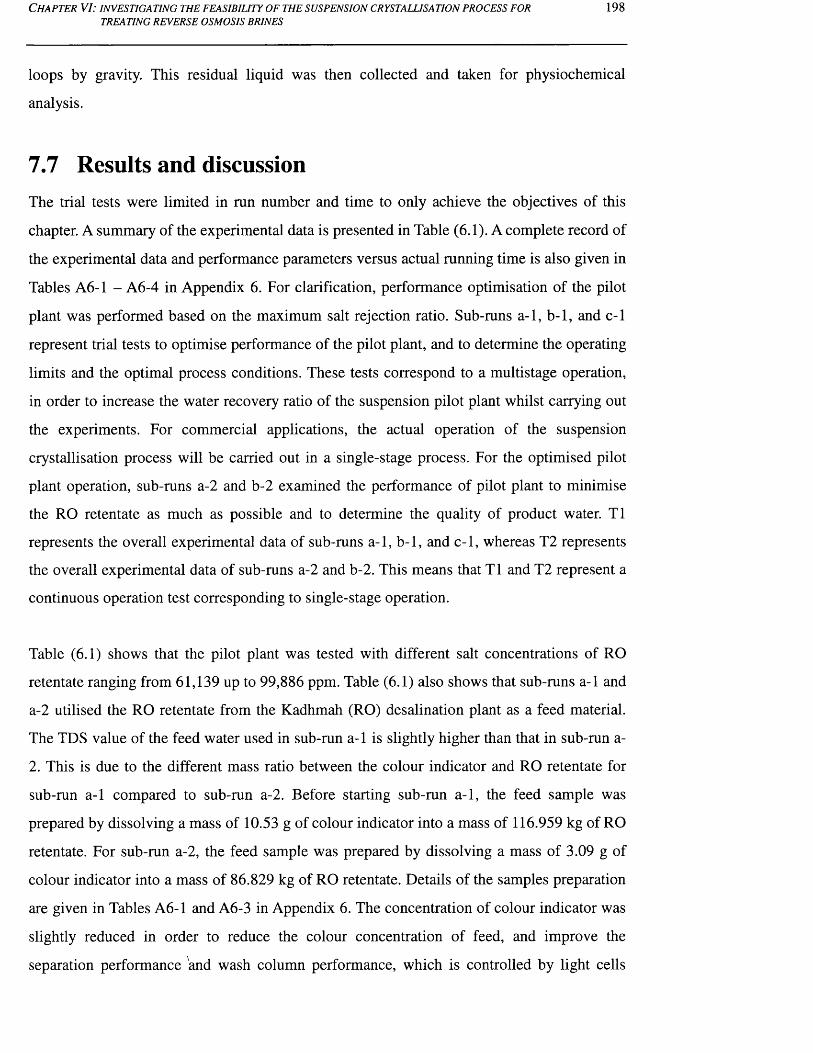
C h a p t e r V I: i n v e s t i g a t i n g t h e f e a s i b i l i t y o f t h e s u s p e n s i o n c r y s t a l l i s a t i o n p r o c e s s f o r
TREATING REVERSE OSMOSIS BRINES198
loops by gravity. This residual liquid was then collected and taken for physiochemical
analysis.
7.7 Results and discussionThe trial tests were limited in run number and time to only achieve the objectives of this
chapter. A summary of the experimental data is presented in Table (6.1). A complete record of
the experimental data and performance parameters versus actual running time is also given in
Tables A6-1 - A6-4 in Appendix 6. For clarification, performance optimisation of the pilot
plant was performed based on the maximum salt rejection ratio. Sub-runs a-1, b-1, and c-1
represent trial tests to optimise performance of the pilot plant, and to determine the operating
limits and the optimal process conditions. These tests correspond to a multistage operation,
in order to increase the water recovery ratio of the suspension pilot plant whilst carrying out
the experiments. For commercial applications, the actual operation of the suspension
crystallisation process will be carried out in a single-stage process. For the optimised pilot
plant operation, sub-runs a-2 and b-2 examined the performance of pilot plant to minimise
the RO retentate as much as possible and to determine the quality of product water. T1
represents the overall experimental data of sub-runs a-1, b-1, and c-1, whereas T2 represents
the overall experimental data of sub-runs a-2 and b-2. This means that T1 and T2 represent a
continuous operation test corresponding to single-stage operation.
Table (6.1) shows that the pilot plant was tested with different salt concentrations of RO
retentate ranging from 61,139 up to 99,886 ppm. Table (6.1) also shows that sub-runs a-1 and
a-2 utilised the RO retentate from the Kadhmah (RO) desalination plant as a feed material.
The TDS value of the feed water used in sub-run a-1 is slightly higher than that in sub-run a-
2. This is due to the different mass ratio between the colour indicator and RO retentate for
sub-run a-1 compared to sub-run a-2. Before starting sub-run a-1, the feed sample was
prepared by dissolving a mass of 10.53 g of colour indicator into a mass of 116.959 kg of RO
retentate. For sub-run a-2, the feed sample was prepared by dissolving a mass of 3.09 g of
colour indicator into a mass of 86.829 kg of RO retentate. Details of the samples preparation
are given in Tables A6-1 and A6-3 in Appendix 6. The concentration of colour indicator was
slightly reduced in order to reduce the colour concentration of feed, and improve the
separation performance and wash column performance, which is controlled by light cells

C h a p t e r V I: i n v e s t i g a t i n g t h e f e a s i b i l i t y o f t h e s u s p e n s i o n c r y s t a l l i s a t i o n p r o c e s s f o r
TREATING REVERSE OSMOSIS BRINES199
04toto<
Hto
**toin*to
<y3"d</)0)to
w3©Uto
13©to
WDC **
*B coto
C/5OH
<sx>tC*NO)O)S-ito
c/5QH
ooc *->*N ®© to
oto
mQH
U
toto
on
a&&
©X)-C
£toto
DCJ*
' fl ■S 31/3 ^
33to
oin i tin i tCO om oi t CNi t i tto to to to to to to
COt-H COON CONO i> cnO) cn00
r-CO to O NO to to
i to i tr- 00ON l>q 00
O00
CN00
00ON ONOnto00 NOON ONON ONON ONON
o r-q <NinONO) o 00
00r-NO
o<N CO<N NO toi t toCN oCN oi t
CO<N O00 o(N o<N oin oON oONtoi ini NOi NOi toi to1 toi
76,2
92
99,8
86
105,
805
105,
805
81,4
98
103,
004
103,
004
VOi t i tCO ONq ONqONT—H H
CNin CNqCOON r- NONO NONO toNO m in
r-~o COO <Nm - cno i to cnooi di di d1 di di oi
1,2
00
20
0
15,0
00
2,03
6
80
oNO T—1i—H
23.5
1 ZYZZ 4.65
50.2
8
21.7
13
13.5
99
35.3
12
o CO<N i>o o oi—H oin oCO1 toi NOi tot toi toi to1
oOCNCNON<N
NO0000
OOCNONcn ooONit
ONcnt-HNO no"l> on"ON
T—\NO NO
r-< 00
HNO
116.
97
93.4
6
71.3
4
116.
97
86.8
32
65.1
19
86.8
32
i—H T i i—l CN CNc3 X> 6 c3 £
H CN T2
-r
I
s-R£
•5-R>O
vq*03r•2R»5+»r
roo<3-Ki
I
!§l©C•S<3
•a.13<x>033+*>R3
-R
•a.a"§0 r
1 *& to
'o5
3
3Co
s©
*R>£
2I£OCj
"§2to&o5>
-R
g3>1 3R3
©0•SRR3
-R
toto
303■R
Co
to
Oo
“a
us132.to
■§13
a<o<30
c<411«*
to
13Sto
R£
C3£tss132to*0*Q
<313
-S3*
&S*<33<3*R
•2 "q■2 to
<3<J<4)
IC3CO
CiO
to
cjCoCJ
tjsISo
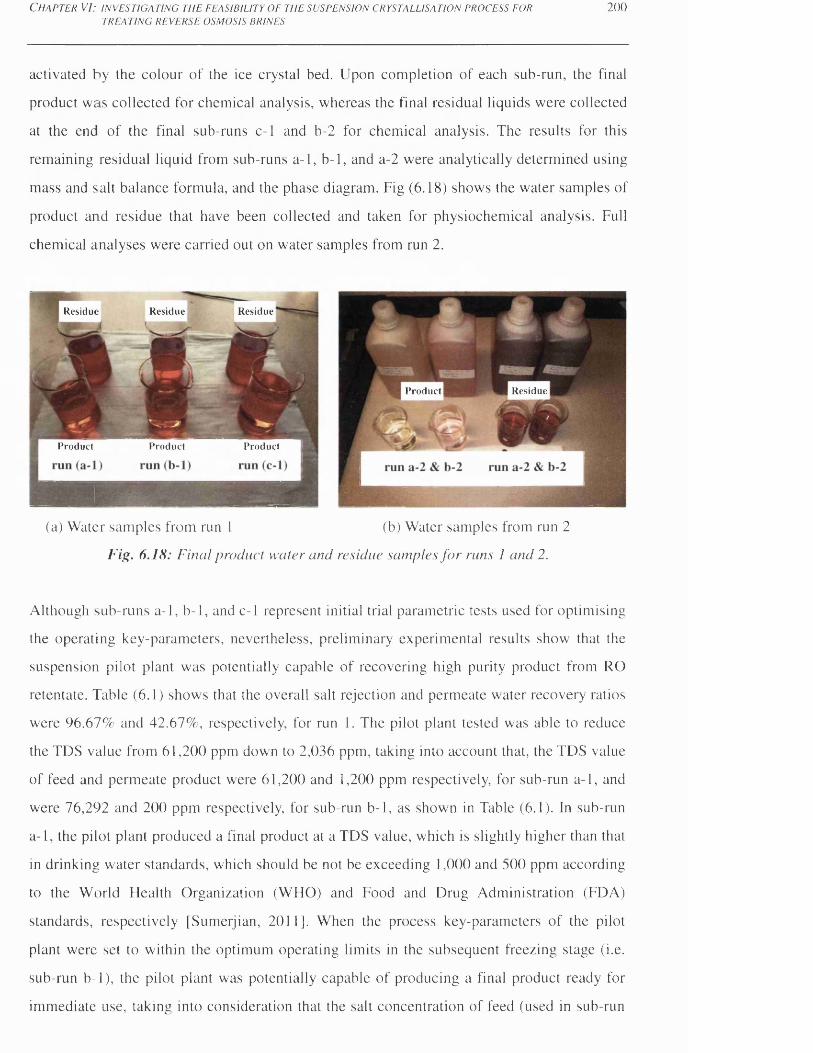
C h a p t e r V I: i n v e s t i g a t i n g t h e f e a s i b i l i t y o f t h e s u s p e n s i o n c r y s t a l l i s a t i o n p r o c e s s f o r
TREATING REVERSE OSMOSIS BRINES2 0 0
activated by the colour of the ice crystal bed. Upon completion of each sub-run, the final
product was collected for chemical analysis, whereas the final residual liquids were collected
at the end of the final sub-runs c-1 and b-2 for chemical analysis. The results for this
remaining residual liquid from sub-runs a-1, b-1, and a-2 were analytically determined using
mass and salt balance formula, and the phase diagram. Fig (6.18) shows the water samples of
product and residue that have been collected and taken for physiochemical analysis. Full
chemical analyses were carried out on water samples from run 2.
R e s id u e R e s id u e R e s id u e
R e s id u eP r o d u c t
P r o d u c t P r o d u c t P r o d u c t
(a) Water samples from run 1 (b) Water samples from run 2
Fig. 6. IS: Final product water and residue samples fo r runs 1 and 2.
Although sub-runs a-1, b-1, and c-1 represent initial trial parametric tests used for optimising
the operating key-parameters, nevertheless, preliminary experimental results show that the
suspension pilot plant was potentially capable of recovering high purity product from RO
retentate. Table (6.1) shows that the overall salt rejection and permeate water recovery ratios
were 96.67% and 42.67%, respectively, for run 1. The pilot plant tested was able to reduce
the TDS value from 61,200 ppm down to 2,036 ppm, taking into account that, the TDS value
of feed and permeate product were 61,200 and 1,200 ppm respectively, for sub-run a-1, and
were 76,292 and 200 ppm respectively, for sub-run b-1, as shown in Table (6.1). In sub-run
a-1, the pilot plant produced a final product at a TDS value, which is slightly higher than that
in drinking water standards, which should be not be exceeding 1,000 and 500 ppm according
to the World Health Organization (WHO) and Food and Drug Administration (FDA)
standards, respectively [Sumerjian, 2011]. When the process key-parameters of the pilot
plant were set to within the optimum operating limits in the subsequent freezing stage (i.e.
sub-run b-1), the pilot plant was potentially capable of producing a final product ready for
immediate use, taking into consideration that the salt concentration of feed (used in sub-run
C h a p t e r VI: in v e s t ig a t in g t h e f e a s ib il it y o f t h e s u s p e n s io n c r y s t a l l is a t io n p r o c e s s f o r 201TREATING REVERSE OSMOSIS BRINES
b-1) was higher than that in sub-run a-1. This was mainly due to the optimum operating
conditions not being known, and applied in the initial test i.e. run a-1. When the operating
temperature of the residual liquid reached -8.2°C, deterioration in the separation
performance of the pilot plant was observed, resulting in product water quality becoming
relatively poor, for sub-run c-1. However, the pilot plant produced saline water of near
brackish water quality. With regard to deterioration in the performance of the pilot plant,
further investigation was carried out in sub-run b-2 to check whether this limitation occurred
due to process optimisation or other factors, which will be discussed later herein this section.
In general, the total results from run 1 (see Table (6.1)) for the final product were quite
encouraging. Nonetheless, the pilot plant did produce a final product of near drinking water
standards in terms of TDS. As mentioned previously, this was mainly due to the optimal
operating conditions not being determined and applied in the initial test (i.e. run a-1).
Moreover, the quality of product water declined further, because of deterioration of pilot
plant performance, when the operating temperature of the residual liquid reached -8.2°C.
As for run 2, the performance of the pilot plant was monitored over an actual operational
period of 4.77 hours. The actual testing period was longer than the stated running time, due
mainly to minor optimisations performed for the pilot plant to improve the quality of product
water before collection. Fig (6.19) shows the operating and performance parameters for the
pilot plant versus actual running time. Fig (6.19) (a) shows that the start-point temperature of
crystallisation and operating residue were -11.3 and -4.6°C, respectively, while the end-point
temperature of crystallisation and operating residue were -19.4 and -8.2°C, respectively. Fig
(6.19) (b) shows that the time cycle adjustment was kept at a constant value (which is 35
seconds) during the course of operation, while the time cycle action averaged about 29
seconds up to 2.77 h of actual operation, and then rapidly declined to an average time of 21.5
seconds. Therefore, the reduction in the time cycle action indicated a decrease in the
operational period of the separation process, leading to an increase in the total product water
output. The maximum and minimum values of time cycle action were 31 and 20 seconds,
respectively. Fig (6.19) (c) shows that the bed-height averaged about 31 mm, and more
specifically, the bed-height was maintained at constant value (which is 30 mm) from the
operational period of 2.93 h until the end of the test. The average product flow-rate was 7.41
kg/h as shown in Table (6.1). During the course of operation, final product water samples
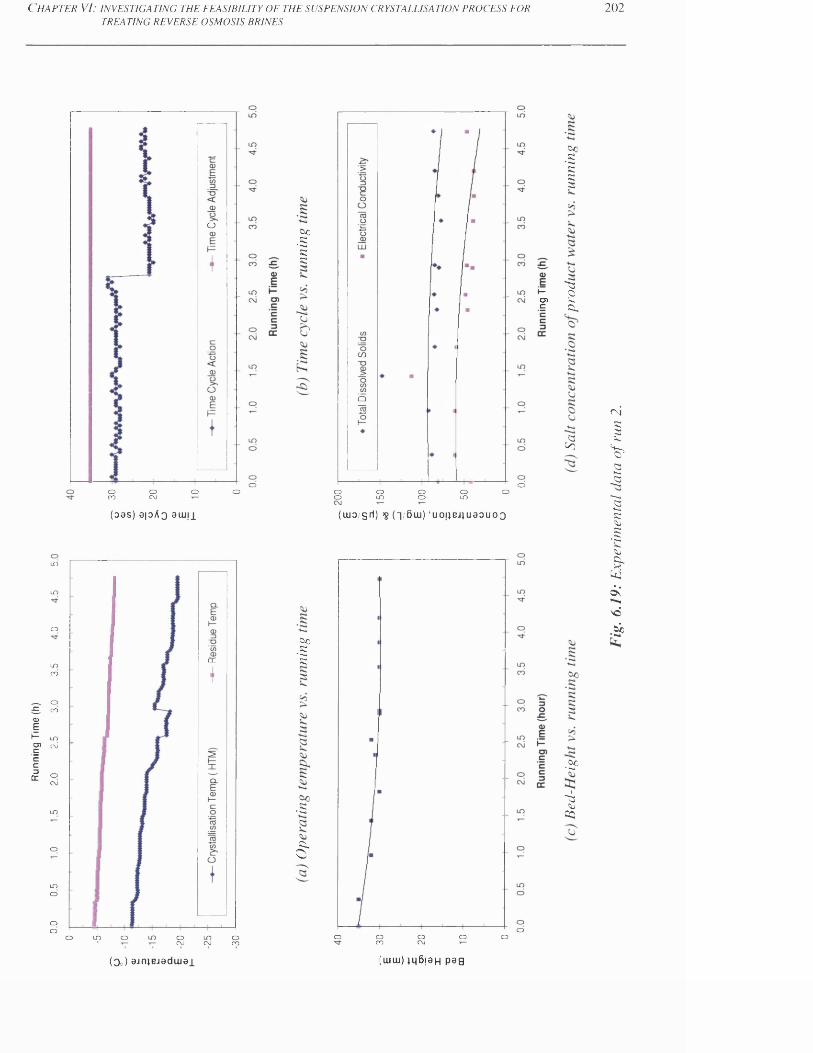
Run
ning
Ti
me
(h)
C h a p t e r V I: i n v e s t i g a t i n g t h e f e a s i b i l i t y o f t h e s u s p e n s i o n c r y s t a l l i s a t i o n p r o c e s s f o r
TREATING REVERSE OSMOSIS BRINES2 0 2
o
OoCO
oCM
O O
&0•S5e
CO
□
ooun oo oun ooo
C>0.C5cs
i= ^ t- 30 5 V .
• i ^
ato
(o a s ) a p A o a w i i (ujo/srl) >5 (-|/6uj)‘uoiiejiuaouoo
ID
LO
O
ocLOco
oCO
LOC\J
oCM
LO
O
LOO
OO O LO O o
CMLOCM
OCO
SO. c5
•S
§
ooco o
CMo oo
•HP
Ms<L>C3
(Oo) ajniejadmai (tu iu ) iq B p H p e a
ig. 6
.19:
Expe
rim
enta
l da
ta of
run
2.
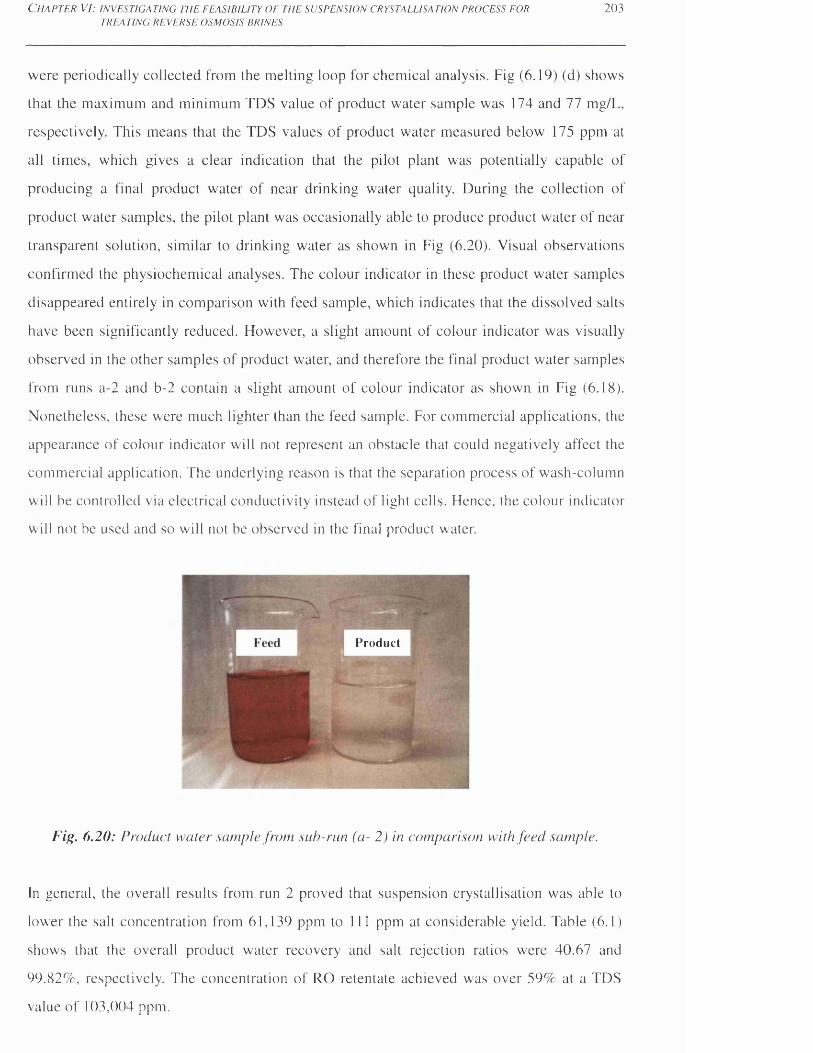
C h a p t e r V I: i n v e s t i g a t i n g t h e f e a s i b i l i t y o f t h e s u s p e n s i o n c r y s t a l l i s a t i o n p r o c e s s f o r
TREATING REVERSE OSMOSIS BRINES2 0 3
were periodically collected from the melting loop for chemical analysis. Fig (6.19) (d) shows
that the maximum and minimum TDS value of product water sample was 174 and 77 mg/L,
respectively. This means that the TDS values of product water measured below 175 ppm at
all times, which gives a clear indication that the pilot plant was potentially capable of
producing a final product water of near drinking water quality. During the collection of
product water samples, the pilot plant was occasionally able to produce product water of near
transparent solution, similar to drinking water as shown in Fig (6.20). Visual observations
confirmed the physiochemical analyses. The colour indicator in these product water samples
disappeared entirely in comparison with feed sample, which indicates that the dissolved salts
have been significantly reduced. However, a slight amount of colour indicator was visually
observed in the other samples of product water, and therefore the final product water samples
from runs a-2 and b-2 contain a slight amount of colour indicator as shown in Fig (6.18).
Nonetheless, these were much lighter than the feed sample. For commercial applications, the
appearance of colour indicator will not represent an obstacle that could negatively affect the
commercial application. The underlying reason is that the separation process of wash-column
will be controlled via electrical conductivity instead of light cells. Hence, the colour indicator
will not be used and so will not be observed in the final product water.
Product
Fig. 6.20: Product water sample from sub-run (a- 2) in comparison with feed sample.
In general, the overall results from run 2 proved that suspension crystallisation was able to
lower the salt concentration from 61,139 ppm to 111 ppm at considerable yield. Table (6.1)
shows that the overall product water recovery and salt rejection ratios were 40.67 and
99.82%, respectively. The concentration of RO retentate achieved was over 59% at a TDS
value of 103,004 ppm.
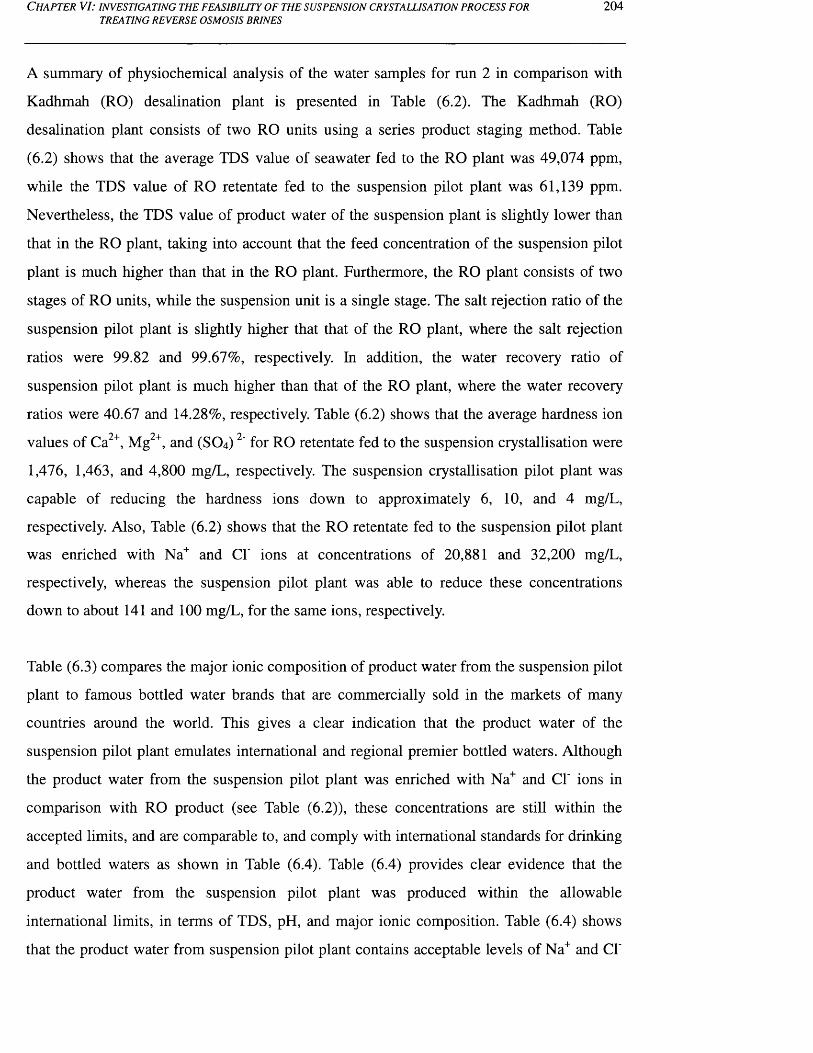
C h a p t e r V I: i n v e s t i g a t i n g t h e f e a s i b i l i t y o f t h e s u s p e n s i o n c r y s t a l l i s a t i o n p r o c e s s f o r
TREATING REVERSE OSMOSIS BRINES204
A summary of physiochemical analysis of the water samples for run 2 in comparison with
Kadhmah (RO) desalination plant is presented in Table (6.2). The Kadhmah (RO)
desalination plant consists of two RO units using a series product staging method. Table
(6.2) shows that the average TDS value of seawater fed to the RO plant was 49,074 ppm,
while the TDS value of RO retentate fed to the suspension pilot plant was 61,139 ppm.
Nevertheless, the TDS value of product water of the suspension plant is slightly lower than
that in the RO plant, taking into account that the feed concentration of the suspension pilot
plant is much higher than that in the RO plant. Furthermore, the RO plant consists of two
stages of RO units, while the suspension unit is a single stage. The salt rejection ratio of the
suspension pilot plant is slightly higher that that of the RO plant, where the salt rejection
ratios were 99.82 and 99.67%, respectively. In addition, the water recovery ratio of
suspension pilot plant is much higher than that of the RO plant, where the water recovery
ratios were 40.67 and 14.28%, respectively. Table (6.2) shows that the average hardness ion
values of Ca2+, Mg2+, and (SO 4 ) 2' for RO retentate fed to the suspension crystallisation were
1,476, 1,463, and 4,800 mg/L, respectively. The suspension crystallisation pilot plant was
capable of reducing the hardness ions down to approximately 6, 10, and 4 mg/L,
respectively. Also, Table (6.2) shows that the RO retentate fed to the suspension pilot plant
was enriched with Na+ and Cl' ions at concentrations of 20,881 and 32,200 mg/L,
respectively, whereas the suspension pilot plant was able to reduce these concentrations
down to about 141 and 100 mg/L, for the same ions, respectively.
Table (6.3) compares the major ionic composition of product water from the suspension pilot
plant to famous bottled water brands that are commercially sold in the markets of many
countries around the world. This gives a clear indication that the product water of the
suspension pilot plant emulates international and regional premier bottled waters. Although
the product water from the suspension pilot plant was enriched with Na+ and CF ions in
comparison with RO product (see Table (6.2)), these concentrations are still within the
accepted limits, and are comparable to, and comply with international standards for drinking
and bottled waters as shown in Table (6.4). Table (6.4) provides clear evidence that the
product water from the suspension pilot plant was produced within the allowable
international limits, in terms of TDS, pH, and major ionic composition. Table (6.4) shows
that the product water from suspension pilot plant contains acceptable levels of Na+ and Cl'
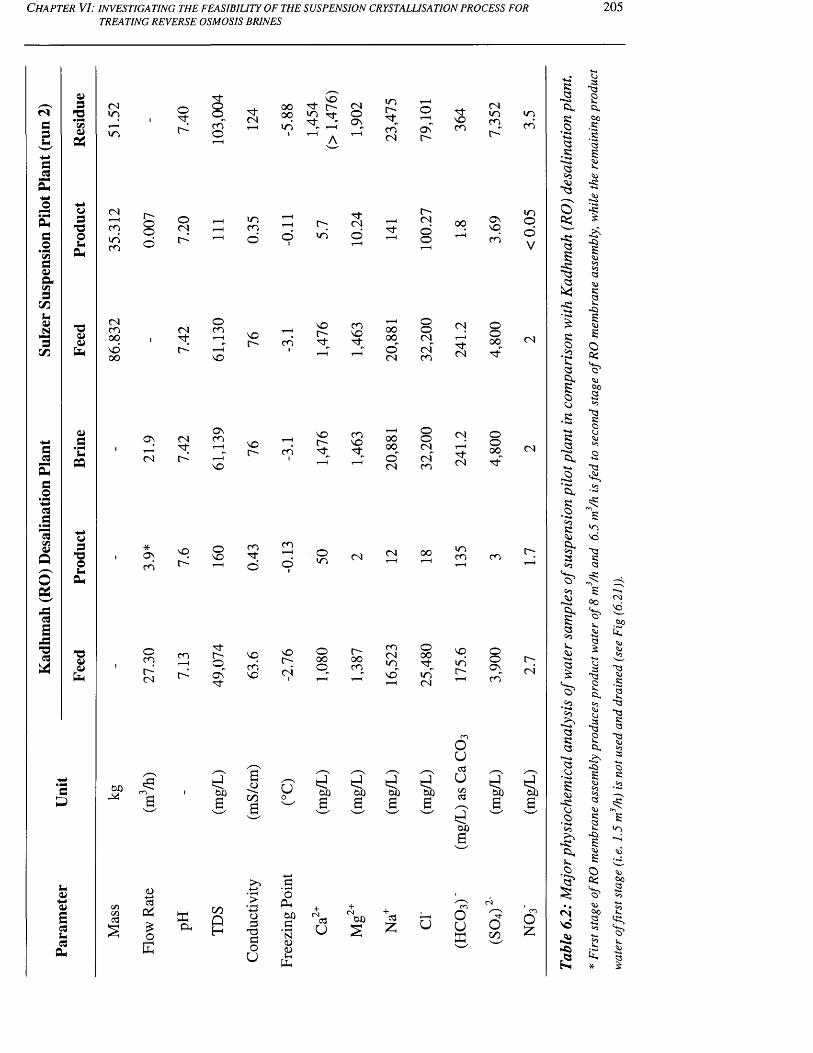
Kad
hmah
(R
O)
Des
alin
atio
n Pl
ant
Sulze
r Su
spen
sion
Pilo
t Pl
ant
(run
2)
C h a p t e r V I: i n v e s t i g a t i n g t h e f e a s i b i l i t y o f t h e s u s p e n s i o n c r y s t a l l i s a t i o n p r o c e s s f o r
TREATING REVERSE OSMOSIS BRINES205
033
V3<u
<Ninm
Oitocn©
it<N
0000ini t i> VO ^^ f a
~ A
(NOO N
m 1—Hr - O r j-
NOcn ON cnCN
CNincn incn
r
faR•2r
s13ga ,00■S•§3
u3
oUfa
T30303fa
033
•u03
o3T3OU
fa
-a0303fa
CN1—Hcninm
(NcnooNOoo
r -oo
*O N
CO
ocnCN
oCN[>
CNiffa
NOfa
incn in
ocn
NO
noi> cn
NOr-it
oNO
cni f
n-cn r- NOo _ cnON NOn -
cn
N O
CN
Om
oooO
i tCNo
cnNOi t
CN
oocn
oo00o'CN
ON CNi t
ONcn
76
r—Hcn
NOr~-
cnNOn -
t-H0000
CN rHNO
i i—H o'CN
CN
cnCNinno"
CNoo
ooCNCNcn
ooCNCNcn
00
o00ifinCN
00
CN
ifCN
CN
i fCN
mcn
N Oinr -
O NN O
cn
oooo
Oooo
cn
ooO N
cn
inoov
CN
CN
r-
i>CN
a
Ofa
QB
*§
r
•2csIo
far•2PIr
&Oosoo
00 031<3oo5.£<3£
■£
-££
•d»o
-O
O
ooa
13£o
13
nNO
13£<3
0O
C3£tSs
13O
3fa
u0303s3U3
fa
00M
dma
03cdfa£
j3fa
fafa
dtoa
COQH
aocna
o3
13ao
U
U dtoad d do oa o o
3o oa
« 3 c
ofaoo3
♦N0303i-ifa
3u
oo +3£ U
OU3
uCZ33
d00a
oufa
dooa
ocn
dooa
o£
Oo- d
Ra»*-«4Qcj
B-RNj
•2Pa
£14.
.O
I
CNVo
-o
os
13gcn
■R
p£
OftC
0013
E*,
wate
r of
first
sta
ge
(i.e.
1.5
m /h
) is
not
used
an
d dr
aine
d (se
e Fig
(6
.21)
).
C h a p t e r V I: i n v e s t i g a t i n g t h e f e a s i b i l i t y o f t h e s u s p e n s i o n c r y s t a l u s a t i o n p r o c e s s f o r
TREATING REVERSE OSMOSIS BRINES206
a.2*>w
w• ml'o
W)c• ppuCkcn'dc.2200
c©■MXPP
eS3O
C3
'd£S3P*
S3Ui-C
cAEjg• ppPU
<Uoao3J-l£0
<DOCal-HHh
W<
a3£b
*-H Ow b^ $ o q►b (Z5p <uc*
a£
03U03PU
00
o
O NOcn
o no
o00
in
VOCN
OO
invd
vo
oovd
incn
e'encn
r-
vqCN
O n
VO
r-;cn
cnvd
oo o ino vq
in voom cn
in cn
oo
o00CN
OCN
mm
O N
o nCN
O nCN CN
r-cn
voin
00
CN
inm
cn
^tb-
oV
O n
in
oo ooNO m■b- r- O N ON
inm CN
CN 00
00 CN mCN in r-' inin o
moCN
CN
l> NOOo 00
inoov
00a
ooa 00a*dooa 00a
xOhcnQH
bu
oo +b£ u
oua3uC/Db*d00a
ouX
oo ooa
ocnO£
o-S3Jh.cu
ft,ae•2■C<3a
3£al"-ftC3£•2-Ga£
£0.&-D'C
1o££ft ,■«-*o
£■255£
£■<£<>D
Ih.
££cj
2Oh
£OOD01o£Cj
s<nvo•3
3£2•ft
££
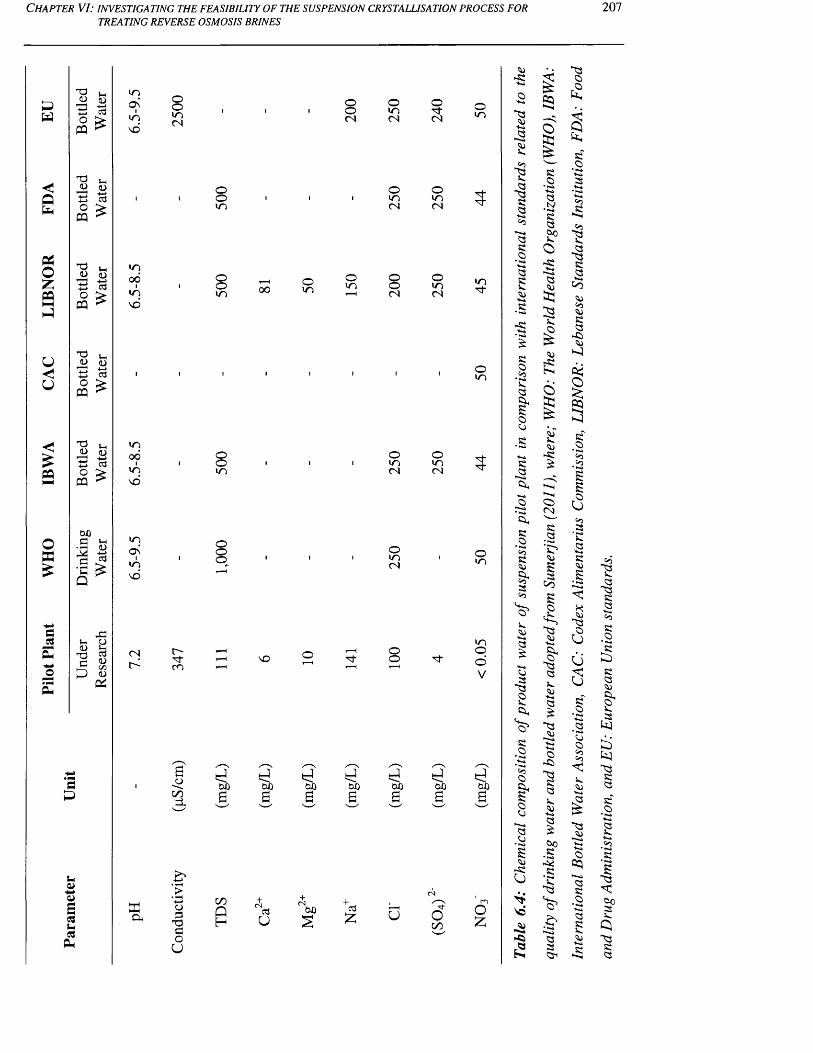
C h a p t e r V I: i n v e s t i g a t i n g t h e f e a s i b i l i t y o f t h e s u s p e n s i o n c r y s t a l l i s a t i o n p r o c e s s f o r
TREATING REVERSE OSMOSIS BRINES207
<GP
GOZG
£G
oa
£
sC3G
£ • PNG
13 fc"5 eS° ^ G ^
13 »-<U (UB B ° £G
13 »H<D <uB td ° £G
<u 53p—H | >cd
° £«
<D S 3 t d
° £G
oo.3 53
cd
£
-GVh O <D H
C ^p s
EP
U0-10i£03S-i03G
mOn
i»nvd
inooiinvd
inooiinvd
mOviinvd
CNl>
ffiG
OOinCN
C-"rd‘cn
ocn
oG
T3EO
u
oo(N
Oom
ooin ooom
om
oin<N
oinCN
ooCN
oom
ooo
oinCN
omCN
VOOO
*d006
ooa oo oos
00s
cnQH
cdU
oo +cdz u
oCN
oinCN
OmCN
oinCN
00a
ocn
om
G-n -
inn -
oin
N"n -
om
moov
doo
Oz
- S i
"33
<3
-isa
"§S3a
S30
• 2331OO
Si•2cnSiOJ£■<Cn3cn
v*
3>3
"33OSV.G
' o 5SiO
c-oOGsoCj
33cj
- S i
o
'vo
a- o
£
S9
IIS3•2t-i35
.NS333
£?o
a
a
Ig
|§e
-s;£
OC iK35
’2?
ss
cn
£"33
§■"33Os>-+-»33£
"33
O-0>"33S3a
•*«»
Oo•S•S
d►•'■idC3s
0
1S3O
cn
a
*§S3acn<x>cn
SC3
P
122P
s f•2cn<>3
Cjcn
• 3£2S3
X"C3
G
3S3"O
cjOcncn
S.<4)
^3
O05
C3S3•2■G3S5
-isa35
"35S335
S3•2
S333
1S
Gcti"35
35
sf•22
"35
OosSV.
Q"35Si33
C h a p t e r V I: i n v e s t i g a t i n g t h e f e a s i b i l i t y o f t h e s u s p e n s i o n c r y s t a l l i s a t i o n p r o c e s s f o r
TREATING REVERSE OSMOSIS BRINES208
ions, while maintaining low concentrations in hardness ions (such as; Ca2+, Mg2+, and
(SO4 )2') and NO3'.
In general, experimental data has proven the suspension pilot plant is potentially capable of
providing a product ready for immediate use, i.e. for human consumption, and
simultaneously able to concentrate the waste stream of RO plant to a considerable degree.
The performance results obtained provided clear evidence that the proposed treatment system
would be ideal for concentrating the RO retentate, and more specifically, the RO retentate
with a TDS value of less than 80,000 ppm.
In order to increase the permeate water recovery ratio, the operating temperature of the
residue can be reduced down to -15°C, as long as the eutectic point is still far away from the
residue temperature. When the operating residue temperature was reduced below -8.2°C in
sub-run b-2, a gradual deterioration in the separation performance of the pilot plant was
observed. The TDS value of the product water increased rapidly up to 1,500 ppm, and then
fluctuations in the TDS value of product water occurred, with a gradual increase until this
value reached 15,000 ppm. At this stage, a number of attempts were made to improve the
quality of product water by optimising the key operating parameters. Unfortunately, all these
attempts failed to improve the product quality. In fact, this phenomenon was previously
detected in run 1, more specifically in sub-run c-1, and similar behaviour was also noticed
during operation, at an operating residue temperature of -8.2°C. This confirms that the
allowable operating temperature of the residue should not be less than -8.2°C. The reason for
this performance deterioration may be explained by one of the following; (i) the optimal
operating conditions were not reached at low operating temperature, and this was due to the
experimental investigation being carried out over a limited number of tests, and key
operating parameters; (ii) the solubility limit of one or some salts in the residual liquid might
have been reached. Table (5.7) shows the solubility limits of major salts available in
seawater. Although precipitation of solid salts was not visually observed from the
experiments, Table (6.2) demonstrates signs of precipitation of salts composed of the
following ions; Ca2+, Mg2+, and Na+, because there are significant percentage losses in their
ionic concentration, which are 41.47, 22.66, and 33.11%, respectively; (iii) precipitation of
solid colour indicator. However, based on the visual observation, there was no clear sign of
salts precipitation composed of colour indicator in the remaining residual liquid, and in the
C h a p t e r V I: i n v e s t i g a t i n g t h e f e a s i b i l i t y o f t h e s u s p e n s i o n c r y s t a l l i s a t i o n p r o c e s s f o r
TREATING REVERSE OSMOSIS BRINES209
pilot plant equipment throughout the experiments; and (iv) precipitation of solid sodium
sulphate (i.e. NaiSO^lOEkO) in the residual liquid. According to [Pounder, 1965], when the
temperature of seawater is reduced below -8.2°C, some of the sodium sulphate might be
precipitated. This means that the seawater will exist in three different phases, solid H2O,
solid sodium sulphate (Na2SO4.10H2O), and remaining residual liquid. This critical
temperature (i.e. -8.2°C) does not represent the eutectic temperature for seawater. However,
at this temperature, some solid salt phase begins to appear in the remaining residual liquid
[Pounder, 1965]. Precipitation of solid salts was not visually observed from the experiments.
However, there is a sign of precipitation of salts composed of (S04)2' and Na+ since the
percentage losses in their ionic concentration are 9.09 and 33.11%, respectively (Table (6.2)).
Table (6.1), specifically sub-run c-1, shows that the pilot plant was able to reduce the TDS
value of the feed from 99,886 ppm down to 15,000 ppm. The experimental results were not
encouraging when the operating temperature of the residue reached -8.2°C or less, where the
pilot plant did not produce a final, near potable quality, product. However, the pilot plant
produced final water of near brackish water quality that can be easily treated by brackish
water RO membranes to reach a final product water of near drinking water quality. This
gives a clear indication that the suspension crystallisation system can be used for desalting
RO retentate, in a rectification stage, and also for concentrating the residue of a previous
stage, at a stripping stage.
This experimental investigation dealt with two different types of residual liquids, namely a
final residue and the operating residue. The water sample of the operating residue was not
considered for chemical analysis in this study, as the remaining ice crystals could not be
separated from the operating residue. However, the operating residue will be considered as
the final residue for commercial applications, because commercial plant will be equipped
with a filtration system, which enables recovery of the remaining ice crystals from the
crystalliser. According to Sulzer, two possible scenarios for recovering the remaining ice
crystal from the crystalliser can be applied. The first scenario is to remove the ice crystals
and operating residue from the crystalliser, and these are separated by a filtration system, and
then the ice crystals can be purified and recovered via a wash column unit. The second
scenario is to remove the operating residue from the crystalliser leaving the ice crystals
behind through a filtration system. This means that the remaining ice crystals will be mixed
C h a p t e r VI: i n v e s t i g a t i n g t h e f e a s i b i l i t y o f t h e s u s p e n s io n c r y s t a l l i s a t i o n p r o c e s s f o rTREATING REVERSE OSMOSIS BRINES
210
with the incoming feed water in the crystalliser before starting the subsequent freezing stage.
The step helps either; (i) to dilute the incoming feed water and simultaneously decrease the
incoming feed temperature (when the incoming feed temperature is higher than its freezing
point), which will result in an increase in the permeate water recovery ratio compared to the
previous stage as the feed concentration will be significantly reduced, or (ii) to maintain the
crystal slurry ratio at 30 wt% ready inside the crystallization loop when the temperature of
the incoming feed reaches its freezing point.
The first scenario might be more feasible for desalting and concentrating RO retentate, and
this is due to the increased total permeate water recovery ratio and simultaneously reduced
waste stream (as far as possible). However, the economic aspects (i.e. capital cost and energy
consumption), and process simplicity and reliability must be taken into consideration to
determine which scenario is the most suitable for desalination applications.
The product water recovery ratios for the pilot plant were theoretically computed at different
temperatures of operating residue. These analytical calculations were performed on different
saline waters, such as ocean seawater, Arabian Gulf seawater, and Reverse Osmosis (RO)
brine. Details of the analytical calculations and results are given Tables A6-5 - A6-10 in
Appendix 6. For simplification, several assumptions were considered in these analytical
calculations, namely; (i) the TDS value of product water was assumed to be 111 ppm as
found in the experimental run 2 (see Table (6.1)); (ii) The mass of feed was assumed to be
86.832 kg, i.e. the same as that in experimental run 2 (see Table (6.1)); (iii) The TDS value of
feed is constant, which is dependant on the type of saline water being treated (i.e. ocean
seawater (35,000 ppm), Arabian Gulf seawater (49,000 ppm), and RO brine (61,000 ppm));
(iv) The TDS values of the residue were obtained from a phase diagram. By rearranging salt
and mass balance formulas, the remaining unknowns, which are the masses of product and
residue, can be theoretically obtained, leading to the permeate water recovery ratio being
determined; (v) The pilot plant can produce a final product water of near drinking water
standards, until the residue temperature reached -15°C; (vi) The operating residue was
assumed to be the final residue (i.e. all ice crystals in the pilot plant were recovered and
purified).
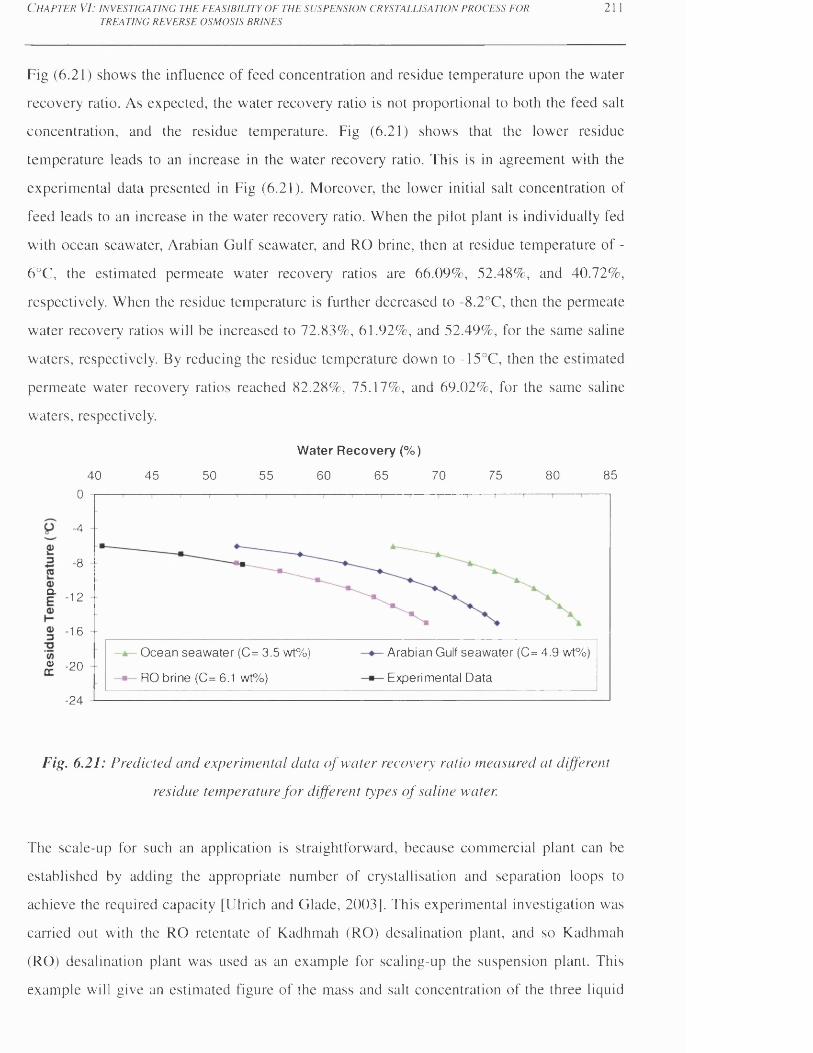
C h a p t e r VI: i n v e s t i g a t i n g t h e f e a s i b i l i t y o f t h e s u s p e n s i o n c r y s t a l l i s a t i o n p r o c e s s f o r 2 11TREATING REVERSE OSMOSIS BRINES
Fig (6.21) shows the influence of feed concentration and residue temperature upon the water
recovery ratio. As expected, the water recovery ratio is not proportional to both the feed salt
concentration, and the residue temperature. Fig (6.21) shows that the lower residue
temperature leads to an increase in the water recovery ratio. This is in agreement with the
experimental data presented in Fig (6.21). Moreover, the lower initial salt concentration of
feed leads to an increase in the water recovery ratio. When the pilot plant is individually fed
with ocean seawater, Arabian Gulf seawater, and RO brine, then at residue temperature of -
6°C, the estimated permeate water recovery ratios are 66.09%, 52.48%, and 40.72%,
respectively. When the residue temperature is further decreased to -8.2°C, then the permeate
water recovery ratios will be increased to 72.83%, 61.92%, and 52.49%, for the same saline
waters, respectively. By reducing the residue temperature down to -15°C, then the estimated
permeate water recovery ratios reached 82.28%, 75.17%, and 69.02%, for the same saline
waters, respectively.
Water Recovery (%)
40 45 50 55 60 65 70 75 80 850
■4
8
Q. 12
16
Arabian Gulf seawater (C= 4 .9 wt%'
Experimental Data
O cean seawater (C= 3.5 wt%)
RO brine (C= 6.1 wt%)£ -20
-24
Fig. 6.21: Predicted and experimental data o f water recovery ratio measured at different
residue temperature fo r different types o f saline water.
The scale-up for such an application is straightforward, because commercial plant can be
established by adding the appropriate number of crystallisation and separation loops to
achieve the required capacity [Ulrich and Glade, 2003]. This experimental investigation was
carried out with the RO retentate of Kadhmah (RO) desalination plant, and so Kadhmah
(RO) desalination plant was used as an example for scaling-up the suspension plant. This
example will give an estimated figure of the mass and salt concentration of the three liquid

C h a p t e r V I: in v e s t ig a t in g t h e f e a s ib il it y o f t h e s u s p e n s io n c r y s t a l l is a t io n p r o c e s s f o r 212TREATING REVERSE OSMOSIS BRINES
streams for large-scale application using continuous mode. These figures were also used for
estimating the water treatment costs. The proposed treatment system was scaled-up
according to the experimental results obtained from run 2, taking into consideration that the
temperature of the operating residue was -8.2°C. Hence, a water recovery ratio of 53% was
obtained from the experimental graph as shown in Fig (6.21). The TDS value of product was
111 ppm (i.e. mass percent of 0.01%) according to run 2 results (seeTable (6.1)), whereas the
volume flow-rate of product was determined by the water recovery ratio. The salt
concentration of the residue was determined from the phase diagram corresponding to -
8.2°C, whereas the volume flow-rate of the residue was determined by mass balance. A novel
treatment option configuration, which represents an integration of RO plant and suspension
crystallisation plant is shown in Fig (6.22). Fig (6.22) also shows that the estimated figures
for the salt concentration of the feed, product, and residue are 6.1%, 0.01%, and 13% by
weight of salt, respectively, whereas estimated figures for the volume flow-rates are 21.9
m3/h, 11.61 m3/h, and 10.29 m3/h, for the same water streams, respectively. According to
Sulzer, this commercial plant can be established without any limitation; however, such an
application might be hindered by the economic aspect, e.g. capital and operational costs.
Table (6.5) shows the estimated annual rates of drinking water production, RO retentate, and
residual liquid of Kadhmah RO plant, suspension commercial plant, and combined
desalination plant. Table (6.5) shows that the estimated annual rate of RO retentate was
significantly reduced from 191.84 to 90.14 ton/year by treating the RO retentate of Kadhmah
RO plant through a large-scale application of the suspension crystallisation process.
Furthermore, the production of drinking water can be substantially increased from 34.17 to
135.87 ton/year by incorporating the commercial scale suspension crystallisation process into
Kadhmah RO plant.
The crystal slurry ratio was recommended to be maintained at 30 wt% before starting to
collect the product water. However, the product water collection depends mainly on the
desired quality. Therefore, simple calculations were performed to determine the theoretical
value of the crystal slurry ratio, and the corresponding residue temperature used for run 2
(i.e. sub-run a-2). These calculations were also used to obtain the temperature of operating
residue corresponding to the crystal slurry ratio of 30 wt%. Details of the analytical
calculations and the results are given in Tables A6-11 - A6-12 in Appendix 6. The theoretical
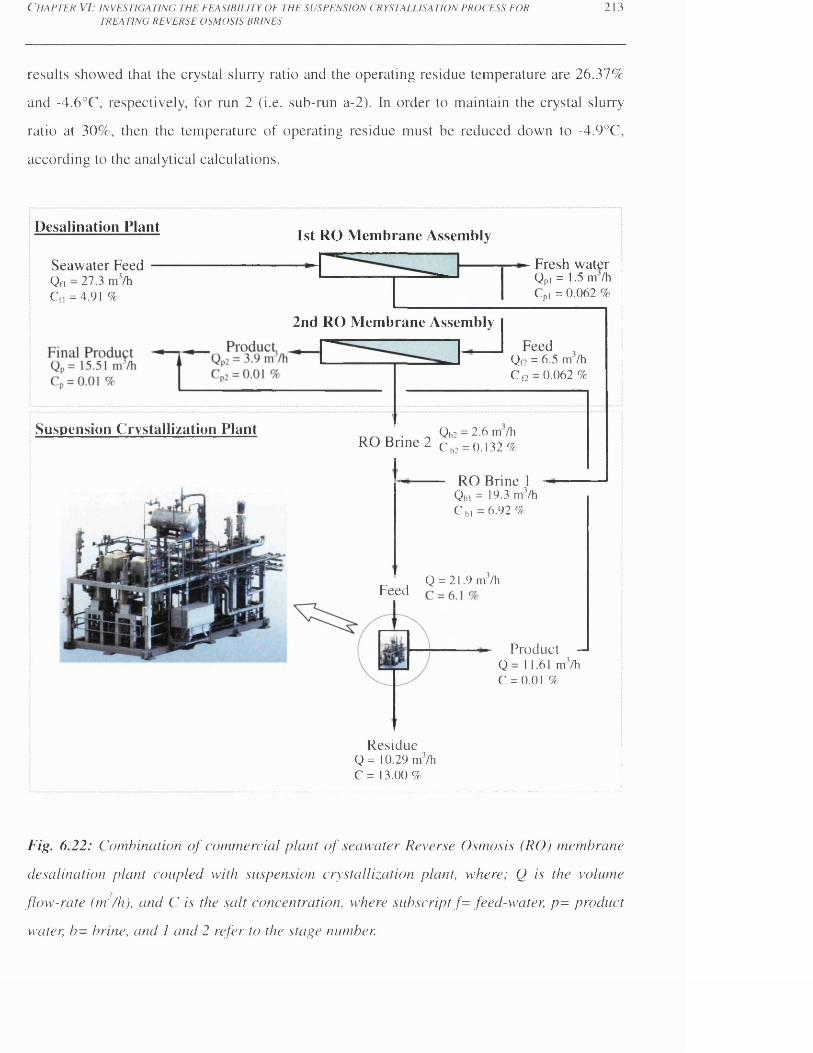
C h a p t e r V I: i n v e s t i g a t i n g t h e f e a s i b i l i t y o f t h e s u s p e n s i o n c r y s t a l l i s a t i o n p r o c e s s f o r
TREATING REVERSE OSMOSIS BRINES2 1 3
results showed that the crystal slurry ratio and the operating residue temperature are 26.37%
and -4.6°C, respectively, for run 2 (i.e. sub-run a-2). In order to maintain the crystal slurry
ratio at 30%, then the temperature of operating residue must be reduced down to -4.9°C,
according to the analytical calculations.
Desalination Plant 1st RO Membrane Assembly
- Fresh water Qpi = 1.5 m /h CD, = 0.062 %
Seawater FeedQ„ = 2 7 .3 m7h CfI =4.91 %
2nd RO Membrane AssemblyFeed
Qo = 6.5 m /h C o = 0.062 %
Qb2 = 2.6 m /h C b2 = 0.132 %RO Brine 2
RO Brine 1Qb, = 19.3 mVh C b, = 6 .9 2 %
Q = 21.9 m /hFeed
Product - Q = 11.61 mVh C = 0.01 %
Residue Q = 10.29 rrrVh C = 13.00%
Fig. 6.22: Combination o f commercial plant o f seawater Reverse Osmosis (RO) membrane
desalination plant coupled with suspension crystallization plant, where; Q is the volume
flow-rate (m'Vh), and C is the salt concentration, where subscript/ = feed-water, p= product
water, b= brine, and I and 2 refer to the stage number.
Suspension Crystallization Plant
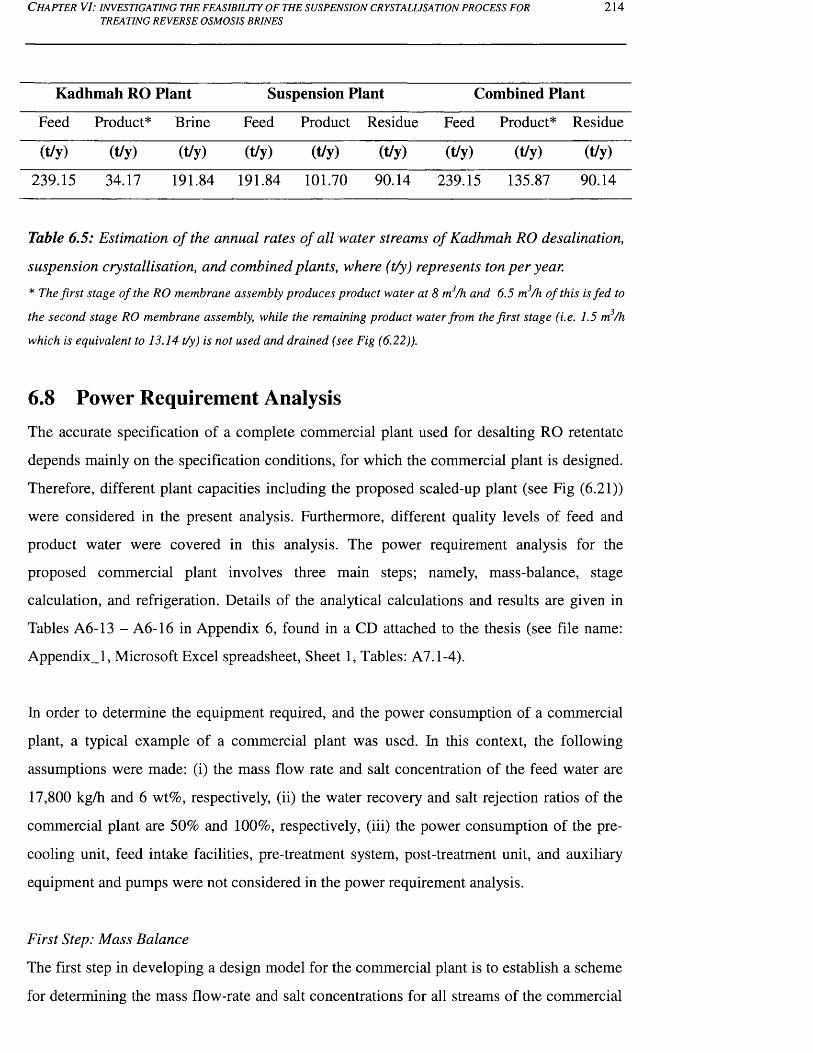
C h a p t e r VI: i n v e s t i g a t i n g t h e f e a s i b i l i t y o f t h e s u s p e n s io n c r y s t a l l i s a t i o n p r o c e s s f o r 214TREATING REVERSE OSMOSIS BRINES
Kadhmah RO Plant Suspension Plant Combined Plant
Feed Product* Brine Feed Product Residue Feed Product* Residue
(t/y) (t/y) (t/y) 1 | | (t/y) (t/y) (t/y)
239.15 34.17 191.84 191.84 101.70 90.14 239.15 135.87 90.14
Table 6.5: Estimation o f the annual rates o f all water streams o f Kadhmah RO desalination,
suspension crystallisation, and combined plants, where (t/y) represents ton per year.
* The f irs t stage o f the RO membrane assembly produces product w ater at 8 m3/h and 6.5 m3/h o f this is fed to
the second stage RO membrane assembly, while the remaining product w ater from the f irs t stage (i.e. 1.5 m3/h
which is equivalent to 13.14 t/y) is not used and drained (see Fig (6.22)).
6.8 Power Requirement AnalysisThe accurate specification of a complete commercial plant used for desalting RO retentate
depends mainly on the specification conditions, for which the commercial plant is designed.
Therefore, different plant capacities including the proposed scaled-up plant (see Fig (6.21))
were considered in the present analysis. Furthermore, different quality levels of feed and
product water were covered in this analysis. The power requirement analysis for the
proposed commercial plant involves three main steps; namely, mass-balance, stage
calculation, and refrigeration. Details of the analytical calculations and results are given in
Tables A6-13 - A6-16 in Appendix 6, found in a CD attached to the thesis (see file name:
Appendix_l, Microsoft Excel spreadsheet, Sheet 1, Tables: A7.1-4).
In order to determine the equipment required, and the power consumption of a commercial
plant, a typical example of a commercial plant was used. In this context, the following
assumptions were made: (i) the mass flow rate and salt concentration of the feed water are
17,800 kg/h and 6 wt%, respectively, (ii) the water recovery and salt rejection ratios of the
commercial plant are 50% and 100%, respectively, (iii) the power consumption of the pre
cooling unit, feed intake facilities, pre-treatment system, post-treatment unit, and auxiliary
equipment and pumps were not considered in the power requirement analysis.
First Step: Mass Balance
The first step in developing a design model for the commercial plant is to establish a scheme
for determining the mass flow-rate and salt concentrations for all streams of the commercial
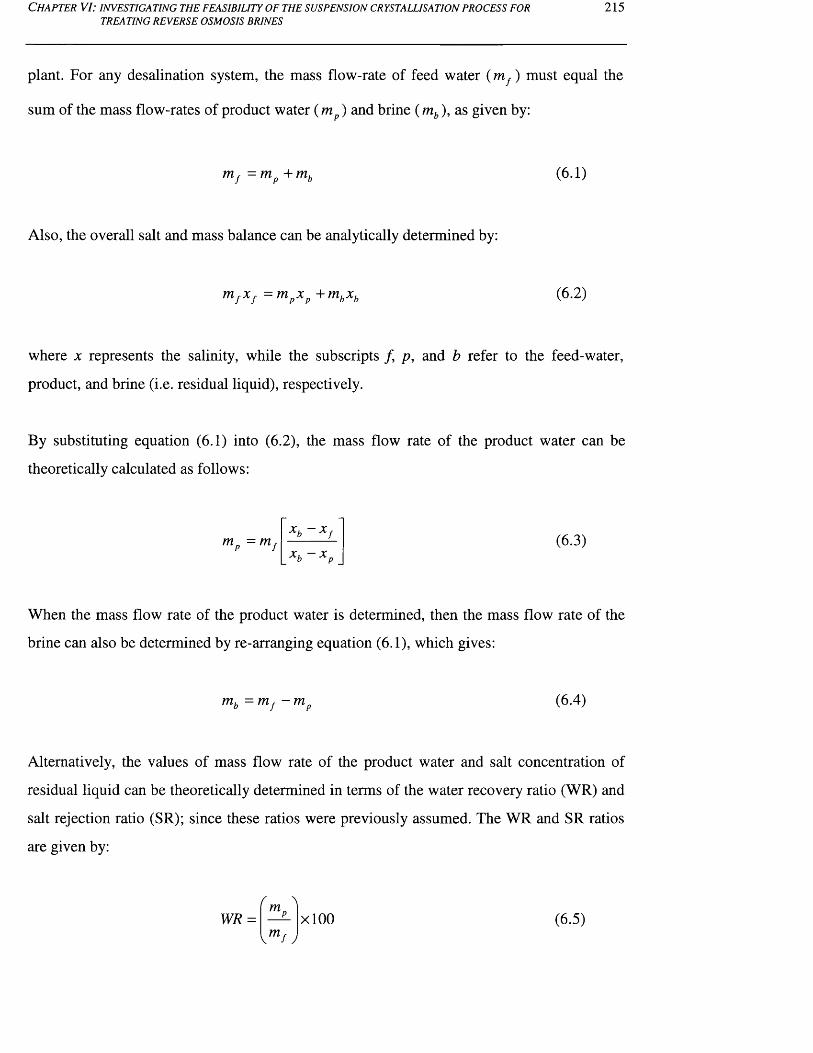
C h a p t e r VI: i n v e s t i g a t i n g t h e f e a s i b i l i t y o f t h e s u s p e n s io n c r y s t a l l i s a t i o n p r o c e s s f o rTREATING REVERSE OSMOSIS BRINES
215
plant. For any desalination system, the mass flow-rate of feed water (mf ) must equal the
sum of the mass flow-rates of product water (mp) and brine ( mb), as given by:
mf = mp + mb (6.1)
Also, the overall salt and mass balance can be analytically determined by:
mf xf = m px p +mbxb (6.2)
where x represents the salinity, while the subscripts /, p, and b refer to the feed-water,
product, and brine (i.e. residual liquid), respectively.
By substituting equation (6.1) into (6.2), the mass flow rate of the product water can be
theoretically calculated as follows:
mp = mfx u - x,x, - x nb p
(6.3)
When the mass flow rate of the product water is determined, then the mass flow rate of the
brine can also be determined by re-arranging equation (6.1), which gives:
mb - mf — mp (6.4)
Alternatively, the values of mass flow rate of the product water and salt concentration of
residual liquid can be theoretically determined in terms of the water recovery ratio (WR) and
salt rejection ratio (SR); since these ratios were previously assumed. The WR and SR ratios
are given by:
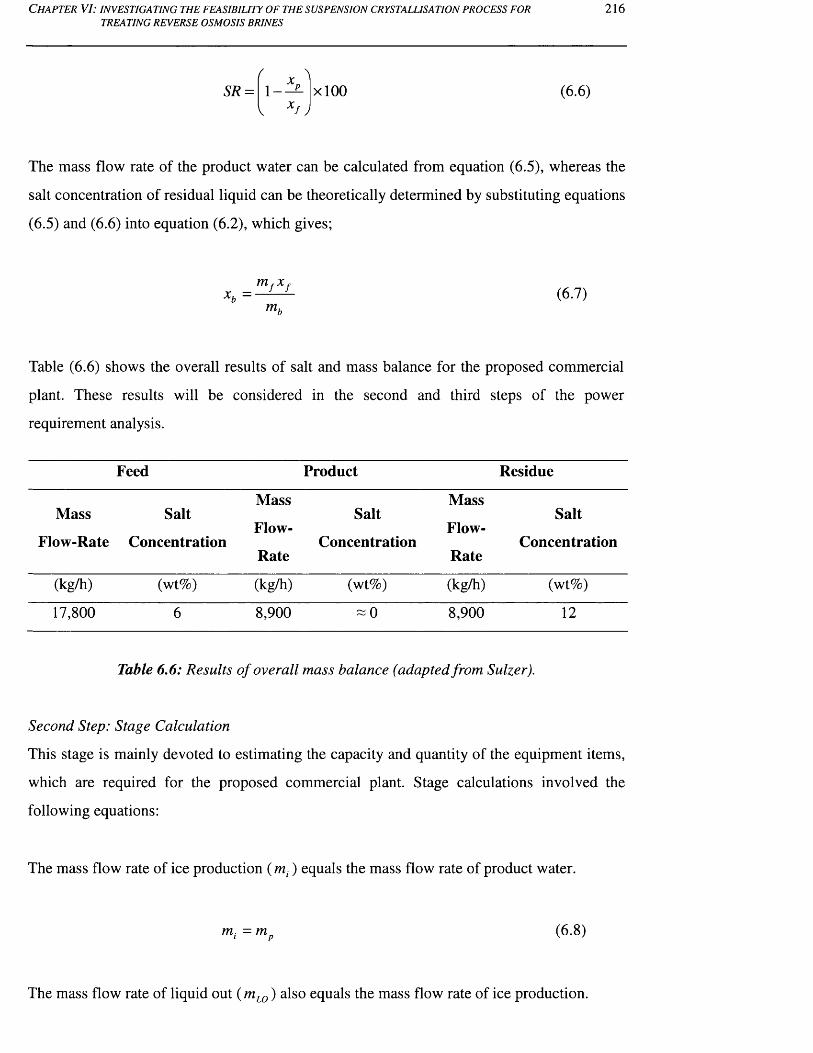
C h a p t e r V I: in v e s t ig a t in g t h e f e a s ib il it y o f t h e s u s p e n s io n c r y s t a l l is a t io n p r o c e s s f o rTREATING REVERSE OSMOSIS BRINES
216
SR = Ci — p-x\
xlOO (6 .6)
The mass flow rate of the product water can be calculated from equation (6.5), whereas the
salt concentration of residual liquid can be theoretically determined by substituting equations
(6.5) and (6.6) into equation (6.2), which gives;
mf xfmu
(6.7)
Table (6.6) shows the overall results of salt and mass balance for the proposed commercial
plant. These results will be considered in the second and third steps of the power
requirement analysis.
Feed Product Residue
Mass
Flow-Rate
Salt
Concentration
Mass
Flow-
Rate
Salt
Concentration
Mass
Flow-
Rate
Salt
Concentration
(kg/h) (wt%) (kg/h) (wt%) (kg/h) (wt%)
17,800 6 8,900 ~ 0 8,900 12
Table 6.6: Results o f overall mass balance (adapted from Sulzer).
Second Step: Stage Calculation
This stage is mainly devoted to estimating the capacity and quantity of the equipment items,
which are required for the proposed commercial plant. Stage calculations involved the
following equations:
The mass flow rate of ice production ( mt ) equals the mass flow rate of product water.
m. =m . (6 .8)
The mass flow rate of liquid out ( mL0) also equals the mass flow rate of ice production.
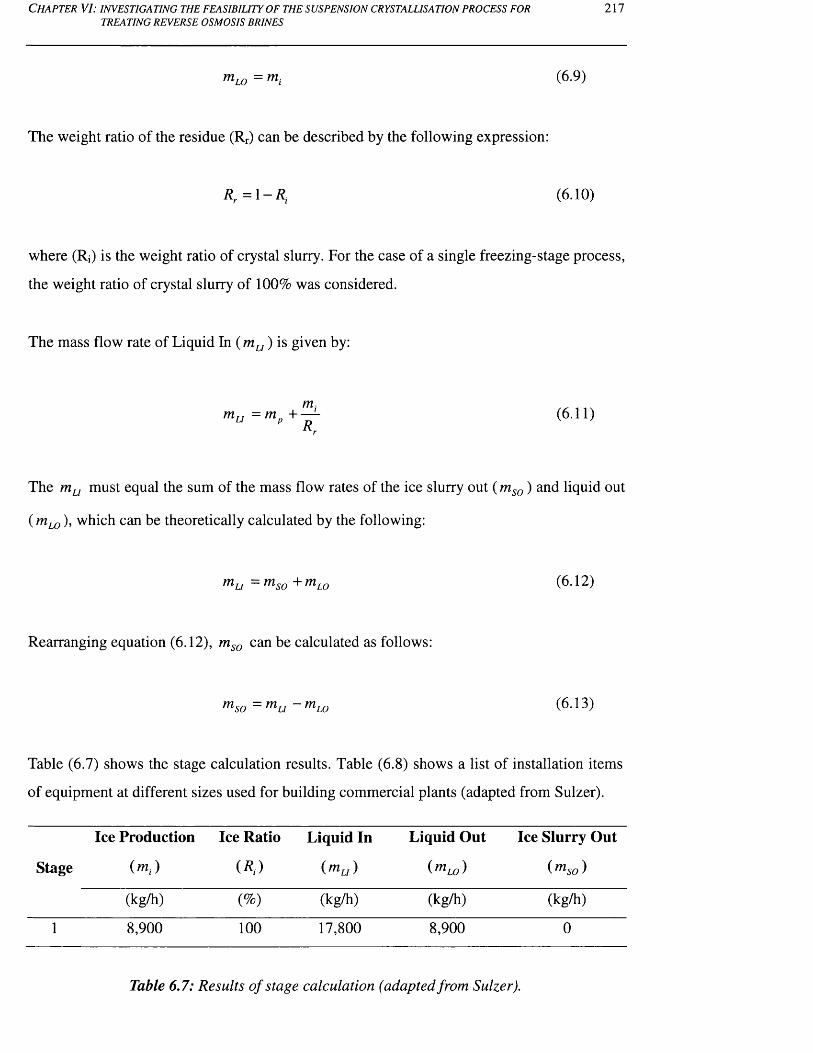
C h a p t e r V I: i n v e s t i g a t i n g t h e f e a s i b i l i t y o f t h e s u s p e n s i o n c r y s t a l l i s a t i o n p r o c e s s f o r
TREATING REVERSE OSMOSIS BRINES217
mLO = 171; (6.9)
The weight ratio of the residue (Rr) can be described by the following expression:
Rr = l - R t (6.10)
where (Rj) is the weight ratio of crystal slurry. For the case of a single freezing-stage process,
the weight ratio of crystal slurry of 100% was considered.
The mass flow rate of Liquid In ( mLI) is given by:
mmu = mP+-z- (6-11)
/V .
The mLI must equal the sum of the mass flow rates of the ice slurry out ( mso) and liquid out
( mL0), which can be theoretically calculated by the following:
m u = m so + m w (6-12)
Rearranging equation (6.12), mso can be calculated as follows:
m SO = m LI ~ m LO ( 6 - 1 3 )
Table (6.7) shows the stage calculation results. Table (6.8) shows a list of installation items
of equipment at different sizes used for building commercial plants (adapted from Sulzer).
Ice Production Ice Ratio Liquid In Liquid Out Ice Slurry Out
Stage ( rni ) w ("*£/) ( m L O ) (mSo)
(kg/h) (%) (kg/h) (kg/h) (kg/h)
1 8,900 100 17,800 8,900 0
Table 6.7: Results o f stage calculation (adapted from Sulzer).
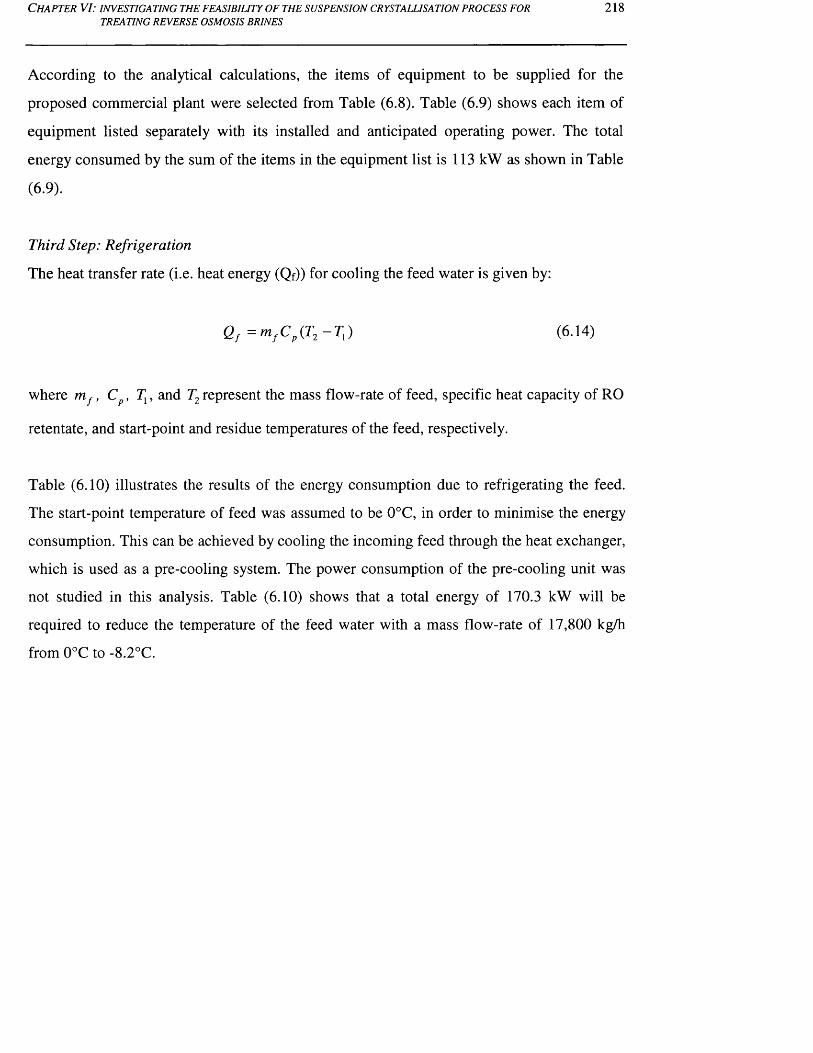
C h a p t e r V I: i n v e s t i g a t i n g t h e f e a s i b i l i t y o f t h e s u s p e n s i o n c r y s t a l l i s a t i o n p r o c e s s f o r
TREATING REVERSE OSMOSIS BRINES218
According to the analytical calculations, the items of equipment to be supplied for the
proposed commercial plant were selected from Table (6.8). Table (6.9) shows each item of
equipment listed separately with its installed and anticipated operating power. The total
energy consumed by the sum of the items in the equipment list is 113 kW as shown in Table
(6.9).
Third Step: Refrigeration
The heat transfer rate (i.e. heat energy (Qf)) for cooling the feed water is given by:
Q, = mf Cp(T2 - 7 j ) (6.14)
where mf , C , 7], and T2 represent the mass flow-rate of feed, specific heat capacity of RO
retentate, and start-point and residue temperatures of the feed, respectively.
Table (6.10) illustrates the results of the energy consumption due to refrigerating the feed.
The start-point temperature of feed was assumed to be 0°C, in order to minimise the energy
consumption. This can be achieved by cooling the incoming feed through the heat exchanger,
which is used as a pre-cooling system. The power consumption of the pre-cooling unit was
not studied in this analysis. Table (6.10) shows that a total energy of 170.3 kW will be
required to reduce the temperature of the feed water with a mass flow-rate of 17,800 kg/h
from 0°C to -8.2°C.
C h a p t e r V I: i n v e s t i g a t i n g t h e f e a s i b i l i t y o f t h e s u s p e n s i o n c r y s t a l l i s a t i o n p r o c e s s f o r
TREATING REVERSE OSMOSIS BRINES219
Ooo inCN
oin
p
'oU
03
<DN• i-H
00
oO
Oinm
in
inin
m
m
in
cdC/3
u
oo
o<NCN
oCN
ovd
oCN
mo
oCN
ino
pDp
a .
<D O <0 • P-i
<3£oOh6J0
_P’■4—>
o 3I-HuP h
oT3P-l-Jo 3
• & 1 ’p
CNCN
oin
in
inin
ocn
in in
in inin in
o ocn
o cncn cn
m
is.<43lyl--> *sCo
£
£C4h^ 3
-i*
<3£
£22R
R<43RO
1)C/3C/3CD>Jp•4-J£O
5
CO
oo
in
qin
ocn
p<
ocn
CNCN
oCNCN
oin
o<0>3l>3<43P
5
" §R<3
i s .
S'S<43
"^3
<3P
P<Daa .Pc r
W
v oo
inr-2
<DC/3C/3<D>
o 3
a ,ap
e upo
• .-H •*-» o 3
3OLh
CD
P h
ap
c ucocd
3oi-H
Hffi
»-HPP hP ho 3Lh0
00pa
J 3'ou 1XI
C/30 3
Cl,aPOhP hOO
hJj—i
13
P>Lh
Qco
Oh
§■P<43
COv o
■ a
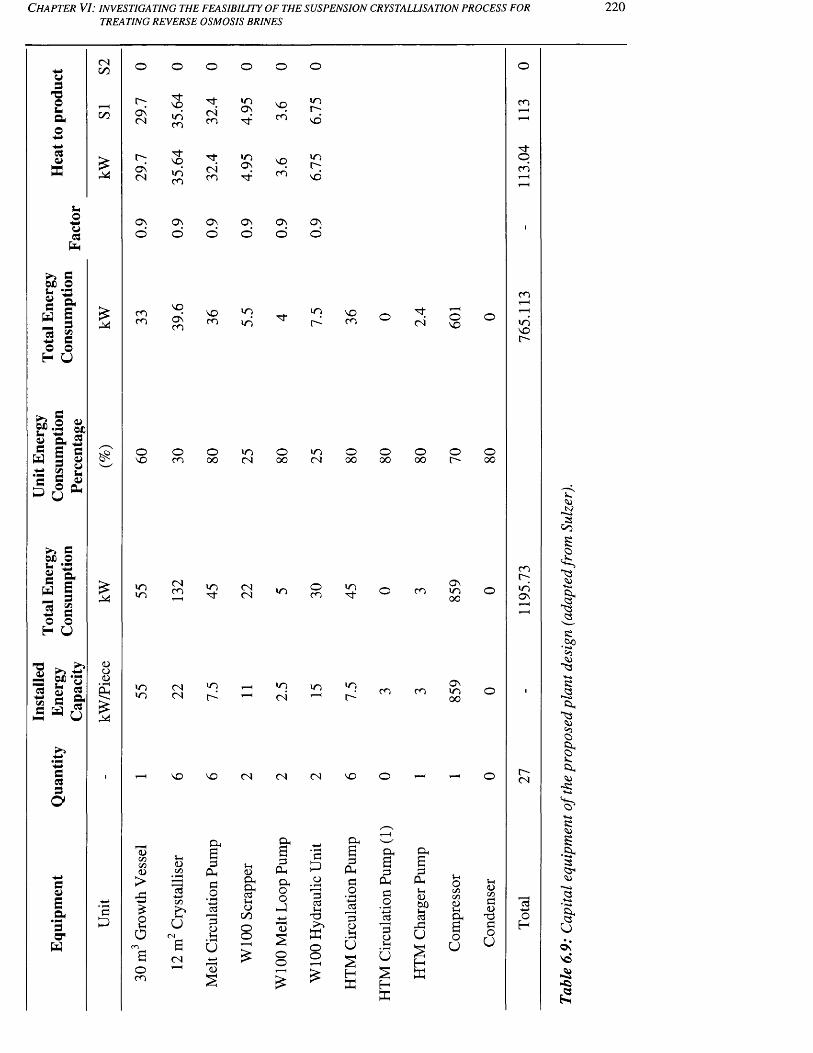
C h a p t e r V I: in v e s t ig a t in g t h e f e a s ib il it y o f t h e s u s p e n s io n c r y s t a l l is a t io n p r o c e s s f o r
TREATING REVERSE OSMOSIS BRINES
CJGT3Ouao
CNC/D
inr-On(N
vOincn
CNcn
mo n VO
cninO;vd
cn
cdaX £
oONCN
VOincn
CNcn
mON NO
cninl>;vd
ocn
uOiicd
ON
oON
oO N
oON
oON
oO N
o
>►> fl OX) o uiigfa13oH
Q<a3C/3Co
U
Icncn
voONcn
NOcn
inin
in NOcn CN
ONO
cn
mNOr-
iiG
fa a/c ^
5 o Sfa (J
ONO
ocn Ooo mCN
oooinCN
ooo O00
o00
or- o00
tn G OX) O U iiGfaOH
a£SGO
u
£ inmCNcn in CN
CN m ocn m cn O nmoo
cn
inON
3 gf wCd 3 Cd^ .5 Q,M B JT£ w <3
ii0 <D
1inin CN
CNini>
inCN
in in cn cnO Nmoo
GCdG
o
NO NO CN CN CN NO r-CN
saB.&*3O'
fa
Gfa
<U<Z>cz><D>£Ol-H
o
ocn
cd■4— iC/3
u
CN
faBG
faGO• i-Hcd3o
l-H• i-Hu■I—I
13
I-H<DfafacdI-Ho
00OO
fa£GfafaOO
fa-4—113
oo
Gfao3cdi-iT3faOO
fa£G
faGO>
cd3o
l-H
u
Hfa
fasGfaGO
• »cd3o5-1 • u
Hfa
fa£Gfa
l-H<uooc3faU
Hfa
a>fa6o
u
S-h<D(Z)G<DGO
u
cd■i—>oH
220
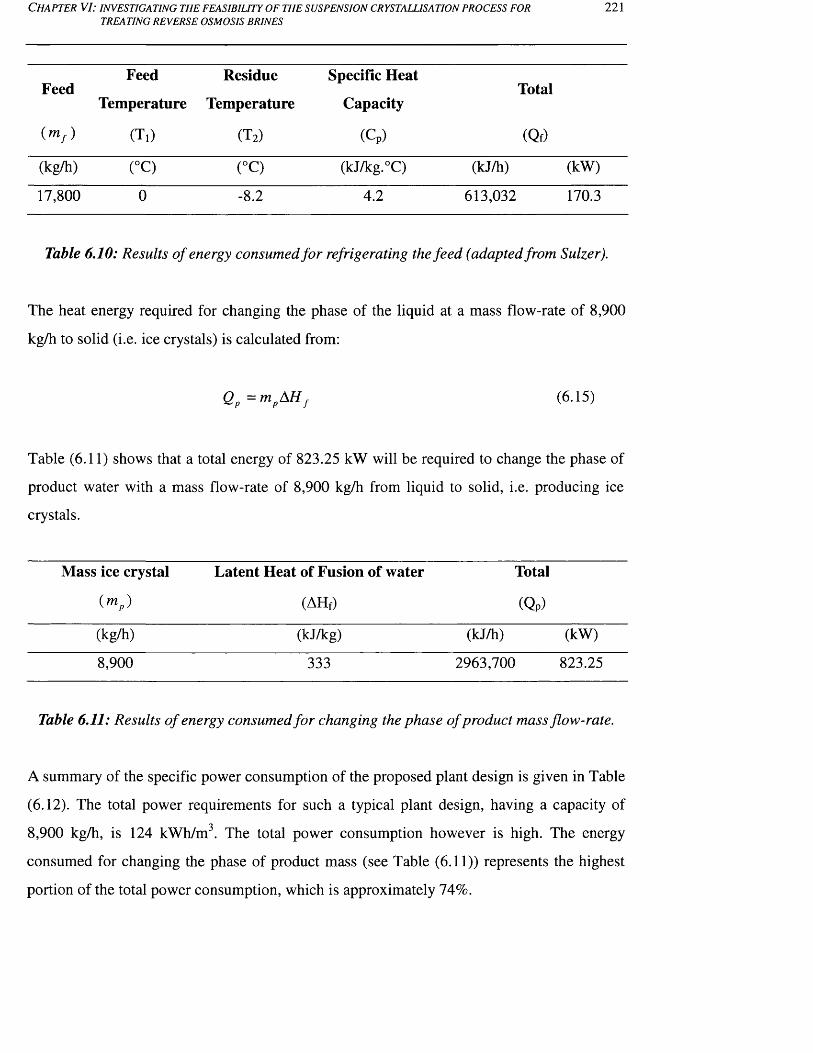
C h a p t e r V I: i n v e s t i g a t i n g t h e f e a s i b i l i t y o f t h e s u s p e n s i o n c r y s t a l l i s a t i o n p r o c e s s f o r
TREATING REVERSE OSMOSIS BRINES221
Feed
( mf )
Feed
Temperature
(Ti)
Residue
Temperature
(T2)
Specific Heat
Capacity
(Cp)
Total
(Qf)
(kg/h) (°C) (°C) (kJ/kg.°C) (kJ/h) (kW)
17,800 0 -8.2 4.2 613,032 170.3
Table 6.10: Results o f energy consumed for refrigerating the feed (adapted from Sulzer).
The heat energy required for changing the phase of the liquid at a mass flow-rate of 8,900
kg/h to solid (i.e. ice crystals) is calculated from:
Qp = mpAH f (6.15)
Table (6.11) shows that a total energy of 823.25 kW will be required to change the phase of
product water with a mass flow-rate of 8,900 kg/h from liquid to solid, i.e. producing ice
crystals.
Mass ice crystal Latent Heat of Fusion of water Total
( mP) (AHf) (QP)
(kg/h) (kJ/kg) (kJ/h) (kW)
8,900 333 2963,700 823.25
Table 6.11: Results o f energy consumed for changing the phase of product mass flow-rate.
A summary of the specific power consumption of the proposed plant design is given in Table
(6.12). The total power requirements for such a typical plant design, having a capacity of
8,900 kg/h, is 124 kWh/m3. The total power consumption however is high. The energy
consumed for changing the phase of product mass (see Table (6.11)) represents the highest
portion of the total power consumption, which is approximately 74%.
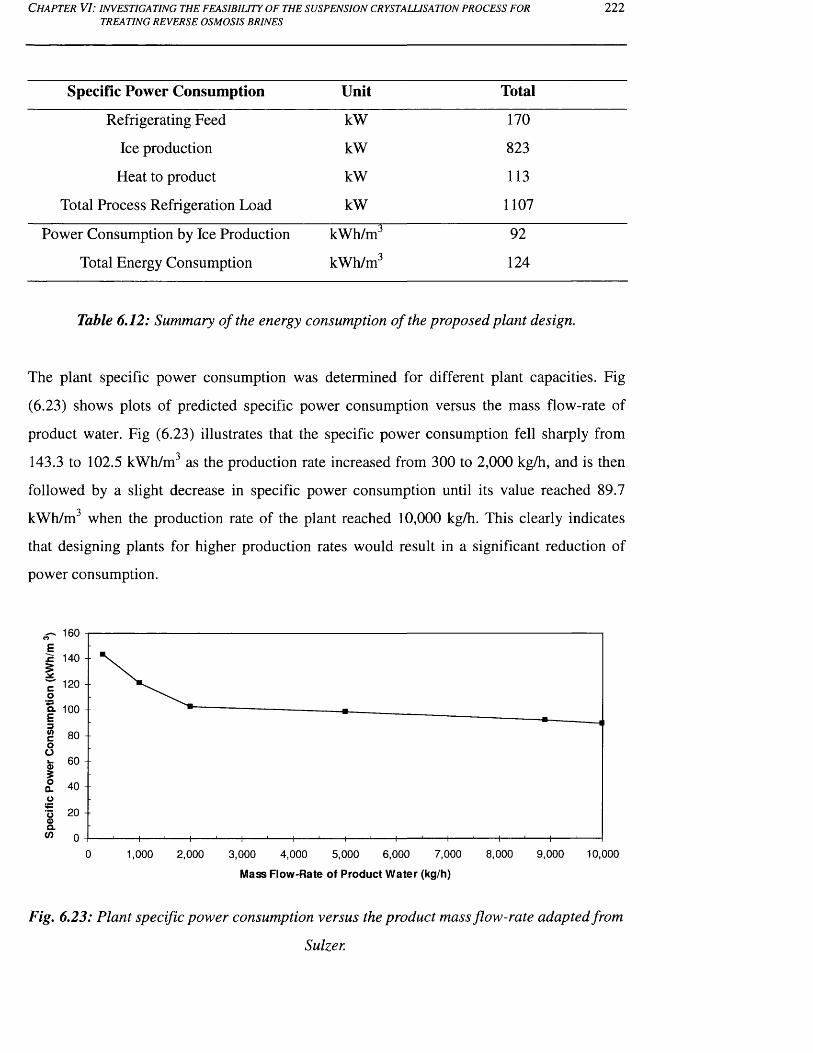
C h a p t e r V I: in v e s t ig a t in g t h e f e a s ib il it y o f t h e s u s p e n s io n c r y s t a l l is a t io n p r o c e s s f o r 2 2 2TREATING REVERSE OSMOSIS BRINES
Specific Power Consumption Unit Total
Refrigerating Feed kW 170
Ice production kW 823
Heat to product kW 113
Total Process Refrigeration Load kW 1107
Power Consumption by Ice Production kWh/m3 92
Total Energy Consumption kWh/m3 124
Table 6.12: Summary of the energy consumption o f the proposed plant design.
The plant specific power consumption was determined for different plant capacities. Fig
(6.23) shows plots of predicted specific power consumption versus the mass flow-rate of
product water. Fig (6.23) illustrates that the specific power consumption fell sharply from
143.3 to 102.5 kWh/m3 as the production rate increased from 300 to 2,000 kg/h, and is then
followed by a slight decrease in specific power consumption until its value reached 89.7
kWh/m3 when the production rate of the plant reached 10,000 kg/h. This clearly indicates
that designing plants for higher production rates would result in a significant reduction of
power consumption.
^ 160
£ 140 --
a. 100
80 -
40 -
20 -
Q.
4 ,0 0 0 5 ,0 0 0 6 ,0 0 0 7 ,0 0 0 8 ,0 0 0 9 ,0 0 0 10,0000 1,000 2,000 3 ,0 0 0
Mass Flow-Rate of Product W ater (kg/h)
Fig. 6.23: Plant specific power consumption versus the product mass flow-rate adapted from
Sulzer.
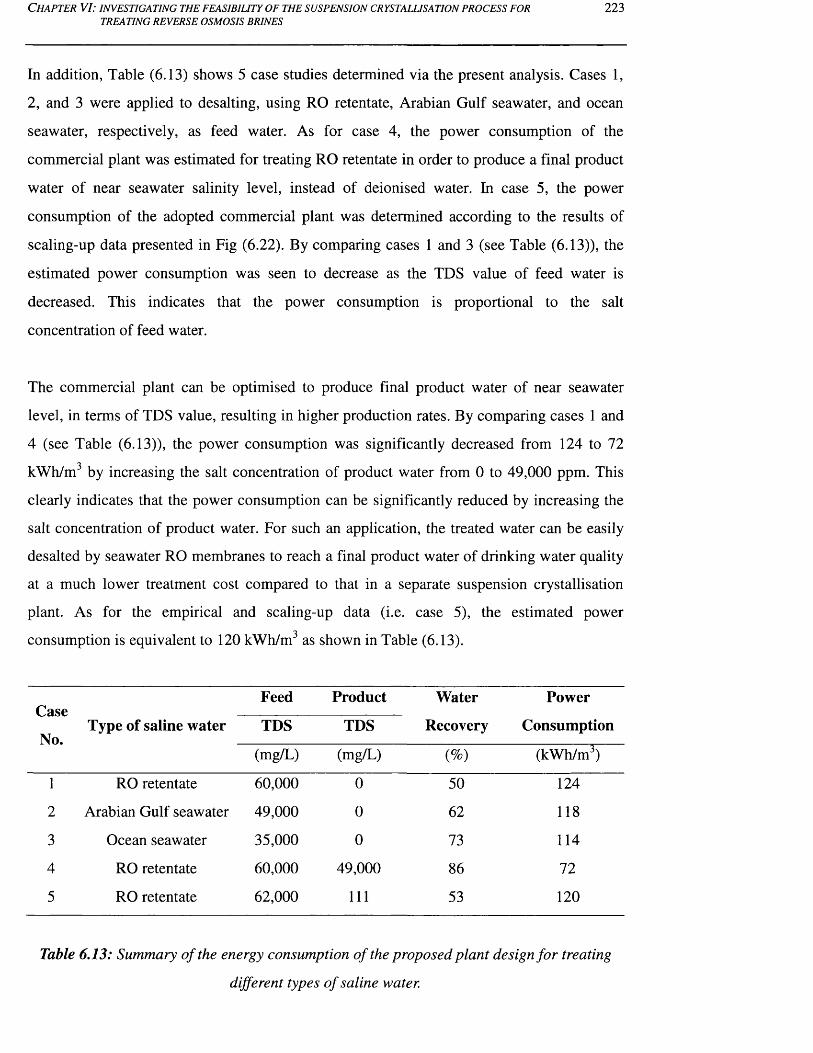
C h a p t e r V I: i n v e s t i g a t i n g t h e f e a s i b i l i t y o f t h e s u s p e n s i o n c r y s t a l u s a t i o n p r o c e s s f o r
TREATING REVERSE OSMOSIS BRINES223
In addition, Table (6.13) shows 5 case studies determined via the present analysis. Cases 1,
2, and 3 were applied to desalting, using RO retentate, Arabian Gulf seawater, and ocean
seawater, respectively, as feed water. As for case 4, the power consumption of the
commercial plant was estimated for treating RO retentate in order to produce a final product
water of near seawater salinity level, instead of deionised water. In case 5, the power
consumption of the adopted commercial plant was determined according to the results of
scaling-up data presented in Fig (6.22). By comparing cases 1 and 3 (see Table (6.13)), the
estimated power consumption was seen to decrease as the TDS value of feed water is
decreased. This indicates that the power consumption is proportional to the salt
concentration of feed water.
The commercial plant can be optimised to produce final product water of near seawater
level, in terms of TDS value, resulting in higher production rates. By comparing cases 1 and
4 (see Table (6.13)), the power consumption was significantly decreased from 124 to 72
kWh/m3 by increasing the salt concentration of product water from 0 to 49,000 ppm. This
clearly indicates that the power consumption can be significantly reduced by increasing the
salt concentration of product water. For such an application, the treated water can be easily
desalted by seawater RO membranes to reach a final product water of drinking water quality
at a much lower treatment cost compared to that in a separate suspension crystallisation
plant. As for the empirical and scaling-up data (i.e. case 5), the estimated power
consumption is equivalent to 120 kWh/m3 as shown in Table (6.13).
Case
No.
Feed Product Water
Recovery
Power
ConsumptionType of saline water TDS TDS
(mg/L) (mg/L) (%) (kWh/m3)
1 RO retentate 60,000 0 50 124
2 Arabian Gulf seawater 49,000 0 62 118
3 Ocean seawater 35,000 0 73 114
4 RO retentate 60,000 49,000 86 72
5 RO retentate 62,000 111 53 120
Table 6.13: Summary o f the energy consumption o f the proposed plant design for treating
different types o f saline water.
C h a p t e r V I: i n v e s t i g a t i n g t h e f e a s i b i l i t y o f t h e s u s p e n s i o n c r y s t a l l i s a t i o n p r o c e s s f o r
TREATING REVERSE OSMOSIS BRINES224
6.9 ConclusionsThis study assessed and validated the viability of using a suspension crystallisation process
as a water desalination system for producing drinking water, while concentrating the RO
retentate. The tests were limited in their number, and were just enough to draw clear and
reasonable conclusions on the separation performance of the proposed desalination system in
such an application. The experiments were performed on a suspension pilot plant operating
in batch mode.
Although the pilot plant was not equipped for desalination applications, the results were
highly encouraging, because it was capable of providing a substantial amount of near potable
product water, and simultaneously concentrating the RO brine. The water analysis results
showed that the product water quality was comparable to international drinking and bottled
water standards. The experimental results showed that the water recovery was around 41%,
while the salt rejection ratio reached over 99%. Therefore, the suspension crystallisation
process might be competitive with other desalination processes in RO brine applications.
Based on the experimental results, the Sulzer suspension crystallisation process was scaled-
up and combined with a commercial plant using RO membrane technology. The production
rate for the combined plant was estimated and compared to the RO plant only. The
theoretical results proved that the combined plant is able to produce a substantial amount of
drinking water much more than in the separate RO plant. This was achieved by concentrating
the waste steam to a considerable extent.
On the other hand, simple economic analysis was carried out to estimate the power
consumption for different applications and also to determine the factors influencing the
energy consumption. In general, production rate, and feed and product water concentrations
are the main influences on the power consumption of the suspension crystallisation process.
The power consumption was estimated and can be varied from 72 to 124 kWh/m3 for RO
brine applications. However, the estimated power consumption is considered to be high
when compared to any conventional desalination technology used for seawater applications.
C h a p t e r V II : i n v e s t i g a t i n g t h e f e a s i b i l i t y o f t h e s t a t i c c r y s t a l l i s a t i o n p r o c e s s f o r
TREATING DIFFERENT CONCENTRATIONS OF REVERSE OSMOSIS BRINES225
C h a p t e r VII:
INVESTIGATING THE FEASIBILITY OF THE
STATIC CRYSTALLISATION PROCESS FOR
TREATING DIFFERENT CONCENTRATIONS
OF REVERSE OSMOSIS BRINES
7.1 IntroductionIn the previous Chapters (i.e. 5 and 6), falling film and suspension crystallisation processes
were used and examined individually for concentrating/desalting RO brine. According to the
experimental results, the suspension crystallisation process was capable of producing high
purity product water, reaching drinking water quality standards, at a reasonable product water
recovery ratio. On the other hand, the falling film crystallisation process was capable of
producing a substantial amount of product water at reasonable quality, reaching Arabian Gulf
seawater standards, i.e. feed water of the RO seawater membrane plant. Although the volume
of RO brine was significantly reduced and concentrated through the mentioned technologies,
the salt concentration of the residual liquids, which were left behind, reached such a high
level that these streams cannot be treated further, either by falling film or suspension
crystallisation technologies. These waste streams must then be treated in an environmentally
friendly way, or they will have severe negative impact on the surrounding environment.
According to the phase diagram of RO brine—given previously in Fig (5.12) (a), the solid
layer crystallisation technologies, and more specifically the static crystallisation process, is
potentially capable of further concentrating the residue. This is because there is a reasonable
temperature difference between the freezing points of the residues, which were discharged
from the suspension and falling film crystallisation technologies, and the eutectic
temperature of NaCl salt—by far the most dominant dissolved salt compared to other
dissolved salts. Therefore, this chapter deals with an experimental investigation into the
performance of a static crystallisation process used to treat such waste streams.
C h a p t e r VII: i n v e s t i g a t i n g t h e f e a s i b i l i t y o f t h e s t a t i c c r y s t a l l i s a t i o n p r o c e s s f o rTREATING DIFFERENT CONCENTRATIONS OF REVERSE OSMOSIS BRINES
2 2 6
A Sulzer static crystalliser was used, with different salt concentrations of RO brines, to
assess and validate the technical feasibility of the adopted treatment system. According to
Sulzer’s experts, this technology has not previously been examined or applied to treating
concentrated solutions of RO brine. Thus, there was a lack of experimental data on the
performance of this technology in such applications. This investigation represents the first
laboratory examination to successfully gather valuable, quantitative information concerning
the separation performance of the proposed technology in such applications. This
investigation also provided useful and important information on combining two different
commercial plants, including the integration of falling film-static crystallisation plants, and
integration of suspension-static crystallisation plants. These integrated plants can be used
individually as a pre-concentrator system for future commercial applications in RO seawater
or brackish-water desalination plants.
The main objective of this study is to determine the viability and assess the technical
feasibility of using static crystallisation and sweating processes to produce final product
water (either close to the quality of seawater or RO retentate) by concentrating the residues
discharged from prior processes, such as the falling film and the suspension crystallisation
processes. The specific aims related to this chapter are:
i) To prepare, operate, and test the static crystalliser, with/without use of the
sweating process, at different operating conditions while collecting
performance data. Along with concentrated solutions of RO brine, Arabian
Gulf seawater, and NaCl solutions were individually used and tested as feed
water in this study.
ii) To verify the influence of several key parameters, namely feed salt
concentration, crystallisation time and temperature, sweating time and
temperature, cooling rate, and growth rate, on the performance of the static
crystallization and sweating processes, in terms of salt rejection and water
recovery.
iii) To validate and evaluate the process’ technical merits for future application
on a large commercial scale.
iv) To shed light on the effectiveness of the static crystallisation process,
combined with a sweating process, in the rejection of the major components
C h a p t e r VII: i n v e s t i g a t i n g t h e f e a s i b i l i t y o f t h e s t a t i c c r y s t a l l i s a t i o n p r o c e s s f o rTREATING DIFFERENT CONCENTRATIONS OF REVERSE OSMOSIS BRINES
227
of ionic concentration, such as Ca2+, Mg2+, (SO4)2', (HCO3)', Cl', Na+, etc. in
samples from feed, product, and residue water.
7.1.1 Description of the Static Crystallisation Process
and Basic OperationThe static crystallisation process is one of the melt crystallisation technologies that was
previously introduced in Chapter 5. According to Ulrich and Glade (2003), the important
advantages of solid layer crystallisation technologies are (i) incrustation problems are
avoided, as these incrustations represent the solid layer, which will eventually be separated,
melted, and recovered as final product water; (ii) easily controllable crystal growth rates, due
to the driving force being dependant on the temperature difference at the refrigerated surface
area of the plate; (iii) a simplified separation process due to absence of an ice slurry. Thus,
complicated ice separation and washing equipment, usually used in conventional desalination
through freezing processes and melt suspension crystallisation technologies, is avoided.
Furthermore, no moving parts are involved in the process equipment (apart from circulation
pump); (iv) the operation of the post-crystallisation treatments, such as washing and
sweating, are simple; and (v) multistage process design can easily be applied. On the other
hand, the limitations of these technologies are summarised in four main points. According to
Ulrich and Glade (2003), (a) the surface area of the refrigerated plate is limited; (b) the
crystal layer adhered on the heat transfer surface requires an increase in temperature driving
force to maintain the constant growth rate; otherwise a reduction in production rate will
occur with increasing thickness; (c) the crystallisation and post-crystallisation operations are
limited in batch operating mode. This is because the desired crystal layer has to be
completely melted and separated from the crystalliser, before starting the subsequent
crystallisation operations. This method requires additional energy for the melting process and
partial heating up of the whole apparatus, (d) In the case of a multistage process, the
operational cost is dramatically increased due to the repetition of the crystallisation process,
while the production rate of the overall multistage process is decreased. The last two points
may be avoided at some point, when the solid layer crystallisation technology is operated in
continuous mode.
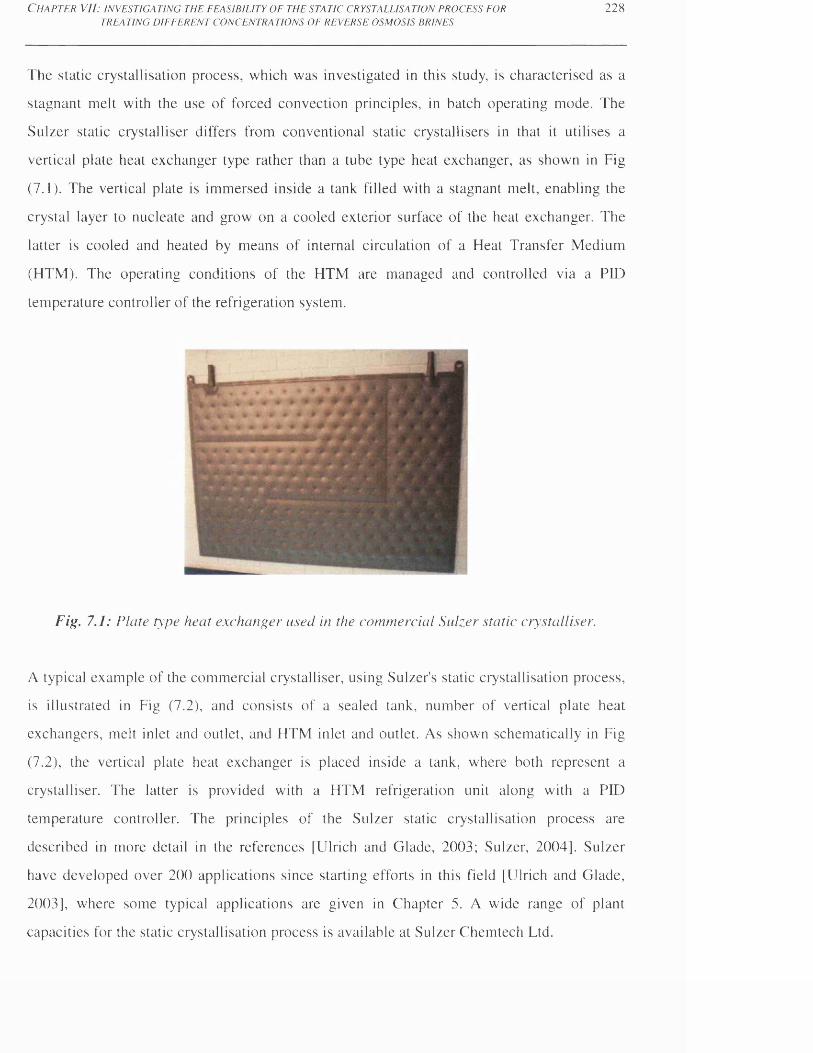
C h a p t e r V I I : i n v e s t i g a t i n g t h e f e a s i b i l i t y o f t h e s t a t i c c r y s t a l l i s a t i o n p r o c e s s f o r
TR E A TIN G D IF F E R E N T C O N C E N T R A T IO N S O F R E V E R SE O SM O SIS B R IN E S2 2 8
The static crystallisation process, which was investigated in this study, is characterised as a
stagnant melt with the use of forced convection principles, in batch operating mode. The
Sulzer static crystalliser differs from conventional static crystallisers in that it utilises a
vertical plate heat exchanger type rather than a tube type heat exchanger, as shown in Fig
(7.1). The vertical plate is immersed inside a tank filled with a stagnant melt, enabling the
crystal layer to nucleate and grow on a cooled exterior surface of the heat exchanger. The
latter is cooled and heated by means of internal circulation of a Heat Transfer Medium
(HTM). The operating conditions of the HTM are managed and controlled via a PID
temperature controller of the refrigeration system.
Fig. 7.1 : Plate type heat exchanger used, in the commercial Sulzer static crystalliser.
A typical example of the commercial crystalliser, using Sulzer's static crystallisation process,
is illustrated in Fig (7.2), and consists of a sealed tank, number of vertical plate heat
exchangers, melt inlet and outlet, and HTM inlet and outlet. As shown schematically in Fig
(7.2), the vertical plate heat exchanger is placed inside a tank, where both represent a
crystalliser. The latter is provided with a HTM refrigeration unit along with a PID
temperature controller. The principles of the Sulzer static crystallisation process are
described in more detail in the references [Ulrich and Glade, 2003; Sulzer, 2004]. Sulzer
have developed over 200 applications since starting efforts in this field [Ulrich and Glade,
2003], where some typical applications are given in Chapter 5. A wide range of plant
capacities for the static crystallisation process is available at Sulzer Chemtech Ltd.
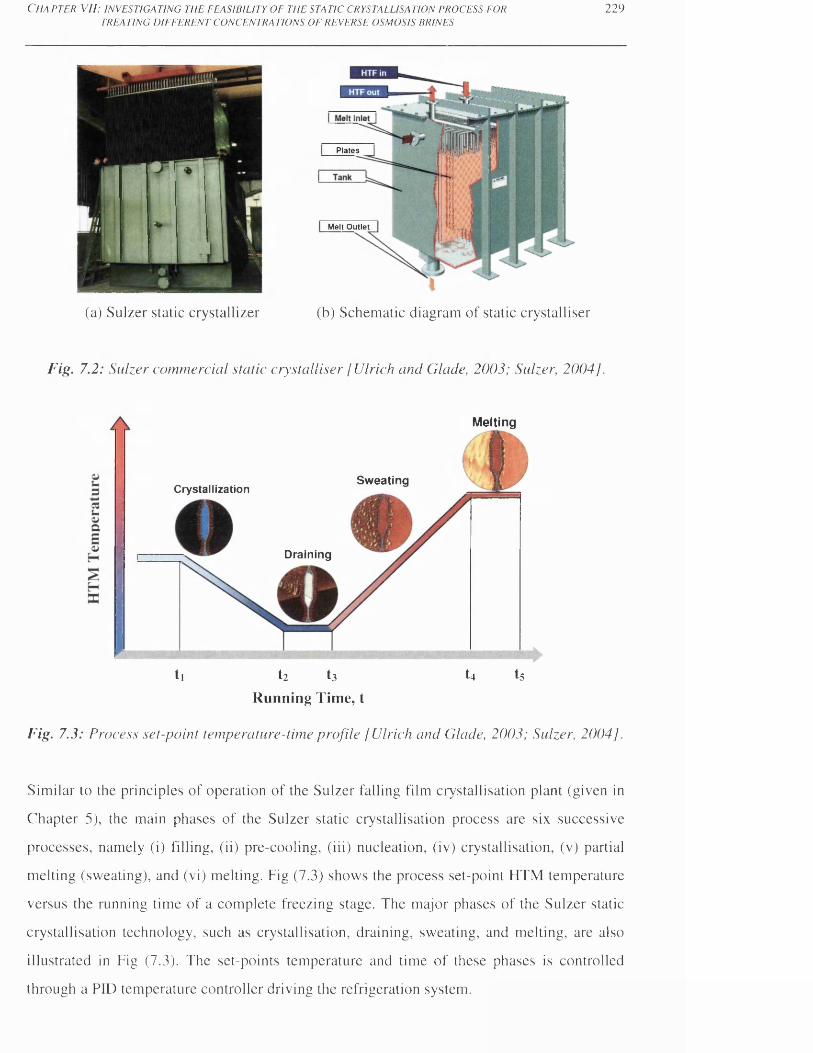
C H A P T E R V I I : IN V E ST IG A T IN G TH E F E A SIB IL IT Y O F TH E STA TIC C R YST A LL ISA T IO N P R O C E SS FO RTR E A TIN G D IF F E R E N T C O N C E N T R A T IO N S O F R E V E R SE O SM O SIS B R IN ES
2 2 9
P la te s
M elt O u tle t
(a) Sulzer static crystallizer (b) Schematic diagram of static crystalliser
Fig. 7.2 : Sulzer commercial static crystalliser [Ulrich and Glade, 2003; Sulzer, 2004].
Melting
S w eatingCrystallization
Draining
tl t2 t3 t4 tsRunning Time, t
Fig. 7.3: Process set-point temperature-time profile [Ulrich and Glade, 2003; Sulzer, 2004].
Similar to the principles of operation of the Sulzer falling film crystallisation plant (given in
Chapter 5), the main phases of the Sulzer static crystallisation process are six successive
processes, namely (i) filling, (ii) pre-cooling, (iii) nucleation, (iv) crystallisation, (v) partial
melting (sweating), and (vi) melting. Fig (7.3) shows the process set-point HTM temperature
versus the running time of a complete freezing stage. The major phases of the Sulzer static
crystallisation technology, such as crystallisation, draining, sweating, and melting, are also
illustrated in Fig (7.3). The set-points temperature and time of these phases is controlled
through a PID temperature controller driving the refrigeration system.
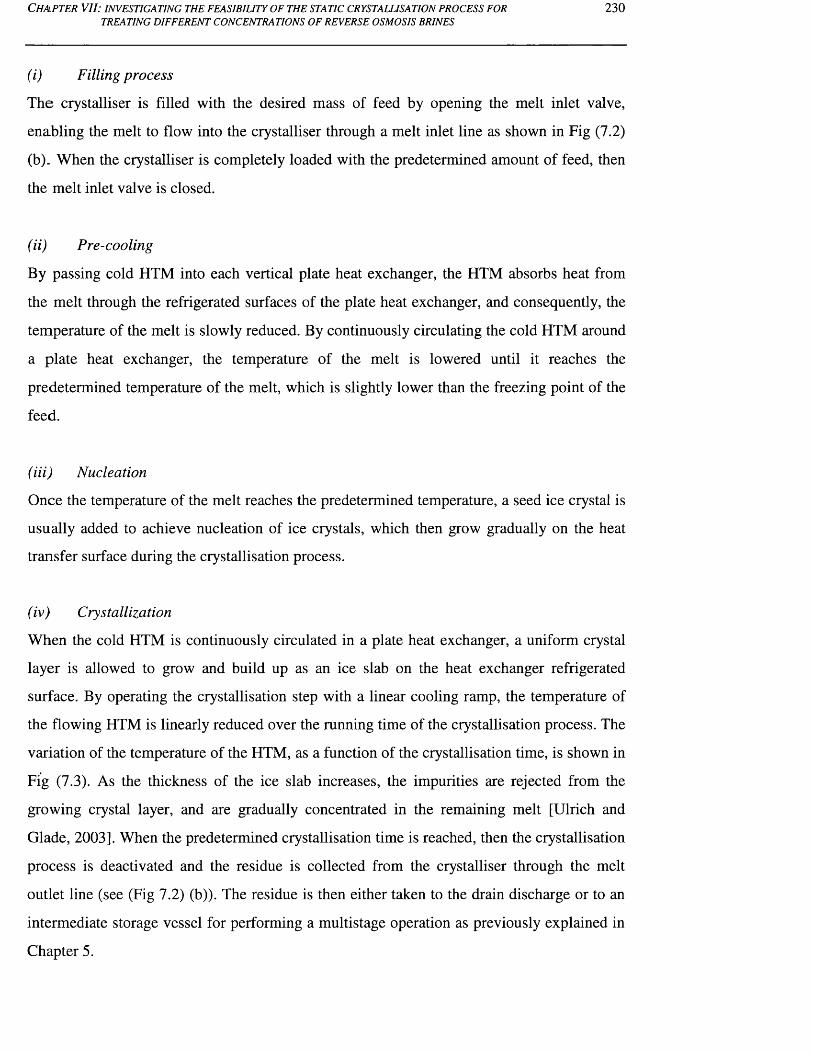
C h a p t e r VII: i n v e s t i g a t i n g t h e f e a s i b i l i t y o f t h e s t a t i c c r y s t a l l i s a t i o n p r o c e s s f o rTREATING DIFFERENT CONCENTRATIONS OF REVERSE OSMOSIS BRINES
230
(i) Filling process
The crystalliser is filled with the desired mass of feed by opening the melt inlet valve,
enabling the melt to flow into the crystalliser through a melt inlet line as shown in Fig (7.2)
(b). When the crystalliser is completely loaded with the predetermined amount of feed, then
the melt inlet valve is closed.
(ii) Pre-cooling
By passing cold HTM into each vertical plate heat exchanger, the HTM absorbs heat from
the melt through the refrigerated surfaces of the plate heat exchanger, and consequently, the
temperature of the melt is slowly reduced. By continuously circulating the cold HTM around
a plate heat exchanger, the temperature of the melt is lowered until it reaches the
predetermined temperature of the melt, which is slightly lower than the freezing point of the
feed.
(iii) Nucleation
Once the temperature of the melt reaches the predetermined temperature, a seed ice crystal is
usually added to achieve nucleation of ice crystals, which then grow gradually on the heat
transfer surface during the crystallisation process.
(iv) Crystallization
When the cold HTM is continuously circulated in a plate heat exchanger, a uniform crystal
layer is allowed to grow and build up as an ice slab on the heat exchanger refrigerated
surface. By operating the crystallisation step with a linear cooling ramp, the temperature of
the flowing HTM is linearly reduced over the running time of the crystallisation process. The
variation of the temperature of the HTM, as a function of the crystallisation time, is shown in
Fig (7.3). As the thickness of the ice slab increases, the impurities are rejected from the
growing crystal layer, and are gradually concentrated in the remaining melt [Ulrich and
Glade, 2003]. When the predetermined crystallisation time is reached, then the crystallisation
process is deactivated and the residue is collected from the crystalliser through the melt
outlet line (see (Fig 7.2) (b)). The residue is then either taken to the drain discharge or to an
intermediate storage vessel for performing a multistage operation as previously explained in
Chapter 5.
C h a p t e r V II: i n v e s t i g a t i n g t h e f e a s i b i l i t y o f t h e s t a t i c c r y s t a l l i s a t i o n p r o c e s s f o r
TREATING DIFFERENT CONCENTRATIONS OF REVERSE OSMOSIS BRINES231
fvj Partial melting (Sweating)
This process is similar to that in the Sulzer falling film crystallisation plant, which was
previously described in Chapter 5. Fig (7.3) shows the temperature profile for the partial
melting process.
(vi) Melting
This process is also identical to that of the Sulzer falling film crystallisation plant, which was
explained previously in Chapter 5. Fig (7.3) shows the behaviour of the temperature profile
during the melting process.
7.1.2 Multi-Stage Design and Basic OperationSimilar to the principles of operation of the Sulzer falling film crystallisation plant, the
multistage design and basic operation is usually carried out as described in Chapter 5.
7.2 Preparation of Feed SamplesThe residues discharged from the falling film and suspension crystallisation processes (see
Chapters 5 and 6) were individually collected, and tested as feed water in this laboratory
investigation. Alongside these residues, aqueous solutions of sodium chloride and process
brines were also used and tested individually as feed samples in this experimental study. The
initial salt concentration of the feed stream, using synthetic water, was 3.5 wt%. The sodium
chloride salts (CH-4133 Pratteln 1, Nr.: 8431, BAGT 64656, Schweizer rheinsalinen) and
high purity water, produced via an ultra-pure water purification system (Destillo, Einweg-
Patrone D2), were used for preparing the aqueous solutions of sodium chloride. The
preparation of NaCl solutions was performed as described in Chapter 4. As for the process
brines, Reverse Osmosis (RO) brine and Arabian Gulf seawater, were also used and
examined individually as feed samples in this study. The preparation of process brines was
carried out as described in Chapter 5.
7.3 Physicochemical Analysis and Measuring
InstrumentsThe physicochemical analysis of the water samples and the measuring instruments are
described in Chapter 5.
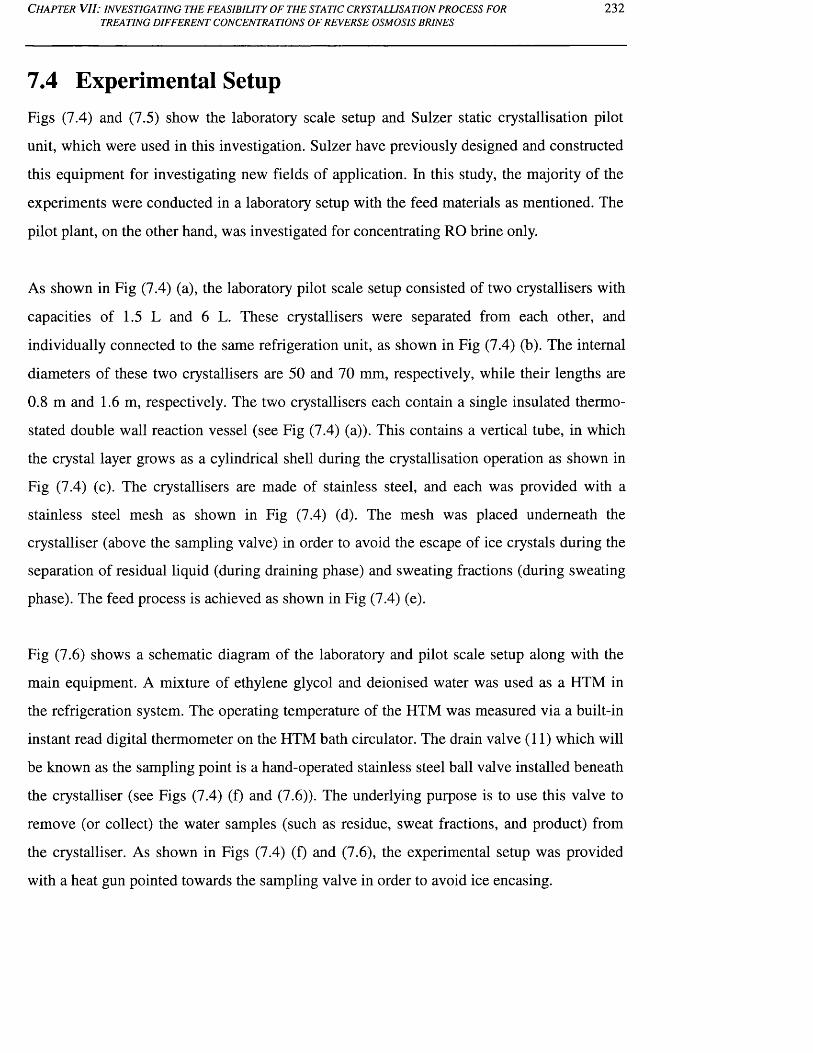
C h a p t e r V I I : i n v e s t i g a t i n g t h e f e a s i b i l i t y o f t h e s t a t i c c r y s t a l l i s a t i o n p r o c e s s f o r
TREATING DIFFERENT CONCENTRATIONS OF REVERSE OSMOSIS BRINES232
7.4 Experimental SetupFigs (7.4) and (7.5) show the laboratory scale setup and Sulzer static crystallisation pilot
unit, which were used in this investigation. Sulzer have previously designed and constructed
this equipment for investigating new fields of application. In this study, the majority of the
experiments were conducted in a laboratory setup with the feed materials as mentioned. The
pilot plant, on the other hand, was investigated for concentrating RO brine only.
As shown in Fig (7.4) (a), the laboratory pilot scale setup consisted of two crystallisers with
capacities of 1.5 L and 6 L. These crystallisers were separated from each other, and
individually connected to the same refrigeration unit, as shown in Fig (7.4) (b). The internal
diameters of these two crystallisers are 50 and 70 mm, respectively, while their lengths are
0.8 m and 1.6 m, respectively. The two crystallisers each contain a single insulated thermo
stated double wall reaction vessel (see Fig (7.4) (a)). This contains a vertical tube, in which
the crystal layer grows as a cylindrical shell during the crystallisation operation as shown in
Fig (7.4) (c). The crystallisers are made of stainless steel, and each was provided with a
stainless steel mesh as shown in Fig (7.4) (d). The mesh was placed underneath the
crystalliser (above the sampling valve) in order to avoid the escape of ice crystals during the
separation of residual liquid (during draining phase) and sweating fractions (during sweating
phase). The feed process is achieved as shown in Fig (7.4) (e).
Fig (7.6) shows a schematic diagram of the laboratory and pilot scale setup along with the
main equipment. A mixture of ethylene glycol and deionised water was used as a HTM in
the refrigeration system. The operating temperature of the HTM was measured via a built-in
instant read digital thermometer on the HTM bath circulator. The drain valve (11) which will
be known as the sampling point is a hand-operated stainless steel ball valve installed beneath
the crystalliser (see Figs (7.4) (f) and (7.6)). The underlying purpose is to use this valve to
remove (or collect) the water samples (such as residue, sweat fractions, and product) from
the crystalliser. As shown in Figs (7.4) (f) and (7.6), the experimental setup was provided
with a heat gun pointed towards the sampling valve in order to avoid ice encasing.
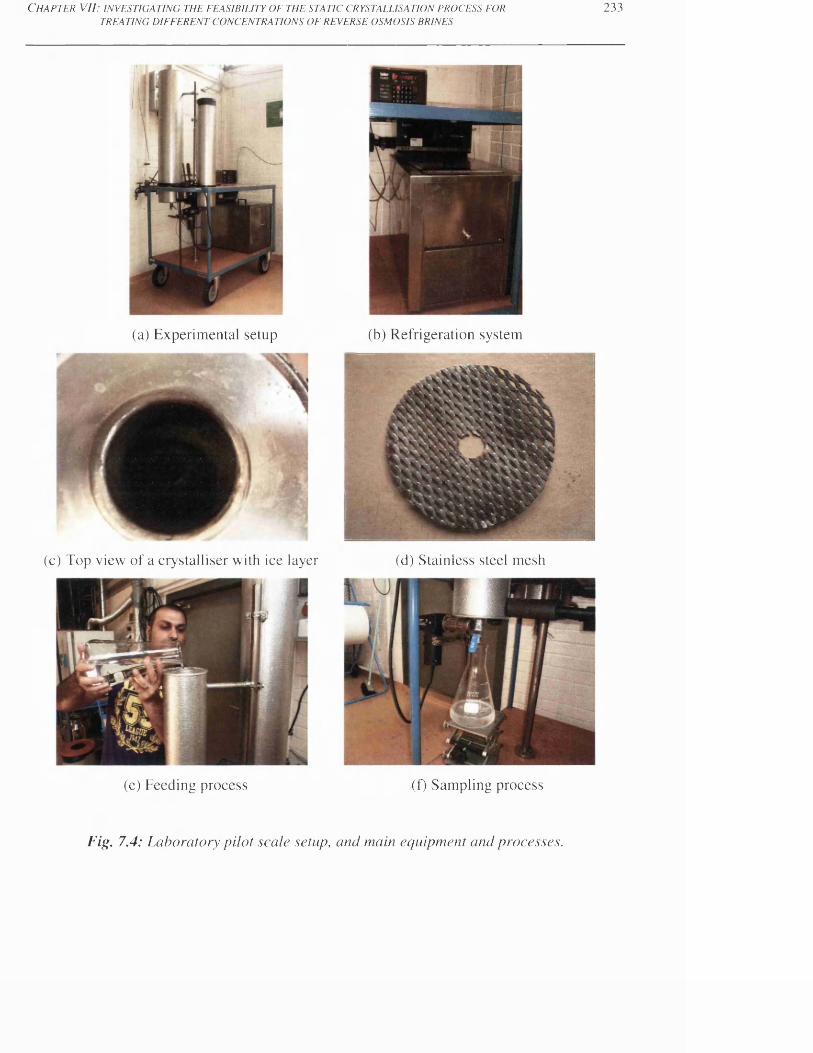
C h a p t e r V I I : i n v e s t i g a t i n g t h e f e a s i b i l i t y o f t h e s t a t i c c r y s t a l l i s a t i o n p r o c e s s f o r
TR E A TIN G D IF F E R E N T C O N C E N T R A T IO N S O F R E V E R SE O SM O SIS B R IN E S2 3 3
(b) Refrigeration system(a) Experimental setup
(c) Top view of a crystalliser with ice layer (d) Stainless steel mesh
(e) Feeding process (f) Sampling process
Fig. 7.4: Laboratory pilot scale setup, and main equipment and processes.

C h a p t e r V I I : i n v e s t i g a t i n g t h e f e a s i b i l i t y o f t h e s t a t i c c r y s t a l l i s a t i o n p r o c e s s f o r
TR E A TIN G D IF F E R E N T C O N C E N T R A T IO N S O F R E V E R SE O SM O SIS B R IN E S2 3 4
(a) Pilot plant crystallizer (b) Refrigeration unit
(c) Internal view of an empty crystallizer (d) A crystalliser with crystal layer
(e) Funnel and top-view of crystallizer (f) Drain valve (sampling point)
Fig. 7.5: Pilot plant apparatus and main equipment.
Alongside the laboratory pilot scale setup, a preliminary experimental investigation was
carried out on the pilot plant having a crystalliser capacity of 70 L. Fig (7.5) shows the skid
mounted pilot plant unit and main equipment used in this investigation. The pilot plant
represents a straightforward scale-up pilot unit since the commercial scale crystallizer is
designed directly by increasing the surface area and number of the plates in the heat

C h a p t e r V I I : i n v e s t i g a t i n g t h e f e a s i b i l i t y o f t h e s t a t i c c r y s t a l l i s a t i o n p r o c e s s f o r
TR E A TIN G D IF F E R E N T C O N C E N T R A T IO N S O F R E V E R SE O SM O SIS B R IN ES2 3 5
exchanger. The crystalliser of the pilot plant was provided with three vertical heat exchanger
plates, in which four crystal layers grow as ice slabs during the crystallisation operation as
shown in Figs (7.5) (c) and (d). The height and width of this crystalliser tank is 2 x 0.5 m,
whereas each vertical heat exchanger plate is 1.95 x 0.45 m. The pilot plant was provided
with a laboratory balance (Mettler-Toledo GmbH, ID1 Plus) attached to the crystalliser's tank
in order to measure the loaded mass of feed material inside the crystalliser. In addition, the
pilot plant was provided with a heat transfer unit (Huber, Unistat 615) via tubes for low
temperature applications, as shown in Fig (7.5) (b). The heat transfer unit contains a
refrigerated thermostatic bath, bath circulator, HTM (Huber, Thermal Fliud: DW-Therm
M90.200.02), and PCD temperature controller are constructed in one compartment. Also, the
pilot plant was provided with a removable stainless steel funnel for the purpose of facilitating
the filling process (see Fig (7.5) (e)).
* -<
10
T 12
Fig. 7.6: Schematic o f laboratory pilot scale setup with (I) Refrigeration unit and
thermostatic bath (Huber, HS 40, Renggli Laboratory systems), (2) heat transfer
medium (HTM), (3) HTM bath circulator (Huber HS40), (4) built-in digital
thermometer, (5) PID temperature controller (Huber PD 420), (6) and (7) inlet and
outlet HTM pipelines, respectively, (8) instant digital thermometer (Taylor, Model:
9847N), (9) feed sample, (10) double wall reaction vessel, (11) sampling valve (HK,
stainless steel ball valve, O.D 1/4"), and (12) heat gun (Weller 1095).
In general, the concept of the refrigeration systems used for the two laboratory setups is the
same. The refrigeration system involves the use of a PID temperature controller and
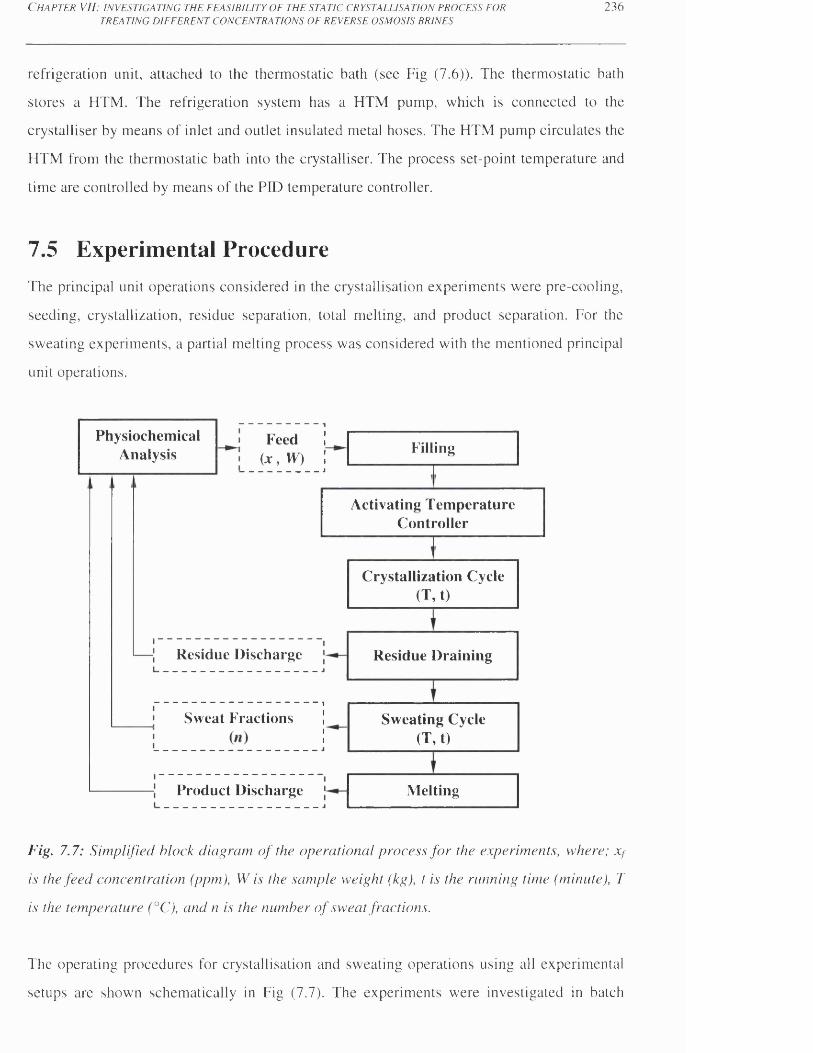
C h a p t e r V I I : i n v e s t i g a t i n g t h e f e a s i b i l i t y o f t h e s t a t i c c r y s t a l l i s a t i o n p r o c e s s f o r
TR E A TIN G D IF F E R E N T C O N C E N T R A T IO N S O F R E V E R SE O SM O SIS B R IN E S2 3 6
refrigeration unit, attached to the thermostatic bath (see Fig (7.6)). The thermostatic bath
stores a HTM. The refrigeration system has a HTM pump, which is connected to the
crystalliser by means of inlet and outlet insulated metal hoses. The HTM pump circulates the
HTM from the thermostatic bath into the crystalliser. The process set-point temperature and
time are controlled by means of the PID temperature controller.
7.5 Experimental ProcedureThe principal unit operations considered in the crystallisation experiments were pre-cooling,
seeding, crystallization, residue separation, total melting, and product separation. For the
sweating experiments, a partial melting process was considered with the mentioned principal
unit operations.
Feed(* , W)
Residue Discharge
Sweat Fractions
Product Discharge
Filling
Melting
PhysiochemicalAnalysis
Crystallization Cycle(T, t)
Residue Draining
Sweating Cycle(T, t)
Activating Temperature Controller
Fig. 7.7: Simplified block diagram o f the operational process fo r the experiments, where; Xf
is the feed concentration (ppm), W is the sample weight (kg), t is the running time (minute), T
is the temperature (°C), and n is the number o f sweat fractions.
The operating procedures for crystallisation and sweating operations using all experimental
setups are shown schematically in Fig (7.7). The experiments were investigated in batch
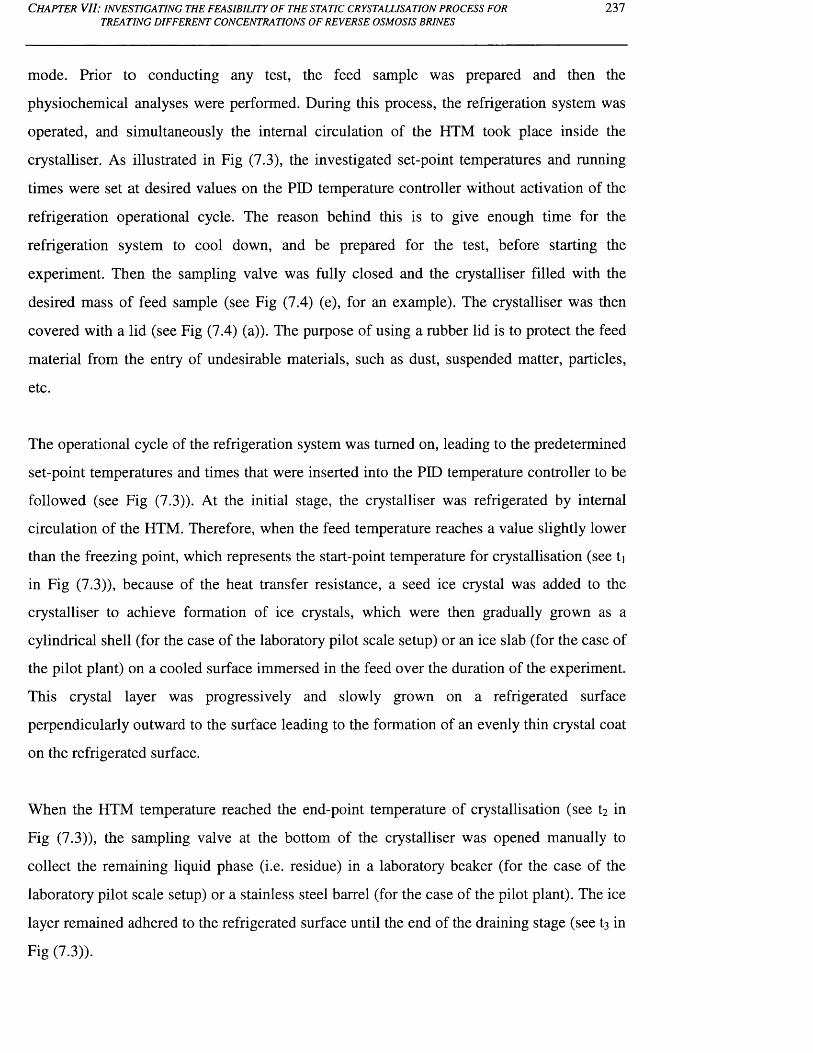
C h a p t e r V II: i n v e s t i g a t i n g t h e f e a s i b i l i t y o f t h e s t a t i c c r y s t a l l i s a t i o n p r o c e s s f o r
TREATING DIFFERENT CONCENTRATIONS OF REVERSE OSMOSIS BRINES237
mode. Prior to conducting any test, the feed sample was prepared and then the
physiochemical analyses were performed. During this process, the refrigeration system was
operated, and simultaneously the internal circulation of the HTM took place inside the
crystalliser. As illustrated in Fig (7.3), the investigated set-point temperatures and mnning
times were set at desired values on the PID temperature controller without activation of the
refrigeration operational cycle. The reason behind this is to give enough time for the
refrigeration system to cool down, and be prepared for the test, before starting the
experiment. Then the sampling valve was fully closed and the crystalliser filled with the
desired mass of feed sample (see Fig (7.4) (e), for an example). The crystalliser was then
covered with a lid (see Fig (7.4) (a)). The purpose of using a rubber lid is to protect the feed
material from the entry of undesirable materials, such as dust, suspended matter, particles,
etc.
The operational cycle of the refrigeration system was turned on, leading to the predetermined
set-point temperatures and times that were inserted into the PID temperature controller to be
followed (see Fig (7.3)). At the initial stage, the crystalliser was refrigerated by internal
circulation of the HTM. Therefore, when the feed temperature reaches a value slightly lower
than the freezing point, which represents the start-point temperature for crystallisation (see t]
in Fig (7.3)), because of the heat transfer resistance, a seed ice crystal was added to the
crystalliser to achieve formation of ice crystals, which were then gradually grown as a
cylindrical shell (for the case of the laboratory pilot scale setup) or an ice slab (for the case of
the pilot plant) on a cooled surface immersed in the feed over the duration of the experiment.
This crystal layer was progressively and slowly grown on a refrigerated surface
perpendicularly outward to the surface leading to the formation of an evenly thin crystal coat
on the refrigerated surface.
When the HTM temperature reached the end-point temperature of crystallisation (see t2 in
Fig (7.3)), the sampling valve at the bottom of the crystalliser was opened manually to
collect the remaining liquid phase (i.e. residue) in a laboratory beaker (for the case of the
laboratory pilot scale setup) or a stainless steel barrel (for the case of the pilot plant). The ice
layer remained adhered to the refrigerated surface until the end of the draining stage (see t3 in
Fig (7.3)).
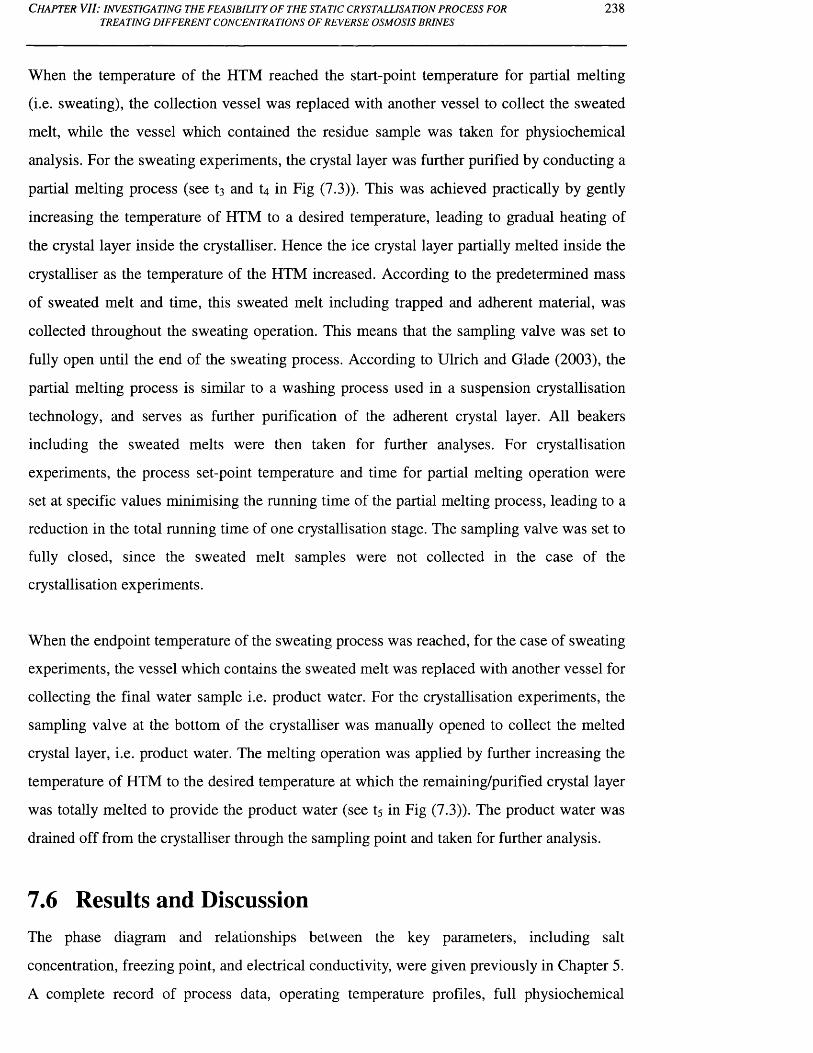
C h a p t e r V II: i n v e s t i g a t i n g t h e f e a s i b i l i t y o f t h e s t a t i c c r y s t a l l i s a t i o n p r o c e s s f o r
TREATING DIFFERENT CONCENTRATIONS OF REVERSE OSMOSIS BRINES238
When the temperature of the HTM reached the start-point temperature for partial melting
(i.e. sweating), the collection vessel was replaced with another vessel to collect the sweated
melt, while the vessel which contained the residue sample was taken for physiochemical
analysis. For the sweating experiments, the crystal layer was further purified by conducting a
partial melting process (see t3 and U in Fig (7.3)). This was achieved practically by gently
increasing the temperature of HTM to a desired temperature, leading to gradual heating of
the crystal layer inside the crystalliser. Hence the ice crystal layer partially melted inside the
crystalliser as the temperature of the HTM increased. According to the predetermined mass
of sweated melt and time, this sweated melt including trapped and adherent material, was
collected throughout the sweating operation. This means that the sampling valve was set to
fully open until the end of the sweating process. According to Ulrich and Glade (2003), the
partial melting process is similar to a washing process used in a suspension crystallisation
technology, and serves as further purification of the adherent crystal layer. All beakers
including the sweated melts were then taken for further analyses. For crystallisation
experiments, the process set-point temperature and time for partial melting operation were
set at specific values minimising the running time of the partial melting process, leading to a
reduction in the total running time of one crystallisation stage. The sampling valve was set to
fully closed, since the sweated melt samples were not collected in the case of the
crystallisation experiments.
When the endpoint temperature of the sweating process was reached, for the case of sweating
experiments, the vessel which contains the sweated melt was replaced with another vessel for
collecting the final water sample i.e. product water. For the crystallisation experiments, the
sampling valve at the bottom of the crystalliser was manually opened to collect the melted
crystal layer, i.e. product water. The melting operation was applied by further increasing the
temperature of HTM to the desired temperature at which the remaining/purified crystal layer
was totally melted to provide the product water (see ts in Fig (7.3)). The product water was
drained off from the crystalliser through the sampling point and taken for further analysis.
7.6 Results and DiscussionThe phase diagram and relationships between the key parameters, including salt
concentration, freezing point, and electrical conductivity, were given previously in Chapter 5.
A complete record of process data, operating temperature profiles, full physiochemical

C h a p t e r V II: i n v e s t i g a t i n g t h e f e a s i b i l i t y o f t h e s t a t i c c r y s t a l l i s a t i o n p r o c e s s f o r
TREATING DIFFERENT CONCENTRATIONS OF REVERSE OSMOSIS BRINES2 3 9
analysis, and crystalline impurity content versus sweating times are given in Tables A7-1 -
A7-18 in Appendix 7, found on the CD attached to the thesis (see file name: Appendix_l,
Microsoft Excel spreadsheet, Sheet 1, Tables: A7.1-4). For all tests, the results of the average
growth rate were analytically computed by assuming that the dimensions and shape of the
solid ice layer are for cylindrical geometry, in the cases using a crystalliser tube, and
rectangular, for the cases using a plate heat exchanger. The cooling rates were analytically
calculated by dividing the temperature difference, between the end-point and start-point
temperatures of the crystallisation operation, by the crystallisation time (Ulrich and Glade,
2003). The theoretical power consumption for the static crystallisation experiments was
analytically determined by the heat transfer rates for cooling the feed water and changing the
phase of the liquid, as described previously in Chapter 4.
In general, the experimental conditions that have been used in this study are shown in Table
(7.1).
Crystallisation Sweating
Run
No.
Exp.
Setup
Feed
Source
Feed
Cone. Time
End-Point
HTM
Temp.
Time
End-Point
HTM
Temp.
(%) (hr) (°C) (hr) (°C)
1 - 7 LPSNaCl
Solution3.5 2 - 2 4 -2 .3 -8 2 - 2 .9 - 0.8
1 - 14 LPSProcess
Brines5 .1 -1 5 3 .5-12 .5 -10 --23 1 - 4 -2 3 -0
1 - 8 PPRO
Brine6.1 4 - 2 4 -4 - -
Table 7.1: Operating parameters and conditions for crystallisation and sweating
experiments, where; PP is the pilot plant and LPS is the laboratory pilot scale setup.
7.6.1 Parametric study o f crystallisation and sweating processes
The first group of experiments was carried out with feed samples using aqueous solutions of
sodium chloride. These experiments were performed on the laboratory pilot scale setup using
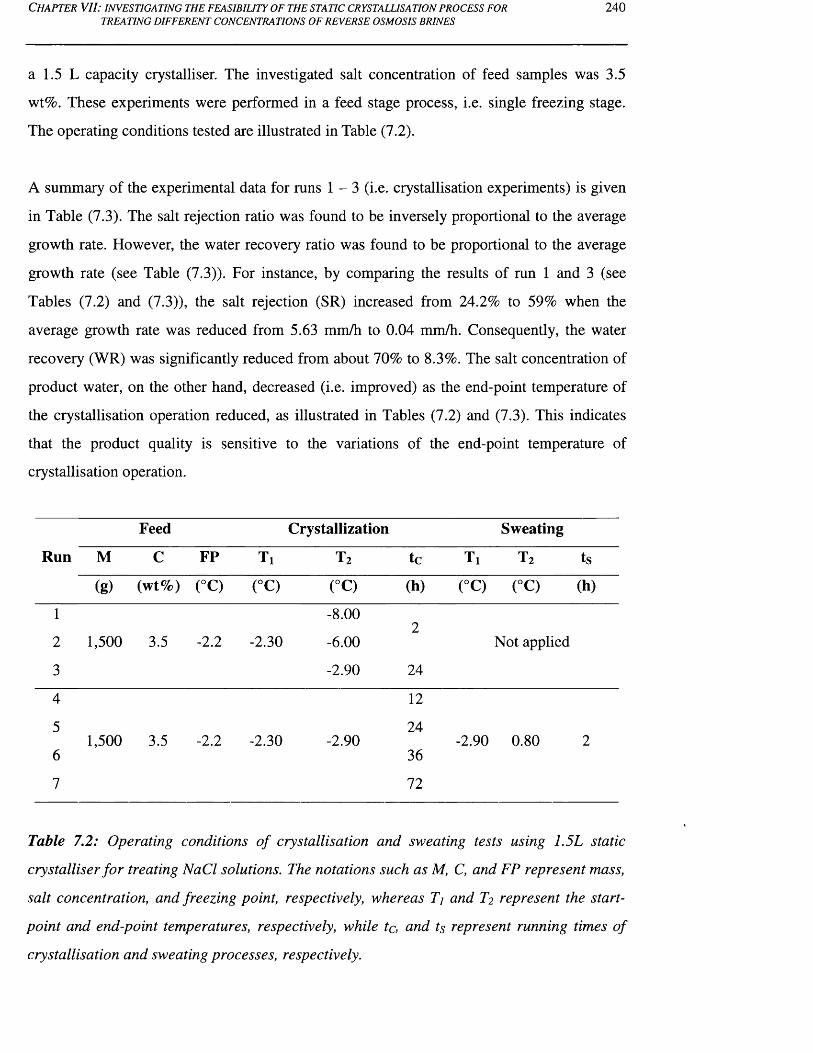
C h a p t e r V II : i n v e s t i g a t i n g t h e f e a s i b i l i t y o f t h e s t a t i c c r y s t a l l i s a t i o n p r o c e s s f o r
TREATING DIFFERENT CONCENTRATIONS OF REVERSE OSMOSIS BRINES240
a 1.5 L capacity crystalliser. The investigated salt concentration of feed samples was 3.5
wt%. These experiments were performed in a feed stage process, i.e. single freezing stage.
The operating conditions tested are illustrated in Table (7.2).
A summary of the experimental data for runs 1 - 3 (i.e. crystallisation experiments) is given
in Table (7.3). The salt rejection ratio was found to be inversely proportional to the average
growth rate. However, the water recovery ratio was found to be proportional to the average
growth rate (see Table (7.3)). For instance, by comparing the results of run 1 and 3 (see
Tables (7.2) and (7.3)), the salt rejection (SR) increased from 24.2% to 59% when the
average growth rate was reduced from 5.63 mm/h to 0.04 mm/h. Consequently, the water
recovery (WR) was significantly reduced from about 70% to 8.3%. The salt concentration of
product water, on the other hand, decreased (i.e. improved) as the end-point temperature of
the crystallisation operation reduced, as illustrated in Tables (7.2) and (7.3). This indicates
that the product quality is sensitive to the variations of the end-point temperature of
crystallisation operation.
Feed Crystallization Sweating
Run M C FP Ti t 2 tc Ti t 2 ts
(g) (wt%) (°C) (°C) (°C) (h) (°C) (°C) (h)
1
2 1,500 3.5 -2.2 -2.30
-8.00
-6.002
Not applied
3 -2.90 24
4 12
51,500 3.5 -2.2 -2.30 -2.90
24-2.90 0.80 2
6 36
7 72
Table 7.2: Operating conditions o f crystallisation and sweating tests using 1.5L static
crystalliser for treating NaCl solutions. The notations such as M, C, and FP represent mass,
salt concentration, and freezing point, respectively, whereas Tj and T2 represent the start-
point and end-point temperatures, respectively, while tc, and ts represent running times of
crystallisation and sweating processes, respectively.
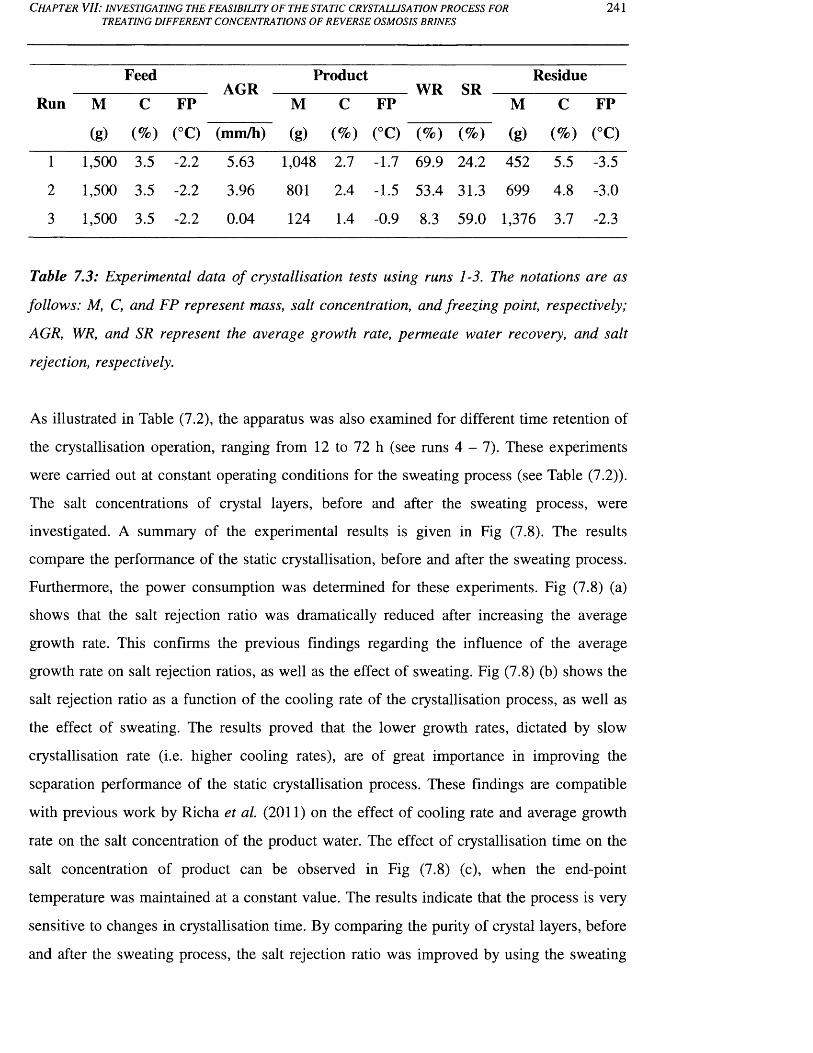
C h a p t e r VII: i n v e s t i g a t i n g t h e f e a s i b i l i t y o f t h e s t a t i c c r y s t a l u s a t i o n p r o c e s s f o r 241TREATING DIFFERENT CONCENTRATIONS OF REVERSE OSMOSIS BRINES
FeedAGR
ProductWR SR
Residue
Run M C FP M C FP M C FP
(g) (%) (°C) (mm/h) (g) (%) (°C) (%) (%) (g) (%) (°C)
1 1,500 3.5 -2.2 5.63 1,048 2.7 -1.7 69.9 24.2 452 5.5 -3.5
2 1,500 3.5 -2.2 3.96 801 2.4 -1.5 53.4 31.3 699 4.8 -3.0
3 1,500 3.5 -2.2 0.04 124 1.4 -0.9 8.3 59.0 1,376 3.7 -2.3
Table 7.3: Experimental data o f crystallisation tests using runs 1-3. The notations are as
follows: M, C, and FP represent mass, salt concentration, and freezing point, respectively;
AGR, WR, and SR represent the average growth rate, permeate water recovery, and salt
rejection, respectively.
As illustrated in Table (7.2), the apparatus was also examined for different time retention of
the crystallisation operation, ranging from 12 to 72 h (see runs 4 - 7). These experiments
were carried out at constant operating conditions for the sweating process (see Table (7.2)).
The salt concentrations of crystal layers, before and after the sweating process, were
investigated. A summary of the experimental results is given in Fig (7.8). The results
compare the performance of the static crystallisation, before and after the sweating process.
Furthermore, the power consumption was determined for these experiments. Fig (7.8) (a)
shows that the salt rejection ratio was dramatically reduced after increasing the average
growth rate. This confirms the previous findings regarding the influence of the average
growth rate on salt rejection ratios, as well as the effect of sweating. Fig (7.8) (b) shows the
salt rejection ratio as a function of the cooling rate of the crystallisation process, as well as
the effect of sweating. The results proved that the lower growth rates, dictated by slow
crystallisation rate (i.e. higher cooling rates), are of great importance in improving the
separation performance of the static crystallisation process. These findings are compatible
with previous work by Richa et al. (2011) on the effect of cooling rate and average growth
rate on the salt concentration of the product water. The effect of crystallisation time on the
salt concentration of product can be observed in Fig (7.8) (c), when the end-point
temperature was maintained at a constant value. The results indicate that the process is very
sensitive to changes in crystallisation time. By comparing the purity of crystal layers, before
and after the sweating process, the salt rejection ratio was improved by using the sweating
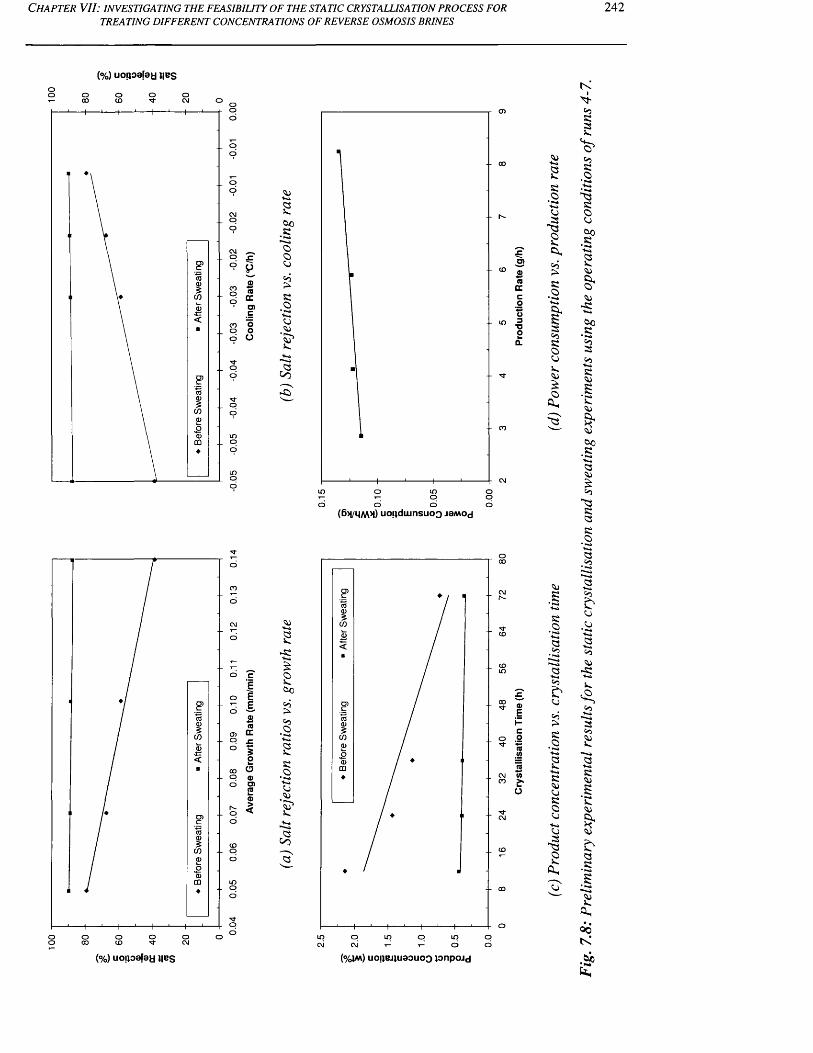
100 -
1 .
I r
100
C h a p t e r V II : i n v e s t i g a t i n g t h e f e a s i b i l i t y o f t h e s t a t i c c r y s t a l l i s a t i o n p r o c e s s f o r
TREATING DIFFERENT CONCENTRATIONS OF REVERSE OSMOSIS BRINES
(%) uoiioefaa lies
sto•Sooojsi•2
a
ino ooin o
88si•2
"a2Cl,03sio
s03sio
£o
ts
( 6 m/ 1M>I) u o ; ) d u i n s u o o ja /w o d
Itic'ss;ss.
05si•2soCo•Sti8§■
-sito•S05s
<*>
to•Sts£0 5
"tssitssio
a> CC3oO0)O)n<5
■I
£!<tc05>05•28si•2+ 0tj
'£■aCoa
in o ooo in
o o
S'o
803
03s;•2-Ki
8■t-4si
sio<0-t~4<Us"ts8
(%) uofioafaa lies (%Im) uojiejiuaouoo pnpojd
803£t)•8803-S
s03J*.
8si
s.
I£>tss;
tot s
•S>k,
242
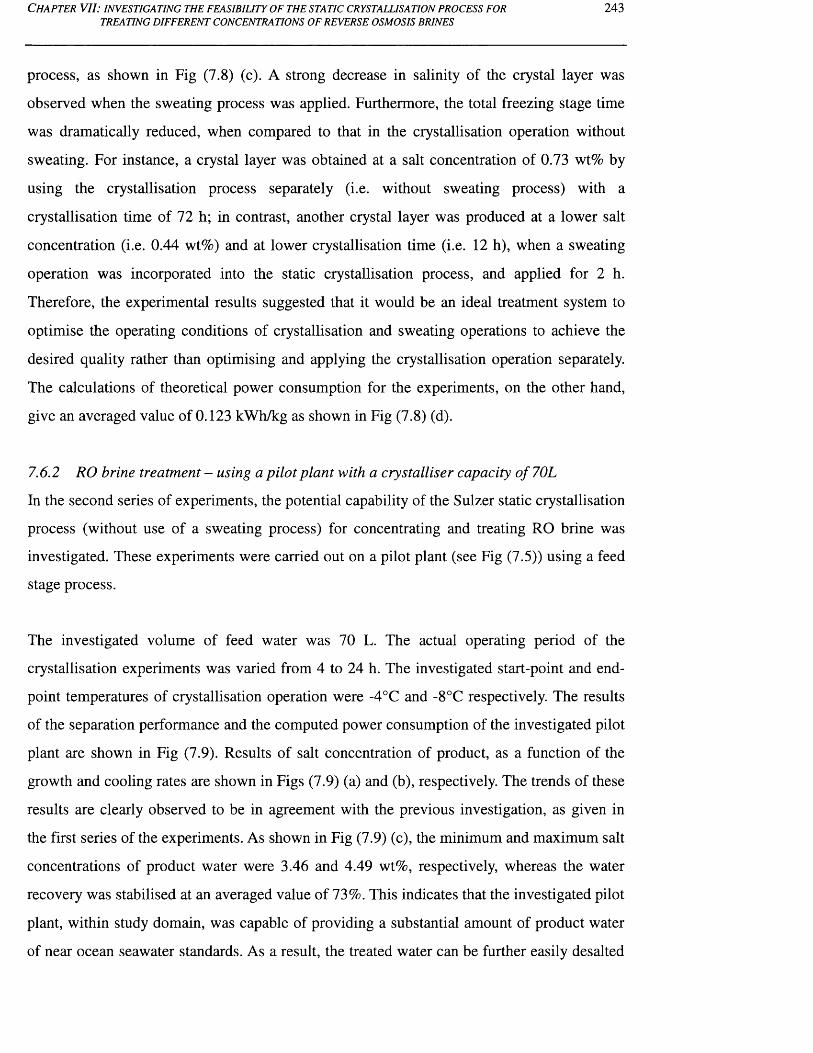
C h a p t e r V II : i n v e s t i g a t i n g t h e f e a s i b i l i t y o f t h e s t a t i c c r y s t a l u s a t i o n p r o c e s s f o r
TREATING D IFFERENT CONCENTRATIONS OF REVERSE OSMOSIS BRINES243
process, as shown in Fig (7.8) (c). A strong decrease in salinity of the crystal layer was
observed when the sweating process was applied. Furthermore, the total freezing stage time
was dramatically reduced, when compared to that in the crystallisation operation without
sweating. For instance, a crystal layer was obtained at a salt concentration of 0.73 wt% by
using the crystallisation process separately (i.e. without sweating process) with a
crystallisation time of 72 h; in contrast, another crystal layer was produced at a lower salt
concentration (i.e. 0.44 wt%) and at lower crystallisation time (i.e. 12 h), when a sweating
operation was incorporated into the static crystallisation process, and applied for 2 h.
Therefore, the experimental results suggested that it would be an ideal treatment system to
optimise the operating conditions of crystallisation and sweating operations to achieve the
desired quality rather than optimising and applying the crystallisation operation separately.
The calculations of theoretical power consumption for the experiments, on the other hand,
give an averaged value of 0.123 kWh/kg as shown in Fig (7.8) (d).
7.6.2 RO brine treatment - using a pilot plant with a crystalliser capacity o f 70L
In the second series of experiments, the potential capability of the Sulzer static crystallisation
process (without use of a sweating process) for concentrating and treating RO brine was
investigated. These experiments were carried out on a pilot plant (see Fig (7.5)) using a feed
stage process.
The investigated volume of feed water was 70 L. The actual operating period of the
crystallisation experiments was varied from 4 to 24 h. The investigated start-point and end
point temperatures of crystallisation operation were -4°C and -8°C respectively. The results
of the separation performance and the computed power consumption of the investigated pilot
plant are shown in Fig (7.9). Results of salt concentration of product, as a function of the
growth and cooling rates are shown in Figs (7.9) (a) and (b), respectively. The trends of these
results are clearly observed to be in agreement with the previous investigation, as given in
the first series of the experiments. As shown in Fig (7.9) (c), the minimum and maximum salt
concentrations of product water were 3.46 and 4.49 wt%, respectively, whereas the water
recovery was stabilised at an averaged value of 73%. This indicates that the investigated pilot
plant, within study domain, was capable of providing a substantial amount of product water
of near ocean seawater standards. As a result, the treated water can be further easily desalted
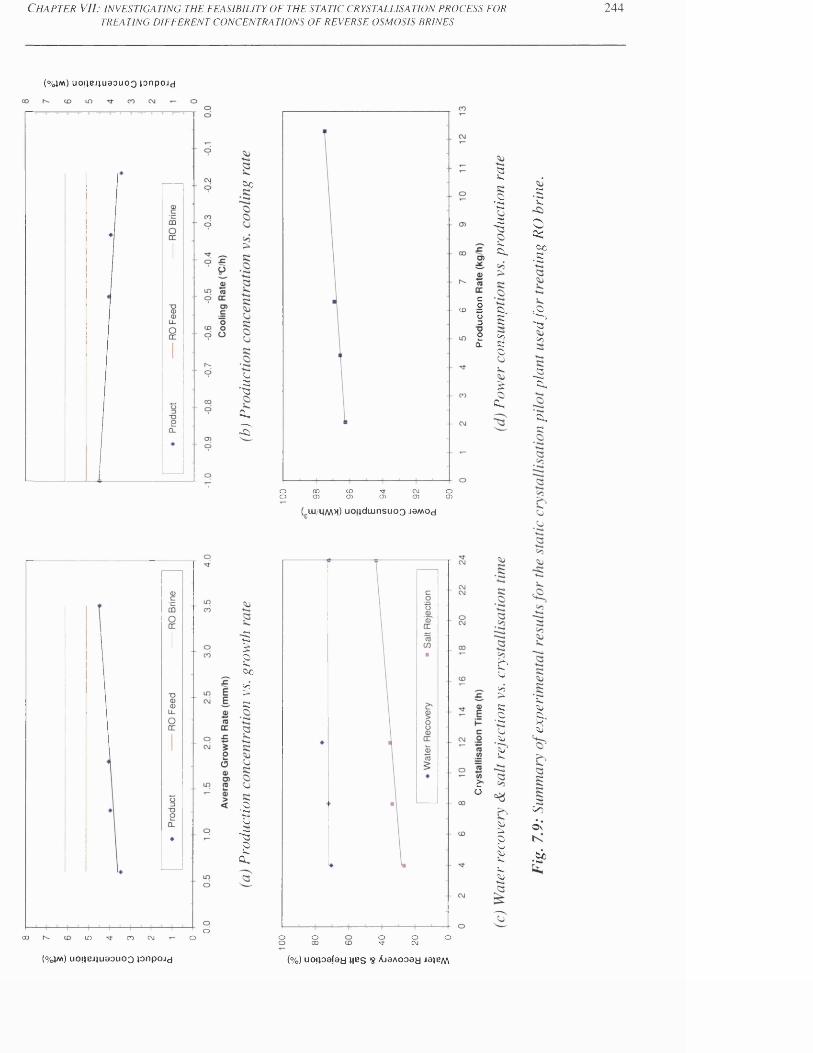
C h a p t e r VII: i n v e s t i g a t i n g t h e f e a s i b i l i t y o f t h e s t a t i c c r y s t a l l i s a t i o n p r o c e s s f o rTR E A TIN G D IF F E R E N T C O N C E N T R A T IO N S O F R E V E R SE O SM O SIS B R IN ES
(%;«) uo|iBJiu0Ouoo jonpojd
Co
Cj3"S3f t *
2T
00CD
CDCD
CMCD
OCD
OO ■'3’CD
5•2■<—>»~2i*.Cx,
ct«o I Q,
S 22 ^ q . s ;O
£ £
( l u / m m m ) u o i j d i u n s u o Q j a / w o d
•SC!Oftcco•S
-s.■aCO
-2"2 ,
f t ,
c
ooo in co eg o
-s:?ftoCoco>K
•2tj"2ov.ft*
oo
o00 oo- oC\J
o
e*o
£ftCoK•2ftftft1V.
ft>ftftftftftft
ftft5-ft
CoON
,Cc•*««*
(%yw) uo|jeJiuaouoo jonpojd ( % ) u o i j o a f a y l i e s $ A j a A o o a y j a j e / w
244

C h a p t e r V II: i n v e s t i g a t i n g t h e f e a s i b i l i t y o f t h e s t a t i c c r y s t a l l i s a t i o n p r o c e s s f o r
TREATING DIFFERENT CONCENTRATIONS OF REVERSE OSMOSIS BRINES2 4 5
either by a sweating process, increasing the number of rectification stages, or simply by
recycling the treated water into the main feed stream of the seawater RO membrane plant to
obtain a final product of drinking water. When the desired salt concentration of product
water is required to be similar to that of Arabian Gulf seawater, then the experimental results
suggested reducing the retention time of the crystallisation process (i.e. less than 4 h) in
future studies. This is because crystal layers were experimentally produced at a lower salt
concentration, when compared to Arabian Gulf seawater. By reducing the overall running
time of the freezing stage, a significant increase in the production rate would be expected,
which will lead to a dramatic fall in the operational cost. As for the energy consumption, Fig
(7.9) (d) shows a plot of the theoretical results of the power consumption versus the
production rate. The theoretical power consumption for the investigated pilot plant gave an
averaged value of 97 kWh/m3.
7.6.3 Process brine treatment - using the laboratory pilot scale setup with a crystalliser
capacity o f 6L
The third group of experiments were carried out on feed samples using process brines to
determine the number of influences on the performance of the static crystallisation process.
These experiments were carried out on the laboratory pilot scale setup using a crystalliser
capacity of 6 L. The experiments were performed in a feed stage process, using
crystallisation and sweating process. The salinities of crystal layers, before and after the
sweating process, were studied.
The first investigation was carried out on feed samples using concentrated RO brine with a
salt concentration of 12 wt%; this was previously taken from the residue sample of
suspension crystallisation experiments (see Chapter 6). This investigation was carried out to
determine the influence of cooling rate of crystallisation operation on the salt separation of
the static crystallisation process as well as the effect of the sweating process. The
investigated cooling rates of the crystallisation were -0.48 and -0.80 °C/min, whereas the
sweating process was maintained at constant operating conditions.
Figs (7.10) (a) and (b) show the influences of several factors, such as: cooling rate of
crystallisation operation, crystal mass ratio, and sweating time, on the salt concentration of

C h a p t e r V I I : i n v e s t i g a t i n g t h e f e a s i b i l i t y o f t h e s t a t i c c r y s t a l l i s a t i o n p r o c e s s f o r
TR E A TIN G D IF F E R E N T C O N C E N T R A T IO N S O F R E V E R SE O SM O SIS B R IN E S246
(%) AjaAooay jaie/\A(°/c4m) uoijBJiuaouoQ pnpojd
(%) AjaAooay JajBM(%jm ) u o j i e j j u a o u o Q p n p o j d
C h a p t e r V II: i n v e s t i g a t i n g t h e f e a s i b i l i t y o f t h e s t a t i c c r y s t a l l i s a t i o n p r o c e s s f o r
TREATING DIFFERENT CONCENTRATIONS OF REVERSE OSMOSIS BRINES247
the crystal layer. The salt concentration of the crystal layer decreased (i.e. improved) as the
cooling rate of the crystallisation process increased, as observed previously in different
experiments. For instance, before performing the sweating process, the salt concentration of
the crystal layer was reduced from 9.78 wt% to 8.40 wt% by decreasing the cooling rate of
the crystallisation process from -0.80 to -0.48 °C/min (Fig (7.10) (a)). Figs (7.10) (a) and (b)
show that the sweating process was found effective in improving the salinity of the crystal
layer, where a notable reduction in the salt concentration of product was observed through
increasing the crystal mass ratio and sweating time. For instance, for the case of the
crystallisation rate of -0.80 °C/min, the salt concentration of the crystal layer was reduced
from 9.78 wt% to 4.50 wt% when the crystal mass ratio reached 35.64%. For the case of the
crystallisation rate of -0.48 °C/min, the salinity of the crystal layer was further reduced by the
sweating process, where the salt concentration of crystal layer was lowered from 8.40 wt% to
3.68 wt% when the crystal mass ratio reached 36.25%. In general, the salt rejection ratio was
increased, via a sweating operation, as the crystal mass ratio and sweating time increased.
For instance, in the case of a crystallisation rate of -0.48 °C/min, the salt rejection ratio
before the sweating process was 29.96 %. In contrast, the final salt rejection ratio increased
to 67.84 % after performing the sweating operation under the investigated operating
conditions. The trend of this finding was also in agreement with the case of the
crystallisation rate of -0.80 °C/min, where the salt rejection ratio, before a sweating
operation, was 18.50 %. The final salt rejection ratio, in contrast, was increased to 62.46 %
after carrying out the sweating process.
When the desired salinity of the crystal layer is required to be near that of Arabian Gulf
seawater, then the experimental results suggested reducing the time retention in the
crystallisation process to 3 h and 2 h for the cases of the crystallisation rate of -0.80 and -0.48
°C/min, respectively. In contrast, when the desired salinity of the crystal layer is required to
be near the RO brine, then the experimental results suggested further reduction in the time
retention of the crystallisation process to 2 h and 1 h for the crystallisation rates of -0.80 and
-0.48 °C/min, respectively. As mentioned previously, the production rate can be substantially
increased by reducing the overall running time of the freezing stage, and thus the operational
cost will be dramatically decreased. The results of water recovery ratio and cooling rate of
the crystallisation process as a function of the mass crystal ratio and sweating time are shown
in Figs (7.10) (c) and (d). The water recovery was found to decrease with increasing crystal
C h a p t e r V I I : i n v e s t i g a t i n g t h e f e a s i b i l i t y o f t h e s t a t i c c r y s t a l l i s a t i o n p r o c e s s f o r
TREATING DIFFERENT CONCENTRATIONS OF REVERSE OSMOSIS BRINES248
mass ratio and sweating time, and to increase with decreasing crystallisation rate. The trends
of these findings are in agreement with all the experimental results given in Chapter 7.
The second study was performed using the previous experimental conditions, except for
changing the investigated crystallisation rate and sweating time. The examined crystallisation
rate was set at constant value, i.e. - 2 °C/min, while the sweating process was carried out at
sweating rates of 5.5 and 22 °C/min. This study was performed to evaluate the change of
sweating time on the salinity of the crystal layer. A summary of the experimental results is
shown in Fig (7.11). Figs (7.11) (a) and (b) show that the salt concentration of the product
water was improved as the sweating time was increased. Fig (7.11) (b) shows that the salt
concentration of the crystal layer was lowered from 11.28 to 8.10 wt%, when the sweating
rate was set to 22 °C/min, which corresponds to a poor sweating efficiency. This was
because the salt concentration of the final product water was relatively poor when compared
to the RO brine. When the sweating rate was set to 5.5 °C/min, the salt concentration of
crystal layer decreased to 4.74 wt%, which corresponds to a reasonable separation
performance since the final product water is close to Arabian Gulf seawater standards. In
other words, the salt rejection ratio was significantly increased, via a sweating operation, as
the sweating rate increased. For instance, the calculations of the salt rejection ratio, before
the sweating operation, give 4.38 %, while the final salt rejection ratio, in contrast, was
increased to 32.47 % after carrying out the sweating process at a sweating rate of 22 °C/min.
In contrast, the salt rejection ratio was significantly increased to 60.47 % after performing the
sweating operation at a sweating rate of 5.5 °C/min. This clearly indicates that the salt
rejection ratio is inversely proportional to the sweating rate.
When the desired salt concentration of the crystal layer was required to be close to that of the
RO brine, then the experimental results suggested lowering the sweating time down to 3 h
for the cases of the sweating time 5.5 °C/min; in contrast, the sweating time must be further
extended for the sweating rate of 22 °C/min to reduce the salt concentration of crystal layer
down to that of the RO brine. However, this action may be accompanied by a dramatic fall in
the water recovery ratio, when compared to that in the sweating process with lower rates. As
previously mentioned, the reduction in the sweating time has a positive impact on the
production rate and operational cost. The crystal mass ratio was found to be proportional to
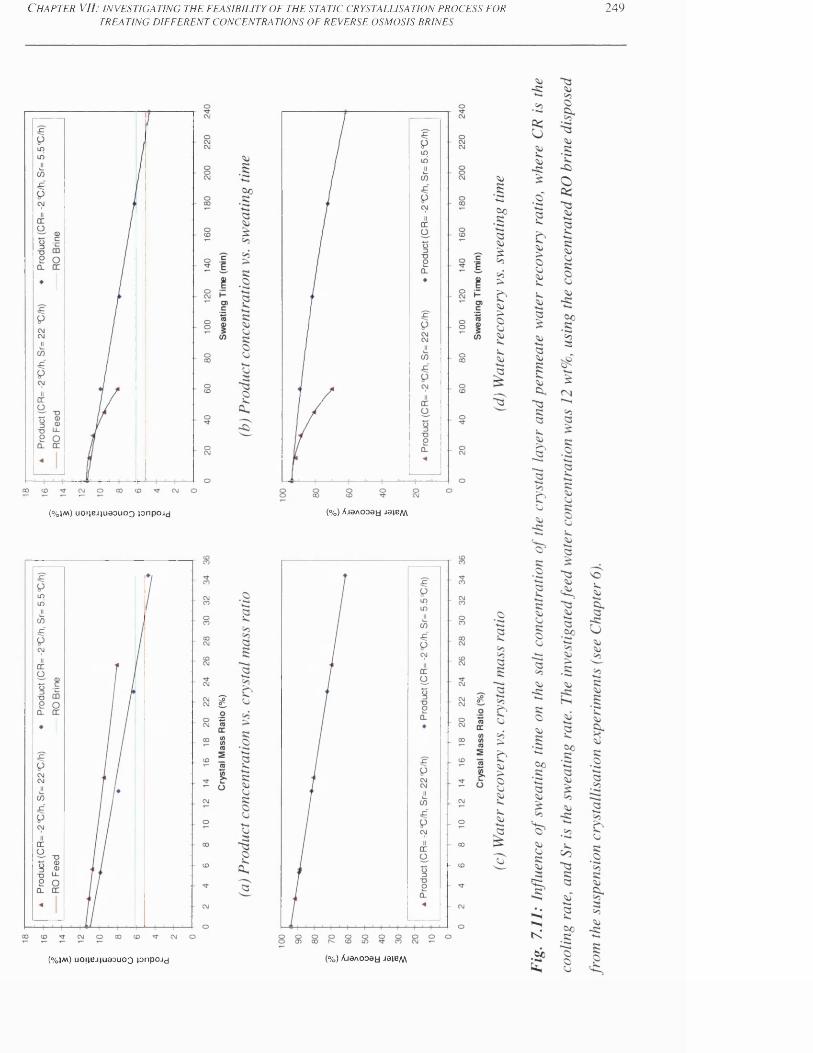
C h a p t e r V I I : i n v e s t i g a t i n g t h e f e a s i b i l i t y o f t h e s t a t i c c r y s t a l l i s a t i o n p r o c e s s f o r
T R E A T IN G D IF F E R E N T C O N C E N T R A T IO N S O F R E V E R SE O SM O SIS B R IN E S249
(%) AjaAOoay jaie/\/\(% Im ) u o iiB J iu a o u o Q jo n p o jd
(% ) AJ9AO03U J31B/W(% j m ) u o ! iB J )u a o u o o jo n p o jd
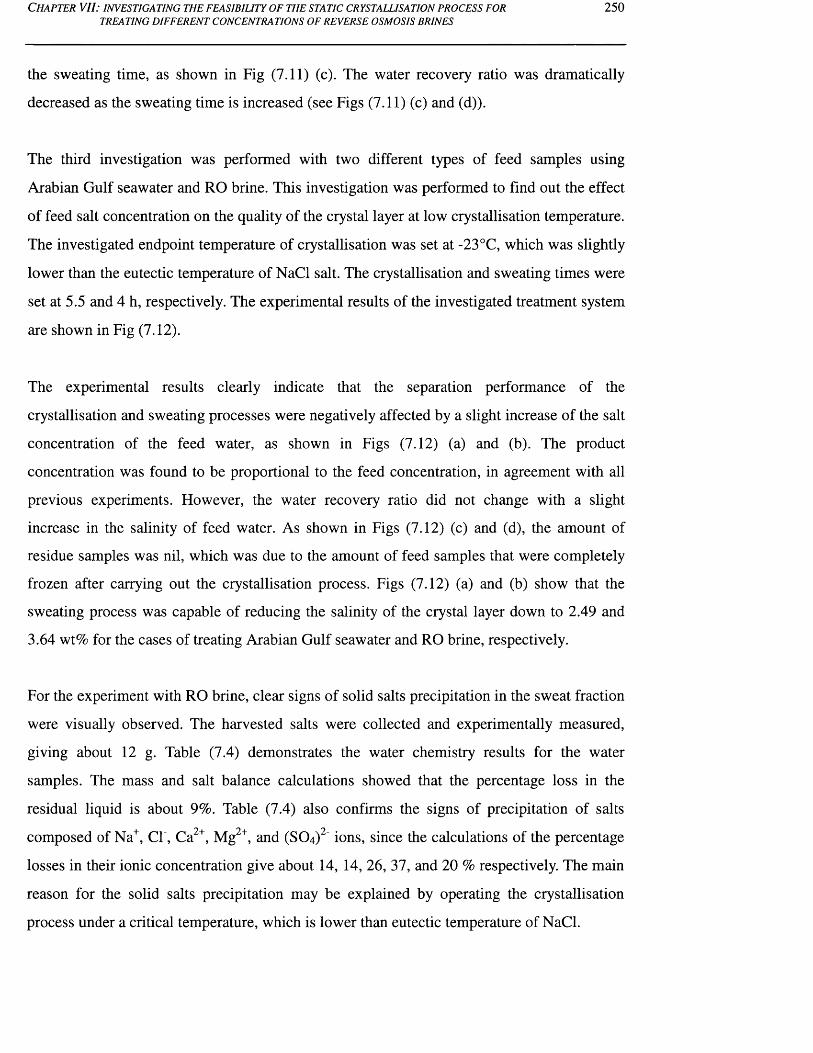
C h a p t e r V II : i n v e s t i g a t i n g t h e f e a s i b i l i t y o f t h e s t a t i c c r y s t a l l i s a t i o n p r o c e s s f o r
TREATING DIFFERENT CONCENTRATIONS OF REVERSE OSMOSIS BRINES250
the sweating time, as shown in Fig (7.11) (c). The water recovery ratio was dramatically
decreased as the sweating time is increased (see Figs (7.11) (c) and (d)).
The third investigation was performed with two different types of feed samples using
Arabian Gulf seawater and RO brine. This investigation was performed to find out the effect
of feed salt concentration on the quality of the crystal layer at low crystallisation temperature.
The investigated endpoint temperature of crystallisation was set at -23°C, which was slightly
lower than the eutectic temperature of NaCl salt. The crystallisation and sweating times were
set at 5.5 and 4 h, respectively. The experimental results of the investigated treatment system
are shown in Fig (7.12).
The experimental results clearly indicate that the separation performance of the
crystallisation and sweating processes were negatively affected by a slight increase of the salt
concentration of the feed water, as shown in Figs (7.12) (a) and (b). The product
concentration was found to be proportional to the feed concentration, in agreement with all
previous experiments. However, the water recovery ratio did not change with a slight
increase in the salinity of feed water. As shown in Figs (7.12) (c) and (d), the amount of
residue samples was nil, which was due to the amount of feed samples that were completely
frozen after carrying out the crystallisation process. Figs (7.12) (a) and (b) show that the
sweating process was capable of reducing the salinity of the crystal layer down to 2.49 and
3.64 wt% for the cases of treating Arabian Gulf seawater and RO brine, respectively.
For the experiment with RO brine, clear signs of solid salts precipitation in the sweat fraction
were visually observed. The harvested salts were collected and experimentally measured,
giving about 12 g. Table (7.4) demonstrates the water chemistry results for the water
samples. The mass and salt balance calculations showed that the percentage loss in the
residual liquid is about 9%. Table (7.4) also confirms the signs of precipitation of salts
composed of Na+, C l, Ca2+, Mg2+, and (S O 4 )2' ions, since the calculations of the percentage
losses in their ionic concentration give about 14, 14, 26, 37, and 20 % respectively. The main
reason for the solid salts precipitation may be explained by operating the crystallisation
process under a critical temperature, which is lower than eutectic temperature of NaCl.
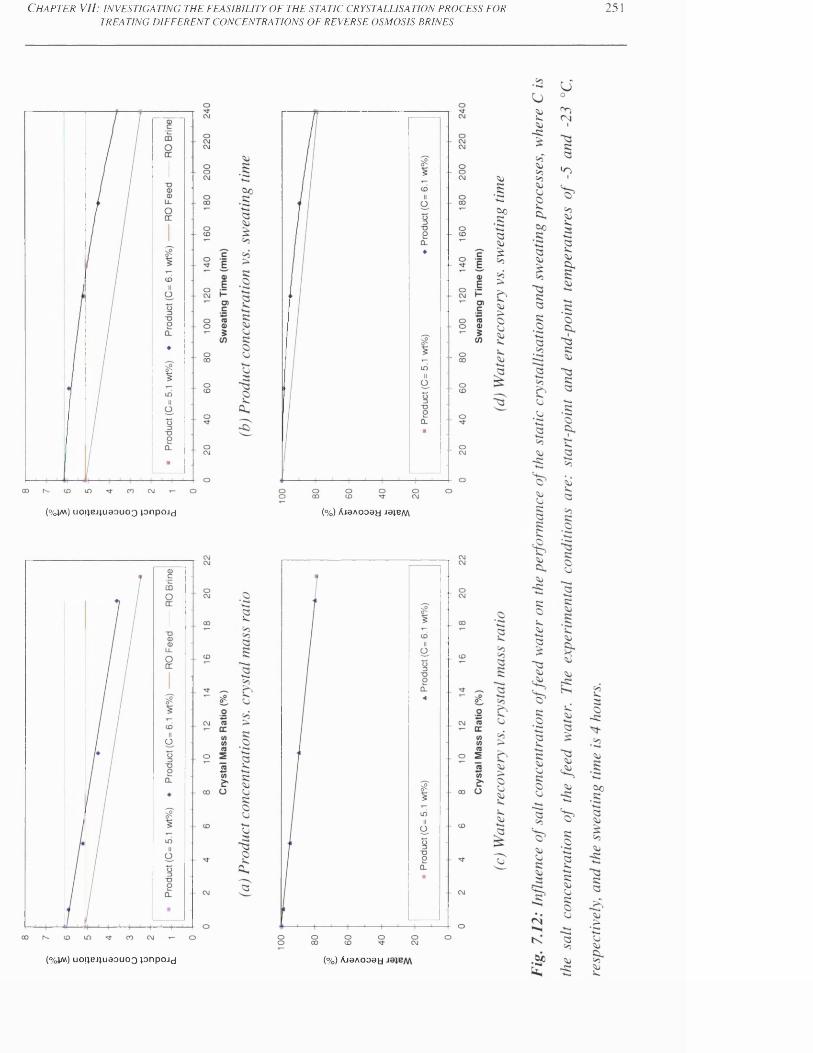
C h a p t e r V II: i n v e s t i g a t i n g t h e f e a s i b i l i t y o f t h e s t a t i c c r y s t a l l i s a t i o n p r o c e s s f o rTR E A TIN G D IF F E R E N T C O N C E N T R A T IO N S O F R E V E R SE O SM O SIS B R IN E S
251
( % ) A j a / \ o o a y j a j e / w(%jm) uouBjjuaouoo jonpojy
( % 4 m ) u o ; ) e j ) u a a u o o p n p o j d ( % ) A j a A O o a y
Ch a p t e r V II: in v e s t ig a t in g t h e f e a s ib il it y o f t h e s t a t ic c r y s t a l l is a t io n p r o c e s s f o r 2 5 2TREATING DIFFERENT CONCENTRATIONS OF REVERSE OSMOSIS BRINES
Parameter Units Feed Product Residue*
Mass (kg) 6.047 4.865 1.182
Conductivity mS/cm 76.60 44.60 164.80
Salt Concentration (wt%) 6.11 3.64 14.75
Melting Point (°C) -3.24 -2.07 -9.62
Ca2+ mg/L 1,476 840 3,040
Mg2+ mg/L 1,463 778 2,717
Na+ mg/L 20,881 15,174 38,324
(S04)2- mg/L 4,800 3,280 10,790
(H C O 3 ) mg/1 as CaC03 241.2 161.3 380.7
cr mg/L 32,200 23,400 59,100
Table 7.4: Water chemistry analysis for concentrating RO brine, where the collected
sweating fraction samples were mixed together and identified as "residue*" for the full
chemical analysis.
The experimental results suggested, for the case of RO brine concentration, to reduce the
crystallisation time from 4 to 1 h to provide a final product water of near the quality of
Arabian Gulf seawater, in terms of salinity (see Figs (7.12) (a) and (b)). Thus, this action will
substantially increase the water recovery ratio from 80.45 to about 99% (see Fig (7.12) (d)),
taking into account that there will be precipitation of solid salts, discharged with sweating
fractions for such an application.
The fourth investigation was carried out on RO brine. The investigated end-point
temperatures were -10 and -23°C, where the crystallisation and sweating times were set at
5.5 and 4 h, respectively. This investigation was carried out to determine the influence of
end-point crystallisation temperature on the salinity of crystal layer and water recovery ratio.
Fig (7.13) shows the variation of the salt concentration of crystal layer and water recovery
ratio, as a function of the crystal mass ratio and sweating time. A clear tendency of
decreasing salt concentration in the crystal layer with increasing end-point crystallisation
temperature can be observed as shown in Fig (7.13) (a) and (b). For example, for the case
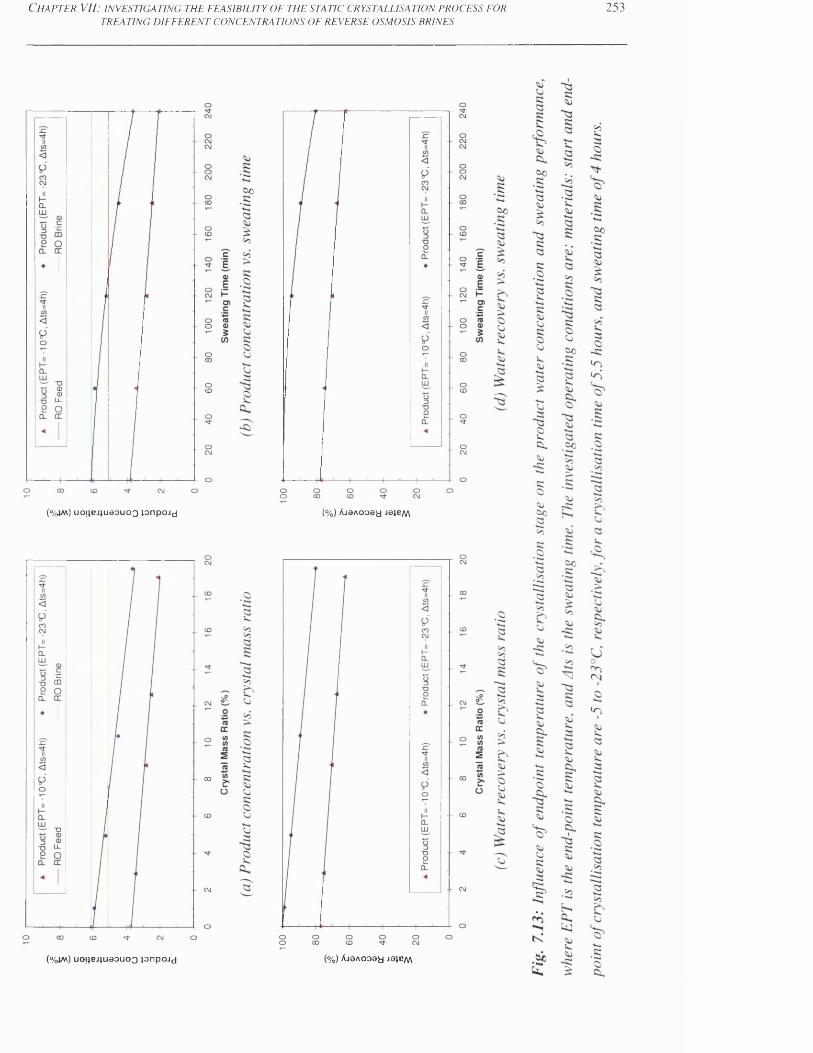
C h a p t e r V I I : i n v e s t i g a t i n g t h e f e a s i b i l i t y o f t h e s t a t i c c r y s t a l l i s a t i o n p r o c e s s f o r
TR E A TIN G D IF F E R E N T C O N C E N T R A T IO N S O F R E V E R SE O SM O SIS B R IN E S253
( % ) A J 9 A 0 0 6 H J8 1 B M(%jm) uo;)ej;ud3uoo pnpoJd
(%) AjaAooaa Jaie/\A( % j m ) u o u e j j u a o u o Q p n p o J d
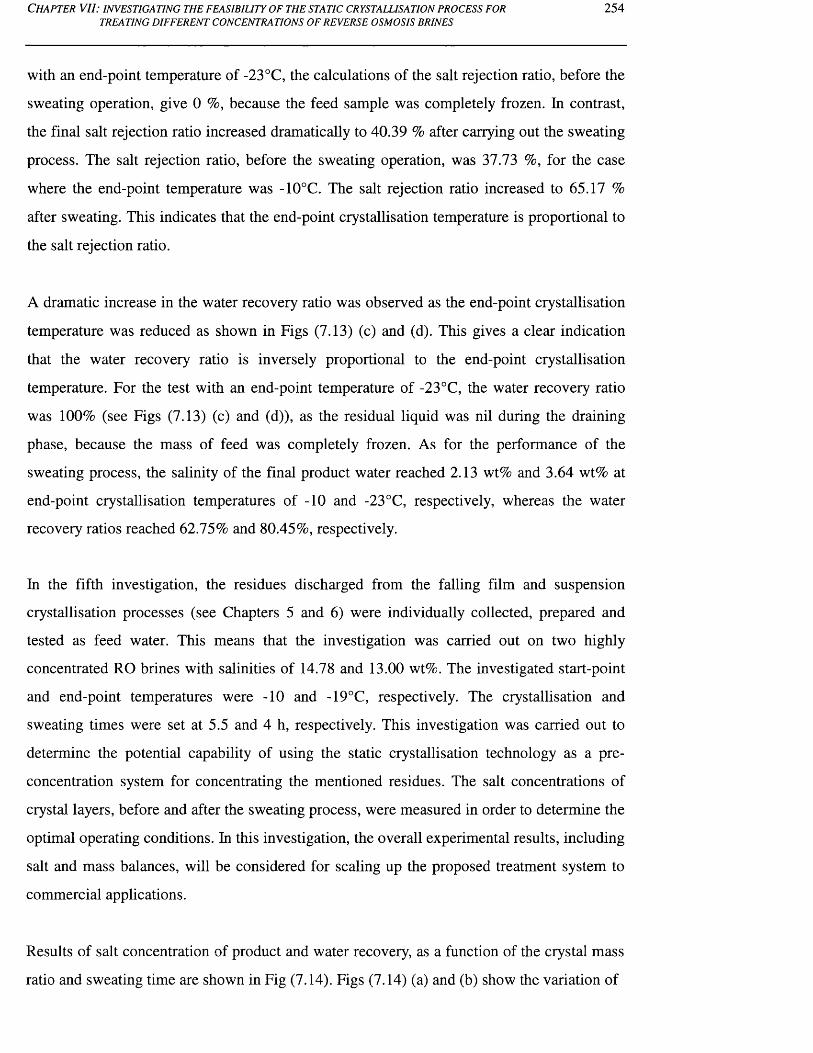
C h a p t e r V II : i n v e s t i g a t i n g t h e f e a s i b i l i t y o f t h e s t a t i c c r y s t a l l i s a t i o n p r o c e s s f o r
TREATING DIFFERENT CONCENTRATIONS OF REVERSE OSMOSIS BRINES254
with an end-point temperature of -23°C, the calculations of the salt rejection ratio, before the
sweating operation, give 0 %, because the feed sample was completely frozen. In contrast,
the final salt rejection ratio increased dramatically to 40.39 % after carrying out the sweating
process. The salt rejection ratio, before the sweating operation, was 37.73 %, for the case
where the end-point temperature was -10°C. The salt rejection ratio increased to 65.17 %
after sweating. This indicates that the end-point crystallisation temperature is proportional to
the salt rejection ratio.
A dramatic increase in the water recovery ratio was observed as the end-point crystallisation
temperature was reduced as shown in Figs (7.13) (c) and (d). This gives a clear indication
that the water recovery ratio is inversely proportional to the end-point crystallisation
temperature. For the test with an end-point temperature of -23°C, the water recovery ratio
was 100% (see Figs (7.13) (c) and (d)), as the residual liquid was nil during the draining
phase, because the mass of feed was completely frozen. As for the performance of the
sweating process, the salinity of the final product water reached 2.13 wt% and 3.64 wt% at
end-point crystallisation temperatures of -10 and -23°C, respectively, whereas the water
recovery ratios reached 62.75% and 80.45%, respectively.
In the fifth investigation, the residues discharged from the falling film and suspension
crystallisation processes (see Chapters 5 and 6) were individually collected, prepared and
tested as feed water. This means that the investigation was carried out on two highly
concentrated RO brines with salinities of 14.78 and 13.00 wt%. The investigated start-point
and end-point temperatures were -10 and -19°C, respectively. The crystallisation and
sweating times were set at 5.5 and 4 h, respectively. This investigation was carried out to
determine the potential capability of using the static crystallisation technology as a pre
concentration system for concentrating the mentioned residues. The salt concentrations of
crystal layers, before and after the sweating process, were measured in order to determine the
optimal operating conditions. In this investigation, the overall experimental results, including
salt and mass balances, will be considered for scaling up the proposed treatment system to
commercial applications.
Results of salt concentration of product and water recovery, as a function of the crystal mass
ratio and sweating time are shown in Fig (7.14). Figs (7.14) (a) and (b) show the variation of
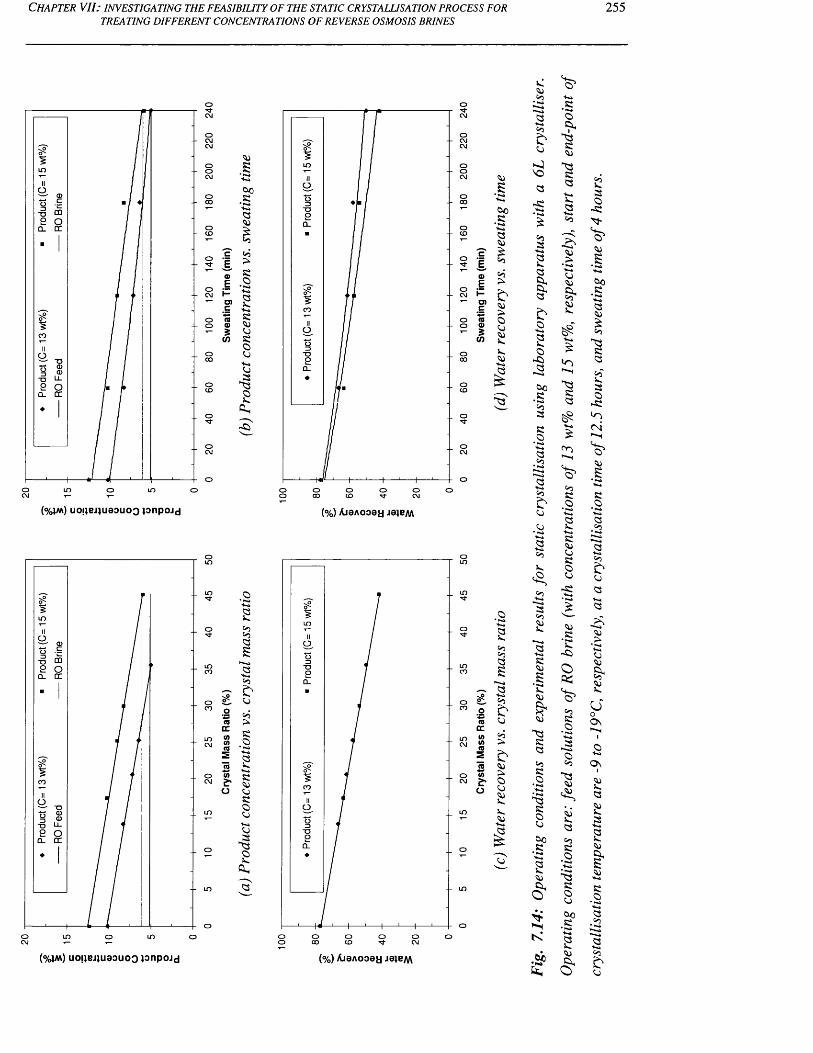
C h a p t e r V II : i n v e s t i g a t i n g t h e f e a s i b i l i t y o f t h e s t a t i c c r y s t a l l i s a t i o n p r o c e s s f o r
TREATING DIFFERENT CONCENTRATIONS OF REVERSE OSMOSIS BRINES255
Q_
OCO
in o o
(%1m) uojiej)ueouoQ lonpojd
CDCL
Q_
OC\J LO LOo o
&0•SG3<3£030 3>R•25R
3RO333"32CL2 s
o
50303a2a03£303>R•25r33ro3■<«*33
"3OfL
CL
CL
OO O00 oCO o oCM
o(%) AjaAOoaa m*IA
CL
CL
o o o o o o
3
•2a3£0350£3
o33RR3
&o
2<o3
5>0£3
032!R3
1
(%jm) uoiiejjuaouoQ lonpojd (%) AjaAooay ja}e/w
2
3
533■R’§>33
23
£o-K*ga
•23R•2+-i•22b3
2toR
-S.
R3CL3
R30 3RO"3RO3
00 •2
1 &3*K
•S>cl
+«»•2o
R3
"3R3+-»R<3
3
33
£2
£•o’""H
"3R
££
•'n
03R•24«4
2R33RO3-R•*»»
3.RR-GOCL
o03~33e3
3R33
00 .R+31 £
R33-R
'g*
&0.R
33£0 3
”3R3233
-R*o<N
203b33*-»a
■G3
2L>OOn
1
2Of\23
2s25USL2•♦oR•2+»>303
3-*«*03£3
C h a p t e r V II: i n v e s t i g a t i n g t h e f e a s i b i l i t y o f t h e s t a t i c c r y s t a l l i s a t i o n p r o c e s s f o r
TREATING DIFFERENT CONCENTRATIONS OF REVERSE OSMOSIS BRINES256
the salt concentration of the crystal layer (investigated at different feed concentrations) as a
function of the mass crystal ratio and sweating time. Agreement with the findings of the
previous investigation, concerning the influence of feed concentration, mass ratio, and
sweating time, on the product quality is clearly observed. Figs (7.14) (c) and (d) show the
effect of several influences, such as feed concentration, crystal mass ratio, and sweating time,
on the water recovery ratio. In general, the salinity of the feed waters with salt concentrations
of 13.00 and 14.78 wt% were lowered to 6.11 wt% and 5.06 wt% respectively, whereas the
final water recovery ratios reached 41.90% and 49.84%, respectively. For the case of a
treating feed with a salinity of 13.00 wt%, the salt rejection ratio, before the sweating
operation, was 21.63 %, whereas the sweating process was capable of increasing the salt
rejection up to 61.10%. In contrast, for the case of treating a feed with a salinity of 14.78
wt%, the salt rejection ratio, before the sweating operation, was 17.87 %, which was then
significantly increased to 60.46 % after performing the sweating process. The results showed
that, for the feed concentration of 14.78 wt%, the minimum sweating time that should be
considered is 4 h. This is because when the sweating time was less than 4 h relatively poor
quality product water was produced. As for the feed concentration of 13.00 wt%, the
minimum sweating time that can be considered was either 3 or 4 h. This is because the
sweating process at a running time of 3 h was capable of providing a crystal layer of near RO
brine standards (see Fig (7.14) (a)), whereas a sweating time of 4 h can further reduce the
salinity of crystal layer, leading to a final product water of near Arabian Gulf seawater, in
terms of salt concentration. Thus, production rate will be increased for such an application,
leading to a reduction in the operational cost.
7.6.4 Scaling-up o f the Sulzer static crystallisation technology
The performance data obtained from the fifth investigation provided clear evidence that the
static crystallisation process, using a single freezing stage with use of a sweating process,
was capable of producing a significant amount of seawater or RO brine from highly
concentrated RO brine, whilst simultaneously minimising the volume of the waste stream as
far as possible. The scale-up for the Sulzer static crystallisation process is straightforward,
since the commercial static crystallizer is usually built by increasing the surface area and
number of the plates. Although the fifth investigation was carried out on the laboratory pilot
scale setup using the crystalliser with a capacity of 6 L, the examined apparatus, according to
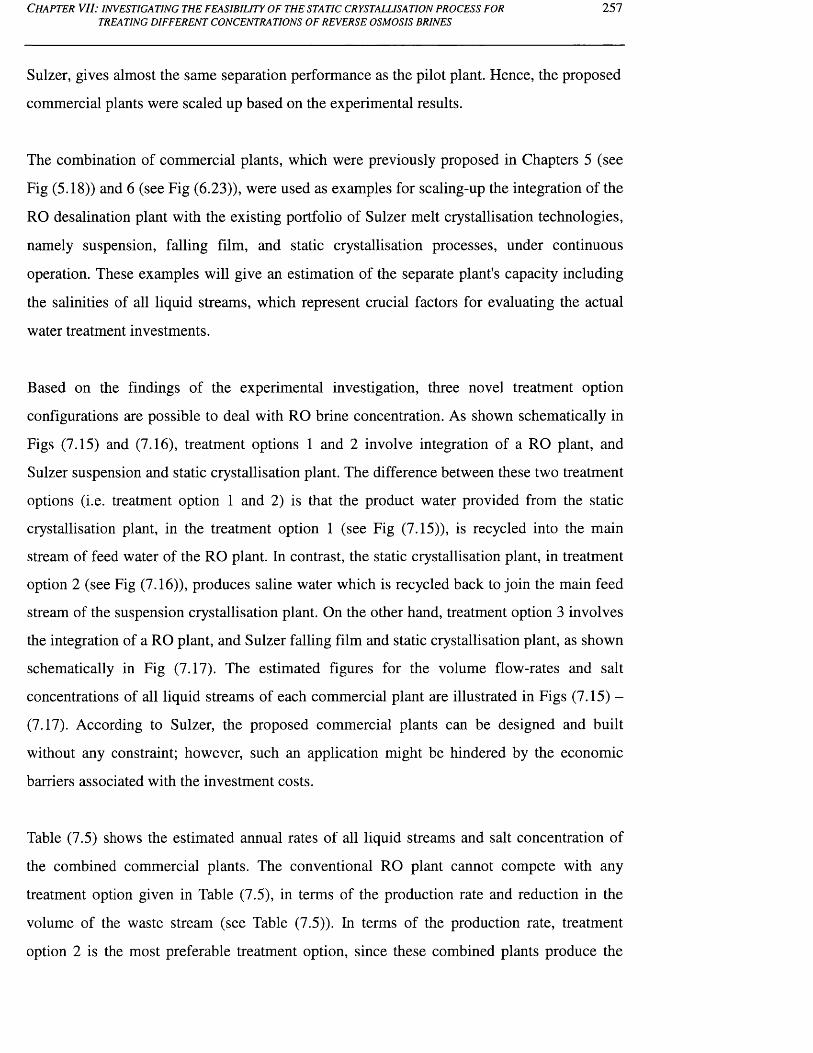
C h a p t e r V II: i n v e s t i g a t i n g t h e f e a s i b i l i t y o f t h e s t a t i c c r y s t a l l i s a t i o n p r o c e s s f o r
TREATING DIFFERENT CONCENTRATIONS OF REVERSE OSMOSIS BRINES257
Sulzer, gives almost the same separation performance as the pilot plant. Hence, the proposed
commercial plants were scaled up based on the experimental results.
The combination of commercial plants, which were previously proposed in Chapters 5 (see
Fig (5.18)) and 6 (see Fig (6.23)), were used as examples for scaling-up the integration of the
RO desalination plant with the existing portfolio of Sulzer melt crystallisation technologies,
namely suspension, falling film, and static crystallisation processes, under continuous
operation. These examples will give an estimation of the separate plant's capacity including
the salinities of all liquid streams, which represent crucial factors for evaluating the actual
water treatment investments.
Based on the findings of the experimental investigation, three novel treatment option
configurations are possible to deal with RO brine concentration. As shown schematically in
Figs (7.15) and (7.16), treatment options 1 and 2 involve integration of a RO plant, and
Sulzer suspension and static crystallisation plant. The difference between these two treatment
options (i.e. treatment option 1 and 2) is that the product water provided from the static
crystallisation plant, in the treatment option 1 (see Fig (7.15)), is recycled into the main
stream of feed water of the RO plant. In contrast, the static crystallisation plant, in treatment
option 2 (see Fig (7.16)), produces saline water which is recycled back to join the main feed
stream of the suspension crystallisation plant. On the other hand, treatment option 3 involves
the integration of a RO plant, and Sulzer falling film and static crystallisation plant, as shown
schematically in Fig (7.17). The estimated figures for the volume flow-rates and salt
concentrations of all liquid streams of each commercial plant are illustrated in Figs (7.15) -
(7.17). According to Sulzer, the proposed commercial plants can be designed and built
without any constraint; however, such an application might be hindered by the economic
barriers associated with the investment costs.
Table (7.5) shows the estimated annual rates of all liquid streams and salt concentration of
the combined commercial plants. The conventional RO plant cannot compete with any
treatment option given in Table (7.5), in terms of the production rate and reduction in the
volume of the waste stream (see Table (7.5)). In terms of the production rate, treatment
option 2 is the most preferable treatment option, since these combined plants produce the
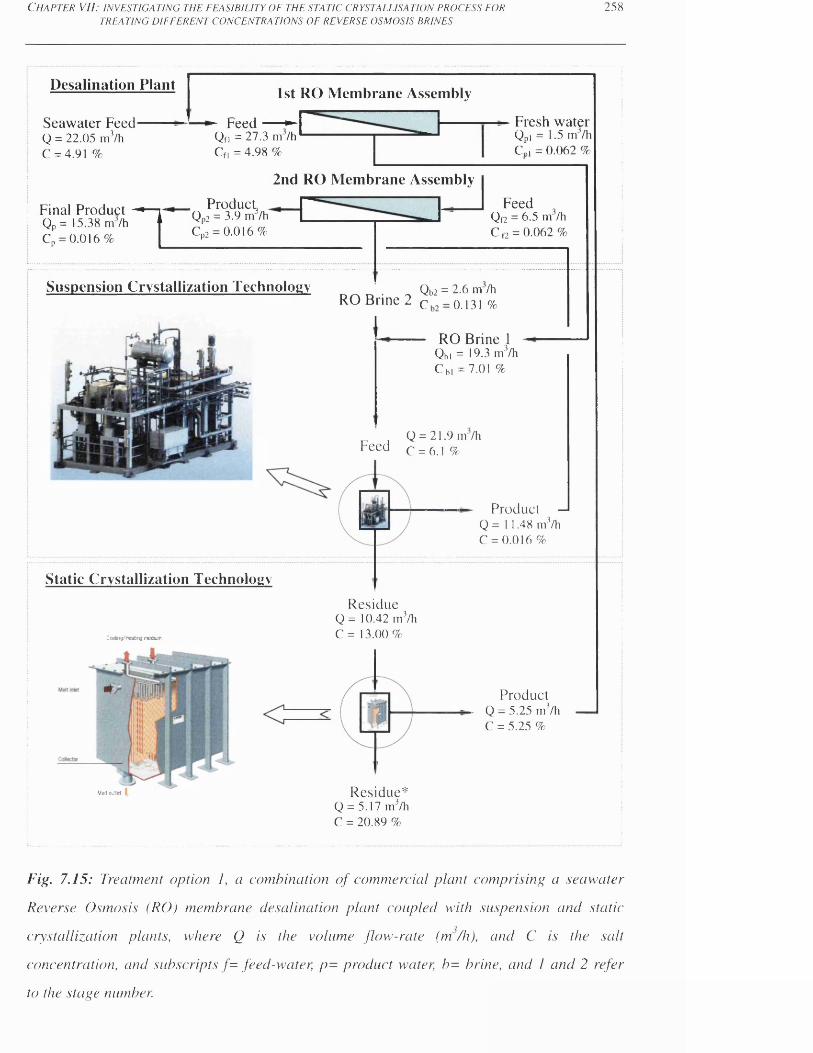
C h a p t e r V I I : i n v e s t i g a t i n g t h e f e a s i b i l i t y o f t h e s t a t i c c r y s t a l l i s a t i o n p r o c e s s f o r
TR E A TIN G D IF F E R E N T C O N C E N T R A T IO N S O F R E V E R SE O SM O SIS B R IN E S258
Desalination Plant
Seawater Feeder = 22.05 mVh C = 4.91 %
1st RO Membrane Assembly
- F e e d ►Qf) = 27.3 m /h Cfl = 4.98 %
2nd RO Membrane Assembly
Final ProductQp = 15.38 m /h Cn = 0.016% 1
. Product,Qp2 = 3.9 m /hCp2 = 0.016%
Suspension Crystallization Technology
- Fresh water Qpi = 1.5 m /h C„, = 0.062 %
FeedQ (2 = 6.5 m /h C n = 0.062 %
Static Crystallization Technology
Cocfcng/Heating medium
Melt outlet 3
Qb2 = 2.6 m /h RO Brine 2 c 0.131 %
RO Brine 1Qb, = 19.3 m3/h C b, = 7.01 %
Q = 21.9 m /h F e e d C = 6.1 %
Product — Q = 11.48 mVh C = 0.016%
Residue Q = 10.42 mVh C = 13.00%
1Product
Q = 5.25 mVh C = 5.25 %
Residue* Q = 5 . l7 m3/h C = 20.89 %
Fig. 7.15: Treatment option I, a combination o f commercial plant comprising a seawater
Reverse Osmosis (RO) membrane desalination plant coupled with suspension and static
crystallization plants, where Q is the volume flow-rate (m /h), and C is the salt
concentration, and subscripts /= feed-water, p - product water, b - brine, and I and 2 refer
to the stage number.
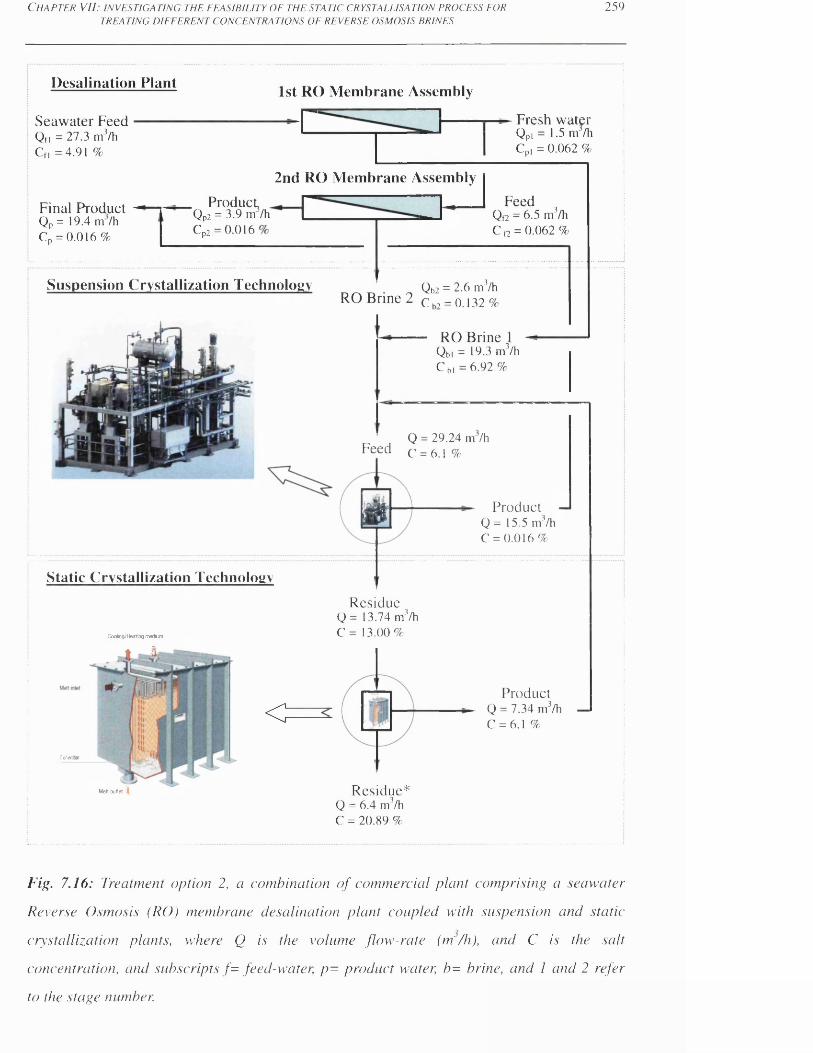
C h a p t e r V I I : i n v e s t i g a t i n g t h e f e a s i b i l i t y o f t h e s t a t i c c r y s t a l l i s a t i o n p r o c e s s f o r
TR E A TIN G D IF F E R E N T C O N C E N T R A T IO N S O F R E V E R SE O SM O SIS B R IN E S2 5 9
Desalination Plant 1st RO Membrane Assembly
Seawater FeedQf, = 27.3 mVh C f, = 4.91 %
2nd RO Membrane Assembly
Final Product -Qp = 19.4 m /h Cp = 0 .016%
. Product,Qp2 = 3.9 m /hCP2 = 0.016
Suspension Crystallization Technology
- Fresh water Q pl = 1.5 m /h Cp, = 0.062 %
FeedQo = 6.5 mVh C 0 = 0.062 %
Static Crystallization Technology
Cooing/Heating medium
4
Caller,
<C
Melt outlet |
Qb2 = 2.6 m3/h RO Brine 2 c h, = 0.132 %
RO Brine 1Qb) = 19.3 m3/h C bl = 6.92 %
Q = 29.24 m /h Feed c = 6.1 %
& Product Q = 15 .5 m3/h C = 0.016 %
Residue Q = 13.74 m3/h C = 13.00%
Product Q = 7.34 m3/h C = 6.1 %
Residue* Q = 6.4 m3/h C = 20.89 %
Fig. 7.16: Treatment option 2, a combination o f commercial plant comprising a seawater
Reverse Osmosis (RO) membrane desalination plant coupled with suspension and static
crystallization plants, where Q is the volume flow-rate (m/h), and C is the salt
concentration, and subscripts /= feed-water, p - product water, b= brine, and 1 and 2 refer
to the stage number.
C h a p t e r V I I : i n v e s t i g a t i n g t h e f e a s i b i l i t y o f t h e s t a t i c c r y s t a l l i s a t i o n p r o c e s s f o r
TR E A TIN G D IF F E R E N T C O N C E N TR A T IO N S O F R E V E R SE O SM O SIS B R IN E S260
Desalination Plant 1st RO Membrane Assembly
Seawater Feed Qf = 7.02 m’/h Cr = 4.91 %
Fresh waterQp2 = 3.9 m’/h Cp2 = 0.016%
► Feed —i Qfl = 27.3 m’/h Crl =4.91 %
Fresh water Qpi = 1.5 m /hCPi = 0.062 %
2nd RO Membrane AssemblyQo = 6.5 m /h C 0 = 0.062%
Fig. 7.17: Treatment option 3, a combination o f commercial plant comprising a seawater
Reverse Osmosis (RO) membrane desalination plant coupled with Sulzer falling film and
static crystallization plants, where Q is the volume flow-rate (m/h), and C is the salt
concentration, and subscripts f - feed-water, p~ product water, b= brine, and I and 2 refer
to the stage number.
CtaTr butoc
RO Brine 2 0 b2 - 2.6 m3/h C b2 = 0.132%
RO Brine 1Qb, = 19.3 nr’/ C bi =6.92 %
Falling Film Crystallization
Product- Q = 1.19 m3/h -
C = 6.11 %
Qc
Residue*= 1.62 m3/h = 21.16%
Coofcnq/ttealing medium
ResidueQ = 2.81 m’/h C = 14.78 %
= 23.09 m’/h = 6.1 %
Product* —Q = 20.28 m’/h C = 4.9 1 %
Static Crystallization Technology
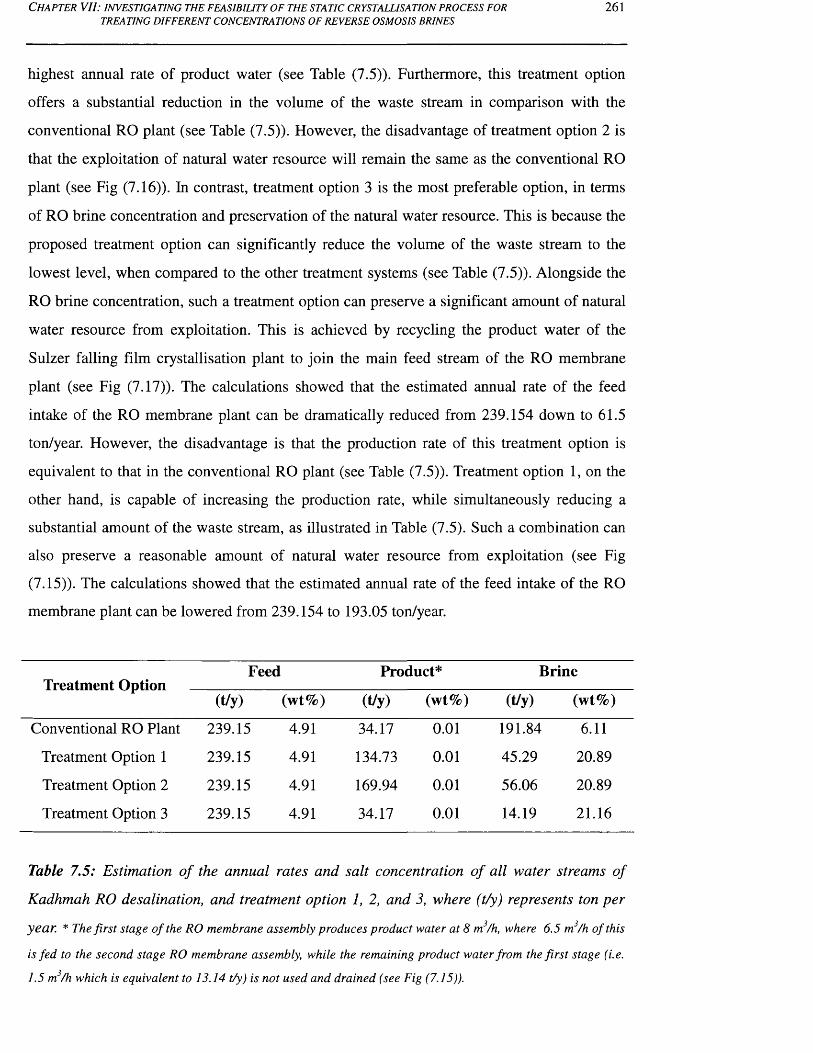
C h a p t e r VII: i n v e s t i g a t i n g t h e f e a s i b i l i t y o f t h e s t a t i c c r y s t a l l i s a t i o n p r o c e s s f o r
TREATING DIFFERENT CONCENTRATIONS OF REVERSE OSMOSIS BRINES261
highest annual rate of product water (see Table (7.5)). Furthermore, this treatment option
offers a substantial reduction in the volume of the waste stream in comparison with the
conventional RO plant (see Table (7.5)). However, the disadvantage of treatment option 2 is
that the exploitation of natural water resource will remain the same as the conventional RO
plant (see Fig (7.16)). In contrast, treatment option 3 is the most preferable option, in terms
of RO brine concentration and preservation of the natural water resource. This is because the
proposed treatment option can significantly reduce the volume of the waste stream to the
lowest level, when compared to the other treatment systems (see Table (7.5)). Alongside the
RO brine concentration, such a treatment option can preserve a significant amount of natural
water resource from exploitation. This is achieved by recycling the product water of the
Sulzer falling film crystallisation plant to join the main feed stream of the RO membrane
plant (see Fig (7.17)). The calculations showed that the estimated annual rate of the feed
intake of the RO membrane plant can be dramatically reduced from 239.154 down to 61.5
ton/year. However, the disadvantage is that the production rate of this treatment option is
equivalent to that in the conventional RO plant (see Table (7.5)). Treatment option 1, on the
other hand, is capable of increasing the production rate, while simultaneously reducing a
substantial amount of the waste stream, as illustrated in Table (7.5). Such a combination can
also preserve a reasonable amount of natural water resource from exploitation (see Fig
(7.15)). The calculations showed that the estimated annual rate of the feed intake of the RO
membrane plant can be lowered from 239.154 to 193.05 ton/year.
Feed Product* BrineTreatment Option
(t/y) (wt%) (t/y) (wt%) (t/y) (wt%)
Conventional RO Plant 239.15 4.91 34.17 0.01 191.84 6.11
Treatment Option 1 239.15 4.91 134.73 0.01 45.29 20.89
Treatment Option 2 239.15 4.91 169.94 0.01 56.06 20.89
Treatment Option 3 239.15 4.91 34.17 0.01 14.19 21.16
Table 7.5: Estimation o f the annual rates and salt concentration o f all water streams of
Kadhmah RO desalination, and treatment option 1, 2, and 3, where (t/y) represents ton per
year. * The first stage o f the RO membrane assembly produces product water at 8 m3/h, where 6.5 m3/h o f this
is fed to the second stage RO membrane assembly, while the remaining product w ater from the firs t stage (i.e.
1.5 m3/h which is equivalent to 13.14 t/y) is not used and drained (see Fig (7.15)).
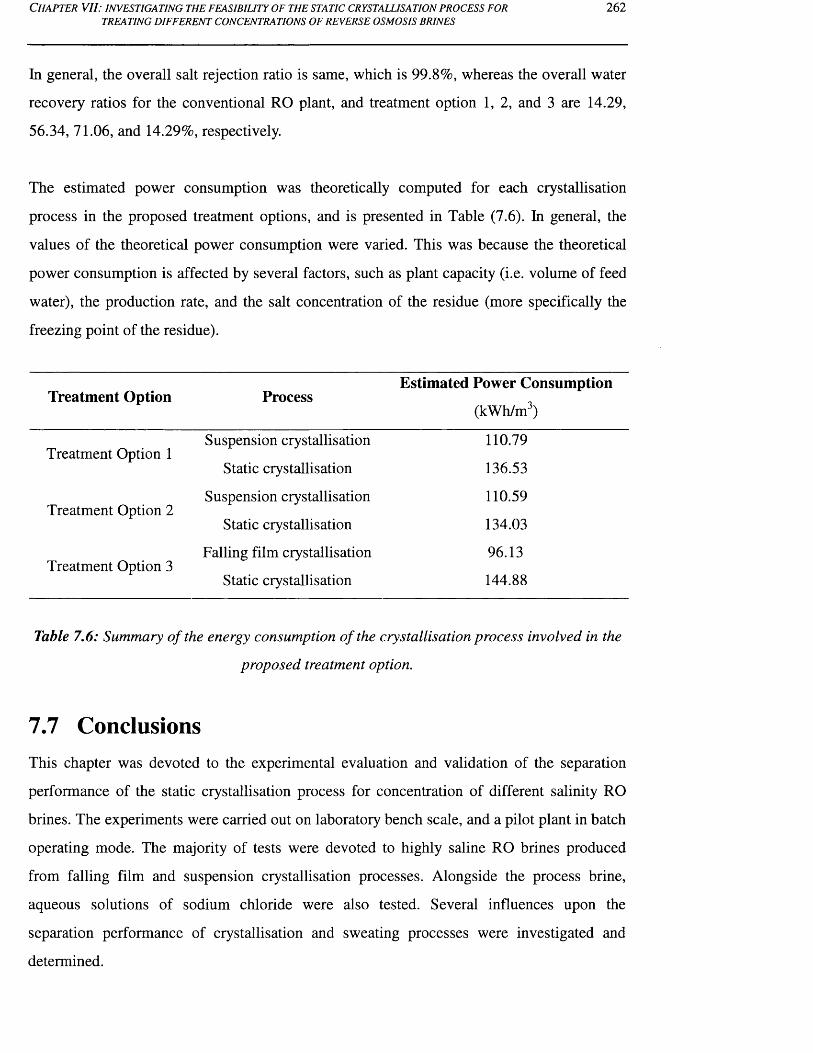
C h a p t e r V II : i n v e s t i g a t i n g t h e f e a s i b i l i t y o f t h e s t a t i c c r y s t a l l i s a t i o n p r o c e s s f o r
TREATING DIFFERENT CONCENTRATIONS OF REVERSE OSMOSIS BRINES262
In general, the overall salt rejection ratio is same, which is 99.8%, whereas the overall water
recovery ratios for the conventional RO plant, and treatment option 1, 2, and 3 are 14.29,
56.34, 71.06, and 14.29%, respectively.
The estimated power consumption was theoretically computed for each crystallisation
process in the proposed treatment options, and is presented in Table (7.6). In general, the
values of the theoretical power consumption were varied. This was because the theoretical
power consumption is affected by several factors, such as plant capacity (i.e. volume of feed
water), the production rate, and the salt concentration of the residue (more specifically the
freezing point of the residue).
Treatment Option ProcessEstimated Power Consumption
(kWh/m3)
Suspension crystallisation 110.79Treatment Option 1
Static crystallisation 136.53
Suspension crystallisation 110.59Treatment Option 2
Static crystallisation 134.03
Falling film crystallisation 96.13Treatment Option 3
Static crystallisation 144.88
Table 7.6: Summary o f the energy consumption o f the crystallisation process involved in the
proposed treatment option.
7.7 ConclusionsThis chapter was devoted to the experimental evaluation and validation of the separation
performance of the static crystallisation process for concentration of different salinity RO
brines. The experiments were carried out on laboratory bench scale, and a pilot plant in batch
operating mode. The majority of tests were devoted to highly saline RO brines produced
from falling film and suspension crystallisation processes. Alongside the process brine,
aqueous solutions of sodium chloride were also tested. Several influences upon the
separation performance of crystallisation and sweating processes were investigated and
determined.
C h a p t e r V II : i n v e s t i g a t i n g t h e f e a s i b i l i t y o f t h e s t a t i c c r y s t a l l i s a t i o n p r o c e s s f o r
TREATING DIFFERENT CONCENTRATIONS OF REVERSE OSMOSIS BRINES263
In general, the results proved that the static crystallisation process, within a single stage
without a sweating process, was able to concentrate a significant amount of RO brine while
producing saline water of near Arabian Gulf seawater quality. As for the experiments with
highly concentrated RO brines, the results proved that the treatment system, for a single
stage, was not able to lower the tested feed down to RO brine without using a sweating
process. By optimising the crystallisation and sweating operations, the product water salinity
was improved and lowered to RO brine and seawater levels. Therefore, the results were
highly encouraging, and suggested the application of the static crystallisation process for
concentrating highly saline RO brine. Thus, the static crystallisation process was scaled up
and combined with a commercial RO plant and falling film crystallisation plants for
minimising the waste stream and maximising the production rate and/or preserving natural
water resource. Simple calculations were made to estimate the power consumption for
different treatment systems. The power consumption of the static crystallisation was varied
from 134 to around 145 kWh/m in such an application.
C h a p t e r V II I : C o n c l u s i o n s a n d R e c o m m e n d a t i o n s 264
C h a p t e r VIII:
C o n c l u sio n s a n d R e c o m m e n d a t io n s
The primary concern of this study was to seek the most feasible and applicable freezing
desalination technologies that are potentially capable of desalting and/or concentrating the
dissolved ionic content of liquid streams, especially those brines causing severe pollution.
Therefore, various forms of melt crystallisation processes, namely solid layer and suspension
crystallisation, were considered and experimentally investigated for such an application.
These experimental studies were intended to evaluate and validate the separation
performance of each treatment process. In general, the experimental investigation was carried
out at both laboratory bench scale and using pilot plant with aqueous solutions of sodium
chloride and process brines as feed samples. The experimental work also focused on a
number of important parameters influencing the separation performance of the investigated
treatment systems.
At the moment there is no best freezing desalination technology which can be considered
among the investigated processes because each examined treatment system has its own
advantages and disadvantages. For example, Table (8.1) shows the general comparison of the
characteristics of the solid crystal layer and suspension crystallisation processes including the
pros and cons of each process. In addition to this, determining the best desalination by
freezing process will vary from one application to another depending on a number of
important factors, such as physiochemical characteristics of feed water (including salinity
and hardness level), desired product concentration, volume of water to be treated, residue
volume and concentration, the solubility limit of some salts, eutectic temperature of salts,
final brine disposal method, site-specific conditions, the federal effluent limitation
guidelines, and capital and operational costs. However, when the selection of the treatment
option that will be considered is based on the quality of product water, such as obtaining
drinking water, then the best selection of desalination by freezing process would be the
suspension crystallisation. On the other hand, the solid layer crystallisation processes (e.g.
falling film and static crystallisation processes) were found as the best treatment options
when the selection that will be considered is based on preserving a large volume of natural
water resource from exploitation and minimising the waste stream to the minimum level. In
general, Table (8.2) summarises the performance of the examined melt crystallisation
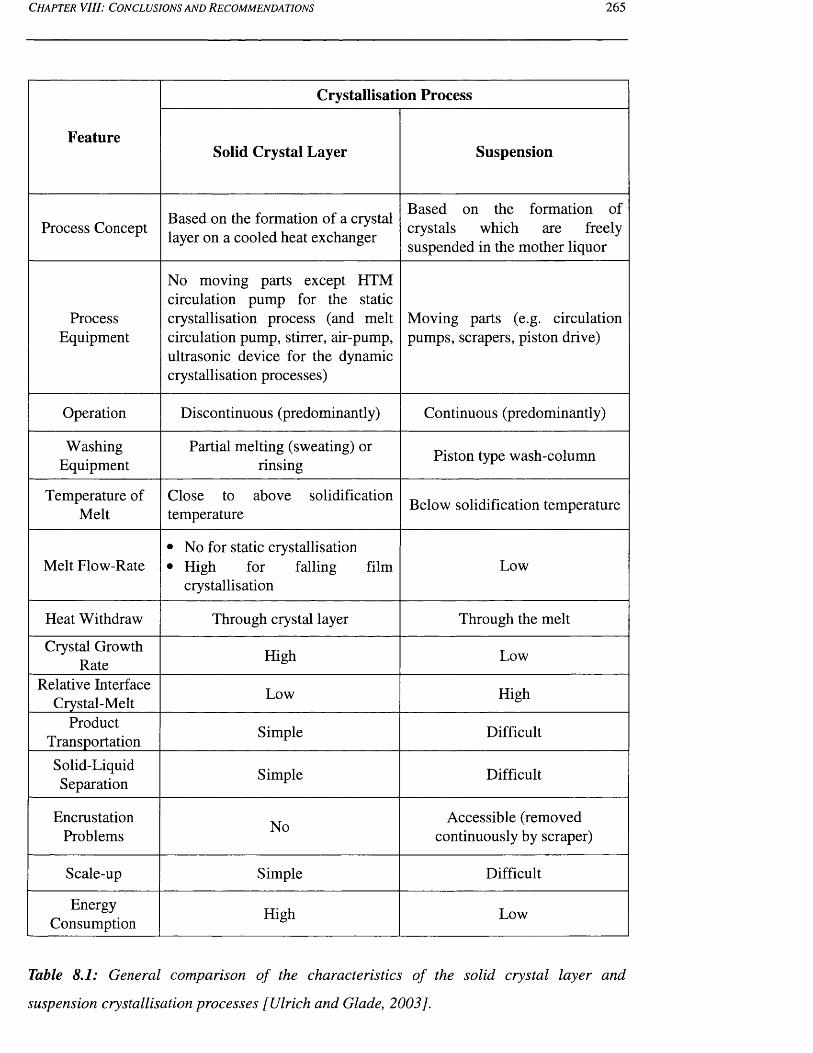
C h a p t e r V II I : C o n c l u s i o n s a n d R e c o m m e n d a t i o n s 265
Feature
Crystallisation Process
Solid Crystal Layer Suspension
Process Concept Based on the formation of a crystal layer on a cooled heat exchanger
Based on the formation of crystals which are freely suspended in the mother liquor
ProcessEquipment
No moving parts except HTM circulation pump for the static crystallisation process (and melt circulation pump, stirrer, air-pump, ultrasonic device for the dynamic crystallisation processes)
Moving parts (e.g. circulation pumps, scrapers, piston drive)
Operation Discontinuous (predominantly) Continuous (predominantly)
WashingEquipment
Partial melting (sweating) or rinsing Piston type wash-column
Temperature of Melt
Close to above solidification temperature Below solidification temperature
Melt Flow-Rate• No for static crystallisation• High for falling film
crystallisationLow
Heat Withdraw Through crystal layer Through the melt
Crystal Growth Rate High Low
Relative Interface Crystal-Melt Low High
ProductTransportation Simple Difficult
Solid-LiquidSeparation Simple Difficult
EncrustationProblems No Accessible (removed
continuously by scraper)
Scale-up Simple Difficult
EnergyConsumption High Low
Table 8.1: General comparison o f the characteristics o f the solid crystal layer and
suspension crystallisation processes [Ulrich and Glade, 2003].
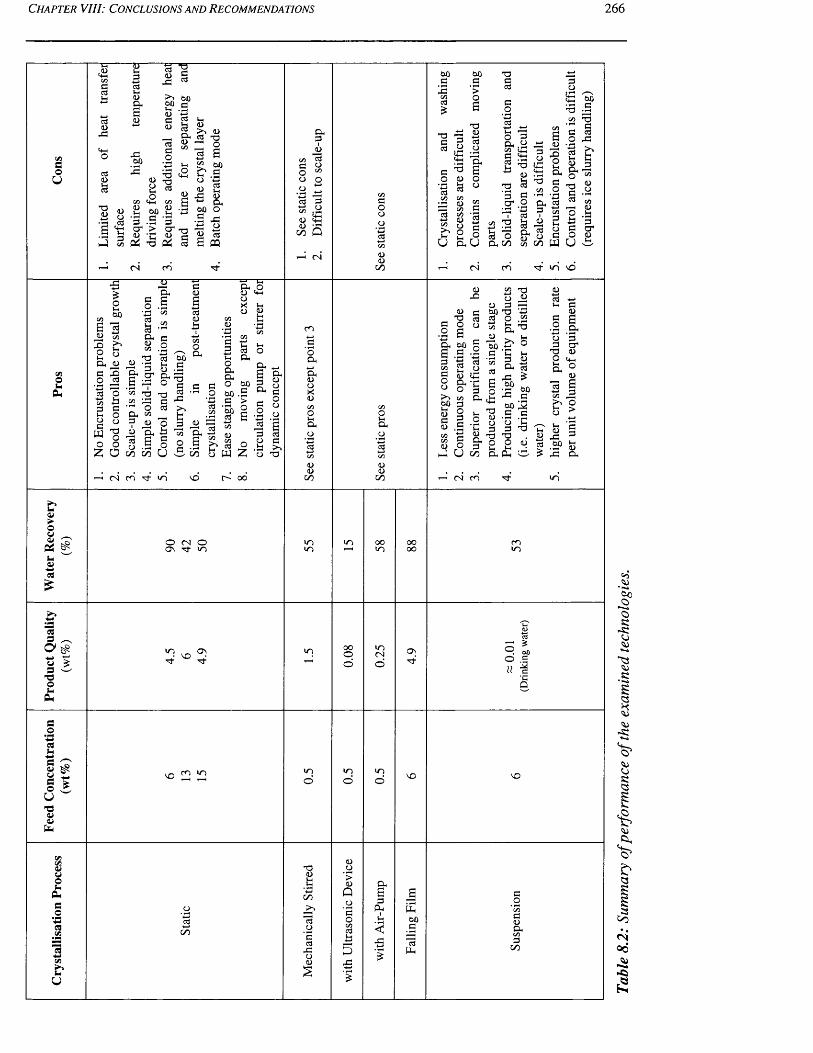
C h a p t e r V II I : C o n c l u s i o n s a n d R e c o m m e n d a t i o n s 266
so
U
343
X
X43
l-i33I-43g
643
3 ^5
X
>-> s>000 ci-h ■43 3 43
4 30 0
3c9g43GOcd
3 O
'■d t !
43x '33 S ’ 5 G
<N
CO <£ » 00
3
t-i .3
— 3
X P i 3
4) G33 3O ■3 - 28 co 300 C 23 o 1/1
\8 o o3l-i4) ■ 2 ^
G 3 3O t« .2
X 43 do 4) v33 00 P
m4343
00
003
X33
003
’ >O8
X43■4—»
a
I*oo
X33
3O
OGGO83G
5J3 00' - 3 £
CO X 3
3 3O 43
33 <o G3 & ‘3
££. « 3h 2 oU ftU
go X
S =5a oo
X jG 43U 733 .2 € ?
* XO h «*U r23 C/D
s43 _
2 2 !■§■ l l■3 3
2 .Ss3cr<u
3- »0 VO
oI*G
£ol-l0 0co
8 * 3
X I2 & o , 43
8O
3o3G43
I *
<*> - 3 3
3 X )o
3 Os h 2 §* XG •§ o o
5 ? O
3 O -hJ2 73 & c r g S X O« 3 T3 co 33 8 • "0 3G c "5 3i
O ^ 3 O
00
oO h
G h o43 <4-1o* 5ri„ g
a ) o
" g £
2 § c/o U
(N m ^ io
X
§ . s43
3 43G
O 6
3 t/DX>
83■4—»1-HO G G
3 © O too G 32 ‘So
c/3
S- o G
G _ 8 G
a* s. S
C 1o G
3
3 .hZ O X
OG
G(UoX0)
Go
4343
00
4)X
^ 3 3 O o
G 2
cf .23 3 &5 O Cm2 g -eo o g
G
I-*-* co 00 3 ■ o
X0 0
G -fa
Go
2 o43 .300 3co 5 43 O
G T !
.H-4 WX 3 4) - 3 o o 3 3
X X O O
G U 0 0 G G '
T 3 43i n 3
1-1XCO 8
X _ o
1-H oO 3tH X03 o3 G
0 0 * 3•4-^
3 CO
t-H3 o
-CX P '
1-H43
8 X4) 3 o p
d - X
8438G
' 3O*4)
>►>U4>
L O <N O O n ■cf c n
m> n
o oin mi n
3
O ' #
1 1of*G
C#o*G3
I?1 1V'O0)4>
u
• n V D 3 - 3 -
o oo i n(No
OV3 "
Oo
u
i no
i no
i no
3!>D
T3<D2
33
XO4)
>4)
PG83
GI!-(
<x
Goo3
3G
3Oco34)Gco3OO
Table
8.2
: Su
mmar
y of
perfo
rman
ce
of the
ex
amin
ed
tech
nolo
gies
.
C h a p t e r V I I I : C o n c l u s i o n s a n d R e c o m m e n d a t i o n s 267
technologies at various feed water concentration ranging from 0.5 to 15 wt%. Pros and cons
for each given treatment system are also covered in Table (8.2). Table (8.3) summarises the
performance of a number of the proposed treatment options by combining the melt
crystallisation technologies with RO plant. These treatment options were introduced for
costal and inland desalination plants aimed at increasing the water recovery and/or
minimising the waste stream to the minimum level. In general, treatment options 3, 5, and 6
are the best selection for increasing the drinking water production and simultaneously
decreasing the waste stream to certain limits, whereas treatment options 2, 4, and 7 are the
best selection for only decreasing the waste stream to minimum levels at constant production
rate. However, treatment option 4 has a significant disadvantage which is that the production
rate of the static crystallisation process is low when compared to falling film crystallisation.
8.1 Static and Agitated Crystallisation ProcessesThis study evaluated the validity of static crystallisation processes, with and without
agitation systems for saline water applications. The objective of this study was to verify
several influences, namely feed concentration, crystallisation temperature, crystallisation
time, and agitation rate, upon the salt rejection and water recovery ratios. This investigation
was carried out on a single freezing stage, without use of a sweating process. The tested
agitation systems were a bubbling process, a mechanically stirred system, and an ultrasonic
process. Aqueous feed solutions of 0.5, 3.5, and 7.0 wt% sodium chloride were used and a
phase diagram was established for the freezing points of the investigated feed samples.
The results of the static crystallisation experiments showed that the salinity of product water
is very sensitive to changes in crystallisation temperature. This was because the salt
concentration of the product was relatively poor for all feed samples, including low feed
concentrations when the crystallisation temperature was -11.5°C. When the crystallisation
temperature was increased to -4.8°C, a dramatic decrease in product salinity was observed. In
fact, the salt rejection ratio was slightly improved with increasing crystallisation time (in the
cases where crystallisation temperature was -11.5°C). This was because the heat transfer rate
was reduced as the thickness of the crystal layer increased. Thus, this action leads to lower
crystal growth rate as the crystallisation time is increased. The product concentration was
found to be proportional to the feed concentration, whereas the water recovery ratio was
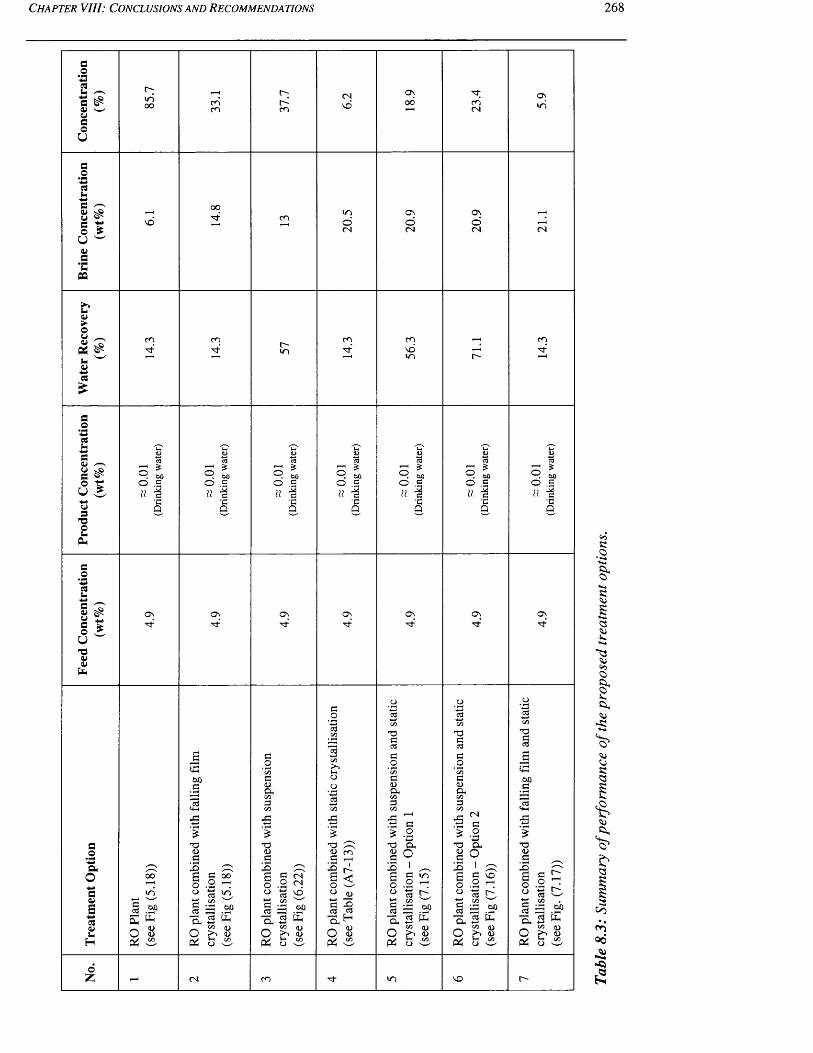
C h a p t e r V I I I : C o n c l u s i o n s a n d R e c o m m e n d a t i o n s 268
s#o*44rtIn4-1G0)uCo
U4>C
‘EM
C3£
inoo cn
cn
oo3
cn cn3
r-cn
in
(NVO
oCO
CO cnNO1—H m
O nOO
OCO
mCO
ONoCO
O nin
cn-3-
a#o'-Mau44C<UuSo
U44u9
T3O
q w° ■§h I
'CQ
oon
so5 *° 4u %
•cQ
q ooO eH ■c
Q
od
oou
g 'T:<U ^2 *- c ^ o sS
UT3<v<ufa
On
■3"O n ON
•3"ON3"
ON■3"
ON3"
ON3"
soa
O44C1)S449<U<4
H
oz
s3faofa
oofa
003
X
£T3<ufi1oo-4—>e
ELOfa
3 00.2 ^
«1 *2, C/5 —
3 .SP 3 faC« (U D
3_gon3Ofa
X■*—»
£T3a)3
XSooc03
Uofa
>5l-log3
T3333oCZ)s<Dfac/33on
X 1-1 X 3 £ .2
T32 ^ 3 r-H
« dC/J
3 .2?fa-t—»co d >■> mu d
X6oo3_3' f a
Ofa
T3<U3X6Oo
faofa
fa01 ^ 3 m2 ^on
3 ■£? 3 fa
'a3<33Oon3<UfaC/33on
X
I33o3
XSoo
(N3o*44fao3 X 2 ’_H s eSco
X O033 . ,fa B fa1/1 <Dfa b d
T333
«4H003
3£
T3<U_S
'Ioo 3
3 3 .3?fa B fa44 1/5 OO ?? <u fa o d-
e*2
§•*4R
a>4+4
co0
1<50
-R44
oRa
Si,' o 5
<3
R00
oo
e2
C h a p t e r V II I : C o n c l u s i o n s a n d R e c o m m e n d a t i o n s 269
found proportional to the crystallisation time and inversely proportional to the crystallisation
temperature and feed concentration.
In general, the experimental results indicate that the agitation systems can improve the salt
concentration of product water for feed salinities of 3.5wt% and below. For the purpose of
scaling up, the bubbling process seems to be the most feasible technique, since this method
can be easily installed in a commercial static crystalliser.
Although this study was carried out within a limited operating condition (and without a
sweating process), the results were highly encouraging. Hence, the assessment of agitated
crystallisation process should be further investigated with a wider range of operating
parameters and limits, as well as applying the sweating process aimed at improving the
separation performance. The recommendation is for the crystalliser capacity to be increased
to a suggested range of 1.5 to 6.0 L, taking into account that the investigated agitation system
might be changed to higher agitation rates corresponding to the crystalliser's capacity.
Detailed technical-economic analysis and studies are recommended to be taken into
consideration in future research to estimate the actual power consumption of the investigated
agitated crystallisation process and compare the figures obtained to those for the static
crystalliser.
8.2 Ice Maker TechnologyAn ice maker machine, which utilises the falling film crystallisation principle, was evaluated
as a water treatment system for saline water applications. The experiments were limited in
their number, but were enough to draw clear and reasonable conclusions that achieved the
objectives of this study. Different parameters influencing the separation performance were
investigated using the ice maker.
Within the domain studied, the experimental investigation gave a clear indication that the
feed concentration has a significant influence on the salt rejection and water recovery ratios.
For the feed samples with low salt concentrations, the salt rejection and water recovery ratios
were strongly dependant on the ice thickness and flow-rate. For the feed samples with high
salt concentration, only the water recovery ratio was influenced by ice thickness and flow-
C h a p t e r VIII: C o n c l u s i o n s a n d R e c o m m e n d a t i o n s 270
rate. The salt rejection ratio did not significantly changed within the predetermined values of
the influential operating parameters.
The power consumption, on the other hand, was found to be strongly dependant on three
important factors, namely the water recovery ratio, and the salt concentrations of the feed and
product water. The production rate dramatically increased when producing a final product
water that is comparable to seawater quality. This leads to a significant reduction in the
power consumption when compared to the seawater desalination application. In order to
estimate the actual power consumption of the treatment/desalination system using the
adopted ice maker technology, detailed technical-economic analysis and studies on industrial
pilot scale must be taken into consideration in future research. The water recovery, salt
rejection, and concentrations ratios should also be considered as influential parameters in
future power requirement analysis. Furthermore, other associated factors, including capital
equipment and costs, power requirements, and operating labour, are highly recommended for
future consideration, in terms of technical-economic studies.
Multistage processing using the icemaker was also investigated. The results showed that the
ice maker was not able to reduce the salinity of seawater down to potable water (at 500 ppm)
or even down to irrigation water (at 1,500 ppm) levels within three stages. Within the studied
domain, the tested ice maker technology cannot compete with conventional seawater
desalination technologies for producing potable or irrigation water, however, the separation
performance of the ice maker, in terms of water recovery and salt rejection ratios, might be
improved by investigating the studied and other influential parameters within a wider range
of operating limits. Also, according to Ulrich and Glade (2003), the impurity within ice
crystals can be significantly reduced by conducting post-crystallisation treatment, such as
rinsing, diffusion washing or sweating processes. Therefore, these post-treatment processes
are highly recommended as the subject of further research. The application of the ice maker,
and more specifically the falling film crystallisation process (involving both crystallisation
and sweating operations) has to be well optimised, in order to find out the actual technical
and economical feasibility in the field of seawater desalination.
RO brine concentration experiments were also tested, and the ice maker was found to be
effective in removing significant amounts of dissolved salt from various concentrated
C h a p t e r V I I I : C o n c l u s i o n s a n d R e c o m m e n d a t i o n s 271
solutions of RO brine over four successive freezing stages. The initial experimental results
suggested that four-stages at least were necessary to lower the concentration ratio to less than
16%, for a water recovery ratio above 84%. The quality of the overall product water was
comparable to the RO feed (i.e. Arabian Gulf seawater), with respect to the salt
concentration, without having the need to use post-treatment crystallisation processes, such
as sweating, rinsing, and washing. This means that the treated waters can easily be further
desalted by recycling the treated water back to join the main feed stream of a RO plant. In
general, this investigation proved that the adopted treatment system and technology is
encouraging and highly attractive for concentrating RO brines.
The simultaneous production of treated water and concentration of RO brine represents a
major advantage of this novel technology. Moreover, the tested ice maker technology is by
far a less complicated process, when compared to the conventional freezing desalination
technologies, since mechanical moving parts (apart from the circulation pump) and the
complications of separation and post-treatment crystallisation processes are eliminated.
Furthermore, the adopted technology can be easily scaled-up for commercial applications.
Although commercially-available ice making technologies are not designed for saline water
applications, minor modifications made to existing designs will enable a change in
application. By combining the facilities of RO membrane technology with those of the ice
maker, or similar technology, great benefits would be rendered for inland RO desalination
plants. For instance, preserving the limited amount of natural water resources, reduction in
chemical additives and cost of pre-treatment, reduction in the capacity and cost of intake
facilities, a significant reduction in the appearance of viruses, bacteria, and colloids,
significant reduction in the volume of waste streams causing the most severe pollution
problems, enhancing the safe disposal methods, reduction in the capacity and water treatment
costs of the subsequent concentration processes and/or disposal system. Hence, the examined
treatment system may compete with other conventional treatment/concentration
technologies.
The majority of previously published articles have focused on seawater desalination by
freezing to produce a product of near drinking water quality, whereas concentrating RO
brines by freezing to produce a final product water of near brackish water or seawater
standards has, to the best knowledge of the researcher, never been investigated and was
C h a p t e r V II I: C o n c l u s i o n s a n d R e c o m m e n d a t i o n s 272
overlooked. Therefore, special attention should be given to such an application. Furthermore,
this study must be taken into consideration for future research with use of an industrial scale
plant to evaluate and validate the actual performance and efficiency of salt separation and
water recovery ratio. Therefore, attention must be given to ice-making machines and similar
technologies in future research.
8.3 Sulzer Falling Film Crystallisation ProcessThis study assessed and validated the performance of solid layer crystallisation and sweating
processes, using Sulzer's falling film crystallisation pilot plant, for desalting and
concentrating different concentrations of process brines, including Arabian Gulf seawater
and RO retentate. Unlike the conventional ‘desalination by freezing’ technologies, the
examined treatment process does not include the complicated solid-liquid separation and
washing equipment, as it relies on the freeze-melt principle.
Due to the absence of appropriate data on seawater and brine applications, different
parameters influencing the crystallisation and sweating separation efficiencies were
investigated using the pilot plant operating in batch mode. The experimental investigation
provided a clear indication that a number of parameters, namely feed concentration,
crystallisation temperature, cooling rate, and average growth rate, had a strong influence on
the separation performance of the crystallisation process, in terms of salt rejection ratios. The
purity of the product water was found to be proportional to the crystallisation temperature
and cooling rate, and inversely proportional to the feed concentration and average growth
rate. The purification efficiency of the sweating process, on the other hand, was found to be
strongly dependant on four important factors, namely the salt concentration of the crystal
layer, sweating rate, sweating time, and the crystal mass ratio. The purity of the crystal layer
was found to be proportional to the sweating time and crystal mass ratio, and inversely
proportional to the crystal layer salinity and sweating rate.
The separation performance of a multistage process, using two successive freezing stages,
was investigated with the sweating process for the seawater desalination application. The
results of the experimental investigation were somewhat encouraging. Although the water
recovery ratio was reasonable, the salt concentration of the final product of the rectification
stage was relatively poor when compared to drinking water. Therefore, the quality of the final
C h a p t e r V I I I : C o n c l u s i o n s a n d R e c o m m e n d a t i o n s 273
product water may be improved by further optimising the temperature and rates of
crystallisation and sweating processes. This is because the mentioned parameters greatly
influence the purification efficiency of crystallisation and sweating processes; otherwise, a
second rectification stage must be taken into consideration to achieve further purification.
The overall production rate of the multistage process, on the other hand, is a critical and
crucial factor for the assessment of the economical feasibility of the proposed treatment
system. Therefore, the overall running time and water recovery ratio of the multistage
process must be maintained at reasonable levels; otherwise a significant increase in the water
treatment costs will be expected. Therefore, these key parameters must be considered and
applied under strict control in future research in the field of seawater desalination. The
preliminary results concluded that the Sulzer falling film crystallisation technology will be
hindered by process reliability and economic aspects in seawater desalination applications.
As a result, the proposed treatment option cannot compete with the available conventional
water desalination technologies, e.g. RO membrane seawater and thermal desalination
technologies.
As for the RO concentration experiments, the experimental data proved that a single freezing
stage, without use of sweating process, was capable of producing a significant amount of
product water, and simultaneously reducing the volume of RO retentate to a minimum as far
as possible. The quality of the final product water (in terms of salinity and ionic composition)
was found to be comparable with Arabian Gulf seawater, and was ready for immediate re-use
as feed water for a RO membrane desalination plant. Based on the experimental results, a
maximum water recovery ratio of 86% was achieved, whereas the theoretical calculations,
using mass and salt balance formulas, determined that the maximum water recovery ratio can
be increased to 92%. In order to increase the experimental water recovery ratio, the
commercial Sulzer plant should be modified and equipped with one of the following
suggested equipments; (i) Replacing the existing pump with another type of pump that can
be run dry without exposing the pump to the risk of damage, taking into account that the
selected pump must be suitable for the chemical characteristics of the RO brine, and can be
used under the operating conditions of Sulzer’s plant. Thus, the pump can be operated at the
minimum level of water in the collecting tank during the crystallisation process; (ii) changing
the design of the existing collecting tank by modifying the shape of the lower surface of the
tank into a conical shape that fits the size and shape of the existing melt circulation pump.
C h a p t e r V I I I : C o n c l u s i o n s a n d R e c o m m e n d a t i o n s 274
The conical shape will help to receive and gather a greater amount of melt, leading
eventually to extending the operation of the pump during the crystallisation process to
recovering more crystal mass, i.e. maximising the water recovery ratio and minimising the
water level in the collecting tank.
By concentrating RO brine in a single freezing stage without use of the sweating process, a
number of important advantages can be rendered to the Sulzer plant; these are (a) the
sweating process will be completely eliminated from the freezing stage, so there is no
product mass loss i.e. crystal mass ratio will be neglected. As a result, the crystal layer will
be maintained at maximum mass; (b) the time retention of the freezing stage will be
substantially reduced, since the partial melting process will be carried out in the fastest
possible way, and the production rate will be dramatically increased; and (c) additional
power consumption of the sweating process will be avoided.
The experimental results gave a clear indication that the Sulzer technology can be operated
under any operating conditions, within the domain studied, as long as the desired quality of
product water is equivalent to Arabian Gulf seawater, i.e. feed water of a RO plant. As a
result, influencing factors, such as crystallisation temperature, crystallisation time, cooling
rate, and average growth rate, are no longer sensitive to the product quality in such an
application. This allows the treatment system to be run at a wider range of operating limits
for the RO brine concentrations. However, low operating crystallisation temperatures and
rates may be limited by operational water treatment costs.
In general, the performance data of the proposed Sulzer plant was highly encouraging in
reducing the volume of the RO retentate to a minimum, and substantially increasing the
volume of treated water. Therefore, the Sulzer plant might be competitive with other
treatment systems used for RO brine concentration. The advantages of the Sulzer plant are
absence of pre-treatment and post-treatment systems, absence of chemical additives, absence
of moving parts (apart from melt and HTM pumps), absence of complicated separation
equipment, process simplicity, ease of operation and maintenance, and less susceptibility to
the major technical limitations in seawater desalination plants, such as scaling, fouling and
corrosion. As for the economical aspect, lower operational costs can be achieved, since the
latent heat of fusion of ice is one seventh for boiling or distillation processes, whereas the

C h a p t e r VIII: C o n c l u s i o n s a n d R e c o m m e n d a t i o n s 275
capital cost can be substantially lowered by using low-cost materials, such as plastic.
Furthermore, ease of operation and process simplicity reduce the labour costs substantially,
while ease of maintenance and lower maintenance costs due to absence of complicated
separation equipment and moving parts dramatically reduces the maintenance costs.
The examined pilot plant was scaled-up according to the performance data obtained from
experiments, in order to integrate the commercial falling film crystallisation plant with the
Kadhmah RO membrane desalination plant. Sulzer confirmed that the proposed commercial
falling film crystallisation plant can be built without any technical problem. Such a
combination offers great advantages, including: preserving natural water resource from
exploitation and minimising the volume of waste stream. In addition to this, the combined
plant offers number of great benefits to the desalination plant, which will be given in section
(8.5)
As treatment of RO retentate is a new application for the Sulzer falling film crystallisation
process, the assessment and verification of the performance of the examined pilot plant
combined with actual RO plant should be considered and studied in continuous operating
mode in future research. This research area should be given special attention due to the
extensive use of natural water resources in water desalination plants, and more specifically in
inland RO desalination plants.
The separation efficiency of feed and rectification stages was assessed with the use of a
sweating process for desalting RO brine. The results of the product water obtained from the
feed and rectification stages were found to be relatively poor, when compared to drinking
water standards. Since the crystallisation and sweating experiments were carry out with a
limited number of key operating parameters, further experimental investigation is
recommended for a wider range of parameters in future research. The suggested key
parameters for the crystallisation experiments are feed concentration, crystallisation
temperature, cooling rate, and average growth rate. The suggested key parameters for the
sweating experiments are the salt concentration of the crystal layer, sweating rate, sweating
time, and the crystal mass ratio. On the other hand, the separation performance of the
stripping stages was investigated with use of the sweating process for concentrating and
treating the highly concentrated solution of RO brine. The results of the experimental
C h a p t e r V I I I : C o n c l u s i o n s a n d R e c o m m e n d a t i o n s 276
investigation for the stripping stage were not encouraging. This was because the stripping
stage was not able to reduce the concentration of product water down to RO feed or RO
brine salinities. In fact, the quality of the product water of the stripping stage was
significantly poor, as the product quality was comparable to the feed water of the stripping
stage. Therefore, the performance results obtained provided clear evidence that the Sulzer
falling film crystallisation would not be an ideal process for a stripping stage, because the
technology cannot deal with a highly concentrated solution of RO brine.
Throughout the experimental investigation with feed and rectification stages, scaling and
fouling problems were not visually observed, which was confirmed through the results of
chemical analysis for all liquid streams. However, precipitation of solid salts was visually
observed in the stripping stage and the results of water chemistry analysis had confirmed that
there was loss in some ions. This was due to several factors, such as low crystallisation
temperature (which was lower than the eutectic temperature of NaCl salt), feed water with a
high TDS value, and high levels of minerals including hardness ions. Therefore, these factors
must be taken into consideration in future research, in order to avoid the precipitation of
solid salts in the stripping stage. Suggested solutions are reducing crystallisation temperature,
higher cooling rate, increasing sweating rate and time, and increasing mass crystal ratio. In
addition, in order to collect the precipitated solid salts in a collecting tank, a mesh filter
strainer screen is recommended to be installed in the collecting tank. The precipitated solid
salts can be easily drained with the residual liquid under the influence of gravity by means of
a drain valve.
In general, the laboratory investigation confirmed that this Sulzer falling crystallisation
technology would again be an ideal treatment system for concentrating RO brines rather than
producing drinking water.
8.4 Sulzer Suspension Crystallisation ProcessThe primary concern of this study was to evaluate the technical feasibility of using
suspension crystallisation technology as a treatment system for desalting and concentrating
RO retentate.
C h a p t e r V I I I : C o n c l u s i o n s a n d R e c o m m e n d a t i o n s 277
Initial trial tests were conducted on a suspension pilot plant operating in batch mode. For the
optimised pilot plant operation, the overall product water recovery and concentration ratios
were around 41% and 59% respectively, for the actual test, and were in the range of 53% and
47%, in the case of the commercial plant, respectively. The overall salt rejection ratio was
more than 99%, whereas the ionic rejections for Ca2+, Mg2+, Na+, (SO 4) 2\ (H C O 3 )', and Na"
were as high as 99%. The product water quality achieved was within the allowable limits for
international drinking and bottled water standards (as illustrated in Table 6.4), with respect to
the salt concentration and major ionic composition. Furthermore, the quality of product water
was found to be comparable with different types of international and regional premier bottled
water, in terms of major ionic composition. The experimental data proved that at least, a
single stage of the suspension crystallisation process was potentially capable of producing a
significant amount of product water that is ready for immediate use in human consumption,
and simultaneously concentrating the RO retentate to a considerable ratio.
The results of the experimental investigation were highly encouraging for increasing the
overall water recovery ratio of the water desalination plant and concentrating the waste
stream i.e. RO retentate. Therefore, the proposed process should be competitive with other
brine disposal methods for desalination processes, taking into account that the proposed
technology has benefits which include better energy consumption, absence of a pre-treatment
system, and less susceptible to the major technical problems in desalination plants, such as
scaling, fouling and corrosion. Furthermore, the capital cost can be dramatically reduced by
using inexpensive materials, e.g. plastic.
The current product water ratio for the pilot plant was limited to a maximum of 53% for a
maximum salt rejection ratio. This was due to the reduced performance of the pilot plant
when the salt concentration of the residual liquid reached 103,000 ppm, which resulted in the
quality of the product water being relatively poor and unacceptable. This performance
deterioration was observed in two different experimental runs. There were many possible
reasons behind this performance deterioration, however, the main reason was not confirmed,
and is still not understood. Therefore, further experimental investigation is needed to
increase the water recovery ratio at maximum salt rejection ratio, in order to decrease the
volume of RO retentate as far as possible. For future investigation, a pilot plant equipped
with electrical conductivity sensors rather than light cells to control the separation process of
C h a p t e r V II I: C o n c l u s i o n s a n d R e c o m m e n d a t i o n s 278
the wash column is highly recommended, in order to avoid adding a colour indicator. Also,
prior to conducting the experimental investigation on RO retentate with a TDS of 103,000
ppm, it is highly recommended to use an aqueous solution of sodium chloride (NaCl)
initially, with the specified salt concentration to verify the performance of the pilot plant.
The residual liquid stream produced from the pilot plant can cause severe pollution problems
when this waste stream is not disposed of in an environmentally-friendly way. Solutions for
concentrating/disposing of the residue of the suspension pilot plant should be considered in
future research. Integrated multistage suspension (i.e. suspension-suspension) or suspension-
static systems is recommended to be the subject of further research.
As treatment of RO retentate is a new application for the suspension crystallisation process,
the evaluation of suspension pilot plant should continue. The aim is to improve the
separation performance by increasing the total product water recovery. This particular
application should be given special attention due to the extensive use of inland and coastal
RO desalination plants, and the potential for use in other industrial sectors, such as
petroleum industries.
Since the experimental investigation was conducted with a limited number of key operating
parameters, a wider range needs to be taken into consideration in any future study. The
suggested key-parameters for the crystallisation loop are crystallisation temperature (cooling
rate), rotation frequency of scraper motor (i.e. scraper speed), number of scrapers,
crystallisation residence time, ice slurry ratio (i.e. suspension density), and flow-rate of melt
circulation pump. The suggested key-parameters for the separation loop are piston stroke,
crystal bed-height, porosity of piston head of wash-column, and ice size, shape, and habit
(which can be determined via a microscopic device).
In the economic analysis carried out, the power consumption and associated cost was
strongly dependant on three important factors, namely the production rate, and the salt
concentration of feed and product water. Indeed, designing plants for higher production rates
would result in a significant reduction of waste streams, as well as the power consumption.
Higher levels of salt concentration in the product water are also able to significantly reduce
the power consumption cost. Detailed technical-economic analysis studies on integrated RO-
C h a p t e r VIII: C o n c l u s i o n s a n d R e c o m m e n d a t i o n s 279
suspension plant and separate RO and suspension crystallisation plants are recommended for
future research. The production rate, and the salt concentration of feed and product water
should be considered as influential parameters for future power requirement analysis. Also,
the associated factors, including capital equipment and costs, power requirements, and
operating labour, are recommended to be taken into consideration in future technical-
economic studies.
8.5 Sulzer Static Crystallisation ProcessThe performance of the static crystallisation process was experimentally evaluated and
validated for RO brine concentration applications. The experimental study presents a new
application for the Sulzer static crystallisation process. Aqueous solutions of sodium chloride
and different salinities of process brines were investigated individually as feed samples. The
laboratory investigation focused on the feed samples of highly concentrated RO brines,
which were discharged from prior processes, namely the falling film and the suspension
crystallisation.
A number of important parameters influencing the separation performance of crystallisation
and sweating processes were investigated, not only on the laboratory bench scale, but also in
a pilot plant (for some experiments). The key findings of the crystallisation experiments
provided a clear indication that the investigated parameters, including feed concentration,
crystallisation temperature, crystallisation rate, and average growth rate, had a strong
influence on the separation performance of the crystallisation step. For example, the salt
rejection ratio was found to be proportional to the crystallisation temperature and cooling
rate, and inversely proportional to the feed concentration and average growth rate. The water
recovery ratio, on the other hand, was found to be inversely proportional to the crystallisation
temperature, cooling rate, and feed concentration, but proportional to the average growth
rate. As for the sweating process, the separation performance of this technique was found to
be strongly dependant on the salinity of the crystal layer, sweating rate, sweating time, and
crystal mass ratio. The salt concentration of the crystal layer was found to be inversely
proportional to the sweating time and crystal mass ratio, and proportional to the crystal layer
salinity and sweating rate. The sweating operation was found to be effective in improving the
purity of the crystal layer, and enhanced the separation efficiency of the static crystallisation
process. However, the disadvantage of using the sweating method is associated with two
C h a p t e r V I I I : C o n c l u s i o n s a n d R e c o m m e n d a t i o n s 280
crucial factors, namely mass loss and freezing-stage time. Therefore, the sweating rate must
be optimised at a reasonable limit to minimise the mass loss, and reduce the time of the
freezing-stage; otherwise a substantial increase in the investment costs of water treatment
will be encountered. In order to provide final product water at reasonable cost and reasonable
reliability, the investigated influences of the crystallisation and sweating operations, more
specifically the cooling and sweating rates, must be appropriately co-optimised.
The experimental results for concentrating RO brine, using a pilot plant, proved that a single
freezing stage, without use of the sweating process, was capable of producing a significant
amount of treated water, while the RO retentate was concentrated to a reasonable level. The
salinity of the treated water was found to be comparable with Arabian Gulf seawater, and was
ready for immediate re-use as feed water for a RO membrane desalination plant. By
eliminating the sweating process, several advantages can be rendered to the Sulzer static
crystallisation plant, for instance, mass loss will be avoided, a dramatic fall in the overall
time for the freezing stage, significant increase in production rate, and a noticeable reduction
in power consumption. On the other hand, the RO brine was tested at various crystallisation
temperatures, which were higher and lower than the eutectic temperature of sodium chloride
salt. These experiments were performed on the laboratory pilot scale setup with use of the
sweating process. Similar findings to the previous investigation were observed in this study,
and apart from that, the water recovery ratio was substantially increased for the case of
crystallisation temperature lower than the eutectic temperature of sodium chloride salt.
As for the experiments on minimising the volume of the highly concentrated RO brines, the
separation performance of a single stage process was investigated with the sweating process.
The results of the experimental investigation were highly encouraging, since the volume of
the waste stream was reduced to a minimum level. Although the final product water of the
static crystallisation technology was not comparable to either drinking water or seawater
standards (for some cases), the proposed process was able to further concentrate the highly
concentrated RO brines as far as possible, while providing a significant amount of treated
water, close to the quality of RO brine or seawater (for some cases). Based on the quality of
the product water, the recommendation is for the treated water to be reused and recycled,
either to join the main feed stream of the prior crystallisation process (i.e. falling film
crystallisation and/or suspension crystallisation) or RO membrane plant. In order to achieve
C h a p t e r VIII: C o n c l u s i o n s a n d R e c o m m e n d a t i o n s 281
the optimum water utilisation and exploitation, as well as environmental protection, three
treatment options were individually proposed. These comprised an RO plant coupled with a
combination of Sulzer crystallisation plants scaled up based on the experimental results for
concentrating RO brine. The power consumption, on the other hand, was theoretically
determined for each treatment option.
Alongside RO brine concentration, the proposed three treatment options offer a significant
increase in the production rate of drinking water and/or preserving a substantial amount of
natural water resource from the RO plant's exploitation. Also, the treatment options, which
were proposed in this study, are highly recommended to be considered for future research
using combined pilot plants tested in continuous operating mode. This applied research is of
great importance, because it offers a number of important solutions for significant problems
facing inland RO membrane desalination plants. These solutions are associated with several
aspects, such as water supply, safe disposal, the environment, and preservation of natural
water resources. Furthermore, the proposed treatment options offer important additional
benefits that can be rendered to the RO membrane plant. These benefits are as follows: (i)
reduced feed intake capacity; (ii) less floor space requirements for the feed intake and pre
treatment facilities; (iii) reduced capital and operational costs of the feed intake and pre
treatment units; (iv) minimised operational and capital costs of advanced treatment systems,
such as Ultra-Filtration (UF), and Micro-Filtration (MF), when these systems are used; (v)
reduced suspended solids and microbiological activity; (vi) reduced plugging and fouling
problems; (vii) reduced colloidal fouling load on the RO membrane, leading to lower and
stabilised the Silt Density Index (SDI) and turbidity; (viii) increased lifespan of RO
membranes; (ix) minimising the operational challenges of the pre-treatment system; (x)
reduced RO membrane cleaning frequency; (xi) reduced overall operational costs of the RO
plant; (xii) minimising the chemical additives consumed by the pre-treatment unit and RO
membrane cleaning frequency; (xiii) minimising the environmental problems by reducing the
chemical additives; (xiii) avoiding the effects of seasonal climatic changes, i.e. fluctuation of
feed temperature, on the performance of the RO membrane unit; and (xiv) hot feed water,
which is usually encountered in hot climate countries, can be avoided.
In general, the experimental investigation showed that the Sulzer static crystallisation
process was feasible for concentrating RO retentate of different salinities. The experimental

C h a p t e r V I I I : C o n c l u s i o n s a n d R e c o m m e n d a t i o n s 282
data can be used as a reference for crystallisation and sweating optimisation in commercial
applications. The experimental results were highly encouraging, and proved that the
treatment system is a powerful pre-concentration unit for minimising different concentrations
of RO brine. The important advantages of the proposed technology are similar to that in the
Sulzer falling film crystallisation process, which are given previously in section (8.3). As a
result, the Sulzer static crystallisation process might be competitive with other pre
concentration systems, which are currently available on the commercial market.
Due to absence of appropriate experimental data in the literature, and the limited number of
experimental runs (as presented in this study), the separation performance of the static
crystallisation process technology for water desalination applications, and more specifically
RO brine concentration, should be further investigated. Since the parameters affecting the
crystallisation and sweating processes were investigated within a limited range and number
of experimental runs, carrying out further investigation with a wider range of parameters is
highly recommended in future research. The suggested key parameters for the crystallisation
tests are feed concentration, start and end-point crystallisation temperatures, crystallisation
time, cooling rate, and average growth rate. The suggested key parameters for the sweating
tests are the salt concentration of the crystal layer, sweating rate, sweating time, and the
crystal mass ratio. Visual observation using microscopy is highly recommended in future
studies by conducting microscopic examinations to determine the crystal morphology. On the
other hand, mathematical modelling to simulate the behaviour of a static crystallisation
process, including sweating process, for concentrating RO brine is recommended. Models
can be used to predict the mass and salt concentration of the crystal layer at various operating
conditions.
A p p e n d i c e s 283
A p p e n d ic e s :
The following appendices are found in a CD attached to the
thesis
Appendix A3: A complete record of experimental data on static and agitated crystallisation
processes
• File name: Appendix, Microsoft Excel spreadsheet, Sheet: Appendix A3
Appendix A4: A complete record of experimental data on ice maker machine
• File name: Appendix, Microsoft Excel spreadsheet, Sheet: Appendix A4
Appendix A5: A complete record of experimental data on Sulzer falling film crystallisation
pilot plant
• File name: Appendix, Microsoft Excel spreadsheet, Sheet: Appendix A5
Appendix A6: A complete record of experimental data on Sulzer suspension crystallisation
pilot plant
• File name: Appendix, Microsoft Excel spreadsheet, Sheet: Appendix A6
• File name: Appendix_5_A5-l, PDF, Operational temperature profiles
Appendix A7: A complete record of process data, operating temperature profiles, full
physiochemical analysis, and crystalline impurity content versus sweating
times
• File name: Appendix, Microsoft Excel spreadsheet, Sheet: Appendix A7
R e f e r e n c e s 284
R e f e r e n c e s :
Ahmad M., and Williams, P., 2009. Application of salinity gradient power for brines disposal and energy utilisation. Desalination 10 (2009), pp. 220 - 228.
Ahmad, M., and Williams, P., 2011. Assessment of desalination technologies for high saline brine applications - Discussion Paper. Desalination 30 (2011), pp. 22-36.
Ahmed, M., Arakel, A., and Hoey, D., 2003. Feasibility of salt production from inland RO desalination plant reject brine: a case study. Desalination, 158 (2003), pp. 109-117.
Ahmed, M., Shayya, W. H., Hoey, D., Mahendran, A., and Morris, R., 2000. Use of evaporation ponds for brine disposal in desalination plants. Desalination, 130(2), pp. 155- 168.
Alhazmy, M. M., 2009. Feed water cooler to increase evaporation range in MSF plants. Energy, 34 (1), January 2009, pp. 7-13.
Alklaibi, A.M., and Loar, N., 2004. Membrane-distillation desalination: status and potential. Desalination 171 (2), pp. 111-131.
Al-Obaidani, S., Curcio, E., Macedonio, F., Di Profio, G., Al-Hinaid H., and Drioli, E., (2008). Potential of membrane distillation in seawater desalination: Thermal efficiency, sensitivity study and cost estimation, 2008. Journal o f Membrane Science, 323 (1), pp. 85- 98.
Auleda, J., Raventos, M., Sanchez, J., Hernandez, E., 2011. Estimation of the freezing point of concentrated fruit juices for application in freeze concentration, Journal o f Food Engineering 105 (2) 289-294.
Ayres, R. W., and Swanson, D. F., Seeger Refrigerator Company, 1954. Ice cube making apparatus, St. Paul, Minn., U.S. Pat.: 2,682,155.
Ayres, R. W., and Swanson, D. F., Whirlpool Cooperation, 1961. Ice cube forming machine, St. Paul, Minn., U.S. Pat.: 2,995,905.
Barduhn, A. J., Freezing processes fo r water conversion in the United States, First International symposium on water desalination, 3-9 October 1965, Washington D. C., USA.
Barnard, W. C., and Hodapp, D. C., Whirlpool Cooperation, 1971. Icemaker with water distributor, White Bear Lake, Minn., U.S. Pat.: 3,580,008.
Bochenek, R., Sitarz, R., Antos D., 2011. Design of continuous ion exchange process for the wastewater treatment. Chemical engineering science, 66 (2011), pp. 6209-6219.
Bond, R., and Veerapaneni, V., Awwa Research Foundation, 2007. Zero liquid discharge fo r inland desalination. [Online] Available at:<http://www.waterrf.org/ProjectsReports/PublicReportLibrary/91190.pdf> [Accessed 14 October 2011].
R e f e r e n c e s 285
Boonnasa, S., Namprakai, P., and Muangnapoh, T., 2006. Performance improvement of the combined cycle power plant by intake air cooling using an absorption chiller. Energy, 31 (12), pp. 2036-2046.
Bostjancic, J., and Ludlum, R., 1994. Reducing wastewater to dryness: Zero liquid discharge case studies at new power plants, Resources Conservation Company (RCC).
Brandt, H., Macero, EL, and Tait, J., Aquatech Services Inc., 1997. Process fo r brine disposal, United States, US Patent 5,695,643, Application Number: 129692.
Brown, C., Sheedy, M, 2002. A new ion exchange process fo r softening high TDS produced water, SPE/Petroleum Society of CIM/CHOA, held in Calgary, Alberta - November, paper No. 78941
BUCO Heat Transfer Technology, 2011. Chip Ice Maker. [Online] Available at: < http://www.htt-ag.com/en/products/industrial-ice-maker-machine> [Accessed 20 January 2012].
Buros, O.K., 2000. ABCs o f desalting, 2nd ed. S.I., International Desalination Association (IDA), Topsfield, Massachusetts, United States of America.
Cath, T. Y., and Childress, A. E., Elimelech, M., 2006. Forward osmosis: Principles, applications, and recent developments. Journal o f Membrane Science, 281(1-2), pp. 70-87.
Chen, J.C.T., 1984. Methods for rapid prediction of wait quality and influent-water quality effects on hardness leakage in steam-flood water. Journal o f Petroleum Technology.
Clayton, A.R., Foundation for Water Research, 2006. Desalination fo r water supply. [Online] Available at: <http://www.fwr.org/desal.pdf> [Accessed 14 October 2011].
Cohen, B., 1983. A renewable energy source. American Journal o f Physics, 51 (1), pp. 75- 76.
Cole-Parmer, 2010. Operating manual and part list fo r Cimarec™ stirring hot plates. [Online] Available at:<http://www.coleparmer.com/catalog/manual_pdfs/LT1072Xl%20Cimarec.pdf> [Accessed 2nd December 2010].
Curcio, E., Ji, X., Profio, G., Sulaiman, A.O., Fontananova, E., and Drioli, E., 2010.Membrane distillation operated at high seawater concentration factors: Role of themembrane on CaC03 scaling in presence of humic acid. Journal o f Membrane Science, 346(2), pp. 263-269.
Datbrowski, A., Hubick, Z., Podkos'cielny, P. and Rubens, E., 2004. Selective removal of the heavy metal ions from water sand industrial wastewaters by ion-exchange method. Chemosphere, 56, pp. 91-106.
Delft, D.v., Freezing physics : Heike Kamerlingh Onnes and the quest fo r cold. History of science and scholarship in the Netherlands. 2007, Amsterdam: Koninklijke Nederlandse Akademie van Wetenschappen. vi, ISBN 978-90-6984-519-7.
R e f e r e n c e s 286
Dirach, J., Nisan, S. and Poletiko, C., 2005. Extraction of strategic materials from the concentrated brine rejected by integrated nuclear desalination systems. Desalination, 182, pp. 449-460.
Dreizin, Y., 2006. Ashkelon seawater desalination project — off-taker’s self costs. Desalination, 190(1-2), pp. 104-116.
El-Bourawi, M.S., Ding, Z., Ma, R. and Khayet, M., 2006. A framework for better understanding membrane distillation separation process. Journal o f Membrane Science, 285 (1-2), pp. 4-29.
El-Dessouky, H.T., and Ettouney, H. M., Fundamentals o f salt water desalination. 2002. Elsevier Science, Amsterdam, ISBN: 9780444508102.
El-Sayed, E., and El-Sayed, Y., 2007. The advantages and the challenges o f zero liquid discharge desalination, In: 3rd International Conference on Desalination Technologies, Sharm El -Sheikh, Egypt, May 7 - 8 , 2007, Conference Proceedings.
Encyclopedia of Desalination and Water Resources (DESWARE), 2011. Energy Requirements o f Desalination Processes. [Online] Available at: <http://www.desware.net/desa4.aspx> [Accessed 13 October 2011].
Flores, V. and Cabassud, C., 1999. A hybrid membrane process for Cu(II) removal from industrial wastewater, comparison with a conventional process system. Desalination, 126,pp. 101-108.
Fritzmann, C., Lowenberg, J., Wintgens, T. and Melin, T., 2007.State-of-the-art of reverse osmosis desalination. Desalination 216 (2007), pp. 1-76.
GAE NIRO, MESSO technologies group, 2003. Evaporation technologies. [Online] Available at:<http://www.niro.com/mde/cmsresources.nsf/filenames/Evaporation.pdf/$file/Evaporation.p df> [Accessed 13 October 2011].
GAE NIRO, Process engineering division, 2011. Crystallization in theory and practice. [Online] Available at:<http://www.niroinc.com/evaporators_crystallizers/crystallization.asp> [Accessed 13 October 2011].
Galvez, J.B., Garcfa-Rodrfguez, L., and Martm-Mateos, I., 2009. Seawater desalination by an innovative solar-powered membrane distillation system: the MEDESOL project. Desalination 246 (1-3), pp. 567-576.
GEA, 2011. Suspension crystallization. [Online] Available at: < http://www.gea-messo- pt.com/geacrystal/cmsdoc.nsf/WebDoc/webb7pzduj > [Accessed 22nd November 2011].
GEV, 2007. Spare parts suitable for: Whirlpool. [Online] Available at: <http://www.gev- online.co.uk/fileadmin/templates_gev_co_uk/pdf/refrigeration/gev_uk_refrigeration_whirlpo ol.pdf> [Accessed 11 November 2010].
R e f e r e n c e s 287
Gorin, C., 2010. Extraction o f uranium from seawater. [Online] Available at: <http://large.stanford.edu/courses/2010/ph240/gorin2> [Accessed 15 October 2011].
Ohya, H., Suzuki, T., and Nakao, S., 2001. Integrated system for complete usage of components in seawater: a proposal of inorganic chemical combined in seawater. Desalination, 134 (1-3), pp. 29-36.
Hanbury, W., Hodgkiess, T., and Morris, R., 1993. Desalination Technology 93, United Kingdom (Glasgow): Porthan Ltd.
Heide, E., Wagener, K., Paschke, M., and Wald, M., 1973. Extraction of uranium from sea water by cultured algae. Natur Wissenschaften, 60 (9), pp. 431-431.
Hernandez, E., Raventos, M., Auleda, J., Ibarz, A., 2009. Concentration of apple and pear juices in a multi-plate freeze concentrator, Innovative Food Science & Emerging Technologies 10(3) 348-355.
Hernandez, E., Raventos, M., Auleda, J., Ibarz, A., 2010. Freeze concentration of must in a pilot plant falling film cryoconcentrator, Innovative Food Science & Emerging Technologies 11(1) 130-136.
Howe, K. J., Corridor, Department of civil engineering, University of New Mexico, 2009. Technical challenges to concentrate disposal from inland desalination. [Online] Available at: <http://www.unm.edu/~cstp/Reports/H20_Session_4/4-7_Howe.pdf> [Accessed 14October 2011].
Hoyle, B., and Dasch, E., Water encyclopedia, 2011. Natural Brines. [Online] Available at: <http://www.waterencyclopedia.com/Bi-Ca/Brines-Natural.html> [Accessed 13 October 2011].
Index Mundi, 2011. Uranium Monthly Price - US Dollars per Pound. [Online] Available at: <http://www.indexmundi.com/commodities/?commodity=uranium&months=60> [Accessed 15 October 2011].
Jeppesen, T., Shu, L., Keir, G. and Jegatheesan V., 2009. Metal recovery from reverse osmosis concentrate. Journal o f Cleaner Production, 17 (2009), pp. 703-707.
Johnson, W., 1976. State-of-the-art of freezing processes, their potential and future, Desalination, 19, pp. 349-358.
Jones, A.T., and Finley, W., 2003. Recent development in salinity gradient power, Proceedings Oceans 2003, Vol. 4, pp. 2284 - 2287, Print ISBN: 0-933957-30-0.
Kanno, M., 1984. Present status of study on extraction of uranium from sea water. Journal o f nuclear scientific and technology, 21(1), pp. 1-9.
Kamofsky, G., and Steinhoff, P., 1960. Saline Water Conversion by Direct Freezing with Butane, Rep. 40, 67 pp. Washington DC: National Technical Information Service.
Kim, K.J. and Ulrich, J., 2002. A quantitative estimation of purity and yield of crystalline layers concerning sweating operations. Journal o f Crystal Growth 234, (2-3) pp. 551-560.
R e f e r e n c e s 288
Kumar, S. A., Pandey, S. P., Shenoy, N. S. and Kumar, S. D., 2011. Matrix separation and preconcentration of rare earth elements from seawater by poly hydroxamic acid cartridge followed by determination using ICP-MS. Desalination, 281, pp. 49-54.
Lattemann, S., and Hopner, T, 2003. Seawater desalination: impacts o f brine and chemical discharge on the marine environment, Balaban Desalination Publications, Italy, ISBN: 0866890629.
Lawson, K.W., and Lloyd, D.R., 1997. Membrane distillation. Journal o f Membrane Science 124(1), pp. 1-25.
LeeWebWorks LLC, 2007. Water Softeners. [Online] Available at: <http://www.homecents.com/h2o/h2o_soft/index.html> [Accessed 28 October 2011].
Lemmer, S., Klomp, R., Ruemekorf, R., Scholz, R., 2001. Preconcentration of Wastewater through the Niro Freeze Concentration Process, Chemical Engineering Technology, 24(5) (2001)485-488.
Lorain, O., Thiebaud, P., Badorc, E., Aurelle, Y., 2001. Potential of Freezing in Wastewater Treatment: Soluble Pollutant Applications, Water Research, 35(2) 541-547.
Martinetti, C.R., Childress A.E., and Cath, T.Y., 2009. High recovery of concentrated RO brines using forward osmosis and membrane distillation. Journal o f Membrane Science, 331 (1-2), pp. 31-39.
McKetta, J., and Anthony, R, 2002. Encyclopedia o f chemical processing and design, Marcel Dekker Inc., USA, Vol. 69, pp. 313, ISBN: 9780824726218.
Miller, J.E., Sandia National Laboratories, 2003. Review o f water resources and desalination technologies. [Online] Available at:<http://www.sandia.gov/water/docs/MillerSAND2003_0800.pdf> [Accessed 14 October 2011].
Mitchell, A. J., Sabelhaus, H. P., and Tinney, J. P., Whirlpool Corporation, 2003. Ice maker with magnetic water conditioner, Benton Harbor, USA, Pub. No.: US 2003/0024263 A1
Miyawaki, O., Liu, L., Shirai, Y., Sakashita, S., Kagitani, K., 2005. Tubular Ice System for Scale-up of Progressive Freeze-Concentration, Journal o f Food Engineering, 69 (2005) 107- 113.
Mommaerts, G.J., 1999. Softening o f produced water: which system is best fo r your application, Proc. SPE International Thermal Operations and Heavy Oil Symposium, 17-19 March 1999, Bakersfield CA.
Mulder, M., 1996. Basic principles o f membrane technology, 2nd ed., Kluwer Academic Publishers, Netherlands. ISBN: 9780792342472.
Myerson, A, 2002. Handbook o f industrial crystallisation, 2002, 2nd edition, Butterworth- Heinemann, ISBN: 0750670126.
R e f e r e n c e s 289
NALCO, 1998. Ion exchange processes. [Online] Available at: <http://www.onlinewatertreatment.com/literature/Nalco/docs/Tf-024.pdf> [Accessed 24 October 2011].
National Research Council (U.S.), 2009. Desalination: a national perspective, National Academy Press Washington, D.C, United States of America, ISBN: 9780309119238.
Nebbia, G. and Menozzi, G., 1968. Early experiments on water desalination by freezing. Desalination 5 (1968), pp. 49-54.
OECD, 2004. Water Consumption. OECD Environmental Data Compendium. OECD (2004) 136-137.
Pankratz, T., 2008. Zero liquid discharge systems are operating challenge, Water Desalination Report: 44(7): 1.
Pintar, A., Batista, J., Levee, J., 2001. Integrated ion exchange/catalytic process for efficient removal of nitrates from drinking water. Chemical Engineering Science. 56, pp. 1551-1559.
Pols, H.B., and Harmsen, G.H., 1994. Industrial wastewater treatment today and tomorrow. Water Science & Technology, 30 (3), pp. 109-117.
Post, J.W., Veerman, J., Hamelers, H.V.M., Euverink, G.J.W., Metz, S.J., Nymeijer, K., and Buisman, C.J.N., 2007. Salinity gradient power: Evaluation of pressure-retarded osmosis and reverse electrodialysis. Journal o f Membrane Science, 288 (1-2), pp. 218-230.
Pounder, E. R., 1965. Physics o f ice, Great British: Pergamon Press Ltd., Library of Congress Catalogue Card No. 65-21141.
Rahman, M., and Ahmed, M., 2006. Freezing melting process and desalination: review o f the state o f the art, Sultanate of Oman, Separation & purification reviews, Copyright: Taylor & Francis Group. 35(2), pp. 59-96.
Rahman, M., Ahmed, M., and Chen, X., 2007. Freezing-melting process and desalination: review of present status and future prospects. International Journal o f Nuclear Desalination, 2(3), pp. 253-264.
Rich, A., Youssef, M., Nourimane, B., Denis, M., Souad, A., Christine, B., Naoual, S., Jean- Paul, K., Tijani, B., Ahmed, B. and Stephane, V., 2011. Freezing desalination of seawater in a static layer crystallizer. Desalination 269, pp. 142-147.
Rodrigues, M., Luque, S., Alvarez, J.R., Coca, J. 2000. A Comparative Study of Reverse Osmosis and Freeze Concentration for Removal of Valeric Acid from Wastewaters, Desalination, 127 (2000), pp. 1-11.
Sanchez, J., Hernandez, E., Auleda, J., Raventos, M., 2011. Freeze concentration of whey in a falling-film based pilot plant: Process and characterization, Journal o f Food Engineering 103(2) 147-155.
Sather, A., Berryman, O., and Rebek, J., 2010. Selective recognition and extraction of the uranyl ion. Journal o f the American chemical Society, 132(39), pp. 13572-13574.
R e f e r e n c e s 290
Schwochau, K., 1984. Extraction o f metals from seawater, Topics in Current Chemistry 124 (91), pp. 91-133.
Seko, N., Katakai, A., Hasegawa, S., Tamada, M., Kasai, N., Takeda, H., Sugo, T. and Saito, K., 2003. Aquaculture of uranium in seawater by a fabric-adsorpent submerged system, Nuclear Technology, 144 (2), pp. 274-278.
Semerjian, L., 2011. Quality assessment of various bottled waters marketed in Lebanon, Earth and environmental science. Environmental Monitoring and Assessment, 172 (1-4), pp. 275-285.
Sethi, S., Walker, S., Drewes, J., and Xu, P., 2006. Existing & emerging concentrate minimization & disposal practices for membrane systems. Florida Water Resources Journal, pp. 38-48.
Shone, R.D.C., 1987. The freeze desalination of mines waters. Journal o f the South African Institute o f Mining and Metallurgy, 87(4), pp. 107-112.
Skilhagen, S.E., Dugstad J.E., and Aaberg, R.J., 2008. Osmotic power - power production based on the osmotic pressure difference between waters with varying salt gradients. Desalination, 220(1-3), pp. 476-482.
Spiegler, K. S., and El-Sayed, Y. M., 1994. A desalination primer, Italy: Balaban Desalination Publications, ISBN: 0866890343.
Spiegler, K. S., and Laird, A. D. K., 1980. Principles o f desalination “Part A ”. 2nd ed., London: Academic Press INC., Vol. 1, ISBN: 0126567018.
Spiegler, K. S., and Laird, A. D. K., 1980. Principles o f desalination “Part B ”. 2nd ed., London: Academic Press INC., Vol. 1, ISBN: 0126567018.
Spiegler, K. S., 1966. Principles o f desalination. London: Academic Press INC., ISBN: 0126567018.
Spiro, D.A., 2009. Ion exchange resins: a retrospective from industrial and engineering chemistry research. Industrial & Engineering Chemistry Research, 48, pp. 388-398.
Sugo, T., 1999. Uranium recovery from seawater. [Online] Available at:<http://www.jaea.go.jp/jaeri/english/ff/ff43/topics.html> [Accessed 15 October 2011].
Sulzer Chemtech Ltd, 2011. Suspension crystallization. [Online] Available at: < http://www.sulzerchemtech.com/desktopdefault.aspx/tabid-2245> [Accessed 22nd November 2011].
Sulzer, 2004. Suspension crystallisation technology, Sulzer Chemtech Ltd., Switzerland. [Online] Available at:<http://www.sulzerchemtech.eom/portaldata/ll/Resources//Brochures/PT/Suspension_Cryst allization_Technology.pdf> [Accessed 5 July 2009].
R e f e r e n c e s 291
Sulzer, 2005. Sulzer Chemtech, Fractional crystallisation, Sulzer Chemtech Ltd., Switzerland. [Online] Available at:<http://www.sulzerchemtech.eom/portaldata/ll/Resources//Brochures/PT/Fraetional_Crysta llization-e.pdf> [Accessed 5 July 2009].
Szacsvay, T., Noser, P., and Posnansky, M., 1999. Technical and economic aspects of small- scale solar-pondpowered seawater desalination systems. Desalination, 122 (2-3), pp. 185 - 193.
T., Tahti, 2004. Suspension melt crystallization in tubular and scraped surface heat exchangers. [Online] Available at: <http://sundoc.bibliothek.uni-halle.de/diss-online/04/04H181/tl.pdf> [Accessed 22nd November 2011].
Tamada, M., 2009. Current status o f technology fo r collection o f uranium from seawater. [Online] Available at:<http://www.physics.harvard.edu/~wilson/energypmp/2009_Tamada.pdf> [Accessed 15 October 2011].
Tillberg, F., Royal Institute of Technology, KTH, Stockholm, 2004. ZLD systems - an overview. [Online] Available at: <http://www.xzero.se/docs/zldanover.pdf> [Accessed 14 October 2011].
Turnbull, D., 1965. The undercooling of liquids. Scientific American, 212, pp. 38-46.
U.S. Congress, Office of Technology Assessment, 1988. Using Desalination Technologies fo r Water Treatment. [Online] Available at:<http://www.princeton.edu/~ota/disk2/1988/8842/8842.PDF> [Accessed 14 October 2011].
Ulrich, J., and Glade, H., 2003. Melt crystallisation, Germany: Shaker Verlag, ISBN: 3- 8322-1533-6.
United Nations, 2001. Water desalination technologies in the ESCWA member countries, New York: United Nations, Report No.: E/ESCWA/TECH/2001/3.
Valverde, J.L., DeLucas, A., Carmona, M., P e ' rez, J.P., Gonza' lez, M. and RodrUguez, J.F., 2006. Minimizing the environmental impact of the regeneration process of an ion exchange bed charged with transition metals. Separation and purification technology, 49, pp. 167-173.
Van der Ham, F., Witkamp, G.J., de Graauw, J., and van Rosmalen, G.M., 1998. Eutectic freeze crystallization: Application to process streams and waste water purification, Chemical Engineering and Processing, 37 (2), pp. 207-213.
Walton, J., Lu, H., Turner, C., Solis, S., and Hein, H., 2004. Solar and Waste Heat Desalination by Membrane Distillation, College of Engineering, United of Texas, El Paso, Texas, United States of America, Agreement No.: 98-FC-81-0048, Program Report No.: 81.
Weiss P., 1973. Desalination by freezing, Practice of Desalination (ed. R Bakish), pp. 260- 270, New Jersey: Noyes Data Corporation, New Jersey.
R e f e r e n c e s 2 9 2
Whirlpool, 2009. Theory o f operation. [Online] Available at: <http://www.truetex.com/ice_machine_gil500.pdf> [Accessed 10 March 2009].
Whirlpool, 2010. User manual: Manual service. [Online] Available at:<http://www.whirlpoolparts.co.uk/downloads/ServiceManual.pdf> [Accessed 10 March 2009].
Whirlpool, 2011. Whirlpool K20 and Whirlpool K40 machines. [Online] Available at: < http://www.whirlpoolk40.co.Uk/#/spare-parts/4531731979> [Accessed 10 March 2009].
Whitman, W. C., Johnson, W. M., and Tomczyk, J. A., 2004. Refrigeration and Air Conditioning Technology, 5th ed. USA: Delmar Cengage Learning, ISBN: 1401837654.
Wiegandt, H., 1960. Saline Water Conversion by Freezing: an Integral Processing Unit Using a Secondary Refrigerant, Rep. 41, 51 pp. Washington DC: National Technical Information Service.
Younos, T., and Tulou, K. E., 2005. Overview of desalination techniques. Journal o f Contemporary Water Research & Education, 132 (1), pp. 3-10.
Ziegra Ice Machines, 2011. Flake Ice Comparison. [Online] Available at: <http://www.ziegra.co.uk/Ice%20machines%20and%20ice%20makers.html?gclid=CMb57ey 9i68CFQnP3wodPlsv-g > [Accessed 20 January 2012].