Michael Peter Rustat Sheldrick - Cronfa
345
1 The relationship between the home environment and children’s physical activity and sedentary behaviour at home Michael Peter Rustat Sheldrick Submitted to Swansea University in fulfilment of requirements for the degree of Doctor of Philosophy Swansea University 2020 Copyright: The author, Michael Peter Rustat Sheldrick, 2021.
-
Upload
khangminh22 -
Category
Documents
-
view
2 -
download
0
Transcript of Michael Peter Rustat Sheldrick - Cronfa
1
The relationship between the home
environment and children’s physical
activity and sedentary behaviour at
home
Michael Peter Rustat Sheldrick
Submitted to Swansea University in fulfilment of
requirements for the degree of Doctor of
Philosophy
Swansea University
2020
Copyright: The author, Michael Peter Rustat Sheldrick, 2021.
A.A.ZASHEVA
New Stamp
2
Abstract
Increasing children’s physical activity (PA) and reducing their sedentary behaviour are
considered important preventative measures for obesity and several other health risk
factors in children. Given children spend significant time at home, an improved
understanding of these behaviours in the home environment would provide invaluable
insight for interventions. Therefore, the overarching aim of this thesis was to provide new
insight into how the home environment is related to children’s home-based PA and
sedentary behaviour.
Study 1 investigated the relationship between sufficient moderate-to-vigorous physical
activity (MVPA) (≥60 min·day–1) and excessive screen-time (≥2 h·day–1) with lifestyle
factors in children, and found they were associated with healthy and unhealthy factors,
respectively. This study highlighted the importance of meeting PA and screen-time
recommendations in relation to important health-related lifestyle factors, which is of
concern, as few children were shown to meet such recommendations. Identifying the
correlates of children’s behaviours is an important stage in intervention development,
therefore studies 2-5 focussed on improving understanding of children’s PA and
sedentary behaviour at home. Study 2 demonstrated the validity and reliability of
HomeSPACE-II, a novel instrument for measuring physical factors that influence
children’s home-based PA and sedentary behaviour. Using HomeSPACE-II, study 3
showed that the physical home environment is related to children’s home-based PA and
sedentary behaviour. Given the established influence of social and individual factors on
children’s behaviour and their confounding effects in study 3, study 4 investigated the
influence of social and individual factors on: (i) children’s home-based PA and sedentary
behaviour, and; (ii) the home physical environment. Study 4 revealed that parental and
child activity preferences and priorities, as well as parental rules were associated with
children’s home-based PA and sedentary behaviour and the physical home environment.
Study 5 found clusters of social and physical factors at home, which were associated with
3
children’s home-based PA and sedentary behaviour as well as background characteristics
in the expected directions.
Scientific outputs
Publications
Sheldrick, M.P.R.; Tyler, R.; Mackintosh, K.A.; Stratton, G. Relationship between
Sedentary Time, Physical Activity and Multiple Lifestyle Factors in Children. J. Funct.
Morphol. Kinesiol. 2018, 3, 15
Sheldrick, M.P; Maitland, C.; Mackintosh, K.A.; Rosenberg, M.; Griffiths, L.J.; Fry, R.;
Stratton, G. Associations between the Home Physical Environment and Children’s Home-
Based Physical Activity and Sitting. Int. J. Environ. Res. Public Health 2019, 16, 4178.
Sheldrick, M.P.R; Maitland, C.; Mackintosh, K.A.; Rosenberg, M.; Stratton, G.
(2020) Validity and reliability of the HomeSPACE-II instrument to assess the influence
of the home physical environment on children’s physical activity and sedentary
behaviour. International Journal of Health Promotion and Education 2020.
Sheldrick, M.P; Maitland, C.; Mackintosh, K.A.; Rosenberg, M.; Griffiths, L.J.; Fry, R.;
Stratton, G. Are parental and child preferences and priorities, as well as parental rules
regarding activity at home associated with children’s home-based behaviour and the
home physical environment?. Journal of Sport Sciences (under review).
Presentations
Sheldrick, M.P.R.; Tyler, R.; Mackintosh, K.A.; Stratton, G. Relationship between
Sedentary Time, Physical Activity and Multiple Lifestyle Factors in Children. The British
Association of Sport and Exercise Sciences (BASES) Student Conference, Bangor,
Wales, UK. March 2016. Oral Presentation.
4
Sheldrick, M.P.R.; Tyler, R.; Mackintosh, K.A.; Stratton, G. Relationship between
Sedentary Time, Physical Activity and Multiple Lifestyle Factors in Children. Applied
Sport Technology Exercise and Medicine Research Centre (A-STEM) Postgraduate
Conference, Swansea, Wales, UK March 2016. Oral Presentation.
Sheldrick, M.P.; Maitland, C.; Mackintosh, K.A; Rosenberg, M.; Stratton, G. Validity
and reliability of the HomeSPACE-II instrument to assess the influence of the home
physical environment on children’s physical activity and sedentary behavior. 1st Annual
Pan-Wales Postgraduate Conference in Sport and Exercise Sciences, Swansea, UK. April
2017. Poster Presentation.
Sheldrick, M.P.; Maitland, C.; Mackintosh, K.A.; Rosenberg, M.; Griffiths, L.J.; Fry, R.;
Stratton, G. Associations between the Home Physical Environment and Children’s Home-
Based Physical Activity and Sitting. Annual Pan-Wales Postgraduate Conference in Sport
and Exercise Sciences, Cardiff, UK. May 2019. Oral Presentation.
5
Declarations and statements
1. I, Michael Sheldrick, hereby declares that the work presented in this thesis has not
previously been accepted in substance for any degree and is not being
concurrently submitted in candidature for any degree.
2. I, Michael Sheldrick, hereby declare that the thesis is the result of my own
investigations, except where otherwise stated and that other sources are
acknowledged by footnotes giving explicit references and that a bibliography is
appended. In chapter 5, data from the 2015 Swan-linx project was analysed. In
this chapter, I analysed the data and wrote the manuscript. I was not involved in
collecting data for that year’s project, but I have participated in data collection for
later editions. In chapter 6-9, I was the sole person responsible for recruitment,
data collection, analysis and the writing of the manuscripts.
3. I, Michael Sheldrick hereby gives consent for the thesis, if accepted, to be
available for photo copying and for inter-library loan, and for the title and
summary to be made available to outside organisations.
Signed: (candidate)
Date:
6
Contents page
Abstract .................................................................................................................... 2
Scientific outputs ..................................................................................................... 3
Declarations and statements .................................................................................. 5
Contents page .......................................................................................................... 6
Acknowledgements ................................................................................................ 13
List of tables ........................................................................................................... 15
List of figures ......................................................................................................... 17
List of abbreviations ............................................................................................. 18
1. Introduction ................................................................................................. 20
1.1. Rational and background .............................................................................. 20
1.2. Problem statement......................................................................................... 22
1.3. Thesis aims ................................................................................................... 23
2. Literature review ........................................................................................ 24
2.1. Physical activity ............................................................................................ 25
2.1.1. Physical activity and health .......................................................................... 25
2.1.2. Physical activity prevalence in children ....................................................... 26
2.2. Sedentary time, screen-time and sedentary breaks ....................................... 28
2.2.1. Sedentary time and health ............................................................................. 28
2.2.2. Breaks in sedentary time and health ............................................................. 30
2.2.3. Prevalence of total sedentary time, screen-time and sitting breaks in children
30
2.3. Standing ........................................................................................................ 34
2.4. Measures of PA, sedentary time and sedentary breaks ................................. 35
2.4.1. Objective measurements of PA..................................................................... 36
2.4.1.1. Accelerometers .......................................................................................... 36
2.4.1.2. Heart rate monitoring ................................................................................. 37
2.4.1.3. Pedometers ................................................................................................. 38
2.4.1.4. Conclusion ......................................................................................................... 39
7
2.4.2. Objective measurements of sedentary time and sedentary breaks ................ 39
2.4.2.1. Accelerometers ........................................................................................... 39
2.4.2.2. Pedometers ................................................................................................. 40
2.4.2.3. Heart rate monitoring ................................................................................. 41
2.4.2.4. Posture sensors ........................................................................................... 41
2.4.2.5. Conclusion ................................................................................................. 42
2.4.3. New and emerging technologies that assess the context of PA and sedentary
time 43
2.4.3.1. Technologies for assessing the location of behaviours ................................ 43
2.4.3.2. Technologies for assessing the social context of behaviours ..................... 45
2.4.3.3. Technologies for assessing the type of behaviour being performed .......... 46
2.4.3.4. Technologies for collecting broader contextual information ....................... 46
2.4.3.5. Conclusion ................................................................................................ 48
2.5. Ecological models ......................................................................................... 48
2.6. Correlates of children’s physical activity and sedentary time within the home
environment............................................................................................................. 50
2.6.1. The home physical environment ................................................................... 50
2.6.2. The home social environment ....................................................................... 54
2.6.3. Evidence gaps and limitations of the social and physical home environment
literature .................................................................................................................. 56
2.7. Measures of the physical home environment ............................................... 57
3. General methodology .................................................................................. 60
3.1. Ethical approval ............................................................................................ 61
3.2. Instruments and procedures .......................................................................... 61
3.2.1. Swan-Linx Fitness Fun Day: Field-Based Fitness ........................................ 61
3.2.2. Child health and activity tool: online questionnaire ..................................... 62
3.2.3. The HomeSPACE-II audit ............................................................................ 63
3.2.4. The HomeSPACE-I questions related to family activity priorities and
preferences .............................................................................................................. 63
3.2.5. The question on the enforcement of a screen-time limiting rule from the BEAP
Study questionnaire ................................................................................................. 64
3.2.6. Objective house and garden size estimates ................................................... 64
3.2.7. ActivPAL posture monitor............................................................................ 65
8
3.2.8. ActiGraph accelerometer .............................................................................. 65
3.2.9. Home log....................................................................................................... 65
4. Development of the online HomeSPACE-II instrument .............................. 66
4.1. The initial HomeSPACE-II instrument prototype ........................................ 66
4.2. Second iteration of the online HomeSPACE-II instrument .......................... 67
4.3. Feasibility testing of questionnaire including questions from validated
measures .................................................................................................................. 70
4.4. Conclusion .................................................................................................... 71
Thesis Map ............................................................................................................. 72
5. Study 1 ......................................................................................................... 73
5.1. Relationship between Sedentary Time, Physical Activity and Multiple
Lifestyle Factors in Children ................................................................................... 73
5.2. Introduction ................................................................................................... 73
5.3. Materials and Methods.................................................................................. 75
5.3.1. Participants.................................................................................................... 75
5.3.2. Instruments and Procedures .......................................................................... 75
5.3.3. Statistical Analysis ........................................................................................ 76
5.4. Results ........................................................................................................... 77
5.5. Discussion ..................................................................................................... 83
5.6. Conclusions ................................................................................................... 88
Thesis map ............................................................................................................. 89
6. Study 2 ......................................................................................................... 90
6.1. Validity and reliability of the HomeSPACE-II instrument to assess the
influence of the home physical environment on children’s physical activity and
sedentary behaviour ................................................................................................ 90
6.2. Introduction ................................................................................................... 90
6.3. Method .......................................................................................................... 93
6.3.1. Participants.................................................................................................... 93
6.3.2. HomeSPACE-II instrument .......................................................................... 93
6.3.3. Procedures ..................................................................................................... 94
6.3.4. Data Reduction ............................................................................................. 94
6.3.5. Demographics ............................................................................................... 95
6.3.6. Statistical Analysis ........................................................................................ 95
9
6.4. Results ........................................................................................................... 96
6.4.1. Validity ......................................................................................................... 96
6.4.2. Reliability...................................................................................................... 97
6.5. Discussion ................................................................................................... 104
6.6. Conclusion .................................................................................................. 109
Thesis map ........................................................................................................... 110
7. Study 3 ....................................................................................................... 111
7.1. Associations between the Home Physical Environment and Children’s Home-
Based Physical Activity and Sitting ...................................................................... 111
7.2. Introduction ................................................................................................. 111
7.3. Materials and Methods................................................................................ 113
7.3.1. Study Design ............................................................................................... 113
7.3.2. Recruitment ................................................................................................. 113
7.3.3. Home Physical Environment ...................................................................... 113
7.3.4. Home Log Diary ......................................................................................... 114
7.3.5. Objectively Measured Home-Based Physical Activity and Postural
Behaviours ............................................................................................................ 115
7.3.6. Children Personal Information and Anthropometric Measures .................. 116
7.3.7. Objectively Measured House and Garden Size .......................................... 116
7.3.8. Additional Measures ................................................................................... 117
7.3.9. Statistical Analysis ...................................................................................... 118
7.4. Results ......................................................................................................... 118
7.4.1. Associations between Physical Home Factors and Home-Based Sitting ... 121
7.4.2. Associations between Physical Home Factors and Home-Based Standing 122
7.4.3. Associations between Physical Home Factors and the Number of Home-
Based Sitting Breaks ............................................................................................. 122
7.4.4. Associations Between Physical Home Factors and Home-Based TPA ...... 122
7.4.5. Associations Between Physical Home Factors and Home-Based MVPA .. 123
7.5. Discussion ................................................................................................... 129
7.6. Conclusion ..................................................................................................... 134
Thesis map ........................................................................................................... 135
8. Study 4 ....................................................................................................... 137
10
8.1. Are parental and child preferences and priorities, as well as parental rules
regarding activity at home associated with children’s home-based behaviour and the
home physical environment? ................................................................................ 137
8.2. Introduction ................................................................................................. 137
8.3. Materials and methods ................................................................................ 139
8.3.1. Sample ........................................................................................................ 139
8.3.2. Physical environment of the home.............................................................. 139
8.3.3. Home-based PA, sitting and sitting breaks ................................................. 139
8.3.4. Children demographic and anthropometric measures ................................ 141
8.3.5. House and garden size estimates ................................................................ 141
8.3.6. Additional Measures ................................................................................... 141
8.3.7. Family social and individual factors ........................................................... 142
8.3.8. Statistical analysis ....................................................................................... 142
8.4. Results ......................................................................................................... 143
8.4.1. Associations between social, individual factors and weekday sitting time,
sitting breaks and PA ............................................................................................ 146
8.4.2. Associations between social, individual factors and weekend sitting time,
sitting breaks and PA ............................................................................................ 147
8.4.3. Associations between social, individual factors and the physical home
environment........................................................................................................... 147
8.5. Discussion ................................................................................................... 153
8.6. Conclusion ...................................................................................................... 156
Thesis map ........................................................................................................... 158
9. Study 5 ....................................................................................................... 160
9.1. Clustering of home physical and social environmental factors ............ 160
9.2. Introduction ................................................................................................. 160
9.3. Materials and Methods................................................................................ 161
9.3.1. Participants.................................................................................................. 161
9.3.2. The physical home environment ................................................................. 162
9.3.3. Social and individual factors....................................................................... 162
9.3.4. Objectively measured home-based physical activity and postural behaviours
163
9.3.5. Children personal information and anthropometric measures .................... 164
11
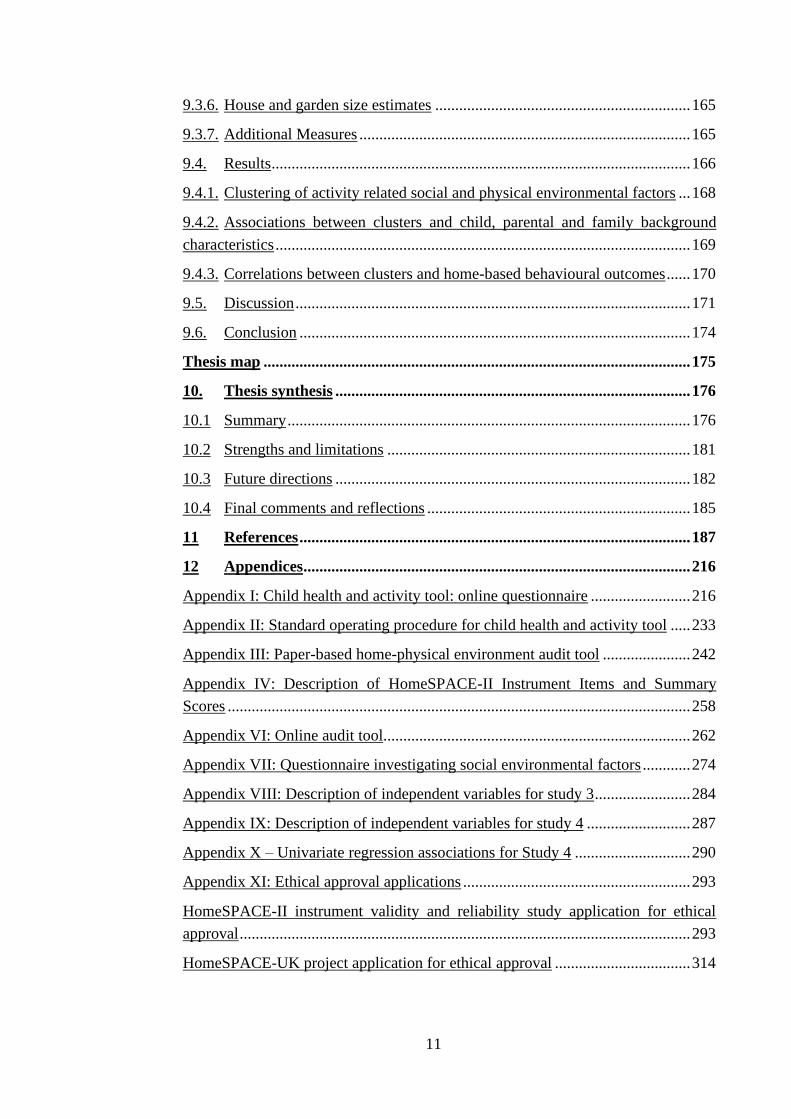
9.3.6. House and garden size estimates ................................................................ 165
9.3.7. Additional Measures ................................................................................... 165
9.4. Results ......................................................................................................... 166
9.4.1. Clustering of activity related social and physical environmental factors ... 168
9.4.2. Associations between clusters and child, parental and family background
characteristics ........................................................................................................ 169
9.4.3. Correlations between clusters and home-based behavioural outcomes ...... 170
9.5. Discussion ................................................................................................... 171
9.6. Conclusion .................................................................................................. 174
Thesis map ........................................................................................................... 175
10. Thesis synthesis ......................................................................................... 176
10.1 Summary ..................................................................................................... 176
10.2 Strengths and limitations ............................................................................ 181
10.3 Future directions ......................................................................................... 182
10.4 Final comments and reflections .................................................................. 185
11 References .................................................................................................. 187
12 Appendices ................................................................................................. 216
Appendix I: Child health and activity tool: online questionnaire ......................... 216
Appendix II: Standard operating procedure for child health and activity tool ..... 233
Appendix III: Paper-based home-physical environment audit tool ...................... 242
Appendix IV: Description of HomeSPACE-II Instrument Items and Summary
Scores .................................................................................................................... 258
Appendix VI: Online audit tool............................................................................. 262
Appendix VII: Questionnaire investigating social environmental factors ............ 274
Appendix VIII: Description of independent variables for study 3 ........................ 284
Appendix IX: Description of independent variables for study 4 .......................... 287
Appendix X – Univariate regression associations for Study 4 ............................. 290
Appendix XI: Ethical approval applications ......................................................... 293
HomeSPACE-II instrument validity and reliability study application for ethical
approval ................................................................................................................. 293
HomeSPACE-UK project application for ethical approval .................................. 314

12
13
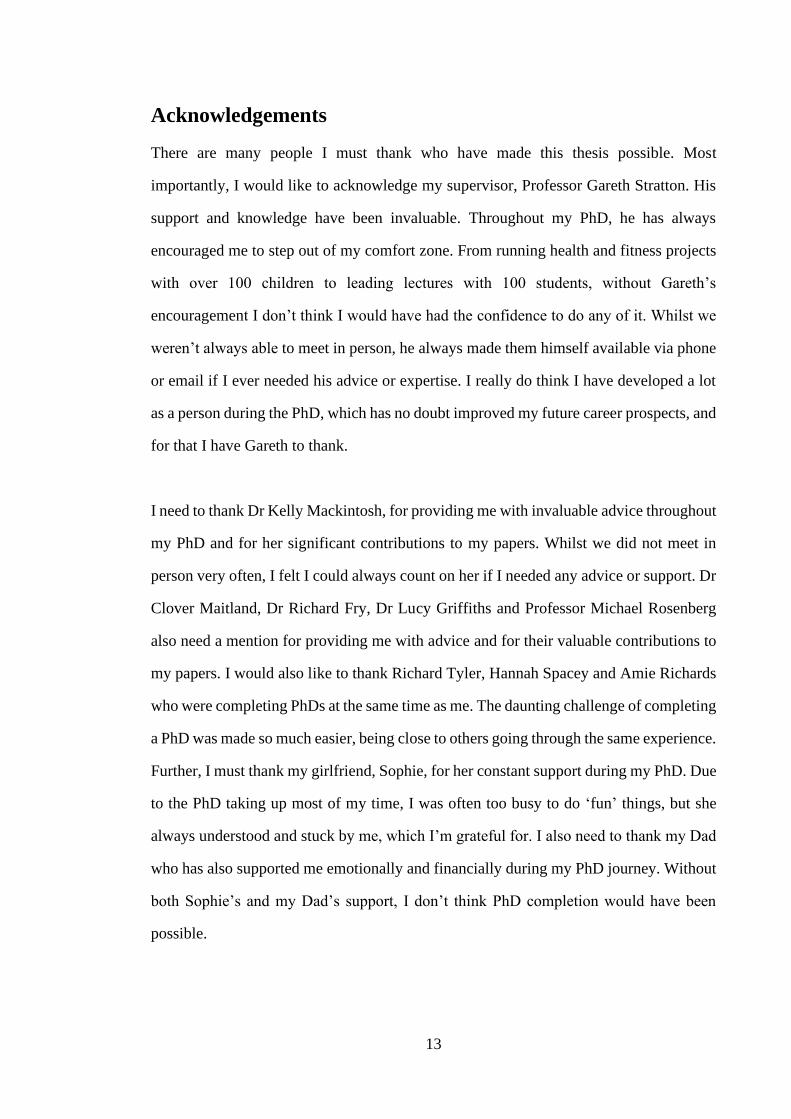
Acknowledgements
There are many people I must thank who have made this thesis possible. Most
importantly, I would like to acknowledge my supervisor, Professor Gareth Stratton. His
support and knowledge have been invaluable. Throughout my PhD, he has always
encouraged me to step out of my comfort zone. From running health and fitness projects
with over 100 children to leading lectures with 100 students, without Gareth’s
encouragement I don’t think I would have had the confidence to do any of it. Whilst we
weren’t always able to meet in person, he always made them himself available via phone
or email if I ever needed his advice or expertise. I really do think I have developed a lot
as a person during the PhD, which has no doubt improved my future career prospects, and
for that I have Gareth to thank.
I need to thank Dr Kelly Mackintosh, for providing me with invaluable advice throughout
my PhD and for her significant contributions to my papers. Whilst we did not meet in
person very often, I felt I could always count on her if I needed any advice or support. Dr
Clover Maitland, Dr Richard Fry, Dr Lucy Griffiths and Professor Michael Rosenberg
also need a mention for providing me with advice and for their valuable contributions to
my papers. I would also like to thank Richard Tyler, Hannah Spacey and Amie Richards
who were completing PhDs at the same time as me. The daunting challenge of completing
a PhD was made so much easier, being close to others going through the same experience.
Further, I must thank my girlfriend, Sophie, for her constant support during my PhD. Due
to the PhD taking up most of my time, I was often too busy to do ‘fun’ things, but she
always understood and stuck by me, which I’m grateful for. I also need to thank my Dad
who has also supported me emotionally and financially during my PhD journey. Without
both Sophie’s and my Dad’s support, I don’t think PhD completion would have been
possible.

14
Lastly, I must thank the schools across South Wales who agreed to get involved in the
research, despite their hectic schedules. However, it is the children and their parents who
participated in the research that deserve the most recognition. Indeed, without them there
would have been no research.
15
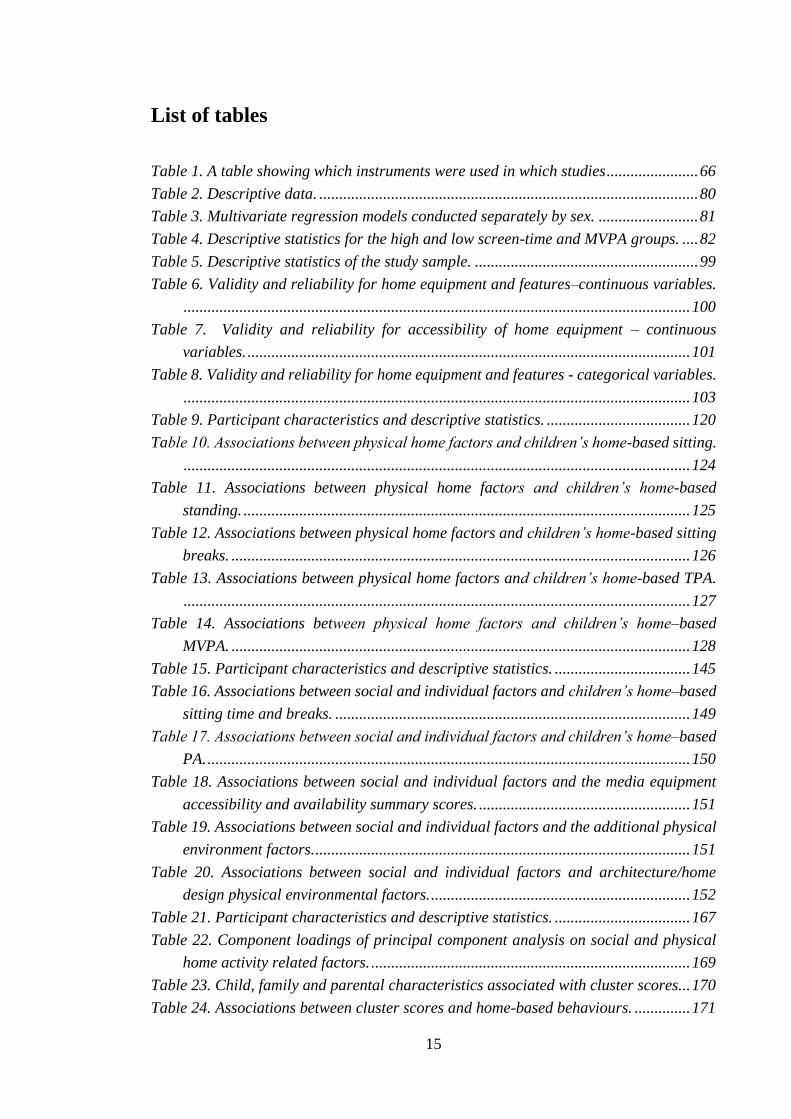
List of tables
Table 1. A table showing which instruments were used in which studies ....................... 66
Table 2. Descriptive data. ............................................................................................... 80
Table 3. Multivariate regression models conducted separately by sex. ......................... 81
Table 4. Descriptive statistics for the high and low screen-time and MVPA groups. .... 82
Table 5. Descriptive statistics of the study sample. ........................................................ 99
Table 6. Validity and reliability for home equipment and features–continuous variables.
............................................................................................................................... 100
Table 7. Validity and reliability for accessibility of home equipment – continuous
variables. ............................................................................................................... 101
Table 8. Validity and reliability for home equipment and features - categorical variables.
............................................................................................................................... 103
Table 9. Participant characteristics and descriptive statistics. .................................... 120
Table 10. Associations between physical home factors and children’s home-based sitting.
............................................................................................................................... 124
Table 11. Associations between physical home factors and children’s home-based
standing. ................................................................................................................ 125
Table 12. Associations between physical home factors and children’s home-based sitting
breaks. ................................................................................................................... 126
Table 13. Associations between physical home factors and children’s home-based TPA.
............................................................................................................................... 127
Table 14. Associations between physical home factors and children’s home–based
MVPA. ................................................................................................................... 128
Table 15. Participant characteristics and descriptive statistics. .................................. 145
Table 16. Associations between social and individual factors and children’s home–based
sitting time and breaks. ......................................................................................... 149
Table 17. Associations between social and individual factors and children’s home–based
PA. ......................................................................................................................... 150
Table 18. Associations between social and individual factors and the media equipment
accessibility and availability summary scores. ..................................................... 151
Table 19. Associations between social and individual factors and the additional physical
environment factors. .............................................................................................. 151
Table 20. Associations between social and individual factors and architecture/home
design physical environmental factors. ................................................................. 152
Table 21. Participant characteristics and descriptive statistics. .................................. 167
Table 22. Component loadings of principal component analysis on social and physical
home activity related factors. ................................................................................ 169
Table 23. Child, family and parental characteristics associated with cluster scores... 170
Table 24. Associations between cluster scores and home-based behaviours. .............. 171
16
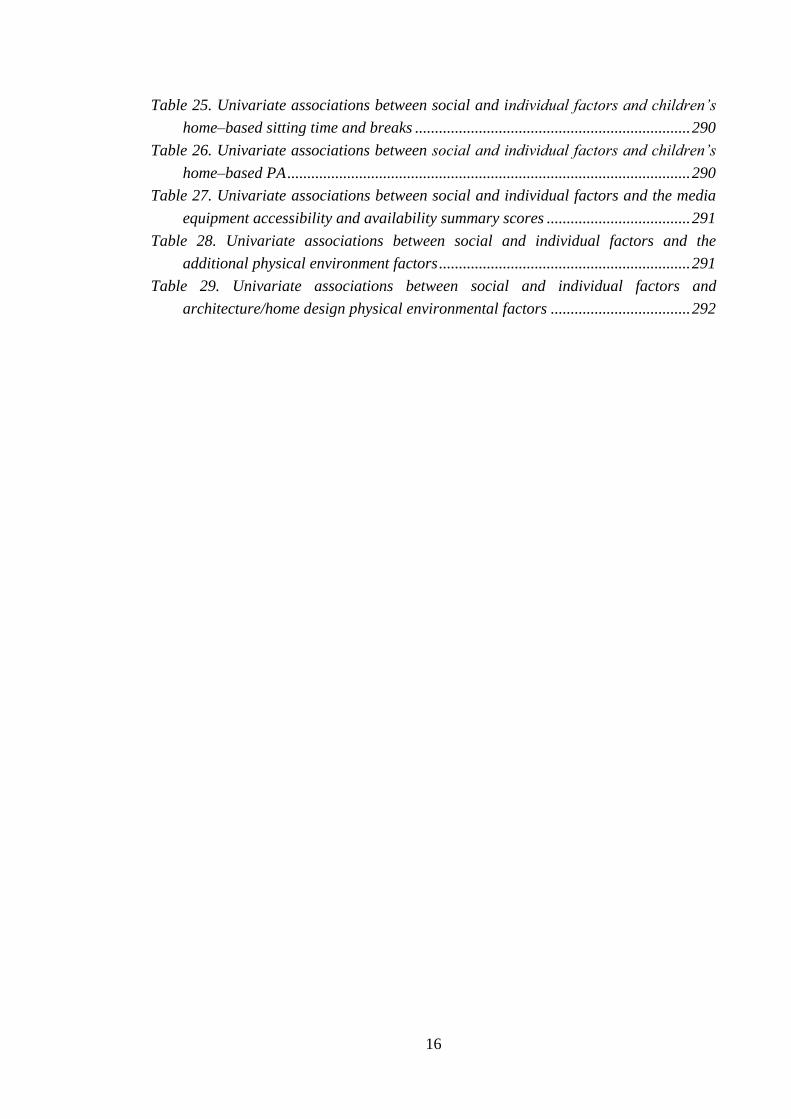
Table 25. Univariate associations between social and individual factors and children’s
home–based sitting time and breaks ..................................................................... 290
Table 26. Univariate associations between social and individual factors and children’s
home–based PA ..................................................................................................... 290
Table 27. Univariate associations between social and individual factors and the media
equipment accessibility and availability summary scores .................................... 291
Table 28. Univariate associations between social and individual factors and the
additional physical environment factors ............................................................... 291
Table 29. Univariate associations between social and individual factors and
architecture/home design physical environmental factors ................................... 292

17
List of figures
Figure 1. Ecological model of health behaviour ............................................................. 49
18
List of abbreviations
20 MSFT 20 metre multi-stage fitness test
β Standardised regression weight
A-STEM
ABP
AYP
Applied Sport Technology Exercise and
Medicine
AddressBase Premium
Active young people
BMI Body mass index; weight (kg) divided by
height (m2)
BMI z-scores
Measure of relative body mass adjusted for
child age and sex with use of reference data
BLE Bluetooth low energy
CFA Confirmatory factor analysis
CHAT Child Health and Activity Tool
CI Confidence interval
CKC Cohen’s Kappa coefficients
CPM Counts per minute
CRF Cardiorespiratory fitness
EMA Ecological momentary assessment
FMS Fundamental movement skills
GPS Global positioning system
GIS Geographic information system
HBSC Health Behaviour in School-Aged
Children survey
HR Heart rate
ICAD International children’s accelerometery
database
ICC Intraclass correlation coefficients
K Kappa Coefficient
Kg Kilogram
KMO Kaiser-Meyer-Olkin
LPA Light physical activity
LPL Lipoprotein lipase
METS Metabolic equivalents
MPA Moderate physical activity
NHANES Health and nutrition examination survey
OSMM Ordnance Survey Mastermap
P Levels of significance
PA Physical activity
PAMI PA and media equipment inventory
19
PCA Principal component analysis
r Coefficient of correlation
r2 Coefficient of determination; statistical
measure that represents the proportion of
the variance for a dependent variable that
is explained by an independent variable
RCT Randomised controlled trial
REE Resting energy expenditure
RFIS Radio-frequency identification
ROC Receiver operating curve
RTLS Real time locating systems
s Seconds
SES Socioeconomic status
SD Standard deviation
TPA Total physical activity
TV Television
UK United Kingdom
USA United States of America
VA Vertical axis
VM Vector magnitude
VPA Vigorous physical activity
WHO World health organisation
WIMD Welsh index of multiple deprivation
20
1. Introduction
1.1. Rational and background
The high prevalence of physical inactivity in children is considered a key contributor to
the global childhood obesity epidemic [1–3]. The significant time children spend in
sedentary behaviours nowadays, particularly screen-based media, is another likely
contributing factor [1,4]. In addition, sedentary behaviour, often characterized as screen-
based behaviours, and PA are associated with a wide range of other health and well-being
outcomes in children [5]. Physical activity of moderate-vigorous intensity has been shown
to have potent health benefits in children including improved fitness, better bone health,
improved cardio metabolic profile, aiding motor skill development and mental health
benefits [6]. Even light physical activity has been shown to have beneficial associations
with health outcomes in children [7,8], albeit not all the time [9,10]. While sedentary time,
specifically screen-time, has been unfavourably associated with cardiometabolic risk
factors, social behaviour problems, fitness, self-esteem and academic achievement [5,11].
There is also some evidence that overall sedentary time [12], particularly in obese and
overweight children [13], and infrequent interruptions in sitting time [14] are also
associated with adverse health outcomes in children. However to date findings are
inconsistent [5,13].
The detrimental health effects of inactivity is particularly significant in adults [15]. In
fact, physical inactivity is considered the fourth leading risk factor for mortality
worldwide, accounting for 16.9% of deaths in the UK and for 6% of all deaths globally
[16]. This may be because regular PA has been shown to reduce adult’s’ risk of
developing several serious health outcomes including metabolic syndrome [17],
hypertension, stroke [18], type 2 diabetes [19], depression and anxiety [20], breast, colon
and endometrial cancer [21], coronary heart disease [22]. Although the evidence for the
harmful effects of sedentary behaviour is less convincing, partly due to methodological
21
issues [23], research has shown serious health consequences of daily sedentary behaviour
in adults and it is estimated to be responsible for 3.8% of deaths globally [24].
Specifically, daily sedentary behaviour has been linked with non-fatal cardiovascular
disease, metabolic syndrome and to a lesser degree cancer (ovarian and endometrial) as
well as type 2 diabetes [25]. Screen-based sedentary behaviours (i.e., screen-time) appear
to have unique detrimental effects on health. Indeed, screen-time, particularly TV
viewing, unlike daily sedentary time, has been strongly associated with type 2 diabetes
and colon cancer [25]. In adults, the way sedentary time is accrued may be also be
relevant, with recent studies showing that prolonged sitting may be particularly harmful
[26]. In fact, more frequent interruptions in sitting time have been associated with a better
cardio-metabolic profile [27,28], a lower waist circumference [28] and even all-cause
mortality [29]. It has been shown that PA [30] and sedentary habits [31] can track into
adulthood. Thus, inactivity and sedentary time may have direct health effects in children,
as well as indirect effects whereby habits track into adulthood putting them at risk for a
plethora of health problems [32]. In fact, children get less active [33] and more sedentary
with age [34], with the change most pronounced between 9 and 12 years [34]. Given the
evidence, there is a pressing need for effective evidence-based PA and sedentary time
interventions in children, particularly among children aged 9-12 years.
When designing and implementing effective interventions targeting sedentary time and
PA, it is important to understand their correlates [35]. Ecological models highlight
environmental influences on PA and sedentary behaviour [36,37]. Aside from school,
children spend most of their time at home [38,39]. As a result, a large proportion of
children’s overall sedentary time and PA is accumulated at home [40]. Therefore, the
home environment has a particularly important role in influencing children’s PA and
sedentary behaviour.
To date, although there is an emerging evidence base on the influence of the home
environment on children’s PA and sedentary behaviour, many aspects of the home
environment remain unexplored, with the physical environment in particular receiving
little attention [41,42]. Despite a qualitative study identifying a wide range of potential
22
influences of the home physical environment including the space and size of the house
and garden as well as other aspects of home design [43], few studies have assessed the
physical environment beyond media and PA equipment. Further, assessment of PA and
media equipment has been limited to self-report, which may partly explain why findings
have been inconsistent to date [41]. The use of more objective instruments which assess
other physical environmental factors is imperative to improving our understanding of
influences within the home, however such measures are lacking. Additionally, although
a large body of literature exists on social influences, home-specific social factors remain
largely unexplored. Another key criticism of past work is that studies have mostly
assessed PA and sedentary behaviour across the entire day. Since children spend
significant time at home [38,39] and that a key tenet of ecological models is that
behaviour is most likely influenced by the environment in which it occurs [36,37],
research investigating how home-specific physical and social factors relate to home-based
behaviours is paramount. Moreover, parents control many elements of the home, however
little is known about what influences these choices. Such information would improve our
understanding of potentially modifiable correlates of PA and sedentary behaviour within
the home. Further, few studies have examined clustering of activity related factors within
the home. Indeed, identifying which social and physical factors cluster could lead to more
efficient interventions, through targeting several factors simultaneously.
Addressing the discussed gaps in the literature would afford new insight and an improved
understanding of the relationship between the home environment and children’s PA and
sedentary behaviour. Such information could inform intervention development with the
objective to promote children’s PA and reduce sedentary behaviour within the home.
1.2. Problem statement
Despite inactivity and sedentary behaviour being associated with detrimental
physiological and psychological effects, few children meet the PA and sedentary
behaviour guidelines. Children become even less active [33] and more sedentary with age
[34], with the change particualry pronounced between 9 and 12 years [34]. This suggests
the importance of research into the correlates of PA and sedentary behaviour in this
particular age group. Although ecological models recognise the environment as an
important sphere of influence on behaviour and children spend significant time at home,
23
little is known about its influence, particularly the physical environment, on children’s
PA and sedentary time at home. An improved understanding of the correlates of these
behaviours among children aged 9-12 years at home will be imperative for informing
interventions.
1.3. Thesis aims
The overall aim of the thesis was to improve researchers’ understanding of the correlates,
particularly within the home environment, of children’s aged 9-12 years PA and sedentary
behaviour. This PhD thesis is comprised of 5 chapters;
Study 1; The first study aimed to explore relationships between multiple lifestyle factors
and sufficient physical activity (≥60 min·day–1) and excessive screen-time (≥2 h·day–1)
in children.
Study 2; The purpose of study two was to assess the validity and reliability of the
HomeSPACE-II instrument, for use in two-storey homes and with the added measure of
accessibility, to measure parameters of the home physical environment hypothesized to
influence children’s PA and sedentary time at home.
Study 3; The aim of the 3rd study was to investigate relationships between physical home
environmental factors and children’s sitting, PA, standing and sitting breaks at home.
Study 4; The aim of study 4 was to investigate the influence of parental and child activity
preferences and priorities, as well as parental rules on: (i) children’s sitting time, PA and
sitting breaks at home, and: (ii) the creation of the home physical environment.
Study 5; The last study aimed to examine clustering of parental and physical factors
within the home, whether they are related to child and parental characteristics, and
children’s sitting, sitting breaks and PA at home.
24
2. Literature review
Regular PA is associated with numerous health benefits in children [6], yet PA levels
among children remain low worldwide [44]. Children also spend a large proportion of
their discretionary time sedentary, particularly engaged in screen-based behaviours [45],
which have been associated with poor health outcomes [5,46]. Additionally, much of
children’s sedentary behaviour occurs in prolonged bouts (> 30 mins) [47,48]. This is a
concern, since more frequent sitting breaks have been associated with lower diabetes and
cardio-metabolic indicators in adults [28,49] and short-term improvements in metabolic
indicators in children [50]. Whilst reviews have found limited and inconsistent evidence
for a relationship between health and both patterns of sedentary behaviour and overall
amounts in children, authors have noted that this is, in part, due to methodological issues
and the infancy of the research [13,23]. Nevertheless, given the emerging evidence in
adults [25] and that sedentary habits appear to track into adulthood [31], interventions are
needed to both increase children’s PA, and reduce their sedentary time, particularly for
extended periods.
The identification of correlates is considered a crucial stage of effective intervention
development [51]. Given, the recognised influence of the environment [36,37], and that
children spend more time at home than anywhere else [39,52], correlates of PA and
sedentary within the home are particularly important. However, in order to improve our
understanding of how the home influences children’s sedentary time and PA,
comprehensive measures of behaviour and the environment are imperative [51]. With this
in mind, this literature review will provide a rationale for this thesis by demonstrating the
prevalence of inactivity and sedentary behaviour in children as well as highlight the health
benefits and detriments of PA and sedentary time, respectively. Further, the current
literature on physical and social environment correlates of the home and the evidence
gaps will be discussed. In addition, measures of behaviours, including novel technologies
25
with largely unknown validity capable of providing broader contextual information, will
be reviewed.
2.1. Physical activity
2.1.1. Physical activity and health
Physical activity (PA) is defined as “any bodily movement produced by skeletal muscles
resulting in energy expenditure higher than resting” [53]. There are different intensities
of PA (light, moderate, vigorous and total) and various sub groups (organised sport,
leisure-time activity and occupational activity) [54], and at home may include exercise,
chores and active play. In adults, PA has been shown to decrease the risk of several
adverse health outcomes including coronary heart disease [22], hypertension, stroke [18],
type 2 diabetes [19], metabolic syndrome [17], depression and anxiety [20], breast, colon
and endometrial cancer [21] as well as all-cause mortality [55]. Regular PA also provides
beneficial health effects in youth, with a recent systematic review reporting consistent
and strong favourable associations between total physical activity (TPA) and physical
fitness, adiposity, bone health and cardio-metabolic biomarkers and weak favourable
associations with quality of life/well-being, psychological distress and motor skill
development [6]. The specific intensities of PA had similar beneficial associations with
health indicators, however on the whole, higher intensity PA (i.e., moderate-to-vigorous)
had the stronger and more consistent relationship with health compared with lower
intensity PA (i.e., light). In addition, favourable associations were found with all patterns
of PA (bouts, sporadic, continuous) [10].
Moderate-to-vigorous physical activity (MVPA) has a long-standing relationship with
health. Accordingly, the UK guidelines, guidelines from other countries (e.g., USA [56],
Australia [57], Canada [58] and the World Health Organisation (WHO) [59] recommend
that children spend a minimum of 60 mins in MVPA each day. In contrast, the importance
26
of light physical activity (LPA) to health has only been acknowledged recently. Indeed,
a review [10] found evidence that LPA is beneficially associated with diastolic BP, BP z-
score, insulin resistance, and HDL cholesterol in children. However, compared with
MVPA, much less studies have examined the health effects of LPA [6]. This discrepancy
may be due to the popularity of subjective PA measures, which unlike objective measures,
cannot assess LPA accurately [60]. This may explain why most PA guidelines do not
include recommendations on LPA. To the author’s knowledge, the Canadian 24-hour
movement guidelines [61] were the first set of behavioural recommendations to consider
LPA. They recommend that children spend several hours each day in a variety of
structured and unstructured LPA. Taken together, despite MVPA being more consistently
associated with health, there is evidence to suggest that even lower intensities of PA (i.e.,
LPA) may be important for health promotion in children, and therefore should be targeted
in evidence-based interventions.
2.1.2. Physical activity prevalence in children
Despite the numerous health benefits of MVPA [6], according to survey data, the majority
of children do not meet the current public health guidelines (≥60 min·day–1) [62].
Nationally representative data in the UK is survey based. In Wales, based on self-reported
data from the 2016/17 survey for Wales and the 2017/18 Health Behaviour in School-
Aged Children survey (HBSC), 34% of children aged 3-17 met PA guidelines [63].
Slightly worse PA participation rates have been reported in England, with only 22% of
children aged 5-15 years meeting PA recommendations based on data from the 2015
health survey for England [64]. Similar low compliance rates have been observed in
surveys worldwide [44].
The few studies with nationally representative samples that objectively measured PA also
indicate that a high proportion of children do not meet PA guidelines. In a large UK study
of 6,497 children aged 7-8 years, 51% of children met the PA guidelines [65]. However,
27
significantly less girls (38%) than boys (63%) achieved the guidelines. There was also
considerable variation by gender among 1,223 children aged 8-9 years in another UK
study, with 73% of boys and only 54% of girls achieving the PA guidelines [66]. Much
lower participation rates were observed in 27,637 participants aged 5-17 years from 10
countries in the international children’s accelerometery database (ICAD), with only 9.0%
of boys and 1.9% of girls achieving the recommended amount of PA [67]. The significant
difference in the proportion of children meeting the PA guidelines in the two samples,
may be explained by the fact PA levels have been shown to decline with age [68]. Indeed,
in the ICAD study, TPA on average decreased by 4.2% with each additional year of age
[67].
While other intensities of PA are also important to health [6], most surveillance studies
have only reported MVPA data due to the historical public health focus on it [69]. The
2016/17 Canadian health measures survey collected TPA data on Canadian youth aged
5-17 years [70]. On average, youth spent 4 hours in LPA and 63 mins in MVPA, and 5
hours in total physical activity (TPA). Similar to the MVPA surveillance data, children
(4 hrs and 19 mins) had higher LPA compared to adolescents (3 hrs and 35 mins). On the
other hand, LPA levels did not differ between girls (3 hrs and 55 mins) and boys (4 hrs
and 1 min).
It is clear from both self-reported and objective PA data in the literature that children are
not doing enough MVPA, particularly girls. Moreover, PA of all intensities appears to
decrease with age. Of note, TPA levels do not seem to differ in girls and boys [70]. This
evidence highlights the pressing need for interventions promoting children’s PA. To date,
interventions solely targeting MVPA have shown limited success [71], thus, increasing
LPA may be more feasible, particularly in girls. In addition, since sedentary time has been
associated with obesity in children, independent of MVPA levels [12], substituting some
of it for LPA may have a beneficial effect on weight outcomes.
28
2.2. Sedentary time, screen-time and sedentary breaks
2.2.1. Sedentary time and health
The universal definition of sedentary behaviour has been proposed as any waking activity,
in a sitting, lying or reclining posture with an energy-expenditure below 1.5 metabolic
equivalents (METs) [72], such as television (TV) viewing, using a computer or reading.
Although there is clear consensus for the accuracy of this definition in adults [72,73],
some argue that the MET threshold characterising sedentary behaviour must be higher in
children as they have a higher resting energy expenditure (REE) [74]. Saint Maurice et
al. [75] confirmed this notion and concluded that the MET threshold should be 2 METs
in children and adolescents, so this value may improve the accuracy of sedentary
behaviour classification in this population.
Until recently, sedentary behaviour was often confused with physical inactivity [76], a
term used to describe an individual who is not meeting PA guidelines [77]. It is important
that sedentary behaviour and physical inactivity are considered separate constructs, as a
child can engage in sufficient PA (60 mins/day), but still spend significant time sedentary
[78]. Sedentary behaviour research has proliferated in recent years, where there is
emerging evidence for an adverse association with health outcomes in adults [32]. Indeed,
a review by Rezende et al. [25] found strong evidence for an adverse relationship between
sedentary time, including screen-based behaviours (e.g., TV viewing, video games and
internet use), and all-cause mortality, cardiovascular disease, type 2 diabetes and
metabolic syndrome in adults [46]. They also found moderate evidence for harmful
associations with ovarian, colon and endometrial cancer as well as type 2 diabetes [46].
Although the results of more recent studies investigating the relationship between all-
cause mortality are relatively mixed, this is, in part, due to methodological issues [79,80].
Specifically, the majority of studies have used accelerometers to assess sedentary
behaviour, which are useful for understanding the health effects associated with a lack of
29
movement, however not so much for the health risks of sitting specifically. Therefore,
despite the promising findings to date, before we can conclude there is a causal
relationship between sedentary behaviour and adverse health outcomes, more studies
using posture sensors to measure sedentary behaviour are needed. The relationship
between overall sedentary time and health in children is even less understood [5]. This
could be because the harmful effects of sedentary time may have not had long enough to
manifest themselves. Additionally, although a recent systematic review found limited
evidence for an adverse relationship between overall sedentary time and health in
children, they noted there were insufficient studies of a randomised controlled trial (RCT)
design using valid and reliable measures of sedentary time to draw any conclusions [5].
Although the way by which excessive sedentary time adversely effects health is not fully
understood, it has been postulated that the lack of local contractile stimulation when
sitting reduces skeletal muscle lipoprotein lipase (LPL) activity (important for regulating
triglyceride and HDL-cholesterol concentrations) and glucose uptake [81,82].
Of the sedentary behaviours, screen-time is thought to have a particularly detrimental
effect on health [5,46], partially because of its relationship with unhealthy lifestyle
behaviours such as shorter sleep duration [83,84], a poorer diet [85–88] and MVPA
[89,90], albeit relationships with the latter are inconsistent [91]. In fact, in children
excessive screen-time has been unfavourably associated with obesity, cardiometabolic
risk factors, social behaviour problems, fitness, self-esteem and academic achievement
[5,11]. On the other hand, a review including only prospective studies found insufficient
evidence that screen-time was associated with either fitness or cardiometabolic indicators
in children [92]. However, the authors did note that there wasn’t enough prospective
studies investigating such relationships to draw any conclusions. Another limitation of
the literature to date is the reliance on self-report measures without reported psychometric
properties to assess screen-time [93]. High quality prospective studies using valid and
reliable measures of screen-time are clearly needed to better understand the relationship
30
between screen-time and health. However, the evidence thus far is sufficient enough for
public health guidelines in the UK [94], Canada [61] and Australia [95] to recommend
that children spend no more than 2 hours/day engaging in screen-time and limit their
sitting as often as possible. Therefore, given the harmful consequences shown in adults
[96], and that children’s sedentary habits appear to persist into adulthood [31], reducing
overall sitting levels and screen-time in childhood should be a public health priority.
Given sedentary time has been shown to have different correlates to low PA [87], it is
likely that strategies required to reduce sedentary behaviour and increase PA may differ
as well [97]. Consequently, when theories and interventions designed for PA have been
applied to reduce sedentary time, they have been unsuccessful [98]. The reason for this
may, in part, be due to PA and sedentary time having different motivational factors [99].
The choice to engage in PA is mostly planned and requires effort whereas sitting is often
spontaneous and requires minimal effort. Therefore, in order to produce meaningful
reductions in sedentary time, future interventions and theories informing them need to
consider the pervasive and habitual nature of sedentary time.
2.2.2. Breaks in sedentary time and health
The way sedentary time is accumulated may be important, with recent evidence
suggesting that prolonged sitting is particularly harmful to health [100]. As a result, there
is an emerging body of evidence on the health effects of increasing sitting breaks [101].
In studies using ActiGraph monitors, breaks have mostly been defined as a transition from
a ‘sedentary’ (<100 counts per minute (cpm)) to an ‘active’ state (> 100 cpm) over a 60-
second epoch in adults [102,103] and youth [104,105]. When using the activPAL, studies
have considered breaks in sitting time as transitions from sit/lie to stand or step in adults
[102,106] and youth [104,106]. Some studies have shown improvements in metabolic and
cardiovascular indicators when periods of sitting are broken up with LPA or MPA
[27,28], however findings on the whole are inconsistent [107,108]. On the other hand,
experimental studies have consistently shown beneficial effects of breaking up prolonged
31
sitting with light PA on postprandial glucose metabolism [23,109]. Interrupting sitting
with LPA was also associated with reduced self-reported fatigue in overweight adults in
a small pilot study [110]. Very few studies have investigated the relationship between
sedentary breaks and all-cause mortality [23]. However, in one study, longer sitting bouts
were associated with a higher all-cause mortality risk over 4 years in 7,985 US middle-
aged or older adults [29]. Conversely, the number of sitting breaks were not associated
with all-cause mortality over 5 years in a smaller sample of 1655 men [111]. The evidence
on the relationship between sedentary breaks and health is scarce and limited to studies
that have used waist worn accelerometers, while posture monitors are thought to provide
a more accurate measure of sitting time, as they can differentiate between sitting and
standing [112]. Despite the limited and inconsistent evidence to date, several national
guidelines recommend interrupting sitting with PA as often as possible [94,113].
Although, several studies have shown benefits of breaking up sitting time on health in
adults, albeit findings are inconsistent, the evidence in youth is even less clear [13].
Carson et al. [114] reported no association between the frequency of sedentary breaks and
cardiometabolic disease risk in children and adolescents. Further, Kwon et al. [115] failed
to detect an association between sedentary breaks and fat mass in children. To our
knowledge, Belcher et al. [14] is one of the few studies to show that interrupting sitting
time may lead to improvements in children’s health as well. This study found that
interrupting sitting time with short bouts of moderate intensity walking improved short-
term metabolic function in healthy children aged 7-11 years. Despite a review finding
limited and inconsistent evidence for a relationship between sitting breaks and health in
youth, the authors noted that more experimental research is needed to make a conclusion
on the relationship [13]. The inconsistencies in the literature may be attributable to several
measurement issues. Specifically, most of the evidence is limited to studies that have used
waist worn accelerometers. The only study in the review that used a posture monitor to
measure sitting time, found a negative relationship between the frequency of sitting
32
breaks and adiposity in adolescent girls [116]. Such a finding supports the case for using
posture monitors to measure sitting time and breaks and raises the possibility that
prolonged sitting may also have harmful health effects in youth. Further, given the
adverse effects of prolonged sitting in adults [73] and evidence that sitting appears to
track from childhood to adulthood [31] , research identifying correlates of sitting breaks
in children is important.
2.2.3. Prevalence of total sedentary time, screen-time and sitting breaks
in children
Screen-time has become the most popular sedentary activity among children [5], which
is of concern given its association with adverse health outcomes [5]. The Office of
Communication (Ofcom) measured weekly screen-time in UK children including TV,
games console and internet use by parental report [117]. Parents reported an average of
over 5 hours/day for children aged 8-11 years, and 6 and half hours/day for children aged
12-15 years. Research on children in Wales reports similar findings. In the 2016/17
National Health Survey for Wales, parents were asked how many hours per day their
children aged 3-17 years spent watching TV or using electronic devices [118,119]. While
average daily screen-time was not reported, the survey found that 81% spent at least 2
hours in screen-time per weekday and 92% spent at least 2 hours in screen-time per
weekend day. The Ofcom 2018 report showed internet use was the most popular screen-
based activity among children aged 8-11 years, with 93% going online for 13 and a half
hours a week. This was followed closely by watching TV on a TV set, where 94%
watched it for 13 hours a week. While still prevalent, video game use was not as common,
with 74% playing video games for 10 hours a week [117].
Studies using accelerometers to assess sedentary time have found that youth spend a high
proportion of their waking time sedentary. In a large UK representative sample of 6,497
children aged 7-8 years, more than half of the children were sedentary for at least 6.4
33
hrs/day [65]. In another large UK cohort of 5,429 children aged 12 years, prevalence of
sedentary time was also high, with children on average spending 7.1 hrs/day sedentary
[120]. Similar findings have been reported in North American children. In a large
nationally representative samples of children aged 6-10 years from Canada [121] and
aged 6-11 years from the United States [122], children were sedentary for 7.4 hrs/day and
6.1 hrs/day, respectively.
Few large accelerometer studies report the number of sedentary breaks However one
study indicated that children aged 9 years have on average 8 sedentary breaks per hour
[123]. Overall sedentary time also appears to increase with age. For example, data from
National Health and Nutrition Examination Survey (NHANES) in the US showed that
sedentary time increased by more than 2 hours per day across three age groups (i.e., 6-12
years, 12-15 years, and 16-19 years) [124]. In a UK longitudinal study [123], where
children had their PA measured at age 7 years, 9 years, 12 years and 15 years, the daily
proportion of time spent sedentary increased from 51.3% at baseline to 74.2% at 15 years
(22.9%). In the same sample, the number of sedentary breaks per hour decreased from
8.6 at 7 years to 4.1 at 15 years. Further, sedentary time increased steadily over each of
the three periods, with the most pronounced increase occurring between 9 years and 12
years (9.2%).
Postural-based monitors can distinguish between sitting and standing, and therefore are
thought to be a more precise measure of sedentary time, however the few studies using
them in children are typically small. One UK study of 79 children aged 9-10 years, which
assessed sitting time using the activPAL, found that children sat for over 10 hrs/day (68%)
on school days and 11 hrs/day on weekend days (73%) [48]. Similar results were reported
from activPAL data on 65 obese Malaysian children aged 9-11 years, with children sitting
in excess of 11 hrs/day (68%) on school days and 12 hrs/day (74%) on weekend days
[125]. In one of the only studies to report the number of activPAL determined sitting
breaks in children, children aged 7-8 years had on average 111 breaks/day [47]. Further,
34
a large proportion of UK children’s sitting time is accumulated in prolonged sitting bouts.
The Sherry et al., (2018) study demonstrated that 20% and 28% of children’s sitting bouts
were prolonged (> 30 mins) on school and weekend days, respectively. Whilst in the Nagy
et al., (2019) study, 24% of total sitting time was generated from prolonged bouts (> 30
mins).
Irrespective of the instruments used to assess sedentary time (self-report, activPAL or
accelerometery), there is a clear consensus in the literature that youth spend too much of
their waking time sedentary. Further, accelerometer data clearly indicates that sedentary
behaviour increases with age. The steepest change seems to occur between 9 and 12 years
[123], representing the transition from primary to secondary school, suggesting this is a
particularly important period to intervene.
A large proportion of children’s sedentary time occurs in the after-school period, with
one study finding that it accounts for 21% of children’s daily levels [126]. Further, a
systematic review [127] reported that children are sedentary for a significant amount of
this period (41-51%). Additionally, the proportion of children’s sitting accumulated in
prolonged bouts is highest during this period, particularly in the evening (6 pm-10 pm),
as demonstrated among children in Belgium [128] and adolescents in Australia [129].
Therefore, after school hours is a key period for targeting reductions in sedentary time,
and it has been recognised as the most feasible time to intervene, as children have greater
control over their behaviour choices in comparison to other times of the day [130]. The
home is a setting where children spend considerable time during after school hours [52],
thus an improved understanding of the correlates of sedentary time in this environment is
imperative for informing effective interventions.
2.3. Standing
Standing has been defined as a position which entails maintaining an upright position
with support from the feet [131]. Until recently, standing was proposed as a “sedentary
behaviour”, due to the limited amount of bodily movement and energy expenditure
35
involved [77]. However, findings from ground-breaking work by Hamilton and
colleagues [81] suggest that standing, through providing greater muscle contractile
activity than sitting, increases lipoprotein lipase (LPL) activity (important for triglyceride
uptake and the production of HDL-cholesterol) and glucose uptake. Other studies have
also reported improvements in insulin and lipid management as well as energy
expenditure (EE) from having the body in a standing position as opposed to a sitting
position [132–134]. Indeed, according to the sedentary behaviour research network
(SBRN), “passive standing” and “active standing” have energy expenditures of < 2.0 and
> 2.0 METs respectively, which makes standing a Light PA (PA) [72]. Indeed, a recent
review noted improvements in energy expenditure when standing compared with sitting
[135]. Although, some studies comparing the EE of standing versus sitting have noted
only negligible improvements [136,137], this may, in part, be due to differences in sample
populations and methodologies. Nonetheless, even modest improvements would
accumulate over time. Therefore, given the barriers to engaging in MVPA, particularly at
home, displacing sitting time with the next lowest form of physical activity (standing)
could be a feasible strategy for increasing Energy Expenditure (EE) and improving
indicators of metabolic health in children. However, given the infancy of research into
the health impact of standing [72], and that early accelerometers were not able to
accurately measure standing [138], few studies have examined the correlates of standing.
2.4. Measures of PA, sedentary time and sedentary breaks
The behavioural epidemiology framework, developed to improve understanding of health
related behaviours to inform evidence-based interventions, comprises of 5 stages [51].
The development of accurate measurements of behaviours is the second of these [51].
Valid and reliable measurement tools are essential for identifying the determinants of PA,
sedentary time and sitting breaks. Although behaviours can be assessed using subjective
methods, objective measurement is considered the most accurate measure. Indeed, self-
report measures are less robust in measuring PA intensities, and are limited by reporting
and recall bias [139,140]. As a result, there is increasing emphasis on objective measures
36
in research. Each measure has advantages and disadvantages, which will be discussed.
2.4.1. Objective measurements of PA
2.4.1.1. Accelerometers
Accelerometers are generally the objective measure of choice in PA research [141].
Accelerometers measure acceleration during movement along three axes (Vertical,
longitudinal and lateral axes), from which PA is estimated. There are several
accelerometer models available (e.g., Actical, GENEActiv), however ActiGraph
monitors have the most evidence supporting their use and are therefore the most
commonly used in the literature [142]. Until recently, accelerometers were always
attached to the hip [143]. This was because it was thought that the trunk location, near the
centre of the body’s mass, would provide the most accurate estimate of whole-body PA
[144]. Although this is still largely the consensus [145], some studies have shown wrist-
worn accelerometers to have comparable validity [146]. Wrist-worn accelerometers have
grown in popularity in recent years due to higher compliance [147,148] because they are
perceived as less burdensome to wear [149]. In fact, the NHANES 2011-2012 found a
100% improvement in wear time for wrist-worn accelerometers compared with previous
years, when devices were attached to the hip [150]. Higher compliance results in less
missing data, which increases researchers chances of obtaining reliable estimates of
habitual PA [151], resulting in more accurate findings and better interpretation of the data
[152]. Additionally, since children find wrist-worn accelerometers more comfortable to
wear [146], participation rates may be better when wrist accelerometer placement is
chosen. Therefore, although hip accelerometer placement is considered more accurate
[145], researchers are regularly opting for wrist accelerometer placement.
Accelerometers generate activity counts, from which cut points are generally used to
classify LPA, MPA, VPA and MVPA. Whilst a multitude of validated cut-points exist
for hip-worn accelerometers [153], cut points derived and validated for wrist-worn
37
accelerometers are limited. Crouter et al. [154] developed PA cut-points among a large
sample. However, they are inapplicable to most data as they were only validated using
the dominant hand. Indeed, accelerometers placed on the dominant wrist may misclassify
sedentary activities involving large amounts of hand movement (e.g., video gaming,
drawing/colouring) as PA, but when attached to the non-dominant wrist they would detect
less movement limiting misclassification. Thus, wrist-worn accelerometers should be
worn on the non-dominant wrist to assess PA and sedentary time in fact. Chandler et al.
[155] are one of the few to develop and validate PA cut-points for accelerometers placed
on the non-dominant wrist, specifically among 8-12 year old children. Similar
classification accuracies were observed for axis 1, axis 2 and the vector magnitude (VM).
However, the use of the VM has been recommended previously. as it is a sum of all axes,
providing a more complete picture of activity compared with one axis alone. The cut-
points for the VM are 306-817, 818-1968 and 1969 + per 5s for light, moderate and
vigorous intensities, respectively [155].
Activity counts are summed over a pre-set sampling period (e.g., 5s), called an epoch,
and then stored by the accelerometer. Epoch length has been shown to significantly
influence PA intensity classifications in children [156,157], therefore the choice of epoch
length is an important consideration when PA intensity is of interest. Researchers have
employed a variety of different epoch lengths, ranging from 1 second to 60 seconds [158].
However, given children’s PA is sporadic, with bouts usually lasting between 3 and 22
seconds [158,159], the use of longer epoch lengths is inappropriate with children as it
may lead to an underestimation of their MVPA [160]. 2 s, 5 s, 10 s, 15 s and 30 s epoch
lengths have been used previously in children [161]. However it is important that the
epoch length does not differ from the one used to validate the chosen cut-points, otherwise
misclassification of PA intensities can occur [162].
2.4.1.2. Heart rate monitoring
38
Heart rate (HR) monitoring is an appealing approach for assessing PA, as it’s relatively
inexpensive compared with accelerometers, whilst still providing an objective
measurement. A major limitation of HR monitors for assessing PA, is that HR can be
affected by factors other than PA such as fitness, anxiety, age, sex and the influence is
greatest during low intensity activity [163]. Therefore, whilst HR monitors can provide
estimates of moderate-vigorous PA, they may introduce measurement error when
assessing light or total levels [141]. Another problem with HR monitoring is the HR delay
in response to movement, which may limit its ability to detect children’s intermittent
movement. One method for overcoming these limitations is to adjust for individual
differences in resting HR [164]. However, this technique relies on an accurate assessment
of resting heart rate and unfortunately there is great variability in how resting HR is
defined and measured in the literature [165]. Taken together, whilst HR monitors are
inexpensive and can provide an objective assessment of PA, given the discussed
limitations as well as the inappropriateness of heart rate monitoring in large scale studies,
they are rarely used to assess PA in high quality research studies [141].
2.4.1.3. Pedometers
Pedometers are a low-cost alternative to accelerometers and HR monitors, with a longer
battery life. They collect data on the number of steps taken, which can be used as an
estimate of PA. Although pedometers have been shown to be a valid and reliable measure
of PA (the number of steps taken) [166,167], until recently they were unable to determine
whether it is of a light, moderate or vigorous intensity. To overcome this notable
limitation, several pedometers have been developed which can assess time spent in MPA
and VPA. Saunders et al. [168] evaluated the accuracy of three such devices in assessing
MPA and VPA in youth against indirect calorimetry. The SC-StepRx demonstrated the
highest validity for assessing MPA and VPA, with estimates comparable to those
observed from indirect calorimetry and accelerometers. Although, the SC-StepRX shows
potential as being an inexpensive alternative to accelerometers for assessing PA, further
39
studies investigating its validity are needed, before studies prioritise its use over the
frequently tested ActiGraph accelerometer.
2.4.1.4. Conclusion
Heart rate monitors, although inexpensive and capable of providing an objective measure
of PA, are not suitable for use in this thesis due to their inability to assess LPA accurately.
Indeed, due to space constraints [41], children’s PA at home is most likely to be of light
intensity. Similarly, whilst pedometers show potential for assessing MVPA, their ability
to accurately assess LPA is still largely unknown. Therefore, owing to the large body of
evidence supporting its ability to provide valid and reliable estimates of PA of all
intensities, the ActiGraph accelerometer will be utilised to measure children’s PA at home
in the present thesis. Specifically, given the better compliance rates, children will wear
accelerometers on the non-dominant wrist.
2.4.2. Objective measurements of sedentary time and sedentary breaks
2.4.2.1. Accelerometers
Accelerometers are the most commonly used objective measure of sedentary time in the
literature [169]. Accelerometers quantify sedentary time based on a lack of movement,
through the accumulation of a number of movement counts below a defined threshold
[139]. They are also used to assess breaks in sedentary time, considered as a bout which
exceeds a specified cut-off point [170]. ActiGraph monitors have undergone extensive
validity testing [139], are considered among the most accurate and reliable devices [171],
and are the most widely used brand because of this. A threshold of 100 CPM [172] is
considered the most accurate cut point for sedentary time in hip-worn accelerometery
[173]. However, it has demonstrated poor classification accuracy, when used on wrist-
worn ActiGraph data [173]. Van Loo et al. [171] evaluated the accuracy of nine
ActiGraph wrist-based cut points in identifying sedentary time in youth against direct
observation. In this study, Kim et al. [173] was shown to have the most accurate cut point
40
(vector magnitude [VM]: <3958 counts/60s, vertical axis [VA]: <1756 counts/60s), while
the Crouter et al. [154] cut point (VM/receiver operating curve [ROC]: < 100 counts,
VA/ROC: < 35 counts) performed the best out of the cut points designed for 5 s epochs.
The optimum threshold for defining a sedentary break is unclear in children, however
studies have often used a transition from a ‘sedentary’ (<100 counts per minute (cpm)) to
an ‘active’ state (> 100 cpm) over a 60-second epoch [104,105]. Until recently, ActiGraph
accelerometers did not have an inclinometer for detecting posture, which meant they were
unable to differentiate between sitting and standing, and therefore they would have
misclassified some standing as sitting. Although, newer models (GT3X and GT9X Link)
include an inclinometer, when worn on the hip and wrist they have been shown to have
only moderate accuracy (60.6-74%) for classifying body posture [174–176]. This may be
because the ActiGraph outputs for standing still and sedentary are similar, which may
lead to some misclassification of standing time as sedentary time [177]. This
misclassification may occur with accelerometers worn on the wrist or hip, due to the wear
location [178]. While thigh mounted GT3X+ ActiGraph accelerometers have shown
promise in providing better accuracy for assessing posture [179,180], the thickness and
sharp edges of the devices limit its wearability on the thigh and more research is needed
to confirm its accuracy compared with the gold standard activPal posture inclinometer
[181].
2.4.2.2. Pedometers
Pedometers are relatively expensive and have a superior battery life compared with other
objective measures. Studies utilising pedometers to measure sedentary time, have used a
cut point by Tudor Locke et al. [182] of <5000 steps to categorise someone as ‘sedentary’
[183,184]. However, this method does not give you any information on the amount of
sedentary time accumulated and an individual may not achieve 5000 steps/day without
having a sedentary lifestyle, particularly if they spend significant time standing. Recently
pedometers have become more sophisticated, for example the PiezoRx pedometer
(Stepscount Inc, Deep River, Canada) can quantify LPA and MVPA based on the number
41
of steps per minute. From which, providing wear time is known, sedentary time can be
determined by subtracting total PA (i.e., LPA + MVPA) from wear time [185]. Given,
the PieszoRx pedometer has been shown to yield similar results to the Actical
accelerometer [185], it may be viable option for measuring sedentary time when other
more researched objective measures are unavailable.
2.4.2.3. Heart rate monitoring
Heart rate monitoring has been used to measure sedentary time in adults [186] and
children [163]. In such studies, sedentary time is determined as low energy expenditure,
calculated as the heart rate observations below an individually established cut point
(threshold separating rest and exercise), called the flex heart point. However, HR
monitors have poor accuracy in determining energy expenditure at very low intensities
(i.e., sedentary time), because the relationship between HR and energy expenditure is not
linear during sedentary time, as factors such as body position, anxiety or caffeine can
affect the relationship [187]. The relationship may also be influenced by age, sex, body
composition or fitness levels [188]. Because of these limitations as well as compliance
issues [165], HR monitors have sparingly been used to measure sedentary time.
2.4.2.4. Posture sensors
Devices with built in inclinometers offer the best opportunity for assessing body posture.
The activPAL is the most commonly used posture sensor. The activPAL micro is the
latest model, and it detects posture based on thigh acceleration at a sampling frequency
of 20 Hz and uses proprietary algorithms to determine body posture (sitting/lying,
standing or stepping), transitions between these postures, number of steps and total MET-
hours. By default, > 10 s of sitting/lying, standing or stepping is required to register an
event. Among very young children (mean age of 4.5 years), Algheed et al. [189] found
that a 2 s, compared with a 1 s, 5 s and 10 s, minimum event period performed the best at
identifying the number of sitting breaks against direct observation. This would suggest
that young children transition quickly from postures and therefore the default setting may
42
not be appropriate for quantifying the number of breaks from sitting in all populations.
On the other hand, to our knowledge similar studies have not been conducted with older
children, so the extent to which the setting would affect the number of breaks calculation
in the 9-12 years population is unknown. Therefore, the 10 s setting, recommended by
the manufacture, has been used in older children [112] and adolescents [129].
In adults, the activPAL has been shown to have excellent agreement with direct
observation for determining sitting/lying time, upright time, sitting breaks and reductions
in sitting time [177,190,191]. Although, there has been relatively few studies examining
the validity of the activPAL for use among children, the current evidence would suggest
that it has a similar classification accuracy in this population. Specifically, Aminian et al.
[112] investigated the validity of the activPAL against video observation in 25 children
aged 9-10 years. Perfect correlations were observed between activPAL data and video
observation for time spent sitting/lying and standing. Correlations for the number of sit-
to-stand transitions were also high. It has also been proven to have high validity in a
sample of adolescent girls for assessing time spent sitting and upright [192], and
acceptable validity and reliability in young children [193,194]. In fact, the activPAL
device is considered as the gold standard for measuring sedentary time [181].
The ability of the activPAL device in providing accurate postural information is thought
to be due to its wear location, on the midline of the thigh [195]. This location is powerful
for distinguishing between standing and sitting/lying. However, the activPAL is not able
to distinguish between lying and sitting, which would improve the objective measurement
of sleep [196]. On the other hand, according to Edwardson and colleagues [197], methods
for differentiating between lying and sitting are in development.
2.4.2.5. Conclusion
There are several technologies which show promise in assessing children’s sedentary
behaviour, although, to date only accelerometers and posture sensors have sufficient
evidence supporting their use. Traditionally, accelerometers were the sedentary behaviour
43
measure of choice [139], However the use of posture sensors for assessing sedentary
behaviour has proliferated in recent years [197]. This is likely due to their ability to
differentiate between sitting and standing, which is important given the difference in
energy expenditure [198]. The activPAL is the most frequently used device, and in fact it
is considered the gold standard measurement of sitting time, standing and sitting breaks
[181]. Given that children spend most of their time at home sedentary [52], a robust
measure of sedentary time is imperative for home environment correlate research.
Further, few studies have investigated the correlates of children’s standing and sitting
breaks, despite increased standing [132,133] and sitting breaks [199,200] being
associated with positive health outcomes. Therefore, the activPAL monitor will be
utilised in this thesis to study children’s sedentary time, standing and sitting breaks at
home.
2.4.3. New and emerging technologies that assess the context of PA and
sedentary time
The key limitation of the objective measures discussed above, is that they do not provide
information on the context of PA and sedentary time such as where the behaviour is being
performed, the type of behaviour being performed and with whom [201]. Objective
accurate measurement of such contextual information is important for improving
researcher’s’ ability to identify correlates of PA and sedentary time, and thereby
informing effective evidence-based interventions based on the social ecological model
[202].
2.4.3.1. Technologies for assessing the location of behaviours
The social ecological model recognises that behaviours are most likely influenced by the
location in which they occur [36,37]. Identifying where PA and sedentary behaviour
occurs will improve our ability to identify their correlates, which will allow interventions
to target locations accordingly. The home is a setting where children spend significant
time [38,39] , suggesting measuring where behaviour occurs in this environment may be
44
particularly valuable. For location tracking, global positioning system (GPS) monitors are
frequently used in behavioural research [203,204], However they require a clean line of
sight to orbiting satellites, meaning they are only suitable for measuring outdoor location
[205]. Since most of children’s time at home is spent indoors [38,39], the ability to assess
indoor location is important. Technologies such as radio-frequency identification (RFID),
real time locating systems (RTLS) and Bluetooth low energy (BLE) ibeacons may be
capable of measuring indoor location [206]. With such systems, a small mobile tag is
usually worn which is read by tag beacons located in the area of interest. The indoor
location of sedentary time within an office setting has been measured using a RFID
system in combination with a posture monitor [207]. However, due to several practical
and technical limitations, analogous systems are not yet fit for accurate indoor location
monitoring. Additionally, along with RTLS, it is unsuitable for location monitoring in the
home, due to a lack of enterprise Wi-Fi, necessary for both technologies to function [208].
BLE ibeacons are comparatively inexpensive but they require a phone to communicate
with. This means they are unsuitable for use with children as many do not own a phone,
and it is possible that the person may not always be carrying the phone. Some ActiGraph
monitors (GT9X and GT3X-BT) have the BLE functionality, allowing proximity based
indoor location monitoring [208]. The advantages of this system include, its low cost
(providing the monitors are already owned), it does not require enterprise Wi-Fi to
function and it measures behaviour and location in one wearable device, making it the
most feasible option for measuring children’s location in the home. The monitors are
initialised as either receivers which are worn by the participant or beacons which are
placed around the environment. Beacons and receivers then communicate through BLE
to identify location. The BLE functionality of the monitors has been employed for
assessing the location of PA and sedentary time within an office [208,209] and an elderly
care home [208]. Clark et al. [209] examined the accuracy of the BLE proximity sensing
function of the ActiGraph GT9X for determining the location of behaviour in an office
setting. Good accuracy was demonstrated for identifying whether workers were in their
45
office, where they spend most of their time and were mostly sedentary. Accuracy was
lower for locations where workers spent less time and/or were more active. Magistro et
al. [210] created an algorithm to improve the accuracy of BLE proximity sensing of
ActiGraph devices, which was shown to reliably infer location within rooms and social
areas of an office setting when compared to a criterion measure (i.e., a wearable camera).
While BLE proximity sensing using ActiGraph monitors shows promise for inferring the
location of adult’s behaviour in an office, its accuracy in different environments (i.e.,
homes) and among other populations (i.e., children) is unknown without further testing
[210]. Further research is needed to examine the utility of BLE proximity sensing for
assessing the location of children’s PA and sedentary time in a home environment and to
investigate more advanced data treatment methods to enhance precision.
2.4.3.2. Technologies for assessing the social context of behaviours
Characterising the social context of a behaviour and whether it is performed alone or with
someone would provide important information for a home-based intervention.
Sociometers are novel devices which include a BLE proximity sensor and an audio
recorder, that both contribute to measuring proximities and interactions between
individuals [211]. The inclusion of a BLE proximity sensor, is consistent with
smartphones and ActiGraph monitors; However, the audio recorder will not only detect
when two individuals are in proximity but also why they are in proximity via the audio
recording. Indeed, the audio recording may capture verbal clues for why individuals are
in proximity with each other. Yu et al. [212] assessed the validity of these devices in a
hospital and found they could accurately detect proximity between individuals, but not
face-to-face interactions. Further, the continuous audio recording creates an ethical issue,
as it may capture private conversations. Wireless proximity sensing using the BLE
function in smartphones has been employed to measure social interaction successfully in
adults [213,214]. However, the limitations of using phones discussed above for BLE
ibeacons, make it unsuitable for measuring children’s social interaction with family
members in homes.
46
2.4.3.3. Technologies for assessing the type of behaviour being performed
Being able to determine the type of behaviour being performed will improve the
specificity of interventions, as some types of PA and sedentary time have different
correlates [37]. In addition, not all types of sedentary time are equal in terms of their
relationship with health [93]. While there is no universally used method for assessing the
type of behaviour performed objectively, there are emerging technologies which may
capable of it in the future. Small BLE stickers (e.g., Estimote in, New York) could be
stuck unobtrusively on electronic media (e.g., TV sets, tablet computers, remote controls)
and PA (e.g., bats, a trampoline) equipment within a home [208]. They could measure
equipment usage as well as indoor location through proximity monitoring between the
participant and the item. This technology currently requires the participant to carry a
phone, so it is unsuitable for use with children. In future, if these stickers can
communicate with other BLE enabled devices such as ActiGraph monitors, they may be
a useful measurement tool for measuring item usage in the home. Recently, there has been
an emergence of mobile applications which can monitor smartphone and tablet computer
usage. Christensen et al. [215] sought to determine the factors associated with smart
phone usage, using an application developed by Ginger. io (San Francisco, CA) to
measure the time adults spent on smartphones. While the study [215] did not encounter
any major problems with the app, the validity of app recorded screen-time is largely
unknown. In addition, it may only be suitable for measuring smartphone usage in
adolescents or older, as there could be multiple users of a tablet computer.
2.4.3.4. Technologies for collecting broader contextual information
Wearable cameras are increasingly being used in PA and sedentary behaviour research,
as they can identify the type of behaviour, its environment and the social context [206].
One of the most frequently used wearable cameras in a research setting is the Microsoft
Sensecam. It is worn on the lanyard around the neck, where it automatically captures
point-of-view images at pre-determined intervals. They have been used to assess the type
47
and context of PA [216] and sedentary time [217]. Wearable cameras can infer location
(providing the captured image has an identifying feature), but unlike RFID and RTLES
location monitoring systems, they also provide broader contextual information. Despite
the wealth of information provided, there are significant ethical and analytical issues with
using wearable cameras. Participants may be wearing the device in situations unsuitable
for photography, coding the images is labour intensive and they have a relatively short
battery life [218]. Additionally, it may also not be a good measure of all types of activity,
specifically TV viewing [208]. For example, due to the camera attachment and the
resultant line of sight, if the participant is not sitting upright while watching TV, the
camera may point away from the TV. A head mounted wearable camera could address
this limitation [219].However so would the more unobtrusive options of wearable gaze
camera glasses [220] and smart glasses that measure blue light emission [221]. Gaze
cameras and smart glasses would also allow for better quantification of other types of
screen time, as the devices’ field of view is aligned with participant’s eyes. Although,
both could be useful measurement tools for detecting the type of behaviour being
performed, currently they are too costly for large scale studies and their usability for
measuring children’s screen time is still unclear. Energy monitors are plugged into
electrical power sockets, and when the plug from an electronic device is inserted into it,
they permit objective information on whether the device is switched on [222]. Therefore,
it could be used to measure TV viewing or playing computer games [223]; However, it
does not provide information on when the device is being used, so it would have to be
used in conjunction with a wearable camera, which would quantify whether the child is
watching TV. This technique has been employed in a small pilot study [208], but the
limitations inherent in wearable cameras remain.
Another technology that can provide broad contextual information on a behaviour, is
ecological momentary assessment (EMA), which uses a computing device (usually a
phone) to record information during or after a behaviour such as TV viewing [224].
48
Usually in the form of a mobile app, participants are prompted to complete a brief
questionnaire at various times during the day to better understand a person’s behaviour
and its determinants. Using accelerometer data, context sensitive EMA [225] can be used
to time prompts with activity to present questions that appear while a person is doing the
activity, which would improve participant’s ability to recall information about what they
were doing. Ecological momentary assessment could provide useful information for an
intervention, and it has previously been used as a measure of behaviour in children
[226,227]. Although it may be the least burdensome method of collecting contextual
information about children’s behaviour at home, it is still largely unsuitable for use in this
population, as each participant would have to be provided with a smartphone.
2.4.3.5. Conclusion
Whilst some of the above technologies show potential as being capable of providing
objective contextual information for PA and sedentary time, at present the issues and
limitations of each technology seem to outweigh the strengths. Therefore, further
developments are needed before such technologies can be used to improve our
understanding of children’s behaviours within the home. In particular, the integration of
data streams as well as the device’s wearability and ability to produce accurate
behavioural outcomes require work.
2.5. Ecological models
To inform effective comprehensive interventions, a conceptual model should be used, for
understanding the opportunities and barriers for different behaviours, to guide
observational studies [35]. Ecological models are often used for contextualising sedentary
time and PA [201], characterised by multiple levels of influence which can interact to
influence behaviour. Ecological models propose that behaviour is influenced by
intrapersonal (e.g., psychological, biological), interpersonal (e.g., social and cultural),
organisational, physical, and policy factors [228]. Additionally, these factors are thought
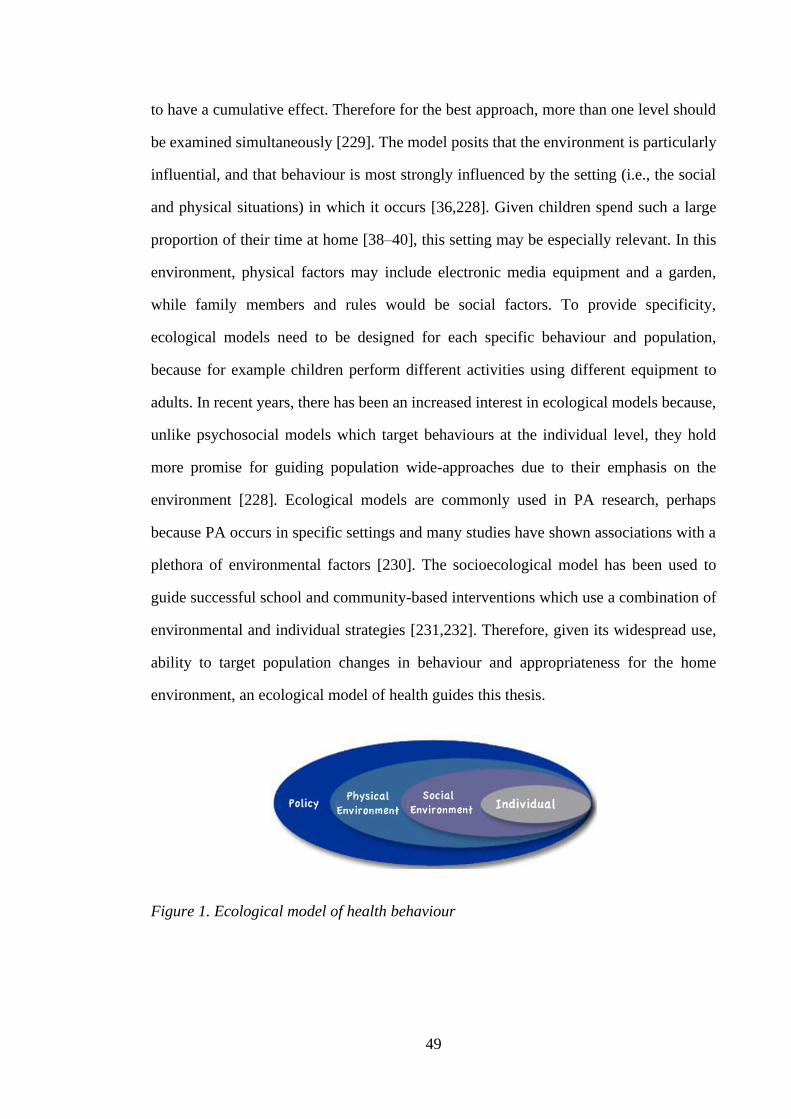
49
to have a cumulative effect. Therefore for the best approach, more than one level should
be examined simultaneously [229]. The model posits that the environment is particularly
influential, and that behaviour is most strongly influenced by the setting (i.e., the social
and physical situations) in which it occurs [36,228]. Given children spend such a large
proportion of their time at home [38–40], this setting may be especially relevant. In this
environment, physical factors may include electronic media equipment and a garden,
while family members and rules would be social factors. To provide specificity,
ecological models need to be designed for each specific behaviour and population,
because for example children perform different activities using different equipment to
adults. In recent years, there has been an increased interest in ecological models because,
unlike psychosocial models which target behaviours at the individual level, they hold
more promise for guiding population wide-approaches due to their emphasis on the
environment [228]. Ecological models are commonly used in PA research, perhaps
because PA occurs in specific settings and many studies have shown associations with a
plethora of environmental factors [230]. The socioecological model has been used to
guide successful school and community-based interventions which use a combination of
environmental and individual strategies [231,232]. Therefore, given its widespread use,
ability to target population changes in behaviour and appropriateness for the home
environment, an ecological model of health guides this thesis.
Figure 1. Ecological model of health behaviour
50
2.6. Correlates of children’s physical activity and sedentary
time within the home environment
Given the current childhood obesity epidemic [233], the development of interventions
designed to increase children’s PA and reduce sedentary time is important, especially in
light of the lack of successful PA [234] and sedentary behaviour [98] interventions to
date. Identifying correlates of behaviours is considered an important stage in the
development of evidence-based interventions [51]. Children’s sedentary time [235,236]
and PA [236,237] are influenced by individual, environmental, socio-cultural and socio-
economic factors. Ecological models emphasise the influence of the environment on
children’s PA and sedentary time [36,37]. Of particular interest is the home environment
where children spend more time than anywhere else [38,39] and accumulate a large
proportion of their daily PA and sedentary time [40]. Since reduced PA and increased
sedentary time are major contributors to the current obesity epidemic [238], the home
environment plays an important role in obesity prevention. Within the home, both
physical and social environmental factors have been shown to influence children’s PA
and sedentary time [41,42].
2.6.1. The home physical environment
In recent years, there has been a small evidence base emerging on the influence of the
home physical environment on children’s PA and sedentary behaviour. Children spend
most of their time at home indoors [38,39], which is of concern as this is where they are
most exposed to harmful screen-based sedentary pursuits (i.e., TV viewing and playing
computer). Indeed, media equipment and its placement in the bedroom are consistently
positively associated with screen-time [41,236]. Regarding media equipment, the most
frequently investigated factor is the presence of a TV in the child’s bedroom, which has
been associated with screen-time [41,236]. Whilst there seems to be consistent evidence
suggesting that media equipment in the home has an important relationship with
children’s screen-time, there is limited evidence for an association with objectively
51
measured sedentary time [41]. This is interesting and may suggest that when opportunities
for screen viewing are limited, children simply engage in other sedentary behaviours. On
the other hand, media equipment, specifically in the bedroom, may be inversely related
to children’s PA [41]. Specifically, one particularly robust international study by
Harrington et al. [239] among 5,859 children aged 9-11 years from 12 countries, showed
that the presence of at least one electronic media device in the bedroom was associated
with less MVPA.
Unlike the convincing evidence for the relationship between home media equipment and
children’s screen-time, relationships between PA equipment and children’s PA are mixed
[41], with some finding an association [240–242] and others not [243–245]. Of note, most
previous studies have used surveys to measure PA equipment [41] which can be
problematic, especially when many PA items exist in the house. Interestingly, the only
not to use a survey found a positive relationship between PA equipment and children’s
PA [240]. Indeed, this study used an audit to measure the home environment, which
allows for a more objective assessment. Whilst, the influence of PA equipment on PA is
inconclusive, a review found enough evidence to suggest that it may be inversely related
to sedentary time [41], supporting the case for increasing PA equipment availability in
homes. Moreover, specific PA items may have differential effects on PA depending on
the country. For example, in Australia the presence of a bike has been associated with
MVPA [246], whilst the presence of a basketball hoop has been associated with PA in the
USA [40]. Although research conducted in the UK is limited, given the popularity of
football in the country, football nets might represent an important cue to engage in PA in
UK homes. Therefore, as countries have different environments and cultures, it is
important studies measure equipment most relevant to the country of interest.
Accessibility is related to “ease of use and cueing of behaviour” [247] and may therefore
act as an important prompt to participate in behaviours. Indeed, studies investigating
52
accessibility have reported positive relationships between PA equipment accessibility and
PA related outcomes [240,248], as well as media equipment accessibility and screen-time
in girls [240]. Despite this, most studies have only assessed the accessibility, and not the
availability of equipment. Reinforcing the importance of measuring an item’s
accessibility, Hales et al. [248] found that portable PA equipment accessibility, but not
availability was associated with increased outdoor play time. Similarly, another study of
children aged 8-12 years found that only the accessibility, and not the availability, of PA
equipment/space to play was positively correlated with PA [249]. Restricting children’s
access to media equipment and making PA equipment more accessible present avenues
for limiting children’s screen-time and promoting their PA, respectively. It also seems
parents are aware of the utility of this strategy, with one study finding that the
accessibility, not availability, of media equipment, was a stronger correlate of parents’
energy balance related knowledge [250]. These findings suggest that an item’s
accessibility should be considered in addition to its availability and will be important to
examine in the future.
To date, research exploring the influence of the home physical environment on children’s
sedentary time and PA has focussed on PA and media equipment, with few assessing
other physical environmental factors [41]. Moreover, most factors have not been studied
frequently enough to draw any conclusions on their influence. Although PA at home is
most likely to take place outdoors [251], a review concluded that there was limited
evidence to suggest garden space promotes PA [41]. This is curious, given several
qualitative studies have identified garden space as a determinant of PA [43,252,253]. On
the other hand, there is some indication that the presence of a garden [254–256] and its
size [248] may be associated with less time spent in screen-based sedentary behaviours,
which is consistent with studies that have found a negative association between outdoor
time and sedentary behaviours [257,258]. The inconsistent findings may be attributable
to the limited and categorical nature of garden variables, therefore, an objective measure
53
such as geographic information systems (GIS) should be utilised to measure garden
space/size in future studies.
Only one previous study investigated house size, which reported no association between
self-reported house size and sedentary time among Spanish children aged 9-18 years
[254]. This study also found that children who lived in an apartment compared with a
house spent more time in sedentary behaviours such as cognitive hobbies, using
motorised transport and sitting to rest. In agreement, Roberts et al. [259] did find that
children living in apartments/condominiums compared with houses, spent four times as
much time using electronic media leisurely (although not significant). It is worth noting
that the Roberts et al. [259] study had a particularly small sample size (n=144), therefore
with a larger sample the relationship may have reached significance. Although, more
studies are needed to explore this relationship, the garden space available in houses may
be promoting alternatives to sedentary behaviours through the provision of a safe space
to play. Such a mechanism is consistent with studies that have shown outdoor play
[260,261] and garden space [248,255] to be negatively associated with children’s
sedentary behaviours.
Household crowding (e.g., number of people per room) has been associated with obesity
in adults [262]. One study by Bafna et al. [263] found adults in houses with greater
integration between rooms (higher interconnectedness) engaged in more social sedentary
activities, particularly TV viewing. The proposed mechanism for this is that the greater
interconnectedness between rooms encourages social interaction which in turn leads to
more time spent in socially susceptible sedentary activities. Therefore, the greater
interconnectedness in crowded homes [263] may be prompting participation in social
sedentary activities, and particularly watching TV, which has consistently been associated
with obesity in children [5] and adults [46]. Whilst to our knowledge no studies have
assessed the relationship between household crowding and sedentary time, one study did
54
assess for an association with PA, and found no relationship [264]. However, given the
limited exploration to date and the results from Bafna et al. [263] and Chambers et al.
[262], the influence of household crowding on children’s sedentary time and PA warrants
further investigation.
2.6.2. The home social environment
Whilst the physical environment of the home has received little attention, there has been
a plethora of studies investigating the home social environment [41,235,236].
Additionally, social environmental factors are more consistently associated with
children’s PA and sedentary time [41,236].
Parents play a significant role in their children’s health behaviours, through numerous
pathways. Parental attitudes and beliefs are thought to be particularly influential
[265,266], and have been shown to directly influence children’s PA and screen-based
behaviours, respectively [236]. Additionally, such beliefs and attitudes also influence
children’s behaviour indirectly through parenting practices and behaviour [265,266]. An
important parenting practice for PA is parent support in various forms and is frequently
associated with increased PA [41,236,237,267]. Parents may support PA through
encouragement to be physically active, by providing transport to places where their child
participates in PA and financial assistance for clubs and equipment [236,237,267]. Parents
also influence children’s behaviour through role modelling of behaviours. For example,
parental PA has been shown to influence children’s PA [236,268], but not always
[269,270]. One possible explanation for the mixed findings is that PA has mostly been
measured across the entire day, including during school hours, which is less likely to be
influenced by parental PA. In support of this explanation, parents’ screen-time behaviours
are consistently associated with children’s screen-time sedentary behaviours [41,236],
which mostly occur at home [52]. Further, although higher overall sedentary time in
parents has also been associated with children’s overall sedentary time [271,272], much
55
less studies have assessed this relationship, most likely due to the difficulties in assessing
parents’ sedentary time objectively. Additionally, through role modelling of behaviours
and/or reciprocal reinforcement, parent-child co-participation in sedentary behaviours
[41,236] and PA [236,270] has also been associated with increased time spent in such
behaviours in children.
Restrictive practices related to screen-time and PA, such as rules limiting usage and
monitoring/supervising children’s behaviour represent strategies parents use to limit their
children’s screen-time and increase their PA. Whilst, parental supervision of PA and
screen-time have been associated with increased PA [273] and less screen-time [274,275],
respectively, findings are mixed [275,276]. However, the evidence to date is too scarce to
draw any conclusions from. On the other hand, the enforcement of screen-time rules by
parents is frequently investigated and has consistently been associated with reduced
screen-time in children [41,236]. Conversely, despite limited evidence, studies have
predominately shown no association between rules limiting screen-time and overall
objectively measured sedentary time [277,278] or PA [278,279]. However, it is worth
noting that most studies have assessed behaviours over the whole day, including
significant time away from parents [52]. It is likely, that away from parents, rules
restricting screen-time have little influence. In support of this, the one study that measured
sedentary time at home, found a positive association with screen-time rules [40] Due to
the historical popularity of TV viewing [117], rules on TV have received considerable
attention and are typically related with less TV viewing [41,236]. The presence of TV
limiting rules has also been associated with more favourable home environments,
including less electronic media and no TV in the child’s bedroom [280,281]. Parental TV
rules have been shown to have a particularly strong influence when there is a TV in the
child’s bedroom [274]. This may be because TV rules have a greater influence when the
child has more control over the TV. Indeed, when the TV is in a communal area, a child
has less accessibility over its use, which limits the utility of TV rules. Nonetheless, taken
56
together, these findings suggest that screen rules have an important role in reducing
children’s sedentary behaviours which mostly occur at home.
Time spent outdoors has been recognised as a key correlate of children’s PA [257,258]
and is inversely related with sedentary time [257]. However, parental concerns over
neighbourhood safety can influence children’s independent mobility and therefore their
outdoor play [282,283]. For example, parents’ concern about crime rates and dangers
from strangers and road traffic has been associated with less PA in children [282]. Given
these concerns have increased in recent years [284], children’s active play is increasingly
being performed indoors [285,286]. The home environment may be particularly relevant,
with studies finding that parental neighbourhood safety concerns are associated with
increased odds of active play at home compared with other locations [287] and increased
sedentary time at home [40]. Further, one study found that PA equipment at home was
only related to PA in adolescents if their neighbourhood was perceived as dangerous by
parents [242]. Given neighbourhood environments are unlikely to change without
significant investment, home environments are of increasing importance and therefore
further research into the correlates of PA and sedentary time within this environment is
needed.
2.6.3. Evidence gaps and limitations of the social and physical home
environment literature
Considering the significant amount of time children spend at home [38,39], there has been
little exploration into the influence of the home physical environment, compared with the
physical neighbourhood environment [41,236,237]. Specifically, investigation of home
physical environmental factors outside of equipment is PA and media equipment is
lacking [41,235]. Additionally, whilst parental influences on children’s PA and sedentary
time are well studied [235–237], few have investigated home-specific parental influences
[41]. Further, whilst it is known parents have significant control over their home physical
environments [43], little is known about what influences its creation [41]. Such
57
information would allow researchers to assist in creating healthy environments with
parental input. Moreover, although, a small number of studies have demonstrated that
physical and social factors related to activity cluster, these studies have also included
dietary measures and activity factors more relevant to behaviours that occur outside the
home [288,289]. Examining solely home-specific activity related social and physical
factors will allow for more precise identification of the correlates of behaviours,
specifically those that occur at home. Lastly, in recent years, there has been some
evidence that having the body in a standing position rather than a sitting position [132–
134] and more frequent sitting breaks are associated with improvements in metabolic
indicators [50,199,200]. Despite this evidence, research into the correlates of children’s
standing and sitting breaks is scarce, and non-existent within the home environment, as
far as the authors are aware.
There are also several criticisms of past work which limit researchers’ ability to draw
conclusions from the findings and may explain the inconsistent findings to date.
Specifically, to our knowledge, all but one study [40] using objective measures, measured
behaviours across the entire day. Given behaviours are most likely influenced by
attributes of the environment in which they occur [36,228], objective measurement of
sedentary time and PA at home is required. Reinforcing the importance of this approach,
aspects of the home physical environment are more consistently associated with screen-
based sedentary behaviours, which are likely to occur at home, than with overall outcomes
[41,235,236]. Further, objective measurement of the home environment is lacking [41].
For example, GIS could be used to measure house as well as garden size objectively and
audits hold potential for collecting more detailed data within the home. Therefore, the
authors of this thesis have sought to address these gaps in order to improve researchers’
understanding of the relationship between the home environment and children’s PA and
sedentary time at home.
2.7. Measures of the physical home environment
58
The home environment, specifically the social and physical environment, is recognised
to be an important sphere of influence on children’s PA and sedentary time [41,235].
Whilst the social environment has been well studied, the physical environment has
received comparatively little attention [41]. This is, in part, attributable to the limited
availability of comprehensive measures of the physical environment with strong validity
and reliability, which are essential to improving understanding of how physical home
environmental factors influence children’s PA and sedentary time. However, the small
number of comprehensive valid and reliable measures available will be discussed in the
following section.
Given children spend considerable time at home [38,39] and that the environment is
recognised to have a significant influence on behaviours [37], the home environment is a
critical sphere of influence on children’s PA and sedentary time. Previous research into
the influence of the home environment on children’s PA and sedentary time has
concentrated on the social environment, with the physical environment receiving little
attention in comparison [41,235]. Comprehensive measures of the home’s physical
environment demonstrating strong validity and reliability are key to improving
researchers’ understanding of how the physical home space influences children’s PA and
sedentary time; however, such instruments are lacking [41,42]. Maitland and colleagues’
[41] review of studies investigating the influence of the home physical environment on
children’s PA and sedentary time, noted inconsistent evidence for most physical
environment factors, except for media equipment at home which was consistently
positively associated with children’s screen-time. The review attributed the inconsistent
findings in part to several limitations of the evidence base. Specifically, Maitland et al.
[41] noted a lack of objective measurement of the physical home environment, limited
exploration of the physical home environment factors beyond equipment and few studies
that used measures with proven validity and reliability. In fact, Sirard et al. [240] was the
only study not to measure the home environment using a survey. Sirard et al. [240] used
59
the PA and media equipment inventory (PAMI), an audit [247] designed to measure the
availability and accessibility of PA and media equipment in the home, which included
room-level location for most items and underwent validity and reliability testing.
Supporting the use of more objective measures, this was the only study to find a
relationship between PA equipment, specifically equipment density, and objectively
measured MVPA.
Recently, the HomeSTEAD instrument [248] was developed, demonstrating solid
validity and reliability, and is a more comprehensive measure than the PAMI [247], as it
allows the recording of a larger range of PA and media equipment as well as garden
features. In addition, the construct validity of the instrument has been established, with
associations being observed between several parameters of the physical home
environment and children’s self-reported screen-time and outdoor play [248]. However,
room-level location was missing for most items, which is a noteworthy limitation. For
example, electronic media equipment in the child’s bedroom or lounge may be more
likely to serve as a visual cue for use, than the same equipment located in a sibling’s
bedroom or the garage [43]. Moreover, determining the location of equipment when
paired with information on where the behaviour is performed will also benefit correlate
research [206]. For example, if a child is most sedentary in the lounge, identifying what
equipment is in there may help elucidate its influence. This information will be imperative
for interventions seeking to create physical home environments, which promote PA and
discourage sedentary time.
The HomeSPACE-I instrument [290] includes room-level data and further advances
previous instruments, by measuring characteristics of the indoor physical home
environment outside of PA and media equipment, including musical instruments,
room/area size and furniture. Like the HomeSTEAD instrument, it also assesses
garden/yard size and the presence of natural outdoor features (e.g., a grassed area, a tree
60
that can be climbed, etc.). However, despite the HomeSPACE-I instrument being the most
comprehensive instrument to date, it was validated in Western Australia where homes are
mostly one-storey, which limits its appropriateness for use in countries with typically
two-storey homes. Indeed, there are several layout and design differences which may
impact the tool’s ability to produce the same consistency of measurement in two-storey
homes. For example, two-storey homes are less frequently open plan and have more
separation between bedroom and living areas which is likely to affect family interaction
and how parents monitor children’s screen-time. One-storey homes allow families more
flexibility in designing the layout to align with their preferences and priorities. On the
other hand, the smaller footprint in two-storey homes, usually provides more outdoor
space when on a comparably sized plot. Additionally, the HomeSPACE-I instrument only
assesses the availability of equipment, and not its accessibility. Accessibility may
encourage “ease of use and cueing of behaviour” [247] and may therefore serve as a
prompt to engage in specific behaviours. Previous studies have observed positive
relationships between the accessibility of PA equipment and objectively measured PA
[240,248,249], as well as between the accessibility of media equipment and screen-time
in girls [240]. Furthermore, in one study, only the accessibility, and not the availability,
of PA equipment and spaces to play was associated with increased PA in overweight
children [249]. Therefore, an item’s accessibility may have an important influence on
behaviours, and thus should be assessed in a measurement tool. Given the limitations of
the HomeSPACE-I instrument, study 2 aimed to develop and test the validity and
reliability of the HomeSPACE-II instrument, with the added measure of accessibility, to
measure the physical environment of two-storey homes in relation to children’s PA and
sedentary time.
3. General methodology
The following chapter consists of a general methodology, which will outline the methods
of data collection employed by each study in the thesis. Specific information (i.e., sample
61
sizes, coding and statistical analyses) for each study can be found in the appropriate
chapters and appendices. Only data that was used is covered.
3.1. Ethical approval
Ethical approval for studies 2-5 was sought by the author of the thesis and granted by the
Swansea University ethics committee (REC numbers: PG/2014/34; REC:2016-110). Data
for study 1 was collected via the Swan-Linx programme which had existing university
ethical approval (REC number; PG/2014/020). Prior to participating in the research, all
children and parents/guardians received information sheets and completed informed
consent and assent forms, respectively. The information sheets and consent/assent forms
for studies 2-5 can be found in Appendix XII
3.2. Instruments and procedures
3.2.1. Swan-Linx Fitness Fun Day: Field-Based Fitness
Fitness measures from the EUROFIT fitness test battery [291] were administered with
children at fitness fun days using standardised protocols [292]. Just body mass, stature
and the 20 multistage fitness test are described in this chapter, as only these were used in
the thesis. More detailed information on the complete set of fitness fun day measures and
the standard operating procedures for administering them can be found in Appendix I.
Swansea City Council active young people (AYP) officers and sport science
postgraduates led the fitness fun day testing, with assistance from Sport Wales young
ambassadors and undergraduate sport and exercise science students. All of these were
trained in administering the measures prior to the fitness fun days commencing.
Additionally, protocols for each test were positioned next to the testing stations to ensure
the standardised techniques were always followed.
All children participated in 8-10 minutes warm ups prior to completing the measures,
after which they were assigned groups. Groups then completed the measures in a timed
circuit. Given the size of the testing facility and the varying number of children
participating (20-100) in each session, having the children complete the tests in the same
order was not possible.
62
Body mass: Children had their body measured to the nearest 0.01 kg using portable
electronic weighing scales (Seca 876, Hamburg, Germany). Children were asked to
remove their shoes, any pull overs as well as to empty their pockets.
Stature: The stature of the child was measured to the nearest 0.001 m using a portable
stadiometer (Seca 213, Hamburg, Germany). Children removed shoes, looked straight
ahead and kept their head level during the measurement. In addition, children also took a
deep breath in before the headpiece was lowered to straighten the spine, providing a more
consistent measure of height [293].
Body mass index: Body mass index (BMI) was calculated (BMI = bodymass
(kg)/stature2 (m)), from which BMI z-scores were derived using the WHO (World Health
Organization) growth reference standard [294].
20m multistage shuttle run test: To complete the 20m multistage shuttle run test (20m
MSRT) [295], children ran between two lines 20m apart, within the sound of beeps
playing from a CD. It is considered a valid and reliable measure of cardiorespiratory
fitness [296]. Consistent with a standardised lap scoring protocol [297], a participant’s
score was the number of laps completed after not reaching the line for two successive
beeps. A researcher ran with the children for pace consistency and to encourage them to
run to fatigue.
3.2.2. Child health and activity tool: online questionnaire
The child health and activity tool (CHAT) questionnaire, similar to the paper-based
Sportlinx survey [298], was created at Swansea University. The CHAT is an online
questionnaire that collects data on a large range of health and lifestyle related behaviours.
Only data used in this thesis is discussed in this chapter, this includes time spent in
MVPA, homework/reading and screen-time, as well as dietary habits, age and sleep
duration. Children were asked how much time they spend in certain activities before (8
categories ranging from “no time at all” to “more than 1 hour”) and after-school (10
categories ranging from “no time at all” to “more than 3 hours”). Additionally, children
were asked to think about the previous 7 days and say how many days they spent in
screen-time (described as watching TV/playing computer games/tablet and internet use)
for 2 or more hours a day and how many days they did sports or exercise (defined as “any
63
activity or sport where your heart beats faster, you breathed faster and you felt warmer”
for at least 1 hour. Further, participants were asked how many portions of fruit and
vegetables they had consumed the previous day, whether they had breakfast, and how
many days of the week they had at least one of the following: a takeaway meal, a sugary
snack, a full sugar soft drink or a diet soft drink. Participants were also asked the time
they went to sleep and woke up. The CHAT was completed at schools and supervised by
teachers and postgraduates or AYP officers. A full copy of the questionnaire is presented
in Appendix II and the protocol for administering it can be found in Appendix III.
3.2.3. The HomeSPACE-II audit
Parents completed an online version of the validated HomeSPACE-II instrument [299],
an audit that assesses the physical home environment in relation to children’s home-based
PA and sedentary behaviours. Parents walked around their house and garden whilst
completing the items for each room/area. The audit permits the presence, quantity and
accessibility of 41 equipment items, as well as room size (perceived), to be recorded for
up to 14 rooms indoors and eight areas outdoors. Each item’s accessibility was rated on
scale of (A) ‘put away and difficult to get to’ to (D) ‘in plain view and easy to get to’
[247]. The audit also consisted of questions related to home equipment (TV service,
smartphones, streaming). Additionally, ten items assessing the presence of outdoor
features in the front garden, back garden and verge were included. Lastly, there were also
items related to home features (home type, home size, number of storeys, stairs, space to
play in front and back garden).
3.2.4. The HomeSPACE-I questions related to family activity priorities
and preferences
Three items from the HomeSPACE-I instrument were used to assess family activity
priorities and preferences [290]. Firstly, parents were asked how important it was to them
for their child to do the following when at home; (1) participate in active play; (2) play
electronic games/computer; (3) watch TV/movies; (4) spend time outside; (5) and be
physically active. Responses were coded on a scale of (1) ‘very unimportant’ to (5) ‘very
important’. Additionally, parents were asked which activities their child preferred at
home when given the choice; (1) sitting OR running around; (2) playing indoors OR
64
playing outdoors; (3) playing electronic games/computer OR active types of play; (4)
watching TV/movies OR active types of play; (5) quiet activities OR energetic activities.
Similarly, parents were asked what activities they preferred to do when at home and given
the choice; (1) watching TV/movies with my child OR doing PA with my child; (2)
watching TV/movies OR doing something physically active; (3) using the
computer/electronic games OR doing something physically active; (4) playing electronic
games/computer with my child OR doing PA with my child; (5) indoor activities with my
child OR outdoor activities with my child; (6) be indoors OR outdoors; (7) quiet pursuits
OR active pursuits.
3.2.5. The question on the enforcement of a screen-time limiting rule
from the BEAP Study questionnaire
Parents were asked one question from the BEAP study questionnaire used in the
neighbourhood impact on kids projects [259], whether they enforce a maximum number
of hours/day of screen-time rule (yes/no).
3.2.6. Objective house and garden size estimates
A combination of different GIS techniques, AddressBase Premium (ABP) [300] and
Ordnance Survey Mastermap (OSMM) [301], were used to derive estimates of garden
and house size for each home. Participants only provided postcodes, therefore it was only
possible to measure house and garden size for each postcode. Due to the variability in the
sizes of homes within postcodes, the median, not the mean, value was used. For
residences (min 4-max 82), the building area was extracted from OSMM and the non-
residential buildings, defined by ABP were filtered out. The same technique was used to
calculate garden size for residences (min 2–max 82), defined in OSMM Greenspace
dataset [302]. To determine house size, the median building area was multiplied by the
number of floors in each house. To test validity, separate analyses was run with the mean
and median values, and the median value had the strongest associations with the outcome
variables on average.
65
3.2.7. ActivPAL posture monitor
Children had the activPAL 3 micro secured on the midline of the upper right thigh using
a hypoallergenic dressing (3M Tegerderm or Hypafix Transparent), and waterproofed
using a nitrile sleeve. Supplementary dressings, sleeves and instructions (see Appendix
XII) on correct reattachment were provided. The device determines body posture (i.e.,
sitting/ lying and upright) and transitions between these postures, based on accelerometer-
derived information about thigh position and acceleration via proprietary algorithms
[197]. The activPAL posture monitor has demonstrated excellent validity in children
[112], and in this thesis was used to measure sitting, standing and sitting breaks.
3.2.8. ActiGraph accelerometer
Children wore the latest monitor from ActiGraph, the ActiGraph GT9X link, on their non-
dominant wrist [303], to improve compliance [304]. Wrist-worn accelerometers have
demonstrated good validity in comparison to hip-worn accelerometers [305]. The data
was collected at a 30 Hz sampling rate [306] and summed over 5-sec epochs. The device
captures acceleration, and subsequently produces activity counts, which allows intensity
to be inferred using cut-points. Specifically, Chandler wrist-based cut-points [155],
applied to the vector-magnitude, were used to categorise LPA (306-817 counts/5 secs),
MVPA (≥818 counts/5-secs) and TPA (≥162 counts/5-secs).
3.2.9. Home log
Parents were given a diary to record when the child was at home each day for seven days,
to allow for the calculation of home-based behaviours. Instructions were provided, where
“Home” was defined as a single location, including the house, garden, driveway and verge
of the home, where the child spends most of their time (i.e., excluding homes of other
parents). To minimise missing data, children completed the diary when parents were
unable to and incomplete diaries were followed up with families. The home log can be
found in Appendix XII.
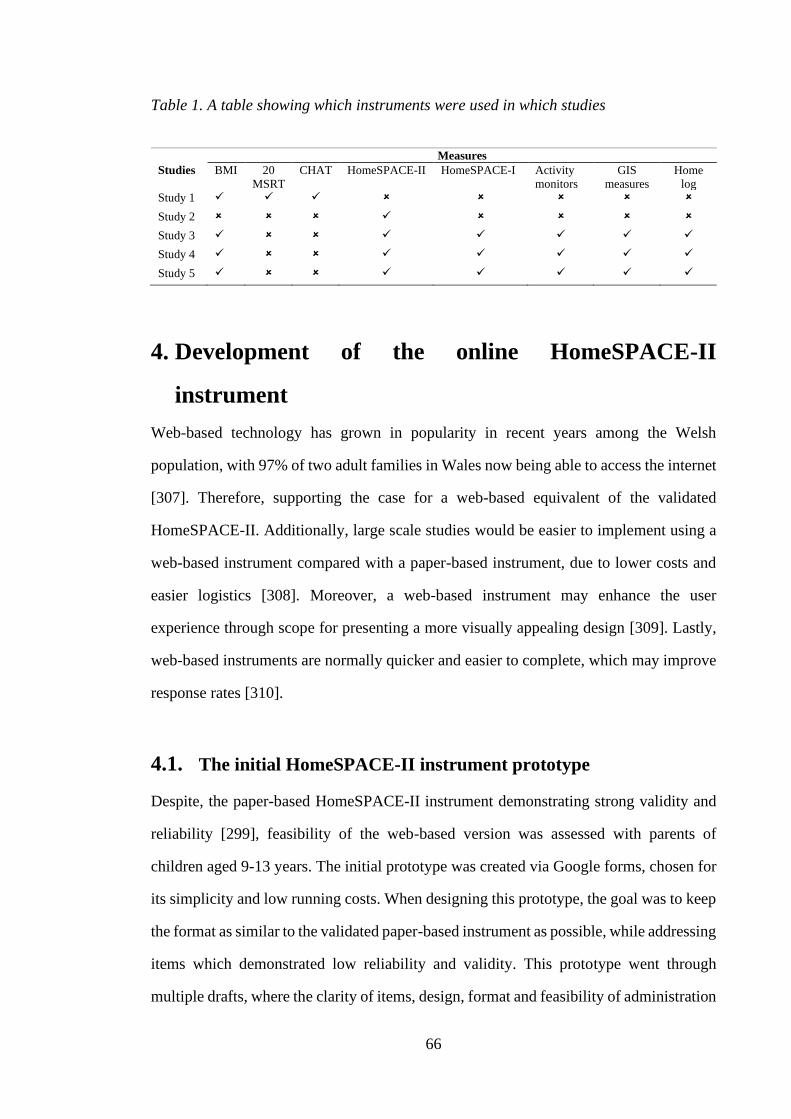
66
Table 1. A table showing which instruments were used in which studies
Measures
Studies BMI 20
MSRT
CHAT HomeSPACE-II HomeSPACE-I Activity
monitors
GIS
measures
Home
log
Study 1 ✓ ✓ ✓
Study 2 ✓
Study 3 ✓ ✓ ✓ ✓ ✓ ✓
Study 4 ✓ ✓ ✓ ✓ ✓ ✓
Study 5 ✓ ✓ ✓ ✓ ✓ ✓
4. Development of the online HomeSPACE-II
instrument
Web-based technology has grown in popularity in recent years among the Welsh
population, with 97% of two adult families in Wales now being able to access the internet
[307]. Therefore, supporting the case for a web-based equivalent of the validated
HomeSPACE-II. Additionally, large scale studies would be easier to implement using a
web-based instrument compared with a paper-based instrument, due to lower costs and
easier logistics [308]. Moreover, a web-based instrument may enhance the user
experience through scope for presenting a more visually appealing design [309]. Lastly,
web-based instruments are normally quicker and easier to complete, which may improve
response rates [310].
4.1. The initial HomeSPACE-II instrument prototype
Despite, the paper-based HomeSPACE-II instrument demonstrating strong validity and
reliability [299], feasibility of the web-based version was assessed with parents of
children aged 9-13 years. The initial prototype was created via Google forms, chosen for
its simplicity and low running costs. When designing this prototype, the goal was to keep
the format as similar to the validated paper-based instrument as possible, while addressing
items which demonstrated low reliability and validity. This prototype went through
multiple drafts, where the clarity of items, design, format and feasibility of administration
67
were reviewed by researchers in pediatric exercise science. When a satisfactory draft was
complete, the researcher conducted home visits with a convenience sample of two
parents. During the home visits, the researcher accompanied the parents on a tour of their
home to complete the audit tool. The parents were guided through the instrument item-
by-item with prompts (see Appendix VI) from the researcher to help identify problems
with instruction clarity and comprehension. The tour was recorded and transcribed. Both
participants completed written informed consent forms.
During the visits, various problems with the instrument were apparent. Firstly, it could
only be completed on devices with highly efficient processers (i.e., Apple devices). The
web page would either crash or lag when scrolling down the page with other devices. The
problem was related to the size of the document, but there was no logical solution.
Although, the functionality of the instrument did improve with Apple devices, there was
still a lag when scrolling down the drop-down menus. Several other issues, unrelated to
the instrument’s speed were identified. Firstly, the parents had to complete each room
according to its order in the audit, instead of its order on the tour. This was because each
drop-down menu (i.e., item, accessibility, quantity) was on a separate line, meaning it
took a while to scroll through each room. Further, parents had to scroll through a room
even if it was not present in their home. Lastly, the parents found it difficult to navigate
off the drop-down menus without assistance. The instrument also included questions from
previously validated measures [259,290], and in contrast participants found this section
relatively easy to complete, except for a few minor clarity problems. However, because
the audit did not function well enough on Google docs for it to be accurately used by
parents, an alternative form building tool was needed that addressed the problems
encountered.
4.2. Second iteration of the online HomeSPACE-II instrument
After trialing several online form building platforms, Formdesk was chosen to create the
second iteration of the instrument. This was because there was no size limit for
68
documents, it had low running costs and it was flexible in terms of format and graphics.
Again, the goal was to keep the format as similar to the paper-based instrument as
possible, which was relatively easy to do with Formdesk. A prototype went through
several iterations, where the clarity of items, design, format and feasibility of
administration were reviewed by researchers in pediatric exercise science. When a
satisfactory draft was complete, the researcher conducted home visits with a convenience
sample of 3 parents. There was representation from each of the socioeconomic status
(SES) groups (i.e., low, medium and high). This was important, given home environments
have been shown to differ across SES groups [246,311], and comprehension skills may
be related to SES [312], which may affect one’s ability to complete the audit tool
accurately. The Welsh index of multiple deprivation (WIMD), derived from postcodes,
was used to calculate SES. The protocol for this trial was identical to the previous one,
and again all the participants completed written informed consent.
The consensus of the participating parents was that the Formdesk version of the audit tool
was relatively easy to complete, as most of the problems identified with the Google docs
version were rectified. Specifically, parents felt the audit tool had excellent instruction
clarity, a visually appealing design, and that the item list covered all relevant items. The
audit tool could now be completed via any device, without any lag, which improved its
speed and functionality. All the drop-down menus for each room were on the same line
(i.e., item, accessibility, quantity), which meant scrolling down the page didn’t take as
long. Participants were also able to complete each room in the order that they came to it
on the tour and navigate off the drop-down menus without assistance. These
improvements significantly reduced completion time and improved functionality.
One parent said they like the design but felt it could be improved.
“Overall I like how it looks, but it could do with tidying up in parts”
One parent said they would have found an alphabetical coded equipment list easier to use.
69
However, since there are more than 26 items on the list, such a change wasn’t possible.
“I would find it easier to use the equipment list, if the equipment was coded
alphabetically. That’s just how my brain works”.
In addition, some parents were not aware that each room had its own section and one
parent was not sure what a verge was.
Another parent commented on the additional questions at the end.
“I think the questions look a little messy; the zig zag design looks untidy”.
Lastly, upon looking at the submitted responses, we noticed the parents missed 1 or 2
questions by mistake while completing the audit.
Considering the positive consensus of the participating parents, the audit tool functioned
well enough in Formdesk to be completed accurately by parents, providing some
modifications were made. Several modifications were made for the final version of the
instrument, informed by comments made by the parents as well as researchers in the
pediatric exercise field. Changes were made to improve the aesthetics of the instrument.
The drop-down menu columns (centered above) were labelled, instead of labeling each
drop-down menu. Spaces were also added between each room section and question, to
make it look less cluttered. Further, the answer boxes for the sex of the children below 18
years were replaced with check boxes, to increase data entry speed. Taking on board
advice from a researcher with experience in creating online surveys (CM), a list of items
was included in the instructions. This would give parents an idea of what items to look
for during the audit prior to starting. The provision of sub-categories in the drop-down
menus was considered, but it wasn’t possible with the software. Moreover, room/area was
underlined, and the font size was increased to ensure parents were aware that each
room/area had its own section. A definition of a verge was provided too. To minimise
missing data, the questions were configured so that responses were forced. If a parent
70
fails to answer a question, an error message will appear, and they would have to complete
the question before they can proceed. Although, personal questions such as income,
education and postcode were not forced. Lastly, the format of the additional questions
was also tidied up. The final version can be found in Appendix VII.
4.3. Feasibility testing of questionnaire including questions from
validated measures
A questionnaire with items taken from previously validated measures [259,290] was also
created and tested for its feasibility with a convenience sample of 2 families. Again,
efforts were made to make sure the format of the questions resembled the format of the
validated questions as closely as possible. Similar to the protocol used for assessing the
audit’s feasibility, the parents were guided through the questionnaire with prompts and
questions (see Appendix VI) to gauge its usability and functionality. Written informed
consent was also received from these parents. Both parents found the questionnaire
relatively easy to complete, however several comments were made.
One parent felt it wasn’t clear, where the questions start and end.
“Without looking closely, it’s difficult to tell where questions start and end”.
Another made a comment regarding the wording of the family health climate (FHC)
questions.
“I think the examples of activities you have could be better suited to children, my children
are definitely too young to go on hikes”
The same parent also commented on the language used.
“I think the wording is quite complicated. I’m not sure what explicitly means?”
Lastly for the activity preferences questions, initially the parents did not notice the
activities on the right.
71
Due to the comments made by the parents, several changes were made to the
questionnaire. To make it clearer where each sub-question starts and ends, the separating
lines were made more pronounced through giving them darker backgrounds. For the
activity preferences section, it was made clearer to the parents that there were activities
on the left and right. Lastly, the activity examples in the FHC questions [313] were
replaced with activities more common among the age group in question. The final version
is provided in Appendix VIII.
4.4. Conclusion
In order to improve researchers’ understanding of how the home influences children’s PA
and sedentary time, it is important to have accurate measures of the environment that have
been tested with the target audience. Based on the home visits and feedback from the
parents, several improvements were made to the instruments to enhance the user
experience, limit participant burden and increase its accuracy. As a result, the final
instruments can be accurately used by parents to measure the physical and social
environment of the home in relation to children’s physical activity and sedentary time.
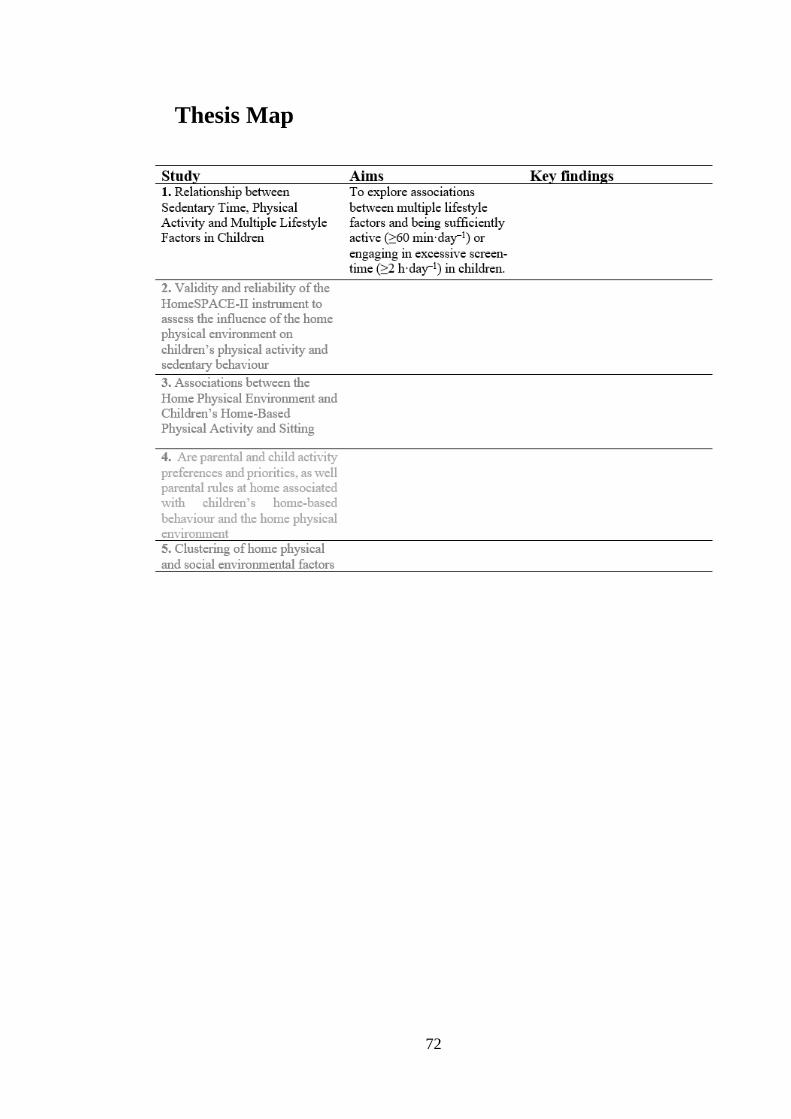
72
Thesis Map
73
5. Study 1
5.1. Relationship between Sedentary Time, Physical Activity
and Multiple Lifestyle Factors in Children
*This chapter is a published manuscript:
Sheldrick, M.P.R.; Tyler, R.; Mackintosh, K.A.; Stratton, G. Relationship between
Sedentary Time, Physical Activity and Multiple Lifestyle Factors in Children. J. Funct.
Morphol. Kinesiol. 2018, 3, 15.
5.2. Introduction
Childhood obesity is a major public health concern [314], particularly in Wales, which
has the highest prevalence in the United Kingdom [315], and often tracks into adulthood
[316]. Associated lifetime health risks are frequently cited, such as cardiovascular disease
[317], type 2 diabetes [318] and other chronic diseases [319]. There is evidence that
modifiable lifestyle factors, including physical inactivity [6], poor diet [320], insufficient
sleep [93] and excessive sedentary behaviour [5] are key contributors to the obesity
epidemic in children and all-cause mortality. Conversely, regular physical activity [6],
adequate consumption of fruit and vegetables [321] and sufficient sleep [93] are widely
accepted as protective. Of these lifestyle factors, physical activity and sedentary time have
been identified as the most strongly associated with obesity and health [1,322].
As well as being shown to have a robust relationship with obesity, regular moderate-to-
vigorous physical activity (MVPA) is also considered to be a preventative measure for
poor cardiorespiratory fitness (CRF) and several other health risk factors in children [6].
The way by which MVPA improves health is not fully understood [6], but may be
partially explained by its relationship with other healthy lifestyle factors [6,89,323].
Indeed, MVPA is associated with healthy dietary habits, such as increased fruit and
vegetable consumption [89,324] , breakfast consumption [325] and a lower intake of
unhealthy sugary snacks [326]. Additionally, MVPA has been associated with better
academic achievement [327] and longer sleep duration [323], however relationships are
74
equivocal [327–329]. Despite this, MVPA levels remain low among children of all ages
with less than 20 percent meeting the current UK physical activity (PA) guidelines of at
least 60 minutes MVPA every day [330]. Furthermore, even children meeting the PA
guidelines [62] spend a large proportion of their discretionary time in sedentary
behaviours (up to 9 h daily) [5].
Whilst homework and reading have been identified as prominent sedentary behaviours
amongst children [331], screen-time remains the most prevalent [5] and has been
associated with obesity, poor CRF, cognitive function and overall cardio metabolic health
[5]. Moreover, screen-time is associated with short sleep duration [83,84], less time spent
in MVPA [89,90], a poorer diet, such as lower fruit and vegetable consumption [88],
greater intake of soft drinks [86] and unhealthful sugary snacks [85]. Conversely, the
relationship between overall sedentary time and cardiometabolic risk markers in children
is less clear [5,92,332]. Screen-time, which current public health guidelines recommend
children spend no more than two hours per day engaged in [61], may therefore have a
stronger link with health due to its associations with numerous unhealthy lifestyle factors
[89,333].
Previous studies investigating the relationship between screen-time and other lifestyle
factors have solely focused on television (TV) viewing [85,334,335], which, given the
vast array of available screen-based technologies, is no longer representative of modern
society. Moreover, evidence investigating activity behaviours and diet in children has
mainly concentrated on screen-time rather than PA, for which data, specifically amongst
British children, is limited. Whilst some studies have investigated relationships between
lifestyle factors and MVPA or screen-time, these have been conducted in isolation.
Assessing both relationships simultaneously will not only enable a better understanding
of the associated multiple lifestyle factors, but inform future interventions.
75
Therefore, the present study sought to explore associations between multiple lifestyle
factors and the number of days being sufficiently active (≥60 min·day–1) or engaging in
excessive screen-time (≥2 h·day–1) in children.
5.3. Materials and Methods
5.3.1. Participants
Data were captured on children who participated in the Swan-Linx programme, a health
and fitness initiative, which is a sister project to Sportslinx [336,337]. In total, 756
children (371 boys, 385 girls) aged 9–11 years (10.4 ± 0.6 years) participated in the study.
Data were collected across 13 socio-demographically representative schools (WIMD:
Welsh index of multiple deprivation) [338], within the city and county of Swansea
between January and May 2015.
5.3.2. Instruments and Procedures
Anthropometric measurements were obtained using standard anthropometric techniques
[339], by the same trained researcher. Children had their stature and body mass measured
to the nearest 0.001 m and 0.1 kg, using a portable stadiometer (Seca 213 portable
stadiometer, Hamburg, Germany) and electronic weighing scales (Seca 876, Hamburg,
Germany), respectively. From these measures, Body Mass Index (BMI) was calculated
(BMI = body mass (kg)/stature2 (m)) and BMI z-scores were derived using the British
1990 growth reference standard [340]. The 20 metre multi-stage fitness test (20 MSFT)
[295], which has been shown to be valid and reliable in similarly-aged children [296],
was conducted by the same trained researchers using a standardised lap scoring protocol
[297] to assess cardiorespiratory fitness. Both the anthropometric measurements and 20
MSFT were carried out at the indoor training centre at Swansea University.
Participants were asked to complete an online 29-item lifestyle questionnaire (CHAT:
Child Health and Activity Tool) akin to the paper-based tool used in Sportlinx [341]. The
76
CHAT questionnaire assessed time spent in MVPA, homework/reading and screen-time,
as well as dietary habits, age and sleep duration. The description of screen-time included
time spent watching TV, playing computer games and tablet/internet use, whereas MVPA
was defined as “any activity or sport where your heart beats faster, you breathed faster
and you felt warmer”. Participants were asked to report time spent in each activity before
(8 categories ranging from “no time at all” to “more than 1 hour”) and after-school (10
categories ranging from “no time at all” to “more than 3 hours”). There were also
questions asking the children how many days a week they engaged in excessive screen-
time (>2 h·day–1) and were sufficiently active (>60 min·day–1). Further, participants were
asked how many portions of fruit and vegetables they had consumed the previous day,
whether they had breakfast, and how many days of the week they had at least one of the
following: a takeaway meal, a sugary snack, a full sugar soft drink or a diet soft drink.
Participants were asked to report the time they went to sleep and woke up, from which
sleep duration was calculated and split into seven groups (<5.5 h; 5.5–6.4 h; 6.5–7.4 h;
7.5–9.4 h; 9.5–11.9 h; 12–12.9 h; 13–14.5 h). Participants postcodes (i.e., zip codes) were
collected to calculate a WIMD score, which considers eight domains of deprivation;
employment; health; income; housing; community safety; access to services; education
and the environment [338].
5.3.3. Statistical Analysis
Missing data were noted for BMI (8 boys (2.2%), 29 girls (7.5%)), CRF (20 boys (5.4%),
22 girls (5.9%)), dietary and activity behaviours (11 boys (3%), 12 girls (3.1%)) and sleep
duration (16 boys (4.3%), 18 girls (4.7%)). Statistical analyses were completed using IBM
SPSS statistics 22 (IBM SPSS Statistics Inc., Chicago, IL, USA), where significance was
set at ≤0.05. Whilst the normality assumption was violated, research suggests that it is not
necessary when the sample size is large (>200) [342,343], therefore parametric tests were
deemed appropriate. Multi-collinearity diagnostics were applied to all the variables.
Linear regression models, were used to examine the extent to which the lifestyle factors
77
(BMI z-scores; CRF; screen-time, homework/reading and MVPA before and after school;
fruit and vegetable consumption; breakfast consumption; full sugar soft drink intake; diet
soft drink intake; sugary snack consumption; sleep duration and takeaway meal
consumption) and potential confounders (i.e., WIMD and age) were associated with the
number of days a week in excessive screen-time and in sufficient levels of MVPA.
Variables with a significant result (p < 0.10) were added to a multiple regression model
using the backward elimination approach. Variables that were not significant (p > 0.10)
were deleted in a stepwise manner, resulting in a model with only significant interactions
(p < 0.05). Due to preliminary analyses indicating significant sex differences for some
variables, regression models were conducted separately by sex, in accordance with
previous work [344]. For each sex, the dependent variables were split at the median to
form high and low screen-time and MVPA groups. Cut-off points of >5 and >4 days in
sufficient MVPA for boys and girls respectively, were used to create MVPA groups. To
classify screen-time groups, cut-off points of >4 and >3 days in excessive screen-time for
boys and girls respectively were used. To help facilitate interpretation of the different
associations between the independent and dependent variables, differences between the
high and low groups were tested post hoc using independent t-tests and χ2 tests for
continuous and categorical variables, respectively.
5.4. Results
Descriptive statistics for the original data set are presented in Table 1. On average, boys
had a CRF score 11 units higher than girls (p < 0.01), and engaged in six more minutes
of screen-time before school (p < 0.01) and 21 more minutes after school (p < 0.01).
Furthermore, boys had at least one full sugar soft drink on 0.4 more days a week (p =
0.01), spent 12 more minutes in MVPA after school (p = 0.04), and consumed 0.4 less
fruit or vegetables (p = 0.02). Breakfast was consumed by 94.1% of the children (93.6%
boys, 94.6% girls). There were no significant sex differences for the number of days a
week spent in excessive screen-time [61] or in sufficient levels of MVPA [62].
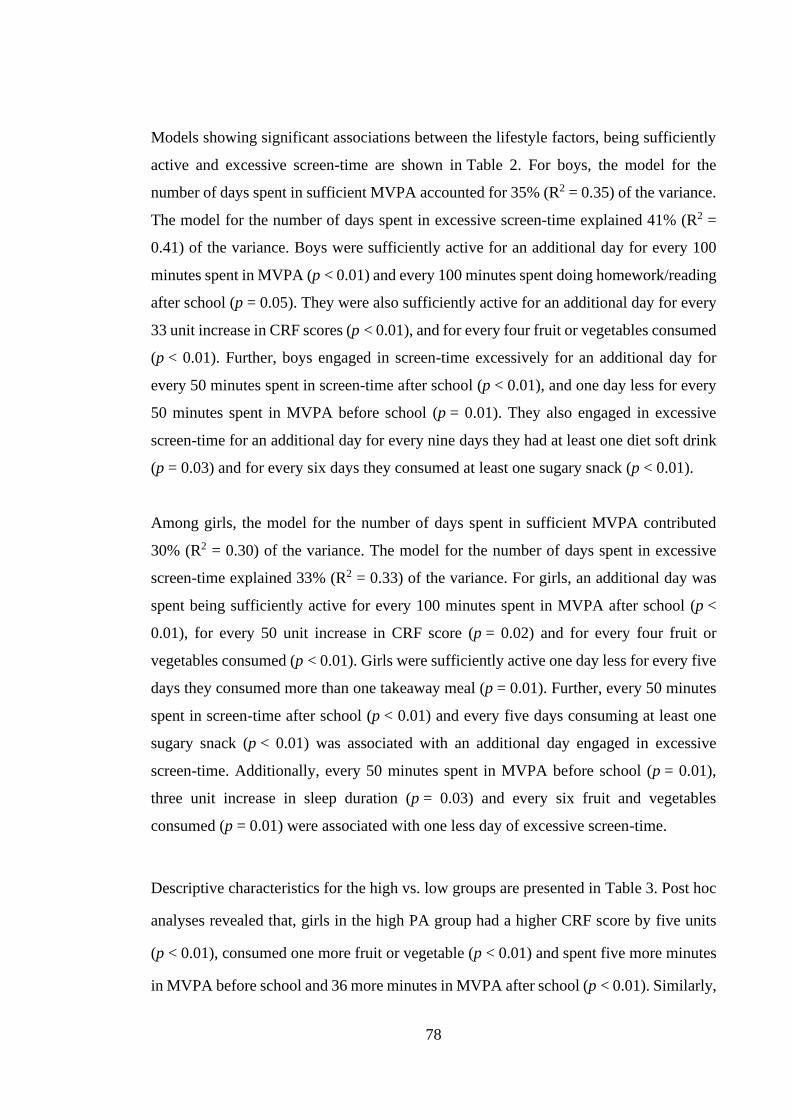
78
Models showing significant associations between the lifestyle factors, being sufficiently
active and excessive screen-time are shown in Table 2. For boys, the model for the
number of days spent in sufficient MVPA accounted for 35% (R2 = 0.35) of the variance.
The model for the number of days spent in excessive screen-time explained 41% (R2 =
0.41) of the variance. Boys were sufficiently active for an additional day for every 100
minutes spent in MVPA (p < 0.01) and every 100 minutes spent doing homework/reading
after school (p = 0.05). They were also sufficiently active for an additional day for every
33 unit increase in CRF scores (p < 0.01), and for every four fruit or vegetables consumed
(p < 0.01). Further, boys engaged in screen-time excessively for an additional day for
every 50 minutes spent in screen-time after school (p < 0.01), and one day less for every
50 minutes spent in MVPA before school (p = 0.01). They also engaged in excessive
screen-time for an additional day for every nine days they had at least one diet soft drink
(p = 0.03) and for every six days they consumed at least one sugary snack (p < 0.01).
Among girls, the model for the number of days spent in sufficient MVPA contributed
30% (R2 = 0.30) of the variance. The model for the number of days spent in excessive
screen-time explained 33% (R2 = 0.33) of the variance. For girls, an additional day was
spent being sufficiently active for every 100 minutes spent in MVPA after school (p <
0.01), for every 50 unit increase in CRF score (p = 0.02) and for every four fruit or
vegetables consumed (p < 0.01). Girls were sufficiently active one day less for every five
days they consumed more than one takeaway meal (p = 0.01). Further, every 50 minutes
spent in screen-time after school (p < 0.01) and every five days consuming at least one
sugary snack (p < 0.01) was associated with an additional day engaged in excessive
screen-time. Additionally, every 50 minutes spent in MVPA before school (p = 0.01),
three unit increase in sleep duration (p = 0.03) and every six fruit and vegetables
consumed (p = 0.01) were associated with one less day of excessive screen-time.
Descriptive characteristics for the high vs. low groups are presented in Table 3. Post hoc
analyses revealed that, girls in the high PA group had a higher CRF score by five units
(p < 0.01), consumed one more fruit or vegetable (p < 0.01) and spent five more minutes
in MVPA before school and 36 more minutes in MVPA after school (p < 0.01). Similarly,
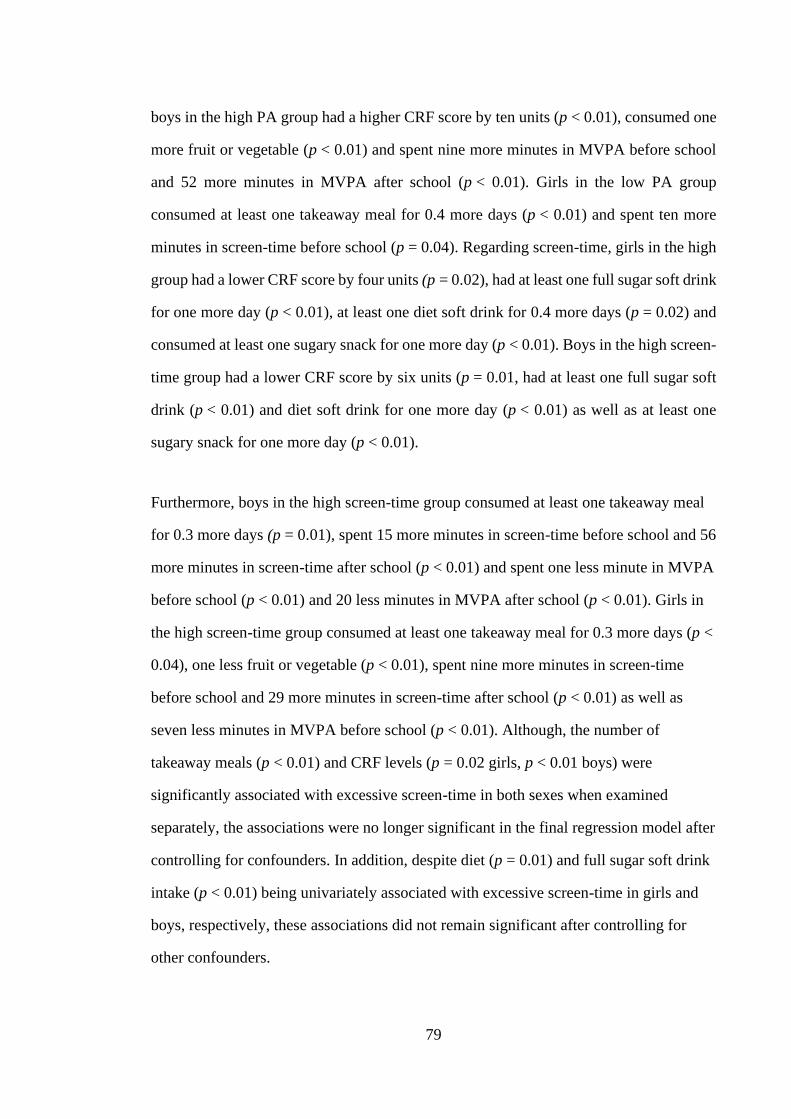
79
boys in the high PA group had a higher CRF score by ten units (p < 0.01), consumed one
more fruit or vegetable (p < 0.01) and spent nine more minutes in MVPA before school
and 52 more minutes in MVPA after school (p < 0.01). Girls in the low PA group
consumed at least one takeaway meal for 0.4 more days (p < 0.01) and spent ten more
minutes in screen-time before school (p = 0.04). Regarding screen-time, girls in the high
group had a lower CRF score by four units (p = 0.02), had at least one full sugar soft drink
for one more day (p < 0.01), at least one diet soft drink for 0.4 more days (p = 0.02) and
consumed at least one sugary snack for one more day (p < 0.01). Boys in the high screen-
time group had a lower CRF score by six units (p = 0.01, had at least one full sugar soft
drink (p < 0.01) and diet soft drink for one more day (p < 0.01) as well as at least one
sugary snack for one more day (p < 0.01).
Furthermore, boys in the high screen-time group consumed at least one takeaway meal
for 0.3 more days (p = 0.01), spent 15 more minutes in screen-time before school and 56
more minutes in screen-time after school (p < 0.01) and spent one less minute in MVPA
before school (p < 0.01) and 20 less minutes in MVPA after school (p < 0.01). Girls in
the high screen-time group consumed at least one takeaway meal for 0.3 more days (p <
0.04), one less fruit or vegetable (p < 0.01), spent nine more minutes in screen-time
before school and 29 more minutes in screen-time after school (p < 0.01) as well as
seven less minutes in MVPA before school (p < 0.01). Although, the number of
takeaway meals (p < 0.01) and CRF levels (p = 0.02 girls, p < 0.01 boys) were
significantly associated with excessive screen-time in both sexes when examined
separately, the associations were no longer significant in the final regression model after
controlling for confounders. In addition, despite diet (p = 0.01) and full sugar soft drink
intake (p < 0.01) being univariately associated with excessive screen-time in girls and
boys, respectively, these associations did not remain significant after controlling for
other confounders.
80
Table 2. Descriptive data.
P-values are based on significance level from the independent t-test for continuous variables (non-italics)
or the chi-squared test for categorical variables (italics).
* Relationship is significant. BMI: body mass index; CRF: cardio-respiratory fitness; MVPA: moderate-
to-vigorous intensity physical activity; WIMD: welsh index of multiple deprivation.
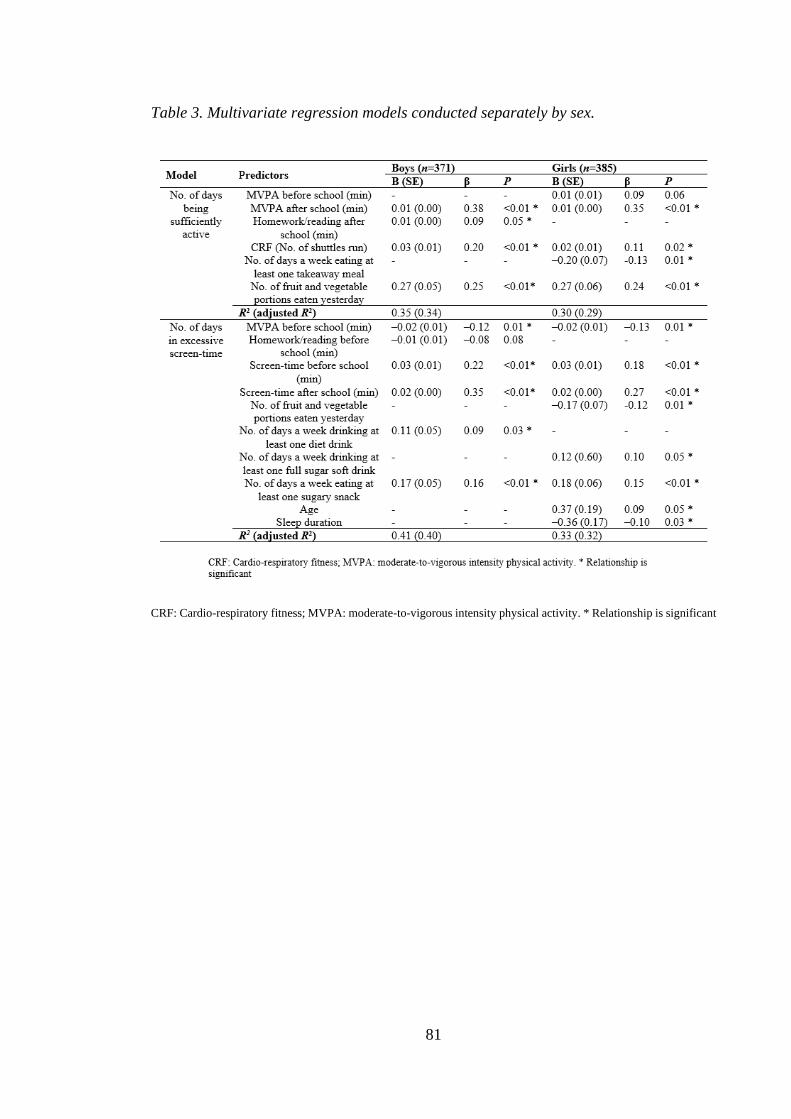
81
Table 3. Multivariate regression models conducted separately by sex.
CRF: Cardio-respiratory fitness; MVPA: moderate-to-vigorous intensity physical activity. * Relationship is significant
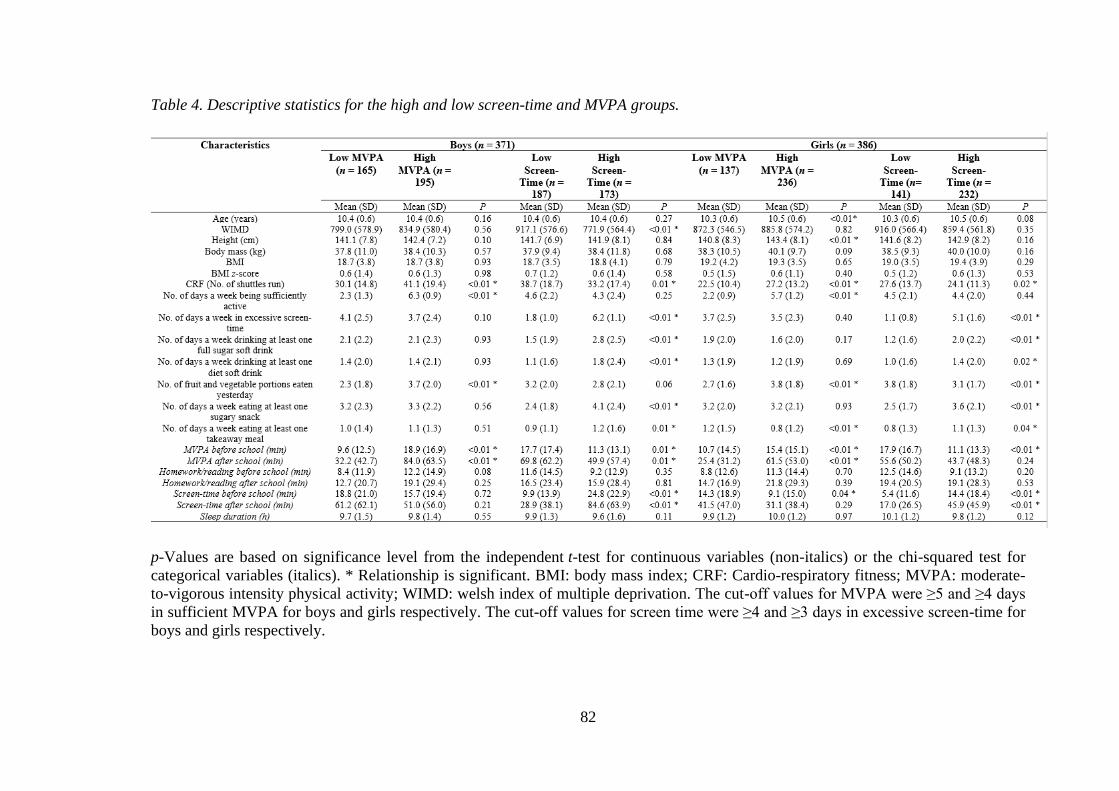
82
Table 4. Descriptive statistics for the high and low screen-time and MVPA groups.
p-Values are based on significance level from the independent t-test for continuous variables (non-italics) or the chi-squared test for
categorical variables (italics). * Relationship is significant. BMI: body mass index; CRF: Cardio-respiratory fitness; MVPA: moderate-
to-vigorous intensity physical activity; WIMD: welsh index of multiple deprivation. The cut-off values for MVPA were ≥5 and ≥4 days
in sufficient MVPA for boys and girls respectively. The cut-off values for screen time were ≥4 and ≥3 days in excessive screen-time for
boys and girls respectively.
83
5.5. Discussion
The present study aimed to explore associations between MVPA, sedentary time and
multiple lifestyle factors in 9–11 years old children. Of note, there was no inverse
relationship between days spent in excessive screen-time and sufficient levels of MVPA
or vice versa. Although studies have reported an inverse relationship between sedentary
time and MVPA [91], there is insufficient evidence to assume a reciprocal relationship
[91]. Whilst both behaviours may directly compete with each other during a specific
time period (e.g., after school) [91], the same may not be true for an entire day or across
a week [258]. Further, similar to previous research [83,86,89,345], excessive screen-
time was associated with unhealthy factors, which were different to those inversely
related to sufficient levels of MVPA. Indeed, available evidence suggests that they are
two separate entities [93], which are independently associated with health [5].
The present study aimed to explore associations between MVPA, sedentary time and
multiple lifestyle factors in 9–11 years old children. Of note, there was no inverse
relationship between days spent in excessive screen-time and sufficient levels of MVPA
or vice versa. Although studies have reported an inverse relationship between sedentary
time and MVPA [91], there is insufficient evidence to assume a reciprocal relationship
[91]. Whilst both behaviours may directly compete with each other during a specific time
period (e.g., after school) [91], the same may not be true for an entire day or across a
week [258]. Further, similar to previous research [83,86,89,345], excessive screen-time
was associated with unhealthy factors, which were different to those inversely related to
sufficient levels of MVPA. Indeed, available evidence suggests that they are two separate
entities [93], which are independently associated with health [5].
While boys were more active than girls after school, both were sufficiently active for the
same number of days a week. Consistent with a recent review [10], sufficient levels of
MVPA were positively related to CRF independent of sex. Aside from low CRF, low fruit
and vegetable intake is another weight-related risk factor [321]. In agreement with
previous research [89,324,346], strong positive associations between fruit and vegetable
consumption and sufficient levels of MVPA were observed in both sexes. Conversely,
Pereira et al. [347] found a negative relationship, whereas Vissers et al. [348] and Jago et

84
al. [344] found a positive relationship in boys and girls, respectively. The equivocal
findings may, in part, be a result of different methodologies and sample characteristics;
Pereira et al. [347] found active children engaged in more screen-time, and studies have
suggested a negative relationship between screen-time and fruit and vegetable
consumption [86,345]; in contrast to the present study, Vissers et al. [348] found MVPA
to be significantly higher in boys and Jago et al. [344] recorded dietary and PA measures
12 months apart.
Sleep duration is an important component of health in children [93] and has been
associated with MVPA, however evidence is scarce and contradictory. In our study,
sufficient levels of MVPA were not associated with sleep duration. On the contrary, Stone
et al. [323] found MVPA to be higher among children with >10 h of sleep per night
compared with those who slept < 9 h per night. However, it is noteworthy that Stone et
al. [323] used parental report to assess sleep duration, which is thought to have
questionable reliability, as parents tend to overestimate sleep duration [349,350].
Although children can also overestimate sleep duration [351], our finding that sleep
duration was not associated with MVPA is in agreement with several studies that
measured sleep duration objectively [329,352]. In children of this age, sleep duration may
be more susceptible to environmental factors, such as social activities or school
arrangements than the actual need for sleep [352], which may explain why MVPA was
not directly associated. However, MVPA has been associated with better sleep efficiency
[352,353] and shorter sleep latency [352] and is therefore considered beneficial for sleep
in children.
Converse to a systematic review [354], this study did not find an association between
BMI and sufficient levels of MVPA irrespective of sex. There was a large amount of data
missing for BMI in girls (7.5%); although the weight status of these girls is unknown, it
is possible that they were overweight or obese. The extent to which this biased results is
unclear, however it may provide a reason for why there was no association between BMI
and MVPA in girls. Further, this relationship may be more related to the intensity of PA
as opposed to total PA [195]; therefore the aggregation of moderate (MPA) and vigorous
(VPA) physical activity may, in part, explain this discrepancy.
85
The lack of association between excessive screen-time and BMI-z scores in the present
study, may have been due to the low prevalence of reported screen-time in the sample.
On average, children engaged in >2 hours of screen-time for only 3.7 days a week,
compared with the average of 3 hours per day reported in studies observing a relationship
between screen-time and adiposity in children [1,4]. Therefore, perhaps only higher
durations of screen-time are associated with adiposity in children [5]. Although the
underpinning mechanisms behind the relationship between screen-time and adiposity are
not completely understood [5], the association between screen-time and elements of a less
healthy diet is believed to be a contributing factor [86]. Sugary snack consumption was
positively associated with excessive screen-time in this study, in agreement with previous
research [86,88,345]. As sugary snack consumption has been shown to increase overall
caloric intake [320], it may be an important factor in the screen-time and
obesity/overweight relationship. Screen-time may influence sugary snack consumption in
children in several ways, through exposure to advertisements for sugary snacks on TV or
online [355], reduced sensitivity to satiety cues and messages imbedded in TV
programmes [356]. Interestingly, diet soft drinks are the most highly advertised product
on TV [355], and since boys watch more TV [357,358], they are more exposed to these
advertisements which may explain the positive relationship between diet soft drinks and
excessive screen-time in boys.
For girls only, low fruit and vegetable consumption was associated with screen time,
consistent with a recent review by Pearson and Biddle [345]. It is not clear why the
relationship only exists in girls, but it may be partially explained by the positive but non-
significant relationship between sufficient levels of MVPA and excessive screen-time in
boys (p = 0.08). This suggests a coexistence of high levels of MVPA and screen-time in
boys, in line with others [359,360]. Therefore, fruit and vegetable consumption may be
higher among boys who engage in excessive screen time as they are also achieving
sufficient levels of MVPA, since studies have found a positive relationship between the
latter and fruit and vegetable consumption.
In contrast to previous research [83,84], we observed a negative relationship between
screen-time and sleep duration only in girls. The reason for this sex difference is not clear,
but mobile phone and MP3 player use is higher among girls, whereas watching TV and
video gaming is higher among boys [358]. As mobile phones and MP3 players are easier
86
to hide from parents in bed [361], it could be postulated that the more frequent use of
these devices by girls before bedtime could reduce sleep time.
The negative relationship observed between MVPA before school and excessive screen-
time may reflect findings from Gorely et al. [362] whereby adolescents who commuted
to school via motorised transport were more likely to spend their discretionary time
watching screens. Since active travel is considered the main source of MVPA before
school [336], it is possible that children who engaged in excessive screen-time more
regularly commuted to and from school via motorised transport. However, since few
studies have investigated associations between active travel to school and screen-time in
children to date, more research is needed to confirm the potential relationship between
active travel and habitual screen-time.
We found positive associations between MVPA and screen-time after-school and meeting
and exceeding their respective recommendations, respectively, which supports the
hypothesis that the after-school period is key for the accumulation of MVPA and screen-
time [336]. Indeed, Atkin et al. [331] revealed that time spent in both screen-time and
MVPA during the after-school period (15:30–18:30) accounted for approximately 30%
and 40%, respectively, of daily totals. Further, Olds et al. [90] found that during this
period the greatest variation in MVPA levels occurred between high active and low active
children.
Although screen-time and MVPA are the most prominent behaviours during the after-
school period [126,331], productive sedentary behaviours, such as homework and
reading, also occur and are thought to directly compete with MVPA [363]. However, in
the present study, there was a positive relationship between homework/reading after
school and sufficient levels of MVPA in boys, similar to data reported in adolescents
[364]. In accord with Booth et al. [365], this suggests that there is time for both MVPA
and homework and reading throughout the day and provides support for the beneficial
influence of MVPA on school endeavours in boys at least. In contrast to most types of
screen-based sedentary behaviours, these productive sedentary behaviours are considered
essential for a child’s education and development [93].
87
The examined lifestyle factors accounted for 35% and 30% of the variance in the number
of days boys and girls were sufficiently active for, respectively. Significant proportions
of variance were also explained in the number of days spent in excessive screen-time,
with 41% and 33% of the variance accounted for in boys and girls, respectively. This
suggests that lifestyle factors relating to sleep duration, diet and behavior have an
important relationship with children’s MVPA and screen-time, particularly among boys.
One reason for this discrepancy, may be that the behaviours examined are more common
among boys. Perhaps behaviours not included in this study such as arts and crafts, chatting
with friends and listening to music are more important for girls. We chose to concentrate
on homework/reading, MVPA and screen-time, as these are more consistently associated
with health [5,6].
The present study has numerous strengths. Firstly, to the authors’ knowledge, it is the first
study to investigate the associations of both sufficient levels of MVPA and excessive
screen-time with multiple lifestyle factors in children within the same sample. The
integration of new types of technology for assessing screen-time advances previous
research, which focused solely on television viewing [85,334,335]. This is important as
screen-time is constantly changing due to technological advances, and multifunctional
devices such as tablets, smartphones and computers are now frequently used by children
[358]. Moreover, children regularly engage in two or more forms of screen viewing
simultaneously [366]. Therefore, children can over-report screen-time when responding
to certain self-report questions, however we were able to address this with our excessive
screen-time question. Further, the sample was socio-demographically representative of
the area and the detailed information collected enabled us to control for a number of
variables. Also, while there is sufficient research investigating associations between diet
and MVPA in adults [367] and adolescents [368], there is a paucity of research among
children. In addition, the present study established a number of sex differences in
relationships, uncommon in the literature. These may be a function of measurement
issues, but equally, they may just be sample dependent, differing by cultural
environments, age or country of study.
Nonetheless, certain limitations should be acknowledged. Given the cross-sectional
nature of the study, it is not possible to infer causal relationships and future research
should clarify such complex relationships by examining longitudinal associations. In
88
addition, the time-specific measures used to assess diet, MVPA, screen-time and sleep
duration may not have captured habitual behaviour. Future studies should seek to assess
diet [88,348] and screen-time [169] using 7 day diary/logs and similarly PA [322] and
sleep duration [369] for 7 days by accelerometer. Measuring PA using an accelerometer
also allows researchers to quantify intensity, which the questionnaire did not allow as it
primarily focused on the frequency and duration of PA. Indeed, MPA and VPA were
aggregated, and VPA is more consistently associated with health [10]. Moreover, the
comparably low prevalence of excessive screen-time found in the sample may be due, at
least in part, to social desirability, inherent in self-reporting [169]. Unfortunately, as the
screen-time measure is an aggregate of three behaviours, we could not examine TV
viewing, playing computer games and tablet/internet use separately. There is evidence to
suggest that internet use for productive purposes, is not related to poor lifestyle habits in
adolescents [370]. Even internet use for gaming may have less of an impact on poor
lifestyle habits, such as snacking than TV viewing, particularly in boys [371]. Direct
comparisons between this cross-sectional study and others are limited by the different
study designs and methodologies used to assess behaviours. Whilst, previous studies
examining multiple lifestyle factors have used approaches such as cluster and co-
occurrence analyses [347,372], this is one of the few to explore the independent
associations between MVPA, screen-time and several other lifestyle factors, while
simultaneously controlling for potential confounders. The approach utilized in the present
study enabled the identification of several important lifestyle factors, which could be
beneficially influenced through implementing interventions designed to change MVPA
and screen-time. As such, the study is of significant public health interest.
5.6. Conclusions
Taken together, the present study enables researchers to gain a better understanding of
other lifestyle factors associated with MVPA and screen-time in children. Specifically,
both healthy and unhealthy lifestyle factors, differing by sex, were associated with
sufficient levels of MVPA and excessive screen-time respectively. Future interventions
seeking to promote health behaviours, should target change in multiple lifestyle factors,
with sex-specific strategies.

89
Thesis map
90
6. Study 2
6.1. Validity and reliability of the HomeSPACE-II instrument
to assess the influence of the home physical environment on
children’s physical activity and sedentary behaviour
*This chapter is a publish manuscript:
Sheldrick, M.P.R; Maitland, C.; Mackintosh, K.A.; Rosenberg, M.; Stratton, G.
(2020) Validity and reliability of the HomeSPACE-II instrument to assess the influence
of the home physical environment on children’s physical activity and sedentary
behaviour. International Journal of Health Promotion and Education 2020.
6.2. Introduction
The importance of physical activity (PA) for disease prevention and health promotion in
children is well established [6]. Conversely, time spent sedentary, particularly using
screens, has been associated with poor health outcomes [5].
Despite this, few children meet the current PA and sedentary behaviour recommendations
[62]. The social ecological model is used to contextualise the determinants of children’s
sedentary behaviour and PA [373,374]. This model emphasises the influence of the
environment and posits that behaviours are most likely influenced by the setting in which
they occur [36,37]. Outside of school, children spend significant time within their home
and neighbourhood environments. The influence of the neighbourhood environment on
children’s PA levels and sedentary behaviour has been well studied, where proximity to
parks and recreation areas has been positively associated with PA [375], and
neighbourhood safety has been negatively associated with sedentary behaviour [376].
However, children have less independent mobility [377] and therefore opportunities for
active free play [378] in their neighbourhoods compared with previous generations. Given
that children spend considerable time at home [38,39], an improved understanding of its
influence on PA and sedentary behaviour is imperative for developing effective
interventions.
91
To date, research into the influence of the home environment on children’s PA and
sedentary behaviour has focused on the social environment, with the physical
environment receiving little attention [41,42]. Nonetheless, there is a consistent positive
relationship between the quantity of media equipment within the home, its presence
within a child’s bedroom, and screen-based sedentary behaviours [41,235]. There is
limited evidence for an association between PA equipment and PA levels [41]. Moreover,
some studies have reported an inverse relationship between media equipment and PA
[379,380], and between PA equipment and sedentary behaviour [240,241], but evidence
is inconclusive [41]. Similarly, whilst PA at home is most likely to occur outdoors [251],
the relationship between garden space and PA remains equivocal [256,381]. Even though
the evidence base is growing, there remains a paucity of research investigating the home
physical environment, outside of PA and media equipment.
In addition, most home environment measurement tools only assess the availability of
equipment, without considering its accessibility, thus limiting investigation. Accessibility
is associated with ‘ease of use and cueing of behaviour’ [247],p.2 therefore, a readily
available item posing little barrier to use may act as an important prompt to engage in a
behaviour. Studies investigating accessibility have reported a positive relationship
between the accessibility of PA equipment and accelerometer-derived PA in children
[240,248,249], as well as the accessibility of media equipment and screen-time in girls
[240]. Hales et al. [248] also found that only the accessibility, and not availability, of
portable play equipment was positively associated with children’s outdoor play [248].
Taken together, these findings demonstrate the potential utility of accessibility in
influencing behaviour, and accordingly the need to include a measure of accessibility in
a measurement tool.
Reviews [41,42] recommended that more objective measurement tools are needed to
improve our understanding of how the home physical environment influences children’s
PA and sedentary behaviour. Sirard et al. [247] developed a valid and reliable PA and
media equipment inventory (PAMI), a room-level home audit which records the
availability and accessibility of PA and media equipment in homes. Similarly, Pinard et
al. [382] created a parent-report instrument to measure PA and media equipment in low-
income family homes; however, in-home observation was not used to assess criterion
validity. Lastly, the HomeSTEAD instrument [248] underwent rigorous validity and
92
reliability testing and it provides a more comprehensive .assessment of the home physical
environment, including a large range of PA and media items as well as garden
characteristics, although it did not include room-level location for most items. Whilst
these provide valid and reliable assessments of media and PA equipment at home, they
lack detailed measures of other physical environmental factors.
The HomeSPACE-I instrument [290] advanced previous instruments by measuring
previously unexplored characteristics of the physical home environment such as musical
instruments, room/area size and furniture, as well as providing room-level data, assessing
garden size and outdoor features. Thus, the HomeSPACE-I instrument allows a more
detailed assessment of the physical home environment than previous instruments
[247,248]. The HomeSPACE-I instrument was designed and validated for use in Western
Australia (WA) where homes are typically onestorey, thereby potentially limiting its
appropriateness for use in countries with predominantly two-storey homes. Specifically,
one-storey homes are often open plan and have less separation between the bedroom and
living areas, and therefore likely to impact family interaction as well as parents’ ability
to monitor children’s electronic media usage. One-storey homes can offer families more
freedom to design the layout to suit their preferences and priorities, which may or may
not be aligned to the promotion of healthy behaviours. In contrast, two-storey homes have
a smaller footprint, which generally allows more outdoor space when on a similar-sized
plot. Such inherent layout and design differences highlight the necessity for the
HomeSPACE instrument to be validated for use in two-storey homes.
The HomeSPACE-II instrument was developed for use in two-story homes with the added
measure of accessibility, to measure parameters of the home physical environment that
may influence children’s PA and sedentary behaviours. The construct validity of the
measure has been established previously, with significant associations between several
home physical environmental factors assessed by the instrument and children’s
objectively measured home-based sitting and PA in the expected directions being found
[383]. Specifically, home-based sitting time was negatively associated with musical
instrument accessibility and availability, perceived house size, and an open-plan living
area, and positively associated with media equipment accessibility and availability. Total
physical activity (TPA) levels at home were also positively associated with the number
93
of floors in the home and an open-plan living area. The present study aimed to test the
criterion validity and test-retest reliability of the HomeSPACE-II instrument.
6.3. Method
6.3.1. Participants
A convenience sample and parents of children participating in the Swan-Linx school
health, fitness and wellbeing project [384] were provided with information about the
study. Thirty-one families, 22 via Swan-Linx and nine from the convenience sample,
living in the two largest conurbations in South Wales (Cardiff and Swansea) agreed to
participate. Families had at least one child aged 9 to 13 years and a parent or guardian
prepared to complete the audit on two separate occasions. Family passes for a local water
park were offered as an incentive for participating in the study. The institutional ethics
committee approved the study.
6.3.2. HomeSPACE-II instrument
The HomeSPACE-II instrument measures the physical environment of the home space in
relation to children’s PA and sedentary behaviour, and was based on the audit section of
its Australian counterpart [290]. However, the instrument was adapted to include
equipment most relevant to home-based activity in the UK, and to assess the accessibility
as well as the availability of each item and where appropriate questions were adapted to
the UK context. A draft instrument was reviewed by researchers with over 10 years of
experience in the field of children’s PA and sedentary behaviour (GS and CM). The
instrument and full study procedure were then pilot tested with a convenience sample of
two families. At the end of the home visits, parents provided verbal feedback on the audit
and home visit data collection protocol. Based on their feedback the audit was refined to
improve instruction clarity, the magazine item was moved to the questions section, and
items commonly found in UK households such as a football net, frisbee, skipping rope,
hula hoop, table football and swing ball were added, and a spa was removed.
The final instrument incorporated 39 equipment items, and allowed the presence, amount
and accessibility of each item, as well as room size (perceived), to be recorded for up to
14 rooms indoors and eight areas outdoors (see instrument provided as a supplementary
94
file). Accessibility was rated on a scale of A-D, using developed and validated scores
[247]. The response options were; A: put away and difficult to get to; B: put away and
easy to get to; C: in plain view and difficult to get to; D: in plain view and easy to get to.
The accessibility options were designed to also account for the condition of an item. For
example, a punctured football in plain view should be given a C rating, while a tennis
racquet in usable condition and in plain view should be given a D rating. Instructions and
examples were provided on the first page of the instrument. There were 10 items assessing
the presence of outdoor features in the front garden, back garden and verge. Items related
to home features (home type, home size, number of storeys, stairs, fencing and adjacency
to public open space) were also included. In addition, there were questions for home
equipment (books, magazines, DVDs, TV channels, electronic games, active electronic
games, smartphones, internet service) and dogs and other pets) that could not be assessed
by the room-level audit.
6.3.3. Procedures
Participant home visits were conducted during February to May 2016. Parents were
provided the study information prior to the visit. Under ethical guidelines, written
informed consent was received upon arrival and all family members provided verbal
permission for the home visit. One parent/guardian was required to walk around their
home and complete the instrument, while a criterion-trained researcher simultaneously,
but independently, completed the instrument. Parents were asked not to communicate
with the researcher during the audit. If items were hidden, such as underneath furniture,
parents were asked to make them visible. At the end of the visit, parents were given a
second copy of the instrument, which they were asked to complete one week later and
return via a pre-paid envelope. All the data collected were kept private and confidential.
6.3.4. Data Reduction
Individual items, features and the number of items within each accessibility group were
collated into category summary scores (Table 1). Density measures were calculated by
dividing the category summary scores by the total number of indoor rooms, outdoor areas
or total rooms/locations in the house. Summary scores that accounted for the accessibility
and availability of the media equipment, PA equipment, musical instrument and seated
furniture items were also created by multiplying each item by their accessibility scores
95
(A = 1; B = 2; C = 3; D = 4). The higher the score, the greater the overall ‘presence’ of
the type of item in the home. Further, an overall home environment score was calculated
to assess whether a home was more conducive to physical activity or sedentary behaviour.
The score was calculated as the ratio of PA equipment summary score to media equipment
summary score (activity: media ratio score). A higher score would reflect a home more
likely to facilitate PA and discourage sedentariness.
6.3.5. Demographics
Parents reported their age, place of birth, sex, educational status, as well as the postcode,
sex and age of the primary child, family situation, homeowner status and the main
language spoken at home. Additionally, postcodes (i.e. zip codes) were used to generate
Welsh Index of Multiple Deprivation (WIMD) scores, using the National Statistics
Postcode Directory database, as an indication of socioeconomic status (SES). The WIMD
scores consider eight domains of deprivation; employment; health; income; housing;
community safety; access to services; education and the environment [338]. Small areas
in Wales are ranked from 1 to 1909, with 1 being the most deprived and 1909 being the
least deprived. Tertiles of SES were formed: Low (1–636), medium (636–1272) and high
(1272–1909).
6.3.6. Statistical Analysis
For continuous variables, criterion validity was assessed by examining agreement
between the “gold standard” trained researcher and the participant using Pearson
correlation coefficients and 95% limits of agreement. Mean differences between the
researcher and the participant were evaluated using two-tailed paired t-tests. Test-retest
reliability between participants at time-points was evaluated using intraclass correlation
coefficients (ICC; 95% confidence intervals displayed, recommended for assessing the
reliability of measurement scales [385]. ICCs were rated using cut-off points of: < 0.40
(poor); 0.40 to 0.59 (fair); 0.60 to 0.74 (good); and 0.75 to 1.00 (excellent) [386].
For the categorical variables, validity and test-retest reliability were assessed by Cohen’s
Kappa coefficients (CKC; 95% confidence intervals displayed). Kappa coefficients were
interpreted as follows: < 0.00 (poor); 0.00 - 0.20 (slight); 0.21- 0.40 (fair); 0.41- 0.60
(moderate); 0.61- 0.80 (substantial); and 0.81-1.00 (almost perfect) [387]. Statistical
96
analyses, were conducted using IBM SPSS statistics 22 (IBM SPSS Statistics Inc.,
Chicago, IL, USA), where significance was set at < 0.05.
6.4. Results
Demographic characteristics of the participating families are provided in Table 1. All
parents (n = 31) completed the HomeSPACE-II instrument at both time-points, where
87.1% were female, 61.3% held a university degree and 45.2% lived in the highest SES
locations. Houses were mostly semi-detached or terraced (61.3%) with two parents
(87.1%), and there were most often four occupants per home (48.4%), including two
children (51.6%). Most participants reported they had either a medium or large-sized
house (45.2% and 41.9%, respectively), and a medium or large-sized garden (42.0% for
both).
6.4.1. Validity
The results of the availability validation analysis are shown in Table 2. Pearson
correlation coefficients between the researcher and parent were >0.80 for all the
room/area summary variables, and ≥0.84 for the availability and density of PA equipment,
musical instruments, media equipment and seated furniture. Three of four outdoor
features correlations were >0.90, only the ‘back garden’ summary item fell below 0.70 (r
= 0.65). There were significant differences for five PA equipment categories. On average,
the researcher recorded two more sports equipment items (p = 0.05), one more PA
equipment item indoors (p = 0.01) and three more in total and a higher density of PA
equipment indoors by 0.2 units (p = 0.02) and in total by 0.3 units (p = 0.03). Significant
mean differences were also noted for three seated furniture categories. Specifically, the
researcher on average recorded one more piece of seated furniture indoors (p = 0.03) and
in total (p = 0.03) and a higher density of seated furniture indoors by 0.1 units (p = 0.05).
Table 3 contains the results for the accessibility variables. Correlation coefficients
between the researcher and participant were ≥0.35 across all four accessibility ratings for
PA equipment (total, indoor and outdoor), media equipment and musical instruments.
Correlation coefficients for three accessibility ratings for seated furniture (total, indoor
and outdoor) fell below 0.18. Correlation coefficients for the number of items recorded
as ‘in plain view and easy to get to’ were most favourable, where six of eight were ≥0.80
(Table 3). Average accessibility ratings for three of eight item categories achieved
97
correlation coefficients ≤0.35. Mean differences were noted between the researcher and
participant for four accessibility ratings, with the researcher on average recording one
more PA equipment item indoors as ‘in plain view and easy to get to’ (p = 0.02), and five
more PA equipment items outdoors and six more in total as ‘put away and easy to get to’
(both p = 0.01), as well as one more media equipment item as ‘in plain view and easy to
get to’ (p = 0.02). Further, there were significant differences in average accessibility
ratings for two item categories, with the researcher observing fewer PA equipment in total
as harder to access (p = 0.04) and more PA equipment outdoors as harder to access (p =
< 0.01).
Correlation coefficients were high for the calculated accessibility and availability
summary scores (number of items * accessibility rating) [r > 0.75; Table 2] and for the
activity: media ratio score (the ratio of PA equipment summary score to the media
equipment summary score) [r = 0.70; Table 3]. However, the media equipment
accessibility and availability summary score was significantly greater for the researcher
(p = 0.02).
Validation results for the categorical variables are provided in Table 4. All variables
assessing adjacent space showed almost perfect agreement (K > 0.81) and those assessing
home design showed either substantial or almost perfect agreement (K ≥ 0.69). Validity
for seven out of 14 size measures showed either substantial or almost perfect agreement
(K ≥ 0.63), and the remaining seven demonstrated fair or moderate agreement (K = 0.24–
0.58).
6.4.2. Reliability
For test–retest reliability, ICCs for 28 of the availability variables were excellent (ICC ≥
0.76), with the other 6 being either fair or good (ICC = 0.52–0.73; Table 2). For the
majority of the categorical variables, Cohen’s Kappa was either substantial or almost
perfect (K > 0.61; Table 4). Most other kappa coefficients were moderate (K = 0.41–
0.60); however, one item, hall size, was fair (K = 0.28).
As shown in Table 3, most of the ICCs for the accessibility categories were either good
or excellent (ICC > 0.60). Across the accessibility summary categories, the highest ICCs
98
were found for the number of items rated as ‘put away and difficult to get to’ and ‘in plain
view and easy to get to’, where six of seven and five of eight, respectively, were excellent
(ICC ≥ 0.75). Conversely, the lowest ICCs were found for the number of items rated as
‘in plain view and difficult to get to’, with five of eight being poor (ICC = −0.03–0.32).
In terms of average accessibility ratings, all but one of the item categories achieved fair
to excellent ICCs ≥0.42; the ICC for musical instruments was poor (ICC = 0.15).
Reliability was excellent between the parent at Time 1 and Time 2 for all four accessibility
and availability summary scores (ICC ≥ 0.84; Table 2), and for the activity: media ratio
score (ICC = 0.79; Table 3).
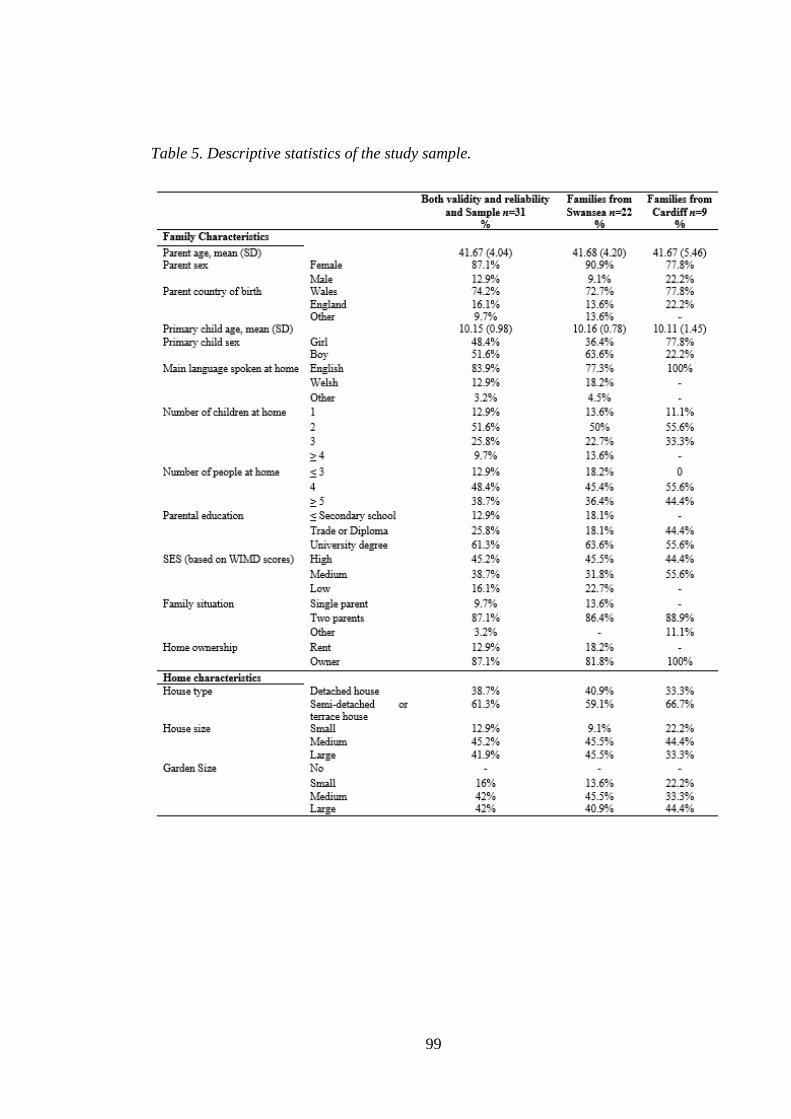
99
Table 5. Descriptive statistics of the study sample.
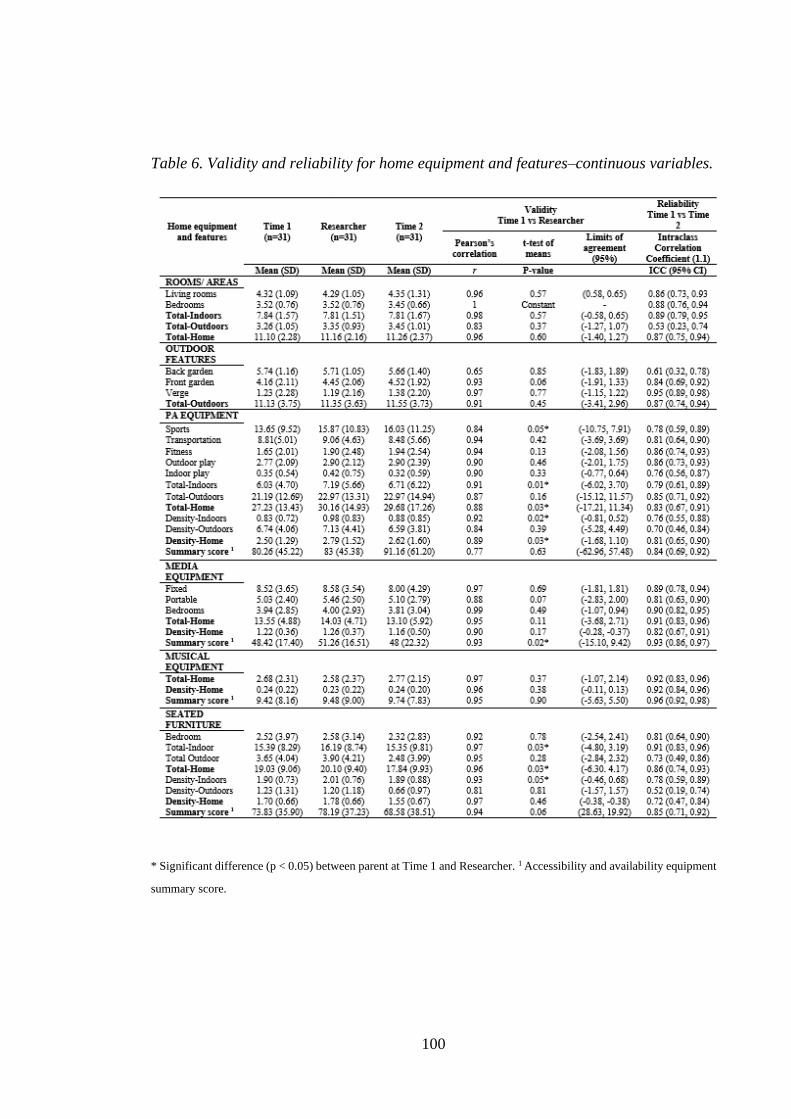
100
Table 6. Validity and reliability for home equipment and features–continuous variables.
* Significant difference (p < 0.05) between parent at Time 1 and Researcher. 1 Accessibility and availability equipment
summary score.
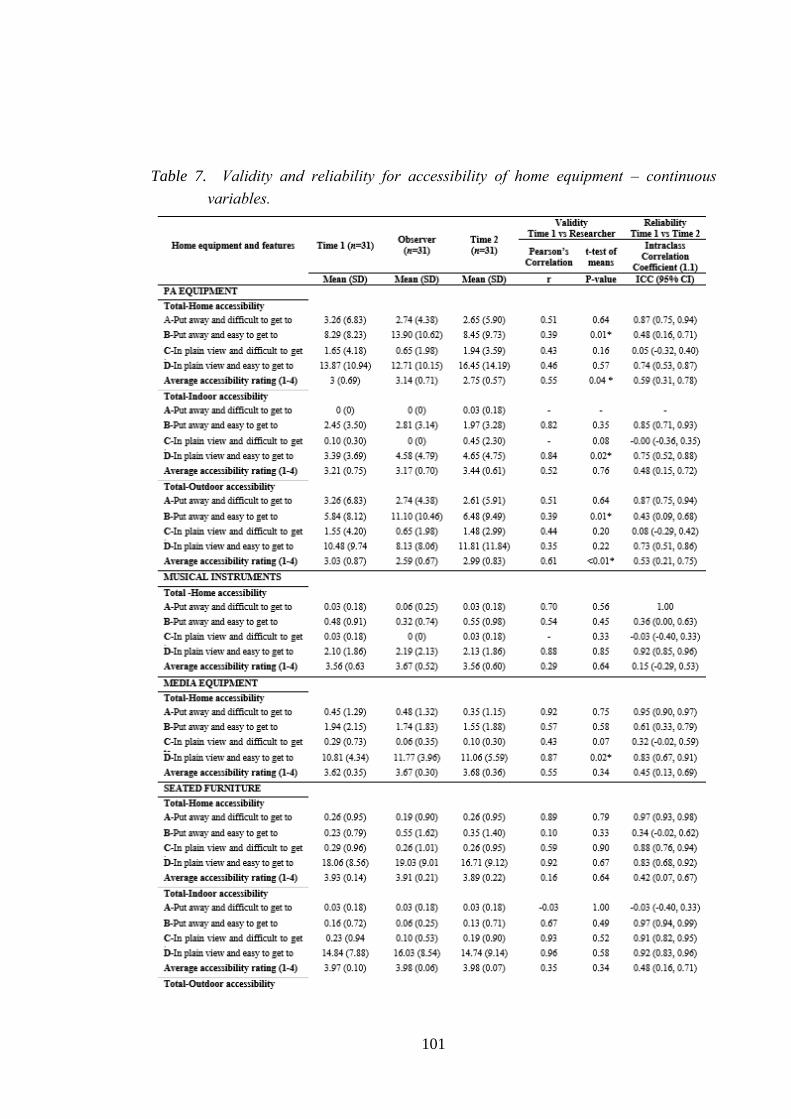
101
Table 7. Validity and reliability for accessibility of home equipment – continuous
variables.
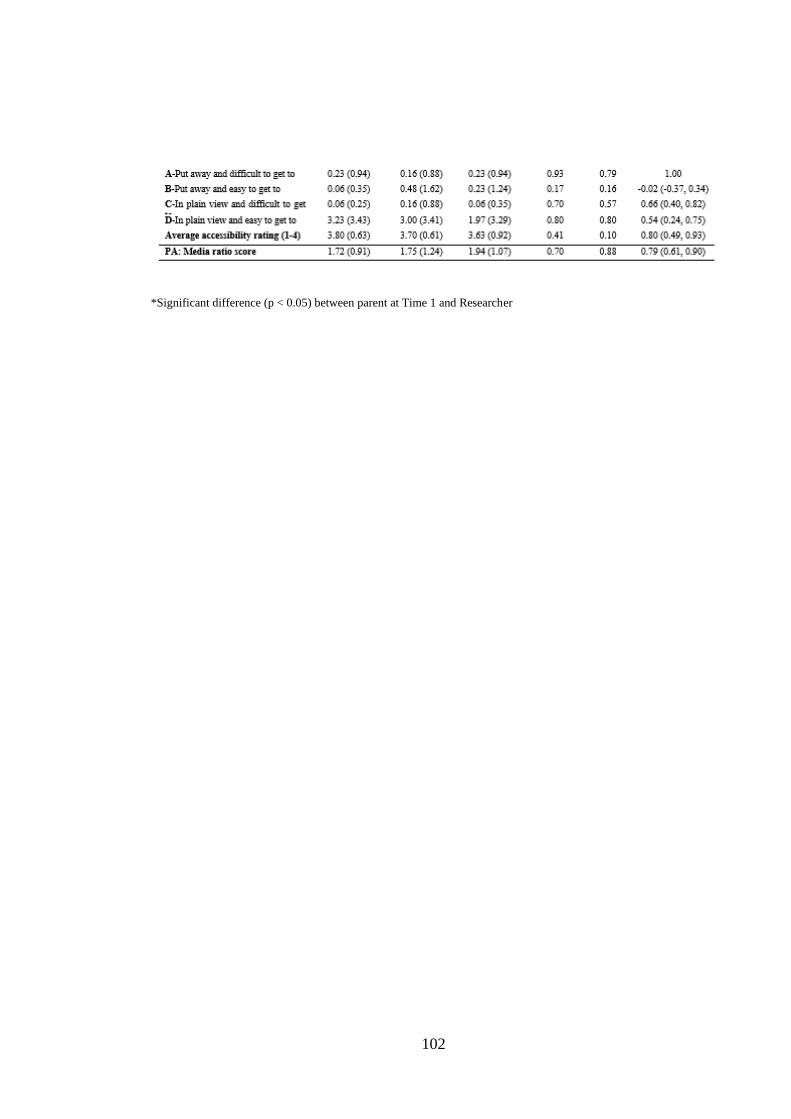
102
*Significant difference (p < 0.05) between parent at Time 1 and Researcher
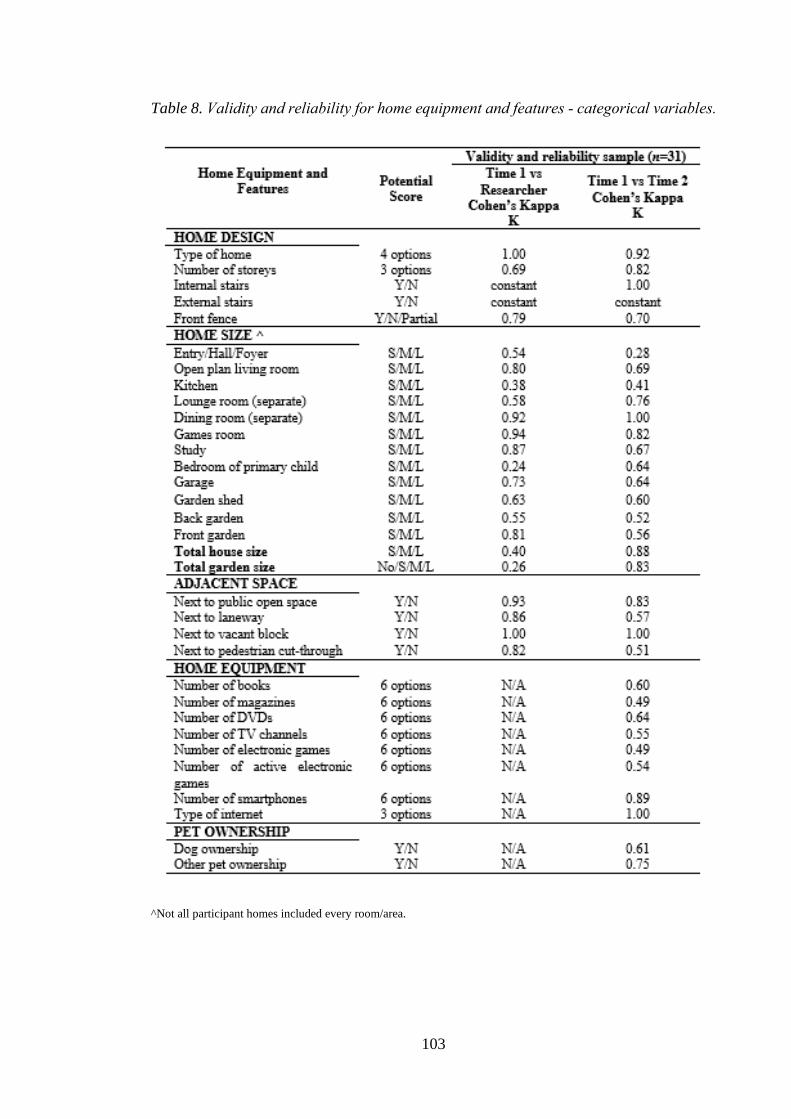
103
Table 8. Validity and reliability for home equipment and features - categorical variables.
^Not all participant homes included every room/area.
104
6.5. Discussion
This study assessed the validity and reliability of the HomeSPACE-II instrument,
designed to measure parameters of the home physical environment that may influence
children’s sedentary behaviour and PA at home. Whilst the instrument was primarily
based on HomeSPACE-I [290], there are several differences. Specifically, it was tested
for use in two-storey homes and modified to include equipment most relevant to home-
based activity in the UK and to assess the accessibility, as well as the availability, of each
item. The strong criterion validity and test-retest reliability demonstrated in this study for
most of the equipment, size, feature and design items and the already established construct
validity of the instrument [383], suggest it can be independently used by parents to detect
important characteristics of the home physical environment that may impact children’s
PA and sedentary time.
Most of the continuous variables for availability showed good to excellent reliability;
however, reliability results for accessibility were mixed. For items rated as ‘put away and
difficult to get to’ and ‘in plain view and easy to get to’, ICCs were mostly to good
excellent. However, ICCs for the number of items rated as ‘put away and easy to get to’
and ‘in plain view and difficult to get to’ were mostly poor to fair. This may be because,
the terms ‘put away and difficult to get to’ and ‘in plain view and easy to get to’ are less
ambiguous and more congruent than ‘put away and easy to get to’ and ‘in plain view and
difficult to get to’. Moreover, ICCs for the average accessibility ratings were mostly fair.
Between the parent completing the instrument at time one and time two, items may have
moved location and therefore the parent’s perception of accessibility may have changed
which may partly explain the lower reliability estimates. Despite this, the overall
summary scores (number of items * accessibility rating) for all four item categories were
strong.
Reliability for the categorical variables was generally high, except for home equipment
and size. Indeed, hall size was the only variable to fall below acceptable reliability limits,
possibly because the parent did not record it at the second time-point as they may not
have perceived it as a living area. Moreover, the moderate reliability limits achieved for
several of the home equipment variables assessed by questions rather than the
105
walkthrough audit may reflect the difficulty in estimating a number of smaller items from
memory, particularly when a large number of that item exists within the home.
Validity was strong for most of the continuous variables, outside of accessibility. Further,
validity coefficients for PA equipment, media equipment, seated furniture and musical
instrument measures were higher than in the HomeSPACE-I tool [290]. However, the
sample size was slightly smaller in this study, which may, at least in part, explain the
more favourable validity coefficients [388]. In contrast, validity for the 10 outdoor
features across the three areas (front garden, back garden and verge) was better in
HomeSPACE-I. It could be postulated that the sample was more familiar with their
outdoor space due to the better climate they experience [389], which may partly explain
this discrepancy.
While validity coefficients, in general, were strong, several differences between the
researcher and the parent were observed. The researcher achieved a higher media
accessibility and availability summary score which might reflect the greater number of
items recorded as ‘in plain view and easy to get to’ by the researcher. In addition, the
researcher recorded a higher number of seated furniture indoors and in total than the
parent, which concurs with Maitland et al. [290]. This could be due to the researcher
taking a more thorough walk-through approach recording all types of seated furniture,
whereas the parent may have not acknowledged some pieces or identified table and chairs
together as one piece of furniture. Further, the researcher recorded more PA equipment
items indoors and in total, which would account for the higher total and indoor PA
equipment density. This difference is likely driven by the greater number of balls recorded
by the researcher in total, indoors and outdoors (result not shown). Perhaps, because the
researcher recorded all types of balls irrespective of their condition, while the parents may
have missed those either in poor condition or smaller balls as they were less visible. To
minimize such error, efforts were made to define what constitutes seated furniture and
balls; parents were also instructed to record everything regardless of condition.
Nonetheless, these items may need further clarification in future versions of the
instrument.
Validity of home size measures was assessed by comparing the parent’s estimates against
the researcher’s. While a number of studies have sought to validate self-reported garden
106
size against a researcher with little success [248,390,391], Maitland et al. [290] are the
only other group to validate self-reported size for indoor rooms, non-garden outdoor
areas, overall house size and garden size. In general, validity estimates for the home size
measures were higher than those reported by Maitland et al. [290], with most showing
moderate agreement. The reason for this difference is not clear; however, the average
house in Australia is one of the largest in the world [392], which may have influenced
parental perceptions in the Maitland et al. [290] study. Although overall house and garden
size achieved only fair agreement, compared to the moderate agreement achieved in the
Maitland et al. [290] study for the equivalent measures. Whilst the reason for this is
unknown, housing type may have influenced perceptions of house and garden size.
Specifically, all the houses in this study had two storeys and were mostly semi-detached
or terraced (61.3%), converse to the Australian sample where most were single-storey
(83%) and detached (90%). Therefore, these discrepancies in parent-researcher
agreement are most likely related to the difference in the nature of homes (e.g. layout,
type and size). As overall house and garden size may influence children’s PA levels and
sedentary time [41,383], an objective measurement of size may be necessary. Conversely,
if UK homes continue to reduce in size [393], the design and layout of homes may be of
greater importance.
Achieving agreement between the researcher and parent for a largely subjective construct,
such as accessibility, was challenging. In general, acceptable validity was observed;
although results for PA equipment were particularly low, with the researcher observing
fewer PA equipment in total as harder to access and more PA equipment outdoors as
harder to access. Similar discrepancies were observed in previous inventories that
assessed the accessibility of PA equipment within the home [247,248], although the
HomeSPACE-II achieved a higher validity estimate for the average accessibility rating
of PA equipment than the HomeSTEAD instrument [248]. These results suggest that
parents may have different perceptions of accessibility, particularly for PA equipment.
However, while trained researchers may provide a more objective assessment of
accessibility, it might be just as, or more, important to consider a parent’s perception of
accessibility. For example, if an item seems hard to access to the researcher, but is
frequently made available to the child by the parent, then the parent’s perception of
accessibility may better indicate how that item influences activity. In support of this, the
HomeSTEAD study [248] found a stronger relationship between child BMI and parent-
107
reported accessibility compared with researcher reported accessibility. The child’s
perception of accessibility may also be important, as they are likely to have a greater
awareness of their barriers to using a particular item. For example, a parent may view a
tablet computer hidden in a drawer as hard to access, however if the child knows it is
there, it poses less of a barrier for use. Taken together, it may be more important for future
studies to consider parent’s and child’s perceptions, when investigating the relationship
between equipment accessibility and children’s behaviour.
The strengths of this study include its rigorous reliability and validity testing procedure
and the extensive nature of the HomeSPACE-II instrument, which covers a wide range
of parameters within the home, providing a comprehensive assessment of the physical
home space. There were equal representations of boys and girls within the sample, which
is important given studies have found a greater density of PA equipment within boys’
houses [240] and boys are mor likely to have electronic media in their bedroom [394].
Although measurement tools have been tested in Australia [290] and the USA
[247,248,382], this is the first to be tested in a European country. This is important due
to several environmental differences; climate differences [389], the average house size is
significantly larger in the USA and Australia than in any European country [392], and
Europe is less ethnically and racially diverse than the USA[395].
This study also has several limitations. First, the sample was homogenous, as most parents
were female, university educated, and houses were mostly semi-detached or terraced with
two parents. Although the predominantly female and university-educated sample is
similar to that of previous studies [247,248,290]. We sought to validate home size
measures against a researcher with mixed success; however, due to the subjective nature
of these items, future research should seek to validate them against objective measures
(e.g. GIS [Geographic Information System software]). There was low between-subject
variation for accessibility ratings in several item categories, which can result in low ICCs
[396] and Pearson correlation coefficients [388], which may explain why some
accessibility variables had low validity coefficients and ICCs, in spite of their means and
standard deviations indicating minimal differences between scores. The sample was
comprised of families living in Wales’ two largest cites. Whilst Wales is less affluent than
the national average [397], its physical geography, home environmental characteristics
and cultural traits are comparable with the rest of the UK. Further, data were collected in
108
the spring and winter and therefore seasonality may have influenced accessibility data,
particularly for outdoor PA equipment, whereby equipment may be stored away in the
winter but made accessible in the spring. Lastly, the large number of statistical tests
conducted in this study may have increased the risk of type I error. Given that some of
the results may have therefore occurred by chance, the authors considered employing a
more stringent alpha value; however, such corrections may have increased the probability
of type II error. As the present results are similar to those reported in other studies
[247,248,290], an alpha value of 0.05 was retained.
Several modifications should be considered for future iterations of the HomeSPACE
instrument. Given that types of seated furniture, balls, electronic games and active games
varied greatly, the instrument would benefit from further clarification around what
defines these. Secondly, although the importance of considering a parent’s perception of
accessibility has been discussed, the accessibility ratings may need further investigation.
Specifically, although the accessibility ratings were designed to take into account
condition [247], this may not have been clear enough to the parents. In addition, the
child’s perception of accessibility was not considered, which may be equally as important.
However, capturing children’s perceptions of accessibility for each individual item would
be a challenge, when the instrument is completed by the parent. To improve how the
accessibility ratings are defined, future research should seek to utilise qualitative
methodologies to ascertain the way both parents and children perceive and interpret
accessibility. Further work on how to capture both parents and children’s perspectives
with the instrument is also needed. Thirdly, the number of TV channels question should
be replaced with a question concerning the type of TV service as even Freeview offers
over 70 channels. Moreover, a question on movie streaming services (e.g. Netflix, Now
TV, Amazon Prime, etc.) should be included, due to their growing popularity, essential
for a comprehensive assessment of media sources available in the home. Portable types
of electronic media (laptops, tablet computers and handheld devices) do not have a fixed
location and can therefore be used almost anywhere, meaning they may not always be
captured with the instrument. Therefore, future work on how to account for the portable
nature of these devices may be needed. Finally, fitness trackers (e.g. Fitbits, apple
watches, Garmin) should be explored, as they have the potential to facilitate children’s
PA in interventions through goal-setting and self-monitoring [398]. The presence of these
in a home may reflect a family promotive of being physically active. Due to constant
109
changes in media technology, updating these types of instruments with relevant media
equipment will be ongoing.
6.6. Conclusion
The HomeSPACE-II instrument builds upon its Australian counterpart [290] by being
tested in two-storey homes and because it includes a wider range of PA equipment, and a
measure of accessibility, rather than just availability. The generally strong test re-test
reliability and criterion validity demonstrated here and the construct validity established
previously [383], suggests HomeSPACE-II, is a useful tool for assessing the home
physical environment in relation to children’s PA and sedentary behaviour. Using the
instrument will provide researchers with greater insight into the correlates of important
health-related behaviours in an environment where children spend a significant amount
of time [38,39]. Such insight may also impact future home planning and design to create
physical home environments more conducive to healthy behaviours. Additionally, the
HomeSPACE-II instrument may also help parents become more aware of how their home
environment is influencing their child’s PA and sedentary time, thereby indirectly
promoting healthy active living in families. The instrument may be appropriate for use in
countries which share similar geographical and home environment characteristics with
the UK.

110
Thesis map
111
7. Study 3
7.1. Associations between the Home Physical Environment
and Children’s Home-Based Physical Activity and Sitting
*This chapter is a published manuscript:
Sheldrick, M.P.; Maitland, C.; Mackintosh, K.A.; Rosenberg, M.; Griffiths, L.J.; Fry, R.;
Stratton, G. Associations between the Home Physical Environment and Children’s Home-
Based Physical Activity and Sitting. Int. J. Environ. Res. Public Health 2019, 16, 4178.
7.2. Introduction
The importance of physical activity (PA) for children’s physiological and psychological
health has been well documented [6], yet few meet current moderate-to-vigorous physical
activity (MVPA) recommendations [62]. Children also spend most of their discretionary
time in sedentary behaviours (7–8 h daily) [45], defined as ‘any waking activity, in a
sitting, lying or reclining posture with an energy-expenditure below 1.5 metabolic
equivalents (METs)’ [72]. Screen-time is the most prevalent sedentary behaviour, and has
been associated with poor health outcomes [5] [92]. However, the relationship between
overall sedentary time and health in children is less clear [5]. Nonetheless, there is strong
evidence for an adverse association between excessive levels and mortality in adults [96].
Recently, breaks from prolonged sitting have been beneficially associated with markers
of body composition and metabolic health in adults [109]. Given the harmful
consequences in adults and that children’s sedentary time appears to track into adulthood
[31], high levels in children are a public health concern. Therefore, it is important to
develop interventions to increase children’s PA and reduce their sedentary time.
Investigating the correlates of PA and sedentary time is essential for informing effective
evidence-based interventions [35]. The social ecological model is often used to guide the
understanding of children’s PA and sedentary time, recognising the important influence
of the environment [37]. This model suggests that behavioural correlates are domain-
specific, whereby behaviours are most likely influenced by the environment in which they
occur [36,37]. Outside of school hours, children have been shown to spend significant
time at home [38,39]. Indeed, there is also evidence indicating that a large proportion of
112
children’s sedentary time and PA occurs at home [40,52,226]. Specifically, Tandon et al.
[40] found that 48 and 42 % of children’s overall sedentary time and MVPA, respectively,
was accumulated at home. The home environment, therefore, may be influential in
affecting children’s PA and sedentary behaviours.
There is a plethora of research demonstrating the importance of the home social
environment on children’s PA and sedentary time [41,235]. However, much less is known
about physical environmental factors at home. Media equipment in the home and
bedroom has consistently been positively associated with screen-time, but not overall
sedentary time [41,235]. Additionally, there is some evidence that PA equipment is
positively associated with PA [40,240] and inversely related to sedentary time [40,41].
Furthermore, whilst PA at home is most likely to occur outdoors [251], whether greater
garden space facilitates PA remains unclear, with equivocal findings [256,381]. Even
though there is an emerging evidence base, findings have been inconsistent, and research
has been limited by the use of self-report instruments to measure the home and through
assessing PA and sedentary time across the entire day [41]. Given behaviours are most
likely influenced by the setting in which they occur [37], investigating sedentary time and
PA at home will enable more precise identification of correlates. The use of objective
measures such as audits and geographic information system (GIS) software to assess the
home will also improve measurement accuracy. Additionally, greater media equipment
accessibility has been shown to be associated with increased screen-time [240]; however,
most studies have only assessed equipment availability.
When at home, children spend most of their time indoors [38,39]. This is of concern,
because this is where children are most likely to be sedentary [251]. The indoor space
may also be relevant for PA, with an ecological momentary assessment study showing
that 30% of children’s aged 9–13 years leisure time PA occurred at home indoors [226].
Yet, few studies have explored influences on sedentary time and PA within the home
indoor physical environment, outside of equipment [41]. A qualitative study identified
several previously unexplored indoor physical environmental factors as potential
influences on children’s sedentary time and PA at home, including multiple indoor living
areas designated for screen-time, the presence of an open plan living area, the availability
and layout of indoor space, as well as furniture within the home [43]. Additionally, new
electronic media technologies such as online TV/movie streaming services may also be

113
relevant, with just over 11 million people in the UK now being subscribed to one, as TV
viewing habits shift online [117]. Moreover, playing musical instruments is an activity
that commonly occurs at home [399], which can be done while sitting or standing [400].
Furthermore, houses with more than one floor may have a favourable effect on PA via
increased stair climbing [401,402]. Exploration of the role of the factors cited by Maitland
et al. [43], as well as musical instruments, movie/TV streaming services and the number
of floors in influencing children’s sedentary time and PA is needed.
The aim of this study was to investigate the relationship between characteristics of the
physical home environment and children’s home-based sitting, PA, standing and sitting
breaks.
7.3. Materials and Methods
7.3.1. Study Design
The HomeSPACE study is a cross-sectional observational study investigating the
relationship between the home environment on children’s PA levels and sedentary time.
Between November 2017 and July 2018, 235 children aged 9–12 years and their parents
(n = 228) (response rate 26%) were recruited through primary schools from four of the
largest conurbations in South Wales, Swansea (n = 174), Bridgend (n = 37), Cardiff (n =
16) and Newport (n = 8). A target sample size of 235 was set based on a reliable formula
[403], while accounting for the possibility of missing data.
7.3.2. Recruitment
Primary schools (n = 23) were invited to participate. Eleven schools (response rate 48%)
consented and 890 children aged 9–11 years were provided with information about the
study. To be eligible, children had to be aged 9–12 years and without a physical disability.
A chance to win a family pass for an outdoor adventure centre and the child’s sitting and
PA results were offered as incentives. Informed consent and child assent were provided.
The Swansea University ethics committee granted ethical approval for the study.
7.3.3. Home Physical Environment
114
HomeSPACE-II, an updated version of the HomeSPACE-I [290] and the Physical
Activity and Media Inventory [247], was administered to the parents. The audit assessed
physical home environmental factors hypothesised to influence children’s home-based
PA and sedentary behaviours [43]. Parents were asked to walk around their house and
garden and complete the items for each room/area. Briefly, the audit allowed the presence,
amount and accessibility of 41 media (e.g., TV, computer, etc.), musical (e.g., drums,
piano, etc.), PA (e.g., balls, trampoline, etc.) and seated furniture (e.g., sofa, desk etc.)
items to be recorded for up to 22 room/areas (14 indoor and eight outdoor). Accessibility
of each item was rated on a scale of A–D [247]. The response options were; A: put away
and difficult to get to; B: put away and easy to get to; C: in plain view and difficult to get
to; D: in plain view and easy to get to. There were questions relating to home features
(house size, garden size, type of house, number of floors) and electronic media
(smartphones, TV service, movie/TV streaming service). In addition, there were
questions referring to the space to play inside the house, and in the back and front garden
[290]. The audit data were reduced to several independent variables. Three dichotomous
variables were generated to reflect the presence of: (1) an open plan living area; (2) a TV
in the primary child’s bedroom; (3) a detached house. Yes and no responses were coded
as 1 or 0, respectively. The number of living areas in the home with a TV was also
calculated. In addition, summary scores that accounted for the accessibility and
availability of PA equipment, seated furniture, overall media equipment, media
equipment in the child’s bedroom and musical instruments were created by multiplying
each item by its accessibility rating (A = 1, B = 2, C = 3, D = 4). A higher score indicates
a greater overall “presence” of that type of item in the home. For descriptive purposes,
we also calculated the total number of each type of item and the number of rooms/areas.
Active video game systems (e.g., Wii Fit, Xbox Kinect, PlayStation move) were coded
as PA equipment. Instruments were checked for missing data and for clarity, and followed
up with families when needed.
7.3.4. Home Log Diary
Parents were given a diary to record when the child was at home each day for seven days,
to allow for the calculation of home-based behaviours. Instructions were provided, where
“Home” was defined as a single location, including the house, garden, driveway and verge
of the home where the child spends most of their time (i.e., excluding homes of other
115
parents). To minimise missing data, children completed the diary when parents were
unable to and incomplete diaries were followed up with families.
7.3.5. Objectively Measured Home-Based Physical Activity and
Postural Behaviours
Children wore the ActiGraph GT9X (ActiGraph, Pensacola, FL, USA) and the activPAL3
micro (PAL Technologies, Glasgow, UK), which measured total physical activity (TPA)
and MVPA as well as postural behaviours (i.e., sitting, standing and sitting breaks),
respectively, for seven consecutive days. A sitting break was defined as a transition from
sitting to standing/stepping [72]. Both were fitted at school, to ensure correct attachment
and to provide instructions on how to reattach them. Participants were asked only to
remove the monitors for swimming. Parents were also required to record sleep and wake
times, device removals and any illness days.
The activPAL has demonstrated excellent validity in children [112], and was placed in a
waterproof nitrile sleeve and secured on the midline of the upper right thigh using a
hypoallergenic dressing (3M Tegerderm or Hypafix Transparent). Supplementary
dressings, sleeves and instructions on correct reattachment were provided. ActivPAL data
were downloaded using the manufacturer software (V8.10.8.32, PAL technologies,
Glasgow, UK), which generated Event.csv files for each device. These files were
processed in ProcessingPAL-V1.1 (Leicester, UK) using a validated algorithm to identify
waking hours, extended non-wear periods (≥5 h) and invalid data [404]. Following
processing, files were visually checked for plausibility of sleep/non-wear classification
using heatmaps. If sleep and wake times looked unfeasible, the diaries were referred to
for verification and when times differed by ≥2 h, the diary times were utilised [405]. A
predominately objective processing method was used for determining sleep duration, as
parent reported sleep and wake time have been shown to have questionable reliability
[349,350]. Additionally, removals noted in the diary were inspected against heatmaps and
the events window in the PAL analysis software (V8.10.8.32, PAL technologies,
Glasgow, UK), and removed using the software if deemed plausible. Bouts were
considered as “non-wear/sleep”, if ≥50% of it was within the period reported in the diary
[197]. To minimise known errors with self-reported diary data, based on inspections of
116
the data and previously used methods [406], we considered sitting/lying or standing bouts
lasting ≥3 h without transitions as non-wear time.
Children wore the ActiGraph GT9X on their non-dominant wrist [303], to improve
compliance [304]. Wrist-worn accelerometers have demonstrated good validity in
comparison to hip-worn accelerometers [305]. The data was collected at a 30 Hz sampling
rate [306] and summed over 5-sec epochs. ActiGraph (ActiLife V6.13.3) software was
used to initialise, download and process files. Chandler wrist-based cut-points [155],
applied to the vector-magnitude, were used to categorise MVPA (≥818 counts/5-secs)
and TPA (≥162 counts/5-secs). Non-wear time, defined as ≥90 consecutive minutes of
zero counts [407], was removed using the software.
Periods when children were at home were uploaded into both the ActiGraph and
Processing PAL software and matched with time-stamped data, allowing home-based PA
and postural behaviours to be generated, respectively. Days were considered valid, when
the device was worn for ≥75% of the time at home [408]. In accordance with previous
research [409], children with completed home diaries, and at least one valid day with ≥3
h of wear time at home were included in the analyses. Reported illness days were also
excluded from the analyses. ActivPAL and ActiGraph data in minutes, were divided by
wear time at home and multiplied by 60 to create the dependent variables conveyed as
averages/h [410]. The activity data was expressed as average minutes/h to allow for better
comparison across studies.
7.3.6. Children Personal Information and Anthropometric Measures
Anthropometric measurements were taken at the children’s respective schools. Stature
and body mass were measured to the nearest 0.001 m and 0.1 kg, using a portable
stadiometer (Seca 213, Hamburg, Germany) and electronic weighing scales (Seca 876,
Hamburg, Germany), respectively, using standard anthropometric techniques [339].
Body mass index (BMI), and subsequently BMI z-scores, were derived using the WHO
(World Health Organization) growth reference standard [294].
7.3.7. Objectively Measured House and Garden Size
Objective house and garden size for each postcode were measured using GIS techniques,
AddressBase Premium (ABP) [300] and Ordnance Survey MasterMap (OSMM) [301].
117
For residences (min 4–max 82), we extracted building footprints from OSMM and filtered
out non-residential buildings, defined by ABP. The process was repeated to determine
garden size for residences (min 2–max 82), defined in OSMM Greenspace dataset [302].
To estimate house size, a median of the extracted building footprints was calculated and
multiplied by the number of floors in each house. A median garden size was also
calculated for each home in the postcode.
7.3.8. Additional Measures
Parents reported their age, gender, whether they own or rent their home, educational status
(Some secondary school/Completed secondary school/Trade qualifications or
apprenticeship/Diploma or certificate/University degree or higher), the pre-tax annual
household income, postcode and the number of children at home. Season of measurement
covered four categories: Winter (December–February), Spring (March–May), Summer
(June–August) and Autumn (September–November). Due to missing data on income and
educational status, Welsh Index of Multiple Deprivation (WIMD) scores, derived from
postcodes, were used as an indicator of socioeconomic status (SES). The WIMD scores,
consider eight domains of deprivation; employment; health; income; housing; community
safety; access to services; education; the environment [338]. Small areas in Wales are
ranked 1–1909, where 1 is the most deprived and 1909 is the least deprived. For
descriptive purposes, tertiles of SES were generated based on WIMD scores; low (1–
636), medium (636–1272) and high (1272–1909). Daylength for the participants’
respective cities during each monitoring day was obtained from a valid and reliable online
resource [411]. Family preferences and priorities for activity within the home [290], as
well as parental media rules [259] were collected via validated questions.
Social and individual factors have been known to influence children’s sedentary and
activity behaviours at home [43]; therefore, they could play an important role in
associations with such behaviours and the home environment. To identify the
confounding factors, the coefficients were computed from the statistical models prior to
and following adjusting for each variable. Variables with the greatest impact on the
coefficients on average were controlled for in the models [412]. These were parent-
reported child and parent activity preferences at home, parent perceptions of the
importance of active play at home for their child, and whether parents enforce a maximum
h/day of screen-time rule.
118
7.3.9. Statistical Analysis
Consent and assent as well as activPAL, ActiGraph, physical and social environment data
were received for 235 (100%), 207 (88%), 214 (91%), 213 (91%) and 207 (88%) children,
respectively. Statistical analyses were conducted using SPSS (IBM SPSS Statistics Inc.,
Chicago, IL, USA; Version 25), where significance was set at ≤0.05. Whilst the normality
assumption was violated, research suggests that it is not necessary when the sample size
is large (>200) [342,343], therefore parametric tests were deemed appropriate. Influential
outliers were replaced with the largest or second smallest value in observations [413] for
overall media equipment (n = 1) and bedroom media equipment (n = 1) summary scores.
The unadjusted associations between each of the physical environment variables and the
five home-based outcomes (min/h spent sitting, standing, in TPA and MVPA and the
number of sitting breaks/h) were examined using linear regression (Model 1). Model 2
adjusted for home ownership, raw WIMD scores, season of measurement, daylength and
the number of siblings at home, as well as the BMI, age and sex of the child. Model 3
further adjusted for social environmental factors associated with children’s PA and
sedentary time. A final model (Model 4) was run for each of the five outcomes, including
all the significant variables (p ≤ 0.10) [414] from model 3 and adjustment variables to
determine independent associations between physical environment factors and the child
home-based outcomes. Paired t-tests revealed that the outcomes differed between
weekday and weekend days. However, separate analyses had little effect on findings;
thus, weekday and weekend days were combined.
7.4. Results
Descriptive statistics are provided in Table 1. The participating children had a mean age
of 10.2 ± 0.7, and 55% were girls. Children spent 40.3 ± 5.9 min sitting (67%), 12.3 ± 4.2
min standing, 21.6 ± 4.7 min in TPA, 6.7 ± 2.3 min in MVPA, and had 7.0 ± 1.9 sitting
breaks per hour at home. Most parents who completed the audit and questions were
female (83%), owned their home (86%), held a university degree (54%) and lived in the
highest SES location (59%). Homes (i.e., the overall plot, including house and outdoor
space) were perceived to have medium houses (60%) which were not detached (64%) and
large gardens (46%), they mostly had two floors (77%), and had on average four
occupants, including two children. Most parents enforced a maximum h/day of screen-
119
time rule (69%) and on average thought it was ‘important’ for their child to engage in
active play at home, their child and themselves enjoyed sedentary and PA activities at
home ‘about equal’ and ‘strongly agreed’ that their child had enough space to play inside
the house and in the back garden. Homes had 11.5 ± 2.1 rooms/areas, 57% had an open
plan living area and 52% of the children had a TV in their bedroom. Homes averaged
27.7 ± 18.3 PA equipment items, 19.6 ± 8.0 seated furniture items, 2.0 ± 2.1 musical
instruments, 11.6 ± 4.7 media equipment items overall and 1.9 ± 1.7 in the primary child’s
bedroom. Lastly, homes tended to have digital TV (82%), access to a movie/TV streaming
service (77%) and 3–4 smartphones.
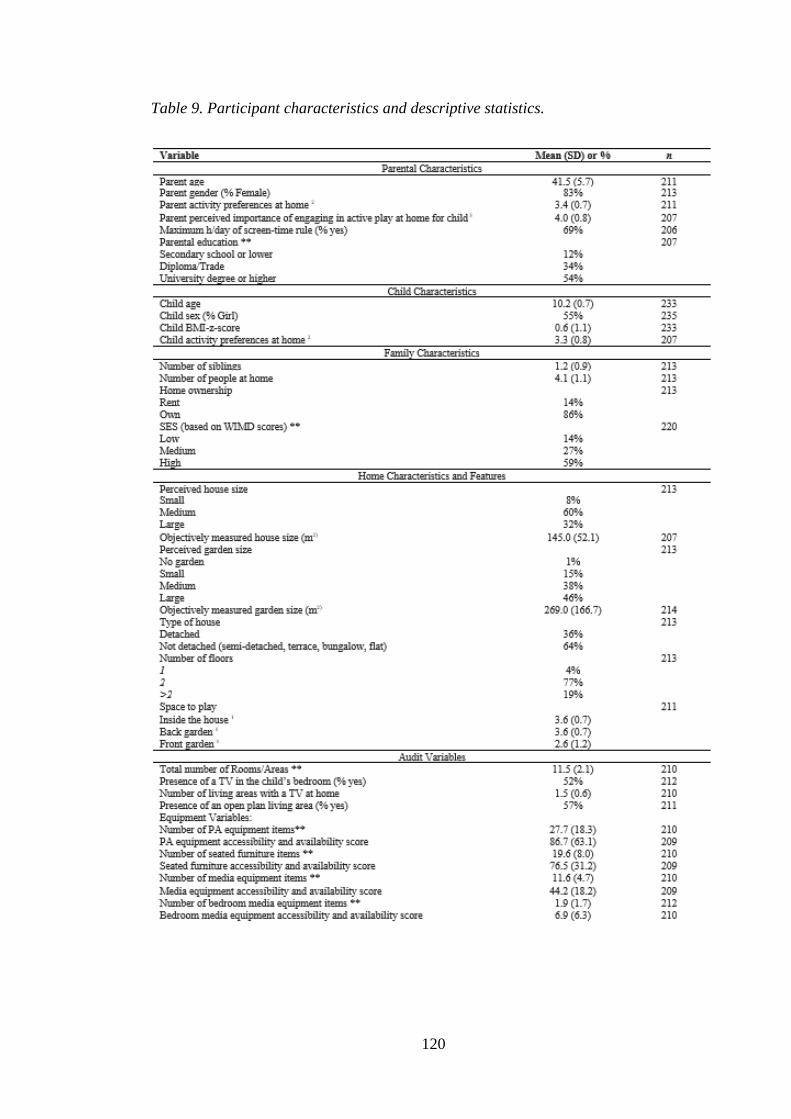
120
Table 9. Participant characteristics and descriptive statistics.
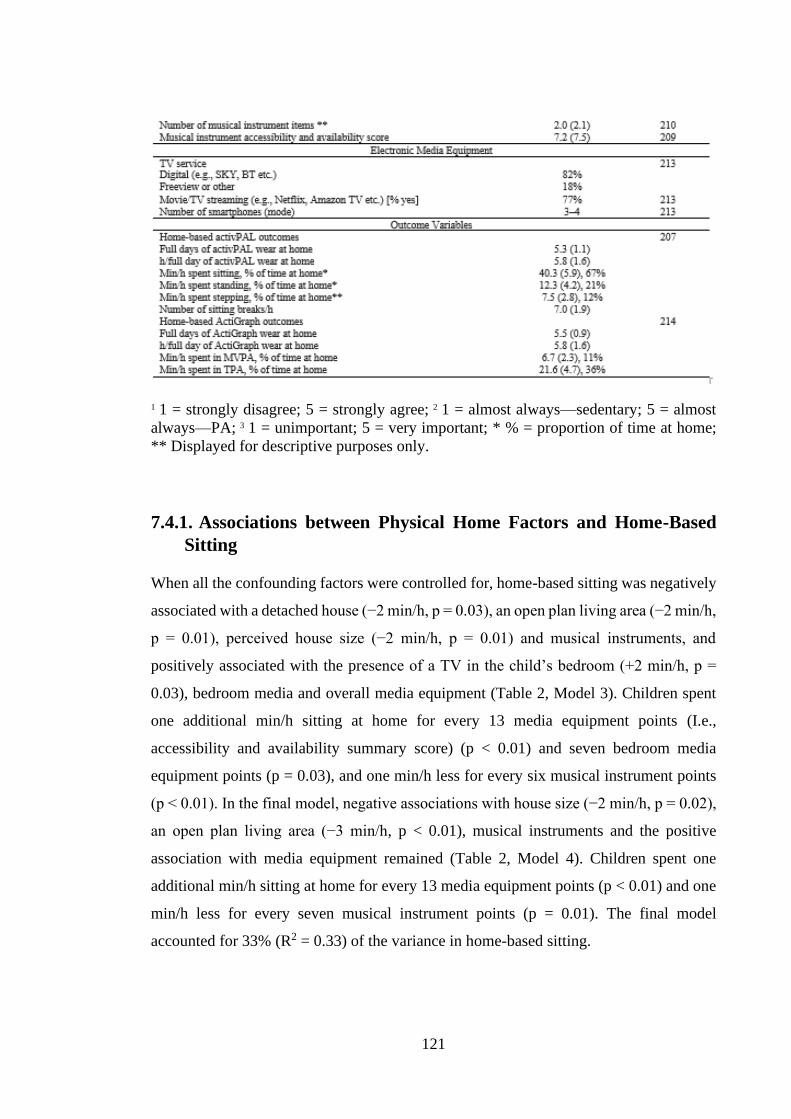
121
1 1 = strongly disagree; 5 = strongly agree; 2 1 = almost always—sedentary; 5 = almost
always—PA; 3 1 = unimportant; 5 = very important; * % = proportion of time at home;
** Displayed for descriptive purposes only.
7.4.1. Associations between Physical Home Factors and Home-Based
Sitting
When all the confounding factors were controlled for, home-based sitting was negatively
associated with a detached house (−2 min/h, p = 0.03), an open plan living area (−2 min/h,
p = 0.01), perceived house size (−2 min/h, p = 0.01) and musical instruments, and
positively associated with the presence of a TV in the child’s bedroom (+2 min/h, p =
0.03), bedroom media and overall media equipment (Table 2, Model 3). Children spent
one additional min/h sitting at home for every 13 media equipment points (I.e.,
accessibility and availability summary score) (p < 0.01) and seven bedroom media
equipment points (p = 0.03), and one min/h less for every six musical instrument points
(p < 0.01). In the final model, negative associations with house size (−2 min/h, p = 0.02),
an open plan living area (−3 min/h, p < 0.01), musical instruments and the positive
association with media equipment remained (Table 2, Model 4). Children spent one
additional min/h sitting at home for every 13 media equipment points (p < 0.01) and one
min/h less for every seven musical instrument points (p = 0.01). The final model
accounted for 33% (R2 = 0.33) of the variance in home-based sitting.
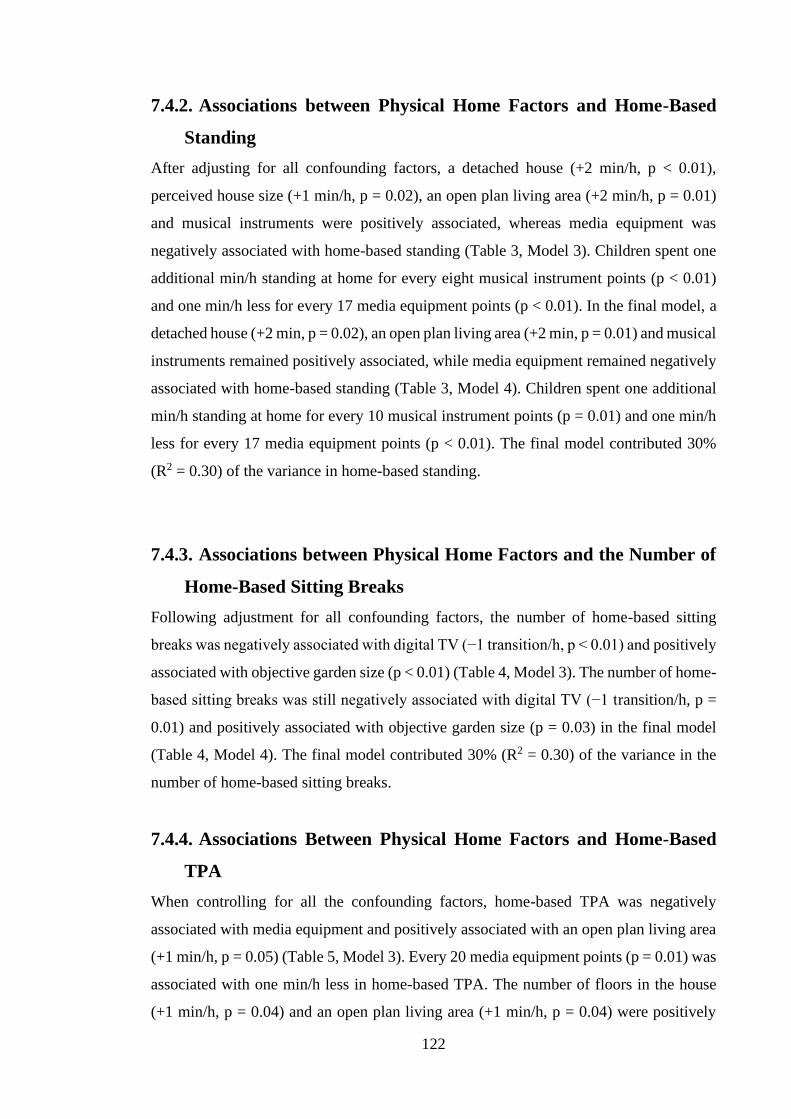
122
7.4.2. Associations between Physical Home Factors and Home-Based
Standing
After adjusting for all confounding factors, a detached house (+2 min/h, p < 0.01),
perceived house size (+1 min/h, p = 0.02), an open plan living area (+2 min/h, p = 0.01)
and musical instruments were positively associated, whereas media equipment was
negatively associated with home-based standing (Table 3, Model 3). Children spent one
additional min/h standing at home for every eight musical instrument points (p < 0.01)
and one min/h less for every 17 media equipment points (p < 0.01). In the final model, a
detached house (+2 min, p = 0.02), an open plan living area (+2 min, p = 0.01) and musical
instruments remained positively associated, while media equipment remained negatively
associated with home-based standing (Table 3, Model 4). Children spent one additional
min/h standing at home for every 10 musical instrument points (p = 0.01) and one min/h
less for every 17 media equipment points (p < 0.01). The final model contributed 30%
(R2 = 0.30) of the variance in home-based standing.
7.4.3. Associations between Physical Home Factors and the Number of
Home-Based Sitting Breaks
Following adjustment for all confounding factors, the number of home-based sitting
breaks was negatively associated with digital TV (−1 transition/h, p < 0.01) and positively
associated with objective garden size (p < 0.01) (Table 4, Model 3). The number of home-
based sitting breaks was still negatively associated with digital TV (−1 transition/h, p =
0.01) and positively associated with objective garden size (p = 0.03) in the final model
(Table 4, Model 4). The final model contributed 30% (R2 = 0.30) of the variance in the
number of home-based sitting breaks.
7.4.4. Associations Between Physical Home Factors and Home-Based
TPA
When controlling for all the confounding factors, home-based TPA was negatively
associated with media equipment and positively associated with an open plan living area
(+1 min/h, p = 0.05) (Table 5, Model 3). Every 20 media equipment points (p = 0.01) was
associated with one min/h less in home-based TPA. The number of floors in the house
(+1 min/h, p = 0.04) and an open plan living area (+1 min/h, p = 0.04) were positively
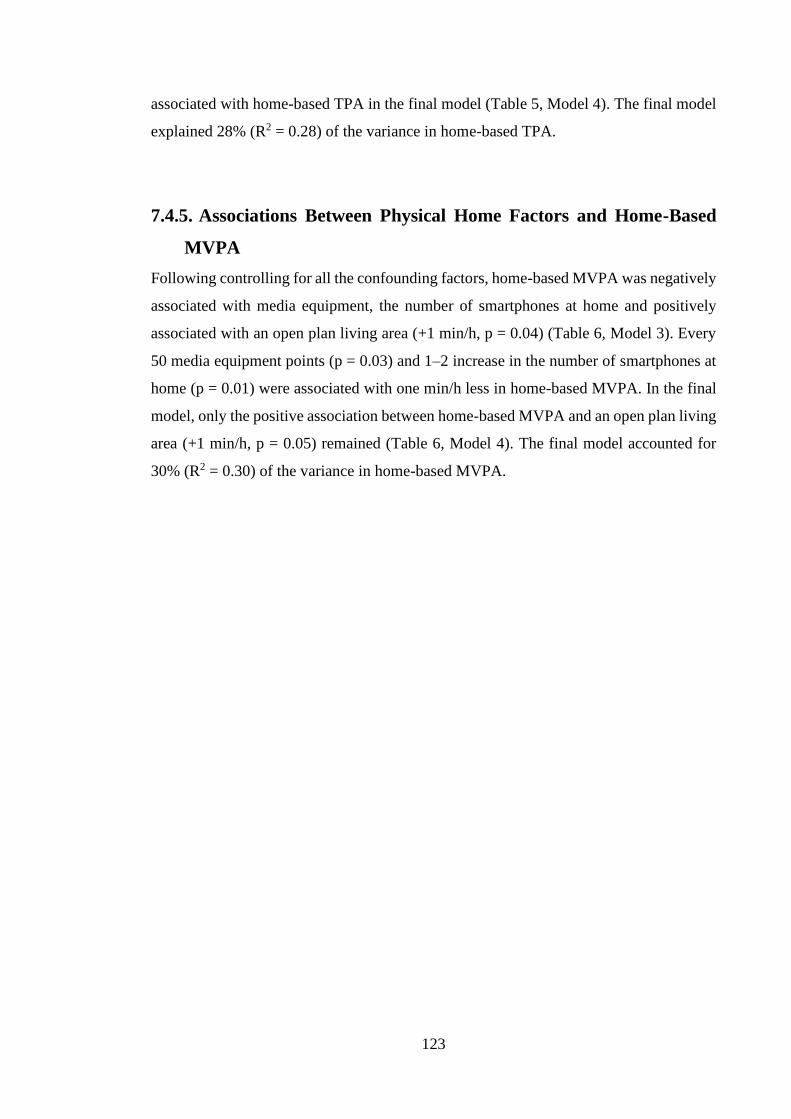
123
associated with home-based TPA in the final model (Table 5, Model 4). The final model
explained 28% (R2 = 0.28) of the variance in home-based TPA.
7.4.5. Associations Between Physical Home Factors and Home-Based
MVPA
Following controlling for all the confounding factors, home-based MVPA was negatively
associated with media equipment, the number of smartphones at home and positively
associated with an open plan living area (+1 min/h, p = 0.04) (Table 6, Model 3). Every
50 media equipment points (p = 0.03) and 1–2 increase in the number of smartphones at
home (p = 0.01) were associated with one min/h less in home-based MVPA. In the final
model, only the positive association between home-based MVPA and an open plan living
area (+1 min/h, p = 0.05) remained (Table 6, Model 4). The final model accounted for
30% (R2 = 0.30) of the variance in home-based MVPA.
124
Table 10. Associations between physical home factors and children’s home-based sitting.
* p ≤ 0.05 in model 1, 2 and 4; * p ≤ 0.10 in model 3. 1 Accessibility and availability equipment score. Model 1: Unadjusted models for each physical factor. Model 2: Model for each physical factor adjusting
for child BMI, age and sex, and the number of siblings, home ownership, season, WIMD and daylength. Model 3: Model for each physical factor adjusting for child BMI, age and sex, and the number of siblings,
home ownership, season, WIMD, daylength, child preferences for sedentary or PA activities, parent preferences for sedentary or PA activities, parent perception of the importance of their child engaging in active
play and a maximum h/day of screen-time rule. Model 4: Final model including all significant physical factors from models 3, adjusting for child BMI, age and sex, and the number of siblings, home ownership,
season, WIMD, daylength, child preferences for sedentary or PA activities, parent preferences for sedentary or PA activities, parent perception of the importance of their child engaging in active play and a
maximum h/day of screen-time rule.
125
Table 11. Associations between physical home factors and children’s home-based standing.
* p ≤ 0.05 in model 1, 2 and 4; * p ≤ 0.10 in model 3. 1 Accessibility and availability equipment score. Model 1: Unadjusted models for each physical factor. Model 2: Model for each physical factor adjusting
for child BMI, age and sex, and the number of siblings, home ownership, season, WIMD and daylength. Model 3: Model for each physical factor adjusting for child BMI, age and sex, and the number of siblings,
home ownership, season, WIMD, daylength, child preferences for sedentary or PA activities, parent preferences for sedentary or PA activities, parent perception of the importance of their child engaging in active
play and a maximum h/day of screen-time rule. Model 4: Final model including all significant physical factors from models 3, adjusting for child BMI, age and sex, and the number of siblings, home ownership,
season, WIMD, daylength, child preferences for sedentary or PA activities, parent preferences for sedentary or PA activities, parent perception of the importance of their child engaging in active play and a
maximum h/day of screen-time rule.
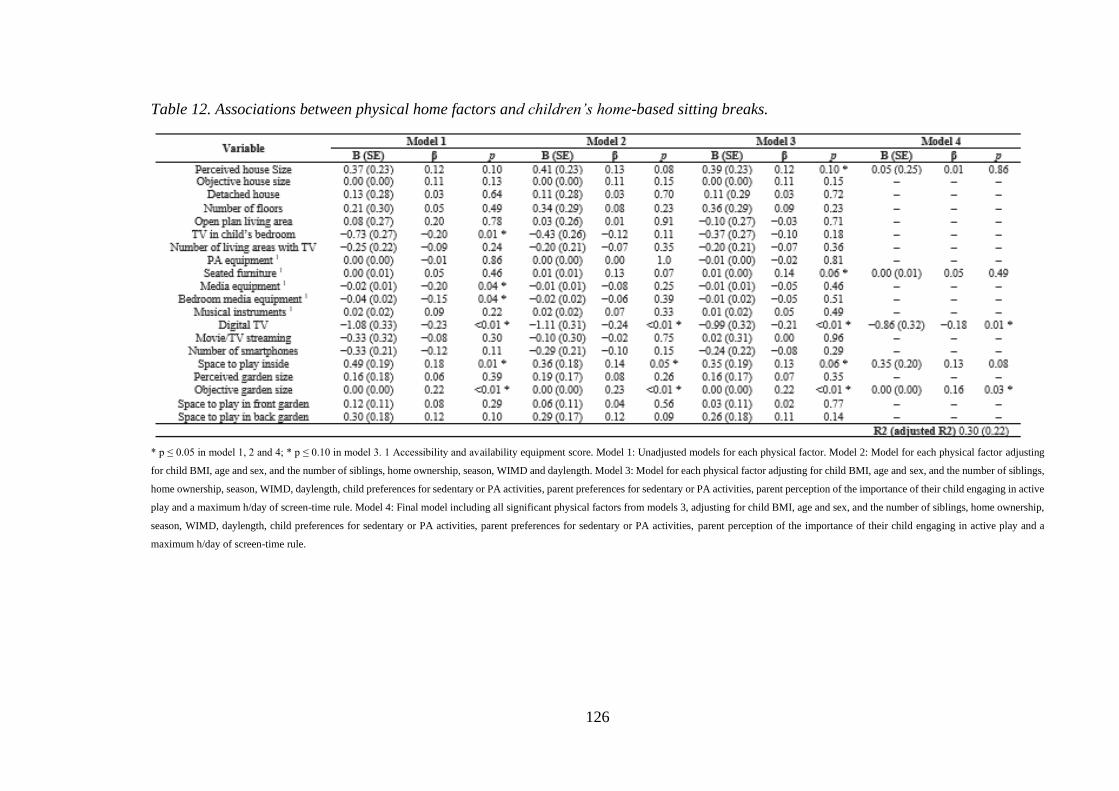
126
Table 12. Associations between physical home factors and children’s home-based sitting breaks.
* p ≤ 0.05 in model 1, 2 and 4; * p ≤ 0.10 in model 3. 1 Accessibility and availability equipment score. Model 1: Unadjusted models for each physical factor. Model 2: Model for each physical factor adjusting
for child BMI, age and sex, and the number of siblings, home ownership, season, WIMD and daylength. Model 3: Model for each physical factor adjusting for child BMI, age and sex, and the number of siblings,
home ownership, season, WIMD, daylength, child preferences for sedentary or PA activities, parent preferences for sedentary or PA activities, parent perception of the importance of their child engaging in active
play and a maximum h/day of screen-time rule. Model 4: Final model including all significant physical factors from models 3, adjusting for child BMI, age and sex, and the number of siblings, home ownership,
season, WIMD, daylength, child preferences for sedentary or PA activities, parent preferences for sedentary or PA activities, parent perception of the importance of their child engaging in active play and a
maximum h/day of screen-time rule.
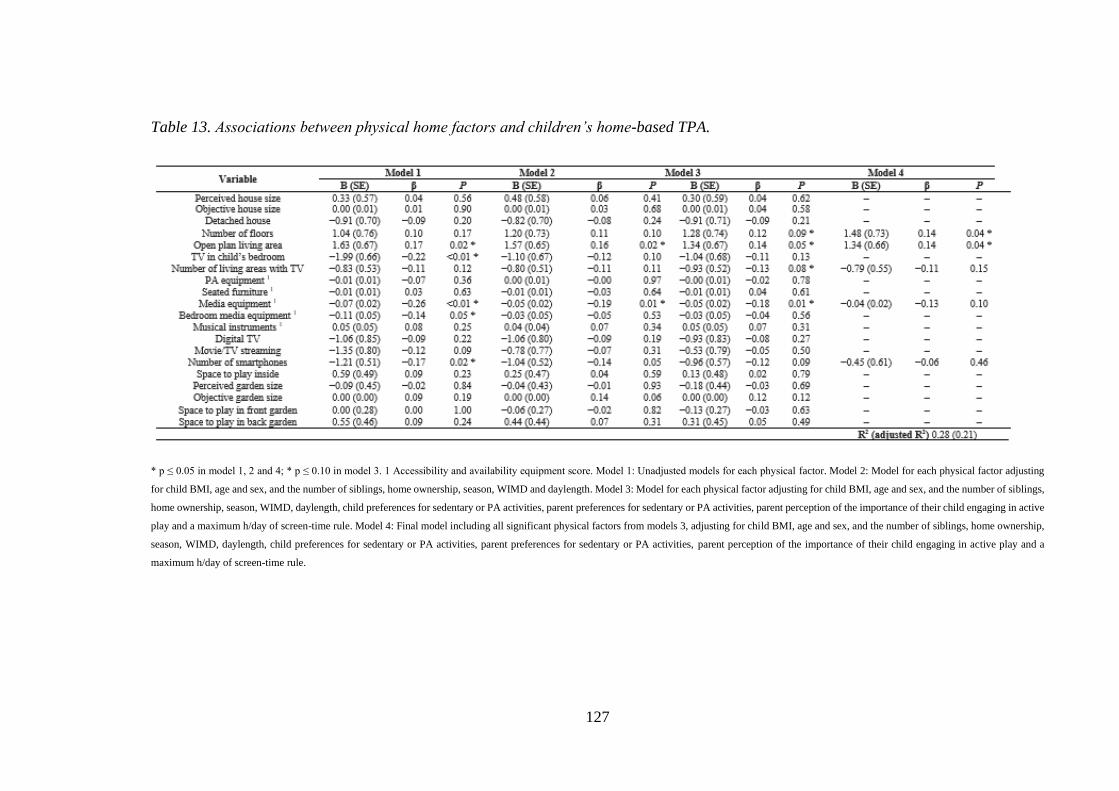
127
Table 13. Associations between physical home factors and children’s home-based TPA.
* p ≤ 0.05 in model 1, 2 and 4; * p ≤ 0.10 in model 3. 1 Accessibility and availability equipment score. Model 1: Unadjusted models for each physical factor. Model 2: Model for each physical factor adjusting
for child BMI, age and sex, and the number of siblings, home ownership, season, WIMD and daylength. Model 3: Model for each physical factor adjusting for child BMI, age and sex, and the number of siblings,
home ownership, season, WIMD, daylength, child preferences for sedentary or PA activities, parent preferences for sedentary or PA activities, parent perception of the importance of their child engaging in active
play and a maximum h/day of screen-time rule. Model 4: Final model including all significant physical factors from models 3, adjusting for child BMI, age and sex, and the number of siblings, home ownership,
season, WIMD, daylength, child preferences for sedentary or PA activities, parent preferences for sedentary or PA activities, parent perception of the importance of their child engaging in active play and a
maximum h/day of screen-time rule.

128
Table 14. Associations between physical home factors and children’s home–based MVPA.
* p ≤ 0.05 in model 1, 2 and 4; * p ≤ 0.10 in model 3. 1 Accessibility and availability equipment score. Model 1: Unadjusted models for each physical factor. Model 2: Model for each physical factor adjusting
for child BMI, age and sex, and the number of siblings, home ownership, season, WIMD and daylength. Model 3: Model for each physical factor adjusting for child BMI, age and sex, and the number of siblings,
home ownership, season, WIMD, daylength, child preferences for sedentary or PA activities, parent preferences for sedentary or PA activities, parent perception of the importance of their child engaging in active
play and a maximum h/day of screen-time rule. Model 4: Final model including all significant physical factors from models 3, adjusting for child BMI, age and sex, and the number of siblings, home ownership,
season, WIMD, daylength, child preferences for sedentary or PA activities, parent preferences for sedentary or PA activities, parent perception of the importance of their child engaging in active play and a
maximum h/day of screen-time rule
129
7.5. Discussion
This study demonstrates the importance of the physical environment to children’s
behaviours at home, with the examined factors accounting for 28%-33% of the total
variance in children’s sitting, PA, standing and sitting breaks at home. The amount of
variance explained was highest for home-based sitting at 33%, suggesting it has the
strongest relationship with the physical environment. Moreover, several previously
unexplored physical factors within the home were identified as correlates of children’s
sitting, standing and PA at home. An open plan living area, the number of floors, musical
instrument accessibility and availability as well as objective garden size were
significantly influential, although, given these relationships have not been investigated
before, it is difficult to make comparisons with past work. This is one of the first in the
field to use a posture monitor and to examine home-based PA and sedentary time and
found that children spent 46% of their time at home, which reinforces the importance of
investigating the correlates of PA and sedentary time in this environment.
The layout of the family home as open plan living, compared with a more segmented
living space was shown in this study to be independently associated with less sitting, more
standing, more TPA and more MVPA irrespective of demographic factors, the social
environment and other significant home factors. According to qualitative research
[43,415], the lack of dividing walls in open plan living areas enable parents to better
monitor electronic media usage and enforce rules. Indeed, electronic media rules have
been shown to be associated with lower screen-time in children [41,235]. Furthermore,
open-plan design may also provide more space to accommodate alternatives to screen-
based pursuits [415].
This study is the first to include a measure of the number of floors in houses, observing a
significant positive association with TPA. Additional floors in houses may result in higher
TPA via increased stair usage. Indeed, the energy cost of stair climbing in children is
between 5.3 and 8.8 METs [400], which is considered moderate-to-vigorous intensity.
However, the relationship did not reach significance until the final model, implying the
relationship is accounted for by other physical environmental factors associated with
130
TPA. This would suggest that the number of floors in houses is not uniquely associated
with TPA.
Our findings showed that increased perceived, but not objective, house size, was
associated with less sitting. This may suggest that perceived and objective house size may
be related to sitting differently, yet it may also be because of the way objective house size
was measured. It is possible that the objective house size measure may not be a true
measure of size, as it was not the exact house size, but instead the median size of houses
in the same postcode unit. One previous study [254], reported no association between
self-reported house size and sedentary time among Spanish children aged 9–18 years.
This discrepancy may be due to the present study measuring home-based sedentary time,
and not sedentary time across the entire day. Indeed, it might be that only home-based,
not overall, sedentary time is influenced by house size. A study that examined the
influence of spatial organisation in homes on activity found adults in houses with higher
integration between rooms (greater interconnectedness) spent more time sedentary,
particularly watching TV [263]. The mechanism proposed for this was that a greater
interconnectedness between rooms encourages social interaction, which in turn can lead
to increased time spent in sedentary activities that are susceptible to social life in homes
such as TV viewing. Larger houses may have less interconnectedness overall, as they
have more rooms, and the average connectivity between rooms does not increase in larger
houses [263]. Although speculative, a higher interconnectedness amongst rooms in
smaller houses may increase sitting time by prompting participation in social sedentary
activities such as TV viewing.
Increased accessibility and availability of musical instruments was associated with less
sitting and more standing at home, which is interesting as many musical instruments can
be played sitting or standing [400]. Playing musical instruments may displace sitting
activities, such as screen-time, studying, socialising, and increase standing periods.
Future research should seek to investigate this relationship further, particularly given the
cognitive benefits of playing a musical instrument [416].
There was a strong association between greater accessibility and availability of media
equipment and reduced standing and increased sitting at home, which was robust to
adjustment for social and demographic factors. In one of the few other studies to have a
131
combined measure of the accessibility and availability of media equipment, a positive
relationship was found with screen-time in girls, but not with overall sedentary time in
either sex [240]. Most studies [240,241], but not all [254], have shown no association
between household media equipment and overall sedentary time. Moreover, bedroom
media equipment was positively associated with sitting, but not after adjusting for the
other significant factors, in contrast to previous studies that have predominantly shown
no association [246,417,418]. The present study used a posture monitor, whereas others
have used accelerometery [40,418], which is considered a less accurate measure of sitting
[196]. Whilst the lack of a relationship between bedroom media equipment and MVPA
is congruent with previous research [417,418], some studies found contradictory results
[239,419]. Such contradictory findings may be attributable to, at least in part,
methodological differences and large inter-individual variation. Nonetheless, our findings
highlight the important role the home media equipment environment may have by
encouraging sitting and consequently reducing standing through acting as a prompt to
engage in screen-time.
Despite the plethora of studies investigating the influence of media equipment, it is worth
noting that, to our knowledge, only one previous study has measured home-based
behaviour, whereby no relationship was found with bedroom media equipment and either
sedentary time or PA in primary school aged children [40]. As behaviours are likely
shaped by characteristics of the setting in which they occur, it is important to measure
sedentary time and PA at home, to improve the understanding of the factors that influence
these behaviours in this environment. Supporting this approach, screen-based behaviours,
that most often occur at home [52], have been consistently positively associated with
media equipment in the home [241,254] and in the bedroom [246,418]. Therefore, further
research measuring home-based sitting and PA objectively may provide some clarity on
the role of media equipment in influencing children’s PA and sitting.
Children with digital TV at home had fewer sitting breaks. Pay TV/digital TV has been
associated with increased TV viewing in adolescents [420], and screen-time in pre-school
children [421]. Therefore, a greater choice of TV channels may be compelling to children,
keeping them entertained for longer periods, resulting in less frequent sitting breaks. In
addition, objectively measured garden size was positively associated with sitting breaks.
This would suggest that children with larger gardens have more opportunities for breaking
132
up screen-based sedentary activities. Fittingly, objectively measured garden size was also
positively associated with MVPA. However, the association was attenuated with the
addition of the social factors to the model. This indicates that factors such as the
importance parents place on their children engaging in active types of play and parental
restrictions on screen-time explain why some children do more MVPA and have larger
gardens.
Despite the inconsistencies in the literature, our findings demonstrate the potential
efficacy of removing electronic media from bedrooms and limiting the electronic media
presence in homes to reduce children’s sitting time. Given the association between greater
accessibility and availability of musical instruments and reduced sitting and increased
standing, encouraging children to learn a musical instrument requires exploration as a
strategy for reducing children’s sitting. Considering the potential utility of an open plan
living area in allowing parents to better monitor electronic media usage and
accommodating alternatives to sedentary activities, moving electronic media to an area
that permits parental supervision and reconfiguring furniture to create space hold promise
as strategies for reducing children’s sitting time and increasing their PA. Our findings
also suggest that larger gardens may be important for PA, and particularly for increasing
sitting breaks. This is important, given there is emerging evidence that more frequent
sitting breaks are beneficially associated with metabolic indicators in children [422],
particularly when interrupted with moderate walking [14]. Therefore, strategies which
break up prolonged sitting such as encouraging children to take 5-min walking breaks
during adverts when watching TV or after completing a level while playing video games
should be incorporated into an intervention. The provision of standing or PA breaks is a
strategy that has been incorporated into school-based interventions, which successfully
increased PA and decreased sitting [423].
More insight into the behavioural type and broader contextual information may lead to a
better understanding of the determinants of PA and sedentary time at home. Automated
wearable cameras when used alongside accelerometery and inclinometers could provide
important information on where the behaviour occurs, as well as the type of behaviour
being performed [424]. However, given participants may be wearing the device in
situations unsuitable for photography, research involving this technology remains
problematic [425]. Radiofrequency identification and open beacon proximity tags hold
133
potential to assess the location of behaviours at home (e.g., bedroom, lounge or kitchen);
however, such technology is currently expensive and difficult to implement in homes due
to their weak Wi-Fi coverage [206], compared with environments where it has been
trialled previously, such as offices [209] and cares homes [208]. Technologies that
provide objective contextual information for sedentary time and PA at home will mostly
likely be available for use in the imminent future.
This study has numerous strengths, such as the use of the comprehensive audit to measure
the physical environment, the assessment of sitting and standing using a posture sensor,
the home-based measures of behaviours and the exploration of several previously
unstudied physical variables. Furthermore, a wide range of important confounding factors
were controlled for and the high response rate increased the representativeness of the
findings. We also included both perceived and objective measures of the environment,
based on recommendations of several reviews [426], as they are related to behaviours
differently [427]. Nonetheless, it is important to acknowledge the limitations. Some
degree of misclassification of when the children were at home is likely, as we relied on
self-reporting to determine this. However, there are currently no feasible objective
alternatives for measuring children’s location-specific behaviours. Whilst the sample size
was relatively small, it was large enough to provide reasonable statistical power [403].
Although this is one of the first studies to measure house and garden size objectively and
investigate how they relate to children’s PA and sitting, since full home addresses were
not available, we could only obtain measures for each postcode, and not for the specific
homes. Thus, the measures may not reflect the true environments, as not all homes with
the same postcode are identical. Additionally, total garden and house size may not
correspond to usable space where children can be active and play. Whilst we tried to
account for this by measuring actual space to play inside and outside via self-reporting,
space syntax software could be used in combination with floor plans to measure indoor
space [428] and also the degree of integration amongst rooms [263]. Furthermore,
although beyond the scope of the current study, future work should also seek to explore
these relationships during the school holidays, when children are less active and more
sedentary [429]. Due to the cross-sectional nature of the study, causal relationships could
not be inferred. Relationships may be complex, and it is likely that social factors work in
combination with the physical environment to influence behaviours. Nonetheless, these
findings are novel and add valuable knowledge to the evidence base.
134
7.6. Conclusion
In conclusion, the results suggest that some aspects of physical home environment may
have an important relationship with children’s sitting, standing and PA at home, even
after adjusting for socio-demographic and social environmental factors. Therefore, it is
imperative that future interventions target this environment, especially given children in
this study spent a large proportion of their time at home sitting (67%) and the lack of
previous home-based interventions [41]. Based on the results, strategies such as
reconfiguring furniture to increase space, introducing electronic media breaks, promoting
time spent in the garden, and housing electronic media in areas which allow parental
supervision could be effective. Given the known influence of the social environment [43],
and the impact of the physical environment on sitting and PA, interventions that consider
both factors hold most promise. Lastly, although several physical factors are not easily
modified, the findings could help impact future home and planning design to reduce
sitting and increase PA and to help promote healthy active living in families.
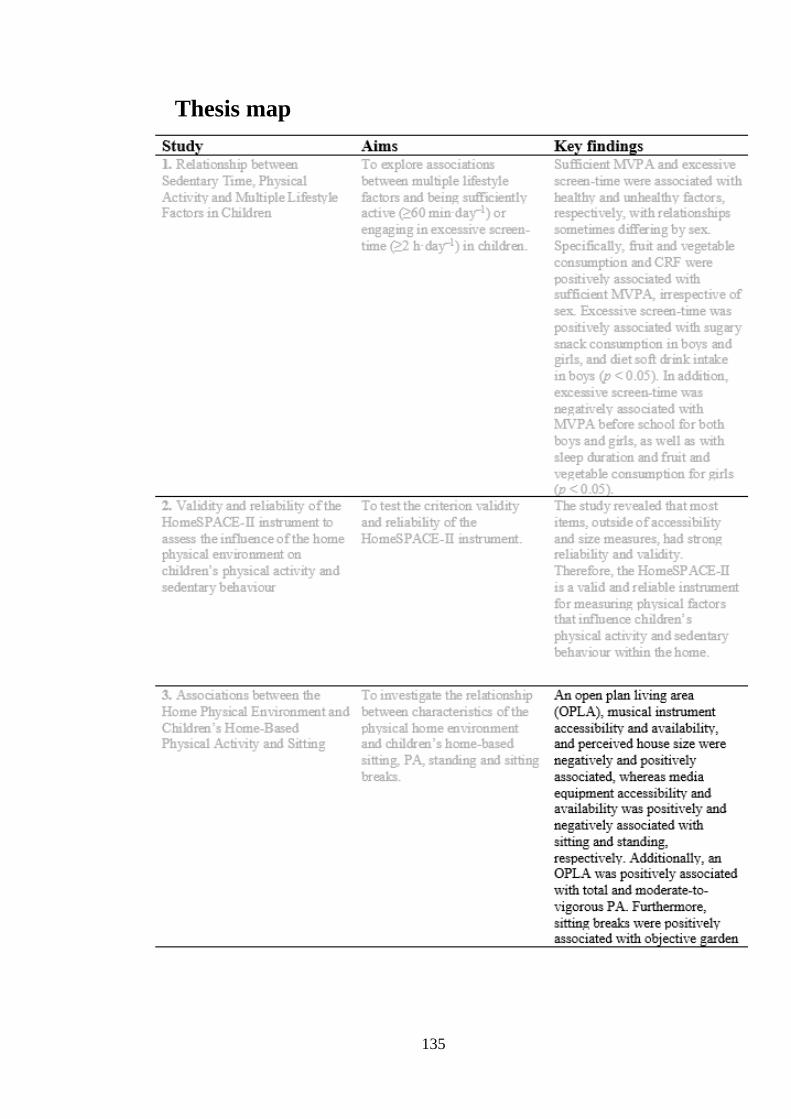
135
Thesis map
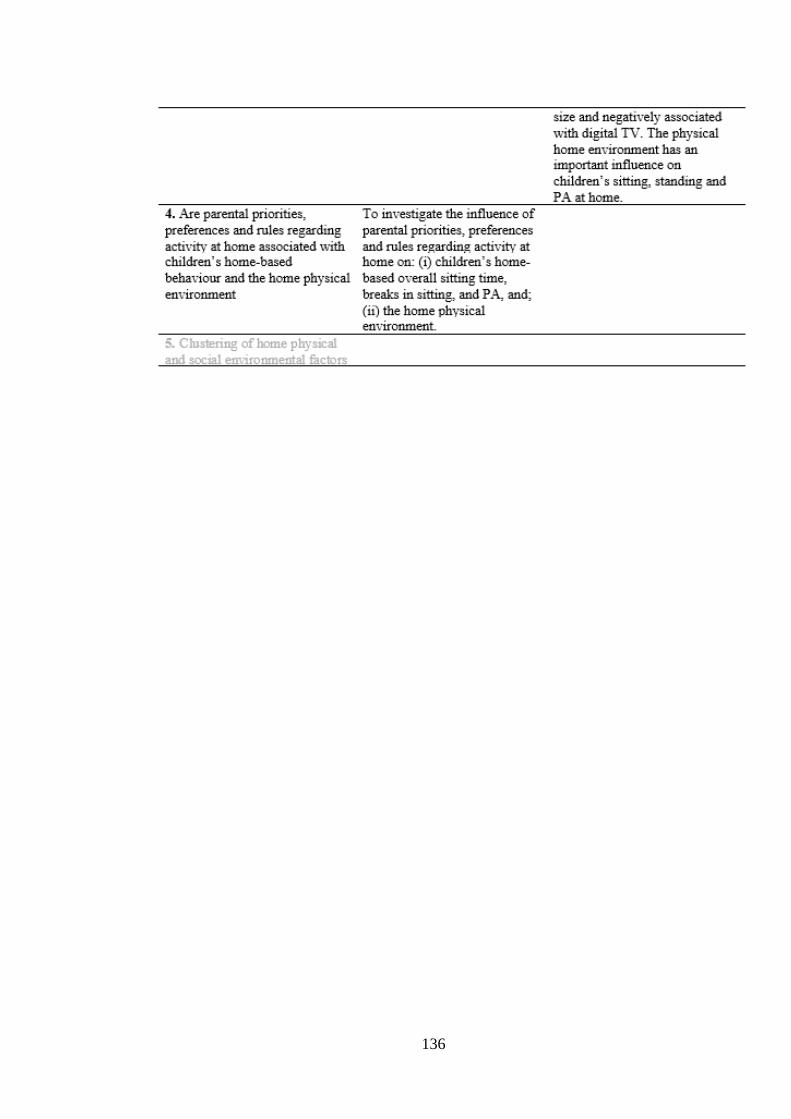
136
137
8. Study 4
8.1. Are parental and child preferences and priorities, as well
as parental rules regarding activity at home associated with
children’s home-based behaviour and the home physical
environment?
8.2. Introduction
The health benefits of physical activity (PA) during childhood have been well established
[6]. Moderate-to-vigorous physical activity (MVPA) is considered most important for
health, however participation rates are low, especially in Wales, where only a third of
children are sufficiently active [119]. Recently, light physical activity (LPA) has also
been shown to provide health benefits [6], prompting the Canadian 24-hour movement
guidelines to recommend children accumulate at least several hours of LPA daily [61].
Furthermore, sedentary time [96], particularly for extended periods [73], is adversely
associated with morbidity and mortality in adults and is of particular concern given that
sedentary time tracks from childhood into adulthood [31]. Indeed, recent international
guidelines recommend children limit their overall sitting time and break up long periods
as often as possible [61,94,95]. However, children spend a significant amount of time
being sedentary (7-8 hrs daily) [45], particularly undertaking screen-time behaviours
[117].
Determining the correlates of PA and sedentary behaviour is central to the development
of effective interventions [35]. Children’s sedentary behaviour [235,236] and
PA[237,430] is strongly influenced by individual, physical and social environmental
factors, particularly within the home setting where children spend most of their time [39].
Parents play an influential role in shaping their children’s PA and sedentary time [41].
Indeed, parental PA, support and co-participation are positively associated with their
children’s PA levels [430,431]. In addition, there is a positive relationship between parent
and child sedentary behaviour, and a negative relationship between screen-time rules and
sedentary behaviour [41,235]. Individual characteristics, such as a child’s preference for
138
being sedentary or physically active, has also been shown to be a consistent predictor of
children’s PA [258,432] and screen use [399]. Although studies have investigated the
influence of individual and social factors on children’s sedentary behaviour and PA [41],
few have examined factors specific to the home, and their influence on home-based
behaviours. Investigating individual and social factors specific to the home, such as the
leisure activity preferences and priorities of parents and children in this physical space
[43] is important, given ecological models posit that behaviour is most likely influenced
by the environment in which it occurs[36,228], and the amount of time children spend at
home [39,40].
The physical environment has been shown to influence children’s PA and sedentary
behaviour within the home [41,42]. Specifically, whilst household and bedroom media
equipment are consistent positive correlates of screen-time [41,235], PA equipment is
associated with being more active [40,240] and less sedentary [40,41]. Furthermore, the
availability of musical instruments is also inversely related to sedentary time [383]. The
use of overall size, space and living design of the home is largely shaped by family
members, particularly parents [43], which in turn influences children’s PA and sedentary
behaviour. For example, parental concerns for television (TV) viewing have been
associated with fewer TVs and less media equipment at home [433]. Moreover, parents
who enforce rules limiting TV viewing are less likely to report the presence of a TV in
their child’s bedroom [280].
Whilst many aspects of the home physical environment are chosen by parents, research
on what social and individual factors influence their decisions remains limited [43].
Although qualitative data suggest leisure activity preferences and priorities of parents and
children, as well as parental rules, influence children’s PA and sedentary behaviour at
home directly and indirectly via the physical environment [43], this theory is yet to be
supported quantitatively. Such research is imperative for interventions seeking to create
activity-promoting home environments and will provide insight into pathways by which
parents could positively influence their children’s PA levels and reduce their sedentary
time at home.
Therefore, the aim of this study was to investigate the relationship between parental and
child priorities and preferences, as well as parental rules regarding leisure activity at home
139
on: (i) children’s home-based sitting time, breaks in sitting, and PA: (ii) the home physical
environment.
8.3. Materials and methods
8.3.1. Sample
Twenty-three primary schools in South Wales were invited to take part between
November 2017 and July 2018, of which 11 consented to participate. Children in years 5
and 6 (n=890) and their parents received information about the study. Entry into a prize
draw to win a family pass for an outdoor activity centre and the child’s sitting and PA
results were offered as incentives. In total, 235 children (26% response rate) returned
consent and assent forms. Procedures complied with the declaration of Helsinki and
ethical approval was obtained from the Swansea University ethics committee.
8.3.2. Physical environment of the home
The home physical environment in relation to children’s PA levels and sedentary time
was assessed using the HomeSPACE-II instrument [299]. Parents were instructed to walk
around their house and garden and audit items in each room/area. The audit, which
accounts for the presence, quantity and accessibility of 34 media (e.g., TV, computer),
PA (e.g., balls, trampoline) and musical (e.g., drums, piano) for up to 22 room/areas, has
been described elsewhere [299]. For each item, accessibility was rated on a scale of (A)
‘put away and difficult to get to’ to (D) ‘in plain view and easy to get to’. Additionally,
there were questions referring to TV service (Freeview/Digital TV/Other) and space to
play in the back garden and inside the house [290]. Open plan living areas were also
noted. Summary scores (reflecting availability and accessibility) for PA equipment,
musical instruments, as well as overall, fixed, portable and bedroom media equipment
were created by multiplying each item by their accessibility score (A=1; B=2; C=3; D=4).
A larger summary score indicates a greater overall “presence” in the home. Physical
activity equipment included active video game systems (e.g., PlayStation move, Wii fit,
X-box Kinect). The total number of each type of item and the number of rooms/areas
were also determined for descriptive purposes only. Missing entries and queries were
clarified with families when necessary.
8.3.3. Home-based PA, sitting and sitting breaks
140
Physical activity (LPA and MVPA) and postural behaviours (i.e., sitting and sitting
breaks) were assessed with the ActiGraph GT9X (Pensacola, Florida, USA) and the
activPAL3 micro (PAL Technologies, Glasgow, UK), respectively. A sit-to-stand/step
transition was considered a sitting break [434]. The monitors were fitted at school to
ensure correct attachment and that children knew how to reattach them. Children were
asked to wear the monitors continuously (including when bathing, but excluding
swimming) for seven consecutive days. Parents completed a diary recording when the
child was at home [383], asleep, awake, periods when the device was removed and illness
days. “Home” meant one single location, including the house and garden, where the child
spent most time (i.e., not including other parent’s homes). To minimise missing data,
children completed the diaries when parents were unable to. Families were contacted for
further information, if the diary was incomplete.
The activPAL has previously been validated in children [112]. A nitrile sleeve was fitted
with a hypoallergenic dressing (3M Tegerderm or Hypafix Transparent) on the midline
of the upper right thigh to ensure the device was waterproof. Participants received
supplementary sleeves, dressings, and instructions for correct attachment. A detailed
explanation of how the data was processed can be found elsewhere [435]. Briefly,
activPAL data was downloaded using the manufacturer software (V8.10.8.32, PAL
technologies, Glasgow, UK) and the subsequent event.csv files were processed in PAL-
V1.1 (Leicester, UK) with a validated algorithm that identified waking hours, prolonged
non-wear time (> 5 h) and invalid data [404]. Diary-reported non-wear periods deemed
plausible were removed. Additionally, based on inspections of the data and methods used
elsewhere, sitting/lying or standing bouts lasting > 3 hours with no transitions were also
classified as non-wear and removed in the software [406].
The ActiGraph GT9X was placed on the child’s non-dominant wrist [303], which has
been shown to improve compliance [304] and have good validity when compared with
hip-placement [305]. The device data was collected at a 30 Hz sampling rate [306] and
summed over 5-sec epochs. Files were initialised, downloaded and processed using
ActiGraph software (ActiLife V6.13.3). Wrist-worn vector-magnitude cut-points [155]
were utilised, whereby LPA and MVPA were categorised as 306-817 and > 818 counts/5
secs, respectively. An algorithm was used to identify non-wear time (> 90 consecutive
minutes of zero counts) [436].
141
Time at home, imported into the ActiLife V6.13.3 and processing PAL software, was
paired with time-stamped data, allowing time spent in PA and postural behaviours at
home to be calculated, respectively. To be included in the weekday and weekend day
analyses, participants needed satisfactory completed home logs, and at least one day with
> 3 hours of data at home [437] when the device was worn for > 75% of the time [408]
(children without a valid weekend day were only included in the weekday analysis).
Sickness days were also excluded from analyses. Minutes in PA and postural behaviours
were divided by wear time at home and multiplied by 60, constituting the dependent
variables as averages/hr [410].
8.3.4. Children demographic and anthropometric measures
At their respective schools, children’s stature and body mass were measured using a
portable stadiometer (Seca 213, Hamburg, Germany) and electronic weighing scales
(Seca 876, Hamburg, Germany), respectively, and standardised procedures [339]. Body
mass index (BMI), and subsequently BMI z-scores, were calculated using WHO growth
reference data [294].
8.3.5. House and garden size estimates
For each postcode unit containing homes included in the study, both the house and garden
size were assessed using geographic information systems (GIS) techniques, Ordnance
Survey MasterMap (OSMM) [301,302] and AddressBase Premium (ABP) [300] [301].
The specific process utilised has been described previously [383]. Due to significant
variation in estimates between homes with the same postcode, median values were used.
8.3.6. Additional Measures
Parents reported their age, sex, whether they owned or rented their home, education status
(some secondary school/ completed secondary school/trade qualifications or
apprenticeship/diploma or certificate/ university degree or higher), family situation
(single parent/two parent/other), annual household income before tax, home postcode and
how many children lived at home. Season of measurement included four categories:
Spring (March-May), Summer (June-August), Autumn (September-November) and
Winter (December-February). Due to missing data for education status and income, the
142
Welsh Index of Multiple Deprivation (WIMD), linked via a postcode lookup table, was
used as an indicator of socioeconomic status (SES). Lower Layer Super Output Areas
(LSOA) in Wales are ranked 1-1,909, where a higher ranking represents higher
deprivation relative to other LSOAs in Wales. The WIMD scores were collapsed into
three tertiles of SES; Low (1-636), medium (636-1,272) and high (1,272-1,909) for
descriptive purposes only. The number of daylight hours for the participant’s respective
geographic locations during each monitoring day was also obtained from a valid and
reliable online source [411].
8.3.7. Family social and individual factors
Items from the HomeSPACE-I were used to assess parental and child activity priorities
and preferences (Maitland et al., 2018). Firstly, parents were asked how important it was
to them for their child to do the following when at home: (1) participate in active play;
(2) play electronic games/computer; (3) watch TV/movies; and (4) spend time outside.
Responses were coded on a scale of (1) ‘very unimportant’ to (5) ‘very important’. Parents
were also asked which activities their child preferred at home when given the choice: (1)
sitting OR running around; (2) playing indoors OR playing outdoors; (3) playing
electronic games/computer OR active types of play; (4) watching TV/movies OR active
types of play; and (5) quiet activities OR energetic activities. Similarly, parents were
asked what activities they preferred to do when at home and given the choice: (1)
watching TV/movies with my child OR doing PA with my child; (2) watching TV/movies
OR doing something physically active; (3) using the computer/electronic games OR
doing something physically active; (4) playing electronic games/computer with my child
OR doing PA with my child; (5) indoor activities with my child OR outdoor activities
with my child; (6) be indoors OR outdoors; and (7) quiet pursuits OR active pursuits. The
parental and child activity preferences were coded on a scale of (1) ‘almost always’ to (5)
‘almost always’, and the mean score was computed for each scale, with a higher score
reflecting a preference for PA activities. Lastly, parents reported whether they enforce a
maximum number of h/day of screen-time rule (yes/no) [259].
8.3.8. Statistical analysis
ActivPAL, ActiGraph, physical and social environment data were received for 207
(88%), 214 (91%), 213 (91%) and 207 (88%) children, respectively. For all statistical
143
analyses, SPSS version 26 (IBM SPSS Statistics Inc., Chicago, IL, USA) was used,
where p < 0.05 was accepted as significant. The largest or second smallest values in
observations replaced influential outliers [413] for overall (n=1) and bedroom (n=1)
media equipment summary scores. Linear regressions were conducted to examine the
association between social and individual factors and each of the home-based behaviour
variables (min/hr spent sitting, in LPA, in MVPA and the number of sitting breaks/hr).
Paired t-tests indicated that the behaviour variables differed significantly between
weekday and weekend days; as such, analyses were run separately for weekday and
weekend days. Separate regression models were conducted to examine the association
between social and individual factors and each of the home physical environment
variables. Univariate linear regression was used to assess unadjusted associations
(Appendix A). Model 1 adjusted for home ownership, family situation, WIMD ranks,
parent age and sex, season of measurement, number of daylight hours, number of siblings
at home as well as the child’s BMI, age and sex. Final model (model 2) included all the
variables in model 1 with p= < 0.10 [414] and all adjustment variables. Final models were
not run for house size and digital TV, since no social or individual factors were significant
in model 1. Multicollinearity checks were performed using Pearson’s correlations.
Perceived importance of active play and spending time outside for child at home were
strongly correlated (r > 0.60), therefore the variable more strongly associated with the
outcome was included in the final models [438].
8.4. Results
Table 1 contains descriptive statistics. Overall, children (55% girls; mean age 10.2 ± 0.7
years) spent 40.3 ± 5.9 (67%), 14.9 ± 2.9 and 6.7 ± 2.3 minutes sitting and in LPA and
MVPA, respectively, and engaged in 7.0 ± 1.9 sitting breaks per hour at home. There
were significant differences between weekdays and weekend days for all behaviour
variables. Specifically, children spent more time sitting (41.4 vs 39.4 min), less time in
LPA (14.2 vs 15.3 min) and MVPA (6.2 vs 7.0 min), and also completed fewer sitting
breaks (6.6 vs 7.2) on the weekend per hour at home. Participating parents were generally
female (83%), homeowners (86%), with a university degree (54%), living in the highest
SES locations (59%). There were usually two parents (81%) and two children at home.
Parents mostly had a maximum h/day of screen-time rule (69%) and believed it was
‘important’ or ‘very important’ that their child participated in active types of play (75%)
144
and spent time outside (89%), and ‘un-important’ or ‘very un-important’ for their child
to watch TV/movies (68%) and play electronic games/use computer for fun when at home
(65%). On average, parents reported that they and their child enjoyed sedentary activities
and PA at home ‘about equal’ and ‘strongly agreed’ there was enough space for their
child to play indoors in the house and outdoors in the back garden. Houses averaged 11.5
± 2.1 rooms/areas, and over half (57%) included an open plan living area and a TV located
in the primary child’s bedroom (52%). On average, homes included 2.0 ± 2.1 musical
instruments, 27.7 ± 18.3 PA equipment items and 11.6 ± 4.7 media equipment items.
Median sizes for the house and garden were 145 m2 and 269 m2, respectively. Lastly,
most families subscribed to digital TV (82%) and had 3-4 smartphones between them.
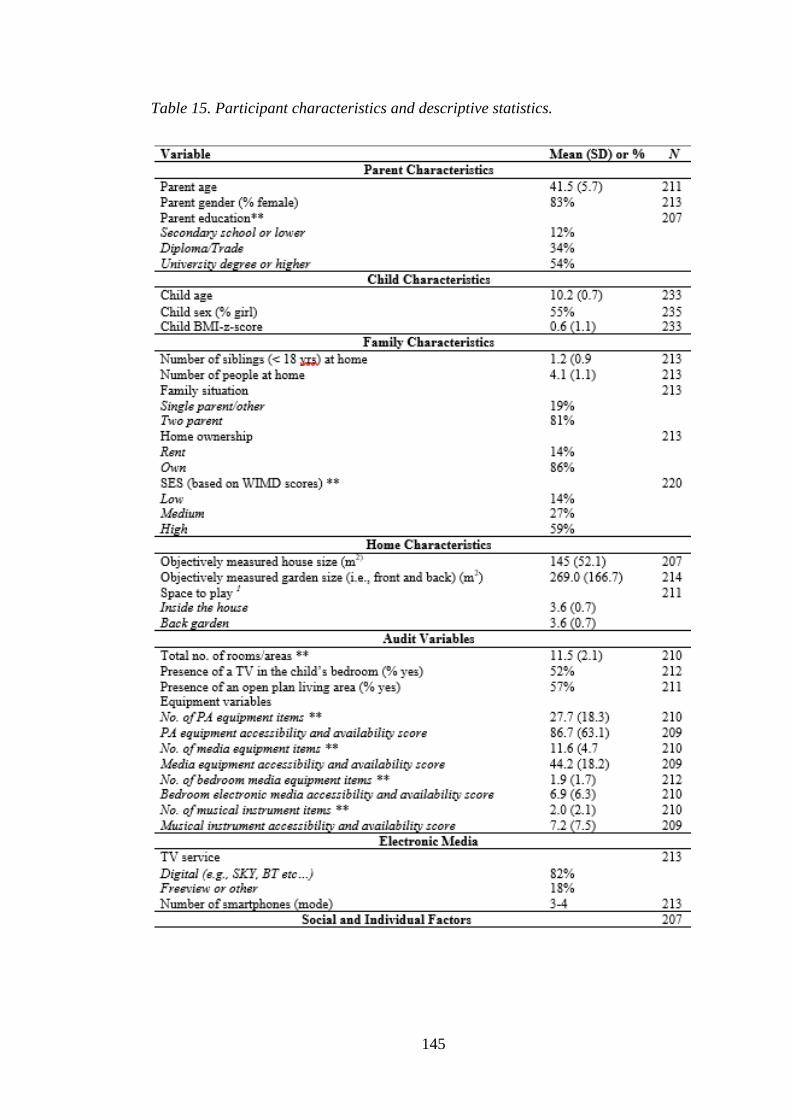
145
Table 15. Participant characteristics and descriptive statistics.

146
11=strongly disagree; 5=strongly agree 2 1=almost always - sedentary; 5=almost always – PA 31=very unimportant; 5=very important
*%=proportion of time at home
**=Displayed for descriptive purposes only
8.4.1. Associations between social, individual factors and weekday
sitting time, sitting breaks and PA
The results for weekday sitting and PA are shown in Tables 3 and 4, respectively. After
adjustment for confounding factors (model 1), a greater child preference for PA was
positively associated with weekday home-based MVPA (β = 0.23, p = < 0.01) and
negatively associated with weekday home-based sitting (β = -0.25, p = < 0.01). Perceived
importance of active play for children was also positively associated (β = 0.16, p = 0.02)
with home-based weekday LPA. Additionally, a greater parental preference for PA was
positively associated with home-based weekday sitting breaks (β = 0.15, p = 0.04). In the
147
final models (model 2), children with a greater preference for PA spent more time in
MVPA (β = 0.23, p = < 0.01) and less time sitting at home on weekdays (β = -0.27, p = <
0.01). On weekdays, children with parents who placed more importance on them
engaging in active play at home, spent more time in LPA at home (β = 0.18, p = 0.02).
Moreover, children whose parents had higher levels of perceived importance of them
playing electronic games/using computer spent less time in LPA (β = -0.14, = 0.05) and
more time sitting at home (β = 0.15, p = 0.03) on weekdays.
8.4.2. Associations between social, individual factors and weekend
sitting time, sitting breaks and PA
Weekend sitting and PA results are presented in Tables 3 and 4, respectively. After
adjustment for all confounding factors, the importance parents assign to active play for
their child was positively associated with LPA (β = 0.16, p = < 0.03) and sitting breaks
(β = 0.16, p = < 0.04) at home on weekends. Only the importance parents place on active
play was included in the final models for LPA and sitting breaks, therefore the results
remained unchanged from model 1.
8.4.3. Associations between social, individual factors and the physical
home environment
Tables 5, 6 and 7 show results for media equipment accessibility and availability,
additional physical factors and architecture/home design factors, respectively. After
adjusting for the confounding factors, a greater parental preference for PA was negatively
associated with overall media equipment (accessibility and availability score) (β = -0.19,
p = < 0.01), fixed media equipment (β = -0.19, p = < 0.01) and media equipment in the
child’s bedroom (β = -0.17, p = 0.02) (model 1). While greater child preference for PA (β
= 0.20, p = < 0.01) and perceived importance of children participating in active play (β =
0.21, p = < 0.01) were positively associated, perceived importance of watching
TV/movies for children was negatively associated (β = -0.14, p = 0.03) with PA
equipment. Perceived importance of children playing electronic games/using computer
was also negatively associated with musical instruments (β = -0.18, p = < 0.01). A
maximum h/day of screen-time rule was negatively associated with portable media
equipment (β = -0.16, p = 0.02), as well as the number of smartphones at home (β = -
0.15, p = 0.03). Additionally, perceived importance of children participating in active

148
play (β = 0.17, p = 0.02) and spending time outside (β = 0.19, p = 0.01) were both
positively associated with perceived space to play in the back garden, whilst perceived
importance of children spending time outside was also positively associated with
objectively measured garden size (β = 0.18, p = 0.01).
In the final models (model 2), a greater parental preference for PA was associated with
less accessibility and availability of overall media equipment (β = -0.16, p = < 0.03), fixed
media equipment (β = -0.19, p = 0.01) and media equipment in the child’s bedroom (β =
-0.15, p = 0.05) [Table 5]. Homes with a maximum h/day of screen-time rule also had
less portable media equipment accessibility and availability (β = -0.16, p = 0.02) [Table
5] and fewer smartphones (β = -0.14, p = 0.04) [Table 6]. Greater perceived importance
of spending time outside for children was associated with a larger garden (front and back)
(β = 0.18, p = 0.01) and more perceived space to play in the back garden (β = 0.19, p =
0.01) [Table 7]. Additionally, a higher level of perceived importance of active play for
child (β = 0.16, p = 0.02) and a greater child preference for PA (β = 0.15, p = 0.04) was
associated with a greater PA equipment accessibility and availability [Table 6]. Lastly,
greater perceived importance of playing electronic games/using computer for child was
associated with less musical instrument accessibility and availability (β = -0.17, p = 0.02)
[Table 6].

149
Table 16. Associations between social and individual factors and children’s home–based sitting time and breaks.
* p = <0.10, ** p = <0.05, *** p = <0.01. 1 Parent perceived importance of activities for their child. Model 1: Model for each social and individual factor adjusting for home ownership, family situation,
WIMD, parent age and sex, season, daylength, no. of siblings, as well as the child’s BMI, age and sex. Model 2; Model including all significant social and individual factors from model 1, adjusting for
home ownership, family situation, WIMD, parent age and sex, season, daylength, no. of siblings, as well as the child’s BMI, age and sex.
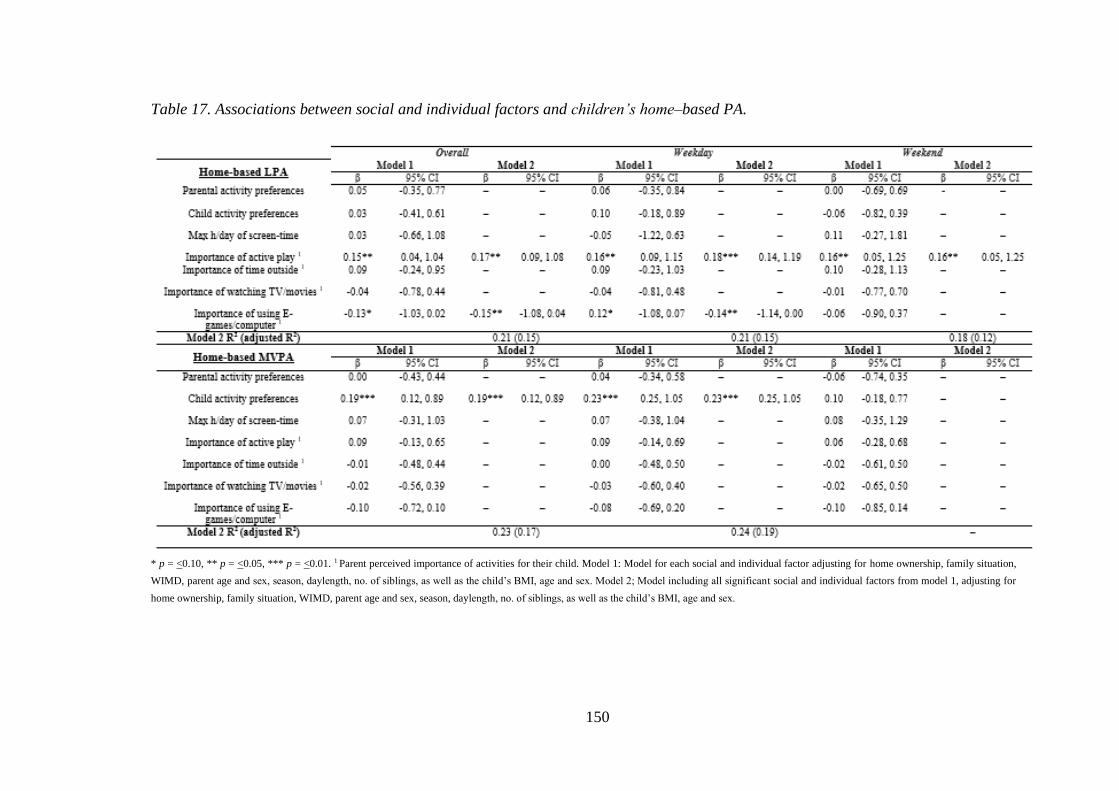
150
Table 17. Associations between social and individual factors and children’s home–based PA.
* p = <0.10, ** p = <0.05, *** p = <0.01. 1 Parent perceived importance of activities for their child. Model 1: Model for each social and individual factor adjusting for home ownership, family situation,
WIMD, parent age and sex, season, daylength, no. of siblings, as well as the child’s BMI, age and sex. Model 2; Model including all significant social and individual factors from model 1, adjusting for
home ownership, family situation, WIMD, parent age and sex, season, daylength, no. of siblings, as well as the child’s BMI, age and sex.
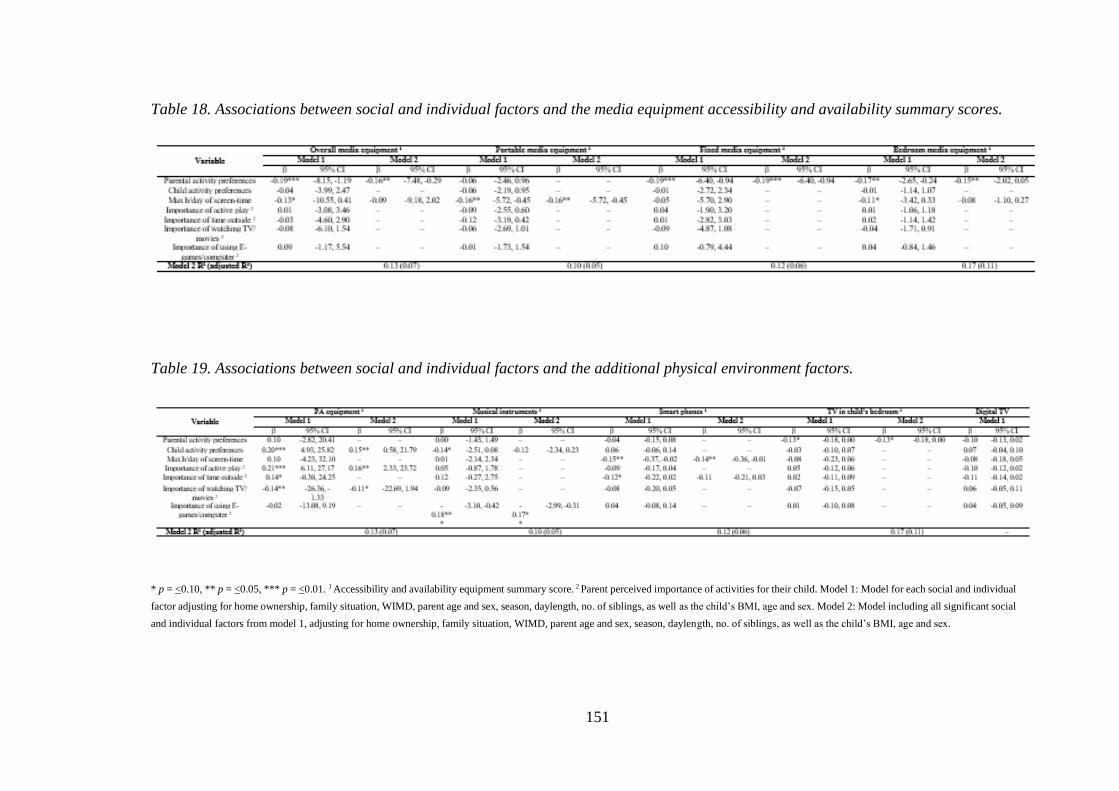
151
Table 18. Associations between social and individual factors and the media equipment accessibility and availability summary scores.
Table 19. Associations between social and individual factors and the additional physical environment factors.
* p = <0.10, ** p = <0.05, *** p = <0.01. 1 Accessibility and availability equipment summary score. 2 Parent perceived importance of activities for their child. Model 1: Model for each social and individual
factor adjusting for home ownership, family situation, WIMD, parent age and sex, season, daylength, no. of siblings, as well as the child’s BMI, age and sex. Model 2: Model including all significant social
and individual factors from model 1, adjusting for home ownership, family situation, WIMD, parent age and sex, season, daylength, no. of siblings, as well as the child’s BMI, age and sex.
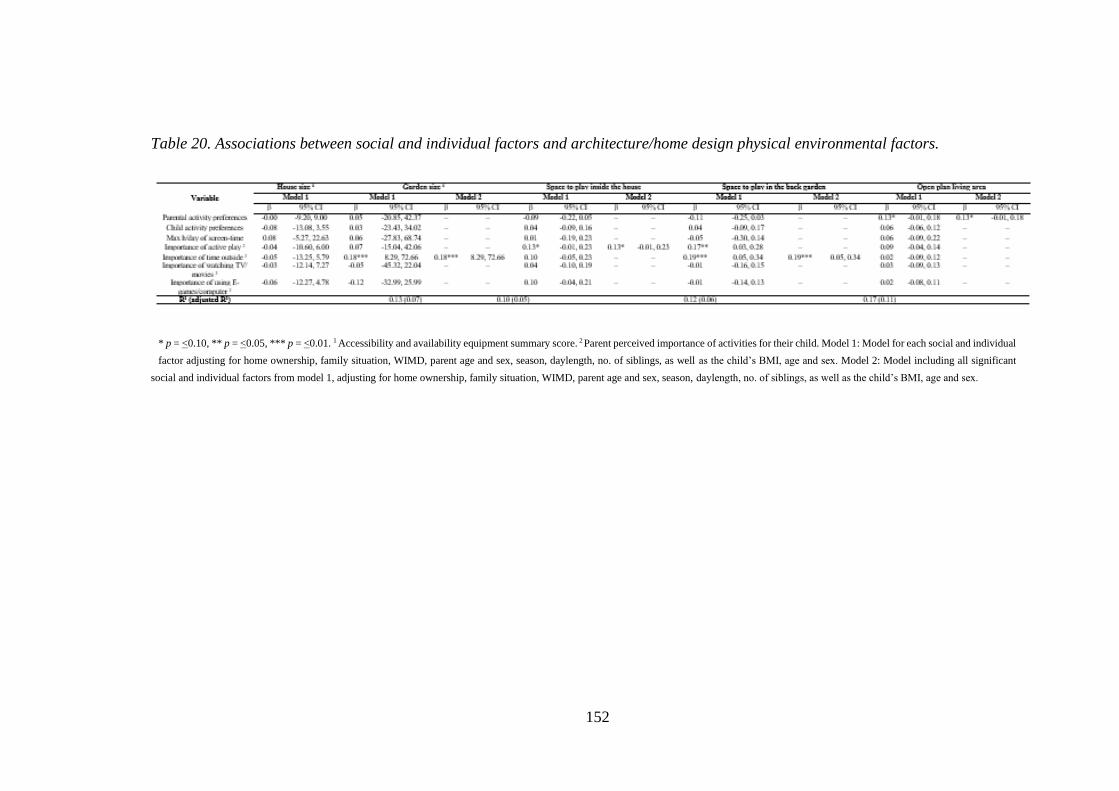
152
Table 20. Associations between social and individual factors and architecture/home design physical environmental factors.
* p = <0.10, ** p = <0.05, *** p = <0.01. 1 Accessibility and availability equipment summary score. 2 Parent perceived importance of activities for their child. Model 1: Model for each social and individual
factor adjusting for home ownership, family situation, WIMD, parent age and sex, season, daylength, no. of siblings, as well as the child’s BMI, age and sex. Model 2: Model including all significant
social and individual factors from model 1, adjusting for home ownership, family situation, WIMD, parent age and sex, season, daylength, no. of siblings, as well as the child’s BMI, age and sex.
153
8.5. Discussion
This study examined whether social and individual factors specific to the home were
associated with: (i) sitting time, breaks in sitting and PA and (ii) the home physical
environment. Parental importance of active play for children was significantly associated
with increased LPA and sitting breaks, as well as a physical environment conducive to
PA. The level of importance that parents placed on children playing electronic
games/using computers for fun was associated with less LPA and more sitting on
weekdays. Parental preference for being active at home and placing limits on screen-time
were both associated with a physical environment less conducive to sedentary activities.
Further, child activity preferences had the greatest relationship with behaviour, where
children who preferred being sedentary engaged in less MVPA and more sitting on
weekdays. The importance parents place on their children watching TV/movies was the
only factor not associated with either the physical environment or children’s behaviour.
In line with previous research that found parental factors to be stronger correlates of
children’s weekday behaviour [279], stronger associations were identified for weekday
behaviour outcomes, suggesting that social and individual factors play a greater role in
children’s weekday behaviour at home. These findings likely reflect the increased
freedom children have to make their own activity choices without parental influence on
weekends.
Parental importance of active play for children at home was positively associated with
home-based LPA and sitting breaks, which is consistent with studies that have shown
parental importance of PA to be positively associated with PA [439] and outdoor play
[440]. Parents who perceive active play as important for their child are more likely to
allow or encourage active play at home, providing children with more opportunities to
engage in LPA and break up their sitting. More importance placed on active play was also
associated with greater accessibility and availability of PA equipment at home. Time
outdoors is an important predictor of children’s active play [257,441], and in this study
parents who perceived it as important had larger gardens. Therefore, it appears a higher
level of importance assigned to active play and time outside at home translates into a
physical environment that better supports active play. However these relationships may
be bidirectional, as parents consider outdoor space and PA equipment an essential factor
154
for their children’s active play at home [43]. Nonetheless, changing parent’s attitudes
towards active play seems important for supporting children’s PA at home.
Children’s computer use, specifically for playing games among boys and social
networking among girls, is sharply increasing [442]. In this study, children whose parents
placed more importance on them playing electronic games/using computers for fun,
accumulated less LPA and more sitting time on weekdays. This is consistent with another
study that found an inverse relationship between parents’ negative attitudes towards
computer use and children’s screen-time [443]. Two thirds of parents considered playing
electronic games/using computers unimportant or very unimportant for their child.
Parents who enforce fewer restrictions on their child’s use of games consoles and
computers, are less aware of the risks associated with excessive usage or they may
perceive them as being important for education and social interaction [43]. Consequently,
children’s increased use of video games and computers may hinder their participation in
PA at home similar to studies that have found children’s screen-time [91], and specifically
computer use [432], to be inversely related with PA.
Enforcing a screen-time limit was not associated with children’s home-based sitting, in
contrast with the only other study to objectively measure home-based sedentary time [40].
This discrepancy likely reflects the sharp increase in the use of portable electronic devices
over the past decade [40]. Indeed, parents find limiting the use of such devices difficult
due to their portability and because of their multi-functionality, hence rules restricting
portable device usage may be harder to enforce [43]. This may also explain why homes
of parents who enforced screen-time limits on their children had lower accessibility and
availability of portable devices as well as fewer smartphones, which is consistent with
one study that found parents who limit screen-time have less media equipment at home
[444]. Similarly, parents with a preference for being active at home reported a lesser
presence of media equipment at home overall and in the child’s bedroom, in line with a
study that found higher parental screen-time was associated with presence of at least one
electronic media device in a child’s bedroom [445]. These findings suggest that parental
activity preferences and limits on screen-time may be indirectly associated with
children’s behaviour through the home physical environment, building on previous
evidence that has shown direct associations with children’s screen-time [41,430].
155
In agreement with studies that have shown activity preferences to be a strong predictor of
children’s PA [258,432] and screen use [399], this study found that children with a
preference for PA at home engaged in more MVPA and less sitting at home, but only on
weekdays. The reason for the lack of a relationship observed with weekend behaviour is
unclear, and it is in contrast to another study reporting that children who preferred PA
were more likely to play in the garden at home only on weekends [287]. This discrepancy
may, in part, be because Veitch et al. [287] found that children played in their garden
more at weekends, whereas children in this study engaged in more MVPA on weekdays.
Nonetheless, these findings suggest children’s activity preferences play an important role
in their PA and sedentary time at home.
This study adds to the evidence that social factors are directly associated with children’s
PA and sedentary time [41,235,269,430], by showing that they may also be indirectly
associated through the physical environment at home. Parent’s limits on screen-time and
their perceived importance of active play, time outdoors or recreational video
game/computer use for children were associated with either children’s behaviour or
predictors of children’s PA and sedentary behaviour within the physical environment at
home [41] or both. Therefore, strategies which change parent’s attitudes towards active
play/time outdoors and encourage more restrictions on electronic media use at home are
warranted. Educating parents on the importance of regular PA and limiting sedentary time
for health as well as how to create healthy home environments may be a promising
approach. Since parental rules and priorities for leisure activity are reflected in their home
environments, this approach may not only be important for the child but for the entire
family, given the associated physical factors are key determinants of sedentary time and
PA [383]. Parental activity preferences were also strongly associated with the physical
home space, and child activity preferences had the strongest relationship with behaviour.
A difficult, but important, challenge for home-based interventions is to develop strategies
which reduce both parents and children’s preferences for sedentary activities.
Specifically, one approach for increasing children’s enjoyment of PA is to target
improvements in their fundamental movement skills (FMS), since mastery of FMS may
lead to increased enjoyment of PA [446]. This combined with restrictions on screen-based
sedentary behaviours set by parents, will provide children with opportunities to
experience alternatives to activities such as TV viewing and playing electronic games,
which they may enjoy just as much. Parental activity preferences may be particularly
156
difficult to change, as they are more ingrained. However, after receiving education on the
benefits of PA and detriments of sedentary behaviour, parents may perceive PA as more
valuable, which may contribute to the formation of a home environment more conducive
to PA.
This study has numerous strengths, including the validated audit used to comprehensively
assess the home physical environment [299], the investigation of associations between
home-specific social and individual factors and home-based behaviour and the objective
measurement of PA, sitting and sitting breaks. The adjustment for a multitude of
important confounding factors was also a strength. Nonetheless, some limitations need to
be acknowledged, including the reliance on self-report to assess the home-specific
individual and social factors and for determining when the children were at home, which
may have introduced some measurement error. However, there is no feasible objective
alternative for these measures. The cross-sectional nature of the study also means that
causal relationships cannot be inferred. Moreover, we did not have data from both parents.
Whilst it is likely that the parent who participated is more involved in the formation of
the home environment and their child’s behaviour at home, it could be that the other
parent has a stronger influence. However, the number of parents at home was controlled
for in all analyses. Further, the overrepresentation of university educated parents living
in the least deprived locations, may limit the generalisability of the findings. However,
the proportion of high SES families is comparable with other studies [240,248]. Lastly,
although the use of GIS to objectively measure house and garden size was a strength, full
home addresses were not obtained, therefore measures pertain to each postcode and not
the specific homes. Thus, the measures only provide estimates of size, given home size is
likely to differ between homes in the same postcode.
8.6. Conclusion In conclusion, parental and child preferences and priorities, as well as parental rules for
leisure activity at home, are associated with children’s sitting and PA at home, particularly
during weekdays. They are also associated with factors related to leisure activity in the
physical environment, providing evidence to support our hypotheses. Such insight is
important, given children spend more time at home than anywhere else [38,39]. The
findings suggest that interventions seeking to create home environments conducive to PA,

157
should target parental attitudes and the activity preferences of children and parents,
alongside adapting the home physical environment. Future home-based interventions
should provide support and education to parents on how to make home environments,
through the instigation of restrictions on screen-time and physical environmental changes,
that hinder engagement in sedentary activities and promote active alternatives.
Additionally, changing children’s and parent’s preferences for home-based activities or
replacing sedentary activities with acceptable active alternatives will also be key targets.
.
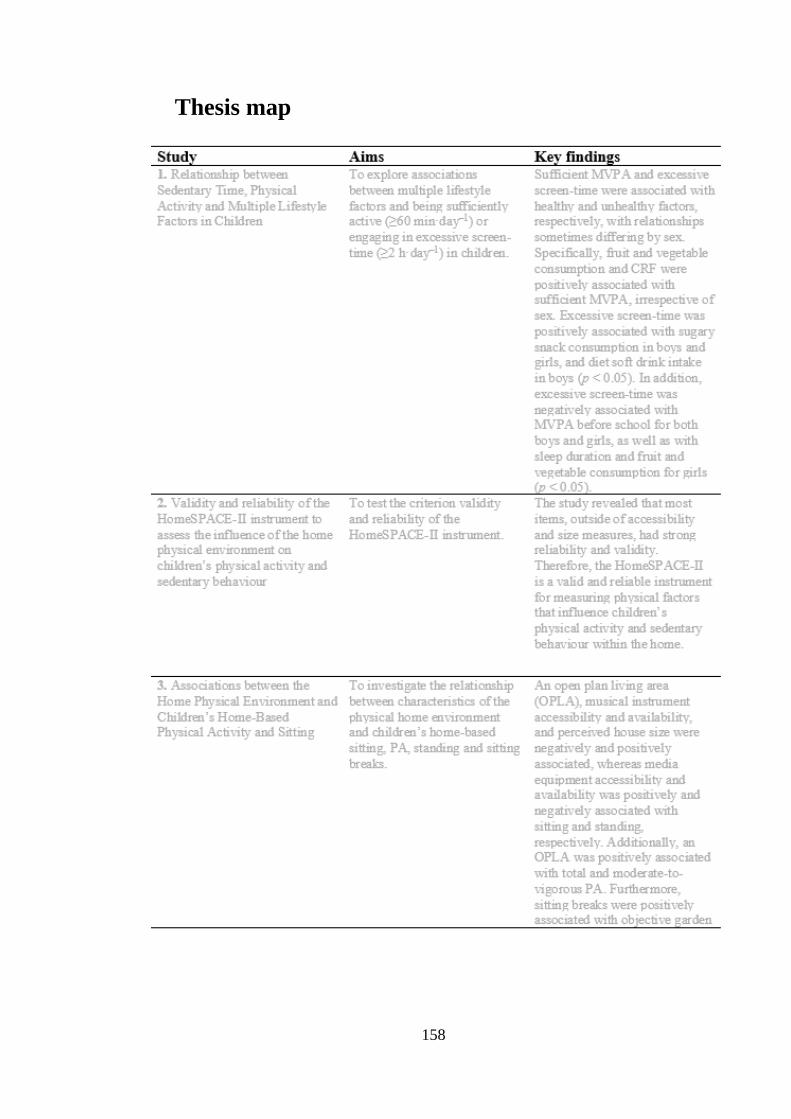
158
Thesis map
159
160
9. Study 5
9.1. Clustering of home physical and social environmental
factors
9.2. Introduction
Physical activity (PA), irrespective of intensity, is important for children’s health and
well-being [6]. Although moderate-to-vigorous physical activity (MVPA) has been
shown to be the most beneficial to health [6], those meeting the government
recommended levels of at least 60 minutes of MVPA, on average, every day [62] remain
low [44]. Specifically, in Wales, only a third of children have been classified as
sufficiently active [63]. Moreover, children also spend a significant amount of time in
sedentary behaviours (7-8 h daily) [45], characterised by ‘an energy-expenditure below
1.5 metabolic equivalents (METs), while in a sitting, lying or reclining posture’ [198].
Screen-time is the most prominent of these (>5 h daily) [117], and has been adversely
associated with health [5]. Further, how sedentary time is accumulated may also be
important, as more frequent sedentary breaks have been shown to improve short-term
metabolic indicators in children [50]. While research has shown significant health
consequences of excessive sedentary time and infrequent sedentary breaks in adults [96],
the health effects are equivocal in children. However, this is likely, at least in part, because
chronic diseases do not manifest until later in life. Nonetheless, due to evidence that
children’s behaviour habits can persist into adulthood [31], high levels of sedentary time,
particularly of a prolonged nature [447], are a public health concern.
Ecological models emphasise the influence of the environment on PA and sedentary time
[37]. Outside of school, children spend a large proportion of time in their neighbourhood
and home environments. While the neighbourhood environment has received much
attention [426,427], less is known about the home environment [41]. However, the
availability of household and bedroom media equipment are consistent physical
environment correlates of screen-time [41,235]. Moreover, PA equipment has been
shown to promote PA [40,240] and discourage sedentary time [40,41], whereas
qualitative research has identified that house and garden size influences children’s PA
and sedentary time at home [43]. Furthermore, parents play a key role in influencing their
161
children’s PA and sedentary time [41]; parental PA levels, support and co-participation
all identified as important correlates of children’s PA [430,431], whereas parental screen-
time and electronic media rules are consistent correlates of children’s sedentary behaviour
[41,235]. This evidence supports the notion that both the physical and social home
environment have an important influence on children’s PA and sedentary time [41,235].
Although studies have assessed individual physical and social related factors, a limited
number of studies have examined clustering or the co-occurrence of such factors
[288,289]. Understanding which social and physical factors cluster or co-occur is
important, as the co-occurrence of influential PA and sedentary behaviour correlates is
likely to have a synergistic effect [448]. Moreover, identifying which social and physical
factors cluster may enable more efficient interventions, by informing strategies which
target multiple factors simultaneously. There is some evidence that physical and social
environmental factors cluster [288,289]. Specifically, at least two studies have shown that
low parental screen-time and high PA equipment availability cluster [288,289].
Moreover, low media equipment availability and greater family rules have also been
found to cluster [289]. However, to date, no study has investigated the clustering of social
and physical factors within the home environment. Given that children spend more time
at home than anywhere else [38,39], such insights are important. To determine their
importance, it is also necessary to assess how home-specific clusters relate to PA and
sedentary time at home. Indeed, ecological models posit that behaviour is most likely
influenced by the environment in which it occurs [37].
The aim of this study was to investigate clustering of social and physical factors within
the home, and whether these clusters are related to home-based sitting, sitting breaks,
MPVA and total physical activity (TPA) in children. A secondary aim was to examine
whether clusters are associated with parental, family and child characteristics to inform
interventions.
9.3. Materials and Methods
9.3.1. Participants
Between November 2017 and July 2018, 11 out of 23 primary schools which were
contacted in South Wales provided headteacher consent to participate in the
162
HomeSPACE project. From these schools, 890 children from school years 5 and 6 (9-11
years old) were provided with project information. Participation was incentivised;
families were offered to be entered into a prize draw to win a family pass for an outdoor
activity centre and children were offered a sedentary time and PA report. Informed
parental/guardian consent and child assent were received from 235 children (55% girls,
aged 10.2 ± 0.7 years) and their parents (n=228) [26% response]. Procedures complied
with the declaration of Helsinki and ethical approval was obtained from the Swansea
University ethics committee.
9.3.2. The physical home environment
Physical factors within the home which are hypothesised to influence children’s PA and
sedentary behaviours at home [43] were assessed using an integrated version of the
HomeSPACE instrument [290] and the PA and media inventory [247]. Parents were
asked to walk around each room/area in their house and garden and use the integrated
tool to record the presence, amount and accessibility of 34 items, including media
equipment (e.g., TV, computer), PA equipment (e.g., balls, trampoline) and musical
instruments (e.g., drums, piano), for up to 22 room/areas. Each item’s accessibility was
rated on a A-D scale, ranging from (A) “put away and difficult to get to” to (D) “in plain
view and difficult to get to”. There were also additional questions referring to electronic
media (smart phones, TV service, movie/TV streaming service). From the audit data,
summary scores were calculated measuring the accessibility and availability of PA
equipment, overall and bedroom media equipment, and musical instruments. The higher
the score, the greater the “presence” of that item type in the home. A binary variable was
also created to determine the presence of an open plan living area and a TV in the primary
child’s bedroom. To aid interpretation, the total number of each item type and rooms/areas
were calculated. Physical activity equipment included active video game systems (e.g.,
Wii fit, X-box Kinect, PlayStation move). Incomplete audits were followed up with
families to, where possible, retrieve additional information.
9.3.3. Social and individual factors
Family priorities and preferences for home-based activity [290] and parental media rules
[259] were assessed with validated questions. The first question asked “When at home,
163
how important is it to you that your child [plays electronic games/computer]; [does some
active play]; [watches TV/movies]?” with responses ranging from (1) ‘very unimportant’
to (5) ‘very important’. The second question asked parents what activities their child
prefers to do when at home; (1) sitting OR running around; (2) playing indoors OR
playing outdoors; (3) playing electronic games/computer OR active types of play; (4)
watching TV/movies OR active types of play; and (5) quiet activities OR energetic
activities. Similarly, parents were asked what activities they preferred to do at home; (1)
watch TV/movies with their child OR engaging in PA with their child; (2) watch
TV/movies OR being physically active; (3) using the computer/electronic games OR
being physically active; (4) play electronic games/computer with their child OR PA with
their child; (5) indoor activities with their child OR outdoor activities with their child; (6)
be indoors OR outdoors; and (7) quiet pursuits OR active pursuits. Child and parental
activity preferences were recorded on a five-point scale and ranged from (1) ‘almost
always’ to (5) ‘almost always’. For each scale, scores were generated using the mean
responses, where a higher score represented a preference for PA activities. Another item
assessed the presence of a maximum number of h/day screen-time rule (yes/no).
9.3.4. Objectively measured home-based physical activity and postural
behaviours
Children wore an ActiGraph GT9X (Pensacola, Florida, USA) and activPAL3 micro
(PAL Technologies, Glasgow, UK) to assess PA (TPA and MVPA) and postural
outcomes (sitting and sitting breaks), respectively. Sitting breaks were considered as
transitions from sitting to standing/stepping [198]. The monitors were fitted at school to
ensure they were attached correctly and that the children knew how to remove and re-
attach. Participants were encouraged to wear the monitors at all times, (including when
bathing, but excluding swimming, for seven consecutive days). A diary was provided for
parents to record child sleep and wake times, device removals, sickness days and when
the child was at home. “Home” included one location, covering the house, driveway and
verge area of the child’s main home (i.e., the home where they spent most of their time,
excluding homes of other parents or relatives etc.). To minimise missing data, children
were asked to complete the diary if parents were unable to; families were also contacted
for further information for incomplete diary entries.
164
The activPAL, shown to have excellent validity in children [112], was protected by a
waterproof nitrile sleeve and positioned on the mid-anterior aspect of the right thigh using
a hypoallergenic dressing (3M Tegerderm or Hypafix Transparent). Additional dressings
and sleeves, as well as instructions for correct attachment were provided. The activPAL
data processing protocol has been described elsewhere [383], but briefly, the data was
downloaded in the manufacturer software (V8.10.8.32, PAL technologies, Glasgow, UK)
and the resultant Event.csv files were processed in Processing PAL-V1.1 (Leicester, UK)
with a validated algorithm that calculates waking hours, extended non-wear time (> 5 h)
and invalid data. Diary-reported non-wear time considered feasible were also removed.
In addition, based on inspections of the data and methods used elsewhere [406], > 3 h
bouts of sitting/lying or standing with no transitions were also treated as non-wear time.
Children wore the ActiGraph GT9X on their non-dominant wrist [303], as wrist-worn
accelerometers have been shown to improve compliance [39] and have comparable
validity to hip-worn accelerometers [305]. Devices were set to collect data at 30 Hz [449],
which was summed over 5-sec epochs. ActiLife V6.13.3 (ActiGraph software) was used
to initialise, download and process files. Chandler wrist-based cut-points [155], applied
to the vector-magnitude, were used to categorise MVPA (>818 counts/5-secs) and TPA
(>162 counts/5-secs). Non-wear periods, identified as >90 minutes of consecutive zero
counts [436], were removed.
To calculate home-based PA and postural outcomes, time at home was imported into both
the ActiLife and Processing PAL software, respectively, and matched with time-stamped
data. To be included in the analyses, participants were required to have satisfactorily
completed home logs, and at least 1 day that had > 3 h of data at home [437] when the
device was worn for >75% of the time [408]. Sickness days were also removed. ActivPAL
and ActiGraph data in minutes, divided by waking wear time at home, were multiplied
by 60 to produce outcome variables expressed as averages/h [410].
9.3.5. Children personal information and anthropometric measures
Within school, trained researchers measured children’s stature and body mass to the
nearest 0.001 m and 0.1 kg [339], using a portable stadiometer (Seca 213 portable,
stadiometer, Hamburg, Germany) and electronic weighing scales (Seca 876, Hamburg,
165
Germany), respectively. Subsequently, body mass index (BMI) was determined, and BMI
z-scores were calculated using the WHO (World Health Organization) growth reference
charts [294].
9.3.6. House and garden size estimates
Using geographic information system techniques (GIS), Ordnance Survey MasterMap
(OSMM) [301] and AddressBase Premium (ABP) [300], house and garden size were
assessed for each postcode unit. For homes (min – max: 4 - 82), the building footprint
area was determined in OSMM and non-residential buildings defined by ABP were
filtered out. Using the same process, garden size (front and back combined) for homes
(min – max: 2 – 82) defined by OSMM [302] was calculated using the same process. To
estimate house size, a median of the building footprints was calculated and multiplied by
the number of floors. A median garden size was also computed for each postcode unit.
9.3.7. Additional Measures
Parents reported their ethnicity; those responding with White were coded as 0 and other
responses (i.e., Mixed race, Asian or Asian British, Black or Black British, Chinese) were
categorised as 1 (defined as ethnic minorities). Parent’s also reported their highest level
of education, which was collapsed into three categories: (1) some secondary
school/completed secondary school; (2) trade qualifications or apprenticeship/diploma or
certificate; and (3) university degree or higher. Pre-tax annual household income was also
reported using seven categories ranging from (1) < £10, 000 to (7) > £100, 000. Further,
parents reported their sex, age, whether they own or rent their home, the number of people
at home and their residential postcode. Hours of daylight for the participant’s respective
location’s during each measurement day were determined using the Time and Date
sunrise and sunset calculator [411].
9.3.8. Statistical analysis
All analyses were conducted using SPSS version 26 (IBM SPSS Statistics Inc., Chicago,
IL, USA). All social and physical home environment variables were converted to
standardised z-scores. A principal component analysis (PCA) was performed to examine
clustering of activity-related home environmental variables. Oblique rotation was used
166
because of the hypothesised correlation between the extracted components [450]. The
scree plot [450] and eigenvalues (> 1) [451] were used to determine the number of
components. Items with component loadings of ± 0.4 [452] and no cross loadings above
± 0.50 [453] were retained and considered part of a component. If an item was within ±
0.05 of the applied loading, the decision as to whether they were included was made based
on theoretical rationale. The final solution was significant in the Bartlett test of sphericity
[450], had a KMO value above 0.5 [451], and components explained > 50% of the total
variance [454]. To calculate cluster scores, the home factors were multiplied by their
component loadings and summed for each component [288]. Due to the exploratory
nature of the analyses, a backwards linear regression was used to assess associations
between the cluster scores and child (BMI and activity preferences), parent (income,
family situation, age, ethnicity and education) and family (number of people, WIMD
scores, home ownership) characteristics. Partial correlation analyses were used to assess
associations between cluster scores and the four home-based behaviour outcomes (min/h
spent sitting, in MVPA and TPA, and the number of sitting breaks/h). All analyses were
corrected for the child, parent and family characteristics, as well as daylight hours,
parental age and the age and sex of the child. Paired t-tests showed significant differences
between weekdays and weekend days for the behavioural outcomes. However, separate
analyses had minimal impact on results; thus, data for the weekday and weekend days
were combined.
9.4. Results
Descriptive statistics are presented in Table 1. Children spent 40.3 ± 5.9, 21.6 ± 4.7, 6.7
± 2.3 mins sitting, in TPA, in MVPA, respectively, and had 7.0 ± 1.9 sitting breaks per
hour, at home. Most participating parents were female (83%), owned their home (86%),
held a university degree (54%) and lived in the highest socioeconomic status (SES)
location (59%). Most parents had a ‘maximum h/day of screen-time’ rule (69%) and
considered engaging in active play at home ‘important’ or ‘very important’ for their child
(75.4%) and watching TV/movies (68%) and playing electronic games/using computer
(65%) at home as ‘un-important’ or ‘very un-important’ for their child. On average,
parents also reported that both they and their child enjoyed sedentary and PA activities at
home ‘about equal’. Homes had 11.5 ± 2.1 rooms/areas, with a large proportion having
an open plan living area (57%). Homes, on average, had 27.7 ± 18.3 items of PA
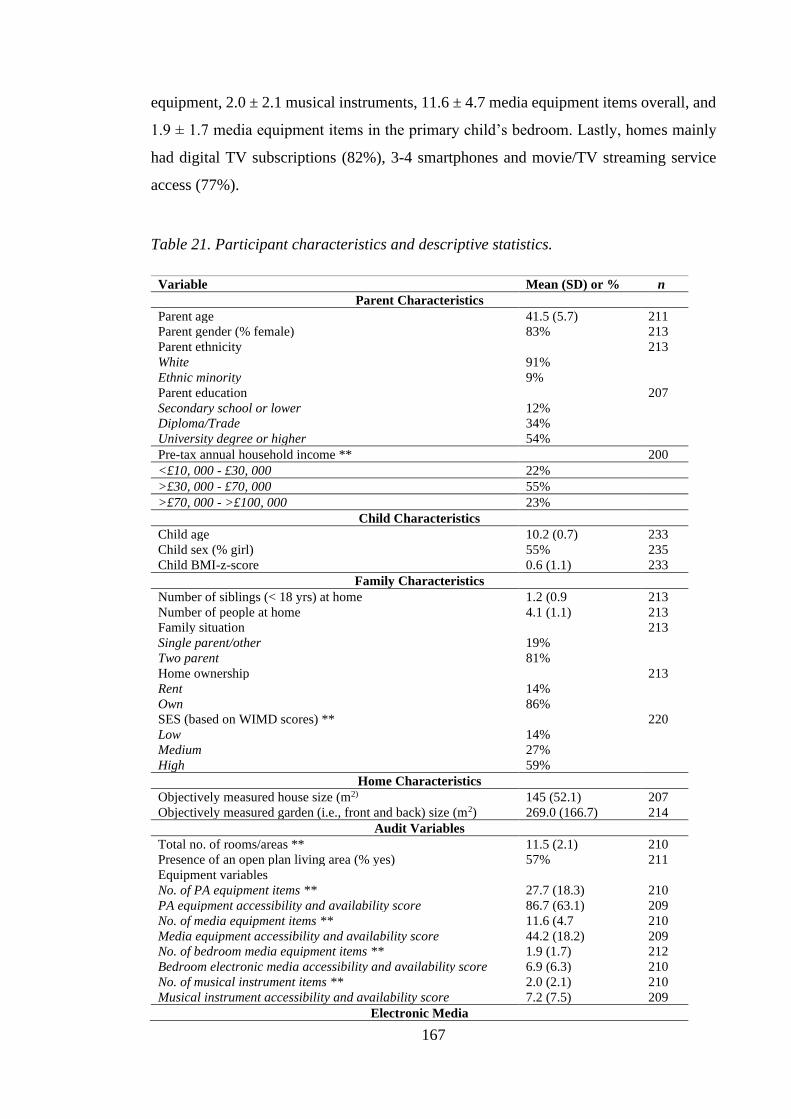
167
equipment, 2.0 ± 2.1 musical instruments, 11.6 ± 4.7 media equipment items overall, and
1.9 ± 1.7 media equipment items in the primary child’s bedroom. Lastly, homes mainly
had digital TV subscriptions (82%), 3-4 smartphones and movie/TV streaming service
access (77%).
Table 21. Participant characteristics and descriptive statistics.
Variable Mean (SD) or % n
Parent Characteristics
Parent age 41.5 (5.7) 211
Parent gender (% female) 83% 213
Parent ethnicity 213
White 91%
Ethnic minority 9%
Parent education 207
Secondary school or lower 12%
Diploma/Trade 34%
University degree or higher 54%
Pre-tax annual household income ** 200
<£10, 000 - £30, 000 22%
>£30, 000 - £70, 000 55%
>£70, 000 - >£100, 000 23%
Child Characteristics
Child age 10.2 (0.7) 233
Child sex (% girl) 55% 235
Child BMI-z-score 0.6 (1.1) 233
Family Characteristics
Number of siblings (< 18 yrs) at home 1.2 (0.9 213
Number of people at home 4.1 (1.1) 213
Family situation 213
Single parent/other 19%
Two parent 81%
Home ownership 213
Rent 14%
Own 86%
SES (based on WIMD scores) ** 220
Low 14%
Medium 27%
High 59%
Home Characteristics
Objectively measured house size (m2) 145 (52.1) 207
Objectively measured garden (i.e., front and back) size (m2) 269.0 (166.7) 214
Audit Variables
Total no. of rooms/areas ** 11.5 (2.1) 210
Presence of an open plan living area (% yes) 57% 211
Equipment variables
No. of PA equipment items ** 27.7 (18.3) 210
PA equipment accessibility and availability score 86.7 (63.1) 209
No. of media equipment items ** 11.6 (4.7 210
Media equipment accessibility and availability score 44.2 (18.2) 209
No. of bedroom media equipment items ** 1.9 (1.7) 212
Bedroom electronic media accessibility and availability score 6.9 (6.3) 210
No. of musical instrument items ** 2.0 (2.1) 210
Musical instrument accessibility and availability score 7.2 (7.5) 209
Electronic Media
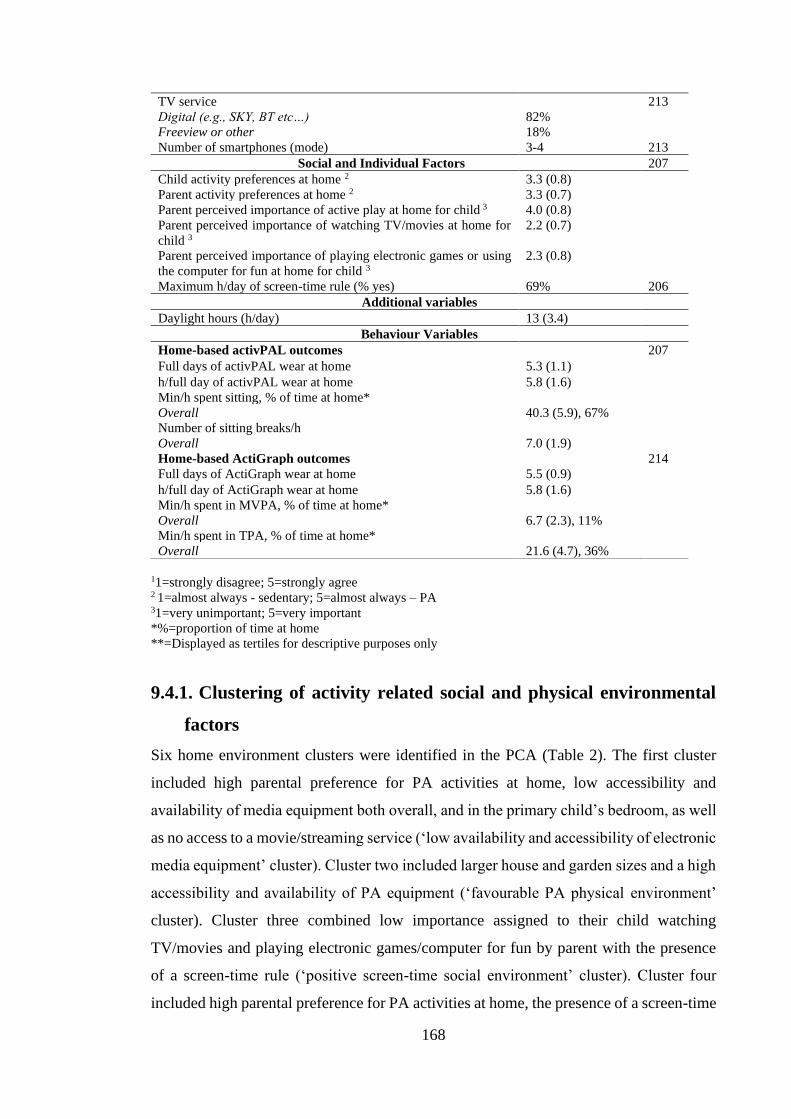
168
TV service 213
Digital (e.g., SKY, BT etc…) 82%
Freeview or other 18%
Number of smartphones (mode) 3-4 213
Social and Individual Factors 207
Child activity preferences at home 2 3.3 (0.8)
Parent activity preferences at home 2 3.3 (0.7)
Parent perceived importance of active play at home for child 3 4.0 (0.8)
Parent perceived importance of watching TV/movies at home for
child 3
2.2 (0.7)
Parent perceived importance of playing electronic games or using
the computer for fun at home for child 3
2.3 (0.8)
Maximum h/day of screen-time rule (% yes) 69% 206
Additional variables
Daylight hours (h/day) 13 (3.4)
Behaviour Variables
Home-based activPAL outcomes 207
Full days of activPAL wear at home 5.3 (1.1)
h/full day of activPAL wear at home 5.8 (1.6)
Min/h spent sitting, % of time at home*
Overall 40.3 (5.9), 67%
Number of sitting breaks/h
Overall 7.0 (1.9)
Home-based ActiGraph outcomes 214
Full days of ActiGraph wear at home 5.5 (0.9)
h/full day of ActiGraph wear at home 5.8 (1.6)
Min/h spent in MVPA, % of time at home*
Overall 6.7 (2.3), 11%
Min/h spent in TPA, % of time at home*
Overall 21.6 (4.7), 36%
11=strongly disagree; 5=strongly agree 2 1=almost always - sedentary; 5=almost always – PA 31=very unimportant; 5=very important
*%=proportion of time at home
**=Displayed as tertiles for descriptive purposes only
9.4.1. Clustering of activity related social and physical environmental
factors
Six home environment clusters were identified in the PCA (Table 2). The first cluster
included high parental preference for PA activities at home, low accessibility and
availability of media equipment both overall, and in the primary child’s bedroom, as well
as no access to a movie/streaming service (‘low availability and accessibility of electronic
media equipment’ cluster). Cluster two included larger house and garden sizes and a high
accessibility and availability of PA equipment (‘favourable PA physical environment’
cluster). Cluster three combined low importance assigned to their child watching
TV/movies and playing electronic games/computer for fun by parent with the presence
of a screen-time rule (‘positive screen-time social environment’ cluster). Cluster four
included high parental preference for PA activities at home, the presence of a screen-time
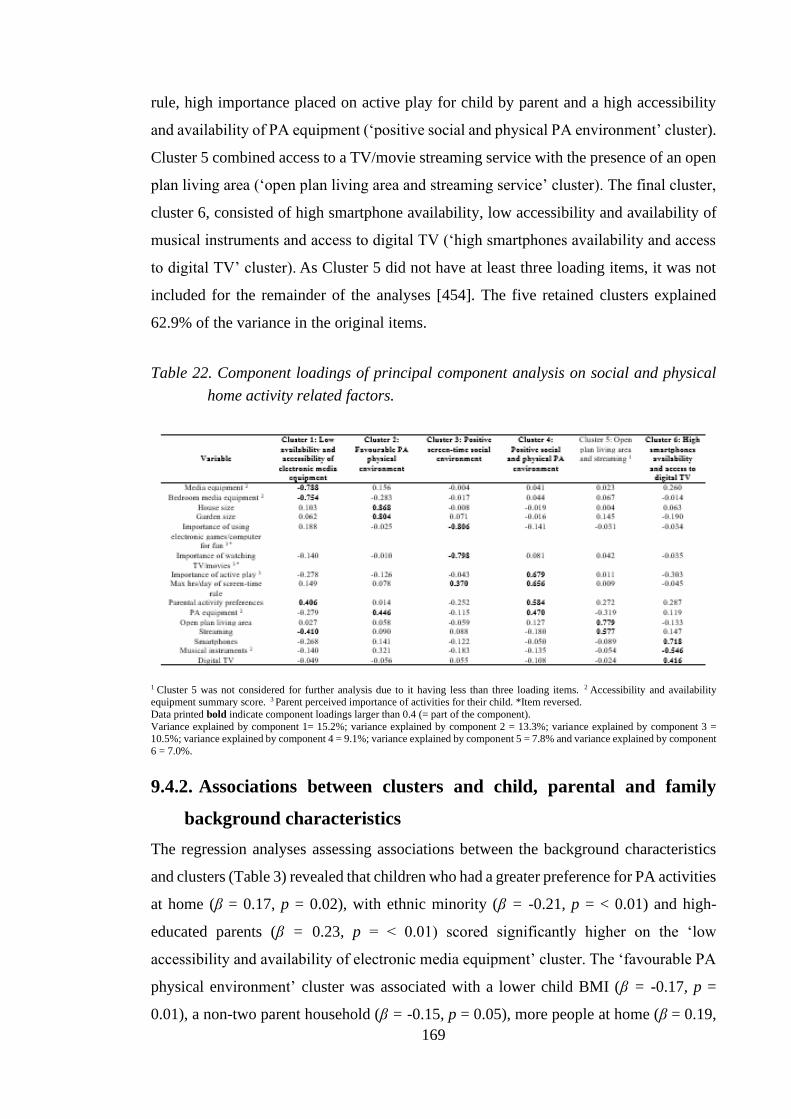
169
rule, high importance placed on active play for child by parent and a high accessibility
and availability of PA equipment (‘positive social and physical PA environment’ cluster).
Cluster 5 combined access to a TV/movie streaming service with the presence of an open
plan living area (‘open plan living area and streaming service’ cluster). The final cluster,
cluster 6, consisted of high smartphone availability, low accessibility and availability of
musical instruments and access to digital TV (‘high smartphones availability and access
to digital TV’ cluster). As Cluster 5 did not have at least three loading items, it was not
included for the remainder of the analyses [454]. The five retained clusters explained
62.9% of the variance in the original items.
Table 22. Component loadings of principal component analysis on social and physical
home activity related factors.
1 Cluster 5 was not considered for further analysis due to it having less than three loading items. 2 Accessibility and availability equipment summary score. 3 Parent perceived importance of activities for their child. *Item reversed.
Data printed bold indicate component loadings larger than 0.4 (= part of the component).
Variance explained by component 1= 15.2%; variance explained by component 2 = 13.3%; variance explained by component 3 = 10.5%; variance explained by component 4 = 9.1%; variance explained by component 5 = 7.8% and variance explained by component
6 = 7.0%.
9.4.2. Associations between clusters and child, parental and family
background characteristics
The regression analyses assessing associations between the background characteristics
and clusters (Table 3) revealed that children who had a greater preference for PA activities
at home (β = 0.17, p = 0.02), with ethnic minority (β = -0.21, p = < 0.01) and high-
educated parents (β = 0.23, p = < 0.01) scored significantly higher on the ‘low
accessibility and availability of electronic media equipment’ cluster. The ‘favourable PA
physical environment’ cluster was associated with a lower child BMI (β = -0.17, p =
0.01), a non-two parent household (β = -0.15, p = 0.05), more people at home (β = 0.19,
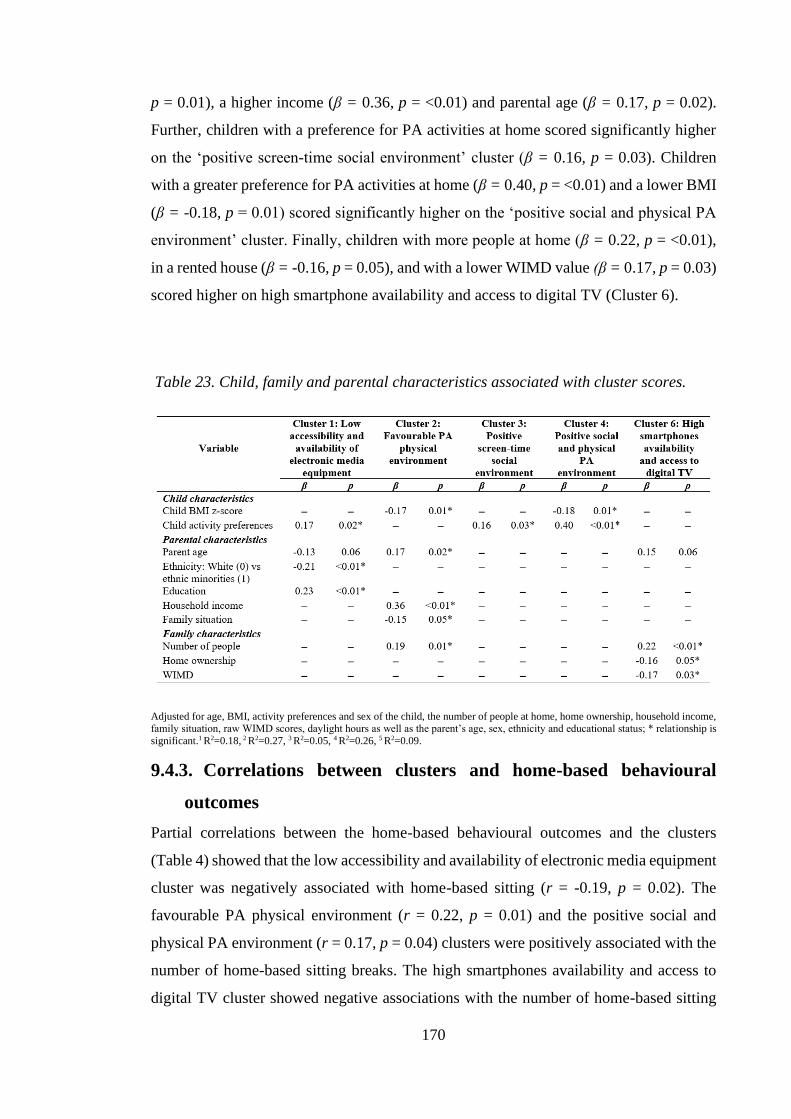
170
p = 0.01), a higher income (β = 0.36, p = <0.01) and parental age (β = 0.17, p = 0.02).
Further, children with a preference for PA activities at home scored significantly higher
on the ‘positive screen-time social environment’ cluster (β = 0.16, p = 0.03). Children
with a greater preference for PA activities at home (β = 0.40, p = <0.01) and a lower BMI
(β = -0.18, p = 0.01) scored significantly higher on the ‘positive social and physical PA
environment’ cluster. Finally, children with more people at home (β = 0.22, p = <0.01),
in a rented house (β = -0.16, p = 0.05), and with a lower WIMD value (β = 0.17, p = 0.03)
scored higher on high smartphone availability and access to digital TV (Cluster 6).
Table 23. Child, family and parental characteristics associated with cluster scores.
Adjusted for age, BMI, activity preferences and sex of the child, the number of people at home, home ownership, household income, family situation, raw WIMD scores, daylight hours as well as the parent’s age, sex, ethnicity and educational status; * relationship is
significant.1 R2=0.18, 2 R2=0.27, 3 R2=0.05, 4 R2=0.26, 5 R2=0.09.
9.4.3. Correlations between clusters and home-based behavioural
outcomes
Partial correlations between the home-based behavioural outcomes and the clusters
(Table 4) showed that the low accessibility and availability of electronic media equipment
cluster was negatively associated with home-based sitting (r = -0.19, p = 0.02). The
favourable PA physical environment (r = 0.22, p = 0.01) and the positive social and
physical PA environment (r = 0.17, p = 0.04) clusters were positively associated with the
number of home-based sitting breaks. The high smartphones availability and access to
digital TV cluster showed negative associations with the number of home-based sitting
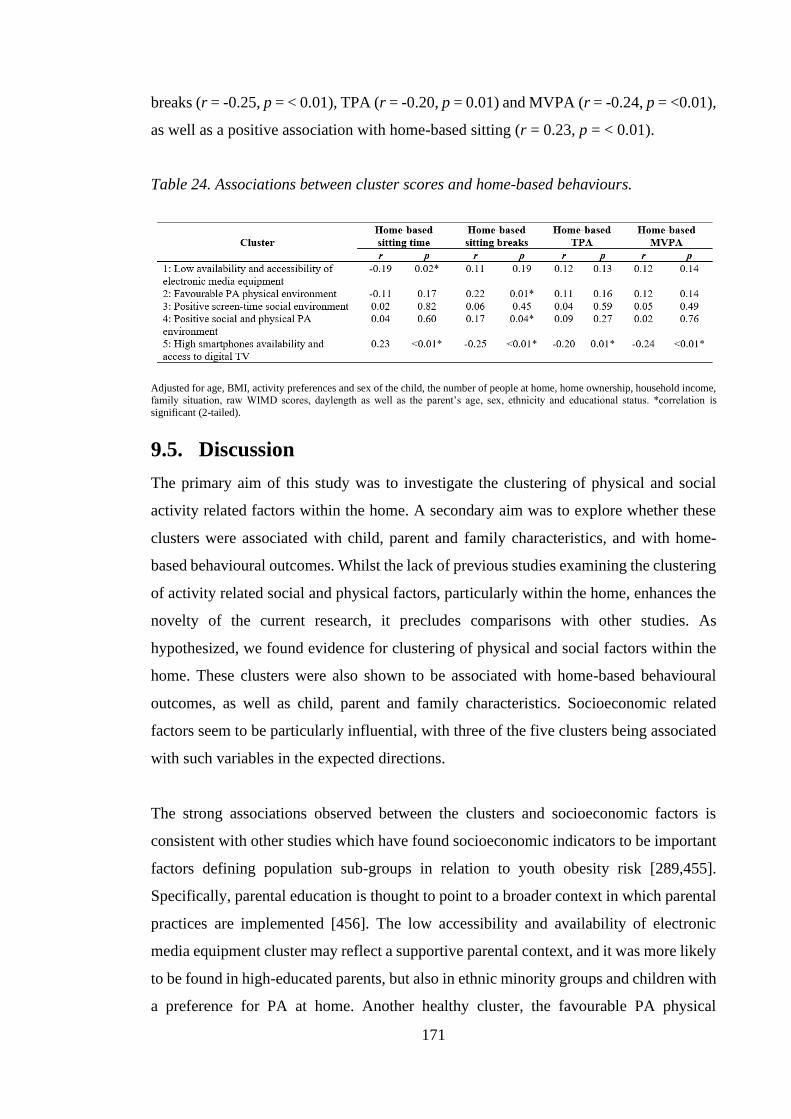
171
breaks (r = -0.25, p = < 0.01), TPA (r = -0.20, p = 0.01) and MVPA (r = -0.24, p = <0.01),
as well as a positive association with home-based sitting (r = 0.23, p = < 0.01).
Table 24. Associations between cluster scores and home-based behaviours.
Adjusted for age, BMI, activity preferences and sex of the child, the number of people at home, home ownership, household income, family situation, raw WIMD scores, daylength as well as the parent’s age, sex, ethnicity and educational status. *correlation is
significant (2-tailed).
9.5. Discussion
The primary aim of this study was to investigate the clustering of physical and social
activity related factors within the home. A secondary aim was to explore whether these
clusters were associated with child, parent and family characteristics, and with home-
based behavioural outcomes. Whilst the lack of previous studies examining the clustering
of activity related social and physical factors, particularly within the home, enhances the
novelty of the current research, it precludes comparisons with other studies. As
hypothesized, we found evidence for clustering of physical and social factors within the
home. These clusters were also shown to be associated with home-based behavioural
outcomes, as well as child, parent and family characteristics. Socioeconomic related
factors seem to be particularly influential, with three of the five clusters being associated
with such variables in the expected directions.
The strong associations observed between the clusters and socioeconomic factors is
consistent with other studies which have found socioeconomic indicators to be important
factors defining population sub-groups in relation to youth obesity risk [289,455].
Specifically, parental education is thought to point to a broader context in which parental
practices are implemented [456]. The low accessibility and availability of electronic
media equipment cluster may reflect a supportive parental context, and it was more likely
to be found in high-educated parents, but also in ethnic minority groups and children with
a preference for PA at home. Another healthy cluster, the favourable PA physical
172
environment, was also more likely to be found in families with a higher income. In
contrast, according to the literature unhealthy clusters are more likely to be found in low
SES groups [288,289,457]. Our finding that WIMD scores, another commonly used
measure of SES, were negatively associated with the occurrence of the high smartphone
availability and access to digital TV cluster is consistent with this. These findings may
reflect the long-standing relationship between SES and health, whereby those
socioeconomically better off generally have healthier lifestyles [458]. Taken together,
these findings suggest that low SES households are an important group to target in
interventions seeking to create healthier physical and social home environments in
relation to children’s PA and sitting.
The positive social and physical PA environment cluster, characterised by positive
screen-time related social factors and a high PA equipment presence at home, is congruent
with studies that have found low parental sedentary behaviour and high PA equipment
accessibility to co-occur [288,289]. This type of cluster may arise because the
perceptions/strategies exhibited are indicative of a parenting style that reflects a healthy
lifestyle based on habits formed in life and health beliefs [459]. The role modelling of a
healthy lifestyle may positively influence children’s health cognitions and choices [460],
and therefore reduce the likelihood of obesity, which may explain why the cluster was
more likely to be found in children with a lower BMI. Similarly, to the positive social
screen-time cluster, children with a preference for PA were more likely to be found in
this cluster. Indeed, the PA and screen-time supportive practices specifically are likely to
affect children’s understanding of the importance of PA and harmful effects of screen-
time and consequently their activity preferences [461]. This combination of increased
preference for PA and reduced BMI paired with a healthful physical and social home
environment may explain why this cluster was associated with increased sitting breaks at
home.
The favourable PA physical environment cluster was more likely to be found in families
with older parents and a higher income. It seems these families have sufficient financial
resources which they use to provide a physical environment conducive to PA. Similar to
the positive social and physical PA environment cluster, this cluster was also associated
with increased sitting breaks and a healthier weight status in children. The greater space
inside and outside, coupled with more available PA equipment, may provide more
173
opportunities for breaking up screen-based sedentary activities [383]. Again, given the
relationship between income and health, this cluster may also denote parents who use
health-promoting practices which have been associated with healthier weight status in
children [462].
The high smartphone availability and access to digital TV cluster was associated with all
four home-based behavioural outcomes in the hypothesised directions, suggesting it is
highly relevant. This cluster was most likely to be found in families who lived in a
deprived area (based on WIMD), in a rented home. The greater presence of smartphones
and digital TV in the households of these families with limited resources, whilst
surprising, is congruent with previous research which shows lower SES families own
more electronic media equipment than higher SES families [246,311]. This suggests that
the socioeconomic differences in electronic media equipment access are not driven by
financial factors. In the case of this cluster, parents living in poorer neighbourhoods have
more safety concerns [463], less time to supervise children’s active play [464] and lack
access to structured PA and play areas [298], making screen-based entertainment a more
convenient alternative to PA. Similarly, parents with a lower educational level, another
indicator of low SES, scored lower on the low accessibility and availability of electronic
media equipment cluster. This cluster was also negatively associated with home-based
sitting. Three of the four factors forming this cluster have been associated with increased
screen-time [41,235], a particularly prevalent sedentary behaviour. Therefore, the
combination of the factors may be having an important synergistic effect on children’s
sitting at home.
One of the keys strengths of this study is the clustering approach, which, to our
knowledge, has only been used in two previous studies investigating parenting practices
[288,289]. Indeed, the present study provides an insight into how physical and social
factors within the home cluster, thereby enabling more effective interventions through
targeting multiple factors simultaneously. Further strengths include, but are not limited
to, the use of the validated audit to comprehensively assess the home physical
environment [299], the investigation of home-specific environmental factors and home-
based behaviours, as well as the objective measures of behaviours. Nonetheless, the study
is not without limitations. First, information on the physical and social environment was
only obtained from one parent. The other parent may have been more influential, with
174
some studies indicating that the father is the most likely role model for boys’ PA, whereas
mothers are for girls [272,465]. However, the number of parents was adjusted for in each
analysis. Additionally, PCA is not a confirmatory, but an exploratory method, and
therefore does not produce definitive clusters. Indeed, the clusters yielded from the
analyses are strongly influenced by researcher-led decisions, particularly which factors
are included in analyses [466]. The factors were chosen based on theoretical rationales
and whether they have been related to children’s PA and sedentary time in previous
studies. The cross-sectional nature, and therefore the inability to infer causal
relationships, coupled with the reliance on self-report data for identifying social factors
and periods when the child was at home, were also limitations.
9.6. Conclusion In conclusion, the findings provide evidence of clustering or co-occurrence of some
physical and social activity related factors within the home. The clusters were shown to
be associated with several parental, child and family characteristics, with socioeconomic
factors particularly influential. Specifically, healthy and unhealthy clusters were more
likely to be found in high and low SES groups, respectively. The healthy and unhealthy
clusters were positively associated with favourable (PA and sitting breaks) and negative
(sedentary time) behaviours, respectively. This indicates that the effects on PA and
sedentary behaviour may increase synergistically when several factors occur
simultaneously. Nonetheless, whilst further research is required to determine why clusters
of physical and social factors occur in certain SES groups, interventions which target
clusters of social and physical factors within the home, especially among low SES
families, are warranted.
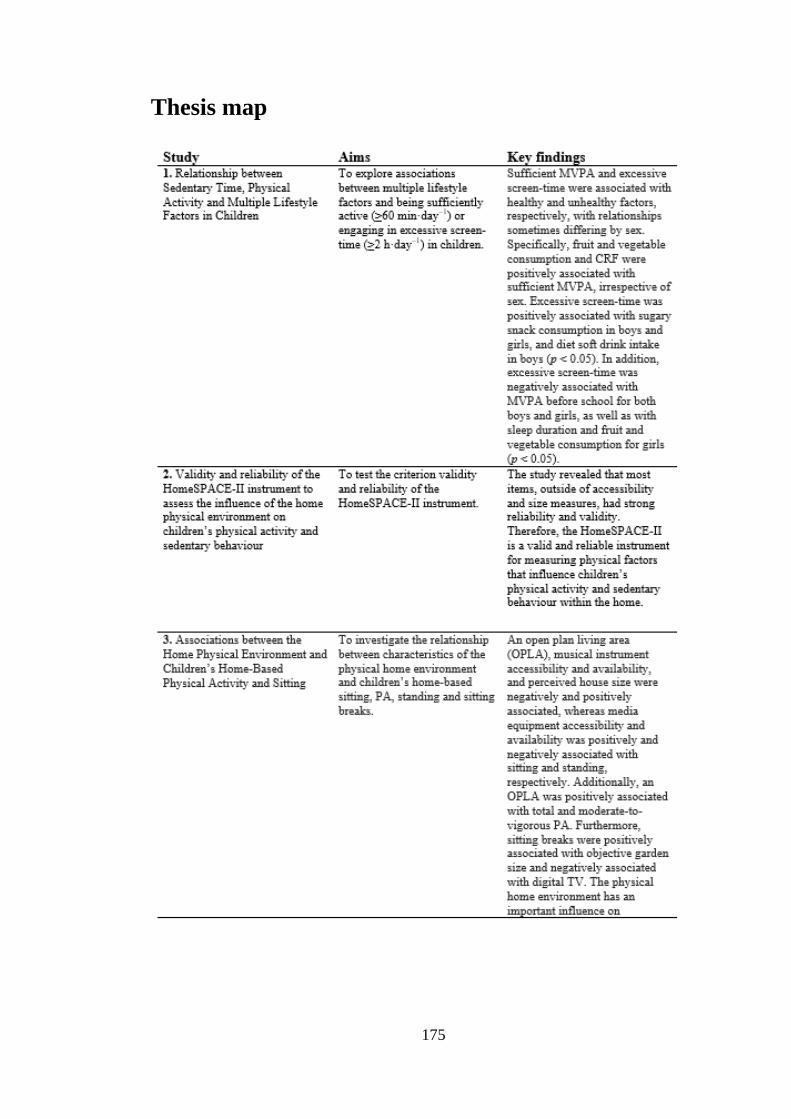
175
Thesis map
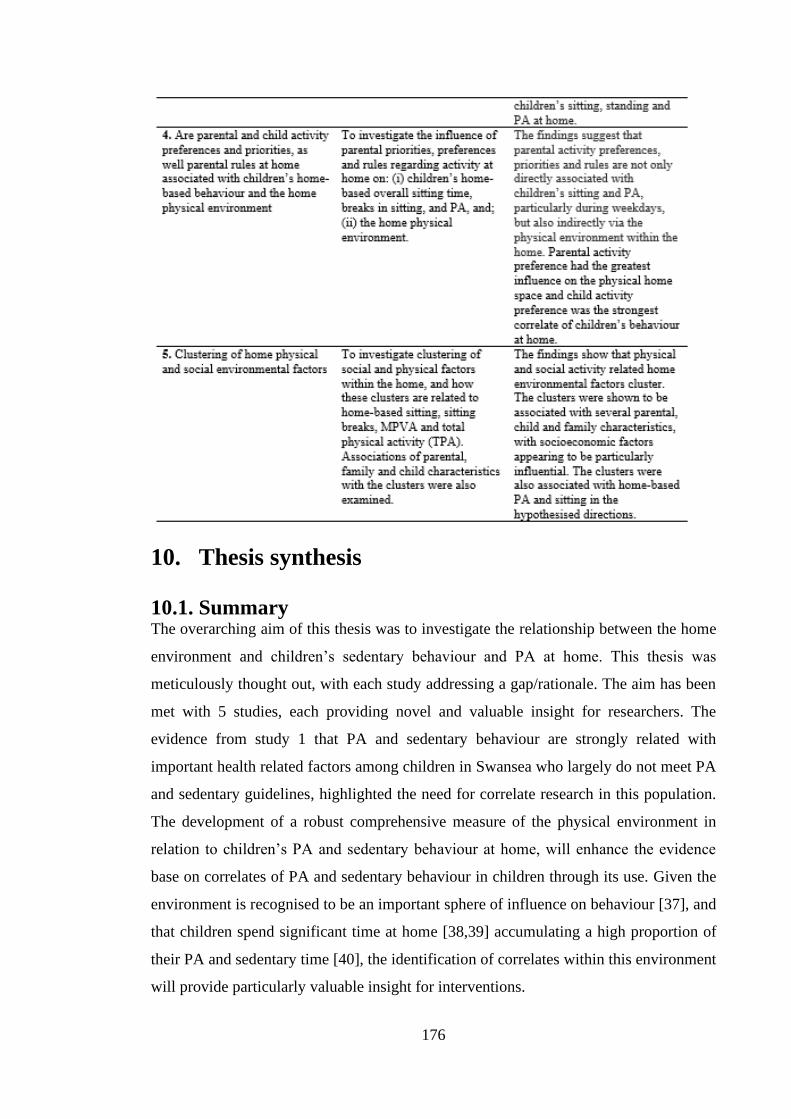
176
10. Thesis synthesis
10.1. Summary The overarching aim of this thesis was to investigate the relationship between the home
environment and children’s sedentary behaviour and PA at home. This thesis was
meticulously thought out, with each study addressing a gap/rationale. The aim has been
met with 5 studies, each providing novel and valuable insight for researchers. The
evidence from study 1 that PA and sedentary behaviour are strongly related with
important health related factors among children in Swansea who largely do not meet PA
and sedentary guidelines, highlighted the need for correlate research in this population.
The development of a robust comprehensive measure of the physical environment in
relation to children’s PA and sedentary behaviour at home, will enhance the evidence
base on correlates of PA and sedentary behaviour in children through its use. Given the
environment is recognised to be an important sphere of influence on behaviour [37], and
that children spend significant time at home [38,39] accumulating a high proportion of
their PA and sedentary time [40], the identification of correlates within this environment
will provide particularly valuable insight for interventions.
177
Chapter 1 described the evidence demonstrating the high prevalence of inactivity and
sedentary behaviour in children. Such high rates are of concern, given the discussed
physiological and psychological benefits and detriments of PA [6] and sedentary
behaviour [5] in children, respectively. Of the sedentary behaviours children engage in,
screen-time is the most strongly associated with health and is the most prevalent [5].
Ubiquitous lifestyle factors important to children’s health such as sleep, diet and CRF
have been associated with children’s PA [6,89,323] and screen-time [83,85,88]. However,
research investigating associations between lifestyle factors and PA is lacking,
specifically amongst British children. Further, previous studies have only assessed
relationships between lifestyle factors and MVPA or screen-time in isolation. The
investigation of both relationships simultaneously in the same sample would allow an
improved understanding of the associated lifestyle factors, as well as providing valuable
insight for future interventions. To address such gaps in the literature, the first study of
this thesis explored associations between multiple lifestyle factors and being sufficiently
active (≥60 min·day–1) or engaging in excessive screen-time (≥2 h·day–1) in children.
Study 1 provides much needed insight on associations between lifestyle factors and PA
in British children, as well allowing a better understanding of associations between
lifestyle factors, PA and screen-time, by assessing relationships simultaneously. This
chapter found that sufficient MVPA and excessive screen-time were associated with
healthy and unhealthy factors, respectively, with relationships sometimes differing by
sex. Such findings support the importance of increasing children’s PA and reducing their
sedentary time, given the associations between the measured lifestyle factors and obesity
in children [5,320]. Additionally, the children in the study on average were not
sufficiently active for 3 days a week and engaged in excessive screen-time for 4 days a
week, suggesting that more insight into the correlates of these behaviours was needed.
Identifying the correlates of PA and sedentary time is key to the development of
successful interventions [35]. The home is thought to be a significant sphere of influence
on children’s PA and sedentary time [41].Therefore the following chapters focused on
improving understanding of these behaviours in the home, to inform effective evidence-
based interventions. Within the home, social and physical environmental factors and
individual characteristics have been shown to influence children’s sedentary time and PA
[43]. According to ecological models, the environment has a particularly important
influence [37]. Whilst a large body of evidence exists on the social environment of the

178
home, research investigating the physical environment, beyond PA and electronic media
equipment, is lacking [41]. Therefore, particular attention was paid to the physical
environment of the home in the following studies, whilst still recognising the important
influence of the social environment.
Valid and reliable comprehensive measures of the environment are essential to improving
understanding of how the home environment influences children’s PA and sedentary
time. Whilst the HomeSPACE-I instrument is a comprehensive measurement tool with
proven validity and reliability, it was tested for use in Western Australia in mostly one-
storey homes which differ in layout and design to two-storey homes which are
commonplace in the UK. Further, it only measures an item’s availability, and not its
accessibility. Therefore, study 2 developed HomeSPACE-II, an instrument for use in two-
storey homes, with a measure of accessibility, to comprehensively measure the physical
environment in relation to children’s home-based PA and sedentary time. It was revealed
that most items, including availability, average accessibility and the combined
accessibility and availability summary scores, but excluding some specific accessibility
ratings and size measures, had strong reliability and validity. This suggests it can be
independently used by parents to measure aspects of the physical environment of homes
that may influence children’s PA and sedentary time. Therefore, it was used as a measure
of the home physical environment in study 3 and thereafter.
Although there is an emerging evidence base on the influence of the home physical
environment on children’s PA and sedentary time, it is largely limited to PA and media
equipment and findings are inconsistent [41]. Research has also been hampered by the
reliance of self-report surveys to measure the environment and the lack of studies
measuring home-based behaviour [41]. The indoor physical environment has received
limited attention compared with the outdoor environment [41]. However, this
environment is particularly relevant in the UK, given its temperamental climate [389]
forcing children indoors [38]. Thus, study 3 sought to assess associations between
objectively measured home physical environment, with a particular focus on the indoor
environment, on children’s home-based PA, standing, sitting breaks and sitting time.
Study 3 showed that some aspects of the home physical environment have an important
relationship with children’s sitting, standing and PA at home, even after adjusting for
179
socio- demographic and social factors. The home physical environment was found to be
most strongly associated with TPA, sitting and standing, therefore future home-based
interventions should concentrate on targeting these behaviours. Of note, some
relationships were strongly attenuated or strengthened with the addition of social
environmental and individual characteristics to the models. Given these confounding
effects, and the previously demonstrated influence of the social environment,
interventions seeking to create home environments conducive to PA, need to consider the
social environment in their design. Whilst a large body of evidence exists on the influence
of the home social environment on children’s PA and sedentary time, few studies have
investigated associations between home-specific factors and home-based behaviours.
Further, it was not known which social and individual factors influence how parents create
their home physical environments, such research would provide invaluable information
to interventions seeking to create home environments more conducive to PA and give
insight into the pathways by which parents influence their children’s PA and sedentary
time. Therefore, study 4 investigated the influence of home-specific social and individual
factors on: (i) children’s home-based sitting time, breaks in sitting, and PA, and; (ii) the
home physical environment.
In the study, parental and child preferences and priorities, as well as parental rules for
leisure activity at home, were associated with children’s sitting and PA at home,
particularly during weekdays. They were also associated with factors related to leisure
activity in the physical environment, providing evidence that they may also be indirectly
associated with children’s PA and sitting via the physical environment. This finding adds
to the evidence that social factors are directly associated with children’s behaviour. It is
worth noting that parental factors had the strongest associations with the physical
environment of the home. Indeed, qualitative research has shown that parents possess the
control to structure their physical home space to align with their preferences and beliefs.
Therefore, physical and social factors may cluster accordingly. Identifying which factors
cluster would lead to more successful and economical interventions, through employing
strategies which target more than one factor simultaneously. However, previous research
investigating clustering of social and physical environmental factors was limited, but
studies which investigate clustering of factors specific to the home were particularly
lacking. Indeed, clusters of these factors could have an important synergistic effect on
behaviour given that physical and social factors were shown to have strong associations
180
with children’s behaviour at home in study 3 and 4, respectively. Fittingly, the last study,
study 5, investigated clustering of physical and social leisure activity related factors
within the home, and their relationships with home-based sitting and PA outcomes in
children. Since an understanding of how clusters arise is imperative to any interventions
applying a cluster approach, associations of parental, family and child characteristics with
clusters were also explored.
As hypothesised, study 5 found evidence of physical and social factors co-occurring
within the home, which is in line with the few studies that have examined clustering of
parenting practices [288,289]. In addition, clusters were related to children’s home-based
behaviours in the expected direction: healthy clusters (i.e., low accessibility and
availability of electronic media equipment) and the unhealthy cluster of high smartphones
availability and access to digital TV were positively associated with positive behaviours
(i.e., PA and sitting breaks) and negative behaviours (i.e., sedentary time), respectively.
Taken together, the findings suggest that when social and physical factors occur
simultaneously within the home, they may have an important synergistic effect on
children’s behaviour at home. Interventions which focus on clusters of social and physical
factors at home particularly among low SES groups seem warranted, albeit more nuanced
research is needed to determine why some clusters are more likely to occur in certain SES
groups.
In conclusion, given study 1 demonstrated the importance of meeting PA and sedentary
behaviour recommendations in terms of health related lifestyle behaviours, and studies 3,
4 and 5 showed that the home environment has a significant relationship with children’s
PA, sedentary time and sedentary breaks, interventions targeting increases in PA and
sedentary breaks as well as reductions in sedentary time in this environment are needed.
Given the multitude of health benefits associated with sufficient PA [6] and the emerging,
albeit preliminary, evidence that excessive sedentary behaviour, particularly of a
prolonged nature is adversely associated with health outcomes [447], such interventions
would have important implications for improving children’s health. Additionally,
increases in PA and reductions in sedentary time during childhood may also lead to
improved health in adulthood, through delaying the onset of serious chronic diseases such
as cardiovascular disease and some types of cancer [32], since behaviour habits have been
shown to track from childhood to adulthood [31].
181
10.2. Strengths and limitations
The most important strength of this study is the novelty of the 5 studies. Study 1 provides
much needed insight on the relationship between PA and diet in British children as well
as an improved understanding of how PA and sedentary behaviour are related to lifestyle
factors through the assessment of relationships simultaneously. The inclusion of the latest
technology in the assessment of screen-time also advanced past work that focused
exclusively on television viewing [85,334,335]. Additionally, the sample was socio-
demographically representative of the population and many confounding factors were
controlled for. The development of HomeSPACE-II, a comprehensive measure of the
physical environment in relation to children’s PA and sedentary behaviour at home, in
study 2 was a particularly important step in this thesis, given its use in study 3 and
thereafter. Although, the instrument was largely based on HomeSPACE-I [290], it builds
on it by being tested for use in two storey homes and because it includes a wider range of
PA equipment, and a measure of accessibility, as well as availability. Since
HomeSPACE-II was also the first instrument of its kind to be rigorously tested for its
reliability and validity outside of Australia and the USA, it may be the most appropriate
measure of the home physical environment in countries which resemble the UK in terms
of geographical and home characteristics. Study 3 was the first to examine relationships
between several home physical environment factors and children’s PA and sedentary
behaviour and one of the first to measure home-based behaviour. The inclusion of both
perceived and objective measures (i.e., GIS and the audit, which is more objective than
surveys) as well as the high response rate were also strengths. Study 4 was the first study
to examine associations between home-specific social factors and children’s behaviour
and the first quantitative study to provide such an in depth understanding of what
individual and social factors may influence the creation of the home physical
environment. Study 5 enables a unique understanding of how home-specific social and
physical factors cluster as well as how they relate to children’s home-based behaviour
and background characteristics. The key strength of this study is the clustering method
utilised, which had only been used twice previously to examine clustering of parenting
practices [288,289]. The insight provided by this method will enable more effective
interventions, through informing an approach that targets several factors simultaneously.
Lastly, the use of objective measures to assess children’s behaviour and the physical
182
environment at home as well as the large number of variables controlled for in study 3
and thereafter, would have enhanced precision in determining meaningful relationships.
Despite the numerous strengths, several limitations should be acknowledged. The
measure used to assess diet, MVPA, screen-time and sleep duration in study 1 may have
introduced some measurement error. First, it was a self-report instrument, thus increasing
the probability of making a type II error [169]. Second, the time-specific questions may
not have been sensitive enough to provide reliable estimates of habitual behaviour. The
over representation of high SES parents in study 2, may limit the generalisability of the
Home-SPACE-II to other less affluent groups. Further, the subjective nature of some
measures made validating them against a researcher a challenge. The reliance on self-
report to determine when the children were at home for study 3 and thereafter was also a
limitation, however there was no feasible alternative for measuring this objectively.
Whilst the objective measures of house and garden were key strengths of studies 3-5, they
may not reflect true size for the specific homes, given they only pertain to each postcode
unit. The lack of data on social factors from both parents in studies 4 and 5 was also a
limitation. Indeed, it is possible that the other parent was more influential in their child’s
behaviour, with some studies reporting gender differences in parental influence
[272,465]. However, an attempt was made to partly overcome this limitation by
controlling for the number of parents in each analysis. Principal component analysis, used
to examine clustering of physical and social factors in study 5, is exploratory, and
therefore not a confirmatory method capable of yielding definitive clusters. This means
that decisions made by the researcher, such as which factors to include in the analysis,
have a significant bearing on the clusters produced [466]. However, deciding which
factors to include was an iterative process, based on theoretical rationale and previous
findings.
10.3. Future directions
Study 1 is a good starting point for demonstrating the importance of meeting PA and
sedentary behaviour recommendations in terms of health-related lifestyle factors.
However, future studies should seek to confirm the findings by measuring diet, screen-
time, MVPA and sleep duration over 7 days, which will provide more reliable estimates
of habitual behaviour. Such studies should also use the most valid and reliable measures
183
available to enhance measurement accuracy, specifically diary/logs for the assessment of
diet and screen-time and accelerometers for the measurement of sleep duration and
MVPA.
The high rates of inactivity and excessive screen-time observed in children also indicate
a pressing need for more interventions which promote children’s PA and reduce their
sedentary behaviour. Given that multiple lifestyle factors, differing by sex, were
associated with sufficient levels of MVPA and excessive screen-time in study 1, one
approach could be to target change in multiple lifestyle behaviours in single sex
interventions with sex-specific strategies. Single sex family-based interventions have
been shown to be more effective than mixed-sex studies among girls [467,468]. In support
of targeting multiple lifestyle factors, a recent review found targeting change in multiple
health behaviours to be effective at increasing PA in school-based interventions [469]. In
contrast, family-level interventions of the same design were shown to have little influence
on PA [469]. The ease of delivery [470] and the additional approaches employed in
school-based interventions such as school policy changes and whole-school
implementation of intervention principles may explain their greater success. Indeed,
further research is warranted on how to make such interventions work at the family-level.
The findings from this thesis demonstrate that the environment plays an important role in
children’s PA and sedentary behaviour at home. Specifically, the findings of study 3 and
thereafter will provide the foundation for research helping to create home environments
more supportive to PA and less conducive to sedentary behaviour. Whilst, most gaps in
the literature were addressed in this thesis, several still remain. For example, greater
insight into the context of PA and sedentary behaviour at home such as the type of
behaviour being performed, where the behaviour is being performed and with whom
[202] is urgently needed. Such contextual information would allow more specificity in
the identification of PA and sedentary behaviour correlates, necessary for informing
successful behaviour change interventions. According to social ecological models, there
is an important link between location and behaviour [36,37], Therefore the objective
measurement of where PA and sedentary behaviour occur at home is imperative. Such
measurement would also allow researchers to determine time at home objectively.
Bluetooth proximity monitoring using ActiGraph monitors holds most promise for
184
inferring the location of children’s PA and sedentary behaviour at home. However, whilst
BLE proximity monitoring has been shown to accurately measure location in adults
within an office setting [209], its accuracy in the home environment among children is
unknown. Wearable cameras can also measure location as well as the type of behaviour
being performed and the social context [206], however the associated ethical and
analytical issues complicate the use of such devices [218]. Similarly, their utility within
the home environment among children is also unknown. Therefore, future research should
seek to assess the feasibility of using wearable cameras and BLE proximity monitoring
to assess the context of children’s behaviour in the home environment.
Given children spent a significant proportion of their time at home sitting (67 %) and the
paucity of previous studies [41], home environment interventions are recommended.
Based on the results from Study 3, changing the physical environment at home holds
promise, particularly for increasing TPA and standing and reducing sitting. The results
suggest strategies such as keeping electronic media in locations which enable parental
supervision, making changes to furniture layouts to free up space, increasing time
outdoors at home and introducing electronic media breaks could be effective. The layout
of homes, although not examined in detail in this thesis, specifically the distance required
to reach key destinations (i.e., kitchen, toilet etc..), may also affect children’s step counts
and sitting time. Spatial software could be used to calculate spatial layouts using floor
plans [209], and subsequently distances between different destinations. Based on this
information, physical environments could be reconfigured to prompt incidental PA and
discourage sitting. Additionally, if Bluetooth proximity monitoring was utilised to
measure where behaviours occur, locations in which prolonged sitting is most likely to
occur could be targeted. For example, if children spend a lot of time sitting in the lounge
or their bedrooms, changes could be made in these locations to enhance movement. Given
study 4 demonstrated that parents have a significant relationship with the physical
environment at home, to give such interventions the best chance of success, negotiation
with parents as well as the entire family on the design of the intervention is important to
ensure buy in from all family members, but in particular the parents. Indeed, it is
important that researchers gauge from families which strategies would be acceptable and
practical before designing a tailored intervention. The results from study 4 also indicate
that interventions need to provide education to parents on how to best support their child’s
PA and restrict their sitting at home. Specifically, parents could be educated on the
185
harmful effects of excessive screen-time and the importance of PA for all ages, strategies
for limiting screen-time and increasing PA at home as well as how to create healthier
home environments. Further, parents should be encouraged to model healthy behaviours
including limiting screentime and participating in PA themseselves, promote particpation
in PA as a family, and enforce limits on screen-time as well as help children find active
alternatives. Since parental and child activity preferences were shown to be significant
influences on the physical environment and children’s home-based behaviour,
respectively, changing activity preferences or finding equally enjoyable active
alternatives to sedentary activities at home will also be an important challenge for future
research. Although we acknowledge it will not be easy, one approach for increasing
children’s preference for PA is to target improvements in their fundamental movement
skills (FMS), as mastery of FMS may lead to increased enjoyment of PA [446]. This in
combination with limits on screen-based sedentary behaviours enforced by parents, will
provide children with opportunities to experience active alternatives to sedentary
activities, which they may enjoy equally as much, if not more. Parental activity
preferences may be harder to change, as they are more ingrained. However, through
provision of education of the importance of PA and detriments of sedentary behaviour,
parents may perceive PA as more important, which may prompt them to create home
environment more supportive of PA.
10.4. Final comments and reflections
This thesis has provided much needed insight into correlates of children’s PA and
sedentary behaviour that previously had received limited attention. In particular, the
findings will allow a much-improved understanding of the relationship between the home
environment and children’s PA and sedentary behaviour at home. Study 1 investigated
relationships between important health related lifestyle factors and sufficient levels of
MVPA or excessive screen-time. The strong associations observed between the obesity
related lifestyle factors and PA and sedentary behaviour reinforced the importance of
promoting PA and discouraging sedentary behaviour in children. Additionally, the low
rates of children meeting MVPA and sedentary behaviour guidelines also indicated that
an improved understanding of the correlates of such behaviours was urgently needed to
inform interventions. Given the recognised influence of the environment on children’s
PA and the significant time children spend at home, studies 2 and thereafter aimed to
186
improve insight into the correlates of PA and sedentary behaviour in the home
environment. There was a need for a comprehensive measure of the home physical
environment in relation to children’s PA and sedentary behaviour validated for use in
two-story homes, therefore study 2 sought to develop HomeSPACE-II, an instrument
which addressed the limitations of previous measures. Using HomeSPACE-II to measure
the physical environment, study 3 examined associations between the home physical
environment and children’s home-based PA, standing, sitting breaks and sitting time.
Certain aspects of the physical environment were shown to be significantly related,
however some relationships were strongly confounded by social and individuals’ factors.
Due to the interaction observed between social and physical factors specific to the home
and the established influence of the social environment, study 4 investigated how home-
specific social and individual factors influence: (i) children’s home-based sitting time,
breaks in sitting, and PA, and: (ii) the home physical environment. Study 4 showed that
parents control the formation of the physical home space to suit their preferences and
attitudes, providing an indication that physical and social factors cluster accordingly.
Identifying which physical and social activity related factors cluster at home will allow
approaches which target more than one factor simultaneously, resulting in more effective
and economical interventions. Previous research also suggested that clusters of such
factors could have an important synergistic effect on children’s behaviours. Thus, study
5 explored clustering of physical and social activity related factors at home, and how they
relate to home-based PA and sedentary behaviour. Due to the necessity of understanding
why clusters arise for interventions, associations of parental, child and family
characteristics with clusters were also examined. The findings of this thesis support the
importance of interventions which aim to increase PA and reduce sedentary behaviour in
the home environment. The results from the individual studies can be utilised to inform
the design and development of such interventions, as well as future research.
187
11. References
1. Trinh, A; Campbell, M.; Ukoumunne, O.C.; Gerner, B.; Wake, M. Physical
Activity and 3-Year BMI Change in Overweight and Obese Children. Pediatrics
2013, 2, 131.
2. Wilkie, H.J.; Standage, M.; Gillison, F.B.; Cumming, S.P.; Katzmarzyk, P.T.
Multiple lifestyle behaviours and overweight and obesity among children aged 9-
11 years: results from the UK site of the International Study of Childhood Obesity,
Lifestyle and the Environment. BMJ Open 2016, 6, e010677.
3. Mcmanus, A.M.; Mellecker, R.R. Physical activity and obese children. Journal of
Sport and Health Science. 2012, 3, 1.
4. Roman-Viñas, B.; Chaput, J.-P.; Katzmarzyk, P.T.; Fogelholm, M.; Lambert, E.
V.; Maher, C.; Maia, J.; Olds, T.; Onywera, V.; Sarmiento, O.L.; et al. Proportion
of children meeting recommendations for 24-hour movement guidelines and
associations with adiposity in a 12-country study. Int. J. Behav. Nutr. Phys. Act.
2016, 13, 123.
5. Carson, V.; Hunter, S.; Kuzik, N.; Gray, C.E.; Poitras, V.J.; Chaput, J.-P.;
Saunders, T.J.; Katzmarzyk, P.T.; Okely, A.D.; Connor Gorber, S.; et al.
Systematic review of sedentary behaviour and health indicators in school-aged
children and youth: an update 1. Appl. Physiol. Nutr. Metab 2016, 41, 240–265.
6. Poitras, V.J.; Gray, C.E.; Borghese, M.M.; Carson, V.; Chaput, J.-P.; Janssen, I.;
Katzmarzyk, P.T.; Pate, R.R.; Connor Gorber, S.; Kho, M.E.; et al. Systematic
review of the relationships between objectively measured physical activity and
health indicators in school-aged children and youth. Appl. Physiol. Nutr. Metab.
2016, 41, S197–S239.
7. Kwon, S.; Janz, K.F.; Burns, T.L.; Levy, S.M. Association between light-intensity
physical activity and adiposity in childhood. Pediatr. Exerc. Sci. 2011, 23, 218–
229.
8. Kuzik, N.; Carson, V.; Andersen, L.B.; Sardinha, L.B.; Grøntved, A.; Hansen,
B.H.; Ekelund, U. Physical Activity and Sedentary Time Associations with
Metabolic Health Across Weight Statuses in Children and Adolescents. Obesity
2017, 25, 1762–1769.
9. Aadland, E.; Kvalheim, O.M.; Anderssen, S.A.; Resaland, G.K.; Andersen, L.B.
The multivariate physical activity signature associated with metabolic health in
children. Int. J. Behav. Nutr. Phys. Act. 2018, 15.
10. Poitras, V.J.; Gray, C.E.; Borghese, M.M.; Carson, V.; Chaput, J.; Janssen, I.;
Katzmarzyk, P.T.; Pate, R.R.; Gorber, S.C.; Kho, M.E.; et al. Systematic review of
the relationships between objectively measured physical activity and health
indicators in. 2016, 239.
11. Stiglic, N.; Viner, R.M. Effects of screentime on the health and well-being of
children and adolescents: A systematic review of reviews. BMJ Open 2019.
12. Mitchell, J.A.; Pate, R.R.; Beets, M.W.; Nader, P.R. Time spent in sedentary
behavior and changes in childhood BMI: A longitudinal study from ages 9 to 15
years. Int. J. Obes. 2013, 37, 54–60.
13. Cliff, D.P.; Hesketh, K.D.; Vella, S.A.; Hinkley, T.; Tsiros, M.D.; Ridgers, N.D.;
Carver, A.; Veitch, J.; Parrish, A.-M.; Hardy, L.L.; et al. Objectively measured
sedentary behaviour and health and development in children and adolescents:
systematic review and meta-analysis. Obes. Rev. 2016, 17, 330–44.
14. Belcher, B.R.; Berrigan, D.; Papachristopoulou, A.; Brady, S.M.; Bernstein, S.B.;
Brychta, R.J.; Hattenbach, J.D.; Tigner, I.L.; Courville, A.B.; Drinkard, B.E.; et al.
188
Effects of Interrupting Children’s Sedentary Behaviors With Activity on Metabolic
Function: A Randomized Trial. J. Clin. Endocrinol. Metab. 2015, 100, 3735–43.
15. González, K.; Fuentes, J.; Márquez, J.L. Physical inactivity, sedentary behavior
and chronic diseases. Korean J. Fam. Med. 2017.
16. Lee, I.M.; Shiroma, E.J.; Lobelo, F.; Puska, P.; Blair, S.N.; Katzmarzyk, P.T.;
Alkandari, J.R.; Andersen, L.B.; Bauman, A.E.; Brownson, R.C.; et al. Effect of
physical inactivity on major non-communicable diseases worldwide: An analysis
of burden of disease and life expectancy. Lancet 2012, 380, 219–229.
17. Salonen, M.K.; Wasenius, N.; Kajantie, E.; Lano, A.; Lahti, J.; Heinonen, K.;
Räikkönen, K.; Eriksson, J.G. Physical activity, body composition and metabolic
syndrome in young adults. PLoS One 2015.
18. Lee, C. Do; Folsom, A.R.; Blair, S.N. Physical activity and stroke risk: A meta-
analysis. Stroke 2003.
19. Gill, J.M.R.; Cooper, A.R. Physical activity and prevention of type 2 diabetes
mellitus. Sports Med. 2008, 38, 807–24.
20. Rebar, A.L.; Stanton, R.; Geard, D.; Short, C.; Duncan, M.J.; Vandelanotte, C. A
meta-meta-analysis of the effect of physical activity on depression and anxiety in
non-clinical adult populations. Health Psychol. Rev. 2015.
21. Brown, J.C.; Winters-Stone, K.; Lee, A.; Schmitz, K.H. Cancer, Physical Activity,
and Exercise. In Comprehensive Physiology; John Wiley & Sons, Inc.: Hoboken,
NJ, USA, 2012.
22. Winzer, E.B.; Woitek, F.; Linke, A. Physical activity in the prevention and
treatment of coronary artery disease. J. Am. Heart Assoc. 2018.
23. Stamatakis, E.; Ekelund, U.; Ding, D.; Hamer, M.; Bauman, A.E.; Lee, I.M. Is the
time right for quantitative public health guidelines on sitting? A narrative review
of sedentary behaviour research paradigms and findings. Br. J. Sports Med. 2019,
53, 377–382.
24. Rezende, L.F.M.; Sá, T.H.; Mielke, G.I.; Viscondi, J.Y.K.; Rey-López, J.P.;
Garcia, L.M.T. All-Cause Mortality Attributable to Sitting Time: Analysis of 54
Countries Worldwide. Am. J. Prev. Med. 2016, 51, 253–263.
25. De Rezende, L.F.M.; Lopes, M.R.; Rey-Loṕez, J.P.; Matsudo, V.K.R.; Luiz,
O.D.C. Sedentary behavior and health outcomes: An overview of systematic
reviews. PLoS One 2014.
26. Ekelund, U.; Steene-Johannessen, J.; Brown, W.J.; Fagerland, M.W.; Owen, N.;
Powell, K.E.; Bauman, A.; Lee, I.M. Does physical activity attenuate, or even
eliminate, the detrimental association of sitting time with mortality? A harmonised
meta-analysis of data from more than 1 million men and women. Lancet 2016, 388,
1302–1310.
27. Bellettiere, J.; Winkler, E.A.H.; Chastin, S.F.M.; Kerr, J.; Owen, N.; Dunstan,
D.W.; Healy, G.N. Associations of sitting accumulation patterns with cardio-
metabolic risk biomarkers in Australian adults. PLoS One 2017, 12, e0180119.
28. Healy, G.N.; Matthews, C.E.; Dunstan, D.W.; Winkler, E.A.H.; Owen, N.
Sedentary time and cardio-metabolic biomarkers in US adults: NHANES 2003-06.
Eur. Heart J. 2011, 32, 590–7.
29. Diaz, K.M.; Howard, V.J.; Hutto, B.; Colabianchi, N.; Vena, J.E.; Safford, M.M.;
Blair, S.N.; Hooker, S.P. Patterns of Sedentary Behavior and Mortality in U . S .
Middle-Aged and Older Adults. Ann. Intern. Med. 2017, 167, 465–475.
30. Telama, R.; Yang, X.; Viikari, J.; Välimäki, I.; Wanne, O.; Raitakari, O. Physical
activity from childhood to adulthood: A 21-year tracking study. Am. J. Prev. Med.
2005, 28, 267–273.
189
31. Biddle, S.J.H.; Pearson, N.; Ross, G.M.; Braithwaite, R. Tracking of sedentary
behaviours of young people: A systematic review. Prev. Med. (Baltim). 2010, 51,
345–351.
32. González, K.; Fuentes, J.; Márquez, J.L. Physical inactivity, sedentary behavior
and chronic diseases. Korean J. Fam. Med. 2017, 38, 111–115.
33. Farooq, A.; Martin, A.; Janssen, X.; Wilson, M.G.; Gibson, A.M.; Hughes, A.;
Reilly, J.J. Longitudinal changes in moderate-to-vigorous-intensity physical
activity in children and adolescents: A systematic review and meta-analysis. Obes.
Rev. 2020, 21.
34. Janssen, X.; Mann, K.D.; Basterfield, L.; Parkinson, K.N.; Pearce, M.S.; Reilly,
J.K.; Adamson, A.J.; Reilly, J.J. Development of sedentary behavior across
childhood and adolescence: Longitudinal analysis of the Gateshead Millennium
Study. Int. J. Behav. Nutr. Phys. Act. 2016, 13.
35. Sallis, J.F.; Owen, N.; Fotheringham, M.J. Behavioral epidemiology: A systematic
framework to classify phases of research on health promotion and disease
prevention. Ann. Behav. Med. 2000, 22, 294–298.
36. Bronfenbrenner, U. Toward an Experimental Ecology of Human Development.
Am. Psychol. 1977, 32, 513–531.
37. Sallis, J.F.; Cervero, R.B.; Ascher, W.; Henderson, K.A.; Kraft, M.K.; Kerr, J. an
Ecological Approach To Creating Active Living Communities. Annu. Rev. Public
Health 2006, 27, 297–322.
38. Briggs, D..; Denman, A..; Gulliver, J.; Marley, R..; Kennedy, C..; Philips, P..;
Field, K.; Crockett, R.. Time activity modelling of domestic exposures to radon. J.
Environ. Manage. 2003, 67, 107–120.
39. Khajehzadeh, I.; Vale, B. How New Zealanders distribute their daily time between
home indoors, home outdoors and out of home. Kōtuitui New Zeal. J. Soc. Sci.
Online 2017, 12, 17–31.
40. Tandon, P.; Grow, H.M.; Couch, S.; Glanz, K.; Sallis, J.F.; Frank, L.D.; Saelens,
B.E. Physical and social home environment in relation to children ’ s overall and
home-based physical activity and sedentary time. Prev. Med. (Baltim). 2014, 66,
39–44.
41. Maitland, C.; Stratton, G.; Foster, S.; Braham, R.; Rosenberg, M. A place for play ?
The influence of the home physical environment on children ’ s physical activity
and sedentary behaviour. Int. J. Behav. Nutr. Phys. Act. 2013, 10, 1.
42. Kaushal, N.; Rhodes, R.E. The home physical environment and its relationship
with physical activity and sedentary behavior: A systematic review. Prev. Med.
(Baltim). 2014, 67, 221–237.
43. Maitland, C.; Stratton, G.; Foster, S.; Braham, R.; Rosenberg, M. The Dynamic
Family Home: a qualitative exploration of physical environmental influences on
children’s sedentary behaviour and physical activity within the home space. Int. J.
Behav. Nutr. Phys. Act. 2014, 11, 157.
44. Aubert, S.; Barnes, J.D.; Abdeta, C.; Abi Nader, P.; Adeniyi, A.F.; Aguilar-Farias,
N.; Andrade Tenesaca, D.S.; Bhawra, J.; Brazo-Sayavera, J.; Cardon, G.; et al.
Global Matrix 3.0 Physical Activity Report Card Grades for Children and Youth:
Results and Analysis From 49 Countries. J. Phys. Act. Heal. 2018, 15, S251–S273.
45. Craig, R.; Mindell, J.; Hirani, V. Health Survey for England 2008 Volume 1:
Physical Activity and Fitness.; 2009;
46. Rezende, L.F.M. de; Rodrigues Lopes, M.; Rey-López, J.P.; Matsudo, V.K.R.;
Luiz, O. do C. Sedentary Behavior and Health Outcomes: An Overview of
Systematic Reviews. PLoS One 2014, 9, e105620.
190
47. Nagy, L.C.; Horne, M.; Faisal, M.; Mohammed, M.A.; Barber, S.E. Ethnic
differences in sedentary behaviour in 6–8-year-old children during school terms
and school holidays: a mixed methods study. BMC Public Health 2019, 19, 152.
48. Sherry, A.P.; Pearson, N.; Ridgers, N.D.; Barber, S.E.; Bingham, D.D.; Nagy,
L.C.; Clemes, S.A. activPAL-measured sitting levels and patterns in 9–10 years
old children from a UK city. J. Public Health (Bangkok). 2018.
49. Bellettiere, J.; Winkler, E.A.H.; Chastin, S.F.M.; Kerr, J.; Owen, N.; Dunstan,
D.W.; Healy, G.N. Associations of sitting accumulation patterns with cardio-
metabolic risk biomarkers in Australian adults. PLoS One 2017, 12.
50. Belcher, B.R.; Berrigan, D.; Papachristopoulou, A.; Brady, S.M.; Bernstein, S.B.;
Brychta, R.J.; Hattenbach, J.D.; Tigner, I.L.; Courville, A.B.; Drinkard, B.E.; et al.
Effects of interrupting children’s sedentary behaviors with activity on metabolic
function: A randomized trial. J. Clin. Endocrinol. Metab. 2015.
51. Sallis, J.F.; Owen, N.; Fotheringham, M.J. Behavioral epidemiology: A systematic
framework to classify phases of research on health promotion and disease
prevention. Ann. Behav. Med. 2000, 22, 294–298.
52. Liao, Y.; Intille, S.; Wolch, J.; Pentz, M.A.; Dunton, G.F. Understanding the
Physical and Social Contexts of Children’s Nonschool Sedentary Behavior: An
Ecological Momentary Assessment Study. J. Phys. Act. Heal. 2014, 11, 588–595.
53. C J Caspersen, K E Powell, and G.M.C. Physical activity, exercise, and physical
fitness: definitions and distinctions for health-related research microcapsules and
application in Bifidobacterium longum BIOMA 5920 ” to Materials Science and
Engineering C for publication . I. 1985.
54. NCDs | Global action plan on physical activity 2018–2030: more active people for
a healthier world. WHO 2019.
55. Paffenbarger, R.S.; Hyde, R.; Wing, A.L.; Hsieh, C. Physical Activity, All-Cause
Mortality, and Longevity of College Alumni. N. Engl. J. Med. 1986, 314, 605–
613.
56. Piercy, K.L.; Troiano, R.P.; Ballard, R.M.; Carlson, S.A.; Fulton, J.E.; Galuska,
D.A.; George, S.M.; Olson, R.D. The physical activity guidelines for Americans.
JAMA - J. Am. Med. Assoc. 2018.
57. Okely, A.; Salmon, J.; Vella, S.; Cliff, D.; Timperio, A.; Tremblay, M.; Trost, S.;
Shilton, T.; Hinkley, T.; Ridgers, N.; et al. A systematic review to update the
Australian physical activity guidelines for children and young people. Fac. Soc.
Sci. - Pap. 2012.
58. Tremblay, M.S.; Warburton, D.E.R.; Janssen, I.; Paterson, D.H.; Latimer, A.E.;
Rhodes, R.E.; Kho, M.E.; Hicks, A.; LeBlanc, A.G.; Zehr, L.; et al. New Canadian
Physical Activity Guidelines. Appl. Physiol. Nutr. Metab. 2011.
59. World Health Organization Recommended Population Levels of Physical Activity
for Health. In Global Recommendations on Physical Activity for Health; 2010
ISBN 978 92 4 159 997 9.
60. Sylvia, L.G.; Bernstein, E.E.; Hubbard, J.L.; Keating, L.; Anderson, E.J. Practical
guide to measuring physical activity. J. Acad. Nutr. Diet. 2014.
61. Tremblay, M.S.; Carson, V.; Chaput, J.-P.; Connor Gorber, S.; Dinh, T.; Duggan,
M.; Faulkner, G.; Gray, C.E.; Gruber, R.; Janson, K.; et al. Canadian 24-Hour
Movement Guidelines for Children and Youth: An Integration of Physical
Activity, Sedentary Behaviour, and Sleep. Appl. Physiol. Nutr. Metab. 2016, 41,
S311–S327.
62. Department of Health Physical Activity, H.I. and P. Start active , stay active: a
report on physical activity from the four home countries’ chief medical officers.
191
Report 2011.
63. Edwards, L.C.; Tyler, R.; Blain, D.; Bryant, A.; Canham, N.; Carter-Davies, L.;
Clark, C.; Evans, T.; Greenall, C.; Hobday, J.; et al. Results From Wales’ 2018
Report Card on Physical Activity for Children and Youth. J. Phys. Act. &
Heal. 2018, 15.
64. Scholes, S. Key findings Health Survey for England 2015 Physical activity in
children Health Survey for England 2015: Physical activity in children; 2016;
ISBN 978-1-78386-896-4.
65. Griffiths, L.J.; Cortina-Borja, M.; Sera, F.; Pouliou, T.; Geraci, M.; Rich, C.; Cole,
T.J.; Law, C.; Joshi, H.; Ness, A.R.; et al. How active are our children? Findings
from the Millennium Cohort Study. BMJ Open 2013, 3, e002893.
66. Jago, R.; Solomon-Moore, E.; Macdonald-Wallis, C.; Sebire, S.J.; Thompson, J.L.;
Lawlor, D.A. Change in children’s physical activity and sedentary time between
Year 1 and Year 4 of primary school in the B-PROACT1V cohort. Int. J. Behav.
Nutr. Phys. Act. 2017, 14.
67. Cooper, A.R.; Goodman, A.; Page, A.S.; Sherar, L.B.; Esliger, D.W.; van Sluijs,
E.M.F.; Andersen, L.B.; Anderssen, S.; Cardon, G.; Davey, R.; et al. Objectively
measured physical activity and sedentary time in youth: The International
children’s accelerometry database (ICAD). Int. J. Behav. Nutr. Phys. Act. 2015,
12.
68. Farooq, M.A.; Parkinson, K.N.; Adamson, A.J.; Pearce, M.S.; Reilly, J.K.;
Hughes, A.R.; Janssen, X.; Basterfield, L.; Reilly, J.J. Timing of the decline in
physical activity in childhood and adolescence: Gateshead Millennium Cohort
Study. Br. J. Sports Med. 2018, 52, 1002–1006.
69. Powell, K.E.; Paluch, A.E.; Blair, S.N. Physical Activity for Health: What Kind?
How Much? How Intense? On Top of What? Annu. Rev. Public Health 2011, 32,
349–365.
70. The 2016/17 Canadian health measures survey Physical activity and screen time
among Canadian children and youth, 2016 and 2017. 2019.
71. Metcalf, B.; Henley, W.; Wilkin, T. Effectiveness of intervention on physical
activity of children: systematic review and meta-analysis of controlled trials with
objectively measured outcomes (EarlyBird 54). Bmj 2012, 345, e5888–e5888.
72. Tremblay, M.S.; Aubert, S.; Barnes, J.D.; Saunders, T.J.; Carson, V.; Latimer-
cheung, A.E.; Chastin, S.F.M.; Altenburg, T.M.; Chinapaw, M.J.M. Sedentary
Behavior Research Network ( SBRN ) – Terminology Consensus Project process
and outcome. 2017, 1–17.
73. Owen, N.; Healy, N, G.; Matthews, E, C.; Dunstan, W, D. Too Much Sitting: The
Population-Health Science of Sedentary Behavior. NIH Public Access 2012, 38,
105–113.
74. Trost, S.G.; Loprinzi, P.D.; Moore, R.; Pfeiffer, K.A. Comparison of accelerometer
cut points for predicting activity intensity in youth. Med. Sci. Sports Exerc. 2011,
43, 1360–8.
75. Saint-Maurice, P.F.; Kim, Y.; Welk, G.J.; Gaesser, G.A. Kids are not little adults:
what MET threshold captures sedentary behavior in children? Eur. J. Appl.
Physiol. 2016, 116, 29–38.
76. Pate, R.R.; O’Neill, J.R.; Lobelo, F. The evolving definition of “sedentary.” Exerc.
Sport Sci. Rev. 2008.
77. Owen, N.; Sparling, P.B.; Healy, G.N.; Dunstan, D.W.; Matthews, C.E. Sedentary
behavior: Emerging evidence for a new health risk. Mayo Clin. Proc. 2010.
78. Salmon, J.; Tremblay, M.S.; Marshall, S.J.; Hume, C. Health risks, correlates, and
192
interventions to reduce sedentary behavior in young people. Am. J. Prev. Med.
2011, 41, 197–206.
79. Evenson, K.R.; Wen, F.; Herring, A.H. Associations of Accelerometry-Assessed
and Self-Reported Physical Activity and Sedentary Behavior with All-Cause and
Cardiovascular Mortality among US Adults. Am. J. Epidemiol. 2016, 184, 621–
632.
80. Koster, A.; Caserotti, P.; Patel, K. V.; Matthews, C.E.; Berrigan, D.; van Domelen,
D.R.; Brychta, R.J.; Chen, K.Y.; Harris, T.B. Association of Sedentary time with
mortality independent of moderate to vigorous physical activity. PLoS One 2012,
7.
81. Hamilton, M.T.; Hamilton, D.G.; Zderic, T.W. Exercise physiology versus
inactivity physiology: an essential concept for understanding lipoprotein lipase
regulation. Exerc. Sport Sci. Rev. 2004, 32, 161–6.
82. Bey, L.; Hamilton, M.T. Suppression of skeletal muscle lipoprotein lipase activity
during physical inactivity: a molecular reason to maintain daily low-intensity
activity. J. Physiol. 2003, 551, 673–682.
83. Hale, L.; Guan, S. Screen time and sleep among school-aged children and
adolescents: A systematic literature review. Sleep Med. Rev. 2015, 21, 50–58.
84. Falbe, J.; Davison, K.K.; Franckle, R.L.; Ganter, C.; Gortmaker, S.L.; Smith, L.;
Land, T.; Taveras, E.M. Sleep Duration, Restfulness, and Screens in the Sleep
Environment. Pediatrics 2015, 135, e367–e375.
85. Hare-Bruun, H.; Nielsen, B.M.; Kristensen, P.L.; Møller, N.C.; Togo, P.;
Heitmann, B.L. Television viewing, food preferences, and food habits among
children: a prospective epidemiological study. BMC Public Health 2011, 11, 311.
86. Börnhorst, C.; Wijnhoven, T.M. a; Kunešová, M.; Yngve, A.; Rito, A.I.; Lissner,
L.; Duleva, V.; Petrauskiene, A.; Breda, J. WHO European Childhood Obesity
Surveillance Initiative: associations between sleep duration, screen time and food
consumption frequencies. BMC Public Health 2015, 15, 442.
87. Sheldrick, M.; Tyler, R.; Mackintosh, K.; Stratton, G.; Sheldrick, M.P.R.; Tyler,
R.; Mackintosh, K.A.; Stratton, G. Relationship between Sedentary Time, Physical
Activity and Multiple Lifestyle Factors in Children. J. Funct. Morphol. Kinesiol.
2018, 3, 15.
88. Shang, L.; Wang, J.W.; O’Loughlin, J.; Tremblay, A.; Mathieu, M.È.; Henderson,
M.; Gray-Donald, K. Screen time is associated with dietary intake in overweight
Canadian children. Prev. Med. Reports 2015, 2, 265–269.
89. Lazzeri, G.; Azzolini, E.; Pammolli, A.; De Wet, D.R.; Giacchi, M. V. Correlation
between physical activity and sedentary behavior with healthy and unhealthy
behaviors in Italy and Tuscan region: A cross sectional study. J. Prev. Med. Hyg.
2013, 54, 41–48.
90. Olds, T.; Maher, C.A.; Ridley, K. The Place of Physical Activity in the Time
Budgets of 10-to 13-Year-Old Australian Children. J. Phys. Act. Health 2011, 8,
548–557.
91. Pearson, N.; Braithwaite, R.E.; Biddle, S.J.H.; van Sluijs, E.M.F.; Atkin, A.J.
Associations between sedentary behaviour and physical activity in children and
adolescents: A meta-analysis. Obes. Rev. 2014, 15, 666–675.
92. Van Ekris, E.; Altenburg, T.M.; Vos, E.E.; Chinapaw, M.J.M. An evidence-update
on the prospective relationship between childhood sedentary behaviour and
biomedical health indicators: A systematic review and meta-analysis. Ned.
Tijdschr. Geneeskd. 2016, 160, 712–714.
93. Carson, V.; Tremblay, M.S.; Chaput, J.-P.; Chastin, S.F.; Carson, V.; Tremblay,
193
M.; Chaput, J.; Chastin, S. Associations between sleep duration, sedentary time,
physical activity, and health indicators among Canadian children and youth using
compositional analyses 1. Appl. Physiol. Nutr. Metab 2016, 41, 294–302.
94. Officers’, U.C.M. UK Chief Medical Officers’ Physical Activity Guidelines; 2019;
95. Health, A.G.D. of Australian 24-Hour Movement Guidelines for Children and
Young People (5-17 years) – An Integration of Physical Activity, Sedentary
Behaviour and Sleep.
96. Ku, P.-W.; Steptoe, A.; Liao, Y.; Hsueh, M.-C.; Chen, L.-J. A cut-off of daily
sedentary time and all-cause mortality in adults: a meta-regression analysis
involving more than 1 million participants. BMC Med. 2018, 16, 74.
97. Owen, N.; Healy, G.N.; Matthews, C.E.; Dunstan, D.W. Too much sitting: the
population health science of sedentary behavior. Exerc. Sport Sci. Rev. 2010, 38,
105–13.
98. Biddle, S.J.H.; Petrolini, I.; Pearson, N. Interventions designed to reduce sedentary
behaviours in young people: a review of reviews. Br. J. Sports Med. 2014, 48, 182–
6.
99. Rollo, S.; Gaston, A.; Prapavessis, H. Cognitive and Motivational Factors
Associated with Sedentary Behavior: A Systematic Review. AIMS public Heal.
2016, 3, 956–984.
100. Biswas, A.; Oh, P.I.; Faulkner, G.E.; Bajaj, R.R.; Silver, M.A.; Mitchell, M.S.;
Alter, D.A. Sedentary time and its association with risk for disease incidence,
mortality, and hospitalization in adults a systematic review and meta-analysis. Ann.
Intern. Med. 2015, 162, 123–132.
101. Biddle, S.J.H.; Bennie, J.A.; De Cocker, K.; Dunstan, D.; Gardiner, P.A.; Healy,
G.N.; Lynch, B.; Owen, N.; Brakenridge, C.; Brown, W.; et al. Controversies in
the science of sedentary behaviour and health: Insights, perspectives and future
directions from the 2018 queensland sedentary behaviour think tank. Int. J.
Environ. Res. Public Health 2019, 16, 4762.
102. Barreira, T. V.; Zderic, T.W.; Schuna, J.M.; Hamilton, M.T.; Tudor-Locke, C.
Free-living activity counts-derived breaks in sedentary time: Are they real
transitions from sitting to standing? Gait Posture 2015, 42, 70–72.
103. Henson, J.; Yates, T.; Biddle, S.J.H.; Edwardson, C.L.; Khunti, K.; Wilmot, E.G.;
Gray, L.J.; Gorely, T.; Nimmo, M.A.; Davies, M.J. Associations of objectively
measured sedentary behaviour and physical activity with markers of
cardiometabolic health. Diabetologia 2013, 56, 1012–1020.
104. Mitchell, T.; Borner, K.; Finch, J.; Kerr, J.; Carlson, J.A. Using Activity Monitors
to Measure Sit-to-Stand Transitions in Overweight/Obese Youth. Med. Sci. Sport.
Exerc. 2017, 49, 1592–1598.
105. Ridley, K.; Ridgers, N.D.; Salmon, J. Criterion validity of the activPALTM and
ActiGraph for assessing children’s sitting and standing time in a school classroom
setting. Int. J. Behav. Nutr. Phys. Act. 2016, 13, 75.
106. Hughes, A.R.; Muggeridge, D.J.; Gibson, A.-M.; Johnstone, A.; Kirk, A.
Objectively Measured Sedentary Time in Children and Their Parents. AIMS public
Heal. 2016, 3, 823–836.
107. van der Berg, J.D.; Stehouwer, C.D.A.; Bosma, H.; van der Velde, J.H.P.M.;
Willems, P.J.B.; Savelberg, H.H.C.M.; Schram, M.T.; Sep, S.J.S.; van der Kallen,
C.J.H.; Henry, R.M.A.; et al. Associations of total amount and patterns of
sedentary behaviour with type 2 diabetes and the metabolic syndrome: The
Maastricht Study. Diabetologia 2016, 59, 709–718.
108. Healy, G.N.; Matthews, C.E.; Dunstan, D.W.; Winkler, E.A.H.; Owen, N.
194
Sedentary time and cardio-metabolic biomarkers in US adults: NHANES 200306.
Eur. Heart J. 2011, 32, 590–597.
109. Chastin, S.F.M.; Egerton, T.; Leask, C.; Stamatakis, E. Meta-analysis of the
relationship between breaks in sedentary behavior and cardiometabolic health.
Obesity 2015, 23, 1800–1810.
110. Wennberg, P.; Boraxbekk, C.J.; Wheeler, M.; Howard, B.; Dempsey, P.C.;
Lambert, G.; Eikelis, N.; Larsen, R.; Sethi, P.; Occleston, J.; et al. Acute effects of
breaking up prolonged sitting on fatigue and cognition: A pilot study. BMJ Open
2016, 6.
111. Jefferis, B.J.; Parsons, T.J.; Sartini, C.; Ash, S.; Lennon, L.T.; Papacosta, O.;
Morris, R.W.; Wannamethee, S.G.; Lee, I.M.; Whincup, P.H. Objectively
measured physical activity, sedentary behaviour and all-cause mortality in older
men: Does volume of activity matter more than pattern of accumulation? Br. J.
Sports Med. 2019, 53, 1013–1020.
112. Aminian, S.; Hinckson, E.A. Examining the validity of the ActivPAL monitor in
measuring posture and ambulatory movement in children. Int. J. Behav. Nutr.
Phys. Act. 2012, 9, 119.
113. Füzéki, E.; Vogt, L.; Banzer, W. Nationale Bewegungsempfehlungen für
Erwachsene und ältere Erwachsene - Methodisches Vorgehen, Datenbasis und
Begründung. Gesundheitswesen, Suppl. 2017, 79, S20–S28.
114. Carson, V.; Janssen, I. Volume, patterns, and types of sedentary behavior and
cardio-metabolic health in children and adolescents: A cross-sectional study. BMC
Public Health 2011, 11, 274.
115. Kwon, S.; Burns, T.L.; Levy, S.M.; Janz, K.F. Breaks in sedentary time during
childhood and adolescence: Iowa bone development study. Med. Sci. Sports Exerc.
2012, 44, 1075–1080.
116. Dowd, K.P.; Harrington, D.M.; Hannigan, A.; Donnelly, A.E. Light-intensity
physical activity is associated with adiposity in adolescent females. Med. Sci.
Sports Exerc. 2014, 46, 2295–2300.
117. The Communications Market Report Ofcom 2015.;
118. National Survey for Wales 2016-17: Child Health - Lifestyle;
119. Edwards, L.C.; Tyler, R.; Blain, D.; Bryant, A.; Canham, N.; Carter-Davies, L.;
Clark, C.; Evans, T.; Greenall, C.; Hobday, J.; et al. Results From Wales’ 2018
Report Card on Physical Activity for Children and Youth. J. Phys. Act. Health
2018, 15, S430–S432.
120. Mitchell, J.A.; Pate, R.R.; Blair, S.N. Screen-based sedentary behavior and
cardiorespiratory fitness from age 11 to 13. Med. Sci. Sports Exerc. 2012, 44,
1302–1309.
121. Colley, R.C.; Garriguet, D.; Janssen, I.; Craig, C.L.; Clarke, J.; Tremblay, M.S.
Physical activity of Canadian children and youth: accelerometer results from the
2007 to 2009 Canadian Health Measures Survey. Heal. reports 2011, 22, 15–23.
122. Matthews, C.E.; Chen, K.Y.; Freedson, P.S.; Buchowski, M.S.; Beech, B.M.; Pate,
R.R.; Troiano, R.P. Amount of Time Spent in Sedentary Behaviors in the United
States, 2003-2004. Am. J. Epidemiol. 2008, 167, 875–881.
123. Janssen, X.; Mann, K.D.; Basterfield, L.; Parkinson, K.N.; Pearce, M.S.; Reilly,
J.K.; Adamson, A.J.; Reilly, J.J. Development of sedentary behavior across
childhood and adolescence: longitudinal analysis of the Gateshead Millennium
Study. Int. J. Behav. Nutr. Phys. Act. 2016, 13, 88.
124. Whitt-Glover, M.C.; Taylor, W.C.; Floyd, M.F.; Yore, M.M.; Yancey, A.K.;
Matthews, C.E. Disparities in physical activity and sedentary behaviors among US
195
children and adolescents: Prevalence, correlates, and intervention implications. J.
Public Health Policy 2009, 30.
125. Wafa, S.W.; Aziz, N.N.; Shahril, M.R.; Halib, H.; Rahim, M.; Janssen, X.
Measuring the Daily Activity of Lying Down, Sitting, Standing and Stepping of
Obese Children Using the ActivPAL TM Activity Monitor. J. Trop. Pediatr. 2016,
63, fmw052.
126. Arundell, L.; Hinkley, T.; Veitch, J.; Salmon, J. Contribution of the after-school
period to children’s daily participation in physical activity and sedentary
behaviours. PLoS One 2015, 10, 1–11.
127. Arundell, L.; Fletcher, E.; Salmon, J.; Veitch, J.; Hinkley, T. A systematic review
of the prevalence of sedentary behavior during the after-school period among
children aged 5-18 years. Int. J. Behav. Nutr. Phys. Act. 2016, 13, 93.
128. Verloigne, M.; Ridgers, N.D.; Chinapaw, M.; Altenburg, T.M.; Bere, E.; Van
Lippevelde, W.; Cardon, G.; Brug, J.; De Bourdeaudhuij, I. Patterns of objectively
measured sedentary time in 10- to 12-year-old Belgian children: an observational
study within the ENERGY-project. BMC Pediatr. 2017, 17, 147.
129. Arundell, L.; Salmon, J.; Koorts, H.; Contardo Ayala, A.M.; Timperio, A.
Exploring when and how adolescents sit: cross-sectional analysis of activPAL-
measured patterns of daily sitting time, bouts and breaks. BMC Public Health
2019, 19, 653.
130. Olds, T.; Wake, M.; Patton, G.; Ridley, K.; Waters, E.; Williams, J.; Hesketh, K.
How Do School-Day Activity Patterns Differ with Age and Gender across
Adolescence? J. Adolesc. Heal. 2009, 44, 64–72.
131. Stevenson, A.; Waite, M. Concise Oxford English dictionary; Oxford University
Press, 2011; ISBN 0199601089.
132. Buckley, J.P.; Mellor, D.D.; Morris, M.; Joseph, F. Standing-based office work
shows encouraging signs of attenuating post-prandial glycaemic excursion. Occup.
Environ. Med. 2014, 71, 109–111.
133. Thorp, A.A.; Kingwell, B.A.; Sethi, P.; Hammond, L.; Owen, N.; Dunstan, D.W.
Alternating Bouts of Sitting and Standing Attenuate Postprandial Glucose
Responses. Med. Sci. Sport. Exerc. 2014, 46, 2053–2061.
134. Amaro-Gahete, F.J.; Sanchez-Delgado, G.; Alcantara, J.M.A.; Martinez-Tellez,
B.; Acosta, F.M.; Merchan-Ramirez, E.; Löf, M.; Labayen, I.; R. Ruiz, J. Energy
expenditure differences across lying, sitting, and standing positions in young
healthy adults. PLoS One 2019, 14, e0217029.
135. Saeidifard, F.; Medina-Inojosa, J.R.; Supervia, M.; Olson, T.P.; Somers, V.K.;
Erwin, P.J.; Lopez-Jimenez, F. Differences of energy expenditure while sitting
versus standing: A systematic review and meta-analysis. Eur. J. Prev. Cardiol.
2018, 25, 522–538.
136. Buckley, J.P.; Hedge, A.; Yates, T.; Copeland, R.J.; Loosemore, M.; Hamer, M.;
Bradley, G.; Dunstan, D.W. The sedentary office: An expert statement on the
growing case for change towards better health and productivity. Br. J. Sports Med.
2015, 49, 1357–1362.
137. Tudor-Locke, C.; Hendrick, C.A.; Duet, M.T.; Swift, D.L.; Schuna Jr, J.M.;
Martin, C.K.; Johnson, W.D.; Church, T.S. Implementation and adherence issues
in a workplace treadmill desk intervention. Appl. Physiol. Nutr. Metab. 2014, 39,
1104–1111.
138. CHEN, K.Y.; JANZ, K.F.; ZHU, W.; BRYCHTA, R.J. Redefining the Roles of
Sensors in Objective Physical Activity Monitoring. Med. Sci. Sport. Exerc. 2012,
44, S13–S23.
196
139. Atkin, A.J.; Gorely, T.; Clemes, S.A.; Yates, T.; Edwardson, C.; Brage, S.;
Salmon, J.; Marshall, S.J.; Biddle, S.J. Methods of Measurement in epidemiology:
Sedentary Behaviour. Int. J. Epidemiol. 2012, 41, 1460–1471.
140. Shephard, R.J. Limits to the measurement of habitual physical activity by
questionnaires. Br. J. Sports Med. 2003, 37, 197–206.
141. Loprinzi, P.D.; Cardinal, B.J. Measuring children’s physical activity and sedentary
behaviors. J. Exerc. Sci. Fit. 2011, 9, 15–23.
142. de Vries, S.I.; Bakker, I.; Hopman-Rock, M.; Hirasing, R.A.; van Mechelen, W.
Clinimetric review of motion sensors in children and adolescents. J. Clin.
Epidemiol. 2006, 59, 670–680.
143. Migueles, J.H.; Cadenas-Sanchez, C.; Ekelund, U.; Delisle Nyström, C.; Mora-
Gonzalez, J.; Löf, M.; Labayen, I.; Ruiz, J.R.; Ortega, F.B. Accelerometer Data
Collection and Processing Criteria to Assess Physical Activity and Other
Outcomes: A Systematic Review and Practical Considerations. Sport. Med. 2017,
47, 1821–1845.
144. Yang, C.C.; Hsu, Y.L. A review of accelerometry-based wearable motion detectors
for physical activity monitoring. Sensors 2010, 10, 7772–7788.
145. Lynch, B.A.; Kaufman, T.K.; Rajjo, T.I.; Mohammed, K.; Kumar, S.; Murad,
M.H.; Gentile, N.E.; Koepp, G.A.; McCrady-Spitzer, S.K.; Levine, J.A. Accuracy
of Accelerometers for Measuring Physical Activity and Levels of Sedentary
Behavior in Children: A Systematic Review. J. Prim. Care Community Heal. 2019,
10, 215013271987425.
146. Scott, J.J.; Rowlands, A. V; Cliff, D.P.; Morgan, P.J.; Plotnikoff, R.C.; Lubans,
D.R. in free-living adolescents. 2017, 2–7.
147. McLellan, G.; Arthur, R.; Buchan, D.S. Wear compliance, sedentary behaviour
and activity in free-living children from hip-and wrist-mounted ActiGraph GT3X+
accelerometers. J. Sports Sci. 2018, 36, 2424–2430.
148. Fairclough, S.J.; Noonan, R.; Rowlands, A. V; Hees, V. Van; Knowles, Z.; Boddy,
L.M. Wear Compliance and Activity in Children Wearing Wrist- and Hip-Mounted
Accelerometers. 2016, 3, 245–253.
149. Scott, J.J.; Rowlands, A. V.; Cliff, D.P.; Morgan, P.J.; Plotnikoff, R.C.; Lubans,
D.R. Comparability and feasibility of wrist- and hip-worn accelerometers in free-
living adolescents. J. Sci. Med. Sport 2017, 20, 1101–1106.
150. Rowlands, A. V.; Rennie, K.; Kozarski, R.; Stanley, R.M.; Eston, R.G.; Parfitt,
G.C.; Olds, T.S. Children’s physical activity assessed with wrist- and hip-worn
accelerometers. Med. Sci. Sports Exerc. 2014, 46, 2308–2316.
151. Levin, S.; Jacobs, D.R.; Ainsworth, B.E.; Richardson, M.T.; Leon, A.S. Intra-
Individual Variation and Estimates of Usual Physical Activity. Ann. Epidemiol.
1999, 9, 481–488.
152. Tudor-Locke, C.; Johnson, W.D.; Katzmarzyk, P.T. U.S. population profile of
time-stamped accelerometer outputs: Impact of wear time. J. Phys. Act. Heal.
2011, 8, 693–698.
153. Kerr, J.; Marinac, C.R.; Ellis, K.; Godbole, S.; Hipp, A.; Glanz, K.; Mitchell, J.;
Laden, F.; James, P.; Berrigan, D. Comparison of Accelerometry Methods for
Estimating Physical Activity. Med. Sci. Sports Exerc. 2017, 49, 617–624.
154. Crouter, S.E.; Flynn, J.I.; Bassett, D.R. Estimating Physical Activity in Youth
Using a Wrist Accelerometer. Med. Sci. Sport. Exerc. 2015, 47, 944–951.
155. Chandler, J.L.; Brazendale, K.; Beets, M.W.; Mealing, B.A. Classification of
physical activity intensities using a wrist-worn accelerometer in 8-12-year-old
children. Pediatr. Obes. 2016, 11, 120–127.
197
156. Edwardson, C.L.; Gorely, T. Epoch length and its effect on physical activity
intensity. Med. Sci. Sports Exerc. 2010, 42, 928–934.
157. Nilsson, A.; Ekelund, U.; Yngve, A.; Sjöström, M. Assessing physical activity
among children with accelerometers using different time sampling intervals and
placements. Pediatr. Exerc. Sci. 2002, 14, 87–96.
158. Berman, N.; Bailey, R.; Barstow, T.J.; Cooper, D.M. Spectral and bout detection
analysis of physical activity patterns in healthy, prepubertal boys and girls. Am. J.
Hum. Biol. 1998, 10, 289–297.
159. Baquet, G.; Stratton, G.; Van Praagh, E.; Berthoin, S. Improving physical activity
assessment in prepubertal children with high-frequency accelerometry monitoring:
A methodological issue. Prev. Med. (Baltim). 2007, 44, 143–147.
160. Ward, D.S.; Evenson, K.R.; Vaughn, A.; Rodgers, A.B.; Troiano, R.P.
Accelerometer use in physical activity: Best practices and research
recommendations. In Proceedings of the Medicine and Science in Sports and
Exercise; Med Sci Sports Exerc, 2005; Vol. 37.
161. Cain, K.L.; Sallis, J.F.; Conway, T.L.; Van Dyck, D.; Calhoon, L. Using
accelerometers in youth physical activity studies: a review of methods. J. Phys.
Act. Health 2013, 10, 437–450.
162. Banda, J.A.; Haydel, K.F.; Davila, T.; Desai, M.; Bryson, S.; Haskell, W.L.;
Matheson, D.; Robinson, T.N. Effects of varying epoch lengths, wear time
algorithms, and activity cut-points on estimates of child sedentary behavior and
physical activity from accelerometer data. PLoS One 2016, 11.
163. Livingstone, M.B.; Robson, P.J.; Totton, M. Energy expenditure by heart rate in
children: an evaluation of calibration techniques. Med. Sci. Sports Exerc. 2000, 32,
1513–9.
164. Kohl, H.W.; Fulton, J.E.; Caspersen, C.J. Assessment of physical activity among
children and adolescents: A review and synthesis. Prev. Med. (Baltim). 2000, 31.
165. Logan, N.; Reilly, J.J.; Grant, S.; Paton, J.Y. Resting heart rate definition and its
effect on apparent levels of physical activity in young children. Med. Sci. Sports
Exerc. 2000, 32, 162–6.
166. Beets, M.W.; Patton, M.M.; Edwards, S. The accuracy of pedometer steps and time
during walking in children. Med. Sci. Sports Exerc. 2005, 37, 513–520.
167. Ramírez-Marrero, F.A.; Smith, B.A.; Sherman, W.M.; Kirby, T.E. Comparison of
methods to estimate physical activity and energy expenditure in African American
children. Int. J. Sports Med. 2005, 26, 363–371.
168. Saunders, T.J.; Gray, C.E.; Borghese, M.M.; McFarlane, A.; Mbonu, A.; Ferraro,
Z.M.; Tremblay, M.S. Validity of SC-StepRx pedometer-derived moderate and
vigorous physical activity during treadmill walking and running in a heterogeneous
sample of children and youth. BMC Public Health 2014, 14, 519.
169. Atkin, A.J.; Gorely, T.; Clemes, S.A.; Yates, T.; Edwardson, C.; Brage, S.;
Salmon, J.; Marshall, S.J.; Biddle, S.J.H. Methods of measurement in
epidemiology: Sedentary behaviour. Int. J. Epidemiol. 2012, 41, 1460–1471.
170. Healy, G.N.; Dunstan, D.W.; Salmon, J.; Cerin, E.; Shaw, J.E.; Zimmet, P.Z.;
Owen, N. Breaks in sedentary time: beneficial associations with metabolic risk.
Diabetes Care 2008, 31, 661–6.
171. Van Loo, C.M.T.; Okely, A.D.; Batterham, M.J.; Hinkley, T.; Ekelund, U.; Brage,
S.; Reilly, J.J.; Trost, S.G.; Jones, R.A.; Janssen, X.; et al. Wrist Accelerometer
Cut Points for Classifying Sedentary Behavior in Children. Med. Sci. Sport. Exerc.
2017, 49, 813–822.
172. Evenson, K.R.; Catellier, D.J.; Gill, K.; Ondrak, K.S.; McMurray, R.G. Calibration
198
of two objective measures of physical activity for children. J. Sports Sci. 2008, 26,
1557–1565.
173. Kim, Y.; Lee, J.-M.; Peters, B.P.; Gaesser, G.A.; Welk, G.J. Examination of
Different Accelerometer Cut-Points for Assessing Sedentary Behaviors in
Children. PLoS One 2014, 9, e90630.
174. Loprinzi, P.; Smith, B. Accuracy of the ActiGraph GT9X Inclinometer to Assess
Human Body Postures. J. Behav. Heal. 2017, 1.
175. Carr, L.J.; Mahar, M.T. Accuracy of Intensity and Inclinometer Output of Three
Activity Monitors for Identification of Sedentary Behavior and Light-Intensity
Activity. J. Obes. 2012, 2012, 1–9.
176. Peterson, N.E.; Sirard, J.R.; Kulbok, P.A.; DeBoer, M.D.; Erickson, J.M.
Validation of Accelerometer Thresholds and Inclinometry for Measurement of
Sedentary Behavior in Young Adult University Students. Res. Nurs. Health 2015,
38, 492–499.
177. Lyden, K.; Kozey-Keadle, S.L.; Staudenmayer, J.W.; Freedson, P.S. Validity of
two wearable monitors to estimate breaks from sedentary time. Med. Sci. Sports
Exerc. 2012, 44, 2243.
178. Koster, A.; Shiroma, E.J.; Caserotti, P.; Matthews, C.E.; Chen, K.Y.; Glynn, N.W.;
Harris, T.B. Comparison of Sedentary Estimates between activPAL and Hip- and
Wrist-Worn ActiGraph. Med. Sci. Sports Exerc. 2016, 48, 1514–1522.
179. Steeves, J.A.; Bowles, H.R.; Mcclain, J.J.; Dodd, K.W.; Brychta, R.J.; Wang, J.;
Chen, K.Y. Ability of Thigh-Worn ActiGraph and activPAL Monitors to Classify
Posture and Motion. Med. Sci. Sport. Exerc. 2015, 47, 952–959.
180. Skotte, J.; Korshøj, M.; Kristiansen, J.; Hanisch, C.; Holtermann, A. Detection of
Physical Activity Types Using Triaxial Accelerometers. J. Phys. Act. Heal. 2014,
11, 76–84.
181. Baumgartner, T.E. Measurement for Evaluation in Kinesiology.; Jones & Bartlett
Learning, 2015; ISBN 9781284084290.
182. Tudor-Locke, C.; Craig, C.L.; Thyfault, J.P.; Spence, J.C. A step-defined sedentary
lifestyle index: <5000 steps/day. Appl. Physiol. Nutr. Metab. 2013, 38, 100–114.
183. McKercher, C.M.; Schmidt, M.D.; Sanderson, K.A.; Patton, G.C.; Dwyer, T.;
Venn, A.J. Physical Activity and Depression in Young Adults. Am. J. Prev. Med.
2009, 36, 161–164.
184. Schmidt, M.D.; Cleland, V.J.; Shaw, K.; Dwyer, T.; Venn, A.J. Cardiometabolic
Risk in Younger and Older Adults Across an Index of Ambulatory Activity. Am.
J. Prev. Med. 2009, 37, 278–284.
185. Donahoe, K.; Macdonald, D.J.; Tremblay, M.S.; Saunders, T.J. Validation of
PiezoRx Pedometer Derived Sedentary Time. Int. J. Exerc. Sci. 2018, 11, 552–
560.
186. Helmerhorst, H.J.F.; Wijndaele, K.; Brage, S.; Wareham, N.J.; Ekelund, U.
Objectively measured sedentary time may predict insulin resistance independent
of moderate- and vigorous-intensity physical activity. Diabetes 2009, 58, 1776–9.
187. Livingstone, M.B. Heart-rate monitoring: the answer for assessing energy
expenditure and physical activity in population studies? Br. J. Nutr. 1997, 78, 869–
71.
188. Keytel, L.; Goedecke, J.; Noakes, T.; Hiiloskorpi, H.; Laukkanen, R.; van der
Merwe, L.; Lambert, E. Prediction of energy expenditure from heart rate
monitoring during submaximal exercise. J. Sports Sci. 2005, 23, 289–297.
189. Alghaeed, Z.; Reilly, J.J.; Chastin, S.F.M.; Martin, A.; Davies, G.; Paton, J.Y. The
Influence of Minimum Sitting Period of the ActivPALTM on the Measurement of
199
Breaks in Sitting in Young Children. PLoS One 2013, 8, e71854.
190. Kozey-keadle, S.; Libertine, A.; Lyden, K.; Staudenmayer, J.; Freedson, P.S.
Validation of Wearable Monitors for Assessing Sedentary Behavior. Med. Sci.
Sport. Exerc. 2011, 43, 1561–1567.
191. Grant, P.M.; Ryan, C.G.; Tigbe, W.W.; Granat, M.H. The validation of a novel
activity monitor in the measurement of posture and motion during everyday
activities. Br. J. Sports Med. 2006, 40, 992–997.
192. Dowd, K.P.; Harrington, D.M.; Donnelly, A.E. Criterion and Concurrent Validity
of the activPALTM Professional Physical Activity Monitor in Adolescent Females.
PLoS One 2012, 7, e47633.
193. Janssen, X.; Cliff, D.P.; Reilly, J.J.; Hinkley, T.; Jones, R.A.; Batterham, M.;
Ekelund, U.; Brage, S.; Okely, A.D. Validation of ActivPAL Defined Sedentary
Time and Breaks in Sedentary Time in 4- to 6-Year-Olds. Pediatr. Exerc. Sci.
2014, 26, 110–117.
194. Davies, G.; Reilly, J.J.; Paton, J.Y. Objective measurement of posture and posture
transitions in the pre-school child. Physiol. Meas. 2012, 33, 1913–1921.
195. Parikh, T.; Stratton, G. Influence of intensity of physical activity on adiposity and
cardiorespiratory fitness in 518 year olds. Sport. Med. 2011, 41, 477–488.
196. Byrom, B.; Stratton, G.; Mc Carthy, M.; Muehlhausen, W. Objective measurement
of sedentary behaviour using accelerometers. Int. J. Obes. (Lond). 2016, 40, 1809–
1812.
197. Edwardson, C.L.; Winkler, E.A.H.; Bodicoat, D.H.; Yates, T.; Davies, M.J.;
Dunstan, D.W.; Healy, G.N. Considerations when using the activPAL monitor in
field-based research with adult populations. J. Sport Heal. Sci. 2017, 6, 162–178.
198. Tremblay, M.S.; Aubert, S.; Barnes, J.D.; Saunders, T.J.; Carson, V.; Latimer-
Cheung, A.E.; Chastin, S.F.M.; Altenburg, T.M.; Chinapaw, M.J.M. Sedentary
Behavior Research Network (SBRN) – Terminology Consensus Project process
and outcome. Int. J. Behav. Nutr. Phys. Act. 2017, 14, 75.
199. Peddie, M.C.; Bone, J.L.; Rehrer, N.J.; Skeaff, C.M.; Gray, A.R.; Perry, T.L.
Breaking prolonged sitting reduces postprandial glycemia in healthy, normal-
weight adults: A randomized crossover trial. Am. J. Clin. Nutr. 2013, 98, 358–366.
200. Stephens, B.R.; Granados, K.; Zderic, T.W.; Hamilton, M.T.; Braun, B. Effects of
1 day of inactivity on insulin action in healthy men and women: Interaction with
energy intake. Metabolism. 2011, 60, 941–949.
201. Zhu, W.; Owen, N. Sedentary behavior and health : concepts, assessments, and
interventions; ISBN 1450471285.
202. Stratton, G.; Murphy, R.; Rosenberg, M.; Fergus, P.; Attwood, A. Creating
intelligent environments to monitor and manipulate physical activity and sedentary
behavior in public health and clinical settings. In Proceedings of the IEEE
International Conference on Communications; 2012.
203. Bürgi, R.; Tomatis, L.; Murer, K.; De Bruin, E.D. Localization of physical activity
in primary school children using accelerometry and global positioning system.
PLoS One 2015.
204. Carlson, J.A.; Schipperijn, J.; Kerr, J.; Saelens, B.E.; Natarajan, L.; Frank, L.D.;
Glanz, K.; Conway, T.L.; Chapman, J.E.; Cain, K.L.; et al. Locations of Physical
Activity as Assessed by GPS in Young Adolescents. Pediatrics 2016.
205. Maddison, R.; Ni Mhurchu, C. Global positioning system: A new opportunity in
physical activity measurement. Int. J. Behav. Nutr. Phys. Act. 2009.
206. Loveday, A.; Sherar, L.B.; Sanders, J.P.; Sanderson, P.W.; Esliger, D.W.
Technologies that assess the location of physical activity and sedentary behavior:
200
A systematic review. J. Med. Internet Res. 2015, 17.
207. Spinney, R.; Smith, L.; Ucci, M.; Fisher, A.; Konstantatou, M.; Sawyer, A.;
Wardle, J.; Marmot, A. Indoor tracking to understand physical activity and
sedentary behaviour: Exploratory study in UK office buildings. PLoS One 2015.
208. Loveday, A.; Sherar, L.B.; Sanders, J.P.; Sanderson, P.W.; Esliger, D.W. Novel
technology to help understand the context of physical activity and sedentary
behaviour. Physiol. Meas. 2016.
209. Clark, B.K.; Winkler, E.A.; Brakenridge, C.L.; Trost, S.G.; Healy, G.N. Using
Bluetooth proximity sensing to determine where office workers spend time at
work. PLoS One 2018, 13, e0193971.
210. Magistro, D.; Sessa, S.; Kingsnorth, A.P.; Loveday, A.; Simeone, A.; Zecca, M.;
Esliger, D.W. A Novel Algorithm for Determining the Contextual Characteristics
of Movement Behaviors by Combining Accelerometer Features and Wireless
Beacons: Development and Implementation. JMIR mHealth uHealth 2018, 6,
e100.
211. Yu, D.; Blocker, R.C.; Hallbeck, S.; Patel, A.M.; Pasupathy, K.S. Wearable
sociometers: Calibration in Chaotic Simulated Environments. J. Med. Device.
2015.
212. Yu, D.; Blocker, R.C.; Sir, M.Y.; Hallbeck, M.S.; Hellmich, T.R.; Cohen, T.;
Nestler, D.M.; Pasupathy, K.S. Intelligent Emergency Department: Validation of
Sociometers to Study Workload. J. Med. Syst. 2016.
213. Carreras, I.; Matic, A.; Osmani, V. Comm2Sense: Detecting Proximity Through
Smartphones;
214. Sapiezynski, P.; Stopczynski, A.; Wind, D.K.; Leskovec, J.;; Jørgensen, S.L.
Inferring Person-to-person Proximity Using WiFi Signals. Proc. ACM Interact.
2019, 1.
215. Christensen, M.A.; Bettencourt, L.; Kaye, L.; Moturu, S.T.; Nguyen, K.T.; Olgin,
J.E.; Pletcher, M.J.; Marcus, G.M. Direct measurements of smartphone screen-
time: Relationships with demographics and sleep. PLoS One 2016.
216. Doherty, A.R.; Kelly, P.; Kerr, J.; Marshall, S.; Oliver, M.; Badland, H.; Hamilton,
A.; Foster, C. Using wearable cameras to categorise type and context of
accelerometer-identified episodes of physical activity. Int. J. Behav. Nutr. Phys.
Act. 2013, 10, 22.
217. Kerr, J.; Marshall, S.J.; Godbole, S.; Chen, J.; Legge, A.; Doherty, A.R.; Kelly, P.;
Oliver, M.; Badland, H.M.; Foster, C. Using the SenseCam to improve
classifications of sedentary behavior in free-living settings. Am. J. Prev. Med.
2013, 44, 290–296.
218. Kelly, P.; Doherty, A.; Berry, E.; Hodges, S.; Batterham, A.M.; Foster, C. Can we
use digital life-log images to investigate active and sedentary travel behaviour?
Results from a pilot study. Int. J. Behav. Nutr. Phys. Act. 2011.
219. Zhang, Y.C.; Rehg, J.M. Watching the TV Watchers. Proc. ACM Interactive,
Mobile, Wearable Ubiquitous Technol. 2018.
220. Chong, E.; Chanda, K.; Ye, Z.; Southerland, A.; Ruiz, N.; Jones, R.M.; Rozga, A.;
Rehg, J.M. Detecting Gaze Towards Eyes in Natural Social Interactions and its
Use in Child Assessment. 2019.
221. Wahl, F.; Kasbauer, J.; Amft, O. Computer Screen Use Detection Using Smart
Eyeglasses. Front. ICT 2017.
222. Kulkarni, A.S.; Welch, K.C.; Harnett, C.K. A review of electricity monitoring and
feedback systems. In Proceedings of the Conference Proceedings - IEEE
SOUTHEASTCON; 2011.

201
223. L.H., E.; J.N., R.; J.L., R.; R.A., P.; D.D., W.; J.H., F.; T.N., R.; Epstein, L.H.;
Roemmich, J.N.; Robinson, J.L.; et al. A randomized trial of the effects of reducing
television viewing and computer use on body mass index in young children. Arch.
Pediatr. Adolesc. Med. 2008.
224. Dunton, G.F. Ecological Momentary Assessment in Physical Activity Research.
Exerc. Sport Sci. Rev. 2017.
225. Intille, S.S. Technological Innovations Enabling Automatic, Context-Sensitive
Ecological Momentary Assessment;
226. Dunton, G.F.; Kawabata, K.; Intille, S.; Wolch, J.; Pentz, M.A. Assessing the
Social and Physical Contexts of Children’s Leisure-Time Physical Activity: An
Ecological Momentary Assessment Study. Am. J. Heal. Promot. 2012, 26, 135–
142.
227. Rofey, D.L.; Hull, E.E.; Phillips, J.; Vogt, K.; Silk, J.S.; Dahl, R.E. Utilizing
Ecological Momentary Assessment in Pediatric Obesity to Quantify Behavior,
Emotion, and Sleep. Obesity 2010.
228. Sallis, J.F.; Owen, N.; Fisher, E.. Ecological models of health behaviour. Heal.
Behav. Heal. Educ. Theory, Res. Pract. 2008, 4, 465–486.
229. Stokols, D. Translating social ecological theory into guidelines for community
health promotion. Am. J. Heal. Promot. 1996.
230. Humpel, N.; Owen, N.; Leslie, E. Environmental factors associated with adults’
participation in physical activity: a review. Am. J. Prev. Med. 2002, 22, 188–99.
231. Sallis, J.F.; McKenzie, T.L.; Conway, T.L.; Elder, J.P.; Prochaska, J.J.; Brown,
M.; Zive, M.M.; Marshall, S.J.; Alcaraz, J.E. Environmental interventions for
eating and physical activity: a randomized controlled trial in middle schools. Am.
J. Prev. Med. 2003, 24, 209–17.
232. Stevens, J.; Murray, D.M.; Catellier, D.J.; Hannan, P.J.; Lytele, L.A.; Elder, J.P.;
Young, D.R.; Simons-Morton, D.G.; Webber, L.S. Design of the Trial of Activity
in Adolescent Girls (TAAG). Contemp. Clin. Trials 2005.
233. Ng, M.; Fleming, T.; Robinson, M.; Thomson, B.; Graetz, N. Global, regional and
national prevalence of overweight and obesity in children and adults 1980-2013:
A systematic analysis. Lancet 2014, 384, 766–781.
234. Sims, J.; Scarborough, P.; Foster, C. The Effectiveness of Interventions on
Sustained Childhood Physical Activity: A Systematic Review and Meta-Analysis
of Controlled Studies. PLoS One 2015, 10, e0132935.
235. Arundell, L.; Fletcher, E.; Salmon, J.; Veitch, J.; Hinkley, T. The correlates of
after-school sedentary behavior among children aged 5–18 years: a systematic
review. BMC Public Health 2015, 16, 58.
236. Maı¨té Verloigne, M.; Lippevelde, W. Van; Maes, L.; Brug, J.; De Bourdeaudhuij,
I. Public Health Nutrition: page 1 of 16 Public Health Nutrition.
237. Sterdt, E.; Liersch, S.; Walter, U. Correlates of physical activity of children and
adolescents: A systematic review of reviews. Health Educ. J. 2014, 73, 72–89.
238. Romieu, I.; Dossus, L.; Barquera, S.; Blottière, H.M.; Franks, P.W.; Gunter, M.;
Hwalla, N.; Hursting, S.D.; Leitzmann, M.; Margetts, B.; et al. Energy balance and
obesity: what are the main drivers? Cancer Causes Control 2017, 28, 247–258.
239. Harrington, D.M.; Gillison, F.; Broyles, S.T.; Chaput, J.-P.; Fogelholm, M.; Hu,
G.; Kuriyan, R.; Kurpad, A.; LeBlanc, A.G.; Maher, C.; et al. Household-level
correlates of children’s physical activity levels in and across 12 countries. Obesity
2016, 24, 2150–2157.
240. Sirard, J.R.; Laska, M.N.; Patnode, C.D.; Farbakhsh, K.; Lytle, L.A. Adolescent
physical activity and screen time: associations with the physical home
202
environment. Int. J. Behav. Nutr. Phys. Act. 2010, 7, 82.
241. Rosenberg, D.E.; Sallis, J.F.; Kerr, J.; Maher, J.; Norman, G.J.; Durant, N.; Harris,
S.K.; Saelens, B.E. Brief scales to assess physical activity and sedentary equipment
in the home. Int. J. Behav. Nutr. Phys. Act. 2010, 7, 10.
242. Kerr, J.; Norman, G.J.; Sallis, J.F.; Patrick, K. Exercise aids, neighborhood safety,
and physical activity in adolescents and parents. Med. Sci. Sports Exerc. 2008, 40,
1244–1248.
243. Maddison, R.; Hoorn, S. Vander; Jiang, Y.; Mhurchu, C.N.; Exeter, D.; Dorey, E.;
Bullen, C.; Utter, J.; Schaaf, D.; Turley, M. The environment and physical activity :
The influence of psychosocial , perceived and built environmental factors. 2009,
10, 1–10.
244. Ridgers, N.D.; Graves, L.E.F.; Foweather, L.; Stratton, G. Examining Infiuences
on Boy ’ s and Giris ’ Physicai Activity Patterns : The A-CLASS Project. 2010,
638–650.
245. Crawford, D.; Cleland, V.; Timperio, A.; Salmon, J.; Andrianopoulos, N.; Roberts,
R.; Baur, L.; Ball, K.; Giles-Corti, B.; Baur, L.; et al. The longitudinal influence of
home and neighbourhood environments on children’s body mass index and
physical activity over 5 years: the CLAN study. Int. J. Obes. (Lond). 2010, 34,
1177–1187.
246. Dumuid, D.; Olds, T.S.; Lewis, L.K.; Maher, C. Does home equipment contribute
to socioeconomic gradients in Australian children’s physical activity, sedentary
time and screen time? BMC Public Health 2016, 16, 1–8.
247. Sirard, J.R.; Nelson, M.C.; Pereira, M.A.; Lytle, L.A. Validity and reliability of a
home environment inventory for physical activity and media equipment. Int. J.
Behav. Nutr. Phys. Act. 2008, 5, 24.
248. Hales, D.; Vaughn, A.E.; Mazzucca, S.; Bryant, M.J.; Tabak, R.G.; McWilliams,
C.; Stevens, J.; Ward, D.S. Development of HomeSTEAD’s physical activity and
screen time physical environment inventory. Int. J. Behav. Nutr. Phys. Act. 2013,
10, 132.
249. Gattshall, M.L.; Shoup, J.A.; Marshall, J.A.; Crane, L.A.; Estabrooks, P.A.
Validation of a survey instrument to assess home environments for physical
activity and healthy eating in overweight children. Int. J. Behav. Nutr. Phys. Act.
2008, 5.
250. Slater, M.E.; Sirard, J.R.; Laska, M.N.; Pereira, M.A.; Lytle, L.A. Relationships
between Energy Balance Knowledge and the Home Environment. J. Am. Diet.
Assoc. 2011, 111, 556–560.
251. Biddle, S.J.H.; Marshall, S.J.; Gorely, T.; Cameron, N. Temporal and
Environmental Patterns of Sedentary and Active Behaviors during Adolescents’
Leisure Time. Int. J. Behav. Med. 2009, 16, 278–286.
252. Veitch, J.; Bagley, S.; Ball, K.; Salmon, J. Where do children usually play? A
qualitative study of parents’ perceptions of influences on children’s active free-
play. Heal. Place 2006, 12, 383–393.
253. Jago, R.; Thompson, J.L.; Page, A.S.; Brockman, R.; Cartwright, K.; Fox, K.R.
Licence to be active: Parental concerns and 10-11-year-old children’s ability to be
independently physically active. J. Public Health (Bangkok). 2009, 31, 472–477.
254. Cabanas-Sánchez, V.; Izquierdo-Gómez, R.; García-Cervantes, L.; Castro-Piñero,
J.; Conde-Caveda, J.; Veiga, O.L. Environmental correlates of total and domain-
specific sedentary behaviour in young people. The UP&DOWN study. Eur.
J. Sport Sci. 2019, 19, 696–706.
255. Pulsford, R.M.; Griew, P.; Page, A.S.; Cooper, A.R.; Hillsdon, M.M.
203
Socioeconomic position and childhood sedentary time: Evidence from the PEACH
project. Int. J. Behav. Nutr. Phys. Act. 2013, 10.
256. Trang, N.; Hong, T.; Dibley, M.; Sibbritt, D. Factors Associated with Physical
Inactivity in Adolescents in Ho Chi Minh City, Vietnam. Med Sci Sport. Exerc
2009, 41, 1374–1383.
257. Gray, C.; Gibbons, R.; Larouche, R.; Sandseter, E.; Bienenstock, A.; Brussoni, M.;
Chabot, G.; Herrington, S.; Janssen, I.; Pickett, W.; et al. What Is the Relationship
between Outdoor Time and Physical Activity, Sedentary Behaviour, and Physical
Fitness in Children? A Systematic Review. Int. J. Environ. Res. Public Health
2015, 12, 6455–6474.
258. Sallis, J.; Prochaska, J.; Taylor, W. A review of correlates of physical activity.
Med. Sci. Sport. Exerc. 2000, 32, 963–975.
259. Roberts, J.D.; Rodkey, L.; Ray, R.; Knight, B.; Saelens, B.E. Electronic media time
and sedentary behaviors in children : Findings from the Built Environment and
Active Play Study in the Washington DC area. 2017, 6, 149–156.
260. Larouche, R.; Garriguet, D.; Gunnell, K.E.; Goldfield, G.S.; Tremblay, M.S.
Outdoor time, physical activity, sedentary time, and health indicators at ages 7 to
14: 2012/2013 Canadian Health Measures Survey. Heal. reports 2016, 27, 3–13.
261. Stone, M.R.; Faulkner, G.E.J. Outdoor play in children: Associations with
objectively-measured physical activity, sedentary behavior and weight status.
Prev. Med. (Baltim). 2014, 65, 122–127.
262. Chambers, E.C.; Schechter, C.; Tow, A.; Torrens, L.; Kohlieber, R.; Calderon, R.
Household density and obesity in young black and white adults. Ethn. Dis. 2010,
20, 366–9.
263. Bafna, S.; Chambers, E. The influence of spatial organization of the home on
inhabitant activity. A/Z ITU J. Fac. Archit. 2014, 11, 31–46.
264. Mcminn, A.M.; Sluijs, E.M.F. Van; Nightingale, C.M.; Griffin, S.J.; Cook, D.G.;
Owen, C.G.; Rudnicka, A.R.; Whincup, P.H. Family and home correlates of
children ’ s physical activity in a multi-ethnic population : the cross- sectional child
heart and health study in england. 2011, 1–8.
265. Davison, K.K.; Birch, L.L. Childhood overweight: A contextual model and
recommendations for future research. Obes. Rev. 2001, 2, 159–171.
266. Bronfenbrenner, U. Ecology of the Family as a Context for Human Development.
Research Perspectives. Dev. Psychol. 1986, 22, 723–742.
267. Edwardson, C.L.; Gorely, T. Parental influences on different types and intensities
of physical activity in youth: A systematic review. Psychol. Sport Exerc. 2010, 11,
522–535.
268. Beets, M.W.; Cardinal, B.J.; Alderman, B.L. Parental social support and the
physical activity-related behaviors of youth: A review. Heal. Educ. Behav. 2010,
37, 621–644.
269. Sterdt, E.; Liersch, S.; Walter, U. Correlates of physical activity of children and
adolescents: A systematic review of reviews. Health Educ. J. 2014, 73, 72–89.
270. Yao, C.A.; Rhodes, R.E. Parental correlates in child and adolescent physical
activity: A meta-analysis. Int. J. Behav. Nutr. Phys. Act. 2015, 12.
271. Jago, R.; Fox, K.R.; Page, A.S.; Brockman, R.; Thompson, J.L. Parent and child
physical activity and sedentary time: Do active parents foster active children? BMC
Public Health 2010, 10, 194.
272. Fuemmeler, B.F.; Anderson, C.B.; Mâsse, L.C. Parent-child relationship of
directly measured physical activity. Int. J. Behav. Nutr. Phys. Act. 2011, 8, 17.
273. Cleland, V.; Timperio, A.; Salmon, J.; Hume, C.; Baur, L.A.; Crawford, D.
204
Predictors of time spent outdoors among children: 5-year longitudinal findings. J.
Epidemiol. Community Health 2010, 64, 400–406.
274. Springer, A.E.; Kelder, S.H.; Barroso, C.S.; Drenner, K.L.; Shegog, R.; Ranjit, N.;
Hoelscher, D.M. Parental influences on television watching among children living
on the Texas-Mexico border. Prev. Med. (Baltim). 2010, 51, 112–117.
275. Hume, C.; Salmon, J.; Ball, K. Children ’ s perceptions of their home and
neighborhood environments , and their association with objectively measured
physical activity : a qualitative and quantitative study. 2005, 20, 1–13.
276. Rushovich, B.R.; Voorhees, C.C.; Davis, C.E.; Neumark-Sztainer, D.; Pfeiffer,
K.A.; Elder, J.P.; Going, S.; Marino, V.G. The relationship between unsupervised
time after school and physical activity in adolescent girls. Int. J. Behav. Nutr. Phys.
Act. 2006, 3.
277. Salmon, J.; Veitch, J.; Abbott, G.; Chinapaw, M.; Brug, J.J.; Saskia, J.; Cleland,
V.; Hume, C.; Crawford, D.; Ball, K. Health & Place Are associations between the
perceived home and neighbourhood environment and children ′ s physical activity
and sedentary behaviour moderated by urban / rural location ? Health Place 2013,
24, 44–53.
278. Lau, E.Y.; Barr-anderson, D.J.; Dowda, M.; Forthofer, M.; Saunders, R.P.; Pate,
R.R. Associations Between Home Environment and After-School Physical
Activity and Sedentary Time Among 6 th Grade Children. 2015, 226–233.
279. McMinn, A.M.; Griffin, S.J.; Jones, A.P.; Van Sluijs, E.M.F. Family and home
influences on children’s after-school and weekend physical activity. Eur. J. Public
Health 2013, 23, 805–810.
280. Johnson, L.; Chen, T.A.; Hughes, S.O.; O’Connor, T.M. The association of
parent’s outcome expectations for child TV viewing with parenting practices and
child TV viewing: An examination using path analysis. Int. J. Behav. Nutr. Phys.
Act. 2015, 12.
281. Ramirez, E.R.; Norman, G.J.; Rosenberg, D.E.; Jacqueline, K.; Saelens, E.;
Durant, N.; Sallis, J.F. NIH Public Access. 2012, 48, 379–385.
282. Carver, A.; Timperio, A.; Crawford, D. Playing it safe: The influence of
neighbourhood safety on children’s physical activity-A review. Heal. Place 2008,
14, 217–227.
283. Miles, R. Neighborhood Disorder, Perceived Safety, and Readiness to Encourage
Use of Local Playgrounds. Am. J. Prev. Med. 2008, 34, 275–281.
284. Niclasen, B.; Petzold, M.; Schnohr, C.W. The association between high
recreational physical activity and physical activity as a part of daily living in
adolescents and availability of local indoor sports facilities and sports clubs. Scand.
J. Public Health 2012, 40, 614–620.
285. Bassett, D.R.; John, D.; Conger, S.A.; Fitzhugh, E.C.; Coe, D.P. Trends in physical
activity and sedentary behaviors of United States youth. J. Phys. Act. Heal. 2015,
12, 1102–1111.
286. Tremblay, M.S.; Gray, C.; Babcock, S.; Barnes, J.; Bradstreet, C.C.; Carr, D.;
Chabot, G.; Choquette, L.; Chorney, D.; Collyer, C.; et al. Position statement on
active outdoor play. Int. J. Environ. Res. Public Health 2015, 12, 6475–6505.
287. Veitch, J.; Salmon, J.; Ball, K. Individual , social and physical environmental
correlates of children ’ s active free-play : a cross- sectional study. 2010, 1–10.
288. Rodenburg, G.; Oenema, A.; Kremers, S.P.J.; van de Mheen, D. Clustering of diet-
and activity-related parenting practices: Cross-sectional findings of the INPACT
study. Int. J. Behav. Nutr. Phys. Act. 2013.
289. Martinson, B.C.; Vazquezbenitez, G.; Patnode, C.D.; Hearst, M.O.; Sherwood,
205
N.E.; Parker, E.D.; Sirard, J.; Pasch, K.E.; Lytle, L. Obesogenic family types
identified through latent profile analysis. Ann. Behav. Med. 2011.
290. Maitland, C.; Foster, S.; Stratton, G.; Braham, R.; Rosenberg, M. Capturing the
geography of children’s active and sedentary behaviours at home: the
HomeSPACE measurement tool. Child. Geogr. 2018, 3285, 1–18.
291. De L’europe, C. Testing physical fitness EUFOFIT experimental battery.
Provisonal handbook. Strasbourg. 1983. Council of europe.
292. Taylor, S.; Hackett, A.; Stratton, G.; Lamb, L. SportsLinx: Improving the Health
and Fitness of Liverpool’s Youth. Educ. Heal. 2004, 22 (1), 11–15.
293. Center for Health Statistics, N. Anthropometry Procedures Manual; 2011;
294. de Onis, M.; Onyango, A.W.; Borghi, E.; Siyam, A.; Nishida, C.; Siekmann, J.
Development of a WHO growth reference for school-aged children and
adolescents. Bull. World Health Organ. 2007, 85, 660–7.
295. Léger, L.A.; Mercier, D.; Gadoury, C.; Lambert, J. The multistage 20 metre shuttle
run test for aerobic fitness. J. Sports Sci. 1988, 6, 93–101.
296. Mayorga-vega, D.; Aguilar-soto, P.; Viciana, J. Criterion-Related Validity of the
20-M Shuttle Run Test for Estimating Cardi- orespiratory Fitness : A Meta-
Analysis. 2015, 536–547.
297. Riddoch C.J The Northern Ireland health and fitness survey-1989: The fitness,
physical activity, attitudes and lifestyles of Northern Ireland post-primary school
children. 1990.
298. Fairclough, S.J.; Boddy, L.M.; Hackett, A.F.; Stratton, G. Associations between
children’s socioeconomic status, weight status, and sex, with screen-based
sedentary behaviours and sport participation. Int. J. Pediatr. Obes. 2009, 4, 299–
305.
299. Sheldrick et al. Validity and reliability of the HomeSPACE-II instrument to assess
the influence of the home physical environment on children’s physical activity and
sedentary behaviour. under Rev.
300. Ordnance Survey AddressBase Premium | Business and government Available
online: http://www.ordnancesurvey.co.uk/business-and-
government/products/addressbase-premium.html.
301. Ordnance Survey OS MasterMap Topography Layer Available online:
https://www.ordnancesurvey.co.uk/business-and-
government/products/topography-layer.html.
302. Ordnance Survey MasterMap Greenspace Layer Available online:
https://www.ordnancesurvey.co.uk/business-and-government/products/os-
mastermap-greenspace.html.
303. NHANES - National Health and Nutrition Examination Survey Homepage
Available online: https://www.cdc.gov/nchs/nhanes/index.htm (accessed on May
24, 2019).
304. Fairclough, S.J.; Noonan, R.; Rowlands, A. V.; Van Hees, V.; Knowles, Z.; Boddy,
L.M. Wear Compliance and Activity in Children Wearing Wrist- and Hip-Mounted
Accelerometers. Med. Sci. Sport. Exerc. 2016, 48, 245–253.
305. Scott, J.J.; Rowlands, A. V.; Cliff, D.P.; Morgan, P.J.; Plotnikoff, R.C.; Lubans,
D.R. Comparability and feasibility of wrist- and hip-worn accelerometers in free-
living adolescents. J. Sci. Med. Sport 2017, 20, 1101–1106.
306. Clevenger, K.A.; Pfeiffer, K.A.; Mackintosh, K.A.; McNarry, M.A.; Brønd, J.;
Arvidsson, D.; Montoye, A.H.K. Effect of sampling rate on acceleration and
counts of hip- and wrist-worn ActiGraph accelerometers in children. Physiol.
Meas. 2019, 40, 095008.
206
307. Welsh Government National Survey for Wales, 2014-15 - internet use and access.
2015, 1–18.
308. Scott, A.; Jeon, S.-H.; Joyce, C.M.; Humphreys, J.S.; Kalb, G.; Witt, J.; Leahy, A.
A randomised trial and economic evaluation of the effect of response mode on
response rate, response bias, and item non-response in a survey of doctors. BMC
Med. Res. Methodol. 2011, 11, 126.
309. Couper, M.P. Web Surveys: The Questionnaire Design Challenge;
310. Wright, K.B. Researching Internet-Based Populations: Advantages and
Disadvantages of Online Survey Research, Online Questionnaire Authoring
Software Packages, and Web Survey Services. J. Comput. Commun. 2006, 10, 00–
00.
311. Tandon, P.S.; Zhou, C.; Sallis, J.F.; Cain, K.L.; Frank, L.D.; Saelens, B.E. Home
environment relationships with children’s physical activity, sedentary time, and
screen time by socioeconomic status. Int. J. Behav. Nutr. Phys. Act. 2012, 9, 88.
312. Noble, K.G.; Farah, M.J.; McCandliss, B.D. Socioeconomic background
modulates cognition-achievement relationships in reading. Cogn. Dev. 2006, 21,
349–368.
313. Niermann, C.; Krapf, F.; Renner, B.; Reiner, M.; Woll, A. Family health climate
scale (FHC-scale): development and validation. Int. J. Behav. Nutr. Phys. Act.
2014, 11, 30.
314. Karnik, S.; Kanekar, A. A. Childhood Obesity: A Global Public Health Crisis. Int.
J. Prev. Med. 2012, 1, 1–7.
315. Jones, M.; Blackaby, D.; Murphy, P. Childhood Obesity in Wales. Welsh Econ.
Rev. 2006, 22, 36–42.
316. Singh, A.S.; Mulder, C.; Twisk, J.W.R.; Van Mechelen, W.; Chinapaw, M.J.M.
Tracking of childhood overweight into adulthood: A systematic review of the
literature. Obes. Rev. 2008, 9, 474–488.
317. Bridger, T. Childhood obesity and cardiovascular disease. Paediatr child Heal.
2009, 14, 177–182.
318. Pulgaron, E.R.; Delamater, A.M. Obesity and type 2 diabetes in children:
Epidemiology and treatment. Curr. Diab. Rep. 2014, 14, 1–21.
319. Biro, F.M.; Wien, M. Childhood obesity and adult morbidities. Am J Clin Nutr
2010, 91, 1499–1505.
320. Bhadoria, A.; Sahoo, K.; Sahoo, B.; Choudhury, A.; Sufi, N.; Kumar, R. Childhood
obesity: Causes and consequences. J. Fam. Med. Prim. Care 2015, 4, 187.
321. Ledoux, T.A.; Hingle, M.D.; Baranowski, T. Relationship of fruit and vegetable
intake with adiposity: A systematic review. Obes. Rev. 2011, 12, 143–150.
322. Katzmarzyk, P.T.; Barreira, T. V.; Broyles, S.T.; Champagne, C.M.; Chaput, J.P.;
Fogelholm, M.; Hu, G.; Johnson, W.D.; Kuriyan, R.; Kurpad, A.; et al. Physical
Activity, Sedentary Time, and Obesity in an International Sample of Children.
Med. Sci. Sports Exerc. 2015, 47, 2062–2069.
323. Stone, M.R.; Stevens, D.; Faulkner, G.E.J. Maintaining recommended sleep
throughout the week is associated with increased physical activity in children.
Prev. Med. (Baltim). 2013, 56, 112–117.
324. Silva, D.A.S.; Silva, R.J. dos S. [Association between physical activity level and
consumption of fruit and vegetables among adolescents in northeast Brazil]. Rev.
Paul. Pediatr. 2015, 33, 167–73.
325. Pearson, N.; Atkin, A.J.; Biddle, S.J.; Gorely, T.; Edwardson, C. Patterns of
adolescent physical activity and dietary behaviours. Int. J. Behav. Nutr. Phys. Act.
2009, 6, 45.
207
326. Szczerbiński, R.; Karczewski, J.K.; Siemienkowicz, J. Wybrane Zachowania
Żywieniowe W Zależności Od Aktywności Fizycznej Młodzieży W Wieku 14-16
Lat W Północno – Wschodniej Polsce Na Przykładzie Powiatu Sokólskiego
Selected Nourishment Habits Depending on Physical Activity of 14-16 Year-Old
Teenagers in the . 2010, 83–86.
327. Howie, E.K.; Pate, R.R. Physical activity and academic achievement in children:
A historical perspective. J. Sport Heal. Sci. 2012, 1, 160–169.
328. Sjödin, a; Hjorth, M.F.; Damsgaard, C.T.; Ritz, C.; Astrup, a; Michaelsen, K.F.
Physical activity, sleep duration and metabolic health in children fluctuate with the
lunar cycle: science behind the myth. Clin. Obes. 2015, 5, 60–6.
329. Mcneil, J.; Tremblay, M.S.; Leduc, G.; Boyer, C.; Bélanger, P.; Leblanc, A.G.;
Borghese, M.M.; Chaput, J.P. Objectively-measured sleep and its association with
adiposity and physical activity in a sample of Canadian children. J. Sleep Res.
2015, 24, 131–139.
330. Vaisto, J.; Eloranta, A.M.; Viitasalo, A.; Tompuri, T.; Lintu, N.; Karjalainen, P.;
Lampinen, E.K.; Agren, J.; Laaksonen, D.E.; Lakka, H.M.; et al. Physical activity
and sedentary behaviour in relation to cardiometabolic risk in children: cross-
sectional findings from the Physical Activity and Nutrition in Children (PANIC)
Study. Int. J. Behav. Nutr. Phys. Act. 2014, 11, 55.
331. Atkin, A.J.; Gorely, T.; Biddle, S.J.H.; Marshall, S.J.; Cameron, N. Critical hours:
physical activity and sedentary behavior of adolescents after school. Pediatr.
Exerc. Sci. 2008, 20, 446–456.
332. Saunders, T.J.; Chaput, J.P.; Tremblay, M.S. Sedentary behaviour as an emerging
risk factor for cardiometabolic diseases in children and youth. Can. J. Diabetes
2014, 38, 53–61.
333. LeBlanc, A.G.; Katzmarzyk, P.T.; Barreira, T. V; Broyles, S.T.; Chaput, J.-P.;
Church, T.S.; Fogelholm, M.; Harrington, D.M.; Hu, G.; Kuriyan, R.; et al.
Correlates of Total Sedentary Time and Screen Time in 9-11 Year-Old Children
around the World: The International Study of Childhood Obesity, Lifestyle and the
Environment. PLoS One 2015, 10, e0129622.
334. Pearson, N.; Biddle, S.J.H.; Williams, L.; Worsley, A.; Crawford, D.; Ball, K.
Adolescent television viewing and unhealthy snack food consumption: the
mediating role of home availability of unhealthy snack foods. Public Health Nutr.
2014, 17, 317–23.
335. Mota, J.; Ribeiro, J.C.; Carvalho, J.; Santos, M.P.; Martins, J. Television viewing
and changes in body mass index and cardiorespiratory fitness over a two-year
period in school children. Pediatr. Exerc. Sci. 2010, 22, 245–253.
336. Fairclough, S.J.; Beighle, A.; Erwin, H.; Ridgers, N.D. School day segmented
physical activity patterns of high and low active children. BMC Public Health
2012, 12, 406.
337. Stratton, G.; Canoy, D.; Boddy, L.M.; Taylor, S.R.; Hackett, a F.; Buchan, I.E.
Cardiorespiratory fitness and body mass index of 9-11-year-old English children:
a serial cross-sectional study from 1998 to 2004. Int. J. Obes. (Lond). 2007, 31,
1172–8.
338. Noble, M.; Wright, G.; Smith, G.; Dibben, C. Measuring multiple deprivation at
the small-area level. Environ. Plan. A 2006, 38, 169–185.
339. Lohman, Timothy; Roche, Alex; Martorell, R. Anthropometric standardization
reference manual; Champaign, IL : Human Kinetics Books., 1988;
340. Cole, T.J. Growth monitoring with the British 1990 growth reference. Arch. Dis.
Child. 1997, 76, 47–49.
208
341. Fairclough, S.J.; Boddy, L.M.; Hackett, A.F.; Stratton, G. Associations between
children’s socioeconomic status, weight status, and sex, with screen-based
sedentary behaviours and sport participation. Int. J. Pediatr. Obes. 2009, 4, 299–
305.
342. Lumley, T.; Diehr, P.; Emerson, S.; Chen, L. The Importance of the Normality
Assumption in Large Public Health Data Sets. Annu. Rev. Public Heal. 2002, 23,
151–169.
343. Williams, M.; Grajales, C.A.G.; Kurkiewicz, D. Assumptions of multiple
regression: Correcting two misconceptions. Pract. Assessment, Res. Eval. 2013,
18, 1–14.
344. Jago R, Ness AR, Emment P, Mattocks C, Jones L, R.C. Obesogenic diet and
physical activity behaviours: independent or associated behaviours in adolescents.
Public Health Nutr. 2010, 13, 673–681.
345. Pearson, N.; Biddle, S.J.H. Sedentary behavior and dietary intake in children,
adolescents, and adults: A systematic review. Am. J. Prev. Med. 2011, 41, 178–
188.
346. Ottevaere, C.; Huybrechts, I.; Béghin, L.; Cuenca-Garcia, M.; De Bourdeaudhuij,
I.; Gottrand, F.; Hagströmer, M.; Kafatos, A.; Le Donne, C.; Moreno, L. a; et al.
Relationship between self-reported dietary intake and physical activity levels
among adolescents: the HELENA study. Int. J. Behav. Nutr. Phys. Act. 2011, 8, 8.
347. Pereira, S.; Katzmarzyk, P.T.; Gomes, T.N.; Borges, A.; Santos, D.; Souza, M.;
dos Santos, F.K.; Chaves, R.N.; Champagne, C.M.; Barreira, T. V.; et al. Profiling
physical activity, diet, screen and sleep habits in Portuguese children. Nutrients
2015, 7, 4345–4362.
348. Vissers, P.A.J.; Jones, A.P.; van Sluijs, E.M.F.; Jennings, A.; Welch, A.; Cassidy,
A.; Griffin, S.J. Association between diet and physical activity and sedentary
behaviours in 9-10-year-old British White children. Public Health 2012, 127, 231–
240.
349. Nelson, T.D.; Lundahl, A.; Molfese, D.L.; Waford, R.N.; Roman, A.; Gozal, D.;
Molfese, V.J.; Ferguson, M.C. Estimating child sleep from parent report of time in
bed: Development and evaluation of adjustment approaches. J. Pediatr. Psychol.
2014, 39, 624–632.
350. Short, M.A.; Gradisar, M.; Lack, L.C.; Wright, H.R.; Chatburn, A. Estimating
adolescent sleep patterns: Parent reports versus adolescent self-report surveys,
sleep diaries, and actigraphy. Nat. Sci. Sleep 2013, 5, 23–26.
351. Yamakita, M.; Sato, M.; Ando, D.; Suzuki, K.; Yamagata, Z. Availability of a
simple self-report sleep questionnaire for 9- to 12-year-old children Study
participants. 2014, 279–288.
352. Ekstedt, M.; Nyberg, G.; Ingre, M.; Ekblom, Ö.; Marcus, C. Sleep, physical
activity and BMI in six to ten- year-old children measured by accelerometry: a
cross-sectional study. Int. J. Behav. Nutr. Phys. Act. 2013, 10, 1.
353. Khan, M.K.A.; Chu, Y.L.; Kirk, S.F.L.; Veugelers, P.J. Are sleep duration and
sleep quality associated with diet quality, physical activity, and body weight
status? A population-based study of Canadian children. Can. J. Public Health
2015, 106, e277–e282.
354. Jimenez-Pavon, D.; Kelly, J.; Reilly, J.J. Associations between objectively
measured habitual physical activity and adiposity in children and adolescents:
Systematic review. Int. J. Pediatr. Obes. 2010, 5, 3–18.
355. Kelly, B.; Halford, J.C.G.; Boyland, E.J.; Chapman, K.; Bautista-Castaño, I.; Berg,
C.; Caroli, M.; Cook, B.; Coutinho, J.G.; Effertz, T.; et al. Television food
209
advertising to children: A global perspective. Am. J. Public Health 2010, 100,
1730–1736.
356. Boyland, E.J.; Halford, J.C.G. Television advertising and branding. Effects on
eating behaviour and food preferences in children. Appetite 2013, 62, 236–241.
357. LeBlanc, A.G.; Katzmarzyk, P.T.; Barreira, T. V.; Broyles, S.T.; Chaput, J.P.;
Church, T.S.; Fogelholm, M.; Harrington, D.M.; Hu, G.; Kuriyan, R.; et al.
Correlates of total sedentary time and screen time in 9-11 year-old children around
the world: The international study of childhood obesity, lifestyle and the
environment. PLoS One 2015, 10, 1–20.
358. Hysing, M.; Pallesen, S.; Stormark, K.M.; Jakobsen, R.; Lundervold, A.J.;
Sivertsen, B. Sleep and use of electronic devices in adolescence: results from a
large population-based study. BMJ Open 2015, 5, e006748–e006748.
359. Marques, A.; Ekelund, U.; Sardinha, L.B. Associations between organized sports
participation and objectively measured physical activity, sedentary time and
weight status in youth. J. Sci. Med. Sport 2015, 19, 1–4.
360. Morgan, K.; Hallingberg, B.; Littlecott, H.; Murphy, S.; Fletcher, A.; Roberts, C.;
Moore, G. Predictors of physical activity and sedentary behaviours among 11-16
year olds: Multilevel analysis of the 2013 Health Behaviour in School-aged
Children (HBSC) study in Wales. BMC Public Health 2016, 16, 569.
361. Hatch, K.E. Determining the Effects of Technology on Children. 2011.
362. Trish Gorely, Stuart biddle, Simon Marshall, N.C. and L.C. The association
between distance to school, physical activity and sedentary behaviors in
adolescents: Project STIL. Pediatr. Exerc. Sci. 2009, 21, 450–461.
363. Ar-Yuwat, S.; Clark, M.J.; Hunter, A.; James, K.S. Determinants of physical
activity in primary school students using the health belief model. J. Multidiscip.
Healthc. 2013, 6, 119–26.
364. Feldman, D.E.; Barnett, T.; Shrier, I.; Rossignol, M.; Abenhaim, L. Is physical
activity differentially associated with different types of sedentary pursuits? Arch.
Pediatr. Adolesc. Med. 2003, 157, 797–802.
365. Booth, J.N.; Leary, S.D.; Joinson, C.; Ness, A.R.; Tomporowski, P.D.; Boyle, J.M.;
Reilly, J.J. Associations between objectively measured physical activity and
academic attainment in adolescents from a UK cohort. Br. J. Sports Med. 2014,
48, 265–70.
366. Jago, R.; Sebire, S.J.; Gorely, T.; Cillero, I.H.; Biddle, S.J.H. “ I ’ m on it 24 / 7 at
the moment ": A qualitative examination of multi-screen viewing behaviours
among UK 10-11 year olds. 2011, 1–8.
367. Pate, R.R.; Taverno Ross, S.E.; Liese, A.D.; Dowda, M. Associations among
physical activity, diet quality, and weight status in US adults. Med. Sci. Sports
Exerc. 2015, 47, 743–750.
368. Fortes, L.; Morgado, F.; Almeida, S.; Ferreira, M. Eating behavior and physical
activity in adolescents. Rev. Nutr. 2013, 26, 529–537.
369. Hjorth, M.F.; Chaput, J.P.; Damsgaard, C.T.; Dalskov, S.M.; Andersen, R.; Astrup,
A.; Michaelsen, K.F.; Tetens, I.; Ritz, C.; Sjödin, A. Low physical activity level
and short sleep duration are associated with an increased cardio-metabolic risk
profile: A longitudinal study in 8-11 year old Danish children. PLoS One 2014, 9.
370. Wang, L.; Luo, J.; Luo, J.; Gao, W.; Kong, J. The effect of Internet use on
adolescents’ lifestyles: A national survey. Comput. Human Behav. 2012, 28, 2007–
2013.
371. Gordon-Larsen, P.; Adair, L.S.; Popkin, B.M. Ethnic differences in physical
activity and inactivity patterns and overweight status. Obes. Res. 2002, 10, 141–
210
149.
372. Elsenburg, L.K.; Corpeleijn, E.; van Sluijs, E.M.F.; Atkin, A.J. Clustering and
correlates of multiple health behaviours in 9-10 year old children. PLoS One 2014,
9, e99498–e99498.
373. Veitch, J.; Arundell, L.; Hume, C.; Ball, K. Children’s perceptions of the factors
helping them to be “resilient” to sedentary lifestyles. Health Educ. Res. 2013, 28,
692–703.
374. Wilk, P.; Clark, A.F.; Maltby, A.; Smith, C.; Tucker, P.; Gilliland, J.A. Examining
individual, interpersonal, and environmental influences on children’s physical
activity levels. SSM - Popul. Heal. 2018, 4, 76–85.
375. Tappe, K.A.; Glanz, K.; Sallis, J.F.; Zhou, C.; Saelens, B.E. Children’s physical
activity and parents’ perception of the neighborhood environment: Neighborhood
impact on kids study. Int. J. Behav. Nutr. Phys. Act. 2013, 10, 1–10.
376. Côté-Lussier, C.; Mathieu, M.-È.; Barnett, T.A. Independent associations between
child and parent perceived neighborhood safety, child screen time, physical
activity and BMI: a structural equation modeling approach. Int. J. Obes. 2015, 39,
1475–1481.
377. Karsten, L. It all used to be better? Different generations on continuity and change
in urban children’s daily use of space. Child. Geogr. 2005, 3, 275–290.
378. Veitch, J.; Salmon, J.; Ball, K. Children’s active free play in local neighborhoods:
A behavioral mapping study. Health Educ. Res. 2008, 23, 870–879.
379. Wong, B.Y.-M.; Cerin, E.; Ho, S.-Y.; Mak, K.-K.; Lo, W.-S.; Lam, T.-H.
Adolescents’ physical activity: Competition between perceived neighborhood
sport facilities and home media resources. Int. J. Pediatr. Obes. 2010, 5, 169–176.
380. Ridgers, N.D.; Graves, L.E.F.; Foweather, L.; Stratton, G. Examining influences
on boy’s and girls’ physical activity patterns: the A-CLASS project. Pediatr.
Exerc. Sci. 2010, 22, 638–50.
381. Page, A.S.; Cooper, A.R.; Griew, P.; Jago, R. Independent mobility, perceptions
of the built environment and children’s participation in play, active travel and
structured exercise and sport: the PEACH Project. Int. J. Behav. Nutr. Phys. Act.
2010, 7, 17.
382. Pinard, C. a; Yaroch, A.L.; Hart, M.H.; Serrano, E.L.; McFerren, M.M.;
Estabrooks, P. a The Validity and reliability of the Comprehensive Home
Environment Survey (CHES). Health Promot. Pract. 2014, 15, 109–17.
383. Sheldrick; Maitland; Mackintosh; Rosenberg; Griffiths; Fry; Stratton Associations
between the Home Physical Environment and Children’s Home-Based Physical
Activity and Sitting. Int. J. Environ. Res. Public Health 2019, 16, 4178.
384. Sheldrick, M.P.R.; Tyler, R.; Mackintosh, K.A.; Stratton, G. Relationship between
Sedentary Time, Physical Activity and Multiple Lifestyle Factors in Children. J.
Funct. Morphol. Kinesiol. 2018, 3, 15.
385. Fisher, R.A. Statistical Methods for Research Workers. In; Springer, New York,
NY, 1992; pp. 66–70.
386. Cicchetti, D. V. Guidelines, criteria, and rules of thumb for evaluating normed and
standardized assessment instruments in psychology. Psychol. Assess. 1994, 6, 284–
290.
387. Landis, J.R.; Koch, G.G. The Measurement of Observer Agreement for Categorical
Data. Biometrics 1977, 33, 159.
388. Goodwin, L.D.; Leech, N.L. Understanding Correlation: Factors That Affect the
Size of r. J. Exp. Educ. 2006, 74, 249–266.
389. Meehl, G.A. Global Climate Projections. Cambridge Univ. Press 2007.
211
390. Bryant, Maria J, Ward, Dianne S, Hales, Derek, Vaughn, Amber, Tabak, Rachel
G, Stevens, J. Reliability and validity of the Healthy Home Survey: A tool to
measure factors within homes hypothesized to relate to overweight in children. Int.
J. Behav. Nutr. Phys. Act. 2008, 4, 61–71.
391. Spurrier, N.J.; Bell, L.; Wilson, A.; Lowe, E.; Golley, R.; Magarey, A.A. Minimal
change in children’s lifestyle behaviours and adiposity following a home-based
obesity intervention: results from a pilot study. BMC Res. Notes 2016, 9, 26.
392. CommSec Australian home size hits 20-year low. Economics 2017.
393. Roberts-Hughes, R. The Case for Space: The Size of England’s New Homes; 2011;
394. Nuutinen, T.; Ray, C.; Roos, E. Do computer use, TV viewing, and the presence
of the media in the bedroom predict school-aged children’s sleep habits in a
longitudinal study? BMC Public Health 2013, 13, 684.
395. Gören, E. Economic Effects of Domestic and Neighbouring Countries’ Cultural
Diversity. Ssrn 2013.
396. Lee, K.M.; Lee, J.; Chung, C.Y.; Ahn, S.; Sung, K.H.; Kim, T.W.; Lee, H.J.; Park,
M.S. Pitfalls and important issues in testing reliability using intraclass correlation
coefficients in orthopaedic research. Clin Orthop Surg 2012, 4, 149–155.
397. Office for national statistics Compendium of UK statistics, Social Indicators; 2014;
398. Ridgers, N.D.; McNarry, M.A.; Mackintosh, K.A. Feasibility and Effectiveness of
Using Wearable Activity Trackers in Youth: A Systematic Review. JMIR mHealth
uHealth 2016, 4, e129.
399. Granich, J.; Rosenberg, M.; Knuiman, M.; Timperio, A. Understanding children’s
sedentary behaviour: a qualitative study of the family home environment. Health
Educ. Res. 2010, 25, 199–210.
400. Butte, N.F.; Watson, K.B.; Ridley, K.; Zakeri, I.F.; McMurray, R.G.; Pfeiffer,
K.A.; Crouter, S.E.; Herrmann, S.D.; Bassett, D.R.; Long, A.; et al. A Youth
Compendium of Physical Activities: Activity Codes and Metabolic Intensities.
Med. Sci. Sports Exerc. 2018, 50, 246–256.
401. Bassett, D.R.; Vachon, J.A.; Kirkland, A.O.; Howley, E.T.; Duncan, G.E.;
Johnson, K.R. Energy cost of stair climbing and descending on the college alumnus
questionnaire. Med. Sci. Sports Exerc. 1997, 29, 1250–4.
402. Teh, K.C.; Aziz, A.R. Heart rate, oxygen uptake, and energy cost of ascending and
descending the stairs. Med. Sci. Sports Exerc. 2002, 34, 695–9.
403. Cohen, J.; Cohen, P.; West, S.G.; Aiken, L.S. Applied multiple
regression/correlation analysis for the behavioral sciences (3rd edition);
Lawrence Erlbaum Associates, 2003;
404. Winkler, E.A.H.; Bodicoat, D.H.; Healy, G.N.; Bakrania, K.; Yates, T.; Owen, N.;
Dunstan, D.W.; Edwardson, C.L. Identifying adults’ valid waking wear time by
automated estimation in activPAL data collected with a 24 h wear protocol.
Physiol. Meas. 2016, 37, 1653–1668.
405. Edwardson, C.L.; Yates, T.; Biddle, S.J.H.; Davies, M.J.; Dunstan, D.W.; Esliger,
D.W.; Gray, L.J.; Jackson, B.; O’Connell, S.E.; Waheed, G.; et al. Effectiveness
of the Stand More AT (SMArT) Work intervention: cluster randomised controlled
trial. BMJ 2018, 363, k3870.
406. Marshall, S.J.; Levy, S.S.; Tudor-Locke, C.E.; Kolkhorst, F.W.; Wooten, K.M.; Ji,
M.; Macera, C.A.; Ainsworth, B.E. Translating Physical Activity
Recommendations into a Pedometer-Based Step Goal. Am. J. Prev. Med. 2009, 36,
410–415.
407. Choi, L.; Liu, Z.; Matthews, C.E.; Buchowski, M.S. Validation of accelerometer
wear and nonwear time classification algorithm. Med. Sci. Sports Exerc. 2011, 43,
212
357–64.
408. Chau, J.Y.; Daley, M.; Srinivasan, A.; Dunn, S.; Bauman, A.E.; van der Ploeg,
H.P. Desk-based workers’ perspectives on using sit-stand workstations: a
qualitative analysis of the Stand@Work study. BMC Public Health 2014, 14, 752.
409. Pearce, M.; Page, A.S.; Griffin, T.P.; Cooper, A.R. Who children spend time with
after school: associations with objectively recorded indoor and outdoor physical
activity. Int. J. Behav. Nutr. Phys. Act. 2014, 11, 45.
410. Hnatiuk, J.A.; Hesketh, K.R.; van Sluijs, E.M.F. Correlates of home and
neighbourhood-based physical activity in UK 3–4-year-old children. Eur. J. Public
Health 2016, 26, 947–953.
411. Time and Date AS. Sunrise and Sunset Calculator Available online:
https://www.timeanddate.com/sun/.
412. Hosmer, D.W.; Lemeshow, S.; May, S. Applied survival analysis : regression
modeling of time-to-event data; Wiley-Interscience, 2008; ISBN 9780471754992.
413. Kwak, S.K.; Kim, J.H. Statistical data preparation: management of missing values
and outliers. Korean J. Anesthesiol. 2017, 70, 407–411.
414. Tabachnick, B.G.; Fidell, L.S. Using Multivariate Statistics; 2019; ISBN 978-0-
13-479054-1.
415. Dowling, R. Accommodating Open Plan: Children, Clutter, and Containment in
Suburban Houses in Sydney, Australia. Environ. Plan. A Econ. Sp. 2008, 40, 536–
549.
416. Miendlarzewska, E.A.; Trost, W.J. How musical training affects cognitive
development: rhythm, reward and other modulating variables. Front. Neurosci.
2013, 7, 279.
417. Atkin, A.J.; Corder, K.; van Sluijs, E.M.F. Bedroom media, sedentary time and
screen-time in children: a longitudinal analysis. Int. J. Behav. Nutr. Phys. Act.
2013, 10, 137.
418. Chaput, J.-P.; Leduc, G.; Boyer, C.; Bélanger, P.; LeBlanc, A.G.; Borghese, M.M.;
Tremblay, M.S. Electronic screens in children’s bedrooms and adiposity, physical
activity and sleep: do the number and type of electronic devices matter? Can. J.
Public Health 2014, 105, e273-9.
419. O’Connor, T.M.; Chen, T.-A.; Baranowski, J.; Thompson, D.; Baranowski, T.
Physical Activity and Screen-Media–Related Parenting Practices Have Different
Associations with Children’s Objectively Measured Physical Activity. Child.
Obes. 2013, 9, 446–453.
420. Hardy, L.L.; Baur, L.A.; Garnett, S.P.; Crawford, D.; Campbell, K.J.; Shrewsbury,
V.A.; Cowell, C.T.; Salmon, J. Family and home correlates of television viewing
in 12–13 year old adolescents: The Nepean Study. Int. J. Behav. Nutr. Phys. Act.
2006, 3, 24.
421. De Decker, E.; De Craemer, M.; De Bourdeaudhuij, I.; Wijndaele, K.; Duvinage,
K.; Koletzko, B.; Grammatikaki, E.; Iotova, V.; Usheva, N.; Fernández-Alvira,
J.M.; et al. Influencing factors of screen time in preschool children: an exploration
of parents’ perceptions through focus groups in six European countries. Obes. Rev.
2012, 13, 75–84.
422. Saunders, T.J.; Tremblay, M.S.; Mathieu, M.-È.; Henderson, M.; O’Loughlin, J.;
Tremblay, A.; Chaput, J.-P.; group, on behalf of the Q. cohort research
Associations of Sedentary Behavior, Sedentary Bouts and Breaks in Sedentary
Time with Cardiometabolic Risk in Children with a Family History of Obesity.
PLoS One 2013, 8, e79143.
423. Hegarty, L.M.; Mair, J.L.; Kirby, K.; Murtagh, E.; Murphy, M.H. School-based
213
Interventions to Reduce Sedentary Behaviour in Children: A Systematic Review.
AIMS public Heal. 2016, 3, 520–541.
424. Doherty, A.R.; Kelly, P.; Kerr, J.; Marshall, S.; Oliver, M.; Badland, H.; Hamilton,
A.; Foster, C. Using wearable cameras to categorise type and context of
accelerometer-identified episodes of physical activity. Int. J. Behav. Nutr. Phys.
Act. 2013, 10, 22.
425. Everson, B.; Mackintosh, K.A.; McNarry, M.A.; Todd, C.; Stratton, G.; Everson,
B.; Mackintosh, K.A.; McNarry, M.A.; Todd, C.; Stratton, G. Can Wearable
Cameras be Used to Validate School-Aged Children’s Lifestyle Behaviours?
Children 2019, 6, 20.
426. Ding, D.; Gebel, K. Built environment, physical activity, and obesity: What have
we learned from reviewing the literature? Heal. Place 2012, 18, 100–105.
427. Ding, D.; Sallis, J.F.; Kerr, J.; Lee, S.; Rosenberg, D.E. Neighborhood
environment and physical activity among youth a review. Am. J. Prev. Med. 2011,
41, 442–55.
428. Neshteruk, C.D.; Mazzucca, S.; Østbye, T.; Ward, D.S. The physical environment
in family childcare homes and children’s physical activity. Child. Care. Health
Dev. 2018, 44, 746–752.
429. Brazendale, K.; Beets, M.W.; Turner-Mcgrievy, G.M.; Kaczynski, A.T.; Pate,
R.R.; Weaver, R.G. Children’s Obesogenic Behaviors During Summer Versus
School: A Within-Person Comparison; 2018;
430. Verloigne, M.; Van Lippevelde, W.; Maes, L.; Brug, J.; De Bourdeaudhuij, I.
Family- and school-based correlates of energy balance-related behaviours in 10–
12-year-old children: a systematic review within the ENERGY (EuropeaN Energy
balance Research to prevent excessive weight Gain among Youth) project. Public
Health Nutr. 2012, 15, 1380–1395.
431. Hutchens, A.; Lee, R.E. Parenting Practices and Children’s Physical Activity: An
Integrative Review. J. Sch. Nurs. 2018, 34, 68–85.
432. Salmon, J.; Timperio, A.; Telford, A.; Carver, A.; Crawford, D.; Timperio, A.;
Carver, A. Association of Family Environment with Children ’ s Television
Viewing and with Low Level of Physical Activity. 2005, 13, 1939–1951.
433. Pearson, N.; Salmon, J.; Crawford, D.; Campbell, K.; Timperio, A. Are parental
concerns for child TV viewing associated with child TV viewing and the home
sedentary environment? Int. J. Behav. Nutr. Phys. Act. 2011, 8, 102.
434. Tremblay, M.S.; Aubert, S.; Barnes, J.D.; Saunders, T.J.; Carson, V.; Latimer-
Cheung, A.E.; Chastin, S.F.M.; Altenburg, T.M.; Chinapaw, M.J.M. Sedentary
Behavior Research Network (SBRN) – Terminology Consensus Project process
and outcome. Int. J. Behav. Nutr. Phys. Act. 2017, 14, 75.
435. Sheldrick, M. Associations between the home physical environment and children’s
home-based physical activity and sitting. under Rev. 2019.
436. Choi, L.; Liu, Z.; Matthews, C.E.; Buchowski, M.S. Validation of Accelerometer
Wear and Nonwear Time Classification Algorithm. Med. Sci. Sport. Exerc. 2011,
43, 357–364.
437. Pearce, M.; Page, A.S.; Griffin, T.P.; Cooper, A.R. Who children spend time with
after school: associations with objectively recorded indoor and outdoor physical
activity. Int J Behav Nutr Phys Act 2014, 11, 45.
438. Tabachnick, B.G.; Fidell, L.S. Using multivariate statistics; Harper & Row, 1989;
ISBN 0060465719.
439. Kahn, J.A.; Huang, B.; Gillman, M.W.; Field, A.E.; Austin, S.B.; Colditz, G.A.;
Frazier, A.L. Patterns and Determinants of Physical Activity in U.S. Adolescents.
214
J. Adolesc. Heal. 2008, 42, 369–377.
440. Boxberger, K.; Reimers, A.K. Parental correlates of outdoor play in boys and girls
aged 0 to 12—A systematic review. Int. J. Environ. Res. Public Health 2019, 16.
441. Sallis, J.F.; Prochaska, J.J.; Taylor, W.C. A review of correlates of physical activity
of children and adolescents. Med. Sci. Sports Exerc. 2000, 32, 963–975.
442. World Health Organization (WHO) Adolescent obesity and related behaviours:
trends and inequalities in the WHO European Region, 2002–2014; 2014;
443. He, M.; Harris, S.; Piche, L.; Beynon, C. Understanding Screen-Related Sedentary
Behavior and its Contributing Factors among School-Aged Children: A Social-
Ecologic Exploration. Am. J. Heal. Promot. 2009, 23, 299–308.
444. Pearson, N.; Salmon, J.; Crawford, D.; Campbell, K.; Timperio, A. Are parental
concerns for child TV viewing associated with child TV viewing and the home
sedentary environment? Int. J. Behav. Nutr. Phys. Act. 2011, 8, 1–8.
445. Lee, E.-Y.; Hesketh, K.D.; Rhodes, R.E.; Rinaldi, C.M.; Spence, J.C.; Carson, V.
Role of parental and environmental characteristics in toddlers’ physical activity
and screen time: Bayesian analysis of structural equation models. Int. J. Behav.
Nutr. Phys. Act. 2018, 15, 17.
446. Loprinzi, P.D.; Davis, R.E.; Fu, Y.C. Early motor skill competence as a mediator
of child and adult physical activity. Prev. Med. Reports 2015, 2, 833–838.
447. Biddle, S.J.H.; Bennie, J.A.; Bauman, A.E.; Chau, J.Y.; Dunstan, D.; Owen, N.;
Stamatakis, E.; van Uffelen, J.G.Z. Too much sitting and all-cause mortality: is
there a causal link? BMC Public Health 2016, 16, 635.
448. Lyn, R. Physical activity research: identifying the synergistic relationships
between individual, social and environmental factors to promote active lifestyles.
Health Educ. Res. 2010, 25, 183–4.
449. Brønd, J.C.; Arvidsson, D. Sampling frequency affects the processing of Actigraph
raw acceleration data to activity counts. J. Appl. Physiol. 2016, 120, 362–369.
450. Field, A.P.; Field, A.P. Discovering statistics using IBM SPSS statistics; ISBN
9781526445766.
451. Kaiser, H.F. An index of factorial simplicity. Psychometrika 1974, 39, 31–36.
452. Guadagnoli, E.; Velicer, W.F. Relation of Sample Size to the Stability of
Component Patterns. Psychol. Bull. 1988, 103, 265–275.
453. Maskey, R.; Fei, J.; Nguyen, H.O. Use of exploratory factor analysis in maritime
research. Asian J. Shipp. Logist. 2018, 34, 91–111.
454. Samuels, P. Advice on Exploratory Factor Analysis. Cent. Acad. Success,
Birmingham City Univ. 2016, 2.
455. Hvid, T.; Lindegaard, B.; Winding, K.; Iversen, P.; Brasso, K.; Solomon, T.P.J.;
Pedersen, B.K.; Hojman, P. Effect of a 2-year home-based endurance training
intervention on physiological function and PSA doubling time in prostate cancer
patients. Cancer Causes Control CCC 2016, 27, 165–174.
456. De Coen, V.; Vansteelandt, S.; Maes, L.; Huybrechts, I.; De Bourdeaudhuij, I.;
Vereecken, C. Parental socioeconomic status and soft drink consumption of the
child. The mediating proportion of parenting practices. Appetite 2012, 59, 76–80.
457. Berge, J.M.; Wall, M.; Bauer, K.W.; Neumark-Sztainer, D. Parenting
Characteristics in the Home Environment and Adolescent Overweight: A Latent
Class Analysis. Obesity 2010, 18, 818–825.
458. Pampel, F.C.; Krueger, P.M.; Denney, J.T. Socioeconomic Disparities in Health
Behaviors. Annu. Rev. Sociol. 2010, 36, 349–370.
459. Sleddens, E.F.C.; Gerards, S.M.P.L.; Thijs, C.; De Vries, N.K.; Kremers, S.P.J.
General parenting, childhood overweight and obesity-inducing behaviors: A
215
review. Int. J. Pediatr. Obes. 2011, 6.
460. Yee, A.Z.H.; Lwin, M.O.; Ho, S.S. The influence of parental practices on child
promotive and preventive food consumption behaviors: A systematic review and
meta-analysis. Int. J. Behav. Nutr. Phys. Act. 2017, 14.
461. Fairbrother, H.; Curtis, P.; Goyder, E. Making health information meaningful:
Children’s health literacy practices. SSM - Popul. Heal. 2016, 2, 476–484.
462. Sigmund, E.; Sigmundová, D.; Badura, P.; Madarasová Gecková, A. Health-
related parental indicators and their association with healthy weight and
overweight/obese children’s physical activity. BMC Public Health 2018, 18, 676.
463. Solomon-Moore, E.; Emm-Collison, L.G.; Sebire, S.J.; Toumpakari, Z.;
Thompson, J.L.; Lawlor, D.A.; Jago, R. “In my day…”-Parents’ Views on
Children’s Physical Activity and Screen Viewing in Relation to Their Own
Childhood. Int. J. Environ. Res. Public Health 2018, 15.
464. Stenhammar, C.; Sarkadi, A.; Edlund, B. The role of parents’ educational
background in healthy lifestyle practices and attitudes of their 6-year-old children.
Public Health Nutr. 2007, 10, 1305–1313.
465. Johansson, E.; Mei, H.; Xiu, L.; Svensson, V.; Xiong, Y.; Marcus, C.; Zhang, J.;
Hagströmer, M. Physical activity in young children and their parents-An Early
STOPP Sweden-China comparison study. Sci. Rep. 2016, 6.
466. Newby, P.K.; Tucker, K.L. Empirically derived eating patterns using factor or
cluster analysis: A review. Nutr. Rev. 2004, 62, 177–203.
467. Brown, H.E.; Atkin, A.J.; Panter, J.; Wong, G.; Chinapaw, M.J.M.; van Sluijs,
E.M.F. Family-based interventions to increase physical activity in children: A
systematic review, meta-analysis and realist synthesis. Obes. Rev. 2016, 17, 345–
360.
468. Biddle, S.J.H.; Braithwaite, R.; Pearson, N. The effectiveness of interventions to
increase physical activity among young girls: A meta-analysis. Prev. Med.
(Baltim). 2014, 62, 119–131.
469. Macarthur, G.; Caldwell, D.M.; Redmore, J.; Watkins, S.H.; Kipping, R.; White,
J.; Chittleborough, C.; Langford, R.; Er, V.; Lingam, R.; et al. Individual-, family-
, and school-level interventions targeting multiple risk behaviours in young people.
Cochrane Database Syst. Rev. 2018, 2018, CD009927.
470. Stockings, E.; Hall, W.D.; Lynskey, M.; Morley, K.I.; Reavley, N.; Strang, J.;
Patton, G.; Degenhardt, L. Prevention, early intervention, harm reduction, and
treatment of substance use in young people. The Lancet Psychiatry 2016, 3, 280–
296.
471. Townsend, N.; Wickramasinghe, K.; Williams, J.; Bhatnagar, P.; Rayner, M.
Physical activity statistics. Br. Hear. Found. 2015, 1–128.
472. Pouliou, T.; Sera, F.; Griffiths, L.; Joshi, H.; Geraci, M.; Cortina-Borja, M.; Law,
C. Environmental influences on children’s physical activity. J. Epidemiol.
Community Health 2014, 1–9.
473. Chastin, S.F.M.; Granat, M.H. Methods for objective measure, quantification and
analysis of sedentary behaviour and inactivity. Gait Posture 2010, 31, 82–86.
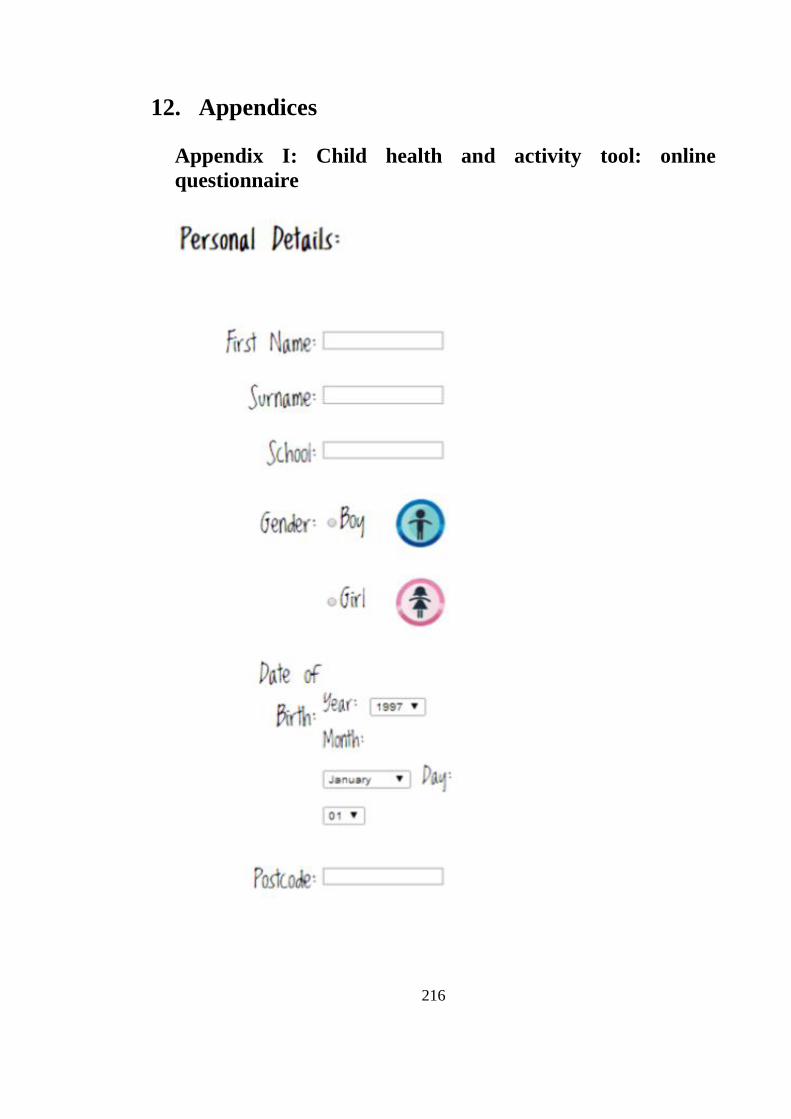
216
12. Appendices
Appendix I: Child health and activity tool: online
questionnaire
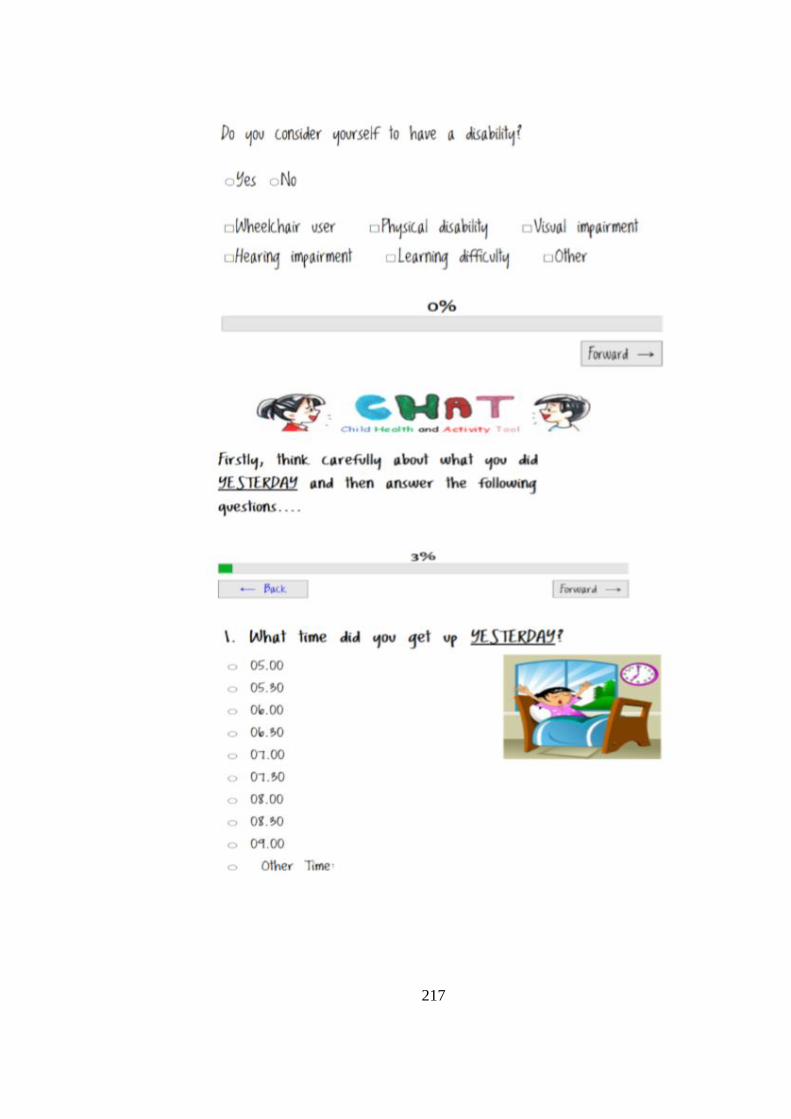
217
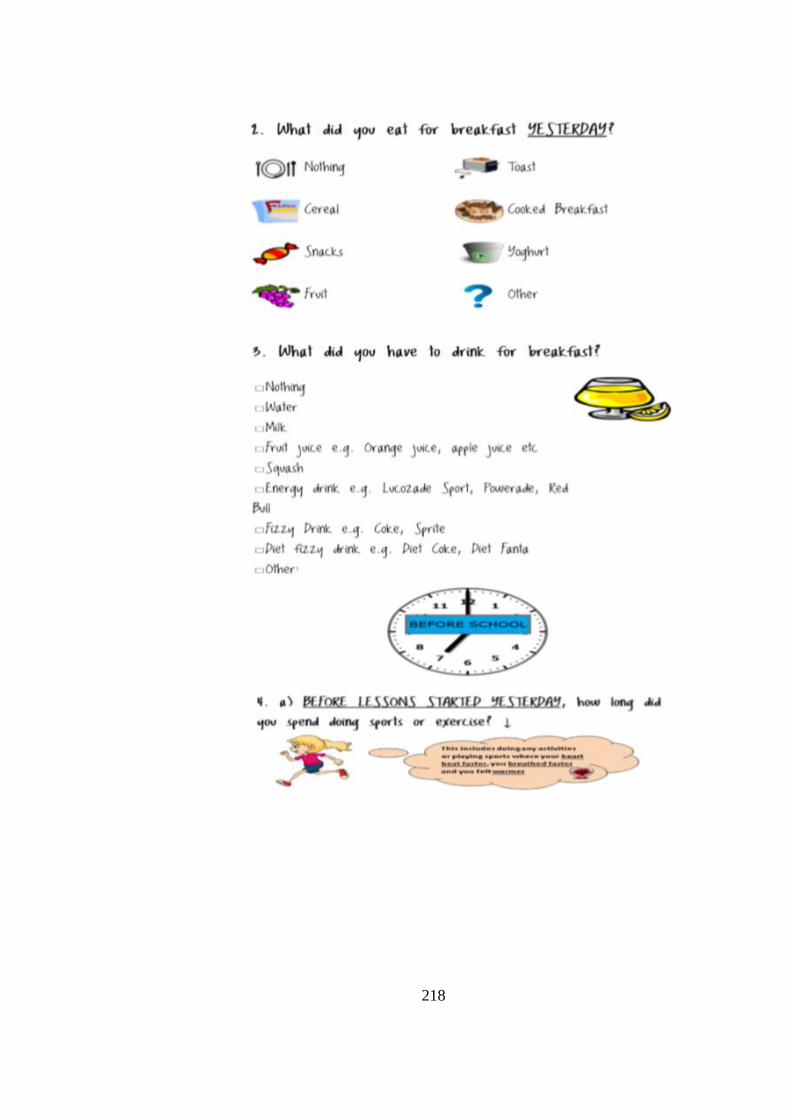
218
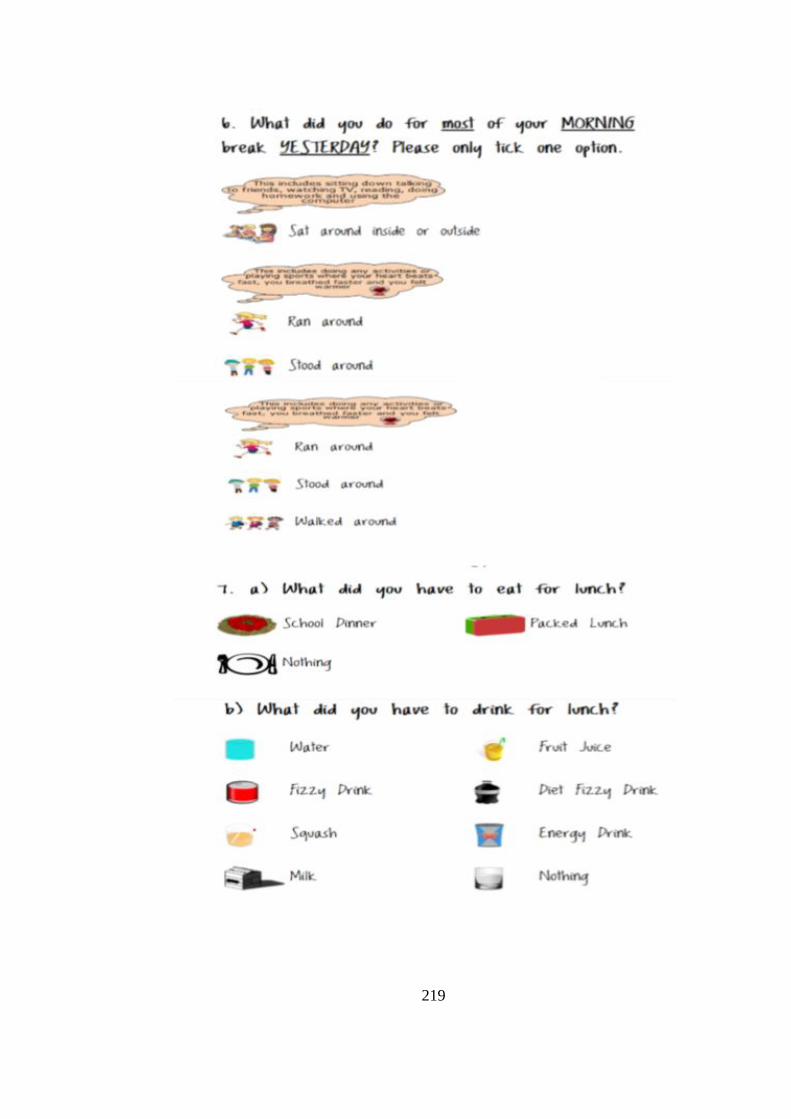
219
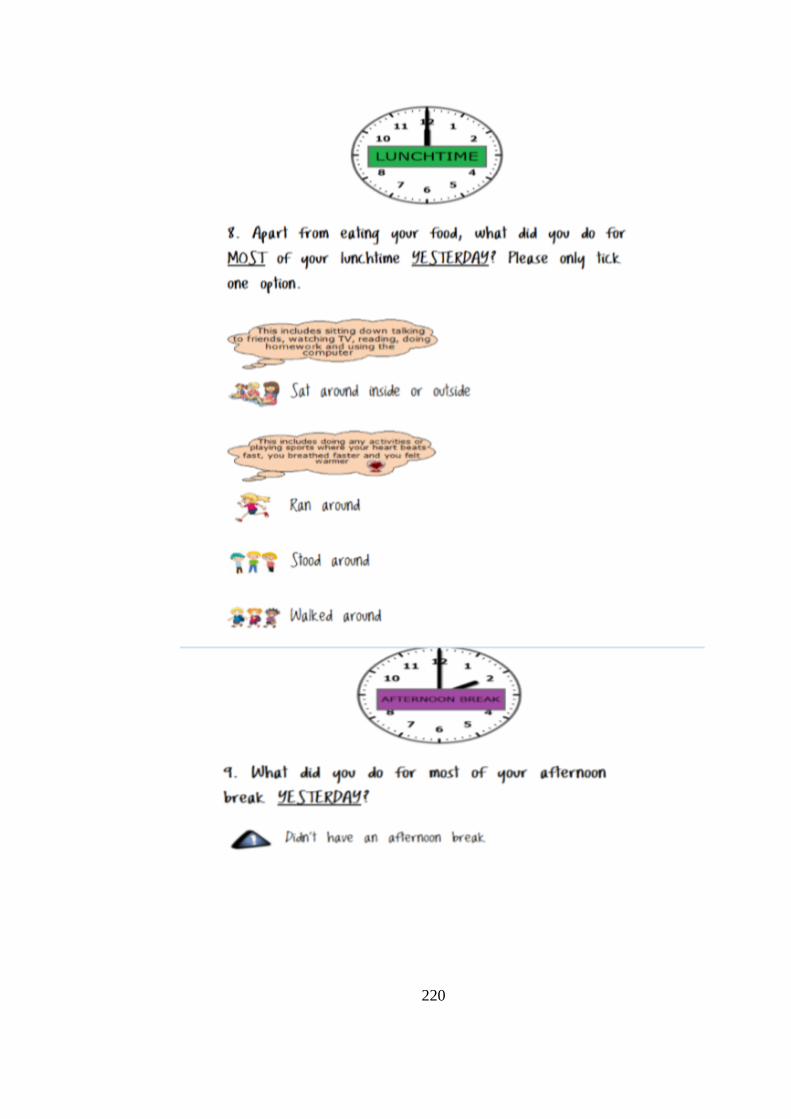
220
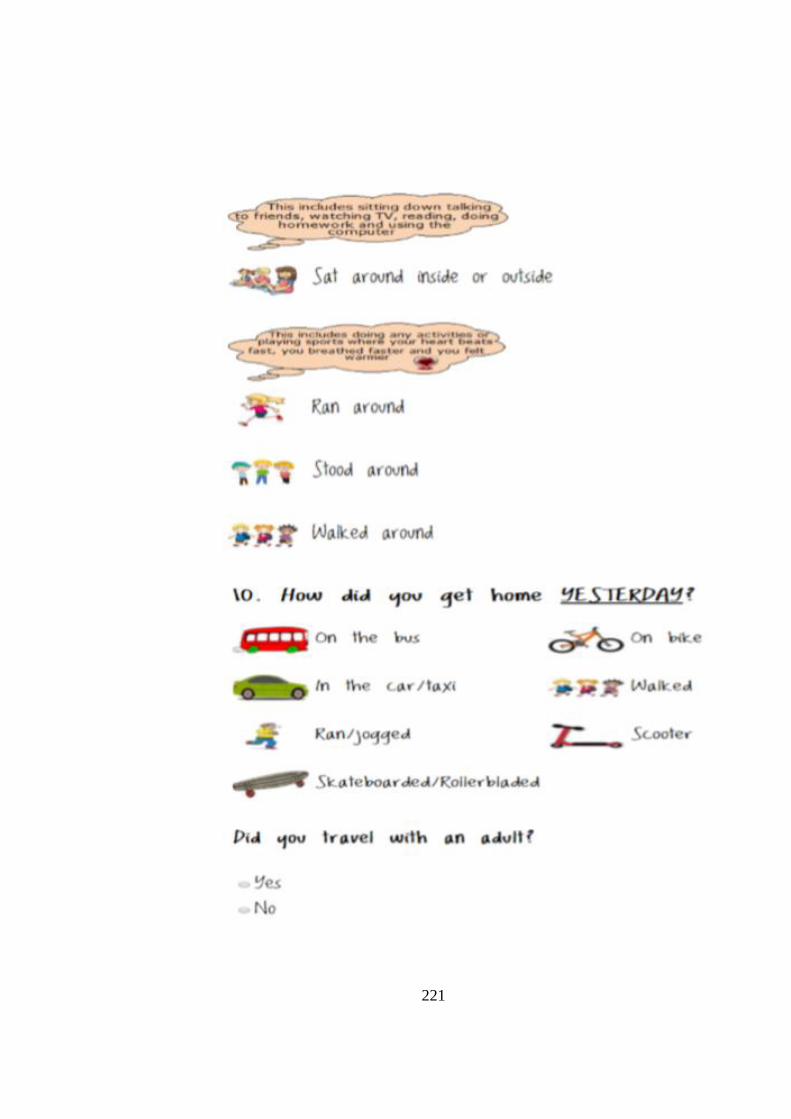
221
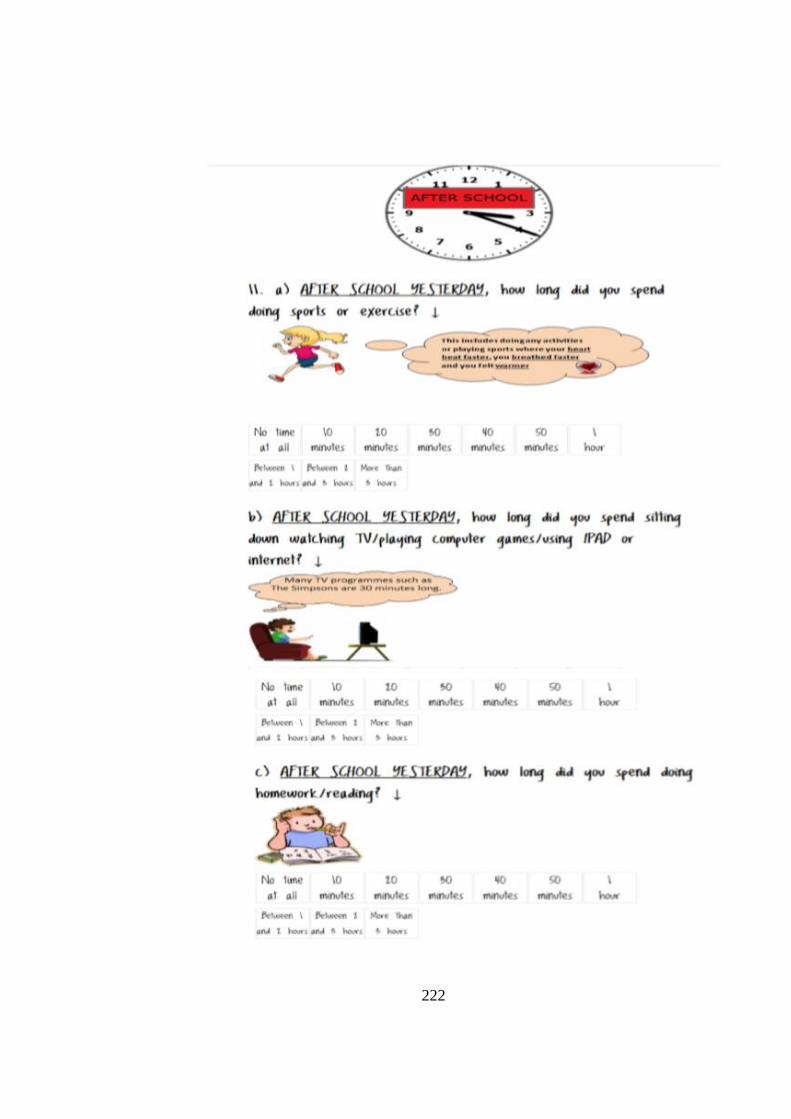
222
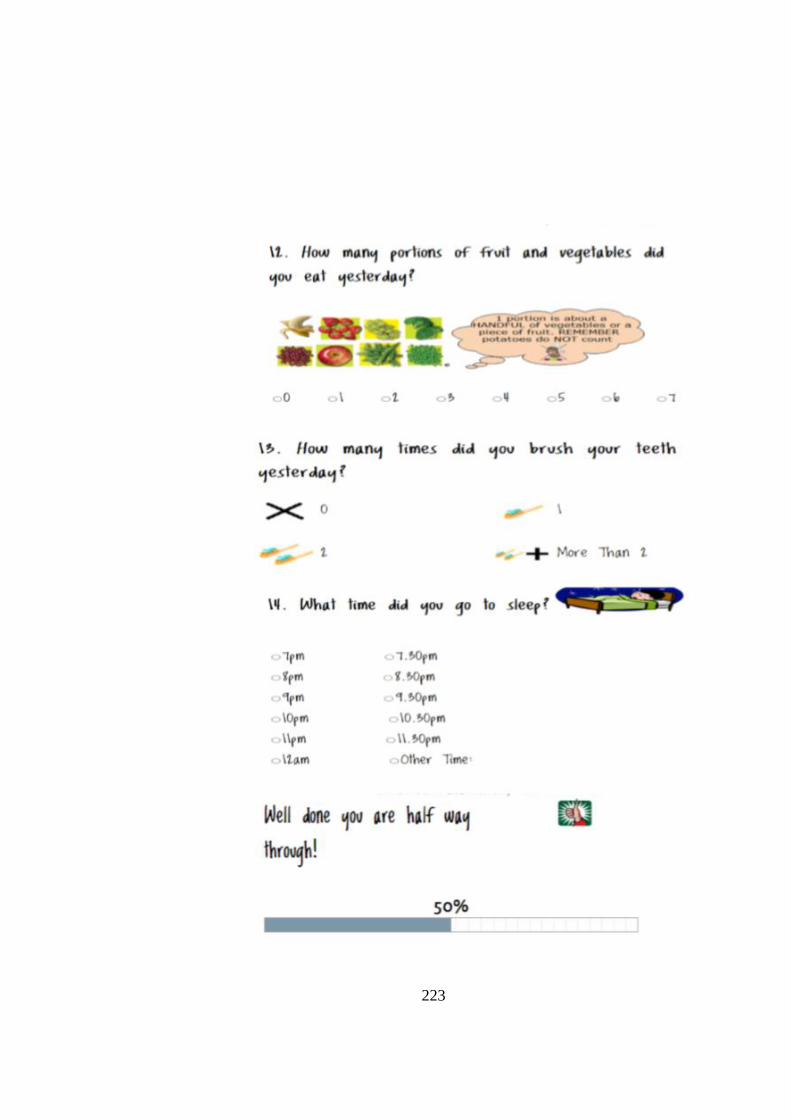
223
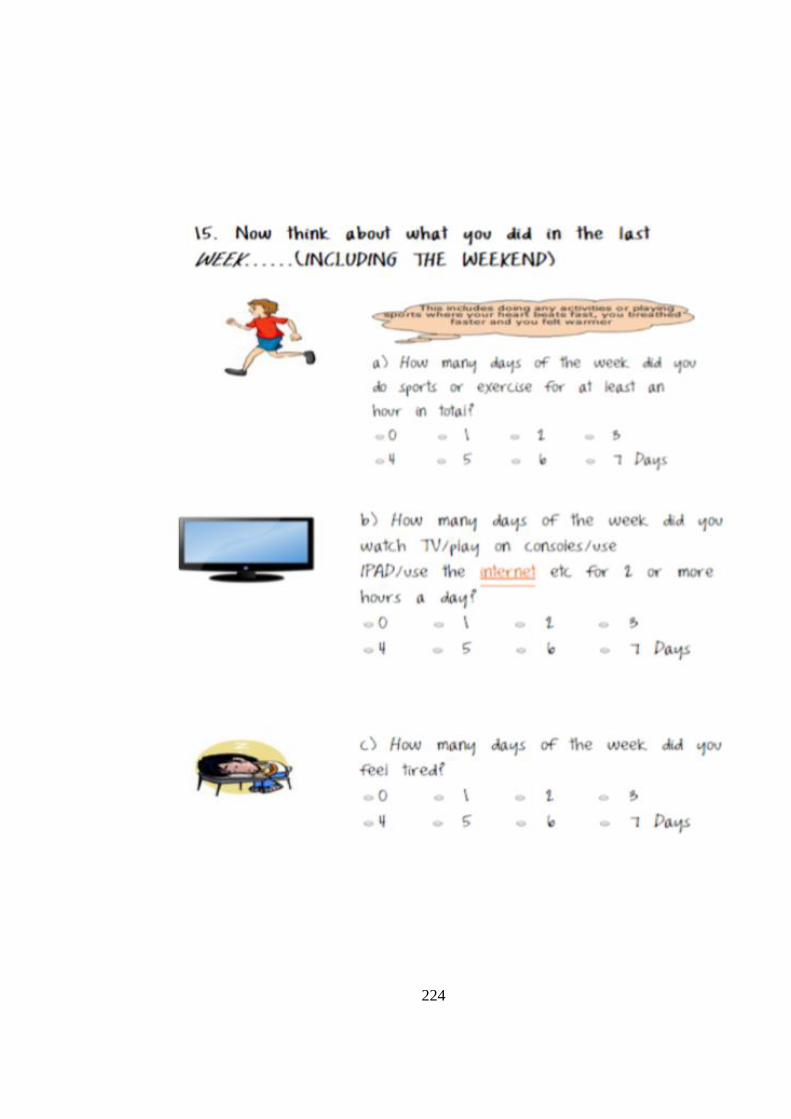
224
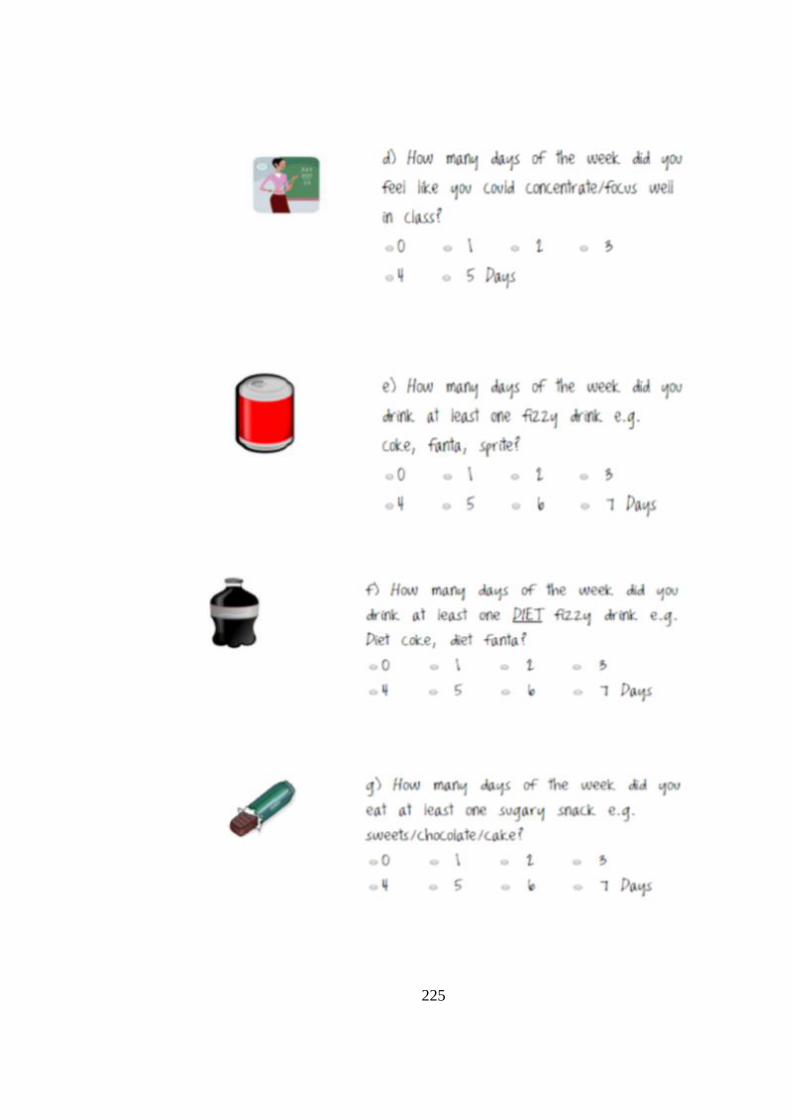
225
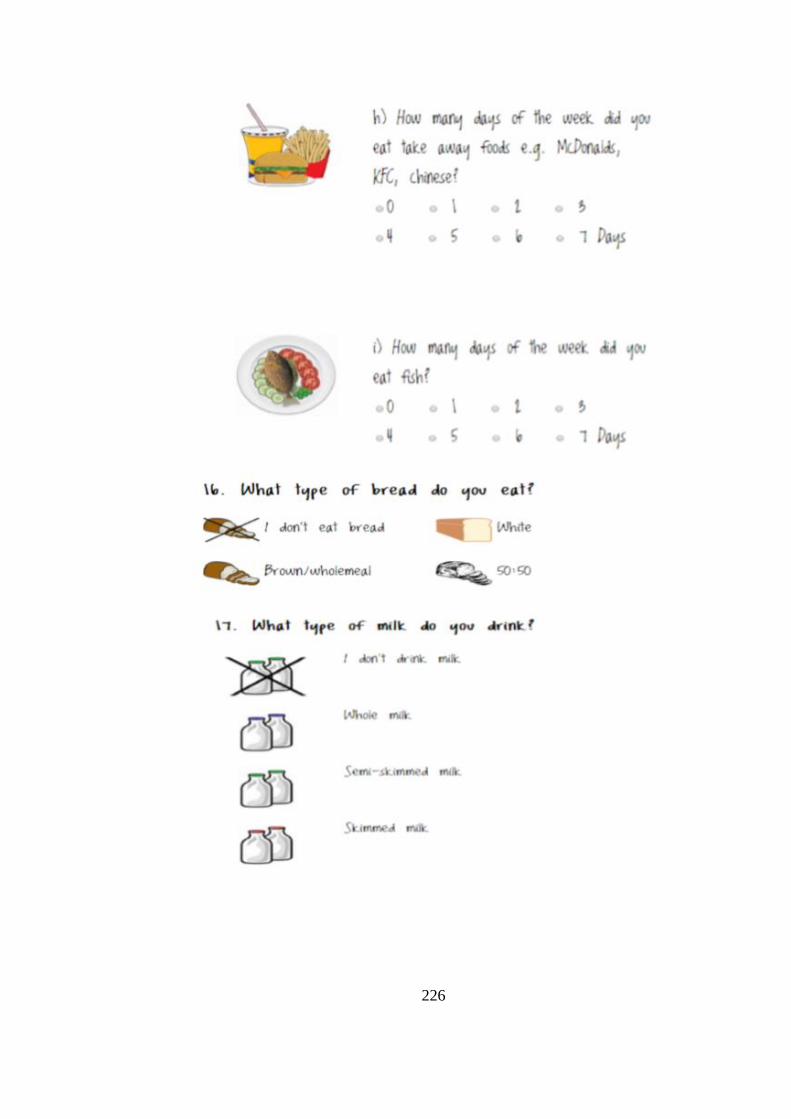
226
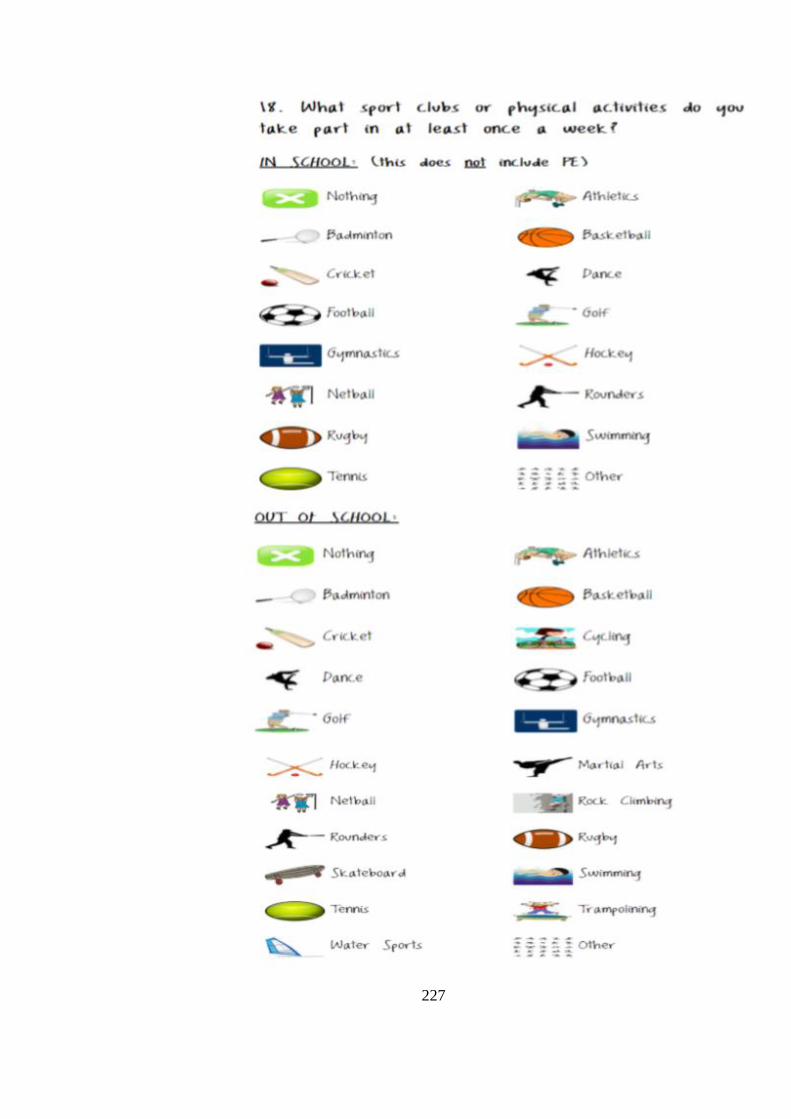
227
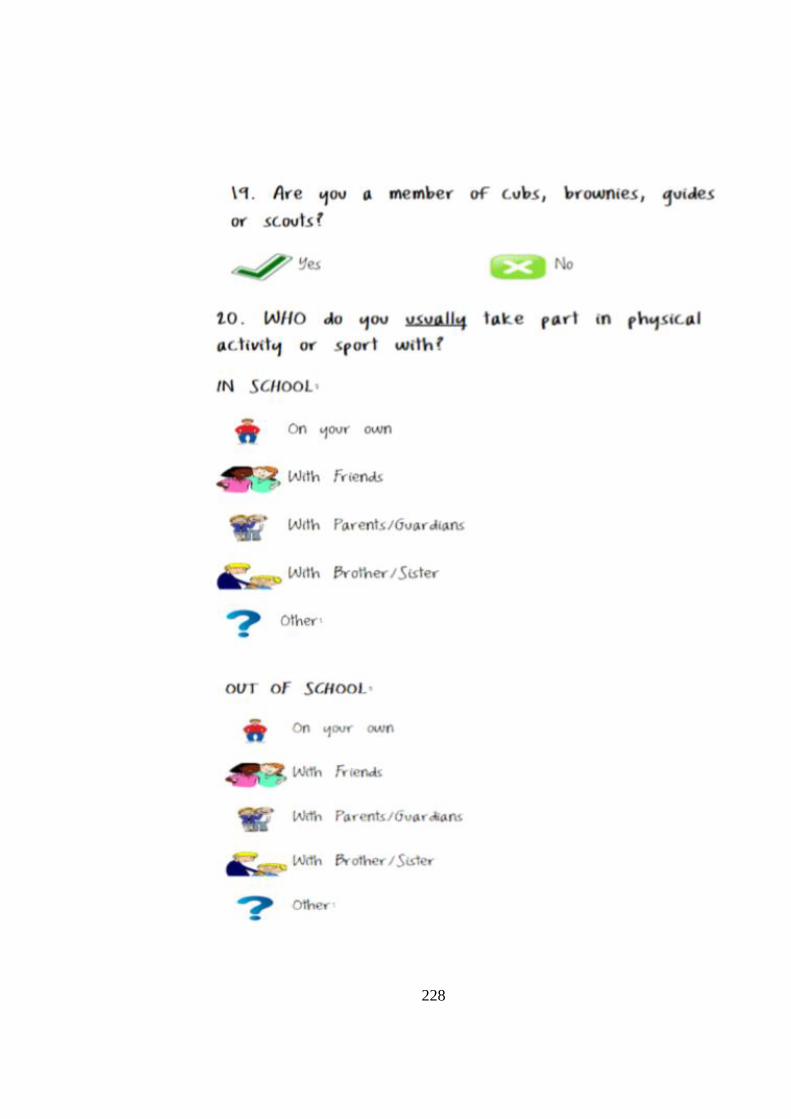
228
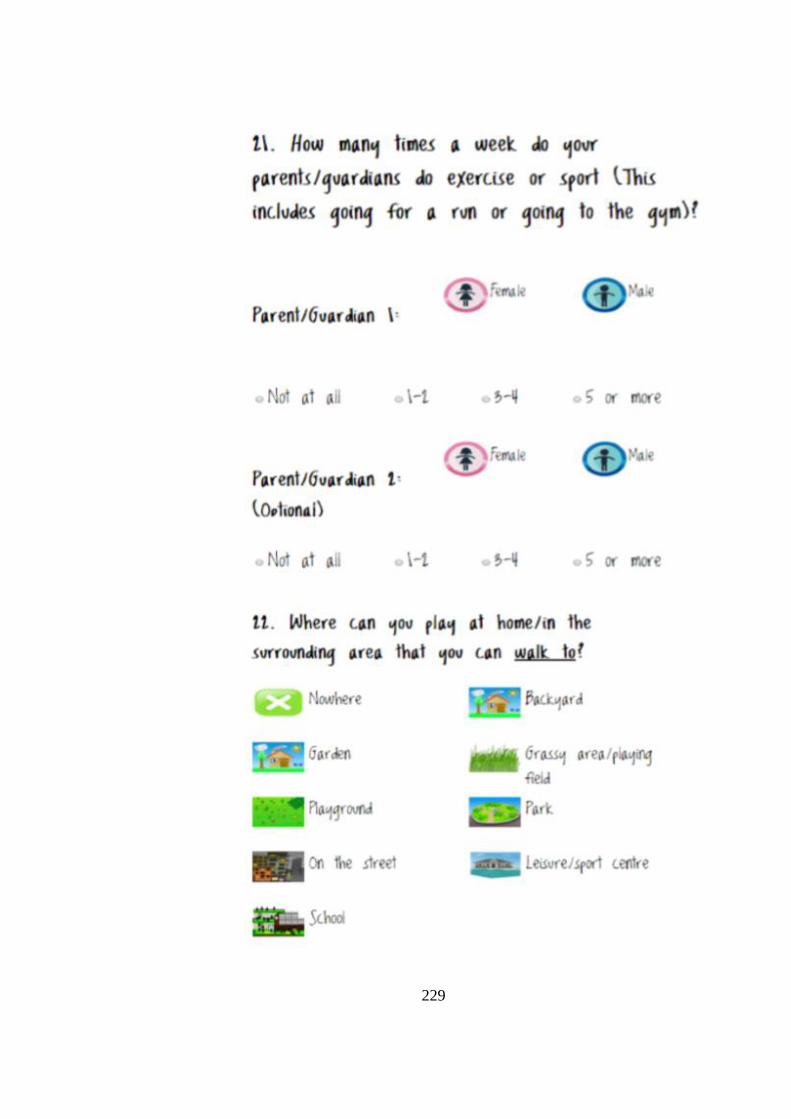
229

230
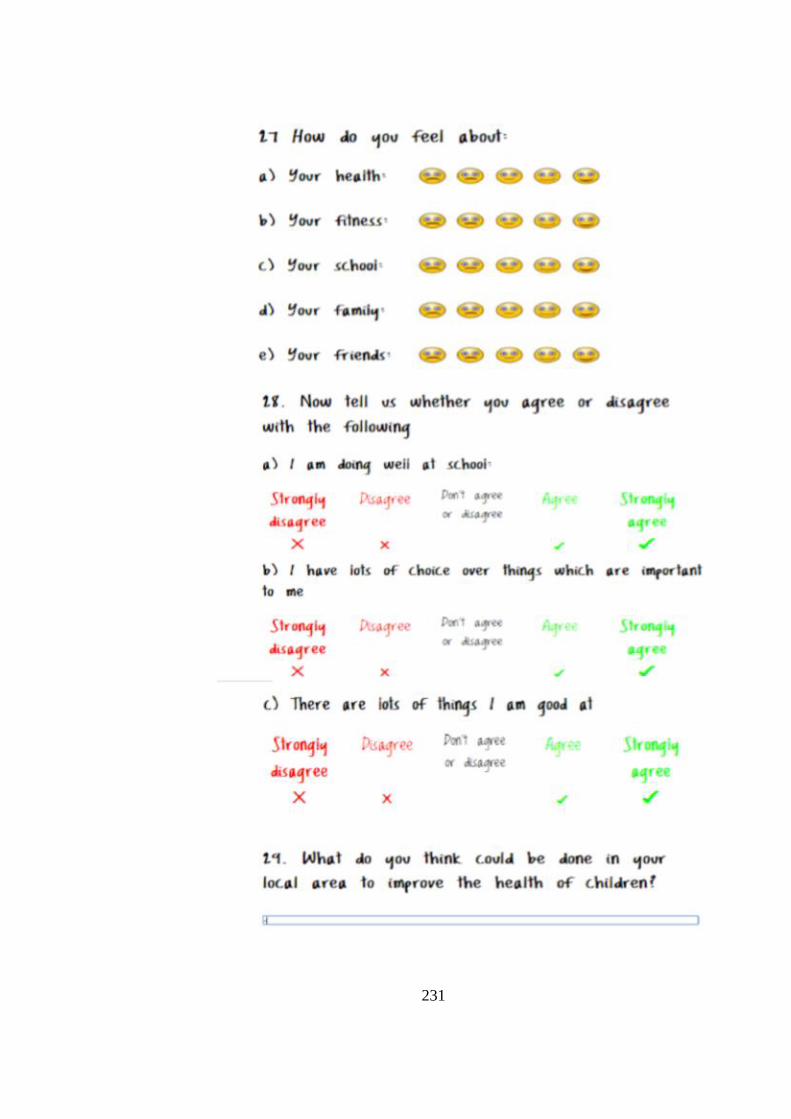
231
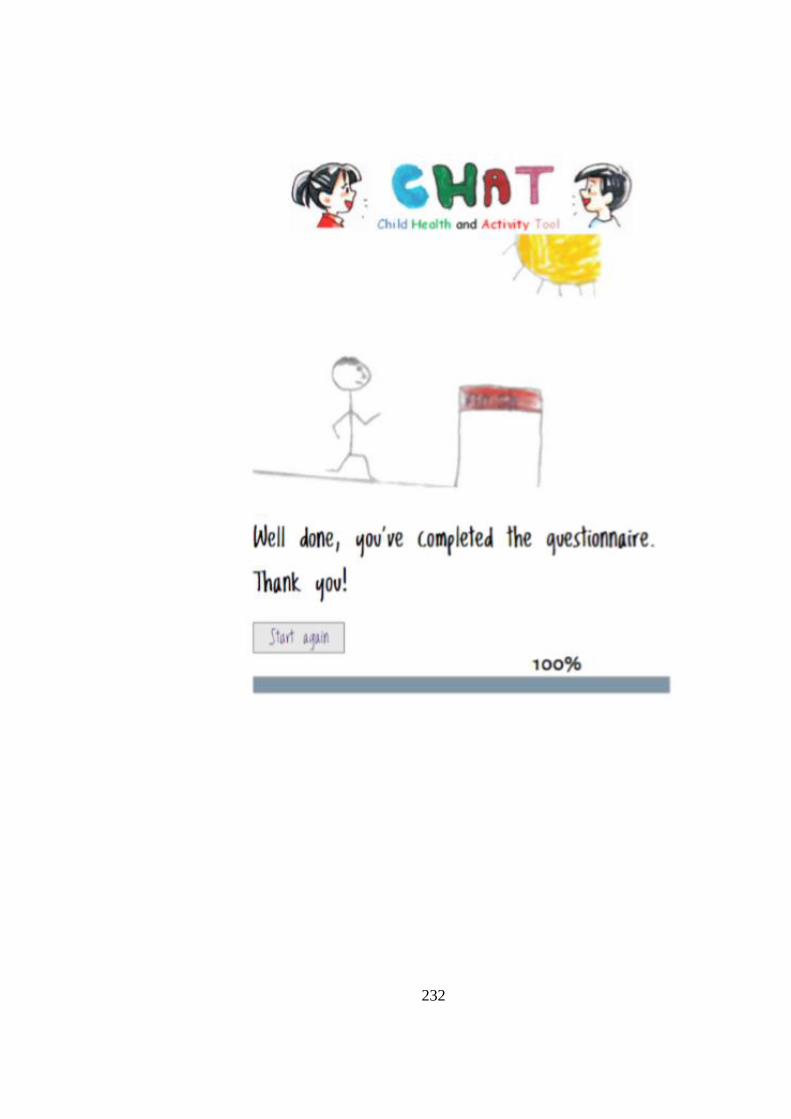
232

233
Appendix II: Standard operating procedure for child health
and activity tool
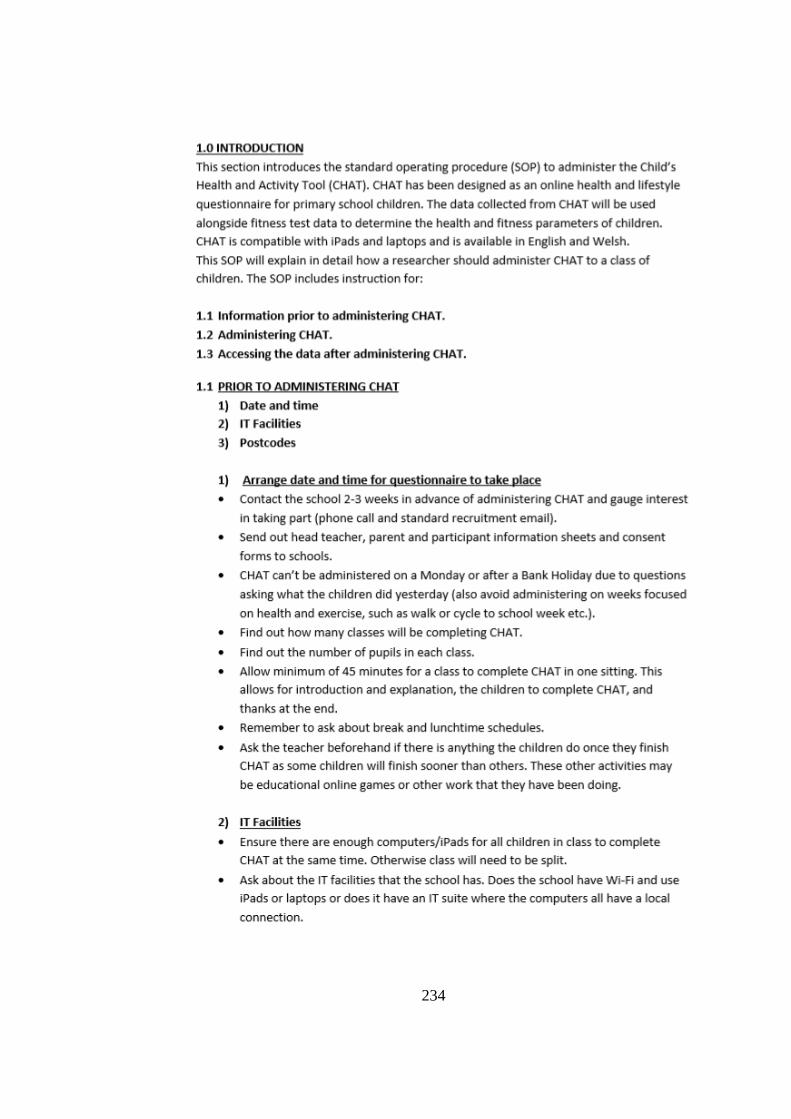
234
235
236
237
238
239

240
241
242
Appendix III: Paper-based home-physical environment
audit tool

243
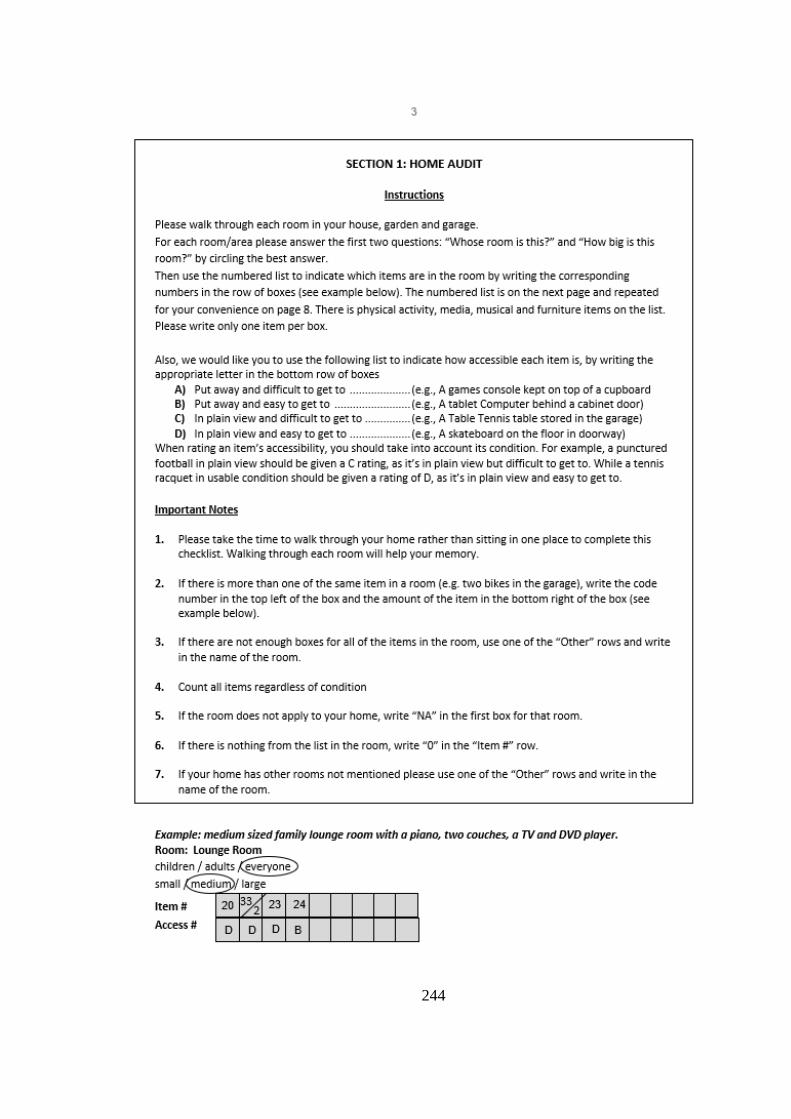
244
245
246
247

248
249
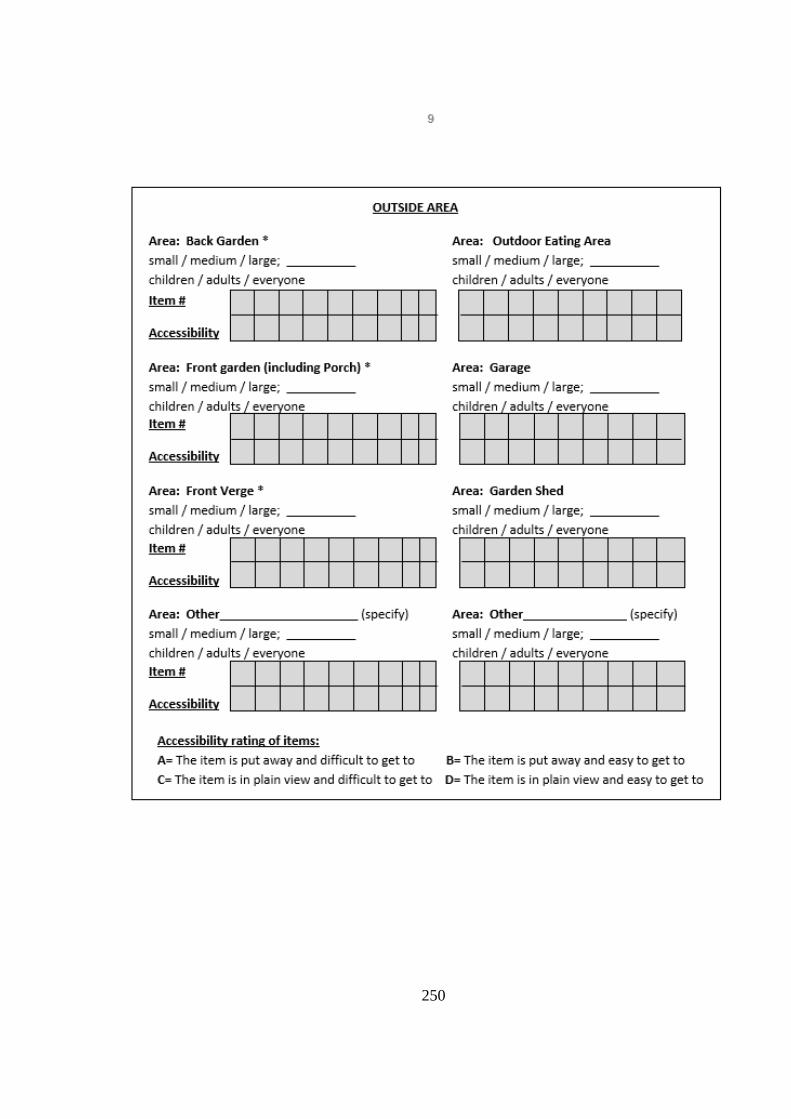
250
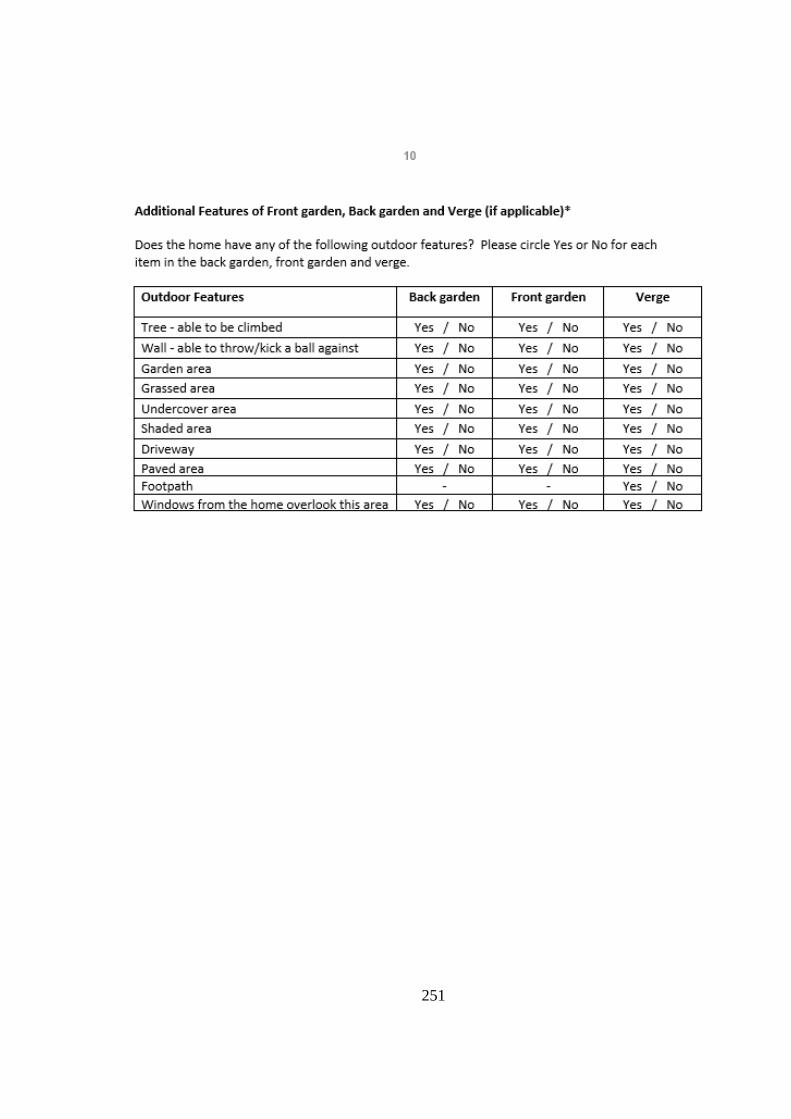
251

252
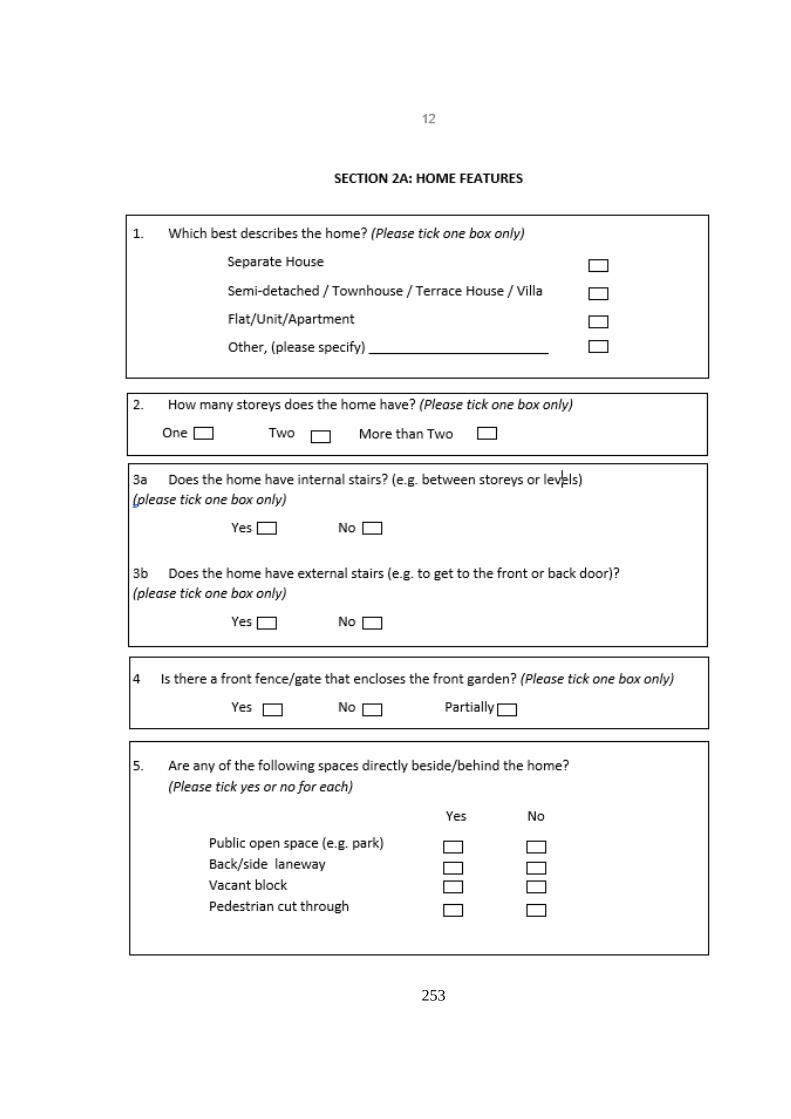
253
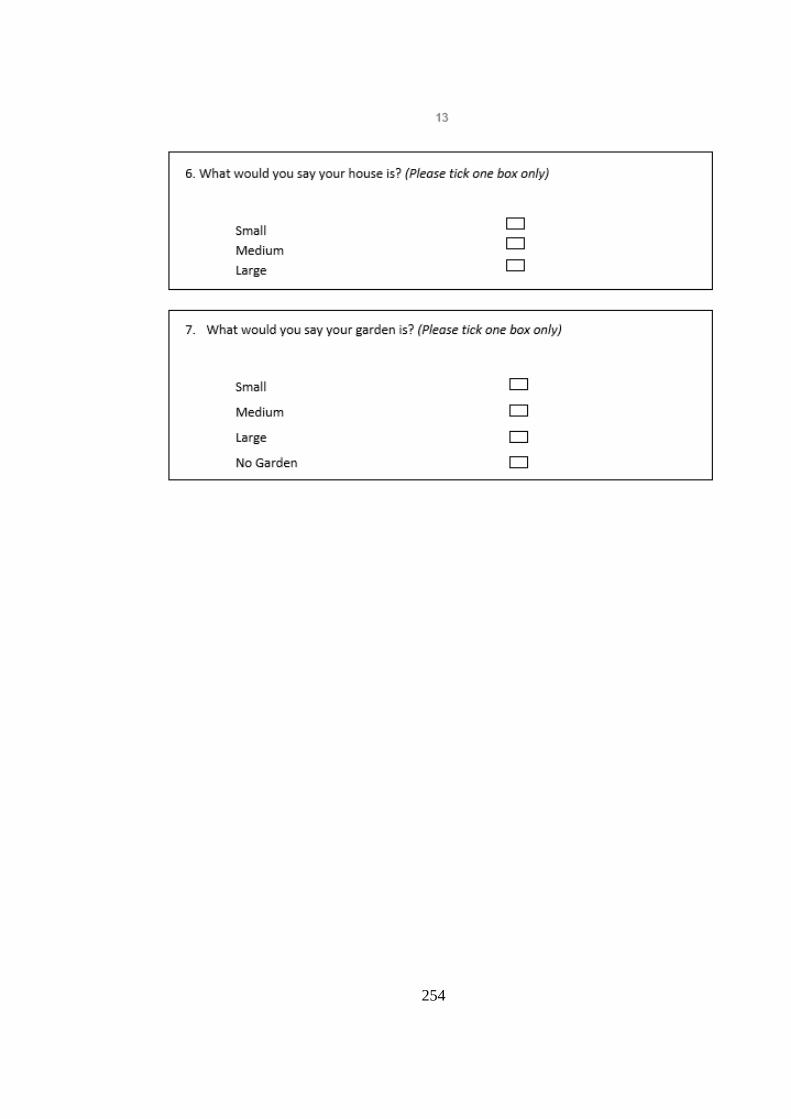
254
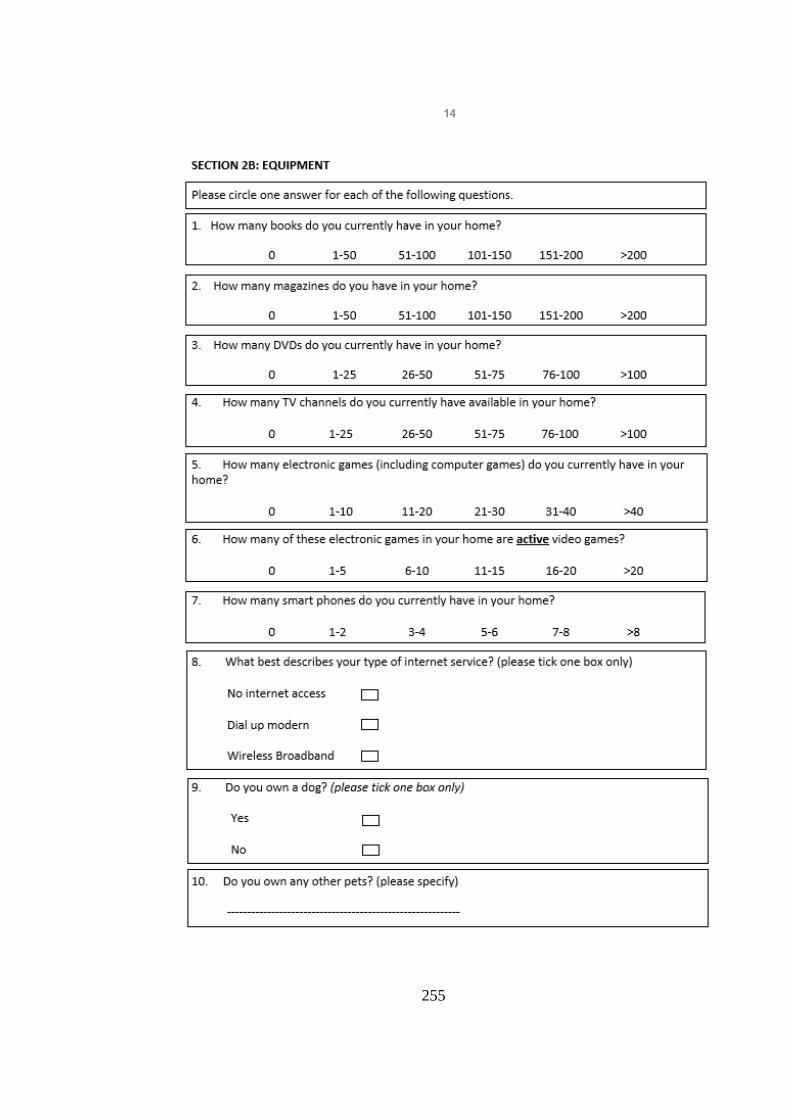
255
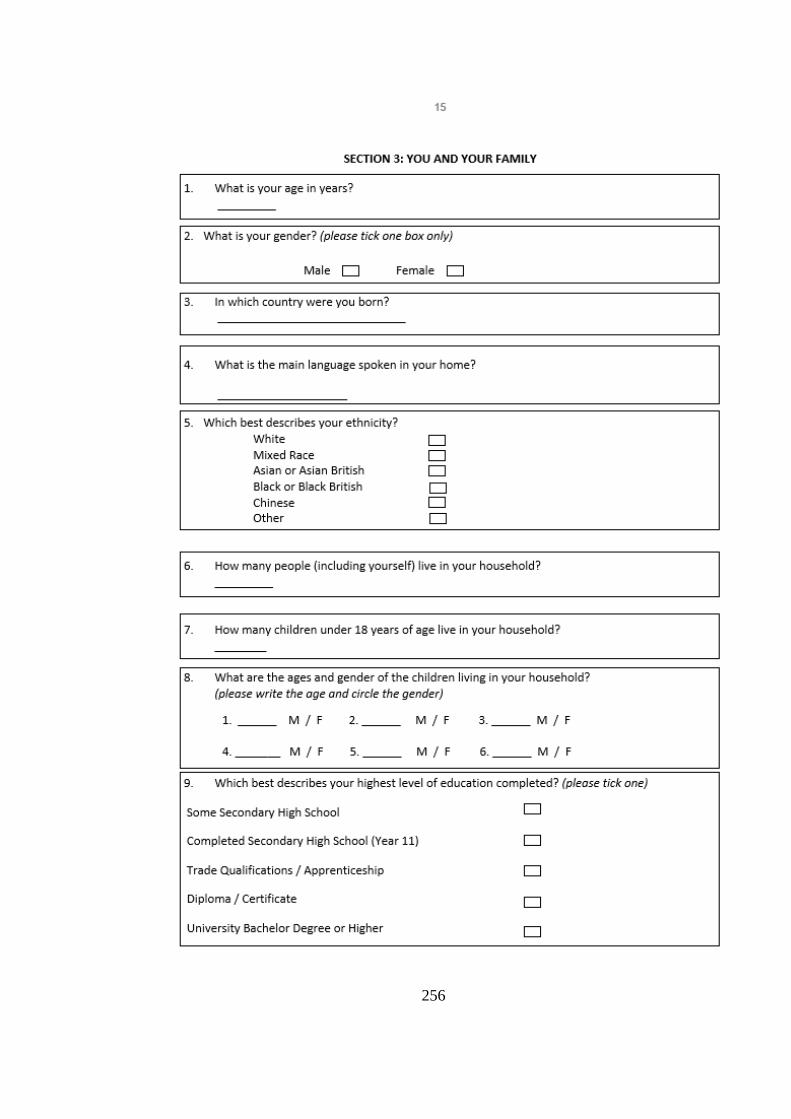
256
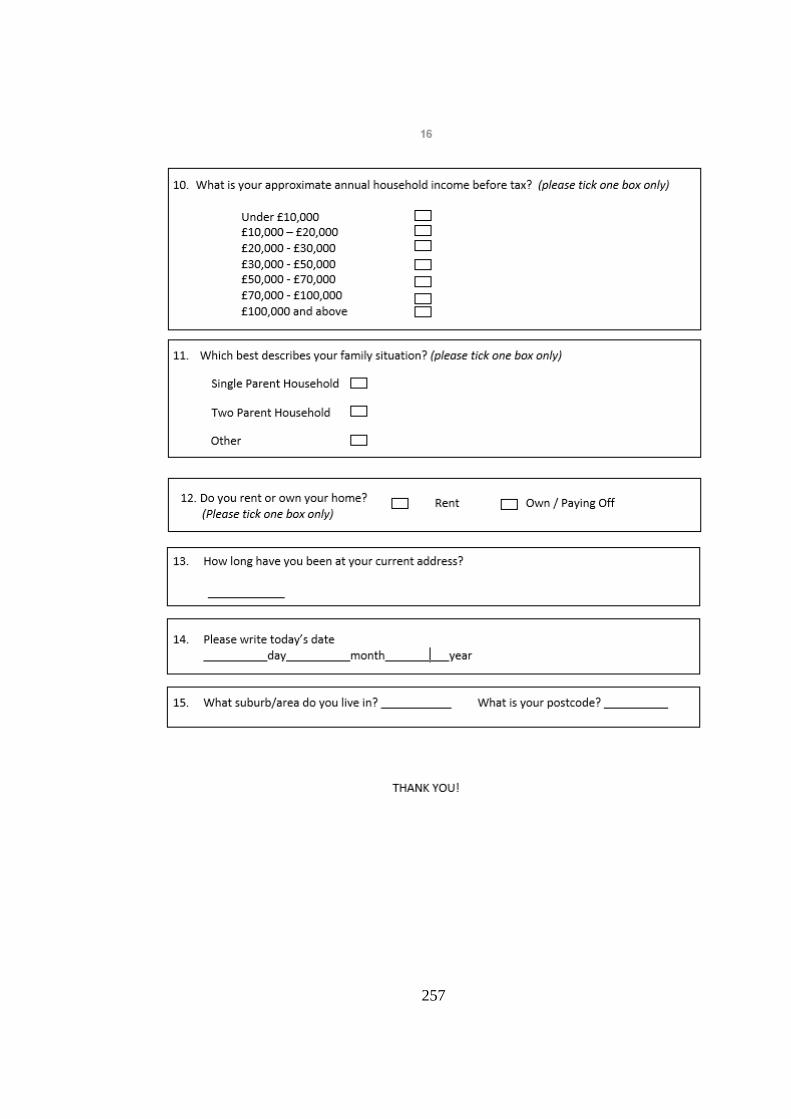
257
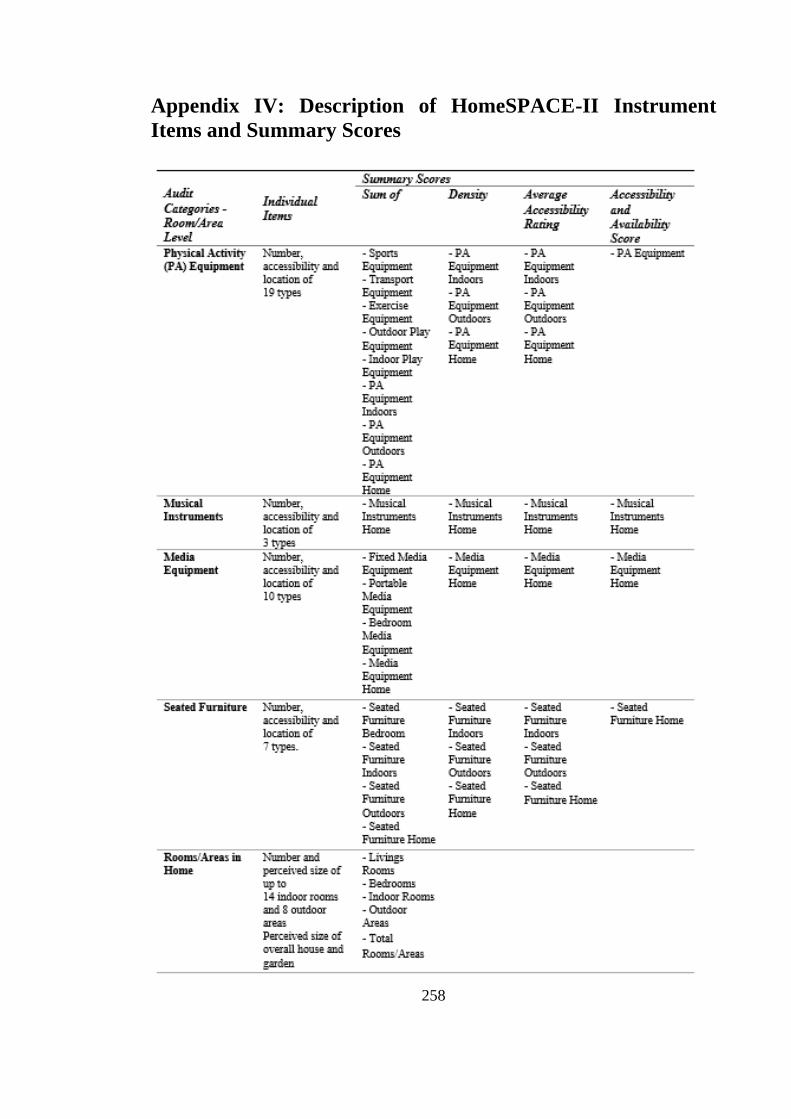
258
Appendix IV: Description of HomeSPACE-II Instrument
Items and Summary Scores
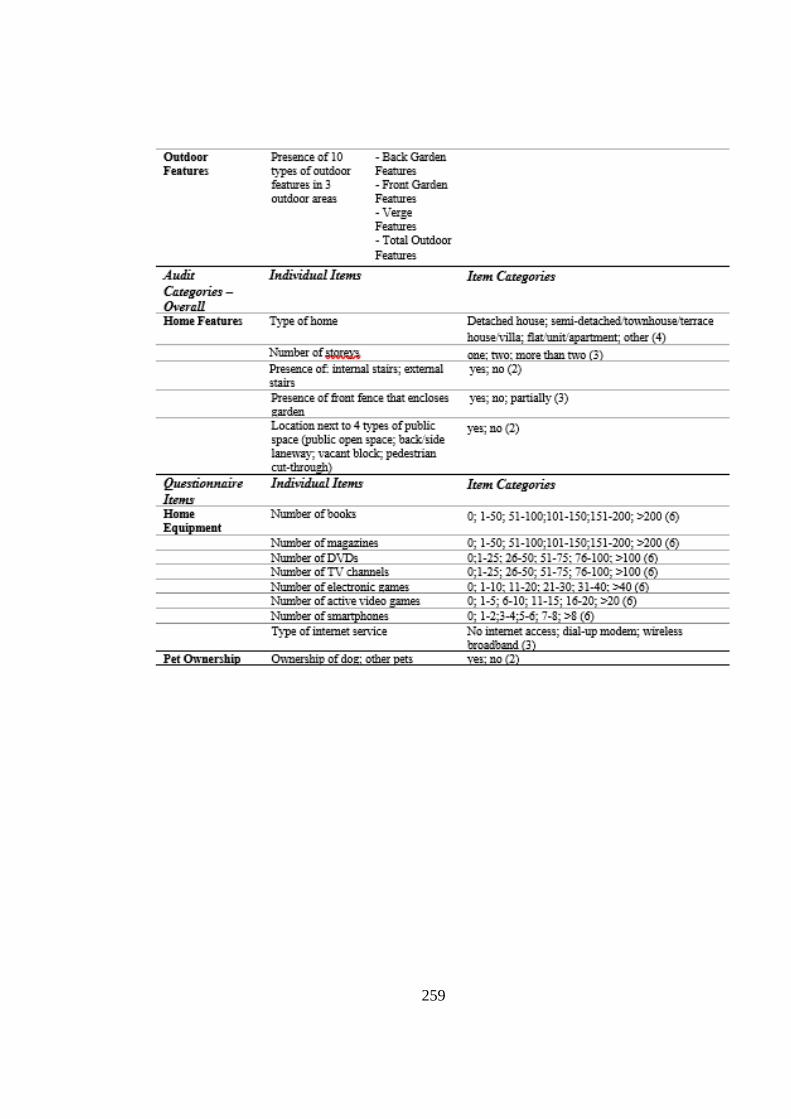
259
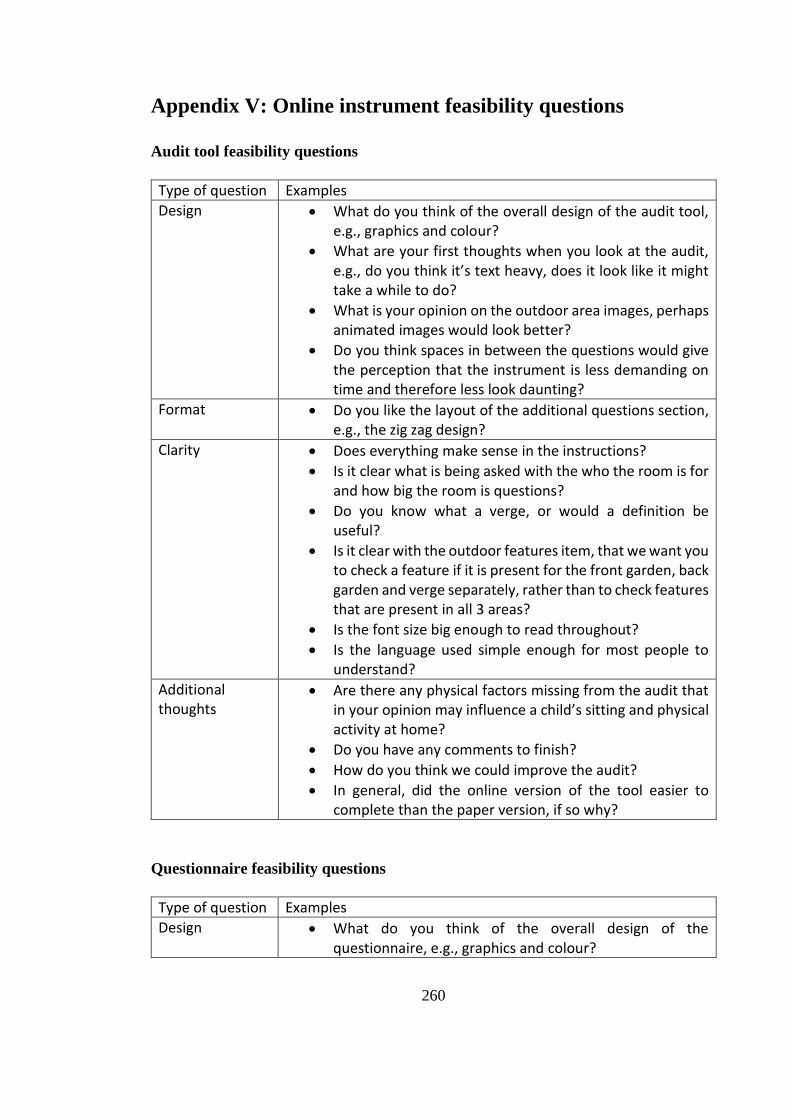
260
Appendix V: Online instrument feasibility questions
Audit tool feasibility questions
Type of question Examples
Design • What do you think of the overall design of the audit tool, e.g., graphics and colour?
• What are your first thoughts when you look at the audit, e.g., do you think it’s text heavy, does it look like it might take a while to do?
• What is your opinion on the outdoor area images, perhaps animated images would look better?
• Do you think spaces in between the questions would give the perception that the instrument is less demanding on time and therefore less look daunting?
Format • Do you like the layout of the additional questions section, e.g., the zig zag design?
Clarity • Does everything make sense in the instructions?
• Is it clear what is being asked with the who the room is for and how big the room is questions?
• Do you know what a verge, or would a definition be useful?
• Is it clear with the outdoor features item, that we want you to check a feature if it is present for the front garden, back garden and verge separately, rather than to check features that are present in all 3 areas?
• Is the font size big enough to read throughout?
• Is the language used simple enough for most people to understand?
Additional thoughts
• Are there any physical factors missing from the audit that in your opinion may influence a child’s sitting and physical activity at home?
• Do you have any comments to finish?
• How do you think we could improve the audit?
• In general, did the online version of the tool easier to complete than the paper version, if so why?
Questionnaire feasibility questions
Type of question Examples
Design • What do you think of the overall design of the questionnaire, e.g., graphics and colour?
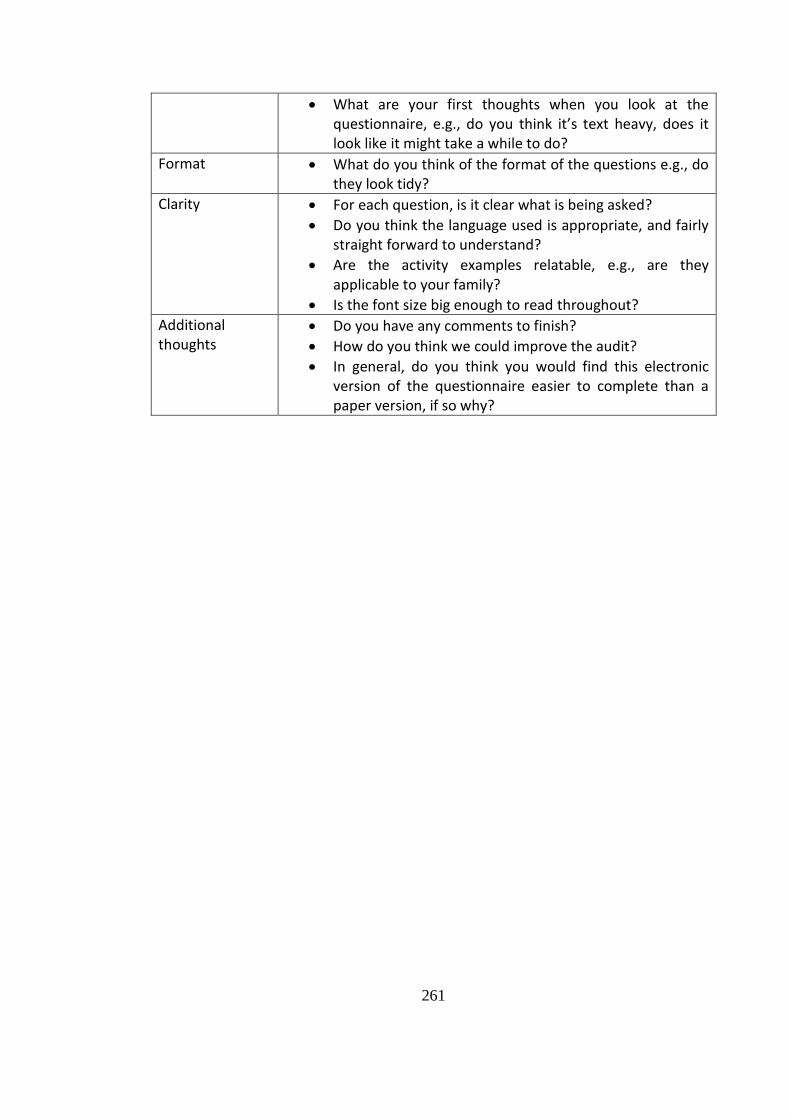
261
• What are your first thoughts when you look at the questionnaire, e.g., do you think it’s text heavy, does it look like it might take a while to do?
Format • What do you think of the format of the questions e.g., do they look tidy?
Clarity • For each question, is it clear what is being asked?
• Do you think the language used is appropriate, and fairly straight forward to understand?
• Are the activity examples relatable, e.g., are they applicable to your family?
• Is the font size big enough to read throughout?
Additional thoughts
• Do you have any comments to finish?
• How do you think we could improve the audit?
• In general, do you think you would find this electronic version of the questionnaire easier to complete than a paper version, if so why?
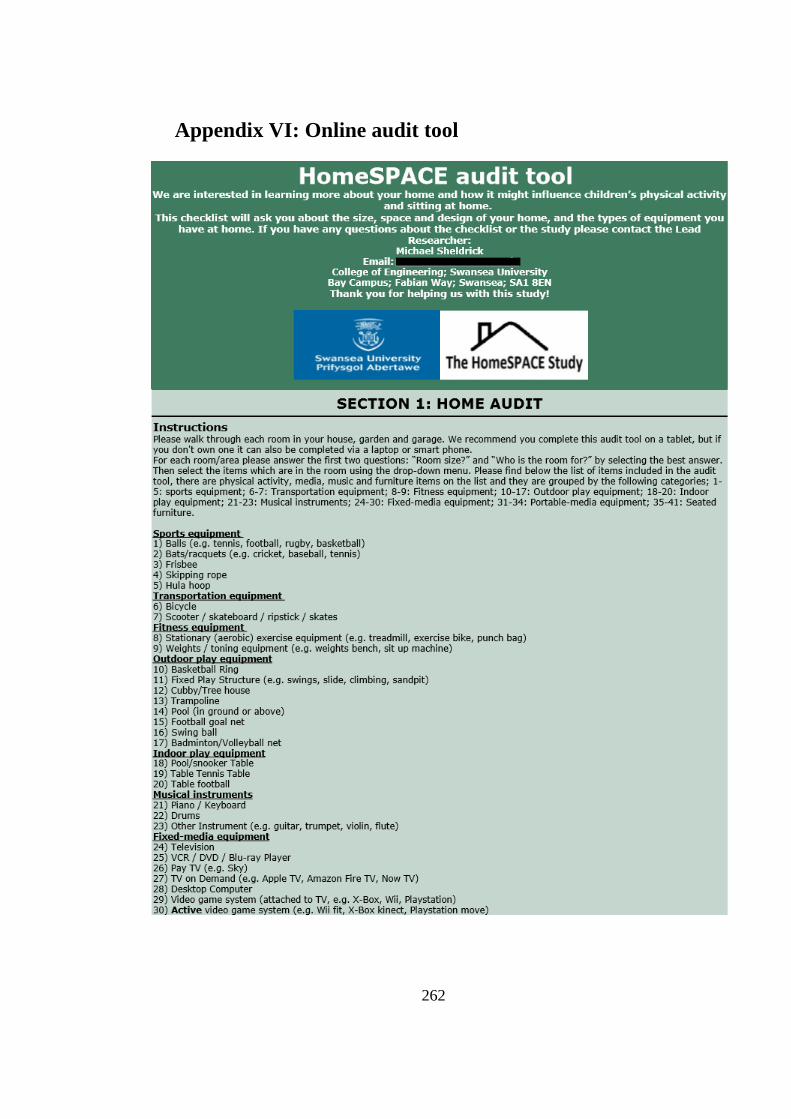
262
Appendix VI: Online audit tool

263
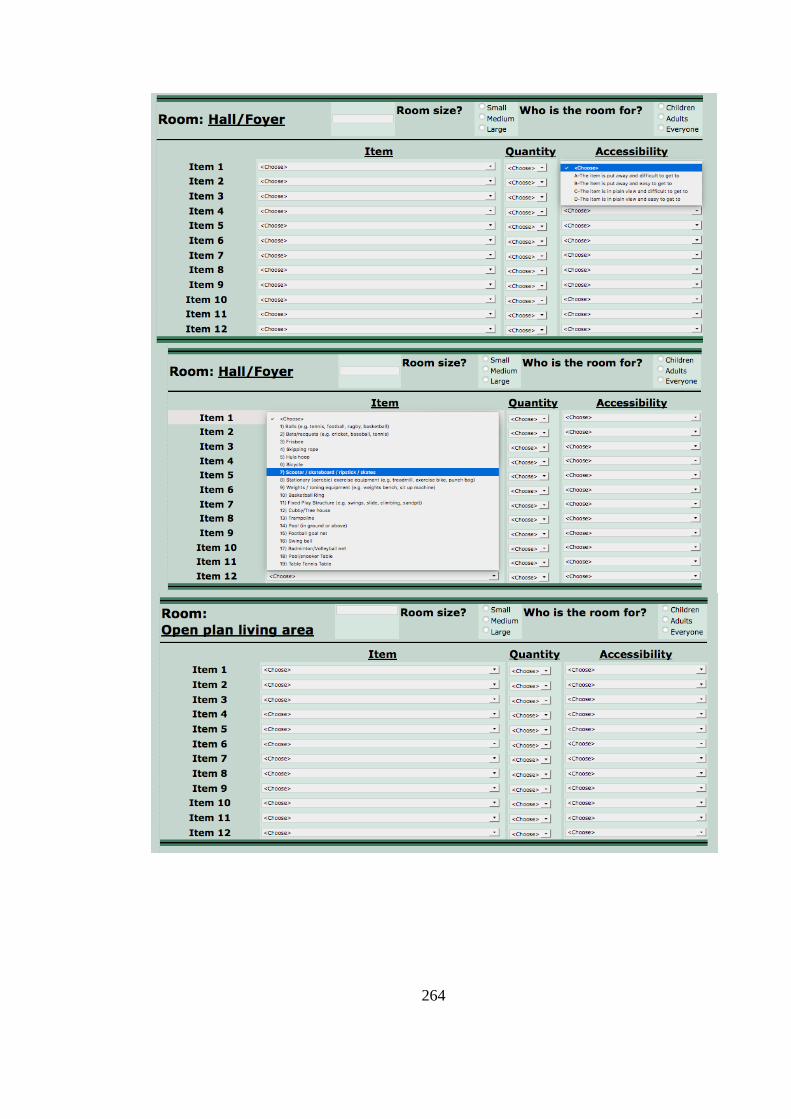
264
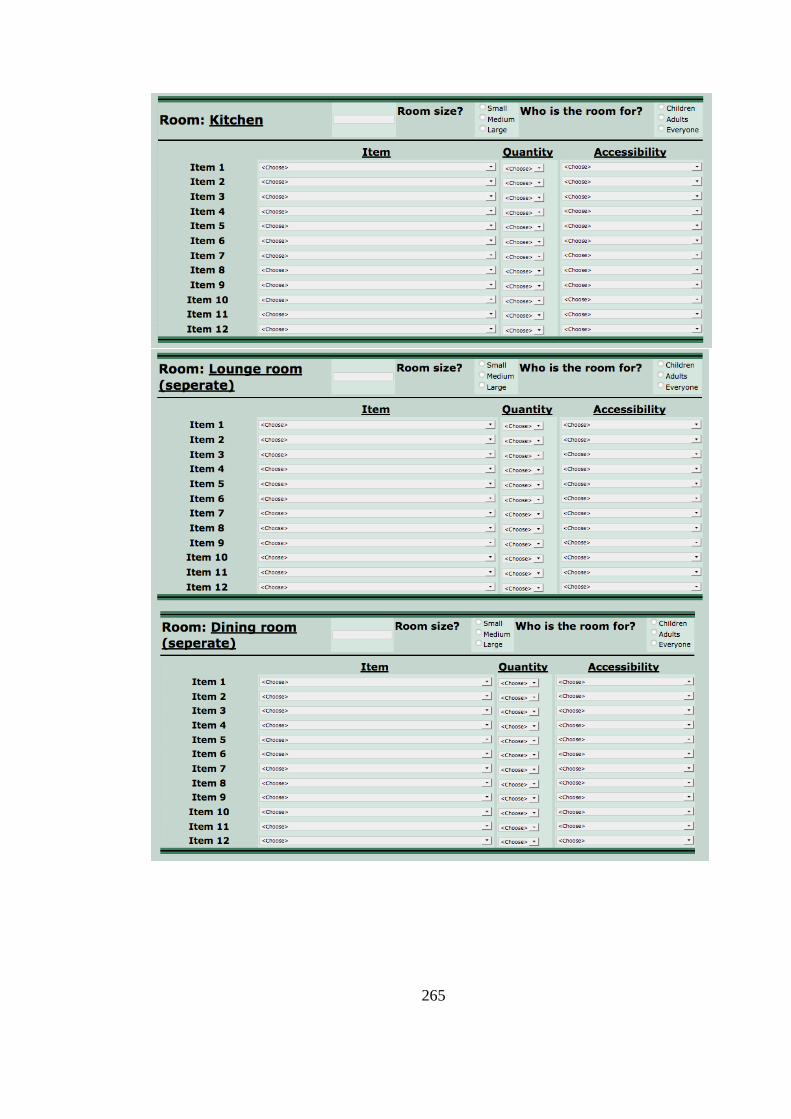
265
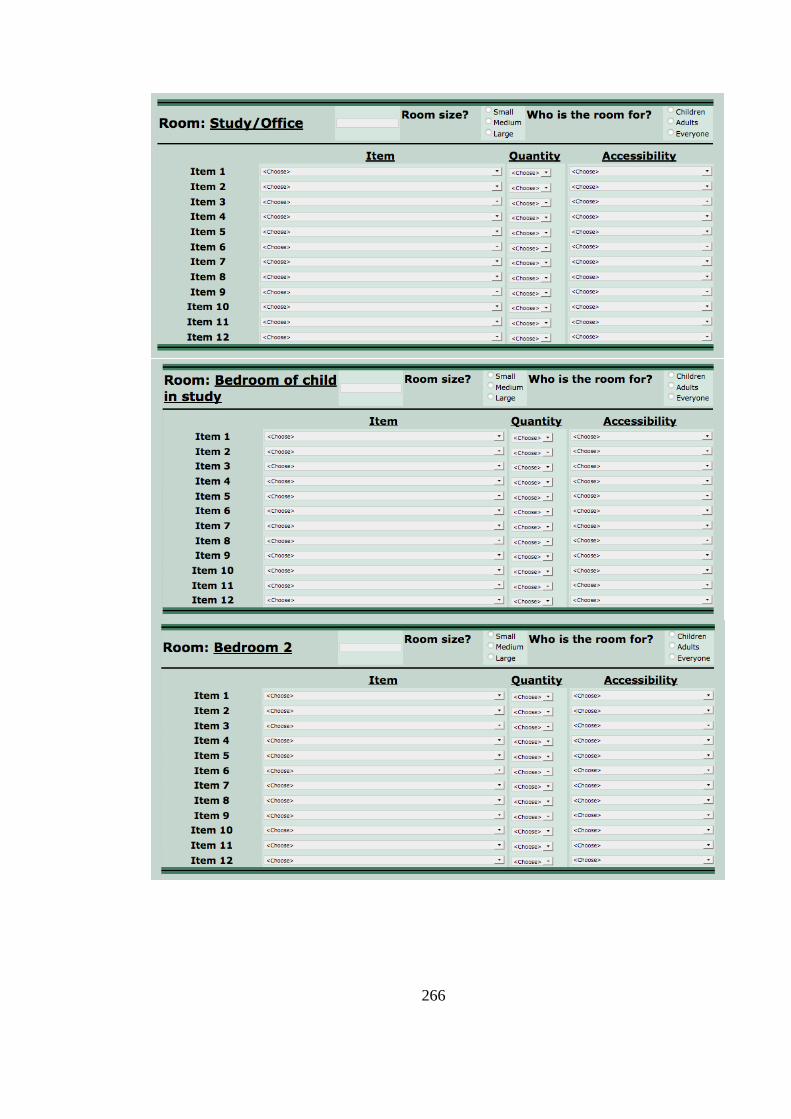
266
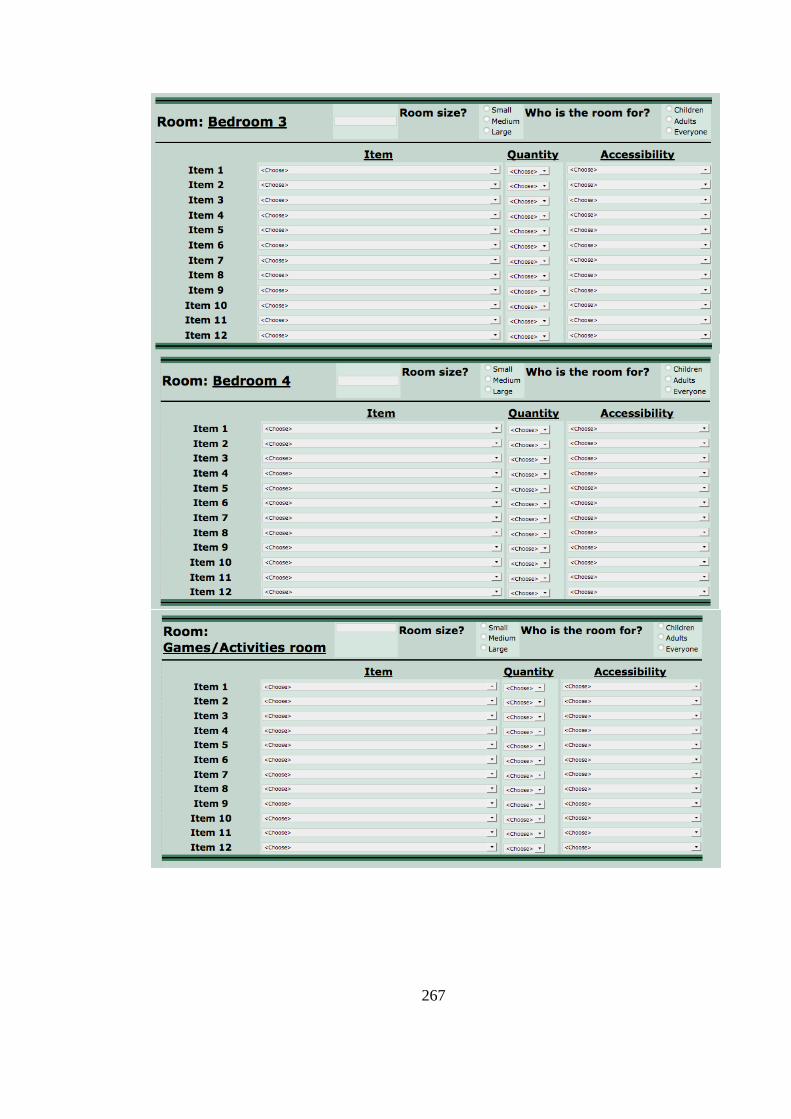
267
268
269
270
271
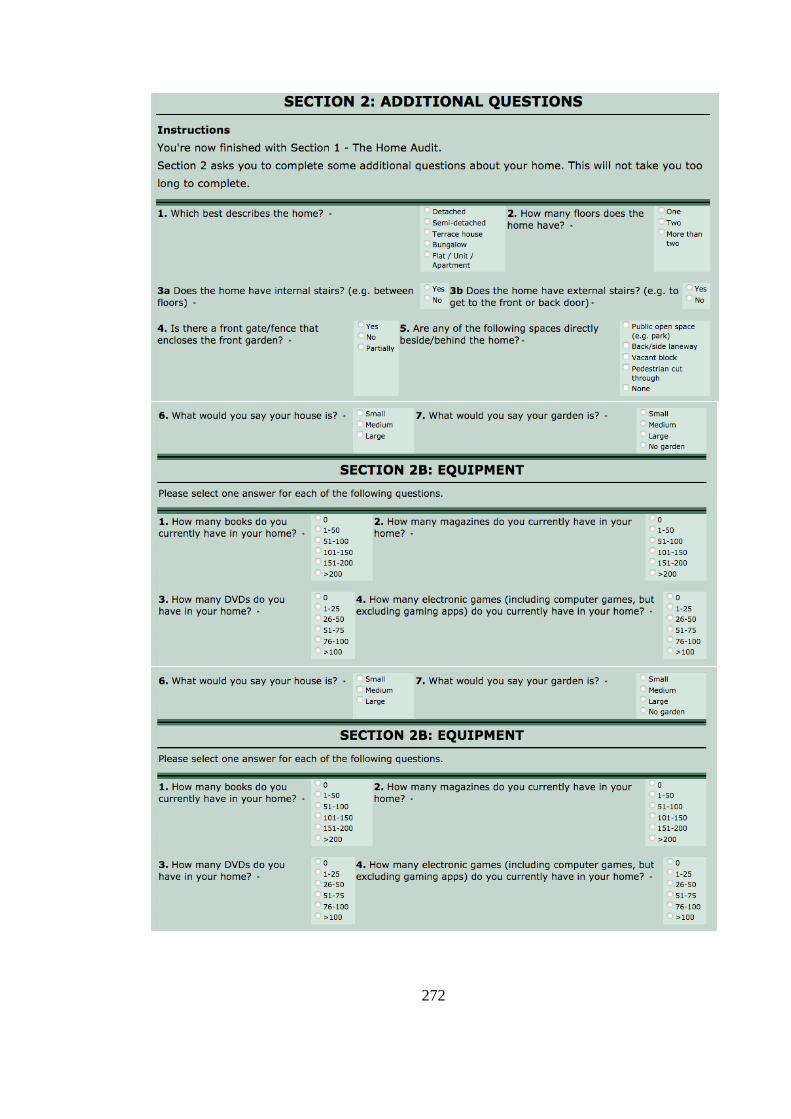
272
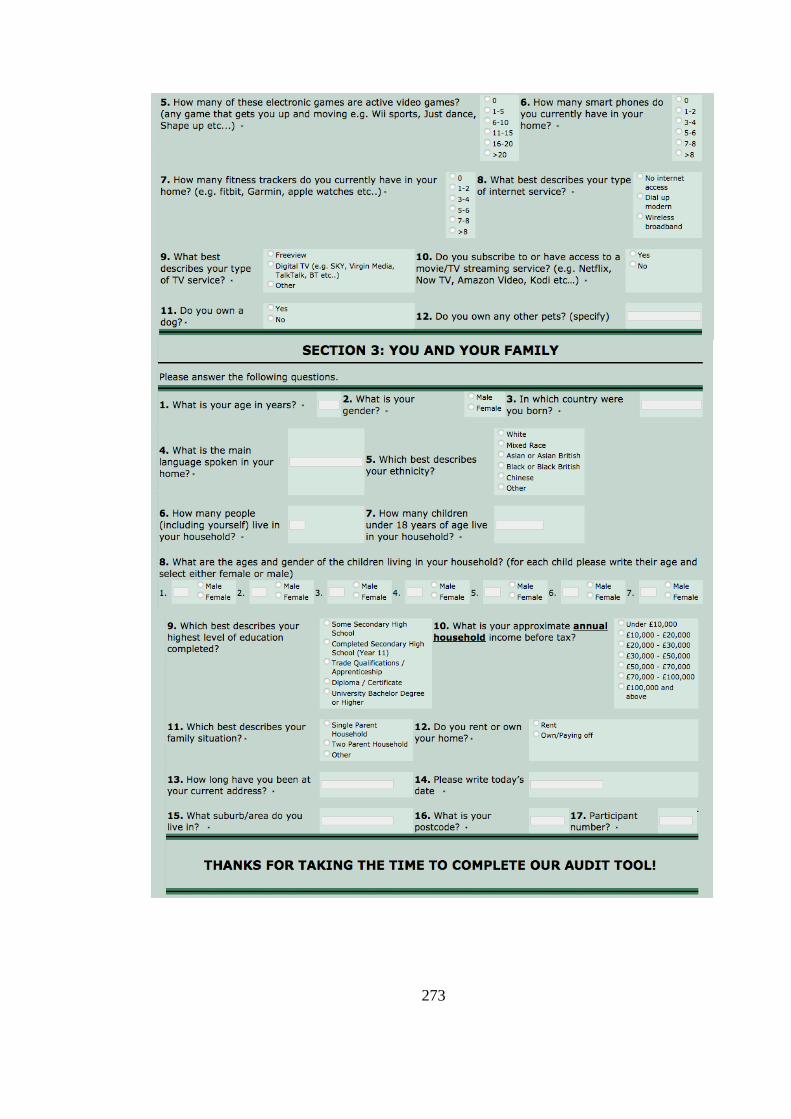
273
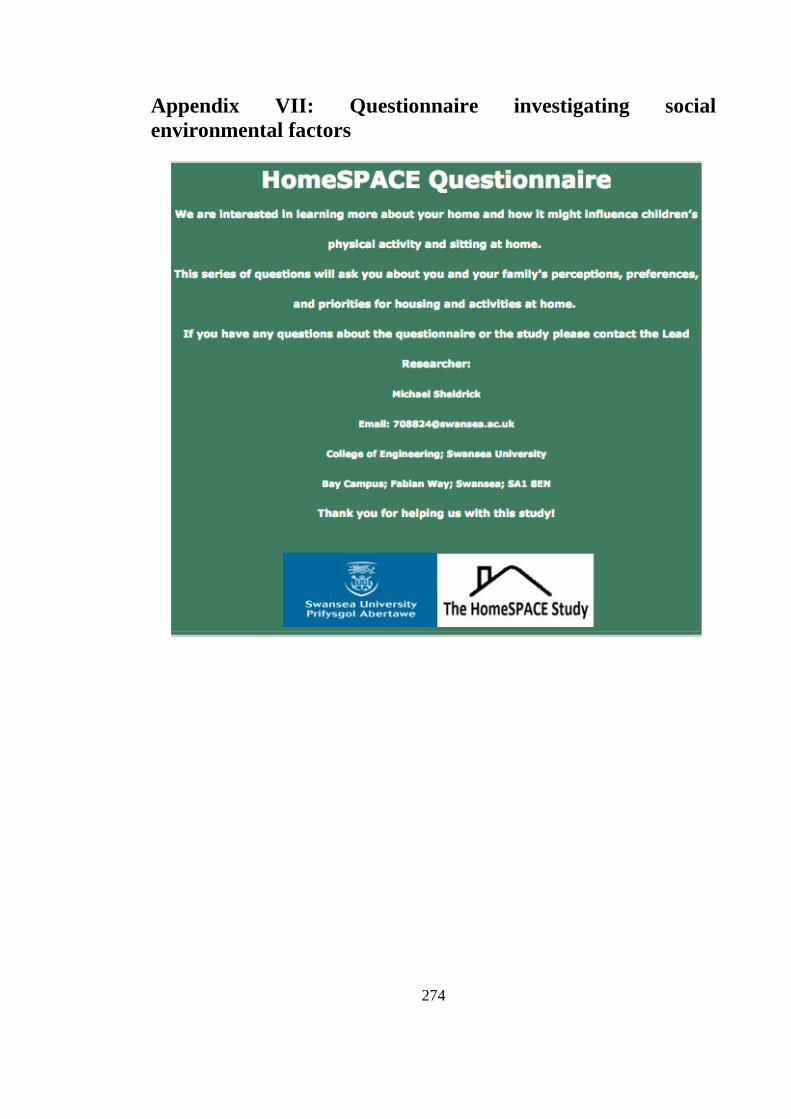
274
Appendix VII: Questionnaire investigating social
environmental factors
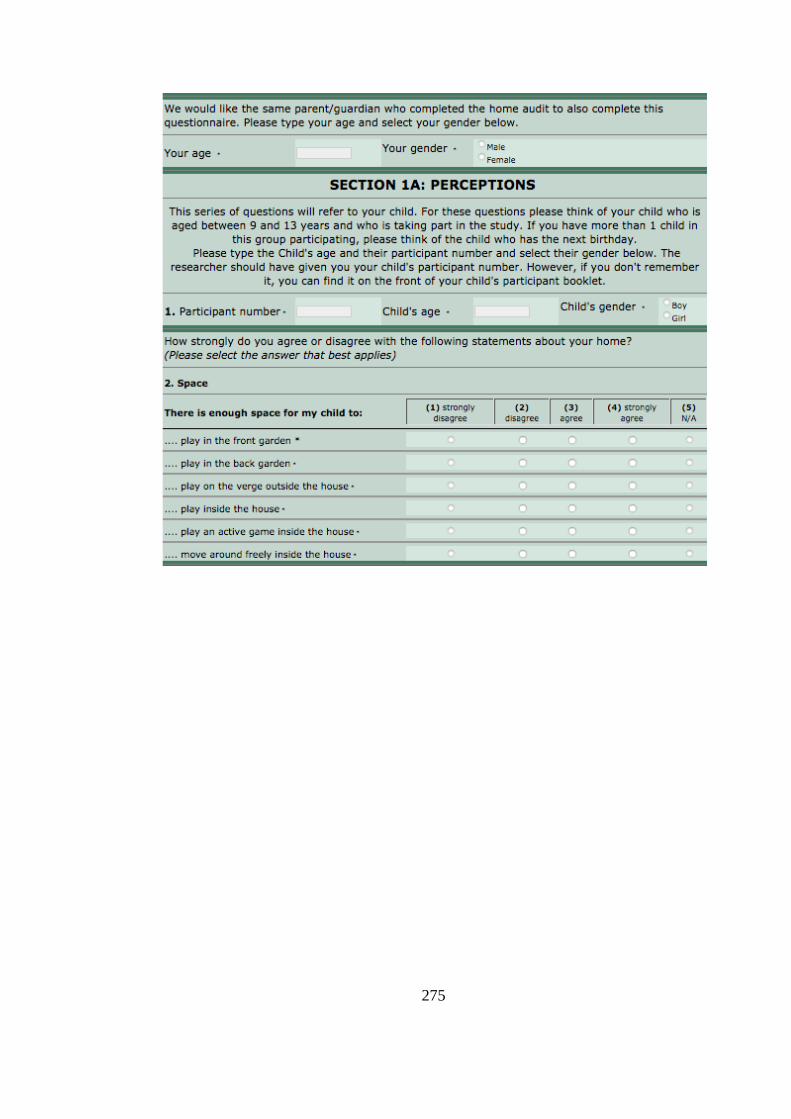
275
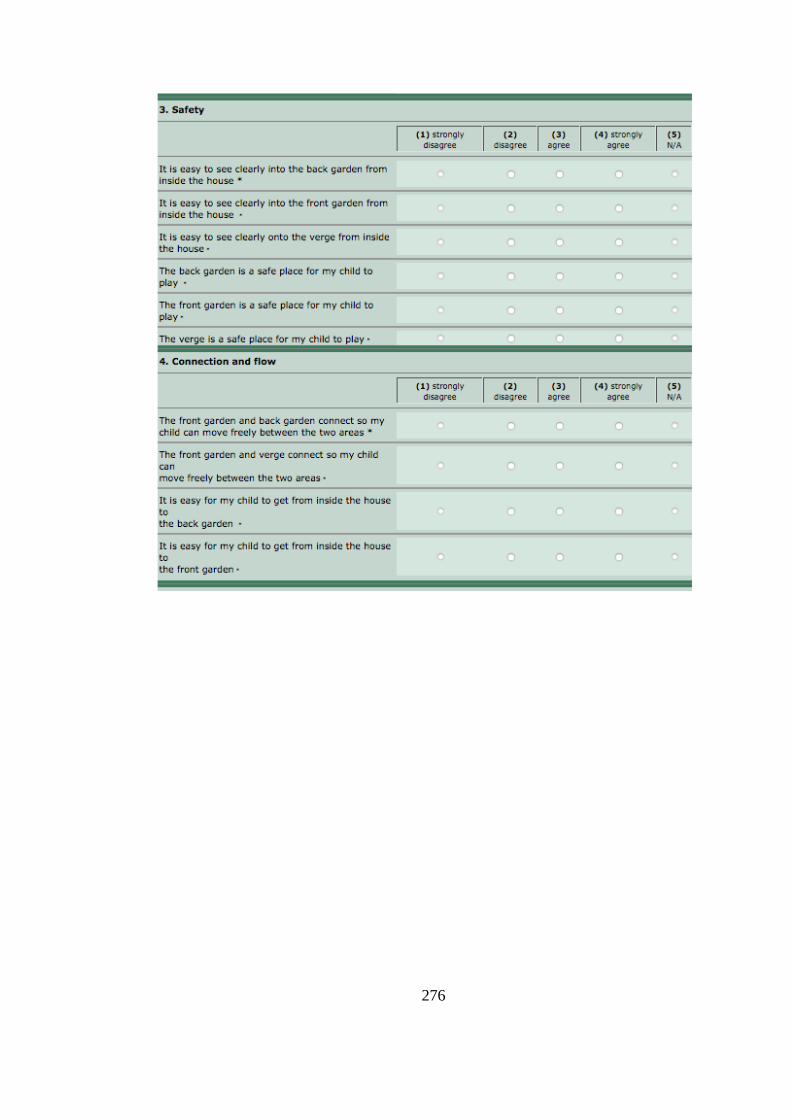
276
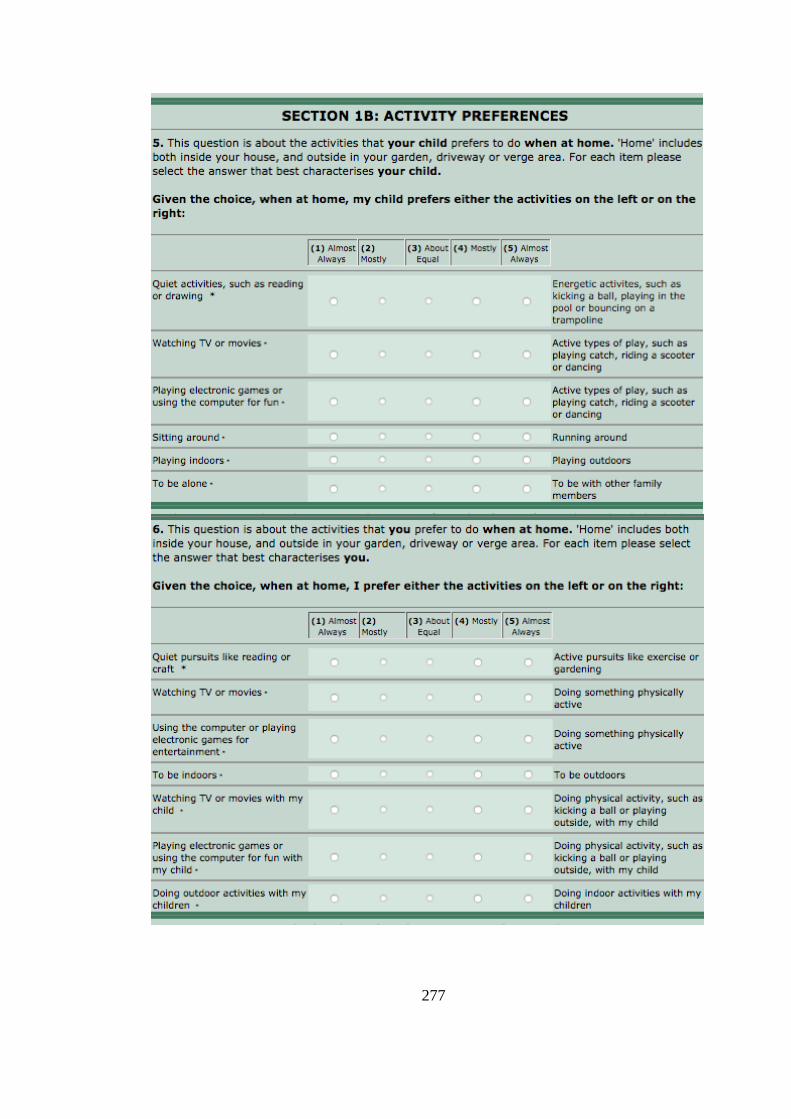
277
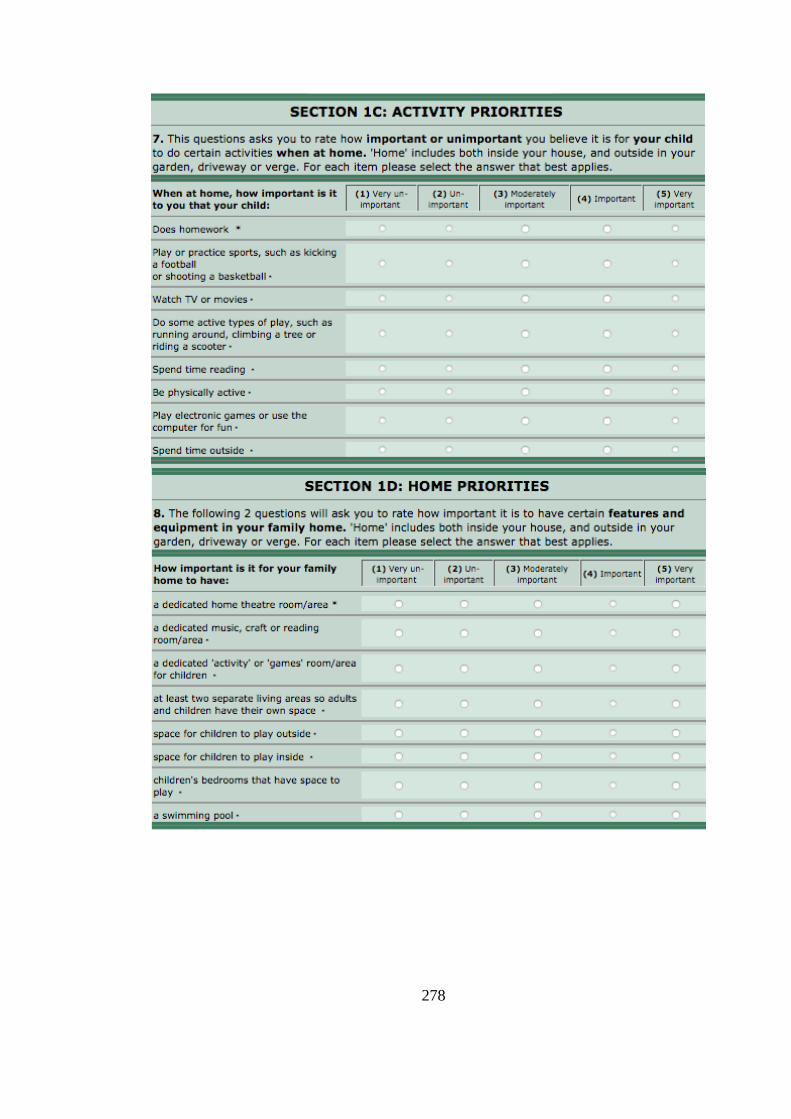
278
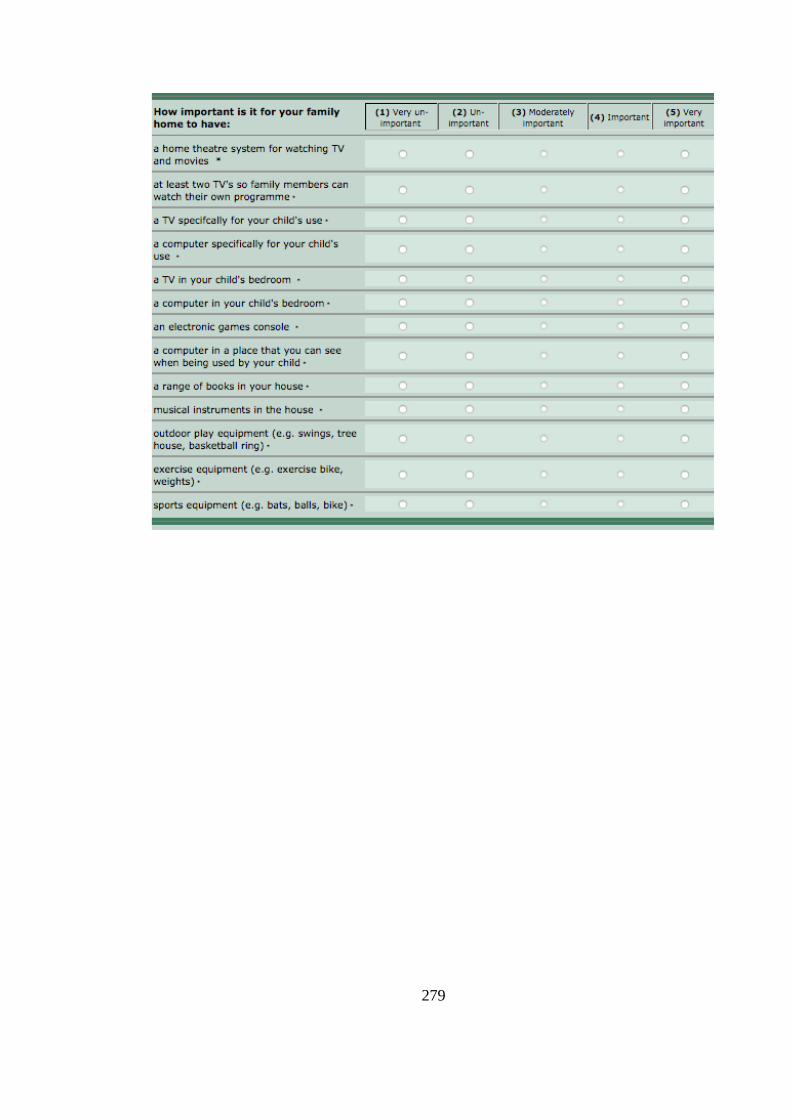
279
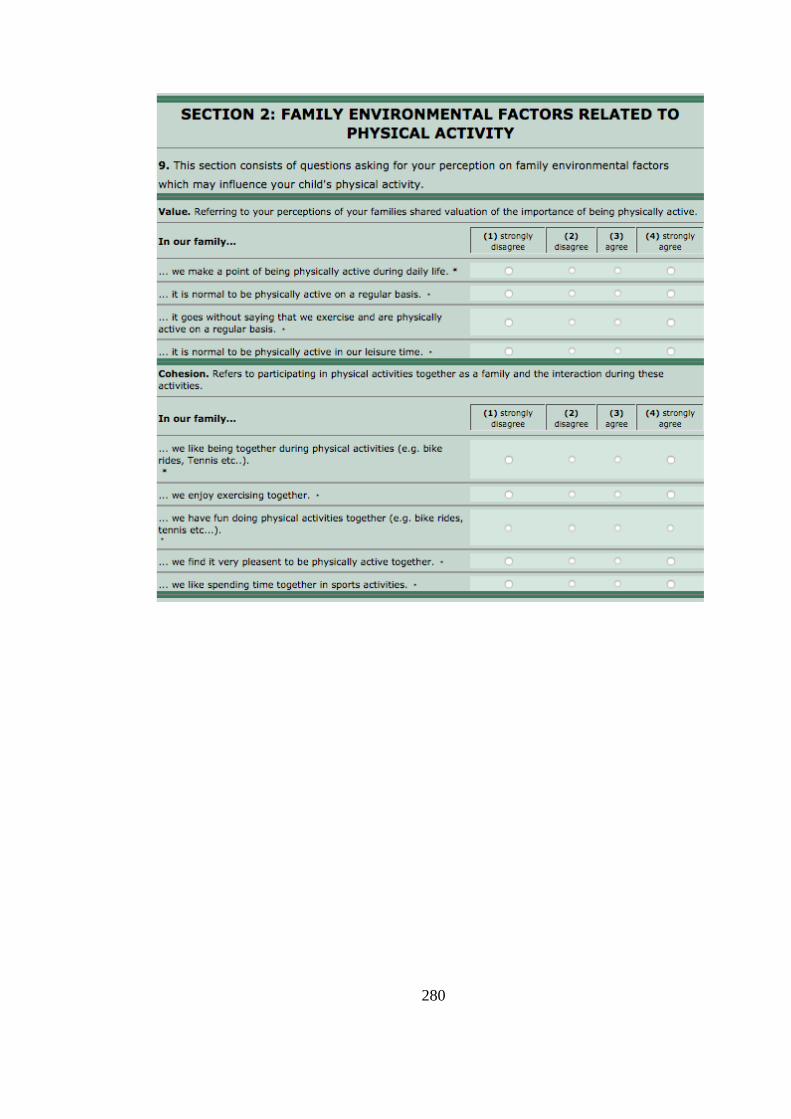
280
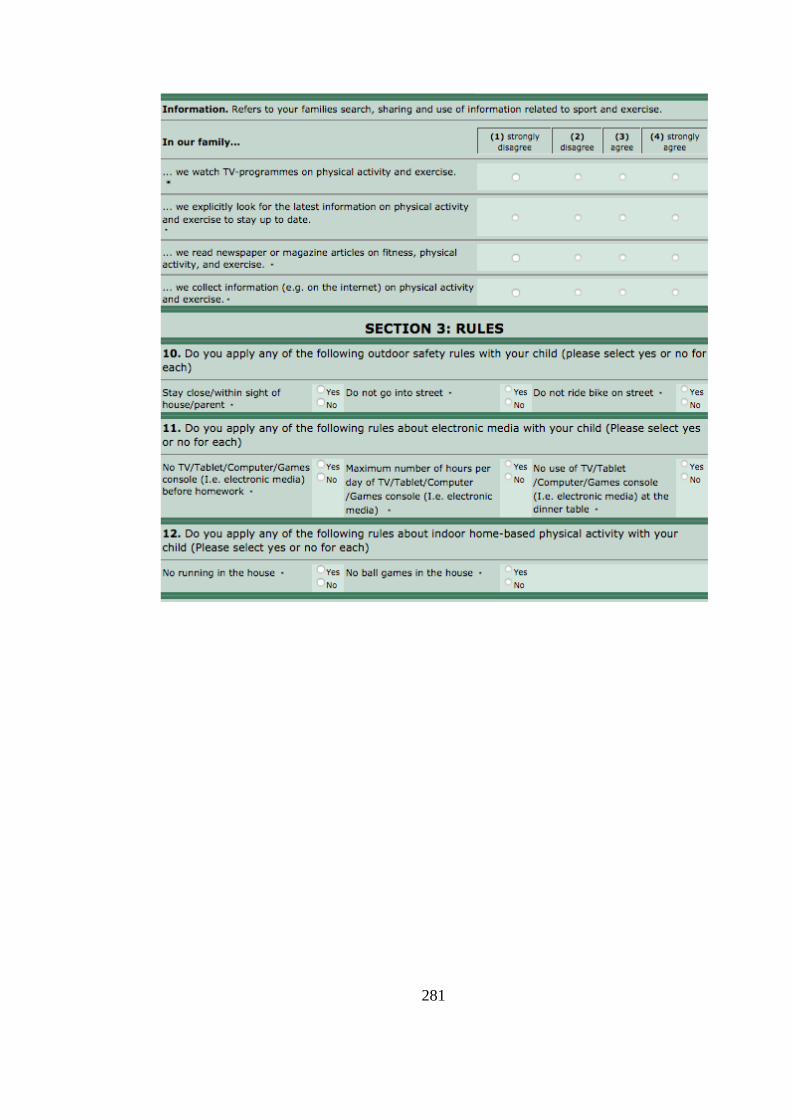
281
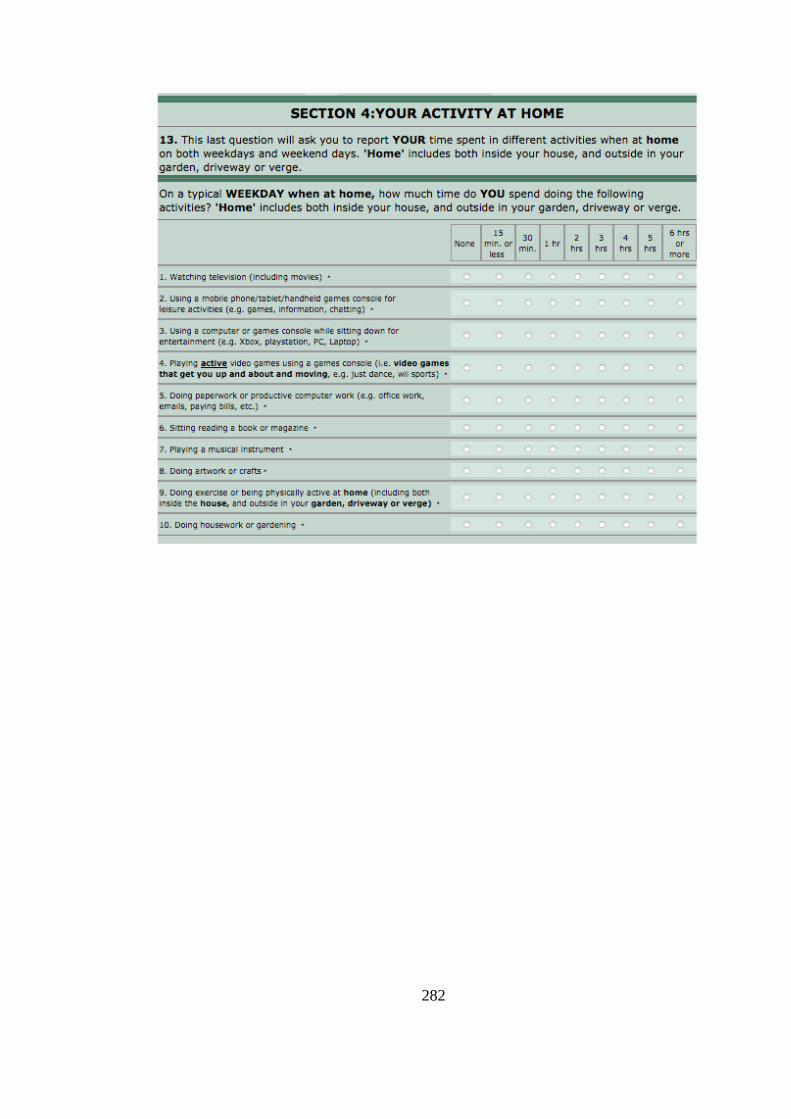
282
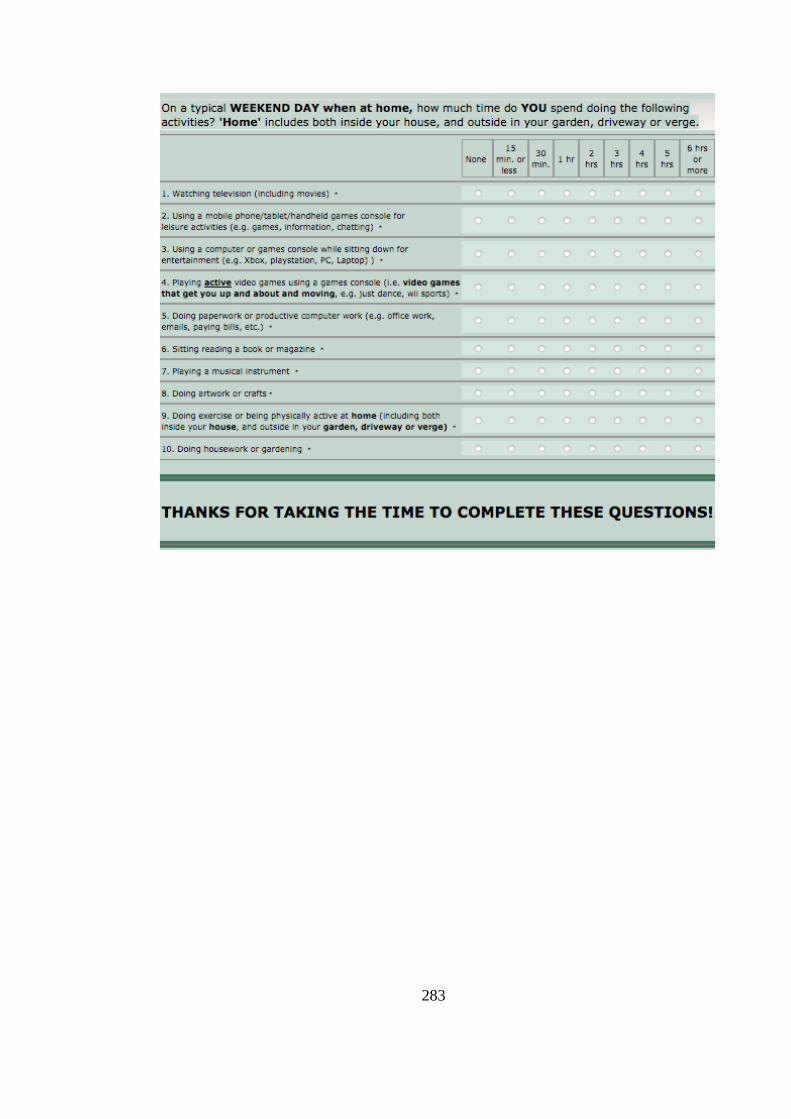
283
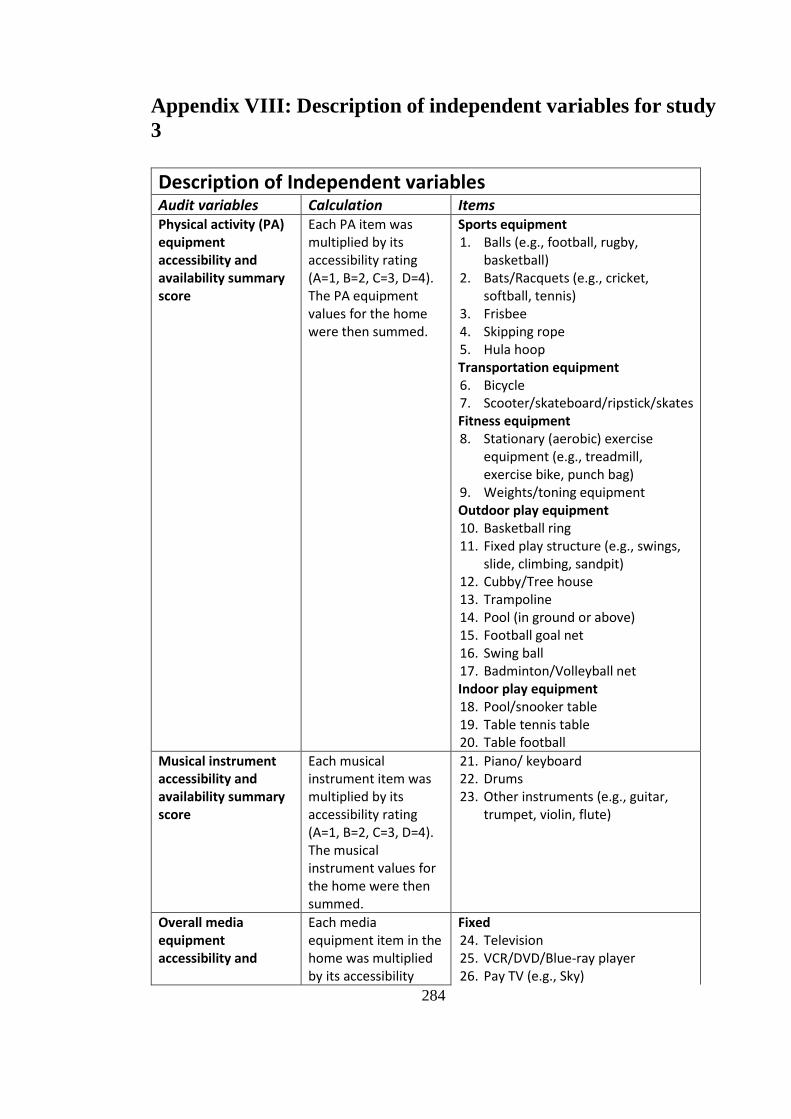
284
Appendix VIII: Description of independent variables for study
3
Description of Independent variables Audit variables Calculation Items Physical activity (PA) equipment accessibility and availability summary score
Each PA item was multiplied by its accessibility rating (A=1, B=2, C=3, D=4). The PA equipment values for the home were then summed.
Sports equipment 1. Balls (e.g., football, rugby,
basketball) 2. Bats/Racquets (e.g., cricket,
softball, tennis) 3. Frisbee 4. Skipping rope 5. Hula hoop Transportation equipment 6. Bicycle 7. Scooter/skateboard/ripstick/skates Fitness equipment 8. Stationary (aerobic) exercise
equipment (e.g., treadmill, exercise bike, punch bag)
9. Weights/toning equipment Outdoor play equipment 10. Basketball ring 11. Fixed play structure (e.g., swings,
slide, climbing, sandpit) 12. Cubby/Tree house 13. Trampoline 14. Pool (in ground or above) 15. Football goal net 16. Swing ball 17. Badminton/Volleyball net Indoor play equipment 18. Pool/snooker table 19. Table tennis table 20. Table football
Musical instrument accessibility and availability summary score
Each musical instrument item was multiplied by its accessibility rating (A=1, B=2, C=3, D=4). The musical instrument values for the home were then summed.
21. Piano/ keyboard 22. Drums 23. Other instruments (e.g., guitar,
trumpet, violin, flute)
Overall media equipment accessibility and
Each media equipment item in the home was multiplied by its accessibility
Fixed 24. Television 25. VCR/DVD/Blue-ray player 26. Pay TV (e.g., Sky)
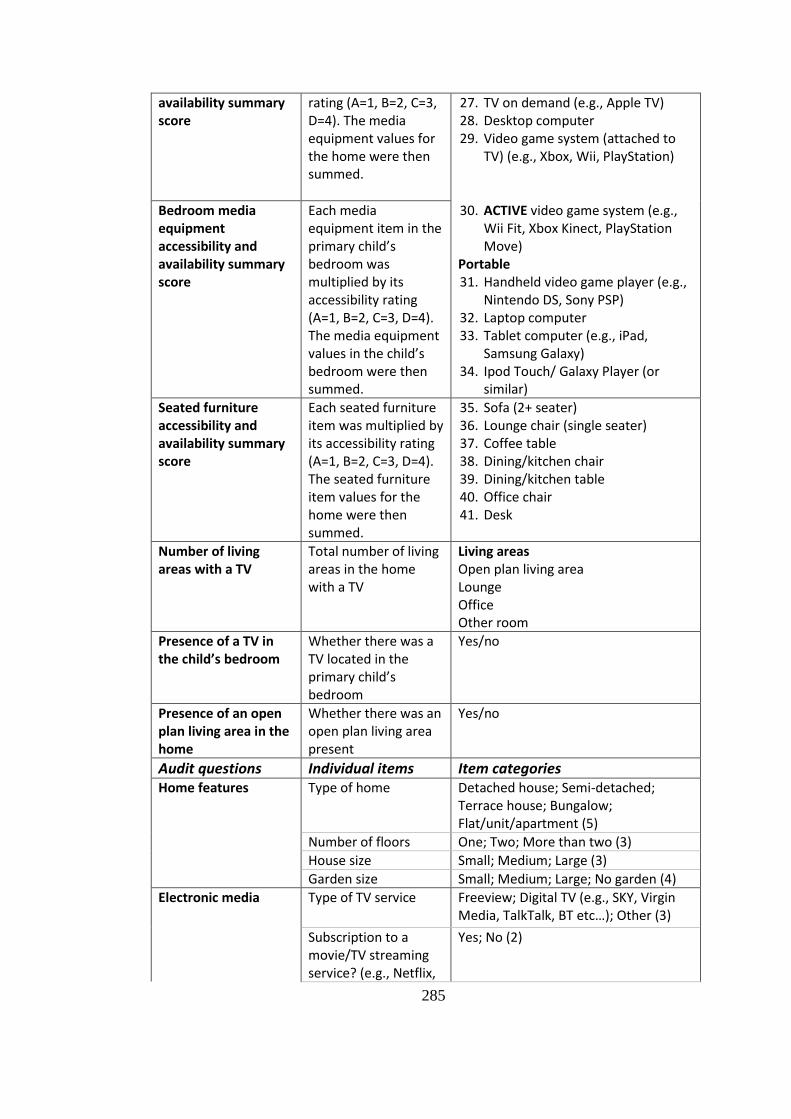
285
availability summary score
rating (A=1, B=2, C=3, D=4). The media equipment values for the home were then summed.
27. TV on demand (e.g., Apple TV) 28. Desktop computer 29. Video game system (attached to
TV) (e.g., Xbox, Wii, PlayStation)
Bedroom media equipment accessibility and availability summary score
Each media equipment item in the primary child’s bedroom was multiplied by its accessibility rating (A=1, B=2, C=3, D=4). The media equipment values in the child’s bedroom were then summed.
30. ACTIVE video game system (e.g., Wii Fit, Xbox Kinect, PlayStation Move)
Portable 31. Handheld video game player (e.g.,
Nintendo DS, Sony PSP) 32. Laptop computer 33. Tablet computer (e.g., iPad,
Samsung Galaxy) 34. Ipod Touch/ Galaxy Player (or
similar)
Seated furniture accessibility and availability summary score
Each seated furniture item was multiplied by its accessibility rating (A=1, B=2, C=3, D=4). The seated furniture item values for the home were then summed.
35. Sofa (2+ seater) 36. Lounge chair (single seater) 37. Coffee table 38. Dining/kitchen chair 39. Dining/kitchen table 40. Office chair 41. Desk
Number of living areas with a TV
Total number of living areas in the home with a TV
Living areas Open plan living area Lounge Office Other room
Presence of a TV in the child’s bedroom
Whether there was a TV located in the primary child’s bedroom
Yes/no
Presence of an open plan living area in the home
Whether there was an open plan living area present
Yes/no
Audit questions Individual items Item categories Home features Type of home
Detached house; Semi-detached; Terrace house; Bungalow; Flat/unit/apartment (5)
Number of floors One; Two; More than two (3)
House size Small; Medium; Large (3)
Garden size Small; Medium; Large; No garden (4)
Electronic media Type of TV service
Freeview; Digital TV (e.g., SKY, Virgin Media, TalkTalk, BT etc…); Other (3)
Subscription to a movie/TV streaming service? (e.g., Netflix,
Yes; No (2)
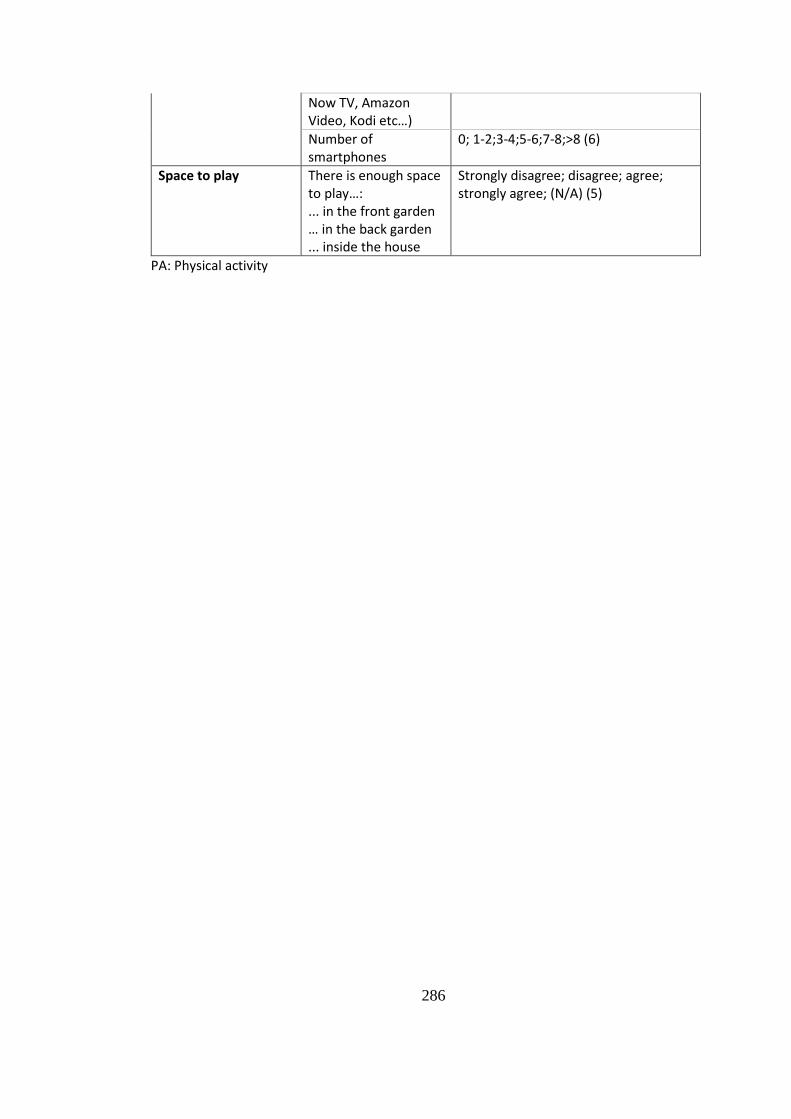
286
Now TV, Amazon Video, Kodi etc…)
Number of smartphones
0; 1-2;3-4;5-6;7-8;>8 (6)
Space to play There is enough space to play…: ... in the front garden … in the back garden ... inside the house
Strongly disagree; disagree; agree; strongly agree; (N/A) (5)
PA: Physical activity
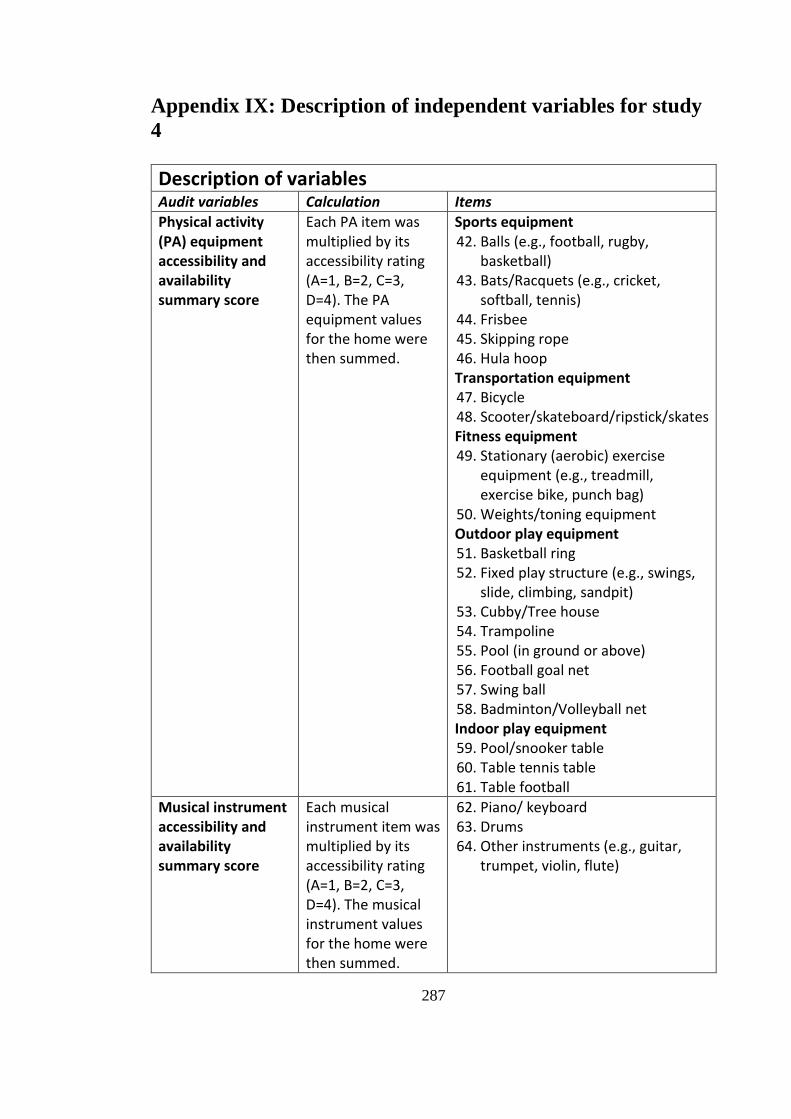
287
Appendix IX: Description of independent variables for study
4
Description of variables Audit variables Calculation Items
Physical activity (PA) equipment accessibility and availability summary score
Each PA item was multiplied by its accessibility rating (A=1, B=2, C=3, D=4). The PA equipment values for the home were then summed.
Sports equipment 42. Balls (e.g., football, rugby,
basketball) 43. Bats/Racquets (e.g., cricket,
softball, tennis) 44. Frisbee 45. Skipping rope 46. Hula hoop Transportation equipment 47. Bicycle 48. Scooter/skateboard/ripstick/skates Fitness equipment 49. Stationary (aerobic) exercise
equipment (e.g., treadmill, exercise bike, punch bag)
50. Weights/toning equipment Outdoor play equipment 51. Basketball ring 52. Fixed play structure (e.g., swings,
slide, climbing, sandpit) 53. Cubby/Tree house 54. Trampoline 55. Pool (in ground or above) 56. Football goal net 57. Swing ball 58. Badminton/Volleyball net Indoor play equipment 59. Pool/snooker table 60. Table tennis table 61. Table football
Musical instrument accessibility and availability summary score
Each musical instrument item was multiplied by its accessibility rating (A=1, B=2, C=3, D=4). The musical instrument values for the home were then summed.
62. Piano/ keyboard 63. Drums 64. Other instruments (e.g., guitar,
trumpet, violin, flute)
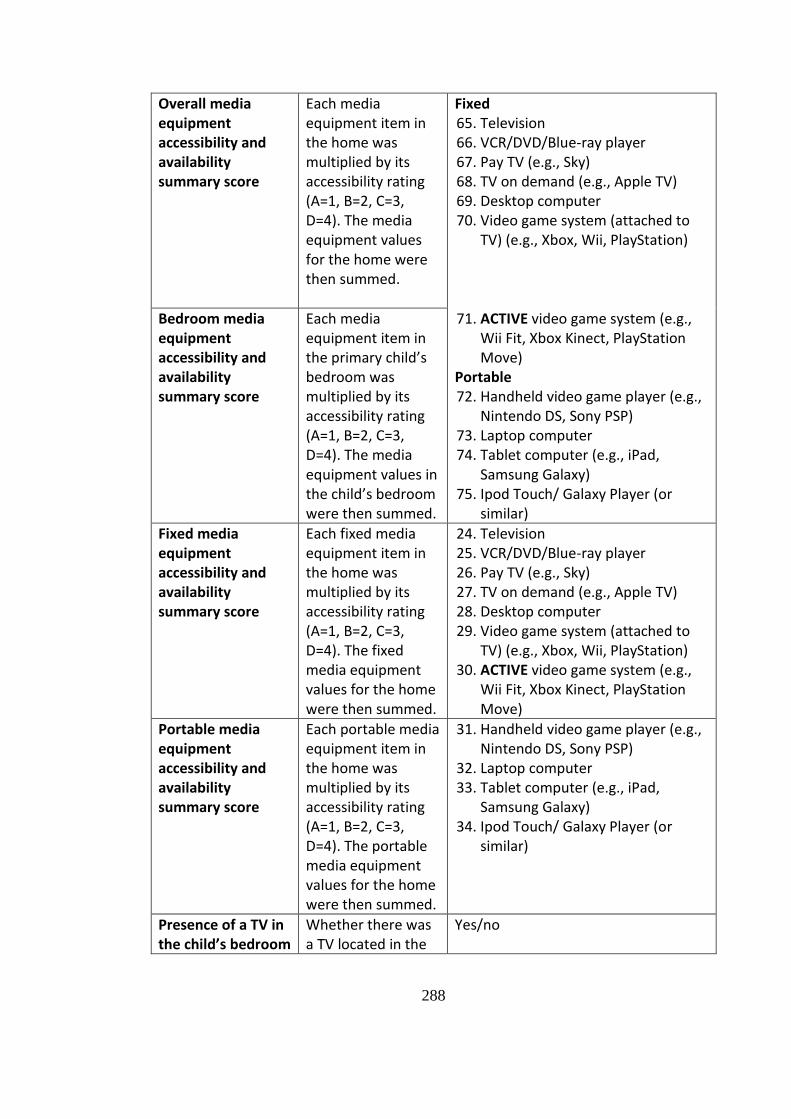
288
Overall media equipment accessibility and availability summary score
Each media equipment item in the home was multiplied by its accessibility rating (A=1, B=2, C=3, D=4). The media equipment values for the home were then summed.
Fixed 65. Television 66. VCR/DVD/Blue-ray player 67. Pay TV (e.g., Sky) 68. TV on demand (e.g., Apple TV) 69. Desktop computer 70. Video game system (attached to
TV) (e.g., Xbox, Wii, PlayStation)
Bedroom media equipment accessibility and availability summary score
Each media equipment item in the primary child’s bedroom was multiplied by its accessibility rating (A=1, B=2, C=3, D=4). The media equipment values in the child’s bedroom were then summed.
71. ACTIVE video game system (e.g., Wii Fit, Xbox Kinect, PlayStation Move)
Portable 72. Handheld video game player (e.g.,
Nintendo DS, Sony PSP) 73. Laptop computer 74. Tablet computer (e.g., iPad,
Samsung Galaxy) 75. Ipod Touch/ Galaxy Player (or
similar)
Fixed media equipment accessibility and availability summary score
Each fixed media equipment item in the home was multiplied by its accessibility rating (A=1, B=2, C=3, D=4). The fixed media equipment values for the home were then summed.
24. Television 25. VCR/DVD/Blue-ray player 26. Pay TV (e.g., Sky) 27. TV on demand (e.g., Apple TV) 28. Desktop computer 29. Video game system (attached to
TV) (e.g., Xbox, Wii, PlayStation) 30. ACTIVE video game system (e.g.,
Wii Fit, Xbox Kinect, PlayStation Move)
Portable media equipment accessibility and availability summary score
Each portable media equipment item in the home was multiplied by its accessibility rating (A=1, B=2, C=3, D=4). The portable media equipment values for the home were then summed.
31. Handheld video game player (e.g., Nintendo DS, Sony PSP)
32. Laptop computer 33. Tablet computer (e.g., iPad,
Samsung Galaxy) 34. Ipod Touch/ Galaxy Player (or
similar)
Presence of a TV in the child’s bedroom
Whether there was a TV located in the
Yes/no
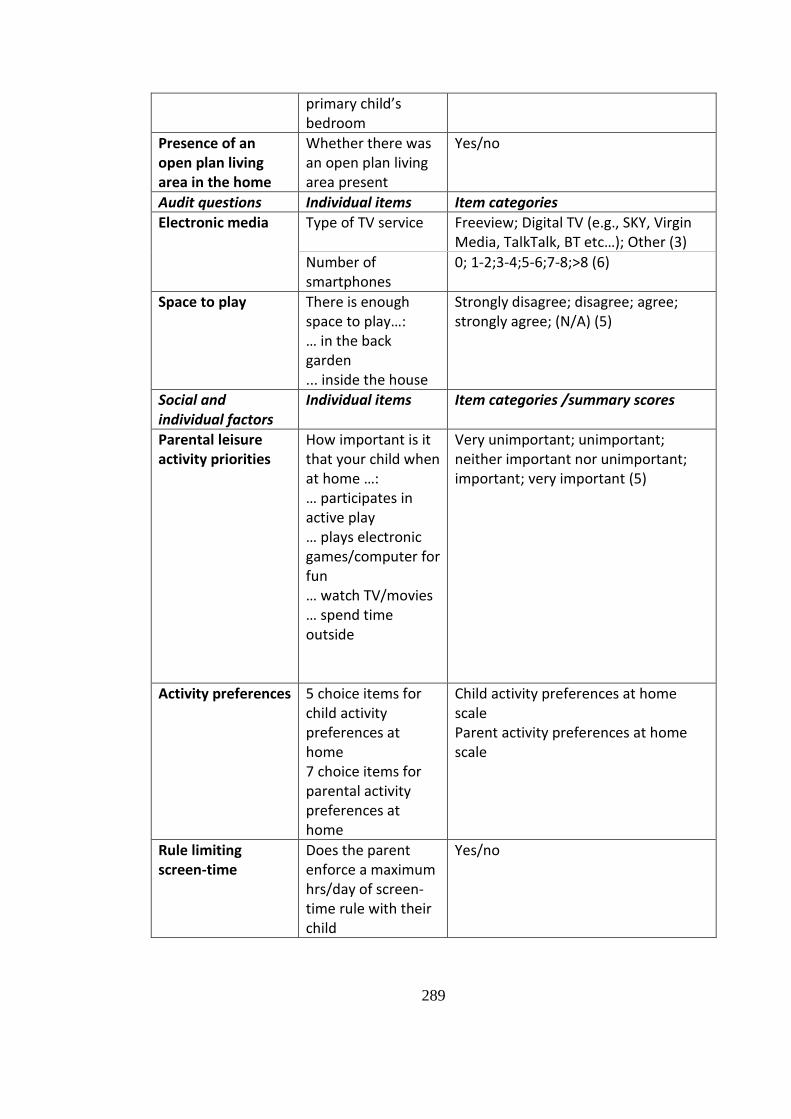
289
primary child’s bedroom
Presence of an open plan living area in the home
Whether there was an open plan living area present
Yes/no
Audit questions Individual items Item categories
Electronic media Type of TV service
Freeview; Digital TV (e.g., SKY, Virgin Media, TalkTalk, BT etc…); Other (3)
Number of smartphones
0; 1-2;3-4;5-6;7-8;>8 (6)
Space to play There is enough space to play…: … in the back garden ... inside the house
Strongly disagree; disagree; agree; strongly agree; (N/A) (5)
Social and individual factors
Individual items Item categories /summary scores
Parental leisure activity priorities
How important is it that your child when at home …: … participates in active play … plays electronic games/computer for fun … watch TV/movies … spend time outside
Very unimportant; unimportant; neither important nor unimportant; important; very important (5)
Activity preferences 5 choice items for child activity preferences at home 7 choice items for parental activity preferences at home
Child activity preferences at home scale Parent activity preferences at home scale
Rule limiting screen-time
Does the parent enforce a maximum hrs/day of screen-time rule with their child
Yes/no
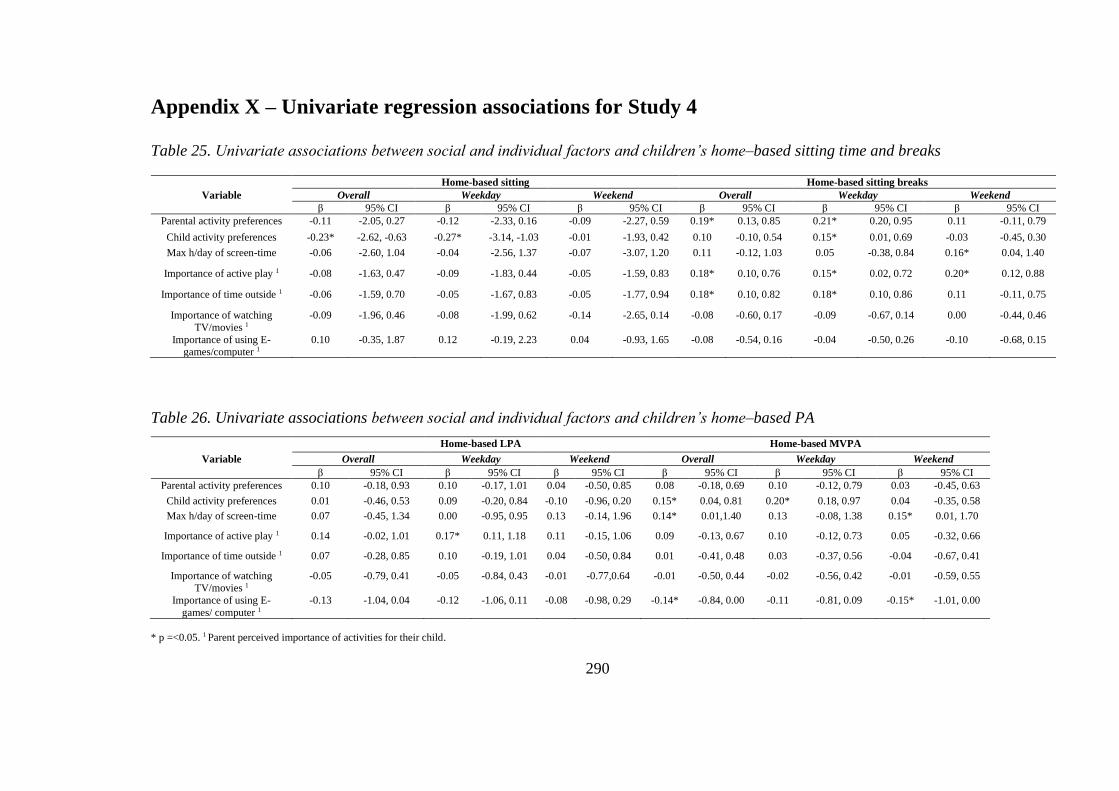
290
Appendix X – Univariate regression associations for Study 4
Table 25. Univariate associations between social and individual factors and children’s home–based sitting time and breaks
Table 26. Univariate associations between social and individual factors and children’s home–based PA
* p =<0.05. 1 Parent perceived importance of activities for their child.
Home-based sitting Home-based sitting breaks
Variable Overall Weekday Weekend Overall Weekday Weekend β 95% CI β 95% CI β 95% CI β 95% CI β 95% CI β 95% CI
Parental activity preferences -0.11 -2.05, 0.27 -0.12 -2.33, 0.16 -0.09 -2.27, 0.59 0.19* 0.13, 0.85 0.21* 0.20, 0.95 0.11 -0.11, 0.79
Child activity preferences -0.23* -2.62, -0.63 -0.27* -3.14, -1.03 -0.01 -1.93, 0.42 0.10 -0.10, 0.54 0.15* 0.01, 0.69 -0.03 -0.45, 0.30
Max h/day of screen-time -0.06 -2.60, 1.04 -0.04 -2.56, 1.37 -0.07 -3.07, 1.20 0.11 -0.12, 1.03 0.05 -0.38, 0.84 0.16* 0.04, 1.40
Importance of active play 1 -0.08 -1.63, 0.47 -0.09 -1.83, 0.44 -0.05 -1.59, 0.83 0.18* 0.10, 0.76 0.15* 0.02, 0.72 0.20* 0.12, 0.88
Importance of time outside 1 -0.06 -1.59, 0.70 -0.05 -1.67, 0.83 -0.05 -1.77, 0.94 0.18* 0.10, 0.82 0.18* 0.10, 0.86 0.11 -0.11, 0.75
Importance of watching
TV/movies 1
-0.09 -1.96, 0.46 -0.08 -1.99, 0.62 -0.14 -2.65, 0.14 -0.08 -0.60, 0.17 -0.09 -0.67, 0.14 0.00 -0.44, 0.46
Importance of using E-games/computer 1
0.10 -0.35, 1.87 0.12 -0.19, 2.23 0.04 -0.93, 1.65 -0.08 -0.54, 0.16 -0.04 -0.50, 0.26 -0.10 -0.68, 0.15
Home-based LPA Home-based MVPA
Variable Overall Weekday Weekend Overall Weekday Weekend β 95% CI β 95% CI β 95% CI β 95% CI β 95% CI β 95% CI
Parental activity preferences 0.10 -0.18, 0.93 0.10 -0.17, 1.01 0.04 -0.50, 0.85 0.08 -0.18, 0.69 0.10 -0.12, 0.79 0.03 -0.45, 0.63
Child activity preferences 0.01 -0.46, 0.53 0.09 -0.20, 0.84 -0.10 -0.96, 0.20 0.15* 0.04, 0.81 0.20* 0.18, 0.97 0.04 -0.35, 0.58
Max h/day of screen-time 0.07 -0.45, 1.34 0.00 -0.95, 0.95 0.13 -0.14, 1.96 0.14* 0.01,1.40 0.13 -0.08, 1.38 0.15* 0.01, 1.70
Importance of active play 1 0.14 -0.02, 1.01 0.17* 0.11, 1.18 0.11 -0.15, 1.06 0.09 -0.13, 0.67 0.10 -0.12, 0.73 0.05 -0.32, 0.66
Importance of time outside 1 0.07 -0.28, 0.85 0.10 -0.19, 1.01 0.04 -0.50, 0.84 0.01 -0.41, 0.48 0.03 -0.37, 0.56 -0.04 -0.67, 0.41
Importance of watching TV/movies 1
-0.05 -0.79, 0.41 -0.05 -0.84, 0.43 -0.01 -0.77,0.64 -0.01 -0.50, 0.44 -0.02 -0.56, 0.42 -0.01 -0.59, 0.55
Importance of using E-
games/ computer 1
-0.13 -1.04, 0.04 -0.12 -1.06, 0.11 -0.08 -0.98, 0.29 -0.14* -0.84, 0.00 -0.11 -0.81, 0.09 -0.15* -1.01, 0.00
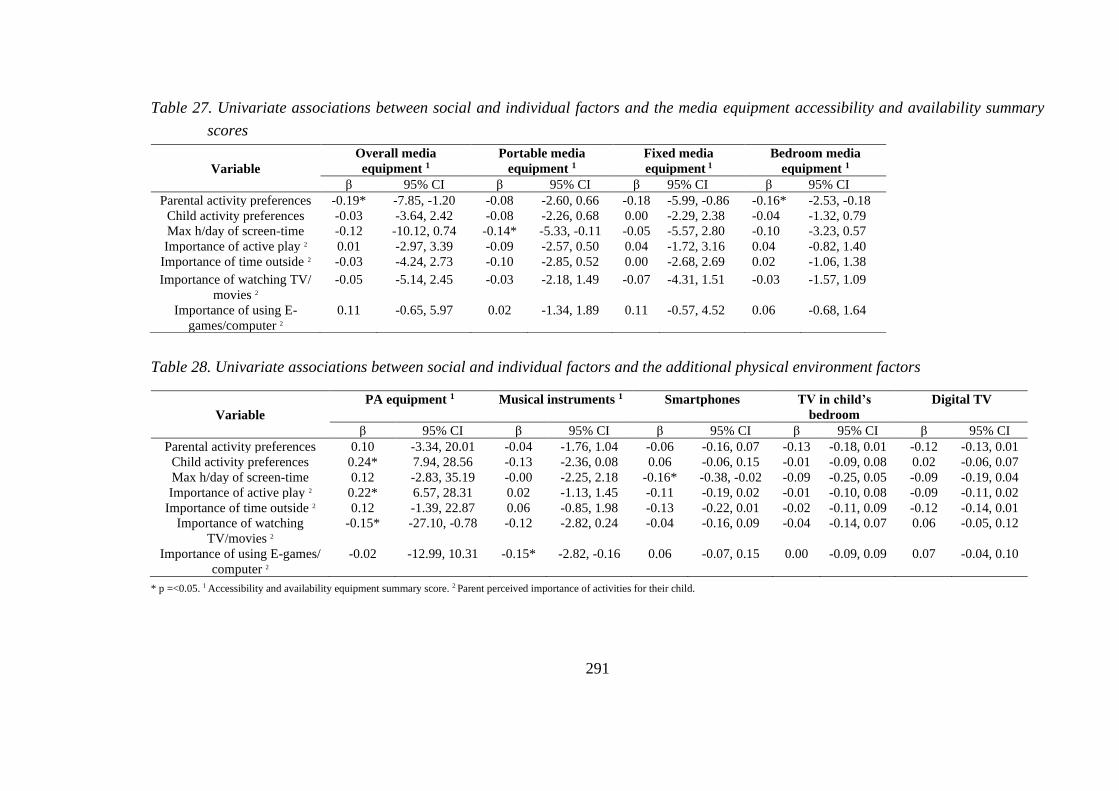
291
Table 27. Univariate associations between social and individual factors and the media equipment accessibility and availability summary
scores
Table 28. Univariate associations between social and individual factors and the additional physical environment factors
* p =<0.05. 1 Accessibility and availability equipment summary score. 2 Parent perceived importance of activities for their child.
Variable
Overall media
equipment 1
Portable media
equipment 1
Fixed media
equipment 1
Bedroom media
equipment 1
β 95% CI β 95% CI β 95% CI β 95% CI
Parental activity preferences -0.19* -7.85, -1.20 -0.08 -2.60, 0.66 -0.18 -5.99, -0.86 -0.16* -2.53, -0.18
Child activity preferences -0.03 -3.64, 2.42 -0.08 -2.26, 0.68 0.00 -2.29, 2.38 -0.04 -1.32, 0.79
Max h/day of screen-time -0.12 -10.12, 0.74 -0.14* -5.33, -0.11 -0.05 -5.57, 2.80 -0.10 -3.23, 0.57
Importance of active play 2 0.01 -2.97, 3.39 -0.09 -2.57, 0.50 0.04 -1.72, 3.16 0.04 -0.82, 1.40
Importance of time outside 2 -0.03 -4.24, 2.73 -0.10 -2.85, 0.52 0.00 -2.68, 2.69 0.02 -1.06, 1.38
Importance of watching TV/
movies 2
-0.05 -5.14, 2.45 -0.03 -2.18, 1.49 -0.07 -4.31, 1.51 -0.03 -1.57, 1.09
Importance of using E-
games/computer 2
0.11 -0.65, 5.97 0.02 -1.34, 1.89 0.11 -0.57, 4.52 0.06 -0.68, 1.64
Variable
PA equipment 1 Musical instruments 1 Smartphones TV in child’s
bedroom
Digital TV
β 95% CI β 95% CI β 95% CI β 95% CI β 95% CI
Parental activity preferences 0.10 -3.34, 20.01 -0.04 -1.76, 1.04 -0.06 -0.16, 0.07 -0.13 -0.18, 0.01 -0.12 -0.13, 0.01
Child activity preferences 0.24* 7.94, 28.56 -0.13 -2.36, 0.08 0.06 -0.06, 0.15 -0.01 -0.09, 0.08 0.02 -0.06, 0.07
Max h/day of screen-time 0.12 -2.83, 35.19 -0.00 -2.25, 2.18 -0.16* -0.38, -0.02 -0.09 -0.25, 0.05 -0.09 -0.19, 0.04
Importance of active play 2 0.22* 6.57, 28.31 0.02 -1.13, 1.45 -0.11 -0.19, 0.02 -0.01 -0.10, 0.08 -0.09 -0.11, 0.02
Importance of time outside 2 0.12 -1.39, 22.87 0.06 -0.85, 1.98 -0.13 -0.22, 0.01 -0.02 -0.11, 0.09 -0.12 -0.14, 0.01
Importance of watching
TV/movies 2
-0.15* -27.10, -0.78 -0.12 -2.82, 0.24 -0.04 -0.16, 0.09 -0.04 -0.14, 0.07 0.06 -0.05, 0.12
Importance of using E-games/
computer 2
-0.02 -12.99, 10.31 -0.15* -2.82, -0.16 0.06 -0.07, 0.15 0.00 -0.09, 0.09 0.07 -0.04, 0.10
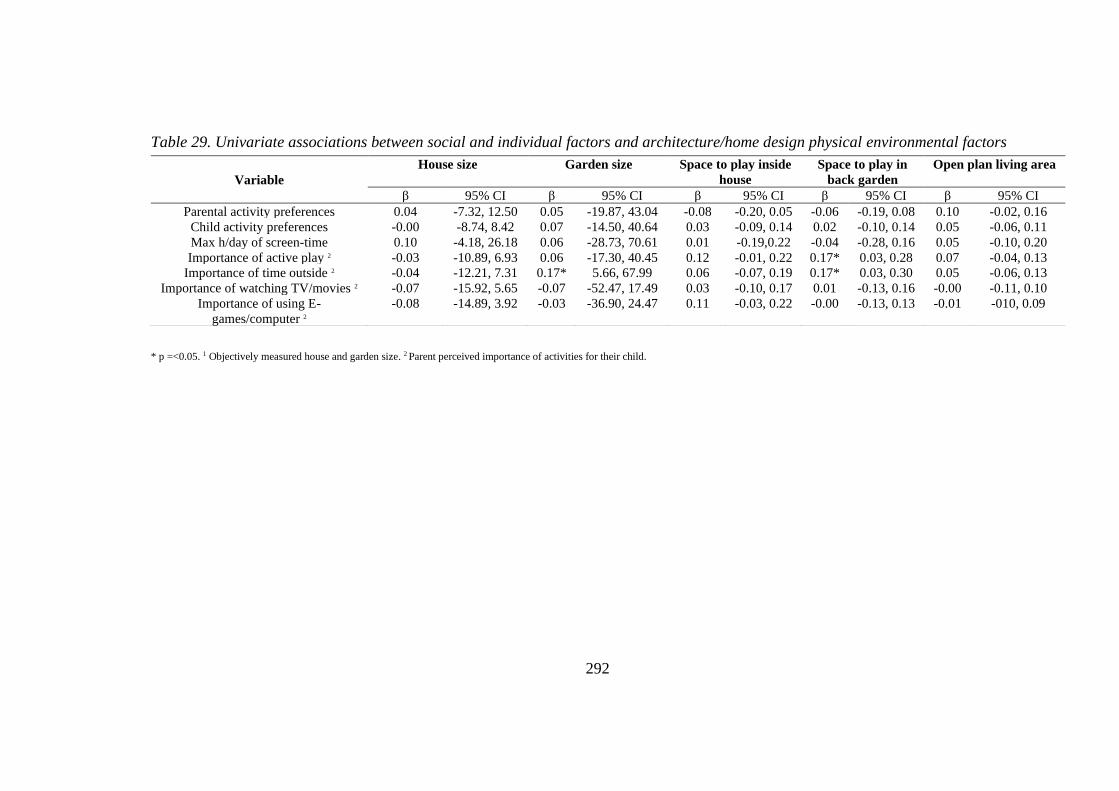
292
Table 29. Univariate associations between social and individual factors and architecture/home design physical environmental factors
* p =<0.05. 1 Objectively measured house and garden size. 2 Parent perceived importance of activities for their child.
Variable
House size Garden size Space to play inside
house
Space to play in
back garden
Open plan living area
β 95% CI β 95% CI β 95% CI β 95% CI β 95% CI
Parental activity preferences 0.04 -7.32, 12.50 0.05 -19.87, 43.04 -0.08 -0.20, 0.05 -0.06 -0.19, 0.08 0.10 -0.02, 0.16
Child activity preferences -0.00 -8.74, 8.42 0.07 -14.50, 40.64 0.03 -0.09, 0.14 0.02 -0.10, 0.14 0.05 -0.06, 0.11
Max h/day of screen-time 0.10 -4.18, 26.18 0.06 -28.73, 70.61 0.01 -0.19,0.22 -0.04 -0.28, 0.16 0.05 -0.10, 0.20
Importance of active play 2 -0.03 -10.89, 6.93 0.06 -17.30, 40.45 0.12 -0.01, 0.22 0.17* 0.03, 0.28 0.07 -0.04, 0.13
Importance of time outside 2 -0.04 -12.21, 7.31 0.17* 5.66, 67.99 0.06 -0.07, 0.19 0.17* 0.03, 0.30 0.05 -0.06, 0.13
Importance of watching TV/movies 2 -0.07 -15.92, 5.65 -0.07 -52.47, 17.49 0.03 -0.10, 0.17 0.01 -0.13, 0.16 -0.00 -0.11, 0.10
Importance of using E-
games/computer 2
-0.08 -14.89, 3.92 -0.03 -36.90, 24.47 0.11 -0.03, 0.22 -0.00 -0.13, 0.13 -0.01 -010, 0.09
293
Appendix XI: Ethical approval applications
HomeSPACE-II instrument validity and reliability study application
for ethical approval
Applied Sports Technology Exercise and Medicine Research Centre (A-STEM)
Sport and Health Portfolio, College of Engineering
APPLICATION FOR ETHICAL COMMITTEE APPROVAL OF A RESEARCH PROJECT
In accordance with A-STEM and College of Engineering Safety Policy, all research undertaken by
staff or students linked with A-STEM must be approved by the A-STEM Ethical Committee.
RESEARCH MAY ONLY COMMENCE ONCE ETHICAL APPROVAL HAS BEEN OBTAINED
The researcher(s) should complete the form in consultation with the project supervisor. After
completing and signing the form students should ask their supervisor to sign it. The form should
be submitted electronically to Prof Mike McNamee ( ) and Dr
Melitta McNarry ( ).
Applicants will be informed of the Committee’s decision via email to the project
leader/supervisor.
1. TITLE OF PROJECT
HomeSPACE study
2. DATE OF PROJECT COMMENCEMENT AND PROPOSED DURATION OF THE STUDY
1st October 2015-30th September 2016
3. NAMES AND STATUS OF RESEARCH TEAM

294
State the names of all members of the research group including the supervisor(s). State the
current status of the student(s) in the group i.e. Undergraduate, Postgraduate, Staff or Other
(please specify).
Michael Sheldrick: Postgraduate Sport and Exercise science masters by research
student (DBS checked, certificate number: 001468440434)
Luke Martin: Postgraduate Sport and Exercise science masters by research student
(DBS), copy of DBS will follow.
Supervisor: Professor Gareth Stratton (DBS checked).
2nd supervisor: Dr Kelly Mackintosh (DBS checked).
4. RATIONALE AND REFERENCES
With reference to appropriate sources of information (using the Harvard system), describe in
no more than 200 words the background to the proposed project.
In recent years house sizes in countries such as Australia and the USA have increased
while private outdoor space has decreased (Australian Bureau of Statistics, 2011),
indeed, the majority of a child’s active leisure time at home is spent outdoors and their
time spent indoors is most likely spent sedentary (Biddle et al., 2009). Additionally,
the use of electronic media and labour saving devices within the home is on the
increase, both of which facilitate sedentary behaviours (Owen et al., 2010). Together
with these changes in home space children’s opportunity to play freely in their local
neighbourhoods is now limited, due to concerns about safety and a lack of places to
play (Living streets, 2009).
As a result children spend much of their time at home, (Karsten, 2005) consequently
the above changes in home space may negatively affect their health through
encouraging sedentariness, associated with overweight and obesity, reduced fitness and
a variety of other physiological and psychological problems (Tremblay et al., 2010).
Currently, few children meet public health recommendations of at least 60 minutes of
moderate to vigorous PA per day and spend a high proportion of their discretionary
time sedentary (e.g. watching television (TV) or playing video games) (Tremblay et
al., 2011). The results of this study will have the potential to impact UK home design
and planning policy in the future in order to decrease sedentary behaviour and facilitate
children’s activity.
Australian Bureau of Statistics. Larger Dwellings, Smaller Households. Canberra:
Commonwealth of Australia; 2007.
295
Biddle, S. J., Marshall, S. J., Gorely, T., & Cameron, N. (2009). Temporal and
environmental patterns of sedentary and active behaviors during adolescents’ leisure
time. International journal of behavioral medicine, 16(3), 278-286.
Living Streets (2009) No Ball Games Here (or Shopping or Talking to their
Neighbours): How UK streets have become no-go areas for our communities. London:
Living Streets.
Owen, N., Healy, G. N., Matthews, C. E., & Dunstan, D. W. (2010). Too much sitting:
the population-health science of sedentary behavior. Exercise and sport sciences
reviews, 38(3), 105.
Maitland, C., Stratton, G., Foster, S., Braham, R., & Rosenberg, M. (2014). The
Dynamic Family Home: a qualitative exploration of physical environmental influences
on children’s sedentary behaviour and physical activity within the home
space. International Journal of Behavioral Nutrition and Physical Activity,11(1), 157.
Karsten, L. (2005). It all used to be better? Different generations on continuity and
change in urban children's daily use of space. Children's Geographies, 3(3), 275-290.
Tremblay, M. S., Colley, R. C., Saunders, T. J., Healy, G. N., & Owen, N. (2010).
Physiological and health implications of a sedentary lifestyle. Applied Physiology,
Nutrition, and Metabolism, 35(6), 725-740.
Tremblay, M. S., LeBlanc, A. G., Kho, M. E., Saunders, T. J., Larouche, R., Colley, R.
C., Goldfield, G. and Gorber, S. (2011) ‘Systematic review of sedentary behaviour and
health indicators in school-aged children and youth’, International Journal of
Behavioral Nutrition and Physical Activity, 8(1),98.
5. OBJECTIVES
State the objectives of the project, i.e. one or more precise statements of what the project is
designed to achieve.
-To investigate the influence of the physical environment of the home space on the
sedentary and non-sedentary behaviour of children aged 10-12 years.
-To test and develop a valid and reliable home audit tool to measure parameters of the
home physical environment that may influence children’s sedentary and non-sedentary
behaviour at home.
296
- To discover the sedentary and physical activity habits of typical school children aged
10-12 years in Wales.
6.1 STUDY DESIGN
- outline the chosen study design (e.g. cross-section, longitudinal, intervention, RCT,
questionnaire etc)
We will use a research approach, which will involve one parent/guardian from a family
and a researcher simultaneously walking through a home, independently completing a
home audit tool (validity) already validated for use in Australian homes. Once the
researcher and the parent have completed the Home audit the children of the family
will be asked to answer an online health and lifestyle questionnaire called the Child
Health and Activity Tool (CHAT) in the presence of their parent, the leader researcher
and another member of the study team who will be supervising the visit. Lastly, the
same parent/guardian will be asked to complete the home audit independently one
week later and return via post (reliability).
6.2 STUDY DESIGN
- state the number and characteristics of study participants
- state the inclusion criteria for participants
- state the exclusion criteria for participants and identify any requirements for health screening
- state whether the study will involve vulnerable populations (i.e. young, elderly, clinical etc.)
- state the requirements/commitments expected of the participants (e.g. time, exertion level etc)
Eligible participants include families from South Wales with at least one
parent/guardian of any age and gender and at least one child aged 10 to 12 years of any
gender. 15 families will be recruited to this study. The sample will include families that
are demographically represented using the Welsh Index of Multiple Deprivation
(WIMD).
6.3 PARTICIPANT RECRUITMENT
How and from where will participants be recruited?
Participants will be recruited to the HomeSPACE study via advertising through a
variety of channels as required. Channels will include schools, the Swan-Linx physical
activity programme, university intranet and sport and recreational clubs. Firstly to
access participants I will need to request approval from the head teachers of the schools
to make a visit either via the Swan-Linx programme or exclusively to recruit for
homeSPACE and the head coaches of the sports clubs to both explain the study and to
give out packs in envelopes to the children. Upon approval, the children will be given
envelopes containing participant information sheets for their parents/guardians
297
enquiring about their potential contribution to the study. Interested parents will be
directed to call or email the researcher for further details of the study or to agree upon
a time for the home visit. Additionally the lead researcher will offer to meet
parents/guardians at the school or sport sessions to explain the study if required. If the
parent/guardian is happy to proceed a pack (including participant consent and assent
forms) will be given in person or sent via email. If necessary snowball recruitment
methods will be used in order to achieve the recruitment target. In this case, existing
study participants will be asked to inform other potential participants of the study
details who can contact the study team via email for further information and to sign up.
The participants for the pilot study will be existing contacts of myself and will be
contacted directly via email enquiring about their potential contribution to the study. I
will also offer to meet up with the families or speak on the phone to answer any further
queries they may have. Copies of the audit tool and PI sheets will be given and
consent/assent forms completed. Given these families will be existing contacts of
myself they may feel obliged to contribute however I will stress that participation
should be entirely voluntary and that I will not be hurt if they wish not to participate.
A family weekend pass for Swansea’s leisure complex (LC2), a water park and activity
centre, will be offered to the parent/guardian providing they complete the second audit
one week later and return via post to show appreciation for the time committed to
participate in the study and to perhaps provide an incentive to initially contribute. The
weekend pass is subject to availability.
6.4 DATA COLLECTION METHODS
- describe all of the data collection/experimental procedures to be undertaken
- state any dietary supplementation that will be given to participants and provide full details in
Section 6.5
- state the inclusion of participant information and consent forms (in appendices)
- refer to the use of the ACA/ACSM health screening questionnaire where appropriate (usually
for maximal effort exercise)
Following receipt of institutional ethics board approval participants will be recruited to
the HomeSPACE study via advertising through a variety of channels as required.
Channels will include schools, the Swan-Linx physical activity programme, the
university internet and sport and recreational clubs or if necessary through snowball
recruitment methods. The participants will be invited to make a suitable time for the
lead researcher and another member of the study team to come to their home. Another
member of the study team will accompany the researcher during the home visit to
supervise proceedings, ensuring the safety of the researcher and that of the family and
help children complete the CHAT. The audit tool will be developed and pilot tested
298
first with a convenience sample of three families recruited through existing contacts of
the researcher to complete and comment on the audit to ensure instruction clarity of the
questions and format. Firstly, one parent/guardian will be asked to complete a written
home environmental audit, already validated for use in Australian homes (Maitland et
al., 2014). Questions will be adapted to the British context where appropriate. For
example for income the dollars signs, the currency in Australia will be changed to
pound sterling. Upon entering the house, as part of the home audit the researcher will
first ask the participants to provide some written demographic background information
(e.g. age; gender; postcode; education; number, age and sex of children). Secondly, the
parent/guardian and the researcher will walk through the house simultaneously but
independently completing the home audit tool with as little communication as possible.
If the participant does speak, the researcher will ask them not to speak. The audit tool
is a checklist which will include questions about house and garden size, space and
design, and physical activity and media equipment. In addition, there will be some
questions about preferences for housing and leisure activities at home, and family. The
participant will be informed of the procedures regarding the home visit in the
participant information sheet prior to agreeing to contribute. Participants will be
advised that it is completely up to them as where to where they go in the home and they
are free to avoid any rooms or questions if they please. The researcher will respect the
decisions of the participant and will wait to be invited or will ask the parent/guardian
before entering each room. The audit tool will take approximately 30 minutes to
complete. However this will depend on the size of the home and the number of items
present. The draft audit tool is attached to this ethics application. Following this
procedure will allow us to test the validity of the home audit tool.
Once the researcher and the parent have completed the Home audit the children will be
asked to answer an online health and lifestyle questionnaire called the Child Health and
Activity Tool (CHAT) on a laptop provided by the study team unless they would prefer
to use one of their own. The children will complete the CHAT in the presence of their
parent and both members of the study team who will be happy to answer any questions
if necessary. The CHAT requires children to record detailed information on the
temporal sequence of their activities including their diet habits. The CHAT will give
an idea of how much time the child spends in specific behaviours that potentially occur
in the home, such as watching TV, video games, homework, active play and leisure
time PA.
Lastly at the end of the first visit, the researcher will leave a blank audit tool with the
participant to complete independently one week later following the same procedure as
before. A stamped-addressed envelope will be provided for mailing the completed
inventory back to the researcher. Reminder messages via email will be made to
families one day prior to the day when the second tool is meant to be completed. This
299
procedure will allow the reliability of the home audit tool to be quantified.
This procedure has been successfully used previously to validate and reliability test an
inventory to assess home electronic media and physical activity equipment (Sirard et
al., 2008).
6.5 DATA ANALYSIS TECHNIQUES
- describe the techniques that will be used to analyse the data
The computer programme SPSS statistics will be used for all data analyses. Firstly, the
data from all 3 copies of the audit tool will be analysed for descriptive statistics. Test-
retest reliability of the variables from the audit tool (i.e., number of items, who uses the
room (e.g. children, parents and everyone), outdoor features and the size of the room
(small, medium, large) will be assessed by intraclass correlation coefficient (ICC, 95%
confidence intervals). The categorical variables (i.e., additional equipment) will be
assessed by spearman rank order correlation. Mean differences in variables between
the 1st audit and 2nd audit completed by the parent/guardian will be identified with a
chi-squared test. Validity will be evaluated by examining between data from the
participant and the researcher using Pearson product moment correlation coefficients
for the above variables. Mean differences in variables between the participant and the
researcher will be identified with two-tailed independent t-tests.
The CHAT data set will be submitted through Google which I can retrieve and
download into Microsoft excel for analysis. The CHAT data will then be analysed for
descriptive statistics to identify the sedentary and activity behaviours.
6.6 STORAGE AND DISPOSAL OF DATA AND SAMPLES
- describe the procedures to be undertaken for the storage and disposal of data and samples
- identify the people who will have the responsibility for the storage and disposal of data and
samples
- Identify the people who will have access to the data and samples
- state the period for which the data will be retained on study completion (normally 5 years, or
end of award)
All the data collected will be kept private and confidential. Any hard copies of the home
audit and consent/assent forms will be kept in a secure office. The CHAT data and any
additional personal information will be stored on a password protected computer for
up to 7 years until they are eventually destroyed by the supervisor of the project. The
data received will only be available for viewing by the researcher and other responsible
individuals of the research team from Swansea University providing consent is
300
provided by the family. The data we collect may be used to influence future UK home
design and planning policy to facilitate children’s activity.
6.7 HOW DO YOU PROPOSE TO ENSURE PARTICIPANT CONFIDENTIALITY AND ANONYMITY?
Initial anonymity in this study is hard to achieve due to the nature of the research
approach as naturally the family will be referring to each other by their names during
the home visit. However upon completing data collection the researcher will remove
identifiers to protect confidential information. The clean data set will not contain
information that identifies the participants, such as a name or address, such information
may be stored somewhere else, in separate, protected files.
Identities will be easily masked for example, the family names will be replaced with
numbers or pseudonyms and the full addresses replaced with postcodes. For the CHAT
specifically, a coding scheme will be devised in which each child will have their own
personal identification number. Therefore, when they complete the CHAT they will
use the ID number and not their own names. If any unaccepted behaviours or physical
environments are observed within the house confidentiality may not always be
possible. At this point, a legal issue arises. The law may not necessarily always allow
privacy (Allen et al., 2011). In such a circumstance, national regulation states the
researcher may be under legal and professional obligation to breach confidentiality and
disclose information to the appropriate authorities. It may be apparent that emergency
action should be taken to safeguard and promote the welfare of a child, in the form of
calling the police which will most likely lead to a strategy discussion between the
police, local authority children’ social services and other agencies as appropriate. In
some cases, it may be necessary to ensure either that the child remains in a safe place
or that the child is removed to a safe place, either on a voluntary basis or by obtaining
an Emergency Protection Order.
6.8 PLEASE PROVIDE DETAILS OF ANY DIETARY SUPPLEMENTATION (DELETE IF NOT
APPLICABLE)
N/A
7. LOCATION OF THE PREMISES WHERE THE RESEARCH WILL BE CONDUCTED.
- list the location(s) where the data collection and analysis will be carried out
- identify the person who will be present to supervise the research at that location
- If a first aider is relevant, please specify the first aider
301
Parents/guardians that agree to participate in the study will be invited to decide upon a
suitable time for the researcher and another member of the study team to make the
home visit to complete the audit and CHAT.
8. POTENTIAL PARTICIPANT RISKS AND DISCOMFORTS
- identify any potential physical risk or discomfort that participants might experience as a result
of participation in the study.
- identify any potential psychological risk or discomfort that participants might experience as a
result of participation in the study.
- Identify the referral process/care pathway if any untoward events occur
The only burden we predict as a result of participating in this study is the time taken to
participate in the tour and complete the CHAT.
9.1 HOW WILL INFORMED CONSENT BE SOUGHT?
Will any organisations be used to access the sample population?
Will parental/coach/teacher consent be required? If so, please specify which and how this will be
obtained and recorded?
Participants will be recruited to the HomeSPACE study via advertising through a
variety of channels as required. Channels will include schools, the Swan-Linx physical
activity programme, and the university intranet and sport and recreation clubs in South
Wales. Firstly, in order to access participants I will need to request approval from the
head teachers of the schools and the head coaches of the clubs to explain the study and
to give out packs in envelopes to the children to hand over to their parents enquiring
about their potential contribution to the study. Additionally the lead researcher will
offer to meet parents/guardians at the schools or club sessions to explain the study if
required. If the parent/guardian is happy to proceed a pack (including participant
consent and assent forms) will be given in person or sent via email. Indeed, the
parent/guardian will be required to provide their active written consent as well as
consent for their child before commencing the home tour and will be provided with the
option to withdraw at that point. Additionally, the children will provide their own assent
to participate. In addition to receiving the participant information sheet, consent form
and assent form prior to the home visit, parents/guardians will be reminded by the
researcher on arrival about the study and what to expect as a participant. Although it
is not necessary to obtain written informed consent from all family members the parents
should seek their verbal permission to allow the researcher to enter their home.
302
9.2 INFORMATION SHEETS AND CONSENT/ASSENT FORMS
• Have you included a Participant Information Sheet for the participants of the
study? YES
• Have you included a Parental/Guardian Information Sheet for the
parents/guardians of the study? YES
• Have you included a Participant Consent (or Assent) Form for the participants of
the study? YES
• Have you included a Parental/guardian Consent Form for the participants of the
study? YES
10. IF YOUR PROPOSED RESEARCH IS WITH VULNERABLE POPULATIONS (E.G.
CHILDREN, PEOPLE WITH A DISABILITY), HAS AN UP-TO-DATE DISCLOSURE AND
BARRING SERVICE (DBS) CEHCK (PREVIOUSLY CRB) IF UK, OR EQUIVALENT NON-UK,
CLEARANCE BEEN REQUESTED AND/OR OBTAINED FOR ALL RESEARCHERS?
EVIDENCE OF THIS WILL BE REQUIRED.
DBS checked, certificate number:001468440434
303
11. STUDENT DECLARATION
Please read the following declarations carefully and provide details below of any ways in which your
project deviates from these. Having done this, each student listed in section 2 is required to sign
where indicated.
• “I have ensured that there will be no active deception of participants.
• I have ensured that no data will be personally identifiable.
• I have ensured that no participant should suffer any undue physical or psychological discomfort (unless specified and justified in methodology).
• I certify that there will be no administration of potentially harmful drugs, medicines or foodstuffs.
• I will obtain written permission from an appropriate authority before recruiting members of any outside institution as participants.
• I certify that the participants will not experience any potentially unpleasant stimulation or deprivation.
• I certify that any ethical considerations raised by this proposal have been discussed in detail with my supervisor.
• I certify that the above statements are true with the following exception(s):”
Student/Researcher signature: (include a signature for each student in research team)
Date:
12. SUPERVISOR’S APPROVAL
Supervisor’s signature:
Date:
304
Applied Sports Technology Exercise and Medicine Research Centre (A-
STEM)
Sport and Health Portfolio, College of Engineering
CHILD INFORMATION SHEET
(04/10/2015)
Project Title:
HomeSPACE study
Contact Details:
Michael Sheldrick-Email:7
Professor Gareth Stratton- Email:
Office Telephone:
Luke Martin-Email:
Invitation Paragraph
We would like to learn more about your home and how it may affect the amount of time
you spend sitting and in physical activity. You are invited to take part in the HomeSPACE
study led by Swansea University.
What is the purpose of the study?
Our aim is look at how the physical home space affects the amount of time you spend
sitting and in physical activity.
3. Why have I been chosen?
You and your family have been invited to take part in the HomeSPACE study, because
you are between the ages of 10 to 12 years. If you feel like you would like to stop at any
time just let us know no one will be upset or cross.
4. What will happen to me if I take part?
After one of your parents and the researcher having taken a tour of your house you will
be asked to complete an online questionnaire called the Child Health and Activity Tool
(CHAT) on a laptop provided by us unless you would like to use your own. The CHAT
will ask you to record detailed information on the type of activities and sports you get up
to, which will help us better understand the time you spend sitting and in activity. The
CHAT will take you about 15 minutes to complete.
305
5. What are the possible disadvantages of taking part?
The only downside in taking part in this study is the time it takes
6. What are the possible benefits of taking part?
Some children spend a lot of time at home and spend most of it watching TV or playing
video games and not much time doing physical activity. Too much time spent sitting
particularly doing these things can lead to overweight and obesity, reduced fitness and
other problems, but physical activity is good for you and can be fun at the same time.
Taking part in this study will help us to understand how the physical home space may
affect the amount of time you spend sitting, in physical activity and your health.
7. Will my taking part in the study be kept confidential?
Your name and the information you give us will be kept a secret – only the people who
are doing the research will be able to see this information. 8. What if I have any questions?
If you have any questions with the project ask your parents to get in contact with me or
another member of the research team (see contact details above) and I’ll be happy to
answer any of them.
If you are currently dealing with any issues which are causing you distress (e.g. abuse,
neglect etc.), please don’t hesitate to call Childline at: 0800 1111, a free 24 hour
counseling service for children which may be able to help.
306
Applied Sports Technology Exercise and Medicine Research Centre (A-STEM)
Sport and Health Portfolio, College of Engineering
PARENT INFORMATION SHEET
(04/10/2015)
Project Title:
HomeSPACE study
Contact Details:
Michael Sheldrick -Email:
Professor Gareth Stratton -Email:
Office Telephone:
Luke Martin-Email
1. Invitation Paragraph
We would like to learn more about your home and how it may affect the amount of time
your child spends sitting and in physical activity. Your family is invited to take part in
the HomeSPACE study led by Swansea University. The study has already been done in
Australian homes but now needs to be tried out in the UK.
2. What is the purpose of the study?
Our aim is look at how the physical home space affects children’s (aged 10-12 years)
activity and time spent sitting. Another aim of this study is to test and develop a home
audit tool that has already been used in Australian homes to measure factors of the
physical home space that may influence children’s time spent sitting and in physical
activity. The information we collect will be used in a student’s project and will help
impact future home and planning design to reduce time spent sitting and to help promote
healthy active living in families.
3. Why have I been chosen?
You and your family have been invited to take part in the HomeSPACE study, because
at least one of your children is aged 10 to 12 years and goes to primary school. During
the study if either you or anyone else in your family does not feel comfortable with
anything you can stop at anytime without fear of penalty.
307
4. What will happen to me if I take part?
You will be asked to give a good time for the main researcher and another colleague to
come to your home. To start with they will ask you to answer some questions about you
and your family (for example gender; age; postcode; education; number, age and gender
of children). They will then ask you to complete the audit tool by walking around your
house and garden and answering the items on the tool. The researcher will follow you
and complete the same audit tool at the same time. It is up to you as to where you go in
your home and you can avoid any places or questions from the tool. The audit tool is a
checklist which will include questions about house and garden size, space and design,
and physical activity and media equipment. There will also be some questions about you
and your family’s preferences for housing and activities at home. The audit tool will take
about 30 minutes to complete. After you and the researcher have completed the audit
tool your children will be asked to complete an online questionnaire called the Child
Health and Activity Tool (CHAT). The CHAT will ask your children to record detailed
information on the type of activities and sports they get up to, which will help us better
understand their time spent sitting and in activity. If you would like a copy of either the
audit or CHAT, just get in touch with any of the researchers via the contact details above
and they will happily send you a copy.
At the end of the home visit you will be left a second copy of the checklist which you
will be asked to complete one week later and to return in a stamp addressed envelope
provided. The time taken in this study will be about 55 minutes in total. This includes 30
minutes to complete the first checklist with the researcher during the home visit, and 25
minutes to complete the second checklist. You will be offered a free family weekend
pass for Swansea’s leisure complex (LC2), a water park and activity centre, after
returning the second checklist, to thank you for your time in taking part in this study
(subject to availability).
5. What are the possible disadvantages of taking part?
The only downside in taking part in this study is the time it takes
6. What are the possible benefits of taking part?
Since children spend a lot of time at home its space can have a large impact on the time
they spend sitting and in physical activity. At the moment the amount of time children
spend sitting using electronic devices (e.g. watching television (TV) or playing video
game) at home is on the rise. Also, children’s opportunity to play freely in their local
areas has decreased, due to worries about safety and a lack of open spaces to play. As a
result, not many children these days meet public health recommendations of at least 60
308
minutes of moderate to vigorous physical activity per day. Too much time spent on the
above devices can lead to overweight and obesity, reduced fitness and a variety of other
problems where as regular moderate to vigorous physical activity can prevent the above
as well as being important for healthy muscle and bones. Taking part in this study may
be able to increase your awareness of how your home environment may affect the amount
of time your child spends sitting and in physical activity and their health. Lastly, the
results from this study may be able to impact future UK home and planning design to
increase children’s activity.
7. Will my taking part in the study be kept confidential?
All the data collected will be kept private and confidential. Any hard copies of the home
audit and CHAT will be kept in a secure office and computer files with any personal
information will be stored on a password protected computer. The data collected will only
be available to look at by responsible individuals of the research team from Swansea
University. The data we collect may be used to impact future UK home design and
planning rules to increase children’s activity. If any unacceptable behaviours such as
physical or verbal abuse or unsafe physical environments are observed within the house
confidentiality will have to be breached. At this point we would invoke disclosure
procedures.
8. What if I have any questions?
If you have any further questions with the project please contact me or another member
of the research team (see contact details above).
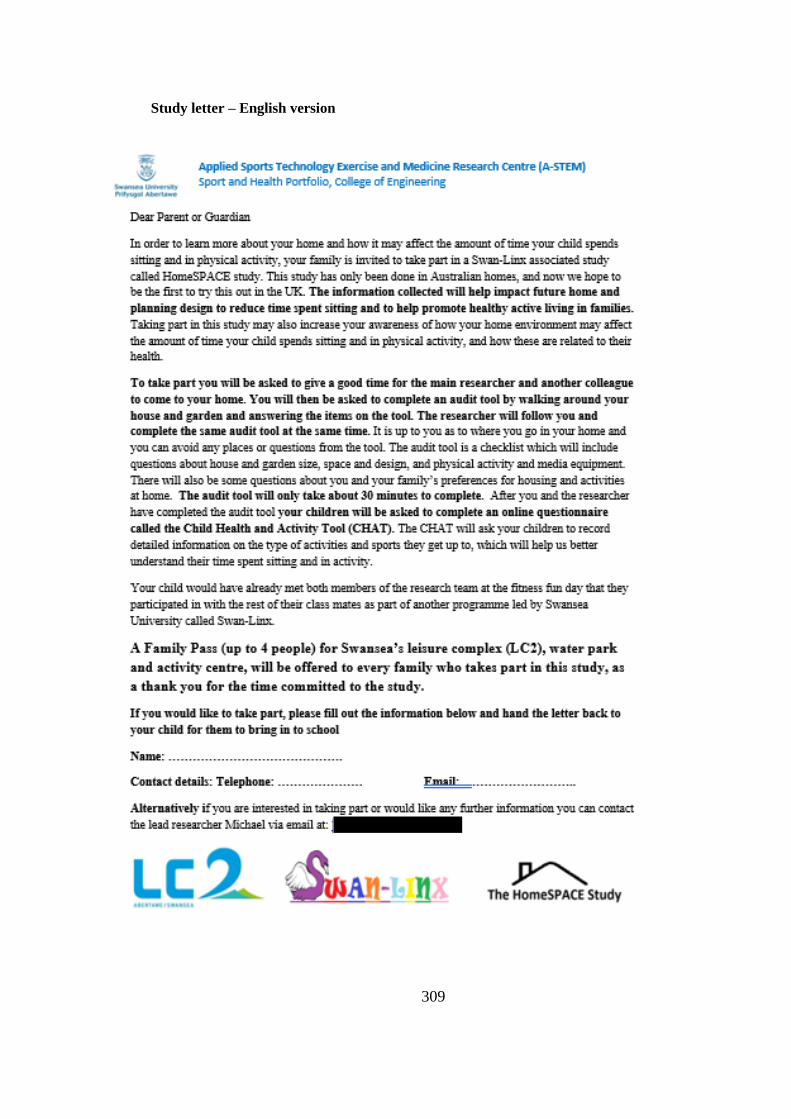
309
Study letter – English version
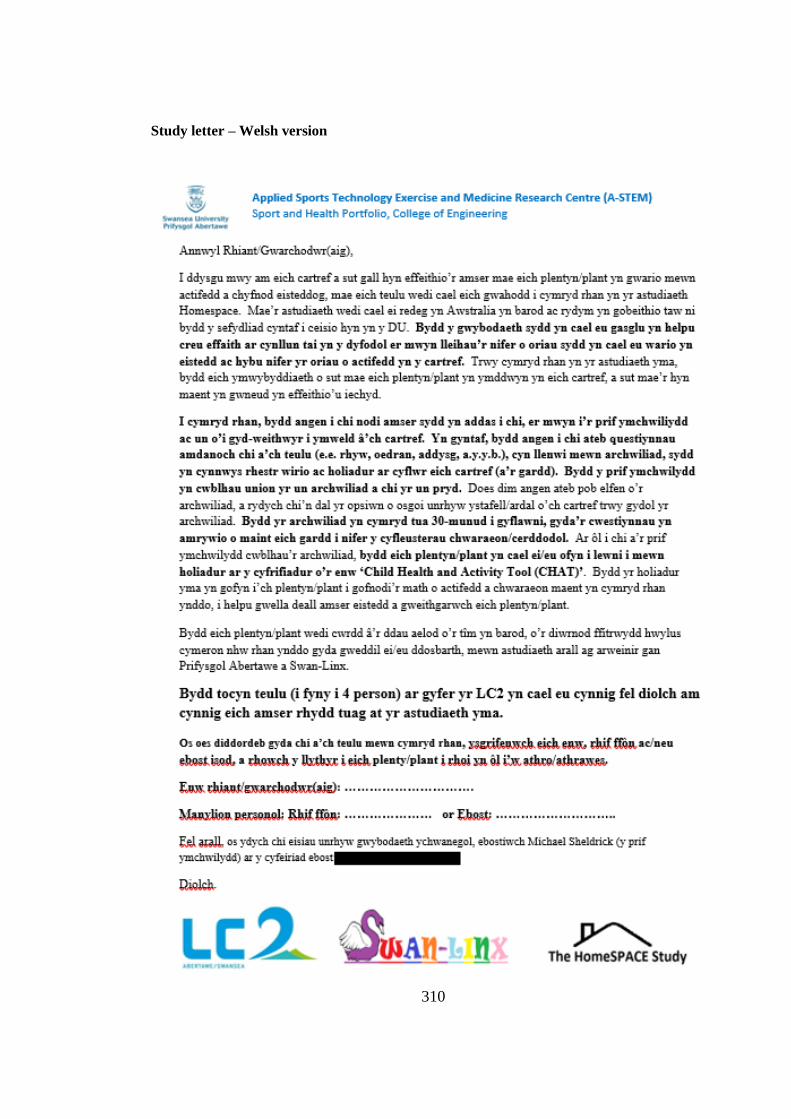
310
Study letter – Welsh version
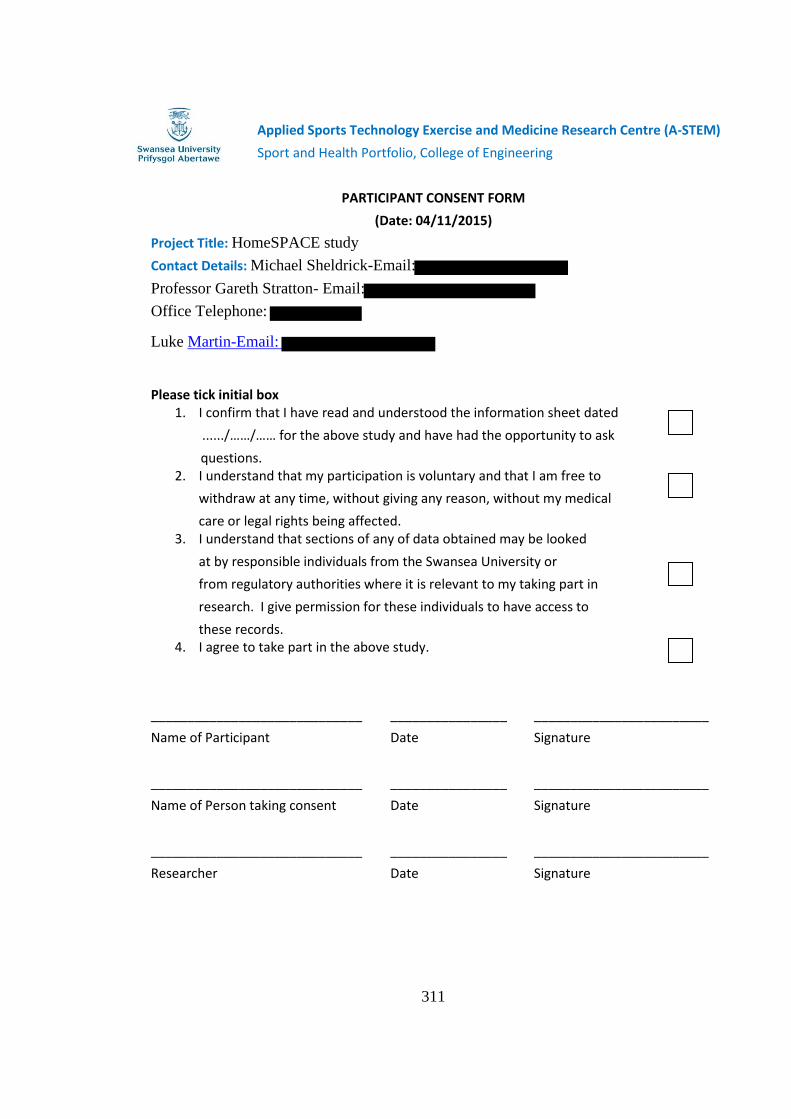
311
Applied Sports Technology Exercise and Medicine Research Centre (A-STEM)
Sport and Health Portfolio, College of Engineering
PARTICIPANT CONSENT FORM
(Date: 04/11/2015)
Project Title: HomeSPACE study
Contact Details: Michael Sheldrick-Email:
Professor Gareth Stratton- Email:
Office Telephone:
Luke Martin-Email:
Please tick initial box 1. I confirm that I have read and understood the information sheet dated
....../……/…… for the above study and have had the opportunity to ask
questions. 2. I understand that my participation is voluntary and that I am free to
withdraw at any time, without giving any reason, without my medical
care or legal rights being affected. 3. I understand that sections of any of data obtained may be looked
at by responsible individuals from the Swansea University or
from regulatory authorities where it is relevant to my taking part in
research. I give permission for these individuals to have access to
these records. 4. I agree to take part in the above study.
_____________________________ ________________ ________________________
Name of Participant Date Signature
_____________________________ ________________ ________________________
Name of Person taking consent Date Signature
_____________________________ ________________ ________________________
Researcher Date Signature

312
Applied Sports Technology Exercise and Medicine Research Centre (A-STEM)
Sport and Health Portfolio, College of Engineering
CHILD ASSENT FORM
Date: 04/11/2015
Project Title: HomeSPACE study
Contact Details: Michael Sheldrick - Email:7
Professor Gareth Stratton -Email:
Office Telephone:
Luke Martin - Email:
Please tick initial box
1. I confirm that I have read and understood the information sheet dated
....../……/…… for the above study and have had the opportunity to ask
questions. 2. I understand that my participation is voluntary and that I am free to
withdraw at any time, without giving any reason, without my medical
care or legal rights being affected. 3. I understand that sections of data obtained may be looked
at by responsible individuals from the Swansea University or
from regulatory authorities where it is relevant to my taking part in
research. I give permission for these individuals to have access to
these records. 4. I agree to take part in the above study. 5. I am happy to complete the CHAT.
If you are currently dealing with any issues which are causing you distress (e.g. neglect abuse
etc.), please don’t hesitate to call Childline at: 0800 1111, a free 24 hour counseling service for
children which may be able to help.
_____________________________ ________________ ________________________
Name of Person giving assent Date Signature
_____________________________ ________________ ________________________
Researcher Date Signature
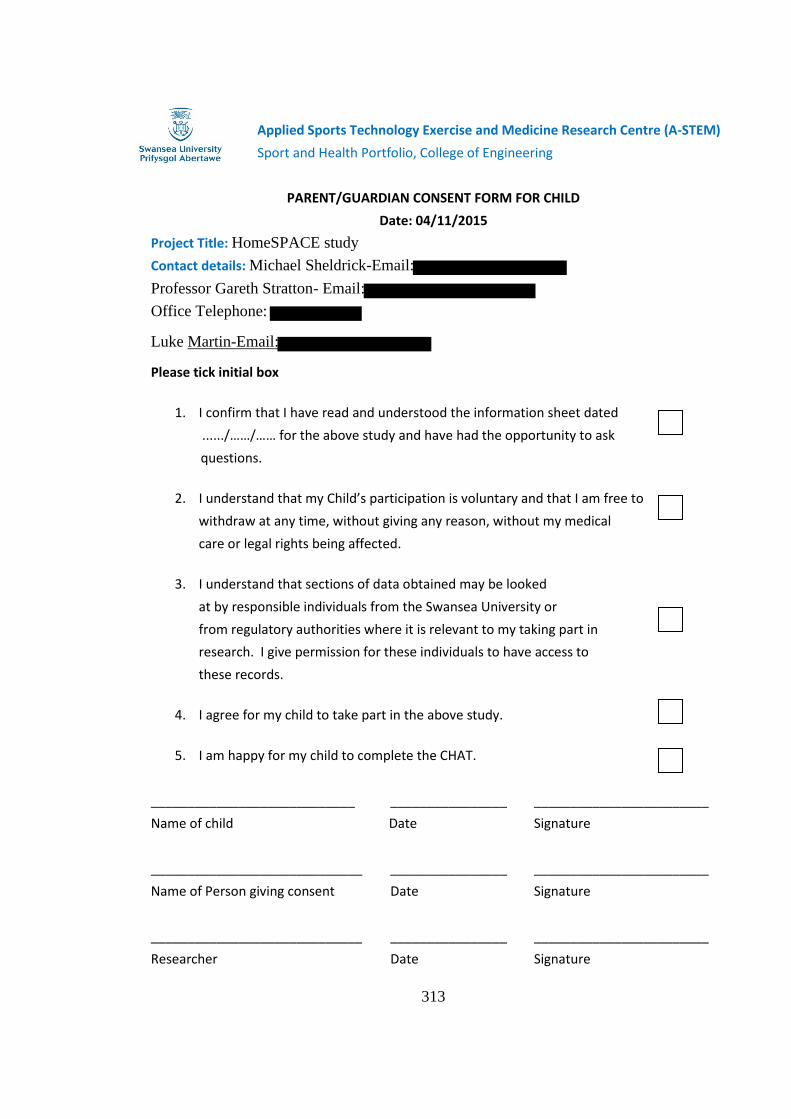
313
Applied Sports Technology Exercise and Medicine Research Centre (A-STEM)
Sport and Health Portfolio, College of Engineering
PARENT/GUARDIAN CONSENT FORM FOR CHILD
Date: 04/11/2015
Project Title: HomeSPACE study
Contact details: Michael Sheldrick-Email:
Professor Gareth Stratton- Email:
Office Telephone:
Luke Martin-Email:
Please tick initial box
1. I confirm that I have read and understood the information sheet dated
....../……/…… for the above study and have had the opportunity to ask
questions.
2. I understand that my Child’s participation is voluntary and that I am free to
withdraw at any time, without giving any reason, without my medical
care or legal rights being affected.
3. I understand that sections of data obtained may be looked
at by responsible individuals from the Swansea University or
from regulatory authorities where it is relevant to my taking part in
research. I give permission for these individuals to have access to
these records.
4. I agree for my child to take part in the above study.
5. I am happy for my child to complete the CHAT.
____________________________ ________________ ________________________
Name of child Date Signature
_____________________________ ________________ ________________________
Name of Person giving consent Date Signature
_____________________________ ________________ ________________________
Researcher Date Signature
314
HomeSPACE-UK project application for ethical approval
College of Engineering Research Ethics and Governance Committee
APPLICATION FOR ETHICAL COMMITTEE APPROVAL OF A RESEARCH PROJECT In accordance with A-STEM and College of Engineering Safety Policy, all research undertaken by staff or students linked with A-STEM must be approved by the A-STEM Ethical Committee.
RESEARCH MAY ONLY COMMENCE ONCE ETHICAL APPROVAL HAS BEEN OBTAINED The researcher(s) should complete the form in consultation with the project supervisor. After completing and signing the form students should ask their supervisor to sign it. The form should
be submitted electronically to [email protected]. Applicants will be informed of the Committee’s decision via email to the project leader/supervisor.
1. TITLE OF PROJECT
HomeSPACE project, investigating the influence of the physical environment of the
home on children’s physical activity and sedentary behaviour
2. DATE OF PROJECT COMMENCEMENT AND PROPOSED DURATION OF THE STUDY
July 2017-July 2018
3. NAMES AND STATUS OF RESEARCH TEAM State the names of all members of the research group including the supervisor(s). State the current status of the student(s) in the group i.e. Undergraduate, Postgraduate, Staff or Other (please specify).
Michael Sheldrick: PhD student researcher (DBS checked, certificate number:
001468440434)
Richard Tyler: Postgraduate Sport and Exercise science PhD student (DBS checked,
certificate number: 001464235079)
Supervisor: Professor Gareth Stratton (DBS checked). 2nd supervisor: Dr Kelly Mackintosh (DBS checked).
315
4. RATIONALE AND REFERENCES With reference to appropriate sources of information (using the Harvard system), describe in no more than 200 words the background to the proposed project.
Physical activity and sedentary behaviour have been associated with physiological and
psychosocial benefits [10] and detriments (Carson et al., 2016), respectively, in
children. Despite this, few children meet current recommendations for PA or sedentary
behaviour (Townsend et al., 2015). Given children spend significant time at home [377],
understanding these behaviours in this environment is imperative to inform behaviour
change interventions. While, there is an emerging body of evidence investigating the
influence of the home environment on children’s sedentary behaviour and PA (Maitland
et al., 2013; Kaushal & Rhodes, 2014), several gaps in the literature remain [41].
Specifically, studies have measured behaviour across the entire day (Pouliou et al.,
2014; Tandon et al., 2012). Thus, including behaviours which occur outside the home,
which may be less likely to be influenced by the home. Determining the amount of each
behaviour children accumulate while at home will improve researcher’s ability to
identify home-specific correlates of such behaviours. In addition, to date, research has
mostly been limited to Australia and the USA, and there is a paucity of European
research, and UK research specifically is lacking. Therefore, this study aims to assess
the influence of the home environment on UK children’s home specific PA and
sedentary behaviour.
5. OBJECTIVES State the objectives of the project, i.e. one or more precise statements of what the project is designed to achieve.
-To investigate the influence of the physical environment of the home on children’s
home-based sedentary behaviour and physical activity.
- To validate a set of questions, already validated for use in Australia referring to
parent’s perceptions, priorities and preferences in terms of housing and leisure activities
at home and family.
- Understand seasonal variation in the influence of the home environment on children’s
physical activity and sedentary behaviour
6.1 STUDY DESIGN
- outline the chosen study design (e.g. cross-section, longitudinal, intervention, RCT, questionnaire etc)
We will use a cross-sectional research approach, which will involve one parent/guardian
from a family, independently completing an online home audit tool, validated for use in
UK homes. In addition, the children in the family will have their height and weight
316
measured, be asked to wear 2 accelerometers for 7 days and complete a short online
questionnaire on their activity habits.
6.2 STUDY DESIGN
- state the number and characteristics of study participants - state the inclusion criteria for participants - state the exclusion criteria for participants and identify any requirements for health screening - state whether the study will involve vulnerable populations (i.e. young, elderly, clinical etc.) - state the requirements/commitments expected of the participants (e.g. time, exertion level etc)
Inclusion criteria
Eligible participants include families from South Wales with at least one child aged 9
to 13 years of any gender. We aim to recruit 215 families. We will use our contacts in
Schools, and recruit a sample of families that reflect the socio-demographics of South
Wales. WIMD (Welsh Index of Multiple Deprivation) scores will be used as an
indicator of SES.
Expected requirements of participants
All participants will receive a participant information sheet prior to the study
commencing.
Child participants (age 9-13 years) will be asked to wear a ActiGraph accelerometer
upon awaking for 7 days and an ActivPAL at all times for 7 days and complete a self-
report questionnaire on their activity habits and have their height and weight measured
for BMI Z-score calculations.
Parents will be asked to complete an online audit of their home and record when the
children are at home, using a logbook provided by the research team.
Continuous periods of non-wear time will be recorded by the children, stating the time
of removal, and duration when completing water based activities or contact sports (see
appendices).
Participants will be given a sleep log to record bed time and wake time for each day.
Participants will be expected to wear the devices for 5 week days and two weekend
days.
After the observation period is completed, the children will be asked to bring the
equipment back into school for the researcher to collect.
6.3 PARTICIPANT RECRUITMENT
How and from where will participants be recruited?
There will be a multi-channel approach to recruitment. We currently run a successful
Swan-linx programme, where over 30 schools take part each year and we will work
alongside these schools to recruit participants. Schools, socio-demographically
representative of South Wales will be approached for recruitment, to best ensure
participating families reflect the typical socio-demographics of South Wales. We will
also use the HAPPEN primary schools network, as well as previous families who took
part in the HomeSPACE project. Further, we will advertise across the University using
317
the intranet and work alongside the City and County of Swansea and Bridgend Borough
Council to recruit using their sport, play and community networks.
Step 1:
In step 1 of recruitment, the lead researcher will request approval from the head
teachers, head coaches or community leads to make a visit to pitch for participants to
both explain the study and give out packs in envelopes containing participant
information. Interested parents will be asked to write down their name and preferred
contact details in the space provided on the study letters, and to then return them to their
respective community leader, sports coach or teacher. Both a welsh and English
language version of the study letter will be provided, printed on each side of the paper.
Step 2:
The researcher will contact interested families via email or phone. Families who agree
to take part will receive participant information sheets, at which point a time for the
researcher to meet the children in school to hand over the equipment will be agreed.
Step 3:
The lead researcher will offer to meet parents/guardians at the school or sport sessions
to explain study process and procedures if necessary. Providing the parent/guardian and
the child is happy to proceed, the child is given a pack (including participant consent
and assent forms) in school for them take home. Once the forms are completed, the
child will be asked to return them to their teacher, ready for the researcher to collect.
Augmenting recruitment:
If required, snowball recruitment methods will be used to augment recruitment. In this
case, existing study participants will be asked to inform other potential participants of
the study, who can then contact the study team directly to sign up or for further
information. Previous participants of the HomeSPACE project will also be contacted
directly via email enquiring about their further participation in the project. Given these
families have built up some rapport with the researcher, they may feel obliged to
participate, however they will be reminded that participation is entirely voluntary and
the researcher will not be hurt if they decide not to take part.
We have had experience in recruiting participants via the above steps, successfully
recruiting 31 families for a previous study of the HomeSPACE project (see REC
approval; PG/2014/34).
Four waves of recruitment will occur over a 1-year period, during each of the four
seasons, to account for seasonal variation in weather and children’s behaviour. In
addition, efforts will be made to ensure assessments are evenly distributed across the
year. Each participating family will get entered into a prize draw, where 5 families
during each of the 4 waves of recruitment will be given a free family pass for one of the
following; Limitless or GoAir, Trampoline parks in Swansea and Cardiff, respectively;
Jump, an indoor play area in Cardiff or entry for an Ospreys rugby match. The specific
prizes given to each family will depend on where they live and their preferences, subject
to availability. The aim of this is to provide an incentive for families to participate.
6.4 DATA COLLECTION METHODS
318
- describe all of the data collection/experimental procedures to be undertaken - state any dietary supplementation that will be given to participants and provide full details in Section 6.5 - state the inclusion of participant information and consent forms (in appendices) - refer to the use of the ACA/ACSM health screening questionnaire where appropriate (usually for maximal effort exercise)
Experimental procedures
Prior to beginning the study, all participants and parents/guardians will be provided with
information sheets, and will have the study clearly explained to them. They will be told
that participation is entirely voluntary and they can withdraw at any point. Written
informed assent for those aged below 16 years and written informed consent for those
aged 16 years and above will be obtained from all participants, and parents (see
appendices).
Each participant will be given a specific ID number which will be used throughout the
study. Devices will be given to the participants by the researcher in school. If possible,
the researcher will make the school visit on the day they are expected to wear them. The
ActivPAL device will be worn at all times and ActiGraph accelerometer will be worn
throughout each day but removed at night. The lead researcher, parent and the school
will need to agree on a suitable time for the visit.
UK HomeSPACE audit tool
Upon agreeing to take part in the study, families will be sent an online version of the
UK HomeSPACE instrument, which has already been assessed for its feasibility for use
by parents with a convenience sample of 4. The audit tool is the first section of the
instrument, and parents will be instructed to complete it independently, while walking
through each room/area in their home. The audit section is a checklist which includes
questions about house and garden size, space and design, and physical activity and
media equipment. The audit tool should take approximately 25 minutes to complete.
However, this will depend on the size of the home and the number of items present. The
participant will be informed of the procedures regarding the home visit in the participant
information sheet prior to agreeing to contribute. After which, the parent will be asked
to complete an online questionnaire about their perceptions, preferences and priority’s
in terms of housing and leisure activities at home and family, as well as questions on
the family’s shared perceptions and thoughts concerning PA from the validated family
health climate PA scale (Niermann et al., 2014). Participants will also be asked to
provide some demographic background information (e.g. age; gender; postcode;
income; education; number, age and sex of children), necessary as such information
will help describe the sample, serve as independent variables in a statistical model, and
319
allow us to draw comparisons between groups. The online questionnaire can be
completed anywhere within the home. Parents will be able to complete the instrument
on a portable electronic device of their choice, but a laptop or a tablet will be
recommended, as the instrument fits on these devices better, due to their larger screen
size. Having a suitable device of their own would be required to take part in this study.
On average, both the audit tool and questionnaire will take around 40 minutes to
complete. A small portion of the (n=50) participants will be reminded to complete the
questions again, 1 week later via email, taking them approximately 15 minutes to
complete. This will allow us to assess the questions for test-retest reliability.
Self-report questionnaire to assess types of physical activity and sedentary
behaviour occurring at home
Due to the difficulty in assessing the type of behaviour being performed objectively
(Atkins et al., 2012), the type of behaviour will be assessed via an online questionnaire
in the presence of the researcher in school. It will be completed on a laptop or tablet
provided by the researcher. The researcher will be careful in how they deliver the
questionnaire and how they respond to questions to reduce bias. We wish to explore the
influence of the home environment on specific types of both sedentary and active
behaviours. They will be asked how many hours on a school day and weekend day in
the previous week they engaged in each of the following activities; TV viewing, using
a Tablet/Smart phone/Portable gaming device, using a computer/playing on a games
console for fun, using the computer for doing homework, doing homework without a
computer, reading for fun, doing crafts or hobbies sitting, active play indoors, active
play outdoors or playing/practicing a musical instrument. They can choose from seven
options, coded as: I did not watch TV on school/ weekend days (0); <1 h (0.5); 1 h (1);
2 h (2); 3 h (3); 4 h (4); 5 h or more (5). The options were taken from the US Youth
Risk Behavior surveillance system (U.S. Centers for Disease Control and Prevention et
al., 2016), deemed valid and reliable for measuring TV and computer use (Schmitz et
al., 2004), and are a popular choice for studies assessing screen-time (Wilkie et al.,
2016; LeBlanc et al., 2015; Vinas et al., 2016). The questions were taken from the valid
and reliable Adolescent Sedentary Activity Questionnaire (Hardy et al., 2007), but
adapted slightly for use with children. We have adapted the questionnaire by choosing
to assess discretionary video/computer game and use of a computer, with separate
questions for portable and fixed media. This will allow us to differentiate between fixed
and portable media, helping improve our ability to identify correlates of specific types
of screen-time. In addition, the questionnaire covers modern day types of screen-time
(I.e., smart phones and tablets), important given screen-time is constantly changing due
to technological advances. Moreover, the questions are fixed response, providing
320
guidance, and therefore questions may appear less daunting to a child (Harris et al.,
2006) and we’ve exclusively included home-based activities, popular among children,
as we are interested mainly interested in children’s home-based activity. For this study,
“Home” includes just one single location for each participant, covering the house, and
both the front and back garden of the main care giver (I.e., the parent who completed
the home audit), therefore homes of other parent/guardians, relatives, friends or
neighbours are excluded.
ActiGraph GT3X + BT and GT9X link devices for measurement of sedentary
behaviour and physical activity
We will be using ActiGraph GT3X + BT and GT9X link devices for measuring
moderate-vigorous-physical activity (MVPA). The ActiGraph acceleromters will be
worn by the child on their right hip and will be initialised to collect proximity data at
10s intervals and raw acceleration at 100 hz. The participants will be instructed to
remove the receivers overnight and place them on charge so they are ready to be
reattached when they woke up in the morning. The same type of ActiGraph device will
be used throughout to assess activity, to avoid any potential differences in measurement
between types of devices.
Determining the amount of physical activity and sedentary behaviour that
children engage in while at home
Previous studies investigating the influence of the home environment on physical
activity and sedentary behaviour have measured behavious across the entire day
(Pouliou et al., 2014; Tandon et al., 2012). Indeed, this includes time spent in behaviours
which occur outside the home, such as at school which may be less likely to be
influenced by the home environment. This may, in part, explain the inconsistent
findings in the literature to date (Maitland et al., 2013). Therefore, quantifying the
amount of sedentary behaviour and physical activity that children accumulate while at
home will advance the literature and allow us to identify home-specific correlates of
such behaviours. In order to do this, we will ask parents to complete a log, recording
when the children enter and leave the home, and time-stamped accelerometer data will
be matched to this log (Kneeshaw-Price et al., 2013). Parent’s will get sent 3 reminders
per day by text to do this. Once in the morning, afternoon and evening.
The ActivPAL device
321
The ActivPAL will be attached to the mid-thigh of participants by the researcher, in the
presence of a teacher, using hypoallergenic fixing tape. This instrument continuously
tracks sitting, standing, stepping and is considered the gold standard for detecting
sedentary behaviour [473].
Anthropometric measures
Children will have their stature measured to the nearest 0.001m using a portable
stadiometer and weight measured to the nearest 0.1 kg using portable electronic
weighing scales, during a break or lunchtime with just a teacher and the researcher
present. For both measures, the children will be asked to remove all but minimal
clothing (i.e. underclothes). In consideration of the school environment, rather than ask
the children to remove all but minimal clothing, we will just ask for as much clothing
as possible to be removed, particularly footwear and outerwear. Body Mass Index
(BMI), can be calculated from stature and weight, and BMI Z-scores derived using the
British 1990 growth reference standard [340]. As there is consistent evidence to suggest
a relationship between a child’s BMI and the amount of sedentary behaviour (Carson et
al., 2016) and PA (Poitras et al., 2016) they engage in, the children’s BMI could be an
important covariate in the analysis.
6.5 DATA ANALYSIS TECHNIQUES - describe the techniques that will be used to analyse the data
The sample size necessary to find the expect effect was estimated to be n=181 using a
valid and reliable online calculator for multiple regression analysis (Soper, 2017), given
the lowest effect size of desired interest (medium effect size = F2=0.15; Cohens, 1988),
the number of independent variables in the statistical analysis model (28), the minimum
level of robust power (1–β=0.80; Cohens, 1988; Noordzij et al., 2010) and the level of
significance (P=0.5; Gogtav et al.,2010; Noordzij et al.,2010). To allow for the
possibility of missing data (I.e. invalid accelerometer data or drop outs), a total of 215
families will be recruited (+18.79%), decided upon through reviewing the literature for
the average amount of missing data in similar studies.
All data will be stored and handled in Microsoft Excel. Data will be transferred and
analysed in IBM SPSS statistics 22 (IBM SPSS Statistics Inc., Chicago, IL, USA).
HomeSPACE audit tool and type of behaviour questionnaire data
322
The audit tool and activity habit questionnaire responses will be sent to a password
protected email account in an encrypted password protected PDF file. These data will
be exported into SPSS for inferential analysis. Descriptive statistics will be calculated
to describe the characteristics of the sample. In addition to the scores which will be
calculated for each type of screen-time, an overall screen-time score will be computed
by summing the TV, games console/computer and tablet/phone/gaming device score,
calculated using weighted averages to account for school and weekend screen-time. A
weighted mean score of hours of daily screen-time will be calculated as follows: [(hours
of TV on weekdays x 5) + (hours of TV on weekend days x 2) + (hours of game
console/computer on weekdays x 5) + (hours of game console/computer on weekend
days x 2) + (hours of tablet/phone/portable gaming device on weekdays x 5) + (hours of
tablet/phone/portable gaming device on weekend days x 2)]/7. During analysis, this will
be presented as a screen-time score, as opposed to total hours spent in screen-time since
after 5 hours/day, we cannot quantify the child’s actual amount of screen-time. In
addition, children who regularly engage in two types of screen-time simultaneously,
may over-report total hours spent in screen-time.
ActiGraph GTX1+BT, GT9X link+BT, GT3X+BT wActisleeps and ActivPAL
devices
Upon downloading data from both the and ActivPAL and ActiGraph devices, files will
be processed using the ActiGraph (ActiLife v 6.11.5) and ActivPAL (v 5.9.1.1)
software. The ActivPAL data will be pre-classified (I.e. sitting, standing and stepping),
while ActiGraph data intensity will be classified using age specific cut points by Trost
et al., (2011), suitable for children aged 5-15 years. By matching the timestamp from
the ActiGraph and ActivPAL devices with when the child is recorded to be at home, we
will be able to infer the amount of sedentary behaviour and physical activity children
accumulate while at home. Data will be exported into a Microsoft Excel where it will
be handled and transferred to SPSS statistics.
Analysis
A mixed model regression will be used to determine the amount of each behaviour
(Screen-time, Sed, LPA, MVPA and VPA) children accumulate while at home. We will
use location logbook, ActiGraph and ActivPAL accelerometer derived variables to
determine, where, when and for how long children are active or sedentary while in their
home. Separate multilevel regression models will be used to determine the influence of
specific elements of the home (e.g., a TV in a bedroom, electronic media density,
presence of a garden) on children’s PA, screen-time, specific types of behaviour and
323
overall sedentary behaviour. Significant predictors of the home will be placed in the one
model to determine the relative significance of the home environment on children’s
behaviour. Analyses will adjust for sociodemographic factors (e.g., child age and sex,
time spent at home and parent socioeconomic status).
Statistical analysis for validation of the families preferences, priorities and
perceptions questions in terms of housing and activity
Firstly, to ensure that the data is suitable for exploratory factor analysis (EFA), the
following checks will be made (Yong and Sean Pearce, 2013) ; case to variable ratio,
there must be at least 5 cases per variable; a correlation matrix will be conducted to
assess correlations between individual variables, where correlation coefficients should
be above 0.30; Kaiser-Meyer-Olkin (KMO) measure of sampling adequacy test will be
used, where values should be above 0.6 as recommended (Hair et al., 2006); and
Bartlett’s Test of Sphericity will be conducted, where the test should be significant
(p<0.05). Providing all these conditions are met, and the sample size is at least 100, as
recommended (Gorsuch, 1983); (Kline, 1979), EFA will be conducted using principal
component analysis (PCA) with oblique rotation on six sets of items: 1) Child activity
preferences at Home; 2) Parent Activity Preferences at Home; 3) Importance of
Children’s Activity at Home; 4) Importance Home Features; 5) Importance of Home
Equipment; 6) Supportiveness of Home Space for Activity.
Internal consistency of each factor will be assessed using Cronbach’s Alpha with >0.70
considered suitable for exploratory research (Tavakol and Dennick, 2011). Items with
values below this, will be removed to improve internal consistency.
The questionnaire section of the instruments completed by a portion of the participants
at time 1 and 2 (1 week later) will be analysed for descriptive statistics, where each scale
and sub-scale will be summed. Test-retest reliability of the questions will be assessed
by comparing the responses from time 1 with time 2, using the interaclass correlation
coefficient (ICC, 95% confidence intervals) and spearman rank correlation tests for the
continuous and categorical variables respectively. The mean differences between the
questionnaire responses at time 1 and 2 will be identified using the chi-squared test and
independent t-test for the categorical and continuous variables respectively.
6.6 STORAGE AND DISPOSAL OF DATA AND SAMPLES describe the procedures to be undertaken for the storage and disposal of data and samples - identify the people who will have the responsibility for the storage and disposal of data and samples
324
- Identify the people who will have access to the data and samples - state the period for which the data will be retained on study completion (normally 5 years, or end of award)
All the data collected will be kept private and confidential. Any hard copies of the
consent/assent forms will be kept securely, in the project supervisor’s office. The
accelerometer data and any additional personal information will be stored on a
password protected computer for up to 5 years until they are eventually destroyed
by the lead researcher. Responses from the audit tool, and both questionnaires will
be sent to a password protected email account in an encrypted password protected
pdf file where the data will be stored. Data will then be downloaded for subsequent
analysis.
6.7 HOW DO YOU PROPOSE TO ENSURE PARTICIPANT CONFIDENTIALITY AND ANONYMITY?
After data collection, the researcher will remove identifiers in the data set to protect
confidential information. Such information will be stored somewhere else, in separate,
protected files. In the clean data set, each participant will be identified by their ID
numbers and full addresses will be replaced with postcodes. If any unacceptable
behaviours are observed during the school visit, the law may not necessarily always
allow privacy (Allen et al., 2011). In such circumstances, national regulation states
the researcher may be under legal and professional obligation to breach confidentiality
and disclose information to the appropriate authorities. At this point we will disclose
this information and seek appropriate action from the chair of the REC.
6.8 PLEASE PROVIDE DETAILS OF ANY DIETARY SUPPLEMENTATION (DELETE IF NOT APPLICABLE)
(a) State the full name of the supplement to be used in the study, including proprietary names under which it is also known
(b) Provide full details of the manufacturer and source of origin of the supplement that will be used
(c) Provide details of the composition of the supplement, including details of any potentially active ingredients
(d) State the quantity & frequency (dosage) of supplement administration (e) State the method/route of supplement administration (e.g. oral) (f) State the time of supplement administration relative to any form of physical exercise that
participants will be asked to undertake as part of the proposed study (g) State the desired (or hypothesised) effects of the supplement in the context of the proposed
study (h) Provide, with references, a list of known contraindications (i.e. conditions or factors that
increases the risk involved in using the supplement) that have been associated with the supplement during resting and exercise indications
(i) Provide, with references, a list of possible side effects (i.e. adverse or unintended, and undesirable, consequences of using the supplement) that might occur after administration of the supplement, during resting and exercise conditions
325
7. LOCATION OF THE PREMISES WHERE THE RESEARCH WILL BE CONDUCTED. - list the location(s) where the data collection and analysis will be carried out - identify the person who will be present to supervise the research at that location - If a first aider is relevant, please specify the first aider
Parents, schools and the researcher will have to agree upon a suitable time for the
researcher to make the school visit to attach the ActiGraph accelerometer and
ActivPAL devices to the children, measure their height and weight, supervise the
children while they complete the questionnaire on their home-based activity habits
and retrieve the assent and consent forms. The ActiGraph will be taken off during
contact sports, showering or bathing and at night for charging, ready for the next
day. The researcher will return to the school one week later to retrieve all the
equipment and pick up the location logbook. The researcher is DBS checked.
8. POTENTIAL PARTICIPANT RISKS AND DISCOMFORTS - identify any potential physical risk or discomfort that participants might experience as a result of participation in the study. - identify any potential psychological risk or discomfort that participants might experience as a result of participation in the study. - Identify the referral process/care pathway if any untoward events occur
The time taken by the participants to complete the HomeSPACE instrument may be a
burden.
Wearing both the ActiGraph and ActivPAL may be perceived as burdensome by the
child. In addition, the ActivPAL may cause skin irritation as it will be attached to the
child’s leg using a hypoallergenic fixing tape, however in general the device is
unobtrusive and user-friendly (Scott, Strath and Pfeiffer, 2013). If skin irritation occurs
under the ActivPAL, the participant will be instructed to remove it, rinse the area with
cold water and attach to it to the other leg, they may need to ask an adult to help. If the
irritation continues, they should remove it and let their parent know and they can contact
the researcher. The participant will be given 4 dressings for re-attachment in case skin
irritation occurs and 4 alcohol wipes to help with attachment and removal of the
dressing.
9.1 HOW WILL INFORMED CONSENT BE SOUGHT? Will any organisations be used to access the sample population? Will parental/coach/teacher consent be required? If so, please specify which and how this will be obtained and recorded?
Participants will be recruited through the following channels; Schools, the Swansea and
Cardiff Swan-Linx programme, the HAPPEN primary schools network, the city and
county of Swansea, Bridgend Borough Council, as well as the university intranet and
sport and recreation clubs across South Wales.
Firstly, to recruit the lead researcher will request approval from the head teachers, head
326
coaches or community leads to both pitch for participants and meet with the children to
attach the wearable devices. Information packs, including participant information will
be placed in envelopes for children to take home. Interested parents will be contacted,
where a suitable time for the researcher to meet the children in school will be agreed. A
pack containing consent and assent forms will be given to these children to take home
with them. Once completed and returned to their teacher, the researcher will make
another visit to the school to pick up the forms and attach the wearable devices.
9.2 INFORMATION SHEETS AND CONSENT/ASSENT FORMS
Have you included a Participant Information Sheet for the participants of the
study? YES/NO
Have you included a Parental/Guardian Information Sheet for the
parents/guardians of the study? YES/NO
Have you included a Participant Consent (or Assent) Form for the participants of
the study? YES/NO
Have you included a Parental/guardian Consent Form for the participants of the
study? YES/NO
10. IF YOUR PROPOSED RESEARCH IS WITH VULNERABLE POPULATIONS (E.G. CHILDREN, PEOPLE WITH A DISABILITY), HAS AN UP-TO-DATE DISCLOSURE AND BARRING SERVICE (DBS) CEHCK (PREVIOUSLY CRB) IF UK, OR EQUIVALENT NON-UK, CLEARANCE BEEN REQUESTED AND/OR OBTAINED FOR ALL RESEARCHERS? EVIDENCE OF THIS WILL BE REQUIRED.
11. STUDENT DECLARATION Please read the following declarations carefully and provide details below of any ways in which your project deviates from these. Having done this, each student listed in section 2 is required to sign where indicated.
“I have ensured that there will be no active deception of participants.
I have ensured that no data will be personally identifiable.
I have ensured that no participant should suffer any undue physical or psychological discomfort (unless specified and justified in methodology).
I certify that there will be no administration of potentially harmful drugs, medicines or foodstuffs.
I will obtain written permission from an appropriate authority before recruiting
327
members of any outside institution as participants.
I certify that the participants will not experience any potentially unpleasant stimulation or deprivation.
I certify that any ethical considerations raised by this proposal have been discussed in detail with my supervisor.
I certify that the above statements are true with the following exception(s):” Student/Researcher signature: (include a signature for each student in research team) Date: 12. SUPERVISOR’S APPROVAL
Supervisor’s signature: Date:

328
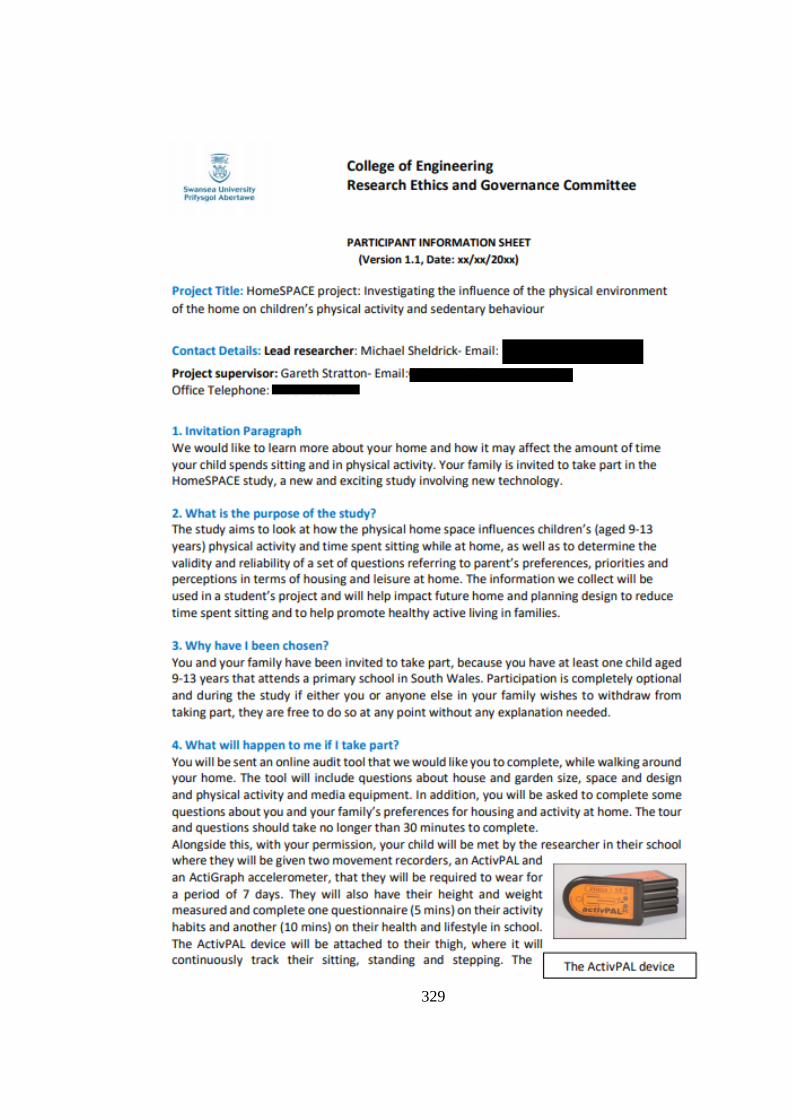
329

330
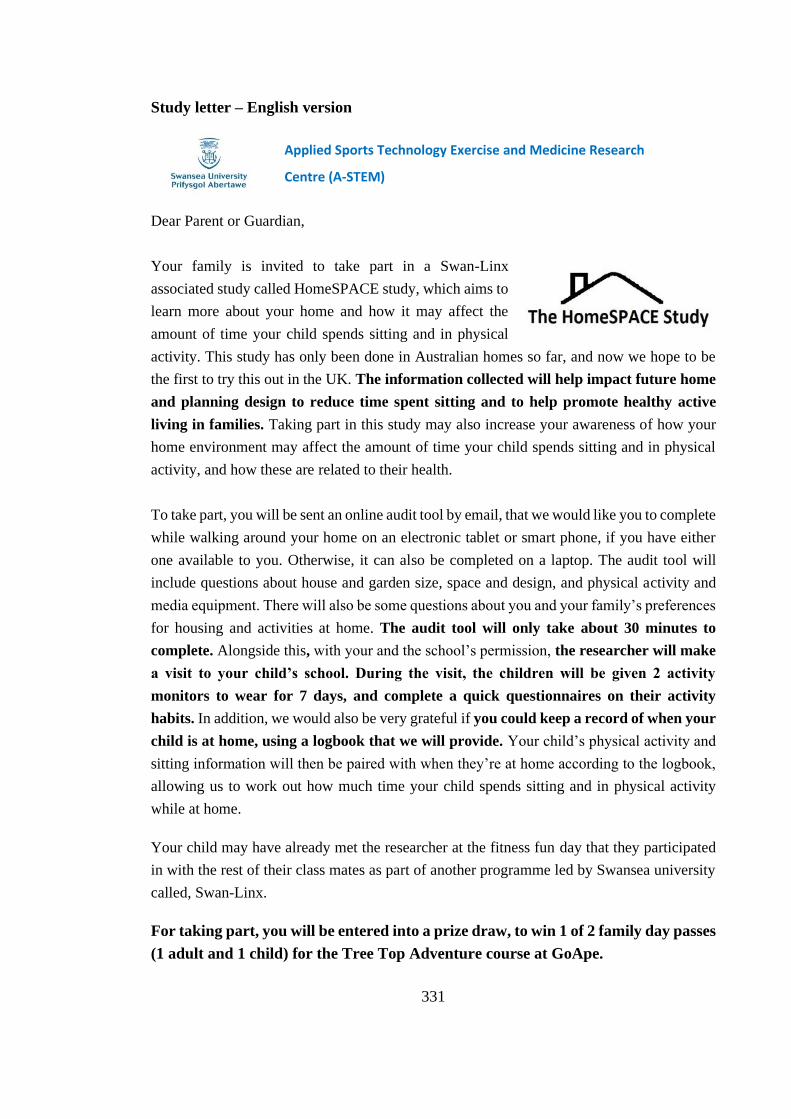
331
Study letter – English version
Dear Parent or Guardian,
Your family is invited to take part in a Swan-Linx
associated study called HomeSPACE study, which aims to
learn more about your home and how it may affect the
amount of time your child spends sitting and in physical
activity. This study has only been done in Australian homes so far, and now we hope to be
the first to try this out in the UK. The information collected will help impact future home
and planning design to reduce time spent sitting and to help promote healthy active
living in families. Taking part in this study may also increase your awareness of how your
home environment may affect the amount of time your child spends sitting and in physical
activity, and how these are related to their health.
To take part, you will be sent an online audit tool by email, that we would like you to complete
while walking around your home on an electronic tablet or smart phone, if you have either
one available to you. Otherwise, it can also be completed on a laptop. The audit tool will
include questions about house and garden size, space and design, and physical activity and
media equipment. There will also be some questions about you and your family’s preferences
for housing and activities at home. The audit tool will only take about 30 minutes to
complete. Alongside this, with your and the school’s permission, the researcher will make
a visit to your child’s school. During the visit, the children will be given 2 activity
monitors to wear for 7 days, and complete a quick questionnaires on their activity
habits. In addition, we would also be very grateful if you could keep a record of when your
child is at home, using a logbook that we will provide. Your child’s physical activity and
sitting information will then be paired with when they’re at home according to the logbook,
allowing us to work out how much time your child spends sitting and in physical activity
while at home.
Your child may have already met the researcher at the fitness fun day that they participated
in with the rest of their class mates as part of another programme led by Swansea university
called, Swan-Linx.
For taking part, you will be entered into a prize draw, to win 1 of 2 family day passes
(1 adult and 1 child) for the Tree Top Adventure course at GoApe.
Applied Sports Technology Exercise and Medicine Research
Centre (A-STEM)
Sport and Health Portfolio, College of Engineering
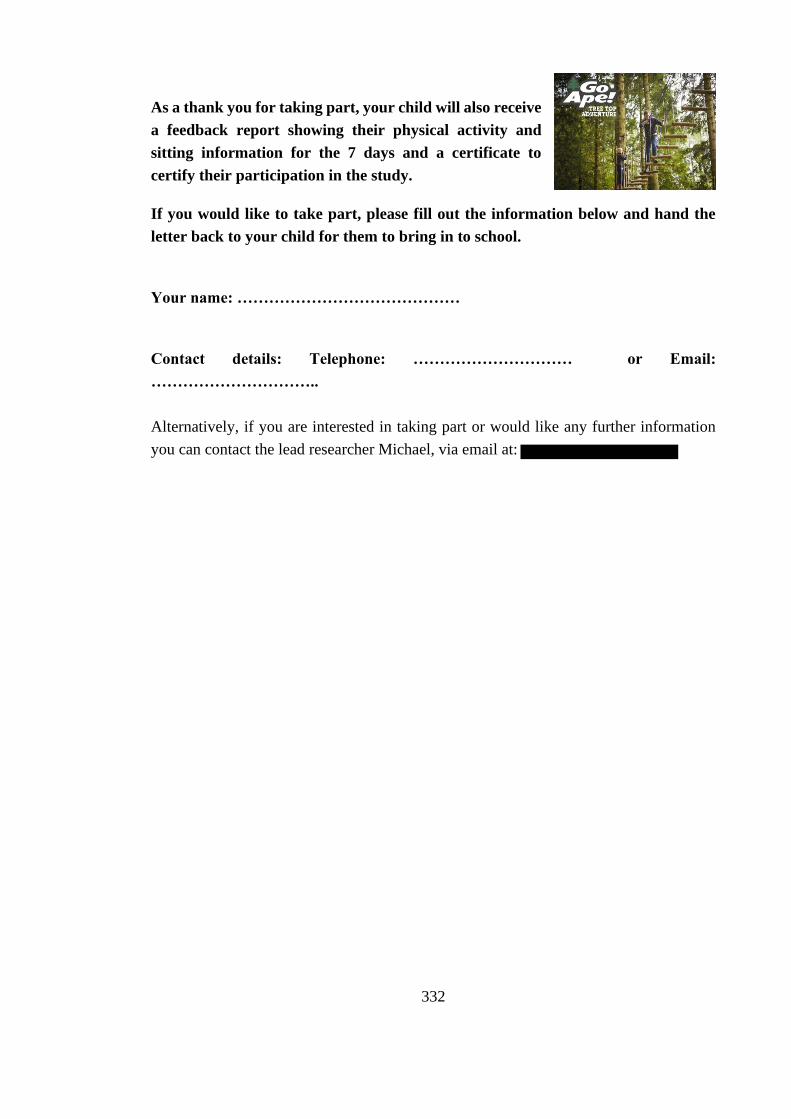
332
As a thank you for taking part, your child will also receive
a feedback report showing their physical activity and
sitting information for the 7 days and a certificate to
certify their participation in the study.
If you would like to take part, please fill out the information below and hand the
letter back to your child for them to bring in to school.
Your name: ……………………………………
Contact details: Telephone: ………………………… or Email:
…………………………..
Alternatively, if you are interested in taking part or would like any further information
you can contact the lead researcher Michael, via email at:
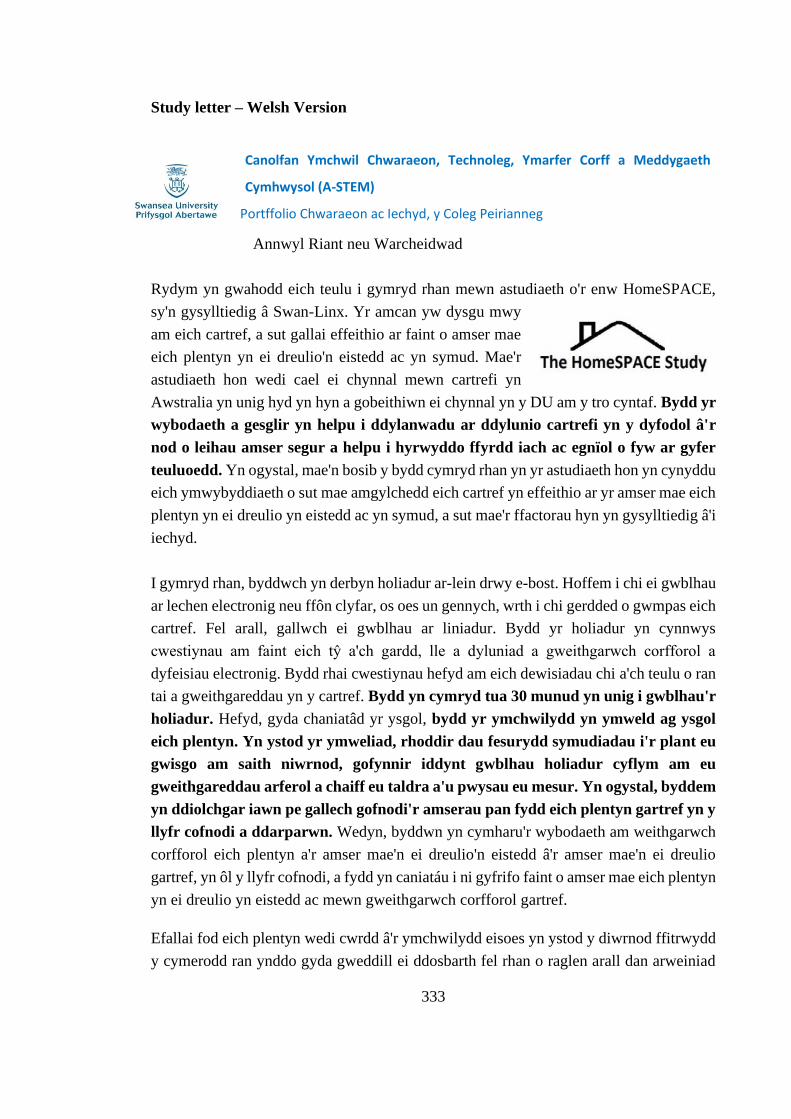
333
Study letter – Welsh Version
Annwyl Riant neu Warcheidwad
Rydym yn gwahodd eich teulu i gymryd rhan mewn astudiaeth o'r enw HomeSPACE,
sy'n gysylltiedig â Swan-Linx. Yr amcan yw dysgu mwy
am eich cartref, a sut gallai effeithio ar faint o amser mae
eich plentyn yn ei dreulio'n eistedd ac yn symud. Mae'r
astudiaeth hon wedi cael ei chynnal mewn cartrefi yn
Awstralia yn unig hyd yn hyn a gobeithiwn ei chynnal yn y DU am y tro cyntaf. Bydd yr
wybodaeth a gesglir yn helpu i ddylanwadu ar ddylunio cartrefi yn y dyfodol â'r
nod o leihau amser segur a helpu i hyrwyddo ffyrdd iach ac egnïol o fyw ar gyfer
teuluoedd. Yn ogystal, mae'n bosib y bydd cymryd rhan yn yr astudiaeth hon yn cynyddu
eich ymwybyddiaeth o sut mae amgylchedd eich cartref yn effeithio ar yr amser mae eich
plentyn yn ei dreulio yn eistedd ac yn symud, a sut mae'r ffactorau hyn yn gysylltiedig â'i
iechyd.
I gymryd rhan, byddwch yn derbyn holiadur ar-lein drwy e-bost. Hoffem i chi ei gwblhau
ar lechen electronig neu ffôn clyfar, os oes un gennych, wrth i chi gerdded o gwmpas eich
cartref. Fel arall, gallwch ei gwblhau ar liniadur. Bydd yr holiadur yn cynnwys
cwestiynau am faint eich tŷ a'ch gardd, lle a dyluniad a gweithgarwch corfforol a
dyfeisiau electronig. Bydd rhai cwestiynau hefyd am eich dewisiadau chi a'ch teulu o ran
tai a gweithgareddau yn y cartref. Bydd yn cymryd tua 30 munud yn unig i gwblhau'r
holiadur. Hefyd, gyda chaniatâd yr ysgol, bydd yr ymchwilydd yn ymweld ag ysgol
eich plentyn. Yn ystod yr ymweliad, rhoddir dau fesurydd symudiadau i'r plant eu
gwisgo am saith niwrnod, gofynnir iddynt gwblhau holiadur cyflym am eu
gweithgareddau arferol a chaiff eu taldra a'u pwysau eu mesur. Yn ogystal, byddem
yn ddiolchgar iawn pe gallech gofnodi'r amserau pan fydd eich plentyn gartref yn y
llyfr cofnodi a ddarparwn. Wedyn, byddwn yn cymharu'r wybodaeth am weithgarwch
corfforol eich plentyn a'r amser mae'n ei dreulio'n eistedd â'r amser mae'n ei dreulio
gartref, yn ôl y llyfr cofnodi, a fydd yn caniatáu i ni gyfrifo faint o amser mae eich plentyn
yn ei dreulio yn eistedd ac mewn gweithgarwch corfforol gartref.
Efallai fod eich plentyn wedi cwrdd â'r ymchwilydd eisoes yn ystod y diwrnod ffitrwydd
y cymerodd ran ynddo gyda gweddill ei ddosbarth fel rhan o raglen arall dan arweiniad
Canolfan Ymchwil Chwaraeon, Technoleg, Ymarfer Corff a Meddygaeth
Cymhwysol (A-STEM)
Portffolio Chwaraeon ac Iechyd, y Coleg Peirianneg
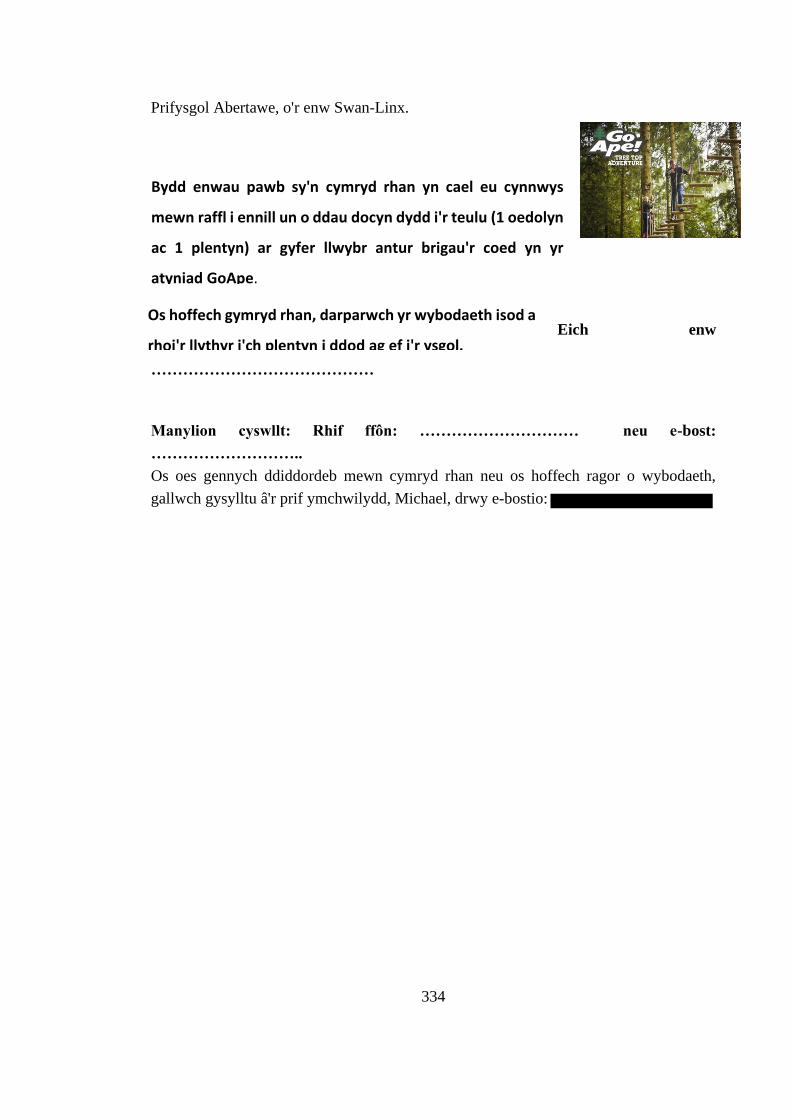
334
Prifysgol Abertawe, o'r enw Swan-Linx.
Eich enw
……………………………………
Manylion cyswllt: Rhif ffôn: ………………………… neu e-bost:
………………………..
Os oes gennych ddiddordeb mewn cymryd rhan neu os hoffech ragor o wybodaeth,
gallwch gysylltu â'r prif ymchwilydd, Michael, drwy e-bostio:
Bydd enwau pawb sy'n cymryd rhan yn cael eu cynnwys
mewn raffl i ennill un o ddau docyn dydd i'r teulu (1 oedolyn
ac 1 plentyn) ar gyfer llwybr antur brigau'r coed yn yr
atyniad GoApe.
Os hoffech gymryd rhan, darparwch yr wybodaeth isod a
rhoi'r llythyr i'ch plentyn i ddod ag ef i'r ysgol.
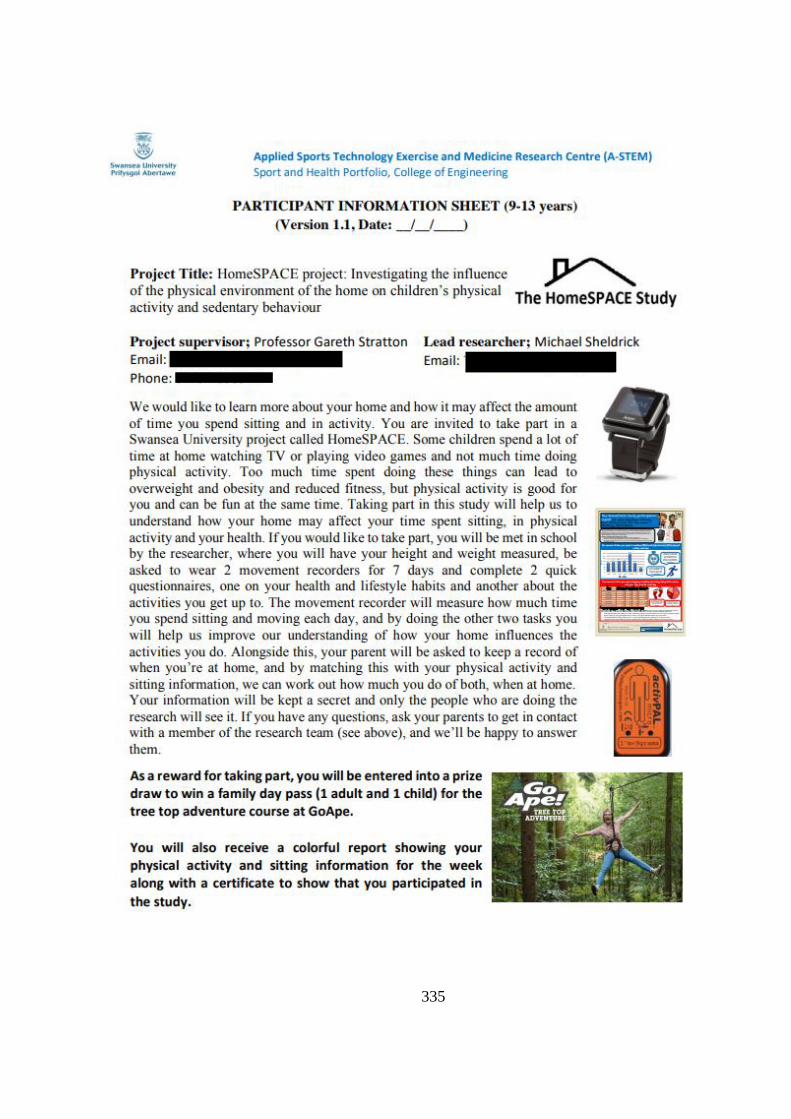
335
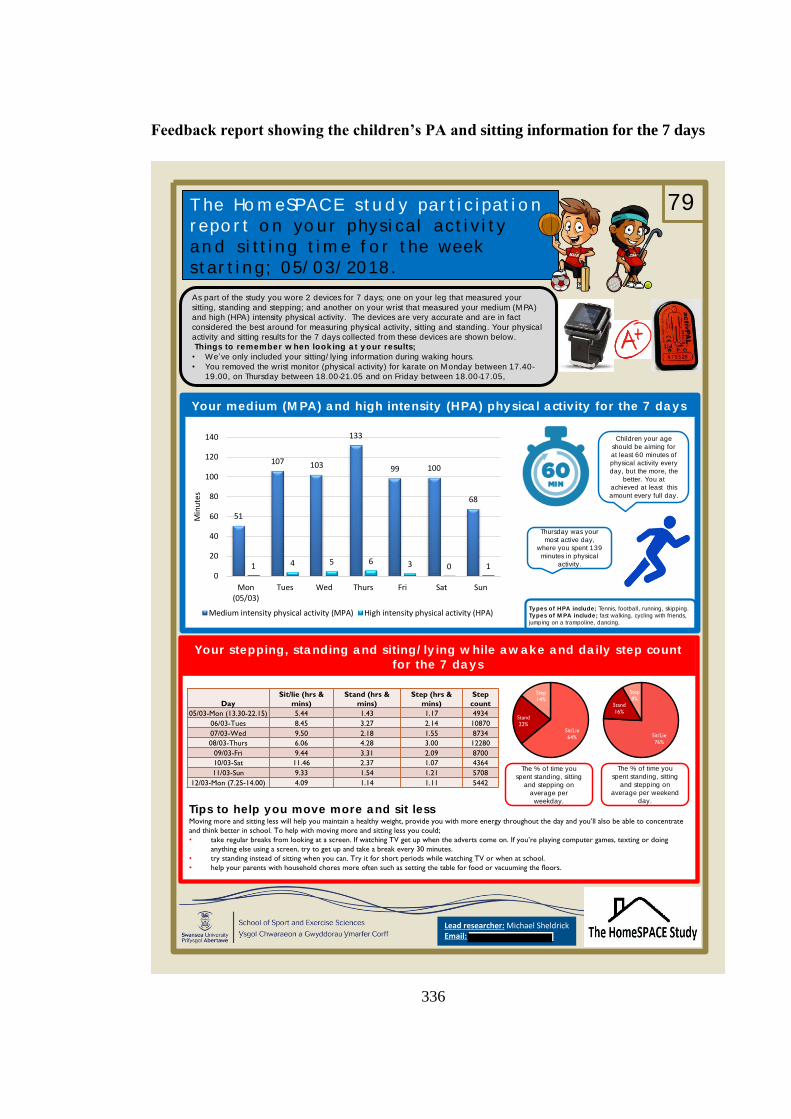
336
Feedback report showing the children’s PA and sitting information for the 7 days
T he Ho m eSPACE st u d y par t i c i pat i o n
r epo r t o n yo u r physi cal act i v i t y
an d si t t i n g t i m e f o r t he week
st ar t i n g; 05/ 03/ 2018 .
Your medium (M PA) a nd high intensity (HPA) physica l a ctivity for the 7 da ys
Your stepping, sta nding a nd siting/ ly ing w hile a w a ke a nd da ily step count
for the 7 da ys
Lead researcher: Michael SheldrickEmail:
Tips to help you move more a nd sit lessMoving more and sitting less will help you maintain a healthy weight, provide you with more energy throughout the day and you’ll also be able to concentrate
and think better in school. To help with moving more and sitting less you could;
• take regular breaks from looking at a screen. If watching TV get up when the adverts come on. If you’re playing computer games, texting or doing
anything else using a screen, try to get up and take a break every 30 minutes.
• try standing instead of sitting when you can. Try it for short periods while watching TV or when at school.
• help your parents with household chores more often such as setting the table for food or vacuuming the floors.
Types of HPA include; Tennis, football, running, skipping.
Types of M PA include; fast walking, cycling with friends,
jumping on a trampoline, dancing.
As part of the study you wore 2 devices for 7 days; one on your leg that measured your
sitting, standing and stepping; and another on your wrist that measured your medium (MPA)
and high (HPA) intensity physical activity. The devices are very accurate and are in fact
considered the best around for measuring physical activity, sitting and standing. Your physical
activity and sitting results for the 7 days collected from these devices are shown below.
Things to remember w hen look ing a t y our results;
• We’ve only included your sitting/ lying information during waking hours.
• You removed the wrist monitor (physical activity) for karate on Monday between 17.40-
19.00, on Thursday between 18.00-21.05 and on Friday between 18.00-17.05,
The % of time you
spent standing, sitting
and stepping on
average per
weekday.
Children your age
should be aiming for
at least 60 minutes of
physical activity every
day, but the more, the
better. You at
achieved at least this
amount every full day.
79
Day
Sit/lie (hrs &
mins)
Stand (hrs &
mins)
Step (hrs &
mins)
Step
count
05/03-Mon (13.30-22.15) 5.44 1.43 1.17 4934
06/03-Tues 8.45 3.27 2.14 10870
07/03-Wed 9.50 2.18 1.55 8734
08/03-Thurs 6.06 4.28 3.00 12280
09/03-Fri 9.44 3.31 2.09 8700
10/03-Sat 11.46 2.37 1.07 4364
11/03-Sun 9.33 1.54 1.21 5708
12/03-Mon (7.25-14.00) 4.09 1.14 1.11 5442
The % of time you
spent standing, sitting
and stepping on
average per weekend
day.
Sit/Lie
76%
Stand
16%
Step
8%
Sit/Lie
64%
Stand
22%
Step
14%
51
107 103
133
99 100
68
1 4 5 6 3 0 10
20
40
60
80
100
120
140
Mon(05/03)
Tues Wed Thurs Fri Sat Sun
Min
ute
s
Medium intensity physical activity (MPA) High intensity physical activity (HPA)
Thursday was your
most active day,
where you spent 139
minutes in physical
activity.
337
The certificate children received for taking part in the study
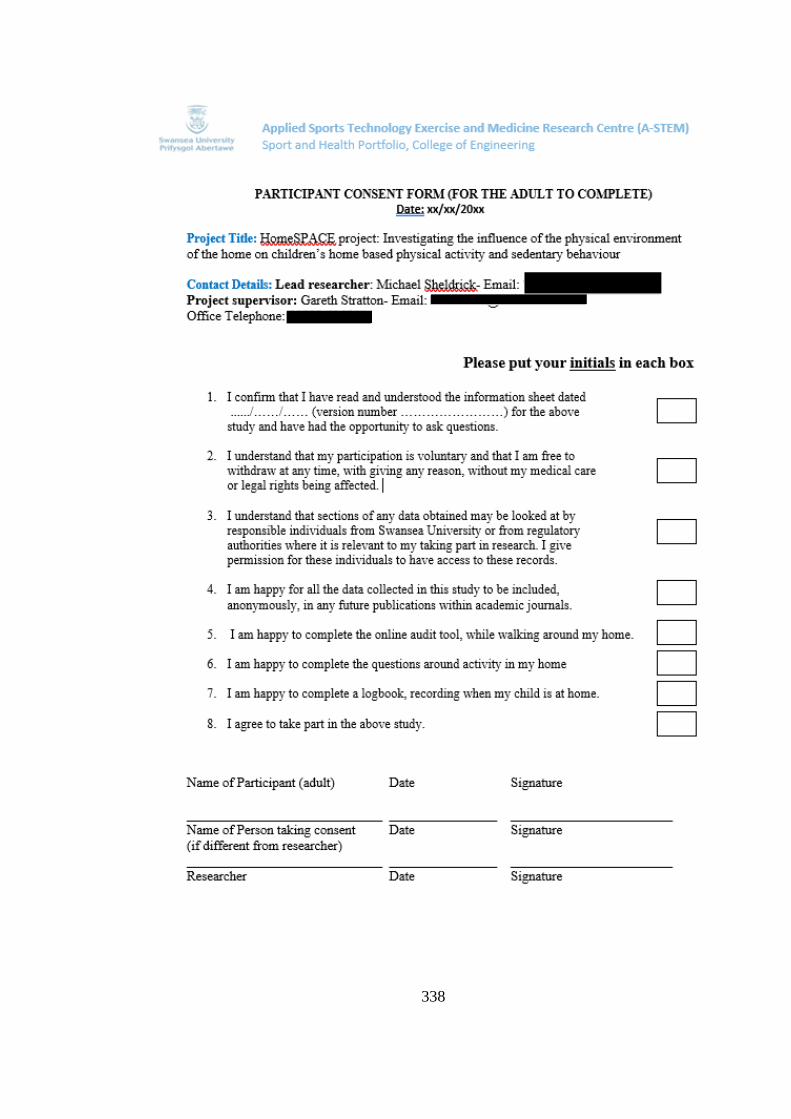
338
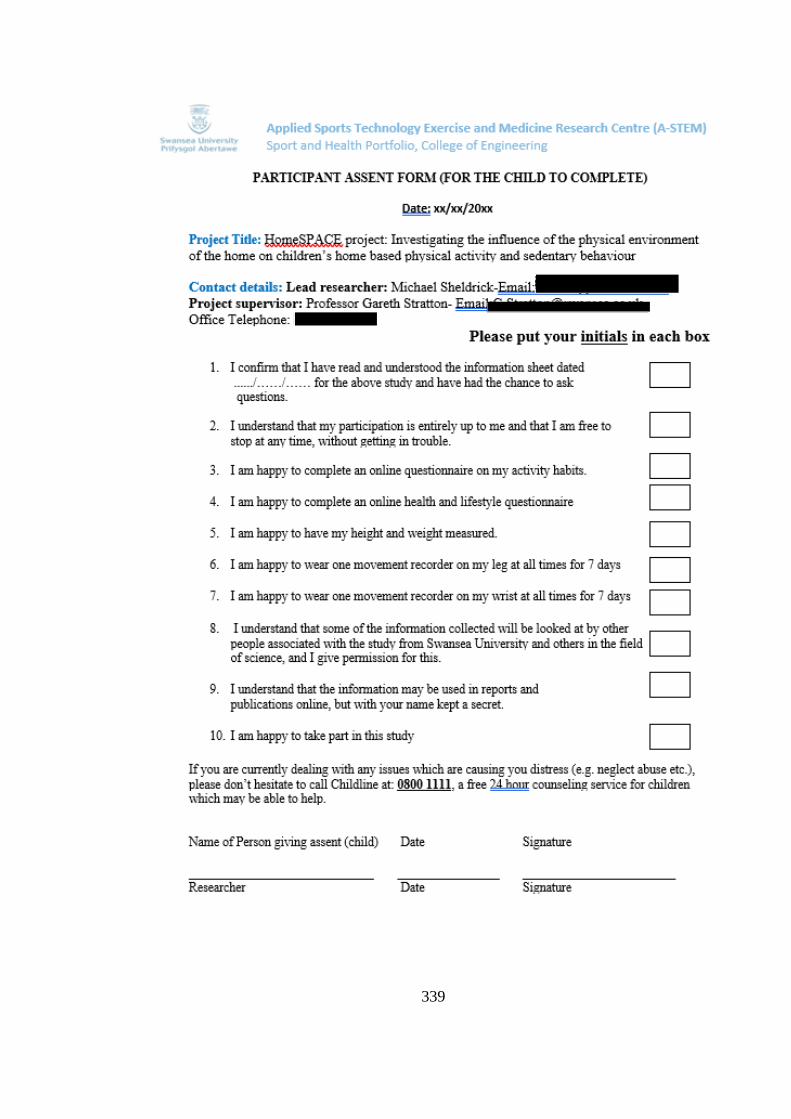
339
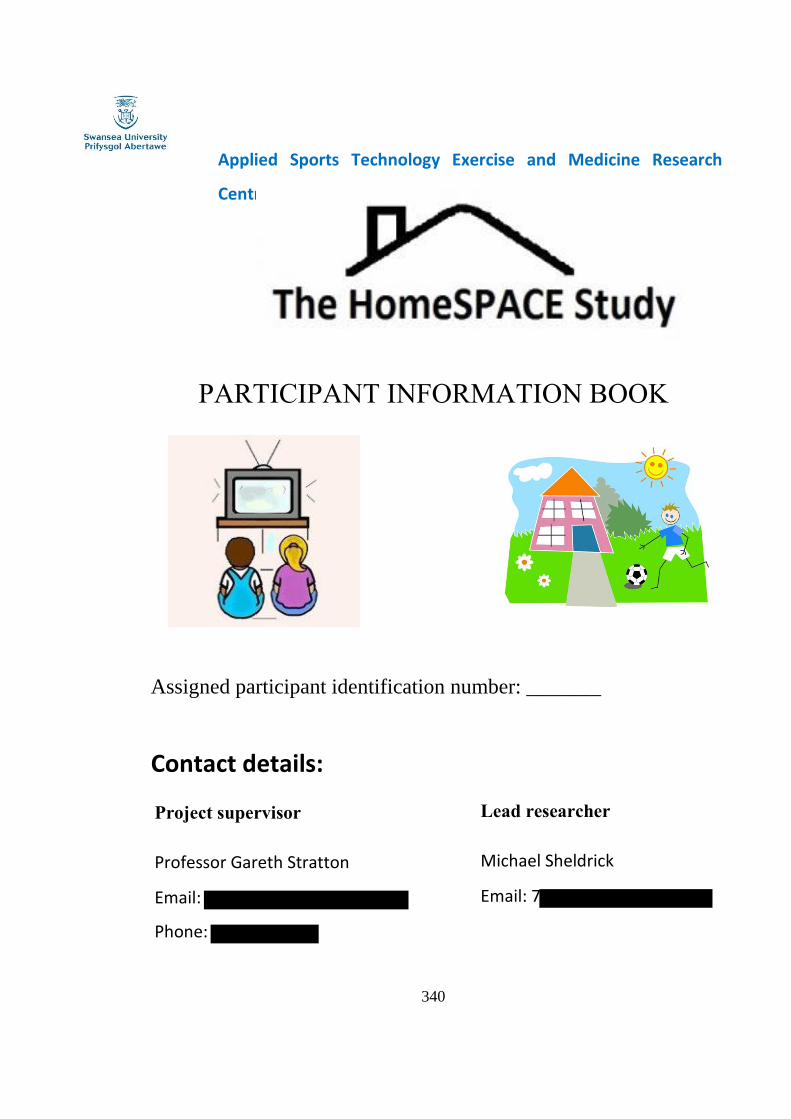
340
PARTICIPANT INFORMATION BOOK
Assigned participant identification number: _______
Contact details:
Project supervisor
Professor Gareth Stratton
Email:
Phone:
Lead researcher
Michael Sheldrick
Email: 7
Applied Sports Technology Exercise and Medicine Research
Centre (A-STEM)
Sport and Health Portfolio, College of Engineering
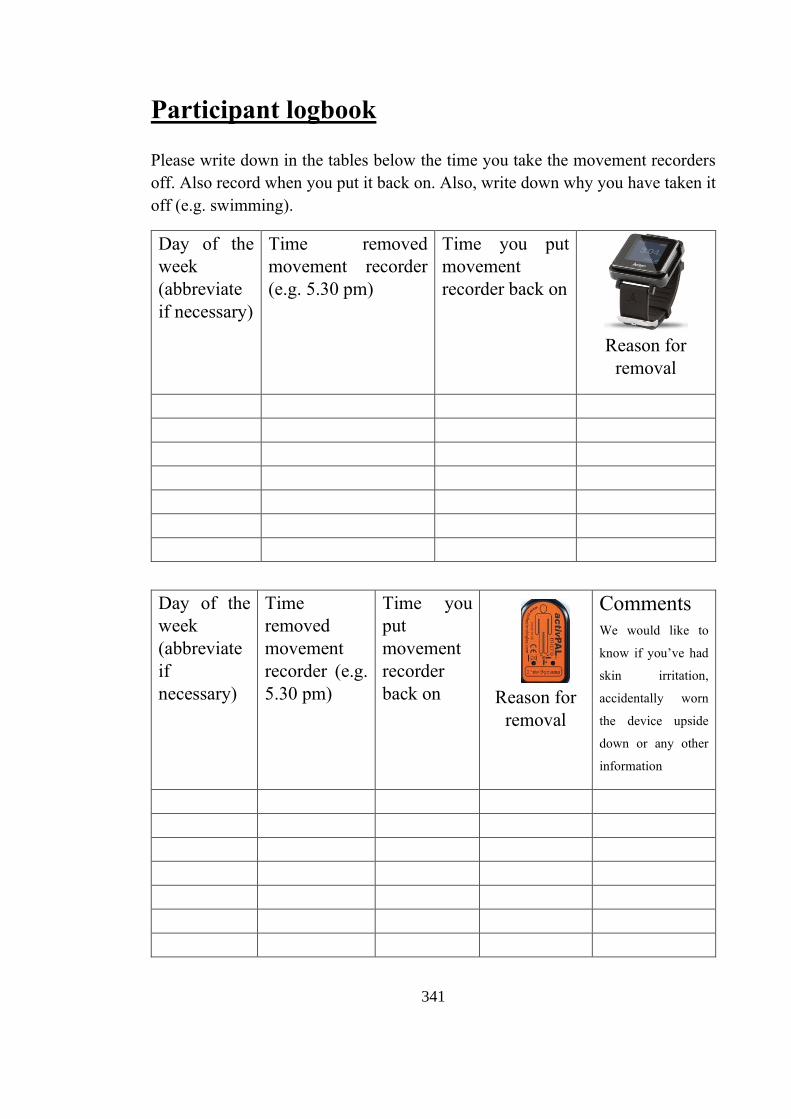
341
Participant logbook
Please write down in the tables below the time you take the movement recorders
off. Also record when you put it back on. Also, write down why you have taken it
off (e.g. swimming).
Day of the
week
(abbreviate
if necessary)
Time removed
movement recorder
(e.g. 5.30 pm)
Time you put
movement
recorder back on
Reason for
removal
Day of the
week
(abbreviate
if
necessary)
Time
removed
movement
recorder (e.g.
5.30 pm)
Time you
put
movement
recorder
back on Reason for
removal
Comments
We would like to
know if you’ve had
skin irritation,
accidentally worn
the device upside
down or any other
information
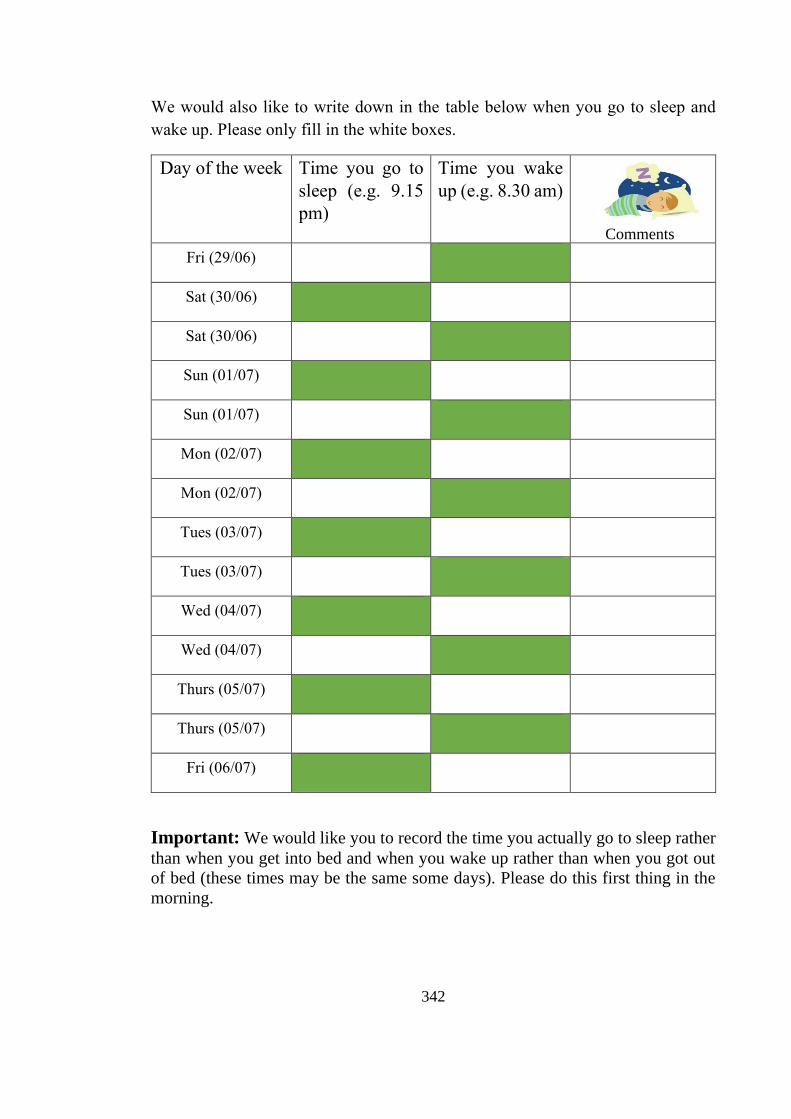
342
We would also like to write down in the table below when you go to sleep and
wake up. Please only fill in the white boxes.
Day of the week Time you go to
sleep (e.g. 9.15
pm)
Time you wake
up (e.g. 8.30 am)
Comments
Fri (29/06)
Sat (30/06)
Sat (30/06)
Sun (01/07)
Sun (01/07)
Mon (02/07)
Mon (02/07)
Tues (03/07)
Tues (03/07)
Wed (04/07)
Wed (04/07)
Thurs (05/07)
Thurs (05/07)
Fri (06/07)
Important: We would like you to record the time you actually go to sleep rather
than when you get into bed and when you wake up rather than when you got out
of bed (these times may be the same some days). Please do this first thing in the
morning.
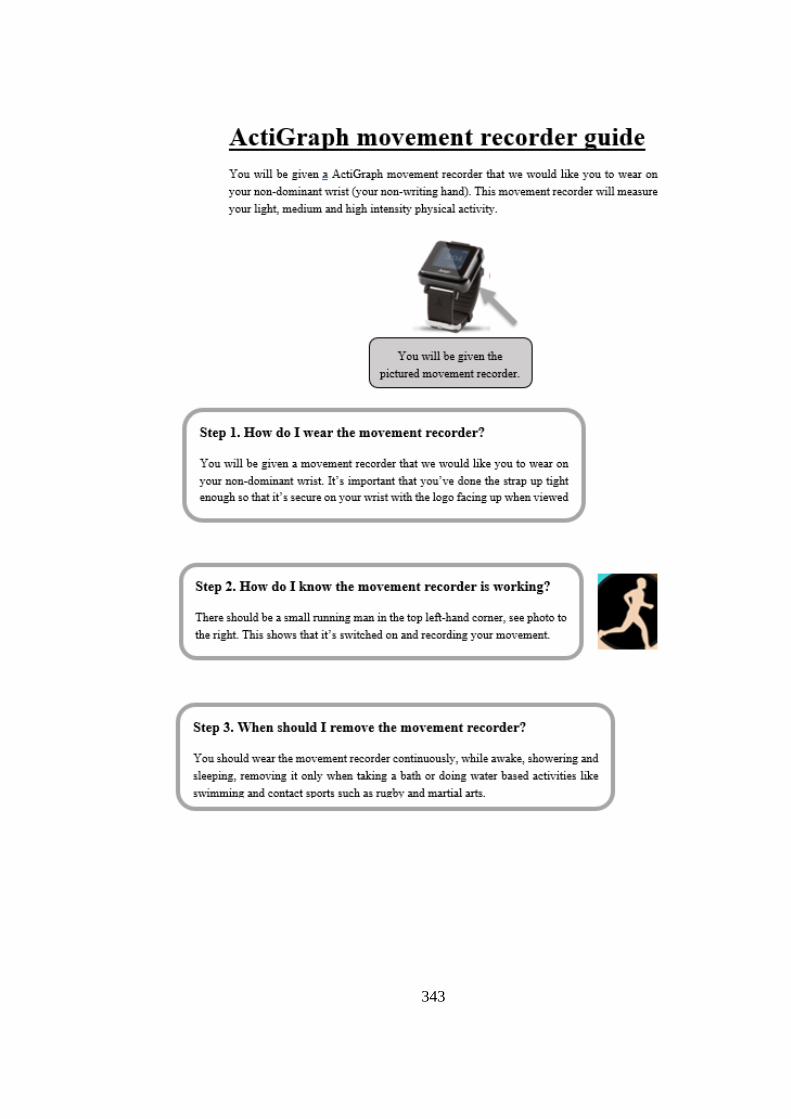
343
344
345