Practical network coding schemes for energy efficient ... - Cronfa
204
Swansea University E-Theses _________________________________________________________________________ Practical network coding schemes for energy efficient long term evolution radio access networks. Hamdoun, Hassan How to cite: _________________________________________________________________________ Hamdoun, Hassan (2013) Practical network coding schemes for energy efficient long term evolution radio access networks.. thesis, Swansea University. http://cronfa.swan.ac.uk/Record/cronfa42828 Use policy: _________________________________________________________________________ This item is brought to you by Swansea University. Any person downloading material is agreeing to abide by the terms of the repository licence: copies of full text items may be used or reproduced in any format or medium, without prior permission for personal research or study, educational or non-commercial purposes only. The copyright for any work remains with the original author unless otherwise specified. The full-text must not be sold in any format or medium without the formal permission of the copyright holder. Permission for multiple reproductions should be obtained from the original author. Authors are personally responsible for adhering to copyright and publisher restrictions when uploading content to the repository. Please link to the metadata record in the Swansea University repository, Cronfa (link given in the citation reference above.) http://www.swansea.ac.uk/library/researchsupport/ris-support/
-
Upload
khangminh22 -
Category
Documents
-
view
0 -
download
0
Transcript of Practical network coding schemes for energy efficient ... - Cronfa

Swansea University E-Theses _________________________________________________________________________
Practical network coding schemes for energy efficient long term
evolution radio access networks.
Hamdoun, Hassan
How to cite: _________________________________________________________________________ Hamdoun, Hassan (2013) Practical network coding schemes for energy efficient long term evolution radio access
networks.. thesis, Swansea University.
http://cronfa.swan.ac.uk/Record/cronfa42828
Use policy: _________________________________________________________________________ This item is brought to you by Swansea University. Any person downloading material is agreeing to abide by the terms
of the repository licence: copies of full text items may be used or reproduced in any format or medium, without prior
permission for personal research or study, educational or non-commercial purposes only. The copyright for any work
remains with the original author unless otherwise specified. The full-text must not be sold in any format or medium
without the formal permission of the copyright holder. Permission for multiple reproductions should be obtained from
the original author.
Authors are personally responsible for adhering to copyright and publisher restrictions when uploading content to the
repository.
Please link to the metadata record in the Swansea University repository, Cronfa (link given in the citation reference
above.)
http://www.swansea.ac.uk/library/researchsupport/ris-support/

P rac tica l N etw ork C oding Schemes for E nergy Efficient Long T erm E volu tion R adio
Access N etw orks
Swansea University Prifysgol Abertawe
Hassan Hamdoun
College of Engineering
Swansea University
S ubm itted to Swansea University in fulfillment of the requirem ents
for the degree of
Doctor o f Philosophy (Ph.D.)
July, 2013

ProQuest Number: 10821218
All rights reserved
INFORMATION TO ALL USERS The quality of this reproduction is dependent upon the quality of the copy submitted.
In the unlikely event that the author did not send a com p le te manuscript and there are missing pages, these will be noted. Also, if material had to be removed,
a note will indicate the deletion.
uestProQuest 10821218
Published by ProQuest LLC(2018). Copyright of the Dissertation is held by the Author.
All rights reserved.This work is protected against unauthorized copying under Title 17, United States C ode
Microform Edition © ProQuest LLC.
ProQuest LLC.789 East Eisenhower Parkway
P.O. Box 1346 Ann Arbor, Ml 48106- 1346
Abstract
Cellular mobile networks are facing the big challenge of delivering high data rates with high reliability everywhere and anytime in order to support the explosive demand for new applications and services. In their current design, however, this data delivery is being achieved by the corresponding increase of the consumed energy. This trend is clearly unsustainable and at some point in the future it will become a limiting factor of delivering the applications and services in the desired quality. Moreover, the high energy consumption negatively affects the operational cost and significantly contribute to C 02 emission. The mobile operators are committed to overcome both of these issues. Motivated by the energy efficiency of wireless networks, we investigate the transmission protocols which are exploiting the concept of Network Coding (NC) in order to achieve throughput improvements with reduced energy consumption.
NC is known to achieve the throughput improvements but its energy consumption savings have not been studied in cellular mobile networks. Hence, this thesis focuses on the implementation aspects and evaluation of benefits of the distributed coding, NC and fountain coding in the Long Term Evolution (LTE) and LTE-Advanced (LTE- A) cellular systems under realistic constraints and assumptions. This thesis presents two practical inter-flow and intra-flow NC transmission protocols that improve the throughput, reduce the energy consumption, save physical layer transmission resources and create distinctive energy-delay trade-offs characteristics in LTE and LTE-A networks.
The contributions of this thesis are concerned with the energy metrics definitions, and with the implementations of inter-flow NC, intra-flow NC in the LTE networks with and without the relay nodes. First, the energy metrics are established for cellular mobile networks to evaluate their power and energy consumption. The specified energy metrics are applicable to network equipment, links, subsystems and to the overall radio access network. The energy metrics used are discussed in light of the relevant standardization activities of the wireless access networks.
Second, a practical inter-flow NC protocol for the LTE network is introduced. The integration of the protocol within the LTE protocol stack is examined. The implementation aspects and constraints of

the NC protocol for the LTE relay network is considered in order to assess the usefulness of the NC under realistic assumptions. The usefulness of the NC protocol is evaluated for varying traffic load levels, varying geographical distances between the nodes, varying transmit powers, and different maximum numbers of retransmissions. Energy savings of 16—25% depending on the traffic in the network is achieved.
Third, the scalability of the inter-flow NC protocol is investigated for multiple users and for various traffic loads. Energy savings are also attained when the number of users is increased and 25% savings is obtained for 4 users. The performance of this NC scheme is assessed in terms of the radio-frequency power as well as the radio overhead power, the throughput gain and the number of physical layer resources saved.
Fourth, it is shown that the Medium Access Control (MAC) layer is well suited to incorporate the inter-flow NC and intra-flow NC schemes. The intra-flow NC implemented at the MAC layer is found to have many benefits and to achieve good performance gains compared to its originally intended implementation at the application layer. Intra-flow NC schemes outperform, under certain conditions, the standardized Hybrid Automatic Repeat Request (HARQ) schemes in terms of the energy consumption, the amount of radio resources used, and the transmission latency.
The main findings of our investigations are: the performance of network coding is affected by the ratio of transmit powers of the nodes involved in NC, MAC layer is well suited for implementing the intraflow as well as inter-flow network coding schemes, and the intra-flow NC strongly effects the design and performance of adaptive transmission strategies including the adaptive modulation and coding schemes.

Declaration and Statem ents
D EC LA R A TIO NThis work has not previously been accepted in substance for any degree and
is not being concurrently submitted in candidature for any degree.
Signed....................................... .........(candidate)
Date, J .S M /..M 3 .. . . . . . . . . .
STA TEM EN T 1This thesis is the result of my own investigations, except where otherwise
stated. Where correction services have been used, the extent and nature of the correction is clearly marked in a footnote(s).
Other sources are acknowledged by footnotes giving explicit references. A bibliography is appended.
Signed... _ ......(candidate)Date I . 'X&. 1.3.............
STA TEM EN T 2I hereby give consent for my thesis, if accepted, to be available for photocopy
ing and for inter-library loan, and for the title and summary to be made available to outside organizations.
Signed... (candidate)Date........l§. I.9C.J. (.Z&. 1.5...........

Acknowledgment
In the name of Allah, the most beneficent, the most merciful. I thank Allah for giving me the strength, determination and inspiration to complete this thesis.
To my parents, for their continuous support and encouragement, their motivating words have always been then to help me during rough times. Their continuous prayers throughout the duiation of my PhD have been the real support when I needed it.
Special thanks to my sister Dr. Eiman Hamdoun and my Brother-in-law Dr. Magdi Gelli who has been always supportive throughout my time in the UK.
I wish to express my gratitude to my supervisor Dr Pavel Loskot for his guidance and invaluable advice, for the numerous discussions and patience and for reviewing the manuscript.
I am thankful to Prof Hue Summers for his support, advice and guidance. He stood with me in very difficult times and his advice was invaluable.
I am thankful to Prof Timothy O’Farrell for his support and guidance, his comments and reviews were invaluable.
I am thankful to all my colleagues in the wireless communications research group, for the nice atmosphere, for their help and support throughout my duration here in Swansea, with particular mention to: Mohammed hassanien, Laurie Hughes, Jafer Alzubi, Charles Turyagvenda, Omar Alzubi and Tommy To .
I am eternally grateful to all my friends who stood with me all the time, with particular mention to: Ammar Kabashi, Waleed Hashim, Mohammed Hamid and Dr. Mohammed Abdelrahman.
Published Contributions
The results in chapter 3 are published in these papers:
-Hassan Hamdoun, Pavel Loskot, Timothy O ’Farrell and Jianhua He,” Survey and Application of Standardized Energy Metrics to Mobile Networks”, that appeared in Annals of Telecommunications Journal, special issue on Green Mobile Networks, Volume 67, Numbers 3-4, pages 113-123, April 2012, DOI: 10.1007/sl2243- 012-0285-z.
This paper is featured in Advances in Engineering (AIE) in Aug 2012, http://advancesinengineering.com, as being of special interest to the Engineering community.
-Ying Hou, Dave Laurenson, Oliver Holland, Panayiotis Kolios, Diogo Quintas, Vasilis Friderikos, Hamid Aghvami, Biljana Badic, Hassan Hamdoun, Jianhua He, Pavel Loskot, Tim OFarrell, Imran Ashraf, Yi Wang, Jiayin Zhang , ” Energy Efficient Architectures for Green Radio Access Networks”, 2010 5th International ICST Conference on Communications and Networking in China (CHINACOM), pp. 1-6, 25-27 Aug. 2010.
The results in chapter 4 are published in the following papers:
-Weisi Guo, Charles Turyagyenda, Hassan Hamdoun, Siyi Wang, Pavel Loskot, Tim OFarrell, ” Towards A Low Energy LTE Cellular Network:Architectures”, European EUSIPCO 2011, Special Session on Energy Efficient Communications for Future Networks, 31 August 2011, Barcelona, Spain.

-Hassan Hamdoun, Pavel Loskot, Timothy OFarrell and Jianhua He, ”Practical Network Coding for Two Way Relay Channels in LTE Networks”, VTC2011- Spring, Second Green Wireless Communications and Networks Workshop (GreeNet),in Budapest, Hungary, 15 May 2011.
The results in chapter 5 are published in:
-Hassan Hamdoun, Pavel Loskot and Timothy OFarrell, ” Scalability of Two- Way Relay Channel Network Coding in Relay Enhanced LTE Cell”, 11th IEEE International Symposium on Communications and Information Technologies (ISCIT 2011), Zhejiang University, in Hangzhou, China, Oct 2011.
The results in chapter 6 have been published in the following papers:
-Hassan Hamdoun, Pavel Loskot and Timothy OWqitqM,” Implementation Tradeoffs of Fountain Codes in LTE and LTE-A”, that appeared in CHINACOM 2012,7th International Conference on Communications and Networking in Kunming, China, August 2012.
-Hassan Hamdoun, Pavel Loskot,” Implementing Network Coding in LTE and LTE-A”, that appeared in ARSR2012 conference, The first International Workshop on Smart Wireless Communications (SWICOM2012), in Manchester, UK, published May 2012.
iv

Contents
D eclaration and Statem ents i
A cknowledgm ent ii
Published Contributions iii
List of Figures ix
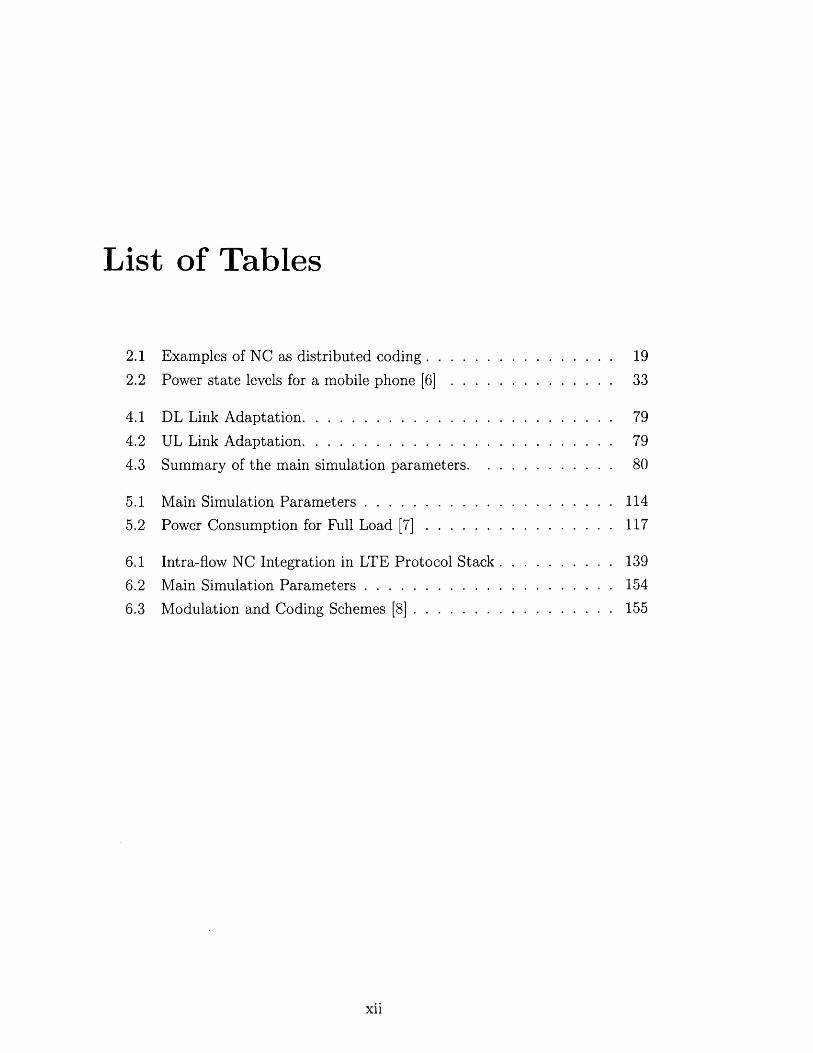
List of Tables xii
Acronym s xiii
1 Introduction 11.1 B ack g ro u n d .............................................................................................. 11.2 Thesis C o n trib u tio n s .............................................................................. 41.3 Thesis L a y o u t........................................................................................... 5
2 Netw ork Coding Background and R elated Work 72.1 Network Coding (NC) .......................................................................... 7
2.1.1 Max-flow Min-cut Theorem .................................................... 102.1.2 Main Network Coding T h e o re m ............................................... 112.1.3 Encoding ..................................................................................... 122.1.4 Decoding ..................................................................................... 13
2.2 Network Coding B enefits....................................................................... 142.2.1 Throughput G a i n s ................................. 142.2.2 Reduced C om plex ity .................................................................. 142.2.3 Improved Packet Transmission Reliability ............................. 15
v

C O N TEN TS
2.3 Previous Work ....................................................................................... 152.3.1 Network Coding for Energy Efficiency................................ 17
2.4 Network Coding in Wireless Networks: A New Perspective . . . . 182.5 LTE Radio Access ................................................................................. 20
2.5.1 LTE Duplexing S chem es....................................................... 212.5.2 LTE Protocol A rchitecture.................................................... 232.5.3 LTE Architecture with Relays: Relay Enhanced Cell . . . 24
2.6 Network Coding for Unicast and Broadcast Applications in RelayNetworks.......................................................................................... 252.6.1 Mathematical Analysis of NC in T W R C .......................... 262.6.2 Network Coding Simulations for a T W R C ...................... 312.6.3 Protocol Design for Relay Aided Cellular Architectures . . 31
2.7 Remarks and Motivations .................................................................... 37
3 Energy M etrics for Cellular Networks 383.1 Definitions of Energy and Power M e tr ic s ................................ 393.2 Energy Efficient Powering of Telecommunications Equipments . . 433.3 General Requirements for Evaluating the Energy Efficiency of Telecom
munication N etw orks.................................................................... 463.4 Standardized Energy and Power M e tr ic s ................................ 47
3.4.1 Energy Consumption Rating (E C R )................................... 483.4.2 ECR-Based M etrics................................................................. 493.4.3 Telecommunications Energy Efficiency Ratio (TEER) . . . 513.4.4 Power per Subscriber, Traffic and D istance/A rea............. 543.4.5 Normalized Energy and P ow er............................................. 543.4.6 Energy Efficiency for Wireless Access N e tw o rk s ............. 563.4.7 Network Level Energy Efficiency of G S M .......................... 58
3.5 ECR Metrics for the Radio Access N etw orks......................... 593.6 System-Based Energy M e tr ic s ................................................... 62
3.6.1 Absolute Energy Consumption Ratio (A E C R )................ 633.6.2 Relative Energy Consumption Gain (R E C G )................... 63
3.7 Ongoing Standardization A c tiv itie s ......................................... 633.8 C onclusions................................................................................... 65
vi

C O N T EN TS
4 Energy Efficient Practical N etw orkC oding for LTE N etworks 664.1 LTE protocol S ta c k ................................................................................. 684.2 System D escrip tion ................................................................................. 72
4.2.1 Practical Network Coding fir LTE n e tw o rk s ........................ 744.2.2 Practical Network Coding wth Subcarrier Division Duplex
(SDD) for LTE netw orks........................................................... 744.3 System M o d e l........................................................................................... 75
4.3.1 Channel M o d e l ......................................................................... 764.3.2 Packet Retransmission M o d i ................................................. 774.3.3 Link Adaptation (MCS se le :tio n ).......................................... 784.3.4 Control Signalling O verheac.................................................... 784.3.5 Simulation S e t u p ...................................................................... 79
4.4 Numerical R esults................................................................................... 834.4.1 Impact of Offered Traffic Lead.................................................. 844.4.2 Impact of the Relay-to-Usei D is tan c e ..................................... 914.4.3 Impact of the Relay Station Transmission P ow er.................. 954.4.4 Impact of Number of Retraismissions......................................... 101
4.5 C onclusions.................................................................................................105
5 Scalability of N etwork Coding for 1TE Networks 1075.1 LTE Scheduling F ram ew o rk ................................................................... 108
5.1.1 Downlink Scheduling..................................................................... 1095.1.2 Uplink Scheduling.......................................................................... 110
5.2 System D escrip tion ....................................................................................1105.2.1 NC with Resource Sharing in LTE N etw orks............................I l l
5.3 System M o d e l............................................................................................. 1135.3.1 Energy M e tr ic s ............................................................................. 1145.3.2 The RF and Operational Energy Efficiencies..........................116
5.4 Numerical R esults .......................................................................................1185.4.1 Impact of the Number of the UEs per the R S ........................ 1195.4.2 Impact of the RS Transmit P o w er...............................................1255.4.3 Impact of the Traffic L o a d ............................................................129
5.5 C onclusions................................................................................................ 132

C O N T E N T S
6 Im plem entation Trade-offs of Intra-flow Network C oding in LTE and LTE-A Networks 1346.1 Overview of Intra-flow NC Schem es....................................................... 136
6.1.1 Application Layer Intra-flow NC s c h e m e ................................. 1376.1.2 Design Considerations of Intra-flow N C .................................... 137
6.2 Proposed Intra-flow NC P r o to c o l .......................................................... 1406.2.1 Proposed Intra-flow NC Protocol Differences to Conven
tional P r o to c o l ...............................................................................1416.2.2 Mathematical Analysis of the Proposed Intra-flow NC Pro
tocol .................................................................................................. 1436.3 System M o d e l..............................................................................................1516.4 Numerical R esults....................................................................................... 1556.5 C onclusions................................................................................................. 164
7 Conclusions 1657.1 Practical Network Coding for LTE N etw orks.......................................1657.2 Energy Consumption-Delay Trade-offs of
Network Coding in LTE N etw orks........................................................... 1667.3 Future W ork ................................................................................................. 167
Bibliography 169

List of Figures
1.1 Evolution of the operational cost of cellular networks over time [1]. 2
2.1 The Butterfly Network with and without NC...................................... 102.2 NC as a distributed coding...................................................................... 192.3 The overall LTE network architecture [ 2 ] ........................................... 212.4 Frequency and time-division duplex schemes....................................... 222.5 The LTE radio protocol architecture..................................................... 232.6 NC schemes and TWRC [3]..................................................................... 272.7 The derived KPIs versus the PER of the A-R link............................ 292.8 The derived ECR values for different values of the receive and idle
powers........................................................................................................... 302.9 The simulated KPIs versus the PER of the AR link.......................... 322.10 Relay aided broadcasting.......................................................................... 342.11 The energy consumption of the destination receivers during a file
broadcasting session................................................................................... 36
3.1 The A3 interface definition [4]................................................................ 453.2 Example of the new A3 interface for powering of telecommunica
tion and datacommunication equipments [4]........................................ 463.3 The ATIS energy efficiency calculation framework............................ 473.4 The comparison of the ECRs versus the number of RAN cells (sim
ulation) [5]................................................................................................... 61
4.1 LTE link Layer design highlighting the interaction between layers 704.2 A bidirectional relaying between the eNB and the UE via the RS. 724.3 A NC scheme for a bidirectional traffic at the RS............................. 73

LIST OF FIG U R ES
4.4 A NC scheme for bidirectional asymmetric rate traffic at the RS. . 754.5 A relaying protocol with the subcarrier division duplexing.............. 754.6 The comparison of the ECRs versus offered traffic load........ 864.7 The comparison of the IER versus offered traffic load........... 874.8 The comparison of the ERGs versus offered traffic load........ 884.9 The comparison of the IER gains versus offered traffic load 894.10 The comparison of the RUGs versus offered traffic load........ 904.11 The comparison of the ECRs versus the RS-UE distance..... 924.12 The comparison of the IER versus the RS-UE distance.................... 934.13 The comparison of the RUGs versus the RS-UE distance..... 944.14 The comparison of the ECRs versus the RS transmit power. . . . 964.15 The comparison of the IER versus the RS transmit power... 974.16 The comparison of the ERG versus the RS transmit power. 984.17 The comparison of the IER gains versus the RS transmit power. . 994.18 The comparison of the RUGs versus the RS transmit power. . . . 1004.19 The comparison of the ERGs versus the number of retransmissions. 1024.20 The comparison of the IER gains versus the number of retransmis
sions..................................................................................................................1034.21 The comparison of the RUGs versus the number of retransmissions. 104
5.1 The uplink and downlink schedulers functionality..................................1095.2 The relaying over multiple TWRCs in a single LTE cell...................... 1125.3 The network coding over multiple TWRCs in a single LTE cell. . 1125.4 The ERG versus the number of UEs per a single RS............................ 1215.5 The throughput gain versus the number of UEs per a single RS. . 1225.6 The number of RBs saved versus the number of UEs per a single
RS..................................................................................................................... 1235.7 The relative number of RBs saved versus the number of UEs per
a single RS...................................................................................................... 1245.8 The throughput gain versus the RS transmit power.............................1275.9 The ERG versus the RS transmit power................................................. 1285.10 The throughput gain versus the traffic load........................................... 1305.11 The ERG versus the traffic load............................................................... 131
x

LIST OF FIG U R E S
6.1 The user data flow between the network layer and the PHY layerin the LTE.......................................................................................................141
6.2 The user data flow between the network layer and the PHY layerin the LTE assuming intra-flow NC encoding at the MAC layer. . 142
6.3 Intra-flow NC scheme with serial transmissions......................................1436.4 Intra-flow NC scheme with parallel transmissions..................................1436.5 The throughput of the parallel intra-flow NC (LT) code versus the
number of parallel links................................................................................ 1496.6 Throughput ratio of parallel intra-flow NC LT code at various
Eb/No values................................................................................................... 1506.7 The CDF of the average number of packet transmissions.................... 1576.8 The average number of transmissions for a given maximum mod
ulation and coding index..............................................................................1606.9 The total and the RF energy consumptions for a given maximum
modulation and coding index...................................................................... 1616.10 The energy consumption-delay trade-offs for the parallel and the
serial LT codes implementations.................................................................163
List of Tables
2.1 Examples of NC as distributed coding................................................ 192.2 Power state levels for a mobile phone [ 6 ] .......................................... 33
4.1 DL Link Adaptation................................................................................. 794.2 UL Link Adaptation................................................................................. 794.3 Summary of the main simulation parameters..................................... 80
5.1 Main Simulation P aram eters ....................................................................1145.2 Power Consumption for Full Load [ 7 ] ....................................................117
6.1 Intra-flow NC Integration in LTE Protocol S tack ................................ 1396.2 Main Simulation P aram eters ....................................................................1546.3 Modulation and Coding Schemes [8].......................................................155
xii

Acronyms
3 G P P Third Generation Partnership ProjectAC Alternating CurrentA E C R Absolute Energy Consumption RatioA M C Adaptive Modulation and CodingATIS Alliance for Telecommunications Industry SolutionsA RQ Automatic Repeat reQuestA W G N Additive white Gaussian NoiseBO A Book of AssumptionsBSC Base Station ControllerB TS Base Transceiver Stationbps bits per secondB P S K Binary Phase Shift KeyingC apE x Capital ExpenditureC D M A Code Division Multiple AccessC D F Cumulative Distribution FunctionC SR Cell-specific Reference signalsC P E Consumer Premises EquipmentCQ I Channel Quality IndicatorD C Direct CurrentDL DownlinkD M -R S Demodulating Reference SymbolsD R X Discontinuous ReceptionDSL Digital Subscriber LineD SLA M Digital Subscriber Line Access MultiplexerD T X Discontinuous TransmissionD V B -H Digital Video Broadcasting for HandheldE C G Energy Consumption GainE C R Energy Consumption Ratio or Energy Consumption RatingEC R -V L ECR-Variable LoadE E R Energy Efficiency RateeN B evolved Node BE T S I European Telecommunications Standards InstituteEPA Extended Pedestrian AE P S Evolved Packet System
x iv
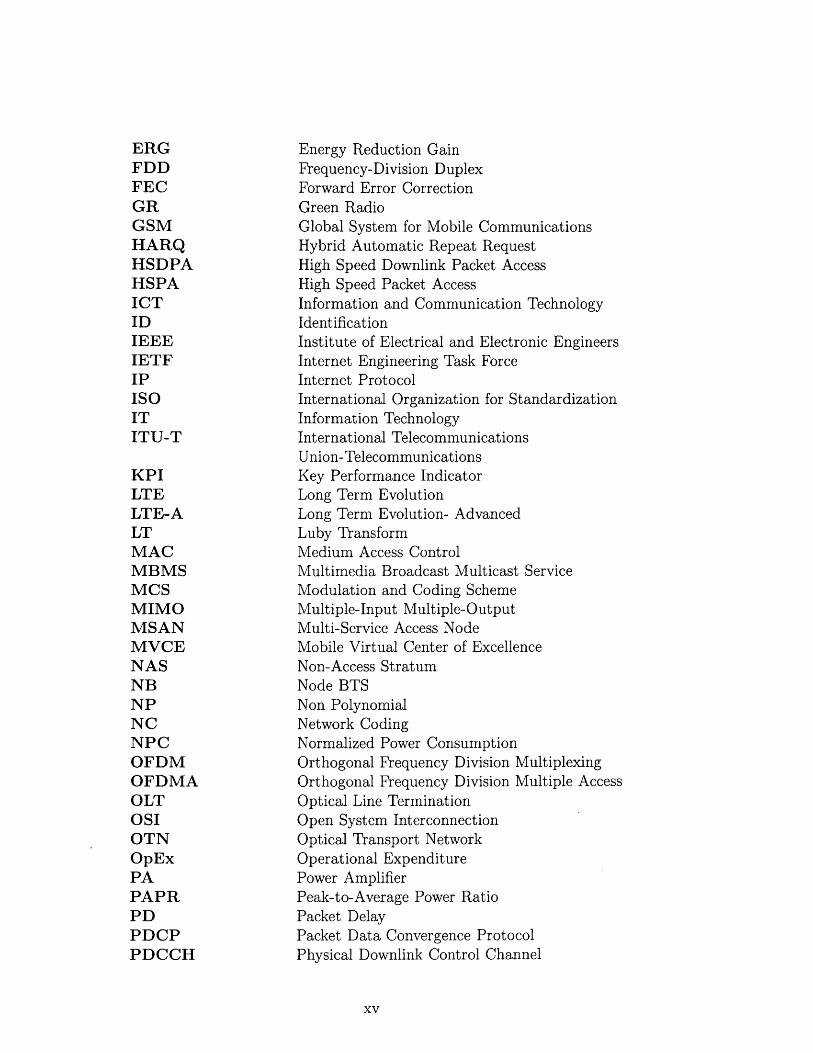
E R G Energy Reduction GainF D D Frequency-Division DuplexF E C Forward Error CorrectionG R Green RadioG SM Global System for Mobile CommunicationsH A R Q Hybrid Automatic Repeat RequestH S D P A High Speed Downlink Packet AccessH SPA High Speed Packet AccessIC T Information and Communication TechnologyID IdentificationIE E E Institute of Electrical and Electronic EngineersIE T F Internet Engineering Task ForceIP Internet ProtocolISO International Organization for StandardizationIT Information TechnologyIT U -T International Telecommunications
Union-TelecommunicationsK P I Key Performance IndicatorLTE Long Term EvolutionLTE-A Long Term Evolution- AdvancedLT Luby TransformM A C Medium Access ControlM B M S Multimedia Broadcast Multicast ServiceM CS Modulation and Coding SchemeM IM O Multiple-Input Multiple-OutputM SA N Multi-Service Access NodeM V C E Mobile Virtual Center of ExcellenceNA S Non-Access StratumN B Node BTSN P Non PolynomialN C Network CodingN P C Normalized Power ConsumptionO FD M Orthogonal Frequency Division MultiplexingO FD M A Orthogonal Frequency Division Multiple AccessOLT Optical Line TerminationOSI Open System InterconnectionO T N Optical Transport NetworkO pE x Operational ExpenditurePA Power AmplifierP A P R Peak-to-Average Power RatioP D Packet DelayP D C P Packet Data Convergence ProtocolP D C C H Physical Downlink Control Channel
XV

PD SC H Physical Downlink Shared ChannelPU SC H Physical Uplink Shared ChannelP D U Protocol Data UnitPE R Packet Error RatePH Y Physical LayerPR B Physical Resource BlockQoS Quality of ServiceQPSK Quadrature Phase Shift KeyingRA Resource AllocationR A N Radio Access NetworkR BS Radio Base StationRE Resource ElementRECG Relative Energy Consumption GainRF Radio FrequencyRLC Radio Link ControlRM S Root Mean SquareR N Relay NodeR NC Radio Network ControllerRNL Radio Network LayerRUG Resource Utilization GainRRC Radio Resource ControlRRH Remote Radio HeadsRRM Radio Resource ManagementSAE System Architecture EvolutionSC -FD M A Single Carrier - Frequency Division Multiple AccessSDD Subcarrier Division DuplexingSISO Single-Input Single-OutputSN R Signal-to-Noise RatioSRS Sounding Reference SignalsSPEC Standard Performance Evaluation CorporationTB Transport BlockTBLER Transport Block Error RateTBS Transport Block SizeTD D Time-Division DuplexTIA Telecommunications Industry AssociationTTI Transmission Time IntervalTW R C Two Way Relay ChannelTEER Telecommunications Energy Efficiency RatioU D P User Datagram ProtocolUE User EquipmentUM TS Universal Mobile Telecommunication SystemUL UplinkU PS Uninterrupted Power SupplyVOIP Voice-Over-IP
xvi

W CD M AW D MW IM A XXO R
Wideband Code Division Multiple Access Wave Division Multiplexing Wireless Interoperability for Microwave Access Exclusive-Or
xvii
1
Introduction
1.1 Background
The proliferation of wireless devices and applications promises higher delivery reliability and increased throughput guaranteed anywhere and anytime. This growth has resulted in explosive data service offerings such as multimedia streaming especially to mobile devices [9, 10]. The trend of the data services growth is not in line with the trend of the revenue growth as indicated in Figure 1.1 [1]. Larger data volumes require more cell site radio equipment, and more base stations per square kilometer resulting in increasing energy costs in spite of the revenue streams remaining flat. Hence, energy consumption per bit has to go down so that the mobile telecommunications business can remain viable and prosperous
in].The need to reduce CO2 emissions and the associated energy consumption are
required in order to meet the corporations responsibility targets; they represent other needs for energy efficient wireless networks. The Information and Communications Technology (ICT) sector is estimated to contribute between 2 to 10% of the global CO2 emissions [12]. For example, Vodafone UK has an average yearly power consumption of 40 Mega watts. Moreover, a Long Term Evolution (LTE) base station, evolved Node B(eNB), covering a suburban area requires up to 4.9 kilo watts of electrical power for its operation which corresponds to the energy
1

1.1 Background
TrafficDiverging expectations for traffic and revenue growth
■*—>oooO
DataVoice
R evenue
Time
Figure 1.1: Evolution of the operational cost of cellular networks over time [1].
consumption of tens of Mega watt-hours per annum. This figure is expected to rise further since the volume of transmitted data approximately doubles every year resulting in 16 to 20% annual increase of the energy consumption of mobile cellular networks [13]. Therefore, the Radio Access Network (RAN) operators are actively searching for innovative techniques that can achieve significant energy and power savings. For example Vodafone has set a group target to reduce its CO2 emissions by 50% by 2020 from 2006/07 levels [14], while Orange has set a target of 20% reduction per customer between 2006 and 2020 [15]. More importantly, these targets aim to find energy savings solutions without significantly sacrificing the required Quality-of-Service (QoS).
Motivated by these problems, in this thesis, transmission protocols employing Network Coding (NC) are investigated and their integration and implementation within the LTE cellular systems are explored. First, the energy consumption metrics that allow comprehensive comparisons of the energy efficiencies of various transmission protocols with and without NC are established. The key principle of NC is an effective exploitation of the distributed diversity created by the broadcast nature of the wireless medium. The efficiency of NC can be measured as a reduction of the number of packets (re)transmissions, since this can equivalently free up the radio resources, increase the network throughput and thus save en-
2

1.1 Background
ergy. We will show that our proposed NC protocols can yield both throughput gains as well as energy savings, and they can be also readily integrated in the LTE protocol stack.
One of the main objectives of this thesis is to study the concept of NC. NC was first introduced from the information theory perspective as a means to achieve the multicast capacity in wireline networks [16]. Subsequent works were mainly theoretical and mostly ignored practical implementation constraints. These works usually assumed NC for multicast traffic and lossless links [17, 18] . They often assumed constant traffic, and did not consider the physical layer transmission constraints. However, the reality of cellular mobile networks is very different. In particular and importantly, traffic in cellular networks are usually unicast, and channels are lossy and experience fading and other channel impairments. Furthermore, traffic is usually bursty and the transmission rates are usually unknown and difficult to predict [19, 20]. Thus, in practice, the wireless medium and its unpredictability makes the application of the NC techniques very challenging.
This thesis investigates the implementation aspects of employing NC in the LTE networks. We will show that NC can be seamlessly integrated into the current protocol stack of LTE networks. The throughput enhancement from NC translates into energy savings by exploiting the reduced number of (re)transmissions These energy savings come from the reduction of the consumed Radio Frequency (RF) power as well as of the operational energy. We also examine the scalability of the practical NC protocols for different LTE parameter settings and traffic loads. We propose NC protocols employing rateless codes implemented at the Medium Access Control (MAC) layer of LTE which outperform the conventional implementations of rateless codes at the application layer in terms of the transmission delay and the energy consumption assuming suitable adaptive modulation and coding schemes selections. Notably, optimization of the adaptive modulation and coding scheme results in distinct energy-delay tradeoff phenomena of the proposed protocol. These protocols are particularly applicable to LTE-Advanced (LTE-A) networks.
3
1.2 Thesis Contributions
1.2 Thesis Contributions
The main objective of this thesis is to incorporate NC schemes into cellular mobile networks, and to understand the connection between the theoretical NC schemes considered in academic papers and the practical characteristics and implementations constraints of the current and future cellular networks. In addition, our aim is to obtain comprehensive evaluation of the possible NC gains and to gain insights into the interaction of NC with other functionalities of the cellular network protocol stack. The specific contributions of this thesis elaborates various aspects of the overall objective and can be enumerated as follows:
1. Comprehensive review of the energy and power metrics used in the open literature and in the standards in order to select the most suitable metrics for our evaluations (i.e for the LTE RAN).
2. The selected energy metric: Energy Consumption Ratio (ECR), Energy Consumption Gain (ECG) and Energy Reduction Gain (ERG), are used for evaluations of the proposed NC schemes and of the conventional NC schemes in the literature.
3. Practical NC protocols implemented at the MAC-sublayer of the LTE protocol stack ate proposed, yielding throughput improvements of 19% and energy consumption reductions of 16 — 25% depending on the offered traffic in the network when applied to bi-directional unicast traffic in LTE multi hop networks.
4. The proposed NC protocol is shown to be scalable with the number of unicast sessions in the LTE multi-hop network. The scalability is assessed with respect to the number of users in the cell, increasing traffic load per user, reduced number of (re)transmissions per packet and varying transmission powers.
5. The resource utilization gain due to NC is explored and shown to give a good indication of the energy saving potential by NC.
6. Another NC protocol implemented at the MAC layer of the LTE protocol stack is proposed. It is based on the rateless codes concept and allows parallel transmissions of multiple packet combinations in each sub-channel
4
1.3 Thesis Layout
of the af interface, resulting in higher utilization of the network physical resources It outperforms the conventional application layer implementations of Ihe rateless codes in terms of the transmission delay and the energy consumption provided that the Adaptive Modulation and Coding (AMC) mechanian in the LTE is considered.
7. The ene:gy consumption-delay trade-offs of the conventional and of the proposec protocols were found to be distinctively different. This is particularly use’ul in the LTE-A networks and contribute to finalizing the LTE-A standard
In summary, our NC schemes favour the MAC layer implementations for several reasons. First, the Transport Block (TB) as a Hybrid Automatic Repeat Request (HALQ) retransmission unit facilitates faster error correction. Second, it also has less impact on lower layers functionality which is usually overlooked in the literature rn NC. Third, the LTE inherent adaptability of packet transmissions, varying sizes and availability of data entities, and signaling of what data packets have been combined; all makes the TB the most appropriate entity for implementation of NC schemes. Finally, The use of the TB entity also facilitate the explo.tation of AMC and HARQ transmissions more than higher layer implementations of NC schemes.
1.3 Thesis Layout
Chapter 2 presents overview of NC, explains its background and reviews the relevant literature. Chapter 3 presents a comprehensive overview of the energy metrics and identifies suitable metrics to use for the performance evaluations of the NC schemes in this thesis. It also presents a case study along with its mathematical analysis of NC and validates the analytical results by computer simulations as a motivation for the work in subsequent chapters. Chapter 4 presents a practical NC protocol for the LTE network. Its integration in the LTE protocol stack is described and numerical analysis of its performance is obtained. Chapter 5 extends the considered NC protocol to the case of multiple users and also the scalability
5

1.3 Thesis Layout
with respect t) the traffic loads for different channel conditions is investigated. Chapter 6 pr6ents a NC protocol based on rateless codes implemented at the MAC layer ofthe LTE along with its mathematical analysis and simulation results of its enegy-delay performance results. Conclusions are given in Chapter 7 including area for possible future research.
6
2
Netwoik Coding Background and Related Work
This chapter preents theoretical fundamentals of NC for wired and wireless communications. Section 2.1 introduces NC as a new paradigm for packet transmission in telecommmications networks. Section 2.2 discusses the benefits of NC in wireless network. Section 2.3 outlines prior work on NC relevant to the research problems considered in the thesis. Section 2.4 presents our perspective on the inclusion of NC n wireless networks as a form of distributed coding. Section 2.5 reviews the LTE air interface, its protocol stack and the network architectures using relay statims. Section 2.6 presents our preliminary study on NC protocols for unicast md broadcast applications in the relay-aided cellular network architectures. The preliminary study on the expected gains from NC assumes numerical simulations which are verified via mathematical analysis. Section 2.7 summarizes the notivations of our work presented in the thesis and the areas of our focus and coisiderations in upcoming chapters.
2.1 Network Coding (NC)
Significant reseaich efforts have been and are still being devoted to optimize the operation of telecommunications networks. A common theme of such research ef-
7

2.1 N etwork Coding (NC)
forts is the way information is treated and transported in the networks. Whether, it is packets in the Internet or in wireless networks or signals in analogue telephony networks, information is transported over different streams and the contents of information is always kept separate in each stream. This is analogous to cars moving on the motorway network or fluids flowing through the pipe network. Therefore, the available bandwidth of the telecommunication network has to be shared among these independent streams in the same way that cars share lanes in the motorway network. Physical layer transmission schemes, packet scheduling and routing, congestion control and error control are examples of telecommunications network functionalities based on this principle [21].
NC further generalizes this principle. Thus, under the NC paradigm, information streams do not necessarily need to be kept separated when transported through the network. NC allows both the source nodes and intermediate nodes to mix information streams together before forwarding them over the network towards the destination nodes. This new principle has direct impact on the design of telecommunications networks [22]. The reliability of information delivery, the network resource savings and the efficiency of flow control are some examples of appealing NC features [23].
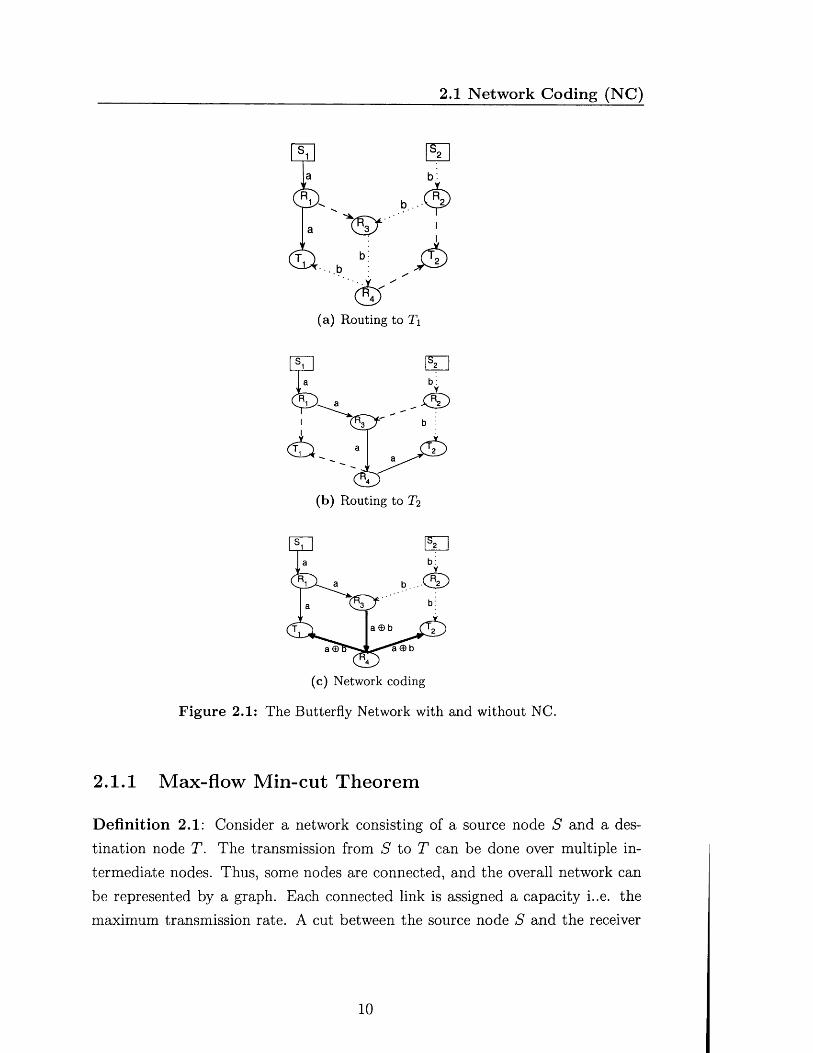
In wired and wireless networks, unlike traditional techniques for cooperative relaying, NC is considered to be a generalization of routing that allows nodes to perform some mathematical operations on the previously received packets before forwarding them to subsequent network nodes [24]. The NC principle is best demonstrated through the canonical butterfly example shown in Figure 2.1a, Figure 2.1b and Figure 2.1c.
Assume tha t the time is slotted, and the capacity per channel is one bit per time slot. The two sources Si and S 2 produce 1 bit of information a and b, respectively. Both receiver terminals T\ and T2 want to simultaneously receive the information bits from both sources. If receiver 7\ uses all the network resources by itself, it can receive both sources as depicted in Figure 2.1a. Similarly, T2 can receive both sources as depicted in Figure 2.1b. However, both receivers can not receive both sources simultaneously, since the bottleneck link R 3 — R 4 can not carry 2 bits simultaneously. Hence, the link R 3 — R 4 has to be shared in time.

2.1 N etwork Coding (N C )
On the other hand, both terminals can receive both sources simultaneously if we allow node i?3 to use exclusive-or(XOR) for information bits a and b to create a © b to be sent through channel R 3 — R 4 , where the XOR operation corresponds to addition over a binary field. Thus, 7\ receives {a, a © 6}, and it can solve this system of two equations to retrieve also b. Similarly, T 2 receives {b, a © 6}, so that it can get also a. Thus, the NC scheme in Figure 2.1c can obtain a multicast throughput of 2 bps which is better than the routing approach which can at best achieve 1.5 bps.
The original theorem of NC was first presented by Ahlswede et.al in [25] in 2000. The NC theorem is based on the famous max-flow min-cut theorem [21]. Due to their significance, these theorems will be presented next.
9
2.1 Network C oding (NC)
b . A ^
(a) Routing to T\
' (E ?" ~ b
<E5(b) Routing to T2
(c) Network coding
Figure 2.1: The Butterfly Network with and without NC.
2.1.1 Max-flow M in-cut Theorem
D efinition 2.1: Consider a network consisting of a source node S and a destination node T. The transmission from S to T can be done over multiple intermediate nodes. Thus, some nodes are connected, and the overall network can be represented by a graph. Each connected link is assigned a capacity i..e. the maximum transmission rate. A cut between the source node S and the receiver
10

2.1 Network Coding (NC)
node T is a set of the graph edges (links) whose removal disconnects S from T [21].
D efinition 2.2: A min-cut is a cut with the minimum value. The value of a cut is the sum of the capacities of the edges in that cut [21].
Theorem 2.1: A network is modeled as a graph G = (V,E) with V vertices (nodes), E edges of unit capacity, a source vertex S and a receiver vertex T. If the min-cut between 5 and T equals h, then the information can be sent from S to R at a maximum rate equal to h . Equivalently, there exist exactly h edge-disjoint paths between S and T [21].
This theorem states that we can find a set of edge-disjoint paths from S to T on which we can carry the maximum total flow of h bps through the network. In other words, the maximum supported information flow in a network is bounded by its min-cut. The min-cut represents the bottleneck of information flow between S and T.
2.1.2 Main Network Coding Theorem
D efinition 2.3: A directed graph is a graph where the edge directions are specified and are uni-directional. Acyclic graph is a graph with no cycles i.e. there are no loops between a source node and a destination node [26].
Theorem 2.2: Consider a directed acyclic graph G = (V, E) with the unit capacity edges, h unit rate sources located on the same vertex of the graph and N receivers. Assume that the value of the min-cut to each receiver is h. Then there exists a multicast transmission scheme over a large enough finite field Fqi in which intermediate network nodes linearly combine their incoming information symbols over Fq, that delivers the information from all sources simultaneously to each receiver at a rate equal to h [27].
From Theorem 2.1, there exist exactly h edge-disjoint paths between the sources and each of the receivers. Thus, for any receiver using all the network resources by itself, information from the h sources can be routed through a set
11

2.1 N etwork C oding (NC)
of h edge disjoint paths, ensuring ;hat each receiver gets a rate equal to h bps. However, when multiple receivers ae using the network simultaneously, their sets of paths may overlap and they shan the network resources, resulting in rates that are less than h bps. Thus, Theorem2.2 states that if we allow intermediate nodes to combine information, then eacl of the receivers will get information at the same rate as if it had sole access tc the network resources.
Although defined for directed md acyclic graphs, NC can also be beneficial for undirected graphs in some ca:es [28]. The loops in cyclic graphs can be mitigated by buffering to enable NO performance gains. Hence, NC achieves the maximum throughput for multicasting. NC transforms the multicast problem into a flow assignment problem that can be, in general, solved using mathematical optimization methods in polynomial time [29].
Prom Theorem 2.2, we can obUin the concept of performing this mixing linearly, which is referred to as linear network coding. In linear network coding the encoding coefficients are drawn fron a finite field Fq. The encoding and decoding operations for linear network codirg are explained next.
2.1.3 Encoding
Assume packets are of L bits length. Groups of 5 bits are represented by a symbol in the field P9, q = 2s, forming a packet with L / s symbols. The encoding operation is performed over finite field Fq. The encoded packet is obtained as (the summation performed for every symbol) [27]:
where P0l, ...POM are the M original packets and G = (g(l), ...g(M)) is the encoding vector for the coded packet Pc- The encoded packets can be coded again with other packets in a recursive manner. For example, the set (Gi, PcO, — (Gn, Pcn) of the encoded packets can be used to generate (G',Pq) using P^ = YTj=\ h{j)Pcj for the set of coefficients h = h(l), .. .h(n). In this case G' = 22j=i
M(2.1)
12
2.1 Network Coding (NC)
2.1.4 Decoding
The destination receives n encoded packet; with their corresponding encoding vectors and can retrieve the original packetsby solving the system of linear equations [27]:
M
Pcj — 9j})Poi (2-2)i=l
The original packets can be recovered as loig as n > M and there are at least M linearly independent combinations among those n packets. The later condition implies that the size q of the finite field Fq should be large enough to guarantee the independence of the packet combinations. Theorem 2.2 states that there exist deterministic encoding vectors to be uied at each node in the network such that the destination node receives at least N linearly independent combinations. Moreover, simulation results show that the rmdom combining of coefficient drawn from relatively small finite field F2 s, 5 = 8 results in negligible probability of selecting linearly dependent combinations [10]. If random coefficients are used, then the encoded packets do not need to carry the encoding vectors in their headers.
The decoding operation is performed in the following steps [21]:1. The received packets with their encocing vectors are stored in a decoding
matrix. Each received coded packet is stored as another row in this matrix.
2. The Gaussian elimination is performed. Any packet increasing the rank of the matrix is stored, while other paclets are reduced to zeros and ignored by the Gaussian elimination.
3. These steps are repeated until the decoding matrix becomes a triangular matrix (equivalent to having a unit vector encoding vectors for all the received packets).
To reduce the size of the decoding matrix, usually the encoding and the decoding are performed on a group of packets (called a packet generation). The packet generation size is related to the finite field size and impacts the decoding performance of NC. For large enough field sizes, say 256, the impact of packet generation size on the performance is negligible [27].
13

2.2 Network Coding Benefits
2.2 Network Coding Benefits
NC has originally been developed and focused on improving the throughput of networks. However, recently, other benefits of NC are arising especially in content delivery, robustness, security, and energy efficiency.
2.2.1 Throughput Gains
As indicated by Theorem 2.1 and 2.2, NC achieves the optimal throughput for multicast flows. In contrast, this optimal throughput is lower for the case of multicast routing which is Non-polynomial (NP)-complete. Whereas NC achieves the multicast capacity using polynomial time algorithms. Multicasting using NC in directed graphs has shown significant gains, however, the gains are bounded by 2 if undirected graphs are assumed [31].
NC also improves the throughput for unicasting. For example, in Figure 2.1c and under the assumption that Si wants to communicate to X2 and S 2 wants to communicate to Ti, NC achieves a rate of 1 bps compared to 0.5 bps achieved by routing for each user.
2.2.2 Reduced Com plexity
Performing NC opportunistically over packets at intermediate nodes allows us to apply simple distributed network algorithms rather than complex centralised ones with excessive overheads. For example, for file sharing using peer-to-peer protocols, NC achieves the optimal performance (e.g the minimum transmission time) using a simple decentralized algorithm. The same performance is also achieved with a centralized algorithm, however, at the cost of higher algorithm complexity and overhead [27]. The reduction in complexity reduces the processing power needed and hence the energy consumption.
14

2.3 Previous Work
2.2.3 Improved Packet Transmission Reliability
For packet transmissions, the performance of end-to-end forward error correction (FEC) protocols and Automatic Repeat reQuest (ARQ) protocols is limited by the Packet Error Rate (PER) of the links. Hence, the performance deteriorates when there are many hops between the source and the destination. By using NC at intermediate nodes in such scenarios, the overall PER is reduced and hence the end-to-end throughput is improved as intermediate nodes can deliver sufficient number of linear combinations to the receiver over fewer links. Thus, this is more beneficial than having to retransmit lost packets all the way from the source [27].
2.3 Previous Work
The area of NC is relatively new and the results in the literature are not conclusive. Most of the papers published on NC are mostly theoretical and based on conceptual system models while focusing mainly on the multicast traffic; see [25], [32], [33] and [34]. The conceptual system models to study NC are often not applicable to mainstream services and applications provided in cellular networks, and more importantly, the reported results are often contradicting one another. For example, [35] shows that NC throughput and energy consumption gains in wireless networks are always bounded while they are unbounded in wire- line networks. The reference [35] also identifies certain architectural scenarios where the throughput and energy consumption gains of NC are nill or close to nill. Reference [36] presents some measurements on WiFi devices with throughput improvements of 52% and 65% less energy consumption when employing NC. However, most results in the literature support benign effects of NC.
In efforts to address the problem of extending NC over multiple unicast sessions, the bounds of the throughput and the energy efficiency improvements were studied thoroughly in the literature. For example, Backpressure algorithms [37] are used to find approximately the throughput optimal nodes for preforming the XOR operations. Reference [38] shows throughput improvements of NC over routing in directed and indirected networks with integral routing requirements.
15

2.3 Previous Work
It also shows that the potential throughput improvements from NC are equivalent to the potential improvements of the network bandwidth efficiency. This potential will be exploited by some NC methods in this thesis.
Reference [39] shows that under certain strong connectivity requirements, the throughput improvements of NC are bounded by 3. Moreover, [40] showed, for a network with nodes positioned at a hexagonal lattice, that the upper bound of 3 for the energy benefit of NC can be achieved. A best known lower bound on the maximum energy benefit of NC over all possible network configurations, under the assumption that all data symbols transmitted by a node are linear combinations only of the source symbols that have been successfully decoded by that node, is 2.4 [41]. For random networks, an energy benefit upper bound of 3 is reported in [42]. However, this bound only applies to a specific type of network codes. Reference [43] analyses the throughput improvements from NC of the practical COPE protocol in [44] from the theoretical perspective and advocates that it is beneficial to make routing aware of the coding opportunities in the network rather than being oblivious to it. Most of the above works give useful insights into the performance improvement gains of NC. However, it is noticed that those gains are mostly network topology, traffic requirements and configurations dependent, fn this thesis, we will investigate the conditions when NC can bring significant gains in LTE networks, and address the cases when such gains are more difficult to obtain.
Practical NC schemes to enhance the network throughput in 802.1 In networks are described in [44]. However, very few considerations have been given to how to employ NC in Orthogonal Frequency Division Multiple Access (OFDMA) based wireless networks, in general, and in LTE and LTE-A in particular. For example, Zhang et al. [45] investigates the performance of NC used at the base station in an OFDMA cell. Reference [45] studies joint NC and subcarrier assignment schemes for Worldwide Interoperability for Microwave Access (WIMAX) networks and shows that the coding aware subcarrier assignment results in higher throughput compared to adaptive assignment schemes without NC. Yuedong Xu et al. [46] derives the routing and scheduling schemes with NC for OFDMA relay networks. The authors observe throughput gains of 1.3 and 1.5 times for the fixed power and
16

2.3 Previous Work
dynamic power OFDMA subcarrier assignment schemes, respectively. However, none of these references consider practical implementation aspects and constraints of the LTE standard. Consequently, in this thesis, the main focus is to investigate how the practical implementation constraints affect the usefulness of NC.
2.3.1 Network Coding for Energy Efficiency
Significant volume of the literature focuses on studying the throughput gains of NC. Few considerations have been given to investigate the usefulness of NC from the energy efficiency point of view. The bounds on the throughput gains from NC in wireless networks for grid topologies are reported in [47]. The gain as the number of transmissions is derived in [48] where NC is applied to minimize energy in sensor networks. Reference [49] obtains the bounds on the number of coded packets in a node. Although important, the work in [49] is limited to certain topologies and does not give the conditions when NC can provide energy savings, and neither is applicable to cellular networks.
Reference [50] illustrates the trade-off between the energy savings from NC and the lifetime of nodes in sensor networks. Both single-path and multi-path routing variations of the NC problem are presented and solved using analytical formulations and subsequent optimizations. Up to 35% energy savings can be obtained from the proposed multi-path protocol. However, much of the gains are offseted by the extra control message transmissions and overhead delays.
Reference [51] presents a routing protocol that exploits coding opportunities. It works on the principle of routing flows to a region where NC can be performed in order to increase the throughput of the network. The trade-off between routing flows to achieve the NC advantage and avoid interference is discussed in [43]. Although improving the throughput, both techniques have adverse impact on the energy consumption and can not- be applied to networks where energy consumption is an issue.
Recently, energy efficient resource management for OFDMA cellular networks based on cooperative relaying and cognitive radio has been discussed in [52]. The design of resource allocation strategies for single and multiuser wireless systems
17

2.4 N etw ork Coding in W ireless Networks: A N ew Perspective
for energy efficiency is studies in [53]. Transmission protocols such as ARQ and Hybrid ARQ(HARQ) has shown to reduce the transmission energy for decoding and in the electronic cercuitry of wireless devices including relay node [54]. NC schemes based on distributed coding have been applied at various wirless nodes including relay nodes. NC can also be jointly designed with resource allocation and other transmission protocols such as HARQ for improved energy efficiency. Hence,the focus of this thesis is to develop energy efficient NC schemes for LTE RANs while achieving the target QoS and throughput improvements. In contrast in order to realize these targets, good understanding of the energy consumption and the throughput performance comparisons of various transmission protocols with and without NC is required. The proposed approach is to evaluate the performance of various NC schemes from the system perspective.
2.4 Network Coding in W ireless Networks: A N ew Perspective
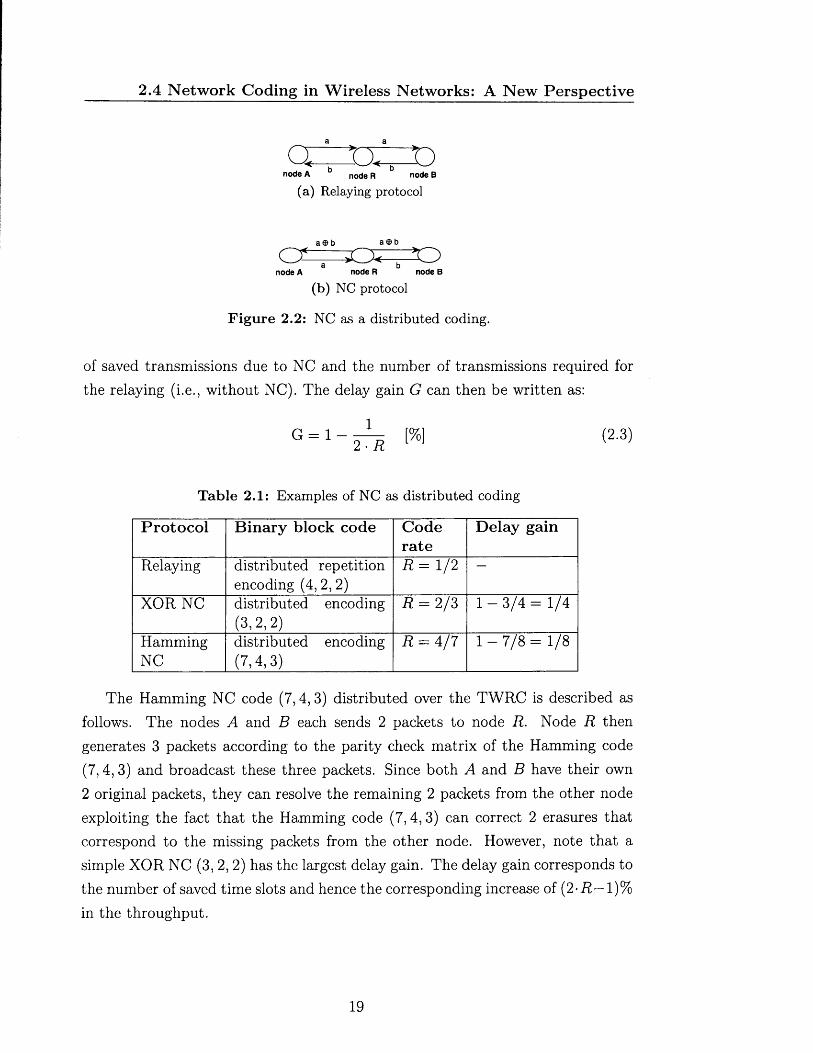
The term ” network coding (NC)” is used throughout this thesis in the sense of a distributed coding among the network nodes. In distributed encoding, the packets from several sources are encoded together at an intermediate node. An example illustrating this is a Two Way Relay Channel (TWRC) shown in Figure 2.2. It illustrates the scenario where two nodes exchange packets with the help of another node R. The node R generates the distributed code (4, 2, 2) and (3, 2, 2) for the relaying and NC protocols respectively. We denote the linear binary block codes as (N ,K ,d min) where N is the block length, K is the code dimension (the number of information bits) and dmin is the minimum Hamming distance of the coding scheme. (TV, A, dmin) can correct at most dmin — 1 erasures and |_(dmm — 1)/2J errors where |_*J denotes the floor function. We also denote the code rate as R = K /N .
The mapping of ‘network coding’ protocols to binary block codes is shown in Table 2.1 for the relaying protocol, the XOR NC protocol and the Hamming NC protocol. We define the delay gain of the NC protocol as a ratio of the number
18
2.4 N etw ork Coding in W ireless Networks: A N ew Perspective
a a
a = a = t )iode A no(je p node B
(a) Relaying protocol
a bnode A node R node B
(b) NC protocol
Figure 2.2: NC as a distributed coding.
of saved transmissions due to NC and the number of transmissions required for the relaying (i.e., without NC). The delay gain G can then be written as:
G = 1 - — [%] (2-3)
Table 2.1: Examples of NC as distributed coding
P rotocol Binary block code Coderate
Delay gain
Relaying distributed repetition encoding (4, 2, 2)
R = 1/2"
XOR NC distributed encoding (3,2,2)
R = 2/3 1 - 3 / 4 = 1/4
HammingNC
distributed encoding (7,4,3)
R = 4/7 1 - 7 / 8 = 1/8
The Hamming NC code (7,4,3) distributed over the TWRC is described as follows. The nodes A and B each sends 2 packets to node R. Node R then generates 3 packets according to the parity check matrix of the Hamming code (7, 4, 3) and broadcast these three packets. Since both A and B have their own 2 original packets, they can resolve the remaining 2 packets from the other node exploiting the fact that the Hamming code (7, 4, 3) can correct 2 erasures that correspond to the missing packets from the other node. However, note that a simple XOR NC (3, 2, 2) has the largest delay gain. The delay gain corresponds to the number of saved time slots and hence the corresponding increase of (2-R— 1)% in the throughput.
19
2.5 LTE Radio Access
Thus, the highest possible delay gain for the TWRC in Figure 2.2 is 25% which is achieved using the XOR NC protocol. The (7,4,3) Hamming NC protocol has a delay gain of 12.5%. To the best of our knowledge, there is no other code that can outperform the XOR NC protocol at least for the TWRC scenario with three nodes. Hence, we will study the performance of the XOR NC protocol only.
More generally and similar to Figure 2.2, one can consider distributed modulation among the nodes which is known as the physical layer network coding. However, in our view, the intentional interference created by the physical layer network coding is not a desirable approach, particularly in LTE networks that are designed for orthogonality among the transmissions within the cell (i.e. a zero intra-cell interference). Therefore we only consider the XOR NC protocol applied at the Open System Interconnection (OSI) layers above the physical layer, in this thesis.
2.5 LTE Radio Access
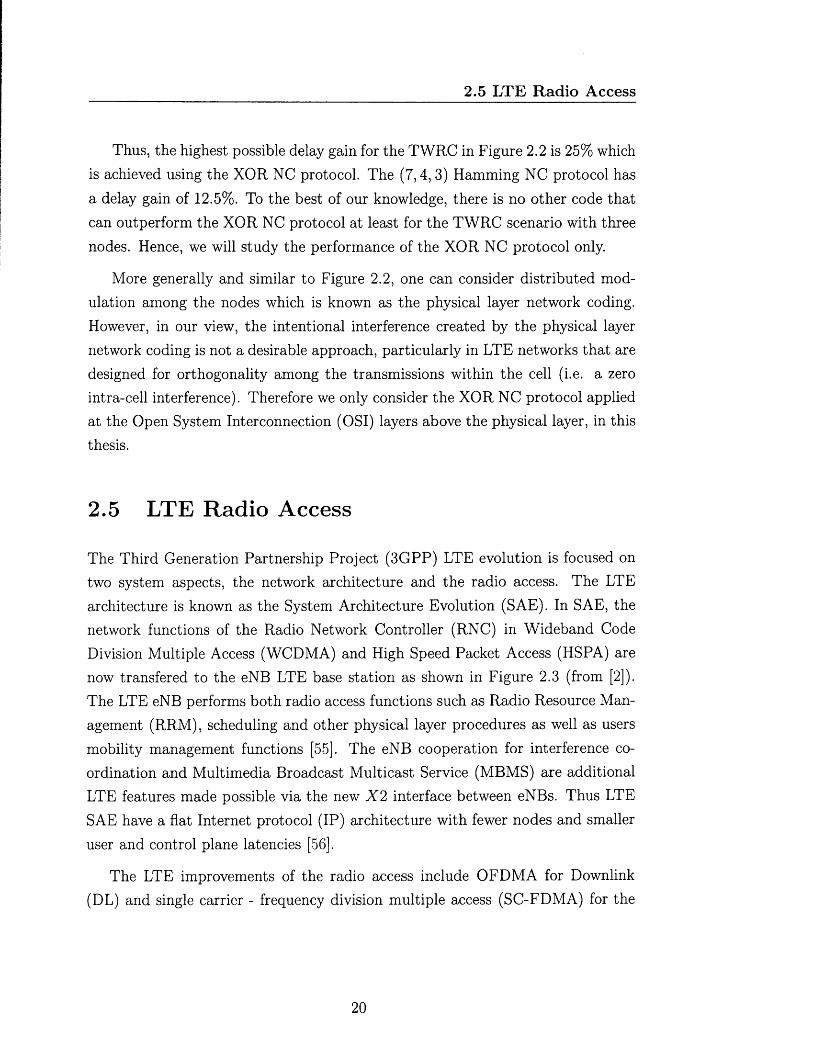
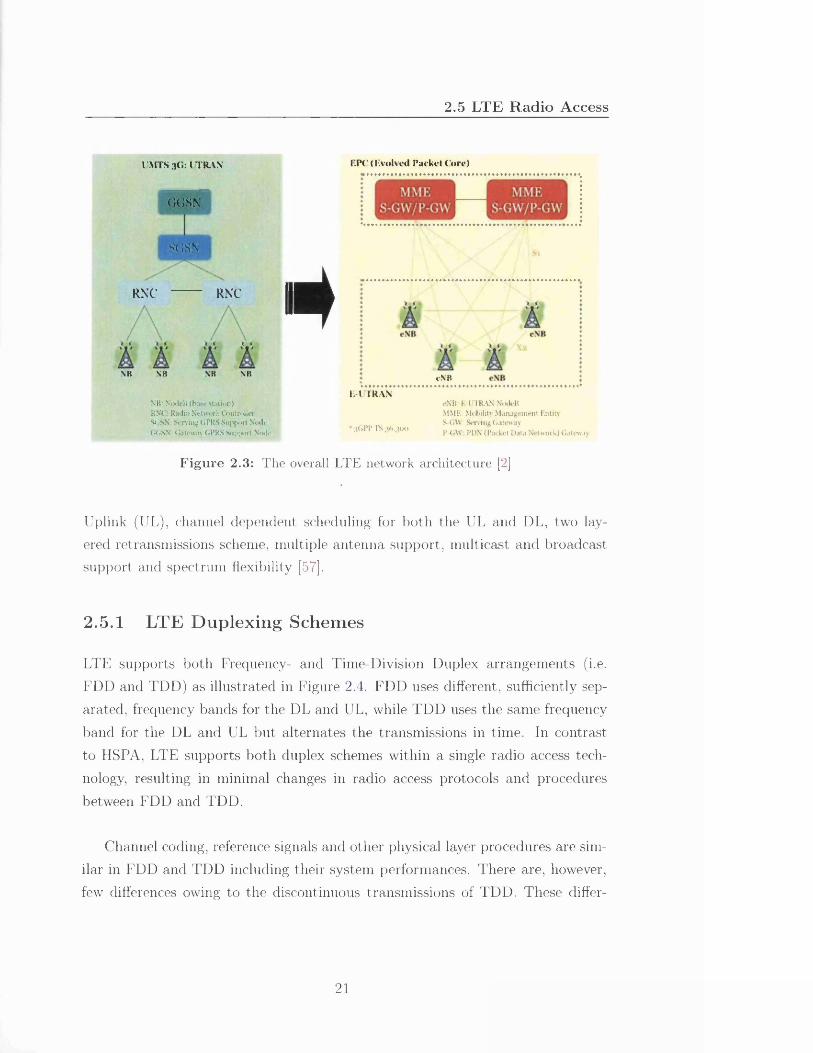
The Third Generation Partnership Project (3GPP) LTE evolution is focused on two system aspects, the network architecture and the radio access. The LTE architecture is known as the System Architecture Evolution (SAE). In SAE, the network functions of the Radio Network Controller (RNC) in Wideband Code Division Multiple Access (WCDMA) and High Speed Packet Access (HSPA) are now transfered to the eNB LTE base station as shown in Figure 2.3 (from [2]). The LTE eNB performs both radio access functions such as Radio Resource Management (RRM), scheduling and other physical layer procedures as well as users mobility management functions [55]. The eNB cooperation for interference coordination and Multimedia Broadcast Multicast Service (MBMS) are additional LTE features made possible via the new X 2 interface between eNBs. Thus LTE SAE have a flat Internet protocol (IP) architecture with fewer nodes and smaller user and control plane latencies [56].
The LTE improvements of the radio access include OFDMA for Downlink (DL) and single carrier - frequency division multiple access (SC-FDMA) for the
20
2.5 LTE R ad io Access
I'MTS 3(1: 1 TRAN
IKJSN
sc;sn
RNC RNC
» *
NR NB NB NB
\ ’B: NixleB (base station)RNl Radio Network ControBtr SGSN: Serving GPRS Support Node GGSN: Gateway GPRS Supjxirt Node
I.PC ( Evolved Packet Core)
HE-l TRAN
■ 3 0 P P T S 3 6 .3 0 0
eNB
eNB: E-UTRAN NodeBMMF: Mobility Management EntityS*GW: Serving GatewayP-GVV I’DN ( Packet Data Network) Gateway
Figure 2.3: The overall LTE network architecture [2]
Uplink (UL), channel dependent scheduling for both the UL and DL, two layered retransmissions scheme, multiple antenna support, multicast and broadcast support and spectrum flexibility [57].
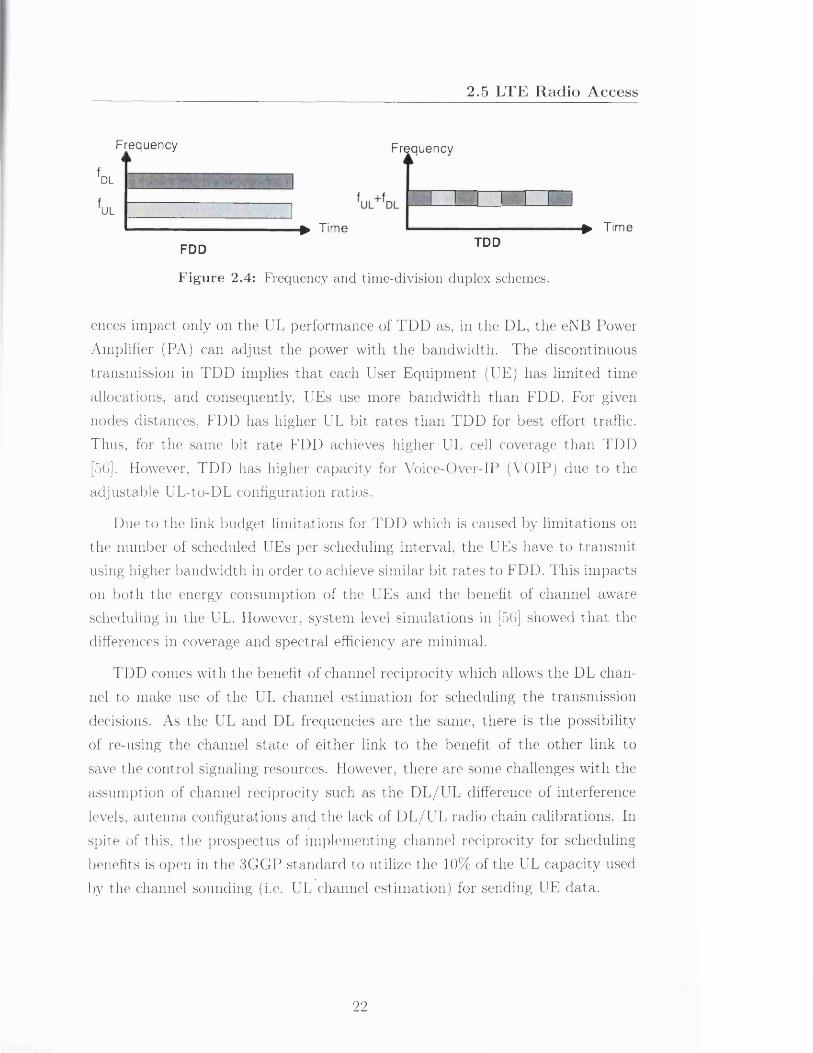
2.5.1 LTE D uplex ing Schem es
LTE supports both Frequency- and Time-Division Duplex arrangements (i.e. FDD and TDD) as illustrated in Figure 2.4. PTD uses different, sufficiently separated, frequency bands for the DL and UL, while TDD uses the same frequency band for the DL and UL but alternates the transmissions in time. In contrast to IISPA, LTE supports both duplex schemes within a single radio access technology, resulting in minimal changes in radio access protocols and procedures between FDD and TDD.
Channel coding, reference signals and other physical layer procedures are similar in FDD and TDD including their system performances. There are, however, few differences owing to the discontinuous transmissions of TDD. These differ-
21
2.5 LT E R ad io A ccess
Frequency Frequency
DL
UL__
> Time ^ Time
FDD TDD
Figure 2.4: Frequency and time-division duplex schemes.
ences impact only on the UL performance of TDD as, in the DL, the eNB Power Amplifier (PA) can adjust the power with the bandwidth. The discontinuous transmission in TDD implies that each User Equipment (UE) has limited time allocations, and consequently, UEs use more bandwidth than FDD. For given nodes distances, FDD has higher UL bit rates than TDD for best effort traffic. Thus, for the same bit rate FDD achieves higher UL cell coverage than TDD [56]. However, TDD has higher capacity for Voice-Over-IP (VOIP) due to the adjustable UL-to-DL configuration ratios.
Due to the link budget limitations for TDD which is caused by limitations on the number of scheduled UEs per scheduling interval, the UEs have to transmit using higher bandwidth in order to achieve similar bit rates to FDD. This impacts on both the energy consumption of the UEs and the benefit of channel aware scheduling in the UL. However, system level simulations in [56] showed that the differences in coverage and spectral efficiency are minimal.
TDD comes with the benefit of channel reciprocity which allows the DL channel to make use of the UL channel estimation for scheduling the transmission decisions. As the UL and DL frequencies are the same, there is the possibility of re-using the channel state of either link to the benefit of the other link to save the control signaling resources. However, there are some challenges with the assumption of channel reciprocity such as the DL/UL difference of interference levels, antenna configurations and the lack of DL/UL radio chain calibrations. In spite of this, the prospectus of implementing channel reciprocity for scheduling benefits is open in the 3GGP standard to utilize the 10% of the UL capacity used by the channel sounding (i.e. UL channel estimation) for sending UE data.
22

2.5 LT E R ad io A ccess
2.5.2 L T E P ro to c o l A rc h i te c tu r e
The LTE radio access protocol architecture for both the eNB and the Relay Node (RN) is shown in Figure 2.5. The role of these protocols is to allocate/release the Evolved Packet System (EPS) radio bearers that are used to carry user data. The EPS radio bearer is the 3GPP terminology used for the data flows and comprises of both signaling and data. Signaling radio bearers carry Radio Resource Control (RRC) signaling while user plane radio bearers carry user data.
Control Plane User Plane
Radio bearers
Logical Channels
Transport Channels
RRC
PDCP
RLC
MAC
Physical Layer
Figure 2.5: The LTE radio protocol architecture.
As shown in Figure 2.5, Medium Access Control (MAC), Radio Link Control (RLC1) and Packet Data Convergence Protocol (PDCP) are layer 2 protocols. Layer 3 consists of the RRC protocol. Above RRC, there is a Non-Access Stratum (NAS) protocol that carries signaling information for paging, system information, call set-up, etc to/from the core network. The radio access protocol architecture is
23
2.5 LTE Radio Access
valid for both the eNB and the RN. Description of the functions of the particular radio protocols are given below:
• PDCP: The main functions of PDCP are data integrity protection, encryption, and IP header compression.
• RLC: The RLC is a sublayer of layer 2 and is responsible for segmentation and concatenation of the higher layers Protocol Data Units (PDUs) and for mapping the EPS radio bearers data into the logical channels. The RLC also handles residual HARQ errors on the MAC layer using the ARQ retransmissions as well as it manages in-order delivery to the higher layers. The ARQ retransmission unit is an RLC PDU.
• MAC: The MAC is a sublayer of layer 2. Its main functions are multiplexing, scheduling and physical layer retransmissions (HARQ).
• Physical Layer (PHY): The physical layer (Layer 1) is responsible for modulation and coding of the UE data and transmitting them into the physical medium.
These functions allow LTE networks to offer data rates and transmission efficiencies of users data that are much higher than HSPA networks. The key transmission techniques employed at the PHY and the MAC of the LTE protocol stack are: AMC, dynamic time and frequency scheduling and data multiplexing, and HARQ error control and recovery [56] which are detailed in the next sections.
2.5.3 LTE Architecture with Relays: Relay Enhanced Cell
Cellular networks — designed for high capacity — suffer from the path-loss phenomenon during radio wave propagation which warrant an increase in the density of base stations in order to cover large geographical area while keeping the QoS. Hence, the transmit RF powers can be reduced significantly provided that the distances between the transmitting and receiving antennas are shortened. This can be achieved, for example, by using relays and distributed antennas, or by reducing the cell sizes in the cellular RANs. The use of NC in conjunction with
24
2.6 N etw ork Coding for U nicast and Broadcast A pplications in RelayNetworks
relays in RANs is the basic principle used to reduce the energy consumption considered in this thesis.
Relaying is a cost-effective approach to improve the capacity or to extend the coverage of the RAN [58, 59]. The LTE and LTE-A standards specify several types of relays that are intended to provide the desired QoS for users at the cell edge [60]. The LTE RNs are utilized for forwarding traffic between the eNB and the UEs. LTE relays are classified into several types according to their characteristics as follows:T ype 1 relay [60]:The type 1 relay is employed for coverage enhancement as it creates its own cell. From the UE perspective, it appears as another base station with its own unique physical layer cell ID. It supports distributed scheduling, broadcast control channels and performs full RRM for the RN-UE link. Thus, the UE receives scheduling information and HARQ feedbacks directly from the relay station. Type 1 relay is characterized by forwarding the user plane traffic data packets on the IP layer, and thus, it can be classified as a self-backhauling relay at Layer 3.Type 2 relay [60]:The type 2 relay is defined by the 3GPP as part of the donor cell. It is intended for throughput enhancements. It does not have its own physical cell identity but performs partial RRM for its users. Hence, type 2 relay is characterized by forwarding the user plane traffic data packets on Layer 2. An example of type 2 relay are smart repeaters (Layer 1 relays) and a decode-and-forward relays (Layer 2 relays). However, due to noise amplification as the main drawback of Layer 2 relays, only the decode-and-forward inband relays are considered in this thesis.
2.6 Network Coding for Unicast and Broadcast Applications in Relay Networks
A preliminary study of NC has been carried out using mathematical analysis for unicast and broadcast applications in the RAN. For unicast applications, mathematical analysis is used to obtain the expected value of the throughput,
25

2.6 N etw ork Coding for Unicast and Broadcast A pplications in RelayNetworks
packet delay and the energy consumption when NC is employed. Simulation results validating the mathematical analysis are presented. For broadcasting, a simulation framework is created to enable study of the implementation of the broadcasting protocols with and without NC, respectively.
2.6.1 M athem atical Analysis of NC in TW RC
Analysis of the XOR NC protocol in a TWRC has been conducted in order to assess the throughput, packet delay and the energy savings benefits. The analysis is based on the expectation of random variables to obtain expressions for the following Key Performance Indicators (KPIs):
• Probability of outage : the probability that the packet does not reach the destination, and thus has to be retransmitted. It is equivalent to the PER of the link.
• Packet Delay (PD): it is measured in time slots i.e. it is the number of time slots required to successfully exchange a pair of packets between the two nodes over a TWRC.
• Packet throughput: it is measured in packets/time slots, and is defined as the average number of successfully exchanged packets over one time slot.
• Energy Consumption Ratio (ECR): it is expressed in joules/bit and is the total energy consumed by all nodes (including the relay) during exchange of packets between end notes over a TWRC.
The TWRC scenario consists of node A and node B that are exchanging packets via the help of node R as depicted in Figure 2.6 assuming NC. The first link connecting node A to node R has PER denoted by P E R \ while the second link connecting node B to node R is denoted as P E R 2 . The powers used during the receive, idle and transmit states are denoted as P 1 ,PId and P Tx respectively.
To derive the expected PD, throughput and energy consumption for the non- NC protocol shown in Figure 2.2a, random variable theory is utilized. Acknowledgment is received each time decoding is not successful and packet retransmission is performed. The expressions for the non-NC protocol given an unlimited number of retransmissions in each link are derived as follows:
26

2.6 N etw ork Coding for U nicast and Broadcast Applications in RelayNetworks
P E R 1 >0 / ^ j \ P E R 2 > 0
( a ) m a®h (b )
Figure 2.6: NC schemes and TWRC [3].
Th expected PD becomes a geometrically distributed random variable [61] with probability equal to the P E R of the given link and hence:
E[PD"0"-NC] = 1 _ p e r j + 1 - P ER i ^
The expected throughput is defined as 2 / E P D non- ^ c [61] and hence:
, , (1 - P E R i )(1 - P E R 2)E[Througputnon_Nc] = (1 _ pERi) + (1 _ pERi) (2-5)
The expected consumed energy is the accumulation of energy at differentpower states of a given link. Taking into account all the time slot needed for theexchange of the two packets and power consumed in each time slot from all the nodes, the energy is computed as:
E[Energynon_Nc] = 1 _ ^ • (Pj* + + iff)
1 (P** + pK* + F f )1 - p e r 2
1 (p F + p** + p ? )1 — P e r 2
1 - P E R i1 (Pr k + P%* + Pb ) (2-6)
Where P j* , P#*, Pq x are the receive power for node A,B and C respectively. Similarly, given the expected value of the maximum of two random variables having possibly different Cumulative Distribution Function(CDF), the expected values of the PD as a sum of different random variables can be readily calculated. Then the throughput and energy consumption are obtained for the NC protocol. The KPIs for the NC protocol with unlimited number of retransmissions in each
27

2.6 N etw ork Coding for U nicast and Broadcast A pplications in RelayNetworks
link are given as:
E[PDNc] : _ p E R + 1 _ p E R 1 _ p E R pER 2 (2.7)
E[ThrougputNC] = ---- ;--------- ;-- -----------;--------- (2.8)1 - P E R i 1 - P E R 2 + 2 ( 1 - P E R 1-PER2)
E[EnergyNCl = 1 _ p E m ' + Pb )
+T 3 l W (PsTx + P*Rx + P “ )/ I 1 ^ \ p T x
+ U - P E R I + 1 - P E R 2 1 - P E R I • P E R 2 ) ' R
1 - P E R I ^ ' Pa + 1 - PER2 ‘ Pb
1 / 1_____ i__ 1________■). pMVl - P E R 2 1 - P E R I - P E R 2 1 A
+ ( ---------- + )Pr (2-9)h - P E R l I - P E R I - P E R 2 1 B v ’
Figure 2.7a, Figure 2.7b and Figure 2.7c compare the obtained expressions of the throughput, PD and the ECR versus the increase in the link PER PERi .
The impact of the powers used in the receive and idle power states on the ECR of the NC are shown in Figure 2.8a and Figure 2.8b. Here the absolute value of P 1 and P Id are selected to be - 1 , - 3 and — 5dB below the power in the P Tx, respectively.
From this analysis, we can conclude that, over a TWRC, the XOR NC provides both energy consumption and packet delay gains. Moreover, we observe that considering the power used in the receiving and idle states results in higher ECR values for both the NC and non-NC protocols. In addition, it is observed that the energy consumption with NC increases due to erroneous links, and there is a greater influence of erroneous links on the packet throughput when NC is used.
28

2.6 N e tw ork C oding for U nicast and B roadcast A pplications in R elayN etw orks
Packet Delay for TWRC with PERar=PERbr
— — n o n -N C
a so« 40
$ 30
0.2 0.4 0.6P E R 1
(a) Packet Delay (time slots)
Througput for TWRC with PERAR=PERgR0.7
s - > NC error free links NCn o n -N C
0.6
n o n ^ C error free links
a> 0.4
0.1
0.2 0.4 0.6P E R 1
(b) Throughput (packets/time slots)
E C R for T W R C with P E R A = P E R DC, , P tx= OdB, P rx = P id = - In f for all n o d e s AR BR
or 100
PER1
(c) ECR (joules/packet)
Figure 2.7: The derived KPIs versus the PER of the A-R link.
29
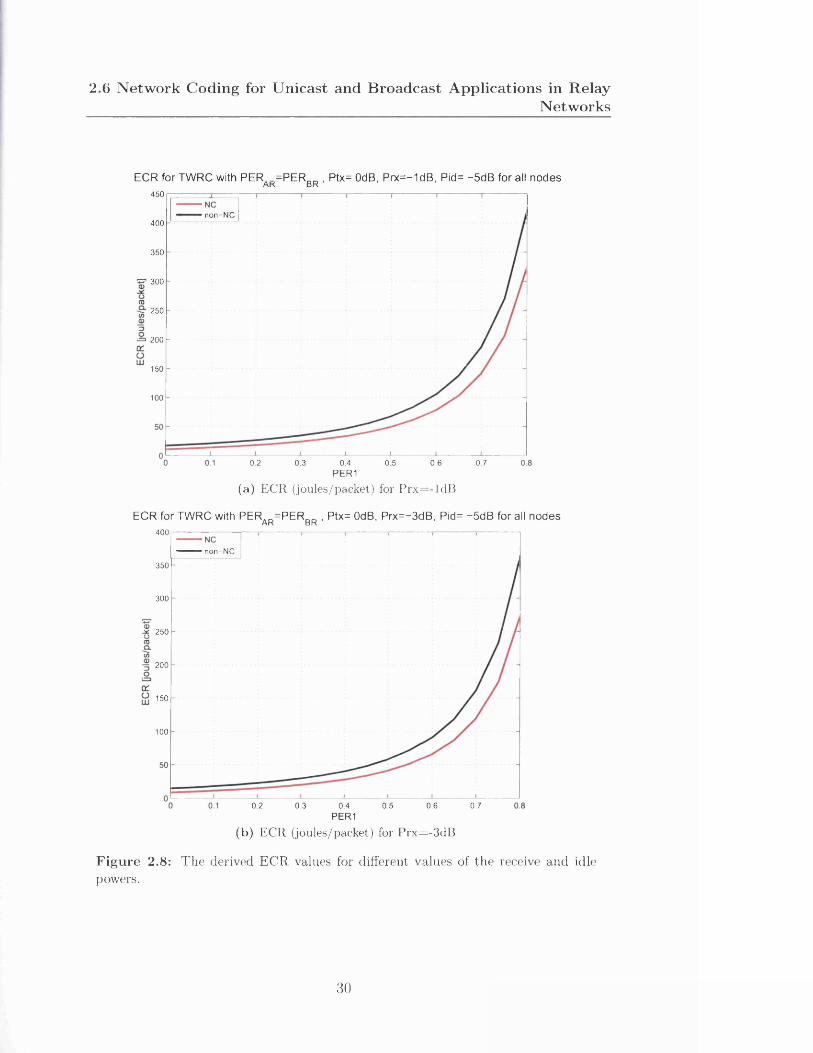
2.6 N etw ork C oding for U nicast and B ro ad cast A pp lications in R elayN etw orks
ECR for TWRC with PER =PERDD , Ptx= OdB, Prx=-1dB, P id=-5dB for all nodesA K d K
450
- n o n -N C400
350
300
250
= > 200
150
100
0 2 0.3 0.4P E R 1
0 5 0.6 0.7
(a) ECR (joules/packet) for Prx=-ldB
ECR for TWRC with PER =PERDD , Ptx= OdB, Prx=-3dB, Pid= -5dB for all nodesA R BR
400
— — no n -N C
350
300
* 250
200
150
100
0.2 0.3 0.4P E R 1
0.5 0.6 0.7
(b) ECR (joules/packet) for Prx=-3dB
Figure 2.8: The derived ECR values for different values of the receive and idle powers.
30

2.6 Network Coding for Unicast and Broadcast A pplications in RelayNetworks
2.6.2 Network Coding Simulations for a TW RC
In order to verify the mathematical analysis presented in the previous subsection, we use simulations for a TWRC system considering the same KPIs. Moreover, we focus on estimating the effects of powers in different states on the ECR. Figure 2.9a and Figure 2.9b show similar trend with the results in Section 2.6.1. Figure 2.9c further indicates the influence of the power states values on the ECR absolute values.
The simulations suggests that NC is beneficial in terms of the throughput and the Packet delay gains even for links with very bad link quality, i.e. having high PERs (as high as 0.8). The crossover point of P E R « 0.8 has been found by simulations as the PER after which the NC packet delay exceeds the non-NC protocol packet delay. The crossover occurs because the simulation treats the PER of the links as instantaneously changing with a given average probability and at high PER the probability of having the broadcast link in outage is higher resulting in increased number of transmissions for the NC protocol. In addition, we observe that taking into account the power states of nodes results in an increased energy consumption budget for both the non-NC and the NC protocols. However, such increase is more pronounced for the NC protocol. Thus, the NC protocol is more sensitive to the effect of the power used in various power states than the non-NC protocol.
2.6.3 Protocol Design for Relay Aided Cellular Architectures
A file broadcasting scenario is considered due to its straightforward network topology, and consequently, straightforward definition of the communication protocols. We consider design of transmission protocols for broadcasting networks with a single source. Our focus is on the broadcasting protocols for a group of end-user terminals aided by a shared relay as shown in Figure 2.10. The network is assumed to be packet-synchronous and the relay is allocated a separate frequency
31
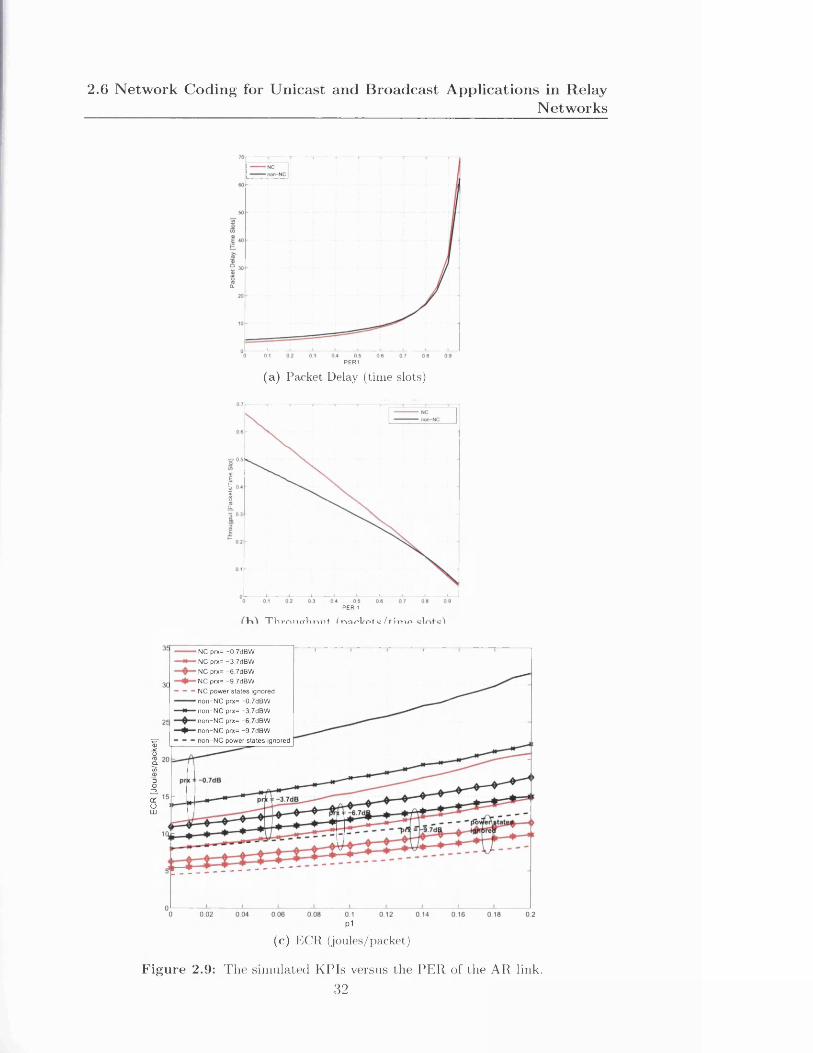
ECR
[Jou
les/
pack
et]
2.6 N etw ork C oding for U nicast and B roadcast A pp lications in R elayN etw orks
PER 1
(a) Packet Delay (time slots)
IIja
P E R 1
T V i r n i i a r V t n n t f n a n t o t c / t i m t i
NC prx= -0.7dBW NC prx= -3.7dBW NC prx= - 6 7dBW NC prx= -9.7dBW NC power s tates ignored non-N C prx= -0 7dBW non-N C prx= -3 7dBW non-N C prx= - 6 7dBW non-N C prx= -9.7dBW non-N C power sta tes ignored
P1(c) ECR (joules/packet)
Figure 2.9: The simulated KPIs versus the PER of the AR link.32

2.6 N e tw o rk C o d in g for U n icas t a n d B ro a d c a s t A p p lic a tio n s in R elayN etw o rk s
band for its communication with the user terminals. While the relay can transmit and receive in both frequency bands simultaneously, the terminals, at any time slot, are constrained to either only transmit or only receive. The source is assumed to either transmit continuously, or to periodically insert silent periods in order to enable in-band communications between the end-user terminals and the relay.
The power states are defined as follows. At any time slot, each node is in one of the following transmission states: transmitting, receiving, idle or turned-off. Each state is then assigned a certain power level. The objective is to investigate the effect of power levels at different transmission states on the statistics of energy consumption per node or per delivered packet for certain QoS level (e.g., guaranteed packet delivery, or guaranteed delay). Examples of the power levels for a mobile phone [6] are shown in Table 2.2. It is noted that the expended power at the receive P Rx and Idle P Id states are higher than 50% of the expended power in the transmit state Ptx. In wireless networks, the power in transmit state is strongly distance and coverage dependent while the powers in receive and idle states are much less distance and coverage dependant. On the other hand in heterogenous cellular networks with small cells and relays, the differences between the transmit and other powers are expected to be small.
Table 2.2: Power state levels for a mobile phone [6]
S ta te E xpendedpow er[W atts]
% R ela tive to tra n sm it s ta te
Transmitting 1.628 -Receiving @3m 1.375 84.4Receiving @30m 1.213 74.5Idle @3m 0.979 60.1Idle @30m 0.952 58.5
A simulation framework for broadcasting transmission protocol has been developed in MATLAB. It includes definitions and models of packet error levels, power states, the probabilities of transition between these power states and signal processing functionalities such as FEC decoding and diversity combing.
33

2.6 N e tw o rk C o d in g for U n ic as t a n d B ro a d c a s t A p p lic a tio n s in R elayN e tw o rk s
Figure 2.10: Relay aided broadcasting.
As the transmissions are time slotted, packets are modeled with Identifica- tions(IDs) that include: a time stamp of the time slot, packet length, packet error level and a list of combined packets in the case of network coded packets. The communication channels are modeled as a link from the MAC layer in a source node to the network layer in a destination node. Hence, the impact of errors at PHY/MAC layers in the combined packets is accounted for statistically by assuming a quantized number of errors (packet error levels) and the probability of transitions between those levels. Thus, the packet error levels are defined for quantized total number of errors in packets. This approximates the system transmission reliability, and describes how the quantized number of errors are statistically different between each pair of nodes in the network. The quantization levels depend on the application and on what signal processing is used.
A simulation example for broadcasting a file has been studied for the above model. The source continuously broadcasts the whole file (uninterrupted). The relay supports the broadcasting by collecting feedback from the receivers to retransmit un-acknowledged network coded packets and normal packets to the receivers at the end of the broadcasting session and during the source silence periods. The file delivery protocol works in the following steps:
34

2.6 N etw ork Coding for U nicast and Broadcast A pplications in RelayNetworks
• The source transmits whole file (uninterrupted).
• The Relay node assigns one time slot for each destination for feedback signaling.
• The Relay node sorts the reported undelivered packets at the destinations as: The packets not received by any destination but received by the relay (these packets are then simply retransmitted). The packets received by at least one destination and by the relay (these packets are network coded/combined to save the number of retransmissions). The packets not received by any destination nor by the relay (these packets might be asked for by the destinations again).
• The packets are (re)transmitted from the relay starting with the older packets first in order to decrease the PD for the destination receivers.
Figure 2.11a, Figure 2.11b and Figure 2.11c show the energy consumption of one destination receiver versus time for various power states for a target packet delivery rate of 98%. It is clear again that varying the value of the power used during the reception of packets ( P ^ ) results in noticeably increased value of the energy consumption for the receiver Dl.
This example demonstrates that NC is applicable to various network topologies and is beneficial to reduce the number of transmissions and hence the energy consumed for the successful file broadcasting. Hence, NC used as a technique at the MAC layer is promising and relies on information compression of bits to save radio resources and transmission time slots. This explains the delay gains and the energy savings potential. These features of NC will be exploited further in next chapters and applied in the LTE and LTE-A networks.
35
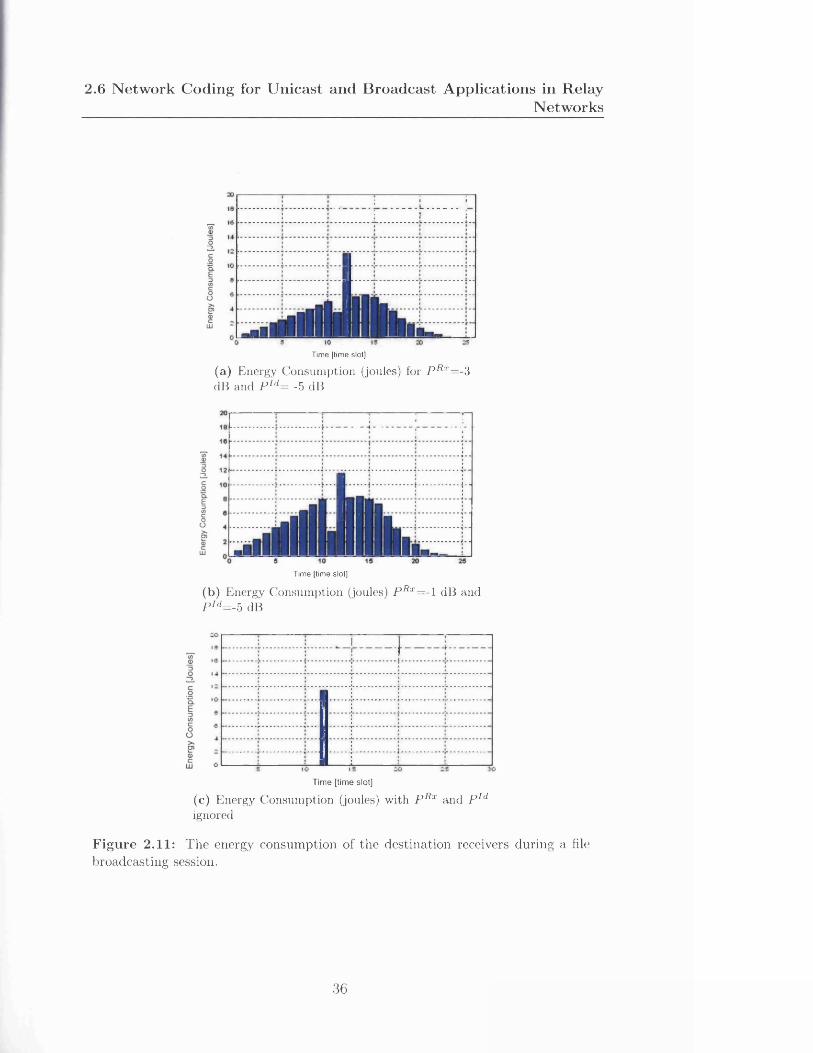
2.6 N etw ork C oding for U nicast and B roadcast A pp lications in R elayN etw orks
Time [time slot]
(a) Energy Consumption (joules) for p Rx= . 3 dB and P ld= -5 dB
Time [time slot]
(b) Energy Consumption (joules) P Rx=- 1 dB and P'd=.5 dB
• !— t - • !
T im e [tim e slot]
(c) Energy Consumption (joules) with P Rx and P Id ignored
Figure 2.11: The energy consumption of the destination receivers during a hie broadcasting session.
36

2.7 Remarks and M otivations
2.7 Remarks and M otivations
The mathematical analysis of NC for a TWRC reveals that NC can tolerate high PERs of the links and still yields positive throughput improvements as well as energy consumption reductions. The simulation results show a similar trend to the analytical results and indicate the existence of a crossover point after which NC gains become negative. The interesting observation is that this crossover point occurs for a very high PER which is unlikely to be experienced in practical wireless networks where typical PER range is below 0.1. The impact of various power states on the ECR performance of the non-NC and NC protocols was studied. It can be concluded that power states contribution to the energy consumption is non-negligible, and thus the power states should be taken into considerations when designing systems with NC protocols.
The NC energy and delay gains were also demonstrated for the broadcasting scenario. The only difference between the broadcasting and unicasting applications is the network topology and the NC protocol design. Hence, NC proves to be applicable to a diverse number of network topologies and communications scenarios.
37

3
Energy M etrics for Cellular Networks
This chapter establishes the baseline energy and power metrics to be used in evaluations, simulations and mathematical analysis throughout the thesis. Selection of appropriate metrics for wireless networks energy efficiency evaluations is important for two reasons. Firstly, these metrics must enable accurate energy measurements for any type of network nodes, sub-systems and networks. Secondly, these metrics must facilitate comparisons of different techniques from the energy efficiency point of view. This chapter addresses some of these issues and makes the following contributions:
1. A comprehensive review of the energy and power metrics in the literature and in the standard bodies is provided.
2. Most, if not all, of the energy metrics considered in the literature and standards are defined for the operational phase of the telecommunications equipments. Thus, the subject of how to extend the use of the current energy metrics to the overall RAN evaluations is considered.
3. The produced technical reports and papers on energy metrics constitute a reference baseline for other researchers in the Mobile Virtual Centre of Excellence (MVCE) Green Radio (GR) programme. Particularly, this work contributed to the Book of Assumption (BOA)section on metrics within the GR programme.
38
3.1 D efinitions of Energy and Power M etrics
4. Recommendations on what energy metrics are useful and should be specifically used are provided. One of such energy metrics, the Energy Consumption Ratio (ECR) is adopted by the GR project.
5. An example application of the ECR metric to assess the energy consumption evaluations of a RAN is provided.
In this chapter, the definitions of energy and power metrics are introduced in Section. 3.1. The energy efficient powering of the telecommunications equipment is discussed in Section. 3.2. General requirements for the energy consumption evaluations are described in Section. 3.3. The energy and power metrics in the literature and in the standards are reviewed in Section. 3.4. Conclusions are given in Section. 3.4.
3.1 Definitions of Energy and Power M etrics
The definitions of energy and power metrics for telecommunications networks have to take into account a number of factors. This is mainly because of the complex multi-stage, multi-layer and multi-purpose architectures of the current telecommunications networks. It is important to initially obtain good a understanding of what aspects the energy and power metrics need to consider and what metrics are suitable for what network setups and communication scenarios. Ultimately, the adopted metrics definitions should be independent from the particular network architectures and communication scenarios in order to enable their comparisons even though the numerical values must be dependent on the network architectures and scenarios. Specifically, the main factors to be considered when defining energy and power metrics are [62, 63]:
• The type of network elements (e.g. base station, backhaul, switch);
• Network load (including the fraction of active network elements) and network resources used (including bandwidth and power);
• Traffic model, communication and application scenario and context;
• Network architecture and topology;
39

3.1 D efinitions of Energy and Power M etrics
• Physical layer interface and protocol stack (e.g. defining bit delivery at some OSI layer);
• Propagation (channel) models;
• Distances between sources and destinations or the coverage area for a given QoS;
• QoS requirements (including reliability, latency, throughput at a given OSI layer);
• User behaviour (profiles) and mobility models.
Furthermore, the above factors can be measured or calculated at a given time instant (instantaneous metrics) or averaged over short or long term time durations (average metrics). Long term average metrics has an advantage of facilitating the quantification of Radio Network Layer (RNL)-based cell switching mechanisms such as Discontinuous Transmission (DTX) and Discontinous Reception (DRX). Moreover, they are more suited to the bursty traffic loads exhibited by the current wireless networks. We can also consider energy metrics for:
• Network nodes (e.g. terminals, base stations etc. leading to the energy measurements at the network equipment);
• Network links (connecting two or more nodes);
• Individual network entities (nodes and links) and group of entities (e.g., terminals served by one base station);
• subnetworks (access and core networks) versus the energy consumption of the whole network.
More importantly, we have to consider all of the above factors to determine when some of the energy and power metrics may be less suitable. For example, some energy metrics developed for the wireless access networks may not be suitable for the wired core networks [62]. The energy and power metrics do not have to necessarily be scalar values in order to better describe the non-linear dependency of the CO2 production of different types of energy. For example, the operational and embodied energy could be reported separately rather than as a scalar of their sum. Obviously, comparison of such vectorized energy and power
40
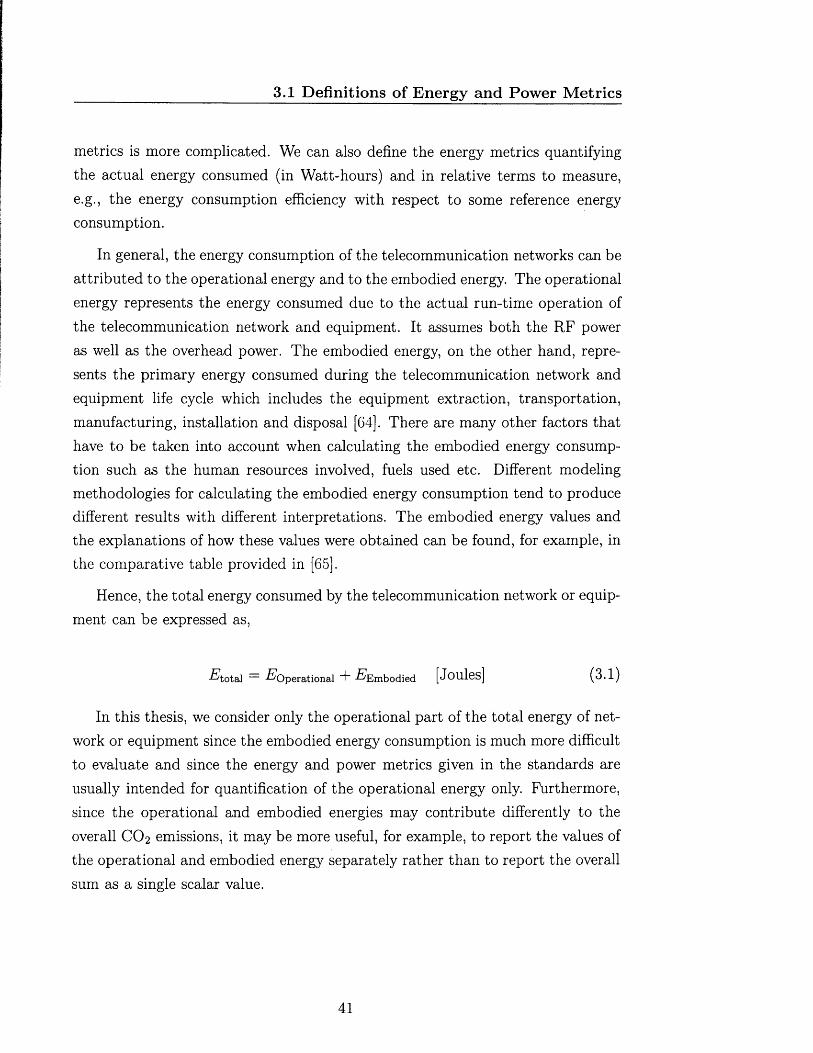
3.1 Definitions of Energy and Power M etrics
metrics is more complicated. We can also define the energy metrics quantifying the actual energy consumed (in Watt-hours) and in relative terms to measure, e.g., the energy consumption efficiency with respect to some reference energy consumption.
In general, the energy consumption of the telecommunication networks can be attributed to the operational energy and to the embodied energy. The operational energy represents the energy consumed due to the actual run-time operation of the telecommunication network and equipment. It assumes both the RF power as well as the overhead power. The embodied energy, on the other hand, represents the primary energy consumed during the telecommunication network and equipment life cycle which includes the equipment extraction, transportation, manufacturing, installation and disposal [G4]. There are many other factors that have to be taken into account when calculating the embodied energy consumption such as the human resources involved, fuels used etc. Different modeling methodologies for calculating the embodied energy consumption tend to produce different results with different interpretations. The embodied energy values and the explanations of how these values were obtained can be found, for example, in the comparative table provided in [65].
Hence, the total energy consumed by the telecommunication network or equipment can be expressed as,
•F'total — -^Operational -^Embodied [Joules] (3*1)
In this thesis, we consider only the operational part of the total energy of network or equipment since the embodied energy consumption is much more difficult to evaluate and since the energy and power metrics given in the standards are usually intended for quantification of the operational energy only. Furthermore, since the operational and embodied energies may contribute differently to the overall CO 2 emissions, it may be more useful, for example, to report the values of the operational and embodied energy separately rather than to report the overall sum as a single scalar value.
41

3.1 Definitions of Energy and Power M etrics
The energy and power metrics are also important for the optimization of energy consumption of telecommunication systems. For each energy and power metric, one can define a constrained optimization problem having the metric as its objective function, and the optimization constraint is, for example, a certain guaranteed level of the QoS. For instance, the authors of [66] investigated the problem of finding a minimum set of nodes and links to be powered on in order to satisfy the QoS constraint. Furthermore, there are many network elements that contribute to the overall energy consumption of the network, so one can consider the weighting factors to sum up the energy consumptions of the individual network elements. Different weighting factors will then lead to different solutions for minimizing the energy consumption. For example, the standards recommend to use the weighting factors in definitions of the energy and power metrics corresponding to different traffic loads, typically, the energy consumption should be considered for 0, 50 and 100% traffic load (cf. Section 3.4.2). Moreover, in order to provide a desired QoS to all the users in the network, a fairness of the energy consumption is another very important consideration that cannot be neglected. For example, a few terminals responsible for majority of the overall energy consumption may correspond to a minimum overall energy solution provided that the fairness is neglected.
According to the standard references quoted throughout this chapter, there appears to be a trend to quantify energy consumption of telecommunication networks in Watt-hours units. The Watt-hours units have an advantage to directly relate the equipment power (in Watts) to the consumed energy. The power itself (expressed in Watts) may be more important and meaningful as it is the often reported and measured quantity rather than directly measuring the energy consumption. Correspondingly, we will strictly distinguish the energy (in Watt- hours) and power (in Watts) in all expressions given in this chapter. We note, however, that some of the metrics terms from the references cited in this chapter have been changed in order to distinguish between the energy and the power. Recall also that one of the objectives of this thesis is to reduce the energy consumption of telecommunication networks. Hence, using the power metrics and
42

3.2 Energy Efficient Powering of Telecom m unications Equipm ents
subsequently converting them into the energy consumption metrics is likely the most viable approach.
In this chapter, we mainly consider outputs from the following standardization bodies involved in standardizations of the energy metrics:
• European Telecommunications Standards Institute (ETSI)
• Alliance for Telecommunications Industry Solutions (ATIS)
• International Telecommunication Union-Telecommunications (ITU-T)
However, to the best of our best knowledge, no standardized energy metrics have been proposed by the following standardization bodies:
• Institute of Electrical and Electronic Engineers (IEEE)
• Internet Engineering Task Force (IETF)
• International Organization for Standardization (ISO)
• Telecommunications Industry Association (TIA)
• 3GPP
3.2 Energy Efficient Powering of Telecommunications Equipments
The ETSI [4] recently defined the A3 interface for powering up telecommunication and datacommunication equipments at data centres, and radio and core network sites. This interface effectively enables the use of datacommunication equipment that is normally Alternating Current (AC) powered since, at the telecommunications centers, the telecommunication equipment is normally 48V Direct Current (DC) powered. The A3 interface aims at minimizing the energy costs incurred in the DC-to-DC conversion. In [67], it is noted that DC-to-DC conversion amounts to 15% of the overall powering budget of the telecommunication equipment. On the other hand, researchers have started tapping on the potential of energy harvesting. In 2011, 385 Million consumer electronics devices and 1 Million mobile phones and 1 Million mesh wireless sensor network devices were powered by
43

3.2 Energy Efficient Powering of Telecom m unications Equipm ents
harvested energy [68]. The market predictions that 250 Million sensors will be powered by harvested energy by 2020 [69]. The combination of energy harvesting techniques and more efficient interfaces are expected to contribute to energy efficiency of telecommunications equipments in the coming years.
The new A3 interface provides a unified power supply system with the same characteristics for all telecommunication and datacommunication equipment. The voltages provided by the A3 interface are: the AC mains, a rectified voltage derived from the AC three phase mains, a rectified voltage derived from the AC single phase mains and a DC voltage derived from the battery. This enables to power up equipment with DC supply requirements up to 400 volts. Thus, the A3 interface defines the requirements for nominal voltages and voltage ranges, their frequencies, transient voltage values, and also abnormal service voltages. The nominal voltages of the A3 interface are calculated as:
• an AC single phase input: The maximum rectified voltage is 230 x1.1 x 1.05 x y/2 = 375V where 1.1 refers to the ±10% tolerance in the nominal Root Mean Square (RMS) voltage 230V, 1.05 refers to the ±5% provision for environments where harmonics exist (e.g., a backup generator with harmonic distortion). The rectified minimum RMS voltage is 220 x0.90 x 0.95 = 188V.
• an AC three phase input: The rectified maximum voltage is 253V. The rectified minimum RMS voltage is 230 x 0.9 x 0.95 = 188V.
• a DC input: The rectified maximum voltage is 375V. The rectified minimum RMS voltage is 188V.
The A3 interface is shown in Figure 3.1 and Figure 3.2[70, 4]. The power supply in Figure 3.2 provides a set of the following power configurations specified in the A3 interface:
• A power supply is connected to a single AC phase sine wave source. A typical voltage at the A3 interface is 230V RMS at 50 Hz. When an AC input voltage failure occurs, the backup voltage is provided by an Uninterrupted Power Supply (UPS).
44

3.2 E n e rg y E ffic ien t P o w erin g o f T e leco m m u n ica tio n s E q u ip m e n ts
• A power supply is connected to the AC three-phase sine wave source. A typical voltage at the A3 interface is a rectified voltage with the ripple of 300 Hz (corresponding to a typical value of 310V RAIS). When an AC input voltage failure occurs, the backup voltage is provided by a battery.
• A power supply is connected to the AC single phase sine wave source. A typical voltage at the A3 interface is a rectified voltage with a ripple of 100 Hz (a typical value of 230V RMS). When an AC input voltage failure occurs, the backup voltage is provided by a battery.
A3 interface
TelecommLllieLH
NeiitraEquipment
PowerSupply
_ PE Piotective Eaitli
F igure 3.1: The A3 interface definition [4].
The main advantage of a universal DC powering system like the one shown in Figure 3.2 is improvement in the energy efficiency, improvement in the power supply quality and increased reliability in the AC power distribution networks as well as reduction in the AC power losses.
Another study by ETSI in [71] indicates that the current power sizing of CDMA and Universal Mobile Telecommunication System (UA1TS) radio sites is overestimated in terms of their yearly power usage and battery backup requirements. Collected data shows that the average power drawn by the whole radio site is always less than the power requirements specified for the power plant at the radio site. Further investigations using 3-sigma statistical maxima (i.e, 3 times the standard deviation above the mean value) in calculating the maximum
45
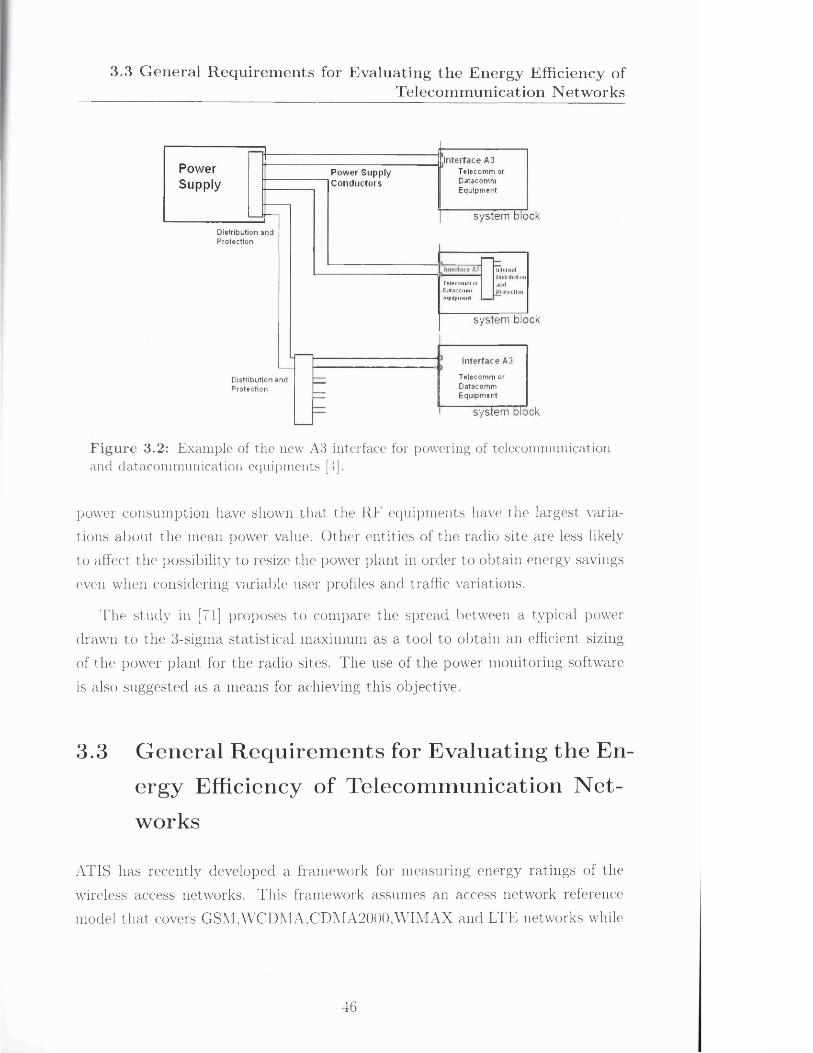
3.3 G enera l R eq u irem en ts for E valua ting th e E nergy Efficiency ofT elecom m unication N etw orks
PowerS upp ly
Power Supply Conductors
D is trib u tio n a n d P ro te c tio n
D istrib u tio n a n d P ro te c tio n
.Interface A3 T e le c o m m or D a ta co m m E q u ip m e n t
system block
Telecomm orDatacommequipment
—
InternalDisti ihiition.11 ulPiotectlon
system block
I n te r fa ce A3
T e le c o m m orD a ta co m mE q u ip m e n t
system block
Figure 3.2: Example of the new A3 interface for powering of telecommunication and datacommunication equipments [4].
power consumption have shown that the RF equipments have the largest variations about the mean power value. Other entities of the radio site are less likely to affect the possibility to resize the power plant in order to obtain energy savings even when considering variable user profiles and traffic variations.
The study in [71] proposes to compare the spread between a typical power drawn to the 3-signra statistical maximum as a tool to obtain an efficient sizing of the power plant for the radio sites. The use of the power monitoring software is also suggested as a means for achieving this objective.
3.3 G e n e ra l R e q u i r e m e n ts for E v a lu a t in g t h e E n e rg y Efficiency of T e leco m m u n ica t io n N e t
w orks
ATIS has recently developed a framework for measuring energy ratings of the wireless access networks. This framework assumes an access network reference model that covers GSM,WCDMA,CDMA2000,WIMAX and LTE networks while
46

3.4 S ta n d a rd iz e d E n e rg y a n d P ow er M e tr ic s
it also scales down to consider BTSs, BSCs, NBs, RNCs and eNBs nodes depending on the particular air interface. An energy efficiency calculation model proposed bv ATIS in 1671 is shown in Figure 3.4.
Inputs
InputsInputs
2. types of se iv ic e s
u se is
Traffic Model
e.y Cost231 modelPerformance parameters
OOS constraints should he satisfied
2. input Values
3. Formulas
1. assum ptions
Energy efficiency calculation ModelCorresponds to one of the metrics discussed in the next section i.e the equations
Netwoik en en jy efficiency Output:
F igu re 3.3: The ATIS energy efficiency calculation framework.
3.4 S ta n d a r d iz e d E n e rg y a n d P o w er M e tr ic s
In this section, we describe the energy and power metrics defined in standards for wired and wireless networks as well as for the telecommunications equipment. In general, the energy and power metrics are standardized, so that the consumed energy is proportional to the useful work that the equipment does. We adopt the same symbol notation that is used in the standards.
47

3.4 Standardized Energy and Power M etrics
3.4.1 Energy Consumption Rating (ECR)
The first energy metric we consider is the ECR metric which has not been standardized, but rather it is a peer-reviewed metric and a test methodology. The ECR is defined as [72]
ECR = [Watts/bps] (3.2)Tf
where Tf is the maximum throughput in bits per second (bps) reached during the measurement, and Pf is the measured peak power in W atts while performing the measurement test. The lower the ECR rate, the less energy is consumed to transport the same amount of data. The ECR metric can be used to measure the energy efficiency of telecommunications equipment as well as of telecommunications networks. The ECR can be also considered to be a payload-normalized power efficiency of the equipment or the network. Although the ECR metric is limited in accounting for the network traffic variations and utilization of the network links and nodes, it is often used in the research literature due to its universality and simplicity. The test and measurement methodologies, the environmental measurement conditions and the equipment utilization for the energy and power measurements are defined in [72]. We summarize some of the important considerations for the measurement procedures below.
Effective Throughput Calculations
The peak throughput Tf of an equipment refers to the attainable throughput under the 100% network load. The ECR measurement methodology [72] can be used to obtain the maximum load Lmax in bps (corresponding to 100% load) sustained by the equipment assuming a zero packet loss. The following two methods are suggested for converting the value of Lmax into Tf depending on the equipment type.
48

3.4 Standardized Energy and Power M etrics
M ethod 1
The Tf value is evaluated as,
T f = TV x Lmax x L [bps] (3.3)
where N, Lmax and L are the equipment number of ports, the measured numberof frames per seconds per port, and the frame length in bits including overheads,respectively. This method is appropriate for core routers, Ethernet switches and any other equipment having equivalent ports, having minimal over-subscription, and being connected in full mesh topologies.
M ethod 2
The Tf value is evaluated as,
NT f = x Ut [bps] (3.4)
where TmaX)i and Ui are the equipment maximum load and the interface utilization for the port z, respectively. This method is appropriate for edge transport devices and any other equipment equipped with network and access ports groups, having over-subscription, and being connected in a dual-group partial mesh topologies.
3.4.2 ECR-Based M etrics
The ECR metric described above is rather generic, and thus, it can be used to derive other energy metrics. Particularly, the ECR-Variable Load (ECR-VL) metric takes into account the dynamic power management capabilities of the network equipment. It is defined as
ECR - VL = a ' Fl0° + P ' h o + 7 ' + * ' -f10 + 6 ' Pl [Watts/bps] (3.5)a - T j + 0 • T50 + 7 • T30 + <5 ■ Tio 1 1 v i \ )
49
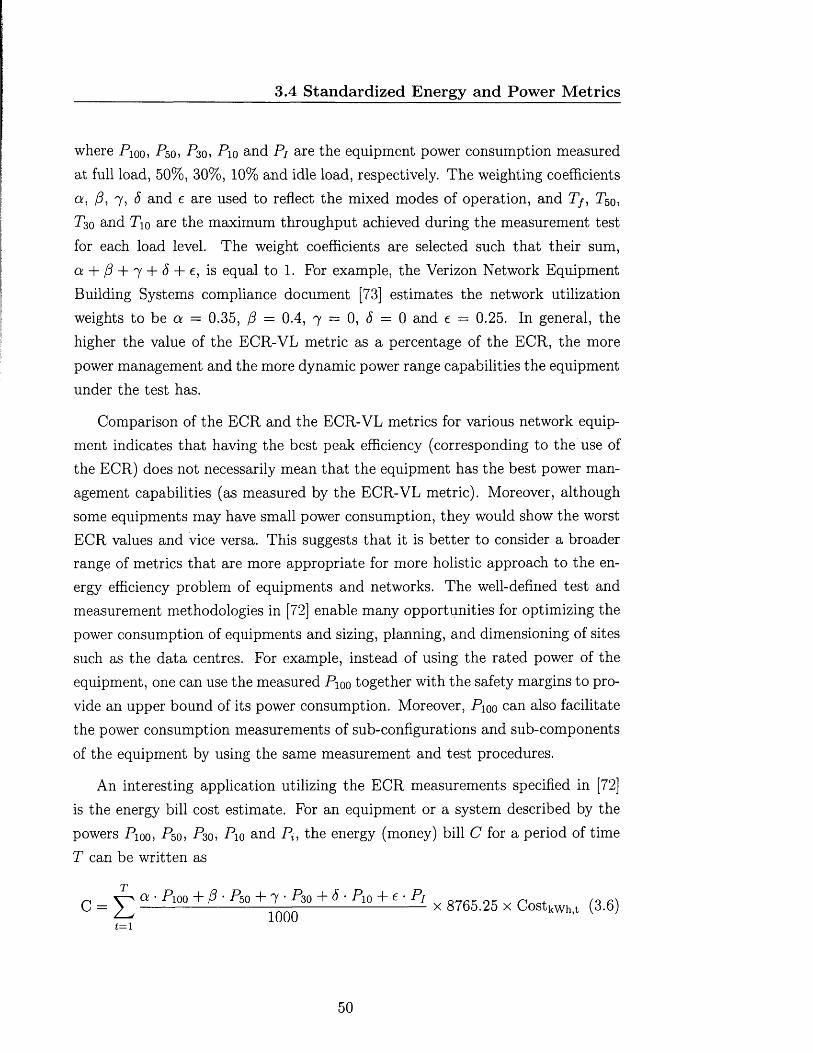
3.4 Standardized Energy and Power M etrics
where P 100, P5 0 , P3 0 , P 10 and Pi are the equipment power consumption measured at full load, 50%, 30%, 10% and idle load, respectively. The weighting coefficients a, /?, 7 , 8 and e are used to reflect the mixed modes of operation, and T/, T50, T3 0 and T10 are the maximum throughput achieved during the measurement test for each load level. The weight coefficients are selected such that their sum, a + ^ + 7 + ^ + e, is equal to 1. For example, the Verizon Network Equipment Building Systems compliance document [73] estimates the network utilization weights to be a = 0.35, (3 = 0.4, 7 = 0, 8 = 0 and e = 0.25. In general, the higher the value of the ECR-VL metric as a percentage of the ECR, the more power management and the more dynamic power range capabilities the equipment under the test has.
Comparison of the ECR and the ECR-VL metrics for various network equipment indicates that having the best peak efficiency (corresponding to the use of the ECR) does not necessarily mean that the equipment has the best power management capabilities (as measured by the ECR-VL metric). Moreover, although some equipments may have small power consumption, they would show the worst ECR values and vice versa. This suggests that it is better to consider a broader range of metrics that are more appropriate for more holistic approach to the energy efficiency problem of equipments and networks. The well-defined test and measurement methodologies in [72] enable many opportunities for optimizing the power consumption of equipments and sizing, planning, and dimensioning of sites such as the data centres. For example, instead of using the rated power of the equipment, one can use the measured Pi0 0 together with the safety margins to provide an upper bound of its power consumption. Moreover, P 1 0 0 can also facilitate the power consumption measurements of sub-configurations and sub-components of the equipment by using the same measurement and test procedures.
An interesting application utilizing the ECR measurements specified in [72] is the energy bill cost estimate. For an equipment or a system described by the powers Pi0 0 , P5 O} P3 0 , P 10 and P*, the energy (money) bill C for a period of time T can be written as
a • P 1 0 0 + P ' P5 0 + 7 ' ^ 3 0 + 8 • P 1 0 + e • Pj ( .C = 2 _ ^ -------------------------------------------- x 8765.25 x CostkWh,t (3.6)t= 1
50

3.4 Standardized Energy and Power M etrics
where Costkwh,t is the money cost per kWh for the year t. The cost metric C is also useful in estimating the energy bill of a reference system which allows comparisons with the energy bill of the proposed system that introduces, for example, the sleep modes and other techniques for reducing the power consumption at different load utilizations.
Another energy metric derived from the basic ECR metric is the Energy Efficiency Rate (EER) [72]. The EER metric is simply the inverted ECR, i.e.,
EER = eSr [bps/WattJ (3-7)The EER metric can be used to indicate the output data rate relative to the power consumed.
3.4.3 Telecommunications Energy Efficiency R atio (TEER)
The TEER metric was developed by the ATIS Network Interface, Power and Protection Committee [74]. The TEER metric provides a fundamental unified methodology for the energy and power measurements of the telecommunication equipment and the corresponding energy and power efficiencies. It standardizes not only the test and measurement methodologies but also the environmental test conditions, utilization of equipments and reporting methods. The TEER metric is receiving increasing interest from the equipment manufacturers as well as from the ITU-T. For example, Cisco worked closely with the ATIS in order to contribute to the development of the TEER. The ITU-T Focus Group on Information and communication technology and climate change adopted the ATIS methodology and the TEER metric in [75].
A general definition of the TEER metric can be written as
TEER = US(1U1 W°rk [?/W att] (3.8)Power
where ‘Useful Work’ (and its unit) varies with the equipment type and is dependent on the equipment function, and ‘Power’ is the average power over the duration of the measurement test. For example, the useful work can represent
51
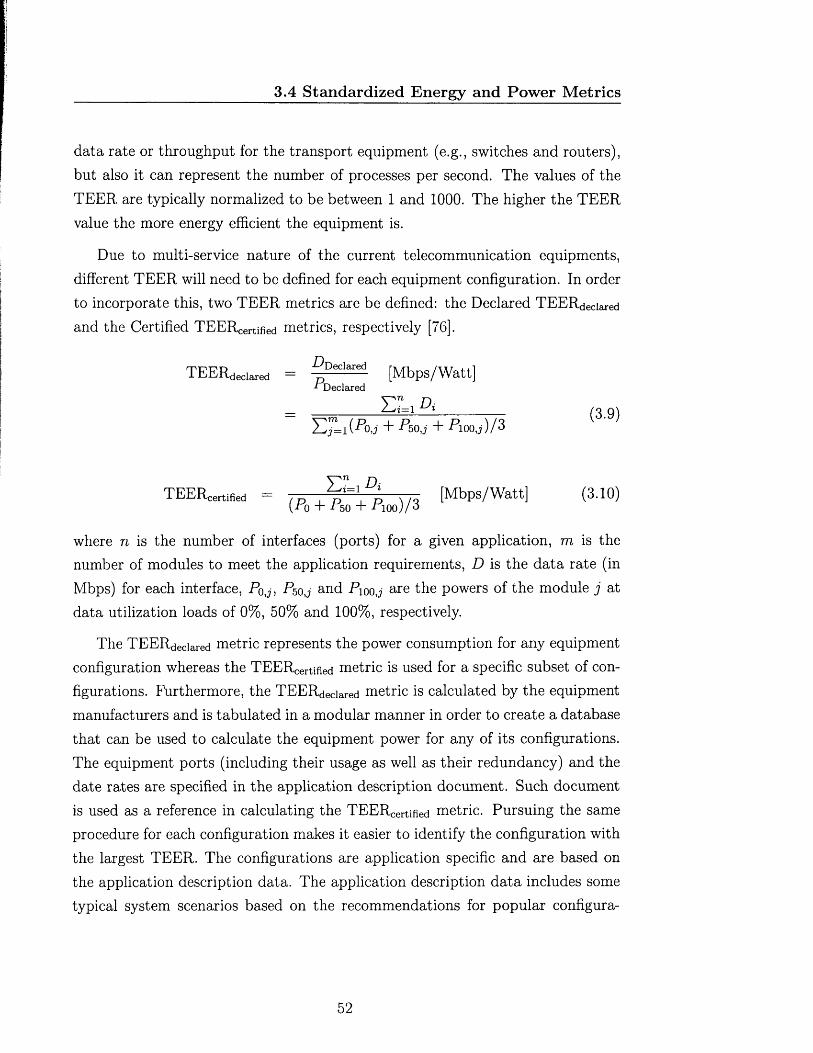
3.4 Standardized Energy and Power M etrics
data rate or throughput for the transport equipment (e.g., switches and routers), but also it can represent the number of processes per second. The values of the TEER are typically normalized to be between 1 and 1000. The higher the TEER value the more energy efficient the equipment is.
Due to multi-service nature of the current telecommunication equipments, different TEER will need to be defined for each equipment configuration. In order to incorporate this, two TEER metrics are be defined: the Declared TEERdeciared and the Certified TEERcertified metrics, respectively [76].
TEERdeclared = pDeclared [Mbps/Watt]-VDeclared
T n D— _________________ Z ^ j = i »____________________________ / q qn
EJ*-i(fl>J + flxu + Aaw)/3
TEERcertified = / [Mbps/Watt] (3.10)t-M) + -*50 + * 1 0 0 ) / o
where n is the number of interfaces (ports) for a given application, m is the number of modules to meet the application requirements, D is the data rate (in Mbps) for each interface, Pqj, P^oj and -Piooj are the powers of the module j at data utilization loads of 0%, 50% and 100%, respectively.
The TEERdeciared metric represents the power consumption for any equipment configuration whereas the TEERcertified metric is used for a specific subset of configurations. Furthermore, the TEERdeciared metric is calculated by the equipment manufacturers and is tabulated in a modular manner in order to create a database that can be used to calculate the equipment power for any of its configurations. The equipment ports (including their usage as well as their redundancy) and the date rates are specified in the application description document. Such document is used as a reference in calculating the TEERcertified metric. Pursuing the same procedure for each configuration makes it easier to identify the configuration with the largest TEER. The configurations are application specific and are based on the application description data. The application description data includes some typical system scenarios based on the recommendations for popular configura
52

3.4 Standardized Energy and Power M etrics
tions (e.g. maximum or minimum loads). In general, the TEERdeciared metric can be used to compare systems providing the same data rates at the same application level, the TEERcertified metric is used as a configuration level comparisons between two different network devices with the same performance. Next, we illustrate the applications of the TEER metric using the following two examples:
Exam ple 1: D ata transport products
The data transport products are equipment that provides connectivity across local or large geographical areas. They may provide electrical, optical (e.g. Optical Transport Network (OTN), Wave Division Multiplexing (WDM)) or wireless transmission (microwave) connectivity and multiplexing. The TEER metrics given above are used to more accurately compute the average power for different configurations with different ports utilizations.
Exam ple 2: Server products
The procedure for calculating TEER outlined in Example 1 above can be used in conjunction with the so-called SPECPowerssj2008 metric [77]. The SPECPow- erssj2008 metric has been proposed to measure energy consumption of data servers and it supports different power meter models and load options. The ATIS server requirements standard [78] uses the SPECPowerssj2008 benchmark to calculate the server TEER as:
SPECPowerssj2008 Power Rating rAT1 . /0 i-.\TEERserver = ---------------- ^ ------------------ - [Mbps/Watt] (3.11)
where the normalization by 10 is introduced for convenience to keep the TEER values below 1000. Two other power efficiency metrics are derived from the SPECPowerssj2008 metric in [77].
More examples illustrating the applications of the TEER metric for different equipment types are:
53
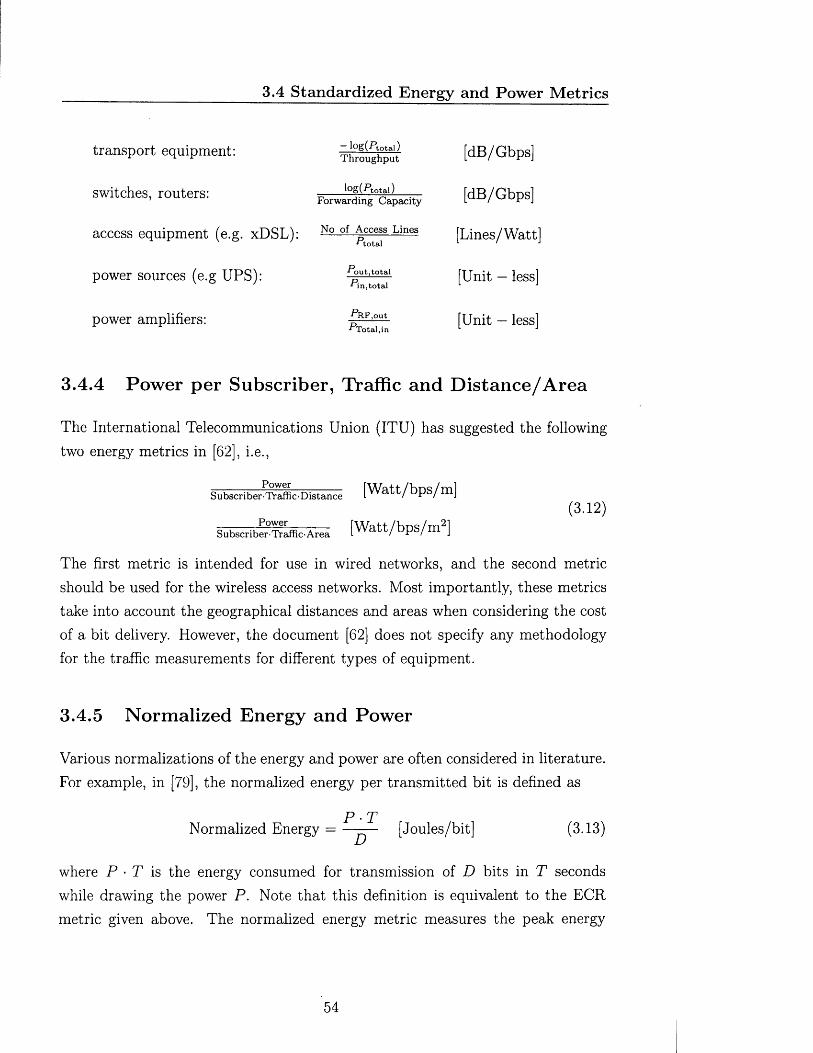
3.4 Standardized Energy and Power M etrics
transport equipment:
switches, routers:
access equipment (e.g. xDSL):
power sources (e.g UPS):
power amplifiers:
- l o g ( A o t a l )Throughput
l o g ( f t o t a i )Forwarding Capacity
No of Access Lines■ftotal
■ R u t,to ta l
R n , tota l
■ P R F ,o u t
R r o t a l . i n
[dB/Gbps]
[dB/Gbps]
[Lines/Watt]
[Unit — less]
[Unit — less]
3.4.4 Power per Subscriber, Traffic and D istance/A rea
The International Telecommunications Union (ITU) has suggested the following two energy metrics in [62], i.e.,
Subscriber ■TVaffic-Distance [W att/bps/m]
Subscriber^TTafficArea [W att/bps/m 2](3.12)
The first metric is intended for use in wired networks, and the second metric should be used for the wireless access networks. Most importantly, these metrics take into account the geographical distances and areas when considering the cost of a bit delivery. However, the document [62] does not specify any methodology for the traffic measurements for different types of equipment.
3.4.5 Normalized Energy and Power
Various normalizations of the energy and power are often considered in literature. For example, in [79], the normalized energy per transmitted bit is defined as
P • TNormalized Energy = - [Joules/bit] (3.13)
where P • T is the energy consumed for transmission of D bits in T seconds while drawing the power P. Note that this definition is equivalent to the ECR metric given above. The normalized energy metric measures the peak energy
54

3.4 Standardized Energy and Power M etrics
consumption of the network elements. The normalized energy metric can take into account the users behavior and temporal variations of the network, and the utilization of the network elements, however, only to a limited extent.
The power consumption per line is typically used for broadband equipments. It is defined as [80]
Power/line = — ^>lme— [Watt] (3-14)-^subscribers
where P]ine is the power consumption of a fully equipped equipment that connects multiple subscribers to the core network, measured at the electric power input interface and ASUbSCribers is the maximum number of subscriber lines that can be served by the broadband equipment. Similarly, the Normalized Power Consumption (NPC) is defined as [80]
NPC = [mWatt/Mbps/km] (3.15)R • L
where R is the data rate in Mbps and L is the line distance in km. Thus, the NPC metric is the power required to provide 1 Mbps data rate over the distance of 1 km. The ‘Power per Line’ and the NPC metrics are mostly intended for broadband wired access with multiple subscribers per equipment. The document [80] also specifies the measurement methods for both metrics, and also describes a Digital Subscriber Line Access Multiplexer (DSLAM) reference model. The DSLAM power limits imposed by the European code of conduct for broadband equipments are given in [81]. Moreover ETSI document [80] provides power consumption limits for most Digital Subscriber Line (xDSL) technologies, for Optical Line Termination (OLT) and a Multi Service Access Node (MSAN) equipment in conjunction with the specified traffic profiles. Hence, the NPC metric is well suited for comparison of different xDSL technologies and equipment and OLT equipment in terms of their energy consumption since the parameters such as a pre-defined reference length, bit-rate and coverage at full-power state are all specified by the ETSI. Note that the low power states (e.g. standby) and the low power modes are significantly dependent on the users behaviour and traffic patterns, and thus, the user and traffic profiles reference parameters have to be
55

3.4 Standardized Energy and Power M etrics
also specified when evaluating these metrics. The DSL standard define several power-saving states such as LO, L2 and L3 representing full, low and standby power states, respectively; see [82] and [83].
3.4.6 Energy Efficiency for W ireless Access Networks
A wireless access network is composed of many network elements. Hence, it is important to consider the energy consumption of these individual network elements in order to subsequently obtain the energy consumption of the whole network. This approach is followed by the ETSI in [84] where energy efficiency metrics for the Radio Base Stations (RBSs) equipment are defined. The power consumption ratings for the RBS sites varies with the RBS equipment manufacturers and the cooling and power solutions adopted. In addition, it is recommended in [84] that the power consumption measurements for the RBS equipment to be performed under a reference equipment configuration, a reference site parameters, a reference frequency bands, a reference operating environment and a reference load levels. This allows different power supply and cooling solutions to be taken into account using correction factors specified as a part of the RBS site reference parameters. More specifically, the average power of the RBS equipment is defined as
^Equipment = Pc + -BlRH [Watt] (3.16)
where Pq and P rrh are the power consumptions (in Watts) of the central and remote parts, respectively. These are defined as
r, -PbH.C ’ ^BH + P med,C ’ bned + P]ow,C ' UIQ = -----------------------------------------------------------------------
^BH T ^small 4“ ow(3.17)
andD T b h .RRH ' f'BH + -fmed,RRH * ^med + Plow,RRH * OW /q -i q \
PrRH = lBH + W n + ^ (3'18)where -Pb h .c and F med,c are the power consumptions for the central parts of the RBS measured in the middle frequency channel of the relevant reference frequency band assuming busy hour load and medium term load, respectively, Piow,c is the power consumption for the central parts of the RBS assuming low load
56

3.4 Standardized Energy and Power M etrics
measurements in a lower, middle and upper edge frequency channel of the relevant reference frequency band, respectively, before the average value is taken, and ^ b h ,rrh > -Pmed.RRH and Piow,r r h denote the corresponding power consumptions for the Remote Radio Heads (RRH) (in case of the distributed RBS architecture), and £bh> ^med and t\ow (in hours) are durations of the corresponding load levels. The different load levels and the corresponding durations are specified for each system using the reference parameters; this facilitates the process of collecting power consumption data for all the RBS equipment. For example, the metric ^Equipment can be used to obtain the power efficiency of the PA.
Similarly, the average power consumption of the RBS site equipment is defined in [84] as
Psite = PSFc • CFc • P c + PSFRRh • C F r r h • PFF • P r r h (3.19)
where PSFc and P S F r r h are the power supply correction factors [unit-less] for the central and remote parts, CFc and C F r r h are the cooling factors for the central and remote parts [unit-less], and PFF is the power feeding factor [unit-less] for the remote units to compensate for the power supply losses of the remote units (e.g. the transceivers and the power amplifiers). The P S F r r h factor depends on the power supply type and the power supply interface; they have different values depending whether the AC or DC power supply is used. The CF factor compensates for losses due to different cooling solutions; different values are used for fan-based, air conditioning controlled, and air-cooling solutions. Furthermore, the term PSFc • CFc • Pc represents the normal RBS site power consumption, and the term P S F r r h - C F r r H-P F F -P r RH corresponds to the RRH power consumption. This power metric is very useful for evaluating the potential energy savings for different RBS cooling and power solutions. In [85], it is noted that the cooling and power supply accounts for more than 30% of the total power consumption of the RBS equipment. Other power metrics derived from this model have been also proposed; see, for example, [86].
57
3.4 Standardized Energy and Power M etrics
3.4.7 Network Level Energy Efficiency of GSM
The power metrics for the rural and urban coverage areas are considered separately. In particular, in rural areas, the network level KPI is defined as
KPIRural = ^ = ^ [km2/W att] (3.20)PSite
where Average is the RBS coverage area in km2 calculated at low traffic loads. In urban areas, the network level KPI is defined as
KPIurban = ^ B“syHour [subscribers/Watt] (3.21)Psite
where WsusyHour is the number of subscribers based on the average busy hourtraffic demand and based on the average RBS busy hour traffic (expressed inErlangs/subscriber) as specified in the reference configuration parameters for the system under consideration. Both these metrics are now considered as preliminary proposals by the ETSI [84], however, they can be regarded as a useful tool for quantifying the energy consumption in the current mobile communication networks. It is worth mentioning that even though these metrics are applicable to any mobile communication network, their measurement methodology assumes mostly the Global System for Mobile Communications (GSM) network. More specifically, the energy efficiency measurements for the GSM network, i.e.,1.04 [subscribers/Watt] and 0.12 [km2/W att], are reported in [84]; the data for other cellular systems are yet to be published by the manufacturers. In addition, the proposed power measurement procedures for the cellular networks are usually independent from the equipment used and the particular wireless access technology employed; this encourages the equipment manufactures to publish their energy consumption reports.
58

3.5 EC R M etrics for the Radio A ccess Networks
3.5 ECR M etrics for the Radio Access Networks
In this section, we discuss how to use the ECR metrics to compare the energy efficiencies and energy consumptions of the wireless access networks at the system level. Our objective is to adopt the energy metrics for the RAN which facilitates research on energy issues with different RAN architectures. The RAN energy metric should account for the amount of the application bits transported M r.a n , the total energy F r a n used to transport this data over a measurement or observation period T. Then, the ECR metric for the RAN can be written as
ECRRAN = = ^ an [Joules/bit] (3.22)-(Wr a n AZr a n M '-’RAN
where E r a n is the RAN energy consumed by delivering M r a n bits over time T, T r a n = E r a n / T is the RAN transmission power, and S r a n — M r a n / T is the RAN average throughput. For a total number of K connections in the RAN, we
have that, M RAn = EjtLi M k and E RAn = E f = 1 E k and
p p p £ r AN E f = l E k S fc = l Rk ' Mk _ Y!k= 1 E C R kM k^ U K r a n = Y 7 = — FT — — — 77— — TTr— 77------
MRAN ^2k=1 Mk J2k=i Mk Efc=i M k
where Pk and R k are the average power and throughput for the k-th connection, respectively. If the RAN has N cells and under commonly used assumption that each cell transmits with the same average power and has the same average throughput, the ECR metric reduces to,
ECRran = = ^ = E C R cu (3.24)iV • M ce\ \ / 1 D c e i i
Such assumption is significant because it makes the ECRceii the key energy metric for the RAN.
As an example, we investigate an High Speed Downlink Packet Access (HS- DPA) outdoor wide area cellular network 1 modeled as a classical hexagonal homogeneous deployment with 3-sectored cell-sites of radius D and inter-site dis
2This investigation has been carrier out by Dr. Biljana Badic [5].
59

3.5 EC R M etrics for the Radio Access Networks
tance 1.5 • D. The area to be served is defined for N = 57 cells with the radius vceii = D /2, and the average transmission power P ceu corresponding to the power per sector. Figure 3.4 shows the evolution of the ECR versus the number of cells in the RAN [5] 2. The number of cells is varied in the simulation, so that the number of users served and their QOS targets are maintained as the cell size is reduced. The ECR decreases with a decreasing cell size and such decrease is different for different antenna downtilt settings. In particular, two antenna tilt settings we consider: (E7 MO) and (E5 MO) where ‘E ’ corresponds to the electrical downtilt and ‘M’ correspond to the mechanical downtilt. In Figure 3.4, the solid line and the dashed line correspond to the downtilt (E7 MO) and (E5 MO), respectively [87].
2Here the ECR is referred to as the Energy Consumption Rate rather than the Energy Consumption Rating that was introduced above
60

3.5 E C R M etrics for th e R adio Access N etw orks
i— ECP, E7 MO - • ECR. £5 MO
U 10
10"“Number of Cells
Figure 3.4: The comparison of the ECRs versus the number of RAN cells (simulation) [5].
61

3.6 System -B ased Energy M etrics
3.6 System -Based Energy M etrics
The logarithmic metric in dBe is proposed in [88] in order to allow comparisons of the absolute energy efficiencies of equivalent Information Technology (IT) systems. Specifically, the Carnot heat engine and a computer entropy are compared. The entropy is related to the energy unavailable for useful work in any thermodynamic system, and thus, can be regarded as the level of disorder in the system. This fact links the useful output from any computer-based system (i.e., the entropy of that system) with a system producing output in order to release its entropy. This sets an absolute limit on the energy efficiency of the system which corresponds to the amount of the released entropy. It is claimed in [88] that,
Absolute Energy per bit = kT In 2 (3.25)
where k is the Boltzmann constant (1.381 x 1CT23 [Joule/Kelvin]) and T is the absolute temperature in Kelvin. Hence, the proposed energy metric is then defined as:
d B . - K M o (3. 26)
The value dBe represents the absolute energy efficiency. This metric shows that the energy efficiency for any ICT system has a limit from the physics point of view. However, and importantly, notice that the dBe metric essentially corresponds to the ECR metric presented in the logarithmic scale. In general, comparison of the energy efficiencies in the logarithmic scale may be of some value and deserves to be investigated further. Consequently, we outline some possible metrics in the logarithmic scale that can be considered. The usefulness of these metrics shall be determined by comparing their outputs to the ECR-based metrics for results validation purposes.
62

3.7 Ongoing Standardization A ctiv ities
3.6.1 A bsolute Energy Consumption Ratio (AECR)
The AECR metric can be defined as the overall absolute power consumed per delivered information bit:
AECR = l0g(P /1^ a t t ) r = k g ( P / W a t t ) [dBm/bps] (3.27)
where P is the power used to deliver M bits over time T, and S = M /T is the data rate in bits per second. Hence, we can measure the energy in dBm.second rather than in Watts.seconds.
3.6.2 R elative Energy Consumption Gain (RECG)
The RECG metric can be defined to compare the energy consumption between two systems having the same data rate S over time T and assuming that one of these systems as a reference:
RECG = !?g | (3-28)log (P2 / l hi Watt)
3.7 Ongoing Standardization A ctivities
The use of alternative energy sources in telecommunications installations is discussed in [89]. This document covers fuel cells, photovoltaic generations, wind turbines as well as energy storage systems in details. Recommendations and system design parameters for the inclusion of the alternative energy generators into telecommunication installations are given. In addition, the use of alternative cooling solutions (such as geo-cooling) using horizontal and vertical collectors is also discussed. The thermal management guidance for the telecommunication equipment and its deployment is discussed in [90].
63

3.7 Ongoing Standardization A ctivities
The ETSI energy efficiency work programme is focusing on the following items to be included into the future standards: 3:
• DTR/EE-00008, “Environmental Impact Assessment of IC T Including the Positive Impact by Using IC T Services
• DES/EE-00014, “LCA Assessment of Telecommunication Equipment and Service Part 1: General Definitions and Common Requirements,” publication scheduled for Feb. 2011;
• DES/EE-00018, “Measurement Methods and Limits for Energy Consumption of End-user Broadband Equipment Consumer Premise Equipments(CPE)”
• DTR/EE-00006, “Environmental Engineering Environmental Consideration for Equipment Installed in Outdoor Locations” ;
• DTR/ATTM-06002, “Power Optimization for xDSL Transceivers”’,
In addition, the ATIS Network Interface, Power and Protection Committee has published the document [91] which specifies definitions of the routers and the Ethernet switches based on their position in a network, and this document also provides a methodology to calculate their TEER. The ATIS approach is to classify products inside functional groups by their position in a network, and use a TEER definition assuming a maximum demonstrated throughput divided by the weighted power with the maximum weight on the utilization level at a representative utilization position in the network. Such approach is likely to give insight into how the position of nodes impacts on the overall power consumption.
An updated draft version of the ETSI specification V I.2.1 [84] will extend the average power metric for the RBS and the case of dynamic operations of the base station equipment, i.e., the updated metric incorporates dynamic behavior of the RBS operations. This document will also specify attenuation models for voice and packet data, and also model dynamic behaviour of the equipment in operation. Such updated metric will be used to adopt dynamic models of the RAN networks for measuring their energy efficiency. The document [84] is important since it highlights and promotes potential power saving features. The met-
3as of the writing of this thesis in Jan 2013.
64

3.8 Conclusions
rics and measurement methods in this document are applicable to GSM/EDGE, WCDMA/HSPA, LTE and WIMAX systems.
3.8 Conclusions
The energy and power metrics proposed in different telecommunication standards were discussed and the ongoing standardization activities are also outlined. The general trend to measure and report the power rather than the energy of telecommunications networks and equipment (expressed in Watts), and subsequently to calculate the corresponding energy consumption in Watt-hours units, were observed. Most, if not all, of the energy metrics considered in the standards are defined for the operational phase of the telecommunications equipments. Among the energy and power metrics discussed in this chapter, the TEER metric and the ECR metric appear to be particularly suitable for a wide range of equipment, system scenarios and applications. In fact, these two metrics are mutually compatible and enable accurate measurement and test procedures under clearly defined environmental test conditions. Selecting a high level methodology approach suggested by the TEER and the ECR metrics can guarantee adaptable and flexible power efficiency measurement procedures. In our paper [87] a case study of the application of the ECR metric in the RAN architecture is provided. The ECR metric was proved to be useful in quantifying the RAN energy consumption which allows comparisons between different RAN architectures. The ECR metric reflects the energy consumption at the system level rather than assuming a particular piece of equipment.
Finally, it is important to realize that, in general, the ECR alone is not sufficient and other (conventional) metrics such as the QoS constraints must be considered. In fact, the energy and power metrics should account not only for the QoS requirements, implementation complexity and the embodied energy even though such considerations are very limited in the current standards. Also, we observed that there exists a trade-off between generic energy metrics and more accurate specialized energy metrics.
65
4
Energy Efficient Practical N etwork Coding for LTE Networks
This chapter discusses the implementation of practical NC schemes in an LTE REC, which has received less attention in the literature. As concluded from the literature review , NC implementation at higher layers is recommended but how and on what layer of the protocol stack remains a questions. Moreover, the interaction between various LTE features and NC are interesting and will help highlight the conditions and scenarios where NC gains are maximized.
Designing practical NC based transmission schemes for LTE networks poses several challenges beyond designing an efficient coding and decoding algorithm. First, what is the appropriate coding entity in the LTE protocol stack where the coding takes place?. The selection of this entity is crucial as it influences the performance of NC schemes from various aspects. Second, since a coded packet is broadcasted for many next hops, the reliable delivery of this coded packets is paramount. Hence, we have to carefully address both these issues along with taking into considerations the characteristics of LTE DL and UL transmission formats. This chapter tackles these challenges and makes the following contributions:
66
1. A practical packet level NC scheme for TWRCs in an LTE REC implemented at MAC-sublayer of the LTE protocol stack is presented. The appropriate coding entity in the LTE protocol stack that facilitates seamless integration into wireless multi-hop LTE networks is articulated.
2. The proposed NC scheme applies to multiple unicast session traversing a common node in both forward and reverse directions in an LTE multi-hop network. The key insight of the NC protocol is the scalability with respect to traffic load and channel variations.
3. Detailed evaluation of the performance of NC scheme using computer simulations is presented. Results are obtained for various LTE parameters and traffic loads. The findings are summarized as follows:
• The proposed NC scheme is beneficial in terms of reduced energy consumption as well as increased throughput.
• The NC scheme without and with subcarrier division duplexing (SDD) consume 16 — 25% and 7 — 12% less RF energy than the corresponding conventional relaying protocols(i.e without and with SDD), respectively.
• The NC scheme without and with SDD consumes 0.5 — 3.2% less RAN physical resources than the the corresponding conventional relaying protocols (i.e without and with SDD), respectively. The resource saving is increasing with the offered traffic. This implies that both NC schemes help to alleviate the RAN congestion issues, and other QoS parameters such as the user delay and PER.
• Both the NC and the NC with SDD schemes considered are found to be robust against varying user distances, so that the energy, throughput and resource savings are even achievable at the cell edge.
• Both NC schemes are found to be useful even when the communication channels are time-varying, i.e when transmission powers vary.
• Both NC schemes maintain their energy savings and throughput gains even when the maximum number of packet retransmissions was decreased. It was also found that the resource savings of the NC schemes can be increased by increasing the value of the maximum number of
67

4.1 LTE protocol Stack
retransmissions. In other words both NC schemes can tolerate more per packet delays for elastic and best effort traffic applications.
In this chapter the main features of LTE protocol stack are discussed in Sec.4.1 within the context of finding an appropriate entity for NC implementation. The system description with and without NC and the practical NC schemes for LTE are introduced and discussed in Sec. 4.2. In Sec. 4.3 the system parameters used to simulate the the proposed NC schemes are described. The simulation results are then shown and discussed in Sec. 4.4. Sec. 4.5 draws the conclusions and lessons learned.
4.1 LTE protocol Stack
In general, the XOR of packets to realize NC can be done at any OSI layer. Hence the task is to identify the data entity in the protocol stack that is the most suitable. Since we ruled out the physical layer from the literature review, we look at higher layers.
We introduce the following standard 3GPP terminology to be used in the rest of the thesis, note that , these terminologies for the DL/UL from /to the eNB are also valid for the DL/UL from/to the RS.
• subframe: unit of time, 1 ms; resources are assigned at subframe granularity.
• PRB: A physical resource block spans 12 subcarriers each with a subcarrier bandwidth of 15 kHz over a subframe duration.
• PDCCH: physical DL control channel, physical resources in time and frequency used to transmit control information from the eNB to UE or RS.
• PDSCH: physical DL shared channel, physical resources in time and frequency used to transmit data from the eNB to UE or RS.
• PUSCH: physical UL shared channel, physical resources in time and frequency used to transmit both control information and data from the UE and RS to eNB. Some resources within the PUSCH are reserved for Layer(L) 1/2 control signals.
68

4.1 LTE protocol Stack
• RE: resource elements, represent 1 subcarrier (15 kHz) over 1 OFDM symbol ( approximately 70[i seconds when using normal cyclic prefix).
• CQI: channel quality indicator, measure of the signal-to-noise ratio (SNR) at the UE from the eNB transmission, calculated as the average of the power measured of the RE that contain cell-specific reference signals (CRS);fed back repeatedly from the UE to the eNB. Similar CQI is fed back between the UE and RS.
• SRS: sounding reference signals, measure of the UL channel quality from the UE to the eNB transmitted using the UL reference symbols, to aid the eNB UL scheduler decisions;fed back repeatedly from the UE to the eNB. Similar SRS is fed back between the RS and eNB.
• TB:transport block 2, refers to the MAC layer PDU. From the physical layer perspective, a transport block is a group of PRBs which corresponds to the data carried in a subframe duration for the particular UE. There is one coded transport block per UE unless 2X2 multiple-input multiple-output (MIMO) is used at both eNB and the UE, where two independently coded transport blocks are transmitted to the UE on virtual streams on the same PRBs.
• TBBLER: transport block error rate, refers to the encoded transport block error rate after decoding at the receiver side.
• TBS: transport block size, refers to the transport block size in bits transm itted to a user during a subframe. The transport block size is a function of the number of scheduled PRBs and modulation and coding scheme (MCS) used on each PRB.
• Coded flow: coded flow refers to the number of bits resulting from the XOR operation. It determines the new broadcast link flow (in bits) after the XOR operation.
• Remaining flow: remaining flow refers to the number of bits remaining after the XOR operation ,waiting to be forwarded to the intended node. It determines the remaining link flow (in bits) after the XOR operation.
2 A coded transport block is called a codeword in the 3GPP terminology
69

4.1 LTE protocol Stack
An illustration of the LTE protocol stack layers design and the interaction between different layers is shown in Figure 4.1. As described in Sec. ??, LTE link layer consists of MAC and the RLC sub layers. The MAC sub layer is responsible for mapping the logical channels received from RLC sub layer to transport channels used by the physical layer. In particular it performs multiplexing/demultiplexing of RLC PDU belonging to one or different EPS radio bearers data into/from TB delivered to/from the physical layer on transport channels. It then carries out packet scheduling, HARQ retransmissions and link adaptation (part of the eNB scheduler functionality) for the user transport blocks [56].
SAE Beareis ^------- 1--------- SAE bearer 1 , , SAE bearer 1 , , SAE b earer2
Header Payload Header Payload Header Payload
PDCPheadercompression,ciphering
RadioB e are r s >__
Header Paytoad
PDCPheader PDCP SDU
Header Payload Header Payload
\ \
PDCPheader PDCP SDU PDCP
header PDCP SDU
IRLCsegmentation,concatenation
Logical C h a n n e ls .
RLC SDU RLC SDU RLC SDU
~r“ ~
RLC~ - - .V ----- ~ >■ ........ .
RLC 1 "’r 11 ■*' RLCheader header header
MACmultiplexing MAC
header MAC SDU
Transport Channels ir PHY
MACheader MAC SDU
Transport block CRC'T O t
Transport block CRC
F ig u r e 4 .1 : LTE link Layer design highlighting the interaction between layers
Given the characteristics of the LTE link layer design, it is possible to perform network coding at the transport block level of the MAC sub layer. A desirable feature in the LTE link layer ,which is beneficial for designing a robust network coding scheme, is that the HARQ retransmission unit is the transport block. This is very desirable and facilitates fast HARQ retransmission of the network coded packets. Furthermore, since the network coding is a new technology that has not been implemented in wireless standards yet, we advocate that initially only simple and robust network coding schemes should be considered for inclusion to
70
4.1 LTE protocol Stack
the standards. The robustness of network coding is important since the network coding will directly influence other functions of the protocol stack, most notably routing, congestion control and scheduling as highlighted in [44].
Hence, and for the above reasons, the implementation of practical NC schemes are suggested to be performed at the MAC sublayer of LTE protocol stack, i.e. on TBs. For REC , NC is performed at Type 2 in-band RS. Type 2 RS is specified by the 3GPP standard to be a part of the donor cell. An example of the Type 2 relaying is a decode-and-forward relaying at Layer 2 of the LTE protocol stack. It performs partial RRM and provides throughput enhancement in LTE cell. This suggestion comes with the intrinsic beneficial features for ensuring the reliability of coded packets via HARQ. Moreover, it also facilitates the inclusion of advanced LTE link layer features such as scheduling, priority handling and transport format selection( selection of the TBS, modulation scheme and code rate). The implications of performing NC on TBs along with the similarities and differences to other practical NC protocols in the literature are discussed next.
NC protocols operating at the physical layer have been studied extensively e.g ANC protocol and MIXIT protocols [27] for 802.11 Ad hoc networks. However, a relevant protocol to our NC protocol is the COPE protocol operating at a shim between the IP and MAC layers [44]. The COPE protocol, implemented in a testbed scenario for 802.11 Ad hoc network , demonstrated throughput gains of 1.33. The throughput improvements,received by the application, from COPE for highly congested medium with random User Datagram Protocol (UDP) traffic are in the range of 3 — 4 times. Although the LTE OFDMA systems shares the same coding structure with the 802.11 Ad hoc networks, they are fundamentally different in various aspects. First, the 802.11 networks uses a single common frequency while the PRBs are the allocable resource in LTE. Second, 802.11 networks employs distributed random access scheme while the LTE eNB scheduler allocate resources to all users and relay stations based on various algorithms. Thirdly, LTE OFDMA networks adapts the MCS according the SNR feedback and thus the data rates and robustness of the packet transmission. Thus, the design of practical coding schemes for LTE OFDMA networks is expected to be quite distinct from COPE in various aspects.
71

4.2 System D escription
4.2 System Description
System models for NC assumes NC is performed at the network layer where the packets are received error free via the error correction mechanisms employed at lower layers. Our practical NC scheme attem pt to address such issues and implement NC at the MAC-sublayer of LTE protocol stack in the TWRC communication scenario in LTE TDD duplex scheme, owing to its added benefits and simplicity when applying NC.
A bidirectional relaying over a TWRC consisting of an eNB, a RS and an UE is shown in Figure 4.2. We adopt the notation a (/, t ) which denotes the packet ‘a 5 to be transm itted at time slot t on subcarrier / . Since all transmissions are occurring on the same subcarrier / , we require 4 time slots to exchange packets ‘a ’ and ‘6’ between the eNB and the UE as indicated in Figure 4.2. On the other hand, one time slot can be saved by exploiting the broadcast nature of the wireless channel as shown in Figure 4.3. In this case, the packets ‘a ’ and ibi are XORed (i.e., encoded) at the RS before being broadcasted to the eNB and the UE while all the transmissions are again assumed to be occurring on the subcarrier / . Such encoding is referred to as NC, and we observe that in this case, NC saves 1 transmission. Note that PERs P/(/, t) for time slot t and subcarrier / are also shown in Figure 4.3, where I refers to the link number.
UEeNB RS
F ig u r e 4 .2 : A bidirectional relaying between the eNB and the UE via the RS.
Recall that the LTE DL uses an OFDMA transmission format while the LTE UL is based on a SC-FDMA transmission format [56]. Hence, in order to implement the exclusive-or based NC in Figure 4.3, we suggest to broadcast the NC packets using OFDMA. In this case, the UE receiver remains unchanged, and the eNB receiver must be extended to enable the reception of the OFDMA modulated packets in the UL channel (i.e., RS-eNB). This modification of the eNB
72

4.2 System D escription
eNB UERS
Figure 4.3: A NC scheme for a bidirectional traffic at the RS.
receiver is likely to be readily accomplished as well as cost effective while also enabling the gains due to NC: OFDMA and SC-FDMA share the same demodulator functionality where the frequency domain equalization is done in the frequency domain by simple element wise multiplication [56]. SC-FDMA contains all the same blocks of OFDMA but moves the Inverse Fast Fourier Transform (IFFT) from the transm itter to the receiver resulting in modulation constellation mapping to occur in the time domain rather than the frequency domain. This makes the Sc-FDMA symbol effectively a group of modulated sub-symbols, simplifying the transm itter [92]. Comparing the Peak-to-Average Power Ratio (PAPR) of OFDMA and SC-FDMA, OFDMA is more likely to have higher power ratio resulting in an increased power consumption. However, it is more easier to control the transmit power of the PA in OFDMA than SC-FDMA in order to fit within the linear region resulting in operating at the higher efficiency [92].
In order to accurately predict the usefulness of NC in the real systems, it is important to adopt system models with realistic assumptions. There are two realistic assumptions that have strong impact upon the performance of NC schemes in real systems3. The first realistic assumption is the non-zero packet error rate (PER) of the communications links between network nodes. As shown in Figure 4.3, each link experiences a PER P/(/, t) at time slot t and on subcarrier / . The second realistic assumption is the in-balance of the potentially time-varying traffic rates from the eNB and from the UE. This flow asymmetry occurs due to the effect of the channel conditions or due to flow rate mismatch between the UL and DL underlying applications in the bidirectional communication session.
3Other major implementation concerns of the NC are the buffer sizes, requirements for opportunistic listening and the packets overhearing.
73

4.2 System D escription
We present our practical NC protocol that accommodates for those two realistic assumptions in the next subsection.
4.2.1 Practical Network Coding for LTE networks
The problem of finite PER of the links can be mitigated by implementing HARQ- ARQ combination at the MAC-sublayer and RLC-sublayers respectively. The problem of in-balance traffic rates can be solved by creating the remaining traffic flows [46] as shown in Figure 4.4. In particular, the RS encodes the smaller of the data rates inbound to the RS from the eNB and from the UE, and creates the so-called Coded flow. Figure 4.4 explains the concept of the coded flow and the remaining flow; the numbers below the packet labels are the example values of the packet sizes in bits. The coded flow is broadcasted assuming the smaller SNR of the two incoming links. The Remaining flow that is not (cannot be) NC is then unicasted to the corresponding node (either the UE or the eNB) using the SNR for that link. Hence, the RS encode the minimum amount of bits from the bidirectional flows creating the coded flow and the remaining (non coded) bits will create the remaining flow.
Packet reliability requirements ensured by HARQ and ARQ in conjunction with the concept of coded and remaining flow constitutes our practical NC scheme which we will show that it can reliably by incorporated into LTE networks. Moreover, coded and remaining flow concept does not alter the LTE packet scheduler functionality and allocation algorithm as the assigned PRBs for the coded flow and the remaining flow can be different.
4.2.2 Practical Network Coding with Subcarrier Division D uplex (SDD) for LTE networks
A modified practical NC protocol which exploit SDD concept is presented here. The concept of SDD is first introduced in the 3GPP 2008 meeting [93] as a candidate transmission scheme for LTE-A networks. The advantages of sharing subcarriers between the eNB and the RS, and the RS and the UE links were
74

4.3 System M odel
NC flow a © b400
400 1000eNB RS UE
600remaining flow
F ig u r e 4 .4 : A NC scheme for bidirectional asymmetric rate traffic at the RS.
discussed. In SDD relaying, the number of orthogonal subcarriers on these links can in principle by dynamically varied. This is useful for decreasing the elapsed transmission time for the packet exchange and for improving the reliability of the received packets at the RS. Moreover, it allows the eNB and the UE to transmit on the remaining subcarriers when the RS is busy receiving data, thus achieving greater coverage relative to the pure TDD relaying scheme, where either the eNB and the UE can transmit in this TWRC scenario.
The SDD concept in conjunction with the our NC protocol (NC SDD) can be used to combine the throughput gains of the relaying SDD (SDD relaying uses 2 time solts only) and the NC protocols. Figure 4.5 illustrates the relaying SDD protocol.
UERSeNB
F ig u r e 4 .5 : A relaying protocol with the subcarrier division duplexing.
4.3 System M odel
We evaluate the performance of the NC and the NC SDD protocols for a TWRC in the LTE network. We use B to denote the total number of PRBs in a single subframe(lms). We assume the TDD bandwidth of 20 MHz, and for simplicity, we use the contiguous PRB allocation for both the UL and the DL.
75

4.3 System M odel
4.3.1 Channel M odel
We first study the NC schemes under Additive White Gaussian Noise (AWGN) channels with Rayleigh fading and no interference is considered. The received signal at any node is given by:
y = ctht r x- \ -n (4.1)
where y and x are the received and transmitted modulated symbols respectively. x. n is the AWGN Gaussian noise with zero mean and double-sided power spectral density of uq/ 2. htr is the channel coefficient between the transm itter t and the receiver r. a is the distance dependent path loss.
Path Loss M odel
The path loss model for urban area LTE REC is taken from COST231 Hata Model and given by [94]:
OdB — 46.3 + 33.9/opio(/) — 13.82logio(htTx)
- H c f + (44.9 - 6.bhlogio{htTx))logio(d) + c [dB] (4.2)
where H c f is the mobile station antenna height correction factor for urban areas and is given by:
Hcf = {l.llog10(f) - 0 .7 )/it^ - 1.56/o£io(/) - 0.8 [dB] (4.3)
and c is a constant and is different for different terrains, c = 3 for urban metropolitan areas. otdB is path loss in decibels, / is the operating frequency in MHz. htxx height of the transmitter in meters and htux is height of the UE in meters, d is distance between the transmitter and received in Km.
76
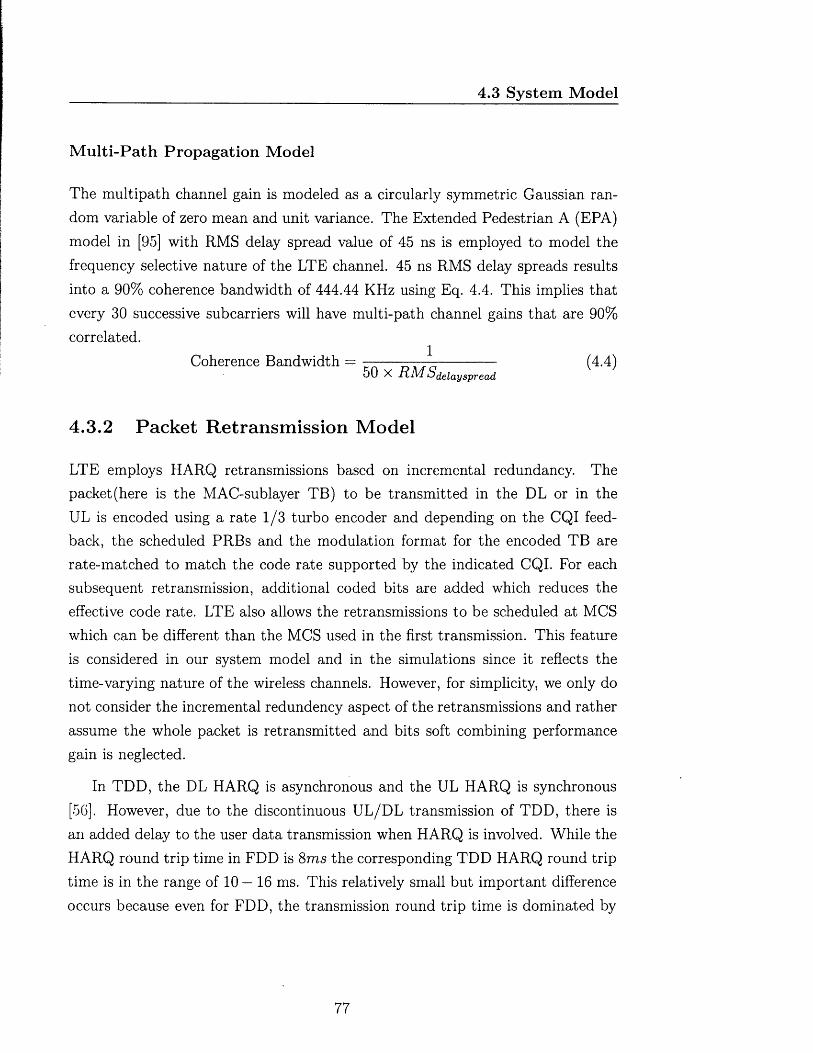
4.3 System M odel
M ulti-P ath Propagation M odel
The multipath channel gain is modeled as a circularly symmetric Gaussian random variable of zero mean and unit variance. The Extended Pedestrian A (EPA) model in [95] with RMS delay spread value of 45 ns is employed to model the frequency selective nature of the LTE channel. 45 ns RMS delay spreads results into a 90% coherence bandwidth of 444.44 KHz using Eq. 4.4. This implies that every 30 successive subcarriers will have multi-path channel gains that are 90% correlated.
Coherence Bandwidth = — p ----------- (4.4)5 0 X riM ddelayspread
4.3.2 Packet Retransmission M odel
LTE employs HARQ retransmissions based on incremental redundancy. The packet (here is the MAC-sublayer TB) to be transmitted in the DL or in the UL is encoded using a rate 1/3 turbo encoder and depending on the CQI feedback, the scheduled PRBs and the modulation format for the encoded TB are rate-matched to match the code rate supported by the indicated CQI. For each subsequent retransmission, additional coded bits are added which reduces the effective code rate. LTE also allows the retransmissions to be scheduled at MCS which can be different than the MCS used in the first transmission. This feature is considered in our system model and in the simulations since it reflects the time-varying nature of the wireless channels. However, for simplicity, we only do not consider the incremental redundency aspect of the retransmissions and rather assume the whole packet is retransmitted and bits soft combining performance gain is neglected.
In TDD, the DL HARQ is asynchronous and the UL HARQ is synchronous [5G]. However, due to the discontinuous UL/DL transmission of TDD, there is an added delay to the user data transmission when HARQ is involved. While the HARQ round trip time in FDD is 8ms the corresponding TDD HARQ round trip time is in the range of 10 — 16 ms. This relatively small but important difference occurs because even for FDD, the transmission round trip time is dominated by
77

4.3 System M odel
the UE and the eNB HARQ processing times (3ms each). For simplicity, we assume synchronous ARQ retransmissions for both the UL and the DL and we ignore the round trip delays as they have no impact on our KPI.
In each subframe, the eNB DL and UL scheduler grants the PRB resources to the UE or to the RS for their transmission in the DL and UL, respectively. Similar scheduling is performed for the UE transmission in the DL and UL to the RS. As mentioned above, we assume that each retransmission of a TB occurs immediately after the first transmission. More importantly, the TBs are being retransmitted until they are successfully decoded at the destination node or until the maximum number of retransmissions have occurred.
4.3.3 Link Adaptation (MCS selection)
In the simulations link adaptation is performed by adaptively changing the MCS following changes in the computed SNR as shown in Table 4.1 and Table 4.2 for the DL and UL, respectively. The link adaptation table is obtained from LTE link layer simulations for a 10% PER target in [56] and [96] for the DL and UL, respectively.
4.3.4 Control Signalling Overhead
The control signaling physical resources (i.e., PDCCH/control signals in PUSCH) are time and frequency-multiplexed with the resources to transmit data (via PDSCH/PUSCH) for the DL and UL, respectively. Each subframe consists of 14 OFDM symbols (assuming a normal length of the OFDM cyclic prefix) of which 3 symbols are reserved for the control signaling in both the UL and in the DL. The simulations take into account those overhead control symbols in the calculation of the number of bits per PRB. Note that we ignore the CRS/SRS used for the DL and the UL channel estimation.
78

4.3 System M odel
MCS SN R [dB]QPSK 78/1024 - 8 to - 6
QPSK 120/1024 - 6 to -4QPSK 193/1024 -4 to -2QPSK 308 /1 024 - 2 to 0
QPSK 449/1024 0 to 2
QPSK 602/1024 2 to 416QAM 378/1024 4 to 6
16QAM 490/1024 6 to 8
16QAM 616/1024 8 to 1 0
64QAM 466/1024 1 0 to 1 2
64QAM 567/1024 12 to 1464QAM 666/1024 14 to 1664QAM 772/1024 16 to 1864QAM 873/1024 18 to 2 0
64QAM 948/1024 > 2 0
T a b le 4 .1: DL Link Adaptation.
MCS SN R [dB]QPSK 1/5 2.4 to -1.3QPSK 1/3 -1.3 to 1 . 1
QPSK 1/2 1.1 to 3.3QPSK 2/3 3.3 to 6.416QAM 1/2 6.4 to 9.116QAM 2/3 9.1 to 10.616QAM 3/4 10.6 to 11.716QAM 4/5 > 11.7
T a b le 4 .2: UL Link Adaptation.
4.3.5 Simulation Setup
For the simulations, various parameters are considered for evaluations are presented here. The eNB and the RS distance and the RS to the UE distances are 1
kilometer (km) and 0.2 km respectively. The transmission power of the eNB, the RS and the UE are 46, 30 and 23 dBm, respectively. All communication links employ a single-input single-output (SISO) transmission. The main simulation parameters are detailed in Table 4.3.
79
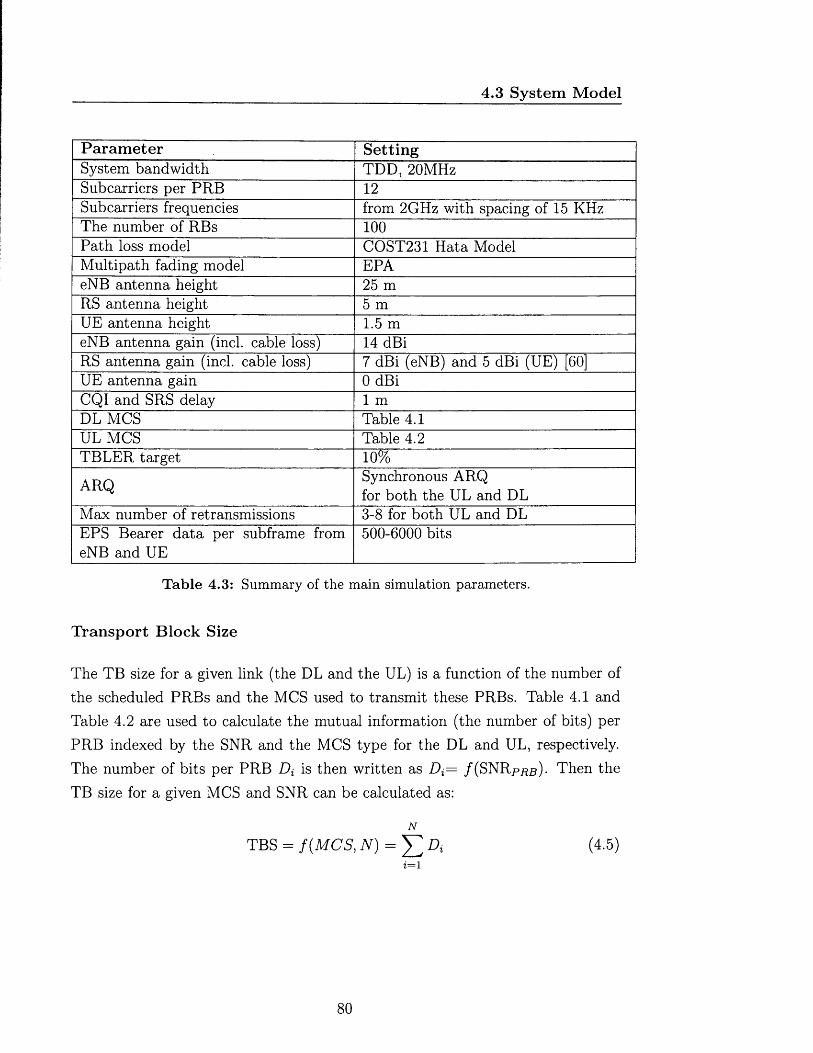
4.3 System M odel
Param eter SettingSystem bandwidth TDD, 20MHzSub carriers per PRB 1 2
Subcarriers frequencies from 2GHz with spacing of 15 KHzThe number of RBs 1 0 0
Path loss model COST231 Hata ModelMultipath fading model EPAeNB antenna height 25 mRS antenna height 5 mUE antenna height 1.5 meNB antenna gain (inch cable loss) 14 dBiRS antenna gain (inch cable loss) 7 dBi (eNB) and 5 dBi (UE) [60]UE antenna gain 0 dBiCQI and SRS delay 1 mDL MCS Table 4.1UL MCS Table 4.2TBLER target 1 0 %
ARQ Synchronous ARQ for both the UL and DL
Max number of retransmissions 3-8 for both UL and DLEPS Bearer data per subframe from eNB and UE
500-6000 bits
Table 4.3: Summary of the main simulation parameters.
Transport B lock Size
The TB size for a given link (the DL and the UL) is a function of the number of the scheduled PRBs and the MCS used to transmit these PRBs. Table 4.1 and Table 4.2 are used to calculate the mutual information (the number of bits) per PRB indexed by the SNR and the MCS type for the DL and UL, respectively. The number of bits per PRB Di is then written as Di= /(SN Rppp). Then the TB size for a given MCS and SNR can be calculated as:
N
TBS = f {M C S , N) = J 2 Di (4-5)z=l
80

4.3 System M odel
where M C S is the MCS used on the scheduled PRBS, Di is the number of bits contained in the PRB 2 , and N is the number of scheduled PRBs.
Transport B lock Error R ate (TBLER)
In every subframe, the TB transmission depends on the channel conditions and is evaluated to decide whether the receiver has decoded the TB successfully or not. The decision of the transmission success is evaluated using the following steps. First, the SNR of each RE i used during the transmission of the TB is calculated
where P ravg is the average received signal power , h is the multipath channel gain modeled as a circularly symmetric Gaussian random variable of zero mean and unit variance. Second, the effective SNReff that captures the channel conditions over all the REs used in the transmission of the encoded TB is obtained as discussed in [97], i.e., the effective SNR is an arithmetic average of the SNRs on the used subcarriers. Finally, the TBLER is obtained for this transmission assuming a mapping table constructed for an AWGN channel on the link level,
The dependence on the M C S is usually characterized using link level simulations for an AWGN channel for given MCS and given sizes of the TBs. The TBLER vs. SNR curves obtained via link level simulations can be found in [99]. The curves are obtained for a given packet length, however, the results in [100] show that the TBLER sensitivity to packet length is generally very small, and thus, it can be neglected for packet sizes larger than 500 bits which is the case of our simulation scenarios considered. A Bernoulli experiment with the TBLER probability is then used to decide whether the TB error event occurred and retransmission must be invoked. Note also that equation 4.6 assumes the RE rather than the PRB, however, we assume the PRBs as the basic unit to obtain the SNR values for the scheduling decisions in our simulations. For the purpose of CQI
as [97]:| |h 2 || • Pr a v g
Noise(4.6)
[98] i.e. ,TBLER = f ( 3 N R eS, M CS). (4.7)
81

4.3 System M odel
and SRS reporting, the effective SNR is calculated in a manner similar to the above utilizing the DL RS and the UL SRS, respectively.
K ey Perform ance Indicators
The ECR energy metric is employed to compare energy efficiency of various protocols with and without NC. In our case, the ECR is an average energy consumed per delivered bit by all nodes (including the relay) during exchange of the TBs over the TWRC. Then, the percentage energy reduction gain (ERG) is defined as [87]:
ERG = — (4-8)
where E C R i refers to the ECR of the relaying protocol with and without SDD, and E C R 2 refers to the ECR of NC protocol with and without SDD.
As another key metric, we consider, is the information exchange rate (IER) metric to compare the information exchange rate of the relaying and of the NC protocols. In our case, the IER is the average number of bits exchanged over the TWRC per unit of time. The exchange of the TBs is assumed to be completed after the protocol cycle time elapses. The protocol cycle Tcycie is defined as the time required to successfully exchange 2 TBs over the TWRC between the eNB and the UE. For example, the protocol cycle times for the relaying protocol in Figure 4.2 and for the NC protocol in Figure 4.3 are given as t\ + £ 2 + £ 3 + £ 4 and £1 T £ 2 + h respectively where £*, i = 1, 2, 3,4 are the times to successfully deliver the TB over a given link. The IER metric is then defined as [101]:
IER = T B S ° + T B S >> (49)-L cycle
where TBSb and TBSb are the TBS in bits that are successfully received at the eNB and the UE over time duration Tcycie. Note also that the definition of the IER contains one way point-to-point transmissions as a special case. For example, in order to calculate the DL end-to-end throughput for a two-hop protocol with the relay, we substitute TBSb = 0 in Eq. 4.9, and £ 3 = £ 4 = 0 in Tcycie. The UL end-to-end throughput can be calculated similarly. The IER gain is calculated
82

4.4 Num erical R esults
similarly to the ERG in (4.8), i.e.,
IER Gain = I E J ) ~ ^ ER a . (4.10)
The resource utilization is calculated as the average percentage of all theresources used on all the links, so that it can be written as:
L T
Resource Utilization = BE Ni/T) (4.11)j=1 4 = 1
where L is the number of links used for the TBs transmissions, i.e., L = 4 and L = 3 for the relaying and for the NC, respectively, Ni is the number of PRBs used for the transmission of a TB during the z-th transmission, and T is the number of ARQ retransmissions for each link. The resource utilization gain expressed as percentage of the saved PRBs due to the use of NC and is calculated similarly to the ERG. It is defined as,
Resource Utilizationi — Resource Utilization^ inn(w Resource Utilization Gain = ------------------------------——-------------------------------xlUU/o.
RU\(4.12)
4.4 Numerical Results
In this chapter, we present the simulation results comparing NC schemes for the TWRC with different settings and assumptions. In particular, the main objective is to compare the relaying with NC when SDD is and is not considered. The outputs of the simulations are the ERG, IER gain and resource utilization gain. All simulations assume identical data flows of constant rate from the eNB and from the UE.
83

4.4 Num erical R esults
4.4.1 Impact of Offered Traffic Load
The distance between the eNB and the RS is fixed and equal to 1 km, and the distance between the RS and the UE is fixed at 0.2 km. The offered traffic for the TWRC is defined as the aggregate EPS bearer amount of data per subframe from the eNB and from the UE.
Figure 4.6 and Figure 4.7 illustrate the IER and the ECR when the traffic load increases from 1000 to 12000 bits per subframe. Figure 4.8, 4.9, Figure 4.10 compare the ERG, IER gain and resource utilization gain for various traffic loads. Figure 4.6 shows that the improvement of the ECR of the NC with SDD is smaller than the ECR improvement of NC without SDD. Overall, the ERGs of the NC without and with SDD are 16 — 25% and 7 — 12%, respectively, and in both cases, the ERGs decrease with the offered traffic. The higher the traffic, the smaller the ECR and hence the relative improvements in ECR starts to decrease. Furthermore, the NC (without SDD) has a roughly constant IER gain of about 19% over the relaying (without SDD), however, the IER of the NC with SDD is slightly smaller than the IER of the SDD relaying. On the other hand, this small decrease of the IER is still worth the average 7.5% decrease of the ECR for the SDD NC over the SDD relaying. Interestingly, the resource utilization gain of the NC with and without SDD is increasing with the offered traffic. This agrees with the intuition that NC works better for high loaded scenarios where it results in faster emptying of the RS queue as well as saves more subcarriers. Hence NC is more beneficial for the overloaded cells since it mitigates the congestion, and thus, enables a better users experience. Although the average resource utilization gain is less than 2%, this gain corresponds to saving about 11 PRBs on average for a typical eNB to UE distance of 1.2 km.
We notice that from Figure 4.6, Figure 4.8 and Figure 4.9 that the ECR decreases with the traffic increase because of the rate increase. However, there is noticeable curve variation for the ECR, ERG and IER gain as the traffic increases. This variation is coming from the fact that the link level BLER-SNR curves used in the simulations exhibit a sharp decrease in BLER with the SNR from using Turbo Codes and hence when used in conjunction with the AMC results
84
4.4 N um erical R esults
in frequent transitions from MCS to another at particular points as the traffic increases in the network. Those transitions results in variations of the BLER and hence temporarily increase in IER that is quickly outpaced by increase in TBLER and hence power from retransmissions, etc and the cycle continues to coincide with points of double data rates i.e. 3000,6000 and 9000 bits/subframe. This explains the variations in results presented next in this chapter.
85

ECR
[|i Jo
ules
/bit
]4.4 N u m e r ic a l R esu lts
Relaying Protocol- - XOR NC Protocol
Relaying Protocol with SDD $ - XOR NC Protocol with SDD
2.8
2.6
2.4
2.2
1000 2000 3000 4000 5000 6000 7000 8000 9000 10000 11000 12000A ggregated Uplink and Downlink Offered Traffic [bits/Subframe]
F ig u re 4 .6 : The comparison of the ECRs versus offered traffic load.
86
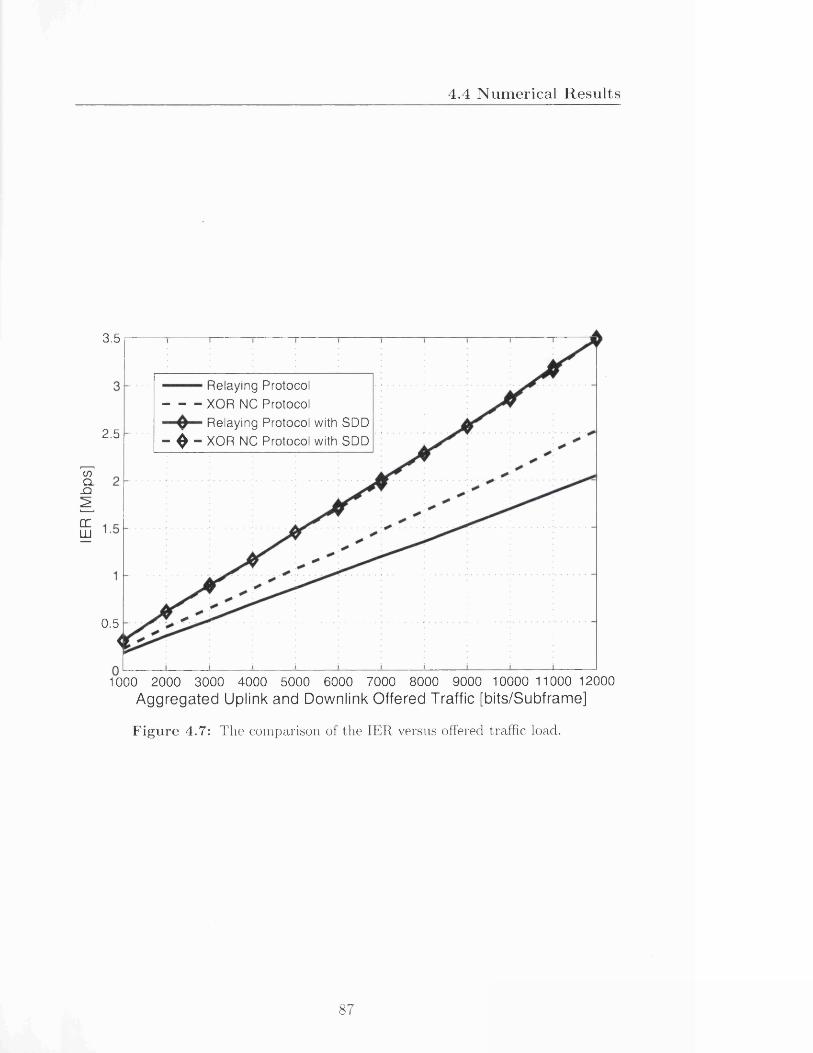
IER
[Mbp
s]4.4 N u m e r ic a l R esu l ts
3.5
Relaying Protocol XOR NC Protocol
Relaying Protocol with SDD - ^ - XOR NC Protocol with SDD2.5
0.5
1000 2000 3000 4000 5000 6000 7000 8000 9000 10000 11000 12000Aggregated Uplink and Downlink Offered Traffic [bits/Subframe]
F ig u re 4 .7 : The comparison of the IER versus offered traffic load.
87

4.4 N u m e r ic a l R esu l ts
25
NC Protocol- $ - NC Protocol with SDD
20 -
CD 15 QC LU
A
1000 2000 3000 4000 5000 6000 7000 8000 9000 10000 11000 12000Aggregated Uplink and Downlink Offered Traffic [bits/Subframe]
F ig u re 4 .8 : The comparison of the ERGs versus offered traffic load.

IER
Gai
n [%
]4.4 N u m e ric a l R esu l ts
30
15 -
10
- - - NC Protocol- ^ - NC Protocol with SDD
0 -
-51000 2000 3000 4000 5000 6000 7000 8000 9000 10000 11000 12000
Aggregated Uplink and Downlink Offered Traffic [bits/Subframe]
F igure 4.9: The comparison of the IER gains versus offered traffic load.
89

Res
ourc
e U
tiliz
atio
n ga
in
[%]
4.4 N u m e r ic a l R esu l ts
3.5
2.5
- - - NC Protocol- ^ - NC Protocol with SDD
a *
>
1000 2000 3000 4000 5000 6000 7000 8000 9000 10000 11000 12000Aggregated Uplink and Downlink Offered Traffic [bits/Subframe]
Figure 4.10: The comparison of the RUGs versus offered traffic load.
90

4.4 Num erical R esults
4.4.2 Im pact of the Relay-to-User D istance
The distance between the eNB and the RS is fixed at 1 km, and the distance between the RS and the UE is varied from 0.1 km to 0.5 km. The offered traffic load is fixed at 6000 bits/subframe. The IER, ECR and the resource utilization are shown in Figure 4.11, Figure 4.12 and Figure 4.13. These figures indicate that the ECR and the IER gains of the NC are maintained for the UE being located far away from the RS5. The RUG of the NC increases with the distance of the UE from the RS. Overall, these results show the robustness of the NC with and without SDD to the location of the UE and to channel conditions.
5The typical coverage radius of the RS in the LTE network is about 0.5 km.
91

ECR
[|i Jo
ules
/bit
]4.4 N u m e ric a l R e su l ts
Relaying Protocol- - - NC Protocol■■ ^ — Relaying Protocol with SDD- $ - NC Protocol with SDD
0.50.450.1 0.15 0.2 0.25 0.3 0.35 0.4
dRN-UEIKmJF igure 4.11: The comparison of the ECRs versus the RS-UE distance.
92

IER
[Mbp
s]4.4 N u m e ric a l R e su l ts
—— Relaying Protocol- - - NC Protocol
0 Relaying Protocol with SDD- $ - NC Protocol with SDD
2.5
0.5
0.45 0.50.1 0.35 0.40.15 0.2 0.25 0.3
d RN-UE[K m )
F ig u re 4.12: The comparison of the IER versus the RS-UE distance.
93
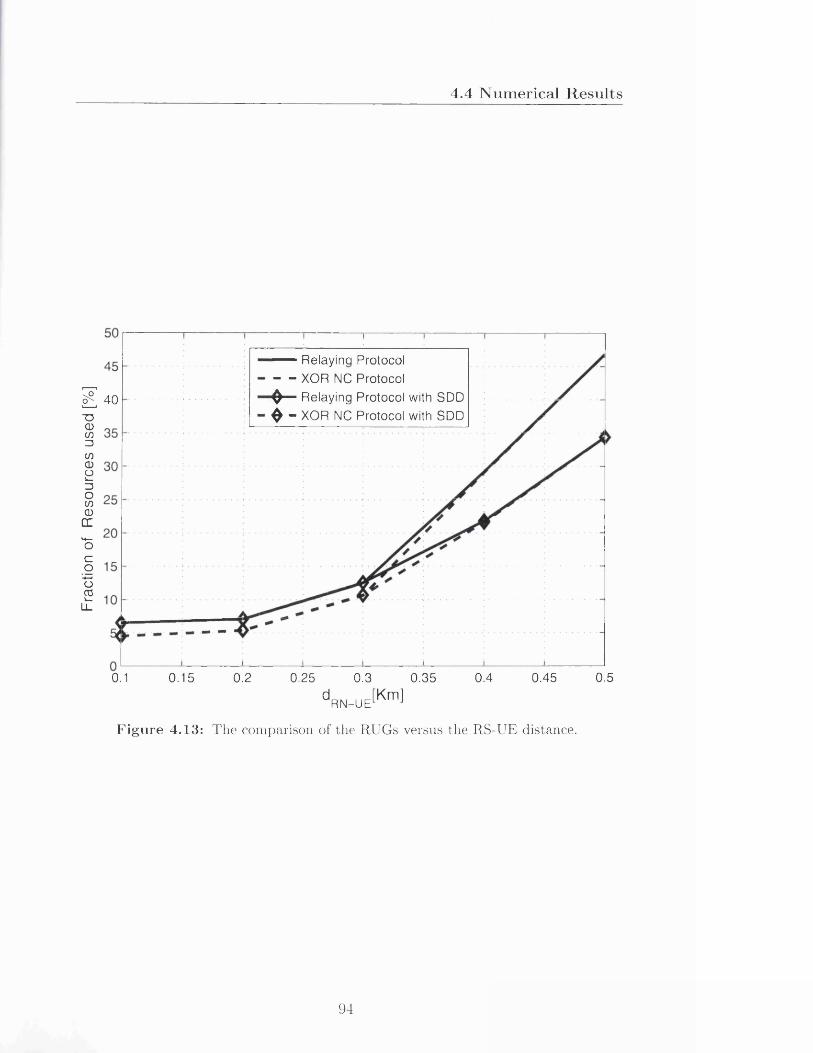
Frac
tion
of R
esou
rces
us
ed
[%]
4.4 N u m e ric a l R es u l ts
— Relaying Protocol- - XOR NC Protocol
■0— Relaying Protocol with SDD £ - XOR NC Protocol with SDD
40
0.45 0.50.1 0.15 0.2 0.25 0.3 0.35 0.4
d R N - U E[K m l
Figure 4.13: The comparison of the RUGs versus the RS-UE distance.
94

4.4 Num erical R esults
4.4.3 Impact of the Relay Station Transmission Power
The transmission powers of the eNB and the RS differ according to the coverage area required and the hardware and cost requirements. The UE transmission power varies with its class and the the power control algorithms employed. The EPS bearer data amount per subframe from the eNB and from the UE is fixed at 6000 bits/subframe, and the the RS-to-UE distance is fixed at 0.2 km. The transmission power of the RS increases from 24 to 42 dBm where the value 42 corresponds to 1/3 of the eNB transmit power [102]. Figure 4.14 and Figure 4.15 show that both the ECR and the IER increase with the RS transmit power. Furthermore, Figure 4.16 and Figure 4.17 show that larger RS transmission powers result in constant IER gains of about 20% for the NC scheme without and with the SDD. On the other hand, large RS transmission powers result in the ERG of about 15% for the NC scheme without and with the SDD. This is further illustrated in Figure 4.18 where the resource utilization gain is shown to increase with the RS transmission power because the RS uses less PRBs when its transmission power is large.
95

ECR
[fi Jo
ules
/bit]
4.4 N u m e r ic a l R esu l ts
— — Relaying Protocol XOR NC Protocol
0 - Relaying Protocol with SDD - ^ - XOR NC Protocol with SDD
3 .5
2 .5
4 2
Relay Station Power [dBm]
Figure 4.14: The comparison of the ECRs versus the RS transmit power.
96

Agg
rega
ted
Thr
ougp
ut
[Mbp
s]4.4 N u m e r ic a l R e su l ts
2.4
Relaying Protocol XOR NC Protocol— 0 — Relaying Protocol with SDD - $ “ XOR NC Protocol with SDD
2.2
24 26 40 4228 30 32 34 36 38Relay Station Power [dBm]
F igure 4.15: The comparison of the IER versus the RS transmit power.
97

ERG
[%}
4.4 N u m e r ic a l R esu l ts
35
30- - - NC Protocol- $ - NC Protocol with SDD
20
15
^ — - 0 -
- - - - 0
24 26 28 30 32 34 36 38 40 42Relay Station Power [dBm]
F igure 4.16: The comparison of the ERG versus the RS transmit power.
98

IER
Gai
n [%
]
4.4 N u m e r ic a l R esu l ts
30
25
20
15
10
-5
- - - NC Protocol- $ - NC Protocol with SDD
00*------- * -----------
24 26 28 30 32 34 36 38Relay Station Power [dBm]
40
Figure 4.17: The comparison of the IER gains versus the RS transmit
99
0
42
power.

Res
ourc
e U
tiliz
atio
n ga
in
[%]
4.4 N u m e r ic a l R e su l ts
1.65 -- XOR NC Protocol
- £ - XOR NC Protocol with SDD
1.55 -
1.4526 28 30 32 34 36
Relay Station Power [dBm]
F igu re 4.18: The comparison of the RUGs versus the RS transmit power.
100

4.4 Num erical R esults
4.4.4 Im pact of Number of Retransm issions
The NC scheme can readily incorporate adaptive retransmissions schemes. In order to assess the robustness of the NC schemes, we vary the maximum number of retransmissions in the DL and in the UL. We assume between 3 and 8 retransmissions. The EPS bearer data amoant per a subframe from the eNB and from the UE is fixed at 6000 bits/subframe. The RS-to-UE distance is fixed at 0.2 km, and the RS transmission power is fixed at 30 dBm. Figure 4.19, Figure 4.20 and Figure 4.21 prove the robustness of both NC protocols without and with the SDD against the varying number of retransmission and for various traffic loads. For example, a best effort traffic usually adopts a varying number of retransmissions over time in order to improve the spectral efficiency when the SNRprb is large. We note that the reference [100] reports up to 20% increase of the spectral efficiency when adaptive retransmissions are employed. Note also a slight decrease of about 1.5% and 4.5% in the ERG for the NC without and with SDD, respectively.

ERG
[%]
4.4 N u m e ric a l R esu l ts
20
18
16
14
12
10
XOR NC Protocol
~ - XOR NC Protocol w ith SDD
4 5 6 7N u m b e r of A R Q R e t r a n s m i s s i o n s
Figure 4.19: The comparison of the ERGs versus the number of retransmissions.
102

IER
Gai
n [%
]4.4 N u m e ric a l R e su l ts
1 . . . 1 !
- - - XOR NC Protocol
“ $ ™ XOR NC Protocol w ith SDD
► ---------------
. . .. .
> - - -----------<
. .
--------------............................... ...
i i. 0 1 1 1 1--------------------------------
3 4 5 6 7 8N u m b e r of A R Q R e t r a n s m i s s i o n s
F igure 4.20: The comparison of the IER gains versus the number of retransmissions.
103

Res
ourc
e U
tiliz
atio
n ga
in [%
]4.4 N u m e r ic a l R esu l ts
1.95
1.9
1.85S '
r . S '
1.75 -
1 . ‘
/ '
✓
- - - NC Protocol
- 0 - NC Protocol w ith SDD
1.654 5 6 7
Number of ARQ Retransmissions
Figure 4.21: The comparison of the RUGs versus the number of retransmissions.
104

4.5 Conclusions
4.5 Conclusions
The ECR, the IER and the resource utilization performances of the NC schemes (with and without SDD) for various levels of the traffic loads, the geographical distances between the nodes, the RS transmit powers, and the maximum number of retransmissions have been conducted.
Simulation results show that, in general, the NC with SDD outperforms the NC without SDD in both the ECR and the throughput measures. Specifically, the ERGs of the NC without and with SDD are 16 — 25% and 7 — 12%, respectively. However, these NC schemes have the same resource utilization gains which is increasing with the offered traffic. Thus, all the NC schemes considered are robust against the increases in the offered traffic and they also provide the throughput and the ECR gains. Furthermore, all the NC schemes considered were found to be robust against the varying distances between the RS and the UE, so that the ERGs, the IER gains and the resource utilization gains are achievable also at the cell edge. It it also found that the ERGs of these NC schemes can be increased by increasing the RS transmit power. Therefore, the NC schemes are useful even when the communication channels are time-varying. In addition, the effect of the maximum number of retransmissions on the usefulness of the NC schemes is investigated. From the simulation results, it is observed that all the NC schemes maintained their ERGs and the IER gains even when the maximum number of retransmissions was decreased. The resource utilization gains is found to be increased by increasing the value of the maximum number of retransmissions.
The proposed NC scheme implemented at the MAC layer of an LTE networks is useful in terms of the reduced energy consumption as well as the increased throughput. Among the system model parameters considered, i.e., the distance of the UE from the RS, the RS transmit power and the maximum number of retransmissions, it was found that the UE-RS distance is the most dominant factor that affects the usefulness of the NC schemes. On the other hand, the RS transmit power influences the throughput gain more that the ERG and the RUG, and the maximum number of retransmissions influences the ERG more than the throughput gain. Furthermore, the robustness of the NC schemes against the varying
105

4.5 Conclusions
distances, varying channel conditions anc varying number of retransmissions is particularly appealing.
106

5
Scalability of Network Coding for LTE Networks
This chapter investigates scalability of the NC schemes discussed in Chapter 4 in terms of the increase in number of users and physical layer resource sharing. In particular, we extend our previous results of the NC for a TWRC in a single REC LTE cell to the case of multiple users. The TWRC in a single LTE cell is again formed by a two-way communication between an eNB and a UE via a relay RS. The impact of sharing the cell radio resources on the performance of the NC scheme is investigated. This investigation of the performance of such NC schemes can indicate their scalability with the number of users in a single LTE cell. Obviously, sharing the same PRBs among multiple users results in the lower overall throughput compared to the unconstrained assignment of the PRBs to only one user. The radio resource sharing among multiple users creates opportunities to exploit multiuser diversity due to uncorrelated frequency selective fadings on subcarriers. The evaluation reveals interesting interactions between our protocol and other functionality of the MAC sublayer of the LTE protocol stack e.g. scheduling. This chapter tackles these constraints and makes the following contributions:
1. The proposed NC scheme is scalable with the number of multiple unicast sessions traversing a common node in both forward and reverse directions
107

5.1 LTE Scheduling Framework
in an LTE multi-hop network. The scheme is scalable with the number of users in the cell, the increasing traffic load per user, the reduced energy consumption, the increased throughput and the radio resources savings.
2. The proposed NC scheme results in both the RF energy as well as the operational energy savings in the network.
3. The achievable energy saving gains of the NC scheme are sensitive to the ratio of the RF power to the overhead power of the node performing NC. The higher this ratio, the better the gains of the NC can be obtained.
4. The variability of the NC schemes improvements with different resource allocation strategies indicates that these improvements are also sensitive to the allocation of the radio resources especially in the broadcast phase of the NC coded packets.
In this chapter, the framework for the resource allocation and scheduling in the LTE networks is first presented in Section. 5.1. The system description with and without NC is described for the case of multiple users in a cell and extensions of this system model are then introduced and discussed in Section. 5.2. In Section. 5.3 the system parameters used in our simulations are described. The simulation results are then shown and discussed in Section. 5.4. Section. 5.5 draws the conclusions and points out the dominant parameters impacting the ERG performance of the NC schemes.
5.1 LTE Scheduling Framework
The purpose of the scheduler is to decide to/from which terminal to transmit/receive data and on which set of the PRBs. The eNB scheduler functions at the MAC-sublayer of the LTE protocol stack. The scheduler makes decisions dynamically each subframe (i.e. each 1 ms), thus, controlling the uplink and downlink packets transmissions activity. An illustration of the downlink and uplink schedulers and their interaction with the other functionalities of the MAC layer is depicted in Figure 5.1.
108

5.1 L T E S ch ed u lin g F ra m e w o rk
eNB
RLC buffer RLC Buffer
____Scheduler
JTMAC Multiplexing
> Modulation, coding
Channel status (CQI)
Downlink
eNBScheduler < Uplink channel quality
Transport format selection
Buffer status
Downlink channel quality
UEModulation, coding
Priority handling m -------
IMAC Multiplexing H—
RLC Buffer RLC Buffer
Uplink
Figure 5.1: The uplink and downlink schedulers functionality.
5.1.1 D o w n l in k S ch ed u l in g
As shown in the left part of Figure 5.1, the TBS selection, MCS and logical channel multiplexing is controlled by the eNB. There is one DL-SCH transport channel per a scheduled terminal that is dynamically mapped to a unique set of the PRBs. The scheduler controls the users’ instantaneous data rates, and consequently, it lias impact on the RLC segmentation/concatenation and the MAC multiplexing. For example, for low instantaneous data rates, the RLC segmentation is performed while, for high instantaneous data rates, the concatenation is performed. The MAC multiplexing is performed based on the priority of different data streams of radio bearers. The channel coding, modulation and advanced physical layer features such as spatial multiplexing are based on the TBS and hence directly affected by the scheduler decisions.
The scheduling decisions are communicated to users via L1/L2 control signaling on the PDCCHs. The scheduler decisions are based on the CQI reports received from the terminals with a pre-configured periodicity, typically every 1 or 2 ms. The CQI feedback from users is obtained using the CRS transmitted
109

5.2 System D escription
periodically in each subframe. The CQI feedback indicates the highest MCS and the TBS for which the estimated received TBLER shall not exceed 10%. This threshold is selected so that the cost in transmission power is kept reasonable [103). The CQI feedback is delivered to the downlink scheduler on the PUCCH physical channel for the non-scheduled users and on the PUSCH phsycial channel for the scheduled users.
Almost 4 of the first 1 — 4 of OFDM symbols of each subframe, as discussed before, are reserved for the L1/L2 control signaling which is necessary for both the decoding of paging channels and for carrying scheduling information to users. The number of control signaling symbols are varied dynamically with the traffic situation. The control signaling symbols carry also uplink scheduling grants including the PUSCH resource indication as well as the HARQ Acknowledgments in response to the UL-SCH transmissions.
5.1.2 Uplink Scheduling
The difference in the uplink scheduling is that the scheduling is done per a mobile terminal rather than per a radio bearer as for the downlink scheduling. Hence, as shown in the right part of Figure 5.1, the user control logical channel multiplexing is based on the rules communicated from the eNB in the RRC signalling. The channel quality estimates are in this case based on the SRS transmitted from each user. All users also transmit the buffer status reports to the eNB to aid scheduling decisions. Importantly, the PRBs assigned to a given UE have to be contiguous in the frequency domain in order to comply with the single carrier property of the LTE uplink.
5.2 System Description
Prior work on the NC has rarely considered practical implementation constraints and the cellular system design limitations. Practical NC schemes employing opportunistic listening and packet combining to enhance the network throughput in
110

5.2 System D escription
802.1 In networks have been considered in [44]. In [104], the authors investigate coordinated scheduling of transmissions in order to maximize the NC opportunities. Th3 joint NC and rate adaptation is proposed in [105]. However, the implementation aspects of the NC schemes in the protocol stack of the OFDM networks have not been considered. In [104], it is noted that the parameters of MAC are critical to obtain sustainable gains from NC in the OFDM A networks. Particular 1;/, one has to consider how the gains from NC scale with the traffic and with the number of users sharing the same OFDMA cell resources. Likewise, the scheduling with NC has not been investigated in the context of the LTE networks.
In this chapter, the RS can utilize the NC over multiple independent TWRCs. However, ve do not exploit the multiuser diversity arising from the resources sharing among multiple users by designing the appropriate scheduler, and we assume a generic fair round-robin scheduler. We obtain numerical results to assess the energy efficiency of the NC schemes. Most importantly, our energy efficiency evaluations take into account both the operational energy as well as the RF energy. We also evaluate the usefulness of the NC schemes in terms of the utilization of radio resources and the cell overall throughput.
5.2.1 NC w ith Resource Sharing in LTE Networks
We adopt a notation a (/, t) which denotes the packet ‘a ’ to be transmitted at time slot t on subcarrier / . The extension of the relaying protocol to the case of multiple UEs over four time slots on a subcarrier / is shown in Figure 5.2. The extension for the NC for TWRC is depicted in Figure 5.3. Thus, the NC saves one time slot to exchange a pair of packets originated in the two end-node pairs.
In this case, we can create N independent TWRCs on subcarriers / i , / 2 , • • •, f yv, between each pair of the UE and the eNB via the RS. Correspondingly, it is straightforward to apply the NC scheme in Figure 5.3 independently for each of the TWRCs. First, the pairs of the TBs originated at the eNB and at the UE, respectively, are combined (using the XOR operation) at the MAC sub-layer. The combined TBs are then broadcasted using the minimum CQI of the RS-eNB link and the RS-UE links as before. Obviously, broadcasting at the smallest SNR of
111

5.2 System D escription
a i ( f u t 2
^Nb)< ______________ i^ R S^ - iwC/5v>*3)
0v (In , J
F ig u r e 5 .2 : The relaying over multiple TW RCs in a single LTE cell.
0 b \ ( / l 5 3) 5'' ’ j&N 0 b ] \ j ( f i y ,£3 )
✓/ \ /
/ V - " " '«i(/i ,f i)>-" ' "i>i(/1 , h ) XleNBj------------------------------ =n RS _
\bN{fN,t 2 )
F ig u r e 5.3: T he network coding over multiple TW RCs in a single LTE cell.
the destination links is inefficient since it represents a throughput loss for all other links having higher values of the SNR. However, the reduced number of used RBs and the shorter transmission time due to NC can outweigh such throughput loss; this is one of the main subjects of our investigations.
This implementation of the NC for TWRC can be easily integrated with other functionalities of the MAC layer such as scheduling whereas the additional signaling overhead required to inform the end-nodes what TBs have been combined is negligible. The round-robin scheduler in the RS-UEs link immediately follows the NC operation. Furthermore, in this chapter, the NC is realized opportunistically by combining the TBs of equal length provided that such TBs have been successfully delivered to the RS from the eNB and from the UE. These combined TBs form a a coded flow. The TBs originated either at the eNB or at the UE that cannot be matched with the delivered TB from the other source node are
112
5.3 System M odel
not combined, bu: they are broadcasted from the RS to the destination node as a remaining flow.
5.3 System M odel
We assume a single LTE cell with the TDD of the traffic in a 20MHz bandwidth. The scheduling is performed as before by the eNB, but this time the round-robin resources is implemented in each link. The round-robin scheduler assigns the radio resources for the transmitting nodes in a round-robin fashion irrespective of the CQI values (i.e., independently of the SNR values). The packets corresponding to the TBs of the N bidirectional flows are sent from the eNB and from each of the N UEs to the RS. Each transmission employs a particular MCS depending on the CQI of the link. Hence, the TB sizes vary depending on the CQI, and so is the opportunity to perform NC and combine the received TBs from both ends of the bidirectional link between the eNB and the UE. Provided that the sizes of the TBs from the eNB and from the UE do not match (i.e., are not equal), or if the TB from either the eNB or the UE node has not been successfully received, the RS creates a rem&ining flow and broadcast this available TB to the corresponding destination.
The RS is placed at a fixed location of 1km from the eNB whereas the N UEs are located randomly about the RS at a distance of 0.5km. The simulation results are averaged over random positions of the UEs. All nodes are equipped with one transmitting and one receiving antenna. The main simulation parameters are summarized in Table 5.1. The LTE relay can typically serve between 1 to 4 UEs whereas each UE can have up to 8 radio bearers [106]. The main aim of this work is to observe the performance gains of the proposed practical NC protocols for the case of multiple users per relay and various traffic loads per user. The following two radio resources allocation strategies are considered in our evaluations: Resource Allocation 1 (RA 1): Both the NC flow and the remaining flow arebroadcasted by the RS at the minimum usable rate of the links eNB-RS and UE-RS.
113

5.3 System M odel
Table 5.1: Main Simulation Parameters
Param eter SettingSystem bandwidth 20MHz, TDDSubcarriers per PRB 12Subcarriers frequencies from 2GHz with spacing of 15
kHzThe number of RBs 100Path loss model COST231 Hata ModelM ultipath fading model Extended Pedestrian A (EPA)eNB antenna height 25 mRS antenna height 5 mUE antenna height 1.5 mChannel Quality Indicator (CQI)delay 1 mTransmission powers of eNB,RS and UE
46, 30 and 23 dBm
Downlink MCS Table 4.1Uplink MCS Table 4.1Packet scheduler Round RobinPER target 10% [57]EPS Bearer data per subframe from eNB and UE
1000-5000 bits
Number of UE per RS varies from 1-6
Resource Allocation 2 (RA 2): Only the NC flow is broadcasted at the minimum usable rate of the links eNB-RS and UE-RS whereas the remaining flow is broadcasted using the possibly higher available rate of the corresponding link.
5.3.1 Energy M etrics
We consider the ECR metric to compare the RF energy efficiencies of the relaying protocols with and without NC, respectively. However, the RF inefficiencies of the radio head equipments are included, for the sake of more accurate calculations of the power consumption. The ECR due to radio head is given by:
ECR = P rf / -mE [Joule/Bit] (5.1)
114

5.3 System M odel
where P r f is the total power consumed a; all nodes during the exchange of one pair of the TBs between the eNB and the HE via the RS, yuE is the joint efficiency of the power amplifier, duplexer and the ether radio head elements. The division by the value of ^zE is important since it gives the overall RF power consumed including the radio overheads of the eNB 3 r the RS. The information rate R can be defined either a sum rate or an average rate of the delivery rates from the eNB to the UE and from the UE to the eNB. Both cases are discussed below.
Sum D elivery R ate
Let bi, i = 1, 2, 3,4 be the number of bits ii the TBs delivered over particular time slot 1, 2, 3 and 4, corresponding to the links eNB-RS, RS-UE, UE-RS, RS-eNB, respectively. Then, the sum delivery rate is defined as,
where E[-] is expectation which is realized in the simulations by time averaging
rate Rs is also averaged over the N TWRCs.
Average D elivery R ate
It is straightforward to show that the average delivery rate is equal to the IER defined in Chapter 6 . Thus, the IER is given by the average number of bits per one time slot (corresponding to one TB) exchanged over a given TWRC. The exchange of the two TBs originated at the eNB and at the UE is assumed to be completed after the protocol cycle time TCJCie. In our case, the cycle time T Cycie for the relaying protocol and for the NC protocol is 4 and 3 time slots, respectively. The IER is then defined as,
&2 6 4
~2 ~2(5.2)
of the number of exchanged bits 6 2 + ^ 4 wer 2 time slots. The value of the sum
+ 4 2 T ^ 4 (5.3)
115

5.3 System M odel
where again, the expectation in the simulations is obtained by averaging over the transmission trials ii time and over the N TWRCs.
The average delivery rate R& is more appropriate than the sum rate Rs to calculate the ECR metric. The reason is that the rate R& takes into account the time slot savings by NC whereas the sum rate Rs is the same for both protocols, i.e., with and without the NC. Note also that whether the rates R d > Rs or R d < Rs depends on the relationship between the SNR values of the eNB-RS and the UE-RS links. More specifically, we can show that if SNReNB-RS < SNRrs-ue and SNRUE-rs < SNRRS- eNB, then the average delivery rate R& is greater than the sum delivery rate R s . This case occurs when the access links(source/destination-to-RS links) are the bottlenck links with low SNR
values. However, i: SNRRS- eNB < SNRrs _ue and SNR6nb-rs < SNRus-eNB, then the average delivery rate R& is exactly the same as the sum delivery rate Z?s- This case occurs when the RS links(RS-source/destination links) are the bottleneck links with low SNR values.
5.3.2 The RF and Operational Energy Efficiencies
The total RF power expended to exchange a pair of the TBs between the eNB and the UE via the RS is given as,
L
Pkt = J 2 P* IWattsl (5-4)i = l
where the number of transmissions L = 4 and L = 3 for the relaying and for the NC, respectively, and Pi is the i-th power to transmit one TB. A simple but accurate model of the operational power consumption for the eNB and for the RS has the form [107],
pPSupply == Frf_total T - Overhead =: ^ T PoH [Watts] (^-5)
where PRF-totai is the expended RF power for transmission and fiT, = 0.25 [7] for the eNB with the maximum RF transmit power PRE = 40 Watts. This reference
116

5.3 System M odel
Table 5.2: Power Consumption for Full Load [7]
Power Consumption (Full Load)
Cell Radius, m Max. Transmit Power,P R F
RF Efficiency, /zE Total RF Power,P R F _ t o t a i
Overhead Power,P 0 v e rhead
Operational Power,P s u p p iy
Macro > 1000 40W 0.25 480W 490W 970W
Micro600-100020W0.35171W375W546W
Micro400-60010W0.3196W290W386W
Pico200-4006W0.2864W126W190W
value is given for the base station with the 40 Watts maximum transmit power which is the value assumed in our simulations. In general, the reference values for as well as for Poh are different for different cell technologies, i.e., for the pico, micro and relay cells. In our simulations, for the eNB, we assume the values /liE = 0.25 and P o h — 490 W atts suggested by Vodafone [108] and corroborated by data from the literature [109] and from the European Union Energy Aware Radio and Network Technologies (EARTH) project [7]; these values are presented in Table 5.2. On the other hand, for the RS, the values of fiE = 0.28 and Poh — 30 W atts are taken from the EARTH project model [110]. In our simulations, we assume the RS transmission power of 30 dBm.
The ERG assuming only the RF power is defined as,
ERGrf = g CR^ g _r _Ey .gf £ x 100% (5.6)Ii/v^rv,reiaying
The Energy Consumption Gain (ECG) is defined as a ratio of the operational energy consumption of the baseline system (i.e., the system using relaying) and the system under consideration (in this case, the system with NC), i.e.,
r p S u p p l y tt'/'-'itd p i p r e la y in gp p p _ r e la y in g _ n i ^ r t re]a y ing • I t - f -t Q H (r
^ ~ ~ ECRNc -R + Pg§ ( ]
where the rate R is the minimum rate of the two systems considering either the rate Rs o>r P p as defined above. The ERG corresponding to the operational
117

5.4 Num erical R esults
energy consumption is given as,
^ S u p p l y _ ^ S u p p l y
E R G o p er = = 1 - x 100% (5.8)- ^ r e la y in g H / U v j o p e r
The throughput gain is defined as a ratio of the throughput for the NC protocol to the throughput of the relaying protocol i.e.,
Throughput Gain = ^ Rel?ymg— x 100% (5.9)-“ •R e lay in g
The amount of resources utilized is calculated as the total of all aggregatedRBs used on all the links during exchange of all pairs of the TBs, i.e.,
L
Resources Utilized = (5.10)j = i
where L is the number of links used for the exchange of the TBs (i.e., L = 4 for relaying, and L = 3 for NC), and Nj is the number of RBs used on the link j. The percentage of resources saved due to NC is expressed as,
Resources Saved - Resources UtilizedRelaying ~ Resources U tilized ^ xResources Utilized R e l a y i n g
(5.11)
5.4 Numerical Results
Simulation results comparing the performances of the NC and of the relaying schemes for multiple UEs connected to a single RS are presented here. In the simulations, two radio resource allocation strategies are compared. The two main metrics of interest are the ERG and the throughput gain. In all simulation scenarios, an equal rate bi-directional data flows from the eNB and from the UE, respectively is assumed.
In the following we investigate the scalability of the NC and the impact of the varying number of the UEs per the RS, the varying traffic load in the cell and
118

5.4 Num erical R esults
the RS transmit power. These varying parameters are considered to obtain both the RF as well is the operational power efficiency.
5.4.1 Impact of the Number of the UEs per the RS
Figure 5.4, Figure 5.5 and Figure 5.6 illustrate the ERG, the throughput gain and the resources sa/ings due to NC, respectively, versus the number of UEs connected to the RS. Fron Figure 5.4, we observe that both the ERG for the operational power as well as for the RF power decreases when the number of UEs is increased. However, in both cases, such decrease of the ERG is moderate, i.e., at most 0.9% as the number of UEs is increased from 1 to 6. More importantly, we observe that the ERG for the operational power is significantly smaller compared to the ERG for the RF power. This is because the operational energy consumption which includes the overhead energy consumption dominates the overall energy consumption irrespectively of the value of the RF power, and thus, irrespectively of the traffic load . Hence, the most significant energy savings due to NC can be obtained by tun ing off the RS during the saved time slots due to NC in order to save the overhead power. Such power saving feature is also shown in Figure 5.4 (the curve labeled as ‘RS O FF’), and the resulting operational energy savings can be as large as 3.8%. However, turning off the RS may be applicable only for low traffic load concitions.
Figure 5.5 snows that the throughput gain of the NC is decreased by 1.6% when the number of UEs is increased from 1 to 6. Such decrease of the throughput gain can be somewhat mitigated provided that the scheduler is designed to exploit the available multiuser diversity gain (recall that we use a round-robin scheduler in our simulations). Note also that the ERG and the throughput gain are slightly better for the resource allocation strategy 2. The variation of the throughput between RA 2 and RA 1 is coming from their differences in selecting the PRBs for transmission of coded packets. RA 2 can better exploit the multiuser diversity gain than RA 1.
Figure 5.6 shows that the resource savings (measured as the number of resource blocks saved due to NC) is linearly increasing with the number of UEs.
119

5.4 Num erical R esults
This increase is almost linearly increasing by 3 RBs with every new UE added to the system. Consequently, the savings of the RBs due to NC can be translated to the RF power savings. On the other hand, the relative RBs savings due to NC are plotted in Figure 5.7. We observe that even though the number of the saved PRBs increases with the number of UEs connected to a RS, the relative savings of the RBs decreases with the number of UEs connected to a RS. This is because the broadcast phase of the NC is bounded by the minimum SNR of all the broadcasting links considered, and this minimum SNR value is decreasing with the number of UEs connected to a RS. Overall, the relative decrease of the saved RBs with the number of UEs increase from 1 to 6 is at most 5%.
120

ER
G[%
]
5.4 N u m e r ic a l R e s u l ts
ERG) i ( ; !
- ■ * - RF RA 2----------RF RA 1- # - Operational RA 2- - - Operational RA 1■ ■ Operational (RS OFF) RA 2■ - ■ - 1 Operational (RS OFF) RA 1
-
-- ------------------ * --------------- 4 - -
1111111111
Number of Users/Relay
F igure 5.4: The ERG versus the number of UEs per a single RS.
121
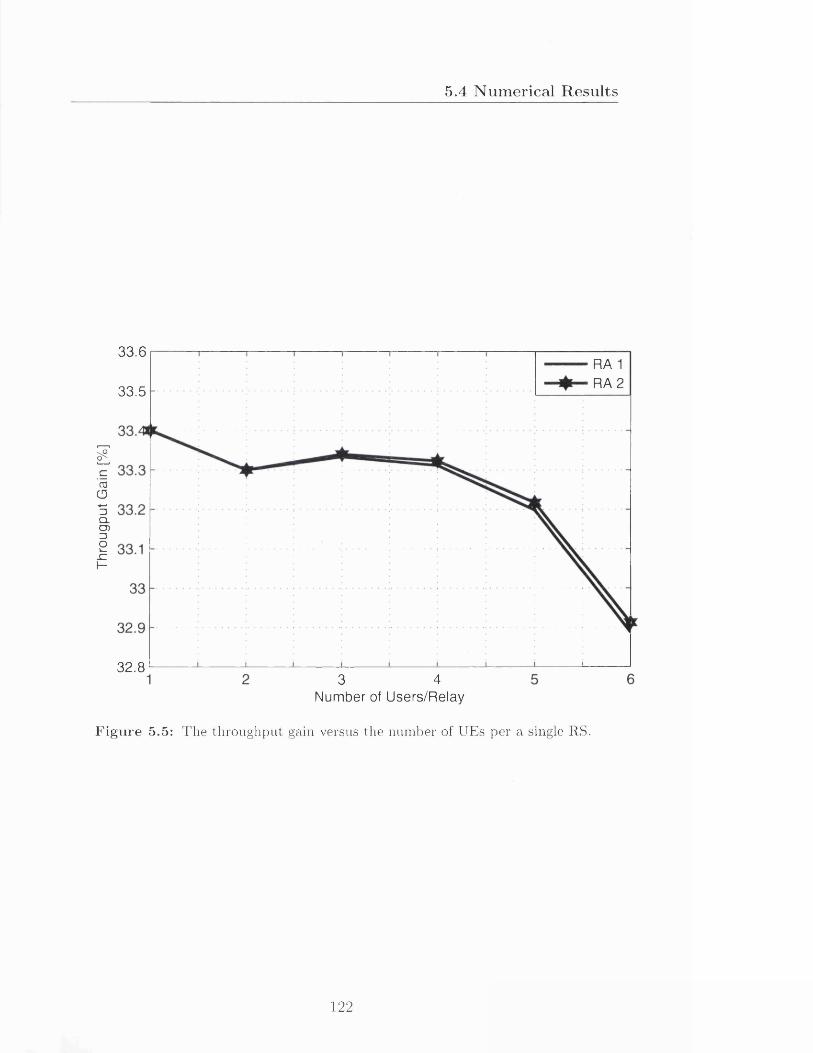
Thr
ougp
ut
Gai
n [%
]5.4 N u m e r ic a l R esu l ts
33.6
33.5
RA 1 RA 2
32.83 4
Num ber of Users/Relay
Figure 5.5: The throughput gain versus the number of UEs per a single RS.
122

Res
ourc
es
Save
d [R
esou
rce
Blo
cks]
5.4 N u m e r ic a l R esu l ts
RA1 RA 2
Number of Users/Relay
Figure 5.6: The number of RBs saved versus the number of UEs per a single RS.
123

Res
ourc
es
Save
d [%
]5.4 N u m e ric a l R esu l ts
20RA1 RA 2
62 3 51 4Number of Users/Relay
Figure 5.7: The relative number of RBs saved versus the number of UEs per a single RS.
124

5.4 Num erical R esults
In summary, the results in Figure 5.4, Figure 5.5 and Figure 5.7 are encouraging and practically acceptable considering the fact that any single RS will support at most several UEs. Thus, the NC is scalable with the number of users and can be practically employed in the LTE networks with many users sharing the same cell resources. The resource saved varies between the RA 1 and RA 2 owing to their differences in selecting the PRBs for transmission of the coded packets. Since RA 2 provides a slightly higher throughput, the rest of the numerical results will be presented only for this strategy.
More importantly, the ERG due to NC for the RF power is limited by the RF transmit power of the RS where the NC operation is performed. It is shown in Chapter 4 that the larger transmission power of the RS the larger the ERG of the NC. Hence, the ERG for the RF power are limited by the much larger transmit power of the eNB compared to the transmit power of the RS. In the next section, the positive effect of increasing the transmit power of the RS to the ERG of the NC is investigated.
5.4.2 Impact of the RS Transmit Power
In this section, the transmission power of the RS is varied from 24 to 46 dBm while the number of UEs per a RS is fixed and equal to 6. The EPS Bearer data per subframe from the eNB and from the UE is also fixed and assumed to be 1000 bits. Different values of //E and Poh are used whenever the RS transmit power is increased in order to obtain more accurate values for the RF and the overhead powers and different network technologies as shown in Table 5.2.
Figure 5.8 shows that the throughput improvement with the increasing RS transmit power is negligible. This result is expected since the number of saved RBs is almost independent of the ratio between the transmit powers of the RS and the eNB. However and importantly, Figure 5.9 shows that larger values of the RS transmission power improve the ERG by about 12% and 4.7% for the RF and the operational power, respectively. The variations of the curve of the operational power is because the RF to overhead energy ratio changes as 0.51, 0.33, 0.46,0.98 resulting in changing dynamic range of power. When the RS transmission power
125

5.4 Num erical R esults
is equal to the eNB transmission power, the ERGs of 37.98% and 4.83% for the RF and operational power are achieved, respectively.
126

Thro
ugpu
t Ga
in [%
]5.4 Num erical R esults
34 i i i i i i i i i i
33.5 - ........... :............ i .............. ................. -
3 3 - ............. :............. :.............■:...............; .............. :...............:.............. ■:..............; ...............:...............:............-
32.5 - ........... : ............. : ..............| .............. j................. -
32 - ........... ■:..............: .............. : ................ -
31.5 - ............ -
31 - ............ :................ -
3 0 .5 - ........... | .............. | ............... -
3 0 _______ i_______ I_______ i_______ i_______ i_______ I_______ i_______ i_______ i_______ i-----------24 26 28 30 32 34 36 38 40 42 44 46
Relay Station Power [dBm]
Figure 5.8: The throughput gain versus the RS transmit power.
127

5.4 Num erical R esults
40
RF- - operational
CD 20DCLU
42 44Relay Station Power [dBm]
F ig u r e 5.9: The ERG versus the RS transm it power.
128
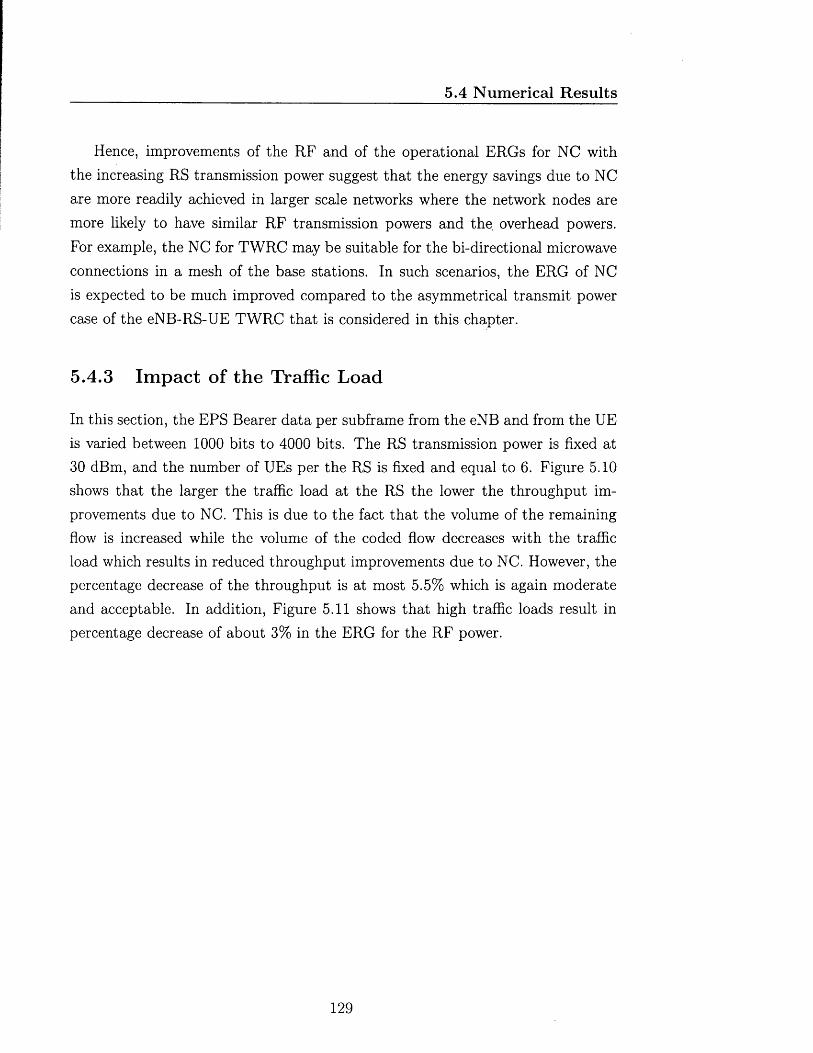
5.4 Num erical R esults
Hence, improvements of the RF and of the operational ERGs for NC with the increasing RS transmission power suggest that the energy savings due to NC are more readily achieved in larger scale networks where the network nodes are more likely to have similar RF transmission powers and the. overhead powers. For example, the NC for TWRC may be suitable for the bi-directional microwave connections in a mesh of the base stations. In such scenarios, the ERG of NC is expected to be much improved compared to the asymmetrical transmit power case of the eNB-RS-UE TWRC that is considered in this chapter.
5.4.3 Impact of the Traffic Load
In this section, the EPS Bearer data per subframe from the eNB and from the UE is varied between 1000 bits to 4000 bits. The RS transmission power is fixed at 30 dBm, and the number of UEs per the RS is fixed and equal to 6. Figure 5.10 shows that the larger the traffic load at the RS the lower the throughput improvements due to NC. This is due to the fact that the volume of the remaining flow is increased while the volume of the coded flow decreases with the traffic load which results in reduced throughput improvements due to NC. However, the percentage decrease of the throughput is at most 5.5% which is again moderate and acceptable. In addition, Figure 5.11 shows that high traffic loads result in percentage decrease of about 3% in the ERG for the RF power.
129
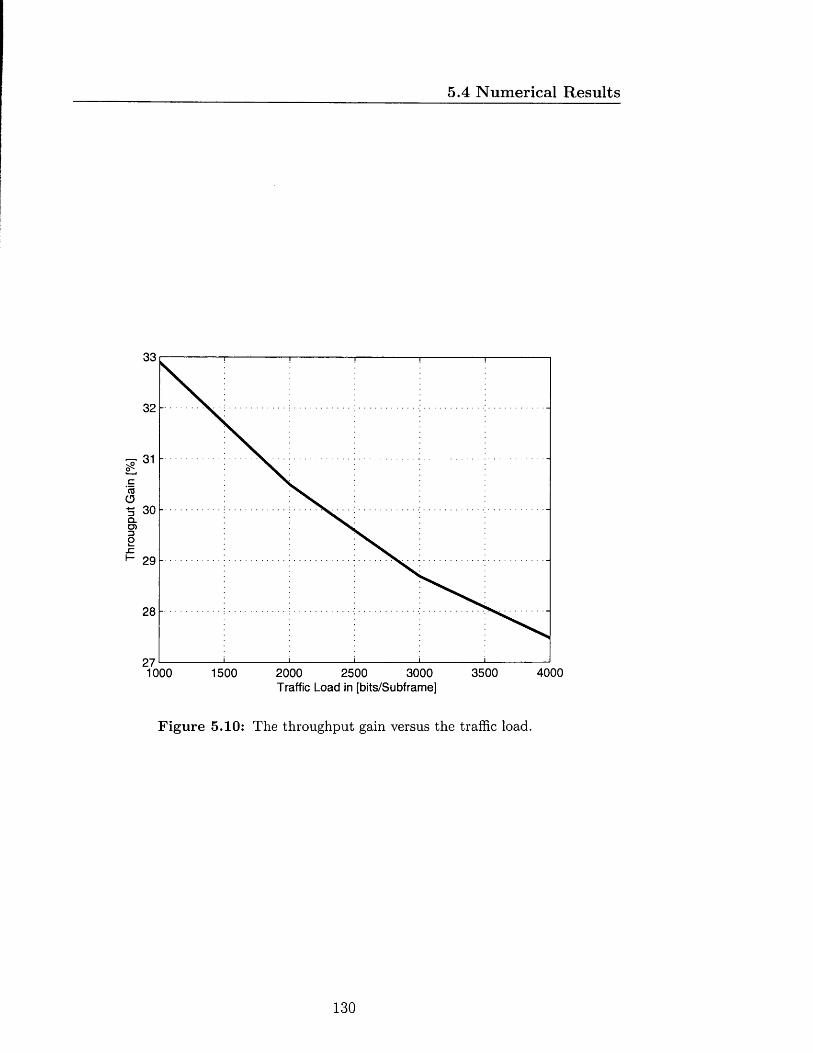
Thro
ugpu
t Ga
in
[%]
5.4 Num erical R esults
28
27 L— 1000 400035001500 2000 2500 3000
Traffic Load in [bits/Subframe]
Figure 5.10: The throughput gain versus the traffic load.
130

ERG
[%]
5.4 Num erical R esults
24.5
24
23.5
23
22.5
2 2 1—
1000 400035002500 30001500 2000Traffic Load in [bits/Subframe]
Figure 5.11: The ERG versus the traffic load.

5.5 Conclusions
A moderate decrease of the throughput and of the ERG gains due to NC with the traffic load indicates that the NC is scalable not only with the number of UEs connected to the RS but also that the NC can accommodate high traffic loads from each UE and still achieve positive throughput and energy gains. Interestingly, the ERG due to NC remains positive for such high traffic loads.
5.5 Conclusions
In this chapter, it was found that the NC schemes for TWRC can provide sustainable gains even when the number of UEs per RS is increased. Specifically, the performances of the NC for TWRC in terms of the ERG, the throughput gain and the resources savings were investigated for the case of the multiple UEs per a RS. As expected, it was found that the operational power dominates the overall energy consumption also in the case when the NC is used. The ERG for NC and the operational power was shown to be independent of the number of UEs. More energy savings due to savings of the operational power can be achieved by turning off the RS during the unused time slots obtained by NC. However, turning off the RS periodically may not be always possible. The ERG of NC due to the RF and the operational powers is increased if the RF transmission power and the overhead power of the RS is also increased, thus reducing the power imbalances between the end-nodes especially the eNB and the RS. This suggests that the energy savings due to NC are more readily achievable in larger scale networks where the network nodes are more likely to have similar RF transmission and the overhead powers. The achievable gains of NC are particularly sensitive to the ratio of the RF power to the overhead power; the higher this ratio, the better the gains of the NC will be obtained.
The two resource allocation strategies considered in this chapter provided similar ERGs and throughput gains of NC when assuming the RF power only. This indicates that the gains of NC may be less sensitive to allocation of at least some of the radio resources, especially in the broadcast phase of the NC coded packets. On the other hand, the scheduling strategy is expected to have much more significant influence on the achievable energy savings by NC especially in
132
5.5 Conclusions
the broadcast phase of the coded packets. The resources savings measured as a number of the unused RBs due to NC were also shown to be scalable with the number of UEs in the cell. Such resources savings due to NC can be readily translated to the RF power savings.
In summary, the results in this chapter show that the reductions in both the throughput and the ERG due to NC with the increasing traffic load in the cell are moderate, but more importantly, the performance gains due to NC are still positive and valuable even at high traffic loads when many users share the same RS radio resources. When considering the operational energy consumption, the observed ERG values for the NC are approximately between 0.1% and 4.8%. These values are small compared to the ERG values for the RF power only, however, the robustness of the NC for the varying traffic load in the cell and for the varying channel conditions is very attractive.
133

6
Im plem entation Trade-offs of Intra-flow Network Coding in LTE and LTE-A Networks
In the previous two chapters, the inter-flow NC has been discussed and its performance investigated for various LTE parameters and constraints. Another type of NC, usually applied at the source nodes is the intra-flow NC. The aim of this chapter is evaluate the implementation aspects of including intra-flow NC 1 in LTE and LTE-A networks. The objective is to improve the HARQ while reusing as many of the existing protocols as possible from the LTE standard. This includes assessing whether the application layer is indeed suitable for intra-flow NC coding, and consideration of advantages and disadvantages of other implementations at different layers of the LTE protocol stack. Specifically, the application layer vs the RLC/MAC layer implementations are investigated. The investigations in this chapter consider for modifications to the LTE protocol stack, efficiency, and performance improvements due to the inter-flow NC.
Since many results on the intra-flow NC schemes in the literature ignore realistic implementation constraints, in this chapter, we take into account specific constraints of the LTE systems. In particular, we propose to implement an intra-
lrThe rateless coding can be regarded as a specific form of the intra-flow network coding.
134

flow NC scheme based on the Luby Transform (LT) codes at the MAC layer, and then compare this implementation with the conventional LT codes employed at the application layer. The comparison is done by computer simulations in terms of the energy consumption and the transmission delay assuming the LTE system model and the LTE parameters. The evaluation reveals interesting interaction between the proposed intra-flow NC protocol and other functionality at the MAC sublayer of the LTE protocol stack, e.g. AMC. This chapter makes the following contributions:
1. The proposed intra-flow NC protocol requires smaller transmission delays to deliver an error-free file to the destination compared to a conventional intra-flow NC provided that the AMC mechanism is employed.
2. Mathematical analysis of the proposed intra-flow NC and the conventional applications layer intra-flow NC is provided.
3. The energy consumption-delay trade-off of the proposed intra-flow NC protocol are found to be distinctively different from those of the conventional protocol.
4. The proposed intra-flow NC protocol outperforms the conventional protocol in terms of the energy consumption and the transmission delay provided the AMC functionality is optimized. Such optimization is especially attractive to the LTE-A networks.
In this chapter, an overview of intra-flow NC schemes is first presented in Section. 7.1. The proposed intra-flow NC protocol, its differences compared to the conventional NC schemes and supporting mathematical analysis are presented in Section. 7.2. In Section. 7.3, the implementations of the proposed intra-flow NC scheme in the LTE is described along with the LTE system parameters. The conventional and the proposed intra-flow NC protocols are compared in Section. 7.4, and the corresponding energy consumption and delay trade-offs are presented there. Section. 7.5 draws conclusions and recommendations for the intra-flow NC protocol design and their the inclusion in LTE and LTE-A networks.
135

6.1 Overview of Intra-flow N C Schem es
6.1 Overview of Intra-flow NC Schemes
Rateless coding has been established as a new transmission paradigm for the efficient wireless information delivery. The LT codes as the first practical realization of the rateless (fountain)1 codes with a small implementation complexity were pioneered by Luby [111]. The distinctive feature of these codes is their inherent ability to average the varying channel conditions by decreasing the rate of encoding until the successful data delivery [112]. The efficiency of the LT codes can be further enhanced by combining the LT codes with the forward error correction codes. For instance, the error resilience of the fountain codes is increased by pre-coding the data with the LDPC or turbo codes. These so-called Raptor codes are adopted by the MBMS within the 3GPP [113], and by the Digital Video Broadcasting for Handheld (DVB-H) devices [114]. Fountain codes can be also used to achieve a near capacity performance over noisy channels [115] including the wireless fading channels [116]. The usefulness of the fountain codes in the wireless relay networks was shown in [117] and in [118]. The intra-flow NC schemes applied at the source node are some times referred to as rateless codes in the literature.
The procedure for generating the intra-flow NC coded packets is described next. For a data file consisting of K packets, the LT effective code rate R = K / N is given by the actual number of transmitted packet combinations N until the decoder at the destination can successfully decode the whole original data file. The packet combinations are generated randomly at the source using a specific degree distribution that can achieve a small transmission overhead; for instance, the robust soliton distribution is often assumed. The decoding at the destination can be accomplished using a simple belief propagation decoding [112]. The encoding and decoding of the LT codes can be realized with the complexity 0 (K \n K ) , and, for sufficiently large K , say, K 1000, the transmission overhead is (N — K ) / K ~ 5 — 10% [111]. For smaller values of K (i.e., K 100), the
1 Rateless codes is a general term to describe the rateless nature of this type of transmission protocols. The label ’Fountain’ is a depiction of the fountain behaviour of the rateless code decoder.
136

6.1 Overview of Intra-flow NC Schemes
typical transmission overhead of 20 — 25% is achieved [119]. One has to also take into account that these codes have been patented by the Digital Fountain Inc.
6.1.1 Application Layer Intra-flow NC scheme
Application layer rateless coding is usually achieved by transmitting a small fraction of the whole file at a time (i.e. a packet combination) until the acknowledgment is received indicating the successful decoding of the whole file. The rateless code performance is governed by the average parameters more than the instantaneous parameters. The instantaneous parameters are determined during the actual transmission while the average parameters can only be determined upon the final successful decoding event, e.g. the effective code rate R. Moreover, the rateless codes offer a great benefit of the reduced feedback compared to the HARQ since only a single feedback message is required to signal the successful decoding of the whole file. Such benefit is very attractive to the OFDMA networks where the CQI feedback per PRB is usually not available.
6.1.2 Design Considerations of Intra-flow NC
Despite their full implementation success as the application layer protocols, the fountain and Raptor codes implementation in the next wireless communication systems standards and the air interfaces is still in its infancy. Implementations in the OFDMA based air interface networks such as LTE/LTE-A are yet to be evaluated. Almost all rateless codes researched to date are designed for the application layer without any attention to the efficiency impact on the lower layers. It is interesting to see the interaction between the rateless codes adaptation to the channel conditions and the AMC functionality in the LTE. Such implementation aspects of the intra-flow NC codes within LTE have been rarely considered in the literature.
The radio resources in the LTE are continuously optimized in order to maximize the overall cell throughput by efficiently utilizing the PRBs. Such optimization is enabled by the periodic CQI reports from all the cell users. The CQI
137

6.1 Overview of Intra-flow N C Schemes
reports are carried within the limited control signaling resources. The CQI also acts as input to the AMC functionality within the MAC scheduler to dynamically optimize the information capacity of the TB. However, there exists a fundamental trade-off between the spectral efficiency, the energy consumption and the cost of obtaining an accurate and frequent CQI feedback [120], [121]. Moreover, the reliance on the CQI is enormous for successful operation of AMC functionality at the MAC layer. On the other hand, transmission schemes based on the rateless coding adapt the transmission to the channel conditions. Hence, combining the reduced feedback requirements of rateless codes with AMC using the MAC layer implementations seems to be a promising approach.
The application layer implementation is beneficial since the protocol stack is unchanged, and the application layer techniques are rarely part of the standard. However, the performance of the protocol services at the lower layers such as the allocation of the radio resources and AMC can be affected by the packet segmentation due to rateless coding at the application layer. In particular, the application layer rateless codes are forming and sending relatively small packets of data, one at a time, until the successful file delivery is acknowledged by the destination. This is contrasting with the design philosophy of the LTE system which utilizes adaptive data rates and data multiplexing in order to achieve high link throughput with small transmission delays. Table 6.1 summarizes the constraints, challenges and observations of different implementation methods at the application, RLC and MAC layers assuming a file size of L bits for transmission which is divided in K packets.
Hence, the motivation of the work in this chapter is to show that the implementation of the intra-flow NC codes at the MAC layer are useful in improving performance of the LTE network. The benefits of the MAC layer intra-flow NC in WIMAX networks from an information-theoretic perspective were studied in [122]. Some conditions when the intra-flow NC outperform the HARQ retransmissions were obtained in [123]. The intra-flow NC in combination with the HARQ were considered in [124] and in [125]. The HARQ and AMC strategies in OFDMA networks were compared in [126]. The results in [117] suggest that the
138

6.1 Overview of Intra-flow NC Schemes
Table 6.1: Intra-flow NC Integration in LTE Protocol Stack
F ea tu re A pp lica tionLayer
R L C Layer M A C Layer
Protocol stack change
Not required Yes, segmentation done twice
Yes, minimal
Impact on performance of protocol service at other layers
Yes No No
Exploit channel conditions variations
No No Yes
Match TBS to channel conditions
No No Yes
Content of TB 1 packet combination
1 packet combination
n packet combinations
RLC PDU size fixed fixed variableAcknowledgments sent every
MAC PDU with file containing m PDUs
MAC PDU with file containing m PDUs
1 ACK sent upon completion of the whole file
W hat is sent at each TTI
1 combination 1 combination n = f ( T B S ) combination
degree distribution of the fountain codes has to be preserved even in multi-hop transmission scenarios in order to maintain the efficiency of the fountain codes.
In the LTE protocol stack, the RLC and the MAC layers appear to be the most suitable for incorporating the intra-flow NC scheme. Among the main services provided by the RLC layer is the segmentation and concatenation of the upper layer data and forming the variable size PDUs to be passed to the MAC layer according to the dynamic channel conditions as perceived at the PHY layer. The RLC layer implementation of the intra-flow NC codes implies several challenges. Firstly, the data segmentation has to be performed in two stages in order to force a fixed sized PDU that can fit the intra-flow NC code packet combinations. Secondly, the number of source packets to be encoded by the intra-flow NC code has to be sufficiently large in order to achieve a low transmission overhead [119]. Given that the typical RLC PDU size is 3200 Bytes and since a large number of source packets can only be created if their length is relatively small, this makes
139

6.2 Proposed Intra-flow N C Protocol
the packet transmissions at the PHY layer to be very inefficient. Therefore, in this chapter, we focus on the MAC layer implementation of the intra-flow NC codes in the LTE and discuss the key parameters and requirements that are critical for achieving the transmission efficiency of the intra-flow NC codes.
The basis for our investigations is the data flow between the IP packets at the network layer and the PRBs at the PHY layer shown in Figure 6.1. The CQI feedback reports at the PHY layer are generated at the UE. The CQI reports are exploited by the AMC functionality to select the MCS and the TBS at the transmitter, and to infer these parameters at the receiver. The TBs of the appropriate TBS are then created at the MAC layer [8]. The CQI is set to achieve the highest possible link throughput for the target TBLER of 10_1. The target TBLER is taken as an average value over the range of SNR values corresponding to a given CQI. The PRB carrying the TBs are allocated by the scheduler, and the PRB allocation is explicitly signaled to the receiver. The TBS parameter is passed from the MAC layer to the RLC layer to aid the process of user data segmentation and concatenation. The RLC layer then passes this information together with the scheduler decision to the upper layers where it is used to select the available data from an EPS bearer for the transmission.
Next we discuss the proposed MAC layer intra-flow NC protocol, and its integration in LTE protocol stack.
6.2 Proposed Intra-flow NC Protocol
We modify the user data flow in Figure 6.1 to incorporate the intra-flow NC at the MAC layer as follows. The RLC PDUs are first buffered at the MAC layer. The rateless encoder operates on this buffer, i.e., the buffered data are split into small packets that are randomly combined assuming some degree distribution. More importantly, the rateless encoder generates as many combinations as necessary to fit the current TBS. This approach which is depicted in Figure 6.2 allows for the dynamic size of the PDUs to be maintained at the RLC layer as well as the transport capacity of the TBs can be utilized fully, and thus, efficiently. We note
140

6.2 P ro p o sed In tra-flow N C P ro to co l
U ser D ata
L Bytes
PDCP/IP
TBS and scheduled
data amount
D ata RLC
L Bytes
( rRLC PDU 1 i RLC PDU 2 RLC PDU c
i * v L---------
TBS
PRB RPRB 1 PRB 2
MAC
PHY
CQI index
Figure 6.1: The user data fiow between the network layer and the PHY layer in the LTE.
that it is also possible to use multiple buffers with the associated independent rateless encoders to generate multiple combinations to fill the TBS. In this case, the buffer whose content is successfully decoded at the destination can be immediately refilled with new data which can further reduce the overall transmission delay.
6.2.1 P ro p o se d In tra-flow N C P ro to c o l D ifferences to C onven tiona l P ro to c o l
It is useful to compare the proposed MAC layer implementation of the intra-flow NC codes with their application layer implementation considered in [111] and standardized in [113]. We note the following differences:
• The data buffer for the intra-flowing NC encoding at the application layer must be significantly larger than a similar data buffer used at the MAC layer which translates into larger transmission delays for the application layer implementation.
141
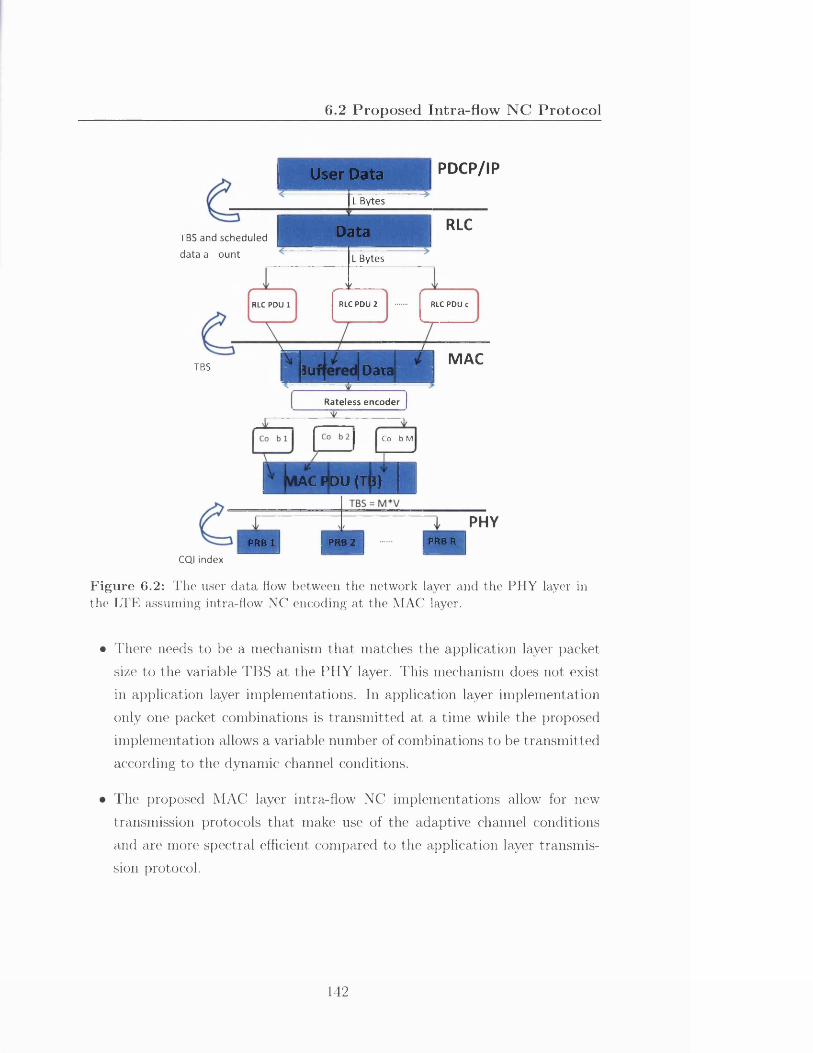
6.2 P ro p o sed Intra-flow N C P ro to co l
PDCP/IPUser DataL Bytes
RLCDataTBS and scheduled
data a ount L Bytes
RLC PDU 2 RLC PDU cRLC PDU 1
MACTBS 3u Data
Rateless encoder
C o b M
I AC PDU (T I )
PHYPRB RPRB 2PRB 1
CQI index
F igu re 6.2: The user data flow between the network layer and the PHY layer in the LTE assuming intra-flow NC encoding at the MAC layer.
• There needs to be a mechanism that matches the application layer packet size to the variable TBS at the PHY layer. This mechanism does not exist in application layer implementations. In application layer implementation only one packet combinations is transmitted at a time while the proposed implementation allows a variable number of combinations to be transmitted according to the dynamic channel conditions.
• The proposed MAC layer intra-flow NC implementations allow for new transmission protocols that make use of the adaptive channel conditions and are more spectral efficient compared to the application layer transmission protocol.
142

6.2 Proposed Intra-flow N C Protocol
6.2.2 M athem atical Analysis of the Proposed Intra-flow NC Protocol
Assuming the point-to-point transmission case, this section provides mathematical analysis of the MAC layer intra-flow NC transmission and obtains the through-
We note that the MAC layer intra-flow NC protocol resembles a parallel transmission while the application layer intra-flow NC protocol resembles a serial transmission scheme. This observation follows from the fact that many combinations are transmitted at a single TTI in our proposed protocol compared to only one combination in the conventional protocol.
Analysis of the eNB to UE transmission case is provided with the following assumptions. For a file of L bits to be transmitted from the eNB to UE, assuming Stop-and-Wait ARQ and single bit ACK/NACK, T transmissions are required before successful decoding. The number of bits transmitted before the L bits can be successfully decoded is denoted as N and each b it1 duration is 1& seconds. M denotes the number of parallel links containing data bits of size L/v, and v is the number of bits in each transmission.
The following analysis refers to Figure 6.3 and Figure 6.4.
put ratio of the parallel to the application layer intra-flow NC protocols.
file
ACK/NACK
Figure 6.3: Intra-flow NC scheme with serial transmissions.
file--------------1 T, N, tb
ACK/NACK
Figure 6.4: Intra-flow NC scheme with parallel transmissions.
:Note that bits are equivalently representing packets
143

6.2 Proposed Intra-flow NC Protocol
We adopt the following definitions for both cases in Figure 6.3 and Figure 6.4:
Transmission Rate = Rate — — (6.1)N v J
Throughput = TH = (6-2)
Transmission Overhead = OV = ^ ^ x 100% = — — 1 (6.3)L T H
For the serial transmission case, we have:
Ns = Ts • v (6.4)
Rates = ~ (6.5)
where Ns is the number of bits transmitted in the case of serial intra-flow NC and Rates is the rate defined as the ratio of the number of successful bits received to the number of time slots it takes to receive those bits successfully, i.e Rates = L/N.For the parallel intra-flow NC, we have:
NP = TP ■ M • v (6.6)
Ratep = — (6.7)i V p • tb
Thus, the following general inequalities can be written:
(6 .8 )
(6.9)
(6 .10)
T P < Ts
M > 1Np TP ' Mivs Ts
Ratep L / ( N P ■ t„) NsRates L / (N S ■ tb) N P T,
TP =/ Ts / MX Ts
M > 1 M = 1
Ts ■JorM > 1 (6.11)
(6 .12)
The above equations assume that the v bits sent at each TTI are matched
144

6.2 Proposed Intra-flow N C Protocol
to the packet combinations of the intra-flow NC, and sending M parallel combinations requires some considerations at the decoder. Hence, for the analysis in the next subsection, assumptions are made for the LTE eNB encoder and the UE decoder.
• PRBs at the eNB carry several combinations within their respective 11 subcarriers. For a certain number M of PRBs, each PRB is carrying a variable number of n combinations.
• There are M LTE decoding entities (implemented in software) at the UE performing a simple belief propagation decoding, and passing the result to be collated, and the individual extracted packets to be decoded.
• The parallel belief propagation decoder is assumed to be fast, so that it can perform M parallel computations in the same time as the serial decoder. This assumption holds in practice as the Gaussian elimination based decoders are now widely available [127]. For instance, practical implementations of NC in mobile phones is reported in Iphone and Nokia N95 is reported recently in [128, 129, 130].
• The power per bit is assumed to be equal for serial and parallel transmission.
Throughput Analysis w ithout A ssum ing the Link B it Error Probability
Here, we provide the throughput ratio between the parallel and the serial protocols.
where tv is the duration of v bits in time units. Substituting Eq. 6.12 into Eq. 6.14 yields:
THSL L L
(6.13)Ns ’ h Ts - v • tb Ts - tv
THP
(6.15)
145
6.2 Proposed Intra-flow NC Protocol
and the ratio of the overheads of the parallel transmission to the serial transmission technique is :
OVp = = M ■ T H s • (1 - T H S) = M - ( 1 - T H S) . .OVs T H S ■ (1 - M ■ T H S) 1 - M - T H S 1 ' ’
Throughput Analysis A ssum ing the Link B it Error Probability
For the same file of L bits there are K = L /v packets for which the rateless code combinations can be created. These combinations have uniform probability distribution, and the degree of the combinations (i.e. how many packets a combination contains) is denoted as d. Thus, each packet combination selection is equally probable, and probability of selecting a packet combination of degree d = i is:
Pr(selectingindex = i) = — • Pr(d = i) (6-17)
and the probability of selection of all combinations is:
K
\Pr(selection) = • P r(d = i) (6.18)i= 1
The intra-flow NC encoder operates as follows:
• The degree distribution is selected ( in this case robust Soliton distribution) to guarantee that at least 1 combination with d — 1 is selected.
• Indexed are randomly generated.
• The total transmission power is divided evenly among all parallel links (in this case subcarriers).
• Assuming Binary Phase Shift Keying(BPSK) and Quadrature Phase Shift
146
6.2 Proposed Intra-flow NC Protocol
Keying (QPSK), the bit error rate with the bit error probability:
Cs = Q (\/2 ■ S N R ) (6.19)
Cp = Q(a / 2 • —7 7 —) (6 .2 0 )M
The SNR as the power per useful bit:
SNR - j A j (6.21)
Then the expected number of successful bits, the dropped bits for both serial and parallel transmission:
jySucc = N Corr + jyDr-op (g
N%rop = Ns ■ is (6.23)
N ^ r = N s -( 1 - is) (6.24)j \ j C o r r
N s = (6.25)1 - C 5a j C o r r
NP = p V (6'26)1 - i s
we require that N § OTr = N p orr for two decoders to decode all the K packets successfully, so that:
TH S = -7T 7 - (6-27)iVs • tb
T Hp = M ■ t t —T" (6.28)i V p • t b
T H S N P Nporr 1 1 - i STH p ~ M ■ Ns ~ (1 - ip) ' M ' Ngorr TH p M ■ (1 - iP ) 1 + OHs T H S ~ 1 - ( 5 ~ l + OVp
(6.29)
(6.30)
147
6.2 Proposed Intra-flow NC Protocol
This ratio of the parallel to serial transmission protocols throughputs for the robust Soliton distribution with c = 0.03 and E^/Nq = 5dB is plotted in Figure 6.5 for case of BPSK and assuming AWGN channel. We observe that the simulation and mathematical results from Eq. 6.30 match. Moreover, Figure 6.6 plots the throughput ratio for a wide range of SNR values. Obviously, the higher the SNR the more throughput gain is achieved. Both figures show that the increase in the number of parallel subcarriers or links linearly increases the throughput. However, note that this assumes that the transmit powers are evenly distributed to all parallel links.
148
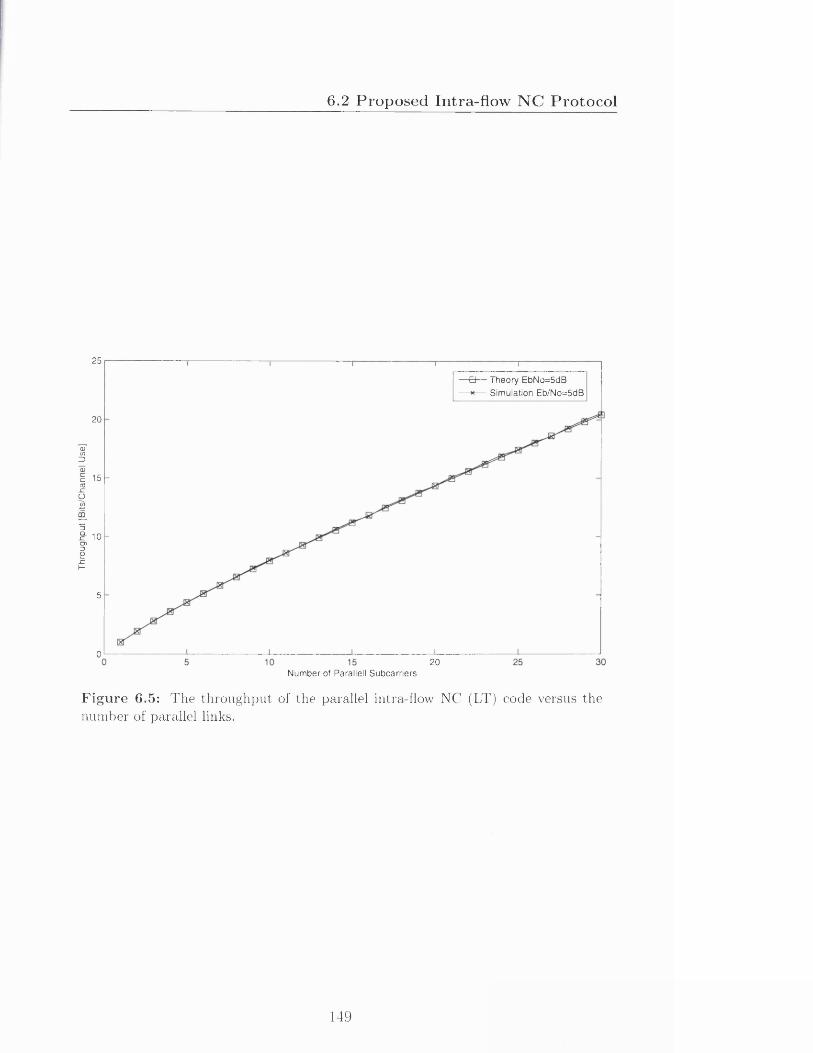
Thro
ughp
ut
[Bits
/Cha
nnel
Use
]
6.2 P ro p o se d In tra -flo w N C P ro to c o l
25
-B— I heory EbNo=5dB -*— Simulation Eb/No=5dB
20
15
10
5
020
Number of Parallell Subcarriers
Figure 6.5: The throughput of the parallel intra-flow NC (LT) code versus the number of parallel links.
149

Par
alle
l to
Ser
ial
LT co
de
Thro
ugpu
t R
atio
6.2 P ro p o se d In tra -flo w N C P ro to c o l
8
E./N = -4 dB
EK/N = -2 dB7
E /N = 0 dB
E J N =3 dB
6 EK/N =8 dB
E./N =12 dB
E./N =16 dB5
E /N =30 dB
4
3
2
186 74 52 3
Number of Subcarriers
Figure 6.6: Throughput ratio of parallel intra-flow NC LT code at various E^/Nq values.
150

6.3 System M odel
6.3 System M odel
We reuse the system model developed in Chapter 5. This model assumes the MAC layer and the PHY layer entities and parameters from the LTE standard such as the SNR of the PRBs, the downlink scheduler, and the AMC mechanism with the variable TBS. The corresponding simulation framework is used to measure the transmission delay and to measure the energy consumed at the network nodes. Here, we included into this simulation framework the rateless LT code at the MAC layer for both the encoder and decoder as described in the previous section.
In the simulations, the LT encoder uses the Robust Soliton distribution derived from the ideal Soliton distribution, i.e.,
where p( d) is the probability of generating a combination with degree d. The expected degree under this distribution is roughly (In A). The fluctuations about the expected degree values are likely to leave the decoder with no degree-one combinations. Thus, there may be not enough degree-one combinations received to aid the decoding-process.
The Robust Soliton distribution addresses this issue by two extra parameters c and S. The value 1 — 5 is a bound on the probability that the decoding will recover K packets after receiving a certain number of K' combinations. The paramter c is free parameter with the values less than 1 corresponds to smaller transmission overheads. This will ensure that the expected number of degree-one combinations is changed to:
where Z = + T(d) . The number of encoded packets (combinations)
(6.31)
(6.32)
(6.33)
(6.34)
151

6.3 System M odel
required at the decoder to ensure that the decoding completes with probability at least (1 — 5) is K' = K • Z. r(d)i where the function r(d) is defined as:
The main simulation parameters from [56] and [8] are summarized in Table 5.2. We assume a single link between the eNB and the UE and that the transmitter and the receiver are both equipped with a single antenna. All simulation results are averaged over random UE locations assuming the uniform distribution of the UEs within a 1km radius about the eNB.
We assume that the transmission channel conditions are evaluated once every Transmission Time Interval (TTI)1. The MCS and the corresponding TBS are set for a given CQI using Table 6.3 (from [8]). Note that the MCS with the CQI = 0 is usually used for control signaling on the PDCCH channel. The success of the TB transmission (i.e., whether the TB was delivered successfully to the destination or not) is determined by the following procedure.
First, the average received signal power at the UE located d meters from the eNB is calculated as [56],
PRx(d) = PTx + GTx + GRx - NF - NpRE - IM - CO - PL(d) - SF (6.36)
where P^x is the transmission power at the eNB, G^x and Gr* are the eNB and the UE antenna gains, respectively, NF is the noise figure at the UE receiver front-end, NpRE is the noise per Resource Element (RE), IM is the interference margin to account for the increased background noise caused by the inter-cell
overhead of the downlink Demodulating Reference Symbols (DM-RS), and PL(d) and SF are the path and the shadowing losses, respectively. The RE is defined as 1 subcarrier over the duration of 1 OFDM symbol of 70/xs.
xThe LTE standard allows to report the channel conditions via the CQI reports less often.
log(S/<5)for d= l,2 ,....(K /S )-l for d= K/S for d > K/S
(6.35)
interference from the neighboring cells, CO accounts for the 10 — 25% control
152
6.3 System M odel
Second, the SNR of the z-th RE is then computed as,
SNRj(d) = |tf i|2 • 10p^ d>/10 (6.37)
where the fading gain at the z-th subcarrier \Hi\ is generated from the multipath channel gains in the time domain using the Fourier transform, so that the fading gains across subcarriers are correlated. The arithmetic average of the SNR values of the REs are then averaged to obtain the effective SNRTb representing the channel conditions of the particular PRB carrying the TB [97].
Finally, the actual TBLER value for the given TB and the effective SNR at given TTI is obtained using the TBLER-SNR curves provided in [99], i.e.,
Once the TBLER value is determined, a Bernoulli experiment is carried out to decide whether the TB transmission error occurred. If the TB transmission is unsuccessful, the TB is dropped and is not provided to the decoder.
The two main metrics of interest to compare the implementations of fountain codes are the energy consumption and the transmission delay. The overall (total) energy consumption at the eNB and at the UE is calculated using the simple but sufficiently accurate model, i.e.,
where pRF-totai is the expended RF transmission power, n E accounts for the PA efficiency, and Poh is the overhead power. In our simulations, for the eNB transmitter, we assume the maximum RF transmit power P r f = 40 watts, the HPA efficiency //E = 0.25, and Poh = 490 watts [109, 7]. The transmission delay is measured as the number of transmissions N , or the average number of transmissions N.
TBLER = / ( S N R t b , MCS) (6.38)
E t o t a l ( T r f —t o t a l + Pon) x Time
(6.39)
153

6.3 System M odel
Table 6.2: Main Simulation Parameters
Param eter SettingTraffic model full-bufferCell Radius 1 kmSystem bandwidth FDD, 20MHzSubcarriers per PRB 12Subcarriers frequencies from 2GHz with spacing
15kHzNumber of RBs 100Path loss model from [60]Shadowing log-normal with std. dev.
8dB at UENoise Figure 7dB at UEMultipath fading model EPA with RMS delay
spread 45ns [95]eNB and UE antenna heights
25m and 1.5m
eNB and UE antenna gains (inch cable losses)
14dBi and OdBi
eNB transmit power 46dBmCQI delay 1msDownlink MCS from [8]; see also Table 6.3Interference margins 4dBControl overhead 25% DM-RS ~ ldB [56]TBLER target 10%Combination size V = 4 bytesFile size per user L = 4096 bytes, L V
154

6.4 Num erical R esults
Table 6.3: Modulation and Coding Schemes [8]
CQIIndex
M od. Coding R ate x 1024
Efficiency[Bits/Sym bol]
TBS[Bytes]
Combs, per TB
0 2 78 0.1523 - - -1 2 120 0.2344 2 12 2 193 0.377 4 13 2 308 0.6016 6 24 2 449 0.877 10 35 2 602 1.1758 15 46 4 378 1.4766 19 57 4 490 1.9141 26 78 4 616 2.4063 33 99 6 466 2.7305 40 1010 6 567 3.3223 46 1211 6 666 3.9023 56 1412 6 772 4.5234 65 1713 6 873 5.1152 73 1914 6 948 5.5547 81 21
6.4 Numerical Results
We investigate the trade-off between the energy consumption and the transmission delay. As a specific example of the fountain code, we employ the LT code with the Robust soliton distribution [111]. We consider the application layer implementation of the intra-flow LT code using the user data flow in Figure 6.1 which is referred to as the serial LT code protocol. This protocol assumes that exactly one LT code combination is transmitted during each TTI. We compare the serial LT code protocol with the proposed parallel LT code protocol(Intra- flow NC at MAC layer) corresponding to the user data flow in Figure 6.2 where the number of the LT code combinations transmitted during each TTI is adjusted according to the current TBS. For both protocols, the LT decoding is performed every time the TB is correctly received. The LT packet combinations are generated continuously until the whole file is recovered at the destination, so that a positive acknowledgment can be sent to the source (i.e., to the eNB).
The serial protocol sends one LT combination in the TB embedded in one
155
6.4 Num erical R esults
PRB. The parallel protocol employs multiple PRBs as well as the TB in each PRB can carry multiple LT combinations. The number of LT combinations for a given TBS is listed in the last column of Table 6.3. Furthermore, the parallel protocol implementation assumes that the LT decoding at the destination is fast enough to process the multiple received LT combinations during the same time as the serial protocol processes just one LT combination. This can be readily achieved in practice by employing the multiple independent LT decoders.
In our first experiment, we obtain the statistics of the number of packets transmissions needed before the file can be successfully decoded at the destination. We compare the transmissions with and without the AMC. We either use the AMC mechanisms with the MCSs from Table 6.3, or we fix the CQI, and thus, the modulation index. The number of the PRBs is either fixed, or variable. The CDF of the number of transmissions for a given maximum number of transmissions Amax is shown in Figure 6.7. We observe that, for given Nmax, the probability of the successful file decoding at the destination increases with the increasing number of the used PRBs (from 1 to 4, in this case); the more PRBs are used to deliver more LT combinations, the more Nmax can be reduced. For given -/Vmax, using the AMC at the fixed target TBLER of 0.1 with the fixed number of PRBs improves the probability of the successful decoding. However, provided that we use a channel-quality dependent number of PRBs and the AMC, the TBLER variability across the PRBs actually increases the required number of transmissions Nmax. However, if the MCS is fixed, the small CQI indexes result in the smallest number of transmissions. For example, CQI = 0 corresponds to the smallest number of transmissions compared to the index CQI = 13. This is due to the fact that the AMC maximizes the transmission throughput at the cost of allowing larger values of the TBLER. On the other hand, fixing the MCS reduces the TBLER fluctuations across the PRBs which results in more reliable delivery of the TBs. Consequently and importantly, these observations indicate that the transmission parameters and procedures of the LTE protocol stack must be optimized should the fountain codes be incorporated.
156
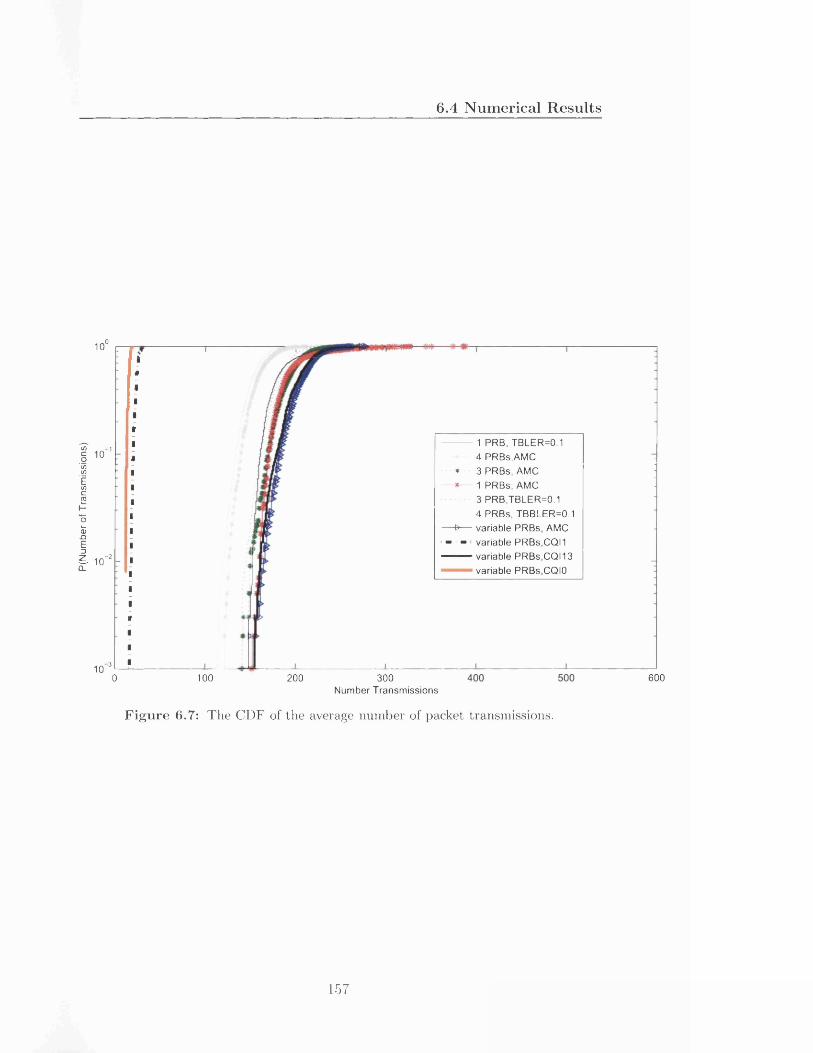
P(N
umbe
r of
Tran
smis
sion
s)
6.4 N um erical R esu lts
.010 '
■10
-210
■3101000 200 300
1 PRB, TBLER=0.14 PRBs,AMC
* 3 PRBs, AMC— *— 1 PRBs, AMC
3 PRB,TBLER=0.14 PRBs, TBBLER=0.1
— 0— variable PRBs, AMC. . . . variable PRBs,CQI1
variable PRBs,CQI13variable PRBs,CQI0
Number Transmissions
F ig u re 6.7: The CDF of the average number of packet transmissions.
157
600
6.4 Num erical R esults
In the next experiment, we compare the average energy consumption of the serial and parallel LT codes protocols. Recall that the serial protocol represents the LT code implementation at the application layer whereas the parallel protocol is the proposed LT code implementation at the MAC layer. We measure the RF energy consumption as well as the total energy consumption and the number of transmissions that are required for the successful file decoding at the destination. Since the results of the first experiment suggest that the fixed MCS can outperform the AMC, we investigate the transmission scheme where the MCS selection is restricted to some maximum CQI index / max and the number of PRBs used varies with the current channel conditions. If the calculated CQI at the receiver exceeds the chosen value of Imax, the calculated CQI value is substituted with the index / max- This mechanism restricts the variability of the TBLER across the PRBs, and thus, can reduce the transmission delays for the LT codes.
Figure 6.8 shows that the number of packet transmissions N for the serial LT code protocol increases rapidly with the index Imax while the parallel LT code protocol exhibits a slight decrease in the number of transmissions N with An ax- This is the case for both when the packet combination length is v = 1 and v = 4 Bytes. Thus, for the serial LT code, the smallest possible index /max should be used corresponding to the fixed MCS in order to increase the packet transmission reliability and reduce the variability of the TBLERs. The reason behind the increase in number of transmission for serial case is the fact that higher MCS indexes increases the variability of the BLER. Also since serial code does not adapt the number of combinations with the channel conditions, increasing the MCS does not result in increase in the number of combinations transmitted by the scheme. For the case of v — 1, more combinations per a given packet size result in visibly more fluctuations of the number of transmissions as the MCS index increases. However, in the case of the parallel LT code, the increase in the instantaneous TBLER of the PRB is offset by the increased number of combinations that can be delivered to the LT decoder which then reduces the transmission delay. Also results are slightly different for different packet combination size but the trend is the same.
The total energy and the RF energy consumptions of the serial and parallel
158

6.4 Num erical R esults
LT code implementations are compared in Figure 6.9. We observe that the RF energy consumption for the serial LT code is lower than that for the parallel LT code owing to the smaller number of the PRBs used. However, as the index / max increases, the reduced number of transmissions outweighs the increased number of PRBs used, and the energy consumption of the parallel LT code approaches the energy consumption of the serial LT code. The same behavior is observed when the overhead energy is considered. These results again emphasize that using the AMC as specified in the LTE standard is not optimum in terms of the transmission delay when the LT codes are employed for the data delivery. However, the use of the AMC does lead to the reduced energy consumption even with the LT codes. Here the absolute values of both the RF and operational energy consumption are a bit lower when packet combination size is 1 rather than 4 and while maintaining the parallel transmission trend of reduced number of transmissions and overall energy compared to serial transmission.
159

6.4 N um erical R esu lts
250
200
150
100
50
Parallel LT code,v=4
O Serial LT code,v=4
-b Parallel LT code,v=1
o Serial LT code,v=1
□ B B -
6 8 10 12- 6 - - - J
14
F igu re 6.8: The average number of transmissions for a given maximum modulation and coding index.
160
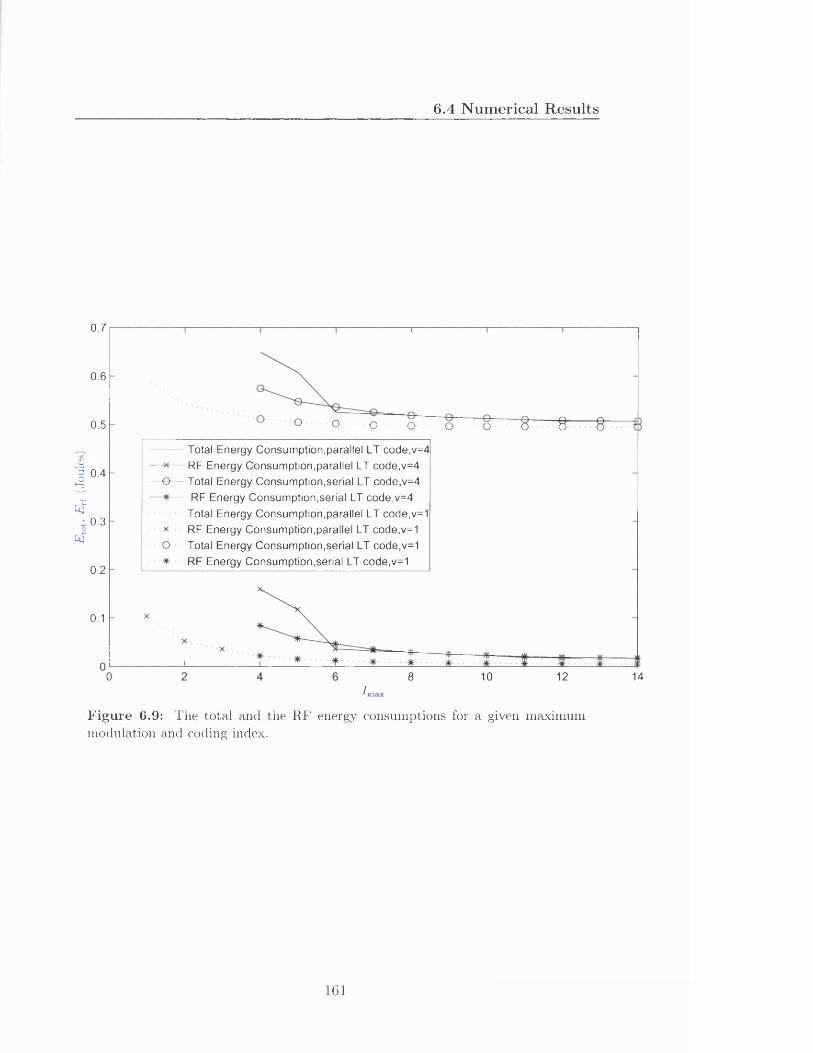
(sojnof) Pg
1
6.4 N um erical R esu lts
0.7
0.6
0.5
0.4
0.3
0.2
0.1
-e-
§— 8 8Total Energy Consumption,parallel LT code,v=4 RF Energy Consumption,parallel LT code,v=4 Total Energy Consumption,serial LT code,v=4 RF Energy Consumption,serial LT code,v=4
Total Energy Consumption,parallel LT code,v=1 RF Energy Consumption,parallel LT code,v=1 Total Energy Consumption,serial LT code,v=1 RF Energy Consumption,serial LT code,v=1
140 8 10 12In
Figure 6.9: The to ta l and the RF energy consum ptions for a given m aximum m odulation and coding index.
161

6.4 Num erical R esults
Finally, Figure 6.10 shows the energy-delay trade-offs for the serial and parallel LT codes implementations. We observe that these trade-offs are distinctly different for the serial and the parallel LT codes. In particular, for the serial LT codes, if larger transmission delays can be tolerated, the energy consumption can be reduced. On the other hand, for the parallel LT codes, as the number of transmissions is allowed to increase by changing the number of the LT combinations per a TB until a maximum transmission delay is reached, the energy consumption increases steeply. Interestingly, after reaching the maximum delay, the energy consumption continues to increase while the delay is slightly reduced. The trade-offs are very similar for different packet combination sizes.
162

6.4 N um erical R esu lts
0.7
0.6
0.5
0.4
0.3
0.2
0.1
— b — RF Energy,Paralle l LT code,v=4
Total Energy,Paralle l LT code,v=4
- * - RF Energy,Serial LT code,v=4- - - Total Energy,Serial LT code,v=4
RF Energy,Paralle l LT code,v=1 Total Energy,Paralle l LT code,v=1- *• - RF Energy,Seria l LT code,v=1 Total Energy,Serial LT code,v=1
X-
50.=JM -=-i= - *c« - - - -mm
100 150 200Delay (ms)
F igu re 6.10: The energy consumption-delay trade-offs for the parallel and the serial LT codes implementations.
163
250
6.5 Conclusions
6.5 Conclusions
In this chapter, the implementation aspects of the rateless code based on the LT codes in LTE were investigated. The rateless codes were incorporated into the LTE protocol stack at the MAC layer. The proposed implementation exploits availability of the several PRBs and can fully utilize the variable TBS to transmit multiple LT combinations at each TTI and allows parallel transmissions of multiple LT codes combinations to be carried by each PRB. The serial LT code protocol corresponding to the application layer implementation and the parallel LT code protocol at the MAC layer were compared by computer simulations in terms of the required number of transmissions for the successful decoding at the destination and in terms of the energy consumption. It was found that the parallel LT code protocol always results in smaller transmission delays in delivering a data file to the destination than the serial LT code protocol provided that the AMC is employed. Furthermore, the energy consumption-delay trade-offs of the serial and the parallel LT code protocols were found to be distinctively different.
It was found that for a given maximum number of packet (re)transmissions, the probability of successful decoding at the UE increases with the use of a number of parallel PRBS. Restricting the AMC to a smaller sub-set of the lower CQI indexes results in smaller number of the required transmitted combinations to achieve the complete successful decoding at the destination(Probability of successful decoding is 1). This has important consequences on the operation of AMC mechanism in LTE.
In summary, the parallel implementation of the LT code in the MAC layer outperforms the serial implementation of the LT code in terms of the transmission delay and the energy consumption provided that the AMC mechanism is modified. Hence, the AMC in the LTE-Advanced has to be optimized for the use with the LT codes in order to exploit a full potential of these rateless codes. Future work includes investigating the performance when relays are utilized within an intraflow NC transmission scenario.
164

7
Conclusions
Despite the extensive research on NC protocols since their inception a decade ago, NC implementations in cellular mobile networks and their impact on other functionalities of the cellular system remain still largely unexplored. This thesis advocates alternative transmission protocols employing NC and shows that they can provide energy savings, throughput gains and resource utilization gains. We next summarize the benefits of the proposed NC schemes and the remaining challenges.
7.1 Practical Network Coding for LTE Networks
The proposed NC schemes present transmission protocols that exploit the intrinsic broadcast properties of the wireless medium while taking into consideration LTE RAN limitations and constraints to save energy and improve network throughput, as follows.
• We have shown that XOR-NC protocols applied at the MAC-sublayer of LTE results in 19% througput gain and 16 — 25% energy savings depending on the traffic in the network. This is achieved with seamless integration with the other functionalities of the MAC layer.
165
7.2 Energy C onsum ption-D elay Trade-offs ofNetwork Coding in LTE Networks
• The resource utilization savings of NC are quantified and shown to be the most important benefit of NC that enables energy savings. Resource savings of 0.5 — 3.25% is achieved increasing with the traffic load increase in the network.
• Further, it is shown that the NC schemes are scalable with respect to traffic loads and number of users, for 6 users per relay, 25% energy savings and 13% resouce savings is achieved. Hence, they can readiy be incorporated in LTE systems with little modifications.
• The interaction between NC at the MAC-sublayer and resource allocation at the RLC layer is found to result in positive sustainable throughput and energy improvements. This positive interaction implies that performing NC on TBs is a promising approach for the inclusion of NC in LTE networks.
7.2 Energy Consum ption-Delay Trade-offs of Network Coding in LTE Networks
The proposed implementation of intra-flow NC into the MAC layer of LTE protocol stack results in smaller transmission delays and reduced energy consumption compared to the application layer implementation given that the AMC is optimized. The proposed implementation offers a different energy-delay trade-offs relationship as well as reduced transmission delay range. Hence, it is more beneficial for delay limited data and applications such as online gaming and e-learning.
The following conclusions can be made:
• Intra-flow NC implemented at the MAC layer saves transmission time, hence energy and radio resources.
• MAC layer Intra-flow NC scheme provides a distinctive energy consumption- delay trade-off than the application layer intra-flow NC scheme. MAC layer intra-flow NC operates at much lower delay range and hence is useful for applications with strict delay requirements such as multimedia streaming and video conferencing.
166

7.3 Future Work
• The AMC in the LTE-Advanced has to be optimized for the use with the intra-flow NC schemes in order to realize their gains.
• Future transmission protocols need to take into account the careful design of AMC functionality
• Adaptive protocol stack works and indicator show it would be a primary feature of the LTE-A networks.
We now look at the bigger picture and how NC schemes can compare with other energy efficiency techniques used in the literature and reviewed in this thesis. Dynamic spectrum management and cognitive radio techniques results in 50% RF energy savings, hetrogenous network deployments( i.e cellular architectures with relays, pico cells, femotcells,etc) can obtain up tp 60% RF energy savings compared to a network with mactoc-cells and the use of fixed relays reduce the RF transmit power by a factor of 5 [131]. Moreover, NC energy savings gains obtained in this thesis are useful especially as the NC can be integrated along with resource allocation, spectrum management and MAC layer trasnsmission techniques. We forsee that NC energy and throughput gains will add up constru- tively to the energy savings gains obtained by those mentioned techniques.
7.3 Future Work
The proposed NC schemes along with the detailed numerical analysis show the usefulness of NC in LTE networks and highlight areas on which the interaction between NC and MAC-layer functionalities need to be explored further. For example, there is potential to achieve even higher throughput gains from our NC schemes if the rate adaptation and scheduling algorithms are taken into consideration together with the coded and remaining flow concepts. However, there is a tradeoff between the broadcast rate adaptation and the packet reliability that appear useful to be further explored.
167

7.3 Future Work
Building on implementation of NC using the HARQ retransmission units (TBs), the tradeoff between NC for end-to-end reliability and rate adaptation and possibly congestion control are areas of interest for future research.
With respect to maximization of the possible achievable energy savings from NC, the following research issues should be considered:
• The wireless backhauling between the base stations and the resulting mesh network topology can provide many opportunities for employing our NC schemes. More importantly, the gains due to such NC schemes are expected to be larger than the values presented in this thesis due to more balanced RF and operational powers among the base stations. For example, the reference [132] shows that the throughput gain of NC over a wireless backbone is higher than that in the wireless ad-hoc networks, since the network topology of the wireless backbone creates more bi-directional packet flows, and hence, it represents more NC opportunities.
• The design of scheduling schemes with NC in realistic LTE scenarios has not been considered previously. Furthermore, we can trade-off the NC gain and the multiuser diversity gain to achieve better energy savings for the RF power. We can mitigate the SNR loss in broadcasting the NC coded packets at the smallest SNR of the destination links by considering a joint design of NC and scheduling.
• Investigation of Intra-flow NC schemes, their implementations and the potential energy and throughput gains when relays are used is another useful research topic. There will be more coding opportunities at the relay and hence higher energy savings are expected. Consideration of how to select the packet combinations from the eNB and the UE for the NC operation at the relay. Also, the impact of this selection on the overall transmission delay and on the energy-delay trade-offs is worthwhile to investigate.
168

Bibliography
[1] F. Meywerk, “The mobile broadband vision - how to make LTE a success.” LTE World Summit, Nov 2008. ix, 1, 2
[2] 3GPP, “Evolved universal terrestrial radio access (E-UTRA) and evolved universal terrestrial radio access network (E-UTRAN):overall description, stage 2 (release 8),” standard TS 36.300 V8.12.0, 3GPP, 2008. ix, 20, 21
[3] P. L. Hassan Hamdoun and T. O’Farrell, “Practical network coding for two way relay channels in LTE networks,” tech. rep., Swansea University, 10-2010. ix, 27
[4] ETSI, “Power supply interface at the input to telecommunications equipment; part 3: Operated by rectified current source, alternating current source ordirect current source up to 400 V,” Technical Specifications ETSI EN 300 132-3 V I.2.1, ETSI, 2010-3. ix, 43, 44, 45, 46
[5] B. Badic, T. O’Farrell, P. Loskot, and J. He, “Energy efficient radio access architectures for green radio: large versus small cell size deployment,” in VTC Fall, pp. 0-, 2009. ix, 59, 60, 61
[6] J. Heide, M. V. Pedersen, F. H. P. Fitzek, and T. Larsen, “Cautious view on network coding from theory to practice,” Communications and Networks, Journal of, vol. 10, pp. 403 -411, Dec 2008. xii, 33
[7] e. a. G. Auer, V. Giannini, “Cellular energy efficiency evaluation framework,” in Proc. Vehicular Tech. Conf. (VTC-Spring 11), Budapest, Hungary, May 2011., 2011. xii, 116, 117, 153
169

BIBL IO G R A PH Y
[8] 3GPP, “TBS and MCS signaling and tables),” Technical Specifications Group Meeting 3GPP TSG RANI No. 52 Rl-081284, 3GPP, 2008. xii, 140, 152, 154, 155
[9] Cisco, “Cisco visual networking index: Global mobile data traffic forecast update,” Feb 2013. h ttp ://w w w .cisco.com . 1
[10] A. S. Sarmiento, A. S. Sarmiento, and E. M. Lopez, Multimedia Services and Streaming for Mobile Devices: Challenges and Innovations. Hershey, PA, USA: IGI Publishing, 1st ed., 2011. 1
[11] Cisco, “NECs approach towards energy-efficient radio access networks,” Feb2010. h ttp ://d e .n e c .c o m . 1
[12] Gartner, “Gartner estimates ICT industry accounts for 2 percent of global CO2 emissions,” Apr 2007. www.gartner. co m /it/p ag e . jsp?id=503867. 1
[13] P. M. Haardt, “Future mobile and wireless radio systems: Challenges in european research.” Report on the FP 7 Consultation Meeting, Feb 2008. 2
[14] Vodafone, “Vodafone group announces commitment to reduce CO2 emissions by 50%,” May 2008. www.vodafone.com/content/index/media/ group_press_releases/2008/0 1.html. 2
[15] Orange, “Corporate responsibility report france telecom,” May 2007. w w w .orange .com /en /finance/general-m eeting /annual-reports . 2
[16] Z. Wang, S. Karande, H. Sadjadpour, and J. J. Garcia-Luna-Aceves, “On the capacity improvement of multicast traffic with network coding,” in Military Communications Conference, 2008. MIL COM 2008. IEEE , pp. 1-7,2008. 3
[17] T. Ho, M. Mdard, R. Koetter, D. R. Karger, M. Effros, J. Shi, and B. Leong, “A random linear network coding approach to multicast,” IEEE TRANS. INFORM. THEORY , vol. 52, no. 10, pp. 4413-4430, 2006. 3
170

BIBL IO G R A PH Y
[18] S. Jaggi, P. Sanders, P. A. Chou, M. Effros, S. Egner, K. Jain, and L. Tol- huizen, “Polynomial time algorithms for multicast network code construction,” 2003. 3
[19] U. Paul, A. Subramanian, M. Buddhikot, and S. Das, “Understanding traffic dynamics in cellular data networks,” in INFOCOM, 2011 Proceedings IEEE , pp. 882-890, 2011. 3
[20] J. G. Markoulidakis, G. L. Lyberopoulos, and M. E. Anagnostou, “Traffic model for third generation cellular mobile telecommunication systems,” Wirel. Netw., vol. 4, pp. 389-400, Aug. 1998. 3
[21] C. Fragouli and E. Soljanin, “Network coding fundamentals,” Foundations and Trends in Networking, vol. 2, pp. 1-133, 2007. 8, 9, 11, 13
[22] J. Barros, “Mixing packets: Pros and cons of network coding,” in Proc. Wireless Personal Multimedia Communications Symp ( WPMC% Sept 2008. 8
[23] Y. E. Sagduyu and A. Ephremides, “Some optimization trade-offs in wireless network coding,” in Proc. of 40th Conference on Information Sciences and Systems (CISS 2006), pp. 6 - 11, 2006. 8
[24] Y. E. Sagduyu, Medium Access Control and Network Coding for Wireless Information Flows. PhD thesis, Department of Electrical and Computer Engineering, University of Maryland, College Park,USA, 2007. 8
[25] R. Ahlswede, N. Cai, S. yen Robert Li, R. W. Yeung, S. Member, and S. Member, “Network information flow,” IEEE Transactions on Information Theory, vol. 46, pp. 1204-1216, 2000. 9, 15
[26] S. Y. Cho, Efficient Information Dissemination in Wireless Multihop Networks. PhD thesis, Ecole Poly technique, Prance, 2009. 11
[27] S. Rajsekhar, Network Coded Wireless Architecture. PhD thesis, Department of Electrical Engineering and Computer Science, Massachusetts Institute of Technology, USA, 2008. 11, 12, 13, 14, 15, 71
171

BIBLIO G R A PH Y
[28] J. Goseling, C. Fragouli, and S. Diggavi, “Network coding for undirected information exchange,” Communications Letters, IEEE , vol. 13, no. 1, pp. 25- 27, 2009. 12
[29] S. Jaggi, P. Sanders, P. Chou, M. Effros, S. Egner, K. Jain, and L. M. G. M. Tolhuizen, “Polynomial time algorithms for multicast network code construction,” Information Theory, IEEE Transactions on, vol. 51, no. 6, pp. 1973-1982, 2005. 12
[30] Y. Wu, P. Chou, and K. Jain, “A comparison of network coding and tree packing,” in Information Theory, 2004. IS IT 2004• Proceedings. International Symposium on, p. 143, Jul 2004. 13
[31] P. Sanders, S. Egner, and L. M. G. M. Tolhuizen., “Polynomial time algorithms for network information flow,” 15th ACM Symposium on Paralel Algorithms and Architectures, pp. 286-294, 2003. 14
[32] S. yen Robert Li, R. W. Yeung, and N. Cai, “Linear network coding,” IEEE Transactions on Information Theory, vol. 49, pp. 371-381, 2003. 15
[33] T. Ho, R. Koetter, M. Medard, D. Karger, and M. Effros, “The benefits of coding over routing in a randomized setting,” in Information Theory, 2003. Proceedings. IEEE International Symposium on, p. 442, Jun 2003. 15
[34] S. Deb, M. Effros, T. Ho, D. R. Karger, R. Koetter, D. S. Lun, M. Mdard, and N. Ratnakar, “Network coding for wireless applications: A brief tutorial,” in International Workshop on Wireless Ad-hoc Networks (IWWAN), pp. 196-200, 2005. 15
[35] A. Keshavarz-haddad and R. Riedi, “Bounds on the benefit of network coding for multicast and unicast sessions in wireless networks,” tech. rep., Department of Statistics, Rice University, 2007. 15
[36] J. Heide, M. V. Pedersen, F. H. Fitzek, and T. Larsen, “Cautious view on network coding - from theory to practice,” Journal of Communications and Networks (JCN), vol. 10, pp. 403-411, Dec 2008. 15
172

BIBL IO G R A PH Y
[37] T. C. Ho and et al., “On constructive network coding for multiple unicasts.” Allerton Conference on Communication, Control and Computing (Allerton), 2006. 15
[38] Z. Li and B. Li, “Network coding: The case for multiple unicast sessions,” in Proceedings of the Allerton Annual Conference on Communication, Control, and Computing, Sept 2004. 15
[39] M. Langberg and M. Medard, “On the multiple unicast network coding, conjecture,” in Communication, Control, and Computing, 2009. Allerton 2009. 47th Annual Allerton Conference on, pp. 222 -227, Oct 2009. 16
[40] J. Goseling, R. Matsumoto, T. Uyematsu, and J. Weber, “On the energy benefit of network coding for wireless multiple unicast,” in Information Theory, 2009. IS IT 2009. IEEE International Symposium on, pp. 2567 - 2571, 2009-Jul 3 2009. 16
[41] M. Effros, T. Ho, and S. Kim, “A tiling approach to network code design for wireless networks,” in Information Theory Workshop, 2006. IT W ’06 Punta del Este. IEEE, pp. 62 -66, March 2006. 16
[42] J. Liu, D. Goeckel, and D. Towsley, “Bounds on the gain of network coding and broadcasting in wireless networks,” in IEEE INFOCOM 2007. 26th IEEE International Conference on Computer Communications, pp. 724 - 732, May 2007. 16
[43] S. Sengupta, S. Rayanchu, and S. Banerjee, “An analysis of wireless network coding for unicast sessions: The case for coding-aware routing,” in INFOCOM 2007. 26th IEEE International Conference on Computer Communications. IEEE, pp. 1028 -1036, May 2007. 16, 17
[44] S. Katti, H. Rahul, W. Hu, D. Katabi, M. Medard, and J. Crowcroft, “XORs in the Air: Practical Wireless Network Coding,” in ACM SIGCOMM 2006, (Pisa, Italy), Sept 2006. 16, 71, 111
173

BIBL IO G R A PH Y
[45] X. Zhang and B. Li, “Joint network coding and subcarrier assignment in OFDMA-based wireless networks,” in Fourth Workshop on Network Coding, Theory and Applications, NetCod 2008, pp. 1-6, Jan 2008. 16
[46] Y. Xu, J. C. S. Lui, and D.-M. Chiu, “Analysis and scheduling of practical network coding in OFDMA relay networks,” Comput. Netw., vol. 53, no. 12, pp. 2120-2139, 2009. 16, 74
[47] J. Liu, D. Goeckel, and D. Towsley, “Bounds on the gain of network coding and broadcasting in wireless networks,” in INFOCOM 2007. 26th IEEE International Conference on Computer Communications. IEEE , pp. 724 - 732, May 2007. 17
[48] A. Keshavarz-Haddadt and R. Riedi, “Bounds on the benefit of network coding: Throughput and energy saving in wireless networks,” in INFOCOM2008. The 27th Conference on Computer Communications. IEEE , pp. 376 -384, Apr 2008. 17
[49] J. Le, J. Lui, and D. M. Chiu, “How many packets can we encode? - an analysis of practical wireless network coding,” in INFOCOM 2008. The 27th Conference on Computer Communications. IEEE , pp. 371 -375, Apr2008. 17
[50] N. Gaddam, “Network coding in wireless networks,” Master’s thesis, Electrical and Computer Engineering,Iowa State University, 2009. 17
[51] Y. Wu, S. M. Das, and R. Ch, “Routing with a markovian metric to promote local mixing,,” tech. rep., Microsoft Research, 2006. 17
[52] V.-A. Le, R.-A. Pitaval, S. Blostein, T. Riihonen, and R. Wichman, “Green cooperative communication using threshold-based relay selection protocols,” in Green Circuits and Systems (ICGCS), 2010 International Conference on, pp. 521-526, 2010. 17
[53] Z. Hasan, E. Hossain, and V. Bhargava, “Resource allocation for multiuser ofdma-based amplify-and-forward relay networks with selective relaying,”
174

BIB L IO G R A PH Y
in Communications (ICC), 2011 IEEE International Conference on, pp. 1- 6, 2011. 18
[54] I. Stanojev, 0 . Simeone, Y. Bar-Ness, and D. H. Kim, “Energy efficiency of non-collaborative and collaborative hybrid-arq protocols,” Wireless Communications, IEEE Transactions on, vol. 8, no. 1, pp. 326-335, 2009. 18
[55] E. Dahlman, A. Furuskr, Y. Jading, M. Lindstrm, and S. Parkvall, “Key features of the LTE radio interface.” Ericsson Review No. 2, 2008. 20
[56] D. H. Holma, Toskala, and D. Antti, LTE for UMTS - OFDMA and SC- FDMA Based Radio Access, wiley publishing, 2009. 20, 22, 24, 70, 72, 73, 77, 78, 152, 154
[57] I. T. Stefania Sesia, Toskala, and M. Baker, LTE The UMTS Long Term Evolution From Theory to Practice, wiley publishing, 2009. 21, 114
[58] G. Lim and L. Cimini, “Energy-efficient cooperative relaying in heterogeneous radio access networks,” Wireless Communications Letters, IEEE, vol. 1, no. 5, pp. 476-479, 2012. 25
[59] S. Dixit and E. Yanmaz, “Self-organization of relay-based next generation radio access networks (rans),” in Personal Wireless Communications, 2005. ICPW C 2005. 2005 IEEE International Conference on, pp. 197-201, 2005. 25
[60] 3GPP, “3rd generation partnership project; technical specification group radio access network; evolved universal terrestrial radio access (e-utra); further advacement for e-utra physcial layer aspects (release 9),” Technical Report 36.814 V9.0.0, 3GPP, 2010. 25, 80, 154
[61] A. Papoulis, Probability, Random Variables, and Stochastic Processes. Mc- Graw Hill, 1984. 27
[62] T. Origuchi, “Contribution to D3 (deliverable 3) network energy efficiency metrics and related requirements,” Tech. Rep. FG ICT&CC-C-78, ITU Focus Group on ICT and Climate Change, Deutsche Telekom AG, Germany, 2009. 39, 40, 54
175
BIBL IO G R A PH Y
[63] M. Etoh, T. Ohya, and Y. Nakayama, “Energy consumption issues on mobile network systems,” in Applications and the Internet, 2008. SA IN T 2008. International Symposium on, pp. 365 -368, 28 2008-Aug 2008. 39
[64] Nokia, “Integrated product policy pilot project stage 1 report,” nokia report, Nokia, 2005. 41
[65] G. P. Hammond and C. I. Jones, “Inventory of (embodied) carbon and energy (ICE),” tech. rep., University of Bath, Department of Mechanical Engineering,University of Bath, United Kingdom, 2006. 41
[66] L. Chiaraviglio, M. Mellia, and F. Neri, “Reducing power consumption in backbone networks,” in Communications, 2009. ICC ’09. IEEE International Conference on, pp. 1-6, Jun 2009. 42
[67] ATIS, “Exploratory group on green (EGG) report and recommendations,” Report Draft 5.0, ATIS, Washington, DC (USA), 2009. 43, 47
[68] P. B. Allen, “Green batteries.” University of Bedfordshire Knowledge Network presentation slides, September 2011. 44
[69] D. P. Harrop and R. Das, “Energy harvesting and storage for electronic devices 2011-2021,” report, IDTechEx, 2011. 44
[70] W. Schulz, “ETSI standards and guides for efficient powering of telecommunication and datacom,” in Telecommunications Energy Conference, 2007. INTELEC 2007. 29th International, pp. 168 -173, 30 2007-Oct 4 2007. 44
[71] ATIS, “Better determination of equipment energy consumption for improved sizing of power plant,” Standard ETSI TR 102 531 VI. 1.1, ETSI Environmental Engineering (EE) Technical Specifications, 2007. 45, 46
[72] ECR, “Network and telecom equipment - energy and performance assessment test procedure and measurement methodology,” Tech. Rep. Draft 3.0.1, ECR initiative, Deutsche Telekom AG, Germany, 2010. 48, 50, 51
176
B IBL IO G R A PH Y
[73] T. Talbot and L. C. Graff, “Verizon: Energy efficiency requirements for telecommunications equipment,” tech. rep., Network Equipment Building Systems, 2008. 50
[74] ATIS, “Energy efficiency for telecommunications equipment: Methodology for measuring and reporting general requirements,” Standard ATIS- 0600015, ATIS, 2009. 51
[75] T. Origuchi, “Deliverable 1: Definition,” Report to TSAG / Deliverables T33070000030001MSWE, International Telecommunications Union, Focus Group on ICT and Climate Change Document, 2009. 51
[76] ATIS, “Energy efficiency for telecommunications equipment: Methodology for measuring and reporting - transport requirements,” Standard ATIS- 0600015, ATIS, 2009. 52
[77] SPEC, “SPEC metric to measure the power consumption of internet servers.” Report SPECPowerssj2008, 2008. 53
[78] ATIS, “Energy efficiency for telecommunications equipment: Methodology for measuring and reporting - server requirements,” Standard ATIS- 0600015, ATIS, 2009. 53
[79] J. Baliga, K. Hinton, and R. S. Tucker, “Energy consumption of the internet,” in Conference on the Optical Internet (COIN), (Melbourne (Australia)), Jun 24-27 2007. 54
[80] ETSI, “Measurement methods and limits for energy consumption in broadband telecommunication networks equipment,” Standard Final draft ETSI ES 203 215 V I.1.1 (2010-09), ETSI, 2010. 55
[81] ETSI, “Code of conduct on energy consumption of broadband communication equipment,” Standard European Commission Directorate-General Final v2, ETSI, 2010. 55
[82] ITU, “Asymmetric digital subscriber line transceivers 2 (ADSL2),” Recommendation ITU-T Recommendation G.992.3 (2005), International Telecommunication Union, 2005. 56
177
BIBLIO G R A PH Y
[83] ITU, “Asymmetric digital subscriber line (ADSL) transceivers - extended bandwidth ADSL2 (ADSL2+),” Recommendation ITU-T Recommendation G.992.5 (2005), International Telecommunication Union, 2005. 56
[84] ETSI, “Energy efficiency of wireless access network equipment,” ETSI Environmental Engineering Standard DTS/EE-00007 V0.0.17, ATIS, 2009. 56, 57, 58, 64
[85] H. Karl, “An overview of energy efficiency techniques for mobile communication systems,” TKN Technical Reports Series TKN-03-XXX, Technical University Berlin,Telecommunication Networks Group, 2003. 57
[86] EARTH consortium, “Energy efficiency analysis of the reference systems, areas of improvements and target breakdown,” Deliverable D2.3, FP7 IP EARTH Project, 2010. 57
[87] H. Hamdoun, P. Loskot, T. O’Farrell, and J. He, “Survey and applications of standardized energy metrics to mobile networks,” Annales des Telecommunications, vol. 67, no. 3-4, pp. 113-123, 2012. 60, 65, 82
[88] M. Parker, S. Nagraj, and S. Walker, “Absolute energy efficiency metric for carbon footprint resource management and network optimisation,” in Clean Electrical Power, 2009 International Conference on, pp. I l l -116, Jun 2009. 62
[89] ETSI, “The use of alternative energy sources in telecommunications installations,” standard TR/EE-00004 (TR102532) VI. 1.1 (2009-06), ETSI Environmental Engineering (EE) Technical Specifications, 2005. 63
[90] ETSI, “Tthermal management guidance for equipment and its deployment,” standard DTR/EE-000XX (TR102489) Vl.2.1 (2010-02), ETSI Environmental Engineering (EE) Technical Specifications, 2010. 63
[91] ATIS, “Tenergy efficiency for telecommunication equipment: Methodology for measurement and reporting for router and ethernet switch products,” standard ANSI/ATIS 0600015.03.2009 (2009-07), ATIS, 2009. 64
178

BIBL IO G R A PH Y
[92] N. Soltan, “Comparison of single carrier fdma vs. ofdma as 3gpp long term evolution uplink,” 2009. h t t p : //www. S ta n fo rd . ed u /~ n so ltan i/ee3 5 9 p ro j e c t /p ro j e c t .pdf.73
[93] 3GPP, “Application of network coding in LTE-advanced relay,” Technical Specification Group Meeting 3GPP TSG RAN WG1 Meeting No 53bis R1082327, 3GPP, 2008. 74
[94] E. Damosso, “Digital mobile radio towards future generation systems: Cost 231 final report,” 2002.h t tp : / /w w w .Ix .i t .p t /c o s t2 3 1 /f in a l_ re p o r t .h tm . 76
[95] 3GPP, “3rd generation partnership project; technical specification group radio access network; evolved universal terrestrial radio access (E-UTRA); user equipment (UE) conformance specification radio transmission and reception, part 1: Conformance testing;(release 8),” Technical Specification TS 36.521-1 V8.0.1, 3GPP, 2008-12. 77, 154
[96] H. Lei and X. Li, “System level study of LTE uplink employing SC-FDMA and virtual MU-MIMO,” in Communications Technology and Applications,2009. ICCTA ’09. IEEE International Conference on, pp. 152 -156, Oct2009. 78
[97] K. Brueninghaus, D. Astely, T. Salzer, S. Visuri, A. Alexiou, S. Karger, and G.-A. Seraji, “Link performance models for system level simulations of broadband radio access systems,” in Personal, Indoor and Mobile Radio Communications, 2005. PIM RC 2005. IEEE 16th International Symposium on, vol. 4, pp. 2306 -2311 Vol. 4, Sept 2005. 81, 153
[98] C. Mehlfhrer, M. Wrulich, J. C. Ikuno, and D. Bosanska, “Simulating the long term evolution physical layer,” in 7th European Signal Processing Conference (EUSIPCO 2009, pp. 1-9, 2009. 81
[99] J. C. Ikuno, M. Wrulich, and M. Rupp, “Performance and modeling of LTE H-ARQ,” in In Proc. International ITG Workshop on Smart Antennas (WSA 2009), Berlin, Germany, 2009. 81, 153
179

B IB L IO G R A PH Y
[100] B. Sadiq, R. Madanb, and A. Sampath, “Downlink scheduling for multiclass traffic in LTE,” EURASIP J. Wirel. Commun. Netw., pp. 9-9, 2009. 81, 101
[101] H. Hamdoun, P. Loskot, T. O’Farrell, and J. He, “Practical network coding for two way relay channels in lte networks,” in VTC Spring, pp. 1-5, 2011. 82
[102] S. W. Peters, A. Y. Panah, I<. T. Truong, and R. W. Heath, “Relay architectures for 3GPP LTE-advanced,” EURASIP Journal on Wireless Communications and Networking, p. 14, 2009. 95
[103] M. Meyer, H. Wiemann, M. Sagfors, J. Torsner, and J.-F. Cheng, “Arq concept for the umts long-term evolution,” in Vehicular Technology Conference, 2006. VTC-2006 Fall. 2006 IEEE 6 4 th, pp. 1-5, 2006. 110
[104] B. Scheuermann, W. Hu, and J. Crowcroft, “Near-optimal co-ordinated coding in wireless multihop networks,” in Proceedings of the 2007 ACM CoNEXT conference, CoNEXT ’07, (New York, NY, USA), pp. 9:1-9:12, ACM, 2007. I l l
[105] P. Chaporkar and A. Proutiere, “Adaptive network coding and scheduling for maximizing throughput in wireless networks,” in Proceedings of the 13th annual ACM international conference on Mobile computing and networking, MobiCom ’07, (New York, NY, USA), pp. 135-146, ACM, 2007. I l l
[106] O. Teyeb, F. Frederiksen, V. V. Phan, B. Raaf, and S. Redana, “User multiplexing in relay enhanced LTE-advanced networks,” in Vehicular Technology Conference (VTC 2010-Spring), 2010 IEEE 71st, pp. 1 -5, May 2010. 113
[107] e. a. Weisi Guo, “Towards a low energy lte cellular network:architectures,” European Signal Processing Conference (EUSIPCO 2011), pp. 879-883, 2011. 116
[108] T. Edler and S. Flectcher, “Reference schematics for ran and rbs architecture,” Technical Report GRR00320, Vodaphone, UK, 2011. 117
180

B IB L IO G R A PH Y
[109] A. J. Fehske, F. Richter, and G. P. Fettweis, “Energy efficiency improvements through micro sites in cellular mobile radio networks,” IEEE Conf. on Global Comm. (Globecom), 2009. 117, 153
[110] F. Richter, G. Fettweis, M. Gruber, and O. Blume, “Micro base stations in load constrained cellular mobile radio networks,” in Personal, Indoor and Mobile Radio Communications Workshops (PIMRC Workshops), 2010 IEEE 21st International Symposium on, pp. 357 -362, Sept 2010. 117
[111] M. Luby, “LT codes,” in Proc. Symp. FOCS, pp. 271-282, 2002. 136, 141, 155
[112] D. MacKay, “Fountain codes,” IEE Proc. Comms., vol. 152, pp. 1062-1068, Dec. 2005. 136
[113] 3GPP, “Technical specification group services and system aspects: Multi- media broadcast/multicast service (MBMS); protocols and codecs (release 10),” Tech. Spec. 26.346 V10.2.0, 3GPP, 2011. 136, 141
[114] ETSI, “Digital video broadcasting (DVB): Transmission system for handheld terminals (DVB-H system),” Tech. Spec. EN 302 304 VI. 1.1, ETSI, 2004. 136
[115] R. Palanki and J. S. Yedidia, “Rateless codes on noisy channels,” in Proc. ISIT, p. 37, 2004. 136
[116] X. Liu and T. J. Lim, “Fountain codes over fading relay channels,” IEEE TRANSACTIONS ON WIRELESS COMMUNICATIONS, vol. 8, pp. 3278-3287, June 2009. 136
[117] A. Apavatjrut, C. Goursaud, K. J. ands Runser, C. Comaniciu, and J. Gorce, “Toward increasing packet diversity for relaying LT fountain codes in wireless sensor networks,” IEEE Comm. Letters, vol. 15, pp. 52-54, Jan. 2011. 136, 138
[118] J. Castura and Y. Mao, “Rateless coding for wireless relay channels,” IEEE TRANSACTIONS ON WIRELESS COMMUNICATIONS, vol. 6, pp. 1638-1642, May 2007. 136
181

BIBL IO G R A PH Y
[119] H. Zhu, C. Zhang, and J. Lu, “Designing fountain codes with short codelength,” in Proc. IW SD A , pp. 65-68, Sept 2007. 137, 139
[120] I. Stanojev, O. Simeone, Y. Bar-Ness, and K. Dong-Ho, “On the energy efficiency of hybrid-ARQ protocols in fading channels,” in Proc. ICC , pp. 3173— 3177, June 2007. 138
[121] T. Ji and W. E. Stark, “Turbo-coded arq schemes for ds-cdma data networks over fading and shadowing channels,” in Proc. MILCOM , vol. 1, pp. 76-80, 1999. 138
[122] J. Jin, B. Li, and T. Kong, “Is random network coding helpful in WiMAX?,” in Proc. INFOCOM , pp. 2162-2170, 2008. 138
[123] D. S. Lun, M. Medard, R. Koetter, and M. Effros, “On coding for reliable communication over packet networks,” in Proc. Allerton Conf. Comm., Control, and Comp., 2004. 138
[124] A. F. Molisch, N. B. Mehta, J. S. Yedidia, and J. Zhang, “Performance of fountain codes in collaborative relay networks,” IEEE TRANSACTIONS ON W IRELESS COMMUNICATIONS, vol. 6, pp. 4108-4119, Nov. 2007. 138
[125] P. Casari, M. Rossi, and M. Zorzi, “Towards optimal broadcasting policies for HARQ based on fountain codes in underwater networks,” in Proc. WONS, pp. 11-19, Jan. 2008. 138
[126] M. Goldoni, M. Lanati, P. Savazzi, and L. Favalli, “Hybrid ARQ based on rateless coding for wireless mesh networks,” in Annual meeting of G TTI,2009. 138
[127] H. Shojania and B. Li, “Parallelized progressive network coding with hardware acceleration,” in Quality of Service, 2007 Fifteenth IEEE International Workshop on, pp. 47 -55, Jun 2007. 145
[128] H. Shojania and B. Li, “Random network coding on the iphone: Fact or fiction?.” ACM NOSSDAV 2009, Williamsburg, USA, Jun 2009. 145
182

BIBL IO G R A PH Y
[129] J. Heide, M. Pedersen, F. Fitzek, and T. Larsen, “Network coding for mobile devices - systematic binary random rateless codes,” in Communications Workshops, 2009. ICC Workshops 2009. IEEE International Conference on, pp. 1 -6, Jun 2009. 145
[130] P. Vingelmann, F. Fitzek, M. Pedersen, J. Heide, and H. Charaf, “Synchronized multimedia streaming on the iphone platform with network coding,” Communications Magazine, IEEE , vol. 49, pp. 126 -132, Jun 2011. 145
[131] Z. Hasan, H. Boostanimehr, and V. K. Bhargava, “Green cellular networks: A survey, some research issues and challenges,” CoRR , vol. abs/1108.5493,2011. 167
[132] H. Guo, Y. Qian, K. Lu, and N. Moayeri, “The benefits of network coding over a wireless backbone,” in Proceedings of the 28th IEEE conference on Global telecommunications, GLOBECOM’09, (Piscataway, NJ, USA), pp. 3002-3007, IEEE Press, 2009. 168
183