Promiscuity of enhancer, coding and non-coding transcription functions in ultraconserved elements
12
RESEARCH ARTICLE Open Access Promiscuity of enhancer, coding and non-coding transcription functions in ultraconserved elements Danilo Licastro 1† , Vincenzo A Gennarino 2† , Francesca Petrera 1 , Remo Sanges 1 , Sandro Banfi 2* , Elia Stupka 3,4* Abstract Background: Ultraconserved elements (UCEs) are highly constrained elements of mammalian genomes, whose functional role has not been completely elucidated yet. Previous studies have shown that some of them act as enhancers in mouse, while some others are expressed in both normal and cancer-derived human tissues. Only one UCE element so far was shown to present these two functions concomitantly, as had been observed in other isolated instances of single, non ultraconserved enhancer elements. Results: We used a custom microarray to assess the levels of UCE transcription during mouse development and integrated these data with published microarray and next-generation sequencing datasets as well as with newly produced PCR validation experiments. We show that a large fraction of non-exonic UCEs is transcribed across all developmental stages examined from only one DNA strand. Although the nature of these transcripts remains a mistery, our meta-analysis of RNA-Seq datasets indicates that they are unlikely to be short RNAs and that some of them might encode nuclear transcripts. In the majority of cases this function overlaps with the already established enhancer function of these elements during mouse development. Utilizing several next-generation sequencing datasets, we were further able to show that the level of expression observed in non-exonic UCEs is significantly higher than in random regions of the genome and that this is also seen in other regions which act as enhancers. Conclusion: Our data shows that the concurrent presence of enhancer and transcript function in non-exonic UCE elements is more widespread than previously shown. Moreover through our own experiments as well as the use of next-generation sequencing datasets, we were able to show that the RNAs encoded by non-exonic UCEs are likely to be long RNAs transcribed from only one DNA strand. Background Ultraconserved elements (UCE) have been defined as segments spanning at least 200 base pairs and showing 100% identity between the human, mouse and rat gen- omes. Further analysis of the distribution of UCEs demonstrates that they tend to be organized in clusters, in regions that are enriched for transcription factors and developmental genes [1]. They have been suggested to be important for functions involving DNA binding, RNA processing and the regulation of transcription and development [2-4], as well as being depleted in regions containing copy number variants [5]. However, our knowledge on these elements is still limited. The mechanisms responsible for maintaining these sequences through evolution are unclear but seem likely to include profound negative selection, suggesting that these seg- ments have important, if not vital, functions [6,7]. Recent studies provide conflicting evidence on their functional role: although it has been shown that many of these elements act as long-range enhancers during mouse development [8], this function is not found for all elements tested and it has been shown that similar proportions of functional enhancers can be found in less constrained sequences [9]. Moreover, deletion of some of these regions in knock-out mice was not associated to any notable phenotype abnormality [10]. These results provided grounds to speculate that UCEs might * Correspondence: [email protected]; [email protected] † Contributed equally 2 Telethon Institute of Genetics and Medicine (TIGEM), via Pietro Castellino 111, 80131, Napoli, Italy 3 UCL Cancer Institute, University College London, London, WC1E 6BT, UK Licastro et al. BMC Genomics 2010, 11:151 http://www.biomedcentral.com/1471-2164/11/151 © 2010 Licastro et al; licensee BioMed Central Ltd. This is an Open Access article distributed under the terms of the Creative Commons Attribution License (http://creativecommons.org/licenses/by/2.0), which permits unrestricted use, distribution, and reproduction in any medium, provided the original work is properly cited.
-
Upload
independent -
Category
Documents
-
view
0 -
download
0
Transcript of Promiscuity of enhancer, coding and non-coding transcription functions in ultraconserved elements

RESEARCH ARTICLE Open Access
Promiscuity of enhancer, coding and non-codingtranscription functions in ultraconservedelementsDanilo Licastro1†, Vincenzo A Gennarino2†, Francesca Petrera1, Remo Sanges1, Sandro Banfi2*, Elia Stupka3,4*
Abstract
Background: Ultraconserved elements (UCEs) are highly constrained elements of mammalian genomes, whosefunctional role has not been completely elucidated yet. Previous studies have shown that some of them act asenhancers in mouse, while some others are expressed in both normal and cancer-derived human tissues. Only oneUCE element so far was shown to present these two functions concomitantly, as had been observed in otherisolated instances of single, non ultraconserved enhancer elements.
Results: We used a custom microarray to assess the levels of UCE transcription during mouse development andintegrated these data with published microarray and next-generation sequencing datasets as well as with newlyproduced PCR validation experiments. We show that a large fraction of non-exonic UCEs is transcribed across alldevelopmental stages examined from only one DNA strand. Although the nature of these transcripts remains amistery, our meta-analysis of RNA-Seq datasets indicates that they are unlikely to be short RNAs and that some ofthem might encode nuclear transcripts. In the majority of cases this function overlaps with the already establishedenhancer function of these elements during mouse development. Utilizing several next-generation sequencingdatasets, we were further able to show that the level of expression observed in non-exonic UCEs is significantlyhigher than in random regions of the genome and that this is also seen in other regions which act as enhancers.
Conclusion: Our data shows that the concurrent presence of enhancer and transcript function in non-exonic UCEelements is more widespread than previously shown. Moreover through our own experiments as well as the use ofnext-generation sequencing datasets, we were able to show that the RNAs encoded by non-exonic UCEs are likelyto be long RNAs transcribed from only one DNA strand.
BackgroundUltraconserved elements (UCE) have been defined assegments spanning at least 200 base pairs and showing100% identity between the human, mouse and rat gen-omes. Further analysis of the distribution of UCEsdemonstrates that they tend to be organized in clusters,in regions that are enriched for transcription factors anddevelopmental genes [1]. They have been suggested tobe important for functions involving DNA binding,RNA processing and the regulation of transcription anddevelopment [2-4], as well as being depleted in regions
containing copy number variants [5]. However, ourknowledge on these elements is still limited. Themechanisms responsible for maintaining these sequencesthrough evolution are unclear but seem likely to includeprofound negative selection, suggesting that these seg-ments have important, if not vital, functions [6,7].Recent studies provide conflicting evidence on their
functional role: although it has been shown that manyof these elements act as long-range enhancers duringmouse development [8], this function is not found forall elements tested and it has been shown that similarproportions of functional enhancers can be found in lessconstrained sequences [9]. Moreover, deletion of someof these regions in knock-out mice was not associatedto any notable phenotype abnormality [10]. Theseresults provided grounds to speculate that UCEs might
* Correspondence: [email protected]; [email protected]† Contributed equally2Telethon Institute of Genetics and Medicine (TIGEM), via Pietro Castellino111, 80131, Napoli, Italy3UCL Cancer Institute, University College London, London, WC1E 6BT, UK
Licastro et al. BMC Genomics 2010, 11:151http://www.biomedcentral.com/1471-2164/11/151
© 2010 Licastro et al; licensee BioMed Central Ltd. This is an Open Access article distributed under the terms of the Creative CommonsAttribution License (http://creativecommons.org/licenses/by/2.0), which permits unrestricted use, distribution, and reproduction inany medium, provided the original work is properly cited.

be simply due to “mutational cold spots”, yet it has beenshown that these regions are ultraselected [6]. Finally ithas also been shown that a larger number of regions inthe genome, although shorter, are under similar evolu-tionary constraints [11].Recently it has also been shown that some UCEs are
expressed and their expression is altered in humantumors, suggesting that these elements may also beinvolved in cancer development [12]. The transcription ofnon-coding RNAs from genomic regions acting as enhan-cers has already been shown to occur in elements with sig-nificant sequence conservation, although little is knownabout the mechanism involved. Indeed the functions ofpromoter, enhancer and non-coding RNA have beenfound to overlap in the same DNA fragments with 85-90%mammalian conservation [13] as well as in one UCE [14].Despite these many findings, the level of constraint
observed in UCEs remains as yet unexplained. Wedecided to further investigate the extent of transcriptionof UCEs by using an ad-hoc developed microarray aswell as several next-generation sequencing datasets. Byhybridizing the microarray with total RNA from differ-ent mouse embryonic stages and from mouse embryonicstem (ES) cells, and comparing this data with existingnext generation sequence (NGS) data, we were able toshow that the majority of UCEs which have been shownto act as enhancers during mouse development are alsotranscribed and investigated salient properties of thesetranscripts.
Results and DiscussionThe majority of UCEs are transcribed during mousedevelopment on a single strandWe decided to systematically ascertain to what extentUCEs are expressed and whether the correspondingtranscripts can be distinguished from general “transcrip-tional noise” in the genome. We therefore designed acustom microarray (CustomarrayTM 12K arrays fromCombimatrix, Mukilteo, WA) encompassing 3 differentprobes on each DNA strand of UCEs (of the currentlyannotated 481 UCEs, probes could be designed for 475),as well as a large number of negative controls (exogen-ous sequences from bacteria and plants, negativecontrols used in the Affymetrix platform, rRNAssequences), which were used to assess the levels of back-ground signal. The sequences of all UCE probes weremanually verified to be unique in the genome. Thisallowed us to assess reliably the levels of expressionfrom both strands of UCE genomic regions duringmouse development. In order to define a UCE probe asbeing expressed, we took into account only probesshowing signal intensity above the 90th percentile of thesignal distribution in at least two of the three indepen-dent hybridizations carried out.
The analysis of the microarray data shows that, ateach developmental stage, 30 to 40% of the UCEs ana-lyzed are transcribed. However, more than half (56%) ofthe transcribed UCEs are expressed in at least one ofthe tested stages (see Figure 1), and 28% of those arefound within an exonic location (i.e. overlap the exon ofanother gene). In total ~50% of transcribed UCEs fallunder the exonic category if those considered “possiblyexonic” are included (i.e. UCEs overlapping ESTs,mRNAs and gene predictions). Although we havedesigned probes on both DNA strands of each UCE,only 4% of them display signal on both strands, indicat-ing that most UCEs are parts of transcripts transcribedfrom only one strand (see Figure 1A). Of these, themajority (59%) is transcribed in all stages tested as wellas in ES cells (see Figure 1B). Moreover, when attempt-ing to identify UCEs with a possible differential expres-sion across development, we did not find any UCEshowing statistically significant differences in expressionbetween stages (using a corrected p-value cut-off of0.05). On the contrary, 83% (117/140) of the UCEs tran-scribed in all stages shows a significantly stable signalacross the developmental stages tested.It should be noted that our experiment can only
account for differences across distinct stages of develop-ment, while previous experiments accounted only fordifferences across tissues but not across developmentalstages [12]. Thus, if UCEs are regulating transcription ina tissue-specific manner these would not be detected inour study. This data suggests that transcription is a con-stitutive function in a large fraction of UCEs duringdevelopment. The only broad difference that was notice-able was the generally lower expression levels in ES cellsas compared to other stages, but this was expected sincelow levels of expression of a broad range of transcriptsare known to occur in ES cells.
RT-PCR validation indicates more widespreadtranscriptionWe proceeded to validate the microarray results by car-rying out Reverse Transcriptase (RT)-PCR experimentson 31 randomly selected UCEs on total RNA extractedfrom E14.5 mouse embryos, using 3 independent RNApreparations [Additional file 1]. The RT-PCR analysiswas considered positive for expression only for UCEsyielding a specific PCR product validated by sequenceanalysis in 3 replicates. We used PCRs without reversetranscriptase as a control to ensure that we were detect-ing a transcribed product rather than a genomic DNAfragment. We observed concordance between the E14.5microarray data and the RT-PCR results from the samestage in 18/31 UCEs analyzed (12 of which wereexpressed and 6 of which were not expressed). Amongthe remaining 13 cases, there are 7 UCEs which were
Licastro et al. BMC Genomics 2010, 11:151http://www.biomedcentral.com/1471-2164/11/151
Page 2 of 12

found to be positive only by RT-PCR and no other data-set (i.e. none of the microarray stages, nor in the RNA-Seq data discussed later, except for 2 which are foundto be positive in the human microarray dataset), 1which is found to be negative only by RT-PCR, but con-firmed by all other methods, 3 which are not confirmedby the microarray data, but are confirmed by the RNA-Seq data, and 2 which are confirmed by the ES microar-ray data [Additional file 1, Additional file 2: Supplemen-tal Table S1]. The discordance observed is likely due toseveral factors. Above all, owing to the fact that the nat-ure and length of UCE transcripts is not yet elucidated,both assays are quite limited. PCRs were conductedwith only two pairs of primers per UCE and each UCEwas represented with 3 probes per strand. Thus it islikely that testing UCEs with further microarray probesand with further PCR primers would yield differentresults and greater concordance. Moreover the stringentcriteria applied to our microarray analysis is likely todetect a lower number of positives than PCR which isknown to be more sensitive. The overall results indicatethat our microarray results are likely to under-estimatethe number of UCEs that are actually expressed. TheRT-PCR validation data would therefore indicate thatthe number of UCEs transcribed at E14.5 is in the rangebetween approximately 38% (+- 15%, C.I. 95%, as indi-cated by the microarray data) and 70% (+- 15%, C.I.
95%, which could be extrapolated from the PCRvalidation).We wanted to investigate further the potential nature
of the transcripts encoded by UCEs and thus performedfurther RT-PCR analysis for five expressed UCEs (fourintergenic and one exonic, UC 475, used as a control)on RNA extracted from either the nucleus or the cyto-plasm of mouse ES cells [Additional file 3]. The resultsindicate that only the control exonic UCE can bedetected in the cytoplasmic fraction of RNA, asexpected, while the other UCEs tested (intergenic) werefound only in the nuclear fraction of ES RNA. Furtherinvestigation will be required to ascertain fully the nat-ure of these transcripts, however this data suggests thatsome intergenic UCEs may act as nuclear transcripts,thus suggesting the possibility that some UCEs mightencode ncRNAs. ncRNAs are known to have an extre-mely wide variety of functions (reviewed in [15]), how-ever given the function of UCEs as enhancers it istempting to speculate that some of them might act in amanner similar to previously studied highly conservedelements which act as both enhancers as well asncRNAs [13,14].
UCE transcription and enhancer function overlapSince we performed our expression analysis duringmouse embryonic development, we were able to
Figure 1 Custom microarrays analysis. A) Bar plot of UCEs expressed across 4 mouse developmental stages tested (ES, E12.5, E14.5 and E16.5)based on the analysis of our UCE custom microarray. Blue bars indicate UCEs which show expression on a single strand, green columns indicateUCEs which show expression on both strands B) Venn diagram of UCE transcription results showing the overlap across the 4 stages analyzed.More than half (n = 140, 56%) of the transcribed UCEs are expressed in all the stages analyzed.
Licastro et al. BMC Genomics 2010, 11:151http://www.biomedcentral.com/1471-2164/11/151
Page 3 of 12

compare our data with previously published data on thefunction of UCEs as long-range enhancers in mouseembryonic stages [8]. A total of 256 UCEs which werenot part of annotated transcripts (intergenic UCEs) weretested for enhancer function and are also present in ourmicroarray design. On this subset of UCEs we wereable, therefore, to compare expression and enhanceractivity. This comparison showed that 20% of all UCEstested are transcribed at some developmental stage andact as enhancers during mouse embryonic development,indicating that the two functions can coexist within thesame DNA sequence, despite the fact that these regionsare intergenic. In the closest embryonic stage analyzed(E12.5) 14% of the tested UCEs still present both enhan-cer and transcription function (i.e. 27% of those actingas enhancers), indicating that the two functions also canoverlap temporally. Some UCEs still present only one ofthe two functions, i.e. 13% are transcribed but withoutenhancer activity and 37% behave as enhancers butshow no transcription (see Figure 2).It must be taken into account that the enhancer data-
set of UCEs was identified based on experiments carriedout at a single developmental stage (E11.5). Therefore,we cannot exclude that the extent of the overlap will begreater when considering enhancer function in otherdevelopmental stages. Moreover, due to the differentapproaches utilized (temporal for our data and spatialfor the enhancer dataset [8]) we cannot comparedirectly expression levels and enhancer function in thesame tissue at the same developmental stage. Therefore,we cannot exclude that the enhancer and transcriptfunction might overlap temporally (i.e. same develop-mental stage) but not spatially (i.e. different tissue) andequally we cannot exclude that a broader overlap couldbe detected if expression assays had been performed onspecific E11.5 tissues in which enhancer function hasbeen observed. A further bias can arise from the con-struct used for the enhancer assays: since some of themcontain two UCE elements within a single construct, itis not always possible to clearly distinguish the contribu-tion of each specific UCE element to the enhancer assayresults.Previous studies have shown that a single ultracon-
served element, contained between the Dlx5 and Dlx6genes, could act at both DNA and RNA level, and thatthe ncRNA encoded within them had an effect on thecoding transcripts within the locus [14]. Our findingswould suggest that the results obtained have a muchwider impact than just a few selected elements, since weshow that transcription from ultraconserved elementsaffects more than half of the ultraconserved elements,and also that the enhancer function attributed to someUCEs overlaps in the majority of cases with that ofRNA transcript.
Analysis of the genomic context of UCE elementsGiven that UCEs are known to be present in bothregions overlapping exons as well as intergenic or intro-nic regions, we proceeded to verify to what extent thetranscription and enhancer functions observed correlatewith the genomic context in which they are found. Wetherefore divided UCEs in the following subgroups: 1)those previously shown to act as enhancers [8] ("MouseEnhancer” dataset), 2) those shown to be transcribed inour microarray study ("Mouse Transcribed” dataset),and 3) those displaying both of the above features("Mouse Enhancer and Transcribed”). We then com-pared these datasets with the genomic context of UCEsas previously defined [1]: a) exonic, for UCEs foundwithin exons of known genes (often referred to also asgenic); b) possibly exonic, for UCEs found within por-tions of the genome for which gene predictions and/orEST evidence indicate the possible correspondence withan exon; c) intronic, for those found within introns andnot classified as possibly exonic, and d) non-genic forthe remaining UCEs (see Figure 3). Most categories didnot show statistically significant enrichment, except forexonic UCEs which are slightly enriched within thetranscribed set of UCEs as expected (adjusted p-value0.0460), and significantly impoverished within the set ofUCEs acting as both transcripts and enhancers as wellas among those acting as enhancers only (adjustedp-values 0.0137 and 0.0005 respectively). This suggeststhat UCEs acting as enhancers are more rarely foundwithin exons of known genes (mostly coding genes).Transcribed UCEs, on the other hand, although slightlyenriched, as expected, within exons, are present in allUCEs, irrespective of their genomic context: in fact, thelargest number of transcribed UCEs in absolute terms iswithin introns. Taken together these findings suggestthat the enhancer function of UCEs negatively correlateswith their localization within the exons of protein cod-ing genes despite showing transcription in a significantpercentage of cases, indicating that transcripts coveringUCEs are very likely to perform different function fromtraditional coding genes.Next, we investigated whether transcribed UCEs are
preferentially clustered together arguing for a gene-likestructure. In order to assess this we verified the distancebetween all UCEs and compared transcribed UCEs tonon-transcribed UCEs. The results indicate quite thecontrary: transcribed UCEs are more distant from eachother than non-transcribed UCEs at all developmentalstages analyzed [Additional file 4]. While it is knownthat some of the UCEs acting as enhancers are quiteclose to each other, this result indicates that transcribedUCEs are less likely than non-transcribed UCEs torequire proximity to other UCEs for their function.Given the average distances observed among transcribed
Licastro et al. BMC Genomics 2010, 11:151http://www.biomedcentral.com/1471-2164/11/151
Page 4 of 12

Figure 2 UCEs transcription and enhancer function overlap. Overlap between the enhancer dataset (Pennacchio et al, 2006) and the mousemicroarray dataset in all samples analyzed, divided by stage. The yellow portion of each bar indicates UCEs that are only transcribed, the greenportion UCEs that are transcribed and act as enhancers, the blue portion UCEs that are only transcribed.
Licastro et al. BMC Genomics 2010, 11:151http://www.biomedcentral.com/1471-2164/11/151
Page 5 of 12
UCEs (~10 Mbs) they are unlikely to funcion as exonsof a gene. We note a bimodal distribution among non-transcribed UCEs with one peak in the 100 kb range,quite distinct from that of transcribed UCEs, and a sec-ond peak which aligns well with the distribution of dis-tances among transcribed UCEs. If distances arerelevant to the function of UCEs, it would be interestingto verify further whether more distant UCEs which donot appear to be transcribed in our study are perhapstranscribed in other tissues/stages or using other valida-tion means.Utilizing the genomic context of each UCE element,
we also verified whether UCEs, classified according toour expression data and published enhancer data, arefound within genes enriched for specific gene ontology(GO) terms. We therefore focused this analysis only on
UCEs that have been tested both for enhancer functionand for expression during mouse development. The ana-lysis shows that UCEs which act as enhancers (regard-less of whether or not they are significantly expressed)are slightly enriched for genes involved in protein bind-ing (p-value 0,02 without multiple test correction).Expressed UCEs, on the other hand, are slightlyenriched for GO terms, related to development and reg-ulation of biological processes. We also verified the GOanalysis on all UCEs (not only those tested in both stu-dies). This further analysis confirmed the GO terms thathad been obtained on the smaller dataset and indicatedseveral additional potential enrichments of UCEs,including an interesting enrichment for UCEs whichhave only evidence for transcription (and not of enhan-cer function) to be contained in genes involved in RNA
Figure 3 Analysis of UCEs genomic context. Classification of UCEs based on genomic context (exonic = overlapping exons of known genes,possibly exonic = overlapping gene predictions, intronic = overlapping introns of known genes, non-exonic = not overlapping any of theabove) in comparison with their enhancer function as described by Pennacchio et al, 2006 and transcription function investigated in this study.
Licastro et al. BMC Genomics 2010, 11:151http://www.biomedcentral.com/1471-2164/11/151
Page 6 of 12
Processing and RNA binding [Additional file 2: Supple-mental Table S3 and S4]. Interestingly a similar enrich-ment for RNA-related functions has recently beenreported for UCEs which preserve completely identicalsequence across primates and rodents [11]. Given thesmall size of this dataset, however, it is not possible todraw strong conclusions, and no significant enrichmentis found when using multiple testing correction. It couldbe interesting in the future study to assess transcrip-tional levels of a larger set of highly conserved elementssimilar to UCEs [11] and verify whether this GO classifi-cation is confirmed.
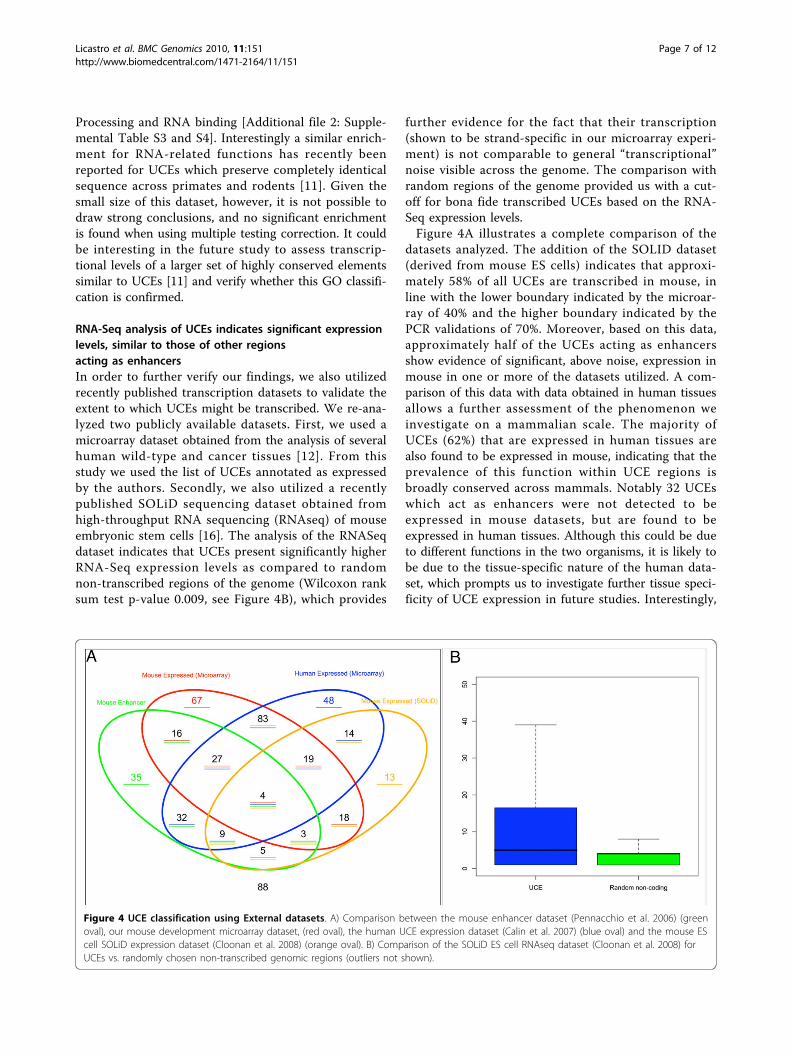
RNA-Seq analysis of UCEs indicates significant expressionlevels, similar to those of other regionsacting as enhancersIn order to further verify our findings, we also utilizedrecently published transcription datasets to validate theextent to which UCEs might be transcribed. We re-ana-lyzed two publicly available datasets. First, we used amicroarray dataset obtained from the analysis of severalhuman wild-type and cancer tissues [12]. From thisstudy we used the list of UCEs annotated as expressedby the authors. Secondly, we also utilized a recentlypublished SOLiD sequencing dataset obtained fromhigh-throughput RNA sequencing (RNAseq) of mouseembryonic stem cells [16]. The analysis of the RNASeqdataset indicates that UCEs present significantly higherRNA-Seq expression levels as compared to randomnon-transcribed regions of the genome (Wilcoxon ranksum test p-value 0.009, see Figure 4B), which provides
further evidence for the fact that their transcription(shown to be strand-specific in our microarray experi-ment) is not comparable to general “transcriptional”noise visible across the genome. The comparison withrandom regions of the genome provided us with a cut-off for bona fide transcribed UCEs based on the RNA-Seq expression levels.Figure 4A illustrates a complete comparison of the
datasets analyzed. The addition of the SOLID dataset(derived from mouse ES cells) indicates that approxi-mately 58% of all UCEs are transcribed in mouse, inline with the lower boundary indicated by the microar-ray of 40% and the higher boundary indicated by thePCR validations of 70%. Moreover, based on this data,approximately half of the UCEs acting as enhancersshow evidence of significant, above noise, expression inmouse in one or more of the datasets utilized. A com-parison of this data with data obtained in human tissuesallows a further assessment of the phenomenon weinvestigate on a mammalian scale. The majority ofUCEs (62%) that are expressed in human tissues arealso found to be expressed in mouse, indicating that theprevalence of this function within UCE regions isbroadly conserved across mammals. Notably 32 UCEswhich act as enhancers were not detected to beexpressed in mouse datasets, but are found to beexpressed in human tissues. Although this could be dueto different functions in the two organisms, it is likely tobe due to the tissue-specific nature of the human data-set, which prompts us to investigate further tissue speci-ficity of UCE expression in future studies. Interestingly,
Figure 4 UCE classification using External datasets. A) Comparison between the mouse enhancer dataset (Pennacchio et al. 2006) (greenoval), our mouse development microarray dataset, (red oval), the human UCE expression dataset (Calin et al. 2007) (blue oval) and the mouse EScell SOLiD expression dataset (Cloonan et al. 2008) (orange oval). B) Comparison of the SOLiD ES cell RNAseq dataset (Cloonan et al. 2008) forUCEs vs. randomly chosen non-transcribed genomic regions (outliers not shown).
Licastro et al. BMC Genomics 2010, 11:151http://www.biomedcentral.com/1471-2164/11/151
Page 7 of 12

on the other hand, the proportion of UCEs acting asenhancers which overlaps with the human dataset isconsiderably lower (~30%), indicating that our focus onmouse development has enabled to identify UCE regionswhich exhibit both enhancer and transcript functionmore effectively. Only 88 UCEs remain elusive withregards to their potential function after this analysis.Supplementary Table s2 [Additional file 2] summarizesthe experimental results obtained for every UCE ele-ment using our microarray dataset, previous enhancerscreens as well as previous human expression data.We also verified if we could obtain UCE expression
information from a recently published small RNAsequencing dataset obtained from human embryonicstem cells. This experiment utilizes a protocol that fil-ters RNAs based on their length, selecting for tran-scripts between 18 and 32 nt long [17]. In this dataset,however, we did not observe significant small RNA-Seqexpression levels within UCEs, indicating that they arenot likely to transcribe small RNAs (data not shown).Further evidence reinforcing this notion is that RNAseqsequences which map to UCEs (filtered for significantexpression levels) always cover 100% of the UCE region.Taken together, these observations suggest that themajority of UCEs are not part of short transcripts.In order to shed further light on the transcription
encoded within UCEs we utilized two recently devel-oped datasets: a recent study in which a genome-wideidentification of mouse brain enhancers was performedusing p300 ChipSeq [18] as well as a recent study inwhich RNASeq was performed on several mouse tissuesincluding brain [19]. Using these two datasets, we wereable to compare RNASeq- based expression levels in thebrain between random regions of the genome, UCEs,p300-bound region likely to encode enhancers, brainenhancers tested in vivo, and coding exons using aZ-score test (see Figure 5). The analysis revealed thatUCEs present levels of expression that are very similarto those of in vivo tested enhancers (p-value 0.7), resem-ble p300-bound regions (p-value 0.012), while they arehigher and significantly different from those of randomnon coding regions of the genome (p-value 1.179978e-25) and lower than and significantly different from thoseof coding exons (p-value 5.29889e-14).This data would confirm that the majority of UCEs in
which we can detect expression are likely to encodetranscripts that are transcribed at significant and, com-parable levels with respect to those of other enhancerregions, but lower to those of coding exons. It should benoted, however, that given that our data indicates thatUCEs could also encode nuclear transcripts, RNASeqresults will be heavily influenced by the RNASeq proto-col used and the resulting proportion of nuclear tran-scripts within the RNA sample sequenced. Given that
the data utilized was made using a Poly(A)+ enrichmentstep, it is likely that the real levels of expression of thenuclear transcripts encoded by UCEs are under-estimated.In order to further investigate the nature of the tran-
scripts derived from transcribed UCEs we verified theRNA-Seq expression levels of ES cells in the regionsproximal to these elements (500 bp upstream and down-stream of each UCE). Our analysis indicates that themajority (60%) of UCEs that were found to be expressedin ES cells using the RNA-Seq data also present signifi-cant expression levels in the surrounding regions. Halfof the UCEs expressed in ES cells present significantlevels of transcription on both sides of the element (70%intronic), while 10% present transcription on one sideonly (80% intronic). The remaining 40% (90% intronic)do not present transcription in nearby regions. In con-trast, only 3% of the UCEs found not to be transcribedin ES cells using RNA-Seq presented transcription inthe proximal 500 bp regions, of which only 2 UCEs(0.5%) appear to be transcribed both upstream anddownstream. Interestingly most of the latter (85%) wereexonic, indicating ultra-conserved exons which might beexpressed in other stages/tissues, but whose surroundingregions are expressed in ES cells. This result indicatesthat in the majority of cases the UCE expression investi-gated in this study might be representative of longer,underlying transcripts which span across and beyondthe UCE region. We also inspected the microarrayresults (since we had designed probes in the surround-ing regions) and obtained similar results, i.e. 44% ofUCEs found to be transcribed in ES cells presentexpression in the surrounding regions (56% of UCEs inE12, 42% in E14 and 39% in E16).Although our data clearly indicates that transcription
is an important function of UCE elements, and that thisfunction clearly overlaps with that of enhancer, itremains to be understood to what extent this explainsthe high evolutionary constrained found in thesesequences. The fact that p300-bound regions and invivo tested enhancers exhibit similar levels of transcrip-tion to UCEs would suggest that the co-occurrence ofthe two functions alone does not explain the constraint.On the other hand, much more in depth investigationof nuclear, tissue-specific transcription should be ana-lyzed before drawing conclusions with regards to theirsimilarity to less constrained enhancers.It was shown recently that there is a much larger
number or regions that are likely to be under similarevolutionary constraint to UCEs, despite their shortersize [11]. Only an in depth analysis of transcriptionallevels of a large set of enhancers and conserved regions(highly conserved as well as ultraconserved) performedon nuclear and cytoplasmic RNA is likely to provide
Licastro et al. BMC Genomics 2010, 11:151http://www.biomedcentral.com/1471-2164/11/151
Page 8 of 12

further clues with regards to the role of transcription inUCEs.
ConclusionIn conclusion, we report that the majority of UCEs areexpressed throughout mouse development in single-stranded transcripts. Based on our preliminary charac-terization of these transcripts the RNAs encoded withinUCEs are unlikely to be short RNAs and some of themmight encode nuclear RNAs. A significant fraction ofUCEs appears to act as both enhancers and RNAs dur-ing mouse development and RNASeq data indicates thatthe levels of transcription found in UCEs are likely to besimilar to other enhancer regions in the mouse genome.This data provides further evidence and clues withregards to their functional complexity, and reinforcesthe possibility that the elevated constraint on theirsequence might arise from multiple concurrentfunctions.
MethodsRNA ExtractionRNA extraction was performed on mouse embryonicstem (ES) cells, E12.5, E14.5 and E16.5 C57/Bl6 mouseembryos. Mouse embryos were dissected from pregnantfemales at stages E12.5, E14.5 and E16.5. The dissectedembryos were immediately frozen in dry ice and thenRNA was isolated using Trizol (Invitrogen) and purifiedusing the RNeasy mini kit (Qiagen). Three independentRNA extractions were performed for each stage and theextracted nucleic acids were treated for DNA
contamination with the DNA-free Kit (Quiagen) to pre-vent DNA carryovers. The cytoplasmic fraction of RNAfrom ES cells was extracted according to the Maniatisprotocol. The quality and concentration of the RNA wasdetermined by measuring the absorbance at 260 and280 nm using the Nanodrop nd-1000 Spectrophot-ometer while the RNA integrity was determined usingthe Agilent Bioanalyzer RNA 6000 Nano chip accordingto manufacturer instructions.
ES Cell CultureThe feeder-independent mouse Embryonic Stem (ES)E14 Tg2A.4 cell lines were grown on gelatin (0.1%),plastic-coated petri dishes in Dulbecco’s modified Eaglemedium (DMEM, Invitrogen) supplemented with 15%(vol/vol) heat-inactivated Fetal Bovine Serum (FBS,Euroclone), 2 mM L-glutamine, 1 mM MEM sodiumpyruvate, 0.1 mM 2- mercaptoethanol and 1,000 units/ml leukemia inhibitor factor at 37°C in a humidifiedchamber supplemented with 5% CO2.
Reverse Transcriptase RT PCRReverse Transcriptase (RT)-PCR was performed in tri-plicate on total RNA extracted from E14.5 mouseembryos. The UCEs were chosen in a different labora-tory from the one performing the RT-PCR experiments,without communicating the result expected on the basisof the microarray data. To prepare cDNA synthesis, weused the Quantitect Reverse Transcription kit (Qiagen,Inc.) starting from 1 μg of DNAse-treated RNA. Tofurther exclude genomic DNA contamination, RT- (no
Figure 5 RNASeq-based expression comparison between random regions, UCEs, p300-bound region and coding exons. Ultraconservedelements present polyA+ RNASeq based expression levels which are significantly different from random non-coding regions as well as fromcoding regions, but not from p300 bound regions. Analysis of RNASeq data derived from mouse brain (A. Mortazavi et al, 2008) on several typesof genomic regions, i.e. ultraconserved elements (red), randomized set of p300 bound regions (blue, Pennacchio et al, 2009), in vivo testedenhancer regions bound by p300 (green, Pennacchio et al, 2009), random non coding regions in the genome (white) and random coding exons(black).
Licastro et al. BMC Genomics 2010, 11:151http://www.biomedcentral.com/1471-2164/11/151
Page 9 of 12

reverse transcriptase added) reactions were used asnegative controls. Oligonucleotide sequences and PCRconditions are available upon request. Only RT-PCRs,which were positive in all three replicas, negative in theRT- and confirmed by sequencing analysis were consid-ered as positive.
Custom Microarray DesignThe electrochemically synthesized oligonucleotidemicroarrays used in this study are CustomarrayTM 12Karrays (Combimatrix, Mukilteo, WA). The oligonucleo-tide sequences and arrays were designed using as areference the murine genome sequence from theEnsembl release 46. The arrays consist of ~12,000 oligo-nucleotide probes. For each UCE, three probes weredesigned, on both DNA strands of the UCE element.We mapped the published UCE sequence to theunmasked murine genome and, through the use of bio-perl scripts, we also retrieved the sequences 500 bpupstream and downstream of the mapped UCE anddesigned probes in these regions. Moreover if the UCEmapped inside known exons, we designed probes alsofor the overlapping exon while if the UCE mappedbetween exons, we designed probes for the nearestupstream and downstream exons. The probes have beenfurther selected according to their melting temperatureusing the Combimatrix ProbeWeaverTM Software. Thedataset of all UCEs analyzed, their sequences and theprobes used is available at http://biodev.cbm.fvg.it/cgi-bin/uce/total_uce.pl. The microarray design and datahas been deposited to the GEO database, as datasetGSE19371.
Microarray Labeling and hybridizationBiotin-labeled cRNAs was produced with Illumina TotalPrep RNA Amplification Kit (Ambion), according tomanufacturer protocol, starting from extracted RNA.The arrays were enclosed within the supplied hybridiza-tion chambers, filled with H2O and incubated in arotisserie hybridization oven for 10 min at 65°C toremove adsorbed oxygen from the slides. The arrayswere then incubated at 45°C for 30 min in prehybridiza-tion solution (6× SSPE (Ambion), 0.05% Tween-20(Sigma Aldrich, St. Louis, MO), 20 mM EDTA(Ambion), 5× Denhardt’s solution (Sigma Aldrich), 100ng/μl salmon sperm DNA (Sigma Aldrich), 0.05% SDS(Sigma Aldrich)). Biotin-labeled RNA was added to thehybridization buffer (100 μl total volume, 6! SSPE, 0.05%Tween-20, 20 mM EDTA, 25% formamide, 100 ng/μlsalmon sperm DNA, 0.05% SDS) heated at 95°C for3 min, chilled briefly on ice, added to microarray slides,and incubated at 45°C overnight. Slides were washed forfive successive washes of 5 min each in Wash I (6!SSPE, 0.05% Tween-20), Wash II (3× SSPE, 0.05%
Tween-20), Wash III (0.5× SSPE, 0.05% Tween-20),Wash IV (2× PBS, 0.1% Tween-20), and Wash V (2×PBS (Sigma Aldrich). Wash I was performed at 45°Cwith all subsequent washes at room temperature. Theslide was removed from the hybridization chamber thenimmediately stained with HRP using biotin-avidin chem-istry according to manufacture protocol and read usinga ElectraSenseTM Reader using the revelation solution
Microarray AnalysisThe raw data signal was exported from the ElectraSenseAnalysis Software, loaded into the R/Bioconductor pro-gram [20], thanks to the Biobase package, and finallyconverted into a Bioconductor Expressionset Object.Gene expression data were normalized by Quantileregression [21]. Probe signal was considered positive ifpresent in at least two of three independent hybridiza-tions above the 90th percentile of the signal distribution.We also required for the signal to be higher than theaverage of the negative probe signal + 2 standard devia-tions, which was the case for all probes selected, giventhe 90th percentile cut-off applied The Limma package[22] was used to perform the statistical analysis to iden-tify differentially expressed UCEs. A cut off after theadjustment of P-values to control the false discoveryrate (FDR) [23] was set to p < 0.05 as set out by theMAQC consortium guidelines [24]. In order to identifyconstitutively expressed UCEs (i.e. with stable signalacross development) we used a method previously devel-oped by our lab [25]. Briefly this involved calculating theMFC (maximal fold change), i.e. the ratio of the maxi-mum and minimum expression values for all microar-rays performed in the experiment, and the CV, i.e. thecoefficient of variation. We considered as constitutivelyexpressed only those UCEs having: MFC < 2, CV < 0.05,an average signal intensity larger than the 5th percentileof the distribution of the signals (to avoid the classifica-tion of UCEs with very low signals) and a signal inten-sity larger than two standard deviations from the meanof the negative probes. For the Gene Ontology (GO)analysis we performed two analyses: one [Additional file2: Supplemental Table S4] which focused only on UCEsthat have been tested for both Enhancer and Transcrip-tion activity, another [Additional file 2] which analyzedGO context of all UCEs, regardless of whether they hadbeen tested for enhancer and/or transcription activity.The analysis has been performed within the Bioconduc-tor environment using the packages GO.db version 2.2.0and GOstats [26] version 2.6.0 with the hyperGTestfunction.
Selection of random non-transcribed regionIn order to obtain a comparable dataset of random non-transcribed regions of the genome for each UCE
Licastro et al. BMC Genomics 2010, 11:151http://www.biomedcentral.com/1471-2164/11/151
Page 10 of 12

analyzed, we selected randomly 3 regions of the samelength with no evidence of transcription and/or presenceof repeated sequences. We exploited the annotation ofthe Ensembl database (mouse genome, version 49) andselected regions presenting no ‘dna align features’ (i.e.no alignment with known cDNAs, ESTs, etc) with ascore higher than 75, no ‘protein align features’, no ‘pre-diction transcripts’ and no ‘repeat features’ overlappingthem. Finally we only selected regions that did not con-tain ‘N’ nucleotides.
UCE classification using External datasetsWe classified UCEs as “exonic”, i.e. if they overlappedknown exons, “intronic”, if they fell within introns ofknown genes, “possibly exonic” if they overlappedregions which present some evidence of genes (e.g.gene predictions, EST alignments, etc) and “non exo-nic” if they did not fall in any of the above. A singlenucleotide of overlap was considered sufficient forUCEs to be classified in the above categories. We thencompared these annotation categories among 4 data-sets: a “UCE” dataset, containing all UCEs; a “MouseTranscribed UCE” dataset, containing UCEs whichwere found to be expressed during mouse developmentusing our custom microarray experiment, a “MouseEnhancer UCE” dataset, containing UCEs which havebeen shown to act as enhancers [8], and a “MouseTranscribed and Enhancer” dataset, containing UCEswhich were found to act as enhancers previously [8] aswell as found to be expressed during mouse develop-ment in our experiment. On each of these sets we per-formed a Perfect test followed by Hochberg correctionto determine if the proportions of annotation cate-gories deviated significantly from the proportionsfound in the complete UCE dataset. The dataset ofUCEs tested for enhancer activity was downloadedfrom the webpage http://enhancer.lbl.gov/ and hasbeen mapped to UCEs sequences using wblast tool andPerl parsing scripts. The dataset of UCEs expressedabove background levels in 19 human normal tissues[12] was downloaded from the webpage of the manu-script. Expressed UCEs were selected as annotated bythe authors (i.e., those displaying a signal higher thanthe average of blank spots on the array + 2 standarddeviations). The RNA-Seq dataset obtained frommouse embryonic stem cell (using SOLiD sequencing)was downloaded from the Supplemental Data of themanuscript [16], using the “ES junction” BED track.Forebrain, Midbrain and Limb p300 Peak boundregions were downloaded from the SupplementaryData of the manuscript [18] and filtered for FDR lowerthan 0.01 as suggested in the manuscript. Solexa RNA-seq normalized wigglegrams of unique reads fromadult brain, liver and skeletal tissues were downloaded
from the Supplementary Methods of the manuscript[19]. Reads from the above experiments were mappedto UCE regions, randomly chosen mouse exons(mouse genome, version 49), random non-transcribedregions, and p300 bound regions using a custom Rscript. The comparison of RNASeq- based expressionlevels in the brain between random regions of the gen-ome, UCEs, p300-bound regions likely to encodeenhancers, brain enhancers tested in vivo, and codingexons has been performed using a Z test with 10,000random sampling.
Additional file 1: Supplementary Figure 1. The summary of results forPCR tested UCEs.Click here for file[ http://www.biomedcentral.com/content/supplementary/1471-2164-11-151-S1.TIFF ]
Additional file 2: Supplementary Tables. Table 1,2 The summaryexpression results for each UCE. Table 3,4 Tables summarizing the GeneOntology Analysis.Click here for file[ http://www.biomedcentral.com/content/supplementary/1471-2164-11-151-S2.XLS ]
Additional file 3: Supplementary Figure 2. RT-PCR analysis for fiveexpressed UCEs on RNA extracted from either the nucleus or thecytoplasm of mouse ES cells.Click here for file[ http://www.biomedcentral.com/content/supplementary/1471-2164-11-151-S3.TIFF ]
Additional file 4: Supplementary Figure 3. The analysis of distancebetween UCEsClick here for file[ http://www.biomedcentral.com/content/supplementary/1471-2164-11-151-S4.PDF ]
AcknowledgementsWe thank A. Romito for providing ES cells, Francesco Strozzi forbioinformatics support and discussion, F. Müller for useful discussions. Weacknowledge the European Commission (Contract n. 511990), the ItalianTelethon Foundation and the Italian Ministry of Health (FIRB 2004) forfinancial support.
Author details1CBM scrl - Genomics, Area Science Park, Basovizza, Trieste, Italy. 2TelethonInstitute of Genetics and Medicine (TIGEM), via Pietro Castellino 111, 80131,Napoli, Italy. 3UCL Cancer Institute, University College London, London,WC1E 6BT, UK. 4Centre for Gastroenterology, Institute of Cell and MolecularScience, Queen Mary University of London, London, E1 2AT, UK.
Authors’ contributionsDL carried out the Custom Microarray Design, Microarray Labeling andhybridization, statistical analysis and the UCE classification using Externaldatasets. VAG carried out the RNA Extraction, ES Cell Culture and ReverseTranscriptase RT-PCR analysis. FP participated in the Microarray preparationand RNA quality controls. RS carried out the Selection of random non-transcribed region. DL and VAG drafted the manuscript. ES and SBconceived and co-ordinated the study and wrote the final version of themanuscript. All authors read and approved the final manuscript.
Competing interestsThe authors declare that they have no competing interests.
Received: 16 October 2009 Accepted: 4 March 2010Published: 4 March 2010
Licastro et al. BMC Genomics 2010, 11:151http://www.biomedcentral.com/1471-2164/11/151
Page 11 of 12

References1. Bejerano G, et al: Ultraconserved elements in the human genome. Science
2004, 304(5675):1321-5.2. Ni JZ, et al: Ultraconserved elements are associated with homeostatic
control of splicing regulators by alternative splicing and nonsense-mediated decay. Genes Dev 2007, 21(6):708-18.
3. Lareau LF, et al: Unproductive splicing of SR genes associated withhighly conserved and ultraconserved DNA elements. Nature 2007,446(7138):926-9.
4. Baira E, et al: Ultraconserved elements: genomics, function and disease.RNA Biol 2008, 5(3):132-4.
5. Derti A, et al: Mammalian ultraconserved elements are strongly depletedamong segmental duplications and copy number variants. Nat Genet2006, 38(10):1216-20.
6. Katzman S, et al: Human genome ultraconserved elements areultraselected. Science 2007, 317(5840):915.
7. Chen CT, Wang JC, Cohen BA: The strength of selection onultraconserved elements in the human genome. Am J Hum Genet 2007,80(4):692-704.
8. Pennacchio LA, et al: In vivo enhancer analysis of human conserved non-coding sequences. Nature 2006, 444(7118):499-502.
9. Visel A, et al: Ultraconservation identifies a small subset of extremelyconstrained developmental enhancers. Nat Genet 2008, 40(2):158-60.
10. Ahituv N, et al: Deletion of ultraconserved elements yields viable mice.PLoS Biol 2007, 5(9):e234.
11. Stephen S, et al: Large-scale appearance of ultraconserved elements intetrapod genomes and slowdown of the molecular clock. Mol Biol Evol2008, 25(2):402-8.
12. Calin GA, et al: Ultraconserved regions encoding ncRNAs are altered inhuman leukemias and carcinomas. Cancer Cell 2007, 12(3):215-29.
13. Jones EA, Flavell RA: Distal enhancer elements transcribe intergenic RNAin the IL-10 family gene cluster. J Immunol 2005, 175(11):7437-46.
14. Feng J, et al: The Evf-2 noncoding RNA is transcribed from the Dlx-5/6ultraconserved region and functions as a Dlx-2 transcriptionalcoactivator. Genes Dev 2006, 20(11):1470-84.
15. Mercer TR, Dinger ME, Mattick JS: Long non-coding RNAs: insights intofunctions. Nat Rev Genet 2009, 10(3):155-9.
16. Cloonan N, et al: Stem cell transcriptome profiling via massive-scalemRNA sequencing. Nat Methods 2008, 5(7):613-9.
17. Rosenkranz R, et al: Characterizing the mouse ES cell transcriptome withIllumina sequencing. Genomics 2008, 92(4):187-94.
18. Visel A, et al: ChIP-seq accurately predicts tissue-specific activity ofenhancers. Nature 2009, 457(7231):854-8.
19. Mortazavi A, et al: Mapping and quantifying mammalian transcriptomesby RNA-Seq. Nat Methods 2008, 5(7):621-8.
20. Gentleman RC, et al: Bioconductor: open software development forcomputational biology and bioinformatics. Genome Biol 2004, 5(10):R80.
21. Bolstad BM, et al: A comparison of normalization methods for highdensity oligonucleotide array data based on variance and bias.Bioinformatics 2003, 19(2):185-93.
22. Wettenhall JM, Smyth GK: limmaGUI: a graphical user interface for linearmodeling of microarray data. Bioinformatics 2004, 20(18):3705-6.
23. Hochberg Y, Benjamini Y: More powerful procedures for multiplesignificance testing. Stat Med 1990, 9(7):811-8.
24. Shi L, et al: The MicroArray Quality Control (MAQC) project shows inter-and intraplatform reproducibility of gene expression measurements. NatBiotechnol 2006, 24(9):1151-61.
25. Ferg M, et al: The TATA-binding protein regulates maternal mRNAdegradation and differential zygotic transcription in zebrafish. Embo J2007, 26(17):3945-56.
26. Falcon S, Gentleman R: Using GOstats to test gene lists for GO termassociation. Bioinformatics 2007, 23(2):257-8.
doi:10.1186/1471-2164-11-151Cite this article as: Licastro et al.: Promiscuity of enhancer, coding andnon-coding transcription functions in ultraconserved elements. BMCGenomics 2010 11:151.
Submit your next manuscript to BioMed Centraland take full advantage of:
• Convenient online submission
• Thorough peer review
• No space constraints or color figure charges
• Immediate publication on acceptance
• Inclusion in PubMed, CAS, Scopus and Google Scholar
• Research which is freely available for redistribution
Submit your manuscript at www.biomedcentral.com/submit
Licastro et al. BMC Genomics 2010, 11:151http://www.biomedcentral.com/1471-2164/11/151
Page 12 of 12