Enhancer function driving cellular senescence, DNA damage ...
234
UNIVERSITY OF CALIFORNIA, SAN DIEGO Enhancer function driving cellular senescence, DNA damage repair, differentiation, and nuclear organization A dissertation submitted in partial satisfaction of the requirements for the degree Doctor of Philosophy in Biology by Thomas Barton Suter Committee in charge: Professor Michael G. Rosenfeld Professor Joseph Ecker Professor Christopher Glass Professor James Kadonaga Professor Cornelis Murre Professor Amy Pasquinelli 2017
-
Upload
khangminh22 -
Category
Documents
-
view
1 -
download
0
Transcript of Enhancer function driving cellular senescence, DNA damage ...

UNIVERSITY OF CALIFORNIA, SAN DIEGO
Enhancer function driving cellular senescence, DNA damage repair, differentiation, and nuclear organization
A dissertation submitted in partial satisfaction of the requirements for the degree Doctor of Philosophy
in
Biology
by
Thomas Barton Suter
Committee in charge:
Professor Michael G. Rosenfeld Professor Joseph Ecker Professor Christopher Glass Professor James Kadonaga Professor Cornelis Murre Professor Amy Pasquinelli
2017


iii
The Dissertation of Thomas Barton Suter is approved, and it is acceptable in quality and form
for publication on microfilm and electronically:
Chair
University of California, San Diego
2017

iv
TABLE OF CONTENTS
Signature Page…………………………………………………………………………… iii
Table of Contents………………………………………………………………………… iv
Acknowledgements………………………………………………………………………. v
Vita………………………………………………………………………………………... vi
Abstract of the Dissertation……………………………………………………………….. vii
Introduction……………………………………………………………………………….. 1
Chapter 1 The Epigenomic Landscape of Replicative Senescence……………………… 3
Chapter 2 The Delineation of Proliferative and Toxic Enhancer Programs of Replicative
Senescence………………………………………………………………………………… 26
Chapter 3 Ligand-dependent Enhancer Activation Regulated by Topoisomerase-I Activity 42
Chapter 4 Barcoding of Cell Type Restricted Enhancers by ESC Transcription Factors
Licenses Their Robust Developmental Activation……………………………………….. . 62
Chapter 5 Chromosomal Enhancer Syntax: Spatially-Distributed Super Enhancers and
Subnuclear Structural Associations Dictate Enhancer Robustness ……………………….. 82
Chapter 6 Discussion………………………………………………………………………. 121
Appendix…………………………………………………………………………………... 130
References…………………………………………………………………………………. 202

v
ACKNOWLEDGEMENTS
I would like to thank Dr. Michael G. Rosenfeld for his support as the chair of my
committee, and my research advisor.
Chapter 1, in part, was prepared with input from Dr. Yousin Suh and Dr. Michael G.
Rosenfeld. The dissertation author was the primary investigator and author of this paper.
Chapter 2, in part, is currently being prepared for submission for publication of the
material. Suter, Thomas; Tazearslan, Cagdas; Merkurjev, Daria; Meluzzi, Dario; Suh, Yousin;
Rosenfeld, Michael. The dissertation author was the primary investigator and author of this
paper.
Chapter 3 is an adaptation of the material as it appears in Cell, 2014. The authors of
this study are Janusz Puc, Piotr Kozbial, Wenbo Li, Yuliang Tan, Zhijie Liu, Tom Suter,
Kenneth A. Ohgi, Jie Zhang, Aneel K. Aggarwal and Michael G. Rosenfeld. The dissertation
author contributed to this study through the screening of factors relevant to the thesis of the
publication.
Chapter 4 is an adaptation of a manuscript that is being submitted for publication.
The authors of this study are Hong Sook Kim, Wubin Ma, Yuliang Tan, Daria Markujev,
Eugin Destici, Qi Ma, Tom Suter, Kenneth Ohgi, Meyer Friedman, Michael G. Rosenfeld.
The dissertation author contributed to this study through performance of experiments related
to DNA methylation and hydroxymethylation, as well as intellectual input.
Chapter 5 is an adaptation of a manuscript that is being submitted for publication.
The authors of this study are Sreejith Nair, Lu Yang, Dimple Notani, Dario Meluzzi, Soohwan
Oh, Qi Ma, Tom Suter, Wenbo Li, Amir Gamliel, Fan Yang, Ranveer Jayani, Hong Sook Kim,
Jane Zhang, Kenneth Ohgi, Michael G. Rosenfeld. The dissertation author contributed to this
study through performance of experiments related to DNA methylation and
hydroxymethylation, SC35 and its genome wide association with chromatin, and analysis of
immune-FISH.

vi
VITA
2008 Bachelor of Arts, William Jewell College
2017 Doctor of Philosophy, University of California, San Diego

vii
ABSTRACT OF THE DISSERTATION
Enhancer function driving cellular senescence, DNA damage repair, differentiation, and nuclear organization
by
Thomas Barton Suter
Doctor of Philosophy in Biology
University of California, San Diego, 2017
Professor Michael G. Rosenfeld, Chair
This dissertation, by Thomas Barton Suter, discusses enhancer function driving
cellular senescence, DNA damage repair, differentiation, and nuclear organization. Enhancers
are a major regulatory feature of epigenomic regulation, and play a diverse array of functions.
In the first chapter, I discuss the background of cellular senescence and the epigenomic
modifications that are known to play a role in this process, including marks associated with
enhancer function. In the second chapter, I provide primary evidence of the key role
enhancers play in driving the senescence phenotype. In the third chapter, I discuss the role
that DNA damage and repair plays in nuclear receptor activity at enhancers. In the fourth

viii
chapter, I discuss the mechanisms by which regions in embryonic stem cells can be marked
for later activation in future cell fates. In the fifth chapter, I present a study showing the role
enhancers can play in nucleating nuclear organization.

1
INTRODUCTION
Regulation of the epigenome involves of interworking of multiple levels of factors ad
structures, all with huge implications for human pathology. This dissertation dissects many
levels of such regulation.
In the first chapter, I provide a comprehensive review of the epigenetics underlying
human cellular senescence, a condition that corresponds closely with human aging related
disease. Senescence is characterized not only by proliferation arrest and a toxic influence on
surrounding cells, but by the immutability of this state. Such an entrenchment suggests the
key role of epigenetic changes in senescence, and a preponderance of literature backs this
claim. Many key epigenetic factors have been shown to correlate significantly with
senescence and aging across multiple organisms, and modification of these elements has been
shown to have major effect upon the senescent phenotype. This chapter discusses these
findings in detail, and provides an overview to the complex mechanisms enforcing senescence.
In my second chapter, I present my findings regarding specific epigenetic features of
senescence, namely a novel characterization of the enhancer programs of cellular senescence,
include their delineation of specific programs of senescence that correspond separately to
proliferative repression and inflammatory phenotypes. We show that 2 sets of transcription
factors, NFI family members and NFkB, correspond distinctly with either the proliferative or
inflammatory phenotype, respectively. We additionally identify a set of histone marks as
being dramatically altered in replicative senescence, providing novel evidence of a histone
code that marks this condition.
In my third chapter, I present a completed manuscript that provides evidence of
topoisomerase I’s recruitment to and nickase activity at androgen receptor bound and activated
enhancers. This study highlights the role that single stranded DNA breaks play in regulated
transcription, and that major components of the DNA damage repair machinery plays a key

2
role in the process of regulated transcription. In this study, I performed screening and
functional analysis of various DNA damage and repair factors that could potentially be
involved nicking process described in this manuscript.
In my third chapter, I present a completed manuscript that shows how enhancers
whose activity is largely restricted to specific cell types are actually pre-marked by the binding
of embryonic stem cell (ESC) factors. Furthermore, pre-marked enhancers are distinct in
ESCs from ESC active enhancers, as the former are marked by generally a single ESC factor,
in stark contrast to the multiple factors typically bound to ESC active enhancers. A major
question proposed by our model, however, is how such pre-marked enhancers have this pre-
marking maintained as cells differentiate. We proposed that DNA CpG hydroxy-methylation,
which is enriched at a pre-marked enhancers and is maintained throughout DNA replication
and cell division, provides the molecular memory needed for the activation of these pre-
marked enhancers. In this study, I performed all genome wide methylation and hydroxy-
methylation experiments that were critical to the formulation of our model.
In my final chapter, I present a completed manuscript identify key enhancers as
playing an organizing role in chromosomal architecture, and that this level or organization is
key to our model of estrogen receptor regulated transcription. This study also shows that sub-
nuclear structures play a key role in the enhancer based organization structures. In this study,
I again performed genome wide analyses of DNA methylation and hydroxy methylation,
which helped to better characterize the epigenetic state of both organizing and associated
enhancers. I also performed analysis of the genome wide associations of the SC35 sub-
nuclear structure, which helped to clarify our understanding of its association with organizing
enhancers.

3
CHAPTER 1 THE EPIGENOMIC LANDSCAPE OF REPLICATIVE SENESCENCE
Abstract
The chromosomal landscape serves as something of a foundation of cellular function,
operating through a complex array of histone proteins, their post-translational modification,
co-regulators, and three dimensional architecture to not only protect the integrity of the
genome but also regulating its transcription and thus cellular activity. When this epigenomic
integrity becomes compromised through any of a variety of chromosomal stressors, including
telomeric, oxidative, or replicative stress; cellular senescence can occur. Cellular senescence
can be generally defined as a cell’s inability to divide even in a context which would
otherwise result in its proliferation, and is both one hallmark of aging as well a means of
resisting malignant transformation. Furthermore, the induction of senescence results in further
alterations to the chromosomal landscape that bolster this cell state. In this review, we survey
the current literature surrounding these chromosomal features that induce and reinforce
cellular senescence, and look into the future of this field.
Introduction
Multicellular organisms experience aging as a result of progressive tissue dysfunction (Bishop
et al., 2010; Cynthia J Kenyon, 2010; Sahin and Depinho, 2010; Stewart and Weinberg, 2006).
Cellular senescence is one of many contributors to organismal aging, and is defined as a cell’s
persistent resistance to proliferation (Campisi and d’Adda di Fagagna, 2007; Sulli et al., 2012).
As such, a senescent cell fails to proliferate when in circumstances that would normally result
in proliferation, e.g. the cell receives a growth signal or is of a cell type that typically divides
independent of any signal. Additionally, the senescent cell fate is typically irreversible, as the
senescent state will typically persist even after the disappearance of the stressor that induced a
cell’s senescent state (Beauséjour et al., 2003). While the induction and maintenance of
senescence involves the integrated function of many levels of cellular machinery

4
(Sulli et al., 2012), this review will focus upon and provide a comprehensive examination of
chromatin and its role in senescence.
As mentioned, senescence is defined not only as a cell’s lack of proliferation, but by
its resistance to proliferation when in a circumstance or given a signal that would otherwise
result in its proliferation (Campisi and d’Adda di Fagagna, 2007). As such, cellular
senescence is characterized by surface level features, such as increased population doubling
time, positive staining by beta-galactosidase due to the increased lysosomal content of
senescent cells (Kurz et al., 2000), increased cell size and altered morphology (Campisi, 2012),
and also increased activity of tumor suppressors p16INK4a/pRb (Kim and Sharpless, 2006)
and p53/p21 and their associated pathways. Other hallmarks of senescence include persistent
foci of DNA damage known as DNA-SCARS (Rodier et al., 2011), senescence associated
heterochromatic foci (SAHF) which are visualized via staining for heterochromatin associated
proteins as well as DAPI (Kosar et al., 2011), and a senescence associated secretory phenotype
(SASP) wherein senescent cells secrete proteases as well as growth and inflammation
associated signaling molecules (Coppé et al., 2010). While senescence is induced via the
activation of tumor suppressor pathways, such as telomeric shortening, direct DNA damage,
or oncogene induction, the senescent state persists even after the senescence-inducing signal is
removed (Beauséjour et al., 2003). While the persistence of this signal is contributed to in
part by a self-perpetuated cell signaling response, the senescent cell’s chromatin state is
essential to the maintenance of cellular senescence.
Senescence is initiated through three general mechanisms, all of which are linked
through similar damage sensing pathways. In each case, chromatin damage results in the
activation of cyclin dependent kinase inhibitors, including the p53/p21 and p16/Rb pathways.
The activation of these pathways results in the repression of the E2F transcriptional program
and a halt of cell cycle in the G1 phase (Campisi, 2012). This silencing of the E2F program

5
occurs through the recruitment of repressive chromatin modifying enzymes to E2F target
promoters by Rb bound E2F transcription factors (Ferreira et al., 2001; Macaluso et al., 2006).
Oncogene induced senescence results from the over-activation of proliferative signals,
which can include overexpression of oncogenes such as HRAS (Serrano et al., 1997) or E2F
(Lazzerini Denchi et al., 2005), or depletion of tumor suppressors such as PTEN (Chen et al.,
2005). These proliferative signals result in rapid progression of cell cycle, a dramatic increase
in replication that results in stalled replication forks and increases in metabolism and
associated oxidative stress, and ultimately activation of a persistent DNA damage response
that results in senescence (Lee et al., 2011).
Direct damage to DNA has been shown to induce senescence through the activation of
a maintained DNA damage response. This response can be activated through the direct
generation of double stranded DNA breaks through sources including ionizing radiation or
chemical agents (Robles and Adami, 1998). Furthermore, chemical lesions can be generated
in DNA through elements including ionizing radiation, oxidative stress such as metabolism
associated ROS, and a variety of chemical elements (Parrinello et al., 2003; Sedelnikova et al.,
2010).
Replicative senescence is the result of the progressive shortening of telomeres that
occurs during continued replication as a result of replication machinery’s inability to replicate
chromosomal ends completely. Telomeres are situated at the ends of linear chromosomes and
utilize highly organized structures to prevent chromosomal ends from being recognized as a
double stranded DNA break (Blasco, 2007). The recognition of chromosomal ends as double
stranded DNA breaks would result in chromosomal ends being either inappropriately repaired,
which would result in genomic instability due to inter-chromosomal fusions; or the activation
of the p53 associated DNA damage machinery to induce an apoptotic or senescence response
(Rodier et al., 2005). However, as telomeres become critically shortened through repeated cell

6
division and DNA replication, they become recognized by the DNA damage machinery, and
activate the p53/p21 signaling pathway. p53/p1 activation in turn results in senescence, and
this cessation of proliferation prevents further shortening of telomeres which would result in
catastrophic genomic instability due to aforementioned chromosomal fusions (d’Adda di
Fagagna et al., 2003). While critically shortened telomeres do not directly activate the p16
pathway, substantial cross-talk between these two pathways does exist (Rayess et al., 2012),
resulting in p16 being frequently being activated during replicative senescence (Di Micco et
al., 2011b; Herbig et al., 2004).
As such, senescence is an aging associated cell state that is induced through the
presence of multiple types of stressors of genomic integrity. As genomic integrity is thus at
the core of senescence, the various epigenomic factors regulating the genome are key to both
the induction and maintenance of the senescent state. In this review, we will survey the
literature surrounding epigenomic features corresponding with cellular senescence, including
DNA methylation, histone levels, histone modifications, chromatin structure, and the enzymes
regulating these features.
DNA Methylation
DNA cytosine methylation is fundamental epigenetic feature, and undergoes changes
during senescence. More broadly, DNA methylation can occur at CG, CHG, and CHH
context, with the bulk of mammalian methylation occurring at CGs (Lister et al., 2009).
Clusters of CG sequences, known as CG islands, frequently occur at gene promoter regions,
while the remainder of the genome is statistically depleted of the CG context. DNA
methylation has been shown to play a wide variety of roles in chromatin regulation,
functioning in promoter and elongation regulation, imprinting, X-inactivation, and the
silencing of transposable elements (Jones, 2012). DNA methylation is catalyzed by the DNA
methyltransferases DNMT1, which methylates hemi-methylated DNA and is thus responsible

7
for preserving methylation during DNA replication, DNMT3a and DNMT3b, which can
methylated non-methylated DNA and are thus responsible for de novo methylation, and
DNMT3L, which is thought to be catalytically inactive but function in the function of
DNMT3A and B (Denis et al., 2011).
During senescence, progressive hypo-methylation has been observed (Wilson and
Jones, 1983) (Gentilini et al., 2012), which corresponds with a decrease in levels of DNMT1
and DNMT3a (Casillas et al., 2003). This association of lower levels of DNA methylation
and senescence is further supported by a centenarian study showed increased levels of global
DNA methylation in the offspring of centenarians versus the offspring of non long-lived
parent (Gentilini et al., 2012). Consistent with DNMT1 decline playing an active role in
senescence, DNMT1 knockdown in human fibroblasts lead to the increased ubiquitylation and
degradation of G9a and GLP H3K9 methyltransferases in a p21-dependent manner. This
result corresponded with decreased H3K9me2 on IL-6 and IL-8 promoters, leading to their
increased transcription (Takahashi et al., 2012). These results thus present a mechanism
linking senescence associated changes in DNMT1 with the p21 DDR pathway as well as
changes in the silencing associated H3K9 methylation, and also provides insight into the
epigenomic regulation of the aging associated SASP. While conditional knockout of
DNMT3a in mice also lead to premature tissue degeneration, it is undetermined whether this
effect was at all related to senescence (Nguyen et al., 2007). Furthermore, accelerated
senescence was observed in mesenchymal stem cells from humans suffering from RETT
syndrome, a largely neural-associated disease which results from mutations in the DNA
methylation binding protein MECP2. These mutations in MECP2, which is largely thought in
normal cells to function in gene silencing, results in induction of senescence through
impairments in DNA damage repair and activation of the p53 pathway (Squillaro et al., 2010).
Interestingly, DNMT3b has been shown to increase during senescence (Casillas et al., 2003).

8
As hyper-methylation of specific promoters has been observed during aging, senescence up-
regulated DNMT3b may function at specific regions. Interestingly, several promoters
hypermethylated in senescence included the tumor suppressors LOX, RUNX3, and TIG1,
suggesting senescence associated promoter hyper-methylation may function to protect against
cancer resulting from aging associated genomic instability (Fraga and Esteller, 2007).
Furthermore, it was shown that age associated hyper-methylation tended to occur in CG
islands of promoters by bivalent domains, which contain the typically transcription activation
associated H3K4me3 and the repression associated H3K27e3 (Rakyan et al., 2010).
Given the effects of DNA methytransferase knockouts and Rett syndrome, DNA
methylation clearly plays a role in genomic maintenance. However, the role of DNA
methylation in the induction and maintenance of senescence is more complex. While the
general hypomethylation observed in senescence is consistent with the decrease of the
maintenance methyltransferase DNMT1, the fact that hypomethylation is not globally uniform
indicates this mechanism needs to be further resolved. Given the association of DNMT1 with
replication machinery through interaction with PCNA (Chuang et al., 1997), replication
dynamics and topography may play a role in explaining senescence associated
hypomethylation. The differential regulation of DNMT1 and DNMT3a versus DNMT3b may
further explain why certain regions are particularly hyper- and hypo-methylated, a question
that can be further explored with global analyses of these methyltransferases. The association
of aging associated hyper-methylation with bivalent domains also provides some insight into
the mechanism of age associated hyper-methylation, linking age associated methylation with
H3K4me3, H3K27me3, and their respective readers, writers, and erasers. Philosophical
questions regarding the role of DNA methylation in senescence also remain, such as whether
the changes in DNA methylation play a causative role in senescence, and whether DNA
methylation’s role in senescence occurs at a large scale (e.g. general hypomethylation results

9
in global chromatin relaxation) or a locus specific level (e.g. repression or activation of
specific genes such as those leading to the increasee ubiquitylation of H3K9
methyltransferases).
Histone Levels, variants, and marks
Central to the chromatin characteristics is the status of histone proteins. Broadly,
histones function to package eukaryotic chromosomal DNA, and the typical octameric histone
subunit consists of two tetramers, each consisting of H2A, H2B, H3 and H4 subunits. Each
octamer packages 147 base pairs of chromosomal DNA into a 10nm filament. Separating
each octamer is a linker region, which is typically bound by histone H1 family protein
involved in the compaction of chromatin into a 30nm structure. The N and C terminal tails of
histones H3 and H4 are generally exposed, allowing for their chemical modification (Hamiche
and Shuaib, 2012). Given their close association with chromosomal DNA, the regulation of
histone proteins plays a major role in regulating the accessibility of chromosomal DNA, which
in turn regulates associated cellular functions such as transcription, DNA damage repair, and
replication. This regulation can occur through a variety of mechanisms, such as the formation
of higher order chromatin structures such as heterochromatin, the chemical modification of
histone tails, the replacement of histone subunits with different variants, and the spacing of
histone octamers along a particular chromosomal region (Kooistra and Helin, 2012).
Complicating the determination of epigenomic changes during senescence is the
observation that total histone levels have been shown to be altered during senescence. In yeast,
protein levels of H2A and H3 were shown to decrease with age, while overexpression of H3
and H4 resulted in increased lifespan (Feser et al., 2010a, p. 20). Protein levels of histones H3
and H4 were also shown to be reduced in aged human cells, with particular nucleosome
reduction at telomeres (Roderick J O’Sullivan et al., 2010).

10
The mechanism underlying this reduction in histone levels has been partially explored.
In yeast, H3 family histones are acetylated at H3K56 soon after translation, and this mark has
been implicated in the association of histones with histone chaperone CAF-1 and thus proper
nucleosome assembly (Li et al., 2008). Consistent with the observation that reduced histone
levels promotes cellular aging, reduction of H3K56ac in yeast, as shown through mutants of
H3K56ac regulators ASF1 and RTT109, results in reduced lifespan. Similarly, deletion of
the histone transcriptional repressor HIR results in increased histone transcript levels and
increased lifespan (Feser et al., 2010a). Histone transcript levels also showed considerable
increase during yeast aging, and, together with the observation that yeast histone gene deletion
resulted in increased transcription from the remaining histone loci, suggests the presence of
compensatory transcription increases in response to the reduced histone protein levels
observed during senescence (Feser et al., 2010a). In humans, stem loop binding protein
(SLBP) is necessary for transcript processing of replication-dependent histones, and is
considerably down-regulated by the activity of ATR, which is activated during the DDR and
thus senescence (Kaygun and Marzluff, 2005). Besides SLBP, histone chaperones CAF1,
ASF1a, and to a lesser extent Asf1b also show decrease during senescence in human cell lines.
Similar to yeast, human H3K56ac is dependent upon ASF1a and ASF1b, functions to facilitate
nucleosome assembly, and is depleted during senescence (Roderick J O’Sullivan et al., 2010).
As such, the down-regulation of histone processing components and chaperones during
senescence may play a considerable role in the consequent histone protein level decrease
during senescence.
The functional consequence of senescence associated histone depletion also remains
unclear. In yeast, nucleosome reduction through H4 depletion resulted in the altered
regulation of 25% of genes, with 15% of genes being up-regulated (including genes in sub-
telomeric regions) while 10% of genes were down-regulated (Wyrick et al., 1999). In human

11
fibroblasts, subtelomeric regions were found to be particularly depleted of histones (Roderick
J O’Sullivan et al., 2010), but there is currently no data characterizing global changes in
transcription upon histone depletion. As such, the mechanism determining whether a gene is
up-regulated, down-regulated, or unchanged during global histone protein reduction remains
unclear. Perhaps certain loci or regions have their nucleosome occupancy more drastically
affected than others during global nucleosome depletion. Perhaps certain loci’s transcriptional
levels respond differently to equivalent changes in histone occupancy. These mechanisms, as
well as the genetic and epigenomic features governing them, will require global transcriptional
and epigenomic data to determine.
As mentioned above, the replacement of components of histone components with
variant subunits has substantial effects upon processes including DNA replication, damage
signaling and repair, and transcription. H1 has 11 variants, differing in their cell type
expression, protein interactions, propensity for specific post translational modifications, and
associations with heterochromatic regions (Izzo et al., 2008). While little is currently known
about the role of H1 variants in senescence, the association of these variants with cell division
(Hergeth et al., 2011), DNA damage response (Hashimoto et al., 2007), and heterochromatin
formation (Weiss et al., 2010); indicate that further study of H1 variants in relation to
senescence may be a fruitful endeavor.
Histone H2A has a multitude of variants, with H2A.Z and H2A.X being the most
prominently conserved. While H2A.Z has been shown to play a major role in a wide range of
biological processes, including transcription activation and repression, chromatin remodeling,
and damage repair (Bönisch and Hake, 2012). H2A.Z is distributed in a non-uniform manner
throughout the genome, with particular enrichment at gene regulatory regions. H2A.Z has
been shown to be enriched in the promoter region of p21, functioning to inhibit p21’s
activation by p53 and counteract the p53 associated senescent state (Gévry et al., 2007).

12
H2A.Z was further shown to be depleted with age in the p21 promoter of senescent fibroblasts
(Lee et al., 2012). It remains to be seen, however, whether H2A.Z plays a more global role in
the onset or maintenance of senescence.
H2A.X has been long implicated in the DNA damage response, being phosphorylated
at serine 139 by ATM/ATR upon the formation of a DNA double stranded break.
Phosphorylated H2A.X, referred to as yH2A.X, demarcates DNA damage foci, where
components of the DDR machinery assemble for break repair (Kinner et al., 2008). H2A.X
has been thought to facilitate repair by functioning in recruitment of repair machinery, as well
as playing a role in the chromatin remodeling at the site of the break (Bönisch and Hake,
2012). yH2A.X is typically observed at increased levels in senescence, consistent with
persistent DDR activation as a hallmark of senescence. Particularly, yH2A.X foci have been
observed at shortened telomeres, consistent with the activation of the p53/p21 pathway in
replicative senescence (d’Adda di Fagagna et al., 2003). yH2A.X foci were also shown to be
increased upon UV radiation induced senescence in an ATR dependent manner (Hovest et al.,
2006), further implicating H2A.X in senescence associated p53 activation.
MacroH2A is an H2A variant with relatively low homology to canonical H2A, and
has been generally associated with transcriptional repression such as that seen during X
chromosome inactivation (Costanzi and Pehrson, 1998). Its mechanism of transcriptional
repression is multipartite, and has been shown to impair nucleosome remodeling, transcription
factor binding, and histone acetylation (Bönisch and Hake, 2012). MacroH2A isoform
MacroH2A.1.1 has also been shown to be a substrate of PARP1, and its recruitment and
PARylation at damage sites has been shown to modulate the DNA damage response by
compacting chromatin, affecting the recruitment of Ku proteins, and altering the yH2A.X
topography of the damage site (Timinszky et al., 2009). MacroH2A has also been noted as a
component of SAHF (Zhang et al., 2005). While SAHFs have been associated with both

13
transcriptional repression of senescence down-regulated genes, such as E2F target genes; as
well as the suppression of the DNA damage response, the specific role of MacroH2A in either
of these processes in SAHFs has not been fully characterized.
H3 variants H3.1 and H3.2 are DNA replication dependent, being introduced into
chromatin largely by the CAF-1 histone chaperone complex during S-phase (De Koning et al.,
2007). Alternatively, H3 variant H3.3 is introduced into chromatin in a replication
independent manner predominantly by the HIRA and ATRX/DAXX histone chaperone
complexes. HIRA complex associated H3.3 deposition has been observed in the bodies of
actively transcribed genes, as well as in regulatory regions of both active and repressed genes
(Anderson et al., 2010; Mito et al., 2005). ATRX/DAXX associated H3.3 deposition was
shown at transcriptional regulatory regions but also heterochromatic regions such as telomeres,
pericentromeric regions, and the inactivated X chromosome (Rai et al., 2011). While the
exact role of H3.3 is quite diverse and remains to be fully characterized, H3.3 deposition into
the histone octamer has been shown to have considerable effect upon histone stability, such as
the looser configuration observed in octamers composed of both H2A.z and H3.3 (Jin and
Felsenfeld, 2007). Both HIRA complex activity and H3.3 levels in chromatin have been
shown to be elevated in senescent cells (Jeyapalan et al., 2007; Rogakou and Sekeri-Pataryas,
1999). In senescent cells, the HIRA complex has also been shown to interact with PML
bodies (Banumathy et al., 2009; Rai et al., 2011; Ye et al., 2007). PML bodies are subnuclear
organelles that have been shown to co-localization with the ATRX/DAXX H3.3 chaperone
complex independent of senescence (Ishov et al., 2004) but whose exact function remains
unclear. This association of the HIRA complex with PML bodies has been shown to be
necessary for SAHF formation (Ye et al., 2007). Furthermore, in senescent fibroblasts p53
activated Rb, E2F factors, and PML bodies were shown to co-localize, with E2F target
promoters showing increased binding of E2F factors upon induction of senescence (Vernier et

14
al., 2011, p. 20). Given the aforementioned heterochromatization of E2F target promoters that
has been observed in senescence, and the association of H3.3 with PML bodies, senescence,
heterochromatin, and gene silencing at promoters, H3.3 could conceivably play a role in
senescence associated transcriptional regulation. It is also worth noting that ATRX/DAXX
has been implicated as a negative regulator of MacroH2A incorporation into telomeres and
sub-telomeric regions, with ATRX mutant lines showing increased MacroH2A as well as
increased expression of genes in sub-telomeric regions (Ratnakumar et al., 2012). While this
finding is intuitively contradictory, given the association of both MacroH2A and
ATRX/DAXX with telomeres and the SAHF associated PML bodies, the co-localization may
represent a complex dynamic of repression and repair present at SAHFs. Additionally, H3.3
was recently identified in mice as having an exceptionally long half-life, with a proportion of
the proteins, which were radiolabelled embryonically, remaining even one year after birth
(Savas et al., 2012, p. 20). This indicates, perhaps counter-intuitively, that even though H3.3
deposition is replication independent, at least some portion of H3.3 is remarkably stable.
However, given the damage or tail cleavage that a long lived protein may experience, perhaps
protein aging may also play a role in the maintenance of chromosomal integrity and the
process of senescence.
Histone marks, co-activators, and co-repressors
Histone modifications are essential to the definition and function of many key
regulatory features of chromatin, affecting both nucleosome structure directly as well as the
association of many auxiliary factors. Histone acetylation occurs on histone lysine residues,
and is typically associated with gene activation due to the negative charge of the acetyl group
leading to the de-compaction of local chromatin through repulsion of the negatively charged
DNA. However, acetylated lysines can be recognized by a variety of activating and repressive
transcriptional regulators, and thus histone acetylation can be both activating and repressive

15
depending upon the residue, genomic location, and each cell’s particular cohort of expressed
transcriptional regulators (Verdone et al., 2006). Histone acetylation is removed by histone
de-acetylases (HDACs), several of which have been implicated in senescence. Importantly,
HDACs are also able to de-acetylate lysine residues on non-histone proteins, an activity that
can have major effects upon cell behavior and should thus be considered alongside HDAC’s
histone targeted functions (Choudhary et al., 2009). HDAC1 functions as a subunit in several
protein complexes, including the Sin3, NuRD, and CoREST complexes (Reichert et al., 2012).
HDAC1’s activities have linked to cell cycle and proliferation regulation, such as HDAC1’s
promoter binding and subsequent transcriptional repression of p21 in embryonic stem cells
(ESCs) (Lagger et al., 2002). In senescence, drug inhibition of HDAC1 lead to accelerated
onset of senescence in both fibroblasts and mesenchymal stem cells (MSCs), though it was not
determined whether this effect upon senescence was due to HDAC1’s histone or non-histone
activities (Di Bernardo et al., 2009; Ogryzko et al., 1996). Conversely, the overexpression of
HDAC1 resulted in accelerated senescence in human melanocytes. As part of this study,
HDAC1 was shown to associate with Rb, and its overexpression lead to an increase in Rb
associated, H3K9me3 and HP1 positive, heterochromatic foci (Bandyopadhyay et al., 2007).
The Sir2 HDAC in yeast was shown to play a major role in senescence, as Sir2
knockouts showed accelerated aging while Sir2’s overexpression resulted in increased yeast
lifespan (M Kaeberlein et al., 1999). Sir2 was shown to be involved in the establishment of
heterochromatin at yeast telomeres, and also function in the silencing of yeast rDNA, which
decreases rDNA’s susceptibility to inappropriate recombination and genomic instability
(Sandmeier et al., 2002). Sir2 was also shown to play dual roles in both transcriptional
repression and DNA damage repair. Interestingly, the recruitment of Sir2 to sites of DNA
damage lead to the de-repression of regions previously bound by Sir2, though overexpression
of Sir2 mitigated this damage induced de-repression (Oberdoerffer et al., 2008). The role of

16
Sir2 homologs in senescence in higher organisms, however, remains uncertain, as a recent
study (68) has called into question two earlier studies which indicated that Sir2 homolog
overexpression resulted in increased longevity in worms (H A Tissenbaum and Guarente,
2001) and flies (Rogina and Helfand, 2004a). The two mammalian homologs for yeast Sir2
are SIRT1 and SIRT6, both of which have been shown to protect against age associated
changes in mice. SIRT1 has been shown to have histone de-acetylase activity upon H1K26,
H3K9, and H4K16, function in gene and repeat silencing, and be recruited to sites of DNA
damage in a ATM and H2AX dependent manner (Oberdoerffer et al., 2008; Vaquero et al.,
2004). As in yeast, recruitment of SIRT1 to damage sites results in de-repression of SIRT1
mediated gene silencing. This damage-induced pattern of deregulation corresponds with
patterns of expression observed in aging tissue, and is abolished by SIRT1 overexpression
(Oberdoerffer et al., 2008). Additionally, SIRT1 has been shown to de-acetylate many non-
histone components involved in regulating transcription (including NFkB, E2F1), chromatin
(including p300 and NcoR/SMRT), and the DNA damage response (including p53 and Ku80)
(Vaquero et al., 2007). SIRT1 deficient mice showed developmental defects and hyper-
acetylation of p53, which corresponds to increased p53 activity and thus increased DDR
(Cheng et al., 2003). SIRT1 overexpressing mice were not shown to have an increased
lifespan over wild type mice in unstressed conditions (Herranz et al., 2010), indicating SIRT1
may not play a role in normal replicative senescence. However, SIRT1 overexpressing mice
show absence of various age associated pathologies, such as Alzheimer’s disease (Kim et al.,
2007) and cancer (R.-H. Wang et al., 2008); and a growing body of evidence has implicated
SIRT1 in calorie restriction and IGF1 associated de-acceleration of senescence (Herranz and
Serrano, 2010a). As such, the role of SIRT1 in these cell stress associated diseases indicates a
possible link between SIRT1 and a subset of senescence inducing stressors (Herranz and
Serrano, 2010a). Interestingly, SIRT1 was shown to negatively regulate HDAC1, which

17
illustrates the complexity of these pathways, the difficulty in delineating the role of each in
senescence, and the need for comprehensive global datasets to determine the specific roles of
these chromatin modifying complexes (Binda et al., 2008, p. 200).
Similarly, SIRT6 has been shown to de-acetylate H3K9 as well as other non-histone
targets. SIRT6 has been shown to have roles in transcriptional repression of genes,
particularly in association with NFkB (Kawahara et al., 2009); the DDR, through the
activation of PARP1 (Mao et al., 2011, p. 20) and acetylation of the non-histone protein CtIP
(Kaidi et al., 2010), and has been implicated in maintaining telomeric structure through the de-
acetylation of telomeric H3K9 (Michishita et al., 2008). SIRT6 knockouts displayed reduced
lifespan, but this phenotype may have resulted from the increased genomic instability
observed in these mice, rather than the direct involvement of SIRT6 in senescence
(Mostoslavsky et al., 2006). Interestingly, an increase in lifespan was observed in SIRT6
overexpressing male, but not female, mice, which was corresponded to changes in the
lifespan-associated IGF1 signaling pathway (Kanfi et al., 2012a).
Histone acetyl-transferases have also been implicated in senescence. p300 and CBP, a
pair of closely related HATs, are key and broad epigenomic regulators of transcription, with
HAT activity on a wide array of histone substrates (L. Wang et al., 2008), non-histone acetyl-
transferase activity, and can mediate a diverse array of interactions between transcriptional
regulators (Chen 2011). p300 and CBP levels decreased during replicative senescence, and
both drug and dominant negative inhibition of p300 results in accelerated onset of senescence
in melanocytes (Bandyopadhyay et al., 2002). Repression of cell cycle regulator cyclin E was
observed, though a global analysis of the effects of p300/CBP would be needed to fully
understand its role in senescence.
Polycomb mediated gene repression occurs through the concerted functions of
Polycomb Repressive Complex 1 (PRC1) and PRC2, and the actions of these repressive

18
complexes have been shown to play a major role in the process of cellular senescence. PRC2,
which typically consists of the subunits EED, SUZ12, and EZH1 or 2; establishes both the
H3K27me3 and H1K26me3 marks through the lysine methyltransferase activity of the PRC2
subunit EZH2 (Cao et al., 2002; Kuzmichev et al., 2004). Human PRC1, which is composed
of subunits that include BMI1, RING1A, RING1B, a PCGF family member, and CBX7;
recognizes the H3K27me3 mark through its CBX7 subunit, which results in ubiquitylation of
H2AK119, chromatin compaction, and transcriptional repression (Gao et al., 2012). The
Polycomb machinery has been shown to regulate p16INK4 expression, with PcG depletion
corresponding to increased p16INK4 expression in senescence and subsequent activation of
the p16/pRB pathway (Agherbi et al., 2009). PRC2 component EZH2 was shown to be
downregulated in senescence, resulting in in the depletion of H3K27me3 at p16INK4
promoter, reduced PRC1 recruitment, and increased expression of p16INK4 (Adrian P
Bracken et al., 2007). Furthermore, JMJD3, a lysine demethylase acting upon H3K27me3,
was shown to be increased during oncogene induced senescence where it recruit to and de-
repress p16INK4 (Agger et al., 2009)(Agger et al., 2009, p. 2)(Agger et al., 2009).
Contributing to this model of Polycomb complexes functioning to inhibit senescence
associated pathways, knockdown of Polycomb subunits CBX8 (Dietrich et al., 2007), BMI1
(Jacobs et al., 1999), and CBX7 in fibroblasts (Gil et al., 2004) all resulted in accelerated
senescence, while overexpression of these factors in these studies resulted in opposite effects
upon senescence. Additionally, PRC2 component EZH2 was shown to interaction with the
replication associated DNA methyltransferase DNMT1 in conjunction with PCNA (Viré et al.,
2006). Given the aforementioned decrease of DNMT1 and global DNA methylation during
senescence, changes in concerted function of Polycomb, DNA methylation, and replication
machinery may play a role in the chromatin changes observed during senescence.

19
In contrast to these results, CBX7 knockout MEFs exhibited delayed senescence as
well as reduced activation of the p53 and p16 pathways (Forzati et al., 2012). These findings
suggest that Polycomb mediated repression in senescence may play a more nuanced role than
one of uniform suppression of senescence. More generally, PRC repression and PRC2
established H3K27me3 have been shown to apply to a diverse and developementally regulated
set of genes, showing unique functions dependent upon its distribution relative to these genes
(Young et al., 2011). As such, Polycomb mediated repression’s role in senescence very likely
extends beyond its well characterized role in the p16INK4 loci. Global analysis of PRC
activity during senescence across cell types may thus explain these apparent discrepancies in
PRC function, and may provide a deeper understanding of the role of PRC mediated
repression in the induction and maintenance of the senescent state.
Heterochromatization and SAFH
The role of heterochromatin in cellular senescence has been given considerable
attention due to senescent cells’ hallmark SAHF. However, the exact function of these bodies
in the process of senescence has been recently scrutinized to generate ambiguity behind the
nature of these structures. SAHF are visible through DAPI staining along, and also stain
positive for H3K9me3, HP1, macroH2A, and HMGA (Narita et al., 2006). SAHF were
initially associated with the silencing of E2F target genes. As previously mentioned,
activation of p53 and p16 pathways results in the Rb’s association with E2F. This complex
then binds to the promoters of E2F target genes where it mediates the formation of
heterochromatin, as seen by the increase of H3K9me3 and HP1y at E2F target gene promoters
and the decrease in E2F target expression in senescent cells. SAHF were originally implicated
in this silencing process given their co-localization with E2F factors as well as the
heterochromatin marks that were shown to increase upon E2F target genes during senescence
(Narita et al., 2003; Ye et al., 2007). Additionally, SAHF have been shown to co-localize with

20
centromeres (Kreiling et al., 2011), raising the possibility for a role of SAHF in regulation of
centromere function or the expression of pericentric repeats. However, a recent study has
shown that the inactivation of the p53 pathway components AMT or p53 in OIS fibroblasts
resulted in the persistence of SAHF but also the restoration of proliferation. Citing the general
association with heterochromatin functioning to repression DDR signaling, the authors
suggested that SAHFs may instead function to suppress the DNA damage response in
senescence (Di Micco et al., 2011b). This finding suggests that, even though they are
frequently present during senescence, SAHF are unnecessary for the silencing of E2F target
genes and thus the senescence state.
Regardless of the function of SAHF, heterochromatin may play a major role in the
maintenance of the senescent state. As mentioned in the discussion of the function of SAHFs,
heterochromatin associated factors are observed to be increased upon senescent silenced E2F
target genes, a cadre of genes whose repression is likely to play a major role in the
proliferation stoppage observed during senescence. H4K20me3, a mark associated with
constitutive heterochromatin, is established by lysine methyltransferases KMT5B and KTM5C,
which have been shown to interact with Rb (Gonzalo et al., 2005). Consistent with
H4K20me3’s dependent upon the senescence activated Rb, H4K20me3 has been shown to
increase during senescence (Sarg et al., 2002) and was shown to be enriched on E2F target
genes, presumably through JMT5B/C-Rb interaction (Gonzalo et al., 2005). However, the
nature of heterochromatin in senescence remains unclear. Changes in H3K9me3 levels vary
between cell type and means of induction of senescence, the role of this key heterochromatin
mark in senescence uncertain (Kosar et al., 2011; Larson et al., 2012; Roderick J O’Sullivan et
al., 2010; Sarg et al., 2002). Further confusing the role of H3K9me3 in senescence,
SUV39H1, a writer of the H3K9me3 mark, was shown to be necessary for oncogene induced
senescence (Braig et al., 2005; Reimann et al., 2010). Conversely, the drug inhibition of

21
SUV39H1 in human microglial cells lead to the release of p21 silencing and the halting of
proliferation (Cherrier et al., 2009). Polycomb mediated repression has been linked to the
spread of facultative heterochromatin (Beck et al., 2010), and, as mentioned above, its levels
have been shown to decrease during senescence.
In all, these studies present a complicated and heterogeneous role for heterochromatin
in senescence. The patterns of heterochromatic marks such as SAHFs, H3K9me3, and
H4K20me3 have been shown to vary depending upon cell type and stress condition, and the
details of the changes, the conservation between cell type and stressor, etc. remain completely
undetermined. As another example, facultative heterochromatin associated polycomb
machinery has been discussed above as being generally depleted during senescence. However,
the observation that H3K27me3 levels have been shown to increase on the promoters of E2F
target genes indicates that changes in H3K27me3 and its associated Polycomb complex are
not entirely unidirectional (Benhamed et al., 2012). As such, an understanding of the role of
heterochromatin in senescence may require comprehensive genome-wide mapping of these
aforementioned heterochromatin associated factors.
Epigenome of premature senescence
The role of genome structure and organization in senescence is emphasized through
studies of HGPS, which is a disease characterized by accelerated cellular senescence and
abnormal nuclear structure and function (Goldman et al., 2004). HGPS is caused by a point
mutation in Lamin A, leading to the generation of a cryptic splice site that results in the
production of a truncated form of Lamin A referred to as progerin (Eriksson et al., 2003).
Mechanistically, the Lamin A domain absent from its truncated form was shown to be
required for Lamin A’s association with the NuRD complex, which is responsible for
chromatin re-modelling as well as histone histone-deacetylation through the activity of its
HDAC subunit (Pegoraro et al., 2009). NuRD has been shown to de-acetylate, among others,

22
both H3K9ac and H3K27ac, with de-acetylation allowing for their tri-methylation into the
heterochromatin associated H3K9me3 and H3K27me3, respectively (Pegoraro et al., 2009;
Reynolds et al., 2012). Consistently, HGPS is likewise characterized by increased histone
acetylation, as well as global reduction in the levels of H3K9me3 and H3K27me3, as well as
the also heterochromatin associated HP1 (Scaffidi and Misteli, 2006; Shumaker et al., 2006).
The role of NuRD in the HGPS pathology is further confirmed by knockdown of NuRD
subunits RBBP4 and RBBP7, closely resembling the HGPS phenotype (Pegoraro et al., 2009).
Increased progerin levels are observed with age in genotypically normal humans (Scaffidi and
Misteli, 2006), implicating this disease as well as NuRD activity in normal human cell
senescence. Furthermore, the NuRD complex associates with DNA methylation through its 2
subunits (Ramírez et al., 2012), creating a plausible link between NuRD mediated chromatin
remodeling and histone de-acetylation and the aforementioned changes in DNA methylation
observed during senescence.
Recent studies provided new insight into HGPS associated senescence, showing
progerin expression corresponds to the dysregulation of Lamin A associated of genes (Kubben
et al., 2012; McCord et al., 2012). It was further shown that these regions showed differential
H3K27me3 binding, as well as loss of Hi-C determined global interaction compartments in
later passage HGPS fibroblasts (McCord et al., 2012). As the Hi-C technique provides
information on global chromosomal interactions, and thus genomic organization, this
publication provides some of the first insight into the changes of chromosomal organization
that occur during senescence. This type of direct organization information will be able to
further the understanding of the senescence associated role of heterochromatin, which is itself
a structural and organizational chromosomal feature. However, as HGPS is a highly
deleterious disease caused by a mutation to a major nuclear structural component, it will be

23
key to determine whether the changes in genomic organization detected in HGPS fibroblasts
are consistent with those observed during other more “normal” routes of senescence.
Several other aspects of chromatin have been implicated in the process of senescence.
Repeat sequences, which are typically silenced due to their threat to genomic instability, are
also shown to be de-repressed during senescence in both yeast and HGPS patients (Kim et al.,
1996; Shumaker et al., 2006). The non-coding RNA ANRIL has been shown to regulate the
p15/p16 INK4 locus, functioning particularly in the polycomb mediated repression of the
tumor suppressor p15 (Kotake et al., 2011). While ANRIL has yet to be studied in rigorous
association with senescence, it or similarly functioning non-coding RNAs may serve major
roles in regulating the senescence associated state. Similarly, telomerase RNA TERC was
shown to have non-telomeric trans-binding to regions of the genome (Chu et al., 2011).
Repetitive Elements
Repetitive DNA elements constitute around 45% of the human genome, and include a
wide array of element size, function, and copy number, including short elements such as
microsatellite repeats and transposable elements such as Alus, SINEs, and LINEs (Alzohairy
et al., 2013; Sharp et al., 2006). Given that the expression of transposable elements results in
genomic instability and damage signaling (Belgnaoui et al., 2006; Konkel and Batzer, 2010),
the expression of these elements is a potential inducer of senescence. This potential role of
repetitive retrotransposable elements has been further suggested by recent studies.
Differential methylation of certain repetitive elements have been observed during human
aging, with Alu and HERV-K elements showing decreased methylation with age, while LINE-
1 methylation showed no correlation with age (Jintaridth and Mutirangura, 2010). It was also
shown in a centenarian study that Alu methylation was increased in the offspring of
centenarian versus non long-lived parents (Gentilini et al., 2012). As methylation of Alu
sequences plays a major role in Alu repression (Liu et al., 1994; Liu and Schmid, 1993), the
24
decreased Alu methylation observed in these studies suggests increased Alu transcription in
aging and senescent cells. Consistently, a study has shown increased transcription of
pericentric Alu repeats upon the replicative senescence of human adipose stem cells. This
increased transcription also corresponded to the observation of yH2AX and p53bp1 defined
damage foci at these specific pericentric regions, and that these centromeres were impaired in
their capacity to recruit the division associated cohesin and condensing complexes.
Interestingly, this study then showed that lentiviral depletion of Alu repeats restored the
proliferative capacity in these cells (Wang et al., 2011). While the association of a subset of
centromeric regions with senescence associated damage foci has been confirmed in mouse
lung and liver tissue(Kreiling et al., 2011), the full impact of these findings has yet to be
determined. Regardless, current literature strongly suggests that the expression of
retrotransposable elements may play a role in senescence. While genome wide studies on
repetitive elements are often complicated due to the difficulty of mapping deep sequencing
reads to repeat sequencing, the increased accessibility of long read and paired end sequencing
should greatly improve our ability to understand the expression, chromatin level regulation,
and thus role in senescence of these factors.
Perspective
Senescence as a whole is characterized by complex and often seemingly contradictory
features and purpose. In vivo, replicative senescence functions both as a major checkpoint
against the unchecked growth of cells bearing cancerous mutations, while also being
responsible for organismal aging through the reduction in proliferation of many tissues. SASP
have a similarly dual function, as such inflammatory secretions have been theorized to lead to
both an anti-cancer immune response as well as the degeneration of tissue associated with
organismal aging.

25
The diverse set of findings covered in this review is an indication that the
complexities of senescence extend to the role of chromatin in senescence. At a broadly
conceptual level, chromatin can facilitate both the induction and maintenance of senescence,
playing a key role in the damage response and tumor suppression pathways that maintain the
delicate middle ground between apoptosis and cancer. The complexity of senescence further
results from the wide array of features that have been implicated in its regulation, and the
apparent contradictions that may result from the lack of comprehensive data on these elements.
These contradictions become further compounded by the final layer of complexity of
senescence, which is the disparate nature of the various cell types and cell stressors that follow
often divergent mechanisms to ultimately achieve a senescent phenotype. Luckily, the recent
advent of accessible deep-sequencing technology will allow for comprehensive mapping of all
relevant epigenomic marks and features, in a wide array of cell types and stressors. Ideally,
this critical mass of data, combined with sufficient computing tools and infrastructure to be
made accessible, would allow for the nuanced understanding that is almost certain to
characterize an omnipresent phenotype as diversely unified as that of senescence.
Chapter 1, in part, was prepared with input from Dr. Yousin Suh and Dr. Michael G.
Rosenfeld. The dissertation author was the primary investigator and author of this paper.

26
CHAPTER 2 THE DELINEATION OF PROLIFERATIVE AND TOXIC ENHANCER
PROGRAMS OF REPLICATIVE SENESCENCE
Introduction
Cellular senescence is a state brought about by various stressors, leading to cells
entering into a dramatically altered state that includes persistent proliferative arrest, altered
morphology, and secretion of cytokines and other abnormal signals in a condition known as
the senescence associated secretory phenotype (SASP) (Muñoz-Espín and Serrano, 2014; Rai
and Adams, 2012; Rodier and Campisi, 2011). Senescence can occur as a result of acute
factors, including oxidative damage or oncogene introduction leading to replicative stress; as
well chronic stressors, such as replicative senescence wherein telomeres become critically
shortened upon progressive cycles of cell replication. These stressors result in activation of
the p53-p21 and/or p16/INK4 pathways, leading to the complex senescent phonotype.
Senescence is highly associated with aging and aging related pathologies, with senescent cells
having been shown to increase in aged and deteriorated tissues across mammalian species (van
Deursen, 2014). The proliferative repression associated with senescence has been implicated
in aging diseases, as the BubR1 progeria mouse model has shown exhaustion of proliferative
potential of progenitor stem cells (Baker et al., 2011). However, the cell non-autonomous
SASP feature of senescence has been shown to play a key role in senescence and aging
pathologies, as clearance of senescent cells has been shown to dramatically improve both life
and healthspan in mice (Baker et al., 2016; Chang et al., 2016).
Central to senescence and its associated pathologies is the persistence of the state.
While studies have shown the ability to rejuvenate aged mice through parabiosis of young and
aged mouse (Conboy et al., 2005), or through treatment with GDF11 (Sinha et al., 2014), they
have failed to show rejuvenation of senescent cells to a non-senescent phenotype. This degree
of entrenchment of the senescent state is consistent with a multitude of causative epigenetic

27
features that have been observed in senescence (Booth and Brunet, 2016; Sen et al., 2016).
Alterations in chromosomal architecture have been observed in senescence, and includes
alteration in lamin associated domains (LADs) (Sadaie et al., 2013; Shah et al., 2013), as well
as deterioration of chromosomal organization observed in HiC experiments (Chandra et al.,
2015). While global DNA CpG hypomethylation has been observed in senescence, increases
in DNA methylation are observed at CpG islands at the promoters of specific genes that
include many associated with senescence bypass and cancer (Cruickshanks et al., 2013).
While global loss of overall histone levels has been observed in senescence (Roderick J.
O’Sullivan et al., 2010), changes to the levels of specific modifications have been shown to be
more complicated. Senescence associated heterochromatic foci (SAHFs) have also been
observed, which are regions enriched for multiple heterochromatic markers, including HP1γ,
H3K9me3, and macro H2A; that form during senescence, and may either play a protective or
causative role in senescence (Di Micco et al., 2011a; Zhang et al., 2007). While overall levels
of the repressive mark H3K27me3 have been shown to fluctuate during senescence (Adrian P.
Bracken et al., 2007), genome wide analyses have shown both increases and decreases in the
mark that are gene and region specific and correspond with transcriptional changes that occur
during senescence (Shah et al., 2013). Gene and region specific changes in the transcriptional
activating mark H3K4me3 have been observed in senescence as well (Shah et al., 2013), with
the H3K4 methyltransferase MLL1 being necessary for SASP (Capell et al., 2016).
Consistent with the gene specific regulation of the epigenetic features of senescence,
activity of several transcription factors has been shown to play a key role in the senescent
phenotype. FOXO/DAF-16 is a transcription factor, which has been shown to bind to
promoter and enhancer regions and have pioneering capability (Webb et al., 2013; Zaret and
Carroll, 2011), has been shown to promote longevity in worms, flies, and mice (Cynthia J.
Kenyon, 2010) and has been implicated in suppressing senescence in human cells in a manner
28
dependent on the histone deacytylase SIRT1 (Ido et al., 2015). NFkB is a key regulator of
inflammation and has been shown to play a major role in acquisition of SASP (Chien et al.,
2011; Salminen et al., 2012). More recently, GATA4 was shown to play a key role in both the
proliferative and SASP features of senescence through autophagy related signaling pathways
(Kang et al., 2015). The relevance of transcription factor and enhancer function in senescence
was further confirmed broadly by the observation of changes in enhancers during oncogene
induced senescence (Tasdemir et al., 2016). While this body of evidence suggests a major
role of enhancers and transcription factors in the onset of senescence, the dynamics of
enhancer activation during senescence and the impact of such a program upon the senescent
phenotype remain poorly understood, as does the relationship of transcription factors with the
senescence enhancer program. Here perform a comprehensive study of the enhancer
dynamics of senescence, relate this program to distinct programs of cellular proliferation and
SASP, associate these programs with NFI family members and NFkB respectively, and finally
identify a novel change in histone dynamics relating to H3K79me3, H4R3me2sym, and
H4R3me2as related to senescence.
Results
In order to examine the epigenetic landscape associated with the process of replicative
senescence, we first sought to characterize the difference in enhancer profiles between early
passage proliferating and late passage, non-proliferating, senescent fibroblasts. We performed
these studies in BJ fibroblasts, which are a normal human foreskin cell line that reaches
cellular senescence approximately at population doubling 64. To identify enhancers, we
performed ChIP-seq in duplicate against H3K4me2 and H3K27ac histone marks, in PD30
(proliferating) and PD64 (senescent) cells, and identified non promoter regions containing
peaks of both marks. We determined that 2169 enhancers were gained in replicative
senescence, based on a 2-fold gain in H3K27ac signal intensity, and a 1.5-fold gain in

29
H3K4me2 (Fig.1). Conversely, we found that 1565 enhancers were lost based on 2-fold
H3K27ac and 1.5-fold H3K4me2 decreases during senescence, as well as 51,293 enhancers
that did not change based on the above criteria. To determine any potential function of these
gained enhancers, we performed RNA-seq and GRO-seq in PD30 and PD64 BJ fibroblasts to
identify any changes in the transcriptional program between proliferating and senescent BJ
fibroblasts. We identified 639 genes that were highly up-regulated during replicative
senescence, and 598 down-regulated, with the criterion of >1.5-fold change in mRNA
transcripts, standard error >1, and an average expression >9 tags per million (Fig.2,3). The
GO terms of these genes were broadly consistent with those observed in replicative
senescence, with the up-regulated genes enriching for activation of the p53 signaling pathway,
regulation of growth, signal secretion and release, while the down-regulated genes enriched
for genes associated with cell cycle and DNA replication (Fig.4,5). Furthermore, analysis of
the GRO-seq showed considerable pause release regulation of both the up and down-regulated
gene sets during replicative senescence (Fig.6).
To determine the relationship between the changed enhancer and transcription profiles
in replicative senescence, we identified the nearest expressed gene for each gained enhancer,
and found that genes nearby gained enhancers showed a gain of transcription during
replicative senescence (Fig.7). Furthermore, by targeting shRNA to eRNAs identified by
GRO-seq to be induced in replicative senescence, we observed a significant reduction on the
nearby senescence-induced target genes (Fig.8). Therefore, the gained enhancers, at least in
part, appear to functionally alter the transcriptome during the senescence process.
In order to explore the plasticity of the onset of senescence in BJ fibroblasts, and the
role that the gained enhancer program may play in the amelioration of aspects of the senescent
phenotype, we treated BJ fibroblasts with rapamycin, a potent inhibitor of mTOR and one of
the most potent drugs in promoting longevity in mice and delaying the onset of replicative

30
senescence. Long term treatment of BJ fibroblasts with 500nM rapamycin results in
approximately 25% increase in the maximum population doubling, before reaching growth
arrest (Fig.9). ChIP-seq of H3K27ac and H3K4me2 in rapamycin treated BJ fibroblasts
showed reduction in the increase in the enhancers gained in replicative senescence (Fig.10,11).
Interestingly, that rapamycin treated PD 80 BJ fibroblasts showed the morphology of early
passage proliferating BJs, as well as very low levels of β-galactosidase staining when
compared with senescent BJs, regardless of the fact that these rapamycin-treated cells were
growth arrested and had undergone >15 additional population doublings from non-rapamycin
treated BJs (Fig12). Given that rapamycin treatment seemed to delay the secretory and
morphological aspects of senescence, we were curious whether the withdrawal of rapamycin
would result in the activation of this aspect of senescence. To our surprise, within just 2
weeks of withdrawal of rapamycin, we observed dramatic onset of senescent morphology and
increase of β-gal staining (Fig.12). Additionally, while RNA-seq of late passage BJ
fibroblasts under rapamycin-maintained versus rapamycin-withdrawal conditions showed a
general correlation between the genes induced with rapamycin withdrawal conditions and the
genes induced in replicative senescence(Fig.13), GO analysis of the withdrawal induced genes
showed striking enrichment of genes associated with the inflammatory and secretory pathways
(Fig.14). We next determined whether these transcriptional and phenotype changes associated
with rapamycin withdrawal correlated to the enhancer program identified in replicative
senescence. ChIP-seq of H3K27ac and H3K4me2 in late passage rapamycin-maintained versus
withdrawal BJ fibroblasts showed a clear increase in the enhancers gained during replicative
senescence (Fig.15,16). Furthermore, examination of the 1512 enhancers gained in rapamycin
withdrawal not only showed a correlation with the enhancers gained in replicative senescence,
but also examination of the nearest expressed genes to the enhancers gained on withdrawal

31
showed a strong correlation of the withdrawal-induced enhancer and transcription programs.
(Fig.17,18).
As several recent publications have used HiC techniques to show dramatic changes in
chromosomal architecture occurring in the onset of senescence, we performed HiC in BJ
fibroblasts that were early passage (PD30), late passage senescent (PD64), late passage
rapamycin treated (PD80) cells, and late passage BJ fibroblasts (PD80) withdrawn from
rapamycin for 2 weeks. Consistent with literature (Chandra et al., 2015; McCord et al., 2013),
we noticed many clear regions of dramatic change in interactions leading to altered in A/B
compartments, even in very late passages, when comparing proliferating and senescent cells.
Interestingly, we observed that these changes in A/B domains seemed to be largely blocked by
sustained treatment with rapamycin, (Fig.19). More surprisingly, we noticed that this
“protection” of the young cell A/B landscape was maintained even after 2 weeks of rapamycin
withdrawal. While these senescence associated changes in A/B compartmentalization could
certainly occur with extended duration of rapamycin withdrawal, and are a subset of these
senescent associated changes in A/B compartmentalization that do occur in rapamycin
withdrawal, these results suggest that these changes in A/B compartmentalization are largely
not necessary factors in the onset of either the proliferative or morphological and secretory
phenotypes of replicative senescence.
Having identified the enhancer program of replicative senescence, as well as
delineating a subset of this program as governing the SASP phenotype, we next sought to
identify what transcription factors might govern these enhancer and transcriptional programs.
We began by performing motif analysis of gained enhancer peaks. Given the broadness of
H3K27ac and H3K4me2 peaks, which increases the sequence length and thus background of
peaks for motif finding, we defined different subsets of gained peaks, using H3k27ac and
H3K4me2 combined and independently, and setting multiple thresholds for fold-change of

32
peak intensity and minimum thresholds of peak intensity in senescent cells. We also
generated multiple control sets of enhancers that were defined by similarly varying the
aforementioned thresholds. Through these analyses and comparing to controls, we found that
NFκB motif was strongly enriched in gained senescence peaks but not in controls, and, when
taking into account the extensive body of literature associating NFκB and inflammation with
aging and senescence, marked NFκB as an ideal candidate for playing a role in the activation
of enhancers in replicative senescence (Fig.20). We also identified the motif of the NFI
family of factors, which includes NFIA, NFIB, NFIC, and NIFX, which have reported roles in
differentiation, tumerigenesis, proliferation activation and repression, and altering chromatin
accessibility (Denny et al., 2016; Fane et al., 2017; Harris et al., 2015) (Fig.21).
To determine the change in p65 binding during replicative senescence, we performed
ChIP-seq against BJ fibroblasts at PD19 (young proliferating), PD30 (young proliferating),
PD46 (early senescence), and PD57 (senescent). We observed both an increase in the number
of peaks during increased population doubling, and an increase in binding of p65 at our
senescence induced enhancers. 284 of 2169 senescence induced enhancers show p65 binding
in PD57 senescent cells (Fig.22).
Additionally, we performed ChIP-seq against NFI transcription factors in early
passage proliferating and senescent BJ fibroblasts using a pan-antibody targeting all four NFI
family members. While we observed minimal difference in overall NFI binding between
proliferating and senescent BJ fibroblasts, we observed a marked increase from 167 to 418
NFI peaks bound at the 2169 senescence induced enhancers (Fig.23).
To determine the function significance of p65 and NFI family members upon the
transcriptional program regulated by the senescence induced program of enhancers, we
knocked down p65, NFIA, NFIB, NFIC, and NFIX in PD64 BJ fibroblasts and performed
RNA-seq and ATAC-seq upon each after 2 weeks of knockdown. We observe a clear

33
reduction in the level of transcripts near senescence induced enhancers in knockdown of p65
versus sh-GFP control, and we observed a clear difference with only two of the NFI family
members (NFIA and NFIC) (Fig.24). Consistent with these findings, we observed that
knockdown of p65, NFIA, and NFIC result in reduction of ATAC-seq signal at the enhancers
induced during replicative senescence (Fig.25). Furthermore, knockdown of p65 reduces the
ATAC-seq signal at senesce-induced enhancers that are bound by p65. Similarly, knockdown
of NFIA and NFIC show reduction of ATAC-seq signal at senescence-induced enhancers
showing peaks in NFI ChIP-seq, while NFIB and NFIX show relatively minimal differences
versus GFP control (Fig.26). These results suggest that p65, NFIA, and NFIC binding during
replicative senescence contributes to the enhancer program changes during replicative
senescence, as well as the resulting changes to the cell transcriptional profile.
To determine the role of NFI family members in the phenotype of senescence, we
performed knockdown of NFIA, NFIB, NFIC, and NFIX in BJ fibroblasts at PD26 and
observed whether each knockdown had an effect of the maximum population doublings of BJ
fibroblasts. Consistent with expression and ATAC-seq data, we observed that NFIA and
NFIC knock-down both dramatically increased maximum population doublings, while
knockdown of NFIB and NFIX resulted in no effect or lowered population doublings,
respectively (Fig.27).
Given that withdrawal of rapamycin from high passage BJ fibroblasts results in an
induction of a SASP like phenotype without any alterations in proliferation, we reasoned that
the genes induced in both rapamycin withdrawal and replicative senescence would be
associated with the SASP phenotype, while those genes induced by replicative senescence but
not induced during rapamycin withdrawal might be enriched for genes associated with
proliferation. Indeed, chemical inhibition of the p65 pathway seemed to have no effect upon
the maximum population doublings of BJ (Fig.28), and knockdown of p65 had a greater

34
impact versus control on the rapamycin induced subset of the 639 genes induced during
replicative senescence (Fig.29). Accordingly, after ranking the 639 genes induced in
replicative senescence based on their induction in rapamycin withdrawal, we observe that the
top 300 least rapamycin-induced genes show enrichment for GO-terms associated with cell
cycle arrest (Fig.30). Interestingly, we observe that NFIA and NFIC knockdown versus
control in PD64 BJ fibroblasts have a significant reduction in the non-rapamycin induced
senescence induced program (300 transcripts) of senescence (Fig.31,32). These results NFIA
and NFIC may promote the proliferative, but not the SASP, aspects of replicative senescence.
To better isolate the role of p65 in the SASP program of senescence, we decided to
examine its dynamics in the context of rapamycin withdrawal. We performed ChIP-seq of
p65 in PD80 BJ fibroblasts either maintained in 500nM rapamycin or removed from 500nM
rapamycin for 2 weeks. We observe a dramatic increase in p65 binding (Fig.33). This result
is confirmed by our observation that treatment of withdrawal cells with TCPA-1 IKK-2
inhibitor blocks this increase in binding. To confirm the functional importance of p65 in the
SASP transcriptional program of senescence, we compared knockdown of p65 versus sh-GFP
control in the rapamycin withdrawal condition, and observed a striking reduction in the levels
of genes induced with rapamycin withdrawal (Fig.34). We also show that knockdown of p65
has a clear effect in preventing the morphological changes that occur in rapamycin withdrawal,
further confirming the importance of p65 in the SASP phenotype (Fig.35). Importantly, we do
not observe this striking inhibition of rapamycin-withdrawal transcript induction upon
knockdown of NFI family members (Fig.34), further establishing the proliferative and SASP
phenotypes of being dependent of distinct enhancer functions.
We then sought to use our novel isolation of the SASP program through rapamycin
withdrawal to identify factors that may specifically regulate the SASP phenotype of
senescence. Based on our RNA-seq and GRO-seq results, we showed that INHBA gene was

35
reduced by an average of 1.88 fold on rapamycin withdrawal. As the INHBA gene product
can either homodomerize to form ActivinA, heterodimerize with INHBB to form Activin AB,
or heterodimerize with INHA to form Inhibin, we decided to treat cells with ActivinA,
ActivinAB, or Inhibin in PD83 cells in rapamycin maintenance or withdrawal conditions. We
observed that both ActivinA and ActivinAB strikingly reduced the genes being activated in
rapamycin withdrawal, while Inhibin treatment had no discernible effect upon the rapamycin
withdrawal program (Fig.36).
We then attempted to determine whether the altered enhancer program we identified
in replicative senescence corresponds to global alterations in the levels of any histone
modifications. We performed western blots in BJ fibroblasts at a range of population
doublings over a large panel of histone modifications and came to identify H3K79me3 and
H4R3me(2as) as increasing in replicative senescence, while H4R3me(2sym) exhibited a clear
decrease (Fig.37). Previous studies from our lab had associated the symmetric to asymmetric
switch at enhancers to increased pause release of associated genes (Liu et al., 2013), and other
reports have widely associated the symmetric mark with transcriptional repression and the
asymmetric mark with transcriptional activation (Baldwin et al., 2014; Kim et al., 2016; Xu et
al., 2010). To determine the conservation of these changes across cell types, condition, and
species, as well as the relevance of these modifications to aging, we examined these
modifications using a ZMPSTE24 knockout mouse model of HGPS premature aging
syndrome in isolated kidney tissue. Consistent with our results in human BJ fibroblasts, we
observed that H3K79me3 and H4R3me2as increased both in knockout of ZMPSTE24, as well
as with increased age (Fig.38). Conversely, H4R3me(2sym)showed a decrease in such
conditions.
To further examine the role of H3K79me3 in replicative senescence, we performed
ChIP-seq upon H3K79me3, its precursor H3K79me2, and H2Bub, whose knockdown’s

36
reduction of H3K79 methylation suggests a role upstream of H3K79me3 (Ma et al., 2011).
While we observe a global increase in the levels of H3K79me3 (Fig.39,40), we observe that
the increase in H3K79me3 is considerably more striking on genes up-regulated during
replicative senescence (Fig.41). As we observe increase of both H3K79me3 and H3K79me2
along gene bodies, with no change in the levels of the upstream H2Bub, we reasoned that the
changes in H3K79 methylation were regulated through its writer, DOT1L (Fig.39,40). The
role of DOT1L in the changes of H3K79me3 was confirmed, as treatment of BJ fibroblasts
with EPZ-5676 resulted in a dramatic reduction of H3K79me3 signal in both ChIP-seq (data
not shown) and western blot (Fig.42c). To determine the functional role of H3K79me3 and
DOT1L on the onset of replicative senescence, we began treating early passage BJ fibroblasts
with EPZ-5676, which resulted in an increase in the maximum population doubling (Fig.42a).
Conversely, BJ fibroblast lines stably over-expressing DOT1L showed a decrease in maximum
population doublings (Fig.42b). To determine the effect of H3K79me3 inhibition on the
senescence transcription patter, BJ fibroblasts continuously treated from early passage with
either rapamycin or DMSO as a control were harvested for RNA-seq at early and late passage.
The data showed that EPZ-5676 reduced expression of the genes induced during replicative
senescence and increased expression of the genes decreased during senescence (Fig43a).
Given that EPZ-5676 showed anti-senescence effects, we decided to explore whether EPZ-
5676 might have additional effect on the senescence transcriptional program when combined
with rapamycin treatment. Interestingly, we observe that that combined EPZ-5676 and
rapamycin treatment resulted in decreased and increased expression for the senescence
induced and repressed gene sets, respectively, when compared with either EPZ-5676 or
rapamycin treatments alone (Fig43b). These results suggest that the H3K79me3 increase is a
key epigenomic aspect of replicative senescence, and that inhibition of the mark’s writer,

37
DOT1L, has potential clinical benefit in aging pathologies alone or in combination with
rapamycin.
To determine the role of H4R3 methylation in replicative senescence, we stably
overexpressed the following in young BJ fibroblasts: PRMT1, the writer of H4R3me(2as);
PRMT5, the writer of H4R3me(2sym); and JMJD6, the eraser or H4R3me(2sym). Consistent with
the changes in H4R3 methylation observed in replicative senescence by western blot, we find
that overexpression of both PRMT1 and JMJD6 result in reduced maximum population
doubling, whereas PRMT5 overexpression increased maximum population doubling (Fig.44).
Conversely, stable knockdown of JMJD6 results in increased maximum population doubling
(Fig.45), which, combined with our overexpression and western blot results, suggest JMJD6
may play a role in establishing replicative senescence. The role of JMJD6 in establishing the
senescent phenotype was further confirmed upon RNA-seq of JMJD6 knockdown lines, as the
senescence induced transcriptional program of 639 genes was significantly reduced in
senescent cells with JMJD6 knockdown versus non-silencing controls(Fig.46). We then
performed ChIP-seq against 2 different stably tagged JMJD6 BJ fibroblast cell lines at early
and senescent population doublings. Both replicates show increased binding during in the
senescent condition at the enhancers we identified as induced during replicative senescence
(Fig.47). To confirm the effect of knockdown of JMJD6 on genomic levels of H4R3me(2sym),
we performed native-ChIP-seq against H4R3me(2sym) in sh-non-silencing control and JMJD6
knockdown lines, at both early and late senescent passages. Consistent with our western blot
results, we observe a dramatic decrease in total H4R3me(2sym) peak number in senescent cells
(Fig.48). Furthermore, we observe that regions showing loss of H4R3me2sym levels in
replicative senescence in control lines show increased level of H4R3me(2sym) in JMJD6
knockdown lines, further confirming the role of JMJD6 in the global decrease of H4R3me(2sym)
observed during replicative senescence (Fig.49). We then sought to determine how the levels

38
of H4R3me(2sym) change during senescence on the enhancers that we identified as induced
during replicative senescence. Interestingly we observe a decrease during senescence of the
repressive H4R3me(2sym) mark on the enhancers gained during replicative senescence (Fig.50).
Furthermore, this decrease in H4R3me(2sym) is, in part, dependent upon JMJD6, as knockdown
of JMJD6 reduced the depletion of H4R3me(2sym) observed in senescence on the senescence
gained enhancers (Fig.50). Taken together, these results suggest that H4R3 methylation
dynamics play a functional role in replicative senescence, and that modulation of the writers
and erasers of these marks have exciting potential for modification of the senescent phenotype.
Discussion
Our results show that not only do enhancers play a key role in driving the senescence
phenotype, but that distinct factors regulate subsets of these enhancers to differentially control
the proliferative and SASP programs of senescence. We show that NFIA and NFIC act on a
subset of enhancers to regulate cell proliferation and its associated transcriptional program.
The NFI family of transcription factors had largely been linked to differentiation and
development (Harris et al., 2015) as well as oncogenesis (Fane et al., 2017), with NFIB being
recently shown to promote metastasis through opening chromatin at enhancer like elements
(Denny et al., 2016). The differential role in senescence of NFI family members in our study
mirrors the varied cancer effect of NFI members in cancers, as different members have been
linked to both oncogenic and tumor suppressor function depending on their system (Fane et al.,
2017).
Conversely, NFkB functions on a different subset of the enhancers gained in
replicative senescence to regulate the SASP program, independent of any effect upon
senescence associated proliferative repression. While the role of NFkB in senescence has long
been shown, our data clarifies the independence of NFkB program from the cell cycle arrest
observed in replicative senescence (Chien et al., 2011; Salminen et al., 2012). This enhancer

39
based delineation of the proliferative and SASP features of senescence highlights their
independence, which suggests the exciting potential for regulation of one phenotype
independently of the other. Furthermore, abundance of transcription factors and complexity of
signaling the occurs in senescence suggests we’ve just begun to scratch the surface of
enhancer regulation, and that further exploration of the different enhancer programs that exist
in replicative senescence may allow for further and more nuanced manipulation of the
senescence phenotype.
We are further excited to explore the relationship of our changed enhancer program to
super-enhancers. Super-enhancers are particularly key regulators of cell behavior (Hnisz et al.,
2013b), and, consistent with recent observations (Tasdemir et al., 2016), we observe that many
of our changed enhancers can be classified as super-enhancers. It remains to be seen how the
super-enhancer code of senescence, and the factors affecting it, relate to the enhancer code we
have observed.
A major goal of aging and senescence research is to develop treatments to increase
lifespan and healthspan without negatively simultaneously promoting cancer. While
overexpression of telomerase allows cells to proliferate indefinitely while bypassing cellular
senescence (Stewart and Weinberg, 2002) and is sufficient to extend mouse lifespan
(Bernardes de Jesus et al., 2012), the bypass of proliferative repression phenotype of
senescence is a hallmark of cancers (Hanahan and Weinberg, 2011), with mice constitutively
overexpressing telomerase showing concordant increases of oncogenesis (Artandi et al., 2002;
Canela et al., 2004; González-Suárez et al., 2001; McKay et al., 2008). Studies showing
extended life and healthspan upon clearance of senescent cells link the pathological influence
of senescent cells to their SASP activity (Baker et al., 2016; Chang et al., 2016). The
delineation of enhancer programs and factors uniquely regulating either proliferation or SASP
in senescence provides a foundation for the discovery of SASP or proliferation selective

40
factors. ActivinA and ActivinAB, which were shown in our study to dramatically block SASP
induction, is one such example of a factor whose treatment could have a major impact on
aging pathologies. We are excited to explore what impact such treatments could have on in
vivo models.
Complementing the identification of transcription factors that regulate distinct
programs of senescence, our identification of the senescence switch of H4R3me2sym high to
H4R3me2asym and H3K79me3 high during senescence has important clinical. Our panel of
histone modifications shows the majority of histone modifications unchanged in BJ fibroblast
replicative senescence, and many key senescence associated histone modifications show gene
specific rather than global changes. However, the dramatic change in levels during
senescence of our aforementioned modifications suggests they may function as a uniquely
strong marker of aging tissue, which could have clinical value for the identification of aging
pathologies. Furthermore, the impact of our manipulation of the histone writers and erasers of
these modifications obviates the need for development of specific small maker inhibitors of
these enzymes. Our results also should encourage the exploration of the roles of additional
under-studies histone modifications, as histone arginine methylation remains poorly explored
in senescence and our results show this family of modifications and their modifiers can have
striking effect on senescence.
Our results thus show a novel integration of the enhancer program, transcriptional
dynamics, histone code, and activated transcription factors involved in senescence, and we use
these finding to delineate and modify the clinically significant proliferation and SASP related
features of senescence.
Chapter 2, in part, is currently being prepared for submission for publication of the
material. Suter, Thomas; Tazearslan, Cagdas; Merkurjev, Daria; Meluzzi, Dario; Suh, Yousin;

41
Rosenfeld, Michael. The dissertation author was the primary investigator and author of this
paper.

42
CHAPTER 3 LIGAND-DEPENDENT ENHANCER ACTIVATION REGULATED BY
TOPOISOMERASE-I ACTIVITY
Summary
The discovery that enhancers are regulated transcription units, encoding eRNAs, has
raised new questions about the mechanisms of their activation. Here, we report an unexpected
molecular mechanism that underlies ligand-dependent enhancer activation, based on DNA
nicking to relieve torsional stress from eRNA synthesis. Using dihydrotestosterone (DHT)-
induced binding of androgen receptor (AR) to prostate cancer cell enhancers as a model, we
show rapid recruitment, within minutes, of DNA topoisomerase I (TOP1) to a large cohort of
AR-regulated enhancers. Furthermore, we show that the DNA nicking activity of TOP1 is a
prerequisite for robust eRNA synthesis and enhancer activation, and is kinetically
accompanied by the recruitment of ATR and the MRN complex, followed by additional
components of DNA damage repair machinery to the AR-regulated enhancers. Together, our
studies reveal a linkage between eRNA synthesis and ligand-dependent TOP1-mediated
nicking – a strategy exerting quantitative effects on eRNA expression in regulating AR-bound
enhancer-dependent transcriptional programs.
Introduction
Research over the past few years, supported by data from GRO-seq analysis and the
ENCODE project, has revealed that most developmental and regulatory transcriptional
regulation programs are controlled by an extensive enhancer network (Kim et al., 2010;
Shlyueva et al., 2014), with each cell type estimated to harbor 70,000-100,000 enhancers,
located upstream and downstream of coding target gene promoters (Pennacchio et al., 2013).
Enhancer signatures include mono-methylated H3K4 (H3K4me1) and H3K27-acetylated
histones (Kim et al., 2010; Li et al., 2013a; Wang et al., 2011). These enhancers are usually
characterized by a nucleosome-depleted core region where many of the cooperating

43
transcription factors bind (Andersson et al., 2014; Hah et al., 2013; Kaikkonen et al., 2013; Lai
et al., 2013; Lam et al., 2013; Li et al., 2013a; Melgar et al., 2011; Melo et al., 2013; Mousavi
et al., 2013). Most surprisingly, enhancers are also transcription units, wherein their effect on
target coding genes correlates with the transcription of the lncRNAs, referred to as eRNAs
(Andersson et al., 2014; De Santa et al., 2010; Hah et al., 2013; Kaikkonen et al., 2013; Kim et
al., 2010; Lai et al., 2013; Lam et al., 2013; Li et al., 2013a; Melgar et al., 2011; Melo et al.,
2013; Mousavi et al., 2013) adding a new layer of regulation to the fundamental mechanisms
underlying enhancer action (Lam et al., 2014; Natoli and Andrau, 2012).
The current prevailing belief, based on chromosome capture assays, where looping
constraints are inferred from interaction frequencies between a point of interest and distal loci
of the genome is that the main mechanism by which enhancers affect their target gene
expression is through chromatin looping. eRNAs transcripts seem to be functionally important
by contributing to the stabilization of juxtaposed enhancer-target gene promoter loops to allow
for optimal gene expression (Lai et al., 2013; Li et al., 2013a). However, both eRNA synthesis
and nucleosome depletion are potential sources of topological strain on enhancers that can
potentially hinder transcription. The movement and rotation of RNA polymerase complex
(RNAP) along DNA template during the process of RNA synthesis (Liu and Wang, 1987) can
generate positive supercoils in front of the advancing RNAP, and negative supercoils behind it
(Darzacq et al., 2007; Kouzine et al., 2013; Kouzine and Levens, 2007; Liu and Wang, 1987).
Because RNA polymerase is a powerful torsional motor, it can alter DNA topology by creating
DNA supercoils, which can propagate and affect transcription elongation (Ma and Wang, 2014).
While negative supercoiling can initially facilitate transcription initiation, either by helping
RNAP to form an open complex or by helping to recruit transcription factors (Ma and Wang,
2014), it can subsequently lead to the generation of R-loops resulting from hybridization of
nascent RNA to the DNA strand that is being transcribed, which in turn can impede

44
transcriptional elongation (El Hage et al., 2010). Positive or over-wound supercoiling can
prevent transcription initiation and greatly diminish mRNA synthesis (Ma and Wang, 2014).
Moreover, the very depletion of histones from the core region of enhancers releases
unconstrained negative supercoils, which can impede transcription factor binding. One
mechanism that resolves the undesirable effects of excessive supercoiling employs DNA
topoisomerases, including topoisomerase I (TOP1). TOP1 can relax both negative and positive
supercoils by transient single-strand breaks for the passage of individual DNA strands through
one another, followed by the rejoining of the phosphodiester backbone of DNA (Pedersen et al.,
2012; Pommier et al., 2006).
While TOP1 activity is well established in DNA replication, its potential functionality
in enhancer activation and transcriptional initiation remains unclear. Most of the experiments
hitherto examining the role of TOP1 in transcription have been limited to artificial promoter
model systems which, if anything, have argued that TOP1 DNA nicking activity is not
involved in transcriptional activation in such in vitro systems (Kretzschmar et al., 1993;
Merino et al., 1993; Shykind et al., 1997).
However, the utilization of a nicking strategy for transcriptional initiation and
enhancer regulated events would be in concert with the elegant explication of the molecular
mechanisms underlying the expression of bacteriophage T4 late genes, with the participation
of DNA-mounted activator of transcription, gp45 and RNAP-bound gp33. Here, a nick in the
strands of the DNA and the actions of an exonuclease are required, with the DNA template
single-strand nicks being essential for transcriptional activation and the nicked-DNA gp45-
loading site located upstream or downstream of its target site (Herendeen et al., 1992). Also, in
human cells, artificially-generated nicks (but not double-strand DNA breaks) have recently
been found to be associated with transcription (Davis and Maizels, 2014). Together, these and

45
other experiments in prokaryotes and eukaryotes suggest an intriguing link between DNA
nicking and transcription but the mechanism and the factors involved remain largely unknown.
Here, we describe a molecular mechanism that operates at functional androgen-
regulated enhancers and identify DNA topoisomerase I as a critical DNA-nicking enzyme
involved in the process of cell-specific, ligand-driven enhancer activation. Recruitment of
TOP1 to these AR-bound enhancers is of functional consequence as knockdown of the
enzyme in the prostate cancer cells results in inhibition of DHT-regulated eRNA and many
coding gene transcriptional targets. Additionally, we provide evidence that recruitment of a
significant repertoire of DNA damage response machinery occurs on these functional
enhancers, potentially to prevent undesirable effects of persistent DNA damage.
Results
TOP1 Recruitment to AR-Regulated Enhancers Affects eRNA and Coding Gene
Expression
To further investigate the mechanism of enhancer activation in ligand-regulated
transcription, we employed an early prostate adenocarcinoma cell line, LNCaP, the growth of
which is androgen-dependent (Horoszewicz et al., 1980). The cell line is exquisitely sensitive
to androgen stimulation and arrests in the G1 phase of the cell cycle upon steroid depletion,
despite the presence of peptide growth factors (Fig. S1A). Regulation of cyclin D expression
and concomitant CDK4 activity represents one mechanism by which androgen impinges on
the cell cycle to govern proliferation (Knudsen et al., 1998).
To investigate whether TOP1 played a role in ligand-regulated transcription, we
undertook to examine the possible recruitment of TOP1 to enhancers; finding that it was
recruited to several AR-enhancers early in response to androgen (5-dihydrotestosterone,
DHT) treatment in the ligand-dependent LNCaP prostate cancer cell line (Fig.51A, Figure
S1B). These data prompted us to study genome-wide localization of this protein by

46
performing chromatin immunoprecipitation (ChIP) coupled with next-generation sequencing
(ChIP-seq). Because exhaustive efforts to identify a TOP1 antibody suitable for ChIP-seq
proved unsuccessful, we generated a stable LNCaP cell line with inducible biotinylated TOP1
expression. We observed that TOP1 recruitment in response to DHT, generated enriched
regions of a range of sizes (Fig. 1B), as opposed to point sources, as found for factors such as
androgen receptor, or broad sources, such as observed for the H3K36me3 histone mark (Sims
et al., 2014). Consistent with the observation that enhancers represent regulated transcription
units, we noticed a hormone-dependent increase in RNA PolII (phospho-Ser5) occupancy
predominately at these enhancers (Fig.51B, Figure S1C). As expected, we also observed
increased TOP1 occupancy over promoters and gene bodies of the representative DHT-
induced genes (e.g., KLK3 and KLK2), consistent with the possibility that TOP1 might be
involved in both enhancer activation and transcriptional elongation events.
Preliminary analysis demonstrated that TOP1 binding overlapped in particular with
that of liganded androgen receptor at enhancers (Fig.51B, Fig. S1C). Genome-wide analysis
revealed 6545 putative “AR-bound enhancer” sites based on the criterion of an AR-bound
locus marked with H3K4me1, H3K27Ac, and more than 1kb away (in either direction), from
the promoter of annotated genes, of which 96% bound TOP1, with 3921 (60%) exhibiting a
DHT-stimulated increase in TOP1 binding (Fig. S1D).
To assess eRNAs induced by DHT, we took advantage of technological advances that
permit mapping of the position, amount, and orientation of transcriptionally engaged RNA
polymerase II on a genome-wide scale (Core et al., 2008). GRO-seq analysis (Core et al., 2008)
of serum-starved LNCaP cells treated for 1h with DHT, identified 644 putative AR enhancers
with significantly up-regulated eRNAs (Fig. 1C), which is the best mark of activated
enhancers (Hsieh et al., 2014; Li et al., 2013a), amongst which 477 (~74%) were noted to
have increased TOP1 occupancy in response to ligand at 30’ (Fig. 1D); and virtually all

47
appear to exhibit DHT-increased TOP1 binding at 15’ (Fig. S5C). Because TOP1 has been
shown to affect the transcriptional activity of RNA PolII (Kretzschmar et al., 1993), we
decided to investigate whether knockdown of TOP1 would alter eRNA synthesis from the
androgen-regulated enhancers. Knockdown of endogenous TOP1 by small interfering RNA
(siRNA) revealed that eRNA induction was reduced in at least 79% (507 of 644) of AR-
regulated enhancers (Fig.51C, E), accompanied by a decrease in the induction of 368 coding
target genes in the experiment shown (Fig.51F), with similar results in repeat experiments. 92%
of DHT-induced eRNAs were up-regulated more than 2-fold, with FC average of 7.6x.
Analysis of 100 randomly selected housekeeping genes not regulated by DHT in our GRO-seq
experiments, confirmed that the specific siRNAs used for this study had no effect on their
expression (Table S3).
To validate all major mechanistic points in this study, we chose four enhancers-gene
pairs. Three of these enhancers (KLK3E, KLK2E and TMPRSS2E) are validated by previous
studies (Andreu-Vieyra et al., 2011; Clinckemalie et al., 2013; Hsieh et al., 2014). The fourth
one, NDRG1E, meets the criteria of others. It is an AR-bound element located not too far
away from the NDRG1 gene TSS (-29kb), it is H3K4me1+, H3K27Ac+ and following
hormone stimulation the transcription unit produces DHT-dependent, bi-directional eRNA,
making it a strong candidate. Using these enhancer sites, we found that recruitment of the
nuclear receptor co-activators (p300 and SRC-1) at AR enhancers was diminished (Figure
S1E). Thus, TOP1 knockdown attenuated the induction of eRNA (1h DHT treatment) and the
production of mRNA of the corresponding target genes 5h after ligand addition (Fig.51G,
Figure S1F). Importantly, the fold-induction (-/+ DHT) was similar between independent
experiments in which eRNA levels were measured. Surprisingly, we noted that ATR (Ataxia
telangiectasia and Rad3-related), a protein involved in DNA damage repair, was recruited to
AR-regulated enhancers at ~15 min following addition of ligand (Fig.51H, Figure S1G).

48
Together, these data identify TOP1-bound genomic regions that bear enhancer marks and
produce eRNA in a DHT-dependent manner. Knockdown of TOP1 reduces production of
eRNA and coding gene RNA for most of these AR-regulated target genes.
NKX3.1 and TOP1 Co-occupy Enhancer Binding Sites and Regulate the AR
Transcription Program
NKX3.1 is an androgen-regulated transcription factor (Bhatia-Gaur et al., 1999),
which is a highly selective and specific marker of metastatic prostatic adenocarcinoma (Gurel
et al., 2010). NKX3.1 has been found to interact with TOP1 to enhance formation of the
TOP1-DNA complex and increase TOP1 nicking of DNA (Bowen et al., 2007). In fact, TOP1
activity in prostates of Nkx3.1 +/- and Nkx3.1-/- mice is reduced compared with wild-type mice,
but not in other organs that do not express Nkx3.1 (Bowen et al., 2007). Overlap of the
reported NKX3.1 ChIP-seq dataset (Tan et al., 2012) with that of AR and TOP1 revealed that
NKX3.1 occupancy was highest at AR enhancers, with NKX3.1 binding sites located over
regions with increased TOP1 binding (Fig.52A, Figure S2A). We observed that AR and
TOP1 started to be recruited to AR-enhancers within a few minutes after DHT stimulation.
Interestingly, siRNA-mediated knockdown of cellular NKX3.1 inhibited recruitment of TOP1
at enhancers of DHT-regulated genes at 5 min following DHT stimulation (Fig.52B), in line
with the previous data suggesting that NKX3.1 is needed for the formation of the TOP1-DNA
cleavage complex (Bowen et al., 2007). We observed that following NKX3.1 knockdown in
LNCaP cells, the DHT-dependent up-regulation of ~70% enhancer eRNAs were significantly
reduced (Fig.52C, D, Figure S2C). We also noted significant reduction in the expression
levels of 273 DHT up-regulated genes (Fig.52E), exemplified for two representative genes
(Fig.52F). Additionally, knockdown of TOP1 and NKX3.1 reduced DHT-up-regulation of
eRNA at the same 351 AR-enhancers in these experiments (Fig.52G), apparently without

49
affecting AR recruitment to the enhancer-binding sites (Fig. S2E). Together, these
experiments demonstrate that NKX3.1 and TOP1 binding occurs at a subset of DHT-regulated
enhancers and the knockdown of either diminishes transcription in response to ligand.
Catalytic Activity of TOP1 is Required for DNA Nicking and Enhancer
Activation.
Based on its mechanism of action as a DNA nickase, by which TOP1 forms a covalent
intermediate with DNA, and possesses intrinsic DNA ligase activity (Pommier et al., 1998;
Champoux, 2001), it would be difficult to detect any such transient nick by available methods.
Indeed, despite extensive attempts to detect such a nick in enhancers by primer extension
approaches, only a few examples could be clearly visualized. Thus, using this approach to
investigate whether AR-regulated enhancers might be the sites of DNA scission by the
activated TOP1, we chose the KLK3 enhancer as a model and examined a region overlapped
by the AR and NKX3.1 peaks and flanked by two PRO-caps, which mark the transcription
initiation sites at high resolution (Kwak et al., 2013), noting that PRO-cap sites could be
located on AR-regulated enhancers following hormone stimulation from the AR binding sites.
(Fig.53A, Table S4). Primer extension analysis of both DNA strands with [32P]-ATP labeled
oligonucleotides yielded several termination products consistent with a series of closely-
spaced DNA nicks; the strongest band that became accentuated in response to DHT was seen
on the lower strand, in support of the notion that it may be one of the major TOP1
binding/scission sites (Figure S3B). Moreover, detailed PRO-cap analysis to locate the
precise start sites revealed that the RNA cap sites located, on average ~134 bp away from the
center of AR peak binding site (Fig. S3C) are occupied by TOP1 (Fig. S3D), and as shown in
GRO-seq experiments, continue to the end of eRNA-encoding sequence, however for the
majority (75th percentile) of these transcripts the GRO-seq signal starts to fade away after
1000 bp from the TSS/cap site.

50
As another approach to infer the possibility of TOP1 DNA nickase actions in
activation of AR-dependent enhancer we sought to mutate TOP1. TOP1 enzymatic activity
depends on Tyr723 to relax superhelical DNA (Madden and Champoux, 1992). Specifically,
Tyr723 of TOP1 initiates the nucleophilic attack on the backbone scissile phosphate resulting
in nicked DNA and a phosphodiester link between the tyrosine and 3’ phosphate (Champoux,
2001; Pommier et al., 2010). Subsequently, the covalent intermediate is re-ligated with
concomitant release of Tyr723 from the DNA (Champoux, 2001; Stewart et al., 1998). We
therefore tested whether the Y723F TOP1 mutant could rescue the defect caused by TOP1
knockdown. For this purpose, endogenous TOP1 was knocked-down with specific siRNA and
either the wild-type or the Y723F TOP1 mutant was then expressed in LNCaP cells. Analysis
of the enhancer RNA after 1h DHT treatment revealed that the wild-type TOP1 largely
reinstated eRNA induction, whereas the catalytically-inactive mutant failed to do so (Fig.53B).
The incomplete rescue with the wild-type construct most likely reflected the fact that not all
cells could be efficiently electroporated with the DNA expression vectors, as LNCaPs are
notoriously difficult to transfect with conventional cationic liposome reagents. Interestingly,
wild-type TOP1 relaxes supercoiled DNA only in the presence of NKX3.1, whereas the active
site mutant does not at all (Bowen et al., 2007), consistent with the presence of TOP1 on AR-
bound enhancers. These findings are of particular interest based on previous in vitro
transcription system analyses. TOP1 has been shown to be essential for transcriptional
activation in a system containing RNA polymerase II and other cofactors (Kretzschmar et al.,
1993; Merino et al., 1993; Shykind et al., 1997) but in these artificial in vitro transcription
system, the Y723F mutant did not block the transcriptional activity of the complex at
promoters. Therefore, in this context, TOP1 was proposed to modulate transcription by
changing the conformation of DNA at the promoter or via interactions with TBP/TFIID
(Kretzschmar et al., 1993; Merino et al., 1993; Shykind et al., 1997). In contrast, on AR-

51
regulated enhancers, the nicking activity of TOP1 appears to be required for its effects on
eRNA transcription.
Incorporation of labeled nucleotide by terminal deoxynucleotidyl transferase (TdT)
has been considered to label both DNA nicks and dsDNA breaks (Gavrieli et al., 1992); hence,
we also employed this assay on specific enhancer sites to assess incorporation of Biotin 11-
dUTP in response to DHT. Therefore, we fixed the cells with Streck Cell Preservative (Ju et
al., 2006), a formulation shown not to cause DNA breaks during the fixation process. Biotin
11-dUTP incorporation with (TdT) was observed at 10 min following addition of DHT
hormone treatment at the several enhancers tested, and this was strikingly reduced after TOP1
knockdown (Fig.53C) Together, these data suggested that TOP1 recruitment to enhancers co-
occupied by AR and NKX3.1 occurred at regions proximal to transcription initiation sites and
caused ssDNA nicks, although the possibility of a dsDNA break cannot be ruled out,
especially as an unligated nick can be converted to a DSB for subsequent processing by the
DSB repair pathway (Davis and Maizels, 2014).
Involvement of MRE11 in the Regulation of the AR-Program
The MRN complex, composed of the meiotic recombination 11 (MRE11), RAD50
and Nijmegan breakage syndrome 1 (NBS1) is central to the DNA damage response (DDR)
pathway which is initiated upon recognition of the DNA breaks by sensor proteins (Stracker
and Petrini, 2011). MRE11 regulates DNA repair by recruitment of DNA-repair proteins that
load onto the chromatin at the site of the break (Price and D'Andrea, 2013).
Recent evidence shows that cleavage of the covalent 3’ phosphotyrosyl bond that joins TOP1
to the DNA backbone by MRE11 generates a product carrying a 3’ phosphate end, which
MRE11-RAD50 can resect in an ATP-regulated reaction, producing a 3’-hydroxyl that can
prime repair synthesis (Hamilton and Maizels, 2010; Sacho and Maizels, 2011). Interestingly,

52
the p300 transcriptional co-activator physically interacts with all three members of the MRN
complex (Jung et al., 2005).
Based on these considerations and the results in Fig.53, we investigated whether
MRE11 was present at AR-regulated enhancers. Kinetic ChIP experiments using a specific
antibody (Fig.54A, Figure S4A) revealed that MRE11 recruitment at enhancer-binding sites
peaked at 15 min of DHT treatment. On performing ChIP-seq, we identified 19,886 loci in the
(–) hormone control and 30,636 loci in the cells treated with DHT for 15 min, observing that
MRE11 sequencing tag density at enhancers increased with DHT treatment (Fig.54B, C,
Figure S4B). We also observed similar recruitment of the RAD50 component of the MRN
complex (Figure S4C). Genome-wide analysis showed indistinguishable alterations in the
number of tags over promoters of these genes in response to DHT treatment, although a small
increase in MRE11 occupancy at promoters of select DHT-regulated genes (e.g., KLK3, KLK2,
NDRG1, and TMPRSS2) could be detected by ChIP-qPCR after DHT treatment (data not
shown). GRO-seq analysis of nascent transcription revealed that induction of ~89% of
detectible enhancer eRNAs induced by DHT were inhibited by MRE11 knockdown (Fig.54D,
E). In addition, expression of 510 induced coding genes was reduced (Fig.54F). Knockdown
of RAD50 caused a similar effect on eRNA and mRNA expression levels (Figure S4D). Given
the role of ATR in sensing single-strand DNA breaks, we also investigated the potential
functional role of ATR following DHT. We found that ATR is rapidly recruited, by 15 min, to
AR-bound enhancers after DHT (Fig.51H). This is of functional significance, as knockdown
of either MRE11 or TOP1 caused dramatic decrease in ATR recruitment to enhancers
(Fig.54G) and a reduction of DHT-induced enhancer and gene transcription (Fig.54H).
Recruitment of Components of DDR to AR-regulated Enhancers
Indeed, a mechanism that could be involved in the repair of single-strand nick would be the
base excision repair pathway (BER), to process nicks that evaded TOP1 ligase activity.

53
Therefore, we investigated whether factors involved in this or other DNA damage repair
pathways might also be recruited to AR-regulated enhancers. We performed kinetic ChIP
experiments using antibodies against phospho-ATM (Ataxia telangiectasia mutated), Ku80
(part of the Ku heterodimer that binds to double-strand DNA break ends), Exonuclease 1
(EXO1), the Bloom syndrome DNA helicase (BLM), and DNA ligase IV (LIGIV).
Additionally, we used antibodies to proteins involved in the base excision repair pathway,
including XRCC1 (X-ray repair cross-complementing protein 1), DNA polymerases and ,
and Ligase I, observing an orderly and reproducible kinetics of recruitment after hormone
treatment at enhancers including KLK3, KLK2, TMPRSS2, and NDRG1 (Fig.55, Figure S5A),
as well on other DHT up-regulated enhancers identified by the GRO-seq (Figure S5B). While
TOP1 and ATR were essentially recruited simultaneously at enhancers at 15’, XRCC1 was
recruited between 15’-30’, consistent with the recruitment of base excision repair pathway
machinery that could process any unligated nicks. Interestingly, DNA ligase IV showed
maximum occupancy after 30 min, while pATM (p-S1983), Ku80, EXO1, BLM and DNA
ligase I were maximally recruited to enhancers ~60 min post DHT treatment (Fig.55, Figure
S5A), indicating recruitment of multiple DNA repair factors that have been conventionally
considered to function in DNA damage repair (Nimonkar et al., 2011). The sequence of events
would be consistent with resolving any unligated DHT/TOP1-induced ssDNA nicks; the DDR
machinery primarily recruited as a ”safety net” against any DNA breaks that are not sealed by
TOP1. From our data, the machineries of transcription and DNA damage repair seem to be
intrinsically linked.
Discussion
Regulated gene expression has been a subject of intense investigation over the past
few decades, yet the precise mechanisms by which enhancers orchestrate tissue-specific
programs with such an astonishing precision remains unclear. In particular, the finding that

54
enhancers are also regulated transcription units, encoding eRNAs, has added to the mystery
and raised new questions about how the subsequent topological strain on enhancers is handled.
Both eRNA synthesis and nucleosome depletion at enhancers are potential sources of
topological strain. Advancing RNA polymerase can generate both positive and negative
supercoils. The amount of supercoiling is potentially enormous given that a positive and a
negative supercoil is generated for every 10 bp transcribed and that the length of an eRNA
transcript is typically 1-2 kbp in length. Indeed, it has been estimated that approximately seven
supercoils may be generated by the transcribing polymerase per second, and that these
supercoils can propagate >1 kbp from the transcription start site (Kouzine et al., 2013). At the
same time, the depletion of histones from enhancers releases unconstrained negative
supercoils, which, in principle, can parse to a change in DNA twist or unwinding to facilitate
transcription and/or to a change in writhe that impedes transcription factor binding. To relieve
torsional stress, it is tempting to predict that cells might employ actions of DNA
topoisomerases, including topoisomerase I as an integral component of regulated enhancer
transcription.
Here, we have elucidated the operation of just such a mechanism in prostate cell-
specific enhancer activation by androgen receptor, using the LNCaP cancer cell line as a
model. In a sense analogous to the role of TOP1 at origins of replication (Simmons et al., 1998;
Tsao et al., 1993), we show here that this DNA nickase is rapidly recruited to a large cohort of
AR/NKX3.1-occupied enhancers to putatively activate the enhancers and relieve torsional
stress due to ongoing transcription (Fig. 6). Our results are consistent with observations that in
yeast cells, Top1/Top2 play a role in the activation of genes characterized by high
transcriptional plasticity (Pedersen et al., 2012). However, the beneficial effects of TOP1 have
to be weighed against the negative effects of retention of TOP1 as an obstacle to further
transcription and the deleterious effects of a single-strand nick if it is not quickly sealed by

55
TOP1 itself, or repaired by the base excision pathway. Unrepaired nicks could lead to the
formation of DNA double-strand breaks (DSB) as, for example, when a replication fork runs
into and collapses at a nick (Kuzminov, 2001; Wimberly et al., 2013). It has also been
suggested that a co-directional collision between the replisome and backtracked RNA
polymerase transcription elongation complexes leads to DNA double-strand breaks (Dutta et
al., 2011). Thus one important role for the MRN complex and other components of the DDR
machinery that we observe recruited to the TOP1-bound enhancers might be for the removal
of any “stalled” TOP1 from the DNA substrate, as well as repair of any possible DNA breaks
that might occur despite TOP1 or the BER actions (Hamilton and Maizels, 2010; Sacho and
Maizels, 2011; Davis and Maizels, 2014).
TOP1 activity is likely to be modulated by factors other than NKX3.1, suggesting that
the mechanism we describe here may not be restricted to prostate cells. In this regard, it has
been shown that the catalytic activity of TOP1 is stimulated by large T antigen during
unwinding of the SV40 origin (Simmons et al., 1998) and overexpression of the antigen
rendered LNCaP cells androgen-independent for cell cycle progression (Knudsen et al., 1998).
This raises the possibility that activation of TOP1 catalytic activity, may in part, trigger a
switch to androgen independence. The Werner syndrome helicase, WRN, has also been found
to enhance the ability of TOP1 to relax negatively supercoiled DNA and specifically stimulate
the religation step of the relaxation reaction (Laine et al., 2003). It is therefore not unlikely
that there exist other, yet undiscovered, activators of TOP1 catalytic activity to regulate eRNA
synthesis and gene expression programs. Alternatively, there may be other DNA nickases that
initiate enhancer activation in tissues other than prostate, in signal-dependent manner, and that
the activities of those nickases are modulated by enhancer-bound factors.
While the finding that ligand-dependent enhancer activation strategy would involve a
DNA nick may seem counter-intuitive in terms of cellular integrity, it is noteworthy that

56
cellular integrity is threatened daily by endogenous and extracellular agents that lead to the
formation of single- and double-strand DNA breaks. For instance, the estimated number of
single-strand breaks and spontaneous base losses in nuclear DNA together with other types of
spontaneous damage may reach 105 lesions per cell per day (Hoeijmakers, 2009), yet the cells
are programmed to survive. To maintain genomic integrity, cells constantly engage the DNA
repair machinery. As such, the usage of a programmed DNA nicking/repair strategy in
regulated transcription to relieve torsional stress and activate transcription in this case, while
apparently surprising, is in keeping with growing evidence that components of DNA damage
machinery do participate in transcriptional regulation. For instance, Reinberg and colleagues
demonstrated that human RNA polymerase II complex contains components with roles in
DNA repair, including Ku70, Ku80 and DNA Pol (Maldonado et al., 1996) and Kung and
colleagues (Mayeur et al., 2005) have identified heterotrimeric DNA-dependent protein kinase
subunits: Ku70, Ku80 and DNA-PKcs, as well as poly(ADP-ribose) as proteins associated
with the C-terminal domain of AR and demonstrated that in LNCaP cells, Ku70 and Ku80,
recruited to the KLK3 promoter and enhancer in a hormone-dependent manner. Interestingly,
Ku70 and Ku80 can function outside of the Ku heterodimer that loads on double-stand DNA.
Hasty and colleagues have shown that Ku80 deletion impairs the base excision pathway (BER)
at the initial lesion recognition/strand scission step, arguing that free Ku70 and free Ku80, but
not Ku heterodimers, associate with apurinic/apyrimidinic (AP) sites that BER corrects (Li, et
al., 2013b; Choi, et al., 2014)Moreover, Mo and Dynan showed that in normally
growing human cells, Ku80 associated with RNA polymerase II elongation sites. This
association occurred independently of the DNA-dependent protein kinase catalytic subunit and
was highly selective. In addition, there was no detectable association with the initiating
isoform of RNAPII or with the general transcription initiation factors. The authors concluded
that association of Ku80 with transcription sites is important for maintenance of global

57
transcription levels, as functional disruption of a discrete C-terminal domain in the Ku80
subunit inhibited transcription in vitro and in vivo (Mo and Dynan, 2002). Importantly, LigIV,
like Ku80, is commonly associated with the NHEJ pathway, but its active site has been found
to be highly permissive and capable of ligating atypical DNA substrates, including nicks with
gaps (Gu et al., 2007). Interestingly, in the absence of RNase H2, the suppression of mutations
arising from mis-insertion of ribonucleoside monophosphates (rNMP) during DNA replication,
involves Top1-mediated cleavage at an rNMP, followed by unwiding of DNA by Srs2 and
digestion by Exo1 (Potenski et al., 2014). Also, earlier studies showed that TOP1 enhanced
TFIID-TFIIA complex assembly during activation of transcription; however, in these
biochemical studies, the catalytic activity of TOP1 was not essential to activate transcription
from promoters. It is also interesting to note that the AR itself has been shown to
transcriptionally regulate a network of DNA repair genes, including those implicated in DNA
damage sensing (MRE11, NBN and ATR), non-homologous end joining (XRCC4 and
XRCC5), homologous recombination (RAD54B and RAD51C), mismatch repair (MSH2 and
MSH6), base excision repair (PARP1 and LIG3) and the Fanconi pathway (FANC1, FANCC
and USP1) (Polkinghorn et al., 2013). Moreover, p53 itself binds enhancers and regulates
eRNA synthesis for transcription enhancement of neighboring genes (Melo et al., 2013).
Together, the recruitment of DNA damage response machinery in specific transcriptional
regulatory events is an emerging theme, from the regulation of pluripotency in embryonic
stem cells by the trimeric XPC-nucleotide excision repair complex (Fong et al., 2011) to the
regulation of human RAR2 gene via XPG induced DNA breaks at the promoter region (Le
May et al., 2012). Moreover, experiments with yeast have revealed that the
Rad1XPF/Rad10ERCC1, Mms4Emi1 orthologs can catalyze the endonucleolytic cleavage of DNA
immediately upstream from the Top1-DNA adduct (Pommier et al., 2010). Indeed, permissive
chromatin architecture seems to be a crucial requirement for transcription initiation events

58
(Fong et al., 2013). While these events are quite distinct from the TOP1-dependent regulatory
events described in the present manuscript, they do suggest a common usage of the DNA
damage repair machinery to regulate gene transcription.
EXPERIMENTAL PROCEDURES
Cell Culture
LNCaP cells were purchased from ATCC and maintained in RPMI-1640 medium
(Life Technologies) supplemented with 10% fetal bovine serum (Omega Scientific), 2mM L-
Glutamine and Penicillin/Streptomycin. For kinetic ChIP experiments, cells were starved in
phenol-free DMEM (Lonza) supplemented with 5% charcoal:dextran stripped fetal bovine
serum (Omega Scientific) for 72 hours. Cells were synchronized with 2.5 M -amanitin
(Sigma) for 2 hours, washed twice with PBS and released. 100 nM 5-dihydrotestosterone
(DHT, Sigma) was added to the starvation media to stimulate the cells.
Small Interfering RNA
siRNA-mediated knockdown was achieved by transfecting cells with Lipofectamine
2000 and specific siRNAs. The following siRNAs were used for this study: AllStars Neg.
Control siRNA (1027281) was from Qiagen. Human ON-TARGETplus SMARTpool siRNAs
against TOP1 (L-005278-00-0020), MRE11 (L-009271-00-0020) and RAD50 (L-005232-00-
0005) were purchased from Dharmacon. Single interfering RNAs targeting AR
(SASI_Hs01_00224483, SASI_Hs01_00224484), TOP1 (SASI_Hs02_00335354,
SASI_Hs01_00047440), ATR (SASI_Hs01_00176270, SASI_Hs01_00176271) and NKX3.1
(SASI_Hs02_00341026, SASI_Hs01_00018365) were obtained from Sigma. Multiple
siRNAs were used during the course of the study to confirm data reproducibility.
Additionally, siRNA sequences are listed in Supplementary Table 2.
For transfection, LNCaP cells were seeded on dishes in RPMI-1640 supplemented with 10%
FBS and allowed to attached overnight. The following day, the cells were washed twice with

59
PBS and fed with phenol-free DMEM supplemented with 5% charcoal:dextran FBS. One day
later, the cells were transfected using Lipofectamine 2000 and 20 pmol mL-1 siRNA diluted in
Opti MEM reduced serum media without phenol red (Life Technologies). The transfection
media was removed after 16 h incubation and the cells were washed twice with PBS. Fresh,
phenol-free DMEM supplemented with 5% charcoal:dextran FBS and Penicillin/Streptomycin
was added to the dishes. Cells were harvested 48-72 h post transfection. All siRNAs used in
this study were validated by vendors or by us and used only if providing >70% knockdown
efficiency. Relative quantities of gene expression level were normalized to the GAPDH gene.
The relative quantities of ChIP samples were normalized by individual inputs, respectively.
ChIP-qPCR
Chromatin immunoprecipitation experiments were done as previously described
(Garcia-Bassets et al., 2007). All ChIPs and qPCRs were repeated at least thrice and
representative results were shown. P-values were calculated by using a two-tailed Student’s t-
test. Primers are listed in Supplementary Table 1.
GRO-seq and PRO-cap
Global run-on sequencing (GRO-seq) was performed as detailed (Wang et al., 2011)
and precision nuclear run–on sequencing of transcription initiation sites (PRO-cap) was
performed as described (Kwak et al., 2013).
Antibodies
AR (N-20), TOP1 (H-300), ATR (N-19), RAD50 (H-300), XRCC1 (H-300), BLM
(H-300), DNA Ligase I (C-21), DNA Ligase IV (H-300), DNA POL (C-21), DNA POL
3/CHRAC17 (N-15), p300 (C-20), SRC-1 (M-341) were from Santa Cruz Biotechnology.
MRE11 (Ab397) and p-S1983-ATM (Ab2888) were obtained from Abcam. Ku80 (A302-
627A) and EXO1 (A302-639A) were purchased from Bethyl Laboratories.
ACCESSION NUMBERS

60
The Gene Expression Omnibus accession number for all sequencing data reported in
this paper is GSE63202.
Supplemental Information
Supplemental Information includes Extended Experimental Procedures, five figures
and four tables and can be found with this article online at http://
Author Contributions
J.P. and M.G.R. conceived the project. J.P., A.K.A and M.G.R. designed experiments.
J.P. performed most of the experiments reported. P.K. performed bioinformatics analyses.
W.L. performed GRO-seq experiments and Y.T. performed the modified PRO-cap
experiments. T.S. carried out screening experiments, while Z.L. generated biotin-TOP1 stable
cell line and carried out TOP1 ChIP-seq. J.Z. and K.A.O. assisted in deep-sequencing library
preparations and sequencing. J.P., A.K.A and M.G.R. wrote the manuscript with input from
P.K.
Acknowledgements
We thank Dr. Bogdan Tanasa and Daria Merkurjev for help with statistical analyses,
Charles Nelson for cell culture assistance, Tara Rambaldo for help with cell cycle analysis and
Janet Hightower for assistance with figure preparation. We are particularly grateful to Dr. E.
Peter Geiduschek for a critical reading of the manuscript, Drs. Kalotina Machini and Patricia
Cortes for discussions and helpful suggestions and thank the members of the Rosenfeld
laboratory for their comments on the work. This work was supported by grants from NIH and
NCI to M.G.R. (DK018477, HL065445, NS034934, DK039949, and CA173903). J.P. was

61
supported, in part, by a NIDDK Mentored Research Scientist Development Award
(K01DK080180). M.G.R. is an Investigator with the HHMI.
The authors declare no competing financial interests.
Chapter 3 is an adaptation of the material as it appears in Cell, 2014. The authors of
this study are Janusz Puc, Piotr Kozbial, Wenbo Li, Yuliang Tan, Zhijie Liu, Tom Suter,
Kenneth A. Ohgi, Jie Zhang, Aneel K. Aggarwal and Michael G. Rosenfeld. The dissertation
author contributed to this study through the screening of factors relevant to the thesis of the
publication.

62
CHAPTER 4 BARCODING OF CELL TYPE RESTRICTED ENHANCERS BY ESC
TRANSCRIPTION FACTORS LICENSES THEIR ROBUST DEVELOPMENTAL
ACTIVATION
Abstract
While cell-type-restricted enhancers are initially detected following cooperative
binding of cell-type-restricted DNA binding transcription factors during
determination/differentiation (Buecker and Wysocka, 2012; Heinz et al., 2015; Ong and
Corces, 2011; Spitz and Furlong, 2012) , it remains unknown whether there are preceding
events in embryonic stem cells (ESCs) that are functionally important to activate cell-type-
restricted enhancer networks. Here, using murine macrophages as a model, we report that,
while largely devoid of characteristic enhancer marks (H3K4me1, H3K4me2, H3K27Ac,
H3K27me3 and p300) in ESCs, macrophage enhancers are activated as transcription units
mainly by the binding of a single, at most two, ESC-specific transcription factor. This
provides “premarking” of these enhancers, as is also observed for other cell types. In contrast,
ESC active enhancers are cooperatively bound by multiple ESC transcription factors.
Interestingly, the strength of this signature in ESCs is functionally important for subsequent
robust cell-restricted enhancer activation during differentiation events, as independently
demonstrated by analysis of multiple Esrrb motif–deleted macrophage-restricted enhancers.
The ENOS-determined location of hydroxymethylation of the enhancer in ESCs could serve
as a potential molecular memory for subsequent robust binding of Pu.1 and enhancer
activation in the mature macrophage. These findings suggest that the massive repertoire of
cell-type-restricted enhancers are essentially hierarchically and obligatorily “barcoded” by
binding of a single ESC transcription factors in ESCs, and strength of binding of this ESC
transcription factor dictates enhancer activation in mature cells.
Enhacers function as critical regulatory elements that integrate genomic information

63
for cell fate transition and cell specific gene regulation programing, both in cell models and in
vivo (Maston et al., 2012; Miguel-Escalada et al., 2015; Ong and Corces, 2011) often
functioning as clustered/super-enhancers for many developmentally and pathologically
important gene targets (Whyte et al., 2013),(Hnisz et al., 2013a). Their activation is key to
understanding the mechanisms by which so many cell types emerge from stem cells harboring
the identical genomes. Macrophage development provides a potent model for investigation of
enhancer activation events because the sequential events leading to its differentiation and
regulation by inflammatory signals are rather well understood (Baldridge et al., 2011;
Epelman et al., 2014; Huang et al., 2013; Kaikkonen et al., 2013; Ostuni et al., 2013; Wu et al.,
2014). Most of the ~22,000 macrophage enhancers present in terminally-differentiated
macrophages compared to enhancers in ESC are ultimately activated based on the co-
recruitment of the late lineage determining factors, Pu.1 and CEBPα, and are marked by
H3K4me2 and H3K27Ac marks (Creyghton et al., 2010; Glass and Natoli, 2016; Heintzman et
al., 2007; Heinz et al., 2010a; van Oevelen et al., 2015). To begin to address the hypothesis
that cell-type-restricted enhancers might be marked in ESCs, the full repertoire of
macrophage-restricted enhancers in ESCs was examined. We found that the vast majority
(18,405) exhibited an absence of H3K4me1, H3K4me2, H3K27Ac and H3K27me3 marks
(referred to as “premarked in the Fig.1a), although ~4000 enhancers, active in both
macrophages and ESCs and including “housekeeping genes”, did exhibit H3K4me2 and
H3K27Ac marks, generally within 200kb of coding genes. Finally, a small number of
macrophage-restricted enhancers (214) had marks of “poised” enhancers, H3K27me3
(Fig.1a,b). To permit further understanding of enhancer features in ESCs, an ATAC-seq assay
was performed both in mature macrophages and in ESCs. We found that the 18,405
“H3K4me1, H3K4me2, H3K27Ac, H3K27me3 and p300 unmarked” macrophage enhancers
were in an “open” configuration compared to random regions (Fig.1c), consistent with

64
published DNase hypersensitivity analyses in ESCs (Fig.1c), but clearly these were not as
robustly marked compared to active enhancer in ESCs (Extended data Fig.1a). To identify
the transcription factor more specifically that might underlie the macrophage enhancer which
has “open” chromatin configuration, we profiled the distribution of several of the most
important ESC transcription factors -Esrrb, Nanog, Oct4 or Sox2 (ENOS)-, and interestingly,
we observed that the binding of ENOS in 6,775 of macrophage enhancers with a -1kb/+1kb
window- from Pu.1 bound enhancers (Fig.57d). Specificity of ENOS binding in macrophage
enhancers in a -1kb/+1kb window was perceived by comparing ENOS binding in random
regions (Extended data Fig.57b), and statistically significant binding of Esrrb, as one of
example, in macrophage enhancer was observed by comparing Esrrb binding in random region
and ESC active enhancer (Extended data Fig.57c). Cooperative binding of ESC factors is
well studied; thus, we further explored their binding pattern in macrophage enhancers. To
ensure that we were exclusively analyzing macrophage-restricted enhancers, ENOS binding in
macrophage enhancer is examined in a -1kb/+1kb window, and interestingly, we found that
~80% of macrophage-restricted enhancers are bound by a single or mostly two ESC
transcription factors, while active ESC enhancers exhibited binding of all four ENOS factors
(Fig.1e and Extended data Fig.57d). Genome browser images show that macrophage
enhancers are slightly open and bound by a single ESC transcription factor in the absence of
enhancer histone marks in ESCs (Extended data Fig.57e). To determine whether cell-type-
restricted enhancers in other cell types might also exhibit similar pre-marking in ESCs, we
extracted cell-type-restricted enhancers from heart, kidney and N2A neuronal cells, finding
that these enhancers in ESCs again exhibited binding of mainly a single ENOS factor and
chromatin openness similar to that observed for the macrophage enhancers (Extended data
Fig.58a-d).

65
To further study premarking events in macrophage enhancers in ESCs, we analyzed
12 of ESC transcription factors from the published literature in ESCs (Chen et al., 2008). We
found that active ESC specific enhancers were characteristically bound by 4~8 of the 12 ESC
transcription factors evaluated (Oct4, Sox2, Nanog, Esrrb, Smad1, E2f1, Tcfcp2l1, Zfx, Stat3,
Klf4, c-myc and n-myc), consistent with their often cooperative binding (Boyer et al., 2005;
Chen et al., 2008; Kim et al., 2008), while the great majority of the active macrophage-
restricted enhancers exhibit binding of only one or two of these factors (Fig.57f). Taken
together, these data indicate that cell type-restricted enhancers are in an “open” configuration,
premarked by binding of generally a single ESC transcription factor. Therefore, it was
important to investigate whether these open enhancer regions could interact with other
genomic regions and mediate gene expression.
To begin to explore this question, we performed 4C-Seq (van de Werken et al., 2012).
A macrophage-specific enhancer located 5’ of IL1a transcription units on Chr.2 was selected
and this Esrrb-bound “premarked” enhancer exhibited specific interactions with other genomic
regions, including an upstream CTCF-bound site in ESCs (Fig.57g), but not with the cognate
promoter it would ultimately regulate in macrophages (Fig.57g). In mature, KLA-treated
macrophages, this enhancer exhibits robust interactions with the promoters of the cognate
target coding gene (Fig.57g). An enhancer located in 5’ of Tnfaip3 was similarly found to
exhibit specific interactions with other genomic regions, but not with the cognate promoter in
ESCs (Extended data Fig.59a). In addition, we performed RNA-seq and examined proximal
macrophage expressed genes of 6,775 macrophage enhancers in ESCs, and found 413
significantly expressed genes (p<0.01) in macrophage, which has function under category of
macrophage, but these genes are not expressed in ESCs (Extended data Fig.59b,c), with 4C-
seq together suggesting that premarked macrophage enhancers are not functional even though
there are ESC transcription factor binding with open chromatin configurations in ESCs.

66
Pu.1 is a transcription factor critically important in coding macrophage-specific
enhancers (Heinz et al., 2010a). To further understand the potential impact of ENOS binding
in ESCs with subsequent function on Pu.1-bound enhancers, we assessed the physical location
of ENOS binding in premarked enhancers. When we plotted ENOS binding centered on Pu.1
binding sites in a -1kb/+1kb window in the macrophage enhancers, we observed that the ESC
transcription factor binding varies in the 6,775 macrophage enhancers, corresponding to the
location of cognate binding sites (Fig.58a).
As eRNA expression is a mark of enhancer activity (Li et al., 2013), the possibility
that transcription units were present in the ENOS-bound premarked enhancers was examined.
Because the GRO-seq data was insufficiently robust on these enhancer regions to draw clear
conclusions, we performed PRO-cap in ESCs and macrophages. 2,336 of significant Cap sites
were identified in -1kb/+1kb window in 6,775 premarked enhancers in ESCs and, interestingly,
were found to be distinct from that observed in the active enhancers in mature macrophages
(Fig.58b). By centering on the Pu.1 binding site, Cap sites were found to be located in close
proximity to the Pu.1 site in the macrophage, while it is observed broadly, at various distances
from the Pu.1 site, in ESCs (Fig.58b), with the sites correlating closely with the site of binding
of the ENOS factors. The median distance from the Pu.1 binding site to the macrophage
specific eRNA Cap was measured by selecting Cap sites within -500bp/+500bp from Pu.1
binding site to only consider significant transcriptional start sites, as expected, ~105 bp in the
mature macrophage (Li et al., 2013), while the median distance from the ENOS binding site to
the ESC specific eRNA Cap was found to be ~160 bp (Fig.58c), suggesting that ENOS factors
serve in ESCs as transcription factors that activate the enhancer as a transcription unit in the
stem cell state. This ESC-induced transcription unit for each enhancer is therefore distinct
from the eRNA transcription units that will subsequently be nucleated by Pu.1 and CEBPα in
the mature macrophage, the binding sites of which are located within a “core” enhancer region.

67
Indeed, ATAC-seq revealed chromatin openness in the region where ENOS factors bound to
the enhancers (Fig.58d).
Given the well-established role of the Cohesin complex in chromatin architecture and
gene regulation(Hadjur et al., 2009; Phillips-Cremins et al., 2013; Schmidt et al., 2010)
(Fig.57g), we examined whether the Cohesin complex plays a role in premarked enhancers.
We performed ChIP-seq for a Cohesin core subunit (Rad21) and used published data for Smc1
binding to examine their binding to premarked enhancers, finding that Cohesin colocalized
with ENOS-bound regions (Fig.58e), and that high Rad21 binding was associated with high
ENOS binding with a more open chromatin configuration (Fig.58f).
All observations were made from the experiments with ESCs cultured in serum, and
ESCs in serum are not completely naïve (Ying et al., 2008). To escape any concern whether
the serum culture condition impacted our results, we performed ChIP-seq with H3K4me2 and
H3K27Ac, and ATAC-seq under two different culture condition, 2i and serum. H3K4me2 and
H3K27Ac were not observed in macrophage enhancers in both 2i- and serum- cultured ESCs,
and ATAC-seq signal was equivalently detected in both conditions (Extended data
Fig.60a,b), suggesting that culturing ESCs in serum culture condition did not impact our
observations.
To investigate the role of binding of stem cell transcription factors in ESCs to ultimate
activity of the enhancers in mature macrophages, we first examined the possible correlation
between recruitment of ENOS factors in ESCs to the ultimate activity of the enhancers in the
mature macrophage. We first examined ~20% of ENOS-bound macrophage enhancers with
the highest or lowest levels of ENOS transcription units among the 6,775 premarked
enhancers, and then evaluated their ultimate activation in the mature macrophage. We found
that the higher group of enhancers in ESC ultimately exhibited the higher “activation” as
determined by binding of the macrophage transcription factors Pu.1, PRO-cap signal, eRNA

68
transcription, H3K4me2, H3K27Ac and binding of Cohesin (Fig.59a-d). In addition, ~20% of
the highest or least active macrophage enhancers were selected based on GRO-seq signal,
reflecting the activity of the enhancers (Li et al., 2013), and ESC features were examined in
these enhancer. ENOS binding and ATAC-seq signal in ESCs proved to be higher in the most
active macrophage enhancers compared to less active macrophage enhancers (Fig.59e,f).
Indeed, interestingly, we observed that putative functional macrophage enhancers defined by
GRO-seq signal in macrophage are much more frequently found in 6,775 enhancers which
have ENOS in a -1kb/+1kb window compared to the rest of 11,630 macrophage enhancers
which do not have ENOS in a -1kb/+1kb window (Fig.59g).
To obtain a general idea whether the this positive tendency apply to the other tissues,
we examined H3K4me1 and H3K27Ac level at ~10% of the highest- or lowest- ENOS bound
enhancers from four different tissues- spleen, lung, cortex and bone marrow- finding that high
binding of ENOS in ESCs results in high levels of H3K4me1 and H3K27Ac in differentiated
tissues (Extended Data Fig.61a-d).
Because these data suggested that the actions of binding of stem cell transcription
factors on macrophage-restricted enhancers in ESCs was actually predictive of the ultimate
efficacy of the enhancer in the mature cell, it was important to test whether the binding of
these factors in ESCs exerted a direct role on the ultimate activation of the cell-type-restricted
enhancer in the mature macrophage. We therefore selected a series of macrophage-restricted
enhancers that were bound by one of the ESC factors in ESCs, choosing enhancers linked to
coding target genes that would not be predicted to influence macrophage development. We
first selected the most prominent enhancer near the Tlr1 locus and Tnfaip3 locus, which was
selectively bound by Esrrb, in proximity to the ultimate Pu.1 binding site, but that harbored no
conventional histone enhancer marks at the ESC stage (Fig.60a,e). The experimental strategy
was to use CRISPR-Cas9 technology to selectively delete the Esrrb binding site, and then to

69
initiate the programed differentiation protocol(Zhuang et al., 2012) to obtain “mature”
macrophages in 20 days. The mature macrophages were selected based on their ability to
adhere to the non-adherent culture plates, as confirmed by expression of Cd11b and F4/80
(Extended data Fig. 6a), permitting only a limited harvest of mature macrophages, thus
precluding global genomic analyses. Significantly, three independently-derived individual
clonal lines (#3, #10, #14) in Tlr1 enhancers were sequence-proven to harbor a deletion of the
Esrrb site, with an 8 bp deletion (Extended data Fig. 6b,c). Consistent with the confirmed
deletion, Esrrb binding in ESCs was inhibited in these mutant clones (#3, #10, #14) compared
to wild type (wt) clones (Fig.60b). The cells harboring the deleted Esrrb site were
differentiated to macrophages with equivalent efficiency to those with the wild-type site; ChIP
for Pu.1 and H3K4me2 was performed, and eRNA was measured followed by Q-PCR of the
enhancer in the ESC derived macrophages (ESDM). These analyses revealed that Pu.1 binding
was inhibited, the KLA-induced transcription of the eRNA was lost, and there was a
consistent decrease in the level of the H3K4me2 mark with deletion of the Esrrb site (Fig.60c).
Mutant clonal cells in Tnfaip3 enhancer were constructed with either a 16 bp deletion (#26) or
a 21 bp deletion (#45) encompassing the Esrrb (Fig.60e, Extended data Fig. 6d,e). The wt
and mutant (#26, #45) ESCs were differentiated to macrophage and enhancer activities were
tested, finding again that the Pu.1 recruitment, eRNA transcription and H3K4me2 level were
all inhibited in mutant cells coinciding with inhibition of Esrrb binding in ESCs (Fig.60f,g).
As additional examples, two other loci, Prdx5 and Nod2, were further studied (Extended data
Fig. 7a,b,d,e). The wt and independently-derived Esrrb binding sites mutant clones were
differentiated to macrophage, finding that eRNA transcription levels were inhibited in three
different mutant clones (B11, F1, G11) at the Prdx5 enhancer (Extended data Fig. 7c) and
two different mutant clones (D2, D12) at the Nod2 enhancer (Extended data Fig. 7f) in
ESDM, consistent with Esrrb inhibition in ESCs (Extended data Fig. 7c,f). Because

70
modifying the genomic locus could potentially result in different genetic events, we performed
RNA-seq in the Tlr1 enhancer clonal cells (wt, #10, #14) to test whether there is transcription
change in these clonal cell lines and we found that normal ESCs and clonal ESCs (wt, #10 and
#14) exhibited same pattern on transcription in the Tlr1 loci (Extended data Fig. 6f).
The enhancer harboring the Esrrb site deletion was evaluated by luciferase reporter
assay for any potential impairment of enhancer function compared to the wt enhancers in
mature macrophages due to genomic sequence disruption, finding that it was competent to
increase reporter expression as wt enhancers in immortalized Raw 264.7 macrophage cells
(Fig.60d).
Even though the number of enhancers we could target was constrained because of
sequence requirements for CRISPR-Cas9 site-specific deletions, we were fortunately able to
obtain mutated clones for four different regions, putative Tlr1 enhancer, Tnfaip3 enhancers,
Prdx5 enhancers and Nod2 enhancers as described above, and this analysis corroborated a
functional importance of ESC factor premarking in macrophage-restricted enhancers.
Poised enhancers, another class of well studied cell type specific enhancers, are often
found near lineage-determining factors (Liber et al., 2010; Rada-Iglesias et al., 2011; Wang et
al., 2015; Xu et al., 2007) , which are usually regulated by super-enhancers (Whyte et al.,
2013),(Hnisz et al., 2013a), and ~214 macrophage enhancers exhibit poised chromatin
signatures in the ESCs (Fig.57a). Many are super-enhancers near genes encoding
determining/pioneer transcription factors, exemplified by Pu.1. Interestingly, these poised
enhancers are marked by binding of 2~4 ENOS factors in the core of their enhancers in ESCs,
in contrast to the premarked cell-type-restricted enhancers generally bound by only one ESC
factor. (Fig.57f, Extended Data Fig. 8a,b). For example, we noted that the Pu.1 gene has four
clustered enhancers with poised chromatin signatures in ESCs, in contrast to the two
enhancers (enh2 and enh3) are active in mature macrophages, other two bound (enh1 and enh4)

71
by Esrrb and Oct4 are not active in mature macrophage (Extended Data Fig. 8b,c). These
two premarked enhancers in ESCs might participate in the early activation of Pu.1, which is
known to exhibit a positive feedback loop on the two Pu.1-binding enhancers(Will et al.,
2015).
A particularly intriguing question raised by the observations of enhancer “premarking”
is how the marking of future cell type restricted enhancers might be “remembered” for their
ultimate activation later in development. There are several non-exclusive possibilities that
merit consideration. Based on the literature and Q-PCR analysis of the mRNA levels of the
ENOS stem cell transcription factors, the temporal pattern of disappearance of these factors,
such as Oct4, virtually coincides with the appearance of first lineage determining factors, Tal1,
Gata2 and RunX1, followed by the appearance of Pu.1 and C/EBPα, which initiate the
activation of the large macrophage enhancer activation program (Lichtinger et al., 2012)
(Extended data Fig. 8d). Another explanation is that binding of one of the stem cell
transcription factors on the future cell-type restricted enhancers might be accompanied by a
specific DNA demethylation event that serves to ensure that an enhancer remains accessible to
TFs, the binding of which may be impaired by DNA methylation. We therefore analyzed
available data in ESCs regarding DNA methylation and, interestingly, we found that the 5-
hmC mark in the 6,775 premarked macrophage enhancers (Fig.61a). Tet1 was also present in
ENOS bound macrophage enhancers in ESCs (Fig.61a), reflecting the previous observation of
presence of TET1 in a complex with Esrrb and Oct4 (Gagliardi et al., 2013). Interestingly, we
further found that knockdown of Esrrb inhibits 5-hmC levels in Esrrb- bound macrophage
enhancers in ESCs (Fig.61b). To examine whether 5hmC is maintained during the
differentiation process, so it could serve as a marker for molecular memory, we examined
5hmC during hematopoiesis using published data (Han et al., 2016) , and finding that 5hmC is
maintained during hematopoiesis (Fig.61a,c,d). The enhancer histone marks, H3K4me1 and

72
H3K27ac, are further studied during hematopoiesis (Lara-Astiaso et al., 2014) and as we
observed, H3K4me1 and H3K27Ac are not found in ESCs, and interestingly even not in
mesoderm, and gradually gaining these marks early in hematopoesis (Fig.61c,e).
Conclusions: Investigation of the premarking of cell type restricted enhancers in
ESCs has provided a surprising insight into the process of genomic enhancer recognition
underlying cell-type-specific transcriptional programs. Thus, it appears most, if not all, cell
type restricted functional enhancers, perhaps ~2-4 x10⁵ genome-wide, are marked in the stem
cell stage by binding of a single, or occasionally two, canonical stem cell transcription factors,
in a varied areas of the enhancers, while ESC enhancers are bound by multiple ESC
transcription factors in the core of the enhancers.
ESC factor binding in ESCs appears to be of functional importance for its ultimate robust
binding of the subsequently-expressed transcription factors required for activation in the
differentiated cell. Indeed, the more robustly a “premarked” macrophage-restricted enhancer
binds to the ESC transcription factor, along with Cohesin, and exhibits an “open”
configuration and expression of a ncRNA transcript distinct from the ultimate eRNA, the more
likely that enhancer is to be strongly active in the mature cell. It is tempting to speculate that
the molecular memory is provided by the altered methylation state of the core region near the
Pu.1 site consequent to the binding and activation in ESCs by binding of ESC transcription
factors.
In this study, we used murine ESCs to propose premarking events, then, next
consequent question was whether human ESCs also could have same premarking events
because there are differences between mouse ESCs and human ESCs, such as poor expression
of Esrrb in human ESCs. However, we think that since ESC factors are equally important

73
based on our observation from ENOS, other ESC factors assume this role in premarking cell
type restricted enhancers in human ESCs.
The marking of the cell type restricted enhancers in ESCs thus serves as an obligatory
code to license activation of these enhancers during development and differentiation, and
apparently functions to not only to help preclude the premature interaction with the ultimate
cognate coding gene promoter, but also to license the ultimate robust activation of the cell
type restricted enhancer in the mature differentiated cell (Fig.61f).
Methods
Cell culture
46c murine ESC was kindly gifted by Austin Smith. It is grown in feeder free
condition as previous described (Ying et al., 2003). ESCs were maintained in serum culture
medium with DMEM-KO(Invitrogen 10829-018) supplemented with 15% ESC qualified-fetal
bovine serum (Omega, FB-05), 2 mM nonessential amino acids (Invitrogen 11140-050),
glutamax (Invitrogen 35050061), penicillin/streptomycin ( Invitrogen 15140122), 2-
mercaptoethanol (Sigma, M7522) and 1000 U/ml LIF (ESGRO, ESG1106). ESCs in 2i
medium were grown in N2/B27 media with 50% Neurobasal (Gibco 21103-049) and 50%
DMEM/F12 (Invitrogen 21331-020), 2 mM nonessential amino acids, glutamax,
penicillin/streptomycin, 2-mercaptoethanol, N2 supplement (Invitrogen, 175020-01), B27
(Invitrogen, 17504-001), 1000 U/ml LIF, and 2i (ESGRO, ESG1121). Peritoneal macrophage
is obtained from 6-8 weeks of female C57BL/6J mice obtained from Jackson laboratory. Mice
are injected with thiogycollate 3-4 days before collecting day, and cultured in RPMI
supplemented with 10% FBS and penicillin/streptomycin for overnight before collection. All
animal care and experimental procedures were in accordance with the University of California,
San Diego research guidelines for the care and use of laboratory animals.

74
Antibodies
Antibodies used for ChIP/ChIP-seq included: Rad21 (abcam, ab992), H3K4me2
(upstate, 07-030), Pu.1 (Santa cruz, sc-352) and H3K27Ac (active motif, 39133); for immuno-
staining, F4/80-FITC (ebioscience, 11-4801-81) and CD11b-PE-Cyanine5 (ebioscience, 15-
0112-81); for MeDIIP, 5hmC (Active Motif, #39769).
Enhancer reporter assay
For construction of Tlr1 enhancer reporter plasmids, 600bp of Tlr1 locus spanning
Esrrb binding site was PCR amplified and cloned into pGL4.23 at the KpnI/XhoI sites
downstream of the luciferase reporter gene. Enhancer reporters were transfected into
RAW264.7 macrophages using lipofectamin 3000 (invitrogen), using 200 ng of enhancer
reporter and 5 ng of Renilla. Luciferase activity was measured 48 h after transfection using a
Veritas microplate luminometer (Turner Biosystems) and normalized to Renilla activity to
correct for differences in transfection efficiency. Experiment was performed five independent
times. P-values were obtained using Welch’s two t-test and data were represent with
median ± s.d..
ESC differentiation to macrophage
ESC differentiation to macrophage was performed as described previously(Zhuang et
al., 2012). Shortly, ESCs were trypsinized and transferred to bacteriological plates in
macrophage differentiation medium A which has 15% L929 conditioned medium and 1ng/ml
IL3 but lack of LIF for 6~8days to make embryoid bodies (EBs). EBs were transferred onto
gelatin-coated tissue culture dishes for 3~4 days. After that, supernatants of adherents EBs
containing floating macrophage progenitors were collected and plated onto bacteriological
dishes for 7 days to obtain adherent macrophage in macrophage differentiation medium B
which has 15% L929 conditioned medium). Medium was readded to the adherent EB plates
and macrophage progenitors were obtained every 2 days.

75
CRSIPR/Cas9 assay
The online software (http://crispr.mit.edu) was employed to design optimal candidate
sgRNAs to target proximal regions of Esrrb motif and these sgRNAs were cloned to vector
PX459 (Addgene #48139), which co-expresses sgRNA and Cas9. This plasmid was
transfected into ESCs with Lipofectamine 2000 and 1.0 ug/ml puromycin was added 2 days
after transfection. Cells were cultured for another 3 days then diluted to pick up single cell-
derived clonal lines. DNA was extracted from these cells and PCR was performed to amplify
fragment containing sgRNA-targeted Esrrb motif. Sequencing was applied to identify Esrrb
motif mutated/deleted clones. sgRNA sequences and primer sequences are listed in
supplementary table 2.
RNA preparation and RT-qPCR
RNA was isolated using Trizol (Invitrogen) or RNeasy kit (Qiagen). RNA is reverse
transcribed using SuperScript III Reverse Transcriptase kit (Invitrogen). Quantitative PCR was
performed using SYBR Green Master Mix (Biorad). The experiments were repeated at least
three times as a biological replicates and P values were obtained using Welch’s two t-test.
Primers are listed in supplementary table 2.
RNA-seq
RNA-seq sequencing libraries were made from 100 ng of DNase-treated total RNA
samples using TrueSeq stranded mRNA Library Prep Kit (Illumina, RS-122-2101, RS-122-
2102) and performed according to the manufacturer’s instructions. RNA-seq libraries were
quantified with Qubit, clustered and sequenced using HiSeq 3000/4000 SR cluster kit
(Illumina GD-410-1001) and HiSeq 3000/4000 SBS kit (Illumina FC-410-1001). RNA-seq
reads were counted by HOMER software considering only exonic regions for RefSeq genes.
EdgeR software was the utilized to calculate the significant expressed genes in different
samples (p<0.01). Cluster 3.0 with K-Means Cluster generated clustering results in

76
differentially expressed genes and the output was viewed using Java Treeview. Gene ontology
analysis and genetic association analysis was performed using Metascape
(http://metascape.org).
Pro-cap
Pro-cap and library preparation for sequencing was described previously (Kwak et al.,
2013). Nuclei were prepared from ~40 million cells for run-on assay. And then run-on
reactions were stopped and RNA was extracted with Trizol LS reagent (Invitrogen). Following
DNase treatment, the RNA was fragmented. Biotin incorporated fragmented RNA was
immunoprecipitated with anti-strepavidin beads (Invitrogen). Then these RNA was treated
with 3′-dephosphorylated with polynucleotide kinase (Enzymatics) and precipitated. The RNA
was dephosphorylated with calf intestinal phosphatase (NEB) and 5′-de-capped with tobacco
acid pyrophosphatase (Epicentre). The reaction was stopped and RNA was extracted with
Trizol LS, and libraries were prepared by ligating Illumina TruSeq-compatible adapters to the
RNA 3′ and 5′ ends with truncated mutant RNA ligase 2 (K227Q) and RNA ligase 1 (NEB),
respectively, followed by reverse transcription, cDNA isolation and PCR amplification. Final
libraries were size selected on TBE gels to 60–110 bp insert size. Pro-cap results were
trimmed to remove A-stretches originating from the library preparation. Each sequence tag
returned by the Illumina Pipeline was aligned to the mm9 assembly using Bowtie2 allowing
up to 3 mismatches. Only tags that mapped uniquely to the genome were considered for
further analysis. Each sequencing experiment was normalized to a total of 107 uniquely
mapped tags by adjusting the number of tags at each position in the genome to the correct
fractional amount given the total tags mapped.
ChIP-seq
Cells were fixed with 2mM disuccinimidyl glutarate (DSG) (proteochem) for 45 mins
and 1% formaldehyde for 10 mins, and followed by glycine for 5 mins. Nucleus lysates are

77
prepared by using sonication buffer with 1% SDS, and immunoprecipitation is performed with
several different antibodies. After overnight incubation with antibodies, beads are added for
another 3hrs, and washing is performed. Reverse-crosslinking is done for overnight at 65°C
and DNA is purified using QIAquick Spin column (Qiagen). For ChIP-seq, extracted DNA is
ligated to adaptors and deep sequencing is performed with Illumina’s HiSeq 2000, 2500, or
4000 system according to the manufacturer’s instructions. The first 48bp for each sequence
tag returned by the Illumina Pipeline is aligned to the mm9 assembly using BFAST or
Bowtie2. Only uniquely mapped tags are selected for further analysis. The data is visualized
by preparing custom tracks on the UCSC genome browser using HOMER. Genomic binding
peaks for transcription factor were identified using the findPeaks.pl command from HOMER
with 8-fold enrichment over the input sample, 4-fold enrichment over local background, a
minimal tag number of 16, and normalization to 107 mapped reads per experiment. For histone
marks, initial seed regions of 500bp were considered to calculate enriched reads. Regions of
maximal density exceeding a given threshold with a FDR<0.001 were called as peaks. The
peaks within ± 1,000bp apart from the RefSeq gene TSS site were considered to be promoter,
and to focus the analysis on enhancers, peaks within 3kb of a gene promoter were filtered out.
4C-Seq
Chromosome confirmation capture was performed as described previously (Werken et
al., 2012). Briefly, 10 million cells were cross-linked with 1% formaldehyde for 10 min.
Soluble chromatin was incubated with 400 units of Hindlll (NEB) for overnight, and then
intramolecular ligations were performed using 1000 U of T4 DNA ligase (NEB) for 4hr at
16°C under dilution. Chromatin was decrosslinked at 65°C and purified using several phenol
and phenol-chloroform extractions and ethanol precipitation. The second restriction digestion
was also performed overnight, using 50units of Dpnll (NEB). Intramolecular interactions were
ligated overnight, and RNaseA was treated in chromatin. DNA was ligated overnight and

78
purified as before and ultimately using Qiagen columns and subjected to inverse PCR (expand
long-range PCR system; Roche Diagnostics) using first primer designed on the viewpoint and
second outer primer designed beside the Dpnll site. Both primers contained Illumina
sequencing adapters and barcodes for multiplexing. PCR samples were purified using a Roche
kit and quantified using a Qubit. We analyzed data using a bioinformatics pipline previously
described (van de Werken et al., 2012).
MeDIP-Seq
Genomic DNA for hMeDIP was isolated from cells using Qiagen’s DNeasy Blood
and Tissue Kit. Isolated genomic DNA was then fragmented through sonication using
Diagenode’s Bioruptor platform to 100-300bp, and the size distribution was confirmed
through gel electrophoresis. Barcoded adaptors for Illumina sequencing were added to 1ug of
fragmented genomic DNA per experiment, using the NEBNext Ultra II DNA Library Prep Kit
for Illumina, following manufacturer’s instructions. This protocol was stopped after adapter
ligation and cleanup (and before any amplification steps), and the adapter ligated fragmented
DNA was then used for hydroxy-methylated DNA pulldown. Denaturing, immune-
precipitation, washing, and purification of hydroxy-methylated DNA were performed as
described previously (Thu et al., 2009), with the following modifications. 1ul of 5-hmC
antibody containing serum was used per IP reaction. Washing was done five times, with each
wash for 15 minutes at 4°C. Also, DNA was eluted from beads using 200uL digestion buffer,
incubated overnight with Proteinase K at 50°C, and purified using Qiagen’s QIAquick PCR
Purification Kit. Purified hydroxy-methylated genomic DNA was then further processed with
NEBNext Ultra II DNA Library Prep Kit for Illumina at the step of PCR Enrichment of
Adpator Ligated DNA, as per manufacturer’s instructions, continuing with the entire protocol
to prepare libraries for Illumina sequencing. Data was mapped to mm9 using Bowtie2 with
standard settings and peaks were found by using MACS with default parameter.

79
ATAC-seq
ATAC-seq was performed as described previously (Buenrostro et al., 2013). Nuclei
were prepared from 50,000 cells and transpose reaction was performed for 30mins at 37°C.
DNA fragments were amplified by PCR, purified and deep sequencing was performed with
Illumina’s HiSeq 2000, 2500, or 4000 system according to the manufacturer’s instructions.
ATAC-seq data was mapped to mm9 using Bowtie2 with standard settings. Tag directories
with reads mapped to the mitochondrial chromosome filtered out were created. ATAC-seq
peaks were identified using findPeaks.pl in HOMER with the settings: -style histone -size 75 -
minDist 75 -minTagThreshold 6 -L 8 -F 8. BED files were created from Tag directories using
the HOMER package.
Deep-sequencing
For all ChIP-seq, RNA-seq, 4C-seq, ATAC-seq, MeDIP-seq and PRO-cap, the DNA
libraries were sequenced for 50cycles on Illumina’s HiSeq 200, 2500 or 4000 system
according to the manufacturer’s instructions. Sequencing experiments were visualized by
preparing custom tracks for the UCSC Genome browser.
Bioinformatic characterization of enhancer
The criteria for identifying Pu.1-H3K4me2 co-bound enhancer regions is that the
distance from the center of a Pu.1 peak to the H3K4me2 peak-occupied region is ≤1kb. ESC
factor bound macrophage enhancers are defined by calculating the distance ≤1kb between
ESC factor peak spanning region and Pu.1 bound macrophage enhancers. The active ESC
enhancers or active macrophage enhancers are defined using H3K27ac (over 100tags) to
examine 12 different ESC factor binding. The functional macrophage enhancer was defined
using GRO-seq (over 20 tags) in macrophage, and these enhancers were used to count number
of functional enhancers in ENOS bound enhancer or non-bound enhancer in a -1kb/+1kb.
Highly active or less active macrophage enhancers were created after excluding non-active

80
macrophage enhancers by using GRO-seq (less than 5 tags) in macrophage. The comparison
of tag intensity of ChIP-seq, ATAC-seq, PRO-cap and GRO-seq or distances between
different categories are presented as boxplots by using normal scales. P-values are calculated
using Welch’s two t-test. To profile the distribution of ESC factors surrounding Pu.1-
H3K4me2 co-bound enhancer regions, ChIP-seq signals surrounding Pu.1 peak centers were
separated by 40 bins, and then were sorted by the tag numbers based on the distance to Pu.1
peak center.
GEO Data
The GEO data bases used in tis study are listed in Supplementary Table 1. All deep
Sequencing DATA is deposited in GEO under accession number GSE81681.
Author Contributions
H.S.K. and M.G.R. conceived the project. H.S.K. performed most of the experiments
reported, with particular contributions from W.M. (CRISPR-Cas9), Y.T.(Pro-cap) and E.D.
(4C-Seq); D.M. and Y.T. performed most of the bioinformatics analyses; T.S. performed the
DNA methylation experiment; K.O. prepared samples for deep sequencing assays;. Q.M.
analyzed 4C-Seq; additional experiments/methods were contributed by M.F.; H.S.K., and
M.G.R. wrote the manuscript with extensive help from Y.T. All the authors declare no conflict
of interests.
Acknowledgements
The authors are grateful to Janet Hightower for assistance with figure preparation; H.
Taylor for help with animal-based cell culture. M.G.R. is an investigator with the Howard
Hughes Medical Institute. This work was supported by grants from NIH to M.G.R.
(DK018477, DK039949, CA173903, and GM104459). The authors declare no conflict of
interests.

81
Chapter 4 is an adaptation of a manuscript that is being submitted for publication.
The authors of this study are Hong Sook Kim, Wubin Ma, Yuliang Tan, Daria Markujev,
Eugin Destici, Qi Ma, Tom Suter, Kenneth Ohgi, Meyer Friedman, Michael G. Rosenfeld.
The dissertation author contributed to this study through performance of experiments related
to DNA methylation and hydroxymethylation, as well as intellectual input.

82
CHAPTER 5 CHROMOSOMAL ENHANCER SYNTAX: SPATIALLY-DISTRIBUTED
SUPER ENHANCERS AND SUBNUCLEAR STRUCTURAL ASSOCIATIONS DICTATE
ENHANCER ROBUSTNESS
Summary
Since their initial description, enhancers have been considered to be transferable
elements that regulate proximal coding gene transcription based on their intrinsic properties.
However, an important, but minimally explored, question is whether the strongest regulated
enhancers, although separated by vast linear distances on a chromosome, might functionally
cooperate to yield higher levels of transcriptional robustness. Here, we report that estradiol-
17β (E2)- induces eRNA-dependent 3D physical proximity of a cohort of the most highly-
induced MegaTrans- and ERα-bound enhancers, altering their relative positions in the
remodeled chromosomal architecture. Genome editing approaches reveal that this gained
physical proximity of “first tier” ERα enhancers imposes cooperative enhancement of
activation on the interacting enhancers and their coding targets. Our data reveal a previously
unappreciated “spatially-redistributed mega enhancers”, with robust enhancer transcription
apparently requiring both Condensin-dependent E2-induced enhancer proximity and
association with an interchromosomal granule (ICG). These events, possibly augmenting
liquid-liquid phase separation (LLPS) in the confined volume of this sub-nuclear architectural
structure, would favor massively-increased concentrations of critical cofactor machinery to
impart robustness to the first tier enhancers.
Introduction
Mammalian development requires the precise coordination of expression of tens of
thousands of coding genes in space and time, giving rise to a myriad of cell types. Studies of
transcriptional control have established the importance of many different types of cis-
regulatory modules of gene expression located at greater distances from the proximal gene
83
promoter, including enhancer, insulators and silencers (Ayer and Benyajati, 1990; Bulger and
Groudine, 2011; Gaszner and Felsenfeld, 2006; Giles et al., 2010; Levine, 2010; Petrykowska
et al., 2008). Enhancers serve as critical regulatory elements for transcriptional programs
directing development, homeostasis and disease states (Bulger and Groudine, 2011; Sakabe et
al., 2012; Shen et al., 2012; Yue et al., 2014).
Global genomic approaches have illuminated the genetic, epigenetic and architectural
features that define active enhancers: DNase I hypersensitivity(Gribnau et al., 2000) ,
enrichment for unstable nucleosome variants H2AZ and H3.3 (Jin et al., 2009; Wang et al.,
2008) specific post-translation modifications of adjacent nucleosomes including H3K4me1,
H3K4me2 and H3K27ac (Calo and Wysocka, 2013; Creyghton et al., 2010; Heintzman et al.,
2007; Heinz et al., 2015; Shen et al., 2012; Thurman et al., 2012; Zentner et al., 2011b) and
finally by the active transcription of noncoding enhancer RNAs (eRNAs) (Kim et al., 2015;
Lai and Shiekhattar, 2014; Lam et al., 2013; Li et al., 2013; Li et al., 2016). Many enhancers
are also bound by nuclear proteins serving as key signal transducers for the various cell
signaling pathways involved in development or homeostasis (Carroll et al., 2006; John et al.,
2011). These studies estimated a total of 500,000 to 1,400,000 enhancers in the mammalian
genome (Consortium, 2012; Hah et al., 2011;; Shen et al., 2012; Thurman et al., 2012).
Prior research had demonstrated the increased potency of multimerized DNA
regulatory elements in proximity (Carey, 1998). This principle, when applied to whole
enhancers suggests that groups of enhancers may have unique properties separate from their
individual constituents (Hnisz et al., 2013; Hong et al., 2008; Parker et al., 2013; Perry et al.,
2010; Whyte et al., 2013). The importance of collections of clustered enhancers in
transcriptional regulation is now clear, a phenomenon alternatively referred to as “shadow
enhancers (Hong et al., 2008) “stretch enhancers” (Parker et al., 2013) or “super enhancers”
(Hnisz et al., 2013; Whyte et al., 2013). “Shadow enhancers” in Drosophila development
84
collectively regulate transcription of developmentally important genes (Perry et al., 2010).
Super enhancers are largely composed of collections individual enhancers with less than 12.5
kb separation between them, producing synergistically high transcriptional output of their
coding target genes (Whyte et al., 2013). However, ~15% of enhancers referred to as super-
enhancers contain only a single enhancer element and are therefore best considered to be
singularly strong individual enhancers (Pott and Lieb, 2015).
The genome is divided into thousands of non-random “topologically associated
domains” (TADs) (Dixon et al., 2012; Nora et al., 2012). These megabase-sized regions
separated by boundary elements place constrains on the interactions of enhancers and genes in
different TADs (Benedetti et al., 2014; Dixon et al., 2012; Nora et al., 2012; Sexton et al.,
2012). The Fractal-globule model for organization, which suggests that DNA is a fractal
globule rather than an equilibrium globule (McNally and Mazza, 2010) at scales of up to 10
megabases, was supported by Hi-C results (Lieberman-Aiden et al., 2009; McNally and
Mazza, 2010). More recent data have further suggested that loop domains, presumed to be
formed by the loop-extrusion activity of extrusion complexes particularly cohesion
(Fudenberg et al., 2016; Sanborn et al., 2015) isolate chromosomal segments into regions
permitting local gene activation events. While emphasis has been placed upon the results of
Hi-C and 5C data that indicate extensive local interactions (de Laat and Duboule, 2013;
Gibcus and Dekker, 2013; Schwarzer and Spitz, 2014) what has remained incompletely
explored is the possibility that even enhancers in distant TADs can interact or be brought into
physical proximity due to three-dimensional chromatin folding potentially forming an
additional transcriptionally-functional enhancer network. In addition to models generated by
Hi-C (Dekker and Mirny, 2016; Gibcus and Dekker, 2013; Nagano et al., 2013) and FISH
(Shopland et al., 2006; Yokota et al., 1995) approaches; recent multiplexed FISH experiments
have also provided further evidence for cell to cell variability in 3D chromosomal architecture

85
(Wang et al., 2016). The introduction of microscopy/deep- sequencing genome architecture
mapping (GAM) (Beagrie et al., 2017), provides evidence of longer-distance interactions in a
crosslinking-independent fashion.
Transcriptional program regulated by 17β-estradiol (E2) in breast cancer cells provides
an accessible model to investigate potentially overlooked mechanisms of enhancer activation
and control of transcriptional programs. Estrogen receptor α (ERα) is a ligand-dependent sex
steroid-regulated transcription factor that mediates most of the biological effects of estrogens,
primarily at the level of gene transcription (Carroll et al., 2006; Lin et al., 2004). Others and
we have investigated the E2 mediated transcriptional program in MCF7 breast cancer cells
(Hah et al., 2011; Hua et al., 2009; Li et al., 2013; Liu et al., 2014). ERα binds to 30,000 to
40,000 EREs genome-wide, a subset of which (7,000-8,000) harbor the identifying histone
marks of enhancers (Li et al., 2013). Functionally important ERα bound enhancers recruit a
variety of co-factors including P300, SRCs, Mediator, Cohesin, Condensin I and II. But the
molecular signature of the most potent ERα enhancers has proved to be the ERα dependent
assembly in trans of a large complex of DNA binding transcription factors including RARα,
FoxA1, AP2γ and GATA3 (MegaTrans) at the enhancer (Bojcsuk et al., 2016; Li et al., 2015;
Liu et al., 2014). The MegaTrans complex is required to activate eRNA transcription and
target gene transcription. Only 30% of these MegaTrans-bound enhancers fit the commonly
used definition of super-enhancers. The most robust ERα regulated enhancers in MCF7 cells
also exhibited the highest levels of eRNA transcription (Li et al., 2013).
In this manuscript, we provide evidence suggesting that a subset of the most robust
ERα enhancers on Chr.21, bound by the mega-dalton sized MegaTrans protein complex, are
brought into non-simultaneous spatial proximity by E2 to form a dynamic E2-regulated
network. These strong ERα-bound enhancers (referred to as “first tier” enhancers) exhibit
rapid, dynamic and non-coincident alterations in topography. These E2-dependent alterations

86
in enhancer proximity proved to be dependent upon the function of the Condensin complex,
which is necessary for the E2-induced proximity of the enhancers. Gene editing approaches
have revealed that many enhancers in this network function in a cooperative fashion, with
disruption of certain strong ERα enhancers resulting in decreased robustness for a network of
first tier ERα enhancers. In response to E2, enhancers located in two A compartments
separated by a central, long B compartment, appear to be brought into proximity and to
become fully transcriptionally active. Surprisingly, as determined by RNA FISH, they become
most robustly transcribed when co-localized in the same phase-separated interchromatin
granule structure (ICGs), perhaps further seeding the process of LLPS in these ICGs
(Brangwynne et al., 2009; Feric et al., 2016; Lin et al., 2015; Molliex et al., 2015). Taken
together, our data provides a largely overlooked structural regulatory strategy, involving 3D
redistribution of MegaTrans enhancers, which associate with subnuclear RNP bodies. These
events facilitate dynamic, ligand-induced networks of enhancers to cooperatively activate the
ligand-regulated transcriptional program.
Results
To investigate any potential relationships between robust ERα-bound enhancers
located at great linear genomic distances within a chromosome, we found it advantageous to
initially focus on a set of ERα enhancers and coding target genes located on Chr.21. Chr.21,
the smallest among human chromosomes, harbors some of the well-characterized ERα
enhancers and coding genes that are located in a wide range of genomic distances (Figure
1.A). Chr.21 is an acrocentric chromosome that harbors a nucleolar organizing region (NOR)
(Dekker and Misteli, 2015; Henderson et al., 1972; Zentner et al., 2011a) in its p-arm. On
Chr.21we identified 132 ERα bound, H3K27Ac, H3K4me1 marked enhancers amongst the
total of 479 enhancers defined by ATAC-seq peaks and eRNA transcription. 39 of these
enhancers were highly active based on E2 dependent recruitment of ERα and multiple key

87
transcription machinery and pioneer factors such as MED1, PolII and FoxA1 (Figure S1.A-D).
We identify them as “first tier” ERα enhancers in this manuscript. The other 93 ERα bound
enhancers had considerably less E2 transcription machinery (Figure S1.A-D), and had a
minimal MegaTrans complex recruitment (Data not shown). We also used 89 active non- ERα
enhancers as a control group in these analyses. As expected enhancers in this group had strong
basal, E2 independent recruitment of MED1, PolII and FoxA1, but no ERα binding. An initial
assessment of the effects of E2 on enhancer function was provided by ATAC-seq (Figure 1.D).
Using chromatin openness as a surrogate for enhancer robustness , meta analysis revealed that
the first tier enhancers exhibited most robust responsiveness to E2 in contrast to the 93 weak
ERα-bound enhancers. E2 had no effect on the basally robust non-ERα-bound enhancers. To
further characterize the first tier ERα enhancers, we examined the distribution of factors,
including several classical co-activators for estrogen receptor. In order to depict the data in a
visually accessible manner by incorporating a combination of criteria, including relative
chromosomal location and ERα abundance we present ‘triangle plots’ (Figure 1.E-I), in which
the area of the triangle corresponds to the total tag density from ChIP-seq data at the indicated
enhancer position. The line height is proportional to the level of ERα recruitment. Top ten of
the 39 first tier enhancers are listed in order 5’ to 3’ along Chr.21 (NRIP1e1-3, NCAM2e1,
TIAM1e1, DOPEY2e1-2, SH3BGRe1, DSCAMe1-2, TMPRSS2e1, UMODL1e1, TFF1e1 and
COL18A1e1 ).
First tier enhancers showed strong recruitment of classic factors associated with
regulatory elements such as p300 and MED1 (Figure 1.E, F). p300, a well-established
cofactor for the estrogen receptor, exhibited a decrease recruitment to weaker ERα enhancers,
and non-ERα enhancers following E2 treatment indicating re-distribution of p300 pool to most
active enhancers. This is consistent with the haploinsufficiency phenotype of CBP/p300 in
humans (Murata et al., 2001). First tier enhancers were also highly marked by components of

88
the MegaTrans complex (AP2γ and GATA3, Figure 1.G, H). These factors were much less
recruited to the remaining 93 ER-bound enhancers. This was also the case for FoxA1 (Figure
1.I), which is both a pioneer factor for ERα-binding to enhancers (Hurtado et al., 2011) and a
component of the MegaTrans (Liu et al., 2014). To evaluate if the first tier enhancers might be
premarked even prior to E2 treatment, we evaluated their methylation and hydroxyl
methylation status (Thu et al., 2009). First tier enhancers were the most demethylated
enhancers in the basal and E2 stimulated state, compared to the other two categories (Figure
1.J). The seemingly simultaneous binding of so many different transcription factors on ERα
enhancers indicated that these loci are “hotspots”, as previously described in the literature
(Junion et al., 2012; Rada-Iglesias et al., 2012; Siersbaek et al., 2014a; Siersbaek et al., 2014b).
To explore the basal and E2-induced alterations in Chr. 21 chromatin architecture, we
performed Hi-C, as modified by the in situ fixation method to increase efficacy (Rao et al.,
2014). Hi-C libraries were sequenced to a depth of >200x106 unique reads for each condition,
analyzed by generating z-scores of contact counts. These analyses indicated the broad area of
B compartment spanning roughly 14Mb in the middle of the Chr. 21 q arm (Fig. 1B) and
treatment with E2 did not substantially alter either the A/B compartment or the chromosomal
boundaries, as determined by insulation scores (Fig. 1B, 1C, respectively). When analyzed at
a resolution of 1Mb the Hi-C data also indicated the presence of extremely long distance
interactions (Fig. 1C), although, not providing the resolution to permit precise detection. This
suggestion of long-distance interactions is consistent with the findings in ES cells using GAM
methodology (Beagrie et al., 2017).
E2-Induced Long-distance Interactions of Chr.21.
Chromatin capture methods, including Hi-C and 5C, favor detection of relatively
short-range interactions falling in the tail end of distribution of distances between two loci.
But these technologies are inefficient in detecting the entire distribution in a population of

89
cells (Dekker, 2016; Giorgetti and Heard, 2016). Hence we elected to employ multi-region
FISH analyses (Figure S2.A), to be more effective at detecting dynamic architectural changes
and putative long-distance interactions across Chr.21.
E2 treatment (50 min) of ERα expressing MCF7 cells induced an increased proximity
of the first tier ERα enhancers located at a wide range of genomic distances (5.7Mb to 30Mb)
(Figure 2.A, B, Figure S2.B). Spatial proximity is defined by number of interacting pairs
coming below a cut off distance that is determined based on the median distance between
these loci in a non- ERα cell type (see Figure S2.E and Methods). E2 dependent reduction in
the spatial distance between these loci is also evident from the cumulative distribution plot of
the measured distances between them (Figure 2.C, Figure S2.C). 2-4 % of all loci pairs
examined exhibited basal levels of interaction, which were increased by 2- to 4-fold following
the addition of E2 (Figure 2D and Figure S2.B), with 9-10% of loci pairs approaching each
other at a distance closer than cut off distance. Even with large genomic separation between
these loci, E2 stimulation brings them in a spatial proximity that is comparable to a typical
enhancer promoter distance by theoretical calculation. For instance, NRIP1 and DSCAM-AS1
enhancer loci were counted as interacting when they came within a radius of 590 nm (Figure.
2D). This radius is similar to the amount of space taken up by 100,000 base pairs of DNA
(Dekker and Mirny, 2016), which is approximately the length of DNA separating the NRIP1
promoter from the NRIP1e1-3 super enhancer.
We examined the effect of E2 stimulation in inducing proximity between several
regions across Chr.21 (Figure S2.D). We found that most of the first tier enhancers showed
decrease in median distance between them upon E2 stimulation; in contrast there were no
significance differences in the spatial distances between a weak ERα enhancer and first tier
enhancer or a non- ERα target and a first tier enhancer (e.g. UBE2G2/DSCAM-AS1 and

90
BCP26/TFF1 respectively (Figure S2.D). This suggests that E2-induced proximity happens
preferentially between first tier enhancers.
These data point to a non-linear relationship between one-dimensional genomic
distance and spatial distance. To better visualize the effects of E2 on chromosome
conformation, we plotted the relative 3D median spatial distances between the NRIP1 and
seven other first tier ERα enhancers in -/+E2 conditions, using NRIP1 as the “viewpoint”
(Figure 2E). Under basal conditions, there is a high similarity between genomic distance and
spatial distance (Figure 2.E, top vs. middle panel). However, after 50 min E2 treatment, the
spatial distances no longer correspond to the linear distances between the regulated genomic
loci. Thus, in E2 treated cells, DSCR3 becomes spatially closer to NRIP1 than to DOPEY2, and
TFF1 becomes closer than DSCAM-AS1, relative to their linear genomic distances. The NRIP1
and TFF1 enhancers have a median spatial distance of 1.86μm under basal conditions and
1.52μm following E2 treatment. If geometrically modeled by placing one locus at the center of
a sphere with a radius R equal to the median spatial distance of cells, after treatment of cells
with E2 ligand for 50 minutes, the volume of this sphere would decrease from 26.95μm3 to
14.71μm3. The rate of interaction between these loci should therefore increase by ~82%.
We next examined the ‘kinetics’ of long distance interaction by DNA FISH using
NRIP1 and TFF1 probes (27.3Mb apart) at different time points after treating cells with E2.
We could observe the interactions between these genomic loci at the earliest time point
examined (5 min) (Figure.2 F). Interestingly, we observed variation is the fraction of alleles
coming below proximity cut off. An elevated induction in proximity was observed at 5-20 min
followed by a decrease during the 20-30 min interval. Fraction of proximal alleles again
increasing at 40-60 min before reaching the baseline at 120 min (Figure.2 F). These data are
consistent with a similar reported periodicity of ERα and its co-factor binding(Liu et al., 2014;

91
Metivier et al., 2003) after E2 treatment, further suggesting the role of ERα and its co-factors
in mediating such long distance interactions.
Dynamic Interactions of First Tier Enhancers
Based on these observations, an important question was whether E2-induce proximity
of multiple first tier enhancers there by bringing them together in time and space, or whether
these are dynamic, transient interactions that occur relatively independently, more in accord
with a “random walk” model of chromatin interactions (Sachs et al., 1995; Yokota et al.,
1995). We therefore performed three-color FISH studies using 40kb fosmid based FISH
probes against several first tier loci of interest (TFF1/NRIP1/TIAM1 and
TFF1/NRIP1/COL18A1). These experiments revealed that E2 dependent two loci interactions
between any two pair of loci were observed at least 8.5 times more frequently than three loci
interactions in the case of TFF1/NRIP1/COL18A1 and no simultaneous 3 loci proximity were
observed for TFF1/NRIP1/TIAM1 (Figure 2.G). Therefore we concluded that the long
distance interaction is likely to follow a random walk model.
Next we explored whether any of these long distance interactions could be observed
by complementary approaches utilizing proximity mediated ligation based strategies. We
performed a 4C experiment using TFF1e1 as the viewpoint (Stadhouders et al., 2013). This
analysis revealed that there was a clear E2-induced interaction between the TFF1e1 and the
DSCAM -AS1e1 region that is located 2 Mb apart in two separate TADs (Figure 2.H). FISH
analysis also confirmed a statistically significant E2 induced proximity between DSCAM-
AS1/TFF1e1 interactions (Figure 2.I). It should be noted that according to FISH data 10-15%
of TFF1e and DSCAM-AS1e loci came closer than 330 nm in spatial distance (Figure 2.I) that
allowed this interaction to be effectively captured by 4C. This demonstrated that the long
distance interactions can be captured by proximity- mediated ligation approaches if the loci
come in close spatial proximity (~300nm) in a sufficient population of nuclei. However,

92
proximity of this extent in such a large fraction of nuclei was rarely noted in other much
longer interactions we observed.
Effects of Induced Proximity on Gene Transcription
In order to test the functional relevance of E2 induced architectural changes in
chromosome, we asked if the induced proximity influence the transcriptional outcome of the
proximal loci. We resorted to RNA FISH to visualize and localize the transcription. eRNAs are
generally shorter species of non-coding RNA that make their visualization challenging. Therefore,
we designed intronic probes against coding genes regulated by two strong enhancers that undergo
E2 induced proximity, namely NRIP1 and TFF1e. Intronic probes allowed us to visualize the
nascent RNA at the site of transcription. We used the intensity of the signal as readout for
transcriptional robustness. Indeed, we observed a negative correlation between the median spatial
distance between actively transcribing NRIP1/TFF1 loci and robustness of transcription, when
these loci where simultaneously expressed in the same nucleus (Figure 2J and K). Based on these
data, we concluded that E2 induced proximity enhances the robustness of the participating
transcribing units in a cooperative manner. Interestingly, we also noted that active transcription of
any of these loci occur only in ~ 30% of nuclei (Figure S2.F) and simultaneous expression of at
least one allele each of NRIP1 and TFF1 in same nucleus is observed ~10% of cells. This in
agreement with the fraction of NRIP1 and TFF1 loci that showed induced proximity in DNA FISH
(Figure 2.D).
Functional Significance of The Induced Enhancer Interactome
The induced interactions between first tier enhancers separated by multiple TADs
contrasts with paucity of similar observations from extensively available Hi-C datasets.
Therefore, it became critical to determine the functional importance, if any, of E2-induced
interactions we observed using microscopy. We employed CRISPR-Cas9 based gene editing
approaches (Cong et al., 2013; Jinek et al., 2013; Ran et al., 2013) to delete NRIP1e3 and

93
TFF1e1 enhancer regions (Fig. S3A,B). To minimize potential off-target effects of gRNA
used, we generated at least 4 different lines for each deletion using independent sets of gRNAs
pairs. Homozygous genotype of the clones used was confirmed with PCR (Figure S3.A, B)
and Sanger sequencing of the genomic DNA (Figure S3.C-S3.L). All the clones used in
functional assays expressed comparable level of ERα protein and responded robustly to E2
(Figure S3.M)
First, we used QPCR to test the transcriptional effect of first tier enhancer deletion on
other first tier enhancers in Chr.21. To reduce clonal variation in gene expression levels,
experiments were repeated using four independent clones. The largest effect of the enhancer
deletion was observed on the cognate target genes. TFF1e1 knockout (KO) resulted in 98%
reduction is TFF1 mRNA (Figure 3.B) and NRIP1e3 KO reduced the NRIP1 mRNA level by
50% (Figure 3.A). A relatively weaker impact of NRIP1e3 deletion could be due to the fact
we deleted only 1 out of 3 enhancers in the NRIP1e3 super enhancer cluster. Interestingly,
TFF1e1 KO reduced the TMPRSS2 transcript, a first tier ERα enhancer located 1 Mb away by
55% and NRIP1e3, that is located 27.3Mb away by 30% both under E2 treated condition
(Figure 3.B). Deletion of the NRIP1e3 also demonstrated long distance effect; TFF1
transcript was reduced by 35% and TMPRSS2 reduced by 50% (Figure 3.A). Intriguingly,
NRIP1e3 enhancer deletion had a more striking effect on TFF1e1 eRNAs, where both sense
and antisense strand reduced by ~ 55% (Figure 3.C).
To quantitate the effects of the TFF1e1 and NRIP1e3 deletion genome-wide, we
performed GRO-seq on the KO lines and compared them to wild type MCF7 cells that had
undergone the same transfection and selection regimens as KO cells. A meta-analysis of the
GRO-seq data found that both enhancer deletions had a significant effect on the transcription
of E2 induced eRNAs from the first tier ERα enhancers on Chr.21; in contrast, the less robust
ERα enhancers and non-ERα bound enhancers were not affected (Fig. 3D). To better visualize

94
the effects of the TFF1e1 and NRIP1e3 deletions on the transcription of individual enhancers
on Chr.21, we use “circle plots” where area of the circles correspond to the RPKM values of
indicated first tier eRNA and length of the lines correspond the ERα ChIP-seq tag counts
(Fig.3E-J). The raw data used to generate this plot is presented in Table 4. TFF1e1 deletion
affected the robustness of the E2 induced eRNA transcription on many distal first tier ERα
enhancers on Chr.21, most notably on NRIP1, NCAM2, DSCAM1, UMODL1 and COL18A1
enhancers (Figure 3.G,H) Similarly NRIP1e3 deletion reduced transcription to varying degree
of multiple tier1 enhancers, such as TFF1e, DSCAM2e1, SH3BGRe, DOPEY2e1-2,
UMODL1e, TMPRSS2e1, and COL18A1e1(Figure 3.I, J). Both deletions also affected coding
transcription units controlled by the affected enhancers. The effects of the TFFIe1 and
NRIP1e3 deletions on the TFF1e1 eRNA and mRNA is illustrated by a browser image given
in Fig.3K, that clearly shows nearly complete absence of transcription from TFF1 coding
genes in TFF1e1 KO and a visible reduction in both coding transcript and eRNA in NRIP1e3
KO. Figure 3.L shows the actual RPKM values of plus and minus TFF1e strands in indicated
genotypes. Qualitatively similar data was observed in an independent GRO-seq experiment,
with meta analysis of 39 first tier enhancers showing a ~80-90% Pearson’s correlation
coefficient in each condition. Further, to exclude any indirect effects from reduction in TFF1
gene product, we deleted the TFF1e1 promoter, which abolished transcription of the TFF1
coding gene. GRO-seq showed that this had no effects on transcription units outside of the
specific TAD in which TFF1 was located (data not shown) indicating that the effects of
TFF1e1 deletion reflected actions of the enhancer rather than any indirect effects of loss of the
TFF1 protein. To test if the transcriptional effect seen extended beyond the first tier enhancers;
we examined the eRNA expression from 82 non- ERα enhancers present in Chr.21 (Figure
S3.P). This analysis revealed no change in eRNA transcription from these enhancers, further
proving the specificity of effect on first tier ERα enhancers. Taken together we observed a

95
striking impact of deletion of first tier enhancers on other first tier enhancers that exhibit an
induced proximity in E2 treatment. These data validated the functional importance of
individual first tier enhancers in contributing to the robustness of the regulated transcriptional
program.
Effects of Enhancer Deletions on Long Distance Interactions.
In order to examine the contribution of first tier enhancer elements in E2 induced
proximity of first tier enhancers we performed DNA FISH analysis using these cells. These
series of experiments demonstrated that both TFF1e1 and NRIP1e3 enhancer deletion
significantly attenuated the E2 induced proximity of NRIP1 and TFF1 (Figure 4.A-C). We
also found that a minimal, 51-nucleotide deletion encompassing a FoxA1 motif at TFF1e1
core (TFF1e1FM KO) 1.6 kb deletion thus alleviating the concern of non-specific effects
resulting from larger genomic deletion (Figure 4.A). Similarly, E2-induced proximity between
NRIP1 and DSCAM-AS was virtually abolished on deletion of the NRIP1e3 enhancer (Figure
S4.A), as was the closer proximity between DSCAM-AS1 and TFF1 upon TFF1e1 KO
(Figure S4.B).
We next wanted know if a first tier enhancer contributed to the induced proximity
between two other first tier enhancers. Deletion of the TFF1e1 resulted in a modest, but
statistically significant, decrease in induced proximity between NRIP1 and DSCR3 (Figure
4.D). Similarly, in NRIP1e3 KO cells E2 induced proximity between TFF1 and DOPEY2,
another robust first tier ERα enhancer, was compromised (Figure 4.E). Based on these results
we concluded that E2 induced proximity between long distant first tier enhancers are driven by
enhancer activity and that each enhancer contribute to the robust architectural changes of other
component enhancers.
Potential Roles of eRNA in the Formation of the Connectome
Prior studies have shown that eRNAs are functionally required for the enhancer

96
activity and enhancer promoter looping (Blinka et al., 2016; Hsieh et al., 2014; Li et al., 2013).
In order examine the contribution of eRNA generated from first tier enhancers in transcription
and induced proximity, we used ASOs that function to knockdown eRNA transcripts in a
RNAse H dependent fashion. FISH analysis revealed that TFF1e1 knockdown caused a clear
decrease in the interactions between NRIP1 and TFF1 regulatory regions (Figure 4.F).
We next addressed the contribution of first tier eRNAs in transcriptional out put from
other enhancers. We performed GRO-seq experiment after knockdown of TFF1e1 and
NRIP1e3. These data revealed that, analogous to effects of enhancer deletions, knockdown of
the TFF1e1 or NRIP1e3 eRNAs caused impairment in the activation of the other 39 first tier
enhancers, while having no effect on the other ERα-bound enhancers or the non-ER-bound
enhancers (Figure 4.G, Figure S4.C). When plotted to visually depict the quantitative effects
on ten of the most robust E2-regulated enhancers, we observed that the pattern highly
resembled those observed following genetic deletion of the TFF1e1 and NRIP1 enhancers
(Figure S4E-J compare to Figure 3.E-J). These data suggest that eRNAs or/and enhancer
transcription play critical roles in these extreme long-distance enhancer interactions, as well as
in short range enhancer: promoter interactions (Blinka et al., 2016; Hsieh et al., 2014; Li et al.,
2013). eRNA knockdown experiments provided independent validation that both
transcriptional and chromosomal architectural phenotypes observed in CRISPR enhancer KO
cells are genuinely contributed by enhancer mutations, not due to clonal variation. All these
data support the hypothesis that transcriptional robustness of first tier ERα-bound enhancers is
imparted by the long distance interactions between component enhancers.
The B Compartment of Chromosome 21
Because of its large size and strategic location close to center of q-arm of Chr.21, we
surmised that the extended B-compartment might contribute to E2 induced architectural
features of Chr.21. Hi-C analysis revealed the presence of a B-compartment in Chr.21 spanning

97
mostly the region between18-32 Mb (Figure 1.B). ChIP-seq analysis revealed that the extended
B-compartment is decorated with H3K27Me3 and H3K9Me3 (Figure S5.E) thus fitting the
epigenetic features of B compartments(Lieberman-Aiden et al., 2009; Rao et al., 2014). This
14Mb stretch of B-compartment is interrupted at three regions by small patches of A-
compartment that showed depletion of heterochromatic marks, but recruitment H4K20me3
(Figure S5.E). A number of first tier ERα-bound enhancers (NCAM2e1, TIAM1e1 and
NRIP1e3), fall in the A-compartment near the extended B-compartment (Figure 1.B). While
NCAM2e1 falls in the A-compartment patch flanked by B-compartment, NRIP1 is ~ 2.5Mb 5’
and TIAM1 is ~1Mb 3’ to the extended B-compartment. We examined if the close positioning
to B-compartment could alter the interaction pattern of these enhancers. DNA FISH studies
revealed that these first tier enhancers had high basal interaction (10% between
NRIP1/NCAM2 and 13% between NRIP1/TIAM1). These regions do not show an E2 induce
movement, possibly because they are already in spatial proximity (Figure 5.A-B). Consistent
with previous report (Lieberman-Aiden et al., 2009) we also noted that A and B compartment
associate with each other at a much less frequency than two A-compartment regardless of the
genomic distance. FISH experiment using a probe against TFF1 (A compartment) and a B
compartment (BCP26) revealed that 1.2 % alleles pairs came below cut off distance (+E2
condition), while under same condition 9% of TFF1-NRIP1 (both A compartment) that are
located 27.3 Mb apart were below the cut off distance (7.5 fold increase over the former)
(Figure 5.C). The difference was also evident at the median spatial distance between these
loci (1.53µm for NRIP1/TFF1 vs. 2.25µm for TFF1-BCP under + E2) (Figure S2.D). Same
trend was seen we did the experiment using probe against NRIP1 (A-compartment) and B
compartment (Figure S5.A, B).
We observed that B-compartment in Chr.21 significantly overlap with published
Lamin Associated Domain data (Figure S5.F), while the first tier enhancers that are proximal

98
to this region is associated with A-compartments and avoid LADs (Figure S5.F). Since NOR
in Chr.21 can associate with nucleolar compartment we examined the relative position of
extended B-compartment in the nucleus. Immuno DNA FISH using B-compartment probe
(BCP), Lamin B1 and Fibrillarin (a nucleolar protein) revealed that 55% of B-compartment is
in close proximity with Lamin B1 or nucleolar surface (Figure S5.G, H). Using pairs of FISH
probes inside B-compartment region we found that E2 stimulation can result in a modest
expansion of the B-compartment (Figure 5. D, E, S5.D). We hypothesize that tethering of
extended B-compartment to two prominent nuclear structures provide a unique 3-D
architecture to Chr.21. The relatively fixed association of B-compartment with these structures
and the E2 depended expansion might result in altered flexibility of the B compartment and
thereby bring the flanking A compartments in close proximity (Figure S5.C).
Estrogen Reconfigures Chr.21 Topography of First Tier Enhancer Networks
Chr.21 is one of 5 acrocentric chromosomes (Chr.13,14,15,21,22) in the human
genome that carry rDNA repeat sequences for ribosome biogenesis and those rDNA-
containing regions tend to be important in forming a subnuclear structure, the nucleolus, for
rDNA transcription, rRNA processing, and ribosome assembly (Henderson et al., 1972;
Zentner et al., 2011a). ImmunoFISH experiments using NRIP1/TFF1 probes and anti-
Fibrillarin antibody indicated that NRIP1 is located immediately adjacent to the outer surface
of the nucleolus in the untreated cells. It relocates further into the peri-nucleolar region in E2-
treated cells when it interacted with TFF1. In turn, a sub-population of TFF1 appears to re-
locate to the nucleolar periphery, where it engaged with NRIP1 (Fig.6A,B).
We wished to determine whether structural proteins might be important determinants
of the E2-induced proximity of first tier enhancers. Because the binding of Cohesin to ERα-
bound cognate enhancers was minimally altered by E2, while binding of Condensins I and II
were highly E2-dependent (Li et al., 2015), it was important to test whether these first tier

99
long-distance interactions might require the actions of Condensins. By ChIP-seq analysis, we
determined that the 39 first tier enhancers on Chr.21 exhibited striking E2-dependent
recruitment of both NCAPG and NACAPH2 (Figure 6.J; Figure S.6D), in contrast to
minimal induction on the other 93 ERα-bound enhancers (Figure 6.J; Figure S.6D).
Following knockdown of RAD21 or NCAPG using specific siRNAs (Figure S.6E) and
performing FISH analyses we found that knockdown of Condensin subunits caused a dramatic
loss of E2-induced proximity of first tier enhancers, while RAD21 (Cohesin) knockdown
caused only minimal effects (Figure 6.K). These data stand in contrast to the strong effects of
Cohesin knockdown on short-range enhancer: promoter interactions (Li et al., 2013) indicating
a specific, strong role of Condensin in these dynamic “long distance” induced proximity. This
is consistent with recent observations in yeast, where Condensins are much more important
than Cohesin for long range interactions (Kim et al., 2016). Given the initial data indicating
that Condensins may be associated with matrix-like structures, these findings suggest that
interactions with a subnuclear architectural structure may be a functional aspect of these first
tier enhancer networks.
Interactions with Subnuclar Aarchitectural Structures
Indeed, we had previously noted that a POU domain factor activating a broad
enhancer program in developing pituitary cell lineages required interactions with specific
subnuclear architectural structures Matrin3 network to permit enhancer activation and
function(Skowronska-Krawczyk et al., 2014). These data indicated that at least a subset of
enhancers require association with specific subnuclear architectural structures to be
functionally activated, and it provoked the possibility that enhancer interactions occurring in
the context of a subnulear architectural structure that permits concentrating coactivator to
contribute to the robustness of enhancer transcription. Based on these data, we initiated
exploration of the potential E2 dependent interactions of first tier enhancers in SC35-

100
containing interchromatin granules (ICGs), an RNA/RNP-generated representative of a Liquid
liquid Phase Separated (LLPS) structure (Han et al., 2012; Kato et al., 2012; Lin et al., 2015;
Molliex et al., 2015; Patel et al., 2015).
By DNA FISH, we observed that TFF1 loci associate with SC35 at a higher frequency
(~22%) compared to NRIP1 loci (Figure 6.C,D). We also observed a position- depended
association of genomic loci with ICGs. Loci at 5’ of Chr.21 (E.g. NRIP1) showed low
association (5%) with speckle domain while those loci in 3’ region associate a significantly
higher rate (e.g. 50% association for COL18A1) (Figure S.6A). We next explored several first
tier interacting enhancers (COL18A1/DSCR3 and TFF1/DSCR3), finding that when these
regions were in close proximity by FISH, they were located in the same SC35 granule in 50-
55% of nuclei, as opposed to 8 -20% associations of more distant allele pairs with same
structure when they did not exhibit proximity by FISH (Figure 6.E, F). The more pertinent
question, whether the localization in SC35 granules was linked to transcriptional activity, was
investigated using immunoRNAFISH (mNRIP1/ mTFF1/SC35). The data revealed that
actively-transcribing TFF1 was markedly associated within ICGs with 78% of the robust
TFF1 RNA loci colocalized with SC35 granules (Figure S6.B, C). The RNA FISH signal for
NRIP1 was much less robust, but it was found that the signal was most robust when the
NRIP1 and TFFI loci were colocalized to the same SC35 granule, compared NRIP1 alone
associating with ICG or when they are not in proximity to ICG (Figure 6.G, H). Similar
observation was made for TFF1 transcript too (Figure 6.I). This data, along with the
observation that transcription of NRIP1 and TFF1 was enhanced by E2 induced physical
proximity (Figure 2.J, K), strongly support the idea that first tier enhancer cooperatively
increase the transcriptional activity of each other in the presence ICG.
Many subnuclear architectural structures are themselves RNA:protein complexes that
have undergone phase separation (Feric et al., 2016). This raised the possibility that

101
interaction of active enhancers on nuclear structures would raise the local concentration of
various ERα co-activations, many which contain low complex RNA binding domains. Based
on the observation of induced proximity of associating loci in ICG enhancing transcriptional
output we decided to test the hypothesis that LLPS might be an underlying mechanism that
bring these first tier enhancers separated by vast genomic space to close physical proximity.
To test this hypothesis we first disrupted the ICG using siRNA against SRSF1 (Pandit et al.,
2013) finding that even with ~65% knockdown efficiency, the eRNA transcription of first tier
enhancer was decreased >60 % (Figure 6.L,M; Figure S6.G,H). Finally, to test the effects of
a aliphatic alcohol that melt the low complexity domain structures, we treated MCF7 cells
with 1,6-Hexanediol (I,6-HD) (Lin et al., 2016). An exposure to 1,6-HD as short as 5 min
virtually abolished robust transcription of the NRIP1e3 and TFFIe1 and a number of other first
tier eRNA in a time frame of 50 min post exposure (Figure 6.L,M; Figure S6.G,H). These
data strongly suggest the involvement of proteins harboring low complexity domains and
LLPS in E2 induced eRNA transcription and enhancer robustness.
Discussion
In this paper, we have uncovered a currently unappreciated functional consequence of
the ligand-induced interactions between robust first tier enhancers separated by vast linear
genomic distances, dictating the robustness of chromosome wide enhancer driven
transcriptional regulation programs. While enhancers are well established to have a
transferable ability to activate transcription of reporter genes (Banerji et al., 1981; Moreau et
al., 1981), the observations described here reveal that the physiological robustness of the
regulated first tier enhancers, at least in part, derives from their interactions with other strong,
regulated enhancers located on the same chromosome. Using the actions of liganded estrogen
receptor (ERα) in breast cancer cells as a model, our data indicates that ligand induces
dynamic, asynchronous, increased proximity of a cohort of the most robust ERα bound

102
enhancers located in two A compartments on Chr.21 that are separated by a centrally located
14Mb long B compartment, which itself preferentially associated with the nucleolar surface
and LaminA-rich nuclear membrane. Surprisingly the E2-induced increased proximity of first
tier enhancers caused an increased robustness of activation for the entire set of interacting
enhancers.
Specifically, we find that proximity and interactions between NRIP1e3 and TFF1e1
enhancers, and several other first tier enhancers, are increased in response to E2 in MCF7 cells
and this appears to occur in a non-synchronous fashion after ligand treatment. We have found
that, in the context of the intact chromosome, robustness of the E2-induced strong enhancers,
marked by the MegaTrans complex, substantially depends on cooperative interactions with
other enhancers, in effect functioning as a dynamic chromosome-wide, ligand-induced,
Megaenhancer. Specificity of these interactions is indicated by the fact that non-E2 regulated
enhancers and weak ERα bound enhancers are essentially unaffected by these interaction-
dependent events.
Roles of eRNAs in Dynamic Induced Enhancer Interactions
Our study additionally revealed that the eRNAs of the strongest and most actively
transcribed enhancers are involved with facilitating the actions of proteins/RNAs involved in
long-distance looping interactions between enhancers and other regulatory elements. Our data
offers further proof in support of prior examples of functional long-distance interactions
between regulatory regions in diverse organisms and tissues that might be related to
transcriptional efficacy, including examples of interchromosomal interactions (Beagrie et al.,
2017; Fanucchi et al., 2013; Markenscoff-Papadimitriou et al., 2014; Proudhon et al., 2016).
These are exemplified by experiments that inserted an extra β-globin locus control region
(LCR) into the mouse genome (Noordermeer et al., 2011), with the ectopic LCR interacting
with the endogenous βh1 gene, interchromosomally, in 5-10% of cells. Indeed, the interaction

103
frequencies for distal ERα enhancers on Chr.21 are also in the range of 5-10% following E2
induction. It has been suggested that the aggregation of olfactory receptor (OR) enhancers
around an OR promoter results in the formation of a stable nucleoprotein complex, which is
sufficient to cause a feedback-eliciting level of OR gene transcription resulting in a permanent
OR choice in that specific sensory neuron (Markenscoff-Papadimitriou et al., 2014) however,
whether this interaction occurs in a preexisting subnuclear structure or generates a novel one is
not known.
Because of the observation that the induced interactions between first tier enhancers
are dynamic and not simultaneous, our data is most consistent with a random walk, and
implies a molecular memory of initially transient interactions. We suggest that these enhancer-
driven events might therefore have some mechanistic similarities to V-D-J recombination
events in B cell development, which involves a condensation of the genomic region, followed
by a random walk until interaction of the DJ region with the V region results in cleavage and
translocation(Lucas et al., 2014).
Implications of Functional Enhancer Network for Future Mechanistic Studies
The unexpected contributions of temporally transient enhancer interactions to
modulating robustness of other first tier enhancers in the network raise the intriguing question:
What are the underlying molecular mechanisms that impart enhancer robustness? Given the
extensive linear distances between the first tier enhancers, it would seem unlikely that this
process could be controlled by loop-extrusion (Bouwman and de Laat, 2015; Fudenberg et al.,
2016; Sanborn et al., 2015) because that process is naturally limited by the presence of
boundary elements (Fudenberg et al., 2016). Therefore, the challenge now is to unravel the
mechanistic basis of the ability of these long-distance interactions to regulate the robustness of
first tier enhancers brought into further proximity in response to ligand. In this regard, ideas
about liquid-liquid phase separation (LLPS), as an underlying mechanism for enhancer
104
robustness becomes a tempting hypothesis, a problem that will require years of further
investigation by the scientific community, using new technologies, to be fully resolved.
However, the findings in this manuscript do provide some initial clues regarding these
questions, including several non-exclusive possibilities. First, even transient ligand-induced
interactions between these enhancers could allow for rapid exchange/interaction of
transcription factors/cofactors/chromatin remodeling components at higher local
concentrations in the ”first tier” enhancers (Tropberger et al., 2013). A highly attractive,
complementary possibility of potential eRNA-dependent seeding of LLPS events centered at
first tier enhancers which can ultimately lead to phase transitions in ICG. This might prove to
be analogous to the formation of the nucleolus, resulting from the process of LLPS induced by
transcription of the rRNA loci found in the nucleolar organizing regions (NORs) (Shav-Tal et
al., 2005).
As RNP bodies tend to exhibit liquid-like physical properties after the process of
LLPS, these suspended liquid droplets can fuse and split apart at rates determined by a variety
of factors including viscosity (Brangwynne et al., 2011) as described for P bodies. The
nucleolus, P bodies and probably other ribonucleoprotein (RNP) nuclear bodies, are
membrane-less structures assembled through phase separation of their molecular components
into internal subcompartments that represent distinct, coexisting liquid phases. We are tempted
to speculate that the enhancers colocalizing at ICGs may participate in the information
exchange underlying enhancer robustness(Feric et al., 2016; Guo and Shorter, 2015; Shukla
and Parker, 2016; Weber and Brangwynne, 2015). An additional example is provided by
enrichment of germplasm proteins and effector RNAs that creates a steep transition between
aggregated germ plasm components at the posterior pole and a low concentration of these
components throughout the rest of the embryo (REF). Such a transition may involve a phase
shift from a fluid to a more gel-like state, as suggested for other RNP particles (Lehmann,

105
2016). We suggest that the eRNA-dependent formation of architectural structures at the
enhancer can alternatively nucleate, or become embedded in, structures including the
SC35/interchromatin granule.
Given the data suggesting that RNP-dependent LLPS could massively increase local
protein concentrations(Zhang et al., 2015), we propose that dynamic, increase in coactivator
complexes associated with the regulated MegaTrans enhancers (Liu et al., 2014) is a key
principle driving the increased robustness of first tier enhancers in the network. It is evident
that RNAs are critical to define the localization and function of granules(Zhang et al., 2015).
Many proteins in the coactivator complex harbor the prion-like LC domains linked to LLPS.
For instance, two of the most robustly recruited cofactors to first tier ERα enhancers, P300 and
BRD4, have low complexity RNA binding motifs, and are known to form fibers in vivo
(Olzscha et al., 2017). Therefore, it becomes tempting to speculate that eRNAs of interacting
enhancers, with other lncRNAs, such as DSCAM-AS1, a first tier enhancer locus on Chr.21,
can stabilize interactions of proteins (Li et al., 2013; Sigova et al., 2015) with enhancers, assist
in nucleation of novel multi-mega dalton sized phase separated RNP bodies that become
essential components in formation of the interacting enhancers, This process could increase
the robustness of enhancers by concentrating transcription factors and cofactors via LLPS
demixing. With fusion to the ICGs, also an LLPS structure, a significantly higher
concentration of coactivators could be achieved within the ICGs relative to the solution phase
(Banani et al., 2017; Li et al., 2012). We posit that this increased concentration of coactivators
would critically augment the robustness of the first tier enhancers in the subnuclear structure.
An additional feature of regulated chromosomal architecture in our study is that first
tier loci tend to colocalize in the basal state with certain favored regions, but not with
disfavored regions, even when they are far closer by 1D genomic distance. E2 further
reinforces these existing biases, such that it becomes possible for two loci located on opposite

106
ends of a chromosome arm like NRIP1 and TFF1 to interact with a much higher frequency
than many loci with far less 1D genomic distance. Given past findings that the structure of
DNA in the nucleus resembles that of a “fractal globule”(Lieberman-Aiden et al., 2009; Mirny,
2011), it should not come as a surprise that 1D genomic distance and 3D spatial distance are
not well correlated in the nucleus. Our study reveals the functional significance of low
frequency mega base scale long distance interactions in the vicinity of membraneless
organelles. These findings also pave way to future explorations into the role of such de novo
assembled structures as organizers linking large-scale chromatin architecture and regulated
transcriptional program in 3-D nuclear space.
Author Contributions
M.G.R, S.J.N, D.N, and L.Y conceived the project. L.Y and S.J.N performed the
CRISPR-Cas9 enhancer deletions. S.J.N and J.Z performed FISH experiments. D.M generated
codes and performed informatic analyses on FISH images. S.O, W.L and S.J.N did GRO-seq
assays with help from L.Y and R.J. L.Y. and S.J.N. performed Q-PCR assays. D.M and Q.M
performed the bioinformatic analyses. A.G. performed the in situ Hi-C. S.J.N. and L.Y
performed ChIP-seq experiments. S.O. performed 4C assay. S.J.N and F.Y. performed the
knockdown experiments. R.J and H.S.K performed ATACseq, T.S performed Methylation
Seq. K.O prepared most samples for deep sequencing. M.G.R., S.J.N, L.Y and D.N. wrote the
manuscript.
Acknowledgements
The authors are grateful to Janet Hightower for assistance with figure preparation,
S.J.N was a recipient of postdoctoral fellowship from American Heart Association. M.G.R. is
an investigator with the Howard Hughes Medical Institute. This work was supported by grants
from NIH to M.G.R. (DK018477, DK039949, NS034934, and CA173903). The authors
declare no conflict of interests.

107
Materials and Methods
Antibodies: The antibodies in this study were: anti-ERα (HC-20, Santa Cruz); anti-α-
tubulin (T5168, Sigma), anti-H3K27Me3 (C15410195, Diagenode), anti-H4K20me3 (ab9053,
Abcam), anti-H3K9me3 (ab8898, Abcam), anti-SC-35 (ab11826, Abcam), anti-SON
(ab121759, Abcam), anti-Lamin-B1 (ab16048, Abcam), anti-Fibrillarin (sc-25397, Santa Cruz
Biotechnology), anti-NCAPG (Bethyl Laboratories, A300-602A).
Cell Culture: MCF7 obtained from ATCC were cultured in DMEM media with 10%
FBS in a humidified incubator with 5% CO2 at 370C. To prepare cells for estrogen
stimulation, they were cultured in phenol-red free DMEM with 5% charcoal stripped FBS for
3-5 days. To induce estrogen signaling, these cells were treated with 100nM 17β-estradiol (E2)
for indicated time points. Control samples where treated with ICI 182,780, a high affinity ERα
antagonist to reduce basal ERα protein level, for a period of 3 hrs.
CRISPR MCF7 Enhancer Deletion Line Generation: Guide RNA sequences were
designed to target the 5’ and 3’ of enhancer sequences by entering these sequences into the
website crispr.mit.edu. Top results from the website were cloned into the pX459-puro vector.
Pairs of pX459 gRNA targeting plasmids were transfected into wild type MCF7 cells using
lipofectamine 3000 reagent. 72 hours after transfection, MCF7 cells were treated with TrypLE
Select reagent and trypsinized for 30 minutes and then pipetted up and down 50 times through
a filtered P100 tip to break up any large clusters of adherent cells. The single cell suspension
was then plated onto many 10cm plates at a density of roughly 50,000 to 100,000 cells per
plate. 12 hours after plating, puromycin selection reagent was added to a final concentration of
400-600ng/mL in multiple 10cm plates in increments of 50ng/mL. The puromycin selection
continued for 72 hours, after which the puromycin media was removed, and non-selective
media with pen/strep and Normocin antibiotics was added. The remaining cells are regrown

108
for between 14-28 days, until colonies made up of 50-100 cells could be observed with a
microscope. At this point, individual colonies of MCF7 cells were lifted from the plate with a
P100 pipette under the observation of a microscope inside of a sterile tissue culture hood.
Colonies were then moved to individual wells of a 96-well or 48-well plate. After reaching
confluence within these wells, the cells were again trypsinized and 50% of the cells were
taken for genotyping while the remaining 50% could regrown. After genotyping, any wild
type, heterozygous and homozygous cell lines deemed fit for further study were systemically
expanded until enough cells were available for freezing stocks at -80C or in liquid nitrogen.
RT-QPCR: RNA was isolated using Trizol (Invitrogen) or RNeasy column (Qiagen),
and total RNA was reverse-transcribed using SuperScript® III Reverse Transcriptase
(Invitrogen). Quantitative PCRs were performed with MX3000P (Stratagene) using VeriQuest
Fast SYBR Green qPCR master mix (Affymetrix, Cat# 75690). The relative gene expression
was normalized to GAPDH or beta actin. Experiments were performed with at least three
independent biological replicates and three technical replicates for each experiment. Statistical
analysis was performed using a paired two-tailed Student’s t-test.
ChIP-seq: Briefly, approximately 107 cells were cross-linked with 1% formaldehyde
at room temperature for 10 min and neutralized with 0.125M glycine. After sonication, ~75µg
soluble chromatin was incubated with 1-5μg of antibody at 40C overnight.
Immunoprecipitated complexes were collected using Dynabeads A/G (Invitrogen).
Subsequently, immuno-complexes were washed, DNA extracted and purified by QIAquick
Spin columns (Qiagen). For ChIP-seq, the extracted DNA was ligated to specific adaptors
followed by deep sequencing with the Illumina’s HiSeq 2000 system according to the
manufacturer’s instructions. Usually, the first 48bp for each sequencing read was aligned to
the hg18 assembly using BFAST or Bowtie2. Only uniquely mapped tags were selected for
further analysis. The data was visualized by preparing custom tracks on the University of

109
California, Santa Cruz, (UCSC) genome browser using HOMER
(http://biowhat.ucsd.edu/homer). The total number of mapable reads were normalized to 107
for each experiment presented in this study.
Identification of ChIP-seq Peaks: The ChIP-seq peaks were identified by HOMER.
Given different binding patterns of transcription factors and histones, parameters were
optimized for the narrow tag distribution characteristic of transcription factors by searching
for high read enrichment regions within a 200bp sliding window. Regions of maximal density
exceeding a given threshold were called as peaks, and adjacent peaks were set to be >500bp
away to avoid redundant detection. The common artifacts from clonal amplification were
circumvented by considering only one tag from each unique genomic position. The threshold
was set at a false discovery rate (FDR) of 0.001 determined by peak finding using randomized
tag positions in a genome with an effective size of 2 × 10⁹ bp. For ChIP-seq of histone marks,
seed regions were initially found using a peak size of 500bp ( FDR<0.001) to identify
enriched loci. Enriched regions separated by <1kb were merged and considered as blocks of
variable lengths. All called peaks were then associated with genes by cross-referencing with
the RefSeq TSS database. Peaks from individual experiments were considered overlapping if
their peak centers were located within 200bp (for some analysis may extend to 1kb). The
peaks within ±1kb apart from RefSeq gene TSS site were considered as promoter-bound
GRO-seq: GRO-seq experiments were performed as previously reported(1). Briefly,
MCF7 cells were swollen in swelling buffer (10mM Tris-Cl pH7.5, 2mM MgCl2, 3mM CaCl2)
for 5 min on ice and then lysed in lysis buffer (swelling buffer with 0.5% IGEPAL and 10%
glycerol), before being re-suspended in 100µl of freezing buffer (50mM Tris-Cl pH8.3, 40%
glycerol, 5mM MgCl2, 0.1mM EDTA). For the run-on assay, re-suspended nuclei were mixed
with an equal volume of reaction buffer (10mM Tris-Cl pH 8.0, 5mM MgCl2, 1mM DTT,
300mM KCl, 20 units of Superase.In, 1% sarkosyl, 500µM ATP, GTP, and Br-UTP, 2µM

110
CTP) and incubated for 5 min at 300C. The nuclear-run-on RNA (NRO-RNA) was then
extracted with TRIzol LS reagent (Invitogen) following manufacturer’s instructions. After
base hydrolysis on ice for 40min and followed by treatment with DNase I and antarctic
phosphatase, the Br-UTP labeled NRO-RNA was purified by an anti-BrdU argarose beads
(Santa Cruz Biotech) in binding buffer (0.5XSSPE, 1mM EDTA, 0.05% tween) for 3hr at 4°C
while rotating. Then T4 PNK (NEB) was used to repair the end of NRO-RNA. Subsequently,
cDNA synthesis was performed as reported(9,33) with few modifications. The RNA fragments
were subjected to poly-A tailing reaction by poly-A polymerase (NEB) for 30 min at 37°C.
Reverse transcription was then performed using superscript III (Invitrogen) with oNTI223
primer. The cDNA products were separated on a 10% polyacrylamide TBE-urea gel with right
product (~100-500bp) being excised and recovered by gel extraction. After that, the first-
strand cDNA was circularized by CircLigase (Epicentre) and re-linearized by Ape1 (NEB).
Re-linearized single strand cDNA were separated by TBE gel and the products of desired size
was excised (~120-320bp) for gel extraction. Finally, cDNA template was amplified by PCR
using the Phusion High-Fidelity enzyme (NEB) with primers oNTI200 and oNTI201 for deep
sequencing.
Computational analysis of GRO-seq: The sequencing reads were aligned to hg18
using Bowtie2. For analyzing estrogen effects and enhancer deletion effects on gene
transcription, we counted the reads from the first 30kb (assuming a RNA polymerase speed of
~0.5 kb/min during 1hr E2 treatment) of entire gene body, excluding the promoter-proximal
region on the sense strand with respect to the gene orientation by using BED Tools or
HOMER. EdgeR (http://www.bioconductor.org/) was used to compute the significance of the
differential gene expression (FC≥1.5, FDR≤0.01). Additionally, a read density threshold (i.e.
GRO-seq normalized read counts/kb) was used in order to exclude lowly expressed genes.
De novo identification of GRO-seq transcripts: GRO-seq read densities were

111
analyzed in a similar manner to ChIP-seq. Provided GRO-seq generates strand-specific data,
separate tracks were uploaded onto the UCSC genome browser; tag-enriched sites were
identified using a sliding window of 250bp. Transcript initiation sites were identified as
regions where the GRO-seq read density increased threefold relative to the preceding 1kb
region. Transcript termination sites were defined by either a reduction in reads below 10% as
compare to that of TSS or when another transcript’s start was identified on the same strand.
Individual high-density peaks spanning a region less than 250bp were considered artifacts and
removed from the analysis. Transcripts were defined as putative eRNAs if their de novo called
start sites was located distal to RefSeq TSS (≥3kb) and were associated with ERα and
H3K27ac co-bound regions.
Bioinformatics characterization of ERα enhancers: The ERα-H3K27ac co-bound
regions are defined as that the distance from the center of an ERα peak to the H3K27ac peak-
occupied region is ≤1kb. Overall, two methods were used to assign the ERα bound enhancers
to E2 upregulated genes: 1) identifying the E2-upregulated coding genes from GRO-seq and
coupling each of them to their closest ERα-H3K27ac co-bound enhancer within first distance
(200kb) (a “gene-centric” view); 2) characterizing the ERα-H3K27ac co-bound enhancers first
and then coupling each of them to their closest TSS that belongs to 1,309 E2 upregulated
coding genes (an “enhancer-centric” view).
DNA FISH and RNA FISH: MCF7 cells grown on acid-washed poly-lysine coated
coverslips were fixed with freshly made 4% paraformaldehyde in PBS for 8 min. Excess
formaldehyde was quenched with 0.1M Tris-HCl (pH 7.4) for 5 min. Coverslips were washed
with PBS and stored at 40C until used. Prior to hybridization coverslips were incubated in
0.1N HCl for 5min at room temperature. Washed twice with PBS. Coverslips were incubated
in PBS containing 100µg/ml RNAse A for 1 hr at 370C-followed by equilibration in 50%
formamide/2XSSC for 1hr. 125ng of probe in equal volume mixture of formamide and 2X

112
hybridization buffer mix (4XSSC/40%Dextran Sulphate) was used per coverslip. Coverslips
on glass slides were heated for 6 min on a hotplate with temperature set at 800C followed by
overnight hybridization at 37C in a humidified dark chamber. The coverslips were then
washed twice with pre-warmed buffer containing 50% formamide/2XSSC and twice with
2XSSC before being finally mounted with Vectashield anitfade mounting medium with DAPI
(Vector Laboratories). For ImmunoFISH (DNA), cells were incubated first with PBS
containing 0.5% Triton-X-100 and 5%BSA for 15 min at room temperature. Primary
antibodies were used at a dilution of 1:50 in blocking buffer (0.1% Triton-100/5% BSA in
PBS) for 1 hr. at 370C. Washed 3 times in PBST (PBS containing 0.1% Triton X-100).
Incubated with appropriated fluorescent conjugated secondary antibody (1:1000) dilution for
30 min at room temperature. Cells were fixed for a second time with freshly prepared 2%
paraformaldehyde for 10 min at room temperature followed by treatment with 0.1M Tris-HCl
(pH 7.4) for 5 minutes. Washed twice in PBS and DNA FISH protocol described above was
resumed.
For RNA FISH, cells containing coverslips were fixed in 4% freshly prepared
paraformaldehyde. Washed twice with PBS with freshly added 2mM Ribonucleoside vanadyl
complexes (Sigma-Aldrich, St. Louis, MO, USA). Cells were permeabilized and stored in 70%
ethanol at 40C. Prior to probe hybridization coverslips were incubated with wash buffer (10%
formamide/2XSSC) for 30 minutes at room temperature. RNA FISH probes were resuspended
in hybridization buffer (10% formamide and 10% Dextran sulphate in 2XSSC). Coverslips
were incubated with probes overnight at 370C in a humidification chamber. Post incubation
washes were done using pre-warmed wash buffer twice at 370C. Immuno RNA FISH were
performed using the protocol described above with addition of primary antibody mixed along
with the RNA FISH probes and incubated overnight. Probes and primary antibody was
washed off using wash buffer at 370C followed by fluorescent conjugated secondary antibody

113
incubation. Nuclei were counterstained by incubating in wash buffer containing Hoechst
33342 at a concentration of 1µg/ml for 15 min.
DNA and RNA FISH probes: All the BAC based probes for DNA FISH were
purchased in the fluorescent labeled from Empire Genomics (Buffalo, NY, USA). Fosmids
were obtained from CHORI (Oakland, CA, USA). Fosmid based hybridization probes for
DNA FISH were generated from 1 µg fosmid using Nick Translation kit (Abbot Molecular),
Green 496, Oragne 552 or Red 650 conjugate dUTP following manufacture recommended
protocol. 125ng of each labeled probes, 4µg human Cot1 DNA (Thermo Fisher Scientific) and
10µg salmon testis DNA (Sigma-Aldrich) were used per coverslip. They were co-precipitated
in ethanol and were resupsended in equal volume mixture of formamide and 2X hybridization
buffer mix (4XSSC/40%Dextran Sulphate) prior to hybridization reaction. BAC and Fosmid
clone ID used in this study is given as a separate table ().
RNA FISH probes were designed using Stellaris Probe Designer tool (Biosearch
Technologies). Repeat masked intronic sequences of TFF1(intron 1), NRIP1 (Intron2),
DSCAM-AS1( Intron 1) were used as template for probe design. Probes were labeled with
FAM, Quasar 570 or Quasar 670 dyes.
Microscopy:
Images were acquired using a Perkin Elmer Spinning Disk Confocal Microscope
(100x Nikon Plane Apochromatic oil immersion objective, numerical aperture: 1.40). The
microscope was equipped with a Piezo-Z drive and EMCCD Hamamatsu 14-bit 1Kx1K
camera. Z-stack data was acquired at a step size of 150 nm. The 3D images were reviewed and
processed using Volocity software (Perkin Elmer, v6.0.1). Background-subtracted image
stacks were used for downstream analysis using Volocity software and custom software.
Image analysis:
3D image stacks were initially analyzed using Volocity software. The functions “Find

114
Object” and “Exclude Objects by Size” were combined for automatic detection of the FISH
probe signals. For accurate and automated calculation of spatial distances between the probed
loci, the 3D coordinates of FISH signals were exported to CSV files using the Volocity
software and were analyzed using custom software implemented with Python, NumPy, and
SciPy. To estimate the 3D distance distribution between any two genomic loci, the centroids
of the FISH signals from those loci were used to calculate a number (see below) of shortest
distances for each nucleus, and those distances were then pooled from all examined nuclei.
This procedure assumed that each of the shortest distances obtained from each nucleus
corresponded to loci located on the same chromosome. For experiments probing one diploid
and one aneuploid locus, up to two shortest distances were obtained per nucleus. For
experiments probing two aneuploid loci, the maximum number of shortest distances obtained
per nucleus was equal to the smallest known copy number among the two loci in MCF-7 cells.
The median distances between control and test conditions were compared using the Mann-
Whitney U test. The empirical cumulative distributions of distances were compared using the
Kolmogorov-Smirnov test. Custom software used for this study is available upon request.
3D Proximity Calculations:
To estimate the E2-induced changes in 3D proximity between different loci on Chr.21,
we calculated the fraction of pairs of loci whose spatial distance is less than a well-defined
cut-off distance. Because the loci considered in this study were separated by a wide range of
genomic distances (from 1.9 Mb to 33 Mb), the corresponding median spatial distances were
also expected to vary greatly. Therefore, using a single cut-off distance as a measure of
proximity was likely to yield excessively large or small fractions of proximal locus pairs at
small or large genomic separations, respectively. To address this problem, each pair of loci
was assessed using a cut-off distance that depends on the genomic separation between the loci.
Specifically, the cut-off distance was taken as 40% of the predicted median spatial distance

115
between those loci under basal conditions. In turn, the predicted median spatial distance was
obtained from a fit of the power-law function y = a xS to experimental data, where y is the
median spatial distance, x is the genomic distance, and a and S are fit parameters. To
determine the fit parameters, two experimental data sets were considered. The first data set
consisted of the 3D-FISH distance measurements obtained in this study for various locus pairs
on Chr.21 of E2-depleted MCF-7 cells. The second data set was taken from (Wang et al., 2016)
and consisted of the 3D coordinates of 34 TADs on Chr.21 of IMR90 cells, which do not
respond to estrogen. Such coordinates were obtained by a novel multiplexed-FISH method
capable of capturing the architecture of entire chromosomes in single cells. Power-law fits
obtained from the two data sets produced qualitatively similar results.
For a given pair of loci, the fraction of observed spatial distances less than the
appropriate cut-off distance was used to generate barplots of fold changes in 3D proximity
between those loci. The theoretical sample standard deviation s for each fold change c = a/b of
fraction a relative to fraction b was estimated using the error propagation formula (s/c)2 =
(va/a2 + vb/b2), where va = a(1−a)/Na is the theoretical sample variance of fraction a, Na is the
number of observations used to calculate a, and similar definitions apply to vb. The p-values
for the changes in fractions of distances less than the cut-off were calculated using a
previously described bootstraping method in which the observed spatial distances for the two
conditions being compared are combined and sampled with replacement to calculate the null
distribution of changes in fractions.
In addition to the cut-off distance approach described above for measuring the 3D
proximity of genomic loci, the “Intersect” function of the Volocity software was also used as
an alternative approach. This function employs the “voxel overlap” between two objects as an
indication of spatial interaction. To improve the reliability of the detected interactions, a
minimum overlap volume of 0.003 µm3 was used. The results from this voxel overlap

116
approach were found to agree qualitatively with those from the cut-off distance approach, in
terms of the induced proximity changes reported in this study.
In-situ Hi-C: In situ Hi-C was essentially performed as described(Rao et al., 2014).
Briefly, for each experiment, 2 x 10⁶ cells, fixed for 10 minutes with 1 % formaldehyde/PBS
and washed twice with PBS, permeabilized for 7 minutes at 62°C in a PCR cycler with 200 µl
lysis buffer (0.5% SDS, 50 mM Tris-HCl pH=7.5, 10 mM NaCl, 1mM EDTA, and 1X
protease inhibitors solution (Roche)) and pelleted at 2500x g for 5 minutes. Supernatant was
removed and nuclei were resuspended in 25 µl 10% Triton X-100, 25 µl NEB 2 buffer, 195 µl
water, and rotated for 15’ at 37°C. Chromatin was digested overnight at 37°C after adding 0.5
µl 1 M DTT and 4 µl 25 U/µl Mbo I and rotated at 8 RPM. MboI was inactivated by
incubation at 62°C for 20 minutes. Nuclei were centrifuged for 5 minutes at 500 x g and 200
µl supernatant was discarded. Overhangs were filled in by adding 32 μL water, 5 μl of 10X
NEBuffer2, 0.35 μl of 10 mM dATP, 0.35 μl of 10 mM dTTP, 0.35 μl of 10 mM dGTP, 7.5 μl
0.4 mM Biotin-14-dCTP (Invitrogen), 4 μl 10% Triton X-100, and 5 μl of 5 U/μl Klenow
enzyme (Enzymatics) and rotating for 40 minutes at room temperature. The reaction was
stopped by adding 2.5 µl 0.5 M EDTA. DNA was ligated under rotation overnight at 16°C in a
total volume of 400 µl ligase mix containing 40ul 10x T4 DNA ligase buffer (Enzymatics),
36 µl 10 % Triton X-100, 5 µl 100x BSA (10 mg/ml), 1 µl (1200 U) T4 DNA ligase
(Enzymatics). The reaction was terminated by adding 20 µl 0.5 M EDTA. Samples were
digested for 15 minutes at 42°C with 1 µl 10 µg/µl RNase A. 33 μl of 5 M sodium chloride
and 55 µl of 10% SDS were added and reverse crosslinked for 4 h at 65°C. Protein was
digested with 10 μl of 20 mg/ml proteinase K (Life Technologies), incubatedat 55°C for 120
minutes, shaking at 800 RPM, then 65°C for 90 minutes. DNA was extracted once with 600 µl
phenol/chloroform/isoamylalcohol (25:24:1) Tris-buffered to pH 8.0 and once with 300 µl
CHCl3, and precipitated overnight at -20°C with 1.5 µl 20 mg/ml glycogen and 1412 µl 100%

117
ethanol overnight. DNA was pelleted for 20 minutes at 16000x g, 4°C and washed once with 1
ml 80% ethanol for 5 minutes, 8000x g, 4°C. Pellets were dissolved in 131 µl TT (0.05%
Tween 20/10 mM Tris pH=8) each. DNA was sheared with 300 bp Covaris protocol in snap
cap tube in a Covaris E220 at 10 % duty cycle, intensity 140 W, 200 cycles/burst for 80” total
time. Large DNA fragments (>400 bp) were depleted with 5 µl speedbeeds and 6.45%
PEG8000/2.5 M NaCl. Supernatant was transferred to fresh tubes and small DNA fragments
were collected with 9.5% PEG8000 by adding an additional 60 µl PEG8000/2.5 M NaCl and 3
µl Speedbeads. DNA was eluted in 50ul TT for 5 minutes. DNA was captured with 50 µl 2x
B&W buffer containing 0.2 % Tween 20 and 15 µl T1 Dynabeads (Invitrogen, washed twice
with 1x B&W buffer (10 mM Tris-HCl pH 7.5, 01 mM EDTA, 2 M NaCl, then suspended in
51 µl 2x B&W buffer containing 0.2% Tween 20), rotating for 30 minutes at room
temperature. Beads were washed once with 500 µl each of 1x B&W/0.1 % Triton-X100, once
with TET (0.05% Tween 20/TE). Beads were resuspend in 100 µl end repair mix (KAPA
Library Preparation for Illumina) Incubated for 30 minutes at 20°C. Reaction was stopped by
adding 2.5 µl 0.5 M EDTA. Beads were collected and washed twice with 150 µl 1x B&W/0.1%
Triton-X100, once with 180 µl TET. Beads were resuspend in 50 ul A-tailing reaction mix
(KAPA Library Preparation for Illumina), incubated 30 minutes at 30°C. Reaction was
stopped by adding 1.5 µl 0.5 M EDTA. Beads were collected and washed twice with 150 µl
1x B&W/0.1% Triton-X100, once with 180 µl TET. Sequencing adapters were ligated to the
bead-bound DNA in 100 µl 1x rapid ligation buffer (Enzymatics) containing 0.1% Tween 20,
2ul 1:20 Truseq adapters (Illumina), 1 µl (3000 U) T4 DNA ligase (Enzymatics) for 20
minutes at room temperature. The reaction was stopped with 5 µl 0.5 M EDTA, beads washed
twice with 1x B&W, twice with 0.1% Tween 20/TE, then resuspended in 30 µl 0.033%
Tween20/LoTE, (TE diluted 1:4 with water). Libraries were PCR-amplified using the 10 µl of
the bead suspension as template for 10 cycles using KAPA HiFi, size-selected to 225-425 bp

118
insert size using speedbeads PEG8000/2.5 M NaCl solutions, and paired-end sequenced on an
Illumina HiSeq 2500.
4-C: The protocol of 4C-seq largely followed a published protocol (Stadhouders et al.,
2013) with following modifications. Briefly, 10 million cells were cross-linked with 1%
formaldehyde for 10 min and nuclei were extracted. Nuclei were resuspended in restriction
enzyme buffer and incubated with 0.3 % SDS for 1h at 37’c and further incubated with 2%
Triton X-100 for 1h. 400U of DpnII restriction enzyme was added and incubated overnight.
Restriction enzyme was heat inactivated at 650C for 20 min. Ligation of DNA regions in close
physical proximity was performed using 1000U of T4 DNA ligase (NEB) for overnight. After
de-crosslinking, the second digestion and ligation was performed using restriction enzyme
NlaIII and T4 DNA ligase. 4C-seq libraries were amplified using PCR with the first primer
designed on each viewpoint and the second primer designed beside the NlaIII site. Both
primers contained illumina sequencing adaptors and barcode. 4C libraries were sequenced on
the Illumina Hi-Seq 2500 using single-read 100-cycle runs.
ATAC-seq: ATAC-seq was performed as previously described (Buenrostro et al.,
2015). Briefly, wild-type or CRISPR deletion clones of MCF7 cells were harvested after
indicated time of ICI/estradiol treatment, washed once with PBS and 50,000 cells were used
for each ATAC-seq sample preparation. Transposition reaction was performed at 37oC for 30
min using Nextera DNA Library Preparation Kit (Illumina Cat No. 15028212) in 50μl volume
(2.5 μl Transposae enzyme, 25 μl 2X TD buffer and 22.5 μl nuclease-free water). The reaction
mixture was immediately purified using MinElute PCR purification Kit (Qiagen, Cat No.
28006) and eluted in 10 μl nuclease-free water. The tagmented DNA was then PCR amplified
using KAPA Real-Time Library Amplification Kit (Kapa Biosystems, Cat No. KK2701) in a
50 μl reaction (10 μl tagmented DNA, 2.5 μl25 μM PCR primer 1, 2.5 μl 25 μM barcoded
PCR primer 2, 25 μl KAPA HiFi HotStart ReadyMix, 10 μl nuclease-free water), using the

119
following program (One cycle at 72oC: 5 min, 98oC: 30sec; 8-12 cycles at 98oC: 10 sec,
63oC: 30 sec and 72oC: 1min). PCR standards, supplied in the kit, were included in separate
wells and the reaction was stopped between standard 2 and 3. The reaction mixture was
subjected to size selection (to select fragments ranging 150-800bp) using 1.6 volume of
Agencourt AMPure XP magnetic beads (Beckman Coulter, Cat No. A63880), washed once
with 80% ethanol, air-dried and eluted in 15 μl of nuclease-free water. The resulting ATAC-
seq library was quantified using Qubit Flurometer (Thermo Fisher) and the quality was
analyzed by resolving 1 μl on Tapestation (Agilent). Ten nmol of the library was sequenced
on HiSeq 4000 sequencer (Illumina). DATA was mapped to hg18 using Bowtie2 with
standard settings. Tag directories were created after removing the reads mapped to the
mitochondrial chromosome. ATAC-seq peaks were identified using HOMER.
Methylated DNA Immunoprecipitation: Genomic DNA from cells was isolated
using DNeasy Blood and Tissue Kit (Qiagen, Cat#69504). DNA was sonicated to fragment
size of 100-300bp using Bioruptor (Diagenode). NEBNext Ultra II DNA Library Prep Kit
(New England Biolabs, E7645) was used to ligate barcoded adaptors for Illumina sequencing
to 1ug of sonicated genomic DNA for each pull down experiment. After size selection and
clean-up, immunoprecipitation of methylated and hydroxymethylated DNA was performed as
previously described (Thu et al., 2009) with the following modifications. 1ug of 5-mC
antibody was used per MeDIP reaction (Active Motif # 39649), and 1uL of 5-hmC antibody
containing serum was used per hMeDIP reaction. DNA was then eluted from beads with
200uL Proteinase K digestion buffer overnight at 50°C. Samples were then purified using
QIAquick PCR Purification Kit (Qiagen, Cat#28104). These MeDIP and hMeDIP libraries
then resumed processing with the NEBNext Ultra II DNA Library Prep Kit for Illumina at the
step of PCR Enrichment of adpator ligated DNA, and the manufacturer protocol for Illumina
library preparation was followed to completion.

120
Chapter 5 is an adaptation of a manuscript that is being submitted for publication.
The authors of this study are Sreejith Nair, Lu Yang, Dimple Notani, Dario Meluzzi, Soohwan
Oh, Qi Ma, Tom Suter, Wenbo Li, Amir Gamliel, Fan Yang, Ranveer Jayani, Hong Sook Kim,
Jane Zhang, Kenneth Ohgi, Michael G. Rosenfeld. The dissertation author contributed to this
study through performance of experiments related to DNA methylation and
hydroxymethylation, SC35 and its genome wide association with chromatin, and analysis of
immune-FISH.

121
CHAPTER 6 DISCUSSION
Global versus gene specific epigenomic changes in senescence
While both literature and the study presented in this dissertation have shown a wide
array of epigenomic changes to occur in the process of senescence, key questions remain
unanswered as to the degree to which each of these factors are causative of the senescence
phenotype. A variety of striking and global epigenomic changes have been observed to occur
during senescence that have led to proposals that senescence may be driven by a tendency of
the senescent chromosome to be more open and dysregulated. However, I argue that our
studies and the body of literature regarding senescence epigenomic suggest that more targeted
and gene specific changes are playing at least as significant a role in driving the senescence
phenotype.
A host of global patterns are observed during senescence. Hypomethylation is observed
generally throughout non-CpG promoter regions (Cruickshanks et al., 2013). Global loss of
total histone levels are observe(Roderick J. O’Sullivan et al., 2010). Large scale deterioration
of local intra-chromosomal interactions are observed (Chandra et al., 2015; McCord et al.,
2013). Large scale deterioration in lamin associated domains are observed(Shah et al., 2013).
While there is inconsistency about the global change of H4K16ac changes during senescence
that seem to depend upon the system being used (Contrepois et al., 2012; Miller et al., 2010),
genome wide analyses showed a depletion of H4K16ac at late replicating regions and an
increase at the promoters of senescent genes regardless of their change in expression during
senescence (Rai et al., 2014). H3K56ac was shown to globally decreasing during senescence
due to the activity of HDAC1 and HDAC2 in response to DNA damage (Miller et al., 2010).
These changes in higher level structure are also suggested to be in part causative of the
senescence phenotype, as knockdown of lamin B1 is sufficient to induce senescence, and
overexpression of histones has been sufficient to extend lifespan of yeast

122
(Feser et al., 2010b). While the data indicating functional impact of these global changes
upon the senescence state is, however, rather limited, it is difficult to determine whether that is
due many of these features are downstream of other events, or because of the technical
difficulty of cleanly manipulating these feature. For example, as the three dimensional
architecture of chromosomes is the result of many interworking components, it is technically
difficult to manipulate the chromatin architecture at this level and determine if such
manipulations have any effect upon the senescent phenotype. Regardless, the correlation of
these global features with senescence is clear, and certain features, such as the sufficiency of
LMNB1 knockdown in inducing senescence, suggest that some of these global features of
senescence play a major role in the senescent phenotype.
Conversely, a host of gene and region specific epigenomic changes are also observed
during replicative senescence. Hypermethylation of specific promoters associated with
proliferation was observed, including CCNA2, CENPA, and TOP2A (Cruickshanks et al.,
2013). H3K4me3, a histone modification classically associated with active promoters, has
been shown to increase at genes associated with SASP during senescence (Shah et al., 2013),
and its writer MLL1 has been shown to be essential for associated SASP genes (Capell et al.,
2016, p. 1). Enhancer gain as marked by H3K27ac was shown to correspond with genes
induced during senescence, with a substantial gain in clusters of high H3K27ac marks known
as super-enhancers (Hnisz et al., 2013b; Tasdemir et al., 2016). Furthermore, inactivation of
these super-enhancers through knockdown or small molecule inhibition of BRD4, a
transcriptional activator shown to be necessary for super-enhancer function, showed inhibition
of SASP. Given that super-enhancers are small in number and have been shown to regulate
key cell state defining genes, these results confirm the relevance of gene specific features on
the senescent phenotype. GATA4 has also been shown to play a significant impact upon the
senescence phenotype in a gene specific man

123
Further emphasizing the relevance of gene specific factors as causative of the
senescent phenotype is the interrelation between global and gene specific epigenetic factors.
HIST1H2AE and HIST1H2BM are among genes shown to gain promoter methylation
(Cruickshanks et al., 2013), which corresponds clearly with core histone reduction observed in
replicative senescence (Roderick J. O’Sullivan et al., 2010). Gene and region specific changes
in H3K27me3 and H3K4me3 are observed in senescence and correlate with senescence
associated genes that include those of the SASP program. However, these regional and gene
specific changes are observed to correlate with and be instigated by senescence associated
depletion of LADs (Shah et al., 2013), which is in turn influenced by reduced levels gene
expression of LMNB1, or can be activated by an autophagy response to oncogenic stress (Dou
et al., 2015).
Our own data also shows support for the importance of gene specific changes
instigating the senescent phenotype, rather than the state being merely the result of global
opening of the genome. When we performed our screen of histone modifications that might
be altered in replicative senescence, we did indeed observe a global decrease in histone
content of senescent samples versus young samples when normalizing all samples to total
levels of protein. When we used ponceau staining and western blotting of total H3 and H4
levels, we found that these core histones were at levels around 2.5 fold higher in young versus
senescent cells, broadly consistent with previous findings (Roderick J. O’Sullivan et al., 2010).
However, we found that, when performing ChIP-seq experiments on a similar number of
senescent and young cells and normalizing DNA content between samples, we found a similar
fold change in genomic content versus total protein levels in young versus senescent cells.
This is consistent with the observation of multinucleation in senescent cells (Akakura et al.,
2010; Salama et al., 2014; Vergel et al., 2010). When looking at the normalization used in the
O’Sullivan paper, we observe that samples are normalized to levels of y-tubulin. While y-

124
tubulin is a classic standard for histone normalization and is closely associated with the
centrosome (Manning and Kumar, 2010), it is possible that this normalization approach may
overstate the significance of histone level change observed during senescence.
Additionally, altered levels of total histone levels without concomitant changes in the
writers and erasers of each modification might predict that there would be major differences in
the levels of different modifications throughout senescence. However, our panel of histone
modifications, once normalized to total histone levels, shows remarkable consistency between
the majorities of modifications throughout senescence. This would seem unlikely under the
proposed model, as different writers and erasers would likely have dramatically different
kinetics, and alterations in substrate would thus suggest relative differences in modifications
would become apparent during senescence. While our findings do not directly or necessarily
conflict with the model of global histone loss during replicative senescence in BJ fibroblasts,
they raise questions as to the appearance and impact of these changes in senescence.
Furthermore, while it is likely that some change in total histone levels occurs in mammalian
senescence, these changes in total levels are indirect evidence of their occupancy upon
chromatin.
The uncertainty regarding changes in total histone levels during senescence could be
better resolved through appropriately normalized genome wide methods. Spike in ChIP-seq
techniques account for different levels of material being pulled down even in the absence of
different distribution of the factor being pulled down (Egan et al., 2016). Use of spike in
ChIP-seq with core histone marks could provide evidence of their altered occupancy or
distribution on the senescent genome. Spike-in MNase-seq has been used in yeast and showed
altered histone occupancy patterns with senescence that were reduced upon histone
overexpression (Hu et al., 2014), which do further support the view that histone levels change
with senescence. However, general differences in the epigenomics of yeast versus

125
mammalian senescence that have been discussed above would emphasize the importance of
these studies being performed in mammalian cells.
Our study further emphasizes the role of gene specific changes in senescence through
our findings regarding enhancers. Consistent with western blots of H3K27ac and H3K4me3
on young and senescent samples, we find that the majority of histone modifications show no
change, and that a similar number of peaks are gained as are lost. Furthermore, we don’t
notice any appreciable difference in the shapes of these peaks, which might be expected with
altered nucleosome density. Our study also showed the impact of specific transcription factors
on both the proliferative and SASP features of senescence.
Additionally, our HiC experiments in rapamycin withdrawal conditions seem to show
the maintenance of young genomic organization even in high passage cells after 2 weeks of
withdrawal from rapamycin, even though these cells are now showing senescence hallmarks
of cell cycle arrest, SASP gene expression, altered morphology, and beta gal staining. The
presence of all the phenotypes of senescence in these cells without any concomitant alterations
in global chromosomal A/B compartmentalization would seem to suggest that the
deterioration of interactions observed in cellular senescence is not a necessary causative factor
in senescence.
Further hints at the role of various epigenomic processes associated with senescence
can be extrapolated from experiments done more broadly upon organismal aging using various
model systems. While a general correspondence exists between aging and senescence, there
are key difference in the epigenetic trends and causality observed between the aging of
different model organisms and cellular senescence. Aspects of the “open-dysregulated
chromosome” model of senescence are apparent in the global epigenomic changes observed in
yeast and worms. This is shown in the manipulation of H3K4me3 levels in worms, as
increasing levels of H3K4me3 results in decrease lifespan, and extension in lifespan is

126
observed upon H3K4me3 reduction (Han and Brunet, 2012). Additionally, knockdown of the
H3K4 demethylase Lid in flies further extended lifespan, showing support for this model in
flies (Li et al., 2010). Consistently, the opposite phenomena holds true in manipulations of
H3K27me3, as increases of this repressive mark tend to extend lifespan, while decreases
reduce it (Jin et al., 2011). Similarly, the histone lysine deacytylase activity of the Sir family
of enzymes has been long linked to extension of lifespan in organisms ranging from yeast to
mouse (Herranz and Serrano, 2010b; Rogina and Helfand, 2004b; Heidi A. Tissenbaum and
Guarente, 2001), with knockout and overexpression of family members in yeast reducing or
extending lifespan, respectively (Howitz et al., 2003; M. Kaeberlein et al., 1999); and
deletions in the H4K16 acetyltransferase SAS2 have additionally been linked to lifespan
extension in yeast (Kozak et al., 2010).
However, the model of global genome opening during senescence also paints in broad
strokes that undervalue the gene specific nature of the changes in model organisms. While a
global H3K27me3 change is indeed observed in worms, it is suggested that changes in aging
occurred largely through alteration in DAF-16/FOXO (Jin et al., 2011), suggesting that the
causative factor in lifespan extension in this instance may more lie with the insulin signaling
pathway, a hallmark regulator of lifespan extension in worms (Cynthia J. Kenyon, 2010),
rather than more general chromatin openness. Furthermore, the observation that reduction in
the levels of H3K27me3 in flies extends lifespan, suggests the incompleteness of the model.
Histone acetylation also fails to follow a consistent trend. While Sir family members have had
a consistent positive impact on lifespan extension throughout multiple organisms, the evidence
of that this impact occurs through its deacetylase activity upon histones specifically is limited
largely to yeast models. While yeast studies have linked Sirtuin histone deacytylase activity in
part to H4K16ac and telomeric shortening induced aging, C. elegans aging has been shown to
be independent of telomere dynamics (Raices et al., 2005) and the impact of Sirtuins could

127
easily explained through their targeting of the FOXO family of transcription factors (Daitoku
et al., 2004). In fact, mammalian studies have typically linked Sirtuin function to its activity
on FOXO family members, rather than its activity upon histone (Brunet et al., 2004; Frescas et
al., 2005). Furthermore, overexpression of SIRT6 in mice resulted in lifespan extension in
males but not females, which is consistent with it impacting specific pathways rather than
globally stabilizing the genome of senescent cells through deacytylation (Kanfi et al., 2012b).
While the importance of sequence specific transcription factors, and therefore specific
enhancers and genes, in senescence does emphasize the importance of gene specific features
in senescence, they in no way preclude more global phenomena from playing a role in the
senescent genome. However, while certain causative global patterns in senescence do exist,
the data in both our study and literature seems to relatively emphasize gene specific changes in
the epigenome driving the senescence cell state.
Cellular Rapamycin Addiction
While our experiments with rapamycin withdrawal showed activation of the SASP
program that is also seen in our replicative senescence experiments, we noticed that rapamycin
withdrawal samples both showed GO terms more strongly associated with SASP, induction of
IL1A, IL1B, and IL6 hallmark SASP genes not found in our replicative senescence
experiments (Laberge et al., 2015), as well as higher binding of NFkB than was ever observed
in replicative senescence experiments. This suggests that, while treatment of rapamycin can
result in extended lifespan, cessation of rapamycin treatment could result in a more severe
aging and SASP phenotype than would have been observed if rapamycin had never been given.
Possible explanations for such a phenomena could include the fact that rapamycin treatment
allows for increased doublings of treated cells, allowing for potential further shortening of
telomere, which could resulting in higher chromosomal instability, activation of DNA damage
machinery, and activation of the senescent phenotype. Alternatively, telomeric shortening

128
during replicative senescence activates DNA damage machinery in a slow and progressive
manner that is kinetically limited by the rate of cell division. As rapamycin treatment may
block the onset of the SASP phenotype through inhibition of DNA damage machinery
(Krześniak et al., 2014; Rai et al., 2013), rapamycin withdrawal may result in immediate
activation of damage machinery in response to fully shortened telomeres, in contrast to the
gradual activation of DNA damage machinery observed in replicative senescence. While
these hypotheses need to be tested experimentally, the clinical use of rapamycin and other
mTor inhibitors in organ transplants, cancer treatments, and other conditions highlights the
importance of understanding these potentially medically significant consequences of
withdrawal.
Methylation dynamics on enhancers in activation and damage
In the course of examining the role of DNA damage repair machinery at androgen
receptor regulated enhancers, we found some limited role in nuclear receptor activated
transcription with factors that are also implicated in active DNA demethylation and
conversion of 5mC into 5hmC, including GADD45, TET enzymes, and several base excision
repair glycosylases (Cortellino et al., 2011; Kangaspeska et al., 2008). In the studies on ESC
pre-marked enhancers and on enhancers as organizing centers from intra-chromosomal
chromosomal interactions, we observed patterns in methylation and hydroxy-methylation at
enhancers that correspond broadly with each’s reported role in repression and activation,
respectively (Ehrlich and Ehrlich, 2014). However, interestingly, while we noticed enhancers
that were generally active were positive for 5hmC and depleted for 5mC, we noticed in both
studies that the most highly activated enhancers were also depleted in both 5hmC and 5mC.
While we were initially puzzled by this breakdown in the expected correlation of higher
activation leading to higher levels of 5hmC, this observation has led to our formulation of a
novel working model for the dynamics of DNA methylation marks over the process of

129
enhancer activation. While 5hmC is associated with activated enhancers, 5hmC cannot be
generated de nova and must instead by formed through enzymatic activity of enzymes such as
the TET family members upon 5mC (Guibert and Weber, 2013). It thus follows that
sufficiently low levels of 5mC would result in depletion of the 5hmC mark. As the most
active enhancers are also particularly depleted in 5mC, it stands to reason that they would also
show 5hmC depletion. Thus, a proposed model for methylation dynamics on pre-marked
enhancers would have them being initially high in 5mC, transitioning to a state of high 5hmC
and low 5mC as they become active, followed by the final transition to a state of low 5hmC
and low 5mC as they become highly active enhancers. We propose that 5hmC may serve as a
molecular memory for pre-marked enhancers as they transition from inactive to active, as may
serve as a bridge between these two states. While we are performing further analysis to
confirm this finding, our early kinetic analyses of enhancer activation over progressive
developmental stages seems to be broadly consistent with our model.

130
APPENDIX
Table 1. Histone modifying factor changes during senescence.
Factor Activity
Change During
Senescence Affect upon senescence
DNMT1 maintenance DNA methyltransferase
Down (Casillas et al., 2003)
DNMT3a de novo DNA
methyltransferase Down (Casillas
et al., 2003)
DNMT3b de novo DNA
methyltransferase Up (Casillas et
al., 2003)
MECP2 Methylated DNA binding; adapter
Mutation accelerates senescence in humans (Squillaro et al., 2010)
EZH2 (PRC2)
H3K27 and H1K26
methyltransferase
Down (Adrian P Bracken et al.,
2007)
JMJD3 H3K27me3 lysine
demethylase Up (Agger et al.,
2009)
BMI1 PRC1 component Deficient mice show accelerated senescence (Jacobs et al., 1999)
CBX7 PRC1 component
Deficient human line show accelerated senescence (Gil et al.,
2004) Deficient mouse fibroblasts showed delayed senescence (Forzati et al.,
2012)
CBX8 PRC1 component
Deficient mouse fibroblasts show accelerated senescence (Dietrich et
al., 2007)
p300/CBP
Lysine acetyltransferase
(multiple substrates)
Down (Bandyopadhyay
et al., 2002)
p300 inhibition accelerated senescence in human melanocytes
(Bandyopadhyay et al., 2002)
SIRT1
Lysine Deacetylase
(multiple substrates)
Down (Han et al., 2010)
Overexpression reduces senescence associated phenotypes in mice
(Herranz and Serrano, 2010a; Kim et al., 2007; R.-H. Wang et al., 2008)
Deficient mice show signs of premature aging (Cheng et al., 2003)
SIRT6
Lysine Deacetylase
(multiple substrates)
Overexpression extends male mouse lifespan (81)
Deficient mice show reduced lifespan (80)
HDAC1
Lysine Deacetylase
(multiple substrates)
Up (Bandyopadhyay
et al., 2002) Drug inhibition accelerates in human
cells (108, 109) Oxerexpression accelerates
senescence in human cells (63)
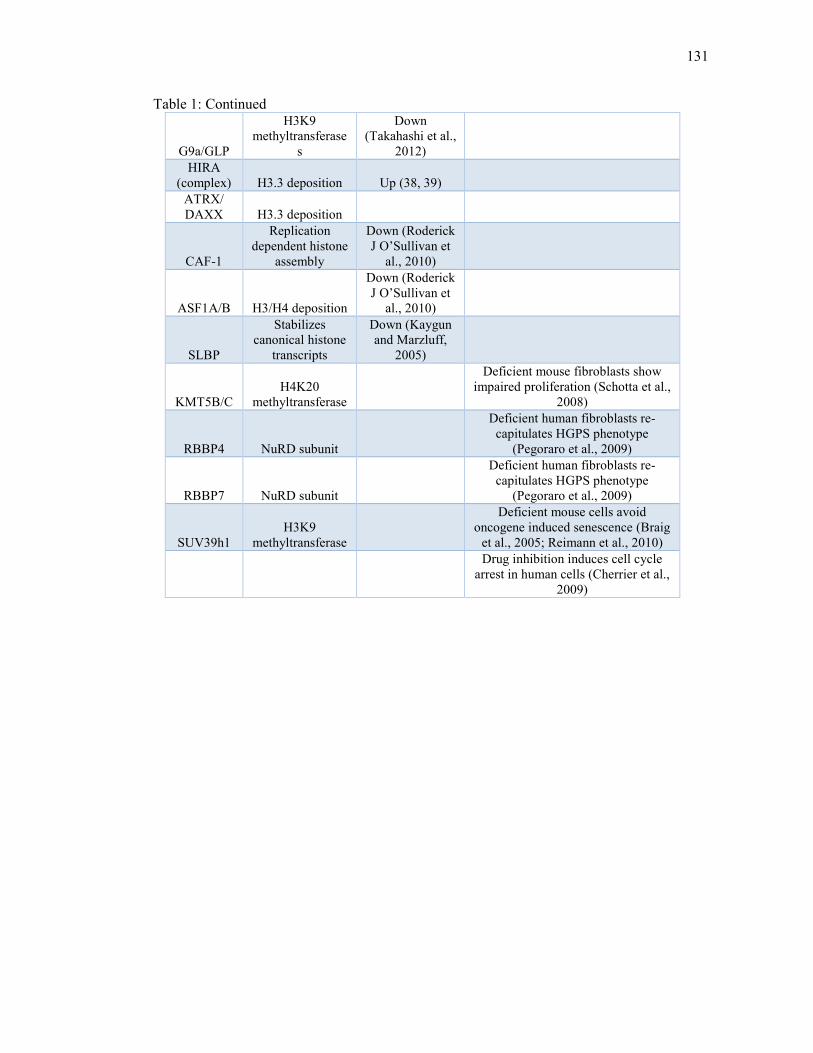
131
Table 1: Continued
G9a/GLP
H3K9 methyltransferase
s
Down (Takahashi et al.,
2012) HIRA
(complex) H3.3 deposition Up (38, 39) ATRX/ DAXX H3.3 deposition
CAF-1
Replication dependent histone
assembly
Down (Roderick J O’Sullivan et
al., 2010)
ASF1A/B H3/H4 deposition
Down (Roderick J O’Sullivan et
al., 2010)
SLBP
Stabilizes canonical histone
transcripts
Down (Kaygun and Marzluff,
2005)
KMT5B/C H4K20
methyltransferase
Deficient mouse fibroblasts show impaired proliferation (Schotta et al.,
2008)
RBBP4 NuRD subunit
Deficient human fibroblasts re-capitulates HGPS phenotype
(Pegoraro et al., 2009)
RBBP7 NuRD subunit
Deficient human fibroblasts re-capitulates HGPS phenotype
(Pegoraro et al., 2009)
SUV39h1 H3K9
methyltransferase
Deficient mouse cells avoid oncogene induced senescence (Braig
et al., 2005; Reimann et al., 2010) Drug inhibition induces cell cycle
arrest in human cells (Cherrier et al., 2009)

132
.
Figure 1. Heatmap of H3K27ac and H3K4me3 ChIP-seq enrichment in young and senescent cells on 2169 enhancers gained in replicative senescence. Each column shows -/+ 3kb window from mid-point of enhancer. Sorted based on averaged fold change of HOMER determined peakscores (Heinz et al., 2010b) of enhancers in replicative senescence.

133
Figure 2. Heatmap of transcriptional changes observed in replicative senescence over up, down, and non-regulated gene sets. Increases (red) or decreases (green) in normalized tags over gene exon (RNA-seq) or body between from young to senescent are shown.

134
Figure 3. Box plot of genes in defined as up or down-regulated in replicative senescence. Whiskers show 5th and 95th percentiles, boundaries of boxes show 25 and 75th percentiles, and line within box shows 50th percentile of population. Values correspond to averaging of fold changes from young to senescent of RNA-seq triplicates and single GRO-seq replicate.

135
Figure 4. Selected GO-terms from Meta-scape analysis of 639 genes up-regulated during replicative senescence. Values listed are negative logP values of the term.

136
Figure 5. Selected GO-terms from Meta-scape analysis of 598 genes down-regulated during replicative senescence. Values listed are negative logP value of term.

137
Figure 6. Pausing index curves determined by GRO-seq analysis in young and senescent cells a) over gene sets of up and down-regulated genes as defined by GRO-seq analysis along, or b) over 639 up and 598 down-regulated genes defined by RNA-seq and GRO-seq analysis combined.

138
Figure 7. Analysis of transcriptional profile of genes above expression threshold nearest to 2169 senescence gained enhancers. a) box plot showing fold change of gene set during senescence b) Gene Set Enrichment Analysis (GSEA) enrichment score plot (Mootha et al., 2003; Subramanian et al., 2005) of gene set over expression dataset of 14,493 genes in BJ fibroblast over minimum expression threshold, ranked by fold change in replicative senescence based on averaging of fold changes of 3 RNA-seq and 1 GRO-seq replicate

139
Figure 8. Fold change of senescence induced transcripts upon shRNA-mediated knockdown of senescence gained enhancers. Enhancers were selected based on proximity to genes induced during replicative senescence, significant gain of H3K27ac binding, and induction of GRO-seq signal in senescence gained H3K27ac peak. shRNAs were targeted to senescence induced GRO-seq signal, RNA was harvested after 2 weeks of knockdown and selection, and qPCR was performed on senescence induced gene. Relative levels of transcript provided in arbitrary units.

140
Figure 9. Growth curves in BJ fibroblasts treated with 500nM rapamycin or control.

141
Figure 10. Box plots of fold change in enhancers between conditions listed on x-axis. Fold change based upon log2 ratio of peakscores of listed conditions.

142
Figure 11. Ranked fold change of peakscores from conditions listed over enhancers gained in senescence. Set of enhancers gained in senescence was determined from independent replicate of H3K27ac and H3K4me2 ChIP-seqs from those used in conditions plotted in figure.

143
Figure 12. Beta-galactosidase staining of population doubling 75 BJ fibroblasts maintained in 500nM rapamycin, or withdrawn from rapamycin maintenance for 1 week.

144
Figure 13. Fold change in rapamycin withdrawal of genes upregulated in replicative senescence. a) Scatterplot of fold changes between conditions b) box plot of fold changes in rapamycin withdrawal of 639 genes induced in replicative senescence

145
Figure 14. Selected GO-terms from Meta-scape analysis of 252 genes up-regulated during rapamycin withdrawal. Values listed are negative logP value of term.

146
Figure 15. Box plots of fold change of enhancers marks upon rapamycin withdrawal over 2169 enhancers gained during replicative senescence. Fold change listed is an average of the fold changes in rapamycin withdrawal of the H3K27ac and H3K4me2 peakscores of these enhancers.

147
Figure 16. Heatmap of H3K27ac and H3K4me3 of 2169 enhancers gained in replicative senescence in young, senescent, rapamycin maintained, and rapamycin withdrawal conditions. Sorted based on fold change of enhancers in rapamycin withdrawal. Each column shows -/+ 3kb window from mid-point of enhancer.

148
Figure 17. Box plots of fold change of enhancer peaks during replicative senescence over 1512 enhancers gained during rapamycin withdrawal. Fold change listed is an average of the fold changes in replicative senescence of the H3K27ac and H3K4me2 peakscores of these enhancers.

149
Figure 18. Analysis of transcriptional profile of genes above expression threshold nearest to 1512 rapamycin withdrawal gained enhancers. a) box plot showing fold change of gene set during rapamycin withdrawal b) GSEA enrichment score plot of gene set over expression dataset of 14,493 genes in BJ fibroblast over minimum expression threshold, ranked by fold change in rapamycin withdrawal

150
Figure 19. A/B compartments from PCA analysis of in situ HiC.

151
Figure 20. Motif analysis performed upon H3K27ac peaks showing 3-fold increase in peakscore during replicative senescence.

152
Figure 21. Motif analysis performed upon H3K27ac peaks showing 4-fold increase in peakscore during replicative senescence.

153
Figure 22. p65 ChIP-seq binding profile at p65 bound subset of 2169 gained senescence enhancers a) Heatmap of p65 ChIP-seq enrichment at listed population doublings. Each column shows -/+ 3kb window from mid-point of p65 peak. Sorted based on p65 peakscore at population doubling 57 b) meta-analysis of p65 tag density from p65-ChIP at listed population doubling over p65 bound enhancers

154
Figure 23. NFI ChIP-seq binding profile at NFI bound subset of 2169 gained senescence enhancers a) Heatmap of replicate 2 of NFI ChIP-seq enrichment from young or senescent cells. Each column shows -/+ 3kb window from mid-point of NFI peak. Sorted based on NFI peakscore b) meta-analysis of NFI tag density from replicate 1 of NFI ChIP-seq at listed population doubling over NFI bound enhancers

155
Figure 24. Box plots showing change in RNA-seq tag density over nearest expressed genes to 2169 senescence gained enhancers upon 2 week knockdown of listed factor in PD64 BJ fibroblasts. Fold change represents ratio of normalized tag count in knockdown listed factor versus sh-GFP control.

156
Figure 25. Box plots showing change in ATAC-seq tag density over 2169 senescence gained enhancers upon 2 week knockdown of listed factor in PD64 BJ fibroblasts. Fold change represents ratio of normalized tag count in knockdown listed factor versus sh-GFP control.

157
Figure 26. Meta-analysis distribution of normalized ATAC-seq tag density over listed transcription factor bound subset of peaks showing H3K27ac gain during replicative senescence, or control enhancers showing no change in H3K27ac.

158
Figure 27. Population doublings over time of BJ fibroblasts after shRNA mediated stable knockdown of NFI family member or sh-GFP control. Different replicates of NFI family members represent distinct shRNA constructs.

159
Figure 28. Population doublings over time of BJ fibroblasts after continued treatment with listed NFkB pathway inhibitor or vehicle control.

160
Figure 29. Box plots showing change in RNA-seq tag density over listed sets and subsets of 639 genes induced in replicated senescence in listed p65 stable knockdowns versus sh-GFP control in PD64 BJ fibroblasts. Fold change represents ratio of normalized tag count in knockdown of p65 versus sh-GFP control.

161
Figure 30. Selected GO-terms from Meta-scape analysis of the 300 genes up-regulated in senescence that are least induced by rapamycin withdrawal. Values listed are negative logP values of the term.

162
Figure 31. GSEA enrichment score plot of gene sets of either a and c) all 639 genes up-regulated in replicative senescence or b and d) the 150 genes up-regulated in senescence that are least induced by rapamycin withdrawal over expression datasets of 14,493 genes in BJ fibroblast over minimum expression threshold, ranked either by fold change in knockdown of either a and b) NFIA or c and d) NFIC versus sh-GFP control in PD64 BJ fibroblasts

163
Figure 32. Box plots showing change in RNA-seq tag density over a) all 639 genes up-regulated in replicative senescence or b) the 150 genes up-regulated in senescence that are least induced by rapamycin withdrawal in listed NFI family member stable knockdowns versus sh-GFP control in PD64 BJ fibroblasts. Fold change represents ratio of normalized tag count in knockdown of listed NFI family member versus sh-GFP control.

164
Figure 33. Heatmap of p65 or H3K27ac ChIP-seq enrichment on p65 bound subset of 1512 rapamycin withdrawal gained enhancers at listed conditions. Each column shows -/+ 3kb window from mid-point of p65 peak. Sorted based on p65 peakscore in rapamycin withdrawal.

165
Figure 34. Box plots showing change in RNA-seq tag density in listed p65 or NFIA stable knockdowns after 2 weeks of rapamycin withdrawal versus sh-GFP control after 2 weeks of rapamycin withdrawal, both in PD75 BJ fibroblasts, over 252 genes up-regulated in rapamycin withdrawal. Fold change represents ratio of normalized tag count in knockdown of p65 or NFIA versus sh-GFP control.

166
Figure 35. Phase contrast images of PD75 BJ fibroblasts under stable knockdown of either p65 or shGFP control after 2 weeks of rapamycin withdrawal.

167
Figure 36. Box plots showing change in RNA-seq tag density in listed treatment after 2 weeks of rapamycin withdrawal versus control DMSO treatment after 2 weeks of rapamycin withdrawal, both in PD75 BJ fibroblasts, over 252 genes up-regulated in rapamycin withdrawal. Fold change represents ratio of normalized tag count in treatment versus DMSO control.

168
Figure 37. Western blots of listed histone modifications at listed population doubling. Samples were normalized by total histone levels, using Ponceau S staining and blotting of histone H3.

169
Figure 38. Western blots of lysates harvested from WT or ZMPSTE24 (Face-/-) mice at either 1 or 6 months of age. Lysates blotted for H3K79me3 were normalized to total H3 levels, while lysates blotted for H4R3 methyl marks were normalized to total H4 levels.

170
Figure 39. Meta-analysis of H2Bub, H3K79me2, or H3K79me3 levels across normalized gene bodies of all Refseq genes a listed population doublings. Underlined region corresponds to 2kb region downstream of TSS.

171
Figure 40. UCSC genome browser bedgraphs of H2Bub, H3K79me2, or H3K79me3 levels at representative genomic regions.

172
Figure 41. Box plot of the fold change during senescence of the total normalized tags of H3K79me3 across the gene bodies of genes up-regulated during senescence versus unchanged genes.
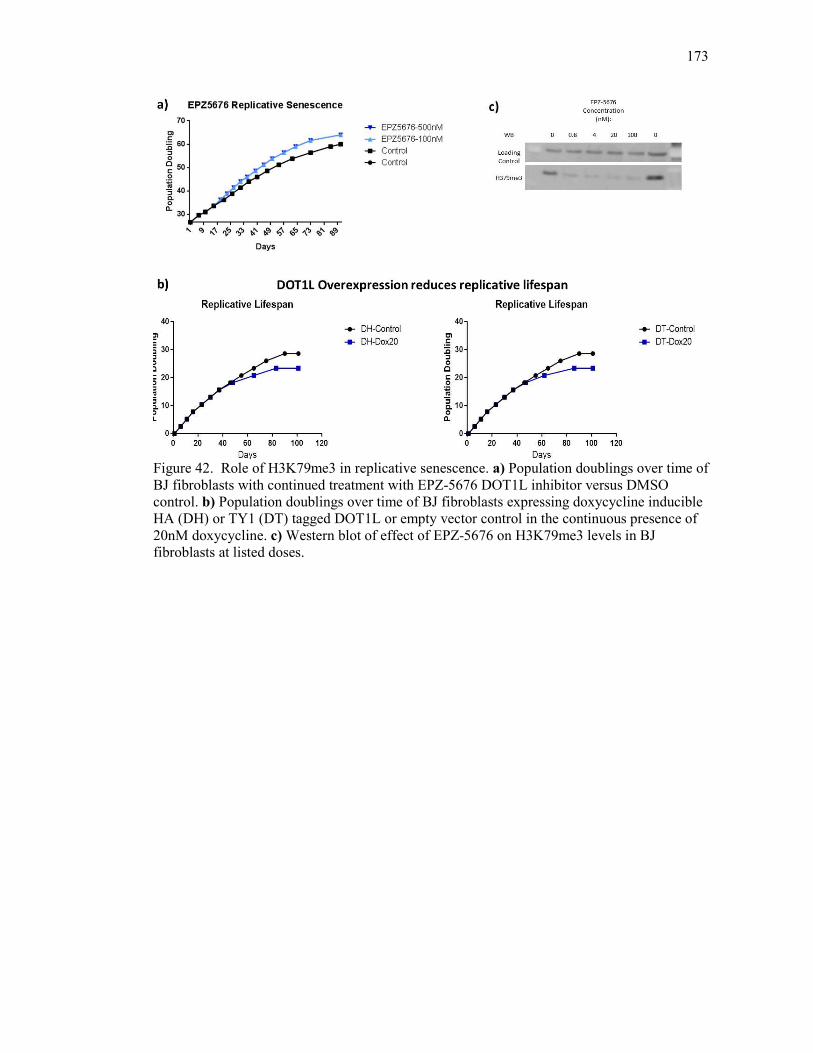
173
Figure 42. Role of H3K79me3 in replicative senescence. a) Population doublings over time of BJ fibroblasts with continued treatment with EPZ-5676 DOT1L inhibitor versus DMSO control. b) Population doublings over time of BJ fibroblasts expressing doxycycline inducible HA (DH) or TY1 (DT) tagged DOT1L or empty vector control in the continuous presence of 20nM doxycycline. c) Western blot of effect of EPZ-5676 on H3K79me3 levels in BJ fibroblasts at listed doses.

174
Figure 43. Box plots showing change in RNA-seq tag density in PD64 versus PD30 BJ fibroblasts in listed treatments across genes either a) up or b) down-regulated during replicative senescence. Fold change represents ratio of normalized tag count in treatment in genes at PD64 versus PD30.

175
Figure 44. Population doublings over time of BJ fibroblasts expressing doxycycline inducible HA DOT1L, JMJD6, PRMT1, PRMT5, or empty vector control in the continuous presence of 20nM doxycycline.

176
Figure 45. Population doublings over time of BJ fibroblasts after shRNA mediated stable knockdown of JMJD6 or sh-non silencing (NS) control. jmjd6-51, 53, 57, and 58 each represent distinct shRNA constructs.

177
Figure 46. Box plots showing change in RNA-seq tag density over 639 genes induced in replicative senescence in listed JMJD6 stable knockdowns versus sh-non-silencing control in senescent BJ fibroblasts. Fold change represents ratio of normalized tag count of genes in JMJD6 stable knockdowns versus sh-non-silencing control. shJMJD6-51 and shJMJD6-53, each represent distinct shRNA constructs.

178
Figure 47. Meta-analysis of the normalized tag density of JMJD6 based on ChIP-seq using a)
HA or b) TY1 epitope tags to determine JMJD6 binding in young or senescent BJ fibroblasts.

179
Figure 48. Total peak numbers of native ChIP seq of H4R3me2sym in young and senescent BJ fibroblasts after shRNA mediated stable knockdown of JMJD6 or expression of sh-non silencing (NS) control. shJMJD6-51 and shJMJD6-53 each represent distinct shRNA constructs.
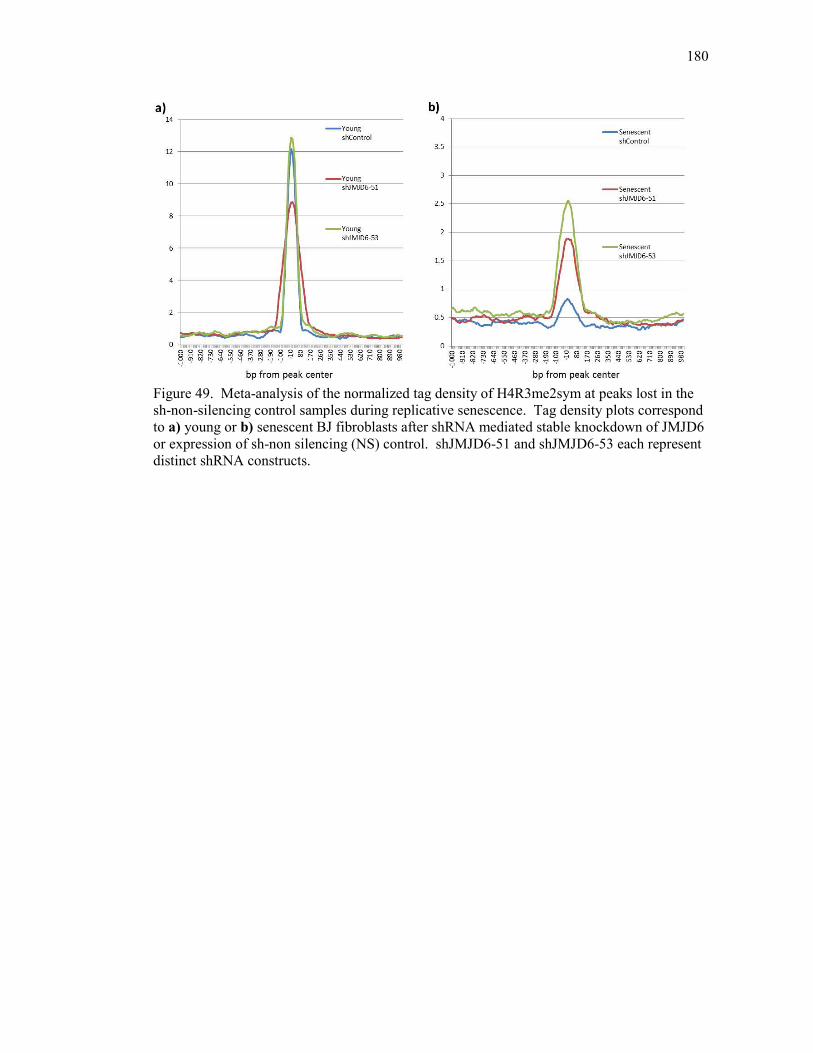
180
Figure 49. Meta-analysis of the normalized tag density of H4R3me2sym at peaks lost in the sh-non-silencing control samples during replicative senescence. Tag density plots correspond to a) young or b) senescent BJ fibroblasts after shRNA mediated stable knockdown of JMJD6 or expression of sh-non silencing (NS) control. shJMJD6-51 and shJMJD6-53 each represent distinct shRNA constructs.

181
Figure 50. Meta-analysis of the normalized tag density of H4R3me2sym at the 2169 enhancers gained during replicative senescence. Tag density plots correspond to a) sh-non-silencing control expressing young or senescent BJ fibroblasts or b) senescent BJ fibroblasts after shRNA mediated stable knockdown of JMJD6 or expression of sh-non silencing (NS) control. shJMJD6-51 and shJMJD6-53 each represent distinct shRNA constructs.

182
Figure 51. TOP1 Occupies AR-enhancers and Affects the Transcriptional Program of the Prostate Cancer Cell Line LNCaP. (A) Recruitment of AR and TOP1 to the KLK3 and KLK2 enhancers. The highest TOP1 binding is detected at 15 min DHT treatment. Data points show mean s.d.; (n=3), P<0.05, P<0.01. (B) The UCSC genome browser screenshot of the KLK3-KLK2 locus showing the occupancy of p-S5-RNA PolII (Pol II), AR and TOP1 (all tested with and without DHT treatment). (C) GRO-seq analysis of the effect of TOP1 knockdown on nascent RNA levels shown as a heatmap for 579 (out of 644, which were upregulated by DHT treatment) with the most affected AR-enhancers at the top. (D) Heatmap showing DHT-induced TOP1 sequencing tags density increase around 644 AR-enhancer binding sites (centered on AR). (E) Boxplot: siTOP1 reduced transcription at ~ 80% of DHT-up-regulated AR-enhancers. P≤2.2e-16 (Wilcoxon test). (F) Boxplot: The response to DHT of 368 DHT-up-regulated genes was reduced after TOP1 knockdown by siRNA. (G) Knockdown of TOP1 affects the induction of both eRNA and mRNA. LNCaP cells, hormone-starved for 1 day and transfected with the indicated siRNA, were stimulated with 100 nM DHT for 1h (eRNA) or 5 h (mRNA) 48 h post transfection. Quantitative RT-PCR was performed with SYBR Green using reverse-transcribed RNA. Data represent mean s.d.; (n=3), P<0.01. (H) Recruitment of ATR to the KLK3 and KLK2 enhancers following DHT stimulation of starved cells. Data represent mean s.d.; (n=3). P<0.01. See also Figure S1 and Table S3.

183
Figure 52. NKX3.1 and TOP1 Co-occupy a Subset of AR Enhancers and Co-regulate the Enhancer Program. (A) The UCSC genome browser screenshot displaying a direct overlap between AR, NKX3.1 and TOP1 binding at enhancers of KLK3 and KLK2 genes. Regions with increased (after DHT) TOP1-binding (except regions present in the background control) are underlined. (B) Knockdown of NKX3.1 prevents TOP1 from binding at AR-regulated enhancers; siCTL-, siNKX3.1- and siTOP1-treated cells were stimulated with DHT for 5 min. Chromatin immunoprecipitation was performed with an antibody against TOP1. Data represent mean s.d. (n=3). P<0.01. (C) Knockdown of NKX3.1 by siRNA affects the induced transcription of ~69% of the regulated eRNAs. P ≤ 2.2e-16 (Wilcoxon test). (D). Heatmap of AR-enhancers sorted from most-to-least affected by siNKX3.1. (E) siNKX3.1 reduces induced transcription of 273 genes in this experiment determined by GRO-seq. (F) The UCSC genome browser screenshot showing the KLK3-KLK2 locus. Knockdown of TOP1 or NKX3.1 by siRNA reduces eRNA and genic RNA induction. (G) Knockdown of either TOP1 or NKX3.1 affects induction of the same 351 eRNAs in the same experiment, as measured by GRO-seq. See also Figure S2 and Table S3.

184
Figure 53. TOP1 Recruits to AR-Regulated Enhancers and Nicks the DNA (A) UCSC browser screenshot displaying the KLK3 enhancer. Arrows indicate the PRO-caps representing (putative) eRNA TSS flank the NKX3.1 peak. (B) eRNA readout assay showing that Tyr723 of TOP1 is required for eRNA induction. LNCaP cells were hormone-starved for 24 h, transfected with siTOP1 to deplete the endogenous protein and then electroporated with either empty expression vector (Veh), wild-type TOP1 (WT), or the Y723F-TOP1 mutant (Mut) before treatment with either ethanol or DHT for 1h. eRNA for KLK2, KLK3 and TMPRSS2 gene enhancers was quantified by RT-PCR . TOP1 mRNA and protein levels are also shown. qPCR data show mean s.d.; (n=3). P<0.01. (C) Knockdown of endogenous TOP1 affects nick/break formation as measured by incorporation of Biotin 11-dUTP at selected AR-enhancers after 10 min DHT treatment. Data represent mean s.d.; (n=3). P<0.01.

185
Figure 54. MRE11 Regulates the AR Transcription Program. (A) Recruitment of MRE11 to the selected DHT-regulated AR-enhancers. Data points show mean s.d. (n=3). P<0.05, P<0.01. (B) MRE11 binding (sequencing tags density) increases over AR-enhancers in a DHT-dependent manner (KLK3 and KLK2 genes shown). (C) Distribution of MRE11 and AR binding (sequencing tag density) centered over AR-enhancer binding sites with DHT-induced eRNA. (D) MRE11 knockdown reduces eRNA expression levels of 89% of DHT up-regulated eRNAs. P≤2.2e-16 (Wilcoxon test). (E) Heatmap for AR-enhancers sorted from the most downregulated by siMRE11 at the top to the least, at the bottom. (F) Boxplot showing 510 genes, where DHT-induced up-regulation of transcription (determined by GRO-seq) was reduced by MRE11. (G) Knockdown of either MRE11 or TOP1 affects recruitment of ATR at enhancers following hormone stimulation of the starved cells, measured after 15 min DHT stimulation. Data show mean s.d. (n=3). P<0.05, P<0.01. (H) siATR affects induction of eRNA (1h DHT) and mRNA (5h DHT treatment) of the corresponding gene. Data are the mean s.d. (n=3). P<0.05, P<0.01. See also Figure S4 and Table S3.

186
Figure 55. Canonical DNA Damage/Repair Machinery Components Recruit to AR-Regulated Enhancers. Kinetic recruitment of factors implicated in the DNA damage response (DDR) to AR- enhancers. All kinetic ChIP experiments were performed at least twice with cells of similar passage number to ensure data reproducibility. Data shown as mean s.d. (n=3). P<0.05, P<0.01. See also Figure S5.

187
Figure 56. A Model for TOP1-mediated Activation of the AR-Enhancer. Following androgen stimulation, AR and DNA topoisomerase I recruit to the enhancer region, premarked by the NKX3.1 pioneer transcription factor. NKX3.1 to TOP1 stimulates enzymatic activity of the topoisomerase, resulting in nicking of DNA on a single strand, followed by recruitment of ATR, XRCC1, and the MRN complex components (MRE11/RAD50). After dismissal of TOP1, ATR and the MRN, additional components of DNA repair machinery recruit to the activated enhancer. The “thin blue line” indicates the presence of low levels of residual eRNA, not totally eliminated by hormone starvation, whereas the “thick blue line” represents induced bidirectional eRNA produced by the transcription unit.

188
Figure 57. Features of macrophage enhancers in ESCs. a, Pu.1+, H3K4me2+ macrophage enhancer profiles in murine ESCs. Premarking is defined in panels d-f. b, Heatmap of H3K4me1, H3K4me2 and H3K27Ac, and p300 with -3kb ~ +3kb window centered on Pu.1 in 18,405 macrophage restricted enhancers in ESCs, indicating no H3K4me1, H3K4me2, H3K27Ac and p300 in these enhancers in ESCs. c, Tag density of ATAC-seq and Dnase-seq in 18,405 macrophage restricted enhancer and random region in mESC, showing small degree of chromatin openness of macrophage restricted enhancer in ESCs. d, ChIP-seq data showing target percentage of ESC transcription factors-Esrrb, Nanog, Oct4, Sox2- in macrophage-restricted enhancers in a -1kb/+1kb from macrophage restricted enhancer. e, ENOS factor binding centered on each ESC factors in 6,775 premarked macrophage restricted enhancer (left) and 28,450 active murine ESC restricted enhancers (right) in -1kb ~ +1kb. f, 12 ESC transcription factors (Oct4, Sox2, Nanog, Esrrb, Smad1, E2f1, Tcfcp2l1, Zfx, Stat3, Klf4, c-myc and n-myc) binding in 6,809 active macrophage restricted enhancer and 8,209 active ESC restricted enhancers defined based on H3K27Ac (over 100 tags) in a -1kb/+1kb window, showing different binding pattern of ESC transcription factors in ESC enhancers and macrophage enhancers. g, 4C-seq in ESCs and macrophage. Black arrow represents the interaction frequency based on the trunc mean in 400kb window. Coordinate of macrophage putative enhancer in 5’ of IL1a is indicated with red box.

189
Figure 58. ENOS binding in macrophage restricted enhancers. a, ENOS binding in -1kb ~ +1kb window from 6,775 premarked macrophage enhancer, plotted relative to the location of the Pu.1 binding sites in the enhancers. Last panel shows corresponding binding sites of ENOS to the presence of the ENOS binding. b, 2345 PRO-cap peak identified in macrophages or ESCs in -1kb ~ +1kb window from 6,775 premarked enhancers is plotted by heatmap centered on Pu.1. c, Location of PRO-cap peak sites from Pu.1 binding in macrophage (top) or PRO-cap peak sites from the ENOS binding in ESCs (bottom) is calculated in 638 premarked macrophage enhancers, which has PRO-cap peaks in a -500bp/+500bp window from Pu.1 binding sites. d, ATAC-seq signal in ESCs in -1kb~+1kb from 6,775 macrophage enhancers is presented by heatmap by considering relative location from Pu.1. e, Relative location of Rad21 and Smc1 binding from Pu.1 binding sites in 6,775 ENOS bound macrophage enhancer in ESCs. f, ENOS binding intensity (top) and ATAC-seq signal intensity (bottom) in ~40% of highly enriched- vs. less enriched- Rad21 bound macrophage enhancers in ESCs.

190
Figure 59. The association of ENOS binding to macrophage restricted enhancer activities. a, b, c, d, Comparison of the ~20% highest or lowest enhancers selected based on ENOS binding and PRO-cap signal in ESCs, and the level of (a), H3K4me2 and H3K27Ac (b), PRO-cap and GRO-seq (c), Pu.1 (d), Rad21 in the mature macrophage. e, f, Comparison of the ~20% highly or less active macrophage enhancers selected based on GRO-seq signal of premarked macrophage enhancers in macrophage, and the level of (e), ENOS (f), ATAC-seq in ESCs. g, The number of functional macrophage enhancers in 6,775 enhancers which has ENOS in a -1kb/+1kb window (premarked enhancers) vs. 11,630 enhancers which doesn't have ENOS in a -1kb/+1kb window (non-premarked enhancers).

191
Figure 60. The functional role of Esrrb binding in macrophage restricted enhancer. a, Screenshot of the Tlr1 locus. The blue box corresponds to CRISPR/Cas9 target region. b, ChIP-qPCR of Esrrb in WT vs. #3, #10 and #14 mutant clone in mESCs. One representative data is added and measured as a control. c, Pu.1 binding (left), TLR1 enhancer RNA (eRNA) transcription level (middle) and H3K4me2 level (right) in WT vs. #3, #10 and #14 mutant clones in ESDM. Each dot indicates each biological experiment (n>=3 biological repeats from two pooled different experiments). P-values are calculated using Welch’s two t-test. d, Promoter activities in native full length Tlr1 enhancer response to WT vs. Esrrb deleted mutation in Raw264.7 cells (n=5 biological repeats). e, Screenshot of the Tnfaip3 locus. The blue box corresponds to CRISPR/Cas9 target region. f, ChIP-qPCR of Esrrb in WT vs. #26 and #45 mutant clone in mESC. One representative data is added and measured as a control. g, Pu.1 binding (left), Tnfaip3 enhancer RNA (eRNA) transcription level (middle) and H3K4me2 level (right) in WT vs. #26 and #45 mutant clones in ESDM. Each dot indicates each biological experiment (n>=3 biological repeats from two pooled different experiments). P-values are calculated using Welch’s two t-test.

192
Figure 61. DNA Methylation modifications in macrophage restricted enhancer. a, Mapping of DNA methylation modification (5-mC and 5-hmC) and binding of Tet1 in 6,775 premarked macrophage enhancer in a -1kb/+1kb window and centered on Pu.1. b, Effects of sictrl vs. siEsrrb on 5-hmC in 6,775 premarked enhancers in ESCs. P-values are calculated using Welch’s two t-test. c, Schematic of the hematopoietic differentiation stages. d, 5hmC in LSK, CMP and GMP in 6,775 premarked enhancers in -3kb ~ +3kb window centered on Pu.1. e, H3K4me1 and H3K27Ac in ESC, mesoderm, LT-HSC, ST-HSC, MPP, CMP, GMP and macrophage in 6,775 premarked enhancers in -3kb ~ +3kb window centered on Pu.1. f, Model of “premarked” lineage determining and terminal differentiation enhancer indicating that poised enhancers bind several ENOS transcription factors, while the late-activated cell-specific enhancers are premarked based on binding of a single ESC transcription factor, causing chromatin opening, transcription of a ncRNA, and appearance of a 5-hmC mark in the area of the enhancer that may provide the molecular memory for what ultimately will be the core Pu.1/C/EBPα core from which eRNAs will be transcribed.

193
Figure 62. Identification of the ERα-bound first tier enhancers. A. Map of Chr.21 from UCSC genome browser. Cartoon below annotate the major structural features of the chromosome, telomeric repeats (TR), rDNA repeats, the centromeric repeats, A (Red) and B (Blue) compartments determined from data in panel B. The length of the line correspond to the level of ERα binding measured as ChIP-seq tag count. () Indicate clustered enhancers. The red bars diagram the E2 -upregulated coding transcription units. B. Hi-C analysis permitted identification of the A/B compartments, and calculation of the insulation scores to identify the larger putative chromosomal contact domains (n=67). C. Contact map from Hi-C data, analyzed at a resolution of 1Mb, detected long distance interactions across Chr.21, indicating the presence of very long distance interactions as well as the expected short-range interactions. D. Quantitative representation of the ATAC-seq data for the39 most robust ERα-bound enhancers, compared to 93 weaker ERα-bound enhancers and 82 non-ERα bound active enhancers, performed in the presence of E2 (1h.). Quantitative “triangle” plot of E2-induced (1hr) binding of p300 (E), MED1 (F), AP2γ (G), GATA3(H), FOXA1(I) to the 10 most robust ERα-positive enhancers. J. Methylation Status of 3 categories of enhancers on Chr21 by MeDIP and hMeDIP under -/+ E2 conditions.

194
Figure 63. Estrogen-induced architectural and transcriptional dynamics in Chr21. A, DNA FISH images showing E2 induced spatial proximity between indicated genomic loci in MCF7 cells. Genomic distance between the probes is indicated at the top left corner of each image pairs. White triangle points to the pair of loci in proximity. TFF1 and DSCAM-AS1 loci show aneuploidy as evident by >2 FISH signal B. E2 induced fold change in proximity compared to the control condition. Fold change is calculated using data shown in panel (1. D). C. Comparison of cumulative distribution of distances between indicated “first tier” enhancers demonstrate that 3D distances between these loci reduces in response to E2 stimulation. D. Fraction of alleles coming below the indicated cut off distance. Determination of cut off distance value is explained in Figure S2.E E. Diagrammatic representation of E2 induced architectural changes in Chr.21. Diagram showing 1-dimensional view of q-arm of Chr.21 scaled to genomic distance (Top). Relative 3-D positions of indicated genomic loci as measured by DNA FISH from NRIP1 loci in un-stimulated (middle) and E2 stimulated conditions (bottom). F. Temporal change in E2-induced spatial proximity between NRIP1 and TFF1. Induced proximity is evident as early as 5 min after E2 treatment. It follows a cyclical pattern with a loss of E2 effect at 30 min and regaining proximity at 40 min time point G. 3 color DNA FISH analysis of NRIP1/TFF1/COL18A1 and NRIP1/DSCAM /COL18A1genomic loci interactions, revealing the simultaneous co-localization of all 3 loci was a rare event under E2 stimulated conditions, compared to the induced proximity between any two of the component enhancers.

195
Figure 63: Continued. H. 4C analysis of E2 induced TFFIe1 interactions with the DSCAM-AS1e region separated by 2Mb genomic DNA The Top panel shows the GRO-seq track of the genomic region I. DNA FISH data showing E2 induced spatial proximity between in TFF1 and DSCAM-AS1 genomic loci J. RNA FISH using NRIP1 and TFF1 intronic mRNA probes showing increased transcription from proximal alleles compared to transcribing loci that are spatially distant. Nuclei highlighted are enlarged on the right side. K. Quantitation of RNA FISH signal intensity (as a read of transcription) and spatial distance between transcribing loci indicating a negative correlation between spatial distance and transcription of component loci. Data are pooled from at least two biological replicates analyzing at leas 120 nuclei in each replicates. Statistical significance (p < 0.05, p < 0.01, p < 0.0001) was calculated with Wilcoxon Rank Sum test. P-value of Cumulative Frequency Distribution was calculated using Kolmogorov Smirnov test.

196
Figure 64: Functional roles of the first tier enhancer network on enhancer robustness. A, B. Q-PCR analysis indicating the reduced transcriptional out put of indicated mRNAs in NRIP1e3 KO clones (A) and TFFe1 KO clones (B). These are pooled data from 4 separate clones generated using different gRNAs for each locus deletion and 3 biological repeats for each clones. Total RNA was collected 3hrs. after addition of E2,. C. Q-PCR analysis of effects of NRIP1e3 deletion on the TFF1 eRNA 1hr following E2 treatment. D. Meta analysis of Gro-seq data showing impact of tier1 enhancer deletion on eRNA transcription of the 39 most robust and 93 less robust ERα-bound enhancers. Minimal transcriptional impact of the deletion of robust ERα enhances on 82 active non-ERα enhancers on Chr21 demonstrate the specific disruption of E2 enhancer network E,F. Visual representation of 1hr E2 stimulated eRNA induction in 10 most robust tier1enhancers on Chr21. Area of the circle is derived from the total GRO-seq tag counts of the eRNA (Raw data used to generate the panels E-J are given in Table 3). G,H. Effect of deletion of TFF1e1 (shown in red) on the extent of eRNA induction in 10 most robust first tier enhancers. .I,J. Effect of deletion of NRIP1e3 (shown in green) on the extent of eRNA induction in t10 most robust first tier enhancers.

197
Figure 64: Continued. K, Browser image of TFF1 genomic locus from ERα ChIP-seq, H3K27Ac ChIP-seq and GROseq of WT and indicated tier1 enhancer knockout clones before (red) after (purple) E2 stimulation. TFF1e deletions abolishes the both TFF1 eRNA and mRNA transcription. Importantly, NRIP1e3 deletion significantly compromises the transcription from both TFF1 enhancer and coding region. L. RPKM value of TFF1eRNA from GRO-seq experiment showing the effect of TFF1e1 deletion and NRIP1e3 deletion of TFF1 enhancer transcription.

198
Figure 65. Effects of enhancer deletion and eRNA depletion on chromosomal dynamics. A. DNA FISH image from E2 treated WT showing E2 induced proximity between TFF1 and NRIP1 loci. This effect is absent in TFF1e1 KO, NRIP1e3 KO and TFF1e1FM KO, where a 51 nucleotide deletion remove the FOXA1 motif present on TFF1e. B. Quantitation of DNA FISH data from WT and mutant clones demonstrated the reduced E2 induced proximity of TFF1 and NRIP1 loci C. Cumulative distribution of TFF1/NRIP1 distances showing reduced spatial distance between NRIP1 and TFF1 in WT cells, but not in tier1 enhancer mutants D. Quantitation of DNA FISH data in WT and TFF1e1 KO cells reveal a compromised induced proximity between two other tier 1 enhancers regions (NRIP1e and DSCR3e) E. ASO mediated TFF1e1 knockdown significantly reduces E2 induced proximity between TFF1e1 and NRIP1e3 F. Meta analysis of GRO-seq data from TFFe1 and NRIP1e3 eRNA knockdown experiment shows strikingly similar pattern to transcriptional impact of CRISPR deletion of respective enhancers (Compare to Figure 3.D). Data are pooled from at least two biological replicates analyzing at leas 120 nuclei in each replicates. Statistical significance (p < 0.05, p < 0.01, p < 0.0001) was calculated with Wilcoxon Rank Sum test. P-value of Cumulative Frequency Distribution was calculated using Kolmogorov Smirnov test.

199
Figure 66. Analysis of interactions in the B compartment of Chr.21. A. DNA FISH analysis of proximity between E2 responsive genomic loci (NRIP1/NCAM2, NRIP1/TIAM1) that are located close to extended B-compartment on Chr.21 reveal an elevated basal interaction between these loci that does not change with E2 stimulation. B. Cumulative distribution of distances between NRIP1/NCAM2 and NRIP1/TIAM1 showing no change in spatial distance between these loci C. Low frequency of interaction between TFF1 loci and BCP26 (B-compartment probe located at Chr21 q-arm 26Mb) compared to TFF1/NRIP1 interaction (15.8x and 7.5x more relative interaction frequency for TFF1/NRIP1 in –E2 and +E2 conditions respectively) despite relatively smaller genomic distance between the former pairs (15.8 Mb vs 27.3 Mb) D. DNA FISH using probes located inside the extended B-compartment (BCP24 and BCP20, that at 4 Mb apart) E. Analysis of regions inside B-compartment reveal an E2 stimulus dependent increase in distance between these internally located probes suggesting an expansion. Data are pooled from at least two biological replicates analyzing at leas 120 nuclei in each replicates. Statistical significance (p < 0.05, p < 0.01, p < 0.0001) was calculated with Wilcoxon Rank Sum test. P-value of Cumulative Frequency Distribution was calculated using Kolmogorov Smirnov test.

200
Figure 67: Sub-nuclear organelles and transcriptional robustness A, B. Immuno FISH using nucleolar marker (Fibrillarin), TFF1 and NRIP1 probes reveal positioning of NRIP1 in the close vicinity of nucleolar periphery. Less than 5% of TFF1 locus are proximal to nucleolar surface in basal condition, but that frequency is increased 3 fold upon E2 treatment indicating a E2 stimulus dependent relocalization of TFF1 C, D. Immuno FISH with Inter Chromatin Granule (ICG) marker (SC35), TFF1 and NRIP1 probes reveal significantly higher association of TFF1 with SC35 surface compared to that of SC35 and NRIP1. E,F. Immuno FISH data using ICG marker (SON) with two different loci showing E2 induced proximity (COL18A1/DSCR3 and TFF1/DSCR3) reveal that in the same nucleus, those probe pairs that are positioned in closer spatial proximity associate with same speckle domain more frequently when compared to probe pairs that are positioned at a much larger spatial distance (52.5% vs 9.8% for COL18A1/DSCR3 and 48% vs 22% for TFF1/DSCR3) G. Immuno RNA FISH using ICG marker (SC35) with TFF1 and NRIP1 intronic RNA probes. White triangle point to proximity of mTFF1 and mNRIP1 signal to same speckle domain H, I. RNA FISH signal intensity as a read out of transcriptional out put reveal that NRIP1 (H) and TFF1 (I) loci positioned on the same speckle domain has higher transcriptional out put compared to those loci that are associated with speckle individually. Loci that are not associated with any speckle domain have the least transcriptional activity. J. Meta analysis of ChIP-seq data using Condensin I subunit NCAPG shown robust E2 mediated enrichment of NCAPG to tier1 enhancers compared to other less robust ERα-bound enhancers K. DNA FISH analysis reveals that siRNA mediated NCAPG knockdown, but not RAD21 (Cohesin subunit) knockdown, diminishes E2 induced proximity between NRIP1 and TFF1. L,M. Q-PCR analysis demonstrate the loss of E2 induced eRNA expression from NRIP1e3 (L) and TFF1e1 (M) as a result of knockdown of SRSF1 (component of nuclear speckle) and treatment of cells with 1,6-Hexanediol (1,6-HD), an aliphatic alcohol that can melt membraneless cellular structures. Data is representative of 3 biological replicates. P-value was calculated using Paired Student’s-t test

201
Figure 67: Continued. N. Model of basal and E2-induced change in Chr.21 architecture. The nucleolar organizing region on the p-arm of Chr.21 tether Chr21 to nucleolus resulting in ‘forced’ proximity of NRIP1 to nucleolar surface. The extended B compartment of Chr.21 is localized to nucleolar or nuclear periphery thus anchoring the chromosome to fixed cellular compartment and making the A compartment ‘mobile’. Loci in in the A compartment of Chr.21 is more frequently associated with speckle than region closer to B-compartment and nucleolus. E2 dependent recruitment of Condensin along with increased production of eRNAs from tier1 enhancers further nucleate low complexity RNA binding proteins to the loci resulting LLPS and several fold increase in the local concentration of various components of co-factors and megatrans complex. This model predicts a random association of multiple robustly active loci to hydrogel like de novo assembled structures and mutually facilitates transcriptional activity. Immuno FISH data were obtained analyzing at leas 120 nuclei. Statistical significance (p < 0.05, p < 0.01, p < 0.0001) was calculated with Wilcoxon Rank Sum test. P-value for comparison of RNA FISH intensity was calculated using Wilcoxon Rank Sum test.

202
REFERENCES
Agger, K., Cloos, P.A.C., Rudkjaer, L., Williams, K., Andersen, G., Christensen, J., Helin, K., 2009. The H3K27me3 demethylase JMJD3 contributes to the activation of the INK4A-ARF locus in response to oncogene- and stress-induced senescence. Genes Dev. 23, 1171–1176. doi:10.1101/gad.510809
Agherbi, H., Gaussmann-Wenger, A., Verthuy, C., Chasson, L., Serrano, M., Djabali, M., 2009. Polycomb mediated epigenetic silencing and replication timing at the INK4a/ARF locus during senescence. PloS One 4, e5622. doi:10.1371/journal.pone.0005622
Akakura, S., Nochajski, P., Gao, L., Sotomayor, P., Matsui, S., Gelman, I.H., 2010. Rb-dependent cellular senescence, multinucleation and susceptibility to oncogenic transformation through PKC scaffolding by SSeCKS/AKAP12. Cell Cycle 9, 4656–4665. doi:10.4161/cc.9.23.13974
Alzohairy, A.M., Gyulai, G., Jansen, R.K., Bahieldin, A., 2013. Transposable elements domesticated and neofunctionalized by eukaryotic genomes. Plasmid 69, 1–15. doi:10.1016/j.plasmid.2012.08.001
Anderson, H.E., Kagansky, A., Wardle, J., Rappsilber, J., Allshire, R.C., Whitehall, S.K., 2010. Silencing mediated by the Schizosaccharomyces pombe HIRA complex is dependent upon the Hpc2-like protein, Hip4. PloS One 5, e13488. doi:10.1371/journal.pone.0013488
Artandi, S.E., Alson, S., Tietze, M.K., Sharpless, N.E., Ye, S., Greenberg, R.A., Castrillon, D.H., Horner, J.W., Weiler, S.R., Carrasco, R.D., DePinho, R.A., 2002. Constitutive telomerase expression promotes mammary carcinomas in aging mice. Proc. Natl. Acad. Sci. U. S. A. 99, 8191–8196. doi:10.1073/pnas.112515399
Baker, D.J., Childs, B.G., Durik, M., Wijers, M.E., Sieben, C.J., Zhong, J., A. Saltness, R., Jeganathan, K.B., Verzosa, G.C., Pezeshki, A., Khazaie, K., Miller, J.D., van Deursen, J.M., 2016. Naturally occurring p16Ink4a-positive cells shorten healthy lifespan. Nature 530, 184–189. doi:10.1038/nature16932
Baker, D.J., Wijshake, T., Tchkonia, T., LeBrasseur, N.K., Childs, B.G., van de Sluis, B., Kirkland, J.L., van Deursen, J.M., 2011. Clearance of p16Ink4a-positive senescent cells delays ageing-associated disorders. Nature 479, 232–236. doi:10.1038/nature10600
Baldridge, M.T., King, K.Y., Goodell, M.A., 2011. Inflammatory signals regulate hematopoietic stem cells. Trends Immunol. 32, 57–65. doi:10.1016/j.it.2010.12.003
Baldwin, R.M., Morettin, A., Côté, J., 2014. Role of PRMTs in cancer: Could minor isoforms be leaving a mark? World J. Biol. Chem. 5, 115–129. doi:10.4331/wjbc.v5.i2.115
Bandyopadhyay, D., Curry, J.L., Lin, Q., Richards, H.W., Chen, D., Hornsby, P.J., Timchenko, N.A., Medrano, E.E., 2007. Dynamic assembly of chromatin complexes

203
during cellular senescence: implications for the growth arrest of human melanocytic nevi. Aging Cell 6, 577–591. doi:10.1111/j.1474-9726.2007.00308.x
Bandyopadhyay, D., Okan, N.A., Bales, E., Nascimento, L., Cole, P.A., Medrano, E.E., 2002. Down-regulation of p300/CBP histone acetyltransferase activates a senescence checkpoint in human melanocytes. Cancer Res. 62, 6231–6239.
Banumathy, G., Somaiah, N., Zhang, R., Tang, Y., Hoffmann, J., Andrake, M., Ceulemans, H., Schultz, D., Marmorstein, R., Adams, P.D., 2009. Human UBN1 is an ortholog of yeast Hpc2p and has an essential role in the HIRA/ASF1a chromatin-remodeling pathway in senescent cells. Mol. Cell. Biol. 29, 758–770. doi:10.1128/MCB.01047-08
Beauséjour, C.M., Krtolica, A., Galimi, F., Narita, M., Lowe, S.W., Yaswen, P., Campisi, J., 2003. Reversal of human cellular senescence: roles of the p53 and p16 pathways. EMBO J. 22, 4212–4222. doi:10.1093/emboj/cdg417
Beck, D.B., Bonasio, R., Kaneko, S., Li, G., Li, G., Margueron, R., Oda, H., Sarma, K., Sims, R.J. 3rd, Son, J., Trojer, P., Reinberg, D., 2010. Chromatin in the nuclear landscape. Cold Spring Harb. Symp. Quant. Biol. 75, 11–22. doi:10.1101/sqb.2010.75.052
Belgnaoui, S.M., Gosden, R.G., Semmes, O.J., Haoudi, A., 2006. Human LINE-1 retrotransposon induces DNA damage and apoptosis in cancer cells. Cancer Cell Int. 6, 13. doi:10.1186/1475-2867-6-13
Benhamed, M., Herbig, U., Ye, T., Dejean, A., Bischof, O., 2012. Senescence is an endogenous trigger for microRNA-directed transcriptional gene silencing in human cells. Nat. Cell Biol. 14, 266–275. doi:10.1038/ncb2443
Bernardes de Jesus, B., Vera, E., Schneeberger, K., Tejera, A.M., Ayuso, E., Bosch, F., Blasco, M.A., 2012. Telomerase gene therapy in adult and old mice delays aging and increases longevity without increasing cancer. EMBO Mol. Med. 4, 691–704. doi:10.1002/emmm.201200245
Binda, O., Nassif, C., Branton, P.E., 2008. SIRT1 negatively regulates HDAC1-dependent transcriptional repression by the RBP1 family of proteins. Oncogene 27, 3384–3392. doi:10.1038/sj.onc.1211014
Bishop, N.A., Lu, T., Yankner, B.A., 2010. Neural mechanisms of ageing and cognitive decline. Nature 464, 529–535. doi:10.1038/nature08983
Blasco, M.A., 2007. Telomere length, stem cells and aging. Nat. Chem. Biol. 3, 640–649. doi:10.1038/nchembio.2007.38
Bönisch, C., Hake, S.B., 2012. Histone H2A variants in nucleosomes and chromatin: more or less stable? Nucleic Acids Res. 40, 10719–10741. doi:10.1093/nar/gks865
Booth, L.N., Brunet, A., 2016. The Aging Epigenome. Mol. Cell 62, 728–744. doi:10.1016/j.molcel.2016.05.013

204
Boyer, L.A., Lee, T.I., Cole, M.F., Johnstone, S.E., Levine, S.S., Zucker, J.P., Guenther, M.G., Kumar, R.M., Murray, H.L., Jenner, R.G., Gifford, D.K., Melton, D.A., Jaenisch, R., Young, R.A., 2005. Core Transcriptional Regulatory Circuitry in Human Embryonic Stem Cells. Cell 122, 947–956. doi:10.1016/j.cell.2005.08.020
Bracken, Adrian P, Kleine-Kohlbrecher, D., Dietrich, N., Pasini, D., Gargiulo, G., Beekman, C., Theilgaard-Mönch, K., Minucci, S., Porse, B.T., Marine, J.-C., Hansen, K.H., Helin, K., 2007. The Polycomb group proteins bind throughout the INK4A-ARF locus and are disassociated in senescent cells. Genes Dev. 21, 525–530. doi:10.1101/gad.415507
Bracken, Adrian P., Kleine-Kohlbrecher, D., Dietrich, N., Pasini, D., Gargiulo, G., Beekman, C., Theilgaard-Mönch, K., Minucci, S., Porse, B.T., Marine, J.-C., Hansen, K.H., Helin, K., 2007. The Polycomb group proteins bind throughout the INK4A-ARF locus and are disassociated in senescent cells. Genes Dev. 21, 525–530. doi:10.1101/gad.415507
Braig, M., Lee, S., Loddenkemper, C., Rudolph, C., Peters, A.H.F.M., Schlegelberger, B., Stein, H., Dörken, B., Jenuwein, T., Schmitt, C.A., 2005. Oncogene-induced senescence as an initial barrier in lymphoma development. Nature 436, 660–665. doi:10.1038/nature03841
Brunet, A., Sweeney, L.B., Sturgill, J.F., Chua, K.F., Greer, P.L., Lin, Y., Tran, H., Ross, S.E., Mostoslavsky, R., Cohen, H.Y., Hu, L.S., Cheng, H.-L., Jedrychowski, M.P., Gygi, S.P., Sinclair, D.A., Alt, F.W., Greenberg, M.E., 2004. Stress-Dependent Regulation of FOXO Transcription Factors by the SIRT1 Deacetylase. Science 303, 2011–2015. doi:10.1126/science.1094637
Buecker, C., Wysocka, J., 2012. Enhancers as information integration hubs in development: lessons from genomics. Trends Genet. 28, 276–284. doi:10.1016/j.tig.2012.02.008
Buenrostro, J.D., Giresi, P.G., Zaba, L.C., Chang, H.Y., Greenleaf, W.J., 2013. Transposition of native chromatin for fast and sensitive epigenomic profiling of open chromatin, DNA-binding proteins and nucleosome position. Nat. Methods 10, 1213–1218. doi:10.1038/nmeth.2688
Campisi, J., 2012. Aging, Cellular Senescence, and Cancer. Annu. Rev. Physiol. doi:10.1146/annurev-physiol-030212-183653
Campisi, J., d’Adda di Fagagna, F., 2007. Cellular senescence: when bad things happen to good cells. Nat. Rev. Mol. Cell Biol. 8, 729–740. doi:10.1038/nrm2233
Canela, A., Martín-Caballero, J., Flores, J.M., Blasco, M.A., 2004. Constitutive Expression of Tert in Thymocytes Leads to Increased Incidence and Dissemination of T-Cell Lymphoma in Lck-Tert Mice. Mol. Cell. Biol. 24, 4275–4293. doi:10.1128/MCB.24.10.4275-4293.2004

205
Cao, R., Wang, L., Wang, H., Xia, L., Erdjument-Bromage, H., Tempst, P., Jones, R.S., Zhang, Y., 2002. Role of histone H3 lysine 27 methylation in Polycomb-group silencing. Science 298, 1039–1043. doi:10.1126/science.1076997
Capell, B.C., Drake, A.M., Zhu, J., Shah, P.P., Dou, Z., Dorsey, J., Simola, D.F., Donahue, G., Sammons, M., Rai, T.S., Natale, C., Ridky, T.W., Adams, P.D., Berger, S.L., 2016. MLL1 is essential for the senescence-associated secretory phenotype. Genes Dev. 30, 321–336. doi:10.1101/gad.271882.115
Casillas, M.A.J., Lopatina, N., Andrews, L.G., Tollefsbol, T.O., 2003. Transcriptional control of the DNA methyltransferases is altered in aging and neoplastically-transformed human fibroblasts. Mol. Cell. Biochem. 252, 33–43.
Chandra, T., Ewels, P.A., Schoenfelder, S., Furlan-Magaril, M., Wingett, S.W., Kirschner, K., Thuret, J.-Y., Andrews, S., Fraser, P., Reik, W., 2015. Global reorganization of the nuclear landscape in senescent cells. Cell Rep. 10, 471–483. doi:10.1016/j.celrep.2014.12.055
Chang, J., Wang, Y., Shao, L., Laberge, R.-M., Demaria, M., Campisi, J., Janakiraman, K., Sharpless, N.E., Ding, S., Feng, W., Luo, Y., Wang, X., Aykin-Burns, N., Krager, K., Ponnappan, U., Hauer-Jensen, M., Meng, A., Zhou, D., 2016. Clearance of senescent cells by ABT263 rejuvenates aged hematopoietic stem cells in mice. Nat. Med. 22, 78–83. doi:10.1038/nm.4010
Chen, X., Xu, H., Yuan, P., Fang, F., Huss, M., Vega, V.B., Wong, E., Orlov, Y.L., Zhang, W., Jiang, J., Loh, Y.-H., Yeo, H.C., Yeo, Z.X., Narang, V., Govindarajan, K.R., Leong, B., Shahab, A., Ruan, Y., Bourque, G., Sung, W.-K., Clarke, N.D., Wei, C.-L., Ng, H.-H., 2008. Integration of External Signaling Pathways with the Core Transcriptional Network in Embryonic Stem Cells. Cell 133, 1106–1117. doi:10.1016/j.cell.2008.04.043
Chen, Z., Trotman, L.C., Shaffer, D., Lin, H.-K., Dotan, Z.A., Niki, M., Koutcher, J.A., Scher, H.I., Ludwig, T., Gerald, W., Cordon-Cardo, C., Pandolfi, P.P., 2005. Crucial role of p53-dependent cellular senescence in suppression of Pten-deficient tumorigenesis. Nature 436, 725–730. doi:10.1038/nature03918
Cheng, H.-L., Mostoslavsky, R., Saito, S., Manis, J.P., Gu, Y., Patel, P., Bronson, R., Appella, E., Alt, F.W., Chua, K.F., 2003. Developmental defects and p53 hyperacetylation in Sir2 homolog (SIRT1)-deficient mice. Proc. Natl. Acad. Sci. U. S. A. 100, 10794–10799. doi:10.1073/pnas.1934713100
Cherrier, T., Suzanne, S., Redel, L., Calao, M., Marban, C., Samah, B., Mukerjee, R., Schwartz, C., Gras, G., Sawaya, B.E., Zeichner, S.L., Aunis, D., Van Lint, C., Rohr, O., 2009. p21(WAF1) gene promoter is epigenetically silenced by CTIP2 and SUV39H1. Oncogene 28, 3380–3389. doi:10.1038/onc.2009.193
Chien, Y., Scuoppo, C., Wang, X., Fang, X., Balgley, B., Bolden, J.E., Premsrirut, P., Luo, W., Chicas, A., Lee, C.S., Kogan, S.C., Lowe, S.W., 2011. Control of the senescence-

206
associated secretory phenotype by NF-κB promotes senescence and enhances chemosensitivity. Genes Dev. 25, 2125–2136. doi:10.1101/gad.17276711
Choudhary, C., Kumar, C., Gnad, F., Nielsen, M.L., Rehman, M., Walther, T.C., Olsen, J.V., Mann, M., 2009. Lysine acetylation targets protein complexes and co-regulates major cellular functions. Science 325, 834–840. doi:10.1126/science.1175371
Chu, C., Qu, K., Zhong, F.L., Artandi, S.E., Chang, H.Y., 2011. Genomic maps of long noncoding RNA occupancy reveal principles of RNA-chromatin interactions. Mol. Cell 44, 667–678. doi:10.1016/j.molcel.2011.08.027
Chuang, L.S., Ian, H.I., Koh, T.W., Ng, H.H., Xu, G., Li, B.F., 1997. Human DNA-(cytosine-5) methyltransferase-PCNA complex as a target for p21WAF1. Science 277, 1996–2000.
Conboy, I.M., Conboy, M.J., Wagers, A.J., Girma, E.R., Weissman, I.L., Rando, T.A., 2005. Rejuvenation of aged progenitor cells by exposure to a young systemic environment. Nature 433, 760–764. doi:10.1038/nature03260
Contrepois, K., Thuret, J.-Y., Courbeyrette, R., Fenaille, F., Mann, C., 2012. Deacetylation of H4-K16Ac and heterochromatin assembly in senescence. Epigenetics Chromatin 5, 15. doi:10.1186/1756-8935-5-15
Coppé, J.-P., Desprez, P.-Y., Krtolica, A., Campisi, J., 2010. The senescence-associated secretory phenotype: the dark side of tumor suppression. Annu. Rev. Pathol. 5, 99–118. doi:10.1146/annurev-pathol-121808-102144
Cortellino, S., Xu, J., Sannai, M., Moore, R., Caretti, E., Cigliano, A., Le Coz, M., Devarajan, K., Wessels, A., Soprano, D., Abramowitz, L.K., Bartolomei, M.S., Rambow, F., Bassi, M.R., Bruno, T., Fanciulli, M., Renner, C., Klein-Szanto, A.J., Matsumoto, Y., Kobi, D., Davidson, I., Alberti, C., Larue, L., Bellacosa, A., 2011. Thymine DNA Glycosylase Is Essential for Active DNA Demethylation by Linked Deamination-Base Excision Repair. Cell 146, 67–79. doi:10.1016/j.cell.2011.06.020
Costanzi, C., Pehrson, J.R., 1998. Histone macroH2A1 is concentrated in the inactive X chromosome of female mammals. Nature 393, 599–601. doi:10.1038/31275
Creyghton, M.P., Cheng, A.W., Welstead, G.G., Kooistra, T., Carey, B.W., Steine, E.J., Hanna, J., Lodato, M.A., Frampton, G.M., Sharp, P.A., Boyer, L.A., Young, R.A., Jaenisch, R., 2010. Histone H3K27ac separates active from poised enhancers and predicts developmental state. Proc. Natl. Acad. Sci. U. S. A. 107, 21931–21936. doi:10.1073/pnas.1016071107
Cruickshanks, H.A., McBryan, T., Nelson, D.M., VanderKraats, N.D., Shah, P.P., van Tuyn, J., Singh Rai, T., Brock, C., Donahue, G., Dunican, D.S., Drotar, M.E., Meehan, R.R., Edwards, J.R., Berger, S.L., Adams, P.D., 2013. Senescent cells harbour features of the cancer epigenome. Nat. Cell Biol. 15, 1495–1506. doi:10.1038/ncb2879

207
d’Adda di Fagagna, F., Reaper, P.M., Clay-Farrace, L., Fiegler, H., Carr, P., Von Zglinicki, T., Saretzki, G., Carter, N.P., Jackson, S.P., 2003. A DNA damage checkpoint response in telomere-initiated senescence. Nature 426, 194–198. doi:10.1038/nature02118
Daitoku, H., Hatta, M., Matsuzaki, H., Aratani, S., Ohshima, T., Miyagishi, M., Nakajima, T., Fukamizu, A., 2004. Silent information regulator 2 potentiates Foxo1-mediated transcription through its deacetylase activity. Proc. Natl. Acad. Sci. U. S. A. 101, 10042–10047. doi:10.1073/pnas.0400593101
De Koning, L., Corpet, A., Haber, J.E., Almouzni, G., 2007. Histone chaperones: an escort network regulating histone traffic. Nat. Struct. Mol. Biol. 14, 997–1007. doi:10.1038/nsmb1318
Denis, H., Ndlovu, M.N., Fuks, F., 2011. Regulation of mammalian DNA methyltransferases: a route to new mechanisms. EMBO Rep. 12, 647–656. doi:10.1038/embor.2011.110
Denny, S.K., Yang, D., Chuang, C.-H., Brady, J.J., Lim, J.S., Grüner, B.M., Chiou, S.-H., Schep, A.N., Baral, J., Hamard, C., Antoine, M., Wislez, M., Kong, C.S., Connolly, A.J., Park, K.-S., Sage, J., Greenleaf, W.J., Winslow, M.M., 2016. Nfib Promotes Metastasis through a Widespread Increase in Chromatin Accessibility. Cell 166, 328–342. doi:10.1016/j.cell.2016.05.052
Di Bernardo, G., Squillaro, T., Dell’Aversana, C., Miceli, M., Cipollaro, M., Cascino, A., Altucci, L., Galderisi, U., 2009. Histone deacetylase inhibitors promote apoptosis and senescence in human mesenchymal stem cells. Stem Cells Dev. 18, 573–581. doi:10.1089/scd.2008.0172
Di Micco, R., Sulli, G., Dobreva, M., Liontos, M., Botrugno, O.A., Gargiulo, G., dal Zuffo, R., Matti, V., d’Ario, G., Montani, E., Mercurio, C., Hahn, W.C., Gorgoulis, V., Minucci, S., d’Adda di Fagagna, F., 2011a. Interplay between oncogene-induced DNA damage response and heterochromatin in senescence and cancer. Nat. Cell Biol. 13, 292–302. doi:10.1038/ncb2170
Di Micco, R., Sulli, G., Dobreva, M., Liontos, M., Botrugno, O.A., Gargiulo, G., dal Zuffo, R., Matti, V., d’Ario, G., Montani, E., Mercurio, C., Hahn, W.C., Gorgoulis, V., Minucci, S., d’Adda di Fagagna, F., 2011b. Interplay between oncogene-induced DNA damage response and heterochromatin in senescence and cancer. Nat. Cell Biol. 13, 292–302. doi:10.1038/ncb2170
Dietrich, N., Bracken, A.P., Trinh, E., Schjerling, C.K., Koseki, H., Rappsilber, J., Helin, K., Hansen, K.H., 2007. Bypass of senescence by the polycomb group protein CBX8 through direct binding to the INK4A-ARF locus. EMBO J. 26, 1637–1648. doi:10.1038/sj.emboj.7601632
Dou, Z., Xu, C., Donahue, G., Shimi, T., Pan, J.-A., Zhu, J., Ivanov, A., Capell, B.C., Drake, A.M., Shah, P.P., Catanzaro, J.M., Daniel Ricketts, M., Lamark, T., Adam, S.A., Marmorstein, R., Zong, W.-X., Johansen, T., Goldman, R.D., Adams, P.D., Berger,

208
S.L., 2015. Autophagy mediates degradation of nuclear lamina. Nature 527, 105–109. doi:10.1038/nature15548
Egan, B., Yuan, C.-C., Craske, M.L., Labhart, P., Guler, G.D., Arnott, D., Maile, T.M., Busby, J., Henry, C., Kelly, T.K., Tindell, C.A., Jhunjhunwala, S., Zhao, F., Hatton, C., Bryant, B.M., Classon, M., Trojer, P., 2016. An Alternative Approach to ChIP-Seq Normalization Enables Detection of Genome-Wide Changes in Histone H3 Lysine 27 Trimethylation upon EZH2 Inhibition. PLOS ONE 11, e0166438. doi:10.1371/journal.pone.0166438
Ehrlich, M., Ehrlich, K.C., 2014. DNA cytosine methylation and hydroxymethylation at the borders. Epigenomics 6, 563–566. doi:10.2217/epi.14.48
Epelman, S., Lavine, K.J., Randolph, G.J., 2014. Origin and Functions of Tissue Macrophages. Immunity 41, 21–35. doi:10.1016/j.immuni.2014.06.013
Eriksson, M., Brown, W.T., Gordon, L.B., Glynn, M.W., Singer, J., Scott, L., Erdos, M.R., Robbins, C.M., Moses, T.Y., Berglund, P., Dutra, A., Pak, E., Durkin, S., Csoka, A.B., Boehnke, M., Glover, T.W., Collins, F.S., 2003. Recurrent de novo point mutations in lamin A cause Hutchinson-Gilford progeria syndrome. Nature 423, 293–298. doi:10.1038/nature01629
Fane, M., Harris, L., Smith, A.G., Piper, M., 2017. Nuclear factor one transcription factors as epigenetic regulators in cancer. Int. J. Cancer. doi:10.1002/ijc.30603
Ferreira, R., Naguibneva, I., Pritchard, L.L., Ait-Si-Ali, S., Harel-Bellan, A., 2001. The Rb/chromatin connection and epigenetic control: opinion. Oncogene 20, 3128–3133. doi:10.1038/sj.onc.1204337
Feser, J., Truong, D., Das, C., Carson, J.J., Kieft, J., Harkness, T., Tyler, J.K., 2010a. Elevated histone expression promotes life span extension. Mol. Cell 39, 724–735. doi:10.1016/j.molcel.2010.08.015
Feser, J., Truong, D., Das, C., Carson, J.J., Kieft, J., Harkness, T., Tyler, J.K., 2010b. Elevated histone expression promotes life span extension. Mol. Cell 39, 724–735. doi:10.1016/j.molcel.2010.08.015
Forzati, F., Federico, A., Pallante, P., Abbate, A., Esposito, F., Malapelle, U., Sepe, R., Palma, G., Troncone, G., Scarfò, M., Arra, C., Fedele, M., Fusco, A., 2012. CBX7 is a tumor suppressor in mice and humans. J. Clin. Invest. 122, 612–623. doi:10.1172/JCI58620
Fraga, M.F., Esteller, M., 2007. Epigenetics and aging: the targets and the marks. Trends Genet. TIG 23, 413–418. doi:10.1016/j.tig.2007.05.008
Frescas, D., Valenti, L., Accili, D., 2005. Nuclear Trapping of the Forkhead Transcription Factor FoxO1 via Sirt-dependent Deacetylation Promotes Expression of Glucogenetic Genes. J. Biol. Chem. 280, 20589–20595. doi:10.1074/jbc.M412357200

209
Gagliardi, A., Mullin, N.P., Ying Tan, Z., Colby, D., Kousa, A.I., Halbritter, F., Weiss, J.T., Felker, A., Bezstarosti, K., Favaro, R., Demmers, J., Nicolis, S.K., Tomlinson, S.R., Poot, R.A., Chambers, I., 2013. A direct physical interaction between Nanog and Sox2 regulates embryonic stem cell self-renewal. EMBO J. 32, 2231–2247. doi:10.1038/emboj.2013.161
Gao, Z., Zhang, J., Bonasio, R., Strino, F., Sawai, A., Parisi, F., Kluger, Y., Reinberg, D., 2012. PCGF homologs, CBX proteins, and RYBP define functionally distinct PRC1 family complexes. Mol. Cell 45, 344–356. doi:10.1016/j.molcel.2012.01.002
Gentilini, D., Mari, D., Castaldi, D., Remondini, D., Ogliari, G., Ostan, R., Bucci, L., Sirchia, S.M., Tabano, S., Cavagnini, F., Monti, D., Franceschi, C., Di Blasio, A.M., Vitale, G., 2012. Role of epigenetics in human aging and longevity: genome-wide DNA methylation profile in centenarians and centenarians’ offspring. Age Dordr. Neth. doi:10.1007/s11357-012-9463-1
Gévry, N., Chan, H.M., Laflamme, L., Livingston, D.M., Gaudreau, L., 2007. p21 transcription is regulated by differential localization of histone H2A.Z. Genes Dev. 21, 1869–1881. doi:10.1101/gad.1545707
Gil, J., Bernard, D., Martínez, D., Beach, D., 2004. Polycomb CBX7 has a unifying role in cellular lifespan. Nat. Cell Biol. 6, 67–72. doi:10.1038/ncb1077
Glass, C.K., Natoli, G., 2016. Molecular control of activation and priming in macrophages. Nat. Immunol. 17, 26–33. doi:10.1038/ni.3306
Goldman, R.D., Shumaker, D.K., Erdos, M.R., Eriksson, M., Goldman, A.E., Gordon, L.B., Gruenbaum, Y., Khuon, S., Mendez, M., Varga, R., Collins, F.S., 2004. Accumulation of mutant lamin A causes progressive changes in nuclear architecture in Hutchinson-Gilford progeria syndrome. Proc. Natl. Acad. Sci. U. S. A. 101, 8963–8968. doi:10.1073/pnas.0402943101
González-Suárez, E., Samper, E., Ramírez, A., Flores, J.M., Martín-Caballero, J., Jorcano, J.L., Blasco, M.A., 2001. Increased epidermal tumors and increased skin wound healing in transgenic mice overexpressing the catalytic subunit of telomerase, mTERT, in basal keratinocytes. EMBO J. 20, 2619–2630. doi:10.1093/emboj/20.11.2619
Gonzalo, S., García-Cao, M., Fraga, M.F., Schotta, G., Peters, A.H.F.M., Cotter, S.E., Eguía, R., Dean, D.C., Esteller, M., Jenuwein, T., Blasco, M.A., 2005. Role of the RB1 family in stabilizing histone methylation at constitutive heterochromatin. Nat. Cell Biol. 7, 420–428. doi:10.1038/ncb1235
Guibert, S., Weber, M., 2013. Functions of DNA methylation and hydroxymethylation in mammalian development. Curr. Top. Dev. Biol. 104, 47–83. doi:10.1016/B978-0-12-416027-9.00002-4
Hadjur, S., Williams, L.M., Ryan, N.K., Cobb, B.S., Sexton, T., Fraser, P., Fisher, A.G., Merkenschlager, M., 2009. Cohesins form chromosomal cis-interactions at the

210
developmentally regulated IFNG locus. Nature 460, 410–413. doi:10.1038/nature08079
Hamiche, A., Shuaib, M., 2012. Chaperoning the histone H3 family. Biochim. Biophys. Acta 1819, 230–237. doi:10.1016/j.bbagrm.2011.08.009
Han, D., Lu, X., Shih, A.H., Nie, J., You, Q., Xu, M.M., Melnick, A.M., Levine, R.L., He, C., 2016. A Highly Sensitive and Robust Method for Genome-wide 5hmC Profiling of Rare Cell Populations. Mol. Cell 63, 711–719. doi:10.1016/j.molcel.2016.06.028
Han, L., Zhou, R., Niu, J., McNutt, M.A., Wang, P., Tong, T., 2010. SIRT1 is regulated by a PPAR{γ}-SIRT1 negative feedback loop associated with senescence. Nucleic Acids Res. 38, 7458–7471. doi:10.1093/nar/gkq609
Han, S., Brunet, A., 2012. Histone methylation makes its mark on longevity. Trends Cell Biol. 22, 42–49. doi:10.1016/j.tcb.2011.11.001
Hanahan, D., Weinberg, R.A., 2011. Hallmarks of Cancer: The Next Generation. Cell 144, 646–674. doi:10.1016/j.cell.2011.02.013
Harris, L., Genovesi, L.A., Gronostajski, R.M., Wainwright, B.J., Piper, M., 2015. Nuclear factor one transcription factors: Divergent functions in developmental versus adult stem cell populations. Dev. Dyn. Off. Publ. Am. Assoc. Anat. 244, 227–238. doi:10.1002/dvdy.24182
Hashimoto, H., Sonoda, E., Takami, Y., Kimura, H., Nakayama, T., Tachibana, M., Takeda, S., Shinkai, Y., 2007. Histone H1 variant, H1R is involved in DNA damage response. DNA Repair 6, 1584–1595. doi:10.1016/j.dnarep.2007.05.003
Heintzman, N.D., Stuart, R.K., Hon, G., Fu, Y., Ching, C.W., Hawkins, R.D., Barrera, L.O., Calcar, S.V., Qu, C., Ching, K.A., Wang, W., Weng, Z., Green, R.D., Crawford, G.E., Ren, B., 2007. Distinct and predictive chromatin signatures of transcriptional promoters and enhancers in the human genome. Nat. Genet. 39, 311–318. doi:10.1038/ng1966
Heinz, S., Benner, C., Spann, N., Bertolino, E., Lin, Y.C., Laslo, P., Cheng, J.X., Murre, C., Singh, H., Glass, C.K., 2010a. Simple combinations of lineage-determining transcription factors prime cis-regulatory elements required for macrophage and B cell identities. Mol. Cell 38, 576–589. doi:10.1016/j.molcel.2010.05.004
Heinz, S., Benner, C., Spann, N., Bertolino, E., Lin, Y.C., Laslo, P., Cheng, J.X., Murre, C., Singh, H., Glass, C.K., 2010b. Simple combinations of lineage-determining transcription factors prime cis-regulatory elements required for macrophage and B cell identities. Mol. Cell 38, 576–589. doi:10.1016/j.molcel.2010.05.004
Heinz, S., Romanoski, C.E., Benner, C., Glass, C.K., 2015. The selection and function of cell type-specific enhancers. Nat. Rev. Mol. Cell Biol. 16, 144–154. doi:10.1038/nrm3949

211
Herbig, U., Jobling, W.A., Chen, B.P.C., Chen, D.J., Sedivy, J.M., 2004. Telomere shortening triggers senescence of human cells through a pathway involving ATM, p53, and p21(CIP1), but not p16(INK4a). Mol. Cell 14, 501–513.
Hergeth, S.P., Dundr, M., Tropberger, P., Zee, B.M., Garcia, B.A., Daujat, S., Schneider, R., 2011. Isoform-specific phosphorylation of human linker histone H1.4 in mitosis by the kinase Aurora B. J. Cell Sci. 124, 1623–1628. doi:10.1242/jcs.084947
Herranz, D., Muñoz-Martin, M., Cañamero, M., Mulero, F., Martinez-Pastor, B., Fernandez-Capetillo, O., Serrano, M., 2010. Sirt1 improves healthy ageing and protects from metabolic syndrome-associated cancer. Nat. Commun. 1, 3. doi:10.1038/ncomms1001
Herranz, D., Serrano, M., 2010a. SIRT1: recent lessons from mouse models. Nat. Rev. Cancer 10, 819–823. doi:10.1038/nrc2962
Herranz, D., Serrano, M., 2010b. SIRT1: recent lessons from mouse models. Nat. Rev. Cancer 10, 819–823. doi:10.1038/nrc2962
Hnisz, D., Abraham, B.J., Lee, T.I., Lau, A., Saint-André, V., Sigova, A.A., Hoke, H., Young, R.A., 2013a. Transcriptional super-enhancers connected to cell identity and disease. Cell 155. doi:10.1016/j.cell.2013.09.053
Hnisz, D., Abraham, B.J., Lee, T.I., Lau, A., Saint-André, V., Sigova, A.A., Hoke, H.A., Young, R.A., 2013b. Super-Enhancers in the Control of Cell Identity and Disease. Cell 155, 934–947. doi:10.1016/j.cell.2013.09.053
Hovest, M.G., Brüggenolte, N., Hosseini, K.S., Krieg, T., Herrmann, G., 2006. Senescence of human fibroblasts after psoralen photoactivation is mediated by ATR kinase and persistent DNA damage foci at telomeres. Mol. Biol. Cell 17, 1758–1767. doi:10.1091/mbc.E05-08-0701
Howitz, K.T., Bitterman, K.J., Cohen, H.Y., Lamming, D.W., Lavu, S., Wood, J.G., Zipkin, R.E., Chung, P., Kisielewski, A., Zhang, L.-L., Scherer, B., Sinclair, D.A., 2003. Small molecule activators of sirtuins extend Saccharomyces cerevisiae lifespan. Nature 425, 191–196. doi:10.1038/nature01960
Hu, Z., Chen, K., Xia, Z., Chavez, M., Pal, S., Seol, J.-H., Chen, C.-C., Li, W., Tyler, J.K., 2014. Nucleosome loss leads to global transcriptional up-regulation and genomic instability during yeast aging. Genes Dev. 28, 396–408. doi:10.1101/gad.233221.113
Huang, H.-T., Kathrein, K.L., Barton, A., Gitlin, Z., Huang, Y.-H., Ward, T.P., Hofmann, O., Dibiase, A., Song, A., Tyekucheva, S., Hide, W., Zhou, Y., Zon, L.I., 2013. A Network of Epigenetic Regulators Guide Developmental Hematopoiesis In Vivo. Nat. Cell Biol. 15, 1516–1525. doi:10.1038/ncb2870
Ido, Y., Duranton, A., Lan, F., Weikel, K.A., Breton, L., Ruderman, N.B., 2015. Resveratrol Prevents Oxidative Stress-Induced Senescence and Proliferative Dysfunction by Activating the AMPK-FOXO3 Cascade in Cultured Primary Human Keratinocytes. PLOS ONE 10, e0115341. doi:10.1371/journal.pone.0115341

212
Ishov, A.M., Vladimirova, O.V., Maul, G.G., 2004. Heterochromatin and ND10 are cell-cycle regulated and phosphorylation-dependent alternate nuclear sites of the transcription repressor Daxx and SWI/SNF protein ATRX. J. Cell Sci. 117, 3807–3820. doi:10.1242/jcs.01230
Izzo, A., Kamieniarz, K., Schneider, R., 2008. The histone H1 family: specific members, specific functions? Biol. Chem. 389, 333–343. doi:10.1515/BC.2008.037
Jacobs, J.J., Kieboom, K., Marino, S., DePinho, R.A., van Lohuizen, M., 1999. The oncogene and Polycomb-group gene bmi-1 regulates cell proliferation and senescence through the ink4a locus. Nature 397, 164–168. doi:10.1038/16476
Jeyapalan, J.C., Ferreira, M., Sedivy, J.M., Herbig, U., 2007. Accumulation of senescent cells in mitotic tissue of aging primates. Mech. Ageing Dev. 128, 36–44. doi:10.1016/j.mad.2006.11.008
Jin, C., Felsenfeld, G., 2007. Nucleosome stability mediated by histone variants H3.3 and H2A.Z. Genes Dev. 21, 1519–1529. doi:10.1101/gad.1547707
Jin, C., Li, J., Green, C.D., Yu, X., Tang, X., Han, D., Xian, B., Wang, D., Huang, X., Cao, X., Yan, Z., Hou, L., Liu, J., Shukeir, N., Khaitovich, P., Chen, C.D., Zhang, H., Jenuwein, T., Han, J.-D.J., 2011. Histone Demethylase UTX-1 Regulates C. elegans Life Span by Targeting the Insulin/IGF-1 Signaling Pathway. Cell Metab. 14, 161–172. doi:10.1016/j.cmet.2011.07.001
Jintaridth, P., Mutirangura, A., 2010. Distinctive patterns of age-dependent hypomethylation in interspersed repetitive sequences. Physiol. Genomics 41, 194–200. doi:10.1152/physiolgenomics.00146.2009
Jones, P.A., 2012. Functions of DNA methylation: islands, start sites, gene bodies and beyond. Nat. Rev. Genet. 13, 484–492. doi:10.1038/nrg3230
Kaeberlein, M, McVey, M., Guarente, L., 1999. The SIR2/3/4 complex and SIR2 alone promote longevity in Saccharomyces cerevisiae by two different mechanisms. Genes Dev. 13, 2570–2580.
Kaeberlein, M., McVey, M., Guarente, L., 1999. The SIR2/3/4 complex and SIR2 alone promote longevity in Saccharomyces cerevisiae by two different mechanisms. Genes Dev. 13, 2570–2580.
Kaidi, A., Weinert, B.T., Choudhary, C., Jackson, S.P., 2010. Human SIRT6 promotes DNA end resection through CtIP deacetylation. Science 329, 1348–1353. doi:10.1126/science.1192049
Kaikkonen, M.U., Spann, N., Heinz, S., Romanoski, C.E., Allison, K.A., Stender, J.D., Chun, H.B., Tough, D.F., Prinjha, R.K., Benner, C., Glass, C.K., 2013. Remodeling of the enhancer landscape during macrophage activation is coupled to enhancer transcription. Mol. Cell 51, 310–325. doi:10.1016/j.molcel.2013.07.010

213
Kanfi, Y., Naiman, S., Amir, G., Peshti, V., Zinman, G., Nahum, L., Bar-Joseph, Z., Cohen, H.Y., 2012a. The sirtuin SIRT6 regulates lifespan in male mice. Nature 483, 218–221. doi:10.1038/nature10815
Kanfi, Y., Naiman, S., Amir, G., Peshti, V., Zinman, G., Nahum, L., Bar-Joseph, Z., Cohen, H.Y., 2012b. The sirtuin SIRT6 regulates lifespan in male mice. Nature 483, 218–221. doi:10.1038/nature10815
Kang, C., Xu, Q., Martin, T.D., Li, M.Z., Demaria, M., Aron, L., Lu, T., Yankner, B.A., Campisi, J., Elledge, S.J., 2015. The DNA damage response induces inflammation and senescence by inhibiting autophagy of GATA4. Science 349, aaa5612. doi:10.1126/science.aaa5612
Kangaspeska, S., Stride, B., Métivier, R., Polycarpou-Schwarz, M., Ibberson, D., Carmouche, R.P., Benes, V., Gannon, F., Reid, G., 2008. Transient cyclical methylation of promoter DNA. Nature 452, 112–115. doi:10.1038/nature06640
Kawahara, T.L.A., Michishita, E., Adler, A.S., Damian, M., Berber, E., Lin, M., McCord, R.A., Ongaigui, K.C.L., Boxer, L.D., Chang, H.Y., Chua, K.F., 2009. SIRT6 links histone H3 lysine 9 deacetylation to NF-kappaB-dependent gene expression and organismal life span. Cell 136, 62–74. doi:10.1016/j.cell.2008.10.052
Kaygun, H., Marzluff, W.F., 2005. Regulated degradation of replication-dependent histone mRNAs requires both ATR and Upf1. Nat. Struct. Mol. Biol. 12, 794–800. doi:10.1038/nsmb972
Kenyon, Cynthia J, 2010. The genetics of ageing. Nature 464, 504–512. doi:10.1038/nature08980
Kenyon, Cynthia J., 2010. The genetics of ageing. Nature 464, 504–512. doi:10.1038/nature08980
Kim, D., Nguyen, M.D., Dobbin, M.M., Fischer, A., Sananbenesi, F., Rodgers, J.T., Delalle, I., Baur, J.A., Sui, G., Armour, S.M., Puigserver, P., Sinclair, D.A., Tsai, L.-H., 2007. SIRT1 deacetylase protects against neurodegeneration in models for Alzheimer’s disease and amyotrophic lateral sclerosis. EMBO J. 26, 3169–3179. doi:10.1038/sj.emboj.7601758
Kim, J., Chu, J., Shen, X., Wang, J., Orkin, S.H., 2008. An Extended Transcriptional Network for Pluripotency of Embryonic Stem Cells. Cell 132, 1049–1061. doi:10.1016/j.cell.2008.02.039
Kim, J.H., Yoo, B.C., Yang, W.S., Kim, E., Hong, S., Cho, J.Y., 2016. The Role of Protein Arginine Methyltransferases in Inflammatory Responses. Mediators Inflamm. 2016, 4028353. doi:10.1155/2016/4028353

214
Kim, S., Villeponteau, B., Jazwinski, S.M., 1996. Effect of replicative age on transcriptional silencing near telomeres in Saccharomyces cerevisiae. Biochem. Biophys. Res. Commun. 219, 370–376. doi:10.1006/bbrc.1996.0240
Kim, W.Y., Sharpless, N.E., 2006. The regulation of INK4/ARF in cancer and aging. Cell 127, 265–275. doi:10.1016/j.cell.2006.10.003
Kinner, A., Wu, W., Staudt, C., Iliakis, G., 2008. Gamma-H2AX in recognition and signaling of DNA double-strand breaks in the context of chromatin. Nucleic Acids Res. 36, 5678–5694. doi:10.1093/nar/gkn550
Konkel, M.K., Batzer, M.A., 2010. A mobile threat to genome stability: The impact of non-LTR retrotransposons upon the human genome. Semin. Cancer Biol. 20, 211–221. doi:10.1016/j.semcancer.2010.03.001
Kooistra, S.M., Helin, K., 2012. Molecular mechanisms and potential functions of histone demethylases. Nat. Rev. Mol. Cell Biol. 13, 297–311. doi:10.1038/nrm3327
Kosar, M., Bartkova, J., Hubackova, S., Hodny, Z., Lukas, J., Bartek, J., 2011. Senescence-associated heterochromatin foci are dispensable for cellular senescence, occur in a cell type- and insult-dependent manner and follow expression of p16(ink4a). Cell Cycle Georget. Tex 10, 457–468.
Kotake, Y., Nakagawa, T., Kitagawa, K., Suzuki, S., Liu, N., Kitagawa, M., Xiong, Y., 2011. Long non-coding RNA ANRIL is required for the PRC2 recruitment to and silencing of p15(INK4B) tumor suppressor gene. Oncogene 30, 1956–1962. doi:10.1038/onc.2010.568
Kozak, M.L., Chavez, A., Dang, W., Berger, S.L., Ashok, A., Guo, X., Johnson, F.B., 2010. Inactivation of the Sas2 histone acetyltransferase delays senescence driven by telomere dysfunction. EMBO J. 29, 158–170. doi:10.1038/emboj.2009.314
Kreiling, J.A., Tamamori-Adachi, M., Sexton, A.N., Jeyapalan, J.C., Munoz-Najar, U., Peterson, A.L., Manivannan, J., Rogers, E.S., Pchelintsev, N.A., Adams, P.D., Sedivy, J.M., 2011. Age-associated increase in heterochromatic marks in murine and primate tissues. Aging Cell 10, 292–304. doi:10.1111/j.1474-9726.2010.00666.x
Krześniak, M., Zajkowicz, A., Matuszczyk, I., Rusin, M., 2014. Rapamycin prevents strong phosphorylation of p53 on serine 46 and attenuates activation of the p53 pathway in A549 lung cancer cells exposed to actinomycin D. Mech. Ageing Dev. 139, 11–21. doi:10.1016/j.mad.2014.06.002
Kubben, N., Adriaens, M., Meuleman, W., Voncken, J.W., van Steensel, B., Misteli, T., 2012. Mapping of lamin A- and progerin-interacting genome regions. Chromosoma 121, 447–464. doi:10.1007/s00412-012-0376-7
Kurz, D.J., Decary, S., Hong, Y., Erusalimsky, J.D., 2000. Senescence-associated (beta)-galactosidase reflects an increase in lysosomal mass during replicative ageing of human endothelial cells. J. Cell Sci. 113 ( Pt 20), 3613–3622.

215
Kuzmichev, A., Jenuwein, T., Tempst, P., Reinberg, D., 2004. Different EZH2-containing complexes target methylation of histone H1 or nucleosomal histone H3. Mol. Cell 14, 183–193.
Kwak, H., Fuda, N.J., Core, L.J., Lis, J.T., 2013. Precise Maps of RNA Polymerase Reveal How Promoters Direct Initiation and Pausing. Science 339, 950–953. doi:10.1126/science.1229386
Laberge, R.-M., Sun, Y., Orjalo, A.V., Patil, C.K., Freund, A., Zhou, L., Curran, S.C., Davalos, A.R., Wilson-Edell, K.A., Liu, S., Limbad, C., Demaria, M., Li, P., Hubbard, G.B., Ikeno, Y., Javors, M., Desprez, P.-Y., Benz, C.C., Kapahi, P., Nelson, P.S., Campisi, J., 2015. MTOR regulates the pro-tumorigenic senescence-associated secretory phenotype by promoting IL1A translation. Nat. Cell Biol. 17, 1049–1061. doi:10.1038/ncb3195
Lagger, G., O’Carroll, D., Rembold, M., Khier, H., Tischler, J., Weitzer, G., Schuettengruber, B., Hauser, C., Brunmeir, R., Jenuwein, T., Seiser, C., 2002. Essential function of histone deacetylase 1 in proliferation control and CDK inhibitor repression. EMBO J. 21, 2672–2681. doi:10.1093/emboj/21.11.2672
Lara-Astiaso, D., Weiner, A., Lorenzo-Vivas, E., Zaretsky, I., Jaitin, D.A., David, E., Keren-Shaul, H., Mildner, A., Winter, D., Jung, S., Friedman, N., Amit, I., 2014. Chromatin state dynamics during blood formation. Science 345, 943–949. doi:10.1126/science.1256271
Larson, K., Yan, S.-J., Tsurumi, A., Liu, J., Zhou, J., Gaur, K., Guo, D., Eickbush, T.H., Li, W.X., 2012. Heterochromatin formation promotes longevity and represses ribosomal RNA synthesis. PLoS Genet. 8, e1002473. doi:10.1371/journal.pgen.1002473
Lazzerini Denchi, E., Attwooll, C., Pasini, D., Helin, K., 2005. Deregulated E2F activity induces hyperplasia and senescence-like features in the mouse pituitary gland. Mol. Cell. Biol. 25, 2660–2672. doi:10.1128/MCB.25.7.2660-2672.2005
Lee, K., Lau, Z.Z., Meredith, C., Park, J.H., 2012. Decrease of p400 ATPase complex and loss of H2A.Z within the p21 promoter occur in senescent IMR-90 human fibroblasts. Mech. Ageing Dev. 133, 686–694. doi:10.1016/j.mad.2012.11.001
Lee, S., Schmitt, C.A., Reimann, M., 2011. The Myc/macrophage tango: oncogene-induced senescence, Myc style. Semin. Cancer Biol. 21, 377–384. doi:10.1016/j.semcancer.2011.10.002
Li, L., Greer, C., Eisenman, R.N., Secombe, J., 2010. Essential Functions of the Histone Demethylase Lid. PLOS Genet. 6, e1001221. doi:10.1371/journal.pgen.1001221
Li, Q., Zhou, H., Wurtele, H., Davies, B., Horazdovsky, B., Verreault, A., Zhang, Z., 2008. Acetylation of histone H3 lysine 56 regulates replication-coupled nucleosome assembly. Cell 134, 244–255. doi:10.1016/j.cell.2008.06.018

216
Li, W., Notani, D., Ma, Q., Tanasa, B., Nunez, E., Chen, A.Y., Merkurjev, D., Zhang, J., Ohgi, K., Song, X., Oh, S., Kim, H.-S., Glass, C.K., Rosenfeld, M.G., 2013. Functional roles of enhancer RNAs for oestrogen-dependent transcriptional activation. Nature 498, 516–520. doi:10.1038/nature12210
Liber, D., Domaschenz, R., Holmqvist, P.-H., Mazzarella, L., Georgiou, A., Leleu, M., Fisher, A.G., Labosky, P.A., Dillon, N., 2010. Epigenetic Priming of a Pre-B Cell-Specific Enhancer through Binding of Sox2 and Foxd3 at the ESC Stage. Cell Stem Cell 7, 114–126. doi:10.1016/j.stem.2010.05.020
Lichtinger, M., Ingram, R., Hannah, R., Müller, D., Clarke, D., Assi, S.A., Lie-A-Ling, M., Noailles, L., Vijayabaskar, M.S., Wu, M., Tenen, D.G., Westhead, D.R., Kouskoff, V., Lacaud, G., Göttgens, B., Bonifer, C., 2012. RUNX1 reshapes the epigenetic landscape at the onset of haematopoiesis. EMBO J. 31, 4318–4333. doi:10.1038/emboj.2012.275
Lister, R., Pelizzola, M., Dowen, R.H., Hawkins, R.D., Hon, G., Tonti-Filippini, J., Nery, J.R., Lee, L., Ye, Z., Ngo, Q.-M., Edsall, L., Antosiewicz-Bourget, J., Stewart, R., Ruotti, V., Millar, A.H., Thomson, J.A., Ren, B., Ecker, J.R., 2009. Human DNA methylomes at base resolution show widespread epigenomic differences. Nature 462, 315–322. doi:10.1038/nature08514
Liu, W., Ma, Q., Wong, K., Li, W., Ohgi, K., Zhang, J., Aggarwal, A., Rosenfeld, M.G., 2013. Brd4 and JMJD6-associated Anti-pause Enhancers in Regulation of Transcriptional Pause Release. Cell 155, 1581–1595. doi:10.1016/j.cell.2013.10.056
Liu, W.M., Maraia, R.J., Rubin, C.M., Schmid, C.W., 1994. Alu transcripts: cytoplasmic localisation and regulation by DNA methylation. Nucleic Acids Res. 22, 1087–1095.
Liu, W.M., Schmid, C.W., 1993. Proposed roles for DNA methylation in Alu transcriptional repression and mutational inactivation. Nucleic Acids Res. 21, 1351–1359.
Ma, M.K.-W., Heath, C., Hair, A., West, A.G., 2011. Histone Crosstalk Directed by H2B Ubiquitination Is Required for Chromatin Boundary Integrity. PLOS Genet. 7, e1002175. doi:10.1371/journal.pgen.1002175
Macaluso, M., Montanari, M., Giordano, A., 2006. Rb family proteins as modulators of gene expression and new aspects regarding the interaction with chromatin remodeling enzymes. Oncogene 25, 5263–5267. doi:10.1038/sj.onc.1209680
Manning, J.A., Kumar, S., 2010. A potential role for NEDD1 and the centrosome in senescence of mouse embryonic fibroblasts. Cell Death Dis. 1, e35. doi:10.1038/cddis.2010.12
Mao, Z., Hine, C., Tian, X., Van Meter, M., Au, M., Vaidya, A., Seluanov, A., Gorbunova, V., 2011. SIRT6 promotes DNA repair under stress by activating PARP1. Science 332, 1443–1446. doi:10.1126/science.1202723

217
Maston, G.A., Landt, S.G., Snyder, M., Green, M.R., 2012. Characterization of Enhancer Function from Genome-Wide Analyses. Annu. Rev. Genomics Hum. Genet. 13, 29–57. doi:10.1146/annurev-genom-090711-163723
McCord, R.P., Nazario-Toole, A., Zhang, H., Chines, P.S., Zhan, Y., Erdos, M.R., Collins, F.S., Dekker, J., Cao, K., 2013. Correlated alterations in genome organization, histone methylation, and DNA-lamin A/C interactions in Hutchinson-Gilford progeria syndrome. Genome Res. 23, 260–269. doi:10.1101/gr.138032.112
McCord, R.P., Nazario-Toole, A., Zhang, H., Chines, P.S., Zhan, Y., Erdos, M.R., Collins, F.S., Dekker, J., Cao, K., 2012. Correlated alterations in genome organization, histone methylation, and DNA-lamin A/C interactions in Hutchinson-Gilford progeria syndrome. Genome Res. doi:10.1101/gr.138032.112
McKay, J.D., Hung, R.J., Gaborieau, V., Boffetta, P., Chabrier, A., Byrnes, G., Zaridze, D., Mukeria, A., Szeszenia-Dabrowska, N., Lissowska, J., Rudnai, P., Fabianova, E., Mates, D., Bencko, V., Foretova, L., Janout, V., McLaughlin, J., Shepherd, F., Montpetit, A., Narod, S., Krokan, H.E., Skorpen, F., Elvestad, M.B., Vatten, L., Njølstad, I., Axelsson, T., Chen, C., Goodman, G., Barnett, M., Loomis, M.M., Lubiñski, J., Matyjasik, J., Lener, M., Oszutowska, D., Field, J., Liloglou, T., Xinarianos, G., Cassidy, A., EPIC Study, Vineis, P., Clavel-Chapelon, F., Palli, D., Tumino, R., Krogh, V., Panico, S., González, C.A., Ramón Quirós, J., Martínez, C., Navarro, C., Ardanaz, E., Larrañaga, N., Kham, K.T., Key, T., Bueno-de-Mesquita, H.B., Peeters, P.H., Trichopoulou, A., Linseisen, J., Boeing, H., Hallmans, G., Overvad, K., Tjønneland, A., Kumle, M., Riboli, E., Zelenika, D., Boland, A., Delepine, M., Foglio, M., Lechner, D., Matsuda, F., Blanche, H., Gut, I., Heath, S., Lathrop, M., Brennan, P., 2008. Lung cancer susceptibility locus at 5p15.33. Nat. Genet. 40, 1404–1406. doi:10.1038/ng.254
Michishita, E., McCord, R.A., Berber, E., Kioi, M., Padilla-Nash, H., Damian, M., Cheung, P., Kusumoto, R., Kawahara, T.L.A., Barrett, J.C., Chang, H.Y., Bohr, V.A., Ried, T., Gozani, O., Chua, K.F., 2008. SIRT6 is a histone H3 lysine 9 deacetylase that modulates telomeric chromatin. Nature 452, 492–496. doi:10.1038/nature06736
Miguel-Escalada, I., Pasquali, L., Ferrer, J., 2015. Transcriptional enhancers: functional insights and role in human disease. Curr. Opin. Genet. Dev., Molecular and genetic bases of disease 33, 71–76. doi:10.1016/j.gde.2015.08.009
Miller, K.M., Tjeertes, J.V., Coates, J., Legube, G., Polo, S.E., Britton, S., Jackson, S.P., 2010. Human HDAC1 and HDAC2 function in the DNA-damage response to promote DNA nonhomologous end-joining. Nat. Struct. Mol. Biol. 17, 1144–1151. doi:10.1038/nsmb.1899
Mito, Y., Henikoff, J.G., Henikoff, S., 2005. Genome-scale profiling of histone H3.3 replacement patterns. Nat. Genet. 37, 1090–1097. doi:10.1038/ng1637
Mootha, V.K., Lindgren, C.M., Eriksson, K.-F., Subramanian, A., Sihag, S., Lehar, J., Puigserver, P., Carlsson, E., Ridderstråle, M., Laurila, E., Houstis, N., Daly, M.J., Patterson, N., Mesirov, J.P., Golub, T.R., Tamayo, P., Spiegelman, B., Lander, E.S.,

218
Hirschhorn, J.N., Altshuler, D., Groop, L.C., 2003. PGC-1α-responsive genes involved in oxidative phosphorylation are coordinately downregulated in human diabetes. Nat. Genet. 34, 267–273. doi:10.1038/ng1180
Mostoslavsky, R., Chua, K.F., Lombard, D.B., Pang, W.W., Fischer, M.R., Gellon, L., Liu, P., Mostoslavsky, G., Franco, S., Murphy, M.M., Mills, K.D., Patel, P., Hsu, J.T., Hong, A.L., Ford, E., Cheng, H.-L., Kennedy, C., Nunez, N., Bronson, R., Frendewey, D., Auerbach, W., Valenzuela, D., Karow, M., Hottiger, M.O., Hursting, S., Barrett, J.C., Guarente, L., Mulligan, R., Demple, B., Yancopoulos, G.D., Alt, F.W., 2006. Genomic instability and aging-like phenotype in the absence of mammalian SIRT6. Cell 124, 315–329. doi:10.1016/j.cell.2005.11.044
Muñoz-Espín, D., Serrano, M., 2014. Cellular senescence: from physiology to pathology. Nat. Rev. Mol. Cell Biol. 15, 482–496. doi:10.1038/nrm3823
Narita, Masashi, Narita, Masako, Krizhanovsky, V., Nuñez, S., Chicas, A., Hearn, S.A., Myers, M.P., Lowe, S.W., 2006. A novel role for high-mobility group a proteins in cellular senescence and heterochromatin formation. Cell 126, 503–514. doi:10.1016/j.cell.2006.05.052
Narita, Masashi, Nuñez, S., Heard, E., Narita, Masako, Lin, A.W., Hearn, S.A., Spector, D.L., Hannon, G.J., Lowe, S.W., 2003. Rb-mediated heterochromatin formation and silencing of E2F target genes during cellular senescence. Cell 113, 703–716.
Nguyen, S., Meletis, K., Fu, D., Jhaveri, S., Jaenisch, R., 2007. Ablation of de novo DNA methyltransferase Dnmt3a in the nervous system leads to neuromuscular defects and shortened lifespan. Dev. Dyn. Off. Publ. Am. Assoc. Anat. 236, 1663–1676. doi:10.1002/dvdy.21176
Oberdoerffer, P., Michan, S., McVay, M., Mostoslavsky, R., Vann, J., Park, S.-K., Hartlerode, A., Stegmuller, J., Hafner, A., Loerch, P., Wright, S.M., Mills, K.D., Bonni, A., Yankner, B.A., Scully, R., Prolla, T.A., Alt, F.W., Sinclair, D.A., 2008. SIRT1 redistribution on chromatin promotes genomic stability but alters gene expression during aging. Cell 135, 907–918. doi:10.1016/j.cell.2008.10.025
Ogryzko, V.V., Hirai, T.H., Russanova, V.R., Barbie, D.A., Howard, B.H., 1996. Human fibroblast commitment to a senescence-like state in response to histone deacetylase inhibitors is cell cycle dependent. Mol. Cell. Biol. 16, 5210–5218.
Ong, C.-T., Corces, V.G., 2011. Enhancer function: new insights into the regulation of tissue-specific gene expression. Nat. Rev. Genet. 12, 283–293. doi:10.1038/nrg2957
Ostuni, R., Piccolo, V., Barozzi, I., Polletti, S., Termanini, A., Bonifacio, S., Curina, A., Prosperini, E., Ghisletti, S., Natoli, G., 2013. Latent Enhancers Activated by Stimulation in Differentiated Cells. Cell 152, 157–171. doi:10.1016/j.cell.2012.12.018
O’Sullivan, Roderick J, Kubicek, S., Schreiber, S.L., Karlseder, J., 2010. Reduced histone biosynthesis and chromatin changes arising from a damage signal at telomeres. Nat. Struct. Mol. Biol. 17, 1218–1225. doi:10.1038/nsmb.1897

219
O’Sullivan, Roderick J., Kubicek, S., Schreiber, S.L., Karlseder, J., 2010. Reduced histone biosynthesis and chromatin changes arising from a damage signal at telomeres. Nat. Struct. Mol. Biol. 17, 1218–1225. doi:10.1038/nsmb.1897
Parrinello, S., Samper, E., Krtolica, A., Goldstein, J., Melov, S., Campisi, J., 2003. Oxygen sensitivity severely limits the replicative lifespan of murine fibroblasts. Nat. Cell Biol. 5, 741–747. doi:10.1038/ncb1024
Pegoraro, G., Kubben, N., Wickert, U., Göhler, H., Hoffmann, K., Misteli, T., 2009. Ageing-related chromatin defects through loss of the NURD complex. Nat. Cell Biol. 11, 1261–1267. doi:10.1038/ncb1971
Phillips-Cremins, J.E., Sauria, M.E.G., Sanyal, A., Gerasimova, T.I., Lajoie, B.R., Bell, J.S.K., Ong, C.-T., Hookway, T.A., Guo, C., Sun, Y., Bland, M.J., Wagstaff, W., Dalton, S., McDevitt, T.C., Sen, R., Dekker, J., Taylor, J., Corces, V.G., 2013. Architectural Protein Subclasses Shape 3D Organization of Genomes during Lineage Commitment. Cell 153, 1281–1295. doi:10.1016/j.cell.2013.04.053
Rada-Iglesias, A., Bajpai, R., Swigut, T., Brugmann, S.A., Flynn, R.A., Wysocka, J., 2011. A unique chromatin signature uncovers early developmental enhancers in humans. Nature 470, 279–283. doi:10.1038/nature09692
Rai, P., Plagov, A., Lan, X., Chandel, N., Singh, T., Lederman, R., Ayasolla, K.R., Mathieson, P.W., Saleem, M.A., Husain, M., Malhotra, A., Chander, P.N., Singhal, P.C., 2013. mTOR plays a critical role in p53-induced oxidative kidney cell injury in HIVAN. Am. J. Physiol. - Ren. Physiol. 305, F343–F354. doi:10.1152/ajprenal.00135.2013
Rai, T.S., Adams, P.D., 2012. Lessons from senescence: Chromatin maintenance in non-proliferating cells. Biochim. Biophys. Acta BBA - Gene Regul. Mech., Histone chaperones and Chromatin Assembly 1819, 322–331. doi:10.1016/j.bbagrm.2011.07.014
Rai, T.S., Cole, J.J., Nelson, D.M., Dikovskaya, D., Faller, W.J., Vizioli, M.G., Hewitt, R.N., Anannya, O., McBryan, T., Manoharan, I., Tuyn, J. van, Morrice, N., Pchelintsev, N.A., Ivanov, A., Brock, C., Drotar, M.E., Nixon, C., Clark, W., Sansom, O.J., Anderson, K.I., King, A., Blyth, K., Adams, P.D., 2014. HIRA orchestrates a dynamic chromatin landscape in senescence and is required for suppression of neoplasia. Genes Dev. 28, 2712–2725. doi:10.1101/gad.247528.114
Rai, T.S., Puri, A., McBryan, T., Hoffman, J., Tang, Y., Pchelintsev, N.A., van Tuyn, J., Marmorstein, R., Schultz, D.C., Adams, P.D., 2011. Human CABIN1 is a functional member of the human HIRA/UBN1/ASF1a histone H3.3 chaperone complex. Mol. Cell. Biol. 31, 4107–4118. doi:10.1128/MCB.05546-11
Raices, M., Maruyama, H., Dillin, A., Karlseder, J., 2005. Uncoupling of Longevity and Telomere Length in C. elegans. PLOS Genet. 1, e30. doi:10.1371/journal.pgen.0010030

220
Rakyan, V.K., Down, T.A., Maslau, S., Andrew, T., Yang, T.-P., Beyan, H., Whittaker, P., McCann, O.T., Finer, S., Valdes, A.M., Leslie, R.D., Deloukas, P., Spector, T.D., 2010. Human aging-associated DNA hypermethylation occurs preferentially at bivalent chromatin domains. Genome Res. 20, 434–439. doi:10.1101/gr.103101.109
Ramírez, J., Dege, C., Kutateladze, T.G., Hagman, J., 2012. MBD2 and multiple domains of CHD4 are required for transcriptional repression by Mi-2/NuRD complexes. Mol. Cell. Biol. 32, 5078–5088. doi:10.1128/MCB.00819-12
Ratnakumar, K., Duarte, L.F., LeRoy, G., Hasson, D., Smeets, D., Vardabasso, C., Bönisch, C., Zeng, T., Xiang, B., Zhang, D.Y., Li, H., Wang, X., Hake, S.B., Schermelleh, L., Garcia, B.A., Bernstein, E., 2012. ATRX-mediated chromatin association of histone variant macroH2A1 regulates α-globin expression. Genes Dev. 26, 433–438. doi:10.1101/gad.179416.111
Rayess, H., Wang, M.B., Srivatsan, E.S., 2012. Cellular senescence and tumor suppressor gene p16. Int. J. Cancer J. Int. Cancer 130, 1715–1725. doi:10.1002/ijc.27316
Reichert, N., Choukrallah, M.-A., Matthias, P., 2012. Multiple roles of class I HDACs in proliferation, differentiation, and development. Cell. Mol. Life Sci. CMLS 69, 2173–2187. doi:10.1007/s00018-012-0921-9
Reimann, M., Lee, S., Loddenkemper, C., Dörr, J.R., Tabor, V., Aichele, P., Stein, H., Dörken, B., Jenuwein, T., Schmitt, C.A., 2010. Tumor stroma-derived TGF-beta limits myc-driven lymphomagenesis via Suv39h1-dependent senescence. Cancer Cell 17, 262–272. doi:10.1016/j.ccr.2009.12.043
Reynolds, N., Salmon-Divon, M., Dvinge, H., Hynes-Allen, A., Balasooriya, G., Leaford, D., Behrens, A., Bertone, P., Hendrich, B., 2012. NuRD-mediated deacetylation of H3K27 facilitates recruitment of Polycomb Repressive Complex 2 to direct gene repression. EMBO J. 31, 593–605. doi:10.1038/emboj.2011.431
Robles, S.J., Adami, G.R., 1998. Agents that cause DNA double strand breaks lead to p16INK4a enrichment and the premature senescence of normal fibroblasts. Oncogene 16, 1113–1123. doi:10.1038/sj.onc.1201862
Rodier, F., Campisi, J., 2011. Four faces of cellular senescence. J. Cell Biol. 192, 547–556. doi:10.1083/jcb.201009094
Rodier, F., Kim, S.-H., Nijjar, T., Yaswen, P., Campisi, J., 2005. Cancer and aging: the importance of telomeres in genome maintenance. Int. J. Biochem. Cell Biol. 37, 977–990. doi:10.1016/j.biocel.2004.10.012
Rodier, F., Muñoz, D.P., Teachenor, R., Chu, V., Le, O., Bhaumik, D., Coppé, J.-P., Campeau, E., Beauséjour, C.M., Kim, S.-H., Davalos, A.R., Campisi, J., 2011. DNA-SCARS: distinct nuclear structures that sustain damage-induced senescence growth arrest and inflammatory cytokine secretion. J. Cell Sci. 124, 68–81. doi:10.1242/jcs.071340

221
Rogakou, E.P., Sekeri-Pataryas, K.E., 1999. Histone variants of H2A and H3 families are regulated during in vitro aging in the same manner as during differentiation. Exp. Gerontol. 34, 741–754.
Rogina, B., Helfand, S.L., 2004a. Sir2 mediates longevity in the fly through a pathway related to calorie restriction. Proc. Natl. Acad. Sci. U. S. A. 101, 15998–16003. doi:10.1073/pnas.0404184101
Rogina, B., Helfand, S.L., 2004b. Sir2 mediates longevity in the fly through a pathway related to calorie restriction. Proc. Natl. Acad. Sci. U. S. A. 101, 15998–16003. doi:10.1073/pnas.0404184101
Sadaie, M., Salama, R., Carroll, T., Tomimatsu, K., Chandra, T., Young, A.R.J., Narita, Masako, Pérez-Mancera, P.A., Bennett, D.C., Chong, H., Kimura, H., Narita, Masashi, 2013. Redistribution of the Lamin B1 genomic binding profile affects rearrangement of heterochromatic domains and SAHF formation during senescence. Genes Dev. 27, 1800–1808. doi:10.1101/gad.217281.113
Sahin, E., Depinho, R.A., 2010. Linking functional decline of telomeres, mitochondria and stem cells during ageing. Nature 464, 520–528. doi:10.1038/nature08982
Salama, R., Sadaie, M., Hoare, M., Narita, M., 2014. Cellular senescence and its effector programs. Genes Dev. 28, 99–114. doi:10.1101/gad.235184.113
Salminen, A., Kauppinen, A., Kaarniranta, K., 2012. Emerging role of NF-κB signaling in the induction of senescence-associated secretory phenotype (SASP). Cell. Signal. 24, 835–845. doi:10.1016/j.cellsig.2011.12.006
Sandmeier, J.J., Celic, I., Boeke, J.D., Smith, J.S., 2002. Telomeric and rDNA silencing in Saccharomyces cerevisiae are dependent on a nuclear NAD(+) salvage pathway. Genetics 160, 877–889.
Sarg, B., Koutzamani, E., Helliger, W., Rundquist, I., Lindner, H.H., 2002. Postsynthetic trimethylation of histone H4 at lysine 20 in mammalian tissues is associated with aging. J. Biol. Chem. 277, 39195–39201. doi:10.1074/jbc.M205166200
Savas, J.N., Toyama, B.H., Xu, T., Yates, J.R. 3rd, Hetzer, M.W., 2012. Extremely long-lived nuclear pore proteins in the rat brain. Science 335, 942. doi:10.1126/science.1217421
Scaffidi, P., Misteli, T., 2006. Lamin A-dependent nuclear defects in human aging. Science 312, 1059–1063. doi:10.1126/science.1127168
Schmidt, D., Schwalie, P.C., Ross-Innes, C.S., Hurtado, A., Brown, G.D., Carroll, J.S., Flicek, P., Odom, D.T., 2010. A CTCF-independent role for cohesin in tissue-specific transcription. Genome Res. 20, 578–588. doi:10.1101/gr.100479.109
Schotta, G., Sengupta, R., Kubicek, S., Malin, S., Kauer, M., Callén, E., Celeste, A., Pagani, M., Opravil, S., De La Rosa-Velazquez, I.A., Espejo, A., Bedford, M.T., Nussenzweig, A., Busslinger, M., Jenuwein, T., 2008. A chromatin-wide transition to

222
H4K20 monomethylation impairs genome integrity and programmed DNA rearrangements in the mouse. Genes Dev. 22, 2048–2061. doi:10.1101/gad.476008
Sedelnikova, O.A., Redon, C.E., Dickey, J.S., Nakamura, A.J., Georgakilas, A.G., Bonner, W.M., 2010. Role of oxidatively induced DNA lesions in human pathogenesis. Mutat. Res. 704, 152–159. doi:10.1016/j.mrrev.2009.12.005
Sen, P., Shah, P.P., Nativio, R., Berger, S.L., 2016. Epigenetic Mechanisms of Longevity and Aging. Cell 166, 822–839. doi:10.1016/j.cell.2016.07.050
Serrano, M., Lin, A.W., McCurrach, M.E., Beach, D., Lowe, S.W., 1997. Oncogenic ras provokes premature cell senescence associated with accumulation of p53 and p16INK4a. Cell 88, 593–602.
Shah, P.P., Donahue, G., Otte, G.L., Capell, B.C., Nelson, D.M., Cao, K., Aggarwala, V., Cruickshanks, H.A., Rai, T.S., McBryan, T., Gregory, B.D., Adams, P.D., Berger, S.L., 2013. Lamin B1 depletion in senescent cells triggers large-scale changes in gene expression and the chromatin landscape. Genes Dev. 27, 1787–1799. doi:10.1101/gad.223834.113
Sharp, A.J., Cheng, Z., Eichler, E.E., 2006. Structural variation of the human genome. Annu. Rev. Genomics Hum. Genet. 7, 407–442. doi:10.1146/annurev.genom.7.080505.115618
Shumaker, D.K., Dechat, T., Kohlmaier, A., Adam, S.A., Bozovsky, M.R., Erdos, M.R., Eriksson, M., Goldman, A.E., Khuon, S., Collins, F.S., Jenuwein, T., Goldman, R.D., 2006. Mutant nuclear lamin A leads to progressive alterations of epigenetic control in premature aging. Proc. Natl. Acad. Sci. U. S. A. 103, 8703–8708. doi:10.1073/pnas.0602569103
Sinha, M., Jang, Y.C., Oh, J., Khong, D., Wu, E.Y., Manohar, R., Miller, C., Regalado, S.G., Loffredo, F.S., Pancoast, J.R., Hirshman, M.F., Lebowitz, J., Shadrach, J.L., Cerletti, M., Kim, M.-J., Serwold, T., Goodyear, L.J., Rosner, B., Lee, R.T., Wagers, A.J., 2014. Restoring Systemic GDF11 Levels Reverses Age-Related Dysfunction in Mouse Skeletal Muscle. Science 344, 649–652. doi:10.1126/science.1251152
Spitz, F., Furlong, E.E.M., 2012. Transcription factors: from enhancer binding to developmental control. Nat. Rev. Genet. 13, 613–626. doi:10.1038/nrg3207
Squillaro, T., Alessio, N., Cipollaro, M., Renieri, A., Giordano, A., Galderisi, U., 2010. Partial silencing of methyl cytosine protein binding 2 (MECP2) in mesenchymal stem cells induces senescence with an increase in damaged DNA. FASEB J. Off. Publ. Fed. Am. Soc. Exp. Biol. 24, 1593–1603. doi:10.1096/fj.09-143057
Stewart, S.A., Weinberg, R.A., 2006. Telomeres: cancer to human aging. Annu. Rev. Cell Dev. Biol. 22, 531–557. doi:10.1146/annurev.cellbio.22.010305.104518
Stewart, S.A., Weinberg, R.A., 2002. Senescence: does it all happen at the ends? Oncogene 21, 627–630. doi:10.1038/sj.onc.1205062

223
Subramanian, A., Tamayo, P., Mootha, V.K., Mukherjee, S., Ebert, B.L., Gillette, M.A., Paulovich, A., Pomeroy, S.L., Golub, T.R., Lander, E.S., Mesirov, J.P., 2005. Gene set enrichment analysis: A knowledge-based approach for interpreting genome-wide expression profiles. Proc. Natl. Acad. Sci. 102, 15545–15550. doi:10.1073/pnas.0506580102
Sulli, G., Di Micco, R., d’Adda di Fagagna, F., 2012. Crosstalk between chromatin state and DNA damage response in cellular senescence and cancer. Nat. Rev. Cancer 12, 709–720. doi:10.1038/nrc3344
Takahashi, A., Imai, Y., Yamakoshi, K., Kuninaka, S., Ohtani, N., Yoshimoto, S., Hori, S., Tachibana, M., Anderton, E., Takeuchi, T., Shinkai, Y., Peters, G., Saya, H., Hara, E., 2012. DNA damage signaling triggers degradation of histone methyltransferases through APC/C(Cdh1) in senescent cells. Mol. Cell 45, 123–131. doi:10.1016/j.molcel.2011.10.018
Tasdemir, N., Banito, A., Roe, J.-S., Alonso-Curbelo, D., Camiolo, M., Tschaharganeh, D.F., Huang, C.-H., Aksoy, O., Bolden, J.E., Chen, C.-C., Fennell, M., Thapar, V., Chicas, A., Vakoc, C.R., Lowe, S.W., 2016. BRD4 connects enhancer remodeling to senescence immune surveillance. Cancer Discov. CD-16-0217. doi:10.1158/2159-8290.CD-16-0217
Thu, K.L., Vucic, E.A., Kennett, J.Y., Heryet, C., Brown, C.J., Lam, W.L., Wilson, I.M., 2009. Methylated DNA Immunoprecipitation. J. Vis. Exp. JoVE. doi:10.3791/935
Timinszky, G., Till, S., Hassa, P.O., Hothorn, M., Kustatscher, G., Nijmeijer, B., Colombelli, J., Altmeyer, M., Stelzer, E.H.K., Scheffzek, K., Hottiger, M.O., Ladurner, A.G., 2009. A macrodomain-containing histone rearranges chromatin upon sensing PARP1 activation. Nat. Struct. Mol. Biol. 16, 923–929. doi:10.1038/nsmb.1664
Tissenbaum, H A, Guarente, L., 2001. Increased dosage of a sir-2 gene extends lifespan in Caenorhabditis elegans. Nature 410, 227–230. doi:10.1038/35065638
Tissenbaum, Heidi A., Guarente, L., 2001. Increased dosage of a sir-2 gene extends lifespan in Caenorhabditis elegans. Nature 410, 227–230. doi:10.1038/35065638
van de Werken, H.J.G., Landan, G., Holwerda, S.J.B., Hoichman, M., Klous, P., Chachik, R., Splinter, E., Valdes-Quezada, C., Öz, Y., Bouwman, B.A.M., Verstegen, M.J.A.M., de Wit, E., Tanay, A., de Laat, W., 2012. Robust 4C-seq data analysis to screen for regulatory DNA interactions. Nat. Methods 9, 969–972. doi:10.1038/nmeth.2173
van Deursen, J.M., 2014. The role of senescent cells in ageing. Nature 509, 439–446. doi:10.1038/nature13193
van Oevelen, C., Collombet, S., Vicent, G., Hoogenkamp, M., Lepoivre, C., Badeaux, A., Bussmann, L., Sardina, J.L., Thieffry, D., Beato, M., Shi, Y., Bonifer, C., Graf, T., 2015. C/EBPα Activates Pre-existing and De Novo Macrophage Enhancers during
224
Induced Pre-B Cell Transdifferentiation and Myelopoiesis. Stem Cell Rep. 5, 232–247. doi:10.1016/j.stemcr.2015.06.007
Vaquero, A., Scher, M., Lee, D., Erdjument-Bromage, H., Tempst, P., Reinberg, D., 2004. Human SirT1 interacts with histone H1 and promotes formation of facultative heterochromatin. Mol. Cell 16, 93–105. doi:10.1016/j.molcel.2004.08.031
Vaquero, A., Sternglanz, R., Reinberg, D., 2007. NAD+-dependent deacetylation of H4 lysine 16 by class III HDACs. Oncogene 26, 5505–5520. doi:10.1038/sj.onc.1210617
Verdone, L., Agricola, E., Caserta, M., Di Mauro, E., 2006. Histone acetylation in gene regulation. Brief. Funct. Genomic. Proteomic. 5, 209–221. doi:10.1093/bfgp/ell028
Vergel, M., Marin, J.J., Estevez, P., Carnero, A., 2010. Cellular senescence as a target in cancer control. J. Aging Res. 2011, 725365. doi:10.4061/2011/725365
Vernier, M., Bourdeau, V., Gaumont-Leclerc, M.-F., Moiseeva, O., Bégin, V., Saad, F., Mes-Masson, A.-M., Ferbeyre, G., 2011. Regulation of E2Fs and senescence by PML nuclear bodies. Genes Dev. 25, 41–50. doi:10.1101/gad.1975111
Viré, E., Brenner, C., Deplus, R., Blanchon, L., Fraga, M., Didelot, C., Morey, L., Van Eynde, A., Bernard, D., Vanderwinden, J.-M., Bollen, M., Esteller, M., Di Croce, L., de Launoit, Y., Fuks, F., 2006. The Polycomb group protein EZH2 directly controls DNA methylation. Nature 439, 871–874. doi:10.1038/nature04431
Wang, A., Yue, F., Li, Y., Xie, R., Harper, T., Patel, N.A., Muth, K., Palmer, J., Qiu, Y., Wang, J., Lam, D.K., Raum, J.C., Stoffers, D.A., Ren, B., Sander, M., 2015. Epigenetic Priming of Enhancers Predicts Developmental Competence of hESC-Derived Endodermal Lineage Intermediates. Cell Stem Cell 16, 386–399. doi:10.1016/j.stem.2015.02.013
Wang, J., Geesman, G.J., Hostikka, S.L., Atallah, M., Blackwell, B., Lee, E., Cook, P.J., Pasaniuc, B., Shariat, G., Halperin, E., Dobke, M., Rosenfeld, M.G., Jordan, I.K., Lunyak, V.V., 2011. Inhibition of activated pericentromeric SINE/Alu repeat transcription in senescent human adult stem cells reinstates self-renewal. Cell Cycle Georget. Tex 10, 3016–3030.
Wang, L., Tang, Y., Cole, P.A., Marmorstein, R., 2008. Structure and chemistry of the p300/CBP and Rtt109 histone acetyltransferases: implications for histone acetyltransferase evolution and function. Curr. Opin. Struct. Biol. 18, 741–747. doi:10.1016/j.sbi.2008.09.004
Wang, R.-H., Sengupta, K., Li, C., Kim, H.-S., Cao, L., Xiao, C., Kim, S., Xu, X., Zheng, Y., Chilton, B., Jia, R., Zheng, Z.-M., Appella, E., Wang, X.W., Ried, T., Deng, C.-X., 2008. Impaired DNA damage response, genome instability, and tumorigenesis in SIRT1 mutant mice. Cancer Cell 14, 312–323. doi:10.1016/j.ccr.2008.09.001
Webb, A.E., Pollina, E.A., Vierbuchen, T., Urbán, N., Ucar, D., Leeman, D.S., Martynoga, B., Sewak, M., Rando, T.A., Guillemot, F., Wernig, M., Brunet, A., 2013. FOXO3 Shares

225
Common Targets with ASCL1 Genome-wide and Inhibits ASCL1-Dependent Neurogenesis. Cell Rep. 4, 477–491. doi:10.1016/j.celrep.2013.06.035
Weiss, T., Hergeth, S., Zeissler, U., Izzo, A., Tropberger, P., Zee, B.M., Dundr, M., Garcia, B.A., Daujat, S., Schneider, R., 2010. Histone H1 variant-specific lysine methylation by G9a/KMT1C and Glp1/KMT1D. Epigenetics Chromatin 3, 7. doi:10.1186/1756-8935-3-7
Werken, H.J.G. van de, Landan, G., Holwerda, S.J.B., Hoichman, M., Klous, P., Chachik, R., Splinter, E., Valdes-Quezada, C., Öz, Y., Bouwman, B.A.M., Verstegen, M.J.A.M., Wit, E. de, Tanay, A., Laat, W. de, 2012. Robust 4C-seq data analysis to screen for regulatory DNA interactions. Nat. Methods 9, 969–972. doi:10.1038/nmeth.2173
Whyte, W.A., Orlando, D.A., Hnisz, D., Abraham, B.J., Lin, C.Y., Kagey, M.H., Rahl, P.B., Lee, T.I., Young, R.A., 2013. Master Transcription Factors and Mediator Establish Super-Enhancers at Key Cell Identity Genes. Cell 153, 307–319. doi:10.1016/j.cell.2013.03.035
Will, B., Vogler, T.O., Narayanagari, S., Bartholdy, B., Todorova, T.I., da Silva Ferreira, M., Chen, J., Yu, Y., Mayer, J., Barreyro, L., Carvajal, L., Neriah, D.B., Roth, M., van Oers, J., Schaetzlein, S., McMahon, C., Edelmann, W., Verma, A., Steidl, U., 2015. Minimal PU.1 reduction induces a preleukemic state and promotes development of acute myeloid leukemia. Nat. Med. 21, 1172–1181. doi:10.1038/nm.3936
Wilson, V.L., Jones, P.A., 1983. DNA methylation decreases in aging but not in immortal cells. Science 220, 1055–1057.
Wu, W., Morrissey, C.S., Keller, C.A., Mishra, T., Pimkin, M., Blobel, G.A., Weiss, M.J., Hardison, R.C., 2014. Dynamic shifts in occupancy by TAL1 are guided by GATA factors and drive large-scale reprogramming of gene expression during hematopoiesis. Genome Res. 24, 1945–1962. doi:10.1101/gr.164830.113
Wyrick, J.J., Holstege, F.C., Jennings, E.G., Causton, H.C., Shore, D., Grunstein, M., Lander, E.S., Young, R.A., 1999. Chromosomal landscape of nucleosome-dependent gene expression and silencing in yeast. Nature 402, 418–421. doi:10.1038/46567
Xu, J., Pope, S.D., Jazirehi, A.R., Attema, J.L., Papathanasiou, P., Watts, J.A., Zaret, K.S., Weissman, I.L., Smale, S.T., 2007. Pioneer factor interactions and unmethylated CpG dinucleotides mark silent tissue-specific enhancers in embryonic stem cells. Proc. Natl. Acad. Sci. 104, 12377–12382. doi:10.1073/pnas.0704579104
Xu, X., Hoang, S., Mayo, M.W., Bekiranov, S., 2010. Application of machine learning methods to histone methylation ChIP-Seq data reveals H4R3me2 globally represses gene expression. BMC Bioinformatics 11, 396. doi:10.1186/1471-2105-11-396
Ye, X., Zerlanko, B., Zhang, R., Somaiah, N., Lipinski, M., Salomoni, P., Adams, P.D., 2007. Definition of pRB- and p53-dependent and -independent steps in HIRA/ASF1a-mediated formation of senescence-associated heterochromatin foci. Mol. Cell. Biol. 27, 2452–2465. doi:10.1128/MCB.01592-06

226
Ying, Q.-L., Stavridis, M., Griffiths, D., Li, M., Smith, A., 2003. Conversion of embryonic stem cells into neuroectodermal precursors in adherent monoculture. Nat. Biotechnol. 21, 183–186. doi:10.1038/nbt780
Ying, Q.-L., Wray, J., Nichols, J., Batlle-Morera, L., Doble, B., Woodgett, J., Cohen, P., Smith, A., 2008. The ground state of embryonic stem cell self-renewal. Nature 453, 519–523. doi:10.1038/nature06968
Young, M.D., Willson, T.A., Wakefield, M.J., Trounson, E., Hilton, D.J., Blewitt, M.E., Oshlack, A., Majewski, I.J., 2011. ChIP-seq analysis reveals distinct H3K27me3 profiles that correlate with transcriptional activity. Nucleic Acids Res. 39, 7415–7427. doi:10.1093/nar/gkr416
Zaret, K.S., Carroll, J.S., 2011. Pioneer transcription factors: establishing competence for gene expression. Genes Dev. 25, 2227–2241. doi:10.1101/gad.176826.111
Zhang, R., Chen, W., Adams, P.D., 2007. Molecular Dissection of Formation of Senescence-Associated Heterochromatin Foci. Mol. Cell. Biol. 27, 2343–2358. doi:10.1128/MCB.02019-06
Zhang, R., Poustovoitov, M.V., Ye, X., Santos, H.A., Chen, W., Daganzo, S.M., Erzberger, J.P., Serebriiskii, I.G., Canutescu, A.A., Dunbrack, R.L., Pehrson, J.R., Berger, J.M., Kaufman, P.D., Adams, P.D., 2005. Formation of MacroH2A-containing senescence-associated heterochromatin foci and senescence driven by ASF1a and HIRA. Dev. Cell 8, 19–30. doi:10.1016/j.devcel.2004.10.019
Zhuang, L., Pound, J.D., Willems, J.J.L.P., Taylor, A.H., Forrester, L.M., Gregory, C.D., 2012. Pure populations of murine macrophages from cultured embryonic stem cells. Application to studies of chemotaxis and apoptotic cell clearance. J. Immunol. Methods 385, 1–14. doi:10.1016/j.jim.2012.06.008