Effect of cryogenic freezing on the rheological and calorimetric ...
Upload
independentCategory
view
0download
0
Antarctic Science 3 (4): 379-388 (7997)
Limnological properties of Antarctic ponds during winter freezing S. SCHMIDT', W. MOSKALl, S. J. DE MORAZ, C. HOWARD-WILLIAMSS and W. F. VINCENP:
'Greenpeace Antarctic Expedition, Private Bag, Auckland, New Zealand 2Chemistry Department, University of Auckland, New Zealand
'Taupo Research Laboratory, DSIR Marine & Freshwater, Taupo, New Zealand 'Permanent address: Dkpartement de Biologie, Universitd Laval, Qukbec GIK 7P4, Canada
Abstract: Two shallow ponds at Cape Evans, Ross Island, were sampled at 1-2 weekintervals, during winter freezing throughout the winter and during the subsequent melt period, to examine the physical and chemical conditions imposed on the biota during the year. Liquid water was first detected at the base of the ponds in late December. During the main summer melt period conductivities were less than 10 mS cm-' with maximum daily temperatures around 5°C. The bottom waters became increasingly saline during freezing and water temperatures decreased below 0°C; by June the remaining water overlying the sediments had conductivities >150 mS cm" and temperatures of -13°C. Calcium carbonate, then sodium sulphate precipitated out of solution during early freezing. The dominant nitrogen species was dissolved organic-N which reached 12 g m-3 in Pond 1 just prior to final freeze up. The organic and inorganic forms of nitrogen and dissolved reactive phosphorus increased with increasing conductivity in the ponds. The behaviour of particulate-N and particulate-P mirrored that of chlorophyll a with a peak in March-April and a second higher peak just before final freeze-up. This study provides clear evidence that organisms which persist throughout the year in Antarctic coastal ponds must be capable of surviving much more severe osmotic, pH, temperature and redox conditions than those measured during the summer melt. Deoxygenation, pH decline and H,S production, however, point to continued respiratory activity well into the dark winter months.
Received 18 October 1990, accepted 26 February 1991
Key words: algae, carbonate, chlorophyll a, cyanobacteria, freeze-thaw, nitrogen, nutrients, phosphorus, sulphate
Introduction
Coastalponds areubiquitously distributed around the margins of Antarctica and are a major habitat for freshwater biota (e.g. Heywood 1984, Vincent 1987, Wynn-Williams 1989). Ponds are particularly abundant in the ice free coastal areas of the McMurdo Sound region (Broady 1989) including Ross Island. The earliest studies on these waters are those of Murray (1910), who focussed on the tolerance of some of the microfauna to freezing and thawing and to salinity changes associated with the winter freeze up of the ponds. One of the unique aspects of Murray's work was that he dug down through the 4 m thick ice to sample the bed of a pond in mid- winter. Such a study has not been repeated.
Although a broad range of limnological information is now available for Antarctic ponds, all of the studies in the Ross Sea sector subsequent to Murray's (1910) work have been confined to brief summer melt periods (Goldman etal. 1972, Spurr 1975, Vincent & Vincent 1982, Broady 1989, Howard- Williams etal. 1989). At this time of year we may expect the waters to be partially or completely ice-free, and at their warmest temperatures and lowest salinities (cf. Goldman et al. 1982). Organisms inhabiting these ponds include dense benthic algal and cyanobacterial felts, various other
groups of bacteria, a phytoplankton community of diatoms and flagellates, and a microfaunal association of tardigrades, nematodes, protozoa and rotifers (Vincent 1987). However, the chemical and physical conditions which these organisms experience during the freeze up and subsequent thaw have not been clearly documented.
A background to the summer limnology of the ponds on Ross Island can be found in Goldman et al. (1972). Primary production by the benthic felts was up to 100 times greater than recorded for the planktonic community. Primary productivity increased through summer to mid-January and then decreased, following the seasonal cycle of solar radiation and water temperature rather than changes in nutrients or salinity. However there was some evidence from this data set that the bottom of the ponds had slightly higher salinities and warmer temperatures than the overlying water column. We suspected that the plankton and bottom dwelling organisms might be subjected to marked extremes at other times of the year.
The present study aimed to measure the physical and chemical conditions imposed on biological communities in this Antarctic habitat duringwinter freezing. Our data reveal large scale changes in pH, salinity, nutrients and temperature that are likely to exert a major control on the species composition and activity of the coastal pond biota.
379
380 S. SCHMIDT eta/
Methods
Study sites
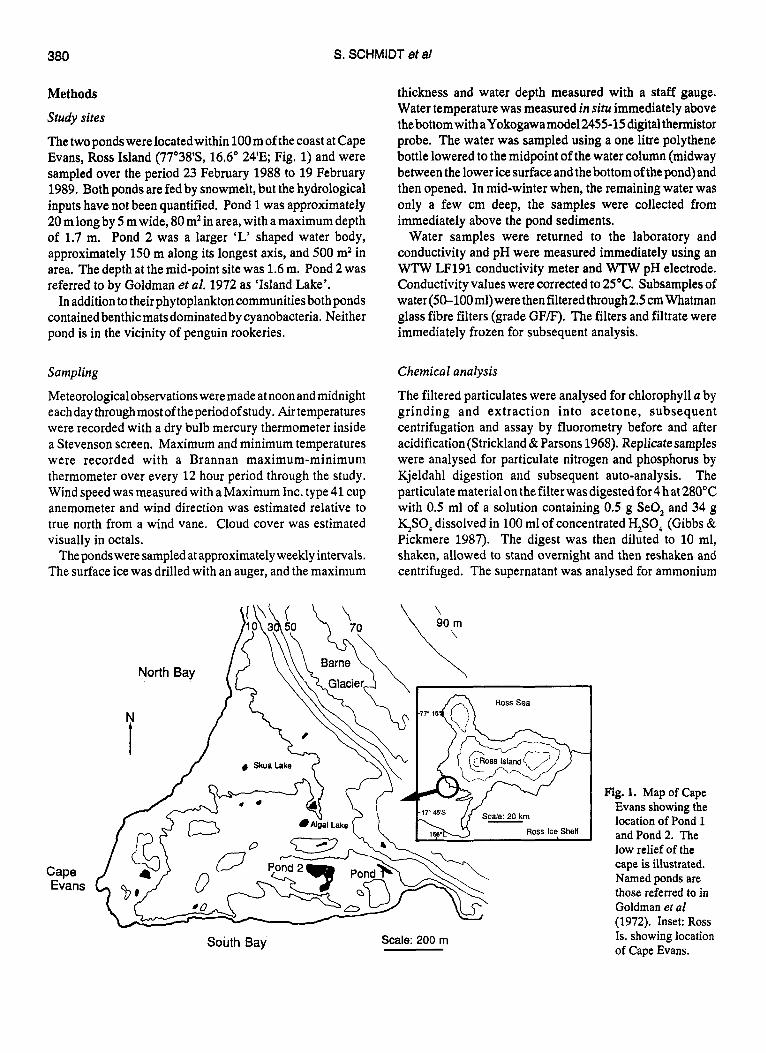
The two ponds were located within 100 mof the coast at Cape Evans, Ross Island (77"38'S, 16.6" 24'E; Fig. 1) and were sampled over the period 23 February 1988 to 19 February 1989. Both ponds are fed by snowmelt, but the hydrological inputs have not been quantified. Pond 1 was approximately 20 m long by 5 m wide, 80 mz in area, with a maximum depth of 1.7 m. Pond 2 was a larger 'L' shaped water body, approximately 150 m along its longest axis, and 500 m2 in area. The depth at the mid-point site was 1.6 m. Pond 2 was referred to by Goldman er al. 1972 as 'Island Lake'.
In addition to their phytoplankton communities both ponds contained benthicmats dominated by cyanobacteria. Neither pond is in the vicinity of penguin rookeries.
Sampling
Meteorological observations were made at noon and midnight eachday throughmost ofthe periodofstudy. Air temperatures were recorded with a dry bulb mercury thermometer inside a Stevenson screen. Maximum and minimum temperatures were recorded with a Brannan maximum-minimum thermometer over every 12 hour period through the study. Wind speed was measured with a Maximum Inc. type 41 cup anemometer and wind direction was estimated relative to true north from a wind vane. Cloud cover was estimated visually in octals.
The ponds were sampled at approximately weekly intervals. The surface ice was drilled with an auger, and the maximum
thickness and water depth measured with a staff gauge. Water temperature was measured in situ immediately above the bottomwith aYokogawamodel2455-15 digital thermistor probe. The water was sampled using a one litre polythene bottle lowered to the midpoint of the water column (midway between the lower ice surface and the bottomof the pond) and then opened. In mid-winter when, the remaining water was only a few cm deep, the samples were collected from immediately above the pond sediments.
Water samples were returned to the laboratory and conductivity and pH were measured immediately using an WTW LF191 conductivity meter and WTW pH electrode. Conductivity values were corrected to 25°C. Subsamples of water(50-100ml) were then filtered through2.5 cm Whatman glass fibre filters (grade GF/F). The filters and filtrate were immediately frozen for subsequent analysis.
Chemical analysis
The filtered particulates were analysed for chlorophyll a by grinding and extraction into acetone, subsequent centrifugation and assay by fluorometry before and after acidification (Strickland & Parsons 1968). Replicate samples were analysed for particulate nitrogen and phosphorus by Kjeldahl digestion and subsequent auto-analysis. The particulate material on the filter was digested for 4 hat 280°C with 0.5 ml of a solution containing 0.5 g SeO, and 34 g $SO, dissolved in 100 ml of concentrated H,SO, (Gibbs & Pickmere 1987). The digest was then diluted to 10 ml, shaken, allowed to stand overnight and then reshaken and centrifuged. The supernatant was analysed for ammonium
Fig. 1. Map of Cape Evans showing the location of Pond 1 and Pond 2. The low relief of the cape is illustrated. Named ponds are those referred to in Goldman et a1 (1972). Inset: Ross Is. showing location of Cape Evans.
Cape Evans
South Bay Scale: 200 rn
LIMNOLOGICAL PROPERTIES OF FROZEN PONDS 381
(Searle 1975) and for phosphorus (Downes 1978). The pond water filtrate was subsequently analysed for
dissolved nitrogen and phosphorus components. Dissolved reactive phosphorus (DRP) was analysed by the autoanalytical method of Downes (1978) modified by eliminating the metabisulphitehhiosulphate reductant. Total dissolved nitrogen (TDN) was measured by persulphate oxidation of the filtered sample to nitrate and nitrite (Solorzano & Sharp 1980), and dissolved organic-N (DON) was then calculated as this total minus the total dissolved inorganic nitrogen that was in the undigested sample. Nitrate plus nitrite nitrogen was determined using anautomatedcadmiumcolumnmethod with Tris-ammonium chloride buffer modified from Nydahl (1976). Ammonium was measured by an automated version of the phenol hypochlorite method of Solorzano (1969). The reaction mixture contained 6.5% trisodium citrate, 0.08% NaOH, 0.0056% sodium cyanurate, 0.24% phenol and 0.03% sodium nitroprusside. The citrate, NaOH and cyanurate were combined and added as the first reagent followed separately by the phenol and the nitroprusside, each dissolved in deionised water. The mixture was heated to 50°C to accelerate colour development, which was measured at 630nm. Urea was analysed by the diacetyl monoxime method of Aminot & Kerouel(l982); the reaction mixture was heated to 75°C and the resulting colour was measured at 540 nm.
All major ion analyses were determined using an ion- suppressed Dionex 2000i SP ion chromatograph. Peak integration was carried out with a Hewlett Packard HP 3396 Integrator. In all cases, sample aliquot volumes were 20pl. Cations were resolved using isocratic elution on the Dionex Fast Sep Cation I and Fast Sep Cation I1 column pair with no guard column present. The eluent was 16 mmol 1" HCl containing 0.24 mmol1-' DAP.HC1 (diaminopropionic acid monohydrochloride) and the flow rate was 1.7 ml min". The regenerant for the cation micromembrane suppressor was 28 mmol 1.' TMAOH (tetramethylammonium hydroxide) at a flow rate of 5.5 ml min-'. Anions were analysed following isocratic elution on a Dionex AS 4A column with an AG 4A guard column. The eluent consisted of 22.5 mmol1-' NaOH (carbonate-free) at a flow rate of 1.8 ml min.'. The regenerant for the anion micromembrane suppressor was 12.5 mmol 1-' H,SO, at a flow rate of 2.8 ml m i d .
Results
Meteorological conditions
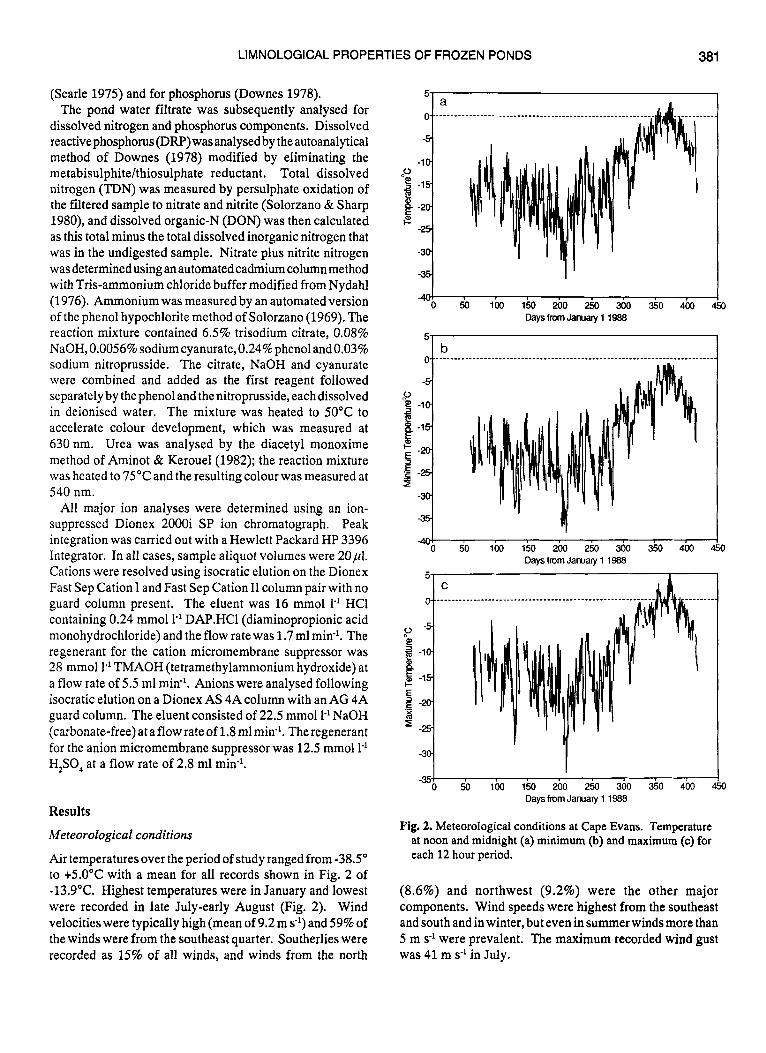
Air temperatures over the period of study ranged from -38.5" to +5.0°C with a mean for all records shown in Fig. 2 of -13.9"C. Highest temperatures were in January and lowest were recorded in late July-early August (Fig. 2). Wind velocities were typically high (mean of 9.2 m SO') and 59% of the winds were from the southeast quarter. Southerlies were recorded as 15% of all winds, and winds from the north
"b 50 100 150 200 250 300 350 400 1
Days from January 1 1988
-4Ob 50 100 150 200 250 300 350 400 1
Days from January 1 1988
51 1
I -30
b 100 150 200 250 300 350 400 Days from January 1 1988
Fig. 2. Meteorological conditions at Cape Evans. Temperature at noon and midnight (a) minimum @) and maximum (c) for each 12 hour period.
(8.6%) and northwest (9.2%) were the other major components. Wind speeds were highest from the southeast and south and in winter, but even in summer winds more than 5 m s-' were prevalent. The maximum recorded wind gust was 41 m s-' in July.
382 S. SCHMIDT eta/
9.5
9 0
8.5
?i 8.0-
7.5
7.0.
Cloud cover was highly variable throughout the year, and averaged 5/8 cover with no clear seasonal trend. Just over half (52%) of all records had 6/8 cloud or greater, and relatively clear skies (O-2/8 cover) comprised only 29% of the data record.
Water column properties
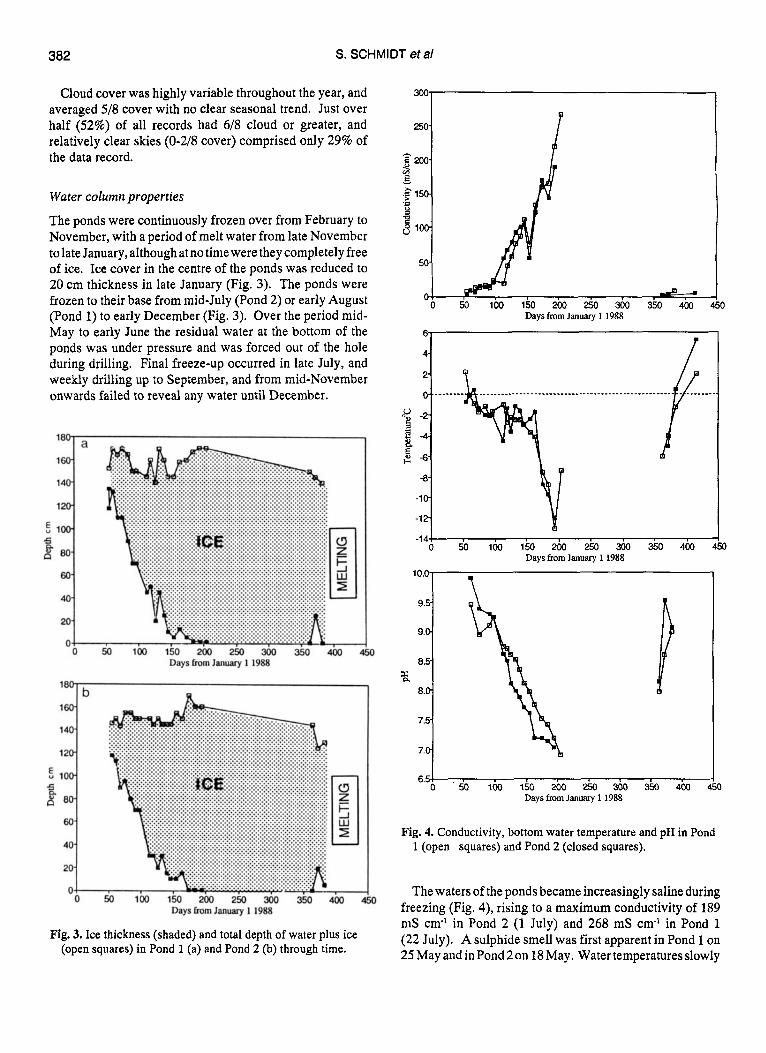
The ponds were continuously frozen over from February to November, with a period of melt water from late November to late January, although at no time were they completely free of ice. Ice cover in the centre of the ponds was reduced to 20 cm thickness in late January (Fig. 3). The ponds were frozen to their base from midJuly (Pond 2) or early August (Pond 1) to early December (Fig. 3). Over the period mid- May to early June the residual water at the bottom of the ponds was under pressure and was forced out of the hole during drilling. Final freeze-up occurred in late July, and weekly drilling up to September, and from mid-November onwards failed to reveal any water until December.
Fig. 3. Ice thickness (shaded) and total depth of water plus ice (open squares) in Pond 1 (a) and Pond 2 (b) through time.
0 L 0
Days from January 1 1988
rrp---. 250 300 350 400 0
-1 4-1 I 0 50 lh 150 200 w) 300 350 400 450
Days from January 1 1988
i I
6.50 50 100 150 200 250 300 350 400 Days from January 1 1988
Fig. 4. Conductivity, bottom water temperature and pH in Pond 1 (open squares) and Pond 2 (closed squares).
io
The waters of the ponds became increasingly saline during freezing (Fig. 4), rising to a maximum conductivity of 189 mS cm-I in Pond 2 (1 July) and 268 mS cm-l in Pond 1 (22 July). A sulphide smell was first apparent in Pond 1 on 25 May and in Pond 2 on 18 May. Water temperatures slowly

LIMNOLOGICAL PROPERTIES OF FROZEN PONDS 383
0 50 100 150 200 250 300 350 400 450 Days from Jan 1,1988 Days from Jan 1,1988
i0 Days from Jan 1.1988 Days from Jan 1,1988
Fig. 5. Cation concentrations in Pond 1 (open squares) and Pond 2 (closed squares).
declined over the period February to early June, and then fell sharply to July minima of -12 to -13°C in both ponds. These extremely low temperatures coincided with high salinities. The pH declined continuously from c. pH 10 in February to pH 7 in late July.
The first date of liquid water at the base of the ice at the drill sites was 20 December (pond 1) and 28 December(pond 2), although some melt was observed around the edges of the ponds c. 20 days prior to this. The first signs of free water were recorded in shallow areas and around mats of algae trapped in pond ice. There was not adequate water for full sampling at the mid-pond site in December, but in situ measurements indicated that this earliest meltwater had a temperature well below O"C, and a conductivity in the range 40-100 mS cm'l. Melt-out in the period late December to February was associated with much lower conductivities and water temperatures near and above 0°C and much higher pH values than during the late freezing period.
Major ions
The ionic balance of both ponds was dominated by Na' and
C1- throughout the year (Figs. 5 & 6). The rise in conductivity duringwinter in Pond 1 was associated with an increase of Na' to a maximum of 5.2 x lo4 g m" and C1-to 1.1 x-lOs g m", withlesserincreasesofMgZ'(to9.x103 gm'3),K+(4.1x lo3 g m") and SO:- (to 1.7 x lo4 g m"). Pond 2 showed a similar trend through time, with slightly lesser maximum concentrations. Most of the ions increased steadily during freezing, but SO: peaked in May (Pond 2) or June (Pond 1) and then fell steadily. This distinctive behaviour of SO: is further emphasized by a plot of this anion and C1- against conductivity: chloride more or less tracked the general increase in conductivity while SO: rose to amaximumwhen the conductivity was about 100 mS cm-', then declined (Fig. 7). There was a general downward trend in the Na:Cl weight ratio with increasing conductivity, implying the precipitation of NaSO,. 10H,O from the pondwaters during winter freeze-up (Fig. 8). In Pond 2, and to a lesser extent in Pond 1, the Ca:Mg weight ratio followed a decreasing exponential relationship with conductivity, with most of the decrease over the range 0-50 mS cm-' (Fig. 9). A Gibbs plot (Gibbs 1970) of total ion concentrations versus the weight ratioNa/(Ca+Na)showsthat thewaterscluster intheevaporite

384 S. SCHMIDT eta/
1 '4
Fig. 6. Anion concentrations in Pond 1 (open squares) and Pond 2 (closed squares).
I=" I I
loo{
I
I 0
0
I
I D
I
Fig. 7. Chloride (open squares = Pond 1, closed squares = Pond 2) and sulphate (open circles = Pond 1, closed circles = Pond 2) concentrations as a function of conductivity.
1.1 I 7: 1.
0.51
0.4 ! I 0 50 100 150 200 250 300
Conductivity (mS/cm)
Fig. 8. The Na+ to C1- weight ratio as a function of conductivity. Pond 1 = open squares. Pond 2 = closed squares.
50 100 150 200 250 300 0.2-1 0
Conductivity (mS/cm)
Fig. 9. The Ca2+ to Mg2+ weight ratio as a function of conductivity. Pond 1 = open squares. Pond 2 = closed squares.
region (Fig. 10) reflecting the concentration processes operating in these ponds. The highest values lie above the global envelope described by Gibbs (1970), indicating the extreme chemical conditions during freezing.
Nutrient concentrations
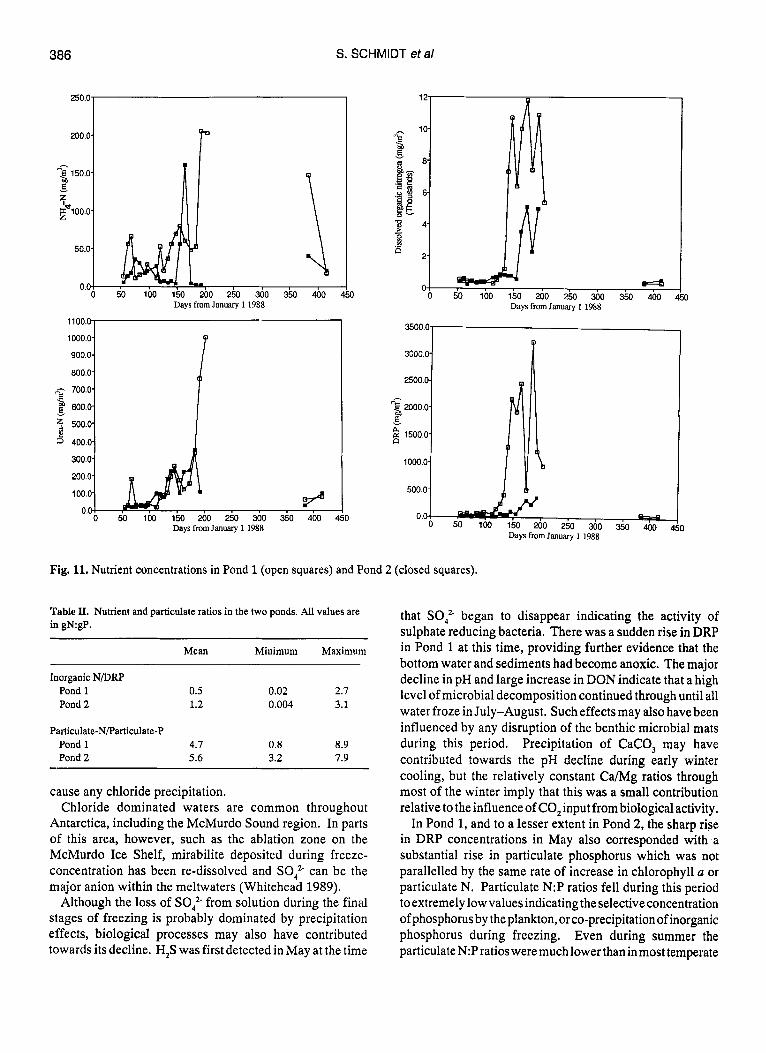
Nutrients were in higher concentration in Pond 1 throughout the year (Table I, Fig. 11). The dominant nitrogen component in both ponds was DON. Urea nitrogen was always at detectable concentrations but constituted less than 10% of the DON. Nitrate remained low or undetectable in both ponds throughout the year. All of the other dissolved nitrogen species in Pond 1 rose in concentration during winter freezing. Pond 2 showed a much less regular change in nitrogen concentration, but as in the other pond the highest

LIMNOLOGICAL PROPERTIES OF FROZEN PONDS 385
100000 h
1 0.0 0.1 0.2 0.3 0.4 0.5 0.6 0.7 0.8 0.9 1.0
Na/(Ca+Na) d g
Fig. 10. Gibbs plot of total ion concentrations versus the weight ratio Na+/(Ca*+ + Na+).
DON, NH, and ureavalues occurred in the middle of the year during the final stages of freezing. DRP rose to very high concentrations in Pond 1 with a similar trend but lower values in Pond 2. In both ponds the N as well as P concentrations were low in the waters sampled during the melt period at the end of the study. The ratio of dissolved inorganic N to DRP was extremely low, with all values around 3 or less, often much less (Table 11).
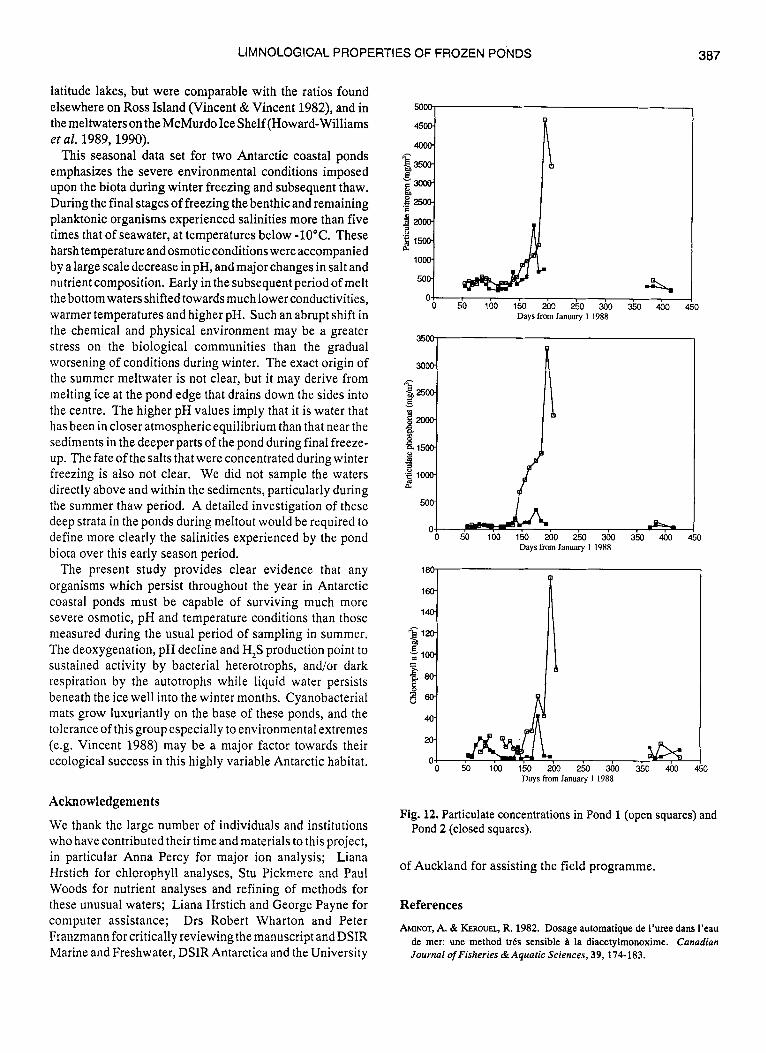
Particulates
As with the dissolved nutrients, particulate concentrations were higher in the smallerof the two ponds, Pond 1 (Table I). The particulate N, P and chlorophyll a increased in concentration during winter freezing, but were at relatively low values in the waters sampled during summer melting (Fig. 12). The three particulate variables, however, did not alwaysvary in concert. For example, particulate phosphorus achieved its highwinter valueswell priorto theparticulate-N peak. A secondary maximum in chlorophyll a and particulate nitrogen and to a lesser extent phosphorus, occurred in the period March-April during early freeze-up in both lakes. The particulate N:P ratios were much higher than the equivalent values for dissolved nutrients, but usually well below the 1O:l ratio sometimes considered optimal for algal growth (Table 11). In Pond 1 the particulate N:P ratio was 6 to 7 at the beginning of the study, rose to 8 during early freezing, then declined to less than 1 by May. In Pond 2 the ratio was similarly 6 to 7 in late March, but then decreased during early freezing and persisted at values in the range 3 to 5.
Discussion
Air temperatures at Cape Evans lay well below 0°C throughout
Table I. Nutrient and particulate concentrations in the two ponds over the period February 1988 to February 1989. All values are in mg N or P m-3 unless otherwise noted. DON = Dissolved Organic Nitrogen, DRP = Dissolved Reactive Phosphorus.
Mean Minimum Maximum
Pond 1 Temperature ("C) Conductivity (mS cm-I) NH, NO3 Urea DON DRP Particulate-N Particulate-P Chlorophyll a (mg m")
Pond 2 Temperature ("C) Conductivity (mS crn-') NH, NO3 Urea DON DRP Particulate-N Particulate-P Chlorophyll a (mg m-9
-3.1 72 60 3
178 3652 715 888 558 27
-2.7 61 24 1
110 1238 73 46 1 88 8
-13.0 1.7
11 <1.0 18 292 7
20 1 23 2.3
-12.1 1.6 1
4.0 9
25 6 6
190 34 0.9
2.2 268 205 13
1004 11642 3234 4665 3322 172
5.3 189 160 5
350 4925 353 1897 344 42
most of the study (Fig. 2), yet despite these persistent freezing conditions and the shallow depth of the ponds, both contained liquid water for more than seven months of the year. The ponds melted out in December-January and gradually refroze towards their base over the subsequent six months. This slow freezing was accompanied by a steady concentration of solutes (and also particulates) which in turn depressed the freezing point of the remaining water. The water temperatures at the base of the ponds dropped well below 0°C for most of the year, and ultimately to below -10°C.
The relative composition of the major ions in both ponds closely resembled that of seawater, reflecting the input of marine salts, for example by seaspray, from adjacent McMurdo Sound. Similarly the changes in composition during winter closely followed the behaviour of seawater during freezing (cf. Thompson & Nelson 1956, Herut et al. 1990). Calcium carbonate is the first salt to precipitate out when seawater is cooled below 0°C. This effect was manifested as an early decline in the Ca:Mg ratio during the initial stages of freeze-concentration (Fig. 9). Freezing seawater precipitates out sodium sulphate decahydrate (mirabilite) at -8.2"C, sodium chloride at -22.9"C, and magnesium and potassium chlorides at -36°C (Thompson & Nelson 1956). In both ponds SO: concentrations and the Na:Cl ratio began to fall beyond julian day 150 (late May) when temperatures dropped well below -4OC. The minimum temperatures reached, however, were not sufficiently low to
S. SCHMIDT eta/
900.0-
800.0- - 700.0- 3 600.0- Y
386
250.0
200.0
“E 150.0 2 v
$100.0
50.0
Days from January 1 1988
1000.0~ P I I D
2 500.0
3 400.0
300.0
i! ,#&/A, , , , e ,
4
0 50 100 150 200 250 300 350 400 Days from January 1 1988
1 450
3000.0
2500.0
3 1500.0
Days from January 1 1988
1000.0
500.0
0. i 0
Days from January 1 1988
Fig. 11. Nutrient concentrations in Pond 1 (open squares) and Pond 2 (closed squares).
Table 11. Nutrient and particulate ratios in the two ponds. All values are in gN:gP.
Mean Minimum Maximum
Inorganic N/DRP Pond 1 0.5 0.02 2.7 Pond 2 1.2 0.004 3.1
Particulate-N/Particulate-P Pond 1 4.7 0.8 8.9 Pond 2 5.6 3.2 7.9
cause any chloride precipitation. Chloride dominated waters are common throughout
Antarctica, including the McMurdo Sound region. In parts of this area, however, such as the ablation zone on the McMurdo Ice Shelf, mirabilite deposited during freeze- concentration has been re-dissolved and SO:- can be the major anion within the meltwaters (Whitehead 1989).
Although the loss of SO:- from solution during the final stages of freezing is probably dominated by precipitation effects, biological processes may also have contributed towards its decline. H,S was first detected in May at the time
- 350 400 4 0
that SOP began to disappear indicating the activity of sulphate reducing bacteria. There was a sudden rise in DRP in Pond 1 at this time, providing further evidence that the bottom water and sediments had become anoxic. The major decline in pH and large increase in DON indicate that a high level of microbial decomposition continued through until all water froze in July-August. Such effects may also have been influenced by any disruption of the benthic microbial mats during this period. Precipitation of CaCO, may have contributed towards the pH decline during early winter cooling, but the relatively constant Ca/Mg ratios through most of the winter imply that this was a small contribution relative to the influence of CO, input from biological activity.
In Pond 1, and to a lesser extent in Pond 2, the sharp rise in DRP concentrations in May also corresponded with a substantial rise in particulate phosphorus which was not parallelled by the same rate of increase in chlorophyll a or particulate N. Particulate N:P ratios fell during this period to extremely low values indicating the selective concentration of phosphorus by the plankton, or co-precipitation of inorganic phosphorus during freezing. Even during summer the particulate N:P ratios were much lower than inmost temperate
LIMNOLOGICAL PROPERTIES OF FROZEN PONDS
latitude lakes, but were comparable with the ratios found elsewhere on Ross Island (Vincent & Vincent 1982), and in the meltwaters on the McMurdo Ice Shelf (Howard-Williams ef al. 1989, 1990).
This seasonal data set for two Antarctic coastal ponds emphasizes the severe environmental conditions imposed upon the biota during winter freezing and subsequent thaw. During the final stages of freezing the benthic and remaining planktonic organisms experienced salinities more than five times that of seawater, at temperatures below -10°C. These harsh temperature and osmotic conditions were accompanied by a large scale decrease in pH, and major changes in salt and nutrient composition. Early in the subsequent period of melt the bottom waters shifted towards much lower conductivities, warmer temperatures and higher pH. Such an abrupt shift in the chemical and physical environment may be a greater stress on the biological communities than the gradual worsening of conditions during winter. The exact origin of the summer meltwater is not clear, but it may derive from melting ice at the pond edge that drains down the sides into the centre. The higher pH values imply that it is water that has been in closer atmospheric equilibrium than that near the sediments in the deeper parts of the pond during final freeze- up. The fate of the salts that were concentrated during winter freezing is also not clear. We did not sample the waters directly above and within the sediments, particularly during the summer thaw period. A detailed investigation of these deep strata in the ponds during meltout would be required to define more clearly the salinities experienced by the pond biota over this early season period.
The present study provides clear evidence that any organisms which persist throughout the year in Antarctic coastal ponds must be capable of surviving much more severe osmotic, pH and temperature conditions than those measured during the usual period of sampling in summer. The deoxygenation, pH decline and H,S production point to sustained activity by bacterial heterotrophs, and/or dark respiration by the autotrophs while liquid water persists beneath the ice well into the winter months. Cyanobacterial mats grow luxuriantly on the base of these ponds, and the tolerance of this group especially to environmental extremes (e.g. Vincent 1988) may be a major factor towards their ecological success in this highly variable Antarctic habitat.
Acknowledgements
We thank the large number of individuals and institutions who have contributed their time and materials to this project, in particular Anna Percy for major ion analysis; Liana Hrstich for chlorophyll analyses, Stu Pickmere and Paul Woods for nutrient analyses and refining of methods for these unusual waters; Liana Hrstich and George Payne for computer assistance; Drs Robert Wharton and Peter Franzmann for critically reviewing the manuscript and DSIR Marine and Freshwater, DSIR Antarctica and the University
40 3
1
0 50 100 150 200 250 300 350 400 1
Days from January 1 1988
3500,
500\ 0 0 50 100 150 200 250 300 350 400
Days from January 1 1988
387
3
io
0 Days from January 1 1988
Fig. 12. Particulate concentrations in Pond 1 (open squares) and Pond 2 (closed squares).
of Auckland for assisting the field programme.
References
AMINOT, A. & KEROUEL, R. 1982. Dosage automatique de l’uree dam I’eau de mer: une method trCs sensible A la diacetylmonoxime. Canadian Journal of Fisheries & Aquatic Sciences, 39, 174-183.

S. SCHMIDT eta/ 388
BROADY, P.A. 1989. Broadscale patterns in the distribution of aquatic and terrestrial vegetation at three ice-free regions on Ross Island, Antarctica. Hydrobiologia, 172,77-95.
DOWNES, M.T. 1978. An automated determination of low reactive phosphorus concentrations in natural waters in the presence of arsenic, silicon and mercuric chloride. Water Research, 12,743-745.
GIBES, M.M. & PICKMERE, S.E. 1987. Optimisation of a semi-automated micro-Kjeldahl digestion method for the simultaneous determination of nitrogen and phosphorus in seston and sediments. Taupo Research Laboratory FileReport 96,23 pp. [Available from DSIR, P.O. Box 415, Taupo, New Zealand].
GIBES, R.J. 1970. Mechanisms controlling world water chemistry. Science, 170,1088-1090.
GOLDMAN, C.R., IMAsoN, D.T. & WOOD, B.J. 1972. Comparative study of the limnology of two small lakes on Ross Island, Antarctica. Antarctic Research Series, 20,l-50.
HERUT, B., STARWSKY, A., KATZ, A. & BEIN, A. 1990. The role of seawater freezing in the formation of subsurface brines. Geochimica et Cosmochimica Acta, 54,13-21.
HEYWOOD, R.B. 1977. Antarcticfreshwaterecosystems: review and synthesis. In LLANO, G.A. ed. Adaptations within Antarctic ecosystems: Proceedings of the 3rd SCAR Symposium on Antarctic Biology, Washington D C Smithsonian Institution, 801-808.
HOWARD-WILLIAMS, C., PRIDMORE, R., DOWNES, M.T. & VINCENT, W.F. 1989. Microbial biomass, photosynthesis and chlorophyll a related pigments in the ponds of the McMurdo Ice Shelf, Antarctica. Antarctic Science, 1, 125-131.
HOWARD-WILLIAMS, C., PRIDMORE, R. D. BROADY, P. A. & VINCENT, W. F. 1990. Environmental and biological variability in the McMurdo Ice Shelf ecosystem. In KERRY, K. & HEMPEL, G. eds. Ecological change and the
conservation of Antarctic ecosystems. Proceedings of the 5th SCAR Symposium on Antarctic Biology. Berlin: Springer-Verlag, 23-31.
MURRAY, J. 1910. On collecting at Cape Royds. In MURRAY, J. ed. British Antarctic Expedition I907-1909, Reports on scientific investigations. Vol. 1. Biology. London: Heinemann, 1-15.
NYDAHL, F. 1976. On the optimal conditions for the reduction of nitrate to nitrite by cadmium. Talanta, 23,349-357.
SEARLE, P.L. 1975. Automated colorimetric determination of ammonium ions in soil extracts with ‘Technicon Autoanalyzer 11’ equipment. New Zealand Journal ofAgricultura1 Research, 18, 183-187.
SOLORZANO, L. 1969. Determination of ammonia in natural waters by the phenolhypochlorite method. Limnology & Oceanography, 14,799-801.
SOLORZANO, L. &SHARP, J.H. 1980. Determination of total dissolved nitrogen in natural waters. Limnology & Oceanography, 25, 751-754.
SPURR, B. 1975. Limnology of Bird Pond, Ross Island, Antarctica. New Zealand Journal of Marine & Freshwater Research, 9,547-562.
THOMSON, T.D. &NELSON, K.H. 1956. Concentrationof brines and deposition of salts from seawater under frigid conditions. American Journal of Science, 254, 227-238.
VINCENT, W.F. 1987. Antarctic limnology. In VNER,A.B. ed. Inland Waters ofNew Zealand. Wellington: DSIR, 377-412.
VINCENT, W.F. 1988. Microbial ecosystems of Antarctica. Cambridge: Cambridge University Press, 304 pp.
VINCENT, W.F. & VINCENT, C.L. 1982. Response to nutrient enrichment by the plankton of antarctic coastal lakes and the inshore Ross Sea. Polar Biology, 1, 159-165.
WHITEHEAD, R.F. 1989. Aqueousgeochemistry ofmeltwater on theMcMurdo Ice Shelf and the Alph River, Antarctica. M.Sc. Thesis. University of Auckland. 132 pp. [Unpublished]
WYNN-WILLIAMS, D. 1990. Ecological aspects of Antarctic microbiology. Advances in Microbial Ecology, 11, 71-146.
Copyright © 2022 FDOKUMEN