Diversity of Anurans Across Agricultural Ponds in Argentina
15
-1 Diversity of anurans across agricultural ponds in Argentina PAOLA M. PELTZER * , RAFAEL C. LAJMANOVICH, ANDRES M. ATTADEMO and ADOLFO H. BELTZER Instituto Nacional de Limnologı´a (INALI-CONICET), Jose ´ Macia ´s 1933, Santo Tome ´, Santa Fe 3016, Argentina; *Author for correspondence (e-mail: [email protected]; fax: +54-0342- 4750394) Received 16 March 2004; accepted in revised form 10 August 2004 Key words: Agroecosystem, Anura, Argentina, Conservation, Soybean cropland Abstract. We examined the anuran diversity of 31 ponds (30 located on the border of soybean cropland and one within a protected forest) in mid-western Entre Rı´os Province (Argentina). Moreover, each species found was characterised with respect to its vertical location. Using principal component (PCA) and canonical correspondence analyses (CCA) we quantified associations be- tween species diversity and habitat and spatial variables. A total of 21 anuran species belonging to four families (Microhylidae, Bufonidae, Leptodactylidae and Hylidae) were detected in ponds surrounded by soybean croplands. PCA generated three principal components, which together explained variation in anuran diversity across the agricultural ponds and control site. Negative values of PC-1 described the smaller ponds with narrower hedgerow and monospecific shore vegetation. PC-2 had high loading on pond depth, and PC-3 had negative loading on air tem- perature. CCA showed a very strong association between the two data sets. We found all guilds related with pond area. Indeed, we found that arboreal species were recorded in large ponds with higher values of shore vegetation index and presence of wider hedgerow. Moreover, a higher number of terrestrial species was found to relate to large pond areas and greater shore vegetation diversity. Finally, aquatic species were related to pond area, shore vegetation index and depth. Anuran diversity across agricultural ponds of mid-western Entre Rı´os Province can be affected by local habitat factors such as reduction in pond size and depth, shore vegetation richness, width of hedgerow and air temperatures. Management of anurans to reverse recent declines will require defining high-quality habitat for individual species or group of species, followed by efforts to retain or restore these aquatic habitat. The maintenance of shore vegetation of ponds and hedgerows may increases the number of species and diversity of anurans within agricultural landscapes. Introduction The causes of amphibian declines are under investigation, but emerging evi- dence indicates that loss of habitat as a result of agricultural development may be contributing to regression of anuran diversity in some locations (Bishop and Pettit 1992; Bonin et al. 1997; Bridges 1999; Hazell et al. 2001; Lajmanovich et al. 2002, 2003; Storfer 2003). Management of amphibian populations to reverse this phenomenon will require defining high-quality habitat for indi- vidual species or group of species, followed by efforts to retain or restore these habitats (Knutson et al. 1999). Biodiversity and Conservation (2006) 15:3499–3513 ȑ Springer 2006 DOI 10.1007/s10531-004-2940-9
-
Upload
independent -
Category
Documents
-
view
2 -
download
0
Transcript of Diversity of Anurans Across Agricultural Ponds in Argentina

-1
Diversity of anurans across agricultural ponds in
Argentina
PAOLA M. PELTZER*, RAFAEL C. LAJMANOVICH,ANDRES M. ATTADEMO and ADOLFO H. BELTZERInstituto Nacional de Limnologıa (INALI-CONICET), Jose Macias 1933, Santo Tome, Santa Fe
3016, Argentina; *Author for correspondence (e-mail: [email protected]; fax: +54-0342-
4750394)
Received 16 March 2004; accepted in revised form 10 August 2004
Key words: Agroecosystem, Anura, Argentina, Conservation, Soybean cropland
Abstract. We examined the anuran diversity of 31 ponds (30 located on the border of soybean
cropland and one within a protected forest) in mid-western Entre Rıos Province (Argentina).
Moreover, each species found was characterised with respect to its vertical location. Using principal
component (PCA) and canonical correspondence analyses (CCA) we quantified associations be-
tween species diversity and habitat and spatial variables. A total of 21 anuran species belonging to
four families (Microhylidae, Bufonidae, Leptodactylidae and Hylidae) were detected in ponds
surrounded by soybean croplands. PCA generated three principal components, which together
explained variation in anuran diversity across the agricultural ponds and control site. Negative
values of PC-1 described the smaller ponds with narrower hedgerow and monospecific shore
vegetation. PC-2 had high loading on pond depth, and PC-3 had negative loading on air tem-
perature. CCA showed a very strong association between the two data sets. We found all guilds
related with pond area. Indeed, we found that arboreal species were recorded in large ponds with
higher values of shore vegetation index and presence of wider hedgerow. Moreover, a higher
number of terrestrial species was found to relate to large pond areas and greater shore vegetation
diversity. Finally, aquatic species were related to pond area, shore vegetation index and depth.
Anuran diversity across agricultural ponds of mid-western Entre Rıos Province can be affected by
local habitat factors such as reduction in pond size and depth, shore vegetation richness, width of
hedgerow and air temperatures. Management of anurans to reverse recent declines will require
defining high-quality habitat for individual species or group of species, followed by efforts to retain
or restore these aquatic habitat. The maintenance of shore vegetation of ponds and hedgerows may
increases the number of species and diversity of anurans within agricultural landscapes.
Introduction
The causes of amphibian declines are under investigation, but emerging evi-dence indicates that loss of habitat as a result of agricultural development maybe contributing to regression of anuran diversity in some locations (Bishop andPettit 1992; Bonin et al. 1997; Bridges 1999; Hazell et al. 2001; Lajmanovichet al. 2002, 2003; Storfer 2003). Management of amphibian populations toreverse this phenomenon will require defining high-quality habitat for indi-vidual species or group of species, followed by efforts to retain or restore thesehabitats (Knutson et al. 1999).
Biodiversity and Conservation (2006) 15:3499–3513 � Springer 2006
DOI 10.1007/s10531-004-2940-9

The conversion of forest to agricultural land is occurring at rapid rates inmany Neotropical areas. These land-cover trends have spurred research toinvestigate the role that agroecosystems play in providing habitat for Neo-tropical organisms and in the conservation of biodiversity (e.g. Lips 1998;Ricketts et al. 2001; Petit and Petit 2003). In the mid-east Argentina, tradi-tional agriculture was replaced by a more specialised agriculture aimed at largescale production with glyphosate-tolerant-soybean (Glycine max L.) as thedominant crop. This new agriculture has led to the expansion of cultivatedareas, thus exerting an increasing pressure on uncultivated portions of the landand wildlife survival. Forest habitat in the agricultural landscapes have beenreduced and fragmented into numerous small plots, and the hedgerows, whichoften represent the only remaining corridors for wildlife between these plots,are also being critically threatened. Indeed, many of the aquatic habitats thatare crucial for anuran reproduction and survival have been greatly altered tothe point where existing amphibian populations may be dependent on alteredwetlands or ephemeral ponds imbedded within or around agricultural areas fortheir survival and reproduction (Peltzer and Lajmanovich 2001; Peltzer et al.2003).We studied the anuran diversity in ponds surrounded by soybean
croplands in Entre Rıos Province (Argentina). Specifically, we asked thefollowing questions: (1) what habitat and spatial variables are influencinganuran diversity from ponds surrounded by soybean croplands? (2) whatare the ecological distributions of species (guilds) across agriculturalponds? (3) what conservation measures are suggested by these results?Answers to these questions are not only of ecological interest but also ofpractical significance for the future conservation management of anuransin agroecosystems.
Material and methods
Study area
The research took place in mid-western Entre Rıos Province, Argentina(31�44¢S–60�31¢W) (Figure 1). This region belongs to the pluvial district ofArgentina with an average annual rainfall below 1000 mm and a mean an-nual temperature of 18 �C. The warmest months are September–March(24 �C average temperature), the coldest, April–August (10 �C). This regionis located at the east boundary of the Parana River course. Agriculture is thepredominant land use in this region, covering more than 60% of its 2500 mil.ha. Most of the agricultural land is devoted to soy (40%) and corn and othercereal production (17%). The remaining area is covered by fluvial and semi-xeric forest (29%), and edge transition habitats (5%, abandoned farmlandand border structures, such as hedgerows). Farmers frequently clear landparcels, whether fallow tracts or the forest, at an onset of the dry season;
3500

usually in August. In September, the dried debris is burned and soybeanplanting occurs soon thereafter (usually in November). It is important to notethat few farmers leave hedgerows with scarce width (>1 m) of natural veg-etation. The vegetation in these narrow hedgerows is often maintained at theherbaceous or shrubby stage through mowing or burning, but it is moreheterogeneous than that of the structurally uniform cropland. This practicestems from the farmers’ belief that such management diminishes the risk ofhedgerows becoming refuges for pest species. The herbaceous vegetation ismostly characterised by a mixture of sown grass species (Cynodon dactylon,Lolium multiflorum and Setaria geniculata) with a high content of clover(Trifolium repens) and goldenrod (Solidago chilensis). The predominantshrubby vegetation is covered by Ligustrum sinence, Aloysia gratisima,Bachharis dracunculifolia and B. salicifolia.
Field survey
Landsat images and serial aerial photographs (first order to fifth order at ascale 1:50.000 – Brigada Aerea Argentina at Parana City of Entre RıosProvince) were used to select 31 ponds: one located within a protected semi-xeric forest (Control site, Natural Reserve ’Parque General San Martın’) and30 agricultural ponds (AP) surrounded by soybean croplands (Figure 1). Forthe selection of the agricultural ponds particular attention was paid to fol-lowing features: (1) all ponds had water during the period studied, (2) the pond
Figure 1. Location of the mid-western Entre Rıos Province with inset maps showing its location
in Argentina and sampling sites within study area. • = agricultural ponds and � = control site.
3501

contained no significant gradients in altitude, and (3) all ponds were primarilytemporary bodies of water. Cattails (Typha latifolia), willow (Salix hum-boldtiana), burhead (Echinodorus grandiflorus), pampas grass (Cortaderiaselloana), duckpotatoe (Sagittaria montevidensis), smartweed (Polygonumpunctatum), bulrush (Schoenoplectus californicus) and rush (Juncus pallescens)were the most common emergent vegetation in the ponds but there were noaquatic floating plants.The pond areas ranged from 50 to 31,000 m2. The surveys were conducted
during the soybean-cropping period from November 2002 to March 2003. Thisperiod is coincident with the breeding activity of anuran in this region.A number of search strategies were used at each pond to study anurans.
Day and night surveys were conducted at each pond on the same day.During the day, surveys were undertaken to detect anuran egg masses andtadpoles. Egg masses that were unidentified in the field were raised in cap-tivity. A fine-meshed net was used for tadpole samples. Night surveys in-cluded active searches to detect non-calling anurans and listening for callingmale anurans. The nocturnal site searches began shortly after sunset (1900 h)and extended until midnight. This method is a combination of the visualencounter surveys of Crump and Scott (1994) and audio strip transects ofZimmerman (1994). Active site searches for anurans consisted of a randomlyplaced transect walked for 10 min, 1 m upslope from and parallel to thewater’s edge. Male anurans calling from up to 100 m from the edge werealso recorded. Each species found was characterised with respect to its ver-tical location using Vallan’s (2000) guild criteria, where (1) were speciesfound on the ground (terrestrial); (2) floating in water or inhabiting marsh(aquatic); (3) inhabiting herbaceous, shrubby, or arboreal habitats (arboreal).Captured anurans were identified, photographed and then released. Un-identifiable specimens (larval or adult) were euthanized and fixed for lateridentification (ASIH et al. 2001). The specimens are held at the InstitutoNacional de Limnologıa (Peltzer and Lajmanovich – INALI AmphibianReference Collection).
The variables
We recorded five habitat variables: pH (with Lovibond), air and watertemperature (with a standard thermometer), maximum depth (with stick)and shore vegetation richness. Shore vegetation was identified and thevegetal richness for each site was gauged on a qualitative scale rangingfrom 1 to 5 (Coneza Fernandez Vitora 1997) where one was monospecificvegetation and five was very diverse vegetation. Moreover, we determinedfour spatial variables: pond area (m2), interpond distance (in km), thedistance (in km) to the pond located within a control site, and width ofhedgerows (m). The last three variables were registered only for agriculturalponds.
3502
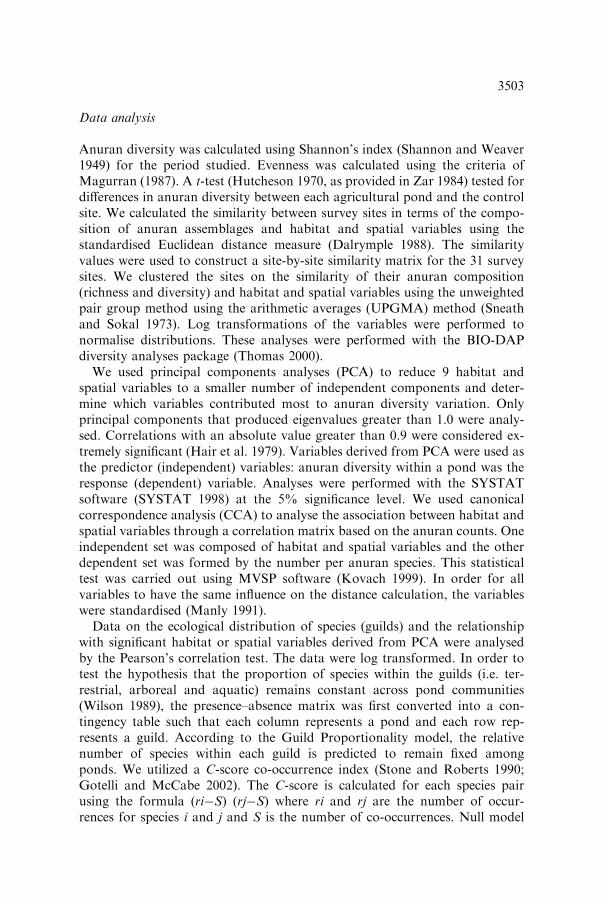
Data analysis
Anuran diversity was calculated using Shannon’s index (Shannon and Weaver1949) for the period studied. Evenness was calculated using the criteria ofMagurran (1987). A t-test (Hutcheson 1970, as provided in Zar 1984) tested fordifferences in anuran diversity between each agricultural pond and the controlsite. We calculated the similarity between survey sites in terms of the compo-sition of anuran assemblages and habitat and spatial variables using thestandardised Euclidean distance measure (Dalrymple 1988). The similarityvalues were used to construct a site-by-site similarity matrix for the 31 surveysites. We clustered the sites on the similarity of their anuran composition(richness and diversity) and habitat and spatial variables using the unweightedpair group method using the arithmetic averages (UPGMA) method (Sneathand Sokal 1973). Log transformations of the variables were performed tonormalise distributions. These analyses were performed with the BIO-DAPdiversity analyses package (Thomas 2000).We used principal components analyses (PCA) to reduce 9 habitat and
spatial variables to a smaller number of independent components and deter-mine which variables contributed most to anuran diversity variation. Onlyprincipal components that produced eigenvalues greater than 1.0 were analy-sed. Correlations with an absolute value greater than 0.9 were considered ex-tremely significant (Hair et al. 1979). Variables derived from PCA were used asthe predictor (independent) variables: anuran diversity within a pond was theresponse (dependent) variable. Analyses were performed with the SYSTATsoftware (SYSTAT 1998) at the 5% significance level. We used canonicalcorrespondence analysis (CCA) to analyse the association between habitat andspatial variables through a correlation matrix based on the anuran counts. Oneindependent set was composed of habitat and spatial variables and the otherdependent set was formed by the number per anuran species. This statisticaltest was carried out using MVSP software (Kovach 1999). In order for allvariables to have the same influence on the distance calculation, the variableswere standardised (Manly 1991).Data on the ecological distribution of species (guilds) and the relationship
with significant habitat or spatial variables derived from PCA were analysedby the Pearson’s correlation test. The data were log transformed. In order totest the hypothesis that the proportion of species within the guilds (i.e. ter-restrial, arboreal and aquatic) remains constant across pond communities(Wilson 1989), the presence–absence matrix was first converted into a con-tingency table such that each column represents a pond and each row rep-resents a guild. According to the Guild Proportionality model, the relativenumber of species within each guild is predicted to remain fixed amongponds. We utilized a C-score co-occurrence index (Stone and Roberts 1990;Gotelli and McCabe 2002). The C-score is calculated for each species pairusing the formula (ri�S) (rj�S) where ri and rj are the number of occur-rences for species i and j and S is the number of co-occurrences. Null model
3503

analyses were conducted with ECOSIM 7.0 simulation software (Gotelli andEntsminger 2001).
Results
A total of 23 anuran species belonging to four families (Microhylidae, Buf-onidae, Leptodactylidae and Hylidae) were detected at ponds surrounded bysoybean croplands and the control site (Table 1). Anuran species found atponds surrounded by soybean croplands and within the protected forest(control site) were Elachistocleis bicolor, Bufo arenarum, B. paracnemis,B. fernandezae, Odontophrynus americanus, Leptodactylus ocellatus, L. chaqu-ensis, L. latinasus, L. mystacinus, L. gracilis, Physalaemus biligonigerus,P. riograndensis, Lysapsus limellus,Hyla nana,H. pulchella,H. sanborni, Scinaxnasicus, S. squalirostris and S. acuminatus. Only L. elenae and H. raniceps wereexclusively recorded at the pond located within the control site, and Physa-laemus albonotatus and Pseudopaludicola falcipes only in agricultural ponds.The most common species observed were P. albonotatus, recorded in 73.3%
of the total ponds sampled surrounded by soybean croplands, following byL. latinasus (70%), and Bufo paracnemis (66.6%). Eggs and tadpoles in foamnests were recorded for L. ocellatus, P. albonotatus, and P. biligonigerus,whereas egg-deposition and larval development directly in water were recordedonly for Hyla pulchella, Scinax nasicus, and S. squalirostris.Species diversity among soybean agricultural ponds varied from 0.30 (AP
20) to 1.14 (AP 27), and evenness values oscillated between 0.90 and 1. Thediversity value of the pond located within the protected forest was 1.27 and theevenness was 0.96 (Figure 2). The t-test showed significant differences betweenthe diversity of each agricultural pond and the diversity of control site (in allcases, t > 3.21, p < 0.001). Similar results were observed in cluster analysis.This analysis, based on the species richness, diversity and habitat and spatialvariables of the 31 survey sites, produced two groups (Figure 3). Group A wasformed by agricultural ponds and was divided into two subgroups (1, groupedponds with higher anuran richness and diversity; 2, clustered ponds with loweranuran richness and diversity). The pond located within protected forest(Control site: B) had a distant association with the former groups.The PCA produced three components, which accounted for 95.61% of the
variance in the raw data (Table 2). The first component (PC-1) accounted for57.35% and was strongly correlated (<0.9) with pond area, width of hedge-rows and shore vegetation. The second component (PC-2) showed strong po-sitive correlation with pond depth and accounted for 27.57% of the variability.The third component (PC-3) explained 9.69% of the variation and was cor-related with air temperature. Canonical correlation analysis (CCA) showed avery strong association between the two data sets, one set formed by anuranspecies (dependent variables) and another by habitat and spatial variables(independent variables) (Table 2, Figure 4a, b).
3504

Table
1.
Anuranrichnessin
pondssurrounded
bysoybeancroplandsin
mid-w
estern
EntreRıosProvince.
Anuranspecies
12
34
56
78
910
11
12
13
14
15
16
17
18
19
20
21
22
23
24
25
26
27
28
29
30
CS
BH
Microhylidae
E.bicolor
��
+��
++
++��
++���
+���
+�
++�
+����
+T
Bufonidae
B.arenarum
+�
++
++�
++���������������
+�����
+T
B.paracnem
is��
+�
+�
+��
++
++
++�
++�
++
++�
++
++
+�
+T
B.fernandezae
++�
+�
++
++�
++�����
++��
+�
+��
+�
+�
+T
Leptodactylidae
O.americanus��
+�
++������
+�
+�
+������
+������
+T
L.ocellatus
��
++
++
++
+���
++
++��
+�
++�
++
++���
+A
L.chaquensis
������������
++��
++
+���
++
+�����
+T
L.latinasus
�+
++
++
+��
+�
++
++�
++�
+�
++
++
++
+�
++
TL.mystacinus
++�
++
+����
+���
++
+���
+��
++��
++
++
TL.elenae
������������������������������
+T
L.gracilis
�����
+�
++����
+�
+�
+���
++��
++�
+�
+T
P.albonotatus��
++
++
++
++��
++
++
+�
+�
++
++
++
+�
++�
AP.biligonigerus���
+��
+�����
+�
+�
+�
+����
++�
+���
+A
P.riograndensis����
+��������
++
+�����
++��
++���
+A
P.falcipes
��
+��
++�����
++�
+��
+����
+�
++����
AHylidae
L.limellus
��
+�
+�������������������������
+A
H.nana
��
++�
+������
+�
++��
+��
+�
+�
++���
+Ar
H.pulchella
��
++
+��������
++
++�
+�
++
+�
+�
+���
+Ar
H.sanborni
��
++
++������
+�
++��
+����
+�
++���
+Ar
S.nasicus
��
++���������
++
+����
+�
++
+�
+���
+Ar
S.squalirostris����
+�������
++
++��
+���
+��
++���
+Ar
S.acuminatus��
+�����������
++����������
+���
+Ar
H.raniceps
������������������������������
+Ar
Diversity
1.3
0.9
2.5
2.2
2.2
2.4
1.9
1.6
1.7
1.0
1.0
1.3
2.4
2.2
2.4
2.4
1.9
1.5
2.1
0.6
1.9
2.0
2.1
2.4
2.2
2.3
2.6
1.1
1.0
1.0
2.9
Richness
33
14
11
12
11
86
63
34
12
11
12
12
85
10
27
810
12
10
11
15
34
321
(+)Presence,(�
)absence.Overviewoftheanuranrichnessandguilds.Withdifferentnumberswelisted
theponds.CS,controlsite;BH,biologicalhabits;T,
terrestrial;A,aquatic;
Ar,arborealspecies.
3505

The number of terrestrial species increased with increasing pond area(Pearson: n = 31, r = 0.59, p < 0.01) and with very-diverse vegetation(Pearson: n = 31, r = 0.47, p < 0.01). The number of aquatic anurans wasdependent of both pond area (Pearson: n = 31, r = 0.82, p < 0.01), depth ofponds (Pearson: n = 31, r = 0.80, p < 0.01) and vegetation diversity index(Pearson: n = 31, r = 0.88, p < 0.01). The number of arboreal anurans was
Figure 2. Anuran diversity (black bars) and evenness (white bars) across agricultural pond (AP)
and control site.
Figure 3. Cluster analysis of the 30 agricultural ponds and the control site examining the simi-
larity of their anuran richness. AP: agricultural ponds.
3506

positively correlated with pond area (Pearson: n = 31, r = 0.88, p < 0.01),width of hedgerow (Pearson: n = 31, r = 0.69, p < 0.01), and shore vegeta-tion index (Pearson: n = 31, r = 0.80, p < 0.01). The proportion of specieswithin each guild varied greatly among pond assemblages (Figure 5). TheC-score index was less than expected by chance. The observed C-score rangedfrom 40.9 for the terrestrial guild to 7.4 for the arboreal guild. The largerC-score values are shown more segregation between species within a guild.
Discussion
Spatial and temporal heterogeneity of the landscape is essential for mainte-nance of specifies diversity (Huston 1995), which depends on the regime ofdisturbances (Risser 1995; Turner et al. 1995; Gustafson 1998). Several studieshave shown that agroecosystem instability is linked to the expansion of cropmonocultures and the decline in local habitat diversity (Altieri 1994), withmore disturbed sites generally having lower species richness (Bishop et al.1999). We found that less abundant species (Physalaemus albonotatus, Pseud-opaludicola falcipes), which do not occur in the protected forest (Lajmanovichand Peltzer 2001) have ’invaded’ the ponds surrounding soybean crops and arecommonly encountered in the soybean matrix, a similar situation also observedin other tropical and subtropical areas (Jansen 1986; Lawton et al. 1998;
Table 2. Principal component loadings for anuran diversity, habitat (air and water temperature,
depth, pH and shore vegetation index) and spatial variables (pond area, width of hedgerows,
distance to control site, interpond distance, and shore vegetation index) measured at 31 survey sites
and results of a canonical correlation analysis between two sets of variables.
Variables PC-1 PC-2 PC-3
Principal component analysis
Habitat variables
Air temperature 0.57 0.14 �0.79Water temperature 0.84 �0.36 0.26
Depth 0.14 0.96 0.05
pH 0.57 �0.71 0.30
Shore vegetation index �0.90 0.42 0.13
Spatial variables
Pond area �0.90 0.26 0.20
Distance to control site 0.85 0.46 0.22
Interpond distance 0.69 0.68 0.06
Hedgerow width �0.91 0.21 0.09
Shore vegetation index �0.90 0.42 0.13
Percentage of variance explained 58.35 27.57 9.69
Cumulative 58.35 85.92 95.61
Canonical correspondence analysis Axis I Axis II Axis III
Species–environmental canonical correlation 0.919 0.916 0.855
Notes:Variableswithhighpositive orhighnegative values are underlined to indicate the variables that
more or most contributed to anuran diversity variation across agricultural ponds and control site.
3507

Gascon et al. 1999). These invading species may well be specialists of non-forested habitats. A substantial number of arboreal species (H. pulchella,Scinax nasicus and S. squalirostris) are capable of using ponds surrounded bysoybean cultivation. We also suggest that an arboreal (H. raniceps) and aterrestrial (L. elenae) species registered only at the control site, may well bespecialists of forested habitat.The results of principal component and CCA showed that pond area, width
of hedgerows, shore vegetation index and depth of ponds contributed signifi-cantly to variability of anuran diversity across agricultural ponds and thecontrol site. The relationship between anuran diversity and pond area may bedue to a habitat-island effect (MacArthur and Wilson 1967; Cook et al. 2002)
Figure 4. Plots of canonical correspondence analysis by species (variables, a) and ponds (cases, b).
� = control site.
3508

with the lowest diversity being predicted for the smallest patch (50 m2). Severalstudies have investigated the effects of patch area on amphibians (e.g.,Zimmerman and Bierregaard 1986; Hecnar and M’Closkey 1997; Peltzer et al.2003) and they found it to be the most important variable in determiningamphibian species diversity. Moreover, we observed increased anuran diversitywith the hedgerow width. Comparable studies have shown that species diver-sity along riparian strips decreases with decreased width of field borders andincreased disturbance of corridor and vegetation complexity of them (Szaro1986; Maisonneuve and Rioux 2001; Marshall and Moonen 2002). Thus, theincrease of anuran diversity with increasing depth could be because that deeperponds may hold water long enough to support larval development in yearswhen the shallower ponds dry before the larvae metarmophose. Indeed, shorevegetation in bodies of water are important for anurans, providing themstructural heterogeneity, moisture, shelter, calling sites, refuge from pesticidecontamination and places to attach their eggs (Stumpel and van der Voet1998). It is well documented that cleared areas generally experienced greatertemperature extremes at the surface and in the upper layers of the soil thanareas with vegetation (Matlack 1997). This is consistent with the lower anurandiversity recorded at ponds with higher air temperatures.The results of our study showed that the proportion of observed guilds
among ponds was less than expected by chance. This could be due to thepatchy distribution of amphibians (Bosch et al. 2004) and the complexity invegetation structure (Maidonneuve and Rioux 2001). We found all guilds
Figure 5. Percentages of ecological distribution of anurans across control and agricultural ponds.
AP: agricultural ponds.
3509

related to pond area. Large areas may hold a greater number of species anddiversity than small pond areas. Indeed, we found that arboreal species such asH. nana, H. pulchella, H. sanborni, H. raniceps, S. nasicus, S. acuminatus andS. squalirostris, were found at large ponds with higher vegetation index valuesand presence of wider hedgerows. Species richness of terrestrial species(B. arenarum, B. paracnemis, B. fernandezae, O. americanus, L. chaquensis,L. mystacinus, L. latinasus, L. gracilis, L. elenae, and E. bicolor) was found torelate to large pond areas and more diverse shore vegetation. Finally, aquaticspecies (L. limellus, P. albonotatus, P. biligonigerus, P. riograndensis, P. falcipesand L. ocellatus) were related to pond area, shore vegetation index and depth.We conclude that arboreal guilds are more prone to local decline than theterrestrial and aquatic guilds and thus the guild proportionality changes inresponse to spatial heterogeneity (shore vegetation and hedgerows).Evidently the factors that determine the presence of anuran species in a pond
are part of a complex network of relationships and are strongly influenced bythe local situation (Bishop et al. 1999). Anuran diversity across agriculturalponds of mid-western Entre Rıos Province can be affected by local habitatfactors such as reduction in pond size and depth, shore vegetation richness,width of hedgerow and change in air temperatures. Moreover, we find that theponds surrounded by soybean croplands vary in their capacity to supportanuran species.
Implications for conservation
The result of our study provides managers with clues to preserve, create orrestore anuran aquatic habitats in intensive agricultural areas where popula-tions are low or declining. It appears that in order to maintain anuran diversityin agricultural landscapes, natural or artificial bodies of water must exist.Maintaining shore vegetation of ponds and hedgerow may increases number ofspecies and diversity of anurans within agricultural landscapes. Knutson et al.(2004) also suggested that constructed farm ponds, properly managed, mayhelp sustain amphibian populations in agricultural landscape and may repre-sent important alternative breeding habitat.Hedgerows are not only recognised as important corridors and habitats for a
great diversity of species, but they also help reduce the impacts of agriculturalpractices on the water quality of pond by filtering pesticides, fertilizers, andthey maintain quality of aquatic habitat by regularizing temperature (Mai-sonneuve and Rioux 2001). With respect to agricultural pesticides and fertil-izers, different authors have suggested they are important factors in amphibiandeclines, malformation and survival (Bishop et al. 1999; Campana et al. 2003;Lajmanovich et al. 2003; Mann et al. 2003).Effective management of amphibian in predominantly agricultural landscape
requires and understanding of what factors influence anuran assemblages.Furthermore, conservation plans must account for the varied life history
3510

requirements and behaviours of different species. The reduction of area ofsuitable habitats is an obvious reason for decline, particularly in arborealspecies, due to a more intensive use of available land.
Acknowledgements
We thank Karen Lips, Kirsten Parris and Malcolm L. Hunter Jr. and twoanonymous reviewers for reviewing a draft of manuscript and made criticalcomments and valuable suggestions. Many thanks to Arturo Kehr for helpwith statistical analysis and Alfredo Berduc for permission to work at thenature reserve and his assistance in fieldwork. We finally thank to Edward deReus and A. T. Bull.
References
Altieri M.A. Biodiversity and Pest Management in Agroecosystems Haworth Press, New York.
ASIH, HL and SSAR. 2001. Guidelines for use of live amphibians and reptiles in field research.
http: //www.utexas.edu/depts/asih/herpcoll.htlm. Accessed on 13/06/02.
Bishop C.A., Mahony N.A., Struger J., Ng P. and Pettit K.E. 1999. Anuran development, density
and diversity in relation to agricultural activities in the Holland River watershed, Ontario,
Canada (1990–1992). Environ. Monitor. Assess. 57: 21–43.
Bishop C.A. and Pettit K.E. (eds), 1992. Declines in Canadian Amphibian Populations: Design a
National Monitoring Strategy. Can. Wildl. Serv. Occas. Paper 76, Environment Canada Ottawa.
Bonin J., DesGranges J.L., Rodriguez J. and Ouellet M. 1997. Anuran species richness in agri-
cultural landscape of Quebec: foreseeing longterm results of road call surveys. In: Green D.M.
(ed.), Amphibian in Decline: Canadian Studies of a Global Problem. Society for the Study of
Amphibian and Reptiles, St. Louis, Missouri, pp. 141–149.
Bosch J., Boyero L. and Martınez-Solano I. 2004. Spatial scales for the management of amphibian
populations. Biodiv. Conserv. 13: 409–420.
Bridges C.M. 1999. Effects of a pesticide on tadpole activity and predator avoidance behaviour.
J. Herpetol. 33: 303–306.
Campana M.A., Panzeri A.M., Moreno V.J. and Dulout F.N. 2003. Micronuclei induction in
Rana catesbeiana tadpoles by the pyrethroid insecticide lambda-cyhalothrin. Genet. Mol. Biol.
26: 99–103.
Coneza Fernandez Vitora V. 1997. Guıa Metodologica para la Evaluacion del Impacto Ambiental.
Mundi Prensa, Madrid.
Cook W.M., Lane K.T., Fester B.L. and Holt R.D. 2002. Island Theory, matrix effects and species
richness pattern in habitat fragments. Ecol. Lett. 5: 619–623.
Crump M.L. and Scott N.J. 1994. Visual encounter surveys. In: Heyer W.R., Donelly M.A.,
McDiarmid R.W., Hayek L.C. and Foster M.S. (eds), Measuring and Monitoring Biological
Diversity, Standard Methods for Amphibians. Smithsonian Institution Press, Washington, DC,
pp. 84–91.
Dalrymple G.H. 1988. The herpetofauna of Long Pine Key, Everglades National Park, in relation
to vegetation and hydrology. In: Szaro R., Severson K.E. and Patton D.R. (eds), Management of
Amphibians, Reptiles, and Small Mammals in North America’’. U.S.D.A.Forest Service.
General Technical Report RM-166, Fort Collins, pp. 72–86.
Gascon C., Lovejoy T.E., Bierregrad Jr. R.O., Malcolm J.R., Stouffer P.C., Vasconcelos H.L.,
Laurance W.F., Zimmerman B., Tocher M. and Borges M. 1999. Matrix habitat and species
richness in tropical forest remnants. Biol. Conserv. 91: 223–229.
3511

Gotelli N.J. and Entsminger G.L. 2001. EcoSim: Null Models Software for Ecology Version 70.
Acquired Intelligence Inc. and Kesey-Bear. http://homepages.together.net/�gentsmin/eco-
sim.html. Accessed on 13/06/03.
Gotelli N.J. and McCabe D.J. 2002. Species co-occurrences: a metaanalysis of J.M. Diamond’s
assembly rule model. Ecology 83: 2091–2096.
Gustafson E.J. 1998. Quantifying landscape spatial pattern: What is the state of the art?. Eco-
systems 1: 143–156.
Hair J.F., Anderson R.E., Tatham R.L. and Grablowsky B.L. 1979. Multivariate Data Analysis.
Petrolium Publishing Co., Tulsa, Oklahoma.
Hazell D., Cunnungham R., Lindenmayer D., Mackey B., Osborne and W. 2001. Use of farm dams
as frog habitat in an Autralian agricultural landscape: factors affecting species richness and
distribution. Biol. Conserv. 102: 155–169.
Hecnar S.J. and M’Closkey R.T. 1997. Patterns of nestedness and species association in a pond
dwelling amphibian fauna. Oikos 80: 371–381.
Huston M.A. 1995. Biological Diversity: the Coexistence of Species on Changing. Cambridge
University Press, Cambridge.
Hutcheson K. 1970. A test for comparing diversities based on the Shannon formula. J. Theo. Biol.
29: 151–154.
Jansen D. 1986. The eternal external threat. In: Soule M.E. (ed.), Conservation Biology. The
Science of Scarcity and Diversity, Sinauer Associates Inc., Sunderland, MA, pp. 286–302.
Knutson M., Richardson W., Reineke D.M., Gray B.R., Parmelee J.R. and Weick S.E. 2004.
Agricultural ponds support amphibian population. Ecol. Appl. 14(3): 669–684.
Knutson M., Sauer J.R., Olsen D.A., Mossman M.J., Hemesath L.M. and Lannoo M.J. 1999.
Effects of landscape composition and wetland fragmentation on frog and toad abundance and
species richness in Iowa and Wisconsin, USA. Conserv. Biol. 13: 1437–1446.
Kovach W.L. 1999. MVSP – Multivariate Statistical Package for IBM-PC, version 3.0.
Lajmanovich R.C., Lorenzatti E., de la Sierra P., Marino F. and Peltzer P.M. 2002. First regis-
trations of organochlorines pesticides residues amphibians of the Mesopotamic Region,
Argentina. Froglog 54: 4.
Lajmanovich R.C. and Peltzer P.M. 2001. Evaluacion de la diversidad de anfibios de un remanente
forestal del valle aluvial del rıo Parana (Entre Rıos- Argentina). Boletın de la Asociacion Her-
petologica Espanola 12: 12–17.
Lajmanovich R.C., Sandoval M.T. and Peltzer P.M. 2003. Induction of mortality and malfor-
mation in Scinax nasicus tadpoles exposed by glyphosate formulations. Bull. Environ. Contam.
Toxicol. 70: 612–618.
Lawton J.H., Bignell D.E., Bolton B., Bloemers G.F., Eggleton P., Hammond P.M., Hodda M.,
Holt R.D., Larsen T.B., Mawdsleu N.A., Stork N.E., Srivasta D.S. and Watt A.T. 1998. Bio-
diversity inventories, indicator taxa and effects of habitat modification in tropical forest. Nature
391: 72–76.
Lips K.R. 1998. Decline of a tropical montane amphibian fauna. Conserv. Biol. 12: 106–117.
MacArthur R.H. and Wilson E.O. 1967. The Theory of Island Biogeography. Princenton Uni-
versity Press, New Jersey.
Magurran A.E. 1987. Ecological Diversity and its Measurements. Princeton University Press,
Princeton, NJ.
Maisonneuve C. and Rioux S. 2001. Importance of riparian habitats for small mammal and
herpetofaunal communities in agricultural landscapes of southern Quebec. Agricult. Ecosyst.
Environ. 83: 165–175.
Manly B.F. 1991. Multivariate Statistical Methods. A Primer. Chapman and Hall, New Zeland.
Mann R.M., Bidwell J.R. and Tyler M.J. 2003. Toxicity of herbicide formulations to frogs and the
implications for product registration: A case study from Western Australia. Appl. Herpetol. 1:
13–22.
Marshall E.J. and Moonen A.C. 2002. Field borders in northern Europe: their functions and
interactions with agriculture. Agricult. Ecosyst. Environ. 89: 5–21.
3512
Matlack G.R. 1997. Lan use and forest habitat distribution in the hinterland of a large city.
J. Biogeogr. 24: 297–307.
Peltzer P.M. and Lajmanovich R.C. 2001. Habitat fragmentation and amphibian species richness in
riparian areas of the Parana River, Argentina. Froglog 46: 5.
Peltzer P.M., Lajmanovich R.C. and Beltzer A.H. 2003. The effects of habitat fragmentation on
amphibian species richness in the floodplain of the middle Parana River. Herpetol. J. 13: 95–98.
Petit L.J. and Petit D.R. 2003. Evaluating the importance of human-modified lands for Neotropical
bird conservation. Conserv. Biol. 17: 687–694.
Ricketts T.H., Daily G.C. and Ehrlich P.R. 2001. Countryside biogeography of moths in a frag-
mented landscape: biodiversity in native and agricultural habitats. Conserv. Biol. 15: 378–388.
Risser P.G. 1995. Biodiversity and ecosystem function. Conserv. Biol. 9: 742–746.
Shannon C.E. and Weaver W. 1949. The Mathematical Theory of Communications. University of
Illinois Press, Urbana.
Sneath P.H. and Sokal R.R. 1973. Numerical Taxonomy. W. H. Freeman & Co, San Francisco.
Stone L. and Roberts A. 1990. The checkerboard score and species distributions. Oecologia 85: 74–
79.
Storfer A. 2003. Amphibian declines: future directions. Diver. Distrib. 9: 151–163.
Stumpel A.H. and van der Voet H. 1998. Characterizing the suitable of new ponds for amphibians.
Amphibia-Reptilia 19: 125–142.
SYSTAT. 1998. Standard Version, Version 9. SPSS Inc., Chicago, IL.
Szaro R.C. 1986. Guild management: an evaluation of avian guilds as a predictive tool. Environ.
Manage. 10: 681–688.
Thomas G.M. 2000. BIO-DAP. A Biodiversity Analysis Package. http://nhsbig.inhs.uiuc.edu/
www/populations.html. Accessed on 28/6/03.
Turner M.G., Arthaud G.J., Engstrom R.T., Hejl S.J., Liu J., Loeb S. and McKelvey K. 1995.
Usefulness of spatially explicit population models in lands management. Ecol. Appl. 5: 12–16.
Vallan D. 2000. Influence of forest fragmentation on amphibian diversity in the nature reserve of
Ambohitantely, highland Madagascar. Biol. Conserv. 96: 31–43.
Wilson J.B. 1989. A null model of guild proportionality, applied to stratification of a New Zealand
temperate rain forest. Oecologia 80: 263–267.
Zar J.H. 1984. Biostatistical Analysis. 2nd ed. Prentice-Hall Inc., Englewood Cliffs, NJ.
Zimmerman B.L. 1994. Audio strip transects. In: Heyer W.R., Donelly M.A., McDiarmid R.W.,
Hayek L.C., Foster M.S. (eds), Measuring and Monitoring Biological Diversity, Standard
Methods for Amphibians. Smithsonian Institution Press, Washington, DC, pp. 92–97.
Zimmerman B. and Bierregaard R.O. 1986. Relevance of the equilibrium theory of island bioge-
ography and species–area relations to conservation with a case from Amazonia. J. Biogeogr. 13:
133–143.
3513