Patterning limnological characteristics of the Chilika lagoon (India) using a self-organizing map
12
ASIA/OCEANIA REPORT Patterning limnological characteristics of the Chilika lagoon (India) using a self-organizing map Kwang-Seuk Jeong Dong-Kyun Kim Ajit Pattnaik Krupasindhu Bhatta Bishnu Bhandari Gea-Jae Joo Received: 23 October 2006 / Accepted: 26 October 2007 / Published online: 13 August 2008 Ó The Japanese Society of Limnology 2008 Abstract In this study, a self-organizing map (SOM) was utilized to classify habitats in the Chilika lagoon located in India, the largest lagoon ecosystem in Asia (maximum length, 64.3 km; mean width, 20.1 km). The lagoon was marginally eutrophic (nitrate, 0.25 ± 0.22 mg L -1 ; ortho- phosphate, 0.26 ± 0.22 mg L -1 ; n = 1,980, respectively) for six years (1999–2004), and it used to be warm, shallow, turbid and predominantly brackish. The SOM model suc- cessfully identified the changing patterns of limnology in the lagoon using the monthly limnological dataset from 30 study sites (July 1999–December 2004). Comparative re-sectoring evaluation of current monitoring sites was accomplished based on the outcome of the modeling. The new site clustering that emerged from the model was similar to conventional ones, and several sites were reorganized. Water physicochemistry was affected by freshwater inflow during monsoon and the new lagoon mouth constructed in September 2000, which resulted in variations in site char- acteristics in terms of limnology. The results of this study may provide information on the limnological patterns in Chilika lagoon, and they leave room for further study into functional changes in the lagoon ecology with respect to changes in climatic factor, freshwater flow and lagoon morphology. Keywords Chilika lagoon Water quality Habitat clustering Self-organizing map (SOM) Limnological patterning Introduction Wetlands are unique in terms of the spatial heterogeneity of their environments, the physical and chemical properties of their substrates and communities, and the large variation in functional ecological processes in their active com- partments (Whitaker and Matvienko 1998). Wetland ecosystems cover between 7 and 8 million km 2 of land globally, consisting of numerous types such as bogs, fens, marshes, swamps, riparian wetlands and lagoons (Mitsch and Gosselink 1993). They are extremely productive landscape components that sustain a high biodiversity (Maltby and Turner 1983; Matthews and Fung 1987; Mitsch et al. 1994). In conjunction with biodiversity research, there have been numerous studies on the devel- opment of wetland classification systems, geographical distributions and their losses, flood control, conservation and restoration, and structural and functional characteris- tics of wetlands (Cowardin et al. 1979; Robinson 1986; Hey and Philippi 1995; Castella and Speight 1996; DeAngelis et al. 1997; Metzker and Mitsch 1997; Findlay and Zheng 1999;O ¨ zesmi and O ¨ zesmi 1999; Buzzelli et al. 2000; Wang and Mitsch 2000; Getzner 2002; Zacharias et al. 2005; Verhoeven et al. 2006; Hallwood 2007). Lagoon systems, which are easily observed in coastal areas, have environmental features which result in a high variability in ecological dynamics (Mitsch and Gosselink 1993). They usually have dynamic limnological variations, and provide crucial systems for migratory birds and bio- diversity (Hattori and Mae 2001). Lagoons also support the K.-S. Jeong D.-K. Kim B. Bhandari (&) G.-J. Joo Department of Biology, Pusan National University, Jang-Jeon Dong, Gum-Jeong Gu, Busan 609-735, South Korea e-mail: [email protected] A. Pattnaik K. Bhatta Chilika Development Authority, Bhubaneswar, India 123 Limnology (2008) 9:231–242 DOI 10.1007/s10201-008-0243-7
Transcript of Patterning limnological characteristics of the Chilika lagoon (India) using a self-organizing map
ASIA/OCEANIA REPORT
Patterning limnological characteristics of the Chilika lagoon(India) using a self-organizing map
Kwang-Seuk Jeong Æ Dong-Kyun Kim Æ Ajit Pattnaik ÆKrupasindhu Bhatta Æ Bishnu Bhandari Æ Gea-Jae Joo
Received: 23 October 2006 / Accepted: 26 October 2007 / Published online: 13 August 2008
� The Japanese Society of Limnology 2008
Abstract In this study, a self-organizing map (SOM) was
utilized to classify habitats in the Chilika lagoon located in
India, the largest lagoon ecosystem in Asia (maximum
length, 64.3 km; mean width, 20.1 km). The lagoon was
marginally eutrophic (nitrate, 0.25 ± 0.22 mg L-1; ortho-
phosphate, 0.26 ± 0.22 mg L-1; n = 1,980, respectively)
for six years (1999–2004), and it used to be warm, shallow,
turbid and predominantly brackish. The SOM model suc-
cessfully identified the changing patterns of limnology in the
lagoon using the monthly limnological dataset from 30 study
sites (July 1999–December 2004). Comparative re-sectoring
evaluation of current monitoring sites was accomplished
based on the outcome of the modeling. The new site
clustering that emerged from the model was similar to
conventional ones, and several sites were reorganized.
Water physicochemistry was affected by freshwater inflow
during monsoon and the new lagoon mouth constructed in
September 2000, which resulted in variations in site char-
acteristics in terms of limnology. The results of this study
may provide information on the limnological patterns in
Chilika lagoon, and they leave room for further study into
functional changes in the lagoon ecology with respect to
changes in climatic factor, freshwater flow and lagoon
morphology.
Keywords Chilika lagoon � Water quality �Habitat clustering � Self-organizing map (SOM) �Limnological patterning
Introduction
Wetlands are unique in terms of the spatial heterogeneity
of their environments, the physical and chemical properties
of their substrates and communities, and the large variation
in functional ecological processes in their active com-
partments (Whitaker and Matvienko 1998). Wetland
ecosystems cover between 7 and 8 million km2 of land
globally, consisting of numerous types such as bogs, fens,
marshes, swamps, riparian wetlands and lagoons (Mitsch
and Gosselink 1993). They are extremely productive
landscape components that sustain a high biodiversity
(Maltby and Turner 1983; Matthews and Fung 1987;
Mitsch et al. 1994). In conjunction with biodiversity
research, there have been numerous studies on the devel-
opment of wetland classification systems, geographical
distributions and their losses, flood control, conservation
and restoration, and structural and functional characteris-
tics of wetlands (Cowardin et al. 1979; Robinson 1986;
Hey and Philippi 1995; Castella and Speight 1996;
DeAngelis et al. 1997; Metzker and Mitsch 1997; Findlay
and Zheng 1999; Ozesmi and Ozesmi 1999; Buzzelli et al.
2000; Wang and Mitsch 2000; Getzner 2002; Zacharias
et al. 2005; Verhoeven et al. 2006; Hallwood 2007).
Lagoon systems, which are easily observed in coastal
areas, have environmental features which result in a high
variability in ecological dynamics (Mitsch and Gosselink
1993). They usually have dynamic limnological variations,
and provide crucial systems for migratory birds and bio-
diversity (Hattori and Mae 2001). Lagoons also support the
K.-S. Jeong � D.-K. Kim � B. Bhandari (&) � G.-J. Joo
Department of Biology, Pusan National University,
Jang-Jeon Dong, Gum-Jeong Gu, Busan 609-735, South Korea
e-mail: [email protected]
A. Pattnaik � K. Bhatta
Chilika Development Authority, Bhubaneswar, India
123
Limnology (2008) 9:231–242
DOI 10.1007/s10201-008-0243-7
basic needs of human society (e.g., fish production, culti-
vation, etc.) and also possess biological functions and
properties (Mohapatra et al. 2007a). These are highly
threatened ecosystems, many of which have relatively
small volumes of water and very restricted connections
with the sea (Panigrahi et al. 2007). Proper management of
the lagoon ecosystem is often critical to the sustainability
of the biodiversity and livelihoods associated with the
lagoon (Choi et al. 1998). Identification of key factors
governing the ecological dynamics of a lagoon are strongly
required to establish the basis for the ecological research
needed to undertake the efficient management and biodi-
versity conservation of lagoon ecosystems. Environmental
patterning from accumulated data is thought to be one of
the solutions to this problem.
Patterning ecosystem dynamics is a fundamental require-
ment when establishing management plans, understanding
ecosystem properties and communicating interdisciplinarity
in marine-coastal as well as freshwater ecosystems (Mumby
and Harborne 1999; Rabeni et al. 2002). Pattern analysis
should be able to represent both the planners’ intention for the
ecosystem (Stevens and Connolly 2004) and ecological inter-
or intra-habitat interactions. The associations between
structures and functions of the ecosystem are also very
complex (see Fielding 1999) and therefore it is necessary to
utilize ecologically suitable methods to discover patterns in
these ecosystems.
The Chilika lagoon, located in Eastern India, is a
wetland of international importance (i.e., Ramsar site; as
designated on 1 October 1981), supporting a large degree
of biodiversity and the livelihoods of 200,000 local
inhabitants. The lagoon has shown environmental and
anthropogenic impacts over the last several decades, such
as environmental degradation, siltation, changes in
salinity gradients, extensive growth of invasive species,
depletion of fishery resources, shifting of the lagoon
inlet, choking of the lagoon-sea channel, etc. (Authority
2002). After this lagoon was included in the Montreux
Record on 16 June 1998 by the Ramsar Bureau due to
changes in its ecological characteristics, many restoration
projects were carried out in the area. In these efforts,
diverse parameters were monitored at numerous moni-
toring stations and the lagoon was entirely managed
along with defined sectors by the Chilika Development
Authority (CDA) (Authority 2002). Also, in the last
decade, various research programs have been conducted
regarding morphological changes, water quality changes
and anthropogenic impacts, fisheries and resource man-
agement, and sediment management in the lagoon
(Nayak et al. 2004; Nayak and Behera 2004; Rath and
Adhikary 2004; Sekhar 2004; Kannan et al. 2005; Rath
and Adhikary 2005; Tripati and Vora 2005; Panda et al.
2006; Mohapatra et al. 2007a; Mohapatra et al. 2007b;
Panigrahi et al. 2007; Sekhar 2007).
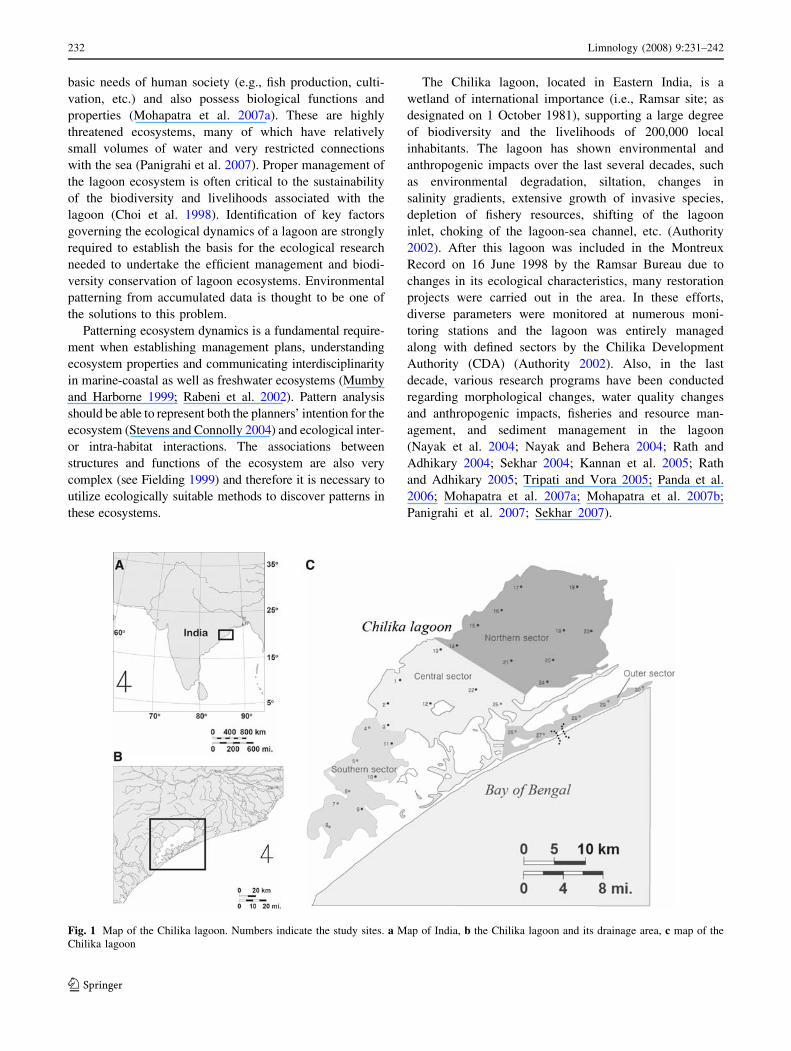
Fig. 1 Map of the Chilika lagoon. Numbers indicate the study sites. a Map of India, b the Chilika lagoon and its drainage area, c map of the
Chilika lagoon
232 Limnology (2008) 9:231–242
123
Most studies from the Chilika lagoon were based on
conventional zoning (Fig. 1), and this must be reconsidered
because of continuous changes in the lagoon’s morphology
and limnology (see Pattnaik 2002). Furthermore, efficient
and effective monitoring should be considered in order to
maximize the long-term research at the lagoon. In order to
accomplish this, it is necessary to discover ecological
pattern dynamics in the lagoon. Accumulated data for a
long period will provide necessary information for the
work, and patterns derived from the data will help to
overcome monitoring, research, and management limits
caused by the lack of information.
Recently, highly effective methods of ecological pattern
analysis have been designed, such as artificial neural net-
works (ANNs), genetic algorithms, and fuzzy logic (see
Chon et al. 1996). ANN has been successfully applied to a
variety of ecosystems to develop or analyze ecological
criteria using biological as well as environmental param-
eters (Lek et al. 1996; Jeong et al. 2003; e.g., Dedecker
et al. 2004). There are numerous branched algorithms that
are intended for specific purposes. For example, the feed-
forward network and its relatives are good for developing
predictive models (Joy and Death 2004; Kasabov 2004; Liu
et al. 2004; Ryan et al. 2004; Almasri and Kaluarachchi
2005; Chang et al. 2005; Taskaya-Temizel and Casey
2005; Valdes and Bonham-Carterb 2006; Curry 2007),
while a self-organizing map (SOM) system is an especially
powerful patterning method for understanding complex
ecosystem dynamics (Chon et al. 2001; Park et al. 2003a,
2004, 2006; Joo and Jeong 2005; Grenier et al. 2006; Lee
and Scholz 2006; Lee et al. 2006; Astel et al. 2007).
This study is an attempt to apply the SOM system to the
Chilika lagoon environment. Three major objectives were
established in this study: (1) to detect seasonal variations in
water quality (mainly to investigate the relationship with
monsoon climate), (2) to delineate the lagoon into different
ecological sectors in accordance with current limnological
characteristics, and (3) to explore changes in the salinity
gradient due to the opening of a new mouth to the sea. The
SOM algorithm analyzed a large set of data (for a period of
six years and from 30 study sites) on various limnological
parameters for the Chilika lagoon. The results of this study
will not only encourage the application of SOM models to
complex environmental data but will also provide infor-
mation on the lagoon’s environmental dynamics, which is
necessary for systematic ecological research studies.
Description of the study site
The Chilika lagoon is the largest lagoon along the east
coast of India, situated between latitudes N 19� 280 and N
19� 540, and longitudes E 85� 050 and E 85� 380 (Pattnaik
2002) (Fig. 1). It covers the Puri, Khurda and Ganjam
districts of the State of Orissa and is separated from the
Bay of Bengal by a sand bar whose width varies from
100 m to 1.5 km. A 32 km long narrow outer channel used
to connect the main lagoon to the Bay of Bengal near the
village of Arakhakuda.
The extent of the lagoon varies between 906 and
1,165 km2 during summer and monsoon, respectively. The
lagoon is pear-shaped, with a linear maximum length of
64.3 km and an average width of 20.1 km; the mean widths
during summer and monsoon are 14.08 and 18.10 km,
respectively. The vegetation-free area of the lagoon is
726 km2, while the area covered with macrophytes is
179 km2 (varies seasonally). The lagoon is estuarine, with
a unique assemblage of marine, and brackish and fresh-
water water ecosystems. Over one million migratory
waterfowl, shorebirds and resident birds winter here, and
the lagoon also supports many endangered species and is
also home to a number of endemic species of flora and
fauna. Therefore, it is a biodiversity hot spot and a wetland
of international importance.
The CDA, based on the outcomes of numerical model
studies, took the decision to restore the lagoon. The sea inlet
of the lagoon was located 32 km away from the outer
channel. On September 2000, the CDA carried out a major
hydrological intervention by opening a new mouth (100 m
width, 2.5 m below the lowest lagoon water level) between
sites 27 and 28 (Fig. 1; it is recommended that readers visit
http://www.chilika.com for more information on the new
mouth). After opening the new mouth, the distance between
the lagoon and outlet was reduced to 18 km. This caused a
large change in salinity. A high salinity level could be
observed near the outer channel and the connection between
the lagoon and channel (site 25). However, the opening of
the new mouth facilitated a spread in the salinity to sites 19,
20, 22, and 23 (Pattnaik 2002). The overall salinity also
increased after the construction work. This may lead to
further ecological changes in the Chilika lagoon.
As previously mentioned in the ‘‘Introduction,’’ the lagoon
was included in the Montreux Record in 1998. The Ramsar
Bureau, based on their assessment of initiatives by the CDA
to restore and maintain the ecological integrity of the lagoon,
removed the lagoon from the Montreux Record on 11
November 2002; the Montreux Record is available at the
website (http://www.ramsar.org/key_montreux_record.htm).
Materials and methods
Selection of sampling station
Under the Hydrobiological Monitoring Programme, the
entire lagoon was taken into consideration by the Chilika
Limnology (2008) 9:231–242 233
123
Development Authority (CDA). The Chilika lagoon was
divided into four ecological sectors and the hydrophysico-
chemical parameters were monitored monthly at 30
sampling stations (eight stations in the southern sector,
seven stations in the central sector, ten stations in the
northern sector, and five stations in the outer channel sectors;
see Fig. 1). These stations were fixed using GPS (geographic
positioning system), which had an error of ±10 m.
A series of limnological variables were monitored for
the surface and bottom layers of the lagoon water. Sam-
pling and field study were conducted for a week (the 18th–
25th days) every month. The monitoring was conducted
using a mechanized site-specific boat equipped with safety
measures and coordinated by the CDA. Monthly monitor-
ing was confined to hydrophysicochemical parameters
such as air temperature, water temperature, depth, Secchi
transparency, specific conductivity, pH, and alkalinity,
salinity, dissolved oxygen, nitrate, and orthophosphate.
These variables were monitored for six years from 1999 to
2004.
Data collection on environmental parameters
Air temperature was recorded with an ordinary thermo-
meter with ±0.1% error at all sampling stations. Surface
and bottom water temperatures were also recorded (with a
salinity conductivity temperature meter). The water trans-
parency was measured using a Secchi disc consisting of a
brass plate of 20 cm diameter with four alternate black and
white quadrants painted on the upper surface. Water depth
was recorded using a sounding chain. The water samples
from the top and the bottom of the water column were
collected from each station and taken to the laboratory in
order to measure the total suspended solids (TSS). The
coarse and medium silt particles were sieved by 75- and
212-micron sieves. The finer particles were filtrated with a
vacuum pump filtration unit and Whatman filter paper No.
42. The bottom water was collected by Ruttner sampler and
Niskin samplers from KC Denmark (Silkeborg, Denmark).
Right after collection, some samples were kept separately
in plastic and glass bottles. The samples were preserved in
5% chloroform, 4N sulfuric acid in glass bottles and deep
frozen (Golterman and Clymo 1971).
Water pH was measured using a Grip D field pH meter,
while the specific conductivity of water was measured
using a digital conductivity meter. Total alkalinity was
analyzed titrimetrically with phenophathelin and methyl
orange indicators (Association 1992). The salinity of water
was measured by both the agentometric method of Harvey
(Barnes 1959) and a Systronics SCT meter. In the agen-
tometric method it was titrated against silver nitrate using
potassium chromate as indicator. DO was measured by
modified Winkler’s titrimetric method (Strickland and
Parsons 1972) and electronically by ELICO water analyzer
with a DO probe. Water nitrate was estimated by a spec-
trophotometry method using phenol disulfonic acid and
ammonia as color developer. Orthophosphate was esti-
mated using the ascorbic acid method incorporating a
double beam spectrophotometer.
Self-organizing map modeling with limnological data
A self-organizing map is an algorithm capable of reducing
data dimensionality (Kohonen 1984). A Kohonen network
is a competitive network system where neurons in
Euclidean map space compete with each other. To pattern
as well as cluster the study sites, a two-dimensional
Kohonen network was adopted.
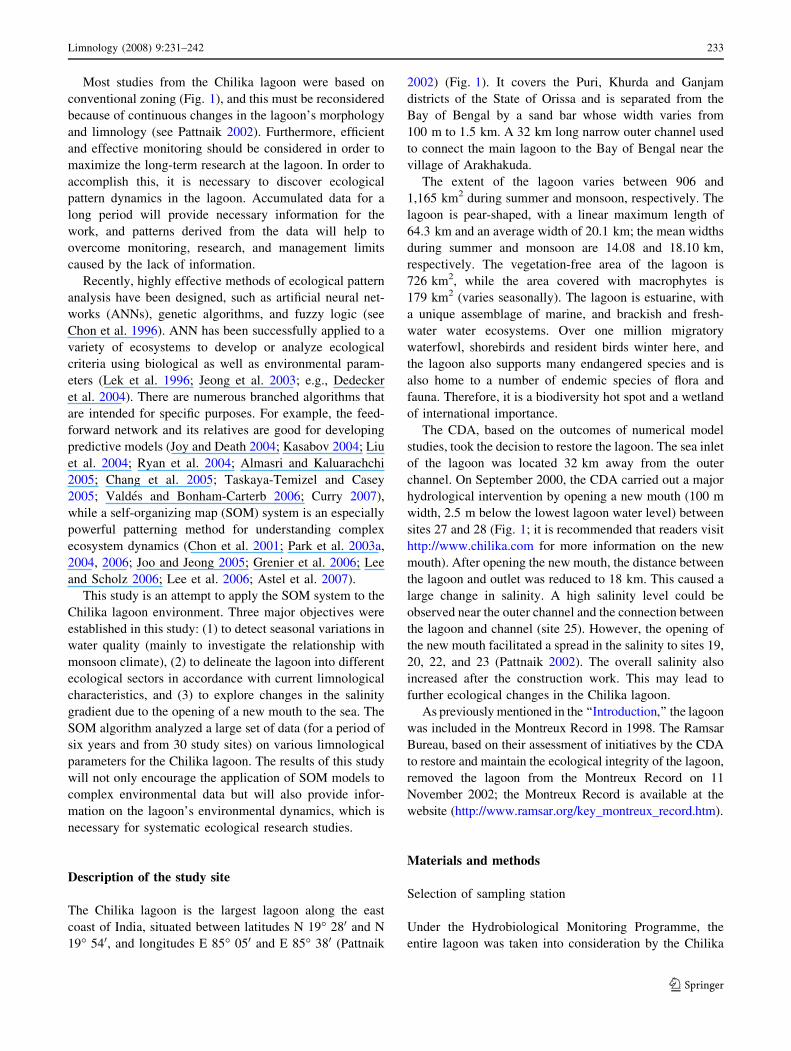
In this study, a Kohonen network was constructed with
artificial neurons (processing elements) connected to input
neurons (Fig. 2). The input for the network were the data
on the limnological variables i, xi identified during the
study period. Every node, j, of the output layer was con-
nected to each node, i, in the input layer. A hexagonal array
of neurons was selected. The weight vector, w(t), repre-
sented the connection between the input and output layers.
As training preceded, each weight value, wij(t), was adap-
tively changed at each iteration t. In the initial stage, w(t)
was randomly and uniformly distributed in the network
Var. iVar. 2 Var. nVar. 1
- - - -- - - -- - - -- - - -- - - -- - - -
Input variables(water quality parameters)
Limnological data
- - - -
Fig. 2 An illustration of the SOM model utilized in this study
234 Limnology (2008) 9:231–242
123
architecture. As input signals entered the network, each
neuron computed the summed distance between the weight
and input.
The neuron with the maximum response among the
given input data was selected as the winning neuron, whose
weight vector had the minimum distance to the input
vector. The winning neuron and its neighborhood can be
learned by changing the weights so as to reduce the dis-
tance between the weight and the input vector. Further
detailed references can be found in (Kohonen 1984, 1998).
SOM training was achieved using a series of limno-
logical data examined at the Chilika lagoon. A total of
1980 data samples (July 1999–December 2004) from 30
study sites were gathered for each variable. There are no
strict rules regarding the number of output neurons that
should be obtained (Park et al. 2007), and so we trained the
SOM with different map sizes in order to choose a suitable
model. A batch learning algorithm was adapted in this
study. After training, the data were clustered according to
the calculated U-matrix, which provides dissimilarity of
data samples on the map plane. The major focus of clus-
tering was how the monitoring stations were organized
into clusters on the basis of (1) different discrete cli-
mate conditions (monsoon and non-monsoon season) and
(2) pre- and post-construction of the new mouth (outlet).
To develop the SOM model, Matlab 6.1 and the SOM
coding solution based on the SOM Toolbox for Matlab
(Alhoniemi et al. 2000) were used.
Results
Limnological characteristics of the Chilika lagoon
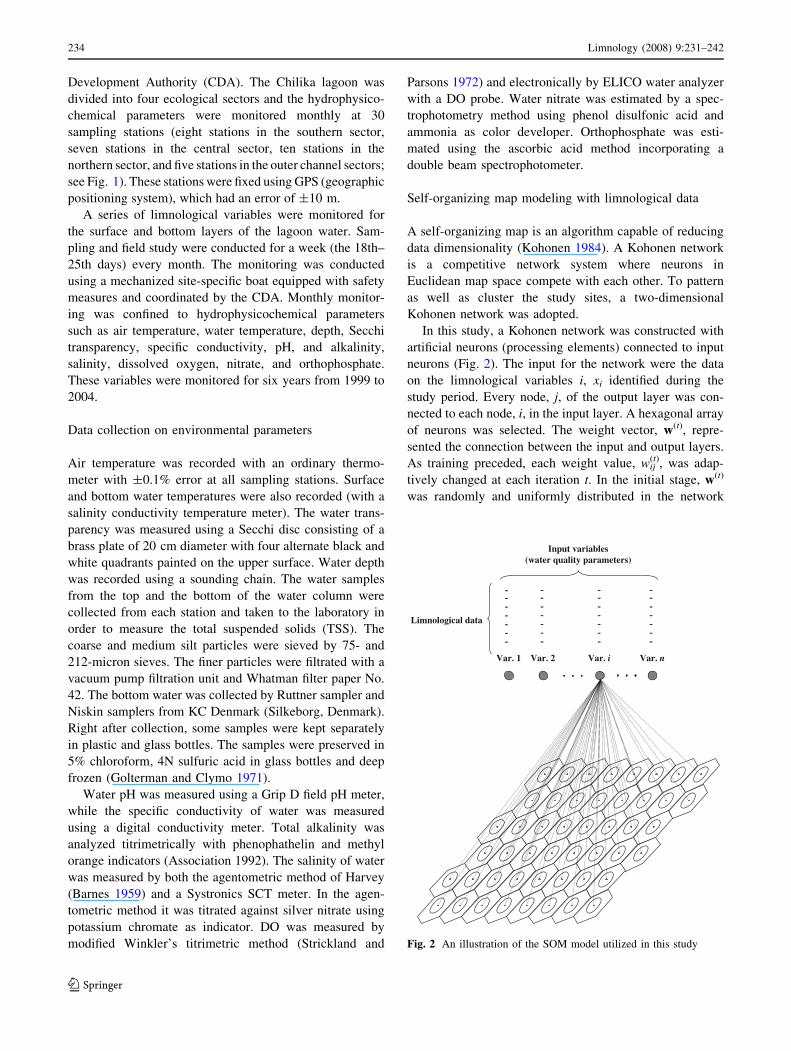
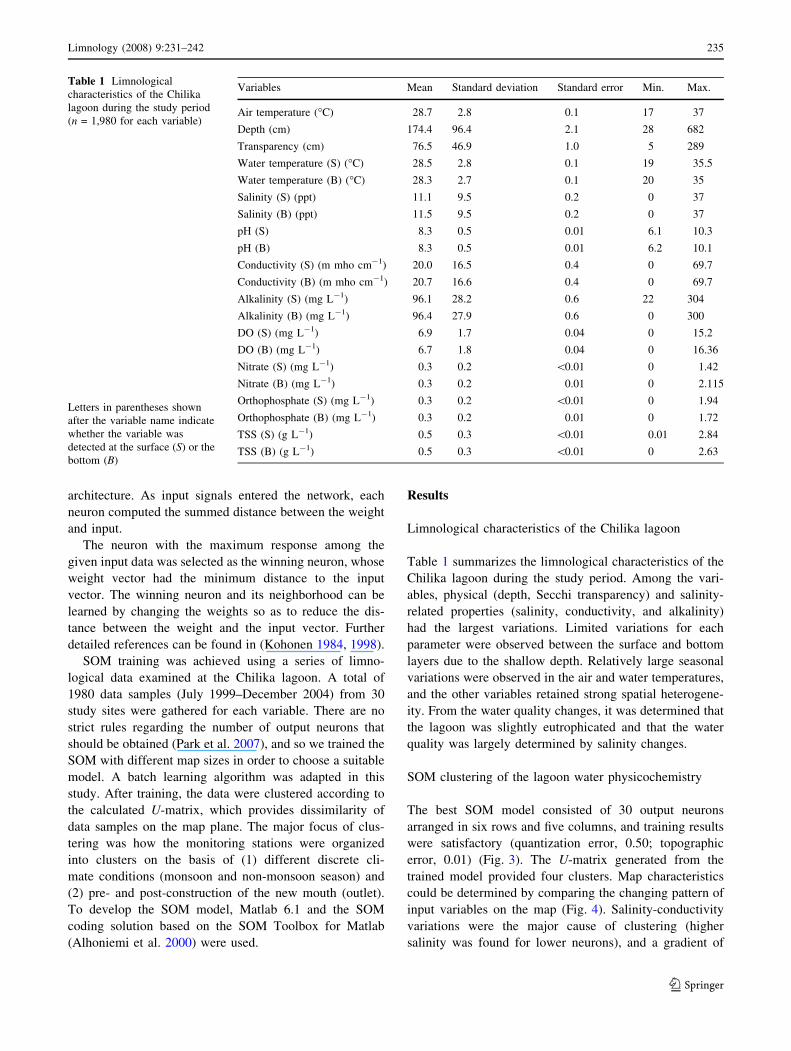
Table 1 summarizes the limnological characteristics of the
Chilika lagoon during the study period. Among the vari-
ables, physical (depth, Secchi transparency) and salinity-
related properties (salinity, conductivity, and alkalinity)
had the largest variations. Limited variations for each
parameter were observed between the surface and bottom
layers due to the shallow depth. Relatively large seasonal
variations were observed in the air and water temperatures,
and the other variables retained strong spatial heterogene-
ity. From the water quality changes, it was determined that
the lagoon was slightly eutrophicated and that the water
quality was largely determined by salinity changes.
SOM clustering of the lagoon water physicochemistry
The best SOM model consisted of 30 output neurons
arranged in six rows and five columns, and training results
were satisfactory (quantization error, 0.50; topographic
error, 0.01) (Fig. 3). The U-matrix generated from the
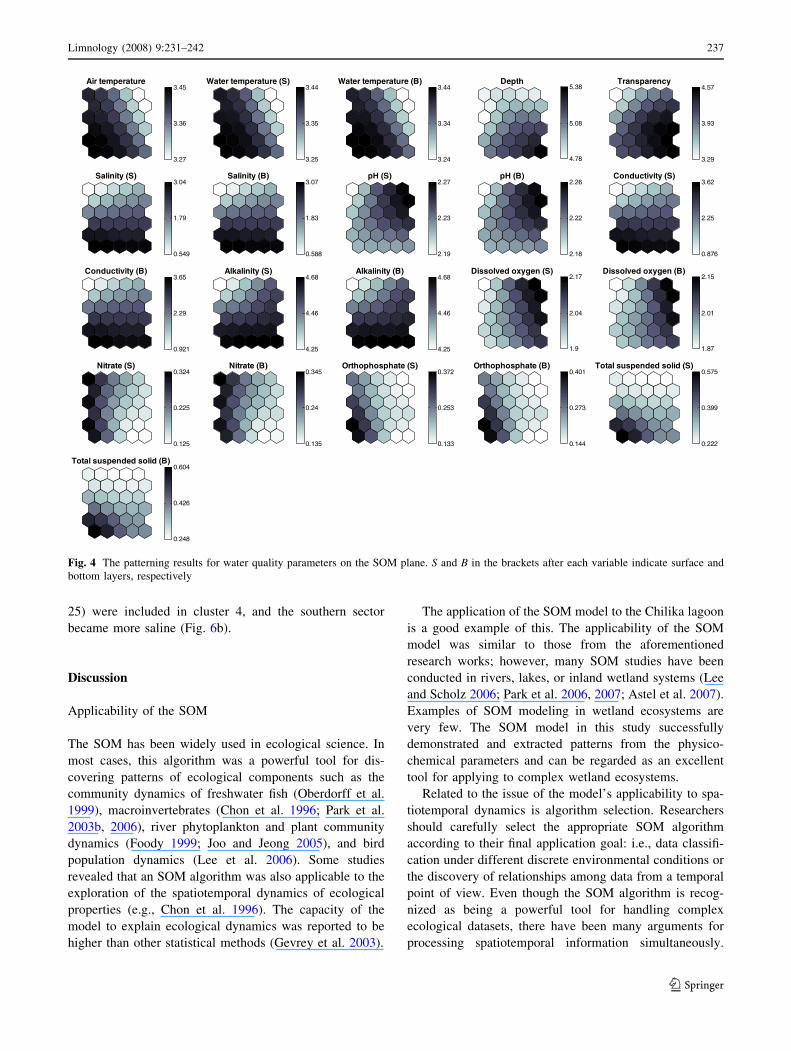
trained model provided four clusters. Map characteristics
could be determined by comparing the changing pattern of
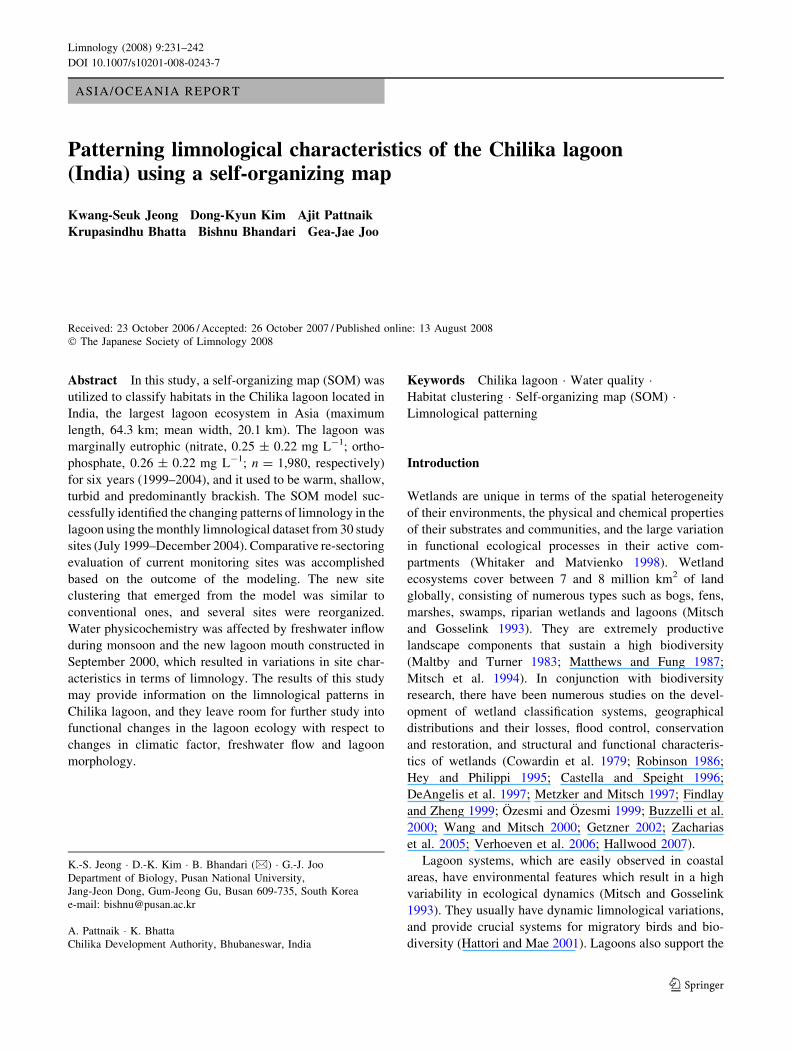
input variables on the map (Fig. 4). Salinity-conductivity
variations were the major cause of clustering (higher
salinity was found for lower neurons), and a gradient of
Table 1 Limnological
characteristics of the Chilika
lagoon during the study period
(n = 1,980 for each variable)
Letters in parentheses shown
after the variable name indicate
whether the variable was
detected at the surface (S) or the
bottom (B)
Variables Mean Standard deviation Standard error Min. Max.
Air temperature (�C) 28.7 2.8 0.1 17 37
Depth (cm) 174.4 96.4 2.1 28 682
Transparency (cm) 76.5 46.9 1.0 5 289
Water temperature (S) (�C) 28.5 2.8 0.1 19 35.5
Water temperature (B) (�C) 28.3 2.7 0.1 20 35
Salinity (S) (ppt) 11.1 9.5 0.2 0 37
Salinity (B) (ppt) 11.5 9.5 0.2 0 37
pH (S) 8.3 0.5 0.01 6.1 10.3
pH (B) 8.3 0.5 0.01 6.2 10.1
Conductivity (S) (m mho cm-1) 20.0 16.5 0.4 0 69.7
Conductivity (B) (m mho cm-1) 20.7 16.6 0.4 0 69.7
Alkalinity (S) (mg L-1) 96.1 28.2 0.6 22 304
Alkalinity (B) (mg L-1) 96.4 27.9 0.6 0 300
DO (S) (mg L-1) 6.9 1.7 0.04 0 15.2
DO (B) (mg L-1) 6.7 1.8 0.04 0 16.36
Nitrate (S) (mg L-1) 0.3 0.2 \0.01 0 1.42
Nitrate (B) (mg L-1) 0.3 0.2 0.01 0 2.115
Orthophosphate (S) (mg L-1) 0.3 0.2 \0.01 0 1.94
Orthophosphate (B) (mg L-1) 0.3 0.2 0.01 0 1.72
TSS (S) (g L-1) 0.5 0.3 \0.01 0.01 2.84
TSS (B) (g L-1) 0.5 0.3 \0.01 0 2.63
Limnology (2008) 9:231–242 235
123
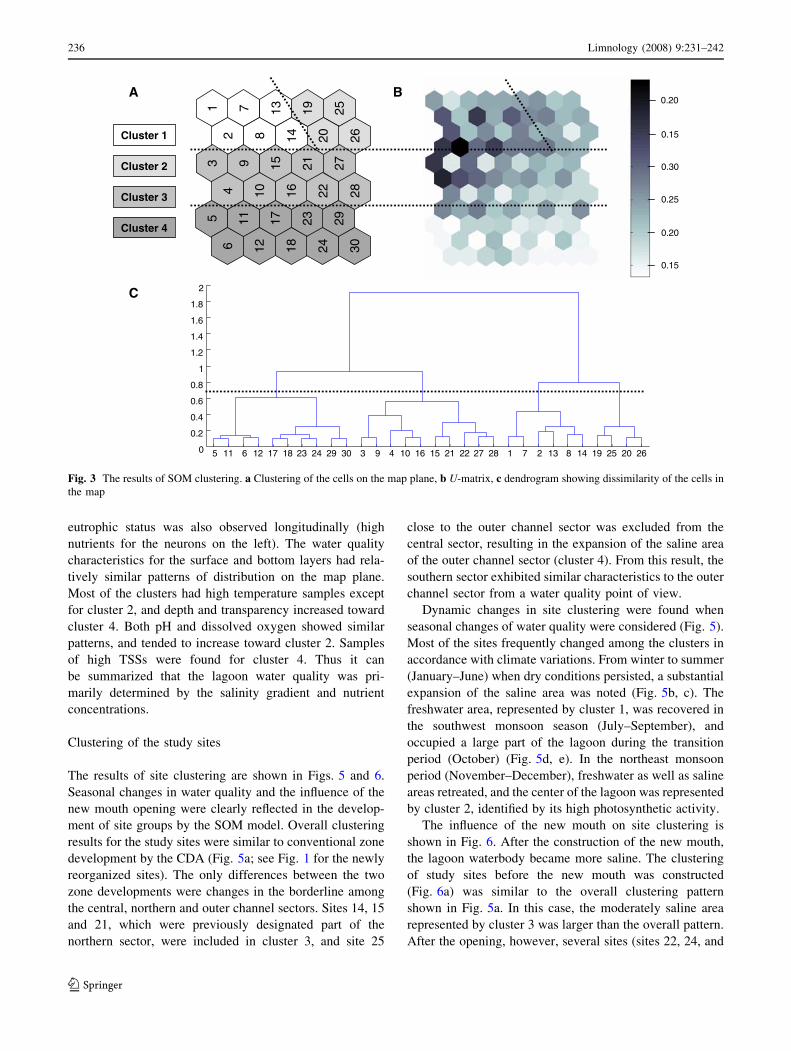
eutrophic status was also observed longitudinally (high
nutrients for the neurons on the left). The water quality
characteristics for the surface and bottom layers had rela-
tively similar patterns of distribution on the map plane.
Most of the clusters had high temperature samples except
for cluster 2, and depth and transparency increased toward
cluster 4. Both pH and dissolved oxygen showed similar
patterns, and tended to increase toward cluster 2. Samples
of high TSSs were found for cluster 4. Thus it can
be summarized that the lagoon water quality was pri-
marily determined by the salinity gradient and nutrient
concentrations.
Clustering of the study sites
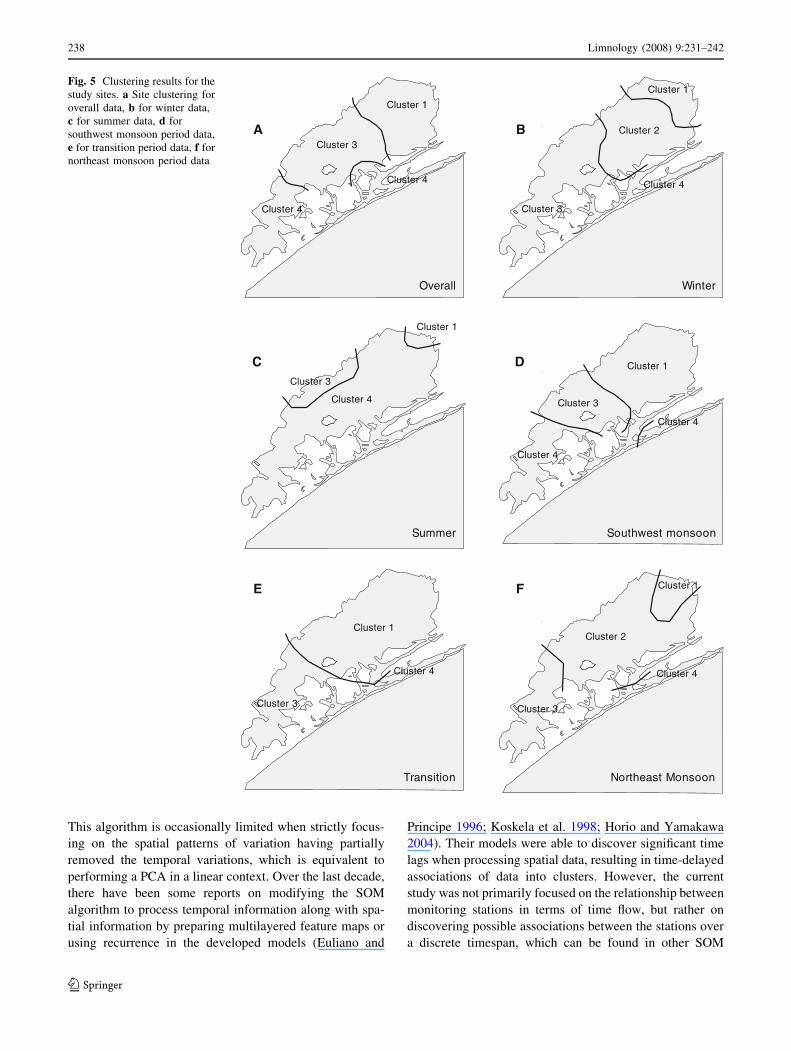
The results of site clustering are shown in Figs. 5 and 6.
Seasonal changes in water quality and the influence of the
new mouth opening were clearly reflected in the develop-
ment of site groups by the SOM model. Overall clustering
results for the study sites were similar to conventional zone
development by the CDA (Fig. 5a; see Fig. 1 for the newly
reorganized sites). The only differences between the two
zone developments were changes in the borderline among
the central, northern and outer channel sectors. Sites 14, 15
and 21, which were previously designated part of the
northern sector, were included in cluster 3, and site 25
close to the outer channel sector was excluded from the
central sector, resulting in the expansion of the saline area
of the outer channel sector (cluster 4). From this result, the
southern sector exhibited similar characteristics to the outer
channel sector from a water quality point of view.
Dynamic changes in site clustering were found when
seasonal changes of water quality were considered (Fig. 5).
Most of the sites frequently changed among the clusters in
accordance with climate variations. From winter to summer
(January–June) when dry conditions persisted, a substantial
expansion of the saline area was noted (Fig. 5b, c). The
freshwater area, represented by cluster 1, was recovered in
the southwest monsoon season (July–September), and
occupied a large part of the lagoon during the transition
period (October) (Fig. 5d, e). In the northeast monsoon
period (November–December), freshwater as well as saline
areas retreated, and the center of the lagoon was represented
by cluster 2, identified by its high photosynthetic activity.
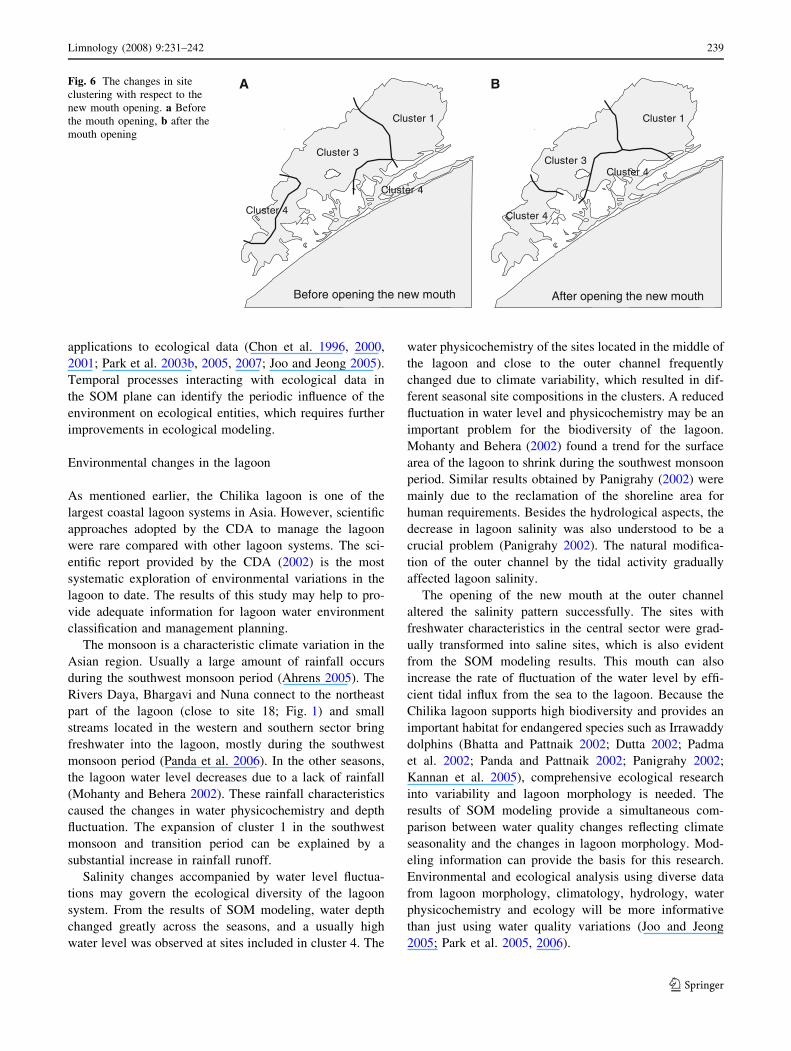
The influence of the new mouth on site clustering is
shown in Fig. 6. After the construction of the new mouth,
the lagoon waterbody became more saline. The clustering
of study sites before the new mouth was constructed
(Fig. 6a) was similar to the overall clustering pattern
shown in Fig. 5a. In this case, the moderately saline area
represented by cluster 3 was larger than the overall pattern.
After the opening, however, several sites (sites 22, 24, and
0.15
0.20
0.25
0.30
0.15
0.20
Cluster 1
Cluster 2
Cluster 3
Cluster 4
1 7 13 19 25
2 8 14 20 26
3 9 15 21 27
4 10 16 22 28
5 11 17 23 29
6 12 18 24 30
5 11 6 12 17 18 23 24 29 30 3 9 4 10 16 15 21 22 27 28 1 7 2 13 8 14 19 25 20 260
0.2
0.4
0.6
0.8
1
1.2
1.4
1.6
1.8
2
BA
C
Fig. 3 The results of SOM clustering. a Clustering of the cells on the map plane, b U-matrix, c dendrogram showing dissimilarity of the cells in
the map
236 Limnology (2008) 9:231–242
123
25) were included in cluster 4, and the southern sector
became more saline (Fig. 6b).
Discussion
Applicability of the SOM
The SOM has been widely used in ecological science. In
most cases, this algorithm was a powerful tool for dis-
covering patterns of ecological components such as the
community dynamics of freshwater fish (Oberdorff et al.
1999), macroinvertebrates (Chon et al. 1996; Park et al.
2003b, 2006), river phytoplankton and plant community
dynamics (Foody 1999; Joo and Jeong 2005), and bird
population dynamics (Lee et al. 2006). Some studies
revealed that an SOM algorithm was also applicable to the
exploration of the spatiotemporal dynamics of ecological
properties (e.g., Chon et al. 1996). The capacity of the
model to explain ecological dynamics was reported to be
higher than other statistical methods (Gevrey et al. 2003).
The application of the SOM model to the Chilika lagoon
is a good example of this. The applicability of the SOM
model was similar to those from the aforementioned
research works; however, many SOM studies have been
conducted in rivers, lakes, or inland wetland systems (Lee
and Scholz 2006; Park et al. 2006, 2007; Astel et al. 2007).
Examples of SOM modeling in wetland ecosystems are
very few. The SOM model in this study successfully
demonstrated and extracted patterns from the physico-
chemical parameters and can be regarded as an excellent
tool for applying to complex wetland ecosystems.
Related to the issue of the model’s applicability to spa-
tiotemporal dynamics is algorithm selection. Researchers
should carefully select the appropriate SOM algorithm
according to their final application goal: i.e., data classifi-
cation under different discrete environmental conditions or
the discovery of relationships among data from a temporal
point of view. Even though the SOM algorithm is recog-
nized as being a powerful tool for handling complex
ecological datasets, there have been many arguments for
processing spatiotemporal information simultaneously.
Total suspended solid (B)
3.27
3.36
3.45Air temperature
3.25
3.35
3.44Water temperature (S)
3.24
3.34
3.44Water temperature (B)
4.78
5.08
5.38Depth
3.29
3.93
4.57Transparency
0.549
1.79
3.04Salinity (S)
0.588
1.83
3.07Salinity (B)
2.19
2.23
2.27pH (S)
2.18
2.22
2.26pH (B)
0.876
2.25
3.62Conductivity (S)
0.921
2.29
3.65Conductivity (B)
4.25
4.46
4.68Alkalinity (S)
4.25
4.46
4.68Alkalinity (B)
1.9
2.04
2.17Dissolved oxygen (S)
1.87
2.01
2.15Dissolved oxygen (B)
0.125
0.225
0.324Nitrate (S)
0.135
0.24
0.345Nitrate (B)
0.133
0.253
0.372Orthophosphate (S)
0.144
0.273
0.401Orthophosphate (B)
0.222
0.399
0.575Total suspended solid (S)
0.248
0.426
0.604
Fig. 4 The patterning results for water quality parameters on the SOM plane. S and B in the brackets after each variable indicate surface and
bottom layers, respectively
Limnology (2008) 9:231–242 237
123
This algorithm is occasionally limited when strictly focus-
ing on the spatial patterns of variation having partially
removed the temporal variations, which is equivalent to
performing a PCA in a linear context. Over the last decade,
there have been some reports on modifying the SOM
algorithm to process temporal information along with spa-
tial information by preparing multilayered feature maps or
using recurrence in the developed models (Euliano and
Principe 1996; Koskela et al. 1998; Horio and Yamakawa
2004). Their models were able to discover significant time
lags when processing spatial data, resulting in time-delayed
associations of data into clusters. However, the current
study was not primarily focused on the relationship between
monitoring stations in terms of time flow, but rather on
discovering possible associations between the stations over
a discrete timespan, which can be found in other SOM
A B
C D
E F
Cluster 3
Cluster 1
Cluster 4
Summer
Cluster 3
Cluster 1
Cluster 4
Cluster 4
Southwest monsoon
Cluster 1
Cluster 4
Cluster 3
Transition
Cluster 2
Cluster 1
Cluster 4
Cluster 3
Winter
Cluster 1
Cluster 4
Cluster 3
Overall
Cluster 4
Cluster 2
Cluster 1
Cluster 4
Northeast Monsoon
Cluster 3
Fig. 5 Clustering results for the
study sites. a Site clustering for
overall data, b for winter data,
c for summer data, d for
southwest monsoon period data,
e for transition period data, f for
northeast monsoon period data
238 Limnology (2008) 9:231–242
123
applications to ecological data (Chon et al. 1996, 2000,
2001; Park et al. 2003b, 2005, 2007; Joo and Jeong 2005).
Temporal processes interacting with ecological data in
the SOM plane can identify the periodic influence of the
environment on ecological entities, which requires further
improvements in ecological modeling.
Environmental changes in the lagoon
As mentioned earlier, the Chilika lagoon is one of the
largest coastal lagoon systems in Asia. However, scientific
approaches adopted by the CDA to manage the lagoon
were rare compared with other lagoon systems. The sci-
entific report provided by the CDA (2002) is the most
systematic exploration of environmental variations in the
lagoon to date. The results of this study may help to pro-
vide adequate information for lagoon water environment
classification and management planning.
The monsoon is a characteristic climate variation in the
Asian region. Usually a large amount of rainfall occurs
during the southwest monsoon period (Ahrens 2005). The
Rivers Daya, Bhargavi and Nuna connect to the northeast
part of the lagoon (close to site 18; Fig. 1) and small
streams located in the western and southern sector bring
freshwater into the lagoon, mostly during the southwest
monsoon period (Panda et al. 2006). In the other seasons,
the lagoon water level decreases due to a lack of rainfall
(Mohanty and Behera 2002). These rainfall characteristics
caused the changes in water physicochemistry and depth
fluctuation. The expansion of cluster 1 in the southwest
monsoon and transition period can be explained by a
substantial increase in rainfall runoff.
Salinity changes accompanied by water level fluctua-
tions may govern the ecological diversity of the lagoon
system. From the results of SOM modeling, water depth
changed greatly across the seasons, and a usually high
water level was observed at sites included in cluster 4. The
water physicochemistry of the sites located in the middle of
the lagoon and close to the outer channel frequently
changed due to climate variability, which resulted in dif-
ferent seasonal site compositions in the clusters. A reduced
fluctuation in water level and physicochemistry may be an
important problem for the biodiversity of the lagoon.
Mohanty and Behera (2002) found a trend for the surface
area of the lagoon to shrink during the southwest monsoon
period. Similar results obtained by Panigrahy (2002) were
mainly due to the reclamation of the shoreline area for
human requirements. Besides the hydrological aspects, the
decrease in lagoon salinity was also understood to be a
crucial problem (Panigrahy 2002). The natural modifica-
tion of the outer channel by the tidal activity gradually
affected lagoon salinity.
The opening of the new mouth at the outer channel
altered the salinity pattern successfully. The sites with
freshwater characteristics in the central sector were grad-
ually transformed into saline sites, which is also evident
from the SOM modeling results. This mouth can also
increase the rate of fluctuation of the water level by effi-
cient tidal influx from the sea to the lagoon. Because the
Chilika lagoon supports high biodiversity and provides an
important habitat for endangered species such as Irrawaddy
dolphins (Bhatta and Pattnaik 2002; Dutta 2002; Padma
et al. 2002; Panda and Pattnaik 2002; Panigrahy 2002;
Kannan et al. 2005), comprehensive ecological research
into variability and lagoon morphology is needed. The
results of SOM modeling provide a simultaneous com-
parison between water quality changes reflecting climate
seasonality and the changes in lagoon morphology. Mod-
eling information can provide the basis for this research.
Environmental and ecological analysis using diverse data
from lagoon morphology, climatology, hydrology, water
physicochemistry and ecology will be more informative
than just using water quality variations (Joo and Jeong
2005; Park et al. 2005, 2006).
Cluster 4
Cluster 3
Cluster 1
Cluster 4
Before opening the new mouth
Cluster 4
Cluster 3
Cluster 1
Cluster 4
After opening the new mouth
A BFig. 6 The changes in site
clustering with respect to the
new mouth opening. a Before
the mouth opening, b after the
mouth opening
Limnology (2008) 9:231–242 239
123
Suggestion for future research in the lagoon
Long-term ecological research (LTER) is a good way to
obtain a comprehensive understanding of the Chilika
lagoon ecosystem. Pattnaik (2002) and Panigrahy (2002)
listed some important issues for the in-depth investigation
of the lagoon system. To improve the efficiency of moni-
toring and the consistency of data management for the
LTER, it would be reasonable to establish several fixed
monitoring stations out of the 30 study sites. Examining the
vast lagoon system often requires much effort and logistics.
After comprehensive validation of the suggested clustering
of the study sites with ecological datasets such as the
abundance of species, it would be possible to select rep-
resentative sites for LTER. The sampling interval might be
shortened (e.g., monthly to biweekly), and representative
sites could be located near the Wetland Research Centre of
the CDA in the central sector. Finally, the deployment of
automatic water quality monitoring systems at selected
sites could increase data precision and improve monitoring
efficiency.
Conclusion
A limnological database from the Chilika lagoon was
modeled using the SOM, and the model successfully
demonstrated patterns in the lagoon water quality dynam-
ics. The water physicochemistry in the lagoon responded
well to changes in climate. The major hydrological resto-
ration activity, which involved opening a new mouth in the
outer channel of the lagoon, affected the limnology, in
terms of salinity gradient changes, resulting in the reor-
ganization of the study sites. A potential re-sectored system
for classifying the monitoring sites was presented which
was slightly different from the previous zoning pattern.
Acknowledgments This work was supported by the LTER Project
from the Ministry of the Environment in South Korea. The authors
deeply appreciate Dr. Sovan Lek at the Universitie Paul Sabatier,
France, for his courtesy of providing an efficient SOM coding solu-
tion, which was utilized throughout the entire analysis in this study.
We also wish to thank the personnel in the Chilika Development
Authority who were involved in collecting a large set of data from
the Chilika lagoon. Most of this work was conducted during the
appointment of the postdoctoral fellowship of K.S. Jeong (PNU
2006).
References
Ahrens CD (2005) Essentials of meteorology. Thomson Brooks/Cole/
Sigma Press, Seoul
Alhoniemi E, Himberg J, Parhankangas J, Vesanto J (2000) SOM
toolbox for Matlab
Almasri MN, Kaluarachchi JJ (2005) Modular neural networks to
predict the nitrate distribution in ground water using the on-
ground nitrogen loading and recharge data. Environ Modell
Softw 20:851–871
APHA (1992) Standard methods for the examination of water and
waste water, p 1193. APHA, AWWA, WEF
Astel A, Tsakovski S, Barbieri P, Simeonov V (2007) Comparison of
self-organizing maps classification approach with cluster and
principal components analysis for large environmental data sets.
Water Res 41:4566–4578
Barnes H (1959) Oceanography and marine biology: a book of
techniques. Macmillan, New York, p 218
Bhatta KS, Pattnaik AK (2002) Environmental monitoring of Chilika
Lagoon. In: Chilika Development Authority (ed) Proceedings of
the international workshop on sustainable development of
Chilika Lagoon. Chilika Development Authority, pp 95–113
Buzzelli CP, Childers DL, Dong Q, Jones RD (2000) Simulation of
periphyton phosphorus dynamics in Everglades National Park.
Ecol Modell 134:103–115
Castella E, Speight MCD (1996) Knowledge representation using
fuzzy coded variables: an example based on the use of Syrphidae
(Insecta, Diptera) in the assessment of riverine wetlands. Ecol
Modell 85:13–25
Chang P-C, Wang Y-W, Tsai C-Y (2005) Evolving neural network
for printed circuit board sales forecasting. Expert Syst Appl
29:83–92
Chilika Development Authority (2002) Proceedings of the Interna-
tional Workshop on the Sustainable Development of Chilika
Lagoon. Chilika Development Authority, Bhubaneswar
Choi SH, Ha K, Ju YH, Kim HW, Joo GJ (1998) Physico-chemical
characteristics of the Woopo Wetland, S. Korea. Korean J
Limnol 31:273–281
Chon T-S, Park YS, Moon KH, Cha EY (1996) Patternizing
communities by using an artificial neural network. Ecol Modell
90:69–78
Chon T-S, Park Y-S, Park JH (2000) Determining temporal pattern of
community dynamics by using unsupervised learning algorithms.
Ecol Modell 132:151–166
Chon T-S, Kwak I-S, Park Y-S, Kim T-H, Kim Y (2001) Patterning
and short-term predictions of benthic macroinvertebrate com-
munity dynamics by using a recurrent artificial neural network.
Ecol Modell 146:181–193
Cowardin LM, Biological Services P, Fish US (1979) Classification
of wetlands and deepwater habitats of the United States. Fish and
wildlife service, US department of the interior: for sale by the
Supt. of Docs., US Govt. Print Off
Curry B (2007) Neural networks and seasonality: some technical
considerations. Eur J Oper Res 179:267–274
DeAngelis DL, Loftus WF, Trexler JC, Ulanowicz RE (1997)
Modeling fish dynamics and effects of stress in a hydrologically
pulsed ecosystem. J Aquat Ecosyst Stress Recovery 6:1–13
Dedecker AP, Goethals PLM, Gabriels W, Pauw ND (2004)
Optimization of Artificial Neural Network (ANN) model design
for prediction of macroinvertebrates in the Zwalm river basin
(Flanders, Belgium). Ecol Modell 174:161–173
Dutta SK (2002) Herpetofauna of Chilika: an overview. In: Chilika
Development Authority (ed) Proceedings of the international
workshop on sustainable development of Chilika Lagoon.
Chilika Development Authority, pp 189–201
Euliano NR, Principe JC (1996) Spatio-temporal self-organizing
feature maps. IEEE international conference on neural networks,
1996, pp 1900–1905
Fielding A (1999) An introduction to machine learning methods.
In: Fielding A (ed) Machine learning methods for ecological
applications. Kluwer, Norwell, MA, pp 1–35
240 Limnology (2008) 9:231–242
123
Findlay CS, Zheng L (1999) Estimating ecosystem risks using cross-
validated multiple regression and cross-validated holographic
neural networks. Ecol Modell 119:57–72
Foody GM (1999) Applications of the self-organising feature map
neural network in community data analysis. Ecol Modell
120:97–107
Getzner M (2002) Investigating public decisions about protecting
wetlands. J Environ Manage 65:237–246
Gevrey M, Dimopoulos I, Lek S (2003) Review and comparison of
methods to study the contribution of variables in artificial neural
network models. Ecol Modell 160:249–264
Golterman HL, Clymo RS (1971) Methods for chemical analysis of
freshwaters. Blackwell Science, Oxford
Grenier M, Campeau S, Lavoie I, Park YS, Lek S (2006) Diatom
reference communities in Quebec (Canada) streams based on
Kohonen self-organizing maps and multivariate analyses. Can J
Fish Aquat Sci 63:2087–2106
Hallwood P (2007) Contractual difficulties in environmental man-
agement: the case of wetland mitigation banking. Ecol Econ
63:446–451
Hattori A, Mae S (2001) Habitat use and diversity of waterbirds in a
coastal Lagoon around Lagoon Biwa, Japan. Ecol Res 16:543–553
Hey DL, Philippi NS (1995) Flood reduction through wetland
restoration: the upper Mississippi River basin as a case history.
Restor Ecol 3:4–17
Horio K, Yamakawa T (2004) Feedback adaptive subspace self-
organizing map for robust spatio-temporal pattern classification.
Int Congr Ser 1269:125–128
Jeong K-S, Recknagel F, Joo G-J (2003) Prediction and elucidation of
population dynamics of a blue-green Alga (Microcystis aeru-ginosa) and diatom (Stephanodiscus hantzschii) in the Nakdong
River-Reservoir System (South Korea) by a recurrent artificial
neural network. In: Recknagel F (ed) Ecological informatics.
Springer, Berlin, pp 196–213
Joo G-J, Jeong K-S (2005) Modelling community changes of
cyanobacteria in a flow regulated river (the lower Nakdong
River, S. Korea) by means of a Self-Organizing Map (SOM). In:
Lek S, Scardi M, Verdonschot PFM, Descy J-P, Park Y-S (eds)
Modelling community structure in freshwater ecosystems.
Springer, Berlin, pp 273–287
Joy MK, Death RG (2004) Predictive modelling and spatial mapping
of freshwater fish and decapod assemblages using GIS and
neural networks. Freshwater Biol 49:1036–1052
Kannan K, Ramu K, Kajiwara N, Sinha RK, Tanabe S (2005)
Organochlorine pesticides, polychlorinated biphenyls, and poly-
brominated diphenyl ethers in Irrawaddy dolphins from India.
Arch Environ Contam Toxicol 49:415–420
Kasabov N (2004) Knowledge-based neural networks for gene
expression data analysis, modelling and profile discovery.
Biosilico 2:253–261
Kohonen T (1984) Self-organization and associative memory.
Springer, Heidelberg
Kohonen T (1998) The self-organizing map. Neurocomputing 21:1–6
Koskela T, Varsta M, Heikkonen J, Kaski K (1998) Recurrent SOM
with local linear models in time series prediction. 6th European
symposium on artificial neural networks, pp 167–172
Lee BH, Scholz M (2006) Application of the self-organizing map
(SOM) to assess the heavy metal removal performance in
experimental constructed wetlands. Water Res 40:3367–3374
Lee W-S, Kwon Y-S, Yoo J-C, Song M-Y, Chon T-S (2006)
Multivariate analysis and self-organizing mapping applied
analysis of nest-site selection in Black-tailed Gulls. Ecol Modell
193:602–614
Lek S, Delacoste M, Baran P, Dimopoulos I, Lauga J, Aulagnier S
(1996) Application of neural networks to modelling nonlinear
relationships in ecology. Ecol Modell 90:39–52
Liu Z, Liu A, Wang C, Niu Z (2004) Evolving neural network using
real coded genetic algorithm (GA) for multispectral image
classification. Future Generations Comp Syst 20:1119–1129
Maltby E, Turner RE (1983) Wetlands of the World. Geogr Mag
55:12–17
Matthews E, Fung I (1987) Methane emission from natural wetlands:
global distribution, area, and environmental characteristics or
sources. Global Biogeochem Cycles 1:61–86
Metzker KD, Mitsch WJ (1997) Modelling self-design of the aquatic
community in a newly created freshwater wetland. Ecol Modell
100:61–86
Mitsch WJ, Gosselink JG (1993) Wetlands. Van Nostrand Reinhold,
p 772
Mitsch WJ, Mitsch RH, Turner RE (1994) Wetlands of the old and
new Worlds: ecology and management. In: Mitsch WJ (ed)
Global wetlands: old world and new. Elsevier, Amsterdam,
pp 3–56
Mohanty ND, Behera G (2002) Studies on shifting of inlet, variations
of water level and its effect on salinity concentrations of Chilika
Lagoon. In: Chilika Development Authority (ed) Proceedings of
the international workshop on sustainable development of
Chilika Lagoon. Chilika Development Authority, pp 48–59
Mohapatra A, Mohanty RK, Mohanty SK, Bhatta KS, Das NR
(2007a) Fisheries enhancement and biodiversity assessment of
fish, prawn and mud crab in Chilika lagoon through hydrological
intervention. Wetlands Ecol Manage 15:229–251
Mohapatra A, Rautray TR, Vijayan V, Mohanty RK, Dey SK (2007b)
Trace elemental characterization of some food crustacean tissue
samples by EDXRF technique. Aquaculture 70:552–558
Mumby PJ, Harborne AR (1999) Development of a systematic
classification scheme of marine habitats to facilitate regional
management and mapping of Caribbean coral reefs. Biol
Conserv 88:155–163
Nayak L, Behera DP (2004) Seasonal variation of some physico-
chemical parameters of the Chilika lagoon (east coast of India)
after opening the new mouth, near Sipakuda. Indian J Mar Sci
33:206–208
Nayak BK, Acharya BC, Panda UC, Nayak BB, Acharya SK (2004)
Variation of water quality in Chilika lake, Orissa. Indian J Mar
Sci 33:164–169
Oberdorff T, Lek S, Guegan J-F (1999) Patterns of endemism in
riverine fish of the Northern Hemisphere. Ecol Lett 2:75–81Ozesmi SL, Ozesmi U (1999) An artificial neural network approach to
spatial habitat modelling with interspecific interaction. Ecol
Modell 116:15–31
Padma M, Kalavati C, Raman AV (2002) Ecobiology of epiphytic
microorganism of Chilika Lagoon, Orissa. In: Chilika Develop-
ment Authority (ed) Proceedings of the international workshop
on sustainable development of Chilika Lagoon. Chilika Devel-
opment Authority, pp 157–167
Panda PC, Pattnaik AK (2002) An enumeration of the flowering
plants of Chilika Lagoon and its immediate neighbourhood. In:
Chilika Development Authority (ed) Proceedings of the interna-
tional workshop on sustainable development of Chilika Lagoon.
Chilika Development Authority, pp 122–141
Panda UC, Rath P, Sahu KC, Majumdar S, Sundaray SK (2006) Study
of geochemical association of some trace metals in the sediment
of Chilika Lake: a multivariate statistical approach. Environ
Monit Assess. doi:10.1007/s10661-006-9187-8
Panigrahy RC (2002) Environmental aspects of the Chilika Lagoon—
a sensitive coastal ecosystem of Orissa. In: Chilika Development
Authority (ed) Proceedings of the international workshop on
sustainable development of Chilika Lagoon. Chilika Develop-
ment Authority, pp 60–76
Panigrahi S, Acharya BC, Panigrahy RC, Nayak BK, Banarjee K,
Sarkar SK (2007) Anthropogenic impact on water quality of
Limnology (2008) 9:231–242 241
123
Chilika lagoon RAMSAR site: a statistical approach. Wetlands
Ecol Manage 15:113–126
Park Y-S, Cereghino R, Compin A, Lek S (2003a) Applications of
artificial neural networks for patterning and predicting aquatic
insect species richness in running waters. Ecol Modell 160:265–
280
Park Y-S, Verdonschot PFM, Chon T-S, Lek S (2003b) Patterning
and predicting aquatic macroinvertebrate diversities using arti-
ficial neural network. Water Res 37:1749–1758
Park Y-S, Chon T-S, Kwak I-S, Lek S (2004) Hierarchical
community classification and assessment of aquatic ecosystems
using artificial neural networks. Sci Total Environ 327:15–122
Park Y-S, Verdonschot PFM, Lek S (2005) Review of modelling
techniques. In: Lek S, Scardi M, Verdonschot PFM, Descy J-P,
Park YS (eds) Modelling community structure in freshwater
ecosystems. Springer, Berlin, pp 21–40
Park Y-S, Lek S, Scardi M, Verdonschotc PFM, Jørgensen SE (2006)
Patterning exergy of benthic macroinvertebrate communities
using self-organizing maps. Ecol Modell 195:105–113
Park Y-S, Song M-Y, Park Y-C, Oh K-H, Cho E, Chon T-S (2007)
Community patterns of benthic macroinvertebrates collected on
the national scale in Korea. Ecol Modell 203:26–33
Pattnaik AK (2002) Chilika Lake—an overview. In: Chilika Develop-
ment Authority (ed) Proceedings of the international workshop on
sustainable development of Chilika Lagoon. Chilika Develop-
ment Authority, pp 12–21
Rabeni CF, Soisy KE, Galat DL (2002) Testing the biological basis of
a stream habitat classification using benthic invertebrates. Ecol
Appl 12:782–796
Rath J, Adhikary SP (2004) Effect of alkali treatment on the yield and
quality of agar from red alga Gracilaria verrucosa (Rhodophyta,
Gracilariales) occurring at different salinity gradient of Chilika
lake. Indian J Mar Sci 33:202–205
Rath J, Adhikary SP (2005) Distribution of marine macro-algae at
different salinity gradients in Chilika lake, east coast of India.
Indian J Mar Sci 34:237–241
Robinson M (1986) Changes in catchment runoff following drianage
and afforestation. J Hydrol 86:71–84
Ryan M, Muller C, Di HJ, Cameron KC (2004) The use of artificial
neural networks (ANNs) to simulate N2O emissions from a
temperate grassland ecosystem. Ecol Modell 175:189–194
Sekhar NU (2004) Fisheries in Chilika lake: how community access
and control impacts their management. J Environ Manage
73:257–266
Sekhar NU (2007) Social capital and fisheries management: the case
of Chilika Lake in India. Environ Manage 39:497–505
Stevens T, Connolly RM (2004) Testing the utility of abiotic
surrogates for marine habitat mapping at scales relevant to
management. Biol Conserv 119:351–362
Strickland JDH, Parsons TR (1972) A practical hands book of sea
water analysis. Fisheries Research Board of Canada
Taskaya-Temizel T, Casey MC (2005) A comparative study of
autoregressive neural network hybrids. Neural Netw 18:781–789
Tripati S, Vora KH (2005) Maritime heritage in and around Chilika
Lake, Orlissa: geological evidences for its decline. Curr Sci India
88:1175–1181
Valdes JJ, Bonham-Carterb G (2006) Time dependent neural network
models for detecting changes of state in complex processes:
applications in earth sciences and astronomy. Neural Netw
19:196–207
Verhoeven JTA, Arheimer B, Yin C, Hefting MM (2006) Regional
and global concerns over wetlands and water quality. Trends
Ecol Evol 21:96–103
Wang N, Mitsch WJ (2000) A detailed ecosystem model of
phosphorus dynamics in created riparian wetlands. Ecol Modell
126:101–130
Whitaker V, Matvienko B (1998) The nitrification potential and
hydrological conditions in the wetland of the Lobo Reservoir.
Verh Int Ver Limnol 26:1377–1380
Zacharias I, Dimitriou E, Koussouris T (2005) Integrated water
management scenarios for wetland protection: application in
Trichonis Lake. Environ Modell Softw 20:177–185
242 Limnology (2008) 9:231–242
123