
Fabrication and characterization of protein arrays for stem cell patterning
11
Fabrication and characterization of protein arrays for stem cell patterning Laura Ceriotti, a Leonora Buzanska, bc Hubert Rauscher, a Ilaria Mannelli, a Lucel Sirghi, a Douglas Gilliland, a Marina Hasiwa, b Frederic Bretagnol, a M. Zychowicz, ac Ana Ruiz, a Susanne Bremer, b Sandra Coecke, b Pascal Colpo * a and Francois Rossi a Received 21st August 2008, Accepted 11th December 2008 First published as an Advance Article on the web 6th February 2009 DOI: 10.1039/b814616k Microarrays of fibronectin and other extracellular matrix (ECM) proteins were fabricated on plasma- deposited poly(ethyleneoxide) (PEO-like) film coated glass slides to study adhesion of stem cells. The arrays were generated by using a non-contact printing technology. The stability and the quality of the spots of fibronectin, used as protein model, were assessed by time of flight secondary ion mass spectrometry (ToF-SIMS), ellipsometry and atomic force microscopy (AFM). It was found that saturation with a mass density of 112 4 ng/cm 2 is reached when protein solutions at concentrations higher than 84 mg/ml are spotted. Fibronectin on the surface form a uniform sub-monolayer with a surface coverage that depends on the spotting solution concentration, as qualitatively demonstrated by AFM measurements. The active conformation of the spotted fibronectin was verified by performing an immunoassay with antibodies specific for the fibronectin RGD sequence by surface plasmon resonance (SPR) imaging. An immunorecognition efficiency of up to 22% was found for a spot with 3% coverage as estimated by ellipsometry. Human umbilical cord blood neural stem cells (HUCB-NSCs) were cultured on different ECM proteins (fibronectin, laminin, collagen I, collagen III and collagen V) arrays and showed protein concentration dependent adhesion on the micro-spots. The cell nuclei were stained for cell counting and preliminary specific cell staining was performed to evaluate the differentiation stage of HUCB-NSCs on such spots. The array platform developed in this study provides a promising approach to investigate in high throughput manner how surfaces patterned with extracellular matrix (ECM) proteins influence stem cell adhesion and development. 1. Introduction Surfaces engineered in order to create micro patterns with areas that either promote or prevent cell adhesion provide an impor- tant tool for studying the factors that affect cell adhesion, migration and proliferation as well as cell–cell and cell–surface interactions. 1,2 For example, the commitment of stem cells to different specific lineages depends on the cell shape which is defined strongly by the microenvironment (including the substrate) where the cells grow. 1 Besides, micro-patterned surfaces were shown to be valuable platforms for the develop- ment of miniaturized systems, such as microfluidic platforms for long-term cell culture studies, 3 toxicity screening in two-dimen- sional co-culture systems 4 and cell based arrays for high throughput analysis of cellular functions. 5–8 Cell microarrays represent, in fact, a promising alternative to microwell plates for studying cell adhesion on a large variety of materials, in partic- ular when only a limited number of cells is available. 9 Many methodologies for cell patterning have already been described in the literature and include stencil assisted patterning, photolithography and soft lithography (ref. 1, 10 and references within). Ablation of anti-adhesive polymers, 11 photocleavage of protecting groups 12 or functionalization of cell repellent poly- meric materials by plasma 13,14 or UV light 7,15 are also methods used to create patterned surfaces for promoting cell adhesion. An interesting approach to create cell arrays is to pattern proteins 5 or polymers 8 onto surfaces previously coated with cell repellent polymeric films by robotic spotting technology. The spotting can be performed using pin (contact) or piezoelectric (non contact) depositions to create spots of biomolecules, to which the cells can adhere and grow forming spatially confined and separated islands. 16,17 Such cell array platforms developed on various kinds of treated surfaces were successfully used in different studies. 5–8 In this paper we report on the optimization of protein microarrays generated by piezoelectric printing technology on a plasma deposited PEO-like coating used as protein and cell repellent layer. 18 Unlike the covalent attachment of PEG on glass slides based on silanization protocols using PEG-silane solutions 19 or mediated by silane and crosslinkers, 17 the plasma deposition of the polymer is fast and can be performed on a wide range of materials, e.g. glass and plastics, either on flat as well as on 3D substrates, e.g. Petri dishes or chambers. 14,20 Further- more, in contrast to their non adhesive properties in liquid environment, the PEO-like films accept protein immobilization a Nanotechnology and Molecular Imaging Unit, European Commission, Joint Research Centre, Institute for Health and Consumer Protection, via E. Fermi 2749, 21027 Ispra, VA, Italy. E-mail: [email protected]; Fax: +0039 0332 785787 b European Centre for the Validation of Alternative Methods, European Commission, Joint Research Centre, Institute for Health and Consumer Protection, via E. Fermi 2749, 21027 Ispra, VA, Italy c Medical Research Centre, Polish Academy of Sciences, Pawinskiego Street 5, 02-106 Warsaw, Poland 1406 | Soft Matter , 2009, 5, 1406–1416 This journal is ª The Royal Society of Chemistry 2009 PAPER www.rsc.org/softmatter | Soft Matter
-
Upload
independent -
Category
Documents
-
view
0 -
download
0
Transcript of Fabrication and characterization of protein arrays for stem cell patterning
Fabrication and characterization of protein arrays for stem cell patterning
Laura Ceriotti,a Leonora Buzanska,bc Hubert Rauscher,a Ilaria Mannelli,a Lucel Sirghi,a Douglas Gilliland,a
Marina Hasiwa,b Frederic Bretagnol,a M. Zychowicz,ac Ana Ruiz,a Susanne Bremer,b Sandra Coecke,b
Pascal Colpo*a and Francois Rossia
Received 21st August 2008, Accepted 11th December 2008
First published as an Advance Article on the web 6th February 2009
DOI: 10.1039/b814616k
Microarrays of fibronectin and other extracellular matrix (ECM) proteins were fabricated on plasma-
deposited poly(ethyleneoxide) (PEO-like) film coated glass slides to study adhesion of stem cells. The
arrays were generated by using a non-contact printing technology. The stability and the quality of the
spots of fibronectin, used as protein model, were assessed by time of flight secondary ion mass
spectrometry (ToF-SIMS), ellipsometry and atomic force microscopy (AFM). It was found that
saturation with a mass density of 112 ! 4 ng/cm2 is reached when protein solutions at concentrations
higher than 84 mg/ml are spotted. Fibronectin on the surface form a uniform sub-monolayer with
a surface coverage that depends on the spotting solution concentration, as qualitatively demonstrated
by AFMmeasurements. The active conformation of the spotted fibronectin was verified by performing
an immunoassay with antibodies specific for the fibronectin RGD sequence by surface plasmon
resonance (SPR) imaging. An immunorecognition efficiency of up to 22% was found for a spot with 3%
coverage as estimated by ellipsometry. Human umbilical cord blood neural stem cells (HUCB-NSCs)
were cultured on different ECM proteins (fibronectin, laminin, collagen I, collagen III and collagen V)
arrays and showed protein concentration dependent adhesion on the micro-spots. The cell nuclei were
stained for cell counting and preliminary specific cell staining was performed to evaluate the
differentiation stage of HUCB-NSCs on such spots. The array platform developed in this study
provides a promising approach to investigate in high throughput manner how surfaces patterned
with extracellular matrix (ECM) proteins influence stem cell adhesion and development.
1. Introduction
Surfaces engineered in order to create micro patterns with areas
that either promote or prevent cell adhesion provide an impor-
tant tool for studying the factors that affect cell adhesion,
migration and proliferation as well as cell–cell and cell–surface
interactions.1,2 For example, the commitment of stem cells to
different specific lineages depends on the cell shape which is
defined strongly by the microenvironment (including the
substrate) where the cells grow.1 Besides, micro-patterned
surfaces were shown to be valuable platforms for the develop-
ment of miniaturized systems, such as microfluidic platforms for
long-term cell culture studies,3 toxicity screening in two-dimen-
sional co-culture systems4 and cell based arrays for high
throughput analysis of cellular functions.5–8 Cell microarrays
represent, in fact, a promising alternative to microwell plates for
studying cell adhesion on a large variety of materials, in partic-
ular when only a limited number of cells is available.9
Many methodologies for cell patterning have already been
described in the literature and include stencil assisted patterning,
photolithography and soft lithography (ref. 1, 10 and references
within). Ablation of anti-adhesive polymers,11 photocleavage of
protecting groups12 or functionalization of cell repellent poly-
meric materials by plasma13,14 or UV light7,15 are also methods
used to create patterned surfaces for promoting cell adhesion.
An interesting approach to create cell arrays is to pattern
proteins5 or polymers8 onto surfaces previously coated with cell
repellent polymeric films by robotic spotting technology. The
spotting can be performed using pin (contact) or piezoelectric
(non contact) depositions to create spots of biomolecules, to
which the cells can adhere and grow forming spatially confined
and separated islands.16,17 Such cell array platforms developed
on various kinds of treated surfaces were successfully used in
different studies.5–8
In this paper we report on the optimization of protein
microarrays generated by piezoelectric printing technology on
a plasma deposited PEO-like coating used as protein and cell
repellent layer.18 Unlike the covalent attachment of PEG on
glass slides based on silanization protocols using PEG-silane
solutions19 or mediated by silane and crosslinkers,17 the plasma
deposition of the polymer is fast and can be performed on a wide
range of materials, e.g. glass and plastics, either on flat as well as
on 3D substrates, e.g. Petri dishes or chambers.14,20 Further-
more, in contrast to their non adhesive properties in liquid
environment, the PEO-like films accept protein immobilization
aNanotechnology and Molecular Imaging Unit, European Commission,Joint Research Centre, Institute for Health and Consumer Protection, viaE. Fermi 2749, 21027 Ispra, VA, Italy. E-mail: [email protected]; Fax:+0039 0332 785787bEuropean Centre for the Validation of Alternative Methods, EuropeanCommission, Joint Research Centre, Institute for Health and ConsumerProtection, via E. Fermi 2749, 21027 Ispra, VA, ItalycMedical Research Centre, Polish Academy of Sciences, PawinskiegoStreet 5, 02-106 Warsaw, Poland
1406 | Soft Matter, 2009, 5, 1406–1416 This journal is ª The Royal Society of Chemistry 2009
PAPER www.rsc.org/softmatter | Soft Matter
when printed in dry conditions, e.g. by microcontact printing
(MC).21–23 The piezoelectric printing technique offers the
opportunity to easily use different array layouts, spot different
materials at various concentrations in series and dispense precise
volumes of solution without carryover of probe from one spot to
another, thereby generating spots of highly reproducible protein
content.
In this work, the printing protocol for the generation of ECM
protein arrays has been developed and optimized in terms of
spot size and array layout using fibronectin as protein model.
The fibronectin spots on PEO-like film have been characterized
qualitatively and quantitatively by time of flight secondary ion
mass spectrometry (ToF-SIMS), ellipsometry and atomic force
microscopy (AFM). Furthermore, the accessibility of the fibro-
nectin RGD peptides, which interact with the integrins of the
cellular membrane and are involved in the transduction of the
outside-in signaling, was assessed by surface plasmon resonance
(SPR) imaging and confirmed by cell culture experiments.
Human umbilical cord blood neural stem cells (HUCB-NSCs)24
were used to verify the array stability in cell culture conditions
and the effect of different ECM protein types and concentra-
tions on cell adhesion. A scheme of the processing steps used for
the fabrication of the protein/cell microarrays is presented in
Fig. 1.
2. Experimental
2.1. Substrate preparation
Standard glass slides (obtained from Sigma) were rinsed in
ethanol before PEO-like coating deposition. To improve the
polymer adhesion on glass, the slides were coated with a thin
layer of SiOx. The SiOx coating was obtained by Plasma
Enhanced Chemical Vapour (PE-CVD) deposition using an
inductively coupled plasma source (ICP) and a hex-
adimethylsiloxane precursor (Sigma Aldrich) mixed with O2 and
Ar (working pressure 50 mTorr, ICP power ¼ 450 W). The
deposition time was 5 min for a thickness of 500 nm.
2.2. PEO-like coating deposition
The system used for the plasma-polymerized PEO-like film
deposition was a homemade reactor of stainless-steel (300 mm #
300 mm # 150 mm) with two symmetrical internal parallel-plate
electrodes (diameter of the electrodes ¼ 140 mm, distance
between the two electrodes ¼ 50 mm).18 The plasma was gener-
ated by a radio frequency generator (13.56 MHz) connected to
the upper electrode whereas the other electrode was grounded
and used as a sample holder. The plasma polymerization was
carried out by using a pulsed plasma discharge (time on¼ 10 ms,
time off ¼ 100 ms, nominal power ¼ 5 W) of pure diethylene
glycol dimethyl ether [DEGDME, (CH3OCH2CH2)2O] vapours
(from Sigma–Aldrich, used as received). The working pressure
was kept constant at 2.7 Pa (50 mTorr). More details can be
found in Bretagnol et al.18 For the cell culture experiments,
a 20 nm thick PEO-like film was deposited on microscope glass
slides cut in half. For the SPR imaging analysis, the film
deposited on the SPR slide was thinner than 20 nm in order to
remain in the thickness range usable by the instrument. Ellips-
ometry measurements of the same PEO-like film deposited on
silicon gave a film thickness of 11.5 nm.
2.3. Piezoelectric dispenser
Spotting of the proteins on the substrates was performed with
the S3 sciFLEXARRAYER (Scienion AG, Germany) using the
piezoelectric printing technology. The instrument has a three-
axis micro-positioning system (accuracy 10 mm) and is equipped
with a glass nozzle 80 mm in diameter. A stroboscopic camera
allows visual monitoring to adjust piezo voltages and pulse
durations for reliable droplet ejection and to avoid satellite
drops. Single drops ejected from the nozzle have a volume of
400 pL under our experimental conditions. In our study we
dispensed between 1- and 5-drop volumes. The vertical sepa-
ration between the nozzle and the substrate was typically
0.5 mm. The distance between spots can vary but typically for
cell culture experiments a pitch of 600 mm was used. Arrays of
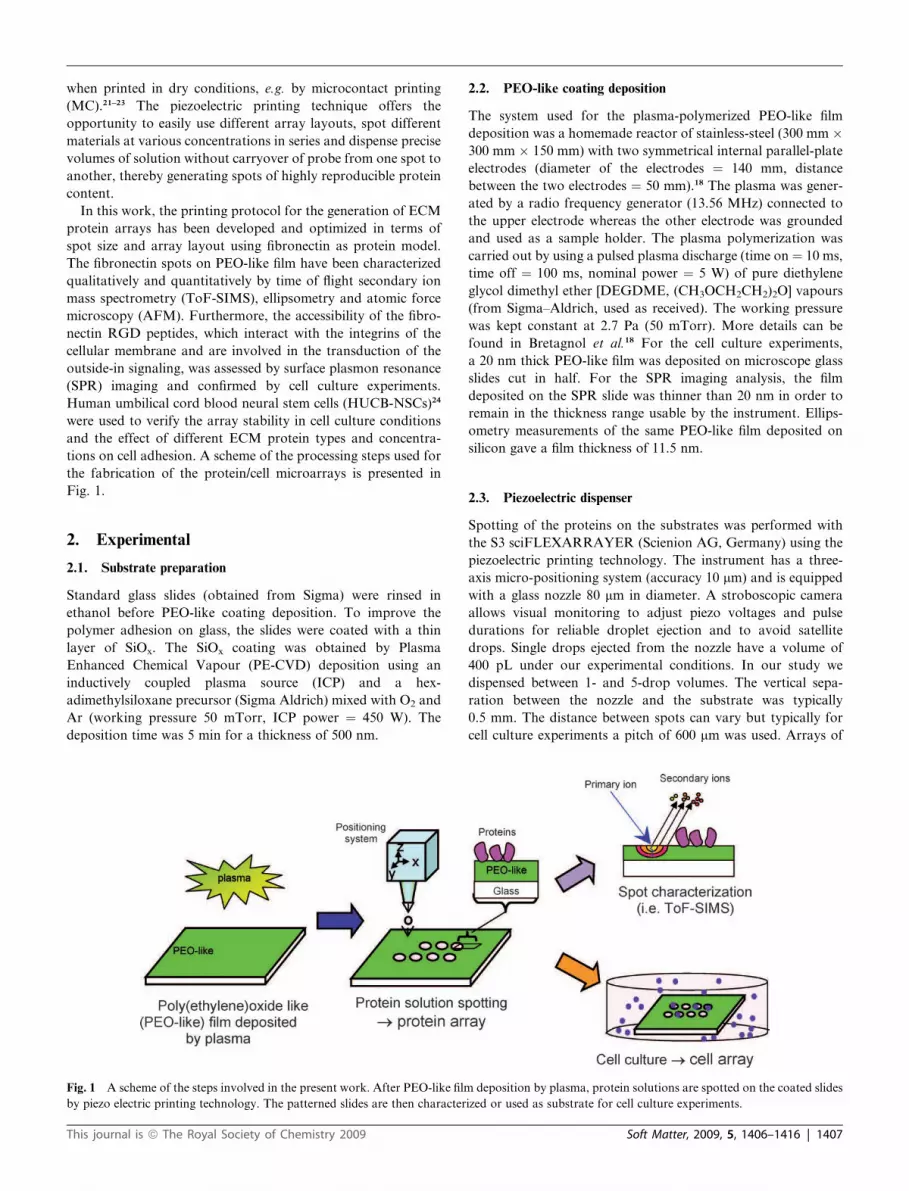
Fig. 1 A scheme of the steps involved in the present work. After PEO-like film deposition by plasma, protein solutions are spotted on the coated slides
by piezo electric printing technology. The patterned slides are then characterized or used as substrate for cell culture experiments.
This journal is ª The Royal Society of Chemistry 2009 Soft Matter, 2009, 5, 1406–1416 | 1407

10 # 10 spots arranged in 2 lines of 3 arrays each were prepared
on half slides.
2.4. Protein spotting
Fibronectin (from Sigma, F0895) was purchased in Tris buffer at
pH 7.5. The protein was first spotted in phosphate buffered saline
(PBS, pH 7.4)(Sigma). Then, the fibronectin was diluted in
a printing buffer to better control spot size and evaporation. The
selected printing buffer consists of 100 mM acetate (Riedel
deHa€en), pH 5, 5 mM EDTA (Merck), 0.01% Triton-X 100
(Fluka) and 0.1% glycerol (Carlo Erba). In order to assess the
effect of the printing buffer alone on cell adhesion, the printing
buffer was also spotted on the PEO-like film. Laminin (L6274),
collagen I (C7774), collagen III (C4407), collagen V (C3657),
bovine serum albumin (BSA)(A4503) and poly-L-lysin
(PLL)(P4707) were also purchased from Sigma and spotted in
the printing buffer on the PEO-like coating. The spotted samples
were inspected with an optical microscope to confirm their
quality (circularity and dimensions) and then stored at 4 $C in
wet conditions5 until further use, which occurred typically within
one week after slide preparation. Longer storage times were not
considered. Typically, the patterned substrates were exposed to
ultraviolet radiation for 10 min and then rinsed in PBS before cell
culturing. It was found that for relatively short culture experi-
ments (1–2 weeks) the UV treatment can be omitted since the
cells did not show any contamination problem.
2.5. Time of flight secondary ion mass spectroscopy (ToF-
SIMS)
The characterization by ToF-SIMS was performed using
a ToF-SIMS IV (ION-TOF GmbH, Germany) equipped with
a primary 25 keV Bi ion gun operating either in high current
surface spectroscopy mode or imaging mode (mass resolution
(m/Dm) > 8000, lateral resolution %1–3 mm). The analyses were
conducted using (Bi3)+ ions and static SIMS conditions were
respected with the total ion flux being maintained below 1 # 1013
ions/cm2.
2.6. Ellipsometry
The protein spots on the PEO-like coating were analyzed by
ellipsometry. Fibronectin at different concentrations ranging
from 21 up to 333 mg/ml was spotted on PEO-like coated silicon
slide as a two-drop spot. In this way, fibronectin spots of about
230 mm in diameter were obtained. Before analysis, the spotted
samples were rinsed in water and dried under nitrogen flow.
Although no spot was optically visible on the surface once the
sample was dried, it was possible to identify the spots and to
distinguish between the different protein concentrations by
ellipsometry. Ellipsometric data were acquired with a variable
angle imaging ellipsometer (model EP3 by Nanofilm Surface
Analysis GmbH, Germany). All imaging measurements were
performed in air at room temperature at an angle of incidence
of 42$, using a monochromatized Xe lamp at a wavelength of
l ¼ 554.3 nm as light source. A polarizer-compensator-sample-
analyzer (PCSA) null-ellipsometric procedure was used to obtain
maps of theD andJ angles for the selected area. Thickness maps
are calculated from the D and J maps by point-by-point
modelling with the software EP3View provided with the ellips-
ometer, using a two-layer model with PEO as first layer and the
protein as the second. The thickness (11.5 nm) and the refractive
index of plasma-deposited PEO (nPEO ¼ 1.51) were indepen-
dently determined by an angle-resolved measurement. A refrac-
tive index of 1.46 was used for the protein.25 For the calculation
of the mass density the nominal thickness was averaged over six
equivalent spots deposited from a solution with equal protein
concentration. Based on the Lorentz–Lorenz relation26 for the
refractive index n of a pure substance, the adsorbed mass per
area, i.e. the mass density m per unit area, can be written as27
m ¼Mwd
A
n2 & 1
n2 þ 2
!
(1)
where Mw and A are the molecular weight of the substance and
molar refractivity, respectively, and d is the effective thickness of
the film as determined by ellipsometry. The molar refractivity
of fibronectin was calculated by Thom et al.28 as the sum of the
individual molar refractivities of all amino acids in fibronectin,
using tabulated values.29 Using this approach, a value of
3.99 g/cm3 was obtained for the term Mw/A of fibronectin in dry
state.
2.7. Atomic force microscopy
The AFM measurements were performed with a commercial
atomic force microscope (Smena B from NT-MDT Co.) oper-
ated in tapping mode. For the measurements of the spotted
samples, a commercial AFM probe (NSG 11 from NT-MDT)
with sharpened silicon tip (nominal curvature radius of 10 nm)
was used. The probe was driven at the resonance frequency of its
cantilever with a free amplitude of 100 nm and tapping amplitude
of 50 nm. Before AFM analysis the samples were incubated in
PBS for 1 h, rinsed in deionized water and dried under nitrogen
flow.
2.8. SPR imaging
The immunoreaction experiments on fibronectin were also
monitored with a Surface Plasmon Resonance imaging system
(Genoptics, France). The light source is a collimated LED with
a centre wavelength of 810 nm and a spectral width Dl of about
10 nm. The incident beam is coupled to the surface plasmons by
a prism (Kretschmann configuration).30 For the SPR experi-
ments, the PEO-like film was deposited on a gold covered glass
slide. Then different concentrations of fibronectin (21, 42, 84,
167, 333 mg/ml) were spotted in two rows for each concentration
as 2-drops with 500 mm pitch to form a 10 # 10 array on the
PEO-like coated slide. Then the sample was incubated in 10 mM
PBS for 2 h, rinsed in water, dried and stored at 4 $C until further
use. For the recognition test, the slide was coupled to the prism
by an index matching oil and inserted into the flow chamber
of the SPR system. The reflectivity curve, R(q), is constructed as
a function of the incident angle of the light beam by varying
the angle between 53$ and 63$. The working angle is determined
as the maximum of the first derivative of the R(q) function.
A baseline is recorded in PBS before switching to the protein
flows with the following sequence: (i) 200 mg/ml BSA (Sigma), (ii)
20 mg/ml anti-ovalbumin (Ab-OVA) (Sigma) and (iii) 10 mg/ml
1408 | Soft Matter, 2009, 5, 1406–1416 This journal is ª The Royal Society of Chemistry 2009

mouse anti-fibronectin monoclonal antibody RGD specific
(Ab-RGD, Chemicon International, MW of 150 kDa). The
reflectivity is monitored in real time during the experiment. The
interaction of the various proteins with the fibronectin spots as
well as with the surrounding PEO-like coating was measured as
reflectance shift with respect to the PBS baseline. The obtained
kinetic curves show the evolution of the protein/antibody inter-
action over time, and the reflectivity difference images immedi-
ately indicate which spots react with the injected sample. The
results, expressed as reflectivity difference with respect to the
baseline DR (%), were calculated as the mean value of signals
from the areas of 6 different spots. Before, between and after
the flow of the individual proteins, PBS was run to condition the
slide surface and to remove the excess of fibronectin molecules
that were not well immobilized on the spots and the proteins
which had not interacted with fibronectin in the spots. The PBS
flow rate used was 12.5 ml/min.
The antibody density on the fibronectin molecules was calcu-
lated by the following formulas:
G ¼DRLzc
SP;R dn=dC
where G is the protein density (ng/cm2), DR the variation of
reflectivity (%), SP,R the variation of reflectivity per unit
of variation of refracted index, Lzc the penetration depth of the
evanescent wave in the medium, dn/dC the variation of the
refractive index as a function of concentration. All the parame-
ters were given by the instrument constructor.
2.9. Cell culture
A neural stem cell line obtained from a non-hematopoietic
fraction of human umbilical cord blood (HUCB-NSC)24 was
maintained as the mixed adherent/floating culture in Dulbecco’s
modified Eagle medium (DMEM/F12, Gibco) containing 2%
fetal bovine serum (FBS, Gibco), insulin-transferrin-selenium
(ITS,1:100, Gibco), antibioticantymycotic solution AAS (1:100,
Gibco), at 37 $C, 5% CO2 and 95% humidity. Serum free medium
contained DMEM/F12, B27 (1:50, Gibco) and EGF (20 ng/ml,
Sigma). HUCB-NSC cultures were propagated every two weeks,
in medium containing 2% serum, by trypsinization (Trypsin/
EDTA 0,025%, Gibco) in 1:4 ratio. For cell array generation, the
cells were plated either at low (1 # 104 cells/cm2) or high (5 # 104
cells/cm2) densities on the spotted slides placed into 5 cm diam-
eter Petri dishes. After cell seeding, the samples were placed into
a cell culture incubator (37 $C and 5% CO2) and agitated for 6 s
every 10 min during the first hour. This period of agitation helps
the distribution of the cells on the protein arrays. Since cells
attached quickly to the spots, the culture medium was replaced
by a fresh one 2 h after cell seeding in order to remove the excess
of non adherent cells and preserve the non-adhesive character of
the PEO-like film. During the course of the experiments (up to
2 weeks) the medium (maintenance medium with 2% of serum or
serum-free) was changed every two days.
2.10. Cell array staining and characterization
During cell culture, the cell arrays were inspected with an Axi-
overt 200 fluorescent microscope (Zeiss). Contrast phase photos
of the arrays were taken every other day during culture. To
obtain an image of a full cell array as presented in this paper for
HUCB-NSCs (Fig. 6) individual photos were taken with the
lowest magnification available (5#) and then combined.
For cell counting experiments, the cells were fixed in 4% par-
aformamide for 20 min after 24 h of culture. For nuclei staining,
the samples were then rinsed in PBS 3 times, immersed in
a solution with Hoestch 33342 (1:1000, Molecular Probes) for
20 min and rinsed extensively in PBS. The slides were either
closed with mounting solution (Fluoromount-G from Southern
Biotech) or kept in PBS for further staining. For the immunos-
taining of differentiating cells, primary antibodies, i.e., mono-
clonal neuronal class III b-tubulin antibody (TUJ1, 1:500,
Covance), and polyclonal rabbit antibodies against S-100b
(1:1000, Swant) were applied overnight. AlexaFluo 488 and
AlexaFluo 546 (1:2000, Jackson) were used to visualize
b-Tubulin III and S-100b, respectively. The counting of the
stained cell nuclei was performed using the WCIF Image
J program.31 Threshold and counter parameters were optimized
for each individual cell spot. Average values and standard
deviation (STD) were calculated for at least 10 spots for each size
and protein concentration from 3 different experiments.
3. Results and discussion
3.1. Protein spots characterization by ToF-SIMS
One of the main prerequisites for the generation of long term
stable biomolecule microarrays is to provide a strong contrast
between well defined active areas (immobilized oligonucleotides,
peptides, proteins, antibodies) and non adhesive zones to avoid
mixing of the biomolecules between different spots. In this work,
the proteins were spotted directly on the PEO-like coated slides.
The stability of the protein array on the PEO-like film and the
effect of the protein concentration on the spot size were evalu-
ated by ToF-SIMS. Different concentrations of fibronectin (21,
42, 84, 167, 333 mg/ml) diluted in PBS were spotted with different
drop numbers (from 1 up to 5 drops) on a coated slide and dried
for 30 min. Then, the sample was incubated overnight in water
prior to analysis. The results are presented in Fig. 2A. These
images show, via the CN(&) signal, that the proteins are present
only on the spots, whereas no proteins are found in between the
spots. This confirms that the proteins remain stably adsorbed on
the PEO-like film after incubation in solution and therefore
can be used as substrate for cell patterning. Furthermore, Fig. 2A
shows that the protein spot sizes depend on the protein
concentration and that the protein molecules are not uniformly
distributed on the spots due to the presence of buffer salts before
rinsing. These salty areas prevent protein adsorption which
results, after rinsing, in dark zones in the ToF-SIMS images.
Since the final objective of the study is to analyze and compare
the behaviour of cells on spots of different kinds of proteins and
protein concentrations, we replaced PBS by a different printing
solution to obtain the same spot size, independent from protein
type and concentration. We tested an acetate buffer at pH
5 which prevents collagen fibril aggregation16 and contains 5 mM
EDTA to prevent laminin polymerization,32 0.01% Triton-X
100 and 0.1% glycerol to slow down the spot evaporation.5
Higher concentrations of the surfactant would compromise the
This journal is ª The Royal Society of Chemistry 2009 Soft Matter, 2009, 5, 1406–1416 | 1409
performance of the piezoelectric spotter due to the creation of
bubbles in the liquid handling unit and nozzle. In this printing
buffer, the spot size remains independent from the protein
concentration as shown in Fig. 2B for the 1 drop fibronectin
spots. It is evident from the CN(&) images that all spots of
fibronectin deposited from 21, 42 and 84 mg/ml solution have the
same diameter of around 200 mm. The same diameter was found
for spots of other ECM proteins, like collagens and laminin (data
not shown). Furthermore, the use of this buffer improved also
the distribution of fibronectin molecules on the spot. For these
reasons, this buffer was used for all further spotting experiments.
3.2. Fibronectin spot density and distribution characterized by
ellipsometry and AFM
The amount of the protein and the distribution within the spots
were investigated using ellipsometry and AFM. First, the
thickness of the PEO-like coating and the two-drops spots of
fibronectin at different concentrations ranging from 21 up to
333 mg/ml were measured in dry conditions by ellipsometry. The
measurement of the thickness of the PEO-like film between
proteins spots gave a value of 11.5 nm.
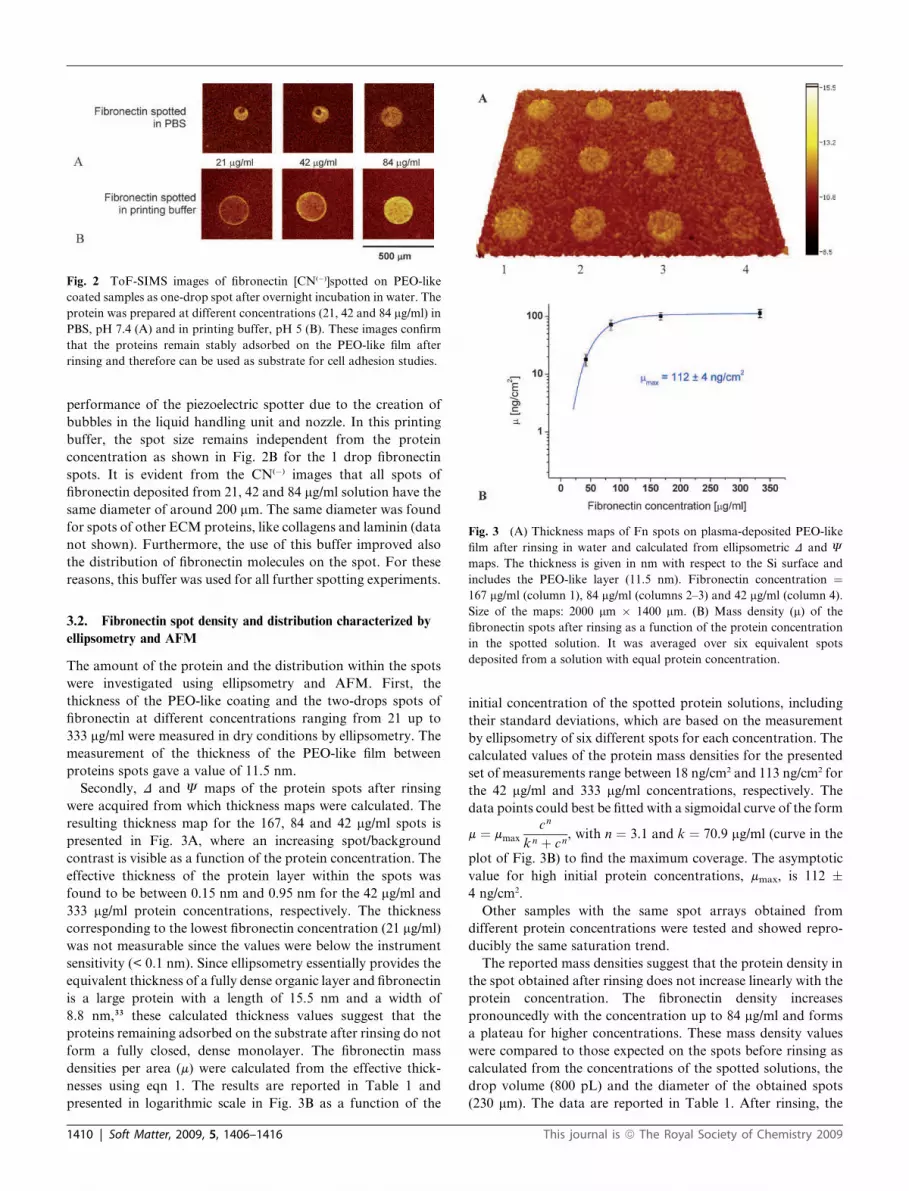
Secondly, D and J maps of the protein spots after rinsing
were acquired from which thickness maps were calculated. The
resulting thickness map for the 167, 84 and 42 mg/ml spots is
presented in Fig. 3A, where an increasing spot/background
contrast is visible as a function of the protein concentration. The
effective thickness of the protein layer within the spots was
found to be between 0.15 nm and 0.95 nm for the 42 mg/ml and
333 mg/ml protein concentrations, respectively. The thickness
corresponding to the lowest fibronectin concentration (21 mg/ml)
was not measurable since the values were below the instrument
sensitivity (< 0.1 nm). Since ellipsometry essentially provides the
equivalent thickness of a fully dense organic layer and fibronectin
is a large protein with a length of 15.5 nm and a width of
8.8 nm,33 these calculated thickness values suggest that the
proteins remaining adsorbed on the substrate after rinsing do not
form a fully closed, dense monolayer. The fibronectin mass
densities per area (m) were calculated from the effective thick-
nesses using eqn 1. The results are reported in Table 1 and
presented in logarithmic scale in Fig. 3B as a function of the
initial concentration of the spotted protein solutions, including
their standard deviations, which are based on the measurement
by ellipsometry of six different spots for each concentration. The
calculated values of the protein mass densities for the presented
set of measurements range between 18 ng/cm2 and 113 ng/cm2 for
the 42 mg/ml and 333 mg/ml concentrations, respectively. The
data points could best be fitted with a sigmoidal curve of the form
m ¼ mmax
cn
k n þ cn, with n ¼ 3.1 and k ¼ 70.9 mg/ml (curve in the
plot of Fig. 3B) to find the maximum coverage. The asymptotic
value for high initial protein concentrations, mmax, is 112 !
4 ng/cm2.
Other samples with the same spot arrays obtained from
different protein concentrations were tested and showed repro-
ducibly the same saturation trend.
The reported mass densities suggest that the protein density in
the spot obtained after rinsing does not increase linearly with the
protein concentration. The fibronectin density increases
pronouncedly with the concentration up to 84 mg/ml and forms
a plateau for higher concentrations. These mass density values
were compared to those expected on the spots before rinsing as
calculated from the concentrations of the spotted solutions, the
drop volume (800 pL) and the diameter of the obtained spots
(230 mm). The data are reported in Table 1. After rinsing, the
Fig. 2 ToF-SIMS images of fibronectin [CN(&)]spotted on PEO-like
coated samples as one-drop spot after overnight incubation in water. The
protein was prepared at different concentrations (21, 42 and 84 mg/ml) in
PBS, pH 7.4 (A) and in printing buffer, pH 5 (B). These images confirm
that the proteins remain stably adsorbed on the PEO-like film after
rinsing and therefore can be used as substrate for cell adhesion studies.
Fig. 3 (A) Thickness maps of Fn spots on plasma-deposited PEO-like
film after rinsing in water and calculated from ellipsometric D and J
maps. The thickness is given in nm with respect to the Si surface and
includes the PEO-like layer (11.5 nm). Fibronectin concentration ¼
167 mg/ml (column 1), 84 mg/ml (columns 2–3) and 42 mg/ml (column 4).
Size of the maps: 2000 mm # 1400 mm. (B) Mass density (m) of the
fibronectin spots after rinsing as a function of the protein concentration
in the spotted solution. It was averaged over six equivalent spots
deposited from a solution with equal protein concentration.
1410 | Soft Matter, 2009, 5, 1406–1416 This journal is ª The Royal Society of Chemistry 2009
spots show a protein density that is always much lower than the
one before rinsing, which suggests that a large part of the spotted
proteins is not strongly bound on the surface and is removed
after rinsing. For instance, only 22% of the proteins from the
42 mg/ml solution and 17% of the 333 mg/ml solution spotted on
the PEO-like film are retained on the surface. Furthermore, it
was estimated from the protein dimensions that a complete,
densely packed monolayer of Fn would result in a mass density
of 600 ng/cm2, assuming that the molecules are oriented with
their long axis parallel to the surface. This results in low protein
coverage as also reported in Table 1 in % of a monolayer. For the
highest analyzed concentration (333 mg/ml) a coverage of 19% is
reached whereas for the lowest concentration (42 mg/ml)
a coverage is of 3% is obtained. These results confirm that
a considerable part of the protein spotted on the PEO-like film is
weakly bound to the surface and suggests that only a non-
compact protein layer remains on the surface. The latter
conclusion is supported by the AFM results, which confirm the
formation of a not fully packed protein layer for protein solu-
tions up to 333 mg/ml. The AFM results for spots generated from
fibronectin solutions of 42 and 167 mg/ml, after the sample was
rinsed and dried, are presented in Fig. 4. The AFM analysis was
performed in the internal part of the spots. At low protein
concentration, fibronectin (white spots) forms small clusters
which are uniformly distributed on the PEO-like coating
substrate (dark background) as evident in the 5 # 5 mm2
topography image (Fig. 4A). For concentrations higher than
84 mg/ml, the proteins are denser and cover a larger part of the
substrate (Fig. 4C). It is difficult to calculate the protein surface
coverage from the AFM measurements due to the tip convolu-
tion effect which overestimates the results. However, the AFM
data confirm that the protein layer is not fully packed on the
surface even for the highest concentrations tested and that
the topographies within spots derived from protein solutions at
different concentrations are notably different.
The height profiles along the scanning lines of the two
topography images are shown in Fig. 4B and 4D. The peaks in
surface height indicate the presence of fibronectin molecules on
the PEO surface. These peaks reach a maximum height of 8 nm
and their number increases with the protein concentration in the
spotting solution. Their broad height distribution suggests that
the proteins are randomly oriented on the surface. Furthermore,
the fact that the observed peak heights are lower than the protein
dimensions can be due to the dry conditions in which these
samples were analyzed and stored.
These results are in agreement with ellipsometry and AFM
data recently reported to describe the morphology of surfaces
developed for bio- and immonological biosensors. Similarly to
the present study, an incomplete layer of proteins (P.96 pertactin
proteins) formed by immersion on a thiolated surface has been
observed.34
3.3. Protein spot reactivity analyzed by SPRi
Once the quantity and the distribution of the spotted proteins on
the PEO-like film had been evaluated, the biological activity of
the spotted fibronectin molecules was investigated. The active
site of the fibronectin is the RGD sequence which is recognized
by the integrins on the cellular membrane. These ligand–integrin
interactions propagate within the cells and influence cell migra-
tion, tissue organization, cell growth and fate.35 Due to the
dimeric structure of the fibronectin, two binding sequences are
present on each molecule. The availability of these active sites is
probed here a posteriori by performing the recognition process in
which they are involved. Thus, the immunorecognition fibro-
nectin/mouse anti-fibronectin monoclonal antibody RGD
specific (Ab-RGD) was monitored by SPR imaging (Fig. 5). For
this purpose, fibronectin was spotted at different concentrations
as two-drop spots on the SPR slides coated by a PEO-like film,
rinsed in 10 mM PBS and exposed to the flows of 200 mg/ml BSA,
20 mg/ml anti-ovalbumin (Ab-OVA) and 10 mg/ml Ab-RGD as
described in the Experimental Section. The changes in reflectivity
after the flow of BSA, Ab-OVA and Ab-RGD were monitored
and analyzed. The results are reported in Fig. 5A. After BSA was
passed over the spotted slide, a marginal change in reflectivity
was measured for all protein spots and the PEO-like film
(Fig. 5A, left). This demonstrates the strong protein repellent
character of the PEO-like film which is not protein covered in
aqueous solution. The graph also clearly shows the specificity of
the immunorecognition test, since, while the Ab-OVA interacts
very slightly with the fibronectin spots and the PEO-like back-
ground, the interaction of the Ab-RGD with the fibronectin
spots is evident (up to 0.7% reflectivity difference) and also
depends on the protein concentration. In particular, the SPR
signal change relative to this interaction is very low for the lowest
fibronectin concentration tested (21 mg/ml) and the PEO-like film
and reaches a saturation value for the two highest protein
concentrations considered. This indicates that the number of
fibronectin molecules recognized by the Ab-RGD is similar
and maximized for these high concentrations. Thus, both
Table 1 Fibronectin concentrations in the initial spotting solutions, on the spot before and after rinsing and protein spot coverage
Initial proteinconcentration (mg/ml)
Average protein density(ng/cm2) before rinsinga
Average protein density(ng/cm2) after rinsingb Protein coveragec (%)
Protein density standarddeviation (ng/cm2) after rinsingd
333 650 113 19 18.3167 326 101 17 15.484 170 72 12 14.342 82 18 3 4.121 41 — — —
a Calculated from initial protein concentration, 2-drop volume (0.8 nL) and spot area (0.041 mm2). b Calculated from the effective thickness of theprotein layer measured by ellipsometry. c Calculated dividing (b) by the protein density estimated necessary to fully pack the spot (600 ng/cm2). Thisdensity was calculated knowing the dimension of the fibronectin (15.5 and 8.8 nm), its mass (440 kDa) and the spot area. d Calculated frommeasuring six different spots for each concentration by ellipsometry.
This journal is ª The Royal Society of Chemistry 2009 Soft Matter, 2009, 5, 1406–1416 | 1411
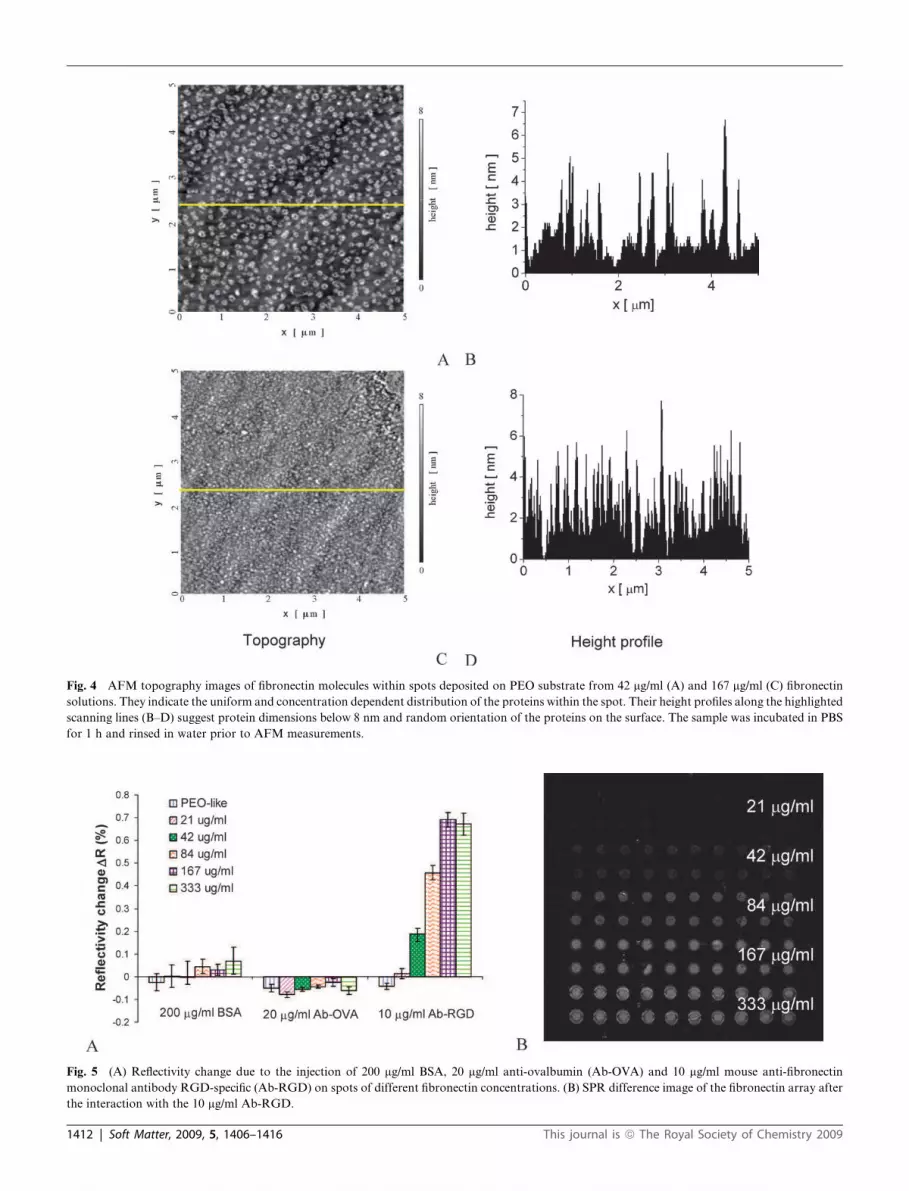
Fig. 4 AFM topography images of fibronectin molecules within spots deposited on PEO substrate from 42 mg/ml (A) and 167 mg/ml (C) fibronectin
solutions. They indicate the uniform and concentration dependent distribution of the proteins within the spot. Their height profiles along the highlighted
scanning lines (B–D) suggest protein dimensions below 8 nm and random orientation of the proteins on the surface. The sample was incubated in PBS
for 1 h and rinsed in water prior to AFM measurements.
Fig. 5 (A) Reflectivity change due to the injection of 200 mg/ml BSA, 20 mg/ml anti-ovalbumin (Ab-OVA) and 10 mg/ml mouse anti-fibronectin
monoclonal antibody RGD-specific (Ab-RGD) on spots of different fibronectin concentrations. (B) SPR difference image of the fibronectin array after
the interaction with the 10 mg/ml Ab-RGD.
1412 | Soft Matter, 2009, 5, 1406–1416 This journal is ª The Royal Society of Chemistry 2009
ellipsometry and SPR imaging indicate the presence of a similar
number of fibronectin molecules on the surface after spotting
from the 167 and 333 mg/ml solutions. The same conclusion can
be drawn by observing the SPR difference image of the fibro-
nectin array after the interaction with the Ab-RGD (Fig. 5B).
Here, the brightness of the spots increases every two rows as
a function of the spotted protein concentration. These results
confirm that fibronectin which is spotted and immobilized on the
PEO-like film exposes the RGD sequence and that therefore
this sequence is available for the integrin mediated cell-surface
interactions. In particular, the SPR imaging data also provide
information on the concentration of Ab-RGD on the fibronectin
spots. From these data it was possible to calculate the number of
Ab that interact with the fibronectin spots as described in the
Experimental section and presented in Table 2. By considering
the number of binding sites of the fibronectin molecules on the
spots as measured by ellipsometry and the molecules of reacted
Ab-RGD, the efficiency of the immunoreaction was calculated
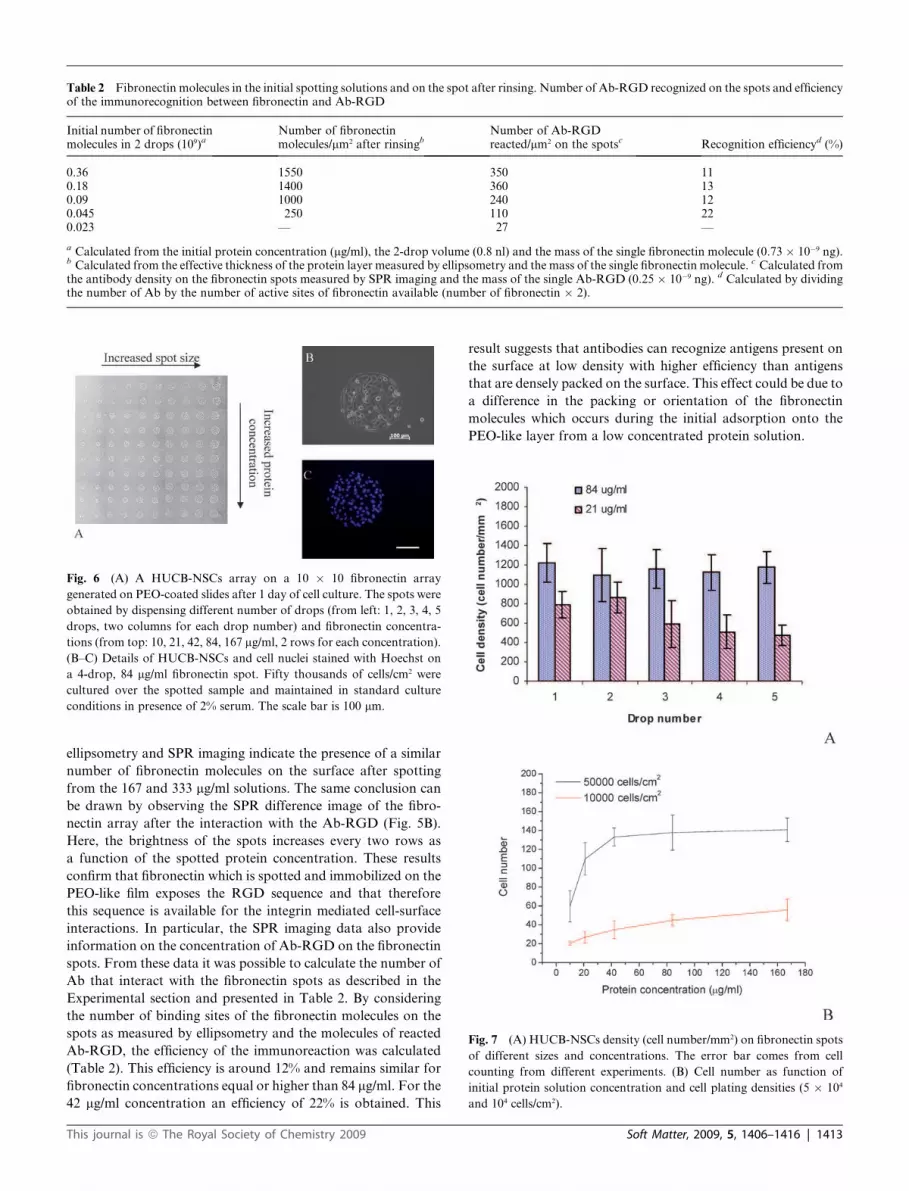
(Table 2). This efficiency is around 12% and remains similar for
fibronectin concentrations equal or higher than 84 mg/ml. For the
42 mg/ml concentration an efficiency of 22% is obtained. This
result suggests that antibodies can recognize antigens present on
the surface at low density with higher efficiency than antigens
that are densely packed on the surface. This effect could be due to
a difference in the packing or orientation of the fibronectin
molecules which occurs during the initial adsorption onto the
PEO-like layer from a low concentrated protein solution.
Table 2 Fibronectin molecules in the initial spotting solutions and on the spot after rinsing. Number of Ab-RGD recognized on the spots and efficiencyof the immunorecognition between fibronectin and Ab-RGD
Initial number of fibronectinmolecules in 2 drops (109)a
Number of fibronectinmolecules/mm2 after rinsingb
Number of Ab-RGDreacted/mm2 on the spotsc Recognition efficiencyd (%)
0.36 1550 350 110.18 1400 360 130.09 1000 240 120.045 250 110 220.023 — 27 —
a Calculated from the initial protein concentration (mg/ml), the 2-drop volume (0.8 nl) and the mass of the single fibronectin molecule (0.73 # 10&9 ng).b Calculated from the effective thickness of the protein layer measured by ellipsometry and the mass of the single fibronectin molecule. c Calculated fromthe antibody density on the fibronectin spots measured by SPR imaging and the mass of the single Ab-RGD (0.25 # 10&9 ng). d Calculated by dividingthe number of Ab by the number of active sites of fibronectin available (number of fibronectin # 2).
Fig. 6 (A) A HUCB-NSCs array on a 10 # 10 fibronectin array
generated on PEO-coated slides after 1 day of cell culture. The spots were
obtained by dispensing different number of drops (from left: 1, 2, 3, 4, 5
drops, two columns for each drop number) and fibronectin concentra-
tions (from top: 10, 21, 42, 84, 167 mg/ml, 2 rows for each concentration).
(B–C) Details of HUCB-NSCs and cell nuclei stained with Hoechst on
a 4-drop, 84 mg/ml fibronectin spot. Fifty thousands of cells/cm2 were
cultured over the spotted sample and maintained in standard culture
conditions in presence of 2% serum. The scale bar is 100 mm.
Fig. 7 (A) HUCB-NSCs density (cell number/mm2) on fibronectin spots
of different sizes and concentrations. The error bar comes from cell
counting from different experiments. (B) Cell number as function of
initial protein solution concentration and cell plating densities (5 # 104
and 104 cells/cm2).
This journal is ª The Royal Society of Chemistry 2009 Soft Matter, 2009, 5, 1406–1416 | 1413
3.4. HUCB-NSCs array
The capability of the protein arrays to address the influence of
different protein types and concentrations on cell behaviour (cell
adhesion, spreading, proliferation, etc.) was verified by culturing
HUCB-NSCs on protein arrays as described in the Experimental
section. Here, we specifically report the effect of fibronectin and
other ECM proteins on cell adhesion.
HUCB-NSCs were seeded on spots having different fibronectin
concentrations and sizes. The cell array resulting after 1 day of cell
culture is shown in Fig. 6A (one 10# 10 spot array). The cell array
is well defined and the effects of spot size and protein concentra-
tion on cell adhesion are visible. In particular, optical images of
HUCB-NSCs on a 4-drops, 84 mg/ml fibronectin spot before and
after nuclei staining are presented in Fig. 6 B–C.
The data obtained from the analysis of spots from three
different experiments are reported in Fig. 7A. Here, cells were
cultured the day after substrate preparation and fixed after 1 day
of culture. The histogram in Fig. 7A shows that the cell density
depends on the initial protein concentration (21 and 84 mg/ml are
presented) and not on the spot size. The large error bars (typi-
cally <23%) derive from protein and cell solutions variability.
Fig. 7B represents the number of cells present on the fibronectin
spots (4-drop spot) as function of the initial protein concentra-
tion. It reveals clearly that for low plating densities (1 # 104 cells/
cm2) the number of cells increases slowly with the protein
concentration. For high cell density (5 # 104 cells/cm2) the cell
number increases sensibly at low protein concentration and
stabilizes at around 135 cells for concentration above 42 mg/ml.
We can notice from these results first that cells recognize protein
concentrations (10 and 21 mg/ml) which the refractivity methods
used in this study are not able to characterize due to sensitivity
limits. Secondly, the cells can adhere on the spots when the
density of the fibronectin molecules, relative to the initial protein
concentration of 42 mg/ml, is 18 ng/cm2 and the protein coverage
is only 3%. This means that the protein distribution as presented
in Fig. 4A as topography image is high enough to allow cell
adhesion and the formation over time of a cell monolayer on the
spotted area under our experimental conditions. Cell adhesion
and growth on low dense nanofabricated surfaces has been
systematically studied elsewhere.36
To assess if the protein buffer can alter the anti-adhesive
property of the PEO-like film, the cells were also cultured on
spots on which only printing buffer was spotted. No cells were
found on these spots confirming that cell adhesion is only due to
the presence of the proteins.
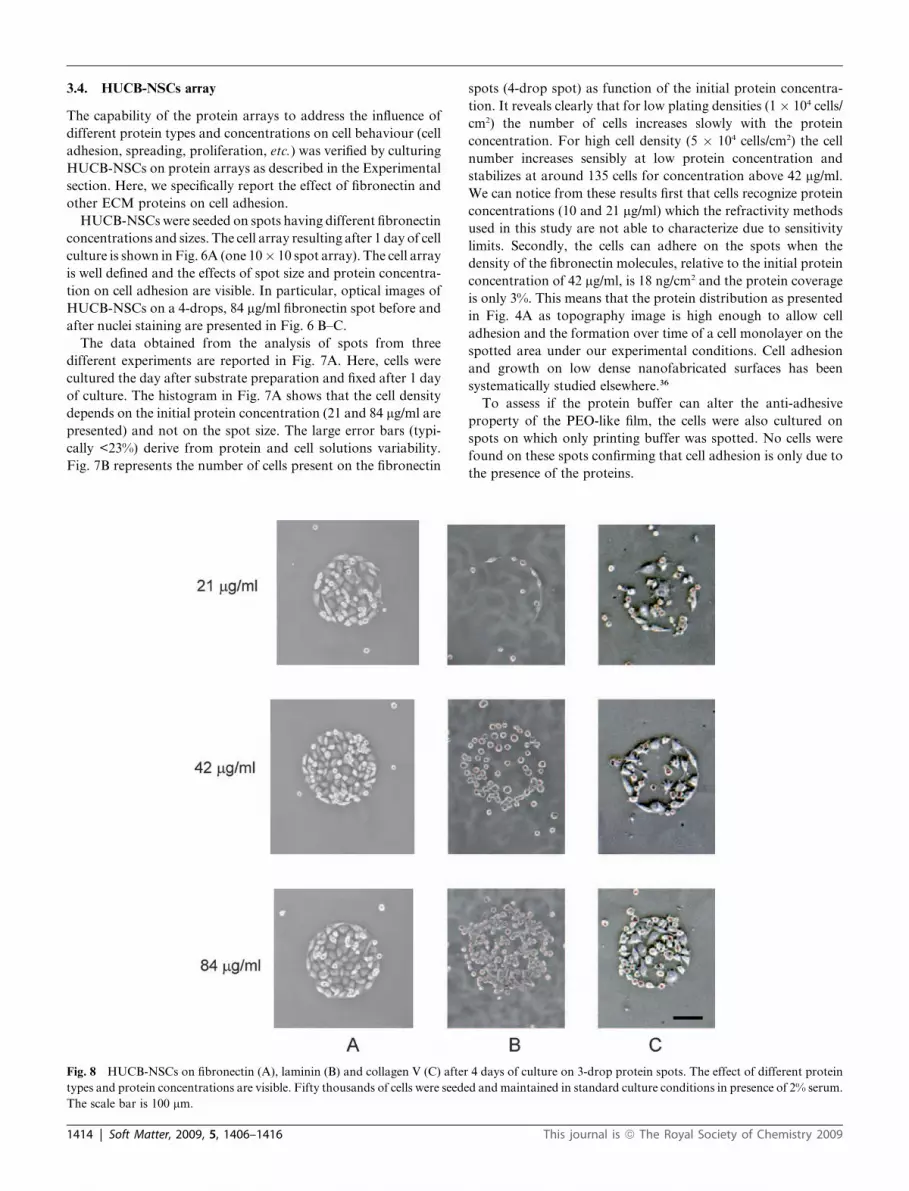
Fig. 8 HUCB-NSCs on fibronectin (A), laminin (B) and collagen V (C) after 4 days of culture on 3-drop protein spots. The effect of different protein
types and protein concentrations are visible. Fifty thousands of cells were seeded and maintained in standard culture conditions in presence of 2% serum.
The scale bar is 100 mm.
1414 | Soft Matter, 2009, 5, 1406–1416 This journal is ª The Royal Society of Chemistry 2009

HUCB-NSCs were culture also on other proteins, including
collagen I, collagen III and collagen V, laminin, BSA and the
polypeptide poly-L-lysine (PLL). The different affinity of the
cells to the tested substrates was confirmed by contrast phase
observations (data not shown). For the collagens, the order of
affinity based on the number of adherent cells counted on the
respective spots was: collagen III < collagen I < collagen V. Cells
do not adhere on BSA (which can be used as negative control),
while remaining rounded but actively attached to PLL spots.
HUCB-NSCs on fibronectin, laminin and collagen V spots at
three different concentrations are presented in Fig. 8. Note also
that the three drops of the different proteins give the same spot
size of about 260 mm (3-drop spot) on the PEO-like coating. It is
evident that the shape and number of the cells on the different
protein spots are protein type and concentration dependent. The
cells adhere well on fibronectin and cover the entire spot area of
the two concentrations considered included the lower concen-
tration presented (Fig. 8A). On laminin, cells have a different
behavior since they do not spread out but attach only to the spot
edges for low protein concentration spot (21 mg/ml) and cover the
entire spot area for higher concentration (84 mg/ml) always
maintaining a rounded shape (Fig. 8B). HUCB-NSCs adhere
well also on collagen V even if cells are less numerous as
compared to those that contain fibronectin. For the three
collagen V concentrations, an increase of the number of cells
attached to the spots is visible (Fig. 8C). Furthermore, for
laminin and collagen V the tendency of the cells to attach first to
the boundary of the protein patterns is also evident.16
This different cell adhesion behavior agrees well with the
expression profile of HUCB-NSCs. Neurally committed cells, as
compared to the starting population of cord blood mononuclear
cells, revealed up-regulation of Collagen V, Collagen III and
Collagen IX. In addition they express b1, a1 and a3 integrin
subunits which in combination form fibronectin and laminin
(b1 with a3) and collagen V (b1 with a1) receptors.37,38
The differentiation of HUCB-NSCs can be spontaneous
(induced by cell adhesion) or induced by soluble factors
(including serum).38 HUCB-NSCs growing for 1 week on
fibronectin spots in the presence of 2% serum revealed positive
staining specific for b tubulin III and S-100b, showing coexis-
tence of cells differentiated into neuronal and astroglial cells on
the same spot (Fig. 9). Other experiments showed that HUCB-
NSCs can be cultured in serum-free conditions on fibronectin
spots with concentrations higher than 84 mg/ml. For lower
concentrations, the cells detached from the protein spots after
few days of culture. The possibility of controlling the adhesive
surfaces and working in serum free-conditions will allow a better
understanding of the role that single ECM proteins and/or
mixtures of them and soluble factors play separately or in
combination on cell differentiation. Successful culture of
embryonic and somatic stem cells in serum deprived conditions,
free from animal product, have been recently reported.39,40 Such
approaches allow controlled drug testing and possible direct
clinical application of stem cells.
4. Conclusions and outlook
We have presented a novel method for patterning fibronectin for
creating well defined stem cell microarrays. The technique is
based on the direct spotting of proteins on a plasma polymerized
poly(ethyleneoxide) film which has amphipathic properties
i.e. protein repellent in wet conditions and protein adhesive when
proteins are spotted or micro-contact printed.
A qualitative and quantitative analysis of fibronectin spots
generated by this technique show that it is possible to create
a stable layer of proteins with a controlled density. The good
activity of the spotted fibronectin molecules has been demon-
strated by monitoring their interactions with antibodies that are
specific to cell binding sites. HUCB-NSCs were seeded on
fibronectin spots having different concentrations and sizes. Well
defined cell microarrays have been generated with a good
stability, which did not show cell migration for several days. The
cell array properties, i.e., cell densities versus spot size and
protein concentrations, have been quantified. The results show
that the cells adhere and cover the fibronectin spots well, even at
low protein concentrations. Different adhesion is reported for
other kind of ECM proteins, BSA and PLL.
These results show that the PEO-like film is an interesting
alternative platform thanks to the high stability of its anti-
adhesive properties during extended cell culturing. Protein
array platforms developed in this study and the optimized cell
culture protocol provide a promising approach to investigate
also in a high throughput manner how insoluble factors
patterned on the surface influence stem cell adhesion and
development. The investigation of the long term effects of
mixtures of proteins or protein layers and gradients on cell
differentiation is foreseen.
Acknowledgements
This work has been supported by the funding for the Exploratory
Research Projects 2007 by the IHCP and continued in the frame
of the Institutional Project 15008 ‘‘NanoBiotechnology for
Health’’, Institutional Project 15003 ‘Validation for chemicals
and correlate’ and Institutional project 15005 ‘Validation for
consumer products’. The authors want to thank E. Parnisari for
the PEO-like coating deposition.
Fig. 9 HUCB-NSCs on a fibronectin spot stained with monoclonal
antibodies against neuronal b tubulin 3 (TUJ1, green) and polyclonal
rabbit antibodies against S-100b (red) specific for neuronal and astroglial
cells, respectively. In blue the cell nuclei stained by Hoechst are visible.
The cell array to which the spot belongs to was fixed and stained after 1
week of cell culture. The scale bar is 100 mm.
This journal is ª The Royal Society of Chemistry 2009 Soft Matter, 2009, 5, 1406–1416 | 1415
References
1 D. Falconnet, G. Csucs, H. M. Grandin and M. Textor, Biomaterials,2006, 27, 3044–3063.
2 C. S. Chen, M. Mrksich, S. Huang, G. M. Whitesides andD. E. Ingber, Science, 1997, 276, 1425–1428.
3 A. Tourovskaia, X. Figueroa-Masot and A. Folch, Lab on a Chip,2005, 5, 14–19.
4 S. R. Khetani and S. N. Bhatia, Nature Biotechnology: Letters, 2007,1–7.
5 C. J. Flaim, S. Chien and S. N. Bhatia, Nature Methods, 2005, 2, 119–125.
6 Y. Soen, A. Mori, T. D. Palmer, P. O. Brown, Molecular SystemsBiology, 2006, DOI: 10.1038/msb4100076.
7 T. Peterbauer, J. Heitz, M. Olbrich and S. Hering, Lab on a Chip,2006, 6, 857–863.
8 D. G. Anderson, S. Levenberg and R. Langer, Nature Biotechnology,2004, 22, 863–866.
9 C. Kuschel, H. Steuer, A. N. Maurer, B. Kanzok, R. Stoop andB. Angres, BioTechniques, 2006, 40, 523–30.
10 A. S. Blawas and W. M. Reichert, Biomaterials, 1998, 19, 595–609.11 S. Iwanaga, Y. Akiyama, A. Kikuchi, M. Yamato, K. Sakai and
T. Okano, Biomaterials, 2005, 26, 5395–5404.12 H. Nakayama, Y. Kikuchi, T. Takarada, H. Nakayama,
K. Yamaguchi and M. Maeda, Analytica Chimica Acta, 2006, 578,100–104.
13 E. Detrait, J.-B. Lhoest, B. Knoops, P. Bertrand and P. van den Boschde Aguilar, J. Neurosci. Methods, 1998, 84, 193–204.
14 F. Bretagnol, O. Kylian, M. Hasiwa, L. Ceriotti, H. Rauscher,G. Ceccone, D. Gilliland, P. Colpo and F. Rossi, Sensors andActuators B, 2007, 123, 283–292.
15 R. Mikulikova, S. Moritz, T. Gumpenberger, M. Olbrich,C. Romanin, L. Bacakova, V. Svorcik and J. Heitz, Biomaterials,2005, 26, 5572–5580.
16 E. A. Roth, T. Xu, M. Das, C. Gregory, J. J. Hickman and T. Boland,Biomaterials, 2004, 25, 3707–3715.
17 N. E. Sanjana and S. B. Fuller, J. Neurosci. Methods, 2004, 136, 151–163.
18 F. Bretagnol, M. Lejeune, A. Papadopoulou-Bouraoui, M. Hasiwa,H. Rauscher, G. Ceccone, P. Colpo and F. Rossi, ActaBiomaterialia, 2006, 2, 165–172.
19 S. Lan, M. Veiseh andM. Zhang, Biosensors and Bioelectronics, 2005,20, 1697–1708.
20 F. Bretagnol, A. Valsesia, G. Ceccone, P. Colpo, D. Gilliland,L. Ceriotti, M. Hasiwa and F. Rossi, Plasma Process. Polym., 2006,3, 443–155.
21 Y. V. Pan, T. C. McDevitt, T. K. Kim, D. Leach-Scampavia,P. S. Stayton, D. D. Denton and B. D. Ratner, Plasma andPolymers, 2002, 7, 171–183.
22 A. Ruiz, L. Ceriotti, L. Buzanska, M. Hasiwa, F. Bretagnol,G. Ceccone, D. Gilliland, H. Rauscher, S. Coecke, P. Colpo andF. Rossi, Microelectronic Engineering, 2007, 84, 1733–1736.
23 A. Ruiz, L. Ceriotti, L. Buzanska, M. Hasiwa, F. Bretagnol,G. Ceccone, D. Gilliland, H. Rauscher, S. Coecke, P. Colpo andF. Rossi, Journal of Biomaterials Science: Polymer Edition, 2008,19, 1649–1657.
24 L. Buzanska, M. Jurga, E. K. Stachowiak, M. K. Stachowiak andK. Domanska-Janik, Stem Cells Dev., 2006, 15, 391–406.
25 L. Guemouri, J. Ogier, Z. Zekhnini and J. J. Ramsden, J. Chem.Phys., 2000, 113, 8183–8186.
26 M. Born, E. E. Wolf, Principles of Optics, Pergamon Press, NewYork, 1965.
27 P. A. Cuypers, J. W. Corsel, M. P. Janssen, J. M. M. Kob andH. C. Hemker, J. Biol. Chem., 1983, 258, 2426–2431.
28 V. H. Thom, G. Altankov, K. Jankova, G. Jonsson and M. Ulbricht,Langmuir, 2000, 16, 2756–2765.
29 R. Pethig, Dielectric and Electronic Properties of Biological Materials,Wiley, New York, 1979.
30 E. Kretschmann and H. Raether, Z. Naturforsch, 1968, 23, 2135–2136.
31 http://www.uhnres.utoronto.ca/facilities/wcif/fdownload.html.32 E. Freire and T. Coelho-Sampaio, J. Biol. Chem., 2000, 275, 817–
822.33 V. E. Koteliansky, M. A. Glukhova, M. V. Bejanian, V. N. Smirnov,
V. V. Filimonov, O. M. Zalite and S. Y. Venyaminov, Eur.J. Biochem., 1981, 119, 619–624.
34 F. Cecchet, A.-S. Duwez, S. Gabriel, C. Jerome, R. Jerome, K. Glinel,S. Demoustier-Champagne, A. M. Jonas and B. Nysten, Anal. Chem.,2007, 79, 6488–6495.
35 C. M. Longhurst and L. K. Jennings, Cellular and Molecular LifeSciences, 1998, 54, 514–526.
36 M. Arnold, A. Cavalcanti-Adam, R. Glass, J. Blummel, W. Eck,H. Kessler and J. P. Spatz, ChemPhysChem, 2004, 3, 383–388.
37 S. Huang, D. W. Greve, D. D. Nguyen, M. M. Domach, Sensors:IEEE, 2003. 204–209.
38 L. Buzanska, A. Habich, M. Jurga, J. Sypecka and K. Domanska-Janik, Toxicology in Vitro, 2005, 19, 991–999.
39 Y. Tsuj, N. Yoshimura, H. Aoki, A. A. Sharov, M. S. H. Ko,T. Motohashi and T. Kunisada, Dev Dyn, 2008, 237, 2129–2138.
40 C. McGuckin, M. Jurga, H. Ali, M. Strbad and N. Forraz, NatureProtocols, 2008, 3, 1046–1055.
1416 | Soft Matter, 2009, 5, 1406–1416 This journal is ª The Royal Society of Chemistry 2009