Fabrication and characterization of linear diffusers based on concave micro lens arrays
11
Fabrication and characterization of linear diffusers based on concave micro lens arrays Roland Bitterli, 1,* Toralf Scharf, 1 Hans-Peter Herzig, 1 Wilfried Noell, 2 Nico de Rooij, 2 Andreas Bich, 3 Sylvain Roth, 3 Kenneth J. Weible, 3 Reinhard Voelkel, 3 Maik Zimmermann, 4 and Michael Schmidt 4 1 Optics and Photonics Technology Laboratory, Ecole Politechnique Federale de Lausanne, A.-L. Breguet 2, 2000 Neuchâtel, Switzerland 2 Sensors, Actuators and Microsystems Laboratory, Ecole Politechnique Federale de Lausanne, Jaquet Droz 1, 2000 Neuchâtel, Switzerland 3 SUSS MicroOptics SA, Jaquet-Droz 7, 2000 Neuchâtel, Switzerland 4 Bayerisches Laserzentrum GmbH, Erlangen, Germany *[email protected] Abstract: We present a new approach of beam homogenizing elements based on a statistical array of concave cylindrical microlens arrays. Those elements are used to diffuse light in only one direction and can be employed together with fly’s eye condensers to generate a uniform flat top line for high power coherent light sources. Conception, fabrication and characterization for such 1D diffusers are presented in this paper. ©2010 Optical Society of America OCIS codes: (140.3300) Laser beam shaping; (220.0220) Optical design and fabrication; (220.4000) Microstructure fabrication; (230.1980) Diffusers; (140.3390) Laser materials processing References and links 1. M. Miyasaka and J. Stoemenos, “Excimer laser annealing of amorphous and solid-phase-crystallized silicon films,” J. Appl. Phys. 86(10), 5556–5565 (1999). 2. G. Schröder, Technische Optik, Grundlagen und Anwendungen, (Vogel Verlag und Druck, 2002). 3. R. Bitterli, M. Kim, T. Scharf, H. P. Herzig, A. Bich, C. Dumouchel, S. Roth, R. Voelkel, and K. J. Weible, “Refractive statistical concave 1D diffusers for laser beam shaping,” Proc. SPIE 7062, 70620P (2008). 4. I. Steingoetter and H. Fouckhardt, “Deep fused silica wet etching using an Au-free and stress-reduced sputter- deposited Cr hard mask,” J. Micromech. Microeng. 15(11), 2130–2135 (2005). 5. H. Zhu, M. Holl, T. Ray, S. Bhushan, and D. R. Meldrum, “Characterization of deep wet etching of fused silica glass for single cell and optical sensor deposition,” J. Micromech. Microeng. 19, 065013 (2009). 6. F. Wippermann, U.-D. Zeitner, P. Dannberg, A. Bräuer, and S. Sinzinger, “Beam homogenizers based on chirped microlens arrays,” Opt. Express 15(10), 6218–6231 (2007). 7. T. A. Leskova, A. A. Maradudin, E. R. Méndez, and A. V. Shchegrov, “The design and fabrication of one- dimensional random surfaces with specified scattering properties,” Phys. Solid State 41 (5), 835–841 (1999). 8. M. C. King and D. H. Berry, “Small-angle diffusing screens for photolithographic camera illumination systems,” Appl. Opt. 11(11), 2460–2462 (1972). 9. E. R. Méndez, E. E. García-Guerrero, H. M. Escamilla, A. A. Maradudin, T. A. Leskova, and A. V. Shchegrov, “Photofabrication of random achromatic optical diffusers for uniform illumination,” Appl. Opt. 40(7), 1098– 1108 (2001). 10. N. M. Ganzherli, “Microlens rasters and holographic diffusers based on PFG-01 silver halide photographic material,” J. Opt. Technol. 76, 384–387 (2009). 11. J. Albero, L. Nieradko, C. Gorecki, H. Ottevaere, V. Gomez, H. Thienpont, J. Pietarinen, B. Päivänranta, and N. Passilly, “Fabrication of spherical microlenses by a combination of isotropic wet etching of silicon and molding techniques,” Opt. Express 17(8), 6283–6292 (2009). 1. Introduction Laser lines with a uniform intensity profile have many applications. An example would be the use of a high power excimer laser for amorphous silicon annealing for the fabrication of TFT’s [1]. To obtain a maximum in throughput and uniformity it is desirable to have a line with a uniform profile. A possible concept to generate the necessary flat-top profile uses multi-aperture elements followed by a lens to recombine separated beamlets [2]. Advantages of this concept are the independence from entrance intensity profile and achromaticity. #124986 - $15.00 USD Received 8 Jun 2010; revised 8 Jun 2010; accepted 9 Jun 2010; published 18 Jun 2010 (C) 2010 OSA 21 June 2010 / Vol. 18, No. 13 / OPTICS EXPRESS 14251
-
Upload
independent -
Category
Documents
-
view
1 -
download
0
Transcript of Fabrication and characterization of linear diffusers based on concave micro lens arrays

Fabrication and characterization of linear diffusers based on concave micro lens arrays
Roland Bitterli,1,* Toralf Scharf,1 Hans-Peter Herzig,1 Wilfried Noell,2 Nico de Rooij,2 Andreas Bich,3 Sylvain Roth,3 Kenneth J. Weible,3 Reinhard Voelkel,3 Maik
Zimmermann,4 and Michael Schmidt4 1Optics and Photonics Technology Laboratory, Ecole Politechnique Federale de Lausanne, A.-L. Breguet 2,
2000 Neuchâtel, Switzerland 2Sensors, Actuators and Microsystems Laboratory, Ecole Politechnique Federale de Lausanne, Jaquet Droz 1,
2000 Neuchâtel, Switzerland 3SUSS MicroOptics SA, Jaquet-Droz 7, 2000 Neuchâtel, Switzerland
4Bayerisches Laserzentrum GmbH, Erlangen, Germany *[email protected]
Abstract: We present a new approach of beam homogenizing elements based on a statistical array of concave cylindrical microlens arrays. Those elements are used to diffuse light in only one direction and can be employed together with fly’s eye condensers to generate a uniform flat top line for high power coherent light sources. Conception, fabrication and characterization for such 1D diffusers are presented in this paper.
©2010 Optical Society of America
OCIS codes: (140.3300) Laser beam shaping; (220.0220) Optical design and fabrication; (220.4000) Microstructure fabrication; (230.1980) Diffusers; (140.3390) Laser materials processing
References and links
1. M. Miyasaka and J. Stoemenos, “Excimer laser annealing of amorphous and solid-phase-crystallized silicon films,” J. Appl. Phys. 86(10), 5556–5565 (1999).
2. G. Schröder, Technische Optik, Grundlagen und Anwendungen, (Vogel Verlag und Druck, 2002). 3. R. Bitterli, M. Kim, T. Scharf, H. P. Herzig, A. Bich, C. Dumouchel, S. Roth, R. Voelkel, and K. J. Weible,
“Refractive statistical concave 1D diffusers for laser beam shaping,” Proc. SPIE 7062, 70620P (2008). 4. I. Steingoetter and H. Fouckhardt, “Deep fused silica wet etching using an Au-free and stress-reduced sputter-
deposited Cr hard mask,” J. Micromech. Microeng. 15(11), 2130–2135 (2005). 5. H. Zhu, M. Holl, T. Ray, S. Bhushan, and D. R. Meldrum, “Characterization of deep wet etching of fused silica
glass for single cell and optical sensor deposition,” J. Micromech. Microeng. 19, 065013 (2009). 6. F. Wippermann, U.-D. Zeitner, P. Dannberg, A. Bräuer, and S. Sinzinger, “Beam homogenizers based on chirped
microlens arrays,” Opt. Express 15(10), 6218–6231 (2007). 7. T. A. Leskova, A. A. Maradudin, E. R. Méndez, and A. V. Shchegrov, “The design and fabrication of one-
dimensional random surfaces with specified scattering properties,” Phys. Solid State 41 (5), 835–841 (1999). 8. M. C. King and D. H. Berry, “Small-angle diffusing screens for photolithographic camera illumination systems,”
Appl. Opt. 11(11), 2460–2462 (1972). 9. E. R. Méndez, E. E. García-Guerrero, H. M. Escamilla, A. A. Maradudin, T. A. Leskova, and A. V. Shchegrov,
“Photofabrication of random achromatic optical diffusers for uniform illumination,” Appl. Opt. 40(7), 1098–1108 (2001).
10. N. M. Ganzherli, “Microlens rasters and holographic diffusers based on PFG-01 silver halide photographic material,” J. Opt. Technol. 76, 384–387 (2009).
11. J. Albero, L. Nieradko, C. Gorecki, H. Ottevaere, V. Gomez, H. Thienpont, J. Pietarinen, B. Päivänranta, and N. Passilly, “Fabrication of spherical microlenses by a combination of isotropic wet etching of silicon and molding techniques,” Opt. Express 17(8), 6283–6292 (2009).
1. Introduction
Laser lines with a uniform intensity profile have many applications. An example would be the use of a high power excimer laser for amorphous silicon annealing for the fabrication of TFT’s [1]. To obtain a maximum in throughput and uniformity it is desirable to have a line with a uniform profile. A possible concept to generate the necessary flat-top profile uses multi-aperture elements followed by a lens to recombine separated beamlets [2]. Advantages of this concept are the independence from entrance intensity profile and achromaticity.
#124986 - $15.00 USD Received 8 Jun 2010; revised 8 Jun 2010; accepted 9 Jun 2010; published 18 Jun 2010(C) 2010 OSA 21 June 2010 / Vol. 18, No. 13 / OPTICS EXPRESS 14251

However, the periodic structure and the overlapping of beamlets produce interference effects especially when highly coherent light is used. Random optical elements that diffuse only in one direction reduce the contrast of the interference pattern [3]. Losses due to undesired diffusion in large angles have to be minimized to maintain a good quality and high efficiency of beam shaping. For high power applications it is interesting to have concave structures that avoid the formation of undesired hot spots.
There are different fabrication methods for diffusers proposed in literature. They can be divided into two groups: etching of ground glass to obtain 2D diffusers only [8] and “engineered” diffusers that allow also to fabricate 1D diffusers. The engineered diffusers are in general based on holographic [10] or photofabricated [7,9] structures.
In this paper we propose a fabrication method that offers similar degrees of freedom as the engineered diffusers combined with the limited fabrication complexity offered by etching of ground glass. We propose a fabrication process to obtain statistical arrays of concave cylinder micro structures in fused silica that diffuse light only in one direction. For simplicity the concave microstructures are called lenses even though they do not fulfill the requirements for diffraction limited lenses. The fabrication process is based on deep isotropic etching of fused silica in hydrofluoric acid (HF). We propose design rules and fabrication parameters and show their influence on the optical properties of the device. A model for the etch process is proposed that allows to predict the properties of the final device. The devices are characterized with a custom made high precision photogoniometer. More applied characterizations were performed at the Bayerisches Laserzentrum GmbH (blz) Erlangen with an excimer laser.
2. Fabrication process
The fabrication is based on isotropic etching of fused silica in non diluted hydrofluoric acid (HF) 49% at room temperature [4,5]. The observed etch rate lies around 1m/min which corresponds to literature values [5]. Wet etching with unbuffered HF is notoriously irreproducible as far as etch rate goes. It depends on many factors such as temperature, age of the solution, number of wafers already etched etc. Test patterns on the etch mask were implemented to insure that the etch depth and thus the ROC can be guaranteed even with varying etch rates. For the linear diffusers uniformity over the wafer is not an issue. The surface quality of the etched structures is very good and reproducible.
To avoid issues with the wet etch reproducibility it is possible to use a wet etched diffuser with the desired parameters as a master and reproduce it then by a transfer process. Such replication processes are well established and allow a very good reproducibility.
The circular cross section of the cylinder lenses is achieved by isotropic etching trough a slit aperture in an etch stop mask. The etch mask is a layer of 600 nm low pressure chemical vapor deposited (LPCVD) poly-Silicon (p-Si). P-Si is an ideal hard mask due to its good adhesion to fused silica, negligible etch rate in HF and more important its hydrophobic surface. This reduces the risk of surface pinholes. To further minimize pinholes the layer is deposited in three steps of 200nm. The mask is patterned by photolithography and reactive ion etching (RIE). Pinholes in the back side poly-Si mask remain a problem since the etch times can be very long (up to 24h). This issue is solved by spinning an additional protective layer of ProTEK A-2 HF protection resist from Brewer Science on the back side.
Double-side polished 4” Fused Silica (Schott Lithosil Q1) wafers with a thickness of 2mm were used as a substrate. During the etch process the mask gets completely under etched and falls off resulting in a 100% fill factor (see Fig. 1). This is quite important since it makes sure that there are no flat regions at the top of the structures which would result in specular transmission of the light and thus an undesired intensity peak in the center of the angular spectrum (zero order).
#124986 - $15.00 USD Received 8 Jun 2010; revised 8 Jun 2010; accepted 9 Jun 2010; published 18 Jun 2010(C) 2010 OSA 21 June 2010 / Vol. 18, No. 13 / OPTICS EXPRESS 14252

Fig. 1. SEM micrograph of a linear diffuser showing the 100% fill factor of the concave cylindrical lenses and the smooth surface.
Once the etch mask has fallen off, the etch process is continued without the mask to achieve the desired radius of curvature (ROC) of the concave lenses. The maximum etch depth achieved, which is equivalent to the ROC, was 1600m. To improve the wetting in the HF bath the wafer is first put 5min in a mixture of a few drops of the detergent Extran® (from Merck) in DI water.
Fig. 2. Schematic representation of the HF etch process. A) Fused silica substrate with a patterned poly-Si etch stop mask. B) Start of the etch process. C) The etch stop mask is completely under etched resulting in 100% fill-factor. D) Continued mask-less etching to adjust the lens’ ROC to the desired value. The dotted circles with their respective center at the edges of the mask openings illustrate how the etched surfaces propagate into the substrate.
Fig. 3. SEM micrographs of a random 2D diffuser (left) and a regular square lens array (right, seen from a slight angle). The fill factor for both arrangements of concave microlenses is close to 100%.
#124986 - $15.00 USD Received 8 Jun 2010; revised 8 Jun 2010; accepted 9 Jun 2010; published 18 Jun 2010(C) 2010 OSA 21 June 2010 / Vol. 18, No. 13 / OPTICS EXPRESS 14253

A perfectly isotropic etch process can be modeled by two circles propagating into the material from the edges of the opening provided by the etch stop. The two circles are joined at the bottom by a flat zone with the dimensions of the etch aperture (see Fig. 2). Since flat zones at the bottom of the lens result in undesired specular transmission it is important to keep the etch opening relatively small compared to the lens width. Etch openings of 1m have proved to be a good compromise for an average lens width of 100-200m. They can still be structured by standard photolithography and RIE, they result in basically no zero order and the whetting in HF is still good especially when enhanced with Extran. As visualized in Fig. 2 under etching leads to fall off of the etch mask when the distance between neighbored etch openings gets equal to the etch depth. Further etching leads to larger radius of curvature without changing position or distance of each element (Fig. 2 D).
The above mentioned fabrication process can of course also be used to fabricate spherical lens arrays and 2D diffusers. The main difference to the fabrication of a linear diffuser is that the slit opening in the mask is replaced by a circular hole. The result is a concave spherical lens array with a fill factor of 100% (see Fig. 3) regardless of the arrangement of the lens array (square, hexagonal, random, etc.). It suffices to etch long enough until the poly-Si mask is completely under etched and all the lenses touch each other. Since the accessible surface for circular openings is much smaller than for slit openings, whetting, etchant transport and as a consequence uniformity are a much bigger issue for spherical than for cylindrical structures. As a consequence of this the etch openings used in literature [11] are much bigger at the cost of a less valid spherical shape.
3. Simulation and design guidelines
In order to develop a certain set of design guidelines for 1D diffusers we used a closed simulation, fabrication, characterization and optimization loop. The fabrication process model allowing to generate realistic profiles of the diffuser with a given set of fabrication and design parameters is based on the assumption of a perfectly isotropic etch process as described above and implemented in Matlab. A typical set of design parameters contains dimension of the chip, average lens width, width variation and the size of the etch opening. For the individual lens width we use a Gaussian normal distribution around a certain mean value and the variation is given as the standard deviation. There is no constraint on the upper or lower limit of the lens width.
The relevant fabrication parameters are the etch rate and etch time resulting in the etch depth which in turn is equivalent to the ROC of the lens. First the positions of the mask openings are defined according to the design parameters. The lens array profile is traced by placing circles at the edges of the mask openings and adding the flat parts where needed (see Fig. 2). The generated profile is then fed into the optical simulation tool. For the optical simulation we used coherent Gaussian ray tracing (FRED from Photon Engineering) as well as a physical optics model where the far field intensity distribution is given by the Fourier transform of the lens array’s phase profile. For the physical optics model we used Frauhenhofer approximation. The device profile y obtained by the mentioned fabrication model is used to calculate the phase profile with Eq. (1).
2 1
.i n y
a e
(1)
The far field intensity is then calculated by taking the Fourier transform of the phase profile. The use of a plane wave approximation is justified since we actually cut the gauss (the raw beam has a diameter of about 30mm, we only use about 8mm). The physical optics simulation resulted in an intensity distribution showing a clearly visible specular transmission peak and the diffusion angle is somewhat larger than the measured values of a real device. Best results where obtained with FRED where the simulated intensity is fairly close to the measured value at the cost of somewhat more time consuming simulation. Figure 4 shows a photo of a section of the intensity pattern generated by a 1D diffuser. The very rapid intensity
#124986 - $15.00 USD Received 8 Jun 2010; revised 8 Jun 2010; accepted 9 Jun 2010; published 18 Jun 2010(C) 2010 OSA 21 June 2010 / Vol. 18, No. 13 / OPTICS EXPRESS 14254

variations are clearly visible. Figure 5 shows a section of the simulation with FRED for a device with the same parameters. Clearly visible in Fig. 4 and 5 are the irregular interference pattern in both images due to statistical distributions of phases and speckles.
Figure 6 shows the complete simulated intensity distribution as a function of diffusion angle with a sample frequency of 0.01°. The diffuser parameters are 200m mean lens width, 40m variation and 1500m ROC. In order to evaluate the FWHM diffusion angle and to filter out the non periodic intensity variation we calculate the envelope by convolution with a boxcar function of 100 samples. The simulation indicates that the diffusion angle is given by the ratio lens width over radius of curvature. The smaller this ratio, the smaller is the diffusion angle. There seems to be an upper limit for the diffusion angle of 30° FWHM. The lower limit of the diffusion angle is given by the maximum obtainable lens radius which is defined by technology and by the thickness of the substrate. For a substrate thickness of 2mm the maximum achievable ROC is about 1500m. According to simulation this should result in approximately 1° FWHM diffusion angle for lenses with 100m mean width.
Fig. 4. Photo of a section of the intensity distribution for a 1D diffuser showing the non periodic intensity variations.
Fig. 5. Simulated intensity distribution for a 1D diffuser. The simulation was done by Gaussian ray tracing (FRED).
Fig. 6. Cross section of the simulated intensity distribution as seen in Fig. 5. The parameters for the diffuser are 200m mean lens width, 40m lens variation and 1.5mm ROC. The predicted diffusion angle is about 3° FWHM.
As a rough design guideline it is also possible to use the average numerical aperture to calculate the expected diffusion FWHM angle (Fig. 7). The following formula Eq. (2) gives the diffusion angle as a function of average lens width D, refractive index n and ROC:
( 1)
2arctan .2
diff
D n
ROC
(2)
#124986 - $15.00 USD Received 8 Jun 2010; revised 8 Jun 2010; accepted 9 Jun 2010; published 18 Jun 2010(C) 2010 OSA 21 June 2010 / Vol. 18, No. 13 / OPTICS EXPRESS 14255
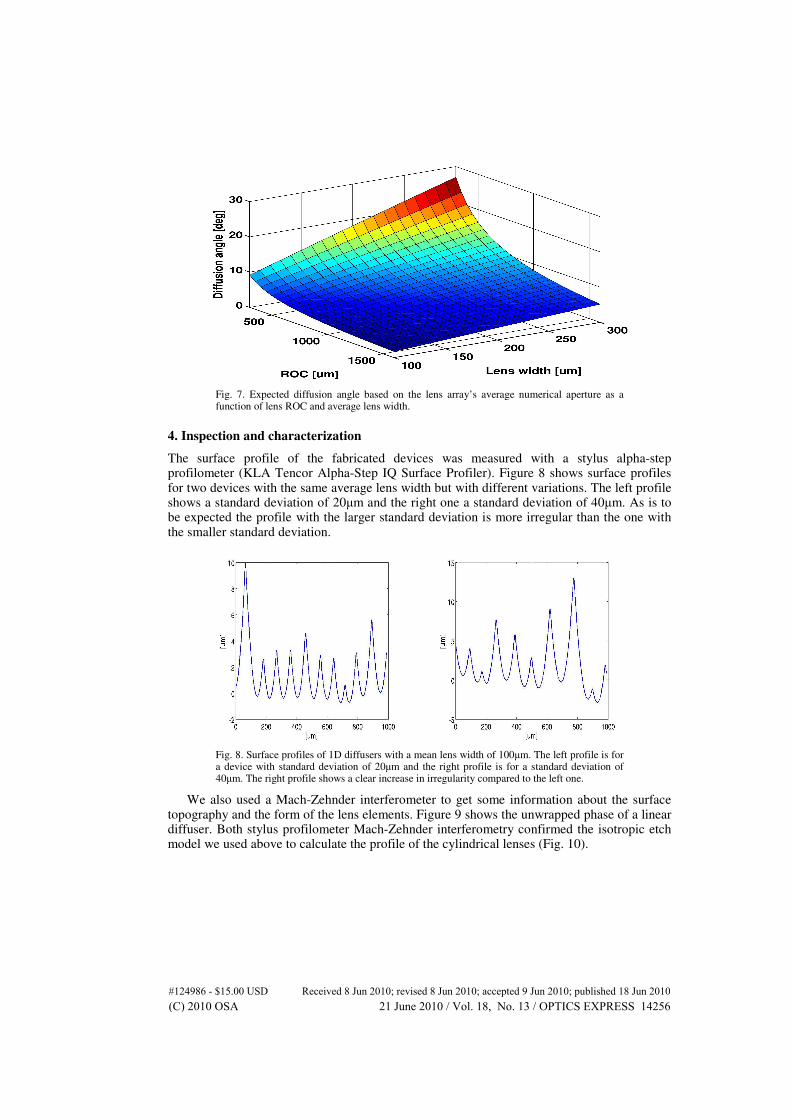
Fig. 7. Expected diffusion angle based on the lens array’s average numerical aperture as a function of lens ROC and average lens width.
4. Inspection and characterization
The surface profile of the fabricated devices was measured with a stylus alpha-step profilometer (KLA Tencor Alpha-Step IQ Surface Profiler). Figure 8 shows surface profiles for two devices with the same average lens width but with different variations. The left profile shows a standard deviation of 20m and the right one a standard deviation of 40m. As is to be expected the profile with the larger standard deviation is more irregular than the one with the smaller standard deviation.
Fig. 8. Surface profiles of 1D diffusers with a mean lens width of 100m. The left profile is for a device with standard deviation of 20m and the right profile is for a standard deviation of 40m. The right profile shows a clear increase in irregularity compared to the left one.
We also used a Mach-Zehnder interferometer to get some information about the surface topography and the form of the lens elements. Figure 9 shows the unwrapped phase of a linear diffuser. Both stylus profilometer Mach-Zehnder interferometry confirmed the isotropic etch model we used above to calculate the profile of the cylindrical lenses (Fig. 10).
#124986 - $15.00 USD Received 8 Jun 2010; revised 8 Jun 2010; accepted 9 Jun 2010; published 18 Jun 2010(C) 2010 OSA 21 June 2010 / Vol. 18, No. 13 / OPTICS EXPRESS 14256
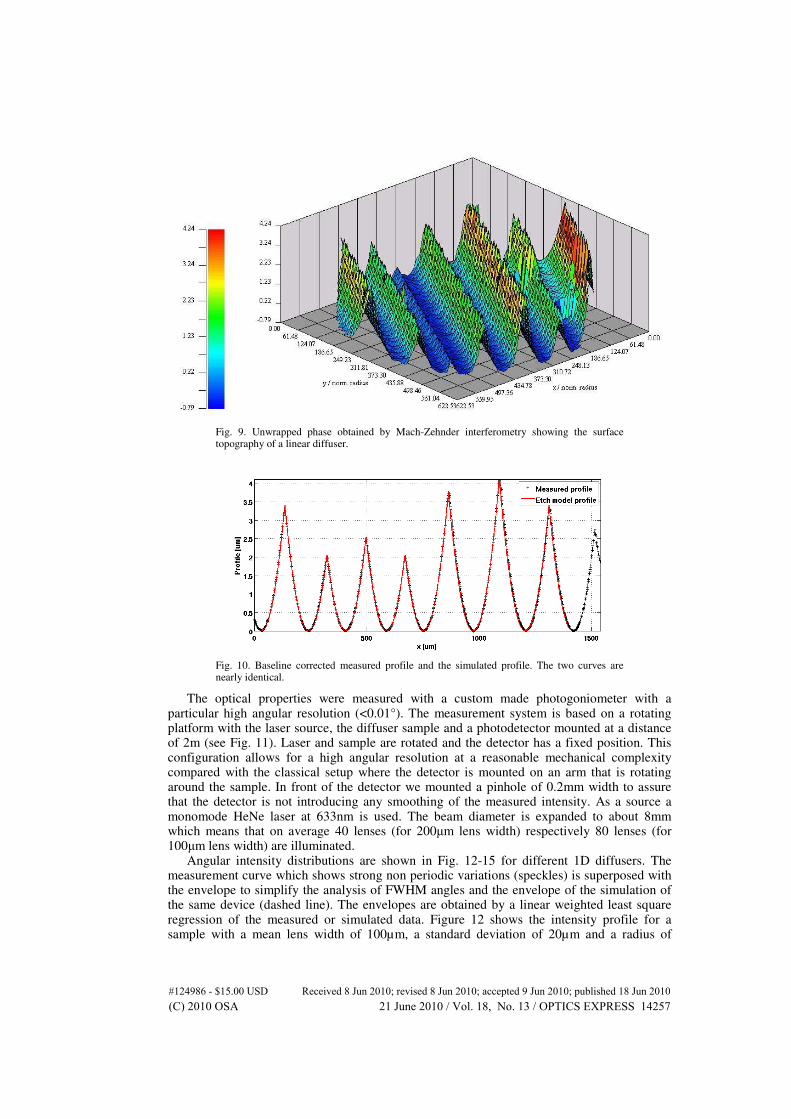
Fig. 9. Unwrapped phase obtained by Mach-Zehnder interferometry showing the surface topography of a linear diffuser.
Fig. 10. Baseline corrected measured profile and the simulated profile. The two curves are nearly identical.
The optical properties were measured with a custom made photogoniometer with a particular high angular resolution (<0.01°). The measurement system is based on a rotating platform with the laser source, the diffuser sample and a photodetector mounted at a distance of 2m (see Fig. 11). Laser and sample are rotated and the detector has a fixed position. This configuration allows for a high angular resolution at a reasonable mechanical complexity compared with the classical setup where the detector is mounted on an arm that is rotating around the sample. In front of the detector we mounted a pinhole of 0.2mm width to assure that the detector is not introducing any smoothing of the measured intensity. As a source a monomode HeNe laser at 633nm is used. The beam diameter is expanded to about 8mm which means that on average 40 lenses (for 200m lens width) respectively 80 lenses (for 100m lens width) are illuminated.
Angular intensity distributions are shown in Fig. 12-15 for different 1D diffusers. The measurement curve which shows strong non periodic variations (speckles) is superposed with the envelope to simplify the analysis of FWHM angles and the envelope of the simulation of the same device (dashed line). The envelopes are obtained by a linear weighted least square regression of the measured or simulated data. Figure 12 shows the intensity profile for a sample with a mean lens width of 100µm, a standard deviation of 20µm and a radius of
#124986 - $15.00 USD Received 8 Jun 2010; revised 8 Jun 2010; accepted 9 Jun 2010; published 18 Jun 2010(C) 2010 OSA 21 June 2010 / Vol. 18, No. 13 / OPTICS EXPRESS 14257
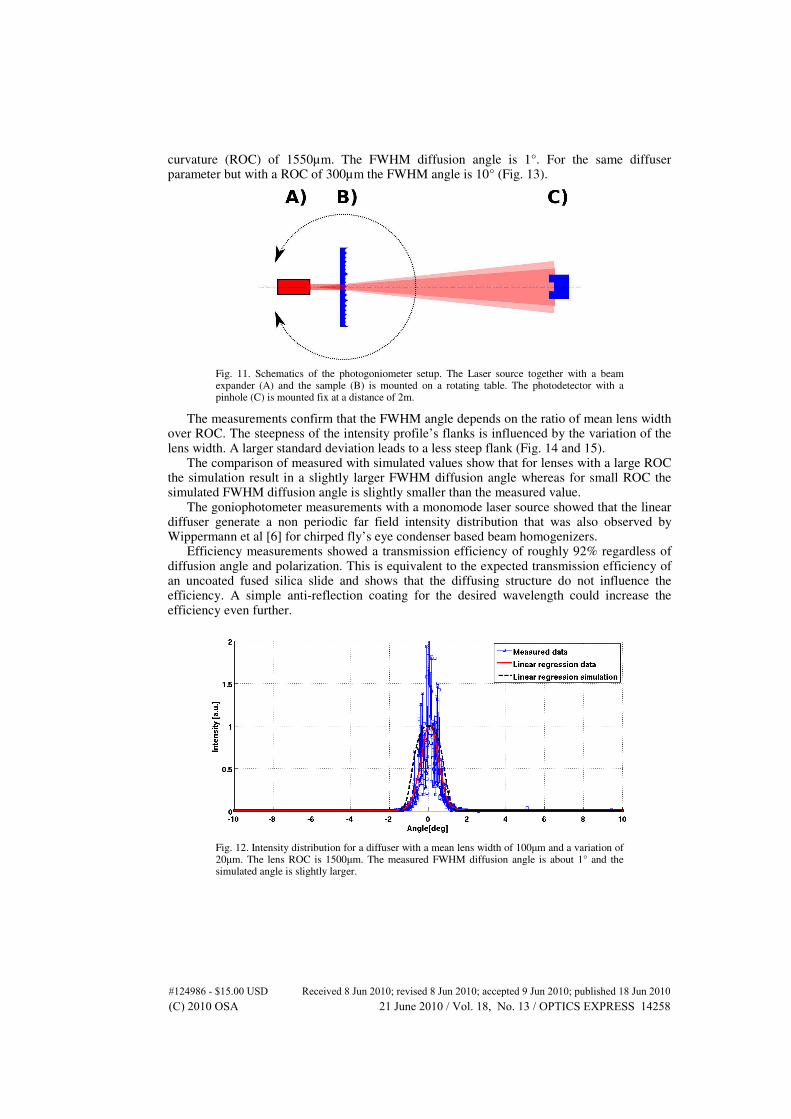
curvature (ROC) of 1550µm. The FWHM diffusion angle is 1°. For the same diffuser parameter but with a ROC of 300µm the FWHM angle is 10° (Fig. 13).
Fig. 11. Schematics of the photogoniometer setup. The Laser source together with a beam expander (A) and the sample (B) is mounted on a rotating table. The photodetector with a pinhole (C) is mounted fix at a distance of 2m.
The measurements confirm that the FWHM angle depends on the ratio of mean lens width over ROC. The steepness of the intensity profile’s flanks is influenced by the variation of the lens width. A larger standard deviation leads to a less steep flank (Fig. 14 and 15).
The comparison of measured with simulated values show that for lenses with a large ROC the simulation result in a slightly larger FWHM diffusion angle whereas for small ROC the simulated FWHM diffusion angle is slightly smaller than the measured value.
The goniophotometer measurements with a monomode laser source showed that the linear diffuser generate a non periodic far field intensity distribution that was also observed by Wippermann et al [6] for chirped fly’s eye condenser based beam homogenizers.
Efficiency measurements showed a transmission efficiency of roughly 92% regardless of diffusion angle and polarization. This is equivalent to the expected transmission efficiency of an uncoated fused silica slide and shows that the diffusing structure do not influence the efficiency. A simple anti-reflection coating for the desired wavelength could increase the efficiency even further.
Fig. 12. Intensity distribution for a diffuser with a mean lens width of 100m and a variation of 20m. The lens ROC is 1500m. The measured FWHM diffusion angle is about 1° and the simulated angle is slightly larger.
#124986 - $15.00 USD Received 8 Jun 2010; revised 8 Jun 2010; accepted 9 Jun 2010; published 18 Jun 2010(C) 2010 OSA 21 June 2010 / Vol. 18, No. 13 / OPTICS EXPRESS 14258

Fig. 13. Intensity distribution for a diffuser with the same parameters as in Fig. 10 but with a ROC of 300m. The measured FWHM diffusion angle is about 10°.
Fig. 14. Intensity distribution for a diffuser with a mean lens width of 200m and a variation of 40m. The lens ROC is 1500m. The measured FWHM diffusion angle is about 3° which is slightly smaller than the simulated value of about 3.5°.
Fig. 15. Intensity distribution for a diffuser with a mean lens width of 200m and a variation of 80m. The lens ROC is 300m. The measured FWHM diffusion angle is about 20°. The diffusion angle is close to maximum
#124986 - $15.00 USD Received 8 Jun 2010; revised 8 Jun 2010; accepted 9 Jun 2010; published 18 Jun 2010(C) 2010 OSA 21 June 2010 / Vol. 18, No. 13 / OPTICS EXPRESS 14259

5. Application
The homogenizing performance of the fabricated linear diffusers was also evaluated with an Excimer laser at the blz in Erlangen, Germany. 10 pulses of 28ns pulse width were applied to a PMMA sample slide. The traces were then inspected with a polarizing optical microscope equipped with Nomarski prism and used in differential interference contrast. This gives a good qualitative impression of the homogeneity of the beam profile.
The laser was a Coherent-Laser ExciStar M-100 ArF Excimer laser at 193 nm with a mean power of up to 12 W, a pulse energy of 120 mJ and a pulse width of 28 ns. The beam dimensions at the exit were 4 mm ! 15 mm and the beam divergence 1 mrad ! 3 mrad. The setup was composed of a fly’s eye condenser based flat top element from SUSS MicroOptics, the random linear diffuser, a field lens and the PMMA slide which serves as target (see Fig. 16).
Fig. 16. Schematics of test the setup with an Excimer laser source. From left to right: raw beam, fly’s eye condenser flat top element, random linear diffuser, field lens and PMMA target slide at the focus of the field lens.
Figure 17 shows the trace left in the PMMA sample if only the flat top element is used without any linear diffuser. We clearly see the regular diffraction pattern generated by this micro optical element. If we add the linear diffuser after the flat top element (Fig. 18) we see that everything gets smeared out resulting in a smooth profile.
Fig. 17. Trace in a PMMA sample left by an Excimer laser after passing through a flat top element from SUSS MicroOptics. The periodic intensity peaks are clearly visible.
#124986 - $15.00 USD Received 8 Jun 2010; revised 8 Jun 2010; accepted 9 Jun 2010; published 18 Jun 2010(C) 2010 OSA 21 June 2010 / Vol. 18, No. 13 / OPTICS EXPRESS 14260
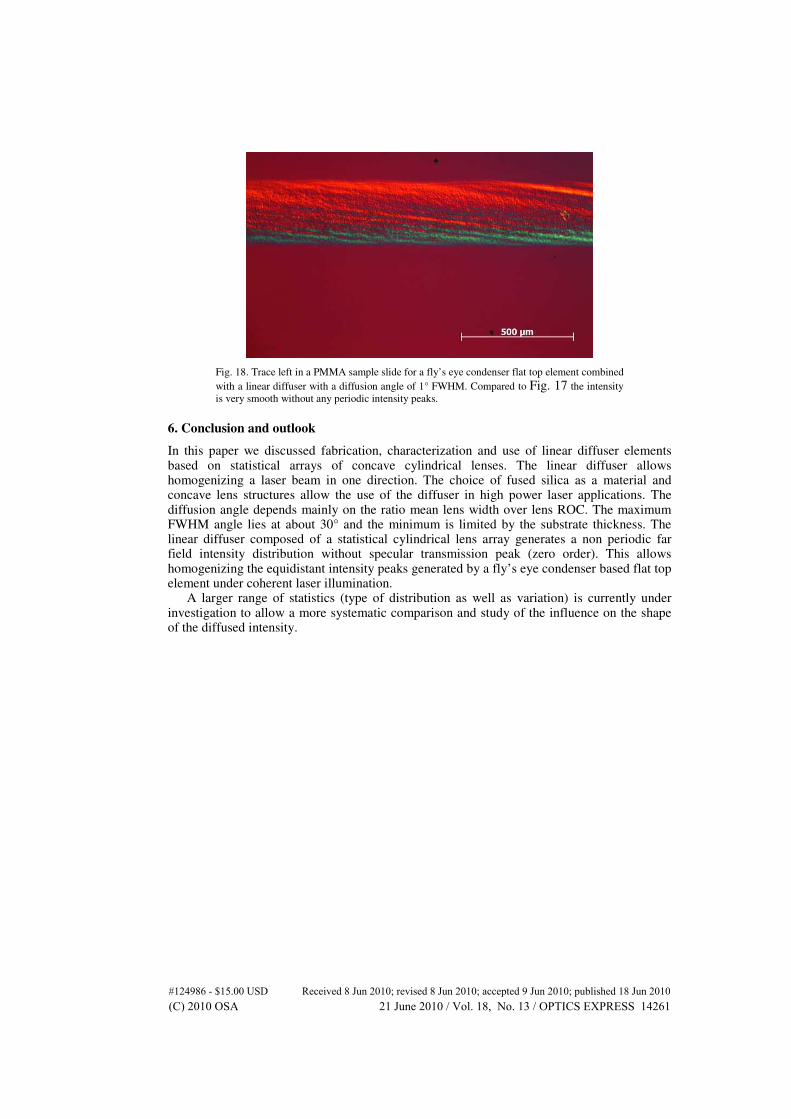
Fig. 18. Trace left in a PMMA sample slide for a fly’s eye condenser flat top element combined
with a linear diffuser with a diffusion angle of 1° FWHM. Compared to Fig. 17 the intensity is very smooth without any periodic intensity peaks.
6. Conclusion and outlook
In this paper we discussed fabrication, characterization and use of linear diffuser elements based on statistical arrays of concave cylindrical lenses. The linear diffuser allows homogenizing a laser beam in one direction. The choice of fused silica as a material and concave lens structures allow the use of the diffuser in high power laser applications. The diffusion angle depends mainly on the ratio mean lens width over lens ROC. The maximum FWHM angle lies at about 30° and the minimum is limited by the substrate thickness. The linear diffuser composed of a statistical cylindrical lens array generates a non periodic far field intensity distribution without specular transmission peak (zero order). This allows homogenizing the equidistant intensity peaks generated by a fly’s eye condenser based flat top element under coherent laser illumination.
A larger range of statistics (type of distribution as well as variation) is currently under investigation to allow a more systematic comparison and study of the influence on the shape of the diffused intensity.
#124986 - $15.00 USD Received 8 Jun 2010; revised 8 Jun 2010; accepted 9 Jun 2010; published 18 Jun 2010(C) 2010 OSA 21 June 2010 / Vol. 18, No. 13 / OPTICS EXPRESS 14261