
Multi-criteria evaluation of renewable energy for desalination
30
MULTI-CRITERIA ANALYSIS OF NON-CONVENTIONAL ENERGY TECHNOLOGIES FOR WATER DESALINATION IN JORDAN Bilal A. Akash 1 , Odeh R. Al-Jayyousi 2 & Mousa S. Mohsen 1 1 Department of Mechanical & Industrial Engineering, Applied Science University, Amman, 11931, Jordan. 2 Department of Civil Engineering, Applied Science University, Amman, 11931, Jordan.
-
Upload
independent -
Category
Documents
-
view
0 -
download
0
Transcript of Multi-criteria evaluation of renewable energy for desalination
MULTI-CRITERIA ANALYSIS OF NON-CONVENTIONAL ENERGY
TECHNOLOGIES FOR WATER DESALINATION IN JORDAN
Bilal A. Akash1, Odeh R. Al-Jayyousi
2 & Mousa S. Mohsen
1
1Department of Mechanical & Industrial Engineering,
Applied Science University, Amman, 11931, Jordan.
2Department of Civil Engineering,
Applied Science University, Amman, 11931, Jordan.
1
SUMMARY
The gap between water supply and demand is widening in Jordan.
Sound measures to overcome this gap is essential for sustainable water
development. In this paper, non-conventional energy technologies for water
desalination are discussed. These include hydropower, solar, wind, and nuclear
technologies. Using multi-criteria analysis, options were evaluated for best
water uses considering water productivity and environmental sustainability
criteria. It was concluded that hydropower and solar technologies are most
effective for water desalination in Jordan. On the other hand, wind and nuclear
technologies have low likelihood to be viable in the short term.
INTRODUCTION
Jordan is characterized by an arid to semi-arid climate. Rainy seasons
are short and annual rainfall intensities range from 600 mm in the northwest to
less than 50 mm in the eastern and southern deserts, which form about 91 % of
the country’s surface area [1]. Jordan’s 1995 population is approximately 4
million, and increasing at a yearly rate of 3.6 % [2]. Accordingly, the
population of Jordan is estimated to reach 4.9 and 6.6 millions in the years
2000 and 2010, respectively. The yearly per capita usage of fresh water is 200
cubic meters (CM) compared with 7500 CM as the world’s yearly average [3].
In 1993, Jordan consumed 983 million cubic meters (MCM) [4]. The
2
contribution of surface water, ground water, and treated-waste water amounted
to 400, 533, and 50 MCM, respectively. Water consumption from all resources
was 738, 214, and 33 MCM for agricultural, industrial, and municipal use,
respectively.
Water demand is rapidly increasing due to increased development and
the high rate of population increase. At the same time, water resource
development constraints are increasing due to high investment cost and quality
degradation. According to Murakami [5] by the beginning of the twenty first
century, Jordan would have depleted virtually all of its renewable sources of
fresh water, if current patterns of consumption are not radically altered as
quickly as possible. Generally, to reduce the gap between supply and demand,
there are two basic solutions: increasing the supply and decreasing the demand.
There are few options to increase the non-conventional water resources which
are looked at as supplements to, but not substitutes for conventional water
supply. These options include: irrigation with saline water, desalination of
brackish or sea water, reuse of treated municipal waste water, rain-water
harvesting, cloud seeding, and importing water across boundaries.
Desalination has been widely used in oil-producing countries. However,
desalination of sea or brackish water could prove economically to be feasible in
some areas in Jordan. The unit cost of water production by desalination in
different countries varies considerably. In Jordan, although water and energy
resources are scarce, the cost of water production can be minimized by efficient
utilization of the sources available and by using non-conventional energy
3
resources. In this work, the application of non-conventional desalination
technologies in Jordan is evaluated. These technologies include: hydropower,
solar, wind-power, and nuclear desalination.
Using a decision-support system through a multi-criteria analysis,
Analytic Hierarchy Process (AHP) an attempt is made to assist decision makers
to evaluate the use of the above non-conventional energy technologies, by
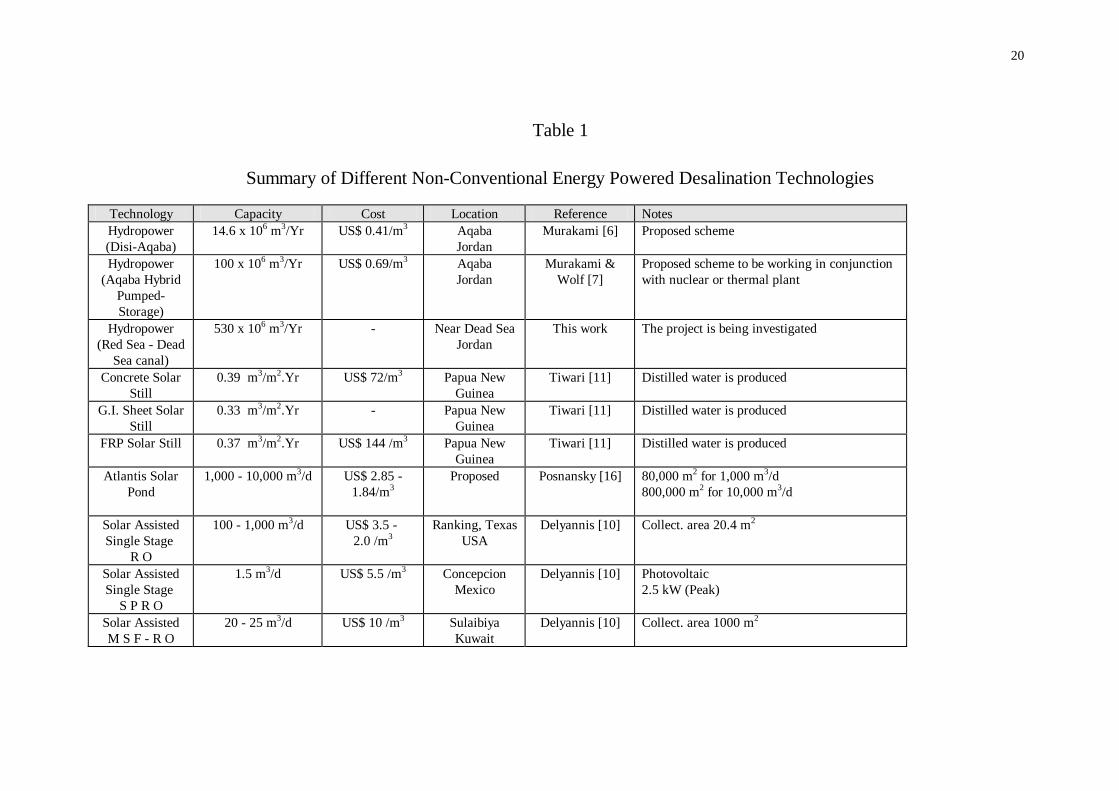
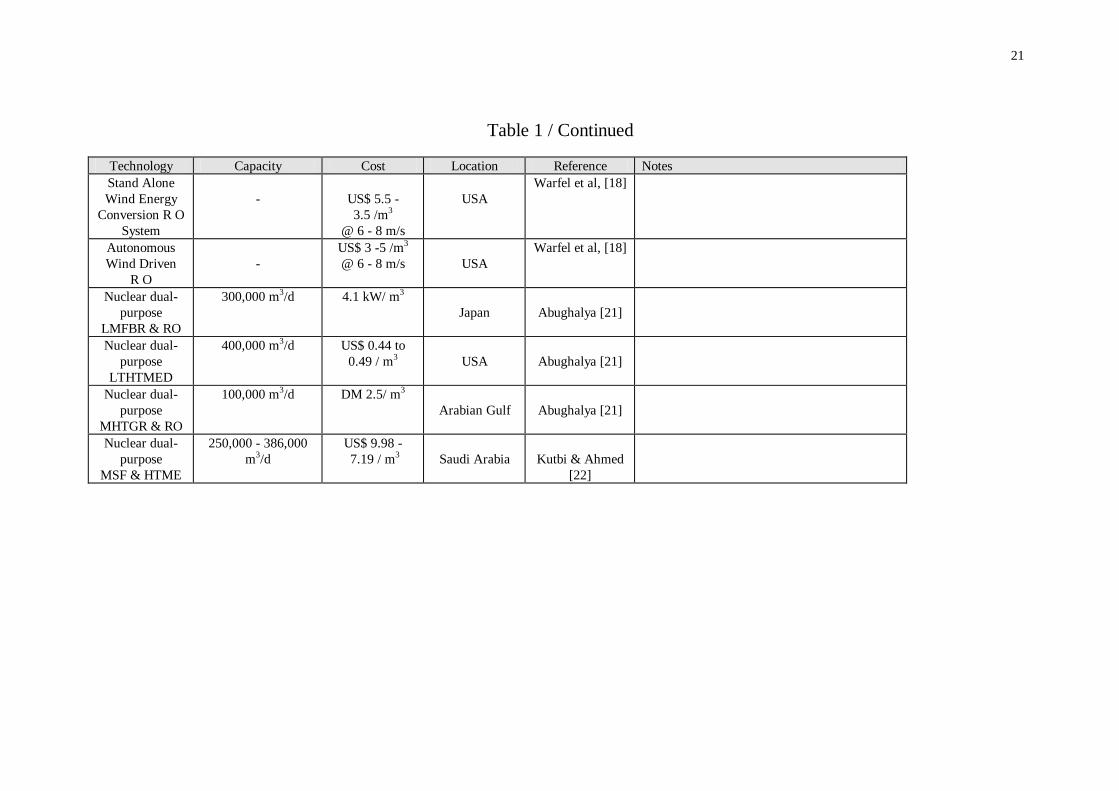
matching the best technology with the most suitable user. Table 1 shows a
synthesis of literature comparing various technologies which include
technology type, capacity, unit cost, and location.
The following is a description of various potential non-conventional
technologies to be used for water desalination in Jordan. It intends to address
options, constraints, and feasibility.
HYDROPOWER REVERSE OSMOSIS DESALINATION IN JORDAN
Disi-Aqaba groundwater hydro-scheme:
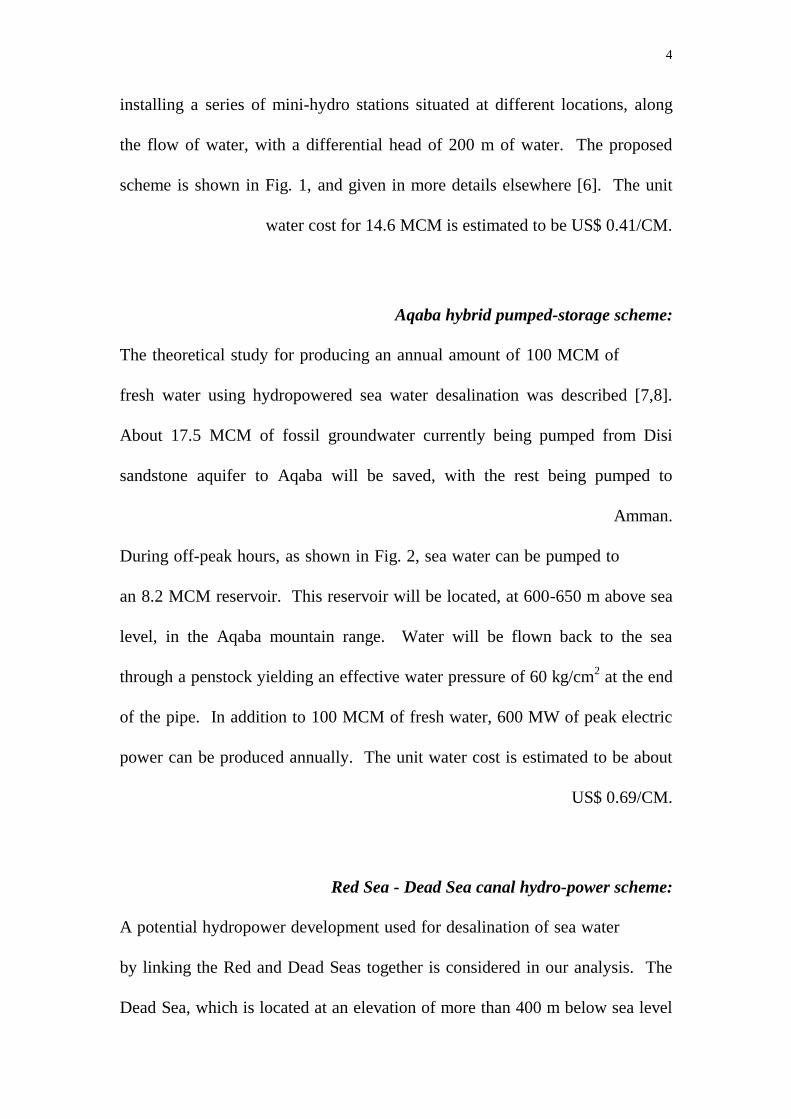
Qa Disi wellfield (see Fig 1) is located at an elevation of 840 m above
sea level, and at a distance of about 80 km from the port of Aqaba. By
assuming a flow discharge of 0.663 CM per second with 800 m effective
differential head of water, it is estimated that 5.2 MW of hydro-potential
energy can be utilized. The utilization of such energy can be accomplished by
4
installing a series of mini-hydro stations situated at different locations, along
the flow of water, with a differential head of 200 m of water. The proposed
scheme is shown in Fig. 1, and given in more details elsewhere [6]. The unit
water cost for 14.6 MCM is estimated to be US$ 0.41/CM.
Aqaba hybrid pumped-storage scheme:
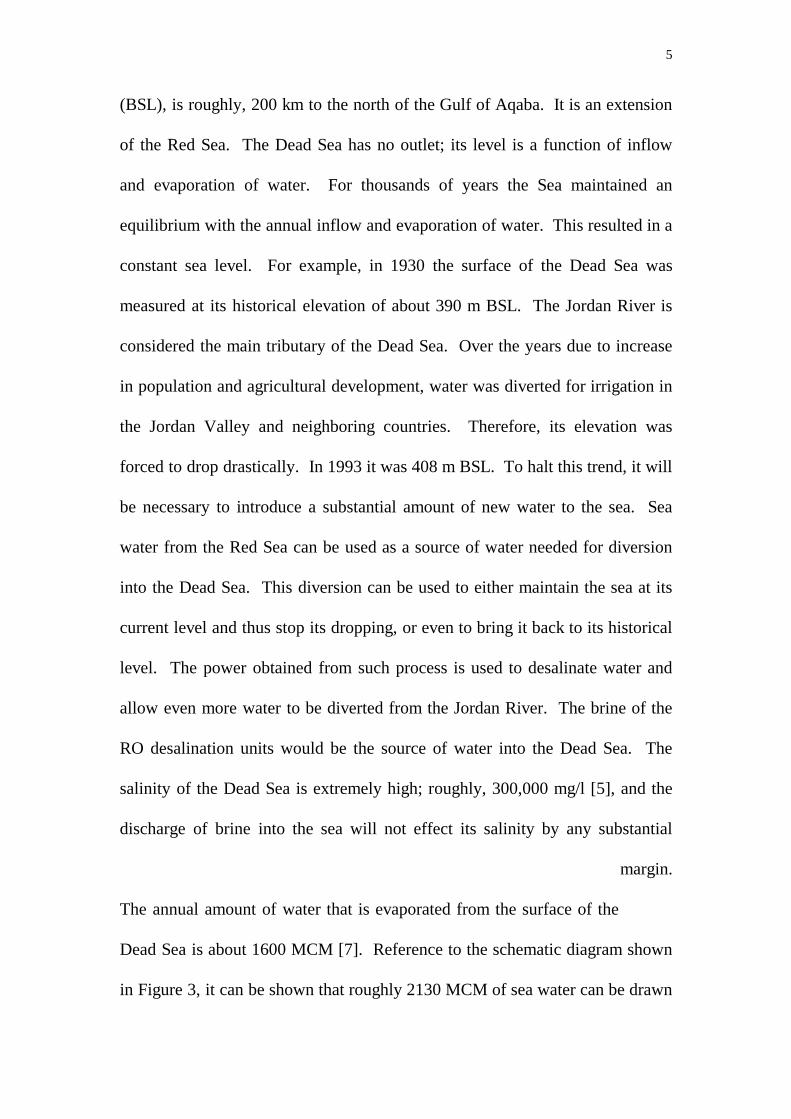
The theoretical study for producing an annual amount of 100 MCM of
fresh water using hydropowered sea water desalination was described [7,8].
About 17.5 MCM of fossil groundwater currently being pumped from Disi
sandstone aquifer to Aqaba will be saved, with the rest being pumped to
Amman.
During off-peak hours, as shown in Fig. 2, sea water can be pumped to
an 8.2 MCM reservoir. This reservoir will be located, at 600-650 m above sea
level, in the Aqaba mountain range. Water will be flown back to the sea
through a penstock yielding an effective water pressure of 60 kg/cm2 at the end
of the pipe. In addition to 100 MCM of fresh water, 600 MW of peak electric
power can be produced annually. The unit water cost is estimated to be about
US$ 0.69/CM.
Red Sea - Dead Sea canal hydro-power scheme:
A potential hydropower development used for desalination of sea water
by linking the Red and Dead Seas together is considered in our analysis. The
Dead Sea, which is located at an elevation of more than 400 m below sea level
5
(BSL), is roughly, 200 km to the north of the Gulf of Aqaba. It is an extension
of the Red Sea. The Dead Sea has no outlet; its level is a function of inflow
and evaporation of water. For thousands of years the Sea maintained an
equilibrium with the annual inflow and evaporation of water. This resulted in a
constant sea level. For example, in 1930 the surface of the Dead Sea was
measured at its historical elevation of about 390 m BSL. The Jordan River is
considered the main tributary of the Dead Sea. Over the years due to increase
in population and agricultural development, water was diverted for irrigation in
the Jordan Valley and neighboring countries. Therefore, its elevation was
forced to drop drastically. In 1993 it was 408 m BSL. To halt this trend, it will
be necessary to introduce a substantial amount of new water to the sea. Sea
water from the Red Sea can be used as a source of water needed for diversion
into the Dead Sea. This diversion can be used to either maintain the sea at its
current level and thus stop its dropping, or even to bring it back to its historical
level. The power obtained from such process is used to desalinate water and
allow even more water to be diverted from the Jordan River. The brine of the
RO desalination units would be the source of water into the Dead Sea. The
salinity of the Dead Sea is extremely high; roughly, 300,000 mg/l [5], and the
discharge of brine into the sea will not effect its salinity by any substantial
margin.
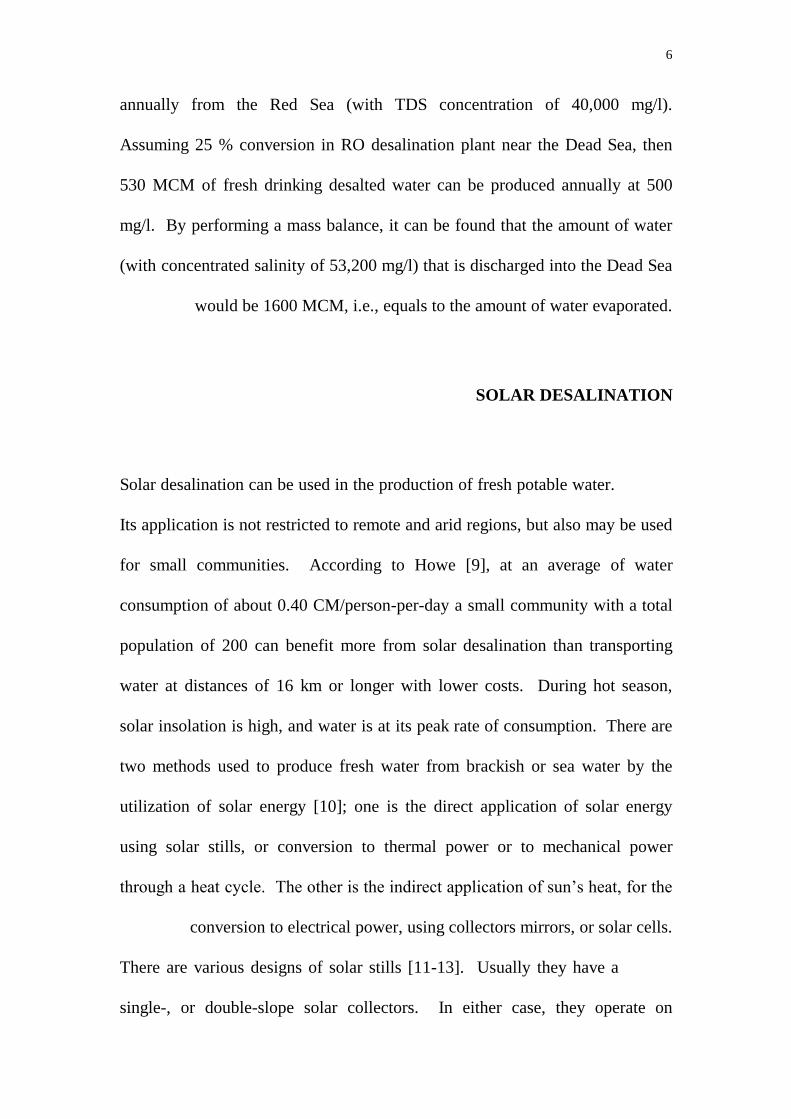
The annual amount of water that is evaporated from the surface of the
Dead Sea is about 1600 MCM [7]. Reference to the schematic diagram shown
in Figure 3, it can be shown that roughly 2130 MCM of sea water can be drawn
6
annually from the Red Sea (with TDS concentration of 40,000 mg/l).
Assuming 25 % conversion in RO desalination plant near the Dead Sea, then
530 MCM of fresh drinking desalted water can be produced annually at 500
mg/l. By performing a mass balance, it can be found that the amount of water
(with concentrated salinity of 53,200 mg/l) that is discharged into the Dead Sea
would be 1600 MCM, i.e., equals to the amount of water evaporated.
SOLAR DESALINATION
Solar desalination can be used in the production of fresh potable water.
Its application is not restricted to remote and arid regions, but also may be used
for small communities. According to Howe [9], at an average of water
consumption of about 0.40 CM/person-per-day a small community with a total
population of 200 can benefit more from solar desalination than transporting
water at distances of 16 km or longer with lower costs. During hot season,
solar insolation is high, and water is at its peak rate of consumption. There are
two methods used to produce fresh water from brackish or sea water by the
utilization of solar energy [10]; one is the direct application of solar energy
using solar stills, or conversion to thermal power or to mechanical power
through a heat cycle. The other is the indirect application of sun’s heat, for the
conversion to electrical power, using collectors mirrors, or solar cells.
There are various designs of solar stills [11-13]. Usually they have a
single-, or double-slope solar collectors. In either case, they operate on
7
absorbing solar radiation through transparent cover, usually made of glass,
which is then transmitted to water. Production rate of water can vary with
design of solar still and location. Usually they have an annual production rate
per collector surface area of 800 to 1000 L/m2.
Solar desalination plants are considered small size desalination units
when compared with fuel-operated units. There are number of solar
desalination plants currently in use throughout the world. A solar plant in
Greece was designed to produce a maximum of 27 CM /d of fresh water [9].
Another was designed in Abu-Dhabi, capable of producing 80 CM/d. A five-
year operational performance and reliability of the unit was published [14].
Another was also designed by a joint Spanish and German research team to
produce 72 CM/d [15]. All three plants use sea water to be desalinated into
fresh water by using solar energy.
Like most Middle Eastern countries, Jordan enjoys long duration of sun.
The local weather has over than 300 cloudless days per year. Future
technology suggests that the Dead Sea itself can be used as a 450 km2 solar
lake, operating a 2500 MW power plant [7]. In part, some of the electric
energy can be used for desalination using RO technology.
WIND ENERGY DESALINATION
Wind energy can be combined with RO desalination techniques for the
production of fresh drinking water. Initial studies have shown that wind energy
8
can be an appropriate method for RO desalination [17,18]. There are number
of sites in Jordan with potentially high wind speeds to be utilized for this
purpose. Habali et al. [19] have presented the three most potential sites in
Jordan which include Ras Munif, Mafraq and Aqaba. Wind speeds range from
4 to 23 m/s throughout 80% of the whole year.
Wind-powered RO desalination could become more economic in the
future because firstly, current developments indicate fuel costs are steady or
increasing. Secondly, Wind turbine cost is becoming less expensive. Thirdly,
RO desalination cost is decreasing due to the continuing development in
membrane technology. At cost of US$ 3 - 6 per CM of water (see Table 1)
wind desalination might not be appropriate for most applications. But for some
remote villages in the Jordan’s Badia wind energy could be utilized for
sustaining human settlements and habitat.
NUCLEAR DESALINATION
Nuclear energy offers an advantage to fossil energy from an
environmental point of view. Ragheb et al [20] reported the production of 1
MCM of fresh water from nuclear energy would avoid the emission of 2
million tons of CO2, 20,000 tons of SO2, and 6000 tons of NOx, as compared to
desalination by energy from fossil fuel. The technical feasibility of using
nuclear power in desalination was reported by a number of researchers [21-23].
In all different studies there are clear indications that nuclear energy has the
9
potential to reduce water cost. In Jordan, where no fossil energy resources are
available, nuclear energy may present a positive impact on water cost, as it has
had on electricity in many countries.
Recent studies [21] have shown that, there are only two types of
desalination processes, namely the RO and MED. They are varying in
reliability, simplicity and adaptability. The modular high-temperature gas
cooled reactor (MHTGR), and the liquid metal fast breeder reactor (LMFBR)
can be employed in the new design of dual purpose plants. That is due to their
small size and compatibility with desalination applications.
A number of studies in the U.S., Germany, and Japan on nuclear
desalination has been conducted [21]. The MHTGR was used in both the U.S.
and Germany. While the LMFBR was used in Japan and the LTHMED process
was used in the U.S. The cost of producing water was reported to be DM 2.5
per CM and US$ 0.44 to 0.49 per CM for both German and American studies,
respectively.
Nuclear energy was used for desalination purpose in the city of
Skeichenko in Russia. The complex is a large multi purpose plant and it has
been supplying the city with fresh water, electricity, and thermal energy [20].
It provides 0.14 MCM of fresh water per day, and generates 150 MW of
electric power. The actual cost of water was reported to be 0.48 ruble per CM.
The average annual cost of water production consists of annual
production charges, operation and maintenance cost, and cost of fuel. Nuclear
10
power plants are highly capital intensive, it was reported that the annual capital
charges represent more than 70 % of the total average annual production cost.
Having described the above options for non-conventional energy
technologies, the following is a framework for evaluating and devising best
uses for each technology.
METHODOLOGY OF THE HIERARCHICAL ANALYSIS
In order to model a multi-objective water desalination technologies in
Jordan, Saaty’s AHP was adopted [24]. A detailed procedure along with a
numerical example can be found in Appendix A [4,25]. Briefly, relative
weights were determined through pairwise comparison. The model can be
applied by breaking down the complex unstructured scorecard problems into
component parts. Value tree structures are formed in order to arrange these
attributes into hierarchical orders. Numerical values are assigned to represent
subjective judgments on the relative importance of each part. These judgments
are then synthesized via the use of eigenvectors to determine which variables
have the highest priority.
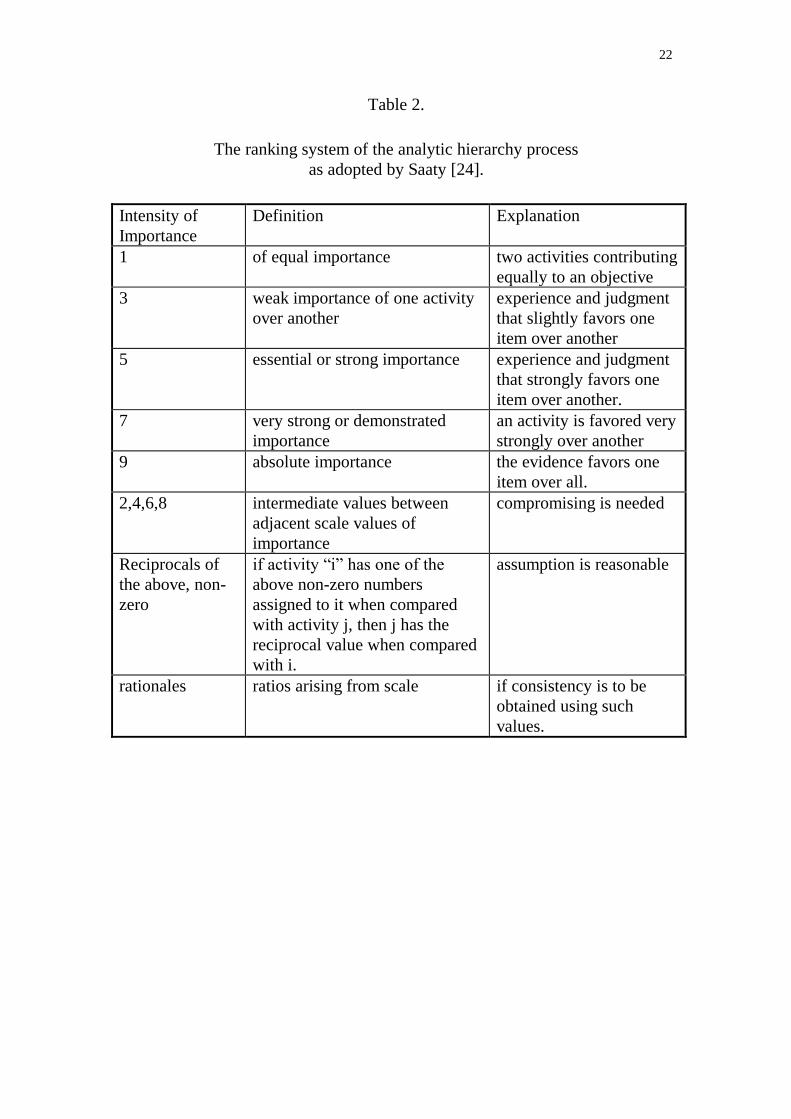
A finite number of values to rank (scale) the importance is assigned.
AHP ranges scale from 1 (to denote equal importance of two attributes) to 9 (to
represent an absolute importance of one attribute over another). The ranking
system used by AHP is presented in Table 2. After the problem is decomposed
to a tree or "hierarchy" of components of various levels, a pairwise comparison
11
is carried out from the top level to lower levels. Then after each comparison, a
"consistency" check is made to enable the analyst to revise his/her weights so
as to obtain a consistency value below 0.1.
For this study, various desalination technologies in Jordan are studied to
evaluate technologies and to define criteria and appropriate uses. The problem
was broken into different levels to construct a hierarchy tree. The hierarchy tree
shown in Figure 4 is composed of four levels. The first level defines the "goal"
to be achieved which is to select the best energy system producing desalinated
water. The second level outlines the main "technologies" to produce energy.
These include hydropower, solar, wind, and nuclear. The third level list criteria.
The fourth level defines water uses; i.e., domestic, industrial, and agriculture.
RESULTS AND DISCUSSION
In light of hierarchical analysis, relative global weights were generated.
They are shown in Figures 5 and 6. Figure 5 shows, relative weight
comparison of type of technology versus water use with respect to water
productivity criteria; i.e., return of one cubic meter in each water sector. The
relative weight comparison of type of technology versus use with respect to
environmental sustainability criteria, as defined in [4], is shown in Figure 6.
Results show that under water productivity criteria the highest weights were
obtained for hydropower to be used in domestic and industrial sectors (with
relative weights of 0.181 and 0.162, respectively). However, solar technology
12
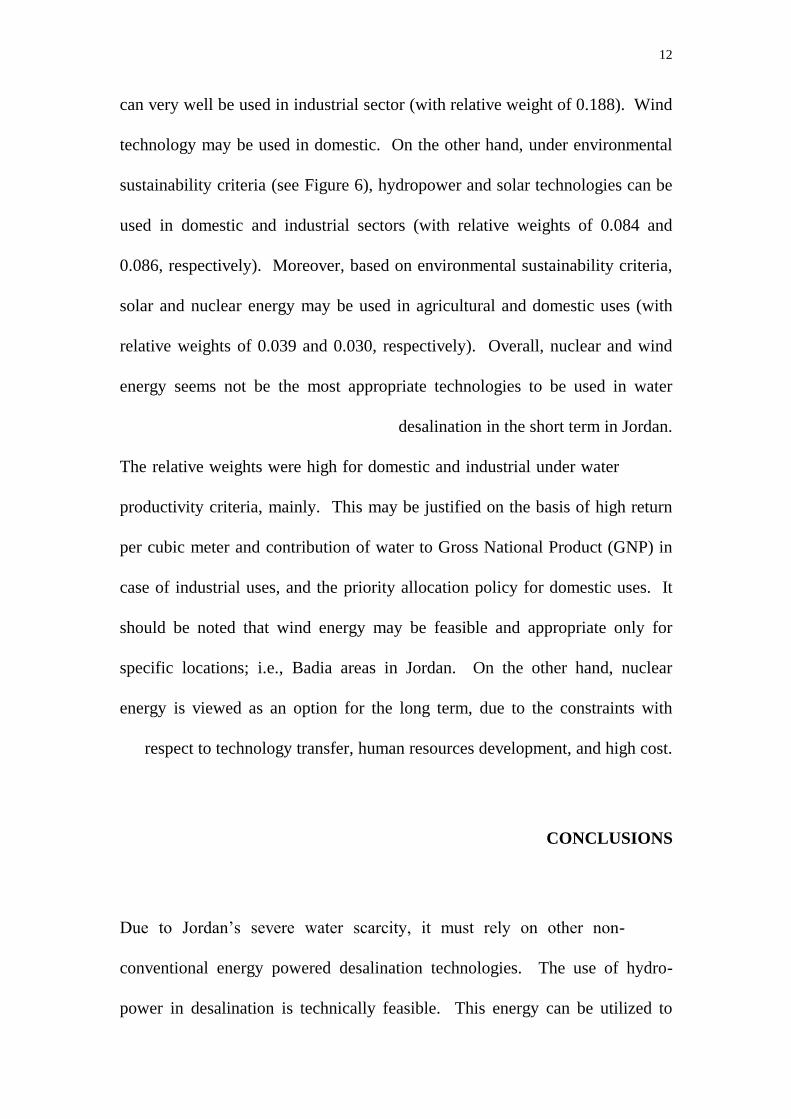
can very well be used in industrial sector (with relative weight of 0.188). Wind
technology may be used in domestic. On the other hand, under environmental
sustainability criteria (see Figure 6), hydropower and solar technologies can be
used in domestic and industrial sectors (with relative weights of 0.084 and
0.086, respectively). Moreover, based on environmental sustainability criteria,
solar and nuclear energy may be used in agricultural and domestic uses (with
relative weights of 0.039 and 0.030, respectively). Overall, nuclear and wind
energy seems not be the most appropriate technologies to be used in water
desalination in the short term in Jordan.
The relative weights were high for domestic and industrial under water
productivity criteria, mainly. This may be justified on the basis of high return
per cubic meter and contribution of water to Gross National Product (GNP) in
case of industrial uses, and the priority allocation policy for domestic uses. It
should be noted that wind energy may be feasible and appropriate only for
specific locations; i.e., Badia areas in Jordan. On the other hand, nuclear
energy is viewed as an option for the long term, due to the constraints with
respect to technology transfer, human resources development, and high cost.
CONCLUSIONS
Due to Jordan’s severe water scarcity, it must rely on other non-
conventional energy powered desalination technologies. The use of hydro-
power in desalination is technically feasible. This energy can be utilized to

13
provide water for domestic and industrial sectors. The use of solar energy with
twenty-first century technology can be utilized in desalting brackish water in
many parts of the country. Wind energy can be utilized in areas where wind
has a high average speed. Nuclear energy is to be considered for the long term
in Jordan. Further research and studies in this area are needed to ensure
technical and economic feasibility of each technology.
14
REFERENCES
1. E. Salameh, Proc. of symposium on Jordan’s Water Resources and Their
Future Potential, (1992), Amman, Jordan, 113-120.
2. Jordan’s Department of Statistics, (1995), Amman, Jordan.
3. M. Bilbeisi, Proc. of symposium on Jordan’s Water Resources and Their
Future Potential, (1992), Amman, Jordan, 7-29.
4. O.R. Al-Jayyousi, and M.R. Shatanawi, Int. J. Water Resources
Development, 11, (1995), 315-330.
5. M. Murakami, Int. J. Water Resources Development, 11, (1995), 391-410.
6. M. Murakami, Managing Water for Peace in the Middle East, United
Nations University Press, (1995), Tokyo, Japan, pp. 167-201.
7. M. Murakami, and A.T. Wolf, Int. J. Water Resources Development, 11,
(1995), 163-183.
8. Middle East Water Commission, Int. J. Water Resources Development,
11, (1995), 351-375.
9. E.D. Howe, Desalination, (1986), 307-332.
11. E.E Delyannis, Desalination, 67, (1987), 3-19.
11. G.N. Tiwari, Desalination, 82, (1991), 233-241.
12. A.Y. Maalej, Desalination, 82, (1991), 207-219.
13. G.N. Tiwari, K. Mukherjee, K.R. Ashok, and Y.P. Yadav, Desalination,
60, (1986), 191-202.
15
14. A. El-Nashar, and A. Qamhiyeh, Desalination, 82, (1991), 165-174.
15. A. Gregorzewski, K. Genthner, E. Zarza, J. Leon, J. de Gunzboourg, G.
Alefeld, and J. Scharfe, Desalination, 82, (1991), 145-152.
16. M. Posnansky, Desalination, 67, (1987), 81-95.
17. P. Feron, Wind Engineering, 9, (1985), 180-199.
18. C.G. Warfel, J.F. Manwell, and J.G. McGowan, Solar & Wind
Technology, 5, (1988), 549-561.
19. S.M. Habali, M.A.S. Hamdan, B.A. Jubran, and A.I. Zaid, Solar Energy,
38, (1987), 59-70.
21. M. Ragheb, K. Toukan, R. Al-Weshah, Proc. Int. Symp. on Water
Resources in The Middle East: Policy and Institutional Aspects, Urbana-
Illinois, USA, (1993), 173-180.
21. Abughalya, Crijns, Kupitz, Tusel, and Wangnick, Desalination, 81,
(1991), 505-523.
22. I.I. Kutbi, and A.M.A. Ahmed, Desalination, 58, (1986) 43-54.
23. I.I. Kutbi, Z.A. Sabri, and A.A. Hussein, Desalination, 58, (1986) 113-
134.
42. T.L. Saaty, The Analytic Hierarchy Process, (1980) ,McGraw-Hill, New
York, USA.
42. T.L. Saaty, Decision Making for Leaders: The Analytic Hierarchy
Process for Decision Making, (1988), RWS Publication, Pittsburgh, PA,
USA.

16
17
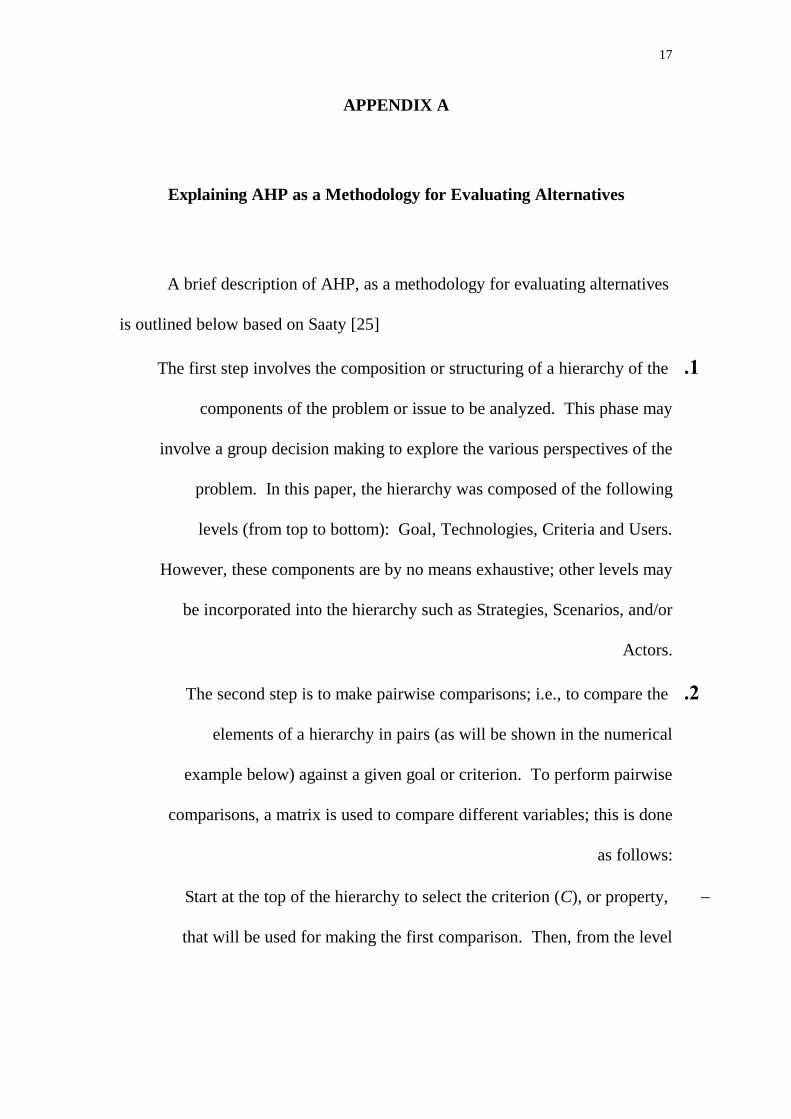
APPENDIX A
Explaining AHP as a Methodology for Evaluating Alternatives
A brief description of AHP, as a methodology for evaluating alternatives
is outlined below based on Saaty [25]
1. The first step involves the composition or structuring of a hierarchy of the
components of the problem or issue to be analyzed. This phase may
involve a group decision making to explore the various perspectives of the
problem. In this paper, the hierarchy was composed of the following
levels (from top to bottom): Goal, Technologies, Criteria and Users.
However, these components are by no means exhaustive; other levels may
be incorporated into the hierarchy such as Strategies, Scenarios, and/or
Actors.
2. The second step is to make pairwise comparisons; i.e., to compare the
elements of a hierarchy in pairs (as will be shown in the numerical
example below) against a given goal or criterion. To perform pairwise
comparisons, a matrix is used to compare different variables; this is done
as follows:
Start at the top of the hierarchy to select the criterion (C), or property,
that will be used for making the first comparison. Then, from the level
18
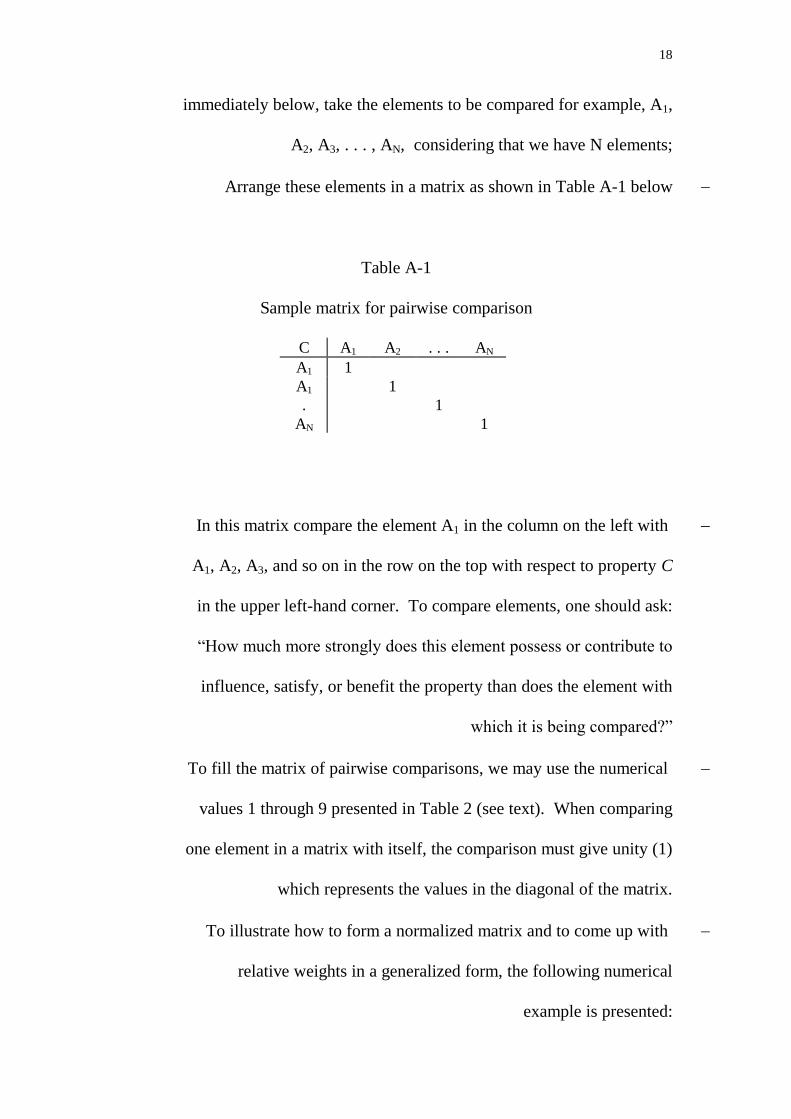
immediately below, take the elements to be compared for example, A1,
A2, A3, . . . , AN, considering that we have N elements;
Arrange these elements in a matrix as shown in Table A-1 below
Table A-1
Sample matrix for pairwise comparison
C A1 A2 . . . AN
A1 1
A1 1
. 1
AN 1
In this matrix compare the element A1 in the column on the left with
A1, A2, A3, and so on in the row on the top with respect to property C
in the upper left-hand corner. To compare elements, one should ask:
“How much more strongly does this element possess or contribute to
influence, satisfy, or benefit the property than does the element with
which it is being compared?”
To fill the matrix of pairwise comparisons, we may use the numerical
values 1 through 9 presented in Table 2 (see text). When comparing
one element in a matrix with itself, the comparison must give unity (1)
which represents the values in the diagonal of the matrix.
To illustrate how to form a normalized matrix and to come up with
relative weights in a generalized form, the following numerical
example is presented:
19
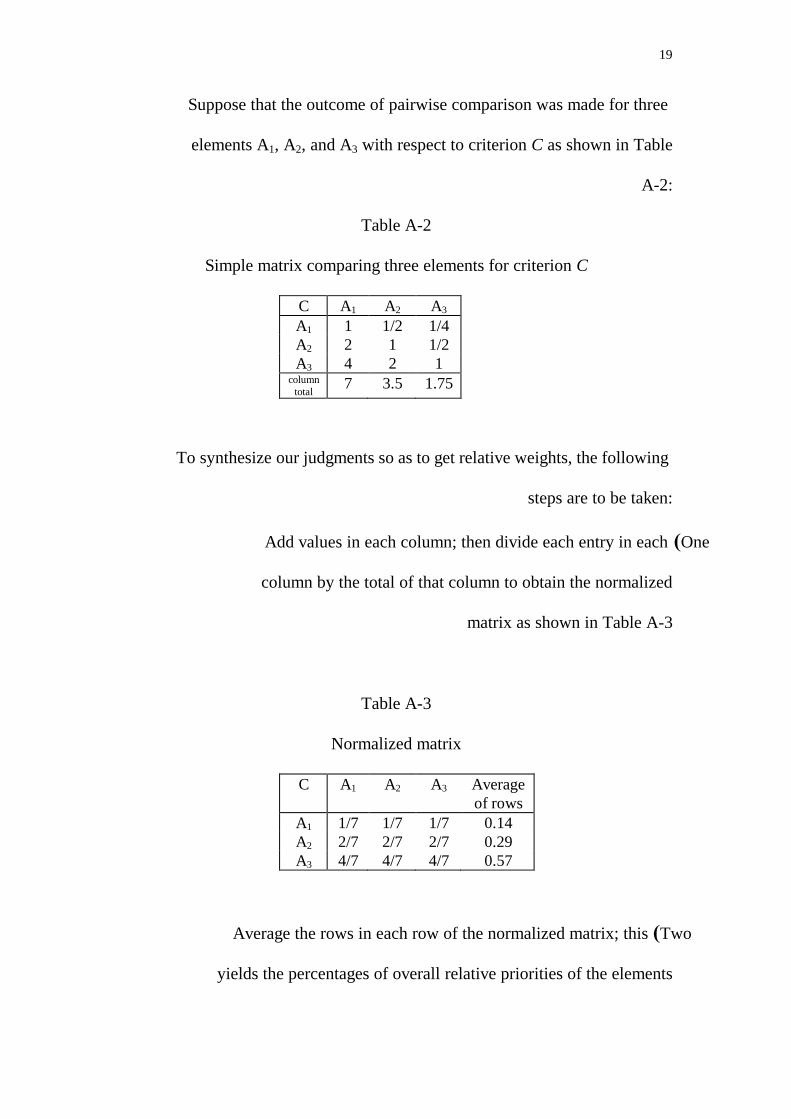
Suppose that the outcome of pairwise comparison was made for three
elements A1, A2, and A3 with respect to criterion C as shown in Table
A-2:
Table A-2
Simple matrix comparing three elements for criterion C
C A1 A2 A3
A1 1 1/2 1/4
A2 2 1 1/2
A3 4 2 1 column
total 7 3.5 1.75
To synthesize our judgments so as to get relative weights, the following
steps are to be taken:
One) Add values in each column; then divide each entry in each
column by the total of that column to obtain the normalized
matrix as shown in Table A-3
Table A-3
Normalized matrix
C A1 A2 A3 Average
of rows
A1 1/7 1/7 1/7 0.14
A2 2/7 2/7 2/7 0.29
A3 4/7 4/7 4/7 0.57
Two) Average the rows in each row of the normalized matrix; this
yields the percentages of overall relative priorities of the elements
20
A1, A2, and A3. Hence, we can make deductions with reference to
relative weights as calculated above.
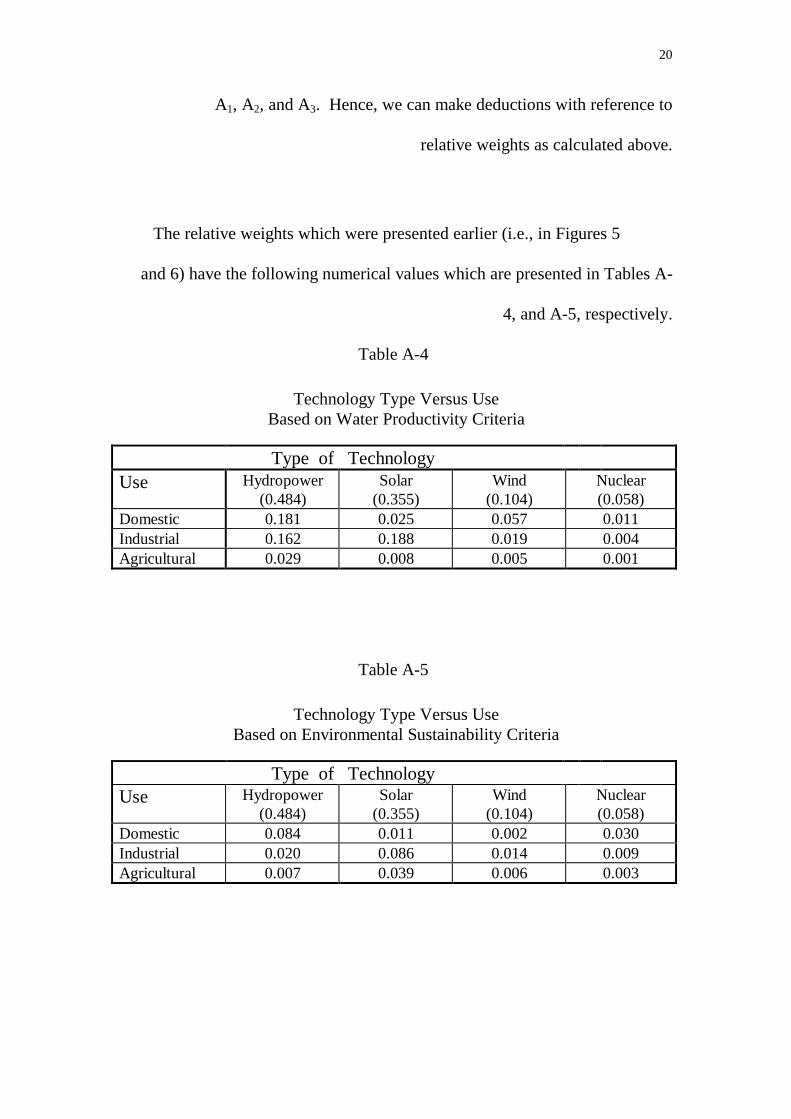
The relative weights which were presented earlier (i.e., in Figures 5
and 6) have the following numerical values which are presented in Tables A-
4, and A-5, respectively.
Table A-4
Technology Type Versus Use
Based on Water Productivity Criteria
Type of Technology
Use Hydropower (0.484)
Solar (0.355)
Wind (0.104)
Nuclear (0.058)
Domestic 0.181 0.025 0.057 0.011 Industrial 0.162 0.188 0.019 0.004 Agricultural 0.029 0.008 0.005 0.001
Table A-5
Technology Type Versus Use
Based on Environmental Sustainability Criteria
Type of Technology
Use Hydropower (0.484)
Solar (0.355)
Wind (0.104)
Nuclear (0.058)
Domestic 0.084 0.011 0.002 0.030 Industrial 0.020 0.086 0.014 0.009 Agricultural 0.007 0.039 0.006 0.003
20
Table 1
Summary of Different Non-Conventional Energy Powered Desalination Technologies
Technology Capacity Cost Location Reference Notes
Hydropower
(Disi-Aqaba)
14.6 x 10⁶ m3/Yr US$ 0.41/m3
Aqaba
Jordan
Murakami [6] Proposed scheme
Hydropower
(Aqaba Hybrid
Pumped-
Storage)
100 x 106 m3/Yr US$ 0.69/m3
Aqaba
Jordan
Murakami &
Wolf [7]
Proposed scheme to be working in conjunction
with nuclear or thermal plant
Hydropower
(Red Sea - Dead
Sea canal)
530 x 106 m3/Yr - Near Dead Sea
Jordan
This work The project is being investigated
Concrete Solar
Still
0.39 m3/m2.Yr US$ 72/m3
Papua New
Guinea
Tiwari [11] Distilled water is produced
G.I. Sheet Solar
Still
0.33 m3/m2.Yr - Papua New
Guinea
Tiwari [11] Distilled water is produced
FRP Solar Still 0.37 m3/m2.Yr US$ 144 /m3
Papua New
Guinea
Tiwari [11] Distilled water is produced
Atlantis Solar
Pond
1,000 - 10,000 m3/d
US$ 2.85 -
1.84/m3
Proposed Posnansky [16] 80,000 m2 for 1,000 m3/d
800,000 m2 for 10,000 m3/d
Solar Assisted
Single Stage
R O
100 - 1,000 m3/d
US$ 3.5 -
2.0 /m3
Ranking, Texas
USA
Delyannis [10] Collect. area 20.4 m2
Solar Assisted
Single Stage
S P R O
1.5 m3/d
US$ 5.5 /m3
Concepcion
Mexico
Delyannis [10] Photovoltaic
2.5 kW (Peak)
Solar Assisted
M S F - R O
20 - 25 m3/d
US$ 10 /m3
Sulaibiya
Kuwait
Delyannis [10] Collect. area 1000 m2
21
Table 1 / Continued
Technology Capacity Cost Location Reference Notes
Stand Alone
Wind Energy
Conversion R O
System
-
US$ 5.5 -
3.5 /m3
@ 6 - 8 m/s
USA
Warfel et al, [18]
Autonomous
Wind Driven
R O
-
US$ 3 -5 /m3
@ 6 - 8 m/s
USA
Warfel et al, [18]
Nuclear dual-
purpose
LMFBR & RO
300,000 m3/d 4.1 kW/ m3
Japan
Abughalya [21]
Nuclear dual-
purpose
LTHTMED
400,000 m3/d US$ 0.44 to
0.49 / m3
USA
Abughalya [21]
Nuclear dual-
purpose
MHTGR & RO
100,000 m3/d DM 2.5/ m3
Arabian Gulf
Abughalya [21]
Nuclear dual-
purpose
MSF & HTME
250,000 - 386,000
m3/d
US$ 9.98 -
7.19 / m3
Saudi Arabia
Kutbi & Ahmed
[22]
22
Table 2.
The ranking system of the analytic hierarchy process
as adopted by Saaty [24].
Intensity of
Importance
Definition Explanation
1 of equal importance two activities contributing
equally to an objective
3 weak importance of one activity
over another
experience and judgment
that slightly favors one
item over another
5 essential or strong importance experience and judgment
that strongly favors one
item over another.
7 very strong or demonstrated
importance
an activity is favored very
strongly over another
9 absolute importance the evidence favors one
item over all.
2,4,6,8 intermediate values between
adjacent scale values of
importance
compromising is needed
Reciprocals of
the above, non-
zero
if activity “i” has one of the
above non-zero numbers
assigned to it when compared
with activity j, then j has the
reciprocal value when compared
with i.
assumption is reasonable
rationales ratios arising from scale if consistency is to be
obtained using such
values.

23
Figure 1: Disi-Aqaba hydropowered RO desalination scheme.
Source: Murakami [6]

24
Figure 2: Aqaba hybrid pumped-storage scheme.
Source: Middle East Water Commission [8].

25
Figure 3: Schematic and flow diagram of RO desalination system.

26
Figure 4: Structure of the hierarchy.

27
Figure 5: Technology type versus use based on water productivity criteria
28
Figure 6: Technology type versus use based on environmental sustainability criteria