desalination technologies and environmental aspects: case ...
249
DESALINATION TECHNOLOGIES AND ENVIRONMENTAL ASPECTS: CASE STUDY IN LIBYA By ALI HASSIN SALEH EL-HAJAJI A thesis submitted in fulfilment of the requirements of Liverpool John Moores University for the degree of Doctor of Philosophy November 2017
-
Upload
khangminh22 -
Category
Documents
-
view
7 -
download
0
Transcript of desalination technologies and environmental aspects: case ...
DESALINATION TECHNOLOGIES
AND ENVIRONMENTAL ASPECTS:
CASE STUDY IN LIBYA
By
ALI HASSIN SALEH EL-HAJAJI
A thesis submitted in fulfilment of the requirements of Liverpool
John Moores University for the degree of
Doctor of Philosophy
November 2017

i
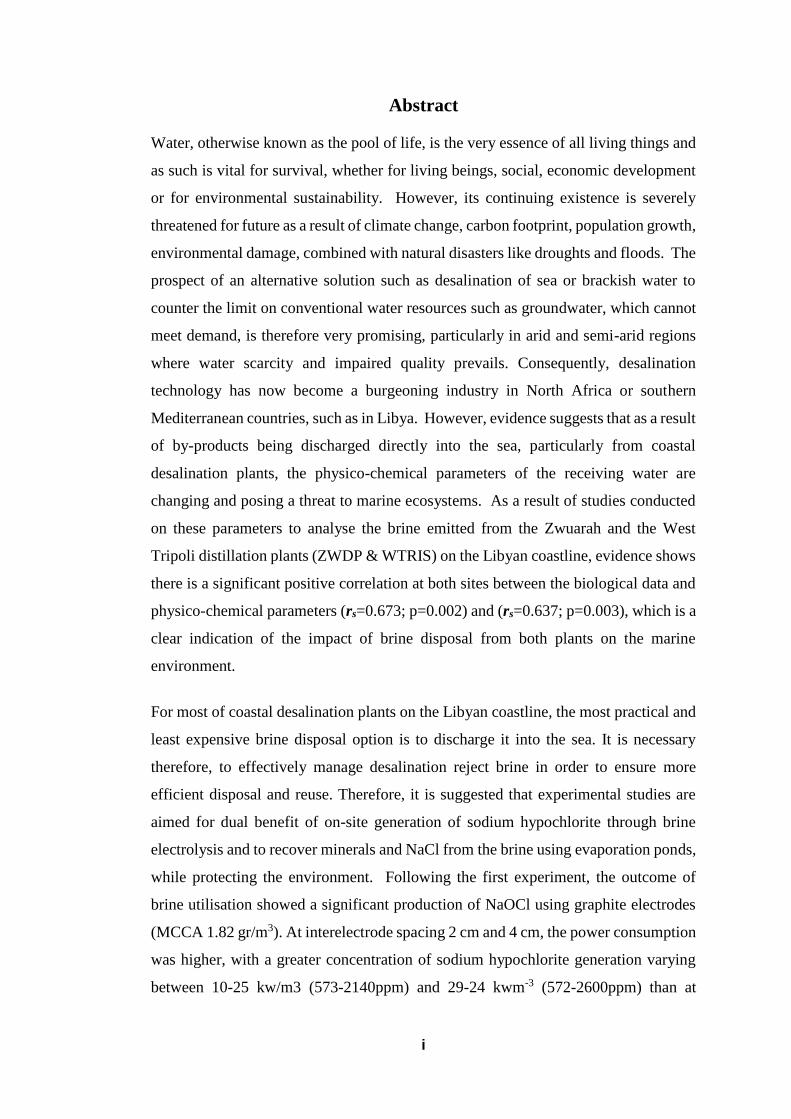
Abstract
Water, otherwise known as the pool of life, is the very essence of all living things and
as such is vital for survival, whether for living beings, social, economic development
or for environmental sustainability. However, its continuing existence is severely
threatened for future as a result of climate change, carbon footprint, population growth,
environmental damage, combined with natural disasters like droughts and floods. The
prospect of an alternative solution such as desalination of sea or brackish water to
counter the limit on conventional water resources such as groundwater, which cannot
meet demand, is therefore very promising, particularly in arid and semi-arid regions
where water scarcity and impaired quality prevails. Consequently, desalination
technology has now become a burgeoning industry in North Africa or southern
Mediterranean countries, such as in Libya. However, evidence suggests that as a result
of by-products being discharged directly into the sea, particularly from coastal
desalination plants, the physico-chemical parameters of the receiving water are
changing and posing a threat to marine ecosystems. As a result of studies conducted
on these parameters to analyse the brine emitted from the Zwuarah and the West
Tripoli distillation plants (ZWDP & WTRIS) on the Libyan coastline, evidence shows
there is a significant positive correlation at both sites between the biological data and
physico-chemical parameters (rs=0.673; p=0.002) and (rs=0.637; p=0.003), which is a
clear indication of the impact of brine disposal from both plants on the marine
environment.
For most of coastal desalination plants on the Libyan coastline, the most practical and
least expensive brine disposal option is to discharge it into the sea. It is necessary
therefore, to effectively manage desalination reject brine in order to ensure more
efficient disposal and reuse. Therefore, it is suggested that experimental studies are
aimed for dual benefit of on-site generation of sodium hypochlorite through brine
electrolysis and to recover minerals and NaCl from the brine using evaporation ponds,
while protecting the environment. Following the first experiment, the outcome of
brine utilisation showed a significant production of NaOCl using graphite electrodes
(MCCA 1.82 gr/m3). At interelectrode spacing 2 cm and 4 cm, the power consumption
was higher, with a greater concentration of sodium hypochlorite generation varying
between 10-25 kw/m3 (573-2140ppm) and 29-24 kwm-3 (572-2600ppm) than at

ii
interelectrode spacing 6cm 17-13 kwm-3 (350-1790ppm). Consequently, the selection
of an optimum electrical consumption level is key in establishing the best scenario in
terms of economy and efficiency. Subsequent to the second experiment of brine
evaporation in the ponds, results showed that the evaporation rate in August was lower
than in September (9.06 mmday-1, 14.63 mmday-1) respectively. The results of the
SEM/EDS test showed that due to elevated surges of Na+ and Cl-, halite (NaCl) was
the main mineral evident during crystallisation of the salt samples. Hence, the two
experiments reveal that brine can be recycled productively, while protecting the
environment.
iii
Declaration
I, Ali Hassin Saleh El-Hajaji, declare that this thesis, submitted in fulfilment of the
requirements for award of Doctor of Philosophy, in the school of Civil Engineering,
Liverpool Johan Moores University, is my own work, except where otherwise
referenced or acknowledged. This thesis was completed under the supervision of Prof.
Rafid Al Khaddar, Dr. Simone Dürr and Dr. Daw Haddoud, and has not been
submitted for qualification at any other academic institution.
Ali Hassin Saleh El-Hajaji
November 2017

iv
Acknowledgements
I would like to express my sincere gratitude to my wonderful supervision team (Prof.
Rafid Al Khaddar, Dr. Simone Dürr and Dr. Daw Haddoud and the advisor Prof. David
Phipps) for their invaluable guidance and great patience during the course of this
study. This would not have been possible to achieve without their academic and moral
support through hard times.
I also would like to thank the laboratory technical staff in the School of Civil
Engineering at Liverpool John Moores University, especially Mr. Malcolm Freegan
and Mr Hewitt David. I should also thank the General Desalination Company of Libya
and Marine Research Centre, Tajura/Tripoli for the laboratory tools that they provided
to complete my research.
The contributions of engineer Sammy Zawgyi (Head of Chemical Department at
Zwuarah Desalination Company in Libya) and Dr. Daw Haddoud (Head of Marine
Research Centre, Tajura/Tripoli) cannot over-emphasised. Eng. Sammy used his
wealth of knowledge and experience in order to install the evaporation ponds close to
Zwuarah Desalination station, while Dr. Daw Haddoud also used his expertise and
skill regarding the marine data collection.
I should also thank the Ministry of Higher Education and Scientific Research of Libya
and Libyan Cultural Affairs in London for their sponsorship and financial help. Also,
I am thankful to my lovely friends and colleagues, namely Caroline Helal and
Amhmed Bhih for their encouragement and moral support.
This project would not have been completed without the support of my great family,
especially my brother Adnan for his continuous support during the course of my study.
GOD BLESS YOU ALL!
Dedication

v
This thesis is dedicated specially to:
Allah, the most Gracious and the most Merciful
Prophet Mohammed (May Allah bless him) and his household
My parents for making my research work possible and their continued prayers, moral
and financial support who have spent their lives raising seven children to see them as
teachers, dentist, and doctors.
My best brother Adnan and my five sisters for their support.
My beloved wife for her endless love, patience, encouragement and support.
My beloved son Al Hussain who makes the world a much happier place.
My Father-in-law Mohamed Shamaka for his continuing support.
GOD BLESS YOU ALL! AND THANKS FOR THEIR LOVE, SUPPORT AND
ENCOURAGEMENT TO MAKE THE DREAM REALISED
vi
Scientific contributions arising from this PhD work
Elhajaji, A and Al Khaddar, R. (2017) Salt production by the evaporation ponds of
brine disposed from distillation plant. Full paper, Faculty Research Week 2017,
Liverpool John Moores University, 22nd May, 2017.
Elhajaji, A and Al Khaddar, R. (2016) Produce Sodium Hypochlorite on site from the
brine disposed of thermal desalination plants: Libya’s case study Full paper, Faculty
Research Week 2016, Liverpool John Moores University, 18th April, 2016.
Elhajaji, A., Al Khaddar, R., Haddoud, D., and Dürr, S. (2015) The Impact of Thermal
Desalination Technologies MED with TVC and without TVC on the Libyan Coastline
(WEWRC: May 2015) , World Environmental and Water Resources Congress 2015:
pp. 2480-2492: doi: 10.1061/9780784479162.243: paper expected and published at:
http://ascelibrary.org/doi/abs/10.1061/9780784479162.243
Elhajaji, A., Al Khaddar, R., Haddoud, D., and Dürr, S. (2014) Thermal Desalination
Technologies as An alternative Option of Water Scarcity in Libya (WEWRC:1-5 Jun
2014), World Environmental and Water Resources Congress 2014: pp. 2247-
2258:doi: 10.1061/9780784413548.224) (Oral presentation) paper expected and
published at: http://ascelibrary.org/doi/abs/10.1061/9780784413548.224
Elhajaji, A., Al Khaddar, R., Haddoud, D., and Dürr, S. (2014) Physicochemical
impact of brine discarded from thermal desalination plants on marine communities:
Case Study-Libya, 9th Annual Bean Conference Proceedings, Liverpool John Moores
University, 18th Jun, 2014.
Elhajaji, A., Al Khaddar, R. (2013) Minimizing the negative impact of thermal
seawater desalination plants by matching MED and solar distiller-Case study Libya –
Part -1, 8th Annual Bean Conference Proceedings, Liverpool John Moores University,
18th Jun, 2013.
vii
Contents
Abstract ......................................................................................................................... i
Declaration ................................................................................................................. iii
Dedication ................................................................................................................... iv
Scientific contributions arising from this PhD work................................................... vi
Contents ..................................................................................................................... vii
List of symbols and abbreviations............................................................................ xiii
Chapter One : Introduction ........................................................................................ 1
1.1. Research Overview .................................................................................................. 1
1.2. Research aims and objectives .................................................................................. 5
1.3. Novelty of research .................................................................................................. 6
1.4. Research benefit and its impact ............................................................................... 7
1.5. Research sources ...................................................................................................... 7
1.6. Thesis outline ........................................................................................................... 8
1.7. Summary .................................................................................................................. 9
Chapter Two : Desalination Technologies ............................................................... 10
2.1. Introduction ................................................................................................................. 10
2.2. Desalination methods .................................................................................................. 11
2.2.1. Thermal desalination technologies ....................................................................... 12
2.2.2. Membrane desalination technologies ................................................................... 20
2.2.3. Alternative processes ........................................................................................... 25
2.3. Chemical treatment procedures for desalination techniques ....................................... 27
2.3.1. Pre-treatment of feed water to desalination plants ............................................... 28
2.3.2. Post treatment of the produced desalinated water ................................................ 31
2.4. Brine discharge flow rates for desalination methods and its impact on marine
environment ....................................................................................................................... 31
2.4.1. Bio-fouling agents ................................................................................................ 32
2.4.2. Coagulants ............................................................................................................ 33
2.4.3. Antifoams ............................................................................................................. 33
2.4.4. Oxygen scavengers .............................................................................................. 33
2.4.5. Acids and alkalis .................................................................................................. 34
2.4.6. Heavy metal (corrosion products) ........................................................................ 34
2.4.7. Scale inhibitors ..................................................................................................... 34
2.4.8. Salinity and temperature ...................................................................................... 35
2.4.9. Cleaning chemicals .............................................................................................. 35
2.5. Air emission ................................................................................................................ 36
2.6. Economic cost of desalination technologies ............................................................... 36
2.7. Summary ..................................................................................................................... 38
Chapter Three: Brine Disposal Management Options for Desalination Technologies
.................................................................................................................................... 41
3.1. Introduction ................................................................................................................. 41
3.2. Brine Discharge Management Methods ...................................................................... 42
3.2.1. Surface Water Disposal ........................................................................................ 42
3.2.2. Deep well injection .............................................................................................. 44
3.2.3. Land application/Spray irrigation ........................................................................ 44
viii
3.2.4. Landfill disposal ................................................................................................... 45
3.2.5. Zero liquid discharge ........................................................................................... 45
3.2.6. Other Brine Minimization Options used for Membrane process ......................... 54
3.3. Mediterranean Legislation of brine discharge from desalination plant into the marine
environment ....................................................................................................................... 54
3.4. Water availability and desalination technologies in Mediterranean region ................ 55
3.5. Summary ..................................................................................................................... 57
Chapter Four: Available Water Resources in Libya ................................................ 59
4.1. Introduction ................................................................................................................. 59
4.2. Study site ..................................................................................................................... 60
4.2.1. Population growth rate in Libya ............................................................................... 61
4.2.2. Water resource management in Libya ..................................................................... 62
4.3. Water resources available in Libya ............................................................................. 66
4.3.1. Groundwater ........................................................................................................ 66
4.3.2. Surface water ....................................................................................................... 70
4.3.4. Water Desalination ............................................................................................... 73
4.4. Cost of different water sources in Libya ..................................................................... 77
4.4.1. Cost of a cubic metre transferred by the GMMRP .............................................. 77
4.4.2. Cost of a cubic metre Produced by thermal desalination technique (MED-TVC)
77
4.5. Results and discussion ................................................................................................ 80
4.6. Summary ..................................................................................................................... 85
Chapter Five: Environmental Impact of Brine Disposed from Distillation Plants on
the Libyan Coastline .................................................................................................. 87
5.1. Introduction ................................................................................................................. 87
5.2. Methods and Materials ................................................................................................ 91
5.2.1. Study Sites ........................................................................................................... 91
5.2.2. Seawater Samples ................................................................................................ 92
5.2.3. Seabed Sediment Samples ................................................................................... 97
5.2.4. Biological Sample Collection ............................................................................ 101
5.3. Statistical Analysis .................................................................................................... 101
5.4. Results ....................................................................................................................... 103
5.4.1. Differences between Stations in Community Composition at ZWDP ............... 103
5.4.2. Differences between Stations in Community Composition at WTRIS .............. 109
5.4.3. Environmental parameters at ZWDP ................................................................. 111
5.4.4. Environmental parameters at WTRIS ................................................................ 119
5.5. Discussion ................................................................................................................. 128
5.6. Summary ................................................................................................................... 137
Chapter Six: On-site sodium hypochlorite generation from brine disposal of
distillation plant ........................................................................................................ 139
6.1. Introduction ............................................................................................................... 139
6.2. Sodium Hypochlorite Production Techniques .......................................................... 140
6.2.1. Chemical Method ............................................................................................... 140
6.2.2. Electrochemical Method: On-site generation of NaOCl .................................... 141
6.3. Study site ................................................................................................................... 141
ix
6.3.1. Experimental procedure ..................................................................................... 142
6.3.2. Sampling and data collection ............................................................................. 143
6.4. Results and discussion .............................................................................................. 144
6.5. Summary ................................................................................................................... 152
Chapter Seven: Salt production by the evaporation ponds of brine disposed from
distillation plant ........................................................................................................ 153
7.1. Introduction ............................................................................................................... 153
7.1.1. Crystallisation of sodium chloride (Halite) in the saltern ponds ........................ 155
7.2. Study Site and Evaporation Ponds Installation ......................................................... 156
7.3. Sampling and Data Collection .................................................................................. 157
7.3.1. SEM and EDX Analysis (Salt Crystal Sample) ................................................. 159
7.3.2. Meteorological Data Collection ......................................................................... 161
7.4. Estimation of Evaporation Rate at Site of Study ...................................................... 162
7.5. Pond Surface Area and Depth Required for ZWDP ................................................. 166
7.6. Cost Estimation of Evaporation Ponds Installation in Libya .................................... 166
7.7. Statistical Analysis .................................................................................................... 169
7.8. Results and Discussion ............................................................................................. 169
7.9. Summary ................................................................................................................... 178
Chapter Eight: Summary and Conclusion ............................................................. 179
8.1. Introduction ............................................................................................................... 179
8.2. Summary and conclusion of contribution ................................................................. 179
8.3. Limitations of research ............................................................................................. 182
8.4. Recommendations ..................................................................................................... 183
8.5. Future research .......................................................................................................... 184
References ............................................................................................................... 186
Appendixes .............................................................................................................. 233
x
List of figures and tables
Figure 2. 1: Desalination Method. ......................................................................................... 11
Figure 2. 2: MSF process ....................................................................................................... 13
Figure 2. 3: MED proces ........................................................................................................ 15
Figure 2. 4: MED process with mechanical vapour compression .......................................... 16
Figure 2. 5: Solar still unit ..................................................................................................... 18
Figure 2. 6: Solar humidification and dehumidification ........................................................ 19
Figure 2. 7: Principle of desalination by reverse osmosis (RO) ........................................... 21
Figure 2. 8: A pressure vessel with three membranes ............................................................ 22
Figure 2. 9: Electrodialysis (ED) method. ............................................................................. 23
Figure 2. 10: Principle of membrane distillation (MD) ......................................................... 25
Figure 2. 11: Typical sequence of treatment procedures in desalination plants .................... 28
Figure 2. 12: Mass balance in desalination process .............................................................. 32
Figure 3. 1: Water Stress in Mediterranean Region…………………………………………56
Figure 3. 2: Water desalting production capacity in selected Mediterranean countries......... 57
Figure 4. 1: Location of Libya………………………………………………………………61
Figure 4. 2: The administrative structure of water resources management in Libya ............. 66
Figure 4. 3: Water regions in Libya ....................................................................................... 66
Figure 4. 4: Great Man-Made River Project in Libya ............................................................ 68
Figure 4. 5: Location of WWTPs in Libya ............................................................................ 72
Figure 4. 6: Case study - Abotraba desalination plant ........................................................... 78
Figure 4. 7: Libyan population between 1982 and 2012 ........................................................ 81
Figure 4. 8: Water deficit in Libyan water regions ................................................................ 82
Figure 4. 9: Water allocated for various uses ......................................................................... 83
Figure 4. 10: Expanded capacities of distillation plants planned ........................................... 83
Figure 4. 11: Cost of a cubic metre of desalinated water by MED-TVC ............................... 85
Figure 5. 1: Location of the ZWDP and WTRIS on the Libyan Coastline............................92
Figure 5. 2: Sampling location at ZWDP and WTRIS on the Libyan Coastline ................... 93
Figure 5. 3: Community Composition at each Station for ZWDP ....................................... 103
Figure 5. 4: Two-dimensional ordination plots from multidimensional scaling analysis of
Bray-Curtis similarity index (2D stress: 0.09; 5 replicates per station). ...................... 104
Figure 5. 5: Species coverage [%] Mean ± SE between station 38 and 39 .......................... 107
Figure 5. 6: Species coverage [%] Mean ± SE between station 38 and 40 .......................... 107
Figure 5. 7: Species coverage [%] Mean ± SE between station 39 and 53 .......................... 108
Figure 5. 8: Species coverage [%] Mean ± SE between station 39 and 44 .......................... 108
Figure 5. 9: Species coverage [%] Mean ± SE between station 40 and 44 .......................... 109
Figure 5. 10: Species coverage [%] Mean ± SE between station 40 and 53 ........................ 109
Figure 5. 11: Community Composition at each Station for WTRIS .................................... 110
Figure 5. 12: Two-dimensional Ordination plots from multidimensional scaling analysis of
bray-Curtis similarity index (2D stress: 0.01; 5 replicates per station) for WTRIS…. 110
Figure 5. 13: Principal components analysis (PCA) ordination of physico-chemical
parameters for ZWDP. ................................................................................................. 111
Figure 5. 14: Principal components analysis (PCA) ordination of sediment data for ZWDP:
(sediment classifications: Ms= medium sand, Fs= fine sand, VFS=very fine sand). .. 112
Figure 5. 15: The classification of the sediments at ZWDP ................................................ 114
Figure 5. 16: Total Hardness (mgl-1) at ZWDP .................................................................... 114
Figure 5. 17: Ca+2 Hardness (mgl-1) at ZWDP .................................................................... 114
Figure 5. 18: Mg+2 Hardness (mgl-1) at ZWDP .................................................................... 115
Figure 5. 19: Ca +2 (mgl-1) at ZWDP .................................................................................... 115
Figure 5. 20: Mg +2 (mgl-1) at ZWDP ................................................................................... 116
xi
Figure 5. 21: SO4- 2 (mgl-1) at ZWDP ................................................................................... 116
Figure 5. 22: K+ (mgl-1) at ZWDP........................................................................................ 116
Figure 5. 23: Na+ (mgl-1) at ZWDP ...................................................................................... 116
Figure 5. 24: Cl- (mgl-1) at ZWDP ....................................................................................... 117
Figure 5. 25: PO4-3 (mgl-1) at ZWDP ................................................................................... 117
Figure 5. 26: Fe (mgl-1) at ZWDP ........................................................................................ 117
Figure 5. 27: NO3 - (mgl-1) at ZWDP .................................................................................. 117
Figure 5. 28: Surface temperature (0C) at ZWDP .............................................................. 118
Figure 5. 29: Bottom temperature (0C) at ZWDP ................................................................ 118
Figure 5. 30: pH at ZWDP ................................................................................................... 119
Figure 5. 31: Salinity (psu) at ZWDP .................................................................................. 119
Figure 5. 32: Dissolved oxygen (DO) (mgl-1) at ZWDP ...................................................... 119
Figure 5. 33: Organic materials (%) at ZWDP .................................................................... 119
Figure 5. 34: Principal components analysis (PCA) ordination of physico-chemical
parameters for WTRIS. ................................................................................................ 120
Figure 5. 35: Principal components analysis (PCA) ordination of sediment data for ZWDP:
(sediment classifications: Ms= medium sand, Fs= fine sand, Cs= coarse sand). ......... 121
Figure 5. 36: The classification of the sediments at WTRIS ............................................... 122
Figure 5. 37: Total Hardness (mgl-1) at WTRIS .................................................................. 123
Figure 5. 38: Ca+2 Hardness (mgl-1) at WTRIS .................................................................... 123
Figure 5. 39: Ca +2 (mgl-1) at WTRIS ................................................................................... 123
Figure 5. 40: Dissolved oxygen (DO) (mgl-1) at WTRIS ..................................................... 123
Figure 5. 41: CaCO3 and HCO-3 (mgl-1) at WTRIS ............................................................. 124
Figure 5. 42: Cl- (mgl-1) at WTRIS ...................................................................................... 124
Figure 5. 43: Na+ (mgl-1) at WTRIS ..................................................................................... 125
Figure 5. 44: Fe (mgl-1) at WTRIS ....................................................................................... 125
Figure 5. 45: pH at WTRIS .................................................................................................. 125
Figure 5. 46: Salinity (psu) at WTRIS ................................................................................. 125
Figure 5. 47: Organic materials (%) at WTRIS ................................................................... 126
Figure 5. 48: Unhealthy seagrass next to inlet pipes at ZWDP ........................................... 126
Figure 5. 49: Polluted Filamentous Algae at the Outfall of WTRIS .................................... 126
Figure 5. 50: Seagrass near and further away from the outfalls for ZWDP and WTRIS..... 127
Figure 5. 51: Air pollution at ZWDP and WTRIS ............................................................... 127
Figure 6. 1: Electrochemical cell for brine utilizing………………………………………142
Figure 6. 2: Variation in NaOCl Production Using Graphite Electrodes ............................. 146
Figure 6. 3: NaOCl Production and Current Density at 2cm ............................................... 147
Figure 6. 4: NaOCl Production and Current Density at 4cm ............................................... 147
Figure 6. 5: NaOCl Production and Current Density at 6cm ............................................... 148
Figure 6. 6: NaOCl Production and Energy Consumption at 2cm ....................................... 149
Figure 6. 7: NaOCl Production and Energy Consumption at 4cm ....................................... 149
Figure 6. 8: NaOCl Production and Energy Consumption at 6cm ....................................... 150
Figure 6. 9: NaOCl production and contact time at different inter electrode spacing ......... 150
Figure 6. 10: Consumption Rate of Electrodes in the Cell for NaOCl Production .............. 151
Figure 7. 1: Site of study…………………………………………………………………..157
Figure 7. 2: Salt harvested from the evaporation ponds at ZWDP ...................................... 159
Figure 7. 3: Salt sample and SEM micrographs of NaCl crystals ........................................ 160
Figure 7. 4: Proposed project of evaporation ponds to estimate the total cost ..................... 167
Figure 7. 5: 3D (PCA) ordination of meteorological parameters at the study site ............... 170
Figure 7. 6: High temperature (°C) ...................................................................................... 171
Figure 7. 7: Low temperature (°C) ....................................................................................... 171
Figure 7. 8: Humidity (%) .................................................................................................... 171
xii
Figure 7. 9: Air pressure (kPa) ............................................................................................. 171
Figure 7. 10: High wind speed (ms-1)................................................................................... 171
Figure 7. 11: Low wind speed (ms-1) ................................................................................... 171
Figure 7. 12: Solar radiation (Wm-2) .................................................................................... 172
Figure 7. 13: Evaporation rate (mmday-1) ............................................................................ 172
Figure 7. 14: 2D (PCA) ordination of metrological parameters at the study site ................ 173
Figure 7. 15: EDX analysis of salt crystal harvested of evaporation ponds......................... 175
Figure 7. 16: Installation cost of one hectare of evaporation ponds by local companies. .... 176
Table 2. 1: Chemical used in pre-treatment processes for RO technique (Darwish et al.,
2013; WHO, 2007) ......................................................................................................... 29
Table 2. 2: Chemical used in pre-treatment processes for thermal desalination techniques
(Darwish et al., 2013; WHO, 2007) ............................................................................... 30
Table 3. 1: Advantages and disadvantages of common brine treatment and disposal methods
……………………………………………………………………………………...51
Table 4. 1: Population growth rate in Libya between 1972-2012..........................................61
Table 4. 2: Location of wellfields and reservoirs of GMMRP ............................................. 70
Table 4. 3: Dam capacity in Libya ........................................................................................ 71
Table 4. 4: Agricultural areas irrigated by wastewater treatment plants . .............................. 71
Table 4. 5: Design and Existing wastewater treatment plants in Libya between 1963-2009 .
....................................................................................................................................... 72
Table 4. 6: Design capacity of desalination plants in Libya .................................................. 75
Table 4. 7: Daily water production from different water sources in Libya ............................ 77
Table 5. 1: Measurement of Physico-chemical Parameters for Zwuarah Desalination Plant 94
Table 5. 2: Measurement of Physico-chemical Parameters for West Tripoli Desalination
Plant ............................................................................................................................... 95
Table 5. 3: Measurement of Physico-chemical Parameters for Zwuarah and West Tripoli
Desalination Plants ......................................................................................................... 96
Table 5. 4: Organic content level (%) of the sediments for Zwuarah and West Tripoli
Desalination Plants ......................................................................................................... 98
Table 5. 5: Classification used for defining sediment type and degree of sediment kurtosis
(KG), Skewness (SKI) and Standard Deviation (δI) for ZWDP. ................................... 99
Table 5. 6: Classification used for defining sediment type and degree of sediment kurtosis
(KG), Skewness (SKI) and Standard Deviation (δI) for WTRIS. ................................ 100
Table 6. 1: Results of Using Graphite Electrodes from Electro Chemical Cell…………..143
Table 6. 2: Graphite Electrode Corroded at Inter Electrode Spacing 2, 4 and 6 cm. ........... 144
Table 7. 1: The bulk element concentrations (mgl-1) and the weight percentages (%) of list
valuable elements in rejected brine up to the salt harvested NaCl stage at different salinity
level……………...………………………………………………………………………...158
Table 7. 2: Essential chemical elements in salt sample ....................................................... 161
Table 7. 3: Meteorological data at site of study ................................................................... 161
Table 7. 4: Daily average evaporation rates at the study site ............................................... 165
Table 7. 5: Pond surface area and depth needed for ZWDP ................................................ 166
Table 7. 6: Estimated cost of hectare to build evaporation ponds ....................................... 167
Table 7. 7: Capital cost of installation of evaporation ponds by mickley’s equation .......... 168
xiii
List of symbols and abbreviations
$ USA dollar
$/ha Dollar per hectare
$/m3 USA dollar per cubic metre 0C Celsius 0F Fahrenheit
A Pond open surface area
acre Land area
Ae Evaporative area
ANOSIM Analysis of similarities
At Total area required (acres)
Br- Bromide
Br2 Bromine
BWRO Brackish water
Ca2+ Calcium ion
CaCO3 Calcium carbonate
CaCO3 Total alkalinity
CaCO3 Total Hardness as CaCO3
CaCO3 Calcium Hardness as CaCO3
CaCO3 Magnesium Hardness as CaCO3
Cc Land clearing cost
CHBr2Cl Dibromochloromethane
CHBr3 Bromoform
Cl- Chloride ion
Cl2 Chlorine
cm A centimetre
CO carbon monoxide
CO2 Carbon dioxide
CO32- Carbonate
Cu2+ Copper
D Minimum pond depth
DC Direct current
DIC Dissolved inorganic carbon
dmin Minimum depth
DPD Chlorine Reagent Powder Pillow
DSA Dimensionally stable anode
E Energy consumption
ED Electrodialysis
EDM Electrodialysis metathesis
EDR Electrodialysis Reversal
EDX Energy-dispersive X-ray spectroscopy
ER Electrodialysis Reversal
es & e Saturation vapour pressure of water and ambient water vapour
pressure
F (u) Wind speed
F1 Empirical safety factor
Fe2− Ferrous ion
FeCl3 Ferric chloride
xiv
FeSO4 Ferric sulphate
ft Feet
g/l A gram per litre
GDCOL General Desalination Company of Libya
GEA General Environment Authority
GECOL Electricity and Renewable Energy Authority
GMMR Great Man-made River Project
gr/m3 Gram per cubic metre
GWA General Water Authority
GWSCo General Water and Sanitation Company
H Hectares
H+ Hydrogen
H2 Hydrogen
H2CO3 Carbonic acid
H2SO4 Sulphuric acid
HCO3- Bicarbonate ion
HEROTM High Efficiency reverse osmosis
HFF hollow fine fibre
HOCl Hypochlorous acid
Hr Daily average of the relative humidity
IPCC Intergovernmental Panel on Climate Change
J Current density
K+ Potassium
KG Sediment kurtosis
km kilometre
km3/year Cubic kilometre per year
kPa kilopascal
kPa °C-1 Kilopascal per Celsius
kV Kilovolts
kW h kilowatt hour
kW h/m3 kilowatt hour per cubic metre
l/m2/day litres per square per day
LBSC Libyan Bureau of Statistics and Census
Lc Land cost
LCV Lower convective zone
M Metre
M km3 Million cubic kilometre
M m3 million cubic metre
M m3 year-1 Million cubic metre per year
m³ A cubic metre
m3/day A cubic metre per day
mA/cm2 Milliampere per square centimetre
MCr Membrane Crystallisation
MD Membrane Distillation
MED Multiple-Effect Evaporation
MED-TVC Multiple-Effect Evaporation with Thermal vapour
compression
MF Microfiltration
Mg (OH)2 Magnesium hydroxide
mg/l milligrams per litre
xv
μg/l Microgram per litre
µS/cm Micro Siemens per centimetre
Mg2+ Magnesium
MGD Million gallons per day
MGZ Main gradient zone
MJ m-2 day-1 Megajoule per square metre per day
MJ/m3 Megajoules per cubic metre
MJkg-1 Megajoule per kilogram
mm Millimetre
Mm3/day Million a cubic metre per day
mmday-1 Millimetres per day
ms-1 Metre per second
MSF Multi-Stage Flash distillation
MVC Mechanical vapour compression
Mz Mean grain size
N2H4 Hydrazine
Na+ Sodium ion
Na2SO3 Sodium sulphite
NaCl Halite
NaHSO3 Sodium bisulphite
NaOCl Sodium hypochlorite
NaOH Sodium hydroxide
NF Nano filtration
nMDS Non-metric multidimensional scaling
NO Nitric oxide
NO2 Nitrogen dioxide
NO3- Nitrate
NOC National Oil Corporation Authority
NOx nitrogen oxides
NPP Net primary productivity
NVC Non-convective zone
OH– Hydroxyl
P Power consumption
PCA Principle component analysis
PCM Phase change material
PGR population growth rate
pH Acidity or alkalinity of a solution on a logarithmic scale
PO43– Phosphorus total
ppm Part per million
psu Practical Salinity Unit
Q Average solar radiation
R Global test
Rn Net radiation
RO Reverse Osmosis
rs Spearman rank correlation coefficient
SAL-PROC Salt Recovery Salt Solidification and Sequestration
SEM scanning electron microscopy
SIMPER Average similarity, dissimilarity and abundance marine
species
Skewness SKI
xvi
SO2 Sulphur dioxide
SO4-- Sulphate
SWRO Seawater reverse osmosis
T The time in hours
T Average of the daily maximum and minimum temperatures
recorded at the site
T period of time between population number in the second
census and the population number in the first census
TDS Total dissolved solids
THM Trihalomethanes
tl Liner thickness
TVC Thermal vapour compression
U The total electric voltage
U2 Average of the daily maximum and minimum wind speed
UCV Upper convective zone
UF Ultrafiltration
V Volume of reject brine
V past population number in the first census
V present population number in the second census
VC Vapour Compression Evaporation
WAIV Wind Aided Intensified Evaporation
WFD Water Frame Work Directives
WHO World Health Organization
WK1 Manganese reagent
WK2 Alkaline-iodide reagent
Wm-2 watt per square metre
wt% Weight percentage
WTRIS West Tripoli distillation plant
ZLD Zero liquid Discharge
ZWDP Zwuarah distillation plant
Γ Psychrometric constant
Δ Saturation vapour pressure
δI Standard Deviation
Λ Latent heat of vaporization
1
Chapter One : Introduction
1.1. Research Overview
The United Nations made a declaration in 2010 regarding the necessity of a stable
drinking water supply as a basic human right, to highlight the major issue of
insufficient water quantity or quality (Pinto and Marques, 2017). Existing
watercourses have long been the source for domestic, commercial, agricultural and
urban use (Foster, 2001). Hence, the study of water quantification has been high on
the agenda of professionals in the field of hydrology (Milano et al., 2013).
Over the past few decades, the intensity and acceleration of global warming has
sparked serious concern (Frich et al., 2002; (Barnett et al., 2001). Following a huge
convention of 20 research groups selected by the Intergovernmental Panel on Climate
Change (IPCC) as part of its Fourth Assessment Report, simulations of anticipated
scenarios using varying levels of greenhouse emissions, were set up to illustrate
predictions in the 20th and 21st centuries. These proved that the raised level of
industrial activity contributed to elevated emissions leading to climate change which
ultimately influences water resources and supply (Milano et al., 2013).
According to the Council of Europe (2012), the Mediterranean basin is defined as
being the most susceptible to climate change, due to anthropogenic activity. It has
been predicted that by 2050, due to climate change, the existing severe water stress
experienced in the southern and eastern regions of the Mediterranean basis will extend
right across the basin, due to a 30-50% drop in freshwater sources and twice the
amount of water consumption in the area (Viola et al., 2014). As the demand for water
significantly increases from residential, industrial and agricultural sectors globally
(Tal, 2006), there is a lack of sustainability to match the need (Barron et al., 2015).
which has prompted the necessity to find alternative water sources. Hence,
desalination has now become an option to meet this global surge of demand and will
eventually become a solution for economic, social and environmental development
Medeazza, 2005; Tsiourtis, 2001) while protecting water sources and maintaining
environmental equilibrium (Bargues, 2014).
2
There are two types of commercial desalination technologies, namely thermal
distillation, i.e. multi-stage flash distillation (MSF) or multiple-effect distillation
(MED) or multiple-effect distillation with thermal vapour compression (MED-TVC)
which are used in medium and large sized plants. The other technology is membrane
separation known as reverse osmosis (RO) which is used in smaller plants (Mezher et
al., 2011; Tsiourtis, 2001; Bargues, 2014). In addition, there are hybrid techniques
using both technologies (Hamed, 2005). Also, there are smaller commercial
desalination units divided into vapour compression (VC) and solar distillation. Other
technologies include electro dialysis (ED) and electro dialysis reversal (EDR) which
are used on a smaller scale, with minimal salinity (Khawaji et al., 2008; Schenkeveld
et al., 2004). Further developments still under research are evolving, such as
membrane distillation (MD) (Belessiotis et al., 2016), forward osmosis (FO),
capacitance deionization (CDI), and gas hydrates (GH), freezing, humidification and
dehumidification (HDH). Other supporting technologies include ultra/nano/ionic
filtration (UF/NF/IF respectively) (Mezher et al., 2011; Cipollina et al., 2009; Krishna,
2004).
Thermal techniques are currently used in the Gulf and North Africa such as Libya
Khordagui,2013; Elabbarb and Elmabrouka, 2005) where energy sources are
abundant, while membrane techniques such as RO is more popular in developed
countries for effective scale of economy (Bargues, 2014). As a sub-Saharan nation,
over 80% of the population of Libya is located along the length of the coastline where
agriculture and industry thrives due to arable land and favourable conditions
(Kershman, 2001; Abufayed and El-Ghuel, 2001) There are 3,500 hours of sunlight
annually, radiation on a horizontal plane is 7.1 kwhm-2day-1 in the coastal areas with
8.1 kwhm-2day-1 in the southern region, causing long term drought. (Saleh, 2006).
Owing to an exceedingly hot and dry climate with temperatures reaching 40°C,
evaporation rates are one of the highest globally (Abufayed and El-Ghuel, 2001).
Potable, industrial and irrigation water originates from groundwater as the main
source. However, for more than 20 years, demands on groundwater from different
sectors has resulted in falling water levels and impaired quality, exacerbated by an
influx of seawater along the coast (Sadeg and Karahanoðlu, 2001). Hence the drive to
search for alternative water sources such as water desalination, large water transfer
3
(Great Man-made River Project), and wastewater recycling and reuse (General Water
Authority, 2004).
In Libya, exploitation of oil uses desalination technology in arid regions where there
is limited water supply, making Libya the largest user of thermal and membrane
technology in North Africa and the Mediterranean region (Abufayed and El-Ghuel,
2001; Kershman, 2001). Desalination optimises the use of available resources such
as saline or brackish natural water sources to produce freshwater (Eslamian, 2016). It
has become a favourable alternative method due to inflation of water production costs
and subsequent improved cost-saving technology (Barron et al., 2015). A large
majority of the more substantial plants are run and managed by the General Electricity
Company of Libya (GECOL) (Kershman, 2001) and General Desalination Company
of Libya (GDCOL) (General Desalination Company of Libya, 2013) in addition to
smaller and high capacity plants that use membrane and thermal techniques (run by
major oil companies. Al-Hengari et al., 2015). Plans are in place to expand the capacity
of thermal desalination plants along the Libyan coast in addition to the installation of
a new one to support the existing somewhat inaccessible Great Man made River
System (Elabbar, 2008; Elabbarb and Elmabrouka, 2005; Elhassadi, 2013).
There are massive implications of the desalination process in terms of environmental
and ecological damage (Dupavillon and Gillanders, 2009), which need to be
considered, such as energy and land usage, toxic emissions and brine discharge during
regular operation. The latter has the most devastating impact (Bleninger and Jirka,
2008, Bleninger et al., 2010), coastal desalination plants continuously discharge by-
products (brine) which have a major effect on the marine environment (Frank et al.,
2017). This rejected brine is characterised by varying concentrations of salts and
minerals including SO4 2–, Cl−, Na+, Ca2+, Mg2+, K+, Fe2− and Cu2+ depending on
feedwater quality, type and recovery percentage of the desalination process as well as
any chemical additives used (Abdulsalam et al., 2016; Hu, 2014). Brine waste
generated from coastal desalination plants has double the salinity of the receiving
environment and is very concentrated causing it to sink onto the seafloor where it
flows as a dense stream (Bleninger et al., 2010; Arafat, 2017; Torquemada et al.,
2005). As it lengthens along the seafloor, (Frank et al., 2017) it intensifies in
temperature, chemicals and salinity thus affecting water quality, causing damage to
4
marine biodiversity, flora and fauna and key components of coastal ecosystems
(Lattemann and Höpner, 2008). Another problem is caused by the corrosion
phenomenon within the desalination process where a combination of metals such as
(copper, nickel, iron, chromium, zinc etc.) released with the brine may also pose an
environmental threat (Giwa et al., 2017).
There is a public misconception that brine waste does not affect marine life (Ahmad
and Baddour, 2014). In fact, there is no evidence of objection from local communities
about the effects of brine discharge (Torquemada and Lizaso, 2005). However,
research indicates adverse impact on echinoderms and bivalves as well as seagrasses
and macroalgae (Castriota et al., 2001). In large-scale desalination plants, it is
frequently conveyed via diffuser systems away from the shore or by direct beach
discharge mixed with cooling water from nearby power plants (Fritzmann et al., 2007;
Lattemann and Höpner, 2008).
Brine management techniques include brine minimization, direct disposal or reuse.
The former applies membrane/thermal based, and emerging technologies still under
development. Direct disposal options involve inland and offshore disposal techniques
(Giwa et al., 2017). Inland desalination plants tend to incur higher disposal costs of
brine than coastal plants, depending on characteristics of brine concentration, volume
and concentration, treatment levels prior to discharge and disposal method (Arnal et
al., 2005). There are several options for direct disposal of desalination into the sea,
namely the use of evaporation ponds or shallow basins that are exposed to the open
air, decreasing the amount of discharge (Rodríguez et al., 2012). This method is
particularly effective in dry, warm locations with high evaporation rates and low land
costs. Recently, there has not been much publicity about the use of brine disposal
from desalination plants as opposed to the conventional use of seawater in salt work
(Ahmed et al., 2000; Cipollina et al., 2012; Rodríguez et al., 2012). Thus, Libya has
been chosen as a case study for considering the environmental impact of brine disposal
from thermal desalination plants (MED, MED-TVC) on the Libyan coastline.
Therefore, the following questions will be asked as outlined:
What are the physico-chemical effects of brine influx from thermal
desalination plants on the Libyan coastline?
5
What strategies can be put in place for Libya to capitalise brine disposal in the
form of minerals and salt?
These questions are behind the performance of this study and its results will provide
the answers. This chapter presents research aims and objectives, novelty of research,
the benefits and its impact, research sources and the thesis outline.
1.2. Research aims and objectives
The main aim of this thesis is to determine the physico-chemical effects of brine influx
from thermal desalination plants on the receiving water in addition to evaluating the
impact on the marine ecosystems. Further to this aim, this study is to look at the
possibility of exploiting brine production by recycling it in the form of sodium
hypochlorite, minerals and NaCl (halite).
This leads to the following specific objectives:
1. To evaluate and review existing global desalination techniques, including the
chemicals that are used and their environmental impact.
2. To identify and evaluate different brine disposal methods used globally, water
availability and regional desalination techniques, to understand Mediterranean
legislation and how it can be relevant to brine management in Libya.
3. To assess existing water sources in Libya and ascertain suitable desalination
technology by using one of the existing desalination plants on the Libyan
coastline as a case study.
4. To examine the environmental impact of brine disposal from desalination
techniques, using the Libyan coastline as a case study, investigating the
relationship between the physico-chemical parameters of brine disposed and
marine species.
5. To look at the potential of recycling brine disposed from Libyan coastal
desalination plants using electrochemical and evaporation pond techniques to
produce sodium hypochlorite, minerals and NaCl (halite).
6
1.3. Novelty of research
The innovative aspect of the current research work project can be summarised in the
following:
Although seawater desalination plants have been operating in various regions,
there is very little data available about the ecological impacts of the brine on
the marine environment (National Research Council, 2008). When any new
project is embarked on, environmental impact assessment (EIA) study is the
best means of recognising, evaluating and preventing ongoing damage to the
environment, but no in-depth study has been carried out for desalination plants
which would be very desirable (Lattemann, 2010). Little has been done in this
area. The majority of analysis in Libya has focussed on the effects of
increasing seawater salinity at the intake and their impact on the components
of the desalination units, such as boilers and vulnerable instruments (Elabbarb
and Elmabrouka, 2005; Brika et al., 2016). There is yet to be any research
done regarding the ecological impact of brine disposal from thermal
desalination plants in Libya. Hence, the novelty of this study and the
knowledge gleaned from the research completed to determine the physico-
chemical composition of brine, contributes to the validity and importance of
this study when assessing the environmental implications of brine on the
marine ecosystems.
Most desalination plants, whether thermal distillation or reverse osmosis, are
normally constructed with a hypochlorination unit, which produces sodium
hypochlorite through seawater electrolysis for the purposes of injecting it at
the seawater intake to prevent ongoing biological fouling in the desalination
pipes and instruments while extending the longevity of the plant (Ozair and
Al-Shangiti, 2013). A few basic experiments have been carried out to test the
production of onsite sodium hypochlorite (NaOCl) through brine electrolysis
(Wahab and Al-Weshahi, 2009). This paves the way for an innovative method
to discuss various critical operating parameters for onsite sodium hypochlorite
(NaOCl) production using an electrochemical cell in controlled conditions fed
by the brine disposal from a thermal desalination plant.
7
One area of concern is the high volume of concentrated brine disposed directly
into the sea from desalination plants (Cipollina, 2012). Hence, the use of
evaporation ponds offers a favourable alternative for brine disposal (Rodríguez
et al., 2012) particularly where evaporation rates are high and accessibility of
land near the coastal area is plentiful and economic. The integrated production
of fresh water and recycled brine from desalinations plants could be achieved
by utilising the brine disposal from thermal desalination plants as a feed for
conventional salt works with the advantages of higher temperatures of brine,
thereby speeding up the evaporation rates on the pond surfaces. Very little data
exists about this concept other than studies completed in Tripani/Italy and
Eilat/Israel (Ravizky, 2007; Cipollina, 2012). As a result of a warm, dry
climate along the Libyan coastline with an abundance of sunshine, and plenty
of land that is not over priced, there is a real opportunity to capitalise on these
favourable conditions. Therefore, the final contribution of this research
advocates the use of evaporation ponds as opposed to traditional salt works to
recover minerals and NaCl (halite) from the brine.
1.4. Research benefit and its impact
There is no doubt that all the research completed for this study reveals huge benefits
to the scientific community and specialists in hydrology. Firstly, the design
methodology of the study on the impact of brine on the marine environment gives new
evidence about the Libyan coastline and how it is affected by this technology, both
locally and globally. Secondly, as a result of the water shortage in Libya, this gives
the Libyan government a warning about the future sustainability of this technology as
well as other countries that suffer from water scarcity in coastal areas. Furthermore,
the recovery and recycling of salt and minerals from the brine will provide an excellent
opportunity to enhance local and international infrastructures. In turn, this will give
rise to increased employment and ongoing commercial and industrial growth, while
reducing costs and environmental impact as well as safeguarding the continuing use
of desalination technology by integrating it with renewable energy sources, such as
solar power.
1.5. Research sources
8
Numerous books, academic articles and journals on the theory of the latest desalination
plants systems and integration with the existing grid were used to gain a better
understanding of the concepts and previously developed analysis and design methods.
The internet is a major source of information with the most up-to-date development in
desalination technologies, a range of reject brine management strategies and work
related to the impact of brine disposal from desalination plants. Other sources used
were primary data, collected from the field study at the sites to achieve the above
mentioned aims.
1.6. Thesis outline
This thesis is structured in eight chapters. The introductory chapter (Chapter 1)
presents a background of the water situation and deficit in the Mediterranean basin
and describes commercial desalination technologies and the impact of the brine
disposal from coastal desalination plants. In addition, it explains methods of brine
management used to reduce the volume and the impact of the brine on the
environment. It also defines the aims and the objectives, the novelty of the research,
benefits and impact, resources and thesis outline.
Chapter 2 presents previously published literature on desalination methods, together
with the advantages and disadvantages, followed by a discussion of brine flow rates
of various desalination techniques, along with the environmental and economic
implications of this technology.
Chapter 3 outlines brine disposal methods used worldwide. Additionally, the benefits
and drawbacks of each method are discussed. One of the challenges to coastline
desalination plants, particularly in arid regions, is the dilemma of brine disposal. This
chapter also presents Mediterranean legislation on brine discharge from desalination
plants into the marine environment, water availability and desalination technologies
in the Mediterranean region.
Chapter 4 assesses existing water resources in Libya and the impact of population
growth on the available water resources in the country. It also gives the context of the
current water infrastructure, the supply and demand and the ongoing challenges.
Finally, this chapter is intended to expose the water deficit across Libyan regions while
9
also comparing the cost of water produced by the Great Man-Made River Project with
a thermal desalination plant by using the Abotraba desalination plant as a case study.
Chapter 5 determines the physico-chemical effects of brine influx from thermal
desalination plants on the receiving water and, pursuant to this, evaluates their impact
on the marine ecosystems at the Zwuarah and West Tripoli distillation plants (ZWDP
&WTRIS) on the Libyan coastline, where the marine environment is considered to be
highly exposed to brine discharges.
Chapter 6 investigates the production of sodium hypochlorite (NaOCl) from an
electrochemical cell fed by brine in a controlled environment on site. Within this
chapter is a discussion on the effects of various critical operating parameters on this
process, including, electrode materials, production of sodium hypochlorite (NaOCl),
inter-electrode spacing, applied current density, energy and power consumption in
addition to determining the price of utilizing the brine using the electrochemical
method.
Chapter 7 supports the use of evaporation ponds as opposed to traditional salt works,
to recover minerals and NaCl (halite) from brine, with particular reference to ZWPD
in Libya, located on the southern Mediterranean coast. The work will also pave the
way for further development of mineral salt exploitation from the brine disposed from
thermal distillation plants.
The final chapter 8 summarises the overall conclusion of the contribution of this
research, followed by limitations, recommendations, future work and validity of the
research data collection and results. Thesis references and appendices are then
presented at the end of the thesis.
1.7. Summary
The introductory chapter sets the scene of the research, its aims and objectives, the
novelty of the research, benefits and its impact, resources and thesis outline. The next
chapter will outline the methods of desalination technologies, together with the
advantages and disadvantages followed by a discussion of brine flow rates of various
desalination techniques along with the environmental and economic implications.
10
Chapter Two: Desalination Technologies
2.1. Introduction
The salinity of accessible fresh water on the earth is up to 10,000 ppm in contrast to
seawater, which is considerably higher, ranging from 35,000–45,000 ppm in the form
of total dissolved salts. The guidelines for appropriate salinity as recommended by the
WHO limits it to 500 ppm, but not exceeding 1,000 ppm in special circumstances
because of potential health and environmental hazards as well as economic
implications (World Health Organization, 1984). Consequently, there is a need to
provide water within the recommended limits of 500 ppm or less, which can only be
achieved through a system of desalination and purification (Eltawil et al., 2009).
Freshwater is produced by a process of extracting excess salts and other minerals from
both brackish and seawater, known as desalination. The largest sources of water
reserves are oceans and seas, which are not appropriate for human consumption, so
desalination is vital to the survival of the human race, particularly in more arid regions
in the Middle East and North Africa where there is a ready supply of energy sources
(Fath et al., 2008). The need for production of freshwater is therefore a priority for
governments and industry in these and other regions with limited groundwater and
surface water, due to increasing global urbanization and industrialisation (Fellows and
Al-Hamzah, 2015).
Traditional methods of water supply have increased, which has made desalination a
preferred option (Khawaji et al., 2008; Einav et al., 2005; Wittholz et al., 2008).
Around 150 countries operated 15,988 desalination plants (including some under
construction or contract) in 2011 to produce desalinated water (Henthorne et al., 2011).
There was a 10% increase in the total global capacity from 2010 to 70.8 Mm3/day in
2011. A further 632 plants were established from mid-2011 to August 2012 reaching
a capacity of 74.8 Mm3/day (Rahimi and Chua, 2017). According to the International
Desalination Association, 2017 the number of desalination plants globally totalled
18,426 with a production rate above 86.8 Mm3/day, reaching approximately 300
million inhabitants, which is testament to the supply and demand factors of
desalination for both production of freshwater and energy consumption. Therefore,
this chapter aims to present previously published literature on desalination methods,
11
together with the advantages and disadvantages followed by a discussion of brine flow
rates of various desalination techniques along with the environmental and economic
implications of this technology.
2.2. Desalination methods
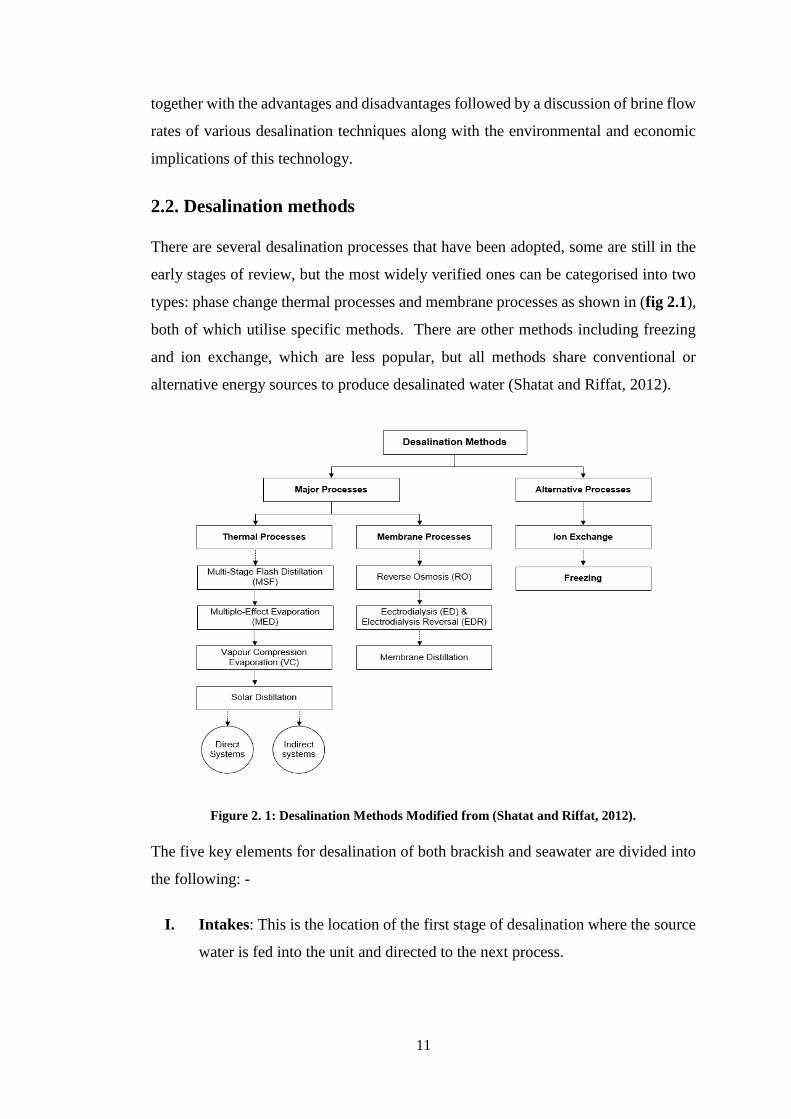
There are several desalination processes that have been adopted, some are still in the
early stages of review, but the most widely verified ones can be categorised into two
types: phase change thermal processes and membrane processes as shown in (fig 2.1),
both of which utilise specific methods. There are other methods including freezing
and ion exchange, which are less popular, but all methods share conventional or
alternative energy sources to produce desalinated water (Shatat and Riffat, 2012).
Figure 2. 1: Desalination Methods Modified from (Shatat and Riffat, 2012).
The five key elements for desalination of both brackish and seawater are divided into
the following: -
I. Intakes: This is the location of the first stage of desalination where the source
water is fed into the unit and directed to the next process.
12
II. Pre-treatment: Water is prepared by filtering and extrapolating the biological
growth to ensure it is acceptable for the next stage.
III. Desalination: This is the main process where the salt and other minerals are
extracted from the feedwater.
IV. Post-treatment: This is the stage where desalinated water is treated by
chemical additives in order to meet the standard for human and industrial
consumption.
V. Concentrate management (Brine): This is the disposal of the final by-
product (Brine) according to appropriate methods of desalination.
2.2.1. Thermal desalination technologies
The definition of thermal technology is the heating of saline water and subsequent
collection of condensed vapour (distillate) to produce fresh water. The use of this
technology is less common using brackish water because of costly overheads, although
it has been used to purify seawater (Krishna, 2004) and divided into four main
methods: -
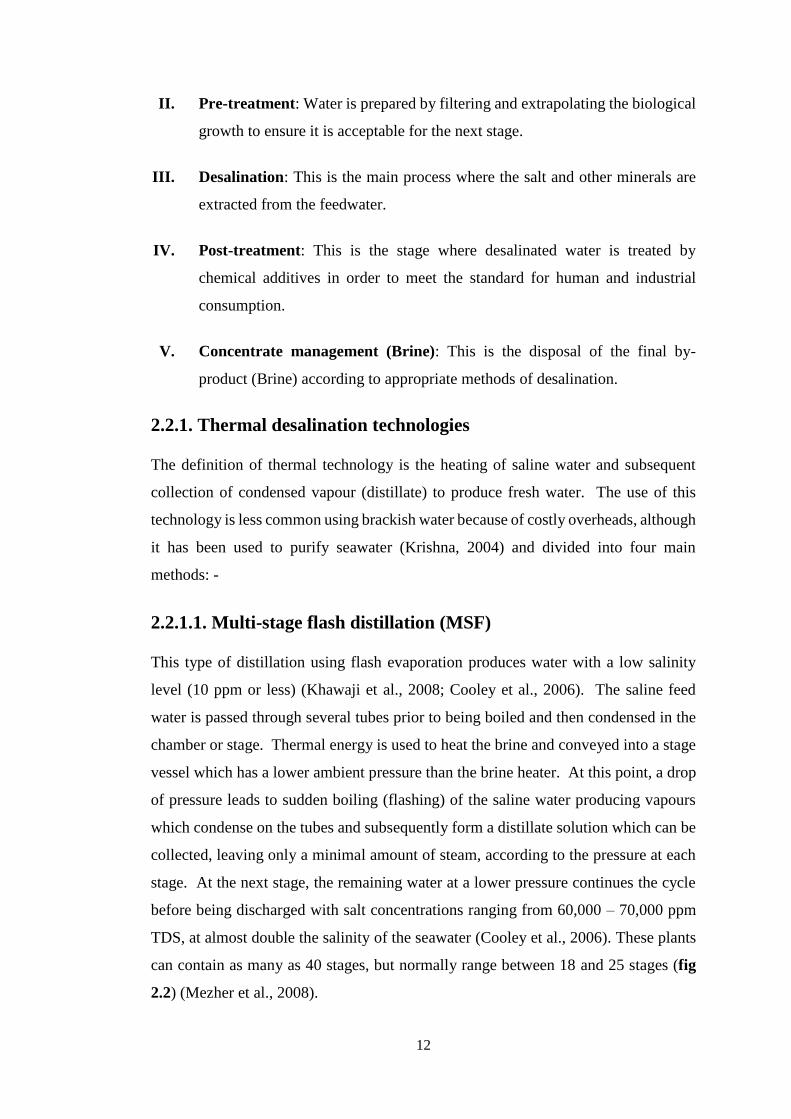
2.2.1.1. Multi-stage flash distillation (MSF)
This type of distillation using flash evaporation produces water with a low salinity
level (10 ppm or less) (Khawaji et al., 2008; Cooley et al., 2006). The saline feed
water is passed through several tubes prior to being boiled and then condensed in the
chamber or stage. Thermal energy is used to heat the brine and conveyed into a stage
vessel which has a lower ambient pressure than the brine heater. At this point, a drop
of pressure leads to sudden boiling (flashing) of the saline water producing vapours
which condense on the tubes and subsequently form a distillate solution which can be
collected, leaving only a minimal amount of steam, according to the pressure at each
stage. At the next stage, the remaining water at a lower pressure continues the cycle
before being discharged with salt concentrations ranging from 60,000 – 70,000 ppm
TDS, at almost double the salinity of the seawater (Cooley et al., 2006). These plants
can contain as many as 40 stages, but normally range between 18 and 25 stages (fig
2.2) (Mezher et al., 2008).
13
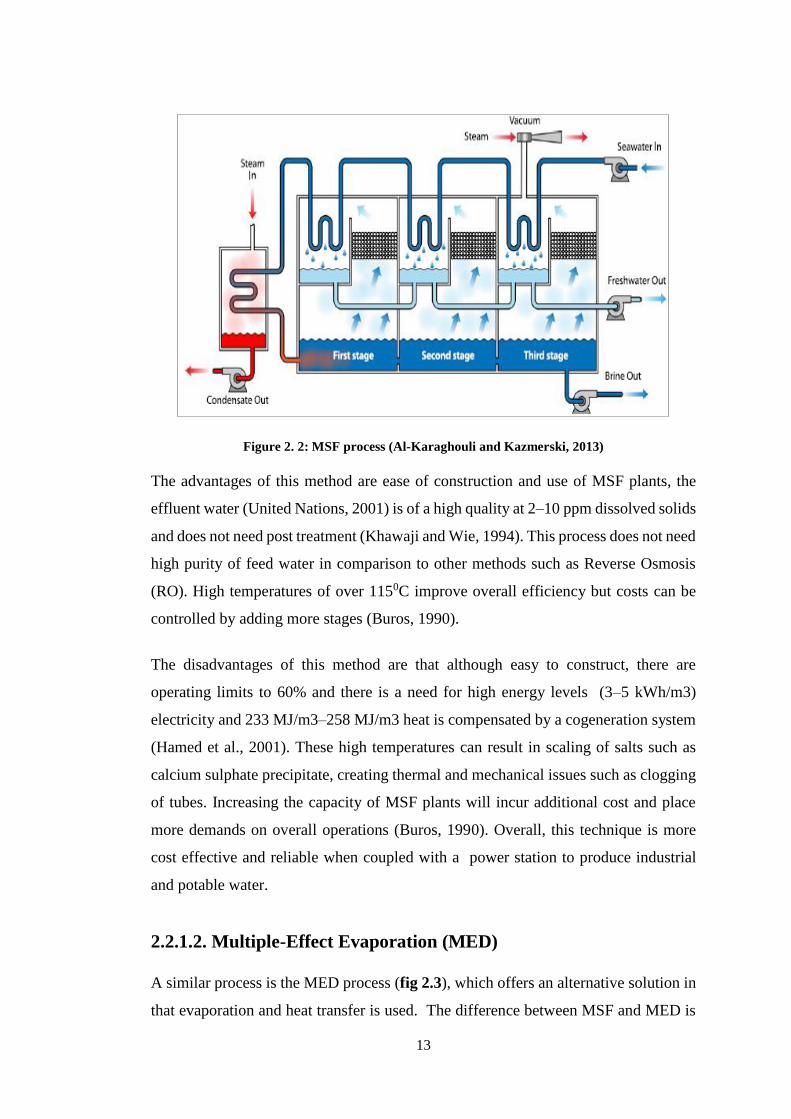
Figure 2. 2: MSF process (Al-Karaghouli and Kazmerski, 2013)
The advantages of this method are ease of construction and use of MSF plants, the
effluent water (United Nations, 2001) is of a high quality at 2–10 ppm dissolved solids
and does not need post treatment (Khawaji and Wie, 1994). This process does not need
high purity of feed water in comparison to other methods such as Reverse Osmosis
(RO). High temperatures of over 1150C improve overall efficiency but costs can be
controlled by adding more stages (Buros, 1990).
The disadvantages of this method are that although easy to construct, there are
operating limits to 60% and there is a need for high energy levels (3–5 kWh/m3)
electricity and 233 MJ/m3–258 MJ/m3 heat is compensated by a cogeneration system
(Hamed et al., 2001). These high temperatures can result in scaling of salts such as
calcium sulphate precipitate, creating thermal and mechanical issues such as clogging
of tubes. Increasing the capacity of MSF plants will incur additional cost and place
more demands on overall operations (Buros, 1990). Overall, this technique is more
cost effective and reliable when coupled with a power station to produce industrial
and potable water.
2.2.1.2. Multiple-Effect Evaporation (MED)
A similar process is the MED process (fig 2.3), which offers an alternative solution in
that evaporation and heat transfer is used. The difference between MSF and MED is
14
that in the MED process, evaporation occurs from a seawater film in contact with a
heat transfer surface, instead of a convective heating of seawater in tubes that results
in “flashing” which is used in the MSF process to produce vapour (Wade, 2001). The
MED method occurs across a line of evaporators named ‘effects’ and uses the
reduction of ambient pressure along these effects (Khawaji et al., 2008). Water is
heated by a boiler and converted to hot steam which heats the saline water in the first
effect. The resultant vapour will provide the heat source for the second evaporator and
subsequently heat the saline water. This process repeats itself in the third evaporator
and continues thus for 8-16 stages which is common number of effects in a large plant
(Saidur et al., 2011; Raluy et al., 2006).
Boiling the saline water in the fourth stage serves as a condenser for steam emitted
from the previous evaporator and the same thermo-mechanical process is repeated for
the whole unit on a reversing scale. The latent heat of vapour condensation is reused
several times before being released outside. The temperature of the first effect should
be maintained below the boiler heating system. In order to ensure an optimum heat
flow between the heating vapour and the saline boiling water, temperature should be
at varying degrees, i.e. the vapour pressure needs to be lower than the vapour pressure
in the previous effect, but higher than the subsequent effect. Restoration of the
desalinated water at an ambient pressure requires the system to be equipped with water
pumps, due to stages’ pressures being below the atmospheric pressure. Furthermore,
the vapour space needs to be evacuated by the use of vacuum pumps until the desired
pressure is reached while depleting non-condensing gases, e.g. oxygen and nitrogen
which are normally dissolved in the feed saline water. Failure to remove these gases
can result in preventing the water boiling and subsequently damaging the entire
distillation operation. In the MED process, more than 1 ton of distilled water per ton
of heating steam is produced, with an exponential increase according to the number of
effects (Saidur et al., 2011). The MED systems can be combined with heat produced
between stages using a range of sources, e.g. by mechanical (MVC) or thermal vapour
compression (TVC) (Miller, 2003).
15
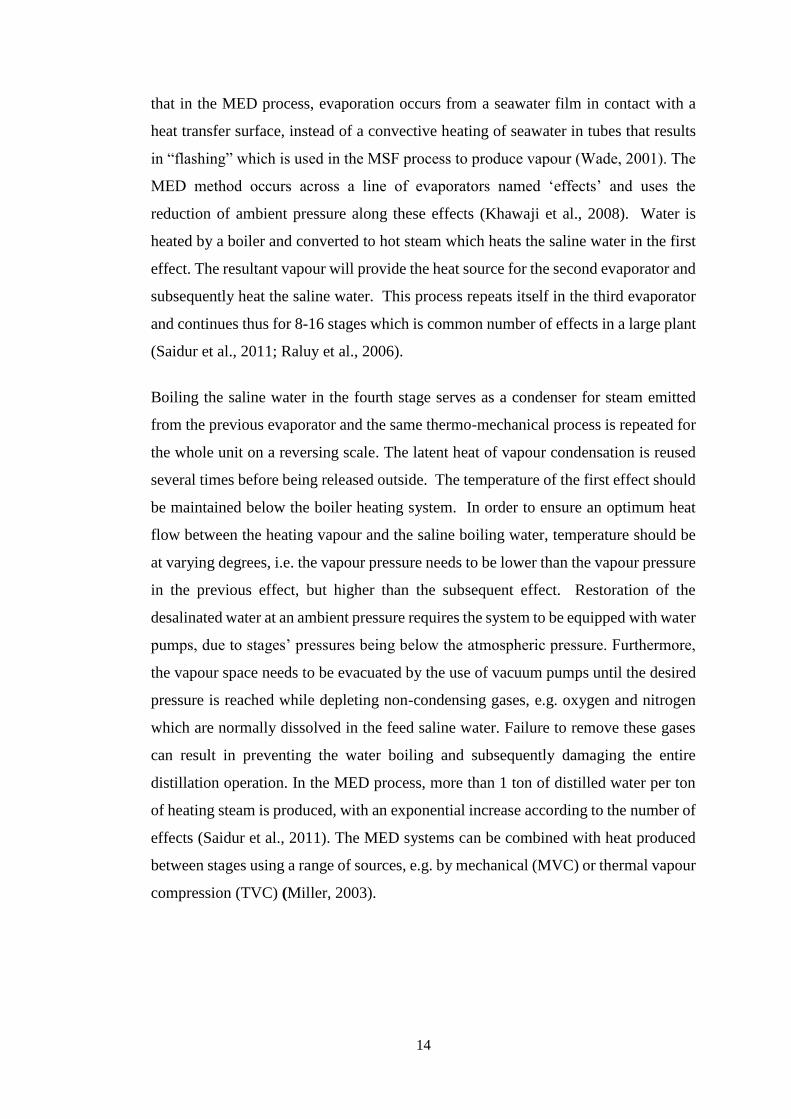
Figure 2. 3: MED process (Al-Karaghouli and Kazmerski, 2013)
The advantages of this method are that corrosion and scale build-up can be controlled
by lowering the temperatures to 700C (1580F) (Buros, 1990). Operational and pre-
treatment costs are cheaper than RO thereby reducing power demands (United
Nations, 2001) in comparison to MSF. Furthermore, heat transfer and freshwater
production costs are much more favourable than MSF plants (Darwish and El-
Dessouky, 1996). Thus, operating costs can easily be reduced by combining MED
with thermal vapour compression, thereby increasing heat transfer co-efficiency
within the unit (Compain, 2012).
The disadvantages of this method are the limited operating capacity at 60%, it is
incompatible with alternative inconsistent power sources. Furthermore, anti-scalants
are required to prevent scale build-up in the evaporator cells (World Bank, 2012).
Overall, this method is reliable when it is coupled with a power station to produce
industrial and fresh water leading to a reduction in overall costs.
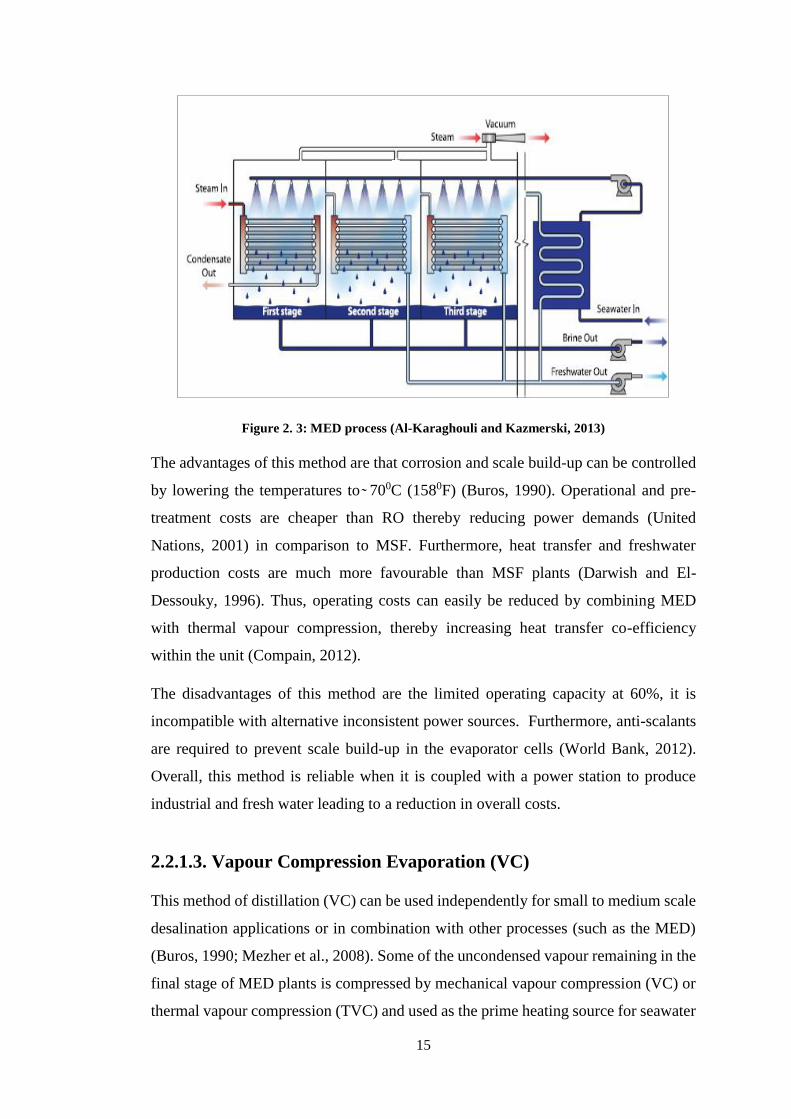
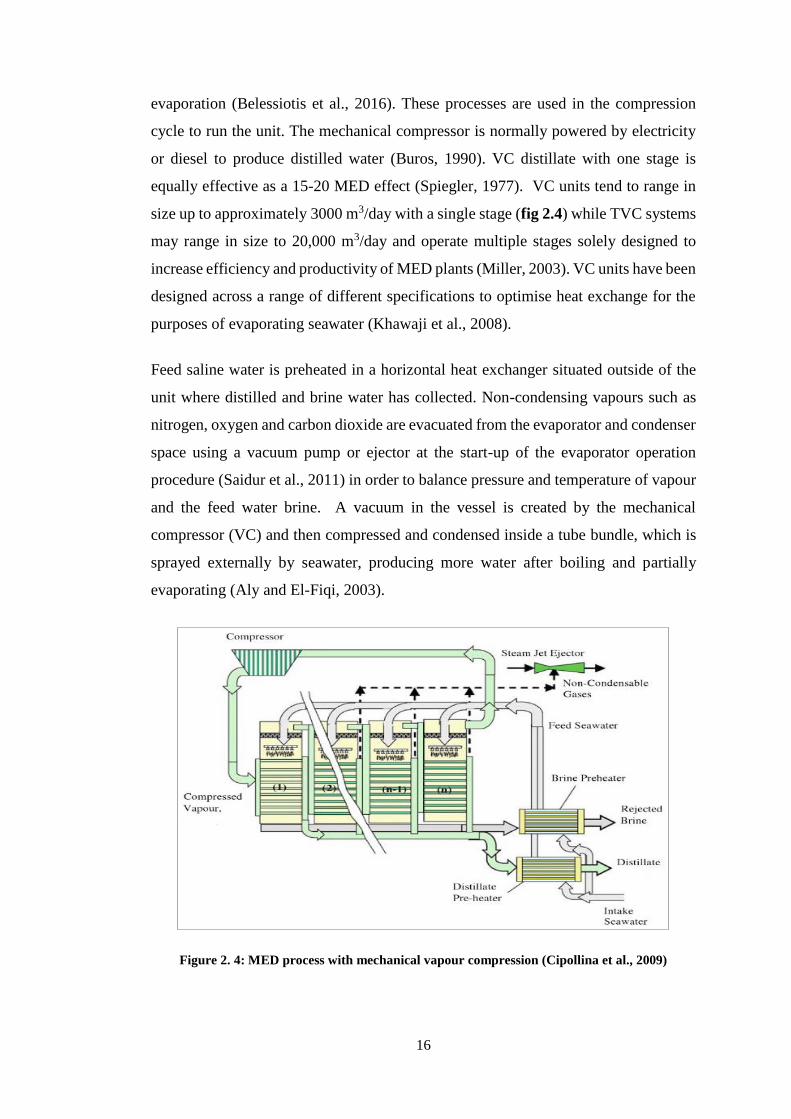
2.2.1.3. Vapour Compression Evaporation (VC)
This method of distillation (VC) can be used independently for small to medium scale
desalination applications or in combination with other processes (such as the MED)
(Buros, 1990; Mezher et al., 2008). Some of the uncondensed vapour remaining in the
final stage of MED plants is compressed by mechanical vapour compression (VC) or
thermal vapour compression (TVC) and used as the prime heating source for seawater
16
evaporation (Belessiotis et al., 2016). These processes are used in the compression
cycle to run the unit. The mechanical compressor is normally powered by electricity
or diesel to produce distilled water (Buros, 1990). VC distillate with one stage is
equally effective as a 15-20 MED effect (Spiegler, 1977). VC units tend to range in
size up to approximately 3000 m3/day with a single stage (fig 2.4) while TVC systems
may range in size to 20,000 m3/day and operate multiple stages solely designed to
increase efficiency and productivity of MED plants (Miller, 2003). VC units have been
designed across a range of different specifications to optimise heat exchange for the
purposes of evaporating seawater (Khawaji et al., 2008).
Feed saline water is preheated in a horizontal heat exchanger situated outside of the
unit where distilled and brine water has collected. Non-condensing vapours such as
nitrogen, oxygen and carbon dioxide are evacuated from the evaporator and condenser
space using a vacuum pump or ejector at the start-up of the evaporator operation
procedure (Saidur et al., 2011) in order to balance pressure and temperature of vapour
and the feed water brine. A vacuum in the vessel is created by the mechanical
compressor (VC) and then compressed and condensed inside a tube bundle, which is
sprayed externally by seawater, producing more water after boiling and partially
evaporating (Aly and El-Fiqi, 2003).
Figure 2. 4: MED process with mechanical vapour compression (Cipollina et al., 2009)
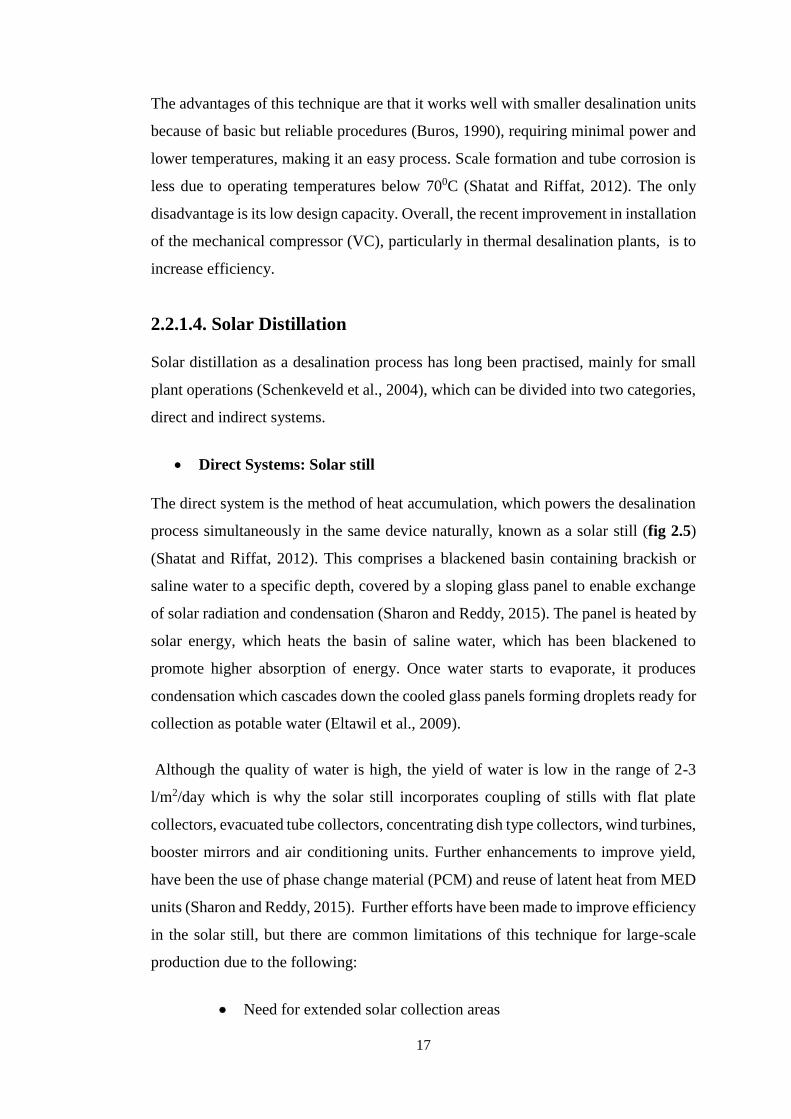
17
The advantages of this technique are that it works well with smaller desalination units
because of basic but reliable procedures (Buros, 1990), requiring minimal power and
lower temperatures, making it an easy process. Scale formation and tube corrosion is
less due to operating temperatures below 700C (Shatat and Riffat, 2012). The only
disadvantage is its low design capacity. Overall, the recent improvement in installation
of the mechanical compressor (VC), particularly in thermal desalination plants, is to
increase efficiency.
2.2.1.4. Solar Distillation
Solar distillation as a desalination process has long been practised, mainly for small
plant operations (Schenkeveld et al., 2004), which can be divided into two categories,
direct and indirect systems.
Direct Systems: Solar still
The direct system is the method of heat accumulation, which powers the desalination
process simultaneously in the same device naturally, known as a solar still (fig 2.5)
(Shatat and Riffat, 2012). This comprises a blackened basin containing brackish or
saline water to a specific depth, covered by a sloping glass panel to enable exchange
of solar radiation and condensation (Sharon and Reddy, 2015). The panel is heated by
solar energy, which heats the basin of saline water, which has been blackened to
promote higher absorption of energy. Once water starts to evaporate, it produces
condensation which cascades down the cooled glass panels forming droplets ready for
collection as potable water (Eltawil et al., 2009).
Although the quality of water is high, the yield of water is low in the range of 2-3
l/m2/day which is why the solar still incorporates coupling of stills with flat plate
collectors, evacuated tube collectors, concentrating dish type collectors, wind turbines,
booster mirrors and air conditioning units. Further enhancements to improve yield,
have been the use of phase change material (PCM) and reuse of latent heat from MED
units (Sharon and Reddy, 2015). Further efforts have been made to improve efficiency
in the solar still, but there are common limitations of this technique for large-scale
production due to the following:
Need for extended solar collection areas
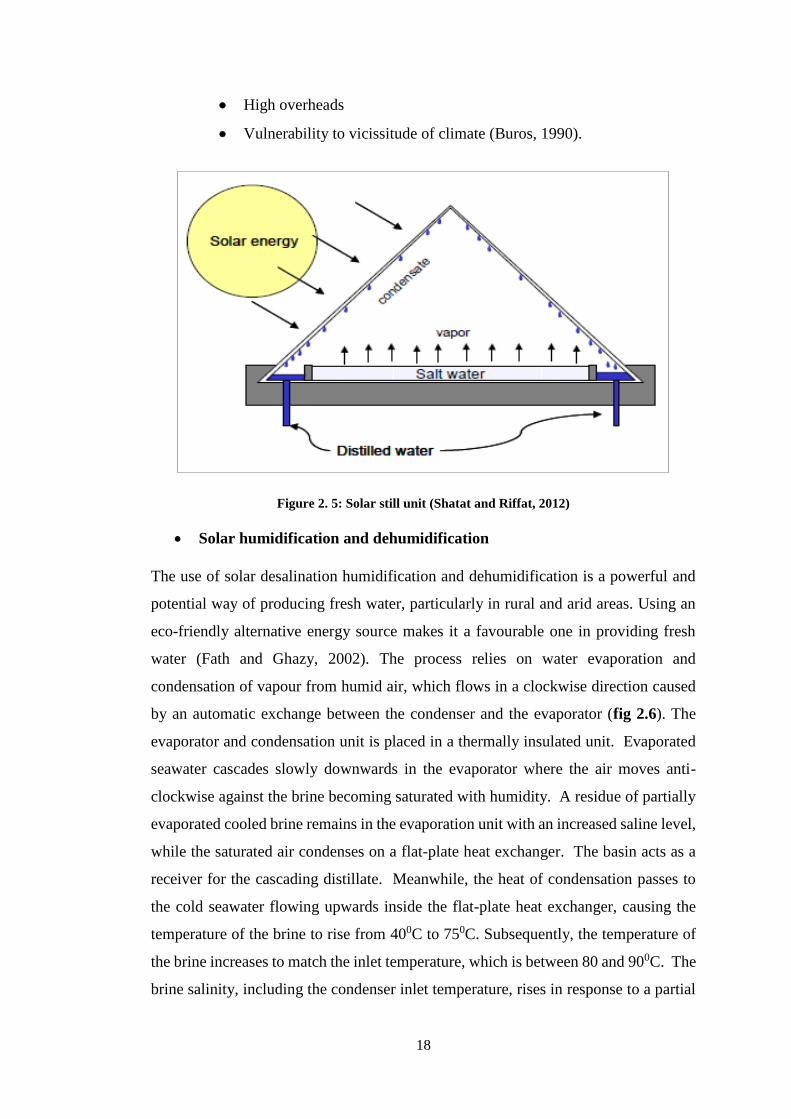
18
High overheads
Vulnerability to vicissitude of climate (Buros, 1990).
Figure 2. 5: Solar still unit (Shatat and Riffat, 2012)
Solar humidification and dehumidification
The use of solar desalination humidification and dehumidification is a powerful and
potential way of producing fresh water, particularly in rural and arid areas. Using an
eco-friendly alternative energy source makes it a favourable one in providing fresh
water (Fath and Ghazy, 2002). The process relies on water evaporation and
condensation of vapour from humid air, which flows in a clockwise direction caused
by an automatic exchange between the condenser and the evaporator (fig 2.6). The
evaporator and condensation unit is placed in a thermally insulated unit. Evaporated
seawater cascades slowly downwards in the evaporator where the air moves anti-
clockwise against the brine becoming saturated with humidity. A residue of partially
evaporated cooled brine remains in the evaporation unit with an increased saline level,
while the saturated air condenses on a flat-plate heat exchanger. The basin acts as a
receiver for the cascading distillate. Meanwhile, the heat of condensation passes to
the cold seawater flowing upwards inside the flat-plate heat exchanger, causing the
temperature of the brine to rise from 400C to 750C. Subsequently, the temperature of
the brine increases to match the inlet temperature, which is between 80 and 900C. The
brine salinity, including the condenser inlet temperature, rises in response to a partial
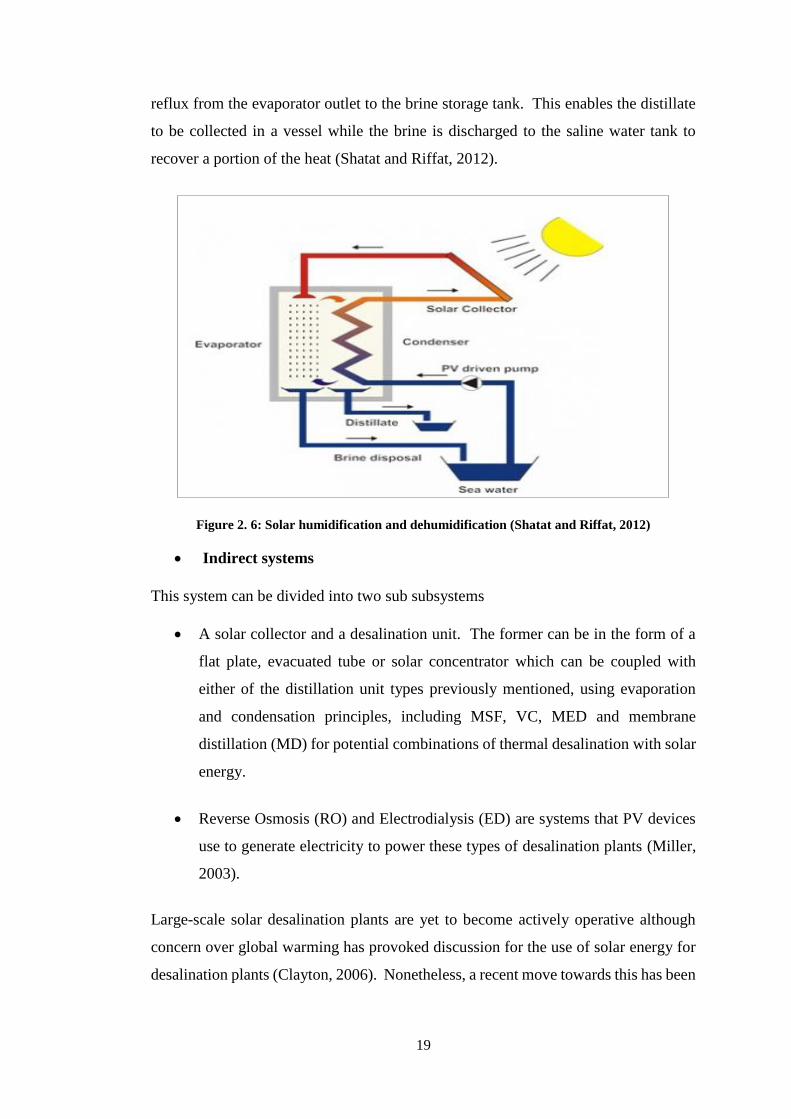
19
reflux from the evaporator outlet to the brine storage tank. This enables the distillate
to be collected in a vessel while the brine is discharged to the saline water tank to
recover a portion of the heat (Shatat and Riffat, 2012).
Figure 2. 6: Solar humidification and dehumidification (Shatat and Riffat, 2012)
Indirect systems
This system can be divided into two sub subsystems
A solar collector and a desalination unit. The former can be in the form of a
flat plate, evacuated tube or solar concentrator which can be coupled with
either of the distillation unit types previously mentioned, using evaporation
and condensation principles, including MSF, VC, MED and membrane
distillation (MD) for potential combinations of thermal desalination with solar
energy.
Reverse Osmosis (RO) and Electrodialysis (ED) are systems that PV devices
use to generate electricity to power these types of desalination plants (Miller,
2003).
Large-scale solar desalination plants are yet to become actively operative although
concern over global warming has provoked discussion for the use of solar energy for
desalination plants (Clayton, 2006). Nonetheless, a recent move towards this has been
20
the proposal of the world’s first large-scale solar-powered desalination plant with total
capacity of 60,000m³ per day in Saudia Arabia (www.water-technology.net).
The advantages of this technique are that in areas that thrive on solar energy and
minimal labour costs, this makes this method feasible for domestic use in less
populous areas (Buros, 1990; Samee et al., 2007). In addition, thermal desalination
methods can be powered by indirect systems such as those that rely on evaporation
and condensation principle, i.e. MSF, VOC, MED and MD (Miller, 2003).
The disadvantages are that this technology is not feasible in urbanised populous areas
as it requires considerable land area that would be in short supply and costly. Also,
high costs of remedial work and ongoing maintenance together with installation makes
this expensive. Selection of the best solar desalination technology is determined by
several criteria such as plant capacity, location, supply of grid electricity, technical
infrastructure; feed water salinity (Buros, 1990; Miller, 2003). Overall this method is
suitable for remote areas where solar energy is available, such as in the Middle East
and North Africa.
2.2.2. Membrane desalination technologies
Membrane desalination technology processes can be classified according to their
driving force(s) as following: -
Pressure-driven membrane methods, such as Reverse osmosis (RO),
Ultrafiltration (UF), Microfiltration (MF) and Nano filtration (NF).
Electrically powered membrane methods, e.g. Electrodialysis (ED) and
Electrodialysis Reversal (ER)
Temperature-driven membrane methods, such as Membrane Distillation (MD)
and Membrane Crystallisation (MCr) (Cipollina et al., 2009; Krishna, 2004).
There are three major commercial desalination processes of membranes (Buros, 1990;
Tsiourtis, 2001) described into the next sections: -
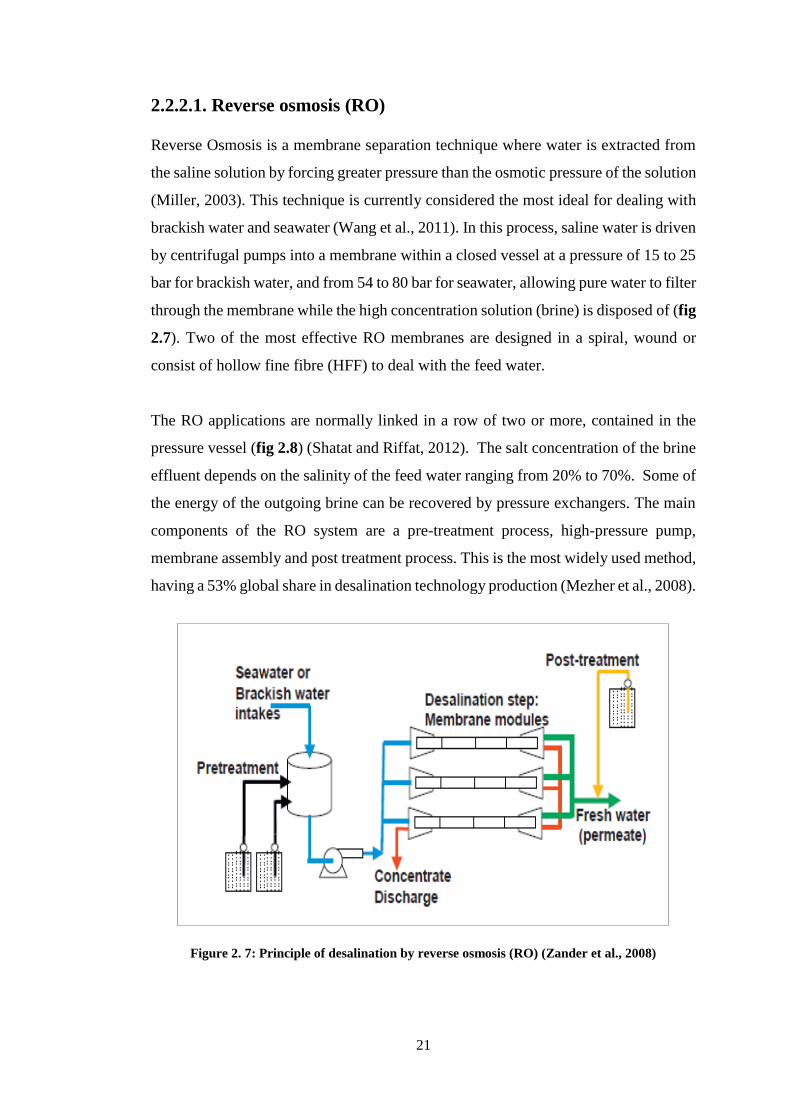
21
2.2.2.1. Reverse osmosis (RO)
Reverse Osmosis is a membrane separation technique where water is extracted from
the saline solution by forcing greater pressure than the osmotic pressure of the solution
(Miller, 2003). This technique is currently considered the most ideal for dealing with
brackish water and seawater (Wang et al., 2011). In this process, saline water is driven
by centrifugal pumps into a membrane within a closed vessel at a pressure of 15 to 25
bar for brackish water, and from 54 to 80 bar for seawater, allowing pure water to filter
through the membrane while the high concentration solution (brine) is disposed of (fig
2.7). Two of the most effective RO membranes are designed in a spiral, wound or
consist of hollow fine fibre (HFF) to deal with the feed water.
The RO applications are normally linked in a row of two or more, contained in the
pressure vessel (fig 2.8) (Shatat and Riffat, 2012). The salt concentration of the brine
effluent depends on the salinity of the feed water ranging from 20% to 70%. Some of
the energy of the outgoing brine can be recovered by pressure exchangers. The main
components of the RO system are a pre-treatment process, high-pressure pump,
membrane assembly and post treatment process. This is the most widely used method,
having a 53% global share in desalination technology production (Mezher et al., 2008).
Figure 2. 7: Principle of desalination by reverse osmosis (RO) (Zander et al., 2008)
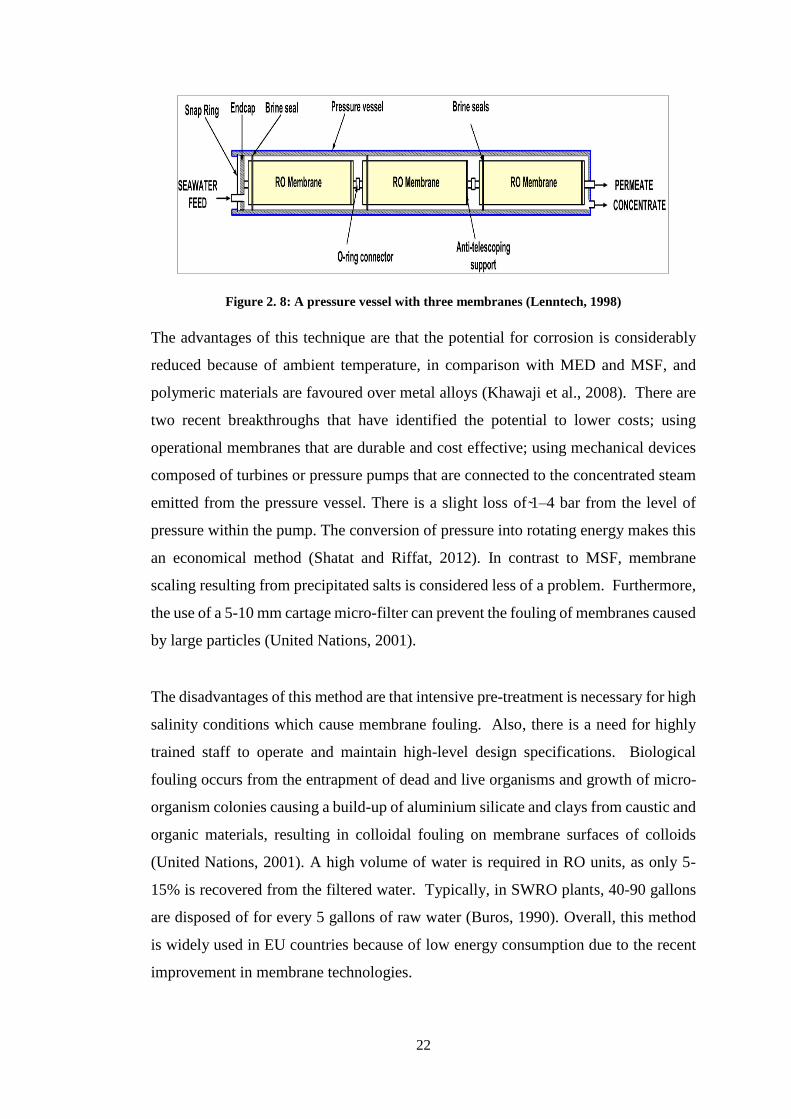
22
Figure 2. 8: A pressure vessel with three membranes (Lenntech, 1998)
The advantages of this technique are that the potential for corrosion is considerably
reduced because of ambient temperature, in comparison with MED and MSF, and
polymeric materials are favoured over metal alloys (Khawaji et al., 2008). There are
two recent breakthroughs that have identified the potential to lower costs; using
operational membranes that are durable and cost effective; using mechanical devices
composed of turbines or pressure pumps that are connected to the concentrated steam
emitted from the pressure vessel. There is a slight loss of 1–4 bar from the level of
pressure within the pump. The conversion of pressure into rotating energy makes this
an economical method (Shatat and Riffat, 2012). In contrast to MSF, membrane
scaling resulting from precipitated salts is considered less of a problem. Furthermore,
the use of a 5-10 mm cartage micro-filter can prevent the fouling of membranes caused
by large particles (United Nations, 2001).
The disadvantages of this method are that intensive pre-treatment is necessary for high
salinity conditions which cause membrane fouling. Also, there is a need for highly
trained staff to operate and maintain high-level design specifications. Biological
fouling occurs from the entrapment of dead and live organisms and growth of micro-
organism colonies causing a build-up of aluminium silicate and clays from caustic and
organic materials, resulting in colloidal fouling on membrane surfaces of colloids
(United Nations, 2001). A high volume of water is required in RO units, as only 5-
15% is recovered from the filtered water. Typically, in SWRO plants, 40-90 gallons
are disposed of for every 5 gallons of raw water (Buros, 1990). Overall, this method
is widely used in EU countries because of low energy consumption due to the recent
improvement in membrane technologies.
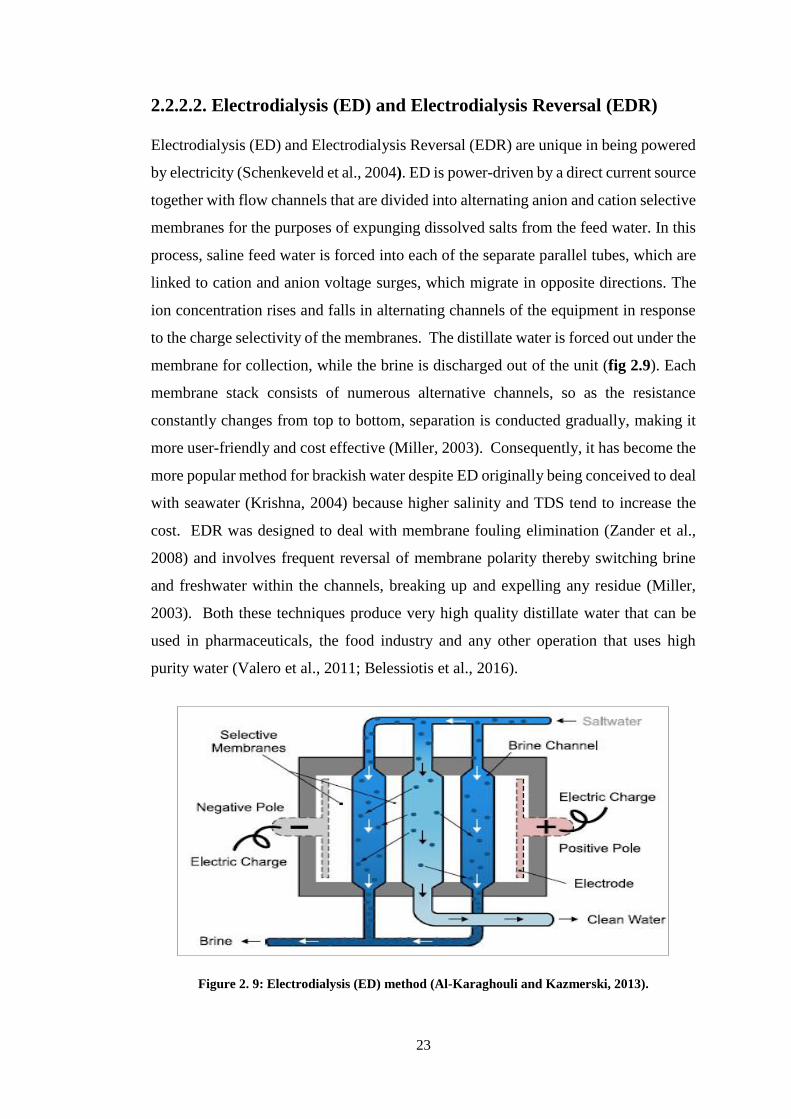
23
2.2.2.2. Electrodialysis (ED) and Electrodialysis Reversal (EDR)
Electrodialysis (ED) and Electrodialysis Reversal (EDR) are unique in being powered
by electricity (Schenkeveld et al., 2004). ED is power-driven by a direct current source
together with flow channels that are divided into alternating anion and cation selective
membranes for the purposes of expunging dissolved salts from the feed water. In this
process, saline feed water is forced into each of the separate parallel tubes, which are
linked to cation and anion voltage surges, which migrate in opposite directions. The
ion concentration rises and falls in alternating channels of the equipment in response
to the charge selectivity of the membranes. The distillate water is forced out under the
membrane for collection, while the brine is discharged out of the unit (fig 2.9). Each
membrane stack consists of numerous alternative channels, so as the resistance
constantly changes from top to bottom, separation is conducted gradually, making it
more user-friendly and cost effective (Miller, 2003). Consequently, it has become the
more popular method for brackish water despite ED originally being conceived to deal
with seawater (Krishna, 2004) because higher salinity and TDS tend to increase the
cost. EDR was designed to deal with membrane fouling elimination (Zander et al.,
2008) and involves frequent reversal of membrane polarity thereby switching brine
and freshwater within the channels, breaking up and expelling any residue (Miller,
2003). Both these techniques produce very high quality distillate water that can be
used in pharmaceuticals, the food industry and any other operation that uses high
purity water (Valero et al., 2011; Belessiotis et al., 2016).
Figure 2. 9: Electrodialysis (ED) method (Al-Karaghouli and Kazmerski, 2013).
24
The advantages of ED method are a higher volume of fresh water being produced with
reduced amount of brine (Burros 1990). Also, it can be used with brackish water with
salinity of ˂ 6 g/l of dissolved solids. It can purify feedwater with a higher
concentration of suspended solids than RO with minimal pre-treatment requirement
(Buros, 1990). Likewise, with EDR, there is a high recovery rate reaching 94% and
there is membrane longevity (potentially 15 years in accordance with correct
application). Furthermore, there is a potential for coupling with RO for improved
recovery of water, reaching 98% (World Bank, 2012).
The disadvantages of ED is that it is inappropriate for water with dissolved solids of
˂ 0.4 g/l. and use of energy is pro rota to salt removal (Shatat and Riffat, 2012). For
salinity levels greater than 30 g/l, as in the case of seawater, desalination comes at a
high price and is therefore not feasible (Kalogirou, 2005). The only disadvantages of
using EDR is the high overhead costs compared to RO (World Bank, 2012).
2.2.2.3. Membrane Distillation (MD)
This method works on the graduation of varying temperatures with one side of the
membrane being warmer and gradually cooling towards the other side. As vapour
rises from the warmed liquid, it filters through the membrane towards the cooler area
where a purified form of freshwater is produced from the condensation (fig 2.10)
(Belessiotis et al., 2016). Unable to pass back through the hydrophobic membrane
which is permeable by vapour only, then it is trapped for collection as the output of
the unit (Miller, 2003). This eliminates the transition of the liquid stage and any
dissolved residue (Shatat and Riffat, 2012). Although this method was initiated for
small scale operations, it has not proved to be viable, possibly due to problems of
maintaining the saturation level of the membranes over prolonged periods together
with fouling and membrane degradation. In addition, a large enthalpy of vaporization
is required through each transition while volatile feed stream contaminants cannot
always be eliminated. The possible benefits of MD is the relatively small carbon
footprint it leaves compared to other methods, lower capital overheads and relatively
simple power sources (Zander et al., 2008).
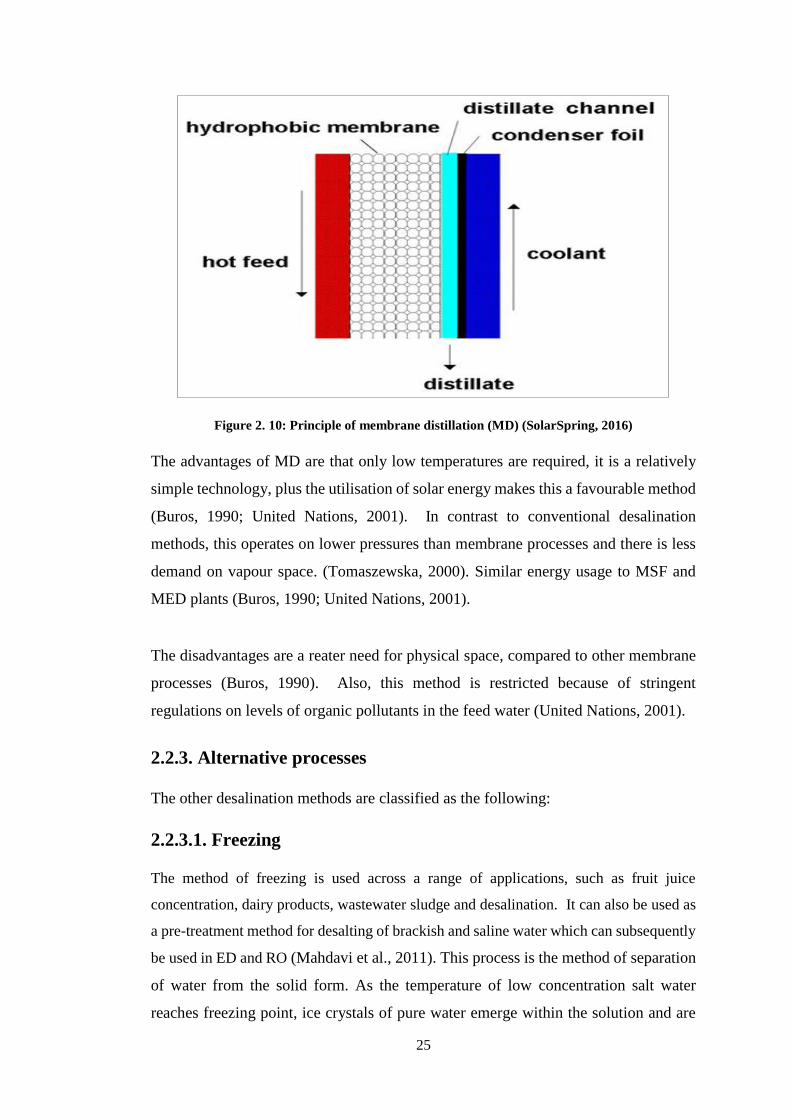
25
Figure 2. 10: Principle of membrane distillation (MD) (SolarSpring, 2016)
The advantages of MD are that only low temperatures are required, it is a relatively
simple technology, plus the utilisation of solar energy makes this a favourable method
(Buros, 1990; United Nations, 2001). In contrast to conventional desalination
methods, this operates on lower pressures than membrane processes and there is less
demand on vapour space. (Tomaszewska, 2000). Similar energy usage to MSF and
MED plants (Buros, 1990; United Nations, 2001).
The disadvantages are a reater need for physical space, compared to other membrane
processes (Buros, 1990). Also, this method is restricted because of stringent
regulations on levels of organic pollutants in the feed water (United Nations, 2001).
2.2.3. Alternative processes
The other desalination methods are classified as the following:
2.2.3.1. Freezing
The method of freezing is used across a range of applications, such as fruit juice
concentration, dairy products, wastewater sludge and desalination. It can also be used as
a pre-treatment method for desalting of brackish and saline water which can subsequently
be used in ED and RO (Mahdavi et al., 2011). This process is the method of separation
of water from the solid form. As the temperature of low concentration salt water
reaches freezing point, ice crystals of pure water emerge within the solution and are
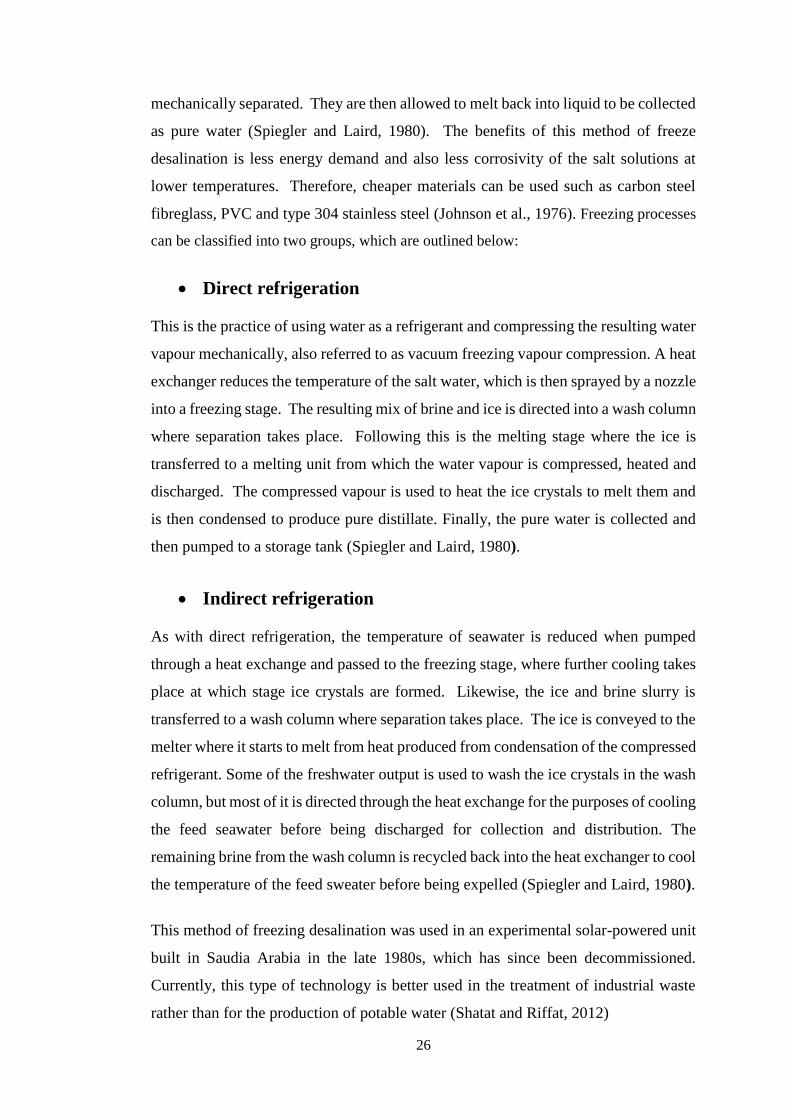
26
mechanically separated. They are then allowed to melt back into liquid to be collected
as pure water (Spiegler and Laird, 1980). The benefits of this method of freeze
desalination is less energy demand and also less corrosivity of the salt solutions at
lower temperatures. Therefore, cheaper materials can be used such as carbon steel
fibreglass, PVC and type 304 stainless steel (Johnson et al., 1976). Freezing processes
can be classified into two groups, which are outlined below:
Direct refrigeration
This is the practice of using water as a refrigerant and compressing the resulting water
vapour mechanically, also referred to as vacuum freezing vapour compression. A heat
exchanger reduces the temperature of the salt water, which is then sprayed by a nozzle
into a freezing stage. The resulting mix of brine and ice is directed into a wash column
where separation takes place. Following this is the melting stage where the ice is
transferred to a melting unit from which the water vapour is compressed, heated and
discharged. The compressed vapour is used to heat the ice crystals to melt them and
is then condensed to produce pure distillate. Finally, the pure water is collected and
then pumped to a storage tank (Spiegler and Laird, 1980).
Indirect refrigeration
As with direct refrigeration, the temperature of seawater is reduced when pumped
through a heat exchange and passed to the freezing stage, where further cooling takes
place at which stage ice crystals are formed. Likewise, the ice and brine slurry is
transferred to a wash column where separation takes place. The ice is conveyed to the
melter where it starts to melt from heat produced from condensation of the compressed
refrigerant. Some of the freshwater output is used to wash the ice crystals in the wash
column, but most of it is directed through the heat exchange for the purposes of cooling
the feed seawater before being discharged for collection and distribution. The
remaining brine from the wash column is recycled back into the heat exchanger to cool
the temperature of the feed sweater before being expelled (Spiegler and Laird, 1980).
This method of freezing desalination was used in an experimental solar-powered unit
built in Saudia Arabia in the late 1980s, which has since been decommissioned.
Currently, this type of technology is better used in the treatment of industrial waste
rather than for the production of potable water (Shatat and Riffat, 2012)
27
The advantages of freezing method are minimal power consumption, less likelihood
of corrosion and negligible amounts of salt scaling. Also, production of very high
quality drinking water, which can also be used for irrigation (Rice and Chau, 1997).
The disadavantge of this method is only elaborate techniques are needed to move and
process ice and freezing water (Buros, 1990).
2.2.3.2. Ion Exchange
Ion exchange is used primarily for water softening and demineralization and its
application is currently quite restricted. This method involves desalination of water,
which is directed through a column of cation exchanger beads in the form of hydrogen
(H+) which eventually replace the cations in the solution that have attached themselves
to the exchanger. The water is then directed through a column of anion exchange beads
in the form of hydroxyl (OH–) which is replaced by the anions that eventually combine
with the hydrogen ions in the water thereby producing deionised water. Thus, this
method is used for the final purification of water that has been previously treated by
other desalination techniques. However, as this practice is normally coupled with
other desalination techniques, is not economically feasible as a means of water
purification for seawater or brackish water on its own (Zander et al., 2008).
The advantages of this method is prevalent in both industrial and commercial sectors
as a method of water treatment (Tripathi, 2016), in particular when coupled with RO
for the purpose of mixing RO by-product with ion exchange to augment water
production (Younos and Tulou, 2005).
The disadvantage of this method is that it is not economically viable for application
with brackish or seawater because of extortionate expense (Shatat and Riffat, 2012).
Overall this technology can be coupled with thermal desalination plants to feed the
power station in order to increase industrial water purity.
2.3. Chemical treatment procedures for desalination techniques
The description of desalination treatment processes offered (fig 2.11) follows the
treatment procedure sequence of typical desalination techniques such as MED, MED-
28
TVC, MSF, and RO. Prior to any desalination technique, raw water (feedwater) needs
to be chemically pre-treated to avoid scaling, foaming, corrosion, biological growth,
or fouling in addition to further chemical post-treatment (Gálvez et al., 2010).
The purpose of this treatment is to ensure plant efficiency, maintain plant equipment
while protecting public health and the safeguarding of the overall water distribution
system (Masnoon and Glucina, 2011; Cotruvo et al., 2010). Chemical treatment
procedures in desalination plants are described in the next sections:
Figure 2. 11: Typical sequence of treatment procedures in desalination plants Modified from
(WHO, 2007)
2.3.1. Pre-treatment of feed water to desalination plants
Prior to seawater and brackish water reaching membrane desalination systems that
treat feed water from surface water sources, pre-treatment is vital to eliminate
suspended and colloidal particles, organisms and natural organic matter. In the case
of treatment of brackish groundwater, very little pre-treatment is necessary due to low
concentrations of suspended solids and any organic matter. Nonetheless, some pre-
treatment will be required to eradicate certain constituents, e.g. dissolved iron,
manganese and sulphides, which can become a fouling hazard to the membranes if
oxidised. Normally, feedwater is conveyed through 5 μm-size cartridge filters as a
final barrier, before entering the RO units. These filters are used both with
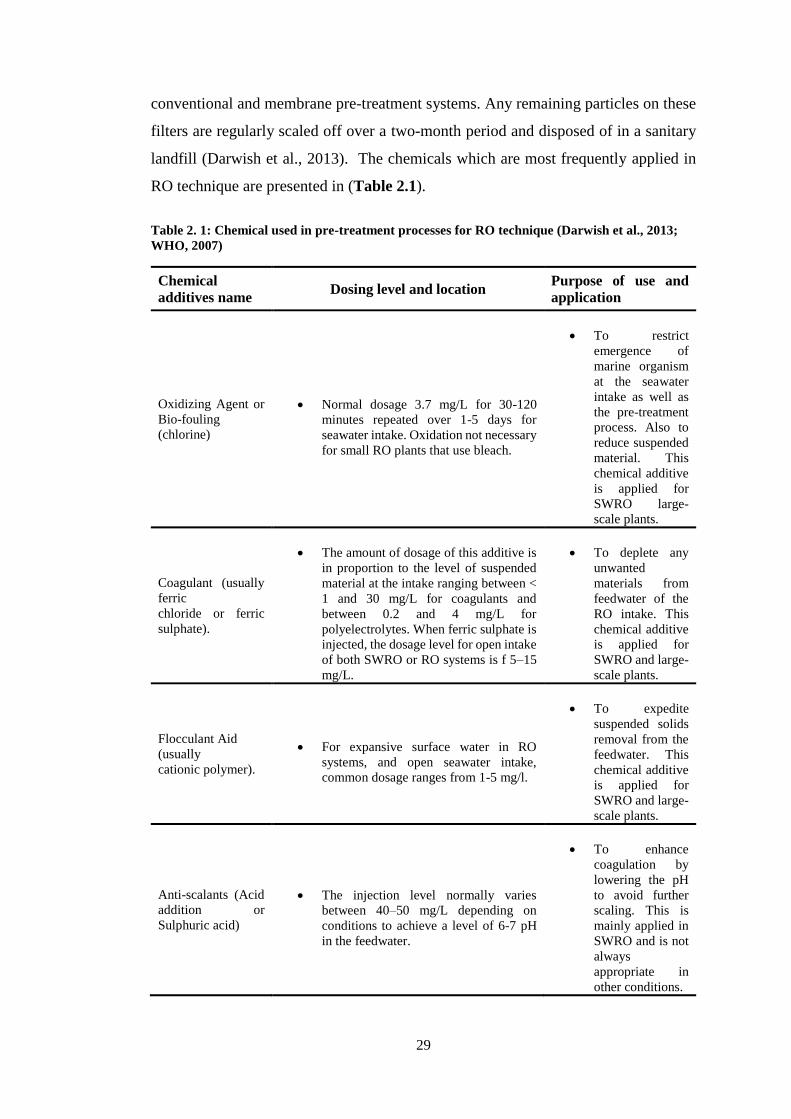
29
conventional and membrane pre-treatment systems. Any remaining particles on these
filters are regularly scaled off over a two-month period and disposed of in a sanitary
landfill (Darwish et al., 2013). The chemicals which are most frequently applied in
RO technique are presented in (Table 2.1).
Table 2. 1: Chemical used in pre-treatment processes for RO technique (Darwish et al., 2013;
WHO, 2007)
Chemical
additives name Dosing level and location
Purpose of use and
application
Oxidizing Agent or
Bio-fouling
(chlorine)
Normal dosage 3.7 mg/L for 30-120
minutes repeated over 1-5 days for
seawater intake. Oxidation not necessary
for small RO plants that use bleach.
To restrict
emergence of
marine organism
at the seawater
intake as well as
the pre-treatment
process. Also to
reduce suspended
material. This
chemical additive
is applied for
SWRO large-
scale plants.
Coagulant (usually
ferric
chloride or ferric
sulphate).
The amount of dosage of this additive is
in proportion to the level of suspended
material at the intake ranging between <
1 and 30 mg/L for coagulants and
between 0.2 and 4 mg/L for
polyelectrolytes. When ferric sulphate is
injected, the dosage level for open intake
of both SWRO or RO systems is f 5–15
mg/L.
To deplete any
unwanted
materials from
feedwater of the
RO intake. This
chemical additive
is applied for
SWRO and large-
scale plants.
Flocculant Aid
(usually
cationic polymer).
For expansive surface water in RO
systems, and open seawater intake,
common dosage ranges from 1-5 mg/l.
To expedite
suspended solids
removal from the
feedwater. This
chemical additive
is applied for
SWRO and large-
scale plants.
Anti-scalants (Acid
addition or
Sulphuric acid)
The injection level normally varies
between 40–50 mg/L depending on
conditions to achieve a level of 6-7 pH
in the feedwater.
To enhance
coagulation by
lowering the pH
to avoid further
scaling. This is
mainly applied in
SWRO and is not
always
appropriate in
other conditions.
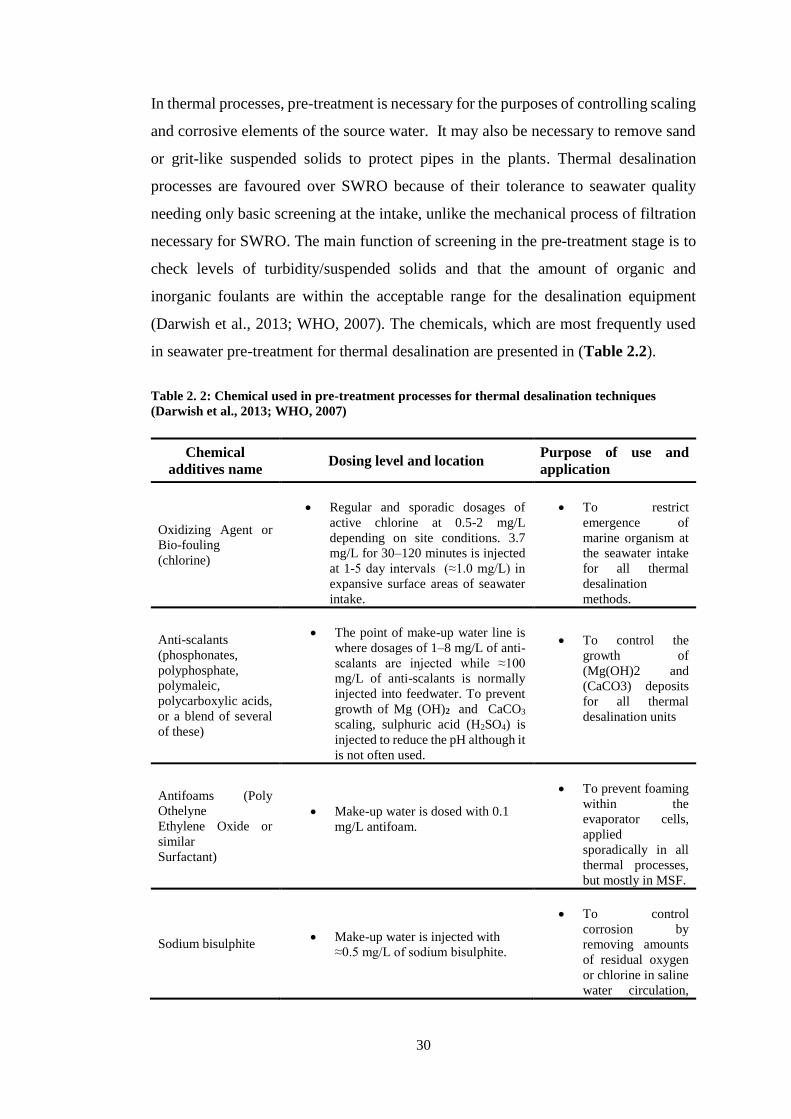
30
In thermal processes, pre-treatment is necessary for the purposes of controlling scaling
and corrosive elements of the source water. It may also be necessary to remove sand
or grit-like suspended solids to protect pipes in the plants. Thermal desalination
processes are favoured over SWRO because of their tolerance to seawater quality
needing only basic screening at the intake, unlike the mechanical process of filtration
necessary for SWRO. The main function of screening in the pre-treatment stage is to
check levels of turbidity/suspended solids and that the amount of organic and
inorganic foulants are within the acceptable range for the desalination equipment
(Darwish et al., 2013; WHO, 2007). The chemicals, which are most frequently used
in seawater pre-treatment for thermal desalination are presented in (Table 2.2).
Table 2. 2: Chemical used in pre-treatment processes for thermal desalination techniques
(Darwish et al., 2013; WHO, 2007)
Chemical
additives name Dosing level and location
Purpose of use and
application
Oxidizing Agent or
Bio-fouling
(chlorine)
Regular and sporadic dosages of
active chlorine at 0.5-2 mg/L
depending on site conditions. 3.7
mg/L for 30–120 minutes is injected
at 1-5 day intervals (≈1.0 mg/L) in
expansive surface areas of seawater
intake.
To restrict
emergence of
marine organism at
the seawater intake
for all thermal
desalination
methods.
Anti-scalants
(phosphonates,
polyphosphate,
polymaleic,
polycarboxylic acids,
or a blend of several
of these)
The point of make-up water line is
where dosages of 1–8 mg/L of anti-
scalants are injected while ≈100
mg/L of anti-scalants is normally
injected into feedwater. To prevent
growth of Mg (OH)2 and CaCO3
scaling, sulphuric acid (H2SO4) is
injected to reduce the pH although it
is not often used.
To control the
growth of
(Mg(OH)2 and
(CaCO3) deposits
for all thermal
desalination units
Antifoams (Poly
Othelyne
Ethylene Oxide or
similar
Surfactant)
Make-up water is dosed with 0.1
mg/L antifoam.
To prevent foaming
within the
evaporator cells,
applied
sporadically in all
thermal processes,
but mostly in MSF.
Sodium bisulphite Make-up water is injected with
≈0.5 mg/L of sodium bisulphite.
To control
corrosion by
removing amounts
of residual oxygen
or chlorine in saline
water circulation,
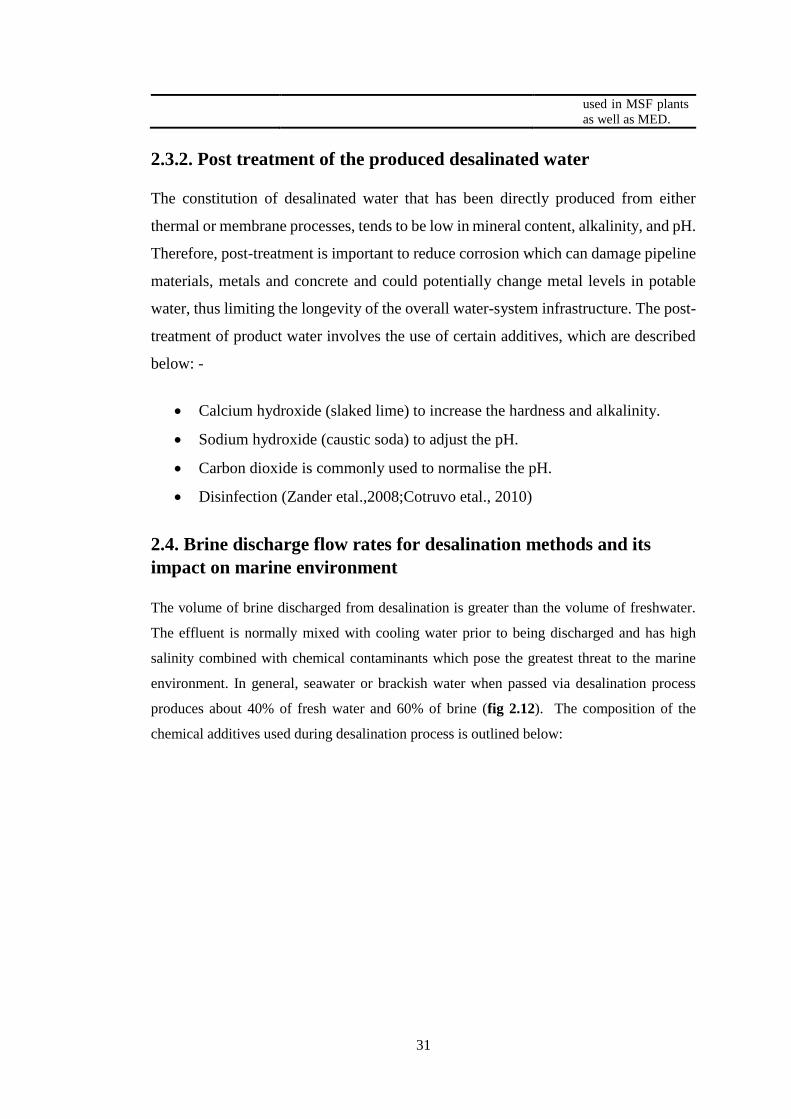
31
used in MSF plants
as well as MED.
2.3.2. Post treatment of the produced desalinated water
The constitution of desalinated water that has been directly produced from either
thermal or membrane processes, tends to be low in mineral content, alkalinity, and pH.
Therefore, post-treatment is important to reduce corrosion which can damage pipeline
materials, metals and concrete and could potentially change metal levels in potable
water, thus limiting the longevity of the overall water-system infrastructure. The post-
treatment of product water involves the use of certain additives, which are described
below: -
Calcium hydroxide (slaked lime) to increase the hardness and alkalinity.
Sodium hydroxide (caustic soda) to adjust the pH.
Carbon dioxide is commonly used to normalise the pH.
Disinfection (Zander etal.,2008;Cotruvo etal., 2010)
2.4. Brine discharge flow rates for desalination methods and its
impact on marine environment
The volume of brine discharged from desalination is greater than the volume of freshwater.
The effluent is normally mixed with cooling water prior to being discharged and has high
salinity combined with chemical contaminants which pose the greatest threat to the marine
environment. In general, seawater or brackish water when passed via desalination process
produces about 40% of fresh water and 60% of brine (fig 2.12). The composition of the
chemical additives used during desalination process is outlined below:
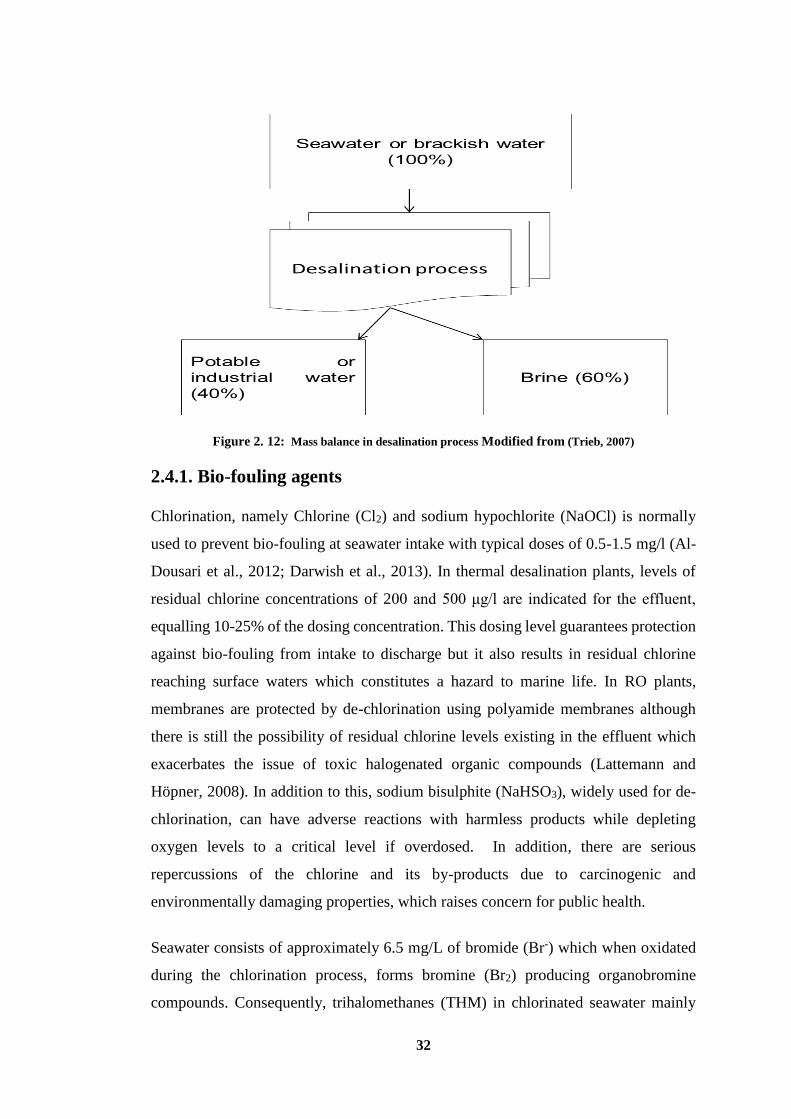
32
Figure 2. 12: Mass balance in desalination process Modified from (Trieb, 2007)
2.4.1. Bio-fouling agents
Chlorination, namely Chlorine (Cl2) and sodium hypochlorite (NaOCl) is normally
used to prevent bio-fouling at seawater intake with typical doses of 0.5-1.5 mg/l (Al-
Dousari et al., 2012; Darwish et al., 2013). In thermal desalination plants, levels of
residual chlorine concentrations of 200 and 500 μg/l are indicated for the effluent,
equalling 10-25% of the dosing concentration. This dosing level guarantees protection
against bio-fouling from intake to discharge but it also results in residual chlorine
reaching surface waters which constitutes a hazard to marine life. In RO plants,
membranes are protected by de-chlorination using polyamide membranes although
there is still the possibility of residual chlorine levels existing in the effluent which
exacerbates the issue of toxic halogenated organic compounds (Lattemann and
Höpner, 2008). In addition to this, sodium bisulphite (NaHSO3), widely used for de-
chlorination, can have adverse reactions with harmless products while depleting
oxygen levels to a critical level if overdosed. In addition, there are serious
repercussions of the chlorine and its by-products due to carcinogenic and
environmentally damaging properties, which raises concern for public health.
Seawater consists of approximately 6.5 mg/L of bromide (Br-) which when oxidated
during the chlorination process, forms bromine (Br2) producing organobromine
compounds. Consequently, trihalomethanes (THM) in chlorinated seawater mainly
33
consist of bromoform (CHBr3) and dibromo-chloro-methane (CHBr2Cl). The end
product in the oxidation of organic substances is bromoform which develops
gradually, so these two compounds have become subjects of identification and
research. The resulting residual oxidant in the coolant water normally ranges from
0.1–0.2 mg/l. Despite the low level of organo-chlorinated by-products present in the
chlorine, they tend to be more prevalent than residual chlorine, thereby constituting
further hazards to the marine environment (Darwish et al., 2013).
2.4.2. Coagulants
Ferric chloride (FeCl3) or ferric sulphate (FeSO4) is used as a primary coagulant or
flocculant in the pre-treatment system of existing SWRO plants to deal with media
filtration of suspended material. Following sporadic backwashing of the media filters,
the suspended debris and coagulants are expelled into the ocean without treatment.
The toxicity of the chemicals is minor although there may be coloration of the reject
stream when ferric salts are used (“red brines”). This can cause increased turbidity
while limiting light penetration, which could have a harmful effect on marine
organisms in the location of discharge (Lattemann and Höpner, 2008).
2.4.3. Antifoams
These are organic (acylated polyglycols, fatty acids and fatty acid eaters) or silicon-based
compounds (composition undisclosed by manufacturers but certified as being non-toxic),
which are added to the feedwater. It is currently unknown what damage they can cause to the
marine environment, or their level of toxicity (Darwish et al., 2013), but it could be
widespread due to low rate of biodegradation (Lattemann and Höpner, 2008).
2.4.4. Oxygen scavengers
There are two methods normally used to extract oxygen from the feedwater of the
boiler in thermal desalination plans. The first method is known as mechanical de-
aearation, which is normally used in the feedwater of the boiler, by means of a
mechanical tower, which causes reduction of the oxygen level in the feedwater, prior
to entrance to the boiler. The second is the addition of chemical oxygen scavengers
such as Sodium sulphite (Na2SO3) or Hydrazine (N2H4) for the principal purpose of
corrosion inhibition. In order to increase the pH level and to reduce the risk of acid
34
corrosion, hydrazine, is widely used in the feedwater of the boiler at high temperatures
and pressure, but it has been classified as being highly hazardous, thereby posing
serious repercussions for the environment (Plumley, 2005; Darwish et al., 2013). The
other oxygen scavenger is sodium bisulphite which is commonly used to prevent
membrane damage in RO plants by removing residual chlorine from RO feedwater
but in cases of overdosing, oxygen levels be may depleted (Abuzinada et al., 2008).
Overall, a low level of oxygen in the seawater may cause harm or damage to marine
life.
2.4.5. Acids and alkalis
The Sulphuric acid (H2SO4) is injected to the feedwater to make calcium carbonate
(CaCO3) and magnesium hydroxide (MgOH) more soluble calcium and magnesium
sulphate salts and in order to shift the pH above 9.0, sodium hydroxide (NaOH) is
added to seawater feed. The ionic composition of the brine discharged is barely
affected by sulphuric acid or sodium hydroxide, therefore not constituting any kind of
threat to the environment (Darwish et al., 2013).
2.4.6. Heavy metal (corrosion products)
Heat exchanger materials are normally made of copper-nickel alloys which presents
problems to thermal plant reject streams because of potential brine contamination from
the corrosive copper. A combination of various metals such as iron, nickel, chromium
and molybdenum are present in the brine discharged from RO plants, but the use of
non-metal equipment and stainless steels ensures that contamination is kept to a
minimum. However, a higher level of heavy metals can be produced as a result of
antiscaling and use of acids. This increased concentration of copper in the sediment
poses cause for concern at the discharge point because it is understood that any toxic
spills can occur at molecular/cellular levels and have organismic effects. Copper,
nickel, chromium and other metals that could be released can have harmful effects on
marine flora and fauna (Lattemann and Höpner, 2008; Hoepner, 1999).
2.4.7. Scale inhibitors
The prevention of scale formation in the feedwater in both thermal and RO plants is
achieved by the use of antiscalants (Lattemann and Höpner, 2008). One of these is
35
known as polyphosphate, which hydrolyzes to orthophosphate at a temperature of
approximately 90°C. Primary production is enhanced by the nutrient of
orthophosphate resulting in the growth of algal blooms at the discharge point so the
BELGARD EV2000, a polymer of maleic acid is used as a replacement to the
polyphosphate. It is not considered toxic in potable water and is widely recognised
although its reputed eco-toxicity is still undecided; even though the BELGARD EV is
considered user-friendly (Dweiri and Badran, 2002), research is still inconclusive as
to the degradation of these anti-scalants and their impact on the marine environment
(Darwish et al., 2013).
2.4.8. Salinity and temperature
The discharged brine from RO plants normally has a salinity of 60-70 psu but this
level is influenced by the salinity concentrate of the intake feedwater. In thermal
desalination plants, the brine blowdown could have a similar level of salinity of 70
psu but is less concentrated when it is mixed with three times the volume of cooling
water (seawater) which dilutes it to a level of around 50 psu prior to discharge. In
thermal desalination plants, the temperature of the discharge ranges 5-15 0C above
ambient temperatures whereas temperatures of RO discharge tend to be similar to
ambient seawater temperature (Abuzinada et al., 2008). The outcome of these high
levels of salinity and temperatures can have a devastating effect on marine life.
(Lattemann and Höpner, 2008).
2.4.9. Cleaning chemicals
The type of fouling dictates the method of cleaning, in RO plants the removal of silt
deposits and biofilms from membranes is achieved by alkaline solutions (pH 11-12)
while metal oxides or scales are dissolved by the application of acidic solutions (pH
2-3). Other chemicals may be added to these chemical solutions to improve their
efficacy such as detergents (e.g. dodecyl benzene sulphonate, dodecyl sulphate) or
oxidants (e.g. sodium hypochlorite, sodium perborate). On completion of cleaning
and prior to storage, it is normal practice to disinfect membranes by the application of
oxidizing biocides (e.g. hydrogen peroxide and chlorine) or non-oxidizing biocides
(e.g. isothiazole, glutaraldehyde or formaldehyde). Heated acidic seawater is used to
cleanse the distillation plant in removing alkaline scales from heat exchanges surfaces
36
where corrosion inhibitors may have built-up (e.g. benzotriazole derivates). When
these chemical solutions are expunged after cleaning in a raw form, there is potential
threat to marine life (Lattemann and Höpner, 2008).
2.5. Air emission
Due to temperatures up to 120°C required in distillation plants such as MSF stations,
there is heavy demand on thermal and/or electrical energy from desalination plants:
for every cubic metre of fresh water produced, 12 kW h of thermal energy and 3.5 Kw
h of electrical energy are required. In MED plants, the temperature is considerably
less at (<70°C) requiring only 6 kW h of thermal and 1.5 kW h of electrical energy per
cubic metre. For the RO plants, only 4-7 kW h/m3 is needed according to the capacity
of the plant and power recovery installations (Lattemann and Höpner, 2008). Thus, it
can be seen that all these methods require substantial levels of energy resulting in
release of toxic gases e.g. CO2, CO, NO, NO2, and SO2. The level of the former is
approximately 25kg/m3 of produced water. In addition, the use of traditional power
sources such as fossil fuels to generate the energy, also has serious implications for
the air quality, therefore alternative sustainable energy sources should be considered
in the future to overcome the effect of these noxious gases (Darwish et al., 2013; Al-
Karaghouli and Kazmerski, 2013).
2.6. Economic cost of desalination technologies
Although the cost of desalination processing has dropped due to developments in the
technology, the actual overheads incurred in sourcing and treating water from
conventional reserves have risen due to required compliance with health and safety
regulations regarding water quality control. In fact, the cost of desalinated water
remains more than double the cost of water from traditional water sources. These
costs vary regionally and globally. For large-scale freshwater production from the
seas, the options to use either thermal processes (MSF, MED, MED-TVC) or
membrane (RO) will influence the ultimate expense dependent on plant capacity and
output, together with environmental factors (Khawaji at el., 2008). These include
seawater properties, quality of produced water, energy source and utilisation, plant
size and efficiency, levels of concentration of discharge, staffing, area required and
overall maintenance. The direct costs are factored into the economic calculations, e.g.
37
capital, energy, manpower, chemical additives, consumables and raw materials
(Darwish, 1989; Wade, 1993; A1-Sahlawi, 1999).
Desalination economics is determined by an assessment of life cycle costs using an
equal uniform annual cost method where capital costs are at a fixed annual rate in
contrast to a variable rate for operation and maintenance overheads. An average figure
for water production based on both capital and operation and maintenance costs, is
determined in $/ m3 by the division of total costs by total water volume produced
(Khawaji et al., 2008). In the case of thermal desalination plants with large-scale
operations of MSF, where water production ranges between 23,000 and 528,000
m3/day, the estimated costs are from 0.52 to 1.75$/m3. In contrast to MED plants
producing over 90,000 m3/day, the estimated costs range between 0.52 and 1.01$/m3.
For medium sized MED plants, costs are lower, ranging between 0.95 and 1.95$/m3
for production of 12,000 to 55,000 m3/day. The cost of Vapour Compression in small-
scale operations with capacity of approximately 1000 m3/day ranges between 2.0 and
2.60 $/m3. In contrast, the costs of RO water production have fallen due to advances
in membrane technology. For large-scale SWRO plants utilizing between 100,000 and
320,000 m3/day, the estimated cost of water production ranged between 0.45 and 0.66
$/m3. For medium-sized SWRO plants processing between 15,000 and 60,000 m3/day,
the water production cost was estimated from 0.48-1.62 $/m3. In the smaller SWRO
plants with a capacity ranging from 1000 to 4800 m3/day, prices were reported
between 0.7 and 1.72 $/m3. While for brackish water, the most cost effective methods
of water desalination are RO and ED, the former can be used with TDS greater than
500 ppm, whereas ED is more economically viable for lower concentration of TDS.
The cost of water production for BWRO with a capacity of 40,000 to 46,000 m3/day
is estimated at 0.26- 0.54$/m3, in contrast to smaller ED plants estimated at 0.6
to1.05$/m3, according to salinity concentration of the feedwater (Karagiannis and
Soldatos, 2008; Mezher et al., 2008).
A favourable alternative is the use of solar distillation for the purposes of water
desalination because it is a simple method with low overheads without any need for
fossil fuel to heat the water. Nonetheless, low productivity of the still means reduced
economy of scale making it a less viable option. With production rates from 4 to 6
l/m2, the estimated cost ranges between 1.3 and 6.5$/m3 (Al-Karaghouli and
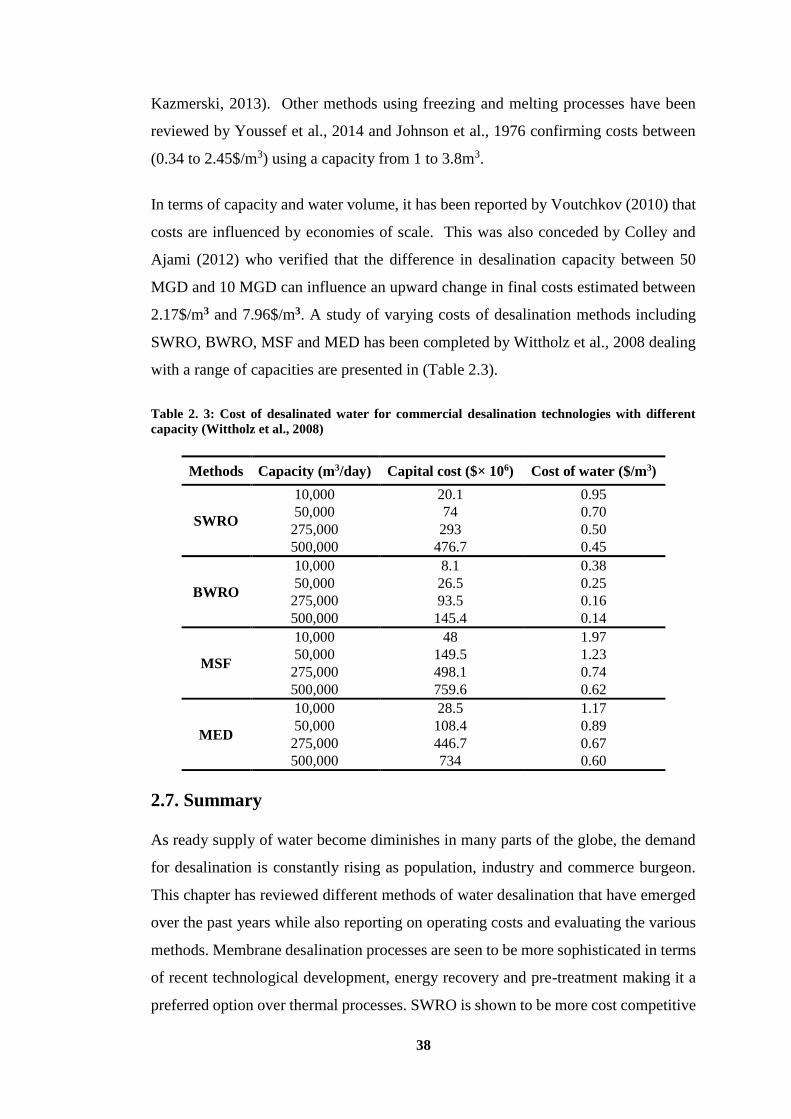
38
Kazmerski, 2013). Other methods using freezing and melting processes have been
reviewed by Youssef et al., 2014 and Johnson et al., 1976 confirming costs between
(0.34 to 2.45$/m3) using a capacity from 1 to 3.8m3.
In terms of capacity and water volume, it has been reported by Voutchkov (2010) that
costs are influenced by economies of scale. This was also conceded by Colley and
Ajami (2012) who verified that the difference in desalination capacity between 50
MGD and 10 MGD can influence an upward change in final costs estimated between
2.17$/m3 and 7.96$/m3. A study of varying costs of desalination methods including
SWRO, BWRO, MSF and MED has been completed by Wittholz et al., 2008 dealing
with a range of capacities are presented in (Table 2.3).
Table 2. 3: Cost of desalinated water for commercial desalination technologies with different
capacity (Wittholz et al., 2008)
Methods Capacity (m3/day) Capital cost ($× 106) Cost of water ($/m3)
SWRO
10,000 20.1 0.95
50,000 74 0.70
275,000 293 0.50
500,000 476.7 0.45
BWRO
10,000 8.1 0.38
50,000 26.5 0.25
275,000 93.5 0.16
500,000 145.4 0.14
MSF
10,000 48 1.97
50,000 149.5 1.23
275,000 498.1 0.74
500,000 759.6 0.62
MED
10,000 28.5 1.17
50,000 108.4 0.89
275,000 446.7 0.67
500,000 734 0.60
2.7. Summary
As ready supply of water become diminishes in many parts of the globe, the demand
for desalination is constantly rising as population, industry and commerce burgeon.
This chapter has reviewed different methods of water desalination that have emerged
over the past years while also reporting on operating costs and evaluating the various
methods. Membrane desalination processes are seen to be more sophisticated in terms
of recent technological development, energy recovery and pre-treatment making it a
preferred option over thermal processes. SWRO is shown to be more cost competitive
39
for seawater, compared to thermal distillation processes such as MSF and MED
because of streamlined operations requiring less use of chemicals, higher operating
efficiency and overall control of scaling and anti-fouling. Meanwhile, the use of
membrane technology for brackish water incurs less cost than seawater membrane
desalination due to low salinity. On the other hand, for large-scale plants such as MED
and SWRO, costs are lower than MSF because of economy of scale and efficiency
under most local conditions.
Clearly, there is a need to consider environmentally friendly alternatives to avoid
further depletion of water sources and climate change. The concept of combining
desalination plants with eco-friendly renewable power sources has become a pressing
and controversial topic due to ever increasing fossil fuel costs and the deleterious
effects of combustion of traditional fuels on the environment. This dilemma is
influenced by factors including the plant size, type of feed water and geographical
location.
As the search for a solution to deal with water scarcity continues in assessing the best
method of desalination, there is concern about the brine discarded from desalination
plants, particularly huge capacity stations, which are constructed on the coastline. This
effluent contains chemical additives, which are normally added in the pre-treatment
process, so compounded with high salinity and temperature, this could have several
knock-on effects on the surrounding environment. The next chapter will present the
methods of brine disposal from desalination plants.
41
Chapter Three: Brine Disposal Management Options for
Desalination Technologies
3.1. Introduction
The management of brine disposal has long been a topic of concern due to certain
factors such as the increasing number and size of desalination plants, particularly in
arid and semi-arid areas, that impacts on disposal options, the regulations governing
disposal and environmental implications (Mickley, 2006). Several techniques for
disposal and volume reduction of the brine waste have been tested and pioneered
without which the production of brine and treatment of produced concentrate could
not be achieved. This is a key component of the operation of desalination plants and
its handling of concentrate, so is critical to effective operation. The location of
desalination plants dictates the type of process used, whether distillation or membrane
technology and the best method of brine disposal (Masnoon and Glucina, 2011;
Ahmed et al., 2009; Jirka, 2008).
The option of brine disposal in inland and coastal areas varies according to discharge.
The simplest and cheapest method is into the ocean, hence its practice by coastal
desalination plants, the rapid mixing dilution makes it the safest disposal option
(Ahmed et al., 2001). For inland areas, this is not a feasible option, as the disposal
costs of inland desalination plants such as RO plants are higher than those of plants
disposing reject brine in nearby seas or lakes. Consequently, alternative methods have
to be adopted that do not pose economic or environmental threats (Svensson, 2005).
The waste cannot be used for agricultural or commercial purposes, so this presents
challenges of exploiting brackish water sources for any other purpose (Glueckstern
and Priel, 1996). In this case, the waste cannot be recycled or disposed of safely,
which has an ongoing impact on the environment (Sethi et al., 2007). There are certain
options for disposal of reject brine from inland areas such as discharge to surface water
or wastewater treatment plants, deep well injection, land application, evaporation
ponds and zero liquid discharge in addition to some brine volume minimization
techniques currently being explored and used (Sethi et al., 2006; Masnoon and
Glucina, 2011).
42
Awareness of the need for environmental regulations varies hugely around the world.
In the Middle East, where about two thirds of desalination plants and oilfields are
located, monitoring is less regulated, with inadequate brine disposal systems (Einav et
al., 2002). The same applies to other countries, for example, Libya where, despite the
current environmental legislation law no 14/1989 being in place, there is little regard
for maintaining the required standards of safe disposal (Nait, 2015). In other countries
nonetheless, the regulations are adhered to (Ahmad and Baddour, 2014).
At the outset of establishing desalination plants, brine disposal processes dominate the
decision-making in terms of their economic feasibility (Abdul and Weshahi, 2009).
Clearly, the cost factor determines the proposed method, ranging from 5% - 33% of
the total cost of desalination. It is influenced by reject brine characteristics, the
required level of treatment prior to disposal, the means of disposal, volume of brine
and the receiving environment (Ahmed et al., 2001).
Overall, this chapter, therefore, aims to outline what kind of brine disposal methods
are being used worldwide. Additionally, the advantages and disadvantages of each
method will be discussed. As one of the challenges to coastline desalination plants,
particularly in arid regions, is the dilemma of the brine disposal, this chapter also
presents Mediterranean legislation of brine discharge from desalination plants into the
marine environment and the water availability and desalination technologies in
Mediterranean region.
3.2. Brine Discharge Management Methods
3.2.1. Surface Water Disposal
There are several methods of surface water disposal into water bodies such as ponds,
streams, lakes and coastal waters such as estuaries, bays and oceans (Younos, 2005).
These involve the installation of various controls, such as outfall diffusion devices and
the dilution of brine by mixing it with less concentrated streams, in order to reduce the
impact on the environment (Sarté et al., 2006). There is a more in-depth explanation
in the next sections.
3.2.1.1. Direct discharge
43
This technique is the most favoured with over 90% of desalination plants using it for
discharge directly to the sea (WHO, 2007). However, this intensifies the salinity along
the coastline which compromises the quality of coastal and groundwater aquifers due
to salinity intrusion (Purnalna et al., 2003). Brine can be mixed through tidal
movements or it can be discharged outside the tidal zones using outfall diffusers in the
mixing zone to enhance the process (WHO, 2007). This method may be a feasible
option for smaller desalination plants but would not be environmentally viable for
discharge into freshwater bodies such as rivers and lakes (Masnoon and Glucina,
2011).
3.2.1.2. Discharge to outlet of the power plant
The technique of dilution of concentrated brines using hot water discharged from the
power station is commonly practised. This is achieved by a hybrid installation, which
is a desalination plant co-located to a power station. The brine is mixed with power
plant cooling water within the outfall line from the power station, using a discharge
line outfall, before going to the sea (Einav et al., 2002). This option is environmentally
friendly because of reduced salinity concentration (Abdul-Wahab and Al-Weshahi,
2009).
3.2.1.3. Discharge via wastewater treatment plant
This technique is used where a desalination plant is situated close to a wastewater
treatment plant. A positive outcome of combining the brine discharge with wastewater
is dual dilation, which reduces the density of concentrate (WHO, 2007). However, this
can result in the production of calcium carbonate on filters which impacts on the
efficiency of wastewater treatment plants (Squire, 2000). The main considerations
therefore are availability and cost of wastewater outfall capacity and the potential for
whole effluent toxicity resulting from an ion imbalance of the blended discharge
(Mickley, 2006).
3.2.1.4. Discharge to sewage system
This option involves discharge of brine into a nearby sewage system from small
brackish water and seawater desalination plants into large-capacity wastewater
treatment facilities (WHO, 2007). The result of this mixed blend would not be
44
appropriate for use in irrigation, so consideration needs to be given to the capacity of
the sewage system (Ahmed et al., 2000).
3.2.2. Deep well injection
The disposal of industrial, commercial and liquid hazardous waste is currently done
by deep well injection (Saripallia et al., 2000). This method has been considered for
land brine disposal, which involves injection of brine from desalination plants into
compatible deep underground aquifers that do not use potable water. The design
ensures that potable water sources are kept separate from the aquifers to avoid
contamination (Glater and Cohen, 2003; Masnoon and Glucina, 2011). This is an
expensive process and is widely used in Florida, which has beneficial hydrogeological
conditions (Reimold et al., 1996; Mickley, 2001). According to a study by Skehan and
Kwiatkowski (2000) who looked at design criteria, deep well injection is the optimum
method compared with other systems in practice for inland desalination plants.
Mickley (2009) has also affirmed these benefits, but stresses the need for maintenance
of a long-term operation to effectively dispose of large amounts of process fluid.
3.2.3. Land application/Spray irrigation
Land application and spray irrigation is an alternative method of brine disposal, used
for landscape and irrigation purposes (Masnoon and Glucina, 2011). Methods used are
spray irrigation, rapid infiltration, percolation ponds and overflow application
(Younos, 2005). Areas that benefit from spray irrigation need to be salt tolerant, such
as grasses and vegetation in lawns, parks, golf courses or cropland (WHO, 2007). A
lesser concentrated brine of reduced volume is used in land application in order to
meet groundwater criteria. The target vegetation must be salt tolerant and comply with
ground water quality standards. Other factors to be considered are availability and cost
of land, percolation rates and irrigation needs (Mickley, 2009), and during heavy rainy
seasons, there needs to be an alternative disposal method (Squire, 2000). Currently
according to a study, Florida is the only state that uses land application for this disposal
method (Younos, 2005). A study in the UAE revealed that discharge of brine resulted
in groundwater contamination and a hardness of groundwater due to inappropriate
design standards (Mohamed et al., 2005).
45
3.2.4. Landfill disposal
An alternative option of brine disposal methods is conversion of brine from liquid to
a solid mass, to be disposed in landfill. This is used as a final disposal mechanism of
brine, e.g. brine concentrators. There is a risk of leakage from landfills into nearby
groundwater, so site selection needs careful consideration (Masnoon and Glucina,
2011). Normally, landfill must consist of a minimum of 50% of solid masses, so the
liquid remainder would need to be contained in drums, involving costly transportation
and permit fees, which vary across landfill facilities (Kepke et al., 2008).
3.2.5. Zero liquid discharge
Zero liquid discharge methods are commonly practised in industrial zones that do not
permit discharge (Davis, 2006). This involves a sequence of brine evaporation,
crystallisation or spray drying to produce a resultant solid mass consisting of solidified
salts and mineral slurries that are later taken to landfill, or used for commercial
purposes (Masnoon and Glucina, 2011).
3.2.5.1. Evaporation ponds
Evaporation ponds are commonly used to dispose of brine from inland RO
desalination plants in desert-type terrain such as in North Africa and the Middle East
(El-Naas, 2011). It is done by a gradual evaporation of water in large ponds through
solar energy, leaving wet salt residues (Leong et al., 2014). This is a less common
method with only 6% being used in the USA in 1993, which later fell to 2% after 1993
(Abdul-Wahab and Al-Weshahi, 2009). This may be attributed to the large amount of
land needed and the fact that very few desalination plants are based inland.
Furthermore, there are potential environmental issues such as strict design
requirements and pond leakage causing contamination of groundwater in the area. The
most recent models are lined with polyvinyl chloride, high-density polyethylene, butyl
rubber and hypalon to prevent leakage and seepage of contaminants into the nearby
groundwater (Morillo et al., 2014). The effectiveness of evaporation ponds is
dependent on the evaporation rate, which is influenced by the climate, including
humidity and temperature so wind-aided intensified evaporation options have been
tested to improve the evaporation rates. However, this is still unpredictable and is
46
only 50% effective in dry conditions (Gilron et al., 2003). Another contributory
technique to speed up the process, is having a greater water surface for optimised
exposure, using spraying or misting movements of water, in addition to use of
saturated textiles to increase exposure. However, the downside to these methods is the
dispersal of mist and dry salt particles although they would reduce the amount of land
required and the capital costs (Mickley, 2009). Consequently, the use of evaporation
ponds is more cost effective for smaller brine flows and coupled with high recovery
desalination process (Masnoon and Glucina, 2011). Further costs are alleviated by the
introduction of particular synergies that provide income in combination with these
ponds, as described below: -
A. Aquaculture
A new cutting-edge industry is aquaculture, which can be used to culture fish. Several
species are reported to thrive in high salinity in Australia, namely Barramundi (lates
calcarifer), Red Snapper (Pagrus auratus), Black Bream (Acanthopagrux butcheri),
Milk fish (Chanos chanos),), Mullet (Mugil cephulux), Tilapia (Oreochromis
mossambicus) and brine shrimp (Artemia salina). There is a mutual relationship
between fish and shrimp production where each can benefit. In addition, the brine
shrimp act as ‘cleaner’ of waste organic matter removing calcium ions, which
propagates healthy salt production. Evaporation ponds also create a zone for algae
growth (Dunaliella salina) which results in commercial grades of beta-carotene at
salinities greater than 200g/L (Ahmed et al., 2001). Therefore, this scenario is highly
beneficial and can be applied to reducing costs and enhancing the evaporation ponds.
B. Salinity Gradient Solar ponds
Another potential synergy project is salinity gradient solar ponds, which combine solar
energy to produce thermal energy at temperatures from 50 to 900C or electricity
(Svensson, 2005). A normal salinity gradient solar pond comprises three regions; the
top one is the surface or upper convective zone (UCZ) that has ambient temperatures
and low salt content. The middle section is the main gradient zone (MGZ) or non-
convective zone (NCZ) which is made up of a layer of thermal insulation and salinity
gradient. The lower section is the storage zone or lower convective zone (LCZ) which
is a homogenous concentrated salt solution that can be heated or remain at a stable
temperature (Masnoon and Glucina, 2011). The solar energy reached at the lower zone
47
is released through conduction. Heat conductivity in the water is low so if the
insulating layer is thick enough, heat loss will be minimal. The high volume of water
in the solar pond has a corresponding high heat capacity making it ideal for energy
collection and long-term storage. The temperature required to run the generation of
electricity efficiently is above 85 0C. Moreover, the clarity of the brine, the thicknesses
of the zones, the salt gradient and the maintenance of the vertical salt gradient and the
pond area all determine the thermal efficiency of the solar pond (Svensson, 2005). A
salinity-gradient solar pond can be an effective and environmentally friendly
heat/cooling source for thermal desalination and brine concentration processes (Lu et
al., 2002).
3.2.5.2. Crystallisers
The final phase of brine disposal in zero liquid discharge systems is the brine
crystalliser method. In this process, the rejected brine is converted to a high purity
water for further use in the plant while the solid masses are disposed of in landfills.
The volume of brine prior to being fed to the crystalliser is minimised and is then fed
to the crystalliser with a TDS concentration of approximately 200,000 – 300,000
mg/L. The first stage of crystallisation is the feeding of brine into the crystalliser,
which is combined with the recirculating brine and then pumped into a heat exchanger
where compression and saturated steam heats brine above boiling point at atmospheric
pressure while steam condensation occurs outside the tubes of the heat exchanger.
The heated brine is then fed to a separator chamber (flash tank), at reduced pressure
causing flash evaporation of the liquid and creation of insoluble salt crystals in the
brine. The majority of the brine is pumped back to the heater leaving a trickle (1-5%
of brine) from the recirculating loop which is sent to the centrifuge where it is filtered
separating the water from the crystals enabling it to be returned to the feed tank while
the solid mass is disposed of. The steam from evaporation is filtered through a mist
eliminator before going into a vapour compressor where it is heated with a hot
distillate and fed to a heat exchanger that heats the internal recirculating solution
within the heat transfer tubes. The final process is the collection or mixing of
condensed water with RO product water.
48
This method is the most expensive compared to other methods of brine management
although has an excellent recovery rate of 95-99%, (Masnoon and Glucina, 2011;
Carollo, 2009). However, a study by Mickley (2006) reveals that although costly in
terms of construction, it is the most feasible method in regions that cannot support
deep well injection treatment but have low solar evaporation rates. This method
requires high levels of energy (200-250 kwh/1000gal) and is also commonly used with
RO plants (Mackey and Seacord, 2008).
3.2.5.3. Spray dryers
An alternative method of crystallisation is the use of spray dryers, which are operated
alongside a brine concentrator evaporator in desalination plants. A large cylindrical
drying chamber with a dried brine separator is used to accommodate the dried solids.
Meanwhile, the brine is pumped into this chamber in the form of a droplet through
brine atomiser, which comprises a shaft and rotating disc protruding into the heated
gas stream. In addition, hot air produced by gas, oil or electric power heater flows to
the top of the drying chamber. It is then drawn into the chamber via filtration from an
exhaust fan. The dry powder residue from the drying chamber is separated from the
hot air stream and then prepared for disposal while the air is expelled from the
atmosphere. This method is considered to be labour intensive and costly, and tends to
be more effective for smaller volumes of brine (1-10 gpm) (Spellman, 2016; Masnoon
and Glucina, 2011).
3.2.5.4. Wind Aided Intensified Evaporation
A more recent technology for brine treatment is Wind Aided Intensified Evaporation
(WAIV), which is used to improve evaporation rates and to minimise the surface area
required (Katzir et al, 2010; Masnoon and Glucina, 2011). Vertically mounted
structures are erected that have wetted surfaces packed in high density footprints,
which are designed to react against air movement, are placed in rows to optimise the
process of using wind power. The hydrophilised ‘sails’ are made of woven netting, or
other geo-textiles, or volcanic rock. Water is pumped from a nearby small storage
tank to reach the vertical surface before gravity causes it to trickle down while dry air
causes evaporation thereby depositing salts on the surfaces. The excess recirculates
to the pond, while the salt deposits flurry and are collected in a trough below the fabric.
49
This method is a favourable option in terms of minimal energy requirements and
reduced land area requirements, as proved in a study by Girlon et al., (2003)
confirming it 20 times more effective than conventional evaporation ponds.
3.2.5.5. Dewvaporation
Another approach in dealing with small-scale applications is a cheaper option of
dewvaporation which involves a thermal distillation process of desalination where
dew is formed after evaporation using combustible fuel, solar or waste. The effluent
disposed from this system can be almost eliminated (90%) while producing high purity
distillate. A compartmentalised tower is separated by a heat transfer wall, one for dew
formation and one for evaporation. Air used as a gas to evaporate the water from brine
feeds forms condensation at atmospheric pressure. This air is forced at an ambient
temperature to the bottom wall of the evaporation vessel while the heat transfer wall
is soaked with brine by pumping it to the top of the evaporation vessel. The rise of
upward-flowing heating air results in evaporation of water from the brine.
Subsequently, the residue water or salt concentrate is expelled while the warm
saturated air continues to rise and then goes to the condenser side of the heat transfer
wall. The cooling downward air starts to condense which releases further heat via the
heat transfer surface. High purity water flows out while the concentrate is collected
and sent for further treatment. An advantage of this process is a lack of any scaling
problems, low operating capital costs and small footprint. The downside is the large
heat transfer area requirement. Although extensive piloting has been carried out, there
is no full-scale application of this process for desalination and RO concentrate
treatment in existence (Masnoon and Glucina, 2011; Hamieh et al., 2001).
3.2.5.6. Salt Recovery Salt Solidification and Sequestration (SAL-
PROC)
Geo-Processors are responsible for a new emerging technology called SAL-PROC,
which achieves ZLD by merging sequential reaction and evapo-cooling stages in a
closed loop to precipitate and crystallise valuable minerals contained in brine avoiding
use of any toxic elements in the process (Neilly et al., 2009). The end product of this
method is a purified chemical salt of commercial value, such as magnesium carbonate,
calcium carbonate and gypsum, depending on the elements contained therein
50
(Masnoon and Glucina, 2011). This method is used in conjunction with RO techniques
and other volume reduction technologies to capitalise on the reduced need for brine
disposal while producing greater amounts of potable water. Having access to
inexpensive energy sources will bring costs down (Svensson, 2005). Another
advantage of implementing this process is that it can recoup profits from commercial
products. The downsides are that one of the main considerations of SAL-PROC
systems is a requirement for sophisticated infrastructure criteria in addition to leaving
a footprint to accommodate chemical reagent and product salt storage (U.S.
Department of the Interior Bureau of Reclamation, 2009). The advantages and
disadvantages of the aforementioned methods are summarised in (Table 3.1)
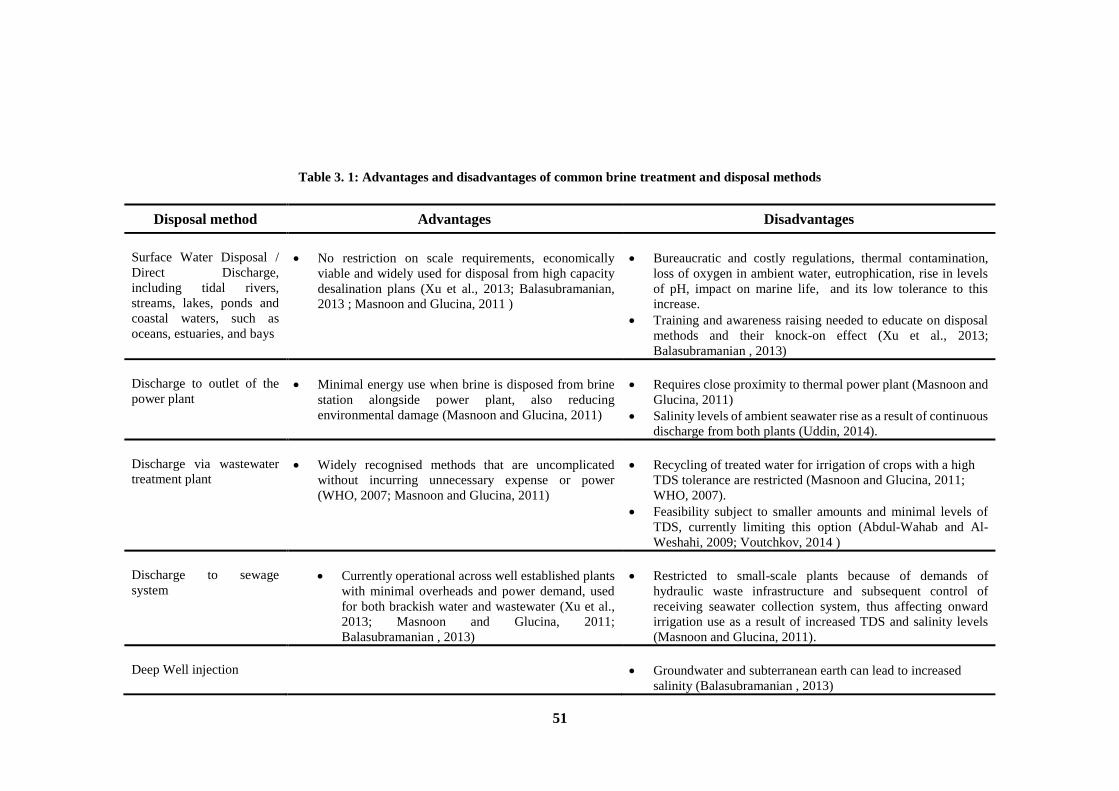
51
Table 3. 1: Advantages and disadvantages of common brine treatment and disposal methods
Disposal method Advantages Disadvantages
Surface Water Disposal /
Direct Discharge,
including tidal rivers,
streams, lakes, ponds and
coastal waters, such as
oceans, estuaries, and bays
No restriction on scale requirements, economically
viable and widely used for disposal from high capacity
desalination plans (Xu et al., 2013; Balasubramanian,
2013 ; Masnoon and Glucina, 2011 )
Bureaucratic and costly regulations, thermal contamination,
loss of oxygen in ambient water, eutrophication, rise in levels
of pH, impact on marine life, and its low tolerance to this
increase.
Training and awareness raising needed to educate on disposal
methods and their knock-on effect (Xu et al., 2013;
Balasubramanian , 2013)
Discharge to outlet of the
power plant
Minimal energy use when brine is disposed from brine
station alongside power plant, also reducing
environmental damage (Masnoon and Glucina, 2011)
Requires close proximity to thermal power plant (Masnoon and
Glucina, 2011)
Salinity levels of ambient seawater rise as a result of continuous
discharge from both plants (Uddin, 2014).
Discharge via wastewater
treatment plant
Widely recognised methods that are uncomplicated
without incurring unnecessary expense or power
(WHO, 2007; Masnoon and Glucina, 2011)
Recycling of treated water for irrigation of crops with a high
TDS tolerance are restricted (Masnoon and Glucina, 2011;
WHO, 2007).
Feasibility subject to smaller amounts and minimal levels of
TDS, currently limiting this option (Abdul-Wahab and Al-
Weshahi, 2009; Voutchkov, 2014 )
Discharge to sewage
system
Currently operational across well established plants
with minimal overheads and power demand, used
for both brackish water and wastewater (Xu et al.,
2013; Masnoon and Glucina, 2011;
Balasubramanian , 2013)
Restricted to small-scale plants because of demands of
hydraulic waste infrastructure and subsequent control of
receiving seawater collection system, thus affecting onward
irrigation use as a result of increased TDS and salinity levels
(Masnoon and Glucina, 2011).
Deep Well injection
Groundwater and subterranean earth can lead to increased
salinity (Balasubramanian , 2013)
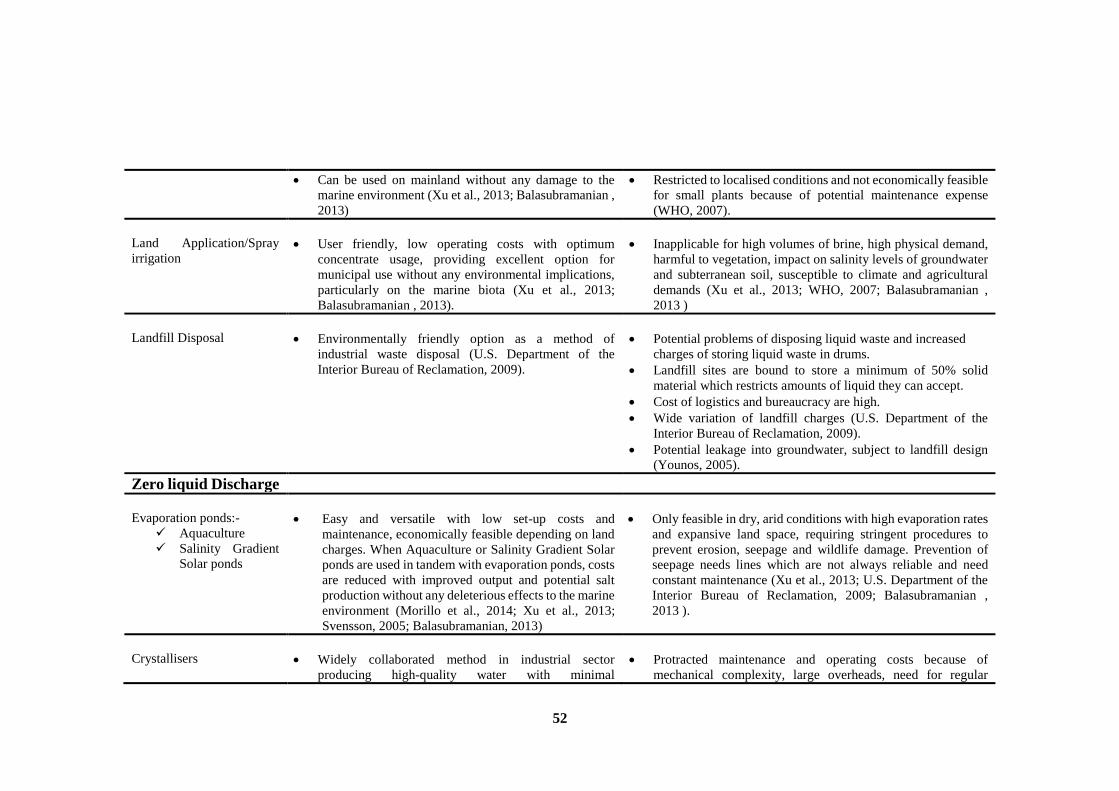
52
Can be used on mainland without any damage to the
marine environment (Xu et al., 2013; Balasubramanian ,
2013)
Restricted to localised conditions and not economically feasible
for small plants because of potential maintenance expense
(WHO, 2007).
Land Application/Spray
irrigation
User friendly, low operating costs with optimum
concentrate usage, providing excellent option for
municipal use without any environmental implications,
particularly on the marine biota (Xu et al., 2013;
Balasubramanian , 2013).
Inapplicable for high volumes of brine, high physical demand,
harmful to vegetation, impact on salinity levels of groundwater
and subterranean soil, susceptible to climate and agricultural
demands (Xu et al., 2013; WHO, 2007; Balasubramanian ,
2013 )
Landfill Disposal
Environmentally friendly option as a method of
industrial waste disposal (U.S. Department of the
Interior Bureau of Reclamation, 2009).
Potential problems of disposing liquid waste and increased
charges of storing liquid waste in drums.
Landfill sites are bound to store a minimum of 50% solid
material which restricts amounts of liquid they can accept.
Cost of logistics and bureaucracy are high.
Wide variation of landfill charges (U.S. Department of the
Interior Bureau of Reclamation, 2009).
Potential leakage into groundwater, subject to landfill design
(Younos, 2005).
Zero liquid Discharge
Evaporation ponds:-
Aquaculture
Salinity Gradient
Solar ponds
Easy and versatile with low set-up costs and
maintenance, economically feasible depending on land
charges. When Aquaculture or Salinity Gradient Solar
ponds are used in tandem with evaporation ponds, costs
are reduced with improved output and potential salt
production without any deleterious effects to the marine
environment (Morillo et al., 2014; Xu et al., 2013;
Svensson, 2005; Balasubramanian, 2013)
Only feasible in dry, arid conditions with high evaporation rates
and expansive land space, requiring stringent procedures to
prevent erosion, seepage and wildlife damage. Prevention of
seepage needs lines which are not always reliable and need
constant maintenance (Xu et al., 2013; U.S. Department of the
Interior Bureau of Reclamation, 2009; Balasubramanian ,
2013 ).
Crystallisers
Widely collaborated method in industrial sector
producing high-quality water with minimal
Protracted maintenance and operating costs because of
mechanical complexity, large overheads, need for regular
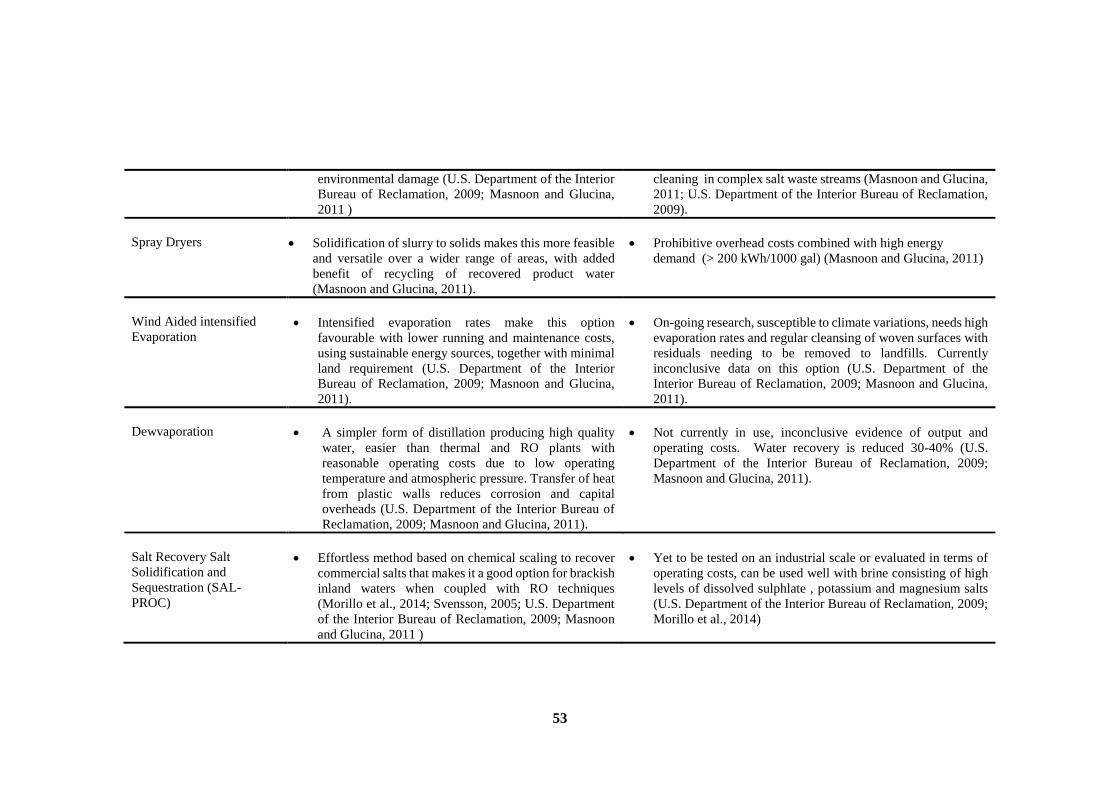
53
environmental damage (U.S. Department of the Interior
Bureau of Reclamation, 2009; Masnoon and Glucina,
2011 )
cleaning in complex salt waste streams (Masnoon and Glucina,
2011; U.S. Department of the Interior Bureau of Reclamation,
2009).
Spray Dryers
Solidification of slurry to solids makes this more feasible
and versatile over a wider range of areas, with added
benefit of recycling of recovered product water
(Masnoon and Glucina, 2011).
Prohibitive overhead costs combined with high energy
demand (> 200 kWh/1000 gal) (Masnoon and Glucina, 2011)
Wind Aided intensified
Evaporation
Intensified evaporation rates make this option
favourable with lower running and maintenance costs,
using sustainable energy sources, together with minimal
land requirement (U.S. Department of the Interior
Bureau of Reclamation, 2009; Masnoon and Glucina,
2011).
On-going research, susceptible to climate variations, needs high
evaporation rates and regular cleansing of woven surfaces with
residuals needing to be removed to landfills. Currently
inconclusive data on this option (U.S. Department of the
Interior Bureau of Reclamation, 2009; Masnoon and Glucina,
2011).
Dewvaporation
A simpler form of distillation producing high quality
water, easier than thermal and RO plants with
reasonable operating costs due to low operating
temperature and atmospheric pressure. Transfer of heat
from plastic walls reduces corrosion and capital
overheads (U.S. Department of the Interior Bureau of
Reclamation, 2009; Masnoon and Glucina, 2011).
Not currently in use, inconclusive evidence of output and
operating costs. Water recovery is reduced 30-40% (U.S.
Department of the Interior Bureau of Reclamation, 2009;
Masnoon and Glucina, 2011).
Salt Recovery Salt
Solidification and
Sequestration (SAL-
PROC)
Effortless method based on chemical scaling to recover
commercial salts that makes it a good option for brackish
inland waters when coupled with RO techniques
(Morillo et al., 2014; Svensson, 2005; U.S. Department
of the Interior Bureau of Reclamation, 2009; Masnoon
and Glucina, 2011 )
Yet to be tested on an industrial scale or evaluated in terms of
operating costs, can be used well with brine consisting of high
levels of dissolved sulphlate , potassium and magnesium salts
(U.S. Department of the Interior Bureau of Reclamation, 2009;
Morillo et al., 2014)
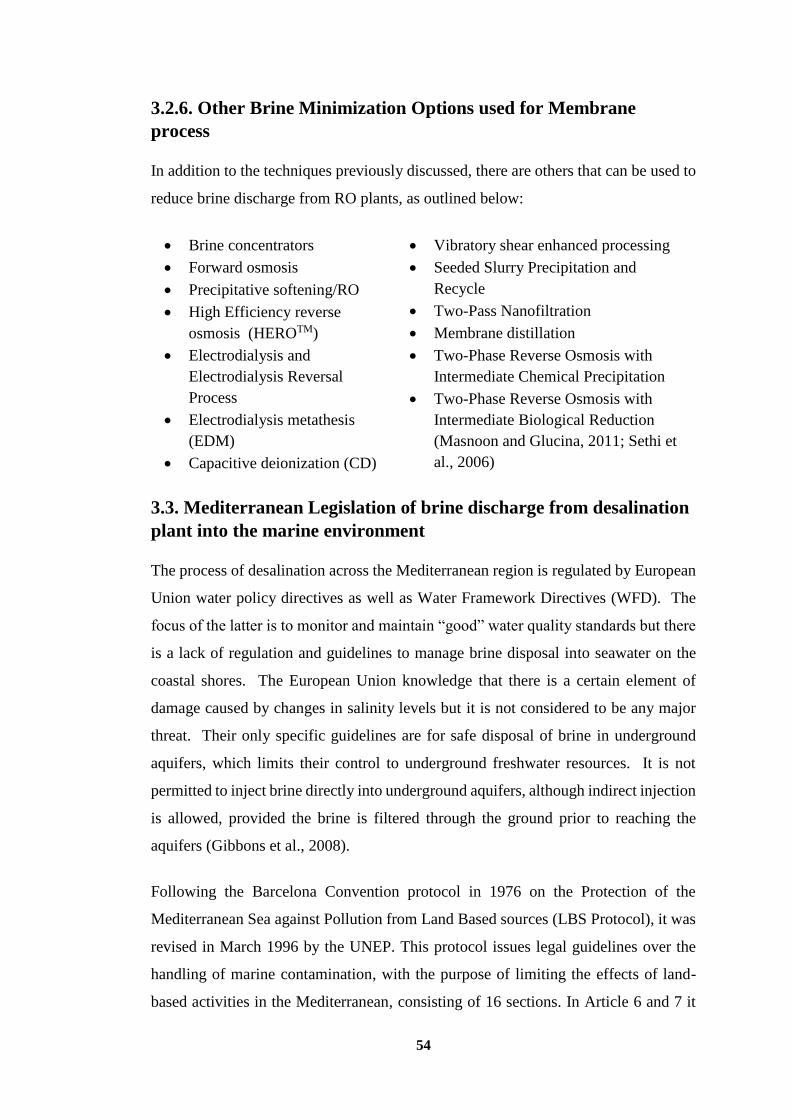
54
3.2.6. Other Brine Minimization Options used for Membrane
process
In addition to the techniques previously discussed, there are others that can be used to
reduce brine discharge from RO plants, as outlined below:
Brine concentrators
Forward osmosis
Precipitative softening/RO
High Efficiency reverse
osmosis (HEROTM)
Electrodialysis and
Electrodialysis Reversal
Process
Electrodialysis metathesis
(EDM)
Capacitive deionization (CD)
Vibratory shear enhanced processing
Seeded Slurry Precipitation and
Recycle
Two-Pass Nanofiltration
Membrane distillation
Two-Phase Reverse Osmosis with
Intermediate Chemical Precipitation
Two-Phase Reverse Osmosis with
Intermediate Biological Reduction
(Masnoon and Glucina, 2011; Sethi et
al., 2006)
3.3. Mediterranean Legislation of brine discharge from desalination
plant into the marine environment
The process of desalination across the Mediterranean region is regulated by European
Union water policy directives as well as Water Framework Directives (WFD). The
focus of the latter is to monitor and maintain “good” water quality standards but there
is a lack of regulation and guidelines to manage brine disposal into seawater on the
coastal shores. The European Union knowledge that there is a certain element of
damage caused by changes in salinity levels but it is not considered to be any major
threat. Their only specific guidelines are for safe disposal of brine in underground
aquifers, which limits their control to underground freshwater resources. It is not
permitted to inject brine directly into underground aquifers, although indirect injection
is allowed, provided the brine is filtered through the ground prior to reaching the
aquifers (Gibbons et al., 2008).
Following the Barcelona Convention protocol in 1976 on the Protection of the
Mediterranean Sea against Pollution from Land Based sources (LBS Protocol), it was
revised in March 1996 by the UNEP. This protocol issues legal guidelines over the
handling of marine contamination, with the purpose of limiting the effects of land-
based activities in the Mediterranean, consisting of 16 sections. In Article 6 and 7 it
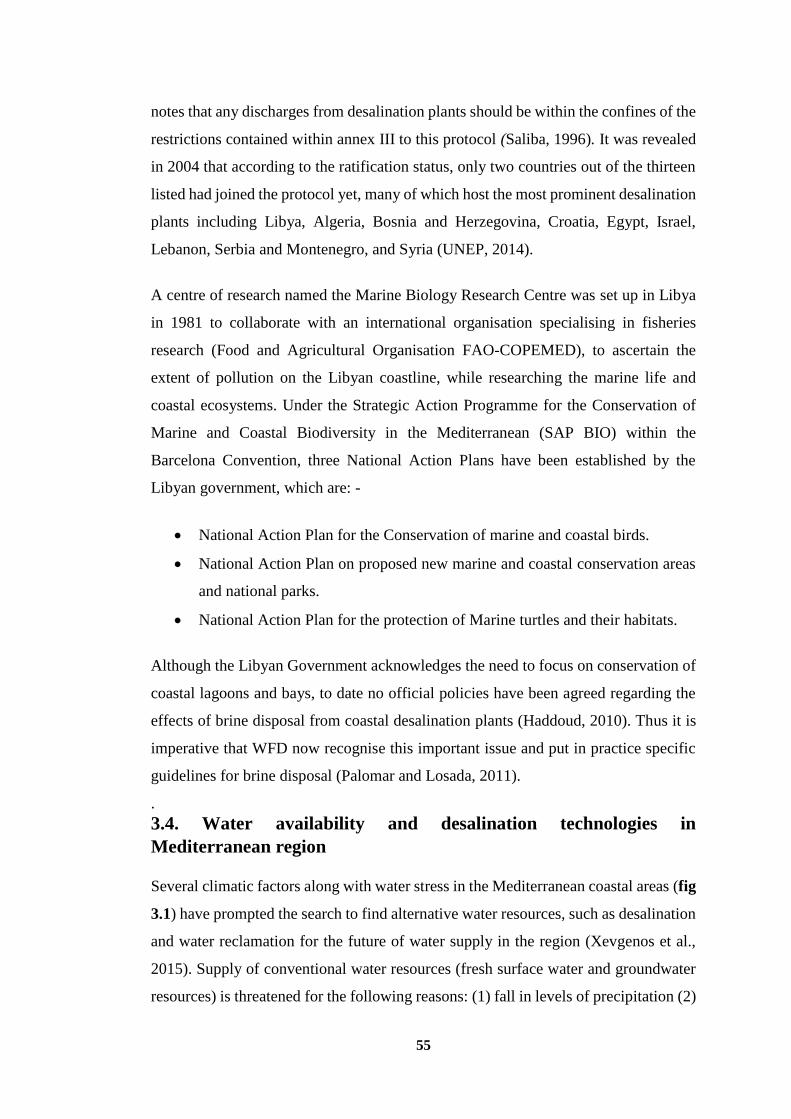
55
notes that any discharges from desalination plants should be within the confines of the
restrictions contained within annex III to this protocol (Saliba, 1996). It was revealed
in 2004 that according to the ratification status, only two countries out of the thirteen
listed had joined the protocol yet, many of which host the most prominent desalination
plants including Libya, Algeria, Bosnia and Herzegovina, Croatia, Egypt, Israel,
Lebanon, Serbia and Montenegro, and Syria (UNEP, 2014).
A centre of research named the Marine Biology Research Centre was set up in Libya
in 1981 to collaborate with an international organisation specialising in fisheries
research (Food and Agricultural Organisation FAO-COPEMED), to ascertain the
extent of pollution on the Libyan coastline, while researching the marine life and
coastal ecosystems. Under the Strategic Action Programme for the Conservation of
Marine and Coastal Biodiversity in the Mediterranean (SAP BIO) within the
Barcelona Convention, three National Action Plans have been established by the
Libyan government, which are: -
National Action Plan for the Conservation of marine and coastal birds.
National Action Plan on proposed new marine and coastal conservation areas
and national parks.
National Action Plan for the protection of Marine turtles and their habitats.
Although the Libyan Government acknowledges the need to focus on conservation of
coastal lagoons and bays, to date no official policies have been agreed regarding the
effects of brine disposal from coastal desalination plants (Haddoud, 2010). Thus it is
imperative that WFD now recognise this important issue and put in practice specific
guidelines for brine disposal (Palomar and Losada, 2011).
.
3.4. Water availability and desalination technologies in
Mediterranean region
Several climatic factors along with water stress in the Mediterranean coastal areas (fig
3.1) have prompted the search to find alternative water resources, such as desalination
and water reclamation for the future of water supply in the region (Xevgenos et al.,
2015). Supply of conventional water resources (fresh surface water and groundwater
resources) is threatened for the following reasons: (1) fall in levels of precipitation (2)
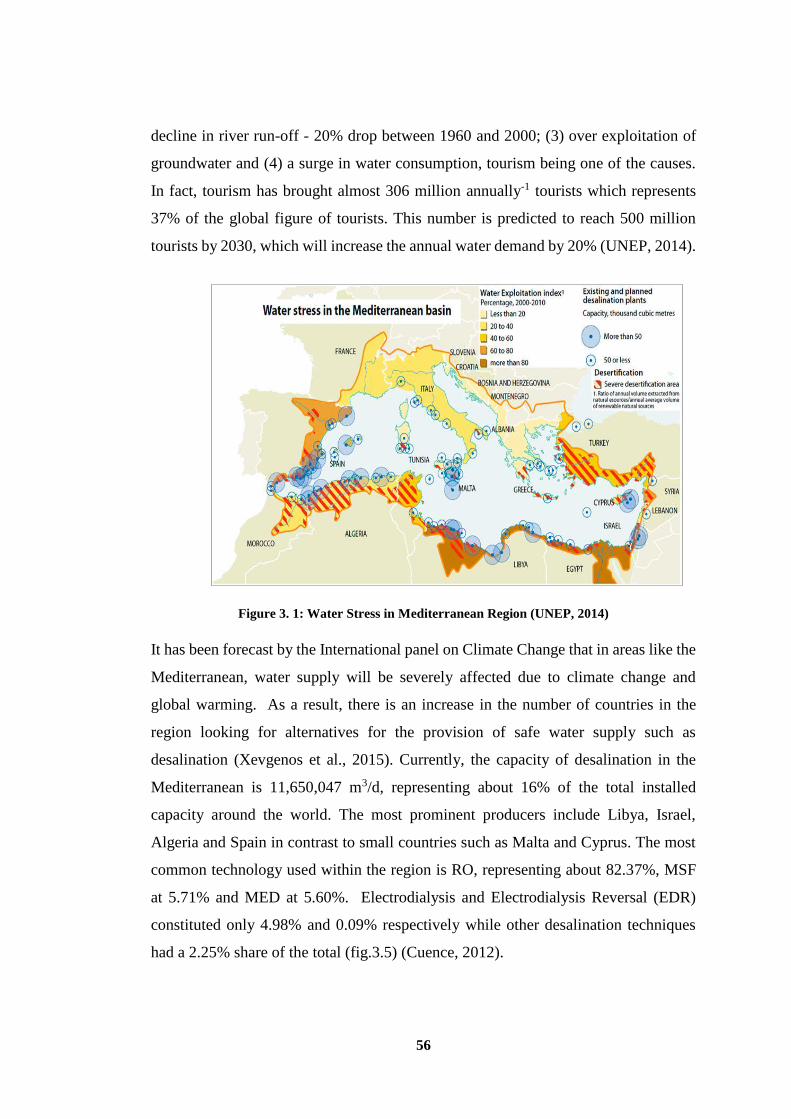
56
decline in river run-off - 20% drop between 1960 and 2000; (3) over exploitation of
groundwater and (4) a surge in water consumption, tourism being one of the causes.
In fact, tourism has brought almost 306 million annually-1 tourists which represents
37% of the global figure of tourists. This number is predicted to reach 500 million
tourists by 2030, which will increase the annual water demand by 20% (UNEP, 2014).
Figure 3. 1: Water Stress in Mediterranean Region (UNEP, 2014)
It has been forecast by the International panel on Climate Change that in areas like the
Mediterranean, water supply will be severely affected due to climate change and
global warming. As a result, there is an increase in the number of countries in the
region looking for alternatives for the provision of safe water supply such as
desalination (Xevgenos et al., 2015). Currently, the capacity of desalination in the
Mediterranean is 11,650,047 m3/d, representing about 16% of the total installed
capacity around the world. The most prominent producers include Libya, Israel,
Algeria and Spain in contrast to small countries such as Malta and Cyprus. The most
common technology used within the region is RO, representing about 82.37%, MSF
at 5.71% and MED at 5.60%. Electrodialysis and Electrodialysis Reversal (EDR)
constituted only 4.98% and 0.09% respectively while other desalination techniques
had a 2.25% share of the total (fig.3.5) (Cuence, 2012).
57
Figure 3. 2: Water desalting production capacity in selected Mediterranean countries (Cuence,
2012; Xevgenos et al., 2015).
3.5. Summary
Reject brine management poses a major environmental and financial challenge for
many desalination plants so this chapter highlights the current brine management
strategies, which are practised globally. The advantages and disadvantages of each
technique were discussed, with considerations of potentially unviable brine disposal
options such as direct discharge, discharge via wastewater treatment plants, discharge
to the sewage systems, deep well injection, land application/spray irrigation and
landfill disposal. They are deemed unfeasible because they can only be practised on a
small scale not to mention their effects on the receiving environment.
Co-discharge of concentrate with power plant cooling water was deemed a feasible
option due to cost advantages and environmental benefits of this disposal method, but
the continuous brine disposal, particularly for coastal desalination plants, may increase
the salinity of the ambient seawater that will affect the marine environment.
Zero liquid discharge such as crystallisers, wind aided intensified evaporation,
dewvaporation, salt recovery salt solidification and sequestration (SAL-PROC) and
other brine minimization options used for membrane techniques are not deemed
feasible because of high costs and intensive energy demand. These technologies are
still under development and are currently used to treat only small volumes of brine.
58
Evaporation ponds have been identified as a feasible application for concentrate
disposal in arid or semi-arid places subject to land availability, such as in Libya.
Furthermore, the cost of this method can be reduced by coupling aquaculture or
salinity gradient solar ponds. Nonetheless, this method is ineffective in damp climates
because the evaporation rate is very low. Therefore, there is still need for research of
feasible solutions that can fulfil the technical, environmental and cost requirements of
desalination technologies, particularly in arid or semi-arid regions, such as those
countries sited in the southern Mediterranean region particularly in Libya, classified
as the fourth largest user of desalination technologies. EU legislation for
Mediterranean countries about the brine disposal from desalination plants into the
marine environment does not contain specific regulations about the impacts of brine
on the marine environment. Hence, the next chapter will evaluate the water resources
availability in Libya.
59
Chapter Four: Available Water Resources in Libya
4.1. Introduction
The earth’s surface comprises 71% water (510 × 106 km2) and 29% land,
(Shiklomanov and Rodda, 2003) but only 3% of that water is potable, the remainder
being saltwater (Cooley et al., 2006). Furthermore, a huge 70% of that potable water
is made up of glaciers with the remaining 30% being underground from which a mere
0.25% reaches rivers and lakes. (Kalogirou, 2005). This poses the dilemma of only
having a small amount of freshwater available globally (Khawaji et al., 2008).
In fact, in 1996 the World Water Council announced that the lack of freshwater posed
a very real threat to existence unless steps were taken to replenish much needed
supplies for continuing economic and social development while protecting the
ecosystems (Bindra et al., 2014).
Between 1955 to 1990, the population of North Africa rose dramatically from 49.5
million to 118.1 million. By 2025, this figure is predicted to rise above 188 million.
The annual water volume per capita was 2,285 m3 in 1955 and declined to 958 m3 in
1990. It is predicted that this figure will reach 602 m3 over the following 35 years.
Availability of potable water in this area is estimated at 113.1 km3/year, so a
significant ongoing depletion of water supplies is expected in the future (Alghariani,
2007).
Across the continent of Africa, there are substantial sedimentary aquifers storing 0.66
million km3 of water, the majority of the contents (0.44 M km3) exist over eight
Saharan nations including the Nubian Sandstone, which supports Libya, Sudan, Egypt
and Chad. Owing to the depth of the aquifers in Libya at 2.5km thick, the cost of
deploying required processes is high. (MacDonald et al., 2012).
Libya has been classified as one of the ten most inadequate water source suppliers and
since 1970, the country has suffered severe water scarcity (Abughlelesha and Lateh,
2013) Thus, the provision of water has been high on the agenda to meet increased
population, not to mention other demands from all sectors (Wheida and Verhoeven,
2007). As a consequence of these demands, several coastal groundwater aquifers have
become contaminated with seawater, causing water in the aquifers to become brackish.
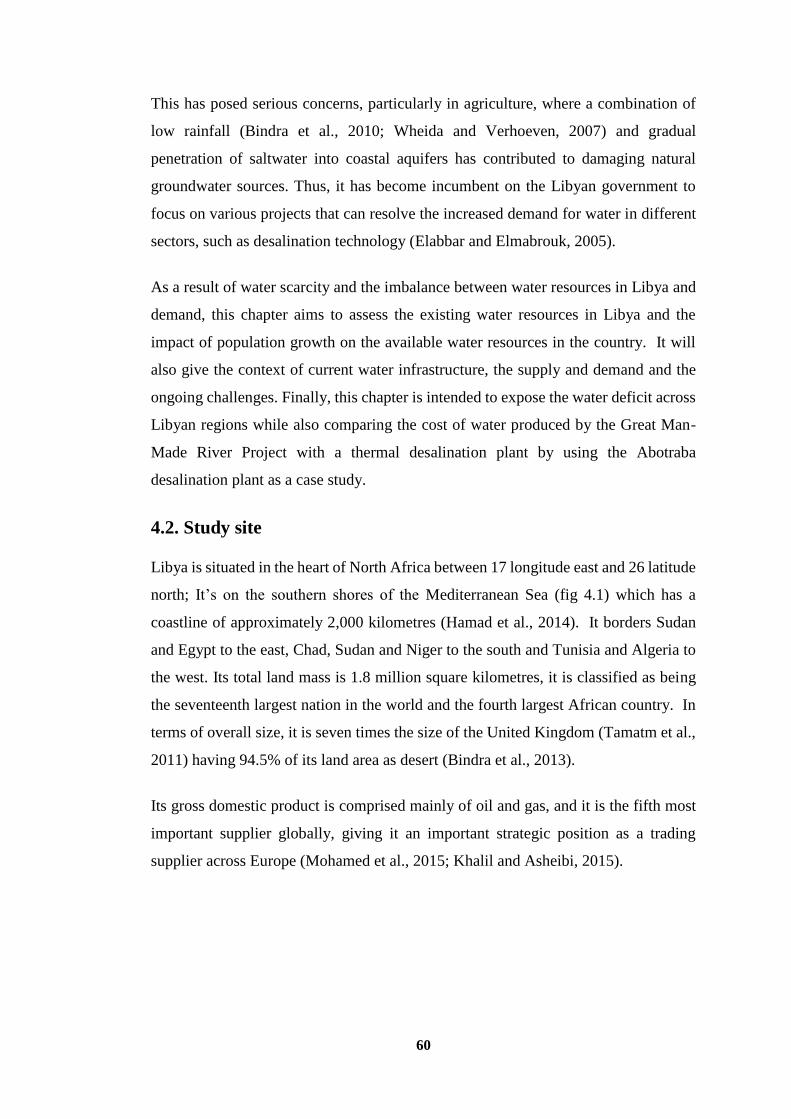
60
This has posed serious concerns, particularly in agriculture, where a combination of
low rainfall (Bindra et al., 2010; Wheida and Verhoeven, 2007) and gradual
penetration of saltwater into coastal aquifers has contributed to damaging natural
groundwater sources. Thus, it has become incumbent on the Libyan government to
focus on various projects that can resolve the increased demand for water in different
sectors, such as desalination technology (Elabbar and Elmabrouk, 2005).
As a result of water scarcity and the imbalance between water resources in Libya and
demand, this chapter aims to assess the existing water resources in Libya and the
impact of population growth on the available water resources in the country. It will
also give the context of current water infrastructure, the supply and demand and the
ongoing challenges. Finally, this chapter is intended to expose the water deficit across
Libyan regions while also comparing the cost of water produced by the Great Man-
Made River Project with a thermal desalination plant by using the Abotraba
desalination plant as a case study.
4.2. Study site
Libya is situated in the heart of North Africa between 17 longitude east and 26 latitude
north; It’s on the southern shores of the Mediterranean Sea (fig 4.1) which has a
coastline of approximately 2,000 kilometres (Hamad et al., 2014). It borders Sudan
and Egypt to the east, Chad, Sudan and Niger to the south and Tunisia and Algeria to
the west. Its total land mass is 1.8 million square kilometres, it is classified as being
the seventeenth largest nation in the world and the fourth largest African country. In
terms of overall size, it is seven times the size of the United Kingdom (Tamatm et al.,
2011) having 94.5% of its land area as desert (Bindra et al., 2013).
Its gross domestic product is comprised mainly of oil and gas, and it is the fifth most
important supplier globally, giving it an important strategic position as a trading
supplier across Europe (Mohamed et al., 2015; Khalil and Asheibi, 2015).
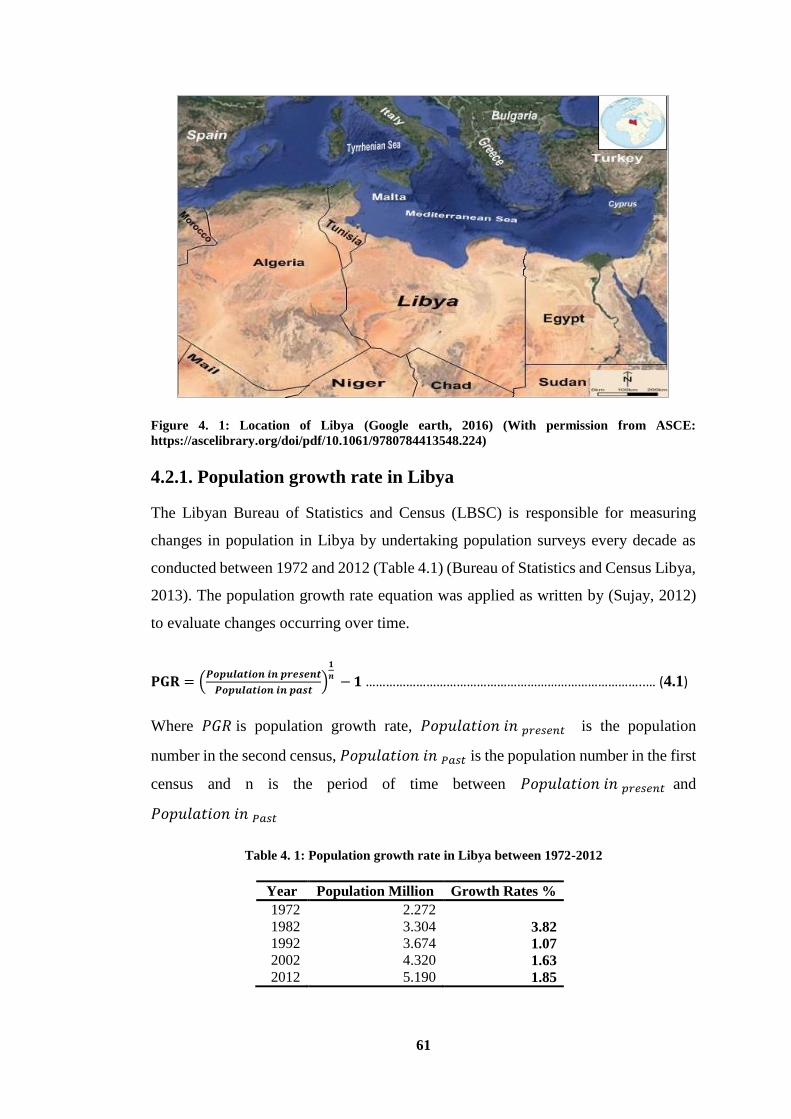
61
Figure 4. 1: Location of Libya (Google earth, 2016) (With permission from ASCE:
https://ascelibrary.org/doi/pdf/10.1061/9780784413548.224)
4.2.1. Population growth rate in Libya
The Libyan Bureau of Statistics and Census (LBSC) is responsible for measuring
changes in population in Libya by undertaking population surveys every decade as
conducted between 1972 and 2012 (Table 4.1) (Bureau of Statistics and Census Libya,
2013). The population growth rate equation was applied as written by (Sujay, 2012)
to evaluate changes occurring over time.
𝐏𝐆𝐑 = (𝑷𝒐𝒑𝒖𝒍𝒂𝒕𝒊𝒐𝒏 𝒊𝒏 𝒑𝒓𝒆𝒔𝒆𝒏𝒕
𝑷𝒐𝒑𝒖𝒍𝒂𝒕𝒊𝒐𝒏 𝒊𝒏 𝒑𝒂𝒔𝒕)
𝟏
𝒏 − 𝟏 ………………………………………………………………………..… (4.1)
Where 𝑃𝐺𝑅 is population growth rate, 𝑃𝑜𝑝𝑢𝑙𝑎𝑡𝑖𝑜𝑛 𝑖𝑛 𝑝𝑟𝑒𝑠𝑒𝑛𝑡 is the population
number in the second census, 𝑃𝑜𝑝𝑢𝑙𝑎𝑡𝑖𝑜𝑛 𝑖𝑛 𝑃𝑎𝑠𝑡 is the population number in the first
census and n is the period of time between 𝑃𝑜𝑝𝑢𝑙𝑎𝑡𝑖𝑜𝑛 𝑖𝑛 𝑝𝑟𝑒𝑠𝑒𝑛𝑡 and
𝑃𝑜𝑝𝑢𝑙𝑎𝑡𝑖𝑜𝑛 𝑖𝑛 𝑃𝑎𝑠𝑡
Table 4. 1: Population growth rate in Libya between 1972-2012
Year Population Million Growth Rates %
1972 2.272
1982 3.304 3.82
1992 3.674 1.07
2002 4.320 1.63
2012 5.190 1.85
62
4.2.2. Water resource management in Libya
Government policies regulating water supply are formulated at different levels. Each
body has a responsibility to stipulate conditions relating to public and national water
supply, considering implications of waste and subsequent damage to the environment
as well as protecting and managing the water sources across the country. There are six
such authorities across different sectors that are responsible for managing water
resources in Libya.
4.2.2.1. General Water Authority (GWA)
In 1972, the General Water Authority was set up as a major independent body to
oversee all matters pertaining to water, but was subsequently established as the
Ministry of Dams and Water Resources, specialising in agriculture in 1979. Later, in
1991, it was run by an appointed committee as a Ministry of Agriculture. In the early
90’s the government focussed on a range of projects relating to water supply pipe
networks, sewage systems and other necessary infrastructure developments which
ultimately led to the establishment of the General Water and Sanitation Company
(GWSCo) in 1997, supervised by the Municipal Secretary. Within this organisation
are five offices covering whole cities across the country, such as Benghazi, Sirte,
Tripoli, Sabha and Gharyan. After the establishment of the GMMR network project,
this authority extended their responsibilities by employing specialists to deal with
hydrogeology sciences, civil engineering applications, agriculture and other water-
related matters. The duties of these specialists included authorising, managing and
regulating any water-related projects, provision of wells drilling licences, maintenance
of groundwater wells, design and construction of dams, water-soil investigation
studies, and supervision of RO practices inland and on the coastline. They regulated
changes in quantitative and qualitative conditions of water resources while ultimately
influencing government policy on national water resources (General Water Authority,
2011).
Challenges
Since the revolution in Libya, there have been several challenges posed that have
threatened the ongoing projects that had been established prior to 2011. Several of the
existing water pumping stations and desalination and waste water treatment plants had
63
gone into decline due to lack of maintenance or skilled operators, combined with loss
of investment and finance. Following sanctions, import of specific parts required was
stopped, causing plants to become neglected and dilapidated, resulting in a loss of
credibility with economic partners (Senoussi, 2012).
4.2.2.2. Great Man-Made River Authority (GMMRP)
The Great Man-Made River Authority was established in 1983 for the purpose of
extracting water from deep aquifers located in the South and conveying it to the North
in the most practical and economically viable way, for consumption in the Libyan
coastal areas. This authority is in charge of five phases of implementation that include
establishing plans. In addition, they are involved with all technical research and data
required for operation. In order to deal with large volumes of water to be consumed
by different sectors such as municipal and industrial but mainly for agricultural needs,
it was necessary to liaise with other relevant stakeholders to distribute water from the
project to all concerned (Great Man-made River Authority, 2012).
Challenges
Following the revolution in Libya, lack of spare parts, financial deficits and delays in
completion of work orders have been some of the challenges facing the authority.
Other problems such as poor condition of pipe networks, disinfection and water
pumping stations combined with lack of maintenance of deep aquifers, have added to
these issues (Alhabishe, 2012).
4.2.2.3. Electricity and Renewable Energy Authority (GECOL)
This was a government authority created in 1984 as an independent body known as
General Electric Company of Libya (GECOL), responsible for constructing the
national grid in the form of major steam and gas power stations, electric control
centres, feed plants, and provision of electricity for national consumption. This
authority was responsible for the provision of industrial water by the construction of
desalination plants in cooperation with steam power stations, due to higher
consumption by certain sectors such as industry, agriculture and domestic use. Before
2010, the majority of such desalination plants had been under the control of this
government authority, which was in charge of design, signing contracts with the main
64
construction companies and subsequent management of these stations. However, after
2010, a resolution decreed that GECOL were to be only responsible for their own
desalination plants for provision of potable water for residential and industrial
consumption, leading to the establishment of the General Desalination Company of
Libya (General Electric Company of Libya, 2015).
Challenges
Prior to the revolution, there had been regular maintenance of power stations, but since
2011, there have been major challenges affecting regular supply of electricity with
frequent blackouts impacting on continuing maintenance and re-building of further
desalination plants that work with power plants. As mentioned earlier, shortages of
spare parts, combined with financial restrictions and trading partners has resulted in
compromised operating standards of desalination plants (Abulqasem, 2012).
4.2.2.4. General Desalination Company of Libya (GDCOL)
This authority took over the previous responsibilities of GECOL to regulate the larger
capacity coastline desalination plants for the provision of freshwater. Its main function
was to produce non-conventional water sources and deliver potable water to all Libyan
cities located close to the coastline. They were also responsible for signing any new
contracts, designing network piping, and managing coastline desalination plants while
maintaining full compliance with legal, health and safety and environmental criteria
(General Desalination Company of Libya, 2013).
Challenges
Following the revolution, several international companies that had previously been
involved in installation, expansion and maintenance of desalination plants were forced
to relinquish their responsibilities due to the situation in Libya. Furthermore, the local
authorities faced challenges due to lack of spare parts, finance, skilled labour and
cessation of capacity building of existing plants (Sidon, 2013).
4.2.2.5. National Oil Corporation Authority (NOC)
In 1970 the Libyan General Petroleum Corporation Authority was replaced by the
National Oil Corporation, which had been established in 1968. Their function was to
65
continue the exploitation of oil reserves for the purposes of providing and optimising
the main source of power to the country to support the national economy (National Oil
Corporation, 2014). Due to lack of water in the country, their role was to provide
potable water for residential consumption and industrial water to service the oil fields
by constructing desalination plants as a water supply. This authority was also
responsible for the design and construction of seawater and brackish water
desalination plants working in the oilfields (Al-Hengari et al., 2015).
Challenges
Following political turmoil after the Libyan revolution, this authority has been unable
to continue at the same capacity because of loss of skilled workforce, lack of
maintenance and safety procedures that have all contributed to a decline in the
operation of desalination plants working within the oilfields (Al-Hengari et al., 2015).
4.2.2.6. General Environment Authority (GEA)
Following environmental laws established in 1982 to protect the environment, this
authority was established in 2000 as an independent body by monitoring and
regulating industrial, agricultural and domestic activities (General environment
Authority, 2011). They were responsible for monitoring the operations of the five
organisations (fig 4.2).
In addition, they put in place awareness raising initiatives that educated the public
about the consequences of pollution of the ecosystem while ensuring sustainable
development. This involved regular inspections to prevent any activity that could be
deemed damaging or toxic to the environment (General environment Authority, 2011).
Challenges
After the revolution, the challenges facing this authority included reduced monitoring
and inspection due to reduced workforce, financial problems and overall management
of authorities (Mohamed, 2013).
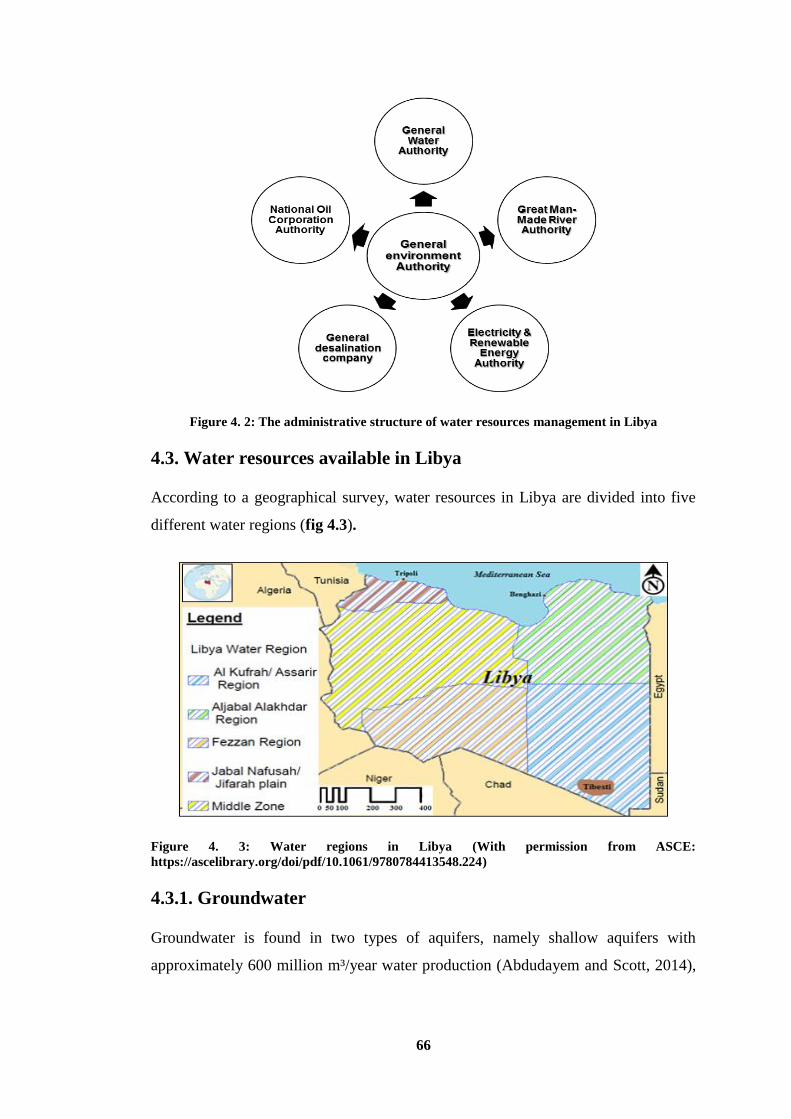
66
Figure 4. 2: The administrative structure of water resources management in Libya
4.3. Water resources available in Libya
According to a geographical survey, water resources in Libya are divided into five
different water regions (fig 4.3).
Figure 4. 3: Water regions in Libya (With permission from ASCE:
https://ascelibrary.org/doi/pdf/10.1061/9780784413548.224)
4.3.1. Groundwater
Groundwater is found in two types of aquifers, namely shallow aquifers with
approximately 600 million m³/year water production (Abdudayem and Scott, 2014),
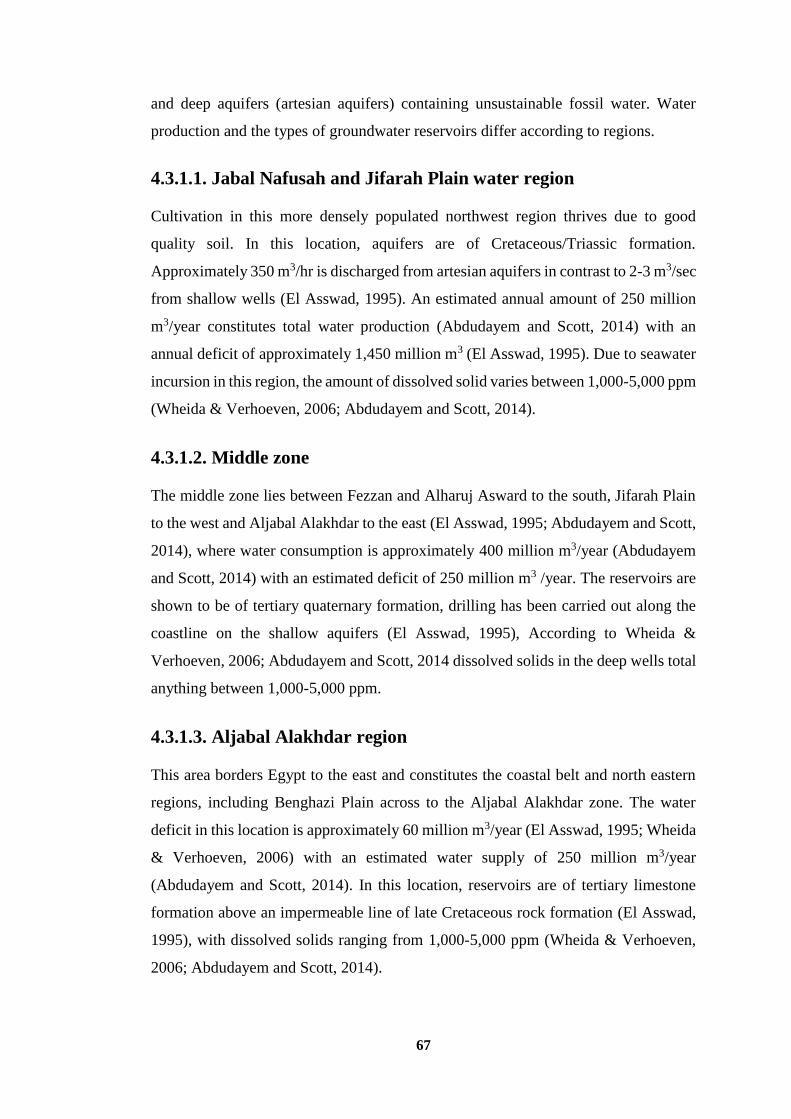
67
and deep aquifers (artesian aquifers) containing unsustainable fossil water. Water
production and the types of groundwater reservoirs differ according to regions.
4.3.1.1. Jabal Nafusah and Jifarah Plain water region
Cultivation in this more densely populated northwest region thrives due to good
quality soil. In this location, aquifers are of Cretaceous/Triassic formation.
Approximately 350 m3/hr is discharged from artesian aquifers in contrast to 2-3 m3/sec
from shallow wells (El Asswad, 1995). An estimated annual amount of 250 million
m3/year constitutes total water production (Abdudayem and Scott, 2014) with an
annual deficit of approximately 1,450 million m3 (El Asswad, 1995). Due to seawater
incursion in this region, the amount of dissolved solid varies between 1,000-5,000 ppm
(Wheida & Verhoeven, 2006; Abdudayem and Scott, 2014).
4.3.1.2. Middle zone
The middle zone lies between Fezzan and Alharuj Asward to the south, Jifarah Plain
to the west and Aljabal Alakhdar to the east (El Asswad, 1995; Abdudayem and Scott,
2014), where water consumption is approximately 400 million m3/year (Abdudayem
and Scott, 2014) with an estimated deficit of 250 million m3 /year. The reservoirs are
shown to be of tertiary quaternary formation, drilling has been carried out along the
coastline on the shallow aquifers (El Asswad, 1995), According to Wheida &
Verhoeven, 2006; Abdudayem and Scott, 2014 dissolved solids in the deep wells total
anything between 1,000-5,000 ppm.
4.3.1.3. Aljabal Alakhdar region
This area borders Egypt to the east and constitutes the coastal belt and north eastern
regions, including Benghazi Plain across to the Aljabal Alakhdar zone. The water
deficit in this location is approximately 60 million m3/year (El Asswad, 1995; Wheida
& Verhoeven, 2006) with an estimated water supply of 250 million m3/year
(Abdudayem and Scott, 2014). In this location, reservoirs are of tertiary limestone
formation above an impermeable line of late Cretaceous rock formation (El Asswad,
1995), with dissolved solids ranging from 1,000-5,000 ppm (Wheida & Verhoeven,
2006; Abdudayem and Scott, 2014).
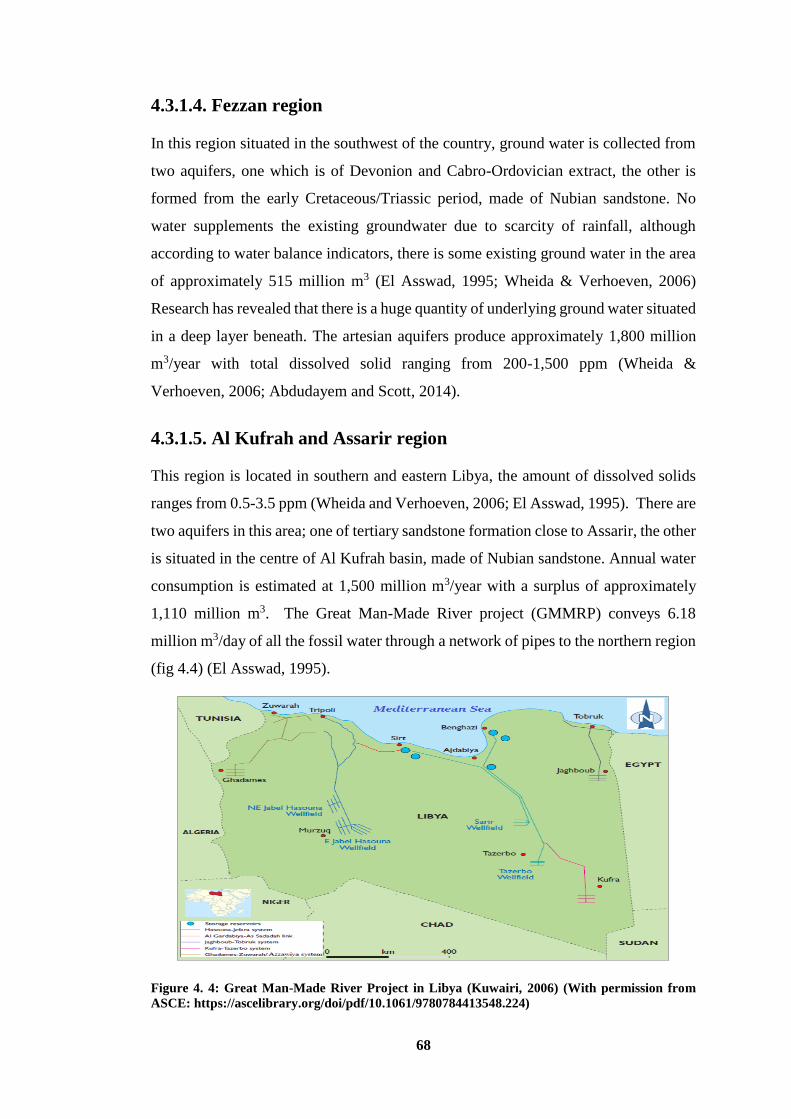
68
4.3.1.4. Fezzan region
In this region situated in the southwest of the country, ground water is collected from
two aquifers, one which is of Devonion and Cabro-Ordovician extract, the other is
formed from the early Cretaceous/Triassic period, made of Nubian sandstone. No
water supplements the existing groundwater due to scarcity of rainfall, although
according to water balance indicators, there is some existing ground water in the area
of approximately 515 million m3 (El Asswad, 1995; Wheida & Verhoeven, 2006)
Research has revealed that there is a huge quantity of underlying ground water situated
in a deep layer beneath. The artesian aquifers produce approximately 1,800 million
m3/year with total dissolved solid ranging from 200-1,500 ppm (Wheida &
Verhoeven, 2006; Abdudayem and Scott, 2014).
4.3.1.5. Al Kufrah and Assarir region
This region is located in southern and eastern Libya, the amount of dissolved solids
ranges from 0.5-3.5 ppm (Wheida and Verhoeven, 2006; El Asswad, 1995). There are
two aquifers in this area; one of tertiary sandstone formation close to Assarir, the other
is situated in the centre of Al Kufrah basin, made of Nubian sandstone. Annual water
consumption is estimated at 1,500 million m3/year with a surplus of approximately
1,110 million m3. The Great Man-Made River project (GMMRP) conveys 6.18
million m3/day of all the fossil water through a network of pipes to the northern region
(fig 4.4) (El Asswad, 1995).
Figure 4. 4: Great Man-Made River Project in Libya (Kuwairi, 2006) (With permission from
ASCE: https://ascelibrary.org/doi/pdf/10.1061/9780784413548.224)
69
This five-stranded project was initiated in the mid-1980’s and is an ongoing
development (Al habashi, 2012). Part one set out plans to distribute 2 million m3/day
of fresh water from south eastern basins in Tazerbo and Sarir across to the north
eastern cities of Benghazi and Sirte through pre-stressed concrete 4m diameter
concrete pipe lines (Kuwairi, 2006) with an annual discharged constant flow of 700
million m3 (Wheida and Verhoeven, 2006). Out of the anticipated water production
from this stage, 410,170 m3/day was destined for municipal use, 1,506,030 m3/day for
agriculture and 83,800 m3/day allocated for industry (Middle East business
intelligence, 2010).
In the second stage, it was planned that 2.5 million m3/day of fresh water would reach
Tarhouna and Tripoli (Abdelrhem et al., 2008) from East Jabal Hasouna and North
East Jabal Hasaouna well fields. Similarly, water was passed through pipe lines
originating from the well field, split into two parts for the purpose of reinforcing the
first phase that was prone to collapsing wells and affected by the reduced number of
coastal aquifers on the coastal belt. In this second phase, 1,316,090 m3/day was
allocated for municipal use, 1,175,660 m3/day for agriculture and 8,250 m3/day
directed to industry (Middle East business intelligence, 2010).
While the third phase was still in progress, there was a plan to build a pump station at
Kufra well field with 380 km of pipeline connecting Tazerbo to Sarir for the purpose
of distributing a further 1.68 million m3/day of fresh water of which 253,000 m3/day
was destined for municipal use and 1,427,000 m3/day for agricultural use, excluding
the industrial sector (Middle East business intelligence, 2010). The last two phases are
still ongoing and will focus on the construction of a pipeline from Gadammes to
connect northwards towards the coastal areas of Zwuarah and Azzawiya.
The fifth phase proposes to construct a pipe network from Jagboub oasis going
eastward to Tubruk (Wheida and Verhoeven, 2006). A total of 5,000 kilometres of
network pipes was used by GGMR, originating from 1,261 wells that had been drilled
from 450 m up to 800 m with reservoir storage capacity reaching 54.9 million m3
(Middle East business intelligence, 2010; Salem, 2007) (Table 4.2).
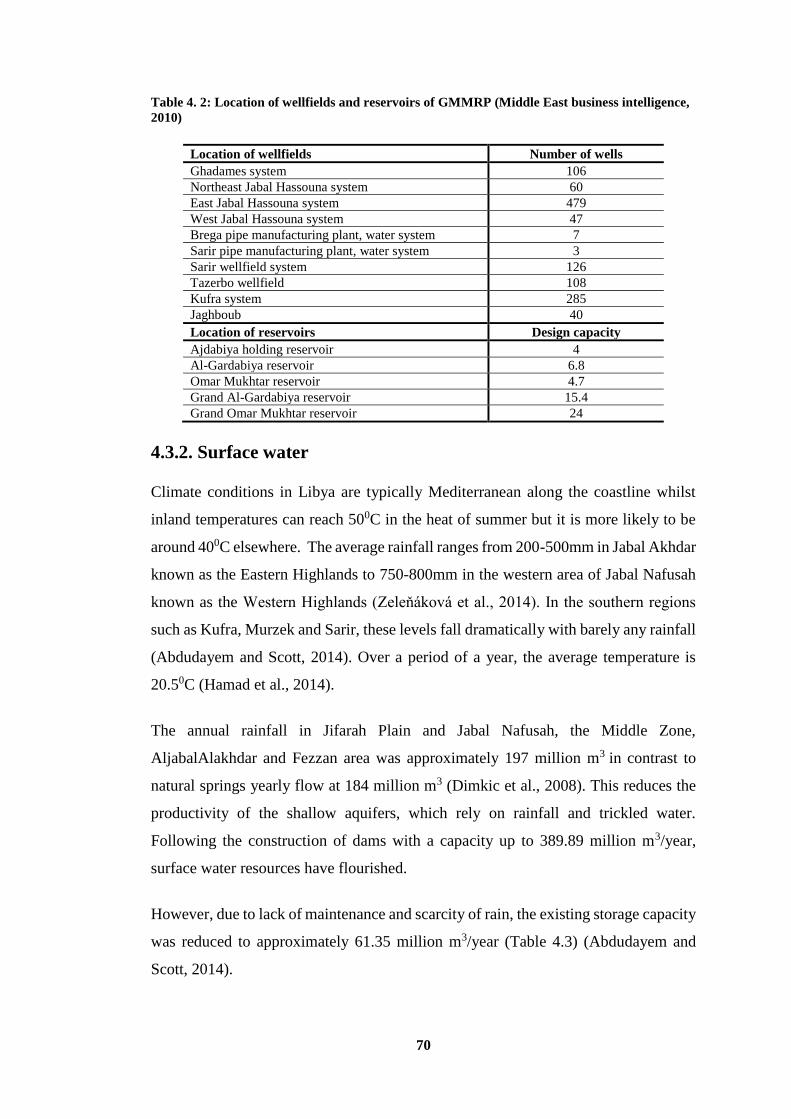
70
Table 4. 2: Location of wellfields and reservoirs of GMMRP (Middle East business intelligence,
2010)
Location of wellfields Number of wells
Ghadames system 106
Northeast Jabal Hassouna system 60
East Jabal Hassouna system 479
West Jabal Hassouna system 47
Brega pipe manufacturing plant, water system 7
Sarir pipe manufacturing plant, water system 3
Sarir wellfield system 126
Tazerbo wellfield 108
Kufra system 285
Jaghboub 40
Location of reservoirs Design capacity
Ajdabiya holding reservoir 4
Al-Gardabiya reservoir 6.8
Omar Mukhtar reservoir 4.7
Grand Al-Gardabiya reservoir 15.4
Grand Omar Mukhtar reservoir 24
4.3.2. Surface water
Climate conditions in Libya are typically Mediterranean along the coastline whilst
inland temperatures can reach 500C in the heat of summer but it is more likely to be
around 400C elsewhere. The average rainfall ranges from 200-500mm in Jabal Akhdar
known as the Eastern Highlands to 750-800mm in the western area of Jabal Nafusah
known as the Western Highlands (Zeleňáková et al., 2014). In the southern regions
such as Kufra, Murzek and Sarir, these levels fall dramatically with barely any rainfall
(Abdudayem and Scott, 2014). Over a period of a year, the average temperature is
20.50C (Hamad et al., 2014).
The annual rainfall in Jifarah Plain and Jabal Nafusah, the Middle Zone,
AljabalAlakhdar and Fezzan area was approximately 197 million m3 in contrast to
natural springs yearly flow at 184 million m3 (Dimkic et al., 2008). This reduces the
productivity of the shallow aquifers, which rely on rainfall and trickled water.
Following the construction of dams with a capacity up to 389.89 million m3/year,
surface water resources have flourished.
However, due to lack of maintenance and scarcity of rain, the existing storage capacity
was reduced to approximately 61.35 million m3/year (Table 4.3) (Abdudayem and
Scott, 2014).
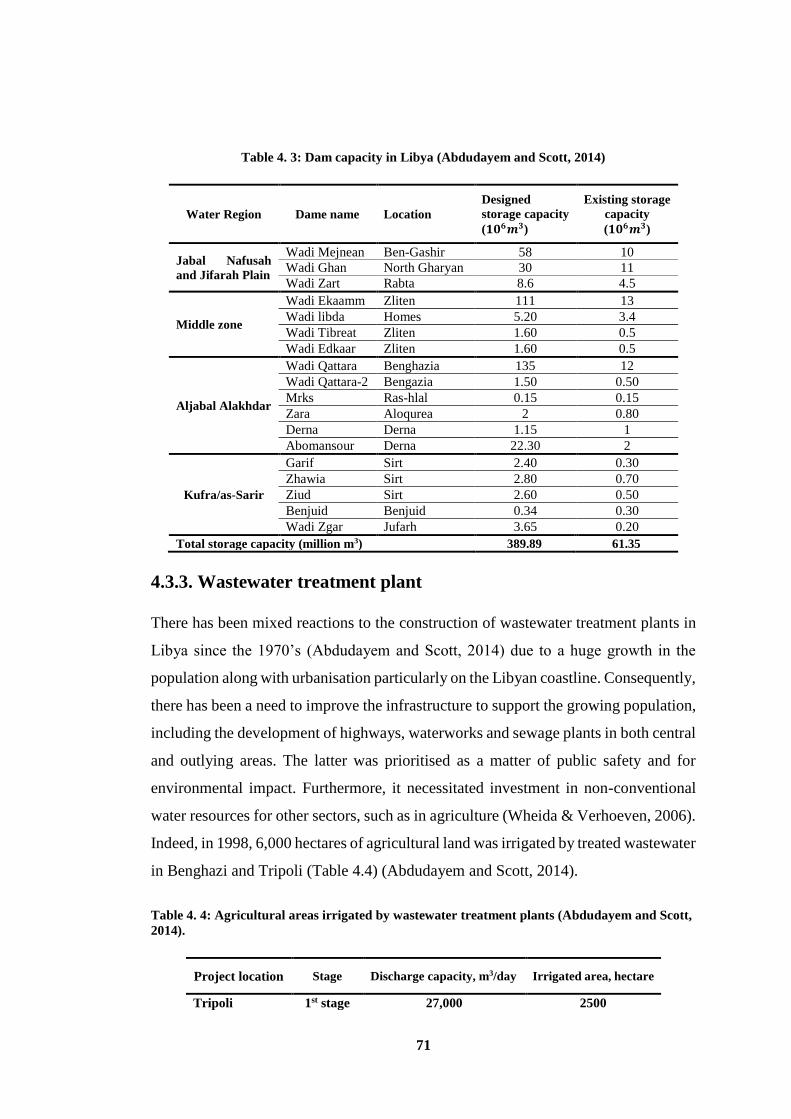
71
Table 4. 3: Dam capacity in Libya (Abdudayem and Scott, 2014)
Water Region Dame name Location
Designed
storage capacity
(𝟏𝟎𝟔𝒎𝟑)
Existing storage
capacity
(𝟏𝟎𝟔𝒎𝟑)
Jabal Nafusah
and Jifarah Plain
Wadi Mejnean Ben-Gashir 58 10
Wadi Ghan North Gharyan 30 11
Wadi Zart Rabta 8.6 4.5
Middle zone
Wadi Ekaamm Zliten 111 13
Wadi libda Homes 5.20 3.4
Wadi Tibreat Zliten 1.60 0.5
Wadi Edkaar Zliten 1.60 0.5
Aljabal Alakhdar
Wadi Qattara Benghazia 135 12
Wadi Qattara-2 Bengazia 1.50 0.50
Mrks Ras-hlal 0.15 0.15
Zara Aloqurea 2 0.80
Derna Derna 1.15 1
Abomansour Derna 22.30 2
Kufra/as-Sarir
Garif Sirt 2.40 0.30
Zhawia Sirt 2.80 0.70
Ziud Sirt 2.60 0.50
Benjuid Benjuid 0.34 0.30
Wadi Zgar Jufarh 3.65 0.20
Total storage capacity (million m3) 389.89 61.35
4.3.3. Wastewater treatment plant
There has been mixed reactions to the construction of wastewater treatment plants in
Libya since the 1970’s (Abdudayem and Scott, 2014) due to a huge growth in the
population along with urbanisation particularly on the Libyan coastline. Consequently,
there has been a need to improve the infrastructure to support the growing population,
including the development of highways, waterworks and sewage plants in both central
and outlying areas. The latter was prioritised as a matter of public safety and for
environmental impact. Furthermore, it necessitated investment in non-conventional
water resources for other sectors, such as in agriculture (Wheida & Verhoeven, 2006).
Indeed, in 1998, 6,000 hectares of agricultural land was irrigated by treated wastewater
in Benghazi and Tripoli (Table 4.4) (Abdudayem and Scott, 2014).
Table 4. 4: Agricultural areas irrigated by wastewater treatment plants (Abdudayem and Scott,
2014).
Project location Stage Discharge capacity, m3/day Irrigated area, hectare
Tripoli 1st stage 27,000 2500
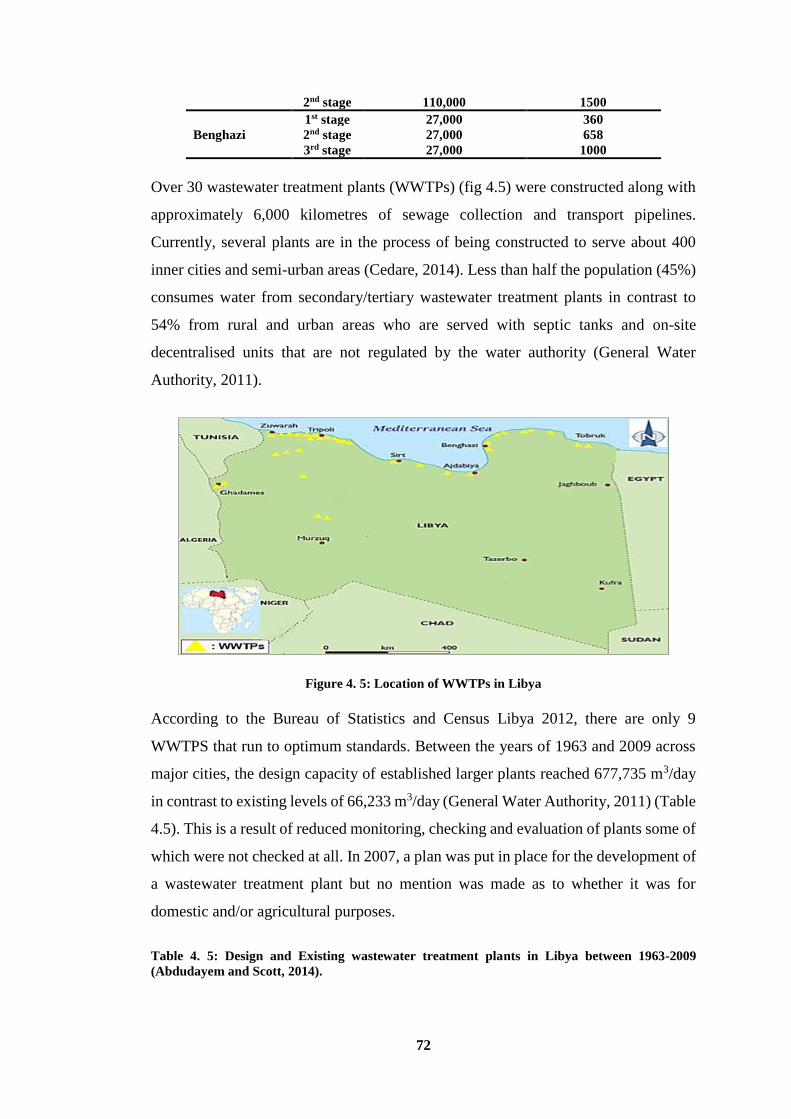
72
2nd stage 110,000 1500
Benghazi
1st stage 27,000 360
2nd stage 27,000 658
3rd stage 27,000 1000
Over 30 wastewater treatment plants (WWTPs) (fig 4.5) were constructed along with
approximately 6,000 kilometres of sewage collection and transport pipelines.
Currently, several plants are in the process of being constructed to serve about 400
inner cities and semi-urban areas (Cedare, 2014). Less than half the population (45%)
consumes water from secondary/tertiary wastewater treatment plants in contrast to
54% from rural and urban areas who are served with septic tanks and on-site
decentralised units that are not regulated by the water authority (General Water
Authority, 2011).
Figure 4. 5: Location of WWTPs in Libya
According to the Bureau of Statistics and Census Libya 2012, there are only 9
WWTPS that run to optimum standards. Between the years of 1963 and 2009 across
major cities, the design capacity of established larger plants reached 677,735 m3/day
in contrast to existing levels of 66,233 m3/day (General Water Authority, 2011) (Table
4.5). This is a result of reduced monitoring, checking and evaluation of plants some of
which were not checked at all. In 2007, a plan was put in place for the development of
a wastewater treatment plant but no mention was made as to whether it was for
domestic and/or agricultural purposes.
Table 4. 5: Design and Existing wastewater treatment plants in Libya between 1963-2009
(Abdudayem and Scott, 2014).
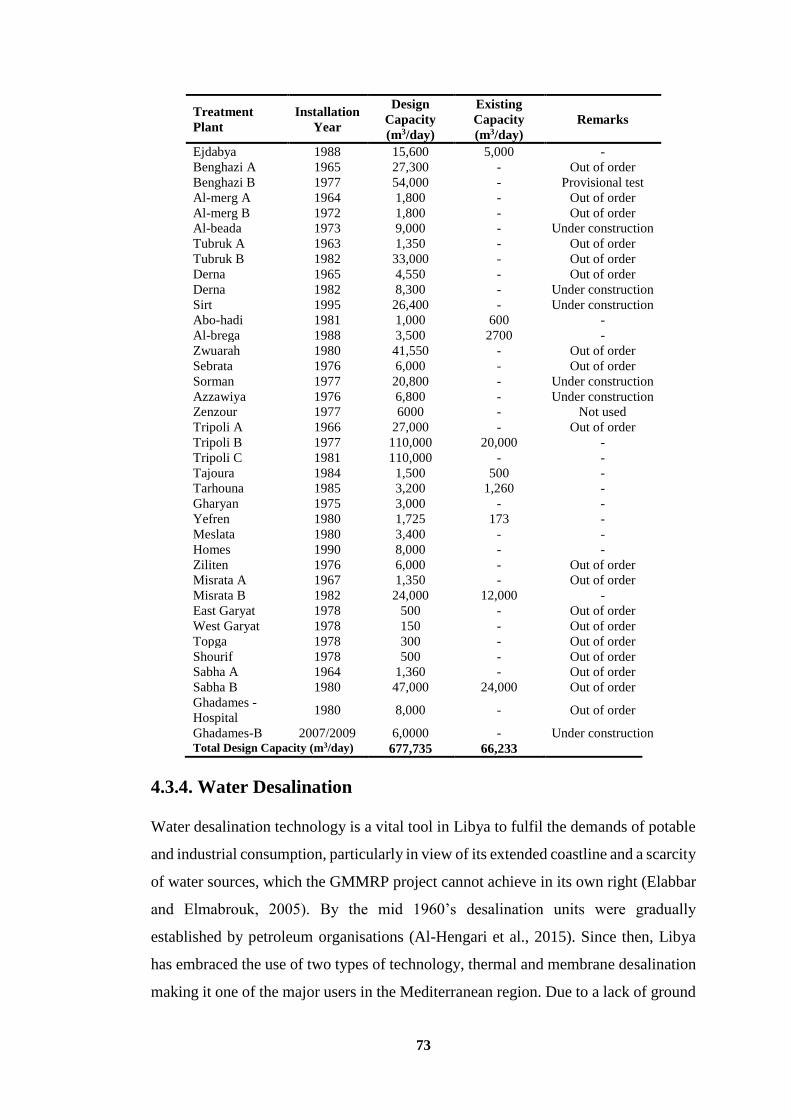
73
Treatment
Plant
Installation
Year
Design
Capacity
(m3/day)
Existing
Capacity
(m3/day)
Remarks
Ejdabya 1988 15,600 5,000 -
Benghazi A 1965 27,300 - Out of order
Benghazi B 1977 54,000 - Provisional test
Al-merg A 1964 1,800 - Out of order
Al-merg B 1972 1,800 - Out of order
Al-beada 1973 9,000 - Under construction
Tubruk A 1963 1,350 - Out of order
Tubruk B 1982 33,000 - Out of order
Derna 1965 4,550 - Out of order
Derna 1982 8,300 - Under construction
Sirt 1995 26,400 - Under construction
Abo-hadi 1981 1,000 600 -
Al-brega 1988 3,500 2700 -
Zwuarah 1980 41,550 - Out of order
Sebrata 1976 6,000 - Out of order
Sorman 1977 20,800 - Under construction
Azzawiya 1976 6,800 - Under construction
Zenzour 1977 6000 - Not used
Tripoli A 1966 27,000 - Out of order
Tripoli B 1977 110,000 20,000 -
Tripoli C 1981 110,000 - -
Tajoura 1984 1,500 500 -
Tarhouna 1985 3,200 1,260 -
Gharyan 1975 3,000 - -
Yefren 1980 1,725 173 -
Meslata 1980 3,400 - -
Homes 1990 8,000 - -
Ziliten 1976 6,000 - Out of order
Misrata A 1967 1,350 - Out of order
Misrata B 1982 24,000 12,000 -
East Garyat 1978 500 - Out of order
West Garyat 1978 150 - Out of order
Topga 1978 300 - Out of order
Shourif 1978 500 - Out of order
Sabha A 1964 1,360 - Out of order
Sabha B 1980 47,000 24,000 Out of order
Ghadames -
Hospital 1980 8,000 - Out of order
Ghadames-B 2007/2009 6,0000 - Under construction Total Design Capacity (m3/day) 677,735 66,233
4.3.4. Water Desalination
Water desalination technology is a vital tool in Libya to fulfil the demands of potable
and industrial consumption, particularly in view of its extended coastline and a scarcity
of water sources, which the GMMRP project cannot achieve in its own right (Elabbar
and Elmabrouk, 2005). By the mid 1960’s desalination units were gradually
established by petroleum organisations (Al-Hengari et al., 2015). Since then, Libya
has embraced the use of two types of technology, thermal and membrane desalination
making it one of the major users in the Mediterranean region. Due to a lack of ground
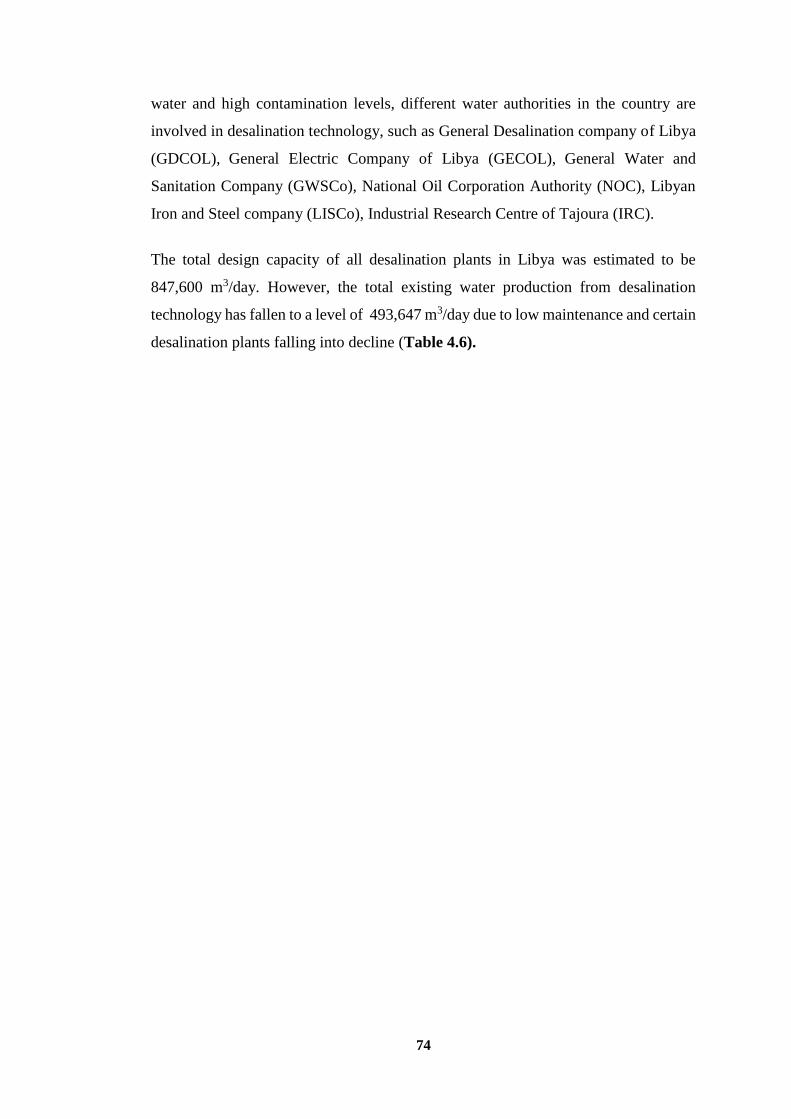
74
water and high contamination levels, different water authorities in the country are
involved in desalination technology, such as General Desalination company of Libya
(GDCOL), General Electric Company of Libya (GECOL), General Water and
Sanitation Company (GWSCo), National Oil Corporation Authority (NOC), Libyan
Iron and Steel company (LISCo), Industrial Research Centre of Tajoura (IRC).
The total design capacity of all desalination plants in Libya was estimated to be
847,600 m3/day. However, the total existing water production from desalination
technology has fallen to a level of 493,647 m3/day due to low maintenance and certain
desalination plants falling into decline (Table 4.6).
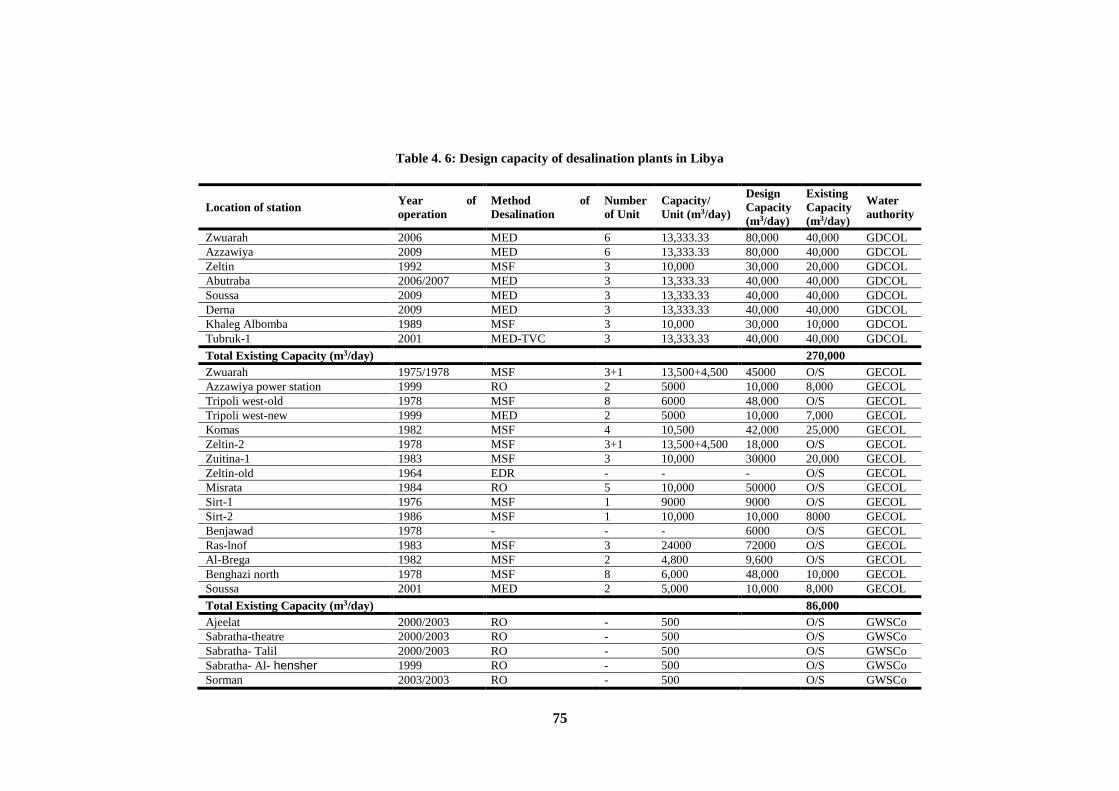
75
Table 4. 6: Design capacity of desalination plants in Libya
Location of station Year of
operation
Method of
Desalination
Number
of Unit
Capacity/
Unit (m3/day)
Design
Capacity
(m3/day)
Existing
Capacity
(m3/day)
Water
authority
Zwuarah 2006 MED 6 13,333.33 80,000 40,000 GDCOL
Azzawiya 2009 MED 6 13,333.33 80,000 40,000 GDCOL
Zeltin 1992 MSF 3 10,000 30,000 20,000 GDCOL
Abutraba 2006/2007 MED 3 13,333.33 40,000 40,000 GDCOL
Soussa 2009 MED 3 13,333.33 40,000 40,000 GDCOL
Derna 2009 MED 3 13,333.33 40,000 40,000 GDCOL
Khaleg Albomba 1989 MSF 3 10,000 30,000 10,000 GDCOL
Tubruk-1 2001 MED-TVC 3 13,333.33 40,000 40,000 GDCOL
Total Existing Capacity (m3/day) 270,000
Zwuarah 1975/1978 MSF 3+1 13,500+4,500 45000 O/S GECOL
Azzawiya power station 1999 RO 2 5000 10,000 8,000 GECOL
Tripoli west-old 1978 MSF 8 6000 48,000 O/S GECOL
Tripoli west-new 1999 MED 2 5000 10,000 7,000 GECOL
Komas 1982 MSF 4 10,500 42,000 25,000 GECOL
Zeltin-2 1978 MSF 3+1 13,500+4,500 18,000 O/S GECOL
Zuitina-1 1983 MSF 3 10,000 30000 20,000 GECOL
Zeltin-old 1964 EDR - - - O/S GECOL
Misrata 1984 RO 5 10,000 50000 O/S GECOL
Sirt-1 1976 MSF 1 9000 9000 O/S GECOL
Sirt-2 1986 MSF 1 10,000 10,000 8000 GECOL
Benjawad 1978 - - - 6000 O/S GECOL
Ras-lnof 1983 MSF 3 24000 72000 O/S GECOL
Al-Brega 1982 MSF 2 4,800 9,600 O/S GECOL
Benghazi north 1978 MSF 8 6,000 48,000 10,000 GECOL
Soussa 2001 MED 2 5,000 10,000 8,000 GECOL
Total Existing Capacity (m3/day) 86,000
Ajeelat 2000/2003 RO - 500 O/S GWSCo
Sabratha-theatre 2000/2003 RO - 500 O/S GWSCo
Sabratha- Talil 2000/2003 RO - 500 O/S GWSCo
Sabratha- Al- hensher 1999 RO - 500 O/S GWSCo
Sorman 2003/2003 RO - 500 O/S GWSCo
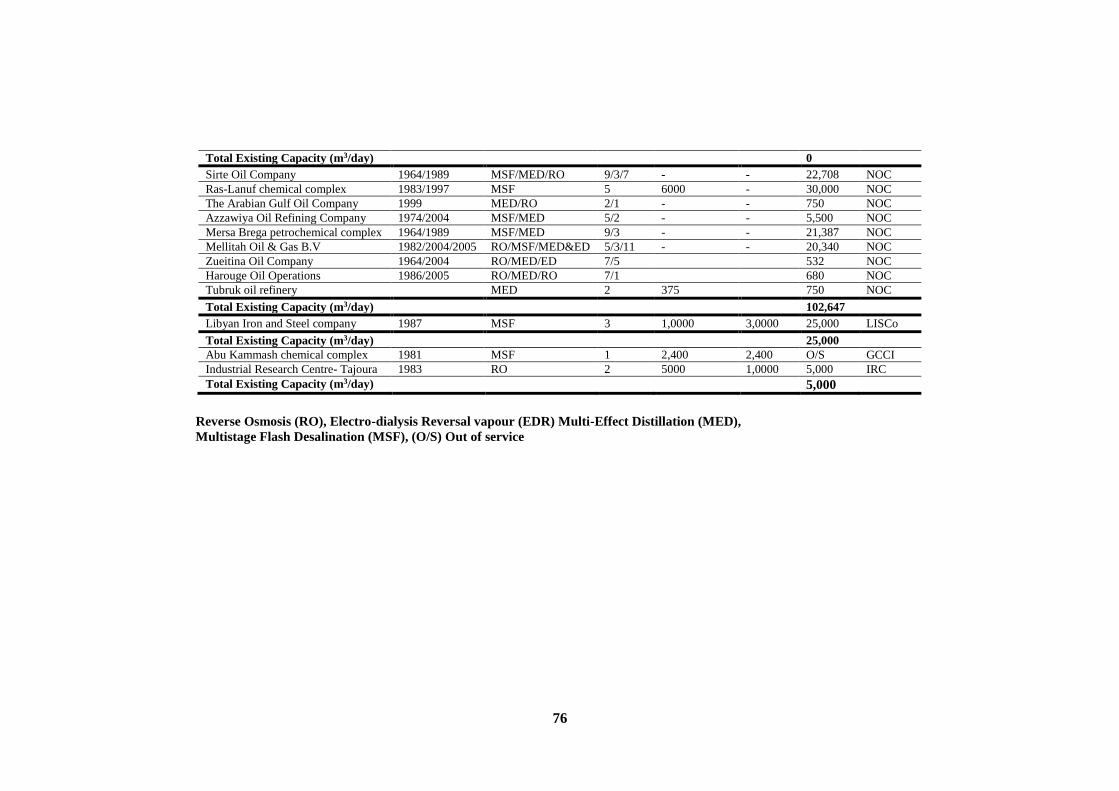
76
Total Existing Capacity (m3/day) 0
Sirte Oil Company 1964/1989 MSF/MED/RO 9/3/7 - - 22,708 NOC
Ras-Lanuf chemical complex 1983/1997 MSF 5 6000 - 30,000 NOC
The Arabian Gulf Oil Company 1999 MED/RO 2/1 - - 750 NOC
Azzawiya Oil Refining Company 1974/2004 MSF/MED 5/2 - - 5,500 NOC
Mersa Brega petrochemical complex 1964/1989 MSF/MED 9/3 - - 21,387 NOC
Mellitah Oil & Gas B.V 1982/2004/2005 RO/MSF/MED&ED 5/3/11 - - 20,340 NOC
Zueitina Oil Company 1964/2004 RO/MED/ED 7/5 532 NOC
Harouge Oil Operations 1986/2005 RO/MED/RO 7/1 680 NOC
Tubruk oil refinery MED 2 375 750 NOC
Total Existing Capacity (m3/day) 102,647
Libyan Iron and Steel company 1987 MSF 3 1,0000 3,0000 25,000 LISCo
Total Existing Capacity (m3/day) 25,000
Abu Kammash chemical complex 1981 MSF 1 2,400 2,400 O/S GCCI
Industrial Research Centre- Tajoura 1983 RO 2 5000 1,0000 5,000 IRC
Total Existing Capacity (m3/day) 5,000
Reverse Osmosis (RO), Electro-dialysis Reversal vapour (EDR) Multi-Effect Distillation (MED),
Multistage Flash Desalination (MSF), (O/S) Out of service
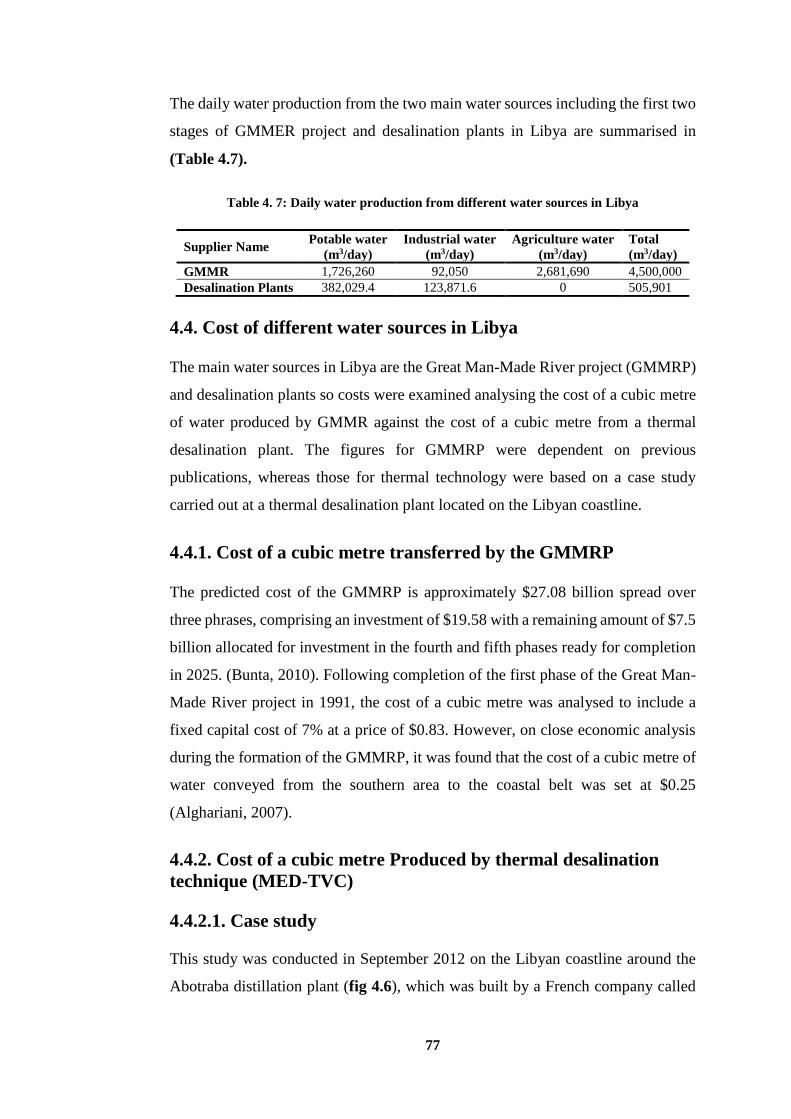
77
The daily water production from the two main water sources including the first two
stages of GMMER project and desalination plants in Libya are summarised in
(Table 4.7).
Table 4. 7: Daily water production from different water sources in Libya
Supplier Name Potable water
(m3/day)
Industrial water
(m3/day)
Agriculture water
(m3/day)
Total
(m3/day)
GMMR 1,726,260 92,050 2,681,690 4,500,000
Desalination Plants 382,029.4 123,871.6 0 505,901
4.4. Cost of different water sources in Libya
The main water sources in Libya are the Great Man-Made River project (GMMRP)
and desalination plants so costs were examined analysing the cost of a cubic metre
of water produced by GMMR against the cost of a cubic metre from a thermal
desalination plant. The figures for GMMRP were dependent on previous
publications, whereas those for thermal technology were based on a case study
carried out at a thermal desalination plant located on the Libyan coastline.
4.4.1. Cost of a cubic metre transferred by the GMMRP
The predicted cost of the GMMRP is approximately $27.08 billion spread over
three phrases, comprising an investment of $19.58 with a remaining amount of $7.5
billion allocated for investment in the fourth and fifth phases ready for completion
in 2025. (Bunta, 2010). Following completion of the first phase of the Great Man-
Made River project in 1991, the cost of a cubic metre was analysed to include a
fixed capital cost of 7% at a price of $0.83. However, on close economic analysis
during the formation of the GMMRP, it was found that the cost of a cubic metre of
water conveyed from the southern area to the coastal belt was set at $0.25
(Alghariani, 2007).
4.4.2. Cost of a cubic metre Produced by thermal desalination
technique (MED-TVC)
4.4.2.1. Case study
This study was conducted in September 2012 on the Libyan coastline around the
Abotraba distillation plant (fig 4.6), which was built by a French company called
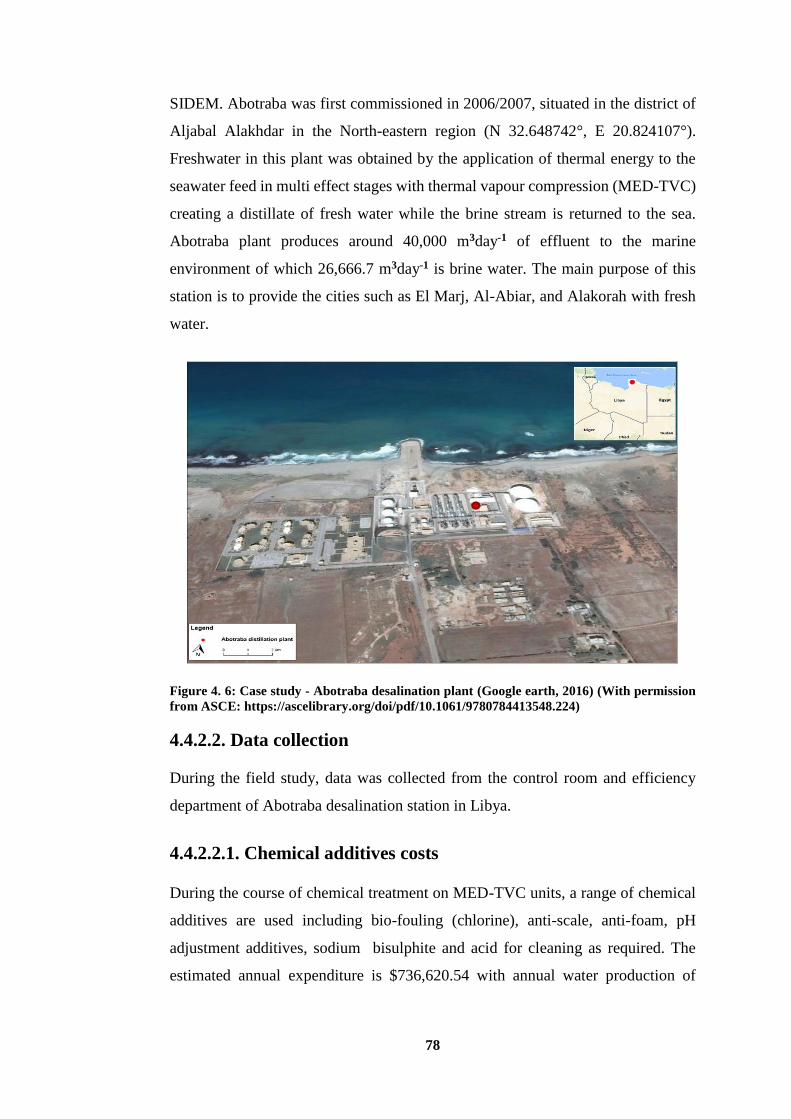
78
SIDEM. Abotraba was first commissioned in 2006/2007, situated in the district of
Aljabal Alakhdar in the North-eastern region (N 32.648742°, E 20.824107°).
Freshwater in this plant was obtained by the application of thermal energy to the
seawater feed in multi effect stages with thermal vapour compression (MED-TVC)
creating a distillate of fresh water while the brine stream is returned to the sea.
Abotraba plant produces around 40,000 m3day-1 of effluent to the marine
environment of which 26,666.7 m3day-1 is brine water. The main purpose of this
station is to provide the cities such as El Marj, Al-Abiar, and Alakorah with fresh
water.
Figure 4. 6: Case study - Abotraba desalination plant (Google earth, 2016) (With permission
from ASCE: https://ascelibrary.org/doi/pdf/10.1061/9780784413548.224)
4.4.2.2. Data collection
During the field study, data was collected from the control room and efficiency
department of Abotraba desalination station in Libya.
4.4.2.2.1. Chemical additives costs
During the course of chemical treatment on MED-TVC units, a range of chemical
additives are used including bio-fouling (chlorine), anti-scale, anti-foam, pH
adjustment additives, sodium bisulphite and acid for cleaning as required. The
estimated annual expenditure is $736,620.54 with annual water production of
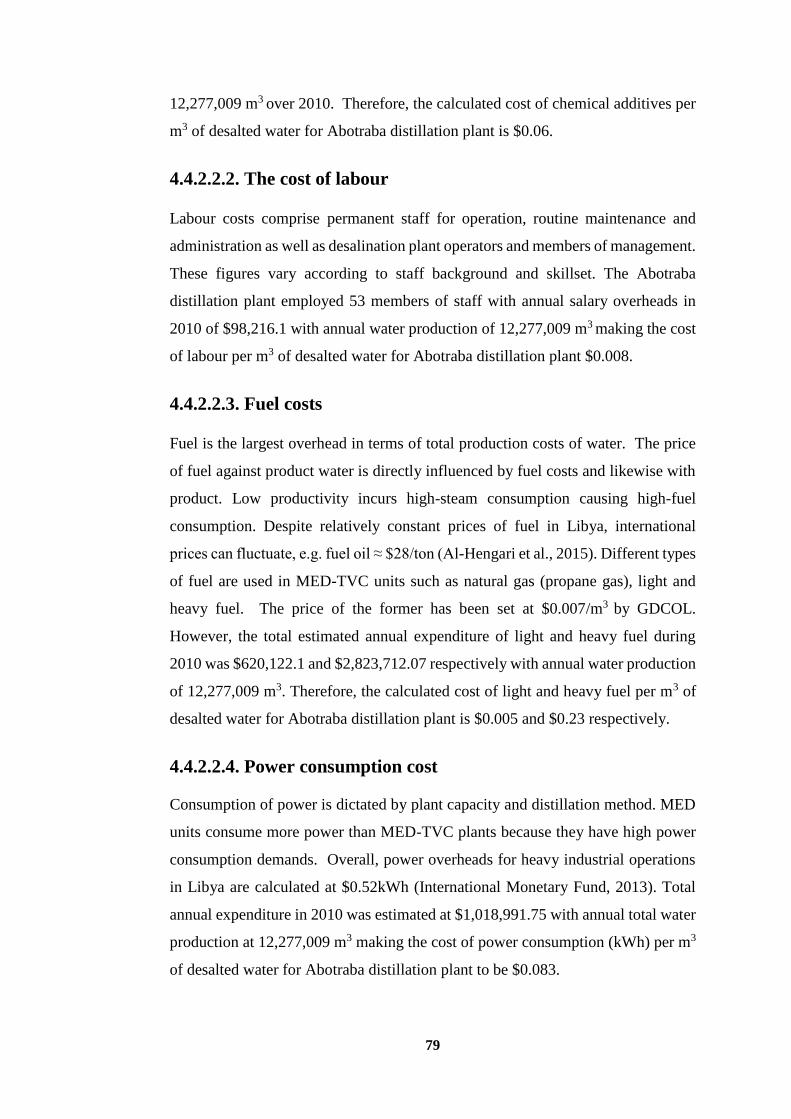
79
12,277,009 m3 over 2010. Therefore, the calculated cost of chemical additives per
m3 of desalted water for Abotraba distillation plant is $0.06.
4.4.2.2.2. The cost of labour
Labour costs comprise permanent staff for operation, routine maintenance and
administration as well as desalination plant operators and members of management.
These figures vary according to staff background and skillset. The Abotraba
distillation plant employed 53 members of staff with annual salary overheads in
2010 of $98,216.1 with annual water production of 12,277,009 m3 making the cost
of labour per m3 of desalted water for Abotraba distillation plant $0.008.
4.4.2.2.3. Fuel costs
Fuel is the largest overhead in terms of total production costs of water. The price
of fuel against product water is directly influenced by fuel costs and likewise with
product. Low productivity incurs high-steam consumption causing high-fuel
consumption. Despite relatively constant prices of fuel in Libya, international
prices can fluctuate, e.g. fuel oil ≈ $28/ton (Al-Hengari et al., 2015). Different types
of fuel are used in MED-TVC units such as natural gas (propane gas), light and
heavy fuel. The price of the former has been set at $0.007/m3 by GDCOL.
However, the total estimated annual expenditure of light and heavy fuel during
2010 was $620,122.1 and $2,823,712.07 respectively with annual water production
of 12,277,009 m3. Therefore, the calculated cost of light and heavy fuel per m3 of
desalted water for Abotraba distillation plant is $0.005 and $0.23 respectively.
4.4.2.2.4. Power consumption cost
Consumption of power is dictated by plant capacity and distillation method. MED
units consume more power than MED-TVC plants because they have high power
consumption demands. Overall, power overheads for heavy industrial operations
in Libya are calculated at $0.52kWh (International Monetary Fund, 2013). Total
annual expenditure in 2010 was estimated at $1,018,991.75 with annual total water
production at 12,277,009 m3 making the cost of power consumption (kWh) per m3
of desalted water for Abotraba distillation plant to be $0.083.
80
4.4.2.2.5. Steam consumption costs
The evaporation procedure in MED-TVC units requires high-purity water for the
purposes of generating steam. The annual total expenditure for water consumption
in 2010 was $98,216.1 with total annual water production of 12,277,009 m3 making
the calculated cost of generating the steam per m3 of desalted water at $0.008.
4.4.2.2.6. Maintenance costs
Maintenance costs are calculated according to provision of spare parts, man-hours
(skilled and unskilled) according to level of skills, plant size and capacity, age and
location as an annual fixed cost. The annual expenditure in 2010 for maintenance
was $85,939.1 with a total annual water production of 12,277,009 m3 making the
calculated cost of maintenance per m3 of desalted water to be $0.007.
4.4.2.2.7. Cleaning costs
There are daily cleaning costs alongside periodic cleaning procedures, which are
authorised and carried out by local contracted firms to include the control room,
internal roads, seawater pump station, chlorination unit and the management areas.
At regular intervals, specialised cleaning is performed by the maintenance
department at Abotraba distillation plant who focus on the cleaning of the seawater
intake area, boiler and evaporation cells. The total annual expenditure in 2010 was
estimated at $61,385.1 with the total annual water production 12,277,009 m3
making the calculated cost of cleaning per m3 of desalted water $0.005.
4.4.2.2.8. Cars and heavy machinery
At the beginning of 2010, the General Desalination Company of Libya supplied
four cars for the management staff and two forklift vehicles for chemical and
maintenance departments to the Abotraba Distillation Plant. The annual total
expenditure was $159,601.1 with total water production of 12,277,009 m3 making
the calculated cost of cars and heavy machinery per m3 of desalted water $ 0.013.
4.5. Results and discussion
81
Libya has witnessed an increase in population and growth rate. Censuses conducted
in Libya have revealed that the overall population has increased significantly from
2.272 million in 1972 to 5.19 million in 2012. The population growth rate in the
years 1982, 1992, 2002 and 2012 was equal to 3.82%, 1.07%, 1.63% and 1.85%
respectively (fig 4.7). Such population growth usually increases demand for water
in all sectors to satisfy its needs and the present limited water resources will
undoubtedly become depleted over time.
Figure 4. 7: Libyan population between 1982 and 2012 (Bureau of Statistics and Census
Libya, 2013)
There are a wide range of policies pertaining to different aspects of water use,
development and protection practised by different water authorities in the country.
However, there is no actual defined policy, which makes clear distinction between
all parties involved in the practice. This has caused confusion and lack of clear
guidelines or line of management regarding water management. Currently, the
water demand exceeds the conventional water resources capacities and there is a
significant water shortage in some regions of the country; the highest annual water
deficit is in Jabal Nafusah and Jifarah Plain region (fig 4.8) due to the population
increases in this region following rapid increases in agricultural and industrial
activities. In addition, some of the coastal aquifers have been depleted (Al Farrah
et al., 2011) and some phases of the GMMR project have not yet been completed.
Furthermore, there is a water deficit in the Middle Zone region because of an
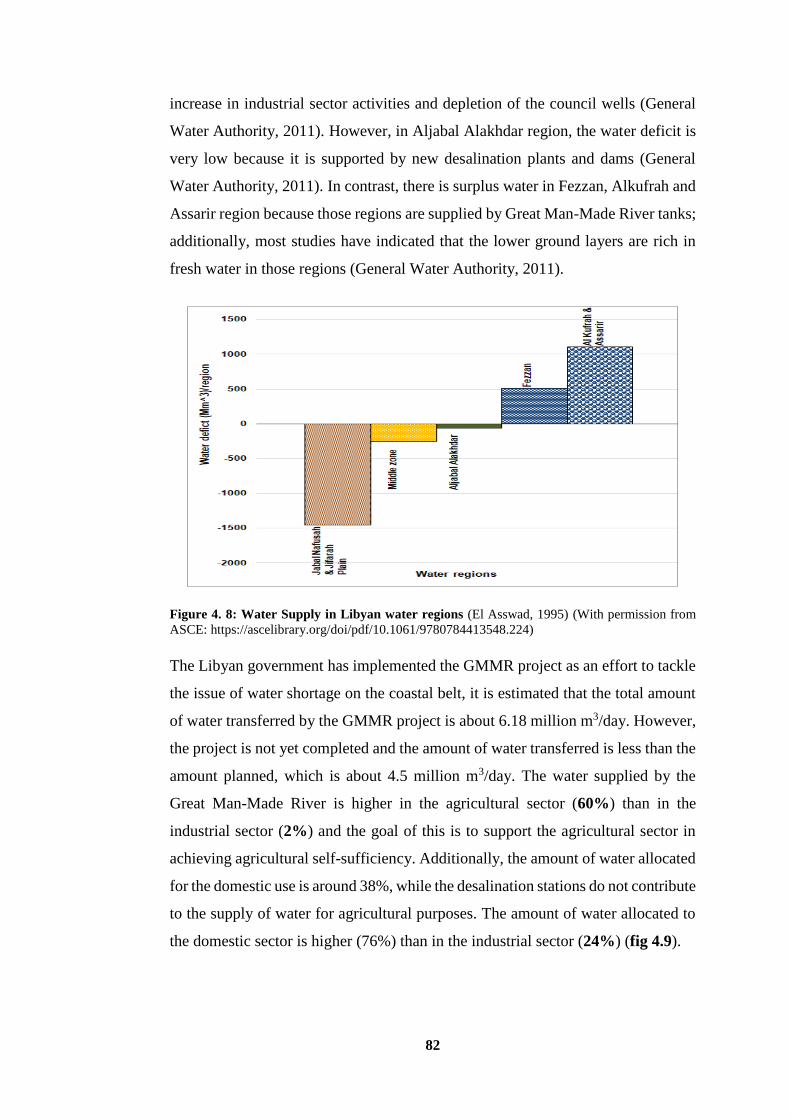
82
increase in industrial sector activities and depletion of the council wells (General
Water Authority, 2011). However, in Aljabal Alakhdar region, the water deficit is
very low because it is supported by new desalination plants and dams (General
Water Authority, 2011). In contrast, there is surplus water in Fezzan, Alkufrah and
Assarir region because those regions are supplied by Great Man-Made River tanks;
additionally, most studies have indicated that the lower ground layers are rich in
fresh water in those regions (General Water Authority, 2011).
Figure 4. 8: Water Supply in Libyan water regions (El Asswad, 1995) (With permission from
ASCE: https://ascelibrary.org/doi/pdf/10.1061/9780784413548.224)
The Libyan government has implemented the GMMR project as an effort to tackle
the issue of water shortage on the coastal belt, it is estimated that the total amount
of water transferred by the GMMR project is about 6.18 million m3/day. However,
the project is not yet completed and the amount of water transferred is less than the
amount planned, which is about 4.5 million m3/day. The water supplied by the
Great Man-Made River is higher in the agricultural sector (60%) than in the
industrial sector (2%) and the goal of this is to support the agricultural sector in
achieving agricultural self-sufficiency. Additionally, the amount of water allocated
for the domestic use is around 38%, while the desalination stations do not contribute
to the supply of water for agricultural purposes. The amount of water allocated to
the domestic sector is higher (76%) than in the industrial sector (24%) (fig 4.9).
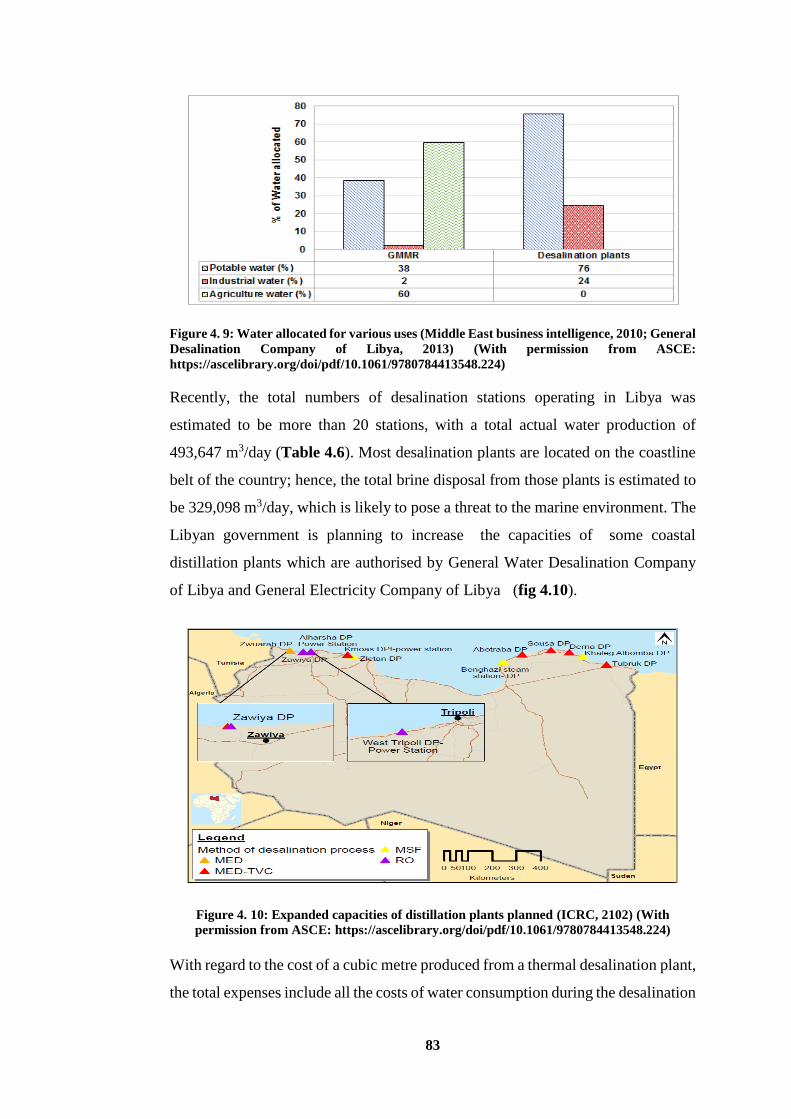
83
Figure 4. 9: Water allocated for various uses (Middle East business intelligence, 2010; General
Desalination Company of Libya, 2013) (With permission from ASCE:
https://ascelibrary.org/doi/pdf/10.1061/9780784413548.224)
Recently, the total numbers of desalination stations operating in Libya was
estimated to be more than 20 stations, with a total actual water production of
493,647 m3/day (Table 4.6). Most desalination plants are located on the coastline
belt of the country; hence, the total brine disposal from those plants is estimated to
be 329,098 m3/day, which is likely to pose a threat to the marine environment. The
Libyan government is planning to increase the capacities of some coastal
distillation plants which are authorised by General Water Desalination Company
of Libya and General Electricity Company of Libya (fig 4.10).
Figure 4. 10: Expanded capacities of distillation plants planned (ICRC, 2102) (With
permission from ASCE: https://ascelibrary.org/doi/pdf/10.1061/9780784413548.224)
With regard to the cost of a cubic metre produced from a thermal desalination plant,
the total expenses include all the costs of water consumption during the desalination
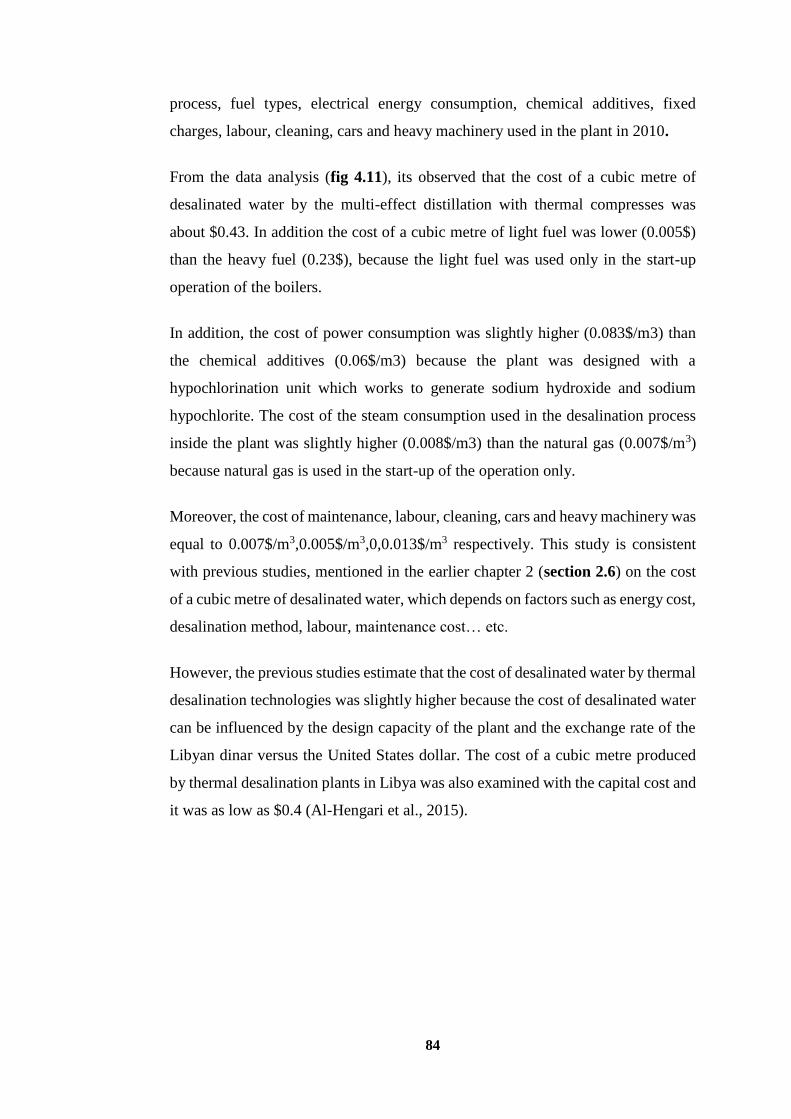
84
process, fuel types, electrical energy consumption, chemical additives, fixed
charges, labour, cleaning, cars and heavy machinery used in the plant in 2010.
From the data analysis (fig 4.11), its observed that the cost of a cubic metre of
desalinated water by the multi-effect distillation with thermal compresses was
about $0.43. In addition the cost of a cubic metre of light fuel was lower (0.005$)
than the heavy fuel (0.23$), because the light fuel was used only in the start-up
operation of the boilers.
In addition, the cost of power consumption was slightly higher (0.083$/m3) than
the chemical additives (0.06$/m3) because the plant was designed with a
hypochlorination unit which works to generate sodium hydroxide and sodium
hypochlorite. The cost of the steam consumption used in the desalination process
inside the plant was slightly higher (0.008$/m3) than the natural gas (0.007$/m3)
because natural gas is used in the start-up of the operation only.
Moreover, the cost of maintenance, labour, cleaning, cars and heavy machinery was
equal to 0.007$/m3,0.005$/m3,0,0.013$/m3 respectively. This study is consistent
with previous studies, mentioned in the earlier chapter 2 (section 2.6) on the cost
of a cubic metre of desalinated water, which depends on factors such as energy cost,
desalination method, labour, maintenance cost… etc.
However, the previous studies estimate that the cost of desalinated water by thermal
desalination technologies was slightly higher because the cost of desalinated water
can be influenced by the design capacity of the plant and the exchange rate of the
Libyan dinar versus the United States dollar. The cost of a cubic metre produced
by thermal desalination plants in Libya was also examined with the capital cost and
it was as low as $0.4 (Al-Hengari et al., 2015).
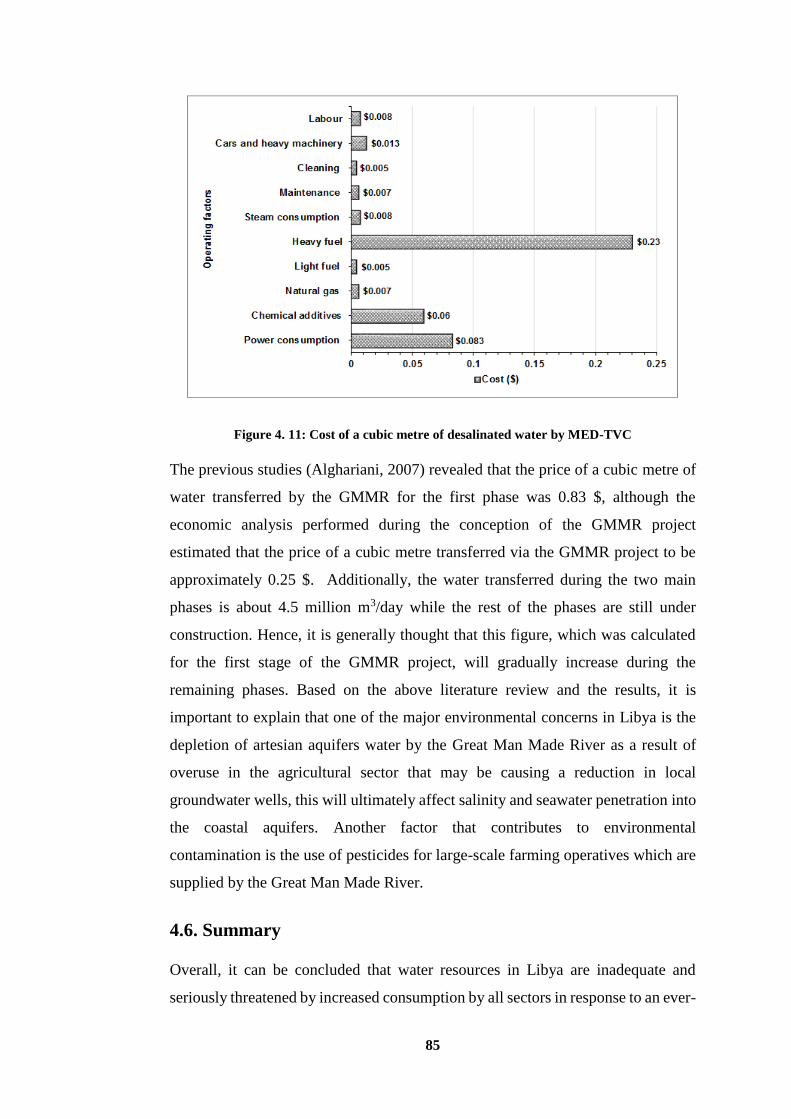
85
Figure 4. 11: Cost of a cubic metre of desalinated water by MED-TVC
The previous studies (Alghariani, 2007) revealed that the price of a cubic metre of
water transferred by the GMMR for the first phase was 0.83 $, although the
economic analysis performed during the conception of the GMMR project
estimated that the price of a cubic metre transferred via the GMMR project to be
approximately 0.25 $. Additionally, the water transferred during the two main
phases is about 4.5 million m3/day while the rest of the phases are still under
construction. Hence, it is generally thought that this figure, which was calculated
for the first stage of the GMMR project, will gradually increase during the
remaining phases. Based on the above literature review and the results, it is
important to explain that one of the major environmental concerns in Libya is the
depletion of artesian aquifers water by the Great Man Made River as a result of
overuse in the agricultural sector that may be causing a reduction in local
groundwater wells, this will ultimately affect salinity and seawater penetration into
the coastal aquifers. Another factor that contributes to environmental
contamination is the use of pesticides for large-scale farming operatives which are
supplied by the Great Man Made River.
4.6. Summary
Overall, it can be concluded that water resources in Libya are inadequate and
seriously threatened by increased consumption by all sectors in response to an ever-
86
increasing population. The water management sector has a responsibility to
safeguard the supply and provision of water in a holistic manner that ensures
coordination from all stakeholders. This requires a seamless provision that involves
all organisations involved in this vital service. There is a clear need for the Libyan
government to take stock and establish clear policies that can be adopted by all
those involved in the sustainable use of the nations’s water resources.
According to the results and literature review regarding the best desalination
technology in Libya, it is obvious that thermal desalination, such as MED, is the
best option due to low cost, efficacy and reliability.
The next chapter will investigate the impact of thermal desalination plants on the
Libyan coastline, which is the preferred location for future development and
expansion.
87
Chapter Five: Environmental Impact of Brine Disposed from
Distillation Plants on the Libyan Coastline
5.1. Introduction
The critical shortage of water in many Mediterranean countries, has led to
environmental issues relating to sea water desalination plants, which had not been
of prior concern, specifically, the results of the by-products discharge involved in
the production of freshwater (Gacia et al., 2007; Einav and Lokiec, 2003).
Moreover, there is still scant information about the impact of desalination effluent
on the marine ecosystem (Safrai and Zask, 2008). This primarily comes to attention
while dealing with the largest reverse osmosis (RO) operated desalination plants
e.g. in (Moreno et al., 2014 and Torquemada et al., 2005). In Europe, 92% of all
new installations apply membrane technology and most of them employ the
seawater reverse osmosis technique (SWRO) (Trancki et al., 2012) being more
efficient, both financially and operationally in terms of cost, space and energy usage
(Pagès et al., 2010). Alternatively, multi-effect distillation techniques (MED) and
multi-effect distillation techniques with thermal vapour compression (MED-
TVC) are some of the most common techniques that provide a considerable
quantity of potable and industrial water. These types of thermal desalination plants
are preferred due to a number of advantages over other thermal desalination
methods such as multi stage flash distillation technique (MSF). The following are
some of the advantages: low operation costs, simple operating and maintenance
procedures, high thermal efficiency, high heat transfer coefficient (Mazini, et al.,
2014; Andrianne and Alardin, 2002), lower energy consumption and higher
performance ratio. More recently, multi stage flash distillation technique (MSF)
has been used (Al-Shayji, 1998) and seawater desalination plants are therefore often
placed in close proximity to power plants to supply them with industrial water for
steam to generate power (Trancki et al., 2012).
The most favoured brine disposal method is ocean brine disposal because of its
efficiency and economic advantage over other methods (Torquemada et al., 2005;
Ahmed et al., 2001). This option was generally acceptable for economic reasons
but the vulnerability of the marine ecosystem towards changes in physico-chemical
factors is making this method unsustainable, requiring more modern methods for
88
brine disposal (Einva and Lokiec, 2003). Therefore, economic reasons should not
be the only factor to be considered when considering brine disposal techniques in
order to safeguard the sustainability of the desalination process. Moreover, the
ecological viability of desalination technologies needs to be assessed by four
components which are environmental, economic, social and technological (Gude,
2016) reflecting a holistic approach to the sustainability of desalination
technologies (Afgan et al., 1999). Indeed, desalination technologies of seawater
offer a range of human health, socio-economic, and environmental benefits by
providing a seemingly unlimited, constant supply of high quality water without
impairing natural fresh water ecosystems (Lattemann and Höpner, 2008). However,
there have been concerns about the environmental effects of high salinity
(69,000psu), high thermal energy (at 110C temperature higher that the ambient
seawater) and chemical additives on the marine ecosystem due to the release of
brine by distillation plants (Pagès et al., 2010; Darwish et al., 2013).
Marine environments that receive the brine are typically subject to chemical and
physical changes that can subsequently impact benthic communities. These
alterations include deterioration in the quality of the seawater and sediment owing
to harmful chemical components, which include heavy metals, antiscaling,
antifouling, antifoaming and anticorrosion additive substances. In the same way,
changes in physico-chemical characteristics of the seawater salinity, temperature,
pH and dissolved oxygen might affect a considerable number of marine species
(Naser, 2013; Lattemann and Höpner, 2002; Sadhwania et al., 2005; Torquemada
et al., 2005).
One of these marine species is seagrass meadows which have become an area of
concern as they are widespread across global coastal ecosystems (Moreno et al.,
2014). The recent growth of desalination plants has altered the salinity levels in
the Mediterranean Sea which vary between 36-40 (Latteman, 2010). This in turn
has an adverse impact on benthic organisms (Yolanda and Luis, 2006), so the
growth and development of seagrasses will subsequently be affected by osmotic
stress resulting in compromised photosynthesis, reproduction and synthesis of new
solutes (Moreno et al., 2014; Torquemada et al., 2005).
89
According to previous studies, Posidonia oceanic, a genus of seawater grass, is
particularly sensitive to salinity of 38 psu causing growth reduction, 45 psu causing
mortality, and 50 psu causing 100% mortality (Latorre, 2005; Torquemada and
Lizaso, 2005). Furthermore, according to Ruiz and Romero (2001) it was found to
have lower tolerance to other environmental factors such as reduction of light or
high sedimentation rates (Manzanera et al., 1998). Consequently, this species is
known as a stenobiotic seagrass making it very vulnerable to increased salinity
levels of effluent from desalination plants (Hartog, 1970). Another type of seagrass
known as Cymodocea nodosa also exists in marine environments subjected to a
range of salinity levels ranging from 17-41 psu and according to experimental study
it was found, with salinity levels below 17 psu and above 50 psu, causing sustained
considerable mortality, and 56 psu causing 100% mortality (Sandoval et al.,
2012;Yolanda and Luis, 2006). While different species displayed varying reactions
for example it was observed that in areas of salinity up to a level of 50 psu, the size
and survival rate of fish was reduced (Ahmed and Anwar, 2012; Parry, 1960).
In addition to salinity levels, other environmental factors contributed to the growth
and diversity of seagrass such as temperature, dissolved oxygen and pH, also
affecting the distribution and growth of several seagrass species (Torquemada et
al., 2005; Hillman et al., 1995). Although desalination continues to be a growing
industry in Libya, little has been done to study the environmental implications
(Elfallah and Bosrgob, 2005).
Temperature is a key factor in the health and survival of many organisms, brine
discharge has a relatively high temperature and low pH (Torquemada et al., 2005).
Even a minimal increase to temperature (such as 1 0C) above ambient water over
an extended period of time can alter species’ metabolism and composition in an
area and even result in death (Marsh et al., 1986; Hiscock et al., 2004). Some marine
organisms can temporarily adapt to minor changes in temperature, but not for any
length of time. For other marine life, long-term temperature change can be fatal
(Lattemann and Höpner, 2008). For this reason, the co-location can reduce the
impact on the marine environment through mixing the power plant’s cooling water
with the effluent from distillation plants, so the combined emissions will dilute the
concentration of the brine and can speed up the dissolution of thermal and saline
90
effluent in the sea (Ahmad and Baddour, 2014). As temperature and salinity levels
rise, the solubility of gases declines resulting in reduced levels of dissolved oxygen
in seawater (Tonner, 2006) which limits respiration in marine organisms (Ahmed
and Anwar, 2012). In turn, photosynthesis of marine angiosperms is compromised
because the main ion hydrogen (pH) influences the concentration and formation of
available carbonates (Torquemada et al., 2005; Beer and Waisel 1979). The three
types of seagrasses were examined by Invers et al., 1997 to determine the effect of
pH on their photosynthesis, namely Posidonia oceanica, Cymodocea nodosa, and
Zostera noltii under controlled lab conditions. The former two displayed reduced
levels of photosynthetic rates with an increase in pH and showed a significant
reduction in net primary productivity (NPP) rates at pH 8.8. Conversely, Z. noltii
showed high photosynthetic rates up to pH 8.8 but a significant reduction in primary
productivity (NPP) rates at only pH 9.0.
Desalination processes require considerable heat and electrical energy which
ultimately produces CO2 emissions. Fossil fuels provide the source of this energy
for thermal and RO processes (Tzen, 2014). In Mediterranean countries such as
Libya, most of the distillation or power plants are designed to burn crude oil, gas-
oil or heavy fuel oil (Enka, 2013). The products of combustion most commonly
released by fossil fuel are ash particles, carbon dioxide (CO2), carbon monoxide
(CO), water vapour, Sulphur dioxide (SO2), and nitrogen oxides (NOx) (European
Union, 2012). Dissolved inorganic carbon (DIC) exists in seawater in three major
forms: bicarbonate ion (HCO3-), carbonate ion (CO3
2-), and aqueous carbon dioxide
(CO2 (aq)), which here also includes carbonic acid (H2CO3). At a pH of 8.2, ⁓88%
of the carbon is in the form of HCO3-, 11% in the form of CO3
2-, and only ⁓0.5%
of the carbon is in the form of dissolved CO2. When CO2 dissolves in seawater,
H2CO3 is formed. Most of the H2CO3 quickly dissociates into a hydrogen ion (H+)
and HCO3-. A hydrogen ion can then react with a CO3
2 ion to form bicarbonate.
Therefore, the net effect of adding CO2 to seawater is to increase the concentrations
of H2CO3, HCO3-, and H+, and decrease the concentration of CO3
-2 and lower pH
(Fabry et al., 2008), which are potential factors in global warming and oceanic
acidification. Previous work indicates that the oceanic uptake of anthropogenic
CO2 and the concomitant changes in seawater chemistry have adverse
consequences for many calcifying organisms, and may result in changes to
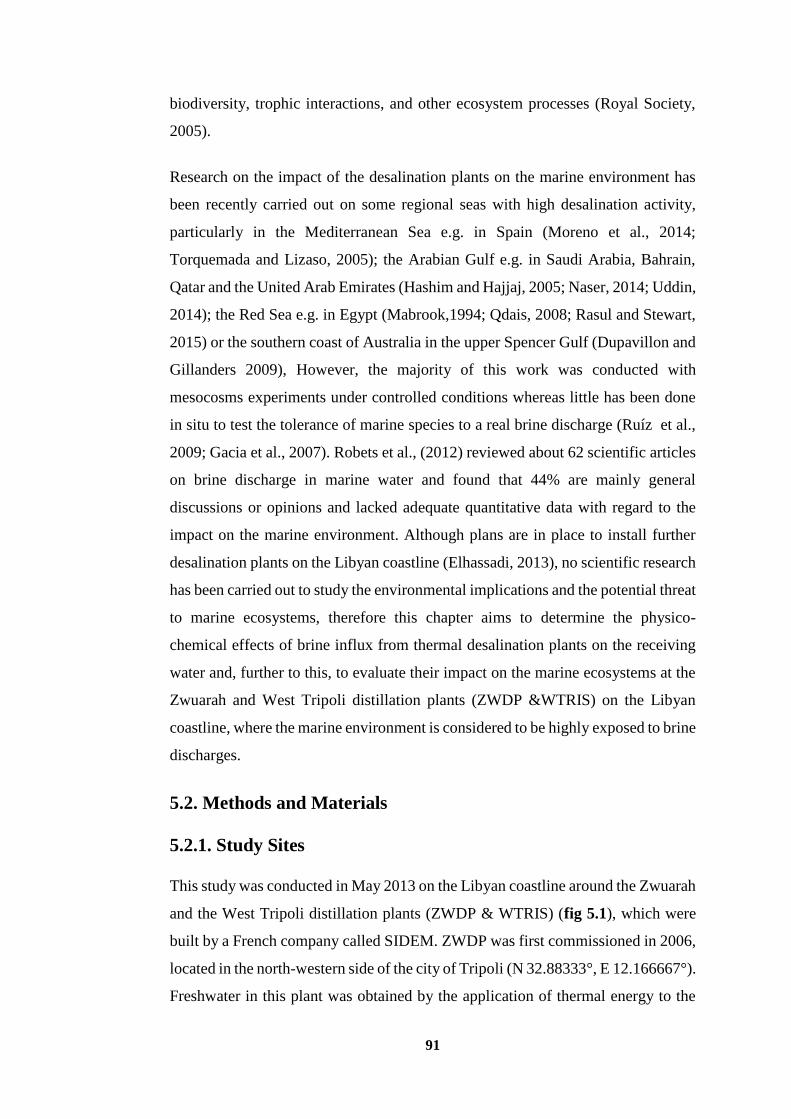
91
biodiversity, trophic interactions, and other ecosystem processes (Royal Society,
2005).
Research on the impact of the desalination plants on the marine environment has
been recently carried out on some regional seas with high desalination activity,
particularly in the Mediterranean Sea e.g. in Spain (Moreno et al., 2014;
Torquemada and Lizaso, 2005); the Arabian Gulf e.g. in Saudi Arabia, Bahrain,
Qatar and the United Arab Emirates (Hashim and Hajjaj, 2005; Naser, 2014; Uddin,
2014); the Red Sea e.g. in Egypt (Mabrook,1994; Qdais, 2008; Rasul and Stewart,
2015) or the southern coast of Australia in the upper Spencer Gulf (Dupavillon and
Gillanders 2009), However, the majority of this work was conducted with
mesocosms experiments under controlled conditions whereas little has been done
in situ to test the tolerance of marine species to a real brine discharge (Ruíz et al.,
2009; Gacia et al., 2007). Robets et al., (2012) reviewed about 62 scientific articles
on brine discharge in marine water and found that 44% are mainly general
discussions or opinions and lacked adequate quantitative data with regard to the
impact on the marine environment. Although plans are in place to install further
desalination plants on the Libyan coastline (Elhassadi, 2013), no scientific research
has been carried out to study the environmental implications and the potential threat
to marine ecosystems, therefore this chapter aims to determine the physico-
chemical effects of brine influx from thermal desalination plants on the receiving
water and, further to this, to evaluate their impact on the marine ecosystems at the
Zwuarah and West Tripoli distillation plants (ZWDP &WTRIS) on the Libyan
coastline, where the marine environment is considered to be highly exposed to brine
discharges.
5.2. Methods and Materials
5.2.1. Study Sites
This study was conducted in May 2013 on the Libyan coastline around the Zwuarah
and the West Tripoli distillation plants (ZWDP & WTRIS) (fig 5.1), which were
built by a French company called SIDEM. ZWDP was first commissioned in 2006,
located in the north-western side of the city of Tripoli (N 32.88333°, E 12.166667°).
Freshwater in this plant was obtained by the application of thermal energy to the
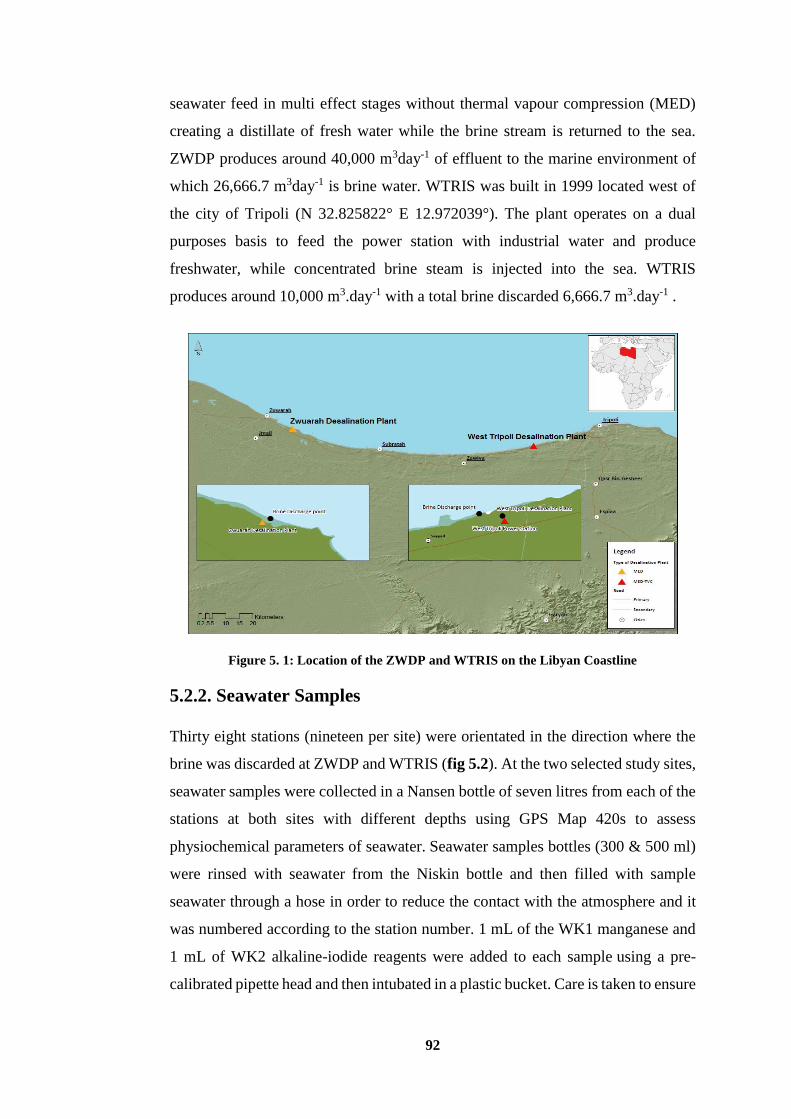
92
seawater feed in multi effect stages without thermal vapour compression (MED)
creating a distillate of fresh water while the brine stream is returned to the sea.
ZWDP produces around 40,000 m3day-1 of effluent to the marine environment of
which 26,666.7 m3day-1 is brine water. WTRIS was built in 1999 located west of
the city of Tripoli (N 32.825822° E 12.972039°). The plant operates on a dual
purposes basis to feed the power station with industrial water and produce
freshwater, while concentrated brine steam is injected into the sea. WTRIS
produces around 10,000 m3.day-1 with a total brine discarded 6,666.7 m3.day-1 .
Figure 5. 1: Location of the ZWDP and WTRIS on the Libyan Coastline
5.2.2. Seawater Samples
Thirty eight stations (nineteen per site) were orientated in the direction where the
brine was discarded at ZWDP and WTRIS (fig 5.2). At the two selected study sites,
seawater samples were collected in a Nansen bottle of seven litres from each of the
stations at both sites with different depths using GPS Map 420s to assess
physiochemical parameters of seawater. Seawater samples bottles (300 & 500 ml)
were rinsed with seawater from the Niskin bottle and then filled with sample
seawater through a hose in order to reduce the contact with the atmosphere and it
was numbered according to the station number. 1 mL of the WK1 manganese and
1 mL of WK2 alkaline-iodide reagents were added to each sample using a pre-
calibrated pipette head and then intubated in a plastic bucket. Care is taken to ensure
93
that the samples are exposed to as little air as possible in order to keep the
concentration of dissolved oxygen constant for each sample.
Figure 5. 2: Sampling location at ZWDP and WTRIS on the Libyan Coastline: (Google
earth, 2016)
Physico-chemical parameters for the two selected sites, including salinity (psu),
conductivity (µS/cm), dissolved Oxygen (mgl-1), pH and total dissolved solids
(mgl-1), bottom and surface temperature (C0) were measured immediately at the
time the seawater was sampled by using a YSI 556 MPS handheld Multiparameter
instrument (YSI Ltd, Hampshire, UK). total alkalinity (mgl-1), bicarbonate (mgl-1),
total hardness (mgl-1), calcium and magnesium hardness (mgl-1), chloride (mgl-1),
nitrate (mgl-1), sulphate (mgl-1), phosphorus (mgl-1), sodium (mgl-1), potassium
(mgl-1), calcium (mgl-1), magnesium (mgl-1), nitrate (mgl-1) and iron (mgl-1) were
analysed in the lab at ZWDP (Table 5.1 and Table 5.2). Additionally, brine
samples disposed from each plant (ZWDP & WTRIS) were analysed (Table 5.3)
according to Hach methods, 2013 for water, wastewater and seawater to determine
physico-chemical parameters (see appendix 5).
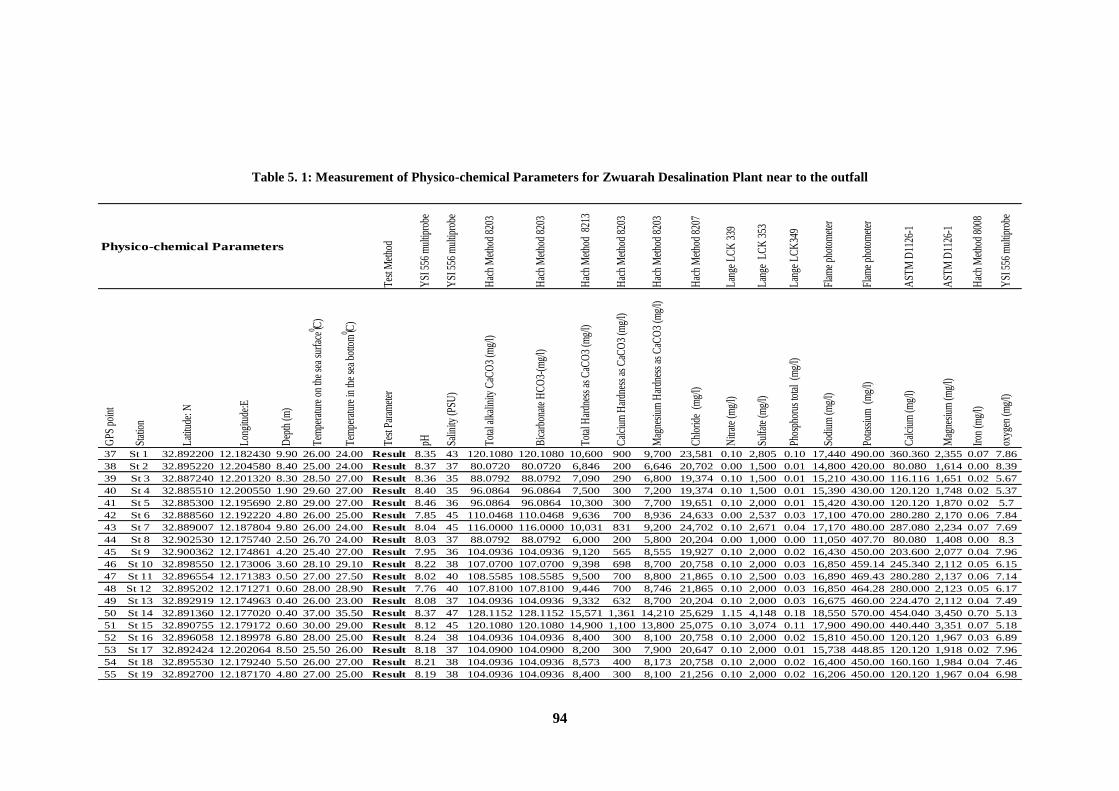
94
Table 5. 1: Measurement of Physico-chemical Parameters for Zwuarah Desalination Plant near to the outfall
Tes
t Met
hod
YSI
556
mul
tipro
be
YSI
556
mul
tipro
be
Hac
h M
etho
d 82
03
Hac
h M
etho
d 82
03
Hac
h M
etho
d 8
213
Hac
h M
etho
d 82
03
Hac
h M
etho
d 82
03
Hac
h M
etho
d 82
07
Lan
ge L
CK
339
Lan
ge L
CK
353
Lan
ge L
CK
349
Flam
e ph
otom
eter
Flam
e ph
otom
eter
AST
M D
1126
-1
AST
M D
1126
-1
Hac
h M
etho
d 80
08
YSI
556
mul
tipro
be
GPS
poi
nt
Stat
ion
Lat
itude
: N
Lon
gitu
de:E
Dep
th (m
)
Tem
pera
ture
on
the
sea
surf
ace
(0 C)
Tem
pera
ture
in th
e se
a bo
ttom
(0 C)
Tes
t Par
amet
er
pH Salin
ity (P
SU)
Tot
al a
lkal
inity
CaC
O3
(mg/
l)
Bic
arbo
nate
HC
O3-
(mg/
l)
Tot
al H
ardn
ess
as C
aCO
3 (m
g/l)
Cal
cium
Har
dnes
s as
CaC
O3
(mg/
l)
Mag
nesi
um H
ardn
ess
as C
aCO
3 (m
g/l)
Chl
orid
e (m
g/l)
Nitr
ate
(mg/
l)
Sulfa
te (m
g/l)
Phos
phor
us to
tal
(mg/
l)
Sodi
um (m
g/l)
Pota
ssiu
m (
mg/
l)
Cal
cium
(mg/
l)
Mag
nesi
um (m
g/l)
Iron
(mg/
l)
oxyg
en (m
g/l)
37 St 1 32.892200 12.182430 9.90 26.00 24.00 Result 8.35 43 120.1080 120.1080 10,600 900 9,700 23,581 0.10 2,805 0.10 17,440 490.00 360.360 2,355 0.07 7.86
38 St 2 32.895220 12.204580 8.40 25.00 24.00 Result 8.37 37 80.0720 80.0720 6,846 200 6,646 20,702 0.00 1,500 0.01 14,800 420.00 80.080 1,614 0.00 8.39
39 St 3 32.887240 12.201320 8.30 28.50 27.00 Result 8.36 35 88.0792 88.0792 7,090 290 6,800 19,374 0.10 1,500 0.01 15,210 430.00 116.116 1,651 0.02 5.67
40 St 4 32.885510 12.200550 1.90 29.60 27.00 Result 8.40 35 96.0864 96.0864 7,500 300 7,200 19,374 0.10 1,500 0.01 15,390 430.00 120.120 1,748 0.02 5.37
41 St 5 32.885300 12.195690 2.80 29.00 27.00 Result 8.46 36 96.0864 96.0864 10,300 300 7,700 19,651 0.10 2,000 0.01 15,420 430.00 120.120 1,870 0.02 5.7
42 St 6 32.888560 12.192220 4.80 26.00 25.00 Result 7.85 45 110.0468 110.0468 9,636 700 8,936 24,633 0.00 2,537 0.03 17,100 470.00 280.280 2,170 0.06 7.84
43 St 7 32.889007 12.187804 9.80 26.00 24.00 Result 8.04 45 116.0000 116.0000 10,031 831 9,200 24,702 0.10 2,671 0.04 17,170 480.00 287.080 2,234 0.07 7.69
44 St 8 32.902530 12.175740 2.50 26.70 24.00 Result 8.03 37 88.0792 88.0792 6,000 200 5,800 20,204 0.00 1,000 0.00 11,050 407.70 80.080 1,408 0.00 8.3
45 St 9 32.900362 12.174861 4.20 25.40 27.00 Result 7.95 36 104.0936 104.0936 9,120 565 8,555 19,927 0.10 2,000 0.02 16,430 450.00 203.600 2,077 0.04 7.96
46 St 10 32.898550 12.173006 3.60 28.10 29.10 Result 8.22 38 107.0700 107.0700 9,398 698 8,700 20,758 0.10 2,000 0.03 16,850 459.14 245.340 2,112 0.05 6.15
47 St 11 32.896554 12.171383 0.50 27.00 27.50 Result 8.02 40 108.5585 108.5585 9,500 700 8,800 21,865 0.10 2,500 0.03 16,890 469.43 280.280 2,137 0.06 7.14
48 St 12 32.895202 12.171271 0.60 28.00 28.90 Result 7.76 40 107.8100 107.8100 9,446 700 8,746 21,865 0.10 2,000 0.03 16,850 464.28 280.000 2,123 0.05 6.17
49 St 13 32.892919 12.174963 0.40 26.00 23.00 Result 8.08 37 104.0936 104.0936 9,332 632 8,700 20,204 0.10 2,000 0.03 16,675 460.00 224.470 2,112 0.04 7.49
50 St 14 32.891360 12.177020 0.40 37.00 35.50 Result 8.37 47 128.1152 128.1152 15,571 1,361 14,210 25,629 1.15 4,148 0.18 18,550 570.00 454.040 3,450 0.70 5.13
51 St 15 32.890755 12.179172 0.60 30.00 29.00 Result 8.12 45 120.1080 120.1080 14,900 1,100 13,800 25,075 0.10 3,074 0.11 17,900 490.00 440.440 3,351 0.07 5.18
52 St 16 32.896058 12.189978 6.80 28.00 25.00 Result 8.24 38 104.0936 104.0936 8,400 300 8,100 20,758 0.10 2,000 0.02 15,810 450.00 120.120 1,967 0.03 6.89
53 St 17 32.892424 12.202064 8.50 25.50 26.00 Result 8.18 37 104.0900 104.0900 8,200 300 7,900 20,647 0.10 2,000 0.01 15,738 448.85 120.120 1,918 0.02 7.96
54 St 18 32.895530 12.179240 5.50 26.00 27.00 Result 8.21 38 104.0936 104.0936 8,573 400 8,173 20,758 0.10 2,000 0.02 16,400 450.00 160.160 1,984 0.04 7.46
55 St 19 32.892700 12.187170 4.80 27.00 25.00 Result 8.19 38 104.0936 104.0936 8,400 300 8,100 21,256 0.10 2,000 0.02 16,206 450.00 120.120 1,967 0.04 6.98
Physico-chemical Parameters
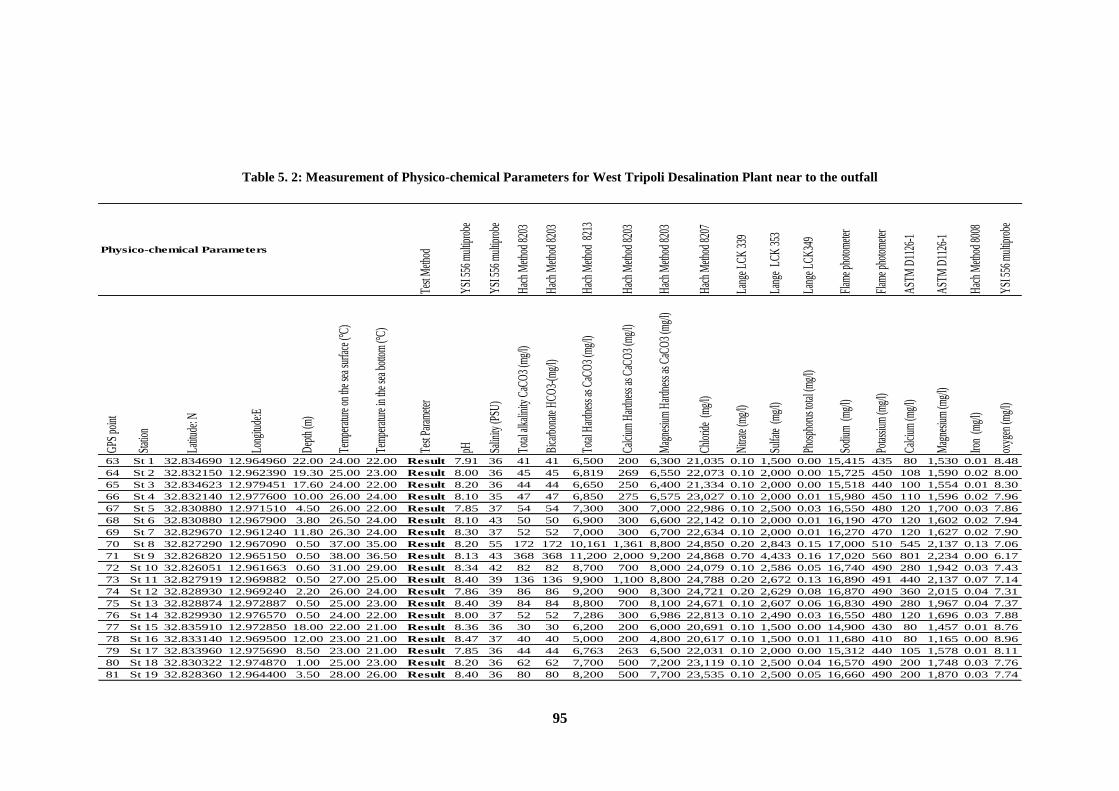
95
Table 5. 2: Measurement of Physico-chemical Parameters for West Tripoli Desalination Plant near to the outfall
Test
Meth
od
YSI
556
mul
tipro
be
YSI
556
mul
tipro
be
Hac
h M
ethod
820
3
Hac
h M
ethod
820
3
Hac
h M
ethod
821
3
Hac
h M
ethod
820
3
Hac
h M
ethod
820
3
Hac
h M
ethod
820
7
Lang
e LCK
339
Lang
e LC
K 3
53
Lang
e LCK
349
Flam
e pho
tom
eter
Flam
e pho
tom
eter
AST
M D
1126
-1
AST
M D
1126
-1
Hac
h M
ethod
800
8
YSI
556
mul
tipro
be
GPS
poi
nt
Stati
on
Latit
ude:
N
Long
itude
:E
Dep
th (m
)
Tem
pera
ture
on
the s
ea su
rface
(°C)
Tem
pera
ture
in th
e sea
bot
tom
(°C)
Test
Para
mete
r
pH Salin
ity (P
SU)
Total
alka
linity
CaC
O3
(mg/
l)
Bica
rbon
ate H
CO3-
(mg/
l)
Total
Har
dnes
s as C
aCO
3 (m
g/l)
Calci
um H
ardn
ess a
s CaC
O3
(mg/
l)
Mag
nesiu
m H
ardn
ess a
s CaC
O3
(mg/
l)
Chlo
ride
(mg/
l)
Nitr
ate (m
g/l)
Sulfa
te (m
g/l)
Phos
phor
us to
tal (m
g/l)
Sodi
um (
mg/
l)
Potas
sium
(mg/
l)
Calci
um (m
g/l)
Mag
nesiu
m (m
g/l)
Iron
(mg/
l)
oxyg
en (m
g/l)
63 St 1 32.834690 12.964960 22.00 24.00 22.00 Result 7.91 36 41 41 6,500 200 6,300 21,035 0.10 1,500 0.00 15,415 435 80 1,530 0.01 8.48
64 St 2 32.832150 12.962390 19.30 25.00 23.00 Result 8.00 36 45 45 6,819 269 6,550 22,073 0.10 2,000 0.00 15,725 450 108 1,590 0.02 8.00
65 St 3 32.834623 12.979451 17.60 24.00 22.00 Result 8.20 36 44 44 6,650 250 6,400 21,334 0.10 2,000 0.00 15,518 440 100 1,554 0.01 8.30
66 St 4 32.832140 12.977600 10.00 26.00 24.00 Result 8.10 35 47 47 6,850 275 6,575 23,027 0.10 2,000 0.01 15,980 450 110 1,596 0.02 7.96
67 St 5 32.830880 12.971510 4.50 26.00 22.00 Result 7.85 37 54 54 7,300 300 7,000 22,986 0.10 2,500 0.03 16,550 480 120 1,700 0.03 7.86
68 St 6 32.830880 12.967900 3.80 26.50 24.00 Result 8.10 43 50 50 6,900 300 6,600 22,142 0.10 2,000 0.01 16,190 470 120 1,602 0.02 7.94
69 St 7 32.829670 12.961240 11.80 26.30 24.00 Result 8.30 37 52 52 7,000 300 6,700 22,634 0.10 2,000 0.01 16,270 470 120 1,627 0.02 7.90
70 St 8 32.827290 12.967090 0.50 37.00 35.00 Result 8.20 55 172 172 10,161 1,361 8,800 24,850 0.20 2,843 0.15 17,000 510 545 2,137 0.13 7.06
71 St 9 32.826820 12.965150 0.50 38.00 36.50 Result 8.13 43 368 368 11,200 2,000 9,200 24,868 0.70 4,433 0.16 17,020 560 801 2,234 0.00 6.17
72 St 10 32.826051 12.961663 0.60 31.00 29.00 Result 8.34 42 82 82 8,700 700 8,000 24,079 0.10 2,586 0.05 16,740 490 280 1,942 0.03 7.43
73 St 11 32.827919 12.969882 0.50 27.00 25.00 Result 8.40 39 136 136 9,900 1,100 8,800 24,788 0.20 2,672 0.13 16,890 491 440 2,137 0.07 7.14
74 St 12 32.828930 12.969240 2.20 26.00 24.00 Result 7.86 39 86 86 9,200 900 8,300 24,721 0.20 2,629 0.08 16,870 490 360 2,015 0.04 7.31
75 St 13 32.828874 12.972887 0.50 25.00 23.00 Result 8.40 39 84 84 8,800 700 8,100 24,671 0.10 2,607 0.06 16,830 490 280 1,967 0.04 7.37
76 St 14 32.829930 12.976570 0.50 24.00 22.00 Result 8.00 37 52 52 7,286 300 6,986 22,813 0.10 2,490 0.03 16,550 480 120 1,696 0.03 7.88
77 St 15 32.835910 12.972850 18.00 22.00 21.00 Result 8.36 36 30 30 6,200 200 6,000 20,691 0.10 1,500 0.00 14,900 430 80 1,457 0.01 8.76
78 St 16 32.833140 12.969500 12.00 23.00 21.00 Result 8.47 37 40 40 5,000 200 4,800 20,617 0.10 1,500 0.01 11,680 410 80 1,165 0.00 8.96
79 St 17 32.833960 12.975690 8.50 23.00 21.00 Result 7.85 36 44 44 6,763 263 6,500 22,031 0.10 2,000 0.00 15,312 440 105 1,578 0.01 8.11
80 St 18 32.830322 12.974870 1.00 25.00 23.00 Result 8.20 36 62 62 7,700 500 7,200 23,119 0.10 2,500 0.04 16,570 490 200 1,748 0.03 7.76
81 St 19 32.828360 12.964400 3.50 28.00 26.00 Result 8.40 36 80 80 8,200 500 7,700 23,535 0.10 2,500 0.05 16,660 490 200 1,870 0.03 7.74
Physico-chemical Parameters
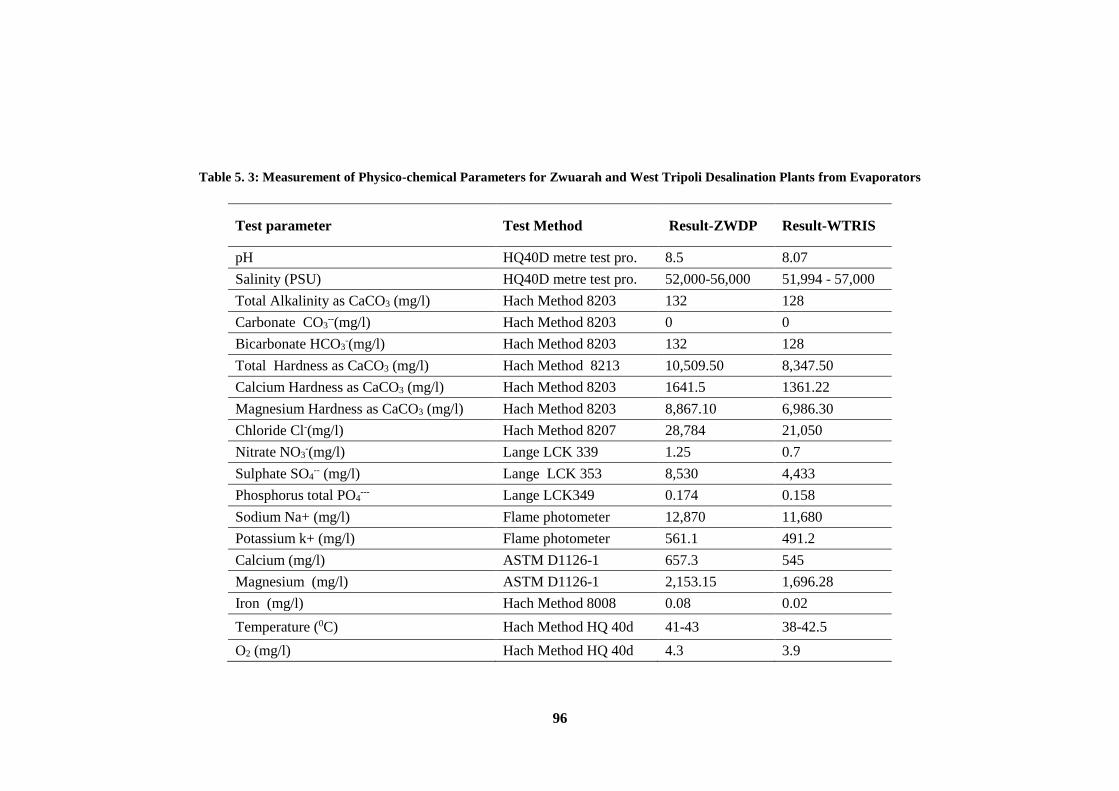
96
Table 5. 3: Measurement of Physico-chemical Parameters for Zwuarah and West Tripoli Desalination Plants from Evaporators
Test parameter Test Method Result-ZWDP Result-WTRIS
pH HQ40D metre test pro. 8.5 8.07
Salinity (PSU) HQ40D metre test pro. 52,000-56,000 51,994 - 57,000
Total Alkalinity as CaCO3 (mg/l) Hach Method 8203 132 128
Carbonate CO3--(mg/l) Hach Method 8203 0 0
Bicarbonate HCO3-(mg/l) Hach Method 8203 132 128
Total Hardness as CaCO3 (mg/l) Hach Method 8213 10,509.50 8,347.50
Calcium Hardness as CaCO3 (mg/l) Hach Method 8203 1641.5 1361.22
Magnesium Hardness as CaCO3 (mg/l) Hach Method 8203 8,867.10 6,986.30
Chloride Cl-(mg/l) Hach Method 8207 28,784 21,050
Nitrate NO3-(mg/l) Lange LCK 339 1.25 0.7
Sulphate SO4-- (mg/l) Lange LCK 353 8,530 4,433
Phosphorus total PO4--- Lange LCK349 0.174 0.158
Sodium Na+ (mg/l) Flame photometer 12,870 11,680
Potassium k+ (mg/l) Flame photometer 561.1 491.2
Calcium (mg/l) ASTM D1126-1 657.3 545
Magnesium (mg/l) ASTM D1126-1 2,153.15 1,696.28
Iron (mg/l) Hach Method 8008 0.08 0.02
Temperature (0C) Hach Method HQ 40d 41-43 38-42.5
O2 (mg/l) Hach Method HQ 40d 4.3 3.9
97
5.2.3. Seabed Sediment Samples
Thirty eight seabed sediment samples were collected from each of the stations from
the seafloor at both sites using a Van Veen Grab and a PVC pipe with a length of
40 cm and a diameter of 10 cm with two stoppers at each end which is also used
for collecting the sea sediments for stations. Each sample was stored in a plastic
bag and labelled according to the station number so that each sample could be
identified (depths 0.4 to 9.9 m, ZWDP; 0.5 to 22 m, WTRIS; Garmin GPS Map
420s). All sediment samples were stored in a refrigerator at < -18 C° in the
laboratory of the Marine Biology Research Centre of Tajura, Libya, where the
sediments experiments were conducted. Organic content of the sediments was
assessed (Table 5.4) and grain size was analysed (Table 5.5 & 5.6) according to
Folk 1974 method for defining sediment type and degree of sediment kurtosis
(KG), Skewness (SKI) and Standard Deviation (δI).
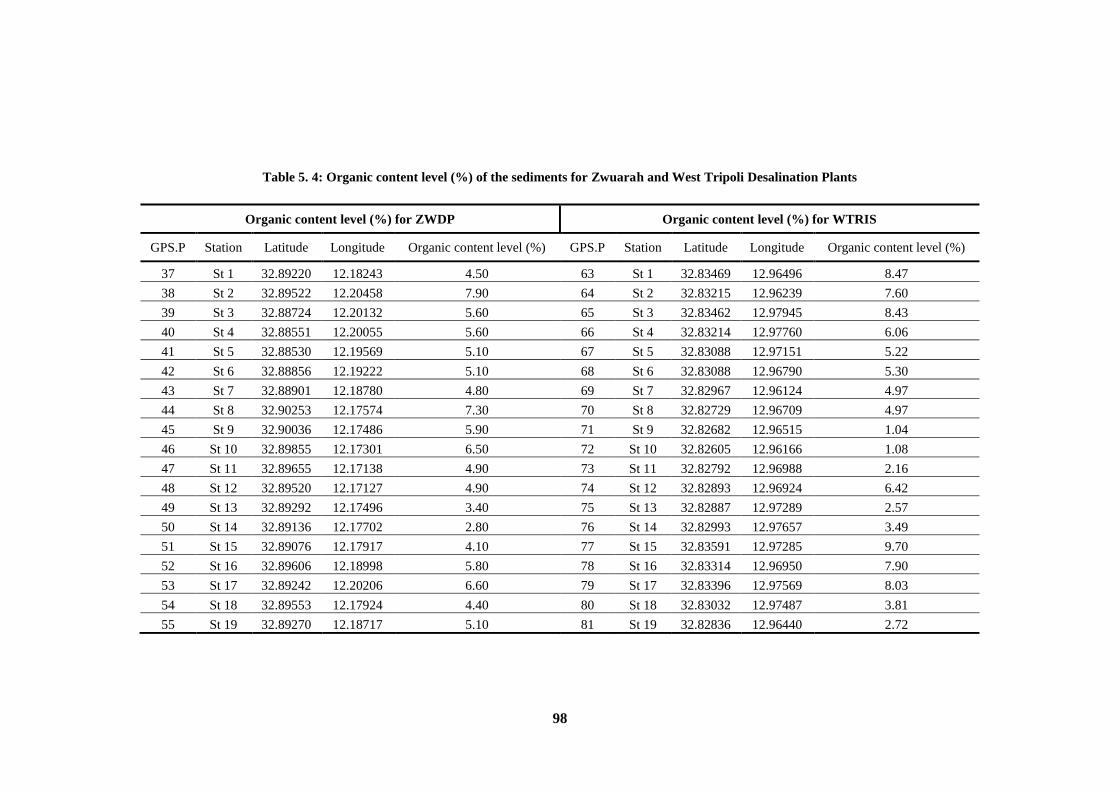
98
Table 5. 4: Organic content level (%) of the sediments for Zwuarah and West Tripoli Desalination Plants
Organic content level (%) for ZWDP Organic content level (%) for WTRIS
GPS.P Station Latitude Longitude Organic content level (%) GPS.P Station Latitude Longitude Organic content level (%)
37 St 1 32.89220 12.18243 4.50 63 St 1 32.83469 12.96496 8.47
38 St 2 32.89522 12.20458 7.90 64 St 2 32.83215 12.96239 7.60
39 St 3 32.88724 12.20132 5.60 65 St 3 32.83462 12.97945 8.43
40 St 4 32.88551 12.20055 5.60 66 St 4 32.83214 12.97760 6.06
41 St 5 32.88530 12.19569 5.10 67 St 5 32.83088 12.97151 5.22
42 St 6 32.88856 12.19222 5.10 68 St 6 32.83088 12.96790 5.30
43 St 7 32.88901 12.18780 4.80 69 St 7 32.82967 12.96124 4.97
44 St 8 32.90253 12.17574 7.30 70 St 8 32.82729 12.96709 4.97
45 St 9 32.90036 12.17486 5.90 71 St 9 32.82682 12.96515 1.04
46 St 10 32.89855 12.17301 6.50 72 St 10 32.82605 12.96166 1.08
47 St 11 32.89655 12.17138 4.90 73 St 11 32.82792 12.96988 2.16
48 St 12 32.89520 12.17127 4.90 74 St 12 32.82893 12.96924 6.42
49 St 13 32.89292 12.17496 3.40 75 St 13 32.82887 12.97289 2.57
50 St 14 32.89136 12.17702 2.80 76 St 14 32.82993 12.97657 3.49
51 St 15 32.89076 12.17917 4.10 77 St 15 32.83591 12.97285 9.70
52 St 16 32.89606 12.18998 5.80 78 St 16 32.83314 12.96950 7.90
53 St 17 32.89242 12.20206 6.60 79 St 17 32.83396 12.97569 8.03
54 St 18 32.89553 12.17924 4.40 80 St 18 32.83032 12.97487 3.81
55 St 19 32.89270 12.18717 5.10 81 St 19 32.82836 12.96440 2.72
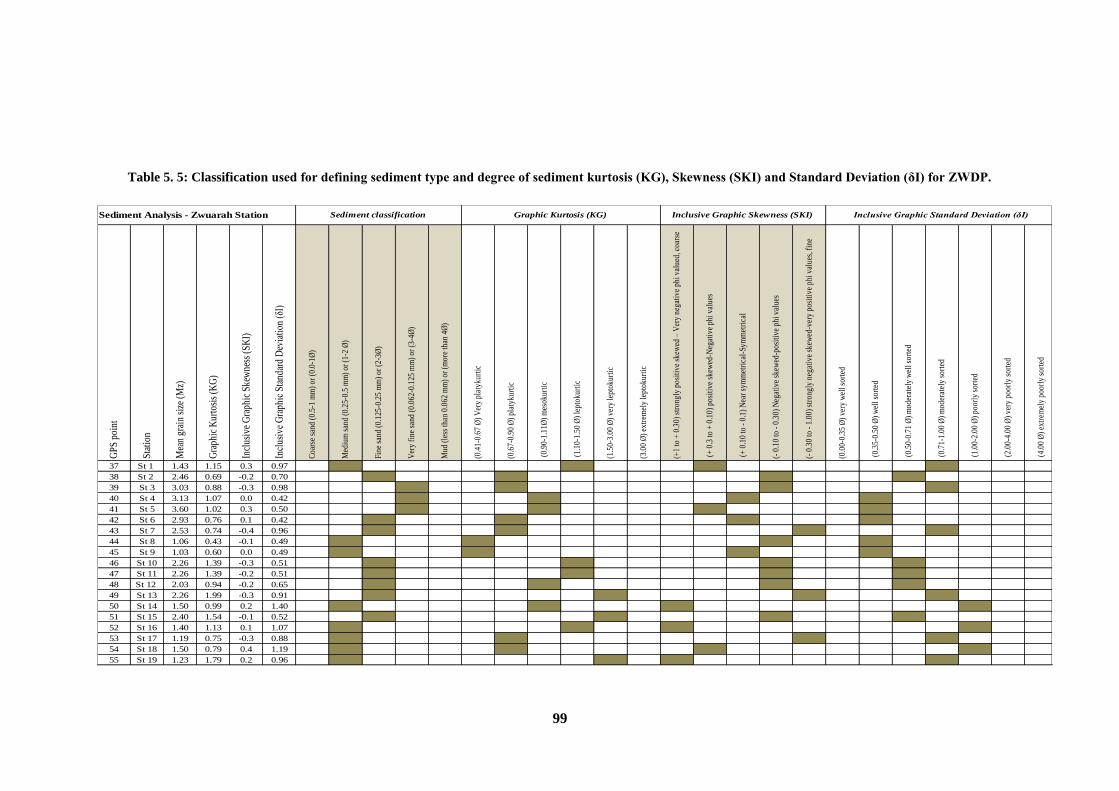
99
Table 5. 5: Classification used for defining sediment type and degree of sediment kurtosis (KG), Skewness (SKI) and Standard Deviation (δI) for ZWDP.
GP
S p
oint
Sta
tion
Mea
n gr
ain
size
(M
z)
Gra
phic
Kur
tosi
s (K
G)
Incl
usiv
e G
raph
ic S
kew
ness
(S
KI)
Incl
usiv
e G
raph
ic S
tand
ard
Dev
iati
on (
δI)
Coa
rse
sand
(0.
5-1
mm
) or
(0.
0-1Ø
)
Med
ium
san
d (0
.25-
0.5
mm
) or
(1-
2 Ø
)
Fine
san
d (0
.125
-0.2
5 m
m)
or (
2-3Ø
)
Ver
y fi
ne s
and
(0.0
62-0
.125
mm
) or
(3-
4Ø)
Mud
(le
ss th
an 0
.062
mm
) or
(m
ore
than
4Ø
)
(0.4
1-0.
67 Ø
) V
ery
plat
ykur
tic
(0.6
7-0.
90 Ø
) pl
atyk
urti
c
(0.
90-1
.11Ø
) m
esok
urti
c
(1.
10-1
.50
Ø)
lept
okur
tic
(1.5
0-3.
00 Ø
) ve
ry le
ptok
urti
c
(3.0
0 Ø
) ex
trem
ely
lept
okur
tic
(+1
to +
0.3
0) s
tron
gly
posi
tive
ske
wed
– V
ery
nega
tive
phi
val
ued,
coa
rse
(+
0.3
to +
0.1
0) p
osit
ive
skew
ed-N
egat
ive
phi v
alue
s
(+
0.1
0 to
- 0
.1)
Nea
r sy
mm
etri
cal-
Sym
met
rica
l
(- 0
.10
to -
0.3
0) N
egat
ive
skew
ed-p
osit
ive
phi v
alue
s
(- 0
.30
to -
1.0
0) s
tron
gly
nega
tive
ske
wed
-ver
y po
siti
ve p
hi v
alue
s, f
ine
(0.0
0-0.
35 Ø
) ve
ry w
ell s
orte
d
(0.
35-0
.50
Ø)
wel
l sor
ted
(0.
50-0
.71
Ø)
mod
erat
ely
wel
l sor
ted
(0.
71-1
.00
Ø)
mod
erat
ely
sort
ed
(1.
00-2
.00
Ø)
poor
ly s
orte
d
(2.
00-4
.00
Ø)
very
poo
rly
sort
ed
(4.
00 Ø
) ex
trem
ely
poor
ly s
orte
d
37 St 1 1.43 1.15 0.3 0.97
38 St 2 2.46 0.69 -0.2 0.70
39 St 3 3.03 0.88 -0.3 0.98
40 St 4 3.13 1.07 0.0 0.42
41 St 5 3.60 1.02 0.3 0.50
42 St 6 2.93 0.76 0.1 0.42
43 St 7 2.53 0.74 -0.4 0.96
44 St 8 1.06 0.43 -0.1 0.49
45 St 9 1.03 0.60 0.0 0.49
46 St 10 2.26 1.39 -0.3 0.51
47 St 11 2.26 1.39 -0.2 0.51
48 St 12 2.03 0.94 -0.2 0.65
49 St 13 2.26 1.99 -0.3 0.91
50 St 14 1.50 0.99 0.2 1.40
51 St 15 2.40 1.54 -0.1 0.52
52 St 16 1.40 1.13 0.1 1.07
53 St 17 1.19 0.75 -0.3 0.88
54 St 18 1.50 0.79 0.4 1.19
55 St 19 1.23 1.79 0.2 0.96
Sediment Analysis - Zwuarah Station Sediment classification Graphic Kurtosis (KG) Inclusive Graphic Skewness (SKI) Inclusive Graphic Standard Deviation (δI)
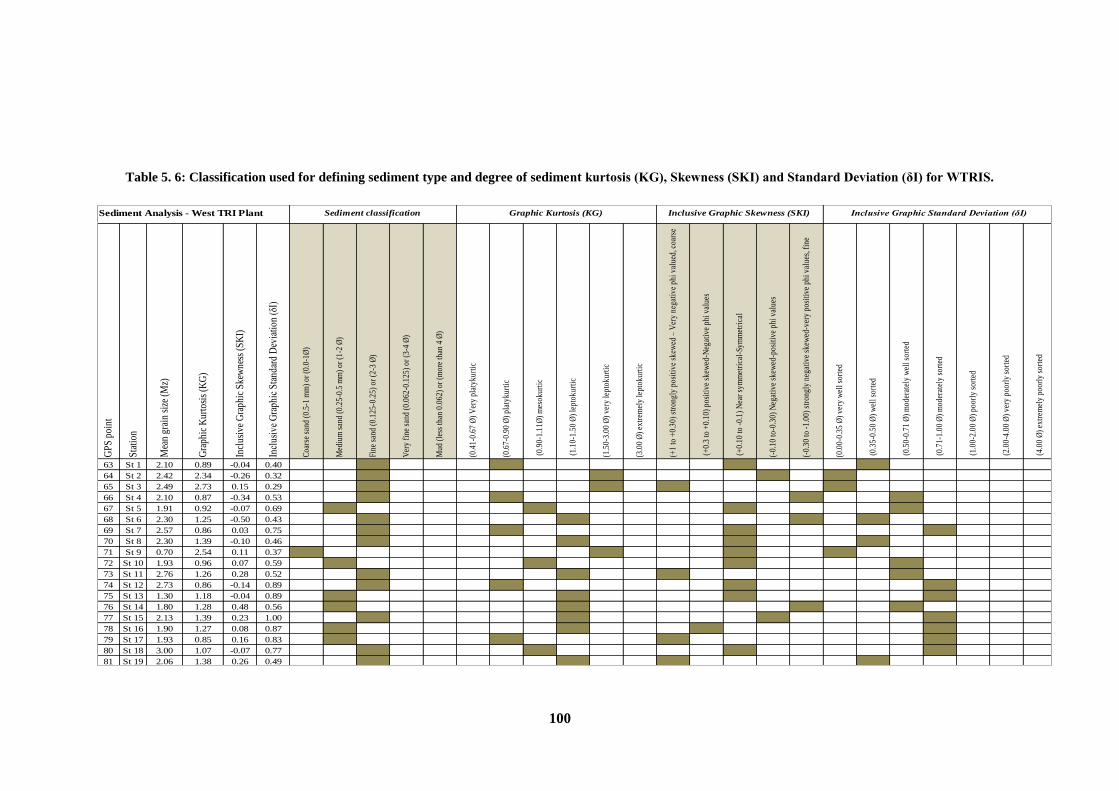
100
Table 5. 6: Classification used for defining sediment type and degree of sediment kurtosis (KG), Skewness (SKI) and Standard Deviation (δI) for WTRIS.
GP
S p
oint
Sta
tion
Mea
n gr
ain
size
(M
z)
Gra
phic
Kur
tosi
s (K
G)
Incl
usiv
e G
raph
ic S
kew
ness
(S
KI)
Incl
usiv
e G
raph
ic S
tand
ard
Dev
iati
on (
δI)
Coa
rse
sand
(0.
5-1
mm
) or
(0.
0-1Ø
)
Med
ium
san
d (0
.25-
0.5
mm
) or
(1-
2 Ø
)
Fine
san
d (0
.125
-0.2
5) o
r (2
-3 Ø
)
Ver
y fi
ne s
and
(0.0
62-0
.125
) or
(3-
4 Ø
)
Mud
(le
ss th
an 0
.062
) or
(m
ore
than
4 Ø
)
(0.4
1-0.
67 Ø
) V
ery
plat
ykur
tic
(0.6
7-0.
90 Ø
) pl
atyk
urti
c
(0.
90-1
.11Ø
) m
esok
urti
c
(1.
10-1
.50
Ø)
lept
okur
tic
(1.5
0-3.
00 Ø
) ve
ry le
ptok
urti
c
(3.0
0 Ø
) ex
trem
ely
lept
okur
tic
(+1
to +
0.30
) st
rong
ly p
osit
ive
skew
ed –
Ver
y ne
gati
ve p
hi v
alue
d, c
oars
e
(+
0.3
to +
0.10
) po
siti
ve s
kew
ed-N
egat
ive
phi v
alue
s
(+
0.10
to -
0.1)
Nea
r sy
mm
etri
cal-
Sym
met
rica
l
(-0.
10 to
-0.3
0) N
egat
ive
skew
ed-p
osit
ive
phi v
alue
s
(-0.
30 to
-1.
00)
stro
ngly
neg
ativ
e sk
ewed
-ver
y po
siti
ve p
hi v
alue
s, f
ine
(0.0
0-0.
35 Ø
) ve
ry w
ell s
orte
d
(0.
35-0
.50
Ø)
wel
l sor
ted
(0.
50-0
.71
Ø)
mod
erat
ely
wel
l sor
ted
(0.
71-1
.00
Ø)
mod
erat
ely
sort
ed
(1.
00-2
.00
Ø)
poor
ly s
orte
d
(2.
00-4
.00
Ø)
very
poo
rly
sort
ed
(4.
00 Ø
) ex
trem
ely
poor
ly s
orte
d
63 St 1 2.10 0.89 -0.04 0.40
64 St 2 2.42 2.34 -0.26 0.32
65 St 3 2.49 2.73 0.15 0.29
66 St 4 2.10 0.87 -0.34 0.53
67 St 5 1.91 0.92 -0.07 0.69
68 St 6 2.30 1.25 -0.50 0.43
69 St 7 2.57 0.86 0.03 0.75
70 St 8 2.30 1.39 -0.10 0.46
71 St 9 0.70 2.54 0.11 0.37
72 St 10 1.93 0.96 0.07 0.59
73 St 11 2.76 1.26 0.28 0.52
74 St 12 2.73 0.86 -0.14 0.89
75 St 13 1.30 1.18 -0.04 0.89
76 St 14 1.80 1.28 0.48 0.56
77 St 15 2.13 1.39 0.23 1.00
78 St 16 1.90 1.27 0.08 0.87
79 St 17 1.93 0.85 0.16 0.83
80 St 18 3.00 1.07 -0.07 0.77
81 St 19 2.06 1.38 0.26 0.49
Sediment Analysis - West TRI Plant Sediment classification Graphic Kurtosis (KG) Inclusive Graphic Skewness (SKI) Inclusive Graphic Standard Deviation (δI)
101
5.2.4. Biological Sample Collection
Video footage was recorded by a scuba diver at both sites along transect lines (fig
5.2) close to the seafloor by using a Fuji finepix f500 exr camera with Fuji wp-
fxf500 housing at different depths from 0.4 to 9.9 m at ZWDP and from 0.5 to 22
m at WTRIS measured using Garmin GPS Map 420s. From each video 138 still
images were randomly sampled and analysed (sixty-eight images for ZWDP and
seventy for WSTRI images) using Image J Analysis software (Random Systematic
Sampling) (Rasband, W.S., ImageJ, U.S. National Institutes of Health, Bethesda,
MD http://imagej.nih.gov/ij/, 1997-2012) to determine percentage coverage for
each species found in the photographs. The chosen size for each photo taken was
20.00×20.00 cm and a 100 random dots grid (= 100%) was overlayed over each
photo. The species underneath each dot in the photo was counted and identified.
5.3. Statistical Analysis
PRIMER® v 6 software (Plymouth Routines In Multivariate Ecological Research
Version Six) was used (Clarke and Gorley 2006). Mean and ± Standard Error for
community composition between the stations at each site (ZWDP & WTRIS) were
analysed statistically. Differences in the community composition between the
stations at each site were assessed using multivariate techniques based on the Bray-
Curtis Similarity index ANOSIM (Clarke, 1993) which is a simple non-parametric
permutation procedure applied to a similarity matrix underlying the ordination or
classification. ANOSIM calculates an R values (Global test) that lies between 0 and
1 (Chapman and Underwood, 1999). The global R is similar to a regression analysis
to measure how well the data modelling fits to the reality (Malcolm and Lancaster,
2013), with R values of 1 denoting complete difference existing between groups
and zero denoting no difference is observed between groups. If R is approximately
zero, then the null hypothesis is accepted and if R equals 1 then the null hypothesis
is rejected. R value will usually fall between 0 and 1 indicating some degree of
discrimination between sites and the statistical significance that was chosen for the
test for two sites between those stations was set at p˂0.05 and the average
similarity, dissimilarity and abundance between stations were identified by using
the SIMPER test (Clarke,1993) for each site, which looks at the role of individual
species in contributing to the separation between two groups of samples and to
102
determine the main species contributing to the groups identified during the cluster
analysis. Average Bray-Curtis dissimilarity was used between all pairs of sample
and represented within this test. The nMDS plots were produced in terms of their
species composition at the selected sites. The nMDS analysis plots a measure of
similarity between the stations into multi-dimensional spaces so that the distance
between objects corresponds closely to their input similarities. Simply stated, the
closer two dots on the nMDS plot are the more similar the samples/stations. The
stress value indicates how precisely the high dimensional relationships among the
samples are represented, the lower the stress value, the less distortion occurs
(Hargrave, 2005).
The physico-chemical and seabed data (organic content levels and grain size) data
for the different stations at both sites were normalised and then characterised by the
principal component analysis (PCA scores; Primer etc). PCA scoring is a standard
parametric ordination technique that plots the distribution of physico-chemical
parameters and seabed data at each station in usually two dimensions based on
linear combinations of variables. It is particularly suited for the analysis of physico-
chemical parameters and seabed sediments (organic content levels and grain size)
data, further to summarise the statistical correlation between the physico-chemical
parameters and seabed sediments (organic content levels and grain size) data with
minimum loss of original information. Inspection of the correlation matrix revealed
the presence of many coefficients of 0.3 or greater, in order to identify the important
factor into each PCA (Pallant, 2010). Williams et al., 2010 stated that a factorability
of 0.3 indicates that the factors account for approximately 30% relationship within
the data. However, Hair et al., 1995 categorised these loadings using another rule
of thumb as ± 0.30 = minimal, ± 0.40 = important, and ±.50=practically significant.
Thus, as data from PCA scores did not meet ration level, linear relativity and normal
bivariate distribution, nonparametric spearman’s rank correlation analysis was
performed (Walls et al., 2013) using SPSS statistical software (IBM Corp. Released
2011. IBM SPSS Statistics for Windows, Version 20.0. Armonk, NY: IBM Corp)
(see appendix 5). This was applied in order to determine the relationship between
the physico-chemical, seabed sediments (organic content levels and grain size)
parameters and the benthic community. If there are no repeated data values, a
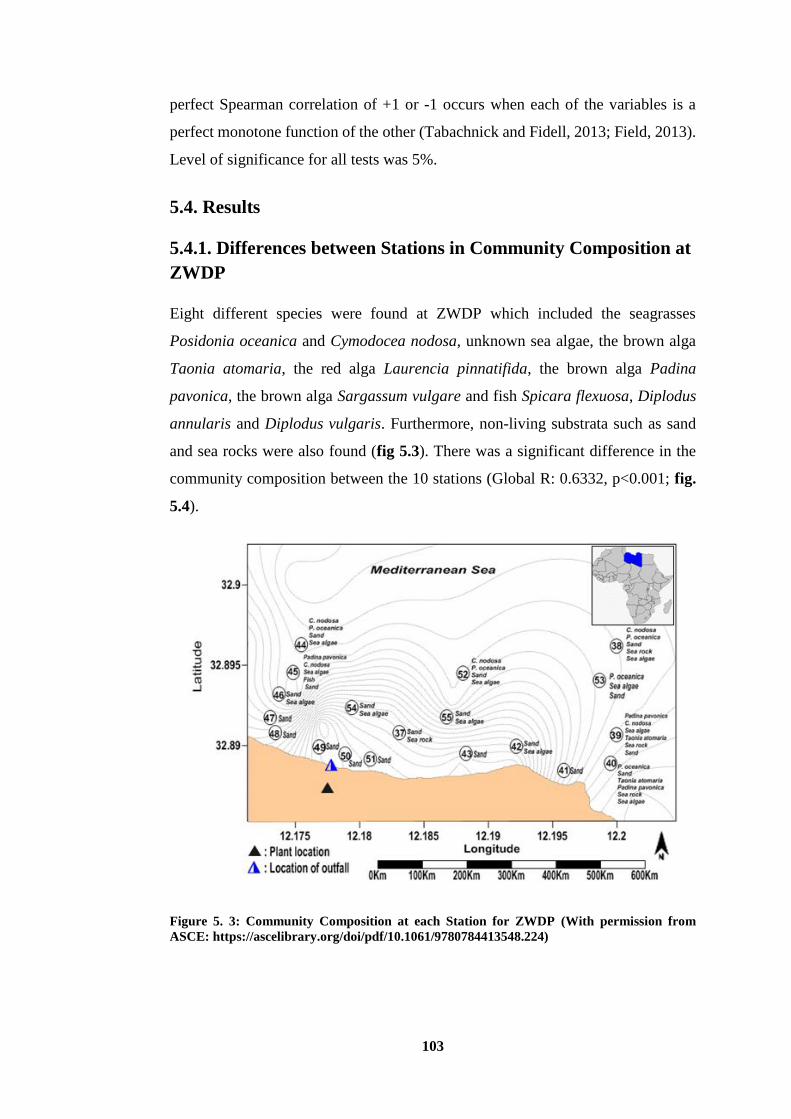
103
perfect Spearman correlation of +1 or -1 occurs when each of the variables is a
perfect monotone function of the other (Tabachnick and Fidell, 2013; Field, 2013).
Level of significance for all tests was 5%.
5.4. Results
5.4.1. Differences between Stations in Community Composition at
ZWDP
Eight different species were found at ZWDP which included the seagrasses
Posidonia oceanica and Cymodocea nodosa, unknown sea algae, the brown alga
Taonia atomaria, the red alga Laurencia pinnatifida, the brown alga Padina
pavonica, the brown alga Sargassum vulgare and fish Spicara flexuosa, Diplodus
annularis and Diplodus vulgaris. Furthermore, non-living substrata such as sand
and sea rocks were also found (fig 5.3). There was a significant difference in the
community composition between the 10 stations (Global R: 0.6332, p<0.001; fig.
5.4).
Figure 5. 3: Community Composition at each Station for ZWDP (With permission from
ASCE: https://ascelibrary.org/doi/pdf/10.1061/9780784413548.224)
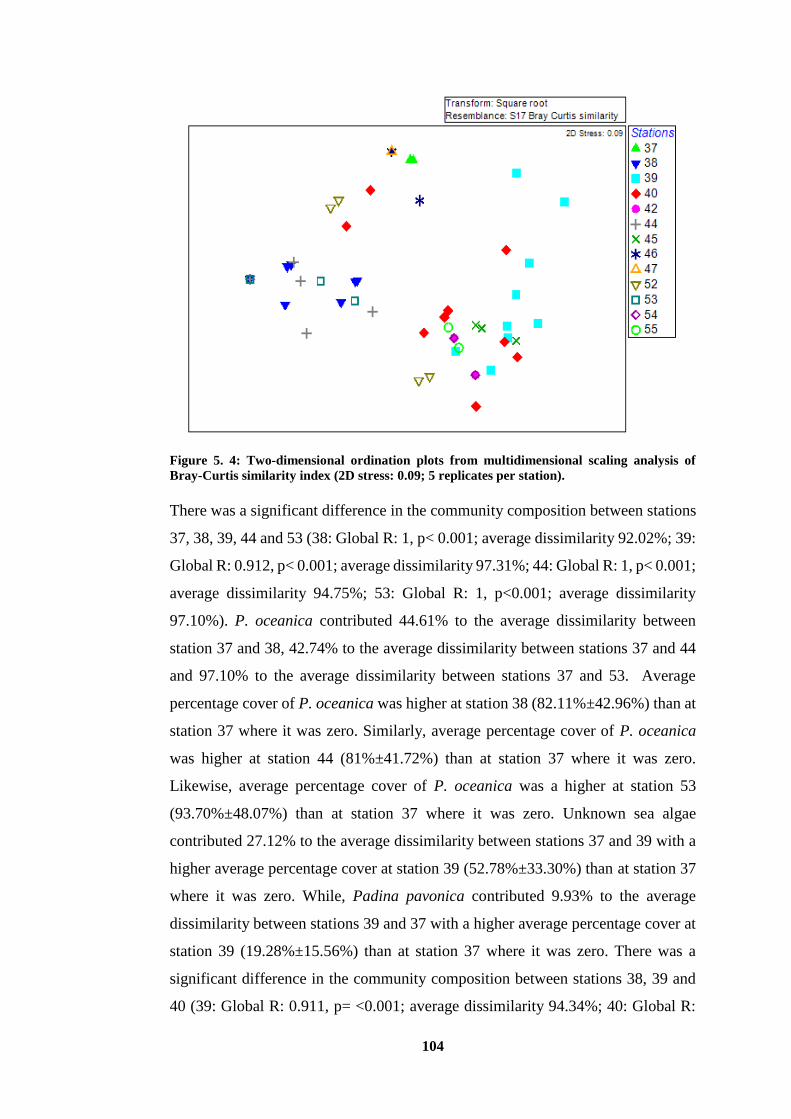
104
Figure 5. 4: Two-dimensional ordination plots from multidimensional scaling analysis of
Bray-Curtis similarity index (2D stress: 0.09; 5 replicates per station).
There was a significant difference in the community composition between stations
37, 38, 39, 44 and 53 (38: Global R: 1, p< 0.001; average dissimilarity 92.02%; 39:
Global R: 0.912, p< 0.001; average dissimilarity 97.31%; 44: Global R: 1, p< 0.001;
average dissimilarity 94.75%; 53: Global R: 1, p<0.001; average dissimilarity
97.10%). P. oceanica contributed 44.61% to the average dissimilarity between
station 37 and 38, 42.74% to the average dissimilarity between stations 37 and 44
and 97.10% to the average dissimilarity between stations 37 and 53. Average
percentage cover of P. oceanica was higher at station 38 (82.11%±42.96%) than at
station 37 where it was zero. Similarly, average percentage cover of P. oceanica
was higher at station 44 (81%±41.72%) than at station 37 where it was zero.
Likewise, average percentage cover of P. oceanica was a higher at station 53
(93.70%±48.07%) than at station 37 where it was zero. Unknown sea algae
contributed 27.12% to the average dissimilarity between stations 37 and 39 with a
higher average percentage cover at station 39 (52.78%±33.30%) than at station 37
where it was zero. While, Padina pavonica contributed 9.93% to the average
dissimilarity between stations 39 and 37 with a higher average percentage cover at
station 39 (19.28%±15.56%) than at station 37 where it was zero. There was a
significant difference in the community composition between stations 38, 39 and
40 (39: Global R: 0.911, p= <0.001; average dissimilarity 94.34%; 40: Global R:
105
0.709, p=<0.001; average dissimilarity 86.88%). P. oceanica contributed 43.50%
to the average dissimilarity between stations 38 and 39 and 44.51% to the average
dissimilarity between stations 38 and 40. Average percentage cover of P. oceanica
was higher at station 38 (82.11%±42.96%) than at station 39 where it was zero.
Similarly, average percentage cover of P. oceanica was higher at station 38
(82.11%±42.96%) than at station 40 (4.78%±8.44%). Unknown sea algae
contributed 26.43% to the average dissimilarity between station 38 and 39 and
26.85% to the average dissimilarity between stations 38 and 40. Average
percentage cover of unknown sea algae was lower at station 38 (5.22%±15.87%)
than at station 39 (52.78%±33.30%). While, average percentage cover of unknown
sea algae was higher at station 40 (49.56%±30.95%) than at station 38
(5.22%±15.87%). The other important species at these stations was Padina
pavonica which contributed 10.24% to the average dissimilarity with a higher
average percentage cover at station 39 (19.28%±15.56%) than at station 38 where
it was zero. Similarly, Sargassum vulgare contributed 4.63% to the average
dissimilarity with a higher average percentage cover at station 39 (8.78%±23.20%)
than at station 38 where it was zero (fig 5.5). Moreover, Laurencia pinnatifida
contributed 7.48% to the average dissimilarity with a higher average percentage
cover at station 40 (13%±13.24%) than at station 38 where it was zero (fig 5.6).
There was a significant difference in the community composition between stations
39, 44 and 53 (44: Global R: 0.943, p=<0.001; average dissimilarity 96.21%; 53:
Global R: 0.961, p=<0.001; average dissimilarity 97.19%). P. oceanica contributed
42.07% to the average dissimilarity between stations 44 and 39 and 48.18% to the
average dissimilarity between stations 53 and 39. Average percentage cover of P.
oceanica was higher at station 44 (81%±0%) than at station 39 where it was zero.
Similarly, average percentage cover of P. oceanica was higher at station 53
(93.7%±48.06) than at station 39 where it was zero. Unknown sea algae contributed
26.72% to the average dissimilarity between stations and 39 and 44 and 26.19% to
the average dissimilarity between stations 39 and 53. Average percentage cover of
unknown sea algae was higher at station 39 (52.78%±4.38%) than at station 44
(4.38%±19.4%). Similarly, the average percentage cover of unknown sea algae was
higher at station 39 (52.78%±33.3%) than at station 53 (3.4%±31.01%). In
addition, Padina pavonica contributed 10.04% to the average dissimilarity between
station 39 and 44 and 9.94% to the average dissimilarity between stations 39 and
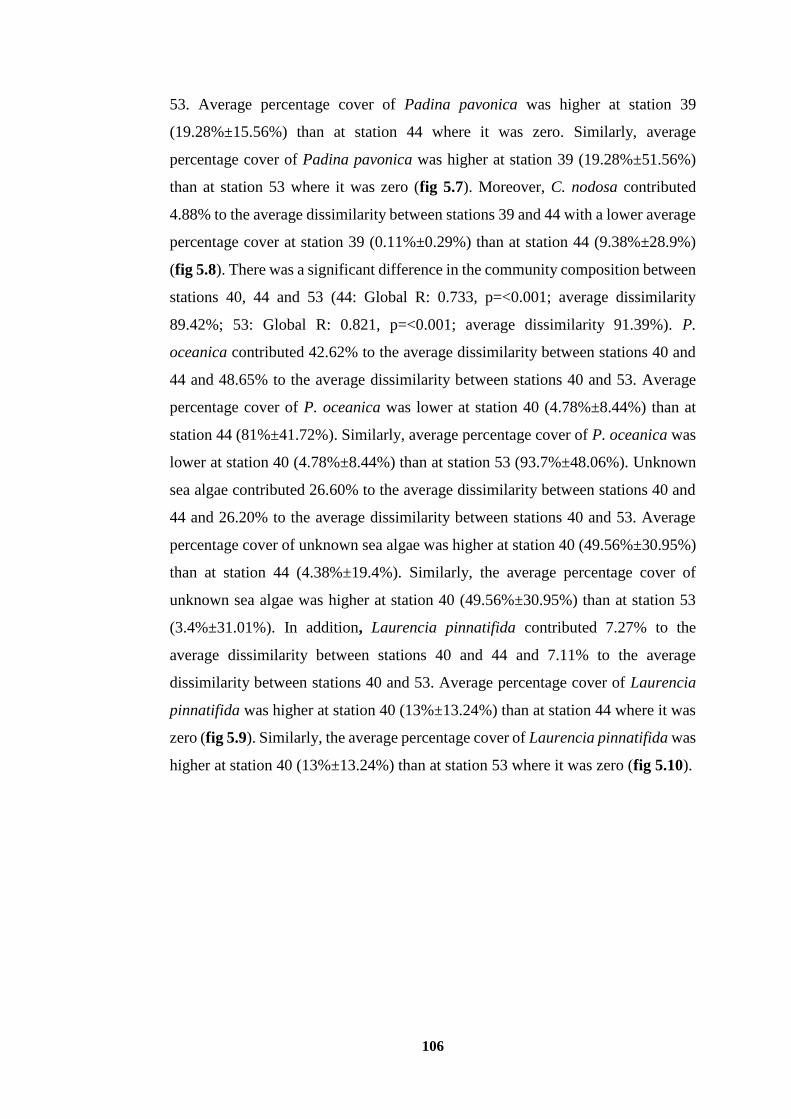
106
53. Average percentage cover of Padina pavonica was higher at station 39
(19.28%±15.56%) than at station 44 where it was zero. Similarly, average
percentage cover of Padina pavonica was higher at station 39 (19.28%±51.56%)
than at station 53 where it was zero (fig 5.7). Moreover, C. nodosa contributed
4.88% to the average dissimilarity between stations 39 and 44 with a lower average
percentage cover at station 39 (0.11%±0.29%) than at station 44 (9.38%±28.9%)
(fig 5.8). There was a significant difference in the community composition between
stations 40, 44 and 53 (44: Global R: 0.733, p=<0.001; average dissimilarity
89.42%; 53: Global R: 0.821, p=<0.001; average dissimilarity 91.39%). P.
oceanica contributed 42.62% to the average dissimilarity between stations 40 and
44 and 48.65% to the average dissimilarity between stations 40 and 53. Average
percentage cover of P. oceanica was lower at station 40 (4.78%±8.44%) than at
station 44 (81%±41.72%). Similarly, average percentage cover of P. oceanica was
lower at station 40 (4.78%±8.44%) than at station 53 (93.7%±48.06%). Unknown
sea algae contributed 26.60% to the average dissimilarity between stations 40 and
44 and 26.20% to the average dissimilarity between stations 40 and 53. Average
percentage cover of unknown sea algae was higher at station 40 (49.56%±30.95%)
than at station 44 (4.38%±19.4%). Similarly, the average percentage cover of
unknown sea algae was higher at station 40 (49.56%±30.95%) than at station 53
(3.4%±31.01%). In addition, Laurencia pinnatifida contributed 7.27% to the
average dissimilarity between stations 40 and 44 and 7.11% to the average
dissimilarity between stations 40 and 53. Average percentage cover of Laurencia
pinnatifida was higher at station 40 (13%±13.24%) than at station 44 where it was
zero (fig 5.9). Similarly, the average percentage cover of Laurencia pinnatifida was
higher at station 40 (13%±13.24%) than at station 53 where it was zero (fig 5.10).
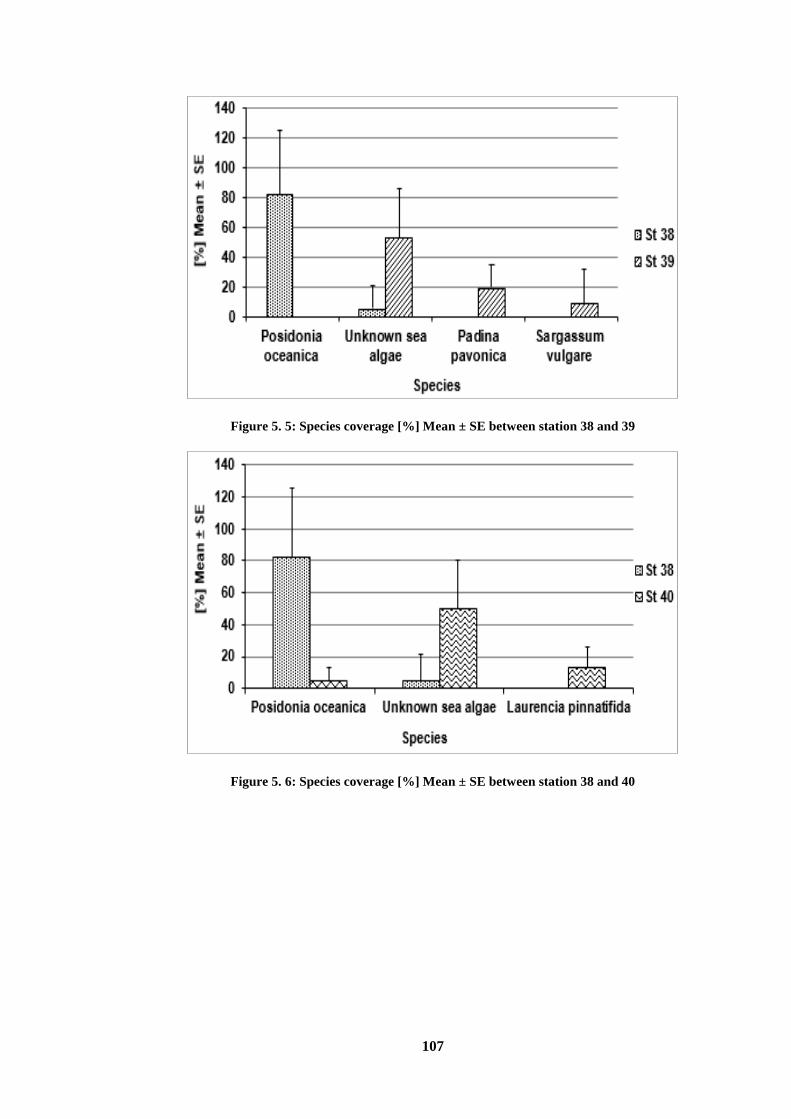
107
Figure 5. 5: Species coverage [%] Mean ± SE between station 38 and 39
Figure 5. 6: Species coverage [%] Mean ± SE between station 38 and 40
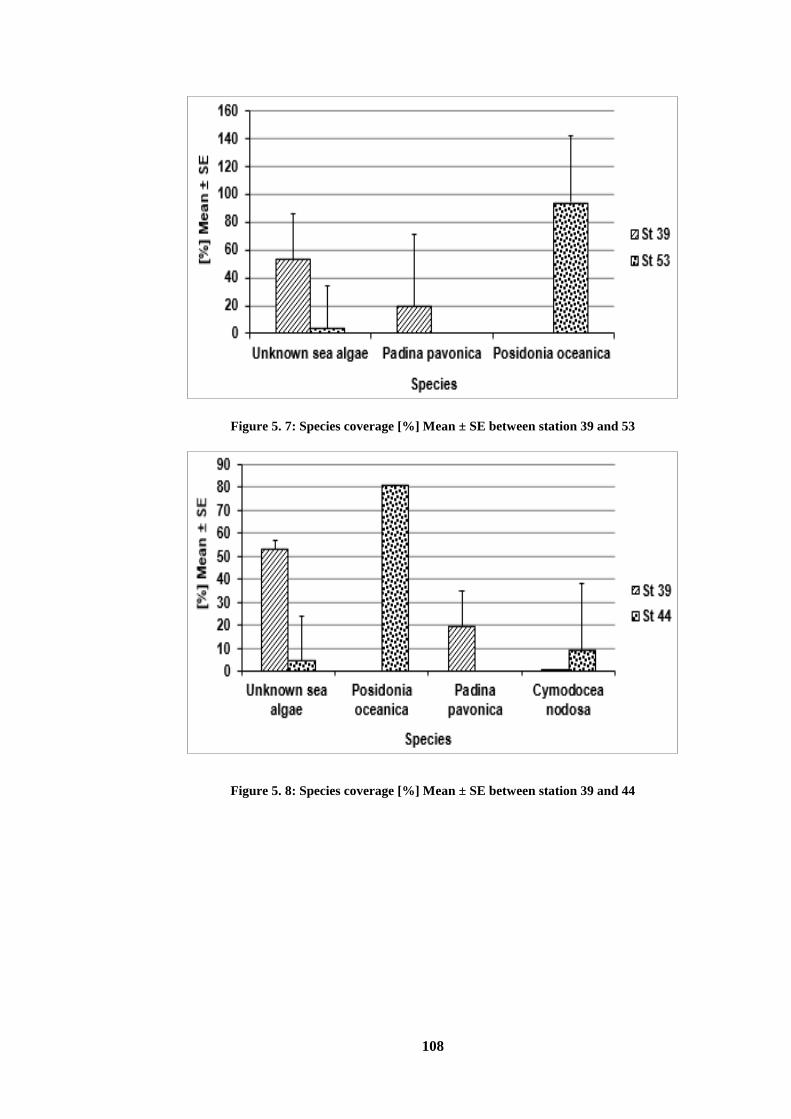
108
Figure 5. 7: Species coverage [%] Mean ± SE between station 39 and 53
Figure 5. 8: Species coverage [%] Mean ± SE between station 39 and 44
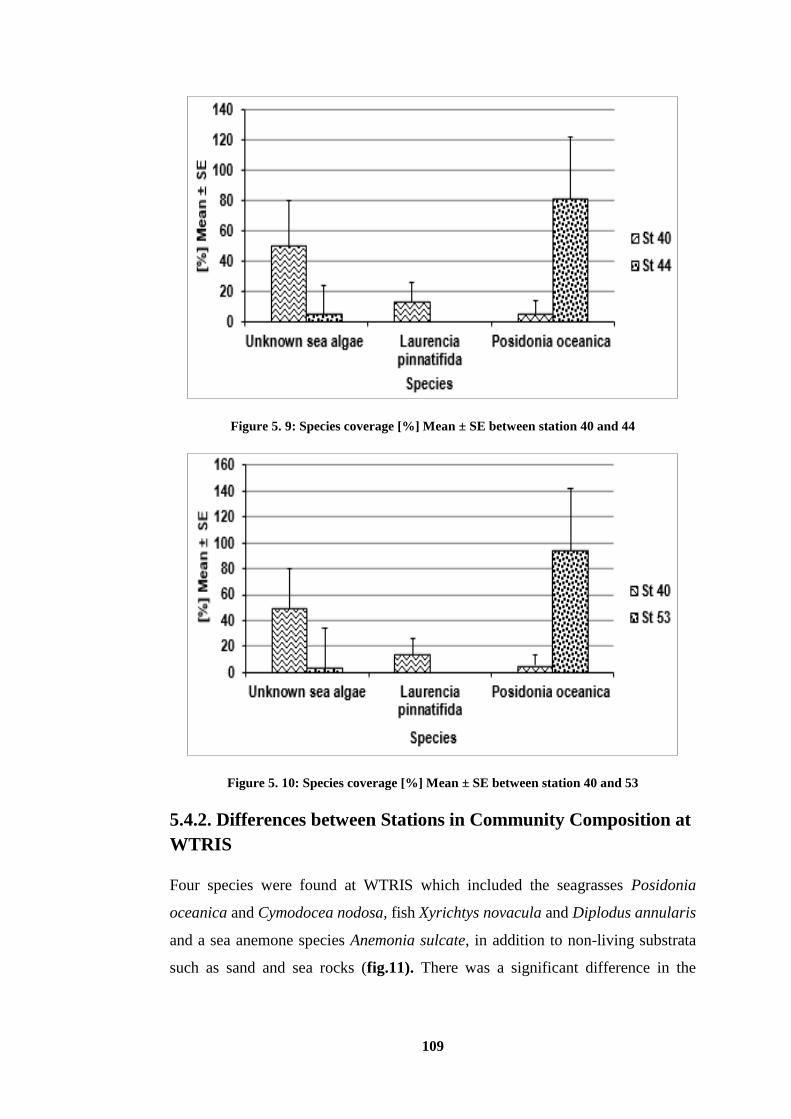
109
Figure 5. 9: Species coverage [%] Mean ± SE between station 40 and 44
Figure 5. 10: Species coverage [%] Mean ± SE between station 40 and 53
5.4.2. Differences between Stations in Community Composition at
WTRIS
Four species were found at WTRIS which included the seagrasses Posidonia
oceanica and Cymodocea nodosa, fish Xyrichtys novacula and Diplodus annularis
and a sea anemone species Anemonia sulcate, in addition to non-living substrata
such as sand and sea rocks (fig.11). There was a significant difference in the
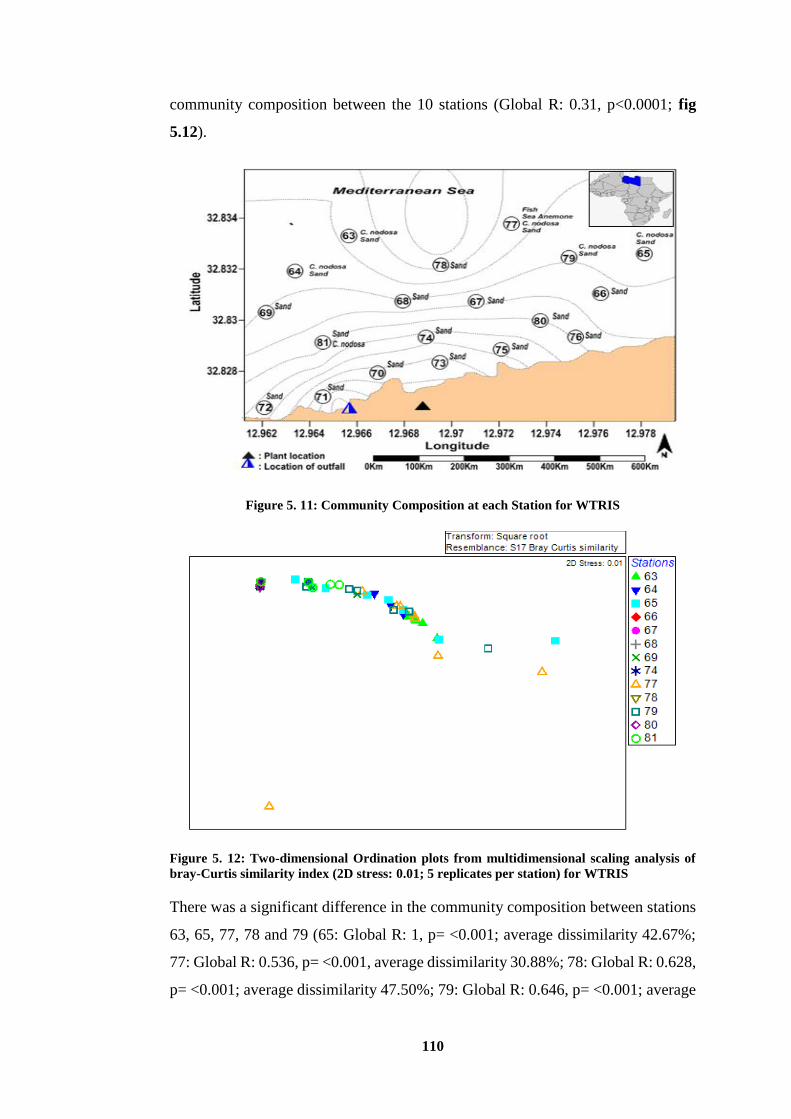
110
community composition between the 10 stations (Global R: 0.31, p<0.0001; fig
5.12).
Figure 5. 11: Community Composition at each Station for WTRIS
Figure 5. 12: Two-dimensional Ordination plots from multidimensional scaling analysis of
bray-Curtis similarity index (2D stress: 0.01; 5 replicates per station) for WTRIS
There was a significant difference in the community composition between stations
63, 65, 77, 78 and 79 (65: Global R: 1, p= <0.001; average dissimilarity 42.67%;
77: Global R: 0.536, p= <0.001, average dissimilarity 30.88%; 78: Global R: 0.628,
p= <0.001; average dissimilarity 47.50%; 79: Global R: 0.646, p= <0.001; average
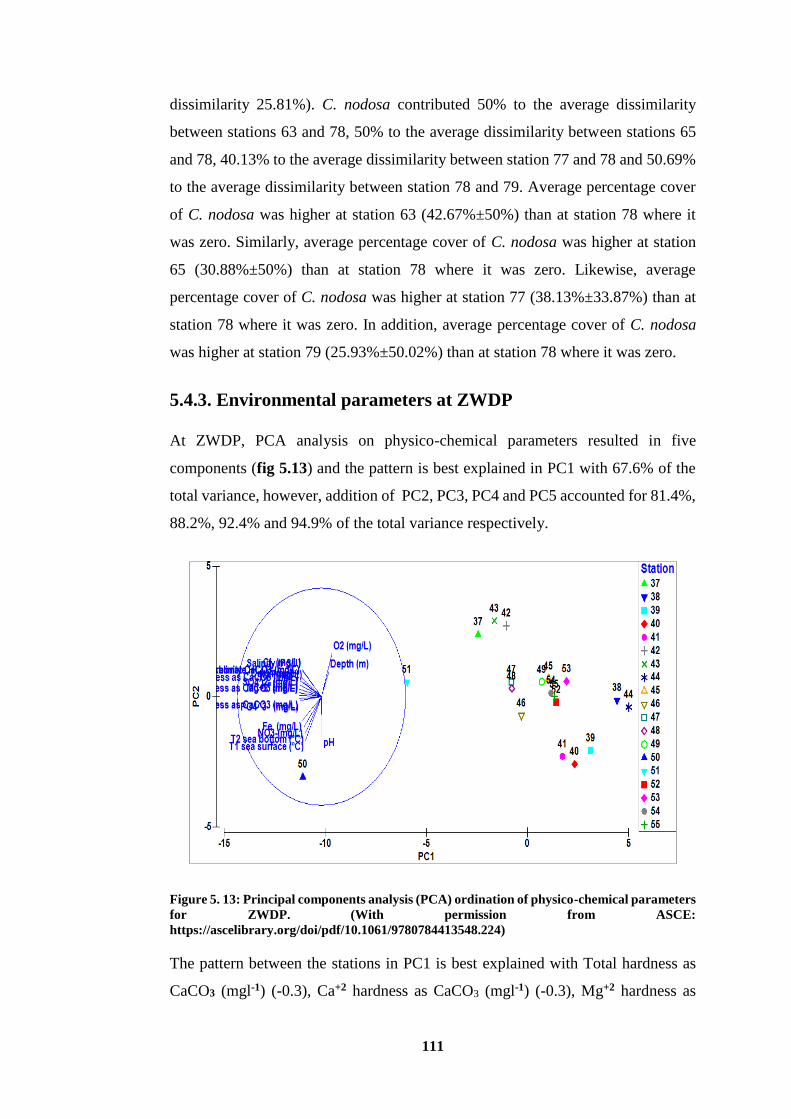
111
dissimilarity 25.81%). C. nodosa contributed 50% to the average dissimilarity
between stations 63 and 78, 50% to the average dissimilarity between stations 65
and 78, 40.13% to the average dissimilarity between station 77 and 78 and 50.69%
to the average dissimilarity between station 78 and 79. Average percentage cover
of C. nodosa was higher at station 63 (42.67%±50%) than at station 78 where it
was zero. Similarly, average percentage cover of C. nodosa was higher at station
65 (30.88%±50%) than at station 78 where it was zero. Likewise, average
percentage cover of C. nodosa was higher at station 77 (38.13%±33.87%) than at
station 78 where it was zero. In addition, average percentage cover of C. nodosa
was higher at station 79 (25.93%±50.02%) than at station 78 where it was zero.
5.4.3. Environmental parameters at ZWDP
At ZWDP, PCA analysis on physico-chemical parameters resulted in five
components (fig 5.13) and the pattern is best explained in PC1 with 67.6% of the
total variance, however, addition of PC2, PC3, PC4 and PC5 accounted for 81.4%,
88.2%, 92.4% and 94.9% of the total variance respectively.
Figure 5. 13: Principal components analysis (PCA) ordination of physico-chemical parameters
for ZWDP. (With permission from ASCE:
https://ascelibrary.org/doi/pdf/10.1061/9780784413548.224)
The pattern between the stations in PC1 is best explained with Total hardness as
CaCO3 (mgl-1) (-0.3), Ca+2 hardness as CaCO3 (mgl-1) (-0.3), Mg+2 hardness as
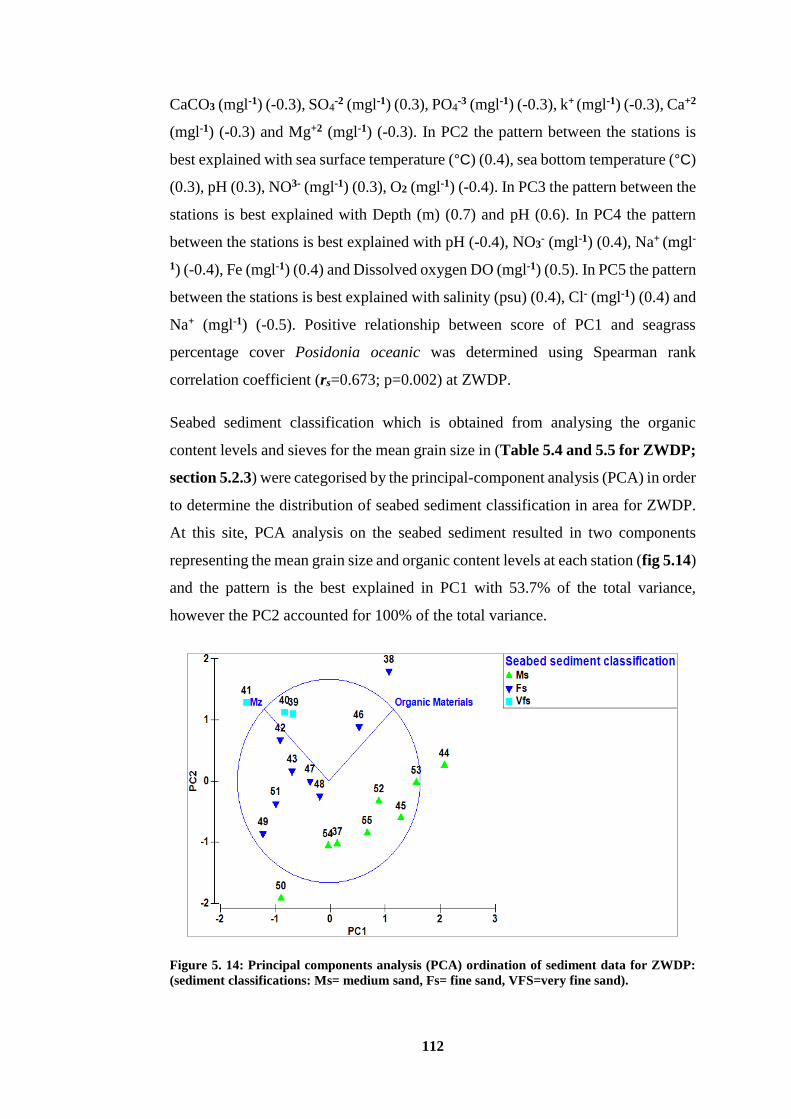
112
CaCO3 (mgl-1) (-0.3), SO4-2 (mgl-1) (0.3), PO4
-3 (mgl-1) (-0.3), k+ (mgl-1) (-0.3), Ca+2
(mgl-1) (-0.3) and Mg+2 (mgl-1) (-0.3). In PC2 the pattern between the stations is
best explained with sea surface temperature (°C) (0.4), sea bottom temperature (°C)
(0.3), pH (0.3), NO3- (mgl-1) (0.3), O2 (mgl-1) (-0.4). In PC3 the pattern between the
stations is best explained with Depth (m) (0.7) and pH (0.6). In PC4 the pattern
between the stations is best explained with pH (-0.4), NO3- (mgl-1) (0.4), Na+ (mgl-
1) (-0.4), Fe (mgl-1) (0.4) and Dissolved oxygen DO (mgl-1) (0.5). In PC5 the pattern
between the stations is best explained with salinity (psu) (0.4), Cl- (mgl-1) (0.4) and
Na+ (mgl-1) (-0.5). Positive relationship between score of PC1 and seagrass
percentage cover Posidonia oceanic was determined using Spearman rank
correlation coefficient (rs=0.673; p=0.002) at ZWDP.
Seabed sediment classification which is obtained from analysing the organic
content levels and sieves for the mean grain size in (Table 5.4 and 5.5 for ZWDP;
section 5.2.3) were categorised by the principal-component analysis (PCA) in order
to determine the distribution of seabed sediment classification in area for ZWDP.
At this site, PCA analysis on the seabed sediment resulted in two components
representing the mean grain size and organic content levels at each station (fig 5.14)
and the pattern is the best explained in PC1 with 53.7% of the total variance,
however the PC2 accounted for 100% of the total variance.
Figure 5. 14: Principal components analysis (PCA) ordination of sediment data for ZWDP:
(sediment classifications: Ms= medium sand, Fs= fine sand, VFS=very fine sand).
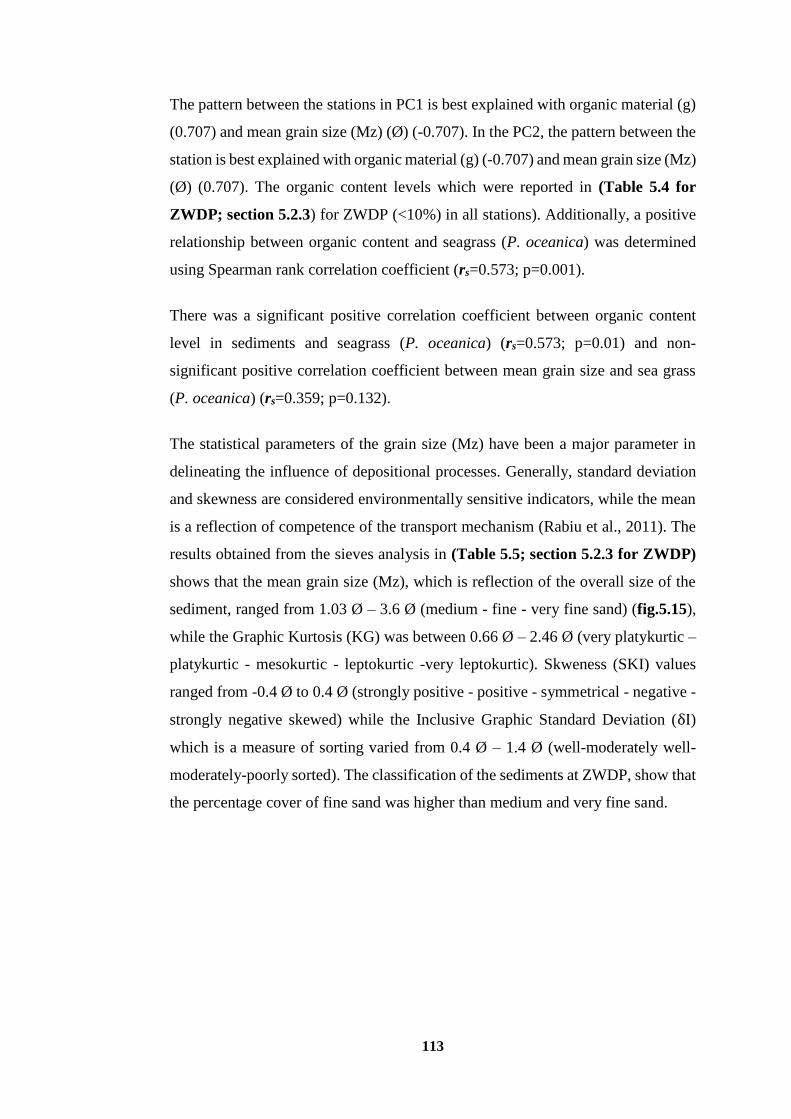
113
The pattern between the stations in PC1 is best explained with organic material (g)
(0.707) and mean grain size (Mz) (Ø) (-0.707). In the PC2, the pattern between the
station is best explained with organic material (g) (-0.707) and mean grain size (Mz)
(Ø) (0.707). The organic content levels which were reported in (Table 5.4 for
ZWDP; section 5.2.3) for ZWDP (<10%) in all stations). Additionally, a positive
relationship between organic content and seagrass (P. oceanica) was determined
using Spearman rank correlation coefficient (rs=0.573; p=0.001).
There was a significant positive correlation coefficient between organic content
level in sediments and seagrass (P. oceanica) (rs=0.573; p=0.01) and non-
significant positive correlation coefficient between mean grain size and sea grass
(P. oceanica) (rs=0.359; p=0.132).
The statistical parameters of the grain size (Mz) have been a major parameter in
delineating the influence of depositional processes. Generally, standard deviation
and skewness are considered environmentally sensitive indicators, while the mean
is a reflection of competence of the transport mechanism (Rabiu et al., 2011). The
results obtained from the sieves analysis in (Table 5.5; section 5.2.3 for ZWDP)
shows that the mean grain size (Mz), which is reflection of the overall size of the
sediment, ranged from 1.03 Ø – 3.6 Ø (medium - fine - very fine sand) (fig.5.15),
while the Graphic Kurtosis (KG) was between 0.66 Ø – 2.46 Ø (very platykurtic –
platykurtic - mesokurtic - leptokurtic -very leptokurtic). Skweness (SKI) values
ranged from -0.4 Ø to 0.4 Ø (strongly positive - positive - symmetrical - negative -
strongly negative skewed) while the Inclusive Graphic Standard Deviation (δI)
which is a measure of sorting varied from 0.4 Ø – 1.4 Ø (well-moderately well-
moderately-poorly sorted). The classification of the sediments at ZWDP, show that
the percentage cover of fine sand was higher than medium and very fine sand.
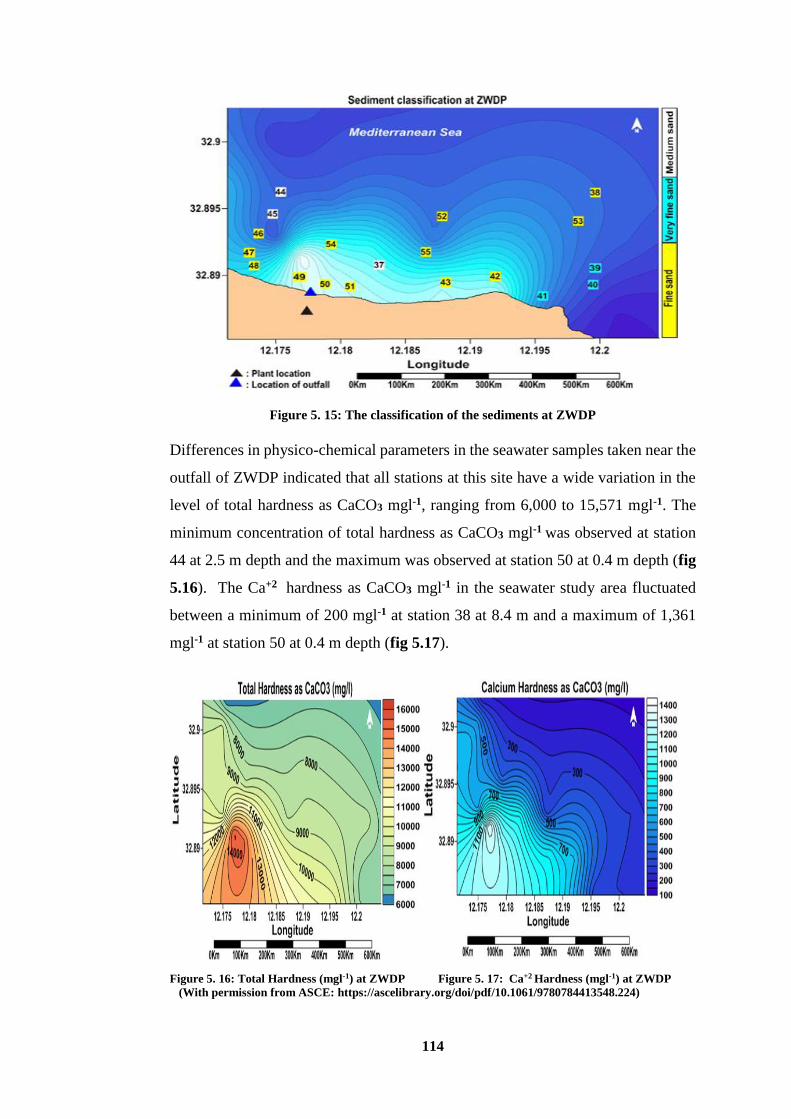
114
Figure 5. 15: The classification of the sediments at ZWDP
Differences in physico-chemical parameters in the seawater samples taken near the
outfall of ZWDP indicated that all stations at this site have a wide variation in the
level of total hardness as CaCO3 mgl-1, ranging from 6,000 to 15,571 mgl-1. The
minimum concentration of total hardness as CaCO3 mgl-1 was observed at station
44 at 2.5 m depth and the maximum was observed at station 50 at 0.4 m depth (fig
5.16). The Ca+2 hardness as CaCO3 mgl-1 in the seawater study area fluctuated
between a minimum of 200 mgl-1 at station 38 at 8.4 m and a maximum of 1,361
mgl-1 at station 50 at 0.4 m depth (fig 5.17).
Figure 5. 16: Total Hardness (mgl-1) at ZWDP Figure 5. 17: Ca+2 Hardness (mgl-1) at ZWDP
(With permission from ASCE: https://ascelibrary.org/doi/pdf/10.1061/9780784413548.224)
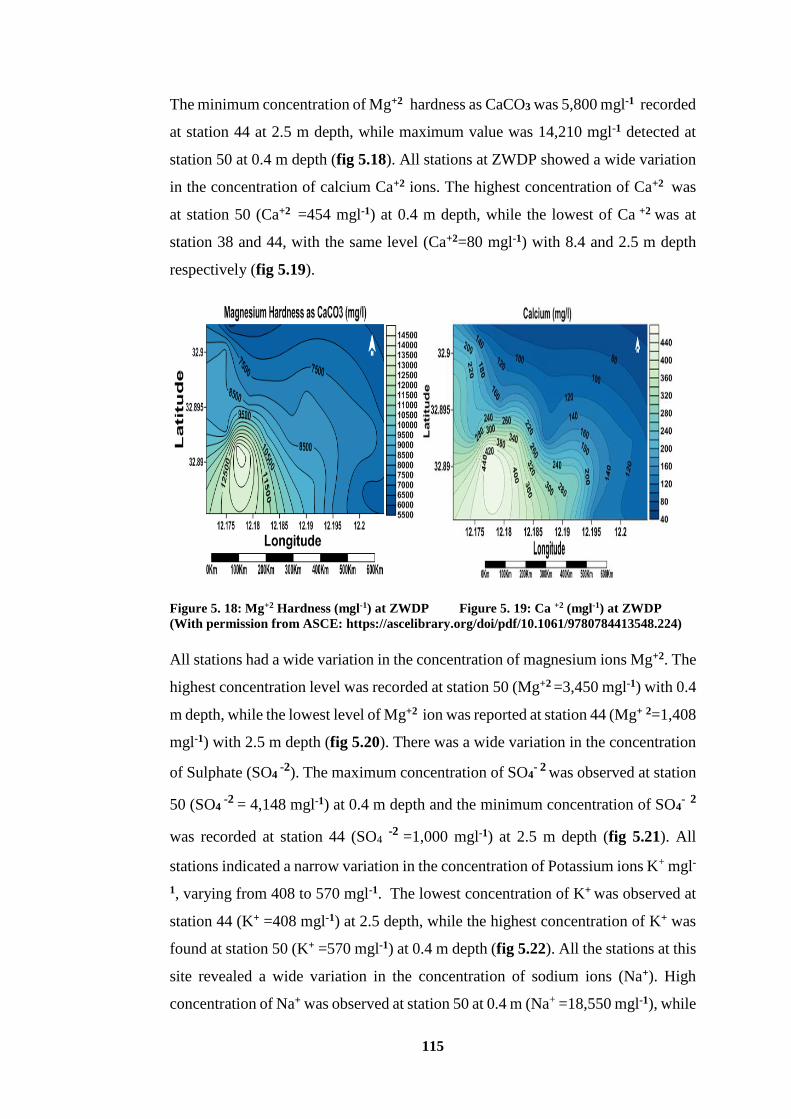
115
The minimum concentration of Mg+2 hardness as CaCO3 was 5,800 mgl-1 recorded
at station 44 at 2.5 m depth, while maximum value was 14,210 mgl-1 detected at
station 50 at 0.4 m depth (fig 5.18). All stations at ZWDP showed a wide variation
in the concentration of calcium Ca+2 ions. The highest concentration of Ca+2 was
at station 50 (Ca+2 =454 mgl-1) at 0.4 m depth, while the lowest of Ca +2 was at
station 38 and 44, with the same level (Ca+2=80 mgl-1) with 8.4 and 2.5 m depth
respectively (fig 5.19).
Figure 5. 18: Mg+2 Hardness (mgl-1) at ZWDP Figure 5. 19: Ca +2 (mgl-1) at ZWDP
(With permission from ASCE: https://ascelibrary.org/doi/pdf/10.1061/9780784413548.224)
All stations had a wide variation in the concentration of magnesium ions Mg+2. The
highest concentration level was recorded at station 50 (Mg+2 =3,450 mgl-1) with 0.4
m depth, while the lowest level of Mg+2 ion was reported at station 44 (Mg+ 2=1,408
mgl-1) with 2.5 m depth (fig 5.20). There was a wide variation in the concentration
of Sulphate (SO4 -2). The maximum concentration of SO4
- 2 was observed at station
50 (SO4 -2 = 4,148 mgl-1) at 0.4 m depth and the minimum concentration of SO4
- 2
was recorded at station 44 (SO4 -2 =1,000 mgl-1) at 2.5 m depth (fig 5.21). All
stations indicated a narrow variation in the concentration of Potassium ions K+ mgl-
1, varying from 408 to 570 mgl-1. The lowest concentration of K+ was observed at
station 44 (K+ =408 mgl-1) at 2.5 depth, while the highest concentration of K+ was
found at station 50 (K+ =570 mgl-1) at 0.4 m depth (fig 5.22). All the stations at this
site revealed a wide variation in the concentration of sodium ions (Na+). High
concentration of Na+ was observed at station 50 at 0.4 m (Na+ =18,550 mgl-1), while
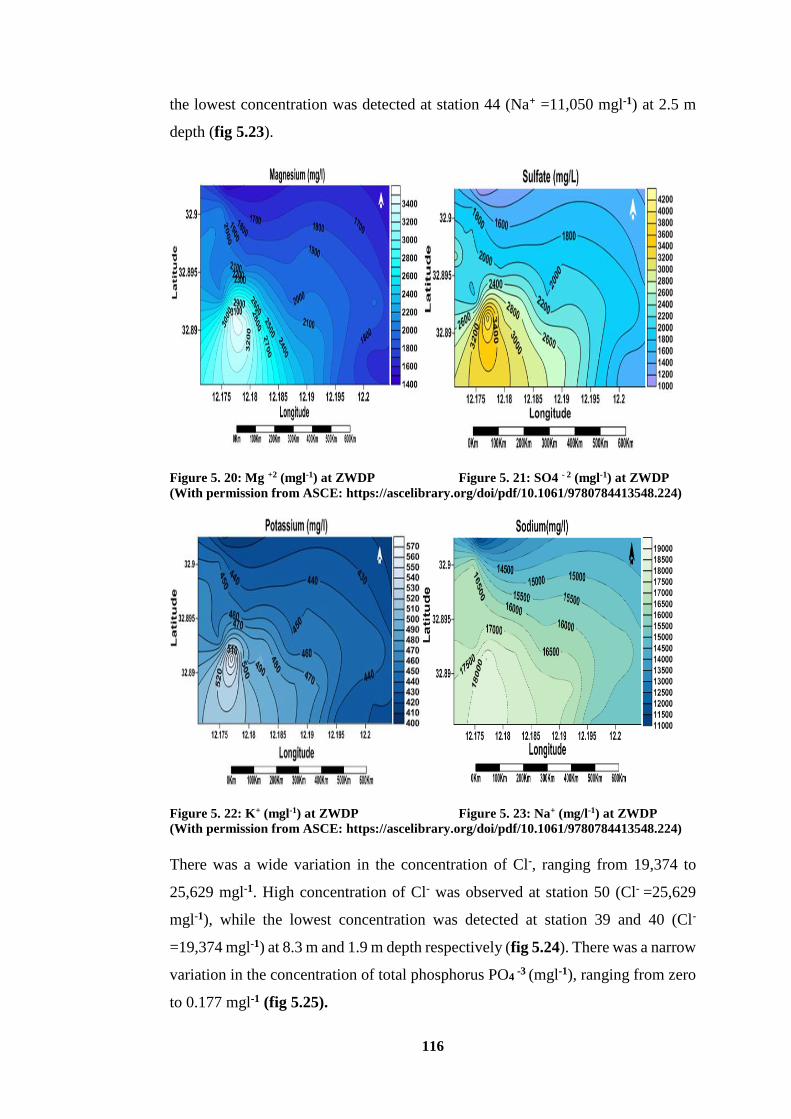
116
the lowest concentration was detected at station 44 (Na+ =11,050 mgl-1) at 2.5 m
depth (fig 5.23).
Figure 5. 20: Mg +2 (mgl-1) at ZWDP Figure 5. 21: SO4 - 2 (mgl-1) at ZWDP (With permission from ASCE: https://ascelibrary.org/doi/pdf/10.1061/9780784413548.224)
Figure 5. 22: K+ (mgl-1) at ZWDP Figure 5. 23: Na+ (mg/l-1) at ZWDP (With permission from ASCE: https://ascelibrary.org/doi/pdf/10.1061/9780784413548.224)
There was a wide variation in the concentration of Cl-, ranging from 19,374 to
25,629 mgl-1. High concentration of Cl- was observed at station 50 (Cl- =25,629
mgl-1), while the lowest concentration was detected at station 39 and 40 (Cl-
=19,374 mgl-1) at 8.3 m and 1.9 m depth respectively (fig 5.24). There was a narrow
variation in the concentration of total phosphorus PO4 -3 (mgl-1), ranging from zero
to 0.177 mgl-1 (fig 5.25).
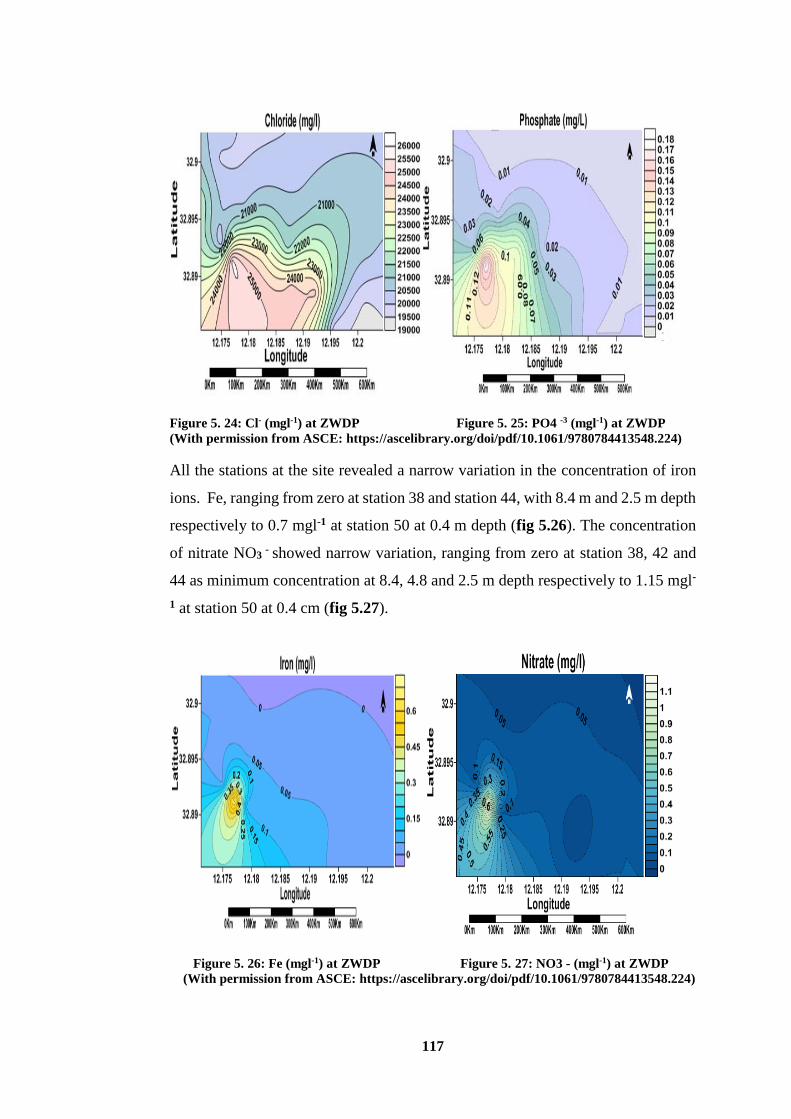
117
Figure 5. 24: Cl- (mgl-1) at ZWDP Figure 5. 25: PO4 -3 (mgl-1) at ZWDP (With permission from ASCE: https://ascelibrary.org/doi/pdf/10.1061/9780784413548.224)
All the stations at the site revealed a narrow variation in the concentration of iron
ions. Fe, ranging from zero at station 38 and station 44, with 8.4 m and 2.5 m depth
respectively to 0.7 mgl-1 at station 50 at 0.4 m depth (fig 5.26). The concentration
of nitrate NO3 - showed narrow variation, ranging from zero at station 38, 42 and
44 as minimum concentration at 8.4, 4.8 and 2.5 m depth respectively to 1.15 mgl-
1 at station 50 at 0.4 cm (fig 5.27).
Figure 5. 26: Fe (mgl-1) at ZWDP Figure 5. 27: NO3 - (mgl-1) at ZWDP
(With permission from ASCE: https://ascelibrary.org/doi/pdf/10.1061/9780784413548.224)
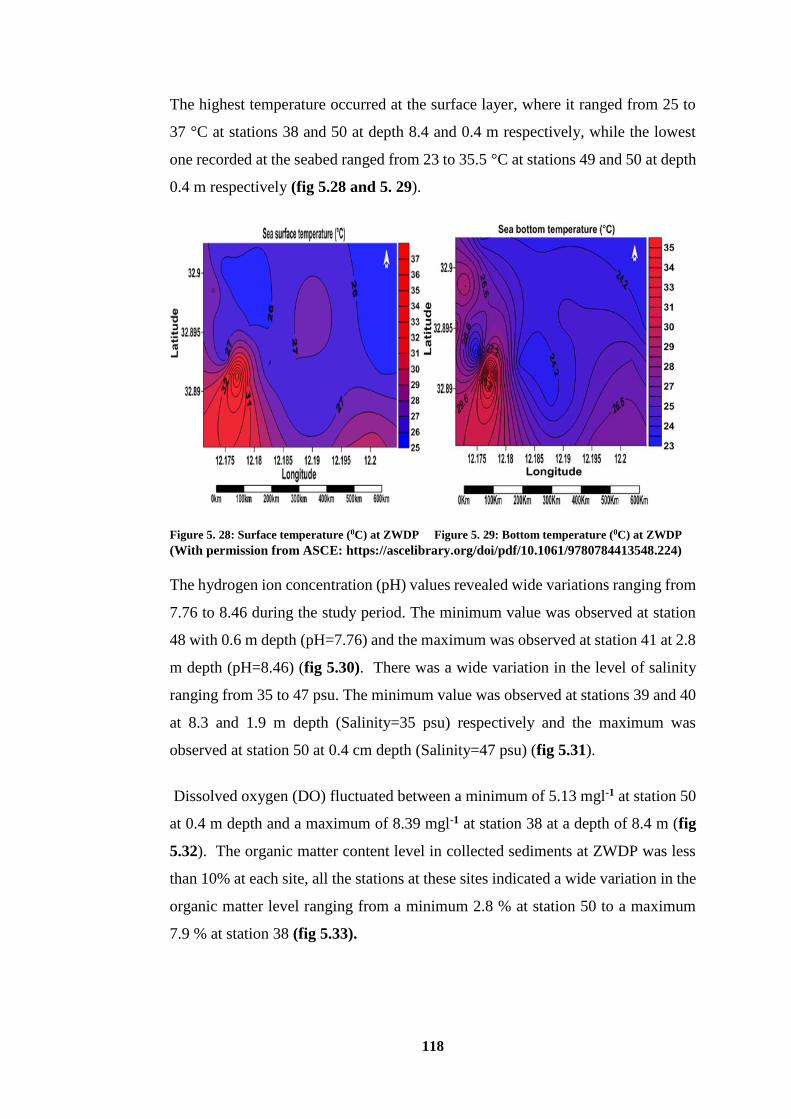
118
The highest temperature occurred at the surface layer, where it ranged from 25 to
37 °C at stations 38 and 50 at depth 8.4 and 0.4 m respectively, while the lowest
one recorded at the seabed ranged from 23 to 35.5 °C at stations 49 and 50 at depth
0.4 m respectively (fig 5.28 and 5. 29).
Figure 5. 28: Surface temperature (0C) at ZWDP Figure 5. 29: Bottom temperature (0C) at ZWDP
(With permission from ASCE: https://ascelibrary.org/doi/pdf/10.1061/9780784413548.224)
The hydrogen ion concentration (pH) values revealed wide variations ranging from
7.76 to 8.46 during the study period. The minimum value was observed at station
48 with 0.6 m depth (pH=7.76) and the maximum was observed at station 41 at 2.8
m depth (pH=8.46) (fig 5.30). There was a wide variation in the level of salinity
ranging from 35 to 47 psu. The minimum value was observed at stations 39 and 40
at 8.3 and 1.9 m depth (Salinity=35 psu) respectively and the maximum was
observed at station 50 at 0.4 cm depth (Salinity=47 psu) (fig 5.31).
Dissolved oxygen (DO) fluctuated between a minimum of 5.13 mgl-1 at station 50
at 0.4 m depth and a maximum of 8.39 mgl-1 at station 38 at a depth of 8.4 m (fig
5.32). The organic matter content level in collected sediments at ZWDP was less
than 10% at each site, all the stations at these sites indicated a wide variation in the
organic matter level ranging from a minimum 2.8 % at station 50 to a maximum
7.9 % at station 38 (fig 5.33).
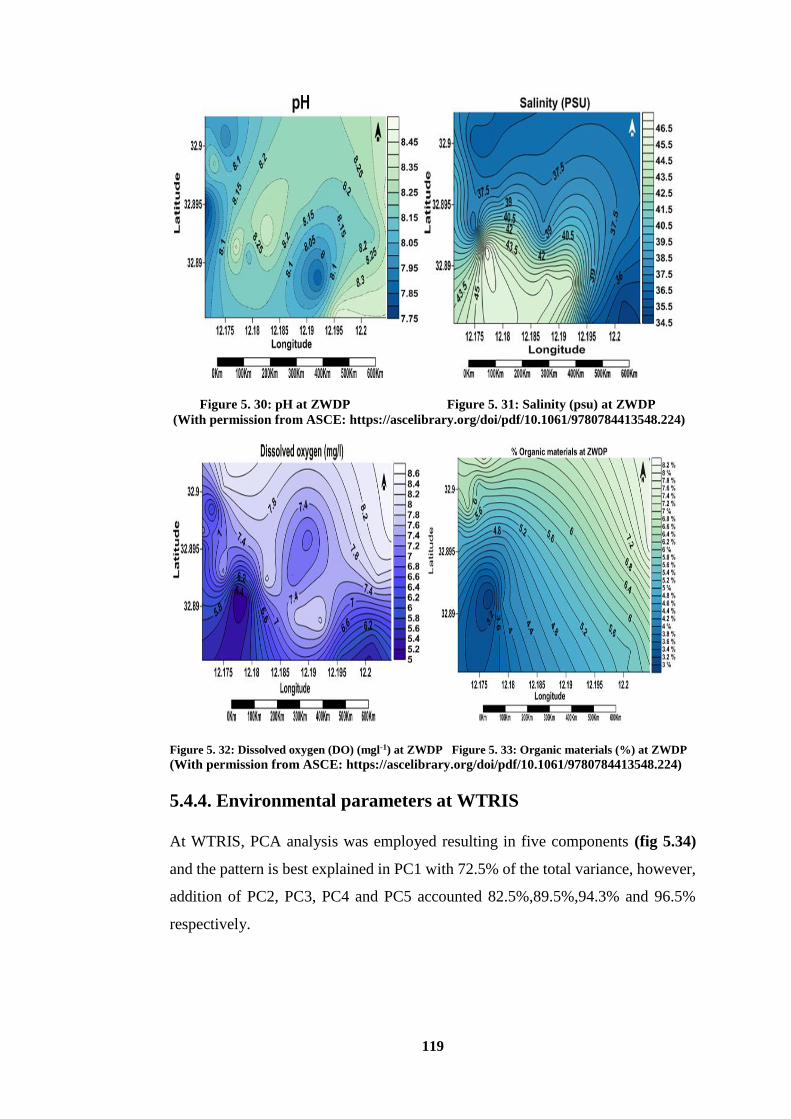
119
Figure 5. 30: pH at ZWDP Figure 5. 31: Salinity (psu) at ZWDP
(With permission from ASCE: https://ascelibrary.org/doi/pdf/10.1061/9780784413548.224)
Figure 5. 32: Dissolved oxygen (DO) (mgl-1) at ZWDP Figure 5. 33: Organic materials (%) at ZWDP
(With permission from ASCE: https://ascelibrary.org/doi/pdf/10.1061/9780784413548.224)
5.4.4. Environmental parameters at WTRIS
At WTRIS, PCA analysis was employed resulting in five components (fig 5.34)
and the pattern is best explained in PC1 with 72.5% of the total variance, however,
addition of PC2, PC3, PC4 and PC5 accounted 82.5%,89.5%,94.3% and 96.5%
respectively.
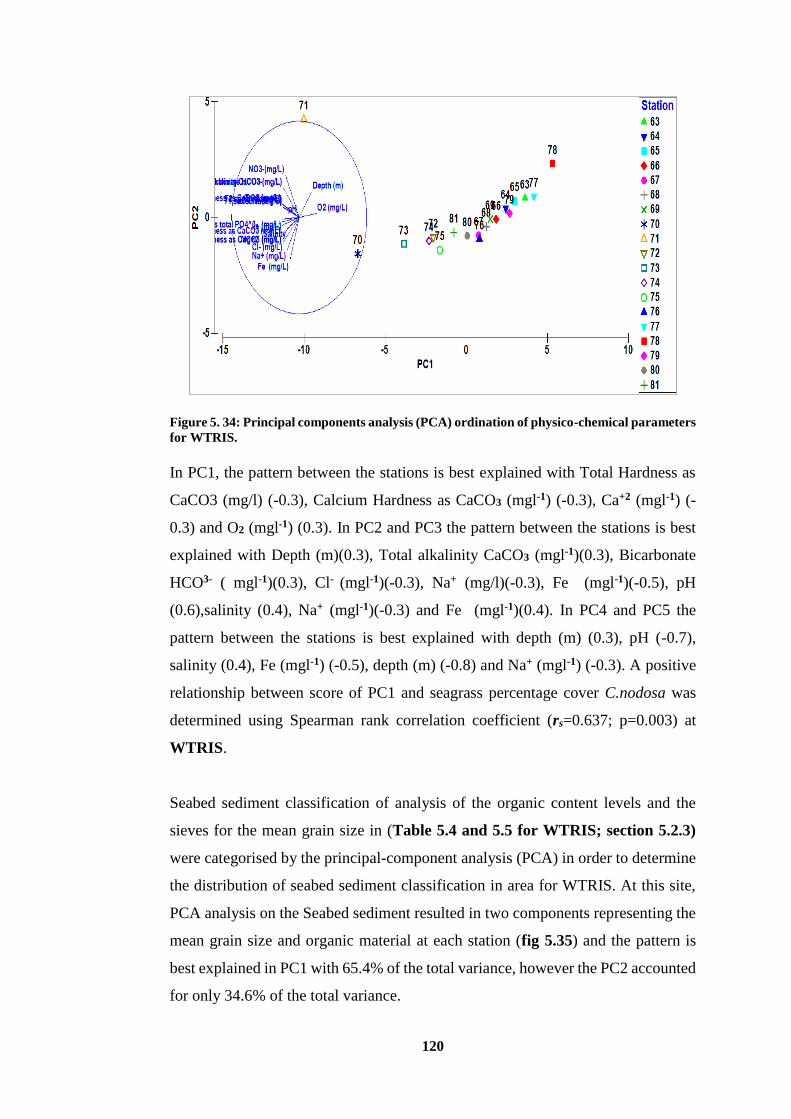
120
Figure 5. 34: Principal components analysis (PCA) ordination of physico-chemical parameters
for WTRIS.
In PC1, the pattern between the stations is best explained with Total Hardness as
CaCO3 (mg/l) (-0.3), Calcium Hardness as CaCO3 (mgl-1) (-0.3), Ca+2 (mgl-1) (-
0.3) and O2 (mgl-1) (0.3). In PC2 and PC3 the pattern between the stations is best
explained with Depth (m)(0.3), Total alkalinity CaCO3 (mgl-1)(0.3), Bicarbonate
HCO3- ( mgl-1)(0.3), Cl- (mgl-1)(-0.3), Na+ (mg/l)(-0.3), Fe (mgl-1)(-0.5), pH
(0.6),salinity (0.4), Na+ (mgl-1)(-0.3) and Fe (mgl-1)(0.4). In PC4 and PC5 the
pattern between the stations is best explained with depth (m) (0.3), pH (-0.7),
salinity (0.4), Fe (mgl-1) (-0.5), depth (m) (-0.8) and Na+ (mgl-1) (-0.3). A positive
relationship between score of PC1 and seagrass percentage cover C.nodosa was
determined using Spearman rank correlation coefficient (rs=0.637; p=0.003) at
WTRIS.
Seabed sediment classification of analysis of the organic content levels and the
sieves for the mean grain size in (Table 5.4 and 5.5 for WTRIS; section 5.2.3)
were categorised by the principal-component analysis (PCA) in order to determine
the distribution of seabed sediment classification in area for WTRIS. At this site,
PCA analysis on the Seabed sediment resulted in two components representing the
mean grain size and organic material at each station (fig 5.35) and the pattern is
best explained in PC1 with 65.4% of the total variance, however the PC2 accounted
for only 34.6% of the total variance.
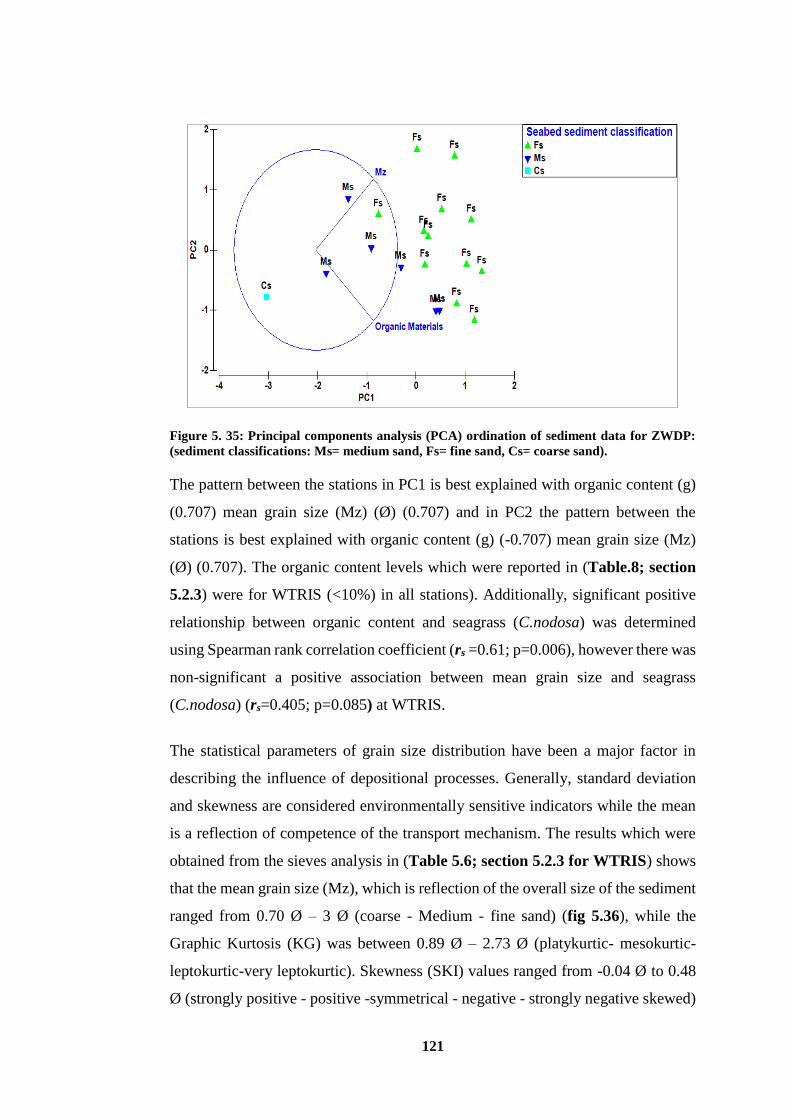
121
Figure 5. 35: Principal components analysis (PCA) ordination of sediment data for ZWDP:
(sediment classifications: Ms= medium sand, Fs= fine sand, Cs= coarse sand).
The pattern between the stations in PC1 is best explained with organic content (g)
(0.707) mean grain size (Mz) (Ø) (0.707) and in PC2 the pattern between the
stations is best explained with organic content (g) (-0.707) mean grain size (Mz)
(Ø) (0.707). The organic content levels which were reported in (Table.8; section
5.2.3) were for WTRIS (<10%) in all stations). Additionally, significant positive
relationship between organic content and seagrass (C.nodosa) was determined
using Spearman rank correlation coefficient (rs =0.61; p=0.006), however there was
non-significant a positive association between mean grain size and seagrass
(C.nodosa) (rs=0.405; p=0.085) at WTRIS.
The statistical parameters of grain size distribution have been a major factor in
describing the influence of depositional processes. Generally, standard deviation
and skewness are considered environmentally sensitive indicators while the mean
is a reflection of competence of the transport mechanism. The results which were
obtained from the sieves analysis in (Table 5.6; section 5.2.3 for WTRIS) shows
that the mean grain size (Mz), which is reflection of the overall size of the sediment
ranged from 0.70 Ø – 3 Ø (coarse - Medium - fine sand) (fig 5.36), while the
Graphic Kurtosis (KG) was between 0.89 Ø – 2.73 Ø (platykurtic- mesokurtic-
leptokurtic-very leptokurtic). Skewness (SKI) values ranged from -0.04 Ø to 0.48
Ø (strongly positive - positive -symmetrical - negative - strongly negative skewed)
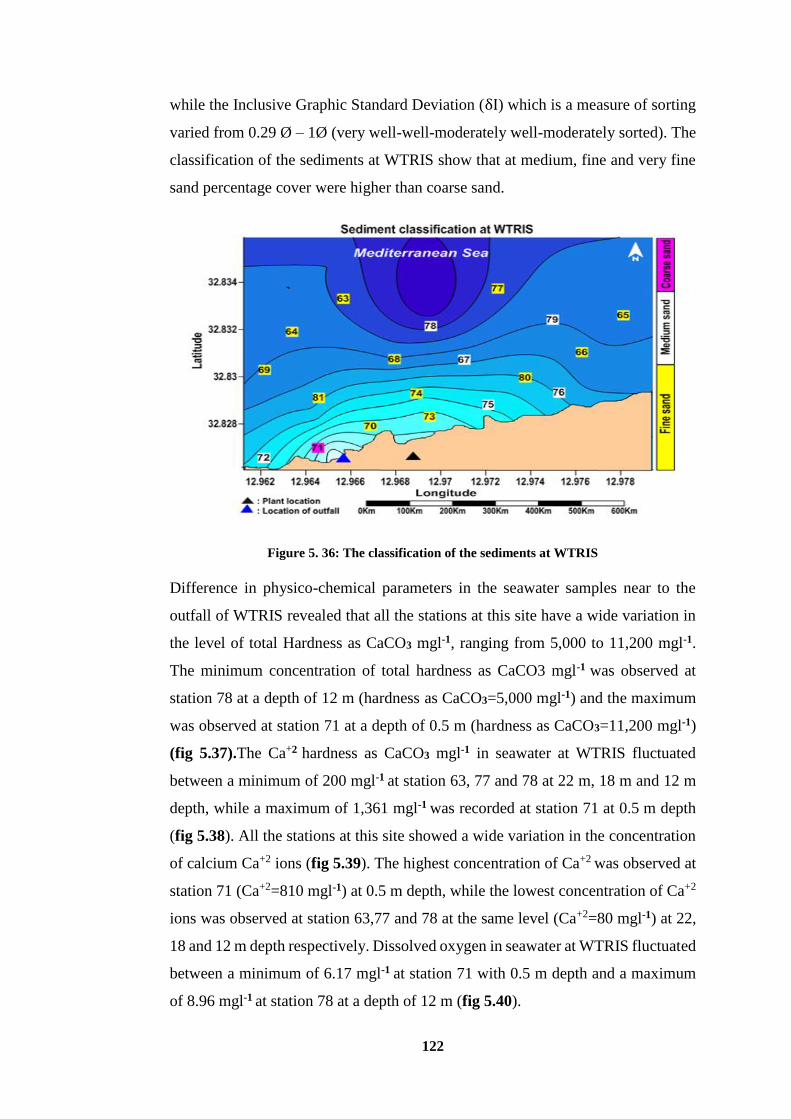
122
while the Inclusive Graphic Standard Deviation (δI) which is a measure of sorting
varied from 0.29 Ø – 1Ø (very well-well-moderately well-moderately sorted). The
classification of the sediments at WTRIS show that at medium, fine and very fine
sand percentage cover were higher than coarse sand.
Figure 5. 36: The classification of the sediments at WTRIS
Difference in physico-chemical parameters in the seawater samples near to the
outfall of WTRIS revealed that all the stations at this site have a wide variation in
the level of total Hardness as CaCO3 mgl-1, ranging from 5,000 to 11,200 mgl-1.
The minimum concentration of total hardness as CaCO3 mgl-1 was observed at
station 78 at a depth of 12 m (hardness as CaCO3=5,000 mgl-1) and the maximum
was observed at station 71 at a depth of 0.5 m (hardness as CaCO3=11,200 mgl-1)
(fig 5.37).The Ca+2 hardness as CaCO3 mgl-1 in seawater at WTRIS fluctuated
between a minimum of 200 mgl-1 at station 63, 77 and 78 at 22 m, 18 m and 12 m
depth, while a maximum of 1,361 mgl-1 was recorded at station 71 at 0.5 m depth
(fig 5.38). All the stations at this site showed a wide variation in the concentration
of calcium Ca+2 ions (fig 5.39). The highest concentration of Ca+2 was observed at
station 71 (Ca+2=810 mgl-1) at 0.5 m depth, while the lowest concentration of Ca+2
ions was observed at station 63,77 and 78 at the same level (Ca+2=80 mgl-1) at 22,
18 and 12 m depth respectively. Dissolved oxygen in seawater at WTRIS fluctuated
between a minimum of 6.17 mgl-1 at station 71 with 0.5 m depth and a maximum
of 8.96 mgl-1 at station 78 at a depth of 12 m (fig 5.40).
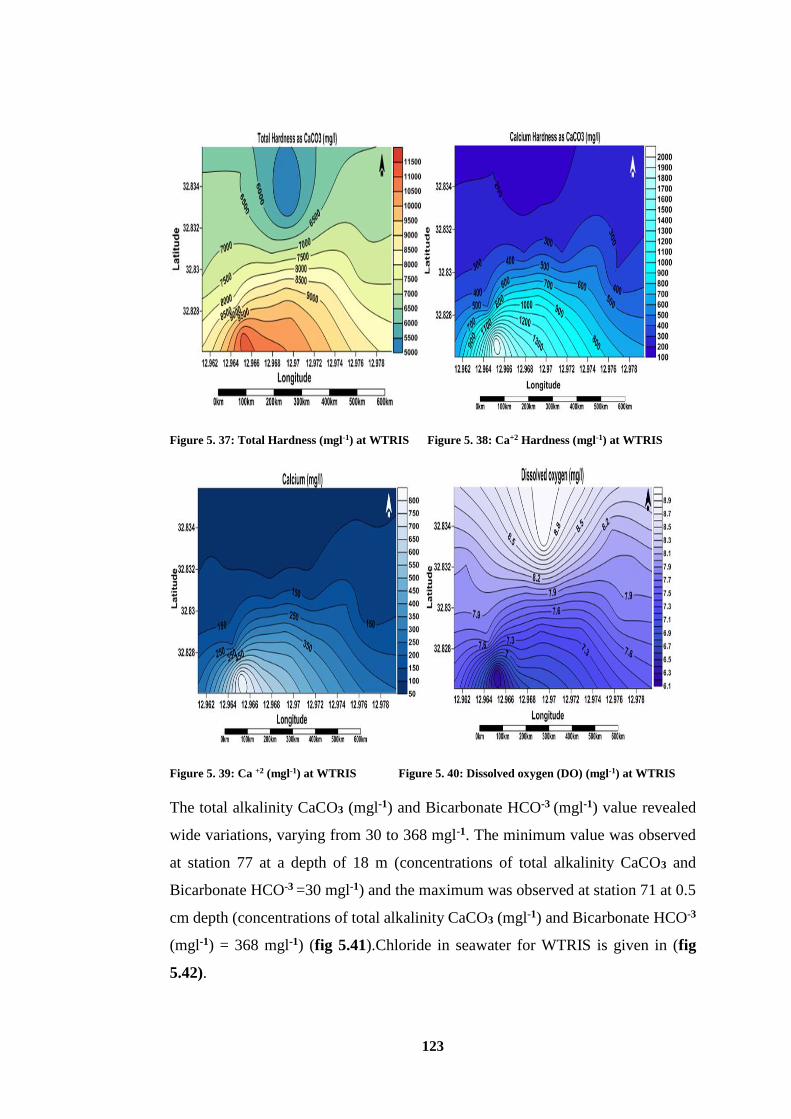
123
Figure 5. 37: Total Hardness (mgl-1) at WTRIS Figure 5. 38: Ca+2 Hardness (mgl-1) at WTRIS
Figure 5. 39: Ca +2 (mgl-1) at WTRIS Figure 5. 40: Dissolved oxygen (DO) (mgl-1) at WTRIS
The total alkalinity CaCO3 (mgl-1) and Bicarbonate HCO-3 (mgl-1) value revealed
wide variations, varying from 30 to 368 mgl-1. The minimum value was observed
at station 77 at a depth of 18 m (concentrations of total alkalinity CaCO3 and
Bicarbonate HCO-3 =30 mgl-1) and the maximum was observed at station 71 at 0.5
cm depth (concentrations of total alkalinity CaCO3 (mgl-1) and Bicarbonate HCO-3
(mgl-1) = 368 mgl-1) (fig 5.41).Chloride in seawater for WTRIS is given in (fig
5.42).
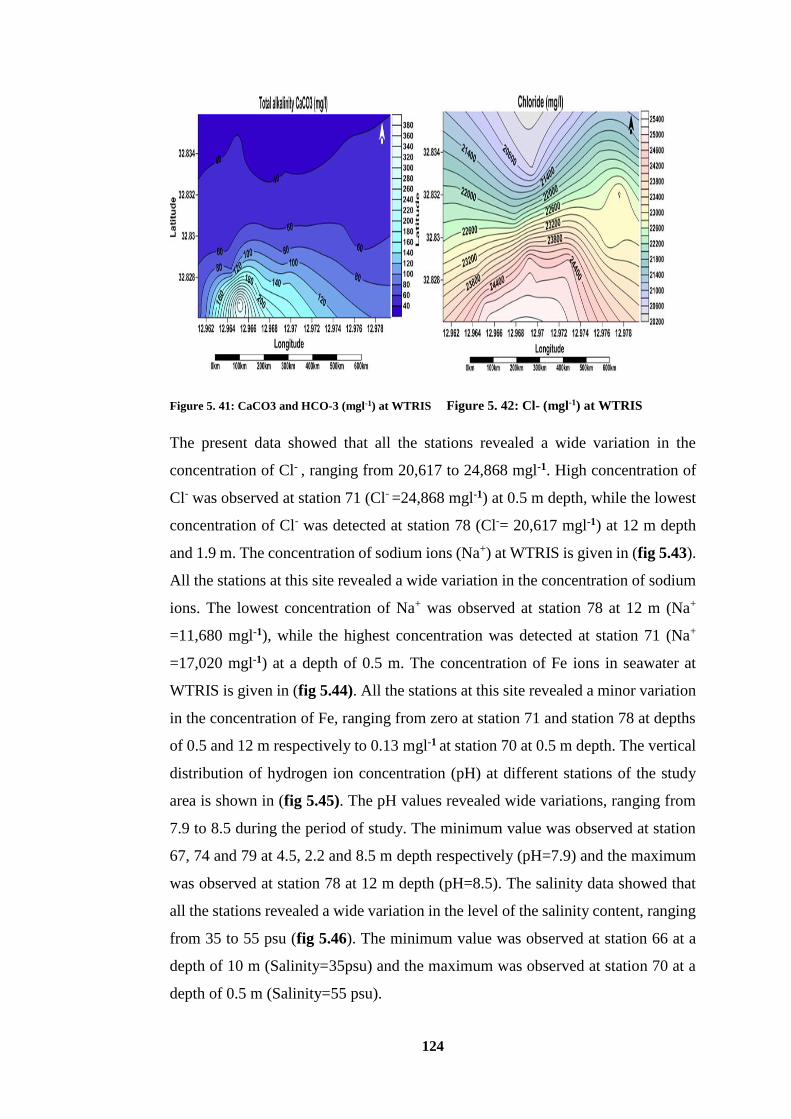
124
Figure 5. 41: CaCO3 and HCO-3 (mgl-1) at WTRIS Figure 5. 42: Cl- (mgl-1) at WTRIS
The present data showed that all the stations revealed a wide variation in the
concentration of Cl- , ranging from 20,617 to 24,868 mgl-1. High concentration of
Cl- was observed at station 71 (Cl- =24,868 mgl-1) at 0.5 m depth, while the lowest
concentration of Cl- was detected at station 78 (Cl-= 20,617 mgl-1) at 12 m depth
and 1.9 m. The concentration of sodium ions (Na+) at WTRIS is given in (fig 5.43).
All the stations at this site revealed a wide variation in the concentration of sodium
ions. The lowest concentration of Na+ was observed at station 78 at 12 m (Na+
=11,680 mgl-1), while the highest concentration was detected at station 71 (Na+
=17,020 mgl-1) at a depth of 0.5 m. The concentration of Fe ions in seawater at
WTRIS is given in (fig 5.44). All the stations at this site revealed a minor variation
in the concentration of Fe, ranging from zero at station 71 and station 78 at depths
of 0.5 and 12 m respectively to 0.13 mgl-1 at station 70 at 0.5 m depth. The vertical
distribution of hydrogen ion concentration (pH) at different stations of the study
area is shown in (fig 5.45). The pH values revealed wide variations, ranging from
7.9 to 8.5 during the period of study. The minimum value was observed at station
67, 74 and 79 at 4.5, 2.2 and 8.5 m depth respectively (pH=7.9) and the maximum
was observed at station 78 at 12 m depth (pH=8.5). The salinity data showed that
all the stations revealed a wide variation in the level of the salinity content, ranging
from 35 to 55 psu (fig 5.46). The minimum value was observed at station 66 at a
depth of 10 m (Salinity=35psu) and the maximum was observed at station 70 at a
depth of 0.5 m (Salinity=55 psu).
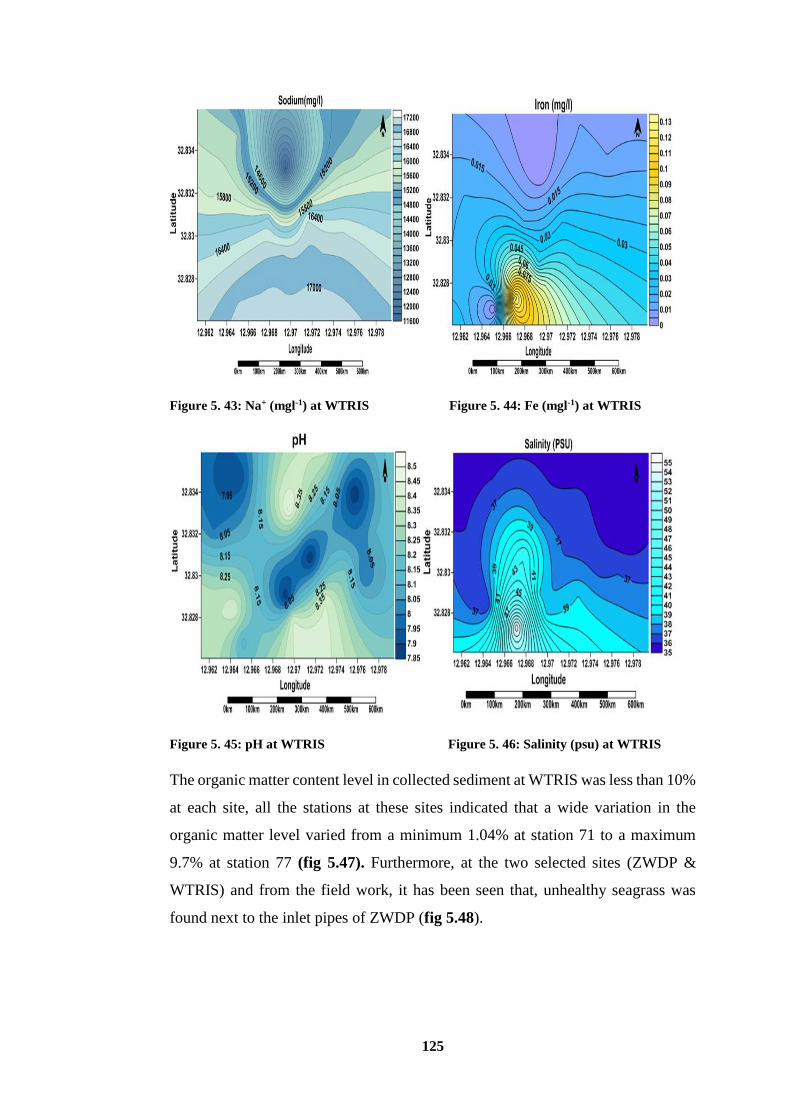
125
Figure 5. 43: Na+ (mgl-1) at WTRIS Figure 5. 44: Fe (mgl-1) at WTRIS
Figure 5. 45: pH at WTRIS Figure 5. 46: Salinity (psu) at WTRIS
The organic matter content level in collected sediment at WTRIS was less than 10%
at each site, all the stations at these sites indicated that a wide variation in the
organic matter level varied from a minimum 1.04% at station 71 to a maximum
9.7% at station 77 (fig 5.47). Furthermore, at the two selected sites (ZWDP &
WTRIS) and from the field work, it has been seen that, unhealthy seagrass was
found next to the inlet pipes of ZWDP (fig 5.48).
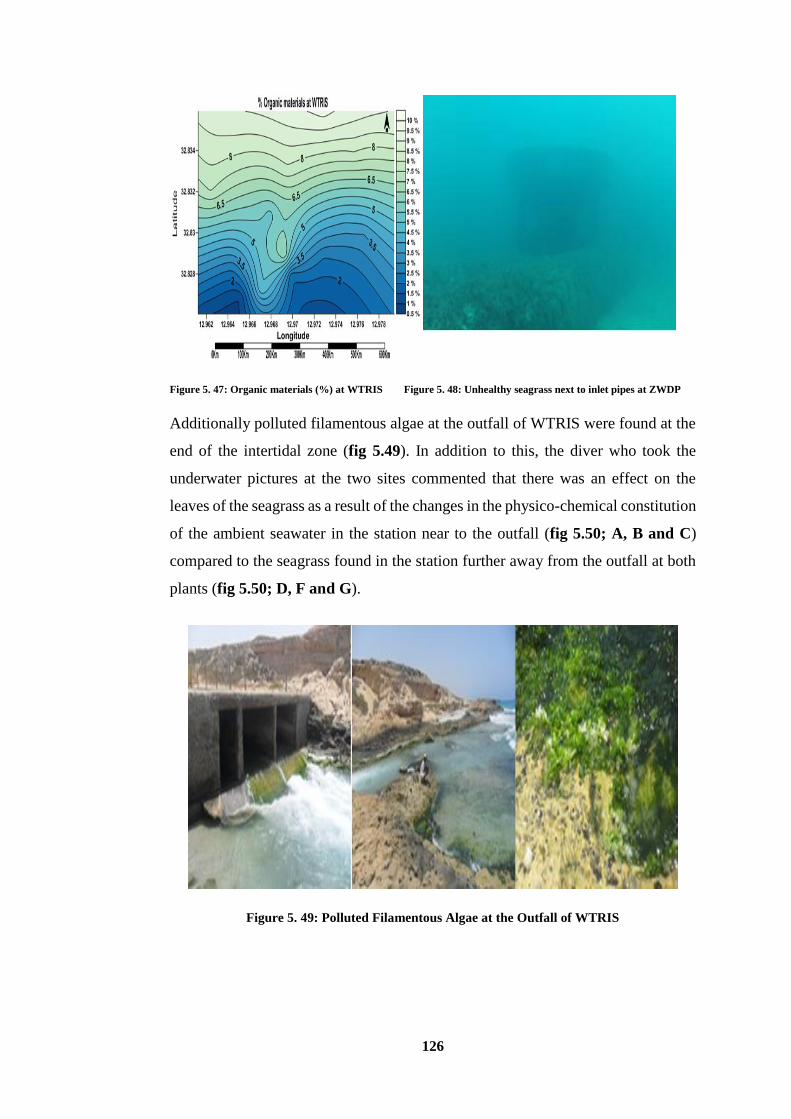
126
Figure 5. 47: Organic materials (%) at WTRIS Figure 5. 48: Unhealthy seagrass next to inlet pipes at ZWDP
Additionally polluted filamentous algae at the outfall of WTRIS were found at the
end of the intertidal zone (fig 5.49). In addition to this, the diver who took the
underwater pictures at the two sites commented that there was an effect on the
leaves of the seagrass as a result of the changes in the physico-chemical constitution
of the ambient seawater in the station near to the outfall (fig 5.50; A, B and C)
compared to the seagrass found in the station further away from the outfall at both
plants (fig 5.50; D, F and G).
Figure 5. 49: Polluted Filamentous Algae at the Outfall of WTRIS
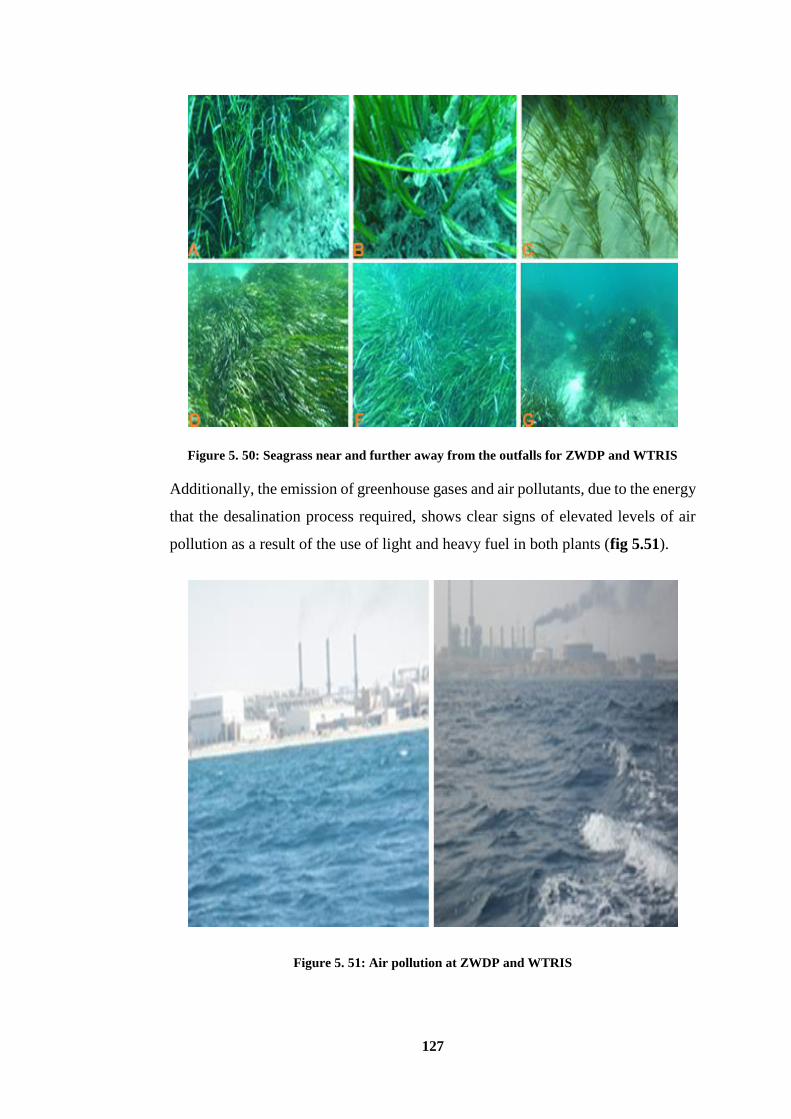
127
Figure 5. 50: Seagrass near and further away from the outfalls for ZWDP and WTRIS
Additionally, the emission of greenhouse gases and air pollutants, due to the energy
that the desalination process required, shows clear signs of elevated levels of air
pollution as a result of the use of light and heavy fuel in both plants (fig 5.51).
Figure 5. 51: Air pollution at ZWDP and WTRIS
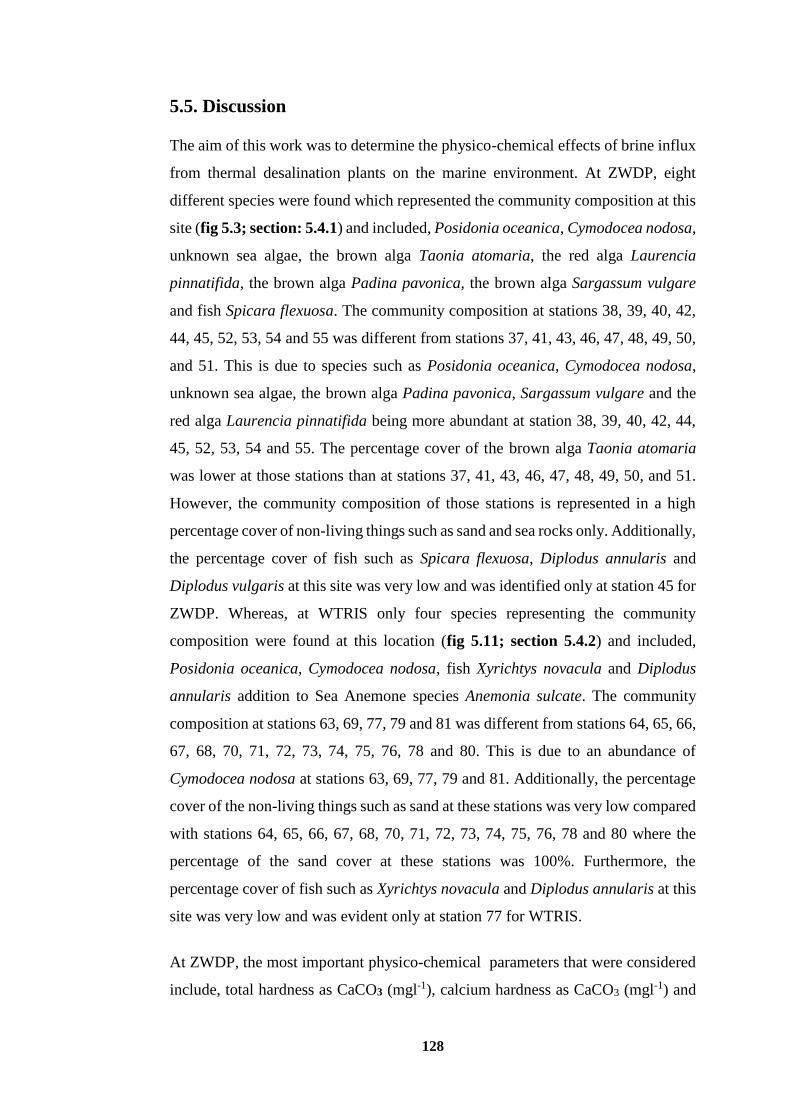
128
5.5. Discussion
The aim of this work was to determine the physico-chemical effects of brine influx
from thermal desalination plants on the marine environment. At ZWDP, eight
different species were found which represented the community composition at this
site (fig 5.3; section: 5.4.1) and included, Posidonia oceanica, Cymodocea nodosa,
unknown sea algae, the brown alga Taonia atomaria, the red alga Laurencia
pinnatifida, the brown alga Padina pavonica, the brown alga Sargassum vulgare
and fish Spicara flexuosa. The community composition at stations 38, 39, 40, 42,
44, 45, 52, 53, 54 and 55 was different from stations 37, 41, 43, 46, 47, 48, 49, 50,
and 51. This is due to species such as Posidonia oceanica, Cymodocea nodosa,
unknown sea algae, the brown alga Padina pavonica, Sargassum vulgare and the
red alga Laurencia pinnatifida being more abundant at station 38, 39, 40, 42, 44,
45, 52, 53, 54 and 55. The percentage cover of the brown alga Taonia atomaria
was lower at those stations than at stations 37, 41, 43, 46, 47, 48, 49, 50, and 51.
However, the community composition of those stations is represented in a high
percentage cover of non-living things such as sand and sea rocks only. Additionally,
the percentage cover of fish such as Spicara flexuosa, Diplodus annularis and
Diplodus vulgaris at this site was very low and was identified only at station 45 for
ZWDP. Whereas, at WTRIS only four species representing the community
composition were found at this location (fig 5.11; section 5.4.2) and included,
Posidonia oceanica, Cymodocea nodosa, fish Xyrichtys novacula and Diplodus
annularis addition to Sea Anemone species Anemonia sulcate. The community
composition at stations 63, 69, 77, 79 and 81 was different from stations 64, 65, 66,
67, 68, 70, 71, 72, 73, 74, 75, 76, 78 and 80. This is due to an abundance of
Cymodocea nodosa at stations 63, 69, 77, 79 and 81. Additionally, the percentage
cover of the non-living things such as sand at these stations was very low compared
with stations 64, 65, 66, 67, 68, 70, 71, 72, 73, 74, 75, 76, 78 and 80 where the
percentage of the sand cover at these stations was 100%. Furthermore, the
percentage cover of fish such as Xyrichtys novacula and Diplodus annularis at this
site was very low and was evident only at station 77 for WTRIS.
At ZWDP, the most important physico-chemical parameters that were considered
include, total hardness as CaCO3 (mgl-1), calcium hardness as CaCO3 (mgl-1) and
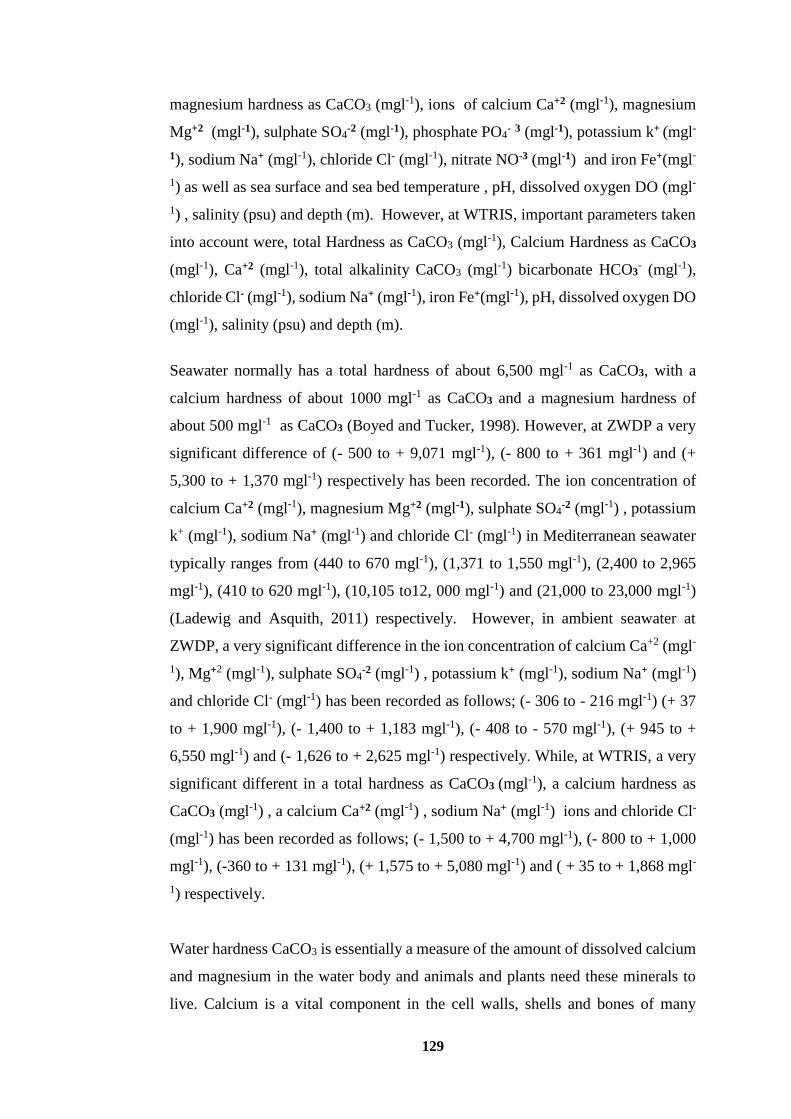
129
magnesium hardness as CaCO3 (mgl-1), ions of calcium Ca+2 (mgl-1), magnesium
Mg+2 (mgl-1), sulphate SO4-2 (mgl-1), phosphate PO4
- 3 (mgl-1), potassium k+ (mgl-
1), sodium Na+ (mgl-1), chloride Cl- (mgl-1), nitrate NO-3 (mgl-1) and iron Fe+(mgl-
1) as well as sea surface and sea bed temperature , pH, dissolved oxygen DO (mgl-
1) , salinity (psu) and depth (m). However, at WTRIS, important parameters taken
into account were, total Hardness as CaCO3 (mgl-1), Calcium Hardness as CaCO3
(mgl-1), Ca+2 (mgl-1), total alkalinity CaCO3 (mgl-1) bicarbonate HCO3- (mgl-1),
chloride Cl- (mgl-1), sodium Na+ (mgl-1), iron Fe+(mgl-1), pH, dissolved oxygen DO
(mgl-1), salinity (psu) and depth (m).
Seawater normally has a total hardness of about 6,500 mgl-1 as CaCO3, with a
calcium hardness of about 1000 mgl-1 as CaCO3 and a magnesium hardness of
about 500 mgl-1 as CaCO3 (Boyed and Tucker, 1998). However, at ZWDP a very
significant difference of (- 500 to + 9,071 mgl-1), (- 800 to + 361 mgl-1) and (+
5,300 to + 1,370 mgl-1) respectively has been recorded. The ion concentration of
calcium Ca+2 (mgl-1), magnesium Mg+2 (mgl-1), sulphate SO4-2 (mgl-1) , potassium
k+ (mgl-1), sodium Na+ (mgl-1) and chloride Cl- (mgl-1) in Mediterranean seawater
typically ranges from (440 to 670 mgl-1), (1,371 to 1,550 mgl-1), (2,400 to 2,965
mgl-1), (410 to 620 mgl-1), (10,105 to12, 000 mgl-1) and (21,000 to 23,000 mgl-1)
(Ladewig and Asquith, 2011) respectively. However, in ambient seawater at
ZWDP, a very significant difference in the ion concentration of calcium Ca+2 (mgl-
1), Mg+2 (mgl-1), sulphate SO4-2 (mgl-1) , potassium k+ (mgl-1), sodium Na+ (mgl-1)
and chloride Cl- (mgl-1) has been recorded as follows; (- 306 to - 216 mgl-1) (+ 37
to + 1,900 mgl-1), (- 1,400 to + 1,183 mgl-1), (- 408 to - 570 mgl-1), (+ 945 to +
6,550 mgl-1) and (- 1,626 to + 2,625 mgl-1) respectively. While, at WTRIS, a very
significant different in a total hardness as CaCO3 (mgl-1), a calcium hardness as
CaCO3 (mgl-1) , a calcium Ca+2 (mgl-1) , sodium Na+ (mgl-1) ions and chloride Cl-
(mgl-1) has been recorded as follows; (- 1,500 to + 4,700 mgl-1), (- 800 to + 1,000
mgl-1), (-360 to + 131 mgl-1), (+ 1,575 to + 5,080 mgl-1) and ( + 35 to + 1,868 mgl-
1) respectively.
Water hardness CaCO3 is essentially a measure of the amount of dissolved calcium
and magnesium in the water body and animals and plants need these minerals to
live. Calcium is a vital component in the cell walls, shells and bones of many
130
aquatic organisms and magnesium is similarly essential in chlorophyll, used by
green plants to photosynthesize. Hardness mitigates the toxicity of metals and
calcium and magnesium ions help prevent fish absorbing metals such as lead,
arsenic and cadmium, through their gills. The greater the hardness, the more
difficult it is for toxins to be absorbed. When hardness equals alkalinity, the only
cations present in significant concentrations in water are calcium and magnesium
(Murphy, 2014). Low calcium levels, coupled with other environmental factors that
affect osmoregulation, can cause problems for marine organisms, for example,
when the pH and salinity is low or high (Boyed and Tucker, 1998).
Stanley (2006) also reported that the growth rates of aragonitic codiacean algae
Penicillus and Halimeda reduced when Mg2+/Ca2+ ratio reduced. Hence, increases
in the level of total hardness (CaCO3) close to the desalination plants (ZWDP and
WRTIS) may be due to dosing levels of anti-scale agents and utilization of sponge-
ball cleaning used for controlling acidification of seawater (Soror, 2009). The
solubility of inorganic salts that form scale (CaCO3, CaSO4, Mg (OH)2) decreases
with increasing temperature. The scale formed on the surfaces reduces the overall
heat transfer coefficient, thus decreasing the efficiency in the production of stations
(Wildebranda et al., 2007). Addition of anti-scalants caused more CaCO3 to be
discharged with the brine and may have an adverse effect on the marine species
Further to this, it was found that the sulphate ions concentration in the marine
environment were higher at ZWDP. This may be due to sodium sulphite being
injected into the feed water line for the boiler, which is necessary in thermal
desalination plants to remove the dissolved oxygen from the steam boiler (Oil and
Water Supplies Limited, 2006).When the sulphite oxidises into forms of sulphide,
this could be harmful because the high concentration of sulphide in the sea sediment
can harm seagrasses, since sulphide is a plant toxin inhibiting respiration (Borum
et al., 2004), which may drive ecosystem level alterations in animal and plant
distribution. Howarth and Teal (1979) reported that due to huge amounts of
sulphates in seawater, breakdown of organic matter often is consumed by sulphate
reducing bacteria that release free sulphide ions into the sediments. This release
may also intoxicate marine plants and organisms. Short-term increase in sediment
sulphide levels can affect the balance between seagrass photosynthesis and
131
respiration while long-term increase may reduce the rate of photosynthesis of sea
grass leading to other effects and plant death (Gwada, 2004).
Moreover, the results show that the concentration levels of sodium and chloride
ions were higher at the two plants which are possibly due to the addition of sodium
hypochlorite. This is because in most distillation plants, the intake seawater is
chlorinated continuously by dosing with a sodium hypochlorite solution for the
disinfection process at a certain dosing rate (Verdier, 2011). This means more
chemical-additives and more chemicals are discharged into the sea. Chlorine is
hazardous to the marine environment and marine resources (Hashim and Hajjaj,
2005).
Seagrasses are salt tolerant even when it exceeds the concentration in the seawater.
Specifically, seagrasses accumulate sodium (Na+), chloride (Cl-) and Potassium
(K+) but balance Na+ and Cl- fluxes to maintain osmotic equilibrium and prevent
its accumulation within the cytoplasm (Morenoa et al., 2014; Exadactylos, 2015).
A study by Khalafallah et al., 2013 shows that accumulation of Na+ under brine
stress was accompanied by a reduction in seagrass health, leading to high mortality
rates. High apoplastic levels of Na+ and C1- alter aqueous and ionic thermodynamic
equilibrium, resulting in hyperosmotic stress, ionic imbalance, and toxicity. Thus,
it is vital for the plant to re-establish cellular ion homeostasis for metabolic
functioning and growth (Niu et al., 1995). Na+ may have adverse effects on plant
catabolism and metabolism, whereas K+ is essential for maintaining osmotic
balance and acts as co-enzyme in biological reactions. Hence, uptake of K+ is vital
for the general health and growth of plants (Touchette, 2007). However, Na+ has
been reported to compete with K+ for intracellular influx. As a result, many K+
transport systems tend to have high affinity for Na+ allowing them to function as
Na+/K+ transporters (Khalafallah et al., 2013). In essence, Na+ levels may therefore
inhibit the efficiency of K+ in marine plants (Mottaleb, 2013). This study also
showed a significant positive correlation between the level of N+ and Cl- at the two
selected sites and also major positive correlation between the levels K+ and Na+ at
ZWDP.
Similarly, phosphate, iron and nitrate ions concentrations in seawater typically
range from 0.088 mgl-1, 0.0034 mgl-1 and < 0.1 mgl-1 (Anthoni, 2006) respectively.
132
However, a difference of (+ 0.068 to + 0.1 mgl-1), (0 to + 0.6966 mgl-1) and (0 to +
0.15 mgl-1) respectively has been recorded in ambient seawater at ZWDP. Whereas,
at WTRIS, a very significant difference of (0 to + 0.1266 mgl-1) in iron ions has
been recorded.
Phosphates are required in pre-treatment processes as chemical additives, such as
Tri-sodium phosphate, which is used to control pH and conductivity for the boilers
in thermal desalination plants (Les, 2015). Increased levels of phosphate and nitrate
ions may cause the eutrophication of the receiving seawater. It also leads to algal
growth (fig 5.49), which, depending on the degree of eutrophication, can develop
severe environmental effects on the marine environment (Davis, 2015). In addition
to this, it was found that the iron ions concentration in the marine environment at
WTRIS is slightly higher. This may be due to backwash processes which result in
the phenomena of reddish brine at the discharge point further to the corrosion
phenomena in thermal desalination plants which depends on the alloys present in
the process line (Lozides, 2015). Further to its co-location with West Tripoli Power
Plant established in 1976 (Ahwide and Aldali,2013), all the brine disposed from
power boilers is mixed with WTRS (desalination plant), so the reddish brine near
to the outlets of desalination plants will lead to increased turbidity of the seawater
thereby affecting marine species.
Seawater normally has a total alkalinity CaCO3 ranging from 100 to 500 mgl-1
(Student Watershed Research Project, 2014), however at WTRIS a very significant
difference of (- 70 to - 130 mgl-1) respectively has been recorded near to the outlet
of the plant. Similarly, bicarbonate HCO3- (mgl-1) ions concentration in
Mediterranean seawater typically ranges from 120 to 161 (mgl-1) (Ladewig and
Asquith, 2012), while in ambient seawater at WTRIS, a very significant difference
of (- 90 to + 207 mgl-1) has been recorded.
In thermal desalination plants, fouling is carried out by scaling with calcium
carbonate or carbonate, calcium sulphate and magnesium hydroxide (Elsaid et al.,
2012). The variation in the ions released by fouling in thermal desalination plants
is due to the evaporation process inside heat exchanger units. MED or MED-TVC
plants usually operate at temperatures between 63 -75 °C known as top brine
temperature (TBT) and due to solubility problems, thermal desalination plants
133
operation is generally limited to TBT. The formation of the alkaline scaling (CaCO3
and Mg (OH)2) has been found to depend on temperature, pH, concentrations of
HCO3-, CO3
-2 , Ca+2 , Mg+2 ions as well as the rate at which CO2 is released (Marie,
2010; Anezi and Hilal, 2007). Most of these substances are discharged with the
brine into the marine environment, while CO2 is released into the air impairing air
quality due to the vacuum process in the evaporator’s cell, thus CO2 lowers the pH
when dissolved in seawater making the ocean more acidic. Coral reefs, calcareous
plankton and other organisms whose skeletons or shells contain calcium carbonate
may be particularly affected as a result of decreases in carbonate ions (Caldira and
Wickett, 2003). Not only that, acidification of the oceans may also threaten oceanic
food chains (Dean, 2009) affecting marine ecosystems in general. Further increases
in the level of CO2 emissions may result from the use of heavy fuel in thermal
desalination plants at both sites, which have been indicated at both sites (fig 5.51).
Seawater temperature profiles were studied on the Libyan coastline by the Marine
Biology Research Centre in 2006. The sea bed and the sea surface varied from
13.6°C to 28°C (Bonanno et al., 2006). However, at ZWDP results showing
differences as +15.4°C to +3°C respectively above ambient seawater temperature
near to the outlet were recorded. However, the results show that at WTRIS there is
no significant difference in seawater temperature in the period of study. Connor et
al., (2007) reported that seawater temperature can influence the population,
community and species level of marine organisms due to fluctuations in seawater
temperature around both sites.
Normally, seawater pH is slightly alkaline and it ranges from 7.9 to 8.4. This range
is created through a balance between biological activity and seawater (Owens,
2009). However, this study results show differences as - 0.14 to + 0.06 near to the
outlet of ZWDP, while, at WTRIS, the results show that, the pH value was at the
same value ranging from 7.9 to 8.4, which has been recorded in ambient seawater.
The changes in the pH value may be due to the salts which are discarded with the
brine into the marine environment, because in most thermal desalination plants,
alkaline scales from heat exchanger surfaces are typically removed by washing with
warm acidic seawater. Furthermore, the use of chemical inhibitors such as
benzotriazole derivatives (Abuzinada et al., 2008), being added to protect the plants
134
from corrosion may also be hazardous to aquatic life. A wide cross-section of
aquatic animals thrives in an environment of pH level ranging between 6.5 and
8.00. Outside this range, the diversity may be reduced because it damages the
physiological system of most organisms and can reduce reproduction. Low levels
of pH can also allow toxic elements to become more available for uptake by aquatic
plants and animals. This can produce conditions that are toxic to aquatic life
(Faragallah et al., 2009) and the constant of pH value at the same level at WTRIS
may be due to the strong wave current of seawater at the period of study. The results
also indicates that the presence of marine species was found to be at a low density
in both sites near to the outfall of the desalination plans. This decrease could be
attributed to a reduction of pH levels which affected their diversity and forced the
marine species to migrate to other zones (Mabrook, 1994) which were more
conducive to their healthy existence.
Dissolved oxygen levels in seawater in the eastern coast of Libya have been studied
by Jack et al., (2009) and found to be between 9.8- 10.5 mgl-1. However, the results
at ZWDP show a very significant difference of - 4.67 to - 2.1 mgl-1. In contrast, at
WTRIS, the results show a difference of - 3.65 to -1.54 mgl-1 near the outlet. This
is possibly due to increases in brine temperature inside the cells/ stages of the units
as thermal desalination plants produce potable or industrial water when it reaches
top brine temperature (TBT) (World Health Organization, 2005). In order to reduce
the temperature, the brine is blended with cool water of the sea, but as the amount
of salts and thermal energy increases, the amount of dissolved oxygen decreases
which will have an impact on the physico-chemical state of the receiving seawater.
Also, de-aeration and the use of sodium sulphate as an oxygen scavenger in the
brine recycle line is used to control corrosion inside the units which could limit the
amount of dissolved oxygen. (Abuzinada et al., 2008; Environmental International
Consultants 2009). The recommended minimum concentration of DO in marine
water is 8.0 mgl-1 and any reduction beyond this level may have lethal and sub-
lethal effects in a variety of organisms particularly in fish (Canadian Council of
Ministers of the Environment, 1999).
The seawater salinity of the Libyan coast is ≤ 37.8 psu (Placenti et al., 2013) and
the difference of (- 2 to + 9.2 psu) and (- 2 to + 6 psu) in the ambient seawater
135
salinity near the outfall of ZWDP and WTRIS respectively was recorded. Marine
organisms commonly are only able to cope with a narrow variation in salinity in
their habitat (North et al., 1995). Salinity thresholds and variations also affect the
composition of the marine ecosystem in a mixohaline environment by constraining
colonisation, germination and species richness (Joyce et al., 2005). Increasing
salinity around the ZWDP and WTRIS outlets is attributed to high temperature,
which is due to cooling water and consequent evaporation and the high
concentration of salts associated with the discharged water. Furthermore, during
the study period, the depth was obvious as an indicator to the marine biodiversity
at both sites, the lower depth stations near to the outlets of the plants were poor in
the biodiversity level compared to the stations located forward of the discharge
points from the plants.
The sediment data analysis which is shown in the physical analysis of the two sites
(fig.5.15 and fig. 5.36; section 5.4.3 and 5.4.4) indicate that, at both sites medium,
fine and very fine sand percentage cover was higher than coarse sand, therefore this
study suggests that the sediment along the coastal water has been transported by
strong sea currents suggesting that fine sand is initially shifted, followed by
medium sand and ultimately the heavier coarse sand. In addition to the results
which are displayed (Table.5.4; section 5.2.3) for the organic matter levels at both
sites reveal that the organic matter content level in the sediments was < 10%. The
organic matter levels can affect the aquatic ecosystem by interacting with inorganic
matter to form complex compounds, which include in its structure several elements.
Organic matter is initially produced by the fixation of inorganic carbon dioxide by
marine phytoplankton in the euphotic zone, and released into the water column by
decomposition of dead cells. The high abundance of organic content level in the
selected area compared to other locations is probably due to the chemical additives
used in desalination processes such as anti-scale, that are commonly added into the
feed water (seawater) and the main components of antiscalants are organic
(Lattemann,2005; Abdelwahab and Hamoda,2012). Sediment quality can also
affect the growth and distribution of seagrasses (Morrision and Greening, 2015),
and the seagrass photosynthesis can also affect sediment metabolism through the
release of organic substrates by seagrass roots (Calleja et al., 2006).
136
The presence of seagrass beds plays a prominent ecological role and supports the
productivity on which many communities of marine animals feed and reproduce
further to enhance stabilization of the sediment such as P. oceanica and C.nodosa,
which have been used as bio-indicators in the Mediterranean Sea and in Libya, as
they are considered one of the most suitable biological indicators for water quality
in order to assess the status of Mediterranean waters. Thus, the importance of taking
these species as indicators of quality of the marine environment seems paramount
(Benkhayal, et al., 2013).
P. oceanica and C.nodosa were included in the red list of threatened marine species
of the Mediterranean Sea (Montefalocne et al., 2005) as a result of increasing the
amount of industrial pollutants into the marine environment. Thermal desalination
stations directly impact the marine environment by returning the relatively high
temperature concentrated brine to the sea. Although data that documents the effects
of the brine disposal from desalination plants is very scarce, it is now clearly
documented that, especially in the Mediterranean region, seagrass such as the P.
oceanic, an endemic plant in the Mediterranean Sea is very sensitive to high salinity
derived from hyper-saline desalination effluent (Laspidou et al.,2010).
Additionally, this increases seawater salinity, water currents, turbidity and
temperature. These in turn deteriorate the marine environment and cause fish to
migrate (Al Mutaz, 2013). Further to this, study in Egypt by Mabrook, 1994 shows
that, most of the coral reefs, planktonic organisms and fish species have declined
and even disappeared as a result of changes in the physico-chemical parameters in
ambient seawater near to outlets of desalination plants as a result of brine discharge.
Therefore, the outcome of this study suggests that at both sites that were chosen as
selected areas of study, a significant positive correlation was observed at ZWDP
and WTRIS between the biological data and physico-chemical parameters which
demonstrates the impact of brine disposal from ZWDP and WTRIS on the marine
environment. Additionally, a significant positive correlation between the organic
content levels in the sediments and seagrass was also detected at ZWDP and
WTRIS and non-significant positive correlation coefficient between mean grain
size and sea grass at both sites. The significant positive correlation indicates that a
positive linear association and increased physico-chemical parameters of brine has
137
caused profound changes in the physico-chemical parameters of seawater and an
effect on abundance and composition of the marine organisms. Hence, these results
are consistent with previous studies, which found similar responses in the marine
species exposed to the brine disposed from distillation plants.
5.6. Summary
To sum up, it can be said that chapter five provides the results methodology
regarding the brine influx from thermal desalination plants into the Libyan marine
environment, with particular references to ZWDP and WTRIS on the Libyan
coastline. The brine influx from both distillation plants into the marine ecosystem
releases chemical residues and thermal energy which negatively affect the marine
ecosystem. An increase in concentration of a number of ions and compounds from
discharged brine indicates an alteration in the physico-chemical properties of the
seawater. Moreover, as most of the Libyan thermal desalination plants are run by
heavy fuel, there is an indication that it is likely to cause future ocean acidity, as a
result of CO2 emissions. Also, the brine has low pH and a high alkalinity which
may lead to an increase in ocean acidification which is supported by the high
amounts of hardness in terms of calcium and magnesium ions and other
compounds. In addition, the high salinity and temperature of brine may have a
negative effect on the marine organisms as the cell osmolarity (salinity) and enzyme
functioning (temperature) may be compromised. Lastly, as the Libyan government
plan to increase the production capacity of their desalination plants, this means
more brine disposal into the sea which has the potential to degrade the physico-
chemical characteristics of the marine ecosystem. There are a number of proposals
for solutions to the problems caused by the discharged brine, which have led to
extending the scope of this chapter, allowing us to respond quickly to minimize any
possible negative effects by using the solutions which are presented into the next
chapters.
139
Chapter Six: On-site sodium hypochlorite generation from brine
disposal of distillation plant
6.1. Introduction Seawater provides the optimum source for desalination technology as an
inexhaustible source with high motility, making it the best medium for industrial
use. However, its composition includes dense components, such as algae, slime
and bacteria, which can cause biological fouling and blockage of the inlet structure
of desalination plants and other related equipment. This is further exacerbated by a
warm climate where microbial activity thrives in warm humid regions (Saleem,
2011). Furthermore, operational problems are affected by biofouling of heat
exchanger surfaces, particularly in desalination and power stations, resulting in
compromised heat transfer efficiency, additional operating and maintenance
expenditure and increased fluid frictional resistance in the piping system (Murthy
et al., 2005).
The majority of desalination plants, e.g. thermal distillation or reverse osmosis,
have been designed with a hypochlorination unit to inject sodium hypochlorite at
the seawater intake to inhibit further biological growth of potential contaminants
such as algae, within the connecting pipeline to onshore facilities (Roux et al., 2015;
Voutchkov, 2013). It is well documented that chlorine, which is normally
electrochemically generated on site, is a very effective chemical widely used for a
range of coastal applications. Once seawater is electrolysed to generate sodium
hypochlorite, it results in a safer, more robust and cost effective option than the use
of purchased chlorine gas, which tends to disintegrate into oxygen and chlorates
which can form trihalomethanes (Saleem, 2011; Abdul and Weshahi, 2009; Choi,
2013).
Along with UV sterilisization, ozone or biocide, chlorine is a valuable disinfectant.
However, it can be volatile in liquid or gas form when in transit, or during a period
of storage, hence the need for it to be generated on site (Saleem, 2011; Xu et al,
2010). It is expedient to electrochemically generate oxidation agents used for water
treatment on, or as near as possible to, their application location and it needs to be
carefully monitored because chlorine-containing oxidisers have high oxidation
140
activity and are considered to be one of the most powerful disinfecting agents
(Bashtan, 1999).
As the scarcity of global water increases, particularly in warmer climes, the
development of desalination technology can overcome this serious issue. Although
the production of brine expelled from desalination plants can pose a threat to the
marine environment (Al-Barwani and Purnama, 2007), it has now been disclosed
that this could be a valuable by-product for on-site generation of hypochlorite.
(Abdul and Weshahi, 2009)
Taking these considerations into account with the results obtained in chapter five,
focussing on the Libyan coastline distillation plants in the Southern Mediterranean
Sea, an integrated production scheme is needed to safeguard this technology in
order to create a synergy between the process and further use in commercial and
industrial sectors, while protecting the marine environment and outlying areas.
Ultimately, this chapter aims to investigate the production of sodium hypochlorite
(NaOCl) from an electrochemical cell fed by brine in a controlled environment on
site. The study will also discuss the effects of various critical operating parameters
on this process, including, electrode materials, production of sodium hypochlorite
(NaOCl), inter-electrode spacing, applied current density, energy and power
consumption further to determine the price of utilizing the brine by using the
electrochemical method.
6.2. Sodium Hypochlorite Production Techniques
6.2.1. Chemical Method
Chloride is made to react with a solution of sodium hydroxide resulting in the
production of sodium hypochlorite, sodium chloride and water, as illustrated in
following equation:
Cl2 + 2NaOH → NaOCl + NaCl + H2 O
This method produces highly concentrated solutions, but their properties are contra-
indicative for alternative uses (Ronco and Mishkin, 2007).
141
6.2.2. Electrochemical Method: On-site generation of NaOCl
Sodium hypochlorite is formed by electrolysis of sodium chloride found in
seawater or brine solutions in a controlled environment. Exothermic chemical
reaction is caused by an electrical Dc current applied to the seawater that flows
through an electrolyser, fitted with customised electrodes resulting in conversion
to sodium hypochlorite solution (NaOCl). Sodium chloride NaCl is broken down
into sodium ion Na+ and Chloride ion Cl− as a result of Dc electrolysis of an
aqueous solution of sodium chloride, as illustrated in following equation:
At the anode, free chlorine is generated
2Cl− → Cl2 + 2e−
At the Cathode, hydrogen evolves with corresponding formation of
hydroxide ions (OH−)
2H2 O + Cl2 → NaOCl + NaCl + H2 O
OH−ions, migrate from the cathode area and react with sodium (Na+) and chloride
(Cl2) near the anode, thus producing sodium hypochlorite (NaOCl) and the overall
reaction can be written as following:
2NaOH + Cl2 → 2NaOCl + H2
The composition of seawater presents a high percentage of hardness ions resulting
in the presence of certain substances such as calcium, magnesium and other metals
from hydroxide and carbonates. These solidify and are removed from the
electrolyser by seawater stream. Meanwhile, certain cathodic deposits that remain
on the surface need to be chemically cleaned periodically (Thangappan and
Sampathkumaran, 2008).
6.3. Study site
This study was conducted in September 2015 on the Libyan coastline around the
brine disposed from Zwuarah distillation plant (ZWDP) as presented in chapter five
(fig 5.1).
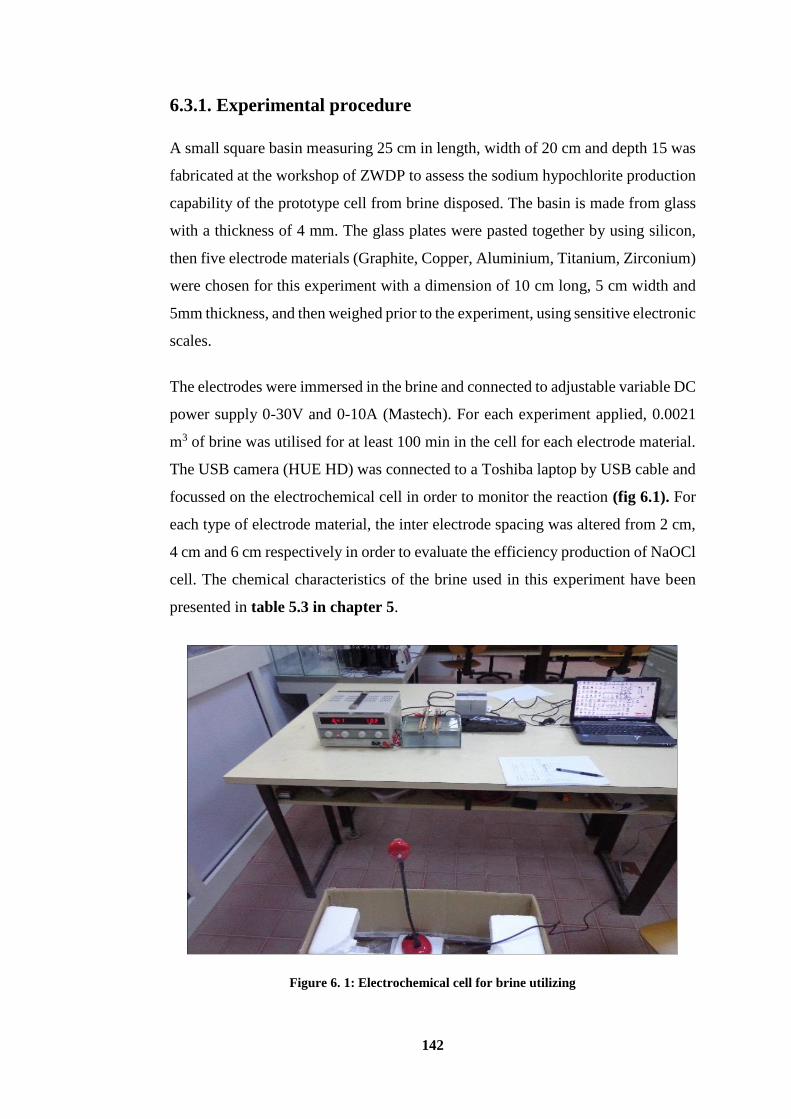
142
6.3.1. Experimental procedure
A small square basin measuring 25 cm in length, width of 20 cm and depth 15 was
fabricated at the workshop of ZWDP to assess the sodium hypochlorite production
capability of the prototype cell from brine disposed. The basin is made from glass
with a thickness of 4 mm. The glass plates were pasted together by using silicon,
then five electrode materials (Graphite, Copper, Aluminium, Titanium, Zirconium)
were chosen for this experiment with a dimension of 10 cm long, 5 cm width and
5mm thickness, and then weighed prior to the experiment, using sensitive electronic
scales.
The electrodes were immersed in the brine and connected to adjustable variable DC
power supply 0-30V and 0-10A (Mastech). For each experiment applied, 0.0021
m3 of brine was utilised for at least 100 min in the cell for each electrode material.
The USB camera (HUE HD) was connected to a Toshiba laptop by USB cable and
focussed on the electrochemical cell in order to monitor the reaction (fig 6.1). For
each type of electrode material, the inter electrode spacing was altered from 2 cm,
4 cm and 6 cm respectively in order to evaluate the efficiency production of NaOCl
cell. The chemical characteristics of the brine used in this experiment have been
presented in table 5.3 in chapter 5.
Figure 6. 1: Electrochemical cell for brine utilizing
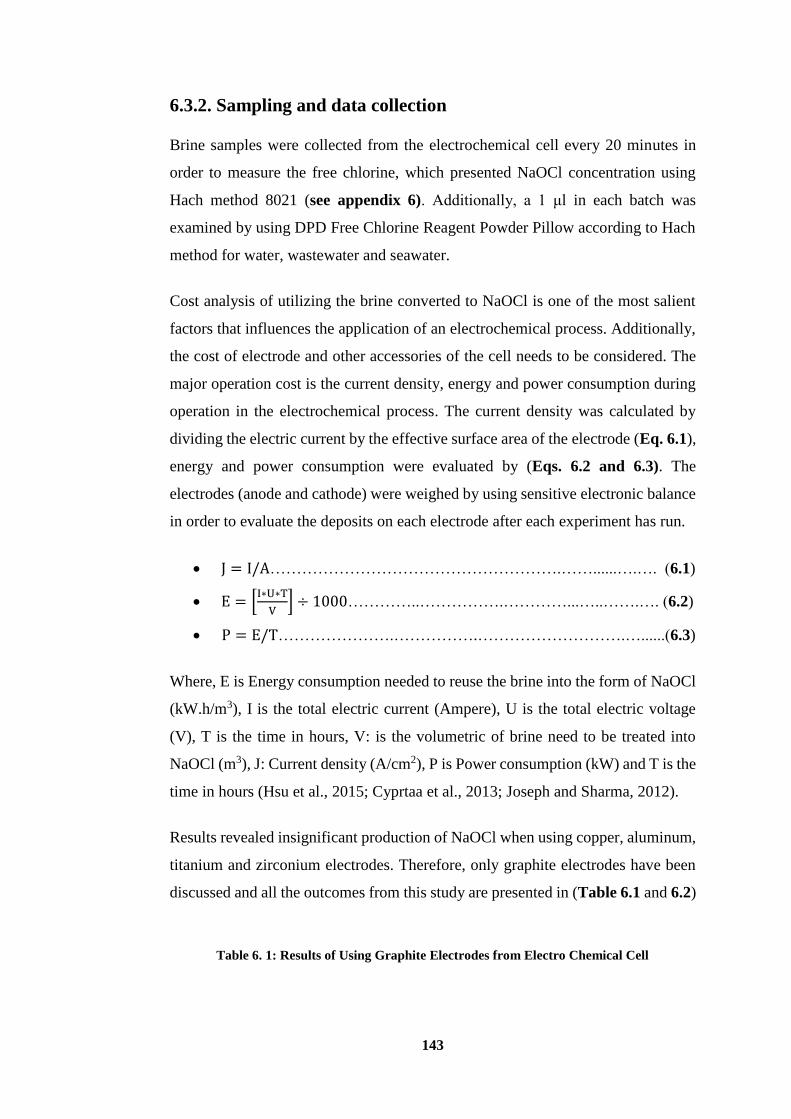
143
6.3.2. Sampling and data collection
Brine samples were collected from the electrochemical cell every 20 minutes in
order to measure the free chlorine, which presented NaOCl concentration using
Hach method 8021 (see appendix 6). Additionally, a 1 μl in each batch was
examined by using DPD Free Chlorine Reagent Powder Pillow according to Hach
method for water, wastewater and seawater.
Cost analysis of utilizing the brine converted to NaOCl is one of the most salient
factors that influences the application of an electrochemical process. Additionally,
the cost of electrode and other accessories of the cell needs to be considered. The
major operation cost is the current density, energy and power consumption during
operation in the electrochemical process. The current density was calculated by
dividing the electric current by the effective surface area of the electrode (Eq. 6.1),
energy and power consumption were evaluated by (Eqs. 6.2 and 6.3). The
electrodes (anode and cathode) were weighed by using sensitive electronic balance
in order to evaluate the deposits on each electrode after each experiment has run.
J = I/A……………………………………………….……......….…. (6.1)
E = [I∗U∗T
V] ÷ 1000…………..…………….…………...…..…….…. (6.2)
P = E/T………………….…………….……………………….…......(6.3)
Where, E is Energy consumption needed to reuse the brine into the form of NaOCl
(kW.h/m3), I is the total electric current (Ampere), U is the total electric voltage
(V), T is the time in hours, V: is the volumetric of brine need to be treated into
NaOCl (m3), J: Current density (A/cm2), P is Power consumption (kW) and T is the
time in hours (Hsu et al., 2015; Cyprtaa et al., 2013; Joseph and Sharma, 2012).
Results revealed insignificant production of NaOCl when using copper, aluminum,
titanium and zirconium electrodes. Therefore, only graphite electrodes have been
discussed and all the outcomes from this study are presented in (Table 6.1 and 6.2)
Table 6. 1: Results of Using Graphite Electrodes from Electro Chemical Cell
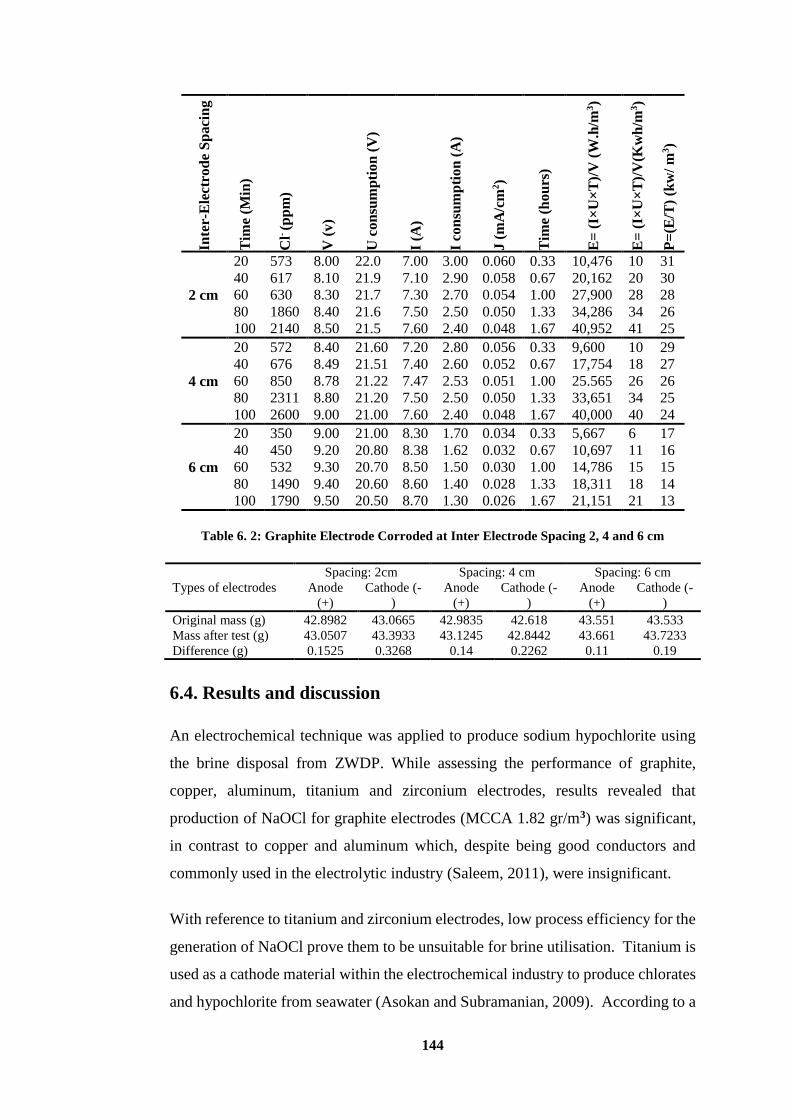
144
Inte
r-E
lect
rod
e S
paci
ng
Tim
e (M
in)
Cl-
(pp
m)
V (
v)
U c
on
sum
pti
on
(V
)
I (A
)
I co
nsu
mp
tio
n (
A)
J (
mA
/cm
2)
Tim
e (h
ou
rs)
E=
(I×
U×
T)/
V (
W.h
/m3)
E=
(I×
U×
T)/
V(K
wh
/m3)
P=
(E/T
) (k
w/
m3)
2 cm
20 573 8.00 22.0 7.00 3.00 0.060 0.33 10,476 10 31
40 617 8.10 21.9 7.10 2.90 0.058 0.67 20,162 20 30
60 630 8.30 21.7 7.30 2.70 0.054 1.00 27,900 28 28
80 1860 8.40 21.6 7.50 2.50 0.050 1.33 34,286 34 26
100 2140 8.50 21.5 7.60 2.40 0.048 1.67 40,952 41 25
4 cm
20 572 8.40 21.60 7.20 2.80 0.056 0.33 9,600 10 29
40 676 8.49 21.51 7.40 2.60 0.052 0.67 17,754 18 27
60 850 8.78 21.22 7.47 2.53 0.051 1.00 25.565 26 26
80 2311 8.80 21.20 7.50 2.50 0.050 1.33 33,651 34 25
100 2600 9.00 21.00 7.60 2.40 0.048 1.67 40,000 40 24
6 cm
20 350 9.00 21.00 8.30 1.70 0.034 0.33 5,667 6 17
40 450 9.20 20.80 8.38 1.62 0.032 0.67 10,697 11 16
60 532 9.30 20.70 8.50 1.50 0.030 1.00 14,786 15 15
80 1490 9.40 20.60 8.60 1.40 0.028 1.33 18,311 18 14
100 1790 9.50 20.50 8.70 1.30 0.026 1.67 21,151 21 13
Table 6. 2: Graphite Electrode Corroded at Inter Electrode Spacing 2, 4 and 6 cm
Types of electrodes
Spacing: 2cm Spacing: 4 cm Spacing: 6 cm
Anode
(+)
Cathode (-
)
Anode
(+)
Cathode (-
)
Anode
(+)
Cathode (-
)
Original mass (g) 42.8982 43.0665 42.9835 42.618 43.551 43.533
Mass after test (g) 43.0507 43.3933 43.1245 42.8442 43.661 43.7233
Difference (g) 0.1525 0.3268 0.14 0.2262 0.11 0.19
6.4. Results and discussion
An electrochemical technique was applied to produce sodium hypochlorite using
the brine disposal from ZWDP. While assessing the performance of graphite,
copper, aluminum, titanium and zirconium electrodes, results revealed that
production of NaOCl for graphite electrodes (MCCA 1.82 gr/m3) was significant,
in contrast to copper and aluminum which, despite being good conductors and
commonly used in the electrolytic industry (Saleem, 2011), were insignificant.
With reference to titanium and zirconium electrodes, low process efficiency for the
generation of NaOCl prove them to be unsuitable for brine utilisation. Titanium is
used as a cathode material within the electrochemical industry to produce chlorates
and hypochlorite from seawater (Asokan and Subramanian, 2009). According to a
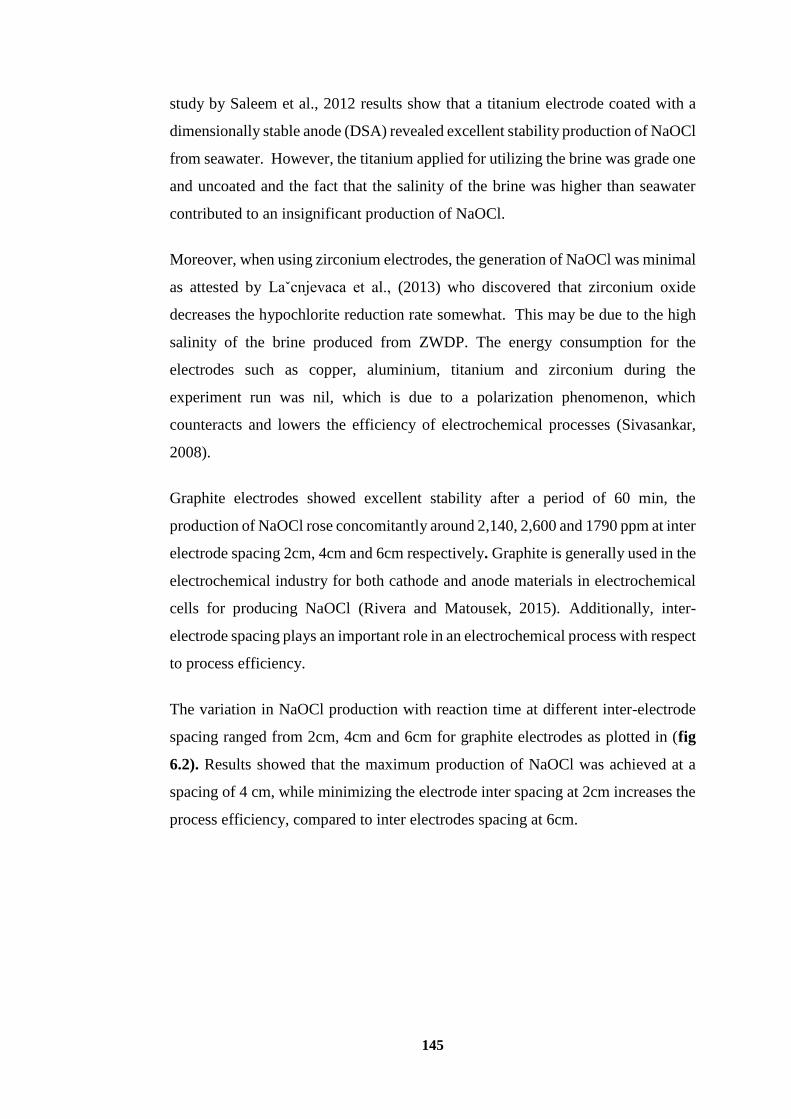
145
study by Saleem et al., 2012 results show that a titanium electrode coated with a
dimensionally stable anode (DSA) revealed excellent stability production of NaOCl
from seawater. However, the titanium applied for utilizing the brine was grade one
and uncoated and the fact that the salinity of the brine was higher than seawater
contributed to an insignificant production of NaOCl.
Moreover, when using zirconium electrodes, the generation of NaOCl was minimal
as attested by Laˇcnjevaca et al., (2013) who discovered that zirconium oxide
decreases the hypochlorite reduction rate somewhat. This may be due to the high
salinity of the brine produced from ZWDP. The energy consumption for the
electrodes such as copper, aluminium, titanium and zirconium during the
experiment run was nil, which is due to a polarization phenomenon, which
counteracts and lowers the efficiency of electrochemical processes (Sivasankar,
2008).
Graphite electrodes showed excellent stability after a period of 60 min, the
production of NaOCl rose concomitantly around 2,140, 2,600 and 1790 ppm at inter
electrode spacing 2cm, 4cm and 6cm respectively. Graphite is generally used in the
electrochemical industry for both cathode and anode materials in electrochemical
cells for producing NaOCl (Rivera and Matousek, 2015). Additionally, inter-
electrode spacing plays an important role in an electrochemical process with respect
to process efficiency.
The variation in NaOCl production with reaction time at different inter-electrode
spacing ranged from 2cm, 4cm and 6cm for graphite electrodes as plotted in (fig
6.2). Results showed that the maximum production of NaOCl was achieved at a
spacing of 4 cm, while minimizing the electrode inter spacing at 2cm increases the
process efficiency, compared to inter electrodes spacing at 6cm.
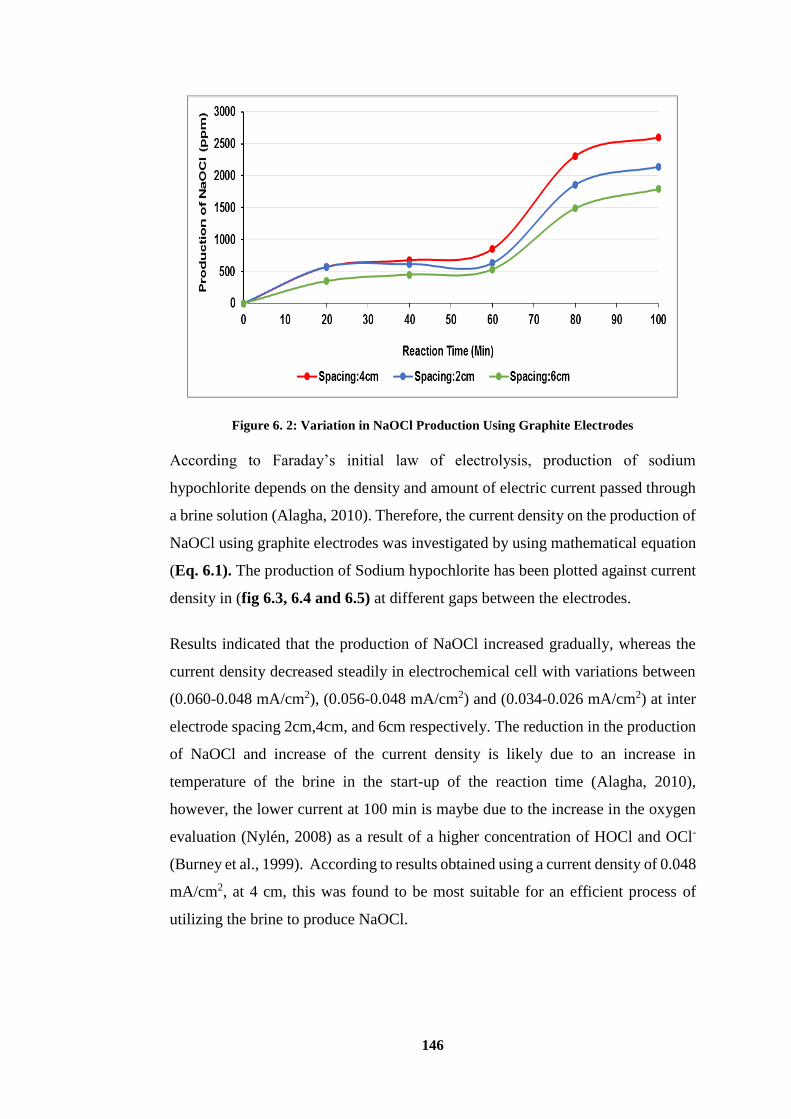
146
Figure 6. 2: Variation in NaOCl Production Using Graphite Electrodes
According to Faraday’s initial law of electrolysis, production of sodium
hypochlorite depends on the density and amount of electric current passed through
a brine solution (Alagha, 2010). Therefore, the current density on the production of
NaOCl using graphite electrodes was investigated by using mathematical equation
(Eq. 6.1). The production of Sodium hypochlorite has been plotted against current
density in (fig 6.3, 6.4 and 6.5) at different gaps between the electrodes.
Results indicated that the production of NaOCl increased gradually, whereas the
current density decreased steadily in electrochemical cell with variations between
(0.060-0.048 mA/cm2), (0.056-0.048 mA/cm2) and (0.034-0.026 mA/cm2) at inter
electrode spacing 2cm,4cm, and 6cm respectively. The reduction in the production
of NaOCl and increase of the current density is likely due to an increase in
temperature of the brine in the start-up of the reaction time (Alagha, 2010),
however, the lower current at 100 min is maybe due to the increase in the oxygen
evaluation (Nylén, 2008) as a result of a higher concentration of HOCl and OCl-
(Burney et al., 1999). According to results obtained using a current density of 0.048
mA/cm2, at 4 cm, this was found to be most suitable for an efficient process of
utilizing the brine to produce NaOCl.
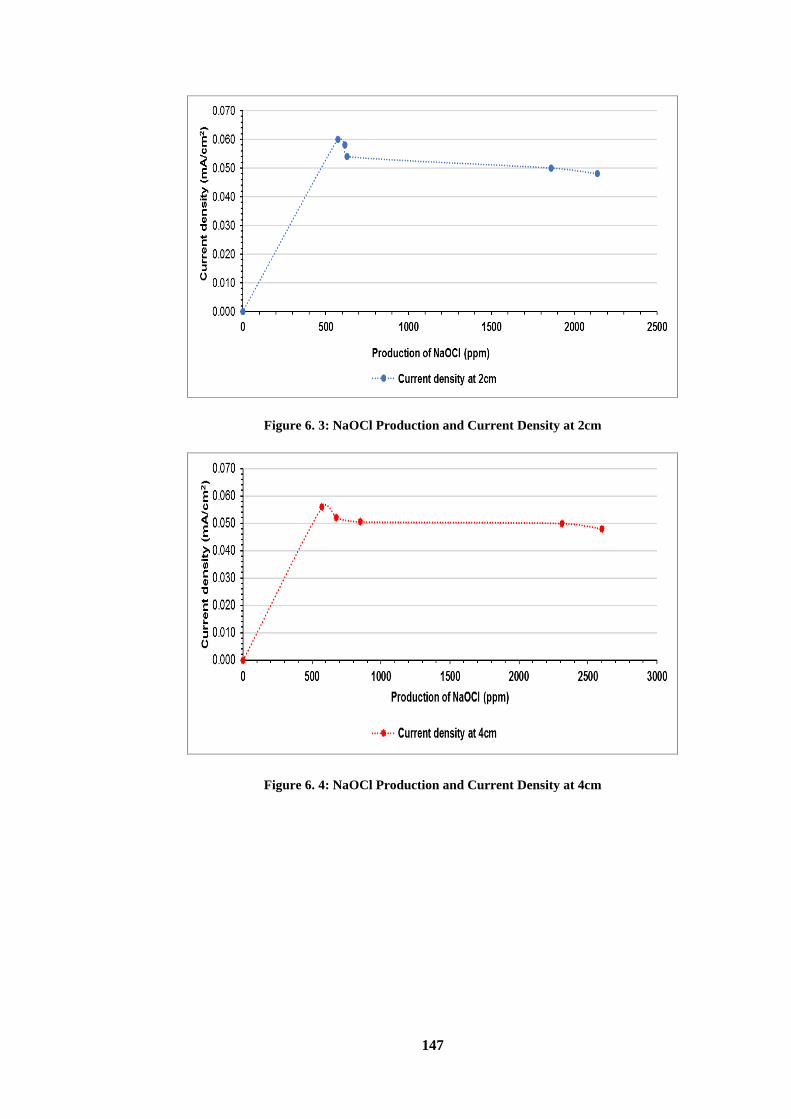
147
Figure 6. 3: NaOCl Production and Current Density at 2cm
Figure 6. 4: NaOCl Production and Current Density at 4cm
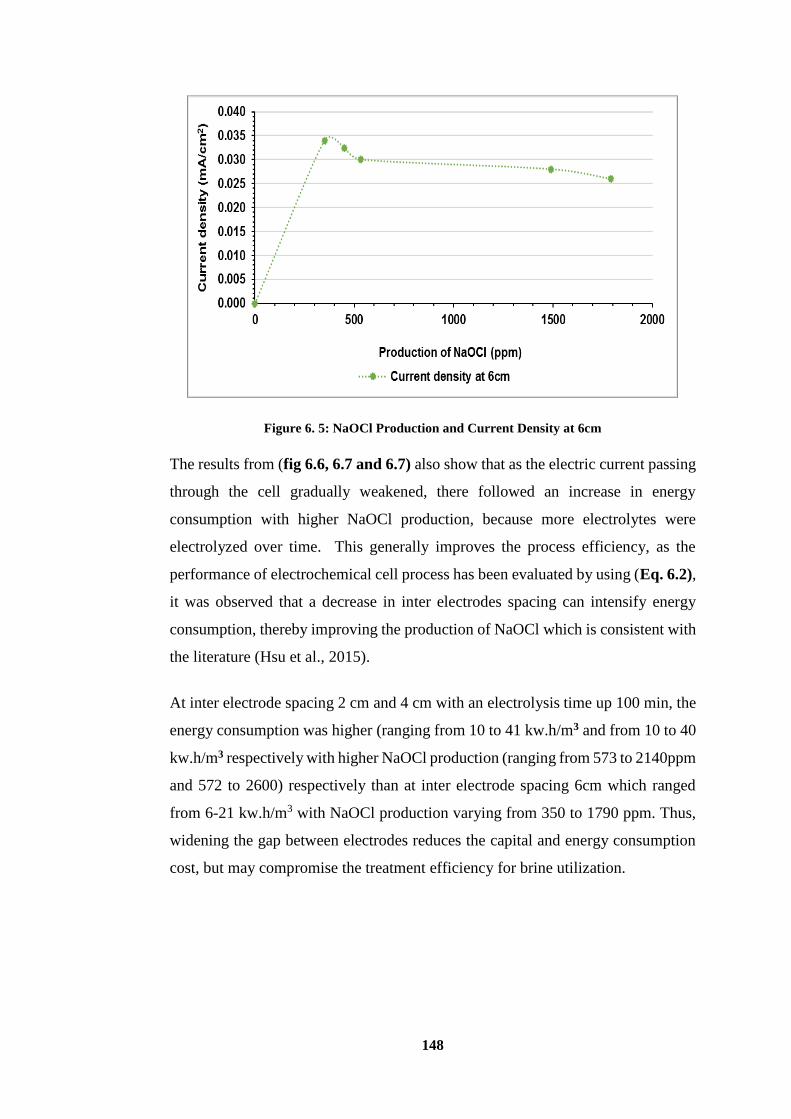
148
Figure 6. 5: NaOCl Production and Current Density at 6cm
The results from (fig 6.6, 6.7 and 6.7) also show that as the electric current passing
through the cell gradually weakened, there followed an increase in energy
consumption with higher NaOCl production, because more electrolytes were
electrolyzed over time. This generally improves the process efficiency, as the
performance of electrochemical cell process has been evaluated by using (Eq. 6.2),
it was observed that a decrease in inter electrodes spacing can intensify energy
consumption, thereby improving the production of NaOCl which is consistent with
the literature (Hsu et al., 2015).
At inter electrode spacing 2 cm and 4 cm with an electrolysis time up 100 min, the
energy consumption was higher (ranging from 10 to 41 kw.h/m3 and from 10 to 40
kw.h/m3 respectively with higher NaOCl production (ranging from 573 to 2140ppm
and 572 to 2600) respectively than at inter electrode spacing 6cm which ranged
from 6-21 kw.h/m3 with NaOCl production varying from 350 to 1790 ppm. Thus,
widening the gap between electrodes reduces the capital and energy consumption
cost, but may compromise the treatment efficiency for brine utilization.
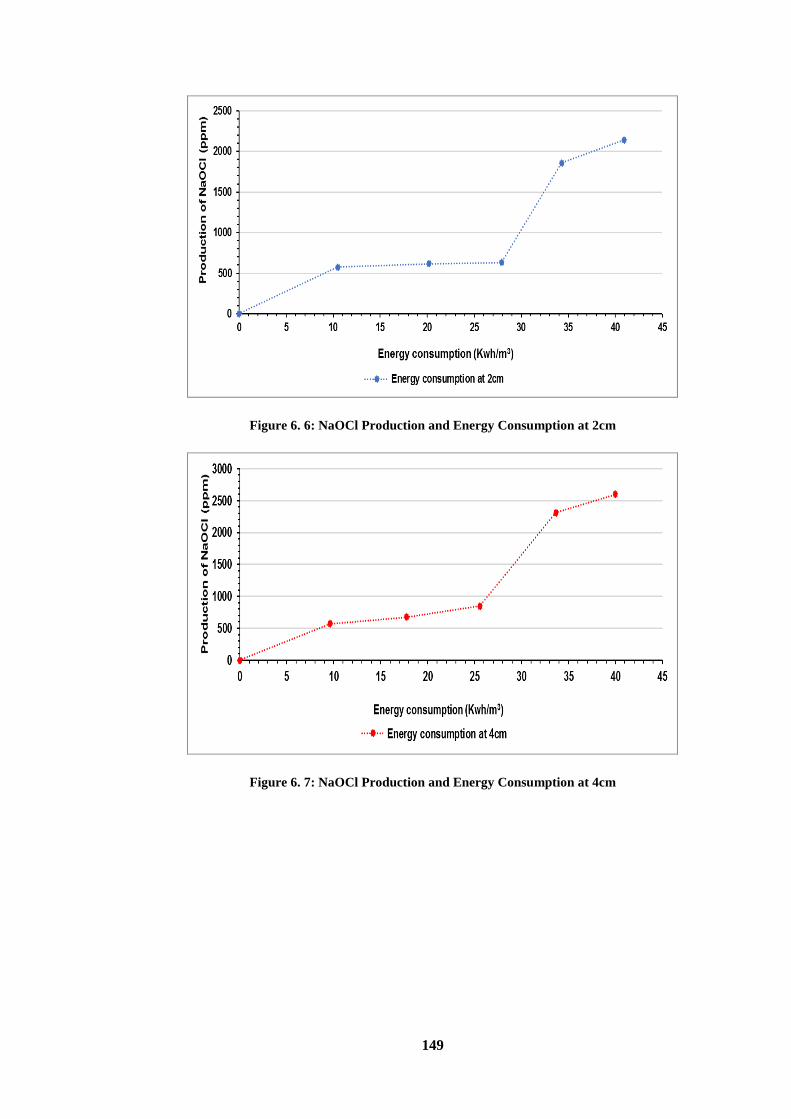
149
Figure 6. 6: NaOCl Production and Energy Consumption at 2cm
Figure 6. 7: NaOCl Production and Energy Consumption at 4cm
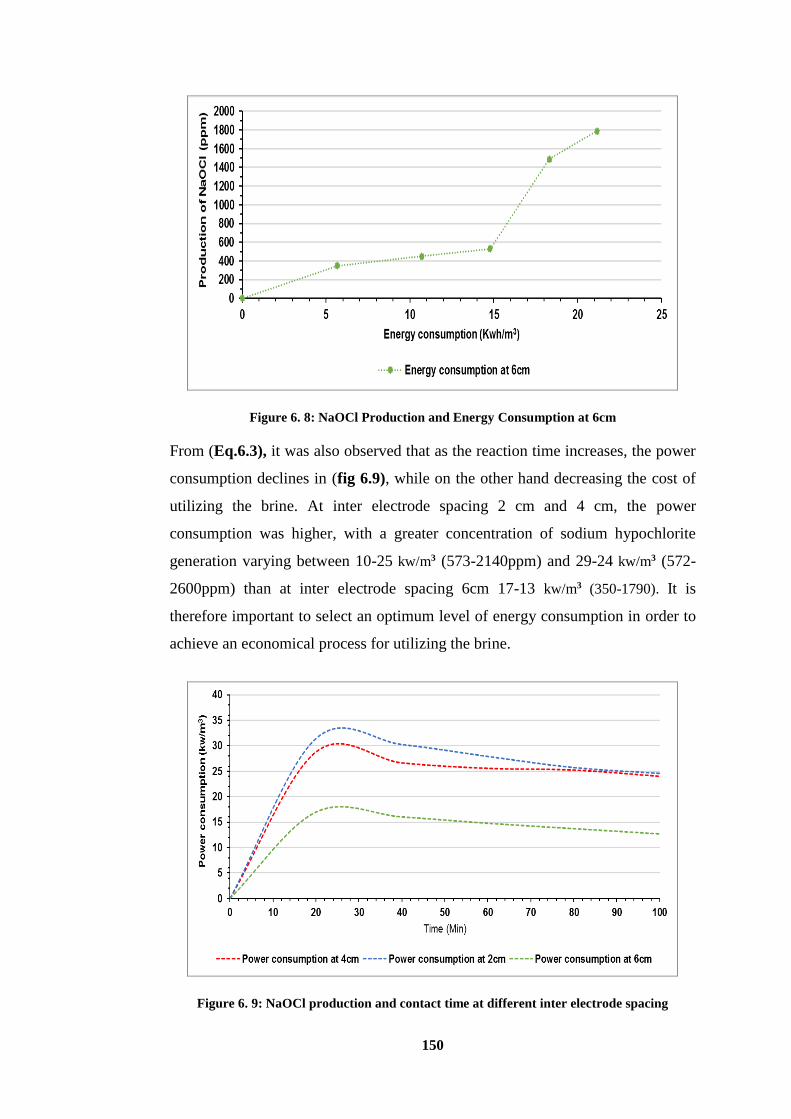
150
Figure 6. 8: NaOCl Production and Energy Consumption at 6cm
From (Eq.6.3), it was also observed that as the reaction time increases, the power
consumption declines in (fig 6.9), while on the other hand decreasing the cost of
utilizing the brine. At inter electrode spacing 2 cm and 4 cm, the power
consumption was higher, with a greater concentration of sodium hypochlorite
generation varying between 10-25 kw/m3 (573-2140ppm) and 29-24 kw/m3 (572-
2600ppm) than at inter electrode spacing 6cm 17-13 kw/m3 (350-1790). It is
therefore important to select an optimum level of energy consumption in order to
achieve an economical process for utilizing the brine.
Figure 6. 9: NaOCl production and contact time at different inter electrode spacing
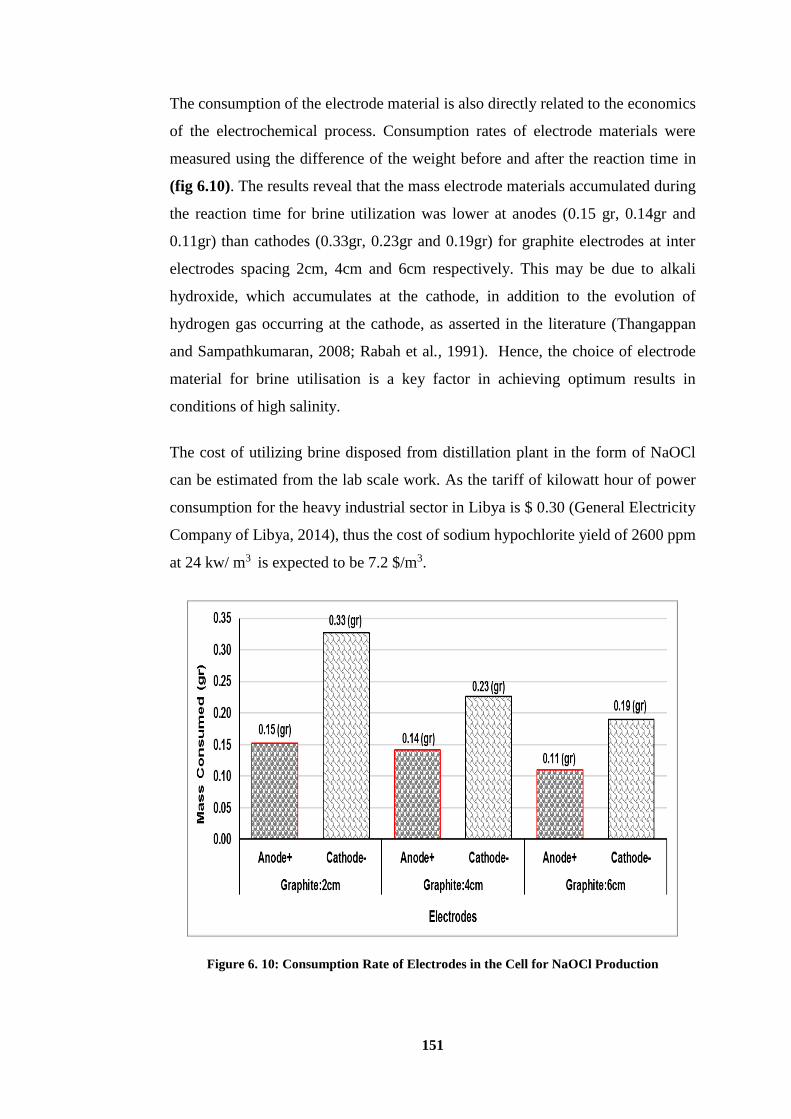
151
The consumption of the electrode material is also directly related to the economics
of the electrochemical process. Consumption rates of electrode materials were
measured using the difference of the weight before and after the reaction time in
(fig 6.10). The results reveal that the mass electrode materials accumulated during
the reaction time for brine utilization was lower at anodes (0.15 gr, 0.14gr and
0.11gr) than cathodes (0.33gr, 0.23gr and 0.19gr) for graphite electrodes at inter
electrodes spacing 2cm, 4cm and 6cm respectively. This may be due to alkali
hydroxide, which accumulates at the cathode, in addition to the evolution of
hydrogen gas occurring at the cathode, as asserted in the literature (Thangappan
and Sampathkumaran, 2008; Rabah et al., 1991). Hence, the choice of electrode
material for brine utilisation is a key factor in achieving optimum results in
conditions of high salinity.
The cost of utilizing brine disposed from distillation plant in the form of NaOCl
can be estimated from the lab scale work. As the tariff of kilowatt hour of power
consumption for the heavy industrial sector in Libya is $ 0.30 (General Electricity
Company of Libya, 2014), thus the cost of sodium hypochlorite yield of 2600 ppm
at 24 kw/ m3 is expected to be 7.2 $/m3.
Figure 6. 10: Consumption Rate of Electrodes in the Cell for NaOCl Production
152
6.5. Summary
According to experimental work in this chapter, it can be concluded that brine has
many favourable properties when considering the environmental and cost factors
pertaining to coastal desalination plants. On-site production of sodium hypochlorite
is deemed to be advantageous for further development of distillation when
specialised units can be connected to brine flow.
After testing different types of electrodes, graphite showed high stability in
performance, producing sodium hypochlorite to a value of approximately
2,600ppm. Furthermore, having a 4cm gap between electrodes with current density
of 0.048 mA/cm was a crucial factor in terms of good process economy, in contrast
to inter electrode spacing of 2cm and 6cm. Consequently, use of brine fed into the
hypochlorination unit should optimise the current input, the DC voltage and
appropriate reaction times in order to achieve optimum results.
Another by-product from electrochemical reaction is hydrogen which can be
collected for further use, thereby reducing operating costs of hypochlorination
units. In addition, the performance of the electrochemical unit can be improved by
mixing brine disposal from distillation plants and using different electrode
materials, such as titanium electrode coated with a dimensionally stable anode
(DSA) mesh thereby optimising cost efficiency while minimizing residual deposits
on the electrodes. Another option for reducing the cost of brine utilisation could be
the use of alternative power supply by the hypochlorination unit such as solar
energy, which is widely available in Libya. Hence, the next chapter will investigate
the use of this in evaporation ponds.
153
Chapter Seven: Salt production by the evaporation ponds of brine
disposed from distillation plant
7.1. Introduction
The production of salt has long been an established global business since the 4th
century millennium in Europe (Olivier and Kovacik, 2006), the first century in
China (Flad et al., 2005) and similarly in Central America (Andrews, 1983). Libya
experienced the introduction of salt trading routes in the 5th century (Batterson and
Boddie, 1972). Without salt, human civilisation could never have evolved, as it is
integral to the development of a society. It has a huge impact on all life forms, man
has used solar evaporation or saltmarshes to produce this valuable mineral since the
dawn of time (Korovessis and Lekkas, 2009).
Approximately 200 million tons of sodium chloride are manufactured in solar
saltworks (marais salants, salinas, saltfields, salzgärten, solnitzi) annually
representing one third of the total amount internationally produced (Davis, 2000).
The solar process of evaporating brine remains the main activity in coastal regions,
to produce salt (Akridge, 2008). This focuses on wetland areas, particularly in salt
marshes that provide optimum conditions in terms of biodiversity and eco-systems
(Kavakli et al., 2006; Deegan et al., 2012), that are key to environmental factors
(Dardir, 2006). A huge range of flora and fauna exist and survive in salt marshes
and solar saltworks areas providing bio-diversity, while enhancing the
improvement of water management and flood prevention (Moosvi, 2006). In the
southern coastline of the Mediterranean Sea, especially in Libya, there are plentiful
salt marshes bordered by sabkhas. A prominent sabkha, located in the western part
of the country is Abu Kammash Salt Marsh, which produces 120,000 tons of
sodium chloride annually from its marine salt operations (El-Magsodi and Haddoud
2010). Until now, the production of marine salt in Libya has been affected by a lack
of technical expertise and equipment, combined with pressures of global
competition and the need for environmental integration (Mohammed, 2003).
Evaporation ponds are constructed to separate the salt from the brine waste by a
process of natural evaporation. They are predominantly used as a storage area of
brine that has been rejected from desalination plants (Thomas, 2009), and offer a
154
viable solution for plants located inland, specifically reverse osmosis, where the
costs of brine management are high (Glueckstern and Priel, 1997; Arnal et al.,
2005). These plants produce much more concentrated waste brine than thermal
desalination plants, which reject diluted amounts because of the ambient seawater
temperature and use of cooling water that is normally mixed with brine prior to
disposal (World Bank, 2012; Darwish et al., 2013).
In both scenarios (reverse osmosis and thermal desalination technologies), the
water produced has a higher salinity concentration than the source water. In cases
of reverse osmosis and thermal desalination, the brine discharged contains chemical
residues of antiscalants, while the by-products of biocides and antifoaming agents
are present in brine discharged from thermal desalination plants. A low
concentration of metals results from the corrosion phenomenon at different levels
in both reject streams (Lattemann and Höpner, 2008). The average dose of antifoam
agent injected into the make-up seawater is 0.1mg/l (Darwish et al., 2013), while
the maximum dose of antiscalants agent is 2 ppm in thermal desalination plants
(Abdulgader and Mustafe, 1998). Neither of these commercial chemical additives
pose any threat to the environment or food grade products (Cipollina et al., 2012).
The seawater intake is also chlorinated with typical doses 0.5–2 mg/l of active Cl2
(Darwish et al., 2013). Because of the extended process within each evaporator and
a high temperature, any residual effects of the brine discharge are minimal due to
high dilution following reaction within the evaporation units (Cipollina et al.,
2012). However, there is an impact on sensitive ecosystems and the marine
environment because of high salinity and continuous disposal (Lattemann and
Höpner, 2008; Medeazza, 2005).
During the desalination process, there are various concentrations of salts and
minerals found in brine including SO42–, Cl−, Na+, Ca2+, Mg2+, K+, Fe2− and Cu2+
(Abdulsalam et al., 2016). The exploitation of these salts and minerals has sparked
interest among scientific communities. Recent literature has revealed that the use
of standard methodologies for exploiting sodium chloride NaCl (halite) can be used
alongside brine recovery processes in thermal desalination plants, reaping
considerable benefits (Ravizky and Nadav, 2007; Hajbi et al., 2010).
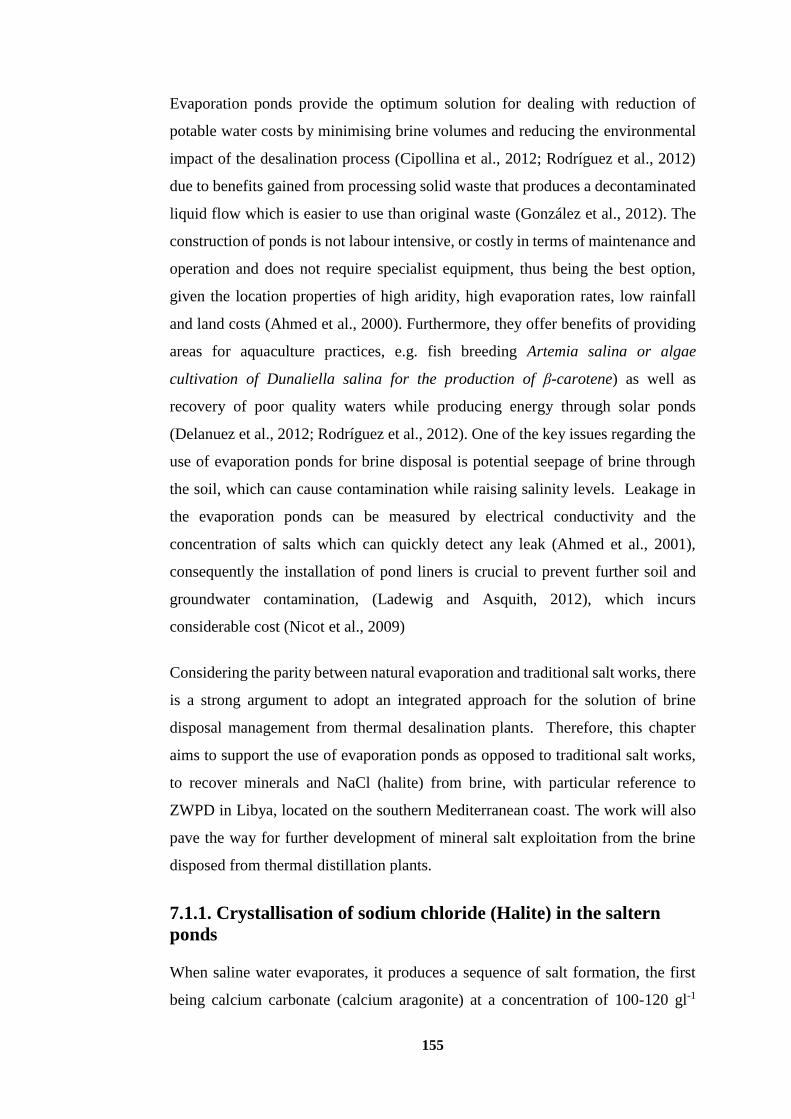
155
Evaporation ponds provide the optimum solution for dealing with reduction of
potable water costs by minimising brine volumes and reducing the environmental
impact of the desalination process (Cipollina et al., 2012; Rodríguez et al., 2012)
due to benefits gained from processing solid waste that produces a decontaminated
liquid flow which is easier to use than original waste (González et al., 2012). The
construction of ponds is not labour intensive, or costly in terms of maintenance and
operation and does not require specialist equipment, thus being the best option,
given the location properties of high aridity, high evaporation rates, low rainfall
and land costs (Ahmed et al., 2000). Furthermore, they offer benefits of providing
areas for aquaculture practices, e.g. fish breeding Artemia salina or algae
cultivation of Dunaliella salina for the production of β-carotene) as well as
recovery of poor quality waters while producing energy through solar ponds
(Delanuez et al., 2012; Rodríguez et al., 2012). One of the key issues regarding the
use of evaporation ponds for brine disposal is potential seepage of brine through
the soil, which can cause contamination while raising salinity levels. Leakage in
the evaporation ponds can be measured by electrical conductivity and the
concentration of salts which can quickly detect any leak (Ahmed et al., 2001),
consequently the installation of pond liners is crucial to prevent further soil and
groundwater contamination, (Ladewig and Asquith, 2012), which incurs
considerable cost (Nicot et al., 2009)
Considering the parity between natural evaporation and traditional salt works, there
is a strong argument to adopt an integrated approach for the solution of brine
disposal management from thermal desalination plants. Therefore, this chapter
aims to support the use of evaporation ponds as opposed to traditional salt works,
to recover minerals and NaCl (halite) from brine, with particular reference to
ZWPD in Libya, located on the southern Mediterranean coast. The work will also
pave the way for further development of mineral salt exploitation from the brine
disposed from thermal distillation plants.
7.1.1. Crystallisation of sodium chloride (Halite) in the saltern
ponds
When saline water evaporates, it produces a sequence of salt formation, the first
being calcium carbonate (calcium aragonite) at a concentration of 100-120 gl-1
156
followed by calcium sulphate (gypsum) at concentration of 180 gl-1 and finally
sodium chloride (halite) at salt concentration of 300–350 gl-1, resulting in a
concentrated mixture of magnesium, potassium, chloride and sulphate ions. The
gypsum gathers at the bottom of the pond where the halite forms crystals (Madkour
and Gaballah, 2012; Oren et al., 2009). These ponds operate continuously and
seasonally, both maintaining a constant salinity gradient during ongoing production
of salt, which is produced annually by the former and only during the summer by
the latter (Davis, 2000).
7.2. Study Site and Evaporation Ponds Installation
An experiment was carried out in July 2014 to construct ten evaporation ponds next
to the outlet of the Zwuarah distillation plant. These ponds are located in the north-
western side of the city of Tripoli (Latitude 32°53’420” N and longitude 12°10'578”
E) (fig 7.1). They are shaped as irregular rectangles with dimensions of (5m) width,
(4.5m) long and (0.25m) deep.
Prior to installation, the pond site was cleaned up to clear away gravel and coarse
sand to prepare a top layer of clean sand. 21,000 tons of dry and soft clay sand were
settled and compacted at site by a wheel loader. Banks around the perimeter of the
evaporation ponds were built using concrete bound blocks. Dry white soft sea sand
was equalised and compacted by using a skid steer loader in each pond. Ten black
pond liners of high density polyethylene measuring approximately 6 × 7m with
0.5mm thickness were installed in the top layer of the lined ponds, welded together
by adhesive liquid.
Following their installation, the outer areas of each pond were covered by concrete
block and soil in order to prevent movement of the pond liners. The main objective
of choosing these durable UV-resistant black pond liners is to enhance evaporation
by absorption of solar radiation and to avoid any environmental issues. A Davis
wireless vantage pro 2 weather station with data logger was installed next to the
site in order to study the weather and weather patterns. The total area of all the
evaporation ponds is about (225m2). The depth of the brine in each pond was
approximately (0.07-0.1m). A volume of 15.75 m3 of brine from the evaporator of
ZWDP for ponds was used to carry out the experiments.
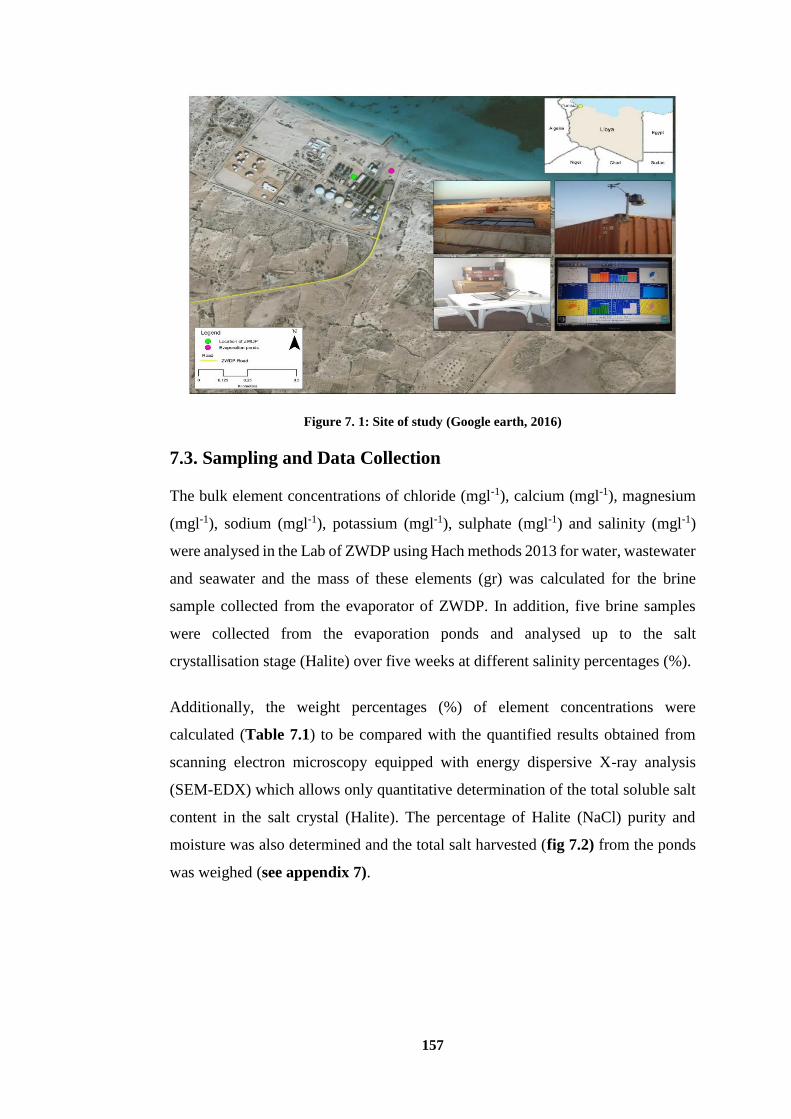
157
Figure 7. 1: Site of study (Google earth, 2016)
7.3. Sampling and Data Collection
The bulk element concentrations of chloride (mgl-1), calcium (mgl-1), magnesium
(mgl-1), sodium (mgl-1), potassium (mgl-1), sulphate (mgl-1) and salinity (mgl-1)
were analysed in the Lab of ZWDP using Hach methods 2013 for water, wastewater
and seawater and the mass of these elements (gr) was calculated for the brine
sample collected from the evaporator of ZWDP. In addition, five brine samples
were collected from the evaporation ponds and analysed up to the salt
crystallisation stage (Halite) over five weeks at different salinity percentages (%).
Additionally, the weight percentages (%) of element concentrations were
calculated (Table 7.1) to be compared with the quantified results obtained from
scanning electron microscopy equipped with energy dispersive X-ray analysis
(SEM-EDX) which allows only quantitative determination of the total soluble salt
content in the salt crystal (Halite). The percentage of Halite (NaCl) purity and
moisture was also determined and the total salt harvested (fig 7.2) from the ponds
was weighed (see appendix 7).
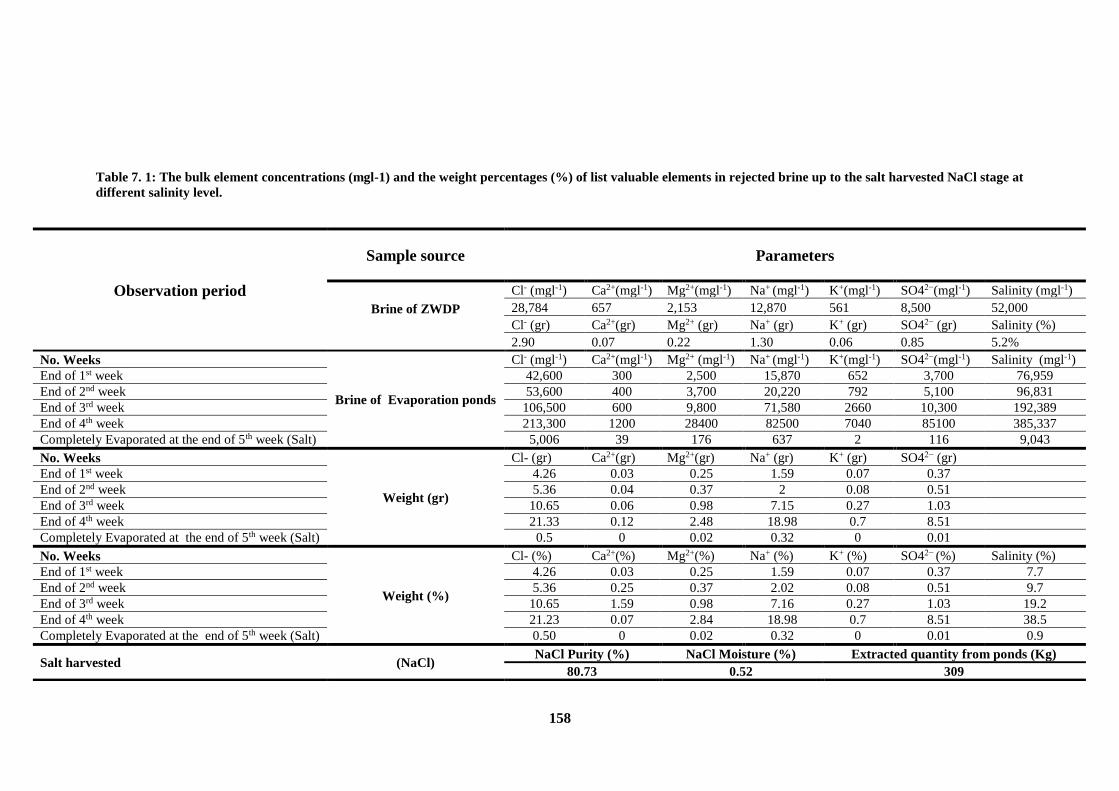
158
Table 7. 1: The bulk element concentrations (mgl-1) and the weight percentages (%) of list valuable elements in rejected brine up to the salt harvested NaCl stage at
different salinity level.
Observation period
Sample source
Parameters
Brine of ZWDP
Cl- (mgl-1) Ca2+(mgl-1) Mg2+(mgl-1) Na+ (mgl-1) K+(mgl-1) SO42−(mgl-1) Salinity (mgl-1)
28,784 657 2,153 12,870 561 8,500 52,000
Cl- (gr) Ca2+(gr) Mg2+ (gr) Na+ (gr) K+ (gr) SO42− (gr) Salinity (%)
2.90 0.07 0.22 1.30 0.06 0.85 5.2%
No. Weeks
Brine of Evaporation ponds
Cl- (mgl-1) Ca2+(mgl-1) Mg2+ (mgl-1) Na+ (mgl-1) K+(mgl-1) SO42−(mgl-1) Salinity (mgl-1)
End of 1st week 42,600 300 2,500 15,870 652 3,700 76,959
End of 2nd week 53,600 400 3,700 20,220 792 5,100 96,831
End of 3rd week 106,500 600 9,800 71,580 2660 10,300 192,389
End of 4th week 213,300 1200 28400 82500 7040 85100 385,337
Completely Evaporated at the end of 5th week (Salt) 5,006 39 176 637 2 116 9,043
No. Weeks
Weight (gr)
Cl- (gr) Ca2+(gr) Mg2+(gr) Na+ (gr) K+ (gr) SO42− (gr)
End of 1st week 4.26 0.03 0.25 1.59 0.07 0.37
End of 2nd week 5.36 0.04 0.37 2 0.08 0.51
End of 3rd week 10.65 0.06 0.98 7.15 0.27 1.03
End of 4th week 21.33 0.12 2.48 18.98 0.7 8.51
Completely Evaporated at the end of 5th week (Salt) 0.5 0 0.02 0.32 0 0.01
No. Weeks
Weight (%)
Cl- (%) Ca2+(%) Mg2+(%) Na+ (%) K+ (%) SO42− (%) Salinity (%)
End of 1st week 4.26 0.03 0.25 1.59 0.07 0.37 7.7
End of 2nd week 5.36 0.25 0.37 2.02 0.08 0.51 9.7
End of 3rd week 10.65 1.59 0.98 7.16 0.27 1.03 19.2
End of 4th week 21.23 0.07 2.84 18.98 0.7 8.51 38.5
Completely Evaporated at the end of 5th week (Salt) 0.50 0 0.02 0.32 0 0.01 0.9
Salt harvested (NaCl) NaCl Purity (%) NaCl Moisture (%) Extracted quantity from ponds (Kg)
80.73 0.52 309
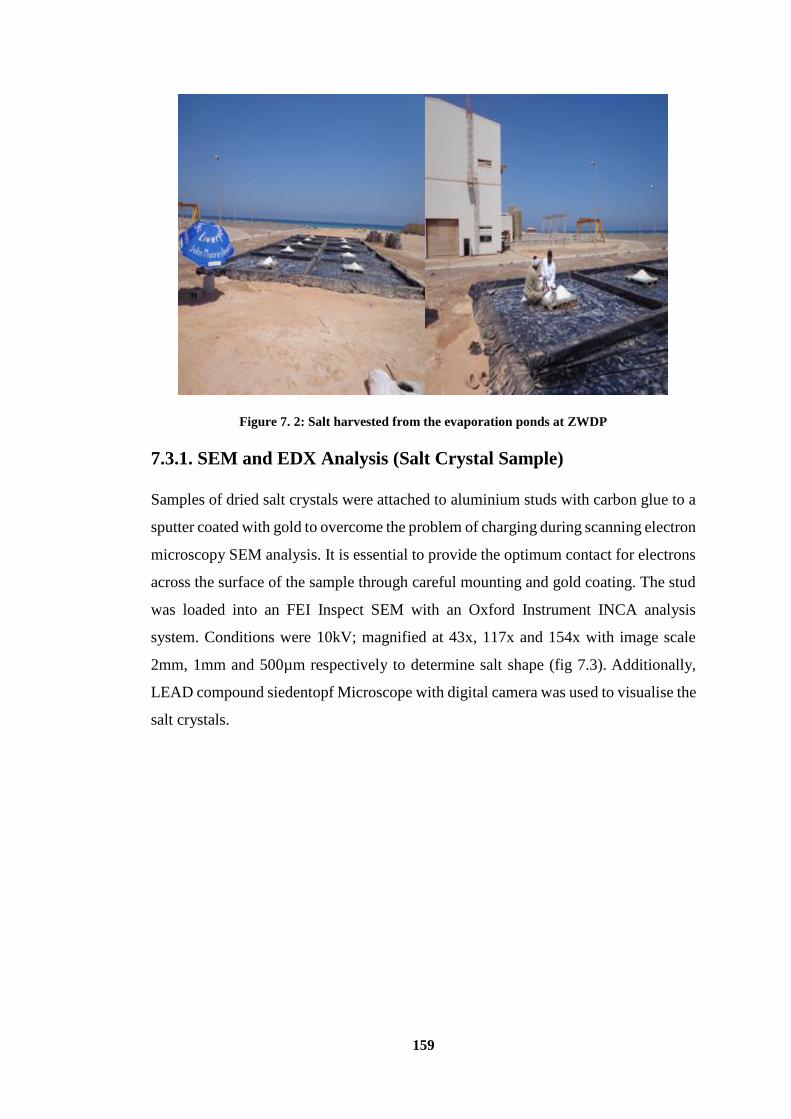
159
Figure 7. 2: Salt harvested from the evaporation ponds at ZWDP
7.3.1. SEM and EDX Analysis (Salt Crystal Sample)
Samples of dried salt crystals were attached to aluminium studs with carbon glue to a
sputter coated with gold to overcome the problem of charging during scanning electron
microscopy SEM analysis. It is essential to provide the optimum contact for electrons
across the surface of the sample through careful mounting and gold coating. The stud
was loaded into an FEI Inspect SEM with an Oxford Instrument INCA analysis
system. Conditions were 10kV; magnified at 43x, 117x and 154x with image scale
2mm, 1mm and 500µm respectively to determine salt shape (fig 7.3). Additionally,
LEAD compound siedentopf Microscope with digital camera was used to visualise the
salt crystals.
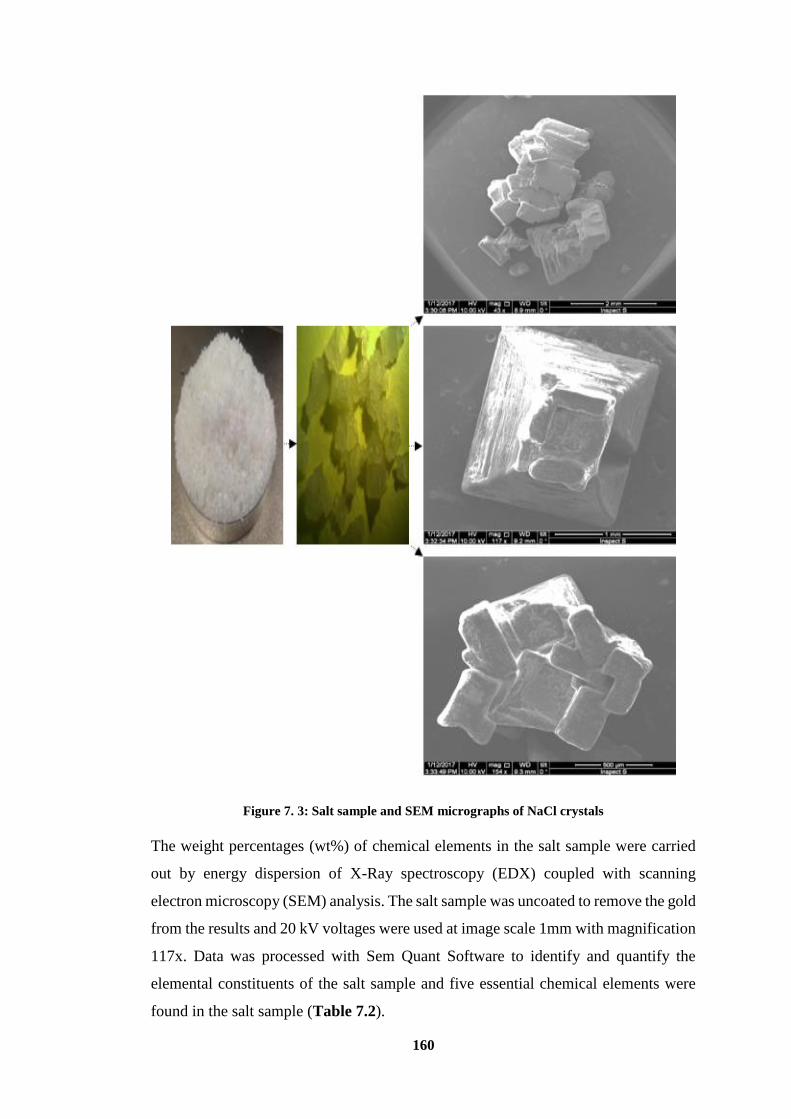
160
Figure 7. 3: Salt sample and SEM micrographs of NaCl crystals
The weight percentages (wt%) of chemical elements in the salt sample were carried
out by energy dispersion of X-Ray spectroscopy (EDX) coupled with scanning
electron microscopy (SEM) analysis. The salt sample was uncoated to remove the gold
from the results and 20 kV voltages were used at image scale 1mm with magnification
117x. Data was processed with Sem Quant Software to identify and quantify the
elemental constituents of the salt sample and five essential chemical elements were
found in the salt sample (Table 7.2).
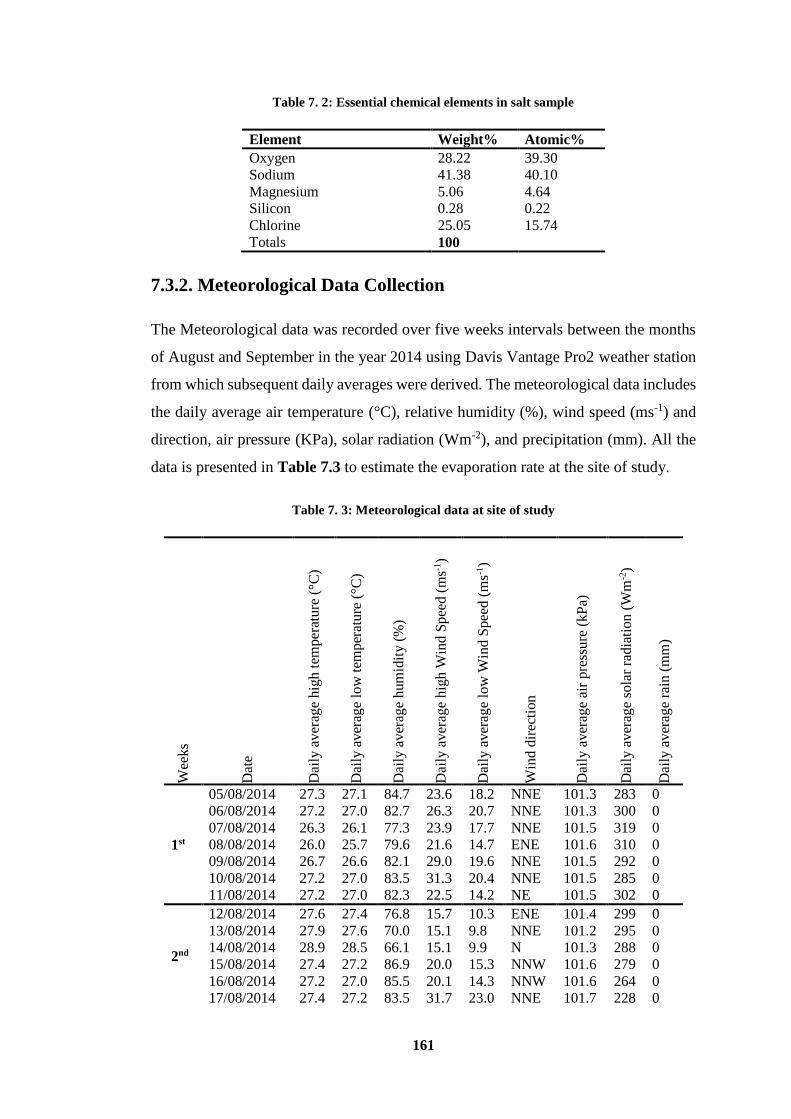
161
Table 7. 2: Essential chemical elements in salt sample
Element Weight% Atomic%
Oxygen 28.22 39.30
Sodium 41.38 40.10
Magnesium 5.06 4.64
Silicon 0.28 0.22
Chlorine 25.05 15.74
Totals 100
7.3.2. Meteorological Data Collection
The Meteorological data was recorded over five weeks intervals between the months
of August and September in the year 2014 using Davis Vantage Pro2 weather station
from which subsequent daily averages were derived. The meteorological data includes
the daily average air temperature (°C), relative humidity (%), wind speed (ms-1) and
direction, air pressure (KPa), solar radiation (Wm-2), and precipitation (mm). All the
data is presented in Table 7.3 to estimate the evaporation rate at the site of study.
Table 7. 3: Meteorological data at site of study
Wee
ks
Dat
e
Dai
ly a
ver
age
hig
h t
emper
ature
(°C
)
Dai
ly a
ver
age
low
tem
per
ature
(°C
)
Dai
ly a
ver
age
hum
idit
y (
%)
Dai
ly a
ver
age
hig
h W
ind S
pee
d (
ms-1
)
Dai
ly a
ver
age
low
Win
d S
pee
d (
ms-1
)
Win
d d
irec
tion
Dai
ly a
ver
age
air
pre
ssure
(kP
a)
Dai
ly a
ver
age
sola
r ra
dia
tion (
Wm
-2)
Dai
ly a
ver
age
rain
(m
m)
1st
05/08/2014 27.3 27.1 84.7 23.6 18.2 NNE 101.3 283 0
06/08/2014 27.2 27.0 82.7 26.3 20.7 NNE 101.3 300 0
07/08/2014 26.3 26.1 77.3 23.9 17.7 NNE 101.5 319 0
08/08/2014 26.0 25.7 79.6 21.6 14.7 ENE 101.6 310 0
09/08/2014 26.7 26.6 82.1 29.0 19.6 NNE 101.5 292 0
10/08/2014 27.2 27.0 83.5 31.3 20.4 NNE 101.5 285 0
11/08/2014 27.2 27.0 82.3 22.5 14.2 NE 101.5 302 0
2nd
12/08/2014 27.6 27.4 76.8 15.7 10.3 ENE 101.4 299 0
13/08/2014 27.9 27.6 70.0 15.1 9.8 NNE 101.2 295 0
14/08/2014 28.9 28.5 66.1 15.1 9.9 N 101.3 288 0
15/08/2014 27.4 27.2 86.9 20.0 15.3 NNW 101.6 279 0
16/08/2014 27.2 27.0 85.5 20.1 14.3 NNW 101.6 264 0
17/08/2014 27.4 27.2 83.5 31.7 23.0 NNE 101.7 228 0
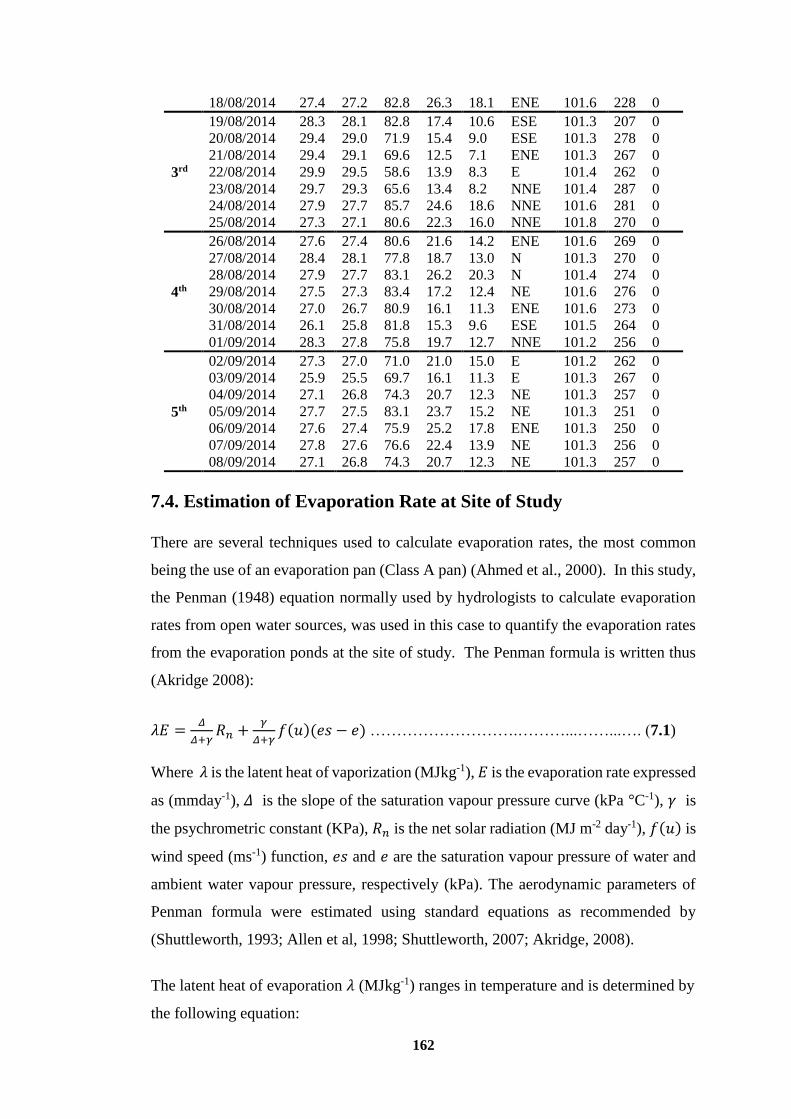
162
18/08/2014 27.4 27.2 82.8 26.3 18.1 ENE 101.6 228 0
3rd
19/08/2014 28.3 28.1 82.8 17.4 10.6 ESE 101.3 207 0
20/08/2014 29.4 29.0 71.9 15.4 9.0 ESE 101.3 278 0
21/08/2014 29.4 29.1 69.6 12.5 7.1 ENE 101.3 267 0
22/08/2014 29.9 29.5 58.6 13.9 8.3 E 101.4 262 0
23/08/2014 29.7 29.3 65.6 13.4 8.2 NNE 101.4 287 0
24/08/2014 27.9 27.7 85.7 24.6 18.6 NNE 101.6 281 0
25/08/2014 27.3 27.1 80.6 22.3 16.0 NNE 101.8 270 0
4th
26/08/2014 27.6 27.4 80.6 21.6 14.2 ENE 101.6 269 0
27/08/2014 28.4 28.1 77.8 18.7 13.0 N 101.3 270 0
28/08/2014 27.9 27.7 83.1 26.2 20.3 N 101.4 274 0
29/08/2014 27.5 27.3 83.4 17.2 12.4 NE 101.6 276 0
30/08/2014 27.0 26.7 80.9 16.1 11.3 ENE 101.6 273 0
31/08/2014 26.1 25.8 81.8 15.3 9.6 ESE 101.5 264 0
01/09/2014 28.3 27.8 75.8 19.7 12.7 NNE 101.2 256 0
5th
02/09/2014 27.3 27.0 71.0 21.0 15.0 E 101.2 262 0
03/09/2014 25.9 25.5 69.7 16.1 11.3 E 101.3 267 0
04/09/2014 27.1 26.8 74.3 20.7 12.3 NE 101.3 257 0
05/09/2014 27.7 27.5 83.1 23.7 15.2 NE 101.3 251 0
06/09/2014 27.6 27.4 75.9 25.2 17.8 ENE 101.3 250 0
07/09/2014 27.8 27.6 76.6 22.4 13.9 NE 101.3 256 0
08/09/2014 27.1 26.8 74.3 20.7 12.3 NE 101.3 257 0
7.4. Estimation of Evaporation Rate at Site of Study
There are several techniques used to calculate evaporation rates, the most common
being the use of an evaporation pan (Class A pan) (Ahmed et al., 2000). In this study,
the Penman (1948) equation normally used by hydrologists to calculate evaporation
rates from open water sources, was used in this case to quantify the evaporation rates
from the evaporation ponds at the site of study. The Penman formula is written thus
(Akridge 2008):
𝜆𝐸 =𝛥
𝛥+𝛾𝑅𝑛 +
𝛾
𝛥+𝛾𝑓(𝑢)(𝑒𝑠 − 𝑒) ……………………….………...……...…. (7.1)
Where 𝜆 is the latent heat of vaporization (MJkg-1), 𝐸 is the evaporation rate expressed
as (mmday-1), 𝛥 is the slope of the saturation vapour pressure curve (kPa °C-1), 𝛾 is
the psychrometric constant (KPa), 𝑅𝑛 is the net solar radiation (MJ m-2 day-1), 𝑓(𝑢) is
wind speed (ms-1) function, 𝑒𝑠 and 𝑒 are the saturation vapour pressure of water and
ambient water vapour pressure, respectively (kPa). The aerodynamic parameters of
Penman formula were estimated using standard equations as recommended by
(Shuttleworth, 1993; Allen et al, 1998; Shuttleworth, 2007; Akridge, 2008).
The latent heat of evaporation 𝜆 (MJkg-1) ranges in temperature and is determined by
the following equation:
163
𝜆 = (2.501 − 0.002361𝑇)…………………..………………….…………... (7.2)
Where 𝑇 is represented in degrees celsius, it is the average of the daily maximum and
minimum temperatures recorded at the site calculated thus:
𝑇 =𝑇max + 𝑇min
2 …..………………………..……………..….……………… (7.3)
The slope of saturation vapour pressure Δ (kPa °C-1) is a function of temperature and
can be calculated as follows:
∆
= 4098es
(237.3 +T)2 ……….……………...…………........…….……….…..…… (7.4)
Where 𝑒𝑠 (KPa) shows the pressure of saturation vapour, as calculated from daily
average temperatures, it verifies the release of water molecules that are released from
the liquid surface, calculated as follows:
𝑒𝑠 = 0.6108𝑒( 17.27𝑇
237.3+𝑇)……………………….……………...…………….…. (7.5)
The psychrometric constant (kPa °C-1) can be identified as the following:
𝛾 = 0.000655𝑃 ……………..………….………………….….…...….……... (7.6)
Where P is the atmospheric pressure (kPa) recorded by the weather station at the site.
At ground surface level, the parity between total upward and downward radiation
fluxes is measured to give net radiation ( 𝑅𝑛), which ultimately energises the processes
of evaporation, evapotranspiration, air and soil fluxes (Imak et al., 2003). It can be
calculated using a range of methods including direct measurement with a radiometer,
analysis of Earth’s orbital characteristics and published latitude tables (Akridge, 2008)
which investigate monthly average net radiation rates (e.g. in Boxwell, 2016). Daily
average net radiation was measured using the following equation:
𝑅𝑛 = 0.0864𝑄 …………...……..…………………....…………..….………. (7.7)
Where Q is daily average solar radiation (Wm-2).
Wind speed for an open water surface is calculated by the following formula:
164
𝑓 (𝑈) = 6.43 (1 + 0.536 𝑈2)……...……………………...…...…….…………. (7.8)
Where U2 is the average of the daily maximum and minimum wind speed (ms-1)
recorded at 5.5 m above the surface at the site of study and is calculated thus:
𝑈2 =𝑈max + 𝑈𝑚𝑖𝑛
2 …………………...…………………….….....……….……… (7.9)
The vapour pressure 𝑒 (KPa) can be determined from the relative humidity by the
following equation:-
𝑒
= 𝐻𝑟𝑒𝑠
100 ……………………….…………...…………….…….………….. (7.10)
Where 𝐻𝑟 is the daily average of the relative humidity (%) recorded at the site of
study by the weather station.
The estimation of the daily average evaporation rates from 5th of August to 8th
September 2014 at the study site are presented in (Table 7.4).
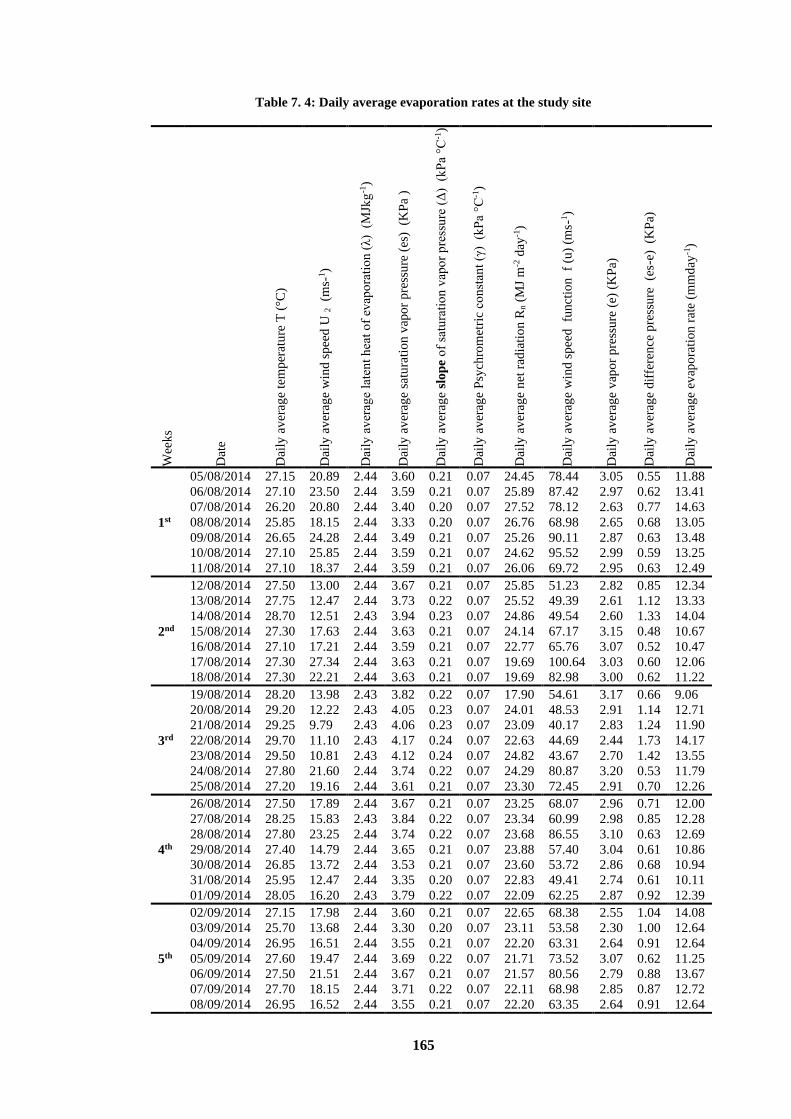
165
Table 7. 4: Daily average evaporation rates at the study site
Wee
ks
Dat
e
Dai
ly a
ver
age
tem
per
atu
re T
(°C
)
Dai
ly a
ver
age
win
d s
pee
d U
2 (m
s-1)
Dai
ly a
ver
age
late
nt
hea
t o
f ev
apo
rati
on
(λ)
(M
Jkg
-1)
Dai
ly a
ver
age
satu
rati
on v
apor
pre
ssu
re (
es)
(K
Pa
)
Dai
ly a
ver
age
slo
pe
of
satu
rati
on
vap
or
pre
ssu
re (
Δ)
(k
Pa
°C-1
)
Dai
ly a
ver
age
Psy
chro
met
ric
con
stan
t (γ
) (
kP
a °C
-1)
Dai
ly a
ver
age
net
rad
iati
on
Rn (
MJ
m-2
day
-1)
Dai
ly a
ver
age
win
d s
pee
d
funct
ion
f
(u)
(ms-
1)
Dai
ly a
ver
age
vap
or
pre
ssu
re (
e) (
KP
a)
Dai
ly a
ver
age
dif
fere
nce
pre
ssu
re
(es-
e) (K
Pa)
Dai
ly a
ver
age
evap
ora
tion
rat
e (m
md
ay-1
)
1st
05/08/2014 27.15 20.89 2.44 3.60 0.21 0.07 24.45 78.44 3.05 0.55 11.88
06/08/2014 27.10 23.50 2.44 3.59 0.21 0.07 25.89 87.42 2.97 0.62 13.41
07/08/2014 26.20 20.80 2.44 3.40 0.20 0.07 27.52 78.12 2.63 0.77 14.63
08/08/2014 25.85 18.15 2.44 3.33 0.20 0.07 26.76 68.98 2.65 0.68 13.05
09/08/2014 26.65 24.28 2.44 3.49 0.21 0.07 25.26 90.11 2.87 0.63 13.48
10/08/2014 27.10 25.85 2.44 3.59 0.21 0.07 24.62 95.52 2.99 0.59 13.25
11/08/2014 27.10 18.37 2.44 3.59 0.21 0.07 26.06 69.72 2.95 0.63 12.49
2nd
12/08/2014 27.50 13.00 2.44 3.67 0.21 0.07 25.85 51.23 2.82 0.85 12.34
13/08/2014 27.75 12.47 2.44 3.73 0.22 0.07 25.52 49.39 2.61 1.12 13.33
14/08/2014 28.70 12.51 2.43 3.94 0.23 0.07 24.86 49.54 2.60 1.33 14.04
15/08/2014 27.30 17.63 2.44 3.63 0.21 0.07 24.14 67.17 3.15 0.48 10.67
16/08/2014 27.10 17.21 2.44 3.59 0.21 0.07 22.77 65.76 3.07 0.52 10.47
17/08/2014 27.30 27.34 2.44 3.63 0.21 0.07 19.69 100.64 3.03 0.60 12.06
18/08/2014 27.30 22.21 2.44 3.63 0.21 0.07 19.69 82.98 3.00 0.62 11.22
3rd
19/08/2014 28.20 13.98 2.43 3.82 0.22 0.07 17.90 54.61 3.17 0.66 9.06
20/08/2014 29.20 12.22 2.43 4.05 0.23 0.07 24.01 48.53 2.91 1.14 12.71
21/08/2014 29.25 9.79 2.43 4.06 0.23 0.07 23.09 40.17 2.83 1.24 11.90
22/08/2014 29.70 11.10 2.43 4.17 0.24 0.07 22.63 44.69 2.44 1.73 14.17
23/08/2014 29.50 10.81 2.43 4.12 0.24 0.07 24.82 43.67 2.70 1.42 13.55
24/08/2014 27.80 21.60 2.44 3.74 0.22 0.07 24.29 80.87 3.20 0.53 11.79
25/08/2014 27.20 19.16 2.44 3.61 0.21 0.07 23.30 72.45 2.91 0.70 12.26
4th
26/08/2014 27.50 17.89 2.44 3.67 0.21 0.07 23.25 68.07 2.96 0.71 12.00
27/08/2014 28.25 15.83 2.43 3.84 0.22 0.07 23.34 60.99 2.98 0.85 12.28
28/08/2014 27.80 23.25 2.44 3.74 0.22 0.07 23.68 86.55 3.10 0.63 12.69
29/08/2014 27.40 14.79 2.44 3.65 0.21 0.07 23.88 57.40 3.04 0.61 10.86
30/08/2014 26.85 13.72 2.44 3.53 0.21 0.07 23.60 53.72 2.86 0.68 10.94
31/08/2014 25.95 12.47 2.44 3.35 0.20 0.07 22.83 49.41 2.74 0.61 10.11
01/09/2014 28.05 16.20 2.43 3.79 0.22 0.07 22.09 62.25 2.87 0.92 12.39
5th
02/09/2014 27.15 17.98 2.44 3.60 0.21 0.07 22.65 68.38 2.55 1.04 14.08
03/09/2014 25.70 13.68 2.44 3.30 0.20 0.07 23.11 53.58 2.30 1.00 12.64
04/09/2014 26.95 16.51 2.44 3.55 0.21 0.07 22.20 63.31 2.64 0.91 12.64
05/09/2014 27.60 19.47 2.44 3.69 0.22 0.07 21.71 73.52 3.07 0.62 11.25
06/09/2014 27.50 21.51 2.44 3.67 0.21 0.07 21.57 80.56 2.79 0.88 13.67
07/09/2014 27.70 18.15 2.44 3.71 0.22 0.07 22.11 68.98 2.85 0.87 12.72
08/09/2014 26.95 16.52 2.44 3.55 0.21 0.07 22.20 63.35 2.64 0.91 12.64
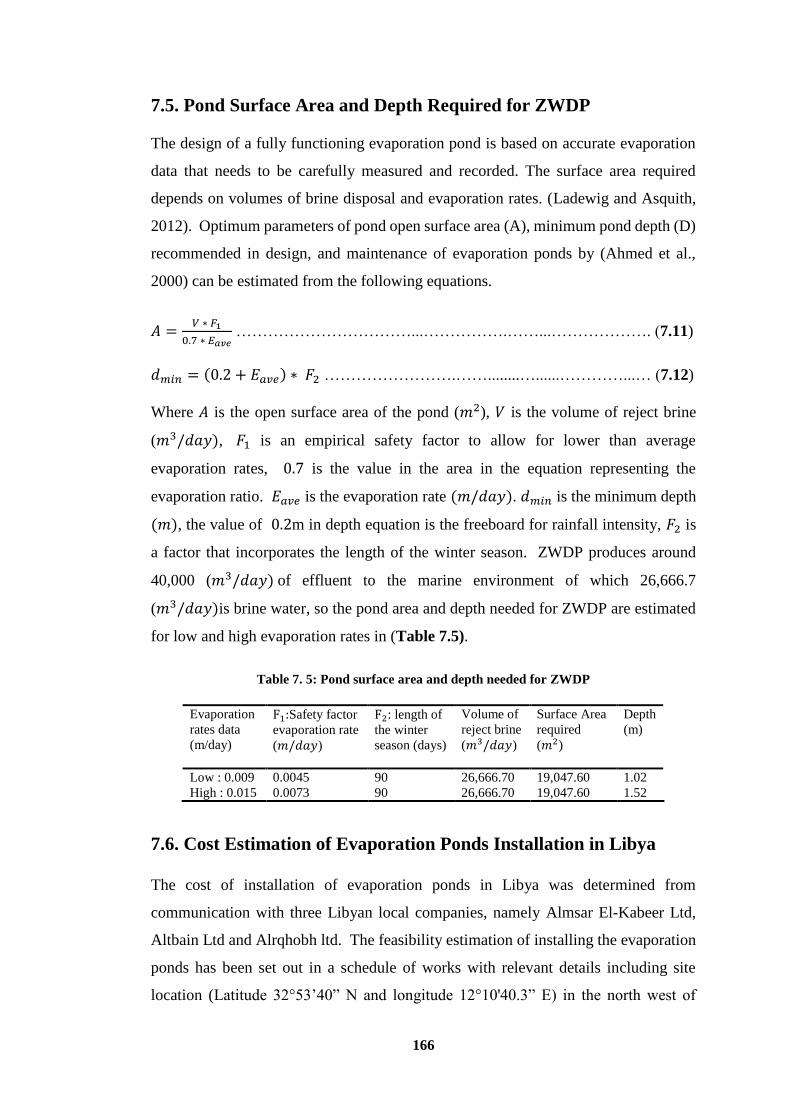
166
7.5. Pond Surface Area and Depth Required for ZWDP
The design of a fully functioning evaporation pond is based on accurate evaporation
data that needs to be carefully measured and recorded. The surface area required
depends on volumes of brine disposal and evaporation rates. (Ladewig and Asquith,
2012). Optimum parameters of pond open surface area (A), minimum pond depth (D)
recommended in design, and maintenance of evaporation ponds by (Ahmed et al.,
2000) can be estimated from the following equations.
𝐴 =𝑉 ∗ 𝐹1
0.7 ∗ 𝐸𝑎𝑣𝑒 ……………………………...…………….……...………………. (7.11)
𝑑𝑚𝑖𝑛 = (0.2 + 𝐸𝑎𝑣𝑒) ∗ 𝐹2 …………………….……........…......…………...… (7.12)
Where 𝐴 is the open surface area of the pond (𝑚2), 𝑉 is the volume of reject brine
(𝑚3/𝑑𝑎𝑦), 𝐹1 is an empirical safety factor to allow for lower than average
evaporation rates, 0.7 is the value in the area in the equation representing the
evaporation ratio. 𝐸𝑎𝑣𝑒 is the evaporation rate (𝑚/𝑑𝑎𝑦). 𝑑𝑚𝑖𝑛 is the minimum depth
(𝑚), the value of 0.2m in depth equation is the freeboard for rainfall intensity, 𝐹2 is
a factor that incorporates the length of the winter season. ZWDP produces around
40,000 (𝑚3/𝑑𝑎𝑦) of effluent to the marine environment of which 26,666.7
(𝑚3/𝑑𝑎𝑦)is brine water, so the pond area and depth needed for ZWDP are estimated
for low and high evaporation rates in (Table 7.5).
Table 7. 5: Pond surface area and depth needed for ZWDP
Evaporation
rates data
(m/day)
F1:Safety factor
evaporation rate
(𝑚/𝑑𝑎𝑦)
F2: length of
the winter
season (days)
Volume of
reject brine
(𝑚3/𝑑𝑎𝑦)
Surface Area
required
(𝑚2)
Depth
(m)
Low : 0.009 0.0045 90 26,666.70 19,047.60 1.02
High : 0.015 0.0073 90 26,666.70 19,047.60 1.52
7.6. Cost Estimation of Evaporation Ponds Installation in Libya
The cost of installation of evaporation ponds in Libya was determined from
communication with three Libyan local companies, namely Almsar El-Kabeer Ltd,
Altbain Ltd and Alrqhobh ltd. The feasibility estimation of installing the evaporation
ponds has been set out in a schedule of works with relevant details including site
location (Latitude 32°53’40” N and longitude 12°10'40.3” E) in the north west of
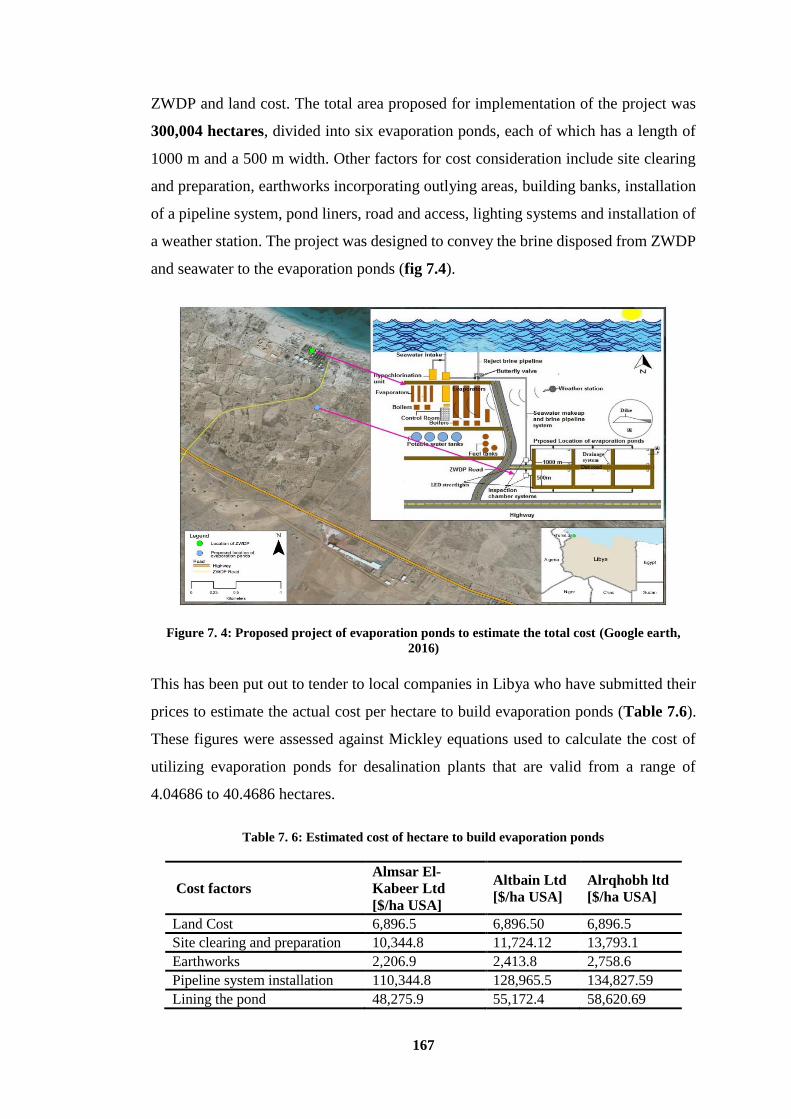
167
ZWDP and land cost. The total area proposed for implementation of the project was
300,004 hectares, divided into six evaporation ponds, each of which has a length of
1000 m and a 500 m width. Other factors for cost consideration include site clearing
and preparation, earthworks incorporating outlying areas, building banks, installation
of a pipeline system, pond liners, road and access, lighting systems and installation of
a weather station. The project was designed to convey the brine disposed from ZWDP
and seawater to the evaporation ponds (fig 7.4).
Figure 7. 4: Proposed project of evaporation ponds to estimate the total cost (Google earth,
2016)
This has been put out to tender to local companies in Libya who have submitted their
prices to estimate the actual cost per hectare to build evaporation ponds (Table 7.6).
These figures were assessed against Mickley equations used to calculate the cost of
utilizing evaporation ponds for desalination plants that are valid from a range of
4.04686 to 40.4686 hectares.
Table 7. 6: Estimated cost of hectare to build evaporation ponds
Cost factors
Almsar El-
Kabeer Ltd
[$/ha USA]
Altbain Ltd
[$/ha USA]
Alrqhobh ltd
[$/ha USA]
Land Cost 6,896.5 6,896.50 6,896.5
Site clearing and preparation 10,344.8 11,724.12 13,793.1
Earthworks 2,206.9 2,413.8 2,758.6
Pipeline system installation 110,344.8 128,965.5 134,827.59
Lining the pond 48,275.9 55,172.4 58,620.69
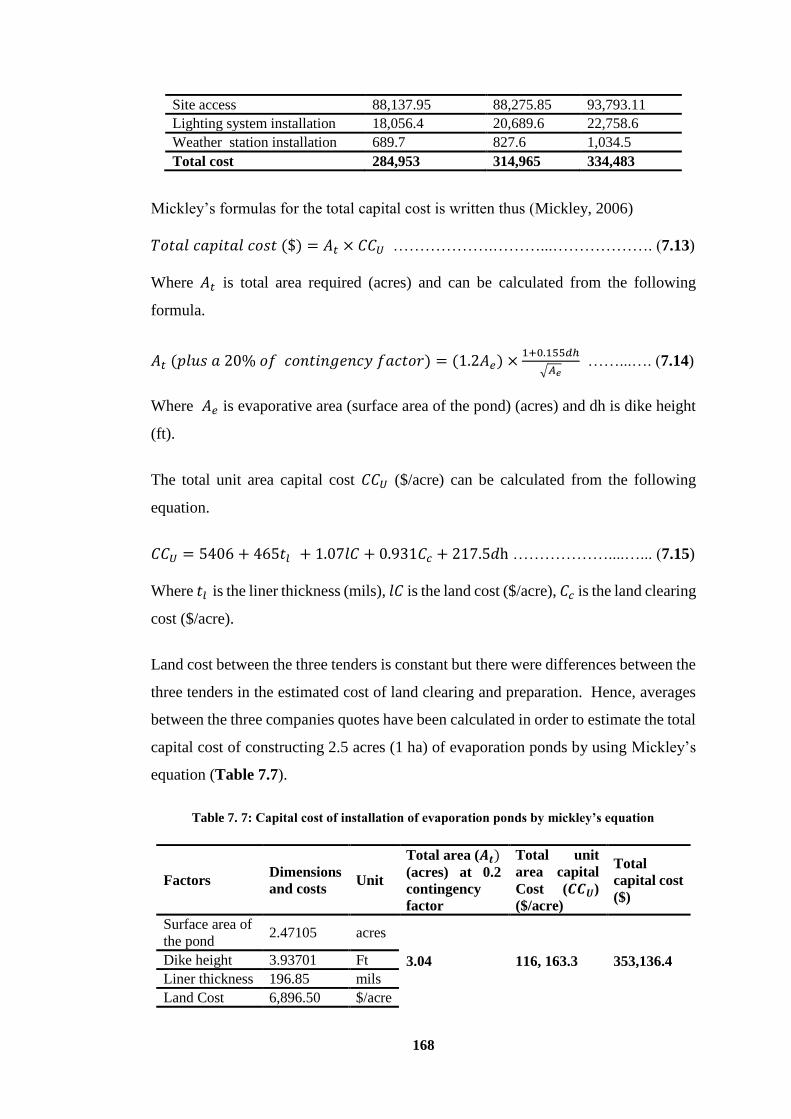
168
Site access 88,137.95 88,275.85 93,793.11
Lighting system installation 18,056.4 20,689.6 22,758.6
Weather station installation 689.7 827.6 1,034.5
Total cost 284,953 314,965 334,483
Mickley’s formulas for the total capital cost is written thus (Mickley, 2006)
𝑇𝑜𝑡𝑎𝑙 𝑐𝑎𝑝𝑖𝑡𝑎𝑙 𝑐𝑜𝑠𝑡 ($) = 𝐴𝑡 × 𝐶𝐶𝑈 ……………….………...………………. (7.13)
Where 𝐴𝑡 is total area required (acres) and can be calculated from the following
formula.
𝐴𝑡 (𝑝𝑙𝑢𝑠 𝑎 20% 𝑜𝑓 𝑐𝑜𝑛𝑡𝑖𝑛𝑔𝑒𝑛𝑐𝑦 𝑓𝑎𝑐𝑡𝑜𝑟) = (1.2𝐴𝑒) ×1+0.155𝑑ℎ
√𝐴𝑒 ……...…. (7.14)
Where 𝐴𝑒 is evaporative area (surface area of the pond) (acres) and dh is dike height
(ft).
The total unit area capital cost 𝐶𝐶𝑈 ($/acre) can be calculated from the following
equation.
𝐶𝐶𝑈 = 5406 + 465𝑡𝑙 + 1.07𝑙𝐶 + 0.931𝐶𝑐 + 217.5𝑑h ………………....…... (7.15)
Where 𝑡𝑙 is the liner thickness (mils), 𝑙𝐶 is the land cost ($/acre), 𝐶𝑐 is the land clearing
cost ($/acre).
Land cost between the three tenders is constant but there were differences between the
three tenders in the estimated cost of land clearing and preparation. Hence, averages
between the three companies quotes have been calculated in order to estimate the total
capital cost of constructing 2.5 acres (1 ha) of evaporation ponds by using Mickley’s
equation (Table 7.7).
Table 7. 7: Capital cost of installation of evaporation ponds by mickley’s equation
Factors Dimensions
and costs Unit
Total area (𝑨𝒕)
(acres) at 0.2
contingency
factor
Total unit
area capital
Cost (𝑪𝑪𝑼)
($/acre)
Total
capital cost
($)
Surface area of
the pond 2.47105 acres
3.04 116, 163.3 353,136.4 Dike height 3.93701 Ft
Liner thickness 196.85 mils
Land Cost 6,896.50 $/acre
169
Land clearing
and preparation 11954.02 $/acre
7.7. Statistical Analysis
All the meteorological data include the daily average air temperature (°C), relative
humidity (%), wind speed (ms-1), air pressure (KPa), solar net radiation (MJ m-2 day-
1). Also included is the total weight percentages (wt%) for the ions composition of the
five brine samples up to crystallisation stage collected from the evaporation ponds
including Cl- (mgl-1), Ca2+ (mgl-1), Mg2+ (mgl-1), Na+ (mgl-1), K+ (mgl-1), SO42− (mgl-
1) which were obtained from the field and lab work over the two months of the
experiment. The results were transferred into PRIMER v6 software (Plymouth
Routines In Multivariate Ecological Research version 6) (Clark and Gorley, 2006) in
order to visualise the patterns of meteorological data which were collected daily and
the total weight percentages (wt%) for ion compositions which were analysed at the
end of each week over the study period. However, the daily average rainfall (mm) at
the study site could not be included for statistical analysis, as it recorded nil during the
period of study. All the data was normalised and then characterised by the principal
component analysis (PCA) to generate 3D and 2D scatterplots displaying the
distribution of the meteorological data and the ions composition of brine samples
during the study period (see appendix 7). A factorability of ±0.3 and greater was
chosen because it is categorised as an important factor into each PCA (Williams et al.,
2010; Pallant, 2010).
7.8. Results and Discussion
The aim of this work was to study the feasibility of salt production from reject brine
released from distillation plants (MED plant) in the south Mediterranean on the
western part of the Libyan coastline, using evaporation ponds. In order to obtain
optimum evaporation rate results, black liners of high-density polyethylene were used,
which ultimately resulted in the production of concentrated brine in a shorter time
span, compared with traditional techniques. Information has been collated to provide
a methodological process of using evaporation ponds as a means of brine management,
described from technological, economical and environmental aspects.
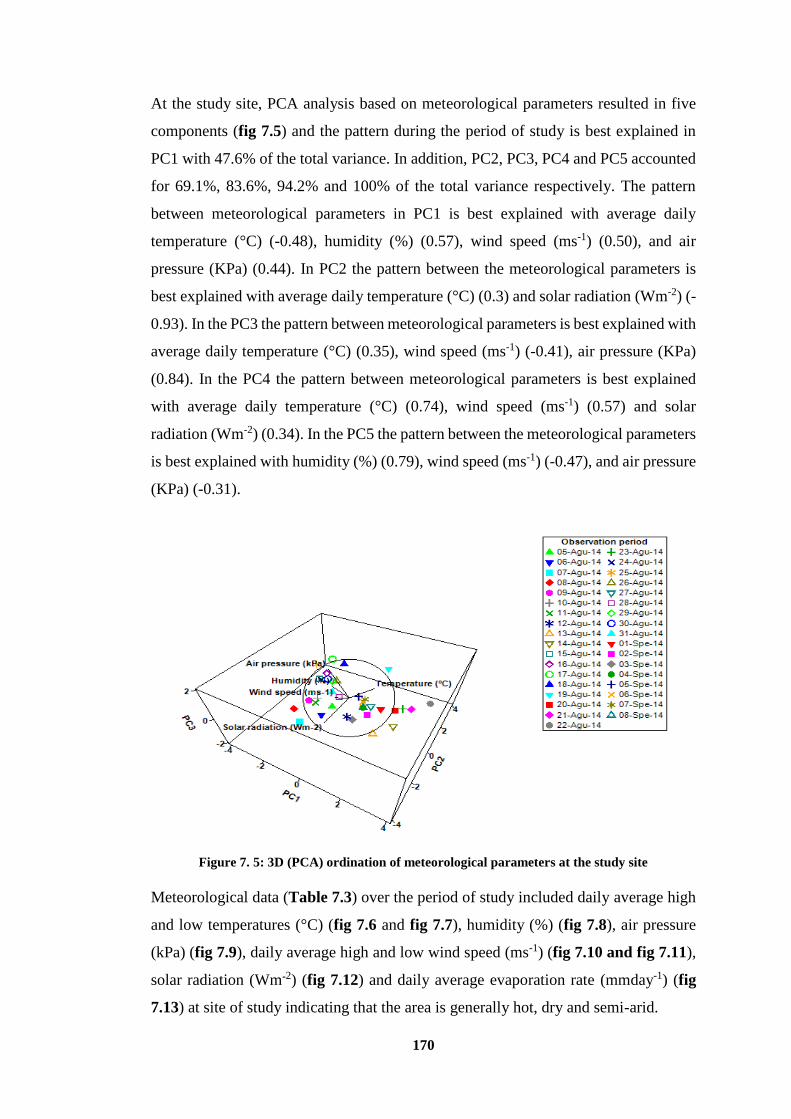
170
At the study site, PCA analysis based on meteorological parameters resulted in five
components (fig 7.5) and the pattern during the period of study is best explained in
PC1 with 47.6% of the total variance. In addition, PC2, PC3, PC4 and PC5 accounted
for 69.1%, 83.6%, 94.2% and 100% of the total variance respectively. The pattern
between meteorological parameters in PC1 is best explained with average daily
temperature (°C) (-0.48), humidity (%) (0.57), wind speed (ms-1) (0.50), and air
pressure (KPa) (0.44). In PC2 the pattern between the meteorological parameters is
best explained with average daily temperature (°C) (0.3) and solar radiation (Wm-2) (-
0.93). In the PC3 the pattern between meteorological parameters is best explained with
average daily temperature (°C) (0.35), wind speed (ms-1) (-0.41), air pressure (KPa)
(0.84). In the PC4 the pattern between meteorological parameters is best explained
with average daily temperature (°C) (0.74), wind speed (ms-1) (0.57) and solar
radiation (Wm-2) (0.34). In the PC5 the pattern between the meteorological parameters
is best explained with humidity (%) (0.79), wind speed (ms-1) (-0.47), and air pressure
(KPa) (-0.31).
Figure 7. 5: 3D (PCA) ordination of meteorological parameters at the study site
Meteorological data (Table 7.3) over the period of study included daily average high
and low temperatures (°C) (fig 7.6 and fig 7.7), humidity (%) (fig 7.8), air pressure
(kPa) (fig 7.9), daily average high and low wind speed (ms-1) (fig 7.10 and fig 7.11),
solar radiation (Wm-2) (fig 7.12) and daily average evaporation rate (mmday-1) (fig
7.13) at site of study indicating that the area is generally hot, dry and semi-arid.
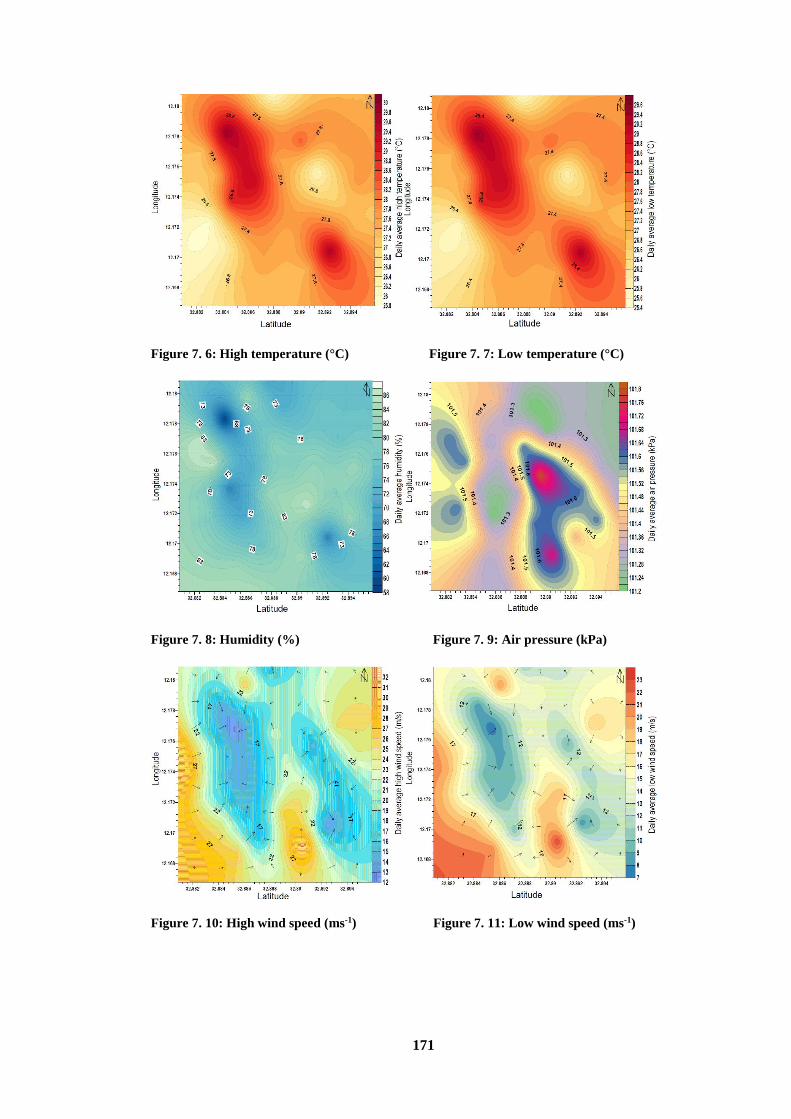
171
Figure 7. 6: High temperature (°C) Figure 7. 7: Low temperature (°C)
Figure 7. 8: Humidity (%) Figure 7. 9: Air pressure (kPa)
Figure 7. 10: High wind speed (ms-1) Figure 7. 11: Low wind speed (ms-1)
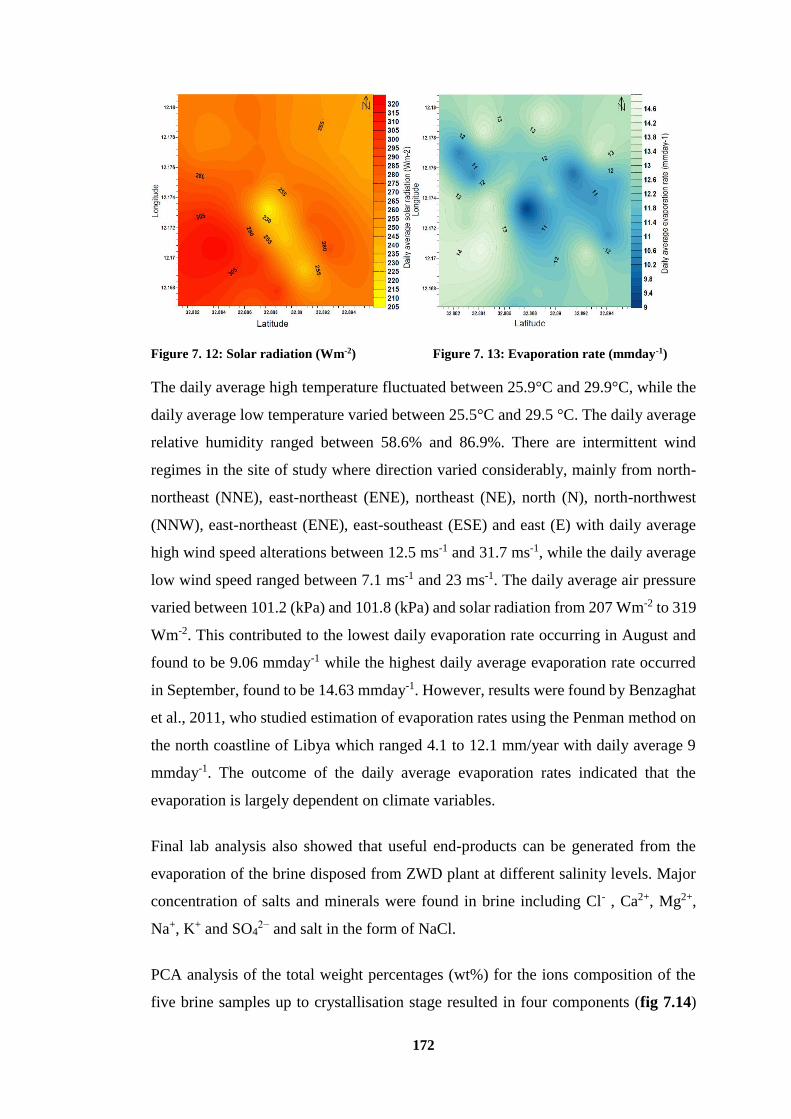
172
Figure 7. 12: Solar radiation (Wm-2) Figure 7. 13: Evaporation rate (mmday-1)
The daily average high temperature fluctuated between 25.9°C and 29.9°C, while the
daily average low temperature varied between 25.5°C and 29.5 °C. The daily average
relative humidity ranged between 58.6% and 86.9%. There are intermittent wind
regimes in the site of study where direction varied considerably, mainly from north-
northeast (NNE), east-northeast (ENE), northeast (NE), north (N), north-northwest
(NNW), east-northeast (ENE), east-southeast (ESE) and east (E) with daily average
high wind speed alterations between 12.5 ms-1 and 31.7 ms-1, while the daily average
low wind speed ranged between 7.1 ms-1 and 23 ms-1. The daily average air pressure
varied between 101.2 (kPa) and 101.8 (kPa) and solar radiation from 207 Wm-2 to 319
Wm-2. This contributed to the lowest daily evaporation rate occurring in August and
found to be 9.06 mmday-1 while the highest daily average evaporation rate occurred
in September, found to be 14.63 mmday-1. However, results were found by Benzaghat
et al., 2011, who studied estimation of evaporation rates using the Penman method on
the north coastline of Libya which ranged 4.1 to 12.1 mm/year with daily average 9
mmday-1. The outcome of the daily average evaporation rates indicated that the
evaporation is largely dependent on climate variables.
Final lab analysis also showed that useful end-products can be generated from the
evaporation of the brine disposed from ZWD plant at different salinity levels. Major
concentration of salts and minerals were found in brine including Cl- , Ca2+, Mg2+,
Na+, K+ and SO42− and salt in the form of NaCl.
PCA analysis of the total weight percentages (wt%) for the ions composition of the
five brine samples up to crystallisation stage resulted in four components (fig 7.14)
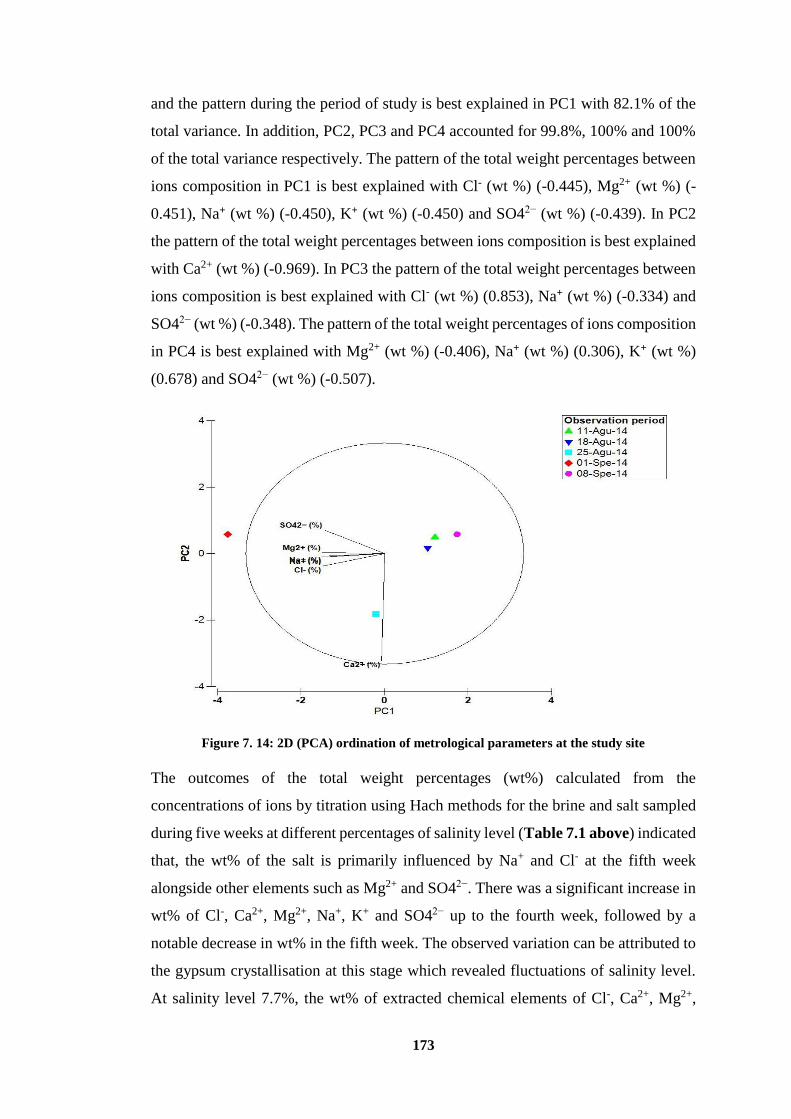
173
and the pattern during the period of study is best explained in PC1 with 82.1% of the
total variance. In addition, PC2, PC3 and PC4 accounted for 99.8%, 100% and 100%
of the total variance respectively. The pattern of the total weight percentages between
ions composition in PC1 is best explained with Cl- (wt %) (-0.445), Mg2+ (wt %) (-
0.451), Na+ (wt %) (-0.450), K+ (wt %) (-0.450) and SO42− (wt %) (-0.439). In PC2
the pattern of the total weight percentages between ions composition is best explained
with Ca2+ (wt %) (-0.969). In PC3 the pattern of the total weight percentages between
ions composition is best explained with Cl- (wt %) (0.853), Na+ (wt %) (-0.334) and
SO42− (wt %) (-0.348). The pattern of the total weight percentages of ions composition
in PC4 is best explained with Mg2+ (wt %) (-0.406), Na+ (wt %) (0.306), K+ (wt %)
(0.678) and SO42− (wt %) (-0.507).
Figure 7. 14: 2D (PCA) ordination of metrological parameters at the study site
The outcomes of the total weight percentages (wt%) calculated from the
concentrations of ions by titration using Hach methods for the brine and salt sampled
during five weeks at different percentages of salinity level (Table 7.1 above) indicated
that, the wt% of the salt is primarily influenced by Na+ and Cl- at the fifth week
alongside other elements such as Mg2+ and SO42−. There was a significant increase in
wt% of Cl-, Ca2+, Mg2+, Na+, K+ and SO42− up to the fourth week, followed by a
notable decrease in wt% in the fifth week. The observed variation can be attributed to
the gypsum crystallisation at this stage which revealed fluctuations of salinity level.
At salinity level 7.7%, the wt% of extracted chemical elements of Cl-, Ca2+, Mg2+,
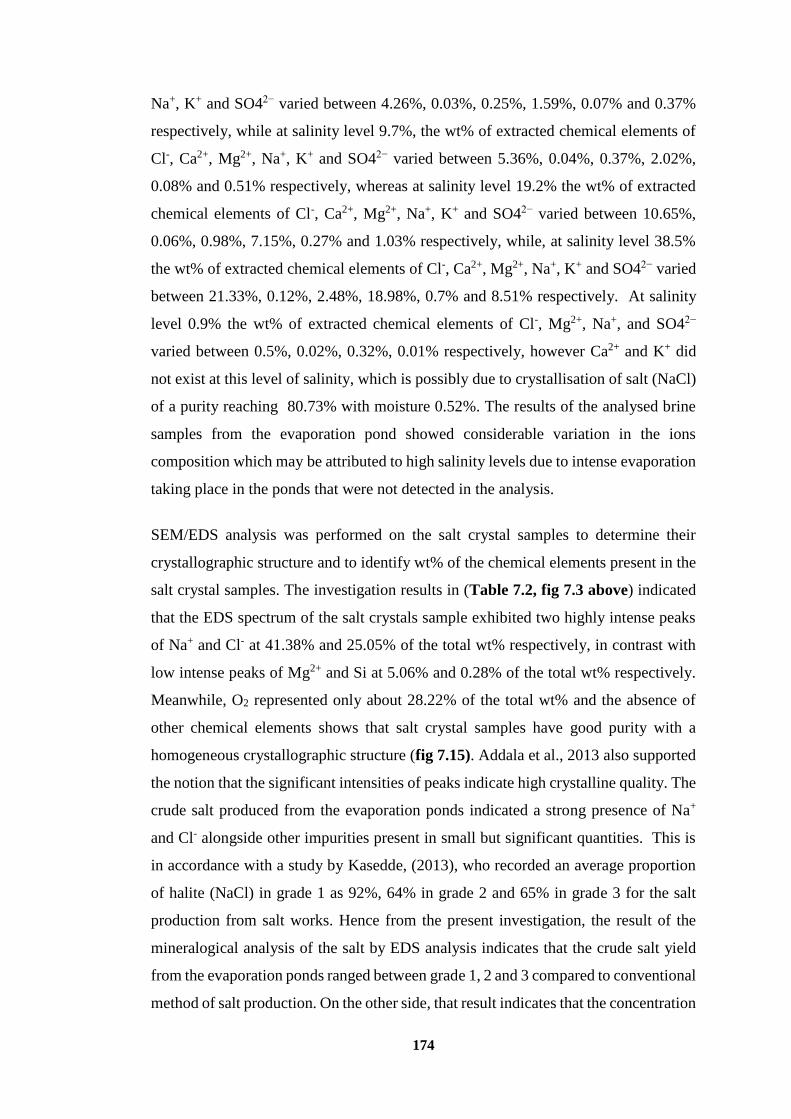
174
Na+, K+ and SO42− varied between 4.26%, 0.03%, 0.25%, 1.59%, 0.07% and 0.37%
respectively, while at salinity level 9.7%, the wt% of extracted chemical elements of
Cl-, Ca2+, Mg2+, Na+, K+ and SO42− varied between 5.36%, 0.04%, 0.37%, 2.02%,
0.08% and 0.51% respectively, whereas at salinity level 19.2% the wt% of extracted
chemical elements of Cl-, Ca2+, Mg2+, Na+, K+ and SO42− varied between 10.65%,
0.06%, 0.98%, 7.15%, 0.27% and 1.03% respectively, while, at salinity level 38.5%
the wt% of extracted chemical elements of Cl-, Ca2+, Mg2+, Na+, K+ and SO42− varied
between 21.33%, 0.12%, 2.48%, 18.98%, 0.7% and 8.51% respectively. At salinity
level 0.9% the wt% of extracted chemical elements of Cl-, Mg2+, Na+, and SO42−
varied between 0.5%, 0.02%, 0.32%, 0.01% respectively, however Ca2+ and K+ did
not exist at this level of salinity, which is possibly due to crystallisation of salt (NaCl)
of a purity reaching 80.73% with moisture 0.52%. The results of the analysed brine
samples from the evaporation pond showed considerable variation in the ions
composition which may be attributed to high salinity levels due to intense evaporation
taking place in the ponds that were not detected in the analysis.
SEM/EDS analysis was performed on the salt crystal samples to determine their
crystallographic structure and to identify wt% of the chemical elements present in the
salt crystal samples. The investigation results in (Table 7.2, fig 7.3 above) indicated
that the EDS spectrum of the salt crystals sample exhibited two highly intense peaks
of Na+ and Cl- at 41.38% and 25.05% of the total wt% respectively, in contrast with
low intense peaks of Mg2+ and Si at 5.06% and 0.28% of the total wt% respectively.
Meanwhile, O2 represented only about 28.22% of the total wt% and the absence of
other chemical elements shows that salt crystal samples have good purity with a
homogeneous crystallographic structure (fig 7.15). Addala et al., 2013 also supported
the notion that the significant intensities of peaks indicate high crystalline quality. The
crude salt produced from the evaporation ponds indicated a strong presence of Na+
and Cl- alongside other impurities present in small but significant quantities. This is
in accordance with a study by Kasedde, (2013), who recorded an average proportion
of halite (NaCl) in grade 1 as 92%, 64% in grade 2 and 65% in grade 3 for the salt
production from salt works. Hence from the present investigation, the result of the
mineralogical analysis of the salt by EDS analysis indicates that the crude salt yield
from the evaporation ponds ranged between grade 1, 2 and 3 compared to conventional
method of salt production. On the other side, that result indicates that the concentration
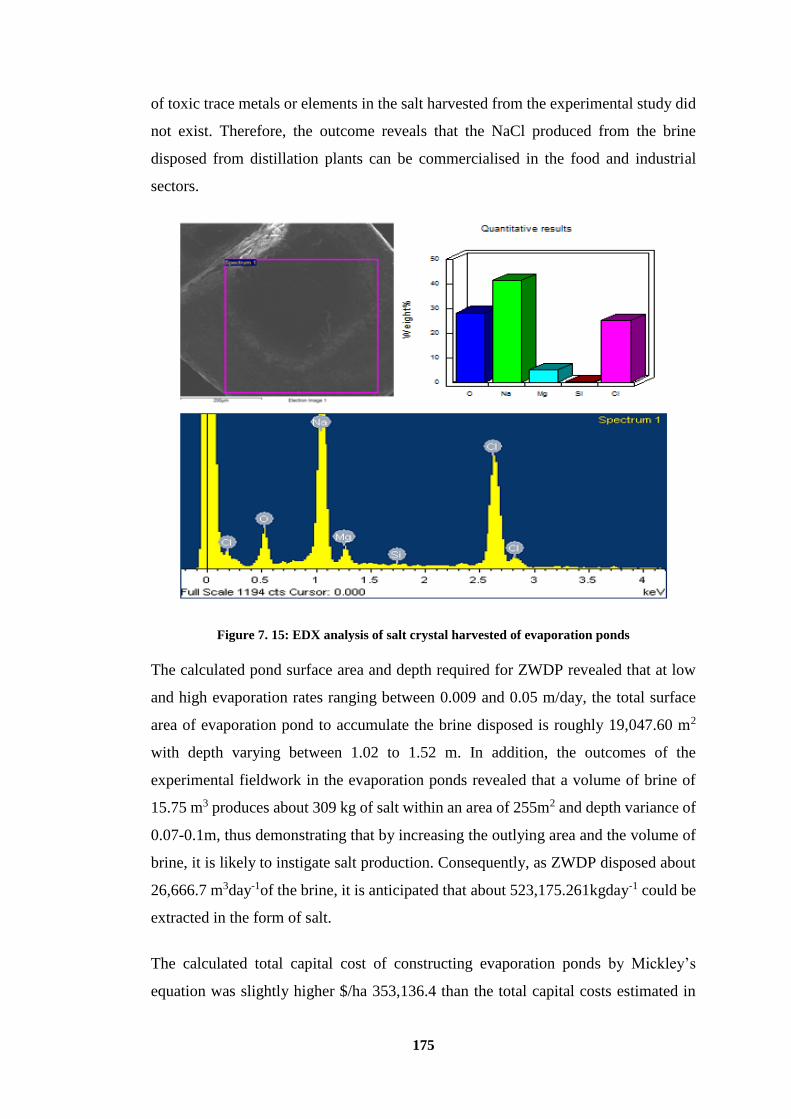
175
of toxic trace metals or elements in the salt harvested from the experimental study did
not exist. Therefore, the outcome reveals that the NaCl produced from the brine
disposed from distillation plants can be commercialised in the food and industrial
sectors.
Figure 7. 15: EDX analysis of salt crystal harvested of evaporation ponds
The calculated pond surface area and depth required for ZWDP revealed that at low
and high evaporation rates ranging between 0.009 and 0.05 m/day, the total surface
area of evaporation pond to accumulate the brine disposed is roughly 19,047.60 m2
with depth varying between 1.02 to 1.52 m. In addition, the outcomes of the
experimental fieldwork in the evaporation ponds revealed that a volume of brine of
15.75 m3 produces about 309 kg of salt within an area of 255m2 and depth variance of
0.07-0.1m, thus demonstrating that by increasing the outlying area and the volume of
brine, it is likely to instigate salt production. Consequently, as ZWDP disposed about
26,666.7 m3day-1of the brine, it is anticipated that about 523,175.261kgday-1 could be
extracted in the form of salt.
The calculated total capital cost of constructing evaporation ponds by Mickley’s
equation was slightly higher $/ha 353,136.4 than the total capital costs estimated in
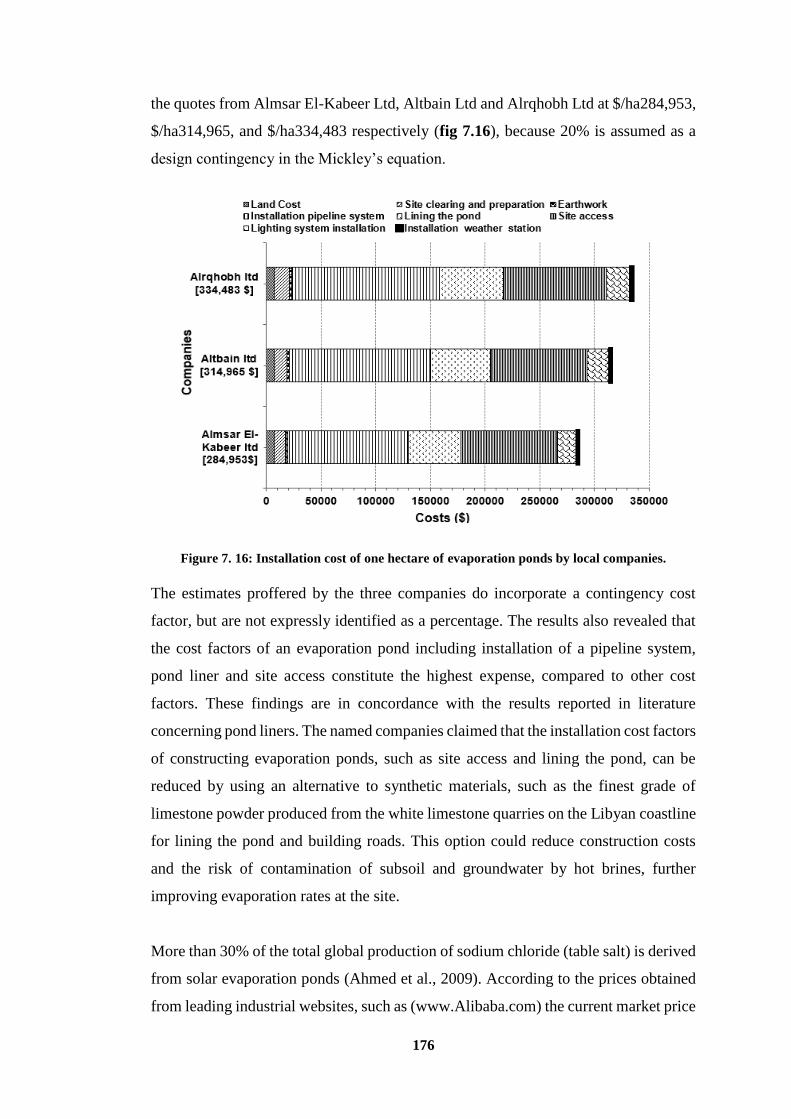
176
the quotes from Almsar El-Kabeer Ltd, Altbain Ltd and Alrqhobh Ltd at $/ha284,953,
$/ha314,965, and $/ha334,483 respectively (fig 7.16), because 20% is assumed as a
design contingency in the Mickley’s equation.
Figure 7. 16: Installation cost of one hectare of evaporation ponds by local companies.
The estimates proffered by the three companies do incorporate a contingency cost
factor, but are not expressly identified as a percentage. The results also revealed that
the cost factors of an evaporation pond including installation of a pipeline system,
pond liner and site access constitute the highest expense, compared to other cost
factors. These findings are in concordance with the results reported in literature
concerning pond liners. The named companies claimed that the installation cost factors
of constructing evaporation ponds, such as site access and lining the pond, can be
reduced by using an alternative to synthetic materials, such as the finest grade of
limestone powder produced from the white limestone quarries on the Libyan coastline
for lining the pond and building roads. This option could reduce construction costs
and the risk of contamination of subsoil and groundwater by hot brines, further
improving evaporation rates at the site.
More than 30% of the total global production of sodium chloride (table salt) is derived
from solar evaporation ponds (Ahmed et al., 2009). According to the prices obtained
from leading industrial websites, such as (www.Alibaba.com) the current market price
177
for sea salt (sodium chloride) with a purity of 99% ranges between US $ 50-100/ tonne,
and high quality food grade pool sodium chloride ranges between US $340-360.
Another website (www.econmist.com) was also used to investigate the current market
price of the lowest grade of gritting salt for de-icing roads. According to this website,
the value of salt per tonne ranges between $ 40-50 in America and Britain. Another
study by Abdulsalam et al., 2016 was also used to investigate the price of different
minerals showing that the price of sodium and magnesium ranges between US $ 350
- US $ 2,410 respectively.
The recovery of such salt or minerals can generate significant revenues annually for
Libya resulting in major investment across public and private sectors, particularly
within the environmental and economic infrastructure. This is because the
geographical location is eminently suitable for the evaporation ponds as it has a mild,
dry temperature and high annual evaporation rates, combined with minimal land costs
and availability.
The cost of land per hectare for the evaporation ponds can be offset against
combinations of promoting synergies using aquaculture practices, such as the sale of
Artemia salina. This does not occur in highly saline conditions, so in order to extract
it, the salinity level in the ponds needs to be reduced and controlled by mixing brine
with seawater, hence the total area designed to accumulate the brine from ZWDP was
300,004 hectares because its continuous daily brine disposal merits further investment.
Therefore, by processing 9,733,345.5 (m3/year) of reject brine disposed from
ZWDP, it would be possible to produce commercial salts of NaCl worth
190,958,968.86 kg/year which is about US $ 9,547,948,442.86 annually, so this is the
most sustainable and optimistic scenario.
In terms of full pond production planning, according to Butts (2011) the actual time
needed to reach stabilisation always takes longer than scheduled. Original predicted
time frames are invariably not met, due to factors such as pond conditioning as well
as brine inventories. Aspects of brine exchange features are not adequately accounted
for in the initial stages of the pond operation. In fact, even the most basic pond system
such as NaCl production from ocean brine can take 3 to 4 years. The duration of the
process could be 12 months for the brine to reach the required concentration and two
178
or three years more to lay down a floor. Consequently, salt production cannot
commence until the fourth or even the fifth year.
7.9. Summary
According to experimental work in this chapter, this study has revealed that the best
way to recover salt and minerals for domestic, commercial and industrial use, an
integrated cycle that utilises a distillation plant with evaporation ponds is undoubtedly
the best method, in terms of production, cost and efficacy, in contrast with more
conventional salt extraction methods. Furthermore, the quality of the end-product
shows a huge potential for further development and investment by building more
desalination plants on the Libyan coastline.
From the short timescales involved to obtain salt or minerals, it would appear that the
use of evaporation ponds is clearly effective in evaporating brine. The chemical and
mathematical analysis data obtained by Hach methods from the brine samples
collected indicated that the wt% of chemical compositions (Cl-, Ca2+, Mg2+, Na+, K+
and SO42-) and salinity levels continued to increase exponentially. In contrast, the
wt% of Ca2+ decreased in the fourth week followed by a fall in the wt% of chemical
compositions when reaching gypsum crystallisation stage (pure salt). Further to this,
the wt% of Ca2+ and K+ was non-existent when the brine evaporated in the form of
salt. However, in the SEM/EDS test, halite (NaCl) was the main mineral evident
during crystallisation of the salt samples, due to elevated surges of Na+ and Cl-. This
proves the efficacy of evaporation ponds for the production of high quality products,
at little or no environmental cost. It also paves the way for further investment and
development of an eco-friendly venture that will ultimately propagate further
economic growth for Libya, while providing further work opportunities. The next
chapter will provide the conclusion and suggestions for future work of this thesis.
179
Chapter Eight: Summary and Conclusion
8.1. Introduction
The aim of this work was to determine the physico-chemical effects of brine influx
from thermal desalination plants on the marine environment. Therefore, this chapter
aims to present the overall summary and conclusion of the contribution of this
research, in addition to providing limitations, recommendations, future work and
validity of the research data collection and results.
8.2. Summary and conclusion of contribution
Over recent decades, several thermal and membrane water desalination processes
have emerged and evolved in a bid to incorporate the best methods, taking
economic and safeguarding factors into consideration. One such method that has
been the focus of research is membrane desalination that includes design of the
membrane module, energy recovery and pre-treatment methods as a cost-effective
alternative to thermal processes such as MSF and MED. This is due to a lower
demand for chemicals, improved operational and refining processes that reduce
scaling, corrosion and anti-fouling. This membrane technology has also been found
to be more cost effective for brackish water than seawater, due to low salinity.
Conversely, larger-scale operations such as MED and SWRO tend to be more
economical due to economy of scale and high efficiency in comparison to MSF.
According to published literature on this topic, water costs vary based on different
factors such as i) fuel cost, (ii) material and construction cost, (iii) feed water
properties (salinity and turbidity), (iv) methods of cost calculation and desalination
capacity. Gradually, thermal desalination such as MED and MSF for large-scale
operations is gaining more momentum, particularly in arid and semi-arid regions
where fuel sources are plentiful such as North Africa and the Middle East where
distillation technologies are combined with power plants for optimum efficiency
and economy. As CO2 emissions escalate, there is need for alternative sustainable
power sources such as solar power, but this is not feasible due to the need for large
areas of land and higher operating costs. As seawater desalination techniques
produce fresh water, there is concern about the by-products (brine) and its potential
damage to the marine environment. During the desalination process, the use of
180
agents and chemicals to deal with the various stages of water treatment as well as
salinity and thermal energy still remain a cause for concern in terms of
environmental damage.
Presently, in literature there are no published legal regulations regarding the
impacts of brine disposal across the Mediterranean. The current brine management
strategies globally practised have provided some options for the treatment of brine
disposed from desalination plants. Each scenario presents benefits and drawbacks,
considering those that are not feasible such as direct discharge, discharge via
wastewater treatment plants, discharge to the sewage systems, deep well injection,
land application/spray irrigation and landfill disposal. None of these is viable
because of environmental implications and poor economy of scale. One possible
option was a co-charge of concentrate with power plant cooling water but when
applied in coastal desalination areas, the salinity of the ambient receiving seawater
will increase which will affect marine life. Other suggestions such as zero liquid
discharge using crystallisers, wind aided intensified evaporation, dew evaporation,
salt recovery salt solidification and sequestrations (SAL-PROC) and other brine
management methods used for membrane techniques have proved impractical due
to high energy demands and costs. Currently, such methods are used for small-scale
operations and are still under development. Recently, one of the best options has
been found to be the use of evaporation ponds in arid or semi-arid places which
would be very cost-effective when coupled with aquaculture or salinity gradient
solar ponds. However, in damp and humid conditions, this would not be feasible
due to low evaporation rates.
In Libya, as water resources are rapidly being exhausted due to an increase in both
population growth and water consumption in various sectors, the Libyan
government has turned to integrating non-conventional water resources such as
multi-effect distillation (MED and MED with TVC) to compensate for the water
deficit. This research has determined that the cost of desalinated water by thermal
desalination plants is about $0.43/m3, thus seeing this as the best option for
providing water resources, due to unlimited seawater sources, compared with the
cost per cubic metre produced by the Great Man-Made River Project, which is
estimated to cost 0.83$/m3, Additionally, the water transferred during the two main
181
phases is about 4.5 million m3day-1 while the rest of the phases are still under
construction. Moreover, the results indicate that the highest annual water deficit in
Libyan water regions was in Jabal Nafusah and Jifarah plain, Middle Zone, and
Aljabal Alakhdar Region in the north and middle of the country equalling 1,450
million m3, 250 million m3, and 60 million m3 respectively, while, there is surplus
water in Fezzan, Alkufrah and Assarir region because those regions are supplied by
Great Man-Made River tanks; additionally, most studies have indicated that the
lower ground layers are rich in fresh water at those regions. From data analysis, the
total numbers of desalination stations operating in Libya was estimated to be more
than 20, with a total actual water production of 493,647 m3day-1. Most desalination
plants are located on the coastline belt of the country; hence, the total brine disposal
from those plants is estimated to be 329,098 m3day-1. Hence the results of case
studies, of determining the impact of physico-chemical effects of brine influx from
thermal desalination plants on the Libyan coastline, as the main contribution
within this research revealed that, the brine disposal from both thermal
desalination plants releases chemical residues and thermal energy which negatively
affect the marine ecosystem. An increase in concentration of a number of ions and
compounds from discharged brine indicates an alteration in the physico-chemical
properties of the seawater. A significant positive correlation was observed at
ZWDP and WTRIS between the biological data and physico-chemical parameters
(rs=0.673; p=0.002) and (rs=0.637; p=0.003) which demonstrates the impact of
brine disposal from both sites on the marine environment. Although at both sites,
the brine was mixed with cooling water (seawater) before being disposed into the
marine environment, it can be said that as result of continued brine discharge it is
most likely to effect the surrounding environment. Additionally, there is an
indication that it’s likely that the desalination plants located on Libya coastline will
cause future ocean acidity as result of CO2 emissions because most of those plants
run on heavy fuel.
The result obtained from the first sub contribution within the research
revealed that, the brine can be recycled in the form of sodium hypochlorite
(NaOCl). The laboratory experiment revealed that production of NaOCl for
graphite electrodes (MCCA 1.82 gr/m3) was significant. It showed high stability in
performance, producing sodium hypochlorite to a value of approximately
182
2,600ppm. Furthermore, having a 4cm gap between electrodes with current density
of 0.048 mA/cm was a crucial factor in terms of good process economy. Thus the
cost of sodium hypochlorite yield of 2600 ppm at 24 kw/m3 is expected to be 7.2
$/m3, which could be reduced by mixing the brine with the seawater to reduce the
salinity level before utilizing it in the electrochemical cell. Hence, it can be
concluded that brine has many favourable properties when considering the
environmental and cost factors pertaining to coastal desalination plants in
environmental and commercial terms. While the second sub contribution within
this research revealed that, the brine can be recycled in the form NaCl, the
investigation results indicated that the EDS spectrum of the salt crystals sample
exhibited two highly intense peaks of Na+ and Cl- at 41.38% and 25.05% of the
total wt% respectively, in contrast with low intense peaks of Mg2+ and Si at 5.06%
and 0.28% of the total wt% respectively. Meanwhile, O2 represented only about
28.22% of the total wt% and the absence of other chemical elements shows that salt
crystal samples have good purity and a homogeneous crystallographic structure.
The result of calculating the evaporation rate revealed that the lowest daily
evaporation rate occurred in August and was found to be 9.06 mmday-1 while the
highest daily average evaporation rate occurred in September, and was found to be
14.63 mmday-1. The outcomes reveal that the NaCl produced from the brine
disposed from distillation plants can be commercialised in the food and industrial
sectors.
8.3. Limitations of research
There are often restrictions when doing PhD research due to limited resources or
data, specific subject sources, or time and funding constraints (Sekaran and Bougie,
2009). When assessing existing water resources in Libya as a key factor within this
research, there were very few up-to-date academic publications on the subject, or
any type of formal reports written by Water Authorities. A further challenge was
the fact that there had been no research previously completed to investigate the
impact of brine influx from thermal desalination plants, especially on the Libyan
coastline, which made it impossible to make valid comparisons on the physico-
chemical effects in other regions on the Libyan coast, which is why comparisons
have been made with results in other countries such as Spain etc. As the Libyan
183
coastline is covered by Posidonia oceanica and Cymodocea nodosa which has been
classified as a healthy environment for marine species, the initial plan was to
investigate and study the effects of varying brine salinity levels on these type of
seagrasses. However, due to time restrictions and the situation in Libya affecting
logistics, these factors have prevented extension of research. Therefore, this
objective is presented for future work.
As the study of the brine impacts on the marine environment was carried out in
May 2013, there are limits to the reliability of data due to seasonal difference. It is
recommended that further study is conducted over different periods throughout the
year.
8.4. Recommendations
Due to the ever increasing population growth, there will be a subsequent increase
in the demand for water. Currently, water resources are constantly being depleted
so it is important that measures are put in place to rectify this issue.
It is recommended that an effective water-pricing system is established by
Water Authorities across all sectors in a bid to conserve natural resources.
Further wastewater treatment plants are required, to be installed by Water
Authorities in order to continue the recycling of wastewater from sewage
and the brine discharged from desalination plants to satisfy the growing
demands across different sectors such as agriculture, industrial and
commercial.
It is advised that irrigation systems are improved and updated to control
water usage with a robust policy in place to monitor usage.
As brine disposal is continually occurring along the coastline, particularly in arid
and semi-arid regions such as Libya, where the technology is needed, there are
growing environmental concerns. With raised salinity and temperatures and
varying physico-chemical parameters of seawater, it is incumbent on the
government to put measures in place for safe disposal options to protect marine
ecosystems.
In benthic areas and wetlands, the habitat is particularly vulnerable to the
effects of brine influx, so Water Authorities should consider moving away
from such protected areas.
184
Annual reports are to be conducted by Water Authorities that scrutinise and
monitor impacts of brine disposal, ultimately minimizing any potential
hazards that threaten the marine ecosystem, with frequent consultation.
Such reports need to include results of studies that measure the impact on
marine species, carried out under a range of climatic conditions, measuring
seasons and inter-annual differences.
Closer liaison with the Environmental Authorities and General Desalination
Companies in Libya is recommended to establish policies and service-level
agreements that set out agreed operating standards and practices that can be
replicated throughout the coastline areas. Studies are strongly encouraged
into the use of concentrates and chemical compounds found in brine, and
their results may warrant more conservative levels.
Environmental Authorities are advised to collaborate with industrial,
agricultural and commercial sectors as well as oil refineries regarding
wastewater effluent management.
All monitoring data is to be published and shared publicly, and made readily
available on the internet at no cost.
Ongoing government legislation on environment protection to be based on
MAP-UNEP guidelines, with continuing liaison with specialists,
conservationists and hydrologists in the field of desalination technology.
8.5. Future research
In order to capitalise on full exploitation of brine disposed from thermal
desalination plants and to protect the marine environment, future work is planned
pursuant to this research.
There are beneficial seagrasses along the Libyan coastline such as
Posidonia oceanica and Cymodocea nodosa which enable other marine life
to reproduce and thrive. Therefore, further attention is required to study
different salinity levels of brine and the long term impact on these types of
seagrasses.
As mentioned previously, sodium hypochlorite can be produced from
recycled brine using electrolysis by graphite electrodes. The use of titanium
electrode coated with a dimensionally stable anode (DSA) mesh using
electrolysis warrants further research.

185
Regarding the use of evaporation ponds on the Libyan coastline to recycle
the brine disposed from thermal desalination plants in the form of minerals
and salt, there is a need for further work to ascertain the optimum conditions
of using solar energy for salt extraction. Once salt has been extracted from
the evaporation ponds, there is scope for further study into the possibility of
cultivating brine shrimp in the ponds at low salinity and temperature, which
can be controlled by the seawater flow.
Further research for longer periods of study during different seasons
throughout the year is recommended to investigate the impact of brine on
the marine ecosystems.
186
References
Abufayed. A and El-Ghuel. M. (2001) Desalination process applications in Libya,
Desalination, [online], v.138 (3), September, pp.47-53
Available at:
http://www.sciencedirect.com/science/article/pii/S0011916401002430
[Accessed 24th July 2014]
Al-Hengari. S, ElMoudir. W and El-Bousiffi. M. (2015) Economic assessment of
thermal desalination processes, Desalination and Water Treatment, [online], v.55
(9), August, pp. 2423–2436
Available at:
http://www.tandfonline.com/doi/abs/10.1080/19443994.2014.957982?journalCod
e=tdwt20
[Accessed 24th July 2016]
Abdulsalam. A, Mohamed. T and Ahsan. A. (2016) An integrated technique using
solar and evaporation ponds for effective brine disposal management, Sustainable
Energy, [online], v.1 (1), January.pp.1-12
Available at:
http://www.tandfonline.com/doi/abs/10.1080/14786451.2015.1135923
[Accessed 24th July 2015]
Arafat. H. (2017) Desalination Sustainability: A Technical, Socioeconomic, and
Environmental Approach. Elsevier. India.
Ahmad. N and Baddour. R. (2014) A review of sources, effects, disposal methods,
and regulations of brine into marine environments, Ocean and Coastal
Management, [online], v.87 (1), January. pp. 1-7
Available at:
http://www.sciencedirect.com/science/article/pii/S0964569113002561
[Accessed 24th July 2014]
Arnal. J, Sancho. M, Iborra. I, Goza´ lvez. J, Santafe´. A and Lora. J. (2005)
Concentration of brines from RO desalination plants by natural evaporation,
Desalination, [online], v.182 (3), November, pp.435-439
Available at:
http://www.sciencedirect.com/science/article/pii/S0011916405004571
[Accessed 24th July 2014]
Ahmed. M, Shayya. W, Hoey. D, Mahendran. A, Morris. R and Al-Handaly. J.
(2000) Use of evaporation ponds for brine disposal in desalination plants,
Desalination, [online], v.130 (2), November, pp 155-168.
Available at:
http://www.sciencedirect.com/science/article/pii/S0011916400000837
[Accessed 24th July 2015]
187
Ameglio. A, Brioschi. M and Garzoglio. M. (2011) offshore seawater intakes for
desalination plants: an operating experience minimizing envirmental impacts,
Proceedings of the International Desalination Association, [online], Italy, 6th June,
pp.1-21
Available at: http://www.fisiait.com/pubblicazioni/34/Garzoglio_01%20RevB.pdf
[Accessed 24th July 2014]
Al-Karaghouli. A and Kazmerski. L. (2013) Energy consumption and water
production cost of conventional and renewable –powered desalination processes,
Renewable and Sustainable Energy Reviews, [online], v.24 (1), August, pp.343-
356
Available at:
http://www.sciencedirect.com/science/article/pii/S1364032113000208
[Accessed 24th July 2015]
Aly. N and El-Fiqi. A. (2003) Mechanical vapor compression desalination systems
— A case study, Desalination, [online], v.158 (3), August, pp 143-150
Available at:
http://www.sciencedirect.com/science/article/pii/S0011916403004442
[Accessed 24th July 2014]
Al-Dousari. A, Al-Ghadban. A and Sturchio. N. (2012) Marine environmental
impacts of power desalination plants in Kuwait, Aquatic Ecosystem Health &
Management, [online], v.15 (10, June, pp.50-55
Available at:
http://www.tandfonline.com/doi/full/10.1080/14634988.2012.667336
[Accessed 24th July 2015]
Albatross Fine Chem Ltd. (2004) Boiler water treatment-frequently Asked
questions. India: Praveen Verma, [online]
Available at: https://books.google.co.uk/books
[Accessed 24th July 2015]
Abuzinada. A, Barth. H, Krupp. F, Böer. B and Al Abdessalaam. T. (2008)
Protecting the Gulf's Marine Ecosystems from Pollution. Switzerland: Springer
Science, [online]
Available at: https://books.google.co.uk/books?
[Accessed 24th July 2015]
A1-Sahlawi. M. (1999) Seawater desalination in Saudi Arabia: economic review
and demand projections, Desalination, [online], v.123 (3), October, pp.143-147
Available at:
http://www.sciencedirect.com/science/article/pii/S0011916499000673
[Accessed 24th July 2014]
Ahmed. M, Shayya. W, Hoey. D and Al-Handaly. J. (2009) Brine disposal from
Inland Desalination Plants Research Needs Assessment, International Water
Resources Association, [online], v.27 (2), Jun, pp.194-201
Available at: http://www.tandfonline.com/doi/pdf/10.1080/02508060208686992
[Accessed 24th July 2014]
188
Ahmed. M, Shayya. W, Hoey. D and Al-Handaly. J. (2001) Brine disposal from
reverse osmosis desalination plants in Oman and the United Arab Emirates,
Desalination, [online], v.133 (2), March, pp.135-147
Available at:
http://www.sciencedirect.com/science/article/pii/S0011916401800047
[Accessed 24th July 2014]
Wahab. S and Al-Weshahi. M. (2009) Brine Management: Substituting Chlorine
with On-Site Produced Sodium Hypochlorite for Environmentally Improved
Desalination Processes, Water Resources Management, [online], v.23 (12),
January, pp.2437-2454
Available at: http://link.springer.com/article/10.1007%2Fs11269-008-9389-7
[Accessed 24th July 2014]
Alghariani. S, (2007) Reducing agricultural water demand in Libya through the
improvement of water use efficiency and crop water productivity. Proceedings of
the International Conference WASAMED Project, [online], Valenzano. Italy, 14
January, v.1 (56), pp.99-107.
Available at: http://om.ciheam.org/article.php?IDPDF=800105
[Accessed 24th July 2015]
Abughlelesha. M and Lateh. H. (2013) A Review and Analysis of the Impact of
Population Growth on Water Resources in Libya, World Applied Sciences,
[online], v.23 (7), July, pp. 965-971
Available at:
https://pdfs.semanticscholar.org/bd36/43cfe0037d52bd0a8a4398af531049ef998d.
[Accessed 24th July 2014]
Alhabishe. A. (2012) Interview by Ali Elhajaji. Gharyan. Libya. 12 May 2012.
Abulqasem. A. (2012) Interview by Ali Elhajaji. Tripoli. Libya. 10 May 2012.
Abdudayem. A and Scott. A. (2014) Water infrastructure in Libya and the water
situation in agriculture in the Jefara region of Libya, African Journal of Economic
and Sustainable Development (AJESD), [online], v.3 (1), May, pp.33-64
Available at:
http://econpapers.repec.org/article/idsajesde/v_3a3_3ay_3a2014_3ai_3a1_3ap_3a
33-64.htm
[Accessed 24th July 2015]
Al habashi. A. (2012) Interview by Ali Elhajaji. Gharyan. Libya. 14 May 2012
Abdelrhem. I, Rashid. K and Ismail. A. (2008) Integrated Groundwater
Management for Great Man-Made River Project in Libya, Scientific Research,
[online], v.22 (4), January, pp.562-569
Available at: http://www.yemenwater.org/wp-
content/uploads/2013/03/Abdelrhem-Isam-Mohamed-Rashid-Kahlim-and-Ismail-
Amiruddin-2008.pdf
189
[Accessed 24th July 2015]
Al Farrah. N, Martens. K and Walraevens. K. (2011) hydrochemistry of the upper
Miocene-Pliocene-quaternary aquifer complex of Jifarah plain, NW- Libya,
Geologica Belgica,[online], v.14 (4), October, pp.159-174.
Available at: https://biblio.ugent.be/publication/1204647
[Accessed 24th July 2014]
Andrianne. J and Alardin. F. (2002) Thermal and membrane processes economics:
selection for seawater desalination optimized, Journal of Desalination, [online],
v.153 (3), February, pp.305-311,
Available at:
http://www.sciencedirect.com/science/article/pii/S0011916402011281
[Accessed 24th July 2014]
Al-Shayji. K. (1998) Modelling, simulation and optimization of large-scale
commercial desalination plants, PhD Thesis: Chemical Engineering, Virginia
Polytechnic Institute and State University, April, pp.1-453
Available at: http://scholar.lib.vt.edu/theses/available/etd-32898-
13261/unrestricted/ETD.PDF
[Accessed 24th July 2014]
Anthoni. J. (2006) The chemical composition of seawater, [online],
Available at: http://www.seafriends.org.nz/oceano/seawater.htm
[Accessed 24th July 2014]
Ahwide. F and Aldali. Y. (2013) The Current Situation and Perspectives of
Electricity Demand and Estimation of Carbon Dioxide Emissions and Efficiency,
Environmental, Ecological, Geological and Geophysical Engineering, [online], ,
v.7 (12), January, pp. 698-703
Available at: http://waset.org/publications/9997922/the-current-situation-and-
perspectives-of-electricity-demand-and-estimation-of-carbon-dioxide-emissions-
and-efficiency
[Accessed 24th July 2014]
Anezi. K and Hilal. N. (2007) Scale formation in desalination plants: effect of
carbon dioxide solubility, Journal of Desalination, [online], v. 204 (3), February,
pp.385-402
Available at:
http://www.sciencedirect.com/science/article/pii/S0011916406013440
[Accessed 24th July 2014]
Abdelwahab. M and Hamoda. A. (2012) Effect of desalination plants on the marine
environment along the red sea, Egypt. (Case study), Journal of Marine Sciences,
[online], v.28 (2), July, pp.27-36
Available at:
http://webs.uvigo.es/thalassas/Thalassas%2028(2)/Art.%203%20Thalassas%2028
(2).pdf
[Accessed 24th July 2014]
190
Al-Mutaz. I. (2013) Environmental impact of seawater desalination plants:
Common fundamentals and unit operations in thermal desalination systems
[online]
Available at: - http://www.desware.net/sample-chapters/d02/d00-010.pdf
[Accessed 24th July 2014]
Afgan. N, Darwish. M and Garvalho. M. (1999) Sustainability assessment of
desalination plants for water production. Desalination, [online], v.124 (3),
November, pp. 19-31.
Available at:
http://www.sciencedirect.com/science/article/pii/S0011916499000855
[Accessed 24th July 2014]
Ahmed. M and Anwar. R. (2012) An Assessment of the Environmental Impact of
Brine Disposal in Marine Environment, Modern Engineering Research, [online],
v.2 (4), July, pp-2756-2761
Available at:- http://www.ijmer.com/papers/Vol2_Issue4/EX2427562761.pdf
[Accessed 24th July 2014]
Al-Barwani. H and Purnama. A, (2007) Re-assessing the impact of desalination
plants brine discharges on eroding beaches, Desalination. [online], v. 204 (3),
February, pp.94-101
Available at:
http://www.sciencedirect.com/science/article/pii/S0011916406013105
[Accessed 24th July 2014]
Asokan. K and Subramanian. K (2009) Design of a Tank Electrolyser for In-situ
Generation of NaClO, Proceedings of the World Congress on Engineering and
Computer Science. [online], San Francisco, v. I (1), October, pp.1-4,
Available at:
http://www.iaeng.org/publication/WCECS2009/WCECS2009_pp139-142.pdf
[Accessed 24th July 2014]
Alagha. A. (2010) Hypochlorite Generation On Some Modified Electrodes For
Treatment Of Wastewater Pollutants. [online], MSc. Thesis, Al-Azhar University
of Gaza. pp.1-90,
Available at:
http://webcache.googleusercontent.com/search?q=cache:7JfaMXMJbCEJ:www.al
azhar.edu.ps/Library/aattachedFile.asp%3Fid_no%3D0043708+&cd=18&hl=en&
ct=clnk&gl=uk
[Accessed 24th July 2014]
Andrews. A. (1983) Maya Salt production and Trade. University of Arizona press,
Tucson.
Akridge. D. (2008) Methods for calculating brine evaporation rates during salt
production, Archaeological Science, [online], v.35 (6), June,pp.1453-1462
Available at:
http://www.sciencedirect.com/science/article/pii/S0305440307001987
[Accessed 24th July 2015]
191
Abdulgader. A and Mustafe. G. (1998) Performance evaluation of Belgard EV2050
at al-Aziza reheat plant, Research and Development Centre, Saline Water
Conversation Corporation; Technical Report No. TR-3808/EVP96004, [online],
October. pp. 1786- 1804
Available at:
http://citeseerx.ist.psu.edu/viewdoc/download?doi=10.1.1.540.3510&rep=rep1&t
ype=pdf
[Accessed 24th July 2015]
Allen. R, Pereira. L, Raes. D and Smith. M. (2008), Crop evapotranspiration-
Guidelines for computing crop water requirements- FAO Irrigation and Drainage
Paper 56, Food and Agriculture Organization, Rome. [online], pp.1-15
Available at:
http://s3.amazonaws.com/academia.edu.documents/40878584/Allen_FAO1998.p
df?AWSAccessKeyId=AKIAJ56TQJRTWSMTNPEA&Expires=1474558936&Si
gnature=g40D%2BtjZrK5HVqeSBHSKONCDaLE%3D&response-content-
disposition=inline%3B%20filename%3DAllen_FAO1998.pdf
[Accessed 24th July 2015]
Addala. S, Bouhdjer. L, Chala. A, Bouhdjar. A,Halimi.O, Boudine. B, Sebais. M.
(2013) Structural and optical properties of a NaCl single crystal doped with CuO
nanocrystals. Science and Technology. [online], March, v.22 (9), pp.1-5.
Available at: http://cpb.iphy.ac.cn/EN/abstract/abstract55314.shtml
[Accessed 24th July 2015]
Barnett. T, Pierce. D and Schnur. R. (2001) Detection of Anthropogenic Climate
Change in the World's Oceans, Science, [online], v.292 (5515), pp. 270-274
Available at: http://science.sciencemag.org/content/292/5515/270
[Accessed 24th July 2017]
Barron. O, Ali. R, Hodgeson. G, Smith. D, Qureshi. E, Mcfarlan. D, Campos. E,
Zarzo. D. (2015) Feasibility assessment of desalination application in Australian
traditional agriculture, Desalination, [online], v.364 (1), May. Pp.33-45
Available at:
http://www.sciencedirect.com/science/article/pii/S0011916414004056
[Accessed 24th July 2017]
Bargues. J. (2014) Analysis of the process of environmental impact assessment for
seawater desalination plants in Spain, Desalination, [online], v.347 (1), August,
pp.166-174
Available at:
http://www.sciencedirect.com/science/article/pii/S0011916414002999
[Accessed 24th July 2014]
Belessiotis.V, Kalogirou. S and Delyannis. E (2016) Thermal Solar Desalination
Methods and Systems. USA. Academic Press Elsevier Ltd
192
Bleninger. T and Jirka. G (2008) Modelling and environmentally sound
management of brine discharges from desalination plants, Desalination, [online],
v.221 (3), pp.585-597
Available at:
http://www.sciencedirect.com/science/article/pii/S0011916407007448
[Accessed 24th July 2015]
Bleninger. T, Niepelt. A and Jirka. G (2010) Desalination plant discharge
calculator, Desalination and Water Treatment, [online], v.13 (3), August, pp.156-
173
Available at: http://www.tandfonline.com/doi/abs/10.5004/dwt.2010.1055
[Accessed 24th July 2015]
Brika. B, Omran. A and Addien. O. (2016) Chemical elements of brine discharge
from operational Tajoura reverse osmosis desalination plant, Desalination and
Water Treatment, [online], v.57 (12)
Available at :
http://www.tandfonline.com/doi/abs/10.1080/19443994.2014.1003330
[Accessed 24th July 2014]
Buros. O. (1990) The Desalting ABC, International Desalination Association,
Topsfield, MA, USA
Available at:
http://www.water.ca.gov/pubs/surfacewater/abcs_of_desalting/abcs_of_desalting.
[Accessed 24th July 2014]
Balasubramanian. P. (2013) A brief review on best available technologies for reject
water (brine) management in industries, Environmental Science, [online], v.3 (6),
June.pp.2010-2013.
Available at: http://connection.ebscohost.com/c/articles/90566538/brief-review-
best-available-technologies-reject-water-brine-management-industries
[Accessed 24th July 2014]
Bindra. S, Hamid. A, Salem. H, Hamuda. K, Abulifa. S. (2014) Sustainable
Integrated Water Resources Management for Energy Production and Food Security
in Libya, Procedia Technology: The 7th International Conference Interdisciplinary
in Engineering, [online], v.12 (1), January, pp.747-752
Available at:
http://www.sciencedirect.com/science/article/pii/S2212017313007433
[Accessed 24th July 2014]
Bindra. S, Abulifa. S, Hamid. A, Al-Reiani. H and Abdalla. H. (2013) Assessment
of impacts on ground water resources in Libya and vulnerability to climate change,
Water supply and irrigation systems, [online], v.10 (2), January, pp.63-69
Available at: http://eds.a.ebscohost.com/eds/pdfviewer/pdfviewer?sid=d82bb493-
8e56-47b1-a86b-f442f848d8a0%40sessionmgr4006&vid=1&hid=4105
[Accessed 24th July 2015]
193
Bureau of Statistics and Census Libya. (2013) State of Libya: Statistical Report:
Population Growth. Tripoli. Libya. In Arabic version
Bureau of Statistics and Census Libya. (2012) State of Libya: Statistical Report:
Quantity of Drinking Water. Tripoli. Libya, [online].
Available at: http://bsc.ly/?P=5&sec_Id=15&dep_Id=4#74
[Accessed 24th July 2015]
Bunta. J. (2010) Libya’s Great Man-Made River, [online]
Available at: http://www.boinc.sk/clanky/libyas-great-man-made-river
[Accessed 24th July 2015]
Beer. S and Waisel. Y. (1979) Some photosynthetic carbon fixation properties of
seagrasses, Aquatic Botany, [online], v.7 (1), March, pp.129–138
Available at: http://www.sciencedirect.com/science/article/pii/0304377079900172
Boyed. C and Tucker. C. (1998) Pond Aquaculture Water Quality Management.
USA. Kluwer Academic
Borum. J, Duarte. C, Jensen. D and Greve. T. (2004) European seagrasses: an
introduction to monitoring and management: Report, EU project Monitoring and
Managing of European Seagrasses (M&MS) EVK3-CT-2000-00044, [online],
September, pp.1-98
Available at: http://www.seagrasses.org/
[Accessed 24th July 2014]
Bonanno. A, Zgozi. S and Bahri. T. (2006) Report of the MedSudMed-06
Oceanographic Survey, Strait of Sicily, Libyan continental shelf, MedSudMed
Component on “Small Pelagic Fish: Stock Identification and Oceanographic
Processes Influencing their abundance and distribution”, MedSudMed Technical
Documents, [online], August, pp.1-67.
Available at:- http://www.faomedsudmed.org/pdf/publications/TD27.pdf
[Accessed 24th July 2014]
Benkhayal. A, Elshrrif. K and El-turki. K. (2013) Determination of some heavy
metals in seagrass "Posidonia oceanica"(L.) Delile of Benghazi Coast in Libya
"Mediterranean", Journal of Marine Sciences, [online], v. 4 (5), January ,pp.1-6,
Available at: http://pelagiaresearchlibrary.com/der-chemica-sinica/vol4-
iss5/DCS-2013-4-5-1-6.pdf,
[Accessed 24th July 2014]
Bashtan. S, Goncharuk. V, Chebotareva. R, Belyakov. V and Linkov. V. (1999)
Production of sodium hypochlorite in an electrolyser equipped with a ceramic
membrane, Desalination. [online], v.126 (3), November. pp. 77-82
Available at:
http://www.sciencedirect.com/science/article/pii/S0011916499001563
[Accessed 24th July 2014]
194
Burney. H, Furuya. N, Hine. F and Ota. K (1999) Electrolytic Sodium Chlorate
Technology: Current Status; Electrochemical Society, United States of America
Batterson. M. and Boddie. W. (1972) Salt, the Mysterious Necessity, United States
of America. Dow Chemical Co.
Boxwell. M. (2016) Solar Electricity Handbook: A simple, practical guide to solar
energy design and installing solar PV system, Greenstream Publishing Limited,
United Kingdom.
http://www.solarelectricityhandbook.com/solar-irradiance.html
Benzaghat. M, Mohammed. T, Ghazali. Abdul and Soom. M. (2011) Comparison
of evaporation estimate models for surface evaporation in semi-arid region of
Libya: A case study. Canadian Journal of Civil Engineering. [online], November,
v.38 (12), pp. 1373-1380. Available at:
http://www.nrcresearchpress.com/doi/abs/10.1139/l11-098#.WJP1BvmLTct
[Accessed 24th July 2015]
Butts. D. (2011) Elements of mineral production from brine in solar ponds, DSB
International Inc, [online], pp. 1-11,
Available at: www.dsbinternational.com
[Accessed 24th July 2015]
Council of Europe. (2012) Biodiversity and Climate Change: Reports and
Guidance Developed Under the Bern Convention: Nature and Environment
No.160: volume 2, [online]. Strasbourg. Council of Europe
Available at:
https://books.google.co.uk/books?id=EsWT8Ukcq48C&printsec=frontcover&sou
rce=gbs_ge_summary_r&cad=0#v=onepage&q&f=false
[Accessed 24th July 2017]
Cipollina. A, Micale. G and Rizzuti. L. (2009) Seawater Desalination:
Conventional and Renewable Energy Processes: Green Energy and Technology.
Springer: Berlin
Castriota. L, Beltrano. M, Giambalvo. O and Sunseri. G. (2001) A one-year study
of the effects of a hyperhaline discharge from a desalination plant on the zoobenthic
communities in the Ustica Island Marine Reserve (Southern Tyrrhenian Sea),
[online], CIESM Congress, Monte Carlo, Monaco, 4. Italy
Available at:
https://www.researchgate.net/profile/Luca_Castriota/publication/260037530_Effe
cts_of_a_hyperhaline_discharge_from_a_desalination_plant_on_the_zoobenthic_
communities_over_one_year_in_the_Ustica_Marine_Reserve_Southern_Tyrrheni
an_Sea/links/558aa8f908ae31beb0ffeb01/Effects-of-a-hyperhaline-discharge-
from-a-desalination-plant-on-the-zoobenthic-communities-over-one-year-in-the-
Ustica-Marine-Reserve-Southern-Tyrrhenian-Sea.pdf
[Accessed 24th July 2014]
195
Cipollina. A, Misseri. A, Staiti. G, Galia. A. Micale. G and Scialdone. O. (2012)
Integrated production of fresh water, sea salt and magnesium from sea water,
Desalination and Water Treatment, [online], v.49 (3), May. pp. 390–403
Available at:
http://www.tandfonline.com/doi/abs/10.1080/19443994.2012.699340
[Accessed 24th July 2015]
Cipollina. A, Misseri. A, Staiti .A, Galia. A, Micale. G and Scialdone. O. (2012).
Integrated production of fresh water, sea salt and magnesium from sea water.
Desalination and Water Treatment,[online], v. 49 (3),Jun, pp.390-403.
Available at :
http://www.tandfonline.com/doi/abs/10.1080/19443994.2012.699340?journalCod
e=tdwt20
[Accessed 24th July 2014]
Cooley. H, Gleick. P and Wolff. G. (2006) Desalination, with a grain of salt a
California perspective: Pacific institute, [online], June, pp. 1-87.
Available at: http://pacinst.org/app/uploads/2015/01/desalination-grain-of-salt.pdf
[Accessed 24th July 2014]
Cipollina. A, Micale. G and Rizzuti. L. (2009) Seawater Desalination:
Conventional and Renewable Energy Processes: Green Energy and Technology.
Springer: Berlin
Cotruvo. J, Fawell. J, Cunliffe. D, Voutchkov. N, Payment. P and Lattemann. S.
(2010) Desalination technology: Health and Environmental Impacts. United States
of America: Taylor and Francis Group
Compain. P. (2012) Solar Energy for Water desalination, Procedia Engineering,
[online], France, v.46 (1), January, pp. 220-227
Available at:
http://www.sciencedirect.com/science/article/pii/S1877705812045316
[Accessed 24th July 2014]
Colley. H and Ajami. N. (2012) Key issues for desalination in California: cost and
financing. Pacific Institute: Oakland. California, [online], November, pp.4-46
Available at: http://pacinst.org/app/uploads/2013/02/financing_final_report3.pdf
[Accessed 24th July 2014]
Carollo. (2009) Water desalination concentrate management and piloting; South
Florida Water Management District, [online], December, pp.1-125Available at:
http://www.sfwmd.gov/portal/page/portal/xrepository/sfwmd_repository_pdf/wat
erdesalinationconcentratemgmtpiloting-dec09-carollo.pdf
[Accessed 24th July 2014]
Cuence. C. (2012) Report on Water Desalination Status in the Mediterranean
Countries, [online], September.
196
Available at:
http://www.imida.es/documents/13436/877249/06_REPORT_ON_WATER+DES
ALINATION.pdf/ae6203f4-68f9-4a37-b728-22b5d247909e
[Accessed 24th July 2014]
Cedare. (2014) “Libya Water Sector M&E Rapid Assessment Report”, Monitoring
and Evaluation for Water In North Africa (MEWINA) Project, Water Resources
Management Program, CEDARE.
Available at: http://web.cedare.org/wp-content/uploads/2005/05/Libya-Water-
Sector-Monitoring-and-Evaluation-Rapid-Assessment-Report.pdf
[Accessed 24th July 2015]
Clarke K.R. and Gorley R.N. (2006) PRIMER v6: User manual/Tutorial. PRIMER-
E Ltd., Plymouth.
Clarke K.R. (1993) Non-parametric multivariate analyses of changes in community
structure. Australian Journal of Ecology, [online], v 18 (1), March 117-143
Available at: http://onlinelibrary.wiley.com/doi/10.1111/aec.1993.18.issue-
1/issuetoc
[Accessed 24th July 2014]
Chapman. M and Underwood. A. (1999) Ecological patterns in multivariate
assemblages: information and interpretation of negative values in ANOSIM tests,
Journal of Marine Ecology, [online], v.180 (1), March, pp.257-265,
Available at: http://www.int-res.com/articles/meps/180/m180p257.pdf
[Accessed 24th July 2014]
Caldira. K and Wickett. M. (2003) Oceanography: Anthropogenic carbon and
ocean pH, Journal of Science, [online], v.425, September, pp.365
Available at:
http://www.nature.com/nature/journal/v425/n6956/full/425365a.html
[Accessed 24th July 2014]
Connor. M, Bruno. J, Gaines. S, Halpern. B, Lester. S, Kinlan. B and Weiss. J.
(2007) Temperature control of larval dispersal and the implications for marine
ecology, evolution, and conservation, National Academy of Sciences, [online], v.
104 (4), January, pp.1266-1271
Available at: - http://www.pnas.org/content/104/4/1266.full.pdf
[Accessed 24th July 2014]
Canadian Council of Ministers of the Environment (1999) Canadian Water Quality
Guidelines for the Protection of Aquatic Life: Dissolved oxygen (Marine) [online],
pp.1-5,
Available at:
file:///C:/Users/user/Downloads/Dissolved%20Oxygen%20(Marine)%20(en).pdf
[Accessed 24th July 2014]
Calleja. M, Barron. C, Hale. J, Frazer. T and Duarte. C. (2006) Light Regulation of
Benthic Sulphate Reduction Rates Mediated by Seagrass (Thalassia testudinum)
197
Metabolism, Journal of Estuaries and Coasts, [online], v.29 (6), December,
pp.1255-1264.
Available at: http://link.springer.com/article/10.1007/BF02781825
[Accessed 24th July 2015]
Choi. J, Shim. S and Yoon. J. (2013) Design and operating parameters affecting an
electrochlorination system, Journal of Industrial and Engineering Chemistry,
[online], v.19 (1), January, pp 215-219.
Available at:
http://www.sciencedirect.com/science/article/pii/S1226086X12002638
[Accessed 24th July 2014]
Cyprtaa. S, Benwd. A and Allenbgle. N. (2013) The use of electro-coagulation in
seawater desalination system, Engineering Sciences, in Arabic Version, [online],
v.29 (1), pp.393-403
Available at: http://www.damascusuniversity.edu.sy/mag/eng/images/stories/1-
2013a/wew/393-403.pdf,
Cipollina. A, Misseri. A, Staiti. G, Galia. A. Micale. G and Scialdone. O. (2012)
Integrated production of fresh water, sea salt and magnesium from sea water,
Desalination and Water Treatment, [online], v.49 (3), May. pp. 390–403
Available at:
http://www.tandfonline.com/doi/abs/10.1080/19443994.2012.699340
[Accessed 24th July 2015]
Dupavillon. J and Gillanders. B. (2009) Impacts of seawater desalination on the
giant Australian cuttlefish Sepia apama in the upper Spencer Gulf, South Australia,
Marine Environmental Research, [online], v.67 (5), May, pp.207-218
Available at:
http://www.sciencedirect.com/science/article/pii/S0141113609000257?via%3Dih
ub
[Accessed 24th July 2015]
Darwish. M, Hassabou. A, Shomar. B. (2013) Using Seawater Reverse Osmosis
(SWRO) desalting system for less environmental impacts in Qatar, Desalination,
[online], v.309 (1), January,pp.113-124
Available at:
http://www.sciencedirect.com/science/article/pii/S0011916412005413
[Accessed 24th July 2015]
Dweiri. S and Badran. M. (2002) Desalination: an imminent solution for the future
water needs in the Aqaba Special Economic Zone (ASEZ), Desalination, [online],
v.152 (3), pp.27-39
Available at:
http://www.sciencedirect.com/science/article/pii/S0011916402010457
[Accessed 24th July 2015]
198
Darwish. M, Jawad. M and Aly. G. (1989) Technical and economic comparison
between large capacity MSF and RO desalting plants, Desalination, [online], v.76
(1), January, pp. 281-304
Available at: http://www.sciencedirect.com/science?
[Accessed 24th July 2014]
Davis. T. (2006) Zero Discharge Seawater Desalination: Integrating the
Production of Freshwater, Salt, Magnesium, and Bromine. Desalination and Water
Purification Research Development Program Report No. 111, [online], May, pp.1-
32
Available at: http://www.cacoastkeeper.org/document/zero-discharge-seawater-
desalination.pdf
[Accessed 24th July 2014]
Dimkic. M, Brauch. H and Kavanaugh. M. (2008) Groundwater Management in
Large River Basins, [online]. London. UK: The International Water Association
Available at: https://books.google.co.uk/books?id
[Accessed 24th July 2015]
Davis. D. (2015) Water quality: What is the water quality, Kent State University,
Lake Scientist, [online],
Available at: http://www.lakescientist.com/lake-facts/water-quality/
[Accessed 24th July 2015]
Dean. C. (2009) Rising acidity is threatening food web of oceans, science panel
says, [online],
Available at:
http://www.nytimes.com/2009/01/31/science/earth/31ocean.html?_r=0
[Accessed 24th July 2015]
Davis. J. (2000) Structure, function, and management of the biological system for
seasonal solar saltworks, Global Nest, [online], v.2 (3), January. pp. 217-226
Available at:
http://journal.gnest.org/sites/default/files/Journal%20Papers/davis.pdf
[Accessed 24th July 2015]
Deegan. L, Johnson. D, Warren. R, Peterson. B, Fleeger. J, Fagherazzi. S and
Wollheim. W, (2012) Coastal eutrophication as a driver of salt marsh loss, Science,
[online], v. 490 (1), October, pp.388-392.
Available at:
http://www.nature.com/nature/journal/v490/n7420/pdf/nature11533.pdf
[Accessed 24th July 2015]
Dardir. A and Wali. A. (2006) Extraction of salts from lake Quaroun, Egypt:
Environmental and economic impacts. Proceedings of the 1st International
Conference on the Ecological Importance of Solar Saltworks, [online], Santorini
Island, Greece,20-22, October, pp. 44-51.
Available at: http://www.srcosmos.gr/srcosmos/showpub.aspx?aa=7852
[Accessed 24th July 2015]
199
Delanuez. F, Suárez. N, Santiago. D, Veza. J and Sadhwani. J. (2012) Reuse and
minimization of desalination brines: a review of alternatives, Desalination and
Water Treatment, [online], v.39 (3), February, pp.137-148
Available at:
http://www.tandfonline.com/doi/abs/10.1080/19443994.2012.669168
[Accessed 24th July 2015]
Elabbarb. M and Elmabrouka. F. (2005) Environmental impact assessment for
desalination plants in Libya. Case study: Benghazi North and Tobrouk desalination
plants, Desalination, [online], v.185 (3), November, pp.31-44
Available at:
http://www.sciencedirect.com/science/article/pii/S0011916405006065
[Accessed 24th July 2014]
Eslamian. S. (2016) Urban Water Reuse Handbook, CRC Press. USA
Elabbar. M. (2008) The Libyan experimental on the environmental impact
assessment for desalination plants, Desalination, [online], v.220 (3), March, pp.24-
36
Available at:
http://www.sciencedirect.com/science/article/pii/S0011916407006029
[Accessed 24th July 2015]
Elhassadi. A. (2013) General Desalination Company of Libya (GDCOL), Libya
Report, [online], 8.8.2013.
Available at: http://www.marcopolis.net/gdcol-plans-to-increase-libyas-
desalination-capacity-by-building-more-desalination-plants.htm
[Accessed 24th July 2015]
Einav. R, Harussi. K and Periy. D. (2003) The footprint of the desalination
processes on the environment, Desalination, [online], v.152 (3), February, pp.141-
154
Available at:
http://www.sciencedirect.com/science/article/pii/S0011916402010573
[Accessed 24th July 2014]
Eltawil. M, Zhengming. Z and Yuan. L. (2009) A review of renewable energy
technologies integrated with desalination systems, Renewable and Sustainable
Energy Reviews, [online], v.13 (9), December, pp.2245-2262
Available at:
http://www.sciencedirect.com/science/article/pii/S1364032109000987
[Accessed 24th July 2014]
Einav. R, Harussi. K and Perry. D. (2002) The foot prints of the desalination
processes on the environment. Desalination, [online], v.152 (1), April, pp.141-154.
200
Available at:
http://citeseerx.ist.psu.edu/viewdoc/download?doi=10.1.1.558.7619&rep=rep1&t
ype=pdf
[Accessed 24th July 2014]
El-Naas. M. (2011) Reject Brine Management, Desalination, Trends and
Technologies, in Schorr. M, Chemical Engineering, DOI: 10.5772/13706, InTech,
[online], February, pp.238-243
Available at: http://www.intechopen.com/books/desalination-trends-and-
technologies/reject-brine-management
[Accessed 24th July 2014]
Elabbar. M and Elmabrouk. F. (2005) Environmental impact assessment for
desalination plants in Libya. Case study: Benghazi North and Tobrouk desalination
plants, Desalination, [online], v.185 (3), November, pp.31-44
Available at:
http://www.sciencedirect.com/science/article/pii/S0011916405006065
[Accessed 24th July 2015]
El Asswad. R. (1995) Agricultural Prospects and Water Resources in Libya,
Journal of agricultural, [online], v. 24 (6), September, pp. 324-327
Available at: http://www.jstor.org/stable/4314361?seq=2 [Oct.25, 2012].
[Accessed 24th July 2015]
Einav. R and Lokiec. F. (2003) Environmental aspects of desalination plant in
Ashkelon, Journal of Desalination, [online], v.156 (3), August, pp.79-85
Available at:
http://www.sciencedirect.com/science/article/pii/S001191640300328X
[Accessed 24th July 2014]
Elfallah. M and Bosrgob. A. (2005) United Nation Environment Program: The
National Action PLAN For the Libyan Coastal Area, [online], pp.1-55
Available at:
http://www.themedpartnership.org/med/documents/library/background-
documents/naps/en/attachments%7Cattachments%3A011%7Cfile
[Accessed 24th July 2015]
Enka. (2013) Enka in Libya: Libya projects, [online]
Available at: http://www.enka.com/en/wp-
content/uploads/2017/01/ENKA_IN_LIBYA.pdf
[Accessed 24th July 2015]
European Union. (2012) Assessment of potential cumulative environmental impacts
of mega desalination plants conglomerating around the Mediterranean under the
pillar non- conventional water resources, Sustainable Water Integrated
Management (SWIM) - Support Mechanism, [online], October, pp.1-7
Available at:
file:///C:/Users/bueaelha/Downloads/concept%20note%20desalination.pdf
Exadactylos. A. (2015) Molecular Approach of Seagrasses Response Related to
Tolerance Acquisition to Abiotic Stress: Molecular Approaches to Genetic
201
Diversity, Agricultural and Biological Sciences, Prof. Mahmut Caliskan (Ed.),
InTech, DOI: 10.5772/59425,[online], April, pp.76-91
Available at: http://www.intechopen.com/books/references/molecular-approaches-
to-genetic-diversity/molecular-approach-of-seagrasses-response-related-to-
tolerance-acquisition-to-abiotic-stress
[Accessed 24th July 2015]
Elsaid. K, Bensalah. N and Wahab. A. (2012) Inland Desalination: Potentials and
Challenges, Advances in Chemical Engineering, Dr Zeeshan Nawaz (Ed.), InTech,
DOI: 10.5772/33134, [online], March, pp.450-480,
Available at: http://www.intechopen.com/books/advances-in-chemical-
engineering/inland-desalination-potentials-and-challenges
[Accessed 24th July 2015]
Environmental International Consultants (2009) Environmental Impact Assessment
for Jebel Ali Power and Desalination Station M, [online], April, pp.1-140,
Available at:
http://www.agaportal.de/pdf/nachhaltigkeit/eia/eia_dubai_kraftwerk.pdf
[Accessed 24th July 2015]
El-Magsodi. M and Haddoud. D. (2010) The Salt Marsh (Sabka) in the Western
part of Libya, in Öztürk. M, Böer. B, Barth. H, Breckle. S. Godt. M and Khan, M.
Sabkha Ecosystems: Volume III: Africa and Southern Europe: 3 (Tasks for
Vegetation Science), Springer, London. pp. 79-84
Foster. S. (2001) The interdependence of groundwater and urbanisation in rapidly
developing cities, Urban Water, [online], v.3 (3), September, pp.185-192
Available at:
http://www.sciencedirect.com/science/article/pii/S1462075801000437
[Accessed 24th July 2017]
Frich. P, alexander. L, Marta. P, Gleason. B, Haylock. M, Tank. A and Peterson. T.
(2002) Observed coherent changes in climatic extremes during the second half of
the twentieth century, Climate Research, [online], v.19 (3), January, pp. 193–212
Available at: http://www.int-res.com/abstracts/cr/v19/n3/p193-212/
[Accessed 24th July 2017]
Frank. H, Rahav. E and Bar-Zeev. E. (2017) Short-term effects of SWRO
desalination brine on benthic heterotrophic microbial communities, Desalination,
[online], v.417 (1), September. Pp.52-59
Available at:
http://www.sciencedirect.com/science/article/pii/S0011916416321749
[Accessed 24th July 2015]
Fritzmann. C, Löwenberg. J, Wintgens. T, Melin. T. (2007) State-of-the-art of
reverse osmosis desalination, Desalination, [online], v.216 (3), October, pp.1-76
Available at:
http://www.sciencedirect.com/science/article/pii/S0011916407004250
202
[Accessed 24th July 2015]
Fath. H, Elsherbiny. S, Hassan. A, Rommel. M, Wieghaus. M, Koschikowski. J and
Vatansever.M. (2008) PV and thermally driven small-scale, stand-alone solar
desalination systems with very low maintenance needs. Desalination, [online],
v.225 (3), May, pp.58-69
Available at:
http://www.sciencedirect.com/science/article/pii/S0011916408000908
[Accessed 24th July 2014]
Fellows. C and Al-Hamzah. A. (2015) Thermal Desalination: Current Challenges.
In Amjad. Z and Demadis. Konstantinos, Mineral Scales and Deposits: Scientific
and Technological Approaches. Oxford. UK. Elsevier, pp. 583-599
Fath. H and Ghazy. A. (2002) Solar desalination using humidification—
dehumidification technology, Desalination, [online], v.142 (2), February, pp.119-
113
Available at:
http://www.sciencedirect.com/science/article/pii/S0011916401004313
[Accessed 24th July 2014]
Fabry. V., Seibel. B, Feely. R, and Orr. J (2008) Impacts of ocean acidification on
marine fauna and ecosystem processes, Journal of Marine Science, [online], v. 65
(1), April, pp. 414–432.
Available at: https://academic.oup.com/icesjms/article/65/3/414/789605/Impacts-
of-ocean-acidification-on-marine-fauna-and?searchresult=1
[Accessed 24th July 2015]
Faragallah. H, Askar. A, Okbah. M and Moustafa. H. (2009) Physico-chemical
characteristics of the open Mediterranean Sea water for about 60 km from Damietta
harbor, Egypt, Journal of Ecology and The Natural Environment,[online],v.1(5),
August,pp.106-119
Available at: http://www.academicjournals.org/JENE,
[Accessed 24th July 2014]
Field. A. (2013) Discovering Statistics Using IBM SPSS Statistics. 4th ed. London
SAGE publication Ltd.
Folk. R. (1974) Petrology of Sedimentary Rocks. Austin, Texas: Hemphill
Publishing Company
Flad. R, Zhu. J, Wang. C, Chen. P, Falkenhausen. L, Sun. Z and Li. S. (2005)
Archaeological and chemical evidence for early salt production in China, The
National Academy of Sciences of the United States of America, [online], v.102 (35),
July, pp.12618-12622.
Available at: http://www.pnas.org/content/102/35/12618.full.pdf
[Accessed 24th July 2015]
Google earth, (2016) Online image by researcher
203
General Water Authority (2004) Water Situation in Libya: Tripoli. Libya. In Arabic
version.
General Desalination Company of Libya. (2013) A brief about the GDCOL. In
Arabic version
Available at: http://www.gdcol.ly/aboutus.php
[Accessed 24th July 2015]
Giwa. A, Dufour. V, Al Marzooqi. F, Al Kaabi. M and Hasan. S. (2017) Brine
management methods: Recent innovations and current status, Desalination,
[online], v.407 (1), April, pp.1-23
Available at:
http://www.sciencedirect.com/science/article/pii/S0011916416305306
[Accessed 24th July 2014]
Gálvez. J, Rodríguez. S, Delyannis. E, Belessiotis. V, Bhattacharya. S and Kumar.
S. (2010) Solar energy conversion and photoenergy systems: thermal systems and
desalination plants-volume III. United Kingdom: EOLSS Publications
Glueckstern. P and Priel. M. (1996) Optimized Brackish Water Desalination Plants
with Minimum Impact on the Environment, Desalination [online], v. 108 (3),
Feburary.pp.19-26
Available at:
http://www.sciencedirect.com/science/article/pii/S0011916497000040
[Accessed 24th July 2014]
Glater. J and Cohen. Y. (2003) Brine disposal from land based membrane
desalination plants: A critical Assessment. Draft Prepared for the Metropolitan
Water District of Southern California, Polymer and Separations Research
Laboratory University of California, Los Angeles, [online], July, pp. 1-16
Available at: http://www.lesico-cleantech.com/pdf/brine_disposal_article_ucla.pdf
[Accessed 24th July 2014]
Gilron. J, Folkman. Y, Savliev. R, Waisman. M. Kedem. O (2003) WAIV—wind
aided intensified evaporation for reduction of desalination brine volume.
Desalination, [online]. v.158 (3), August. pp. 205-2014
Available at:
http://www.sciencedirect.com/science/article/pii/S0011916403004533
[Accessed 24th July 2014]
Gibbons. J Papapetrou. M and Epp. C. (2008) Assessment of EU policy:
Implications for the implementation of autonomous desalination units powered by
renewable resources in the Mediterranean region, Desalination, [online], v.220 (3),
March.pp.422-430
Available at:
http://www.sciencedirect.com/science/article/pii/S0011916407006418
[Accessed 24th July 2014]
204
Great Man-Made River Authority (2012) Report about the GMRP: Implementation
and Management of the GMRP: Tripoli. Libya. In Arabic version.
General Electric Company of Libya. (2015) A brief about the GECOL:
Implementation and Management of the GECOL. Tripoli. Libya. In Arabic version
Available at: https://www.gecol.ly/GECOL_LY/about.aspx
[Accessed 24th July 2015]
General environment Authority. (2011) A brief report about the General
environment Authority. Tripoli. Libya. In Arabic version
Gacia. E, Invers. O, Manzanera. M, Ballesteros. E, Romero. J. (2007) Impact of the
brine from a desalination plants on a shallow seagrass (Posidonia oceanica)
meadow, Journal of Estuarine, Coastal and shelf Science, [online] v.72 (4), May,
pp.579-590
Available at:
http://www.sciencedirect.com/science/article/pii/S0272771406005221
[Accessed 24th July 2015]
Gwada. P. (2004) An assessment of seagrass survival and Function in response to
manipulations in sediment redox at Nyali Lagoon, Kenya. Report, Marine
Ecological and Environmental Research Programme, [online], February, pp.1-39
Available at:
http://www.oceandocs.org/bitstream/handle/1834/1284/WIOMSAMARG-
I200401PGWADA.pdf?sequence=1&isAllowed=y
[Accessed 24th July 2015]
Gude. V. (2016) Desalination and sustainability -An appraisal and current
perspective. Water Research [online], v.89 (1), February, pp. 87-106.
Available at:
http://www.sciencedirect.com/science/article/pii/S0043135415303390
[Accessed 24th July 2014]
General Electricity Company. (2014) Libya Electricity Tariffs: Dynamic, Energy
and water solution, [online]
Available at: http://www.dynamic-
ews.com/Tariffs/Electricity%20Tariffs/Libya.pdf
[Accessed 24th July 2014]
González. A, Urtiaga. A, Ibáñez. R and Ortiz. I. (2012) State of the art and review
on the treatment technologies of water reverse osmosis concentrates, Water
Research [online], v.46 (2). February, pp.267-283
Available at:
http://www.sciencedirect.com/science/article/pii/S0043135411006440
[Accessed 24th July 2015]
Hamed. O. (2005) Overview of hybrid desalination systems — current status and
future prospects, Desalination, [online], v.186 (3), December, pp. 207-214
205
Available at:
http://www.sciencedirect.com/science/article/pii/S0011916405006934
[Accessed 24th July 2014]
Hu. Z. (2014) Comparison of sustainability of technologies for water desalination,
[online], Master’s Thesis in Chemical and Process Engineering, School of
Technology, Lappeenranta University of Technology
Available at: https://core.ac.uk/download/pdf/39962109.pdf
[Accessed 24th July 2015]
Henthorne. L, Pankratz. T and Murphy. S. (2011) The state of desalination 2011:
IDA World Congress on Desalination and Water Reuse, Desalination: Sustainable
Solutions for a Thirsty Planet, [online], September.
Available at: http://desalination.edu.au/wp-content/uploads/2011/09/IDA-State-
of-Desalination-2011.pdf
[Accessed 24th July 2014]
Hamed. O, Mustafa. G, BaMardouf. K and Al-Washmi. H. (2001) Prospects of
improving energy consumption of the multi-stage flash distillation process,
Proceedings of the Fourth Annual Workshop on Water Conservation in the
Kingdom of Saudi Arabia [online], Dhahran, 23rd - 25th April,
Available at:
https://www.researchgate.net/publication/242319364_PROSPECTS_OF_IMPRO
VING_ENERGY_CONSUMPTION_OF_THE_MULT-
STAGE_FLASH_DISTILLATION_PROCESS1
[Accessed 24th July 2014]
Hoepner. T. (1999) A procedure for environmental impact assessments (EIA) for
seawater desalination plants, Desalination, [online], v.124 (3), November, pp.1-12
Available at:
http://www.sciencedirect.com/science/article/pii/S0011916499000831
[Accessed 24th July 2015]
http://www.water-technology.net/projects/al-khafji-solar-saline-water-reverse-
osmosis-solar-swro-desalination-plant/
Hamieh. B, Beckman. J and Ybarra. M. (2001) Brackish and seawater desalination
using a 20 ft2 dewvaporation tower, Desalination , [online], v.140 (3),
Novmber,pp.217-226,
Available at:
http://www.sciencedirect.com/science/article/pii/S001191640100371X
[Accessed 24th July 2014]
Haddoud. D. (2013) interview by Ali El.hajaji. Marine Biology Research Centre.
Libya. 3rd July.
Hamad. T, Agll. A, Hamad. Y and Sheffield. J. (2014) Solid waste as renewable
source of energy: current and future possibility in Libya, Case Studies in Thermal
Engineering, [online], v.4 (1), November, pp.144-152
206
Available at:
http://www.sciencedirect.com/science/article/pii/S2214157X1400032X
[Accessed 24th July 2015]
Hartog. C. (1970) The Sea-Grasses of the World. Amsterdam, London: North-
Holland Publications Company, [online], pp.1-29
Available at: http://pdf.usaid.gov/pdf_docs/PNAAM467.pdf
[Accessed 24th July 2014]
Hillman. K, McComb. A and Walker. D.(1995) The distribution, biomass and
primary production of the seagrass Halophila ovalis in the Swan/Canning Estuary,
Western Australia, Aquatic Botany,[online], v.51 (2), July,pp.1-54
Available at:
http://www.sciencedirect.com/science/article/pii/030437709500466D
[Accessed 24th July 2014]
Hiscock. K, Southward. A, Tittley. I, Hawkins. A. (2004) Effect of changing
temperature on benthic marine life in Britain and Ireland, Aquatic Conservation:
Marine and Freshwater Ecosystems, [online], v.14 (4), Jun, pp.333-362
Available at: http://onlinelibrary.wiley.com/doi/10.1002/aqc.628/pdf
[Accessed 24th July 2014]
Hargrave. B. (2005) Environmental effects of Marine finfish Aquaculture, Berlin:
Springer.
Hair. J. Anderson. R. Tatham. L. Black. W. (1995) Multivariate data analysis. 4th
ed. New Jersey: Prentice-Hall.
Howarth. R and Teal. J. (1979) Sulphate reduction in a New England salt marsh,
Journal of Limnology and Oceanography,[online], v.24 (6), November, pp.999-
1013
Available at: - http://onlinelibrary.wiley.com/doi/10.4319/lo.1979.24.6.0999/pdf
[Accessed 24th July 2014]
Hashim. A and Hajjaj. M. (2005) Impact of desalination plants fluid effluent on the
integrity of seawater, with the Arabian Gulf in perspective, Journal of Desalination
and Environment, [online], v.182 (3), November, pp.373-393
Available at:
http://www.sciencedirect.com/science/article/pii/S0011916405004534
[Accessed 24th July 2014]
Hsu. G, Hsia. C and Hsu. S. (2015) Effects of electrode settings on chlorine
generation efficiency of electrolyzing seawater, Food and Drug Analysis, [online],
v.23 (4), Decmber.pp.729-734.
Available at:
http://www.sciencedirect.com/science/article/pii/S1021949815000915
[Accessed 24th July 2014]
Hajbi. F, Hammi. H and M’nif. A. (2010) Reuse of RO Desalination Plant Reject
Brine, Phase Equilibria and Diffusion, [online], v.31 (4), August, pp. 341-347
207
Available at: http://link.springer.com/article/10.1007/s11669-010-9727-3
[Accessed 24th July 2015]
https://www.alibaba.com/trade/search?fsb=y&IndexArea=product_en&CatId=&S
earchText=+salt+price&isGalleryList=G
http://www.economist.com/node/15276675
International Monetary Fund. (2013) Staff Country Reports: Libya. Report No (13).
Washington. USA, [online].
Available at:
https://books.google.co.uk/books?id=lHkJ303fme8C&printsec=frontcover&sourc
e=gbs_ge_summary_r&cad=0#v=onepage&q&f=false
[Accessed 24th July 2015]
ICRC, (2012) Water and habitat department: International Committee of the Red
Cross, Unpublished.
Invers. O, Romero J and Pe´rez. M (1997) Effects of pH on seagrass
photosynthesis: a laboratory and field assessment. Aquatic Botany, [online], v.59
(4), December, pp.185-194
Available at:
http://www.sciencedirect.com/science/article/pii/S0304377097000727
[Accessed 24th July 2014]
Irmak. S, Irmak. A, Jones. J, Howell. T, Jacobs. J, Allen. R and Hoogenboom. G.
(2003) Predicting Daily Net Radiation Using Minimum Climatological Data,
Irrigation and Drainage Engineer, [online], v.129 (4), August, pp.256-269
Available at: http://ascelibrary.org/doi/pdf/10.1061/(ASCE)0733-
9437(2003)129:4(256)
[Accessed 24th July 2015]
Johnson. D, Lott. J and Sliepcevich. C. (1976) The exchange crystallization freeze
desalination process, Desalination, [online], v.18 (3), June, pp.231-240
Available at:
http://www.sciencedirect.com/science/article/pii/S0011916400841156
[Accessed 24th July 2014]
Johnson. D, Lott. J and Seliepcevich. C. (1976) The exchange crystallization freeze
desalination process, Desalination, [online], v.18 (3). Pp. 231-240
Available at:
http://www.sciencedirect.com/science/article/pii/S0011916400841156
[Accessed 24th July 2014]
Jirka. G. (2008) Improved Discharge Configurations for Brine Effluents from
Desalination Plants, Hydraulic Engineering, [online], v.134 (1), January, pp.166-
120
Available at: http://ascelibrary.org/doi/full/10.1061/(ASCE)0733-
9429(2008)134%3A1(116)
[Accessed 24th July 2014]
208
Kepke. J, Foster. L, Gesca J and McCann. D. (2008) Hold the salt: innovative
treatment of RO concentrate, [online], January, pp. 2619-2630
Available at:
https://www.researchgate.net/publication/274226393_Hold_the_Salt_Innovative_
Treatment_of_RO_Concentrate
[Accessed 24th July 2014]
Jack. J, Abdsalam. A and Khalifa. N. (2009) Assessment of dissolved oxygen in
coastal waters of Benghazi, Libya, Journal of Black Sea/Mediterranean
Environment, [online], v.15 (3), October, pp. 135-156,
Available at: http://edc-connection.ebscohost.com/c/articles/52249539/assesment-
dissolved-oxygen-coastal-waters-benghazi-libya
[Accessed 24th July 2014]
Joyce. C, Vina. C and Metcalfe. D. (2005) Biotic variation in coastal water bodies
in Sussex, England: Implication for saline lagoons, Journal of Estuarine, Coastal
and Shelf Science, [online], v.65 (4), December, pp. 633-644
Available at:
http://www.sciencedirect.com/science/article/pii/S027277140500243X
[Accessed 24th July 2014]
Joseph. A and Sharma. S. (2012) The IIT Foundation Series - Physics, 2nd ed,
Dorling Kindersley, India.
Khawaji. A, Kutubkhanah. I and Wie. J. (2008) Advances in seawater desalination
technologies, Desalination, [online], v.221 (3), March, pp.47-69
Available at:
http://www.sciencedirect.com/science/article/pii/S0011916407006789
[Accessed 24th July 2014]
Krishna. H. (2004) Introduction to Desalination Technologies. Texas Water
Development Board, [online]
Available at:
http://www.twdb.texas.gov/publications/reports/numbered_reports/doc/r363/c1.pd
f
[Accessed 24th July 2014]
Khordagui, H. (2013). Assessment of potential cumulative environmental impacts
of desalination plants around the Mediterranean Sea. SWIM Final report, Activity
1.3.2.1.
Available at: http://www.swim-
sm.eu/files/Environmental_Impacts_of_Desalination.pdf
[Accessed 24th July 2014]
Kershman. S. (2001) 25 years of experience in operating thermal desalination
plants, Desalination, [online], v.136 (3), May, pp.141-145
Available at:
http://www.sciencedirect.com/science/article/pii/S001191640100176X
209
[Accessed 24th July 2014]
Khawaji. A and Wie. J. (1994) Potabilization of desalinated water at Madinat
Yanbu Al-Sinaiyah, Desalination, [online], v.98 (3), September, pp.135-146
Available at: http://www.sciencedirect.com/science/article/pii/0011916494001383
[Accessed 24th July 2014]
Kalogirou. S. (2005) Seawater desalination using renewable energy sources,
Progress in Energy and Combustion Science, [online], v.31 (3), March, pp.242-281
Available at:
http://www.sciencedirect.com/science/article/pii/S0360128505000146
[Accessed 24th July 2014]
Karagiannis. I and Soldatos. P. (2008) Water desalination cost literature: review
and assessment, Desalination, [online], v.223 (3), March, pp.448-456.
Available at:
http://www.sciencedirect.com/science/article/pii/S0011916407008843
[Accessed 24th July 2014]
Katzir. L, Volkmann.Y, Daltrophe. N, Korngold. E, Mesalem. R, Oren. Y and
Gilron. J. (2010) WAIV-Wind aided intensified evaporation for brine volume
reduction and generating mineral byproducts, Desalination and Water Treatment,
[online], v.13 (3), Jun, pp.63-74
Available at: http://www.tandfonline.com/doi/abs/10.5004/dwt.2010.772
[Accessed 24th July 2014]
Khalil. A and Asheibi. A. (2015) The Chances and Challenges for Renewable
Energy in Libya. Proceedings in the 4th International Conference on Renewable
Energy Research and Applications, [online], Palermo, Italy,22-25 November, pp
1-6
Available at:
https://www.researchgate.net/profile/Ashraf_Khalil13/publication/283722527_Th
e_Chances_and_Challenges_for_Renewable_Energy_in_Libya/links/5853966208
aef7d030a52abd/The-Chances-and-Challenges-for-Renewable-Energy-in-
Libya.pdf
[Accessed 24th July 2015]
Kuwairi. A. (2006) Water mining: the Great Man-made River, Libya, Proceedings
of the Institution of Civil Engineers - Civil Engineering, [online], Libya, 1st
May,v.159 (5), pp.39-43
Available at:
http://www.icevirtuallibrary.com/doi/pdf/10.1680/cien.2006.159.5.39
[Accessed 24th July 2015]
Khalafallah. A, Geneid .Y, Shaetaey. S and Shaaban. B. (2013) Responses of the
seagrass Halodule uninervis (Forssk.) Aschers to hypersaline conditions, Journal
of Aquatic Research-Egypt, [online], v.39 (3), October, pp.167-176
Available at:
http://www.sciencedirect.com/science/article/pii/S168742851300109X
[Accessed 24th July 2014]
210
Korovessis. N and Lekkas. T. (2009) Solar saltworks Wetland function, Global nest
[online], v.11 (1), October, pp. 49-57.
Available at: http://journal.gnest.org/sites/default/files/Journal%20Papers/49-
57_575_Korovessis.pdf
[Accessed 24th July 2015]
Kavakli. Z, Tsirtsis. G, Korovessis. N, Karydis. M. (2006) A comparative analysis
of the ecological systems of two Greek seasonal saltworks (Mesolonghi and
Kalloni): Implications for salt production, Proceedings of the 1st International
Conference on the Ecological Importance of Solar Saltworks (CEISSA 06),
[online], Santorini Island, Greece, 20-22, October, pp.95-102.
Available at: http://www.srcosmos.gr/srcosmos/showpub.aspx?aa=7858
[Accessed 24th July 2015]
Kasedde. H. (2013) Characterization of Raw Materials for salt Extraction from
Lake Katwe, Uganda, 1-35. [online] MSc. Thesis, KTH, Royal Institute of
Technology, Stockholm University, Sweden.
Available at: https://www.diva-
portal.org/smash/get/diva2:667784/FULLTEXT01.pdf
[Accessed 24th July 2015]
Lattemann. S and Höpner. T. (2008) Environmental impact and impact assessment
of seawater desalination, Desalination, [online], v.220 (3), March.pp.1-15
Available at:
http://www.sciencedirect.com/science/article/pii/S0011916407006005
[Accessed 24th July 2015]
Lattemann. S. (2010) Development of an environmental impact assessment and
decision support system for seawater desalination plants, [online], Ph. D, thesis,
Delft University of Technology and of the Academic Board of the UNESCO-IHE
Institute for Water Education, Salzgitter, Germany
Available at:
https://books.google.co.uk/books?hl=en&lr=&id=2kXLBQAAQBAJ&oi=fnd&pg
=PP1&dq=Development+of+an+environmental+impact+assessment+and+decisio
n+support+system+for+seawater+desalination+plants&ots=vWhKRzwx7K&sig=
i0dXo8hPno2NdPiPsNWPR0JvIiA#v=onepage&q=Development%20of%20an%
20environmental%20impact%20assessment%20and%20decision%20support%20
system%20for%20seawater%20desalination%20plants&f=false
[Accessed 24th July 2017]
Lenntech, (1998) Reverse Osmosis Desalination Process, [online image]
Available at: http://www.lenntech.com/processes/desalination/reverse-
osmosis/general/reverse-osmosis-desalination-process.htm
[Accessed 24th July 2014]
Leong. J, Tan. J, Charrois. J and Ladweig. B. (2014) Review of high recovery
concentrate management options, Desalination and Water Treatment, [online],
v.52 (42), August, pp.7609-7627
211
Available at:
http://www.tandfonline.com/doi/abs/10.1080/19443994.2013.834273
[Accessed 24th July 2014]
Lu. H, Walton. J and Hein. H. (2002) Thermal Desalination using MEMS and
Salinity-Gradient Solar Pond Technology, Desalination Research and
Development Program Report No. 80, University of Texas at El Paso El Paso,
Texas [online], Aguste. pp.1-40
Available at: https://www.usbr.gov/research/AWT/reportpdfs/report080.pdf
[Accessed 24th July 2014]
Latteman. S. (2010) Development of an Environmental Impact Assessment and
Decision Support System for Seawater Desalination Plant, [online] Ph.D. thesis.
Delft University of Technology
Available at: https://books.google.co.uk/
[Accessed 24th July 2014]
Latorre. M. (2005) Environmental impact of brine disposal on Posidonia
seagrasses, Desalination, [online], v.182 (3), November, pp 517–524.
Available at:
http://www.sciencedirect.com/science/article/pii/S0011916405004662
[Accessed 24th July 2014]
Ladewig. B and Asquith. B. (2011) Desalination Concentrate Management.
Australia. Springer
Les. E. (2015) Reducing Corrosion and potential Boiler Failure with Superior
Iron: Transport Technology, [online], pp.1-37
Available at: http://www.nace-jubail.org/meetings/nace_jubail%20gewpt1.pdf
[Accessed 24th July 2014]
Lozides. L. (2015) The Cost of Environmental and Social Sustainability of
Desalination, Marine Pollution Chemistry, [online], pp. 175-189
Available at: http://132.68.226.240/english/pdf/IDS/96.pdf
[Accessed 24th July 2014]
Lattemann. S. (2005) Potential Impacts of Seawater Desalination, [online],
Available at: http://www.paua.de/Impacts.htm
[Accessed 24th July 2014]
Laspidou. C, Hadjibiros. K and Gialis. S. (2010) Minimizing the environmental
impact of sea brine disposal by coupling desalination plants with solar saltworks:
A case study for Greece, Journal of Water, [online], v.2 (1), February, pp.75-84
Available at: http://www.mdpi.com/2073-4441/2/1/75,
[Accessed 24th July 2014]
Laˇcnjevaca. U, Jovi´ca. B, Gaji´c-Krstaji. Lj, Kovaˇc. J, Jovi´ca. V, Krstaji´c. N.
(2013) Ti substrate coated with composite Cr–MoO2 coatings as highly selective
cathode materials in hypochlorite production, Electrochimica Acta. [online], v.96
(1), April, pp. 34-42.
212
Available at:
http://www.sciencedirect.com/science/article/pii/S0013468613003319
[Accessed 24th July 2014]
Ladewig. B and Asquith. B. (2012) Desalination Concentrate Management:
Evaporation Ponds Industrial Chemistry and Chemical Engineering, Berlin
Heidelberg, Springer.
Milano. M, Ruelland. D, Fernandez. S, Dezetter. A, Fabre. J, Servat. E, Fritsch.J,
Bardin. S and Thivet. G. (2013) Current state of Mediterranean water resources and
future trends under climatic and anthropogenic changes, Hydrological Sciences,
[online], v.58 (3), March, pp.498-518
Available at:
http://www.tandfonline.com/doi/full/10.1080/02626667.2013.774458
[Accessed 24th July 2017]
Medeazza. G. (2005) “Direct” and socially-induced environmental impacts of
desalination, Desalination, [online], v.185 (3), November, pp. 57-70
Available at:
http://www.sciencedirect.com/science/article/pii/S0011916405006089
[Accessed 24th July 2017]
Mezher. T, Abbas. H and Khaled. A. (2011) Techno-economic assessment and
environmental impacts of desalination technologies, Desalination, [online], v. 266
(3), January, pp. 263-273.
Available at:
http://www.sciencedirect.com/science/article/pii/S0011916410006296
[Accessed 24th July 2014]
Miller. J. (2003) Review of Water Resources and Desalination Technologies,
Sandia National Laboratories. California. USA, [online], March, pp. 1-49
Available at: http://prod.sandia.gov/techlib/access-control.cgi/2003/030800.pdf
[Accessed 24th July 2014]
Mahdavi. M, Mahvi. A and Nasseri. S. (2011) Application of Freezing to the
Desalination of Saline Water, Arabian Journal for Science and Engineering,
[online], v.36 (7), November, pp.1171-1177.
Available at: http://link.springer.com/article/10.1007/s13369-011-0115-z
[Accessed 24th July 2014]
Mickley. M. (2006) Membrane Concentrate Disposal: Practices and Regulation,
Desalination and Water Purification Research and Development Program: Report
No. 123, 2nd edn. U.S. Department of the Interior, Bureau of Reclamation. Denver.
[online], April, pp. 1-303
Available at: https://www.usbr.gov/research/AWT/reportpdfs/report123.pdf
[Accessed 24th July 2015]
213
Masnoon. S & Glucina. K. (2011) Desalination: Brine and Residual Management:
Project WWIR N°RI024:Réf. : RI024_PEP_KG/sm/18695: Global Water Research
Coalition-Report [online], October, pp.2-91
Available at:
http://www.waterrf.org/resources/Lists/SpecialReports/Attachments/2/GWRC_St
ate_of_Science_Report_on_Brine_and_Residual_Management.pdf
[Accessed 24th July 2014]
Mickley. M. (2001) Membrane concentrate disposal: Practices and regulation.
Desalination and Water Purification Research and Development Program Report
No. 69, [online], September, pp. 1-252
Available at: http://www.usbr.gov/research/AWT/reportpdfs/report069.pdf
[Accessed 24th July 2014]
Mickley, M. C. (2009) Treatment of Concentrate, Desalination and Water
Purification Research and Development Program Report N. 155, U.S. Department
of Interior Bureau of Reclamation, Denver, Colo. [online], May, pp.1-155
Available at: https://www.usbr.gov/research/AWT/reportpdfs/report155.pdf
[Accessed 24th July 2014]
Mohamed. A, Maraqa. M, Al Handhaly. J. (2005) Impact of land disposal of reject
brine from desalination plants on soil and groundwater, Desalination, [online],
v.182 (3), November, pp. 411-433
Available at:
http://www.sciencedirect.com/science/article/pii/S001191640500456X
[Accessed 24th July 2014]
Morillo. J, Usero. J, Rosado. D, El Bakouri. H, Riaza. A and Bernaola. F. (2014)
Comparative study of brine management technologies for desalination plants,
Desalination, [online], v.336 (1), March, pp.32-49
Available at:
http://www.sciencedirect.com/science/article/pii/S0011916414000071
[Accessed 24th July 2014]
Mackey. E and Seacord. T. (2008) Regional Solutions to Concentrate Management,
Water Reuse Foundation Project No. WRF-02-006d-01, Water Reuse Foundation,
Alexandria VA, [online], pp.1-129
Available at:
http://www.waterboards.ca.gov/water_issues/programs/grants_loans/water_recycl
ing/research/02_006d_01.pdf
[Accessed 24th July 2014]
MacDonald. A, Bonsor. H, Dochartaigh. B and Taylor. R. (2012) Quantitative maps
of groundwater resources in Africa, Environmental Research Letters,[online], v.7
(2), April, pp.1-7
Available at: http://iopscience.iop.org/article/10.1088/1748-9326/7/2/024009/meta
[Accessed 24th July 2014]
Mohamed. A, Al-Habaibeh. A, Abdo. H and Elabar. S. (2015) Towards exporting
renewable energy from MENA region to Europe: An investigation into domestic
214
energy use and householders’ energy behaviour in Libya, Applied Energy, [online],
v.146 (15), May, pp.247-262.
Available at:
http://www.sciencedirect.com/science/article/pii/S0306261915001750
[Accessed 24th July 2015]
Mohamed. S. (2013) Interview by Ali Elhajaji. Tripoli. Libya. 13 September 2013
Middle East business intelligence. (2010) The Great Man-made River project:
MEED project, [online]
Available at:
https://www.meed.com/Journals/1/Files/2011/12/11/Sample%20Chapter.pdf
[Accessed 24th July 2015]
Moreno. A, Torquemada. Y and Lizaso. J. (2014) Salinity fluctuation of the brine
discharge affects growth and survival of the seagrass Cymodocea nodosa, Journal
of Marine Pollution Bulletin, [online], v.81 (1), April, pp 61-60
Available at:
http://www.sciencedirect.com/science/article/pii/S0025326X14001155
[Accessed 24th July 2014]
Marsh. J, Dennison. W and Alberte. R. (1986) Effects of temperature on
photosynthesis and respiration in eelgrass (Zostera marina L.), Journal of
Experimental Marine Biology and Ecology, [online], v.101 (3), November, pp.257-
267
Available at:
http://www.sciencedirect.com/science/article/pii/0022098186902674#
[Accessed 24th July 2014]
Mabrook. B. (1994) Environmental impact of waste brine disposal of desalination
plants, Red Sea, Egypt. Desalination, [online], v.97 (3), August, pp.453-465.
Available at: http://www.sciencedirect.com/science/article/pii/0011916494001081
[Accessed 24th July 2014]
Mazini. M, Yazdizadeh. A and Ramezani. M. (2014) Dynamic modelling of multi-
effect desalination with thermal vapour compressor plant, Journal of Desalination,
[online], v.353 (1), November, pp.98-108
Available at:
http://www.sciencedirect.com/science/article/pii/S0011916414004895
[Accessed 24th July 2014]
Malcolm. F and Lancaster. J. (2013) Analysis of Marine Ecology Monitoring Plan
Data from the Robin Rigg Offshore Wind Farm, Scotland (Operational Year 3),
Report Nr: 1029455, [online], September, pp.1-58
Available at: http://www.gov.scot/Resource/0046/00463655.pdf
[Accessed 24th July 2014]
Murphy. S. (2014) Global water watch program: More information about
parameters: Auburn University, [online],
Available at:
http://www.globalwaterwatch.org/GWW/GWWeng/GWWhardnessEng.aspx
215
[Accessed 24th July 2014]
Morenoa. A, McDonald. A, Shermand. T, Sánchez-Lizasoa. J, Jr. K and Cebrian.
J. (2014) Short-term impacts of salinity pulses on ionic ratios of the seagrasses
Thalassia testudinum and Halodule wrightii, Journal of Aquatic Botany, [online],
v.120 (2), pp.315-321
Available at:
http://www.sciencedirect.com/science/article/pii/S030437701400151X
[Accessed 24th July 2014]
Manzanera. M, Pe´rez. M and Romero. J (1998) Seagrass mortality due to
oversedimentation: an experimental approach, Journal of Coastal Conservation,
[online], v.4(1), December, pp.67-70
Available at: https://link.springer.com/article/10.1007/BF02806491
[Accessed 24th July 2014]
Mottaleb. S. (2013) Molecular basis of salt tolerance in Physcomitrella Patens
model plant: potassium homeostasis and physiological roles of chx transporters,
PhD thesis: Universidad Politécnica de Madrid [online], November, pp.1-164
Available at: http://oa.upm.es/21428/1/SHADY_ABDEL_MOTTALEB.pdf
[Accessed 24th July 2014]
Marie. Z. (2010) Thermal Desalination: Structural Optimization and Integration
in Clean Power and Water, MSc thesis, Massachusetts Institute of Technology.
Dept. of Mechanical Engineering, [online], June, pp. 1-144
Available at: http://dspace.mit.edu/handle/1721.1/74955
[Accessed 24th July 2014]
Morrision. G and Greening. H. (2015) Seagrass. Chapter 4, [online], pp. 63-103,
Available at: http://pubs.usgs.gov/circ/1348/pdf/Chapter%204_63-104.pdf
[Accessed 24th July 2014]
Montefalcone. M, Albertelli. G, Bianchi. C, Mariani. M and Morri. C. (2005) A
new synthetic index and a protocol for monitoring the status of Posidonia oceanica
meadows: a case study at Sanremo (Ligurian Sea, NW Mediterranean), Journal of
Aquatic Conservation: Marine and Freshwater Ecosystems, [online], v.16 (1),
pp.29-42,
Available at: http://onlinelibrary.wiley.com/doi/10.1002/aqc.688/pdf
[Accessed 24th July 2014]
Murthy. P, Venkatesan. R, Nair. K, Inbakandan. D, Jahan. S, Peter. D and
Ravindran. M. (2005) Evaluation of sodium hypochlorite for fouling control in
plate heat exchangers for seawater application, International Biodeterioration &
Biodegradation. [online], v. 55 (3), April, pp.161-170
Available at:
http://www.sciencedirect.com/science/article/pii/S0964830504001350
[Accessed 24th July 2014]
216
Moosvi. J. (2006) Ecological importance of solar saltworks, Proceedings of the 1st
International Conference on the Ecological Importance of Solar Saltworks,
[online], Santorini Island, Greece,20-22, October, pp. 243-248.
Available at: http://www.srcosmos.gr/srcosmos/showpub.aspx?aa=7878
[Accessed 24th July 2015]
Mohammed. O. (2003) The Chemical Complex utilizes Libyan natural resources of
brine: General Company for Chemical Industries (Libya): 2-GCCI. [Report in
Arabic version]
Madkour. F and Gaballah. M. (2012) Hypersaline Environments. Microbiology and
Biogeochemistry, Oceanologia. [online], v.54 (4), November, pp.687-700.
Available at:
http://www.sciencedirect.com/science/article/pii/S0078323412500321
[Accessed 24th July 2015]
Muftah.T, (2014) Sabratha University: Department of Environmental engineering:
laboratory documents, Libya [in Arabic version].
National Research Council. (2008) Desalination: A National Perspective.
Washington, D.C, National Academies Press.
Available at: https://books.google.co.uk/books?hl=en&lr=&id=L-
pTAgAAQBAJ&oi=fnd&pg=PT15&dq=National+Research+Council+(NRC)++d
esalination&ots=SwG_I48bZB&sig=Kk84MBzMt-
5zESgEYz3Alz01zU0#v=onepage&q=National%20Research%20Council%20(N
RC)%20%20desalination&f=false
[Accessed 24th July 2017]
Nait. S. (2015) ENPI-SEIS project: Country Report – LIBYA: European
Environment Agency [online], March, pp.1-16
Available at: http://www.eea.europa.eu/
[Accessed 24th July 2014]
Neilly. A, Jegatheesan.V and Shu. L. (2009) Evaluating the potential for zero
discharge from reverse osmosis desalination using integrated processes – A review,
Desalination and water treatment, [online],v.11 (3), August, pp. 58-65.
Available at: http://www.tandfonline.com/doi/abs/10.5004/dwt.2009.843
[Accessed 24th July 2014]
National Oil Corporation. (2014) A brief about the National Oil Corporation,
[online]
Available at: https://noc.ly/index.php/en/about-us-2
[Accessed 24th July 2015]
Naser. H. (2013) Effects of Multi-Stage Flash and Reverse Osmosis Desalinations
on Benthic Assemblages in Bahrain, Arabian Gulf, Journal of Environmental
Protection, [online], v.4 (2), February, pp. 180-187
217
Available at:
http://www.scirp.org/journal/PaperInformation.aspx?PaperID=28320#.VLGOGz
GsXO4 [Dec.21, 2014].
[Accessed 24th July 2014]
Naser. H. (2014) Marine Ecosystem Diversity in the Arabian Gulf: Threats and
Conservation. In: Grillo. O, Biodiversity - The Dynamic Balance of the Planet,
PhD. Oscar Grillo (Ed), InTech, DOI: 10.5772/57425, [online], May, pp.297-328
Available at: http://www.intechopen.com/books/biodiversity-the-dynamic-
balance-of-the-planet/marine-ecosystem-diversity-in-the-arabian-gulf-threats-and-
conservation
[Accessed 24th July 2014]
Niu. X, Bressan. R, Hasegawa. P and Pardo. J. (1995) Ion Homeostasis in NaCl
Stress Environments, Journal of Plant Physiology, [online], v.109 (3),November,
pp.735-742.
Available at: - http://www.ncbi.nlm.nih.gov/pmc/articles/PMC161372/
[Accessed 24th July 2014]
North. G, Schmandt. J and Clarkson. J. (1995) The impact of global warming on
Texas: A Report of the Task Force on Climate Change in Texas. USA. University
of Texas Press.
Nylén. L. (2008) Influence of the electrolyte on the electrode reactions in the
chlorate process. [online], PhD. Thesis, Royal Institute of Technology, University
in Stockholm, Sweden.pp.1-55.
Available at: http://www.diva-portal.org/smash/get/diva2:13397/fulltext01.pdf
[Accessed 24th July 2014]
Nicot. J, Gross. B, Walden. S and Baier. R. (2009) Self-Sealing Evaporation Ponds
for Desalination Facilities in Texas; Contract No. 2005-483-027; Texas Water
Development Board, [online], Austin, January, pp. 1-225
Available at:
http://www.twdb.texas.gov/innovativewater/desal/doc/SSEP_FinalReport_Rev1.p
df [Accessed 24th July 2015]
Ozair. G and Al-Shangiti. M. (2013) Best practices in the management of
disinfection by-products & their formation potential, Proceedings of the
International Desalination Association World Congress on Desalination and
Water Reuse, [online], Tianjin, China, pp.1-18
Available at :
http://www.academia.edu/18069333/BEST_PRACTICES_IN_THE_MANAGEM
ENT_OF_DISINFECTION_BY-
PRODUCTS_and_THEIR_FORMATION_POTENTIAL
[Accessed 24th July 2014]
Oil and Water Supplies Limited (2006) Water Treatment Chemicals: PRO-TEK SB
101, [online].
Available at: http://www.owsupplies.biz/water/tcd.html
218
[Accessed 24th July 2014]
Owens. N. (2009) What is ocean acidification?, [online]
Available at:
http://www.rgs.org/ourwork/Schools/Geography+in+the+news/Ask+the+experts/
ocean+acidification.htm
[Accessed 24th July 2014]
Olivier. L and Kovacik. J. (2006) The ‘Briquetage de la Seille’ (Lorraine, France):
proto-industrial salt production in the European Iron Age, Antiquity, [online], v. 80
(309), September, pp.558-566.
Available at:
http://journals.cambridge.org/action/displayAbstract?fromPage=online&aid=9436
994
[Accessed 24th July 2015]
Oren. A, Sørensen. K, Canfield. D, Teske. A, Ionescu. D, Lipski. A and Altendorf.
K. (2009) Microbial communities and processes within a hypersaline gypsum crust
in a saltern evaporation pond (Eilat, Israel), Hydrobiologia, [online], v.626 (1),
june.pp.15-26
Available at: http://link.springer.com/article/10.1007/s10750-009-9734-8
[Accessed 24th July 2015]
Pinto. F and Marques. R. (2017) Desalination projects economic feasibility: A
standardization of cost determinants, Renewable and Sustainable Energy Reviews,
[online], v.78 (1), October, pp.904-915
Available at:
http://www.sciencedirect.com/science/article/pii/S1364032117306585
[Accessed 24th July 2017]
Plumley. J. (2005) ABB: Improving power plant efficiency using analytical
instrumentation, [online], January
Available at:
http://www.abb.com/cawp/seitp202/f95b7920b6f64682c1256f8d0055b672.aspx
[Accessed 24th July 2015]
Purnalna. A, Al-barwani. H, Al-Lawati. M. (2003) Modelling dispersion of brine
waste discharge from a coastal desalination plant, Desalination, [online], v.155 (1),
May, pp.41-47
Available at:
http://www.sciencedirect.com/science/article/pii/S0011916403002376
[Accessed 24th July 2014]
Palomar. P and Losada. I. (2010) Desalination in Spain: Recent developments and
recommendations, Desalination, [online], v.225 (3), May, pp.97-106
Available at:
http://www.sciencedirect.com/science/article/pii/S0011916410000305
[Accessed 24th July 2014]
219
Parker. B. (2002) Planning Analysis: Calculating Growth Rates, [online]
Available at: http://pages.uoregon.edu/rgp/PPPM613/class8a.htm
[Accessed 24th July 2015]
Pagès. J, Pérez. M and Romero. J. (2010) Sensitivity of the seagrass Cymodocea
nodosa to hypersaline conditions: A microcosm approach, Journal of Experimental
Marine Biology and Ecology, [online], v. 386 (2), April, pp. 34-38
Available at:
http://www.sciencedirect.com/science/article/pii/S0022098110000729
[Accessed 24th July 2014]
Parry. G. (1960) The development of salinity tolerance in the salmon, salmon salmo
(L) and some related species, Exp. Biol, [online], v. 37 (1), February, pp. 425–434.
Available at:
http://citeseerx.ist.psu.edu/viewdoc/download?doi=10.1.1.562.2654&rep=rep1&t
ype=pdf
[Accessed 24th July 2014]
Pallant. J. (2010) SPSS Survival Manual: A step by step guide to data analysis using
SPSS. 4th ed, London. UK: McGraw Hill
Placenti. F, Schroeder. K, Bonanno. A, Zgozi. S, Sprovieri. M, Borghini. M,
Rumolo. P, Gerrati. G, Bonnomo. S, Genovese. S, Basilone. G, Haddoud. D, Patti.
B, El-turki. A, Hamza. M, Mazzola. S. (2013) Water mass and nutrient distribution
in the Gulf of Syrte and between Sicily and Libya, Journal of Marine Systems,
[online], v.122 (1) July, pp. 36-46
Available at:
http://www.sciencedirect.com/science/article/pii/S092479631300081X
[Accessed 24th July 2014]
Penman. L. (1948) Natural evaporation from open water, bare soil, and grass.
Mathematical and Physical, [online], v.193 (1032), April, pp.120-145
Available at: http://www.jstor.org/stable/98151?origin=JSTOR-
pdf&seq=1#page_scan_tab_contents
[Accessed 24th July 2015]
Qdais. H. (2008) Environmental impacts of the mega desalination project: the Red–
Dead Sea conveyor. Desalination, [online], v.220 (3), March, pp.16-23.
Available at:
http://www.sciencedirect.com/science/article/pii/S0011916407006017
[Accessed 24th July 2014]
Rahimi. B and Chua. H. (2017) Low Grade Heat Driven Multi-Effect Distillation
and Desalination. Oxford. UK: Elsevier
International Desalination Association. (2017) Desalination by the Numbers,
[online],
Available at: http://idadesal.org/desalination-101/desalination-by-the-numbers/
[Accessed 24th July 2014]
220
Raluy. G, Serra. L and Uche. J. (2006) Life cycle assessment of MSF, MED and
RO desalination technologies, Energy, [online], v.31 (13), October, pp.2361-2372
Available at:
http://www.sciencedirect.com/science/article/pii/S0360544206000442
[Accessed 24th July 2014]
Rice. W and Chau. D. (1997) Freeze desalination using hydraulic refrigerant
compressors, Desalination, [online], v.109 (2), May, pp.157-164
Available at:
http://www.sciencedirect.com/science/article/pii/S0011916497000611
[Accessed 24th July 2014]
Reimold. R, Loland-McLaughlin. G, and Bloetscher. F. (1996) An innovative
opportunity for water reuse. Florida water resources, [online], July, 26-30
Available at: www.fwrj.com/articles/9607.pdf
[Accessed 24th July 2014]
Ruiz. J. and Romero. J. (2001) Effects of in situ experimental shading on the
Mediterranean seagrass Posidonia oceanica, Marine ecology, [online], v.215 (1),
March, pp. 107– 120.
Available at: http://www.int-res.com/articles/meps/215/m215p107.pdf
[Accessed 24th July 2014]
Royal Society (2005) Ocean acidification due to increasing atmospheric carbon
dioxide, Policy Document 12/05, London: Clyvedon Press Ltd
[Accessed 24th July 2014]
Rasul. N and Stewart. I. (2015) The Red Sea: The Formation, Morphology,
Oceanography and Environment of a Young Ocean Basin, Berlin
Ruíz. J, Guirao. L and Gil. J. (2009) Responses of the Mediterranean seagrass
Posidonia oceanica to in situ simulated salinity increase, Journal of Botanica
Marina, [online], v.52 (5), November, pp. 459–470.
Available at: https://www.degruyter.com/view/j/bot.2009.52.issue-
5/bot.2009.051/bot.2009.051.xml
[Accessed 24th July 2014]
Roberts. D, Johnston. E and Knott. N. (2010) Impacts of desalination plant
discharges on the marine environment: A critical review of published studies,
Journal of Desalination, [online], v.44 (18), October, pp.5117-5128
Available at:
http://www.sciencedirect.com/science/article/pii/S0043135410002903
[Accessed 24th July 2014]
Rabiu. A, Akinnigbagbe. E, Imo. O, Imhansoloeva. M, Ibitola. P, Faleye. R and
Shonde. O. (2011) Textural Characteristics of Bottom Sediments in Parts of the
Lagos Atlantic/Seabed Coastal Waters, Journal of Life and Physical Sciences,
[online], vol.4 (1), September ,pp.64-73,
Available at: http://www.actasatech.com/index.php?q=journal.view.126
[Accessed 24th July 2014]
221
Roux. J, Nada. N, Khan. M and Croué. J. (2015) Tracing disinfection byproducts
in full-scale desalination plants, Desalination. [online], v.359 (1), March, pp.141-
148
Available at:
http://www.sciencedirect.com/science/article/pii/S0011916414006821
[Accessed 24th July 2014]
Ronco. C and Mishkin. G. (2007) Disinfection by Sodium Hypochlorite: Dialysis
Applications, Karger AG: Basel, Switzerland
Rivera. S and Matousek. R. (2015) Overview: Chapter 1: AWWA manual: on-site
generation of hypochlorite, American Water Works Association. [online]
Available at:
http://www.awwa.org/portals/0/files/publications/images/m65excerpt.pdf
[Accessed 24th July 2014]
Rabah. M, Nassif. N, and Azim. A. (1991) Electrochemical wear of graphite anodes
during electrolysis of brine, Carbon. [online], v.29 (2), pp.165-171,
Available at:
http://www.sciencedirect.com/science/article/pii/000862239190066R
[Accessed 24th July 2014]
Ravizky. A and Nadav. N. (2007) Salt production by the evaporation of SWRO
brine in Eilat: a success story, Desalination, [online], v.205 (3), February, pp.374-
379.
Available at:
http://www.sciencedirect.com/science/article/pii/S0011916406013919
[Accessed 24th July 2015]
Rodríguez. F, Santiago. D, Suárez. N, Méndez. J and Veza. J (2012) Comparison
of evaporation rates for seawater and brine from reverse osmosis in traditional salt
works: empirical correlations, Water Science and Technology: Water Supply,
[online], v.12 (2), December, pp. 234 - 240
Available at: http://ws.iwaponline.com/content/12/2/234
[Accessed 24th July 2015].
Sadeg. S and Karahanoðlu. N. (2001) Numerical assessment of seawater intrusion
in the Tripoli region, Libya, Environmental Geology, [online], v.40 (9), pp.1151-
1168
Available at: https://link.springer.com/article/10.1007/s002540100317
[Accessed 24th July 2014]
Saleh. I. (2006) Prospects of renewable energy in Libya, International Symposium
on Solar Physics and Solar Eclipses (SPSE), [online]
Available at:
http://www.google.co.uk/url?sa=t&rct=j&q=&esrc=s&source=web&cd=4&cad=r
ja&uact=8&ved=0ahUKEwje_9zSiPTWAhVJPBoKHQIEDkAQFgg8MAM&url
222
=http%3A%2F%2Fdata.irsol.ch%2Fspse%2Fspse-
download.php%3Fpid%3D20&usg=AOvVaw0ag5LohcH3yX_42Ud7Cdst
[Accessed 24th July 2014]
Sekaran. U and Bougie. R. (2009) Research Methods for Business: A Skill
Building Approach (5th Edition), John Wiley & Sons Ltd, UK.
Shatat. M and Riffat. S. (2012) Water desalination technologies utilizing
conventional and renewable energy sources, Low-Carbon Technologies, [online],
v.9 (1), February. pp. 1-19.
Available at: https://academic.oup.com/ijlct/article/9/1/1/663897/Water-
desalination-technologies-utilizing
[Accessed 24th July 2014]
Saidur. R, Elcevvadi. E, Mekhilef. S, Safari. A, Mohammed. H. (2011) An
overview of different distillation methods for small scale applications, Renewable
and Sustainable Energy Reviews, [online], v.15 (9), December, pp.4756-4762
Available at:
http://www.sciencedirect.com/science/article/pii/S1364032111003224
[Accessed 24th July 2014]
Spiegler. K. (1977) Salt water purification. 2nd ed. New York. John Wiley and
Sons.
Schenkeveld. M, Morris. R, Budding. B, Helmer. J and Innanen. S. (2004)
Seawater and Brackish Water Desalination in the Middle East, North Africa and
Central Asia — A Review of Key issues and Experience in Six Countries (Algeria,
Tunisia, Jordan, Uzbekistan, Malta, Cyprus),World Bank, [online], December,
pp.1-125
Available at: http://www.worldbank.org/watsan/bnwp
[Accessed 24th July 2014]
Sujay. K. (2012) A Study of Retail Trade with special reference to Grocery Trade
in Kolhapur city, [online], Ph.D. thesis, Symbiosis International University, India
Available at: http://shodhganga.inflibnet.ac.in/handle/10603/15089
[Accessed 24th July 2017]
Sharon. H and Reddy. K. (2015) A review of solar energy driven desalination
technologies, Renewable and Sustainable Energy Reviews, [online], v.41 (1),
January, pp.1080-1118
Available at:
http://www.sciencedirect.com/science/article/pii/S1364032114007758
[Accessed 24th July 2014]
SolarSpring. (2016) Potable water for people process and wastewater treatment
scientific investigations: Membrane Distillation, [online image]
Available at: http://www.solarspring.de/index.php?id=7
[Accessed 24th July 2014]
223
Spiegler. K and Laird. A. (1980) Principles of Desalination: Pt.B, 2nd . New York:
Academic Press.
Samee. M, Mirza. U, Majeed. T and Ahmad. N. (2007) Design and performance of
a simple single basin solar still, Renewable and Sustainable Energy Reviews,
[online],v.11 (3), April,pp.543-549
Available at:
http://www.sciencedirect.com/science/article/pii/S1364032105000481
[Accessed 24th July 2014]
Svensson. M. (2005) Desalination and the Environment: Options and
considerations for brine disposal in inland and coastal locations: Department of
Biometry and Engineering: Swedish University of Agricultural Sciences [online],
September, pp. 1-55
Available at: http://ex-epsilon.slu.se/805/1/exjobb_05_02.pdf
[Accessed 24th July 2014]
Sethi. S, Xu. P and Drewes. J (2007) New Desalination Configurations and
Technologies for Recovery Increase and Concentrate Minimization. Desalination,
Municipal water, World Environmental and Water Resources Congress [online],
pp. 1-9.
Available at: http://dx.doi.org/10.1061/40927(243)450
[Accessed 24th July 2014]
Sethi. S, Walker. S, Drewes. J & Xu. P. (2006) Existing & Emerging Concentrate
Minimization & Disposal Practices for Membrane Systems, Florida water
resources, [online], v.1 (1). pp. 38-48
Available at:
http://www.lesico-
cleantech.com/pdf/existing_and_emerging_concentrate_minimization.pdf
[Accessed 24th July 2014]
Squire. D. (2000) Reverse osmosis concentrate disposal in the UK, Desalination,
[online], v.132 (3), December, pp.47-54
Available at:
http://www.sciencedirect.com/science/article/pii/S0011916403002376
[Accessed 24th July 2014]
Saripallia. K, Sharmaa. M and Bryantb. S. (2000) Modeling injection well
performance during deep-well injection of liquid wastes, Hydrology, [online],
v.227 (4), January, pp.41-55
Available at:
http://www.sciencedirect.com/science/article/pii/S002216949900164X
[Accessed 24th July 2014]
Skehan. S and Kwiatkowski. P (2000) Concentrate Disposal via injection wells-
permitting and design Considerations, Florida Water Resources, [online], May, pp.
19-24
Available at: https://www.fwrj.com/articles3/0005.pdf
[Accessed 24th July 2014]
224
Spellman. F. (2016) Reverse osmosis: A guide for the Nonengineering
Professional. USA. Taylor & Francis Group.
Saliba. L. (1996) Guidelines for Authorizations for the Discharge of Liquid Wastes
in the Mediterranean Sea. UNEP: California. [online]. May.
Available at: https://books.google.co.uk/books/
[Accessed 24th July 2014]
Shiklomanov. I and Rodda. J. (2003) World Water Resources at the Beginning of
the Twenty-First Century: Cambridge. United Kingdom: Cambridge University
Press.
Senoussi. M. (2012) Interview by Ali Elhajaji. Sabha. Libya. 24th Jun 2012.
Sidon. A. (2013) Interview by Ali Elhajaji. Tripoli. Libya. 13 September 2013.
Salem. O. (2007) The great manmade river project: A partial solution to Libya's
future water supply, Water Resources Development, [online], v. 8 (4), May, pp.
270-278
Available at: http://iahr.tandfonline.com/doi/abs/10.1080/07900629208722564
[Accessed 24th July 2015]
Safrai. I and Zask. A. (2008) Reverse osmosis desalination plants — marine
environmentalist regulator point of view, Journal of Desalination, [online], v.220
(3), March, pp.72-84
Available at:
http://www.sciencedirect.com/science/article/pii/S0011916407006066
[Accessed 24th July 2014]
Sandoval. J, Guirao. L and Ruiz. J. (2012) The effect of salinity increase on the
photosynthesis, growth and survival of the Mediterranean seagrass Cymodocea
nodosa, Estuarine, Coastal and Shelf Science, [online], v.115 (1), December, pp.
260–271
Available at:
http://www.sciencedirect.com/science/article/pii/S0272771412003678
[Accessed 24th July 2014]
Sadhwania. J, Vezaa. J and Santanab. C. (2005) Case studies on environmental
impact of seawater desalination, Journal of Desalination, [online], v.185 (3),
November, pp. 1-8
Available at:-
http://www.sciencedirect.com/science/article/pii/S0011916405006041#
[Accessed 24th July 2014]
Stanley. S. (2006) Influence of seawater chemistry on biomineralization throughout
Phanerozoic time: Paleontological and experimental evidence, Journal of
Palaeogeography, Palaeoclimatology, Palaeoecology, [online], v.232 (4), March,
pp.214-236,
225
Available at:
http://www.sciencedirect.com/science/article/pii/S0031018205007182
[Accessed 24th July 2014]
Soror. T. (2009) Scale and Corrosion Prevention in Cooling Water Systems Part I:
Calcium Carbonate, The Open Corrosion Journal, [online], v.2 (1), February,
pp.45-50.
Available at: - http://benthamopen.com/contents/pdf/TOCORRJ/TOCORRJ-2-
45.pdf
[Accessed 24th July 2014]
Student Watershed Research Project. (2014) Introduction-alkalinity, [online], pp 1-
3
Available at:
http://swrp.esr.pdx.edu/publications/manual/alkalinity_introduction.pdf
[Accessed 24th July 2014]
Saleem. M. (2011) Biofouling Management in the Cooling Circuit of a Power
Industry Using Electrochemical Process, General and Physical, [online], v.33 (3),
September, pp. 295-304
Available at:
http://jcsp.org.pk/Search.aspx?s=Biofouling%20Management%20in%20the%20C
ooling%20Circuit%20of%20a%20Power%20Industry%20Using%20Electrochem
ical%20Process
[Accessed 24th July 2014]
Saleem. M, Chakrabarti. M, Hasan. D, Islam. M, Yussof. R, Hajimolana. S,
Hussain. M, Khan. G and Ali. B. (2012) On site Electrochemical Production of
Sodium Hypochlorite Disinfectant for a power Plant Utilizing Seawater,
Electrochemical Science. [online], vol.7 (1), May, pp.3929-3938,
Available at: http://www.electrochemsci.org/list12.htm#issue1
[Accessed 24th July 2014]
Sivasankar. B. (2008) Engineering chemistry, McGraw Hill, New Delhi. India
Shuttleworth. W. (1993). Evaporation, Chapter 4, in: Maidment. D.R (ed),
Handbook of Hydrology. McGraw-Hill, New York
Shuttleworth. W. (2007) Putting the "vap" into evaporation, Hydrology and Earth
System Sciences, [online], v.11 (1), January, pp.210-244
Available at: http://www.hydrol-earth-syst-sci.net/11/210/2007/
[Accessed 24th July 2015]
Tal. A. (2006) Seeking Sustainability: Israel’s Evolving Water Management
Strategy, Science, [online], v.313 (5790), August, pp.1081-1084
Available at: http://science.sciencemag.org/content/313/5790/1081
[Accessed 24th July 2017]
226
Tsiourtis. N. (2001) Desalination and the environment, Desalination, [online],
v.141 (3), December, pp.223-236
Available at:
http://www.sciencedirect.com/science/article/pii/S0011916401850013
[Accessed 24th July 2014]
Tsiourtis. N. (2001) Seawater desalination projects. The Cyprus experience,
Desalination, [online], v.139 (3), September, pp.139-147
Available at:
http://www.sciencedirect.com/science/article/pii/S0011916401003034
[Accessed 24th July 2014]
Tomaszewska. M. (2000) Membrane distillation—examples of applications in
technology and environmental protection, Environmental Studies, [online], v.9 (1),
January, pp.27-36
Available at: http://www.pjoes.com/pdf/9.1/27-36.pdf
[Accessed 24th July 2014]
Tripathi. N. (2016) The Disadvantages of Ion Exchange, [online]
Available at: http://sciencing.com/disadvantages-ion-exchange-8092882.html
[Accessed 24th July 2014]
Trieb. F. (2007) Concentrating Solar Power for Seawater Desalination: Final
Report, German Aerospace Centre (DLR) Section System Analysis and
Technologies Assessment: Germany. DLR. [online], November, pp.1-65
Available at: http://www.dlr.de/tt/aqua-csp
[Accessed 24th July 2015]
Tamtam. A, Gallagher. F, Olabi. A and Nahere. S. (2011) Higher education in
Libya, system under stress, Social and Behavioural Sciences, [online], v.29 (1).
January, pp.742-751
Available
at:http://www.sciencedirect.com/science/article/pii/S1877042811027613
[Accessed 24th July 2015]
Torquemada. Y, Lizaso. J and Correa. J. (2005) Preliminary results of the
monitoring of the brine discharge produced by the SWRO desalination plant of
Alicante (SE Spain), Journal of Desalination, [online], v.182 (3), November,
pp.395-402
Available at:
http://www.sciencedirect.com/science/article/pii/S0011916405004546
[Accessed 24th July 2014]
Torquemada. Y and Lizaso. J. (2005) Effects of salinity on leaf growth and survival
of the Mediterranean seagrass Posidonia oceanica (L.) Delile, Experimental Marine
Biology and Ecology, [online], v.320 (5), June, pp.57-63
Available at:
http://www.sciencedirect.com/science/article/pii/S0022098105000079
[Accessed 24th July 2014]
227
Torquemada. Y, Durako. M and Lizaso. J. (2005) Effects of salinity and possible
interactions with temperature and pH on growth and photosynthesis of Halophila
johnsonii Eiseman, Marine Biology, [online], v.148 (2), December, pp251-260
Available at:-
https://link.springer.com/article/10.1007/s00227-005-0075-5
[Accessed 24th July 2014]
Tonner. J. (2006) An Environmental Literature Review and Position Paper for
Reverse Osmosis Desalination Plant Discharges: Water Corporation of Western
Australia, (Report No: 1890), Sydney, [online], April, pp.1-38.
Available at: ftp://ftp.sccwrp.org/pub/download/DOCUMENTS/BrinePanel
/Resources/WaterConsultantsInt_ReverseOsmosisPaper.pdf
[Accessed 24th July 2014]
Tzen. E. (2014) How Desalination growth affects the environment and energy
demand?, [online],
Available at: http://uest.ntua.gr/win4life/proceedings/papers/tzen.pdf
[Accessed 24th July 2014]
Tarnacki. K, Meneses. M, Melin. T, Van Medevoort. J and Jansen. A. (2012)
Environmental assessment of desalination processes: Reverse osmosis and
Memstill®, Journal of Desalination, [online], v.296 (1), June, pp.69-80
Available at:
http://www.sciencedirect.com/science/article/pii/S0011916412002093
[Accessed 24th July 2014]
Tabachnick. B and Fidell. L. (2013) Using Multivariate Statistics. 6th ed. USA:
Prentice Hall.
Touchette. B. (2007) Seagrass-salinity interactions: Physiological mechanisms
used by submersed marine angiosperms for a life at sea, Journal of Experimental
Marine Biology and Ecology, [online], v.350 (2), November, pp. 194–215
Available at:
http://www.sciencedirect.com/science/article/pii/S0022098107003164#
[Accessed 24th July 2014]
Thangappan. R and Sampathkumaran. S. (2008) Electrochlorination system: a
unique method of prevention of biofouling in seawater desalination, Nuclear
Desalination. [online], v.3 (2).pp.135-143
available at:
http://www.inderscienceonline.com/doi/abs/10.1504/IJND.2008.020221
[Accessed 24th July 2014]
Thomas. D. (2009) Managing brine in inland regional recycling plants: Beca Pty
Ltd, Parramatta, NSW [online], pp.1-6.
Available at:
http://www.beca.com/publications/technical_papers/~/media/publications/technic
al_papers/managing_brine_in_inland_regional_recycling_plants_2009.ashx
228
[Accessed 24th July 2015]
United Nations, (2001) Water Desalination Technologies in the ESCWA Member
Countries: Economic and social commission for western Asia, [online], New York,
July, pp.1-193
Available at:
http://s3.amazonaws.com/zanran_storage/www.escwa.un.org/ContentPages/1795
2025.pdf
[Accessed 24th July 2014]
U.S. Department of the Interior Bureau of Reclamation (2009) Bureau of
Reclamation: Managing Water in the West: Brine-Concentrate Treatment and
Disposal Options Report; Southern California Regional Brine-Concentrate
Management Study – Phase I Lower Colorado Region: [online], October, pp.1-89
Available at:
http://www.usbr.gov/lc/socal/reports/brineconcentrate/6TreatmentandDisposal_pa
rt2.pdf
[Accessed 24th July 2014]
Uddin. S. (2014) Environmental Impacts of Desalination Activities in the Arabian
Gulf, Environmental Science and Development, [online],v.5 (2), April, pp.114-117.
Available at:
http://www.ijesd.org/index.php?m=content&c=index&a=show&catid=50&id=76
7
[Accessed 24th July 2014]
UNEP. (2014) Mediterranean Action Plan (UNEP/MAP), State of the
Mediterranean Marine and Coastal Environment: Athens. Greece. [online].
Available at:
http://www.undp.org/content/dam/turkey/docs/Publications/EnvSust/akdenizrapor
[Accessed 24th July 2014]
Viola. F, Sapiamo. M, Schembri. M, Brincat. C, Lopez. A, Toscano. A,
Diamadopoulos. E, Charalambous. B, Molle. B, Zoumadakis. M, Armengol. A,
Vich. M and Noto. M. (2014) The State of Water Resources in Major
Mediterranean Islands, Water Resources, [online], v.41 (6). November, pp.639-648
Available at: https://link.springer.com/article/10.1134/S0097807814060207
[Accessed 24th July 2017]
Valero. F, Barcelo. A and Arbos. R. (2011) Electrodialysis Technology - Theory
and Applications, Desalination, Trends and Technologies, Schorr. M. (Ed),
ISBN:978-953-307-311-8, InTech: Croatia, [online]
Available at: https://www.intechopen.com/books/desalination-trends-and-
technologies/electrodialysis-technology-theory-and-applications
[Accessed 24th July 2014]
Voutchkov. N. (2010) How much does seawater desalination cost? Water Globe
Consulting, Texas Innovative Water, [online],
229
Available at: http://www.twdb.texas.gov/innovativewater/events/tiw2010/
[Accessed 24th July 2014]
Voutchkov. N. (2014) Overview of seawater concentrate disposal alternatives,
Desalination, [online], v.273 (1), June.pp.205-2019.
Available at:
http://www.sciencedirect.com/science/article/pii/S0011916410007332
[Accessed 24th July 2014]
Verdier. F. (2011) Mena regional water outlook: Part II: Desalination Using
Renewable Energy: Task 1 – Desalination Potential, [online], March, pp.1-47
Available at:-
http://www.dlr.de/tt/en/Portaldata/41/Resources/dokumente/institut/system/projec
ts/MENA_REGIONAL_WATER_OUTLOOK.pdf
[Accessed 24th July 2014]
Voutchkov. N. (2013) Desalination Engineering: Planning and Design. McGraw-
Hill, New York
Wittholz. M, O’Neill. B, Colby. C and Lewis. D. (2008) Estimating the cost of
desalination plants using a cost database, Desalination, [online], v.229 (3),
September, pp.10-20
Available at:
http://www.sciencedirect.com/science/article/pii/S0011916408002683
[Accessed 24th July 2014]
World Health Organization. (1984) Guidelines for drinking water quality
Recommendations, v. (I), Geneva, Switzerland: World Health Organization
Wade. N. (2001) Distillation plant development and cost update, Desalination,
[online], v.136 (3), May, pp.3-12
Available at:
http://www.sciencedirect.com/science/article/pii/S001191640100159X
[Accessed 24th July 2014]
Wang. L, Chen. J, Hung. Y and Shammas. N. (2011) Membrane and Desalination
Technologies, London: Springer Science
WHO. (2007) Desalination for Safe Water Supply: Guidance for the Health and
Environmental Aspects Applicable to Desalination, Geneva, [online],
Available at:
http://www.who.int/water_sanitation_health/gdwqrevision/desalination.pdf
[Accessed 24th July 2014]
World Bank. (2012). Renewable Energy Desalination: An Emerging Solution to
Close the Water Gap in the Middle East and North Africa. Washington, DC: World
Bank. DOI: 10.1596/978-0-8213-8838-9. License: Creative Commons Attribution
CC BY 3.0, [online]
Available at: http://elibrary.worldbank.org/doi/pdf/10.1596/978-0-8213-8838-9
[Accessed 24th July 2014]
230
Wade. N. (1993) Technical and economic evaluation of distillation and reverse
osmosis desalination processes, Desalination, [online], v.93 (3), August, pp.343-
363
Available at: http://www.sciencedirect.com/science/article/pii/0011916493801132
[Accessed 24th July 2014]
WHO. (2007) Desalination for Safe Water Supply: Guidance for the Health and
Environmental Aspects Applicable to Desalination, Public Health and the
Environment World Health Organization Geneva, [online], pp.1-161.
Available at:
http://www.who.int/water_sanitation_health/gdwqrevision/desalination.pdf
[Accessed 24th July 2014]
Wheida. E and Verhoeven. R. (2007) An alternative solution of the water shortage
problem in Libya, Water Resources Management, [online], v.21 (6), June, pp.961-
982
Available at: https://link.springer.com/article/10.1007/s11269-006-9067-6
[Accessed 24th July 2015]
Wheida. E and Verhoeven. R. (2006) Review and Assessment of Water Resources
in Libya, Journal of Water International, [online], v.3 (3), Jan, pp. 295-309,
[Online],
Available at: http://www.tandfonline.com/doi/abs/10.1080/02508060608691933
[Accessed 24th July 2015]
Williams. B, Onsman. A and Brown. T. (2010) Exploratory factor analysis: A five-
step guide for novices, Journal of Emergency Primary Health Care, [online], v.8
(3), January, pp.1-13
Available at:
http://ro.ecu.edu.au/cgi/viewcontent.cgi?article=1373&context=jephc,
[Accessed 24th July 2014]
Walls. R, Canning. S, Lye. G, Givens. L, Garrett. C and Lancaster. J. (2013)
Analysis of Marine Ecology Monitoring Plan Data from the Robin offshore: Wind
farm, Scotland (Operational Year 1), Report Nr: 1022189, [online], January, pp.1-
19
Available at: http://www.scotland.gov.uk/Resource/0041/00413017.pdf,
[Accessed 24th July 2014]
Wildebranda. C, Gladea. H, Willa. S, Essigb. M, Riegerb. J, Büchnerc .K and
Brodtc. G. (2007) Effects of process parameters and anti-scalants on scale
formation in horizontal tube falling film evaporators, Journal of Desalination,
[online], v.204 (3), February, pp.448-463
Available at:
http://www.sciencedirect.com/science/article/pii/S001191640601349X
[Accessed 24th July 2014]
231
World Health Organization (2005) Desalination for Safe Water Supply, Guidance
for the Health and Environmental Aspects Applicable to Desalination, [online],
pp.1-137,
Available at:
http://www.who.int/water_sanitation_health/gdwqrevision/desalination.pdf
[Accessed 24th July 2014]
Xu. P, Cath. T, Robertson. A, Reinhard. M, Leckie. J and Drewes .J. (2013) Critical
Review of Desalination Concentrate Management, Treatment and Beneficial Use,
Environmental Engineering Science, [online], v.30 (8), August. Pp.502-514
Available at: http://online.liebertpub.com/doi/abs/10.1089/ees.2012.0348
[Accessed 24th July 2014]
Xevgenos. D, Vidalis. A, Moustakas. K, Malamis. D, Loizidou. M. (2015)
Sustainable management of brine effluent from desalination plants: the SOL-
BRINE system, Desalination and Water Treatment, [online], v.53 (12), July, pp.
3151–3160
Available at:
http://www.tandfonline.com/doi/abs/10.1080/19443994.2014.933621
[Accessed 24th July 2014]
Xu. J, Ruan. G, Zou. L, Gao. C. (2010) Effect of chlorine and acid injection on
hollow fiber RO for SWRO, Desalination. [online], v. 262 (3), November, pp.115-
120
Available at:
http://www.sciencedirect.com/science/article/pii/S0011916410003735
[Accessed 24th July 2014]
Younos. T and Tulou. K. (2005) Overview of Desalination Techniques,
Contemporary water research and education, [online], v.1 (132), December, pp.3-
10.
Available at:
http://ucowr.com/files/Achieved_Journal_Issues/v132Overview%20of%20Desali
nation%20Techniques.pdf
[Accessed 24th July 2014]
Youssef. P, Dadah. R and Mahmoud. S. (2014) Comparative Analysis of
Desalination Technologies, Energy Procedia, [online], v.61 (1), January, pp.2604-
2607
Available at:
http://www.sciencedirect.com/science/article/pii/S1876610214032871
[Accessed 24th July 2014]
Younos. T. (2005) Environmental Issues of Desalination, Contemporary Water
Research & Education, [online], v.132 (1), pp.11-18
Available at: http://onlinelibrary.wiley.com/doi/10.1111/j.1936-
704X.2005.mp132001003.x/full
[Accessed 24th July 2014]
232
Yolanda. T and Luis. S. (2006) Effects of salinity on growth and survival of
Cymodocea nodosa (Ucria) Ascherson and Zostera noltii Hornemann, Biologia
Marina Mediterranean, [online], v.13 (6), January, pp 46-47
Available at: http://rua.ua.es/dspace/handle/10045/6576?locale=en
[Accessed 24th July 2014]
Zander. A, Elimelech. M, Furukawa. D, Gleick. P, Herd. K, Jones. K, Rolchigo. P,
Sethi. S, Tonner. J, Vaux. H, Weis. J and Wood. W. (2008) Desalination: a
National Perspective. The National Academies Press, Washington. USA, [online]
Available at: https://www.nap.edu/catalog/12184/desalination-a-national-
perspective
[Accessed 24th July 2014]
Zeleňáková. M, Purcz. P. Gargar. I and Hlavatá. H. (2014) Research of monthly
precipitation trends in Libya and Slovakia: Recent Advances in Environmental
Science and Geoscience. Proceedings of the 2014 International Conference on
Environmental Science and Geoscience (ESG '14), [online], Venice, Italy 15th -17th
of March 15‐17, pp. 46-50
Available at: http://www.inase.org/library/2014/venice/ENVIR.pdf#page=46
[Accessed 24th July 2015]

233
Appendixes