SOLAR DESALINATION USING LOW COST TUBULAR SOLAR STILL (TSS)
14
ICETCESD 2012 March 10-12, 2012, Sylhet, Bangladesh SOLAR DESALINATION USING LOW COST TUBULAR SOLAR STILL (TSS) Md. Abdur Rab 1 *, Dr. Kh. Md. Shafiul Islam 2 , A. K. M. Maminul Islam 3 , Md. Manjur-A-Elahi 4 ABSTRACT: In the world, demand of portable fresh water is increasing day by day because of population explosion all over the world, greater industrial development, expansion of agricultural activities and climate change. The available underground and surface water sources are being affected by salinity, industrial and agricultural wastes, limit the suitability of many fresh water availability resources. Now it is recognized that freshwater is a scare resources and more country is converted into water-stressed country due to the scarcity of freshwater resources. Therefore, this project was undertaken to study the performance of tubular solar still for desalination purpose. At first, a low cost tubular solar still was designed and constructed using locally available materials. Field experiment was carried out on constructed unit located on the roof top of the Civil Engineering Department, KUET, Khulna, Bangladesh from January 01 to April 30, 2011. The hourly output and ambient air temperature data was also collected in some typical days (2, 3 and 10 May, 2011) to show the effect of air temperature on productivity of tubular solar still. The analysis shows that the production rate of a tubular solar still is mainly depend on the intensity of solar radiation and the production rate will be higher in the summer season. It was observed that average daily distilled output of Tubular solar still increases for the months January to March except for the month April. It is founded that the average daily production rate of tubular solar still was 0.302lit/day (1.885lit/m 2 -day) and the production cost of distilled water was Tk.0.453/lit. The construction, operation and maintenance of tubular solar still are easier. So, one can easily construct a tubular solar still using locally available material to produce fresh water from saline water in the remote, coastal and arid areas to meet small scale fresh water demand. 1. Introduction Water is one of the most abundant resources on earth, covering three-fourths of the planet’s surface. There is an almost unfathomable amount of water on earth: about 1.4 billion km 3 (330 million cubic miles) (Barlow and Clark, 2002). About 97% of the earth’s water is salt water in the oceans and a tiny 3% (about 36 million km 3 ) is fresh water contained in the poles in the form of ice, ground water, lakes and rivers, which supply most of human and animal needs (Ahmed and 1 Under Graduate student, Civil Engineering Department, KUET, Khulna, Bangladesh. abdur.rab06kuet@ gmail.com 2 Professor, Civil Engineering Department, KUET, Khulna, Bangladesh. [email protected] 3 Under Graduate student, Civil Engineering Department, KUET, Khulna, Bangladesh. shaikat.engr.ce@g mail.com 4 Deputy Project Engineer, DOM-INNO Developers Limited, Dhaka, Bangladesh. [email protected]
-
Upload
independent -
Category
Documents
-
view
6 -
download
0
Transcript of SOLAR DESALINATION USING LOW COST TUBULAR SOLAR STILL (TSS)

ICETCESD 2012
March 10-12, 2012, Sylhet, Bangladesh
SOLAR DESALINATION USING LOW COST TUBULAR SOLAR STILL (TSS)
Md. Abdur Rab1*, Dr. Kh. Md. Shafiul Islam2, A. K. M. Maminul Islam3, Md. Manjur-A-Elahi4
ABSTRACT: In the world, demand of portable fresh water is increasing day by day because of
population explosion all over the world, greater industrial development, expansion of agricultural
activities and climate change. The available underground and surface water sources are being
affected by salinity, industrial and agricultural wastes, limit the suitability of many fresh water
availability resources. Now it is recognized that freshwater is a scare resources and more country
is converted into water-stressed country due to the scarcity of freshwater resources. Therefore,
this project was undertaken to study the performance of tubular solar still for desalination
purpose. At first, a low cost tubular solar still was designed and constructed using locally
available materials. Field experiment was carried out on constructed unit located on the roof top
of the Civil Engineering Department, KUET, Khulna, Bangladesh from January 01 to April 30,
2011. The hourly output and ambient air temperature data was also collected in some typical days
(2, 3 and 10 May, 2011) to show the effect of air temperature on productivity of tubular solar still.
The analysis shows that the production rate of a tubular solar still is mainly depend on the
intensity of solar radiation and the production rate will be higher in the summer season. It was
observed that average daily distilled output of Tubular solar still increases for the months January
to March except for the month April. It is founded that the average daily production rate of
tubular solar still was 0.302lit/day (1.885lit/m2-day) and the production cost of distilled water
was Tk.0.453/lit. The construction, operation and maintenance of tubular solar still are easier. So,
one can easily construct a tubular solar still using locally available material to produce fresh
water from saline water in the remote, coastal and arid areas to meet small scale fresh water
demand.
1. Introduction
Water is one of the most abundant resources on earth, covering three-fourths of the planet’s
surface. There is an almost unfathomable amount of water on earth: about 1.4 billion km3
(330
million cubic miles) (Barlow and Clark, 2002). About 97% of the earth’s water is salt water in the
oceans and a tiny 3% (about 36 million km3) is fresh water contained in the poles in the form of
ice, ground water, lakes and rivers, which supply most of human and animal needs (Ahmed and
1 Under Graduate student, Civil Engineering Department, KUET, Khulna, Bangladesh. abdur.rab06kuet@
gmail.com 2 Professor, Civil Engineering Department, KUET, Khulna, Bangladesh. [email protected] 3 Under Graduate student, Civil Engineering Department, KUET, Khulna, Bangladesh. shaikat.engr.ce@g
mail.com 4 Deputy Project Engineer, DOM-INNO Developers Limited, Dhaka, Bangladesh. [email protected]
Rahman, 2002). Nearly, 70% from this tiny 3% of the world’s fresh water is frozen in glaciers,
permanent snow cover, ice and permafrost. Thirty percent of all fresh water is in underground,
most of it is in deep, hard-to-reach aquifers. Lakes and rivers together contain just a little more
than 0.25% of all fresh water; lakes contain most of it (Kalogirou, 2005). The data relevant to
water requirements shows that around 25% of the total world populations do not have an
adequate fresh water supply, both for quality and quantity (Agha et al., 2005). Water shortages
affect 88 developing countries that are home to half of the world’s population. In these places,
80-90% of all diseases and 30% of all deaths result from poor water quality (Leitner, 1998).
Furthermore, over the next 25 years, the number of people affected by severe water shortages is
expected to increase fourfold (Engelman et al., 2000). Some of this increase is related to
population growth, some is related to the demands of industrialization. Currently, water
consumption doubles every 20 years, about twice the rate of population growth (Barlow and
Clark, 2002). The ground water source is being polluted by organisms, organic and inorganic
compounds due to the ultimate disposal of man-made harmful pollutant into the underground
reservoir (Malik et.al., 1982).
It is estimated that approximately one-third of the world’s population use groundwater for
drinking (Nickson et al., 2005). However, in the coastal regions in any country, groundwater
quality patterns are complex because of the input from many different water sources. These
include precipitation, seawater, ascending deep groundwater, and anthropogenic sources such as
wastewater or irrigation return flow (Ramkumar et al., 2010). The main sources of water in
Bangladesh are surface waters in rivers, reservoirs, lakes, canals and ponds, and ground water in
deep and shallow aquifers. In the coastal areas of Bangladesh water supply is facing great
challenges in meeting the rising freshwater demand due to limited water supply from the
available underground and surface water sources, which are affected by salinity. The increase in
salinity in Khulna started after the commencement in 1975 of the Farrakka Barrage operation in
India, which significantly reduced the flow in the Ganges, located at upstream of the Gorai River,
a major source of freshwater to the rivers surrounding Khulna. At present, the principle cause of
salinity intrusion in Khulna region is the drop of hydraulic head during the dry period (November
to May) into both surface and groundwater of the area (Hassan et al., 1998). The major difficulty
in developing the appropriate water supply system for the communities is that the aquifers
containing fresh water are not always found at convenient locations. So, it would be feasible to
address the water shortage problem with seawater desalination. Most of the modern interest in
desalination is focused on developing cost-effective ways of providing fresh water for human use
which typically needs extremely huge amount of energy as well as specialized expensive
infrastructure. But small scale and renewable energy powered desalination plants are also being
taken interest as a particular option where solar power is rich. Solar desalination is the simplest
desalination technique and environmentally friendly compared other methods such as reverse-
osmosis, electro-dialysis and biological treatment.
2. Design, Construction and field experiment of tubular solar still
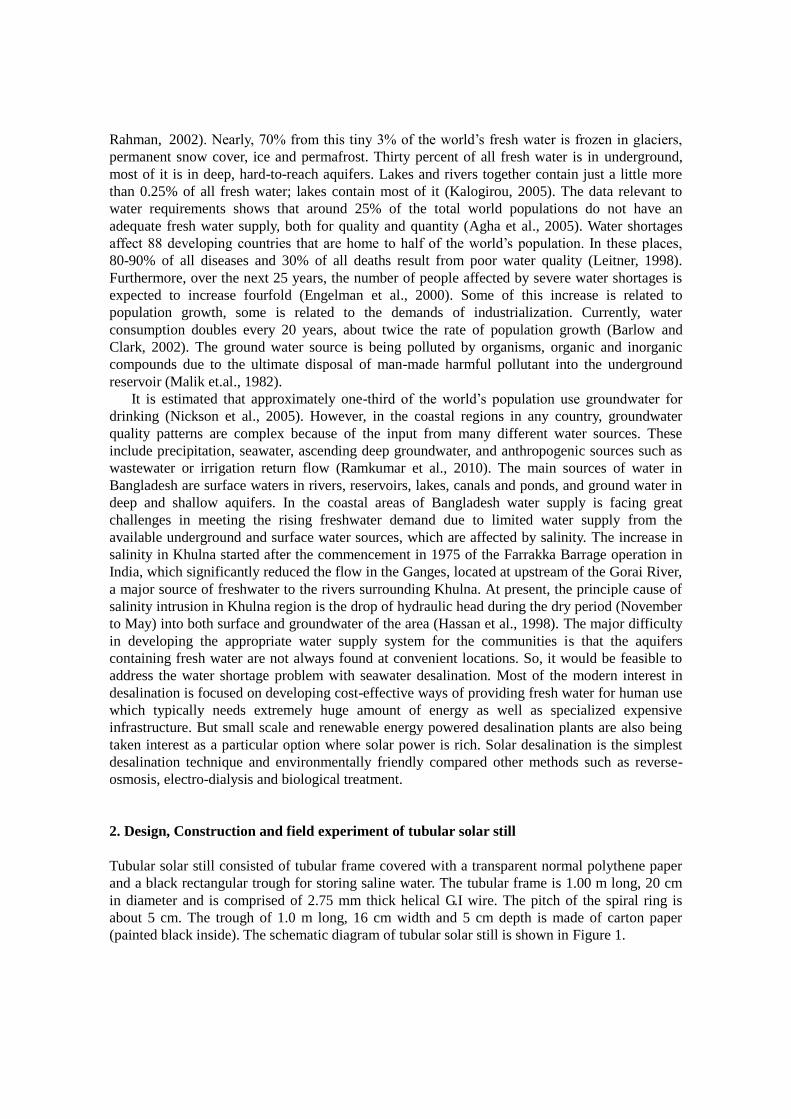
Tubular solar still consisted of tubular frame covered with a transparent normal polythene paper
and a black rectangular trough for storing saline water. The tubular frame is 1.00 m long, 20 cm
in diameter and is comprised of 2.75 mm thick helical G.I wire. The pitch of the spiral ring is
about 5 cm. The trough of 1.0 m long, 16 cm width and 5 cm depth is made of carton paper
(painted black inside). The schematic diagram of tubular solar still is shown in Figure 1.

Cross section at A-A
Figure 1 Schematic diagram of tubular solar still
2.1. Production principle of tubular solar still
The solar radiation, after transmission through a tubular cover, is mainly absorbed by saline water
in the trough. The tubular cover and trough absorb the remaining small amount of the solar
energy. Thus, the water in the trough is heated and then begins to evaporate. Many types of heat
transfer occur inside the tubular cover and outside, e.g., evaporative heat transfer from the saline
water to the tubular cover, condensate heat transfer between the saline water and tubular cover,
convective heat transfer between the saline water and the tubular cover, the trough and the water,
the trough and the tubular cover and the cover and the atmosphere, radioactive heat transfer
between the water surface and the tubular cover and the tubular cover and the atmosphere. The
evaporative water vapor is transferred to the tubular cover and then finally condensed on the
tubular cover inner surface, releasing its latent heat of vaporization. The condensed water trickles
down at the bottom of the tubular cover due to gravity and is stored in a collection bottle through
a pipe (12 mm diameter) provided at the bottom point of trough. Production principle of a tubular
solar still is illustrated in Figure 1.
2.2. Mass balance and energy balance equations
Figure 2 shows, the mass and energy transfer within and outside of a tubular solar still. The key
point of modeling is the accuracy of the evaporation from the saline water surface and the
condensation on the tubular cover.

Figure 2 Mass and energy transfer of a tubular solar still
2.2.1. Assumptions
The mass and energy balance equations are made up on the following assumptions:
1. Heat and mass transfer in a TSS are formalized using the representative temperature of the
saline water, trough and tubular cover.
2. Water vapour on the water surface is saturated.
3. There is no water vapour leakage across the tubular cover.
4. The absorption of the solar radiation in the humid air is negligibly small.
2.2.2. Mass balance equation
Mass balance equation for saline water in trough is given in equation (1)
w
e v pwm
t
h
(1)
2.2.3 Energy balance equations
Energy balance equations for saline water, trough and tubular cover are given in equation (2), (3)
and (4), respectively.

rwcwewctwww
w QQQQRt
TCV
)( (2)
ctcctwtrtr
tr QQRt
TCV
)( (3)
rcccrwctccwcdccc
c QQQQQQRt
TCV
)( (4)
Where,
C : Specific heat capacity (J/Kg)
hw : Depth of water in the trough (m)
Rw : Solar radiation adsorbed by saline water (J/s)
Rtr : Solar radiation adsorbed by trough (J/s)
Rc : Solar radiation adsorbed by tubular cover (J/s)
mevp : Evaporation flux (Kg/m2-s)
Qcc : Convective heat transferred between cover and atmosphere (J/s)
Qcdc : Convective heat transferred between cover and water (J/s)
Qcw : Convective heat transferred between water surface and cover (J/s)
Qew : Evaporative heat transferred from water surface and cover (J/s)
Qrc : Radiative heat transferred between tubular cover and atmosphere (J/s)
Qrw : Radiative heat transferred between tubular cover and water surface (J/s)
Qctc : Convective heat transferred between trough and cover (J/s)
Qctw : Convective heat transferred between trough and water (J/s)
Rs : Solar radiation (W/m2)
T : Temperature (℃)
ρw : Density of water (Kg/m3)
Vw : Volume of water (m3)
The subscripts a, c, t and w denote atmosphere, tubular cover, trough and saline water,
respectively.
2.3 Field experiment
The field experiment was carried out on the constructed tubular solar still from January 01 to
April 30, 2011. A wooden frame was used to support tubular solar still so that free circulation of
air occurs beneath the TSS. The vessel for distilled water collection was put in a wooden box in
order to collect the distilled water from the tubular solar still accurately. One end of tubular solar
still can be opened to feed raw water into the trough and to remove the accumulated saline into
the trough. The depth of solution into the trough was kept low to increase water temperature and
daily production rate. The daily output of distilled water from the tubular solar still is collected
approximately two hour after sunset. The hourly output and ambient air temperature was
measured in some typical days (2, 3 and 10 May, 2011) to show the effect of air temperature on
productivity. Hourly data of water temperature, humid-air temperature, air temperature and
productivity is also collected in 10 May, 2011. Figure 3 shows, the photograph of the field
experiment. The instrumental set up for the collection of data of water temperature, temperature

between cover and water surface (humid-air temperature) and ambient air temperature are shown
in Figure 4.
Figure 3 Photograph of field experiment
Figure 4 Experimental set up for temperature measurement
2.4. Data collection
The output of distilled water from the tubular solar still is collected everyday approximately two
hour after sunset from 01 January to 30 April, 2011. The hourly output is also collected in some
typical days (2 and 3 May, 2011). Table 1 shows, the daily production of distilled water from the
tubular solar still. Table 2 shows, the hourly production of distilled water for tubular solar still.
Table 3 shows, the water temperature, humid-air temperature, air temperature and distillate output
Thermometer
for measuring
air temperature
Thermometer for
measuring water
temperature
Thermometer for
measuring humid-
air temperature
Tubular cover inside
rectangular trough
Collection Vessel
inside the wooden
box

of tubular solar still in 10 May, 2011.
Table 1 Daily distilled water production of tubular solar still from January to April, 2011
Day
Daily distilled water production (Lit./day)
January February March April
1 0.241 0.293 0.338 0.503
2 0.235 0.237 0.472 0.338
3 0.296 0.212 0.397 0.319
4 0.164 0.233 0.408 0.293
5 0.282 0.306 0.319 0.217
6 0.247 0.293 0.410 0.338
7 0.244 0.202 0.481 0.345
8 0.251 0.303 0.437 0.293
9 0.273 0.306 0.449 0.247
10 0.280 0.358 0.416 0.205
11 0.079 0.360 0.176 0.317
12 0.176 0.265 0.374 0.316
13 0.205 0.286 0.436 0.299
14 0.118 0.326 0.293 0.234
15 0.159 0.355 0.273 0.364
16 0.153 0.303 0.364 0.341
17 0.228 0.287 0.449 0.325
18 0.231 0.241 0.390 0.371
19 0.213 0.286 0.377 0.452
20 0.241 0.111 0.345 0.325
21 0.199 0.039 0.338 0.428
22 0.243 0.341 0.291 0.294
23 0.190 0.347 0.408 0.333
24 0.200 0.356 0.363 0.484
25 0.252 0.391 0.267 0.291
26 0.235 0.381 0.382 0.320
27 0.172 0.289 0.456 0.321
28 0.273 0.429 0.273 0.352
29 0.228 - 0.391 0.425
30 0.216 - 0.346 0.267
31 0.225 - 0.389 -

Table 2 Hourly distilled water production from the tubular solar still
Table 3 Water temperatures, temperature between cover and water surface (humid-air
temperature), air temperature and distillate output of tubular solar still in 10 May,
2011
Time
At 02/05/2011 At 03/05/2011
Air
Tem. (°C)
Hourly
Pro. (Lit/hr.)
Air
Tem. (°C)
Hourly
Pro. (Lit/hr.)
07.00 am 30.1 0.000 26.3 0.000
08.00 am 31.1 0.000 31.3 0.000
09.00 am 34.4 0.003 33.0 0.008
10.00 am 35.0 0.004 38.1 0.026
11.00 am 39.1 0.014 38.3 0.025
12.00 am 33.6 0.054 38.7 0.030
01.00 pm 34.7 0.075 37.0 0.033
02.00 pm 35.5 0.042 34.2 0.070
03.00 pm 36.1 0.048 35.1 0.060
04.00 pm 34.7 0.030 32.8 0.024
05.00 pm 32.2 0.028 31.0 0.031
06.00 pm 29.5 0.018 30.0 0.010
07.00 pm 28.1 0.004 29.2 0.008
08.00 pm 27.5 0.004 28.2 0.003
09.00pm 26.3 0.000 27.6 0.000
Time Temperature (◦C) Distillate
output
(Lit/hr.) Water Humid-air Ambient air
07.00 am 28 26 31 0.000
08.00 am 37 33 31 0.005
09.00 am 49 43 33 0.017
10.00 am 58 53 35 0.022
11.00 am 57 52 35 0.047
12.00 am 59 54 36 0.055
01.00 pm 61 55 38 0.053
02.00 pm 56 52 38 0.073
03.00 pm 53 50 36 0.050
04.00 pm 51 47 35 0.048
05.00 pm 47 41 35 0.027
06.00 pm 40 33 33 0.023
07.00 pm 34 29 32 0.006
08.00 pm 33 28 31 0.005
09.00 pm 30 26 29 0.000

3. Data Analysis, results and discussions
3.1. Data analysis
Data of Table 1, 2 and 3 were used to calculate the daily and hourly production rate per unit
surface area of the trough. Table 4 shows, the daily production rate of tubular solar still from 01
January to 30 April, 2011. Table 5 shows, the hourly production rate of tubular solar still for some
typical days (2, 3 and 10 May, 2011).
Table 4 Daily distilled water production rate of TSS for January to April, 2011
Day Daily distilled water production (Lit/m2-day)
January February March April
1 1.507 1.824 2.113 3.146
2 1.47 1.477 2.947 2.113
3 1.854 1.322 2.474 1.986
4 1.027 1.455 2.548 1.824
5 1.765 1.906 1.994 1.359
6 1.544 1.824 2.556 2.113
7 1.529 1.264 3.007 2.149
8 1.567 1.892 2.733 1.824
9 1.707 1.906 2.799 1.544
10 1.751 2.231 2.6 1.286
11 0.495 2.253 1.093 1.98
12 1.101 1.655 2.341 1.972
13 1.286 1.788 2.718 1.869
14 0.738 2.038 1.832 1.463
15 0.989 2.217 1.707 2.275
16 0.961 1.892 2.275 2.127
17 1.418 1.795 2.799 2.032
18 1.448 1.507 2.438 2.311
19 1.33 1.788 2.357 2.829
20 1.507 0.694 2.149 2.032
21 1.242 0.244 2.113 2.674
22 1.521 2.127 1.817 1.84
23 1.19 2.171 2.548 2.083
24 1.248 2.223 2.267 3.021
25 1.573 2.445 1.661 1.817
26 1.47 2.379 2.386 2.002
27 1.071 1.802 2.851 2.009
28 1.707 2.682 1.707 2.201
29 1.426 - 2.445 2.659
30 1.352 - 2.165 1.669
31 1.404 - 2.43 -

Table 5 Hourly distilled water production rate of tubular solar still
Time Production rate (lit/m2-hr)
At 02/05/2011 At 03/05/2011 At 10/05/2011
07.00 am 0.000 0.000 0.000
08.00 am 0.000 0.000 0.031
09.00 am 0.019 0.050 0.106
10.00 am 0.025 0.163 0.138
11.00 am 0.088 0.156 0.294
12.00 am 0.338 0.188 0.344
01.00 pm 0.469 0.206 0.331
02.00 pm 0.263 0.438 0.456
03.00 pm 0.300 0.375 0.313
04.00 pm 0.188 0.150 0.300
05.00 pm 0.175 0.194 0.169
06.00 pm 0.113 0.063 0.144
07.00 pm 0.025 0.050 0.038
08.00 pm 0.025 0.019 0.031
09.00 pm 0.000 0.000 0.000
3.2. Results and discussions
Figure 5 shows, daily distilled output per unit surface area of the trough of tubular solar still from
January 01 to April 30, 2011. In Figure 5, it is evident that daily distilled output increases
gradually approximately from January to mid of March then gradually decreases up to mid of
April and therefore increases again. The average daily production rate of the tubular solar still is
0.302 lit/day (1.885 lit/m2-day). The daily production rate can be expressed by the linear
regression equation (5). This regression equation is only valid for month January to April, 2011.
P = 1.3817 + 0.00844 RD (5)
Where,
P = Productivity rate of distilled water (Lit/m2-day)
RD = Rank of the day in which 1 is for January 01 and 120 for April 30.
The variations of daily average productivity for different months for tubular solar still are shown
in Figure 6. It is observe that the average daily production rate is maximum for the month March
and minimum for January. The average daily production rates of tubular solar still were 1.361,
1.813, 2.317 and 2.074 lit/m2-day, respectively for the months January to April.

Figure 5 Variation of daily productivity (lit/m2-day) for tubular solar still
Figure 6 Variation of average daily productivity in different months for tubular solar still
Figure 7 shows, the variation in hourly production rate for different ambient air temperature in
some typical days (2, 3 and 10 May, 2011). From Figure 7, it is evident that the hourly production
becomes maximum after one or two hour of maximum ambient air temperature. It was also
observed from the figure that all temperatures and hourly production slopes are steeper in the
morning than that of afternoon.
January February March April0
0.5
1.0
1.5
2.0
2.5
3.0
Ave
rage
pro
duct
ivity
(lit/
m2 -d
ay)
Month
0 30 60 90 1200
1
2
3
4
P= 1.3817+0.00844RD
January February March April
Dis
tille
d ou
tput
(lit/
m2 -d
ay)
Time (Day)
Data collection from January 01 to April 30, 2011

Figure 7 Hourly variations of productivity and ambient air temperature for the TSS
Figure 8 shows, the variation of water temperature, humid air temperature, air temperature and
hourly production rate in 10 May, 2011. From the figure, it is observe that all air temperature rise
rapidly from the morning to noon, peak approximately at 1.00 pm and then decline gradually. The hourly
production rate is also rise gradually from morning to noon then decline gradually.
Figure 8 Hourly variations of production rate and tem. parameters for the TSS in 10 May, 2011
7 8 9 10 11 12 13 14 15 16 17 18 19 20 210
10
20
30
40
50
60
70
80
90
Tem
pera
ture
(°C
)
pmamTime of Day (hr)
Water temperature oC
Humid air temperatureoC
Air temperatureoC
0
0.2
0.4
0.6
0.8
1.0
1.2
Dis
tille
d ou
tput
(lil/
m2 -h
r)
Distilled output (Lit/m2-hr)
7 8 9 10 11 12 13 14 15 16 17 18 19 20 21
20
25
30
35
40
45
50
Air temp. Productivity
Air
tem
pera
ture
(0 C)
Time of Day (hour)
7 8 9 10 11 12 13 14 15 16 17 18 19 20 210
0.2
0.4
0.6
0.8
1.0
pmam
Pro
duct
ivity
(lit/
m2 /h
r)
May 02
May 03
May 10

3.3 Cost Analysis
Table 6 Cost estimation of tubular solar still
SL. No. Item Unit Rate Quantity Amount (Tk)
1 G. I. wire m 4.5 12 54
2 Trough nos. -- 1 16
3 Polythene
30
4 Wooden frame 40
Total = Tk. 140.00
If we consider design life of tubular solar still is 4 years and in a year 70% time one can get the
calculated average daily output (i.e. 0.302lit/day) then,
The production of water in the design life =0.302×365×0.70×4 =308.64 Lit.
Production cost of water = (140 /308.64) =Tk. 0.453 /lit.
4. Conclusions:
It is concluded that the design and construction of tubular solar still is very simple and the
construction cost is very low. The technology involved in desalination of saline water using solar
energy is relatively simple, the fabrication of component is very simple and maintenance can be
carried out by households. The analysis shows that the production rate of a solar still is mainly
depend on the intensity of solar radiation and the production rate will be higher in the summer
season. All temperatures and hourly production slopes are steeper in the morning than that of
afternoon. The hourly production rate is also rise gradually with air temperature from morning to
noon then decline gradually. It is founded that average daily distilled output of Tubular solar still
increases for the months January to March except for the month April. The average daily
production rates of tubular solar still were 1.361, 1.813, 2.317 and 2.074 lit/m2-day, respectively
for the months January to April. It is founded that the average daily production rate of tubular
solar still was 0.302lit/day (1.885lit/m2-day) and the production cost of distilled water was
Tk.0.453/lit. Since the construction, operation and maintenance of tubular solar still is easier so,
one can easily construct a tubular solar still using locally available material to produce fresh
water from saline water in the remote, coastal and arid areas to meet small scale fresh water
demand.
Acknowledgements
The authors wish to express their acknowledgements to the Department of Civil Engineering,
Khulna University of Engineering & Technology (KUET), Khulna, Bangladesh for extending all
sorts of supports for this study.

References
Agha, K.R., Wahab, M.A., Mansouri, K.EL. (2005). Potential of Solar Desalination in the Arid
States of North Africa and the Middle East. Renewable Energy Research and Water
Desalination, Tripoli – Libya.
Ahmed, M.F. and Rahman, M.M. (2000). Water Supply & Sanitation, International Training
Network (ITN), Bangladesh University of Engineering and Technology (BUET), Bangladesh.
Barlow, M. and Clark, T. (2002). Blue Gold, New Press, New York.
Hassan, M.Q., Rahman, M.M., Islam, M.S. and Shamsad, S.Z.K.M. (1998). Effects of Salinity on
the Hydrogeo-Environment of Khulna City and Mongla Port Areas of Bangladesh, Dhaka
University Journal of Biological Sciences, vol. 7(2), pp.113-127.
Kalogirou, S.A.(2004). Seawater desalination using renewable energy sources. Progress in
Energy and Combustion Science, Nicosia, Cyprus.
Leitner, G.F. (1998). Int.Desalination and Water Reuse Quart.
Malik, M.A.S., Tiwari, G.N., Kumar, A. and Sodha, M.S. (1982). A practical study of a wide
range of stills and their optimum design, construction and performance. Solar Distillation,
First edition, Pergamon Press.
Nickson, R.T., McArthur, J.M., Shrestha, B., Kyaw-Nyint, T.O., and Lowry, D. (2005). Arsenic
and other Drinking Water Quality Issues, Muzaffargarh District, Pakistan. Appl Geochem
vol.20, pp. 55–68.
Ramkumar, T. and Anita Mary, I. (2010). Hydrogeochemical Quality of Groundwater in
Vedaraniyam Town, Tamil Nadu, India. Journal of Environmental and Earth Sciences, vol. 2,
pp. 44-48.