177_2020_89.pdf - Desalination and Water Treatment
13
* Corresponding author. 1944-3994/1944-3986 © 2020 Desalination Publications. All rights reserved. Desalination and Water Treatment www.deswater.com doi: 10.5004/dwt.2020.24928 177 (2020) 89–101 February Breakthrough studies and mass transfer studies on the decolorization of paint industry wastewater using encapsulated beads of Cactus opuntia (ficus-indica) S. Vishali a, *, P. Mullai b , R. Karthikeyan c a Department of Chemical Engineering, SRMIST, Kattankulathur – 603 203, Tamil Nadu, India, Tel. +91-94438 83562; email: [email protected] b Department of Chemical Engineering, Annamalai University, Chidambaram 608 002, India, Tel. +91-94869 18357; email: [email protected] c Anjalai Ammal Mahalingham Engineering College, Thanjavur – 614 403, Tamil Nadu, India, Tel. +91-99405 61915; email: [email protected] Received 3 April 2019; Accepted 14 September 2019 abstract This article reports the performance of an encapsulated form of C. opuntia as an adsorbent for the decolorization of water-based paint industry wastewater in a fixed-bed column. Experimental results revealed that the performance is excellent under these conditions. The impact of operational variables viz., adsorbent bed height, effluent flow rate and effluent initial concentration, on the breakthrough curves was analyzed. Breakthrough curves were validated with the help of different models viz., Thomas/Bed depth service time, Adams–Bohart, Yoon–Nelson and Wang. To identify the rate limiting step of the process, various mass transfer models such as Weber–Morris, Boyd, Urano–Tachikawa, and Mathews-Weber were performed. From the model parameters, it was concluded that the intra particle diffusion was not the only rate controlling step but film diffusion was also a likely influencing factor. The results recommended that the green-based encapsulated adsorbent C. opuntia guaranteed its ability to act as an adsorbent in the decolorization of paint industry wastewaters. Keywords: Paint industry wastewater; C. opuntia; Immobilized beads; Breakthrough curves; Mass transfer studies 1. Introduction A developing country such as India has plenty of oppor- tunities in the growth of paint industry, the boom in the infrastructure development aided by the easy availability of housing loans is the prime driving force for the growth of the decorative paint segment. The industrial paints sector is wit- nessing a 50% increase in revenue, mainly due to a 10% rise in the manufacture of automobiles. So the expected paint industry effluent generation is also in the increasing trend [1]. The paint effluent has to be treated before disposal, due to its hazardous composition such as the presence of heavy metals and high concentration of organic matter, which endanger aquatic life and wildlife and contaminate the food chain. It is the responsibility of the individual to safeguard the quality of the environment. The treated wastewater can be effectively, recycled and reused within the plant as a coolant, diluent or a compo- nent of low-cost paint, and for effective water management. Many physico-chemical methods are tried on the treatment of paint industry effluent, but always biosorption validates its ability in the removal of color and heavy metals [2]. The biosorption process has various merits viz., thorough pollutant removal from dilute solutions, simple and easy operation and it becomes cheaper, when the selected adsor- bent does not need any additional pre-treatment process. If the selected adsorbent is either a natural product or an
-
Upload
khangminh22 -
Category
Documents
-
view
0 -
download
0
Transcript of 177_2020_89.pdf - Desalination and Water Treatment
* Corresponding author.
1944-3994/1944-3986 © 2020 Desalination Publications. All rights reserved.
Desalination and Water Treatment www.deswater.com
doi: 10.5004/dwt.2020.24928
177 (2020) 89–101February
Breakthrough studies and mass transfer studies on the decolorization of paint industry wastewater using encapsulated beads of Cactus opuntia (ficus-indica)
S. Vishalia,*, P. Mullaib, R. Karthikeyanc
aDepartment of Chemical Engineering, SRMIST, Kattankulathur – 603 203, Tamil Nadu, India, Tel. +91-94438 83562; email: [email protected] bDepartment of Chemical Engineering, Annamalai University, Chidambaram 608 002, India, Tel. +91-94869 18357; email: [email protected] cAnjalai Ammal Mahalingham Engineering College, Thanjavur – 614 403, Tamil Nadu, India, Tel. +91-99405 61915; email: [email protected]
Received 3 April 2019; Accepted 14 September 2019
a b s t r a c tThis article reports the performance of an encapsulated form of C. opuntia as an adsorbent for the decolorization of water-based paint industry wastewater in a fixed-bed column. Experimental results revealed that the performance is excellent under these conditions. The impact of operational variables viz., adsorbent bed height, effluent flow rate and effluent initial concentration, on the breakthrough curves was analyzed. Breakthrough curves were validated with the help of different models viz., Thomas/Bed depth service time, Adams–Bohart, Yoon–Nelson and Wang. To identify the rate limiting step of the process, various mass transfer models such as Weber–Morris, Boyd, Urano–Tachikawa, and Mathews-Weber were performed. From the model parameters, it was concluded that the intra particle diffusion was not the only rate controlling step but film diffusion was also a likely influencing factor. The results recommended that the green-based encapsulated adsorbent C. opuntia guaranteed its ability to act as an adsorbent in the decolorization of paint industry wastewaters.
Keywords: Paint industry wastewater; C. opuntia; Immobilized beads; Breakthrough curves; Mass transfer studies
1. Introduction
A developing country such as India has plenty of oppor-tunities in the growth of paint industry, the boom in the infrastructure development aided by the easy availability of housing loans is the prime driving force for the growth of the decorative paint segment. The industrial paints sector is wit-nessing a 50% increase in revenue, mainly due to a 10% rise in the manufacture of automobiles. So the expected paint industry effluent generation is also in the increasing trend [1]. The paint effluent has to be treated before disposal, due to its hazardous composition such as the presence of heavy metals and high concentration of organic matter, which endanger aquatic life and wildlife and contaminate the food
chain. It is the responsibility of the individual to safeguard the quality of the environment.
The treated wastewater can be effectively, recycled and reused within the plant as a coolant, diluent or a compo-nent of low-cost paint, and for effective water management. Many physico-chemical methods are tried on the treatment of paint industry effluent, but always biosorption validates its ability in the removal of color and heavy metals [2]. The biosorption process has various merits viz., thorough pollutant removal from dilute solutions, simple and easy operation and it becomes cheaper, when the selected adsor-bent does not need any additional pre-treatment process. If the selected adsorbent is either a natural product or an
S. Vishali et al. / Desalination and Water Treatment 177 (2020) 89–10190
industrial waste, the treatment will be done in a more eco-nomical way. The preparation of new and effective low-cost adsorbent is extremely essential for the treatment of paint effluent. From the literature, it was noticed that, S. potatorum, Moringa oleifera, Guar gum and Crab shell wastes were attempted as an adsorbent in the treatment of paint indus-try effluent and proved its ability in the decolorization [3].
The literature suggested the new eco-friendly adsorbent for the treatment of paint industry effluent. Cactus opuntia (ficus-indica) commonly known as prickle pear, which grows well in dry land and the availability was found in United States, Mexico, South America and other areas including Africa, Australia and Mediterranean regions [4]. The hetero polysaccharide is a component which has 2.3–300 × 104 g/mol of molecular weight and is a primary constituent of cac-tus cladode. It was used as a coagulant in the treatment of paint industry wastewater [5], turbidity removal from sur-face water and wastewater [6–8]. The adsorption capacity of Cactus has been tested in the removal of cadmium and lead, chromium (VI) [9], Pb2+ [10] and in the removal of Methylene blue, Eriochrome Black, Alizarin S [4] and bril-liant green dyes [11]. As an added application, it is used as thickener, emulsifier in food industry and also has utiliza-tion in cosmetic industry. There is no information in litera-ture of utilizing cactus as an adsorbent for the treatment of paint effluent.
This work is focused onto the evaluation of the perfor-mance of C. opuntia as an encapsulated adsorbent for the decolorization of water-based paint industry wastewater (WPW) in a fixed-bed column. The influence of the design parameters in the breakthrough curves was analyzed.
2. Materials and methods
2.1. Materials
2.1.1. Wastewater
All chemicals used in the study were of analytical grade (AR). The WPW was synthetically produced by adding white primer and colorant (5% v/v) using double distilled water. Three samples with different initial concentration viz., 3,100; 5,650 and 7,693 mg/L were prepared and labeled as Sample numbers 1–3, respectively (Table 1). The physico-chemical characteristics of the effluent were analyzed and the results are given in Table 2 [12].
2.1.2. Adsorbent
Pads of C. opuntia were collected from Thirumayam, an agronomic area of Pudukottai district, South India.
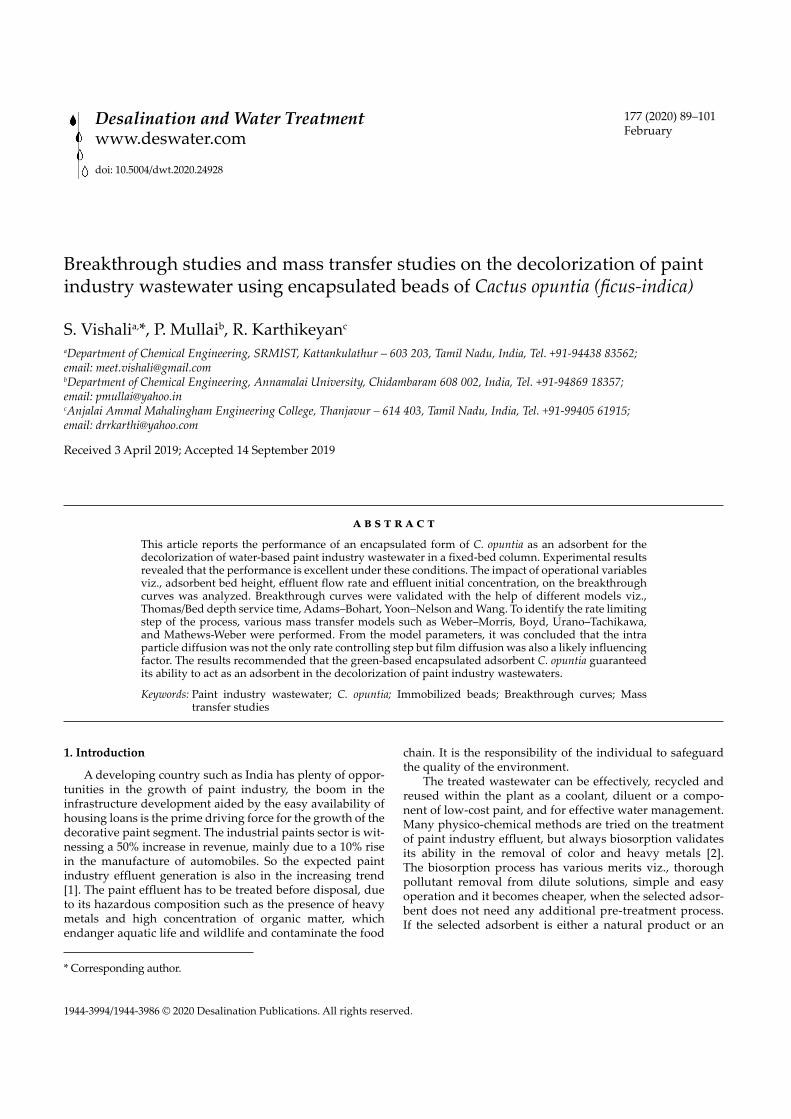
The thorns present in the pads were completely removed before washing thoroughly with distilled water, after which the pads were sliced into small pieces, and dried in a convec-tion oven at 100°C for 1 h with periodical supervision. The dried material was powdered using conventional mixer and sieved through a 0.5 mm sieve (Fig. 1).
2.1.3. Fixed-bed column
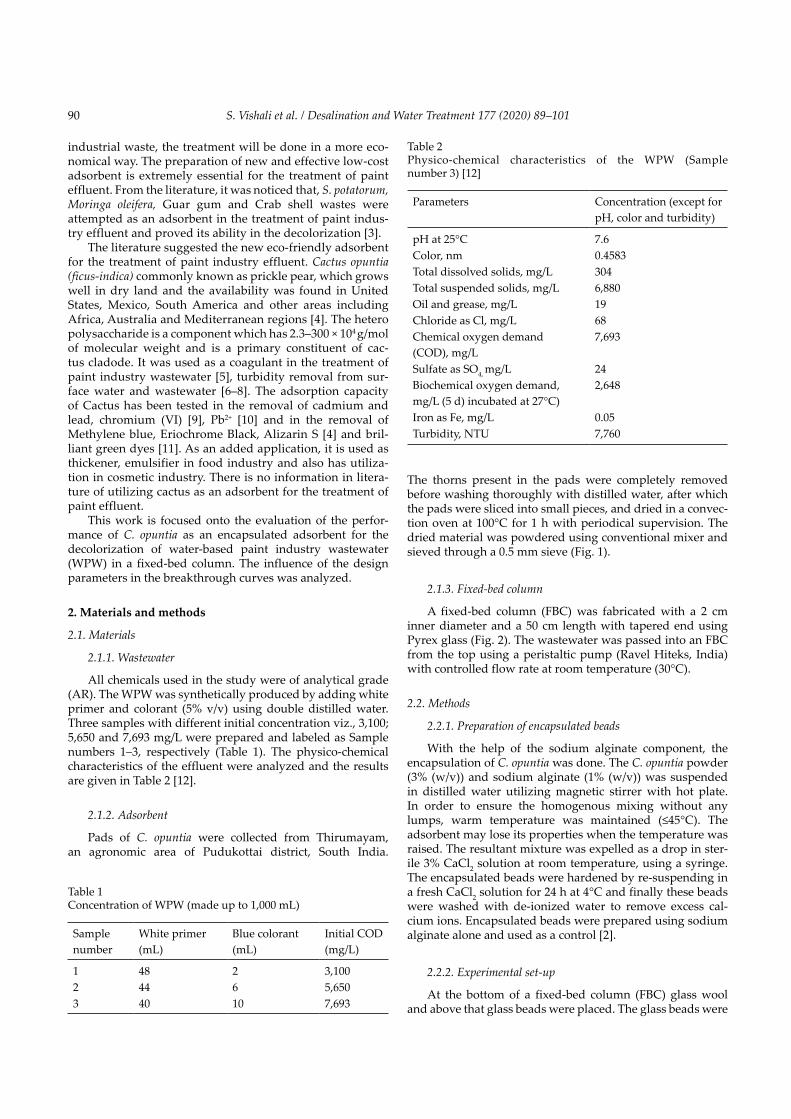
A fixed-bed column (FBC) was fabricated with a 2 cm inner diameter and a 50 cm length with tapered end using Pyrex glass (Fig. 2). The wastewater was passed into an FBC from the top using a peristaltic pump (Ravel Hiteks, India) with controlled flow rate at room temperature (30°C).
2.2. Methods
2.2.1. Preparation of encapsulated beads
With the help of the sodium alginate component, the encapsulation of C. opuntia was done. The C. opuntia powder (3% (w/v)) and sodium alginate (1% (w/v)) was suspended in distilled water utilizing magnetic stirrer with hot plate. In order to ensure the homogenous mixing without any lumps, warm temperature was maintained (≤45°C). The adsorbent may lose its properties when the temperature was raised. The resultant mixture was expelled as a drop in ster-ile 3% CaCl2 solution at room temperature, using a syringe. The encapsulated beads were hardened by re-suspending in a fresh CaCl2 solution for 24 h at 4°C and finally these beads were washed with de-ionized water to remove excess cal-cium ions. Encapsulated beads were prepared using sodium alginate alone and used as a control [2].
2.2.2. Experimental set-up
At the bottom of a fixed-bed column (FBC) glass wool and above that glass beads were placed. The glass beads were
Table 1Concentration of WPW (made up to 1,000 mL)
Sample number
White primer (mL)
Blue colorant (mL)
Initial COD (mg/L)
1 48 2 3,1002 44 6 5,6503 40 10 7,693
Table 2Physico-chemical characteristics of the WPW (Sample number 3) [12]
Parameters Concentration (except for pH, color and turbidity)
pH at 25°C 7.6Color, nm 0.4583Total dissolved solids, mg/L 304Total suspended solids, mg/L 6,880Oil and grease, mg/L 19Chloride as Cl, mg/L 68Chemical oxygen demand (COD), mg/L
7,693
Sulfate as SO4, mg/L 24Biochemical oxygen demand, mg/L (5 d) incubated at 27°C)
2,648
Iron as Fe, mg/L 0.05Turbidity, NTU 7,760
91S. Vishali et al. / Desalination and Water Treatment 177 (2020) 89–101
acting as a supporting layer and glass wool was placed to avoid the blockage of glass beads in the outlet. The encap-sulated beads of C. opuntia were packed in the column to the desired height, between two supporting layers of glass beads. The presence of glass beads at the top is to provide a uniform inlet flow. In a down flow mode, the adsorbate was introduced, at a controlled flow rate and at a room tempera-ture of 30°C without any pH adjustment.
As a first step of the packing of the beads, distilled water was half filled in a fixed-bed column, then a known mass of beads were gently added. Due to the concept of terminal settling velocity, close to constant and uniform packing was achieved for each run. The water was drained out, after the acquirement of desired bed height, which resulted in more compressed packing. At regular spell, the treated wastewater was collected for residual color analysis.
The treatment was terminated once the column has reached the saturation point. To ensure the reproducibility, the experiments were performed thrice. The reported values were the average of three data sets. The experiments were repeated to understand the impact of bed height, flow rate and initial concentration of WPW on removal efficiency.
2.2.3. Analysis
The ability of the adsorbent in the WPW treatment was analyzed in terms of residual color at λmax 612 nm in a SL 218 double UV visible spectrophotometer (Elico, India). The λmax was selected by scanning the sample between 200 and 800 nm and the peak was observed at 612 nm.
3. Design parameters of adsorption column
Fixed-bed column (FBC) experiments are performed to generate data that will enable the record of breakthrough curves. The breakthrough time and the shape of the break-through curve are very important determinants of the dynamic response of the adsorption column. The break-through time is defined as the time of adsorption when the outlet concentration from the column is about 5%–10% of the inlet concentration. The depth of the exchange zone, time required for the exchange zone to move its own height, adsorption rate and adsorption capacity are some of the main considerations when designing an adsorption column [13]. They are generally expressed in terms of normalized dye
Fig. 1. C. opuntia pads, powder and immobilized beads.
Fig. 2. A fixed-bed column.
S. Vishali et al. / Desalination and Water Treatment 177 (2020) 89–10192
concentration, defined as the ratio of instantaneous or outlet adsorbate concentration to the initial adsorbate concentra-tion (Ct/C0), as a function of time for a given bed height or adsorbate flow rate [14].
In the present studies of fixed-bed adsorption process, the adsorption capacities of pollutant at breakthrough (qb) and exhaustion (qe) time, the breakthrough time (tb), time equivalent to the total capacity of column (tt), the exhaus-tion time (te), the total or stoichiometric amount of solute adsorbed (qt), the total amount of solute sent to the column (mt), volume of effluent treated (Veff) and empty bed resi-dence time (EBRT) are usually used in the description and comparison. For a desired bed height, flow rate and initial concentration of WPW, the value of the total mass of solute adsorbed, qt (mg) can be calculated as being equal to the area under the plot of the adsorbed solute concentration (Table 3).
4. Results and discussions
4.1. Characterization of C. opuntia (ficus-indica)
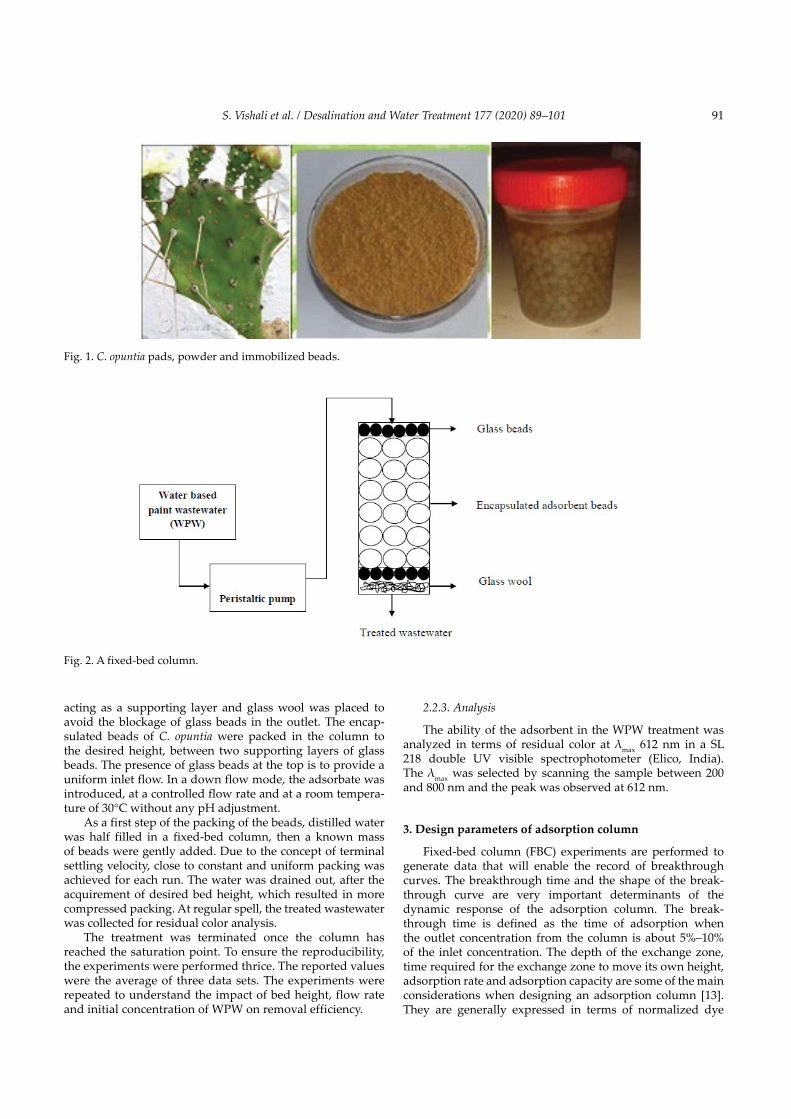
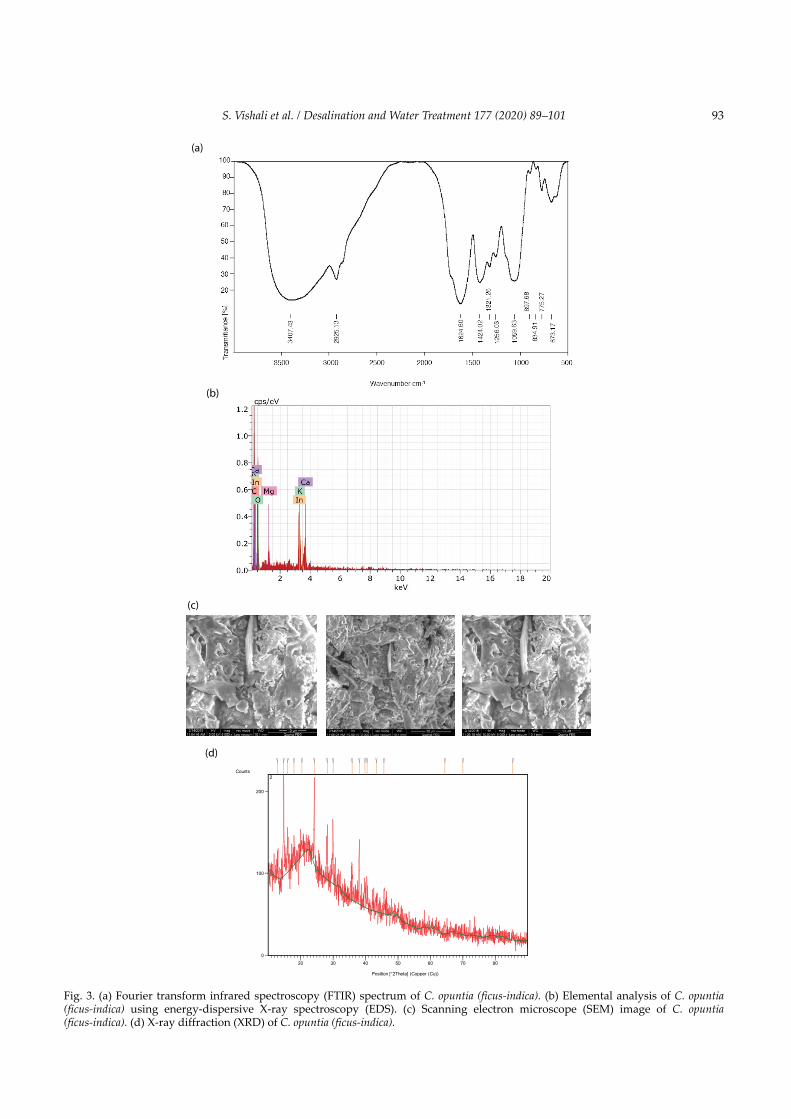
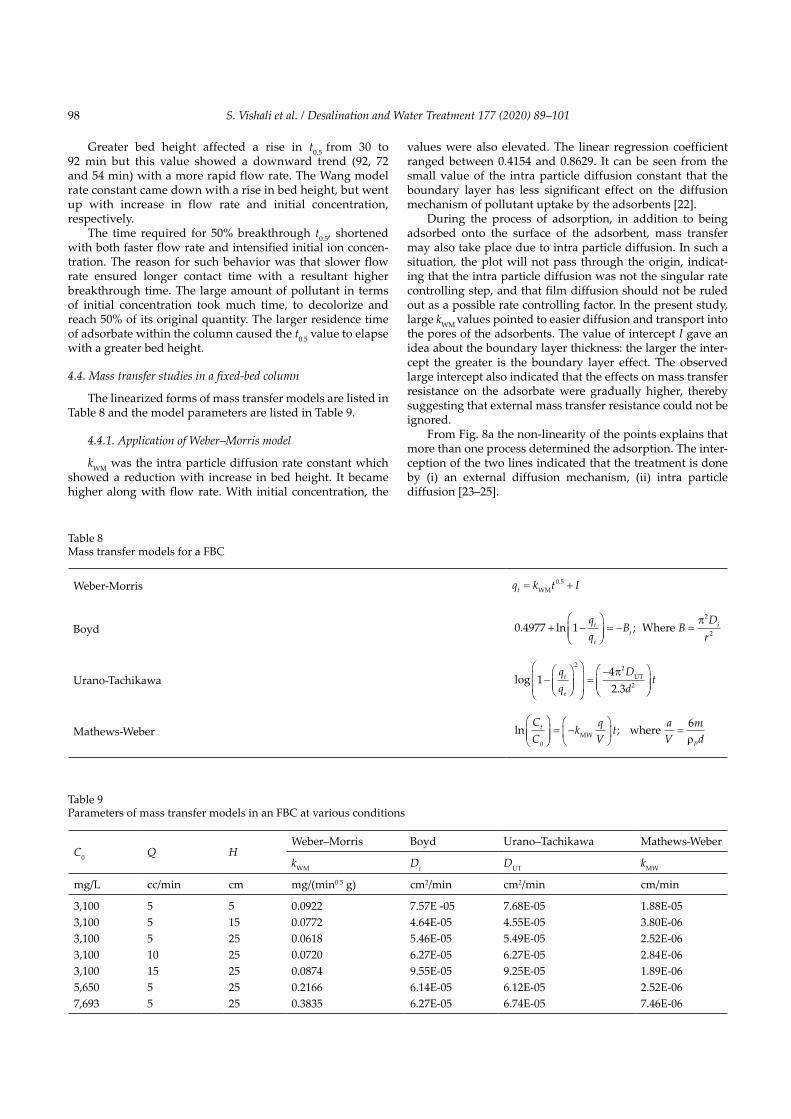
The FTIR spectrum of C. opuntia is shown in Fig. 3a and the functional groups are listed in Table 4. Using the glucose solution, the existence of cellulose in C. opuntia powder was estimated using glucose solution. It was observed from the glucose standard curve that the 1,000 µL of C. opuntia eluate contains 91.87 mole of cellulose in it. Energy-dispersive X-ray spectroscopy (EDS), scanning electron microscope (SEM), X-ray diffraction (XRD) is explained in Figs. 3b–d [5].
The mean diameter of the immobilized bead was calculated using volume displacement method and the value
was 0.5186 cm. The bead density (ρP) 0.7904 g/cc was calcu-lated by using the ratio between the mass of known number of beads and its volume. The bulk density (ρB) of the adsor-bent was also calculated using the ratio between the total mass of the beads used for the required packing height per volume of the beads, and the value was 0.8280 g/cc.
4.2. Influence of operating variables on breakthrough curves
4.2.1. Influence of bed height
The term bed height is related with the mass of adsorbent used, which indirectly dictates the availability of active sites on it. The entire adsorption process depends on the availabil-ity of the adsorbent dose based on the initial concentration of the pollutant. The scale up of a fixed-bed column to han-dle a specific load of pollutant present in the WPW may end with unsatisfactory way due to insufficient bed height.
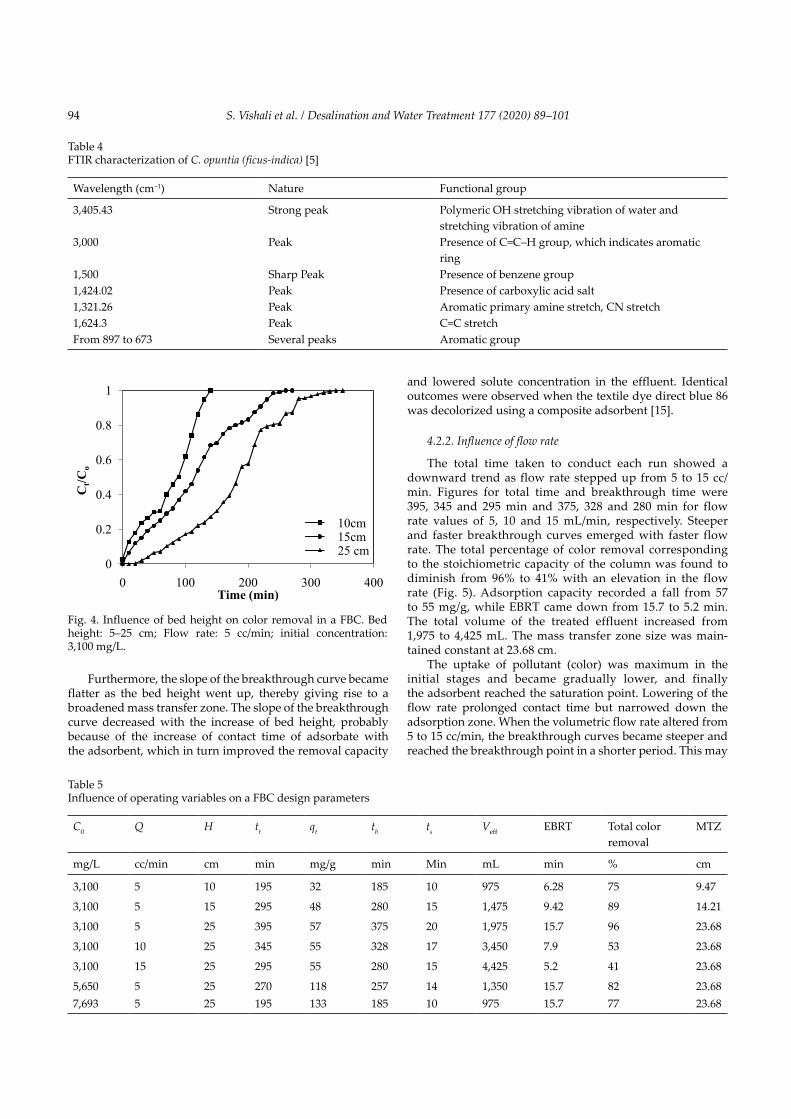
Columns with 10, 15 and 25 cm height prepared from encapsulated C. opuntia beads, recorded during 195, 295 and 395 min as time taken to attain saturation. The initial concen-tration of the effluent (3,100 mg/L [sample number 1]) and flow rate (5 cc/min) were kept constant (Fig. 4). The break-through times under these conditions were 185, 280 and 375 min. The total percentage removal of color rose from 75% to 96% when the adsorbent bed height was increased. Following the same trend, adsorption capacities (qt) were 32, 48 and 57 mg/g, and the length of mass transfer zone advanced from 9.47 to 23.68 cm. Similarly, the volume of treated effluent escalated from 975 to 1,975 mL and the EBRT increased from 6.28 to 15.7 cm (Table 5).
Table 3Process analysis parameters of a FBC
Volume of effluent treated, mL V teff Qt=
Empty bed residence time (EBRT),min BedvolumeVolumetric flowrate of the effluent
Total quantity of solute adsorbed for a given C0, Q, mg q QCCC
dtt
tt
t
= −
×∫0
0 0
1
Total amount of solute sent to the column, mgC t0
1 000Qt,
Exhaustion rate of adsorbent mass of adsorbent in columnVolume treated at B.T
Total color removal %qCt
t
1 000
0
,Qt
Total stoichiometric capacity of the column, minq tmt t
t
Mass transfer zone or equivalent length of unused bed (MTZ), cm Httb
s
1−
qe, mg/g qmt
93S. Vishali et al. / Desalination and Water Treatment 177 (2020) 89–101
Position [°2Theta] (Copper (Cu))
20 30 40 50 60 70 80
Counts
0
100
200
2
(a)
(b)
(c)
(d)
Fig. 3. (a) Fourier transform infrared spectroscopy (FTIR) spectrum of C. opuntia (ficus-indica). (b) Elemental analysis of C. opuntia (ficus-indica) using energy-dispersive X-ray spectroscopy (EDS). (c) Scanning electron microscope (SEM) image of C. opuntia (ficus-indica). (d) X-ray diffraction (XRD) of C. opuntia (ficus-indica).
S. Vishali et al. / Desalination and Water Treatment 177 (2020) 89–10194
Furthermore, the slope of the breakthrough curve became flatter as the bed height went up, thereby giving rise to a broadened mass transfer zone. The slope of the breakthrough curve decreased with the increase of bed height, probably because of the increase of contact time of adsorbate with the adsorbent, which in turn improved the removal capacity
and lowered solute concentration in the effluent. Identical outcomes were observed when the textile dye direct blue 86 was decolorized using a composite adsorbent [15].
4.2.2. Influence of flow rate
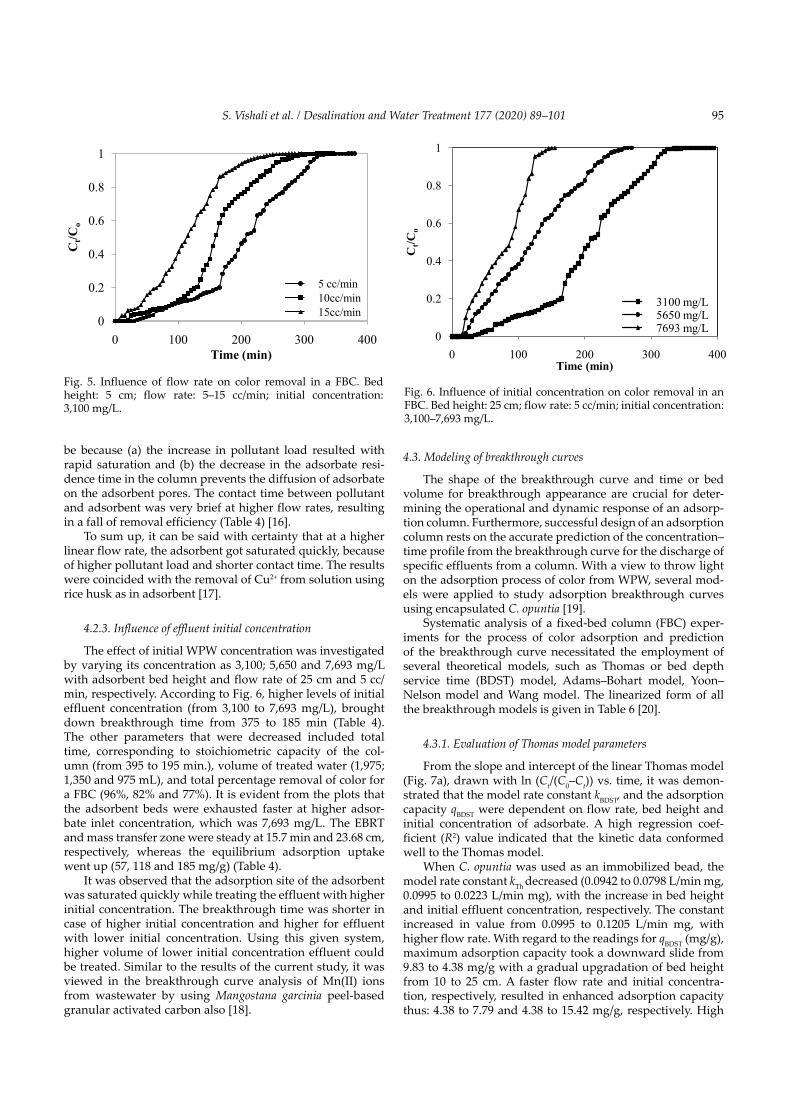
The total time taken to conduct each run showed a downward trend as flow rate stepped up from 5 to 15 cc/min. Figures for total time and breakthrough time were 395, 345 and 295 min and 375, 328 and 280 min for flow rate values of 5, 10 and 15 mL/min, respectively. Steeper and faster breakthrough curves emerged with faster flow rate. The total percentage of color removal corresponding to the stoichiometric capacity of the column was found to diminish from 96% to 41% with an elevation in the flow rate (Fig. 5). Adsorption capacity recorded a fall from 57 to 55 mg/g, while EBRT came down from 15.7 to 5.2 min. The total volume of the treated effluent increased from 1,975 to 4,425 mL. The mass transfer zone size was main-tained constant at 23.68 cm.
The uptake of pollutant (color) was maximum in the initial stages and became gradually lower, and finally the adsorbent reached the saturation point. Lowering of the flow rate prolonged contact time but narrowed down the adsorption zone. When the volumetric flow rate altered from 5 to 15 cc/min, the breakthrough curves became steeper and reached the breakthrough point in a shorter period. This may
Table 4FTIR characterization of C. opuntia (ficus-indica) [5]
Wavelength (cm–1) Nature Functional group
3,405.43 Strong peak Polymeric OH stretching vibration of water and stretching vibration of amine
3,000 Peak Presence of C=C–H group, which indicates aromatic ring
1,500 Sharp Peak Presence of benzene group1,424.02 Peak Presence of carboxylic acid salt1,321.26 Peak Aromatic primary amine stretch, CN stretch1,624.3 Peak C=C stretchFrom 897 to 673 Several peaks Aromatic group
0
0.2
0.4
0.6
0.8
1
0 100 200 300 400
Ct/C
o
Time (min)
10cm15cm 25 cm
Fig. 4. Influence of bed height on color removal in a FBC. Bed height: 5–25 cm; Flow rate: 5 cc/min; initial concentration: 3,100 mg/L.
Table 5Influence of operating variables on a FBC design parameters
C0 Q H tt qt tb ts Veff EBRT Total color removal
MTZ
mg/L cc/min cm min mg/g min Min mL min % cm
3,100 5 10 195 32 185 10 975 6.28 75 9.47
3,100 5 15 295 48 280 15 1,475 9.42 89 14.21
3,100 5 25 395 57 375 20 1,975 15.7 96 23.68
3,100 10 25 345 55 328 17 3,450 7.9 53 23.68
3,100 15 25 295 55 280 15 4,425 5.2 41 23.68
5,650 5 25 270 118 257 14 1,350 15.7 82 23.687,693 5 25 195 133 185 10 975 15.7 77 23.68
95S. Vishali et al. / Desalination and Water Treatment 177 (2020) 89–101
be because (a) the increase in pollutant load resulted with rapid saturation and (b) the decrease in the adsorbate resi-dence time in the column prevents the diffusion of adsorbate on the adsorbent pores. The contact time between pollutant and adsorbent was very brief at higher flow rates, resulting in a fall of removal efficiency (Table 4) [16].
To sum up, it can be said with certainty that at a higher linear flow rate, the adsorbent got saturated quickly, because of higher pollutant load and shorter contact time. The results were coincided with the removal of Cu2+ from solution using rice husk as in adsorbent [17].
4.2.3. Influence of effluent initial concentration
The effect of initial WPW concentration was investigated by varying its concentration as 3,100; 5,650 and 7,693 mg/L with adsorbent bed height and flow rate of 25 cm and 5 cc/min, respectively. According to Fig. 6, higher levels of initial effluent concentration (from 3,100 to 7,693 mg/L), brought down breakthrough time from 375 to 185 min (Table 4). The other parameters that were decreased included total time, corresponding to stoichiometric capacity of the col-umn (from 395 to 195 min.), volume of treated water (1,975; 1,350 and 975 mL), and total percentage removal of color for a FBC (96%, 82% and 77%). It is evident from the plots that the adsorbent beds were exhausted faster at higher adsor-bate inlet concentration, which was 7,693 mg/L. The EBRT and mass transfer zone were steady at 15.7 min and 23.68 cm, respectively, whereas the equilibrium adsorption uptake went up (57, 118 and 185 mg/g) (Table 4).
It was observed that the adsorption site of the adsorbent was saturated quickly while treating the effluent with higher initial concentration. The breakthrough time was shorter in case of higher initial concentration and higher for effluent with lower initial concentration. Using this given system, higher volume of lower initial concentration effluent could be treated. Similar to the results of the current study, it was viewed in the breakthrough curve analysis of Mn(II) ions from wastewater by using Mangostana garcinia peel-based granular activated carbon also [18].
4.3. Modeling of breakthrough curves
The shape of the breakthrough curve and time or bed volume for breakthrough appearance are crucial for deter-mining the operational and dynamic response of an adsorp-tion column. Furthermore, successful design of an adsorption column rests on the accurate prediction of the concentration–time profile from the breakthrough curve for the discharge of specific effluents from a column. With a view to throw light on the adsorption process of color from WPW, several mod-els were applied to study adsorption breakthrough curves using encapsulated C. opuntia [19].
Systematic analysis of a fixed-bed column (FBC) exper-iments for the process of color adsorption and prediction of the breakthrough curve necessitated the employment of several theoretical models, such as Thomas or bed depth service time (BDST) model, Adams–Bohart model, Yoon–Nelson model and Wang model. The linearized form of all the breakthrough models is given in Table 6 [20].
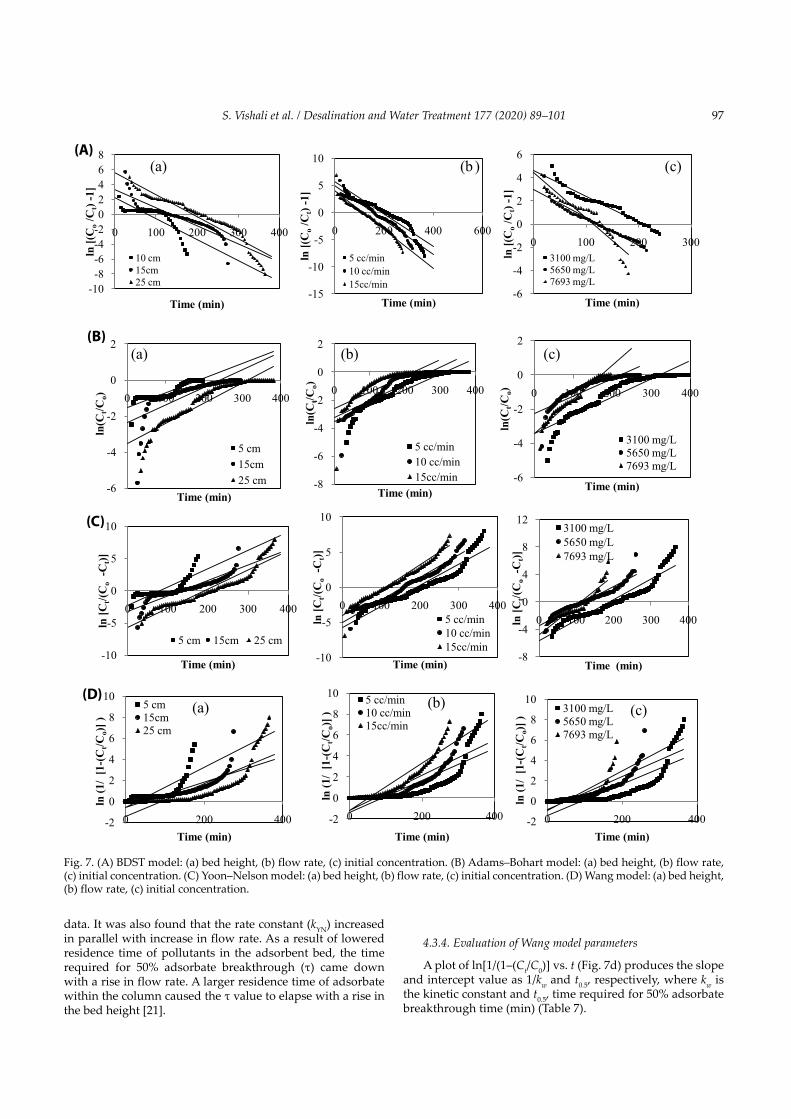
4.3.1. Evaluation of Thomas model parameters
From the slope and intercept of the linear Thomas model (Fig. 7a), drawn with ln (Ct/(C0–Ct)) vs. time, it was demon-strated that the model rate constant kBDST, and the adsorption capacity qBDST were dependent on flow rate, bed height and initial concentration of adsorbate. A high regression coef-ficient (R2) value indicated that the kinetic data conformed well to the Thomas model.
When C. opuntia was used as an immobilized bead, the model rate constant kTh decreased (0.0942 to 0.0798 L/min mg, 0.0995 to 0.0223 L/min mg), with the increase in bed height and initial effluent concentration, respectively. The constant increased in value from 0.0995 to 0.1205 L/min mg, with higher flow rate. With regard to the readings for qBDST (mg/g), maximum adsorption capacity took a downward slide from 9.83 to 4.38 mg/g with a gradual upgradation of bed height from 10 to 25 cm. A faster flow rate and initial concentra-tion, respectively, resulted in enhanced adsorption capacity thus: 4.38 to 7.79 and 4.38 to 15.42 mg/g, respectively. High
0
0.2
0.4
0.6
0.8
1
0 100 200 300 400
Ct/C
o
Time (min)
3100 mg/L5650 mg/L7693 mg/L
Fig. 6. Influence of initial concentration on color removal in an FBC. Bed height: 25 cm; flow rate: 5 cc/min; initial concentration: 3,100–7,693 mg/L.
0
0.2
0.4
0.6
0.8
1
0 100 200 300 400
Ct/C
o
Time (min)
5 cc/min10cc/min15cc/min
Fig. 5. Influence of flow rate on color removal in a FBC. Bed height: 5 cm; flow rate: 5–15 cc/min; initial concentration: 3,100 mg/L.
S. Vishali et al. / Desalination and Water Treatment 177 (2020) 89–10196
regression coefficient values confirmed that the kinetic data fitted well with the Thomas model (Table 7). The kinetic constant kTH went up with an increase in flow rate, but came down when bed height and initial concentration were raised [18].
4.3.2. Evaluation of Adams–Bohart model parameters
The mass transfer coefficient (kAB) and maximum adsorp-tion capacity (N0) values were calculated from the slope and intercept of the linear curves (Fig. 7b), respectively, and listed in Table 7.
An increase in bed height and flow rate resulted in a rise in kAB values; the reverse was noticed for initial concentra-tion. With an increase in bed height and flow rate, N0 came down (8.85, 7.64, 5.97 mg/L) and went up (5.97, 10.44 and 12.79 mg/L), respectively. In the case of initial concentration, N0 shot up (5.97, 35.1, 61.07 mg/L). The linear regression coefficient R2 ranged from 0.649 to 0.942.
The adsorbent displayed a gradual downward slant in their adsorption capacity with augmented flow rate of effluent. The elevated initial concentration enhanced the maximum adsorption capacity per unit volume of adsorption column or N0 (mg/L). The driving force behind adsorption was the concentration difference between the
pollutant on the surface of the adsorbent and in the effluent. The concentration gradient increased with initial concentra-tion. This demonstrated that the overall system kinetics was dominated by external mass transfer in the initial part of adsorption in the column [21].
4.3.3. Evaluation of Yoon–Nelson model parameters
The Yoon and Nelson equation regarding a single- component system was investigated where kYN the rate constant (l/min), τ is the time required for 50% adsorbate breakthrough (min), and t is the breakthrough (sampling) time (min). A plot of ln [Ct/(C0–Ct)] vs. t gave a straight line with slope of kYN, and intercept of –τ (Fig. 7c).
The kYN value declined from 0.028 to 0.024 min–1 and the τ value heightened from 79 to 189 min when bed height grew from 10 to 25 cm. With faster flow rate, the kYN upturned and τ value shrank from 189 to 112 min. There was a marked influence of initial concentration on both kYN and τ. kYN climbed and τ value reduced (Table 7). The maximum value of R2 was 0.963.
The time required for 50% breakthrough τ reduced with elevation of both flow rate and initial ion concentration. High values of correlation coefficients indicated that the Yoon and Nelson model fitted well with the experimental
Table 6Breakthrough curve models for a FBC
BDST lnCC
k C tk q m
Qt
001
−
= −( ) +BDST
BDST BDST
Adams–Bohart lnCC
k C tk N HU
t
00
0
0
= ( ) −AB
AB
Yoon–Nelson model ln( )C
C Ck t kt
t0 −
= −YN YNτ
Wang ln .11 0
0 5−
= − +
CC
k t k ttW W
Table 7Parameters of breakthrough models in an FBC at various conditions
Co Q H
BDST Adams–Bohart Yoon–Nelson Wang
kBDST qBDST R2 kAB N0 R2 kYN τ R2 kW t0.5 R2
mg/L cc/min cm L/(min mg) mg/g L/(min mg) mg/L 1/min min 1/min min
3,100 5 10 0.0942 9.83 0.662 0.0273 8.85 0.771 0.028 79 0.662 0.0189 30 0.5683,100 5 15 0.0798 5.66 0.819 0.0330 7.64 0.563 0.024 136 0.819 0.0121 47 0.6963,100 5 25 0.0995 4.38 0.909 0.0376 5.97 0.866 0.030 189 0.909 0.0155 92 0.6503,100 10 25 0.1065 7.24 0.963 0.0399 10.44 0.808 0.032 157 0.963 0.0169 72 0.7783,100 15 25 0.1205 7.79 0.961 0.0393 12.79 0.649 0.036 112 0.962 0.0226 54 0.8575,650 5 25 0.0299 7.62 0.948 0.0128 35.10 0.766 0.028 119 0.919 0.0160 50 0.7527,693 5 25 0.0223 15.42 0.895 0.0111 61.07 0.942 0.042 111 0.873 0.0193 47 0.594
97S. Vishali et al. / Desalination and Water Treatment 177 (2020) 89–101
data. It was also found that the rate constant (kYN) increased in parallel with increase in flow rate. As a result of lowered residence time of pollutants in the adsorbent bed, the time required for 50% adsorbate breakthrough (τ) came down with a rise in flow rate. A larger residence time of adsorbate within the column caused the τ value to elapse with a rise in the bed height [21].
4.3.4. Evaluation of Wang model parameters
A plot of ln[1/(1–(Ct/C0)] vs. t (Fig. 7d) produces the slope and intercept value as 1/kw and t0.5, respectively, where kw is the kinetic constant and t0.5, time required for 50% adsorbate breakthrough time (min) (Table 7).
-10-8-6-4-202468
0 100 200 300 400
ln [(
Co
/Ct)
-1]
Time (min)
10 cm15cm 25 cm
-15
-10
-5
0
5
10
0 200 400 600
ln [(
Co
/Ct)
-1]
Time (min)
5 cc/min10 cc/min15cc/min
-6
-4
-2
0
2
4
6
0 100 200 300
ln [(
Co
/Ct)
-1]
Time (min)
3100 mg/L5650 mg/L7693 mg/L
-6
-4
-2
0
2
0 100 200 300 400
ln(C
t/Co)
Time (min)
5 cm15cm 25 cm -8
-6
-4
-2
0
2
0 100 200 300 400
ln(C
t/Co)
Time (min)
5 cc/min10 cc/min15cc/min -6
-4
-2
0
2
0 100 200 300 400
ln(C
t/Co)
Time (min)
3100 mg/L5650 mg/L7693 mg/L
(a) (b ) (c)
(a) (b) (c)
-10
-5
0
5
10
0 100 200 300 400
ln [C
t/(C
o-C
t)]
Time (min)
5 cm 15cm 25 cm-10
-5
0
5
10
0 100 200 300 400
ln [C
t/(C
o-C
t)]
Time (min)
5 cc/min10 cc/min15cc/min
-8
-4
0
4
8
12
0 100 200 300 400ln [C
t/(C
o-C
t)]
Time (min)
3100 mg/L5650 mg/L7693 mg/L
-2
0
2
4
6
8
10
0 200 400
ln (1
/ [1
-(C
t/Co)
] )
Time (min)
5 cm15cm 25 cm
-2
0
2
4
6
8
10
0 200 400
ln (1
/ [1
-(C
t/Co)]
)
Time (min)
5 cc/min10 cc/min15cc/min
-2
0
2
4
6
8
10
0 200 400
ln (1
/ [1
-(C
t/Co)]
)
Time (min)
3100 mg/L5650 mg/L7693 mg/L
(a) (b) (c)
(A)
(B)
(C)
(D)
Fig. 7. (A) BDST model: (a) bed height, (b) flow rate, (c) initial concentration. (B) Adams–Bohart model: (a) bed height, (b) flow rate, (c) initial concentration. (C) Yoon–Nelson model: (a) bed height, (b) flow rate, (c) initial concentration. (D) Wang model: (a) bed height, (b) flow rate, (c) initial concentration.
S. Vishali et al. / Desalination and Water Treatment 177 (2020) 89–10198
Greater bed height affected a rise in t0.5 from 30 to 92 min but this value showed a downward trend (92, 72 and 54 min) with a more rapid flow rate. The Wang model rate constant came down with a rise in bed height, but went up with increase in flow rate and initial concentration, respectively.
The time required for 50% breakthrough t0.5, shortened with both faster flow rate and intensified initial ion concen-tration. The reason for such behavior was that slower flow rate ensured longer contact time with a resultant higher breakthrough time. The large amount of pollutant in terms of initial concentration took much time, to decolorize and reach 50% of its original quantity. The larger residence time of adsorbate within the column caused the t0.5 value to elapse with a greater bed height.
4.4. Mass transfer studies in a fixed-bed column
The linearized forms of mass transfer models are listed in Table 8 and the model parameters are listed in Table 9.
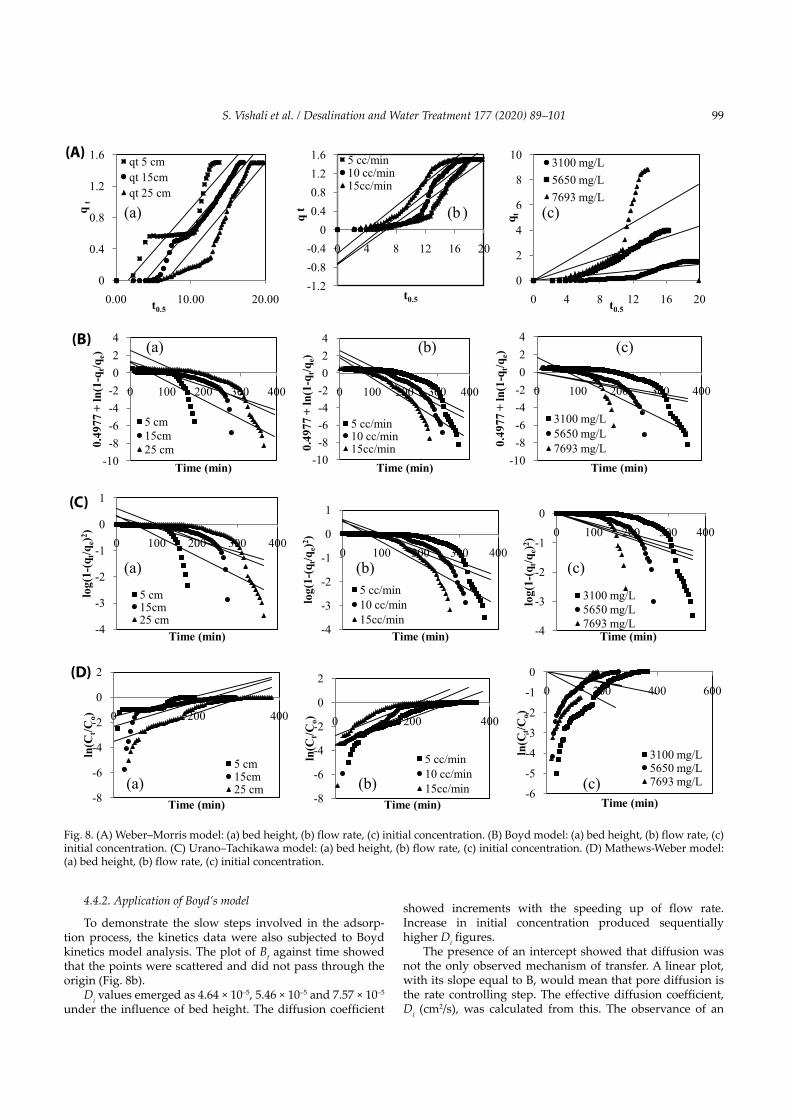
4.4.1. Application of Weber–Morris model
kWM was the intra particle diffusion rate constant which showed a reduction with increase in bed height. It became higher along with flow rate. With initial concentration, the
values were also elevated. The linear regression coefficient ranged between 0.4154 and 0.8629. It can be seen from the small value of the intra particle diffusion constant that the boundary layer has less significant effect on the diffusion mechanism of pollutant uptake by the adsorbents [22].
During the process of adsorption, in addition to being adsorbed onto the surface of the adsorbent, mass transfer may also take place due to intra particle diffusion. In such a situation, the plot will not pass through the origin, indicat-ing that the intra particle diffusion was not the singular rate controlling step, and that film diffusion should not be ruled out as a possible rate controlling factor. In the present study, large kWM values pointed to easier diffusion and transport into the pores of the adsorbents. The value of intercept I gave an idea about the boundary layer thickness: the larger the inter-cept the greater is the boundary layer effect. The observed large intercept also indicated that the effects on mass transfer resistance on the adsorbate were gradually higher, thereby suggesting that external mass transfer resistance could not be ignored.
From Fig. 8a the non-linearity of the points explains that more than one process determined the adsorption. The inter-ception of the two lines indicated that the treatment is done by (i) an external diffusion mechanism, (ii) intra particle diffusion [23–25].
Table 8Mass transfer models for a FBC
Weber-Morris q k t It = +WM0 5.
Boyd 0 4977 12
2. ln ;+ −
= − =
B BDr
t
et
iWhereπ
Urano-Tachikawa log.
142 3
2 2
2−
=
−
Dd
tt
e
π UT
Mathews-Weber ln ;CC
k t aV
md
qV
t
P0
6
= −
=MW where
ρ
Table 9Parameters of mass transfer models in an FBC at various conditions
C0 Q HWeber–Morris Boyd Urano–Tachikawa Mathews-Weber
kWM Di DUT kMW
mg/L cc/min cm mg/(min0.5 g) cm2/min cm2/min cm/min
3,100 5 5 0.0922 7.57E -05 7.68E-05 1.88E-053,100 5 15 0.0772 4.64E-05 4.55E-05 3.80E-063,100 5 25 0.0618 5.46E-05 5.49E-05 2.52E-063,100 10 25 0.0720 6.27E-05 6.27E-05 2.84E-063,100 15 25 0.0874 9.55E-05 9.25E-05 1.89E-065,650 5 25 0.2166 6.14E-05 6.12E-05 2.52E-067,693 5 25 0.3835 6.27E-05 6.74E-05 7.46E-06
99S. Vishali et al. / Desalination and Water Treatment 177 (2020) 89–101
4.4.2. Application of Boyd’s model
To demonstrate the slow steps involved in the adsorp-tion process, the kinetics data were also subjected to Boyd kinetics model analysis. The plot of Bt against time showed that the points were scattered and did not pass through the origin (Fig. 8b).
Di values emerged as 4.64 × 10⁻⁵, 5.46 × 10⁻⁵ and 7.57 × 10⁻⁵ under the influence of bed height. The diffusion coefficient
showed increments with the speeding up of flow rate. Increase in initial concentration produced sequentially higher Di figures.
The presence of an intercept showed that diffusion was not the only observed mechanism of transfer. A linear plot, with its slope equal to B, would mean that pore diffusion is the rate controlling step. The effective diffusion coefficient, Di (cm2/s), was calculated from this. The observance of an
0
0.4
0.8
1.2
1.6
0.00 10.00 20.00
q t
t0.5
qt 5 cmqt 15cm qt 25 cm
-1.2-0.8-0.4
00.40.81.21.6
0 4 8 12 16 20
q t
t0.5
5 cc/min10 cc/min15cc/min
0
2
4
6
8
10
0 4 8 12 16 20
q t
t0.5
3100 mg/L5650 mg/L7693 mg/L
-10
-8-6-4-2024
0 100 200 300 400
0.49
77 +
ln(1
-qt/q
e)
Time (min)
5 cm15cm 25 cm
-10-8-6-4-2024
0 100 200 300 400
0.49
77 +
ln(1
-qt/q
e)
Time (min)
5 cc/min10 cc/min15cc/min
-10-8-6-4-2024
0 100 200 300 400
0.49
77 +
ln(1
-qt/q
e)
Time (min)
3100 mg/L5650 mg/L7693 mg/L
-4
-3
-2
-1
0
1
0 100 200 300 400
log(
1-(q
t/qe)2 )
Time (min)
5 cm15cm 25 cm
-4
-3
-2
-1
0
1
0 100 200 300 400
log(
1-(q
t/qe)2 )
Time (min)
5 cc/min10 cc/min15cc/min
-4
-3
-2
-1
00 100 200 300 400
log(
1-(q
t/qe)2 )
Time (min)
3100 mg/L5650 mg/L7693 mg/L
-8
-6
-4
-2
0
2
0 200 400
ln(C
t/Co)
Time (min)
5 cm15cm 25 cm
-8
-6
-4
-2
0
2
0 200 400
ln(C
t/Co)
Time (min)
5 cc/min10 cc/min15cc/min -6
-5
-4
-3
-2
-1
00 200 400 600
ln(C
t/Co)
Time (min)
3100 mg/L5650 mg/L7693 mg/L
(a) (b ) (c)
(a) (b) (c)
(a) (b) (c)
(a) (b) (c)
(A)
(B)
(C)
(D)
Fig. 8. (A) Weber–Morris model: (a) bed height, (b) flow rate, (c) initial concentration. (B) Boyd model: (a) bed height, (b) flow rate, (c) initial concentration. (C) Urano–Tachikawa model: (a) bed height, (b) flow rate, (c) initial concentration. (D) Mathews-Weber model: (a) bed height, (b) flow rate, (c) initial concentration.
S. Vishali et al. / Desalination and Water Treatment 177 (2020) 89–101100
intercept is predictive of a second mass transfer mechanism (external mass transfer) [25].
4.4.3. Application of Urano–Tachikawa model
The dependence of f (qt/qe) on t is plotted in a linear form (Fig. 8c). The constant of the internal diffusion was deter-mined from the slopes of the lines. It was observed that diffu-sivity showed an upward trend with increase in flow rate and initial concentration. The values ranged from 5.49–9.25 × 10⁻⁵ and 5.49–6.74 × 10⁻⁵ for flow rate and initial concentration, respectively.
The dependence of f (qt/qe) on t is linear within the time interval from 0 to 90 min, except for the small spells of sorp-tion. A deviation from the linear dependence is also seen from the graphical depiction in, where the linear sections do not pass through the origin [26].
When the effluent flow rate increases, the sorbate diffu-sivity into the adsorbent also increases. The amount of pol-lutant present in the effluent was directly proportional to its initial concentration. Due to the escalated concentration gra-dient, with the increase in the initial concentration, the dif-fusivity also elevated. Earlier studies [27] explained that the DUT values in the range of 10−12–10−13 cm2/s confirm that the intra particle diffusion is the rate-limiting step for the adsorp-tion of organic compounds. In the present study, the DUT values were in the order of 10−12 cm2/s. The adsorption process could be best explained by the Urano–Tachikawa equation, indicating the controlling nature of intra particle diffusion.
4.4.4. Application of Mathews-Weber model
The Mathews-Weber model is plotted in Fig. 8d. The kinetic constant of Mathews-Weber models showed an ups-wing with initial concentration and ranged from 1.89 × 10⁻⁶ to 2.84 × 10⁻⁶ with bed height.
The kMW values decreased with increments in the initial dye concentrations, indicating that the external mass transfer rate is slower at higher initial dye concentration. The velocity of dye transport from liquid phase to solid phase decreased but the intra particle diffusion increased with increase in the initial dye concentrations [28].
5. Conclusions
During the course of this explorative study, it was found that the natural material C. opuntia could be used as an adsorbent in the treatment of WPW, for achieving reduction in color, so that the wastewater discharge would fall within the prescribed regulatory safety limits. The materials were characterized using FTIR, EDS, SEM and XRD for their func-tional groups, chemical compositions, morphological and phase identification, besides confirming the presence of cellulose in C. opuntia in substantial quantities.
The percentage color removal was noticed to improve with raise in bed height and decrease with an ascending nature of flow rate and initial concentration of effluent. The existence of huge number of active sites (due to larger bed height), larger gradient in mass transfer (due to higher efflu-ent initial concentration) and greater residence time (due to lower flow rate) resulted in a higher removal efficiency.
Modeling of breakthrough curves was performed. The results of the model parameters revealed (i) adsorption capacity, (ii) kinetic rate constants and (iii) time required to reduce the 50% adsorbate concentration. Mass transfer models were performed to understand the transportation of pollutant and the rate limiting step.
In summary, it may be stated that C. opuntia could be effectively used for the treatment of WPW, by virtue of being biodegradable, it is safe to human health, inexpensive, abun-dantly available and, last but not the least, efficient in the removal of toxic pollutants from WPW. It was also observed that, these materials could act successfully as an adsorbent and propitious surrogate for chemical activated carbon. The results derived for the synthetic WPW were promising and could be useful to apply on real wastewater too.
Symbols
A — Total interfacial area of particle, cm2
Co, Ce, Ct — Concentration of the solute, at t = 0, at equi-librium and time t in the effluent, mg/L
D — Mean diameter of immobilized beads, cmDi — Effective diffusivity, cm2/minDUT — Diffusion constant in Urano–Tachikawa
model, cm2/minE — Mean free energy of adsorption per molecule
of adsorbate, kJ/molH — Bed height, cmI — Thickness of boundary layer, mg/gkAB — Kinetic constant in the model Adams–Bohart,
L/(min mg)kBDST — Kinetic constant in the model BDST,
L/(min mg)kid — Kinetic rate constant in the intra particle dif-
fusion model, mg/g min0.5
kMW — External mass transfer coefficient from Mathews-Weber model, cm/min
kW — Kinetic constant in the model Wang, 1/minkWM — Kinetic constant in the model Weber–Morris,
mg/(min0.5 g)kYN — Kinetic constant in the model Yoon–Nelson,
1/minM — Total mass of adsorbent, gn — Number of measurementsN0 — Maximum adsorption capacity per unit vol-
ume of adsorption column, mg/Lp — Number of parameters present in the adsorp-
tion isotherm modelQ — Inlet feed flow rate, mL/minqBDST — Maximum adsorption capacity in BDST
model, mg/gqt, qe — Total quantity of pollutant adsorbed at time t
and at equilibrium, mg/gr — Mean radius of immobilized adsorbent
beads, cmR — Gas constant, 8.314 J/mol KR2 — Correlation coefficientRL — Separation factorT — Absolute temperature, Kt, tb, ts, tt, — Time, breakthrough time, saturation time,
total time taken in FBC, min
101S. Vishali et al. / Desalination and Water Treatment 177 (2020) 89–101
t0.5 — Time required for 50% adsorbate break-through time, min
U0 — Linear velocity of inlet effluent, cm/minV, Veff — Volume of effluent, volume of effluent
treated, mLβ — Activity coefficient related to biosorption
mean free energy, mol2/kJ2
ε — Polanyi potentialt — Time required for 50% adsorbate break-
through time in Yoon–Nelson model, minρP — Apparent density of the adsorbent, g/mLρB — Bulk density, g/mL
References[1] S. Vishali, Studies on Treatability of Paint Industry Wastewater
by Physical Methods, Dissertation, SRM University, India, 2015.
[2] S. Vishali, P. Rashmi, R. Karthikeyan, Potential of environmental-friendly, agro-based material Strychnos potatorum, as an adsorbent in the treatment of paint industry effluent, Desal. Wat. Treat., 57 (2016) 18326–18337.
[3] S. Vishali, R. Karthikeyan, S. Prabhakar, Utilization of seafood processing waste, as an adsorbent, in the treatment of paint industry effluent using a fixed-bed column, Desal. Wat. Treat., 66 (2017) 149–157.
[4] B. Noureddine, K. Ouzaouit, M. Abdennouri, E.L. Mohammed, Makhfouk, Dried prickly pear cactus (Opuntia ficus indica) cladodes as a low-cost and eco friendly biosorbent for dyes removal from aqueous solutions, J. Taiwan. Inst. Chem. Eng., 44 (2013) 52–60.
[5] S. Vishali, R. Karthikeyan, Cactus opuntia (ficus-indica): an eco friendly alternative coagulant in the treatment of paint effluent, Desal. Wat. Treat., 56 (2014) 1489–1497.
[6] A. Diaz, N. Rincon, A. Escorihuela, N. Fernandez, E. Chacin, C.F. Forster, A preliminary evaluation of turbidity removal by natural coagulants indigenous to Venezuela, Process Biochem., 35 (1999) 391–395.
[7] M.V. Jadhav, Y.S. Mahajan, Assessment of feasibility of natural coagulants in turbidity removal and modeling of coagulation process, Desal. Wat. Treat., 52 (2014) 5812–5821.
[8] U.S. Carpinteyro, M. Vaca, L. Torres, Can vegetal biopolymers work as coagulant- flocculant aids in the treatment of high-load cosmetic industrial wastewaters?, Water Air Soil Pollut., 223 (2012) 4925–4936.
[9] M. Dakiky, A. Khamis, Manassra, Selective adsorption of chromium (VI) in industrial wastewater using low-cost abun-dantly available adsorbents, Adv. Environ. Sci., 6 (2002) 533–540.
[10] M. Patricia, C. Munoz, A.C. Chavez, Experimental binding of lead to a low cost on biosorbent: Nopal (Opuntia streptacantha), Bioresour. Technol., 99 (2008) 211–1217.
[11] R. Kumar, M.A. Barakat, Decolorization of hazardous brilliant green from aqueous solution using binary oxidized cactus fruit peel, Bioresour. Technol., 226 (2013) 377–383.
[12] APHA, Standard Methods for the Examination of Waste and Wastewater, sixteenth edition, American Public Health Associations, New York, NY, 1995.
[13] S. Gupta, B.V. Babu, Experimental investigations and theoretical modeling aspects in column studies for removal of Cr (VI) from aqueous solutions using activated tamarind seeds, J. Water Res. Prot., 2 (2010) 706–716.
[14] A.A. Ahmad, B.H. Hameed, Fixed bed adsorption of reactive azo dye onto granular activated carbon prepared from waste, J. Hazard. Mater., 175 (2010) 298–303.
[15] D. Monal, J.B. Kumar, M.F. Hassan, G. Nitin, A. Kumar, Fixed bed column of textile dye direct blue 86 by using a composite adsorbent, Arch. Appl. Sci. Res., 4 (2012) 882–891.
[16] J.T. Nwabanne, P.K. Igbokwe, Adsorption of packed bed column for the removal of lead (II) using oil palm fibre, Int. J. Appl. Sci. Eng., 2 (2012) 106–115.
[17] X. Luo, Z. Deng, X. Lin, C. Zhang, Fixed bed column study for Cu2+ removal from solution using expanding rice husk, J. Hazard Mater., 187 (2011) 182–189.
[18] Z.Z. Chowdhury, S.M. Zain, A.K. Rashid, R.F. Rafique, K. Khalid, Breakthrough curve analysis for column dynamics sorption of Mn (II) ions from wastewater by using Mangostana garcinia Peel-based granular activated carbon, J. Chem., (2013) 1–8.
[19] S. Xiao Feng, T. Imai, M. Sekine, H. Takaya, Y. Koichi, K. Ariyo, N.A. Shiori, Adsorption of phosphate using calcined Mg3-Fe layered double hydroxides in a fixed bed column study, J. Ind. Eng. Chem., 20 (2014) 3623–3630.
[20] X. Lin, R. Li, Q. Wen, J. Wu, J. Fan, X. Jin, W. Qian, D. Liu, X. Chen, Y. Chen, J. Xie, J. Bai, H. Ying, Experimental and modeling studies on the sorption breakthrough behaviors of butanol from aqueous solution in affixed bed of KA-I resin, Biotechnol. Bioprocess Eng., 18 (2013) 223–233.
[21] Z. Saadi, R. Saadi, R. Fazaeli, Fixed-bed adsorption dynamics of Pb (II) adsorption from aqueous solution using nanostructured γ-alumina, J. Nanostruct. Chem., 3 (2013) 1–8.
[22] A.O. Okewale, K.A. Babayemi, A.P. Olalekan, Adsorption isotherms and kinetics models of starchy adsorbents on uptake of water from ethanol–water systems, Int. J. Appl. Sci. Technol., 3 (2013) 35–42.
[23] R.N.P. Teixera, V.O.S. Neto, J.T. Oliveira, T.C. Oliveira, D.Q. Melo, M.A,A. Silva, R.F. Nascimento, Study on the use of roasted barley powder for adsorption of Cu2+ ions in batch experiments and in fixed bed columns, Bioresources, 8 (2013) 3556–3573.
[24] M. Kapur, M.K. Mondal, Mass transfer and related phenomena for Cr (VI) adsorption from aqueous solutions onto Mangifera indica saw dust, chemical engineering saw dust, Chem. Eng. J., 218 (2013) 138–146.
[25] I.E. Hristova, Comparison of different kinetic models for adsorption of heavy metals onto activated carbon from apricot stones, Bulg. Chem. Commun., 43 (2011) 370–377.
[26] S.V. Dimitrova, Removal of lead (II) from aqueous solutions by blast-furnace metallurgical slags, Indian J. Eng. Mater. Sci., 5 (1998) 89–193.
[27] V.P. Vinod, T.S. Anirudhan, Adsorption behavior of basic dyes on the humic acid immobilized pillared clay, Water Air Soil Pollut., 150 (2003) 193–217.
[28] E.W. Bao, Y.H. Yong, X. Lei, P. Kang, Biosorption behavior of azo dye by inactive CMC immobilized Aspergillus fumigates beads, Bioresour. Technol., 99 (2008) 794–800.