M26-A - Methods for Determining Bactericidal Activity of ...

A RT I C L E S
NATURE CELL BIOLOGY VOLUME 8 | NUMBER 9 | SEPTEMBER 2006 933
CFTR regulates phagosome acidification in macrophages and alters bactericidal activityAnke Di1, Mary E. Brown1, Ludmila V. Deriy1, Chunying Li2, Frances L. Szeto1, Yimei Chen3, Ping Huang1, Jiankun Tong4, Anjaparavanda P. Naren2, Vytautas Bindokas1, H. Clive Palfrey1 and Deborah J. Nelson1,5
Acidification of phagosomes has been proposed to have a key role in the microbicidal function of phagocytes. Here, we show that in alveolar macrophages the cystic fibrosis transmembrane conductance regulator Cl– channel (CFTR) participates in phagosomal pH control and has bacterial killing capacity. Alveolar macrophages from Cftr–/– mice retained the ability to phagocytose and generate an oxidative burst, but exhibited defective killing of internalized bacteria. Lysosomes from CFTR-null macrophages failed to acidify, although they retained normal fusogenic capacity with nascent phagosomes. We hypothesize that CFTR contributes to lysosomal acidification and that in its absence phagolysosomes acidify poorly, thus providing an environment conducive to bacterial replication.
Phagocytosis of foreign particles is a fundamental property of macro-phages and serves not only as the first line in microbial defense within the body, but also as a signalling stimulus that recruits other cellular components of the immune system. Following bacterial ingestion and internalization, phagosomes undergo a complex series of fusion reactions with different endo-membrane systems that terminates in the fusion of late phagosomes with lysosomes to form the phagolysosome1. The mature organelle has an acidic pH and a rich complement of proteolytic enzymes, which ensures final destruction of internalized microbes2. Various patho-gens have developed ways to subvert the phagosomal pathway to prolong their intracellular survival and promote infection3, 4. Among these mecha-nisms are those that prevent phagolysosome formation and thus phago-somal acidification, for example, Mycobacterium tuberculosis5. Certain genetic diseases, for example, chronic granulomatous disease6, also affect phagocyte function and produce defects in the phagocytic response.
Cl– channels have not been associated with phagocytic cell function to any significant degree. However, they have been implicated in the pH regulation of several organelles, presumably through the provision of counter ions to neutralize lumenal H+ accumulation7. The Cl–-channel family is a large and diverse group of proteins with multiple functions; CFTR is a specialized member of this family whose best-known role is in the regulation of salt transport in a number of epithelia. Nonetheless, CFTR is expressed in non-epithelial cell types (for example, heart CFTR8) and is found on intracellular membranes, as well as the plasma membrane9. Here, we report that alveolar macrophages, but not neu-trophils, normally express functional CFTR. Cells lacking the protein exhibit aberrant acidification of phagosomes and do not kill internalized
microorganisms as effectively as wild-type cells. Our results pinpoint the defect to a failure of phagolysosomes to acidify, suggesting that CFTR function is essential for the production of an acidic environment that is favourable for bactericidal activity.
RESULTSFunctional CFTR is present in alveolar macrophagesCFTR is a widely distributed protein and occurs on both plasma and intracellular membranes in a variety of cell types9. However, whether macrophages or neutrophils express CFTR and if this protein has an important function in these cells, is not known. Cftr–/– mice were used as these mutants are viable but exhibit an increased propensity to develop lung infections when appropriately challenged. Whole-cell and single-channel voltage-clamp analyses were performed on primary alveolar macrophages from transgenic and wild-type mice and the data were compared to currents obtained from human alveolar macrophages and neutrophils, as well as cells from the murine macrophage cell line, J774 (Fig. 1a–c and see Supplementary Information, Fig. S1). Recordings of cAMP-dependent Cl– currents in the human and murine alveolar mac-rophages were similar in magnitude and had biophysical and pharma-cological properties compatible with currents previously shown to be carried by CFTR in both natively expressing cells and in heterologous expression systems10, 11 (see Supplementary Information, Fig. S1 and Table S1). For example, single-channel conductance of 5–6 pS (Fig. 1c) is in agreement with that determined for recombinant CFTR8. Most nota-bly, unitary currents were sensitive to the novel thiazolidinone inhibi-tor, CFTRinh-172 (Fig. 1a, b), which has been reported to block CFTR
1Dept. of Neurobiology, Pharmacology and Physiology, University of Chicago, Chicago, IL 60637, USA. 2Department of Physiology, University of Tennessee-Memphis, 894 Union Avenue 420 Nash, Memphis, TN 38163, USA. 3Dept. of Molecular Genetics and Cell Biology, University of Chicago, Chicago, IL 60637, USA. 4Dept. of Medicine, University of Chicago, Chicago, IL 60637, USA. 5Correspondence should be addressed to D.J.N. (e-mail: [email protected])
Received 9 March 2006; accepted 12 July 2006; published online 20 August 2006; DOI: 10.1038/ncb1456
print ncb1456.indd 933print ncb1456.indd 933 16/8/06 11:27:59 am16/8/06 11:27:59 am
Nature Publishing Group ©2006

934 NATURE CELL BIOLOGY VOLUME 8 | NUMBER 9 | SEPTEMBER 2006
A RT I C L E S
Cl– conductance, but not other anion channels12. In contrast, alveolar macrophages from CFTR-null mice, or human neutrophils, showed negligible changes in anion conductance under similar conditions (Fig. 1a, b and see Supplementary Information, Table S1). These data establish that both human and murine alveolar macrophages express a functional CFTR-like Cl– channel at their plasma membrane.
Immunological characterization and localization of CFTR in macrophagesImmunoblot analysis using CFTR-specific affinity-purified anti-bodies revealed that human and murine alveolar and peritoneal macrophages, but not the corresponding neutrophils, express a membrane protein with a relative molecular mass (Mr) of 180,000
a
b
c d
Cftr+/+
No cAMPCftr+/+
No cAMPCftr+/+
cAMPCftr+/+
cAMPCftr−/−
cAMP
Cftr+/+
cAMP+ CTFRinh-172
Cftr+/+
cAMP+ CTFRinh-172
0.5 nA
0.5 pA
0.5 pA
50 ms
50 s
2 s
0.5 pA2 s
Murine alveolar macrophages
Murine alveolar macrophages
pCPT−cAMPpCPT−cAMP
Human alveolar macrophages
Human alveolar macrophages
Control ControlO
O3
O2O1
C
C
C
O
O2O1
C
C
C
−Vp = 80mV
−Vp = 80mV −Vp = 80mV
−Vp = 80mV
−Vp = 80mV
−Vp = 80mVpCPT−cAMP + CFTRinh-172 pCPT−cAMP + CFTRinh-172
0.6
0.4
0.2
0.0
0.6
0.4
0.2
0.040 60 80 100
− Vp (mV)
40 60 80 100
− Vp (mV)
5.3 pS
Murine alveolar macrophages
6.1 pS
Human alveolar macrophages
Cur
rent
(pA
)
Cur
rent
(pA
)
Figure 1 Whole-cell and single channel recordings of cAMP-evoked Cl– current in murine and human alveolar macrophages. (a) Whole-cell currents evoked in response to the introduction of a cAMP-elevating cocktail (400 µM cAMP, 10 µM forskolin, 1 mM IBMX) into voltage-clamped murine and human alveolar macrophages. Currents were elicited by 200 ms voltage steps from –110 to +110 mV in 10 mV increments from a holding potential of –40 mV. All current was eliminated in the presence of the specific inhibitor CFTRinh-172 added to the bath solution. The right-hand trace in the murine panel indicates lack of detectable Cftr current in Cftr–/– macrophages. (b) Single-channel recordings of CFTR Cl– currents in murine and human alveolar macrophages in the absence and presence of the agonist pCPT–cAMP (400 µM) in the pipette solution. In single channel recordings from human alveolar macrophages, total single channel open probability (NPo) was 0.05 ± 0.03 (n = 3) in the absence of pCPT–cAMP and 0.74 ± 0.05 (n = 4)
in the presence of pCPT–cAMP. Single-channel events were not observed in the presence of pCPT–cAMP when the specific inhibitor CFTRinh-172 (10 µM; n = 3) was added to the bath solution following current activation. In the murine alveolar macrophage recordings, NPo was 0.07 ± 0.03 (n = 3) in the absence of pCPT–cAMP and 0.92 ± 0.04 (n = 4) in the presence of pCPT–cAMP. Similar to the human cells, single-channel events were not observed in the presence of pCPT–cAMP and the specific inhibitor CFTRinh-172 (n = 3). Broken lines represent closed channel level (C), single channel opening (O1) and two and three channel openings (O2 and O3), respectively. (c, d) Single-channel conductance values derived from I–V curves were comparable for both murine (c) and human (d) alveolar macrophages. Mean single-channel amplitude was determined from 3–5 patches at each voltage. Summary data are expressed as mean ± s.e.m., with the number of experiments in parentheses. In some cases, the error bars are within the symbols.
print ncb1456.indd 934print ncb1456.indd 934 16/8/06 11:28:03 am16/8/06 11:28:03 am
Nature Publishing Group ©2006

NATURE CELL BIOLOGY VOLUME 8 | NUMBER 9 | SEPTEMBER 2006 935
A RT I C L E S
that comigrates with purified CFTR (Fig. 2a). These data correlated well with current density that was measured electrophysiologically in the same cell types (Fig. 2a). To corroborate the immunoblot-ting data phosphorylation experiments were performed on anti-CFTR immunoprecipitates from various cells using several different antibodies (Fig. 2b, c). As previously shown13, this is a sensitive technique that identifies CFTR in preparations that contain small amounts of the protein. Phosphorylation of immunoprecipitates by the PKA catalytic subunit confirmed the identity of the Mr ~180 K protein as CFTR in macrophages and again indicated its absence from neutrophils. Finally, RT–PCR analysis confirmed expression of CFTR mRNA in both primary alveolar macrophages and J774 cells (data not shown).
Immunocytochemical labelling of J774 cells indicated that CFTR is widely distributed throughout the cytoplasm in resting macrophages, with heavier staining in perinuclear regions and possibly the Golgi apparatus (Fig. 2d). When macrophages were induced to phagocytose, CFTR-staining seemed to cluster around ingested latex beads (Fig. 2d). Immunogold analysis of macrophages that had internalized latex beads clearly showed anti-CFTR immunoreactivity on phagosomal membranes (Fig. 2e). Codetection of CFTR and the lysosomal marker LAMP-1 by immunoelectron microscopy in presumptive lysosomal compartments from J774 cells (Fig. 2h) indicated that lysosomes also expressed CFTR. Thus, CFTR in macrophages is present not only at the plasma membrane, but also within phagosomes, lysosomes and possibly several other intracellular compartments.
a
d e
f
g
h
b c
CFTR
Hum
an A
M
Hum
an P
N
Mur
ine
AMM
urin
e PN
Mur
ine
PM
Western blotting (R3195 lgG)100
0
50
Cur
rent
den
sity
(pA
/pF)
Purified CFTR(100 ng)
J774 (2.65 mgtotal cell lysate)
R31
95 lg
GM
M13
-4 lg
G24
-1 lg
G
R31
95 lg
GM
M13
-4 lg
G24
-1 lg
G
Non
-Imm
(mou
se)
Non
-Imm
(rab
bit)
Anti-CFTR
250
15010075
In vitro phosphorylationIn vitro phosphorylation
CFTR
Hum
an A
M
Hum
an P
NH
uman
mon
oN
on-im
mun
eAn
ti-C
FTR
Mur
ine
AMM
urin
e PN
Mur
ine
PM
Purified CFTR(100 ng)
CFTR
Resting
After phagocytosis
DIC CFTR
DIC CFTR
Mr(K)
Figure 2 CFTR expression in alveolar macrophages and related cells. (a) Immunodetection of CFTR protein in human and murine alveolar macrophages (AM), peripheral neutrophils (PN) and murine peritoneal macrophages (PM). Crude membrane proteins were resolved by SDS–PAGE in 4–15% gels (50 µg per lane) and CFTR was detected at approximately 180 K by anti-C-CFTR affinity-purified polyclonal IgG (R3195). Note that neutrophils lack detectable CFTR immunoreactivity. The corresponding CFTR current densities derived from whole-cell recordings of the different cell types are shown. (mean ± s.e.m.; n = 4–10 cells; current density data for each cell type are summarized in the Supplementary Information, Table S1). (b) CFTR immunoprecipitated from J774 macrophages using three different anti-CFTR antibodies. CFTR was immunopurified from crude membrane samples (200 µg protein; 2.5 µg anti-CFTR as indicated) and immunoprecipitates were incubated with PKA and γ-32P-ATP as previously described48, then gel electrophoresed and autoradiographed. Recombinant 6×His–CFTR (~100 ng) immunopurified from overexpressing BHK cells49 was used as a control. (c) Phosphorylation of immunopurified CFTR from various samples by PKA. Immunoprecipitation and phosphorylation was carried
out as in b using solubilized membrane samples from the tissues indicated and a mixture of three anti-CFTR antibodies: R3195, MM13-4, and 24-1. Control lanes are as in b. (d) Immunostaining of CFTR protein in resting and polystyrene-particle (3 µm) loaded J774 macrophages (after phagocytosis). Ring-like staining was enlarged and is indicated by an arrow. The inset (arrow) shows an enlargement of a region surrounding a phagosome indicating localized anti-CFTR staining. DIC, differential interference contrast. The scale bars represent 6 µm. (e, f) Immunogold (10 nm particles) labelling of CFTR on the phagosomal membrane of a J774 cell (arrows). Cells were loaded with 0.8 µm polystyrene particles. Rabbit affinity-purified polyclonal antibody against amino acids 521–828 of human CFTR (anti-NBD1-R-CFTR), was used in f and not used in e, which serves as a negative control. The scale bar represents 0.2 µm. (g, h) Immunogold labelling of CFTR protein on the lysosomal membrane of J774 cells. CFTR (10 nm gold particles) was identified with anti-NBD1-R-CFTR and the lysosomal marker LAMP-1 (15 nm gold particles) was identified with monoclonal anti-LAMP-1. Both primary CFTR and LAMP1 antibodies were not used in g which served as a negative control. The scale bars represent 200 nm.
print ncb1456.indd 935print ncb1456.indd 935 16/8/06 11:28:05 am16/8/06 11:28:05 am
Nature Publishing Group ©2006
936 NATURE CELL BIOLOGY VOLUME 8 | NUMBER 9 | SEPTEMBER 2006
A RT I C L E S
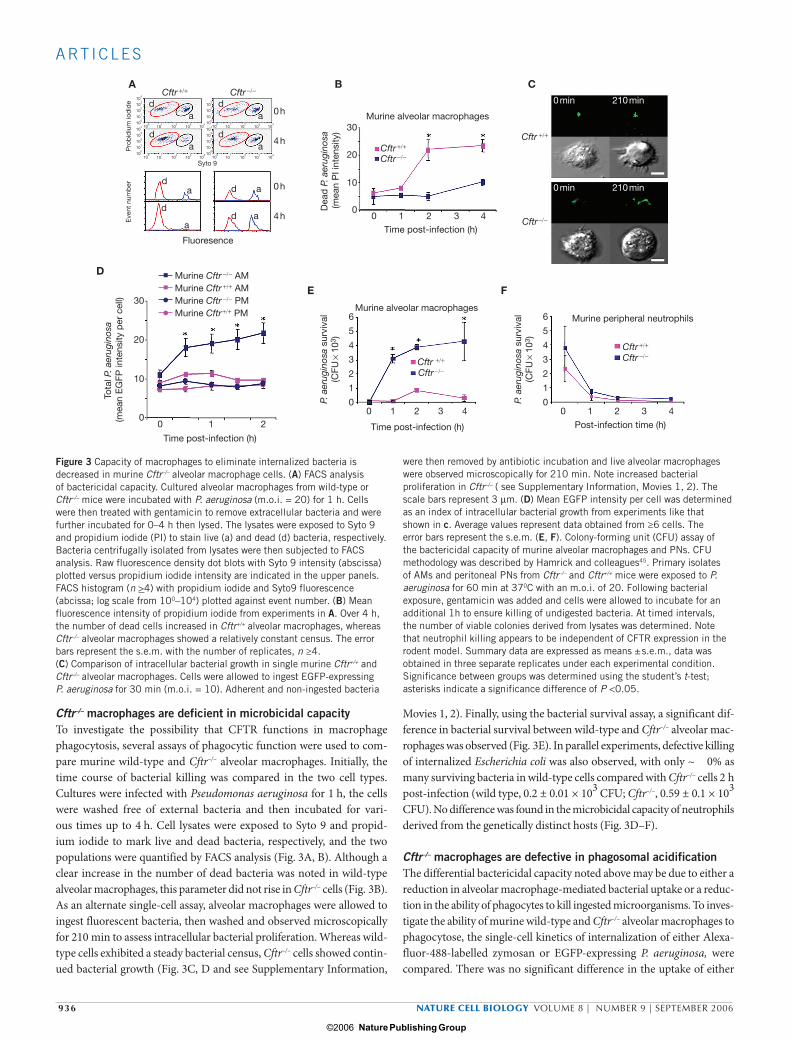
Cftr–/– macrophages are deficient in microbicidal capacityTo investigate the possibility that CFTR functions in macrophage phagocytosis, several assays of phagocytic function were used to com-pare murine wild-type and Cftr–/– alveolar macrophages. Initially, the time course of bacterial killing was compared in the two cell types. Cultures were infected with Pseudomonas aeruginosa for 1 h, the cells were washed free of external bacteria and then incubated for vari-ous times up to 4 h. Cell lysates were exposed to Syto 9 and propid-ium iodide to mark live and dead bacteria, respectively, and the two populations were quantified by FACS analysis (Fig. 3A, B). Although a clear increase in the number of dead bacteria was noted in wild-type alveolar macrophages, this parameter did not rise in Cftr–/– cells (Fig. 3B). As an alternate single-cell assay, alveolar macrophages were allowed to ingest fluorescent bacteria, then washed and observed microscopically for 210 min to assess intracellular bacterial proliferation. Whereas wild-type cells exhibited a steady bacterial census, Cftr–/– cells showed contin-ued bacterial growth (Fig. 3C, D and see Supplementary Information,
Movies 1, 2). Finally, using the bacterial survival assay, a significant dif-ference in bacterial survival between wild-type and Cftr–/– alveolar mac-rophages was observed (Fig. 3E). In parallel experiments, defective killing of internalized Escherichia coli was also observed, with only ~ 0% as many surviving bacteria in wild-type cells compared with Cftr–/– cells 2 h post-infection (wild type, 0.2 ± 0.01 × 10³ CFU; Cftr–/–, 0.59 ± 0.1 × 10³
CFU). No difference was found in the microbicidal capacity of neutrophils derived from the genetically distinct hosts (Fig. 3D–F).
Cftr–/– macrophages are defective in phagosomal acidificationThe differential bactericidal capacity noted above may be due to either a reduction in alveolar macrophage-mediated bacterial uptake or a reduc-tion in the ability of phagocytes to kill ingested microorganisms. To inves-tigate the ability of murine wild-type and Cftr–/– alveolar macrophages to phagocytose, the single-cell kinetics of internalization of either Alexa-fluor-488-labelled zymosan or EGFP-expressing P. aeruginosa, were compared. There was no significant difference in the uptake of either
A
D
E F
B CCftr +/+
Cftr +/+
Cftr +/+
Cftr −/−
Cftr −/−
Cftr −/−
Cftr +/+
Cftr −/−
Cftr +/+
Cftr −/−
104
103
102
101
100
104 10
4
103
103
102
102
101
101
100
100
104
103
102
101
100
103
102
101
100
104 10
4
103
103
102
102
101
101
100
100
104
103
102
101
100
d
d
ad
a
da
da
a d a
dd
aa
Syto 9
Pro
bid
ium
iod
ide
Eve
nt n
umb
er
0 h
4 h
0 h
4 h
Fluoresence
30
20
10
00 1 2 3 4
Dea
d P
. aer
ugin
osa
(mea
n P
I int
ensi
ty)
P. a
erug
inos
a su
rviv
al(C
FU ×
103
)
Tota
l P. a
erug
inos
a(m
ean
EG
FP in
tens
ity p
er c
ell)
Murine alveolar macrophages
Time post-infection (h)
Time post-infection (h)Time post-infection (h)
0 min 210 min
0 min 210 min
Murine Cftr +/+ AMMurine Cftr −/− AM
Murine Cftr +/+ PMMurine Cftr −/− PM30
20
10
00 1 2
6
5
4
3
2
1
00 1 2 3 4
P. a
erug
inos
a su
rviv
al(C
FU ×
103
)
6
5
4
3
2
1
00 1 2 3 4
Post-infection time (h)
Murine alveolar macrophagesMurine peripheral neutrophils
Figure 3 Capacity of macrophages to eliminate internalized bacteria is decreased in murine Cftr–/– alveolar macrophage cells. (A) FACS analysis of bactericidal capacity. Cultured alveolar macrophages from wild-type or Cftr–/– mice were incubated with P. aeruginosa (m.o.i. = 20) for 1 h. Cells were then treated with gentamicin to remove extracellular bacteria and were further incubated for 0–4 h then lysed. The lysates were exposed to Syto 9 and propidium iodide (PI) to stain live (a) and dead (d) bacteria, respectively. Bacteria centrifugally isolated from lysates were then subjected to FACS analysis. Raw fluorescence density dot blots with Syto 9 intensity (abscissa) plotted versus propidium iodide intensity are indicated in the upper panels. FACS histogram (n >4) with propidium iodide and Syto9 fluorescence (abcissa; log scale from 100–104) plotted against event number. (B) Mean fluorescence intensity of propidium iodide from experiments in A. Over 4 h, the number of dead cells increased in Cftr+/+ alveolar macrophages, whereas Cftr–/– alveolar macrophages showed a relatively constant census. The error bars represent the s.e.m. with the number of replicates, n ≥4.(C) Comparison of intracellular bacterial growth in single murine Cftr+/+ and Cftr–/– alveolar macrophages. Cells were allowed to ingest EGFP-expressing P. aeruginosa for 30 min (m.o.i. = 10). Adherent and non-ingested bacteria
were then removed by antibiotic incubation and live alveolar macrophages were observed microscopically for 210 min. Note increased bacterial proliferation in Cftr–/– ( see Supplementary Information, Movies 1, 2). The scale bars represent 3 µm. (D) Mean EGFP intensity per cell was determined as an index of intracellular bacterial growth from experiments like that shown in c. Average values represent data obtained from ≥6 cells. The error bars represent the s.e.m. (E, F). Colony-forming unit (CFU) assay of the bactericidal capacity of murine alveolar macrophages and PNs. CFU methodology was described by Hamrick and colleagues45. Primary isolates of AMs and peritoneal PNs from Cftr–/– and Cftr+/+ mice were exposed to P. aeruginosa for 60 min at 370C with an m.o.i. of 20. Following bacterial exposure, gentamicin was added and cells were allowed to incubate for an additional 1h to ensure killing of undigested bacteria. At timed intervals, the number of viable colonies derived from lysates was determined. Note that neutrophil killing appears to be independent of CFTR expression in the rodent model. Summary data are expressed as means ± s.e.m., data was obtained in three separate replicates under each experimental condition. Significance between groups was determined using the student’s t-test; asterisks indicate a significance difference of P <0.05.
print ncb1456.indd 936print ncb1456.indd 936 16/8/06 11:28:08 am16/8/06 11:28:08 am
Nature Publishing Group ©2006
NATURE CELL BIOLOGY VOLUME 8 | NUMBER 9 | SEPTEMBER 2006 937
A RT I C L E S
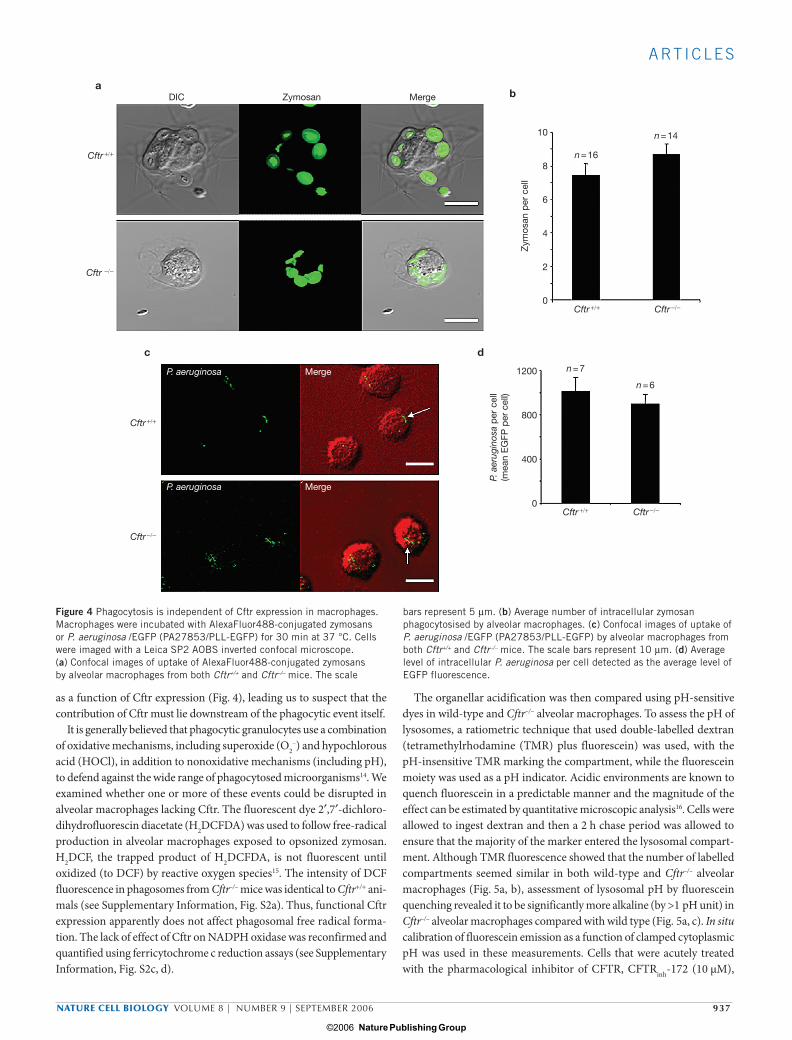
as a function of Cftr expression (Fig. 4), leading us to suspect that the contribution of Cftr must lie downstream of the phagocytic event itself.
It is generally believed that phagocytic granulocytes use a combination of oxidative mechanisms, including superoxide (O2
–) and hypochlorous acid (HOCl), in addition to nonoxidative mechanisms (including pH), to defend against the wide range of phagocytosed microorganisms14. We examined whether one or more of these events could be disrupted in alveolar macrophages lacking Cftr. The fluorescent dye 2′,7′-dichloro-dihydrofluorescin diacetate (H2DCFDA) was used to follow free-radical production in alveolar macrophages exposed to opsonized zymosan. H2DCF, the trapped product of H2DCFDA, is not fluorescent until oxidized (to DCF) by reactive oxygen species15. The intensity of DCF fluorescence in phagosomes from Cftr–/– mice was identical to Cftr+/+ ani-mals (see Supplementary Information, Fig. S2a). Thus, functional Cftr expression apparently does not affect phagosomal free radical forma-tion. The lack of effect of Cftr on NADPH oxidase was reconfirmed and quantified using ferricytochrome c reduction assays (see Supplementary Information, Fig. S2c, d).
The organellar acidification was then compared using pH-sensitive dyes in wild-type and Cftr–/– alveolar macrophages. To assess the pH of lysosomes, a ratiometric technique that used double-labelled dextran (tetramethylrhodamine (TMR) plus fluorescein) was used, with the pH-insensitive TMR marking the compartment, while the fluorescein moiety was used as a pH indicator. Acidic environments are known to quench fluorescein in a predictable manner and the magnitude of the effect can be estimated by quantitative microscopic analysis16. Cells were allowed to ingest dextran and then a 2 h chase period was allowed to ensure that the majority of the marker entered the lysosomal compart-ment. Although TMR fluorescence showed that the number of labelled compartments seemed similar in both wild-type and Cftr–/– alveolar macrophages (Fig. 5a, b), assessment of lysosomal pH by fluorescein quenching revealed it to be significantly more alkaline (by >1 pH unit) in Cftr–/– alveolar macrophages compared with wild type (Fig. 5a, c). In situ calibration of fluorescein emission as a function of clamped cytoplasmic pH was used in these measurements. Cells that were acutely treated with the pharmacological inhibitor of CFTR, CFTRinh-172 (10 µΜ),
a
c d
b
Cftr +/+
Cftr −/−
Cftr +/+ Cftr −/−
Cftr +/+ Cftr −/−
Cftr +/+
Cftr −/−
DIC Zymosan Merge
n = 16
n = 7
n = 6
n = 1410
1200
800
400
0
8
6
4
2
0
P. aeruginosa
P. aeruginosa
Merge
Merge
Zym
osan
per
cel
l
P. a
erug
inos
a p
er c
ell
(mea
n E
GFP
per
cel
l)
Figure 4 Phagocytosis is independent of Cftr expression in macrophages. Macrophages were incubated with AlexaFluor488-conjugated zymosans or P. aeruginosa /EGFP (PA27853/PLL-EGFP) for 30 min at 37 °C. Cells were imaged with a Leica SP2 AOBS inverted confocal microscope. (a) Confocal images of uptake of AlexaFluor488-conjugated zymosans by alveolar macrophages from both Cftr+/+ and Cftr–/– mice. The scale
bars represent 5 µm. (b) Average number of intracellular zymosan phagocytosised by alveolar macrophages. (c) Confocal images of uptake of P. aeruginosa /EGFP (PA27853/PLL-EGFP) by alveolar macrophages from both Cftr+/+ and Cftr–/– mice. The scale bars represent 10 µm. (d) Average level of intracellular P. aeruginosa per cell detected as the average level of EGFP fluorescence.
print ncb1456.indd 937print ncb1456.indd 937 16/8/06 11:28:11 am16/8/06 11:28:11 am
Nature Publishing Group ©2006

938 NATURE CELL BIOLOGY VOLUME 8 | NUMBER 9 | SEPTEMBER 2006
A RT I C L E S
a
b c
ed
Cftr +/+
Cftr −/−
Cftr +/+
+CFTRinh-172
Cftr +/+
+BAF
TMR Fluorescein Merge Merge with DIC
30 4.0
3.5
3.0
4
4.0 4.5 5.0 5.5 6.0 6.5 7.0 7.5
5 6 7 8
2.5
2.0
1.5
1.0
20
10
0
n = 16 n = 15
Cftr +/+
Cftr +/+
Cftr +/+
Cftr −/−
Cftr +/+ + BAF
Cftr +/+ Cftr +/+
Cftr +/+
+CFTRinh-172
Cftr −/−
Cftr −/−
Num
ber
of d
extr
an-
cont
aini
ng v
esic
les
per
cel
l
Rat
io (5
43:4
88)
pH
pH sensitivefluorescein
Cftr −/− Cftr −/−
pH sensitivefluorescein
Merge with DIC
Merge with DIC
60555045403530252015
Mea
n flu
ores
cenc
e in
tens
ity
pH
Figure 5 Cftr expression regulates acidification of intracellular lysosome-like compartments and phagosomes. (a–c) Determination of intra-organelle pH in lysosome-like compartments. Murine alveolar macrophages were incubated with double-labelled TMR-fluorescein dextran (Mr ~10 K) for 1 h, then washed and post-incubated for 2 h to allow dye transport to the lysosomal compartment. Dye emission was then determined by confocal microscopy. Addition of the CFTR inhibitor (CFTRinh-172, 10 µM) or V-ATPase inhibitor bafilomycin (BAF, 100 nM, bottom panel) prevented lysosomal acidification in wild-type cells. The calibration bars in a represent 120 µm. The number of dextran-containing vesicles per cell for wild-type and Cftr–/– cells is compared in b. In c, fluorescein emission was calibrated in vivo using nigericin/K as previously described24 and the values obtained from the samples shown in a were determined by interpolation. Summary data are expressed as mean ± s .e.m., where the number of lysosomes examined in a variable number
of cells under each experimental condition varied between 32 and 133 for the calibration curve and between 72 and 133 for the Cftr–/– and Cftr+/+ alveolar macrophages, both control and pharmacologically treated. The error bars indicate a ratio of ≤0.1 (see text). (d, e). Acidification defect in phagosomes following particle ingestion in alveolar macrophagess from Cftr–/– mice. Cells that had ingested fluorescein-conjugated opsonized zymosan were observed by confocal microscopy. The scale bar represents 5 µm. In e, intraphagosome pH values for the two cell types are interpolated on a standard curve for zymosan fluorescence versus pH determined in vitro using a series of buffers. Data were fit by linear regression (R = 0.99). Summary data are expressed as means ± s.e.m., with the number of zymosan particles examined to determine the calibration curve in vitro between 45 and 133. Means were determined for 75 phagosomes from Cftr+/+ alveolar macrophages and 64 phagosomes from Cftr–/– alveolar macrophages.
print ncb1456.indd 938print ncb1456.indd 938 16/8/06 11:28:17 am16/8/06 11:28:17 am
Nature Publishing Group ©2006

NATURE CELL BIOLOGY VOLUME 8 | NUMBER 9 | SEPTEMBER 2006 939
A RT I C L E S
demonstrated a defect in acidification with an intralysosomal pH of 6.1 ± 0.1 similar to that observed in cells from the Cftr–/– mouse (5.9 ± 0.1; Fig. 5a, c), further supporting the hypothesis that lysosomal Cftr is nec-essary for full lysosomal acidification. Control experiments using the lysosomal V-type H+-ATPase inhibitor bafilomycin17 confirmed that the fluorescein signal was emanating either from lysosome-like organelles or early endosomes, both of which have been shown to express the V-type H+-ATPase18. Treatment of wild-type alveolar macrophages with this compound increased the average pH of these compartments to a value slightly more alkaline than that of organelles in Cftr–/–cells (Fig. 5c).
To further confirm that a defect in acidification existed in Cftr-defi-cient cells, fluorescein-conjugated zymosan was used to estimate the pH of the phagosomal compartment. Again, quenching was readily observed in wild-type alveolar macrophages, signifying acidification, but intracellular zymosan fluorescence remained high (similar to that of extracellular zymosan) in Cftr–/– cells. (Fig. 5d, e). In these experiments, calibration of the fluorescence for the two cell types was interpolated on a standard curve for zymosan fluorescence versus pH that was determined in vitro using a series of buffers (Fig. 5e). Phagosomes from Cftr–/– alveo-lar macrophages were on average >1 pH unit more alkaline than their wild-type counterparts.
We carried out studies to determine whether cAMP affects acidifica-tion, given that CFTR is known to be a cAMP-activated Cl– channel, as demonstrated in the electrophysiological studies in Fig. 1. Wild-type primary mouse alveolar macrophages were exposed to the membrane permeable pCPT–cAMP to elevate intracellular cAMP and acidification kinetics were examined in cells loaded with the trapped double-labelled fluorescein-TMR dextran. Data obtained in these studies revealed no
appreciable difference in the acidity of lysosomes as compared with untreated controls (data not shown). However, it has been suggested that cAMP levels in ‘resting’ phagocytic cells may be high enough to sustain cAMP-dependent processes19,20 and that cellular effects may be elicited following down regulation of cAMP. Thus, the permeant cAMP antagonist Rp-8-hexylaminoadenosine HA–cAMPS was used to assess whether inhibition of the cAMP pathway significantly altered acidifica-tion. Indeed, as seen in Fig. 6, exposure of Cftr+/+ alveolar macrophages to Rp-8-hexylaminoadenosine HA–cAMPS (0.5 mM) reversed lysosomal acidification over a period of 15 min, such that the final pH in the lyso-some–endosome compartment labelled by the dextran was approxi-mately 7.0. Lysosomal acidification was partially restored to a value of approximately 6.0 following reversal of the cAMP-antagonist effect by pCPT–cAMP (0.5 mM; Fig. 6a, b).
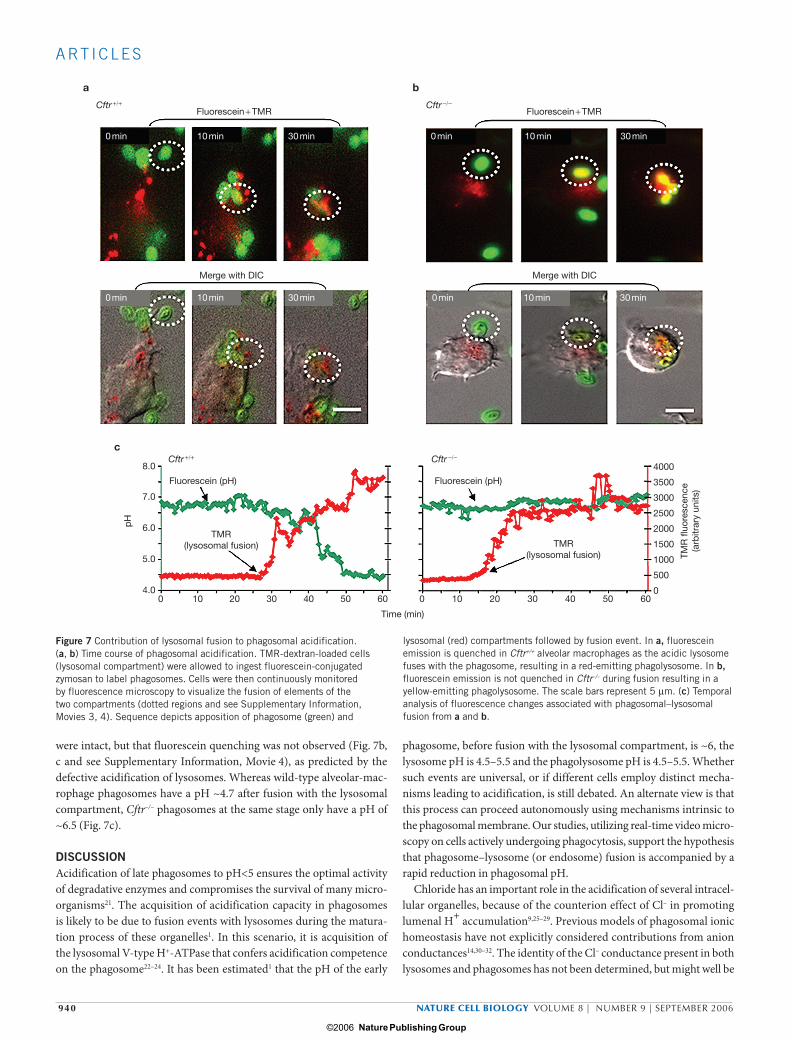
To address whether phagosomal acidification in alveolar macrophages occurred before or after lysosomal fusion and degranulation into the maturing phagosome, the lysosomal compartment was loaded with labelled dextran and the phagosomal compartment with conjugated zymosan, then fluorescein quenching was followed as a function of lysosomal fusion. Live-cell imaging of wild-type alveolar macrophages revealed that acid-induced fluorescence quenching of the conjugated zymosan only occurred in phagosomes that had previously fused with the dextran-containing compartment (Fig. 7a and see Supplementary Information, Movie 3). Continuous temporal analysis of individual organelles demonstrated that quenching occurred following stepwise increases in dextran loading of the phagosomal compartment, which followed sequential lysosomal fusions (Fig. 7c). Parallel analysis of Cftr–/– alveolar macrophages showed that lysosomal fusion events per se
a b
TMR
Fluorescein
Merge
Merge with DIC
8.0
7.5
7.0
6.5
6.0
5.5
5.0
4.5
4.00 10 20 30 40 50
Time (min)
Rp-8-HA−cAMPSpCPT−cAMP
l
ll
lll
Control
pH
Bas
al
Rp-
8-H
A−cA
MPS
Rp-
8-H
A−cA
MPS
+pC
PT−c
AMP
l ll lll
Figure 6 Inhibition of cAMP-dependent kinase prevents lysosomal acidification in Cftr+/+ alveolar macrophages. Murine alveolar macrophages were incubated with double-labelled TMR-fluorescein dextran as in Fig. 5. Dye emission was then determined by confocal microscopy. (a). Confocal images of alveolar macrophages loaded with double-labelled TMR-fluorescein dextran before and after exposure to Rp-8-HA–cAMPS (inhibitor of cAMP-dependent kinase, 0.5 mM), as well as after recovery
of kinase activity in the presence of Rp-8-HA–cAMPS + pCPT–cAMP (0.5 mM). The scale bar represents 3 µm. (b) Summary of the dynamic changes of lysosomal pH in 21 cells. Maximal inhibition by Rp-8-HA–cAMPS of lysosomal acidification occured ~25 min after application on the cells. The arrows indicate the times when the images in a were taken. Summary data are expressed as mean ± s.e.m. for seven control and seven pharmacologically treated cells.
print ncb1456.indd 939print ncb1456.indd 939 16/8/06 11:28:24 am16/8/06 11:28:24 am
Nature Publishing Group ©2006
940 NATURE CELL BIOLOGY VOLUME 8 | NUMBER 9 | SEPTEMBER 2006
A RT I C L E S
were intact, but that fluorescein quenching was not observed (Fig. 7b, c and see Supplementary Information, Movie 4), as predicted by the defective acidification of lysosomes. Whereas wild-type alveolar-mac-rophage phagosomes have a pH ~4.7 after fusion with the lysosomal compartment, Cftr–/– phagosomes at the same stage only have a pH of ~6.5 (Fig. 7c).
DISCUSSIONAcidification of late phagosomes to pH<5 ensures the optimal activity of degradative enzymes and compromises the survival of many micro-organisms21. The acquisition of acidification capacity in phagosomes is likely to be due to fusion events with lysosomes during the matura-tion process of these organelles1. In this scenario, it is acquisition of the lysosomal V-type H+-ATPase that confers acidification competence on the phagosome22–24. It has been estimated1 that the pH of the early
phagosome, before fusion with the lysosomal compartment, is ~6, the lysosome pH is 4.5–5.5 and the phagolysosome pH is 4.5–5.5. Whether such events are universal, or if different cells employ distinct mecha-nisms leading to acidification, is still debated. An alternate view is that this process can proceed autonomously using mechanisms intrinsic to the phagosomal membrane. Our studies, utilizing real-time video micro-scopy on cells actively undergoing phagocytosis, support the hypothesis that phagosome–lysosome (or endosome) fusion is accompanied by a rapid reduction in phagosomal pH.
Chloride has an important role in the acidification of several intracel-lular organelles, because of the counterion effect of Cl– in promoting lumenal H+ accumulation9,25–29. Previous models of phagosomal ionic homeostasis have not explicitly considered contributions from anion conductances14,30–32. The identity of the Cl– conductance present in both lysosomes and phagosomes has not been determined, but might well be
a
c
Cftr +/+
Cftr +/+
Fluorescein + TMR
Merge with DIC Merge with DIC
b
Cftr −/−
Cftr −/−
Fluorescein + TMR
0 min 10 min 30 min
0 min 10 min 30 min 0 min 10 min 30 min
0 min 10 min 30 min
8.0
7.0
6.0
5.0
4.00 10 20 30 40 50 60 0 10 20 30 40 50 60
TMR(lysosomal fusion) TMR
(lysosomal fusion)
Fluorescein (pH) Fluorescein (pH)
4000
3500
3000
2500
2000
1500
1000
500
0
Time (min)
TMR
fluo
resc
ence
(arb
itrar
y un
its)
pH
Figure 7 Contribution of lysosomal fusion to phagosomal acidification. (a, b) Time course of phagosomal acidification. TMR-dextran-loaded cells (lysosomal compartment) were allowed to ingest fluorescein-conjugated zymosan to label phagosomes. Cells were then continuously monitored by fluorescence microscopy to visualize the fusion of elements of the two compartments (dotted regions and see Supplementary Information, Movies 3, 4). Sequence depicts apposition of phagosome (green) and
lysosomal (red) compartments followed by fusion event. In a, fluorescein emission is quenched in Cftr+/+ alveolar macrophages as the acidic lysosome fuses with the phagosome, resulting in a red-emitting phagolysosome. In b, fluorescein emission is not quenched in Cftr–/– during fusion resulting in a yellow-emitting phagolysosome. The scale bars represent 5 µm. (c) Temporal analysis of fluorescence changes associated with phagosomal–lysosomal fusion from a and b.
print ncb1456.indd 940print ncb1456.indd 940 16/8/06 11:28:31 am16/8/06 11:28:31 am
Nature Publishing Group ©2006

NATURE CELL BIOLOGY VOLUME 8 | NUMBER 9 | SEPTEMBER 2006 941
A RT I C L E S
diverse, and possibly distinct in various cell types. CFTR is a Cl–-specific ion channel that is found both at the cell surface and intracellularly, and early studies identifying CFTR expression in the endosomal compart-ment led to the proposal that it may fulfill a counter-ion conductance role in this organelle7,26,33–35. Although there is some disagreement over the acidification status of intracellular organelles in cystic fibrosis7,36–38, our data unequivocally indicate the presence of CFTR in rodent and human alveolar macrophages and suggest that this channel has a signifi-cant role in macrophage-organelle pH regulation. Both lysosomes and phagosomes in macrophages from Cftr–/– mice failed to acidify strongly supporting the contention that this Cl– channel provides a significant fraction of the counterion conductance necessary for generation of large H+ gradients. It should be noted that distinct shunting mechanisms may be present to compensate for other components of the phago-somal microbicidal machinery. For example, it has been suggested that K+ movements and H+ channels facilitate electron production by the NADH oxidase complex responsible for superoxide generation14,30,32. It is possible that CFTR expression contributes only indirectly to lyso-somal pH; CFTR-deficiency could affect the targeting of other mem-brane proteins that are themselves the effectors of pH regulation in lysosomes. However, we have shown the acute effects of both the cAMP pathway, as well as specific CFTR channel inhibition, on lysosomal acidification, which would argue strongly against CFTR exerting its effect indirectly.
These findings demonstrate that the loss of subcellular acidification in CFTR-deficient alveolar macrophages is a key factor that contrib-utes to the enhanced survival of bacterial loads within the phagosomal compartment (a schematic model incorporating this notion is shown in Fig. 8). However, the relationship of these data to the etiology of cystic fibrosis is unclear. Mutations in CFTR give rise to cystic fibrosis mainly through alterations in salt transport in various epithelia. How this results
in the increased propensity for cystic fibrosis patients to develop bacte-rial respiratory infections and associated chronic inflammation — the prime morbidity factors in the disease — is not known. The defence mechanisms in the lung against bacterial infection are multi-faceted and possibly involve phagocytic activity of epithelial cells themselves, secre-tory products like defensins produced by the epithelium, in addition to elements of the innate immune system, such as alveolar macrophages and neutrophils. Although alveolar macrophages clearly express CFTR and use it in acidification mechanisms, we show here that neutrophils lack CFTR (see also ref. 39). The observation that neutrophil microbicidal activity must, therefore, be independent of functional CFTR may account for the absence of chronic systemic infections in cystic fibrosis patients. Nevertheless, pulmonary neutrophils show a lower phagocytic capacity than circulating neutrophils from the same cystic fibrosis patients39, fur-ther emphasizing the complex microenvironmental changes that need to be understood before a comprehensive picture of microbicidal activities emerges in this disease.
METHODS
Materials. The mouse J774 macrophage cell lines was propagated as previously described41. Unlabelled P. aeruginosa strain 27853 (PA27853) and P. aeruginosa /EGFP (PA27853/PLL-EGFP) were kind gifts from J. C. Alverdy (University of Chicago, Chicago, IL). Unlabelled zymosan, fluorescein-labelled zymosan, Alexa-fluor-488- labelled zymosan, opsonizing reagent, H2DCFDA (2′,7′- dichlorodi-hydrofluorescin diacetate), live or dead bacterial viability and counting kit for flow cytometry (L34856), tetramethylrhodamine (TMR)-tagged dextran (aver-age Mr,10 K), fluorescein-TMR-tagged dextran (average Mr ,10 K), nigericin and valinomycin were obtained from Molecular Probes (Eugene, OR). Thiazolidinone CFTR inhibitor (CFTRinh-172) was a kind gift from A. S. Verkman (University of California, San Francisco, CA). Rat anti-mouse lysosomal membrane glycoprotein (LAMP1) antibody, 1D4B, was purchased from Development Studies Hybridoma bank (University of Iowa, Iowa City, IA). Gold-conjugated (10 mn) goat anti-rab-bit IgG and 15 nm gold-conjugated goat anti-rat IgG were purchased from Ted
a bCFTR+/+ CFTR−/−
Plasma membrane
NADPH oxidase Proton channelV-ATPase
CFTR
Lysosome
Phagosome
202 − 2H+
H2 O
2 + O2
Cl −
Cl −
MPO
HOCI + HO −
Bacteria
pH~4.7
pH~4.4H+
Plasma membrane
NADPH oxidase Proton channelV-ATPase
Lysosome
Phagosome
202 − 2H+
H2 O
2 + O2
Cl −
MPO
HOCI + HO −
Bacteria
pH~6.5
pH~5.9H+
Figure 8 Schematic representation of a model summarizing the results of this study. (a) CFTR-mediated Cl–entry functions as a charge shunt to balance H+ influx through the V-ATPase in the lysosome, thereby maintaining an acidified lysosomal environment. Lysosomal fusion with the nascent phagosome contributes both V-ATPase and CFTR to the mature phagolysosomal membrane (indicated by red dotted lines). Release of lysosomal lumenal contents, including proteases (such as elastase and cathepsin) that operate optimally at acidic pH, contributes to bacterial killing. Also shown is the contribution of the NADH oxidase, which liberates superoxide radicals (O2
–) into the phagosomal lumen. These combine
with protons carried by voltage-gated proton channels to form hydrogen peroxide (H2O2). H2O2 in combination with phagosomal Cl–in the presence of myeloperoxidase (MPO) results in the formation of hypochlorous acid (HOCl), also part of the bactericidal response. (b) In CFTR–/– alveolar macrophages, there is no charge shunt to counter H+ influx through the lysosomal V-ATPase resulting in stunted lysosomal acidification. As a result of incomplete lysosomal acidicification, bactericidal factors (including lysosomal proteases) fail to function efficiently, favouring the growth and survival of ingested bacteria. The pH values indicated are those derived from measurements in this study.
print ncb1456.indd 941print ncb1456.indd 941 16/8/06 11:28:48 am16/8/06 11:28:48 am
Nature Publishing Group ©2006

942 NATURE CELL BIOLOGY VOLUME 8 | NUMBER 9 | SEPTEMBER 2006
A RT I C L E S
Pella Company (Redding, CA). DIDS (4, 4′-diisothiocyanatostilbene-2,2′-disul-phonic acid) and DPC (diphenylamine-2-carboxylic acid) were obtained from Calbiochem (San Diego, CA). IgG-coated polystyrene particles were purchased from Spherotech (Libertyville, IL). GBC (glybenclamide), DPI (diphenylenei-odonium), bafilomycin A1, IBMX (1-methyl-3-isobutylxanthine), forskolin (7β-acetoxy-8,13-epoxy-1α,6β,9α-trihydroxylabd-14-en-11-one), cAMP (adenosine 3′,5′-cyclic monophosphate), pCPT–cAMP (8-(4-chlorophenylthio)adenosine 3′,5′-cyclic monophosphate), Rp-8-HA–cAMPS (Rp-8-hexylaminoadenosine 3′, 5′-monophosphorothioate) and other chemicals were obtained from Sigma (St. Louis, MO).
Animals. The 4–6 week-old C57BL/6 mice used in the biochemical studies were purchased from the Division of Cancer Treatment at the National Cancer Institute (Frederick, MD). Bitransgenic null mutant (Cftr–/–) mice expressing the human CFTR protein in the gut, under the influence of the rat fatty acid binding protein (FABP) promoter, as well as their littermate Cftr+/+ control animals were obtained as a generous gift from J. A. Whitsett (University of Cincinnati Children’s Hospital Medical Center, Cincinnati, OH) and were, in addition, purchased from Case Western Reserve University’s Cystic Fibrosis Animal Core (Cleveland, OH). Animals were housed in a specific pathogen-free biohazard level 2 facility main-tained by the University of Chicago Animal Resources Center (Chicago, IL). The studies detailed herein conform to the principles set forth by the Animal Welfare Act and the National Institutes of Health guidelines for the care and use of animals
in biomedical research.
Human subjects. The use of human subjects for bronchoalveolar lavage was approved by the Institutional Review Board at the University of Chicago Hospitals (Chicago, IL).
CFTR antibodies . R-3195 IgG (affinity-purified polyclonal IgG raised against CFTR-C-tail peptide, amino acids1467–1480) was a kind gift from C. Marino (University of Tennessee, Memphis, TN). MM13-4 IgG (Chemicon affinity-puri-fied monoclonal IgG) was raised against N-terminal residues 24-35 of human CFTR. 24-1 IgG from R&D Systems (Mineapolis, MN) was raised against the last four amino acids of human CFTR (DTRL). NBD1-R (affinity purified polyclonal IgG) was raised in rabbit against amino acids 521–828 (NBD1-R) of human CFTR and was a kind gift from D. Bedwell (University of Alabama at Birmingham, Birmingham, AL). The distributors of MM13-4 IgG (Chemicon International, Temecula, CA) states that this CFTR IgG does not recognize mouse Cftr in par-affin sections (immuno-histochemistry). In our laboratory, MM13-4 IgG rec-ognizes both purified human and mouse N-terminal CFTR (amino acids 1–80) protein in immunoprecipitation studies (data not shown).
Immunoblotting. Cells were harvested in H20E1D1 solution (20 mM HEPES at pH 8.0, 1 mM EDTA, 1 mM DTT) in the presence of a protease inhibitor cocktail (Boehringer Mannheim, Indianapolis, IN). Cells were then homogenized in five volumes of buffer (20 mM HEPES, 1 mM EDTA at pH 7.4) and spun at 800g in a microfuge tube. The supernatant was centrifuged again at 100,000g and the result-ing pellet was suspended in the same buffer. This sample was used as the source of crude membranes and the protein concentration was measured by the Bradford method. Membrane proteins were resolved by SDS–(4–15%)PAGE and transferred to a PVDF membrane. Blots were incubated overnight at 4 °C with CFTR antibodies as indicated in the figures and subsequently with goat anti-rabbit antibody conju-gated to horseradish peroxidase (Pierce, Rockford, IL) at a 1:50,000 dilution for 60 min at room temperature. Detection was by enchanced chemiluminesence.
In vitro phosphorylation of CFTR13. Cell pellets or membrane preparations were solubilized in RIPA buffer (150 mM NaCl, 50 mM Tris–HCl at pH 8.0, 0.5% Na-deoxycholate, 0.1%, SDS, 1% NP40 plus protease inhibitors) and the extracts centrifuged at 15,000g for 10 min at 4 °C. The clear supernatant was used for immunoprecipitation. CFTR IgG or non-immune IgG (2.5 µg per tube) were mixed for 30 min at 4 °C and then 20 µl of protein A–G beads (Santa Cruz Biotechnology, Santa Cruz, CA) per tube were added and incubated at 4 °C over-night. Beads were washed two times with RIPA buffer (1 ml each) and three times (1 ml each) with PKA buffer (50 mM Tris–HCl, 1 mM MgCl2, 0.1 mg ml–1 BSA at pH 7.5). Beads were then resuspended in 100 µl of PKA buffer containing 40 units of PKA, 10 µCi γ32P-ATP and incubated at 30 °C for 60 min. Following incuba-tion, beads were washed three times with RIPA buffer and the proteins bound to
the beads were eluted with SDS sample buffer and separated by 5% SDS−PAGE. The gel was subsequently dried and exposed to film.
Analysis of zymosan and P. aeruginosa uptake. Macrophages were incubated with AlexaFluor488-conjugated zymosan or P. aeruginosa/EGFP (PA27853/PLL-EGFP) for 30 min at 37 °C and then cells were washed 5 times with PBS (in P. aeruginosa /EGFP infection group, cells were incubated with 50 µg ml–1 kan-amycin for 30 min to remove the adherent bacteria). Cells were imaged with a Leica SP2 AOBS inverted confocal microscope using a 488 nm argon laser, a 63× glycerol objective lens (NA = 1.3) and an emission bandwidth of 500–535 nm. The intracellular localizations of zymosan or P. aeruginosa were confirmed by z-series sections through the whole cell (one section approximately 0.1 µm). Images were acquired with LCS software. Phagocytosed zymosan or P. aeruginosa were counted in Image J.
Determination of dextran-containing vesicles. Cells were incubated with TMR-tagged dextran (5 mg ml–1) for 1 h, then the cells were washed several times and reincubated in fresh medium for 2 h, followed by washing five times with PBS. Cells were imaged with a Leica SP2 AOBS inverted confocal microscope using a 594 nm argon laser, a 63× glycerol objective lens (NA = 1.3) and an emission bandwidth of 607–686 nm. Images were acquired with LCS software. Dextran-containing vesicles were counted in Image J.
Determination of lysosomal acidification16, 28. Alveolar macrophages from both Cftr–/– and Cftr+/+ mice were incubated with fluorescein–TMR-tagged dextran (5 mg ml-1) for 1 h, then the cells were washed several times and reincubated in fresh medium for 2 h, followed by five washes with PBS. Cells were visualized with Leica SP2 AOBS inverted confocal microscope using a 488 nm laser and a 594 nm laser, a 63× glycerol objective lens (NA = 1.3) and emission bandwidth of 500–535 nm and 607–686 nm, respectively. Some cells from Cftr+/+ group were treated with 100 nM bafilomycin A1 for 15–20 min before confocal observation. In some groups, to trace lysosomal pH change during the application of inhibitor and/or activators of cAMP-dependent protein kinases, time-lapse videos were recorded.
Lysosomal pH calibration protocols. Lysosomal pH was equalized by incubating cells for 15–20 min at 37 °C in calibration buffer (120 mM KCl, 20 mM NaCl, 1 mM CaCl2, 1 mM MgCl2, 10 mM HEPES with the pH adjusted from 4 to 8) containing the ionophores nigericin (10 µM) plus valinomycin (10 µM) and the H+-ATPase pump inhibitor, bafilomycin (0.1 µM). Cells were imaged with confo-cal microscopy as described above. Changes in pH were measured by the intensity ratios of tetramethylrhodamine (red) and fluorescein (green) in each lysosome. A customized programme was written (Y. Kataoka and V.P. Bindokas, University of Chicago, Chicago, IL) into ImageJ to calculate area-integrated intensities for each fluorophore in each lysosome and computed their red:green intensity ratios were calculated. Red:green ratios were plotted against pH values and curves were fitted with the sigmoidal Boltzmann equation, Y = (A1–A2) / [1 + e(x–xo) / dx] + A2, where Y is the excitation ration 543:488; A1-A2 is the difference between the highest and the lowest excitation ratios; xo is the pH at the midpoint of the curve; and dx is the steepness of the pH dependence of the excitation ratio.
Determination of phagosomal acidification. Alveolar macrophages from both Cftr–/– and Cftr+/+ mice were incubated for 40–60 min at 37 °C with fluorescein-conjugated opsonized zymosan, then cells were visualized with IX70 Olympus Fluoview laser-scanning confocal microscope using 6% of the 488 nm argon laser line and a 510–530 nm barrier filter while the DIC image was simultaneously collected on a second detector. Titrations of fluorescein-labelled zymosan fluo-rescence versus pH were performed by measuring the fluorescence of fluorescein-labelled zymosan in different pH buffer made of anhydrous citric acid, HEPES and 30-cyclo-hexlamino-ethylsulphonic acid (CHES), in which pH was adjusted to various values using NaOH42. The standard curve for fluorescein-conjugated zymosan fluorescence versus pH was determined in vitro using a series of solu-tions buffered to the appropriate pH as mentioned above. The data were fit with linear regression analysis.
Determination of phagosomal–lysosomal fusion. Alveolar macrophages from Cftr+/+ and Cftr–/– mice were incubated with TMR-tagged dextran (5 mg ml–1) for 1 h, cells were then washed several times and reincubated in fresh medium for 2 h. Cells were further incubated with AlexaFluor-488-conjugated zymosan for
print ncb1456.indd 942print ncb1456.indd 942 16/8/06 11:28:57 am16/8/06 11:28:57 am
Nature Publishing Group ©2006

NATURE CELL BIOLOGY VOLUME 8 | NUMBER 9 | SEPTEMBER 2006 943
A RT I C L E S
an additional 40–60 min and data collected using a Leica SP2 AOBS confocal microscope. Experiments were conducted at 37 °C using a temperature controlled heating stage. Phagosomes (intracellular zymosan, green) fused with lysosomes (red) appeared yellow.
Dynamic observation of phagosomal pH changes and lysosomal fusion. Time-lapse video recording was used to follow intra-phagosomal pH during phago-somal–lysosomal fusion. Video recording was initiated once cells (loaded with TMR-tagged-dextran as mentioned above) were exposed to pH sensitive fluo-rescein conjugated zymosan using an Olympus IX81 inverted microscope with a 60× numerical aperture, 1.45 objective lens and 480/40 excitation and 535/30–600 LP/30 emission filters. To obtain high spatial resolution, some fusion events were collected using a Leica SP2 AOBS confocal microscope. Temporal analysis of fluo-rescence changes associated with phagosomal–lysosomal fusion was performed in Image J. A custom programme was written in Image J to compute area-integrated
intensities in each phagosome of the fluorescein image and the same regions were identified automatically in the corresponding TMR image. Changes in pH were calculated from the standard curve as described in text.
CFTR-immunostaining of cells loaded with beads. J774 cells were plated at a density of 300,000 cells on 25 mm coverslips. Following a 24 h incubation, cells were washed in PBS, then cooled in HEPES–DMEM on ice. Opsonized latex beads (0.8 µm; Spherotech, Libertyville, IL) were added and allowed to sediment for 30 min on ice. Phagocytosis was initiated by warming cells to 37 °C and con-tinued for 45 min. Phagocytosis was stopped by transferring coverslips to ice-cold PBS, washing 5 times with PBS to remove any remaining external beads and fixation for 20 min in 3% paraformaldehyde–PBS. In another group, cells were incubated with 5 mg ml–1 lysine-fixable dextran-TexasRed for 1 h, then the cells were washed several times and reincubated in fresh medium for 2 h, followed by five washes with PBS, and fixation for 20 min in 3% paraformaldehyde–PBS. Cells were blocked and permeabilized in 0.25% fish skin gelatin (Sigma), 0.01% saponin (Calbiochem, San Diego, CA) in PBS for 30 min. Cells were stained with CFTR antibody for 1 h, coverslips were washed, then incubated with goat antirab-bit-AlexaFluor488 (Molecular Probes) for 1 h, washed again and mounted in 4% n-propyl gallate, 25 mM Tris at pH 8.5 and 75% glycerol.
Related localization of CFTR and phagocytosed beads were imaged with a Leica SP2 AOBS inverted confocal microscope using a 488 nm laser and/or a 594 nm laser, a 63× glycerol objective lens (NA = 1.3) and an emission band-width of 500–535 nm. Images were acquired with LCS software and images were processed with ImageJ or MetaMorph.
Phagosomal localization of CFTR by immunoelectron microscopy. J774 mac-rophages were incubated with 0.8 µm IgG-coated polystyrene beads at 37 °C for 1 h and then cells were collected and fixed by 4% paraformaldehyde and 0.15% glutaraldehyde in 0.1 M PB buffer for 1 h. Cells were subsequently washed with 0.1 M PB buffer, dehydrated with ethanol and embedded with L.R. White resin (Electron Microscopy Science, Hatfield, PA) in a vacuum oven at 45 °C for 48 h. Sections (100 nm) were incubated with anti-CFTR primary antibody (anti-NBD-R1 of CFTR) for 3 h and further incubated with 10-nm gold-conjugated second-ary antibody, goat anti-rabbit IgG (H+L; Ted Pella Inc., Redding, CA) for 1 h. Cells were further stained with uranyl acetate and lead citrate and examined on a FEI Tecnai F30 at 300 KV.
Lysosomal localization of CFTR by double immuno-gold staining electron microscopy. Cells were fixed with 0.2% glutaraldehyde and embedded in L.R. white resin. Post-embedding, staining was performed with rabbit anti- CFTR and rat anti-LAMP-1. Primary antibody staining was detected with goat anti-rabbit IgG conjugated to 10-nm gold beads and goat anti-rat IgG conjugated to 15-nm gold beads (Ted Pella Inc., Redding, CA). Details of whole-cell recording43, 44, single channel recording, bactericidal assays45, isolation of murine alveolar mac-rophages46, isolation of murine and human neutrophil 47 and determination of free-radical production15 are provided in the Supplementary Information, Text.
Data analysis. Images were analysed using Fluoview software (Olympus, Corp.) ImageJ (National Institutes of Health, Bethesda, MD), and MetaMorph (Universal Imaging Corp, Downingtown PA). Electrophysiological data were acquired using a Pentium 4 PC and analysed off-line using the integrated graphics package, IGOR Pro (WaveMetrics, Lake Oswego, OR) and TacX4.1.5 (Bruxton Corp., Seattle,
WA). Single-channel conductance was obtained by fitting the single-channel cur-rent versus test potential using Origin (Microcal Software, Inc., Northhampton, MA). Summary data are expressed as the mean ± s.e.m., with the number of experiments in parentheses. Significance between groups was determined using the t-test and asterisks indicate a significance difference of P <0.05.
Note: Supplementary Information is available on the Nature Cell Biology website.
ACKNOWLEDGEMENTSThis work was supported by National Institutes of Health (NIH) and the National Institute of General Medical Sciences (NIGMS) (R01 GM36823), the Cystic Fibrosis Foundation (Nelson03G0) and the University of Chicago DDRCC (DK42086). The authors wish to thank L. Lester, Director of the Cystic Fibrosis Center at the University of Chicago for many helpful discussions.
AUTHOR CONTRIBUTIONSA.D., M.E.B., L.V.D., C.L., F.L.S., Y.C., P.H. and J.K. performed experiments, A.P.N. and V.B. designed and performed immunochemical and fluorescence labelling experiments, H.C.P. and D.J. designed the study and wrote the paper with input from the other authors.
COMPETING FINANCIAL INTERESTSThe authors declare that they have no competing financial interests.
Published online at http://www.nature.com/naturecellbiology/Reprints and permissions information is available online at http://npg.nature.com/reprintsandpermissions/
1. Vieira, O. V., Botelho, R. J. & Grinstein, S. Phagosome maturation: aging gracefully. Biochem. J. 366, 689–704 (2002).
2. Lee, W. L., Harrison, R. E. & Grinstein, S. Phagocytosis by neutrophils. Microbes Infect. 5, 1299–1306 (2003).
3. Aderem, A. & Underhill, D. M. Mechanisms of phagocytosis in macrophages. Annu. Rev. Immunol. 17, 593–623 (1999).
4. Scott, C. C., Botelho, R. J. & Grinstein, S. Phagosome maturation: a few bugs in the system. J. Membr. Biol. 193, 137–152 (2003).
5. Russell, D. G. Mycobacterium tuberculosis: here today, and here tomorrow. Nature Rev. Mol. Cell Biol. 2, 569–577 (2001).
6. Babior, B. M. NADPH oxidase. Curr. Opin. Immunol. 16, 42–47 (2004).7. Hara-Chikuma, M. et al. ClC-3 chloride channels facilitate endosomal acidification and
chloride accumulation. J. Biol. Chem. 280, 1241–1247 (2005).8. Gadsby, D. C., Nagel, G. & Hwang, T. C. The CFTR chloride channel of mammalian
heart. Annu. Rev. Physiol. 57, 387–416 (1995).9. Bradbury, N. A. Intracellular CFTR: localization and function. Physiol. Rev. 79, S175–
S191 (1999).10. Schwiebert, E. M., Benos, D. J., Egan, M. E., Stutts, M. J. & Guggino, W. B. CFTR is a con-
ductance regulator as well as a chloride channel. Physiol. Rev. 79, S145–S166 (1999).11. McCarty, N. A. Permeation through the CFTR chloride channel. J. Exp. Biol. 203,
1947–1962 (2000).12. Ma, T. et al. Thiazolidinone CFTR inhibitor identified by high-throughput screening
blocks cholera toxin-induced intestinal fluid secretion. J. Clin. Invest. 110, 1651–1658 (2002).
13. Jovov, B. et al. Interaction between cystic fibrosis transmembrane conductance regu-lator and outwardly rectified chloride channels. J. Biol. Chem. 270, 29194–29200 (1995).
14. Roos, D. & Winterbourn, C. C. Immunology. Lethal weapons. Science 296, 669–671 (2002).
15. Kobayashi, T. et al. A simple approach for the analysis of intracellular movement of oxidant-producing intracellular compartments in living human neutrophils. Histochem. Cell Biol. 113, 251–257 (2000).
16. Belhoussine, R., Morjani, H., Sharonov, S., Ploton, D. & Manfait, M. Characterization of intracellular pH gradients in human multidrug-resistant tumour cells by means of scanning microspectrofluorometry and dual-emission-ratio probes. Int. J. Cancer 81, 81–89 (1999).
17. Bowman, E. J., Siebers, A. & Altendorf, K. Bafilomycins: a class of inhibitors of mem-brane ATPases from microorganisms, animal cells, and plant cells. Proc. Natl Acad. Sci. USA 85, 7972–7976 (1988).
18. Lukacs, G. L., Rotstein, O. D. & Grinstein, S. Determinants of the phagosomal pH in macrophages. In situ assessment of vacuolar H(+)–ATPase activity, counterion conduct-ance, and H+ “leak”. J. Biol. Chem. 266, 24540–24548 (1991).
19. Makranz, C., Cohen, G., Reichert, F., Kodama, T. & Rotshenker, S. cAMP cascade (PKA, Epac, adenylyl cyclase, Gi, and phosphodiesterases) regulates myelin phagocytosis mediated by complement receptor-3 and scavenger receptor-AI/II in microglia and macrophages. Glia 53, 441–448 (2006).
20. Ydrenius, L., Majeed, M., Rasmusson, B. J., Stendahl, O. & Sarndahl, E. Activation of cAMP-dependent protein kinase is necessary for actin rearrangements in human neutrophils during phagocytosis. J. Leukoc. Biol. 67, 520–528 (2000).
21. Oh, Y. K. & Straubinger, R. M. Intracellular fate of Mycobacterium avium: use of dual-label spectrofluorometry to investigate the influence of bacterial viability and opsoni-zation on phagosomal pH and phagosome-lysosome interaction. Infect. Immun. 64, 319–325 (1996).
print ncb1456.indd 943print ncb1456.indd 943 16/8/06 11:29:04 am16/8/06 11:29:04 am
Nature Publishing Group ©2006

944 NATURE CELL BIOLOGY VOLUME 8 | NUMBER 9 | SEPTEMBER 2006
A RT I C L E S
22. Jensen, M. S. & Bainton, D. F. Temporal changes in pH within the phagocytic vacuole of the polymorphonuclear neutrophilic leukocyte. J. Cell. Biol. 56, 379–388 (1973).
23. Styrt, B. & Klempner, M. S. Internal pH of human neutrophil lysosomes. FEBS Lett. 149, 113–116 (1982).
24. Yates, R. M. & Russell, D. G. Phagosome maturation proceeds independently of stimula-tion of Toll-like receptors 2 and 4. Immunity 23, 409–417 (2005).
25. Kasper, D. et al. Loss of the chloride channel ClC-7 leads to lysosomal storage disease and neurodegeneration. EMBO J. 24, 1079–1091 (2005).
26. Barasch, J. et al. Defective acidification of intracellular organelles in cystic fibrosis. Nature 352, 70–73 (1991).
27. Sonawane, N. D., Thiagarajah, J. R. & Verkman, A. S. Chloride concentration in endo-somes measured using a ratioable fluorescent Cl- indicator: evidence for chloride accumulation during acidification. J. Biol. Chem. 277, 5506–5513 (2002).
28. Sonawane, N. D. & Verkman, A. S. Determinants of [Cl-] in recycling and late endo-somes and Golgi complex measured using fluorescent ligands. J. Cell Biol. 160, 1129–1138 (2003).
29. Barg, S. et al. Priming of insulin granules for exocytosis by granular Cl(-) uptake and acidification. J. Cell Sci. 114, 2145–2154 (2001).
30. DeCoursey, T. E. During the respiratory burst, do phagocytes need proton channels or potassium channels, or both? Sci STKE pe21 (2004).
31. Harrison, R. E., Touret, N. & Grinstein, S. Microbial killing: oxidants, proteases and ions. Curr. Biol. 12, R357–R359 (2002).
32. Reeves, E. P. et al. Killing activity of neutrophils is mediated through activation of proteases by K+ flux. Nature 416, 291–297 (2002).
33. Chandy, G., Grabe, M., Moore, H. P. & Machen, T. E. Proton leak and CFTR in regulation of Golgi pH in respiratory epithelial cells. Am. J. Physiol. Cell Physiol. 281, C908–C921 (2001).
34. al-Awqati, Q., Barasch, J. & Landry, D. Chloride channels of intracellular organelles and their potential role in cystic fibrosis. J. Exp. Biol. 172, 245–266 (1992).
35. Barasch, J. & al-Awqati, Q. Defective acidification of the biosynthetic pathway in cystic fibrosis. J. Cell Sci. 17, 229–233 (1993).
36. Poschet, J., Perkett, E. & Deretic, V. Hyperacidification in cystic fibrosis: links with lung disease and new prospects for treatment. Trends Mol. Med. 8, 512–519 (2002).
37. Gibson, G. A., Hill, W. G. & Weisz, O. A. Evidence against the acidification hypothesis in cystic fibrosis. Am. J. Physiol. Cell Physiol. 279, C1088–C1099 (2000).
38. Luckie, D. B., Singh, C. N., Wine, J. J. & Wilterding, J. H. CFTR activation raises extracellular pH of NIH3T3 mouse fibroblasts and C127 epithelial cells. J. Membr. Biol. 179, 275–284 (2001).
39. Morris, M. R., Doull, I. J., Dewitt, S. & Hallett, M. B. Reduced iC3b-mediated phago-cytotic capacity of pulmonary neutrophils in cystic fibrosis. Clin. Exp. Immunol. 142, 68–75 (2005).
40. Moraes, T. J. et al. Abnormalities in the pulmonary innate immune system in cystic fibrosis. Am. J. Respir. Cell Mol. Biol. 34, 364–374 (2006).
41. Di, A., Krupa, B. & Nelson, D. J. Calcium-G protein interactions in the regulation of macrophage secretion. J. Biol. Chem. 276, 37124–37132 (2001).
42. Newman, J. Novel buffer systems for macromolecular crystallization. Acta. Crystallogr. D Biol. Crystallogr. 60, 610–612 (2004).
43. Hamill, O. P., Marty, A., Neher, E. & Sakmann, B. Improved patch-clamp techniques for high resolution current recording from cells and cell-free membrane patches. Pflügers Arch. 391, 85–100 (1981).
44. Naren, A. P. et al. Regulation of CFTR chloride channels by syntaxin and Munc18 isoforms. Nature 390, 302–305 (1997).
45. Hamrick, T. S., Havell, E. A., Horton, J. R. & Orndorff, P. E. Host and bacterial factors involved in the innate ability of mouse macrophages to eliminate internalized unop-sonized Escherichia coli. Infect. Immun. 68, 125–132 (2000).
46. Tesciuba, A. G. et al. Inducible costimulator regulates Th2-mediated inflammation, but not Th2 differentiation, in a model of allergic airway disease. J. Immunol. 167, 1996–2003 (2001).
47. Grisham, M. B., Engerson, T. D., McCord, J. M. & Jones, H. P. A comparative study of neutrophil purification and function. J. Immunol. Methods 82, 315–320 (1985).
48. Fu, J., Ji, H. L., Naren, A. P. & Kirk, K. L. A cluster of negative charges at the amino ter-minal tail of CFTR regulates ATP-dependent channel gating. J. Physiol. 536, 459–470 (2001).
49. Li, C., Roy, K., Dandridge, K. & Naren, A. P. Molecular assembly of cystic fibrosis transmembrane conductance regulator in plasma membrane. J. Biol. Chem. 279, 24673–24684 (2004).
print ncb1456.indd 944print ncb1456.indd 944 16/8/06 11:29:08 am16/8/06 11:29:08 am
Nature Publishing Group ©2006
S U P P L E M E N TA RY I N F O R M AT I O N
WWW.NATURE.COM/NATURECELLBIOLOGY 1
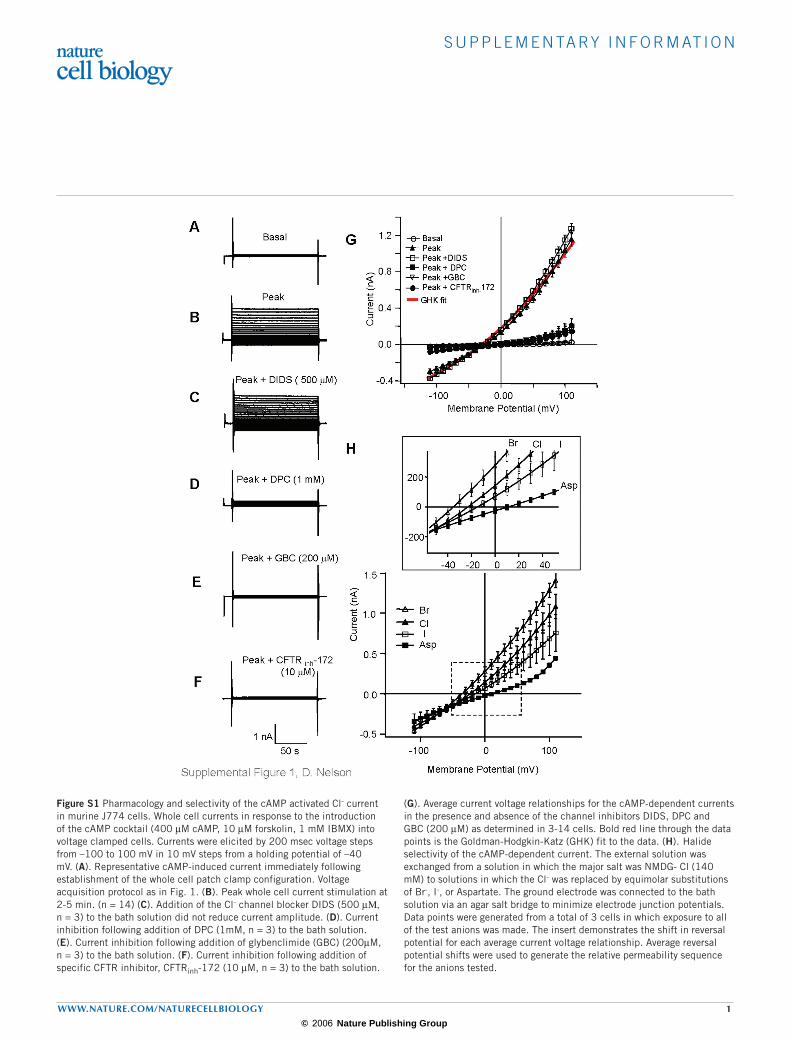
Figure S1 Pharmacology and selectivity of the cAMP activated Cl- current in murine J774 cells. Whole cell currents in response to the introduction of the cAMP cocktail (400 µM cAMP, 10 µM forskolin, 1 mM IBMX) into voltage clamped cells. Currents were elicited by 200 msec voltage steps from –100 to 100 mV in 10 mV steps from a holding potential of –40 mV. (A). Representative cAMP-induced current immediately following establishment of the whole cell patch clamp configuration. Voltage acquisition protocol as in Fig. 1. (B). Peak whole cell current stimulation at 2-5 min. (n = 14) (C). Addition of the Cl- channel blocker DIDS (500 µΜ, n = 3) to the bath solution did not reduce current amplitude. (D). Current inhibition following addition of DPC (1mM, n = 3) to the bath solution. (E). Current inhibition following addition of glybenclimide (GBC) (200µM, n = 3) to the bath solution. (F). Current inhibition following addition of specific CFTR inhibitor, CFTRinh-172 (10 µM, n = 3) to the bath solution.
(G). Average current voltage relationships for the cAMP-dependent currents in the presence and absence of the channel inhibitors DIDS, DPC and GBC (200 µM) as determined in 3-14 cells. Bold red line through the data points is the Goldman-Hodgkin-Katz (GHK) fit to the data. (H). Halide selectivity of the cAMP-dependent current. The external solution was exchanged from a solution in which the major salt was NMDG- Cl (140 mM) to solutions in which the Cl- was replaced by equimolar substitutions of Br-, I-, or Aspartate. The ground electrode was connected to the bath solution via an agar salt bridge to minimize electrode junction potentials. Data points were generated from a total of 3 cells in which exposure to all of the test anions was made. The insert demonstrates the shift in reversal potential for each average current voltage relationship. Average reversal potential shifts were used to generate the relative permeability sequence for the anions tested.
© 2006 Nature Publishing Group

S U P P L E M E N TA RY I N F O R M AT I O N
2 WWW.NATURE.COM/NATURECELLBIOLOGY
Figure S2 Superoxide production in the alveolar macrophages (AMs) is not dependent upon CFTR expression. (A) Determination of free radical production in alveolar macrophages with confocal microscope. AMs from CFTR+/+ and CFTR-/- mice were loaded with 25 µM H2DCFDA which is not fluorescent until oxidized by reactive oxygen species15. The oxidized fluorescence of H2DCF (DCF) was apparent in the phagosome containing zymosan in both CFTR+/+ AMs and CFTR-/- AMs as indicated by arrows. The DCF was not observed when CFTR+/+ AMs were treated with 300 nM
DPI (diphenyleneiodonium) at the same time. (B, C). Release of O2- was
measured as reduction of ferricytochrome c as an increase in absorbance at 550 nm. AMs from both CFTR+/+ and CFTR-/- mice were incubated with 1µg/ml PMA (B) or Zymosan (C) for 30 min at 370C to enhance the O2
- release. There is no difference in the absorbance at 550 nm between CFTR+/+ AMs and CFTR-/- AMs treated with PMA or Zymosan. WT: wild type (Cftr+/+); KO: knockout (Cftr-/-). N equals the number of mice used in these experiments.
© 2006 Nature Publishing Group

S U P P L E M E N TA RY I N F O R M AT I O N
WWW.NATURE.COM/NATURECELLBIOLOGY 3
Supplementary Movie Legend Movie S1 Time course of P. aeruginosa growth in alveolar macrophage from wild type CFTR mouse.Alveolar macrophages were infected with EGFP-expressing P. aeruginosa (PA27853/PLL-EGFP) at an MOI of 10 for 30 min at 37ºC, and incubated with 50 µg/ml kanamycin for 30 min to remove the adherent bacteria. Time lapse was recorded with Olympus IX81 inverted microscope with a 60X numerical aperture 1.45 objective lens and 480/40 excitation and 535/30 emission filters. Time interval between two frames was 10 min.
Movie S2 Time course of P. aeruginosa growth in alveolar macrophage from CFTR knock-out mouse. Experimental conditions are the same as used in Video 1. Time interval between two frames was 30 min. Note the growth of intracellular P. aeruginosa (green).
Movie S3 Time course of phagosomal acidification following lysosomal fusion of CFTR +/+ alveolar macrophages.Alveolar macrophages incubated with TMR-tagged dextran as described in “Methods”. Video recording was initiated once dextran-loaded cells were exposed to pH sensitive fluorescein-conjugated zymosan. Time interval between two frames was 30 sec. Note quenching of the fluorescein- conjugated zymosan following fusion with the TMR-dextran-containing lysosomes and the red color of the fused phagolysosome. Yellow arrow indicates associated lysosomal fusion events (green + red=yellow). White arrow indicates internalized phagosome.
Movie S4 Time course of phagosomal acidification following lysosomal fusion of CFTR -/- alveolar macrophages.Method used here is the same as in “video 3”. Note the green fluorescence from fluorescein- conjugated zymosan following fusion with the TMR-dextran-containing lysosomes was not quenched and thus the color of fused phagolysosome was yellow.
© 2006 Nature Publishing Group

1
Supplemental text for Methods
Electrophysiology
All experiments were conducted at room temperature (22 – 24o C) using an EPC-9 patch
clamp amplifier (HEKA Electronik GmbH, Lambrecht, Germany) and using the Pulse +
PulseFit V 8.65 acquisition program (HEKA Electronik GmbH, Lambrecht, Germany).
Patch-clamp pipettes were obtained using quartz class (Sutter Instrument Co., Novato,
CA), and a Sutter model P-2000 puller and had resistances of between 6-8 MOhms.
Whole-cell recordings were obtained from J774 macrophage cells, alveolar macrophages
and neutrophils using methods as previously described 1 and solutions in which Cl- was
the only permeant species as previously described for epithelial cells 2. The pipette
solution contained (in mM): 140 N-methyl D-glucamine; 40 HCl; 100 L-glutamic acid;
0.2 CaCl2; 2 MgCl2; 1 EGTA; 10 HEPES; and 2 ATP-Mg, pH 7.2. The bath solution
contained (in mM): 140 N-methyl D-glucamine; 140 HCl; 2 CaCl2; 1 MgCl2; and 10
HEPES, pH 7.4. The Cl- equilibrium potential in these experiments was –31 mV. Cells
were maximally stimulated by the addition of a cAMP-activating cocktail (400 µM
cAMP, 10 µM forskolin, 1 mM IBMX ) to the pipette solution with voltage steps ranging
from –110 to +110 mV in increments of 10 mV from a holding potential of –40 mV.
Single-channel recordings were obtained from both human and murine alveolar
macrophages using the cell–attached configuration. The extracellular (both pipette and
bath) solution contained 140 mM NMDG-Cl, 2 mM MgCl2, 2 mM CaCl2, 10 mM
HEPES and 200 µM DIDS (to pharmacologically block non-CFTR anion channels)
titrated to a pH of 7.4 with NMDG. CFTR channels were activated with 400 µM pCPT-
© 2006 Nature Publishing Group

2
cAMP included in the pipette solution. Single-channel currents were continuously
recorded for 5 min at test potentials ranging from 0 mV to 100 mV (referenced to the cell
interior) delivered from the recording electrode and were filtered at 1 kHz and sampled at
2 kHz.
Bactericidal assay
Bactericidal activity was evaluated in three different ways.
Microscopy assay:
Gentamicin-resistant P. aeruginosa strain 27853 expressing EGFP (PA27853/PLL-
EGFP) were cultured for 14 h at 37ºC in tryptic soy broth with 50 µg/ml gentamicin and
0.5 mM IPTG and the bacteria concentration was determined by serial dilution and
counting colony forming units. Alveolar macrophages or peritoneal macrophages were
infected at an MOI of 10 for 30 min at 37ºC, and incubated with 50 µg/ml kanamycin for
30 min to remove the adherent bacteria. Coverslips were washed five times with PBS,
then mounted onto an Olympus IX81 inverted microscope with a heating stage
maintained at 37ºC. Bacteria were illuminated with a 100-watt mercury-arc lamp (ND 2.3
filtered) and visualized with a 60X numerical aperture 1.45 objective lens and 480/40
excitation and 535/30 emission filters. Fluorescence and differential interference contrast
images were collected on a Retiga EXi chilled charged coupled device (QImaging) every
10-30 min over 3.5 – 7 h with automatic refocus under control of METAMORPH
software (Universal Imaging).
Flow cytometry assay:
© 2006 Nature Publishing Group

3
Alveolar macrophages were infected with P. aeruginosa at an MOI of 20 for 1 h at 37ºC.
Cells were washed extensively with PBS and incubated in bacteria-free growth medium
again for 0, 1, 2, and 4 h. After washing, macrophages were lysed in 1% Triton
X100/PBS for 2 min at RT. Lysates were immediately centrifuged at 1000 x g for 10 min
at 4ºC and from the resulting supernatant, bacteria were pelleted by centrifugation at
10,000 x g for 10 min. Bacteria pellets were resuspended in 20 µl of TBS and kept on ice.
Bacteria viability was determined with the LIVE/DEAD BacLight Bacterial Viability kit
(Molecular Probes) according to the manufacturer specifications. Briefly, 20 µl of
resuspended bacteria were added to an assay mixture containing 1.5 µl SYTO 9 (5 µM
final), 1.5 µl propidium iodide (30 µM final), 10 µl resuspended microsphere standard,
and 967 µl ddH2O. The assay mixture was incubated for 15 min in the dark at room
temperature, then samples were promptly read on a BD Biosciences LSR II flow
cytometer. Samples were illuminated with a 488 nm Sapphire OPSL and fluorescence
was detected through 530/30 and 505 LP filters for SYTO 9 and 695/40 and 635 LP
filters for propidium iodide. Data for side scattering, forward scattering, and fluorescence
were acquired and analyzed with FACSDiVa software. Fluorescence data are shown in
density dot blots with viable and nonviable bacteria gated into different regions
respectively. Event numbers in each region were tabulated and plotted against SYTO 9
and propidium iodide fluorescence.
Colony-Forming-Unit (CFU) assay:
CFU bactericidal assay was described by Hamrick and colleagues 3. P. aeruginosa strain
27853 (PA27853) or E. coli (BL21) were grown in tryptic soy broth for 14 h at 37ºC and
the bacteria concentration was determined as described above. In each sample, 1 x 10⁶
© 2006 Nature Publishing Group

4
neutrophils or 2 x 10⁵ alveolar macrophages were infected with bacteria at an MOI of 20
for 1 h at 37ºC. Samples were centrifuged at 500 x g for 10 min at 4ºC, supernatant
aspirated, and pellets were resuspended in FBS/HEPES/DMEM. Noninternalized bacteria
were killed by adding 100 µg/ml gentamicin to the medium and incubating for 1 h at
37ºC. Samples were centrifuged, and the pellets resuspended in medium with 10 µg/ml
gentamicin. Neutrophil or alveolar macrophage bactericidal activity continued at 37ºC
over several time points (0, 1 and 2 h for alveolar macrophages, 0, 1, 2 and 4 h for
neutrophils). At each time point, cells were centrifuged at 500 x g for 5 min and the cell
pellet was resuspended 1% Triton X 100/PBS. Cells were lysed for two min at room
temperature and 50, 100, and 500 µl aliquots of lysate were spread onto Pseudomonas
isolation agar plates or E. coli selective agar plates. Surviving bacteria were grown for 16
h and subsequently the number of colony forming units was tabulated.
Isolation of alveolar macrophages from human subjects
The use of human subjects for bronchoalveolar lavage was approved by the Institutional
Review Board at the University of Chicago Hospitals. Bronchoalveolar lavage samples
were washed and transferred to 10-cm culture dishes and macrophages were allowed to
adhere for 2 hr at 37ºC. Alveolar macrophages collected from each lavage were cultured
for further experiments or pooled for immunoblot analysis.
Isolation of alveolar macrophages from mice 4
Mice were sacrificed via i.p. injection of 30 mg/mouse ketamine-HCl. Bronchoalveolar
lavage was performed by delivering 0.8 ml cold PBS into the airway via a trachea
© 2006 Nature Publishing Group

5
cannula and gently aspirating the fluid. The lavage was repeated three times to recover a
total volume of 2–3 ml. Cells collected from each wash were further cultured for further
experiments or pooled for Western blot analysis.
Isolation of neutrophils from human blood
Neutrophils were isolated from heparinized venous blood of healthy donors by density
gradient centrifugation as described elsewhere 5. Briefly, blood was diluted 1:3 with 150
mM NaCl, 2.5 mM EDTA, then layered onto Histopaque-1077 (Sigma-Aldrich, St.
Louis, MO) and centrifuged at 300 x g for 30 min at room temperature. Plasma and
mononuclear cells were aspirated down to the pellet. Erythrocytes in the pellet were
removed via quick hypotonic lysis with ice-cold water followed by tonicity restoration
with an equal volume of 2X buffer. Neutrophils were pelleted by centrifugation, and lysis
of remaining red blood cells was repeated. Neutrophils were washed in 1X PAG,
counted in hemacytometer, and the viability was assessed by Trypan blue (found to be
>95%).
Isolation of murine peritoneal neutrophil and macrophage via thioglycollate-
induced peritonitis
Wild-type or CFTR knock-out mice were injected i.p. with sterile 3% thioglycollate
medium (1 ml; Sigma); 18 hr post-injection, mice were sacrificed by CO2 inhalation. A
midline incision was made over the abdominal cavity and the skin layers separated by
hand. Sterile PBS (3 ml) was injected into the peritoneum through the muscle layer with a
23-gauge needle and the abdominal cavity was gently massaged for ~1 min. The
abdominal cavity was opened and the lavage fluid was removed with an 18-gauge
cannula and 3 ml syringe. Cells were pelleted by centrifugation at 500 x g for 10 min at
© 2006 Nature Publishing Group

6
4ºC, then resuspended in HEPES buffer plus 10% FBS. The cell suspension was
transferred to 10-cm culture dishes and macrophages were allowed to adhere for 1 h at
37ºC. Suspended neutrophils were recovered, counted with a hemacytometer, and
suspended in medium at the desired concentration.
Determination of free radical production in alveolar macrophages with confocal
microscope.
Alveolar macrophages were loaded with 25 µM H2DCFDA which is not fluorescent until
oxidized by reactive oxygen species6. After loading with H2DCFDA for 20 min at room
temperature, cells were exposed to opsonized zymosan at 370C, data were collected from
dye labeled cells 10-30 min later with IX70 Olympus Fluoview 200 laser-scanning
confocal microscope using 6% of the 488 nm argon laser line and a 510-530 nm barrier
filter while the DIC image was simultaneously collected on a second detector.
Experiments were conducted at 37oC using a temperature controlled heating stage (Brook
Industries, Lake Villa, IL, USA).
Measurement of superoxide release from alveolar macrophages using
ferricytochrome c reduction assay.
Bronchoalveolar lavages from 21- 23 WT or 20 -25 CFTR-/- mice were combined and
centrifuged at 1000 x g for 10 min. Cells were cultured overnight at 37ºC with 5% CO2.
Non-adherent cells were removed by aspiration, and the remaining cells were washed,
gently scraped and suspended in HBSS, pH 7.4 at 106/ml. The survival of the cells was
verified by Trypan blue. Release of O2- from macrophages was measured as reduction of
ferricytochrome c (Sigma, St-Louis, MO) mesuared as an increase in absorbance at 550
© 2006 Nature Publishing Group

7
nm in a 96-well plate format. Non-specific protein binding cites were blocked by
overnight incubation with 5% BSA and the wells were washed twice with PBS before
use. PMA at 1µg/ml or Zymosan were used as a stimulus. Cells incubated with PMA or
Zymosan vehicle buffer were used as blanks. Cytochrome C was added to 100 µM to the
cells before the stimulus. Absorbance at 550 nm was recorded for 120 minutes at 10 min
intervals in a temperature-controlled Multi-Detection Microplate Reader (Synergy HT,
Biotek).
References 1. Hamill, O. P., Marty, A., Neher, E. & Sakmann, B. Improved patch-clamp
techniques for high resolution current recording from cells and cell-free
membrane patches. Pflügers Archives European Journal of Physiology 391, 85-
100 (1981).
2. Naren, A. P. et al. Regulation of CFTR chloride channels by syntaxin and
Munc18 isoforms. Nature 390, 302-5. (1997).
3. Hamrick, T. S., Havell, E. A., Horton, J. R. & Orndorff, P. E. Host and bacterial
factors involved in the innate ability of mouse macrophages to eliminate
internalized unopsonized Escherichia coli. Infect Immun 68, 125-32 (2000).
4. Tesciuba, A. G. et al. Inducible costimulator regulates Th2-mediated
inflammation, but not Th2 differentiation, in a model of allergic airway disease. J
Immunol 167, 1996-2003 (2001).
© 2006 Nature Publishing Group

8
5. Grisham, M. B., Engerson, T. D., McCord, J. M. & Jones, H. P. A comparative
study of neutrophil purification and function. J Immunol Methods 82, 315-20
(1985).
6. Kobayashi, T. et al. A simple approach for the analysis of intracellular movement
of oxidant-producing intracellular compartments in living human neutrophils.
Histochem Cell Biol 113, 251-7 (2000).
© 2006 Nature Publishing Group
Copyright © 2022 FDOKUMEN