Quantitative comparison of a human cancer cell surface proteome between interphase and mitosis
Upload
khangminh22Category
view
3download
0
Feature ReviewProteome-Scale HumanInteractomicsKatja Luck,1,2,3,* Gloria M. Sheynkman,1,2,3,* Ivy Zhang,1,2,3
and Marc Vidal1,2
Cellular functions are mediated by complex interactome networks of physical,biochemical, and functional interactions between DNA sequences, RNA mol-ecules, proteins, lipids, and small metabolites. A thorough understanding ofcellular organization requires accurate and relatively complete models of inter-actome networks at proteome scale. The recent publication of four humanprotein–protein interaction (PPI) maps represents a technological breakthroughand an unprecedented resource for the scientific community, heralding a newera of proteome-scale human interactomics. Our knowledge gained from theseand complementary studies provides fresh insights into the opportunities andchallenges when analyzing systematically generated interactome data, definesa clear roadmap towards the generation of a first reference interactome, andreveals new perspectives on the organization of cellular life.
Proteome-Scale Human Interactome MapsCellular functions are orchestrated by complex ‘interactome’ networks of physical and func-tional interactions between biological macromolecules, including DNA, RNA, proteins, andlipids, as well as smaller molecules such as metabolites. The relationships between suchcomponents are best modeled as graphical networks in which molecules are represented by‘nodes’ and the interactions between them by links or ‘edges’ [1]. Analyzing the properties ofsuch networks can provide important insights into cellular organization and the underlyingsystems-level properties of life [1].
Because proteins are crucial for most cellular functions and typically participate in biologicalprocesses in concert with other proteins, reference maps of PPIs in an organism, or its PPIinteractome, should provide a deeper and more mechanistic understanding of cellular func-tions. However, in contrast to genome and transcriptome reference sequences, human PPIinteractome maps are still relatively far from completeness. The reasons are twofold. First,compared to DNA or RNA, proteins tend to be more biochemically complex and thustechnically challenging to manipulate and study. Second, the detection of interactions is moredifficult than directly detecting molecules given the wide range of interaction strengths andspecificities. Indeed, it took several decades to develop robust methods for detecting PPIs atproteome-scale. These efforts, paired with the availability of nearly complete ‘ORFeome’collections of ‘ready-to-be-expressed’ human open reading frames (ORFs) [2], laid the neces-sary foundation to enable substantial progress in mapping the human PPI interactome (here-after referred to as ‘interactome’ for simplicity). In the span of a couple of years, fourgroundbreaking human interactome maps have been published (Figure 1), each utilizingdifferent methodologies and thus capturing different aspects of the human interactome [3–6]. This review compares and contrasts these four interactome maps, puts their achievementsand findings into context, and identifies remaining challenges in the field of human proteininteractomics.
TrendsProteome-scale maps of human pro-tein interactions are becoming avail-able, generated by complementaryapproaches.
High-throughput protein interactomemaps are of high quality, on a par withliterature-curated interaction datasets.
Systematically generated interactomemaps more uniformly cover the humanproteome than do literature-curatedinteraction datasets that display astrong study bias.
Analysis of systematically generatedinteractome maps spurs new discov-eries impossible to obtain with litera-ture-curated interaction maps.
1Center for Cancer Systems Biology(CCSB), Dana-Farber Cancer Institute,Boston, MA 02215, USA2Department of Genetics, HarvardMedical School, Boston, MA 02115,USA3Department of Cancer Biology, Dana-Farber Cancer Institute, Boston, MA02215, USA
*Correspondence:[email protected] (K. Luck)[email protected](G.M. Sheynkman).
TIBS 1341 No. of Pages 13
Trends in Biochemical Sciences, Month Year, Vol. xx, No. yy http://dx.doi.org/10.1016/j.tibs.2017.02.006 1© 2017 Elsevier Ltd. All rights reserved.

TIBS 1341 No. of Pages 13
Human PPI Mapping at the Proteome ScaleWe define a PPI as a direct physical contact between two proteins. Such interactions mayoccur on their own in a binary manner or may require additional interaction partners. Proteinscan form multimeric complexes in which there are many direct interactions (PPIs) as well asindirect protein–protein associations (PPAs) between the different proteins of the complex.Currently, two orthogonal approaches exist for experimentally identifying biophysical relation-ships between pairs of proteins (in short, biophysical protein pairs or BPPs, which include PPIsand PPAs) at proteome scale: binary mapping and protein complex mapping (Figure 2).
Binary mapping approaches interrogate pairs of proteins for the existence of direct interactionsbetween them (PPIs). Protein-complex mapping approaches, [308_TD$DIFF]by contrast, aim to identify theset of proteins that belong to amultimeric protein complex, wherein pairs of proteins form eitherdirect contacts (PPIs) or are linked by indirect associations (PPAs). Yeast two-hybrid (Y2H)systems combined with orthogonal validation assays performed in mammalian cells and/or invitro [7] are now routinely used to screen hundreds of millions of protein pairs for possibleinteractions [8]. Y2H is based on the activation of a reporter gene upon the reconstitution of atranscription factor via a pair of interacting proteins in yeast, resulting in a growth selection(Figure 2). The relative ease of working with yeast and the ability to select for interacting pairsdetermine the scalability of Y2H. The precision and sensitivity of datasets generated with Y2Hare determined with the help of validation assays in which pairs identified in the screens aresystematically tested together with large sets of known PPIs and random pairs of proteins aspositive and negative controls, respectively. The validation assays routinely used for thispurpose are based on reconstitution of split enzymes or on the activation of the STAT3pathway, resulting in a readout such as fluorescence or luminescence [9–11].
Two approaches exist for the identification of protein complexes at proteome scale: affinitypurification (AP) followed by mass spectrometry (MS) or ‘AP-MS’ and co-fractionation (CoFrac)followed by MS or ‘CoFrac-MS’. In AP-MS, protein baits are purified from a cell lysate andcopurified proteins (the preys) are detected by MS. In CoFrac-MS, protein extracts areextensively fractionated to separate protein complexes whose components are then detectedby MS (Figure 2). Current methods for protein-complex identification operated at proteomescale are unable to distinguish between PPAs and PPIs for all reported protein pairs. Y2H
0
5 000
10 000
15 000
20 000
25 000
30 000
35 000
40 000
20052006
20072008
20092010
20112012
20132014
20152016
Num
ber o
f BPP
s
Stelzl et al.
Rual et al.
Ewing et al.
CoFrac-12HI-II-14
BioPlex
QUBICY2H AP-MS CoFrac-MS
CoFrac-15Kristensen et al.
Figure 1. Published Systematic Human Protein InteractomeMaps. It took about 10 years from the first publicationof amedium-scale set of human protein–protein interactions (PPIs) to the publication of several proteome-scale systematicmaps of biophysical relationships between pairs of human proteins (BPPs). The color code indicates the primary screeningmethod used. The displayed datasets are, from left to right, Stelzl et al. [57], Rual et al. [58], Ewing et al. [59], CoFrac-12[17], Kristensen et al. [60], HI-II-14 [5], BioPlex [4], CoFrac-15 [6], and QUBIC [3]. Abbreviations: AP-MS, affinity purification(AP) followed by mass spectrometry (MS); CoFrac-MS, co-fractionation (CoFrac) followed by MS; Y2H, yeast two-hybrid.
2 Trends in Biochemical Sciences, Month Year, Vol. xx, No. yy

TIBS 1341 No. of Pages 13
......
A B CABC
ABCD
Space
Screeningmethod Reporter
AD fusionsD
B fu
sion
s
Y2H
ZX
Y
W
VU
A A
AB
B
C
AB
CDEF
AB
CD
E
F
Readout
Resul!ngprotein pairs
+ NGS sequencing
Scoring and filtering
Yeast growth MS MS
HumanORFeome
ADBADB Tag A
Z
XY
WV
U
AP-MS Co-frac!ona!on
Binary interac!onmapping
Protein complex mappingApproaches
Primary screen-ing method
A
A
C
BC
Type of biophys-ical rela!onship PPI PPA + PPI PPA + PPI
Number of pairs
Dataset HI-II-14 BioPlex QUBIC CoFrac
13 867 23 744 16 46828 780
Number ofproteins
4297 5457 34267668
Valida!on MAPPIT, PCA, wNAPPA None SILAC-based AP-MS AP-MS or co-IP
Figure 2. Overview of the Generation of Four Recently Published Human Interactome Maps. Empty circles represent expression constructs, filled circlesrepresent proteins. The number of pairs and proteins are determined after mapping each dataset to the Entrez Gene ID gene space. The maps are HI-II-14 [5], BioPlex[4], QUBIC [3], and CoFrac-15 [6]. Abbreviations: AD, activation domain of the Gal4 transcription factor; AP-MS, affinity purification (AP) followed by mass spectrometry(MS); co-IP, co-immunoprecipitation; DB, DNA-binding domain; MAPPIT, mammalian protein–protein interaction trap; NGS, next-generation sequencing; PCA, proteincomplementation assay; PPA, protein–protein association; PPI, protein–protein interaction; SILAC, stable isotope labeling of amino acids in cell culture; wNAPPA, wellnucleic acid programmable protein array; Y2H, yeast two-hybrid.
Trends in Biochemical Sciences, Month Year, Vol. xx, No. yy 3

TIBS 1341 No. of Pages 13
followed by systematic orthogonal validation, two forms of AP-MS, and CoFrac-MS strategieshave been applied to the human proteome to produce four recently published human inter-actome maps, hereafter referred to as HI-II-14 [5], BioPlex [4], QUBIC [3], and CoFrac [6](Figure 2).
Insights from Analyzing Systematically Generated Human Interactome MapsThese four human interactome maps have been generated and processed using differentexperimental and analytical frameworks, resulting in exciting findings that span topics asdiverse as the quality and biases of current interactome maps, the evolution of proteincomplexes, and how interaction strength relates to interactome organization [3–6]. Rollandand colleagues used computational and experimental approaches to investigate the quality ofliterature-curated PPIs originating from small-scale studies [5]. Retesting literature PPIs in twodifferent assays revealed a threefold higher rate at which literature PPIs with multiple lines ofexperimental evidence (hereafter referred to as Lit-BM-13) scored positive compared to thosePPIs with only one piece of evidence. Further analysis of Lit-BM-13 PPIs identified an inherentbias of the ‘literature interactome’ towards heavily studied and/or highly expressed proteins(Figure 3) [5]. In fact, Lit-BM-13 mostly consists of PPIs involving proteins encoded by genescharacterized in many publications, and is depleted of interactions involving proteins describedin few or no publications [5]. In contrast to the patterns in Lit-BM-13, the rate at which the foursystematic interactome maps detect BPPs across the genome-by-genome space is morehomogeneous, suggesting that the observed skewed distribution of Lit-BM-13 PPIs originatesfrom a ‘sociological’ or ‘study’ bias (Figure 3) [5]. Therefore, the exclusive use of literature-derived PPI maps in network analysis may lead to incorrect conclusions about systems-levelproperties. For example, correlations between the number of interaction partners, or ‘degree’,of proteins and the functional properties of their corresponding genes, such as essentiality,might have been observed mainly because essential genes are more studied [12,13]. Using HI-II-14, the interactome map that is least biased among the four with respect to the number of
Human genome ranked by decreasing number of publica!ons
100
1000
10
1
100
10
1
100
10
1
10
1
10
1
100
10
1
Lit-BM-13
GO QUBIC
HI-I-II BioPlex
CoFrac-12-15Hum
an g
enom
era
nked
by
decr
easi
ngnu
mbe
r of p
ublic
a!on
s
Hum
an g
enom
era
nked
by
decr
easi
ngnu
mbe
r of p
ublic
a!on
s
Num
ber o
f int
erac!o
nsN
umbe
r of i
nter
ac!o
ns
Figure 3. Genome-Wide Coverage Biases of Functional and Biophysical Protein Networks. Interactomemapsare each represented as an adjacency matrix in which all genes in the human genome are ranked based on publicationcount as extracted from [5] and grouped into bins of 478. The color scale was adjusted for every network to range from 0 tothe largest number of protein pairs observed in any bin-by-bin subspace. Sources of the networks: Lit-BM-13 extractedfrom [5], HI-I-II merge of [5,58], BioPlex [4], GO (Gene Ontology) network extracted from [5] (briefly, pairs of proteins werebuilt if they share GO annotations, GO terms were filtered to those with at most 30 annotated genes), QUBIC [3], CoFrac-12-15 merge of [6,17]. Every dataset was mapped to the Entrez Gene ID gene space. Observed study biases in theBioPlex, QUBIC, and CoFrac-12-15 datasets are likely related to their propensity to detect interactions between morehighly expressed genes.
4 Trends in Biochemical Sciences, Month Year, Vol. xx, No. yy
TIBS 1341 No. of Pages 13
publications, Rolland et al. could for the first time assess in a truly systematically generated PPInetwork the properties of proteins from genes involved in cancer, confirming that they tend to (i)bind to each other more often, (ii) have higher degrees, and (iii) be more central in a PPI networkthan proteins encoded by genes with no known associationwith cancer susceptibility [5]. Theseproperties were successfully exploited to prioritize candidate genes of loci from cancer-associated genome-wide association studies (GWASs) by selecting genes within these locithat are linked via PPIs to well-established cancer genes [5].
Compared to literature-compiled interactome maps, systematically generated maps tend todisplay a more homogeneous sampling of protein interactions across the human proteomewhen proteins are ranked by publication count (Figure 3). It follows that systematically gener-atedmaps containmanymore interactions for less-studied genes, and are a powerful source ofinformation for annotating proteins of unknown function using the ‘guilt-by-association’approach, the transfer of functional annotations from one protein to its less-studied interactionpartners [14,15]. The discovery of new proteins that are involved in biological processes asdiverse as embryonic development (CoFrac), the cell cycle, and chaperone function (QUBIC),as well as diseases such as amyotrophic lateral sclerosis (BioPlex) and cancer (HI-II-14),showcases the broad applicability of this approach using any of the four interactome maps[3–6]. Furthermore, protein interaction data have been leveraged to predict the subcellularlocalization of interaction partners (BioPlex) and new classes of domain–domain interactions(BioPlex, HI-II-14) [4,5].
Studying the conservation or divergence of protein interactions on evolutionary timescaleshas proven difficult largely because comparing PPIs across taxa relied on heterogeneous data(i.e., data derived from different methods). This heterogeneity has created uncertainty aboutwhether the observed differences in PPIs between organisms reflect true adaptation or are dueto methodological differences or low assay sensitivities [16]. The CoFrac study is unique in thatit employed the same BPP screening platform to detect protein complexes in nine differentspecies that span 1 billion years of evolution [6,17]. The authors find that, although 75% of allhuman genes arose in metazoa, these younger genes only constitute 40% of the proteins in thecomplexes detected in CoFrac. This observation suggests that most biophysically stableprotein complexes arose in unicellular ancestors and were only slightly modified over time[6]. Furthermore, Wan et al. have shown that the proteins in these ancient complexes tend to bebroadly and abundantly expressed, and display lower average domain complexity [6]. In linewith these findings, proteins in ancient complexes are enriched for core biological processes,such as metabolism, whereas proteins in more ‘modern’ complexes, defined as those formedafter the emergence of metazoa, are enriched for functions linked to multicellularity [6]. Inaddition, the protein subunits of modern complexes display more diverse domain architectures(i.e., each protein contains multiple distinct domains), a common property of proteins involvedin cell signaling processes [6].
The set of interactions in the interactome is characterized by a continuum of binding affinitiesranging from very weak or transient to highly stable protein interactions. Owing to the technicalchallenges of obtaining such affinity data at interactome scale, little is known about howinteraction strength relates to interactome organization. In the QUBIC study, technologicaladvances of label-free quantitative MS-based proteomics enabled an unprecedented view ofprotein association strength at interactome scale [3]. In this study endogenously expressedbaits fused to GFP were affinity purified from HeLa cells, and the interaction stoichiometries –
the relative abundances of each bait–prey pair –were quantified using a label-free MSmethod.Using a similar methodology, the abundance stoichiometries – the endogenous abundances ofeach prey and bait in the HeLa cell lysate – were also quantified. Both measures of stoichiom-etry were combined to define the strength of every bait–prey association [3]. ‘Strong’
Trends in Biochemical Sciences, Month Year, Vol. xx, No. yy 5

TIBS 1341 No. of Pages 13
associations were defined as those pairs of proteins with one-to-one stoichiometry relation-ships, and are likely part of very stable protein complexes. ‘Weak’ associations betweenproteins were defined as those exhibiting sub-stoichiometric bait–prey recoveries (less preythan bait in the co-immunoprecipitations) and are considered cases in which the prey becamepartially dissociated during the affinity purification or where the prey associates with a fraction ofthe bait pool in vivo [3]. The weak associations between proteins seem to vastly outnumber themore stable associations in the human interactome. Systematically removing associations fromthe network in silico, starting with the weakest associations (i.e., the lowest stoichiometry),leads to the rapid disconnection of the network and to the formation of a large number ofisolated subnetworks [3]. Alternatively, iterative removal starting with the strongest associationstends to leave the network more intact compared to random edge removal. Thus, Hein et al.suggest that weak protein associations may mediate connections between more stablecomplexes and their regulators or adaptors, whereas strong protein associations are formedwithin complexes [3].
Interactome Maps of High QualityIn only a couple of years, four systematic human interactomemaps have led to the identificationof almost 93 000 unique protein interactions and associations. This is comparable in scale tothe !115 000 BPPs detected in small-scale studies over several decades [5]. While these fourinteractome maps comprise high numbers of systematically generated BPPs, the majority(90%) were observed in only one of the fourmaps, even for those pairs tested in all four maps (e.g., only !150 baits were screened by both BioPlex and QUBIC). It has been hypothesized thatthese small overlaps (Figure 4) are explained by the large numbers of false positives reported inindividual interactome datasets [18]. In the following sections we argue that these maps are ofhigh quality, that small overlaps are due to low assay sensitivities and high assay comple-mentarities, and that previous conclusions of high false positive rates were based on incorrectassumptions.
HI-II-14, BioPlex, QUBIC, and CoFrac were generated by experts in the field who have honedprotein interaction mapping methods over many years, specifically in pinpointing sources offalse positives and, in turn, prompting their avoidance [8,19–21]. For example, Y2H-based PPImapping transitioned from using cDNA libraries to using sequence-validated and arrayable sets
25 430 22 164
15 389 26 849
556
71
1007 197
579100
2226
181 29
16
CoFrac-12-15 BioPlex
HI-I-II QUBIC
Figure 4. Overlaps Between the Four Human Interactome Maps. All the displayed datasets (as in Figure 3) weremapped to the Entrez Gene ID gene space before calculating their overlaps. The interactome maps were not restricted tothe common gene space that was screened by all four studies.
6 Trends in Biochemical Sciences, Month Year, Vol. xx, No. yy

TIBS 1341 No. of Pages 13
of ORF clones during screening [22]. These sets have grown into near-complete ‘humanORFeome collections’, resources of protein-encoding ORF clones with a representative proteinfor almost every human gene [2]. Furthermore, rigorous quality-control measures were imple-mented that eliminated spontaneous auto-activation of DNA-binding fusion proteins (i.e.,activation of the reporter gene in the absence of the activation domain-containing fusionconstruct) [7,23]. MS-based approaches also evolved through the years. The identificationof associated proteins in purified complexes became practical after improvement of computa-tional algorithms for peptide identification and quantification [24,25], as well as throughexperimental modifications and sophisticated computational analysis that more efficientlyremoved background and non-specifically bound proteins [26].
High-throughput screening offers many advantages over small-scale studies – such as theability to test large sets of positive and negative controls, operate under uniform experimentalsettings, identify technical artifacts, and discriminate between signal and noise from theabundant data. The four human interactome mapping efforts incorporated rigorous qualitycontrol, which followed a general strategy as outlined in Figure 5. Key steps include internalbenchmarking to generate the protein pairs followed by external validation (retesting of a subsetof these pairs in orthogonal assays) to quantify the quality of the generated pairs [21]. Moredetails on the quality-control process for each map are provided in Box 1 and Figure 5. A fewgeneral observations can be made. Key in the implementation of internal benchmarks for theMS-based approaches is the combination of state-of-the art quantitative proteomics withsophisticated machine learning (or probabilistic modeling in the case of QUBIC) using gold
HI-II-14 CoFrac BioPlex QUBIC
Y2H screeningpairwise test
Co-frac!ona!on MSspectral coun!ng
HA-tag pulldown MSspectral coun!ng
GFP-tag pulldown MSspectral intensi!es
Binary scoring of growing yeastScoring based on elu!on profilesimilarity and shared func!onal
annota!ons (HumanNet)
Scoring based on 9 differentparameters derived from pep!de
spectral counts
Scoring based on enrichment ofprey compared to its background
distribu!on and interac!onprofile correla!ons
Method SVM classifier Probabilis!c scoring
Posi!ve setSubset of pairs in CORUM(remaining is hold-out set) Pairs in STRING and GeneMania N/A
Nega!ve set Random pairs not in CORUMRandom pairs not in STRING or
GeneMania
Es!mate of rate of false posi!vesfrom number of preys depleted in
pulldown
Posi!ve set450 Lit-BM-13 in pairwise test in
Y2HRemaining pairs in CORUM (hold-
out set) Preys of one bait (RAB11B) Pairs in CORUM
Nega!ve set682 random pairs in pairwise test
in Y2H Random pairs not in CORUM Preys of one bait (GFP) None
None Based on trainer Based on trainerBased on FDR and correla!on
coefficient
Sensi!vity: 10%, FPR: 0.4% Sensi!vity: 23%, Precision: 67.5% Sensi!vity: 80%, FPR: 10% Sensi!vity: 50%, FDR: 1%
800 Y2H pairs (6% of dataset), 450Lit-BM-13, 683 random pairs
tested in MAPPIT, PCA (humancells), and wNAPPA (in vitro)
Eight CoFrac complexes (1% ofdataset) tested in co-IP or AP-MS None
PAM-SILAC for three complexes tovalidate inferred interac!on
strength
Precision: 80%, comparable toLit-BM-13
50% complexes recovered None None
General workflow
Pair scoring
Filtering of pairs
Pair genera!on
External valida!on results
External valida!on
Training classifieror buildingprobabilis!cmodel to filterpairs
N/A
Internal benchmark results
Tes!ng classifieror probabilis!cmodel
Figure 5. Comparison of the Different Quality-Control Approaches for Generating the Four Human Interactome Maps. Sources and definitions: BPPs,biophysical relationships between pairs of proteins; CoFrac, co-fractionation; coIP, co-immunoprecipitation; CORUM [62]; FDR, false discovery rate (the fraction of allidentified BPPs that are false positives); FPR, false positive rate (the fraction of negative BPPs scored as positive); GeneMania [64]; GFP, green fluorescent protein; HA,hemagglutinin; HumanNet [61]; MAPPIT, mammalian protein–protein interaction trap [11]; MS, mass spectrometry; N/A, not applicable; PAM-SILAC, purify after mixing– stable isotope labeling of amino acids in cell culture; PCA, protein complementation assay [10]; precision, the fraction of all reported BPPs that are correct; RAB11B,Ras-related protein Rab-11B; sensitivity, the fraction of ‘real’ BPPs identified; STRING [63]; SVM, support vector machine; wNAPPA, well nucleic acid programmableprotein array [65]; Y2H, yeast two-hybrid.
Trends in Biochemical Sciences, Month Year, Vol. xx, No. yy 7
TIBS 1341 No. of Pages 13
standard BPP datasets for training or testing. [309_TD$DIFF]By contrast, the MS-based methods were foundto be more limited in their external validation, likely because of the unavailability of orthogonalassays at the necessary throughput. Of note are external benchmarking efforts conducted inHI-II-14, for which 800 PPIs together with hundreds of positive (Lit-BM-13 pairs) and negative(random protein pairs) controls were tested in three orthogonal binary PPI detection assays,and in which HI-II-14 and Lit-BM-13 PPIs were recovered at similar rates (Box 1 and Figure 5)[5]. Thus, contrary to the perception that systematically generated maps are of low quality [18],multiple lines of evidence suggest that proteome-scale screening efforts to systematicallyidentify protein interactions can result in datasets of equal or superior reproducibility comparedto interactions identified in focused studies.
Potential Sources of Small Overlaps Between Interactome MapsClearly, the data quality is unlikely to explain the observed small overlaps between the maps(Figure 4). Instead, small overlaps are more likely the result of high rates of false negatives (i.e.,low sensitivities) as indicated in Figure 5. Why do systematic interactome screening efforts missso many PPIs and PPAs, as revealed by assessing these methods using literature-derived goldstandard datasets? One reason is attributable to the complexity of the human proteome. It iswell known that human genes typically give rise to multiple protein isoforms, each of which canbe further processed by post-translational modifications to produce ‘proteoforms’ [27]. Proteo-forms from the same gene can differ strikingly in the interactions that they are able to form withother proteins (discussed in more detail in Box 2). Thus, a known interaction between twoproteoforms may not be detected in any of the four systematic studies, [310_TD$DIFF]even if the corre-sponding genes are part of the search space because the relevant proteoforms are not tested,either because they are not expressed in the cell lines used in the MS-based approaches or thecorresponding clones are not available in the ORFeome collection. Furthermore, many reportedbinary interactions have been reported for protein fragments, not full-length sequences, the
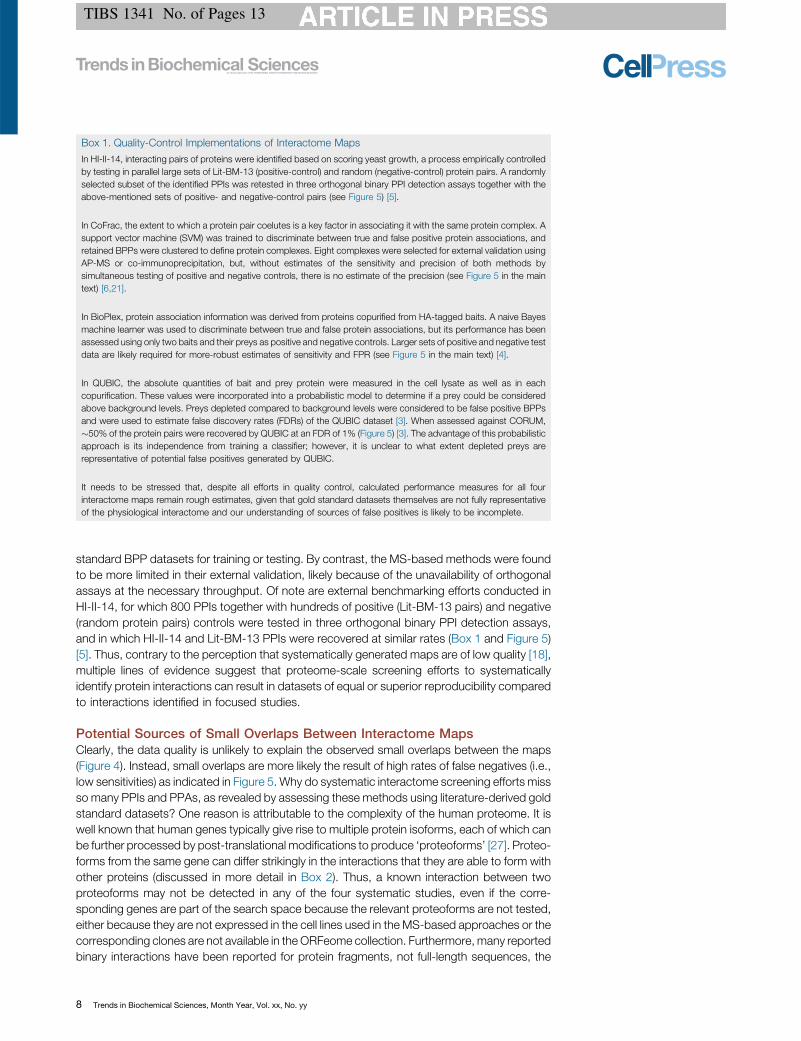
Box 1. Quality-Control Implementations of Interactome MapsIn HI-II-14, interacting pairs of proteins were identified based on scoring yeast growth, a process empirically controlledby testing in parallel large sets of Lit-BM-13 (positive-control) and random (negative-control) protein pairs. A randomlyselected subset of the identified PPIs [305_TD$DIFF]was retested in three orthogonal binary PPI detection assays together with theabove-mentioned sets of positive- and negative-control pairs ( [306_TD$DIFF]see Figure 5) [5].
In CoFrac, the extent to which a protein pair coelutes is a key factor in associating it with the same protein complex. Asupport vector machine (SVM) was trained to discriminate between true and false positive protein associations, andretained BPPs were clustered to define protein complexes. Eight complexes were selected for external validation usingAP-MS or co-immunoprecipitation, but, without estimates of the sensitivity and precision of both methods bysimultaneous testing of positive and negative controls, there is no estimate of the precision ( [307_TD$DIFF]see Figure 5 in the maintext) [6,21].
In BioPlex, protein association information was derived from proteins copurified from HA-tagged baits. A naive Bayesmachine learner was used to discriminate between true and false protein associations, but its performance has beenassessed using only two baits and their preys as positive and negative controls. Larger sets of positive and negative testdata are likely required for more-robust estimates of sensitivity and FPR ( [307_TD$DIFF]see Figure 5 in the main text) [4].
In QUBIC, the absolute quantities of bait and prey protein were measured in the cell lysate as well as in eachcopurification. These values were incorporated into a probabilistic model to determine if a prey could be consideredabove background levels. Preys depleted compared to background levels were considered to be false positive BPPsand were used to estimate false discovery rates (FDRs) of the QUBIC dataset [3]. When assessed against CORUM,!50% of the protein pairs were recovered by QUBIC at an FDR of 1% (Figure 5) [3]. The advantage of this probabilisticapproach is its independence from training a classifier; however, it is unclear to what extent depleted preys arerepresentative of potential false positives generated by QUBIC.
It needs to be stressed that, despite all efforts in quality control, calculated performance measures for all fourinteractome maps remain rough estimates, given that gold standard datasets themselves are not fully representativeof the physiological interactome and our understanding of sources of false positives is likely to be incomplete.
8 Trends in Biochemical Sciences, Month Year, Vol. xx, No. yy

TIBS 1341 No. of Pages 13
original reason being that fragments are more amenable to exogenous expression and tend tohave higher PPI detection sensitivities [28]. The four human interactome mapping efforts areunlikely to detect interactions for these fragments because they exclusively screened forinteractions between full-length proteins. Lastly, the information about which proteoformsor protein fragments were used to identify a BPP in a small-scale study may not be reliableor available in the first place, and hence cannot be curated for addition into literature-derivedgold standard datasets [29] – making it impossible to account for proteomic variations upondetermination of assay sensitivities.
An equally if not more important contributor to small overlaps between interactome maps arethe variations in the experimental methods that lead to different subsets of BPPs beingdetected, a phenomenon known as assay complementarity [30,31]. This becomes mostapparent upon comparison of binary versus protein complex detection methods, with theformer detecting PPIs and the latter a mix of PPIs and PPAs. Furthermore, PPIs display a largecontinuum of binding affinities, and different BPP detection methods – each based onfundamentally different modes of detection – inevitably vary in the range of binding affinitiesin which they can detect interactions. Variations in the particular parameters of the BPPdetection method itself can delimit the set of detectable BPPs. For example, the use of differentfusion constructs (variable linker lengths between the epitope tag and protein, C- versus N-terminal tag configurations, etc.) can influence the binding properties of the proteins assayed[3,32]. The use of different stringencies of washing buffers (variable formulas of detergents,salts, chaotropic agents, etc.) to remove non-specific binders in AP-MS can influence whichproteins are retained in the affinity purifications [30,31]. More indications of assay complemen-tarity between the four interactome mapping attempts become apparent upon closer inspec-tion. The CoFrac map is enriched for ancient proteins (60%) compared to the 20–30% of theproteins in BioPlex and HI-II-14 that more closely match the estimated fraction of ancientproteins in the human genome [6]. Furthermore, CoFrac seems to be enriched for very stableprotein complexes, as illustrated by a relatively high overlap of 26% with the very stable protein
Box 2. Leveraging Protein Interactions To Infer Protein FunctionProtein interactions represent powerful data for the functional characterization of proteins, and the precise patterns ordynamics of interactions between related proteins can lead to a deeper understanding of their function. For example,several groups have investigated the extent to which splice-driven sequence differences between protein isoforms ofthe same gene can lead to different protein interactions, and by extension, function [49–51]. The most recent studydescribed a new methodology in which isoforms are cloned from large numbers of genes and then systematicallyprofiled for PPIs [51]. Interaction profiles were compared between isoforms of the same gene (366 isoforms, 161 genes)to provide an indication of their functional divergence. Strikingly, these profiles differ by at least 50% for about half of theisoform pairs tested, suggesting that functional divergence between alternative isoforms encoded by the same gene ismore widespread than is generally appreciated [51]. Inference of isoform function through properties of their interactionpartners revealed that alternative isoforms behave like distinct proteins within a global network context [51].
Molecular interaction profiling has also uncovered the functional effect of the vast number of genetic variants identified inhuman genome sequencing efforts such as GWASs. For example, one study utilized a binary interaction screeningplatform to generate and compare protein interaction profiles between hundreds of proteins and their disease allele-containing counterparts [52]. About one fourth of the disease-associated proteins lost all PPIs compared to the wild-type protein (‘node removal’ alleles), whereas one third only lost a subset of PPIs (‘edgetic’ alleles). The rates ofinteraction perturbation were sevenfold more likely for proteins containing disease-associated variants compared tocommon variants [5,52]. Interestingly, existing tools to predict deleterious effects of mutations failed to distinguishbetween node removal and edgetic alleles, highlighting the relevance of assessing disease alleles experimentally. Finally,differences in interaction perturbation between mutant alleles of the same gene correlated with different diseasephenotypes, and the extent of interaction perturbation correlated with disease severity.
These molecular interaction profiling strategies find application beyond the study of protein sequence variations.Interaction profile changes can be induced by protein phosphorylation [53] or other post-translational modifications(reviewed in [54]). Further, molecular interaction profiling is not limited to PPIs. Profiling protein–DNA interaction changesinduced by variations in transcription factors or regulatory DNA is an equally powerful tool for the functional char-acterization of disease-related alleles [52,55,56].
Trends in Biochemical Sciences, Month Year, Vol. xx, No. yy 9

TIBS 1341 No. of Pages 13
pairs reported in the QUBIC study [3]. Interestingly, CORUM seems to be biased towards morestable complexes [3] and ancient proteins [6], and thus gold standard datasets are notnecessarily representative of the properties of the whole interactome.
Even though overlaps between interactome maps are very small, they are still highly significantgiven the vast proteome-by-proteome search space from which BPPs are sampled. In line withthis finding is another observation reported by Braun et al. where five different PPI detectionassays were tested on a manually curated gold standard dataset of 92 binary PPIs [30,33]. Ofthe 55 PPIs detected by at least one assay, eight PPIs were detected by all five assays. Again,this overlap appears to be small, but it is extremely unlikely to have occurred under the null-hypothesis that each of these five methods uniformly sampled a subset of interactions from thereference set of PPIs. Furthermore, 22 gold standard PPIs were only detected by one of the fivetested assays, overall suggesting that true protein interactions are not equally detectable bydifferent assays.
These complex and interrelated factors, that must be considered when interpreting overlapsbetween BPP datasets, have been unknown or ignored in many studies, leading to largeoverestimates of false positive rates of systematically generated yeast interactome datasets[18,34,35]. With human proteome-scale interactome maps now at hand, it is time to use thisknowledge for a more accurate interpretation of the data. Through further exploration of thesemaps, we may gain a better understanding of the types of BPPs that are preferentially detectedin different assays as well as of the factors that differentiate between quality and detectability ofBPPs, insights that will be invaluable to improve interactome benchmarks and to obtain moredetailed views on the composition and nature of the human protein interactome.
On Biophysical Versus Functionally Relevant PPIsProteins that can biophysically interact with each other do not necessarily mediate an interac-tion with a noticeable functional effect within the cell. The term ‘pseudointeractions’ has beenintroduced to refer to these non-functional PPIs [21]. Most assays, including Y2H, AP-MS, andCoFrac-MS, produce datasets of biophysical relationships between proteins whose functionalrelevance remains to be demonstrated. One can think of two different sources of biophysicalbut non-functional protein pairs in interactome maps [36]. The first source includes pairs ofproteins that can interact or associate but do so only under non-native conditions. For example,in AP-MS and CoFrac-MS, associated proteins are detected from cell lysates in which thecellular localization of the proteins is perturbed. In Y2H, proteins are expressed and tested forinteraction in the yeast nucleus. In these artificial settings, biophysical relationships betweenpairs of proteins can be detected, although there might not be a single cellular state underwhich these proteins would normally meet. The second source of biophysical but non-functional interactions includes pairs of proteins that actually interact or associate with eachother at a specific time-point within a cell, but for which the interaction is ‘agnostic’, without anyfunctional relationship or effect. BPPs that are non-functional have been considered to be falsepositives [37–39]. We strongly argue against such a classification upon several grounds: first,the objective of interactomemapping approaches is, because of technical limitations, to identifyBPPs irrespective of their functional relevance; second, disproving the functional relevance ofany BPP is nearly impossible; and third, non-functional BPPs within a cell may actually serve asan evolutionary reservoir for future functional BPPs during adaptation processes [36]. It is asubject of active research to understand the extent to which non-functional PPIs can formunder cellular and non-natural (e.g., during experimental manipulations) conditions. Recentwork provides some evidence for natural selection against non-functional PPIs [40,41].
Integration of systematically generated interactome maps with other (ideally, systematicallygenerated) functional datasets can reveal the degree to which interactome maps are enriched
10 Trends in Biochemical Sciences, Month Year, Vol. xx, No. yy

TIBS 1341 No. of Pages 13
with functional relationships between proteins as compared to random networks. All fourinteractomemaps have been integrated with functional information such as the set of literature-curated BPPs, colocalization data, gene ontology (GO) annotations, mouse phenotypes,coexpression datasets, or kinase–substrate relationships, and all results universally demon-strate that each map is highly enriched for protein pairs that share functional annotations [3–6].Interactome datasets derived from the literature (by curating BPPs from small-scale studies)usually display a higher fraction of BPPs with shared functional annotations compared tosystematically generated interactome datasets [5,18,37,39]. However, this does not mean thatliterature-derivedmaps are of higher quality [18,37,39]. First, many published BPPs themselveshave been used to build functional annotation resources, such as the Gene Ontology [42], andthus some degree of functional enrichment originates from circularity of information flow.Second, most functional annotations for human proteins originate from non-systematic stud-ies. Heavily studied proteins tend to have more functional annotations, while less-studiedproteins that exhibit interactions in the vast ‘sparse zone’ covered by the systematic maps willhave few if any annotations (see the GO plot in Figure 3) [5]. Thus, functional enrichmentsamong PPIs in systematic and non-systematic maps, as an isolated measure, should not besolely relied upon to make conclusions about the quality or biological significance of inter-actome maps with respect to each other.
Defining a Reference Map of Human Protein InteractionsThe ultimate goal of human interactomemapping is the generation of a referencemap of humanprotein interactions, but how can such a reference map be defined? The genome, tran-scriptome, proteome, and interactome can be defined as the entirety of genes, transcripts,proteins, and interactions in a given cell. The actual set of expressed transcripts, proteins, orinteractions that exist at a given cellular state represent subsets of these ‘omes’ and can beconsidered to be cell state-specific transcriptomes, proteomes, or interactomes themselves.Y2H detects PPIs in a uniform cellular context, thus building a dataset that resembles anaggregate interactome that requires integration with gene or protein expression data to derivecell state-specific interactomes. Alternatively, CoFrac-MS identifies protein complexes that areendogenous to a given cell line. This is also the case in AP-MS studies if the baits are expressedfrom endogenous expression systems, as in the QUBIC study [3]. Furthermore, differentmapping approaches identify complementary sets of biophysical relationships between pro-teins ranging from direct (binary) interactions to protein co-complex memberships. Given thesemethodological and conceptual differences, it is important to consider the different method-dependent interactome reference maps that can be built.
How complete does an interactome map need to be to be considered as a reference inter-actome? Estimates on human interactome sizes range from 120 000 to more than one million[21,43,44], reflecting our vast uncertainties about the proportions of different types of proteininteractions in the interactome and unknown biases in existing interactome maps originatingfrom the different BPP detection methods. Given our uncertainties in the size of the humaninteractome, the completeness of a reference map can only be defined in a practical sense. Thisleads us to define a ‘working version’ of a reference map of human protein interactions: all BPPsthat are detectable by a method after a specified number of screens on a protein-by-proteinmatrix space that covers at least one isoform for every human protein-coding gene.
Generating such reference maps for the human interactome in this decade is within reach.Both the published BioPlex and HI-II-14 datasets are intermediates in ongoing projects. TheseBPP maps in their current implementation are already substantially larger through increasesin the space of protein pairs interrogated for interaction and the number of completedscreens (BioPlex, http://wren.hms.harvard.edu/bioplex/ and http://thebiogrid.org/; HI-II-14,http://interactome.baderlab.org and www.ebi.ac.uk/intact/).
Trends in Biochemical Sciences, Month Year, Vol. xx, No. yy 11

TIBS 1341 No. of Pages 13
Although such interactome reference maps will be incomplete in their approximation of thephysiological human interactome, the very process of conceptualizing the problem of gener-ating a reference interactome map and the identification of concrete milestones will help todirect concerted effort towards their completion.
Concluding RemarksWe have entered an exciting new era of human protein interactome mapping. Systematicallygenerated and high-quality BPP datasets contain a wealth of functional information that can aidgenome annotation and deepen our understanding of biological processes and cellularorganization. Key challenges towards generating more-complete interactome maps will beto better understand the types of interactions identified by different methods, improve thesensitivity and scalability of BPP detection methods, complete current human ORFeomecollections to contain at least one isoform per human protein-coding gene, incorporate theability to screen and detect proteoforms in BPP assays, develop strategies to determinebinding affinities of protein pairs at high-throughput, and to build (via binary approaches)or to dissect (via MS-based approaches) protein complex topologies (see OutstandingQuestions). Important innovations along these lines have already been made. For instance,crosslinking MS methods are providing higher-resolution topologies of intra-complex contactsbetween subunits and are approaching proteome scale [45–47]. In tandem with large-scalemapping studies, focused studies on conditional interactomes are increasingly definingcell-, tissue-, and disease- specific interaction landscapes [48]. These and other develop-ments promise to lead to a better understanding of how binary and co-complex-basedBPP maps can complement each other to provide a more complete picture of the humanprotein interactome.
AcknowledgmentsWe thank D. Hill, A. Richardson, andM. Calderwood for helpful discussions, valuable comments, and critical reading of the
manuscript. K.L. and I.Z. were supported by National Human Genome Research Institute (NHGRI) grant U41HG001715,
and G.M.S. was supported by National Institutes of Health (NIH) training grant T32CA009361. Interactome mapping
studies at CCSB are supported by NHGRI grants U41HG001715 and P50HG004233 Center of Excellence in Genomic
Science awarded to M.V.
References1. Vidal, M. et al. (2011) Interactome networks and human disease.
Cell 144, 986–998
2. The ORFeome Collaboration (2016) The ORFeomeCollaboration:a genome-scale human ORF-clone resource. Nat. methods 13,191–192
3. Hein, M.Y. et al. (2015) A human interactome in three quantitativedimensions organized by stoichiometries and abundances. Cell163, 712–723
4. Huttlin, E.L. et al. (2015) The BioPlex network: a systematicexploration of the human interactome. Cell 162, 425–440
5. Rolland, T. et al. (2014) A proteome-scale map of the humaninteractome network. Cell 159, 1212–1226
6. Wan, C. et al. (2015) Panorama of ancient metazoan macromo-lecular complexes. Nature 525, 339–344
7. Dreze, M. et al. (2010) High-quality binary interactome mapping.Methods in enzymol. 470, 281–315
8. Vidal, M. and Fields, S. (2014) The yeast two-hybrid assay: stillfinding connections after 25 years. Nat. methods 11, 1203–1206
9. Cassonnet, P. et al. (2011) Benchmarking a luciferase comple-mentation assay for detecting protein complexes. Nat. methods8, 990–992
10. Nyfeler, B. et al. (2005) Capturing protein interactions in thesecretory pathway of living cells. Proc. Natl. Acad. Sci. U.S.A.102, 6350–6355
11. Eyckerman, S. et al. (2001) Design and application of a cytokine-receptor-based interaction trap. Nat. cell biol. 3, 1114–1119
12. Hart, T. et al. (2015) High-resolution CRISPR screens revealfitness genes and genotype-specific cancer liabilities. Cell 163,1515–1526
13. Yu, H. et al. (2008) High-quality binary protein interaction map ofthe yeast interactome network. Science 322, 104–110
14. Oliver, S. (2000) Guilt-by-association goes global. Nature 403,601–603
15. Uetz, P. et al. (2000) A comprehensive analysis of protein–proteininteractions in Saccharomyces cerevisiae. Nature 403, 623–627
16. Vo, T.V. et al. (2016) A proteome-wide fission yeast interactomereveals network evolution principles from yeasts to human. Cell164, 310–323
17. Havugimana, P.C. et al. (2012) A census of human soluble proteincomplexes. Cell 150, 1068–1081
18. von Mering, C. et al. (2002) Comparative assessment of large-scale data sets of protein–protein interactions. Nature 417,399–403
19. Smits, A.H. and Vermeulen, M. (2016) Characterizing protein–protein interactions using mass spectrometry: challenges andopportunities. Trends in biotechnol. 34, 834–835
20. Sowa, M.E. et al. (2009) Defining the human deubiquitinatingenzyme interaction landscape. Cell 138, 389–403
21. Venkatesan, K. et al. (2009) An empirical framework for binaryinteractome mapping. Nat. methods 6, 83–90
22. Rual, J.F. et al. (2004) Human ORFeome version 1.1: a platformfor reverse proteomics. Genome Res. 14, 2128–2135
Outstanding QuestionsHow big is the human proteininteractome?
How prevalent are different types ofPPIs in the human interactome?
What are the methodological biasesintroduced into every interactomemap, and how do these influenceour views on the physiological humaninteractome?
What is the fraction of functional inter-actions within the set of BPPs reportedin interactome maps?
What is the topology of identified pro-tein complexes?
What proportion of BPPs reported byprotein-complex methods directlycontact each other in the complex?
Towhat extent do pairs of proteins thatdirectly contact each other in proteincomplexes also form a binary interac-tion (i.e., have a measurable bindingaffinity outside the environment of thecomplex)?
12 Trends in Biochemical Sciences, Month Year, Vol. xx, No. yy

TIBS 1341 No. of Pages 13
23. Walhout, A.J. and Vidal, M. (1999) A genetic strategy to eliminateself-activator baits prior to high-throughput yeast two-hybridscreens. Genome res. 9, 1128–1134
24. Mann, M. et al. (2013) The coming age of complete, accurate, andubiquitous proteomes. Mol. cell 49, 583–590
25. Nesvizhskii, A.I. (2010) A survey of computational methods anderror rate estimation procedures for peptide and protein identifi-cation in shotgun proteomics. J. of proteomics 73, 2092–2123
26. Nesvizhskii, A.I. (2012) Computational and informatics strategiesfor identification of specific protein interaction partners in affinitypurification mass spectrometry experiments. Proteomics 12,1639–1655
27. Smith, L.M. et al. (2013) Proteoform: a single term describingprotein complexity. Nat. methods 10, 186–187
28. Boxem, M. et al. (2008) A protein domain-based interactomenetwork for C. elegans early embryogenesis. Cell 134, 534–545
29. Orchard, S. et al. (2012) Protein interaction data curation: theInternational Molecular Exchange (IMEx) consortium. Nat. meth-ods 9, 345–350
30. Braun, P. et al. (2009) An experimentally derived confidence scorefor binary protein–protein interactions. Nat. methods 6,91–97
31. Chen, Y.C. et al. (2010) Exhaustive benchmarking of the yeasttwo-hybrid system. Nat. methods 7, 667–668 author reply 668
32. Caufield, J.H. et al. (2012) A comparison and optimization of yeasttwo-hybrid systems. Methods 58, 317–324
33. Cusick, M.E. et al. (2009) Literature-curated protein interactiondatasets. Nat. methods 6, 39–46
34. D’Haeseleer, P. and Church, G.M. (2004) Estimating and improv-ing protein interaction error rates. Proc. IEEE Computat. Syst.Bioinform. Conf. 2004, 216–223
35. Hart, G.T. et al. (2006) How complete are current yeast andhuman protein-interaction networks? Genome biol. 7, 120
36. Landry, C.R. et al. (2013) Extracting insight from noisy cellularnetworks. Cell 155, 983–989
37. Deane, C.M. et al. (2002) Protein interactions: two methods forassessment of the reliability of high throughput observations.Mol.cell. proteomics 1, 349–356
38. Levy, E.D. et al. (2009) How perfect can protein interactomes be?Sci. signaling 2, pe11
39. Sprinzak, E. et al. (2003) How reliable are experimental protein–protein interaction data? J. Mol. Biol. 327, 919–923
40. Zarrinpar, A. et al. (2003) Optimization of specificity in a cellularprotein interaction network by negative selection. Nature 426,676–680
41. Zhong, Q. et al. (2016) An inter-species protein–protein interac-tion network across vast evolutionary distance.Mol. syst. biol. 12,865
42. Ashburner, M. et al. (2000) Gene ontology: tool for the unificationof biology. The Gene Ontology Consortium. Nat. genet. 25,25–29
43. Stumpf, M.P. et al. (2008) Estimating the size of the humaninteractome. Proc. Natl. Acad. Sci. U.S.A. 105, 6959–6964
44. Tompa, P. et al. (2014) A million peptide motifs for the molecularbiologist. Mol. cell 55, 161–169
45. Shi, Y. et al. (2015) A strategy for dissecting the architectures ofnative macromolecular assemblies. Nat. methods 12, 1135–1138
46. Makowski, M.M. et al. (2016) Cross-linking immunoprecipitation-MS (xIP-MS): topological analysis of chromatin-associatedprotein complexes using single affinity purification. Mol. cell.proteomics 15, 854–865
47. Liu, F. et al. (2015) Proteome-wide profiling of protein assembliesby cross-linkingmass spectrometry.Nat. methods 12, 1179–1184
48. Pankow, S. et al. (2015) F508 CFTR interactome remodellingpromotes rescue of cystic fibrosis. Nature 528, 510–516
49. Ellis, J.D. et al. (2012) Tissue-specific alternative splicing remod-els protein–protein interaction networks. Mol. Cell. 46, 884–892
50. Buljan, M. et al. (2013) Alternative splicing of intrinsically disor-dered regions and rewiring of protein interactions. Curr. Opin.Struc. Biol. 23, 443–450
51. Yang, X.P. et al. (2016) Widespread expansion of protein inter-action capabilities by alternative splicing. Cell 164, 805–817
52. Sahni, N. et al. (2015) Widespread macromolecular interactionperturbations in human genetic disorders. Cell 161, 647–660
53. Grossmann, A. et al. (2015) Phospho-tyrosine dependentprotein–protein interaction network. Mol. syst. biol. 11, 794
54. Woodsmith, J. and Stelzl, U. (2014) Studying post-translationalmodifications with protein interaction networks.Curr. Opin. Struc.Biol 24, 34–44
55. Barrera, L.A. et al. (2016) Survey of variation in human transcrip-tion factors reveals prevalent DNA binding changes. Science 351,1450–1454
56. Fuxman Bass, J.I. (2015) Human gene-centered transcriptionfactor networks for enhancers and disease variants. Cell 161,661–673
57. Stelzl, U. et al. (2005) A human protein–protein interaction net-work: a resource for annotating the proteome. Cell 122, 957–968
58. Rual, J.F. et al. (2005) Towards a proteome-scale map ofthe human protein–protein interaction network. Nature 437,1173–1178
59. Ewing, R.M. et al. (2007) Large-scale mapping of human protein–protein interactions by mass spectrometry. Mol. syst. biol. 3, 89
60. Kristensen, A.R. et al. (2012) A high-throughput approach formeasuring temporal changes in the interactome.Nat. methods 9,907–909
61. Lee, I. et al. (2011) Prioritizing candidate disease genes by net-work-based boosting of genome-wide association data.Genomeres. 21, 1109–1121
62. Ruepp, A. et al. (2010) CORUM: the comprehensive resource ofmammalian protein complexes – 2009. Nucleic acids res. 38,D497–501
63. Szklarczyk, D. et al. (2015) STRING v10: protein–protein interac-tion networks, integrated over the tree of life. Nucleic acids res.43, D447–D452
64. Warde-Farley, D. et al. (2010) The GeneMANIA predictionserver: biological network integration for gene prioritization andpredicting gene function. Nucleic acids res. 38, W214–220
65. Ramachandran, N. et al. (2008) Next-generation high-densityself-assembling functional protein arrays. Nat. methods 5,535–538
Trends in Biochemical Sciences, Month Year, Vol. xx, No. yy 13
Copyright © 2022 FDOKUMEN