2DE proteome analysis of a proliferating and differentiating human neuronal stem cell line (ReNcell...
15
RESEARCH ARTICLE 2-DE proteome analysis of a proliferating and differentiating human neuronal stem cell line (ReNcell VM) Raimund Hoffrogge 1 , Stefan Mikkat 2 , Christian Scharf 3, 8 , Susanne Beyer 1 , Hilmar Christoph 1 , Jens Pahnke 1 , Eilhard Mix 1 , Matthias Berth 4 , Adelinde Uhrmacher 5 , Igor Z. Zubrzycki 1, 7 , Erik Miljan 6 , Uwe Völker 3 and Arndt Rolfs 1 1 Neurobiological Laboratory, Department of Neurology, Medical Faculty, University of Rostock, Germany 2 Core Facility Proteome Analysis, Medical Faculty, University of Rostock, Rostock, Germany 3 Laboratory for Functional Genomics, Medical Faculty, Ernst-Moritz-Arndt-University, Greifswald, Germany 4 DECODON GmbH, Greifswald, Germany 5 Department of Computer Science, University of Rostock, Rostock, Germany 6 ReNeuron Ltd., Guildford, Surrey, UK 7 Department of Biotechnology, Faculty of Natural Sciences, Rzeszow University, Rzeszow, Poland 8 Department of Otorhinolaryngology, Head and Neck Surgery, Ernst-Moritz-Arndt-University, Greifswald, Germany The proteome of a proliferating human stem cell line was analyzed and then utilized to detect stem cell differentiation-associated changes in the protein profile. The analysis was conducted with a stable human fetal midbrain stem cell line (ReNcell VM) that displays the properties of a neural stem cell. Therefore, acquisition of proteomic data should be representative of cultured human neural stem cells (hNSCs) in general. Here we present a 2-DE protein-map of this cell line with annotations of 402 spots representing 318 unique proteins identified by MS. The sub- sequent proteome profiling of differentiating cells of this stem cell line at days 0, 4 and 7 of dif- ferentiation revealed changes in the expression of 49 identified spots that could be annotated to 45 distinct proteins. This differentiation-associated expression pattern was validated by Western blot analysis for transgelin-2, proliferating cell nuclear antigen, as well as peroxiredoxin 1 and 4. The group of regulated proteins also included NudC, ubiquilin-1, STRAP, stress-70 protein, creatine kinase B, glial fibrillary acidic protein and vimentin. Our results reflect the large rear- rangement of the proteome during the differentiation process of the stem cells to terminally differentiated neurons and offer the possibility for further characterization of specific targets driving the stem cell differentiation. Received: July 25, 2005 Revised: September 23, 2005 Accepted: September 27, 2005 Keywords: 2-DE-map / Neuronal stem cells / Peroxiredoxin / Proteome profiling / Transgelin Proteomics 2006, 6, 0000–0000 1 1 Introduction Stem cells are defined by several unique properties: they are unspecialized cells, capable of dividing and renewing them- selves for long periods of time (self-renewal), and they can give rise to many cell types such as blood, nerve, and muscle cells. Whereas embryonic stem cells, which are derived from very early embryos (blastocysts), are totipotent, i.e. they are Correspondence: Dr. Arndt Rolfs, Department of Neurology, Uni- versity of Rostock, P. O. Box 100 888, 18055 Rostock, Germany E-mail: [email protected] Fax: 149-381-494-9542 Abbreviations: EGF , epidermal growth factor; GFAP , glial fibril- lary acidic protein; hNSC, human neural stem cells; NSC, neural stem cells; PCNA, proliferating cell nuclear antigen DOI 10.1002/pmic.200500556 2006 WILEY-VCH Verlag GmbH & Co. KGaA, Weinheim www.proteomics-journal.com
Transcript of 2DE proteome analysis of a proliferating and differentiating human neuronal stem cell line (ReNcell...

RESEARCH ARTICLE
2-DE proteome analysis of a proliferating and
differentiating human neuronal stem cell line
(ReNcell VM)
Raimund Hoffrogge1, Stefan Mikkat2, Christian Scharf3, 8, Susanne Beyer1,Hilmar Christoph1, Jens Pahnke1, Eilhard Mix1, Matthias Berth4,Adelinde Uhrmacher5, Igor Z. Zubrzycki1, 7, Erik Miljan6, Uwe Völker3 and Arndt Rolfs1
1 Neurobiological Laboratory, Department of Neurology, Medical Faculty, University of Rostock, Germany2 Core Facility Proteome Analysis, Medical Faculty, University of Rostock, Rostock, Germany3 Laboratory for Functional Genomics, Medical Faculty, Ernst-Moritz-Arndt-University, Greifswald, Germany4 DECODON GmbH, Greifswald, Germany5 Department of Computer Science, University of Rostock, Rostock, Germany6 ReNeuron Ltd., Guildford, Surrey, UK7 Department of Biotechnology, Faculty of Natural Sciences, Rzeszow University, Rzeszow, Poland8 Department of Otorhinolaryngology, Head and Neck Surgery, Ernst-Moritz-Arndt-University,
Greifswald, Germany
The proteome of a proliferating human stem cell line was analyzed and then utilized to detectstem cell differentiation-associated changes in the protein profile. The analysis was conductedwith a stable human fetal midbrain stem cell line (ReNcell VM) that displays the properties of aneural stem cell. Therefore, acquisition of proteomic data should be representative of culturedhuman neural stem cells (hNSCs) in general. Here we present a 2-DE protein-map of this cellline with annotations of 402 spots representing 318 unique proteins identified by MS. The sub-sequent proteome profiling of differentiating cells of this stem cell line at days 0, 4 and 7 of dif-ferentiation revealed changes in the expression of 49 identified spots that could be annotated to45 distinct proteins. This differentiation-associated expression pattern was validated by Westernblot analysis for transgelin-2, proliferating cell nuclear antigen, as well as peroxiredoxin 1 and 4.The group of regulated proteins also included NudC, ubiquilin-1, STRAP, stress-70 protein,creatine kinase B, glial fibrillary acidic protein and vimentin. Our results reflect the large rear-rangement of the proteome during the differentiation process of the stem cells to terminallydifferentiated neurons and offer the possibility for further characterization of specific targetsdriving the stem cell differentiation.
Received: July 25, 2005Revised: September 23, 2005
Accepted: September 27, 2005
Keywords:
2-DE-map / Neuronal stem cells / Peroxiredoxin / Proteome profiling / Transgelin
Proteomics 2006, 6, 0000–0000 1
1 Introduction
Stem cells are defined by several unique properties: they areunspecialized cells, capable of dividing and renewing them-selves for long periods of time (self-renewal), and they cangive rise to many cell types such as blood, nerve, and musclecells. Whereas embryonic stem cells, which are derived fromvery early embryos (blastocysts), are totipotent, i.e. they are
Correspondence: Dr. Arndt Rolfs, Department of Neurology, Uni-versity of Rostock, P. O. Box 100 888, 18055 Rostock, GermanyE-mail: [email protected]: 149-381-494-9542
Abbreviations: EGF, epidermal growth factor; GFAP, glial fibril-lary acidic protein; hNSC, human neural stem cells; NSC, neuralstem cells; PCNA, proliferating cell nuclear antigen
DOI 10.1002/pmic.200500556
2006 WILEY-VCH Verlag GmbH & Co. KGaA, Weinheim www.proteomics-journal.com
2 R. Hoffrogge et al. Proteomics 2006, 6, 0000–0000
capable of generating all cell types of the body, adult stemcells have a restricted potential to differentiate into certaincell types. The latter are present at all stages of developmentand probably exist in all multicellular organisms.
Replacement of lost neurons by cell transplantation ofneural stem cells (NSC) constitutes a promising newapproach to the treatment of progressive neurodegenerativediseases, like Parkinson’s disease, Huntington’s disease,stroke, Alzheimer’s disease and probably multiple sclerosis.However, it becomes increasingly difficult to draw consistentconclusions from published and ongoing studies mainly be-cause of the differences in the cell types and the preparationprotocols applied. For example, rodent neural stem cells aredistinctly different in their properties from the human NSCand the data generated are not necessarily comparable [1, 2].The variable results obtained from human fetal-derived NSCcan probably be attributed to the different age, quality andpreparation method of the NSC derived from different tissuesamples.
However, in vitro generation of stable, renewable andconsistently functional specific NSC lines will prove to beparticularly beneficial in the studies required to move to-wards cell therapy, and various immortalized neural stemcell lines have been established [3–5]. Furthermore, thein vitro storage, expansion and characterization of such NSCare very likely to alleviate the ethical and logistic problemsassociated with the use of fresh embryonic tissue. Using anumber of variations in culture conditions and/or geneticmodifications, these cultured cells can be differentiated intodifferent neuronal progeny.
The commitment of stem cells to differentiate as well asthe maturation involves dramatically complex events leadingto the generation of different phenotypes via distinctivedevelopmental programs. These regulatory changes can bestudied systematically with transgenic technology andmicroarray techniques [6–9]. However, ultimately, the reg-ulatory functions are carried out by the cellular protein con-stituents, and thus comprehensive proteome expressionprofiling will likely provide important clues to the under-standing of the differentiation processes [10–12]. Proteomicprofiling has previously mainly been applied for the study ofthe protein inventory in the adult nervous system in healthand disease [13–19]. Even if transcriptional profiling cur-rently provides a more comprehensive coverage, only prote-omic approaches will address such important issues such asprotein amount, protein stability, sub-cellular localization ofproteins, post-translational modifications and protein–pro-tein interactions.
Maurer and coworkers [20] presented a proteomic data-base for NSC isolated from the brains of adult rats and cul-tured for 10 weeks. The authors were able to map about1100 protein spots in a 2-DE proteome profiling approach ofwhich 266 were identified.
However, up to now human fetal neural stem cells havenot been subjected to profound proteome analysis, althoughthey have a great therapeutic capacity [21–23]. Furthermore,
the proteome map of neural stem cells will prove to be avaluable tool for the investigation of signal modulation fordirected differentiation and will provide quality control cri-teria for immortalized cell lines. Applying proteome ap-proaches, the programs that control self-renewal, differ-entiation, and plasticity will be accessible at a comprehensivescale. In addition, new specific markers for neuronal devel-opment and factors driving the differentiation of stem cellsin defined directions may be identified.
However, although human neural stem cells (hNSC) areavailable for research purposes, stable neural stem cell lineshave not been extensively characterized. To meet this need,using the ReNcell VM model we now want to provide a pro-teome reference database for human neural midbrain stemcells that constitutes the basis for further investigations ofdifferential protein expression during differentiation. Thisneural stem cell line is nestin-positive in the undifferentiatedstate and displays neural lineage restricted multi-potentialityupon differentiation (manuscript in preparation, ReNeuronLimited, Guildford, Surrey, UK). ReNcell VM can be culturedas proliferating undifferentiated cells and reliably differ-entiated into neurons, astrocytes and oligodendrocytes in vi-tro. Thus, proteome information of this cell line is of generaluse for the understanding of stem cells and might ultimatelylead to the design and selection of future cell lines for thetreatment of neurodegenerative diseases such as Parkinson’sdisease.
2 Materials and methods
2.1 Immortalized ventral mesencephalic cell line
(ReNcell VM)
ReNcell VM is an immortalized human neural stem cell line(ReNeuron Ltd., Guildford, Surrey, UK) derived from theventral mesencephalon from 10-week fetal neural tissue. Thecell line was established following immortalization with thev-myc oncogene by retroviral transduction. Non-geneticallymodified human NSC in vitro cultures have reduced telo-merase activity leading to genetic instabilities [24]. Transfor-mation using the myc transcription factor has proven highlyeffective at extending the normal lifespan of human NSCin vitro and maintaining a stable genotype and phenotype[19]. ReNcell VM cells were infected with high titer ampho-tropic retrovirus (TEFLY-A) carrying the immortalizingtransgene v-myc plus a selection marker and were selectedfor 2 weeks with 150 mg/mL G418 (Invitrogen, Paisley, UK).The cells are readily expandable with a doubling time ofabout 24 h. They reveal chromosomal stability over .200population doublings. The cell line was selected after in vitroassays for stable karyotype, proliferation (CyQuant, Molecu-lar Probes) and neural differentiation with Western blot andimmunofluorescence detection of nestin for immature neu-ronal progenitors, glial fibrillary acidic protein (GFAP) forastrocytic glial cells, ß-III tubulin for mature neuronal cells,
2006 WILEY-VCH Verlag GmbH & Co. KGaA, Weinheim www.proteomics-journal.com
Proteomics 2006, 6, 0000–0000 Cell Biology 3
tyrosine hydroxylase (TH) for catecholaminergic neuronsand Hoechst 33342 for nuclear DNA, as well as robustness(freeze-thaw viability). The differentiation resulted in about50% glial (mainly astrocytic) cells and 50% neurons, 10% ofwhich had a dopaminergic phenotype (manuscript in prepa-ration, ReNeuron).
2.2 Cell growth and differentiation
A standard differentiation protocol was used to differentiatethe stem cell monolayer of paving stone morphology into adifferentiated cellular neural/glial network. Briefly, afterthawing and resuspension of the ReNcell VM cells withmedia [DMEM:F12 with B27 supplement mix, L-glutamine,gentamycin (all from Invitrogen, Karlsruhe, Germany) andheparin (Sigma, Munich, Germany)] the cell viability wasanalyzed. Subsequently, cells were spun down, resuspendedagain in fresh media, and plated in a dish. A 4-day cultivation(377C) with growth factors [epidermal growth factor (EGF),basic fibroblast growth factor; Peprotech, London, UK] wasperformed to reach confluency on laminin-coated (1 to 5 mg/cm2) plastic surface.
To passage the cells each culture was rinsed once withcalcium- and magnesium-free HBSS solution, and then2.5 mL of trypsin solution (BioWhittaker, USA) was added,and the cultures were incubated for 20 min at 377C. As soonas the cells rounded up, the culture dishes were gently tap-ped to promote detachment of cells and trypsin was inacti-vated with the addition of culture medium. The cell suspen-sions were transferred to fresh tubes, rinsed again withmedia and centrifuged at 5006g for 5 min at 47C in aswinging bucket bench-top centrifuge. After removal of thesupernatant, the pellets were resuspended five times in 1 mLof media. A cell count and viability determination was per-formed using a hemocytometer and cells diluted 1:1 in0.4% trypan blue. Finally, cell suspensions were diluted inmedia (containing basic fibroblast growth factor 1 mL/mL;EGF 2 mL/mL) to an appropriate cell concentration (250 000to 500 000 cells per 10-cm dish), plated in laminin-coatedtissue culture plates and returned into the incubator at 377C.Differentiation of the cells was achieved by growing the cellsin the presence of mitogens for 3–4 days followed by thewithdrawal of growth factors in culture medium. Within 2–3 days of removal of the growth factors, the cells begin tochange to a more differentiated morphology. Cells were har-vested for proteomics analysis undifferentiated and after 4and 7 days of differentiation, respectively.
2.3 Protein preparation
For the preparation of crude protein extracts culture mediumwas removed from the ReNcell VM cells and the adherentcells were washed once with 5 mL PBS followed by an addi-tional short rinsing with ice-cold double distilled H2O toremove remaining proteins. The complete tissue culturedish was quickly frozen with liquid nitrogen, allowed to
warm up to room temperature and 1 mL lysis buffer con-taining 7 M urea, 2 M thiourea, 70 mM DTT, 4% w/vCHAPS and 1.5 mg/mL Complete and PMSF protease in-hibitor (all reagents from Roche, Mannheim, Germany) wereadded. The suspension was transferred to fresh tubes,quickly frozen with liquid nitrogen and sonicated in an ice-cold ultrasonic bath for 30 min to achieve optimum proteinextraction. Subsequently, the lysate was centrifuged at 13 000rpm for 5 min at 47C. Protein content of the supernatant wasmeasured with an Ettan 2-D Quant Kit (Amersham Bio-sciences, Uppsala, Sweden). Sample aliquots were stored at2807C.
2.4 2-DE
Aliquots of the protein samples, 150 mg for silver-stained gelsand 500 mg for colloidal Coomassie-stained gels, were pre-cipitated with chloroform/methanol and resuspended in420 mL rehydration buffer containing 8 M urea, 2% CHAPS,1.3% IPG-buffer and 16.2 mM DTT. The samples werepassively rehydrated overnight followed by the IEF procedureon 24-cm non-linear pH 3–10 immobilized gradient strips(Immobiline DryStrips, Amersham Biosciences) by usingthe Protean IEF Cell (Bio-Rad, Hercules, CA, USA). Electrofocusing was carried out at 8000 V resulting in approximate-ly 95 kVh in total. After IEF, proteins were reduced for20 min at room temperature using 50 mM Tris-HCl, pH 8.8,6 M urea, 30% glycerol, 2% SDS, and 10 mg/mL DTT fol-lowed by alkylation for 20 min with the same buffer con-taining 40 mg/mL iodacetamide instead of DTT. The seconddimension was carried out on 12.5% SDS PAGE gels(25 cm622.5 cm60.5 cm) and 8 W/gel at 157C. Gels werefixed with 10% acetic acid, 50% ethanol/40% double distilledH2O and 0.1 mL/L of 37% formaldehyde for silver gels.Analytical gels were stained using silver nitrate according toBlum et al. [25] and preparative gels for mass spectrometricanalysis were stained with colloidal CBB G-250 (Serva, Hei-delberg, Germany). Silver- and CBB-stained gel images weredigitized using Microtec ScanMaker 9600 XL.
2.5 Spot detection and quantitation
Gel evaluations were performed with the Delta2D softwareversion 3.2 (Decodon, Greifswald, Germany). For identifica-tion of the differentially expressed protein, spots of tworeplicate silver-stained gels of each of the time points werefirst matched to each other and merged to fused images. In asecond step, these fused images of the different time points(0, 4 and 7 days of differentiation) were fused again, result-ing in a merged image from all time points. By choosing the“average” option for the fusion process, the relative inten-sities of the spots were kept in the fused image. A spotdetection was performed with the Delta 2D software for thefused image of all time points [26]. Spots of the fused gelwere manually edited by comparing the original gel imageswith the fused image and subsequently the spot map and the
2006 WILEY-VCH Verlag GmbH & Co. KGaA, Weinheim www.proteomics-journal.com
4 R. Hoffrogge et al. Proteomics 2006, 6, 0000–0000
corresponding labels were propagated to each of the threefused gel images (0, 4 and 7 days of differentiation) includedin the analysis.
Spot intensities were determined and normalized. Therelative intensity of each spot was calculated by dividing theintensity of each spot by the sum of the intensities of all spotson the corresponding gel. Induction / repression ratios be-tween the different time points were calculated by dividingthese relative intensities. For spot isolation and subsequentprotein identification from the CBB-stained gels, the spotpattern of gels stained with silver nitrate or colloidal CBBwere matched, thus assuring unequivocal assignment ofspots. Thereby each cell culture gave rise to one CBB gel andtwo analytical silver-stained gels.
2.6 Preparation of tryptic peptide mixtures
Protein spots were excised from colloidal CBB-stained 2-Dgels using spot pickers (Flexys Proteomics picker, GenomicSolutions, Ann Arbor, MI, USA or Proteome Works, Bio-Rad, respectively) and transferred to 96-well plates. For theMALDI-MS measurements with a Reflex III mass spec-trometer (Bruker Daltonics, Bremen, Germany) digestionwith trypsin was performed manually, using specific 96-wellplates (Genomic Solutions) and a low-salt procedure adaptedfrom the methods of Fountoulakis and Langen [27] andNordhoff and coworkers [28]. Manually digested peptidesamples were spotted for MALDI-MS measurement ontoBruker AnchorChip (384/600 mm) according to the methodbeing published from Nordhoff and coworkers in 2003 [29].For MALDI-MS/MS measurements with a 4700 Proteomics-Analyzer (Applied Biosystems, Foster City, CA, USA) thedigestion and spotting of the peptide mixtures to the MALDItarget were done automatically with the Ettan Spot HandlingWorkstation (Amersham-Biosciences). For both MS-meth-ods CHCA was used as matrix solution.
2.7 MALDI-TOF-MS analysis
Peptide mixtures were analyzed by MALDI-TOF-MS using aReflex III mass spectrometer (Bruker Daltonics) operating inpositive ion reflector mode. Measurements were externallycalibrated with [M1H]1 ions of angiotensin II, angio-tensin I, substance P, bombesin, and adrenocorticotropichormones (clip 1–17 and clip 18–39). Mass spectra wereacquired and analyzed automatically using Bruker software,but, if necessary, peak picking and calibration were improvedmanually using XMASS/NT 5.1.5 (Bruker Daltonics). Data-base searches were performed by an in-house SWALLsequence database (Swiss-Prot and TrEMBL) using theMASCOT 1.8 software (Matrix Science, London, UK) viaBioTools 2.1 software (Bruker Daltonics). A mass tolerance of80 ppm and one missing cleavage site were allowed, oxida-tion of methionine residues was considered as variablemodification, and carbamido-methylation of cysteines asfixed modification. The search was restricted to human pro-
teins. All results were examined for reliability and occur-rence of multiple proteins in the same sample. With a fewexceptions, the identification was based on at least fivematching peptides. If the database search against theSWALL sequence database resulted in homologous proteinsto which the same number of matched peptides wasassigned, the entry from Swiss-Prot was selected. Entriesfrom TrEMBL were used only, if no homologous protein wascontained in Swiss-Prot or if a higher number of peptidesmatched to a sequence from the TrEMBL database.
2.8 MALDI-TOF-MS/MS analysis
MALDI-TOF MS/MS measurement of spotted peptide solu-tions was carried using a 4700 Proteomics-Analyzer (AppliedBiosystems). The spectra were recorded in reflector mode ina mass range from 800 to 3700 Da with a focus mass of2000 Da. If the autolytic fragment of trypsin with the mono-isotopic [M1H]1 m/z at 2211.104 reached S/N of at least 10,an internal calibration was automatically performed usingthis peak for one-point-calibration. Calibration was per-formed manually for the less than 1% samples for which theautomatic calibration failed. Additionally, MALDI-TOF-TOFanalysis was performed for the two strongest peaks of theTOF-spectrum after subtraction of peaks corresponding tobackground or trypsin fragments. The internal calibrationwas automatically performed as one-point-calibration if themono-isotopic arginine [M1H]1 m/z at 175.119 or lysi-ne[M1H]1 m/z at 147.107 reached S/N of at least 5. Aftercalibration, a combined database search of MS and MS/MSmeasurements was performed using the GPS Explorer soft-ware (Applied Biosystems) with the following settings:(i) MS peak filtering: mass range from 800 to 3700 Da;minimum S/N filter of 10; peak density of 50 peaks per rangeof 200 Da and maximal 200 peaks per protein spot; massexclusion list contained background peaks and trypsin frag-ments with an exclusion tolerance of 100 ppm; (ii) MS/MSpeak filtering: mass range from 60 Da to a mass that was20 Da lower than the precursor mass; peak density of50 peaks per 200 Da and maximal 65 peaks per MS/MS;minimum S/N filter of 10; (iii) database search: precursortolerance 35 ppm and MS/MS fragment tolerance 0.65 Da.
The peptide search tolerance was 35 ppm but the actualRMS value was between 5 and 15 ppm. Peak lists were com-pared with the Swiss-Prot or NCBInr database restricted tohuman taxonomy using the MASCOT search engine (MatrixScience). Peptide mixtures that yielded at least twice aMOWSE score [30] of at least 49 for Swiss-Prot and 63 forNCBInr results, respectively, were defined as positive identi-fications.
2.9 Western blotting
Cell lysates were adjusted to 10 mg/mL protein in16Laemmli-buffer. Twenty (for peroxiredoxin 1 and trans-gelin) or fifty (for peroxiredoxin 4 and proliferating cell
2006 WILEY-VCH Verlag GmbH & Co. KGaA, Weinheim www.proteomics-journal.com
Proteomics 2006, 6, 0000–0000 Cell Biology 5
nuclear antigen, PCNA) micrograms, respectively, of totalprotein extract of each sample was separated by SDS/PAGEelectrophoresis (120 V for 2 h) using a Criterion Cell (Bio-Rad). Proteins were transferred to NC (Hybond ECL,Amersham Biosciences, UK) by semidry blotting (Bio-Rad)using transfer buffer (48 mM Tris, 39 mM glycine,1.3 mM SDS, 20% methanol).
Membranes were blocked for 1 h using Top-Block block-ing buffer (FLUKA, Steinheim, Germany) and incubatedwith antibodies against b-actin (mouse b-actin mAb, Sigma,A-5441, 1:1000; rabbit b-actin polyclonal antibody, DB070,Delta Biolabs, Campbell, USA, 1:200), peroxiredoxin 1 (rab-bit anti-peroxiredoxin-1 polyclonal antibody, 16805, 1:2000),peroxiredoxin 4 (mouse anti-peroxiredoxin-4 mAb, 16943,1:2000), PCNA (rabbit anti-PCNA polyclonal antibody, 2426,1:200) and transgelin-2 (goat anti-SM22, polyclonal antibody,10135, 1:1000), all from Abcam (Cambridge, UK). The fol-lowing secondary antibodies were used: Alexa Fluor 680 goatanti-rabbit IgG, Alexa Fluor 680 rabbit anti-goat IgG (bothfrom Molecular Probes, purchased from Invitrogen, and alldiluted 1:10 000), and IRDye 800CW conjugated affinity pu-rified goat-anti-mouse and rabbit-anti-mouse IgG (Rockland,BIOMOL, Hamburg, Germany; 1:5000).
Subsequently, the membranes were washed four timesin PBS containing 0.1% Tween 20 and specific signals weredetected using an Odyssey Infrared Imaging System (LI-COR Bioscience, Bad Homburg, Germany) according to themanufacturer’s instructions. As molecular weight marker,the prestained peqGOLD marker IV (PEQLAB, Erlangen,Germany) was used. All immunoblots were scanned at awavelength of 700 nm for Alexa Fluor 680-labeled antibodiesand at a wavelength of 800 nm for IRDye 800CW-labeledantibodies. The intensity of the signals was quantified withthe Odyssey software version 1.2 using the level of expres-sion of b-actin as internal standard.
2.10 Bioinformatics analysis of protein functions
GeneOntology entries were retrieved based on the XML datafiles from Uniprot, Genbank and H-InvDB. GeneOntologyterms were then mapped to Ontoglyph terms (www.blue-print.org/products/ontoglyphs/) to provide a coarse-grainedclassification of gene function.
3 Results and discussion
3.1 Proteome map of ReNcell VM NSC
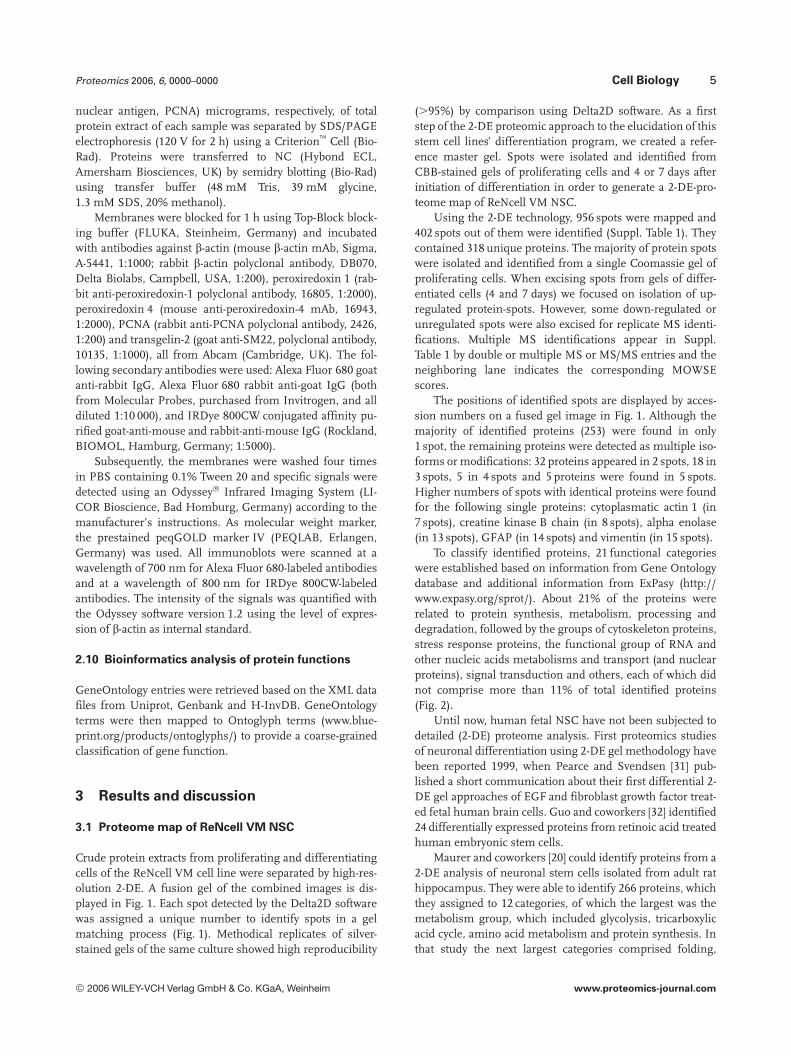
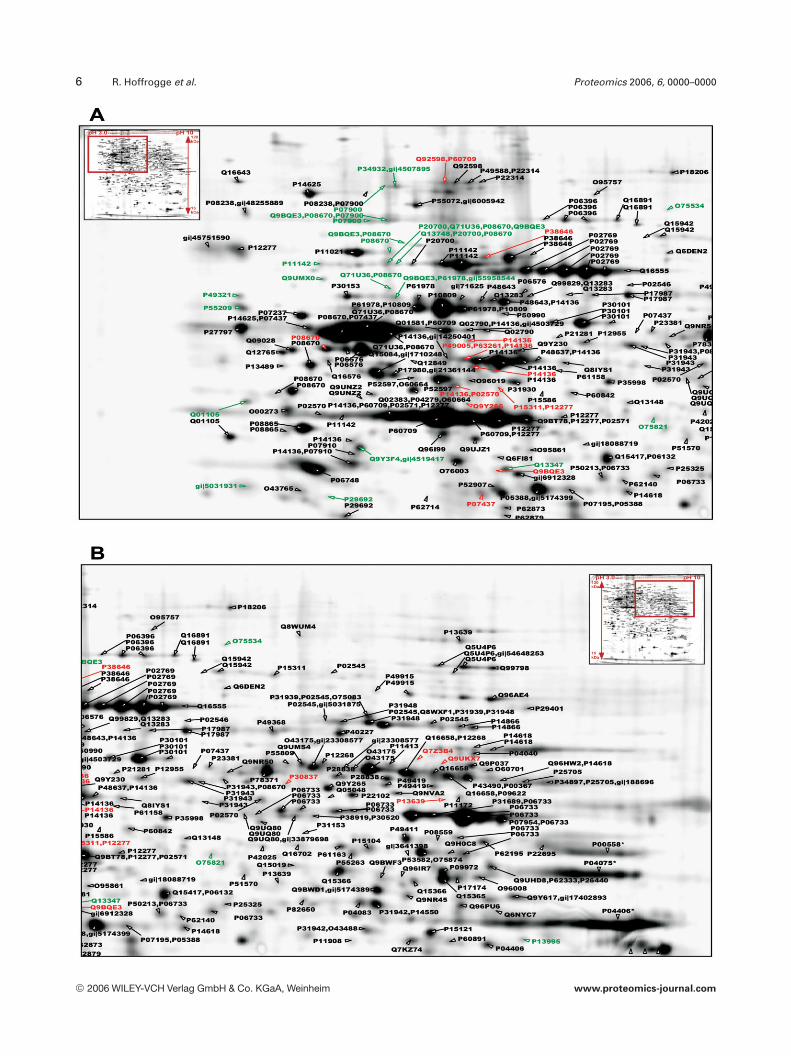
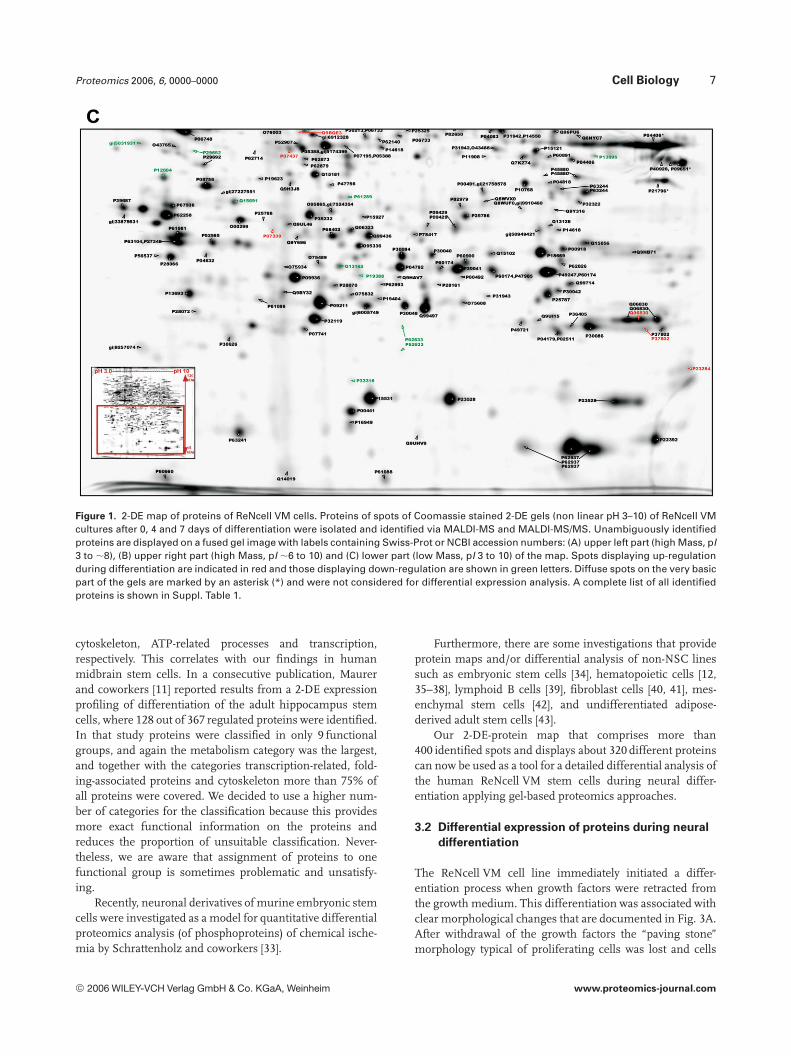
Crude protein extracts from proliferating and differentiatingcells of the ReNcell VM cell line were separated by high-res-olution 2-DE. A fusion gel of the combined images is dis-played in Fig. 1. Each spot detected by the Delta2D softwarewas assigned a unique number to identify spots in a gelmatching process (Fig. 1). Methodical replicates of silver-stained gels of the same culture showed high reproducibility
(.95%) by comparison using Delta2D software. As a firststep of the 2-DE proteomic approach to the elucidation of thisstem cell lines’ differentiation program, we created a refer-ence master gel. Spots were isolated and identified fromCBB-stained gels of proliferating cells and 4 or 7 days afterinitiation of differentiation in order to generate a 2-DE-pro-teome map of ReNcell VM NSC.
Using the 2-DE technology, 956 spots were mapped and402 spots out of them were identified (Suppl. Table 1). Theycontained 318 unique proteins. The majority of protein spotswere isolated and identified from a single Coomassie gel ofproliferating cells. When excising spots from gels of differ-entiated cells (4 and 7 days) we focused on isolation of up-regulated protein-spots. However, some down-regulated orunregulated spots were also excised for replicate MS identi-fications. Multiple MS identifications appear in Suppl.Table 1 by double or multiple MS or MS/MS entries and theneighboring lane indicates the corresponding MOWSEscores.
The positions of identified spots are displayed by acces-sion numbers on a fused gel image in Fig. 1. Although themajority of identified proteins (253) were found in only1 spot, the remaining proteins were detected as multiple iso-forms or modifications: 32 proteins appeared in 2 spots, 18 in3 spots, 5 in 4 spots and 5 proteins were found in 5 spots.Higher numbers of spots with identical proteins were foundfor the following single proteins: cytoplasmatic actin 1 (in7 spots), creatine kinase B chain (in 8 spots), alpha enolase(in 13 spots), GFAP (in 14 spots) and vimentin (in 15 spots).
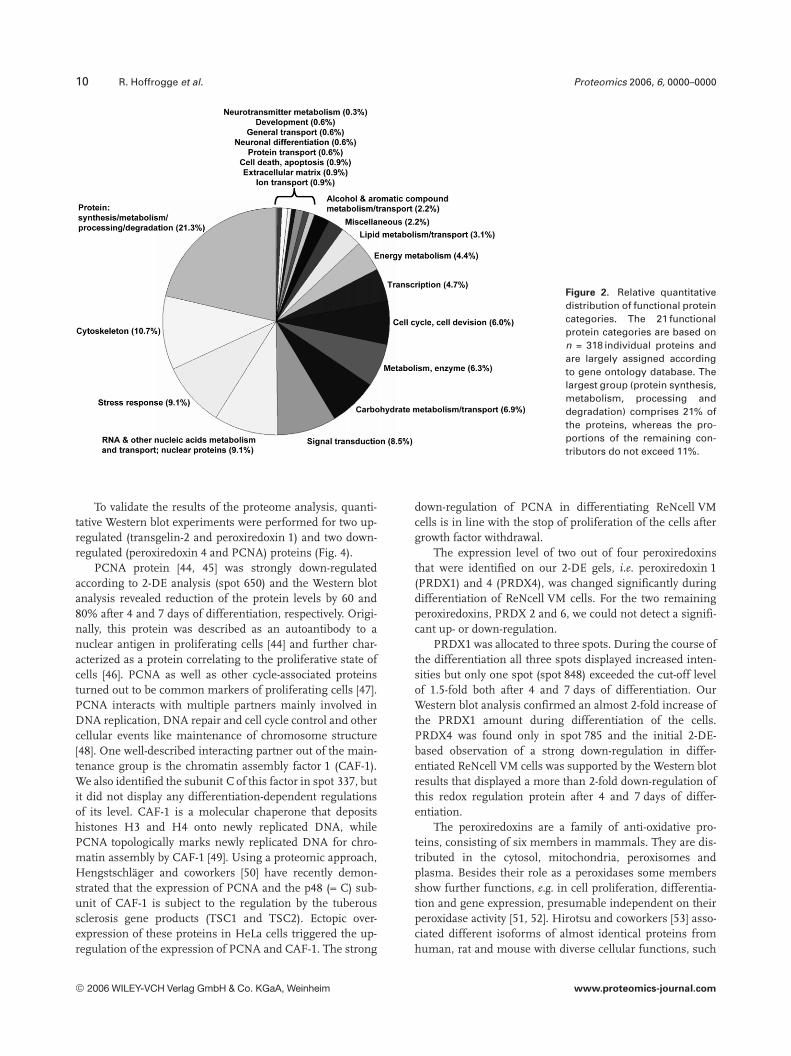
To classify identified proteins, 21 functional categorieswere established based on information from Gene Ontologydatabase and additional information from ExPasy (http://www.expasy.org/sprot/). About 21% of the proteins wererelated to protein synthesis, metabolism, processing anddegradation, followed by the groups of cytoskeleton proteins,stress response proteins, the functional group of RNA andother nucleic acids metabolisms and transport (and nuclearproteins), signal transduction and others, each of which didnot comprise more than 11% of total identified proteins(Fig. 2).
Until now, human fetal NSC have not been subjected todetailed (2-DE) proteome analysis. First proteomics studiesof neuronal differentiation using 2-DE gel methodology havebeen reported 1999, when Pearce and Svendsen [31] pub-lished a short communication about their first differential 2-DE gel approaches of EGF and fibroblast growth factor treat-ed fetal human brain cells. Guo and coworkers [32] identified24 differentially expressed proteins from retinoic acid treatedhuman embryonic stem cells.
Maurer and coworkers [20] could identify proteins from a2-DE analysis of neuronal stem cells isolated from adult rathippocampus. They were able to identify 266 proteins, whichthey assigned to 12 categories, of which the largest was themetabolism group, which included glycolysis, tricarboxylicacid cycle, amino acid metabolism and protein synthesis. Inthat study the next largest categories comprised folding,
2006 WILEY-VCH Verlag GmbH & Co. KGaA, Weinheim www.proteomics-journal.com
6 R. Hoffrogge et al. Proteomics 2006, 6, 0000–0000
2006 WILEY-VCH Verlag GmbH & Co. KGaA, Weinheim www.proteomics-journal.com
Proteomics 2006, 6, 0000–0000 Cell Biology 7
Figure 1. 2-DE map of proteins of ReNcell VM cells. Proteins of spots of Coomassie stained 2-DE gels (non linear pH 3–10) of ReNcell VMcultures after 0, 4 and 7 days of differentiation were isolated and identified via MALDI-MS and MALDI-MS/MS. Unambiguously identifiedproteins are displayed on a fused gel image with labels containing Swiss-Prot or NCBI accession numbers: (A) upper left part (high Mass, pI3 to ,8), (B) upper right part (high Mass, pI ,6 to 10) and (C) lower part (low Mass, pI 3 to 10) of the map. Spots displaying up-regulationduring differentiation are indicated in red and those displaying down-regulation are shown in green letters. Diffuse spots on the very basicpart of the gels are marked by an asterisk (*) and were not considered for differential expression analysis. A complete list of all identifiedproteins is shown in Suppl. Table 1.
cytoskeleton, ATP-related processes and transcription,respectively. This correlates with our findings in humanmidbrain stem cells. In a consecutive publication, Maurerand coworkers [11] reported results from a 2-DE expressionprofiling of differentiation of the adult hippocampus stemcells, where 128 out of 367 regulated proteins were identified.In that study proteins were classified in only 9 functionalgroups, and again the metabolism category was the largest,and together with the categories transcription-related, fold-ing-associated proteins and cytoskeleton more than 75% ofall proteins were covered. We decided to use a higher num-ber of categories for the classification because this providesmore exact functional information on the proteins andreduces the proportion of unsuitable classification. Never-theless, we are aware that assignment of proteins to onefunctional group is sometimes problematic and unsatisfy-ing.
Recently, neuronal derivatives of murine embryonic stemcells were investigated as a model for quantitative differentialproteomics analysis (of phosphoproteins) of chemical ische-mia by Schrattenholz and coworkers [33].
Furthermore, there are some investigations that provideprotein maps and/or differential analysis of non-NSC linessuch as embryonic stem cells [34], hematopoietic cells [12,35–38], lymphoid B cells [39], fibroblast cells [40, 41], mes-enchymal stem cells [42], and undifferentiated adipose-derived adult stem cells [43].
Our 2-DE-protein map that comprises more than400 identified spots and displays about 320 different proteinscan now be used as a tool for a detailed differential analysis ofthe human ReNcell VM stem cells during neural differ-entiation applying gel-based proteomics approaches.
3.2 Differential expression of proteins during neural
differentiation
The ReNcell VM cell line immediately initiated a differ-entiation process when growth factors were retracted fromthe growth medium. This differentiation was associated withclear morphological changes that are documented in Fig. 3A.After withdrawal of the growth factors the “paving stone”morphology typical of proliferating cells was lost and cells
2006 WILEY-VCH Verlag GmbH & Co. KGaA, Weinheim www.proteomics-journal.com
8 R. Hoffrogge et al. Proteomics 2006, 6, 0000–0000
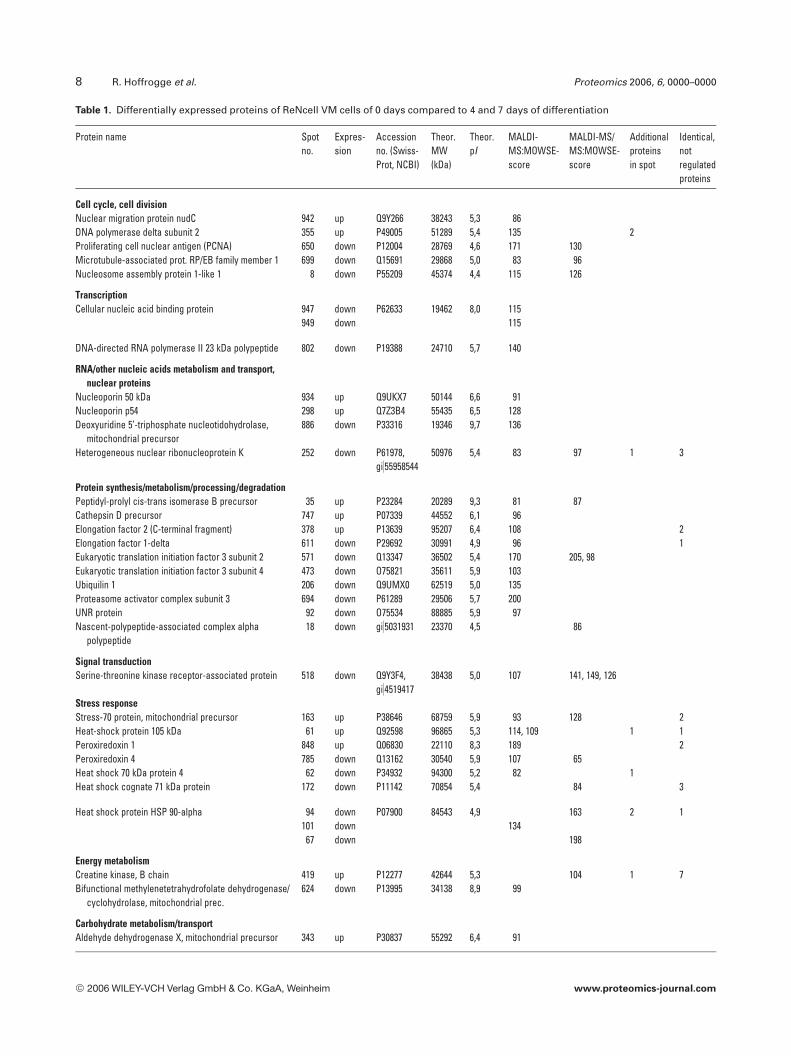
Table 1. Differentially expressed proteins of ReNcell VM cells of 0 days compared to 4 and 7 days of differentiation
Protein name Spotno.
Expres-sion
Accessionno. (Swiss-Prot, NCBI)
Theor.MW(kDa)
Theor.pI
MALDI-MS:MOWSE-score
MALDI-MS/MS:MOWSE-score
Additionalproteinsin spot
Identical,notregulatedproteins
Cell cycle, cell divisionNuclear migration protein nudC 942 up Q9Y266 38243 5,3 86DNA polymerase delta subunit 2 355 up P49005 51289 5,4 135 2Proliferating cell nuclear antigen (PCNA) 650 down P12004 28769 4,6 171 130Microtubule-associated prot. RP/EB family member 1 699 down Q15691 29868 5,0 83 96Nucleosome assembly protein 1-like 1 8 down P55209 45374 4,4 115 126
TranscriptionCellular nucleic acid binding protein 947 down P62633 19462 8,0 115
949 down 115
DNA-directed RNA polymerase II 23 kDa polypeptide 802 down P19388 24710 5,7 140
RNA/other nucleic acids metabolism and transport,nuclear proteins
Nucleoporin 50 kDa 934 up Q9UKX7 50144 6,6 91Nucleoporin p54 298 up Q7Z3B4 55435 6,5 128Deoxyuridine 5’-triphosphate nucleotidohydrolase,
mitochondrial precursor886 down P33316 19346 9,7 136
Heterogeneous nuclear ribonucleoprotein K 252 down P61978,gi)55958544
50976 5,4 83 97 1 3
Protein synthesis/metabolism/processing/degradationPeptidyl-prolyl cis-trans isomerase B precursor 35 up P23284 20289 9,3 81 87Cathepsin D precursor 747 up P07339 44552 6,1 96Elongation factor 2 (C-terminal fragment) 378 up P13639 95207 6,4 108 2Elongation factor 1-delta 611 down P29692 30991 4,9 96 1Eukaryotic translation initiation factor 3 subunit 2 571 down Q13347 36502 5,4 170 205, 98Eukaryotic translation initiation factor 3 subunit 4 473 down O75821 35611 5,9 103Ubiquilin 1 206 down Q9UMX0 62519 5,0 135Proteasome activator complex subunit 3 694 down P61289 29506 5,7 200UNR protein 92 down O75534 88885 5,9 97Nascent-polypeptide-associated complex alpha
polypeptide18 down gi)5031931 23370 4,5 86
Signal transductionSerine-threonine kinase receptor-associated protein 518 down Q9Y3F4,
gi)451941738438 5,0 107 141, 149, 126
Stress responseStress-70 protein, mitochondrial precursor 163 up P38646 68759 5,9 93 128 2Heat-shock protein 105 kDa 61 up Q92598 96865 5,3 114, 109 1 1Peroxiredoxin 1 848 up Q06830 22110 8,3 189 2Peroxiredoxin 4 785 down Q13162 30540 5,9 107 65Heat shock 70 kDa protein 4 62 down P34932 94300 5,2 82 1Heat shock cognate 71 kDa protein 172 down P11142 70854 5,4 84 3
Heat shock protein HSP 90-alpha 94 down P07900 84543 4,9 163 2 1101 down 134
67 down 198
Energy metabolismCreatine kinase, B chain 419 up P12277 42644 5,3 104 1 7Bifunctional methylenetetrahydrofolate dehydrogenase/
cyclohydrolase, mitochondrial prec.624 down P13995 34138 8,9 99
Carbohydrate metabolism/transportAldehyde dehydrogenase X, mitochondrial precursor 343 up P30837 55292 6,4 91
2006 WILEY-VCH Verlag GmbH & Co. KGaA, Weinheim www.proteomics-journal.com
Proteomics 2006, 6, 0000–0000 Cell Biology 9
Table 1. Continued
Protein name Spot no. Expres-sion
Accessionno. (Swiss-Prot, NCBI)
Theor.MW(kDa)
Theor.pI
MALDI-MS:MOWSE-score
MALDI-MS/MS:MOWSE-score
Additionalproteinsin spot
Identical,notregulatedproteins
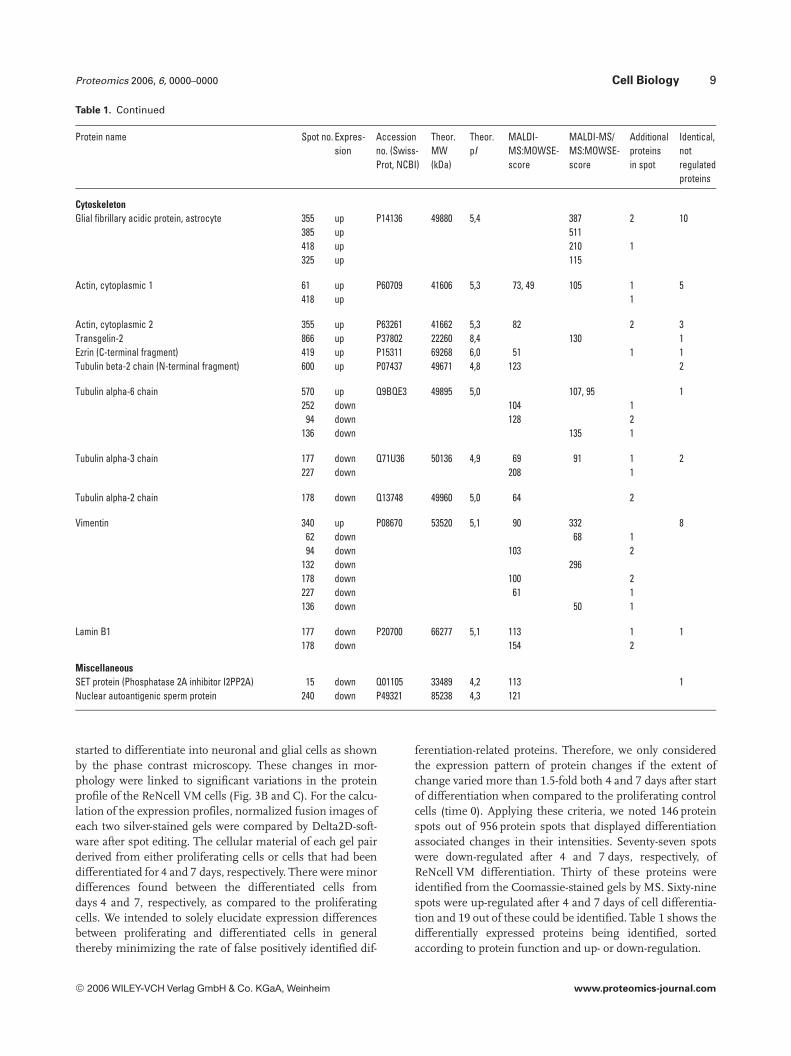
CytoskeletonGlial fibrillary acidic protein, astrocyte 355 up P14136 49880 5,4 387 2 10
385 up 511418 up 210 1325 up 115
Actin, cytoplasmic 1 61 up P60709 41606 5,3 73, 49 105 1 5418 up 1
Actin, cytoplasmic 2 355 up P63261 41662 5,3 82 2 3Transgelin-2 866 up P37802 22260 8,4 130 1Ezrin (C-terminal fragment) 419 up P15311 69268 6,0 51 1 1Tubulin beta-2 chain (N-terminal fragment) 600 up P07437 49671 4,8 123 2
Tubulin alpha-6 chain 570 up Q9BQE3 49895 5,0 107, 95 1252 down 104 1
94 down 128 2136 down 135 1
Tubulin alpha-3 chain 177 down Q71U36 50136 4,9 69 91 1 2227 down 208 1
Tubulin alpha-2 chain 178 down Q13748 49960 5,0 64 2
Vimentin 340 up P08670 53520 5,1 90 332 862 down 68 194 down 103 2
132 down 296178 down 100 2227 down 61 1136 down 50 1
Lamin B1 177 down P20700 66277 5,1 113 1 1178 down 154 2
MiscellaneousSET protein (Phosphatase 2A inhibitor I2PP2A) 15 down Q01105 33489 4,2 113 1Nuclear autoantigenic sperm protein 240 down P49321 85238 4,3 121
started to differentiate into neuronal and glial cells as shownby the phase contrast microscopy. These changes in mor-phology were linked to significant variations in the proteinprofile of the ReNcell VM cells (Fig. 3B and C). For the calcu-lation of the expression profiles, normalized fusion images ofeach two silver-stained gels were compared by Delta2D-soft-ware after spot editing. The cellular material of each gel pairderived from either proliferating cells or cells that had beendifferentiated for 4 and 7 days, respectively. There were minordifferences found between the differentiated cells fromdays 4 and 7, respectively, as compared to the proliferatingcells. We intended to solely elucidate expression differencesbetween proliferating and differentiated cells in generalthereby minimizing the rate of false positively identified dif-
ferentiation-related proteins. Therefore, we only consideredthe expression pattern of protein changes if the extent ofchange varied more than 1.5-fold both 4 and 7 days after startof differentiation when compared to the proliferating controlcells (time 0). Applying these criteria, we noted 146 proteinspots out of 956 protein spots that displayed differentiationassociated changes in their intensities. Seventy-seven spotswere down-regulated after 4 and 7 days, respectively, ofReNcell VM differentiation. Thirty of these proteins wereidentified from the Coomassie-stained gels by MS. Sixty-ninespots were up-regulated after 4 and 7 days of cell differentia-tion and 19 out of these could be identified. Table 1 shows thedifferentially expressed proteins being identified, sortedaccording to protein function and up- or down-regulation.
2006 WILEY-VCH Verlag GmbH & Co. KGaA, Weinheim www.proteomics-journal.com
10 R. Hoffrogge et al. Proteomics 2006, 6, 0000–0000
Figure 2. Relative quantitativedistribution of functional proteincategories. The 21 functionalprotein categories are based onn = 318 individual proteins andare largely assigned accordingto gene ontology database. Thelargest group (protein synthesis,metabolism, processing anddegradation) comprises 21% ofthe proteins, whereas the pro-portions of the remaining con-tributors do not exceed 11%.
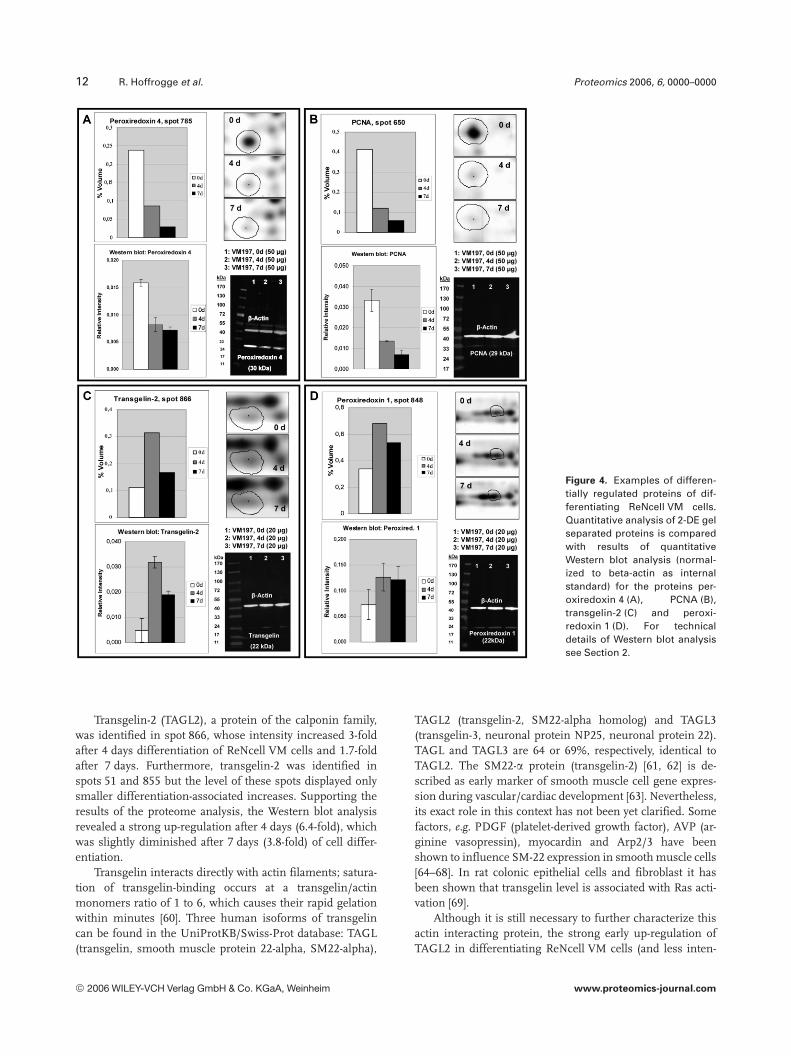
To validate the results of the proteome analysis, quanti-tative Western blot experiments were performed for two up-regulated (transgelin-2 and peroxiredoxin 1) and two down-regulated (peroxiredoxin 4 and PCNA) proteins (Fig. 4).
PCNA protein [44, 45] was strongly down-regulatedaccording to 2-DE analysis (spot 650) and the Western blotanalysis revealed reduction of the protein levels by 60 and80% after 4 and 7 days of differentiation, respectively. Origi-nally, this protein was described as an autoantibody to anuclear antigen in proliferating cells [44] and further char-acterized as a protein correlating to the proliferative state ofcells [46]. PCNA as well as other cycle-associated proteinsturned out to be common markers of proliferating cells [47].PCNA interacts with multiple partners mainly involved inDNA replication, DNA repair and cell cycle control and othercellular events like maintenance of chromosome structure[48]. One well-described interacting partner out of the main-tenance group is the chromatin assembly factor 1 (CAF-1).We also identified the subunit C of this factor in spot 337, butit did not display any differentiation-dependent regulationsof its level. CAF-1 is a molecular chaperone that depositshistones H3 and H4 onto newly replicated DNA, whilePCNA topologically marks newly replicated DNA for chro-matin assembly by CAF-1 [49]. Using a proteomic approach,Hengstschläger and coworkers [50] have recently demon-strated that the expression of PCNA and the p48 (= C) sub-unit of CAF-1 is subject to the regulation by the tuberoussclerosis gene products (TSC1 and TSC2). Ectopic over-expression of these proteins in HeLa cells triggered the up-regulation of the expression of PCNA and CAF-1. The strong
down-regulation of PCNA in differentiating ReNcell VMcells is in line with the stop of proliferation of the cells aftergrowth factor withdrawal.
The expression level of two out of four peroxiredoxinsthat were identified on our 2-DE gels, i.e. peroxiredoxin 1(PRDX1) and 4 (PRDX4), was changed significantly duringdifferentiation of ReNcell VM cells. For the two remainingperoxiredoxins, PRDX 2 and 6, we could not detect a signifi-cant up- or down-regulation.
PRDX1 was allocated to three spots. During the course ofthe differentiation all three spots displayed increased inten-sities but only one spot (spot 848) exceeded the cut-off levelof 1.5-fold both after 4 and 7 days of differentiation. OurWestern blot analysis confirmed an almost 2-fold increase ofthe PRDX1 amount during differentiation of the cells.PRDX4 was found only in spot 785 and the initial 2-DE-based observation of a strong down-regulation in differ-entiated ReNcell VM cells was supported by the Western blotresults that displayed a more than 2-fold down-regulation ofthis redox regulation protein after 4 and 7 days of differ-entiation.
The peroxiredoxins are a family of anti-oxidative pro-teins, consisting of six members in mammals. They are dis-tributed in the cytosol, mitochondria, peroxisomes andplasma. Besides their role as a peroxidases some membersshow further functions, e.g. in cell proliferation, differentia-tion and gene expression, presumable independent on theirperoxidase activity [51, 52]. Hirotsu and coworkers [53] asso-ciated different isoforms of almost identical proteins fromhuman, rat and mouse with diverse cellular functions, such
2006 WILEY-VCH Verlag GmbH & Co. KGaA, Weinheim www.proteomics-journal.com
Proteomics 2006, 6, 0000–0000 Cell Biology 11
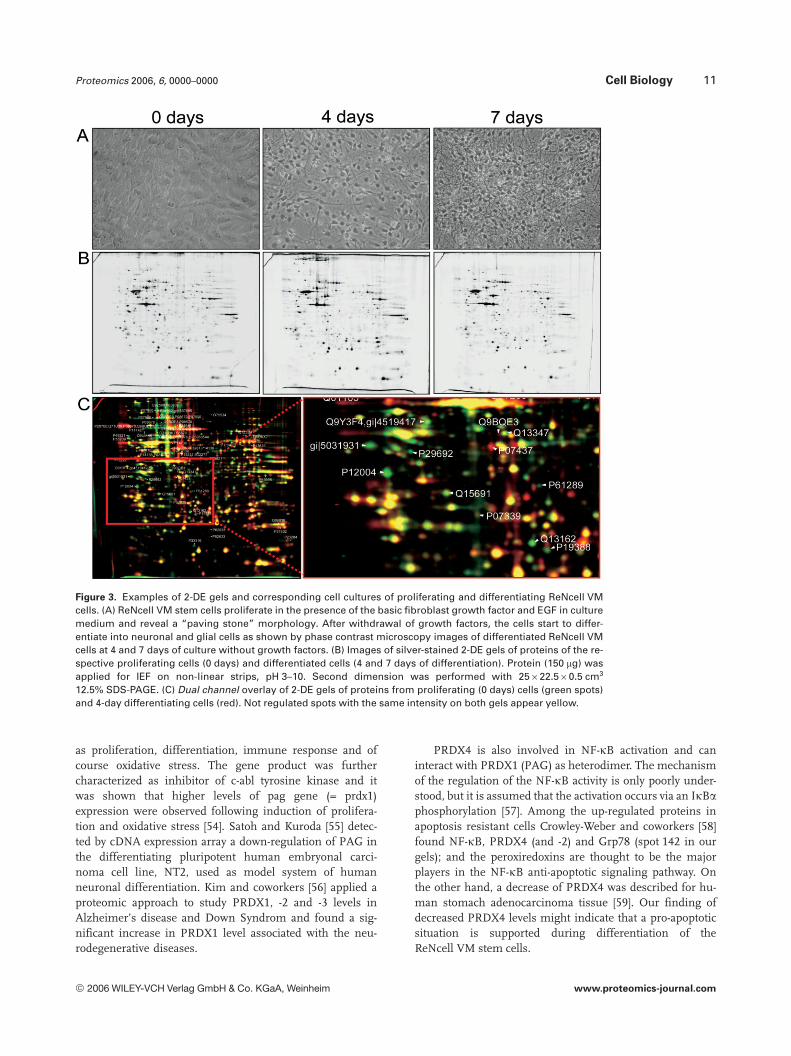
Figure 3. Examples of 2-DE gels and corresponding cell cultures of proliferating and differentiating ReNcell VMcells. (A) ReNcell VM stem cells proliferate in the presence of the basic fibroblast growth factor and EGF in culturemedium and reveal a “paving stone” morphology. After withdrawal of growth factors, the cells start to differ-entiate into neuronal and glial cells as shown by phase contrast microscopy images of differentiated ReNcell VMcells at 4 and 7 days of culture without growth factors. (B) Images of silver-stained 2-DE gels of proteins of the re-spective proliferating cells (0 days) and differentiated cells (4 and 7 days of differentiation). Protein (150 mg) wasapplied for IEF on non-linear strips, pH 3–10. Second dimension was performed with 25622.560.5 cm3
12.5% SDS-PAGE. (C) Dual channel overlay of 2-DE gels of proteins from proliferating (0 days) cells (green spots)and 4-day differentiating cells (red). Not regulated spots with the same intensity on both gels appear yellow.
as proliferation, differentiation, immune response and ofcourse oxidative stress. The gene product was furthercharacterized as inhibitor of c-abl tyrosine kinase and itwas shown that higher levels of pag gene (= prdx1)expression were observed following induction of prolifera-tion and oxidative stress [54]. Satoh and Kuroda [55] detec-ted by cDNA expression array a down-regulation of PAG inthe differentiating pluripotent human embryonal carci-noma cell line, NT2, used as model system of humanneuronal differentiation. Kim and coworkers [56] applied aproteomic approach to study PRDX1, -2 and -3 levels inAlzheimer’s disease and Down Syndrom and found a sig-nificant increase in PRDX1 level associated with the neu-rodegenerative diseases.
PRDX4 is also involved in NF-kB activation and caninteract with PRDX1 (PAG) as heterodimer. The mechanismof the regulation of the NF-kB activity is only poorly under-stood, but it is assumed that the activation occurs via an IkBaphosphorylation [57]. Among the up-regulated proteins inapoptosis resistant cells Crowley-Weber and coworkers [58]found NF-kB, PRDX4 (and -2) and Grp78 (spot 142 in ourgels); and the peroxiredoxins are thought to be the majorplayers in the NF-kB anti-apoptotic signaling pathway. Onthe other hand, a decrease of PRDX4 was described for hu-man stomach adenocarcinoma tissue [59]. Our finding ofdecreased PRDX4 levels might indicate that a pro-apoptoticsituation is supported during differentiation of theReNcell VM stem cells.
2006 WILEY-VCH Verlag GmbH & Co. KGaA, Weinheim www.proteomics-journal.com
12 R. Hoffrogge et al. Proteomics 2006, 6, 0000–0000
Figure 4. Examples of differen-tially regulated proteins of dif-ferentiating ReNcell VM cells.Quantitative analysis of 2-DE gelseparated proteins is comparedwith results of quantitativeWestern blot analysis (normal-ized to beta-actin as internalstandard) for the proteins per-oxiredoxin 4 (A), PCNA (B),transgelin-2 (C) and peroxi-redoxin 1 (D). For technicaldetails of Western blot analysissee Section 2.
Transgelin-2 (TAGL2), a protein of the calponin family,was identified in spot 866, whose intensity increased 3-foldafter 4 days differentiation of ReNcell VM cells and 1.7-foldafter 7 days. Furthermore, transgelin-2 was identified inspots 51 and 855 but the level of these spots displayed onlysmaller differentiation-associated increases. Supporting theresults of the proteome analysis, the Western blot analysisrevealed a strong up-regulation after 4 days (6.4-fold), whichwas slightly diminished after 7 days (3.8-fold) of cell differ-entiation.
Transgelin interacts directly with actin filaments; satura-tion of transgelin-binding occurs at a transgelin/actinmonomers ratio of 1 to 6, which causes their rapid gelationwithin minutes [60]. Three human isoforms of transgelincan be found in the UniProtKB/Swiss-Prot database: TAGL(transgelin, smooth muscle protein 22-alpha, SM22-alpha),
TAGL2 (transgelin-2, SM22-alpha homolog) and TAGL3(transgelin-3, neuronal protein NP25, neuronal protein 22).TAGL and TAGL3 are 64 or 69%, respectively, identical toTAGL2. The SM22-a protein (transgelin-2) [61, 62] is de-scribed as early marker of smooth muscle cell gene expres-sion during vascular/cardiac development [63]. Nevertheless,its exact role in this context has not been yet clarified. Somefactors, e.g. PDGF (platelet-derived growth factor), AVP (ar-ginine vasopressin), myocardin and Arp2/3 have beenshown to influence SM-22 expression in smooth muscle cells[64–68]. In rat colonic epithelial cells and fibroblast it hasbeen shown that transgelin level is associated with Ras acti-vation [69].
Although it is still necessary to further characterize thisactin interacting protein, the strong early up-regulation ofTAGL2 in differentiating ReNcell VM cells (and less inten-
2006 WILEY-VCH Verlag GmbH & Co. KGaA, Weinheim www.proteomics-journal.com
Proteomics 2006, 6, 0000–0000 Cell Biology 13
sive TAGL3) and the linkage of transgelin to the RAS signal-ing pathway suggests this protein to be an interesting candi-date for further investigations of early neuronal develop-ment.
Many of the other identified proteins, which are differ-entially expressed after transition from proliferation to dif-ferentiation, are not yet identified to play an active role in theprocess of differentiation. However, the following proteins,representing a large spectrum of functional groups, may beinteresting candidates for further elucidation of their partic-ipation in the neural differentiation process such as stop ofcell division and induction of apoptosis, establishing of celladherence junctions, growth cone development, neuriteelongation and synapse formation.
The nucleosome assembly protein 1-like 2 protein(NP1L2) controls the neurulation according to investigationsof Rogner and coworkers [70] in a mutant mouse model.Defects were correlated with an overproduction of neuronalprecursor cells. We found the 55% homologous NP1L1-pro-tein out of the NAP-1 gene family to be accordingly down-regulated in the differentiated ReNcell VM cells. Two pro-teins controlling cell cycle and cell division, i.e. the nuclearmigration protein nudC that is known to be involved inneurogenesis and neuronal migration [71, 72] and the DNApolymerase delta subunit 2, are increased during differ-entiation in our study, which is in accordance with publisheddata [72, 73].
The heterogeneous nuclear ribonucleoprotein K repres-ses the translation of p21, an enhancer of neuronal differ-entiation, in non-neuronal and neuronal cells [74] and wasfound to be down-regulated in our study. Nucleoporin50 kDa (Nup50) is a component of the nuclear pore complexwith a role in protein export, and its expression increased indifferentiated ReNcell VM cells compared to proliferatingcells in our 2-DE expression approach. Nup50 was shownbefore to be strongly expressed in developing neural tubes,and its disruption resulted in neural tube defects [75].
Two proteins of the functional group of protein synthe-sis/metabolism/processing/degradation, i.e. ubiquilin andthe elongation factor 2, are known to be involved in neuronaldevelopment. Ubiquilin-1 (synonym: PLIC-1) that protectsagainst neuronal apoptosis [76] and counteracts neuronalacetylcholine receptors [77] is down-regulated in differ-entiated ReNcell VM cells in our study. Furthermore, ubi-quilin-1 links CD47 (integrin-associated protein, IAP) to thecytoskeleton via vimentin [78] and regulates the surfaceexpression of GABA-A receptors [79]. In addition, PDI (pro-tein-disulfide isomerase) that is up-regulated in response tohypoxia/brain ischemia in astrocytes interacts with ubiquilin[80]. The elongation factor 2 increases protein synthesisinvolved in neuronal differentiation of N1E115 mouse neu-roblastomal cells [81] and is up-regulated in differentiatedReNcell VM cells in our approach.
Creatine kinases are involved in energy metabolism ofcells and tissues with high-energy demands such as brain[82]. Creatine kinase B chain (BCK) protein expression was
increased in the differentiated ReNcell VM cells. BCKmRNA level was reported to be strongly expressed in primaryneurons of 1-day-old zebrafish embryos and it is suggested toplay role in neuronal differentiation [83].
There are five stress-related proteins besides the above-mentioned peroxiredoxins found to be differentially regu-lated in our study. The up-regulated stress-70 protein(GRP75, 75 kDa glucose regulated protein) is implicated inthe control of cell proliferation and cellular aging [84, 85].The heat shock protein HSP-105 was also up-regulated,whereas HSP-70, HSP 90-alpha and HSP7C were down-regulated. The relationship of these heat shock proteins tothe process of neural differentiation remains unclear. How-ever, these findings may reflect different functions of distinctmembers of the heat shock protein family for differentiationprocesses, which are certainly connected with cellular stress.
Generally, reassembling of cytoskeletal proteins is animportant feature of morphological changes during neuraldifferentiation [86, 87]. Therefore, it is not surprising thatmore than 10 out of 45 differentially regulated proteinsbelong to components of microfilaments, microtubuli andintermediary filaments. The group of up-regulated cytoskel-eton proteins includes actin (cytoplasmatic 1 and 2), ezrin (aC-terminal fragment), tubulins and four GFAP (astrocyte).In total GFAP was identified alone or together with otherproteins in further 14 spots. Of those, 4 (325, 355, 385 and418) displayed a differentiation-associated increase in inten-sity. For spots 325 and 385 this increase is clearly due tohigher GFAP levels, because both spots contained onlyGFAP. GFAP is a well-known cell-specific marker [88] that,during the development of the central nervous system, dis-tinguishes astrocytes from other glial cells. The up-regula-tion of GFAP in a number of spots confirms the expected50% differentiation of ReNcell VM stem cells into glia,mainly astrocytes using the most simple differentiation pro-cedure. The extensive structural rearrangements of the cyto-skeleton are reflected by changes in the intensity of spotscontaining structure proteins. In addition to some tubulinand laminin spots, predominantly vimentin was down-regu-lated in six spots (and once up-regulated). The intermediatefilament vimentin is used as (immature) radial glial marker[89–91]. However, only certain isoforms of vimentin dis-played reduced levels in differentiating ReNcell VM stemcells because eight additional vimentin spots did not displaysignificant changes in their intensities during the timecourse of the experiment. Concerning the other differentiallyregulated proteins, the current literature is lacking evidencefor a direct involvement in neural differentiation processes.Nevertheless, they may contribute to these processes in a sofar not disclosed manner.
The comparison of the results of our approach with thoseof proteomics screening of Maurer and coworkers [11] inNSC from adult rat hippocampus shows a few correspond-ing protein expressions. The proteins regulated concordantlyto our study are the elongation factor 2 (up-regulated in 9 of11 spots), tubulin alpha (down-regulated in 2 of 6 spots) and
2006 WILEY-VCH Verlag GmbH & Co. KGaA, Weinheim www.proteomics-journal.com
14 R. Hoffrogge et al. Proteomics 2006, 6, 0000–0000
b-actin (= cytoplasmic 1, up-regulated in 1 of 2 spots). Areverse expression was found for peroxiredoxin 1 and 4: per-oxiredoxin 4 was up-regulated and peroxiredoxin 1 down-regulated (each in a single spot) during differentiation in thestudy of Maurer and coworkers [11]. The few congruentresults between studies on fetal rat midbrain and adult hu-man hippocampal stem cells indicate a lack of common fea-tures of NSC of different origin with regard to proteomeprofiling, which is also supported by gene expression micro-array studies in different systems [6–9, 55].
4 Concluding remarks
In the present study, we describe a proteome database ofhNSC isolated from the ventral mesencephalon and immor-talized via v-myc. This database provides a protein inventorythat will allow specifying changes in the protein expressionpattern due to specific pathways activated or suppressedduring proliferation and differentiation of NSC. Therefore,the present database is not only a valuable basis for short-term interval assessment of differentiation-related changesof protein expression but also presents the possibility toemploy the expression pattern observed as a quality controlduring the cultivation and differentiation process of hNSC.Furthermore, it will help to describe the pathways, which areinvolved in differentiation and neural plasticity, indicating afunctional role for newly identified proteins in hNSC.
We thank Carla Biedermann and Nicole Deinet for theirexcellent technical support and Olaf Wolkenhauer (Chair inSystems Biology and Bioinformatics, University of Rostock) forhelpful comments on the manuscript. The work was supported bythe Bundesministerium für Bildung und Forschung (NBL3FKZ01-ZZ-0108) as well as by the intramural University fund-ing system FORUN.
5 References
[1] Barker, R. A., Jain, M., Armstrong, R. J., Caldwell, M. A., J.Neurol. Neurosurg. Psychiatry 2003, 74, 553–557.
[2] Ginis, I., Rao, M. S., Exp. Neurol. 2003, 184, 61–77.
[3] Flax, J. D., Aurora, S., Yang, C., Simonin, C. et al., Nat. Bio-technol. 1998, 16, 1033–1039.
[4] Cattaneo, E., Conti, L., J. Neurosci. Res. 1998, 53, 223–234.
[5] Gropp, M., Itsykson, P., Singer, O., Ben Hur, T. et al., Mol. Ther.2003, 7, 281–287.
[6] Pazman, C., Castelli, J. C., Wen, X., Somogyi, R., Neuroreport2000, 11, 719–724.
[7] Boettcher, T., Mix, E., Koczan, D., Bauer, P. et al., J. Neurosci.Res. 2003, 73, 42–53.
[8] Pahnke, J., Mix, E., Knoblich, R., Müller, J. et al., Exp. Cell Res.2004, 297, 484–494.
[9] Gurok, U., Steinhoff, C., Lipkowitz, B., Ropers, H. H. et al., J.Neurosci. 2004, 24, 5982–6002.
[10] Unwin, R. D., Gaskell, S. J., Evans, C. A., Whetton, A. D., Exp.Hematol. 2003, 31, 1147–1159.
[11] Maurer, M. H., Feldmann, R. E., Jr., Fütterer, C. D., Butlin, J.et al., Neurochem. Res. 2004, 29, 1129–1144.
[12] Evans, C. A., Tonge, R., Blinco, D., Pierce, A. et al., Blood2004, 103, 3751–3759.
[13] Rohlff, C., Int. J. Neuropsychopharmacol. 2001, 4, 93–102.
[14] Rohlff, C., Electrophoresis 2000, 21, 1227–1234.
[15] Husi, H., Grant, S. G., Trends Neurosci. 2001, 24, 259–266.
[16] Lubec, G., Krapfenbauer, K., Fountoulakis, M., Prog. Neuro-biol. 2003, 69, 193–211.
[17] Choudhary, J., Grant, S. G., Nat. Neurosci. 2004, 7, 440–445.
[18] Taylor, C. M., Marta, C. B., Claycomb, R. J., Han, D. K. et al.,Proc. Natl. Acad. Sci. USA 2004, 101, 4643–4648.
[19] Kim, S. I., Voshol, H., van Oostrum, J., Hastings, T. G. et al.,Neurochem. Res. 2004, 29, 1317–1331.
[20] Maurer, M. H., Feldmann, R. E., Jr., Fütterer, C. D.,Kuschinsky, W., Proteome. Sci. 2003, 1, 4.
[21] Ben Hur, T., Idelson, M., Khaner, H., Pera, M. et al., Stem Cells2004, 22, 1246–1255.
[22] Chu, K., Kim, M., Jung, K. H., Jeon, D. et al., Brain Res. 2004,1023, 213–221.
[23] Lindvall, O., Bjoerklund, A., Neurotox. 2004, 1, 382–393.
[24] Svendsen, C., Trends Neurosci. 2000, 23, 450.
[25] Blum, H., Beier, H., Gross, H. J., Electrophoresis 1987, 8, 93–99.
[26] Luhn, S., Berth, M., Hecker, M., Bernhardt, J., Proteomics2003, 3, 1117–1127.
[27] Fountoulakis, M., Langen, H., Anal. Biochem. 1997, 250, 153–156.
[28] Nordhoff, E., Egelhofer, V., Giavalisco, P., Eickhoff, H. et al.,Electrophoresis 2001, 22, 2844–2855.
[29] Nordhoff, E., Schürenberg, M., Thiele, G., Lübbert, C. et al.,Int. J. of Mass Spectrom. 2003, 226, 163–180.
[30] Pappin, D. J., Hojrup, P., Bleasby, A. J., Curr. Biol. 1993, 3,327–332.
[31] Pearce, A., Svendsen, C. N., Electrophoresis 1999, 20, 969–970.
[32] Guo, X., Ying, W., Wan, J., Hu, Z. et al., Electrophoresis 2001,22, 3067–3075.
[33] Schrattenholz, A., Wozny, W., Klemm, M., Schroer, K. et al.,J. Neurol. Sci. 2005, 229–230, 261–267.
[34] Elliott, S. T., Crider, D. G., Garnham, C. P., Boheler, K. R. et al.,Proteomics 2004, 4, 3813–3832.
[35] Behre, G., Reddy, V. A., Tenen, D. G., Hiddemann, W. et al.,Expert. Opin. Ther. Targets. 2002, 6, 491–495.
[36] Ota, J., Yamashita, Y., Okawa, K., Kisanuki, H. et al., Onco-gene 2003, 22, 5720–5728.
[37] Tao, W., Wang, M., Voss, E. D., Cocklin, R. R. et al., Stem Cells2004, 22, 1003–1014.
[38] Tian, Q., Stepaniants, S. B., Mao, M., Weng, L. et al., Mol. CellProteomics 2004, 3, 960–969.
[39] Kim, D. R., J. Chromatogr. B 2005, 815, 295–303.
[40] Boraldi, F., Bini, L., Liberatori, S., Armini, A. et al., Proteom-ics 2003, 3, 917–929.
2006 WILEY-VCH Verlag GmbH & Co. KGaA, Weinheim www.proteomics-journal.com
Proteomics 2006, 6, 0000–0000 Cell Biology 15
[41] Park, Y. D., Kim, S. Y., Jang, H. S., Seo, E. Y. et al., Proteomics2004, 4, 3446–3455.
[42] Kratchmarova, I., Blagoev, B., Haack-Sorensen, M., Kassem,M. et al., Science 2005, 308, 1472–1477.
[43] Delany, J. P., Floyd, Z. E., Zvonic, S., Smith, A. et al., Mol. CellProteomics 2005, 4, 731–740.
[44] Miyachi, K., Fritzler, M. J., Tan, E. M., J. Immunol. 1978, 121,2228–2234.
[45] Almendral, J. M., Huebsch, D., Blundell, P. A., Macdonald–Bravo, H. et al., Proc. Natl. Acad. Sci. USA 1987, 84, 1575–1579.
[46] Takasaki, Y., Fishwild, D., Tan, E. M., J. Exp. Med. 1984, 159,981–992.
[47] Iatropoulos, M. J., Williams, G. M., Exp. Toxicol. Pathol.1996, 48, 175–181.
[48] Tsurimoto, T., Front Biosci. 1999, 4, D849–D858.
[49] Shibahara, K., Stillman, B., Cell 1999, 96, 575–585.
[50] Hengstschlaeger, M., Rosner, M., Fountoulakis, M., Lubec,G., Biochem. Biophys. Res. Commun. 2003, 307, 737–742.
[51] Butterfield, L. H., Merino, A., Golub, S. H., Shau, H., Antioxid.Redox. Signal. 1999, 1, 385–402.
[52] Fujii, J., Ikeda, Y., Redox. Rep. 2002, 7, 123–130.
[53] Hirotsu, S., Abe, Y., Okada, K., Nagahara, N. et al., Proc. Natl.Acad. Sci. USA 1999, 96, 12333–12338.
[54] Prosperi, M. T., Ferbus, D., Rouillard, D., Goubin, G., FEBSLett. 1998, 423, 39–44.
[55] Satoh, J., Kuroda, Y., J. Neurosci. Methods 2000, 94, 155–164.
[56] Kim, S. H., Fountoulakis, M., Cairns, N., Lubec, G., J. NeuralTransm. Suppl. 2001, 223–235.
[57] Jin, D. Y., Chae, H. Z., Rhee, S. G., Jeang, K. T., J. Biol. Chem.1997, 272, 30952–30961.
[58] Crowley-Weber, C. L., Payne, C. M., Gleason-Guzman, M.,Watts, G. S. et al., Carcinogenesis 2002, 23, 2063–2080.
[59] Jang, J. S., Cho, H. Y., Lee, Y. J., Ha, W. S. et al., Oncol. Res.2004, 14, 491–499.
[60] Shapland, C., Hsuan, J. J., Totty, N. F., Lawson, D., J. CellBiol. 1993, 121, 1065–1073.
[61] Solway, J., Seltzer, J., Samaha, F. F., Kim, S. et al., J. Biol.Chem. 1995, 270, 13460–13469.
[62] Lawson, D., Harrison, M., Shapland, C., Cell Motil. Cytoskel-eton 1997, 38, 250–257.
[63] Duband, J. L., Gimona, M., Scatena, M., Sartore, S. et al.,Differentiation 1993, 55, 1–11.
[64] Xu, R., Ho, Y. S., Ritchie, R. P., Li, L., Am. J. Physiol. HeartCirc. Physiol. 2003, 284, H1398–H1407.
[65] Kaplan-Albuquerque, N., Garat, C., Van, P., V, Nemenoff, R.A., Am. J. Physiol. Heart Circ. Physiol. 2003, 285, H1444–H1452.
[66] Zeidan, A., Nordstrom, I., Albinsson, S., Malmqvist, U. et al.,Am. J. Physiol. Cell Physiol. 2003, 284, C1387–C1396.
[67] Du, K. L., Ip, H. S., Li, J., Chen, M. et al., Mol. Cell Biol. 2003,23, 2425–2437.
[68] Kaverina, I., Stradal, T. E., Gimona, M., J. Cell Sci. 2003, 116,4915–4924.
[69] Shields, J. M., Rogers-Graham, K., Der, C. J., J. Biol. Chem.2002, 277, 9790–9799.
[70] Rogner, U. C., Spyropoulos, D. D., Le Novere, N., Changeux,J. P. et al., Nat. Genet. 2000, 25, 431–435.
[71] Morris, S. M., Albrecht, U., Reiner, O., Eichele, G. et al., Curr.Biol. 1998, 8, 603–606.
[72] Aumais, J. P., Tunstead, J. R., McNeil, R. S., Schaar, B. T. etal., J. Neurosci. 2001, 21, RC187.
[73] Raji, N. S., Krishna, T. H., Rao, K. S., Int. J. Dev. Neurosci.2002, 20, 491–496.
[74] Yano, M., Okano, H. J., Okano, H., J. Biol. Chem. 2005, 280,12690–12699.
[75] Smitherman, M., Lee, K., Swanger, J., Kapur, R. et al., Mol.Cell Biol. 2000, 20, 5631–5642.
[76] Nomura, Y., Biol. Pharm. Bull. 2004, 27, 961–963.
[77] Ficklin, M. B., Zhao, S., Feng, G., J. Biol. Chem. 2005.
[78] Wu, A. L., Wang, J., Zheleznyak, A., Brown, E. J., Mol. Cell1999, 4, 619–625.
[79] Bedford, F. K., Kittler, J. T., Muller, E., Thomas, P. et al., Nat.Neurosci. 2001, 4, 908–916.
[80] Ko, H. S., Uehara, T., Nomura, Y., J. Biol. Chem. 2002, 277,35386–35392.
[81] Li, H., Chen, H. C., Huang, F. L., Biochem. Biophys. Res.Commun. 1995, 217, 131–137.
[82] Wyss, M., Kaddurah-Daouk, R., Physiol Rev. 2000, 80, 1107–1213.
[83] Dickmeis, T., Rastegar, S., Aanstad, P., Clark, M. et al., Mech.Dev. 2001, 109, 409–412.
[84] Wadhwa, R., Taira, K., Kaul, S. C., Cell Stress. Chaperones2002, 7, 309–316.
[85] Wadhwa, R., Kaul, S. C., Ikawa, Y., Sugimoto, Y., J. Biol.Chem. 1993, 268, 6615–6621.
[86] Kaech, S., Parmar, H., Roelandse, M., Bornmann, C. et al.,Proc. Natl. Acad. Sci. USA 2001, 98, 7086–7092.
[87] Chauvet, N., Prieto, M., Fabre, C., Noren, N. K. et al., Mol.Cell Neurosci. 2003, 22, 467–486.
[88] Eng, L. F., Ghirnikar, R. S., Lee, Y. L., Neurochem. Res. 2000,25, 1439–1451.
[89] Dahl, D., Rueger, D. C., Bignami, A., Weber, K. et al., Eur. J.Cell Biol. 1981, 24, 191–196.
[90] Kalman, M., Ajtai, B. M., Int. J. Dev. Neurosci. 2001, 19, 101–108.
[91] Noctor, S. C., Flint, A. C., Weissman, T. A., Wong, W. S. et al.,J. Neurosci. 2002, 22, 3161–3173.
2006 WILEY-VCH Verlag GmbH & Co. KGaA, Weinheim www.proteomics-journal.com