Effects of Azelaic Acid on Proliferation and Ultrastructure of Mouse Keratinocytes in Vitro
Upload
hms-harvardCategory
view
1download
0
A RT I C L E S
EGFR signalling as a negative regulator of Notch1 gene transcription and function in proliferating keratinocytes and cancerVihren Kolev1,6, Anna Mandinova1,6, Juan Guinea-Viniegra2, Bing Hu3, Karine Lefort3, Chiara Lambertini3, Victor Neel4, Reinhard Dummer5, Erwin F. Wagner2 and G. Paolo Dotto1,3,4,7
The Notch1 gene has an important role in mammalian cell-fate decision and tumorigenesis. Upstream control mechanisms for transcription of this gene are still poorly understood. In a chemical genetics screen for small molecule activators of Notch signalling, we identified epidermal growth factor receptor (EGFR) as a key negative regulator of Notch1 gene expression in primary human keratinocytes, intact epidermis and skin squamous cell carcinomas (SCCs). The underlying mechanism for negative control of the Notch1 gene in human cells, as well as in a mouse model of EGFR-dependent skin carcinogenesis, involves transcriptional suppression of p53 by the EGFR effector c-Jun. Suppression of Notch signalling in cancer cells counteracts the differentiation-inducing effects of EGFR inhibitors while, at the same time, synergizing with these compounds in induction of apoptosis. Thus, our data reveal a key role of EGFR signalling in the negative regulation of Notch1 gene transcription, of potential relevance for combinatory approaches for cancer therapy.
Cell growth and differentiation are controlled by a complex interplay of signalling pathways functioning in an integrated, rather than sequential or parallel, fashion. Chemical genetics is based on the principle of using small molecular weight compounds to abrogate or enhance specific regulatory pathways, providing a powerful means of analysing complex regulatory systems. In the present study we used this approach to probe the signalling network involved in the control of Notch1 gene expression and function in human keratinocytes, skin and tumours.
Notch signalling has a key role in promoting keratinocyte differen-tiation and suppressing keratinocyte-derived tumours1,2. Notch recep-tors, with Notch1 (A001670) and 2 being the main forms expressed in keratinocytes, are activated by consecutive cleavage by an ADAM metal-loproteinase and a presenilin/γ-secretase complex. The resulting Notch intracellular domain (ICN) translocates to the nucleus where it associates with the DNA-binding protein CSL (CBF-1 or RBP-Jκ in mammalian cells), converting it from a repressor into an activator of transcription3. Binding of a second ancillary protein, Mastermind-like 1 (MAML1) or related family members, is required for sustained levels of Notch/CSL-dependent transcriptional activation (through recruitment of further transcription co-activators such as p300; ref. 4).
We recently showed that in primary human keratinocytes, genetic or pharmacological suppression of Notch signalling results in lesser
commitment to differentiation, expansion of stem-cell populations and markedly increased susceptibility to ras-induced oncogenic conver-sion2. Similar effects were observed after pharmacological suppression of endogenous Notch activity by a γ-secretase inhibitor2. These findings are likely to be of clinical significance, as Notch1 gene expression and activity are substantially downmodulated in keratinocyte cancer cell lines and tumours, with expression of this gene being under positive p53 (A001721) control in these cells2,5.
EGFR (A000823) is among the most intensely studied and well under-stood determinants of epithelial cell proliferation, and EGFR inhibitors are outstanding examples of rational-based drug design for tumours6. EGFR signalling is thought to function in the keratinocyte proliferative compartment of the epidermis as a ‘built-in’ mechanism to maintain self-renewal and, at the same time, suppress differentiation, whereas in the upper layers this pathway is downregulated. Indeed, abrogation of EGFR/ERK signalling in proliferating keratinocytes, by either chemi-cal or genetic manipulation, induces differentiation, whereas sustained activation of this pathway, under conditions where it is normally down-regulated, suppresses differentiation7,8. This has potentially important implications for keratinocyte-derived tumours, where EGFR signalling is persistently activated and promotes proliferation9. At the biochemical level, little is known about the link between EGFR/ERK pathways and
1Cutaneous Biology Research Center, Massachusetts General Hospital, Charlestown, MA 02129, USA. 2Research Institute of Molecular Pathology (IMP), A-1030 Vienna, Austria. 3Department of Biochemistry, University of Lausanne, Epalinges CH-1066, Switzerland. 4Department of Dermatology, Massachusetts General Hospital, Boston, MA 02114, USA. 5Department of Dermatology, University Hospital Zürich, Zürich CH-8091, Switzerland.6These authors contributed equally to the work.7Correspondence should be addressed to G.P.D. (e-mail: [email protected])
Received 27 March 2008; accepted 2 June 2008; published online 6 July 2008; DOI: 10.1038/ncb1750
nature cell biology advance online publication 1
© 2008 Macmillan Publishers Limited. All rights reserved.

A RT I C L E S
control of differentiation. Here we report that this pathway has a role in the negative regulation of Notch1 gene transcription in both normally proliferating keratinocytes and cancer cells, which impinges on control of differentiation as well as apoptosis.
RESULTSNegative regulation of Notch1 gene expression by EGFR/ERK signallingLittle is known of the pathways involved in upstream control of Notch1 gene expression and activity. To address this issue we undertook a chemi-cal genetics approach. We chose a small library of compounds with estab-lished target selectivity, using a luciferase Notch/CSL-responsive reporter
as read-out. The negative regulators of Notch signalling identified by this screen included inhibitors of matrix metalloproteinases and γ-secretase, which are required for endogenous Notch activation4, confirming the validity of the assay (Supplementary Information, Table S1). Statistical analysis of the results pointed to a number of other candidate pathways. In particular, the most significant compounds to induce Notch activity were kinase inhibitors that target components of signalling networks connected to EGFR signalling, which were of special interest, given the relevance of this pathway in keratinocytes and cancer10,11.
To validate the findings of our screen, we compared the effects of EGFR inhibition and stimulation on endogenous Notch signalling in human primary keratinocytes (HKCs). A concentration-response
15
10
5
0
15
10
5
0
1.2
0.8
0.4
0
1.2
0.8
0.4
0Control No.1 No.2 No.2
EGFRsiRNA
Control No.1
EGFRsiRNA
siRNAsiRNA
No.2Control No.1EGFRsiRNA
Notch14
2
0
4
2
0
EGFR
1.2
0.8
0.4
0
1.2
0.8
0.4
0
1
0.6
0.2
1.2
0.8
0.4
0
1
0.6
0.2
0 µM
Hes1
Hes1
3.5
10.5
0
32.5
21.5
Hes5
mR
NA
leve
ls(r
elat
ive
units
)
mR
NA
leve
ls(r
elat
ive
units
)
mR
NA
leve
ls(r
elat
ive
units
)
mR
NA
leve
ls(r
elat
ive
units
)
mR
NA
leve
ls(r
elat
ive
units
)
mR
NA
leve
ls(r
elat
ive
units
)
Elk1
c-Ju
nJu
nB
20
Herp1
8
4
2
6
0
Notch1a b
AG1478 0 0.2 2.0 EG
F
Notch1
Activated Notch1
Notch2
Tubulin
Hes1
EGFR
siR
NA
No.
1
c-Ju
nsi
RN
A N
o.1
Contro
l
EGFR
Notch1
Tub
No.2c-JunsiRNA
Notch1
Tubulin
Notch1
6543210
89
7
Con
trol
5
4
3
2
1
0
4
3
2
1
0
Con
trol
AK
T1A
KT2
JNK1
JNK2
MEK
1M
EK2
ERK1
ERK2
JunD
c-Fo
sFr
a1
Notch1 Notch1
c d
e f g
Con
trol
Con
trol C
ontro
l
EGF
Con
trol
EGF
Con
trol
EGF
Con
trol
EGF0.2 2.0
AG14780 µM0.2 2.0
AG14780 µM0.2 2.0
AG14780 µM0.2 2.0
AG1478
Control
Figure 1 Negative control of Notch1 activity and expression by EGFR/ERK/AP1 signalling. (a, b) Primary human keratinocytes (HKCs) were treated with AG1478 at the indicated concentrations or with recombinant EGF (1 ng ml–1) for 24 h. Hes1, Hes5 and Herp1 (a) and Notch1 (b) mRNA levels were quantified by real-time RT–PCR. Values are expressed as relative units after internal normalization for 36B4 mRNA levels, with similar results being obtained after normalization for β-actin mRNA. (c) HKCs were treated with AG1478 and EGF as in the previous panel, followed by immunoblot analysis for Hes1, total and activated Notch1 and Notch2, and γ-tubulin as equal loading control. (d) HKCs were transfected with two different siRNAs specific for EGFR, in parallel with scrambled siRNA control. Expression of the EGFR, Hes1 and Notch1 genes was assessed 48 h after transfection by real-time RT–PCR analysis (left panels), and confirmed at the protein level by immunoblotting
(right panel). (e, f) HKCs were transfected with validated siRNAs for the indicated protein kinase (e) and transcription factor (f) genes, in parallel with scrambled siRNA control. Knockdown efficiency of >80% was obtained for each of these genes, as verified by real-time RT–PCR analysis with the corresponding specific primers 48 h after transfection (data not shown). Levels of Notch1 mRNA expression were assessed by real time RT–PCR analysis as in the previous panels. For ERK1, ERK2, c-Jun, c-Fos and ELK1, similar results were obtained after transfection with a second set of specific siRNAs. (g) HKCs, transfected with siRNA specific for c-Jun and scrambled siRNA control as in the previous panel, were analysed by immunoblotting for total Notch1; γ-tubulin was used as an equal-loading control. Data were quantified by densitometric scanning, using the γ-tubulin signal for normalization (right panel). Complete western blot scans for c, d and g are presented in Supplementary Information, Fig. S7.
2 nature cell biology advance online publication
© 2008 Macmillan Publishers Limited. All rights reserved.
A RT I C L E S
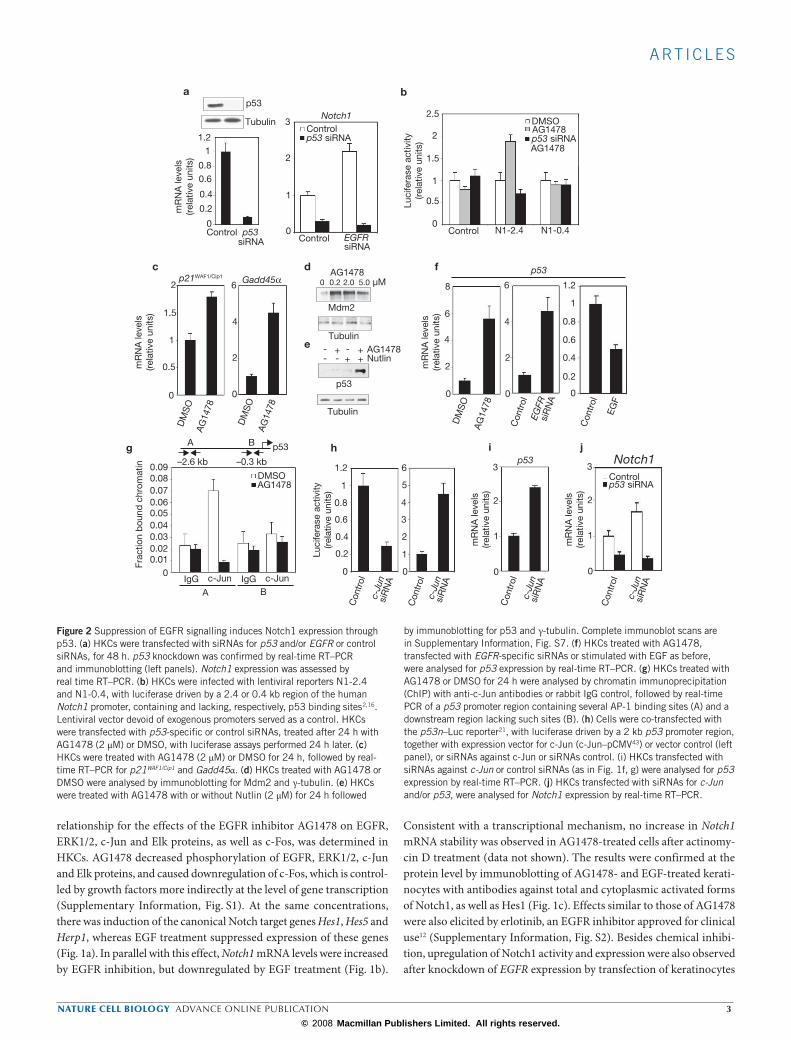
relationship for the effects of the EGFR inhibitor AG1478 on EGFR, ERK1/2, c-Jun and Elk proteins, as well as c-Fos, was determined in HKCs. AG1478 decreased phosphorylation of EGFR, ERK1/2, c-Jun and Elk proteins, and caused downregulation of c-Fos, which is control-led by growth factors more indirectly at the level of gene transcription (Supplementary Information, Fig. S1). At the same concentrations, there was induction of the canonical Notch target genes Hes1, Hes5 and Herp1, whereas EGF treatment suppressed expression of these genes (Fig. 1a). In parallel with this effect, Notch1 mRNA levels were increased by EGFR inhibition, but downregulated by EGF treatment (Fig. 1b).
Consistent with a transcriptional mechanism, no increase in Notch1 mRNA stability was observed in AG1478-treated cells after actinomy-cin D treatment (data not shown). The results were confirmed at the protein level by immunoblotting of AG1478- and EGF-treated kerati-nocytes with antibodies against total and cytoplasmic activated forms of Notch1, as well as Hes1 (Fig. 1c). Effects similar to those of AG1478 were also elicited by erlotinib, an EGFR inhibitor approved for clinical use12 (Supplementary Information, Fig. S2). Besides chemical inhibi-tion, upregulation of Notch1 activity and expression were also observed after knockdown of EGFR expression by transfection of keratinocytes
p53
p53
p53
Tubulin
1.2
0.8
0.4
0
1
0.6
0.2
1.2
0.8
0.4
0
1
0.6
0.2
1.2
0.8
0.4
0
1
0.6
0.2
1
0
3
2
1
0
3
2
1
0
3
2
1
0
2.5
2
0 µM0.2 2.0 5.0AG1478
Control p53siRNA Control EGFR
siRNA
Control N1-2.4 N1-0.4
1.5
0.5
1
0
2
1.5
0.5
DM
SO
AG
1478
DM
SO
AG
1478
DM
SO
AG
1478
Con
trol
EGFR
siR
NA
Con
trol
EGF
8
6
4
2
0
6
4
1
3
5
2
0
6
4
2
0
6
DMSOAG1478
2
0
4
p21WAF1/Cip1 Gadd45α
Mdm2
Tubulin
Tubulin
-- -
-
p53
0.090.080.070.060.050.040.03
0.010
IgG c-Jun IgG c-Jun
0.02
Con
trol
Con
trol
siR
NA
c-J
un
siR
NA
c-J
un
Con
trol
Con
trol
siR
NA
c-J
un
siR
NA
c-J
un
Notch1
Notch1
Frac
tion
bou
nd c
hrom
atin
a b
c d
e
f
g h i j
+ +++
AG1478Nutlin
–2.6 kb –0.3 kb
A B
Controlp53 siRNA
Controlp53 siRNA
DMSO
AG1478
AG1478p53 siRNA
p53A B
mR
NA
leve
ls(r
elat
ive
units
)
mR
NA
leve
ls(r
elat
ive
units
)
mR
NA
leve
ls(r
elat
ive
units
)
mR
NA
leve
ls(r
elat
ive
units
)
mR
NA
leve
ls(r
elat
ive
units
)
Luci
fera
se a
ctiv
ity(r
elat
ive
units
)
Luci
fera
se a
ctiv
ity(r
elat
ive
units
)
Figure 2 Suppression of EGFR signalling induces Notch1 expression through p53. (a) HKCs were transfected with siRNAs for p53 and/or EGFR or control siRNAs, for 48 h. p53 knockdown was confirmed by real-time RT–PCR and immunoblotting (left panels). Notch1 expression was assessed by real time RT–PCR. (b) HKCs were infected with lentiviral reporters N1-2.4 and N1-0.4, with luciferase driven by a 2.4 or 0.4 kb region of the human Notch1 promoter, containing and lacking, respectively, p53 binding sites2,16. Lentiviral vector devoid of exogenous promoters served as a control. HKCs were transfected with p53-specific or control siRNAs, treated after 24 h with AG1478 (2 µM) or DMSO, with luciferase assays performed 24 h later. (c) HKCs were treated with AG1478 (2 µM) or DMSO for 24 h, followed by real-time RT–PCR for p21WAF1/Cip1 and Gadd45α. (d) HKCs treated with AG1478 or DMSO were analysed by immunoblotting for Mdm2 and γ-tubulin. (e) HKCs were treated with AG1478 with or without Nutlin (2 µM) for 24 h followed
by immunoblotting for p53 and γ-tubulin. Complete immunoblot scans are in Supplementary Information, Fig. S7. (f) HKCs treated with AG1478, transfected with EGFR-specific siRNAs or stimulated with EGF as before, were analysed for p53 expression by real-time RT–PCR. (g) HKCs treated with AG1478 or DMSO for 24 h were analysed by chromatin immunoprecipitation (ChIP) with anti-c-Jun antibodies or rabbit IgG control, followed by real-time PCR of a p53 promoter region containing several AP-1 binding sites (A) and a downstream region lacking such sites (B). (h) Cells were co-transfected with the p53n–Luc reporter21, with luciferase driven by a 2 kb p53 promoter region, together with expression vector for c-Jun (c-Jun–pCMV43) or vector control (left panel), or siRNAs against c-Jun or siRNAs control. (i) HKCs transfected with siRNAs against c-Jun or control siRNAs (as in Fig. 1f, g) were analysed for p53 expression by real-time RT–PCR. (j) HKCs transfected with siRNAs for c-Jun and/or p53, were analysed for Notch1 expression by real-time RT–PCR.
nature cell biology advance online publication 3
© 2008 Macmillan Publishers Limited. All rights reserved.

A RT I C L E S
with specific siRNAs (Fig. 1d). In contrast to Notch1, Notch2 expres-sion was modulated by EGFR signalling at the mRNA but not protein level (Supplementary Information, Figs S1c, S3a), and expression of the Notch ligands Jagged 1 and Delta-like 1 was not consistently changed (Supplementary Information, Fig. S3b, c).
EGFR suppression can cause growth inhibition and increased apoptosis6,13, a finding that we confirmed experimentally, suggesting that induction of Notch1 expression is only an indirect consequence of these events. However, treatment of keratinocytes with TNF-α at pro-apoptotic concentrations had no effects on Notch1 expression, which was simi-larly unaffected by TGF-β-induced growth suppression (Supplementary Information, Fig. S2).
The ERK1/2 kinases and the AP-1 transcription complex function as downstream effectors of EGFR activation10. Induction of Notch1 gene expression similar to that caused by EGFR suppression was observed after siRNA-mediated knockdown of the MEK1 and ERK1 genes whereas, consistent with their proposed distinct functions in kerati-nocytes14, knockdown of MEK2 or ERK2 had no such effect (Fig. 1e). In contrast to MEK1 and ERK1, no increase of Notch1 expression, or even suppression, was observed after knockdown and/or pharmaco-logical inhibition of the p38 and JNK kinases, Akt and PKA (Fig. 1e; Supplementary Information, Fig. S2). Induction of Notch1 expression also occurred after knockdown of c-Jun and c-Fos, two key AP-1 family
members (Fig. 1f, g). Even in this case, the effects were specific, as they were not observed after knockdown of other AP-1 family members, such as JunB, Jun D, Fra1 or Elk-1, a transcription factor which is activated by EGFR though an AP-1 independent mechanism15 (Fig. 1f).
Modulation of Notch1 gene transcription by EGFR signalling through p53We and others showed recently that the Notch1 gene is a direct transcrip-tional target of p53 in keratinocytes2,5,16. Consistent with these results, our chemical screen pointed to a p53 inhibitor, pifithrin, as a negative regula-tor of Notch signalling (Supplementary Information, Table S1), a finding which we confirmed directly by treating keratinocytes with this compound (data not shown). We therefore surmised that a p53-dependent mecha-nism is involved. To test this possibility, p53 expression was suppressed in HKCs by siRNA knockdown. This resulted in reduced levels of Notch1 expression already under basal conditions and, much more substantially, in response to EGFR knockdown (Fig. 2a). Consistent with a p53-dependent transcriptional control mechanism, luciferase reporter activity of a 2.4 kbp Notch1 promoter region containing p53 binding sites2,5, but not of a shorter region lacking these sites, was induced in HKCs after EGFR inhibition. This was abrogated by p53 knockdown (Fig. 2b).
Endogenous p53 activity, as assessed by expression of well established targets, p21WAF1/Cip1 and Gadd45α17, was induced by EGFR suppression
AG1478
AG1478 + +
AG1478
– –
+ +– –+ +– –
+ +– –
+ +– –+– + +– –
+ +– –
+ +– – + +– – + +– – + +– –
Notch1 Hes1 Keratin1 Involucrin
Hes1 Keratin1
Keratin1 Keratin1 Keratin1
Involucrinb
c d eN1Tub
0
2
4
0
2
4
6
0
2
4
6
6
0
2
4
6
3
1
0
2
4
3
1
5
0
2
43
1
0 0
2
4
3
1
5
0
15
0
20
AG1478DAPT
Keratin1
Tubulin
N1siRNA0
3.5 32.5
21.5 10.5
0
1.21
0.80.60.40.2
GFP icN1
8
10
GFP Hes1
a
10
5
16
12
8
4
1.2
0.9
0.6
0.3
GFPMAM51
ControlEGF
Controlp53
ControlNotch1siRNA
GFPMAM51
GFPMAM51
GFPMAM51
DMSODAPT
DMSODAPT
DMSODAPT
mR
NA
leve
ls(r
elat
ive
units
)
mR
NA
leve
ls(r
elat
ive
units
)
mR
NA
leve
ls(r
elat
ive
units
)
Figure 3 Downregulation of EGFR signalling induces keratinocyte differentiation through a Notch-dependent mechanism. (a) HKCs infected with a retrovirus expressing the dominant-negative MAM51 peptide or GFP control (black and white bars, respectively) were treated with AG1478 (2 µM) or DMSO control for 24 h. Expression of the Notch1, Hes1, keratin 1 and involucrin genes was assessed by real-time RT–PCR. (b) HKCs were treated with AG1478 (2 µM) and DAPT (10 µM) or DMSO control for 24 h, followed by real-time RT–PCR analysis of Hes1, keratin 1 and Involucrin expression (left panel). Similarly treated cells were also analysed for keratin1 protein expression by immunoblot analysis, with γ-tubulin as an equal
loading control (right panels). (c) HKCs were transfected with Notch1- or p53-specific siRNAs in parallel with scrambled siRNA control (black and white bars, respectively) and treated with AG1478 (2 µM) or DMSO followed by RT–PCR for keratin1. Knockdown of Notch1 expression was confirmed by real-time RT–PCR and immunoblot analysis (left panels). (d) HKCs were transduced with adenoviruses expressing the activated form of Notch1 or GFP control and 24 h after infection stimulated with EGF (1 ng ml–1). Expression of keratin1 was assayed by real-time RT–PCR analyses. (e) HKCs were transduced with adenoviruses expressing Hes1 or GFP control followed by real-time RT–PCR analysis of keratin1.
4 nature cell biology advance online publication
© 2008 Macmillan Publishers Limited. All rights reserved.
A RT I C L E S
(Fig. 2c). There was also a substantial increase in Mdm2, a negative regu-lator of p53 stability and itself a p53 target gene17 (Fig. 2d). Consistent with the negative-feedback loop between p53 and Mdm2 protein expression, induction of p53 protein levels by AG1478 became much more evident in cells concomitantly treated with Nutlin, an Mdm2 inhibitor18 (Fig. 2e).
Emerging evidence indicates that transcription of this gene is important in the control of p53 activity19–21. Consistent with this pos-sibility, real-time RT–PCR analysis showed that p53 mRNA levels
were significantly increased as a consequence of EGFR inhibition but reduced by EGF treatment (Fig. 2f). Previous work with mouse embryonic fibroblasts implicated c-Jun as a direct negative regulator of p53 gene transcription22. Consistent with this mechanism, chro-matin immunoprecipitation experiments showed that endogenous c-Jun protein binds to a predicted AP-1 binding region of the p53 promoter in control keratinocytes, whereas such binding is abro-gated in AG1478-treated cells (Fig. 2g). Reporter assays showed that
DMSO AG1478 40
30
20
10
0
5
4
3
2
1
0
GFP Notch1
mR
NA
leve
ls(r
elat
ive
units
)
mR
NA
leve
ls(r
elat
ive
units
)
mR
NA
leve
ls(r
elat
ive
units
)
mR
NA
leve
ls(r
elat
ive
units
)
wa2/wa2wa/2+
3
2
1
0
3210
45
3
2
1
0
4
5
20
5
15
10
0
256
321
0
4
567
2
0
4
6
p53 Notch1 p53Keratin1
8
8
10
12
Control
AZD6244
Notch1
Notch1
DMSO AG1478DMSO AG1478DMSO AG1478DMSO AG1478
DMSO AG1478
Keratin1 Involucrin Notch1 p53
a b
c d
e
f g
DMSODAPT
DMSODAPT
DMSODAPT
DMSODAPT
100 µm
100 µm
No.1 No.2
DMSONo.1 No.2
DMSO
No.1 No.2
DMSO
No.1 No.2
AG1478No.1 No.2
AG1478
No.1 No.2
AG1478
No.1 No.2
AG1478
No.1 No.2 No.1 No.2No.1 No.2
wa2/wa2wa/2+
No.1 No.2No.1 No.2
DMSO
50 µm
3.5
3
2.5
2
1.5
1
0
0.5
4.54
3.53
2.52
0
1.5
0.51
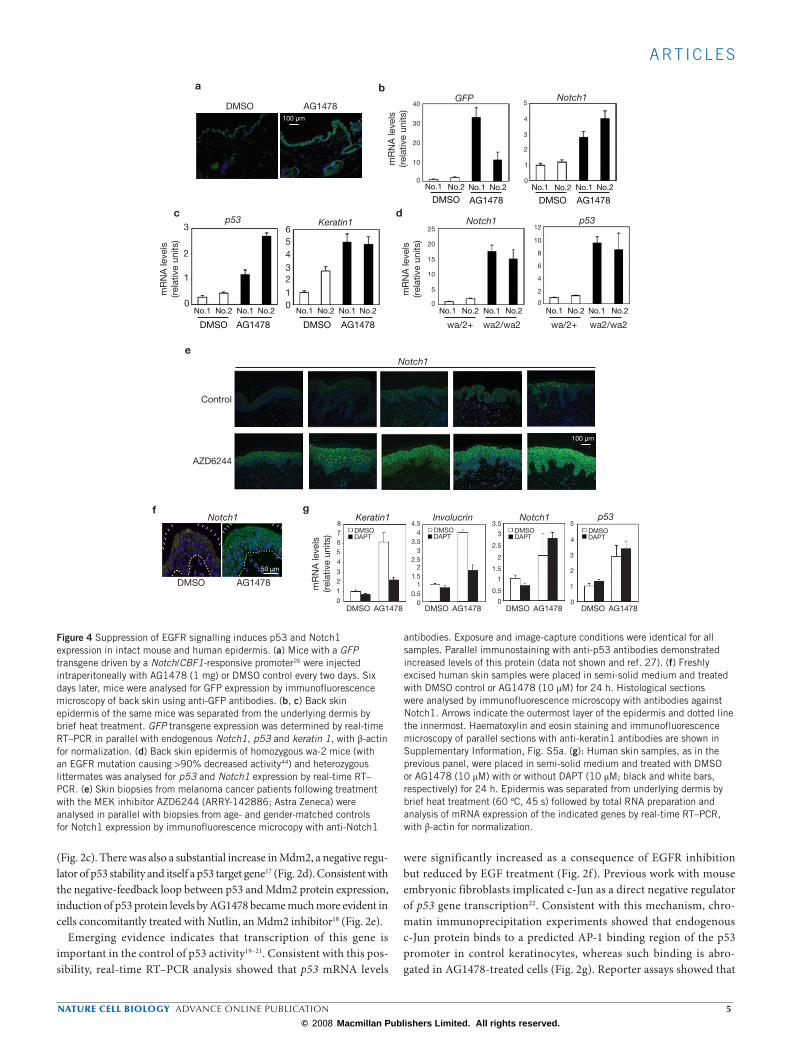
Figure 4 Suppression of EGFR signalling induces p53 and Notch1 expression in intact mouse and human epidermis. (a) Mice with a GFP transgene driven by a Notch/CBF1-responsive promoter26 were injected intraperitoneally with AG1478 (1 mg) or DMSO control every two days. Six days later, mice were analysed for GFP expression by immunofluorescence microscopy of back skin using anti-GFP antibodies. (b, c) Back skin epidermis of the same mice was separated from the underlying dermis by brief heat treatment. GFP transgene expression was determined by real-time RT–PCR in parallel with endogenous Notch1, p53 and keratin 1, with β-actin for normalization. (d) Back skin epidermis of homozygous wa-2 mice (with an EGFR mutation causing >90% decreased activity44) and heterozygous littermates was analysed for p53 and Notch1 expression by real-time RT–PCR. (e) Skin biopsies from melanoma cancer patients following treatment with the MEK inhibitor AZD6244 (ARRY-142886; Astra Zeneca) were analysed in parallel with biopsies from age- and gender-matched controls for Notch1 expression by immunofluorescence microcopy with anti-Notch1
antibodies. Exposure and image-capture conditions were identical for all samples. Parallel immunostaining with anti-p53 antibodies demonstrated increased levels of this protein (data not shown and ref. 27). (f) Freshly excised human skin samples were placed in semi-solid medium and treated with DMSO control or AG1478 (10 µM) for 24 h. Histological sections were analysed by immunofluorescence microscopy with antibodies against Notch1. Arrows indicate the outermost layer of the epidermis and dotted line the innermost. Haematoxylin and eosin staining and immunofluorescence microscopy of parallel sections with anti-keratin1 antibodies are shown in Supplementary Information, Fig. S5a. (g): Human skin samples, as in the previous panel, were placed in semi-solid medium and treated with DMSO or AG1478 (10 µM) with or without DAPT (10 µM; black and white bars, respectively) for 24 h. Epidermis was separated from underlying dermis by brief heat treatment (60 °C, 45 s) followed by total RNA preparation and analysis of mRNA expression of the indicated genes by real-time RT–PCR, with β-actin for normalization.
nature cell biology advance online publication 5
© 2008 Macmillan Publishers Limited. All rights reserved.

A RT I C L E S
p53 promoter activity was suppressed by increased c-Jun expression, whereas it was induced by c-Jun knockdown (Fig. 2h), with a similar effect on endogenous p53 gene transcription (Fig. 2i). The role of p53 in mediating control of Notch1 expression was demonstrated by the finding that induction of Notch1 expression by c-Jun knockdown was blocked by concomitant downmodulation of p53 (Fig. 2j).
EGFR–p53–Notch control of differentiation in primary keratinocytes and intact skinEGFR signalling exerts an inhibitory effect on keratinocyte differ-entiation, whereas increased Notch activity promotes this process1. Downregulation of EGFR signalling, by either siRNA transfection or AG1478 treatment, induced expression of terminal differentiation mark-ers, including keratin 1, 10 and involucrin (Supplementary Information, Fig. S4 and data not shown). To assess whether induction of differen-tiation by EGFR suppression is caused by upregulation of Notch sig-nalling, primary human keratinocytes were infected with a retroviral vector expressing MAM51, a 51-amino-acid peptide that competes for
MAML1 binding to the Notch–CBF-1 complex and prevents down-stream transcription23. Treatment of MAM51-expressing keratinocytes with AG1478 caused a similar induction of Notch1 expression as that seen in control cells; by contrast, induction of Hes1 and differentiation markers was suppressed (Fig. 3a). Chemical inhibitors of γ-secretase activity, such as DAPT, suppress proteolysis-dependent activation of endogenous Notch receptors24. As with MAM51 expression, treatment of HKCs with DAPT counteracted induction of Hes1 and differentiation marker expression caused by EGFR downregulation (Fig. 3b). Similar counteracting effects were observed after knockdown of Notch1 and p53 expression, indicating that upregulation of these genes by EGFR inhibi-tion is responsible for the observed induction of differentiation (Fig. 3c). In Drosophila melanogaster, instead of being involved in direct inhibi-tion of Notch activity and/or expression, EGFR signalling was reported to negatively regulate Groucho, a downstream effector of Notch (as well as other pathways)25. Such an indirect mechanism does not apply to our system. Indeed, EGFR activation exerted no counteracting effects on induction of differentiation by activated Notch1 (Fig. 3d) and dif-ferentiation was suppressed rather than induced by Hes1, an effector of the mammalian homologue of Groucho (Fig. 3e).
Growth and differentiation of keratinocytes in culture differs in signifi-cant aspects from that in intact skin. For further validation of our find-ings, we resorted to several complementary approaches. First, mice with a green fluorescent protein (GFP) reporter for Notch activity26 were injected with AG1478. Immunofluorescence microscopy showed increased GFP expression in the epidermis of the AG1478-treated mice, compared with control mice (Fig. 4a). For confirmation and quantification of the results, the epidermis of these mice was separated from the underlying dermis by brief heat treatment, followed by RNA preparation and real-time RT–PCR. This confirmed that GFP expression was increased, which par-alleled increased expression of the endogenous Notch1, p53 and keratin 1 genes (Fig. 4b, c). As a second approach, the epidermis of homozygous mice for a hypomorphic EGFR mutation was analysed in parallel with heterozygous littermates. Decreased EGFR activity was found to cause an increase in p53 and Notch1 expression (Fig. 4d).
In humans, inhibitors of the EGFR pathway are now used for treat-ment of several types of cancer6,12. Immunofluorescence microscopy of skin biopsies from melanoma patients treated with the MEK inhibitor AZD6244, compared with matched controls, showed consistent upregu-lation of Notch1 expression (Fig. 4e), which paralleled that of p53 (ref. 27 and data not shown). Similar results were obtained with an organ culture system of freshly excised human skin. Immunohistochemical analysis, as well as real-time RT–PCR, indicated that even in this case, EGFR inhibition caused induction of Notch1 and p53 expression and activ-ity, together with differentiation (Fig. 4f; Supplementary Information, Fig. S5). Induction of differentiation by EGFR inhibition was Notch-dependent, as it was counteracted by concomitant treatment with DAPT, whereas, as expected, induction of the Notch1 gene itself, or of p53, was unaffected or even increased (Fig. 4g).
Inhibition of EGFR signalling in cancer cells induces Notch1 gene expression through p53To assess whether the above findings apply to conditions where EGFR sig-nalling has been causally linked with cancer development, we analysed transgenic mice expressing an active form of the EGFR/Ras adaptor protein SOS under the control of a keratin 5 promoter (K5-SOS-F). These mice
98
6543
10
2
7
c-Junf/f SOS+ c-Jun∆ep SOS+ c-Junf/f SOS+ c-Jun∆ep SOS+
c-Junf/f SOS+ c-Jun∆ep SOS+
mR
NA
leve
ls(r
elat
ive
units
)
mR
NA
leve
ls(r
elat
ive
units
)
4
3
1
0
2
4.5
3.5
1.5
0.5
2.5
Notch1 p53
Notch1
p53
c-Jun
Actin
50 µm
Notch1
a
c
b
c-Junf/f SOS+ c-Jun∆ep SOS+
Figure 5 Differential Notch1 and p53 expression in the EGFR-dependent SOS-mouse skin tumour model with or without c-Jun deletion. (a) Tumours formed by two K5-SOS-F transgenic mice with an intact c-Jun gene (Junf/f SOS+) and from two transgenics with a concomitant keratinocyte-specific deletion of the c-Jun gene (c-Jun∆ep SOS+) were analysed by real-time RT–PCR for levels of Notch1 and p53 expression (left and right panels, respectively), using β-actin for normalization. (b) Extracts from another set of tumours, from three mice per genotype, were analysed by immunoblotting with antibodies against the indicated proteins. Complete western blot scans are presented in Supplementary Information, Fig. S7. (c) Immunofluorescence/confocal microscopy analysis with anti-Notch1 antibodies of tumours formed by K5-SOS-F transgenics with or without c-Jun deletion. Hoechst staining was used for cell identification.
6 nature cell biology advance online publication
© 2008 Macmillan Publishers Limited. All rights reserved.

A RT I C L E S
develop skin tumours spontaneously and this is strictly dependent on the presence of functional EGFR28. In K5-SOS-F transgenics with concomi-tant keratinocyte-specific deletion of c-Jun, skin tumour development is impaired, correlating with reduced EGFR expression and increased dif-ferentiation29. Our results suggest that EGFR/c-Jun regulation of p53 and Notch1 expression may also be involved. In fact, real-time RT–PCR showed significantly higher levels of Notch1 and p53 expression in the small tumours formed by K5-SOS-F transgenic mice with epidermal deletion of c-Jun (c-Jun∆ep SOS+), relative to tumours formed in K5-SOS-F transgenics with the intact c-Jun gene (c-Junf/f SOS+) (Fig. 5a). Results were confirmed at the protein level by immunoblotting of a separate set of tumours, as well as by immunofluorescence microscopy for Notch1 expression (Fig. 5b, c).
To assess whether similar EGFR regulation of Notch1 expression applies to human cancer, keratinocyte-derived SCC cells (SCCO28, SCC12 and SCC13) with wild-type p53 (http://www.sanger.ac.uk/genetics/CGP/CellLines/) were treated with AG1478. Besides mutations, p53 activity can also be reduced in tumours as a consequence of decreased p53 gene transcription21,30–33. Consistent with this mode of regulation, EGFR inhibi-tion of SCC cells induced expression of the p53 gene as well as of p21WAF1/
Cip1, indicative of increased p53 activity (Fig. 6a, b). This was paralleled by a substantial increase in Notch1 mRNA and protein levels and differentiation markers (Fig. 6c, d; Supplementary Information, Fig. S6a). As with HKCs, p53 knockdown experiments showed that even in cancer cells, induction of Notch1 expression by EGFR-inhibition is p53-dependent (Fig. 6e).
Cancer cell lines can differ substantially in their control mechanisms from cells in primary tumours. Therefore, as a further validation of our findings, the same organ culture system described above for intact skin
was adapted to the analysis of clinically occurring SCCs freshly excised from patients. In five independent tumours, EGFR inhibition resulted in reduction of c-Fos expression, indicative of EGFR signalling suppres-sion, and concomitant induction of Notch1, p53 and keratin 1 (Fig. 6f; Supplementary Information, Fig. S6c). In four other tumours no such effects were observed, consistent, in two cases, with resistance of EGFR inhibition (as assessed by no decrease in c-Fos expression) and, in the other two, undetectable p53 expression or activity (data not shown).
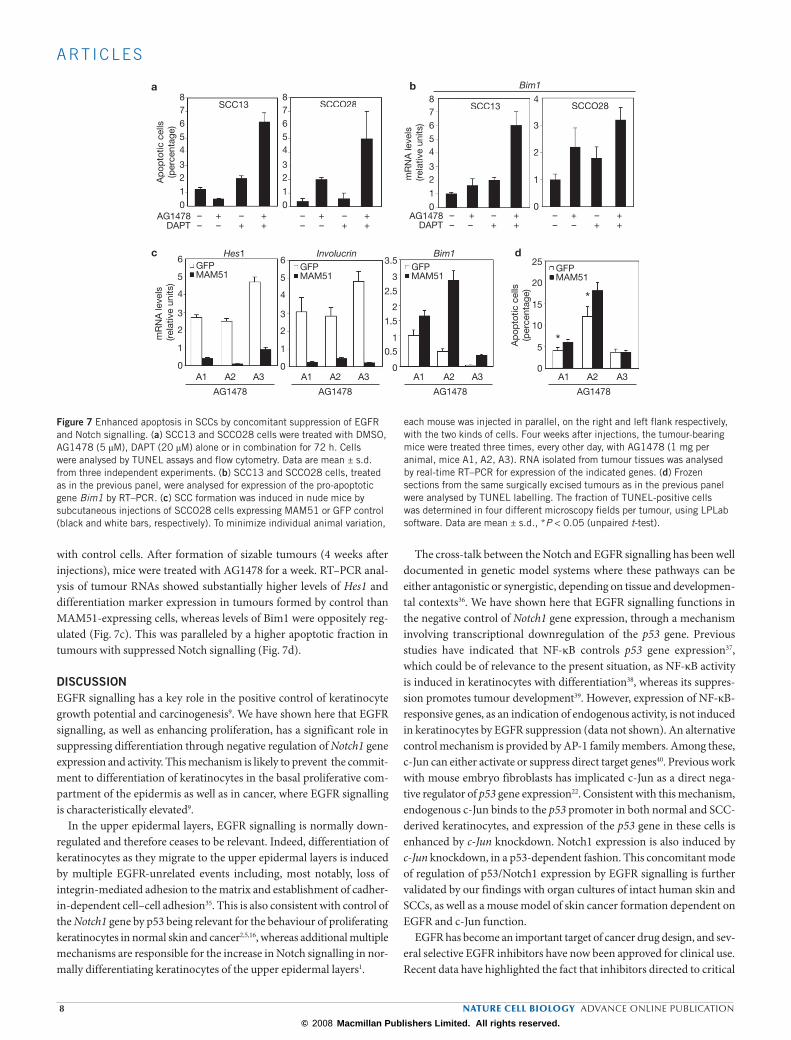
Inhibition of Notch signalling in cancer cells suppresses differentiation induced by EGFR suppression while it synergizes for apoptosisAs with HKCs, inhibition of EGFR signalling in SCC cells caused upreg-ulation of differentiation marker expression through a Notch-dependent mechanism (Supplementary Information, Fig. S6a, b). We have recently found that Notch-dependent differentiation of keratinocytes renders these cells more resistant to apoptosis16. Thus, an attractive possibility was that suppression of Notch signalling, while suppressing the pro-differentiation effects of EGFR inhibitors, may synergize with these compounds in triggering apoptosis. When SCC cells were treated with DAPT and AG1478, apoptosis was increased substantially (Fig. 7a). These findings were paralleled by a synergistic induction of Bim1 expres-sion (Fig. 7b), a pro-apoptotic Bcl2 family member recently implicated in the cancer cell response to EGFR inhibitors34.
To further validate the relevance of these findings for the behaviour of cancer cells in vivo, immunocompromised mice were injected with SCC cells expressing the Notch inhibitory MAM51 peptide, in parallel
AG14780 0.2 2.0
Notch1
Keratin1
Tubulin
p53 p21
6
4
2
0
12
10
8
6
4
2
0
12
14
10
8
4
2
0
10
12
8
6
5
4
3
2
4
3
2
0 0
11
5
4
3
2
0
1
SCC12 SCC13 SCCO28 SCC12 SCC13 SCCO28
mR
NA
leve
ls(r
elat
ive
units
)
mR
NA
leve
ls(r
elat
ive
units
)
mR
NA
leve
ls(r
elat
ive
units
)
mR
NA
leve
ls(r
elat
ive
units
)
mR
NA
leve
ls(r
elat
ive
units
)
6
7
8
9 2.5
2
1.5
1
0.5
0
2.5
3
3.5
2
1.5
1
0.5
0
SCC1 SCC2 SCC3 SCC4 SCC5 SCC1 SCC2 SCC3 SCC4 SCC5
Notch1
SCC12 SCC13 SCCO28
Notch1
DMSO AG1478
a b c
d e f
AG1478 – + – + – + AG1478 – + – + – +
AG1478 – + – + – + – + – + – + – + – + – + – +
AG1478 – + – + – +
Notch1 p53
Controlp53siRNA
µM
2.5
3
3.5
2
1.5
1
0.5
0
2.5
3
3.5
2
1.5
1
0.5
0
2.5
3
2
1.5
1
0.5
0
2.5
3
2
1.5
1
0.5
0
Figure 6 EGFR-dependent regulation of p53 and Notch in cancer cell lines and human squamous cell carcinomas (SCCs). (a–c) SCC12, SCC13 and SCCO28 cells, treated with AG1478 (2 µM) versus DMSO control for 24 h, were analysed for levels of p53 (a), p21WAF1/Cip1 (b) and Notch1 (c) expression by real-time RT–PCR. (d) SCCO28 cells were treated with AG1478 at the indicated concentrations for 24 h followed by immunoblot analysis for Notch1 and γ-tubulin as equal loading control. Complete western blot scans are presented in Supplementary Information, Fig. S7. (e) SCCO28 cells were transfected with p53-specific siRNA in parallel with
scrambled control siRNA followed 24 h later by treatment with AG1478 or DMSO for 24 h. Real-time RT–PCR was used to determine resulting levels of Notch1 expression, as well as to verify p53 knockdown (data not shown). (f) Surgically excised SCCs from five different patients (SCC1, 2, 3, 4, 5) were cut into small pieces of similar size, placed in semi-solid medium and treated with AG1478 (10 µM) or DMSO control for 24 h. Real-time RT–PCR was used to measure expression of Notch1 and p53. Analysis of c-Fos (as a measure of response to EGFR inhibition) and keratin 1 expression in these tumours is shown in Supplementary Information, Fig. S6c.
nature cell biology advance online publication 7
© 2008 Macmillan Publishers Limited. All rights reserved.
A RT I C L E S
with control cells. After formation of sizable tumours (4 weeks after injections), mice were treated with AG1478 for a week. RT–PCR anal-ysis of tumour RNAs showed substantially higher levels of Hes1 and differentiation marker expression in tumours formed by control than MAM51-expressing cells, whereas levels of Bim1 were oppositely reg-ulated (Fig. 7c). This was paralleled by a higher apoptotic fraction in tumours with suppressed Notch signalling (Fig. 7d).
DISCUSSIONEGFR signalling has a key role in the positive control of keratinocyte growth potential and carcinogenesis9. We have shown here that EGFR signalling, as well as enhancing proliferation, has a significant role in suppressing differentiation through negative regulation of Notch1 gene expression and activity. This mechanism is likely to prevent the commit-ment to differentiation of keratinocytes in the basal proliferative com-partment of the epidermis as well as in cancer, where EGFR signalling is characteristically elevated9.
In the upper epidermal layers, EGFR signalling is normally down-regulated and therefore ceases to be relevant. Indeed, differentiation of keratinocytes as they migrate to the upper epidermal layers is induced by multiple EGFR-unrelated events including, most notably, loss of integrin-mediated adhesion to the matrix and establishment of cadher-in-dependent cell–cell adhesion35. This is also consistent with control of the Notch1 gene by p53 being relevant for the behaviour of proliferating keratinocytes in normal skin and cancer2,5,16, whereas additional multiple mechanisms are responsible for the increase in Notch signalling in nor-mally differentiating keratinocytes of the upper epidermal layers1.
The cross-talk between the Notch and EGFR signalling has been well documented in genetic model systems where these pathways can be either antagonistic or synergistic, depending on tissue and developmen-tal contexts36. We have shown here that EGFR signalling functions in the negative control of Notch1 gene expression, through a mechanism involving transcriptional downregulation of the p53 gene. Previous studies have indicated that NF-κB controls p53 gene expression37, which could be of relevance to the present situation, as NF-κB activity is induced in keratinocytes with differentiation38, whereas its suppres-sion promotes tumour development39. However, expression of NF-κB-responsive genes, as an indication of endogenous activity, is not induced in keratinocytes by EGFR suppression (data not shown). An alternative control mechanism is provided by AP-1 family members. Among these, c-Jun can either activate or suppress direct target genes40. Previous work with mouse embryo fibroblasts has implicated c-Jun as a direct nega-tive regulator of p53 gene expression22. Consistent with this mechanism, endogenous c-Jun binds to the p53 promoter in both normal and SCC-derived keratinocytes, and expression of the p53 gene in these cells is enhanced by c-Jun knockdown. Notch1 expression is also induced by c-Jun knockdown, in a p53-dependent fashion. This concomitant mode of regulation of p53/Notch1 expression by EGFR signalling is further validated by our findings with organ cultures of intact human skin and SCCs, as well as a mouse model of skin cancer formation dependent on EGFR and c-Jun function.
EGFR has become an important target of cancer drug design, and sev-eral selective EGFR inhibitors have now been approved for clinical use. Recent data have highlighted the fact that inhibitors directed to critical
SCC13 SCCO28 SCC13 SCCO28SCCSCCSCCSCCSCCO28O28O28OO28 SCC13 SCCO28
AG1478
AG1478
Bim1
Bim1Hes1 dInvolucrin
–
A1 A2 A3
AG1478
A1 A2 A3
AG1478
A1 A2 A3
AG1478
A1 A2 A3
87654
32
10
6
5
4
3
2
1
0
3
2
1
0
6
5
4
3
2
1
0
87654
32
10
87654
32
10
4
3
2
1
0
Ap
opto
tic c
ells
(per
cent
age)
Ap
opto
tic c
ells
(per
cent
age)
mR
NA
leve
ls
(rel
ativ
e un
its)
mR
NA
leve
ls
(rel
ativ
e un
its)
0.5
1.5
2.5
3.5 25
20
15
5
0
10
a b
cGFPMAM51
GFPMAM51
GFPMAM51
GFPMAM51
+ – +– +– +
– + – +– +– +DAPT
AG1478 – + – +– +– +
– + – +– +– +DAPT
*
*
Figure 7 Enhanced apoptosis in SCCs by concomitant suppression of EGFR and Notch signalling. (a) SCC13 and SCCO28 cells were treated with DMSO, AG1478 (5 µM), DAPT (20 µM) alone or in combination for 72 h. Cells were analysed by TUNEL assays and flow cytometry. Data are mean ± s.d. from three independent experiments. (b) SCC13 and SCCO28 cells, treated as in the previous panel, were analysed for expression of the pro-apoptotic gene Bim1 by RT–PCR. (c) SCC formation was induced in nude mice by subcutaneous injections of SCCO28 cells expressing MAM51 or GFP control (black and white bars, respectively). To minimize individual animal variation,
each mouse was injected in parallel, on the right and left flank respectively, with the two kinds of cells. Four weeks after injections, the tumour-bearing mice were treated three times, every other day, with AG1478 (1 mg per animal, mice A1, A2, A3). RNA isolated from tumour tissues was analysed by real-time RT–PCR for expression of the indicated genes. (d) Frozen sections from the same surgically excised tumours as in the previous panel were analysed by TUNEL labelling. The fraction of TUNEL-positive cells was determined in four different microscopy fields per tumour, using LPLab software. Data are mean ± s.d., *P < 0.05 (unpaired t-test).
8 nature cell biology advance online publication
© 2008 Macmillan Publishers Limited. All rights reserved.
A RT I C L E S
receptors like EGFR use the cell-death pathway for inducing tumour regression34. However, the exact molecular mechanisms underlying sen-sitivity and resistance of tumour cells to EGFR inhibition, including the contribution of other integrated pathways, such as those identified here, remain to be elucidated41. Importantly, suppression of Notch signal-ling in SCCs counteracts the differentiation-inducing effects of EGFR inhibitors, while, at the same time, synergizing with these compounds in induction of apoptosis. Other ongoing studies in the laboratory indi-cate that the enhancing effects of Notch suppression on apoptosis may extend also to lung cancer cells. This suggests an attractive new avenue of combination cancer therapy that may enhance the potency of EGFR inhibitory agents on tumours, while at the same time ameliorating their well known toxic effects on the skin, which have been attributed, at least in part, to aberrant differentiation11.
METHODSCell culture and viruses. Culturing of primary human keratinocytes and SCC 12, 13 and O28 cells, and infection with the MSCV–MAM51 (ref. 23) and control retrovirus were performed as previously reported2. Adenoviruses for Notch1, Hes1 and GFP, and adenoviral infections were previously described38. Chemical inhibitors, AG1478 (LC Labs), Nutlin (Calbiochem), DAPT (Calbiochem), ERK inhibitory peptide-cell permeable (Calbiochem) were dissolved in DMSO and applied at the indicated con-centrations. For knockdown experiments, cells were transfected as described previ-ously38 with validated stealth siRNAs for human EGFR, p53, c-Fos and c-Jun in parallel with corresponding Stealth siRNA controls (Invitrogen), or ERK1, ERK2 and Notch1 (GeneGlobe, Qiagen), and analysed 48–72 h after transfection. siRNA sequences are presented in Supplementary Information, Table S3. The Notch1 promoter regions –2472/–1 and –392/–1 (numbered referred to the ATG) were amplified by PCR from human genomic DNA with the primer pairs 5´-CTGCCTCCCGACCTGTAGGAG-3´ and 5´-GCCTCCCCACCGGCTGCCCTC-3´ , and 5 ´ - C T C G G G G A G G C G C A A A G G C G G - 3 ´ a n d 5´-GCCTCCCCACCGGCTGCCCTC-3´, and subcloned into the of pGL4 vec-tor (Promega) using the KpnI/NheI sites. The two promoter regions were inserted into lentivector pTRH4–mCMV–Luc (System Biosciences) at the EcoRI/SpeI sites. Lentiviruses were produced as described before42
Luciferase assays, quantitative real-time RT–PCR, chromatin immunopre-cipitation (ChIP) and immunodetection techniques. Conditions for luciferase assays, real-time RT–PCR analysis, ChIP, immunoblotting and immunofluo-rescence microscopy were performed as described previously2. The list of gene-specific primers is provided in Supplementary Information, Table S2. We used the following antibodies: Notch1 (C-20, 1:500; Santa Cruz), activated Notch1 (1:1000; Cell Signaling), Hes1 (1:500; Chemicon AB5702), keratin1 (1:5000; Babco AF87), involucrin (1:5000; Babco PRB140C), EGFR (1:1000; Cell Signaling), p53 (1:1000; Cell Signaling), MDM2 (1:1000; Cell Signaling), integrin β4 (1:500; Santa Cruz) and γ-tubulin (1:5000; Sigma GTU87), and for immunoblotting for mouse proteins: Notch1 (1:500; Pharmingen), p53 (1:1000; Novacastra), c-Jun (1:500; Transduction Labs) and actin (Sigma), and c-Jun for Chip assays (1:500; Santa Cruz, H79).
Organ cultures. Discarded human skin samples from abdominoplasty procedures were obtained from the Centre Hospitalier – Universitaire Vaudois (Lausanne, Switzerland) with patient consent and institutional approval. Skin samples, steri-lized in 70% ethanol and cut, after removal of subcutaneous fat, into 1 × 1cm pieces, were placed in keratinocyte serum-free medium (KSF, GIBCO-BRL) sup-plemented with EGF and bovine pituitary extract (BPE), in 0.25% agar (Sigma). The epidermis was maintained at the air-medium interface. For RNA collection, skin samples were placed in preheated PBS at 60 °C for 45 s, then chilled (on ice) in 0.1 M PBS for 1 min, followed by mechanical separation of the epidermis and dermis. The epidermis was homogenized in TRI reagent (Sigma) for RNA prepa-ration. Human SCC samples were obtained as discarded material from Mohs Micrographic Surgery at Massachusetts General Hospital (Boston, MA) with patient consent and institutional approvals. Tumour samples were sterilized in 70% ethanol, cut into pieces of approximately 2 × 2 mm and placed in semi-solid medium similarly to skin organ cultures.
Tumorigenicity assays. For in vivo tumorigenicity assays, control and MAM51-expressing SCCO28 cells were brought into suspension, admixed with Matrigel (BD Biosciences), and injected (5 × 10⁶ cells per injection) subcutaneously into 8-week-old female athymic nude mice. Four weeks later, animals were treated three times (every other day) with AG1478 (1 mg per animal, dissolved in 200 µl 50% DMSO:DMEM) or DMSO vehicle control by intraperitoneal injections. Mice were killed two days after the last treatment and tumours processed for RNA preparation and analysis.
TUNEL assays. Cells were trypsinized, recovered by centrifugation at 300g and fixed in 2% paraformaldehyde in PBS for 16 h. Permeabilization and enzymatic labelling with TMR red-conjugated-dUTP were performed according to the manufacturer’s protocol (Roche). The percentage of cells that incorporated the fluorescence-conjugated dUTP was determined by flow cytometry. TUNEL assay on histological sections was analysed with fluorescence microscopy and IPLab software.
Statistical analysis. In all histograms, results of real-time RT–PCR and luciferase assays are presented as mean ± s.d., all assays being performed in triplicate wells (n = 3) with internal normalization, with similar results being observed in two or more independent experiments.
Accession codes. USCD-Nature Signaling Gateway (http://www.signaling-gateway.org): A001670, A000823 and A001721
Note: Supplementary Information is available on the Nature Cell Biology website.
ACKNoWLEDGEMENtsWe thank J. Follen and C. Shamu of the Harvard Institute for Chemistry and Cell Biology, and N. Tolliday from the Broad Institute (Harvard/MIT, Cambridge, MA) for assistance with screening; W. Austen (Massachusetts General Hospital, Boston, MA) and W. Raffoul (University of Lausanne) for human skin material; N. Gaiano (John Hopkins University, Baltimore, MD) for the Notch reporter GFP mice (TNR); R. Zenz for mouse skin tumour samples; Vikram Rajashakera for technical help, and C. Brisken and C. Missero for careful reading of the manuscript. This work was supported by NIH Grants AR39190, AR 054856, the Swiss National Foundation, a grant from the European Union (Epistem, Sixth Framework Program, LSHB-CT-2005-019067) and, in part, by the Cutaneous Biology Research Center through the Massachusetts General Hospital/Shiseido Co. Agreement.
AutHoR CoNtRiButioNsV.K., A.M. and G.P.D. designed the experiments and wrote the manuscript; V.K., A.M., J.G.-V., B.H., K.L., C.L., performed the experiments; V.N., R.D. and E.F.W. provided unique sample material and conceptual insights.
CoMPEtiNG FiNANCiAL iNtEREstsThe authors declare no competing financial interests.
Published online at http://www.nature.com/naturecellbiology/ Reprints and permissions information is available online at http://npg.nature.com/reprintsandpermissions/
1. Lefort, K. & Dotto, G. P. Notch signaling in the integrated control of keratinocyte growth/differentiation and tumor suppression. Semin. Cancer Biol. 14, 374–386 (2004).
2. Lefort, K. et al. Notch1 is a p53 target gene involved in human keratinocyte tumor suppression through negative regulation of ROCK1/2 and MRCKα kinases. Genes Dev. 21, 562–577 (2007).
3. Artavanis-Tsakonas, S., Rand, M. D. & Lake, R. J. Notch signaling: cell fate control and signal integration in development. Science 284, 770–776 (1999).
4. Bray, S. J. Notch signalling: a simple pathway becomes complex. Nature Rev. Mol. Cell Biol. 7, 678–689 (2006).
5. Yugawa, T. et al. Regulation of Notch1 gene expression by p53 in epithelial cells. Mol. Cell Biol. 27, 3732–3742 (2007).
6. Scaltriti, M. & Baselga, J. The epidermal growth factor receptor pathway: a model for targeted therapy. Clin. Cancer Res. 12, 5268–5272 (2006).
7. Jost, M., Kari, C. & Rodeck, U. The EGF receptor — an essential regulator of multiple epidermal functions. Eur. J. Dermatol. 10, 505–510 (2000).
8. Zenz, R. & Wagner, E. F. Jun signalling in the epidermis: From developmental defects to psoriasis and skin tumors. Int. J. Biochem. Cell Biol. 38, 1043–1049 (2006).
9. Kalyankrishna, S. & Grandis, J. R. Epidermal growth factor receptor biology in head and neck cancer. J. Clin. Oncol. 24, 2666–2672 (2006).
10. Citri, A. & Yarden, Y. EGF–ERBB signalling: towards the systems level. Nature Rev. Mol. Cell Biol. 7, 505–516 (2006).
11. Lacouture, M. E. Mechanisms of cutaneous toxicities to EGFR inhibitors. Nature Rev. Cancer 6, 803–812 (2006).
nature cell biology advance online publication 9
© 2008 Macmillan Publishers Limited. All rights reserved.
A RT I C L E S
12. Collins, I. & Workman, P. New approaches to molecular cancer therapeutics. Nature Chem. Biol. 2, 689–700 (2006).
13. Gong, Y. et al. Induction of BIM is essential for apoptosis triggered by EGFR kinase inhibi-tors in mutant EGFR-dependent lung adenocarcinomas. PLoS Med. 4, e294 (2007).
14. Scholl, F. A., Dumesic, P. A. & Khavari, P. A. Mek1 alters epidermal growth and dif-ferentiation. Cancer Res. 64, 6035–6040 (2004).
15. Friday, B. B. & Adjei, A. A. Advances in targeting the Ras/Raf/MEK/Erk mitogen-acti-vated protein kinase cascade with MEK inhibitors for cancer therapy. Clin. Cancer Res. 14, 342–346 (2008).
16. Mandinova A. et al. The FoxO3A gene is a key negative target of canonical Notch signaling in the keratinocyte UVB response. EMBO J. 27, 1243–1254 (2008).
17. Laptenko, O. & Prives, C. Transcriptional regulation by p53: one protein, many pos-sibilities. Cell Death Differ. 13, 951–961 (2006).
18. Vassilev, L. T. et al. In vivo activation of the p53 pathway by small-molecule antagonists of MDM2. Science 303, 844–848 (2004).
19. Boggs, K. & Reisman, D. C/EBPβ participates in regulating transcription of the p53 gene in response to mitogen stimulation. J. Biol. Chem. 282, 7982–7990 (2007).
20. Bruno, T. et al. Che-1 phosphorylation by ATM/ATR and Chk2 kinases activates p53 transcription and the G2/M checkpoint. Cancer Cell 10, 473–486 (2006).
21. Phan, R. T. & Dalla-Favera, R. The BCL6 proto-oncogene suppresses p53 expression in germinal-centre B cells. Nature 432, 635–639 (2004).
22. Schreiber, M. et al. Control of cell cycle progression by c-Jun is p53 dependent. Genes Dev. 13, 607–619 (1999).
23. Weng, A. P. et al. Growth suppression of pre-T acute lymphoblastic leukemia cells by inhibition of notch signaling. Mol. Cell. Biol. 23, 655–664 (2003).
24. Miele, L., Miao, H. & Nickoloff, B. J. NOTCH signaling as a novel cancer therapeutic target. Curr. Cancer Drug Targets 6, 313–323 (2006).
25. Hasson, P. et al. EGFR signaling attenuates Groucho-dependent repression to antago-nize Notch transcriptional output. Nature Genet. 37, 101–105 (2005).
26. Mizutani, K., Yoon, K., Dang, L., Tokunaga, A. & Gaiano, N. Differential Notch signalling distinguishes neural stem cells from intermediate progenitors. Nature 449, 351–355 (2007).
27. Schad K. et al. Continuous MEK inhibition by AZD6244 (ARRY-142886) results in exhaustion of the cutaneous keratinocytic stem cell pool and resembles senescence driven skin aging. J. Clin. Oncol. 26, (May 20 suppl.) abstr 9075 (2008).
28. Sibilia, M. et al. The EGF receptor provides an essential survival signal for SOS-dependent skin tumor development. Cell 102, 211–220 (2000).
29. Zenz, R. et al. c-Jun regulates eyelid closure and skin tumor development through EGFR signaling. Dev. Cell 4, 879–889 (2003).
30. Hodge, D. R. et al. Interleukin 6 supports the maintenance of p53 tumor suppressor gene promoter methylation. Cancer Res. 65, 4673–4682 (2005).
31. Kang, J. H. et al. Methylation in the p53 promoter is a supplementary route to breast carcinogenesis: correlation between CpG methylation in the p53 promoter and the mutation of the p53 gene in the progression from ductal carcinoma in situ to invasive ductal carcinoma. Lab. Invest. 81, 573–579 (2001).
32. Raman, V. et al. Compromised HOXA5 function can limit p53 expression in human breast tumours. Nature 405, 974–978 (2000).
33. Stuart, E. T., Haffner, R., Oren, M. & Gruss, P. Loss of p53 function through PAX-mediated transcriptional repression. EMBO J. 14, 5638–5645 (1995).
34. Cragg, M. S., Kuroda, J., Puthalakath, H., Huang, D. C. & Strasser, A. Gefitinib-induced killing of NSCLC cell lines expressing mutant EGFR requires BIM and can be enhanced by BH3 mimetics. PLoS Med. 4, 1681–1689 (2007).
35. Dotto, G. P. Signal transduction pathways controlling the switch between keratinocyte growth and differentiation. Crit. Rev. Oral Biol. Med. 10, 442–457 (1999).
36. Doroquez, D. B. & Rebay, I. Signal integration during development: mechanisms of EGFR and Notch pathway function and cross-talk. Crit. Rev. Biochem. Mol. Biol. 41, 339–385 (2006).
37. Tergaonkar, V. & Perkins, N. D. p53 and NF-κB crosstalk: IKKα tips the balance. Mol. Cell 26, 158–159 (2007).
38. Nguyen, B. C. et al. Cross-regulation between Notch and p63 in keratinocyte commit-ment to differentiation. Genes Dev. 20, 1028–1042 (2006).
39. Dajee, M. et al. NF-κB blockade and oncogenic Ras trigger invasive human epidermal neoplasia. Nature 421, 639–643 (2003).
40. Eferl, R. & Wagner, E. F. AP-1: a double-edged sword in tumorigenesis. Nature Rev. Cancer 3, 859–868 (2003).
41. Reuter, C. W., Morgan, M. A. & Eckardt, A. Targeting EGF-receptor-signalling in squamous cell carcinomas of the head and neck. Br. J. Cancer 96, 408–416 (2007).
42. Dull, T. et al. A third-generation lentivirus vector with a conditional packaging system. J. Virol. 72, 8463–8471 (1998).
43. Musti, A. M., Treier, M. & Bohmann, D. Reduced ubiquitin-dependent degradation of c-Jun after phosphorylation by MAP kinases. Science 275, 400–402 (1997).
44. Luetteke, N. C. et al. The mouse waved-2 phenotype results from a point mutation in the EGF receptor tyrosine kinase. Genes Dev. 8, 399–413 (1994).
10 nature cell biology advance online publication
© 2008 Macmillan Publishers Limited. All rights reserved.

s u p p l e m e n ta ry i n f o r m at i o n
www.nature.com/naturecellbiology 1
Figure S1 Dose dependent inhibition of EGFR signaling by AG1478. A : Primary human keratinocytes (HKCs) were treated with AG1478 for 24h at the indicated concentrations, followed by immunoblot analysis for phospho- and total EGFR, ERK1/2, cJun, ELK1, with γ-Tubulin as equal
loading control. B : HKCs treated as in the previous panel were analyzed for levels of c-Fos expression by RT-PCR. mRNA levels are expressed as relative values after normalization for 36B4. Similar results were obtained after normalization to β-Actin.
© 2008 Macmillan Publishers Limited. All rights reserved.

s u p p l e m e n ta ry i n f o r m at i o n
2 www.nature.com/naturecellbiology
Figure S2 Specific induction of Notch1 expression and activity by inhibition of EGFR activity. A : HKCs were treated with the EGFR inhibitor Tarceva (1.0 µM) in parallel with inhibitors for PDGFR (AG370; 10 µM), PKA (4-cyano-3-methylisoquinoline; 10 µM), p38 (SB202190; 10 µM), MEK (PD980509, 10 µM) and ERK inhibitory peptide (25 µM), for 24
hours. Parallel cultures were also treated with TNFα (50 ng/ml) or TGFβ (5 ng/ml) for 24 hours. TUNEL assays were used to confirm induction of apoptosis by TNFα treatment (~8-12% positive cells). Levels of Hes1 and Notch1 expression were determined by real-time RT-PCR with 36B4 for normalization.
© 2008 Macmillan Publishers Limited. All rights reserved.

s u p p l e m e n ta ry i n f o r m at i o n
www.nature.com/naturecellbiology 3
Figure S3 Impact of EGFR signaling on Notch2, Jagged1 and Delta like1 expression. A : HKCs were treated with either DMSO or AG1478 at the indicated concentrations or EGF (1ng/ml) for 16 hours. Expression of Notch2 was analyzed by real time RT-PCR with β-Actin mRNA for
normalization. B, C : HKCs were treated with either EGF (1 ng/ml) or AG1478 (2 µM) and mRNA levels of Jagged1 (Jag1) and Delta like 1 (Dll1) were determined by real time RT-PCR as in the previous panel.
© 2008 Macmillan Publishers Limited. All rights reserved.

s u p p l e m e n ta ry i n f o r m at i o n
4 www.nature.com/naturecellbiology
Figure S4 Down-modulation of EGFR signaling induces keratinocyte differentiation. HKCs were transfected with EGFR-specific siRNAs (+) in parallel with scrambled siRNAs control (-). Cells were analyzed for
expression of the Keratin1, 10 and Involucrin differentiation markers by real time RT-PCR and immunoblotting (left and right panels, respectively).
© 2008 Macmillan Publishers Limited. All rights reserved.
s u p p l e m e n ta ry i n f o r m at i o n
www.nature.com/naturecellbiology 5
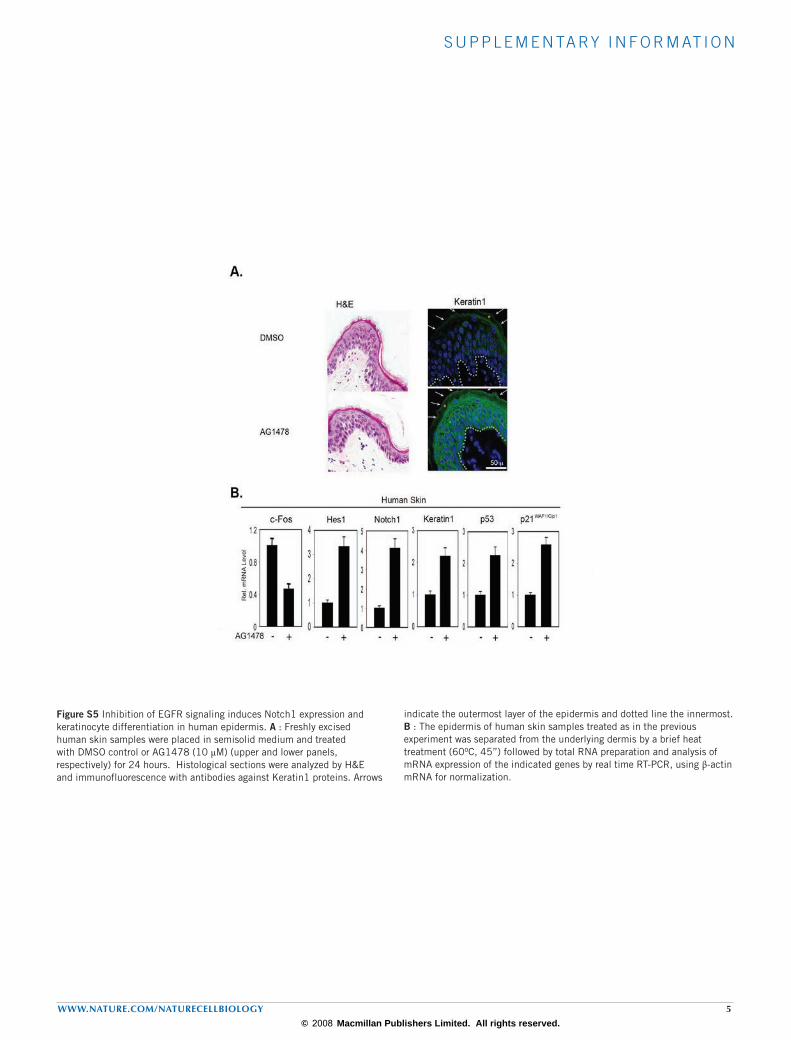
Figure S5 Inhibition of EGFR signaling induces Notch1 expression and keratinocyte differentiation in human epidermis. A : Freshly excised human skin samples were placed in semisolid medium and treated with DMSO control or AG1478 (10 µM) (upper and lower panels, respectively) for 24 hours. Histological sections were analyzed by H&E and immunofluorescence with antibodies against Keratin1 proteins. Arrows
indicate the outermost layer of the epidermis and dotted line the innermost. B : The epidermis of human skin samples treated as in the previous experiment was separated from the underlying dermis by a brief heat treatment (60oC, 45”) followed by total RNA preparation and analysis of mRNA expression of the indicated genes by real time RT-PCR, using β-actin mRNA for normalization.
© 2008 Macmillan Publishers Limited. All rights reserved.

s u p p l e m e n ta ry i n f o r m at i o n
6 www.nature.com/naturecellbiology
Figure S6 EGFR inhibition in SCC cell lines and tumors promotes differentiation. A : SCCO28, SCC12 and SCC13 cells were treated with AG1478 (2.0 µM) for 24h. Keratin1 and Involucrin mRNA expression was analyzed by real time RT-PCR analysis, with β-actin mRNA levels for normalization. B : SCCO28 cells infected with the retrovirus expressing the dominant negative MAM51 peptide or GFP control were treated with AG1478
(2 µM) or DMSO control for 24 hours. Keratin1 expression was measured by real time RT-PCR. C : Surgically excised squamous cell carcinomas from five different patients (SCC1, 2, 3, 4, 5) were placed in semisolid medium and treated with AG1478 (10 µM) or DMSO control for 24 hours as described in Fig. 6F. Real time RT-PCR was used to measure expression of c-Fos (as a measure of response to EGFR inhibition) and Keratin 1 expression.
© 2008 Macmillan Publishers Limited. All rights reserved.
s u p p l e m e n ta ry i n f o r m at i o n
www.nature.com/naturecellbiology 7
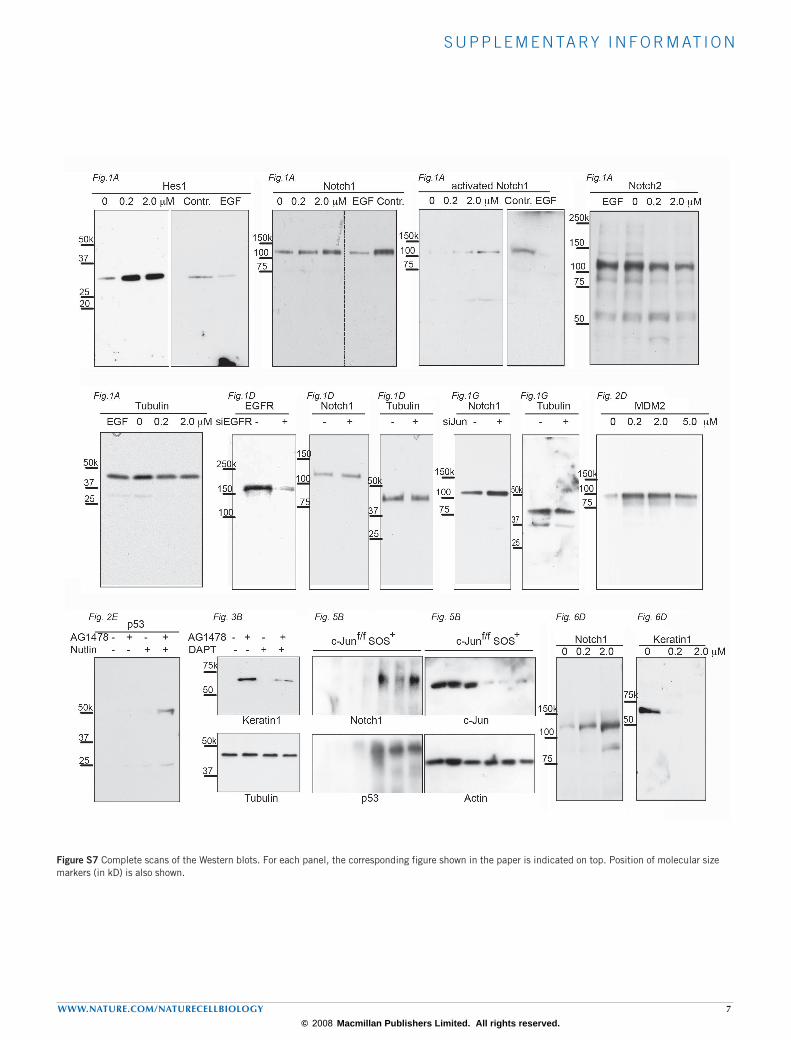
Figure S7 Complete scans of the Western blots. For each panel, the corresponding figure shown in the paper is indicated on top. Position of molecular size markers (in kD) is also shown.
© 2008 Macmillan Publishers Limited. All rights reserved.
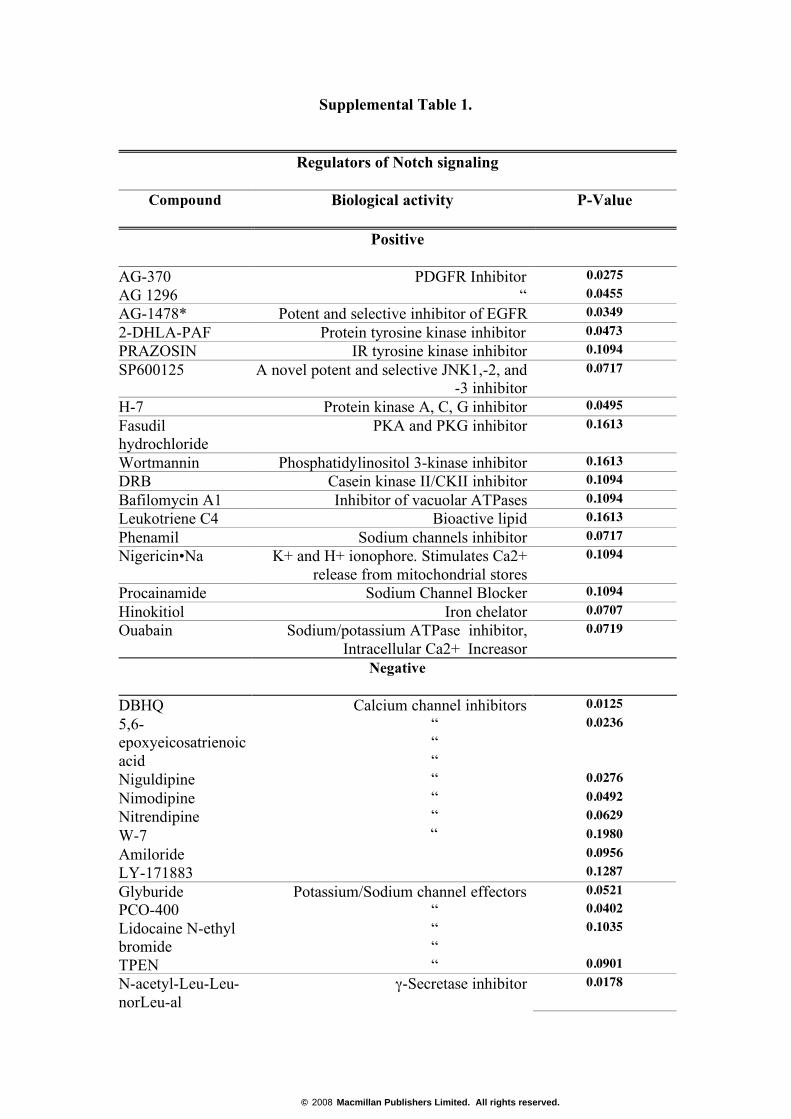
Supplemental Table 1.
Regulators of Notch signaling
Compound Biological activity P-Value
Positive
AG-370 0.0275 AG 1296
PDGFR Inhibitor “ 0.0455
AG-1478* Potent and selective inhibitor of EGFR 0.0349 2-DHLA-PAF Protein tyrosine kinase inhibitor 0.0473 PRAZOSIN IR tyrosine kinase inhibitor 0.1094 SP600125 A novel potent and selective JNK1,-2, and
-3 inhibitor 0.0717
H-7 Protein kinase A, C, G inhibitor 0.0495 Fasudil hydrochloride
PKA and PKG inhibitor 0.1613
Wortmannin Phosphatidylinositol 3-kinase inhibitor 0.1613 DRB Casein kinase II/CKII inhibitor 0.1094 Bafilomycin A1 Inhibitor of vacuolar ATPases 0.1094 Leukotriene C4 Bioactive lipid 0.1613 Phenamil Sodium channels inhibitor 0.0717 Nigericin•Na K+ and H+ ionophore. Stimulates Ca2+
release from mitochondrial stores 0.1094
Procainamide Sodium Channel Blocker 0.1094 Hinokitiol Iron chelator 0.0707 Ouabain Sodium/potassium ATPase inhibitor,
Intracellular Ca2+ Increasor 0.0719
Negative
DBHQ 0.0125 5,6-epoxyeicosatrienoic acid
0.0236
Niguldipine 0.0276 Nimodipine 0.0492 Nitrendipine 0.0629 W-7 0.1980 Amiloride 0.0956 LY-171883
Calcium channel inhibitors “ “ “ “ “ “
“
0.1287 Glyburide 0.0521 PCO-400 0.0402 Lidocaine N-ethyl bromide
0.1035
TPEN
Potassium/Sodium channel effectors “ “ “ “ 0.0901
N-acetyl-Leu-Leu-norLeu-al
γ-Secretase inhibitor 0.0178
© 2008 Macmillan Publishers Limited. All rights reserved.

GM6001 0.0156 Triptolide (PG490)
MMP inhibitors “ 0.0267
3,4-dichloroisocoumarin
Non-specific searine protease inhibitor 0.0722
HBDDE Inhibits PKCα and PKCγ 0.0421 Castanospermine Protein kinase C Activator, bioactive lipid 0.0681 SB415286 Potent and selective inhibitor of GSK-3 0.0781 Bezafibrate 0.0372 Eicosa-5,8-dienoic acid(20:2,n-12)
0.1894
Carbacyclin
PPAR activators “ “
0.0539 Trans-Retinoic acid Keratolitic, bioactive lipid 0.0740 Lyso-C16-PAF Bioactive lipid 0.0643 N,N-dimethylsphingosine
Stereospecifically induces EGF receptor autophosphorylation producing EGF-like
activity in vitro
0.0372
Pifithrin p53 Inhibitor (reversible), bioactive lipid 0.0264 Supplemental Table 1. Chemical compounds modulating Notch signaling.
A synthetic nucleotide sequence containing 6 RBP binding sites was cloned in front
of a luciferase gene into the pHTS-MCS reporter vector (Byomix), at the BglII and
XhoI restriction sites. The reporter construct was transfected into HEK293 cells in 10
cm dishes. Sixteen hours after transfection, cells were re-plated onto 384-well plates
(500 cells/well). Chemicals from ICCB Bioactives 1 (http://iccb.med.harvard.edu/,
Biomol’s library #2840) at 5 mg/ml concentration were added to cells in triplicate
wells 8h after they were plated, and luciferase activity was measured 24 hours later.
Arbitrary values of activity were calculated relative to those in cells treated with
DMSO (vehicle) alone. Shown are compounds which caused >1.75 (positive) or <
0.25 (negative) folds changes in reporter activity relative to the DMSO control, with
similar effects being observed in two independent experiments.
© 2008 Macmillan Publishers Limited. All rights reserved.
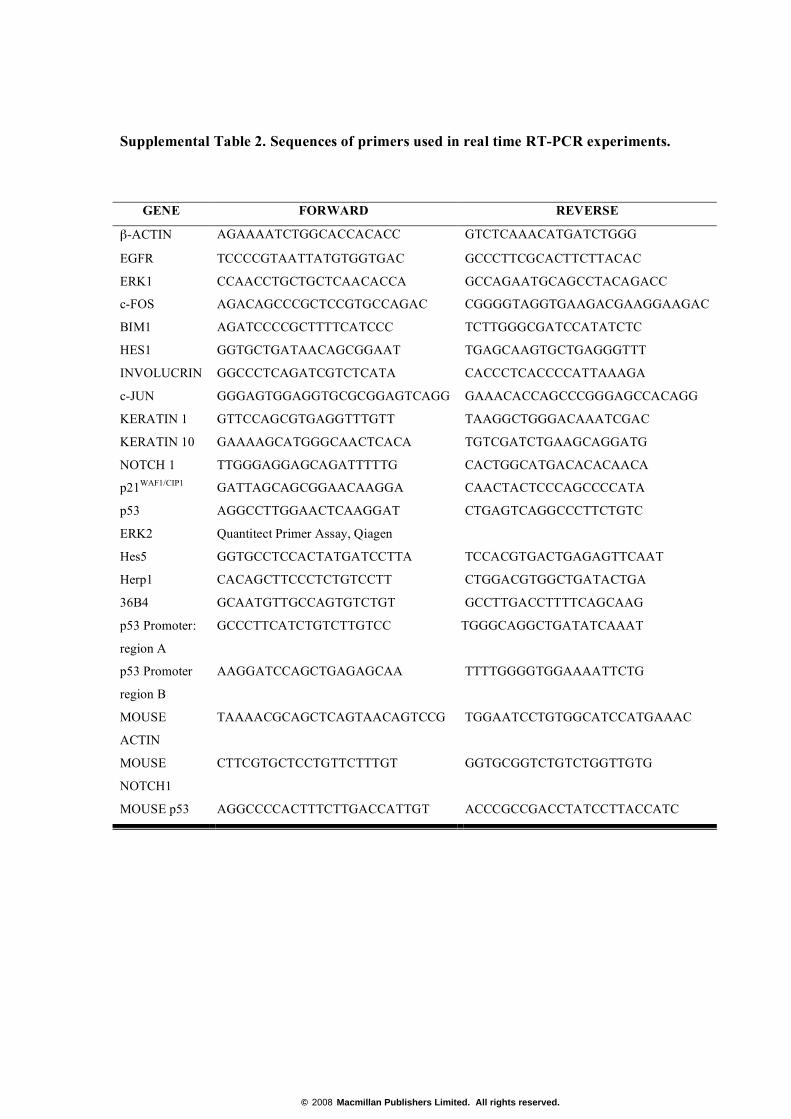
Supplemental Table 2. Sequences of primers used in real time RT-PCR experiments.
GENE FORWARD REVERSE
β-ACTIN AGAAAATCTGGCACCACACC GTCTCAAACATGATCTGGG
EGFR TCCCCGTAATTATGTGGTGAC GCCCTTCGCACTTCTTACAC
ERK1 CCAACCTGCTGCTCAACACCA GCCAGAATGCAGCCTACAGACC
c-FOS AGACAGCCCGCTCCGTGCCAGAC CGGGGTAGGTGAAGACGAAGGAAGAC
BIM1 AGATCCCCGCTTTTCATCCC TCTTGGGCGATCCATATCTC
HES1 GGTGCTGATAACAGCGGAAT TGAGCAAGTGCTGAGGGTTT
INVOLUCRIN GGCCCTCAGATCGTCTCATA CACCCTCACCCCATTAAAGA
c-JUN GGGAGTGGAGGTGCGCGGAGTCAGG GAAACACCAGCCCGGGAGCCACAGG
KERATIN 1 GTTCCAGCGTGAGGTTTGTT TAAGGCTGGGACAAATCGAC
KERATIN 10 GAAAAGCATGGGCAACTCACA TGTCGATCTGAAGCAGGATG
NOTCH 1 TTGGGAGGAGCAGATTTTTG CACTGGCATGACACACAACA
p21WAF1/CIP1 GATTAGCAGCGGAACAAGGA CAACTACTCCCAGCCCCATA
p53 AGGCCTTGGAACTCAAGGAT CTGAGTCAGGCCCTTCTGTC
ERK2 Quantitect Primer Assay, Qiagen
Hes5 GGTGCCTCCACTATGATCCTTA TCCACGTGACTGAGAGTTCAAT
Herp1 CACAGCTTCCCTCTGTCCTT CTGGACGTGGCTGATACTGA
36B4 GCAATGTTGCCAGTGTCTGT GCCTTGACCTTTTCAGCAAG
p53 Promoter:
region A
GCCCTTCATCTGTCTTGTCC TGGGCAGGCTGATATCAAAT
p53 Promoter
region B
AAGGATCCAGCTGAGAGCAA TTTTGGGGTGGAAAATTCTG
MOUSE
ACTIN
TAAAACGCAGCTCAGTAACAGTCCG TGGAATCCTGTGGCATCCATGAAAC
MOUSE
NOTCH1
CTTCGTGCTCCTGTTCTTTGT GGTGCGGTCTGTCTGGTTGTG
MOUSE p53 AGGCCCCACTTTCTTGACCATTGT ACCCGCCGACCTATCCTTACCATC
© 2008 Macmillan Publishers Limited. All rights reserved.

Supplemental Table 3. siRNA sequences used in knock-down experiments.
siRNA
Gene siRNA set #1 siRNA set #2
Notch1 GCGGATTAATTTGCATCTGAA CCGATGCGAGATCGACGTCAA
AKT1 AATCACACCACCTGACCAAGA ACGCTACTTCCTCCTCAAGAA
AKT2 AACAACTTCTCCGTAGCAGAA AAGGTACTTCGATGATGAATT
MEK1 CTGGATCAAGTCCTGAAGAAA TTGTGAATAAATGCTTAATAA
MEK2 CAGCATTTGCATGGAACACAT CCGGCCTGCCATGGCCATCTT
JNK1 GCCCAGTAATATAGTAGTAAA ATGAAATGTGTTAATCACAAA
JNK2 ATCGTGAACTTGTCCTCTTAA AAGAGAGCTTATCGTGAACTT
ERK1 CCCGTCTAATATATAAATATA CTCCCTGACCCGTCTAATATA
ERK2 AACACTTGTCAAGAAGCGTTA AATGACATTATTCGAGCACCA
JunB CACGACTACAAACTCCTGAAA ACAGACTCGATTCATATTGAA
JunD GAGGATGGAAACACCCTTCTA GCGCCTCATCATCCAGTCCAA
Fra1 CCCACCTAGAACACTAACTCA CCGAGTAAGGCGCGAGCGGAA
ELK1 CTGCTGAGAGAGCAAGGCAAT AGGGAGTCATCTCTTCCTATA
P53 CCAUCCACUACAACUACAUGUGUAA CCAGUGGUAAUCUACUGGGACGGAA
EGFR GCAGUCUUAUCUAACUAUGAUGCAA GCAAAGUGUGUAACGGAAUAGGUAU
c-Jun GCAAACCUCAGCAACUUCAACCCAG GCAAAGAUGGAAACGACCUUCUAUG
c-Fos ACUCCAAGCGGAGACAGACCAACUA AGAAGUCUGCUUUGCAGACCGAGAU
© 2008 Macmillan Publishers Limited. All rights reserved.
Copyright © 2022 FDOKUMEN