The co-evolution of social institutions, demography, and large-scale human cooperation
9
LETTER The co-evolution of social institutions, demography, and large- scale human cooperation Simon T. Powers 1 * and Laurent Lehmann 1 1 Department of Ecology & Evolu- tion, University of Lausanne, CH- 1015, Lausanne, Switzerland *Correspondence: E-mail: simon. [email protected] Abstract Human cooperation is typically coordinated by institutions, which determine the outcome structure of the social interactions individuals engage in. Explaining the Neolithic transition from small- to large-scale socie- ties involves understanding how these institutions co-evolve with demography. We study this using a demo- graphically explicit model of institution formation in a patch-structured population. Each patch supports both social and asocial niches. Social individuals create an institution, at a cost to themselves, by negotiat- ing how much of the costly public good provided by cooperators is invested into sanctioning defectors. The remainder of their public good is invested in technology that increases carrying capacity, such as irriga- tion systems. We show that social individuals can invade a population of asocials, and form institutions that support high levels of cooperation. We then demonstrate conditions where the co-evolution of coopera- tion, institutions, and demographic carrying capacity creates a transition from small- to large-scale social groups. Keywords Agriculture, cooperation, institutions, irrigation, large-scale societies, Neolithic Demographic Transition, punishment, tragedy of the commons. Ecology Letters (2013) 16: 1356–1364 INTRODUCTION Understanding the origin of large-scale human societies is of interest to both the social and biological sciences. For many millennia humans lived in small-scale hunter-gatherer societies, engaging in localised cooperative interactions such as hunting and food sharing (Boehm 1999; Kaplan et al. 2009; Whiten & Erdal 2012). Much work has addressed how cooperation could evolve under natural selection in such small-scale societies. Mechanisms for this include kin discrimination (Hamilton 1975; Dawkins 1976), direct and indi- rect reciprocity (Trivers 1971; Nowak & Sigmund 2005), punish- ment of defectors (Oliver 1980; Boyd & Richerson 1992), and cultural group selection (Boyd & Richerson 1990; Turchin 2010). Models of these mechanisms, however, usually assume that the choice of actions by group members are uncoordinated. That is, each individual decides in isolation whether to cooperate or not, whether and who to punish, etc. While the extent to which hunter- gatherer groups meet the assumption of entirely uncoordinated social decisions has been questioned (Boyd et al. 2010; Whiten & Erdal 2012; Guala 2012), this assumption becomes even more prob- lematic when attempting to explain the origin of large-scale socie- ties. This is because post–hunter-gatherer groups engage in social behaviours that affect a large number of individuals, and which require some degree of coordination and planning; clear examples include the construction of irrigation channels, trade links, and forti- fications. In particular, human groups typically have various institu- tions that help to coordinate social interactions and diffuse social dilemmas (Ostrom 1990; North 1990; Hurwicz 1996; Turchin 2003; Guala 2012). A key question is then: how can cooperation-promot- ing institutions co-evolve with demography to create a transition from small- to large-scale social groups? Addressing this provides an understanding of the role of social evolution in the Neolithic Demographic Transition and the origin of agricultural societies. We study this here using a model of the cultural co-evolution of social institutions and demography. By ‘institution’, we follow the game theoretic definition in which an institution represents a set of game forms (Hurwicz 1996). That is, an institution is a set of alter- native rules (‘rules of the game’) that determines the outcomes of the social interactions individuals engage in (e.g. different possible distributions of material resources). The particular institutional rules that will be implemented are then selected from this set. Humans need not remain trapped in a prisoner’s dilemma situation, but rather they may form an institution and communicate with each other such as to agree upon rules that transform the game structure into one where cooperation may be a stable equilibrium (Ostrom 1990; Ostrom & Gardner 1993). Real-world examples of this process are provided by the self- organised management of irrigation systems (Hunt 1988; Trawick 2001; Janssen et al. 2012), where rules devised and enforced by the resource users themselves can prevent a tragedy of the commons (Hardin 1968) in water usage. For example, institutional rules might specify how much water may be taken and when, as in the 600- year-old self-managed huerta irrigation systems in Valencia, Murcia, and Alicante (Ostrom 1990). Rules may also specify how often indi- viduals should contribute to construction and maintenance of the system, as in the zanjera irrigation systems in the Philippines (Ostrom 1990). In both cases, the institutional rules are created by a peer assembly of group members, and are enforced through both peer monitoring and the creation of formal guard roles that are funded from the irrigator’s common resources. These examples illustrate that cooperation-promoting institutions do not have to be coercively imposed by a dominant leader, as has been assumed in some recent evolutionary models (e.g. Hooper et al. 2010; Isakov & Rand 2011; Sasaki et al. 2012). Moreover, as examples of the institu- tionalised regulation of irrigation systems, they are of direct rele- vance to the origin of agricultural societies (Carballo 2013). © 2013 John Wiley & Sons Ltd/CNRS Ecology Letters, (2013) 16: 1356–1364 doi: 10.1111/ele.12178
Transcript of The co-evolution of social institutions, demography, and large-scale human cooperation
LETTER The co-evolution of social institutions, demography, and large-
scale human cooperation
Simon T. Powers1* and Laurent
Lehmann1
1Department of Ecology & Evolu-
tion, University of Lausanne, CH-
1015, Lausanne, Switzerland
*Correspondence: E-mail: simon.
AbstractHuman cooperation is typically coordinated by institutions, which determine the outcome structure of the
social interactions individuals engage in. Explaining the Neolithic transition from small- to large-scale socie-
ties involves understanding how these institutions co-evolve with demography. We study this using a demo-
graphically explicit model of institution formation in a patch-structured population. Each patch supports
both social and asocial niches. Social individuals create an institution, at a cost to themselves, by negotiat-
ing how much of the costly public good provided by cooperators is invested into sanctioning defectors.
The remainder of their public good is invested in technology that increases carrying capacity, such as irriga-
tion systems. We show that social individuals can invade a population of asocials, and form institutions that
support high levels of cooperation. We then demonstrate conditions where the co-evolution of coopera-
tion, institutions, and demographic carrying capacity creates a transition from small- to large-scale social
groups.
KeywordsAgriculture, cooperation, institutions, irrigation, large-scale societies, Neolithic Demographic Transition,
punishment, tragedy of the commons.
Ecology Letters (2013) 16: 1356–1364
INTRODUCTION
Understanding the origin of large-scale human societies is of interest
to both the social and biological sciences. For many millennia
humans lived in small-scale hunter-gatherer societies, engaging in
localised cooperative interactions such as hunting and food sharing
(Boehm 1999; Kaplan et al. 2009; Whiten & Erdal 2012). Much
work has addressed how cooperation could evolve under natural
selection in such small-scale societies. Mechanisms for this include
kin discrimination (Hamilton 1975; Dawkins 1976), direct and indi-
rect reciprocity (Trivers 1971; Nowak & Sigmund 2005), punish-
ment of defectors (Oliver 1980; Boyd & Richerson 1992), and
cultural group selection (Boyd & Richerson 1990; Turchin 2010).
Models of these mechanisms, however, usually assume that the
choice of actions by group members are uncoordinated. That is,
each individual decides in isolation whether to cooperate or not,
whether and who to punish, etc. While the extent to which hunter-
gatherer groups meet the assumption of entirely uncoordinated
social decisions has been questioned (Boyd et al. 2010; Whiten &
Erdal 2012; Guala 2012), this assumption becomes even more prob-
lematic when attempting to explain the origin of large-scale socie-
ties. This is because post–hunter-gatherer groups engage in social
behaviours that affect a large number of individuals, and which
require some degree of coordination and planning; clear examples
include the construction of irrigation channels, trade links, and forti-
fications. In particular, human groups typically have various institu-
tions that help to coordinate social interactions and diffuse social
dilemmas (Ostrom 1990; North 1990; Hurwicz 1996; Turchin 2003;
Guala 2012). A key question is then: how can cooperation-promot-
ing institutions co-evolve with demography to create a transition
from small- to large-scale social groups? Addressing this provides
an understanding of the role of social evolution in the Neolithic
Demographic Transition and the origin of agricultural societies.
We study this here using a model of the cultural co-evolution of
social institutions and demography. By ‘institution’, we follow the
game theoretic definition in which an institution represents a set of
game forms (Hurwicz 1996). That is, an institution is a set of alter-
native rules (‘rules of the game’) that determines the outcomes of
the social interactions individuals engage in (e.g. different possible
distributions of material resources). The particular institutional rules
that will be implemented are then selected from this set. Humans
need not remain trapped in a prisoner’s dilemma situation, but
rather they may form an institution and communicate with each
other such as to agree upon rules that transform the game structure
into one where cooperation may be a stable equilibrium (Ostrom
1990; Ostrom & Gardner 1993).
Real-world examples of this process are provided by the self-
organised management of irrigation systems (Hunt 1988; Trawick
2001; Janssen et al. 2012), where rules devised and enforced by the
resource users themselves can prevent a tragedy of the commons
(Hardin 1968) in water usage. For example, institutional rules might
specify how much water may be taken and when, as in the 600-
year-old self-managed huerta irrigation systems in Valencia, Murcia,
and Alicante (Ostrom 1990). Rules may also specify how often indi-
viduals should contribute to construction and maintenance of the
system, as in the zanjera irrigation systems in the Philippines
(Ostrom 1990). In both cases, the institutional rules are created by
a peer assembly of group members, and are enforced through both
peer monitoring and the creation of formal guard roles that are
funded from the irrigator’s common resources. These examples
illustrate that cooperation-promoting institutions do not have to be
coercively imposed by a dominant leader, as has been assumed in
some recent evolutionary models (e.g. Hooper et al. 2010; Isakov &
Rand 2011; Sasaki et al. 2012). Moreover, as examples of the institu-
tionalised regulation of irrigation systems, they are of direct rele-
vance to the origin of agricultural societies (Carballo 2013).
© 2013 John Wiley & Sons Ltd/CNRS
Ecology Letters, (2013) 16: 1356–1364 doi: 10.1111/ele.12178
We consider a scenario in which individuals can voluntarily
choose to take part in a social activity, and create institutional rules
to regulate it. These individuals compete with asocials who choose
not to take part in, or benefit from, the social activity, and whose
pay-offs are not affected by the institutional rules and the cost of
their formation (these individuals are asocial in the sense of not
joining the institution; they could still have other social interactions
such as consumption of shared resources within groups). The par-
ticular case that we consider is the option to engage in the coopera-
tive development and usage of agricultural technology, as
exemplified by an irrigation system. This technology provides a ben-
efit to those that produce it, by increasing their yield. Through the
resulting increase in carrying capacity, the development of such
technology is thought to have been a driver of the transition from
small-scale nomadic to larger scale sedentary societies (Spencer
1993; Carballo et al. 2012).
We model the technology as a partly excludible good; asocial indi-
viduals who do not take part in its production are not able to benefit
from it. However, amongst social individuals who choose to partici-
pate, there is the opportunity for free-riding. Social individuals then
play a two-stage game. In the first stage, the institution is formed and
individuals determine how much of their common resources (a frac-
tion 1�h) should be used to monitor and sanction free-riding defec-
tors – this is the formation of institutional rules governing the social
activity. The remainder of their common resources (h) are invested in
production of the technology. We assume that all social individuals
pay a cost to form the institution, which represents the time and
effort spent creating the institutional rules. In the second stage of the
game, after the sanctioning rules have been agreed upon, social indi-
viduals play a public goods game. Defectors are then sanctioned
according to the institutional rules agreed in the first stage.
We demonstrate here that the co-evolution of institution forma-
tion, cooperation, and demography in such a setting can provide an
explanation of the transition from small- to large-scale societies.
THE MODEL
Life cycle and population structure
We consider a population that is subdivided into a finite number
Np of resource patches or sites (Wright’s 1931 finite island model
of dispersal). The life cycle consists of discrete and non-overlapping
generations, as follows. (1) Local interactions occur on each patch,
with social individuals forming an institution. (2) Each individual on
a patch has a Poisson distributed number of offspring who survive
to adulthood, with the mean of the distribution being determined
by the local social interactions and resource abundance (defined
explicitly below). (3) Adults of the previous generation perish. (4)
Each individual of the descendant generation either remains on its
local patch (with probability 1�m) or disperses to a randomly cho-
sen patch (excluding the natal one).
Individuals in this population carry two cultural traits that are
transmitted vertically from parents to offspring – an important mode
of cultural transmission in extant hunter-gatherer groups (Hewlett
et al. 2011), and one which parallels genetic transmission (Cavalli-
Sforza & Feldman 1981). The first trait determines the social behav-
iour of individuals. Specifically, whether the individual joins an insti-
tution and contributes to the public good (is a cooperator), joins an
institution but does not contribute (is a defector) or remains outside
of an institution and hence receives no public good or sanctioning (is
asocial). A mutation (or innovation) on this trait changes the value to
one of the other two variants chosen at random. The second trait is a
continuous number h varying between 0 and 1, which is interpreted
phenotypically as the proportion of public good that the bearer
would like its group to invest in helping as opposed to sanctioning.
Asocials carry this trait but do not express it, as they do not partici-
pate in institution formation. A mutation on this trait changes the
value according to a truncated normally distributed random variable
(with variance r), centred around the current trait value. The proba-
bility that an offspring undergoes a mutation is l, in which case one
of the two traits sampled at random is mutated.
How the institution affects reproduction
Fitness
The expected number wsjðtÞ of offspring who survives to adulthood
(fitness) produced by an individual of type s ∈ {a,c,d} (asocial,
cooperator, and defector respectively) in patch j at time t is assumed
to follow a Beverton–Holt model (e.g. Chow & Hsieh 2013) with
two niches. Specifically, cooperators and defectors (socials) on a
patch occupy a social niche in which they can improve their envi-
ronment through cooperative investment in technology. Asocials do
not take part in or benefit from this activity, and hence occupy a
different ecological niche. An example would be a horticultural
rather than agricultural mode of subsistence (Kaplan et al. 2009).
The degree of competition between these niches is set by two
parameters, aas and asa, which give the per capita effect of socials
on asocials’ fitness and asocials on socials’ fitness respectively.
According to these assumptions, we write the fitnesses of the three
types on patch j at time t as
wajðtÞ ¼ ra
1þ najðtÞ=Ka þ aas½ncjðtÞ þ ndjðtÞ�wcjðtÞ ¼ rc
1þ ½ncjðtÞ þ ndjðtÞ�=KsjðtÞ þ asanajðtÞ
wdjðtÞ ¼ rdjðtÞ1þ ½ncjðtÞ þ ndjðtÞ�=KsjðtÞ þ asanajðtÞ;
ð1Þ
where nsjðtÞ is the number of individuals of type s on patch j at
time t. The numerator in each expression can be thought of as the
maximal growth rate of an individual of the corresponding type,
whereas the denominator as the intensity of density-dependent com-
petition faced by that individual. We now detail the parameters in
these expressions.
Growth rate and sanctioning
First, ra (≥ 0) is the maximal growth rate of an asocial type. Namely
its growth rate in the absence of density dependence, which occurs
when the denominator of wajðtÞ is equal to one. The maximal
growth rate of a cooperator is assumed to be given by
rc ¼ ra � I � C ; ð2Þ
where I (≥ 0) is the cost of participating in institution formation,
whereas C (≥ 0) is the individual cost of producing an amount B of
public good. This entails that an amount ncjðtÞB of public good is
created on patch j by cooperators, which can be devoted to
resource enhancement or sanctioning. Social defectors participate in
institution formation but do not contribute to the public good, and
© 2013 John Wiley & Sons Ltd/CNRS
Letter Co-evolution of social institutions & demography 1357
can be sanctioned for this. We assume that the maximal growth rate
of a defector is
rdjðtÞ ¼ ra � I � ½1� hjðtÞ�ncjðtÞBndjðtÞ ; ð3Þ
where 1� hjðtÞ is the proportion of the public good produced on
patch j devoted to sanctioning. We assume that this fraction of the
public good is used for two purposes: first, to fund a monitoring
and sanctioning system, and second, to incentivise monitoring
behaviour by providing direct benefits to individuals who actively
monitor. We provide empirical examples of such a set-up in the
Discussion section, but we do not explicitly model at the micro-level
the monitoring and sanctioning actions that take place after an insti-
tution has been formed (see Weissing & Ostrom 2000 for such a
model). Instead, our focus is on the selection pressures that popula-
tion structure and demography exert on institutional forms.
Given these assumptions, ½1� hjðtÞ�ncj B=ndjðtÞ represents the per
capita cost of being sanctioned for defecting. The value of hjðtÞ in
our model is set by an aggregation rule, as is standard in social
choice theory (Conradt & List 2009). This is a function that trans-
forms a collection of individual preferences into a group’s decision,
and represents a functional abstraction of the communication and
negotiation process between social individuals on a patch. This type
of functional abstraction is often used in models of decision making
in animal social groups (Conradt & Roper 2003; Conradt & List
2009), where the effects of the outcome of the decision-making
process on fitness are of more evolutionary interest than the proxi-
mate behavioural mechanisms underlying it. We first consider the
case where hjðtÞ is set by the mean preference of social individuals
on patch j:
hjðtÞ ¼ 1
ncjðtÞ þ ndjðtÞXnj ðtÞ
i¼1
sijðtÞhijðtÞ; ð4Þ
where sijðtÞ ¼ 1 if individual i on patch j is a cooperator or defector
(i.e. a ‘social’), sijðtÞ ¼ 0 otherwise, hijðtÞ is the preference of indi-
vidual i on patch j at time t and njðtÞ ¼ ncjðtÞ þ ndjðtÞ þ najðtÞ is
the total number of individuals on patch j. This type of decision
making is well documented empirically in animal social groups
(Conradt & Roper 2003), as well as in humans from hunter-gather-
ers to industrial societies (Hastie & Kameda 2005).
Carrying capacity enhancement
The parameter Ka (≥ 0) in eqn 1 can be thought of as the ‘carry-
ing capacity’ of asocial individuals, which is the base carrying
capacity in the absence of social interactions. This interpretation
follows from the fact that in the absence of cooperators and
defectors, and assuming deterministic growth, the equilibrium num-
ber of asocials on a patch is ðra � 1ÞKa. Throughout this article we
fix ra ¼ 2 (without loss of generality), so that Ka can be regarded
as the intrinsic carrying capacity of a patch in the absence of social
interactions.
A key element of our model is that the institution, by facilitating
coordinated cooperation, allows the possibility of increasing the car-
rying capacity KsjðtÞ of social individuals. This is a dynamic variable
depending on the remainder of the public good not used for sanc-
tioning: hjðtÞncjðtÞB. This good is invested into increasing the carry-
ing capacity of cooperators and defectors on the patch, for which
we assume the functional form
KsjðtÞ ¼ Ka þ bf1� exp½�chjðtÞncjðtÞB�g; ð5Þwhich is a positive concave function of the number of cooperators.
The benefits of increased public good eventually become saturated,
with a maximal possible increase in carrying capacity of b. The
parameter c sets the gradient of the increase in carrying capacity
with respect to investment in cooperation.
Our model defines a stochastic process for the state variables
(najðtÞ, ncjðtÞ, ndjðtÞ, hjðtÞ) in each patch j of the spatially structured
population. These variables allow us to evaluate the average fre-
quency of each type, and the average h-value in the population.
Due to the strong nonlinearity of our model, we analyse the sto-
chastic process by means of individual-based simulations. The base-
line parameters used for the simulations, unless otherwise specified,
are given in Table 1.
RESULTS
Before proceeding to the analysis of the full model, we first present
results for a population where social interactions are well-mixed
(single patch), to aid intuition of the model dynamics.
Evolution under well-mixed social interactions
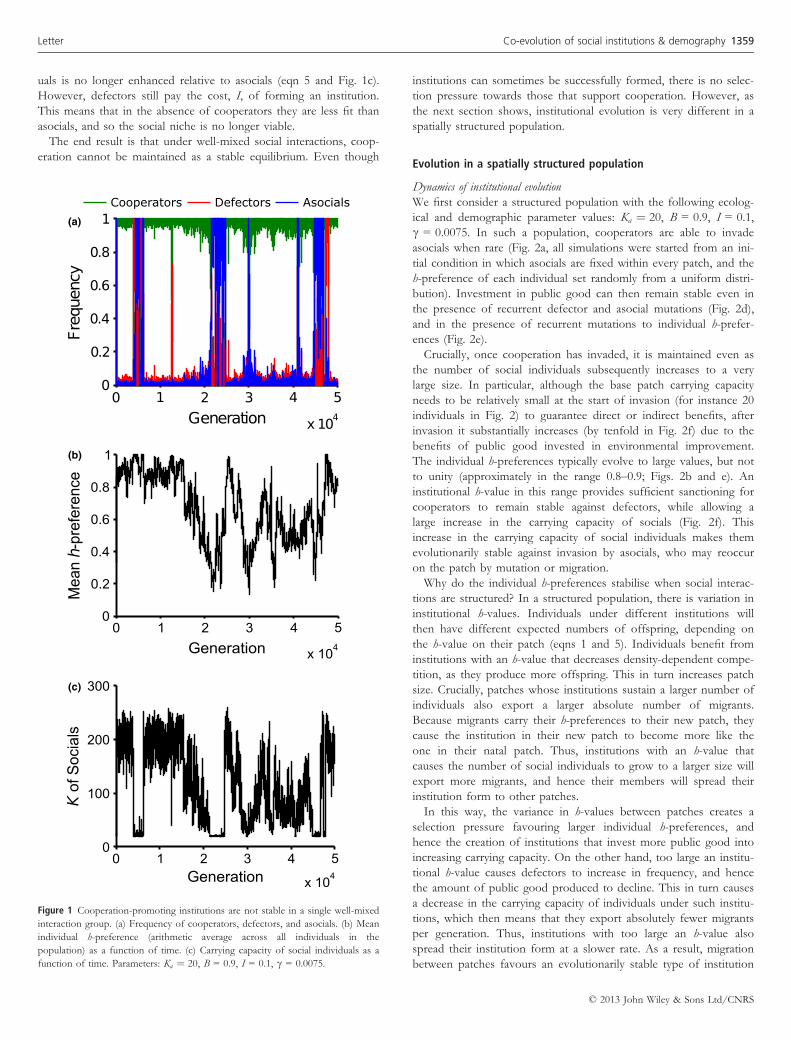
Neither cooperators, defectors, or asocials are stable when intera-
ctions are well-mixed (Fig. 1a). Cooperators may invade a population
of asocials once their frequency rises above a threshold by stochastic
means. But cooperators are stable against defectors only when the
cost of cooperating is less than the cost of being sanctioned
fC\½1� hðtÞ�ncðtÞB=ndðtÞg. This depends on the h-value of the
institution and, in turn, on the h-preferences of the social individuals
(eqn 4). However, under well-mixed social interactions there is no
selection pressure on individual h-preferences. This is because the
only way that an individual’s h-preference affects its fitness is through
its contribution to forming the h-value of its patch (eqn 4), the effects
of which are felt by all social individuals on the patch equally (eqns 3
and 5). As a consequence, the h-value of the institution changes
entirely as a result of mutations to individual h-preferences (Fig. 1b).
Because of these mutations, the institutional h-value may increase
over time. However, as it becomes close to one then cooperation
can no longer be maintained in the face of mutant defectors. This
is because too little of the public good of social individuals is
invested into sanctioning defectors, and so the cost of cooperating
becomes greater than the cost of being sanctioned. Consequently,
defectors replace cooperators. Defectors, in turn, are then replaced
by asocials. This is due to the loss of cooperative investment in
technology, which means that the carrying capacity of social individ-
Table 1. Baseline parameter settings
Parameter Value
Cost of cooperating, C 0.1
Base growth rate, ra 2
Per capita effect of asocial individuals upon socials, asa 0.05
Per capita effect of social individual upon asocials, aas 0.05
Maximum increase in carrying capacity due to cooperation, b 300
Mutation rate, l 0.01
Variance of normal distribution used for mutations on h, r 0.1
Number of patches, Np 50
© 2013 John Wiley & Sons Ltd/CNRS
1358 S. T. Powers and L. Lehmann Letter
uals is no longer enhanced relative to asocials (eqn 5 and Fig. 1c).
However, defectors still pay the cost, I, of forming an institution.
This means that in the absence of cooperators they are less fit than
asocials, and so the social niche is no longer viable.
The end result is that under well-mixed social interactions, coop-
eration cannot be maintained as a stable equilibrium. Even though
institutions can sometimes be successfully formed, there is no selec-
tion pressure towards those that support cooperation. However, as
the next section shows, institutional evolution is very different in a
spatially structured population.
Evolution in a spatially structured population
Dynamics of institutional evolution
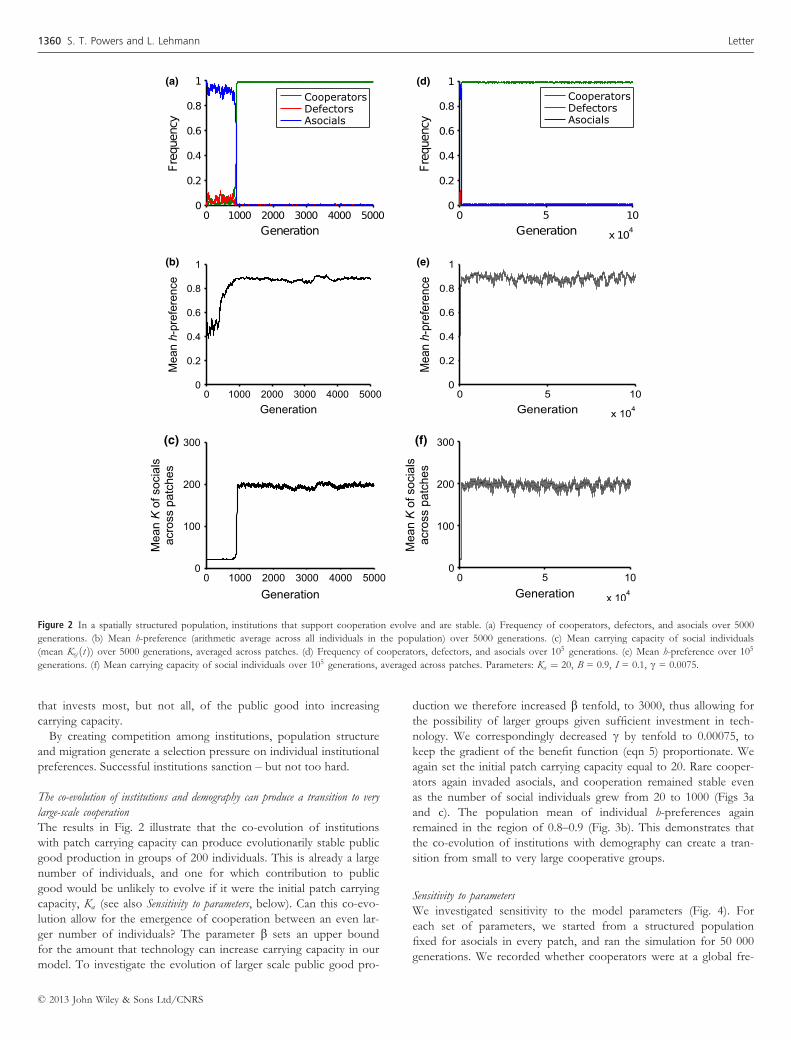
We first consider a structured population with the following ecolog-
ical and demographic parameter values: Ka ¼ 20, B = 0.9, I = 0.1,
c = 0.0075. In such a population, cooperators are able to invade
asocials when rare (Fig. 2a, all simulations were started from an ini-
tial condition in which asocials are fixed within every patch, and the
h-preference of each individual set randomly from a uniform distri-
bution). Investment in public good can then remain stable even in
the presence of recurrent defector and asocial mutations (Fig. 2d),
and in the presence of recurrent mutations to individual h-prefer-
ences (Fig. 2e).
Crucially, once cooperation has invaded, it is maintained even as
the number of social individuals subsequently increases to a very
large size. In particular, although the base patch carrying capacity
needs to be relatively small at the start of invasion (for instance 20
individuals in Fig. 2) to guarantee direct or indirect benefits, after
invasion it substantially increases (by tenfold in Fig. 2f) due to the
benefits of public good invested in environmental improvement.
The individual h-preferences typically evolve to large values, but not
to unity (approximately in the range 0.8–0.9; Figs. 2b and e). An
institutional h-value in this range provides sufficient sanctioning for
cooperators to remain stable against defectors, while allowing a
large increase in the carrying capacity of socials (Fig. 2f). This
increase in the carrying capacity of social individuals makes them
evolutionarily stable against invasion by asocials, who may reoccur
on the patch by mutation or migration.
Why do the individual h-preferences stabilise when social interac-
tions are structured? In a structured population, there is variation in
institutional h-values. Individuals under different institutions will
then have different expected numbers of offspring, depending on
the h-value on their patch (eqns 1 and 5). Individuals benefit from
institutions with an h-value that decreases density-dependent compe-
tition, as they produce more offspring. This in turn increases patch
size. Crucially, patches whose institutions sustain a larger number of
individuals also export a larger absolute number of migrants.
Because migrants carry their h-preferences to their new patch, they
cause the institution in their new patch to become more like the
one in their natal patch. Thus, institutions with an h-value that
causes the number of social individuals to grow to a larger size will
export more migrants, and hence their members will spread their
institution form to other patches.
In this way, the variance in h-values between patches creates a
selection pressure favouring larger individual h-preferences, and
hence the creation of institutions that invest more public good into
increasing carrying capacity. On the other hand, too large an institu-
tional h-value causes defectors to increase in frequency, and hence
the amount of public good produced to decline. This in turn causes
a decrease in the carrying capacity of individuals under such institu-
tions, which then means that they export absolutely fewer migrants
per generation. Thus, institutions with too large an h-value also
spread their institution form at a slower rate. As a result, migration
between patches favours an evolutionarily stable type of institution
Cooperators Defectors Asocials
(a)
(b)
(c)
Figure 1 Cooperation-promoting institutions are not stable in a single well-mixed
interaction group. (a) Frequency of cooperators, defectors, and asocials. (b) Mean
individual h-preference (arithmetic average across all individuals in the
population) as a function of time. (c) Carrying capacity of social individuals as a
function of time. Parameters: Ka ¼ 20, B = 0.9, I = 0.1, c = 0.0075.
© 2013 John Wiley & Sons Ltd/CNRS
Letter Co-evolution of social institutions & demography 1359
that invests most, but not all, of the public good into increasing
carrying capacity.
By creating competition among institutions, population structure
and migration generate a selection pressure on individual institutional
preferences. Successful institutions sanction – but not too hard.
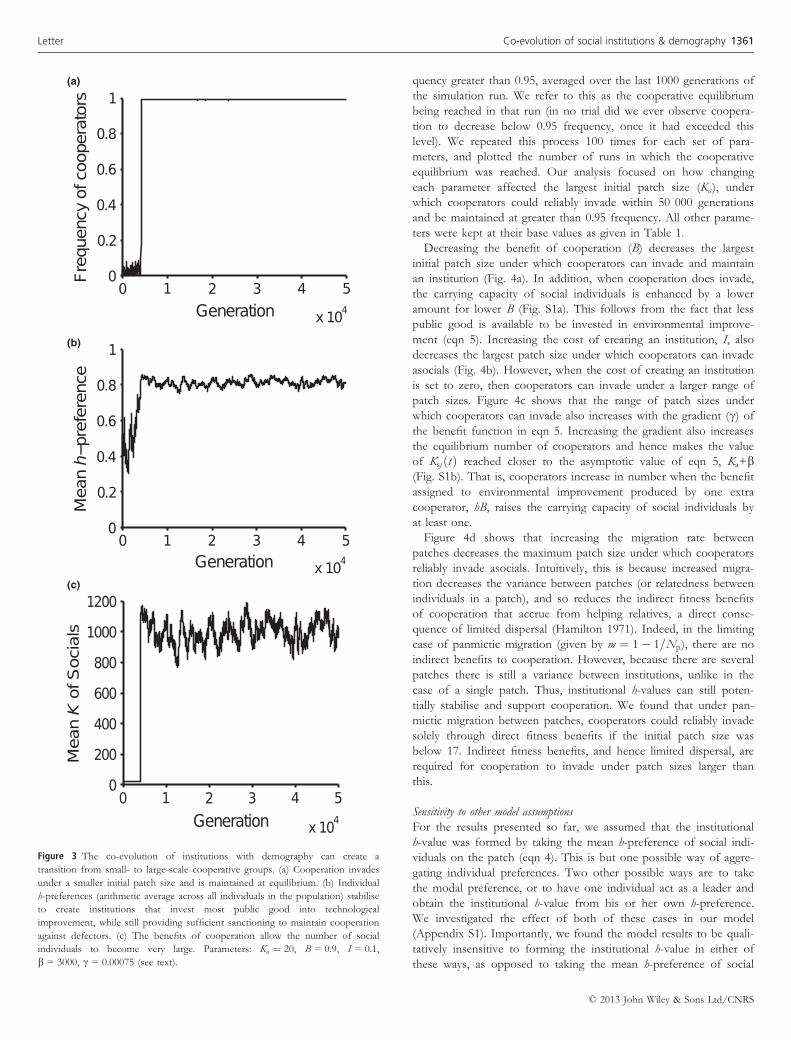
The co-evolution of institutions and demography can produce a transition to very
large-scale cooperation
The results in Fig. 2 illustrate that the co-evolution of institutions
with patch carrying capacity can produce evolutionarily stable public
good production in groups of 200 individuals. This is already a large
number of individuals, and one for which contribution to public
good would be unlikely to evolve if it were the initial patch carrying
capacity, Ka (see also Sensitivity to parameters, below). Can this co-evo-
lution allow for the emergence of cooperation between an even lar-
ger number of individuals? The parameter b sets an upper bound
for the amount that technology can increase carrying capacity in our
model. To investigate the evolution of larger scale public good pro-
duction we therefore increased b tenfold, to 3000, thus allowing for
the possibility of larger groups given sufficient investment in tech-
nology. We correspondingly decreased c by tenfold to 0.00075, to
keep the gradient of the benefit function (eqn 5) proportionate. We
again set the initial patch carrying capacity equal to 20. Rare cooper-
ators again invaded asocials, and cooperation remained stable even
as the number of social individuals grew from 20 to 1000 (Figs 3a
and c). The population mean of individual h-preferences again
remained in the region of 0.8–0.9 (Fig. 3b). This demonstrates that
the co-evolution of institutions with demography can create a tran-
sition from small to very large cooperative groups.
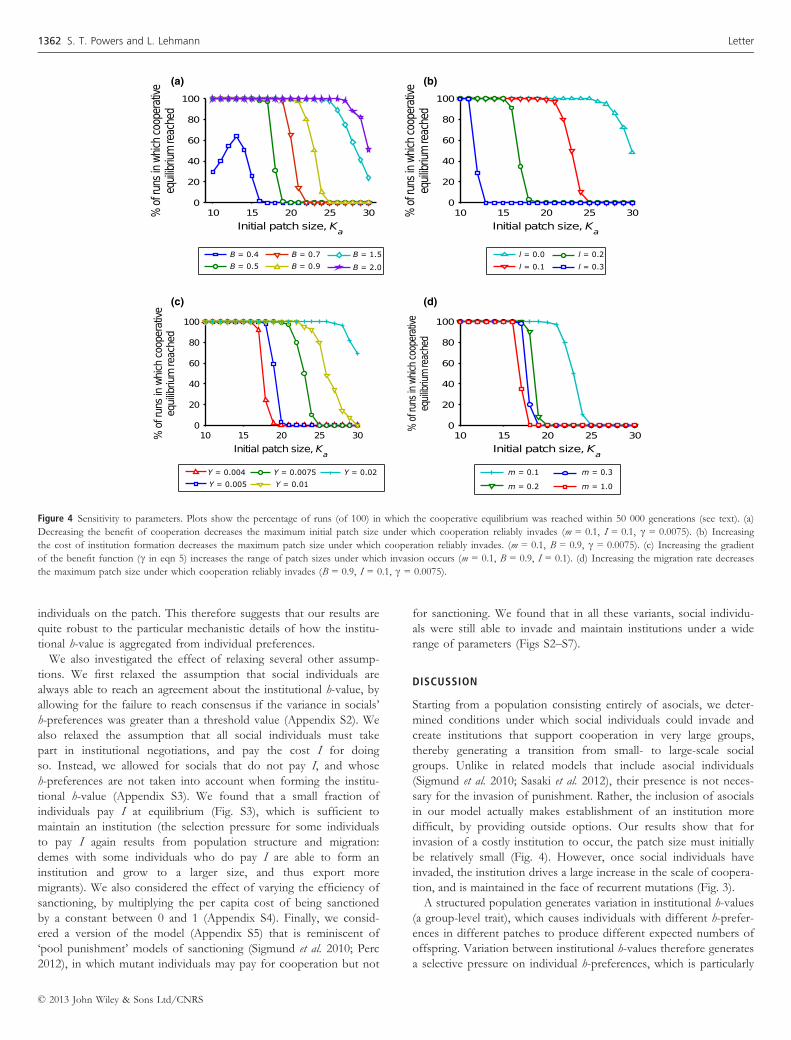
Sensitivity to parameters
We investigated sensitivity to the model parameters (Fig. 4). For
each set of parameters, we started from a structured population
fixed for asocials in every patch, and ran the simulation for 50 000
generations. We recorded whether cooperators were at a global fre-
CooperatorsDefectorsAsocials
CooperatorsDefectorsAsocials
(a) (d)
(b) (e)
(c) (f)
Figure 2 In a spatially structured population, institutions that support cooperation evolve and are stable. (a) Frequency of cooperators, defectors, and asocials over 5000
generations. (b) Mean h-preference (arithmetic average across all individuals in the population) over 5000 generations. (c) Mean carrying capacity of social individuals
(mean Ksj ðtÞ) over 5000 generations, averaged across patches. (d) Frequency of cooperators, defectors, and asocials over 105 generations. (e) Mean h-preference over 105
generations. (f) Mean carrying capacity of social individuals over 105 generations, averaged across patches. Parameters: Ka ¼ 20, B = 0.9, I = 0.1, c = 0.0075.
© 2013 John Wiley & Sons Ltd/CNRS
1360 S. T. Powers and L. Lehmann Letter
quency greater than 0.95, averaged over the last 1000 generations of
the simulation run. We refer to this as the cooperative equilibrium
being reached in that run (in no trial did we ever observe coopera-
tion to decrease below 0.95 frequency, once it had exceeded this
level). We repeated this process 100 times for each set of para-
meters, and plotted the number of runs in which the cooperative
equilibrium was reached. Our analysis focused on how changing
each parameter affected the largest initial patch size (Ka), under
which cooperators could reliably invade within 50 000 generations
and be maintained at greater than 0.95 frequency. All other parame-
ters were kept at their base values as given in Table 1.
Decreasing the benefit of cooperation (B) decreases the largest
initial patch size under which cooperators can invade and maintain
an institution (Fig. 4a). In addition, when cooperation does invade,
the carrying capacity of social individuals is enhanced by a lower
amount for lower B (Fig. S1a). This follows from the fact that less
public good is available to be invested in environmental improve-
ment (eqn 5). Increasing the cost of creating an institution, I, also
decreases the largest patch size under which cooperators can invade
asocials (Fig. 4b). However, when the cost of creating an institution
is set to zero, then cooperators can invade under a larger range of
patch sizes. Figure 4c shows that the range of patch sizes under
which cooperators can invade also increases with the gradient (c) ofthe benefit function in eqn 5. Increasing the gradient also increases
the equilibrium number of cooperators and hence makes the value
of KsjðtÞ reached closer to the asymptotic value of eqn 5, Ka+b(Fig. S1b). That is, cooperators increase in number when the benefit
assigned to environmental improvement produced by one extra
cooperator, hB, raises the carrying capacity of social individuals by
at least one.
Figure 4d shows that increasing the migration rate between
patches decreases the maximum patch size under which cooperators
reliably invade asocials. Intuitively, this is because increased migra-
tion decreases the variance between patches (or relatedness between
individuals in a patch), and so reduces the indirect fitness benefits
of cooperation that accrue from helping relatives, a direct conse-
quence of limited dispersal (Hamilton 1971). Indeed, in the limiting
case of panmictic migration (given by m ¼ 1� 1=Np), there are no
indirect benefits to cooperation. However, because there are several
patches there is still a variance between institutions, unlike in the
case of a single patch. Thus, institutional h-values can still poten-
tially stabilise and support cooperation. We found that under pan-
mictic migration between patches, cooperators could reliably invade
solely through direct fitness benefits if the initial patch size was
below 17. Indirect fitness benefits, and hence limited dispersal, are
required for cooperation to invade under patch sizes larger than
this.
Sensitivity to other model assumptions
For the results presented so far, we assumed that the institutional
h-value was formed by taking the mean h-preference of social indi-
viduals on the patch (eqn 4). This is but one possible way of aggre-
gating individual preferences. Two other possible ways are to take
the modal preference, or to have one individual act as a leader and
obtain the institutional h-value from his or her own h-preference.
We investigated the effect of both of these cases in our model
(Appendix S1). Importantly, we found the model results to be quali-
tatively insensitive to forming the institutional h-value in either of
these ways, as opposed to taking the mean h-preference of social
(a)
(b)
(c)
Figure 3 The co-evolution of institutions with demography can create a
transition from small- to large-scale cooperative groups. (a) Cooperation invades
under a smaller initial patch size and is maintained at equilibrium. (b) Individual
h-preferences (arithmetic average across all individuals in the population) stabilise
to create institutions that invest most public good into technological
improvement, while still providing sufficient sanctioning to maintain cooperation
against defectors. (c) The benefits of cooperation allow the number of social
individuals to become very large. Parameters: Ka ¼ 20, B = 0.9, I = 0.1,
b = 3000, c = 0.00075 (see text).
© 2013 John Wiley & Sons Ltd/CNRS
Letter Co-evolution of social institutions & demography 1361
individuals on the patch. This therefore suggests that our results are
quite robust to the particular mechanistic details of how the institu-
tional h-value is aggregated from individual preferences.
We also investigated the effect of relaxing several other assump-
tions. We first relaxed the assumption that social individuals are
always able to reach an agreement about the institutional h-value, by
allowing for the failure to reach consensus if the variance in socials’
h-preferences was greater than a threshold value (Appendix S2). We
also relaxed the assumption that all social individuals must take
part in institutional negotiations, and pay the cost I for doing
so. Instead, we allowed for socials that do not pay I, and whose
h-preferences are not taken into account when forming the institu-
tional h-value (Appendix S3). We found that a small fraction of
individuals pay I at equilibrium (Fig. S3), which is sufficient to
maintain an institution (the selection pressure for some individuals
to pay I again results from population structure and migration:
demes with some individuals who do pay I are able to form an
institution and grow to a larger size, and thus export more
migrants). We also considered the effect of varying the efficiency of
sanctioning, by multiplying the per capita cost of being sanctioned
by a constant between 0 and 1 (Appendix S4). Finally, we consid-
ered a version of the model (Appendix S5) that is reminiscent of
‘pool punishment’ models of sanctioning (Sigmund et al. 2010; Perc
2012), in which mutant individuals may pay for cooperation but not
for sanctioning. We found that in all these variants, social individu-
als were still able to invade and maintain institutions under a wide
range of parameters (Figs S2–S7).
DISCUSSION
Starting from a population consisting entirely of asocials, we deter-
mined conditions under which social individuals could invade and
create institutions that support cooperation in very large groups,
thereby generating a transition from small- to large-scale social
groups. Unlike in related models that include asocial individuals
(Sigmund et al. 2010; Sasaki et al. 2012), their presence is not neces-
sary for the invasion of punishment. Rather, the inclusion of asocials
in our model actually makes establishment of an institution more
difficult, by providing outside options. Our results show that for
invasion of a costly institution to occur, the patch size must initially
be relatively small (Fig. 4). However, once social individuals have
invaded, the institution drives a large increase in the scale of coopera-
tion, and is maintained in the face of recurrent mutations (Fig. 3).
A structured population generates variation in institutional h-values
(a group-level trait), which causes individuals with different h-prefer-
ences in different patches to produce different expected numbers of
offspring. Variation between institutional h-values therefore generates
a selective pressure on individual h-preferences, which is particularly
Y = 0.004
Y = 0.005
Y = 0.0075
Y = 0.01
Y = 0.02 m = 0.1
m = 0.2
m = 0.3
m = 1.0
l = 0.0
l = 0.1
l = 0.2
l = 0.3
B = 0.4
B = 0.5
B = 0.7
B = 0.9
B = 1.5
B = 2.0
(a) (b)
(c) (d)
Figure 4 Sensitivity to parameters. Plots show the percentage of runs (of 100) in which the cooperative equilibrium was reached within 50 000 generations (see text). (a)
Decreasing the benefit of cooperation decreases the maximum initial patch size under which cooperation reliably invades (m = 0.1, I = 0.1, c = 0.0075). (b) Increasing
the cost of institution formation decreases the maximum patch size under which cooperation reliably invades. (m = 0.1, B = 0.9, c = 0.0075). (c) Increasing the gradient
of the benefit function (c in eqn 5) increases the range of patch sizes under which invasion occurs (m = 0.1, B = 0.9, I = 0.1). (d) Increasing the migration rate decreases
the maximum patch size under which cooperation reliably invades (B = 0.9, I = 0.1, c = 0.0075).
© 2013 John Wiley & Sons Ltd/CNRS
1362 S. T. Powers and L. Lehmann Letter
strong in our explicit demographic model owing to the fact that indi-
viduals form institutions that are likely to increase local carrying
capacity. This increase in carrying capacity generally markedly raises
the selection pressure on social traits causing it (Lehmann et al. 2006),
as their carriers export a significantly larger number of successful
migrant offspring than individuals living in smaller groups. Thus,
individuals rapidly spread their institutional and behaviourial prefer-
ences to other patches. In this way, group structure solves the prob-
lem posed by institution evolution when interactions are well-mixed.
Importantly, warfare, group extinctions, or group fissioning are not
required for this mechanism to work. The spread of institutions
through population growth and migration is aligned with the demic
diffusion hypothesis for the spread of agriculture across Neolithic
Europe (Ammerman & Cavalli-Sforza 1984).
The degree to which the carrying capacity of human groups was
affected by the origin of agricultural technology is an important
empirical question. Data from cemeteries show a marked increase in
fertility during the origin of agriculture, indicating significant popu-
lation growth (Bocquet-Appel 2011). Other studies suggest that
while the population density of hunter-gatherer groups is usually
below 0.1 person/sq. mi., that of early dry farmers is around 4 per-
sons/sq. mi. (Hassan & Sengel 1973). Moreover, estimates for the
population density of early irrigation farming have ranged from 16
to 25 person/sq. mi. (Hassan & Sengel 1973). Thus, the density of
human groups practising irrigation farming may have been up to
250 times greater than that of hunter-gatherers. Such data suggest
that a relatively large value of b is plausible in our model.
Our institutional approach to sanctioning should be contrasted with
typical models of peer or ‘altruistic’ punishment (e.g. Boyd & Richer-
son 1992; Boyd et al. 2003; Nakamaru & Iwasa 2005; Lehmann et al.
2007). In those models, each cooperator decides in isolation whether
to punish a defector or not, and pays a unilateral cost for doing so.
The main focus of such models is then to address the ‘second-order
free-rider’ problem. That is, if acts of punishment are individually
costly to the punisher, then the sanctioning system itself becomes a
public good that is vulnerable to exploitation. If such altruistic punish-
ment is to evolve, then it must be through indirect, kin-selected bene-
fits (it is often suggested that these necessary indirect benefits arise
through quite specific mechanisms, such as pairwise intergroup war-
fare under limited dispersal, e.g. Boyd et al. 2003). However, outside
of artificial economic games played in the laboratory, empirical evi-
dence for punishment acts that decrease the direct lifetime fitness of
the punisher remains scant (Baumard 2010; Guala 2012). Rather, field
studies have demonstrated that successful sanctioning institutions
work by creating conditions that provide direct benefits to individuals
who actively monitor and enforce institutional rules (Ostrom 1990;
Baumard 2010; Guala 2012). Our model has captured these direct
benefits in a simple manner, by considering the evolution of institu-
tional rules that allow for the individual costs of monitoring and sanc-
tioning to be paid for from the public good. A similar abstraction
from the mechanistic details of day-to-day monitoring and sanction-
ing has also been used in recent models of pool punishment (Sigmund
et al. 2010; Perc 2012). Nevertheless, it is insightful to consider
anthropological evidence for how monitoring and sanctioning are in-
centivised on a mechanistic level.
Ostrom (1990) describes how the use of common land in the
Hirano, Nagaike, and Yamanoka villages in Japan was governed by
a set of institutional rules that determined how much a household
could harvest from the commons each year, and at what time. The
villagers then often used some of their common resources to hire
monitors – individuals who specialised in patrolling the commons
and reporting violations. These individuals were further incentivised
to actively monitor, by allowing them to demand a supply of money
and sak�e from any defectors whom they personally found (Ostrom
1990). Thus, sanctioning became a profitable activity for those mon-
itors who were efficient in finding defectors (Guala 2012). Similarly,
in the huerta irrigation systems in Spain, individual irrigators were
often nominated to act as monitors by their peers, and were incenti-
vised by being able to keep a third of the fine levied on any defec-
tor whom they found (Ostrom 1990).
Furthermore, the monitors are themselves accountable to ordinary
group members in the commons institutions studied by Ostrom
(1990). A monitor who is seen to under-perform can be quickly
stripped of the role, causing the cost of shirking to be greater than
the cost of monitoring. In all these empirical cases, institutional
arrangements cover the cost of monitoring and sanctioning and so
prevent a second-order free-rider problem from occurring.
Coordinated, large-scale, cooperation between individuals was
likely to have become particularly important during the transition
from hunter-gatherer to agricultural societies (Boone 1992; Kaplan
et al. 2009; Hooper et al. 2010; Carballo et al. 2012). For example,
there is archaeological evidence that the need to cooperatively con-
struct irrigation systems was a driver in the evolution of social insti-
tutions in pre-Hispanic Mexico (Spencer 1993; Carballo et al. 2012).
Construction of an irrigation system can, in turn, increase carrying
capacity. Co-evolution of institution creation, cooperation, and
demography could therefore be a key driver in the transition from
small-scale hunter-gatherer to large-scale agricultural societies. Our
model has demonstrated the logical cogency of such an explanation.
ACKNOWLEDGEMENTS
We thank three anonymous referees for useful comments that
improved this study. This work is supported by Swiss NSF grant
PP00P3-123344.
AUTHORSHIP
STP and LL designed research; STP performed research; STP analy-
sed data; STP and LL wrote the manuscript.
REFERENCES
Ammerman, A.J. & Cavalli-Sforza, L.L. (1984). The Neolithic Transition and The
Genetics of Populations in Europe. Princeton University Press, Princeton, NJ.
Baumard, N. (2010). Has punishment played a role in the evolution of
cooperation? A critical review. Mind. Soc., 9, 171–192.Bocquet-Appel, J.P. (2011). When the world’s population took off: The
springboard of the Neolithic Demographic Transition. Science, 333, 560–561.Boehm, C. (1999). Hierarchy in the Forest: The Evolution of Egalitarian Behavior.
Harvard University Press, Cambridge, MA.
Boone, J.L. (1992). Competition, cooperation and the development of social
hierarchies. In: Evolutionary Ecology and Human Behavior (eds. Smith, E.A. &
Winterhalder, B.). Aldine de Gruyter, New York, pp. 301–337.Boyd, R., Gintis, H. & Bowles, S. (2010). Coordinated punishment of defectors
sustains cooperation and can proliferate when rare. Science, 328, 617–620.Boyd, R., Gintis, H., Bowles, S. & Richerson, P.J. (2003). The evolution of
altruistic punishment. Proc. Natl. Acad. Sci. U. S. A., 100, 3531–3535.Boyd, R. & Richerson, P. (1992). Punishment allows the evolution of
cooperation (or anything else) in sizable groups. Ethol. Sociobiol., 13, 171–195.
© 2013 John Wiley & Sons Ltd/CNRS
Letter Co-evolution of social institutions & demography 1363
Boyd, R. & Richerson, P.J. (1990). Group selection among alternative
evolutionarily stable strategies. J. Theor. Biol., 145, 331–342.Carballo, D.M., Roscoe, P. & Feinman, G.M. (2012). Cooperation and collective
action in the cultural evolution of complex societies. J. Archaeol. Method. Th.,
DOI: 10.1007/s10816-012-9147-2.
Carballo, D.M. (2013). Cultural and evolutionary dynamics of cooperation in
archaeological perspective. In: Cooperation & Collective Action: Archaeological
Perspectives (ed. Carballo, D.M.). University Press of Colorado, Boulder, CO.
Cavalli-Sforza, L.L. & Feldman, M.W. (1981). Cultural Transmission and Evolution:
A Quantitative Approach. Princeton University Press, Princeton, NJ.
Chow, Y. & Hsieh, J. (2013). On multidimensional discrete-time Beverton-Holt
competition models. J. Differ. Equ. Appl., 19, 491–506.Conradt, L. & List, C. (2009). Group decisions in humans and animals: a survey.
Philos. Trans. R. Soc. Lond. B Biol. Sci., 364, 719–742.Conradt, L. & Roper, T.J. (2003). Group decision-making in animals. Nature,
421, 155–158.Dawkins, R. (1976). The Selfish Gene. Oxford University Press, Oxford, UK.
Guala, F. (2012). Reciprocity: weak or strong? What punishment experiments do
(and do not) demonstrate. Behav. Brain Sci., 35, 1–15.Hamilton, W.D. (1971). Selection of selfish and altruistic behaviour in some
extreme models. In: Man and Beast: Comparative Social Behavior (eds. Eisenberg,
J. & Dillon, W.). Smithsonian Institutions Press, Washington, DC, pp. 59–91.
Hamilton, W.D. (1975). Innate social aptitudes in man, an approach from
evolutionary genetics. In: Biosocial Anthropology (ed. Fox, R.). Malaby Press,
London, UK, pp. 133–155.Hardin, G. (1968). The tragedy of the commons. Science, 162, 1243–1248.Hassan, F.A. & Sengel, R.A. (1973). On mechanisms of population growth
during the neolithic. Curr. Anthropol., 14, 535–542Hastie, R. & Kameda, T. (2005). The robust beauty of majority rules in group
decisions. Psychol. Rev., 112, 494–508.Hewlett, B.S., Fouts, H.N., Boyette, A.H. & Hewlett, B.L. (2011). Social learning
among congo basin hunter-gatherers. Philos. Trans. R. Soc. Lond. B Biol. Sci.,
366, 1168–1178.Hooper, P.L., Kaplan, H.S. & Boone, J.L. (2010). A theory of leadership in
human cooperative groups. J. Theor. Biol., 265, 633–646.Hunt, R.C. (1988). Size and the structure of authority in canal irrigation systems.
J. Anthropol. Res., 44, 335–355Hurwicz, L. (1996). Institutions as families of game forms. Jpn. Econ. Rev., 47,
113–132.Isakov, A. & Rand, D.G. (2011). The evolution of coercive institutional
punishment. Dyn. Games Appl., 2, 97–109.Janssen, M.A., Bousquet, F., Cardenas, J.C., Castillo, D. & Worrapimphong, K.
(2012). Field experiments on irrigation dilemmas. Agr. Syst., 109, 65–75.Kaplan, H.S., Hooper, P.L. & Gurven, M. (2009). The evolutionary and
ecological roots of human social organization. Philos. Trans. R. Soc. Lond. B
Biol. Sci., 364, 3289–3299.Lehmann, L., Perrin, N. & Rousset, F. (2006). Population demography and the
evolution of helping behaviors. Evolution, 60, 1137–1151.Lehmann, L., Rousset, F., Roze, D. & Keller, L. (2007). Strong reciprocity or
strong ferocity? A population genetic view of the evolution of altruistic
punishment. Am. Nat., 170, 21–36.
Nakamaru, M. & Iwasa, Y. (2005). The evolution of altruism by costly
punishment in lattice-structured populations: score-dependent viability versus
score-dependent fertility. Evol. Ecol. Res., 7, 853–870.North, D.C. (1990). Institutions, Institutional Change and Economic Performance (Political
Economy of Institutions and Decisions). Cambridge University Press, Cambridge,
UK.
Nowak, M.A. & Sigmund, K. (2005). Evolution of indirect reciprocity. Nature,
437, 1291–1298.Oliver, P. (1980). Rewards and punishments as selective incentives for collective
action: theoretical investigations. Am. J. Sociol., 85, 1356–1375.Ostrom, E. (1990). Governing the Commons: The Evolution of Institutions for Collective
Action (Political Economy of Institutions and Decisions). Cambridge University Press,
Cambridge, UK.
Ostrom, E. & Gardner, R. (1993). Coping with asymmetries in the commons:
self-governing irrigation systems can work. J. Econ. Perspect., 7, 93–112.Perc, M. (2012). Sustainable institutionalized punishment requires elimination of
second-order free-riders. Sci. Rep., 2.
Sasaki, T., Br€annstr€om, �A., Dieckmann, U. & Sigmund, K. (2012). The take-it-
or-leave-it option allows small penalties to overcome social dilemmas. Proc.
Natl. Acad. Sci. U. S. A., 109, 1165–1169.Sigmund, K., De Silva, H., Traulsen, A. & Hauert, C. (2010). Social learning
promotes institutions for governing the commons. Nature, 466, 861–863.Spencer, C.S. (1993). Human agency, biased transmission, and the cultural
evolution of chiefly authority. J. Anthropol. Archaeol., 12, 41–74.Trawick, P.B. (2001). Successfully governing the commons: Principles of social
organization in an andean irrigation system. Hum. Ecol., 29, 1–25.Trivers, R.L. (1971). The evolution of reciprocal altruism. Q. Rev. Biol., 46, 35–57.Turchin, P. (2003). Historical Dynamics. Princeton University Press, Princeton, NJ.
Turchin, P. (2010). Warfare and the evolution of social complexity: a multilevel-
selection approach. Structure and Dynamics, 4, Article 2. Available at: http://
www.escholarship.org/uc/item/7j11945r.
Weissing, F. & Ostrom, E. (2000). Irrigation institutions and the games irrigators
play: rule enforcement on government- and farmer-managed systems. In:
Polycentric Games and Institutions: Readings from the Workshop in Political Theory and
Policy Analysis. University of Michigan Press, Ann Arbor, pp. 366–398.Whiten, A. & Erdal, D. (2012). The human socio-cognitive niche and its
evolutionary origins. Philos. Trans. R. Soc. Lond. B Biol. Sci., 367, 2119–2129.Wright, S. (1931). Evolution in mendelian populations. Genetics, 16, 97–159.
SUPPORTING INFORMATION
Additional Supporting Information may be downloaded via the online
version of this article at Wiley Online Library (www.ecologyletters.com).
Editor, Minus Van Baalen
Manuscript received 24 April 2013
First decision made 29 May 2013
Second decision made 1 August 2013
Manuscript accepted 12 August 2013
© 2013 John Wiley & Sons Ltd/CNRS
1364 S. T. Powers and L. Lehmann Letter