Islamic Financial Institutions, Corporate Governance, and Corporate Risk Disclosure in Gulf...
22
J. of Multi. Fin. Manag. 31 (2015) 1–22 Contents lists available at ScienceDirect Journal of Multinational Financial Management journal homepage: www.elsevier.com/locate/econbase Insurance development and the finance-growth nexus: Evidence from 34 OECD countries Rudra P. Pradhan a,∗ , Mak B. Arvin b,1 , Neville R. Norman c,d,2 a Vinod Gupta School of Management, Indian Institute of Technology, Kharagpur 721302, India b Department of Economics, Trent University, Peterborough, Ontario K9J 7B8, Canada c Department of Economics, University of Melbourne, Victoria 3053, Australia d Department of Economics, University of Cambridge, Cambridge CB3 9DD, UK a r t i c l e i n f o Article history: Received 5 November 2014 Accepted 7 February 2015 Available online 14 February 2015 JEL classification: G10 G20 O2 O16 O20 O53 Keywords: Insurance market development Financial development Economic growth OECD countries a b s t r a c t This paper examines causal relationships between insurance mar- ket development, financial development, and economic growth in 34 OECD countries for the period 1988–2012. Insurance market development is defined in terms of life, non-life, and total insur- ance pervasiveness, both by density and penetration. Financial development is a composite index constructed from eight finan- cial development indicators relating to banking and stock markets. We use a panel vector auto-regression model to reveal the nature of Granger causality among the variables. Our results reveal that insurance market development specifically and financial market development overall seem both to be long-run causative factors of economic growth. On the other hand, our short-run causality results show a diverse pattern of short-run adjustment dynamics between the variables, including the possibility of feedback between them in several instances. © 2015 Elsevier B.V. All rights reserved. ∗ Corresponding author. Tel.: +91 9733742104; fax: +91 3222 278027. E-mail addresses: [email protected] (R.P. Pradhan), [email protected] (M.B. Arvin), [email protected], [email protected] (N.R. Norman). 1 Tel.: +1 705 748 1011x7299; fax: +1 705 748 1567. 2 Tel.: +61 95926120; mobile: +61 8344 5327/0414 653 770. http://dx.doi.org/10.1016/j.mulfin.2015.02.001 1042-444X/© 2015 Elsevier B.V. All rights reserved.
-
Upload
independent -
Category
Documents
-
view
1 -
download
0
Transcript of Islamic Financial Institutions, Corporate Governance, and Corporate Risk Disclosure in Gulf...

J. of Multi. Fin. Manag. 31 (2015) 1–22
Contents lists available at ScienceDirect
Journal of Multinational FinancialManagement
journal homepage: www.elsevier.com/locate/econbase
Insurance development and the finance-growthnexus: Evidence from 34 OECD countries
Rudra P. Pradhana,∗, Mak B. Arvinb,1, Neville R. Normanc,d,2
a Vinod Gupta School of Management, Indian Institute of Technology, Kharagpur 721302, Indiab Department of Economics, Trent University, Peterborough, Ontario K9J 7B8, Canadac Department of Economics, University of Melbourne, Victoria 3053, Australiad Department of Economics, University of Cambridge, Cambridge CB3 9DD, UK
a r t i c l e i n f o
Article history:Received 5 November 2014Accepted 7 February 2015Available online 14 February 2015
JEL classification:G10G20O2O16O20O53
Keywords:Insurance market developmentFinancial developmentEconomic growthOECD countries
a b s t r a c t
This paper examines causal relationships between insurance mar-ket development, financial development, and economic growth in34 OECD countries for the period 1988–2012. Insurance marketdevelopment is defined in terms of life, non-life, and total insur-ance pervasiveness, both by density and penetration. Financialdevelopment is a composite index constructed from eight finan-cial development indicators relating to banking and stock markets.We use a panel vector auto-regression model to reveal the natureof Granger causality among the variables. Our results reveal thatinsurance market development specifically and financial marketdevelopment overall seem both to be long-run causative factors ofeconomic growth. On the other hand, our short-run causality resultsshow a diverse pattern of short-run adjustment dynamics betweenthe variables, including the possibility of feedback between themin several instances.
© 2015 Elsevier B.V. All rights reserved.
∗ Corresponding author. Tel.: +91 9733742104; fax: +91 3222 278027.E-mail addresses: [email protected] (R.P. Pradhan), [email protected] (M.B. Arvin), [email protected],
[email protected] (N.R. Norman).1 Tel.: +1 705 748 1011x7299; fax: +1 705 748 1567.2 Tel.: +61 95926120; mobile: +61 8344 5327/0414 653 770.
http://dx.doi.org/10.1016/j.mulfin.2015.02.0011042-444X/© 2015 Elsevier B.V. All rights reserved.

2 R.P. Pradhan et al. / J. of Multi. Fin. Manag. 31 (2015) 1–22
1. Introduction
Economic theory and empirical evidence have confirmed for over a century that technologicaldevelopment and investment can foster the economic growth. (A pertinent recent survey of suchstudies is found in Horng et al., 2012.) The more contemporary studies of this vital subject indicatethat it is financial development3 specifically that has the considerable potential for disseminatingpositive externalities throughout the economies that experience it, fostering even greater economicgrowth (see, for instance, Andersson et al., 2010; Levine, 1999, 2005; Beck and Levine, 2004; Ward andZurbruegg, 2002; Beck et al., 2000; Levine et al., 2000; Rousseau and Wachtel, 2000; Levine and Zervos,1998; Barro and Sala-i-Martin, 1995). Accordingly, the nexus between financial development4 andeconomic growth is one of the most vibrant research works in development economics, particularlysince seminar works of Schumpeter (1911). The finance-growth relationship then becomes importantfor two specific reasons. First, governments can properly formulate growth-enhancing financial policy.If we can affirm and quantify any causality between financial development and economic growth,then any policies designed to increase/decrease financial flows within an economy would impact oneconomic growth. Second, these findings can enhance debates on any causal nexus between financialdevelopment and economic growth themselves.
Recent5 theoretical and empirical approaches, as articulated by Horng et al. (2012), Levine (2005),Beck et al. (2000), King and Levine (1993a), Robinson (1952), and others, have examined causalrelationships between financial development and economic growth. They maintain that financialdevelopment is central to fostering long-run economic growth as it facilitates the efficient inter-temporal allocation of resources, capital accumulation, and technological diffusion. This notionsupports a “supply-leading hypothesis.” The rival “demand-following hypothesis” states that it is theeconomic growth that determines financial development. In reality, while financial development maylead to economic growth, the latter may itself lead to further financial development.6
Financial development, which encompasses both banking-sector and stock market developments,can also be linked to insurance-market development (see, for instance, Horng et al., 2012; Ching et al.,2010; Outreville, 1990). Like banks and stock markets development, insurance market developmentalso plays a vital role in generating economic growth (Cristea et al., 2014; Liu and Lee, 2014; Lee et al.,2013a,b; Chang et al., 2013a; Han et al., 2010; Lee et al., 2012; Pan et al., 2012; Hou et al., 2012; Lee,2011; Lee et al., 2010; Jawadi et al., 2009; Brainard, 2008; Webb et al., 2005; D’Arcy and Gorvett, 2004;Park et al., 2002; Ward and Zurbruegg, 2000; Holsboer, 1999). The importance of the insurance-growthrelationship has risen in recent decades because of the greater prominence of insurance within thefinancial sector (Lee et al., 2013a,b; Outreville, 1991).
Linkages formed in theory between insurance market development and both financial develop-ment and economic growth are well-summarized in a number of studies (see, for instance, Cristeaet al., 2014; Lee et al., 2013a,b; Horng et al., 2012; Chen et al., 2012; Chang and Lee, 2012; Ward andZurbruegg, 2000; Brainard, 2008; Outreville, 1996). Some such studies have documented the specificcontributions of insurance-market development to the economic growth7 process as well as to the
3 Financial development facilitates economic growth through multiple channels, which include (i) providing informationabout possible investments, so as to allocate capital efficiently; (ii) monitoring firms and exerting corporate governance; (iii)risk diversification; (iv) mobilizing and pooling savings; (v) easing the exchange of goods and services; and (vi) technologytransfers (see, for example, Pradhan et al., 2014a; Zhang et al., 2012; Levine, 2005; Garcia and Liu, 1999; Pagano, 1993; Fritz,1984; Drake, 1980).
4 Financial development captures the factors, policies, and institutions that lead to effective financial intermediation andmarkets, and which deepen and broaden access to capital and financial services (IMF, 2005).
5 Recent endogenous growth models such as those provided by Greenwood and Jovanovic (1990), Bencivenga and Smith(1991), and King and Levine (1993a, 1993b) among others suggest that both the growth level and rate can be affected byfinancial development (see, for instance, Boon, 2010).
6 Economic growth can be either supply-led through growth in financial development or, alternatively, financial developmentcan be demand-led through growth in the economy (Patrick, 1966). Alternatively, they may cause each other.
7 The evidence suggests that insurance contributes materially to economic growth by improving the investment climate andpromoting a more efficient mix of activities that would be undertaken in the absence of risk management instruments. Thiscontribution is magnified by the complementary development of banking and other financial systems (Chang et al., 2013b;
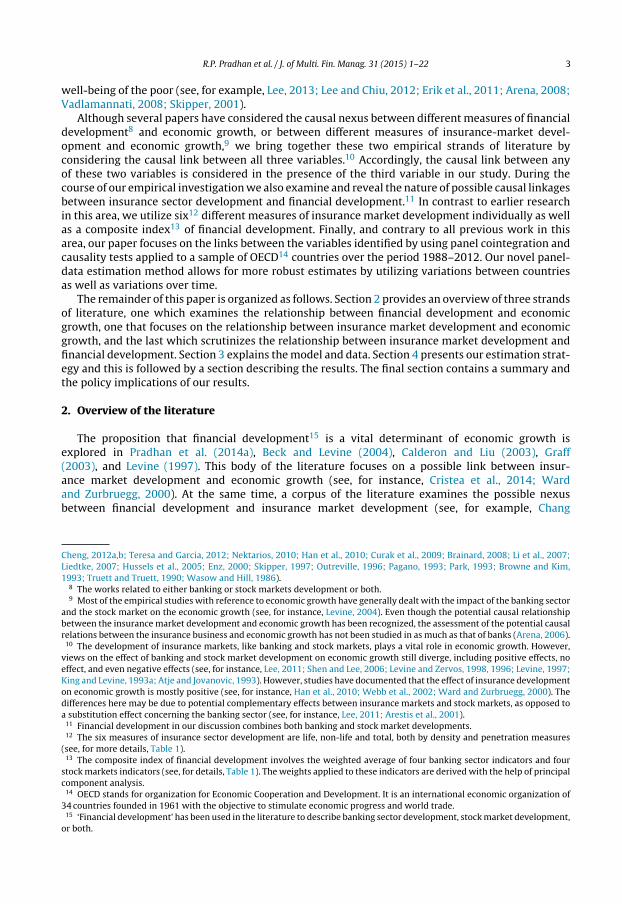
R.P. Pradhan et al. / J. of Multi. Fin. Manag. 31 (2015) 1–22 3
well-being of the poor (see, for example, Lee, 2013; Lee and Chiu, 2012; Erik et al., 2011; Arena, 2008;Vadlamannati, 2008; Skipper, 2001).
Although several papers have considered the causal nexus between different measures of financialdevelopment8 and economic growth, or between different measures of insurance-market devel-opment and economic growth,9 we bring together these two empirical strands of literature byconsidering the causal link between all three variables.10 Accordingly, the causal link between anyof these two variables is considered in the presence of the third variable in our study. During thecourse of our empirical investigation we also examine and reveal the nature of possible causal linkagesbetween insurance sector development and financial development.11 In contrast to earlier researchin this area, we utilize six12 different measures of insurance market development individually as wellas a composite index13 of financial development. Finally, and contrary to all previous work in thisarea, our paper focuses on the links between the variables identified by using panel cointegration andcausality tests applied to a sample of OECD14 countries over the period 1988–2012. Our novel panel-data estimation method allows for more robust estimates by utilizing variations between countriesas well as variations over time.
The remainder of this paper is organized as follows. Section 2 provides an overview of three strandsof literature, one which examines the relationship between financial development and economicgrowth, one that focuses on the relationship between insurance market development and economicgrowth, and the last which scrutinizes the relationship between insurance market development andfinancial development. Section 3 explains the model and data. Section 4 presents our estimation strat-egy and this is followed by a section describing the results. The final section contains a summary andthe policy implications of our results.
2. Overview of the literature
The proposition that financial development15 is a vital determinant of economic growth isexplored in Pradhan et al. (2014a), Beck and Levine (2004), Calderon and Liu (2003), Graff(2003), and Levine (1997). This body of the literature focuses on a possible link between insur-ance market development and economic growth (see, for instance, Cristea et al., 2014; Wardand Zurbruegg, 2000). At the same time, a corpus of the literature examines the possible nexusbetween financial development and insurance market development (see, for example, Chang
Cheng, 2012a,b; Teresa and Garcia, 2012; Nektarios, 2010; Han et al., 2010; Curak et al., 2009; Brainard, 2008; Li et al., 2007;Liedtke, 2007; Hussels et al., 2005; Enz, 2000; Skipper, 1997; Outreville, 1996; Pagano, 1993; Park, 1993; Browne and Kim,1993; Truett and Truett, 1990; Wasow and Hill, 1986).
8 The works related to either banking or stock markets development or both.9 Most of the empirical studies with reference to economic growth have generally dealt with the impact of the banking sector
and the stock market on the economic growth (see, for instance, Levine, 2004). Even though the potential causal relationshipbetween the insurance market development and economic growth has been recognized, the assessment of the potential causalrelations between the insurance business and economic growth has not been studied in as much as that of banks (Arena, 2006).
10 The development of insurance markets, like banking and stock markets, plays a vital role in economic growth. However,views on the effect of banking and stock market development on economic growth still diverge, including positive effects, noeffect, and even negative effects (see, for instance, Lee, 2011; Shen and Lee, 2006; Levine and Zervos, 1998, 1996; Levine, 1997;King and Levine, 1993a; Atje and Jovanovic, 1993). However, studies have documented that the effect of insurance developmenton economic growth is mostly positive (see, for instance, Han et al., 2010; Webb et al., 2002; Ward and Zurbruegg, 2000). Thedifferences here may be due to potential complementary effects between insurance markets and stock markets, as opposed toa substitution effect concerning the banking sector (see, for instance, Lee, 2011; Arestis et al., 2001).
11 Financial development in our discussion combines both banking and stock market developments.12 The six measures of insurance sector development are life, non-life and total, both by density and penetration measures
(see, for more details, Table 1).13 The composite index of financial development involves the weighted average of four banking sector indicators and four
stock markets indicators (see, for details, Table 1). The weights applied to these indicators are derived with the help of principalcomponent analysis.
14 OECD stands for organization for Economic Cooperation and Development. It is an international economic organization of34 countries founded in 1961 with the objective to stimulate economic progress and world trade.
15 ‘Financial development’ has been used in the literature to describe banking sector development, stock market development,or both.

4 R.P. Pradhan et al. / J. of Multi. Fin. Manag. 31 (2015) 1–22
et al., 2013a,b; Chang and Lee, 2012; Chen et al., 2012). In this paper, we explore the possi-bility that there is a link between all three variables: financial development, insurance marketdevelopment, and economic growth. This section presents an overview of three strands of litera-ture.
The first strand of the literature examines the link between financial development and economicgrowth. In this regard, Menyah et al. (2014), Pradhan et al. (2014b), Hsueh et al. (2013), Pradhanet al. (2013a), Bojanic (2012), Kolapo and Adaramola (2012), Chaiechi (2012), Kar et al. (2011), Jalilet al. (2010), Wu et al. (2010), Colombage (2009), Enisan and Olufisayo (2009), Tsouma (2009),Abu-Bader and Abu-Qarn (2008), Ang (2008), Naceur and Ghazouani (2007), Nieuwerburgh et al.(2006), Boulila and Trabelsi (2004), Christopoulos and Tsionas (2004), Calderon and Liu (2003), Al-Yousif (2002), Thakor (1996), Thornton (1994), Bencivenga and Smith (1991), and Greenwood andJovanovic (1990) all demonstrate the validity of a “supply-leading” view, where unidirectional causal-ity from financial development to economic growth is present. According to this view, financialdevelopment contributes to economic growth through two main channels: first, by raising the effi-ciency of capital accumulation and, in turn, the marginal productivity of capital (Goldsmith, 1969)and, second, by raising the savings rate and thus, the investment rate (McKinnon, 1973; Shaw,1973).
In contrast to the “supply-leading” view, Pradhan et al. (2013a), Kar et al. (2011), Odhiambo(2008, 2010), Panopoulou (2009), Liu and Sinclair (2008), Ang and McKibbin (2007), Liangand Teng (2006), Dritsaki and Dritsaki-bargiota (2005), Demetriades and Hussein (1996), andIreland (1994) supply evidence in favor of a “demand-following” view, where the causal-ity runs from economic growth to financial development. According to this view, as theeconomy expands, demand for financial services increases, leading to the growth of these ser-vices.
Studies such as those of Pradhan et al. (2013b), Cheng (2012a,b), Hou and Cheng (2010), Wolde-Rufael (2009), Lee and Chang (2009), Rashid (2008), Darrat et al. (2006), Caporale et al. (2004),Dritsakis and Adamopoulos (2004), Al-Yousif (2002), Hassapis and Kalyvitis (2002), Wongbangpo andSharma (2002), Craigwell et al. (2001), Muradoglu et al. (2000), Masih and Masih (1999), Ahmedand Ansari (1998), Greenwood and Smith (1997), Demetriades and Hussein (1996), and Nishat andSaghir (1991) claim to have uncovered “feedback”, whereby the causality runs in both directionssimultaneously.
It is evident from studying this literature that identifying the direction of causality between thesetwo variables needs more advanced statistical analysis than the literature has previously affordedit. Table 1 presents a synopsis of research on the causal nexus financial development and economicgrowth.
A second strand of the literature examines the direction of causality between insurance marketdevelopment and economic growth. In this vein, Lee et al. (2013a,b), Pan and Su (2012), Chen et al.(2012), Lee (2011), Avram et al. (2010), Han et al. (2010), Adams et al. (2009), Arena (2008), Haiss andSumegi (2008), Kugler and Ofoghi (2005), Boon (2005), and Ward and Zurbruegg (2000) support thevalidity of a “supply-leading” view, where unidirectional causality from insurance market developmentto economic growth is present. By contrast, Kugler and Ofoghi (2005), Esho et al. (2004), Beck and Webb(2003), Hwang and Gao (2003), Ward and Zurbruegg (2000), Catalan et al. (2000), and Beenstock et al.(1986) present evidence in support of a “demand-following” hypothesis, where unidirectional causalityfrom economic growth to stock market development is purported. Finally, Pan and Su (2012), Kuglerand Ofoghi (2005), and Beck and Webb (2003) demonstrate that causation runs in both directionssimultaneously, consistent with a “feedback hypothesis.”
Once again, the existing literature does not provide a definitive answer as to the directionof causality between insurance market development and economic growth. Table 2 presents asynopsis of research on the causal nexus between stock market development and economicgrowth.
Finally, a third and smaller body of literature offers a mixed set of results. Here the focus is onthe relationship between financial development and insurance market development. The handful ofpapers includes studies by Chang et al. (2013a,b), Chang and Lee (2012), Cheng (2012a,b), Chen et al.(2012), Boon (2005), and Outreville (1996).
R.P. Pradhan et al. / J. of Multi. Fin. Manag. 31 (2015) 1–22 5
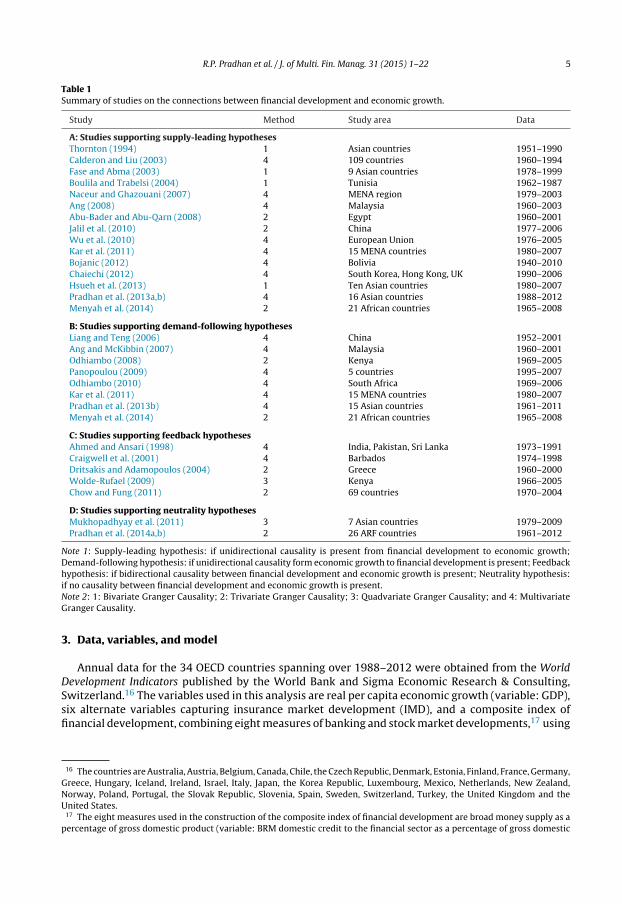
Table 1Summary of studies on the connections between financial development and economic growth.
Study Method Study area Data
A: Studies supporting supply-leading hypothesesThornton (1994) 1 Asian countries 1951–1990Calderon and Liu (2003) 4 109 countries 1960–1994Fase and Abma (2003) 1 9 Asian countries 1978–1999Boulila and Trabelsi (2004) 1 Tunisia 1962–1987Naceur and Ghazouani (2007) 4 MENA region 1979–2003Ang (2008) 4 Malaysia 1960–2003Abu-Bader and Abu-Qarn (2008) 2 Egypt 1960–2001Jalil et al. (2010) 2 China 1977–2006Wu et al. (2010) 4 European Union 1976–2005Kar et al. (2011) 4 15 MENA countries 1980–2007Bojanic (2012) 4 Bolivia 1940–2010Chaiechi (2012) 4 South Korea, Hong Kong, UK 1990–2006Hsueh et al. (2013) 1 Ten Asian countries 1980–2007Pradhan et al. (2013a,b) 4 16 Asian countries 1988–2012Menyah et al. (2014) 2 21 African countries 1965–2008
B: Studies supporting demand-following hypothesesLiang and Teng (2006) 4 China 1952–2001Ang and McKibbin (2007) 4 Malaysia 1960–2001Odhiambo (2008) 2 Kenya 1969–2005Panopoulou (2009) 4 5 countries 1995–2007Odhiambo (2010) 4 South Africa 1969–2006Kar et al. (2011) 4 15 MENA countries 1980–2007Pradhan et al. (2013b) 4 15 Asian countries 1961–2011Menyah et al. (2014) 2 21 African countries 1965–2008
C: Studies supporting feedback hypothesesAhmed and Ansari (1998) 4 India, Pakistan, Sri Lanka 1973–1991Craigwell et al. (2001) 4 Barbados 1974–1998Dritsakis and Adamopoulos (2004) 2 Greece 1960–2000Wolde-Rufael (2009) 3 Kenya 1966–2005Chow and Fung (2011) 2 69 countries 1970–2004
D: Studies supporting neutrality hypothesesMukhopadhyay et al. (2011) 3 7 Asian countries 1979–2009Pradhan et al. (2014a,b) 2 26 ARF countries 1961–2012
Note 1: Supply-leading hypothesis: if unidirectional causality is present from financial development to economic growth;Demand-following hypothesis: if unidirectional causality form economic growth to financial development is present; Feedbackhypothesis: if bidirectional causality between financial development and economic growth is present; Neutrality hypothesis:if no causality between financial development and economic growth is present.Note 2: 1: Bivariate Granger Causality; 2: Trivariate Granger Causality; 3: Quadvariate Granger Causality; and 4: MultivariateGranger Causality.
3. Data, variables, and model
Annual data for the 34 OECD countries spanning over 1988–2012 were obtained from the WorldDevelopment Indicators published by the World Bank and Sigma Economic Research & Consulting,Switzerland.16 The variables used in this analysis are real per capita economic growth (variable: GDP),six alternate variables capturing insurance market development (IMD), and a composite index offinancial development, combining eight measures of banking and stock market developments,17 using
16 The countries are Australia, Austria, Belgium, Canada, Chile, the Czech Republic, Denmark, Estonia, Finland, France, Germany,Greece, Hungary, Iceland, Ireland, Israel, Italy, Japan, the Korea Republic, Luxembourg, Mexico, Netherlands, New Zealand,Norway, Poland, Portugal, the Slovak Republic, Slovenia, Spain, Sweden, Switzerland, Turkey, the United Kingdom and theUnited States.
17 The eight measures used in the construction of the composite index of financial development are broad money supply as apercentage of gross domestic product (variable: BRM domestic credit to the financial sector as a percentage of gross domestic

6 R.P. Pradhan et al. / J. of Multi. Fin. Manag. 31 (2015) 1–22
Table 2Summary of studies on the connection between insurance market development and economic growth.
Study Method Study area Data
A: Studies supporting supply-leading hypothesesGuochen and Wei (2012) 1 China 2006–2011Webb et al. (2002) 1 55 countries 1980–1996Boon (2005) 1 Singapore 1991–2002Arena (2008) 2 56 countries 1976–2004Haiss and Sumegi (2008) 1 29 European countries 1992–2005Adams et al. (2009) 1 Sweden 1830–1998Avram et al. (2010) 2 93 countries 1980–2006Han et al. (2010) 2 77 countries 1994–2005Chen et al. (2012) 2 60 countries 1976–2005
B: Studies supporting demand-following hypothesesBeenstock et al. (1988) 2 12 OECD countries 1970–1981Catalan et al. (2000) 14 OECD countries 1975–1997Esho et al. (2004) 2 44 countries 1984–1998Guochen and Wei (2012) 1 China 2006–2011Kugler and Ofoghi (2005) 1 UK 1966–2003Ward and Zurbruegg (2000) 1 9 OECD countries 1961–1996
C: Studies supporting feedback hypothesesGuochen and Wei (2012) 1 China 2006–2011Kugler and Ofoghi (2005) 1 UK 1966–2003Ward and Zurbruegg (2000) 1 9 OECD countries 1961–1996
D: Studies supporting neutrality hypothesesGuochen and Wei (2012) 1 China 2006–2011
Note 1: Supply-leading hypothesis: if unidirectional causality is present from insurance market development to economicgrowth; Demand-following hypothesis: if unidirectional causality form economic growth to insurance market developmentis present; Feedback hypothesis: if bidirectional causality between insurance market development and economic growth ispresent; Neutrality hypothesis: if no causality between insurance market development and economic growth is present.Note 2: 1: Bivariate Granger Causality; 2: Dynamic panel data model.
principal component analysis (variable: FID).18 The IMD variables are life insurance19 density20 (LID;i.e. direct domestic life premiums divided by population), non-life insurance21 density (NID; i.e., directdomestic non-life premiums divided by population), total insurance density (TID; i.e., direct domesticlife and non-life premiums divided by population), life insurance penetration22 (LIP; i.e., direct domes-tic life premiums as a percentage of gross domestic product), non-life insurance penetration (NIP; i.e.,direct domestic non-life premiums as a percentage of gross domestic product), total insurance pene-tration (TIP; i.e., direct domestic life and non-life premiums as a percentage of gross domestic product).All the variables are converted into their natural logarithms for our estimation purposes.
product (variable: DCF), domestic credit provided by the banking sector as a percentage of gross domestic product (variable:DCB), and domestic credit to the private sector as a percentage of gross domestic product (variable: DCP), market capitalization(variable: MAC), traded stocks expressed as a as a percentage in the total value of traded stocks (variable: TRA), turnover ratioexpressed as a percentage as a percentage in the turnover ratio in the stock market (variable: TUR), and the number of listedcompanies (variable: NLC).
18 FID is constructed using principal component analysis (PCA). PCA linearly transforms the variables so that they are ortho-gonal to each other (Lewis-Beck, 1994). This procedure is apposite because it maximizes the variance, rather than minimizingthe least square distance. In sum, PCA transforms the data into new variables (i.e., principal components) so that they are notcorrelated. The approach is described in most textbooks and is used in several papers including Pradhan et al. (2014a) andPradhan et al. (2013b). Thus, it is not further described here.
19 Life insurance, in its general form, is guaranteed to pay a specific amount of indemnification to a beneficiary after theinsured’s death or to the insured who lives beyond a certain age.
20 All measures of ‘density’ are defined as direct domestic premiums (in USD) divided by population.21 Non-life insurance, commonly called “general insurance” in many countries, includes all other types of insurance such as
homeowners’ insurance, motor vehicle insurance, marine insurance, liability insurance, etc. (Chen et al., 2013).22 All measures of ‘penetration’ are defined as direct domestic premiums (in USD) expressed as a percentage of gross domestic
product.
R.P. Pradhan et al. / J. of Multi. Fin. Manag. 31 (2015) 1–22 7
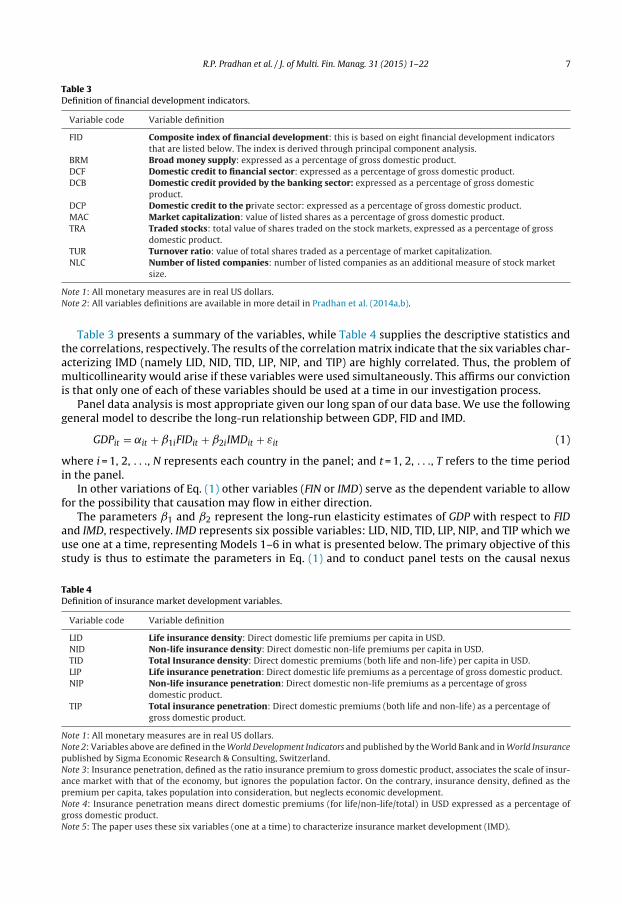
Table 3Definition of financial development indicators.
Variable code Variable definition
FID Composite index of financial development: this is based on eight financial development indicatorsthat are listed below. The index is derived through principal component analysis.
BRM Broad money supply: expressed as a percentage of gross domestic product.DCF Domestic credit to financial sector: expressed as a percentage of gross domestic product.DCB Domestic credit provided by the banking sector: expressed as a percentage of gross domestic
product.DCP Domestic credit to the private sector: expressed as a percentage of gross domestic product.MAC Market capitalization: value of listed shares as a percentage of gross domestic product.TRA Traded stocks: total value of shares traded on the stock markets, expressed as a percentage of gross
domestic product.TUR Turnover ratio: value of total shares traded as a percentage of market capitalization.NLC Number of listed companies: number of listed companies as an additional measure of stock market
size.
Note 1: All monetary measures are in real US dollars.Note 2: All variables definitions are available in more detail in Pradhan et al. (2014a,b).
Table 3 presents a summary of the variables, while Table 4 supplies the descriptive statistics andthe correlations, respectively. The results of the correlation matrix indicate that the six variables char-acterizing IMD (namely LID, NID, TID, LIP, NIP, and TIP) are highly correlated. Thus, the problem ofmulticollinearity would arise if these variables were used simultaneously. This affirms our convictionis that only one of each of these variables should be used at a time in our investigation process.
Panel data analysis is most appropriate given our long span of our data base. We use the followinggeneral model to describe the long-run relationship between GDP, FID and IMD.
GDPit = ˛it + ˇ1iFIDit + ˇ2iIMDit + εit (1)
where i = 1, 2, . . ., N represents each country in the panel; and t = 1, 2, . . ., T refers to the time periodin the panel.
In other variations of Eq. (1) other variables (FIN or IMD) serve as the dependent variable to allowfor the possibility that causation may flow in either direction.
The parameters ˇ1 and ˇ2 represent the long-run elasticity estimates of GDP with respect to FIDand IMD, respectively. IMD represents six possible variables: LID, NID, TID, LIP, NIP, and TIP which weuse one at a time, representing Models 1–6 in what is presented below. The primary objective of thisstudy is thus to estimate the parameters in Eq. (1) and to conduct panel tests on the causal nexus
Table 4Definition of insurance market development variables.
Variable code Variable definition
LID Life insurance density: Direct domestic life premiums per capita in USD.NID Non-life insurance density: Direct domestic non-life premiums per capita in USD.TID Total Insurance density: Direct domestic premiums (both life and non-life) per capita in USD.LIP Life insurance penetration: Direct domestic life premiums as a percentage of gross domestic product.NIP Non-life insurance penetration: Direct domestic non-life premiums as a percentage of gross
domestic product.TIP Total insurance penetration: Direct domestic premiums (both life and non-life) as a percentage of
gross domestic product.
Note 1: All monetary measures are in real US dollars.Note 2: Variables above are defined in the World Development Indicators and published by the World Bank and in World Insurancepublished by Sigma Economic Research & Consulting, Switzerland.Note 3: Insurance penetration, defined as the ratio insurance premium to gross domestic product, associates the scale of insur-ance market with that of the economy, but ignores the population factor. On the contrary, insurance density, defined as thepremium per capita, takes population into consideration, but neglects economic development.Note 4: Insurance penetration means direct domestic premiums (for life/non-life/total) in USD expressed as a percentage ofgross domestic product.Note 5: The paper uses these six variables (one at a time) to characterize insurance market development (IMD).

8 R.P. Pradhan et al. / J. of Multi. Fin. Manag. 31 (2015) 1–22
between the variables. It is postulated that ˇ1 > 0 as higher financial development will likely cause anincrease in per capita economic growth. Similarly, we expect ˇ2 > 0, which represents an increase ininsurance pervasiveness will likely to cause an increase in per capita economic growth.
4. Estimation strategy and empirical results
We test the following three general hypotheses:
• FID Granger-causes economic growth and vice versa.• IMD Granger-causes economic growth and vice versa.• FID Granger-causes IMD and vice versa.
More specifically, we test the followings sub-hypotheses:
H1A,B: Life insurance density Granger-causes economic growth and vice versa.H2A,B: Life insurance density Granger-causes financial development and vice versa.H3A,B: Non- life insurance density Granger-causes economic growth and vice versa.H4A,B: Non- life insurance density Granger-causes financial development and vice versa.H5A,B: Total (both life and non-life) insurance density Granger-causes economic growth and viceversa.H6A,B: Total insurance density Granger-causes financial development and vice versa.H7A,B: Financial development Granger-causes economic growth and vice versa.H8A,B: Life insurance penetration Granger-causes economic growth and vice versa.H9A,B: Life insurance penetration Granger-causes financial development and vice versa.H10A,B: Non- life insurance penetration Granger-causes economic growth and vice versa.H11A,B: Non-life insurance penetration Granger-causes financial development and vice versa.H12A,B: Total insurance penetration Granger-causes economic growth and vice versa.H13A,B: Total insurance penetration Granger-causes financial development and vice versa.
Fig. 1 summarizes these sub-hypotheses, which describe the direction of possible causality amongthese variables.
The empirical verification procedure follows three tests: unit root tests, cointegration tests andGranger causality tests.
4.1. Unit root test and empirical results
Unit root tests are necessary steps for examining possible cointegration of the variables (Engleand Granger, 1987) and Granger causality (Granger, 1988) tests. The unit root tests first determine theorder of integration (i.e. I (n), for n = 1, 2, . . ., N) where the time-series variables first attain stationarity.The paper uses panel unit root test to ascertain the degree (or order) of integration between GDP, FID,and IMD.23
While several forms of panel unit-root tests are available, this paper specifically uses five differenttests. These are a homogeneous unit-root test proposed by Levine et al. (2002), hereafter LLC: Levine, Linand Chu; three heterogeneous unit-root tests proposed by: Im et al. (2003), hereafter IPS: Im-Pesaran-Shin, Maddala and Wu (1999), hereafter MW, and Choi (2001), hereafter CH; and a stationarity paneltest proposed by Breitung (2000), hereafter BRE. Since these tests are widely used in many academicpapers and are described in advanced econometrics textbooks, we choose not to describe them furtherhere.
Table 5 shows the results of the panel unit root tests for each variable. It is observed that the levelvalues of all series (GDP, FID, LID, LIP, NID, NIP, TID, and TIP) are non-stationary and all variables are
23 IMD is used for LID, LIP, NID, NIP, TID, and TIP throughout Section 4 (see Table 4 for a summary of these variables).

R.P. Pradhan et al. / J. of Multi. Fin. Manag. 31 (2015) 1–22 9
Fig. 1. Possible causality links involving insurance market development, financial development, and economic growth.
stationary at the 1% significance level in the first difference, i.e., all variables are integrated of orderone [i.e., I (1)].
4.2. Cointegration test and empirical results
We have recognized that the model’s variables are stationary at I (1). Hence, we consider a vec-tor autoregressive (VAR) order p to capture the dynamics between the GDP, FID and IMD, as shownbelow:
�Yit = ˘Yit−1 +q−1∑s=1
�s�Yit−s + BXit + εit (2)
with
=q∑
s=1
As − I (3)
�s = −q∑
j=s+1
Aj (4)
where Yit is a three vector non-stationary I (1) variables; Xit is a d-vector of exogenous variables;and εit are random error (for all i = 1, . . ., N; and t = 1, . . ., T), are independently and normally

10 R.P. Pradhan et al. / J. of Multi. Fin. Manag. 31 (2015) 1–22
Table 5Summary statistics for the variables.
Variables GDP FID LID NID TID LIP NIP TIP
Part 1: summary statisticsMean 1.20 1.18 2.54 2.57 2.90 −1.70 −1.66 −1.33Median 1.21 1.18 2.76 2.77 3.08 −1.59 −1.65 −1.28Maximum 1.40 1.29 3.84 3.55 3.92 −0.83 −1.30 −0.75Minimum −1.17 0.96 0.13 0.90 0.97 −3.31 −2.54 −2.48Standard deviation 0.14 0.07 0.78 0.55 0.63 0.51 0.23 0.32Skewness −10.4 −0.46 −0.64 −0.73 −0.71 −0.81 −0.83 −0.78Kurtosis 17.5 2.57 2.56 2.61 2.59 3.05 3.93 3.38
Part 2: correlation matrixGDP 1.00FID 0.08 1.00
[0.10]LID 0.06 0.84* 1.00
[0.22] [0.00]LIP 0.01 0.72* 0.92* 1.00
[0.89] [0.00] [0.00]NID 0.10 0.82* 0.86* 0.64* 1.00
[0.02] [0.00] [0.00] [0.00]NIP 0.04 0.71* 0.73* 0.62* 0.88* 1.00
[0.36] [0.00] [0.00] [0.00] [0.00]TID 0.08 0.87 0.96 0.79 0.96 0.81* 1.00
[0.07] [0.00] [0.00] [0.01] [0.00] [0.00]TIP 0.02 0.80* 0.94* 0.92* 0.82* 0.83* 0.91* 1.00
[0.71] [0.00] [0.00] [0.00] [0.00] [0.00] [0.00]
Note 1: GDP: Per capita economic growth rate; FID: Financial development index; LID: Life insurance density; NID: Non-lifeinsurance density; TID: Total insurance density; LIP: Life insurance penetration; NIP: Non-life insurance penetration; and TIP:Total insurance penetration.Note 2: Values reported in square brackets are the probability levels of significance.
* Indicate significance at the 1% level.
distributed random variables for all i and t, with zero means and finite heterogeneous variances(�i
2).The number of cointegration relationships in the model represented by Eq. (4) can be deter-
mined by the coefficient matrix �. If � has reduced rank, i.e. r < k, then there exist k × rmatrices and ˇ, each with rank r, such that = ˛ˇ′ and that ˇ′Yit is I (0). This impliesthat r means the number of cointegration relations and each column of is a cointegrationvector.
Johansen’s (1995) method proposes the estimation of the � matrix from an unrestricted VARand then tests to determine if the reduced rank of the � matrix can be rejected. In this context,the Johansen trace statistic (T) tests the null hypothesis of r cointegrating relations against the alter-native of k cointegrating relations, where k is the number of endogenous variables, for r = 0, 1, . . .,k − 1.
This test is sequential, where the null hypothesis of r = 0 is not rejected. This implies that there is nocointegration among the relevant time series. Contrarily, if the null hypothesis of r = 0 is rejected, andthen there exists at least one cointegrating relationship. Next, we test the null hypothesis that there isat most one cointegrating relationship against the alternative that there are at least two cointegratingrelationships. The sequential test continues until the null hypothesis cannot be rejected. If none ofthe series has a unit root, then a stationary VAR can be specified to capture the relationship betweenIMD, FID, and GDP. Table 6 shows the results of the cointegration tests. The results in each case showat least one cointegrating relationship, indicating the presence of a long-run relationship among thevariables.

R.P. Pradhan et al. / J. of Multi. Fin. Manag. 31 (2015) 1–22 11
Table 6Results of panel unit root tests.
Variables Level Model 1 Model 2 Model 3 Model 4 Model 5 Model 6 Unit rootinferences
GDP 0 3.23 3.23 3.23 3.23 3.23 3.231 −4.09* −4.09* −4.09* −4.09* −4.09* −4.09* I (1)
FID 0 −0.12 −0.12 −0.12 −0.12 −0.12 −0.121 −3.92* −3.92* −3.92* −3.92* −3.92* 3.92* I (1)
LID 0 1.23 I (1)1 −4.73*
LIP 0 −1.091 −4.96* I (1)
NID 0 0.581 −6.19* I (1)
NIP 0 −0.511 −5.35* I (1)
TID 0 1.641 −4.81* I (1)
TIP 0 −1.041 −4.12* I (1)
Cointegrationinferences
Y Y Y Y Y Y Y
Note 1: GDP: Per capita economic growth rate; FID: Financial development index; LID: Life insurance density; NID: Non-lifeinsurance density; TID: Total insurance density; LIP: Life insurance penetration; NIP: Non-life insurance penetration; TIP: Totalinsurance penetration.Note 2: 0: Stands for the use of level data; 1: stands for the use of first difference data; I (1) indicates integration of order one.Note 3: Model 1: indicates the causal nexus between GDP, FID and LID; Model 2: indicates the causal nexus between GDP, FIDand LIP; Model 3: indicates causal nexus between GDP, FID and NID; Model 4: indicates the causal nexus between GDP, FID andNIP; Model 5: indicates the causal nexus between GDP, FID and TID; Model 6: indicates the causal nexus between GDP, FID andTIP.The study conducted one homogeneous unit root test (Levine et al., 2002, LLC), three heterogeneous unit root tests (Im et al.,2003, IPS; Maddala and Wu, 1999, MW; Choi, 2001, CH), and the stationarity panel test (Breitung, 2000, BRE). The latter testresults are reported in this table.Note 5: The study conducted Johansen’s (1991, 1995) cointegration test. The results are summarized and reported in the formof ‘Y’, indicating the presence of cointegration between the variable in the different models.
* Indicates statistical significance at 1%.
4.3. Granger causality test and results
On the basis of panel unit root and panel cointegration test results described above, the followingvector error-correction model (VECM) is used to ascertain the nature of the short-run and long-runcausal relationships between the three variables.
⎡⎢⎣
� ln GDPit
� ln FIDit
� ln IMDit
⎤⎥⎦ =
⎡⎢⎣
�1j
�2j
�3j
⎤⎥⎦
+p∑
k=1
⎡⎢⎢⎣
�11ik(L)�12ik(L)�13ik(L)
�21ik(L)�22ik(L)�23ik(L)
�31ik(L)�32ik(L)�33ik(L)
⎤⎥⎥⎦
⎡⎢⎣
� ln GDPit−k
� ln FIDit−k
� ln IMDit−k
⎤⎥⎦
+
⎡⎢⎣
1iECTit−1
2iECTit−1
3iECTit−1
⎤⎥⎦ +
⎡⎢⎣
1it
2it
3it
⎤⎥⎦
(5)

12 R.P. Pradhan et al. / J. of Multi. Fin. Manag. 31 (2015) 1–22
Table 7Hypotheses tested.
Cases Causal flows Restrictions
1 FID => GDP; GDP => FID �12ik /= 0; 1i /= 0; �22ik /= 0; 2i /= 02 IMD => GDP; GDP => IMD �13ik /= 0; 1i /= 0; �22ik /= 0; 2i /= 03 FID => IMD; IMD => FID �23ik /= 0; 2i /= 0; �32ik /= 0; 3i /= 0
Note 1: GDP: Per capita economic growth; FID: Financial development index; and IMD: Insurance market development.Note 2: IMD is used for individual use of LID, LIP, NID, NIP, TID, and TIP.Note 3: LID: Life insurance density; NID: Non-life insurance density; TID: Total insurance density; LIP: Life insurance penetration;NIP: Non-life insurance penetration; and TIP: Total insurance penetration.Note 4: FID is the composite index of financial development capturing both banking and stock market activities (see, Table 3for more details).
where � is first difference filter (I − L); i = 1, . . ., N; t = 1, . . ., T; and jit (j = 1, 2, 3) are independentlyand normally distributed random variables for all i and t, with zero means and finite heterogeneousvariances (�i
2).IMD is insurance market development, which is captured by six different variables, described
earlier.The ECTs are error-correction terms, derived from the cointegrating equations. The ECTs represent
the long-run dynamics, akin to an equilibrium process, while differenced variables represent the short-run adjustment dynamics between the variables. We look for both short-run24 and long-run25 causalrelationships. Table 7 presents a summary of the restrictions relating to both short-run and long-runGranger causal relationships between the variables.
Tables 8 and 9 and present a summary of the direction of Granger causality between GDP, FID, andIMD. The tests were conducted for 1%, 5% and 10% significance levels. Results for the long-run andshort-run Granger Causality tests are reported below.
From Table 8 it is often the case that when �GDP serves as the dependent variable, the lagged error-correction terms (ECT−1) are statistically significant. In such cases, economic growth tends to convergeto its long-run equilibrium path in response to changes in its regressors, which comprise of the financialdevelopment composite index and a variables characterizing insurance market development (LID, LIP,NID, NIP, TID, or TIP). From these results, we can state that financial development along with insurancemarket development are significant drivers of economic growth in the long run, no matter whichvariable we use to capture IMD.
Evidently, in Models 1–6, when �GDP is the dependent variable, the estimated lagged ECTscoefficients all carry negative signs. This suggests that the change in the level of economic growth(�GDP) rapidly responds to any deviation in the long-run equilibrium (or short-run disequilibrium)for the t − 1 period. In other words, the effect of an instantaneous shock to the insurance marketdevelopment and financial development on the economic growth will completely be adjusted in thelong-run. But the return to equilibrium occurs at differ rates: 108% in Model 1, 123% in Model 2, 111%in Model 3, 118% in Model 4, 113% in Model 5, and 151% in Model 6.
However, when �IMD or �FID act as the dependent variables, the lagged error-correction termsare not statically significant in any one of the six models (LID/LIP/NID/NIP/TID/TIP) we tested. Thus,there is no reverse causality in the long run. In other words, economic growth and insurance marketdevelopment do not Granger-cause financial development in the long run. Furthermore, economicgrowth and financial development are not significant drivers of insurance market development in thelong run, no matter which measure of IMD we use.
In contrast to the long-run Granger causality results, the study reveals a wide spectrum of short-runcausality results between the three variables. These results are summarized in Table 9 and presentedbelow.
24 The short-run causal relationship is measured through F-statistics and the significance of the lagged changes in independentvariables.
25 The long-run causal relationship is measured through the significance of the t-test of the lagged ECTs.

R.P. Pradhan et al. / J. of Multi. Fin. Manag. 31 (2015) 1–22 13
Table 8Granger causality test results: 1988–2012.
Dependent variable Independent variables(possible sources of causation)
ECT−1 coefficient (for possiblelong run causality)
Model 1: VECM with GDP, FID, LID�GDP �FID �LID ECT−1
�GDP — 38.1* 13.2* −1.08**
[—] [0.00] [0.01] (−5.58)�FID 7.04** — 4.91*** 0.03
[0.05] [—] [0.10] (1.50)�LID 11.3* 10.6* — 0.19
[0.01] [0.01] [—] (1.70)
Model 2: VECM with GDP, FID, LIP�GDP �FID �LIP ECT−1
�GDP — 39.7* 11.9* −1.23**
[—] [0.00] [0.01] (−7.59)�FID 5.01*** — 10.1* −0.001
[0.10] [—] [0.01] (−0.16)�LIP 4.79*** 9.01* — −0.03
[0.10] [0.01] [—] (−0.45)
Model 3: VECM with GDP, FID, NID�GDP �FID �NID ECT−1
�GDP — 39.7* 5.51** −1.11**
[—] [0.00] [0.05] (−6.00)�FID 5.45** — 2.02 0.01
[0.05] [—] [0.75] (0.58)�NID 7.79* 9.02* — −0.13
[0.01] [0.01] [—] (−2.00)
Model 4: VECM with GDP, FID, NIP�GDP �FID �NIP ECT−1
�GDP — 37.5* 6.19** −1.18**
[—] [0.02] [0.64] (−7.14)�FID 4.89*** — 2.29 −0.001
[0.10] [—] [0.68] (−0.06)�NIP 5.32*** 7.01** — 0.05
[0.10] [0.01] [—] (1.95)
Model 5: VECM with GDP, FID, TID�GDP �FID �TID ECT−1
�GDP — 37.9* 4.97*** −1.13**
[—] [0.00] [0.10] (−5.87)�FID 4.82*** — 2.13 0.02
[0.10] [—] [0.62] (1.07)�TID 9.80* 8.95* — 0.12
[0.01] [0.01] [—] (1.47)
Model 6: VECM with GDP, FID, TIP�GDP �FID �TIP ECT−1
�GDP — 46.9* 4.98*** −1.51**
[—] [0.00] [0.10] (−6.37)�FID 4.88*** — 7.13** −0.004
[0.10] [—] [0.05] (−0.25)�TIP 5.07*** 4.94*** — −0.001
[0.10] [0.10] [—] (−0.01)
Note 1: GDP: Per capita economic growth rate; FID: Financial development index; LID: Life insurance density; NID: Non-lifeinsurance density; TID: Total insurance density; LIP: Life insurance penetration; NIP: Non-life insurance penetration; and TIP:Total insurance penetration.Note 2: VECM: vector error-correction model; ECT−1: lagged error-correction term.Note 3: Values in square brackets represent probabilities for F-statistics.Note 4: Values in parentheses represent t-statistics.Note 5: The basis for the determination of long-run causality lies in the significance of the lagged ECT coefficients.
* Indicate statistical significance at 1%.** Indicate statistical significance at 5%.
*** Indicate statistical significance at 10%.

14 R.P. Pradhan et al. / J. of Multi. Fin. Manag. 31 (2015) 1–22
Table 9Summary of short-run granger causality test results.
Causal relationships tested in the models FID vs. GDP IMD vs. GDP FID vs. IMD
Model 1: GDP – FID – LID FID <=> GDP LID <=> GDP FID <=> LIDModel 2: GDP – FID – LIP FID <=> GDP LIP <=> GDP FID <=> LIPModel 3: GDP – FID – NID FID <=> GDP NID <=> GDP FID => NIDModel 4: GDP – FID – NIP FID <=> GDP NIP <=> GDP FID => NIPModel 5: GDP – FID – TID FID <=> GDP TID <=> GDP FID => TIDModel 6: GDP – FID – TIP FID <=> GDP TIP <=> GDP FID <=> TIP
Note 1: GDP: Per capita economic growth; FID: Financial development index; and IMD: Insurance market development.Note 2: IMD is used for individual use of LID, LIP, NID, NIP, TID, and TIP.Note 3: LID: Life insurance density; NID: Non-life insurance density; TID: Total insurance density; LIP: Life insurance penetration;NIP: Non-life insurance penetration; and TIP: Total insurance penetration.Note 4: => indicates the direction of short-run causality.
Model 1 shows the existence of bidirectional causality between economic growth and finan-cial development [FID <=> GDP], economic growth and insurance market development [LID <=> GDP],and financial development and insurance market development [FID <=> LID]. This supports the feed-back hypothesis in that there is bidirectional causality between financial development and economicgrowth, between insurance market development (life insurance density) and economic growth, andbetween financial development and insurance market development.
In Model 2, we also find the existence of bidirectional causality between economic growthand financial development [FID <=> GDP], economic growth and insurance market development[LIP <=> GDP], and financial development and insurance market development [FID <=> LIP]. This sup-ports the feedback hypothesis across financial development and economic growth, across insurancemarket development (life insurance premium) and economic growth, and across financial develop-ment and insurance market development.
In Model 3, we detect the existence of bidirectional causality between economic growth andfinancial development [FID <=> GDP], and economic growth and insurance market development[NID <=> GDP]. However, we find a unidirectional causality from financial development to insurancemarket development [FID => NID]. This is consistent with feedback between financial developmentand economic growth, and between insurance market development (non-life insurance density) and
Fig. 2. Responses to shocks on the causal relationships between GDP, FID, and LID.

R.P. Pradhan et al. / J. of Multi. Fin. Manag. 31 (2015) 1–22 15
Fig. 3. Responses to shocks on the Granger causal relationships between GDP, FID, and LIP.
economic growth. There is also support for the supply-leading hypothesis between financial develop-ment and insurance market development.
Model 4 shows the existence of bidirectional causality between economic growth and financialdevelopment [FID <=> GDP], and economic growth and insurance market development [NIP <=> GDP].Additionally, Model 4 shows a unidirectional causality from financial development to insurance mar-ket development [FID => NIP]. This is again in line with the feedback hypothesis: there is bidirectionalcausality between financial development and economic growth, and between insurance market devel-opment (non-life insurance premium) and economic growth. Furthermore, there is support for thesupply-leading hypothesis between financial development and insurance market development.
Model 5 reveals the existence of bidirectional causality between economic growth and financialdevelopment [FID <=> GDP], economic growth and insurance market development [TID <=> GDP], andfinancial development and insurance market development [FID <=> TID]. This lends support to the
Fig. 4. Responses to shocks on the Granger causal relationships between GDP, FID, and NID.

16 R.P. Pradhan et al. / J. of Multi. Fin. Manag. 31 (2015) 1–22
Fig. 5. Responses to shocks on the Granger causal relationships between GDP, FID, and NIP.
existence of feedback between financial development and economic growth, between insurance mar-ket development (total insurance density) and economic growth, and between financial developmentand insurance market development.
Model 6 illustrates the existence of bidirectional causality between economic growth and finan-cial development [FID <=> GDP], economic growth and insurance market development [TIP <=> GDP],and financial development and insurance market development [FID <=> TIP]. Once again, there issupport for feedback across financial development and economic growth, across insurance marketdevelopment (total insurance premium) and economic growth, and across financial development andinsurance market development.
Fig. 6. Responses to shocks on the Granger causal relationships between GDP, FID, and TID.

R.P. Pradhan et al. / J. of Multi. Fin. Manag. 31 (2015) 1–22 17
Fig. 7. Responses to shocks on the Granger causal relationships between GDP, FID, and TIP.
Finally, to complement our analysis, we employ generalized impulse response functions (GIRFs26)to offer additional insight into how shocks to variables capturing IMD, FID, and economicgrowth impact one another. This centers on the responses of insurance market development(LID/LIP/NID/NIP/TID/TIP), financial development, and economic growth to their own and other shocks.In particular, we use GIRFs to indicate how long and to what extent insurance market developmentreacts to changes in the finance-growth nexus in the panel of the 34 OECD countries. The results arereported in Figs. 2–7.
The results show the responses of all the variables to a one standard deviation shock in othervariables. In each case, the insurance market variable is found to display an initial cyclical response toan exogenous shock (albeit in varying degrees). It can be noted that the responses of all the variablesto exogenous shocks stabilize in around 10 years. However, the significance of the impulse response islargely determined by the use of confidence bands. The shaded area represents the confidence bands.When the horizontal line in the GIRFs falls between confidence bands, the impulse responses are notstatistically significant. In this case, the null hypothesis of “no effects of a particular shock” on thespecific variable cannot be rejected. For comparative analysis, we report the GRIFs to one-standard-error confidence bands (roughly equal to 95% confidence bands) and the responses are very alike tothose which we obtained using Cholesky-one-standard innovation. In each case, the responses of allvariables to an exogenous shock are found to be broadly similar, irrespective of which measure ofinsurance market development we use.
5. Conclusion and policy implications
This paper investigated causal relationships between insurance market development, financialdevelopment, and economic growth for an important spectrum of the world economy. Using paneldata relating to selected major OECD countries from 1988 to 2012, we found that insurance marketdevelopment, financial development, and economic growth are cointegrated. Panel Granger causalitytests further confirmed that insurance market development specifically and financial market develop-ment overall seem both to be long-run causative factors of economic growth. However, our short-run
26 GIRFs examine the effect of a one-off shock to one of the innovations on the current and future values of the endogenousvariables. The key importance of the GIRFs are that the responses are invariant to any re-ordering of the variables in the VECMand, as orthogonality is not imposed, it allows for meaningful interpretation of the initial impact response of each variable toshocks to any other variables.

18 R.P. Pradhan et al. / J. of Multi. Fin. Manag. 31 (2015) 1–22
causality results revealed a diverse pattern of short-run adjustment dynamics between the variables,including the possibility of feedback between them in several instances.
These results demonstrate that studies on economic growth that do not simultaneously considerinsurance market development and financial development will run significant risks of relying uponbiased results and may fail to identify the exact nature and strength of the linkages that policy makersand analysts will need to heed in designing short and long term (including finance-structure) policies.This limitation will potentially mislead growth analysts and policy makers. This is because the primacyin policy-making for achieving insurance (and financial reforms to raise their penetration in subjecteconomies) varies from minor to central, if fostering economy-wide economic growth is a centralpolicy objective point for the OECD countries. On the policy front, close linkages between insurancemarket development, financial development, and economic growth show that the OECD countrieswishing to sustain economic growth in the long run should in general focus attention on developingtheir insurance sectors and not just seek financial development indiscriminately.
Acknowledgment
We thank the Editor and an anonymous referee for their comments and suggestions.
References
Abu-Bader, S., Abu-Qarn, A.S., 2008. Financial development and economic growth: empirical evidence from six MENA countries.Rev. Dev. Econ. 12 (4), 803–817.
Adams, M., Andersson, J., Andersson, L.F., Lindmark, M., 2009. Commercial banking, insurance and economic growth in Swedenbetween 1830 and 1938. Account. Bus. Financ. Hist. 19 (1), 21–38.
Ahmed, S.M., Ansari, M.I., 1998. Financial sector development and economic growth: the South-Asian experience. J. Asian Econ.9 (3), 503–517.
Al-Yousif, Y.K., 2002. Financial development and economic growth: another look at the evidence from developing countries.Rev. Financ. Econ. 11 (2), 131–150.
Andersson, L.A., Eriksson, L., Lindmark, M., 2010. Life insurance and income growth: the case of Sweden 1830–1950. Scand.Econ. Hist. Rev. 58 (3), 203–219.
Ang, J.B., 2008. What are the mechanisms linking financial development and economic growth in Malaysia? Econ. Model. 25(1), 38–53.
Ang, J.B., McKibbin, W.J., 2007. Financial liberalization. Financial sector development and growth: evidence from Malaysia? J.Dev. Econ. 84 (1), 215–233.
Arena, M., 2006. Does Insurance Market Activities Promote Economic Growth? A Cross-Country Study of Industrialized andDeveloping Countries. World Bank Policy Research Paper, No. 4098. The World Bank, Washington DC, pp. 1–3.
Arena, M., 2008. Does insurance market activity promote economic growth? A cross country study for industrialized anddeveloping countries. J. Risk Insur. 75 (4), 921–946.
Arestis, P., Demetriades, P.O., Luintel, K.B., 2001. Financial development and economic growth: the role of stock markets. J.Money Credit Bank. 33 (1), 16–41.
Atje, R., Jovanovic, B., 1993. Stock markets and development. Eur. Econ. Rev. 37 (2–3), 632–640.Avram, K., Nguyen, Y., Skully, M., 2010. Insurance and economic growth: a cross country examination. In: Australian Centre for
Financial Studies-Finsia Banking and Finance Conference. Working Paper, Australia.Barro, R.J., Sala-i-Martin, X., 1995. Economic Growth. McGraw Hill, New York.Beck, T., Levine, R., 2004. Stock markets, banks, and growth: panel evidence. J. Bank. Finance 28 (3), 423–442.Beck, T., Webb, I., 2003. Economic, demographic, and institutional determinants of life insurance consumption across countries.
World Bank Econ. Rev. 17 (1), 51–88.Beck, T., Levine, R., Loayza, N., 2000. Finance and source of growth. J. Financ. Econ. 58 (1–2), 261–300.Beenstock, M., Dickinson, G., Khajuria, S., 1986. The determination of life premiums: an international cross-section analysis
1970–1981. Insur. Math. Econ. 5 (1), 616–634.Beenstock, M., Dickinson, G., Khajuria, S., 1988. The relationship between property-liability insurance premiums and income:
an international analysis. J. Risk Insur. 55 (2), 259–272.Bencivenga, V.R., Smith, B.D., 1991. Financial intermediation and endogenous growth. Rev. Econ. Stud. 58 (2), 195–209.Bojanic, A.N., 2012. The impact of financial development and trade on the economic growth of Bolivia. J. Appl. Econ. 15 (1),
51–70.Boon, T.K., 2005. Do Commercial Banks, Stock Markets and Insurance Market Promote Economic Growth? An Analysis of the
Singapore Economy. Working Paper. Nanyang Technological University, Singapore.Boulila, G., Trabelsi, M., 2004. Financial development and long run growth: evidence from Tunisia: 1962–1997. Sav. Dev. 28 (3),
289–314.Brainard, L., 2008. What is the Role of Insurance in Economic Development? Though Leadership Series Paper, No. 2. Zurich
Government and Industry Affairs, Zurich.Breitung, J., 2000. The local power of some unit root tests for panel data. Advances in econometrics. In: Baltagi, B.H. (Ed.),
Nonstationary Panels, Panel Cointegration, and Dynamic Panels, vol. 15. JAY Press, Amsterdam, pp. 161–178.Browne, M.J., Kim, K., 1993. An international analysis of life insurance demand. J. Risk Insur. 60 (4), 671–688.
R.P. Pradhan et al. / J. of Multi. Fin. Manag. 31 (2015) 1–22 19
Calderon, C., Liu, L., 2003. The direction of causality between financial development and economic growth. J. Dev. Econ. 72 (1),321–334.
Caporale, G.M., Howells, P.G., Soliman, A.M., 2004. Stock market development and economic growth: the causal linkage. J. Econ.Dev. 29 (1), 33–50.
Catalan, M., Impavido, G., Musalem, A.R., 2000. Contractual savings or stock markets development: which leads? Policy ResearchPaper, No. 2421. In: The World Bank, Washington, DC.
Chaiechi, T., 2012. Financial development shocks and contemporaneous feedback effect on key macroeconomic indicators: apost Keynesian time series analysis. Econ. Model. 29 (2), 487–501.
Chang, C., Lee, C., 2012. Non-linearity between life insurance and economic development: a revisited approach. Geneva RiskInsur. Rev. 37 (2), 223–257.
Chang, T., Cheng, S.C., Pan, G., Wu, T.P., 2013a. Does globalization affect the insurance markets? Bootstrap panel granger causalitytest. Econ. Model. 33 (1), 254–260.
Chang, T., Lee, C.C., Chang, C.H., 2013b. Does insurance activity promote economic growth? Further evidence basedon bootstrap panel granger causality test. Eur. J. Finance, 1–24, http://dx.doi.org/10.1080/1351847X.2012.757555http://www.tandfonline.com/doi/pdf/
Chen, P.F., Lee, C.C., Lee, C.F., 2012. How does the development of life insurance market affect economic growth? Some inter-national evidence. J. Int. Dev. 24 (7), 865–893.
Chen, S.S., Cheng, S.C., Pan, G., Wu, T.P., 2013. The relationship between globalization and insurance activities: a panel dataanalysis. Jpn. World Econ. 28 (3), 151–157.
Cheng, S., 2012a. Substitution or complementary effects between banking and stock markets: Evidence from financial opennessin Taiwan. J. Int. Financ. Mark. Inst. Money 22 (3), 508–520.
Cheng, S., 2012b. Substitution or complementary effects between banking and stock markets: evidence from financial opennessin Taiwan. J. Int. Financ. Mark. Inst. Money 22 (3), 508–520.
Ching, K., Kogid, M., Furuoka, F., 2010. Causal relation between life insurance funds and economic growth evidence fromMalaysia. ASEAN Econ. Bull. 27 (2), 185–199.
Choi, I., 2001. Unit root tests for panel data. J. Int. Money Finance 20 (2), 249–272.Chow, W.W., Fung, M.K., 2011. Financial development and growth: a clustering and causality analysis. J. Int. Trade Econ. Dev.
35 (3), 1–24.Christopoulos, D.K., Tsionas, E.G., 2004. Financial development and economic growth: evidence from panel unit root and
cointegration tests. J. Dev. Econ. 73, 55–74.Colombage, S.R.N., 2009. Financial markets and economic performances: empirical evidence from five industrialized countries.
Res. Int. Bus. Finance 23 (3), 339–348.Craigwell, R., Downes, D., Howard, M., 2001. The finance-growth nexus: a multivariate VAR analysis of a small open economy.
Sav. Dev. 25 (2), 209–223.Cristea, M., Marcu, N., Carstina, S., 2014. The relationship between insurance and economic growth in Romania compared to
the main results in Europe – a theoretical and empirical analysis. Procedia Econ. Finance 8, 226–235.Curak, M., Loncar, S., Poposki, K., 2009. Insurance sector development and economic growth in transition countries. Int. Res. J.
Finance Econ. 34 (3), 29–41.Darrat, A.F., Elkhal, K., McCallum, B., 2006. Finance and macroeconomic performance: some evidence from emerging markets.
Emerg. Mark. Finance Trade 42 (3), 5–28.Demetriades, P., Hussein, K., 1996. Financial development and economic growth: cointegration and causality tests for 16
countries. J. Dev. Econ. 51 (2), 387–411.Drake, P.J., 1980. Money, Finance and Development. Halsted Press, New York.Dritsaki, C., Dritsaki-bargiota, M., 2005. The causal relationship between stock, credit market and economic development: an
empirical evidence of Greece. Econ. Change Restruct. 38 (1), 113–127.Dritsakis, N., Adamopoulos, A., 2004. Financial development and economic growth in Greece: an empirical investigation with
Granger causality analysis. Int. Econ. J. 18 (4), 547–559.D’Arcy, S., Gorvett, R., 2004. The use of dynamic financial analysis to determine whether an optimal growth rate exists for a
property-liability insurer. J. Risk Insur. 71 (4), 583–616.Engle, R.F., Granger, C.W.J., 1987. Cointegration and error correction: representation, estimation and testing. Econometrica 55
(2), 251–276.Enisan, A.A., Olufisayo, A.O., 2009. Stock market development and economic growth: evidence from seven sub-Saharan African
countries. J. Econ. Bus. 61 (2), 162–171.Enz, R., 2000. The S-curve relation between per-capita income and insurance penetration. Geneva Pap. Risk Ins. 25 (3),
396–406.Erik, F., Rodney, L., Roberto, R., 2011. What Drives The Development of The Insurance Sector? An Empirical Analysis Based on
a Panel of Developed and Developing Countries. The World Bank Policy Research Working Paper, No. 5572. World Bank,Washington, DC.
Esho, N., Kirievsky, A., Ward, D., Zurbruegg, R., 2004. Law and the determinants of property-causality insurance. J. Risk Insur.71 (2), 265–283.
Fase, M.M.G., Abma, R.C.N., 2003. Financial environment and economic growth in selected Asian countries. J. Asian Econ. 14 (1),11–21.
Fritz, R.G., 1984. Time series evidence of the causal relationship between financial deepening and economic development. J.Econ. Dev. 9 (1), 91–111.
Garcia, V.F., Liu, L., 1999. Macroeconomic determinants of stock market development. J. Appl. Econ. 11 (1), 29–59.Goldsmith, R.W., 1969. Financial Structure and Development. Yale University Press, New Haven, CT.Graff, M., 2003. Finance development and economic growth in corporatist and liberal market economies. Emer. Mark. Finance
Trade 39 (2), 47–69.Granger, C.W.J., 1988. Some recent developments in a concept of causality. J. Econometrics 39 (1-2), 199–211.Greenwood, J., Jovanovic, B., 1990. Financial development, growth, and the distribution of income. J. Pol. Econ. 98 (5), 1076–1107.

20 R.P. Pradhan et al. / J. of Multi. Fin. Manag. 31 (2015) 1–22
Greenwood, J., Smith, B., 1997. Financial markets in development, and the development of financial markets. J. Econ. Dyn.Control 21 (1), 145–181.
Guochen, P., Wei, S.C., 2012. Paper presented at 2012 China International Conference on Insurance and Risk Management, held atQingdao, during July 18–21, 2012. The relationship between insurance development and economic growth: a cross-regionstudy for China.
Haiss, P.R., Sumegi, K., 2008. The relationship between insurance and economic growth in Europe: a theoretical and empiricalanalysis. Empirica 35 (4), 405–431.
Han, L., Li, D., Moshirian, F., Tian, L., 2010. Insurance development and economic growth. Geneva Pap. Risk Ins. 35 (2), 183–199.Hassapis, C., Kalyvitis, S., 2002. Investigating the links between growth and stock price changes with empirical evidence from
the G7 economies. Q. Rev. Econ. Finance 42 (3), 543–575.Holsboer, J.H., 1999. Repositioning of the insurance industry in the financial sector and its economic role. Geneva Pap. Risk Ins.
24 (3), 243–290.Horng, M.S., Chang, Y.W., Wu, T.Y., 2012. Does insurance demand or financial development promote economic growth? Evidence
from Taiwan. Appl. Econ. Lett. 19 (2), 105–111.Hou, H., Cheng, S.Y., 2010. The roles of stock market in the finance-growth nexus: time series cointegration and causality
evidence from Taiwan. Appl. Financ. Econ. 20 (12), 975–981.Hou, H., Cheng, S., Yu, C., 2012. Life insurance and Euro zone’s economic growth. Procedia Soc. Behav. Sci. 57, 126–131.Hsueh, S., Hu, Y., Tu, C., 2013. Economic growth and financial development in Asian countries: a bootstrap panel granger causality
analysis. Econ. Model. 32 (3), 294–301.Hussels, S., Ward, D., Zurbruegg, R., 2005. Stimulating the demand for insurance. Risk Manage. Insur. Rev. 8 (2), 257–278.Hwang, T., Gao, S., 2003. The determinants of the demand for life insurance in an emerging economy – the case of China.
Managerial Finance 29 (5-6.), 82–96.Im, K.S., Pesaran, M.H., Shin, Y., 2003. Testing for unit roots in heterogeneous panels. J. Econometrics 115 (1), 53–74.Ireland, P.N., 1994. Money and growth: an alternative approach. Am. Econ. Rev. 84 (1), 47–65.Jalil, A., Feridun, M., Ma, Y., 2010. Finance-growth nexus in china revisited: new evidence from principal components and ARDL
bounds tests. Int. Rev. Econ. Finance 19 (2), 189–195.Jawadi, F., Bruneau, C., Sghaier, N., 2009. Non-linear cointegration relationships between non-life insurance premiums and
financial markets. J. Risk Insur. 76 (3), 753–783.Johansen, S., 1991. Stimation and hypothesis testing of cointegration vectors in Gaussian vector autoregressive models. Econo-
metrica 59 (6), 1551–1580.Johansen, S., 1995. A statistical analysis for cointegration for I (2) variables. Econ. Theory 11 (1), 25–59.Kar, M., Nazlioglu, S., Agir, H., 2011. Financial development and economic growth nexus in the MENA countries: bootstrap panel
granger causality analysis. Econ. Model. 28 (1-2), 685–693.King, R., Levine, R., 1993a. Finance and growth: Schumpeter might be right. Q. J. Econ. 108 (3), 717–737.King, R., Levine, R., 1993b. Finance, entrepreneurship and economic growth: theory and evidence. J. Monet. Econ. 32 (3), 513–542.Kolapo, F.T., Adaramola, A.O., 2012. The impact of the Nigerian capital market on economic growth (1990–2010). Int. J. Dev. Soc.
1 (1), 11–19.Kugler, M., Ofoghi, R., 2005. Does insurance promote economic growth? evidence from the UK. In: Paper Presented at the Money
Macro and Finance (MMF) Research Group Conference, United Kingdom.Lee, C., Chang, C., 2009. FDI, financial development and economic growth: international evidence. J. Appl. Econ. 12 (2), 249–271.Lee, C.C., Lee, C.C., Chiu, Y.B., 2013a. The link between life insurance activities and economic growth: some new evidence. J. Int.
Money Finance 32 (3), 405–427.Lee, C.C., 2011. Does insurance matter for growth: empirical evidence from OECD countries. B.E. J. Macroecon. 11 (1), 1–26.Lee, C.C., 2013. Insurance and real output: the key role of banking activities. Macroecon. Dyn. 17 (2), 235–260.Lee, C.C., Chiu, Y.B., 2012. The impact of real income on insurance penetration: evidence from panel data. Int. Rev. Econ. Finance
21 (1), 246–260.Lee, C.C., Chang, C.P., Chen, P.F., 2012. Further evidence on property-casualty insurance premiums: do multiple breaks and
country characteristics matter? Jpn. World Econ. 24 (3), 215–226.Lee, C.C., Tsong, C.C., Yang, S.J., Chang, C.H., 2013b. Investigating the stationarity of insurance premiums: international evidence.
Eur. J. Finance 19 (4), 276–297.Lee, S.J., Kwon, S.I., Chung, S.Y., 2010. Determinants of household demand for insurance: the case of Korea. Geneva Pap. Risk Ins.
35 (1), 82–91.Levine, R., 2004. Finance and Growth: Theory and Evidence. Working Paper No. 10766. National Bureau of Economic Research,
Massachusetts Avenue, Cambridge.Lewis-Beck, M., 1994. Factor Analysis and Related Techniques. Sage Publications, New Delhi.Levine, A., Lin, C.F., Chu, C.S., 2002. Unit root tests in panel data: asymptotic and finite sample properties. J. Econometrics 108
(1), 1–2, 4.Levine, R., 1997. Financial development and economic growth: views and agenda. J. Econ. Lit. 35 (20), 688–726.Levine, R., 1999. Law, finance and economic growth. J. Financ. Intermed. 8 (1-2), 8–35.Levine, R., 2005. Finance and growth: theory and evidence. In: Aghion, P., Durlauf, S. (Eds.), Handbook of Economic Growth.
Elsevier Science, Amsterdam, pp. 865–934.Levine, R., Zervos, S., 1996. Stock market development and long-run growth. World Bank Econ. Rev. 10 (2), 323–339.Levine, R., Zervos, S., 1998. Stock markets, banks and economic growth. Am. Econ. Rev. 88 (3), 537–558.Levine, R., Loayza, N., Beck, T., 2000. Financial intermediation and growth: causality analysis and causes. J. Monetary Econ. 46
(1), 31–77.Li, D., Moshirian, F., Nguyen, P., Wee, T., 2007. The demand for life insurance in OECD countries. J. Risk Insur. 74 (3), 637–652.Liang, Q., Teng, J., 2006. Financial development and economic growth: evidence from China. China Econ. Rev. 17 (4), 395–411.Liedtke, P.M., 2007. What’s insurance to a modern economy? Geneva Pap. Risk Ins. 32 (2), 211–221.Liu, G.C., Lee, C.C., 2014. Insurance activities and banking credit causal nexus: evidence from China. Appl. Econ. Lett. 21 (9),
626–630.

R.P. Pradhan et al. / J. of Multi. Fin. Manag. 31 (2015) 1–22 21
Liu, X., Sinclair, P., 2008. Does the linkage between stock market performance and economic growth vary across greater China.Appl. Econ. Lett. 15 (7), 505–508.
Maddala, G.S., Wu, S., 1999. A comparative study of unit root tests with panel data and new sample test. Oxford Bull. Econ. Stat.61 (S1), 631–652.
Masih, A.M.M., Masih, R., 1999. Are Asian stock market fluctuations due mainly to intra-regional contagion effects? Evidencebased on Asian emerging stock markets. Pac. Basin Finance J. 7 (3–4), 251–282.
McKinnon, R.I., 1973. Money and Capital in Economic Development. The Brookings Institution, Washington DC.Menyah, K., Nazlioglu, S., Wolde-Rufael, Y., 2014. Financial development. Trade openness and economic growth in African
countries: new insights from a panel causality approach. Econ. Model. 37 (2), 386–394.Mukhopadhyay, B., Pradhan, R.P., Feridun, M., 2011. Finance-growth nexus revisited for some Asian countries. Appl. Econ. Lett.
18 (16), 1527–1530.Muradoglu, G., Taskin, F., Bigan, I., 2000. Causality between stock returns and macroeconomic variables in emerging markets.
Russ. East Eur. Finance Trade 36 (6), 33–53.Naceur, S.B., Ghazouani, S., 2007. Stock markets, banks, and economic growth: empirical evidence from the MENA region. Res.
Int. Bus. Finance 21 (2), 297–315.Nektarios, M., 2010. A growth theory for the insurance industry. Risk Manag. Insur. Rev. 13 (1), 45–60.Nieuwerburgh, S.V., Buelens, F., Cuyvers, L., 2006. Stock market development and economic growth in Belgium. Explorations
Econ. Hist. 43 (1), 13–38.Nishat, M., Saghir, A., 1991. The stock market and Pakistan economy – 1964–87. Sav. Dev. 15 (2), 131–146.Odhiambo, N.M., 2008. Financial development in Kenya: a dynamic test of the finance-led growth hypotheses. Econ. Issues 13
(2), 21–36.Odhiambo, N.M., 2010. Finance-investment-growth nexus in South Africa: an ARDL bounds testing procedure. Econ. Change
Restruct. 43 (3), 205–219.Outreville, J.F., 1990. The economic significance of insurance markets in developing countries. J. Risk Insur. 57 (3), 487–498.Outreville, J.F., 1991. The relationship between insurance. Financial development and market structure in developing countries.
UNCTAD Rev. 3 (1), 53–69.Outreville, J.F., 1996. Life insurance markets in developing countries. J. Risk Insur. 63 (2), 263–278.Pagano, M., 1993. Financial markets and growth: an overview. Eur. Econ. Rev. 37 (2-3), 613–622.Pan, G., Su, C.W., 2012. The relationship between insurance development and economic growth: a cross-region study for China.
In: China International Conference on Insurance and Risk Management, July 18–21, 2012, Qingdao, China.Pan, G., Chang, H., Su, C.W., 2012. Regional differences in development of life insurance markets in China. Emerg. Mark. Rev. 13
(4), 548–558.Panopoulou, E., 2009. Financial variables and euro area growth: a non-parametric causality analysis. Econ. Model. 26 (6),
1414–1419.Park, H., 1993. Cultural impact on life insurance penetration: a cross-country analysis. Int. J. Manage. 10 (3), 342–350.Park, H., Borde, S.F., Choi, Y., 2002. Determinants of insurance pervasiveness: a cross-national analysis. Int. Business Rev. 11 (1),
79–96.Patrick, H.T., 1966. Financial development and economic growth in underdeveloped countries. Econ. Dev. Cultural Change 67
(4), 489–506.Pradhan, R.P., Arvin, M.B., Bele, S., Taneja, S., 2013a. The impact of stock market development on inflation and economic growth
of 16 Asian countries: a panel VAR approach. Appl. Econometrics Int. Dev. 13 (1), 203–220.Pradhan, R.P., Arvin, M.B., Norman, N.R., Hall, J.H., 2014a. The dynamics of banking sector and stock market maturity and the
performance of Asian economies. J. Econ. Adm. Sci. 30 (1), 16–44.Pradhan, R.P., Arvin, M.B., Norman, N.R., Nishigaki, Y., 2014b. Does banking sector development affect economic growth and
inflation? A panel cointegration and causality approach. Appl. Financ. Econ. 24 (7), 465–480.Pradhan, R.P., Mukhopadhyay, B., Gunashekar, A., Bele, S., Pandey, S., 2013b. Financial development, social development, and
economic growth: the causal nexus in Asia. Decision 40 (1–2), 69–83.Rashid, A., 2008. Macroeconomic variables and stock market performance: testing for dynamic linkages with a known structural
break. Sav. Dev. 32 (1), 77–102.Robinson, J., 1952. The generalization of the general theory. In: The Rate of Interest and Other Essays. MacMillan, London, pp.
67–142.Rousseau, P.L., Wachtel, P., 2000. Banks, stock markets and China’s great leap forward. Emer. Mark. Rev. 8 (3), 206–217.Schumpeter, J.A., 1911. The Theory of Economic Development. Harvard University Press, Cambridge, MA.Skipper Jr., H., 1997. Foreign insurers in emerging markets: issues and concerns. In: Occasional paper 97–92. Center for Risk
Management and Insurance, Georgia State University, Atlanta.Skipper, H.D., 2001. Insurance in the General Agreement on Trade in Services. American Enterprise Institute, Washington, DC.Shaw, E.S., 1973. Financial Deepening in Economic Development. Oxford University Press, New York.Shen, C., Lee, C., 2006. Same financial development yet different economic growth-why? J. Money Credit Bank. 38 (7), 1907–1944.Teresa, M., Garcia, M., 2012. Determinants of the property-liability insurance market: evidence from Portugal. J. Econ. Stud. 39
(4), 440–450.Thakor, A.V., 1996. The design of financial systems: an overview. J. Bank. Finance 20 (5), 917–948.Thornton, J., 1994. Financial deepening and economic growth: evidence from Asian economies. Sav. Dev. 18 (1), 41–51.Truett, D., Truett, L., 1990. The demand for life insurance in Mexico and the United States: a comparative study. J. Risk Insur. 57
(2), 321–328.Tsouma, E., 2009. Stock returns and economic activity in nature and emerging markets. Q. Rev. Econ. Finance 49 (2), 668–685.Vadlamannati, K.C., 2008. Do insurance sector growth and reforms affect economic development? Empirical evidence from
India. J. Appl. Economic Res. 2 (1), 43–86.Ward, D., Zurbruegg, R., 2000. Does insurance promote economic growth? Evidence from OECD countries. J. Risk Insur. 67 (4),
489–506.Ward, D., Zurbruegg, R., 2002. Law, politics and life insurance consumption in Asia. Geneva Pap. Risk Insur. 27 (3), 395–412.

22 R.P. Pradhan et al. / J. of Multi. Fin. Manag. 31 (2015) 1–22
Wasow, B., Hill, R.D., 1986. Determinants of insurance penetration: a cross-country analysis. In: Wasow, B.B., Hill, R.D. (Eds.),Insurance Industry in Economic Development. New York University Press, New York, pp. 160–176.
Webb, I.P., Grace, M.F., Skipper, H.D., 2005. The effect of banking and insurance on the growth of capital and output. SBS Rev.Termas Financ. 2 (2), 1–32.
Webb, I., Grace, M.F., Skipper, H.D., 2002. The effect of banking and insurance on the growth of capital and output. In: WorkingPaper No. 02. Center for Risk Management and Insurance, Georgia State University, Atlanta.
Wolde-Rufael, Y., 2009. Re-examining the financial development and economic growth nexus in Kenya. Econ. Model. 26 (6),1140–1146.
Wongbangpo, P., Sharma, S.C., 2002. Stock market and macroeconomic fundamental dynamic interactions: ASEAN-5 countries.J. Asian Econ. 13 (1), 27–51.
Wu, J., Hou, H., Cheng, S., 2010. The dynamic impacts of financial institutions on economic growth: evidence from the EuropeanUnion. J. Macroecon. 32 (3), 879–891.
Zhang, J., Wang, L., Wang, S., 2012. Financial development and economic growth: recent evidence from China. J. Comp. Econ.40 (3), 393–412.