Effects of Duality, Board Size and Board Composition on Corporate Governance Disclosure in Pakistan
Upload
khangminh22Category
view
4download
0
HASSAN, O.A.G. and MARSTON, C. 2019. Corporate financial disclosure measurement in the empirical accounting literature: a review article. International journal of accounting, 54(2), article ID 1950006. Available
from : https://doi.org/10.1142/S1094406019500069
Corporate financial disclosure measurement in the empirical accounting literature: a review
article.
HASSAN, O.A.G. and MARSTON, C.
2019
This document was downloaded from https://openair.rgu.ac.uk
Electronic version of an article published as International Journal of Accounting, 54(2), article ID 1950006 https://doi.org/10.1142/S1094406019500069
© World Scientific Publishing Company https://www.worldscientific.com/worldscinet/tija
brought to you by COREView metadata, citation and similar papers at core.ac.uk
provided by Open Access Institutional Repository at Robert Gordon University

1
Corporate Financial Disclosure Measurement in the Empirical Accounting
Literature: A Review Article
OMAIMA A. G. HASSAN* and CLAIRE MARSTON
ABSTRACT
This paper develops a framework for corporate financial disclosure measurement to identify
and evaluate measures of financial disclosure employed in prior empirical accounting studies.
It identifies two approaches: (i) a disclosure-based approach that investigates actual
disclosure, operationalizes the concept of disclosure in terms of its main dimensions such as
the quantity and quality of disclosure, and develops methods to measure them such as the
disclosure index and textual analysis, and (ii) a non-disclosure-based approach that uses the
values of some observable variables to proxy for disclosure such as market-based disclosure
measures. The study also discusses the extent to which the reliability and validity of these
different measures of disclosure are tested. The purposes of this review are: (i) to help future
researchers identify exemplars and select or develop their own suitable disclosure measures,
and (ii) to identify measurement issues relating to corporate financial disclosure and provide
avenues for future research.
Keywords: accounting information; financial disclosure; financial reporting; measurement;
reliability; validity.

2
*Corresponding author
OMAIMA A. G. HASSAN ([email protected]) is a lecturer in Accounting and Finance,
Department of Accounting and Finance, Robert Gordon University, Garthdee House,
Garthdee Road, Aberdeen, AB10 7QB; and CLAIRE MARSTON ([email protected]) is
Emeritus Professor of Accountancy, Department of Accountancy, Economics and Finance,
School of Management and Languages, Heriot-Watt University, Riccarton, Edinburgh, EH14
4AS.

3
1. INTRODUCTION
Corporate financial disclosure1 is any deliberate release of financial information,
whether numerical or qualitative, required or voluntary, via formal or informal channels
(Gibbins, Richardson, & Waterhouse, 1990, p. 122). Companies disclose information2 through
various means such as annual reports, conference calls, interim reports, prospectuses, press
releases, and websites. Prior empirical accounting studies have attempted to develop various
measures for financial disclosure, but to date there is no comprehensive systematic review
that identifies and evaluates these measures. This paper addresses this gap and develops a
framework for financial disclosure measurement based on a review of 280 prior empirical
studies published in top rated accounting journals.
Financial disclosure is important because it is the primary means of communication
between management and outside investors as well as market participants in general. Hence
the literature on financial disclosure is enormous and investigates a wide range of issues such
as the determinants of voluntary disclosure, the impact of regulatory change on the extent of
disclosure, and the economic consequences of disclosure. Although many studies investigate
financial disclosure for the private sector companies, others look at the public sector and not-
for-profit organizations. In all these studies, disclosure plays a key role and must be measured
in some way. However, measuring disclosure is difficult because disclosure is a theoretical
construct which is not directly observable.
1 Some researchers refer to the numbers in the financial statements as “financial reporting”. Other scholars view numbers outside the financial statements and texts as “disclosure”. Others view both these types as financial disclosure (e.g., Gibbins et al., 1990). We belong to the third school and adopt Gibbins et al.’s (1990) definition of corporate financial disclosure, which covers both the numbers in the financial statements and other numbers as well as texts in the disclosure vehicle. 2 Corporate disclosure can also be directed to parties other than outside investors, such as stakeholders more generally, strategic investors, and strategic debtholders.

4
Previous review articles discuss several ways of measuring disclosure, by looking at
either one method or one type of disclosure. For example, Marston and Shrives (1991)
concentrate on the disclosure index, whereas Jones and Shoemaker (1994) examine textual
analysis techniques. Healy and Palepu (2001) discuss concerns about measuring voluntary
disclosure and consider the disadvantages of three measurement proxies: management
forecasts, analyst ratings, and self-constructed disclosure indices developed by researchers.
They consider that analyst ratings and self-constructed disclosure indices are likely to be
noisy3 measures of disclosure.
Beattie, McInnes, and Fearnley (2004) present a selection of methods for measuring
narratives in annual reports, including methods reviewed by Jones and Shoemaker (1994) as
well as Healy and Palepu (2001). Beyer, Cohen, Lys, and Walther (2010) expand on this list
and include properties of reported earnings. Leuz and Wysocki (2016) enlarge this list and
include binary indicators and frequency of disclosure. Table 1 provides an overview of the
measures of disclosure identified in these studies; however, our study provides a more
comprehensive review and discussion of various methods for measuring disclosure, and
further extends the list to include measurements of disclosure through other observable
variables such as market-based measures and the voluntary adoption of generally accepted
accounting principles (GAAP). It goes further by developing a framework for corporate
financial disclosure measurement and discussing some related measurement issues. The
purpose of this framework is to provide a consistent approach for systematically collecting,
analyzing, and evaluating existent measures of financial disclosure. We hope this will help
3 Healy and Palepu (2001) consider that using these measures of disclosure as independent variables in prior studies are likely to suffer from omitted variable bias.

5
researchers to make more informed decisions about their choices of measures of financial
disclosure or allow them to locate any new measure or method that they develop.
<<Insert Table 1 about here>>
Current gaps in the disclosure literature provide several motivations for our study.
Firstly, a framework for disclosure measurement does not currently exist in the literature.
Accounting studies do not specifically consider issues involved in measuring disclosure as a
latent (unobservable) variable. Secondly, although this literature offers a variety of potential
measures for disclosure, to date, there is no comprehensive systematic review that identifies
and evaluates existent measures of disclosure. Thirdly, although the assessment of measures
of disclosure is discussed to some extent in the extant accounting literature, a comprehensive
analysis is lacking. Our study contributes to the literature by filling in these gaps through (i)
developing a framework for corporate financial disclosure measurement, (ii) identifying and
evaluating common measures of financial disclosure employed in prior empirical studies
through a review of the literature from 2005 to 2016, and (iii) providing an in-depth discussion
of some related empirical challenges including casual claims, and how the reliability and
validity of different measures of disclosure are assessed. The purpose of this review is to help
future researchers to identify exemplars and to guide them in the selection or development
of their own suitable measures. Additionally, our study highlights some measurement issues
related to corporate financial disclosure and provides avenues for future research.
A review of the empirical accounting literature was conducted to identify measures of
financial disclosure employed in articles published between 2005 and 2016; articles in
accountancy journals that are rated 3* or 4* by the Association of Business Schools were

6
investigated.4 We believe that selecting articles from top rated accounting journals over a 12-
year period provides a reasonably up-to-date time frame for this review. Employing a Boolean
search for ‘financial reporting’ or ‘financial disclosure’, on the title, abstract and keywords
fields of the selected journals over the selected time frame, the results show 2514 articles
published between 2005 and 2016. The titles, abstracts and conclusions were then carefully
read to identify empirical studies of corporate financial disclosure/reporting in the private
sector. We excluded5 the following studies: intellectual capital studies, timely disclosure
studies, research that empirically examines the economic consequences of individual items
of financial disclosure, and image/picture disclosure studies. The application of these research
criteria yielded a sample of 280 disclosure studies. Table 2 presents a break-down of these
studies by journal and shows that most of them are published in the Accounting Review,
Journal of Accounting and Economics, Journal of Accounting Research, and the International
Journal of Accounting.
<<Insert Table 2 about here>>
We followed an inductive reasoning approach to develop a framework for disclosure
measurement. From specific observations about measurements of disclosure developed in
the empirical accounting literature, the analysis moves onto broader generalizations. To
inform our analysis, we also consulted the literature on the problem associated with
measurement of latent variables (Jarvis, MacKenzie, & Podsakoff, 2003; Goertz, 2008). We
4 This choice may seem biased toward US academic journals. The Association of Business Schools rankings are heavily used in the UK during the selection of academic staff and articles to be entered in the periodic Research Excellence Framework exercise by which UK University departments are ranked. US–based, highly quantitative journals are predominant in these rankings. However, in the first version of this paper prior to our systematic review, we did not apply any restrictions to the academic papers covered, and we reached similar conclusions about common financial disclosure measures in the accounting literature. 5 We were pragmatically trying to make the review manageable by missing some disclosure areas out.
7
identified, evaluated and coded the different types of disclosure measures contained within
the 280 studies and categorized them into 11 common measures of disclosure. These
measures of disclosure are then classified into disclosure-based and non-disclosure-based
measures.
The remainder of this paper is organized as follows: in Section 2 we develop a
framework for disclosure measurement and identify as well as evaluate different measures
of disclosure. In Section 3 we discuss causal claims in prior disclosure studies and explore the
extent to which reliability and validity of measures of disclosure are tested within papers
identified in the systematic review of the literature. Finally, in section 4 we discuss some
measurement issues relating to financial disclosure and highlight areas for future research.
2. A FRAMEWORK FOR DISCLOSURE MEASUREMENT
In this section, we develop a framework to classify various measures of disclosure. To
do this, either a deductive or an inductive reasoning approach can be followed.
A deductive reasoning approach works from the more general to the more specific,
informally called a “top-down” approach. Applying the deductive approach when
constructing or evaluating concepts and quantitative measures, Goertz (2008) suggests,
among other things, that the first consideration must be the theory embodied in the concept.
Another consideration should be the necessary (minimum) and sufficient (maximum) parts of
the concept. However, there is no single theory of disclosure (Verrecchia, 2001), which makes
it more complex to develop or evaluate a measure of disclosure. Additionally, empirical
studies consider different types of disclosure, for example mandatory and voluntary
disclosures. Also, financial disclosure can take different formats such as textual or numerical

8
disclosure (e.g., Kravet & Muslu, 2013; Nelson & Rupar, 2015). This deductive approach is
even more complex when we consider that within a single type of disclosure there are
different dimensions that can be captured such as the quality and quantity of information
disclosure (e.g., Wynn, 2008; Ernstberger & Grüning, 2013; André, Filip, & Moldovan, 2016).
For all these reasons, it is probably impossible to adopt a deductive approach to disclosure
measurement.
Alternatively, an inductive reasoning approach can be employed to develop a
framework for disclosure measurement. Inductive reasoning is a type of thinking that involves
identifying patterns in a data set to reach conclusions and build theories (Hair, Wolfinbarger,
Money, & Samouel, 2011, p. 276). It moves from specific observations to broader
generalizations and theories, informally called a “bottom-up” approach. Using this approach,
we review 280 empirical accounting studies published in top rated accounting journals from
2005 to 2016 and identify6 common proxies employed for financial disclosure. Table 3 shows
a list of the common measures of disclosure identified in the review of the literature and
provides some exemplars for each measure. It shows 11 different measures of financial
disclosure with the classification approach being the most popular, while the disclosure
survey (analyst ratings) and the voluntary adoption of quality GAAP are the least popular
method employed in the recent empirical accounting literature.
6 Since human coding is inevitably subjective, to ensure the reliability of our coding, the authors of the papers have agreed on the coding instructions of the different measures of disclosure before the coding took place. When in doubt, the same paper would be coded by both authors and any discrepancies were discussed and resolved. In addition, after the coding was finalized, a random sample of 40 papers has been re-coded (test-retest) by one of the authors. The recoding of measures of corporate financial disclosure was almost identical to the original ones, which indicates the reliability of our coding.

9
<<Insert Table 3 about here>>
Analyzing these common measures of disclosure, we identify two main measurement
methods: a disclosure-based approach and a non-disclosure-based approach. A further
classification7 relates to whether the non-disclosure-based measure is a formative or
reflective variable.
2.1 Disclosure-based approach
This approach investigates actual disclosure and reduces (operationalizes) it to its
main dimensions such as quantity, quality, timing, complexity, tone and prominence. It
attempts to measure one or more of these dimensions via various means such as textual
analysis or the disclosure index approach. Table 4 provides a summary of common disclosure-
based measures identified in this review of the literature.
<<Insert Table 4 about here>>
2.1.1 Classification approach
This approach involves sorting observations into mutually exclusive groups according
to an aspect of corporate financial disclosure that is being studied. The focus could be broad
such as a disclosure policy or a reporting regime, for example whether a firm publicly provide
an annual report or files a 10-K report, or narrow such as specific disclosure, for example
whether a firm hosts conference calls or provides management forecasts (Leuz & Wysocki,
7 We acknowledge that some overlap inevitably exists between the sub-clusters. For example, textual analysis methods can be employed to create textual sentiments, but to recognize that sentiment analysis is not limited to written words only and that it can be employed on quantitative data, we prefer to address it as a separate sub-cluster, even if it has some overlap with textual analysis.

10
2016). Then, it uses a categorical variable to represent these groups in numerical terms. The
resultant measure of corporate financial disclosure could be dichotomous or multicategory.
For example, Cannizzaro and Weiner (2015) classify disclosures into minimal, partial, and full
disclosure to assess transparency. Marquardt and Wiedman (2007) measure the quality of
disclosure by classifying information on contingently convertible securities to “high-quality”
if the number of shares related to the convertible securities is disclosed; “medium-quality” if
enough information is provided for investors to calculate the dilutive impact; and “low-
quality” if insufficient information is provided. Gillan and Panasian (2014) sort firms into cross-
listed (foreign) firms filing a 40-F, 20-F, 10-K form, or their US-matched domestic counterparts
to capture the differential disclosure complexity in these filings. Hollander et al. (2010) assess
incomplete disclosure by determining whether requests for information made during
conference calls are granted. If at least one request is not granted, they mark this call as
containing incomplete disclosure. Bowen et al. (2005), Files, Swanson, and Tse (2009), and
Marques (2010) assess the prominence of disclosure using a classification approach based on
the position of information in the disclosure vehicle.
A classification approach is commonly applied to specific disclosures such as
conference calls, segment information, management forecasts, disclosure of non-GAAP
numbers, material restatement and material weakness disclosures, and financial statement
disclosure (e.g., Kimbrough, 2005; Botosan & Stanford, 2005; Marques, 2006; Nagy, 2010;
Weiss, 2014; Bernard, 2016). However, given the simplicity of this approach, it can be applied
to any type of disclosure.
The data have the advantages of being relatively time-efficient to collect and code and
can be used for large-scale samples. This might explain the popularity of this method among

11
prior studies with 112 cases identified in the current systematic review of the literature. This
approach is able to capture one type of disclosure at a time (e.g., voluntary, or mandatory) in
contrast to other methods which fail to separate between these two types of disclosure such
as disclosure survey and market-based measures. In addition, Leuz and Wysocki (2016) argue
that this approach focuses on the existence of certain disclosures and hence disclosure can
be precisely measured. Perhaps this is true when the focus of the measure is narrow, but still
other disclosure activities might act as a substitute or a complement which need to be
controlled for in the research design. When the focus of the measure is broad, however, at
best they only partition companies into mutually exclusive groups (with some sort of order
emerging if ordinal variables are employed), without any attempt to capture differences in
the dimension of disclosure among companies that belong to the same group. In addition,
coding could be subjective, in particular when weights are assigned, and hence results could
be difficult to replicate, compare and generalize.
2.1.2 Disclosure index
A disclosure index8 is a research instrument used to assess the extent of information
reported in a disclosure vehicle(s) by a specific entity according to a list of selected items of
information. The items of information could be quantitative or qualitative or both. It can be
applied to different types of disclosures: mandatory or voluntary; or even to a specific type of
8 Both the disclosure index method and textual analysis could be generally viewed as sub-types of content analysis because we are trying to draw valuable information from the data to the context of their use (Krippendorff, 1980). However, these two methods differ from each other in several aspects. For example, the unit of analysis under the disclosure index method could be figures or texts or both, while the unit of analysis under textual analysis is texts only. Using a disclosure index method, the researcher assesses whether disclosures have been made about some selected items of information, in contrast to the commonly used bag-of-words methods in textual analysis, for example, where the focus is on word count or word frequency, and where word sequence is ignored. Furthermore, while only human coding is used to develop disclosure scores using a disclosure index method, textual analysis can be conducted either manually or electronically. Therefore, we prefer to address these two methods separately.

12
disclosure such as management forecasts and segmental data. It does not count all items of
information disclosed, but rather assesses whether disclosures have been made about the
selected items of information through a close reading of the disclosure vehicle. Thus, the
selection of items to include in the disclosure index is a key issue with this approach (Marston
& Shrives, 1991). It can also be extended to assess the usefulness of information provided by
awarding scores on an ordinal scale (e.g., 0/1/2/3) for disclosures of each item in a list (e.g.,
disclosures that contain quantitative data or report more information would receive a higher
score than a minimal level of disclosure). However, the assignment of weights is itself subject
to conceptual and procedural problems (e.g., Dhaliwal, 1980; Cooke & Wallace, 1989;
Hodgdon et al., 2009; Cheung, Jiang, & Tan, 2010). The first use of such an index was by Cerf
in 1961, and the method has been widely employed ever since (Marston & Shrives, 1991).
A disclosure index can be developed by the researcher (self-constructed disclosure
indices) or developed externally by an academic or professional body (existing disclosure
indices) such as Standard and Poor’s transparency and disclosure scores, US Securities and
Exchange Commission (SEC) ratings of the management discussion and analysis disclosure,
the Center for International Financial Analysis and Research (CIFAR) disclosure scores, and
the Joint Society of Management Accountants of Canada/University of Quebec and Montreal
disclosure scores. Our review finds that the disclosure index approach is one of the most
popular measures of disclosure; it is used in a variety of contexts indicating how flexible the
method is. From our review of the literature, 50 cases were identified, including self-
constructed disclosure indices as well as existing disclosure indices. A more detailed analysis
reveals that most studies use self-constructed disclosure indices with data extracted from
company reports and websites (e.g., Webb, Cahan, & Sun, 2008; Hodgdon et al., 2009; Melis

13
et al., 2015; Mangena et al., 2016; Bazrafshan, Kandelousi, & Hooy, 2016), but some use the
CIFAR index (e.g., Guedhami & Pittman, 2006; Han et al., 2012) or Standard and Poor’s
transparency and disclosure scores (e.g., Dargenidou et al., 2006; Ali, Chen, & Radhakrishnan,
2007).
Self–constructed disclosure indices have the advantage that they can be designed to
fit the project (e.g., country, voluntary and/or mandatory disclosure, disclosure topic).
However, the use of existing disclosure indices saves time, and results can be compared with
the findings from other studies. Self-constructed disclosure index studies generally employ
small samples owing to the labor-intensive data collection process, and results obtained are
often difficult to replicate, compare and generalize (Hassan, Romilly, Giorgioni, & Power,
2009; Beyer et al., 2010). In addition, the construction of a disclosure index in prior studies
often fails to explicitly account for the incremental information content of each new data item
added to the index. Future research may develop an approach that can better capture the
incremental information content of additional items of information disclosed by means of
data reduction techniques such as factor analysis and principal component analysis.
Furthermore, the appropriate method of aggregation is also of relevance here. For example,
two companies may have disclosed completely different sets of information within the
disclosure index and receive the same disclosure score.
2.1.3 Disclosure count
This approach counts the number of distinctive disclosures usually, but not
necessarily, without evaluating their content or context. For example, the number of press
releases (Francis, Nanda, & Olsson, 2008), the frequency of disclosure of non- GAAP earnings
measures over a period of time (Marques, 2010), the number of online announcements

14
(Debreceny & Rahman, 2005), the number of segments reported by a firm (Kou & Hussain,
2007), and the number of internal control weaknesses reported by a firm in its Management
Discussion & Analysis (Lu et al., 2011). This approach usually relates to particular types of
disclosure such as conference calls, management forecasts, disclosure of non-GAAP numbers,
information about material restatements and weakness, and segmental data (e.g., Rogers &
Van Buskirk, 2009; Bergman & Roychowdhury, 2008; Marques, 2006; Lu et al., 2011; Kou &
Hussain, 2007). It is frequently used in conjunction with a classification approach (e.g., Ge &
McVay, 2005; Wasley & Wu, 2006; Francis et al., 2008; Levine & Smith, 2011).
Our systematic review shows that disclosure count is one of the most popular
measures of disclosure with 36 cases identified from the articles analyzed. It is commonly
used to measure the quantity of disclosure (Francis et al., 2008; Fu et al., 2012; Baginski,
Clinton, & Mcguire, 2014), but it has also been used to assess other dimensions of disclosure
such as quality (Sengupta & Zhang, 2015), the quantity and quality of disclosure (Wynn, 2008;
Cuny, 2016) as well as the complexity (Kou & Hussain, 2007; Brochet et al., 2016), and
credibility (Lu et al., 2011) of disclosures.
The data have the advantage of being relatively time-efficient to collect and code and
the data can be used to study large scale samples. Disclosure count can provide new valuable
information to the capital market, for example the management might hold frequent
conference calls to update outside providers of funds on relevant up-to-date information
about the business. However, it could also be induced by other managerial incentives such as
management reputation.

15
2.1.4 Properties of reported earnings
This approach uses properties of reported earnings to measure financial reporting
quality (e.g., Wang, 2006; Altamuro & Beatty, 2010; Chen et al., 2011; Kim & Venkatachalam,
2011; Koh et al., 2013; Filip et al., 2015). For example, while Krishnan, Wen, and Zhao (2011)
use accruals quality and discretionary accruals to measure financial reporting quality,
Altamuro and Beatty (2010) use various characteristics of reported earnings such as changes
in loan-loss provision, earnings persistence, earnings predictability, benchmark beating
behavior, and accounting conservatism. Lang, Lins, and Maffett (2012) measure firm
transparency by less evidence of earnings management using properties of reported earnings,
among other measures such as better accounting standards, higher quality auditors, more
analyst following, and more accurate analyst forecasts.
Coding of these variables could be relatively easy and time-efficient and can be used
for large-scale samples because these variables are constructed by means of economic
modelling of available accounting figures rather than coding texts. Furthermore, both
continuous and discrete proxies can be constructed. Dechow, Ge, and Schrand (2010) review
different measures of earnings quality such as the magnitude of accruals, residuals from
accrual models and earnings persistence among others, and reach no single conclusion on
what earnings quality is, because ‘‘quality’’ is dependent on the decision context. Thus,
different properties of reported earnings may capture different dimensions of quality and
may be valid in different contexts (Berger, 2011). Dechow et al. (2010) also suggest that
properties of reported earnings capture underlying earnings process with errors that are
related to fundamental firms’ characteristics, real economic performance and the
measurement of performance, a problem that is common for almost all measures of

16
disclosure (Leuz & Wysocki, 2016). Dechow et al. (2010) further suggest that different proxies
based on reported earnings are not equally affected by these factors which emphasizes that
these measures are not measuring the same underlying construct. In addition, corporate
financial disclosure is not limited to the accounting figures disclosed in the financial
statements. It also includes qualitative information in the form of text (e.g., Core, 2001; Easley
& O’Hara, 2004; Beyer et al., 2010). Thus, using accounting quality to proxy for the overall
quality of corporate financial disclosure would be limited. Leuz and Wysocki (2016) consider
attributes of reported earnings as narrow measures of corporate disclosure and reporting
which have the advantages of being able to facilitate consistent measurement across firms,
but these measures raise concerns about other disclosure activities that could serve as a
substitute or a complement, which need to be controlled for in the research design. For
example, firms can compensate poor earnings quality with enhanced voluntary disclosure.
Even though, whether earnings quality could serve as a substitute or a complement of
disclosure quality is still an empirical issue since some scholars suggest that they are
substitutes (Mouselli, Jaafar, & Hussainey, 2012), while others suggest that they are
complements (Francis et al., 2008).
2.1.5 Sentiment analysis
Scholars have used both quantitative and qualitative financial information to generate
sentiments from corporate financial disclosure such as good/bad news disclosure and
favorable/unfavorable disclosure. Some of the pioneer studies in this area include Clarkson,
Kao, and Richardson (1994) and Skinner (1994). For example, Clarkson et al. (1994) measure
voluntary disclosure of good (bad) news by positive (negative) changes in earnings in the
current year compared to those of the previous year (or analysts’ forecasts of earnings).

17
Alternatively, a firm is classified as good news if the cumulative residuals from the market
model for the firm over the eight-month period after the annual report date are larger than
zero. Ali et al. (2007) use the change in earnings per share from that of the same quarter in
the previous fiscal year, deflated by stock price at the beginning of the quarter as a measure
for voluntary disclosure of bad news (negative changes) and vice versa. Bamber et al. (2010)
measure good/bad news disclosure by the difference between the management forecast and
the most recent I/B/E/S consensus analyst forecast, deflated by the closing price one day prior
to the management forecast date. If the difference is non-negative (negative), this is coded
as good (bad) news, and 0 otherwise. Desir (2012) measures good/bad news disclosure based
on changes in dividends, where an increase in dividends is considered good news, while a
decrease is considered bad news.
In addition, both manual and automated textual analysis methods are used to
measure the tone of a financial document (e.g. Skinner, 1994; Kothari et al., 2009; Li, 2010b;
Rogers et al., 2011; Yekini et al., 2016). For example, Skinner (1994) constructs a measure of
disclosure where disclosures are subjectively classified as good/bad/no news via manual
textual analysis if the particular disclosure documents indicate that earnings will be
better/worse/same compared to investor expectations. Rogers et al. (2011) use a dictionary-
based text analysis program to quantify optimistic tone on a continuous scale. Kravet and
Muslu (2013) measure the negative tone in risk disclosures by changes in companies’ textual
risk disclosures in the 10-K filings and provide evidence that textual risk disclosures reveal
new information about corporate risks and uncertainties. Kearney and Liu (2014) survey
different textual analysis methods applied on textual sentiment in the finance literature such
as word lists, dictionary-based approach, and supervised machine learning. They suggest that

18
corporate disclosure literature often use the term ‘tone’ to refer to textual sentiment, but
sentiment in a broader term is not limited to positivity–negativity, but also include other
affects such as strong–weak, and active–passive. Loughran and McDonald (2016) find that
much of the literature uses a bag-of-words approach, where the word sequence is ignored,
and the characters of a document is parsed into chunks of words, to measure document
sentiment.
Sentiment analysis can be applied to both quantitative and qualitative financial
information which indicates the flexibility of the method. Sentiments created from
quantitative data, and textual sentiments developed using automated textual analysis are
economical in terms of money, time and effort needed to implement the analysis, and can be
applied to large samples. Both continuous and discrete proxies for disclosure can be
constructed. However, the approach is inevitably subjective, hence the results could be hard
to replicate and generalize, in particular with textual sentiments. In addition, while
quantitative data can be distorted for several reasons such as earnings management, textual
sentiments can be driven by different managerial incentives such as management reputation
and impression management. In addition, textual sentiment analysis could be biased because
of a managerial tendency to use positive words to frame negative statements (Loughran &
McDonald, 2016). Perhaps future research should consider both quantitative and qualitative
sentiments to control for this potential bias. Future research might also investigate how
sentiments created using quantitative data compare with textual sentiments.

19
2.1.6 Textual analysis
Textual analysis is a research method to draw inferences from texts to the context of
their use. Loughran and McDonald (2016) suggest the following hierarchy9 of textual analysis:
lexical, collocation, syntactic, semantic, pragmatic, and discourse. They claim that, to date,
applications in accounting and finance are predominately in the initial phase of this
interpretive sequence of lexical to discourse analysis.
We discuss textual analysis to the extent relevant to the current study and refer the
reader to several excellent review studies on the subject (e.g., Jones & Shoemaker, 1994; Li,
2010a; Guo, Shi, & Tu, 2016; Loughran & McDonald, 2016; Grimmer & Stewart, 2013) for
more in-depth discussion of the different methods employed under this approach. For
example, Li (2010a) surveys recent empirical large-scale textual analysis studies by topical
area (e.g., information content, earnings quality, market efficiency), and provides details on
earlier manual-based textual analysis studies. Loughran and McDonald (2016) survey
readability methods which attempts to measure the ability of the reader to decipher the
intended message, and methods which typically focus on computationally extracting meaning
from a collection of text such as bag-of-words methods and measuring document similarity.
They address various methodological tripwires involved in these methods, highlight the
challenges of separating out the concepts of business complexity and readability, and
9 Loughran and McDonald (2016, pp.26-28) explain this hierarchy as following: the first step in analyzing text is lexical (bag-of-words) where the word sequence is ignored, and the characters of a document is parsed into chunks of words. Research interests at this stage are focused on some linguistic features such as word count, word difficulty and word frequency (Beattie, 2014). The second step, collection, is where meaning is derived from a collocation of words (or grams). For instance, the bigram of “going” and “concern” is an example where collocation is important, and if we extend this to n-grams, we can identify a collection of words as a sentence. Then using syntactic analysis, we can derive additional information by examining the grammatical structure of the sentence. Beyond syntax, semantics attempts to infer meaning within the context of the sentence. Pragmatics infers meaning from information immediately preceding and following the sentence, in addition to context provided by external knowledge. Finally, discourse is the attempt to derive meaning from the collective document.

20
emphasize the importance of replicability in the less-structured methods used in textual
analysis. While, Guo et al. (2016) classify textual analysis methods into lexicon-based
approach and machine learning approach, where the former includes readability measures
and dictionary-based approach, and the later includes Naïve Bayes, Support Vector Machines,
Semantic Analysis and Neural Network.
Textual analysis is commonly used to measure the quantity of disclosure (e.g., Chen,
Cheng, Gong, & Tan, 2017a). However, the method is also used to assess other dimensions of
disclosure such as quality (e.g., Chen, Miao, & Shevlin, 2015), complexity (e.g., You & Zhang,
2009; Filzen & Peterson, 2015) and horizon (Brochet, Loumioti, & Serafeim, 2015). The
disclosure being studied can be mandatory, voluntary, or both, which highlights the flexibility
of the method. Textual analysis can be partial or comprehensive. Partial textual analysis
covers part of a document or selected items of information or key words. Comprehensive
textual analysis covers a whole document.
Textual analysis can be conducted manually or automatically. One of the major
limitations of manual textual analysis is that it is a labor-intensive data collection process,
which inevitably tends to restrict the sample size employed (Beattie & Thomson, 2007).
Therefore, in the 1980s, automated textual analysis emerged and has been commonly
employed ever since (e.g., Frazier, Ingram, & Tennyson, 1984; Abrahamson & Amir, 1996;
Smith & Taffler, 2000; Breton & Taffler, 2001; Schleicher, Hussainey, & Walker, 2007; You &
Zhang, 2009; Brown & Tucker, 2011). Automated textual analysis is often accompanied by
some element of manual textual analysis depending on the research method. Examples of
studies that use automated textual analysis are Schleicher et al. (2007), You and Zhang (2009)

21
and Elshandidy, Fraser, and Hussainey (2015), and examples of manual textual analysis
studies are Linsley and Shrives (2006), Boesso and Kumar (2007), and Chen et al. (2017a).
Automated textual analysis is easy to use and economic in terms of the time, effort
and financial resources needed to implement the method. It can be easily used to conduct a
comprehensive textual analysis and to cover sizable samples. However, textual analysis is not
problem–free. When implementing this approach either manually or automatically using the
frequency of words or key words, all possible synonyms and words with multiple meanings
should be included (Weber, 1990). Using inappropriate or insufficient key words could lead
to over- or underestimation of a disclosure level. Additionally, using words or key words
isolated from their context in the whole sentence does not provide a sound unit of analysis
and may yield misleading results (Milne & Adler, 1999; Beattie & Thomson, 2007).
Furthermore, coding (either manually or electronically) that is entirely based on a pre-defined
word list without recourse to actual disclosure content may not be able to fully capture the
construct under investigation, which limits the validity of the constructed measure of
disclosure (Beattie & Thomson, 2007; Grüning, 2011; Loughran & McDonald, 2016).
Moreover, the focus of this method is on reported qualitative information, which means that
quantitative information well be ignored under this approach.
Attempts to extend this approach beyond lexical analysis include, but are not limited
to, the analysis of phrases rather than words and semantic analysis. For example, Grüning
(2011) uses an information-retrieval vector space model (VSM), a supervised machine
learning tool, to automatically analyze phrases (n-grams) rather than words; he argues that
this provides better unit of analysis and eliminates human involvement in the process. Using
VSM, Grüning (2011) undertakes the coding of corporate disclosure in two phases: training

22
and application. In the training phase, Grüning manually develops a comprehensive coding
scheme based on a sample of representative annual reports, attempting to classify and
quantify the diversity of corporate financial and non-financial disclosures. In the application
phase, the coding scheme is automatically applied to a larger number of annual reports
without human involvement to develop a disclosure score. Brown and Tucker (2011) provide
another example of advancement in this area where they use VSM to measure changes in
disclosure documents based on identifying semantic similarity. Changes in disclosure rather
than disclosure levels could give us more meaningful insights about disclosure practice by
removing boiler-plate disclosure for instance. However, the measure obtained is a summary
of changes in a document and does not specify the nature of any changes in disclosure which
have taken place (Berger, 2011).
2.1.7 Attributes of management forecasts
A management forecast is an item of forward-looking information, which
management may provide in annual reports, interim reports, or elsewhere. This information
may be quantitative (where a specific figure or range of figures is supplied) or qualitative
(where a general direction or trend in company performance might be given). For example,
management earnings forecasts available in the First Call database can take the following
forms: point, range, one-sided directional, or confirming statements. They can be verified
through actual earnings realizations, and hence they enable researchers to construct
variables such as management forecast accuracy, error and bias. Recent studies also use
management forecasts of cash flows, capital expenditures and store openings (e.g., Adhikari
& Duru, 2006; Wasley & Wu, 2006; Cole & Jones, 2015) to construct their measure of
disclosures.

23
Management forecasts have been used widely in the accounting literature to assess
voluntary disclosure quantity and quality, especially studies from the US10. This may be
because of the availability of these data in different databases such as that provided by First
Call and the Dow Jones News Retrieval Service. Some studies only use attributes of
management forecasts to assess the quality of voluntary disclosure (e.g., Yang, 2012; Bonsall
et al., 2013; Cole & Jones, 2015; Kitagawa & Okuda, 2016; Zuo, 2016). While management
earnings forecasts have the advantages of being concrete disclosure events, they are
considered less comprehensive than other measures of disclosure such as AIMAR disclosure
scores (Lang & Lundholm, 1996). In addition, management forecasts could be driven by
different managerial incentives other than facilitating communication with external providers
of funds such as management reputation and earnings management, which would affect the
credibility of measures of disclosure developed from management forecasts (Kim & Park,
2012; Beyer & Dye, 2012; Cheng, Luo, & Yue, 2013). However, attributes of management
forecasts are relatively easy and time-efficient to construct and can be used for large-scale
samples. Also, both continuous and discrete proxies for disclosure can be constructed using
attributes of management forecasts (e.g., Baginski & Rakow, 2012; Bonsall et al., 2013).
2.2 Non-disclosure-based approach
The second measurement approach views disclosure as a latent (unobservable)
variable, and thus measures it through some other (non-disclosure-based) observable
variables such as market-based data and the adoption of high-quality accounting standards.
10 While management earnings forecast disclosure is voluntary in the US market, it is mandatory for Japanese companies listed on a stock exchange (Suto & Takehara, 2018).

24
These observable variables are assumed to relate to the underlying concept (disclosure) that
needs to be measured.
Non-disclosure-based observable variables can be further classified into formative and
reflective variables. The difference between formative and reflective variables is in the
theorized direction of causality between the latent variable and the observable variables (e.g.,
Fayers & Hand, 2002; Jarvis et al., 2003). If the direction of causality is from the latent variable
to the observable variables, and if changes in the latent variable are hypothesized to cause
changes in the observable variables, then these measures are referred to as reflective
variables. If the observable variables are hypothesized to cause changes in the latent variable,
then they are referred to as formative variables. In the context of financial disclosure, possible
examples of reflective variables are disclosure surveys and market-based measures of
disclosure. This is because the direction of causality is hypothesized to be from corporate
financial disclosure to these observable variables. Possible examples of formative variables
are regulatory change, the adoption of high-quality accounting standards, and the use of
American depositary receipts. This is because these observable variables are hypothesized to
cause changes in corporate financial disclosure. Jarvis et al. (2003) provide decision rules for
determining whether a measure is formative or reflective, although they note that answering
the questions associated with these rules may be difficult and the answers may be
contradictory. Although non-disclosure-based measures are less labor-intensive for
researchers to develop because they do not require detailed analysis and coding of disclosure
instruments and can be used for large-scale samples, their relationship with disclosure may
be weak or bidirectional. In addition, using a reduced-form research design, that is not
following the entire causal path between corporate disclosure and the variables of interest,
25
makes the analysis susceptible to omitted variable bias, e.g. the change in the variable of
interest could be triggered by other omitted confounding variables such as institutional
changes and economic shocks (Leuz & Wysocki, 2016). Table 5 provides a summary of
common non-disclosure-based measures identified in the current review of the literature.
<<Insert Table 5 about here>>
2.2.1 Formative measures
(i) Regulatory change that affects disclosure
Many prior studies use a regulatory change event to proxy for a change in disclosure
quantity or quality or both. For example, Zhou (2007) investigates the link between
information asymmetry and increased accounting disclosures following the adoption of new
auditing standards using a dummy variable that takes the value of one if the observation is
from the post-adoption period, and zero otherwise. Wang (2010) uses a dummy variable
equal to zero for the years 1998 through 2001 and one for the years 2002 through 2005 to
proxy for increased internal control disclosures mandated by the Sarbanes-Oxley Act (SOX).
Leuz et al. (2008) analyze the effects of SOX on SEC deregistration and examine the causes
and consequences of a significant and voluntary decrease in a firm’s commitment to
disclosure which they attribute largely to SOX. Bonaimé (2015) uses a categorical variable to
proxy for increased transparency around the 2003 modification to SEC Rule 10b-18, which
mandates enhanced disclosure of repurchase transactions. Other studies (e.g., Herrmann,
Hope, & Thomas, 2008; Canace, Caylor, Johnson, & Lopez, 2010; Chen, Dhaliwal, & Xie, 2010)
examine the consequences of Regulation Fair Disclosure, which prohibits the disclosure of
material non-public information to selected groups or individuals such as financial analysts or

26
institutional investors. These studies use a dummy variable to proxy for the quantity and
quality of disclosure.
The method is easy to use and economical in terms of the time, effort and money
consumed in constructing a proxy for a change in disclosure. Data to construct these variables
either come from the event date or filings or databases containing information related to the
event. However, the variables merely indicate that a change in disclosure either has/has not
taken place, with no attempt to measure the size of this change. In addition, there is no
attempt to assess the actual level of compliance with the regulatory change, which could be
problematic; particularly in the absence of strong enforcement policies. Leuz and Wysocki
(2016) suggest that the observed outcomes around a regulatory change are joint effects of
that change and institutional complementarities such as the auditing supervisory agencies,
and legal remedies. The impact of the institutional settings will also limit the ability to
generalize the outcomes to other environments even if the causal relationship between a
regulatory change and the variables of interest is correctly observed.
(ii) Voluntary use of GAAP (e.g., US GAAP or IFRS) to indicate higher disclosure (GAAP)
Several prior studies construct dummy variables about the voluntary adoption of
GAAP which are used to proxy for higher disclosure (e.g., US GAAP or International Financial
Reporting Standards [IFRS]) versus lower disclosure (local GAAP). For example, Van Tendeloo
and Vanstraelen (2005) examine whether the adoption of IFRS is associated with lower levels
of earnings management using a dummy variable that takes the value of one if the firm
voluntarily adopts IFRS and zero otherwise; this dummy variable is used to proxy for enhanced
financial reporting quality. Another example is Frino et al. (2013) who use the early adoption

27
of IFRS in Italy to proxy for increased disclosure and examine its effect on stock liquidity. A
further example is Wan–Hussin (2009) who use the early adoption of an accounting standard
associated with greater disclosure, namely the disaggregation of accounting information by
business segments to proxy for corporate transparency.
Data to construct the variable can be retrieved from databases, or researchers may
need to inspect companies’ annual reports. These data have the advantage of being relatively
time-efficient to collect and code and can be used for large-scale samples. However, the use
of a dummy variable only splits companies into two mutually exclusive groups where actual
disclosure can still differ among the members of the same group.
2.2.2 Reflective measures
(i) Market–based measures
Market-based measures11 have been used to proxy for disclosure quantity or quality
in prior studies (e.g., Ascioglu et al., 2005; Rogers, 2008; Rogers & Van Buskirk, 2009; Reeb &
Zhao, 2013). For example, Rogers (2008) uses changes in market liquidity to proxy for
disclosure quality based on the argument that high-quality disclosure improves market
liquidity. However, Berger (2011) notes that changes in market liquidity may arise for reasons
other than changes in disclosure quality, that is the omitted variable problem. This problem
can be eliminated by using control variables and validation tests, but the number of control
variables needed might be sizeable. According to Berger (2011), Rogers’ (2008) attempt to
include controls provides some validation for his measure of disclosure.
11 We only provide some examples of market-based disclosure measures; thus, this should not be interpreted as a complete list of these measures.

28
Market-based measures of disclosure have the advantage of being easily obtainable from
databases and can be estimated for large samples. Also, they can be constructed using both
discrete and continuous variables. However, these measures usually suffer from a lack of
theoretical casual path linking them with disclosure. In addition, failure to integrate market
efficiency into the discussion could be a fatal oversight (Verrecchia, 2001). Moreover, the
availability of these measures will be limited to listed companies only which indicates
potential selection bias. Furthermore, market-based measures are noisy measures of
corporate financial disclosure because they are likely to capture both public and private
information, financial and non-financial information, and information provided by the
company and by a third party such as financial analysts and the media. They are also likely to
capture not only a firm’s disclosure practice but also its fundamental characteristics and
performance.
(ii) Disclosure survey
A disclosure survey is an investigation of the perceptions of financial analysts,
investors, or other user groups about firms’ disclosure practices through questionnaires or
interviews (e.g., Nikolaev & Van Lent, 2005; Daske & Gebhardt, 2006; Brown & Hillegeist,
2007; Glaum et al., 2013).
Perhaps the most common example of a disclosure survey in the empirical accounting
literature is that conducted by the Financial Analysts Federation and the Association for
Investment Management and Research (AIMR), where results of these surveys have been
used as proxies for disclosure quantity and quality in many prior US studies (e.g., Dhaliwal,
Khurana, & Pereira, 2011; Huang & Zhang, 2012; Ali, Klasa, & Yeung, 2014). Original scores
about the importance of different disclosures can be also converted into a dummy variable

29
(e.g., Brown & Hillegeist, 2007). However, these scores are now out of date, given that they
were discontinued in 1997 after the fiscal year 1995 (Core, 2001). Since then, several
regulatory changes have taken place in the US that may have an impact on firms’ disclosure
practices (Ertimur, 2007); the earlier survey evidence may therefore be redundant.
Other examples of studies using disclosure survey results in a European context are
those of Daske and Gebhardt (2006) and Glaum et al. (2013). Both studies use quality scores
extracted from competitions for the best annual reports run by business journals to proxy for
disclosure quality.
Disclosure scores constructed by third-party organizations from surveys that they have
conducted are not labor-intensive for a researcher because they are already completed. If the
survey is applicable to a wide range of organisations, they can be employed for a sizable
sample of firms compared to other research methods, such as the self-constructed disclosure
index. Additionally, the scores obtained are usually constructed by using inputs from
professional analysts familiar with the firms’ disclosures, and thus claimed to enable direct
measurement of disclosure quality (Glaum et al., 2013). The scores are also claimed to capture
both the quantity and quality of disclosure since they provide useful information to expert
users of this information (Leuz & Wysocki, 2016). However, this approach is based on analysts’
(or other user groups’) perceptions about firms’ disclosure rather than actual disclosure (Lang
& Lundholm, 1993; Beattie et al., 2004). Moreover, the ratings are potentially biased towards
large firms which tend to feature prominently in the surveys. Additionally, the objectivity of
the views of the investigated user group may be doubted, given that no one will know the
user group’s incentives to supply their ratings and the types of biases that may be present
(Lang, 1999).

30
3. SOME EMIRICAL CHANLLENGES
In this section we discuss some measurement issues related to the development of a
measure of disclosure. These are causal claims and reliability and validity assessment.
3.1 Causal claims
A major empirical issue that most prior empirical studies on corporate financial
disclosure face is the causal claim, whether implicit or explicit, made between corporate
financial disclosure and other observable variables. Such a claim must first be grounded in
theory, that is the causal link between corporate financial disclosure and the observable
variables is established in theory, and properly examined using suitable econometric
methods. Scholars often borrow theories from economics, finance and psychology to
establish a theoretical causal link between corporate financial disclosure and other
observable variables (e.g., Healy & Palepu, 2001; Knooe, Seybert, & Smith, 2011). Gow,
Larcker and Reiss (2016) view that accounting research needs a clear discussion of the
theoretical causal mechanism that is being assumed for the research question and suggest
researchers to use causal diagrams to be very transparent about such claims. However, a lack
of a relevant theory that links corporate financial disclosure with other observable variables
could be an issue. For example, Core (2001, p.449) suggests that tests of a link between
disclosure quality and the cost of capital are joint tests of a theory linking disclosure quality
to information asymmetry and a theory linking information asymmetry to a cost of capital.
Even when a strong theoretical link between corporate financial disclosure and other
observable variables can be established, a causal claim may still not be attainable if the
variables are endogenous. Endogeneity occurs when the explanatory variable correlates with
the error term of the estimation model. This will result in inconsistent and biased estimation

31
of the coefficient of the explanatory variable, that is it does not converge to its true population
value no matter how large the sample size is. This, in turn, means that the effect of the
independent variable on the dependent variable cannot be interpreted. Some scholars shy
away from inferring a causal link between disclosure and other observable variables, claiming
that they are testing for association rather than causation. However, if endogeneity exists,
even a simple correlation between the dependent variable and independent variable cannot
be inferred because the magnitude of the effect can be wrong as well as its sign (Antonakis,
Bendahan, Jacquart, & Lalive, 2010). Endogeneity occurs for a variety of reasons such as
omitting important control variables from the estimation model, omitting fixed effects,
omitting confounding variables, reverse causality, measurement errors in the independent
variables, and model misspecification, among others (Ibid). For example, most disclosure
studies either examine the determinants or consequences of disclosure but not both, which
might fail to account for the full causal chain between disclosure and the variables of interest.
This is called a reduced-form research design, which makes the analysis susceptible to
endogeneity bias.
Examples12 of prior studies which explicitly control for endogeneity bias in corporate
financial disclosure literature are Nikolaev and Van Lent (2005), Lapointe–Antunes et al.
(2006), Altamuro and Beatty (2010), Lim, Matolcsy, and Chow (2007), and Hope and Thomas
(2008). For example, Nikolaev and Van Lent (2005) investigate two sources of endogeneity
bias that affect the estimation of the relation between cost-of-debt capital and disclosure,
namely: unobservable firm heterogeneity and observable omitted variables. They attempt to
12 We were not specifically looking for discussions of endogeneity issue in prior studies when we did our survey, so this is not to be interpreted as a comprehensive list of studies that dealt with this issue in this review.

32
mitigate this endogeneity bias by relying on theory to identify additional variables correlated
with both disclosure and cost-of-debt capital and by applying fixed effects estimation.
Another source of endogeneity bias is reverse causality, which means that the relationship
between corporate financial disclosure and other observable variables could be bi-directional.
For example, Brown and Hillegeist (2007) control for the endogeneity bias caused by a reverse
causality between disclosure quality and information asymmetry by employing a
simultaneous equations approach.
Antonakis et al. (2010) provide an excellent review of the different sources of
endogeneity bias and present methods that allow social scientists to test causal claims in non-
experimental settings where randomization is not possible, such as simultaneous-equation
models, Heckman selection models, regression discontinuity and difference-in-difference
models, among others. Attempts to discuss sources of endogeneity bias in the accounting
literature include Larcker and Rusticus (2010), Tucker (2010), Peel (2014; 2016), Gow et al.
(2016), and Leuz and Wysocki (2016). For example, Larcker and Rusticus (2010) provide some
insights into the use of instrumental variables and simultaneous equations by accounting
researchers to mitigate the biases caused by endogeneity of the predictor variables. Table 1
in their study shows that disclosure research makes use of instrumental variables and
identifies other accounting research areas such as auditing and earnings management. Gow
et al. (2016) evaluate the different approaches accounting researchers adopt to draw causal
inferences from observational data based on a review of all papers published in three leading
accounting journals in 2014. They find that about 90% of these papers seek to draw causal
inferences and that the most common estimation methods used in these studies include
ordinary least-squares regression, difference-in-differences estimates, and propensity-score

33
matching. However, they claim that the assumptions required for these methods to deliver
credible estimates of causal effects are unlikely to be met in many applications that rely on
observational data. They suggest that accounting research would benefit from more in-depth
descriptive research, including a greater focus on the study of causal mechanisms and
increased emphasis on the structural modeling of the phenomena of interest. Leuz and
Wysocki (2016) discuss how all measures of corporate disclosure and reporting share a
fundamental problem which is the need to separate a firm’s reporting from its underlying
economic characteristics and performance. However, corporate economic characteristics,
disclosure policy and performance are co-determined by management strategy, that is
management strategy identifies what a firm does and how it performs, and that the omission
of this variable from the study methodologies causes an endogeneity problem. Leuz and
Wysocki (2016) suggest structural equations modelling, among others, to address this
problem. Tucker (2010) and Peel (2014; 2016) discuss selection bias in accounting research
that is due to both observable and unobservable differences between the selected control
firms and the sample firms in evaluating treatment effects and suggest methods to control
both types of bias.
3.2 Reliability and validity assessment
In our search for measures of corporate financial disclosure, we observe that most
studies tend to use a single measure of disclosure. Some studies use more than one measure
for disclosure to examine different aspects of corporate disclosure or to check the robustness
of their results. For example, Francis et al. (2008) use a disclosure index, as well as four
categories of disclosure within the index, and finally, three alternative measures of voluntary

34
disclosure: management forecast behaviour, number of firm-initiated press releases, and
conference call activity.
However, whether a study uses one or more measures for corporate disclosure, and
whatever the approach or scale used to develop it, it is constructed to approximate a
theoretical concept that is difficult to measure directly. Hence, it is necessary to assess
whether the measure of disclosure employed is a reliable and valid one. If the measure is not
reliable and invalid, the resultant statistical inferences will not be meaningful. Although
assessment of measures of disclosure is discussed to some extent in the accounting literature,
a comprehensive analysis is lacking. Therefore, this section discusses the extent to which
testing for reliability and validity is carried out within papers identified in our systematic
literature review. Table 6 shows a list of the papers that have conducted some sorts of
reliability and validity testing.
<<Insert Table 6 about here>>
3.2.1 Reliability Assessment
Reliability concerns the ability of a measurement instrument (e.g., a disclosure index)
to produce consistent results in repeated trials. It also concerns the internal consistency of a
measurement instrument, that is, the extent to which all parts of a measurement instrument
are measuring the same thing (Carmines & Zeller, 1991). Reliability has three common forms:
test-retest, inter-coder reliability, and internal consistency.
The test-retest measures the stability of the results obtained from a measurement
instrument over time. In terms of textual analysis, for example, stability can be determined
when the same text is coded more than once by the same coder (Weber, 1990, p. 17). Al-Akra
35
and Ali’s (2012) study is one example of how the test-retest approach can be used in manual
coding for a self-constructed disclosure index. They rely on one coder in the coding process,
and to reduce coding error, the annual reports were screened twice with the voluntary
disclosure checklists.
Reproducibility or inter-coder reliability refers to the extent to which content
classification produces the same results when the same text is coded by more than one coder
(Weber, 1990, p. 17). Inter-coder reliability can be measured by the coefficient of agreement
(e.g., Al-Shammari et al., 2008), which is the ratio of the number of pairwise inter-judge
agreements to the total number of pairwise judgements (Beattie et al., 2004, p. 214). The
higher the coefficient obtained, the higher the reliability of the measurement instrument.
Because this measure does not consider the likelihood of random agreement between the
coders, it is not perceived as an adequate measure of inter-rater reliability unless
discrepancies between the coders are scarce or the discrepancies have been analyzed and
any differences have been resolved (e.g., Rogers & Grant, 1997; Milne & Adler, 1999). To
overcome the problem of random agreement between the coders, other measures including
Scott’s pi (e.g., Linsley & Shrives, 2006; Abraham & Cox, 2007), Krippendorff’s alpha (e.g.,
Boesso & Kumar, 2007), Cohen’s kappa (e.g., Hooghiemstra, 2010), and Leigh’s lambda are
used to test for inter-coder reliability (for more details, see Milne & Adler, 1999).
The third form of reliability is internal consistency. Litwin (1995, p. 21) describes
internal consistency as ‘an indicator of how well the different items measure the same issue.
This is important because a group of items that purports to measure one variable should
indeed be clearly focused on that variable’. For example, Hassan et al. (2009), Cormier et al.
(2010), and Elshandidy and Shrives (2016) use Cronbach’s alpha, which is a measure of inter-

36
item correlation, to assess the internal consistency of their measures of disclosure. Cheng and
Courtenay (2006) compute pairwise parametric and non-parametric correlations between all
the components of their disclosure index to assess internal consistency. Similarly, Kelton and
Yang (2008) assess the correlation between the categories of their internet financial reporting
index.
The low level of reliability testing identified within our review is consistent with
research by Beattie and Thomson (2007), who report that reliability issues do not appear to
be addressed in most intellectual capital disclosure studies which they examined. Reliability
tests are mainly performed in studies that use a disclosure index and manual textual analysis.
These types of disclosure measures are susceptible to coder error and judgement. However,
many studies with no apparent reliability testing use a disclosure index or other variables
obtained from company disclosures. Other measures of disclosure are based on third-party
data with less room for coder error and judgement, such as market-based measures of
disclosure. We recommend that researchers should consider the importance of conducting
reliability tests of disclosure measures in future studies, when measures of disclosure are
subject to coder error and judgement.
3.2.2 Validity Assessment
Validity is defined as ‘the extent to which any measuring instrument measures what it
is intended to measure’ (Carmines & Zeller, 1979, p. 17). There are three common types of
validity scrutinised in disclosure studies: content, criterion, and construct.
The first type of validity is content validity. This is assessed by seeking subjective
opinions or judgements from non-experts and/or professionals (hence some refer to it as face

37
validity) about how well the instrument measures what it is intended to measure. In our
systematic review, we find that most cases of content validity testing are conducted in
disclosure index and textual analysis studies. Not surprisingly, these studies use measures of
disclosure that are subject to judgement; hence the authors seek reassurance about the face
validity of their measurements of disclosure. A typical example is Patelli and Prencipe (2007),
who explain that the inclusion of an item in their disclosure checklist is based on a prior study
and is subject to amendment to suit the country in the investigation. They then consult with
three experienced auditors and three financial analysts to test its suitability for the Italian
setting that they are examining. However, this type of validity is never seen as sufficient when
concluding about the validity of a measure. This may be because of concerns about users’
perceptions regarding their own use of the information (Dhaliwal, 1980).
Criterion validity is a measure of how well one instrument compares with another
instrument or “predictor” (Litwin, 1995, p. 37). Criterion validity assesses if there is a
significant correlation between a measure and an external criterion (a desirable outcome).
The higher the magnitude of the correlation coefficient, the more valid this instrument or
measure is for this criterion. There are two types of criterion validity: concurrent and
predictive. The difference between them is the time horizon considered: concurrent validity
concerns the correlation between a measure and the criterion at the same time, whereas
predictive validity concerns the correlation between a future criterion and the relevant
measure. For example, Boesso and Kumar (2007) test the criterion validity of their measure
of voluntary disclosure by correlating the number of observations on social perspectives
obtained through their textual analysis with the number of awards received by the company.
They argue that the greater the emphasis of a company on social activities, the greater the

38
likelihood of being recognized in the form of awards for stakeholder communication by
independent evaluators. Grüning (2011) and Ernstberger and Grüning (2013) provide another
example where their measures of disclosure correlate negatively with measures of
information asymmetry, that is the desired outcomes of enhanced disclosure is to reduce
information asymmetry. However, criterion validity is less likely to be used when assessing
the validity of social science measures. This is because most social science measures represent
theoretical concepts for which there are no known criterion variables available for
comparison. The more abstract the concept, the less likely one is to discover an appropriate
criterion for assessing a measure of it (Carmines & Zeller, 1979, p.20). Therefore, it is not
surprising that in our systematic review we find relatively few examples of this test among
the studies considered.
In contrast to both content validity and criterion validity, construct validity has
generalized applicability in the social sciences. ‘It is concerned with the extent to which a
particular measure relates to other external measures consistent with theoretically derived
hypotheses concerning the concepts (or constructs) that are being measured’ (Carmines &
Zeller, 1979, p. 23). Therefore, testing for the construct validity of a measure of disclosure
involves three steps: (i) to specify the links between the measure of disclosure and some
theoretically related external variables, (ii) to test this theoretical links empirically, and (iii) to
explain how the empirical evidence clarifies the construct validity of the measure of
disclosure, which requires a pattern of consistent findings with prior studies. For example,
Blanco et al. (2014) examine the association between their measure of the quantity of
segment disclosure and common control variables, such as firm size, firm age, profitability,
and leverage, and obtain results that are largely consistent with prior studies, to provide

39
evidence on the construct validity of their measure of disclosure. Additionally, according to
Weber (1990, p. 19), ‘a measure has construct validity to the extent that it is correlated with
some other measures of the same construct13’, provided that these measures are proven to
be reliable and valid measures of that construct. For example, Ernstberger and Grüning (2013)
show that their measure of disclosure has construct validity with respect to other disclosure
rankings; its association with the AIMR rating, Standard & Poor’s transparency disclosure
score and other rating methods is significant.
Although in our systematic review we find some evidence of validity testing, future
researchers should carry out validity tests as a matter of course, otherwise the link between
their proposed measures and corporate financial disclosure might be wrong or misleading.
Overall, Table 6 shows that both the disclosure index and textual analysis methods are heavily
scrutinised for their reliability and validity as measures for financial disclosure, which justifies
more reliance being placed on these measures of disclosure in future studies.
4. DISCUSSION AND RECOMMENDATIONS
The framework for disclosure measurement developed in this study identifies two
approaches: (i) a disclosure-based approach that focuses on investigating actual disclosure,
operationalizes the concept of disclosure by disaggregating it into its main dimensions such
as the quantity and quality of disclosure, and develops methods to measure them, such as
the disclosure index and textual analysis, and (ii) a non-disclosure-based approach that deals
with disclosure as a latent (unobservable) variable that we indirectly observe through the
values of another observable variable(s). These non-disclosure observable variables can be
13 In our view, this definition of construct validity could be seen as a narrower application of the former, as Weber limits the potential external variables to other measures of the same construct only.

40
further classified into formative variables and reflective variables, depending on whether the
measure is a determinant or a consequence of disclosure. Our systematic review shows that
most prior studies tend to use disclosure-based measures rather than non-disclosure-based
measures when investigating disclosure. This is because disclosure-based measures have
concrete links to actual disclosure and their reliability and validity can be extensively assessed
– as in prior studies. Additionally, most measures of disclosure uncovered in our review are
discrete. Discrete measures can be bivariate (0/1 dummies) or multivariate (e.g., disclosure
index). Some non-disclosure-based measures are continuous (e.g., market liquidity).
However, most disclosure proxies merely rank companies relative to each other, that is, there
is no true zero point. Thus, these measures do not possess the characteristics of a ratio scale,
but at best only possess the characteristics of an interval scale. Other measures are merely
ordinal. Whether a measure is discrete or continuous is important because it impacts the type
of econometric analysis that can be employed on the data.
We find that traditional methods for measuring disclosure through direct investigation
of a disclosure vehicle such as the disclosure index method continue to dominate the
literature, with the classification approach being particularly popular. This prevalence seems
to be motivated by ease of coding and the ability to consider large samples. However, the
classification approach only sorts companies into mutually exclusive groups with no attempt
to study variations in the disclosure attribute within each group. To the best of the authors’
knowledge, no new methods are observed that investigate a disclosure vehicle directly, but
new directions in the application of automated textual analysis are observed. For example,
Grüning (2011) uses VSM, a supervised machine learning tool, to analyze phrases rather than
words and to replicate human coding, while Brown and Tucker (2011) use VSM to measure
41
document similarity. Further developments in the artificial intelligence area are expected to
induce improvement in automated textual analysis by providing different units for
investigation and new directions of analysis. For example, the application of the concept of
deep learning in natural language processing could enhance machine coding of textual
sentiment analysis and eliminate human involvement (e.g., Araque, Corcuera-Platas,
Sánchez-Rada, & Iglesias, 2017; Chen, Xu, He, & Wang, 2017b). However, automated textual
analysis methods will never replace careful and close reading of texts given the complexity of
language and research interests in both the intended and unintended information conveyed
by the text (Grimmer & Stewart, 2013; Loughran & McDonald, 2016). Another common
feature of traditional methods is that they focus on individual items of information, key words
or phrases rather than the inter-relationship between them. New visualization methods in
qualitative data analysis software, such as tag clouds, tree maps, cluster analysis, and word
trees, will help researchers to see the patterns and connections in their data and gain more
insight about the disclosures.
The non-disclosure-based measurement approach considers a range of observable
variables that are related to financial disclosure, such as market-based measures. The non-
disclosure-based measures are used to reflect on the different dimensions of financial
disclosure such as its quality and quantity. The measures are relatively less labor-intensive for
researchers because these they do not require detailed analysis and coding of the disclosure
instruments. Data are mostly retrieved and coded from databases, thus enabling the usage of
large-scale samples. This may be a pragmatic response to the preference given to large
samples by US–based journals. However, the link between these observable variables and
financial disclosure may be weak or bidirectional, thus they should be treated with caution.

42
In addition, an estimation model that involves these variables is likely to suffer from
endogeneity bias for different reasons such as reduced-form research design.
We also discuss some empirical challenges related to causal claims and the reliability
and validity assessment of measures of disclosure. To make a causal claim between a
measure of disclosure and other observable variables, a full theoretical causal path must be
grounded in theory and properly examined using suitable econometric methods. However,
the theoretical link between disclosure and other observable variables might be weak or
bidirectional and the research model might be susceptible to endogeneity bias. If endogeneity
exists, scholars must deal with it, otherwise their results cannot be interpreted. Antonakis et
al. (2010) provide an excellent review of the different sources of the endogeneity problem
and present methods that allow social scientists to test causal claims in non-experimental
settings where randomization is not possible. In addition, the Granger causality test might
statistically help to detect the direction of causation (Gujarati, 2010) for temporal data, but
the results of this test are sensitive to the number of lags included. While there are some
attempts to discuss sources of endogeneity bias in accounting research in general (e.g.,
Larcker & Rusticus, 2010; Tucker, 2010; Peel, 2016; Gow et al., 2016; Leuz & Wysocki, 2016)
to date, a comprehensive review of causal claims in corporate financial disclosure literature
is lacking. Due to the gravity of this issue and how false inferences from empirical studies
could impact business practice and policy formulation at firm level and national and
international levels, future research might consider reviewing causal claims in prior empirical
financial disclosure studies and their methodological rigor.
Finally, we document a low level of reliability and validity testing within papers
identified in our systematic literature review. Reliability and validity tests are mainly

43
performed in studies employing either textual analysis or the disclosure index method to
measure disclosure. Furthermore, these two methods have the advantages of being
disclosure-based and flexible measures of disclosure; hence they could be considered
superior to other measures of disclosure. However, ‘reliability’ and ‘validity’ are typically
perceived as inversely related (Deffner, 1986). For instance, while human coding shows
greater validity because coding can be linked to the underlying construct, it is subject to
judgement and coding errors which could reduce its reliability. Therefore, while validity
assessment will continue to be essential for all measures of financial disclosure in future
research because they are developed to measure a construct that cannot be measured
directly, reliability assessment will only be an issue for the measures that are subject to
coders’ judgment and errors. In addition, researchers should be cautious because validity is
context-specific, that is what could be a valid measure for corporate financial disclosure in
one context might be invalid in a different context.
A current phenomenon of research into corporate financial disclosure is that it often
fails to state explicitly the dimension of disclosure it is investigating (e.g., quantity, quality,
tone, prominence, etc.). This is problematic because different measures of disclosure may
only be appropriate for investigating specific dimensions of disclosure. For example, while
textual analysis could be a suitable method to measure the extent of disclosure, a
classification method would be more suitable to examine the prominence given to certain
disclosures. Additionally, different inferences can be drawn about different dimensions of the
same type of disclosure. For example, some prior studies use disclosure quantity (e.g., Cheung
et al., 2010; Mouselli et al., 2012) as a proxy for disclosure quality, although the quantity and
the quality measures may lead to different rankings for one sample of companies. In addition,

44
the concept of disclosure quality is subjective and what constitutes quality is still a research
question (e.g., Core, 2001; Botosan, 2004; Beattie et al., 2004). Also, more disclosure
(quantity) can come at the cost of quality if it hinders readability and increases complexity.
Therefore, future researchers should be explicit about the exact dimension(s) of financial
disclosure they are investigating and whether the measure of disclosure being employed is,
in fact, measuring what it seeks to measure. Additionally, some methods or measures of
disclosure are limited in their scope (either numbers or texts) such as textual analysis which
focuses on analyzing texts, whereas properties of reported earnings approach focus on
accounting numbers only. Therefore, inferences obtained from such metrics should be
qualified to reflect their limitations. Furthermore, prior studies have tried to develop proxies
for the different dimensions of financial disclosure such as transparency, complexity,
quantity, quality, tone, etc. However, a comprehensive list of the necessary and sufficient
dimensions of disclosure is lacking, which future research might seek to develop.
Whether a measure of disclosure can be used to assess voluntary or mandatory
disclosure is another issue that a researcher needs to consider. Most disclosure-based
measures have the flexibility to be applied to different types of disclosure. However, while
manual coding can possibly account for different types of disclosure being studied, machine
coding is less able to distinguish between the two types of disclosure based on a search of
some key words or targeted phrases. This problem can be mitigated if the document is only
covering one type of disclosure. On the other hand, some measures are linked to a specific
type of disclosure such as the properties of reported earnings, which relate to financial
reporting regulations. Others, such as a disclosure survey (Beyer et al., 2010), can capture
both voluntary and mandatory disclosures. Therefore, future researchers should be clear

45
about their choice of disclosure measure and consider whether it is solely identifying the
specific type of disclosure they aim to measure.
Another related issue to consider is the time orientation of information disclosure,
that is whether it is historical information, concurrent information or forward-looking
information. Some measures of disclosure can be used to reflect on these different aspects
of disclosure such as the disclosure index and textual analysis methods. Other measures of
disclosure can only reflect on a specific type of information. For example, attributes of
management forecasts are measures for forward-looking information, while properties of
reported earnings are reflecting on historical information. Thus, understanding the time
orientation of information disclosure is important to define a suitable measure for disclosure.
Additionally, the content of disclosure could vary, which might cause different proxies of the
same attribute of the same type of disclosure to behave differently in empirical analysis. For
example, Francis et al. (2008) find that various measures of the level of voluntary disclosure
(self-constructed disclosure index, management forecast behavior, press releases,
conference calls) do not produce consistent results in their relations with earnings quality and
cost of capital. They suggest that these different measures of the extent of voluntary
disclosure are likely to capture different forms of voluntary disclosure (forward-looking
information supplied by management; contemporaneous discussion of results in conference
calls; an overall index of voluntary disclosure in mandatory filings) that have different content
and are likely to be motivated by different managerial incentives.
Given the several aspects of financial disclosure that are at play, and the considerable
number of measures of financial disclosure identified in our paper, there is a scope for further
research into how the different measures, all other things being equal, compare with one

46
another. It would be interesting to obtain or calculate as many proxies of disclosure as
possible for a carefully selected sample of companies. Analysis could then be carried out to
see how the different proxies compare in one period and over time. Future research might
also investigate the interactions between the different dimensions, the different time
orientation and the different types of disclosure, their determinants and consequences, and
how they compare. For example, how does the quality of concurrent voluntary disclosure
compare to the quality of forward-looking voluntary disclosure? And which one is better able
to explain changes in firm value for example, and why? How does the tone or complexity of
concurrent voluntary disclosure compare to that of concurrent mandatory disclosure? Which
type of information disclosure tends to be more complex and why?
To conclude, the concept of corporate financial disclosure is inherently
complex. Corporate financial disclosure has different types (mandatory and voluntary),
different vehicles (e.g., company reports, conference calls and press release), different time
orientations (e.g., historical data, concurrent data, forward–looking data), different
dimensions (e.g., quality, quantity, tone, and prominence), and different formats (e.g.,
numbers and texts). The different aspects of corporate financial disclosure are probably
impossible to unequivocally and conclusively determine. Consequently, all measurement, to
some extent, is inevitably subjective and partial. This paper identifies 11 common measures
of disclosure that a researcher can choose from depending on the purpose of study, data
availability and economic factors in terms of time, effort and money needed to develop a
measure of disclosure. However, more work is needed to develop innovative and diverse
research methods that can capture the richness of the concept of financial disclosure. New
methods need not be sophisticated if simple methods can address the research question(s).

47
Scholars introducing new methods to the literature should explain them in detail to make
their results replicable.
ACKNOWLEDGEMENT
The authors wish to thank two anonymous referees, Emeritus Professor Pauline Weetman,
University of Edinburgh, Dr Peter Romilly, Ecmetrika Consultancy & Research, Professor David
M. Power, University of Dundee, and Professor Louise Crawford, Robert Gordon University
for their constructive and detailed feedback. Remaining errors are the responsibility of the
authors.
REFERENCES
Abraham, S., & Cox, P. (2007). Analysing the determinants of narrative risk information in UK FTSE 100 annual reports. The British Accounting Review, 39(3), 227–248. Abrahamson, E., & Amir, E. (1996). The information content of the president’s letter to shareholders. Journal of Business Finance & Accounting, 23(80), 1157–1182.
Adhikari, A., & Duru, A. (2006). Voluntary disclosure of free cash flow information. Accounting Horizons, 20(4), 311–332.
Akhtaruddin, M. (2005). Corporate mandatory disclosure practices in Bangladesh. The International Journal of Accounting, 40(4), 399–422. Al-Akra, M., & Ali, M. J. (2012). The value relevance of corporate voluntary disclosure in the Middle–East: The case of Jordan. Journal of Accounting and Public Policy, 31(5), 533–549. Al-Akra, M., Eddie, I. A., & Ali, M. J. (2010a). The influence of the introduction of accounting disclosure regulation on mandatory disclosure compliance: Evidence from Jordan. The British Accounting Review, 42 (3), 170-186. Al-Akra, M., Eddie, I. A., & Ali, M. J. (2010b). The association between privatisation and voluntary disclosure: Evidence from Jordan. Accounting and Business Research, 40 (1), 55-74. Ali, A., Chen, T., & Radhakrishnan, S. (2007). Corporate disclosures by family firms. Journal of Accounting and Economics, 44(1–2), 238–286.
Ali, A., Klasa, S., & Yeung, E. (2014). Industry concentration and corporate disclosure policy. Journal of Accounting and Economics, 58(2–3), 240-264.

48
André, P., Filip, A., & Moldovan, R. (2016). Segment disclosure quantity and quality under IFRS 8: Determinants and the effect on financial analysts' earnings forecast errors. The International Journal of Accounting, 51(4), 443-461. Al-Shammari, B., Brown, P., & Tarca, A. (2008). An investigation of compliance with international accounting standards by listed companies in the Gulf Co-operation Council member states. The International Journal of Accounting, 43(4), 425–447.
Altamuro, J., & Beatty, A. (2010). How does internal control regulation affect financial reporting? Journal of Accounting and Economics, 49(1–2), 58–74.
Antonakis, J., Bendahan, S., Jacquart, P., & Lalive, R. (2010). On making causal claims: A review and recommendations. The Leadership Quarterly, 21(6), 1086-1120. Araque, O., Corcuera-Platas, I., Sánchez-Rada, J. F., & Iglesias, C. A. (2017). Enhancing deep learning sentiment analysis with ensemble techniques in social applications. Expert Systems with Applications, 77, 236–246. Arping, S., & Sautner, Z. (2013). Did SOX section 404 make firms less opaque? Evidence from cross–listed firms. Contemporary Accounting Research, 30(3), 1133–1165. Ascioglu, A., Hegde, S. P., & McDermott, J. B. (2005). Auditor compensation, disclosure quality, and market liquidity: Evidence from the stock market. Journal of Accounting and Public Policy, 24(4), 325–354.
Association of Business Schools (2015). Academic Journal Guide 2015. London: The Association of Business Schools.
Baginski, S. P., Clinton, S. B., & Mcguire, S. T. (2014). Forward-looking voluntary disclosure in proxy contests. Contemporary Accounting Research, 31(4), 1008–1046. Baginski, S.P., & Rakow, K. (2012). Management earnings forecast disclosure policy and the cost of equity capital. Review of Accounting Studies, 17(2), 279-321. Bamber, L.S., Hui, K.W., & Yeung, P.E. (2010). Managers' EPS forecasts: Nickeling and diming the market? The Accounting Review, 85(1), 63-95. Bazrafshan, E., Kandelousi, A. S., & Hooy, C. (2016). The impact of earnings management on the extent of disclosure and true financial performance: Evidence from listed firms in Hong Kong. The British Accounting Review, 48(2), 206–219. Beattie, V. (2014). Accounting narratives and the narrative turn in accounting research: Issues, theory, methodology, methods and a research framework. The British Accounting Review, 46(2), 111-134.
Beattie, V., & Thomson, S. (2007). Lifting the lid on the use of content analysis to investigate intellectual capital disclosures. Accounting Forum, 31(2), 129–163.

49
Beattie, V., McInnes, W., & Fearnley, S. (2004). A methodology for analysing and evaluating narratives in annual reports: A comprehensive descriptive profile and metrics for disclosure quality attributes. Accounting Forum, 28(3), 205–236.
Beneish, M. D., Billings, M. B., & Hodder, L. D. (2008). Internal control weaknesses and information uncertainty. The Accounting Review, 83(3), 665–703. Berger, P. G. (2011). Challenges and opportunities in disclosure research—A discussion of “The Financial Reporting Environment: Review of the Recent Literature”. Journal of Accounting and Economics, 51(1–2), 204–218. Bergman, N. K., & Roychowdhury, S. (2008). Investor sentiment and corporate disclosure. Journal of Accounting Research, 46(5), 1057–1083.
Bernard, D. (2016). Is the risk of product market predation a cost of disclosure? Journal of Accounting and Economics, 62(2–3), 305-325. Beyer, A., & Dye, R. A. (2012). Reputation management and the disclosure of earnings forecasts. Review of Accounting Studies, 17(4), 877–912. Beyer, A., Cohen, D. A., Lys, T. Z., & Walther, B. R. (2010). The financial reporting environment: Review of the recent literature. Journal of Accounting and Economics, 50(2–3), 296–343. Blanco, B., Lara, J. M. G., & Tribó, J. (2014). The relation between segment disclosure and earnings quality. Journal of Accounting and Public Policy, 33(5), 449–469. Boesso, G., & Kumar, K. (2007). Drivers of corporate voluntary disclosure: A framework and empirical evidence from Italy and the United States. Accounting, Auditing & Accountability Journal, 20(2), 269–296.
Bonaimé, A. A. (2015). Mandatory disclosure and firm behavior: Evidence from share repurchases. The Accounting Review, 90(4), 1333–1362. Bonsall, S. B., Bozanic, Z., & Fischer, P.E. (2013). What do management earnings forecasts convey about the macroeconomy? Journal of Accounting Research, 51(2), 225–266. Botosan, C. A. (2004). Discussion of ‘A Framework for the Analysis of Firm Risk Communication’. The International Journal of Accounting, 39(3), 289–95.
Botosan, C. A., & Stanford, M. (2005). Withhold segment disclosures and the effect of SFAS no. 131 on analysts' information environment. The Accounting Review, 80(3), 751–771.
Bowen, R. M., Davis, A. K., & Matsumoto, D. A. (2005). Emphasis on pro forma versus GAAP earnings in quarterly press releases: Determinants, SEC intervention, and market reactions. The Accounting Review, 80(4), 1011–1038.
Breton, G., & Taffler, R. J. (2001). Accounting information and analyst stock recommendation decisions: A content analysis approach. Accounting and Business Research, 31(2), 91–101.

50
Brochet, F., Loumioti, M., & Serafeim, G. (2015). Speaking of the short–term: Disclosure horizon and managerial myopia. Review of Accounting Studies, 20(3), 1122–1163. Brochet, F., Naranjo, P., & Yu, G. (2016). The capital market consequences of language barriers in the conference calls of non–U.S. firms. The Accounting Review, 91(4), 1023–1049. Brown, S. V., & Tucker, J. W. (2011). Large-sample evidence on firms’ year-over-year MD&A modifications. Journal of Accounting Research, 49(2), 309–346. Brown, S., & Hillegeist, S. A. (2007). How disclosure quality affects the level of information asymmetry. Review of Accounting Studies, 12(2–3), 443–477.
Canace, T. G., Caylor, M. L., Johnson, P. M., & Lopez, T. J. (2010). The effect of regulation fair disclosure on expectations management: International evidence. Journal of Accounting and Public Policy, 29(5), 403–423.
Cannizzaro, A. P., & Weiner, R. J. (2015). Multinational investment and voluntary disclosure: Project–level evidence from the petroleum industry. Accounting, Organizations and Society, 42, 32–47. Carcello, J. V., Hollingsworth, C. W., & Neal, T. L. (2006). Audit committee financial experts: A closer examination using firm designations. Accounting Horizons, 20(4), 354–373.
Carmines, E. G., & Zeller, R. A. (1979). Reliability and Validity Assessment. London: Sage.
Cerf, A. R. (1961). Corporate Reporting and Investment Decisions. Berkeley: University of California Press.
Chen, F., Hope, O., Li, Q., & Wang, X. (2011). Financial reporting quality and investment efficiency of private firms in emerging markets. The Accounting Review, 86(4), 1255–1288. Chen, J. J., Cheng, X., Gong, S. X., & Tan, Y. (2017a). Implications of political patronage and political costs for corporate disclosure: Evidence from the Shanghai pension corruption scandal. Journal of Accounting, Auditing & Finance, 32(1), 92–122. Chen, S., Miao, B., & Shevlin, T. (2015). A new measure of disclosure quality: The level of disaggregation of accounting data in annual reports. Journal of Accounting Research, 53(5), 1017–1054. Chen, T., Xu, R., He, Y., & Wang, X. (2017b). Improving sentiment analysis via sentence type classification using BiLSTM–CRF and CNN. Expert Systems with Applications, 72, 221–230. Chen, Z., Dhaliwal, D. S., & Xie, H. (2010). Regulation fair disclosure and the cost of equity capital. Review of Accounting Studies, 15(1), 106–144.
Cheng, E. C. M., & Courtenay, S. M. (2006). Board composition, regulatory regime and voluntary disclosure. The International Journal of Accounting, 41(3), 262–289.

51
Cheng, Q., Luo, T., & Yue, H. (2013). Managerial incentives and management forecast precision. The Accounting Review, 88(5), 1575–1602. Cheung, Y., Jiang, P., & Tan, W. (2010). A transparency disclosure index measuring disclosures: Chinese listed companies. Journal of Accounting and Public Policy, 29(3), 259–280.
Cho, Y. J. (2015). Segment disclosure transparency and internal capital market efficiency: Evidence from SFAS No. 131. Journal of Accounting Research, 53(4), 669-723. Clarkson, P. M., Kao, J. L., & Richardson, G. D. (1994). The voluntary inclusion of forecasts in the MD&A section of annual reports. Contemporary Accounting Research, 11 (I–II), 423– 450. Cole, C. J., & Jones, C. L. (2015). The quality of management forecasts of capital expenditures and store openings in MD&A. Journal of Accounting, Auditing & Finance, 30(2), 127–149. Cooke, T. E., & Wallace, R. S. O. (1989). Global surveys of corporate disclosure practices and audit firms: A review essay. Accounting and Business Research, 47–57.
Core, J. E. (2001). A Review of the empirical disclosure literature. Journal of Accounting and Economics, 31 (1–3), 441–456.
Cormier, D., Aerts, W., Ledoux, M., & Magnan, M. (2010). Web–based disclosure about value creation processes: A monitoring perspective. Abacus, 46(3), 320–347.
Cuny, C. (2016). Voluntary disclosure incentives: Evidence from the municipal bond market. Journal of Accounting and Economics, 62(1), 87-102. Çürük, T. (2009). An analysis of the companies’ compliance with the EU disclosure requirements and corporate characteristics influencing it: A case study of Turkey. Critical Perspectives on Accounting, 20(5), 635–650. Dargenidou, C., Mcleay, S., & Raonic, I. (2006). Expected earnings growth and the cost of capital: An analysis of accounting regime change in the European financial market. Abacus, 42(3–4), 388–414.
Daske, H., & Gebhardt, G. (2006). International financial reporting standards and experts’ perceptions of disclosure quality. Abacus, 42(3–4), 461–498.
Debreceny, R., & Rahman, A. (2005). Firm–specific determinants of continuous corporate disclosures. The International Journal of Accounting, 40(3), 249–278.
Dechow, P., Ge, W., & Schrand, C. (2010). Understanding earnings quality: A review of the proxies, their determinants and their consequences. Journal of Accounting and Economics, 50(2–3), 344-401. Deffner, G. (1986). Microcomputers as aids in Gottschalk–Gleser rating. Psychiatry Research, 18(2), 151–159.

52
Desir, R. (2012). How do managers of non-announcing firms respond to intra-industry information transfers? Journal of Business Finance & Accounting, 39(9-10), 1180–1213. Dhaliwal, D. S. (1980). Improving the quality of corporate financial disclosure. Accounting and Business Research, 385–391.
Dhaliwal, D. S., Khurana, I.K., & Pereira, R. (2011). Firm disclosure policy and the choice between private and public debt. Contemporary Accounting Research, 28(1), 293-330. Easley, D., & O’Hara, M. (2004). Information and the cost of capital. Journal of Finance, 69, 1553–1583.
Elshandidy, T., & Shrives, P. J. (2016). Environmental incentives for and usefulness of textual risk reporting: Evidence from Germany’, The International Journal of Accounting, 51(4), 464–486. Elshandidy, T., Fraser, I., & Hussainey, K. (2015). What drives mandatory and voluntary risk reporting variations across Germany, UK and US? The British Accounting Review, 47(4), 376-394. Entwistle, G. M., Feltham, G.D., & Mbagwu, C. (2006). Financial reporting regulation and the reporting of pro forma earnings’. Accounting Horizons, 20(1), 39–55. Ernstberger, J., & Grüning, M. (2013). How do firm- and country-level governance mechanisms affect firms’ disclosure? Journal of Accounting and Public Policy, 32(3), 50–67. Ertimur, Y. (2007). Discussion of “How Disclosure Quality Affects the Level of Information Asymmetry”. Review of Accounting Studies, 12(2–3), 479–485.
Fayers, P. M., & Hand, D. J. (2002). Causal variables, indicator variables and measurement scales: An example from quality of life, Journal of the Royal Statistical Society: Series A (Statistics in Society), 165(2), 233–261.
Feldman, R., Govindaraj, S., Livnat, J., & Segal, B. (2010). Management’s tone change, post earnings announcement drift and accruals. Review of Accounting Studies, 15(4), 915–953.
Files, R. (2012). SEC enforcement: Does forthright disclosure and cooperation really matter? Journal of Accounting and Economics, 53(1–2), 353–374. Files, R., Swanson, E. P., & Tse, S. (2009). Stealth disclosure of accounting restatements. The Accounting Review, 84(5), 1495–1520.
Filip, A., Labelle, R., & Rousseau, S. (2015). Legal regime and financial reporting quality. Contemporary Accounting Research, 32(1), 280–307. Filzen, J. J., & Peterson, K. (2015). Financial statement complexity and meeting analysts’ expectations. Contemporary Accounting Research, 32(4), 1560–1594.

53
Francis, J., Nanda, D., & Olsson, P. (2008). Voluntary disclosure, earnings quality, and cost of capital. Journal of Accounting Research, 46(1), 53–99.
Frazier, K. B., Ingram, R. W., & Tennyson, B. M. (1984). A methodology for the analysis of narrative accounting disclosures. Journal of Accounting Research, 22(1), 318–331.
Frino, A., Palumbo, R., Capalbo, F., Gerace, D., & Mollica, V. (2013). Information disclosure and stock liquidity: Evidence from Borsa Italiana. Abacus, 49(4), 423–440. Fu, R., Kraft, A., & Zhang, H. (2012). Financial reporting frequency, information asymmetry, and the cost of equity. Journal of Accounting and Economics, 54(2–3), 132–149. Ge, W., & McVay, S. (2005). The disclosure of material weaknesses in internal control after the Sarbanes–Oxley Act. Accounting Horizons, 19(3), 137–158.
Gibbins, M., Richardson, A., & Waterhouse, J. (1990). The management of corporate financial disclosure: Opportunism, ritualism, policies, and processes. Journal of Accounting Research, 28(1), 121–143.
Gillan, S. L., & Panasian, C. A. (2014). On litigation risk and disclosure complexity: Evidence from Canadian firms cross-listed in the US. The International Journal of Accounting, 49(4), 426-454. Glaum, M., Baetge, J.R., Grothe, A., & Rster, T.O. (2013). Introduction of international accounting standards, disclosure quality and accuracy of analysts’ earnings forecasts. European Accounting Review, 22(1), 79–116. Goertz, G. (2008). Concepts, theories and numbers: A checklist for constructing, evaluating and using concepts or quantitative measures. In J. M. Box–Steffensmeier, H. E. Brady, & D. Collier (eds), The Oxford handbook of political methodology (pp. 97–118). Oxford: Oxford University Press.
Gow, I.D., Larcker, D.F., & Reiss, P.C. (2016). Causal inference in accounting research. Journal of Accounting Research, 54(2), 477-523. Grimmer, J., & Stewart, B. (2013). Text as data: The promise and pitfalls of automatic content analysis methods for political texts. Political Analysis, 21(3), 267-297. Grüning, M. (2011). Artificial intelligence measurement of disclosure (AIMD). European Accounting Review, 20(3), 485–519. Gu, F., & Li, J. Q. (2007). The credibility of voluntary disclosure and insider stock transactions. Journal of Accounting Research, 45(4), 771–810.
Guedhami, O., & Pittman, J. A. (2006). Ownership concentration in privatized firms: The role of disclosure standards, auditor choice, and auditing infrastructure. Journal of Accounting Research, 44(5), 889–929.

54
Guo, L., Shi, L., & Tu, J. (2016). Textual analysis and machine leaning: Crack unstructured data in finance and accounting. The Journal of Finance and Data Science, 2(3), 153-170.
Gujarati, D. N. (2010). Essentials of econometrics. New York: McGraw–Hill.
Han, S., Kang, T., & Yoo, Y. K. (2012). Governance role of auditors and legal environment: Evidence from corporate disclosure transparency. European Accounting Review, 21(1), 29–50. Hair, J.F., Wolfinbarger, M., Money, A.H, & Samouel, P. (2011). Essentials of business research methods paperback. (2nd ed.). London: M.E. Sharpe, Inc. Hassan, O. A. G., Romilly, P., Giorgioni, G., & Power, D. (2009). The value relevance of disclosure: Evidence from the emerging capital market of Egypt. The International Journal of Accounting, 44(1), 79–102.
Healy, P. M., & Palepu, K. G. (2001). Information asymmetry, corporate disclosure, and the capital markets: A review of the empirical disclosure literature. Journal of Accounting and Economics, 31(1–3), 405–440.
Herrmann, D. R., Hope, O., & Thomas, W. B. (2008). International diversification and forecast optimism: The effects of Reg FD. Accounting Horizons, 22(2), 179–197.
Hodgdon, C., Tondkar, R. H., Adhikari, A., & Harless, D. W. (2009). Compliance with international financial reporting standards and auditor choice: New evidence on the importance of the statutory audit. The International Journal of Accounting, 44(1), 33–55.
Hollander, S., Pronk, M., & Roelofsen, E. (2010). Does silence speak? An empirical analysis of disclosure choices during conference calls. Journal of Accounting Research, 48(3), 531–563.
Hooghiemstra, R. (2010). Letters to the shareholders: A content analysis comparison of letters written by CEOs in the United States and Japan. The International Journal of Accounting, 45(3), 275–300.
Hope, O., & Thomas, W. B. (2008). Managerial empire building and firm disclosure. Journal of Accounting Research, 46(3),591-626. Huang, P., & Zhang, Y. (2012). Does enhanced disclosure really reduce agency costs? Evidence from the diversion of corporate resources. The Accounting Review, 87(1), 199–229. Jarvis, C. B., MacKenzie, S. B., & Podsakoff, P. M. (2003). A critical review of construct indicators and measurement model misspecification in marketing and consumer research. Journal of Consumer Research, 30(2), 199–218.
Jones, M. J., & Shoemaker, P. A. (1994). Accounting narrative: A review of empirical studies of content and readability. Journal of Accounting Literature, 13, 142–184.
Kelton, A. S., & Yang, Y. (2008). The impact of corporate governance on internet financial reporting. Journal of Accounting and Public Policy, 27(1), 62–87.

55
Kim, I., & Venkatachalam, M. (2011). Are sin stocks paying the price for accounting sins? Journal of Accounting, Auditing & Finance, 26(2), 415–442. Kim, Y., & Park, M.S. (2012). Are all management earnings forecasts created equal? Expectations management versus communication. Review of Accounting Studies, 17(4), 807–847. Kimbrough, M. D. (2005). The effect of conference calls on analyst and market underreaction to earnings announcements. The Accounting Review, 80(1), 189–219.
Kirk, M. P., & Vincent, J. D. (2014). Professional investor relations within the firm. The Accounting Review, 89(4), 1421-1452. Kearney, C., & Liu, S. (2014). Textual sentiment in finance: A survey of methods and models. International Review of Financial Analysis, 33(3),171-185. Kitagawa, N., & Okuda, S. (2016). Management forecasts, idiosyncratic risk, and the information environment. The International Journal of Accounting, 51(4), 487–503. Koh, K., Rajgopal, S., & Srinivasan, S. (2013). Non-audit services and financial reporting quality: Evidence from 1978 to 1980. Review of Accounting Studies, 18(1), 1–33. Koonce, I., Seybert, N., & Smith, J. (2011). Causal reasoning in financial reporting and voluntary disclosure. Accounting, Organizations and Society, 36(4–5), 209-225.
Kothari, S. P., Li, X., & Short, J. E. (2009). The effect of disclosures by management, analysts, and business press on cost of capital, return volatility, and analyst forecasts: A study using content analysis. The Accounting Review, 84(5), 1639–1670.
Kou, W., & Hussain, S. (2007). Predictive gains to segmental disclosure matrices, geographic information and industry sector comparability. The British Accounting Review, 39(3), 183–195.
Kravet, T., & Muslu, V. (2013). Textual risk disclosures and investors’ risk perceptions. Review of Accounting Studies, 18(4), 1088–1122. Krippendorff, K. (1980). Content analysis: An introduction to its methodology. London: Sage.
Krishnan, J., Wen, Y., & Zhao, W. (2011). Legal expertise on corporate audit committees and financial reporting quality. The Accounting Review, 86(6), 2099–2130. Lang, M., Lins, K. V., & Maffett, M. (2012). Transparency, liquidity, and valuation: International evidence on when transparency matters most. Journal of Accounting Research, 50(3), 729-774. Lang, M. H., & Lundholm, R. J. (1993). Cross–sectional determinants of analyst ratings of corporate disclosures. Journal of Accounting Research, 31(2), 246–271.

56
Lang, M. H., & Lundholm, R. J. (1996). Corporate disclosure policy and analyst behavior. The Accounting Review, 71(4), 467–492.
Lang, M.H. (1999). Discussion of “Stock Performance and Intermediation Changes Surrounding Sustained Increases in Disclosure”. Contemporary Accounting Research, 16(3), 521–524.
Lapointe–Antunes, P., Cormier, D., Magnan, M., & Gay-Angers, S. (2006). On the relationship between voluntary disclosure, earnings smoothing and the value-relevance of earnings: The case of Switzerland. European Accounting Review, 15(4), 465–505.
Larcker, D.F., & Rusticus, T.O. (2010). On the use of instrumental variables in accounting research. Journal of Accounting and Economics, 49(3), 186-205.
Leuz, C., Triantis, A., & Wang, T. Y. (2008). Why do firms go dark? causes and economic consequences of voluntary SEC deregistrations. Journal of Accounting and Economics, 45(2–3), 181–208.
Leuz, C., & Wysocki, P. (2016). The economics of disclosure and financial reporting regulation: Evidence and suggestions for future research. Journal of Accounting Research, 54(2), 525-622. Levine, C. B., & Smith, M. J. (2011). Critical accounting policy disclosures. Journal of Accounting, Auditing & Finance, 26(1), 39-76. Li, F. (2010a). Textual analysis of corporate disclosures: A survey of the literature. Journal of Accounting Literature, 29, 143–65. Li, F. (2010b). The information content of forward-looking statements in corporate filings— A Naive Bayesian machine learning algorithm approach. Journal of Accounting Research, 48, 1049–1102.
Li, S. (2010c). Does mandatory adoption of international financial reporting standards in the European union reduce the cost of equity capital? The Accounting Review, 85(2), 607–636.
Lim, S., Matolcsy, Z., & Chow, D. (2007). The Association between board composition and different types of voluntary disclosure. European Accounting Review, 16(3), 555–583. Linsley, P. M., & Shrives, P. J. (2006). Risk reporting: A study of risk disclosures in the annual reports of UK companies. The British Accounting Review, 38(4), 387–404.
Litwin, M. S. (1995). How to measure survey reliability and validity. London: Sage.
Loughran, T., & McDonald, B. (2016). Textual analysis in accounting and finance: a survey. Journal of Accounting Research, 54(4), 1187-1230. Lu, H., Richardson, G., & Salterio, S. (2011). Direct and indirect effects of internal control weaknesses on accrual quality: Evidence from a unique Canadian regulatory setting. Contemporary Accounting Research, 28(2), 675–707.

57
Mangena, M., Li, J., & Tauringana, V. (2016). Disentangling the effects of corporate disclosure on the cost of equity capital: A study of the role of intellectual capital disclosure. Journal of Accounting, Auditing & Finance, 31(1), 3–27. Marquardt, C. A., & Wiedman, C. I. (2007). Disclosure, incentives, and contingently convertible securities. Accounting Horizons, 21(3), 281-294. Marques, A. (2006). SEC interventions and the frequency and usefulness of non–GAAP financial measures. Review of Accounting Studies, 11(4), 549–574.
Marques, A. (2010). Disclosure strategies among S&P 500 firms: Evidence on the disclosure of non-GAAP financial measures and financial statements in earnings press releases. The British Accounting Review, 42(2), 119–131.
Marston, C. L., & Shrives, P. J. (1991). The use of disclosure indices in accounting research: A review article. The British Accounting Review, 23(3), 195–210.
Melis, A., Gaia, S., & Carta, S. (2015). Directors' remuneration: A comparison of Italian and UK non–financial listed firms' disclosure. The British Accounting Review, 47(1), 66–84. Merkley, K. J. (2014). Narrative disclosure and earnings performance: Evidence from R&D disclosures. The Accounting Review, 89(2), 725–757. Miihkinen, A. (2012). What drives quality of firm risk disclosure? The impact of a national disclosure standard and reporting incentives under IFRS. The International Journal of Accounting, 47(4), 437–468. Milne, M. J., & Adler, R. W. (1999). Exploring the reliability of social and environmental disclosures content analysis. Accounting, Auditing & Accountability Journal, 12(2), 237–256.
Mouselli, S., Jaafar, A., & Hussainey, K. (2012). Accruals quality vis-à-vis disclosure quality: Substitutes or complements? The British Accounting Review, 44(1), 36–46. Nagy, A. L. (2010). Section 404 compliance and financial reporting quality. Accounting Horizons, 24(3), 441–454.
Nelson, M. W., & Rupar, K. K. (2015). Numerical formats within risk disclosures and the moderating effect of investors' concerns about management discretion. The Accounting Review, 90(3), 1149-1168. Nikolaev, V., & Van Lent, L. (2005). The endogeneity bias in the relation between cost-of-debt capital and corporate disclosure policy. European Accounting Review, 14(4), 677–724.
Orens, R., & Lybaert, N. (2007). Does the financial analysts' usage of non-financial information influence the analysts' forecast accuracy? Some evidence from the Belgian sell-side financial analyst. The International Journal of Accounting, 42(3), 237–271.

58
Owusu–Ansah, S., & Yeoh, J. (2005). The effect of legislation on corporate disclosure practices. Abacus, 41(1), 92–109. Patelli, L., & Prencipe, A. (2007). The relationship between voluntary disclosure and independent directors in the presence of a dominant shareholder. European Accounting Review, 16(1), 5–33.
Peel, M.J. (2014). Addressing unobserved endogeneity bias in accounting studies: Control and sensitivity methods by variable type. Accounting and Business Research, 44(5), 545-571. Peel, M.J. (2016). Addressing unobserved selection bias in accounting studies: The bias minimization method. European Accounting Review, 0(0), 1-11. Plumlee, M., & Yohn, T. L. (2010). An analysis of the underlying causes attributed to restatements. Accounting Horizons, 24(1), 41–64.
Reeb, D.M., & Zhao, W. (2013). Director capital and corporate disclosure quality. Journal of Accounting and Public Policy, 32(4), 191–212. Rogers, J. L. (2008). Disclosure quality and management trading incentives. Journal of Accounting Research, 46(5), 1265–1296.
Rogers, J. L., & Van Buskirk, A. (2009). Shareholder litigation and changes in disclosure behaviour. Journal of Accounting and Economics, 47(1–2), 136–156.
Rogers, J. L., Van Buskirk, A., & Zechman, S. L.C. (2011). Disclosure tone and shareholder litigation. The Accounting Review, 86(6), 2155–2183. Rogers, R. K., & Grant, J. (1997). Content analysis of information cited in reports of sell–side financial analysts. Journal of Financial Statement Analysis, 3(1), 14−30.
Schleicher, T., Hussainey, K., & Walker, M. (2007). Loss firms’ annual report narratives and share price anticipation of earnings. The British Accounting Review, 39(2), 153–171.
Sengupta, P., & Zhang, S. (2015). Equity-based compensation of outside directors and corporate disclosure quality. Contemporary Accounting Research, 32(3), 1073-1098. Skinner, D. J. (1994). Why Firms Voluntarily Disclose Bad News. Journal of Accounting Research, 32(1), 38–60.
Smith, G. M., & Taffler, R. J. (2000). The Chairman’s statement: A content analysis of discretionary narrative disclosures. Accounting, Auditing & Accountability Journal, 13(5), 624–647.
Sun, Y. (2010). Do MD&A disclosures help users interpret disproportionate inventory increases? The Accounting Review, 85(4), 1411–1440.
Suto, M., & Takehara, H. (2018). Corporate Social Responsibility and Corporate Finance in Japan. Advances in Japanese Business and Economics, 17, Singapore: Springer.

59
Sutthachai, S., & Cooke, T. E. (2009). An analysis of Thai financial reporting practices and the impact of the 1997 economic crisis. Abacus, 45(4), 493–517. Tucker, J. (2010). Selection bias and econometric remedies in accounting and finance research. Journal of Accounting Literature, 29, 31–57. Van Tendeloo, B., & Vanstraelen, A. (2005). Earnings management under German GAAP versus IFRS. European Accounting Review, 14(1), 155–180.
Verrecchia, R. E. (2001). Essays on disclosure. Journal of Accounting and Economics, 32(1–3), 97–180. Wang, D. (2006). Founding family ownership and earnings quality. Journal of Accounting Research, 44(3), 619–656. Wang, I.Y. (2007). Private earnings guidance and its implications for disclosure regulation. The Accounting Review, 82(5), 1299–1332. Wang, X. (2010). Increased disclosure requirements and corporate governance decisions: evidence from chief financial officers in the pre- and post-Sarbanes-Oxley periods. Journal of Accounting Research, 48(4), 885–920.
Wan–Hussin, W. (2009). The impact of family-firm structure and board composition on corporate transparency: Evidence based on segment disclosures in Malaysia. The International Journal of Accounting, 44(4), 313–333. Wasley, C. E., & Wu, J. S. (2006). Why do managers voluntarily issue cash flow forecasts? Journal of Accounting Research, 44(2), 389–429.
Webb, K. A., Cahan, S. F., & Sun, J. (2008). The effect of globalization and legal environment on voluntary disclosure. The International Journal of Accounting, 43(3), 219–245.
Weber, R. P. (1990). Basic content analysis. (2nd ed.). London: Sage.
Weiss, D. (2014). Internal controls in family-owned firms. European Accounting Review, 23(3), 463-482. Wynn, J. P. (2008). Legal liability coverage and voluntary disclosure. The Accounting Review, 83(6), 1639–1669.
Yang, H. I. (2012). Capital market consequences of managers' voluntary disclosure styles. Journal of Accounting and Economics, 53(1–2), 167–184. Yekini, L. S., Wisniewski, T. P., & Millo, Y. (2016). Market reaction to the positiveness of annual report narratives. The British Accounting Review, 48(4), 415-430.

60
You, H., & Zhang, X. (2009). Financial reporting complexity and investor underreaction to 10-K information. Review of Accounting Studies, 14(4), 559–586.
Zhou, H. (2007). Auditing standards, increased accounting disclosure, and information asymmetry: Evidence from an emerging market. Journal of Accounting and Public Policy, 26 (5), 584–620. Zuo, L. (2016). The informational feedback effect of stock prices on management forecasts. Journal of Accounting and Economics, 61(2–3), 391–413.
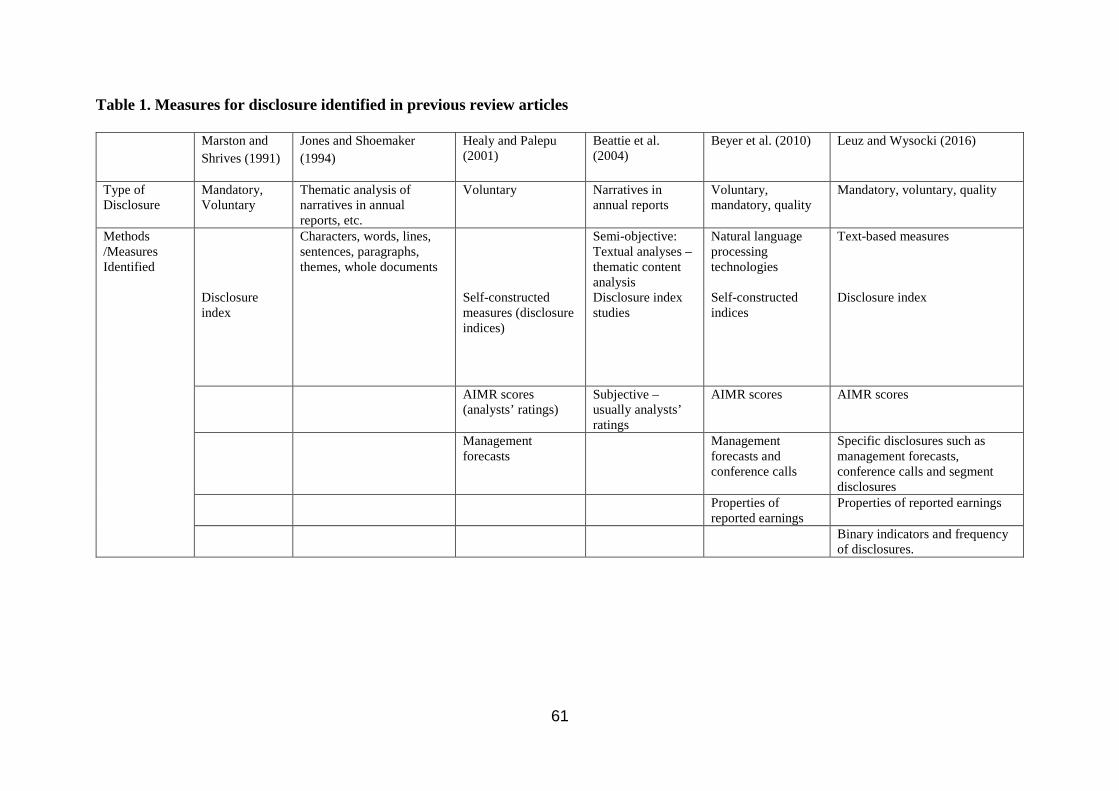
61
Table 1. Measures for disclosure identified in previous review articles
Marston and Shrives (1991)
Jones and Shoemaker (1994)
Healy and Palepu (2001)
Beattie et al. (2004)
Beyer et al. (2010) Leuz and Wysocki (2016)
Type of Disclosure
Mandatory, Voluntary
Thematic analysis of narratives in annual reports, etc.
Voluntary Narratives in annual reports
Voluntary, mandatory, quality
Mandatory, voluntary, quality
Methods /Measures Identified
Disclosure index
Characters, words, lines, sentences, paragraphs, themes, whole documents
Self-constructed measures (disclosure indices)
Semi-objective: Textual analyses – thematic content analysis Disclosure index studies
Natural language processing technologies Self-constructed indices
Text-based measures Disclosure index
AIMR scores (analysts’ ratings)
Subjective – usually analysts’ ratings
AIMR scores AIMR scores
Management forecasts
Management forecasts and conference calls
Specific disclosures such as management forecasts, conference calls and segment disclosures
Properties of reported earnings
Properties of reported earnings
Binary indicators and frequency of disclosures.

62
Table 2. Information about the sample of studies used in the systematic review
This table shows a break-down of the 280 papers covered in this review by journal.
Journal Number of papers % The Accounting Review 45 16.07
Journal of Accounting and Economics 40 14.29
Journal of Accounting Research 31 11.07
The International Journal of Accounting 26 9.29
Review of Accounting Studies 22 7.86
Contemporary Accounting Research 19 6.79
Journal of Accounting and Public Policy 19 6.79
European Accounting Review 17 6.07
Accounting Horizons 16 5.71
The British Accounting Review 15 5.36
Journal of Accounting, Auditing and Finance 9 3.21
Abacus 7 2.50
Journal of Business Finance and Accounting 6 2.14
Accounting and Business Research 3 1.07
Accounting, Organizations and Society 2 0.71
Accounting Forum 1 0.36
Accounting, Auditing and Accountability Journal 1 0.36
Critical Perspectives on Accounting 1 0.36
Total 280 100

63
Table 3. Common proxies for financial disclosure
This table shows the extent of commonly used measurements for disclosure in prior studies and provides some exemplars.
Measurement Approach Count % Exemplars
Classification approach
DB 112 30.19 Bowen, Davis, and Matsumoto (2005); Marquardt and Wiedman (2007); Hollander, Pronk, and Roelofsen (2010); Gillan and Panasian (2014); Cannizzaro and Weiner (2015).
Disclosure index DB 50 13.48 Dargenidou, Mcleay, and Raonic (2006); Guedhami and Pittman (2006); Hodgdon, Tondkar, Adhikari, and Harless (2009); Han, Kang, and Yoo (2012); Melis, Gaia, and Carta (2015); Mangena, Li, and Tauringana (2016).
Disclosure count DB 36 9.70 Debreceny and Rahman (2005); Bergman and Roychowdhury (2008); Lu, Richardson, and Salterio (2011); Fu, Kraft, and Zhang (2012); Kirk and Vincent (2014); Brochet, Naranjo, and Yu (2016).
Properties of reported earnings
DB 34 9.16 Wang (2006); Altamuro and Beatty (2010); Chen, Hope, Li, and Wang (2011); Kim and Venkatachalam (2011); Koh, Rajgopal, and Srinivasan (2013); Filip, Labelle, and Rousseau (2015).
Sentiment analysis DB 34 9.16 Kothari, Li, and Short (2009); Li (2010b); Bamber, Hui, and Yeung (2010); Rogers, Van Buskirk, and Zechman (2011); Kravet and Muslu (2013); Yekini, Wisniewski, and Millo (2016).
Textual analysis DB 31 8.36 Boesso and Kumar (2007); Abraham and Cox (2007); Grüning (2011); Brown and Tucker (2011); Miihkinen (2012); Filzen and Peterson (2015)
Attributes of management forecasts
DB 29 7.82 Yang (2012); Bonsall, Bozanic, and Fischer (2013); Cole and Jones (2015); Kitagawa and Okuda (2016); Zuo (2016).
Regulatory change that affects disclosure
NDB 21 5.66 Zhou (2007); Leuz, Triantis, and Wang (2008); Wang (2010); Arping and Sautner (2013); Bonaimé (2015); Cho (2015).
Market-based measures
NDB 10 2.70 Ascioglu, Hegde, and McDermott (2005); Rogers (2008); Rogers and Van Buskirk (2009); Reeb and Zhao (2013).
Disclosure surveys NDB 7 1.89 Nikolaev and Van Lent (2005); Daske and Gebhardt (2006); Brown and Hillegeist (2007); Huang and Zhang (2012); Glaum, Baetge, Grothe, and Rster (2013).
Use of GAAP (e.g., US GAAP or IFRS) to indicate higher disclosure
NDB 7 1.89 Van Tendeloo and Vanstraelen (2005); Lapointe–Antunes, Cormier, Magnan, and Gay-Angers (2006); Wan-Hussin (2009); Frino, Palumbo, Capalbo, Gerace, and Mollica (2013).
Total number of common proxies of disclosure
371* 100
*. Some studies use more than one measure of disclosure, therefore the total number of measures of disclosure employed in prior studies exceeds the number of studies covered in our systematic review, that is 280 studies. DB (NDB): disclosure-based (non-disclosure-based) measurement approach.
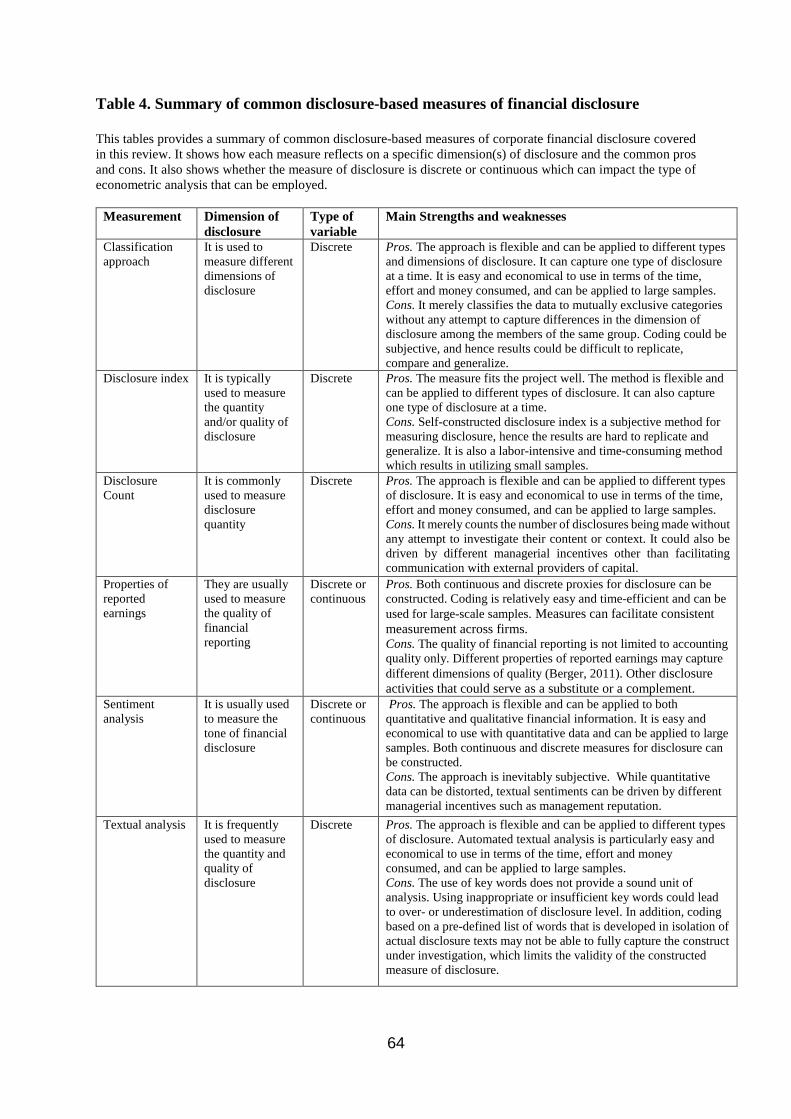
64
Table 4. Summary of common disclosure-based measures of financial disclosure
This tables provides a summary of common disclosure-based measures of corporate financial disclosure covered in this review. It shows how each measure reflects on a specific dimension(s) of disclosure and the common pros and cons. It also shows whether the measure of disclosure is discrete or continuous which can impact the type of econometric analysis that can be employed.
Measurement Dimension of disclosure
Type of variable
Main Strengths and weaknesses
Classification approach
It is used to measure different dimensions of disclosure
Discrete Pros. The approach is flexible and can be applied to different types and dimensions of disclosure. It can capture one type of disclosure at a time. It is easy and economical to use in terms of the time, effort and money consumed, and can be applied to large samples. Cons. It merely classifies the data to mutually exclusive categories without any attempt to capture differences in the dimension of disclosure among the members of the same group. Coding could be subjective, and hence results could be difficult to replicate, compare and generalize.
Disclosure index It is typically used to measure the quantity and/or quality of disclosure
Discrete Pros. The measure fits the project well. The method is flexible and can be applied to different types of disclosure. It can also capture one type of disclosure at a time. Cons. Self-constructed disclosure index is a subjective method for measuring disclosure, hence the results are hard to replicate and generalize. It is also a labor-intensive and time-consuming method which results in utilizing small samples.
Disclosure Count
It is commonly used to measure disclosure quantity
Discrete Pros. The approach is flexible and can be applied to different types of disclosure. It is easy and economical to use in terms of the time, effort and money consumed, and can be applied to large samples. Cons. It merely counts the number of disclosures being made without any attempt to investigate their content or context. It could also be driven by different managerial incentives other than facilitating communication with external providers of capital.
Properties of reported earnings
They are usually used to measure the quality of financial reporting
Discrete or continuous
Pros. Both continuous and discrete proxies for disclosure can be constructed. Coding is relatively easy and time-efficient and can be used for large-scale samples. Measures can facilitate consistent measurement across firms. Cons. The quality of financial reporting is not limited to accounting quality only. Different properties of reported earnings may capture different dimensions of quality (Berger, 2011). Other disclosure activities that could serve as a substitute or a complement.
Sentiment analysis
It is usually used to measure the tone of financial disclosure
Discrete or continuous
Pros. The approach is flexible and can be applied to both quantitative and qualitative financial information. It is easy and economical to use with quantitative data and can be applied to large samples. Both continuous and discrete measures for disclosure can be constructed. Cons. The approach is inevitably subjective. While quantitative data can be distorted, textual sentiments can be driven by different managerial incentives such as management reputation.
Textual analysis It is frequently used to measure the quantity and quality of disclosure
Discrete Pros. The approach is flexible and can be applied to different types of disclosure. Automated textual analysis is particularly easy and economical to use in terms of the time, effort and money consumed, and can be applied to large samples. Cons. The use of key words does not provide a sound unit of analysis. Using inappropriate or insufficient key words could lead to over- or underestimation of disclosure level. In addition, coding based on a pre-defined list of words that is developed in isolation of actual disclosure texts may not be able to fully capture the construct under investigation, which limits the validity of the constructed measure of disclosure.

65
Attributes of management forecasts
They are traditionally used to measure the quantity and quality of voluntary disclosure for the US market.
Discrete or continuous
Pros. Both continuous and discrete measures for disclosure can be constructed. Coding is relatively easy and time-efficient and can be used for large-scale samples. Cons. Management forecasts are relatively less comprehensive measures of disclosure and they could be subject to earnings management, which would affect the quality of these forecasts as measures of disclosure.

66
Table 5. Summary of common non-disclosure-based measures of financial disclosure
This tables provides a summary of common non-disclosure-based measures of corporate financial disclosure covered in this review. It shows how each measure reflects on a specific dimension(s) of disclosure and the common pros and cons. It also shows whether the measure of disclosure is discrete or continuous which can impact the type of econometric analysis that can be employed.
Measurement Dimension of disclosure
Type of variable
Main Strengths and weaknesses*
Formative measures Regulatory change that affects disclosure
It is often used to proxy for a change in the quantity or quality of disclosure
Discrete Pros. The approach is easy to use and economical in terms of time, effort and money consumed in constructing a proxy for disclosure. Cons. The variable merely indicates a change in disclosure, with no attempt to measure the size of that change. There is no attempt to assess actual level of compliance with the regulatory change, which could be problematic, particularly in the absence of strong enforcement policies.
Voluntary use of GAAP (e.g., US GAAP or IFRS) to indicate higher disclosure
It is generally used to proxy for higher level of disclosure quantity and/or quality
Discrete Pros. It is a relatively easy and time-efficient variable to construct and can be used for large-scale samples. Cons. It only divides the sample into two mutually exclusive groups where actual disclosure can still differ among the members of the same group.
Reflective measures Market-based measures
They are frequently used to proxy for the quality of disclosure
Discrete or continuous
Pros. These measures are easily obtainable from databases and can be used for large samples. Also, they can be constructed using both discrete and continuous variables. Cons. However, these measures usually suffer from a lack of theoretical casual path linking them with disclosure and are likely to be noisy measures of disclosure.
Disclosure surveys
They are usually used to proxy for disclosure quantity and quality
Discrete Pros. Disclosure scores are ready-made by professional analysts and can be obtained for sizable samples. Cons. The scores reflect analysts’ perceptions about firms’ disclosure policies, rather than direct investigation of actual disclosure practices. Analysts’ ratings are profoundly geared towards large firms. This approach is subject to measurement bias because the disclosure score created could capture not only the disclosure practice of a company but also its fundamental characteristics and performance.
*These measures share some common cons such as a reduced-form research design and their relationship with disclosure could be bidirectional.

67
Table 6. The extent of conducting reliability and validity tests in prior studies
This table shows a list of the studies that have conducted some sorts of reliability and validity testing on their measures of disclosure, so studies that have not explicitly done so are not listed in this table.
Test Disclosure Index Textual analysis/ Textual Sentiment Analysis
Other Measures of Disclosure
Test-retest Al-Akra and Ali (2012). Boesso and Kumar (2007).
Inter-coder reliability
Owusu-Ansah and Yeoh (2005); Cheng and Courtenay (2006); Al-Shammari, Brown, and Tarca (2008); Cheung et al. (2010); Cormier, Aerts, Ledoux, and Magnan, (2010); Melis et al. (2015); Mangena et al. (2016).
Linsley and Shrives (2006); Abraham and Cox (2007); Boesso and Kumar (2007); Hooghiemstra (2010); Miihkinen (2012); Chen et al. (2017a).
Adhikari and Duru (2006); Carcello, Hollingsworth, and Neal (2006); Entwistle, Feltham, and Mbagwu (2006); Hollander et al. (2010); Plumlee and Yohn (2010).
Internal consistency
Cheng and Courtenay (2006); Lapointe–Antunes et al. (2006); Kelton and Yang (2008); Cormier et al. (2010); Hassan et al. (2009).
Abraham and Cox (2007); Elshandidy et al. (2015).
Content validity
Akhtaruddin (2005); Owusu-Ansah and Yeoh (2005); Cheng and Courtenay (2006); Lim et al. (2007); Orens and Lybaert (2007); Patelli and Rencipe (2007); Al-Shammari et al. (2008); Francis et al. (2008); Webb et al. (2008); Çürük (2009); Hodgdon et al. (2009); Sutthachai and Cooke (2009); Al-Akra, Eddie, and Ali (2010a; 2010b), Melis et al. (2015); Bazrafshan et al. (2016).
Linsley and Shrives (2006); Abraham and Cox (2007); Boesso and Kumar (2007); Feldman, Govindaraj, Livnat, and Segal (2010); Sun (2010); Miihkinen (2012); Merkley (2014); Brochet et al. (2015).
Plumlee and Yohn (2010).
Criterion validity
Melis et al. (2015). Boesso and Kumar (2007); Grüning (2011); Ernstberger and Grüning (2013).
Beneish, Billings and Hodder (2008).
Construct validity
Cheng and Courtenay (2006); Lapointe–Antunes et al. (2006); Guedhami and Pittman (2006); Patelli and Rencipe (2007); Francis et al. (2008); Mangena et al. (2016).
Li (2010b); Brown and Tucker (2011); Grüning (2011); Ernstberger and Grüning (2013); Kravet and Muslu (2013); Blanco, Lara, and Tribó (2014); Brochet et al. (2015); Chen, et al. (2015); Elshandidy et al. (2015); Filzen and Peterson (2015).
Gu and Li (2007); Wang (2007); Files (2012).
*. These include classification approach, disclosure count and market-based disclosure measures. References in italic are examples of textual sentiment analysis.
Copyright © 2022 FDOKUMEN