
Dublin Jewish Demography a Century Ago
25
The Economic and Social Review, Vol. 37, No. 2, Summer/Autumn, 2006, pp. 123-147 Dublin Jewish Demography a Century Ago CORMAC Ó GRÁDA* University College Dublin Abstract: This paper examines the demography of Ireland’s Jewish community a century ago. Its focus is on Dublin Jewry, then mainly a community of immigrants from the Tsarist Empire and their children. It compares the marital fertility and infant and child mortality of immigrant couples with those of native couples living in the same neighbourhood. While ‘economic’ variables are shown to have mattered, there remains a large ‘cultural’ component to the distinctive demography of Jewish households. I INTRODUCTION [Jews] are better husbands than we are, better fathers, and better sons. James Joyce (cited in Ellman 1983, p. 373) B rendan Walsh has always been interested in Ireland’s peculiar demographic history. His publications in this area range from analyses of the under-registration of births and the shifting gender gap in life expectancy to studies of the impact of emigration on domestic economic wellbeing and the impact of urbanisation on the spread of population across Ireland (e.g., Walsh 1969, 1975, 2000; Ó Gráda and Walsh, 1994; Walsh and Walsh, 1978). Several of these papers reflect his curiosity about the past. This paper is concerned 123 *An earlier version was presented at the Conference on Macroeconomic Perspectives in Honour of Brendan M. Walsh, held at University College Dublin on 7 October, 2005. I am grateful to conference participants and to Barry Chiswick, Morgan Kelly, Brendan Walsh and a referee for comments on an earlier version. Email address: [email protected]
Transcript of Dublin Jewish Demography a Century Ago

The Economic and Social Review, Vol. 37, No. 2, Summer/Autumn, 2006, pp. 123-147
Dublin Jewish Demography a Century Ago
CORMAC Ó GRÁDA*University College Dublin
Abstract: This paper examines the demography of Ireland’s Jewish community a century ago. Itsfocus is on Dublin Jewry, then mainly a community of immigrants from the Tsarist Empire andtheir children. It compares the marital fertility and infant and child mortality of immigrantcouples with those of native couples living in the same neighbourhood. While ‘economic’ variablesare shown to have mattered, there remains a large ‘cultural’ component to the distinctivedemography of Jewish households.
I INTRODUCTION
[Jews] are better husbands than we are, better fathers, and better sons.
James Joyce (cited in Ellman 1983, p. 373)
Brendan Walsh has always been interested in Ireland’s peculiardemographic history. His publications in this area range from analyses of
the under-registration of births and the shifting gender gap in life expectancyto studies of the impact of emigration on domestic economic wellbeing and theimpact of urbanisation on the spread of population across Ireland (e.g., Walsh1969, 1975, 2000; Ó Gráda and Walsh, 1994; Walsh and Walsh, 1978). Severalof these papers reflect his curiosity about the past. This paper is concerned
123
*An earlier version was presented at the Conference on Macroeconomic Perspectives in Honour ofBrendan M. Walsh, held at University College Dublin on 7 October, 2005. I am grateful toconference participants and to Barry Chiswick, Morgan Kelly, Brendan Walsh and a referee forcomments on an earlier version.Email address: [email protected]

with another of Brendan’s long-standing interests in the field: the associationbetween religion and demographic patterns (e.g. Walsh, 1970; Ó Gráda andWalsh, 1995). It compares the demography of Ireland’s Jewish population acentury ago with that of the host population.
Today three features of Jewish demography stand out. These are thecontrasting marital fertility rates of secular and non-orthodox Jews, on theone hand, and ultra-orthodox and Hasidic Jews, on the other; the increasingincidence of ‘marrying out’ among diasporic Jews; and the relatively high lifeexpectancy of Jews everywhere. A century ago, it was the low infant and childmortality of Jewish populations everywhere that struck observers most. Thislow mortality and the fertility of Jewish marriages are the focus of the presentstudy.
Historical demography is an inherently interdisciplinary field.Sociological, economic, and biological interpretations complement andcompete with one another in accounting for variations in demographicbehaviour, both over time and across groups and nations. In the analysis of,for example, Jewish mortality or Catholic fertility, cultural explanationsusually bulk large. Disentangling economic and non-economic factors istypically difficult, however. Here, by concentrating on the differences between Jewish and non-Jewish couples living in similar housing in the same neighbourhoods in Ireland in the decades before the First World War, we will be seeking to partly control for socio-economic and environmentalfactors. Thus, for example, Jewish and non-Jewish households in Dublin’sLittle Jerusalem area shared the same water and air quality, and had accessto the same medical facilities, and the same public services (such as theywere). Household level data on housing quality, literacy, domestic servants,and male occupations offer a guide to the influence of living standards onmortality and fertility. By accounting as best we can for economic andenvironmental factors, we hope to better isolate and understand the impact of‘culture’.
II INFANT AND CHILD MORTALITY
Dublin’s chief public health officer in the pre-First World War era, SirCharles Cameron, and others repeatedly pointed to the city’s poverty as themain cause of its high mortality. The sharp contrasts in death rates betweenrich and poor neighbourhoods and between professional and unskilledoccupational groups support such claims (Ó Gráda, 2004). Research on infantand child mortality in Europe a century ago also stresses the importance ofsocio-economic factors (for recent research see Breschi and Pozzi, 2004). This
124 THE ECONOMIC AND SOCIAL REVIEW

comes as no surprise, since not only did the rich consume healthier food and live in healthier neighbourhoods: they also had more resources to devote to childcare in general. In the first days and weeks of an infant’s life,the role of genetic defects and the trauma of birth bulked large, but thereaftersocio-economic factors mattered more. The impact of such factors was even greater during early childhood than in the first year of life. Yet as notedat the outset, the infant and child mortality rates of Jewish communitiesthroughout Europe and North America a century ago were low, and thisachievement has been linked less to their socio-economic status than tocultural factors.
Several scholars have focused on the higher survival prospects of Jewishinfants and children in the past. In 1917 William Guilfoy, New York City’sregistrar of records, produced data showing that Jews in the city were at lowerrisk from all the major causes of infant and child mortality. Such was theimpact of Jewish immigration that excluding Jewish children from bothnumerator and denominator in 1915 would increase the infant mortality ratein the city from 98 to 105 per thousand (Guilfoy’s data are cited in Meyer,1921, Table X). In R.M. Woodbury’s classic study of infant mortality in eightAmerican cities in the 1920s, the Jewish advantage over other ethnic groups(alas, the Irish are not included separately) is also highlighted. Woodburyemphasised the role of breast-feeding, but his cross-tabulations also allowsome scope for other factors. He instanced the lower marital fertility of Jewishwomen and the higher average income of Jewish families. Noting the lowmortality of the infants and children of Jewish immigrants to the US in theearly twentieth century Samuel Preston, Douglas Ewbank, and MarkHereward put it down to “… unmeasured child care practices, having mostlyto do with feeding practices and general hygienic standards …”. InvokingWoodbury’s classic study, Preston et al., point in particular to the low incidenceof Jewish infant and child deaths from ‘gastric and intestinal diseases’ asevidence that the Jewish diet was particularly ‘pure’. They also speculate onthe possible roles of community support systems, the care with which Jewishcitizens upheld sanitary laws, the long experience of Jewish communities withurban living, and the likelihood that Jewish mothers were healthier(Woodbury, 1926; Preston et al., 1994). The point that Jews had becomeadapted to city life over the generations, and that life in the shtetl was a goodpreparation for life in the slums of New York, Boston, or London, goes back atleast a century (e.g., Bushee, 1903, p. 54). But these remain no more thanplausible hypotheses, unsupported by firm evidence. The search forexplanations continues. Closer to home, medical historian Lara Marks hasalso pondered the issue; in her study of Jewish mothers in London’s East Enda century ago, she put the healthiness of their children down to behavioural
DUBLIN JEWISH DEMOGRAPHY A CENTURY AGO 125

factors such as inspections by the Jewish Board of Guardians and the ritualwashing of hands before meals. Demographer Alice Goldstein and her co-authors conveniently isolate six factors that might explain the lower Jewishmortality: racial and biological differences; religious practices; personalcleanliness and housekeeping; socio-economic status; family and childcarepractices; better access to scientific care (Goldstein et al., 1994; Marks ,1994;Garrett et al., 2001, pp. 152-53). The first of these may be dismissed: there isno evidence that race per se influenced mortality. The last is less compellingwhen one is comparing Jewish and non-Jews living in the same or adjoiningneighbourhoods (as I shall be doing here), since in that case the same medicalpractitioners, chemists, dispensaries, and hospitals were available to all – aslong as one was prepared to pay. However, if Jewish culture valued medicinemore than non-Jewish did, then the Jewish children may have had betteraccess to medical facilities for cultural rather than locational reasons. Giventhe marked gradient in infant and child mortality rates in Dublin, socio-economic status presumably mattered, although its impact within the SouthCircular Road neighbourhood remains to be seen. The other factors noted byGoldstein et al. are tied up with culture.1
III NETWORKS AND SOCIAL INTERACTION
Modern research into the spread of fertility control in less developedcountries emphasises the importance of social interaction and social networks.Women often obtain their information about contraceptive technologies
126 THE ECONOMIC AND SOCIAL REVIEW
1A century ago a significant share of the high infant mortality in urban areas was due to deathsfrom diarrhoea/dysentery during the summer months (July, August, and September). Perhaps theJewish mortality advantage stemmed from a proportionately lower incidence of deaths from thiscause? If so, this should be reflected in the different seasonality patterns of Jewish and non-Jewish infant mortality. The relevant Irish data are lacking, but data on births and infant deathsfor London in the 1900s should have a bearing on the issue. Comparing London as a whole withthree East End registration sub-districts – Spitalfields, Goodman’s Fields (both of which wereheavily Jewish at the time), and Bethnal Green (which was not) – we find the following. The infantmortality rate in London (102.8 per thousand) was higher than in either Spitalfields (85.4 perthousand) or Goodman’s Fields (95.0 per thousand), but lower than in Bethnal Green (132.8 perthousand). However, all four had roughly similar mortality peaks in the third quarter of the year.In Spitalfields the percentage was 32.1, in Goodman’s Fields it was 30.2, and in Bethnal Green27.3. In London as a whole 29.3 per cent of all infant deaths occurred in July-September. Thissuggests that a lower incidence of diarrhoea was just one of a range of factors responsible for lowerJewish mortality in the 1900s (Mooney, 1994). I am grateful to Graham Mooney of Johns HopkinsUniversity for sharing his dataset of London births and infant deaths by registration sub-district.
informally from their neighbours. Neighbours can also offer reassurance andvalidation. The denser the social networks in which women participate,typically the quicker the diffusion of new information. Demographic behaviourand outcomes depend on living standards and cultural factors, but they alsorespond to the transmission of such information. An early study of familylimitation in South Korean villages in the 1960s showed that socially isolatedindividuals (or couples) were significantly slower to use contraceptives; themore members of an individual’s network were using contraceptives, the morelikely that individual was to use them also. More recent research highlightsthe importance of gossip about family planning in societies as different asnorth-eastern Thailand and a Luo-speaking area in Kenya. The precisemechanism whereby networks help diffusion is not always clear. SociologistHans-Peter Kohler distinguishes between social learning and social influence.The former is about reducing uncertainty and helping the individual make theappropriate choice; the latter is more about how the behaviour of othersgenerates copying and conformity.
The forces governing the diffusion of information about birth controlshould also apply, broadly speaking, to the spread of information about newhealth-improving technologies and personal hygiene. They may be lessinfluential, however, since agents find it easier to identify the mechanismsresulting in an averted birth than those preventing the death of some child orinfant. On the other hand, taboos of the kind possibly surrounding birth-control are less likely to hinder the spread of information about, say, soap orpasteurisation (compare Watkins and Danzi, 1995; Kohler, Behrman, andWatkins, 2001; Kohler, 2001).
The dense social networks operating within the Irish Jewish community,fortified by blood ties, are consistent with the faster spread of contraceptiveknowledge and of new health-enhancing medical practices within thatcommunity. Gaps between Jewish and non-Jewish fertility and mortality inDublin or urban Ireland would therefore have depended in part on how, andhow quickly, new information or habits specific to one group were transmittedto the other. It would be nice to know how much contact there was, since thiswould have affected the extent of mutual influences on mortality and fertility.The degree of social integration or isolation of a minority group may matter inanother respect: it may affect their exposure to infectious disease. A recentstudy of religious differentials in infant and child mortality in the Netherlandssuggests that in the second half of the nineteenth century the isolation of thechildren of Jews and of members of minority Christian denominations mayhave increased their life chances, though the particular diseases and socialmechanisms at work are not clarified (van Poppel, Schellekens and Liefbroer,2002).
DUBLIN JEWISH DEMOGRAPHY A CENTURY AGO 127
IV THE 1911 POPULATION CENSUS
The data used here are taken from the manuscript enumerators’ forms ofthe 1911 Irish census of population.2 The 1911 census, though largely modelledon its immediate predecessors, differed from them in one important respect: itrequired all co-resident couples to answer questions about marriage duration,the number of children born to them, and the number still alive (e.g., Ó Gráda,1985). In this respect the Irish census was modelled on those conductedsimultaneously across the Irish Sea and on the US censuses of 1900 and 1910.The new questions were prompted by an increasing eugenics-inspired concernin official quarters that the decline in the birth rate was unevenly spreadacross socio-economic and ethnic groups. The resultant data are a rich sourceof information on marital fertility patterns and trends. Though the ages atdeath of non-surviving children are not given, these data, taken together withdata on marriage duration, also allow an analysis of infant and child mortality.The data are subject to the limitation that the reporting of infant and childdeaths was retrospective and supposedly confined to the deaths of children ofcouples cohabiting on census night. It is hard to imagine that these data areperfect. Still, demographers and historians deem them sufficiently accuratefor both cross-sectional and time-series inferences (see Watterson, 1988, p.292; Preston and Haines, 1991; Garrett et al., 2001).3
The database producing the results described here consists of 329 Dublin-Jewish households containing 2,112 people, or over two-thirds of all Jewsliving in Greater Dublin at the time.4 The birthplaces of co-resident Jewishchildren bespeak an immigrant community. While most children were bornin Dublin, 53 of the 290 couples on which there is information in the database had co-resident children born in ‘Russia’, while 44 had children born in Great Britain. About 40 Jewish children were listed as born elsewherein Ireland.
The database contains several mixed marriages between Catholics andother Christians but none involving Jews. In the database 94 per cent of theJewish husbands and 83 per cent of the wives had been born either in theRussian Empire (i.e., Lithuania) or Poland. There were 16 Jewish wives and 3husbands Irish-born, while 9 husbands and 27 wives had been born in Britain.
128 THE ECONOMIC AND SOCIAL REVIEW
2These are deposited and available for inspection in the Irish National Archives in Dublin. 3Note that children born out of wedlock are thus left out of the reckoning in our analysis.4A significant, well-known limitation of the 1911 census is the misreporting of ages prompted bythe Old Age Pensions Act of 1908 (Ó Gráda, 2002). By matching couples in the 1901 and 1911censuses, we obtain a good sense of the extent of age misreporting. The outcome (not reportedhere) suggests that age misreporting was not serious in Dublin and that there was little differencebetween the three confessional groups in this respect.

Comparing Jews and non-Jews living in the same small districts of Dublinhelps control for or neutralise the impact of factors such as water andenvironmental quality, access to hospitals and other medical facilities, and soon. Only streets on which there was at least a minimal Jewish presence areincluded in the database. The total number of households in the database is1,185, of which 329 are Jewish, 558 Catholic, 219 Episcopalian, and theremaining 79 either belonged to other Christian denominations or were mixedmarriages involving one Catholic partner. Given the small number in the lasttwo categories, in some of the cross-tabulations reported below they arelumped together with members of the Episcopalian Church of Ireland. Theexclusion of families headed by single parents and of children born outside ofwedlock means that our measures of fertility are not comprehensive, thoughthey are comparable with measures derived from enumeration forms in theUS and in Great Britain.
The census also reports the occupation (if any) and the place of birth ofeverybody enumerated. Only the occupations of husbands were noted since itwas quite exceptional for a married woman to work outside the home. Table 1reports literacy (coded 0=Illiterate; 1=Read Only; 2=Read and Write) andnumeracy as proxied by a simple index of age-heaping. The index used here issimply the proportion of those aged 30-34, 40-44, 50-54, and 60-64 years givingtheir ages as 30, 40, 50, and 60 years, respectively. Table 1 reports illiteracyand age-heaping levels for males and females by religious affiliation (Jewish,Catholic and Other). Both male and female Jews were more likely to age-heapthan either of the other two groups.
Jewish literacy levels are perhaps lower than expected. Only 70 per centof husbands and 56 per cent of their wives claimed that they could read andwrite. Older men and women were less likely to be literate. Socio-economicstatus was a factor too; for example, households in which the husband wasable to read and write had an average of 7.8 rooms, while households in whichthe husband could neither read nor write had an average of 4.4 rooms. Fortyper cent of Jewish women (and a striking 62 per cent of women aged 40 yearsand over) declared that they were unable to either read or write. Perhaps somerespondents who were literate in Yiddish or Hebrew interpreted the questionon literacy as referring to literacy in English only. In that event literacy mightbe seen as a measure of another kind of human capital, the ability to speakEnglish. Other evidence, however, suggests that literacy among Russian Jewswas far from universal. And it is worth noting that while more than one in fourof those declaring illiteracy or partial literacy had ‘proletarian’ occupations,only one in nine of those declaring literacy did. Either way, the Dublin literacyrates largely mirror socio-economic status. It also bears noting that theliteracy rates for men and women reported in Table 1 are higher than those
DUBLIN JEWISH DEMOGRAPHY A CENTURY AGO 129

recorded for Russia’s Jewish population in the 1897 census (Ó Gráda, 2006,Chapter 7).
Table 1: Age-Heaping and Literacy in Dublin in 1911
(a) Age-heaping:Jewish Catholic Other
Age Male Female Male Female Male Female
30-34 Years 0.250 0.319 0.244 0.291 0.306 0.19440-44 Years 0.383 0.424 0.308 0.434 0.256 0.29450-54 Years 0.385 0.400 0.414 0.400 0.222 0.36060-64 Years 0.667 0.400 0.417 0.391 0.333 0.300
(b) Literacy:Jewish Catholic Other
Level Male Female Male Female Male Female
0 0.243 0.399 0.007 0.013 0.000 0.0031 0.053 0.043 0.004 0.013 0.000 0.0002 0.705 0.558 0.989 0.974 1.00 0.997
Table 2: Housing and Occupations: 1911 Dublin Database
(a) Housing:Jews Catholics All Others
Average No. of Rooms 5.4 4.4 5.2Standard deviation 1.9 2.4 2.7Density 1.29 1.63 1.16% w. Dom. Servant(s) 27.7 9.3 15.50
(b) Occupations (%):Jews Catholics All Others
Unskilled 0.6 21.0 12.5Commercial 64.4 7.2 9.8Artisan 20.1 30.3 24.3Professional 2.4 2.9 13.2Clerical, w/collar 5.5 11.5 16.6Police 0.0 5.6 5.1Other 7.0 21.5 18.5
N 329 558 296
Source: 1911 database.
130 THE ECONOMIC AND SOCIAL REVIEW

Table 2 reports on housing and occupational status in Dublin. The censusdata on housing quality is quite detailed: here we rely on the number of roomsas the best indicator of quality. By this yardstick, Jewish households hadsignificantly more living space than Catholic households and marginally morethan other residents. The higher percentage of Jewish households with one ormore live-in domestic servants is also significant. Note too, based on thestandard deviation of rooms per household, the implication that the gapbetween rich and poor was smallest in the Jewish community in 1911. Otherdata point to a social pecking order, however. For example, none of the 20Jewish couples on working-class Martin Street had a domestic servant, while9 of the 17 on middle-class Dufferin Avenue had one.
Table 3 compares the marital fertility and infant/child mortality levels of Dublin Jews and others. Note first how infant and child mortality in the Dublin Registration Area (or Greater Dublin, including the sub-urban townships) exceeded that in Ireland as a whole by a considerablemargin. Within Dublin, the life chances of Catholic infants and children were presumably considerably worse. In the South Circular Road area that supplied our database, the Jewish advantage is clear. Catholics laggedbehind both Jews and other non-Catholics.5 Moreover, Jewish fertility washigh, and completed family size higher than for either of the other groups.This was at least partly a product of early age at marriage, since Table 3 showsthat Jewish age-specific fertility was highest at most durations and age-groups.
V INFANT AND CHILD MORTALITY IN JEWISH IRELAND
In the South Circular Road area all 42 infants born to Jewish mothersmarried for four years or less on census night in 1911 were still alive. This isindeed an impressive outcome: in the same area 15 per cent of Catholic infantsand 10 per cent of all other infants born to mothers married for four years orless had died. The gaps for marriages of 5-9 years duration are proportionatelynarrower, but still striking: only 6.3 per cent of Jewish infants and childrenhad died, as against 15.6 per cent of Catholic and 16.8 per cent of all others.The record of this artisanal, lower-middle class area was little better than thatof the city as a whole in this respect (see Table 3).
DUBLIN JEWISH DEMOGRAPHY A CENTURY AGO 131
5Although note the implied high mortality rate of ‘Other Religions’ at marriages of 5-9 yearsduration.

Table 3: Marriage Duration, Fertility and Mortality in Ireland and in DublinBefore 1911
Duration N Avg. Ch. % Dead N Avg. Ch. % DeadBorn Born
Pembroke SCR Catholics0-4 Years 0.93 8.2 117 1.07 15.15-9 Years 2.47 11.2 112 2.52 15.610-14 Years 3.79 16.6 91 3.51 20.415-19 Years 4.91 20.1 70 5.06 20.420-24 Years 5.59 21.2 47 6.26 24.825-34 Years 7.26 25.1 77 5.83 27.4
SCR Jews SCR ‘All Others’0-4 Years 42 1.12 0.0 64 0.64 10.05-9 Years 65 3.17 6.3 49 2.31 16.810-14 Years 60 4.68 9.6 40 2.28 19.215-19 Years 41 5.98 10.2 39 3.56 15.120-24 Years 38 6.76 13.2 23 4.13 10.525-34 Years 49 6.41 19.4 55 5.47 21.9
Ireland Greater Dublin0-4 Years 0.98 8.4 0.95 10.95-9 Years 2.81 11.2 2.62 16.810-14 Years 4.17 14.0 3.93 20.815-19 Years 5.20 16.0 4.91 23.920-24 Years 5.87 17.9 5.61 27.325-34 Years 6.57 20.3 6.24 30.4
Nevertheless, the gap between Irish Jews and non-Jews is perhaps not sostriking when compared to rates recorded elsewhere around the same time. InFrankfurt-am-Main in the 1890s and 1900s, the infant mortality rate of Jewswas 73 per thousand live births and that of the general population 155 perthousand live births; in Amsterdam in 1900-13 the rates were 77 per thousandfor Jews and 102 per thousand for non-Jews; in Montreal in 1931 the rateswere 43 for Jews and 113 for the general population. The evidence formortality in early childhood suggests comparable gaps. Thus in Montreal in1931 the mortality rates for children aged 0-4 years were 13.6 per cent forJews and 36.7 per cent for the general population; in New York six yearsearlier the rates were 14.7 and 24.5 per cent; in Berlin in the mid-1920s 10.3and 25.5 per cent. In Amsterdam the mortality rates of children aged 1-4 yearsin the 1900s were 11.2 per cent for Jews and 18.2 per cent for the generalpopulation. For first generation urban Irish immigrants in the US circa 1900the probability of dying before age 5 was 0.246, for first generation urban East
132 THE ECONOMIC AND SOCIAL REVIEW

European (and so disproportionately Jewish) immigrants it was 0.206(Schmeltz, 1971, pp. 22-33; Preston and Haines, 1991: Table 3.4).
Our strategy of comparing Dublin’s Jews with other residents of LittleJerusalem is a way of controlling for environmental factors: the air breathedand the water consumed by everybody in the neighbourhoods was presumablyvery similar. This reduces the Jewish mortality advantage, but there is still aconsiderable gap to account for. In modelling infant and child mortality, thenumber of children dead in a household (CDEAD) or the proportion of childrendead (PDEAD) are probably the most obvious candidates for the dependentvariable. Here, I rely on PDEAD.6 In the estimation we also include theinteraction term, RCJETHOS, which measures the impact of living on a moreJewish street on Catholic mortality.
The outcome of our estimation is given in Table 4. The coefficientsmeasure marginal effects. The signs on most of the coefficients are asexpected. Mortality was negatively correlated with the number of rooms andthe number of domestic servants, while having a professional occupation,being a policeman, an artisan, or engaged in trade also reduced the risk ofdeath. Similarly, female illiteracy and youthful marriage increased the risk,while the infants and children of women born in Dublin or in Great Britainwere at less risk. Most striking of all, perhaps, is the big negative coefficienton being Jewish. An interesting feature is the implication of the negativecoefficient on CJETHOS that Catholic mortality was lower on ‘Jewish’ streets.This is not so easily explained. That Catholics learned habits of hygiene andhealthy eating from their Jewish neighbours seems unlikely. Perhaps therewas a lower incidence of infectious disease on heavily Jewish streets. Perhapstoo there was an element of selection bias at play here: some Catholics mayhave chosen to live on or to remain living on such streets because they wereculturally closer to their Jewish neighbours to begin with. But precisely howthat should have been so is less obvious.
The birth and burial records of the small ‘pre-Litvak’ Dublin Jewishcommunity suggest that it too was characterised by ‘low’ infant and childmortality. Given the changing size and high mobility of this community, thedata must be considered indicative rather than conclusive. The registerrecorded 299 births between 1838 and 1879. Among the deaths recorded inthese years were five of children aged less than three months, seventeen ofchildren aged between three months and a year, and fourteen of children agedbetween one and five years (Hyman 1972, pp. 244-266). With one exception, allthese deaths were of children also included in the births register. The deaths
DUBLIN JEWISH DEMOGRAPHY A CENTURY AGO 133
6Elsewhere I report very similar results using the mortality index devised by Samuel Preston andMichael Haines for their classic study of infant and child mortality in the United States a centuryago (Ó Gráda, 2006).

of children and infants who left the country immediately, or soon after birthare excluded. Presumably these were a small fraction of the total. The impliedinfant mortality rate was therefore almost certainly under 100 per thousand,and the mortality rate of children aged 1.0-4.9 years considerably less thanthat. Though the lack of reliable civil registration data for this period rule out
134 THE ECONOMIC AND SOCIAL REVIEW
Table 4: Accounting for the Variation in Mortality:Marginal Effects
Depvar PDEAD PDEAD PDEADEstimation Tobit Tobit TobitLL –528.2 –524.6 –508.69Pseudo R2 0.157 0.160 0.185N 991 986 986
Variable dy/dx dy/dx dy/dx Mean Value (**)
ROOMS –0.028 ^^ –0.025 ^^ 4.94DOMS –0.038 –0.035 0.192
JEWISH* –0.209 ^^ –0.263 ^^ 0.309CATH* 0.105 0.060 0.461RCJETHOS –0.392 ^^ –0.346 ^^ 0.077
PROF* –0.064 –0.057 0.046CLERICAL* –0.022 0.003POLICE* –0.068 –0.096 0.040COMM* –0.190 ^^ –0.071 0.250ARTISAN* –0.117 ^^ –0.078 ^^ 0.273
HLIT 0.015 –0.045 1.82AAMW 0.002 0.007 ^^ 0.002 23.2WDUB* 0.002 –0.081 ^^ 0.384WGB* –0.039 –0.084 0.099
CHBORN 0.045 ^^ 0.048 ^^ 0.048 ^^ 4.73DUR 0.001 ^^ 0.000 ^^ 0.000 ^^ 424.1
(*) dy/dx is for discrete change of dummy variable from 0 to 1.(^^) significant at 1 per cent.
Variables: ROOMS=number of rooms; DOMS=number of domestics; WDUB=wifeDublin born; WGB=wife British born; AAMW=wife’s age at marriage; AAMW2= wife’sage at marriage squared; HLIT=husband’s literacy (see text); wlit=wife’s literacy;JETHOS=jewish ethos (see text); MIXED=rc-prot marriage; PROF=professional;RCJETHOS=CATH*JETHOS; COMM=commercial.

a formal comparison with rates in Dublin as a whole, the gap between Jewishand non-Jewish rates can only have been substantial, since the rates reportedin Table 3 were almost certainly exceeded in earlier decades. Data on Jewishinfant mortality elsewhere in western Europe before 1900 are scarce, but ourrough guess at Ireland’s rate compares favourably with e.g., Westphalia’s (96per thousand in 1819-1870), Glasgow’s (about 90 per thousand c. 1880-1900),Berlin’s (about 170 per thousand in 1816-66), or Florence’s (139 per thousandin 1818-47) (Schmeltz, 1971, pp. 21-23; Collins, 2000, pp. 79-80).
VI THE FERTILITY TRANSITION
Today the control of births within marriage is virtually a worldwidephenomenon. By a recent reckoning only a handful of the world’s pooresteconomies have yet to embark on a ‘fertility transition’. Yet for most ofrecorded history it is reckoned that homo and mulier sapiens did not controlfertility within marriage. The decades that are the primary focus of this study– the 1870s to the 1930s – were central in this regard. These were the years ofthe so-called European Fertility Transition, when an increasing proportion ofmarried couples throughout Western Europe began to limit family size. Thetransition was the focus of a famous research project by a team of scholars ledby Princeton University’s Ansley J. Coale and of an extensive,interdisciplinary literature. Coale and his colleagues offered both newmeasures of the timing and extent of the transition, and a theoretical frame-work for describing it. The monographs that flowed from their PrincetonEuropean Fertility Project between the late 1960s and mid-1980s highlightedthe role of sociological and cultural factors; they could find little correlationbetween economic backwardness or economic growth, on the one hand, and theonset or intensity of the transition, on the other. They found that Catholicpopulations almost everywhere, regardless of the economic context, were morereluctant to control births. So, it seemed, were certain categories of workers,such as coalminers. In the Princeton view, the spread of birth control owedmore to culture and to social networks and who-met-whom than to strictlyeconomic considerations. Subsequent research has placed more emphasis oneconomic factors such as urbanisation and shifting occupational opportunitiesfor women, but the relative importance of ‘culture’ and ‘economics’ is stilldebated (Coale and Watkins, 1986; Galloway, Hammel and Lee, 1994; Brownand Guinnane, 2002).
In this literature, the Irish are well known for having been unenthusiasticparticipants in the fertility transition. Ireland’s low rates of industrialisationand urbanisation and the dominance of the Roman Catholic religion are the
DUBLIN JEWISH DEMOGRAPHY A CENTURY AGO 135

explanations usually invoked to explain this. Nonetheless, scrutiny ofpublished data reveals that in Ireland a significant minority of marriedcouples were already controlling births by 1914, and estimates of the standardPrinceton measure of marital fertility (Ig) suggest considerable variationacross the counties of Ireland even before the turn of the century. Analyses of1911 household level data confirm that Catholic couples were slower to adjusttheir behaviour and that the decline in fertility was fastest in urban, middle-class Ireland. Studies of households in the relatively well-off Dublin suburbsof Rathmines and Pembroke yield evidence of birth ‘spacing’ early in marriage,of a socio-economic class gradient to fertility, and of higher fertility in Catholichouseholds. Within a few decades there would be a sizeable gap between themarital fertility of Catholics, who formed the overwhelming majority of thepopulation, and non-Catholics (Ó Gráda, 1993, pp. 206-207; Ó Gráda andDuffy, 1995). Shifts in Irish fertility after 1911 have been less scrutinised, butthe drop in marital fertility was modest: according to the Princeton survey Igin the two Irelands, north and south, fell from 0.610 in 1926 to 0.570 in 1936and 0.548 in 1961. Yet a US Jesuit sociologist studying Dubliners in the late1940s and early 1950s was informed by ‘several priests’ and a doctor that theCatholic middle and lower-middle classes were increasingly resorting to birthcontrol. This entailed abstinence, not reliance on contraceptives (Coale andTreadway, 1986, p. 120; Ó Gráda and Walsh, 1995; Ó Gráda, 1997, pp. 193-195).
West European Jews, on the other hand, were precocious participants inthe fertility transition. The marital fertility of Italy’s small Jewish communityhad already fallen significantly before the fertility decline reached othergroups. In the kingdom of Bavaria the Jewish birth rate fell by half, from 32.7per thousand in 1876-1880 to 16.3 per thousand three decades later, while theCatholic birth rate fell by only a sixth, from 43.3 to 36.0 per thousand, over thesame period. Evidence from Munich shows that the mainly urban character ofBavaria’s Jewish population only partly accounts for this. Between 1875 andthe early 1890s the marital fertility of Munich’s Jews fell from 0.522 to 0.299on the Princeton Ig scale, while that of Munich Catholics registered a gentlerdecline from 0.660 to 0.532. In late nineteenth-century Berlin the confessionalgap was narrower: Ig was 0.337 for Jews, 0.393 for Lutherans, and 0.446 forCatholics. John Knodel, who supplied these numbers, suggests that the closeness of family and cultural ties within the Jewish community “… provided a situation in which changing norms regarding family size andfamily limitation could spread rapidly and relatively independently of the restof German society”. Given these signs of fertility control among German andItalian Jews, it is hardly surprising to find that already in the mid-nineteenthcentury Anglo-Jewry was showing some signs of a population embarking on
136 THE ECONOMIC AND SOCIAL REVIEW
the fertility transition (Livi Bacci, 1986; Knodel 1974, pp. 136-138; Kosmin,1982).
In Ireland in the 1930s and 1940s the marital fertility of Jewish coupleswas less than half that of Catholic couples and also less than that of Churchof Ireland couples. This statement is based on an admittedly rather crude butserviceable measure of marital fertility, taken from the Irish census of 1946. Itis the number of children aged 0-2 years divided by the weighted sum ofmarried women aged 15-49 years. The weights used are the so-called Hutteriteweights, familiar to historical demographers, and also used in constructing Ig.(e.g. Coale and Watkins, 1986; Vann and Eversley, 1992, p. 45). The Hutteritesare an Anabaptist sect found mainly in rural communities in North America.Their marital fertility in the early twentieth century exceeded that of all otherrecorded populations, and was therefore used as a standard in the PrincetonEuropean Fertility Transition Project. The weights refer to the number ofchildren born per thousand married Hutterite women in five-year age-groupsfrom 15-19 to 45-49 years. The outcomes for the Irish Free State and forDublin in 1946 are given below. A separate estimate for Dublin Jews isimpossible, but since a majority of Jews lived in the capital, that for thecountry as a whole would not be far off the mark.
Ireland DublinAll 1.88 1.60Catholic 1.92 1.65Church of Ireland 1.27 1.03All Others 1.33 1.04Jewish 0.99 –
This measure makes no allowance for infant and child mortality, but since(as indicated above) Jewish mortality was almost certainly lower than non-Jewish mortality, it probably underestimates the marital fertility gap betweenJews and others.7 The calculations surely imply that the marital fertility ofIreland’s Jews was lower than that of any other significant confessional groupin the 1940s. Ireland’s Jewish community thus shared the enthusiasm withwhich other immigrant Jewish communities from Eastern Europeparticipated in the fertility transition in the 1920s and 1930s (compare Marks,1994, pp. 85-86).
DUBLIN JEWISH DEMOGRAPHY A CENTURY AGO 137
7The underlying data are in Saorstát Éireann, Census of Population 1946, Vol. 3, p. 32.

VII LITVAK AND GENTILE FERTILITY
Fifteen children he had. Births every year almost. That’s their theology … Increase and multiply.
James Joyce, Ulysses
East European Jewish marriages were highly fertile in the late nineteenthand early twentieth centuries. One of the ‘surprising results’ of the Princetonstudy of Russian fertility was that in the census year of 1897 there was verylittle variation across provinces in the marital fertility of urban Jews, and thatJewish marital fertility was higher than that of the rest of the urbanpopulation in all but one of fifteen provinces. Ansley J. Coale and his co-authors found corroboration for this outcome in ‘an odd place’: the 1910 UScensus revealed that the average parity among Russian-born (and thus mainlyJewish) women aged 45-49 years and married at least twenty years wasexceeded only by that of French-Canadians and Poles (Coale, Anderson andHärm, 1979, pp. 78-80. See too Bushee, 1903, p. 46). In this respect the Jewsof Eastern Europe differed markedly from those of Western Europe, whosefertility had already been declining for a century or two, and was lower than that of most, if not all, other confessional groups (Livi-Bacci, 1986, pp. 189-195).
So what of Dublin’s Litvaks? First, their women married young and few ofthem remained unmarried. In Dublin’s case the mean age at marriage ofJewish women was very low by local standards before 1911, four years lowerthan that of other women living in the same part of the city (Table 5). Jewishmen married young too, though the gap between Jewish and non-Jewishmales was about a year less.
Table 5: Average Age at Marriage in Little Jerusalem
Mean Jews Catholics Others
Male 24.8 (5.0) 28.9 (7.3) 29.0 (8.0)Female 20.9 (3.5) 24.9 (5.3) 25.7 (6.7)Female, duration 0-9 21.8 25.9 26.0Female, duration 10-19 20.9 24.7 27.0Female, duration 20+ 20.2 23.8 24.3
MedianMale 21 28 27Female 24 24 24
Average duration 17.1 (12.1) 14.9 (11.4) 16.2 (12.2)
Note: standard deviations in brackets.
138 THE ECONOMIC AND SOCIAL REVIEW

The high marital fertility of the Jewish community was undoubtedly duein part to early marriage. But was age-specific marital fertility also higher?The great care that Jewish women took of their young, the religiousrestrictions on sexual intercourse after giving birth and menstruation, and theprevalence of breast-feeding might argue for longer intervals between births.However, Table 6 suggests that, for more recent marriages at least, age-specific Jewish marital fertility was higher than that of Catholics living in thesame part of south Dublin. For marriages of less than twenty years’ duration,the difference is striking. Note too, however, the implication that the Jewishfertility advantage did not persist for longer marriage durations.8 Thisprobably means that Jewish mothers stopped having children at an earlier agethan non-Jewish mothers. If so, they bore a higher proportion of their childrenwhen they were younger and healthier.
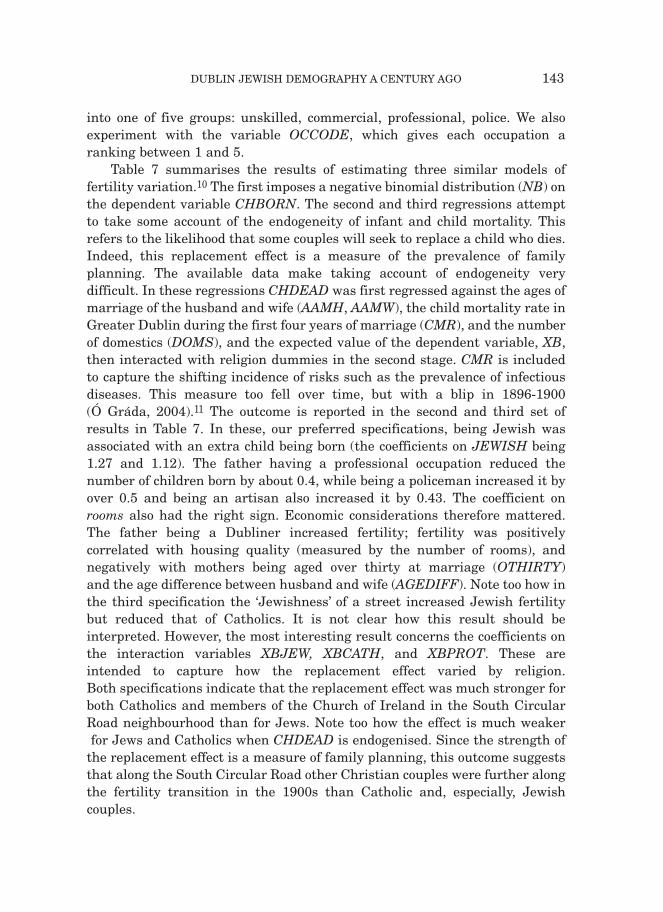
Another remarkable feature of Jewish fertility in Dublin is the much lowerincidence of childless marriages. It holds across all marriage durations (Figure1). The lower incidence of Jewish childlessness is partly due to Jews marryingyounger, though it also holds true when the age at marriage is controlled for.9
To some extent the gap may reflect the better health status of Jewish couplesand the lower incidence of sexually transmitted diseases, but it is alsoevidence that fewer of them wanted to limit family size. In Dublin a significantminority of both Catholic and Protestant couples were already spacing birthsearly in their marriages on the eve of the First World War (Ó Gráda, 1991; Ó Gráda and Duffy, 1995). There is no evidence here of spacing on the part ofJewish couples, though. For the most part, these patterns suggest that thebetter survival chances of Jewish infants and children were not the product oflower fertility.
DUBLIN JEWISH DEMOGRAPHY A CENTURY AGO 139
8 This is suggested by comparing the changes in the mean number of children from one durationcategory to the next for Jews and Catholics. The increases for Jews are significantly biggerbetween durations of 0-4 and 5-9 years and between 5-9 and 10-4 years, but not so thereafter. 9 For marriages where the female age at marriage was 20-24 years, the percentages childless wereas follows:
Jews CatholicsDuration Percentage Number Percentage Number
0-4 20.7 29 21.6 375-9 5.6 36 6.7 45
10-14 2.6 39 12.8 3915-19 14.3 21 15.2 3320-24 5.9 17 9.5 2125-29 9.1 11 13.6 22
On the relation between age at marriage and childlessness see Wrigley (2004), pp. 410-11.
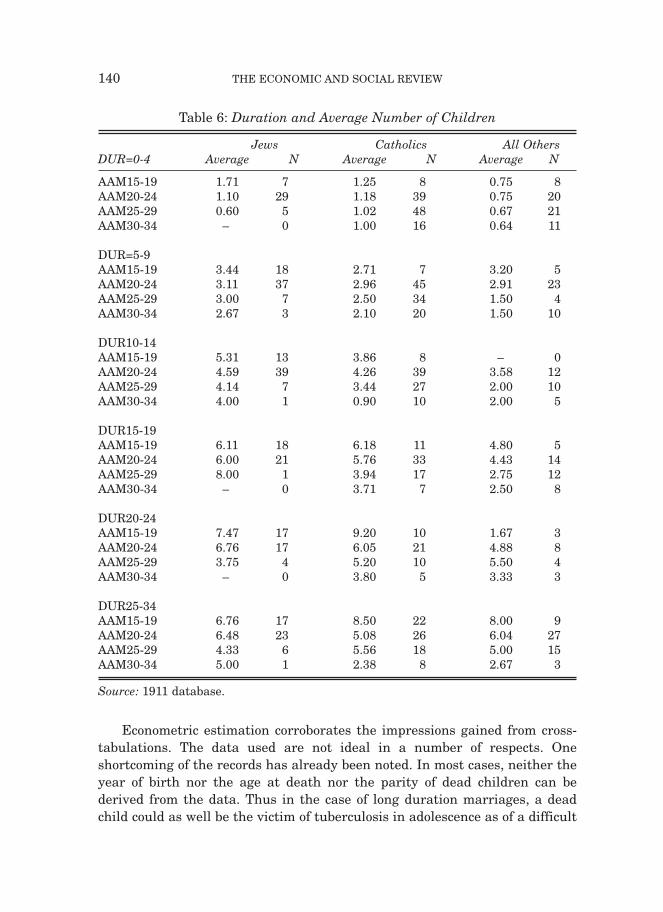
Econometric estimation corroborates the impressions gained from cross-tabulations. The data used are not ideal in a number of respects. Oneshortcoming of the records has already been noted. In most cases, neither theyear of birth nor the age at death nor the parity of dead children can bederived from the data. Thus in the case of long duration marriages, a deadchild could as well be the victim of tuberculosis in adolescence as of a difficult
140 THE ECONOMIC AND SOCIAL REVIEW
Table 6: Duration and Average Number of Children
Jews Catholics All OthersDUR=0-4 Average N Average N Average N
AAM15-19 1.71 7 1.25 8 0.75 8AAM20-24 1.10 29 1.18 39 0.75 20AAM25-29 0.60 5 1.02 48 0.67 21AAM30-34 – 0 1.00 16 0.64 11
DUR=5-9AAM15-19 3.44 18 2.71 7 3.20 5AAM20-24 3.11 37 2.96 45 2.91 23AAM25-29 3.00 7 2.50 34 1.50 4AAM30-34 2.67 3 2.10 20 1.50 10
DUR10-14AAM15-19 5.31 13 3.86 8 – 0AAM20-24 4.59 39 4.26 39 3.58 12AAM25-29 4.14 7 3.44 27 2.00 10AAM30-34 4.00 1 0.90 10 2.00 5
DUR15-19AAM15-19 6.11 18 6.18 11 4.80 5AAM20-24 6.00 21 5.76 33 4.43 14AAM25-29 8.00 1 3.94 17 2.75 12AAM30-34 – 0 3.71 7 2.50 8
DUR20-24AAM15-19 7.47 17 9.20 10 1.67 3 AAM20-24 6.76 17 6.05 21 4.88 8AAM25-29 3.75 4 5.20 10 5.50 4AAM30-34 – 0 3.80 5 3.33 3
DUR25-34AAM15-19 6.76 17 8.50 22 8.00 9AAM20-24 6.48 23 5.08 26 6.04 27AAM25-29 4.33 6 5.56 18 5.00 15AAM30-34 5.00 1 2.38 8 2.67 3
Source: 1911 database.

high parity birth late in marriage. A second problem is that the occupationslisted in 1911 were not necessarily the same as those when the decisions abouthaving children were made. As noted earlier, some occupations, particularly inthe Jewish community, were more likely to be chosen by younger men. Third,quite apart from this life-cycle aspect, some occupations are uncomfortablyvague. A baker or might be a journeyman or a self-employed businessman; anengineer might be a skilled craftsman or a professional; while ‘clerk’ and ‘civilservant’ cover a wide range of occupations. Still, the insights to be gained fromsuch data are important. Here we include the bulk of the occupations listed
DUBLIN JEWISH DEMOGRAPHY A CENTURY AGO 141
10We also estimated a zero inflated negative binomial (ZINB) version which allows for thepossibility that the CHBORN=0 is a function of both choice (couples deciding not to have children)and necessity (couples not being able to produce children). The outcome was virtually the same asin the negative binomial version.11 The resulting regression produced:
Coefficient zAAMW –.0285 –2.24AAMH –.0210 –2.10DOMS –.4068 3.16CMR 0.0253 11.37CONSTANT –2.876 –6.35
Pseudo R2 0.077
Figure 1: Percentage Childless by Duration

142 THE ECONOMIC AND SOCIAL REVIEWTa
ble
7: A
ccou
nti
ng
for
the
Vari
atio
n i
n F
erti
lity
:Mar
gin
alE
ffec
ts
[1]
[2]
[3]
Est
imat
ion
Met
hod
NB
N
B
NB
Nu
mbe
r of
obs
11
8010
7610
76M
ean
Val
ue
LR
ch
i2(1
6)
934.
9770
5.86
711.
32of
Var
iabl
eP
rob
> c
hi2
0.
0000
0.00
000.
0000
Log
lik
elih
ood
–242
37.5
4–2
221.
75–2
219.
02P
seu
do
R2
0.16
10.
137
0.13
8
Vari
able
d
y/d
xz
dy/
dx
zd
y/d
xz
n=
1180
n=
1076
DU
R
0.29
418
.60
0.44
716
.48
0.44
316
.38
15.8
213
.44
DU
R2
–0.0
05–1
4.22
–0.0
09–1
2.39
–0.0
09–1
2.23
389.
726
6.3
JEW
ISH
*1.
314.
031.
275
2.84
1.12
02.
540.
2788
0.27
32C
AT
H*
0.07
40.
270.
491
1.42
0.70
01.
900.
4720
0.47
68P
RO
T*
–0.0
34–0
.12
–0.2
24–0
.58
–0.2
27–0
.59
0.18
470.
1831
CD
JEW
0.
422
7.20
0.18
39C
DC
AT
H
0.64
112
.71
0.43
14C
DP
RO
T
0.54
67.
260.
1398
XB
JEW
0.
162
0.61
0.10
30.
390.
2031
XB
CA
TH
0.
312
1.31
0.30
11.
270.
2946
XB
PR
OT
0.
718
2.07
0.66
81.
930.
1097
PR
OF
*–0
.411
–1.5
4–0
.417
–1.4
9–0
.380
–1.3
40.
0517
0.05
39P
OL
ICE
*0.
555
1.62
0.54
81.
530.
536
1.51
0.03
900.
0409
AR
TIS
AN
*0.
352
2.59
0.43
42.
940.
415
2.80
0.25
930.
2584
HD
UB
*0.
294
1.88
0.39
82.
370.
391
2.29
0.34
660.
3513
WD
UB
*0.
084
0.56
–0.0
12–0
.08
–0.0
07–0
.005
0.39
070.
3996
RO
OM
S
0.06
12.
340.
034
1.18
0.04
31.
504.
872
4.86
9A
GE
DIF
F–0
.019
–1.7
8–0
.023
–2.0
4–0
.024
–2.1
33.
782
3.79
5O
TH
IRT
Y–0
.059
–9.4
7–0
.056
–8.5
4 –0
.056
–8.6
54.
901
5.15
8JE
TH
OS
0.92
32.
330.
2248
RC
JET
HO
S–1
.08
–1.5
30.
0785
(*)
dy/d
x is
for
dis
cret
e ch
ange
of
dum
my
vari
able
fro
m 0
to
1.
vari
able
s: A
GE
DIF
F=a
ge d
iffe
ren
ce b
etw
een
hu
sban
d an
d w
ife;
OT
HIR
TY
=age
of
wif
e if
30+
, zer
o ot
her
wis
e;C
DJE
W=C
HD
EA
D*J
EW
ISH
, CD
CA
TH
=CD
EA
D*C
AT
H, C
DP
RO
T=C
DE
AD
*PR
OT
; DU
R2=
dura
tion
squ
ared
Not
e: [
2] a
nd
[3]
incl
ude
mar
riag
es o
f on
ly 0
-34
year
s du
rati
on.
into one of five groups: unskilled, commercial, professional, police. We alsoexperiment with the variable OCCODE, which gives each occupation aranking between 1 and 5.
Table 7 summarises the results of estimating three similar models offertility variation.10 The first imposes a negative binomial distribution (NB) onthe dependent variable CHBORN. The second and third regressions attemptto take some account of the endogeneity of infant and child mortality. Thisrefers to the likelihood that some couples will seek to replace a child who dies.Indeed, this replacement effect is a measure of the prevalence of familyplanning. The available data make taking account of endogeneity verydifficult. In these regressions CHDEAD was first regressed against the ages ofmarriage of the husband and wife (AAMH, AAMW), the child mortality rate inGreater Dublin during the first four years of marriage (CMR), and the numberof domestics (DOMS), and the expected value of the dependent variable, XB,then interacted with religion dummies in the second stage. CMR is includedto capture the shifting incidence of risks such as the prevalence of infectiousdiseases. This measure too fell over time, but with a blip in 1896-1900 (Ó Gráda, 2004).11 The outcome is reported in the second and third set ofresults in Table 7. In these, our preferred specifications, being Jewish wasassociated with an extra child being born (the coefficients on JEWISH being1.27 and 1.12). The father having a professional occupation reduced thenumber of children born by about 0.4, while being a policeman increased it byover 0.5 and being an artisan also increased it by 0.43. The coefficient onrooms also had the right sign. Economic considerations therefore mattered.The father being a Dubliner increased fertility; fertility was positivelycorrelated with housing quality (measured by the number of rooms), andnegatively with mothers being aged over thirty at marriage (OTHIRTY) and the age difference between husband and wife (AGEDIFF). Note too how inthe third specification the ‘Jewishness’ of a street increased Jewish fertilitybut reduced that of Catholics. It is not clear how this result should beinterpreted. However, the most interesting result concerns the coefficients onthe interaction variables XBJEW, XBCATH, and XBPROT. These areintended to capture how the replacement effect varied by religion. Both specifications indicate that the replacement effect was much stronger forboth Catholics and members of the Church of Ireland in the South CircularRoad neighbourhood than for Jews. Note too how the effect is much weakerfor Jews and Catholics when CHDEAD is endogenised. Since the strength of
the replacement effect is a measure of family planning, this outcome suggeststhat along the South Circular Road other Christian couples were further alongthe fertility transition in the 1900s than Catholic and, especially, Jewishcouples.
DUBLIN JEWISH DEMOGRAPHY A CENTURY AGO 143

VIII CULTURE MATTERED
Though separated from its neighbours by history, religion, and language,Dublin’s Jewish immigrants were much less segregated than, say, those ofLondon’s East End or New York’s Lower East Side. Nonetheless, theirdemographic characteristics were quite distinct from both those of Dublin atlarge and those of its south city non-Jewish neighbours. The most strikingdifference is that the infants and children of Dublin’s Jews were much morelikely to survive than non-Jewish children growing up in the sameneighbourhood. The higher socio-economic status of their parents only partlyexplains their better survival prospects.
Nor had differential fertility much to do with it. This may seem surprising,given that throughout Europe Jewish couples were in the vanguard of themarital fertility transition, deciding early on to invest their parental resourcesin the ‘quality’ rather than the ‘quantity’ of children. Yet the fertility of ourfirst generation of Jewish immigrant women, nearly all of them born inLithuania, was largely unaffected by the transition. Age-specific Jewishmarital fertility was higher than that of either Catholics or other Christiansin the same neighbourhood. And Jewish couples were less likely than othersto have another child in order to replace any infants or children who died.Their high fertility was undoubtedly one part of their culture or belief-systemthat this first generation of Ireland’s Jewish immigrants had not left behindin Lithuania. At the same time there is a hint in the data that the age at whichJewish women ‘stopped’ having children was lower. In the followinggeneration, as the occupational status and aspirations of the Jewishcommunity shifted, so did their marital fertility.
The dramatic contrast between the situation in 1911 and that in 1946suggests that Irish Jews replicated a pattern described by Israel Kosmin forGreat Britain. There over four-fifths of Jewish couples marrying in the 1920srelied on artificial methods to control births. “The important point here”, notedKosmin, “is that the majority of these Jewish women were the daughters ofwomen from a natural fertility regime”. Kosmin mentions two other featuresof Jewish demography that survived this remarkable transition in bothBritain and Ireland: a low illegitimacy rate, and a low percentage of childlesscouples (Kosmin, 1982, pp. 258-259). In their rapid transition to low maritalfertility Irish Jews had much more in common with their English co-religionists than with their non-Jewish neighbours.
144 THE ECONOMIC AND SOCIAL REVIEW

BIBLIOGRAPHY
BRESCHI, MARCO and LUCIA POZZI (eds.), 2004. The Determinants of Infant andChild Mortality in Past European Populations. Udine: Forum.
BROWN, JOHN and TIMOTHY W. GUINNANE, 2002. “Fertility transition in a rural,Catholic population: Bavaria, 1880-1910”, Population Studies, Vol. 56, No. 1, pp.35-49.
BUSHEE, FREDERICK A., 1903. “Ethnic factors in the Population of Boston”,Publications of the American Economic Association, 3rd ser., Vol. 4, No. 2, pp. 1-171.
COALE, ANSLEY J., BARBARA ANDERSON and ERNA HÄRM, 1979. HumanFertility in Russia since the Nineteenth Century, Princeton: Princeton UniversityPress.
COALE, ANSLEY J. and ROY TREADWAY, 1986. “A summary of the changingdistribution of overall fertility, marital fertility and proportions married in theprovinces of Europe”, in A. J. Coale and S. C. Watkins (eds.), The Decline ofFertility in Europe, Princeton: Princeton University Press, pp. 31-181.
COALE, ANSLEY J. and SUSAN C. WATKINS (eds.), 1986. The Decline of Fertility inEurope, Princeton: Princeton University Press.
COLLINS, KENNETH E. 2001. Be Well! Jewish Health and Welfare in Glasgow, 1860-1914, East Linton: Tuckwell Press.
ELLMAN, RICHARD, 1983. James Joyce, Oxford: Oxford University Press.GALLOWAY, PATRICK R., EUGENE A. HAMMEL and RONALD D. LEE, 1994.
“Fertility decline in Prussia 1875 to 1910: a pooled cross-section time seriesanalysis”, Population Studies, Vol. 48, No.1, pp.135-158.
GARRETT, EILIDH, ALICE REID, KEVIN SCHÜRER and SIMON SZRETER, 2001.Changing Family Size in England & Wales. Cambridge: Cambridge UniversityPress.
GOLDSTEIN, ALICE, SUSAN C. WATKINS and ANN ROSEN SPECTOR, 1994.“Childhood health-care practices among Italians and Jews in the United States,1910-1940”, Health Transition Review, Vol. 4, No. 1, pp. 45-61.
HYMAN, LOUIS, 1972. History of the Jews in Ireland, Shannon: Irish Academic Press.KOHLER, HANS-PETER, 2001. Fertility and Social Interaction: An Economic
Perspective, Oxford: Oxford University Press.KOHLER, HANS-PETER, JERE R. BEHRMAN, and SUSAN C. WATKINS, 2001. “The
density of social networks and fertility decisions: evidence from South NyanzaDistrict, Kenya”, Demography, Vol. 38, No.1, pp. 43-58.
KNODEL, JOHN E., 1974. The Decline of Fertility in Germany, 1871-1939, Princeton:Princeton University Press.
KOSMIN, BARRY A., 1982. “Nuptiality and fertility patterns of British Jews 1850-1980: an immigrant transition?” in David A. Coleman (ed.), The Demography ofImmigrants and Minority Groups in the UK (Proceedings of the 18th AnnualSymposium of the Eugenics Society 1981). London: Academic Press, pp. 245-261.
KUZNET, SIMON, 1975. “Immigration of Russian Jews to the United States:background and structure”, Perspectives in American History, Vol. 9, pp. 35-124.
LIVI BACCI, MASSIMO, 1986. “Social-group forerunners of fertility control inEurope”, in A. J. Coale and S. C. Watkins (eds.), The Decline of Fertility in Europe,pp. 182-200.
DUBLIN JEWISH DEMOGRAPHY A CENTURY AGO 145

MARKS, LARA, 1994. Model Mothers: Jewish Mothers and Maternity Provision in EastLondon, 1870-1939, Oxford: Oxford University Press.
MEYER, ERNEST CHRISTOPHER, 1921. Infant Mortality in New York City, NewYork: Rockefeller Foundation International Health Board.
MOONEY, GRAHAM, 1994. “Did London pass the “sanitary test”? Seasonal infantmortality in London, 1870-1914”, Journal of Historical Geography, Vol. 20, No.2,pp. 158-174.
Ó GRÁDA, CORMAC, 1985. “Did Ulster Catholics always have larger families?”, IrishEconomic and Social History, Vol. 12, pp.79-88.
Ó GRÁDA, CORMAC, 1991. “New evidence on the fertility transition in Ireland”,Demography, Vol. 28, No. 4, pp. 535-548.
Ó GRÁDA, CORMAC, 1993. Ireland before and after the Famine, 2nd ed. Manchester:Manchester University Press.
Ó GRÁDA, CORMAC, 1997. A Rocky Road: The Irish Economy since the 1920s.Manchester: Manchester University Press.
Ó GRÁDA, CORMAC, 2002. “The greatest benefit of all: old age pensions in Ireland”,Past & Present, No. 175, pp. 124-161.
Ó GRÁDA, CORMAC, 2004. “Infant and child mortality in south Dublin a century ago”,in Marco Breschi and Lucia Pozzi (eds.), The Determinants of Infant and ChildMortality in Past European Populations. Udine: Forum, pp. 89-104.
Ó GRÁDA, CORMAC, 2005. “Settling in: Dublin’s Jewish immigrants of a century ago”,Field Day Review. No. 1, pp. 87-99.
Ó GRÁDA, CORMAC, 2006. Jewish Ireland in the Age of Joyce: A Social and EconomicHistory, Princeton: Princeton University Press.
Ó GRÁDA, CORMAC and NIALL DUFFY, 1995. “Fertility control early in marriage inIreland a hundred years ago”, Journal of Population Economics, Vol. 8, pp. 423-431.
Ó GRÁDA, CORMAC and BRENDAN M. WALSH, 1994. “The economic effects ofemigration: Ireland”, in Beth Asch (ed.), Emigration and its Effects on the SendingCountry. Santa Monica: Rand Corporation, pp. 97-152.
Ó GRÁDA, CORMAC and BRENDAN M. WALSH, 1995. “Fertility and population inIreland, North and South”, Population Studies, Vol. 49, No. 2, pp. 259-279.
PRESTON, SAMUEL H. and MICHAEL R. HAINES, 1991. Fatal Years: ChildhoodMortality in the United States in the Late Nineteenth Century, Princeton: PrincetonUniversity Press.
PRESTON, S. H., DOUGLAS EWBANK and MARK HEREWARD, 1994. “ChildMortality Differences by Ethnicity and Race in the United States; 1900-1910” inSusan Cotts Watkins (ed.), After Ellis Island: Newcomers and Natives in the 1910Census. New York: Russell Sage Foundation, pp. 35-82.
SCHMELTZ, U.O., 1971. Infant and Early Childhood Mortality among the Jews of theDiaspora, Jerusalem: The Institute of Contemporary Jewry, Hebrew University ofJerusalem.
VAN POPPEL, FRANS, JONA SCHELLEKENS, and AART C. LIEFBROE, 2002.“Religious differentials in infant and child mortality in the Netherlands, 1855-1912”, Population Studies, Vol. 56, No. 3, pp. 277-289.
VANN, RICHARD T. and DAVID EVERSLEY, 1992. Friends in Life and Death: TheBritish and Irish Quakers in the Demographic Transition, Cambridge: CambridgeUniversity Press.
146 THE ECONOMIC AND SOCIAL REVIEW

WALSH, BRENDAN M., 1969. “A perspective on Irish population patterns”, Éire-Ireland, Vol. 4, No. 3, pp. 3-21.
WALSH, BRENDAN M., 1970. Religion and Demographic Behaviour in Ireland,General Research Series Paper No. 55, Dublin: The Economic and Social ResearchInstitute.
WALSH, BRENDAN M., 1975. “Trends in the religious composition of the populationof the Republic of Ireland, 1946-71”, The Economic and Social Review, Vol. 6, No.4, pp. 543-555.
WALSH, BRENDAN M., 2000. “Urbanization and the regional distribution ofpopulation in post-famine Ireland”, Journal of European Economic History, Vol. 29,No. 1, pp. 109-130.
WALSH, BRENDAN M. and DERMOT WALSH, 1978. “The male/female differential inlife expectancy in Ireland: a note”, Journal of the Irish Medical Association, Vol. 71,No. 14, pp. 475-480.
WATKINS, SUSAN C., and ANGELA D. DANZI, 1995. “Women’s gossip and socialchange: childbirth and fertility control among Italian and Jewish women in theUnited States, 1920-1940”, Gender & Society, Vol. 9, No. 4, pp. 469-490.
WATTERSON, P. A., 1988. “Infant mortality by father’s occupation from the 1911census of England and Wales”, Demography, Vol. 25, pp. 289-306.
WOODBURY, R. M., 1926. Infant Mortality and its Causes. Baltimore: The Williamsand Wilkins Company.
WRIGLEY, E. A., 2004. Poverty, Progress, and Population, Cambridge: CambridgeUniversity Press.
DUBLIN JEWISH DEMOGRAPHY A CENTURY AGO 147