
Indigenous Archaeology (Oxford Bibliographies in Anthropology)
Upload
independentCategory
view
5download
0
This page intentionally left blank

D E M O G R A PH Y I N A RC H A E O LO G Y
Demography in Archaeology is a review of current theory and method in the reconstructionof populations from archaeological data. Starting with a summary of demographic conceptsand methods, the book examines historical and ethnographic sources of demographic evidencebefore addressing the methods by which reliable demographic estimates can be made fromskeletal remains, settlement evidence and modern and ancient biomolecules. Recent debatesin palaeodemography are evaluated, new statistical methods for palaeodemographic recon-struction are explained, and the notion that past demographic structures and processes weresubstantially different from those pertaining today is critiqued. The book covers a wide span ofevidence, from the evolutionary background of human demography to the influence of naturaland human-induced catastrophes on population growth and survival. This is essential read-ing for any archaeologist or anthropologist with an interest in relating the results of field andlaboratory studies to broader questions of population structure and dynamics.
andrew t. chamberlain is Reader in Biological Anthropology at the University ofSheffield.
C A M B R I D G E M A N UA L S I N A RC H A E O LO G Y
General EditorGraeme Barker, University of Cambridge
Advisory EditorsElizabeth Slater, University of LiverpoolPeter Bogucki, Princeton University
Books in the seriesPottery in Archaeology, Clive Orton, Paul Tyers and Alan VinceVertebrate Taphonomy, R. Lee LymanPhotography in Archaeology and Conservation, 2nd edition, Peter G. DorrellAlluvial Geoarchaeology, A. G. BrownShells, Cheryl ClaasenZooarchaeology, Elizabeth J. Reitz and Elizabeth S. WingSampling in Archaeology, Clive OrtonExcavation, Steve RoskamsTeeth, 2nd edition, Simon HillsonLithics, 2nd edition, William Andrefsky Jr.Geographical Information Systems in Archaeology, James Conolly and Mark LakeDemography in Archaeology, Andrew T. Chamberlain
Cambridge Manuals in Archaeology is a series of reference handbooks designed for aninternational audience of upper-level undergraduate and graduate students, and professionalarchaeologists and archaeological scientists in universities, museums, research laboratoriesand field units. Each book includes a survey of current archaeological practice alongsideessential reference material on contemporary techniques and methodology.
D E M O G R A P H Y I N A R C H A E O L O G Y
Andrew T. Chamberlain
Cambridge, New York, Melbourne, Madrid, Cape Town, Singapore, São Paulo
Cambridge University PressThe Edinburgh Building, Cambridge , UK
First published in print format
- ----
- ----
- ----
© Andrew T. Chamberlain 2006
2006
Information on this title: www.cambridg e.org /9780521593670
This publication is in copyright. Subject to statutory exception and to the provision ofrelevant collective licensing agreements, no reproduction of any part may take placewithout the written permission of Cambridge University Press.
- ---
- ---
- ---
Cambridge University Press has no responsibility for the persistence or accuracy of sfor external or third-party internet websites referred to in this publication, and does notguarantee that any content on such websites is, or will remain, accurate or appropriate.
Published in the United States of America by Cambridge University Press, New York
www.cambridge.org
hardback
paperback
paperback
eBook (EBL)
eBook (EBL)
hardback

To Clive and Stephen, who pointed the way.

C O N T E N TS
List of figures page xiii
List of tables xvi
Preface xviii
1 I N T RO D U C T I O N 1
1.1 The principal concerns of demography 1
1.1.1 What is a population? 1
1.1.2 Population characteristics 2
1.1.3 Demographic data: from individual life histories
to population parameters 3
1.2 Demography in archaeology 4
1.2.1 Archaeology and people 4
1.2.2 Population pressure: cause or effect? 4
1.2.3 Population structure 6
1.2.4 Health and disease 7
1.2.5 Migration 8
1.3 Sources of evidence 10
1.3.1 Theoretical models 10
1.3.2 Ethnographic and historical evidence 11
1.3.3 Archaeological evidence: skeletal remains,
settlements and site catchments 11
1.3.4 Genetic and evolutionary evidence 12
1.3.5 Evidence from disease 13
viii contents
2 D E M O G R A PH I C C O N C E P TS , T H E O RY
A N D M E T H O D S 15
2.1 Population structure 15
2.1.1 Age categories and age distributions 15
2.1.2 Sex distributions 18
2.1.3 Other structuring categories 19
2.2 Population growth and demographic transition 19
2.2.1 Geometric and exponential growth 19
2.2.2 Logistic growth 21
2.2.3 Demographic transition 23
2.3 Mortality, survivorship and life tables 25
2.3.1 Mortality 25
2.3.2 Survivorship 25
2.3.3 Stable populations 26
2.3.4 The life table 27
2.3.5 Hazard functions for modelling mortality and
survivorship 32
2.4 Fertility and population projection 35
2.4.1 Fertility 35
2.4.2 Population projection 36
2.5 Migration and colonisation 38
2.5.1 Migration 38
2.5.2 Colonisation 40
2.6 Population standardisation and comparison 41
2.6.1 Population standardisation 41
2.6.2 Population comparison 43
3 H I S TO R I C A L A N D E T H N O G R A PH I C
D E M O G R A PH Y 45
3.1 Documentary sources of demographic data 45
3.1.1 Vital registration 45
3.1.2 Censuses 46
contents ix
3.1.3 Commemorative inscriptions 47
3.1.4 Other written sources 48
3.2 Families and households 50
3.2.1 Family units 50
3.2.2 Family reconstitution 50
3.2.3 Household size 52
3.3 Longevity, menarche and menopause 52
3.3.1 Perceptions and misperceptions of
longevity 52
3.3.2 Menarche and menopause 54
3.4 Historical evidence of migration and colonisation 55
3.4.1 Migration in pre-industrial Europe 55
3.4.2 Mass migration and colonisation in the
modern era 57
3.5 Hunter-gatherer demography 58
3.5.1 Population structure in hunter-gatherers 58
3.5.2 Mortality and fertility in hunter-gatherers 62
3.6 Demography of agricultural populations 64
3.6.1 Population structure in agricultural
populations 64
3.6.2 Mortality and fertility in agricultural
populations 67
3.7 Conditions of high mortality 69
3.7.1 Crisis mortality and natural disasters 69
3.7.2 Famine 70
3.7.3 Epidemic disease 74
3.7.4 Conflict mortality 77
4 A RC H A E O LO G I C A L D E M O G R A PH Y 81
4.1 Past population structure 81
4.1.1 Background to the palaeodemography debate 81
4.1.2 The challenge by Bocquet-Appel and Masset 84

x contents
4.1.3 Uniformitarian assumptions in palaeodemography 87
4.1.4 Bias in samples and in estimation 89
4.2 Estimation of sex 92
4.2.1 Human sex differences 92
4.2.2 Morphological sex differences in pre-adolescent
skeletons 93
4.2.3 Morphological sex differences in adult skeletons 95
4.2.4 Accuracy of sex estimation 97
4.2.5 Biomolecular methods of sex estimation 97
4.3 Estimation of age at death 98
4.3.1 Human skeletal development and ageing 98
4.3.2 Age estimation in fetuses and children 101
4.3.3 Age estimation in adults: macroscopic methods 105
4.3.4 Age estimation in adults: microscopic methods 110
4.4 Bayesian and maximum likelihood approaches to age
estimation 112
4.4.1 General principles in estimating age from
morphological indicators 112
4.4.2 Bayes’ theorem and its application to age
estimation 113
4.4.3 Evaluative studies of Bayesian methods in age
estimation 116
4.4.4 Alternative ways of modelling likelihoods:
transition analysis and latent traits 119
4.4.5 Perinatal age estimation from long bone length 120
4.4.6 Age estimation and catastrophic mortality
profiles 123
4.4.7 Prospects for the future 125
4.5 Estimation of population numbers from archaeological
data 126
4.5.1 House sizes and floor areas 126
4.5.2 Settlement sizes 127
4.5.3 Site catchments and resource utilisation 128
contents xi
4.5.4 Monitoring population size from radiocarbon
dating distributions 131
5 EVO LU T I O NA RY A N D G E N E T I C
PA L A E O D E M O G R A PH Y 133
5.1 Age and sex structure in animal populations 133
5.1.1 Natural animal populations 133
5.1.2 Demography of non-human primates 134
5.2 Demography of fossil hominids 137
5.2.1 Maturation times and longevity in fossil
hominids 137
5.2.2 Demography of Australopithecus and early Homo 140
5.2.3 Demography of Homo heidelbergensis and Homo
neanderthalensis 143
5.3 Human genetic palaeodemography 146
5.3.1 Genetic studies of present-day populations 146
5.3.2 Genetic studies of ancient populations 148
6 D E M O G R A PH Y A N D D I S E A S E 151
6.1 Disease in archaeological populations 151
6.1.1 Concepts and evidence of disease 151
6.1.2 Infectious and epidemic diseases 154
6.1.3 Metabolic, nutritional and deficiency diseases 160
6.1.4 Neoplastic and congenital diseases 165
6.1.5 Trauma and homicide 168
6.2 Social and demographic impacts of disease 172
6.2.1 Demographic responses to disease 172
6.2.2 Social responses to disease 173
7 C O N C LU D I N G R E M A R K S 177
7.1 The relevance of demography for archaeology 177
7.2 How meaningful are the results of palaeodemographic
analysis? 179

xii contents
7.3 How different were populations in the past? 180
7.4 Demographic processes and cultural change 183
7.5 Challenges for the future 185
References 189
Index 225
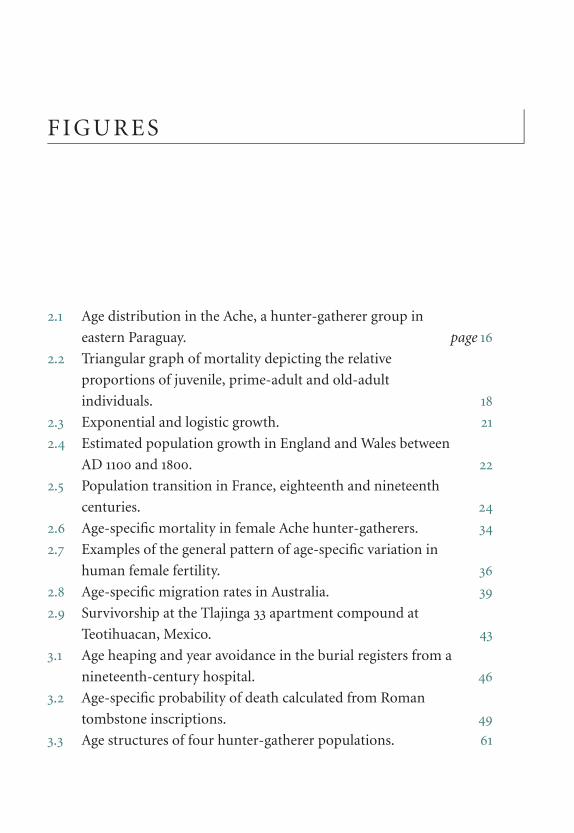
F I G U R E S
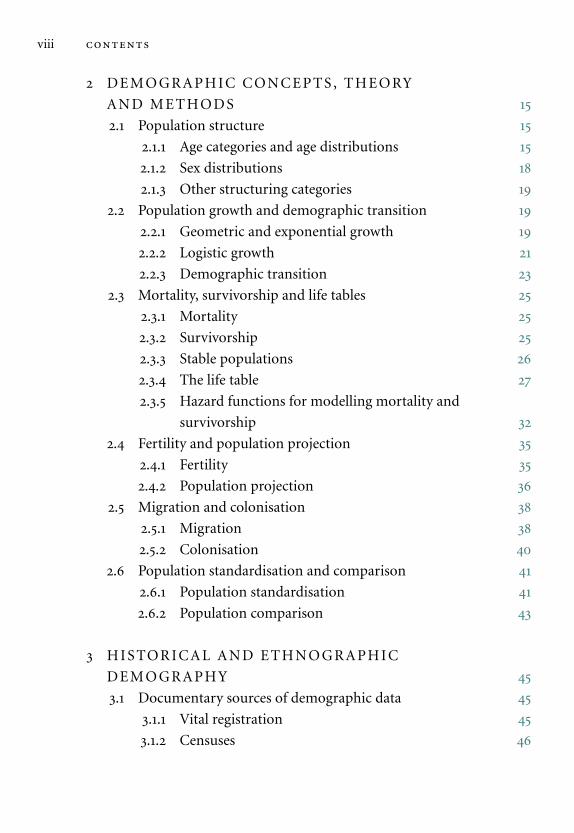
2.1 Age distribution in the Ache, a hunter-gatherer group in
eastern Paraguay. page 16
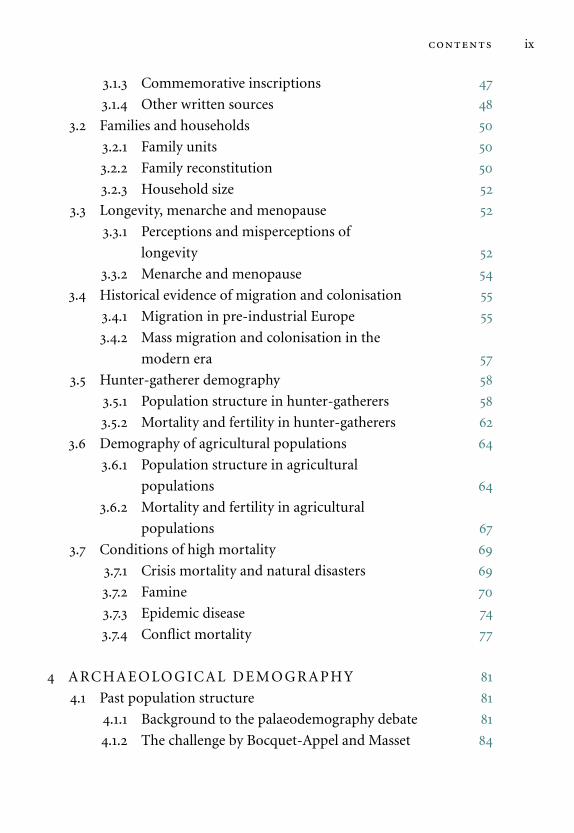
2.2 Triangular graph of mortality depicting the relative
proportions of juvenile, prime-adult and old-adult
individuals. 18
2.3 Exponential and logistic growth. 21
2.4 Estimated population growth in England and Wales between
AD 1100 and 1800. 22
2.5 Population transition in France, eighteenth and nineteenth
centuries. 24
2.6 Age-specific mortality in female Ache hunter-gatherers. 34
2.7 Examples of the general pattern of age-specific variation in
human female fertility. 36
2.8 Age-specific migration rates in Australia. 39
2.9 Survivorship at the Tlajinga 33 apartment compound at
Teotihuacan, Mexico. 43
3.1 Age heaping and year avoidance in the burial registers from a
nineteenth-century hospital. 46
3.2 Age-specific probability of death calculated from Roman
tombstone inscriptions. 49
3.3 Age structures of four hunter-gatherer populations. 61
xiv figures
3.4 Age-specific probability of death in three hunter-gatherer
populations. 64
3.5 Age-specific fertility in hunter-gatherer women. 65
3.6 Age structure in agricultural populations. 66
3.7 Survivorship in agricultural populations. 67
3.8 Age-specific fertility in women from agricultural
populations. 68
3.9 Age-specific mortality in catastrophic floods. 71
3.10 Age-specific mortality during famines in Berar
province, India. 72
3.11 Crude birth and death rates in Berar province, India. 73
3.12 Age-specific death rates from influenza. 75
3.13 Distribution of deaths from plague in Penrith. 76
3.14 Age distribution of civilian deaths in Srebrenica. 79
3.15 Age distribution of combatant deaths. 80
4.1 Age-specific mortality (percentage of deaths) in the
Libben cemetery. 83
4.2 Juvenility index in stable populations with different mortality
levels and rates of population growth. 86
4.3 Age-specific mortality in four archaeological samples of
human skeletal remains. 90
4.4 Age-specific mortality in hunter-gatherers and subsistence
agriculturalists. 91
4.5 Unfused epiphysis at the proximal end of the femur. 100
4.6 Growth profiles constructed from archaeological samples of
skeletal remains, compared to the modern Denver growth
standard. 104
4.7 Age-related changes in the pubic symphysis. 107
4.8 Pattern of wear on the occlusal surfaces of the lower teeth. 109
4.9 Estimated distribution of age at death for Loisy-en-Brie. 118
4.10 Distribution of gestational ages estimated from the
diaphyseal lengths of femurs. 124
figures xv
4.11 Distribution of adult ages at death for two catastrophic
skeletal assemblages. 125
4.12 Proxy archaeological data indicating relative changes in
population size in Roman London. 130
4.13 Distribution of 14C dates obtained on human bone from
Mesolithic and early Neolithic archaeological sites in Britain. 131
5.1 Survivorship curves and average mortality for natural cervid
populations. 134
5.2 Survivorship curves for cercopithecine monkeys, Pan
troglodytes and Homo sapiens. 136
5.3 Survivorship curves for cercopithecine monkeys, Pan
troglodytes and Homo sapiens, compared to a common
developmental scale. 137
5.4 Age distributions in samples of Homo heidelbergensis and
Homo neanderthalensis. 144
6.1 Osteomyelitis in an arm bone. 155
6.2 Season of mortality in Rome. 160
6.3 Cribra orbitalia. 163
6.4 Nitrogen isotope ratios in infant skeletons. 166
TA B L E S
2.1 Changes in population parameters during the
demographic transition. page 23
2.2 Life table for Northern Ache females. 29
2.3 Leslie matrix for Northern Ache females. 37
2.4 Comparison of mortality in the Early Period (AD 300–550)
and the Late Period (AD 550–700) at the Tlajinga 33 site at
Teotihuacan, Mexico. 42
3.1 Data recorded on a family reconstitution form (FRF). 51
3.2 Population structure from census data for hunter-gatherer
and subsistence-farming populations. 59
3.3 Age-specific risk of death in hunter-gatherer populations. 63
4.1 Factors contributing to differences between the skeletons of
human adult males and females. 94
4.2 Options for the selection of prior probabilities of age in
Bayesian age estimation. 116
4.3 Distribution of femoral-head trabecular involution in a
reference series. 117
4.4 Diaphyseal length of femurs in known-age individuals. 121
4.5 Posterior probabilities of gestational age given femur length. 122
5.1 Average duration (in years) of the formation of teeth. 139
5.2 Numbers and proportions of old adults in mortality samples. 140
5.3 Proportions of subadults in samples of fossil hominids. 142
tables xvii
5.4 Distributions of age at death in Homo heidelbergensis and
Homo neanderthalensis. 143
6.1 Changes in prevalence of selected health conditions at the
transition from foraging to farming. 159
6.2 Modern frequencies of congenital diseases (per thousand live
births) that are diagnosable from skeletal remains. 167
6.3 Proportions of juveniles and of adult females in skeletal
assemblages from European prehistoric conflict sites. 171

P R E FAC E
The original impetus to write this volume emerged nearly a decade ago. It
stemmed from a dissatisfaction, in fact a cognitive dissonance, between on
the one hand the need to instruct graduate students in the available pro-
cedures for the reconstruction of past populations from skeletal remains,
and on the other hand a profound unease at the results generated by such
exercises. Fortunately it turned out that several researchers were simul-
taneously trying to square the same circle, and although the gestation of
this book has been inordinately long, it has benefited from the insights
provided by the combined endeavours of a new generation of anthropol-
ogists, archaeologists, population geneticists and biostatisticians whose
research has reinvigorated the science of palaeodemography. In this book
I have attempted to summarise and evaluate some of these exciting new
developments, as well as to revisit some of the older and more established
procedures for inferring population parameters from archaeological evi-
dence.
Many individuals and organisations have knowingly or unwittingly con-
tributed to the production of this book. Thanks are due first of all to the
stimulating intellectual environment provided by colleagues and students
at the University of Sheffield, and to the long-standing policy of the Depart-
ment of Archaeology to resource periods of study leave for some of its aca-
demic staff. Some of the ideas expressed in this book have been trialled on
successive cohorts of students enrolled on the Human Osteology masters
preface xix
training programme at the University of Sheffield. A few of those students
have helped me substantially by contributing to the research reported here
through their graduate and postdoctoral studies, in particular Dr Rebecca
Gowland of the University of Cambridge and Dr Jo Buckberry of the Uni-
versity of Bradford. Other colleagues have been generous with their data,
ideas and opinions – too many to name them all individually, but a partic-
ular debt of thanks is owed to Professor Charlotte Roberts of the University
of Durham who sensibly reminded me of the inverse correlation between
health and mortality! And quietly watching from the sidelines have been
my editors at Cambridge University Press, whose enduring patience and
support, flavoured with occasional gentle cajoling, have been invaluable.
Funding for some of my research has been provided by the Arts
and Humanities Research Council, and several individuals and organi-
sations have facilitated the study of unpublished skeletal remains. Louise
Humphrey (Natural History Museum) and Eugenia Cunha (Coimbra) per-
mitted access to their collections of known-age skeletons, and James Vaupel
(Director of the Max Planck Institute of Demographic Research) kindly
invited me to participate in some of the research projects sponsored by his
Institute.


1
Introduction
1 .1 the principal concerns of demography
1.1.1 What is a population?
The term ‘population’ refers to a bounded group of living individuals, but
the concept of a population is fluid depending on whether it is used in a
biological or a sociocultural context. In biology, a population is a group of
interbreeding organisms, or more formally a cluster of individuals which
have a high probability of mating with each other compared to their prob-
ability of mating with members of some other population (Pianka, 1978).
Biological populations have many properties, only some of which are the
primary concern of demography. For example, the interaction between a
population and its environment is the concern of ecology, while the varia-
tion of genes within and between populations is the concern of population
genetics and evolutionary biology. Demography considers the population
as a singular object for quantitative analysis, and seeks to explain variations
in population size, structure and dynamics.
An alternative definition, more frequently encountered in the human
sciences, views the population as a social unit in which individuals are
linked by their common linguistic, cultural or historical experience. This
kind of population, sometimes labelled a ‘community’, a ‘culture’ or a
‘people’, refers to a group of individuals united by their mutual social
recognition of ancestry and kinship, by other cultural affinities and by
2 demography in archaeology
co-residence or geographical proximity (Kreager, 1997). This definition
emphasises socioeconomic and sociocultural factors in the formation and
maintenance of human populations.
In considering archaeological populations both the biological and the
social perspectives are important. Economic factors are often deeply impli-
cated in the determination of patterns of migration and in an individual’s
reproductive decisions, while at the same time the constraints of biology
are evident in regular patterns of fertility and mortality that are common
to all human and animal populations.
1.1.2 Population characteristics
The following characteristics or attributes of populations are important
in demographic analysis (Daugherty and Kammeyer, 1995: more formal
quantitative definitions of these attributes are provided in Chapter 2).
� Population size: the number of individuals in the population� Population structure: the distribution of the individuals across desig-
nated categories, principally those of age and sex� Population dynamics: the growth or decline in the size of the population
or of its component parts over time� Population density: the number of individuals resident per unit area of
territory� Fertility: the number of offspring produced by an individual in a given
time interval� Mortality: the likelihood of death occuring to an individual in a given
time interval� Migration: the proportion of individuals entering or leaving the popu-
lation, other than through fertility or mortality.
Changes in the first four of these attributes (size, structure, dynamics and
density) can in principle be predicted for a particular population if fertility,
mortality and migration rates for that population are known. However, in
real examples of living populations fertility, mortality and migration rates
introduction 3
vary substantially across age and sex categories, and they also change over
time. As a result, quantitative demographic models of real populations
are often complex and population characteristics occasionally change in a
counter-intuitive fashion.
1.1.3 Demographic data: from individual life histories to population
parameters
Life-history variables are chronological properties of an organism’s life
cycle, such as gestation period, time to maturation, frequency of repro-
duction and longevity (Roff, 1992; Stearns, 1992). In all successful groups
of animals individuals are born, move around their environment, poten-
tially reproduce and eventually die. These four classes of life-history events,
which are fundamental to the lives of all animals, generate the data for
demographic analysis. Within every population individuals vary in their
probability of death, in their fertility and in their participation in migra-
tion. In the case of mortality and fertility, these events are strongly age
structured, with the probability of death usually being much higher in the
very young and in the very old, while fertility is usually at a maximum
during the early and middle part of adult life. Age and sex differences in
migration are observed in most animal species and are also characteristic of
many human groups, as the propensity to migrate is strongly conditioned
by socioeconomic circumstances and by cultural norms.
The demographic properties and behaviour of a population are therefore
a summation and an average of the characteristics and behaviour of its
constituent members. The total number of individuals in a population will
vary over time if the number of births, deaths, immigrants and emigrants
do not balance to zero over the relevant time period. The structure of
a population can also change over time independently of the size of the
population, and short-term changes in size and structure may be hidden
from view by temporal averaging if the data are accumulated over a series
of lifespans or generations (such as may happen when vital records are
aggregated or when cemetery data are analysed).
4 demography in archaeology
1.2 demography in archaeology
1.2.1 Archaeology and people
In seeking to reconstruct the cultures and societies of the past, archaeology
primarily investigates the material remnants that survive in the present-day
environment. This evidence consists typically of the more robust elements
of material culture, supplemented by the organic evidence for past envi-
ronments and to a lesser extent by the surviving skeletal remains of the
people themselves. There is no quick and easy route by which popula-
tion size and structure can be inferred from these kinds of archaeological
data. A multitude of confounding factors, including the differential depo-
sition, preservation and recovery of archaeological remains, conspire to
render samples incomplete and unrepresentative, while indirect evidence
for population numbers (such as settlement size) is amenable to a variety of
conflicting interpretations. However, the following examples outline some
of the ways in which demographic models and data can play an impor-
tant role both in underpinning the theoretical basis of archaeology and in
aiding the interpretation of particular sites and assemblages.
1.2.2 Population pressure: cause or effect?
Qualitative demographic models have frequently played an important role
in theoretical archaeology, as they have more widely within social his-
tory. Significant increases in population seem to have accompanied major
technological advances such as the invention of Upper Palaeolithic blade
industries (Shennan, 2001), the origins of food production (Hassan, 1973;
Bronson, 1975; Cohen, 1977) and the onset of industrialisation in west-
ern Europe (McKeown, 1976). One general explanation for these episodic
rises in population numbers, presented by Childe (1936) and endorsed
by subsequent generations of economic historians and prehistorians, is
the neo-Malthusian axiom that under normal circumstances the size of
a population approaches an upper limit determined by the availability of

introduction 5
critical resources. According to this viewpoint, technological, social and/or
ideological change brings about the conditions under which a population is
free to expand beyond these restraints until it is limited by a new barrier to
growth. The recurring resource ‘problem’ is solved through a succession of
sociocultural innovations, including change in land use, novel patterns of
exploitation of resources, technological advance, specialisation, increased
economic exchange and so on, enabling the population to periodically
increase in size and density.
Set against this view is the theory, first articulated by Boserup (1965)
and Dumond (1965), and taken up with enthusiasm during the rise of New
Archaeology by Binford (1968), Carneiro (1970) and Renfrew (1973), that
cultural change is primarily a consequence of population growth rather than
a trigger for growth. It is perhaps noteworthy that Boserup’s model not only
appealed to Processual Archaeologists as a plausible exemplar of the theo-
rised ecological basis of cultural change, but it also coincided with wider
concerns about the possible economic and social consequences of uncon-
strained twentieth-century global population growth (Ehrlich, 1968). Pop-
ulation growth has been invoked as a prime mover in prehistoric cultural
change, e.g. in the replacement of Neanderthals (Homo neanderthalensis)
by anatomically modern Homo sapiens (Zubrow, 1989), in the rapid peo-
pling of the Americas (Martin, 1973) and in the wave of advance model
for the spread of agriculture in Europe (Ammerman and Cavalli-Sforza,
1973).
Case Study 1.1 Colonisation and population growth in the
Late Pleistocene Americas
The Americas constitute the last continental land mass to be colonised by
humans. This event took place in the Late Pleistocene, and although there
is sporadic evidence for earlier settlement the main colonisation event prob-
ably occurred towards the end of the last Ice Age and involved the migra-
tion of hunter-gatherers into North America from eastern Siberia. The timing
6 demography in archaeology
and rate of spread of this major colonisation event is controversial, and sev-
eral lines of evidence have been pursued in order to investigate the early
demographic history of the Americas including linguistic diversity amongst
present-day native Americans (Nettle, 1999), genetic diversity in modern
and ancient native populations (Torroni et al., 1994; Stone and Stoneking,
1999), morphological comparisons amongst human skeletal remains (Jantz
and Owsley, 2001), chronological patterning of archaeological sites (Meltzer,
1995) and computer geographical modelling of population dispersal routes
(Anderson and Gillam, 2000).
The colonisation process in the initial inhabitation of the Americas is
believed to have been very rapid, based on the near contemporaneity between
the earliest dated Palaeoindian sites in North and South America and the
abundance of archaeological sites that emerge across North America at around
12,000 years BP. The colonisation of an unoccupied space is relatively easy to
simulate mathematically, and several authors have generated numerical mod-
els that reconstruct the colonisation process. These models, which incorporate
high average rates of population growth (increase in numbers of 1% to 3%
per annum) and rapid geographical migration (up to 300km per generation),
show that the Americas could have been occupied to carrying capacity within
2,000 years starting from a relatively small initial founding population (Young
and Bettinger, 1995; Steele et al., 1998; Anderson and Gillam, 2000; Hazle-
wood and Steele, 2004). The demographic models rely on the assumption that
hunter-gatherer populations migrating through unoccupied territory can pur-
sue the option of long-distance ‘leap-frog’ colonisation movements to ensure
that unexploited and productive foraging territory is immediately available for
population expansion.
1.2.3 Population structure
Quite apart from the importance of overall numbers and rates of popula-
tion growth, the analysis of population structure can also provide signifi-
cant insights into past lifestyles and processes. Both human and animal
populations exhibit a restricted range of age–class structures and sex ratios
under natural circumstances. These structures of the living community
introduction 7
translate into regular mortality profiles which can be reconstructed from
assemblages of skeletal remains (see Chapter 2). Mortality profiles provide
two key lines of information about past communities and processes. If a
mortality profile reconstructed from archaeological evidence bears a close
resemblance to a previously established profile derived from a present-day
population, then it is reasonable to assume that the attributes of the mod-
ern population also apply to the archaeological sample. In contrast, the
extent to which the age structure of an archaeological sample departs from
the mortality profile of the modern population can provide the inves-
tigator with evidence about specific cultural and natural (taphonomic)
processes that may have biased the composition of the archaeological
sample.
1.2.4 Health and disease
Palaeopathology (the study of disease in past populations: Roberts and
Manchester, 1995; Larsen, 1997) provides important evidence for past
lifestyles and adaptations. Population statistics are now recognised to
be crucially important in studies of medical history and palaeopathol-
ogy (Waldron, 1994), as the prevalences of many diseases are age and sex
dependent, and morbidity from infectious disease in particular is strongly
dependent on population size and density. The demographic structure of
a population, in turn, is influenced by the cumulative effects of the current
and historical experience of health and disease in that population.
In some circumstances demographic data may provide evidence of a par-
ticular cause of death (Margerison and Knusel, 2002; Dutour et al., 2003;
Gowland and Chamberlain, 2005). Catastrophic mortality, occurring as a
result of a natural mass disaster or from an outbreak of disease with high
infectivity and mortality, will generate a mortality profile that reflects the
living-age structure of the population at risk, whereas chronic malnutri-
tion and ill health will tend to have a greater impact on the youngest and
oldest age classes. Human migration and colonisation have had a profound
effect on the global distribution of disease, with catastrophic consequences

8 demography in archaeology
for many aboriginal populations (Verano and Ubelaker, 1992; Larsen and
Milner, 1994).
Case Study 1.2 Impact of European contact on aboriginal
North American populations
When Europeans began to colonise the New World in the late fifteenth century
they encountered native aboriginal populations who lacked immunity to some
infections such as measles, smallpox and scarlet fever, diseases that were com-
mon in Old-World communities. Following the arrival of European colonists
outbreaks of these diseases became frequent amongst the native New-World
populations, and although estimates of precontact aboriginal population num-
bers vary widely there is little doubt that contact-induced infectious disease
was a major contributor to the decline of the native-American populations.
The cumulative effects of repeated outbreaks of epidemic disease could be very
great, as individual epidemics often killed more than 50% of the exposed native
population.
Detailed studies of archaeological settlement data, combined with historical
demographic records have provided clear evidence for the timing and cause of
this ‘crisis’ mortality in native northeastern North America during the seven-
teenth century (Snow, 1996; Warrick, 2003). These studies indicate that there
was a delay of about one century between initial European colonisation of
North America and the arrival and spread of pandemic European diseases in
the native populations. Warrick (2003) has attributed this delay to the small
size of the original colonising populations and the fact that subsequent waves
of European immigrants included larger numbers of children who were more
likely to carry contagious diseases.
1.2.5 Migration
Hypotheses of human migration are often central, if controversial, in
reconstructions of culture change. The physical migration of popu-
lations is sometimes put forward as a competing hypothesis to set
against non-migrational models of cultural diffusion and indigenous
introduction 9
development. Culture change may itself result in demographic change,
thus the demographic signature of migration, particularly in prehistory,
may be unclear. Nonetheless, there exist a wide range of historical and
ethnographic studies of migration that can provide the theoretical basis
for understanding the importance of migration in archaeology and the cir-
cumstances under which it takes place (Adams et al., 1978; Anthony, 1990).
Information about the history of residence of individuals represented in
the archaeological record can also be obtained from the chemical analysis
of human skeletal remains.
Case Study 1.3 Isotopic evidence for prehistoric migration in Europe
Stable isotopes are non-radioactive, chemically similar forms of an element that
can be detected and discriminated through small differences in their physical
properties. Stable isotopes can be used in studies of migration, because individ-
uals who are born and live in a specific geographical region will have an isotopic
signature in their skeleton that is characteristic of the local sources of ingested
nutrients (i.e. food and water) found in that region (Katzenberg, 2000). The
presence of migrants in past populations can be detected by unusual isotopic
values in their skeletal remains: this is normally undertaken using stable iso-
tope ratios of bone-seeking elements such as strontium and lead, although in
some regions of the world the isotopic ratios of oxygen can also be used to
infer place of residence.
Migration has been invoked to explain the origin and rapid spread of vari-
ous prehistoric cultures in Europe, including the early Neolithic Linearband-
keramik (LBK) and the late Neolithic Bell-Beaker culture. Price et al. (2001)
used the ratio of 87Sr to 86Sr in the tooth enamel of skeletons from LBK ceme-
teries in Flomborn and Schwetzingen in the Upper Rhine Valley, Germany, to
distinguish locally born individuals from people who had migrated into the
Rhine Valley from elsewhere. Tooth enamel, which is formed during infancy
and early childhood, retains the isotopic signature of the early years of an indi-
vidual’s life, whereas bone which is continually remodelled throughout the
lifespan has isotopic values that reflect approximately the last decade of life.
At the Flomborn LBK cemetery 7 (64%) of the 11 individuals were classified
10 demography in archaeology
as migrants on the basis of their elevated strontium isotopic ratios (indicating
that they had grown up outside the region), while at the Schwetzingen cemetery
33% of 21 individuals were classified as migrants. At both cemeteries females
were over-represented amongst the migrants, a finding that is consistent with
genetic evidence for historically higher migration rates in females than in males
(Seielstad et al., 1998).
Grupe et al. (1997) sampled tooth enamel and bone from 69 skeletons from
Bell-Beaker cemeteries in southern Bavaria, Germany, and identified 17 immi-
grants (25% of the sample) on the basis of discrepancies between the strontium
isotope ratios of enamel when compared to the isotopic ratios in bone from
the same skeleton. As with the study of LBK cemeteries, a higher proportion of
females than males exhibited residential mobility as evidenced by their isotopic
ratios. In both studies these estimates of migration frequency are minimum
values, as it is not possible to detect individuals who move between regions
that have the same underlying geology.
1 .3 sources of evidence
1.3.1 Theoretical models
As is the case in many areas of archaeological research, uniformitarian mod-
els play a very important role in palaeodemography. Certain life-history
parameters such as age at reproductive maturation, age at menopause and
longevity are subject to evolutionary constraints and are relatively invari-
ant across human populations, and patterns of age-specific fertility and
mortality tend to vary in predictable and easily modelled ways (Coale and
Trussell, 1974; Coale and Demeny, 1983).
The application of the uniformitarian principle in palaeodemography is
still controversial, as there are persistent claims that the human populations
of the past differed systematically from present-day populations in their
structure and dynamics. For instance, there is a durable belief that people
in the past aged more rapidly, died at a young age and that few individuals
survived beyond what would today be regarded as middle age. This belief
has been sustained by a combination of systematic bias in skeletal-age

introduction 11
estimation (which has generated mortality profiles with too few old-adult
individuals) coupled with a tendency to confuse average age at death, or
life expectancy, with maximum age at death, or longevity.
The theoretical basis for the study of palaeodemography is explained
in detail in Chapter 2, while the use of uniformitarian models to inform
Bayesian approaches to the reconstruction of mortality profiles is addressed
in more detail in Chapter 4.
1.3.2 Ethnographic and historical evidence
Ethnographic studies have provided a very important body of historical
demographic data for hunter-gatherer and subsistence-agriculture com-
munities. Unfortunately, reliable data for hunter-gatherers is exceedingly
sparse, particularly for periods that antedate full contact with modern
western civilisations. Nevertheless, the available data for hunter-gatherers
can be compared to ‘model’ life tables, which are theoretical population
structures designed to represent a broad spectrum of real-life sedentary
populations. Such comparisons show that the structures of mobile hunter-
gatherer and pastoralist communities resemble those of more sedentary
populations.
Historical sources for demography include systematic records of vital
events (births, marriages and deaths), cross-sectional enumerations of liv-
ing populations (censuses and taxation records) and an assortment of
other records including commemorative inscriptions. In Europe there are
few systematic records of vital events before the sixteenth century AD, but
census data is sometimes available from much earlier periods (Wiseman,
1969; Ball, 1996). This evidence is discussed further in Chapter 3.
1.3.3 Archaeological evidence: skeletal remains, settlements
and site catchments
Hollingsworth (1969) published a list of written and material sources for
historical demography. Ranked nineteenth, and therefore least important,
12 demography in archaeology
on this list were cemetery data, which he regarded as ‘most unreliable
sources for making any demographic estimate’ (Hollingsworth, 1969: 43).
This attitude has sometimes been endorsed by archaeologists, but skeletal
remains, together with evidence of the size of settlements and calculations
of carrying capacity, constitute essential sources of evidence for archaeo-
logical demography. Although skeletal remains are the primary source of
data for palaeodemography, the demographic analysis of skeletal remains
can be problematic, partly because of the potential for error in estimating
age at death and sex, and partly because of the confounding effects of cul-
tural and taphonomic factors that may introduce bias both when bones
enter the archaeological record and during their subsequent detection and
recovery.
Analyses of house size, settlement size and of the area, accessibility and
productivity of land surrounding settlements (‘site catchment analysis’)
can provide independent estimates of the size of local and regional popu-
lations (Hassan, 1978; Roper, 1979). Such estimates often depend on ethno-
graphic parallels that allow population density to be inferred from the
floor space of buildings and sustainable population size to be calculated
from the availability and distribution of arable land and pasture. Where a
cemetery is known to serve a particular settlement the average size of the
population can also be estimated from the size, age structure and period of
usage of the cemetery (Acsadi and Nemeskeri, 1970), which can serve as an
independent check on population estimates derived from settlement size
or site catchment analysis. The nature of archaeological evidence for past
populations, and problems in its interpretation, are discussed in further
detail in Chapter 4.
1.3.4 Genetic and evolutionary evidence
There is a wealth of information about the demographic history of the
human species contained in the genome, and an understanding of human
life histories can be gained from comparative analyses of other closely
related species and from the fossil record of human evolution. Studies of
introduction 13
the human genotype, including analyses of allele and haplotype frequen-
cies, karyotypes and mitochondrial and genomic DNA sequences, provide a
fertile source of information about past population history (Cavalli-Sforza
et al., 1994). Modern human genetic diversity has arisen through the cumu-
lative effects of the process of population expansion, subdivision, migration
and extinction, and both recent and ancient demographic events have left
a signature in the genetic record. Analysis of this diversity can be extended
to past populations through the techniques of biomolecular archaeology
which allows the extraction and characterisation of genetic material from
ancient remains, and through biometric studies of the morphological vari-
ation in ancient skeletal remains.
A fundamental question in demography is whether the distinctive
aspects of human-population structure and dynamics, such as increased
generation length and longevity or survival, are the consequence of recent
historical events or whether they reflect a deep evolutionary history. This
question can be addressed through comparisons of human-population
data with other animal species (especially non-human primates) and
through the elucidation of life-history data obtained from fossil hominids.
These questions are reviewed in Chapter 5.
1.3.5 Evidence from disease
Age-specific patterns of mortality are a direct reflection of the differential
risk of fatal disease and injury throughout the life cycle. Palaeopatholog-
ical and palaeoepidemiological studies are therefore central to gaining an
understanding of the demography of past populations. Infectious disease is
believed to have been a major determinant of mortality in the past, and with
increased population density and the development of more sedentary and
nucleated settlement following the transition to agriculture new oppor-
tunities emerged for the evolution and spread of new infectious diseases.
The presence of disease in past populations can be identified from a range
of evidence, including morphological changes in bones and teeth, textual
and pictorial representations of disease and the biomolecular signature of
14 demography in archaeology
disease organisms. Epidemic diseases that cause mass mortality can also
be identified through the demographic structure of the mortality sample.
However, as only a minority of individuals affected by disease will manifest
skeletal changes, the application of biomolecular methods is a particularly
important approach in the detection and diagnosis of disease in past pop-
ulations. The nature of the interaction between disease and demography
is explored further in Chapter 6.
2
Demographic concepts, theoryand methods
2.1 population structure
2.1.1 Age categories and age distributions
The age structure of a population refers to the distribution of numbers
of individuals according to their instantaneous age at the time when the
population is censused. Age structures can be recorded either for living
populations or for a sample of deaths from a living population. It is impor-
tant to note that the age-at-death structure of a mortality sample will gen-
erally differ from the age structure of the living population within which
the deaths occur. In most populations the risk of death varies significantly
with age and this results in proportionately greater numbers of deaths in
the higher-risk age categories.
Although population and mortality profiles can be treated as continu-
ous distributions of ages, the curves of survivorship and mortality contain
multiple inflections and therefore they require the determination of sev-
eral parameters in order to describe them as continuous mathematical
functions (see Section 2.3 below). It is a long-standing demographic con-
vention to aggregate age distributions into discrete age intervals, which
in the case of humans are usually measured in units of months, years or
multiples of years since birth. For example, in human historical demog-
raphy age distributions are often determined by summating the num-
ber of individuals within five-year or ten-year age classes (Figure 2.1).

16 demography in archaeology
Figure 2.1 Age distribution in the Ache, a hunter-gatherer group in easternParaguay. Females are shown as shaded bars above the horizontal axis, malesare below the horizontal axis. The data form a classic ‘population pyramid’with large numbers of children, substantial numbers of young adults andreduced numbers of older adults. This pattern of survivorship is generated bythe cumulative effects of attritional mortality as the members of thepopulation progress through the successive stages of life. Data taken from Hilland Hurtado (1995: Figure 4.8), ages are in 5-year intervals.
In fact, five-year age categories may represent too fine a subdivision for
some historical datasets in which inaccuracies in age recording are evident
from the patterns of ‘age heaping’ (see Section 3.1.1. below). For archae-
ological samples precise estimates of chronological age are usually not
available, and instead rather broad age categories may be adopted that
reflect the imprecision with which ages at death are estimated from skeletal
remains.
One of the simplest subdivisions by age, and one that is applicable to
both human and non-human species, is to divide the lifespan into three
intervals: juvenile (i.e. pre-adult), prime adult and old adult (Stiner, 1991).
These age stages may be of unequal length when expressed in chrono-
logical years, but the boundaries between the intervals reflect important
demographic concepts, theory and methods 17
physiological and behavioural transitions in the life history of the individ-
ual. Juvenile organisms are physically and socially immature, and in some
species including humans are highly dependent on adults for subsistence
and protection: in most vertebrate species juveniles experience the highest
levels of mortality of any age class. The boundary between the juvenile
and the prime-adult stages may differ between the sexes, and as a general
rule the onset of fecundity in females and of sexual maturity in males are
the appropriate markers for the attainment of adulthood, as both of these
life-history stages coincide approximately with the cessation of somatic
growth. Prime adults are physically and reproductively mature, and usu-
ally experience the highest fertility and the lowest levels of mortality. The
transition from prime adult to old adult is less well defined biologically,
but is marked by a decline in (female) fecundity and an increase in levels
of mortality in both sexes as individuals become increasingly vulnerable
to senescence, disease and predation.
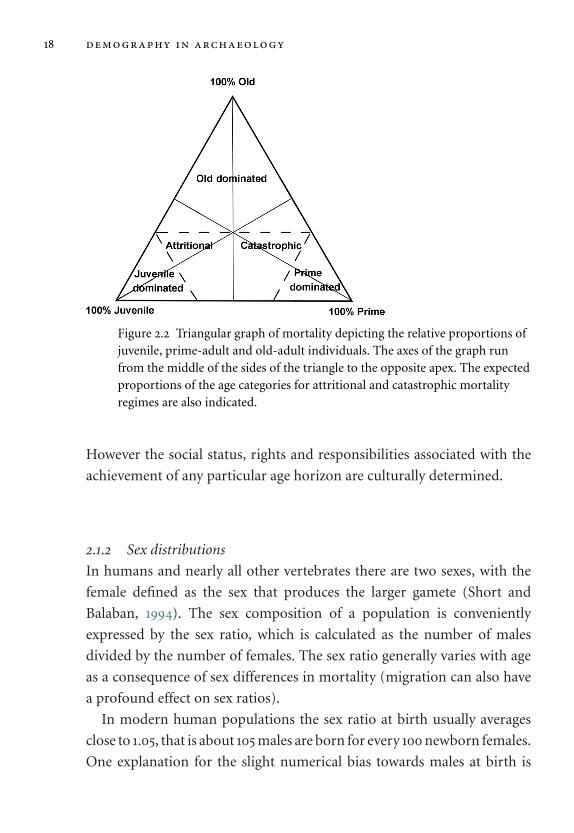
Stiner (1991) has used a three-age system for distinguishing patterns
of animal mortality that are attributable to different predation strategies
(Figure 2.2). In human demography a socioeconomic version of the three-
age system is utilised in calculating a population’s Dependency Ratio, which
is defined as the sum of the numbers of persons under 15 years of age plus
those over 65 years of age, expressed as a percentage of the number of
persons aged between 15 and 65 years (Daugherty and Kammeyer, 1995:
85). In palaeodemography the transition between the human prime-adult
and old-adult categories is sometimes placed at 45 or at 50 years of age,
which corresponds to the upper limit of female fertility as well as being the
approximate limit of conventional macroscopic methods for determining
adult age at death (see Chapter 4).
There has been some discussion in the historical and anthropological
literature concerning the ages at which individuals are considered to enter
and leave socially defined life stages such as childhood and old age (Aries,
1962; Shahar, 1993). To a certain extent, such age categories are based on
physical maturation and the timing of biological senescence, which exhibit
limited variation across populations and cultures (see Section 3.3 below).
18 demography in archaeology
Figure 2.2 Triangular graph of mortality depicting the relative proportions ofjuvenile, prime-adult and old-adult individuals. The axes of the graph runfrom the middle of the sides of the triangle to the opposite apex. The expectedproportions of the age categories for attritional and catastrophic mortalityregimes are also indicated.
However the social status, rights and responsibilities associated with the
achievement of any particular age horizon are culturally determined.
2.1.2 Sex distributions
In humans and nearly all other vertebrates there are two sexes, with the
female defined as the sex that produces the larger gamete (Short and
Balaban, 1994). The sex composition of a population is conveniently
expressed by the sex ratio, which is calculated as the number of males
divided by the number of females. The sex ratio generally varies with age
as a consequence of sex differences in mortality (migration can also have
a profound effect on sex ratios).
In modern human populations the sex ratio at birth usually averages
close to 1.05, that is about 105 males are born for every 100 newborn females.
One explanation for the slight numerical bias towards males at birth is
demographic concepts, theory and methods 19
that postnatal mortality in all age classes is usually higher in males than in
females, so that the sex ratio at the age of first reproduction is closer to unity.
However, higher sex ratios at birth are found in some human populations,
particularly hunter-gatherers (Hewlett, 1991; Hill and Hurtado, 1995). It has
been argued that this may occur because under certain conditions parental
investment can make a greater contribution to the reproductive success
of offspring when it is directed towards male children rather than female
children (Sief, 1990: 27). The same factor may also take effect through
sex-biased infanticide (Daly and Wilson, 1984).
In archaeological skeletal samples sex determination may be difficult or
impossible to achieve, particularly in the pre-adult age classes, and sex dis-
tributions are often available only for adults. There are alternative methods
for estimating sex that rely on sex-specific sequences of DNA (Brown, 1998).
These can be applied to human skeletal remains from archaeological sites
where there is exceptionally good preservation of the organic constituents
of bones and teeth.
2.1.3 Other structuring categories
Age and sex are the principal variables which are used to characterise pop-
ulation structure, but other physical parameters such as spatial location
and genotype, as well as social categories such as marital status, employ-
ment, religious affiliation, ethnic identity, socioeconomic and health status
are sometimes important in the demographic analysis of modern human
populations.
2.2 population growth and demographic transition
2.2.1 Geometric and exponential growth
The change through time in the number of individuals in a population
depends on the balance between births, deaths and migration into and out
of the population. Births and deaths are sometimes referred to as intrinsic
20 demography in archaeology
or vital events, while migration is an extrinsic factor. Births, deaths and out-
migration are usually density dependent: that is, the numbers born, dying
and out-migrating are usually dependent on, and a positive function of, the
size of the parent population. In-migration may depend partly on the size of
the receiving population (for example, a large settlement might be expected
to attract and accommodate more migrants than a small settlement), but
will also depend on the size of the potential donor populations. The partial
or complete density dependence of the intrinsic and extrinsic factors that
determine the total number of individuals in a population gives rise to
the property of geometric growth. Populations increase or decrease in
size geometrically rather than arithmetically, because at a given rate of
population growth or decline a fixed proportion of the total (rather than a
fixed number) is added to or subtracted from the population in each time
interval.
The rate of geometric increase r can be modelled as the proportion of
the original population that is added in unit time: if P0 is the initial size of
the population at time t = 0, and Pt is its size at time t, then
r t = Pt − Po
Po
or by rearranging terms
Pt = Po (1 + r t)
When the population is decreasing, Pt is less than P0 and r is negative.
When population numbers are stable Pt is equal to P0 and r = 0.
However, because populations grow continuously rather by a sudden
increment at the end of a discrete time interval, the above formulas are
better replaced by the formulas for instantaneous or exponential growth:
r t = ln(Pt) − ln(Po) or Pt = Po exp(r t)
[note that exp(r t) is the limit of (1 + r t/j) j as j → ∞]
From the equations for exponential growth we can derive a useful quan-
tity known as the population doubling time, which is achieved when

demographic concepts, theory and methods 21
Figure 2.3 Exponential and logistic growth. The dotted line depicts apopulation growing exponentially at a rate of r = 0.01 per annum. The solidline depicts a population growing logistically with growth rate r = 0.02,carrying capacity k = 800, and with maximum growth rate occurring att = 100 years.
exp(r t) = 2, so that t = ln(2) ÷ r = 0.693 ÷ r. Thus for a population
growth rate of 1% per annum, r = 0.01 and the doubling time is 69.3 years.
At higher rates of growth the doubling time is proportionately shorter:
a population growing exponentially at a growth rate of 3% per annum
will double in size in just 23 years, which is somewhat less than the average
length of a human generation. Exponential growth is depicted in Figures 2.3
and 2.4.
2.2.2 Logistic growth
The formula for exponential growth implies that there is no limit to the
ultimate size of the population, which therefore will increase inexorably
and ever more rapidly with time. In practice, natural populations tend to

22 demography in archaeology
0
2
4
6
8
10
1100 1200 1300 1400 1500 1600 1700 1800Po
pu
lati
on
of
En
gla
nd
an
d W
ales
(m
illio
ns)
Annual growth = 0.5%
Figure 2.4 Estimated population growth in England and Wales betweenAD 1100 and 1800 compared to an annual exponential growth rate of 0.5%.The population decline in the fourteenth century is associated with the BlackDeath and its aftermath.
be limited by competition for limited resources, and the rate of increase in
population size will level off as the population approaches the maximum
possible size, which is sometimes denoted the carrying capacity k. This
pattern of population increase can be modelled by the logistic growth
curve, which is described by the formula:
Pt = k
1 + exp(−r t)
where t is measured from time of maximum growth rate
The logistic growth curve is S-shaped, with P close to 0 for very negative
values of t, P = k ÷ 2 for t = 0, and P approximating to k for large positive
values of t (Figure 2.3).
The logistic growth equation has been applied extensively in human
demography because it provides a reasonable model for the pattern of
population size increase that has occured historically during demographic
transitions, when populations move from conditions of high fertility and

demographic concepts, theory and methods 23
Table 2.1 Changes in population parameters during the demographic
transition
Stage Death rate Birth rate Growth rate Population age structure
Stage 1 High High Low Low average age of livingpopulation, high proportion ofchildren
Stage 2 Falling High High Low average age of livingpopulation, highest proportionof children
Stage 3 Low Falling Falling Increasing average age of livingpopulation, falling proportionof children
Stage 4 Low Low Low High average age of livingpopulation, low proportion ofchildren
high mortality to low fertility and low mortality (see Section 2.2.3 below).
However, it is arguable whether any human populations (with the possible
exception of hunting/foraging societies, and perhaps some groups confined
to oceanic islands) are limited by an ecologically determined maximum
population size.
2.2.3 Demographic transition
Demographic transition is the name given to a widespread and consistent
pattern of change in birth and death rates, with its consequent impact on
rate of population growth, that has occurred during the last few centuries
in regional human populations undergoing economic development. The
transition is manifest as a decline in mortality followed, usually after a
delay of several generations, by a parallel decline in fertility (Notestein,
1945). The demographic transition is made up of a sequence of four stages,
each with a characteristic mortality and fertility experience (Table 2.1). A
typical outcome of a demographic transition is a doubling of the average
duration of life and a halving of the number of children born to each female
24 demography in archaeology
1
2
3
4
1770
1780
1790
1800
1810
1820
1830
1840
1850
1860
1870
1880
1890
1900
1910
1920
1930
Bir
th a
nd
dea
th r
ate
(% p
er y
ear)
20
25
30
35
40
45
Po
pu
lati
on
(M
illio
ns)
Birth rate
Death rate
Population
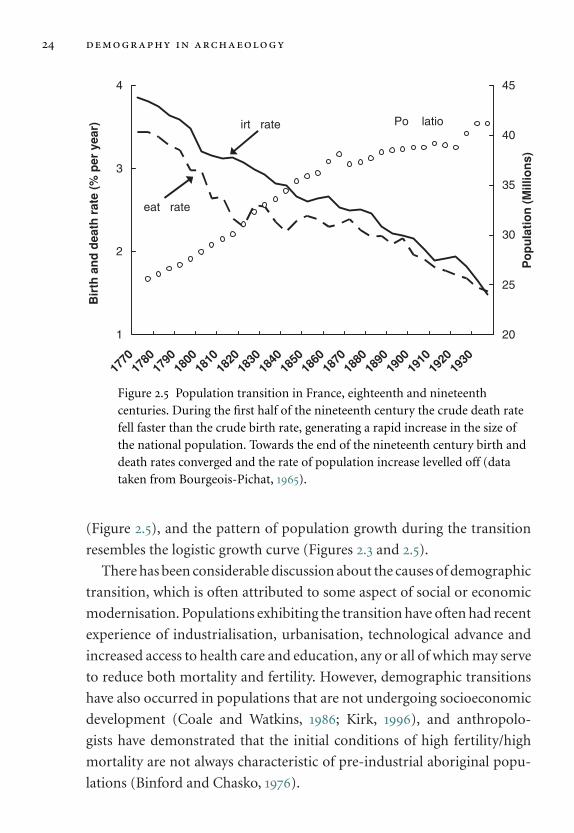
Figure 2.5 Population transition in France, eighteenth and nineteenthcenturies. During the first half of the nineteenth century the crude death ratefell faster than the crude birth rate, generating a rapid increase in the size ofthe national population. Towards the end of the nineteenth century birth anddeath rates converged and the rate of population increase levelled off (datataken from Bourgeois-Pichat, 1965).
(Figure 2.5), and the pattern of population growth during the transition
resembles the logistic growth curve (Figures 2.3 and 2.5).
There has been considerable discussion about the causes of demographic
transition, which is often attributed to some aspect of social or economic
modernisation. Populations exhibiting the transition have often had recent
experience of industrialisation, urbanisation, technological advance and
increased access to health care and education, any or all of which may serve
to reduce both mortality and fertility. However, demographic transitions
have also occurred in populations that are not undergoing socioeconomic
development (Coale and Watkins, 1986; Kirk, 1996), and anthropolo-
gists have demonstrated that the initial conditions of high fertility/high
mortality are not always characteristic of pre-industrial aboriginal popu-
lations (Binford and Chasko, 1976).

demographic concepts, theory and methods 25
2.3 mortality, survivorship and life tables
2.3.1 Mortality
The mortality or death rate is defined as the proportion of a population
that dies within a specified interval of time. In most biological species the
probability of dying is not constant with age: in humans and many other
organisms the age-specific mortality is high in juveniles, falls to a mini-
mum in late adolescence and early adulthood, and thereafter rises steadily
with increasing age (Caughley, 1966). Mortality rates also vary with sex
and socieconomic status and with other population parameters. Therefore
valid comparisons of the mortality experience of different populations may
require that these parameters are controlled by means of standardisation
(see Section 2.6 below).
The crude death rate (CDR) is obtained by dividing the number of
deaths D by the product of the size of the population at risk P and the time
period t during which the deaths occur.
CDR = D
Pt
This formula assumes that the population is of constant size during the
period when deaths are recorded. The CDR can be decomposed into a
vector of age-specific death rates provided that the age structure of the
population is known. Then, for a given age category x, the age-specific
death rate (ADR) is Dx (the number of deaths at age x), divided by the
product of Px (the size of the population of age x) and the time period t.
ADR = Dx
Pxt
2.3.2 Survivorship
Survivorship is a useful demographic concept that expresses the proba-
bility that an individual will survive to a specified age. Individuals have
a maximum probability of 1.0 (or 100%) of being born, i.e. of achieving
an age of zero, and a minimum probability of 0 of exceeding the greatest
longevity recorded for the population. At intermediate ages the probability

26 demography in archaeology
of survivorship is between 1.0 and 0, and by definition the survivorship
function decreases monotonically with increasing age. An alternative way
of thinking of survivorship is to consider a cohort, or group of individu-
als all born in the same year, and then to record, for each successive time
interval, the proportion of this original cohort that is still alive at the end
of the time interval.
Survivorship is a cumulative function in which the value of the function
at a specified age is dependent on the values of survivorship at all preceding
ages. Thus points on a survivorship curve are not independent data, a fact
that has implications for the statistical comparison of survivorship patterns
in different populations.
2.3.3 Stable populations
In a population that is closed to inward and outward migration the age
and sex distribution is determined by the population’s current and recent
history of mortality and fertility. If age-specific birth and death rates are
constant over a period of time the population will eventually converge on a
stable age structure with population size increasing or decreasing at a con-
stant rate (this property of a stable population was shown mathematically
by Sharpe and Lotka (1911), and can be demonstrated empirically using
Leslie matrices, see Table 2.3 and Section 2.4 below). In a stable population
the numbers of individuals in each age category increase or decrease at
the same rate as the whole population. It takes a few generations, typically
50–100 years, for the age distribution of a human population to achieve
stable structure (Coale, 1957), and in practice any given closed population
will show in its age structure the cumulative effects of up to a century of
intrinsic demographic events.
Stable populations are idealised constructs because no real population
maintains unchanging fertility and mortality schedules for long peri-
ods of time (and few real-life populations are truly closed to migra-
tion). However, pre-industrial human populations may approximate
stable populations, as the rapid changes in fertility and mortality rates
demographic concepts, theory and methods 27
associated with demographic transitions appear to be a recent historical
phenomenon.
A special case of stable structure is the stationary population, in which
crude birth and death rates are equal and the population is therefore nei-
ther increasing or decreasing in size. Demographers sometimes use the
concept of a quasi-stable population, in which fertility is approximately
constant but mortality rates continue to fall, a situation which charac-
terises some present-day populations. Quasi-stable populations approxi-
mate quite closely to the ideal of stable structure because fertility has a
much greater impact on age distribution than does mortality. As a general
rule, both increasing fertility and decreasing mortality tend to shift the age
structure of a living population towards a higher proportion of juveniles,
but the effect of changes in fertility on age structure is much more marked
because fertility affects a single age cohort (the birth cohort) whereas mor-
tality is distributed across the complete range of lifespans (Coale, 1957).
This leads to a counter-intuitive property of populations, that an aggre-
gate parameter of the age structure of a population, such as mean length
of life (i.e. life expectancy at birth) is more influenced by fertility than it is
by mortality (Sattenspiel and Harpending, 1983).
2.3.4 The life table
Introducing the life table
The life table, sometimes known as discrete time survival analysis, is a math-
ematical device for representing the mortality experience of a population
and for exploring the effects on survivorship of age-specific probabilities
of death. One reason why life tables have been ubiquitous in demography
is that mortality cannot easily be modelled as a single equation or contin-
uous function of age (see Section 2.3.5 below for continuous modelling
of mortality with hazard functions). Instead, the cumulative effects of
age-specific mortality on a succession of discrete age classes are deter-
mined under the assumption that age-specific mortality rates do not change
28 demography in archaeology
during the lifetime of an individual. The calculation of a life table by hand is
tedious, time consuming and prone to error, but the widespread availabil-
ity of computer spreadsheets now makes the necessary calculations simple
and straightforward.
The central concepts in life-table analysis are mortality and survivor-
ship. A cohort of individuals of a given age will experience a predictable
number of deaths during a finite interval of time, with the proportion
dying depending on the length of the time interval and on the population’s
age-specific probability of death. The number of survivors at the end of the
time interval will equal the original cohort minus the individuals who have
died. Thus survivorship decreases at each successive age interval, from a
maximum value at birth to zero at the age at which the last survivor dies. By
convention, life tables are standardised so that the original cohort is equal
to a large round number such as 100,000 but in the following examples
survivorship is treated as a probability of survival to a given age, starting
from a maximum value of 1.0 at birth.
There are two approaches to constructing a life table. A cohort life table
requires observations over at least one maximum lifespan, and is based on
records of the collective mortality experience of an entire group of indi-
viduals born at the same time. An instantaneous life table is constructed by
determining the effects of fixed age-specific mortality rates on a hypothet-
ical cohort of individuals, and it is this type of life table that is illustrated
in the following example (see also Table 2.2).
Calculating the life table
The life table is based on a tabulation of the age-specific probability of
death qx for a series of discrete age categories x. The age categories can vary
in the length of time that they represent, but for convenience the examples
that follow use five-year age categories, beginning with the interval 0 to
4 years. The value of x refers to the age of the individual at the start of a
particular five-year age interval, thus x = 0 refers to the age interval 0 to 4
years, x = 5 refers to 5 to 9 years and so on.

demographic concepts, theory and methods 29
Table 2.2 Life table for Northern Ache females. The table is calculated from
survivorship data in Hill and Hurtado (1995). x = age at start of 5-year
interval, Lx = average years per person lived within age interval, Tx = sum
of average years lived within current and remaining age intervals, lx =survivorship, dx = proportion of deaths, qx = probability of death, ex =average years of life remaining (average life expectancy).
x lx dx qx Lx Tx ex
0 1.00 0.27 0.27 4.34 37.35 37.355 0.73 0.09 0.12 3.45 33.01 44.97
10 0.64 0.04 0.05 3.13 29.57 45.9115 0.61 0.02 0.03 2.99 26.43 43.4020 0.59 0.03 0.06 2.86 23.44 39.8625 0.56 0.01 0.02 2.75 20.58 37.0930 0.54 0.04 0.07 2.62 17.84 32.7835 0.50 0.01 0.01 2.50 15.22 30.1940 0.50 0.03 0.07 2.40 12.71 25.5845 0.46 0.04 0.10 2.21 10.31 22.2750 0.42 0.02 0.05 2.04 8.11 19.3555 0.40 0.05 0.13 1.86 6.07 15.2460 0.35 0.07 0.19 1.57 4.20 12.1165 0.28 0.03 0.11 1.32 2.60 9.4170 0.25 0.11 0.45 0.97 1.31 5.2775 0.14 0.14 1.00 0.35 0.35 2.5080 0.00 0.00 – 0.00 0.00 0.00
The survivorship lx for each age category is defined as the probability
that an individual from the hypothetical birth cohort is still alive at the
start of the age category (as all members of the birth cohort are alive at the
beginning of the first age category, l0 = 1). The value of lx declines through
the life table as survivorship is successively depleted by the proportion of
deaths dx occurring in each successive age interval, so that lx + i = lx − dx
for an age interval of length i. The proportion of the total deaths that occur
in each age interval is given by the equation
dx = lxqx

30 demography in archaeology
Thus during the first age interval (x = 0), the proportion of total deaths
(d0) is l0q0, and the proportion of the population surviving and entering
the next age interval (lx + i) is l0 − d0. The proportion of total deaths in the
next age interval is given by dx + i = (lx + i) (qx + i), and so on.
Additional calculations are used to calculate age-specific average life
expectancy, that is the number of years of life remaining to the average
individual on entering a particular age category. First is calculated the
number of years that an average person will live within each age interval,
designated Lx. This is found by averaging the proportion of individuals
at the beginning and end of each interval, multiplied by the length of the
interval in years (this assumes that individuals tend to die at a constant rate
during the age interval, an assumption that may need to be modified for
the initial age interval in the life table when probability of death is changing
rapidly). The values of Lx are then summed cumulatively from the bottom
of the column, to give the total person-years of life remaining to the cohort
entering each age category Tx. This total is divided by the proportion of
individuals entering the age interval to give the age-specific average life
expectancy ex = Tx ÷ lx.
The average life expectancy at birth e0 is an often quoted but somewhat
misleading figure, as it takes a value that is typically in the range of ages
when probability of death is a minimum. Probability of death in animal and
human populations subject to attritional mortality is bimodally distributed
with respect to age, and most individuals therefore die either when they
are very young or when they are old, rather than in the middle years of life.
However, life expectancy at birth is important as a single parameter that
summarises the mortality experience of the entire population, and it is a
useful measure when comparing different model life tables (see ‘Model life
tables’ below).
Because dx, lx and qx are directly related to each other a life table can be
constructed starting either from a set of age-specific deaths (dx), or a set
of age-specific probabilities of death (qx), or indeed the age-specific sur-
vivorship (lx). However, in a population that is not stationary (i.e. in which
the number of births exceeds the total number of deaths, or vice versa) the

demographic concepts, theory and methods 31
individuals of different ages will belong to birth cohorts of different sizes,
and therefore both dx and lx must be known in order to calculate qx. In most
archaeological applications of life-table analysis the primary demographic
data is in the form of age-specific deaths (dx), and age-specific survivorship
and probability of death can only be calculated indirectly by making addi-
tional assumptions about the stability or stationarity of the population.
If the life table is constructed assuming zero population growth, but the
birth rate actually exceeds the overall death rate (i.e. conditions of intrinsic
population growth) then there will be an expansion of birth cohort size
in the younger age categories and this will result in proportionately more
subadult deaths. Paradoxically, the apparent effects of intrinsic population
growth are a decrease in survivorship at all ages and reduced average life
expectancy at birth.
Although non-stationarity has been raised as a substantial problem in
palaeodemography (Wood et al., 1992b), it is easily dealt with under the
assumption of stable population structure. It is straightforward to convert
the dx values for a stable population into the equivalent values for a sta-
tionary population if the growth rate r of the stable population is known
or can be estimated over the duration of the lifespans included in the life
table. In this case dx for the stationary population is approximated by dx
(1 + r)x.
Model life tables
A model life table summarises the mortality experience of a typical or
ideal population. A model life table is constructed by averaging the age-
specific mortality data for a series of historical populations with broadly
similar mortality rates. Individual real-life populations may approximate
to a model life table, but will show irregular deviations from the model as a
result of stochastic variations in age-specific fertility and mortality. Model
life tables are particularly useful when the investigator wishes to reconstruct
the life table of a population for which reliable data is available only for
some of the age categories. For example, using the appropriate model life
32 demography in archaeology
table one can estimate infant and child mortality for a population in which
only the adult deaths have been recorded.
The most widely used model life tables are those compiled by the Office
of Population Research at Princeton University (Coale and Demeny, 1983).
These regional tables are based on over 300 censused populations, although
the sample is mainly from developed countries and with an emphasis on
European populations. The tables are grouped into four regions, desig-
nated ‘North’, ‘South’, ‘East’ and ‘West’, to indicate the areas within Europe
where different mortality patterns were typically found. The average mor-
tality pattern, and the one which is most widely and frequently used in
human palaeodemography, is given by the Coale and Demeny ‘West’ model
life tables. The West model life tables are thought to give the most reliable
results at the high levels of mortality that characterise present-day pop-
ulations in some developing countries (Coale and Demeny, 1983: 25) and
by extrapolation are appropriate for modelling historical and prehistoric
populations.
The Coale and Demeny tables are organised according to differing levels
of average female life expectancy at birth, with the lowest life expectancy set
at 20 years (Level 1) and the highest at 80 years (Level 25). Each increment
in level corresponds to an increase in average female life expectancy at
birth of 2.5 years. Most of the differences between the mortality levels are
accounted for by variation in infant and childhood mortality.
2.3.5 Hazard functions for modelling mortality and survivorship
Hazard functions express the instantaneous risk of death as a continuous
function of time, and therefore provide the basis for modelling demo-
graphic structure as a continuous function, rather as a series of discrete
values (Wood et al., 1992a). Hazard functions provide some advantages
over life tables, particularly when exact ages at death are known, as they
enable the maximum amount of information to be used in the analysis of
deaths in a population.
demographic concepts, theory and methods 33
The basis for calculating a hazard function is to consider length of life in
a sample of individuals as a continuous random variable T, whose variation
with age t can be described by the Survivor Function, or S(t), defined as:
S(t) = p(T > t) the probability that an individual survives
to at least time = t.
Note that S(t) is the continuous time equivalent of the life-table quantity
lx (survivorship to age x).
The Probability Density Function of T, or f(t), expresses the instanta-
neous rate of change of the Survivor Function:
f (t) = − d
dtS(t)
The negative sign ensures that f(t) is positive even though S always
declines with increasing t. Note that f(t) is equivalent to the life-table quan-
tity dx (proportion of deaths in age-interval x).
The Hazard Function, h(t), is then defined as the Probability Density
Function of T conditional on survival to age t, and is thus the Probability
Density Function divided by the Survivor Function:
h(t) = − 1
S(t)× d
dtS(t)
Note h(t) is equivalent to the life-table quantity qx (probability of death in
age interval x).
As noted above, the risk of death is not constant with age and the
usual pattern across the entire lifespan is for h(t) to decline from a high
level at birth to a minimum around the age of maturity, and then to
increase steadily with advancing adult age. This pattern can be matched
by a competing hazards model, in which the total age-specific hazard is
the combined sum of three hazards: one hazard acting mainly on juve-
niles, one acting mainly on adults, and a constant hazard that is age
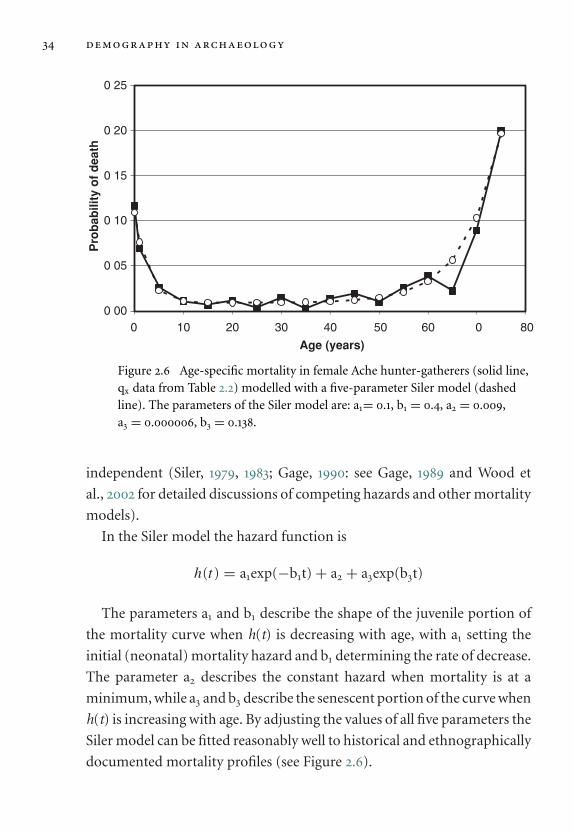
34 demography in archaeology
0.00
0.05
0.10
0.15
0.20
0.25
0 10 20 30 40 50 60 70 80
Age (years)
Pro
bab
ility
of
dea
th
Figure 2.6 Age-specific mortality in female Ache hunter-gatherers (solid line,qx data from Table 2.2) modelled with a five-parameter Siler model (dashedline). The parameters of the Siler model are: a1= 0.1, b1 = 0.4, a2 = 0.009,a3 = 0.000006, b3 = 0.138.
independent (Siler, 1979, 1983; Gage, 1990: see Gage, 1989 and Wood et
al., 2002 for detailed discussions of competing hazards and other mortality
models).
In the Siler model the hazard function is
h(t) = a1exp(−b1t) + a2 + a3exp(b3t)
The parameters a1 and b1 describe the shape of the juvenile portion of
the mortality curve when h(t) is decreasing with age, with a1 setting the
initial (neonatal) mortality hazard and b1 determining the rate of decrease.
The parameter a2 describes the constant hazard when mortality is at a
minimum, while a3 and b3 describe the senescent portion of the curve when
h(t) is increasing with age. By adjusting the values of all five parameters the
Siler model can be fitted reasonably well to historical and ethnographically
documented mortality profiles (see Figure 2.6).
demographic concepts, theory and methods 35
2.4 fertility and population projection
2.4.1 Fertility
In demographic terminology fertility refers to the number of children born
to an individual, whereas fecundity refers to the physiological ability to bear
children. As with mortality, natural patterns of fertility characterise human
and animal populations. However, whereas mortality has the potential to
affect all sectors of a population, births are confined to those individuals
who are fecund. Furthermore, human fertility (to a much greater extent
than mortality) is directly influenced by individual reproductive behaviour,
so that parameters such as age at first marriage and deliberate birth spacing
have strong effects on population fertility rates.
There are several ways of quantifying the fertility rate for a population
The simplest is the crude birth rate, CBR = (number of births ÷ popu-
lation size) per unit time, the calculation being analogous to that used to
determine the crude death rate. In a stationary population,
CBR = CDR = 1 ÷ e0,
where e0 = average life expectancy at birth.
A quantity that partially controls for the age and sex structure of the
population is the general fertility rate,
GFR = (number of births ÷ number of fecund women) per unit time.
It is usually assumed that women are fecund between the ages of 15 and
49. Population age structure is more comprehensively accounted for by
calculating age-specific fertility rates, ASFRs, using the same age categories
that are employed in the calculation of a life-table. Typically ASFRs are
calculated for the seven five-year age categories beginning with 15–19 and
ending with 45–49 years. Human ASFRs show a characteristic pattern of
change with age, peaking in the decade 20–29 and declining rapidly after
40 years of age (Figure 2.7). The population age-specific fertilities for five-
year age categories can be aggregated to give the total fertility rate, TFR
TFR∑
(ASFR × i)
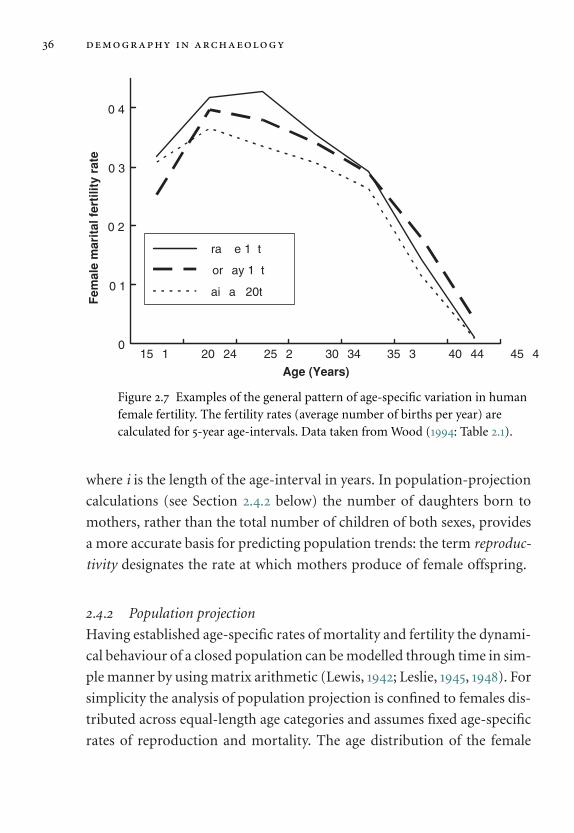
36 demography in archaeology
0
0.1
0.2
0.3
0.4
15Ð19 20Ð24 25Ð29 30Ð34 35Ð39 40Ð44 45Ð49
Age (Years)
Fem
ale
mar
ital
fer
tilit
y ra
te
France 17thC.
Norway 19thC.
Taiwan 20thC.
Figure 2.7 Examples of the general pattern of age-specific variation in humanfemale fertility. The fertility rates (average number of births per year) arecalculated for 5-year age-intervals. Data taken from Wood (1994: Table 2.1).
where i is the length of the age-interval in years. In population-projection
calculations (see Section 2.4.2 below) the number of daughters born to
mothers, rather than the total number of children of both sexes, provides
a more accurate basis for predicting population trends: the term reproduc-
tivity designates the rate at which mothers produce of female offspring.
2.4.2 Population projection
Having established age-specific rates of mortality and fertility the dynami-
cal behaviour of a closed population can be modelled through time in sim-
ple manner by using matrix arithmetic (Lewis, 1942; Leslie, 1945, 1948). For
simplicity the analysis of population projection is confined to females dis-
tributed across equal-length age categories and assumes fixed age-specific
rates of reproduction and mortality. The age distribution of the female

demographic concepts, theory and methods 37
Table 2.3 Leslie matrix for Northern Ache females. The matrix was
calculated from mortality and fertility data in Hill and Hurtado (1995:
Tables 6.1 and 8.1), aggregated into 5-year age intervals. Reproductivity
values (first row of the matrix) were derived from female age-specific
fertilities divided by 2.05 to account for a probable male-biased sex ratio at
birth. Survival probabilities (sub-leading diagonal of the matrix) were
calculated as 1 − qx from female life-table probabilities of death. The matrix
models the Ache population with a growth rate of 2.5% per annum. Both
axes are in 5-year age categories.
x 0 5 10 15 20 25 30 35 40 45 50 55 60 65 70 75 80
0 – – 0.02 0.37 0.67 0.73 0.78 0.68 0.53 0.17 – – – – – – –5 0.73 – – – – – – – – – – – – – – – –10 – 0.88 – – – – – – – – – – – – – – –15 – – 0.95 – – – – – – – – – – – – – –20 – – – 0.97 – – – – – – – – – – – – –25 – – – – 0.94 – – – – – – – – – – – –30 – – – – – 0.98 – – – – – – – – – – –35 – – – – – – 0.93 – – – – – – – – – –40 – – – – – – – 0.99 – – – – – – – – –45 – – – – – – – – 0.93 – – – – – – – –50 – – – – – – – – – 0.90 – – – – – – –55 – – – – – – – – – – 0.95 – – – – – –60 – – – – – – – – – – – 0.87 – – – – –65 – – – – – – – – – – – – 0.81 – – – –70 – – – – – – – – – – – – – 0.89 – – –75 – – – – – – – – – – – – – – 0.55 – –80 – – – – – – – – – – – – – – – 0.00–
population at time t is represented by a column vector P(t) containing the
numbers of individuals Px in each age category x. The age-specific female
reproductivity data (fx) and survival probabilities (sx) are contained in
a square projection matrix M (sometimes known as a Leslie matrix, see
Table 2.3) in which each row and column corresponds to a single age

38 demography in archaeology
category. The first row of the projection matrix contains the age-specific
reproductivities, or rates of production of female offspring fx (these rates
are set at zero for the age categories outside the reproductive years of 15 to
49). The sub-leading diagonal of the projection matrix contains the age-
specific probabilities of survival (sx = 1 − qx), calculated from the life-table
values of qx, for each age category up to the penultimate category (individ-
uals in the last age category do not contribute to the future population).
Then the population at future time t′ = t + i (where i is the duration of a
single age category) is given by the matrix multiplication P(t′) = M·P(t).
The operation can be repeated to give the projected population at time (t
+ 2i), (t + 3i) and so on.
2.5 migration and colonisation
2.5.1 Migration
Migration refers to the process whereby individuals enter or leave a popu-
lation other than through birth and death. As with fertility and mortality,
migration is influenced by age and sex but in a less consistent fashion.
The analysis of migration requires that the population has recognisable
boundaries, usually defined for human populations in terms of the indi-
vidual’s place of permanent residence. Migration also implies the existence
of two populations (donor and recipient) and as migrants’ mortality and
fertility characteristics may differ from those of both donor and recipient
populations it is likely that migration will have an effect on population
structure.
Migration is a special instance of spatial mobility, and it is distinct from
the regular movements within a territory that are undertaken by nomadic
peoples, itinerant workers and the like. The latter are more appropriately
termed ‘circulation’ (Pressat, 1985). The rate of migration is also usually an
inverse function of the distance migrated, and some demographers have
developed gravity models in which migration is proportional to the size
of the donor and recipient populations and inversely proportional to a
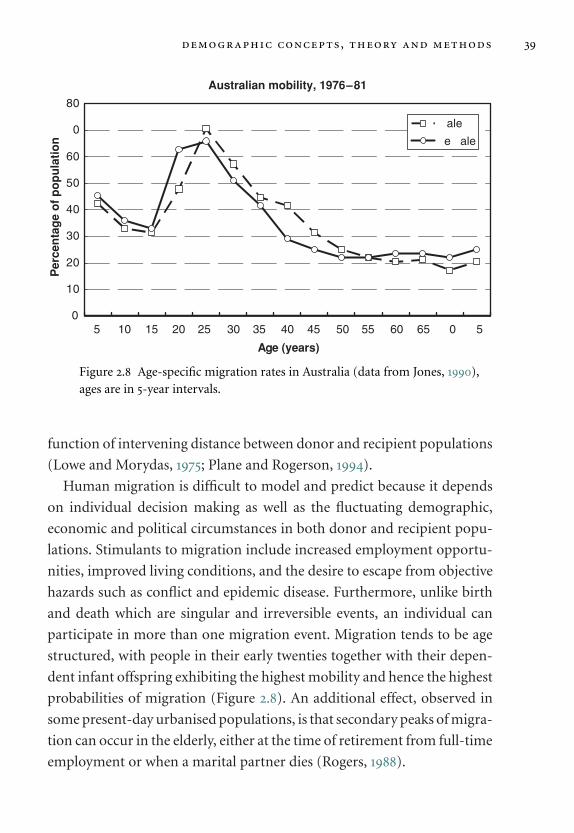
demographic concepts, theory and methods 39
Australian mobility, 1976–81
0
10
20
30
40
50
60
70
80
5- 10- 15- 20- 25- 30- 35- 40- 45- 50- 55- 60- 65- 70- 75+
Age (years)
Per
cen
tag
e o
f p
op
ula
tio
n
Male
Female
Figure 2.8 Age-specific migration rates in Australia (data from Jones, 1990),ages are in 5-year intervals.
function of intervening distance between donor and recipient populations
(Lowe and Morydas, 1975; Plane and Rogerson, 1994).
Human migration is difficult to model and predict because it depends
on individual decision making as well as the fluctuating demographic,
economic and political circumstances in both donor and recipient popu-
lations. Stimulants to migration include increased employment opportu-
nities, improved living conditions, and the desire to escape from objective
hazards such as conflict and epidemic disease. Furthermore, unlike birth
and death which are singular and irreversible events, an individual can
participate in more than one migration event. Migration tends to be age
structured, with people in their early twenties together with their depen-
dent infant offspring exhibiting the highest mobility and hence the highest
probabilities of migration (Figure 2.8). An additional effect, observed in
some present-day urbanised populations, is that secondary peaks of migra-
tion can occur in the elderly, either at the time of retirement from full-time
employment or when a marital partner dies (Rogers, 1988).
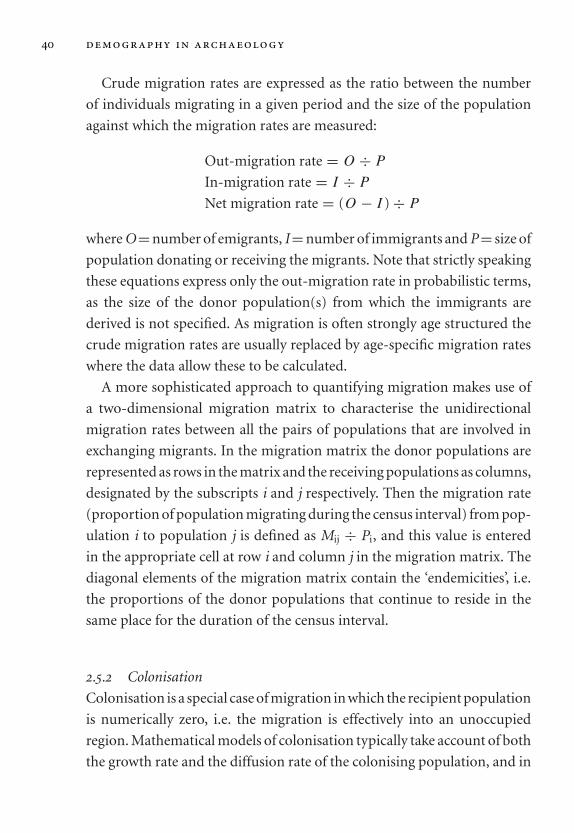
40 demography in archaeology
Crude migration rates are expressed as the ratio between the number
of individuals migrating in a given period and the size of the population
against which the migration rates are measured:
Out-migration rate = O ÷ P
In-migration rate = I ÷ P
Net migration rate = (O − I ) ÷ P
where O = number of emigrants, I = number of immigrants and P = size of
population donating or receiving the migrants. Note that strictly speaking
these equations express only the out-migration rate in probabilistic terms,
as the size of the donor population(s) from which the immigrants are
derived is not specified. As migration is often strongly age structured the
crude migration rates are usually replaced by age-specific migration rates
where the data allow these to be calculated.
A more sophisticated approach to quantifying migration makes use of
a two-dimensional migration matrix to characterise the unidirectional
migration rates between all the pairs of populations that are involved in
exchanging migrants. In the migration matrix the donor populations are
represented as rows in the matrix and the receiving populations as columns,
designated by the subscripts i and j respectively. Then the migration rate
(proportion of population migrating during the census interval) from pop-
ulation i to population j is defined as Mij ÷ Pi, and this value is entered
in the appropriate cell at row i and column j in the migration matrix. The
diagonal elements of the migration matrix contain the ‘endemicities’, i.e.
the proportions of the donor populations that continue to reside in the
same place for the duration of the census interval.
2.5.2 Colonisation
Colonisation is a special case of migration in which the recipient population
is numerically zero, i.e. the migration is effectively into an unoccupied
region. Mathematical models of colonisation typically take account of both
the growth rate and the diffusion rate of the colonising population, and in

demographic concepts, theory and methods 41
some cases also the carrying capacity of the colonised region (Young and
Bettinger, 1995; Steele et al., 1998) or of physiographic barriers to movement
(Anderson and Gillam, 2000).
2.6 population standardisation and comparison
2.6.1 Population standardisation
Standardisation is a statistical technique that weights average values of
vital rates to allow valid comparisons to be made among populations with
different demographic structures. For example, in comparing the overall
death rate in two populations we need to take account of age structure: a
population which has a large proportion of very old or very young indi-
viduals will normally have a higher crude death rate than a population of
predominately young adults. Standardisation is also an important tech-
nique in epidemiology, as the likelihood of contracting disease is often
found to be correlated with age and sex.
Direct age standardisation uses the age structure of an arbitrarily chosen
population as a weighting standard. An appropriate standard age structure
might be the average age structure of all of the populations under study,
alternatively the standard age structure can be selected from a family of
model life tables. For each population to be compared the age-specific rates
of the test population are multiplied by the number of individuals in each
age category in the standard population, thereby allowing the calculation
of an average rate for the test population that is weighted according to the
standard population age structure:
Directly Standardised Rate =∑ Rx,t Px,s
Ps
where Rx,t is the age-specific rate in the test population, Px,s is the size of age
cohort x in the standard population, and Ps is the total size of the standard
population.
In some situations the crude overall rate but not the age-specific rates
are known for the test population. In this case indirect standardisation can

42 demography in archaeology
Table 2.4 Comparison of mortality in the Early Period (AD 300–550) and
the Late Period (AD 550–700) at the Tlajinga 33 site at Teotihuacan, Mexico
(data taken from Storey, 1985). Dx = number of deaths, dx = percentage of
total deaths.
Age (years) Dx Early dx Early Dx Late dx Late
0 28 28.9 24 32.40.2 2 2.1 5 6.81 3 3.1 2 2.73 7 7.2 3 4.15 2 2.1 8 10.810 5 5.2 4 5.415 6 6.2 5 6.820 4 4.1 6 8.125 8 8.2 3 4.130 10 10.3 2 2.735 9 9.3 2 2.740 2 2.1 6 8.145 2 2.1 3 4.150+ 9 9.3 1 1.4
Total 97 100.0 74 100.0
be used, provided that the age structure of the test population is known
or can be estimated. Indirect standardisation applies a standard set of
age-specific rates to the test population age structure to give an expected
overall rate for the test population. The ratio of the actual to the expected
overall rates in the test population is then multiplied by the overall rate for
the standard population to give the standardised overall rate for the test
population:
Indirectly Standardised Rate = Rs Rt∑(Rx,s Px,t) ÷ Pt
where Rt = crude rate for the test population and Rs = crude rate for the
standard population.

demographic concepts, theory and methods 43
0
20
40
60
80
100
0 10 20 30 40 50
Age (years)
Su
rviv
ors
hip
(%
)
Early Period
Late Period
Figure 2.9 Survivorship at the Tlajinga 33 apartment compound atTeotihuacan, Mexico. The Early Period is represented by the solid line and theLate Period by the dashed line. The difference in survivorship between thechronological periods, when examined by the Wilcoxon-Mann-Whitney test,is of marginal statistical significance.
2.6.2 Population comparison
In some instances it may be desirable to demonstrate whether populations
differ significantly in their age or sex distributions. Sex is a binomial vari-
able, and therefore the difference in sex ratio between populations can be
tested in a straightforward manner using the Chi-squared statistic. Age
is recorded as a continuous or a discrete ordered variable, but age distri-
butions are often multimodal and it is therefore preferable to use a non-
parametric or distribution-free statistic for testing differences in age struc-
ture between samples. A further consideration is that age categories may
not be equal in length, especially adult age categories where the oldest
recorded category may in fact be open ended.
Appropriate nonparametric tests for comparing age distributions are
the Kolmogorov-Smirnov test, which tests the maximum divergence in the
shapes of the cumulative frequency distributions of the two population

44 demography in archaeology
samples, and the Wilcoxon-Mann-Whitney test, which determines whether
the summed ranks of individual ages are significantly different between
the samples (Zar, 1999). The Wilcoxon-Mann-Whitney test is the more
powerful of these statistical tests and it is generally preferred for this reason.
Both tests are available in computer statistical packages such as SPSS.
As an example of population comparison, Table 2.4 shows the age-
specific mortality derived from chronologically distinct samples of
skeletal remains excavated from the Tlajinga 33 locality, an apartment com-
pound within the urban Mesoamerican site Teotihuacan, Mexico (Storey,
1985). Survivorship at all ages appears to be higher in the Early Period at
Tlajinga 33 (Figure 2.9), but the difference in survivorship between the two
periods is only of marginal statistical significance when subjected to the
Kolmogorov-Smirnov test (p = 0.093) and the Wilcoxon-Mann-Whitney
test (p = 0.057). Note the lower p-value associated with the greater power
of the Wilcoxon-Mann-Whitney test.

3
Historical and ethnographic demography
3.1 documentary sources of demographic data
3.1.1 Vital registration
Vital registration refers to the collection of data on individual life-history
events, such as births, marriages and deaths. In most countries in the
present day some form of registration of vital events is mandatory. In
England, for example, systematic ecclesiastical records of baptisms, mar-
riages and burials began to be collected in every parish from 1538, and civil
registration of births and deaths became a statutory civic requirement in
1837 (Hollingsworth, 1969). In Japan the Buddhist temples maintained reg-
isters of deaths from the sixteenth century onwards (Janetta and Preston,
1991). Less frequently, and only in a minority of present-day countries, a
population register is maintained with individual records for each citizen
which are revised following each vital event. These registers also record
citizens’ changes of permanent residence, and therefore such registers can
provide comprehensive data on internal and external migration.
A common problem with data that are collected in vital registration is
that of age heaping, with exact ages being rounded up or down usually
to the nearest five or ten years. This may occur where individuals do not
know their exact age, or when the age of a deceased individual is reported
by a surviving relative or estimated by the person registering the death. Age
heaping is often accompanied by an avoidance of ages ending in certain
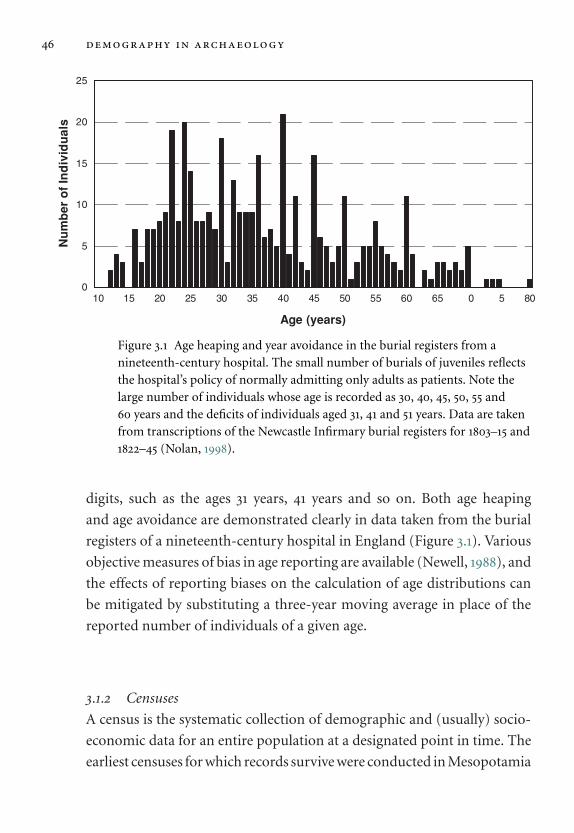
46 demography in archaeology
0
5
10
15
20
25
10 15 20 25 30 35 40 45 50 55 60 65 70 75 80
Age (years)
Nu
mb
er o
f In
div
idu
als
Figure 3.1 Age heaping and year avoidance in the burial registers from anineteenth-century hospital. The small number of burials of juveniles reflectsthe hospital’s policy of normally admitting only adults as patients. Note thelarge number of individuals whose age is recorded as 30, 40, 45, 50, 55 and60 years and the deficits of individuals aged 31, 41 and 51 years. Data are takenfrom transcriptions of the Newcastle Infirmary burial registers for 1803–15 and1822–45 (Nolan, 1998).
digits, such as the ages 31 years, 41 years and so on. Both age heaping
and age avoidance are demonstrated clearly in data taken from the burial
registers of a nineteenth-century hospital in England (Figure 3.1). Various
objective measures of bias in age reporting are available (Newell, 1988), and
the effects of reporting biases on the calculation of age distributions can
be mitigated by substituting a three-year moving average in place of the
reported number of individuals of a given age.
3.1.2 Censuses
A census is the systematic collection of demographic and (usually) socio-
economic data for an entire population at a designated point in time. The
earliest censuses for which records survive were conducted in Mesopotamia

historical and ethnographic demography 47
in the third millennium BC (Alterman, 1969; Ball, 1996), and were under-
taken in order to establish the size of the taxable population. The censuses
carried out in republican Rome from the sixth century BC were initially
for assessing citizens’ liabilities for military service, but were subsequently
used to levy taxes and to assign voting rights (Wiseman, 1969). As a result
of the political and fiscal motives that underpin many censuses there is
an understandable tendency for the less economically visible categories
of a population to be under-enumerated, while some individuals may
actively evade enumeration as a tax-avoidance strategy or because of reli-
gious or ethnic persecution. For sound logistical reasons censuses focus on
interview and questionnaire data obtained from permanent households,
and therefore vagrants and migrant workers may be omitted from census
returns.
The first reliable modern censuses of national populations were con-
ducted in Quebec in 1665 and in Iceland in 1703 (Hollingsworth, 1969;
Tomasson, 1977) and from the end of the eighteenth century many western
countries have conducted a regular national census, usually at intervals
of ten years. Each census provides an instantaneous demographic profile
of a living population, so the comparison of data from consecutive cen-
suses separated by a fixed interval of time allows estimates to be made of
demographic parameters such as the intercensal population growth rate
and survivorship ratios (Preston, 1983; Gage et al., 1984).
3.1.3 Commemorative inscriptions
As a durable record of vital events, inscriptions on tombstones and other
commemorative artefacts can provide a useful source of demographic
data. However, there are considerable difficulties in using simple aggre-
gations of data from tombstone inscriptions because of the selectivity
involved in creating memorials. A typical finding is that children, and
especially young infants, are heavily under-represented among tombstone
inscriptions, while various biases can affect the age and sex distribution
among commemorated adults. As Hopkins (1966: 262) aptly commented,

48 demography in archaeology
‘tombstones are a function not only of the mortality of the commemorated,
but also of the survival of the commemorator’.
Several studies (e.g. Henry, 1959; Hopkins, 1966) have found an excess
of young-female adult deaths in the age range 15 to 45 years represented on
tombstones, in comparison to official registers of actual deaths and when
compared to model life-table predictions of age-specific mortality. Early
authors attributed the apparent excess female mortality to the hazards of
childbirth, but Hopkins has argued convincingly that in the case of Roman
tombstone inscriptions dating to the first to third centuries AD, women
were more likely to be commemorated if they predeceased their husbands,
and with husbands being on average nine years older than their wives most
of the commemorated women were necessarily relatively young when they
died. Mortality distributions calculated under the assumption that deaths
recorded on Roman tombstones are unbiased show anomalous peaks in
the young-adult age categories for both males and females (Figure 3.2),
reflecting the fact that older adults were less likely to have a surviving
spouse and hence they had a lower probability of being commemorated.
The bias is accentuated for females because of the sex difference in average
age at marriage.
3.1.4 Other written sources
Wrigley (1966) and Hollingsworth (1969) have reviewed a wide range of
documentary sources from which the researcher can extract demographic
data of varying quality. Taxation returns are widely available in all parts
of the world where tax-collecting governments have been empowered,
confirming Benjamin Franklin’s aphorism that ‘in this world nothing can
be certain, except death and taxes’. Certain categories of people were often
exempt from taxation (most obviously children and paupers) but these can
be allowed for in computing population numbers from taxation records.
As with census data, tax collection often focused on households (e.g. hearth
taxes) and a coefficient for numbers of people per residence must be
introduced in order to estimate population size from the numbers of resi-
dences taxed. Archaeological and historical evidence for the dimensions of

historical and ethnographic demography 49
0.00
0.10
0.20
0.30
0.40
0.50
0.60
0- 5- 10- 15- 20- 25- 30- 35- 40- 45- 50- 55- 60- 65- 70+
Age (years)
Pro
bab
ility
of
dea
th
Females
Males
Model Life Table e0 = 20
Figure 3.2 Age-specific probability of death calculated from Romantombstone inscriptions, compared to probability of death in the West Level 1female model life table in which average life expectancy at birth (e0) = 20years. Note the effects of under-enumeration of young children (ages 0–4years) and the over-representation of young and prime-aged adults (ages 15 to45 years) in the tombstone inscriptions. Data taken from Hopkins (1966).
domestic buildings provide the basis for an independent estimator of
household size (see Section 4.5 below).
Genealogies – the recording of patterns of marriage and descent within
families – are important in many societies in determining the inheri-
tance of status and wealth and in negotiating the privileges and obliga-
tions conferred by kinship. Historical records of genealogies tend to be
more complete for families with high social position, but some religious
groups such as the English Quakers have traditionally maintained accurate
and comprehensive genealogies for all of their members (the Quakers also
recorded births, rather than baptisms, providing more reliable data for the
estimation of perinatal mortality). Genealogical records tend to be more
complete for families that survive to the present day: records may be lost
when lineages become extinct with no surviving descendants, but in some
50 demography in archaeology
circumstances genealogies can be reconstructed from documentary records
through the method of family reconstitution.
3.2 families and households
3.2.1 Family units
Families are kinship units, minimally defined as a married couple and their
dependent offspring (a conjugal unit). Extended families include more than
one conjugal unit; if these are distributed across successive generations the
unit is a stem family, and if there are multiple conjugal units per generation
the unit is referred to as a joint family (Skinner, 1997). The members of a
family typically participate in a single cooperative domestic economy, but
the additional requirement of close kinship distinguishes family members
from those that constitute a household (see Section 3.2.3 below).
3.2.2 Family reconstitution
Family reconstitution is a method of record linkage that assembles infor-
mation on the vital events affecting a single individual or married couple,
together with similar information on their parents and offspring, in such a
way that the demographic history of a family can be reconstructed across
multiple generations. Family reconstitution was formalised as a method
in the 1950s by the French demographers Fleury and Henry, and the tech-
nique has been applied extensively by historical demographers working
with parish registers and census data. The method is based around the
family reconstitution form, a record on which information relating to a
single marriage is collated (Table 3.1). Each family reconstitution form is
allocated a unique identification number, and the preceding generations
of a single family are cross-linked to it via the identification numbers of
the forms relating to the marriages of the husband’s and wife’s parents.
The advantage of family reconstitution is that it facilitates longitudinal
(cohort) studies of life histories, whereas only cross-sectional (period)

Tabl
e3.
1D
ata
reco
rded
ona
fam
ilyre
cons
titu
tion
form
(FR
F).
Fam
ilyM
embe
rN
ame
Dat
eof
Bap
tism
Dat
eof
Mar
riag
eD
ate
ofB
uri
alP
lace
ofB
apti
smP
lace
ofM
arri
age
Pla
ceof
Bu
rial
Occ
upa
tion
atM
arri
age
Occ
upa
tion
atB
uri
al
Lin
kin
gFR
FN
um
ber
Hu
sban
d✔
✔✔
✔✔
✔✔
✔✔
Wif
e✔
✔✔
✔✔
✔✔
✔✔
Hu
sban
d’s
Fath
er✔
✔✔
✔
Hu
sban
d’s
Mot
her
✔✔
Wif
e’s
Fath
er✔
✔✔
✔
Wif
e’s
Mot
her
✔✔
Ch
ildre
n.. ..
✔ .. ..
✔ .. ..
✔ .. ..
✔ .. ..
52 demography in archaeology
studies are otherwise possible using vital registration data. In particular,
reproductive parameters such as age-specific fertility and birth intervals can
be readily calculated. However the records on which family reconstitution
are based are often incomplete, most frequently because one or other of
the marriage partners has migrated from an adjacent or distant location,
and often the records for several contiguous areas must be consulted in
order to complete a satisfactory number of forms.
3.2.3 Household size
A household is defined as one or more persons who make common provi-
sion for food, shelter and other living essentials (Pressat, 1985). Households
figure prominently in historical demography because they often form the
unit of assessment in censuses, taxation and other exercises in enumera-
tion. Household size can vary substantially and depending on family struc-
ture (e.g. conjugal versus extended families), completed family size, age at
marriage of offspring and other factors such as population density and sub-
sistence practice a range of estimates of numbers of persons per household
are possible. Estimates of household sizes based on ethnographic obser-
vations of agricultural communities tend to fall within the range three to
seven individuals with a median value of five (Hassan, 1981: 73; Kolb, 1985),
and similar values have emerged from historical studies of census data
from rural communities (e.g. Drake, 1969; Laslett, 1969; Bagnall and Frier,
1994). Estimates of total fertility and completed family size are often much
higher than this, but the conditions of relatively high infant mortality in
pre-modern populations ensured that at any given time families and hence
households were usually limited in size.
3.3 longevity, menarche and menopause
3.3.1 Perceptions and misperceptions of longevity
Longevity is a general term that refers to the length of life, and there are
several ways in which this attribute can be quantified. Lifespan designates

historical and ethnographic demography 53
the maximum age to which an individual may live, whereas life expectancy
captures the central tendency of longevity in a population (Daugherty and
Kammeyer, 1995: 137). Life expectancy and lifespan are therefore quite dif-
ferent, the first measuring the centre of a range of variation and the second
the upper extreme of that range. Life expectancy is usually quantified as an
arithmetical average, but as ages at death are often distributed bimodally
in a population the modal (i.e. most frequent) length of life may differ
substantially from the average life expectancy. As an illustrative example,
for females in the United States in 1988 average life expectancy at birth
was 75 years, modal age at death was 85 years and the verified longest-
lived individual was aged 120 years (Olshansky et al., 1990: 635). Clearly the
maximum observed length of life is likely to be influenced by sample size:
as the United States population includes over 250 million individuals, the
maximum age recorded in this population is likely to be an extreme outlier
that is wholly unrepresentative of the norm.
A commonly expressed view is that in medieval and Renaissance Europe
individuals aged more rapidly than in modern times, and that people
were considered to be old in their fifth decade of life. By implication, life-
span would have been reduced prior to the modern era. Shahar (1993)
has compiled an array of historical evidence that indicates that this is a
mistaken perception, based partly on the confusion between the concepts
of lifespan and average life expectancy and compounded by the uncrit-
ical reading of contemporary autobiographical texts. Shahar makes the
forceful argument that in the Middle Ages, as it does in modern times,
physical competence began to become limited, on average, in the sev-
enth decade of life and this was the age at which medieval people were
exempted from military service and other forms of obligatory work. A
similar exemption from military service after the age of sixty was operative
in Republican Rome (Harlow and Laurence, 2002: 118). There is thus no
clear historical evidence that maximum lifespan was reduced in earlier his-
torical times. Ethnographic studies of hunter-gatherer populations which
experience moderate or high levels of mortality also confirm that some
individuals in these populations survive into their seventies or eighties (see
54 demography in archaeology
below, Section 3.5.1). Taken together, the historical and ethnographic data
thoroughly refute the notion that ageing progressed more rapidly in past
populations.
Despite Shahar’s evidence, Crawford (1999: 114) has argued that the
impact of low average life expectancy would have resulted in high rates of
orphancy and a lack of grandparents in medieval England, and she quotes
a figure of only 2.3% of medieval children as having a living grandpar-
ent, based on data collected by the Cambridge Group for the History of
Population and Social Structure (Laslett, 1972: 148). However, this low esti-
mate of grandparental survival seems to derive from a misunderstanding
of the nature of the Cambridge Group’s household data, in which children
were only defined as ‘grandchildren’ if they were actually living in a house-
hold containing one or more grandparents. By ignoring the unknown (but
potentially large) numbers of grandparents living outside the child’s house-
hold, Crawford has inevitably underestimated the proportion of children
whose grandparents were still alive. Simulation studies show that even
in a population with relatively high rates of mortality, with average life
expectancy at birth of 30 years, 84% of newborn children and 62% of
10-year-old children have at least one living grandparent (LeBras and
Wachter, 1978: see also Saller, 1994, for evidence of high proportions of
children with surviving grandparents in Roman families).
3.3.2 Menarche and menopause
Menarche and menopause designate respectively the commencement and
cessation of menstruation in women, and to a first approximation they
define the limits of the female reproductive span. Menarche is followed by
a short period (one to two years) of adolescent sub-fecundity, reflecting
a delay in the commencement of regular ovulation, and menopause is
similarly preceded by several years of sub-fecundity (Pavelka and Fedigan,
1991; Wood, 1994).
The age at menarche varies amongst populations but is closely corre-
lated with developmental maturity and nutritional quality. Median age
historical and ethnographic demography 55
at menarche is approximately 12.5 to 13.5 years in modern western pop-
ulations, but median ages as high as 18 years have been recorded in
some foraging communites (Eveleth and Tanner, 1990). Historical data for
European countries show a secular decline in the average age at menarche
during the last two centuries, with most of the decline occurring in the first
half of the twentieth century, and it is believed that this may be attributable
to improvements in nutritional status (Wood, 1994: 416–17).
Average age at menopause is close to fifty years in modern western popu-
lations, and is likely to be invariant as similar values have been established
in ethnographic surveys of hunter-gatherer populations (Howell, 1979;
Hill and Hurtado, 1995). Studies of historical datasets (e.g. Amundsen and
Diers, 1970, 1973; Post, 1971) provide closely comparable estimates and
confirm that there has been little change in the age of onset of menopause
in human populations over the last two millennia. As female longevity
generally exceeds menopause by at least a decade there has been some
speculation about the function and role of post-menopausal survival in
women, which is best explained by the reproductive benefits to daughters
and other genetically related kin from the care-giving assistance provided
by grandmothers (Hawkes et al., 1997; Blurton Jones et al., 2002).
3.4 historical evidence of migration
and colonisation
3.4.1 Migration in pre-industrial Europe
Sparse historical accounts, together with more extensive place-name and
material cultural evidence suggest that substantial population movements
took place in early medieval Europe following the collapse of the western
Roman empire. It is difficult to quantify the numbers of people involved
in these migrations, and there is controversy over the extent to which the
cultural changes that marked this period were consequent on wholesale
population replacement or whether they reflect elite transfer followed by
cultural emulation (Burmeister, 2000: 548). Recent genetic studies of British
56 demography in archaeology
and northwest European populations have helped to resolve these issues
(see Section 5.3 below).
From the late medieval and early modern periods many historical doc-
uments are available that record the place of origin and/or residence of
individuals, thus providing a quantitative basis for inferring patterns of
migration. However, such sources record migration incidentally rather
than by design, and the evidence may therefore need to be treated with cir-
cumspection (Whyte, 2000). For example, in parish registers the place of
residence recorded for partners at the time of their marriage may post-date
the movement of one or both of the partners into the parish, and thus the
extent of migration at marriage may be underestimated.
In late medieval and early modern pre-industrial Europe migra-
tion mainly occurred over short distances, typically between contiguous
parishes or between a rural hinterland and its urban centre (Tilly, 1978: 65).
Migration at marriage has been studied intensively, mainly because of the
wide availability of marriage registers, notwithstanding the fact that the
migration of hired labour was also a significant component of population
movement. In rural England during this period the incidence of endoga-
mous marriages (both partners resident within the same parish) averaged
between 30% and 70%, and in exogamous marriages the partners tended
to move only short distances (Whyte, 2000).
Population turnover – the proportion of individuals still present in a
community after a given time interval – also provides a basis for esti-
mating out-migration rates, after accounting for losses through mortality.
Turnover rates of around 4–6% per annum, of which 2–3% typically repre-
sents mortality with the balance attributable to migration, have been esti-
mated for a sample of English rural parishes in the sixteenth century (Kitch,
1992). Somewhat higher in-migration rates of up to 10% per annum have
been established for pre-industrial cities in seventeenth-century Europe
(Moch, 1992: 44). From the mid-eighteenth century onwards Britain
experienced burgeoning population growth, developing industrialisation,
accelerating urbanisation and improved communications, all of which con-
tributed to a substantial increase in the volume of migration – though the

historical and ethnographic demography 57
distances travelled were still short, with much of the migration being from
rural areas to the nearest urban centre.
Colonisation events are often alluded to in accounts of ethnogenesis,
but nonetheless they are poorly documented in the classical and medieval
eras. The settlement of Iceland by Norse peoples in the ninth century
AD constitutes one of the few such events for which statistics can be
reconstructed. Perhaps twenty to thirty thousand settlers migrated to the
previously uninhabited island from Scandinavia and the British Isles
between AD 870 and AD 930, and continued migration and indigenous
population growth resulted in Iceland having an estimated population
of 60,000 by AD 965 (Tomasson, 1977). Genetic studies of present-day
Icelanders have confirmed the predominant Norse and British source of
Iceland’s founding populations (Williams, 1993; Helgason et al., 2000).
3.4.2 Mass migration and colonisation in the modern era
The development of long-distance trade and global routes of commu-
nication at the beginning of the sixteenth century initiated a process of
large-scale European migration and colonisation, together with forced
migration of subjugated peoples, that continued for the next 400 years.
During the sixteenth century about 250,000 people migrated from Spain
to the New World, and perhaps twice that number left Britain for the
American colonies during the seventeenth century (Canny, 1994). While
substantial, these numbers are small compared to European transatlantic
migration in the nineteenth century. For example, nearly three million
people emigrated from Ireland in the decade following the great famine
and epidemics of 1847, and by 1900 the rate of emigration from Europe
was about one third of the rate of natural growth of the population of the
continent.
The Atlantic slave trade of the eighteenth and nineteenth centuries
resulted in the forced migration of many millions of people from West
Africa to the colonies of the New World. The demand for slaves in the
colonies was fuelled both by the expansion of plantation agriculture and

58 demography in archaeology
by the fact that mortality amongst the captive slave populations was
exceptionally high and usually exceeded their reproductivity (Sheridan,
1985; John, 1988), necessitating continual augmentation of the plantation
workforce through importation of fresh slaves. The effect of the Atlantic
slave trade on the indigenous West African population is not easy to deter-
mine, but a simulation study has indicated that the preferential selection
of slaves in their prime reproductive years resulted in a marked reduction
of fertility in the indigenous African populations (Manning and Griffiths,
1988).
3.5 hunter-gatherer demography
3.5.1 Population structure in hunter-gatherers
Human life-history traits evolved hundreds of thousands of years ago when
all members of our species pursued a foraging lifestyle, so it is logical to
regard the world’s few surviving hunter-gatherer communities as poten-
tially rich sources of information about ancestral human demographic
patterns and processes. Unfortunately ethnographers had only a fleeting
opportunity to study such communities from a demographic perspec-
tive before irrevocable changes in health and subsistence practice were
imposed on hunter-gatherers as a consequence of their contact with peoples
from industrialised nations. Very few anthropological surveys of hunter-
gatherers provide census and vital registration data of sufficient quality
to allow reliable reconstruction of age and sex structure and patterns
of mortality and fertility. Lack of written records, uncertainty concern-
ing the chronological age of individuals and the dates when vital events
occurred and sometimes the difficulty of obtaining information about
deceased individuals have complicated the task of the anthropological
demographer.
Data obtained from four hunter-gatherer communities (the Ache, the
Agta, the Hadza and the !Kung) have been assembled here to provide a com-
parative baseline for the analysis of prehistoric populations (Table 3.2). The
Ache were formerly a foraging population inhabiting the tropical forests

historical and ethnographic demography 59
Table 3.2 Population structure from census data for hunter-gatherer and
subsistence-farming populations (numbers of males and females are
combined). Sources of census data: Northern Ache: 1970 census, annual
growth rate = +0.7% (Hill and Hurtado, 1995); Casiguran Agta: 1984
census, annual growth rate = −0.2% (Headland, 1989); Eastern Hadza:
1985 census, annual growth rate = +1.3% (Blurton Jones et al., 1992); Dobe
!Kung: 1968 census, annual growth rate = +0.2% (Howell, 1979).
Age (years) Ache Agta Hadza !Kung
0–4 102 75 112 705–9 67 64 84 58
10–14 60 72 79 3815–19 53 67 67 5420–24 54 59 61 3825–29 54 63 48 4930–34 41 49 47 5635–39 19 34 39 3940–44 21 24 32 4645–49 19 28 27 2850–54 16 26 27 2755–59 11 15 21 2260–64 11 17 24 2065–69 12 11 20 1070–74 3 4 12 975–79 2 1 6 5
80+ 2 0 0 3
Total 547 609 706 572
of eastern Paraguay. An intensive ethnographic study of the Ache com-
menced some ten years after the hunter-gatherers’ first sustained contact
with sedentary Paraguayans, following which the hunter-gatherer bands
were encouraged to leave the forest and were thereafter largely confined
to reservation settlements. The census data used here are for the Northern
Ache population in 1970, the last year when they were still subsisting as
forest-dwelling hunter-gatherers (Hill and Hurtado, 1995). During the last
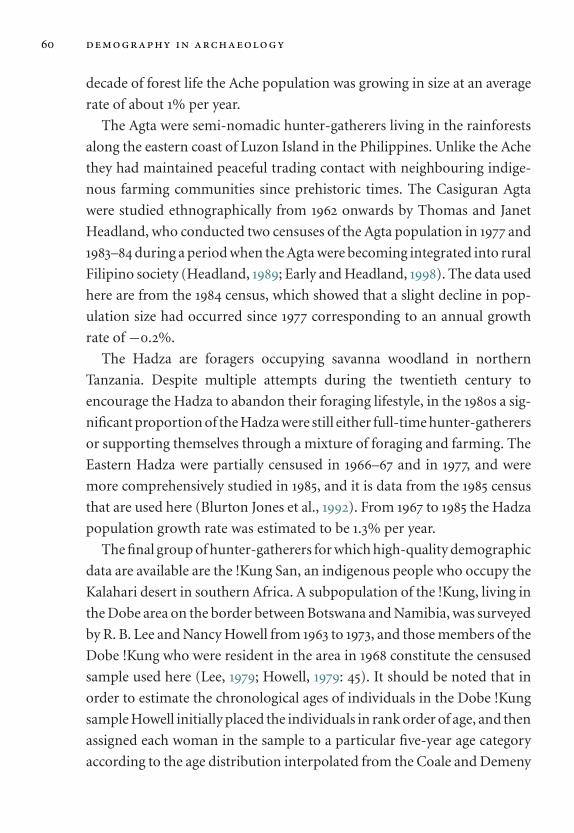
60 demography in archaeology
decade of forest life the Ache population was growing in size at an average
rate of about 1% per year.
The Agta were semi-nomadic hunter-gatherers living in the rainforests
along the eastern coast of Luzon Island in the Philippines. Unlike the Ache
they had maintained peaceful trading contact with neighbouring indige-
nous farming communities since prehistoric times. The Casiguran Agta
were studied ethnographically from 1962 onwards by Thomas and Janet
Headland, who conducted two censuses of the Agta population in 1977 and
1983–84 during a period when the Agta were becoming integrated into rural
Filipino society (Headland, 1989; Early and Headland, 1998). The data used
here are from the 1984 census, which showed that a slight decline in pop-
ulation size had occurred since 1977 corresponding to an annual growth
rate of −0.2%.
The Hadza are foragers occupying savanna woodland in northern
Tanzania. Despite multiple attempts during the twentieth century to
encourage the Hadza to abandon their foraging lifestyle, in the 1980s a sig-
nificant proportion of the Hadza were still either full-time hunter-gatherers
or supporting themselves through a mixture of foraging and farming. The
Eastern Hadza were partially censused in 1966–67 and in 1977, and were
more comprehensively studied in 1985, and it is data from the 1985 census
that are used here (Blurton Jones et al., 1992). From 1967 to 1985 the Hadza
population growth rate was estimated to be 1.3% per year.
The final group of hunter-gatherers for which high-quality demographic
data are available are the !Kung San, an indigenous people who occupy the
Kalahari desert in southern Africa. A subpopulation of the !Kung, living in
the Dobe area on the border between Botswana and Namibia, was surveyed
by R. B. Lee and Nancy Howell from 1963 to 1973, and those members of the
Dobe !Kung who were resident in the area in 1968 constitute the censused
sample used here (Lee, 1979; Howell, 1979: 45). It should be noted that in
order to estimate the chronological ages of individuals in the Dobe !Kung
sample Howell initially placed the individuals in rank order of age, and then
assigned each woman in the sample to a particular five-year age category
according to the age distribution interpolated from the Coale and Demeny
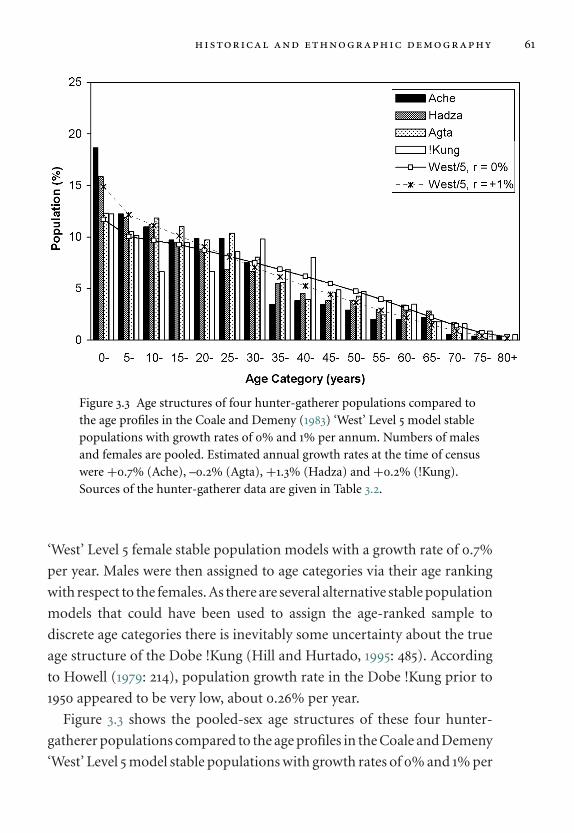
historical and ethnographic demography 61
Figure 3.3 Age structures of four hunter-gatherer populations compared tothe age profiles in the Coale and Demeny (1983) ‘West’ Level 5 model stablepopulations with growth rates of 0% and 1% per annum. Numbers of malesand females are pooled. Estimated annual growth rates at the time of censuswere +0.7% (Ache), –0.2% (Agta), +1.3% (Hadza) and +0.2% (!Kung).Sources of the hunter-gatherer data are given in Table 3.2.
‘West’ Level 5 female stable population models with a growth rate of 0.7%
per year. Males were then assigned to age categories via their age ranking
with respect to the females. As there are several alternative stable population
models that could have been used to assign the age-ranked sample to
discrete age categories there is inevitably some uncertainty about the true
age structure of the Dobe !Kung (Hill and Hurtado, 1995: 485). According
to Howell (1979: 214), population growth rate in the Dobe !Kung prior to
1950 appeared to be very low, about 0.26% per year.
Figure 3.3 shows the pooled-sex age structures of these four hunter-
gatherer populations compared to the age profiles in the Coale and Demeny
‘West’ Level 5 model stable populations with growth rates of 0% and 1% per
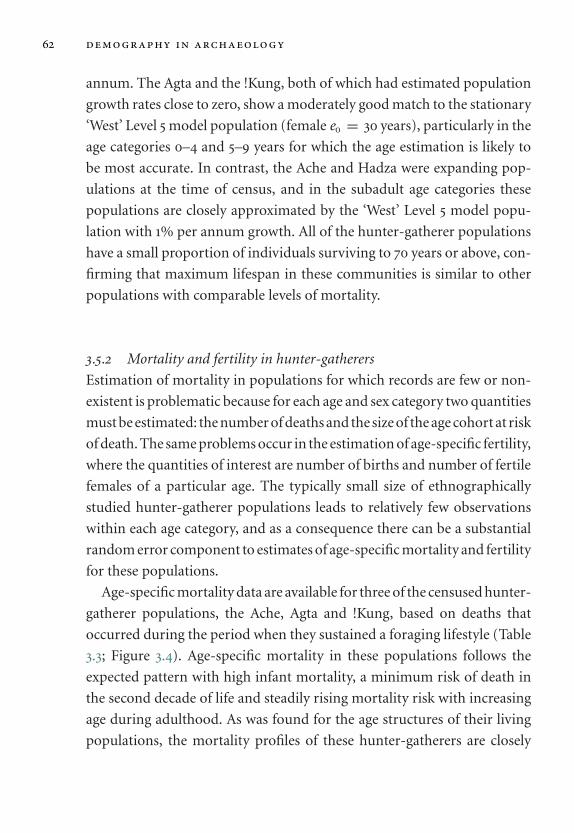
62 demography in archaeology
annum. The Agta and the !Kung, both of which had estimated population
growth rates close to zero, show a moderately good match to the stationary
‘West’ Level 5 model population (female e0 = 30 years), particularly in the
age categories 0–4 and 5–9 years for which the age estimation is likely to
be most accurate. In contrast, the Ache and Hadza were expanding pop-
ulations at the time of census, and in the subadult age categories these
populations are closely approximated by the ‘West’ Level 5 model popu-
lation with 1% per annum growth. All of the hunter-gatherer populations
have a small proportion of individuals surviving to 70 years or above, con-
firming that maximum lifespan in these communities is similar to other
populations with comparable levels of mortality.
3.5.2 Mortality and fertility in hunter-gatherers
Estimation of mortality in populations for which records are few or non-
existent is problematic because for each age and sex category two quantities
must be estimated: the number of deaths and the size of the age cohort at risk
of death. The same problems occur in the estimation of age-specific fertility,
where the quantities of interest are number of births and number of fertile
females of a particular age. The typically small size of ethnographically
studied hunter-gatherer populations leads to relatively few observations
within each age category, and as a consequence there can be a substantial
random error component to estimates of age-specific mortality and fertility
for these populations.
Age-specific mortality data are available for three of the censused hunter-
gatherer populations, the Ache, Agta and !Kung, based on deaths that
occurred during the period when they sustained a foraging lifestyle (Table
3.3; Figure 3.4). Age-specific mortality in these populations follows the
expected pattern with high infant mortality, a minimum risk of death in
the second decade of life and steadily rising mortality risk with increasing
age during adulthood. As was found for the age structures of their living
populations, the mortality profiles of these hunter-gatherers are closely

historical and ethnographic demography 63
Table 3.3 Age-specific risk of death in hunter-gatherer populations.
Probabilities are expressed as average risk of death per annum within each
age interval, with the sexes pooled. Sources of mortality data: Northern
Ache: deaths during the foraging period prior to 1970 (Hill and Hurtado,
1995: 196–198); San Ildefonso Agta: deaths during the foraging period
1950–64 (Early and Headland, 1998: 102); Dobe !Kung: deaths during the
foraging period prior to 1969 (Howell, 1979: 81).
Age (years) Ache Agta !Kung
0–1 0.115 0.369 0.2021–4 0.032 0.032 0.0445–9 0.020 0.010 0.01510–19 0.010 0.006 0.00820–29 0.010 0.010 0.00930–39 0.011 0.034 0.02340–49 0.015 0.029 –50–59 0.026 0.053 –60–69 0.033 0.051 –70–79 0.100 0.100 –80+ – – –
matched by the Coale and Demeny (1983) ‘West’ Level 5 model life table
(Figure 3.4).
The pattern of age-specific fertility of hunter-gatherer women is dis-
tinctive in that the peak of fertility may occur in the late twenties or early
thirties (Figure 3.5), rather than in the early twenties as is the case in
many sedentary agriculturalist populations practising natural fertility (see
Figure 3.8). Hunter-gatherer women also tend to reach sexual maturity at
an older age, and the period of sub-fecundity following menarche may
therefore extend into the early twenties in these women (Wood, 1994: 39).
In the !Kung, age-specific fertility reaches a maximum in the early twen-
ties, but fertility at higher ages is reduced as a consequence of extended
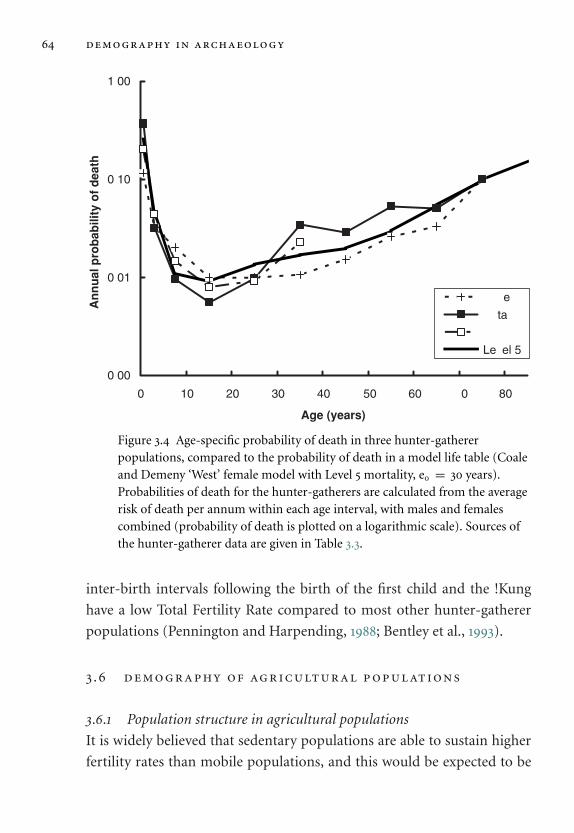
64 demography in archaeology
0.00
0.01
0.10
1.00
0 10 20 30 40 50 60 70 80
Age (years)
An
nu
al p
rob
abili
ty o
f d
eath
Ache
Agta
!Kung
Level 5
Figure 3.4 Age-specific probability of death in three hunter-gathererpopulations, compared to the probability of death in a model life table (Coaleand Demeny ‘West’ female model with Level 5 mortality, e0 = 30 years).Probabilities of death for the hunter-gatherers are calculated from the averagerisk of death per annum within each age interval, with males and femalescombined (probability of death is plotted on a logarithmic scale). Sources ofthe hunter-gatherer data are given in Table 3.3.
inter-birth intervals following the birth of the first child and the !Kung
have a low Total Fertility Rate compared to most other hunter-gatherer
populations (Pennington and Harpending, 1988; Bentley et al., 1993).
3.6 demography of agricultural populations
3.6.1 Population structure in agricultural populations
It is widely believed that sedentary populations are able to sustain higher
fertility rates than mobile populations, and this would be expected to be

historical and ethnographic demography 65
0.0
0.1
0.2
0.3
0.4
10Ð14 15Ð19 20Ð24 25Ð29 30Ð34 35Ð39 40Ð44 45Ð49
Maternal age (years)
Fer
tilit
y (b
irth
s p
er y
ear)
Ache
Agta
!Kung
Figure 3.5 Age-specific fertility in hunter-gatherer women. Sources of thehunter-gatherer data are given in Table 3.2.
reflected in population structure, with proportionately larger cohorts of
infants and juveniles due to rapid population growth. Some agricultural
populations show the effects of high fertility, such as the Cocos Islanders
who were censused in 1947 after nearly three decades of high intrinsic
population growth (Smith, 1960). This population grew in size from 782
individuals in 1921 to 1802 individuals at the time of census in 1947, which
equates to an exponential growth rate of 3.2% per year. The age struc-
ture of the Cocos Islanders corresponds closely to the West Level 5 stable
population with an annual growth rate of 3% (Figure 3.6).
Such high growth rates are unusual, however, and more moderate growth
rates are probably more typical of agricultural populations, as exemplified
by a census of a rural community at Otmoor, England in 1851 which matches
a West Level 5 stable population with a growth rate of 1% (Figure 3.6). This
population had grown from about 2800 to 3800 between censuses con-
ducted in 1801 and 1831, although the annual numbers of baptisms and
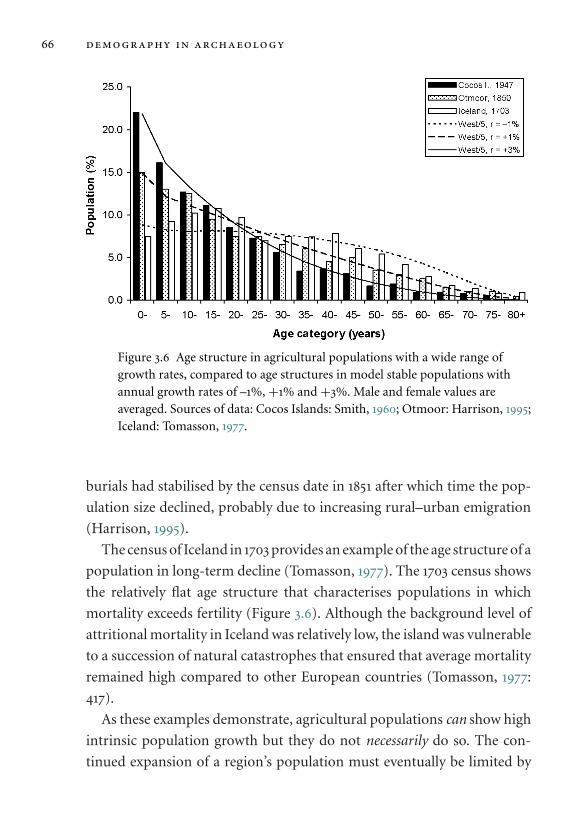
66 demography in archaeology
Figure 3.6 Age structure in agricultural populations with a wide range ofgrowth rates, compared to age structures in model stable populations withannual growth rates of –1%, +1% and +3%. Male and female values areaveraged. Sources of data: Cocos Islands: Smith, 1960; Otmoor: Harrison, 1995;Iceland: Tomasson, 1977.
burials had stabilised by the census date in 1851 after which time the pop-
ulation size declined, probably due to increasing rural–urban emigration
(Harrison, 1995).
The census of Iceland in 1703 provides an example of the age structure of a
population in long-term decline (Tomasson, 1977). The 1703 census shows
the relatively flat age structure that characterises populations in which
mortality exceeds fertility (Figure 3.6). Although the background level of
attritional mortality in Iceland was relatively low, the island was vulnerable
to a succession of natural catastrophes that ensured that average mortality
remained high compared to other European countries (Tomasson, 1977:
417).
As these examples demonstrate, agricultural populations can show high
intrinsic population growth but they do not necessarily do so. The con-
tinued expansion of a region’s population must eventually be limited by

historical and ethnographic demography 67
0.0
0.1
0.2
0.3
0.4
0.5
0.6
0.7
0.8
0.9
1.0
0 10 20 30 40 50 60 70 80 90
Age (years)
Su
rviv
ors
hip
Penrith 1600Ð49Ceylon 1910Ð12Ogen-ji 1776Ð95West Level 7West Level 3
Figure 3.7 Survivorship in agricultural populations. Data are taken from theOgen-ji temple death register, Japan, 1776–95 (Janetta and Preston, 1991); vitalregistration records for Ceylon, 1910–12 (Sarkar, 1951); and familyreconstitution data for females in Penrith, England, 1600–49 (Scott andDuncan, 1998).
available resources, so it is likely that agricultural populations will vary
in growth rate depending on how closely they approach their regional
carrying capacity, with excess numbers being removed either by increased
mortality or by increased out-migration.
3.6.2 Mortality and fertility in agricultural populations
Vital registration data for samples of other agricultural populations con-
firm the pattern seen in the census data. Survivorship curves calculated
from mortality data for agricultural communities in England, Ceylon and
Japan show relatively high levels of mortality that resemble West Level 3
to Level 7 model life tables (Figure 3.7). These levels and patterns of mor-
tality do not differ substantively from those observed in hunter-gatherer
populations, however the pattern of female marital fertility in agricultural

68 demography in archaeology
0.00
0.05
0.10
0.15
0.20
0.25
0.30
0.35
0.40
0.45
0.50
0.55
10Ð14 15Ð19 20Ð24 25Ð29 30Ð34 35Ð39 40Ð44 45Ð49
Maternal age (years)
Fer
tilit
y (b
irth
s p
er y
ear)
Hutterites
Mormons
Germany
England
Figure 3.8 Age-specific fertility in women from agricultural populations.Hutterites: marriages pre-1921 (Wood, 1994, after Eaton and Mayer, 1953);Mormons: marital fertility in Utah 1840–69 (Mineau et al., 1979); Germanvillages: marital fertility pre-1750 (Knodel, 1978); English rural parishes:marital fertility 1550–1849 (Wilson, 1984).
populations is distinctive (Figure 3.8). Compared to fertility in hunter-
gatherers (Figure 3.5), the peak in natural fertility in agricultural commu-
nities tends to occur at younger maternal ages and the peak fertility rate is
higher, typically 0.4–0.5 births per year compared to maximum values of
around 0.3 births per year in hunter-gatherers.
The pattern of higher total fertility in agricultural groups has been con-
firmed in carefully constructed studies using ethnographic data from a
wide range of populations (Bentley et al, 1993; Sellen and Mace, 1997).
There are a diverse set of explanations for the higher average fertility in
agriculturalists, including the direct effects of sedentism on maternal fertil-
ity (through reducing the need to carry dependent offspring between tem-
porary campsites: Sussman, 1972), increased food availability and security
of food supply under agricultural-subsistence regimes (Boserup, 1965),
increased availability of suitable weaning foods (Lee, 1972), and earlier
net contributions of children to household energy budgets (Kramer and
Boone, 2002).

historical and ethnographic demography 69
3.7 conditions of high mortality
3.7.1 Crisis mortality and natural disasters
Model life tables, such as those published by Coale and Demeny (1983), are
designed to provide stable age distributions for the full range of mortal-
ity and fertility patterns likely to be encountered amongst self-sustaining
populations, but it is recognised that extraordinary causes of death such as
warfare, famine, large-scale natural disasters and outbreaks of epidemic dis-
ease can cause deviations from stable structure. Crisis mortality is believed
to be responsible, in part, for the observation that long-term population
growth rates tend to be much lower than short-term growth rates, with the
average rate of growth being curtailed by the occurrence of episodic events
of high mortality in a so-called ‘boom and bust’ pattern (see Watkins and
Menken, 1985, for discussion of this theory).
Episodes of high mortality can be catastrophic, with all age categories
experiencing the same elevated risk of mortality, or they can be essentially
attritional, with proportionately elevated mortality across all age categories
but with the highest death rates occurring in the youngest age and oldest age
categories. Short periods of famine, episodes of adverse climate, imposition
of harsh working conditions and exposure to new disease environments all
tend to produce an elevated attritional pattern of mortality. For example,
the deaths experienced by emigrants in the Donner Party of 1846 and the
Willie Company of 1856 were attritional in nature, although the overall
crude death rates in these natural disasters were very high at 45% and 16%
respectively (Grayson, 1990, 1996). Extreme attritional mortality rates have
also been reported for plantation slaves in nineteenth-century Caribbean
colonies (Roberts, 1952; John, 1988) and amongst American emigrants to
West Africa (McDaniel, 1992).
The demographic effects of large-scale natural disasters, including earth-
quakes, volcanic eruptions, floods and extreme storms, have been reviewed
by Seaman et al. (1984). Deaths in earthquakes are caused mainly by the
collapse of buildings, although rockfalls and landslips in steep terrain and
tsunami (‘tidal waves’) in coastal locations may also contribute to mortality.
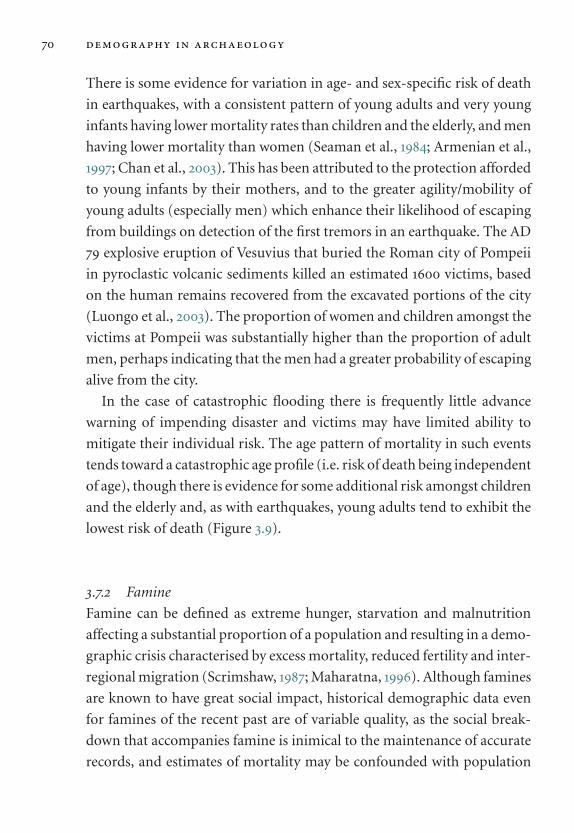
70 demography in archaeology
There is some evidence for variation in age- and sex-specific risk of death
in earthquakes, with a consistent pattern of young adults and very young
infants having lower mortality rates than children and the elderly, and men
having lower mortality than women (Seaman et al., 1984; Armenian et al.,
1997; Chan et al., 2003). This has been attributed to the protection afforded
to young infants by their mothers, and to the greater agility/mobility of
young adults (especially men) which enhance their likelihood of escaping
from buildings on detection of the first tremors in an earthquake. The AD
79 explosive eruption of Vesuvius that buried the Roman city of Pompeii
in pyroclastic volcanic sediments killed an estimated 1600 victims, based
on the human remains recovered from the excavated portions of the city
(Luongo et al., 2003). The proportion of women and children amongst the
victims at Pompeii was substantially higher than the proportion of adult
men, perhaps indicating that the men had a greater probability of escaping
alive from the city.
In the case of catastrophic flooding there is frequently little advance
warning of impending disaster and victims may have limited ability to
mitigate their individual risk. The age pattern of mortality in such events
tends toward a catastrophic age profile (i.e. risk of death being independent
of age), though there is evidence for some additional risk amongst children
and the elderly and, as with earthquakes, young adults tend to exhibit the
lowest risk of death (Figure 3.9).
3.7.2 Famine
Famine can be defined as extreme hunger, starvation and malnutrition
affecting a substantial proportion of a population and resulting in a demo-
graphic crisis characterised by excess mortality, reduced fertility and inter-
regional migration (Scrimshaw, 1987; Maharatna, 1996). Although famines
are known to have great social impact, historical demographic data even
for famines of the recent past are of variable quality, as the social break-
down that accompanies famine is inimical to the maintenance of accurate
records, and estimates of mortality may be confounded with population

historical and ethnographic demography 71
0.1
1.0
10.0
100.0
0- 5- 10- 15- 20- 25- 30- 35- 40- 45- 50- 55- 60- 65-
Age (years)
Ag
e-S
pec
ific
Dea
th R
ate
(%)
Bangladesh FloodArmenia EarthquakeTaiwan EarthquakeNetherlands Flood
Figure 3.9 Age-specific mortality in catastrophic floods (Netherlands 1953,Bangladesh 1970) and in earthquakes (Armenia 1988, Taiwan, 1999). Data aretaken from Seaman et al., 1984; Armenian et al., 1997, and Chan et al., 2003.Although the mortality rates differ by up to a factor of 100, all of these naturaldisasters show a partially catastrophic mortality profile, with reduced variationin age-specific mortality rates compared to standard models of attritionalmortality. Note that the age-specific death rates are plotted on a logarithmicscale.
losses due to migration (Watkins and Menken, 1985; De Waal, 1989). The
excess deaths that occur during famines are usually not attributed directly
to malnutrition and starvation, but are instead mainly due to increased sus-
ceptibility to infectious diseases such as measles, malaria and diarrhoeal
conditions (de Waal, 1989; Moore et al., 1993).
Maharatna (1996) undertook a detailed analysis of patterns of mortality
in four large-scale famines that affected extensive areas of the Indian sub-
continent during the last quarter of the nineteenth century. Figure 3.10
shows the age-specific pattern of mortality during the famines that
occurred in Berar province of central India during 1896–97 and 1889–1900,
compared to the pre-famine baseline years of 1891–95 (Maharatna, 1996).
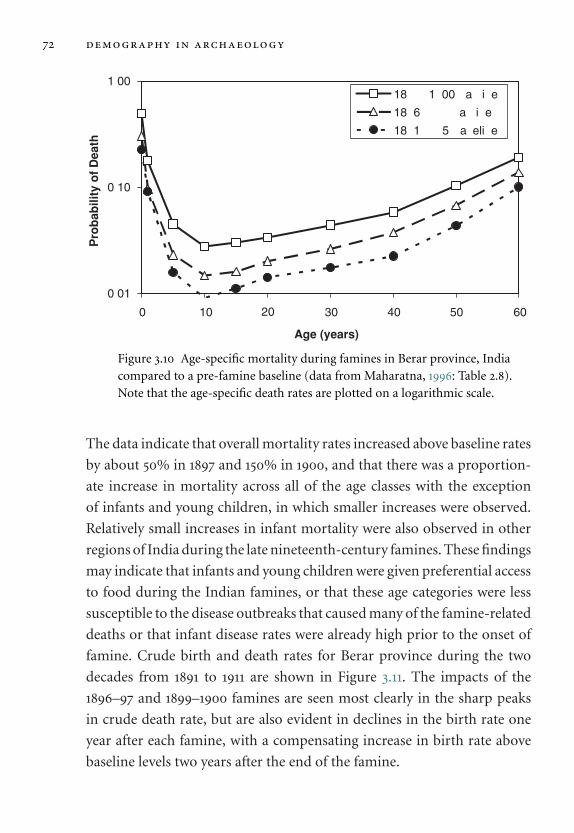
72 demography in archaeology
0.01
0.10
1.00
0 10 20 30 40 50 60
Age (years)
Pro
bab
ility
of
Dea
th1899Ð1900 Famine
1896Ð 97 Famine
1891Ð 95 Baseline
Figure 3.10 Age-specific mortality during famines in Berar province, Indiacompared to a pre-famine baseline (data from Maharatna, 1996: Table 2.8).Note that the age-specific death rates are plotted on a logarithmic scale.
The data indicate that overall mortality rates increased above baseline rates
by about 50% in 1897 and 150% in 1900, and that there was a proportion-
ate increase in mortality across all of the age classes with the exception
of infants and young children, in which smaller increases were observed.
Relatively small increases in infant mortality were also observed in other
regions of India during the late nineteenth-century famines. These findings
may indicate that infants and young children were given preferential access
to food during the Indian famines, or that these age categories were less
susceptible to the disease outbreaks that caused many of the famine-related
deaths or that infant disease rates were already high prior to the onset of
famine. Crude birth and death rates for Berar province during the two
decades from 1891 to 1911 are shown in Figure 3.11. The impacts of the
1896–97 and 1899–1900 famines are seen most clearly in the sharp peaks
in crude death rate, but are also evident in declines in the birth rate one
year after each famine, with a compensating increase in birth rate above
baseline levels two years after the end of the famine.

historical and ethnographic demography 73
Figure 3.11 Crude birth and death rates in Berar province, India from 1895 to1911 (data from Maharatna, 1996: Table 2.2). Shading indicates death rates infamine years.
The demographic impact of a famine in Darfur, western Sudan, in 1984–
85 has been reported by De Waal (1989). As in the Indian famines studied by
Maharatna, increases in age-specific mortality during the famine in Darfur
occurred across all age categories except for infants, in which mortality did
not rise significantly above the pre-famine baseline rate. Fertility declined
significantly in the year following the famine in Darfur, and reduced birth
rates were also recorded during the severe 1984–85 famine in Ethiopia
(Kidane, 1989).
Fertility decline followed by a compensating fertility rebound appears to
be a regular feature of famines, and may be attributable to a combination of
biological and social causes (Watkins and Menken, 1985: 656–57). Recovery
of fertility, together with the removal of frail individuals from the pop-
ulation, can result in population numbers returning to pre-famine levels
within a few years. Watkins and Menken (1985) have simulated the effects
of an extremely severe famine of two years’ duration, in which mortality
increased by 110% and fertility declined by 33%. The simulation showed

74 demography in archaeology
that with an average annual growth rate of 0.5% the famine-affected popu-
lation returned to its original pre-famine size within 12 years, even though
the simulation did not include post-famine fertility rebound. Watkins and
Menken argue that although the social impacts of famines may be severe,
they have relatively small long-term demographic effects because of the
ability of human populations to recover from mortality crises by intrinsic
growth.
3.7.3 Epidemic disease
An epidemic is defined as a mass outbreak of disease, typically confined
to a geographical locality and constrained in time (Pressat, 1985). Epi-
demics are contrasted with endemic disease (disease that is present with
constant frequency in a population) and with pandemics, which are epi-
demics that lack geographical confinement and thus spread throughout
an entire population. An epidemic of infectious disease can arise through
several mechanisms including changes in the infectivity and susceptibility
of hosts, increases in virulence and transmissibility of infective organisms,
and interactions between the life cycles of infective organisms and host
population size. Disease outbreaks can also vary in their demographic
impact: an infective agent may cause low mortality in a population whose
individuals have been exposed to the disease organism and have therefore
built up immunity, whereas the same infection may result in high mortality
in a so-called ‘virgin soil’ population which lacks prior immunity (Crosby,
1976). Disease organisms may also become resistant to therapeutic treat-
ments through the mechanism known as drug resistance (Anderson and
May, 1991).
The pattern of age-specific mortality in an epidemic may be attritional,
catastrophic or a mixture of both. In the pandemic of influenza A virus,
which spread across the world in 1918–19, the age-specific mortality rates
in Britain followed an approximately attritional pattern up to age 30 years,
but in adults older than 30 years the age-specific mortality was reduced,
perhaps because older cohorts of the population had been exposed to earlier
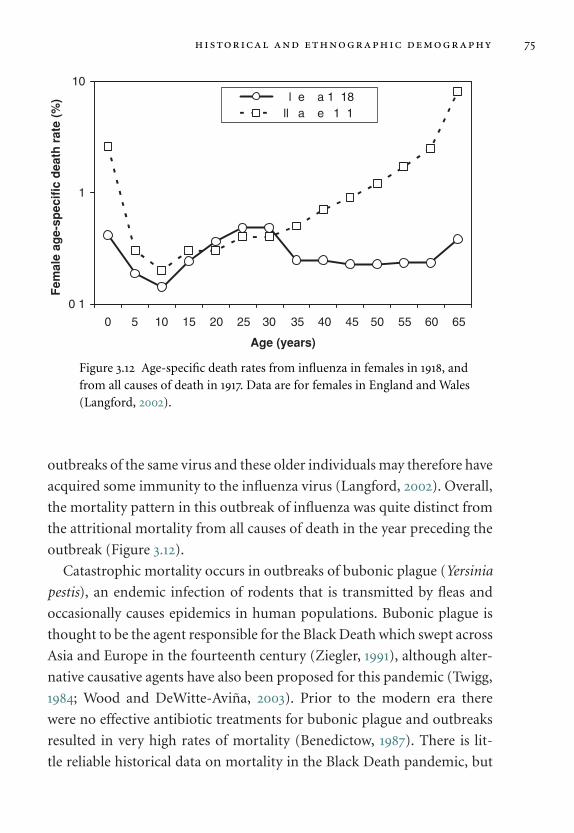
historical and ethnographic demography 75
0.1
1
10
0- 5- 10- 15- 20- 25- 30- 35- 40- 45- 50- 55- 60- 65+
Age (years)
Fem
ale
age-
spec
ific
dea
th r
ate
(%) Influenza 1918
All causes 1917
Figure 3.12 Age-specific death rates from influenza in females in 1918, andfrom all causes of death in 1917. Data are for females in England and Wales(Langford, 2002).
outbreaks of the same virus and these older individuals may therefore have
acquired some immunity to the influenza virus (Langford, 2002). Overall,
the mortality pattern in this outbreak of influenza was quite distinct from
the attritional mortality from all causes of death in the year preceding the
outbreak (Figure 3.12).
Catastrophic mortality occurs in outbreaks of bubonic plague (Yersinia
pestis), an endemic infection of rodents that is transmitted by fleas and
occasionally causes epidemics in human populations. Bubonic plague is
thought to be the agent responsible for the Black Death which swept across
Asia and Europe in the fourteenth century (Ziegler, 1991), although alter-
native causative agents have also been proposed for this pandemic (Twigg,
1984; Wood and DeWitte-Avina, 2003). Prior to the modern era there
were no effective antibiotic treatments for bubonic plague and outbreaks
resulted in very high rates of mortality (Benedictow, 1987). There is lit-
tle reliable historical data on mortality in the Black Death pandemic, but
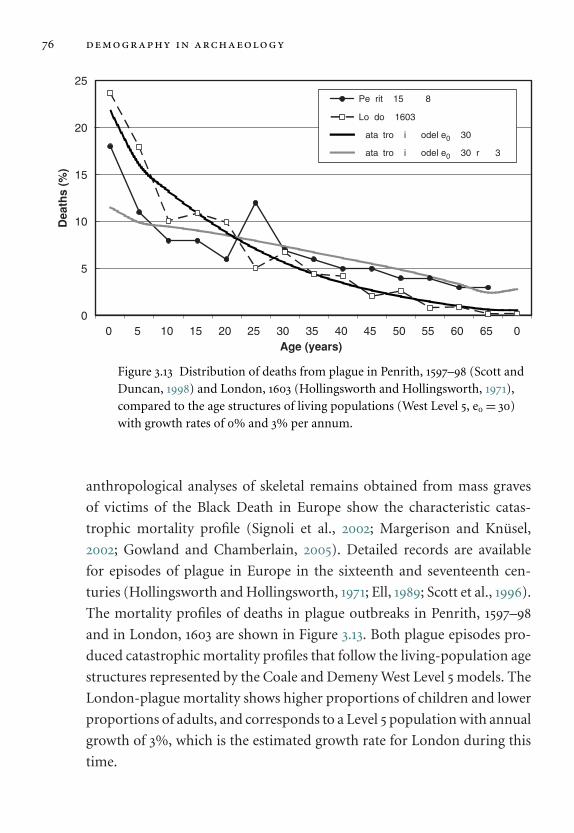
76 demography in archaeology
0
5
10
15
20
25
0- 5- 10- 15- 20- 25- 30- 35- 40- 45- 50- 55- 60- 65- 70+Age (years)
Dea
ths
(%)
Penrith, 1597Ð98
London, 1603
Catastrophic model e0 = 30
Catastrophic model e0 = 30, r = +3%
Figure 3.13 Distribution of deaths from plague in Penrith, 1597–98 (Scott andDuncan, 1998) and London, 1603 (Hollingsworth and Hollingsworth, 1971),compared to the age structures of living populations (West Level 5, e0 = 30)with growth rates of 0% and 3% per annum.
anthropological analyses of skeletal remains obtained from mass graves
of victims of the Black Death in Europe show the characteristic catas-
trophic mortality profile (Signoli et al., 2002; Margerison and Knusel,
2002; Gowland and Chamberlain, 2005). Detailed records are available
for episodes of plague in Europe in the sixteenth and seventeenth cen-
turies (Hollingsworth and Hollingsworth, 1971; Ell, 1989; Scott et al., 1996).
The mortality profiles of deaths in plague outbreaks in Penrith, 1597–98
and in London, 1603 are shown in Figure 3.13. Both plague episodes pro-
duced catastrophic mortality profiles that follow the living-population age
structures represented by the Coale and Demeny West Level 5 models. The
London-plague mortality shows higher proportions of children and lower
proportions of adults, and corresponds to a Level 5 population with annual
growth of 3%, which is the estimated growth rate for London during this
time.
historical and ethnographic demography 77
3.7.4 Conflict mortality
Armed conflict unsurprisingly leads to an increase in mortality amongst
both military and civilian populations. Hostile actions amongst combat-
ants typically cause a minority of deaths in recorded episodes of warfare,
and most deaths are instead attributable to hostility directed by combat-
ants against civilians and to the disruptions that inevitably occur to food
supplies, health care and hygiene amongst civilian populations. Data on
civilian deaths in conflicts are often uncertain, even for military actions
conducted during the last 100 years, but in modern (post-World War II)
warfare civilian deaths can amount to 90% of total conflict-related mor-
tality (Spiegel and Salama, 2000; Roberts et al., 2004). For example, in the
Vietnam War from 1964 to 1973 over one million Vietnamese civilians died,
but less than 50,000 US military deaths were attributable to hostile action.
In the recent conflict in Iraq, unofficial estimates of Iraqi civilian deaths due
to military action range from many thousands (Iraq Body Count, 2004) to
over 100,000 (Roberts et al., 2004).
From ethnographic data on non-literate societies a mixed picture
emerges, with an estimated one quarter of surveyed societies targeting non-
combatants in warfare (Otterbein, 2000 – but see Keeley, 1996, for higher
estimates). The extent to which prehistoric warfare resulted in deaths of
non-combatants is largely unknown, but in a recent analysis, samples of
human skeletal remains from eleven prehistoric mass burial sites were
studied to determine if they exhibited the demographic characteristics of
combatant warfare (Bishop and Knusel, 2005). These sites all showed skele-
tal evidence of fatal trauma inflicted at the time of death. The demographic
measures included the ratio of subadult to adult mortality and the adult sex
ratio. None of the mass-mortality sites fitted the demographic structure
expected of combatant mortality, instead these assemblages were found to
contain substantial proportions of children, adolescents and adult females.
The authors of the study concluded that the burials represented either mas-
sacres of non-combatants, or a mixture of combatant and non-combatant
deaths, suggesting that the targetting of non-combatants may have formed
a common element of prehistoric warfare strategies.

78 demography in archaeology
Civilian deaths are numerically high during conflict for several reasons.
Firstly, much use of force during conflicts is indiscriminate in nature rather
than targeted specifically against combatants. Put crudely, combatants tend
to be far fewer in number than civilians and, when encountered, combat-
ants are harder to kill: on average they are physically stronger and they are
better trained in defensive tactics than are their equivalents in the civilian
population. Thus indiscriminate application of force inevitably results in
high civilian mortality, even if civilians are not specifically targeted. Sec-
ondly, during conflicts armed combatants are often able to secure vital
resources such as food, shelter, and health care, to a much greater extent
than are civilians within the conflict area who are therefore more exposed
to the effects of disease and malnutrition. During the 1998–99 conflict
in Kosovo crude rates of civilian mortality amongst Kosovar Albanians
increased by a factor of 2.3 above a pre-conflict baseline, with war-related
trauma being responsible for two thirds of the civilian deaths (Spiegel and
Salama, 2000). Much greater increases in civilian mortality are seen during
conflicts in less developed countries, where elevated mortality from famine
and disease are the principal causes of death (Guha-Sapir and van Panhuis,
2003).
Distinguishing between civilian and military deaths in modern con-
flicts is problematic, and official military records may either ignore civilian
deaths (Herold, 2002) or they may deliberately disguise massacres of civil-
ians by recording these events as engagements with opposing armed forces
(Rainio et al., 2001). However, combatant and non-combatant groups
are demographically highly distinguishable. The age structures of mili-
tary organisations are typically dominated by young adult males with a
modal age at death in the early twenties, whereas civilian groups have age
structures that reflect the distribution of ages in the living population, and
these very different age structures result in quite distinct mortality pat-
terns. Figure 3.14 shows the age structure of recent conflict-related violent
deaths in samples of adult (>15 years old) male civilians from Palestine
and from Bosnia in the former Yugoslavia. The Palestinian sample consists

historical and ethnographic demography 79
0
10
20
30
40
0- 15- 20- 25- 30- 35- 40- 45- 50- 55- 60- 65- 70-
Age (years)
Per
cen
tag
e o
f p
op
ula
tio
n (
>10
year
s)
Palestinian noncombatants (n = 693)
Palestinian living population
Srebrenica noncombatants (n = 7500)
Yugoslavian living population
Figure 3.14 Age distribution of civilian deaths in Srebrenica, 1995 (Brunborget al., 2003) and Palestine, 2000–02 (Radlauer, 2002) compared to the agestructures of the populations living in the conflict areas.
of 693 non-combatants who died in 2000–02 during the Al-Aqsa upris-
ing (Radlauer, 2002). The sample of non-combatants from Srebrenica in
Eastern Bosnia includes 7,570 male Bosnian Muslim civilians judged to have
been massacred by Bosnian Serbs in July 1975, based on well-corroborated
informant records compiled by the International Committee of the Red
Cross and the humanitarian organisation Physicians for Human Rights
(Brunborg et al., 2003; see also Komar, 2003). Both the Palestine and the
Srebrenica samples show age distributions that approximate those of their
source (i.e. living) populations, with the exception that the age category
20–30 years is slightly over-represented in both samples of deaths indi-
cating greater exposure of younger adults to conflict-related death. These
age distributions contrast strongly with the age distribution of military
personnel and combat deaths in modern and historical conflicts, in which

80 demography in archaeology
0
10
20
30
40
50
0- 15- 20- 25- 30- 35- 40- 45- 50- 55- 60- 65- 70-
Age (years)
Per
cen
tag
e o
f p
op
ula
tio
n (
> 15
yea
rs)
US combatant deaths, 1950s
US Civil War enlistment, 1860s
Spanish Netherlands army, 1630s
French Veteran infantry, 1567Roman Imperial Army enlistment
Figure 3.15 Age distribution of combatant deaths in a modern conflict, anddistribution of ages at enlistment and at muster in military organisations fromvarious periods. Sources of data are McKern and Stewart, 1957 (UScombatants, Korean War), www.shepherd.edu/gtmcweb (US Civil Warenlistment), Parker, 1972 (Spanish Netherlands army in 1630–34), Wood, 1996(Brissac Company Veteran Infantry in 1567), and Scheidel, 1996 (RomanImperial Army enlistment).
a marked peak is observed in the age category 20–24 years, with very few
deaths of individuals aged above 45 years (Figure 3.15). Thus the age distri-
butions of samples of conflict deaths can provide an indication of whether
the deaths are likely to be those of combatants or of non-combatants.
4
Archaeological demography
4.1 past population structure
4.1.1 Background to the palaeodemography debate
Prior to the 1930s most studies of human palaeodemography relied on his-
torical records such as commemorative inscriptions and censuses as sources
of mortality and survivorship data. Following pioneering work by T. W.
Todd (1920, 1924) on the timing of age-related changes in the adult human
skeleton there emerged new opportunities to utilise anthropological data
in palaeodemography (Acsadi and Nemeskeri, 1970: 51–57). Early applica-
tions of skeletal evidence for estimating age at death in palaeodemography
include the demographic analysis of skeletons from Pecos Pueblo (Hooton,
1930) and a study by Vallois (1937) of longevity in European Palaeolithic and
Mesolithic populations. During the second half of the twentieth century
there was a proliferation of publications on the age structure of skeletal
samples, and palaeodemographic studies became almost a routine aspect
of the laboratory analysis of large series of large assemblages of excavated
skeletons.
In this early phase of palaeodemography methodological concerns
focused on ensuring that skeletal samples were representative of the deaths
that had occurred in the population, and that procedures for estimating
sex and age at death were accurate (Angel, 1969; Acsadi and Nemeskeri,
1970: 57–58). The problem of under-representation of infants in skeletal

82 demography in archaeology
samples was well recognised (e.g. Goldstein, 1953: 5; Howells, 1960: 167)
and some workers also noted that young-adult deaths appeared to be over-
represented in cemetery samples, most likely as a result of systematic bias
in adult-age estimation (Goldstein, 1953: 5; Weiss, 1973: 59; Masset, 1976).
In 1977 Lovejoy and co-workers published the results of their palaeode-
mographic study of the Libben ossuary population, a Late Woodland skele-
tal sample of 1327 individuals, of which 1289 skeletons were included in their
life-table analysis (Lovejoy et al., 1977). Claiming that their sample con-
stituted ‘the largest and most comprehensively censused North American
prehistoric cemetery’, they drew attention to contrasts between the Libben
mortality experience as inferred from estimating skeletal age at death and
the demographic pattern established from ethnographic censuses of post-
contact aboriginal populations. The Libben population had an average life
expectancy at birth of 20 years, but it apparently exhibited lower infant
mortality and higher adult mortality than comparable living populations.
In Figure 4.1 the age-specific mortality (% of total deaths) in the Libben
sample is compared with mortality from the model ‘West’ Level 1 life table
of Coale and Demeny (1983) which has the same estimated life expectancy
at birth of 20 years. Compared to the model life-table profile, the Libben
mortality distribution clearly shows reduced numbers of deaths between
0 and 5 years of age, a marked excess of adult mortality between 25 and
45 years, and a truncated age-at-death distribution with no individuals
surviving beyond 60 years.
Lovejoy et al. (1977) rejected under-enumeration of the infants and erro-
neous age estimation of the adult skeletons as possible explanations for the
divergence between the Libben mortality profile and the mortality profiles
of contemporary ‘anthropological populations’. They argued that infants
must be adequately represented in the skeletal population because the
Libben site showed excellent bone preservation and had been carefully and
totally excavated. Also they claimed that their estimates of adult age were
reliable because they had been achieved using a combination of seven mor-
phological age indicators. Lovejoy et al. proposed that it was the modern
anthropological populations which were abnormal as they were exposed
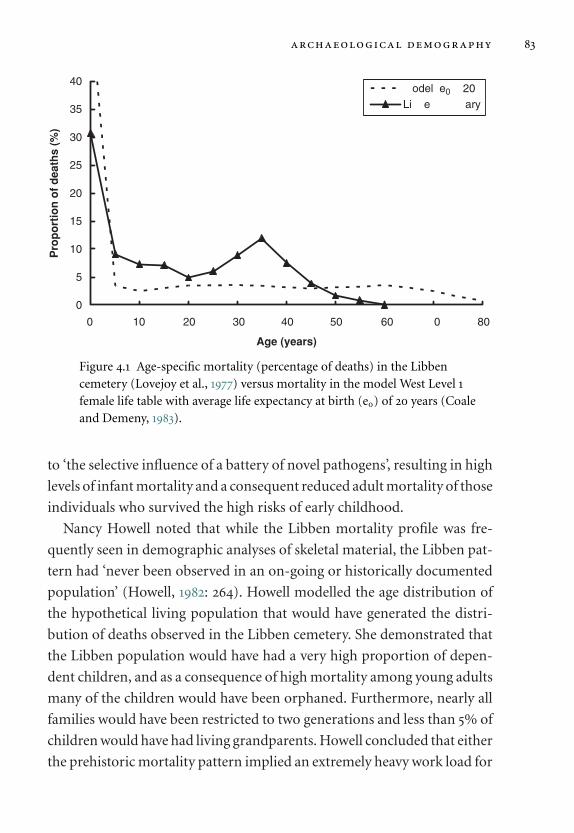
archaeological demography 83
0
5
10
15
20
25
30
35
40
0 10 20 30 40 50 60 70 80
Age (years)
Pro
po
rtio
n o
f d
eath
s (%
)
Model, e0 = 20Libben Ossuary
Figure 4.1 Age-specific mortality (percentage of deaths) in the Libbencemetery (Lovejoy et al., 1977) versus mortality in the model West Level 1female life table with average life expectancy at birth (e0) of 20 years (Coaleand Demeny, 1983).
to ‘the selective influence of a battery of novel pathogens’, resulting in high
levels of infant mortality and a consequent reduced adult mortality of those
individuals who survived the high risks of early childhood.
Nancy Howell noted that while the Libben mortality profile was fre-
quently seen in demographic analyses of skeletal material, the Libben pat-
tern had ‘never been observed in an on-going or historically documented
population’ (Howell, 1982: 264). Howell modelled the age distribution of
the hypothetical living population that would have generated the distri-
bution of deaths observed in the Libben cemetery. She demonstrated that
the Libben population would have had a very high proportion of depen-
dent children, and as a consequence of high mortality among young adults
many of the children would have been orphaned. Furthermore, nearly all
families would have been restricted to two generations and less than 5% of
children would have had living grandparents. Howell concluded that either
the prehistoric mortality pattern implied an extremely heavy work load for
84 demography in archaeology
adults in order to provide subsistence for large numbers of dependent chil-
dren, or that the life table had been distorted by the effects of differential
preservation of skeletal remains and inaccurate estimation of age at death
from skeletal indicators.
4.1.2 The challenge by Bocquet-Appel and Masset
In the same year that Howell published her critique of Lovejoy et al.’s
analysis, Bocquet-Appel and Masset (1982) presented a more wide-ranging
attack on traditional palaeodemographic techniques. Starting from the
observation (c.f. Howell, 1982) that mortality patterns derived from skeletal
samples differed systematically from age at death profiles recorded in a
wide range of historically documented populations, Bocquet-Appel and
Masset explained how the use of imprecise skeletal age indicators coupled
with statistical procedures for age estimation led to the age structure of
reference series being superimposed on series of skeletons from excavated
cemeteries. They illustrated this effect by constructing two sub-samples of
a known-age skeletal reference series in which the extent of cranial suture
closure had been recorded previously. One of these sub-samples had a
mean age at death of 26 years, while the other had a mean age of 51 years.
Bocquet-Appel and Masset showed that while the mean stage of cranial
suture closure for a given age did not vary appreciably between the two
sub-samples, the mean age for a given stage of closure was profoundly
dependent on the mean age of the sub-sample of the reference series. They
pointed out that most biological anthropologists used inverse regressions
with age at death as the dependent variable and skeletal indicator stage as
the independent variable to establish standards for the estimation of age
from the skeleton, rather than the biologically more appropriate regression
of skeletal indicator stage on age (statistically it is the skeletal morphology
that depends on chronological age, not vice versa). Bocquet-Appel and
Masset showed that when inverse regression is employed the age structure
of the reference series is effectively superimposed on any skeletal sample
which is assessed using the reference series as an ageing standard.
archaeological demography 85
Bocquet-Appel and Masset also drew attention to the generally low cor-
relation between skeletal-age indicators and actual age at death, which
resulted in unacceptably large standard errors of estimation. Typical cor-
relation coefficients between single age indicators and actual age at death
were within the range r = 0.5 to 0.7, while multiple-correlation coefficients
based on combinations of two or more age indicators ranged from r =0.7 to 0.8. Bocquet-Appel and Masset argued that for an indicator with a
correlation coefficient of r = 0.7 the 95% confidence interval for a single
estimate of adult age at death is approximately 30 years, and they regarded
this as being much too imprecise to be of any use in palaeodemographic
analysis.
One palaeodemographic parameter which can be estimated reliably
from skeletal samples, according to Bocquet-Appel and Masset, is the juve-
nility index i.e. the ratio D5–14 / D20+, which expresses the number of deaths
in older children (aged 5 to 14 years) as a ratio of the number of adult
deaths (aged 20 years or greater). This ratio is unaffected by the preser-
vation and recovery bias that frequently causes under-representation of
infants and young children in skeletal samples, and furthermore it avoids
the problems discussed above in assigning adult skeletons a specific age
at death (see Figure 4.2). Bocquet-Appel demonstrated that in historically
documented populations the reciprocal of the D5–14/D20+ ratio had a high
correlation (r > 0.9) with standard life-table parameters including average
life expectancy at birth and the overall birth and death rates. However,
the application of this ratio to published European and North African
cemetery samples gave a relatively narrow range of estimates of average life
expectancy at birth (e0 typically close to 25 years), which Bocquet-Appel
and Masset suggested was evidence for another kind of reference series
bias: in this case superimposing the age structure of the historically doc-
umented populations from which the ratio had been derived. In overall
conclusion Bocquet-Appel and Masset stated that while the aim of obtain-
ing unbiased age estimates from skeletal remains was a valuable one, the
current application of demographic methods to skeletal age at death data
was futile.
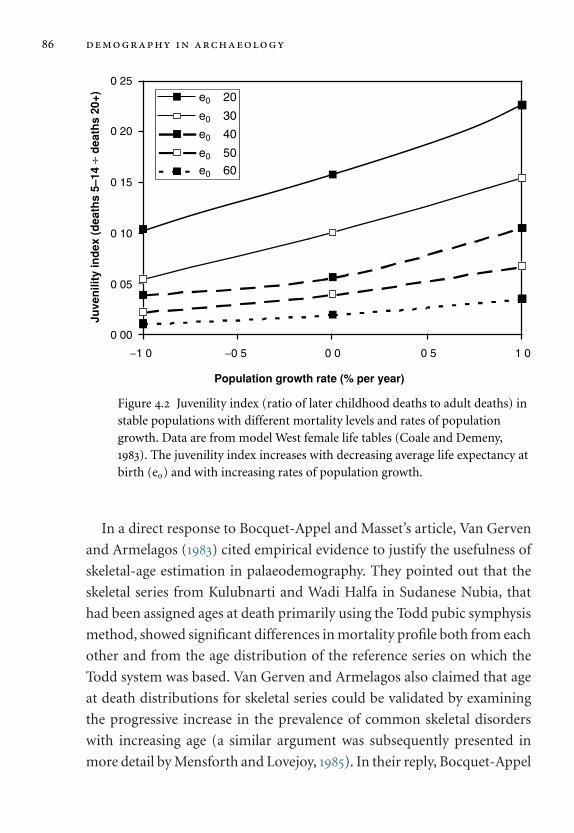
86 demography in archaeology
0.00
0.05
0.10
0.15
0.20
0.25
−1.0 −0.5 0.0 0.5 1.0
Population growth rate (% per year)
Juve
nili
ty in
dex
(d
eath
s 5–
14 ÷
dea
ths
20+) e0 = 20
e0 = 30
e0 = 40
e0 = 50
e0 = 60
Figure 4.2 Juvenility index (ratio of later childhood deaths to adult deaths) instable populations with different mortality levels and rates of populationgrowth. Data are from model West female life tables (Coale and Demeny,1983). The juvenility index increases with decreasing average life expectancy atbirth (e0) and with increasing rates of population growth.
In a direct response to Bocquet-Appel and Masset’s article, Van Gerven
and Armelagos (1983) cited empirical evidence to justify the usefulness of
skeletal-age estimation in palaeodemography. They pointed out that the
skeletal series from Kulubnarti and Wadi Halfa in Sudanese Nubia, that
had been assigned ages at death primarily using the Todd pubic symphysis
method, showed significant differences in mortality profile both from each
other and from the age distribution of the reference series on which the
Todd system was based. Van Gerven and Armelagos also claimed that age
at death distributions for skeletal series could be validated by examining
the progressive increase in the prevalence of common skeletal disorders
with increasing age (a similar argument was subsequently presented in
more detail by Mensforth and Lovejoy, 1985). In their reply, Bocquet-Appel
archaeological demography 87
and Masset (1983) challenged the evidence presented by Van Gerven and
Armelagos and reasserted the conclusions of their earlier article.
Buikstra and Konigsberg (1985) also responded to the specific arguments
in Bocquet-Appel and Masset’s critique, and while Buikstra and Konigsberg
acknowledged that systematic under-aging of older-adult skeletons was a
widespread and persistent problem in palaeodemography they nonethe-
less demonstrated that meaningful comparisons could be made between
the mortality profiles calculated from samples of archaeological skeletons.
They explicitly rejected Bocqet-Appel and Masset’s claim (1982: 329) that
‘the information conveyed by the age indicators is so poor that the age
distributions thus available can hardly reflect anything but random fluc-
tuations and errors of method’.
Jackes (1985) demonstrated that age at death distributions calculated
from pubic symphysis scores often showed unexpected peaks at particular
ages, and that this was an artefact of the procedure for assigning to each
skeleton the mean age associated with a particular symphysis score. Jackes
recommended instead that ages should be assigned to skeletons according
to probability distributions, so that skeletons with the same symphysis score
would have assigned ages that were distributed normally around the mean
age for that symphysis score. Jackes stated that her revised procedure for
assigning ages at death would alleviate some of the problems highlighted
by Bocqet-Appel and Masset (1982).
The eventual acceptance that there were serious problems with basing
demographic inferences on traditional methods of age estimation led to the
development of new methods based on Bayesian and maximum-likelihood
techniques. These methods are described in more detail in Section 4.4.
4.1.3 Uniformitarian assumptions in palaeodemography
In order to use demographic information obtained from human skeletal
material several assumptions about the nature of past biological and demo-
graphic processes have to be made and justified. The biological assump-
tions concern the assignment of sex and age at death to individual skeletons,
88 demography in archaeology
matters which are described in detail in Sections 4.2 and 4.3 below. Mor-
phological methods for estimating sex and age at death from the skeleton
depend on the prior establishment, usually in modern reference series, of
the relationship between skeletal morphology and biological sex or chrono-
logical age. The application of these methods to samples taken from past
populations depends on an assumption that patterns of sexual dimor-
phism and rates of skeletal growth, maturation and degeneration were
similar in the past and in the present day and were constant across dif-
ferent populations. Clearly, over the very wide span of human evolution
from the time when human ancestors diverged from the ancestors of the
African apes there have been substantial changes both in the nature and
extent of human sexual dimorphism and in rates of skeletal maturation
(see Section 5.2 below). Where appropriate data are available, these unifor-
mitarian assumptions can be circumvented by developing new standards
for the assignment of sex and age at death that are specific to the population
under investigation.
Uniformitarian assumptions about past demographic processes are also
required in some areas of palaeodemographic analysis. The construction
of a life table from records of mortality depends on the assumption of
population stability and either an absence of age-structured migration or at
least a stable balance between emigration and immigration. Interpretation
of life-table parameters derived from a skeletal sample also depends on
assumptions about time-averaged rates of population growth during the
period when the skeletal sample accumulated. Bayesian methods for the
assignment of age at death (see Section 4.4 below) depend on the selection of
appropriate age-specific prior probabilities of death, which in turn require
uniformitarian inferences about past demographic parameters.
Finally the technique of pattern matching (Milner et al., 1989; Paine,
1989), in which the demographic structure of an archaeological sample is
compared to model life-table mortality schedules, is based on the assump-
tion that the age structure of the population represented in the archaeolog-
ical assemblage must have originally resembled one of a family of model
life tables. Meindl and Russell (1998: 390) have challenged this assumption,

archaeological demography 89
claiming that the widely-used Princeton model life tables are based on a
restricted range of modern mortality experience in populations with artif-
ically protracted longevity, and that the Princeton models are therefore
inappropriate as comparata for the mortality schedules of past popula-
tions. This critique echoes similar statements made earlier by Lovejoy et al.
(1977), and does not account for the fact that the Princeton model life tables
provide a close match to historical and ethnographic data (see Chapter 3).
4.1.4 Bias in samples and in estimation
The term ‘bias’ is used here to refer to a systematic (i.e. consistent in
direction) departure of a measured or estimated quantity from the true
or expected value of that quantity (Orton, 2000: 23). A major potential
source of bias in palaeodemographic data is the under-representation of
the youngest age classes, which is a feature of some assemblages of human
skeletal remains from archaeological contexts. The shortfall in numbers
of children, particularly infants and young children, can occur even when
large samples of skeletons are recovered from the cemeteries of communi-
ties in which deceased individuals of all ages are expected to have received
normative funerary rites. Depending on the precise circumstances of burial
at particular sites, the skeletal remains of infants and children may have a
lower preservation potential (children’s skeletons are smaller, their bones
are less resistant to physical damage and bioturbation, and their graves are
more easily disturbed or truncated) and a lower likelihood of recovery (chil-
dren’s skeletal remains are less easily recognised, they may have less elabo-
rate graves, they may be overlooked when commingled with the remains
of adults). The pattern of under-representation of infants in archaeolog-
ical assemblages is not confined to human examples: archaeozoological
samples of the skeletal remains of wild and domestic mammals may also
show lower than expected numbers in the youngest age classes (Klein and
Cruz-Uribe, 1984: 85).
Another bias in age-distributed demographic data has emerged from
comparing adult mortality in archaeological samples with the mortality
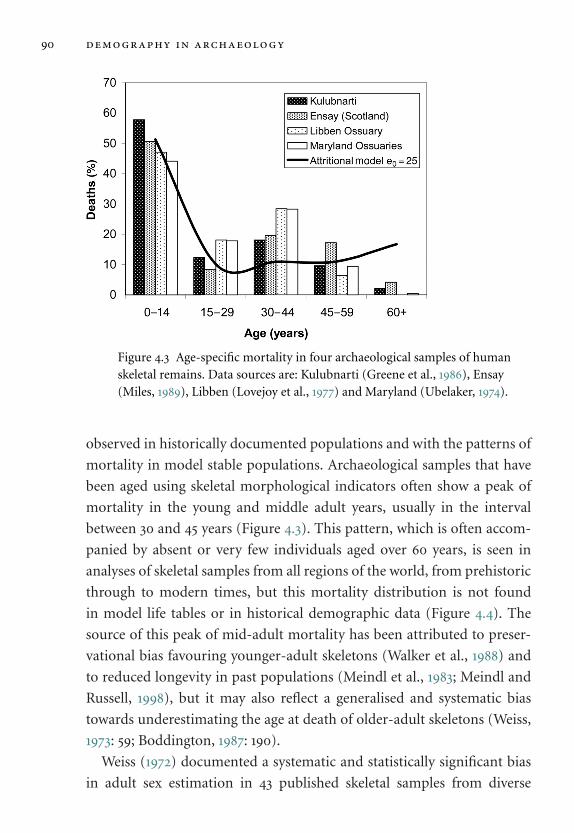
90 demography in archaeology
Figure 4.3 Age-specific mortality in four archaeological samples of humanskeletal remains. Data sources are: Kulubnarti (Greene et al., 1986), Ensay(Miles, 1989), Libben (Lovejoy et al., 1977) and Maryland (Ubelaker, 1974).
observed in historically documented populations and with the patterns of
mortality in model stable populations. Archaeological samples that have
been aged using skeletal morphological indicators often show a peak of
mortality in the young and middle adult years, usually in the interval
between 30 and 45 years (Figure 4.3). This pattern, which is often accom-
panied by absent or very few individuals aged over 60 years, is seen in
analyses of skeletal samples from all regions of the world, from prehistoric
through to modern times, but this mortality distribution is not found
in model life tables or in historical demographic data (Figure 4.4). The
source of this peak of mid-adult mortality has been attributed to preser-
vational bias favouring younger-adult skeletons (Walker et al., 1988) and
to reduced longevity in past populations (Meindl et al., 1983; Meindl and
Russell, 1998), but it may also reflect a generalised and systematic bias
towards underestimating the age at death of older-adult skeletons (Weiss,
1973: 59; Boddington, 1987: 190).
Weiss (1972) documented a systematic and statistically significant bias
in adult sex estimation in 43 published skeletal samples from diverse
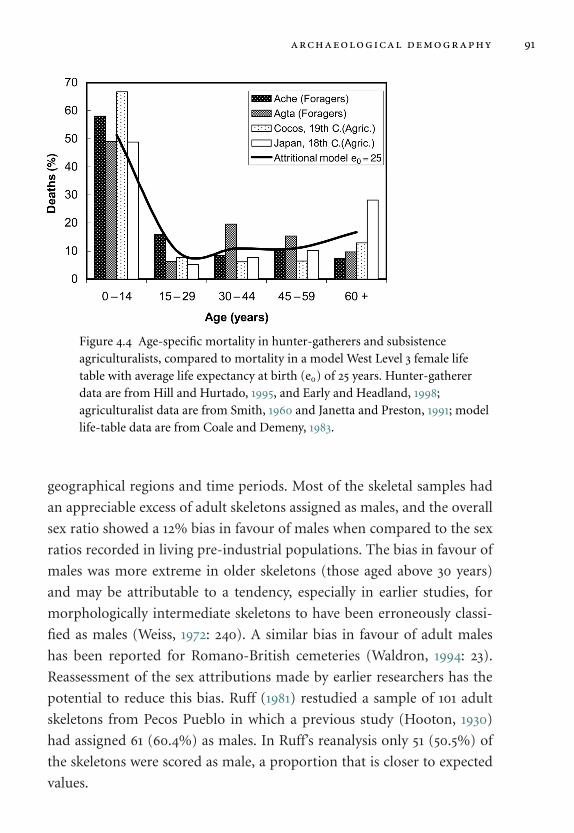
archaeological demography 91
Figure 4.4 Age-specific mortality in hunter-gatherers and subsistenceagriculturalists, compared to mortality in a model West Level 3 female lifetable with average life expectancy at birth (e0) of 25 years. Hunter-gathererdata are from Hill and Hurtado, 1995, and Early and Headland, 1998;agriculturalist data are from Smith, 1960 and Janetta and Preston, 1991; modellife-table data are from Coale and Demeny, 1983.
geographical regions and time periods. Most of the skeletal samples had
an appreciable excess of adult skeletons assigned as males, and the overall
sex ratio showed a 12% bias in favour of males when compared to the sex
ratios recorded in living pre-industrial populations. The bias in favour of
males was more extreme in older skeletons (those aged above 30 years)
and may be attributable to a tendency, especially in earlier studies, for
morphologically intermediate skeletons to have been erroneously classi-
fied as males (Weiss, 1972: 240). A similar bias in favour of adult males
has been reported for Romano-British cemeteries (Waldron, 1994: 23).
Reassessment of the sex attributions made by earlier researchers has the
potential to reduce this bias. Ruff (1981) restudied a sample of 101 adult
skeletons from Pecos Pueblo in which a previous study (Hooton, 1930)
had assigned 61 (60.4%) as males. In Ruff’s reanalysis only 51 (50.5%) of
the skeletons were scored as male, a proportion that is closer to expected
values.

92 demography in archaeology
Biological mortality bias refers to the situation where there are system-
atic differences between a sample of deaths from a population and the
surviving members from the same age groups of the living population.
It is often assumed that the principal causes of death in the past were
relatively undiscriminating and that most individuals in the population
had an approximately equal chance of dying in any given age interval.
Wood et al. (1992b) explored the consequences of individual variation in
frailty, whereby the risk of death at a given age is considerably greater in
some individuals (those designated as ‘frail’) than in others (those desig-
nated as ‘robust’). According to this perspective, the individuals who die
in a particular age group, and thus who enter the burial record, may be
constitutionally different from those of the same age cohort who survive
and continue to be active members of the living population. If biological
mortality bias is substantial then this has important potential implications
both for demography and palaeopathology, depending on the extent to
which frail individuals might have different growth patterns or sustain
different frequencies of skeletal markers of disease. However, modelling
of the potential effects of mortality bias on growth rates calculated from
cross-sectional samples of children’s skeletons suggests that the effects of
this potential source of bias are likely to be small (Saunders and Hoppa,
1993: 142–43).
4.2 estimation of sex
4.2.1 Human sex differences
Humans, like virtually all vertebrates and many other organisms, possess
two biological sexes. The social and cognitive recognition of the primary
human sex distinction is termed gender (Mays and Cox, 2000: 117). The
interplay between biological sex and social gender is complex and varies
between cultures, but for the purposes of biological anthropology a clear-
cut distinction is useful: sex refers to the biological genotype and its mor-
phological expression as the phenotype, while gender refers to the social
archaeological demography 93
registration and reinforcement of biological sex differences, often expressed
most markedly in material culture and in social behaviour (Walker and
Cook, 1998).
Much of the morphological difference between the sexes is genetically
determined and is the result of two separate processes of natural selec-
tion. The sex-determining genes control the development of the primary
sex organs which equip the individual for either the male or the female
reproductive role. Because successful reproduction is the key to the sur-
vival of an individual’s genes, these sex differences are under close control
by stabilising selection. But the separate process of sexual selection also has
an important influence on the visible or phenotypic differences between
the sexes. To put it simply, some of the observable differences in mor-
phology and behaviour between human males and human females are not
adaptive in a mechanical sense, but are the result of one sex preferring
certain aesthetically valued traits in their mating partner. Indirectly, the
possession of these sexually selected traits may contribute to successful
reproduction. The difference in physical form between male and female
organisms is known as sexual dimorphism (Table 4.1). Externally the adult-
human female body is clearly distinguished from the male by primary and
secondary sexual characteristics. When we consider the human skeleton,
although the differences between the sexes are less apparent, several factors
can be identified as contributing to the biological differences between adult
males and females.
4.2.2 Morphological sex differences in pre-adolescent skeletons
It is difficult to establish the sex of a juvenile human skeleton because
the principal skeletal sex differences that characterise adult skeletons only
emerge during and after puberty. A considerable amount of research has
been applied to this question, and several authors have presented morpho-
logical traits and metrical procedures that are claimed to allow the diag-
nosis of sex from the skeletal remains of children (Boucher, 1957; Weaver,
1980; Hunt, 1990; Schutkowski, 1993; Molleson et al., 1998). Few of these

94 demography in archaeology
Table 4.1 Factors contributing to differences between the skeletons of human
adult males and females.
Size Adult males are on average larger than adult females, but theaverage size difference is not the same for all populations, andthere is usually a substantial range of size overlap between thesexes. Volume and mass differences between the sexes areproportionately greater than the differences in lineardimensions, as a consequence of allometric scaling effects.
Robusticity Males bones tend to be more robust, with larger joint surfacesand more prominent muscle attachments. The differencesresult partly from larger average volume and massin males, but are also due to their greater muscle bulkand hormonally-mediated differential bone growth.
Reproduction The morphology of the adult female hip bones and sacrumreflects adaptations for childbirth. As a consequence thefemale pelvis has a transversely expanded shape with abroader pelvic outlet, and diagnostic sex-specific features arepresent in the pubic region.
Cultural practices The presence of culturally-determined sex differences inbehaviour may provide additional information that may beuseful in sexing skeletons. For example, sex differences indiet and nutrition, physical activity, interpersonal violenceand disease susceptibility may all have skeletal consequences.
methods have been subjected to blind testing, and most have not con-
trolled for age variation between the samples of each sex. Holcomb and
Konigsberg (1995) measured the shape of the greater sciatic notch in 133
fetal ilia of known age and sex. They found a small, statistically signifi-
cant difference in the shape of the notch between male and female fetuses,
but there was considerable overlap in morphology between the sexes and
only 60% of specimens could be classified to the correct sex using iliac
shape.
Discriminant analysis has been used to investigate metrical differences in
the crown dimensions of children’s deciduous teeth (De Vito and Saunders,
archaeological demography 95
1990), and discriminant functions for permanent teeth can also be applied
to children aged above ∼4 years. The crowns of the developing permanent
teeth are present, though unerupted, in the child’s jaw: this is the only part of
the child’s skeleton that will persist unchanged to adulthood. It is therefore
possible to obtain detailed measurements of the teeth of the known-sex
adult members of the skeletal population and then to use discriminant
analysis to develop a mathematical function that distinguishes male and
female permanent teeth. The resulting discriminant function can then be
applied to the permanent tooth crowns in the juvenile specimens, with a
claimed accuracy of above 90% (Rosing, 1983). However, it is a complex and
time-consuming method that requires relatively large samples of reliably
sexed adult skeletons, and is therefore not always readily applicable to
archaeological samples.
4.2.3 Morphological sex differences in adult skeletons
The bony pelvis, including the hip bones and the sacrum, is the most reliable
part of the adult skeleton for sex estimation because it is the only skeletal
region which exhibits specific morphological adaptations to the different
sexes’ reproductive capacities. In the adult-female pelvis the postural and
locomotor functions of the pelvis are modified by the requirement for
the birth canal to allow the passage of a fully developed neonate. This is
achieved by additional transverse growth of the pelvic bones which occurs
around the time of puberty. This differential growth is manifest both in the
overall shape of the pelvis, and in a series of specific morphological traits,
each of which contributes to the overall adaptation.
After the pelvis, the skull (cranium and mandible) provides the next
most reliable group of sex-specific morphological indicators. The prin-
cipal sex-discriminating features of the human skull are related to over-
growth or hypertrophy of bone in males, and to the tendency for males
to show greater development of musculature and articulations with more
prominent muscle markings and larger joint surfaces. For most of the

96 demography in archaeology
sex-diagnostic traits of the cranium, the presence of the trait indicates
a male and its absence indicates a female. Skeletal hypertrophy is seen
most clearly in the skull of the adult male in the supraorbital region, the
nuchal region, the mastoid process, the attachment areas for the muscles
of mastication and in the development of the mental trigone (chin) on the
mandible. Recent research has indicated that these skeletal traits vary in
their efficacy in sex discrimination (Rogers, 2005). When we move away
from the pelvis and the skull, sex discrimination relies principally on the
average size differences between the sexes, particularly in the sizes of the
articular surfaces at the ends of the long bones. On average the muscle
bulk and body weight of males is considerably greater than that of females,
and muscle forces and static weight must be transmitted through the joint
surfaces which as a consequence are on average larger in males than in
females.
Skeletal features that are believed to be related to the birth process itself
have been identified on the pelvis near the sacro-iliac joint (pre-auricular
sulcus), on the postero-superior aspect of the pubis near the pubic symph-
ysis and at the pubic tubercle (Stewart, 1970; Suchey et al., 1979; Bergfelder
and Herrmann, 1980; Cox and Scott, 1992; Cox, 2000). In females parturi-
tion can produce cavitation or pitting at the margins of the pubic symphy-
seal surface, and similar changes have been reported around the sacro-iliac
joint. Studies of the skeletons of women of known parity have established
that there is a poor correlation between actual number of births and the
extent of these skeletal changes (Cox, 2000), and while so-called ‘parturi-
tion scars’ are rarely found in nulliparous women (or in men), there are
many multiparous women who do not show any visible skeletal changes
(Suchey et al., 1979). Age changes at the pubic symphysis may modify and
conceal earlier parturition features, and many women appear to be able to
accommodate the stresses of childbirth without incurring lasting damage
to the pelvic joints. It has been suggested that some of the pelvic changes
previously interpreted as relating to parturition may instead reflect pelvic
shape and biomechanical influences on the skeleton (Cox and Scott, 1992;
Cox, 2000).
archaeological demography 97
4.2.4 Accuracy of sex estimation
Male and female adult skeletal morphology varies across a continuum.
There are always a few individuals whose skeletons are intermediate in form
and it is impossible to sex these individuals accurately using morphological
methods alone. In general, the accuracy of skeletal sexing increases as more
parts of the skeleton are considered: with complete adult skeletons up to
100% accuracy in sexing has been claimed, provided that the range of sex
variation in the population is already known (Krogman and Iscan, 1986:
259). The pelvis is the most reliable area for skeletal sexing. A blind test of the
reliability of morphological sexing, applied to a mixed-race sample of adult
pelvic bones, achieved 96% accuracy (Meindl et al., 1985b: 80). A similar
level of accuracy has also been demonstrated using morphological traits of
the pubic bone (Phenice, 1969; Sutherland and Suchey, 1991). The skull and
the remainder of the postcranial skeleton provide less accuracy, but Meindl
et al. (1985b) achieved 92% accuracy in a blind test using morphological
criteria to assign sex to a mixed-race sample of adult skulls. It is likely
that several of the above measures of accuracy are over optimistic as the
sexing methods have usually been tested on populations whose variation
is already familiar to the observer.
As with methods of adult-age estimation, the techniques for skeletal sex-
ing have been developed using skeletons of known sex, but there are also
indirect tests of the accuracy of the methods. For example, if it can reason-
ably be inferred that a cemetery contains approximately equal numbers of
male and female adult skeletons, then we expect our skeletal sexing meth-
ods to classify about half the skeletons as male and half as female. Weiss
(1972) demonstrated that this expectation is often not fulfilled, and that
morphological methods for estimating sex from the skeleton have tended
to produced a bias in favour of males.
4.2.5 Biomolecular methods of sex estimation
Methods for identifying the sex of skeletal remains using DNA have been
reviewed by Brown (1998; 2000). The advantages of using DNA for sexing

98 demography in archaeology
skeletal remains lie in the potential to estimate sex with equal reliability in
juveniles and adults, and the theoretically low probability of misclassifica-
tion as more than 99% of males and females have the standard sex chro-
mosome complement of XY and XX respectively. Several protocols have
been developed for sex identification that recognise sex-specific sequences
in the amelogenin gene, which has different alleles on the X and Y chro-
mosomes (Lassen et al., 1996; Stone et al., 1996; Gotherstrom et al., 1997;
Faerman et al., 1998). However, the utility of this approach for sex iden-
tification in ancient human remains is limited. The survival of DNA in
ancient remains is highly variable and studies reporting amelogenin-based
sexing of ancient remains show that on average only 60% of specimens
tested were identified successfully (Brown, 2000: 465). In part this reflects
the fact that amelogenin is a single copy gene which has a low probability of
survival in ancient bone compared to mitochondrial DNA which is present
in multiple copies in each cell.
4.3 estimation of age at death
4.3.1 Human skeletal development and ageing
In common with other tissues of the body the skeleton grows in size and
attains successive levels of maturity as the individual progresses through
life from conception to the achievement of adulthood. Further age-related
changes are observable in adult skeletal tissues as some parts of the skeleton
continue to grow, remodel and degenerate throughout adult life. The tim-
ing and rate of developmental growth is genetically determined but is also
influenced by maternal environment and by the health and nutritional sta-
tus of the growing individual. Some physiological disturbances to growth
cause temporary retardation of the rate of somatic growth which may be
compensated by accelerated ‘catch-up’ growth once the adverse conditions
have ameliorated. Growth rates are high prenatally and in the immediate
postnatal period, and rates also increase briefly during adolescence (the
‘adolescent growth spurt’). Rates of growth vary both within and between
archaeological demography 99
populations (Eveleth and Tanner, 1990), and this constrains attempts to
draw a close correspondence between the extent of skeletal growth and the
chronological age of the individual.
The term ‘subadult’ is used here to refer to all developmental stages
before reaching skeletal maturity. The developing human passes through
a succession of well-defined maturational stages. These are the embryonic
stage, from conception to 8 weeks; the fetal stage, from 9 to 40 weeks
gestational age; the neonatal stage, from birth to 1 month; infancy, from 2
to 11 months; early childhood, from 1 to 5 years, later childhood from 6 to 11
years, adolescence from 12 to 17 years, and adulthood from 18 years onwards.
Bones and teeth begin forming in the fetus well before birth. Ossification
begins at eight weeks in utero, and the deciduous teeth begin calcifying at
fifteen weeks. Most of the bones of the skeleton are initially formed as a
cartilage model, in the middle of which appears the primary centre of ossi-
fication. Secondary centres of ossification appear at the ends of the bone,
and are separated from the primary centre by intervening growth plates.
These secondary centres subsequently become the bony epiphyses that sup-
port the articular surfaces (see Figure 4.5). Bone growth continues by the
addition of new bone on surfaces facing the direction of bone growth, while
resorption takes place on surfaces facing away from the growth direction.
The crowns of the deciduous and the permanent teeth develop within the
jaw, and the teeth subsequently develop roots as they erupt through the
oral tissues into the mouth.
Towards the end of puberty most of the bones stop growing and the
cartilagenous growth plates underneath the epiphyses are converted to
bone. The epiphyses fuse to their respective diaphyses at different times
but mainly from about 12 years onwards. Some growth centres in the
skull and vertebral column fuse much earlier, while the medial end of
the clavicle, the epiphyses of the vertebral bodies and the growth plates
between the segments of the body of the sacrum do not fuse until the mid
to late 20s. Most epiphyses fuse between 1 and 2 years earlier in girls than in
boys, and fusion itself is a protracted process rather than a sudden event.
With the cessation of somatic growth skeletal tissues continue to participate

100 demography in archaeology
Figure 4.5 Unfused epiphysis at the proximal end of the femur in anindividual aged about 8 years at death.

archaeological demography 101
in processes of remodelling and degeneration which result in cumulative
change to bones and teeth. These changes can be used as indicators of
progression through stages of adult life.
4.3.2 Age estimation in fetuses and children
During fetal and early neonatal life the bones grow quickly, with about
20mm added to the length of long bone diaphyses in just 10 weeks, com-
pared to an average of 20mm per year during the postnatal growth period.
Thus in principle the age at death of a fetus can be estimated accurately
from measurements of the size of its bones. There are several published
studies of bone length in fetuses of known gestational age (Scheuer and
Black, 2000a: 14) and data from these studies have been used to establish
growth standards for the assessment of age at death in forensic and archae-
ological material (e.g. Scheuer et al., 1980; Kosa, 1989; Sherwood et al.,
2000). These growth standards are influenced by the age structure of the
reference series from which they are calculated, and revised standards based
on Bayesian estimation methods are discussed below.
The timing of the initial appearance of primary and secondary ossifica-
tion centres is well established from radiographic studies of living children,
but these data are not particularly useful in archaeological age estimation.
Unlike the developing tooth crowns (which may be retained in their crypts
inside the jaw) ossification centres often do not survive burial and the
epiphyses in young children’s skeletons are infrequently recovered at exca-
vation. The times at which the various ossification centres coalesce and
the epiphyses fuse to the diaphyses have also been documented in mod-
ern populations, and these fusion events form the basis of maturational
schedules that are more pertinent to the requirements of age estimation in
subadult skeletons. It should be noted, however, that radiographic evidence
for fusion of ossification centres may differ systematically from fusion
assessed by visual inspection of bones. A comprehensive review of the tim-
ing of initial ossification and epiphyseal fusion in the human skeleton can
be found in Scheuer and Black (2000b).
102 demography in archaeology
The deciduous teeth commence calcification between 13 and 20 weeks
gestational age (Sunderland et al., 1987; Smith, 1991), but the crowns
of these teeth do not complete formation until the postnatal period.
Deciduous dental development proceeds faster in prenatal males than in
females (Scheuer and Black, 2000b: 152). Developing deciduous teeth are
observable in some archaeological fetal skeletons but they are often not
recovered at excavation, especially if the delicate bones of the develop-
ing mandible and maxilla are damaged. The permanent teeth commence
calcification at around the time of birth and their protracted develop-
ment provides a continuous series of chronological markers throughout
childhood and adolescence. In contrast to the prenatal formation of the
deciduous dentition, the development of the permanent teeth tends to be
more advanced in girls than in boys of the same age. Published standards
for the chronology of human deciduous and permanent tooth formation,
as with long bone diaphyseal length, are influenced by reference-series
age structure, but in addition the different statistical methods used for
assessing age of attainment of tooth formation stages contribute a further
source of variation to the standard chronologies (Smith, 1991). Methods
that are based on cumulative distribution functions provide the best basis
for determining the age of attainment of particular dental development
stages (Smith, 1991: 149).
The tooth crowns are formed within the jaw and then erupt through the
gum into the mouth while the tooth roots grow downwards into the jaw.
Stages of tooth crown and root development can be recognised either by
visual inspection or from a radiograph of the jaw with the developing teeth
inside it. Up to 14 discrete stages of tooth development can be recognised
radiographically from the initial appearance of calcification of the tooth
cusps through to closure of the root apex following eruption (Moorrees
et al., 1963a, 1963b). Alternatively the height of the crown of the developing
tooth can be measured and compared to standard growth curves calculated
from known-age samples (Liversidge and Molleson, 1999; Liversidge et al.,
1993). The resorption of the roots of the deciduous teeth prior to their
exfoliation can also be used as a chronological marker in children aged
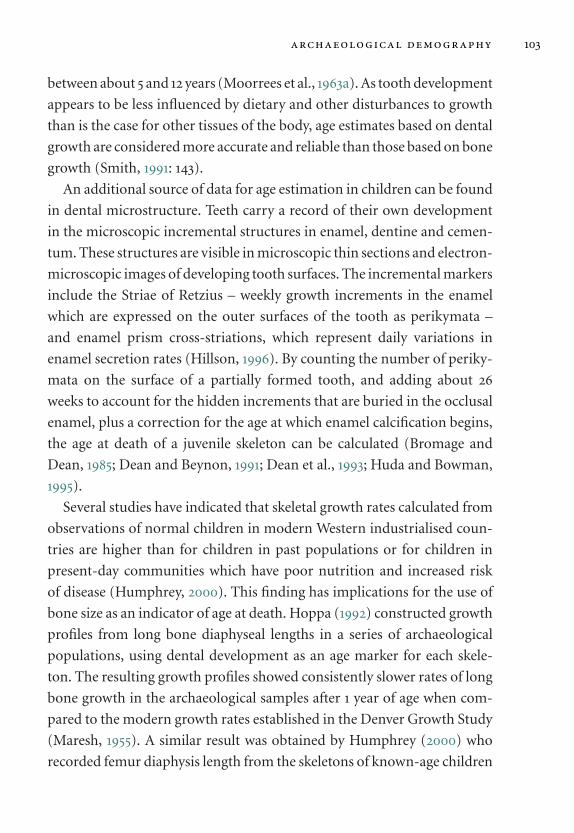
archaeological demography 103
between about 5 and 12 years (Moorrees et al., 1963a). As tooth development
appears to be less influenced by dietary and other disturbances to growth
than is the case for other tissues of the body, age estimates based on dental
growth are considered more accurate and reliable than those based on bone
growth (Smith, 1991: 143).
An additional source of data for age estimation in children can be found
in dental microstructure. Teeth carry a record of their own development
in the microscopic incremental structures in enamel, dentine and cemen-
tum. These structures are visible in microscopic thin sections and electron-
microscopic images of developing tooth surfaces. The incremental markers
include the Striae of Retzius – weekly growth increments in the enamel
which are expressed on the outer surfaces of the tooth as perikymata –
and enamel prism cross-striations, which represent daily variations in
enamel secretion rates (Hillson, 1996). By counting the number of periky-
mata on the surface of a partially formed tooth, and adding about 26
weeks to account for the hidden increments that are buried in the occlusal
enamel, plus a correction for the age at which enamel calcification begins,
the age at death of a juvenile skeleton can be calculated (Bromage and
Dean, 1985; Dean and Beynon, 1991; Dean et al., 1993; Huda and Bowman,
1995).
Several studies have indicated that skeletal growth rates calculated from
observations of normal children in modern Western industrialised coun-
tries are higher than for children in past populations or for children in
present-day communities which have poor nutrition and increased risk
of disease (Humphrey, 2000). This finding has implications for the use of
bone size as an indicator of age at death. Hoppa (1992) constructed growth
profiles from long bone diaphyseal lengths in a series of archaeological
populations, using dental development as an age marker for each skele-
ton. The resulting growth profiles showed consistently slower rates of long
bone growth in the archaeological samples after 1 year of age when com-
pared to the modern growth rates established in the Denver Growth Study
(Maresh, 1955). A similar result was obtained by Humphrey (2000) who
recorded femur diaphysis length from the skeletons of known-age children

104 demography in archaeology
50
100
150
200
250
300
350
400
450
0 1 2 3 4 5 6 7 8 9 10 11 12 13 14 15 16
Age (years)
Fem
ur
dia
ph
ysea
l len
gth
(m
m)
Figure 4.6 Growth profiles constructed from archaeological samples ofskeletal remains, compared to the modern Denver growth standard (Maresh,1955). The archaeological samples are prehistoric Europeans (square symbols:Piontek et al., 2001), Anglo-Saxons (diamond symbols: Hoppa, 1992) and18th/19th century Londoners (circular symbols: Humphrey, 2000). Age atdeath in the archaeological samples was taken from mortuary documentation(18th/19th century skeletons) or was estimated from dental development(prehistoric and Anglo-Saxon skeletons). The solid line and vertical barsrepresent the trendline and +/− two standard deviations for the Denvergrowth standard.
buried in eighteenth- and nineteenth-century church crypts in London (see
Figure 4.6). By the age of 15 months most of the London children were
more than 2 standard deviations below the age-specific mean bone length
established by the Denver Growth Study. However another nineteenth-
century sample of children’s skeletons studied by Saunders et al. (1993)
showed no evidence of a deficit in growth rate compared to modern growth
archaeological demography 105
standards. These results support the conclusion that there are real differ-
ences in growth rates among populations, and that the pattern of reduced
growth observed in some skeletal samples is not simply a consequence of
mortality bias (Saunders and Hoppa, 1993: 146).
4.3.3 Age estimation in adults: macroscopic methods
Overview
Age estimation from adult skeletal remains is one of the more difficult and
error-prone procedures in biological anthropology. When the individual
has reached adult size and growth ceases, age-related changes continue to
occur in the bones and the teeth, though these changes do not proceed with
the regularity and predictability of the developmental changes that occur
during the subadult years. Most adult-ageing methods depend on measur-
ing degenerative and reparative changes that reflect the cumulative effects
of wear and tear on the skeleton, and the biological processes involved may
be influenced by environmental factors such as diet, disease and physical
activity.
Age-related changes in adult bones and teeth involve several aspects of
gross morphology and microscopic structure. The final stages of skeletal
maturation continue into the early years of adulthood, with some epiphy-
ses remaining unfused into the third decade of life. Many of the joints
with restricted mobility, including the cranial sutures, the fibrous joints of
the vertebral column and some secondary cartilaginous joints such as the
pubic symphysis, show age-related changes throughout adult life in which
the bone surfaces adjacent to the joint tissues become remodelled or (in the
case of cranial sutures) fused. Progressive demineralisation of long bones
during adult life leads to expansion of the medullary cavity and thinning
of the bone cortex and trabeculae: these changes are most easily visualised
through radiography (Sorg et al., 1989). At the microscopic level age mark-
ers are provided by the accumulation of osteons in cortical bone (Robling
and Stout, 2000) and the development of root dentine transparency and
106 demography in archaeology
accumulation of layers of cementum on the roots of the teeth (Whittaker,
2000).
Pubic symphysis ageing
A series of progressive age-related changes occur at the pubic symphysis,
the fibrocartilaginous joint which connects the hip bones at the front of
the pelvis (Figure 4.7). These changes have been investigated in several sys-
tematic research studies (Todd, 1920; McKern and Stewart, 1957; Nemeskeri
et al., 1960; Meindl et al., 1985a; Brooks and Suchey, 1990) and they form
the basis of what is considered to be one of the more reliable means of esti-
mating age at death in adult skeletons (Suchey et al., 1986). In young adults
the surface of the bone underlying the pubic symphysis has a distinctive
appearance, with about 8 horizontal ridges and grooves crossing the sur-
face from front to back. Thus the symphyseal surface in a young adult has
a similar appearance to the bone surfaces that underlie the growth plate
between an unfused epiphysis and its matching diaphysis. In older individ-
uals the appearance of the pubic symphyseal surface is modified through
the normal stresses acting on the joint. The transverse ridges become less
well defined as the grooves become filled in with new bone. The front
(ventral) and rear (dorsal) margins of the joint surface also become thick-
ened, and the upper and lower margins of the face become delimited by
the fusion of ossific nodules. Eventually these margins join to form a com-
plete rim around the symphyseal face. In the oldest age categories the entire
surface becomes pitted and porous and it develops an uneven appearance.
(Figure 4.7).
Dental attrition
As soon as the permanent teeth have fully erupted into the mouth their
occlusal surfaces begin to wear down, partly from abrasive particles in
the diet but also from contact between the teeth in opposite jaws and
from the non-dietary usage of teeth as tools. The pattern and rate of
dental wear is influenced by cultural practices and by the incidence of dental
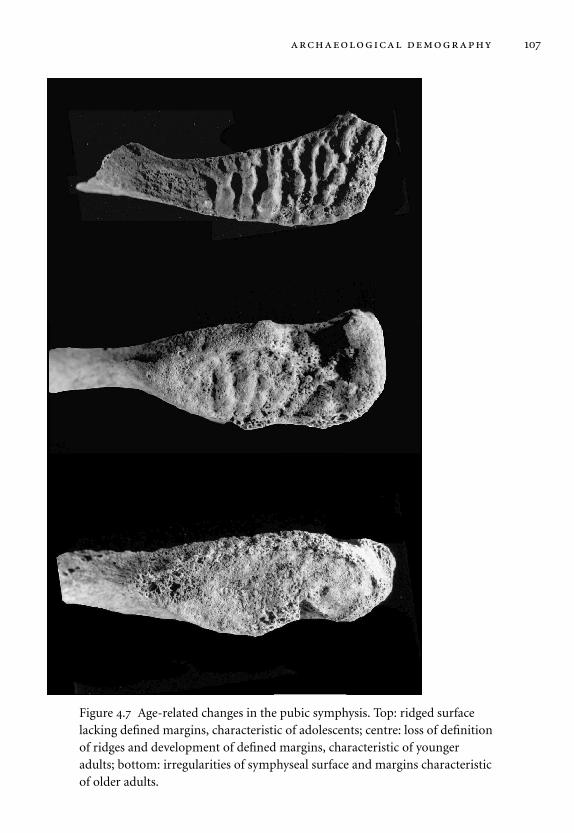
archaeological demography 107
Figure 4.7 Age-related changes in the pubic symphysis. Top: ridged surfacelacking defined margins, characteristic of adolescents; centre: loss of definitionof ridges and development of defined margins, characteristic of youngeradults; bottom: irregularities of symphyseal surface and margins characteristicof older adults.
108 demography in archaeology
disease, because the loss of teeth through decay, injury or gum disease may
increase the loading, and hence the rate of wear, on the remaining healthy
teeth. Although average rates of wear vary between populations, for a
particular individual the rate of dental wear can be assessed by establishing
the differential amount of wear along the molar tooth row (Miles, 1963,
2001). In an adult jaw, in which the permanent molars will have erupted
at intervals of about 6 years, there will be a difference or gradient of wear
between the first molar (greatest wear) and the third molar (least wear),
as shown in Figure 4.8. The amount of wear can be recorded either by
matching the teeth to a modal wear scheme or by measuring the area of
dentine exposure (Richards and Miller, 1991) or the amount of reduction
in crown height (Walker et al., 1991).
Other macroscopic ageing methods
Lovejoy et al. (1985) have described a system of adult-age estimation based
around changes that occur on the auricular surface of the hip bone which
forms the lateral surface of the sacro-iliac joint. The stages of their ageing
scheme are characterised by changes in the transverse organisation, gran-
ularity, porosity and outline of the joint surface. Although the sequence of
changes is not so readily apparent as in the pubic symphysis, one advantage
of this method is that the auricular surface is often much better preserved
than the pubic symphysis in archaeological skeletal remains. A revised
version of this ageing method that utilises quantitative scoring of the
component indicators has been published by Buckberry and Chamberlain
(2002).
The sutures between the individual cranial bones are distinct in young
adults, but gradually become obliterated in older individuals as the adjacent
bones fuse together. This process has long served as a basis for age estima-
tion, and the cranial vault bones are often well preserved in archaeological
contexts. In the cranial suture closure scheme of Meindl and Lovejoy (1985)
the degree of closure is recorded at five discrete locations on the supe-
rior part of the cranial vault and five locations on the lateral-anterior region
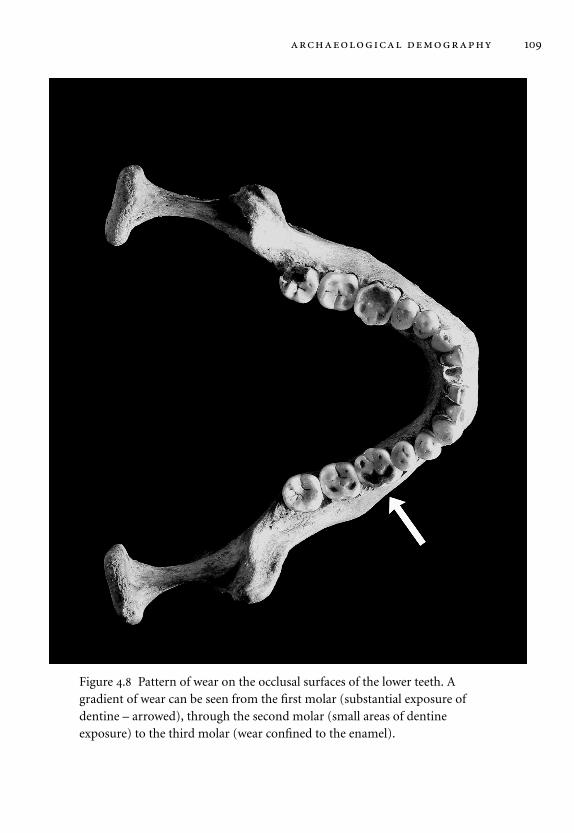
archaeological demography 109
Figure 4.8 Pattern of wear on the occlusal surfaces of the lower teeth. Agradient of wear can be seen from the first molar (substantial exposure ofdentine – arrowed), through the second molar (small areas of dentineexposure) to the third molar (wear confined to the enamel).

110 demography in archaeology
of the vault. Each location is given a score from 0 (open) to 4 (fully oblit-
erated), and the scores are summed across the anatomical sites in each
of the two regions to give two composite scores, which are converted to
age estimates via a table of values of mean ages established from skeletons
with known age at death. Cranial sutures provide a relatively inaccurate
age estimation over a rather narrow interval, as the age distribution for
a given score is large, and individuals younger than 30 years usually have
open sutures, while in individuals over 50 years of age the cranial sutures
are mainly closed.
Finally, some pathological skeletal conditions such as Paget’s disease of
bone and DISH are age progressive and are rarely seen in individuals under
about 40 years (Resnick, 2002). Degenerative arthritis and osteoporosis are
also more common in older adults, thus the presence of these conditions
can support an age estimate based on other evidence.
4.3.4 Age estimation in adults: microscopic methods
The search for reliable methods of estimating adult age at death has led to
the investigation of microscopic changes in bone and teeth that might occur
on a regular and progressive basis. Osteons are longitudinal vascular chan-
nels in compact bone that consist of a central Haversian canal surrounded
by concentric lamellae which are delimited on the outside by a reversal line.
They are generated by organised remodelling of bone, and the accumula-
tion of osteons in human compact bone provides a means of measuring
the age of the bone that contains them. Osteon counting to estimate age at
death was pioneered by Ellis Kerley (1965). The method involves preparing
a ground thin section of bone suitable for viewing by transmitted-light
microscopy. The number of intact and fragmentary osteons are counted
within a defined field of view, and the age is then calibrated from a standard
curve that has been derived from a sample of individuals of known age at
death.
Osteon accumulation in bone does not, however, proceed uniformly
with increasing age of the individual. The actual physiological age of
archaeological demography 111
unremodelled bone is nearly always less than the chronological age of the
individual, and the discrepancy depends on which location in the skeleton
is sampled. Also, the number of accumulated osteons eventually reaches
an asymptote as newly created osteons remove all observable traces of ear-
lier osteons. Various authors have published modified versions of Kerley’s
original method (reviewed in Robling and Stout, 2000).
Cementum growth is the basis of another microscopic method for esti-
mating age at death in adult skeletons. Cementum is a thin bone-like tissue
that forms a layer around the roots of the teeth, providing attachment for
the periodontal ligament that anchors each tooth to its socket in the jaw.
Cementum deposition commences as soon as the tooth has erupted, and
cementum continues to accumulate throughout life. In animal and human
populations which experience seasonal variations in diet cementum forms
alternating light and dark bands that are arranged concentrically as annu-
lations around the tooth root, in a manner analogous to the formation of
tree rings (Lieberman, 1994). The dark bands of cementum are deposited
in the reduced-growth season, which is usually the winter in temperate
latitudes. The growth increments can be counted and added to the age
of eruption of the tooth, so that the final age of the individual can be
estimated.
The use of cementum in ageing human skeletal remains dates back to
Gustafson (1950) who included overall cementum thickness (though not
counts of individual cementum layers) as a criterion in his multifactorial
dental-ageing method. The method has the potential to achieve very high
accuracy when applied to freshly extracted teeth (Wittwer-Backofen et al.,
2004), but there are difficulties in using the cementum annulation method
to estimate age at death in archaeological human skeletal remains due to
the thinness of the cementum layers (Hillson, 1996: 204) and their varying
degrees of preservation.
Another microscopic ageing method, also originally developed by
Gustafson, is that of root-dentine translucency. As ageing progresses the
microscopic tubules within the dentine of the tooth root become infilled
with secondary dentine. This process begins at the apex of the root and

112 demography in archaeology
progressively involves the rest of the tooth root in a cervical direction. The
tooth root is originally opaque because of refractive differences between
the crystals of the dentine and organic material within the dentine tubules.
When the tubules become mineralised the root gradually becomes trans-
parent to transmitted light. Relatively high correlation coefficients have
been reported between the extent of root translucency and chronological
age in modern clinical material (Solheim, 1989; Drusini et al., 1991).
4.4 bayesian and maximum likelihood approaches
to age estimation
4.4.1 General principles in estimating age from morphological indicators
The relationship between chronological age at death and the state of a
skeletal indicator is usually modelled and parameterised using a reference
series comprised of a large number of skeletons, each of whose age and
indicator state is known. Given knowledge of how chronological age and
the morphological indicator state covary within a representative sample
of a population, and by means of a uniformitarian assumption (that the
relationship between age and indicator is constant across samples and pop-
ulations) the age of any unknown or target skeleton can then be estimated
provided that its skeletal indicator state can be observed.
The determination of age at death from the state of the skeletal indicator
requires that the indicator state changes in some predictable fashion with
the chronological age of the individual. The relationship between indicator
state (I) and the individual’s age (A) can be modelled by a continuous linear
function, expressed algebraically as I = f(A) + e. According to this model
the state of the indicator is determined by the individual’s age A and by other
factors, the latter being subsumed here under a random error term (e). If
the function f(A) relating I to A is known, then A can be predicted from
I, though the accuracy of this prediction will depend on the magnitude
of the error e, which in biological examples is often substantial and may
increase with increasing age.

archaeological demography 113
Traditional anthropological methods of age estimation have often used
calculations of the central tendency of age for a particular indicator state
in a reference series, or have used regressions of age on indicator state
in the reference series (i.e. inverse regression), as a means of predicting
the age of a target specimen. Both of these approaches suffer from the
deficiency that the predicted age of the target specimen will be influenced
by the age structure of the reference series (Bocquet-Appel and Masset, 1982;
Konigsberg and Frankenberg, 1992; Konigsberg et al., 1997). In recent years
alternative procedures have been developed for inferring age from indicator
state that make use of Bayesian and maximum likelihood methods (Hoppa
and Vaupel, 2002), and these will be outlined in the following sections.
4.4.2 Bayes’ theorem and its application to age estimation
Konigsberg and Frankenberg (1992) pioneered the use of Bayesian statistical
inference as a way to render age estimation independent of reference-series
age structure. Bayes’ theorem provides a logical formulation of the proce-
dure by which current beliefs are revised in the light of new information
(Buck et al., 1996). The theorem states that given a parameter (in this case
age A) and some data (in this case the state of the morphological indicator
I) that are held to influence the probability of the parameter, then the pos-
terior probability of the parameter [p(A|I)] is equal to its prior probability
[p(A)prior] multiplied by the standardised likelihood of the data [p(I | A)]:
p(A | I) = p(I | A) × p(A)prior
∫[p(I | A) × p(A)prior]
Note that in this and subsequent equations, p(x | y) designates the condi-
tional probability of x, given y, and the denominator is equal to the integral
across all possible ages of the expression in parentheses. For datasets in
which the ages and indicator states are recorded as discrete categories, the
integral becomes simply a sum across the designated age categories.
In plain words, the probability [p(A|I)] of being a particular age A,
given a particular state of the indicator I, is equal to the probability
114 demography in archaeology
[p(I | A)] of possessing that indicator state, conditional on the individual
being age A, divided by the overall probability of possessing the indicator
state, multiplied by the prior probability [p(A)prior] of being age A. Note
also that this approach does not yield a single estimate of age for a given
indicator state, but rather it generates a posterior probability density distri-
bution across all possible ages (the prior probability of age is also expressed
as a probability distribution across all possible ages).
Derivation of prior probabilities of age
In Bayesian age estimation the prior probability of age [p(A)prior] serves
as a weighting function that influences the calculation of the posterior
probability of age, but unlike traditional regression-based approaches it is
the investigator who selects an appropriate set of prior probabilities rather
than allowing the age structure of the reference series to influence the
age-estimation procedure. There are several alternatives in arriving at a
decision on the most appropriate prior probability to use in any particular
case.
One procedure is to assume a uniform prior probability across all age
categories, a so-called ‘uninformative prior’ (Bocquet-Appel, 1986; Konigs-
berg and Frankenberg, 1992: 239). In this case Bayes’ theorem gives:
p(A | I) = p(I | A)
∫[p(I | A)]
(Konigsberg and Frankenberg, 1992: 239)
Under the assumption of uniform prior probability of age, the probability
of age given the state of the indicator [p(A|I)] is equal to the probability
of the indicator given the age category, divided by the unweighted integral
across all age categories of the conditional probabilities of the indicator
given age.
The uniform prior can be used when no other information is available
on which to judge the selection of a prior age distribution. However, in
most natural populations there is an uneven distribution of individuals
across age categories, and the age-specific probability of death also varies,

archaeological demography 115
and therefore the assumption of a uniform prior probability of age at death
in the target sample is often unwarranted. As an alternative to using a uni-
form prior probability of age, fixed model age structures taken from model
life tables, from historically documented age-at-death profiles or from haz-
ard functions can be used as a source of prior probabilities. The simplest
realistic age distributions to use in this context are the attritional mortality
distribution, the catastrophic mortality distribution, and an intermediate
profile consisting of a mixture of the attritional and catastrophic profiles.
Using a set of informative (i.e. determined, but non-uniform) priors,
the probability of age given the state of an indicator [p(A|I)] is:
p(A | I) = p(I | A) × p(A)model
∫[p(I | A) × p(A)model]
where the values of p(A)model are taken from the age structures or hazard
functions and the values of p(I|A) are, as usual, taken from the reference
series of known-age and indicator status.
A third alternative to using uniform priors or model priors is to esti-
mate the prior probabilities of age in the target sample from the distribu-
tion of target sample indicator states. Konigsberg and Frankenberg (1992)
described a maximum likelihood estimation method for deriving the prior
probabilities of age in this way, and the approach has since been formalised
as part of the ‘Rostock Manifesto’ for age estimation in palaeodemography
(Hoppa and Vaupel, 2002).
Prior probabilities of age derived from the target sample indicator states
are used in the same way as the model age structures were in the equation
above:
p(A | I) = p(I | A) × p(A)target
∫[p(I | A) × p(A)target]
where p(I | A) is taken from the reference-series and p(A)target is obtained
from the target sample indicator states by fitting an age distribution using
maximum likelihood methods (see Table 4.2).

116 demography in archaeology
Table 4.2 Options for the selection of prior probabilities of age in Bayesian
age estimation.
Prior probabilities Derivation Applications
Uniform p(A) = constant for allages
Individual skeletal remainswith no contextualinformation
Attritional Model life-table mortalityschedules/hazardmodels
Samples of normativeburials from communitycemeteries
Catastrophic Model life-tableliving-populationschedules
Homicides, mass disasters,human rights violations
Target SampleEstimation
MLE estimation for targetsample age indicators
‘Rostock Manifesto’ ageestimation
4.4.3 Evaluative studies of Bayesian methods in age estimation
Konigsberg and Frankenberg (1992) applied a form of Bayesian age-
estimation, with maximum likelihood estimation of target sample age
structure, to several morphological age indicators, including the McKern
and Stewart pubic-symphysis ageing system, cementum-annulation counts
in teeth and cranial-suture closure in the skulls of rhesus macaques. Each
of their target samples was generated synthetically by taking a model age
distribution and then assigning age-indicator states to the model age distri-
bution according to the likelihoods of indicator given age in the appropriate
reference series. Konigsberg and Frankenberg demonstrated that the age
distributions for the target samples could be recovered accurately even in
cases where the age distributions for the target sample and the reference
series differed substantially.
Lucy et al. (1996) used data from a reference series of teeth from known
age individuals in order to calculate posterior probabilities of age by
Bayesian methods. Prior probabilities of age were taken from the reference-
series age structure, and posterior probabilities of age were then calcu-
lated by combining the likelihoods of the separate age indicators. The
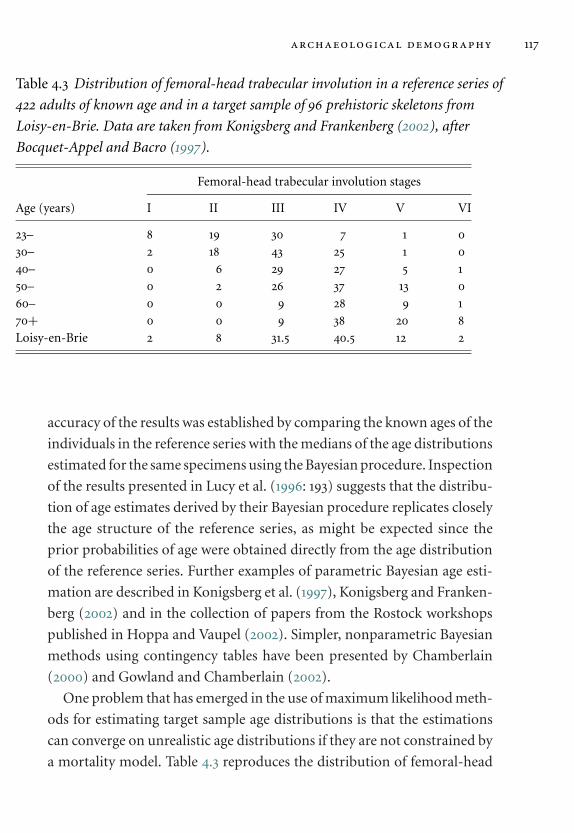
archaeological demography 117
Table 4.3 Distribution of femoral-head trabecular involution in a reference series of
422 adults of known age and in a target sample of 96 prehistoric skeletons from
Loisy-en-Brie. Data are taken from Konigsberg and Frankenberg (2002), after
Bocquet-Appel and Bacro (1997).
Femoral-head trabecular involution stages
Age (years) I II III IV V VI
23– 8 19 30 7 1 030– 2 18 43 25 1 040– 0 6 29 27 5 150– 0 2 26 37 13 060– 0 0 9 28 9 170+ 0 0 9 38 20 8Loisy-en-Brie 2 8 31.5 40.5 12 2
accuracy of the results was established by comparing the known ages of the
individuals in the reference series with the medians of the age distributions
estimated for the same specimens using the Bayesian procedure. Inspection
of the results presented in Lucy et al. (1996: 193) suggests that the distribu-
tion of age estimates derived by their Bayesian procedure replicates closely
the age structure of the reference series, as might be expected since the
prior probabilities of age were obtained directly from the age distribution
of the reference series. Further examples of parametric Bayesian age esti-
mation are described in Konigsberg et al. (1997), Konigsberg and Franken-
berg (2002) and in the collection of papers from the Rostock workshops
published in Hoppa and Vaupel (2002). Simpler, nonparametric Bayesian
methods using contingency tables have been presented by Chamberlain
(2000) and Gowland and Chamberlain (2002).
One problem that has emerged in the use of maximum likelihood meth-
ods for estimating target sample age distributions is that the estimations
can converge on unrealistic age distributions if they are not constrained by
a mortality model. Table 4.3 reproduces the distribution of femoral-head

118 demography in archaeology
0
5
10
15
20
25
30
35
40
23- 30- 40- 50- 60- 70+
Age (years)
Dea
ths
(%)
MLE (unconstrained)MLE (Gompertz)Uniform priorAttritional prior
Figure 4.9 Estimated distribution of age at death for Loisy-en-Brie, using anunconstrained Maximum Likelihood Estimation (MLE) method (diamonds),a Gompertz hazard model MLE method (triangles) and the nonparametricBayesian method of Chamberlain (2000) using uniform priors (circles) andattritional priors taken from Coale and Demeny ‘West’ female Level 2 modellife tables (squares) priors. The unconstrained MLE method results in a highlyirregular, multimodal mortality profile, whereas the other methods generatesmooth mortality profiles.
trabecular involution in a reference series of 422 adults of known age at
death and in a target sample of prehistoric skeletons from Loisy-en-Brie,
France. The data are taken from Konigsberg and Frankenberg (2002), based
on the dataset originally presented by Bocquet-Appel and Bacro (1997).
Konigsberg and Frankenberg (2002) calculated the age distribution in
the Loisy-en-Brie target sample using two maximum likelihood estimation
(MLE) methods: the first simply determined the proportions of individ-
uals in discrete age categories that maximised the likelihood of obtaining
the observed indicator states, while the second method fitted a two-
parameter Gompertz mortality model to achieve the same objective. The
results of these alternative methods are shown in Figure 4.9, alongside

archaeological demography 119
the age distributions obtained from the same data with the nonparametric
method of Chamberlain (2000), using uniform and attritional prior proba-
bilities of age. The unconstrained MLE method generates a highly irregular,
multimodal mortality profile which is a priori unlikely to represent the true
age structure of the prehistoric target sample. The best-fitting Gompertz
hazard model MLE, and the nonparametric calculations using uniform and
attritional priors, all generate relatively smooth mortality profiles which
differ markedly from the results obtained using the unconstrained MLE.
4.4.4 Alternative ways of modelling likelihoods: transition analysis and
latent traits
In Bayesian age estimation the likelihoods (i.e. the probabilities of possess-
ing a particular indicator state conditional on age, or p(I|A)) are usually
expressed either as a contingency table of discrete probabilities for each
age/indicator category, or as a series of continuous probability functions
against age for each indicator state. An alternative approach to determin-
ing these likelihoods is to model the timing of transitions between discrete
adjacent indicator states, so that it is the age-specific probability of hav-
ing completed the transition between one state and the following state
that forms the basis of the likelihood: this approach is termed ‘transi-
tion analysis’ (Boldsen et al., 2002; Konigsberg and Herrmann, 2002). The
approach assumes that changes between indicator states are unidirectional
and that individuals only change between immediately adjacent indicator
states at any given transition (Boldsen et al., 2002: 82), which are reasonable
assumptions for most skeletal indicators. In transition analysis the transi-
tion probabilities are modelled using either logistic or probit regression,
and the calculations can be adapted to consider multiple age indicators.
A ‘latent-trait’ approach has also been developed to account for the fact
that when estimating age from multiple indicators it is strictly incorrect to
assume that each indicator provides independent information about age.
Indicators are inevitably intercorrelated, not solely through their collec-
tive dependence on age, but also because individuals vary in their rates of
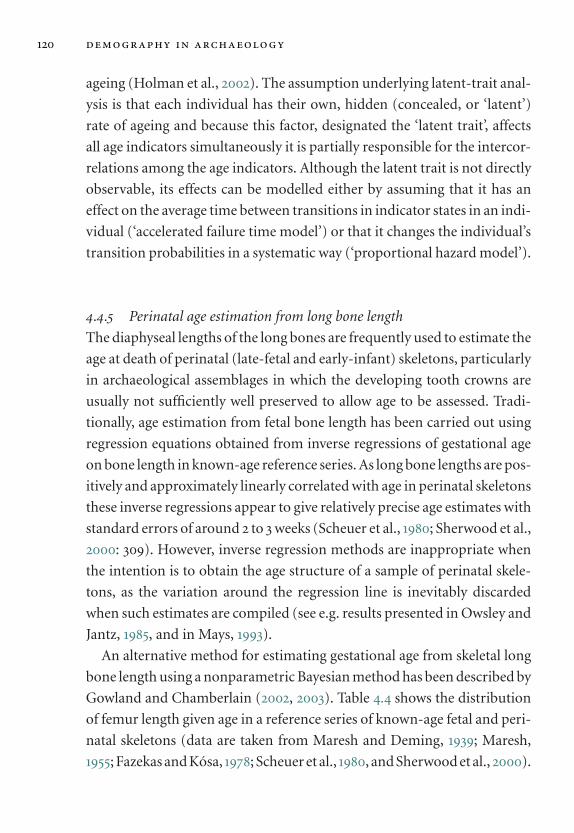
120 demography in archaeology
ageing (Holman et al., 2002). The assumption underlying latent-trait anal-
ysis is that each individual has their own, hidden (concealed, or ‘latent’)
rate of ageing and because this factor, designated the ‘latent trait’, affects
all age indicators simultaneously it is partially responsible for the intercor-
relations among the age indicators. Although the latent trait is not directly
observable, its effects can be modelled either by assuming that it has an
effect on the average time between transitions in indicator states in an indi-
vidual (‘accelerated failure time model’) or that it changes the individual’s
transition probabilities in a systematic way (‘proportional hazard model’).
4.4.5 Perinatal age estimation from long bone length
The diaphyseal lengths of the long bones are frequently used to estimate the
age at death of perinatal (late-fetal and early-infant) skeletons, particularly
in archaeological assemblages in which the developing tooth crowns are
usually not sufficiently well preserved to allow age to be assessed. Tradi-
tionally, age estimation from fetal bone length has been carried out using
regression equations obtained from inverse regressions of gestational age
on bone length in known-age reference series. As long bone lengths are pos-
itively and approximately linearly correlated with age in perinatal skeletons
these inverse regressions appear to give relatively precise age estimates with
standard errors of around 2 to 3 weeks (Scheuer et al., 1980; Sherwood et al.,
2000: 309). However, inverse regression methods are inappropriate when
the intention is to obtain the age structure of a sample of perinatal skele-
tons, as the variation around the regression line is inevitably discarded
when such estimates are compiled (see e.g. results presented in Owsley and
Jantz, 1985, and in Mays, 1993).
An alternative method for estimating gestational age from skeletal long
bone length using a nonparametric Bayesian method has been described by
Gowland and Chamberlain (2002, 2003). Table 4.4 shows the distribution
of femur length given age in a reference series of known-age fetal and peri-
natal skeletons (data are taken from Maresh and Deming, 1939; Maresh,
1955; Fazekas and Kosa, 1978; Scheuer et al., 1980, and Sherwood et al., 2000).
Tabl
e4.
4D
iaph
ysea
llen
gth
offe
mur
sin
know
n-ag
ein
divi
dual
s.T
hece
llsco
ntai
nth
enu
mbe
rof
indi
vidu
als
inth
e
refe
renc
ese
ries
sam
ples
wit
ha
give
nag
ean
dbo
nele
ngth
.Ges
tati
onal
ages
are
inw
eeks
post
-con
cept
ion,
leng
ths
are
in
mill
imet
res.
Fem
ur
diap
hyse
alle
ngt
h(m
m)
Age
10–
15–
20–
25–
30–
35–
40–
45–
50–
55–
60–
65–
70–
75–
80–
85–
90–
161
67
––
––
––
––
––
––
––
18–
–4
122
––
––
––
––
––
––
20–
24
414
2–
––
––
––
––
––
22–
–3
16
121
––
––
––
––
––
24–
––
11
119
1–
––
––
––
––
26–
––
––
37
61
––
––
––
––
28–
––
––
13
11–
––
––
––
–30
––
––
–1
–9
42
––
––
––
–32
––
––
––
––
36
–1
––
––
–34
––
––
––
––
–4
52
––
––
–36
––
––
––
––
––
42
2–
––
–38
––
––
––
––
––
22
73
2–
–40
––
––
––
––
––
–2
1028
7–
–42
––
––
––
––
––
–2
718
15–
–44
––
––
––
––
––
––
314
185
–46
––
––
––
––
––
––
–4
2035
1448
––
––
––
––
––
––
–1
710
15

Tabl
e4.
5Po
ster
ior
prob
abili
ties
ofge
stat
iona
lage
give
nfe
mur
leng
th,a
ssum
ing
unif
orm
prio
rpr
obab
iliti
esof
age.
Ges
tati
onal
ages
are
inw
eeks
post
-con
cept
ion,
leng
ths
are
inm
illim
etre
s.
Fem
urdi
aphy
seal
leng
th(m
m)
Age
10–
15–
20–
25–
30–
35–
40–
45–
50–
55–
60–
65–
70–
75–
80–
85–
90–
161.
0.8
5.5
0–
––
––
––
––
––
––
–18
––
.22
.73
.12
––
––
––
––
––
––
20–
.15
.15
.17
.56
.06
––
––
––
––
––
–22
––
.13
.05
.27
.38
.04
––
––
––
––
––
24–
––
.05
.05
.35
.37
.03
––
––
––
––
–26
––
––
–.1
3.3
9.2
1.1
0–
––
––
––
–28
––
––
–.0
5.1
9.4
3–
––
––
––
––
30–
––
––
.05
–.3
3.4
1.1
1–
––
––
––
32–
––
––
––
–.4
9.5
5–
.13
––
––
–34
––
––
––
––
–.3
3.4
2.2
4–
––
––
36–
––
––
––
––
–.4
6.3
3.2
2–
––
–38
––
––
––
––
––
.12
.17
.38
.11
.08
––
40–
––
––
––
––
––
.06
.19
.36
.10
––
42–
––
––
––
––
––
.06
.15
.26
.23
––
44–
––
––
––
––
––
–.0
7.2
1.2
9.1
4–
46–
––
––
––
––
––
––
.03
.17
.53
.30
48–
––
––
––
––
––
––
.02
.14
.33
.70
archaeological demography 123
Although Mays (2003: 1698) has criticised this reference dataset for its
alleged high dispersion of femur length, this assertion is unwarranted as
the average standard deviation of femur length controlling for age in the
combined data from these studies is in fact less than 5mm (which is the
size of the length categories employed in the analysis). Using these data
the posterior probabilities of gestational age, given femur length, were
calculated in a contingency table using the Bayesian procedure described
in Section 4.4.2 above.
These posterior probabilities (Table 4.5) were then used to estimate age
at death in a sample of 284 perinatal infant skeletons from Romano-British
archaeological sites (Gowland and Chamberlain, 2002). Figure 4.10 shows
that when compared to the inverse regression method, the Bayesian esti-
mation method using uniform priors generated a broader distribution of
ages at death with less evidence of the perinatal deaths being clustered
sharply in the interval 38 to 40 gestational weeks. Gowland and Chamber-
lain (2003) present tables for estimating gestational age from the lengths of
all major long bones, using either a uniform prior probability of age or a
model prior probability distribution based on the age structure of a large
sample of recorded perinatal deaths.
4.4.6 Age estimation and catastrophic mortality profiles
Attritional mortality can be considered the default mortality pattern for
most populations under most circumstances, whereas catastrophic mor-
tality in which the risk of death is high in all age categories is unusual,
because a population subjected to repeated catastrophic episodes would
rapidly decline to extinction. As discussed in Section 3.7 above, mortality
in epidemics and in violent conflicts can generate catastrophic mortality
profiles in which the age pattern of deaths mirrors the age structure of the
living population. Catastrophic profiles have been recovered from skele-
tal assemblages from mass graves associated with outbreaks of bubonic
plague (Margerison and Knusel, 2002; Signoli et al., 2002; Dutour et al.,
2003; Gowland and Chamberlain, 2005). Figure 4.11 shows the distribution
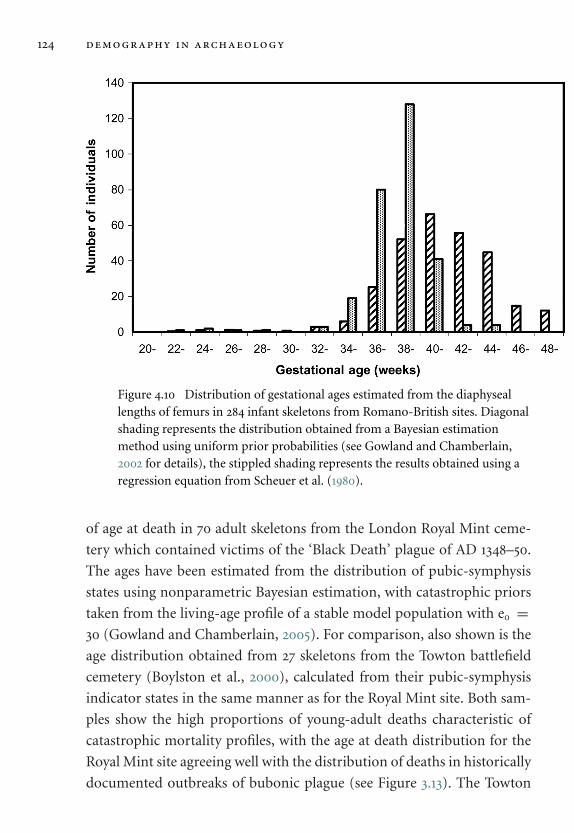
124 demography in archaeology
Figure 4.10 Distribution of gestational ages estimated from the diaphyseallengths of femurs in 284 infant skeletons from Romano-British sites. Diagonalshading represents the distribution obtained from a Bayesian estimationmethod using uniform prior probabilities (see Gowland and Chamberlain,2002 for details), the stippled shading represents the results obtained using aregression equation from Scheuer et al. (1980).
of age at death in 70 adult skeletons from the London Royal Mint ceme-
tery which contained victims of the ‘Black Death’ plague of AD 1348–50.
The ages have been estimated from the distribution of pubic-symphysis
states using nonparametric Bayesian estimation, with catastrophic priors
taken from the living-age profile of a stable model population with e0 =30 (Gowland and Chamberlain, 2005). For comparison, also shown is the
age distribution obtained from 27 skeletons from the Towton battlefield
cemetery (Boylston et al., 2000), calculated from their pubic-symphysis
indicator states in the same manner as for the Royal Mint site. Both sam-
ples show the high proportions of young-adult deaths characteristic of
catastrophic mortality profiles, with the age at death distribution for the
Royal Mint site agreeing well with the distribution of deaths in historically
documented outbreaks of bubonic plague (see Figure 3.13). The Towton

archaeological demography 125
0
5
10
15
20
25
30
35
15Ð24 25Ð34 35Ð44 45Ð54 55Ð64 65Ð74 75+
Age (years)
Ad
ult
dea
ths
(%)
Catastrophic e0 = 30
Attritional e0 = 30
Royal Mint
Towton
Figure 4.11 Distribution of adult ages at death for two catastrophic skeletalassemblages: the Royal Mint site cemetery (dashed line) and the Towton massgrave (dotted line). Age distributions were estimated from observations of thepubic symphysis using a nonparametric Bayesian estimation proceduredescribed by Gowland and Chamberlain (2005). The distributions of ages ofliving individuals (catastrophic profile) and deaths (attritional profile) in amodel population with average life expectancy at birth of 30 years (e0 = 30)are also shown.
sample has been interpreted as a group of combatants, and nearly all of
the skeletons exhibited fatal perimortem trauma, but the presence of a
substantial proportion of older adults in the sample is more characteristic
of non-combatant mortality (see Figure 3.14).
Boylston et al. (2000: 53) have suggested that combatants in medieval
warfare may have been older than in modern conflicts, and further inves-
tigation of this possibility through analysis of other battlefield skeletal
assemblages is desirable.
4.4.7 Prospects for the future
The Rostock workshops on palaeodemography, held in 1999 and 2000
at the Max Planck Institute for Demographic Research in Rostock,
Germany, achieved a consensus on procedures for estimating age at death

126 demography in archaeology
from skeletal remains and the ‘Rostock Manifesto’ advocated the appli-
cation of Bayesian and maximum likelihood methods to problems of
palaeodemographic estimation (Hoppa and Vaupel, 2002). It is likely that
it will take a number of years for the recommendations of the Rostock
Manifesto to be implemented as it requires all traditional age estimation
techniques to be reappraised and there are still relatively few accessible
skeletal collections of individuals of known-age at death.
4.5 estimation of population numbers from
archaeological data
4.5.1 House sizes and floor areas
Methods for estimating population size from the floor area of dwelling
space have been reviewed by Hassan (1981) and by Kolb (1985). A widely
cited study is by Naroll (1962), who analysed 18 globally distributed seden-
tary societies and proposed an approximate average ratio of 10m2 of roofed
space per person, a value that has since achieved such wide currency that it
has been termed ‘Naroll’s Constant’ (Brown, 1987). The estimates of space
occupancy per person for individual settlements in Naroll’s dataset varied
between very wide extremes, but the notion that there may be some modal
value for residential space use by villagers has been supported by similar,
though generally lower, figures derived from several ethnographic studies.
These include average values of 7–10m2 of roofed area per person for Iranian
rural village households (Le Blanc, 1971; Kramer, 1982), 6.5m2 per person for
lowland South American aboriginal villages (Curet, 1998), 6.1m2 per person
for Mesoamerican agricultural households (Kolb, 1985) and 5.3m2 per per-
son in New World multifamily dwellings (Casselberry, 1974). As might be
expected, considerably smaller estimates of 2–4m2 per person have been cal-
culated for barrack room living space in military installations (Kardulias,
1992). In applying these kinds of formulae to archaeological evidence it
is important to distinguish habitation space from storage and livestock-
housing space, and to take into account the proportion of buildings or
rooms that were occupied at any given time. Stratigraphic information
archaeological demography 127
about the relative ages of houses is essential as a settlement may be occu-
pied for a longer time period than the use-life of any of its constituent
dwellings.
An alternative approach to estimating population numbers from set-
tlement data is simply to multiply the number of identified households
by an estimate of average household size (Schacht, 1981). As outlined in
Section 3.2.3 above, ethnographic estimates of household size in agricul-
tural communities converge on a narrow range of values, and by assuming
a reasonable central value for the numbers of individuals per household
(e.g. a median value of 5) some of the difficulties associated with accurate
measurements of dwelling space can be mitigated.
4.5.2 Settlement sizes
In archaeological field investigations it is often difficult or impossible to
determine the area of dwelling space, but the overall spatial extent of a
settlement can usually be discerned in a straightforward manner from
the spatial distribution of cultural material. The estimation of population
size from settlement area is not straightforward as there appears to be an
allometric relationship between population and settlement size, with the
allometric exponent varying for different classes of settlement (Wiessner,
1974). Wiessner proposed the formula:
Area = constant × (population)b
where the exponent takes the values b = 2 for open camps, b = 1 for
enclosed or defended villages and b = 2/3 for urban communities.
For open settlements the exponent of 2 indicates that settlement area
increases as the square of population size: according to Wiessner (1974) this
is because dwellings in open camps tend to be organised circumferentially
around a central area, so that doubling the number of dwellings doubles
the diameter of the village and increases the settlement area by a factor of
four. In enclosed villages the areal density is expected to remain constant
and settlement area then increases in direct proportion to the size of the
128 demography in archaeology
population. In urban communities population density tends to increase
with increasing population size, leading to an exponent of less than one.
The hypothesis that the settlement area of hunter-gatherer camps
increases in proportion to the square of population size has been cor-
roborated by an extensive comparative study of Australian aboriginal
settlements which showed that maximum residential density in these
hunter-gatherer communities decreased markedly as the size of the com-
munity increased (Fletcher, 1990). For village-, town- and city-scale set-
tlements, unfortunately, there is no single constant that can be employed
to transform settlement area into population size, as there appear to be
wide inter-regional variations in the spatial density of human settlement
(Kramer, 1982: 163). Typical modal densities derived from ethnographic
data are around 30 persons/ha for highland agricultural villages in Mexico
(De Roche, 1983); 100 to 150 persons/ha for nucleated Iranian villages
(Kramer, 1982; Sumner, 1989); 130 persons/ha for pre-industrial urban cen-
tres (Storey, 1997) and 160 persons/ha for lowland South American aborig-
inal villages (Curet, 1998). Much higher estimated densities, ranging from
about 250 to 1200 persons per hectare, have been derived from analyses of
housing floor plans in some ancient cities (Postgate, 1994; Storey, 1997). A
regular relationship between the area of Roman military camps and the size
of the forces that occupied them has been proposed by Richardson (2000),
and the calculated density of 127 persons/ha for these camps is close to the
value derived above for non-industrial settlements.
4.5.3 Site catchments and resource utilisation
In site catchment analysis the spatial extent of an area utilised by a com-
munity is delineated and characterised in terms of its economic potential
(Vita-Finzi and Higgs, 1970; Dennell, 1980). By determining the amount
and nature of resources available to the occupants of a site, and by assum-
ing self-sufficiency and isolation from adjacent communities, an estimate
of site carrying capacity (maximum sustainable-population size) can be
arrived at. The approach is perhaps better suited to modelling the use of
natural resources by hunter-gatherer communities, who fit the criteria of

archaeological demography 129
isolation and self-sufficiency better than do most pastoral or agricultural
communities (Dennell, 1980: 7–8), but a detailed example of the modelling
of carrying capacity in prehistoric agricultural communities of Eastern Ari-
zona has been presented by Zubrow (1975). Some other examples of the use
of site catchment analysis in the investigation of demographic hypotheses
are cited by Roper (1979: 134).
Quantitative measures of the production and consumption of resources,
including amounts of food residues, quantities of building materials, arte-
fact counts and volumes of storage pits, can also be used as proxies for
population size (Hassan, 1981; Schact, 1981). As with estimates of popula-
tion size from settlement evidence, the analysis of resource utilisation can
be useful for determining long-term rates of population growth, which is
an essential prerequisite for the accurate application of stable population
models in palaeodemography. However, even when it can be established
that population numbers are proportional to the amounts of material
remains, it is not easy to convert material evidence of resource usage into
actual population numbers, and this approach is therefore better suited to
the analysis of change through time of relative rather than absolute popu-
lation size. Schiffer (1976: 59) formally proposed a ‘discard equation’ that
allows the size of a community to be inferred from the volume of dis-
carded artefacts, but this requires knowledge of artefact use-life as well as
the quantity of undiscarded artefacts in use per person at any given time
during the period of site occupation (Gallivan, 2002).
Ashton and Lewis (2002) used estimates of the rate of stone arte-
fact accumulation in river terrace gravels in the Middle Thames Valley,
England, as a proxy for human population density in the Lower and Middle
Palaeolithic. By mapping the areas of the gravel deposits and the historical
extent of quarrying and urban development they were able to control for
variations in preservation and artefact collection intensity, and their results
showed a marked decline in human activity (expressed as artefacts per unit
area per year) between Oxygen Isotope Stage 10 (350,000 years ago) and
the start of Oxygen Isotope Stage 5 (140,000 years ago).
Marsden and West (1992) used a range of proxies for the scale of
human activity in order to monitor changes in population size in Roman

130 demography in archaeology
Figure 4.12 Proxy archaeological data indicating relative changes inpopulation size in Roman London between AD 50 and AD 400 (data takenfrom Marsden and West, 1992). The numbers of dated layers in rubbish pits,dated ceramic sherds, numbers of wells and total weights of animal bonesfrom dated contexts all indicate a decline in human activity after 150 AD.
London from AD 50 to AD 400 (Figure 4.12). Assuming equal probabil-
ities of discovery and recording of remains from different time periods,
they assessed the number of excavated rubbish pits, the number of dat-
able ceramic types (‘spot dates’), the number of wells (as an indicator
of demand for water supply) and the weight of animal bones from three
successive time periods within the period of interest. Across all classes of
resource there was evidence for a decline in human activity after AD 150,
interpreted as a reduction in the size of the urban population after that
date. Marsden and West provided some control over the possibility of dif-
ferential survival of material from different time periods by also assessing
residual Roman pottery recovered from much later depositional contexts:
the chronological distribution of residual pottery sherds confirmed that the
volume of discard was higher in the earlier Roman than in the later Roman
periods.

archaeological demography 131
Figure 4.13 Distribution of 14C dates obtained on human bone fromMesolithic and early Neolithic archaeological sites in Britain between 9000and 3500 calibrated years BC. The data points are calibrated dates on singleskeletons plus and minus two standard errors (the data are taken fromBlockley, 2005). The frequency of dates declines after 6500 BC, coinciding withthe isolation of Britain from continental Europe by rising sea levels, and thereis a gap in the distribution of dates between 5600 and 4600 BC. The transitionfrom foraging to farming in the early Neolithic occurs in Britain around 4000BC and is accompanied by a marked increase in the frequency of dates,reflecting the much greater number of excavated Neolithic burial sitescompared to those of Mesolithic foragers.
4.5.4 Monitoring population size from radiocarbon dating distributions
Radiocarbon (14C) determinations are used frequently by archaeologists
to establish the dates of stratigraphic deposits and to obtain direct dates
on artefacts and animal and human remains. In many regions of the world
there exist extensive datasets of 14C dates and these provide a new resource
for modelling past population processes (Figure 4.13). Subject to certain
132 demography in archaeology
important assumptions, the frequencies of dates on cultural material and
deposits can serve as a proxy for human activity (Rick, 1987), and disconti-
nuities in 14C distributions can be interpreted as reflecting changes through
time in the distributions and densities of human populations. The accu-
mulation of large databases of radiocarbon determinations, together with
the increased precision and smaller sample requirements of accelerator
mass spectrometry (AMS) dating, has widened the opportunity to utilise14C data in palaeodemographic analysis.
This approach has been used to investigate the contraction and extinc-
tion of the last Neanderthal population in Europe (Pettitt, 1999; Bocquet-
Appel and Demars, 2000), the re-colonisation of Europe by humans after
the last glacial maximum (Housley et al., 1997; Gamble et al., 2004; Fort
et al., 2004), the initial human colonisation of the Americas (Anderson and
Faught, 2000) and mid-Holocene demographic extinction and population
replacement on the southeastern Pampas of Argentina (Barrientos and
Perez, 2005). One interesting finding that has emerged from the study of
Pleistocene colonisation events in Europe based on 14C distributions is that
the rate of advance of Palaeolithic hunters was relatively rapid and com-
parable with rates established for the later spread of Neolithic agriculture
in the same continent (Housley et al., 1997; Fort et al., 2004).

5
Evolutionary and geneticpalaeodemography
5.1 age and sex structure in animal populations
5.1.1 Natural animal populations
Demographic profiles and life tables have been obtained for many animal
species, using data obtained either from the age structure of stable and
stationary animal populations or from recorded ages at death of repre-
sentative samples of animal mortality. Many vertebrate species resemble
humans in possessing a two-component age-specific attritional mortality
pattern, with a juvenile phase where initially high mortality rates decline
rapidly as the animal matures and a post-juvenile phase where mortality
rates either stabilise or increase slowly but progressively with age (Deevey,
1947; Caughley, 1966: 916, see also Figure 5.1).
In most mammals the sex ratio at birth averages close to unity, though
in some species there may be considerable variance in the sex ratio of off-
spring, especially in polygynous animals (Trivers and Willard, 1973). Mor-
tality rates can also differ substantially between the sexes, with male animals
often experiencing higher age-specific mortality as a result of reproductive
competition and exclusion of subordinate males from access to resources.
As a result the adult sex ratio in wild-animal populations is frequently
biased towards females (Collier and White, 1976).
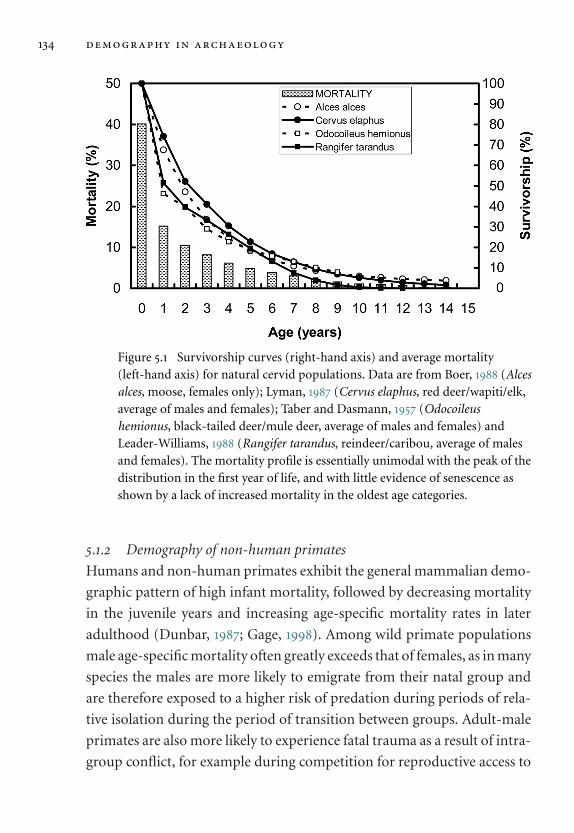
134 demography in archaeology
Figure 5.1 Survivorship curves (right-hand axis) and average mortality(left-hand axis) for natural cervid populations. Data are from Boer, 1988 (Alcesalces, moose, females only); Lyman, 1987 (Cervus elaphus, red deer/wapiti/elk,average of males and females); Taber and Dasmann, 1957 (Odocoileushemionus, black-tailed deer/mule deer, average of males and females) andLeader-Williams, 1988 (Rangifer tarandus, reindeer/caribou, average of malesand females). The mortality profile is essentially unimodal with the peak of thedistribution in the first year of life, and with little evidence of senescence asshown by a lack of increased mortality in the oldest age categories.
5.1.2 Demography of non-human primates
Humans and non-human primates exhibit the general mammalian demo-
graphic pattern of high infant mortality, followed by decreasing mortality
in the juvenile years and increasing age-specific mortality rates in later
adulthood (Dunbar, 1987; Gage, 1998). Among wild primate populations
male age-specific mortality often greatly exceeds that of females, as in many
species the males are more likely to emigrate from their natal group and
are therefore exposed to a higher risk of predation during periods of rela-
tive isolation during the period of transition between groups. Adult-male
primates are also more likely to experience fatal trauma as a result of intra-
group conflict, for example during competition for reproductive access to

evolutionary and genetic palaeodemography 135
females. Mortality rates tend to be lower in captive groups of primates than
in wild populations of the same species (Gage, 1998).
Rates of physical and behavioural development and maturation vary
markedly between the major taxonomic groups within primates, as shown
by comparative studies of skeletal growth (Smith, 1989; Smith et al., 1994;
Watts, 1990) and by the documentation in captive and wild primates of
life-history variables such as gestation length, age at weaning, age of sexual
maturity and longevity (Harvey et al., 1987). As a broad generalisation,
maturation times are approximately doubled in great apes compared to
Old-World monkeys, and are increased again by a factor of 1.5 between
great apes and modern humans. For example, mothers’ age at first birth is
typically 4 to 6 years in cercopithecine monkeys, 12 years in the chimpanzee
Pan troglodytes, and around 18 years in modern humans (Harvey et al., 1987:
184–185). As expected on theoretical grounds (Cole, 1954), variations in life-
history characteristics and developmental timing have an appreciable effect
on rates of mortality and fertility in primate populations.
Figure 5.2 shows survivorship curves derived from published model
life tables calculated for cercopithecine monkeys (sexes combined), Pan
troglodytes females and modern Homo sapiens females. The cercopithecine
survivorship curve summarises the mortality pattern observed in eight
large populations of Macaca and Papio, one of which was a wild population
while the others were either provisioned or fully captive groups (Gage
and Dyke, 1988, 1993). Gage and Dyke fitted a three-component (five-
parameter) Siler mortality model to each of the cercopithecine datasets,
and the means of the parameter values were then used to generate a set of
age-specific mortality rates from which an instantaneous life-table model
was constructed. The average life expectancy at birth (e0) for this life table
is 15.8 years. The Pan troglodytes model life table was calculated by similar
methods using data from three major captive-breeding colonies (Dyke
et al., 1995). The average life expectancy at birth for the captive chimpanzee
populations is 29 years, a value that is much larger than average female life
expectancy in wild chimpanzee populations (Hill et al., 2001) but is close to
the average female life expectancy for wild orang-utans (Wich et al., 2004).

136 demography in archaeology
0.0
0.1
0.2
0.3
0.4
0.5
0.6
0.7
0.8
0.9
1.0
0 10 20 30 40 50 60 70 80 90 100
Age (years)
Su
rviv
ors
hip
Old-World monkeys
Chimpanzees
Humans (West-11)
Figure 5.2 Survivorship curves derived from published model life tablescalculated for cercopithecine monkeys (sexes combined), Pan troglodytesfemales and modern Homo sapiens females. Data are taken from Gage andDyke (1988, 1993); Dyke et al. (1995) and Coale and Demeny (1983).
The Homo sapiens survivorship curve is taken from the Level 11 ‘West’ model
life table for females, in which average life expectancy at birth is 45 years
(Coale and Demeny, 1983). This model life table has a level of mortality
that is intermediate within the modern human range of variation, and it
was chosen because it represents a population with average life expectancy
approximately three times that of cercopithecines and 1.5 times greater than
chimpanzees.
These separate survivorship curves can be transformed from a strictly
chronological scale to a common developmental scale by converting the
ages of the non-human primates to their biological equivalent in human
years. The cercopithecine age scales were therefore multiplied by 3, and
those of Pan troglodytes by 1.5, to achieve comparability with the human
data (Figure 5.3). When compared in this fashion it can be seen that when
differences in rates of maturation and longevity are controlled for, the

evolutionary and genetic palaeodemography 137
0.0
0.1
0.2
0.3
0.4
0.5
0.6
0.7
0.8
0.9
1.0
0 10 20 30 40 50 60 70 80 90 100 110
Age (human years equivalent)
Su
rviv
ors
hip
Old-World monkeysChimpanzeesHumans (West-11)
Figure 5.3 Survivorship curves for cercopithecine monkeys, Pan troglodytesfemales and modern Homo sapiens females, compared to a commondevelopmental scale (data sources as in Figure 5.2).
mortality experience of cercopithecines and chimpanzees is broadly com-
parable with that of a human population experiencing intermediate levels
of mortality. The non-human primate survivorship curves appear slightly
‘flatter’ (i.e. less inflected) than the human curve, suggesting that age-
specific mortality rates in the non-human primates may be relatively lower
at very young and very old ages compared to the pattern in the ‘West’ model
human population.
5.2 demography of fossil hominids
5.2.1 Maturation times and longevity in fossil hominids
The human fossil record extends back 6 million years to a time around
the cladogenetic event when the evolutionary lineages leading to living
African apes (gorillas, chimpanzees and bonobos) divided from the lineage
leading to modern Homo sapiens. Human palaeontologists now recognise
138 demography in archaeology
about fifteen fossil species within the human evolutionary lineage (Collard,
2003), and these are referred to here collectively by the term ‘hominids’, an
expression that is being replaced in some quarters by the term ‘hominins’ in
recognition of the fact that ancestral human species cluster taxonomically
at the tribal rather than the family level. Hominids are characterised by a
suite of unique morphological, physiological and behavioural adaptations
that include bipedal posture and locomotion, encephalisation, enhanced
manual dexterity and changes in life-history variables.
Despite previous suggestions that the relatively rapid growth rates
demonstrated by anthropoids might also characterise fossil hominid
species (Weidenreich, 1939), the first studies of the demography of fossil
hominids assumed that rates of maturation in fossil hominids resembled
those of modern Homo sapiens (McKinley, 1971; Mann, 1975). Since that
time considerable evidence has accumulated in favour of the hypothesis
that both tooth crown-formation times and tooth-eruption times were
accelerated in fossil hominids when compared to modern Homo sapi-
ens (Beynon and Dean, 1988; Smith and Tompkins, 1995; Dean et al.,
2001; Ramirez Rozzi and Bermudez de Castro, 2004). Chronological data
for anterior dental-crown formation, based on counts of perikymata,
and data for the eruption of the first permanent molar in four hominid
species are shown in Table 5.1. These results show that fossil species
of hominids matured in about two thirds of the time taken for mod-
ern humans to reach maturity, a developmental pattern that is closer
to that observed in great apes such as the chimpanzee. If demographic
parameters such as longevity and age-specific survivorship closely track
rates of maturation in primates, then developmental schedules poten-
tially provide a useful source of demographic data for extinct hominid
species.
There has been some speculation concerning the selective advantages of
delayed maturation in humans. Evolutionary theory predicts that individ-
uals usually benefit from reproducing with a minimum of delay, so that
under normal circumstances there should be selective pressure against
delayed maturation. Suggested explanations for delayed maturation fall
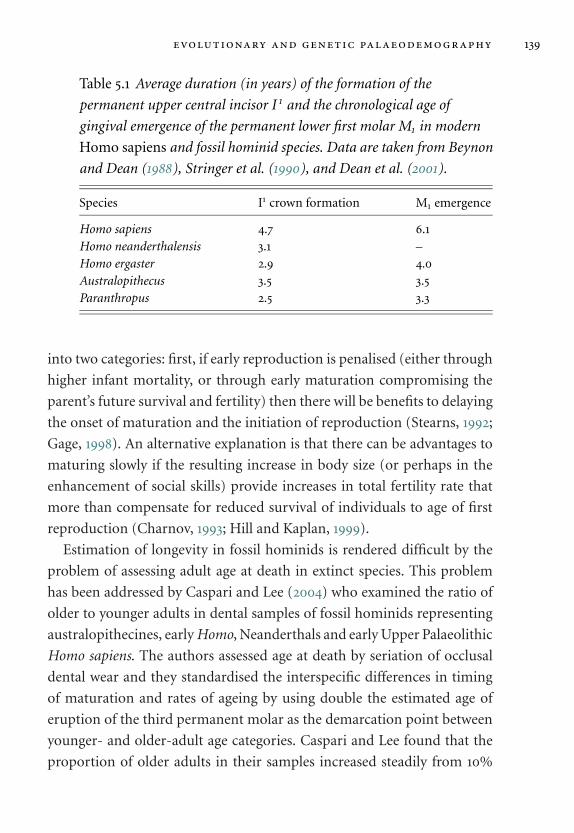
evolutionary and genetic palaeodemography 139
Table 5.1 Average duration (in years) of the formation of the
permanent upper central incisor I 1 and the chronological age of
gingival emergence of the permanent lower first molar M1 in modern
Homo sapiens and fossil hominid species. Data are taken from Beynon
and Dean (1988), Stringer et al. (1990), and Dean et al. (2001).
Species I1 crown formation M1 emergence
Homo sapiens 4.7 6.1Homo neanderthalensis 3.1 –Homo ergaster 2.9 4.0Australopithecus 3.5 3.5Paranthropus 2.5 3.3
into two categories: first, if early reproduction is penalised (either through
higher infant mortality, or through early maturation compromising the
parent’s future survival and fertility) then there will be benefits to delaying
the onset of maturation and the initiation of reproduction (Stearns, 1992;
Gage, 1998). An alternative explanation is that there can be advantages to
maturing slowly if the resulting increase in body size (or perhaps in the
enhancement of social skills) provide increases in total fertility rate that
more than compensate for reduced survival of individuals to age of first
reproduction (Charnov, 1993; Hill and Kaplan, 1999).
Estimation of longevity in fossil hominids is rendered difficult by the
problem of assessing adult age at death in extinct species. This problem
has been addressed by Caspari and Lee (2004) who examined the ratio of
older to younger adults in dental samples of fossil hominids representing
australopithecines, early Homo, Neanderthals and early Upper Palaeolithic
Homo sapiens. The authors assessed age at death by seriation of occlusal
dental wear and they standardised the interspecific differences in timing
of maturation and rates of ageing by using double the estimated age of
eruption of the third permanent molar as the demarcation point between
younger- and older-adult age categories. Caspari and Lee found that the
proportion of older adults in their samples increased steadily from 10%
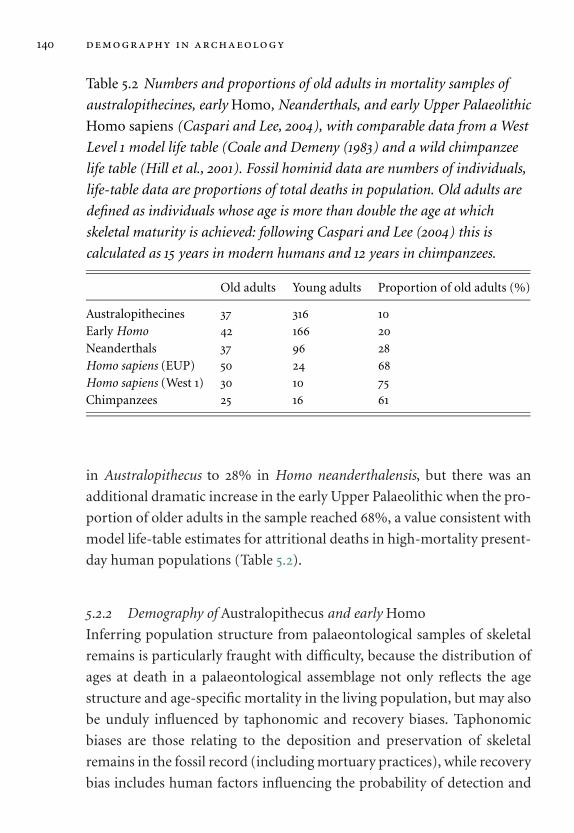
140 demography in archaeology
Table 5.2 Numbers and proportions of old adults in mortality samples of
australopithecines, early Homo, Neanderthals, and early Upper Palaeolithic
Homo sapiens (Caspari and Lee, 2004), with comparable data from a West
Level 1 model life table (Coale and Demeny (1983) and a wild chimpanzee
life table (Hill et al., 2001). Fossil hominid data are numbers of individuals,
life-table data are proportions of total deaths in population. Old adults are
defined as individuals whose age is more than double the age at which
skeletal maturity is achieved: following Caspari and Lee (2004) this is
calculated as 15 years in modern humans and 12 years in chimpanzees.
Old adults Young adults Proportion of old adults (%)
Australopithecines 37 316 10Early Homo 42 166 20Neanderthals 37 96 28Homo sapiens (EUP) 50 24 68Homo sapiens (West 1) 30 10 75Chimpanzees 25 16 61
in Australopithecus to 28% in Homo neanderthalensis, but there was an
additional dramatic increase in the early Upper Palaeolithic when the pro-
portion of older adults in the sample reached 68%, a value consistent with
model life-table estimates for attritional deaths in high-mortality present-
day human populations (Table 5.2).
5.2.2 Demography of Australopithecus and early Homo
Inferring population structure from palaeontological samples of skeletal
remains is particularly fraught with difficulty, because the distribution of
ages at death in a palaeontological assemblage not only reflects the age
structure and age-specific mortality in the living population, but may also
be unduly influenced by taphonomic and recovery biases. Taphonomic
biases are those relating to the deposition and preservation of skeletal
remains in the fossil record (including mortuary practices), while recovery
bias includes human factors influencing the probability of detection and
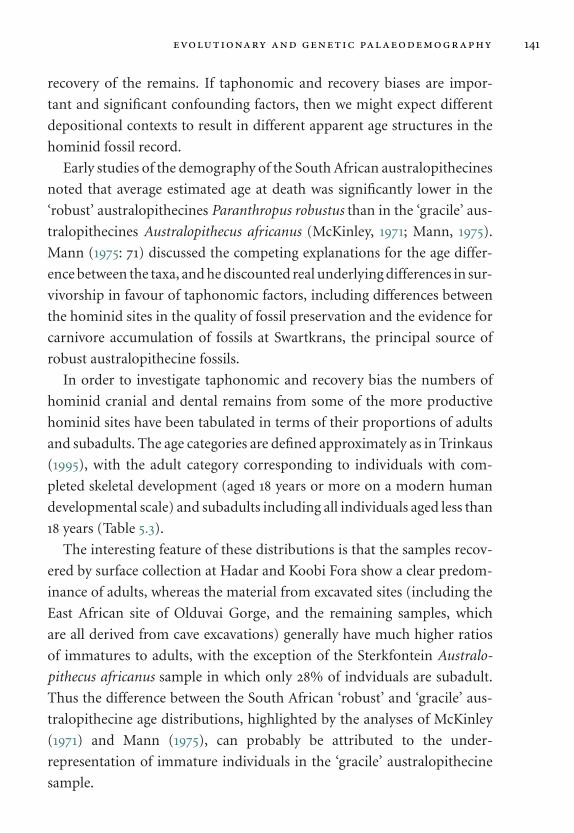
evolutionary and genetic palaeodemography 141
recovery of the remains. If taphonomic and recovery biases are impor-
tant and significant confounding factors, then we might expect different
depositional contexts to result in different apparent age structures in the
hominid fossil record.
Early studies of the demography of the South African australopithecines
noted that average estimated age at death was significantly lower in the
‘robust’ australopithecines Paranthropus robustus than in the ‘gracile’ aus-
tralopithecines Australopithecus africanus (McKinley, 1971; Mann, 1975).
Mann (1975: 71) discussed the competing explanations for the age differ-
ence between the taxa, and he discounted real underlying differences in sur-
vivorship in favour of taphonomic factors, including differences between
the hominid sites in the quality of fossil preservation and the evidence for
carnivore accumulation of fossils at Swartkrans, the principal source of
robust australopithecine fossils.
In order to investigate taphonomic and recovery bias the numbers of
hominid cranial and dental remains from some of the more productive
hominid sites have been tabulated in terms of their proportions of adults
and subadults. The age categories are defined approximately as in Trinkaus
(1995), with the adult category corresponding to individuals with com-
pleted skeletal development (aged 18 years or more on a modern human
developmental scale) and subadults including all individuals aged less than
18 years (Table 5.3).
The interesting feature of these distributions is that the samples recov-
ered by surface collection at Hadar and Koobi Fora show a clear predom-
inance of adults, whereas the material from excavated sites (including the
East African site of Olduvai Gorge, and the remaining samples, which
are all derived from cave excavations) generally have much higher ratios
of immatures to adults, with the exception of the Sterkfontein Australo-
pithecus africanus sample in which only 28% of indviduals are subadult.
Thus the difference between the South African ‘robust’ and ‘gracile’ aus-
tralopithecine age distributions, highlighted by the analyses of McKinley
(1971) and Mann (1975), can probably be attributed to the under-
representation of immature individuals in the ‘gracile’ australopithecine
sample.
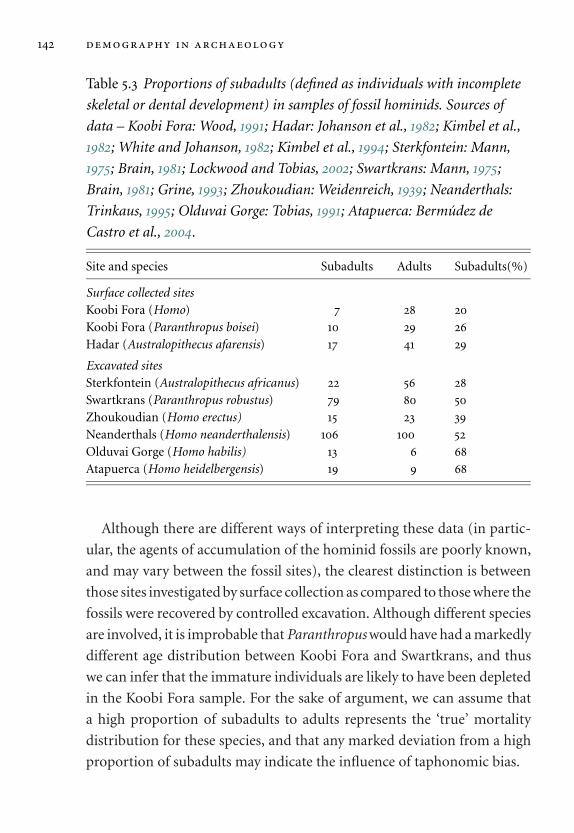
142 demography in archaeology
Table 5.3 Proportions of subadults (defined as individuals with incomplete
skeletal or dental development) in samples of fossil hominids. Sources of
data – Koobi Fora: Wood, 1991; Hadar: Johanson et al., 1982; Kimbel et al.,
1982; White and Johanson, 1982; Kimbel et al., 1994; Sterkfontein: Mann,
1975; Brain, 1981; Lockwood and Tobias, 2002; Swartkrans: Mann, 1975;
Brain, 1981; Grine, 1993; Zhoukoudian: Weidenreich, 1939; Neanderthals:
Trinkaus, 1995; Olduvai Gorge: Tobias, 1991; Atapuerca: Bermudez de
Castro et al., 2004.
Site and species Subadults Adults Subadults(%)
Surface collected sitesKoobi Fora (Homo) 7 28 20Koobi Fora (Paranthropus boisei) 10 29 26Hadar (Australopithecus afarensis) 17 41 29
Excavated sitesSterkfontein (Australopithecus africanus) 22 56 28Swartkrans (Paranthropus robustus) 79 80 50Zhoukoudian (Homo erectus) 15 23 39Neanderthals (Homo neanderthalensis) 106 100 52Olduvai Gorge (Homo habilis) 13 6 68Atapuerca (Homo heidelbergensis) 19 9 68
Although there are different ways of interpreting these data (in partic-
ular, the agents of accumulation of the hominid fossils are poorly known,
and may vary between the fossil sites), the clearest distinction is between
those sites investigated by surface collection as compared to those where the
fossils were recovered by controlled excavation. Although different species
are involved, it is improbable that Paranthropus would have had a markedly
different age distribution between Koobi Fora and Swartkrans, and thus
we can infer that the immature individuals are likely to have been depleted
in the Koobi Fora sample. For the sake of argument, we can assume that
a high proportion of subadults to adults represents the ‘true’ mortality
distribution for these species, and that any marked deviation from a high
proportion of subadults may indicate the influence of taphonomic bias.

evolutionary and genetic palaeodemography 143
Table 5.4 Distributions of age at death in Homo heidelbergensis
(Bermudez de Castro et al., 2004) and Homo neanderthalensis
(Trinkaus, 1995).
Homo heidelbergensis Homo neanderthalensisCategory(range in years) N % N %
Neonate (<1) 0 0 10 4Child (1–4) 1 4 29 14Juvenile (5–9) 0 0 30 15Adolescent (10–19) 18 64 37 18young adult (20–39) 6 21 80 39old adult (40+) 3∗ 11 20 10
∗ includes those individuals listed as aged 35+ in Bermudez de Castro et al.(2004)
5.2.3 Demography of Homo heidelbergensis and Homo neanderthalensis
The Middle Pleistocene site of Sima de los Huesos in the Sierra de Atapuerca
(Burgos, Spain) has yielded an exceptionally large and well-preserved
sample of hominid remains which are all assigned to the species Homo hei-
delbergensis. The Atapuerca-SH sample has been studied repeatedly from a
demographic perspective (Bermudez de Castro and Dıez, 1995; Bermudez
de Castro and Nicolas, 1997; Bocquet-Appel and Arsuaga, 1999; Bermudez
de Castro et al., 2004). In the most recent of these analyses the mandibular,
maxillary and dental remains from Atapuerca-SH were assigned to 28 sep-
arate individuals, and the ages at death of the fossils were estimated using
modern human standards of age estimation (Bermudez de Castro et al.,
2004). The Atapuerca-SH sample is dominated by the remains of adoles-
cents (aged 10–19 years, in terms of modern human skeletal development)
and young adults (20–39 years), and there are few individuals assigned
to the oldest-adult age category (Table 5.4, Figure 5.4). It is also notable
that there is just one child under the age of 10 years in the Atapuerca-SH
sample, in contrast to the age distribution in a pooled sample of Homo
neanderthalensis where about one third of the sample are less than 10 years
old (Trinkaus, 1995).
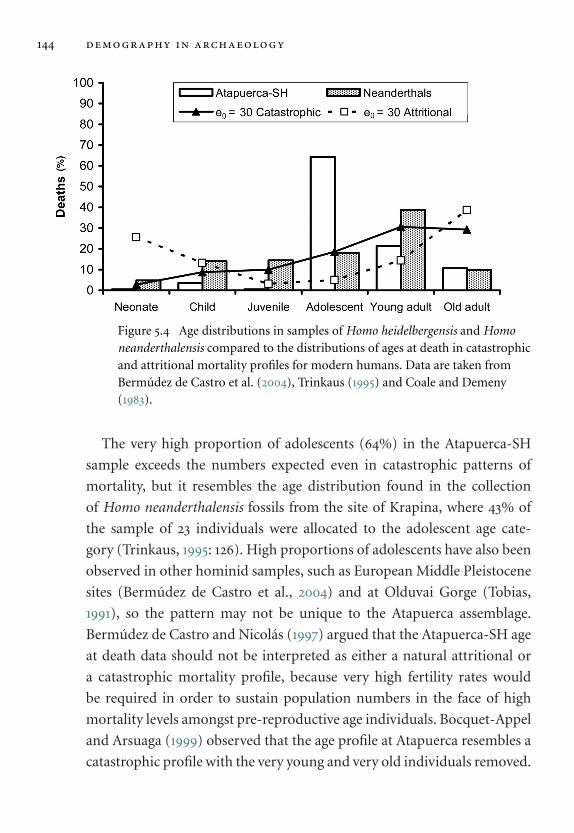
144 demography in archaeology
Figure 5.4 Age distributions in samples of Homo heidelbergensis and Homoneanderthalensis compared to the distributions of ages at death in catastrophicand attritional mortality profiles for modern humans. Data are taken fromBermudez de Castro et al. (2004), Trinkaus (1995) and Coale and Demeny(1983).
The very high proportion of adolescents (64%) in the Atapuerca-SH
sample exceeds the numbers expected even in catastrophic patterns of
mortality, but it resembles the age distribution found in the collection
of Homo neanderthalensis fossils from the site of Krapina, where 43% of
the sample of 23 individuals were allocated to the adolescent age cate-
gory (Trinkaus, 1995: 126). High proportions of adolescents have also been
observed in other hominid samples, such as European Middle Pleistocene
sites (Bermudez de Castro et al., 2004) and at Olduvai Gorge (Tobias,
1991), so the pattern may not be unique to the Atapuerca assemblage.
Bermudez de Castro and Nicolas (1997) argued that the Atapuerca-SH age
at death data should not be interpreted as either a natural attritional or
a catastrophic mortality profile, because very high fertility rates would
be required in order to sustain population numbers in the face of high
mortality levels amongst pre-reproductive age individuals. Bocquet-Appel
and Arsuaga (1999) observed that the age profile at Atapuerca resembles a
catastrophic profile with the very young and very old individuals removed.
evolutionary and genetic palaeodemography 145
In consequence they suggest that the Atapuerca sample may have included
primarily the more mobile members of a hominid community who were
seeking to escape from a regional environmental crisis, and under this
scenario the remains of the very young and the elderly from the hominid
community might be expected to be located at a distance from the known
Sima de los Huesos fossil site.
Trinkaus (1995) collated data on age at death for a sample of 206 Nean-
derthals (Homo neanderthalensis) from 77 sites in Europe and Asia. Age
estimation was carried out using modern human standards of skeletal
development and, for adult individuals, a combination of bone histological
ageing, joint-surface metamorphosis and the Miles method for estimating
age from dental wear. When compared to historically documented modern
human attritional mortality profiles the Neanderthal sample shows under-
representation of young children and old adults, and an excess of deaths
in the adolescent and young-adult age categories (Table 5.4, Figure 5.4).
Weighting of the data, so that each site makes an equal contribution to the
total, had only a marginal effect in reducing the high level of adolescent
mortality. Trinkaus invoked catastrophic mortality as a partial explanation
of the high level of young-adult mortality in the Neanderthal dataset, and
he explained the dearth of old-adult deaths as reflecting exclusion of this
age category from the rock shelter and cave sites where the majority of
Neanderthal remains have been recovered.
The predominance of young adults in the samples of Homo heidelber-
gensis and Homo neanderthalensis is quite unlike the pattern of attritional
mortality in documented modern human populations and in chimpanzees,
where it is usual for 40% or more of the adults to survive into the old-adult
age category. The Homo neanderthalensis age profile provides a reasonably
good match to a modern human catastrophic mortality profile, especially
if we allow for some systematic underestimation of adult age at death in
the hominid samples (Figure 5.4). Both Trinkaus (1995) and Bermudez de
Castro et al. (2004) argued that the techniques that they used for estimating
age at death do not substantially underestimate the ages of adult individ-
uals, but, as we have seen earlier, the traditional anthropological ageing
146 demography in archaeology
methods do not generate realistic adult-age distributions for human pop-
ulations and they generally give systematic underestimates of age when
applied to older adult individuals.
A further difficulty with these datasets is that the subadult ages have been
estimated by applying modern human standards of skeletal development,
but as shown in Section 5.2.1 above it is probable that all fossil hominid
species had accelerated dental maturation compared to modern humans.
Allowing for this difference in dental maturation would have the effect of
reducing all subadult chronological age estimates by approximately one
third, although the relative distribution of individuals across developmen-
tal categories would remain the same.
5.3 human genetic palaeodemography
5.3.1 Genetic studies of present-day populations
With continuing advances in molecular biological methods there are
increasing opportunities to investigate the demographic histories of pop-
ulations through genetic analysis. In studies of present-day populations
the geographical variations in the frequency of classical genetic markers
(mainly variants in the structural genes encoded by nuclear DNA) have
been used to reconstruct large-scale prehistoric population movements
(Sokal et al., 1991; Cavalli-Sforza et al., 1994). Also useful in this regard
are haploid genetic loci, including the maternally inherited mitochondrial
DNA and the male-specific non-recombining parts of the Y chromosome
(Donnelly and Tavare, 1995; Harpending et al., 1993). These parts of the
genome can be used to define distinct genetic lineages, with the divergence
between the lineages being proportional to the time since the lineages
shared a most recent common genetic ancestor. This allows the investigator
to reconstruct the phylogenetic history of a group of related populations,
and the divergence between populations may correspond to major demo-
graphic events such as large-scale migrations and colonisations (Goldstein
and Chikhi, 2002).
evolutionary and genetic palaeodemography 147
Periods of rapid population expansion also leave a distinctive genetic
signature, for example in the distribution of pairwise differences between
the DNA sequences of individuals in a population and in the geometric
patterns of lineage relationships (Harpending et al., 1998; Rogers, 1995;
Richards et al., 1996; Forster, 2004). In a population that has undergone a
substantial expansion of numbers through intrinsic growth (i.e. through
fertility exceeding mortality) most of the genetic mutations in the popu-
lation will have occurred post-expansion, in separate genetic lineages, and
each mutation will thus be present in just one or two copies in the popu-
lation. A pairwise comparison between the DNA sequences of individuals
will show the effects of this in a narrow distribution of differences, and a
phylogeny of genetic lineages will exhibit a ‘starlike’ topology in which the
lineages radiate from a common ancestral sequence (Harpending et al.,
1993; Rogers, 1995). In a population that is stationary or has increased only
at a slow rate the proportion of shared ancestral mutations will be greater
and the spread of pairwise sequence differences will be broader and often
multimodal.
Comparisons of diversity in mitochondrial DNA and Y-chromosome
DNA in the same populations have revealed a difference in the average
transgenerational migration rate of the sexes, with the females having a
history of much higher migration rates than males (Seielstad et al., 1998).
This finding, which has been demonstrated separately among both African
and European modern population samples, has been linked to the historical
predominance of patrilocality among human populations, especially since
the adoption of agriculture when communities became more settled and
some lineages established their tenure on land through male-line inher-
itance. In patrilocal societies the women, rather than the men, migrate
transgenerationally and, given equivalent effective population sizes, the
sex-specific between-population genetic diversity is reduced in females
relative to the diversity in the males of the same population.
Studies of genetic variation in the Y chromosome have revealed the male
genetic contribution made by immigration from continental Europe into
the British Isles during the early medieval period. These studies show close
148 demography in archaeology
genetic affinities between the present-day populations of central England
and northwest Holland, Germany and Denmark, consistent with large-
scale immigration into England during the last 2,000 years (Weale et al.,
2002). More detailed Y-chromosome studies suggest that the Danish and
German migrants primarily settled in central and northern England and
mainland Scotland, rather than in the regions of southern England that are
traditionally viewed as the Anglo-Saxon heartland (Capelli et al., 2003).
5.3.2 Genetic studies of ancient populations
Studies of ancient DNA extracted from archaeological human remains have
the potential to corroborate or refute hypotheses about population history,
but the difficulty and expense of ancient-DNA analysis ensures that most
published projects have had relatively small sample sizes, limiting the extent
to which inferences can be made concerning ancient population genetics.
Some of the most important ancient DNA results have been obtained from
the skeletal remains of the extinct hominid species Homo neanderthalensis.
Following the initial report of the recovery of mitochondrial DNA from the
type specimen of Homo neanderthalensis from Feldhofer Cave, Germany
(Krings et al., 1997), additional mtDNA sequences have been obtained
from Neanderthal fossils from sites in Russia (Ovchinnikov et al., 2000),
Croatia (Krings et al., 2000; Serre et al., 2004), Belgium (Serre et al., 2004),
France (Serre et al., 2004; Beauval et al., 2005) and Spain (Laluela-Fox et al.,
2005). All of the Neanderthal mtDNA sequences recovered in these analyses
were different from mtDNA types present in living human populations,
and comparisons of the mtDNA sequences suggest that the Homo sapiens
and Homo neanderthalensis genetic lineages diverged between 365,000 and
853,000 years ago (Ovchinnikov et al., 2000).
An alternative source of genetic information about past populations is
provided by morphometric analyses of skeletal remains, although the size,
shape and structure of bones and teeth is only partly determined by the
genome. A widely used measure of genetic diversity is FST, the propor-
tion of total genetic variance that is attributable to differences between
evolutionary and genetic palaeodemography 149
separate population groups. FST increases with increasing time since the
initial divergence between the population groups, and increases faster
when effective population sizes are small, but is decreased in proportion
to the rate of migration between the groups because migration has the
effect of reducing between-group genetic variance. FST is usually calculated
directly from gene-frequency data (Reynolds et al., 1983; Cavalli-Sforza et
al., 1994) but good proxies to FST can also be derived from craniometric data
(Relethford, 1994) and from the frequencies of discrete skeletal mor-
phological traits that have high heritabilities (Tyrrell and Chamberlain,
1998).


6
Demography and disease
6.1 disease in archaeological populations
6.1.1 Concepts and evidence of disease
Disease, illness and sickness
A contemporary dictionary definition of disease is a disorder or want of
health in mind or body: an ailment: cause of pain (Schwarz et al., 1990). This
broad but succinct definition summarises the widely held modern Western
view that there is both a biological dimension to disease – the underlying
organic disorder that perturbs the normal or optimal functioning of the
individual – and a social or psychological dimension – the recognition
and expression of the disorder as a discomforting or socially disvalued
condition. From the theoretical perspective of medical anthropology, the
term ‘disease’ is usually applied strictly to the biomedical abnormality
or pathology, while ‘illness’ and ‘sickness’ are variably used to designate
the individual consciousness and social recognition of the presence of an
underlying disease condition (Young, 1982; McElroy and Townsend, 1996).
These distinctions are important in understanding the occurrence and
spread of diseases in populations, because individual and social responses
to disease play a part in determining the overall frequencies of disease in
communities and in the manner in which a society manages the burden of
disease amongst its members.
152 demography in archaeology
In biomedical research that is directed primarily towards the under-
standing, control and treatment of ill-health, diseases are usually distin-
guished and classified according to their causative agents. These agents
include genetic abnormalities, parasitic and opportunistic infections
by microbial and invertebrate organisms, failures in physiological and
metabolic functions and external environmental agents including nutri-
tion, climate and physical injury or trauma (Underwood, 2004). In his-
torical and archaeological studies of ancient diseases these classifications
are often supplemented by considering specific organ systems that are
affected by disease, such as the synovial joints in the case of degenera-
tive joint disease, and the teeth and surrounding structures in the case
of dental disease. As the soft tissues of the body are rarely preserved in
archaeological contexts, those diseases which leave a macroscopic, micro-
scopic or chemical signature in the bones and the teeth have been the main
focus of palaeopathological research (Ortner and Putschar, 1985; Roberts
and Manchester, 1995; Aufderheide and Rodrıguez Martın, 1998; Schultz,
2001). Increasingly researchers are turning to the methods of biomolecular
archaeology in order to detect disease organisms that only affect the soft
tissues of the body and therefore may not be evident from studies of human
skeletal remains.
Epidemiological concepts
Epidemiologists utilise two principal measures of disease frequency: inci-
dence, which quantifies the rate of appearance of new cases of disease in a
population during a specified period of time, and prevalence, which mea-
sures the proportion of individuals in a population possessing the disease
at a given moment of time (Waldron, 1994). The applicability of these
alternative measures depends on the duration of the disease process. For
acute diseases of short duration, that terminate either in the death or the
recovery of the individual, measures of incidence are most appropriate,
whereas for chronic and irreversible disease conditions the prevalence of
the disease is the more suitable measure of disease frequency. In the study

demography and disease 153
of non-fatal infectious diseases which are transmitted amongst members
of a population, further distinctions are made between the frequencies of
susceptible, infected and immune (i.e. recovered infected) individuals, as
the relative proportions of these numbers are key determinants of the pat-
terns of disease transmission in the population (Anderson and May, 1991).
Epidemiological data are usually stratified by age, and often by sex, because
susceptibilities to both chronic and acute diseases are often strongly affected
by these parameters (Coggon et al., 2003: 17).
Sources of evidence for diseases in past populations
Evidence relating to the occurrence and frequency of diseases in past pop-
ulations includes descriptive historical materials such as texts, inscrip-
tions and artistic representations; abnormalities observed in human
skeletal remains and preserved soft tissues; biomolecular evidence in the
form of host and pathogen genetic material, as well as biomolecules gener-
ated in immune responses; perturbations to demographic structures due
to disease-related mortality; and artefactual evidence for medical and sur-
gical treatment. Some of these sources of evidence point only to the phys-
ical presence of a disorder in an individual, and we often have no way of
knowing how or even whether the disorder was perceived as an illness or
recognised as an instance of sickness by the individual or by their com-
munity. Social perceptions of disease are complex and changeable, as was
seen in the case of leprosy in the past and is true of present-day conditions
such as physical disability, HIV infection and mental disease. Documents,
iconography and evidence of treatment provide some indication of the
social perception of disease in the past, while inferences can also be made
about the way in which socioeconomic circumstances and living condi-
tions, including hygiene, access to health care, wealth, diet, interpersonal
violence and so on may have contributed to the incidence of disease in a
population.
While macroscopic and microscopic studies of human skeletal remains
provide a principal source of data about ancient-human disease, genetic
154 demography in archaeology
evidence for the origins and history of disease obtained from ancient tis-
sue samples is an increasingly important additional source of information
(Zink et al., 2002). As the genomes of present-day humans and pathogens
are catalogued and explored in ever greater detail, many genes that deter-
mine or influence disease expression in humans are being identified, and
patterns of evolution and diversification of pathogens are being recon-
structed. In some cases coalescent theory can be used to estimate the date of
origin and timing of expansion of particular species and strains of pathogen
(e.g. Brosch et al., 2002).
6.1.2 Infectious and epidemic diseases
Skeletal evidence
Palaeopathologists classify bone infections into specific infections, in which
a particular disease organism causes a specific and therefore diagnostic
response in the bone, and non-specific infections which produce gen-
eralised signs of inflammatory reaction to infection such as periostitis
(inflammation of the periosteal membrane on the external cortical surface
of the bone) and osteomyelitis (subcortical bone infection). In periosti-
tis, inflammation of the periosteum leads to a form of hyperostosis with
a characteristic thin porous layer of woven bone being deposited on the
periosteal surface of the cortex of the affected skeletal element. After the
infection has disappeared this periosteal deposit may become remodelled
and eventually indiscernible as it becomes integrated with the bone cortex.
In osteomyelitis, pus-forming bacteria invade the medullary cavity, caus-
ing destruction and cavitation of the surrounding bone which responds by
forming a thick deposit of irregular new bone around the site of infection
(see Figure 6.1). Often the infection is drained by a small hole or sinus
that connects the inside of the bone to the surrounding soft tissues. When
infectious pathogenic organisms are introduced into bone they are often
persistent, especially if foreign material is present, as may occur after a
penetrating injury or a compound fracture (Underwood, 2004: 713).
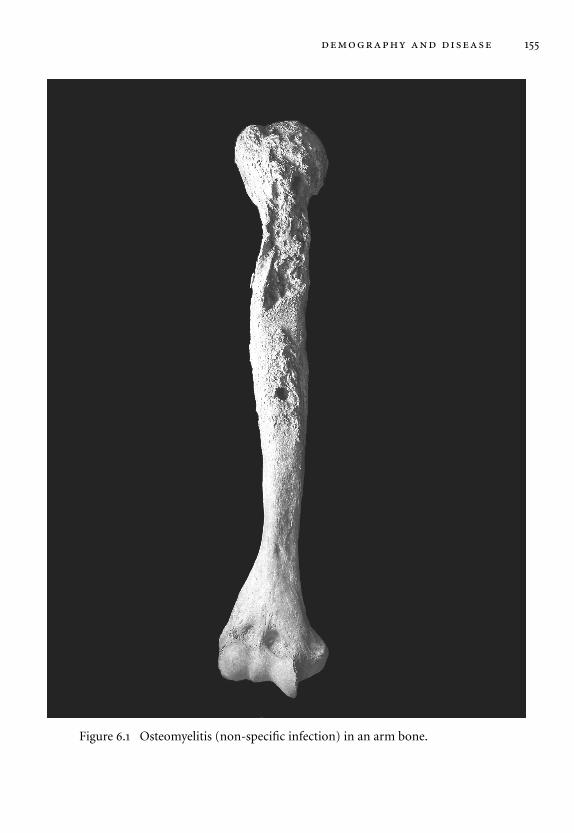
demography and disease 155
Figure 6.1 Osteomyelitis (non-specific infection) in an arm bone.
156 demography in archaeology
A small number of infectious diseases produce specific changes in the
external appearance of bones, and these conditions therefore can be diag-
nosed with reasonable accuracy in archaeological skeletons (Aufderheide
and Rodrıguez Martın, 1998). Such diseases include leprosy, tuberculo-
sis, and some of the treponemal diseases (including venereal syphilis). In
leprosy the organism Mycobacterium leprae can cause diagnostic skeletal
changes in the bones of the face as a direct result of bacterially induced
bone resorption and in the bones of the hands and feet as a secondary
consequence of bacterial invasion of the peripheral nervous system, which
causes loss of sensation in these vulnerable extremities.
Tuberculosis in humans is usually caused by either Mycobacterium tuber-
culosis, derived from inhalation of infected aerosolised droplets expelled
by other infected humans, or by Mycobacterium bovis, derived from the
ingestion of infected meat or milk or by inhalation of droplets from ani-
mals. Tuberculosis infection causes osteomyelitic changes at characteristic
skeletal sites in a small proportion of infected individuals. These lesions
are found most frequently in the spine, hips or knees, with involvement
of the vertebral bodies eventually leading to collapse and kyphosis of the
spine in a condition called Pott’s disease. Pulmonary tuberculosis may also
cause periostitis on the visceral surfaces of the ribs, although the mech-
anism for this inflammatory response is unclear. Infection by Treponema
pallidum causes the disease conditions known as venereal syphilis, bejel
(endemic syphilis) and yaws. Primary skeletal sites for venereal syphilis are
the cranial vault and face, especially the frontal and nasal areas, and the
long bone diaphyses. Cranial lesions are typically star-shaped and erosive
(‘caries sicca’) with aggressive periosteal reaction and bone remodelling
around the margins of the lesions.
Biomolecular evidence
Significant new evidence for the evolution of infectious organisms and
for their occurrence in ancient-human remains has been provided by the
analysis of biomolecules that are specific to particular species and strains
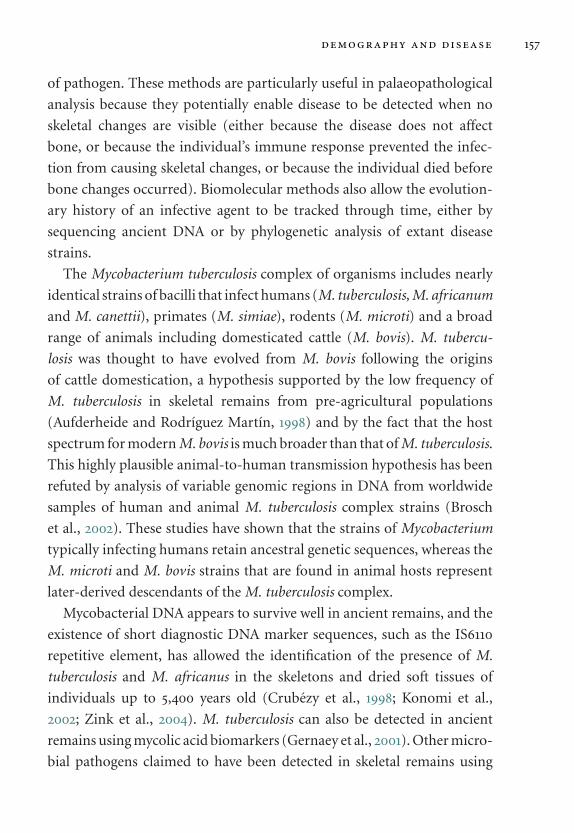
demography and disease 157
of pathogen. These methods are particularly useful in palaeopathological
analysis because they potentially enable disease to be detected when no
skeletal changes are visible (either because the disease does not affect
bone, or because the individual’s immune response prevented the infec-
tion from causing skeletal changes, or because the individual died before
bone changes occurred). Biomolecular methods also allow the evolution-
ary history of an infective agent to be tracked through time, either by
sequencing ancient DNA or by phylogenetic analysis of extant disease
strains.
The Mycobacterium tuberculosis complex of organisms includes nearly
identical strains of bacilli that infect humans (M. tuberculosis, M. africanum
and M. canettii), primates (M. simiae), rodents (M. microti) and a broad
range of animals including domesticated cattle (M. bovis). M. tubercu-
losis was thought to have evolved from M. bovis following the origins
of cattle domestication, a hypothesis supported by the low frequency of
M. tuberculosis in skeletal remains from pre-agricultural populations
(Aufderheide and Rodrıguez Martın, 1998) and by the fact that the host
spectrum for modern M. bovis is much broader than that of M. tuberculosis.
This highly plausible animal-to-human transmission hypothesis has been
refuted by analysis of variable genomic regions in DNA from worldwide
samples of human and animal M. tuberculosis complex strains (Brosch
et al., 2002). These studies have shown that the strains of Mycobacterium
typically infecting humans retain ancestral genetic sequences, whereas the
M. microti and M. bovis strains that are found in animal hosts represent
later-derived descendants of the M. tuberculosis complex.
Mycobacterial DNA appears to survive well in ancient remains, and the
existence of short diagnostic DNA marker sequences, such as the IS6110
repetitive element, has allowed the identification of the presence of M.
tuberculosis and M. africanus in the skeletons and dried soft tissues of
individuals up to 5,400 years old (Crubezy et al., 1998; Konomi et al.,
2002; Zink et al., 2004). M. tuberculosis can also be detected in ancient
remains using mycolic acid biomarkers (Gernaey et al., 2001). Other micro-
bial pathogens claimed to have been detected in skeletal remains using
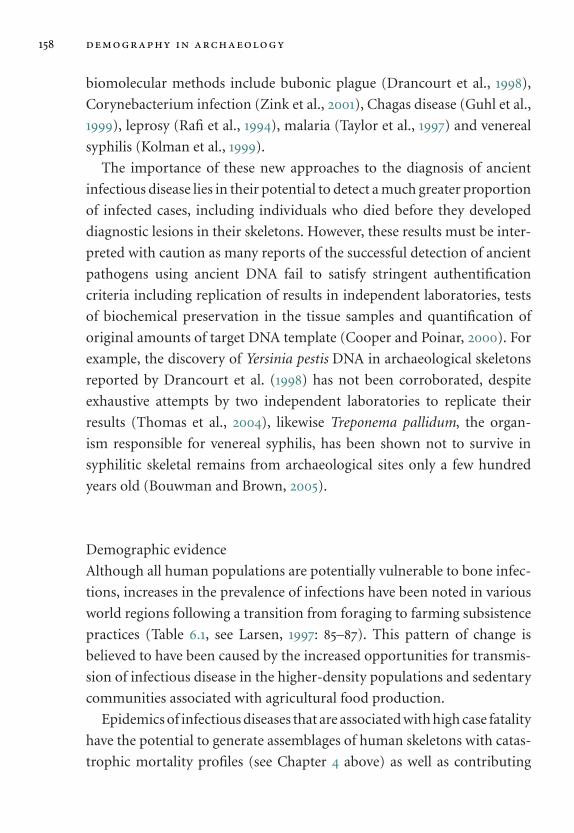
158 demography in archaeology
biomolecular methods include bubonic plague (Drancourt et al., 1998),
Corynebacterium infection (Zink et al., 2001), Chagas disease (Guhl et al.,
1999), leprosy (Rafi et al., 1994), malaria (Taylor et al., 1997) and venereal
syphilis (Kolman et al., 1999).
The importance of these new approaches to the diagnosis of ancient
infectious disease lies in their potential to detect a much greater proportion
of infected cases, including individuals who died before they developed
diagnostic lesions in their skeletons. However, these results must be inter-
preted with caution as many reports of the successful detection of ancient
pathogens using ancient DNA fail to satisfy stringent authentification
criteria including replication of results in independent laboratories, tests
of biochemical preservation in the tissue samples and quantification of
original amounts of target DNA template (Cooper and Poinar, 2000). For
example, the discovery of Yersinia pestis DNA in archaeological skeletons
reported by Drancourt et al. (1998) has not been corroborated, despite
exhaustive attempts by two independent laboratories to replicate their
results (Thomas et al., 2004), likewise Treponema pallidum, the organ-
ism responsible for venereal syphilis, has been shown not to survive in
syphilitic skeletal remains from archaeological sites only a few hundred
years old (Bouwman and Brown, 2005).
Demographic evidence
Although all human populations are potentially vulnerable to bone infec-
tions, increases in the prevalence of infections have been noted in various
world regions following a transition from foraging to farming subsistence
practices (Table 6.1, see Larsen, 1997: 85–87). This pattern of change is
believed to have been caused by the increased opportunities for transmis-
sion of infectious disease in the higher-density populations and sedentary
communities associated with agricultural food production.
Epidemics of infectious diseases that are associated with high case fatality
have the potential to generate assemblages of human skeletons with catas-
trophic mortality profiles (see Chapter 4 above) as well as contributing

demography and disease 159
Table 6.1 Changes in prevalence of selected health conditions at the transition
from foraging to farming in seven world regions. The symbols +, − and 0 indicate
increased, decreased and unchanged prevalences respectively. −/+ indicates that
there is conflicting evidence from different studies within a given world region.
Data are taken primarily from Larsen (1997).
NorthAmerica
CentralAmerica
SouthAmerica Europe
West andSouth Asia East Asia
NorthAfrica
Dental caries + + + + + +Dental enamel
hypoplasia+ − + + −
Anaemia∗ −/+ + + +Infections of
bone+ + + + + 0
Degenerativejoint disease
−/+ − −
Growthretardation
−/+ −/+ 0 + + +
∗cribra orbitalia and porotic hyperostosis
to longer-term declines in population numbers. In early modern Britain
several lethal infections including bubonic plague, cholera, smallpox and
typhus had mortality rates of between 20% and 80% of infected cases
(Roberts and Cox, 2003) and these diseases together with other infections
were in part responsible for a series of mortality crises and temporary,
localised episodes of population decline during this period (Scott and
Duncan, 1998). Additional mortality effects of infectious disease can be
discerned in the seasonal patterns of deaths observed especially in large
urbanised communities. Records of the month of death obtained from
tombstone inscriptions in Imperial Rome showed a single marked peak of
mortality occuring in late summer and early autumn (Figure 6.2), a time
of year when infectious diseases affecting the respiratory and digestive sys-
tems (Shaw, 1996) as well as malaria (Scheidel, 1996) had their greatest
impact on the population.

160 demography in archaeology
Figure 6.2 Season of mortality in Rome, based on 2125 Christian tombstoneinscriptions dating from the third to the sixth century AD. The data are takenfrom Scheidel, 1996, Figure 4.1, after Nordberg, 1963.
Much larger effects of the introduction of infectious disease on popu-
lation numbers have been proposed in the case of the catastrophic decline
in numbers of Native Americans following contact with European set-
tlers from the sixteenth to nineteenth centuries (Verano and Ubelaker,
1992). Although the pre-contact size of the aboriginal population of North
America has been a topic of persistent debate (Daniels, 1992; Ubelaker,
1992) and the exclusive role of communicable disease in post-contact pop-
ulation decline has been questioned (e.g. Thornton, 1997), there is broad
agreement that epidemics of infectious disease introduced by European
immigrants caused devastating morbidity and loss of life amongst non-
immune native populations.
6.1.3 Metabolic, nutritional and deficiency diseases
Skeletal evidence
Nutritional deficiency diseases have been a particular focus of interest
among archaeologists as these diseases may reflect both dietary practices
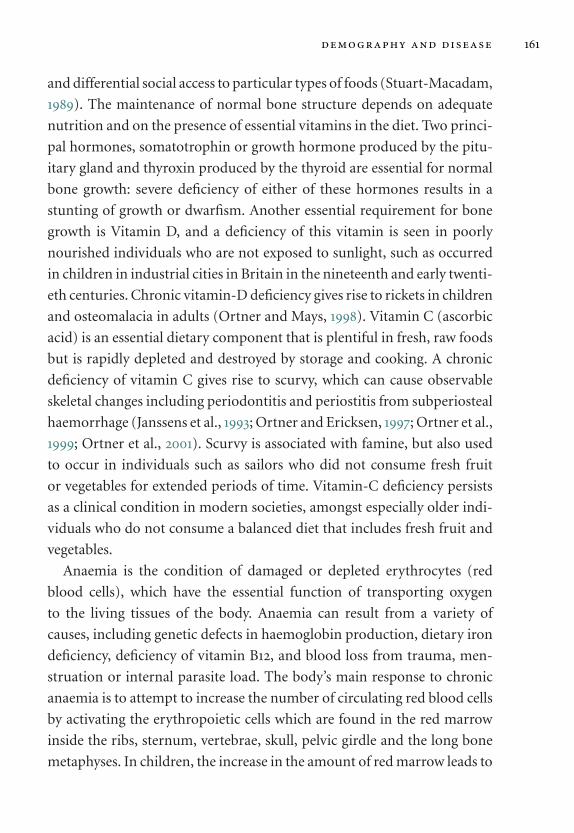
demography and disease 161
and differential social access to particular types of foods (Stuart-Macadam,
1989). The maintenance of normal bone structure depends on adequate
nutrition and on the presence of essential vitamins in the diet. Two princi-
pal hormones, somatotrophin or growth hormone produced by the pitu-
itary gland and thyroxin produced by the thyroid are essential for normal
bone growth: severe deficiency of either of these hormones results in a
stunting of growth or dwarfism. Another essential requirement for bone
growth is Vitamin D, and a deficiency of this vitamin is seen in poorly
nourished individuals who are not exposed to sunlight, such as occurred
in children in industrial cities in Britain in the nineteenth and early twenti-
eth centuries. Chronic vitamin-D deficiency gives rise to rickets in children
and osteomalacia in adults (Ortner and Mays, 1998). Vitamin C (ascorbic
acid) is an essential dietary component that is plentiful in fresh, raw foods
but is rapidly depleted and destroyed by storage and cooking. A chronic
deficiency of vitamin C gives rise to scurvy, which can cause observable
skeletal changes including periodontitis and periostitis from subperiosteal
haemorrhage (Janssens et al., 1993; Ortner and Ericksen, 1997; Ortner et al.,
1999; Ortner et al., 2001). Scurvy is associated with famine, but also used
to occur in individuals such as sailors who did not consume fresh fruit
or vegetables for extended periods of time. Vitamin-C deficiency persists
as a clinical condition in modern societies, amongst especially older indi-
viduals who do not consume a balanced diet that includes fresh fruit and
vegetables.
Anaemia is the condition of damaged or depleted erythrocytes (red
blood cells), which have the essential function of transporting oxygen
to the living tissues of the body. Anaemia can result from a variety of
causes, including genetic defects in haemoglobin production, dietary iron
deficiency, deficiency of vitamin B12, and blood loss from trauma, men-
struation or internal parasite load. The body’s main response to chronic
anaemia is to attempt to increase the number of circulating red blood cells
by activating the erythropoietic cells which are found in the red marrow
inside the ribs, sternum, vertebrae, skull, pelvic girdle and the long bone
metaphyses. In children, the increase in the amount of red marrow leads to
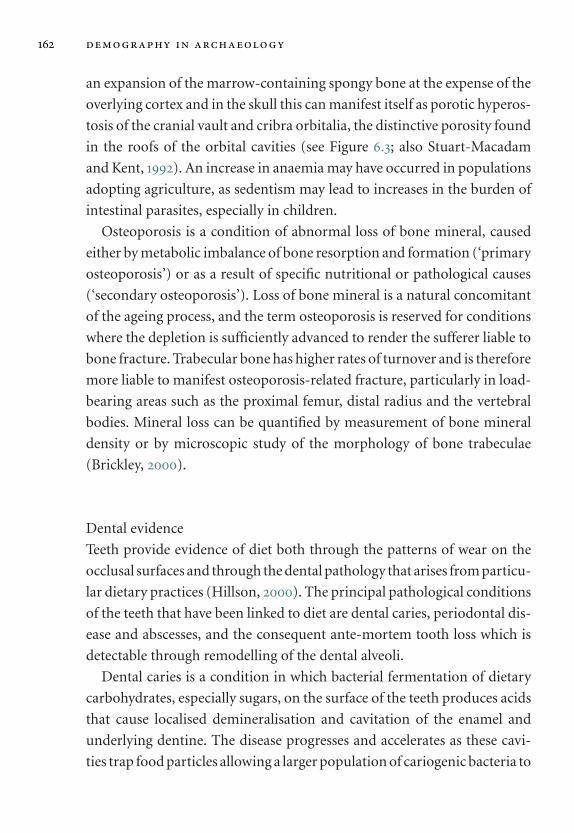
162 demography in archaeology
an expansion of the marrow-containing spongy bone at the expense of the
overlying cortex and in the skull this can manifest itself as porotic hyperos-
tosis of the cranial vault and cribra orbitalia, the distinctive porosity found
in the roofs of the orbital cavities (see Figure 6.3; also Stuart-Macadam
and Kent, 1992). An increase in anaemia may have occurred in populations
adopting agriculture, as sedentism may lead to increases in the burden of
intestinal parasites, especially in children.
Osteoporosis is a condition of abnormal loss of bone mineral, caused
either by metabolic imbalance of bone resorption and formation (‘primary
osteoporosis’) or as a result of specific nutritional or pathological causes
(‘secondary osteoporosis’). Loss of bone mineral is a natural concomitant
of the ageing process, and the term osteoporosis is reserved for conditions
where the depletion is sufficiently advanced to render the sufferer liable to
bone fracture. Trabecular bone has higher rates of turnover and is therefore
more liable to manifest osteoporosis-related fracture, particularly in load-
bearing areas such as the proximal femur, distal radius and the vertebral
bodies. Mineral loss can be quantified by measurement of bone mineral
density or by microscopic study of the morphology of bone trabeculae
(Brickley, 2000).
Dental evidence
Teeth provide evidence of diet both through the patterns of wear on the
occlusal surfaces and through the dental pathology that arises from particu-
lar dietary practices (Hillson, 2000). The principal pathological conditions
of the teeth that have been linked to diet are dental caries, periodontal dis-
ease and abscesses, and the consequent ante-mortem tooth loss which is
detectable through remodelling of the dental alveoli.
Dental caries is a condition in which bacterial fermentation of dietary
carbohydrates, especially sugars, on the surface of the teeth produces acids
that cause localised demineralisation and cavitation of the enamel and
underlying dentine. The disease progresses and accelerates as these cavi-
ties trap food particles allowing a larger population of cariogenic bacteria to
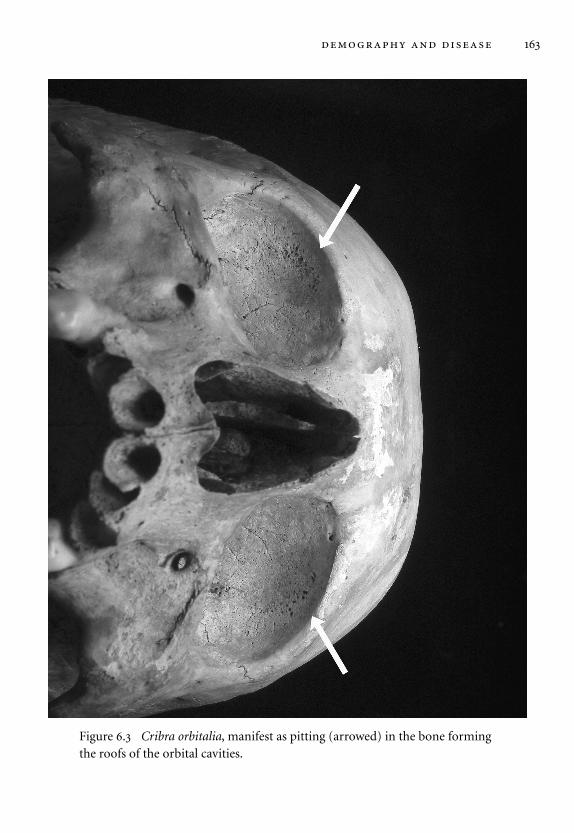
demography and disease 163
Figure 6.3 Cribra orbitalia, manifest as pitting (arrowed) in the bone formingthe roofs of the orbital cavities.

164 demography in archaeology
develop: eventually the crown of the tooth is destroyed. The prevalence
of dental caries is directly associated with the amount of soft and sticky
carbohydrates in the diet, and the condition is usually uncommon in
pre-agricultural communities (Larsen et al., 1991). Periodontal disease is
recognised archaeologically by progressive resorption of the margins of the
tooth sockets exposing the roots of the teeth. This alveolar resorption has
been linked to chronic gum disease (gingivitis) and to the accumulation
of bacteria-containing plaque on the teeth, although non-dietary factors
including oral hygiene may contribute to its development (Hildebolt and
Molnar, 1991).
Dental calculus, or tartar, is a mineralised deposit that accumulates on
the non-occlusal surfaces of the teeth above the gum line. It is usually white,
yellow or light brown in colour and consists of the calcified remnants of
food debris and bacterial plaque. Dental calculus is more common in indi-
viduals who consume a high protein/low carbohydrate diet, but its preva-
lence is also influenced by dental-hygiene practices (Lieverse, 1999). Finally
enamel hypoplasia appears as transverse lines and pits on the non-occlusal
enamel surface and is the result of a temporary stress-related disturbance
to enamel growth during the period when the tooth crown was calcified.
Dietary deficiencies and episodes of illness during childhood are known
to produce these enamel defects, and their presence has been used to infer
conditions of life in past populations (Goodman and Rose, 1991).
Chemical and biomolecular evidence
All living organisms ultimately derive their constituent chemical elements
from the environment, but the position or ‘trophic level’ of each organism
in the food web determines the proximate source of its diet and hence the
extent to which it incorporates the metabolic products of other organisms.
The lighter elements such as carbon, nitrogen and oxygen have stable iso-
topes that behave sufficiently differently during chemical reactions to allow
them to be used as dietary tracers. Stable-isotope ratios in the atmosphere
and the oceans are relatively constant, but growing and respiring organisms
demography and disease 165
are discriminatory in their uptake, metabolism and excretion of these light
stable isotopes, and this allows the identification of the sources of different
foods and the trophic levels occupied by past populations. The atmosphere
contains a small proportion of the stable isotope of nitrogen 15N, which
increases in concentration in animal tissues at successively higher trophic
levels providing a means of estimating the contributions of different food
sources in human diets. For example, nursing infants obtain their proteins
from their mother’s milk, and the isotopic fractionation that occurs when
these proteins are incorporated into the infant’s skeleton provides a means
of determining the timing and duration of weaning (see Figure 6.4, also
Katzenberg et al., 1996). The proportion of a stable isotope of carbon, 13C,
in the diet is influenced by the biomes from which the dietary constituents
are obtained (e.g. terrestrial versus marine) and by the photosynthetic
metabolic pathways utilised by different plants. The analysis of the stable-
isotope composition of collagen in bones and teeth has made a substantial
contribution to knowledge of prehistoric human diet and to understand-
ing of the timing and extent of past dietary transitions (Katzenberg, 2000;
Sealy, 2001).
6.1.4 Neoplastic and congenital diseases
Skeletal evidence
Neoplastic conditions detectable in skeletal remains include primary bone
tumours, which originate from disorders of bone-cell activity, and sec-
ondary tumours (metastases) which spread from neoplastic growths that
originate in non-bone tissues. Primary bone tumours are further subdi-
vided into the relatively common benign conditions, such as osteoma and
osteochondroma, in which the growth is localised to the tissue of ori-
gin, and the rarer malignant or invasive conditions, such as osteosarcoma
and multiple myeloma. Secondary bone tumours can either cause bone
resorption (osteolytic lesions) or bone deposition (osteoblastic lesions),
or a combination of both processes. In addition, some soft-tissue tumours

166 demography in archaeology
8
9
10
11
12
13
14
15
0 1 2 3
Age (years)
Nit
rog
en is
oto
pe
rati
o (
δ15N
)
Figure 6.4 Nitrogen isotope ratios in infant skeletons from a 19th-centurypopulation in Canada (data taken from Herring et al., 1998: Table 3). The δ15Nvalues reach a maximum in infants aged around 1 year. In older individuals thevalues decline towards adult levels as bone incorporates amino acids derivedfrom the post-weaning diet. The curve is a quadratic trendline fitted throughthe data (r 2 = 0.24, p < 0.001).
that grow next to bone, for example meningiomas, can induce a response
in the adjacent skeletal tissues.
Evidence for tumours or neoplastic disease is relatively rare in the archae-
ological record, although such cases may be under-reported (Anderson,
2000: 217). The most common instances of neoplastic disease in human
skeletal material are ivory (‘button’) osteoma (Eshed et al., 2002) and osteo-
chondroma, a benign bone tumour which arises usually in adolescents dur-
ing the period of maximal bone growth. In present-day populations the
most common clinical bone cancers are secondary or metastatic tumours
that develop from a primary tumour located elsewhere in the body, but
these tend to occur in older adults and frequencies in skeletal assemblages
will therefore depend on the age structure of the sample.

demography and disease 167
Table 6.2 Modern frequencies of congenital diseases (per thousand live
births) that are diagnosable from skeletal remains. Data from
Anderson (2000), Roberts and Cox (2003) and Underwood (2004).
Note that the frequency of Down’s Syndrome may have been lower in
the past because of its dependency on maternal age.
Disease Frequency
Spina bifida aperta or cystica (in both stillbirths and live births) 2.5Congenital dislocation of the hip 1.0Cleft palate 0.8Down’s syndrome 0.7Hydrocephaly 0.4Achondroplasia 0.1Osteogenesis imperfecta 0.025
Congenital or genetically determined abnormalities affecting the skele-
ton occur at low incidence among present-day populations (Table 6.2), and
this accounts for the infrequency with which they tend to be encountered
in the archaeological record (Brothwell, 1967). For example, achondropla-
sia is a rare condition in which the limb bones are severely shortened
leading to dwarfism while the skull develops normally. Although achon-
droplasia only occurs today in about 1 in 25,000 live births, a surprising
number of achondroplastic dwarfs have been identified among excavated
skeletal remains, and there is supporting documentary and artistic evi-
dence that these people were valued and enjoyed wealth and status in some
past societies (Brothwell, 1967: 432; Dasen, 1988). A similar association of
short stature and high social status has been recognised in the case of an
Upper-Palaeolithic acromesomelic dwarf from Italy (Frayer et al., 1987).
Biomolecular evidence
In principle, genetically determined abnormalities could be detected
through the analysis of DNA extracted from ancient skeletal remains, but
in practice efforts to achieve this have been hampered by the fact that

168 demography in archaeology
most heritable abnormalities result from mutations in functionally coding
nuclear DNA, which exists only as single copies within the nucleus of each
cell and is inherently difficult to study with ancient-DNA methods. Pusch
et al. (2004) attempted to amplify and sequence lengths of DNA from short
statured skeletons believed to have suffered from achondroplasia, dating
from between 1,000 and 5,000 years ago. The sequence targeted was a 164-
bp stretch of the fibroblast growth factor receptor 3 gene (FGFR3), which
has a single base transition in individuals affected by achondroplasia. The
diagnostic mutation was identified in DNA from two out of four positive
ancient cases that were tested, but unfortunately the achondroplasia muta-
tion was also detected in ancient-DNA sequences obtained from several
healthy control individuals. Pusch et al. (2004) attributed this anomalous
result to artificial sequence alterations generated by their PCR method
when testing damaged ancient DNA.
Other reported successes in the biomolecular identification of congen-
ital disease include the detection of the mutation in the β–globin gene
responsible for sickle cell anaemia in DNA extracted from bone in a recent
autopsy case (Faerman et al., 2000) and the use of in-situ hybridisation to
detect chromosomal abnormalities in a 250-year-old stored human-tissue
sample (Hummel et al., 1999). These results are encouraging, but it remains
to be demonstrated that genetic mutations can be successfully identified
in DNA obtained from archaeological material.
6.1.5 Trauma and homicide
Skeletal evidence
Trauma refers to an acute physical injury or wounding of living tissues.
When hard tissues are stressed beyond their breaking point they will
fracture, and the shape of the fracture surface provides information about
the strength and direction of the applied force. In addition to acute forceful
injury, bone can also fracture from repeated low levels of physical stress,
or from moderate stress to a pre-existing weakness such as a region of
demography and disease 169
osteoporotic bone. Trauma may also cause dislocation of the joints, and if
these injuries are left untreated they eventually cause changes to the artic-
ular surfaces of the bone. Bone responds to trauma with a natural repair
mechanism. Bone fragments are initially bound together by fibrous tissue,
then the smaller bone fragments are removed by cell-mediated resorption
and new bone mineral is deposited around the fibrous tissue to form a
bony callus enclosing the site of the fracture. The callus reaches its greatest
size a few months after the initial injury, and the callus is then subjected to
remodelling until the original strength and rigidity of the bone is restored.
Successful union of fractures depends on the bone fragments being
immobilised, otherwise movement between the fragments will delay or pre-
vent the healing process. Well-healed fractures show a continuous, smooth
join between the broken ends of the bone, but in archaeological mate-
rial there is frequently some shortening and deformity as a result of poor
alignment between long bone fragments. Fractures may have short- and
long-term complications. Fractures sites may communicate with the sur-
face of the skin, allowing entry of bacteria and infection of the fracture site.
Healed fractures that result in shortening and bone deformity may lead to
abnormal stresses being placed on the adjacent joints, which in turn may
result in degenerative joint disease.
Although the nature of the applied force can often be determined from
the geometry of the fracture surface, it is not always possible to distinguish
accidental from intentional injury in the analysis of bone fractures. There
is considerable variation amongst cultures in the nature of interpersonal
conflict, but injuries to the cranium such as fractures of the nasal bones
are considered more likely to be caused by interpersonal violence (Walker,
1997). Mid-shaft fractures of the ulna and radius are widely interpreted
as ‘parrying’ injuries sustained in defending the body against a deliberate
blow from a weapon but these can also occur as a consequence of accidental
trauma (Jurmain, 1999: 218). Linear incisions from sharp-edged weapons,
penetrating injuries from projectiles and massive blunt-force trauma are
characteristic of injuries sustained in violent interpersonal conflict (Larsen,
1997).
170 demography in archaeology
Demographic evidence for conflict and homicide
Recent publications have testified to an increasing recognition of the social
importance of violent conflicts in prehistory (Martin and Frayer, 1997;
Carman and Harding, 1999; Gilchrist, 2003; Parker Pearson and Thorpe,
2005). Archaeological evidence for collective violence is diverse but prob-
lematic in its interpretation, with contentious issues arising from the
difficulty of distinguishing between symbolic and physical functions of
artefacts interpreted as weapons, and in determining the extent and nature
of any interpersonal violence that may have taken place. Material-cultural
evidence for violent conflict includes weaponry and armour, defensive
fortifications and iconographic representations of battle, while biological
anthropology can supply evidence from the patterns of physical trauma
visible on human skeletal remains.
Victims of traumatic violence are often assumed to be combatants, but
this assumption has rarely been scrutinised, and only recently has there
been any attempt to examine palaeodemographic evidence for prehistoric
conflict (Bishop and Knusel, 2005). The latter authors examined demo-
graphic data from prehistoric skeletal assemblages with high frequencies
of perimortem violent trauma, previously interpeted as victims of war-
fare. They used a modified juvenility index (the ratio of deaths aged 7
to 16 years to the deaths aged 17 years and above in a given sample) and
the proportion of females amongst the adult deaths as estimators of the
demographic composition of their samples (Table 6.3). For the European
prehistoric sites, the age and sex profiles are more consistent with attacks on
non-combatant communities, rather than combatant mortality, as shown
by the substantial proportions of juveniles and female adults in most of
the samples (Maiden Castle is the only site analysed that did not have any
subadult skeletal material). The estimated 95% confidence intervals for
the juvenility index in contemporary non-combatant populations ranged
from 0.35 to 0.71, and the confidence intervals for the expected propor-
tion of adult females ranged from 26% to 61% (Bishop and Knusel, 2005),
values that encompass most of the prehistoric samples included in the
study. The results of their analysis show that attacks on demographically
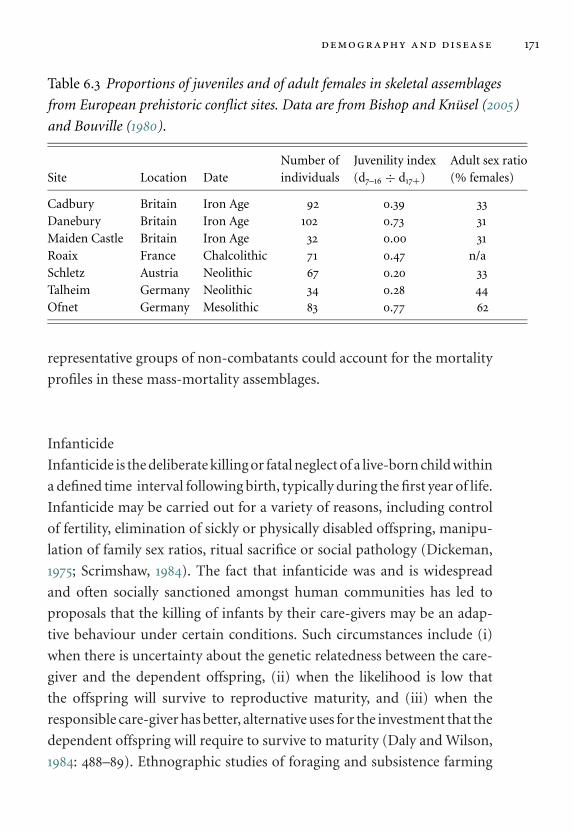
demography and disease 171
Table 6.3 Proportions of juveniles and of adult females in skeletal assemblages
from European prehistoric conflict sites. Data are from Bishop and Knusel (2005)
and Bouville (1980).
Site Location DateNumber ofindividuals
Juvenility index(d7–16 ÷ d17+)
Adult sex ratio(% females)
Cadbury Britain Iron Age 92 0.39 33Danebury Britain Iron Age 102 0.73 31Maiden Castle Britain Iron Age 32 0.00 31Roaix France Chalcolithic 71 0.47 n/aSchletz Austria Neolithic 67 0.20 33Talheim Germany Neolithic 34 0.28 44Ofnet Germany Mesolithic 83 0.77 62
representative groups of non-combatants could account for the mortality
profiles in these mass-mortality assemblages.
Infanticide
Infanticide is the deliberate killing or fatal neglect of a live-born child within
a defined time interval following birth, typically during the first year of life.
Infanticide may be carried out for a variety of reasons, including control
of fertility, elimination of sickly or physically disabled offspring, manipu-
lation of family sex ratios, ritual sacrifice or social pathology (Dickeman,
1975; Scrimshaw, 1984). The fact that infanticide was and is widespread
and often socially sanctioned amongst human communities has led to
proposals that the killing of infants by their care-givers may be an adap-
tive behaviour under certain conditions. Such circumstances include (i)
when there is uncertainty about the genetic relatedness between the care-
giver and the dependent offspring, (ii) when the likelihood is low that
the offspring will survive to reproductive maturity, and (iii) when the
responsible care-giver has better, alternative uses for the investment that the
dependent offspring will require to survive to maturity (Daly and Wilson,
1984: 488–89). Ethnographic studies of foraging and subsistence farming

172 demography in archaeology
communities show that younger children, female children, twins and chil-
dren who have lost one or both parents are often at greater risk of being
killed by members of their own community (Daly and Wilson, 1984; Hill
and Hurtado, 1995).
Archaeological identification of infanticide has been primarily through
identifying the demographic signature of perinatal mortality and through
recognising the non-normative contexts of the burials of supposed infan-
ticide victims. Analyses of the distributions of age at death estimates for
perinatal skeletons from Roman settlement sites have shown clustering
of deaths at around the time of birth, a pattern that it is suggested is
consistent with infanticide (Smith and Kahila, 1992; Mays, 1993). Gow-
land and Chamberlain (2002; 2003) have challenged this interpretation
on the basis that regression-based age estimation methods generate artif-
ically narrow age distributions, although Mays (2003) has questioned the
validity of the Bayesian approach to infant-age estimation from skeletal
measurements.
6.2 social and demographic impacts of disease
6.2.1 Demographic responses to disease
Diseases with a fatal outcome obviously contribute to overall mortality
and place constraints on potential rates of population growth. In addi-
tion, severe mortality crises precipitated by outbreaks of virulent epidemic
disease such as bubonic plague can have a lasting impact on population
dynamics, especially in populations in which both the birth rate and popu-
lation size are related to available resources in a density-dependent fashion.
Scott et al. (1996) and Scott and Duncan (1998) have described how an
episode of plague in the small English town of Penrith in 1597–98, which
killed an estimated 40% of the population, set in train a long-wavelength
oscillation in the birth and death rates that persisted for up to 200 years. The
cycle length of this oscillation, 44 years, was driven by a density-dependent
response in birth rate, death rate and migration following the plague
demography and disease 173
outbreak. After the precipitating mortality crisis, the population of Pen-
rith was slowly restored by a combination of rising birth rate and immi-
gration from neighbouring communities (itself an important contributor
to increased fertility) until the size of the population had risen to a level
where increased mortality from communicable disease and poor nutri-
tion, combined with emigration, led to a compensating fall in population
numbers. The Penrith population cycle repeated itself every 44 years until
the density-dependent limits on population size were removed towards the
end of the eighteenth century by improvements in agricultural production
and in transport (Scott and Duncan, 1998: 140). A similar long-wavelength
oscillation in birth and death rates occurred in London following the Great
Plague of 1665 (Scott and Duncan, 1998: 187).
The phenomenon of localised inward migration to sustain population
numbers in response to high levels of disease-related mortality was a feature
of post-medieval urban centres in Europe (Tilly, 1978: 65–66). This replace-
ment migration was driven by the increased employment opportunities
and enhanced wages created by labour shortages in the towns and cities.
Reduction in disease-related mortality, either indirectly through improve-
ments to nutrition or directly through advances in hygiene, preventive
medicine and treatment, was also one of the factors that brought about the
demographic transition in European populations during the eighteenth
and nineteenth centuries (Kirk, 1996: 368).
Fertility rates are also influenced by disease, especially sexually trans-
mitted diseases that can induce sub-fertility or sterility, and an elevated
incidence of infectious sterility has been proposed as an explanation of low
fertility rates in some foraging communities (Harpending, 1994).
6.2.2 Social responses to disease
Treatment
Direct evidence for the treatment of disease is hard to detect from skele-
tal remains, but effective herbal remedies for painful disorders and the
174 demography in archaeology
treatment of fractures using splints and bandages to immobilise the bro-
ken bones were probably used in many communities (Roberts, 2000a), as
were tooth extraction and other remedies for dental disease (Milner and
Larsen, 1991). Healing after amputation through a long bone can be recog-
nised by development of a bony callus at the site of amputation followed by
closure of the exposed medullary cavity (Mays, 1996), although this need
not constitute treatment because amputation could equally be performed
as a judicial punishment rather than as a therapeutic measure, or could
result from accidental trauma. Similarly trepanation, in which a piece of
the skull vault is removed surgically, may in some instances have been
undertaken to alleviate conditions such as persistent pain or for epilepsy,
but equally could have been conducted for ritual reasons. Many hundreds
of instances of trepanation have been found from sites around the world
(Arnott et al., 2003), and in most archaeological examples the surround-
ing bone shows evidence of healing, indicating that the patient or subject
survived for at least several months after the procedure had been carried
out (Aufderheide and Rodrıguez Martın, 1998).
Isolation
Isolation of potential or actual disease carriers by temporary or permanent
exclusion from the community has long been an institutional response to
diseases that were thought to be contagious (McNeil, 1979: 160). Cities in
later medieval and early modern Europe, especially the major ports on the
coast of the Mediterranean Sea, enforced quarantine regulations in order
to isolate travellers arriving from countries where outbreaks of plague had
occurred.
Isolation was also enforced in cases of leprosy, an endemic disease that
increased in prevalence in Europe from the eleventh to the thirteenth cen-
turies AD (Roberts, 1986). Leprosy was recognised by medieval physicians
to be a communicable disease, and there is historical and archaeological
evidence that the disease was successfully diagnosed at least in severe cases.
This period of increasing prevalence of leprosy witnessed the foundation
demography and disease 175
of leprosy hospitals and the introduction of legal measures to restrict con-
tacts between leprosy sufferers and the rest of society. The subsequent
decline of the disease in later medieval Europe probably owes less to the
efficacy of the isolation policy and more to the rise of urbanisation and
the increasing prevalence of tuberculosis, which may have conferred some
cross-immunity to leprosy and displaced the disease through a process of
competitive exclusion (Lietman et al., 1997).
Evidence for compassion
Archaeological evidence for the long-term survival of individuals with dis-
abling physical impairments is relatively uncommon, and this has led to
claims that, when found, skeletons which exhibit signs of long-standing
severe physical impairment provide evidence for compassion in past soci-
eties. Dettwyler (1991: 380–81) cautions against simplistic assumptions
about and interpretations of the survival of individuals with impairments,
pointing out that whether an impairment constitutes a disability or a hand-
icap in the sense of rendering the sufferer non-productive is a social ques-
tion, rather than a biological one. Roberts (2000b) suggests that societies
can respond in several ways to disability, ranging from support and care
through neutrality to neglect and ostracism, and with a corresponding
range of status being accorded to the affected individual. Furthermore,
humans (like other animals) are adept at coping with and adapting to dis-
ability (Keenleyside, 2003), so we cannot assume the existence of disability
solely on the basis of skeletal changes. The variety of psychological and
social responses to disease and disability are perhaps as important as the
evidence for physical impairment in considering the impact of disability
in the past.


7
Concluding remarks
7.1 the relevance of demography for archaeology
Archaeology seeks to achieve an understanding of humankind through the
study of the material remains of past cultures. In most circumstances these
cultural remains are incomplete, and are often rather unrepresentative of
the people and societies that generated them, therefore an important role
of demographic studies within archaeology is to help place constraints on
the kinds of populations that could have existed in the past and to evalu-
ate the nature of the demographic processes that contributed to patterning
in the archaeological record. A comprehensive and well-tested body of the-
ory exists in anthropological and historical demography, so archaeologists
do not need to depend on adventitious circumstances of preservation and
recovery in order to achieve meaningful reconstructions of past popula-
tion structures and processes. Although human societies are extraordinar-
ily diverse, the demographic structure of any viable (i.e. self-sustaining, or
demographically stable) population can be located within a limited range
of possible variation. The application of this uniformitarian principle can
be of great benefit to palaeodemography, firstly as a reality check when
appraising the results of palaeodemographic analyses, and secondly as a
source of prior probabilities for Bayesian and maximum likelihood esti-
mation of population characteristics and parameters.
A wide range of important archaeological questions can be approached
and addressed through palaeodemographic methods – these include the
178 demography in archaeology
impact of environmental change on human populations; the nature of
populational responses to changes in subsistence technology; the extent
to which population expansion, migration and colonisation accompanied
cultural change; the interaction between population structure and com-
municable disease; the balance of attritional and catastrophic mortality in
past populations; the level of mortality attributable to warfare, infanticide
and other forms of interpersonal violence; and the role of population pro-
cesses in social conflict and cultural collapse. The prospects of significant
progress in investigating these questions are enhanced by the availability
of new analytical methods that are being developed in biomolecular and
environmental archaeology, as well as by increasingly sophisticated recon-
structions of past human activity patterns based on analyses of resource
usage and the history of landscape occupation.
As well as these practical applications of demographic methods to
archaeological questions, the theoretical perspectives provided by demo-
graphic models of past populations can be particularly illuminating.
Demographic studies can help repopulate the past with individuals whose
presence is suspected yet the material evidence for their existence is lack-
ing. For example, children have a low visibility in the archaeological record,
not only because children are under-represented in mortality samples (see
Section 4.1.4 above) but also because the discovery of material cultural
residues attributable to children is rare, except in the restricted context
of mortuary deposits. Yet simple demographic modelling, based on the
high infant and childhood mortality rates that characterised pre-modern
populations, indicates that children probably constituted a third or more
of past living populations (and that an equivalent proportion of the popu-
lation’s total person-years were lived in childhood). The presence of a large
cohort of economically dependent children in a population also implies
the existence of sufficient adult care-givers to ensure their survival. Howell
(1982) and others have noted that some palaeodemographic reconstruc-
tions of attritional cemetery samples posit excessive young-adult deaths
that would have resulted in high rates of orphancy amongst the chil-
dren, limited overlap between successive generations and a virtual absence
concluding remarks 179
of grandparents, conditions that are unprecedented in historically docu-
mented populations and that are incompatible with long-term population
survival.
7.2 how meaningful are the results of
palaeodemographic analysis?
The challenge to palaeodemography issued by Bocquet-Appel and Masset
in 1982 has led to nearly a quarter of a century of reappraisal of the bases on
which population structure and dynamics are inferred from archaeological
evidence. Much of the debate has focused on the reconstruction of mortal-
ity profiles from samples of human skeletal remains and the extent to which
these mortality patterns diverge from demographic norms. It is now widely
accepted that in addition to the vagaries of taphonomic factors affecting
sample composition, systematic biases occur in palaeodemographic data
and that these stem, in part, from the uncritical application of traditional
anthropological methods for estimating age and sex from skeletal remains.
These methodological biases have been addressed both from a statistical
standpoint (particularly through the development of new anthropological
methods that take account of the variation both in the reference series and
in the target series of skeletons) and from a theoretical perspective that
highlights the uniformitarian nature of population processes and seeks to
avoid creating past population structures that have no analogues in the
historical or ethnographic records. The new approaches to palaeodemog-
raphy that are emerging from this protracted period of introspection and
revision, as exemplified by the contributions to the Rostock workshops on
palaeodemography (Hoppa and Vaupel, 2002), are more explicit in their
aims and methods and they encourage a guarded optimism for the future
of the discipline.
Substantial progress is being made in the application of palaeodemo-
graphic methods in the interpretation of mass-mortality assemblages of
human skeletal remains. Recent research on this topic has investigated
the demographic signatures of outbreaks of fatal diseases such as bubonic
180 demography in archaeology
plague, as well as delineating the age and sex profiles of victims of armed
conflict and infanticide. Further work is in progress on detecting the demo-
graphic impacts of ancient natural disasters including earthquakes and
volcanic eruptions. These examples of applied palaeodemography make
use of the fact that the demographic processes under investigation are well
understood from an anthropological and historical demographic perspec-
tive, with reliable comparative data being available from epidemiological
and ethnographic studies of present-day and recent historical populations.
Further studies of high-mortality population samples need to be under-
taken – for example, slavery is thought to have played an important social
and economic role in prehistory as well as in classical times, yet there has
been little detailed investigation (and no palaeodemographic analysis) of
slavery in pre-Roman populations (Parker Pearson and Thorpe, 2005).
In addition to studies of skeletal samples, new approaches to the analysis
of proxy data such as artefact usage and radiometric date distributions are
extending the reach of palaeodemography back into very early time periods
for which the quantity of surviving human remains is limited and the scope
for reconstructing mortality patterns from human skeletal remains is cor-
respondingly restricted. For example, Ashton and Lewis (2001) have used
artefact densities to track population decline in the Thames Valley in the
Late Middle Pleistocene, despite the lack of other evidence (such as skeletal
remains or occupation sites) for the hominids that were present in Britain
at that time. By extending the time range of palaeodemographic evidence
in this way there is the potential to discover correlations between major
climatic transitions and continental-scale human population movements.
7.3 how different were populations in the past?
The application of uniformitarian principles in palaeodemography
requires the validation of certain assumptions about the nature of past pop-
ulations. There is good historical and ethnographic evidence that, despite
wide variations in levels of mortality and fertility, there are some life-history
parameters that are relatively constant amongst human populations, for

concluding remarks 181
example longevity and the age of female reproductive senescence. Rates
of skeletal maturation in children show some variation amongst human
populations (as evidenced by studies of long bone growth, which reveal
slower rates of growth in some past populations) but the timing of stages
of dental development appears to be relatively invariant, at least within the
species Homo sapiens. The issue of recent changes in longevity is more con-
troversial, and there are a number of instances where palaeodemographic
evidence has been interpreted as supporting the hypothesis for short life-
spans prior to the modern era. However, the historical and ethnographic
evidence agrees with life-history theory in suggesting that longevity is a
property that scales in proportion with other life-history variables and
is therefore likely to be relatively invariant across populations of Homo
sapiens.
Both fertility and generation length show some systematic differences
between ethnographically recorded foragers and subsistence farmers, with
foragers generally having a lower potential for rapid population growth.
Nonetheless it is clear that under favourable circumstances foragers could
sustain continuous and rapid population expansion, as must have been
the case in the continental-scale colonisation of northwestern Europe and
the Americas by Pleistocene foragers towards the end of the last Ice Age. The
calculated rates of geographic expansion in Pleistocene hunter-gatherer
colonisation events are comparable to those that occurred at the origins of
agriculture in Europe, and this lends some support to the notion that Homo
sapiens can be characterised as an ‘r-selected’ colonising species that is
adapted to rapid recovery and expansion from extreme population crashes
(Hill and Hurtado, 1995: 470). The ability to exploit the opportunities for
geographical expansion provided by climatic change and by advances in
subsistence technology may be a general property of human populations,
and therefore it may be misleading to regard hunter-gatherers as being
typically adapted to stationary (zero-growth) population conditions at or
near the carrying capacity of their habitat.
The basic bimodal pattern of attritional mortality, in which the oldest
and youngest individuals are at greater risk of death, can be reconstructed

182 demography in archaeology
for some past populations. Comparative studies of populations practising
foraging and subsistence agriculture suggest that infectious disease and
trauma were amongst the principal causes of death in the past, and in most
populations between one third and one half of attritional deaths would
have occurred in individuals under 15 years of age. The potential for catas-
trophic mortality events was also ever present through the mechanisms of
epidemic disease, natural disasters and violent inter-group conflict. Catas-
trophic mortality may be under-recognised in the archaeological record
as the social disruption that accompanies natural and human-induced
catastrophes is often inimical to the organised burial of the victims (a fact
that has been illustrated quite starkly by the many thousands of missing
presumed dead as a result of the Indian Ocean tsunami of December 2004).
It is possible that catastrophic mortality may form an important con-
straint on long-term rates of human population growth, and studies of
human genetic diversity have confirmed that some populations have passed
through genetic ‘bottlenecks’ caused by drastic reductions in population
size. Simple modelling suggests that if human populations have an average
short- to medium-term potential for growth in numbers of 1% per annum,
yet long-term population growth averages close to zero, then episodes of
catastrophic mortality amounting to a loss of half of the living popula-
tion every 70 years would be required to keep numbers in check. In this
hypothetical situation catastrophic mortality would represent 25% of total
deaths, with attritional mortality making up the remaining 75% of deaths.
If short-term growth rates were of the order of 2% per annum then the
catastrophic mortality required to limit long-term growth would amount
to 50% of total mortality.
These simple calculations suggest that catastrophic mortality may play
a greater role in population history than previously suspected, and further
research into the identification and quantification of episodes of catas-
trophic death and their impact on past populations is highly desirable.
Intriguingly, the available samples of skeletal remains of Homo habilis,
Homo heidelbergensis and Homo neanderthalensis show an excess of ado-
lescent and young-adult deaths, which would be expected if these samples
concluding remarks 183
represent catastrophic rather than attritional mortality (see Section 5.2.3
above). The same pattern of excess young-adult deaths has been identi-
fied by Caspari and Lee (2004) in samples of Australopithecus and fossil
species of Homo, but the latter authors interpret their findings as evi-
dence for reduced longevity prior to the evolution of modern Homo sapi-
ens. However, this excess of young-adult mortality is not characteristic
of attritional mortality in wild-primate populations, so neither should it
be expected amongst early hominids. Rather than hypothesising reduced
natural longevity, it is more likely that these age-at-death profiles indicate
a substantial contribution of catastrophic mortality to the hominid fossil
record. The pattern of excess young-adult mortality is exactly what would
be expected if predation by large carnivores were a major contributor to
the hominid fossil record. Large carnivores that hunt by stalking or by
ambush techniques select their prey in proportion to encounter rates, and
thus these predators generate mortality profiles that reflect the age struc-
ture of the living-prey population (Stiner, 1991: 160–61). In the case of later
species of Homo, instances of predation by large carnivores were probably
less frequent, but intra-specific violence would be expected to generate a
similar mortality profile to that resulting from carnivore predation. It may
be the case that attritional mortality profiles only become visible in the
hominid fossil record with the advent of normative burial practice during
the Middle Palaeolithic.
7.4 demographic processes and cultural change
Despite the theorisation of population growth as a potent agent of social
transformations, the links between demographic parameters, subsistence
levels and cultural change in prehistory and in early historical times are
not clear cut. For instance, while there is strong evidence for higher fertil-
ity amongst agriculturalists compared to foraging communities, it is not
apparent whether this elevated fertility is linked to the shift from high
mobility to greater sedentism, or the increasing availability and quality
of food sources (especially foods suitable for sustaining infants after early
184 demography in archaeology
weaning), or the potential for agriculturalist children to make an earlier
contribution to the household economy, or indeed a combination of all
three factors.
Perhaps the most straightforward kind of hypothesis to test concern-
ing demographic/cultural interaction is the proposal that major cultural
transitions were associated with large-scale migrations or colonisations,
as opposed to being achieved through cultural diffusion or indigenous
cultural innovation (Shennan, 2000, 2002). In addressing this type of
hypothesis several categories of evidence can be examined, including the
determination of population affinities from genetic or morphological stud-
ies of human remains, the detection of migrants through their isotopic
signatures, and the investigation of rates of spread of colonising popu-
lations by detailed analysis of archaeological dating evidence. Although
such studies are still limited in scope, the results obtained so far suggest
that relatively high rates of migration, rapid processes of colonisation and
substantive genetic turnover may have accompanied the major cultural
transitions in northwest European prehistory.
Another populational phenomenon that has attracted the attention of
palaeodemographers is ‘cultural collapse’ followed by subsequent recovery
or non-recovery of population numbers in specific geographical regions
or urban centres. Modelling of recovery times for historically documented
urban populations following conflict-induced or natural disaster-induced
population loss indicates that in most instances intrinsic population growth
is greatly augmented by immigration from adjacent regions, and recovery
of population size therefore occurs in a much shorter timespan than would
be predicted from simple exponential growth (Me-Bar and Valdez, 2004).
Where intrinsic growth rates are low, and there are reduced opportuni-
ties for in-migration, the likelihood of non-recovery following population
decline is much greater. This latter situation may have occurred in the
medieval Norse settlements of Greenland, an island which was initially
colonised by Europeans in AD 986 but was completed depopulated of
colonists by AD 1500. In Greenland it appears that the combined effects of
climatic change, economic decline, disease and out-migration may have
concluding remarks 185
reduced the Norse population below a sustainable level, and with little
incentive to resettlement the population finally entered a two-hundred-
year period of terminal decline (Lynnerup, 1998). Although this represents
a small-scale example of cultural collapse (the Norse population of Green-
land never exceeded a few thousand living individuals) the same kind of
factors may also have operated on much larger communities at a regional
scale, for example in the collapse of the Mesoamerican Mayan civilisation
around AD 800.
The relationship between the frequency of disease and cultural history
is a fertile field for research, and advances in the standardisation of diag-
nostic criteria in palaeopathology, coupled with the presentation of disease
frequency data in a form that allows comparisons between time periods
and across cultures (e.g. Roberts and Cox, 2003), provide better opportuni-
ties for testing hypotheses of disease/culture interactions and co-evolution.
Many diseases that afflict human populations in the present day have great
antiquity, but infectious disease organisms also show evolutionary adapt-
ability in their capacity to cross between host species, develop resistance
to treatments and respond to the new opportunities for infection that
are provided by changes in human cultural behaviour. Opportunities for
migration and colonisation are intimately connected with patterns of dis-
ease, as shown by migration into depopulated regions following major
episodes of epidemic mortality, and by the ‘virgin soil’ epidemics that dev-
astated native American populations during the European colonisation of
the New World.
7.5 challenges for the future
In addition to ongoing efforts to solve long-standing methodologi-
cal problems, there are many opportunities to exploit new sources of
palaeodemographic data in order to obtain quantitative estimates of the
parameters of past populations. The advent of new analytical approaches
that utilise chemical and biomolecular evidence has provided insights into
the histories and affinities of past populations, and allows the possibility
186 demography in archaeology
of measuring the extent and pace of migration on a local or regional scale.
Biomolecular methods can also be applied in the detection of the organ-
isms responsible for outbreaks of epidemic disease and in conjunction
with coalescent theory provide a means of establishing the evolutionary
history of diseases that affect human populations. The widespread avail-
ability and increasing precision of radiocarbon dates, especially those that
are obtained directly on human remains or on securely stratified archae-
ological materials, has provided an additional impetus to the reconstruc-
tion of population numbers using proxy measures of human activity, with
the result that long-term population processes and correlations between
demographic and environmental variables can potentially be explored.
One of the most important challenges facing palaeodemography is to
understand the pattern of evolution of modern human life-history traits
and to discern the impact of these traits on demographic structure and
dynamics in the different hominid species that are known from the fossil
record. We have a reasonably good understanding of the demography of
our closest living relatives amongst the primates, but there is relatively little
known of human demographic history over the six or seven million years
since the human lineage diverged from the lineage of the African apes. The
evidence from dental and skeletal development indicates that earlier matu-
ration prevailed in fossil hominid species, as is also the case for our closest
primate relatives, but there are competing explanations for the emergence
of the delayed maturation that is a unique characteristic of the species
Homo sapiens. There are also major questions to be answered concerning
the nature of interactions between sympatric hominid species, in particular
whether demographic factors were important in the extinction of previ-
ously successful hominid lineages such as the robust australopithecines
and our closest fossil relative, Homo neanderthalensis.
Hoppa and Vaupel (2002: 3–4) point out that in order to improve meth-
ods for palaeodemographic estimation there is a need for researchers to
gain access to more and better-documented collections of reference skele-
tons with known life-history attributes. Although this is a requirement
that might conflict with ethical concerns about the long-term storage and
concluding remarks 187
curation of human skeletal remains, it is important for biological anthro-
pologists to be able to record skeletal attributes in as wide a range of samples
as possible current skeletal reference collections are mainly from popula-
tions of north European origin, while populations from other parts of
the world are under-represented in the collections currently available. As
part of the effort to validate the uniformitarian assumptions that under-
pin palaeodemography it is desirable to study rates of maturation and
senescence in a wide range of modern human populations. These tasks are
amongst many that are likely to provide productive lines of enquiry for
future generations of palaeodemographers.

R E F E R E N C E S
Acsadi, G. and Nemeskeri, J. 1970. History of Human Life Span and Mortality.
Budapest: Akademiai Kiado.
Adams, W. Y., Van Gerven, D. P. and Levy, R. S. 1978. The retreat from
migrationism. Annual Review of Anthropology 7: 483–532.
Alterman, H. 1969. Counting People: the Census in History. New York: Harcourt,
Brace and World.
Ammerman, A. J. and Cavalli-Sforza, L. L. 1973. A population model for the
diffusion of early farming in Europe. In Renfrew, C. (ed.) The Explanation
of Culture Change. London: Duckworth, pp. 343–357.
Amundsen, D. W. and Diers, C. J. 1970. The age of menopause in classical Greece
and Rome. Human Biology 42: 79–86.
1973. The age of menopause in medieval Europe. Human Biology 45: 605–612.
Anderson, D. G. and Faught, M. K. 2000. Paleoindian artefact distributions:
evidence and implications. Antiquity 74: 507–513.
Anderson, D. G. and Gillam, J. C. 2000. Paleoindian colonization of the
Americas: implications from an examination of physiography, demography
and artefact distribution. American Antiquity 65: 43–66.
Anderson, R. M. and May, R. M. 1991. Infectious Diseases of Humans. Oxford:
Oxford University Press.
Anderson, T. 2000. Congenital conditions and neoplastic disease in British
palaeopathology. In Cox, M. and Mays, S. (eds.) Human Osteology in
Archaeology and Forensic Science. London: Greenwich Medical Media,
pp. 199–226.

190 references
Angel, J. L. 1969. The bases of paleodemography. American Journal of Physical
Anthropology 30: 427–438.
Anthony, D. W. 1990. Migration in archaeology: the baby and the bathwater.
American Anthropologist 92: 895–914.
Aries, P. 1962. Centuries of Childhood: A Social History of Family Life. New York:
Vintage Books.
Armenian, H. K., Melkonian, A., Noji, E. K. and Hovanesian, A. P. 1997. Deaths
and injuries due to the earthquake in Armenia: a cohort approach.
International Journal of Epidemiology 26: 806–813.
Arnott, R., Finger, S. and Smith, C. U. M. (eds.) 2003. Trepanation: History,
Discovery and Theory. Lisee: Swets and Zeitlinger.
Ashton, N. and Lewis, S. 2002. Deserted Britain: declining populations in the
British Late Middle Pleistocene. Antiquity 76: 388–396.
Aufderheide, A. C. and Rodrıguez Martın, C. 1998. The Cambridge Encyclopedia
of Human Palaeopathology. Cambridge: Cambridge University Press.
Bagnall, R. S. and Frier, B. W. 1994. The Demography of Roman Egypt.
Cambridge: Cambridge University Press.
Ball, W. 1996. The first census. Geographical Magazine, January: 16–18.
Barrientos, G. and Perez, S. I. 2005. Was there a population replacement during
the Late mid-Holocene in the southeastern Pampas of Argentina?
Archaeological evidence and palaeoecological bias. Quaternary
International 132: 95–105.
Beauval, C., Maureille, B., Lacrampe-Cuyaubere, F. et al. 2005. A late Neandertal
femur from Les Rochers-de-Villeneuve, France. Proceedings of the National
Academy of Sciences of the USA 102: 7085–7090.
Benedictow, O. J. 1987. Morbidity in historical plague epidemics. Population
Studies 41: 401–431.
Bentley, G. R., Jasienska, G. and Goldberg, T. 1993. Is the fertility of
agriculturalists higher than that of nonagriculturalists? Current
Anthropology 34: 778–785.
Bergfelder, T. and Herrmann, B. 1980. Estimating fertility on the basis of birth
traumatic changes in the pubic bone. Journal of Human Evolution 9: 611–613.
Bermudez de Castro, J. M. and Dıez, J. C. 1995. Middle Pleistocene mortality
pattern and fertility: the case of the Atapuerca hominids (Sima de los
Huesos, Burgos, Spain). Revista Espanola de Paleontologia 10: 259–272.
references 191
Bermudez de Castro, J. M. and Nicolas, E. 1997. Palaeodemography of the
Atapuerca-SH Middle Pleistocene hominid sample. Journal of Human
Evolution 33: 333–355.
Bermudez de Castro, J. M., Martinon-Torres, M., Lozano, M., Sarmiento, S. and
Muela, A. 2004. Palaeodemography of the Atapuerca-SH hominin sample:
a revision and new approaches to the palaeodemography of the European
Middle Pleistocene population. Journal of Anthropological Research 60: 5–26.
Beynon, A. D. and Dean, M. C. 1988. Distinct dental development patterns in
early fossil hominids. Nature 335: 509–514.
Binford, L. R. 1968. Post-Pleistocene adaptations. In Binford, S. R. and Binford,
L. R. (eds.) New Perspectives in Archeology. Chicago: Aldine, pp. 313–341.
Binford, L. R. and Chasko, W. J. 1976. Nunamiut demographic history: a
provocative case. In Zubrow, E. B. W. (ed.) Demographic Anthropology,
Quantitative Approaches. Albuquerque: University of New Mexico Press,
pp. 63–143.
Bishop, N. A. and Knusel, C. J. 2005. A palaeodemographic investigation of
warfare in prehistory. In Parker Pearson, M. and Thorpe, I. J. N. (eds.)
Warfare, Violence and Slavery in Prehistory. British Archaeological Reports,
International Series, 1374: 201–216.
Blockley, S. M. 2005. Two hiatuses in human bone radiocarbon dates in Britain
(17000 to 5000 cal BP). Antiquity 79: 505–513.
Blurton Jones, N. G., Smith, L. C., O’Connell, J. F., Hawkes, K. and Kamuzora,
C. L. 1992. Demography of the Hadza, an increasing and high density
population of savanna foragers. American Journal of Physical Anthropology
89: 159–181.
Blurton Jones, N. G., Hawkes, K. and O’Connell, J. F. 2002. Antiquity of
postreproductive life: are there modern impacts on hunter-gatherer
postreproductive life spans? American Journal of Human Biology 14: 184–205.
Bocquet-Appel, J-P. 1986. Once upon a time: paleodemography. Mitteil. Berlin
Gesell. Anthropol. Ethnol. Urges. 7: 127–133.
Bocquet-Appel, J-P. and Arsuaga, J-L. 1999. Age distributions of hominid
samples at Atapuerca (SH) and Krapina could indicate accumulation by
catastrophe. Journal of Archaeological Science 26: 327–338.
Bocquet-Appel, J-P. and Bacro, J. N. 1997. Brief communication: estimates of
some demographic parameters in a Neolithic rock-cut chamber
192 references
(approximately 2000 BC) using iterative techniques for ageing and
demographic estimators. American Journal of Physical Anthropology 102:
569–575.
Bocquet-Appel, J-P. and Demars, P. Y. 2000. Neanderthal contraction and
modern human colonization of Europe. Antiquity 74: 544–552.
Bocquet-Appel, J-P. and Masset, C. 1982. Farewell to paleodemography. Journal
of Human Evolution 11: 321–333.
1983. Paleodemography: resurrection or ghost? Journal of Human Evolution 14:
107–111.
Boddington, A. 1987. From bones to population: the problem of numbers. In
Boddington, A., Garland, A. N. and Janaway, R. C. (eds.) Death Decay and
Reconstruction: Approaches to Archaeology and Forensic Science. Manchester:
Manchester University Press, pp. 179–197.
Boer, A. H. 1988. Mortality rates of moose in New Brunswick: a life table
analysis. Journal of Wildlife Management 52: 21–25.
Boldsen, J. L., Milner, G. R., Konigsberg, L. W. and Wood, J. W. 2002. Transition
analysis: a new method for estimating age from skeletons. In Hoppa, R. D.
and Vaupel, J. W. (eds.) Paleodemography. Age Distributions from Skeletal
Samples. Cambridge: Cambridge University Press, pp. 73–106.
Boserup, E. 1965. The Conditions of Agricultural Growth. Chicago: Aldine.
Boucher, B. J. 1957. Sex differences in the foetal pelvis. American Journal of
Physical Anthropology 15: 581–600.
Bourgeois-Pichat, J. 1965. The general development of the population of France
since the eighteenth century. In Glass, D. V. and Eversley, D. E. C. (eds.)
Population in History. London: Arnold, pp. 474–506.
Bouville, C. 1980. L’hypogee chalcolithique de Roaix apport a l’etude de la
demographie en Provence. Bulletin et Memoire de la Societe d’Anthropologie
de Paris 7: 85–89.
Bouwman, A. S. and Brown, T. A. 2005. The limits of biomolecular
palaeopathology: ancient DNA cannot be used to study venereal syphilis.
Journal of Archaeological Science 32: 703–713.
Boylston, A., Holst, M. and Coughlan, J. 2000. Physical anthropology. In
Fiorato, V., Boylston, A. and Knusel, C. (eds.) Blood Red Roses. The
Archaeology of a Mass Grave from the Battle of Towton AD 1461. Oxford:
Oxbow Books, pp. 45–59.

references 193
Brain, C. K. 1981. The Hunters or the Hunted. An Introduction to African Cave
Taphonomy. Chicago: University of Chicago Press.
Brickley, M. 2000. The diagnosis of metabolic disease in archaeological bone. In
Cox, M. and Mays, S. (eds.) Human Osteology in Archaeology and Forensic
Science. London: Greenwich Medical Media, pp. 183–198.
Bromage, T. G. and Dean, M. C. 1985. Re-evaluation of the age at death of
immature fossil hominids. Nature 317: 525–527.
Bronson, B. 1975. The earliest farming: demography as cause and consequence.
In Polgar, S. (ed.) Population, Ecology and Social Evolution. The Hague:
Mouton, pp. 53–78.
Brooks, S. and Suchey, J. M. 1990. Skeletal age determination based on the os
pubis: a comparison of the Acsadi-Nemeskeri and Suchey-Brooks methods.
Human Evolution 5: 227–238.
Brosch, R., Gordon, S. V., Marmiesse, M. et al. 2002. A new evolutionary
scenario for the Mycobacterium tuberculosis complex. Proceedings of the
National Academy of Sciences of the USA 99: 3684–3689.
Brothwell, D. 1967. Major congenital anomalies of the skeleton: evidence from
earlier populations. In Brothwell, D. and Sandison, A. T. (eds.) Diseases in
Antiquity. Springfield: Thomas, pp. 423–443.
Brown, B. M. 1987. Population estimation from floor area: a re-study of ‘Naroll’s
Constant’. Behavior Science Research 21: 1–49.
Brown, K. A. 1998. Gender and sex – what can ancient DNA tell us? Ancient
Biomolecules 2: 3–15.
2000. Ancient DNA applications in human osteoarchaeology: achievements,
problems and potential. In Cox, M. and Mays, S. (eds.) Human Osteology in
Archaeology and Forensic Science. London: Greenwich Medical Media,
pp. 455–473.
Brunborg, H., Lyngstad, T. H. and Urdal, H. 2003. Accounting for genocide: how
many were killed in Srebrenica? European Journal of Population 19:
229–248.
Buck, C. E., Cavanagh, W. G. and Litton, C. D. 1996. Bayesian Approach to
Interpreting Archaeological Data. Chichester: Wiley.
Buckberry, J. L. and Chamberlain, A. T. 2002. Age estimation from the auricular
surface of the ilium: a revised method. American Journal of Physical
Anthropology 119: 231–239.
194 references
Buikstra, J. E. and Konigsberg, L. W. 1985. Paleodemography: critiques and
controversies. American Anthropologist 87: 316–333.
Burmeister, S. 2000. Archaeology and migration. Approaches to an
archaeological proof of migration. Current Anthropology 41: 539–567.
Canny, N. (ed.) 1994. Europeans on the Move. Studies on European Migration,
1500–1800. Oxford: Clarendon Press.
Capelli, C., Redhead, N., Abernethy, J. K. et al. 2003. A Y chromosome census of
the British Isles. Current Biology 13: 979–984.
Carman, J. and Harding, A. (eds.) 1999. Ancient Warfare: Archaeological
Perspectives. Stroud: Sutton.
Carneiro, R. L. 1970. A theory of the origin of the state. Science 169: 733–738.
Caspari, R. and Lee, S-H. 2004. Older age becomes common late in human
evolution. Proceedings of the National Academy of Sciences of the USA 101:
10895–10900.
Casselberry, S. E. 1974. Further refinement of formulae for determining
population from floor area. World Archaeology 6: 117–122.
Caughley, G. 1966. Mortality patterns in mammals. Ecology 47: 906–918.
Cavalli-Sforza, L. L., Menozzi, P. and Piazza, A. 1994. The History and Geography
of Human Genes. Princeton: Princeton University Press.
Chamberlain, A. T. 2000. Problems and prospects in palaeodemography. In Cox,
M. and Mays, S. (eds.) Human Osteology in Archaeology and Forensic
Science. London: Greenwich Medical Media, pp. 101–115.
Chan, C-C., Lin, Y-P., Chen, H-H., Chang, T-Y., Cheng, T-J. and Chen, L-S.
2003. A population-based study on the immediate and prolonged effects of
the 1999 Taiwan earthquake on mortality. Annals of Epidemiology 13:
502–508.
Charnov, E. L. 1993. Life History Invariants. Oxford: Oxford University Press.
Childe, V. G. 1936. Man Makes Himself. London: Watts.
Coale, A. J. 1957. How the age distribution of a human population is determined.
Cold Spring Harbor Symposia on Quantitative Biology 22: 83–88.
Coale, A. J. and Demeny, P. 1983. Regional Model Life Tables and Stable
Populations. 2nd edition. Princeton: Princeton University Press.
Coale, A. J. and Trussell, T. J. 1974. Model fertility schedules: variations in the age
structure of childbearing in human populations. Population Index 40:
185–258.
references 195
Coale, A. J. and Watkins, S. C. 1986. The Decline of Fertility in Europe. Princeton.
Coggon, D., Rose, G. and Barker, D. J. P. 2003. Epidemiology for the Uninitiated.
London: BMJ Books.
Cohen, M. N. 1977. The Food Crisis in Prehistory: Overpopulation and the Origin
of Agriculture. New Haven: Yale University Press.
Cole, L. C. 1954. The population consequences of life history phenomena.
Quarterly Review of Biology 29: 103–137.
Collard, M. 2003. Grades and transitions in human evolution. Proceedings of the
British Academy 106: 6–100.
Collier, S. and White, J. P. 1976. Get them young? Age and sex inferences of
animal domestication in archaeology. American Antiquity 41: 96–102.
Cooper, A and Poinar, H. N. 2000. Ancient DNA: do it right or not at all. Science
289: 1139.
Cox, M. 2000. Assessment of parturition. In Cox, M. and Mays, S. (eds.) Human
Osteology in Archaeology and Forensic Science. London: Greenwich Medical
Media, pp. 131–142.
Cox, M. and Scott, A. 1992. Evaluation of the obstetric significance of some
pelvic characters in an 18th Century British sample of known parity status.
American Journal of Physical Anthropology 89: 431–440.
Crawford, S. 1999. Childhood in Anglo-Saxon England. Stroud: Sutton.
Crosby, A. W. 1976. Virgin soil epidemics as a factor in the aboriginal
depopulation in America. William and Mary Quarterly 33: 289–299.
Crubezy, E., Ludes, B., Poveda, J-D., Clayton, J., Crouau-Roy, B. and
Montagnon, D. 1998. Identification of Mycobacterium DNA in an Egyptian
Pott’s disease of 5400 years old. Comptes Rendu d’ Academie des Sciences,
Paris. Life Sciences 321: 941–951.
Curet, L. A. 1998. New formulae for estimating prehistoric populations for
lowland South America and the Caribbean. Antiquity 72: 359–375.
Daly, M. and Wilson, M. 1984. A sociobiological analysis of human infanticide.
In Haufstater, G. and Hrdy, S. B. (eds.) Infanticide: Comparative and
Evolutionary Perspectives. New York: Aldine, pp. 487–502.
Daniels, J. D. 1992. The Indian population of North America in 1492. William
and Mary Quarterly 49: 298–320.
Dasen, V. 1988. Dwarfism in Egypt and Classical Antiquity: iconography and
medical history. Medical History 32: 253–276.

196 references
Daugherty, H. G. and Kammeyer, K. C. W. 1995. An Introduction to Population,
2nd edition. New York: The Guilford Press.
Dean, M. C. and Beynon, A. D. 1991. Histological reconstruction of crown
formation times and initial root formation times in a modern human child.
American Journal of Physical Anthropology 86: 215–228.
Dean, M. C., Beynon, A. D., Thackeray, J. F. and Whittaker, D. K. 1993. A
longitudinal study of tooth growth in a single individual based on long and
short period incremental markings in dentine and enamel. International
Journal of Osteoarchaeology 3: 249–264.
Dean, [M.]C., Leakey, M. G., Reid, D., Schrenk, F., Schwartz, G. T., Stringer, C.
and Walker, A. 2001. Growth processes in teeth distinguish modern
humans from Homo erectus and earlier hominins. Nature 414: 628–631.
Deevey, E. S. 1947. Life tables for natural populations of animals. The Quarterly
Review of Biology 22: 283–314.
Dennell, R. 1980. The use, abuse and potential of site catchment analysis. In
Findlow, F. J. and Ericson, J. E. (eds.) Catchment Analysis. Essays on
Prehistoric Resource Space. Los Angeles: Department of Anthropology,
University of California, pp. 1–20.
De Roche, C. D. 1983. Population estimates from settlement area and number of
residences. Journal of Field Archaeology 10: 187–192.
Dettwyler, K. A. 1991. Can paleopathology provide evidence for ‘compassion’?
American Journal of Physical Anthropology 84: 375–384.
De Vito, C. and Saunders, S. R. 1990. A discriminant function analysis of
deciduous teeth to determine sex. Journal of Forensic Sciences 35: 845–
858.
De Waal, A. 1989. Famine mortality: a case study of Darfur, Sudan 1984–5.
Population Studies 43: 5–24.
Dickeman, M. 1975. Demographic consequences of infanticide in man. Annual
Review of Ecology and Systematics 6: 107–137.
Donnelly, P. and Tavare, S. 1995. Coalescents and genealogical structure under
neutrality. Annual Review of Genetics 29: 401–421.
Drake, M. 1969. Population and Society in Norway, 1735–1865. Cambridge:
Cambridge University Press.
Drancourt, M., Aboudharam, G., Signoli, M. and Dutour, O. 1998. Detection of
400-year-old Yersinia pestis DNA in human dental pulp: an approach to the

references 197
diagnosis of ancient septicemia. Proceedings of the National Academy of
Sciences of the USA 95: 12637–12640.
Drusini, A., Calliari, I. and Volpe, A. 1991. Root dentine transparency: age
determination of human teeth using computerized densitometric analysis.
American Journal of Physical Anthropology 85: 25–30.
Dumond, D. E. 1965. Population growth and cultural change. Southwestern
Journal of Anthropology 21: 302–324.
Dunbar, R. I. M. 1987. Demography and reproduction. In Smuts, B. B., Cheney,
D. L., Seyfarth, R. M. et al. (eds.) Primate Societies. Chicago: University of
Chicago Press, pp. 240–249.
Dutour, O., Ardagna, Y., Maczel, M. and Signoli, M. 2003. Epidemiology of
infectious diseases in the past. In Greenblatt, C. and Spigelman, M. (eds.)
Emerging Pathogens: the Archaeology, Ecology and Evolution of Infectious
Disease. Oxford: Oxford University Press, pp. 151–165.
Dyke, B., Gage, T. B., Alford, P. L., Swenson, B. and Williams-Blangero, S. 1995.
Model life tables for captive chimpanzees. American Journal of Primatology
37: 25–37.
Early, J. D. and Headland, T. N. 1998. Population Dynamics of a Philippine Rain
Forest People. The San Ildefonso Agta. Gainesville: University of Florida
Press.
Eaton, J. W. and Mayer, A. J. 1953. The social biology of very high fertility among
the Hutterites: the demography of a unique population. Human Biology 25:
206–264.
Ehrlich, P. R. 1968. The Population Bomb. New York: Ballantine Books.
Ell, S. R. 1989. Three days in October of 1630: detailed examination of mortality
during an early modern plague epidemic in Venice. Reviews of the Infectious
Diseases 11: 128–139.
Eshed, V., Latimer, B., Greenwald, C. M. et al. 2002. Button osteoma: its etiology
and pathophysiology. American Journal of Physical Anthropology 118:
217–230.
Eveleth, P. B. and Tanner, J. M. 1990. Worldwide Variation in Human Growth.
2nd edition. Cambridge: Cambridge University Press.
Faerman, M., Bar-Gal, G. K., Filon, D. et al. 1998. Determining the sex of
infanticide victims from the late Roman era through ancient DNA analysis.
Journal of Archaeological Science 25: 861–865.
198 references
Faerman, M., Nebel, A., Filon, D., Thomas, M. G., Bradman, N., Ragsdale, B. D.,
Schultz, M. and Oppenheim, A. 2000. From a dry bone to a genetic
portrait: a case study of sickle cell anemia. American Journal of Physical
Anthropology 111: 153–163.
Fazekas, I. G. and Kosa, F. 1978. Forensic Fetal Osteology. Budapest: Akademiai
Kiado.
Fletcher, R. 1990. Residential densities, group sizes and social stress in Australian
aboriginal settlements. In Meehan, B. and White, N. (eds.) Hunter-Gatherer
Demography. Oceania Monographs 39. Sydney: University of Sydney,
pp. 81–95.
Forster, P. 2004. Ice ages and the mitochondrial DNA chronology of human
dispersals: a review. Philosophical Transactions of the Royal Society of London
B 359: 255–264.
Fort, J., Pujol, T. and Cavalli-Sforza, L. L. 2004. Palaeolithic populations and
waves of advance. Cambridge Archaeological Journal 14: 53–61.
Frayer, D. W., Horton, W. A., Macchiarelli, R. and Mussi, M. 1987. Dwarfism in
an adolescent from the Italian late Upper Palaeolithic. Nature 330: 60–62.
Gage, T. B. 1989. Bio-mathematical approaches to the study of human variation
in mortality. Yearbook of Physical Anthropology 32: 185–214.
1990. Variation and classification of human age patterns of mortality: analysis
using competing hazards models. Human Biology 62: 589–617.
1998. The comparative demography of primates: with some comments on the
evolution of life histories. Annual Review of Anthropology 27: 197–221.
Gage, T. B. and Dyke, B. 1988. Model life tables for the larger Old World
monkeys. American Journal of Primatology 16: 305–320.
1993. Model life tables for the larger Old World monkeys: a revision. American
Journal of Primatology 29: 287–290.
Gage, T. B., Dyke, B. and Riviere, P. G. 1984. Estimating mortality from two
censuses: an application to the Trio of Surinam. Human Biology 56: 489–501.
Gallivan, M. D. 2002. Measuring sedentariness and settlement population:
accumulations research in the Middle Atlantic region. American Antiquity
67: 535–557.
Gamble, C., Davies, W., Pettitt, P. and Richards, M. 2004. Climate change and
evolving human diversity in Europe during the last glacial. Philosophical
Transactions of the Royal Society B 359: 243–254.

references 199
Gernaey, A. M., Minnikin, D. E., Copley, M. S., Dixon, R. A., Middleton, J. C.
and Roberts, C. A. 2001. Mycolic acids and ancient DNA confirm an
osteological diagnosis of tuberculosis. Tuberculosis 81: 259–265.
Gilchrist, R. (ed.) 2003. The Social Commemoration of Warfare. World
Archaeology 35(1).
Goldstein, D. B. and Chikhi, L. 2002. Human migrations and population
structure: what we know and why it matters. Annual Review of Genomics
and Human Genetics 3: 129–152.
Goldstein, M. S. 1953. Some vital statistics based on skeletal material. Human
Biology 25: 3–12.
Goodman, A. H. and Rose, J. C. 1991. Dental enamel hypoplasias as indicators of
nutritional status. In Kelley, M. A. and Larsen, C. S. (eds.) Advances in
Dental Anthropology. New York: Wiley-Liss, pp. 279–293.
Gotherstrom, A., Liden, K., Ahlstrom, T., Kallersjo, M. and Brown, T. A. 1997.
Osteology, DNA and sex identification: morphological and molecular sex
identifications of five Neolithic individuals from Ajvide, Gotland.
International Journal of Osteoarchaeology 7: 71–81.
Gowland, R. L. and Chamberlain, A. T. 2002. A Bayesian approach to ageing
perinatal skeletal material from archaeological sites: implications for
infanticide in Roman Britain. Journal of Archaeological Science 29: 677–
685.
2003. A new method for estimating gestational age from skeletal long bone
length. In Robson Brown, K. A. (ed.) Archaeological Sciences 1999. Oxford,
British Archaeological Reports, British Series 1111: 42–58.
2005. Detecting plague: palaeodemographic characterisation of a catastrophic
death assemblage. Antiquity 79: 146–157.
Grayson, D. K. 1990. Donner party deaths: a demographic assessment. Journal of
Anthropological Research 46: 223–242.
1996. Human mortality in a natural disaster: the Willie Handcart Company.
Journal of Anthropological Research 52: 185–205.
Greene, D. L., Van Gerven, D. P. and Armelagos, G. J. 1986. Life and death in
ancient populations: bones of contention in paleodemography. Human
Evolution 1: 193–207.
Grine, F. E. 1993. Description and preliminary analysis of new hominid
craniodental fossils from the Swartkrans Formation. In Brain, C. K. (ed.)

200 references
Swartkrans: a Cave’s Chronicle of Early Man. Pretoria: Transvaal Museum,
pp. 75–116.
Grupe, G., Price, T. D., Schroter, P., Sollner, F., Johnson, C. M. and Beard, B. L.
1997. Mobility of Bell Beaker people revealed by strontium isotope ratios of
tooth and bone: a study of southern Bavarian skeletal remains. Applied
Geochemistry 12: 517–525.
Guha-Sapir, D. and van Panhuis, W. G. 2003. The importance of conflict-related
mortality in civilian populations. The Lancet 361: 2126–2128.
Guhl, F., Jaramillo, C., Vallejo, G. A., Yockteng, R., Cardenas-Arroyo, F.,
Fornaciari, G., Arriaza, B. and Aufderheide, A. C. 1999. Isolation of
Trypanosoma cruzi DNA in 4,000-year-old mummified human tissue
from Northern Chile. American Journal of Physical Anthropology 108:
401–407.
Gustafson, G. 1950. Age determinations on teeth. Journal of the American Dental
Association 41: 45–54.
Harlow, M. and Laurence, R. 2002. Growing Up and Growing Old in Ancient
Rome. London: Routledge.
Harpending, H. 1994. Infertility and forager demography. American Journal of
Physical Anthropology 93: 385–390.
Harpending, H. C., Sherry, S. T., Rogers, A. R. and Stoneking, M. 1993. The
genetic structure of ancient human populations. Current Anthropology 34:
483–496.
Harpending, H. C., Batzer, M. A., Gurven, M., Jorde, L. B., Rogers, A. R. and
Sherry, S. T. 1998. Genetic traces of ancient demography. Proceedings of the
National Academy of Sciences USA 1998; 95: 1961–1967.
Harrison, G. A. 1995. The Human Biology of the English Village. Oxford: Oxford
University Press.
Harvey, P., Martin, R. D. and Clutton-Brock, T. H. 1987. Life histories in
comparative perspective. In Smuts, B. B., Cheney, D. L., Seyfarth, R. M.
et al. (eds.) Primate Societies. Chicago: University of Chicago Press,
pp. 181–196.
Hassan, F. A. 1973. On mechanisms of population growth during the Neolithic.
Current Anthropology 14: 535–540.
1978. Demographic archaeology. In Schiffer, M. B. (ed.) Advances in
Archaeological Method and Theory Vol. I. New York: Academic, pp. 49–103.
references 201
1981. Demographic Archaeology. New York: Academic.
Hawkes, K., O’Connell, J. F. and Blurton Jones, N. G. 1997. Hadza women’s time
allocation, offspring provisioning, and the evolution of long
postmenopausal life spans. Current Anthropology 38: 551–577.
Hazlewood, L. and Steele, J. 2004. Spatial dynamics of human dispersals.
Constraints on modelling and archaeological validation. Journal of
Archaeological Science 31: 669–679.
Headland, T. N. 1989. Population decline in a Philippine Negrito
hunter-gatherer society. American Journal of Human Biology 1: 59–72.
Helgason, A., Sigurdardottir, S., Nicholson, J., Sykes, B., Hill, E. W., Bradley,
D. G., Bosnes, V., Gulcher, J. R., Ward, R. and Stefansson, K. 2000.
Estimating Scandinavian and Gaelic ancestry in the male settlers of Iceland.
American Journal of Human Genetics 67: 697–717.
Henry, L. 1959. L’age du deces d’apres les inscriptions funeraires. Population 14:
327–329.
Herold, M. W. 2002. US bombing and Afghan civilian deaths: the official neglect
of ‘unworthy’ bodies. International Journal of Urban and Regional Research
26: 626–634.
Herring, D. A., Saunders, S. R. and Katzenberg, M. A. 1998. Investigating the
weaning process in past populations. American Journal of Physical
Anthropology 105: 425–439.
Hewlett, B. S. 1991. Demography and childcare in preindustrial societies. Journal
of Anthropological Research 47: 1–37.
Hildebolt, C. F. and Molnar, S. 1991. Measurement and description of
periodontal disease in anthropological studies. In Kelley, M. A. and Larsen,
C. S. (eds.) Advances in Dental Anthropology New York: Wiley-Liss, pp. 225–
240.
Hill, K., Boesch, C., Goodall, J., Pusey, A., Williams, J., and Wrangham, R. 2001.
Mortality rates among wild chimpanzees. Journal of Human Evolution 40:
437–450.
Hill, K. and Hurtado, A. M. 1995. Ache Life History. The Ecology and Demography
of a Foraging People. New York: Aldine de Gruyter.
Hill, K. and Kaplan, H. 1999. Life history traits in humans: theory and empirical
study. Annual Review of Anthropology 28: 397–430.
Hillson, S. 1996. Dental Anthropology. Cambridge: Cambridge University Press.
202 references
2000. Dental pathology. In Katzenberg, M. A. and Saunders, S. R. (eds.)
Biological Anthropology of the Human Skeleton. New York: Wiley-Liss,
pp. 249–286.
Holcomb, S. M. C. and Konigsberg, L. W. 1995. Statistical study of sexual
dimorphism in the human fetal sciatic notch. American Journal of Physical
Anthropology 97: 113–125.
Hollingsworth, M. F. and Hollingsworth, T. H. 1971. Plague mortality rates by
age and sex in the Parish of St. Botolph’s Without Bishopgate, London,
1603. Population Studies 25: 131–146.
Hollingsworth, T. H. 1969. Historical Demography. London: Hodder and
Stoughton.
Holman, D. J., Wood, J. W. and O’Connor, K. A. 2002. Estimating age-at-death
distributions from skeletal samples: multivariate latent-trait approach. In
Hoppa, R. D. and Vaupel, J. W. (eds.) Paleodemography. Age Distributions
from Skeletal Samples. Cambridge: Cambridge University Press, pp. 193–221.
Hooton, E. A. 1930. The Indians of Pecos Pueblo. A Study of their Skeletal Remains.
New Haven: Yale University Press.
Hopkins, K. 1966. On the probable age structure of the Roman population.
Population Studies 20: 245–264.
Hoppa, R. D. 1992. Evaluating human skeletal growth: an Anglo-Saxon example.
International Journal of Osteoarchaeology 2: 275–288.
Hoppa, R. D. and Vaupel, J. W. (eds.) 2002. Paleodemography. Age Distributions
from Skeletal Samples. Cambridge: Cambridge University Press.
Housley, R. A., Gamble, C. S., Street, M. and Pettitt, P. B. 1997. Radiocarbon
evidence for the Lateglacial human recolonisation of Northern Europe.
Proceedings of the Prehistoric Society 63: 25–54.
Howell, N. 1979. Demography of the Dobe !Kung. New York: Academic Press.
1982. Village composition implied by a paleodemographic life table: the
Libben site. American Journal of Physical Anthropology 59: 263–270.
Howells, W. W. 1960. Estimating population numbers through archaeological
and skeletal remains. In Heizer, R. F. and Cook, S. F. (eds.) The Application
of Quantitative Methods in Archaeology. Chicago: Quadrangle, pp. 158–185.
Huda, T. F. J. and Bowman, J. E. 1995. Age determination from dental
microstructure in juveniles. American Journal of Physical Anthropology 97:
135–150.
references 203
Hummel, S., Herrmann, B., Rameckers, J., Muller, D., Sperling, K., Neitzel, H.
and Tonnies, H. 1999. Proving the authenticity of ancient DNA by
comparative genomic hybridization. Naturwissenschaften 86: 500–503.
Humphrey, L. 2000. Growth studies of past populations: an overview and an
example. In Cox, M. and Mays, S. (eds.) Human Osteology in Archaeology
and Forensic Science. London: Greenwich Medical Media, pp. 23–38.
Hunt, D. R. 1990. Sex determination in the subadult ilia: an indirect test of
Weaver’s nonmetric sexing method. Journal of Forensic Sciences 35:
881–885.
Iraq Body Count. 2004. Available at www.iraqbodycount.net/bodycount.htm
Jackes, M. K. 1985. Pubic symphysis age distributions. American Journal of
Physical Anthropology 68: 281–299.
Janetta, A. B. and Preston, S. H. 1991. Two centuries of mortality change in
central Japan: the evidence from a temple death register. Population Studies
45: 417–436.
Janssens, P. A., Marcsik, A., de Meyere, C. and de Roy, G. 1993. Qualitative and
quantitative aspects of scurvy in ancient bones. Journal of Paleopathology 5:
25–36.
Jantz, R. L. and Owsley, D. W. 2001. Variation among early North American
crania. American Journal of Physical Anthropology 114: 146–155.
Johanson, D. C., White, T. D. and Coppens, Y. 1982. Dental remains from the
Hadar Formation, Ethiopia: 1974–1977 collections. American Journal of
Physical Anthropology 57: 545–603.
John, A. M. 1988. Plantation slave mortality in Trinidad. Population Studies 42:
161–182.
Jones, H. 1990. Population Geography. 2nd edition. London: Chapman.
Jurmain, R. 1999. Stories from the Skeleton: Behavioral Reconstruction in Human
Osteology. Amsterdam: Gordon and Breach.
Kardulias, P. N. 1992. Estimating population size at ancient military sites: the
use of historical and contemporary analogy. American Antiquity 57:
276–287.
Katzenberg, M. A. 2000. Stable isotope analysis: a tool for studying past diet,
demography and life history. In Katzenberg, M. A. and Saunders, S. R.
(eds.) Biological Anthropology of the Human Skeleton. New York: Wiley-Liss,
pp. 305–327.
204 references
Katzenberg, M. A., Herring, D. A. and Saunders, S. R. 1996. Weaning and infant
mortality: evaluating the skeletal evidence. Yearbook of Physical
Anthropology 39: 177–199.
Keeley, L. H. 1996. War Before Civilization. Oxford: Oxford University Press.
Keenleyside, A. 2003. An unreduced dislocated mandible in an Alaskan eskimo: a
case of altrusim or adaptation? International Journal of Osteoarchaeology 13:
384–389.
Kerley, E. R. 1965. The microscopic determination of age in human bone.
American Journal of Physical Anthropology 23: 149–163.
Kidane, A. 1989. Demographic consequences of the 1984–1985 Ethiopian famine.
Demography 26: 515–522.
Kimbel, W. H., Johanson, D. C. and Coppens, Y. 1982. Pliocene hominid cranial
remains from the Hadar Formation, Ethiopia. American Journal of Physical
Anthropology 57: 453–499.
Kimbel, W. H., Johanson, D. C. and Rak, Y. 1994. The first skull and other new
discoveries of Australopithecus afarensis at Hadar, Ethiopia. Nature 368:
449–451.
Kirk, D. 1996. Demographic transition theory. Population Studies 50: 361–387.
Kitch, M. 1992. Population movement and migration in pre-industrial rural
England. In Short, B. (ed.) The English Rural Community. Cambridge:
Cambridge University Press, pp. 62–84.
Klein, R. G. and Cruz-Uribe, K. 1984. The Analysis of Animal Bones from
Archaeological Sites. Chicago: University of Chicago Press.
Knodel, J. 1978. Natural fertility in pre-industrial Germany. Population Studies
32: 481–510.
Kolb, C. C. 1985. Demographic estimates in archaeology: contributions from
ethnoarchaeology on Mesoamerican peasants. Current Anthropology 26:
581–599.
Kolman, C. J., Centurion-Lara, A., Lukehart, S. A., Owsley, D. W. and Tuross, N.
1999. Identification of Treponema pallidum subspecies pallidum in a
200-year old skeletal specimen. Journal of Infectious Diseases 180: 2060–
2063.
Komar, D. 2003. Lessons from Srebrenica: the contributions and limitations of
physical anthropology in identifying victims of war crimes. Journal of
Forensic Sciences 48: 713–716.
references 205
Konigsberg, L. W. and Frankenberg, S. R. 1992. Estimation of age structure in
anthropological demography. American Journal of Physical Anthropology
89: 235–256.
2002. Deconstructing death in paleodemography. American Journal of Physical
Anthropology 117: 297–309.
Konigsberg, L. W., Frankenberg, S. R. and Walker, R. B. 1997. Regress what on
what? Paleodemographic age estimation as a calibration problem. In Paine,
R. R. (ed.) Integrating Archaeological Demography: Multidisciplinary
Approaches to Prehistoric Population. Carbondale: Southern Illinois
University, pp. 64–88.
Konigsberg, L. W. and Herrmann, N. P. 2002. Markov chain Monte Carlo
estimation of hazard model parameters in paleodemography. In Hoppa,
R. D. and Vaupel, J. W. (eds.) Paleodemography. Age Distributions from
Skeletal Samples. Cambridge: Cambridge University Press, pp. 222–242.
Konomi, N., Lebwohl, E., Mowbray, K., Tattersall, I. and Zhang, D. 2002.
Detection of mycobacterial DNA in Andean mummies. Journal of Clinical
Microbiology 40: 4738–4740.
Kosa, F. 1989. Age estimation from the fetal skeleton. In Iscan, M. Y. (ed.) Age
Markers in the Human Skeleton. Springfield: Thomas, pp. 21–54.
Kramer, C. 1982. Village Ethnoarchaeology. Rural Iran in Archaeological
Perspective. New York: Academic Press.
Kramer, K. L. and Boone, J. L. 2002. Why intensive agriculturalists have higher
fertility: a household energy budget approach. Current Anthropology 43:
511–517.
Kreager, P. 1997. Population and identity. In Kertzer, D. I. and Fricke, D. (eds.)
Anthropological Demography. Chicago: University of Chicago Press,
pp. 139–174.
Krings, M., Stone, A., Schmitz, R., Krainitzki, H., Stoneking, M. and Paabo, S.
1997. Neandertal DNA sequences and the origin of modern humans. Cell
90: 19–30.
Krings, M., Capelli, C., Tshentscher, F., Geisert, H., Meyer, S., von Haeseler, A.,
Grossschmidt, K., Possnert, G., Paunovic, M. and Paabo, S. 2000. A view of
Neandertal genetic diversity. Nature Genetics 26: 144–146.
Krogman, W. M. and Iscan, M. Y. 1986. The Human Skeleton in Forensic
Medicine. 2nd edition. Springfield: Thomas.

206 references
Laluela-Fox, C., Sampietro, M. L., Caramelli, D., Puder, Y., Lari, M., Calafell, F.,
Martınez-Maza, C., Bastir, M., Fortea, J., de la Rasilla, M., Bertranpetit, J.
and Rosas, A. 2005. Neandertal evolutionary genetics: mitochondrial DNA
data from the Iberian peninsula. Molecular Biology and Evolution 22:
1077–1081.
Langford, C. 2002. The age pattern of mortality in the 1918–19 influenza
pandemic: an attempted explanation based on data for England and Wales.
Medical History 46: 1–20.
Larsen, C. S. 1997. Bioarchaeology. Cambridge: Cambridge University Press.
Larsen, C. S. and Milner, G. R. (eds.) 1994. In the Wake of Contact: Biological
Responses to Conquest. New York: Wiley-Liss.
Larsen, C. S., Shavit, R. and Griffin, M. C. 1991. Dental caries evidence for
dietary change: an archaeological context. In Kelley, M. A. and Larsen, C. S.
(eds.) Advances in Dental Anthropology. New York: Wiley-Liss, pp. 179–202.
Laslett, P. 1969. Size and structure of the household in England over three
centuries. Population Studies 23: 199–223.
1972. Mean household size in England since the sixteenth century. In Laslett, P.
(ed.) Household and the Family in Past Time: Comparative Studies in the Size
and Structure of the Domestic Group. Cambridge, Cambridge University
Press, pp. 125–158.
Lassen, C., Hummel, S. and Herrmann, B. 1996. PCR based sex identification of
ancient human bones by amplification of X- and Y-chromosomal
sequences: a comparison. Ancient Biomolecules 1: 25–33.
Leader-Williams, N. 1988. Reindeer on South Georgia. Cambridge: Cambridge
University Press.
Le Blanc, S. 1971. An addition to Naroll’s suggested floor area and settlement
population relationship. American Antiquity 36: 210–211.
LeBras, H. and Wachter, K. W. 1978. Living forbears in stable populations. In
Wachter, K. W., Hammel, E. A. and Laslett, P. (eds.) Statistical Studies of
Historical Social Structure. New York, Academic Press, pp. 163–188.
Lee, R. B. 1972. Population growth and the beginnings of sedentary life among
the !Kung Bushmen. In Spooner, S. (ed.) Population Growth:
Anthropological Implications. Cambridge, MA: MIT Press, pp. 329–342.
1979. The !Kung San. Cambridge: Cambridge University Press.
references 207
Leslie, P. H. 1945. On the use of matrices in certain population mathematics.
Biometrika 33: 183–212.
1948. Some further notes on the use of matrices in population mathematics.
Biometrika 35: 213–245.
Lewis, E. G. 1942. On the generation and growth of a population. Sankhya 6:
93–96.
Lieberman, D. E. 1994. The biological basis for seasonal increments in dental
cementum and their application to archaeological research. Journal of
Archaeological Science 21: 525–539.
Lietman, T., Porco, T. and Blower, S. 1997. Leprosy and tuberculosis: the
epidemiological consequences of cross-immunity. American Journal of
Public Health 87: 1923–1927.
Lieverse, A. R. 1999. Diet and the aetiology of dental calculus. International
Journal of Osteoarchaeology 9: 219–232.
Liversidge, H. M. and Molleson, T. I. 1999. Developing permanent tooth length
as an estimate of age. Journal of Forensic Sciences 44: 917–920.
Liversidge, H. M., Dean, M. C. and Molleson, T. I. 1993. Increasing human tooth
length between birth and 5.4 years. American Journal of Physical
Anthropology 90: 307–313.
Lockwood, C. A. and Tobias, P. V. 2002. Morphology and affinities of new
hominin cranial remains from Member 4 of the Sterkfontein Formation,
Gauteng Province, South Africa. Journal of Human Evolution 42: 389–450.
Lovejoy, C. O., Meindl, R. S., Pryzbeck, T. R., Barton, T. S., Heiple, K. G. and
Kotting, D. 1977. Paleodemography of the Libben Site, Ottawa, Ohio.
Science 198: 291–293.
Lovejoy, C. O., Meindl, R. S., Pryzbeck, T. R. and Mensforth, R. P. 1985.
Chronological metamorphosis of the auricular surface of the ilium: a new
method for the determination of adult skeletal age at death. American
Journal of Physical Anthropology 68: 15–28.
Lowe, J. C. and Morydas, S. 1975. The Geography of Movement. Boston:
Houghton-Mifflin.
Lucy, D., Aykroyd, R. G., Pollard, A. M. and Solheim, T. 1996. A Bayesian
approach to adult human age estimation from dental observations by
Johanson’s age changes. Journal of Forensic Sciences 41: 189–194.
208 references
Luongo, G., Perotta, A., Scarpati, C., De Carolis, E., Patricelli, G. and Ciarallo, A.
2003. Impact of the AD 79 explosive eruption on Pompeii, II. Causes of
death of the inhabitants inferred by stratigraphic analysis and areal
distribution of the human casualties. Journal of Volcanology and Geothermal
Research 126: 169–200.
Lyman, R. L. 1987. On the analysis of vertebrate mortality profiles: sample size,
mortality type, and hunting pressure. American Antiquity 52: 125–142.
Lynnerup, N. 1998. The Greenland Norse: a Biological-Anthropological Study.
Meddelelser om Grønland, Man and Society 24. Copenhagen: The
Commission for Scientific Research in Greenland.
McDaniel, A. 1992. Extreme mortality in nineteenth century Africa: the case of
Liberian immigrants. Demography 29: 581–594.
McElroy, A. and Townsend, P. K. 1996. Medical Anthropology in Ecological
Perspective. Boulder: Westview Press.
McKeown, T. 1976. The Modern Rise of Population. New York: Academic Press.
McKern, T. W. and Stewart, T. D. 1957. Skeletal Age Changes in Young American
Males. Natick: Quartermaster Research and Development Command.
McKinley, K. 1971. Survivorship in gracile and robust australopithecines: a
demographic comparison and a proposed birth model. American Journal of
Physical Anthropology 34: 417–426.
McNeil, W. H. 1979. Plagues and Peoples. London: Penguin.
Maharatna, A. 1996. The Demography of Famines. An Indian Historical
Perspective. Delhi: Oxford University Press.
Mann, A. 1975. Some Paleodemographic Aspects of the South African
Australopithecines. Philadelphia: University of Pennsylvania.
Manning, P. and Griffiths, W. S. 1988. Divining the unprovable: simulating the
demography of African slavery. Journal of Interdisciplinary History 19:
177–201.
Maresh, M. M. 1955. Linear growth of long bones of extremities from infancy
through adolescence. American Journal of Diseases of Children 89: 725–742.
Maresh, M. M. and Deming, J. 1939. The growth of long bones in 80 infants.
Child Development 10: 91–100.
Margerison, B. J. and Knusel, C. J. 2002. Paleodemographic comparison of a
catastrophic and attritional death assemblage. American Journal of Physical
Anthropology 119: 134–143.
references 209
Marsden, P. and West, B. 1992. Population change in Roman London. Britannia
23: 133–140.
Martin, D. L. and Frayer, D. W. (eds.) 1997. Troubled Times: Violence and Warfare
in the Past. Amsterdam: Gordon and Breach.
Martin, P. S. 1973. The discovery of America. Science 179: 969–974.
Masset, C. 1976. Sur la mortalite chez les anciens Indiens de l’Illinois. Current
Anthropology 17: 128–132.
Mays, S. 1993. Infanticide in Roman Britain. Antiquity 67: 883–888.
1996. Healed limb amputations in human osteoarchaeology and their causes:
a case study from Ipswich, U.K. International Journal of Osteoarchaeology 6:
101–113.
2003. Comment on ‘A Bayesian approach to ageing perinatal skeletal material
from archaeological sites: implications for the evidence for infanticide in
Roman Britain’ by R. L. Gowland and A. T. Chamberlain. Journal of
Archaeological Science 30: 1695–1700.
Mays, S. and Cox, M. 2000. Sex determination in skeletal remains. In Cox, M.
and Mays, S. (eds.) Human Osteology in Archaeology and Forensic Science.
London: Greenwich Medical Media, pp. 117–130.
Me-Bar, Y. and Valdez, F. 2004. Recovery time after a disaster and the ancient
Maya. Journal of Archaeological Science 31: 1311–1324.
Meindl, R. S. and Lovejoy, C. O. 1985. Ectocranial suture closure: a revised
method for the determination of skeletal age at death based on the
lateral-anterior sutures. American Journal of Physical Anthropology 68:
57–66.
Meindl, R. S. and Russell, K. F. 1998. Recent advances in method and theory in
paleodemography. Annual Review of Anthropology 27: 375–399.
Meindl, R. S., Lovejoy, C. O. and Mensforth, R. P. 1983. Skeletal age at death:
accuracy of determination and implications for paleodemography. Human
Biology 55: 73–87.
Meindl, R. S., Lovejoy, C. O., Mensforth, R. P. and Walker, R. A. 1985a. A revised
method of age determination using the os pubis, with a review and tests of
accuracy of other current methods of pubic symphyseal aging. American
Journal of Physical Anthropology 68: 29–45.
Meindl, R. S., Lovejoy, C. O., Mensforth, R. P. and Carlos, L. D. 1985b.
Accuracy and direction of error in the sexing of the skeleton: implications
210 references
for paleodemography. American Journal of Physical Anthropology 68: 79–
85.
Meltzer, D. J. 1995. Clocking the first Americans. Annual Review of Anthropology
24: 21–45.
Mensforth, R. P. and Lovejoy, C. O. 1985. Anatomical, physiological, and
epidemiological correlates of the aging process: a confirmation of
multifactorial age determination in the Libben skeletal population.
American Journal of Physical Anthropology 68: 87–106.
Miles, A. E. W. 1963. The dentition in the assessment of individual age in skeletal
material. In Brothwell, D. R. (ed.) Dental Anthropology. Oxford: Pergamon,
pp. 191–209.
1989. An Early Christian Chapel and Burial Ground on the Isle of Ensay, Outer
Hebrides, Scotland with a Study of the Skeletal Remains. Oxford. British
Archaeological Reports, British Series 212.
2001. The Miles method for assessing age from tooth wear revisited. Journal of
Archaeological Science 28: 973–982.
Milner, G. R. and Larsen, C. S. 1991. Teeth as artifacts of human behavior:
intentional mutilation and accidental modification. In Kelley, M. A. and
Larsen, C. S. (eds.) Advances in Dental Anthropology. New York: Wiley-Liss,
pp. 357–378.
Milner, G. R., Humpf, D. A. and Harpending, H. C. 1989. Pattern matching of
age at death distributions in paleodemographic analysis. American Journal
of Physical Anthropology 80: 49–58.
Mineau, G. P., Bean, L. L. and Skolnick, M. 1979. Mormon demographic
history II: the family cycle and natural fertility. Population Studies 33:
429–446.
Moch, L. P. 1992. Moving Europeans: Migration in Western Europe since 1650.
Bloomington: Indiana University Press.
Molleson, T., Cruse, K. and Mays, S. 1998. Some sexually dimorphic features of
the human juvenile skull and their value in sex determination in immature
skeletal remains. Journal of Archaeological Science 25: 719–728.
Moore, P. S., Marfin, A. A., Quenemoen, L. E., Gessner, B. D., Ayub, Y. S., Miller,
D. S., Sullivan, K. M. and Toole, M. J. 1993. Mortality rates in displaced and
resident populations of central Somalia during 1992 famine. The Lancet 341:
935–938.

references 211
Moorrees, C. F. A., Fanning, E. A. and Hunt, E. E. 1963a. Formation and
resorption of three deciduous teeth in children. American Journal of
Physical Anthropology 21: 205–213.
1963b. Age variation of formation stages for ten permanent teeth. Journal of
Dental Research 42: 1490–1502.
Naroll, R. 1962. Floor area and settlement population. American Antiquity 27:
587–589.
Nemeskeri, J., Harsanyi, L. and Acsadi, G. 1960. Methoden zur diagnose des
lebensalters von skelettfunden. Anthropologischer Anzeiger 24: 70–95.
Nettle, D. 1999. Linguistic diversity of the Americas can be reconciled with a
recent colonization. Proceedings of the National Academy of Sciences of the
USA 96: 3325–3329.
Newell, C. 1988. Methods and Models in Demography. London: Belhaven.
Nolan, J. 1998. The Newcastle Infirmary at the Forth, Newcastle upon Tyne.
Volume I: The Archaeology and History. Unpublished report by Northern
Counties Archaeological Services for Tyne and Wear Development
Corporation.
Nordberg, H. 1963. Biometrical notes: the information on ancient Christian
inscriptions from Rome concerning the duration of life and the dates of birth
and death. Helsinki.
Notestein, F. 1945. Population – the long view. In Schultz, T. W. (ed.) Food for the
World. Chicago: University of Chicago Press, pp. 36–57.
Olshansky, S. J., Carnes, B. A. and Cassel, C. 1990. In search of Methuselah:
estimating the upper limits to human longevity. Science 250: 634–640.
Ortner, D. J., Butler, W., Cafarella, J. and Milligan, L. 2001. Evidence of probable
scurvy in subadults from archaeological sites in North America. American
Journal of Physical Anthropology 114: 343–351.
Ortner, D. J. and Ericksen, M. F. 1997. Bone changes in the human skull probably
resulting from scurvy in infancy and childhood. International Journal of
Osteoarchaeology 7: 212–220.
Ortner, D. J., Kimmerle, E. H. and Diez, M. 1999. Probable evidence of scurvy in
subadults from archaeological sites. American Journal of Physical
Anthropology 108: 321–331.
Ortner, D. J. and Mays, S. 1998. Dry bone manifestations of rickets in infancy
and early childhood. International Journal of Osteoarchaeology 8: 45–55.

212 references
Ortner, D. J. and Putschar, W. G. J. 1985. Identification of Pathological Conditions
in Human Skeletal Remains. Washington DC: Smithsonian Institution
Press.
Orton, C. 2000. Sampling in Archaeology. Cambridge: Cambridge University
Press.
Otterbein, K. F. 2000. Killing of captured enemies: a cross-cultural study.
Current Anthropology 41: 439–443.
Ovchinnikov, I. V., Gotherstrom, A., Romanova, G. P., Kharitonov, V. M., Liden,
K. and Goodwin, W. 2000. Molecular analysis of Neandertal DNA from the
northern Caucasus. Nature 404: 490–493.
Owsley, D. W. and Jantz, R. L. 1985. Long bone lengths and gestational age
distributions of post-contact Arikara Indian perinatal infant skeletons.
American Journal of Physical Anthropology 68: 321–328.
Paine, R. R. 1989. Model life tables as a measure of bias in the Grasshopper
Pueblo skeletal series. American Antiquity 54: 820–824.
Parker, G. 1972. The Army of Flanders and the Spanish Road, 1567–1659.
Cambridge: Cambridge University Press.
Parker Pearson, M. and Thorpe, I. J. N. (eds.) 2005. Warfare, Violence and
Slavery in Prehistory. British Archaeological Reports, International Series,
1374.
Pavelka, M. S. M. and Fedigan, L. M. 1991. Menopause: a comparative life history
perspective. Yearbook of Physical Anthropology 34: 13–38.
Pennington, R. and Harpending, H. 1988. Fitness and fertility among Kalahari
!Kung. American Journal of Physical Anthropology 77: 303–319.
Pettitt, P. B. 1999. Disappearing from the world: an archaeological perspective on
Neanderthal extinction. Oxford Journal of Archaeology 18: 217–240.
Phenice, T. W. 1969. A newly developed visual method of sexing the os pubis.
American Journal of Physical Anthropology 30: 297–301.
Pianka, E. R. 1978. Evolutionary Ecology, 2nd edition. New York: Harper and
Row.
Piontek, J., Jerszynska, B. and Segeda, S. 2001. Long bones growth variation
among prehistoric agricultural and pastoral populations from Ukraine
(Bronze Era to Iron Age). Variability and Evolution 9: 61–73.
Plane, D. A. and Rogerson, P. A. 1994. The Geographical Analysis of Population,
With Applications to Planning and Business. New York: Wiley.
references 213
Post, J. B. 1971. Ages at menarche and menopause: some mediaeval authorities.
Population Studies 25: 83–87.
Postgate, N. 1994. How many Sumerians per hectare? Probing the anatomy of an
early city. Cambridge Archaeological Journal 4: 47–65.
Pressat, R. 1985. The Dictionary of Demography. Oxford: Blackwell.
Preston, S. H. 1983. An integrated system for demographic estimation from two
age distributions. Demography 20: 213–226.
Price, T. D., Bentley, R. A., Luning, J., Gronenborn, D. and Wahl, J. 2001.
Prehistoric human migration in the Linearbandkeramik of Central Europe.
Antiquity 75: 593–603.
Pusch, C. M., Broghammer, M., Nicholson, G. J., Nerlich, A. G., Zink, A.,
Kennerknecht, I., Bachman, L. and Blin, N. 2004. PCR-induced sequence
alterations hamper the typing of prehistoric bone samples for diagnostic
achondroplasia mutation. Molecular Biology and Evolution 21: 2005–2011.
Radlauer, D. 2002. An engineered tragedy: statistical analysis of casualities in the
Palestinian-Israeli conflict, September 2000 – September 2002. Available at:
www.ict.org.il/articles/articledet.cfm?articleid = 439
Rafi, A., Spiegelman, M., Stanford, J., Lemma, E., Donoghue, H. and Zias, J.
1994. DNA of Mycobacterium leprae detected by PCR in ancient bone.
International Journal of Osteoarchaeology 4: 287–290.
Rainio, J., Lalu, K. and Penttila, A. 2001. Independent forensic autopsies in an
armed conflict: investigation of the victims from Racak, Kosovo. Forensic
Science International 116: 171–185.
Ramirez Rozzi, F. V. and Bermudez de Castro, J. M. 2004. Surprisingly rapid
growth in Neanderthals. Nature 428: 936–939.
Relethford, J. H. 1994. Craniometric variation among modern human
populations. American Journal of Physical Anthropology 95: 53–62.
Renfrew, C. 1973. Before Civilisation. London: Cape.
Resnick, D. 2002. Diagnosis of Bone and Joint Diseases. 4th edition. London:
Saunders.
Reynolds, J., Weir, B. S. and Cockerham, C. C. 1983. Estimation of the coancestry
coefficient: basis for a short-term genetic distance. Genetics 105: 767–779.
Richards, L. C. and Miller, S. L. J. 1991. Relationship between age and dental
attrition in Australian aboriginals. American Journal of Physical
Anthropology 84: 159–164.

214 references
Richards, M., Corte-Real, H., Forster, P. et al. 1996. Paleolithic and Neolithic
lineages in the European mitochondrial gene pool. American Journal of
Human Genetics 59: 185–203.
Richardson, A. 2000. The numerical basis of Roman camps. Oxford Journal of
Archaeology 19: 425–437.
Rick, J. 1987. Dates as data: an examination of the Peruvian preceramic
radiocarbon record. American Antiquity 52: 55–73.
Roberts, C. 1986. Leprosy and leprosaria in Medieval Britain. MASCA Journal 4:
15–21.
2000a. Trauma in biocultural perspective: past, present and future work in
Britain. In Cox, M. and Mays, S. (eds.) Human Osteology in Archaeology and
Forensic Science. London: Greenwich Medical Media, pp. 337–356.
2000b. Did they take sugar? The use of skeletal evidence in the study of past
disability in past populations. In Hubert, J. (ed.) Madness, disability and
social exclusion. The archaeology and anthropology of ‘difference’. London:
Routledge, pp. 46–59.
Roberts, C. and Cox, M. 2003. Health and Disease in Britain from Prehistory to
the Present Day. Stroud: Sutton.
Roberts, C. and Manchester, K. 1995. The Archaeology of Disease. Stroud:
Sutton.
Roberts, G. W. 1952. A life table for a West Indian slave population. Population
Studies 5: 238–242.
Roberts, L., Lafta, R., Garfield, R., Khudhairii, J. and Burnham, G. 2004.
Mortality before and after the 2003 invasion of Iraq: cluster sample survey.
The Lancet 364: 1857–1864.
Robling, A. G. and Stout, S. D. 2000. Histomorphometry of human cortical
bone: applications to age estimation. In Katzenberg, M. A. and Saunders,
S. R. (eds.) Biological Anthropology of the Human Skeleton. New York:
Wiley-Liss, pp. 187–213.
Roff, D. A. 1992. The Evolution of Life Histories. Theory and Analysis. New York:
Chapman and Hall.
Rogers, A. 1988. Age patterns of elderly migration: an international comparison.
Demography 25: 355–370.
Rogers, A. R. 1995. Genetic evidence for a Pleistocene population explosion.
Evolution 49: 608–615.

references 215
Rogers, T. L. 2005. Determining the sex of human remains through cranial
morphology. Journal of Forensic Sciences 50: 493–500.
Roper, D. C. 1979. The method and theory of site catchment analysis: a review. In
Schiffer, M. B. (ed.) Advances in Archaeological Method and Theory Vol. II.
New York: Academic, pp. 119–140.
Rosing, F. W. 1983. Sexing immature human skeletons. Journal of Human
Evolution 12: 149–155.
Ruff, C. B. 1981. A reassessment of demographic estimates for Pecos Pueblo.
American Journal of Physical Anthropology 54: 147–151.
Saller, R. 1994. Patriarchy, Property and Death in the Roman Family. Cambridge:
Cambridge University Press.
Sarkar, N. K. 1951. A note on abridged life tables for Ceylon, 1900–1947.
Population Studies 4: 439–443.
Sattenspiel, L. and Harpending, H. 1983. Stable populations and skeletal age.
American Antiquity 48: 489–498.
Saunders, S. R. and Hoppa, R. D. 1993. Growth deficit in survivors and
non-survivors: biological mortality bias in subadult skeletal samples.
Yearbook of Physical Anthropology 36: 127–151.
Saunders, S.[R.], Hoppa, R.[D.] and Southern, R. 1993. Diaphyseal growth in a
nineteenth century skeletal sample of subadults from St Thomas’ Church,
Belleville, Ontario. International Journal of Osteoarchaeology 3: 265–281.
Schact, R. M. 1981. Estimating past population trends. Annual Review of
Anthropology 10: 119–140.
Scheidel, W. 1996. Measuring sex, age and death in the Roman Empire. Journal of
Roman Archaeology Supplementary Series 21: 1–184.
Scheuer, [J.]L. and Black, S. 2000a. Development and ageing of the juvenile
skeleton. In Cox, M. and Mays, S. (eds.) Human Osteology in Archaeology
and Forensic Science. London: Greenwich Medical Media, pp. 9–21.
2000b. Juvenile Developmental Osteology. London: Academic Press.
Scheuer, J. L., Musgrave, J. H., and Evans, S. P. 1980. The estimation of late fetal
and perinatal age from limb bone length by linear and logarithmic
regression. Annals of Human Biology 7: 257–265.
Schiffer, M. B. 1976. Behavioral Archeology. New York: Academic Press.
Schultz, M. 2001. Paleohistopathology of bone: a new approach to the study of
ancient diseases. Yearbook of Physical Anthropology 44: 106–147.

216 references
Schutkowski, H. 1993. Sex determination of infant and juvenile skeletons. I.
Morphognostic features. American Journal of Physical Anthropology 90:
199–205.
Schwarz, C., Davidson, G., Seaton, A. and Tebbit, V. (eds.) 1990. Chambers
English Dictionary. Edinburgh: W. and R. Chambers Ltd.
Scott, S. and Duncan, C. J. 1998. Human Demography and Disease. Cambridge:
Cambridge University Press.
Scott, S., Duncan, C. J. and Duncan, S. R. 1996. The plague in Penrith, Cumbria,
1597/8: its causes, biology and consequences. Annals of Human Biology 23:
1–21.
Scrimshaw, N. S. 1987. The phenomenon of famine. Annual Reviews of Nutrition
7: 1–21.
Scrimshaw, S. C. M. 1984. Infanticide in human populations: societal and
individual concerns. In Haufstater, G. and Hardy, S. B. (eds.) Infanticide:
Comparative and Evolutionary Perspectives. New York: Aldine, pp. 439–462.
Sealy, J. 2001. Body tissue chemistry and palaeodiet. In Brothwell, D. R. and
Pollard, A. M. (eds.) Handbook of Archaeological Sciences. Chichester:
Wiley, pp. 269–279.
Seaman, J., Leivesley, S. and Hogg, C. 1984. Epidemiology of Natural Disasters.
Basel: Karger.
Seielstad, M. T., Minch, E. and Cavalli-Sforza, L. L. 1998. Genetic evidence for a
higher female migration rate. Nature Genetics 20: 278–280.
Sellen, D. W. and Mace, R. 1997. Fertility and mode of subsistence: a
phylogenetic analysis. Current Anthropology 38: 878–888.
Serre, D., Langaney, A., Chech, M., Teschler-Nicola, M., Paunovic, M.,
Mennecier, P., Hofreiter, M., Possnert, G. and Paabo, S. 2004. No evidence
of Neandertal mtDNA contribution to early modern humans. PLoS Biology
2: 0313–0317.
Shahar, S. 1993. Who were old in the Middle Ages? Social History of Medicine 6:
313–341.
Sharpe, F. R. and Lotka, A. J. 1911. A problem in age distribution. Philosophical
Magazine 6: 435–438.
Shaw, B. D. 1996. Seasons of death: aspects of mortality in Imperial Rome.
Journal of Roman Studies 86: 100–138.
references 217
Shennan, S. 2000. Population, culture history, and the dynamics of culture
change. Current Anthropology 41: 811–835.
2001. Demography and cultural innovation: a model and its implications for
the emergence of modern human culture. Cambridge Journal of Archaeology
11: 5–16.
2002. Genes, Memes and Human History. Darwinian Archaeology and Cultural
Evolution. London: Thames and Hudson.
Sheridan, R. B. 1985. Doctors and Slaves: a Medical and Demographic History of
Slavery in the British West Indies 1680–1834. Cambridge: Cambridge
University Press.
Sherwood, R. J., Meindl, R. S., Robinson, H. B. and May, R. L. 2000. Fetal age:
methods of estimation and effects of pathology. American Journal of
Physical Anthropology 113: 305–315.
Short, R. V. and Balaban, E. (eds.) 1994. The Differences Between the Sexes.
Cambridge: Cambridge University Press.
Sief, D. 1990. Explaining biased sex ratios in human populations. Current
Anthropology 31: 25–48.
Signoli, M., Seguy, I., Biraben, J.-N. and Dutour, O. 2002. Paleodemography and
historical demography in the context of an epidemic: plague in Provence in
the eighteenth century. Population 57: 829–854.
Siler, W. 1979. A competing-risk model for animal mortality. Ecology 60:
750–757.
1983. Parameters of mortality in human populations with widely varying life
spans. Statistics in Medicine 2: 373–380.
Skinner, G. W. 1997. Family systems and demographic processes. In Kertzer, D. I.
and Fricke, T. (eds.) Anthropological Demography. Chicago: University of
Chicago Press, pp. 53–95.
Smith, B. H. 1989. Dental development as a measure of life history in primates.
Evolution 43: 683–688.
1991. Standards of human tooth formation and dental age assessment. In
Kelley, M. A. and Larsen, C. S. (eds.) Advances in Dental Anthropology. New
York: Wiley-Liss, pp. 143–168.
Smith, B. H. and Tompkins, R. L. 1995. Toward a life history of the hominidae.
Annual Review of Anthropology 24: 257–279.

218 references
Smith, B. H., Crummett, T. L. and Bradt, K. L. 1994. Ages of eruption of primate
teeth: a compendium for ageing individuals and comparing life histories.
Yearbook of Physical Anthropology 37: 177–232.
Smith, P. and Kahila, G. 1992. Identification of infanticide in archaeological sites:
a case study from the late Roman-early Byzantine periods at Ashkelon,
Israel. Journal of Archaeological Science 19: 667–675.
Smith, T. E. 1960. The Cocos-Keeling Islands: a demographic laboratory.
Population Studies 14: 94–130.
Snow, D. R. 1996. Mohawk demography and the effects of exogenous epidemics
on American Indian populations. Journal of Anthropological Archaeology 15:
160–182.
Sokal, R. R., Oden, N. L. and Wilson, C. 1991. Genetic evidence for the spread of
agriculture in Europe by demic diffusion. Nature 351: 143–145.
Solheim, T. 1989. Dental root translucency as an indicator of age Scandinavian
Journal of Dental Research 97: 189–197.
Sorg, M. H., Andrews, R. P. and Iscan, M. Y. 1989. Radiographic ageing of the
adult. In Iscan, M. Y. (ed.) Age Markers in the Human Skeleton. Springfield:
Thomas, pp. 169–193.
Spiegel, P. B. and Salama, P. 2000. War and mortality in Kosovo, 1998–99: an
epidemiological testimony. The Lancet 355: 2204–2209.
Stearns, S. C. 1992. The Evolution of Life Histories. New York: Oxford University
Press.
Steele, J., Adams, J. and Sluckin, T. 1998. Modelling paleoindian dispersals. World
Archaeology 30: 286–305.
Stewart, T. D. 1970. Identification of the scars of parturition in the skeletal
remains of females. In Stewart, T. D. (ed.) Personal Identification
in Mass Disasters. Washington: Smithsonian Institution, pp. 127–
135.
Stiner, M. C. 1991. An interspecific perspective on the emergence of the modern
human predatory niche. In Stiner, M. C. (ed.) Human Predators and Prey
Mortality. Boulder: Westview Press, pp. 150–185.
Stone, A. C., Milner, G. R., Paabo, S. and Stoneking, M. 1996. Sex determination
of ancient human skeletons using DNA. American Journal of Physical
Anthropology 99: 231–238.
references 219
Stone, A. C. and Stoneking M. 1999. Analysis of ancient DNA from a prehistoric
Amerindian cemetery. Philosophical Transactions of the Royal Society B, 354:
143–149.
Storey, G. R. 1997. The population of ancient Rome. Antiquity 71: 966–978.
Storey, R. 1985. An estimate of mortality in a Pre-Columbian urban population.
American Anthropologist 87: 519–535.
Stringer, C. B., Dean, M. C. and Martin, R. D. 1990. A comparative study of
cranial and dental development within a recent British sample and among
Neandertals. In Rousseau, C. J. (ed.) Primate Life History and Evolution.
New York: Wiley-Liss, pp. 115–152.
Stuart-Macadam, P. L. 1989. Nutritional deficiency diseases: a survey of scurvy,
rickets and iron-deficiency anemia. In Iscan, M. Y. and Kennedy, K. A. R.
(eds.) Reconstructing Life from the Skeleton. New York: Wiley-Liss,
pp. 210–222.
Stuart-Macadam, P. and Kent, S. (eds.) 1992. Diet, Demography and Disease:
Changing Perspectives on Anemia. New York: Aldine de Gruyter.
Suchey, J. M., Wisely, D. V., Green, R. F. and Noguchi, T. T. 1979. Analysis of
dorsal pitting in the os pubis in an extensive sample of modern American
females. American Journal of Physical Anthropology 51: 517–540.
Suchey, J. M., Wisely, D. V. and Katz, D. 1986. Evaluation of the Todd and
McKern-Stewart methods for aging the male os pubis. In Reichs, K. (ed.)
Forensic Osteology: Advances in the Identification of Human Remains.
Springfield: Thomas, pp. 33–67.
Sumner, W. M. 1989. Population and settlement area: an example from Iran.
American Anthropologist 91: 631–641.
Sunderland, E. P., Smith, C. J. and Sunderland, R. 1987. A histological study of
the chronology of initial mineralization in the human deciduous dentition.
Archives of Oral Biology 32: 167–174.
Sussman, R. W. 1972. Child transport, family size, and increase in human
population in the Neolithic. Current Anthropology 13: 258–259.
Sutherland, L. D. and Suchey, J. M. 1991. Use of the ventral arc in pubic sex
determination. Journal of Forensic Sciences 36: 501–511.
Taber, R. D. and Dasmann, R. F. 1957. The dynamics of three natural populations
of the deer Odocoileus hemionus columbianus. Ecology 38: 233–246.
220 references
Taylor, G. M., Rutland, P. and Molleson, T. 1997. A sensitive polymerase chain
reaction method for the detection of Plasmodium species DNA in ancient
human remains. Ancient Biomolecules 1: 193–203.
Thomas, M., Gilbert, P., Cuccui, J., White, W., Lynnerup, N., Titball, R. W.,
Cooper, A. and Prentice, M. B. 2004. Absence of Yersinia pestis-specific
DNA in human teeth from five European excavations of putative plague
victims. Microbiology 150: 341–354.
Thornton, R. 1997. Aboriginal North American population and rates of decline,
ca. 1500–1900. Current Anthropology 38: 310–315.
Tilly, C. 1978. Migration in modern European history. In McNeill, W. H. and
Adams, R. S. (eds.) Human Migration: Patterns and Policies. Bloomington:
Indiana University Press, pp. 48–72.
Tobias, P. V. 1991. Olduvai Gorge Volume IV. The Skulls, Endocasts and Teeth of
Homo habilis. Cambridge: Cambridge University Press.
Todd, T. W. 1920. Age changes in the pubic bone. I. The white male pubis.
American Journal of Physical Anthropology 3: 285–334.
1924. Cranial suture closure: its progress and age relationship. American
Journal of Physical Anthropology 7: 325–384.
Tomasson, R. F. 1977. A millennium of misery: the demography of the
Icelanders. Population Studies 31: 405–427.
Torroni, A., Neel, J. V., Barrantes, R., Schurr, T. G. and Wallace, D. C. 1994.
Mitochondrial DNA ‘clock’ for the Amerinds and its implications for
timing their entry into North America. Proceedings of the National Academy
of Sciences of the USA 91: 1158–1162.
Trinkaus, E. 1995. Neanderthal mortality patterns. Journal of Archaeological
Science 22: 121–142.
Trivers, R. L. and Willard, D. E. 1973. Natural selection of parental ability to vary
the sex ratio of offspring. Science 179: 90–92.
Twigg, G. 1984. The Black Death: a Biological Reappraisal. London: Batsford.
Tyrrell, A. J. and Chamberlain, A. T. 1998. Non-metric trait evidence for modern
human affinities and the distinctiveness of Neanderthals. Journal of Human
Evolution 34: 549–554.
Ubelaker, D. H. 1974. Reconstruction of demographic profiles from ossuary
skeletal samples. A case study from the Tidewater Potomac. Smithsonian
Contributions to Anthropology 18: 1–79.

references 221
1992. North American Indian population size: changing perspectives. In
Verano, J. W. and Ubelaker, D. H. (eds.) Disease and Demography in the
Americas. Washington DC: Smithsonian Institution Press, pp. 169–195.
Underwood, J. C. E. (ed.) 2004. General and Systematic Pathology. 4th edition.
Edinburgh: Churchill Livingstone.
Vallois, H. V. 1937. La duree de la vie chez l’homme fossile. L’ Anthropologie 47:
499–532.
Van Gerven, D. P. and Armelagos, G. J. 1983. ‘Farewell to paleodemography?’
Rumors of its death have been greatly exaggerated. Journal of Human
Evolution 12: 353–360.
Verano, J. W. and Ubelaker, D. H. (eds.) 1992. Disease and Demography in the
Americas. Washington DC: Smithsonian Institution Press.
Vita-Finzi, C. and Higgs, E. S. 1970. Prehistoric economy in the Mount Carmel
area: site catchment analysis. Proceedings of the Prehistoric Society 36: 1–37.
Waldron, T. 1994. Counting the Dead: The Epidemiology of Skeletal Populations.
New York: Wiley-Liss.
Walker, P. L. 1997. Wife beating, boxing and broken noses: skeletal evidence for
cultural patterning of interpersonal violence. In Martin, D. L. and Frayer,
D. W. (eds.) Troubled Times: Violence and Warfare in the Past. Amsterdam:
Gordon and Breach, pp. 145–179.
Walker, P. L. and Cook, D. C. 1998. Brief communication: gender and sex: vive la
difference. American Journal of Physical Anthropology 106: 255–259.
Walker, P. L., Dean, G. and Shapiro, P. 1991. Estimating age from tooth wear in
archaeological populations. In Kelly, M. A. and Larsen, C. S. (eds.)
Advances in Dental Anthropology, New York: Wiley, pp. 169–178.
Walker, P. L., Johnson, J. R. and Lambert, P. M. 1988. Age and sex biases in the
preservation of human skeletal remains. American Journal of Physical
Anthropology 76: 183–188.
Warrick, G. 2003. European infectious disease and depopulation of the
Wendat-Tionontate (Huron-Petun). World Archaeology 35: 258–275.
Watkins, S. C. and Menken, J. 1985. Famines in historical perspective. Population
and Development Review 11: 647–675.
Watts, E. S. 1990. Evolutionary trends in primate growth and development. In
Rousseau, C. J. (ed.) Primate Life History and Evolution. New York:
Wiley-Liss, pp. 89–104.

222 references
Weale, M. E., Weiss, D. A., Jager, R. F., Bradman, N. and Thomas, A. G. 2002. Y
chromosome evidence for Anglo-Saxon mass migration. Molecular Biology
and Evolution 19: 1008–1021.
Weaver, D. S. 1980. Sex differences in the ilia of a known age and sex sample of
fetal and infant skeletons. American Journal of Physical Anthropology 52:
191–195.
Weidenreich, F. 1939. The duration of life of fossil man of China and the
pathological lesions found in his skeleton. Chinese Medical Journal 55:
34–44.
Weiss, K. M. 1972. On the systematic bias in skeletal sexing. American Journal of
Physical Anthropology 37: 239–250.
1973. Demographic models for anthropology. Memoirs of the Society for
American Archaeology 27 (American Antiquity 38(2): 1–186).
White, T. D. and Johanson, D. C. 1982. Pliocene hominid mandibles from the
Hadar Formation, Ethiopia: 1974–1977 collections. American Journal of
Physical Anthropology 57: 501–544.
Whittaker, D. 2000. Ageing from the dentition. In Cox, M. and Mays, S. (eds.)
Human Osteology in Archaeology and Forensic Science. London: Greenwich
Medical Media, pp. 83–99.
Whyte, I. D. 2000. Migration and Society in Britain 1550–1830. London:
Macmillan.
Wich, S. A., Utami-Atmoko, S. S., Mitra Setia, T., Rijksen, H. D., Schurmann, C.,
van Hoof, J. A. R. and van Schaik, C. P. 2004. Life history of wild Sumatran
orangutans (Pongo abelii). Journal of Human Evolution 47: 385–398.
Wiessner, P. 1974. A functional estimator of population from floor area.
American Antiquity 39: 343–349.
Williams, J. T. 1993. Origin and population structure of the Icelanders. Human
Biology 65: 167–191.
Wilson, C. 1984. Natural fertility in pre-industrial England. Population Studies
38: 225–240.
Wiseman, T. P. 1969. The census in the first century B.C. Journal of Roman
Studies 59: 59–75.
Wittwer-Backofen, U., Gampe, J. and Vaupel, J. W. 2004. Tooth cementum
annulation for age estimation: results from a large known-age validation
study. American Journal of Physical Anthropology 123: 119–129.

references 223
Wood, B. A. 1991. Koobi Fora Research Project. Vol. IV. Hominid Cranial Remains.
Oxford: Clarendon Press.
Wood, J. B. 1996. The King’s Army. Cambridge: Cambridge University Press.
Wood, J. W. 1994. Dynamics of Human Reproduction. Biology, Biometry,
Demography. New York: Aldine de Gruyter.
Wood, J.[W.] and DeWitte-Avina, S. 2003. Was the Black Death yersinial plague?
The Lancet Infectious Diseases 3: 327–328.
Wood, J. W., Holman, D. J., Weiss, K. M., Buchanan, A. V. and LeFor, B. 1992a.
Hazards models for human population biology. Yearbook of Physical
Anthropology 35: 43–87.
Wood, J. W., Milner, G. R., Harpending, H. C. and Weiss, K. M. 1992b. The
osteological paradox: problems of inferring prehistoric health from skeletal
remains. Current Anthropology 33: 343–370.
Wood, J. W., Holman, D. J., O’Connor, K. A. and Ferrell, R. J. 2002. Mortality
models for paleodemography. In Hoppa, R. D. and Vaupel, J. W.
Paleodemography. Age Distributions from Skeletal Samples. Cambridge:
Cambridge University Press, pp. 129–168.
Wrigley, E. A. (ed.) 1966. An Introduction to English Historical Demography.
London: Weidenfeld and Nicolson.
Young, A. 1982. The anthropologies of illness and sickness. Annual Review of
Anthropology 11: 257–283.
Young, D. A. and Bettinger, R. L. 1995. Simulating the global human
expansion in the Late Pleistocene. Journal of Archaeological Science 22:
89–92.
Zar, J. H. 1999. Biostatistical Analysis. 4th edition. London: Prentice Hall.
Ziegler, P. 1991. The Black Death. Stroud: Sutton.
Zink, A.[R.], Reischl, U., Wolf, H., Nerlich, A. G. and Miller, R. L. 2001.
Corynebacterium in ancient Egypt. Medical History 45: 267–272.
Zink, A. R., Reischl, U., Wolf, H. and Nerlich, A. G. 2002. Molecular analysis
of ancient microbial infections. FEMS Microbiology Letters 213: 141–
147.
Zink, A. R., Sola, C., Reischl, U., Grabner, W., Rastogi, N., Wolf, H. and Nerlich,
A. G. 2004. Molecular characterisation of Mycobacterium tuberculosis
complex in ancient Egyptian mummies. International Journal of
Osteoarchaeology 14: 404–413.

224 references
Zubrow, E. 1975. Prehistoric Carrying Capacity: a Model. Menlo Park: Cummings
Publishing Company.
1989. The demographic modelling of Neanderthal extinction. In Mellars, P.
and Stringer, C. (eds.) The Human Revolution: Behavioural and Biological
Perspectives on the Origin of Modern Humans. Edinburgh: Edinburgh
University Press, pp. 212–231.
I N D E X
Ache, 16, 29, 34, 58–60, 61, 63, 64, 65
Acsadi, G., 12, 81
Adams, W.Y., 9
age avoidance, 45, 46
age categories, 15–18, 28, 43, 99
age distributions, 15–18
see also agriculturalists; hunter-gatherers
age estimation, 98–26
from auricular surface, 108
Bayesian, 112–23, 124, 125
from bone microstructure, 105, 110–11
from cementum growth, 106, 111
from cranial sutures, 84, 108–10
from dental attrition, 106–8
from dental development, 101–3, 138
from dental microstructure, 103, 138
effect of reference-series age structure on,
112–13
and latent traits, 119–20
maximum likelihood, 117–19
from pathology, 86, 110
from pubic symphysis, 86, 87, 106, 107
from radiography, 105
regression methods, 84–5, 113, 120, 124
from root-dentine transparency, 105,
111–12
from skeletal growth and development,
98–105, 120–3, 124
from trabecular involution, 117
transition analysis, 119
age heaping, 16, 45, 46
agriculturalists, 64–8
birth rates, 67–8
death rates, 67, 91
population structure, 59, 64–7
survivorship, 67
Agta, 59, 60, 61, 63, 64, 65
Alterman, H., 47
Ammerman, A.J., 5
Amundsen, D.W., 55
Anderson, D.G., 6, 41, 132
Anderson, R.M., 74, 153
Anderson, T., 167, 172
Angel, J.L., 81
animal populations, 133–7
Anthony, D.W., 9
Argentina, 132
Aries, P., 17
Arizona, 129
Armelagos, G.J., 86–7
Armenia, 71
Armenian, H.K., 70, 71

226 index
Arnott, R., 174
Arsuaga, J-L., 143, 144
Ashton, N., 129
Atapuerca, 142, 143–5
Aufderheide, A.C., 152, 156, 157, 174
Australia, 39
Bacro, J.N., 117, 118
Bagnall, R.S., 52
Balaban, E., 18
Ball, W., 11, 47
Bangladesh, 71
Barrientos, G., 132
Bayes theorem see age estimation
Beauval, C., 148
Benedictow, O.J., 75
Bentley, G.R., 64, 68
Berar, 71–2, 73
Bergfelder, T., 96
Bermudez de Castro, J.M., 138, 142, 143, 144,
145
Bettinger, R.L., 6, 41
Beynon, A.D., 103, 138, 139
bias, 89–92, 179
in age estimation, 82, 84, 87, 89–90, 145–6
in age reporting, 46
from infant under-representation, 47, 49,
81, 82, 89, 141–2, 145
mortality, 92
preservational (taphonomic), 90, 140–2
recovery, 140–2
from reference series, 85, 102
in sex estimation, 90–1, 97
Binford, L.R., 5, 24
birth rates, 35–6
see also agriculturalists; hunter-gatherers
Bishop, N.A., 77, 170, 171
Black, S., 101, 102
Black Death see disease, plague
Blurton Jones, N.G., 55, 59, 60
Bocquet-Appel, J-P., 84–7, 113, 114, 117, 118,
132, 143, 144, 179
Boddington, A., 90
Boer, A.H., 134
Boldsen, J.L., 119
Boone, J.L., 68
Boserup, E., 5, 68
Bosnia, 78–9
Botswana, 60
Boucher, B.J., 93
Bourgeois-Pichat, J., 24
Bouville, C., 171
Bouwman, A.S., 158
Bowman, J.E., 103
Boylston, A., 124, 125
Brain, C.K., 142
Brickley, M., 162
Bromage, T.G., 103
Bronson, B., 4
Brooks, S., 106
Brosch, R., 154, 157, 158
Brothwell, D., 167
Brown, B.M., 126
Brown, K.A., 19, 97, 98
Brown, T.A., 158
Brunborg, H., 79
Buck, C.E., 113
Buckberry, J.L., 108
Buikstra, J.E., 87
Burmeister, S., 55
Cadbury, 171
Canny, N., 57
Capelli, C., 148
Carman, J., 170
Carneiro, R.L., 5
carrying capacity, 21, 22, 41, 67
Caspari, R., 139
Casselberry, S.E., 126
catastrophic mortality see mortality
index 227
Caughley, G., 25, 133
Cavalli-Sforza, L.L., 5, 13, 146, 149
censuses, 11, 46–7
Ceylon, 67
Chamberlain, A.T., 7, 76, 108, 117, 118, 119, 120,
123, 124, 125, 149, 172
Chan, C-C., 70, 71
Charnov, E.L., 139
Chasko, W.J., 24
Chikhi, L., 146
Childe, V.G., 4
circulation see migration
Coale, A.J., 10, 24, 26, 27, 32, 61, 69, 83, 91, 136,
144
Cocos Islanders, 65, 66
Coggon, D., 153
Cohen, M.N., 4
Cole, L.C., 135
Collard, M., 138
Collier, S., 133
colonisation, 40–1, 57–8
of Americas by aboriginals, 5–6, 132
of Americas by Europeans, 8, 57
conflict deaths, 77–80, 125, 170–1
Cooper, A., 158
Cook, D.C., 93
Cox, M., 92, 96, 159, 167
Crawford, S., 54
crisis mortality see mortality
Crosby, A.W., 74
Crubezy, E., 157
Cruz-Uribe, K., 89
cultural change and demography, 183–5
Curet, L.A., 126, 128
Daly, M., 19, 171, 172
Danebury, 171
Daniels, J.D., 160
Darfur, 73
Dasen, V., 167
Dasmann, R.F., 134
Daugherty, H.G., 2, 17, 53
Dean, M.C., 103, 138, 139
death rates, 25, 28
from skeletal samples, 82, 83, 90, 125
from tombstone inscriptions, 49, 160
see also agriculturalists; conflict deaths;
hazard functions; hunter-gatherers
Deevey, E.S., 133
Demars, P.Y., 132
Demeny, P., 10, 32, 61, 69, 83, 91, 136, 144
Deming, J., 120
demographic transition, 22, 23–4
Dennell, R., 128, 129
density-dependence, 20
dependency ratio, 17
De Roche, C.D., 128
Dettwyler, K.A., 175
De Vito, C., 94
De Waal, A., 71, 73
DeWitte-Avina, S., 75
Dickeman, M., 171
Diers, C.J., 55
Dıez, J.C., 143
disasters, natural, 69–70, 71
discard equation, 129
disease and injury, 14, 151–75
achondroplasia, 167
Chagas disease, 158
concepts and classification, 151–3
Corynebacterium, 158
dental, 162–4
effects on demographic structure,
158–60
epidemics, 8, 14, 74–6
epidemiology, 152–3
genetic and biomolecular evidence, 153–4,
156–8, 167–8
impact on fertility, 173
infections, 8, 13, 71, 154–60

228 index
disease and injury (cont.)
influenza, 74–5
leprosy, 156, 158, 174–5
malaria, 158, 159
metabolic and nutritional, 160–5
neoplastic and congenital, 165–8
palaeopathology, 7, 13, 152
plague, 22, 75–6, 123–4, 158,
172–3
social responses, 173–5
syphilis, 156, 158
trauma, 77, 168
treatment, 173–4
tuberculosis, 156, 157, 175
DNA see genetic demography
Donnelly, P., 146
Donner Party, 69
doubling time see population growth
Drake, M., 52
Drancourt, M., 158
Drusini, A., 112
Dumond, D.E., 5
Dunbar, R.I.M., 134
Duncan, C.J., 67, 76, 159, 172, 173
Dutour, O., 7, 123
Dyke, B., 135, 136
Early, J.D., 60, 63, 91
earthquakes, 69–70
Eaton, J.W., 68
Ehrlich, P.R., 5
Ell, S.R., 76
endemicities, 40
Ensay, 90
epidemics see disease
Ericksen, M.F., 161
Eshed, V., 166
Ethiopia, 73
Eveleth, P.B., 55, 99
exponential growth see population growth
Faerman, M., 98, 168
families, 50–2
family reconstitution, 50–2
famines, 70–4
Faught, M.K., 132
Fazekas, I.G., 120
fecundity, 35
Fedigan, L.M., 54
Feldhofer Cave, 148
fertility, 2, 35–6
decline, 73
see also birth rates
Fletcher, R., 128
Fleury, M., 50
Flomborn, 9
Forster, P., 147
Fort, J., 132
frailty, 73, 92
Frankenberg, S.R., 113, 114, 115, 116, 117, 118
Frayer, D.W., 167, 170
Frier, B.W., 52
Gage, T.B., 34, 47, 134, 135, 136, 139
Gallivan, M.D., 129
Gamble, C., 132
gender and sex, 92–3
genealogies, 49–50
genetic demography, 12–13, 146–9
ancient DNA, 148
migration, 147–8
population diversity, 6, 13, 148–9
population expansion, 147
see also disease
geometric growth see population growth
Gernaey, A.M., 157
Gilchrist, R., 170
Gillam, J.C., 6, 41
Goldstein, D.B., 146
Goldstein, M.S., 82
Gompertz model see hazard functions

index 229
Goodman, A.H., 164
Gotherstrom, A., 98
Gowland, R.L., 7, 76, 117, 120, 123, 124, 125,
172
grandparents, 54, 55, 83
Grayson, D.K., 69
Greene, D.L., 90
Greenland, 184–5
Grine, F.E., 142
Griffiths, W.S., 58
growth, demographic see population growth
growth, skeletal see age estimation
growth profiles, 103–5
Grupe, G., 10
Guha-Sapir, D., 78
Guhl, F., 158
Gustafson, G., 111
Hadar, 141, 142
Hadza, 59, 60, 61
Harding, A., 170
Harlow, M., 53
Harpending, H.C., 27, 64, 146, 147, 173
Harrison, G.A., 66
Harvey, P., 135
Hassan, F.A., 4, 12, 52, 126, 129
Hawkes, K., 55
hazard functions, 27, 32–4
Gompertz model, 118–19
Siler model, 34
Hazlewood, L., 6
Headland, T.N., 59, 60, 63, 91
Helgason, A., 57
Henry, L., 48, 50
Herold, M.W., 78
Herrmann, B., 96
Herrmann, N.P., 119
Hewlett, B.S., 19
Higgs, E.S., 128
Hildebolt, C.F., 164
Hill, K., 16, 19, 29, 55, 59, 61, 63, 91, 135, 139,
172, 181
Hillson, S., 103, 111, 162
historical demography, 11, 45–58
Holcomb, S.M.C., 94
Hollingsworth, M.F., 76
Hollingsworth, T.H., 11, 45, 47, 48, 76
Holman, D.J., 120
homicide, 170–1
see also infanticide
hominid populations, 137–46
Hooton, E.A., 81, 91
Hopkins, K., 47, 48, 49
Hoppa, R.D., 92, 103, 113, 115, 117, 126,
179
house size see population size estimation
households, 52
Housley, R.A., 132
Howell, N., 55, 59, 60, 61, 63, 83, 84
Howells, W.W., 82
Huda, T.F.J., 103
Hummel, S., 168
Humphrey, L., 103
Hunt, D.R., 93
hunter-gatherers, 5, 11, 128
birth rates, 63–4, 65, 68
camps, 128
death rates, 34, 62–3, 64, 91
longevity, 53
menarche, 63
menopause, 55
population structure, 16, 58–62
sex ratios, 19
Hurtado, A.M., 16, 19, 29, 55, 59, 61, 63, 91,
172, 181
Hutterites, 68
Iceland, 47, 57, 66
infanticide, 19, 171–2
inscriptions, 47–8
230 index
Iraq, 77
Iraq Body Count, 77
Ireland, 57
Iscan, M.Y., 97
isotopes, 164–5
Jackes, M.K., 87
Janetta, A.B., 45, 67, 91
Janssens, P.A., 161
Jantz, R.L., 6, 120
Japan, 45, 67
Johanson, D.C., 142
John, A.M., 58, 69
Jones, H., 39
Jurmain, R., 169
juvenility index, 85, 170
Kahila, G., 172
Kammeyer, K.C.W., 2, 17, 53
Kaplan, H., 139
Kardulias, P.N., 126
Katzenberg, M.A., 9, 165
Keeley, L.H., 77
Keenleyside, A., 175
Kent, S., 162
Kerley, E.R., 110
Kidane, A., 73
Kimbel, W.H., 142
Kirk, D., 24, 173
Kitch, M., 56
Klein, R.G., 89
Knodel, J., 68
Knusel, C.J., 7, 76, 77, 123, 170, 171
Kolb, C.C., 52, 126
Kolman, C.J., 158
Kolmogorov-Smirnov test, 43, 44
Komar, D., 79
Konigsberg, L.W., 87, 94, 113, 114, 115, 116, 117,
118, 119
Konomi, N., 157, 158
Koobi Fora, 141, 142
Korean War, 80
Kosa, F., 101, 120
Kosovo, 78
Kramer, C., 126, 128
Kramer, K.L., 68
Krapina, 144
Kreager, P., 2
Krings, M., 148
Krogman, W.M., 97
Kulubnarti, 86, 90
!Kung, 59, 60–1, 63, 64, 65
Laluela-Fox, C., 148
Langford, C., 75
Larsen, C.S., 7, 8, 158, 164, 169,
174
Laslett, P., 52, 54
Lassen, C., 98
Laurence, R., 53
Leader-Williams, N., 134
Le Blanc, S., 126
LeBras, H., 54
Lee, R.B., 60, 68
Lee, S-H., 139
Leslie, P.H., 36
Leslie matrices, 26, 37
Lewis, E.G., 36
Lewis, S., 129
Libben, 82–4, 90
Lieberman, D.E., 111
Lietman, T., 175
Lieverse, A.R., 164
life expectancy, 11, 27, 30, 53–4
from skeletal samples, 82
see also longevity
life history variables, 3, 10, 180
see also maturation rates
life span see longevity
life tables, 27–32

index 231
cohort, 28
hunter-gatherers, 29
instantaneous, 28
model, 11, 69, 88–9
see also life expectancy
Liversidge, H.M., 102
Lockwood, C.A., 142
logistic growth see population growth
Loisy-en-Brie, 117, 118–19
London
crypt samples, 104
plague mortality in, 76, 173
Roman population, 76, 130
Royal Mint cemetery, 124, 125
longevity, 11, 52–4
in hunter-gatherers, 62
in hominids, 139–40
in past populations, 90
Lotka, A.J., 26
Lovejoy, C.O., 82, 83, 86, 89, 90, 108
Lowe, J.C., 39
Lucy, D., 116–17
Luongo, G., 70
Lyman, R.L., 137
Lynnerup, N., 185
Mace, R., 68
Maharatna, A., 70, 71, 72, 73
Maiden Castle, 170, 171
Malthus, 4
Manchester, K., 7, 152
Mann, A., 138, 141, 142
Manning, P., 58
Maresh, M.M., 103, 120
Margerison, B.J., 7, 76, 123
Marsden, P., 129
Martin, D.L., 170
Martin, P.S., 5
Maryland, 90
Masset, C., 82, 84–7, 113, 179
maturation rates
hominids, 138–9, 146
non-human primates, 135–7
maximum likelihood see age estimation
May, R.M., 74, 153
Mayer, A.J., 68
Mays, S., 92, 120, 123, 161, 172,
174
McDaniel, A., 69
McElroy, A., 151
McKeown, T., 4
McKern, T.W., 80, 106
McKinley, K., 138, 141
McNeil, W.H., 174
Me-Bar, F., 184
Meindl, R.S., 88, 90, 97, 106, 108
Meltzer, D.J., 6
menarche, 54–5
Menken, J., 69, 71, 73, 82–4
menopause, 54
Mensforth, R.P., 86
Mesopotamia, 46
Mexico, 128
migration, 2, 8–10, 38–40, 55–8, 184
circulation, 38
emigration, 20, 56
immigration, 20
in response to disease, 172–3
matrix, 40
rates, 6, 38
stable isotope evidence, 9–10
Miles, A.E.W., 90, 108
Miller, S.L.J., 108
Milner, G.R., 8, 88, 174
Mineau, G.P., 68
Moch, L.P., 56
Molleson, T.I., 93, 102
Molnar, S., 164
Moore, P.S., 71
Moorrees, C.F.A., 102, 103
232 index
Mormons, 68
mortality, 2, 18, 25
attritional, 69, 74, 123, 133, 145, 181–2
catastrophic, 7, 69, 71, 75–6, 123–4, 125,
144–6, 158, 179, 182
crises, 8, 69–80, 159
seasonality, 159, 160
see also death rates
Morydas, S., 39
Namibia, 60
Naroll, R., 126
Nemeskeri, J., 12, 81, 106
Netherlands, 71
Nettle, D., 6
Newcastle, 46
Newell, C., 46
Nicolas, E., 143, 144
Nolan, J., 46
Nordberg, H., 160
Notestein, F., 23
Ofnet, 171
Olduvai Gorge, 141, 142, 144
Olshansky, S.J., 53
orphancy, 83
Ortner, D.J., 152, 161
Orton, C., 89
osteons see age estimation from bone
microstructure
Otmoor, 65, 66
Otterbein, K.F., 77
Ovchinnikov, I.V., 148
Owsley, D.W., 6, 120
Paine, R.R., 88
palaeodemography, 12–13, 31
debate, 81–7, 179
palaeopathology see disease
Palestine, 78–9
Paraguay, 59
Parker, G., 80
Parker Pearson, M., 170, 180
parturition scars, 96
patrilocality, 147
pattern matching, 88
Pavelka, M.S.M., 54
Pecos Pueblo, 81, 91
Pennington, R., 64
Penrith, 67, 76, 172–3
Perez, S.I., 132
perikymata see age estimation
Pettitt, P.B., 132
Phenice, T.W., 97
Philippines, 60
Pianka, E.R., 1
Plane, D.A., 39
Poinar, H.N., 158
Pompeii, 70
population
characteristics, 2–3
comparison, 44
decline, 66, 159–60
definition, 1–2
density, 2
dynamics, 2
pressure, 4–5
projection, 36–8
structure, 2, 6–7, 15–19
turnover, 56
see also age distributions, sex distributions,
animal populations, hominid
populations, primate populations
population growth, 4, 5, 6, 19–23, 65–6,
129
doubling time, 20
exponential, 20–1, 22
geometric, 20
logistic, 21–3, 24
long-term, 69

index 233
population size estimation, 12
from house floor area, 126–7
from household size, 127
from radiocarbon date distributions, 131–2
from resource utilisation, 129–30
from settlement area, 127–8
from site catchments, 12, 128–9
Post, J.B., 55
Postgate, N., 128
Pressat, R., 38, 52, 74
Preston, S.H., 45, 47, 67, 91
Price, T.D., 9
primate populations, 134–7
survivorship, 135–7
probability density functions see hazard
functions
Pusch, C.M., 168
Putschar, W.G.J., 152
Quebec, 47
Radlauer, D., 79
Rafi, A., 158
Rainio, J., 78
Ramirez Rozzi, F.V., 138
Relethford, J.H., 149
Renfrew, C., 5
reproductivity, 36
Resnick, D., 110
Reynolds, J., 149
Richards, L.C., 108
Richards, M., 147
Richardson, A., 128
Rick, J., 132
Roaix, 171
Roberts, C.A., 7, 152, 159, 167, 174, 175
Roberts, G.W., 69
Roberts, L., 77
Robling, A.G., 105, 111
Rodrıguez Martın, C., 152, 156, 157, 174
Roff, D.A., 3
Rogers, A., 39
Rogers, A.R., 147
Rogers, T.L., 96
Rogerson, P.A., 39
Rome, 47, 53, 159, 160
Roper, D.C., 12, 129
Rose, J.C., 164
Rosing, F.W., 95
Rostock Manifesto, 115, 125–6
Ruff, C.B., 91
Russell, K.F., 88, 90
Salama, P., 77, 78
Saller, R., 54
Sarkar, N.K., 67
Sattenspiel, L., 27
Saunders, S.R., 92, 94, 104
Schact, R.M., 127, 129
Scheidel, W., 80, 159, 160
Scheuer, J.L., 101, 102, 120, 124
Schiffer, M.B., 129
Schletz, 171
Schultz, M., 152
Schutkowski, H., 93
Schwarz, C., 151
Schwetzingen, 9
Scott, A., 96
Scott, S., 67, 76, 159, 172, 173
Scrimshaw, N.S., 70
Scrimshaw, S.C.M., 171
Sealy, J., 165
Seaman, J., 69, 70, 71
seasonality see mortality
Seielstad, M.T., 10, 147
Sellen, D.W., 68
Serre, D., 148
settlement area see population size
estimation
sex distributions, 18–19

234 index
sex estimation, 92–8
accuracy of, 97
biomolecular (DNA), 19, 97–8
by discriminant analysis, 94–5
in adults, 95–6
in juveniles, 93–5
from pelvis, 95, 97
from skull, 95–6
see also bias
sex ratios, 18–19, 133
sexual dimorphism, 93, 94
Shahar, S., 17, 53, 54
Sharpe, F.R., 26
Shaw, B.D., 159
Shennan, S., 4
Sheridan, R.B., 58
Sherwood, R.J., 101, 120
Short, R.V., 18
Sief, D., 19
Signoli, M., 76, 123
Siler, W., 34
Siler model see hazard functions
Sima de los Huesos see Atapuerca
Skinner, G.W., 50
slavery, 57–8, 69, 180
Smith, B.H., 102, 103, 135, 138
Smith, P., 172
Smith, T.E., 65, 66, 91
Snow, D.R., 8
Sokal, R.R., 146
Solheim, T., 112
Sorg, M.H., 105
Spiegel, P.B., 77, 78
Srebrenica see Bosnia
stable populations, 26–7, 31
standardisation of populations, 41
stationary populations, 27, 31
Stearns, S.C., 3, 139
Steele, J., 6, 41
Sterkfontein, 141, 142
Stewart, T.D., 80, 96, 106
Stiner, M.C., 16, 17
Stone, A.C., 6, 98
Stoneking, M., 6
Storey, G.R., 128
Storey, R., 42, 44
Stout, S.D., 105, 111
Striae of Retzius see dental microstructure
Stringer, C.B., 139
Stuart-Macadam, P.L., 161, 162
Suchey, J.M., 96, 97, 106
Sumner, W.M., 128
Sunderland, E.P., 102
survival analysis see life tables
survivor functions see hazard functions
survivorship, 15, 28, 29, 43
see also agriculturalists, primate
populations
Sussman, R.W., 68
Sutherland, L.D., 97
Swartkrans, 142
Taber, R.D., 134
Taiwan, 71
Talheim, 171
Tanner, J.M., 55, 99
Tanzania, 60
Tavare, S., 146
Taylor, G.M., 158
Teotihuacan, 42, 43, 44
Thames Valley, 129
Thomas, M., 158
Thornton, R., 160
Thorpe, I.J.N., 170, 180
Tilly, C., 56, 173
Tobias, P.V., 142, 144
Todd, T.W., 81, 106
Tomasson, R.F., 47, 57, 66
Tompkins, R.L., 138
Torroni, A., 6
index 235
Townsend, P.K., 151
Towton, 124, 125
Trinkaus, E., 141, 142, 143, 144, 145
Trivers, R.L., 133
Trussell, T.J., 10
tsunamis, 69, 182
Twigg, G., 75
Tyrrell, A.J., 149
Ubelaker, D.H., 8, 90, 160
Underwood, J.C.E., 152, 154, 167
uniformitarian principle, 10–11, 87–9, 112,
180–1
Valdez, F., 184
Vallois, H.V., 81
Van Gerven, D.P., 86–7
van Panhuis, W.G., 78
Vaupel, J.W., 113, 115, 117, 126, 179
Verano, J.W., 8, 160
Vesuvius, 70
Vietnam War, 77
Vita-Finzi, C., 128
vital events, 11, 20, 45–6
Wachter, K.W., 54
Wadi Halfa, 86
Waldron, T., 7, 91, 152
Walker, P.L., 90, 93, 108, 169
warfare see conflicts
Warrick, G., 8
Watkins, S.C., 24, 69, 71, 73
Watts, E.S., 135
Weale, M.E., 148
Weaver, D.S., 93
Weidenreich, F., 138, 142
Weiss, K.M., 82, 90, 91, 97
West, B., 129
White, J.P., 133
White, T.D., 142
Whittaker, D., 106
Whyte, I.D., 56
Wich, S.A., 135
Wiessner, P., 127
Wilcoxon-Mann-Whitney test, 43, 44
Willard, D.E., 133
Williams, J.T., 57
Willie Company, 69
Wilson, C., 68
Wilson, M., 19, 171, 172
Wiseman, T.P., 11, 47
Wittwer-Backofen, U., 111
Wood, B.A., 142
Wood, J.B., 80
Wood, J.W., 31, 32, 34, 36, 54, 55, 63, 68, 75,
92
Wrigley, E.A., 48
Young, A., 151
Young, D.A., 6, 41
Zar, J.H., 44
Zhoukoudian, 142
Ziegler, P., 75
Zink, A.R., 154, 157, 158
Zubrow, E., 5, 129
Copyright © 2022 FDOKUMEN


![Phenomenology in Contact Archaeology [AAA 2013]](https://static.fdokumen.com/doc/165x107/6319d63f77252cbc1a0ee287/phenomenology-in-contact-archaeology-aaa-2013.jpg)