DEMOGRAPHY AND BREEDING PHENOLOGY OF A ...
198
DEMOGRAPHY AND BREEDING PHENOLOGY OF A MARINE TOP PREDATOR Line Søltoft Cordes M.Sc. Marine & Fisheries Science, University of Aberdeen (2007) B.Sc. Marine Science, Coastal Carolina University (2005) A thesis presented for the degree of Doctor of Philosophy (School of Biological and Environmental Sciences) at University of Aberdeen September 2011
-
Upload
khangminh22 -
Category
Documents
-
view
2 -
download
0
Transcript of DEMOGRAPHY AND BREEDING PHENOLOGY OF A ...

DEMOGRAPHY AND BREEDING PHENOLOGY
OF A MARINE TOP PREDATOR
Line Søltoft Cordes
M.Sc. Marine & Fisheries Science, University of Aberdeen (2007)
B.Sc. Marine Science, Coastal Carolina University (2005)
A thesis presented for the degree of Doctor of Philosophy (School of
Biological and Environmental Sciences) at University of Aberdeen
September 2011

i
THESIS CONTENTS
Author’s Declaration..................................................................................................... iv
Summary........................................................................................................................ v
Acknowledgements........................................................................................................ vi
CHAPTER I: General Introduction............................................................................ 1
Worldwide monitoring efforts................................................................................ 4
Eastern North Pacific coast.................................................................................... 4
Western North Atlantic coast................................................................................. 5
Northern European coast........................................................................................ 5
Understanding drivers of population change.......................................................... 7
Harbour seal demography....................................................................................... 9
Shifting breeding phenology as an indicator of variation in environmental
conditions............................................................................................................... 9
Aims and objectives............................................................................................... 11
References.............................................................................................................. 13
CHAPTER II: Long-term patterns in harbour seal site-use and the
consequences for managing protected areas............................................................. 24
Introduction........................................................................................................ 25
Materials and methods....................................................................................... 27
Study area.................................................................................................. 27
Distribution of seals at terrestrial haul-out sites....................................... 27
Identification of foraging areas................................................................. 28
Results................................................................................................................ 30
Temporal changes in distribution of seals during the breeding season.... 30
Long-term consistency of seasonal patterns............................................. 31
Changes in the relative importance of different pupping sites................. 33
Comparison of foraging areas in 1989 and 2009...................................... 34
Discussion.......................................................................................................... 36
Temporal changes in haul-out distribution............................................... 36
Long-term consistency of seasonal patterns............................................. 38
Management implications......................................................................... 38
References.......................................................................................................... 40
CHAPTER III: An individual-based approach to estimating fine-scale site
fidelity and abundance in harbour seals: implications for conservation
management................................................................................................................. 44
Introduction........................................................................................................ 45
Methods............................................................................................................. 47
Photo-identification surveys..................................................................... 47
Re-sighting rates....................................................................................... 48
Determining sex........................................................................................ 48
Statistical analysis.............................................................................................. 49
Between-year site fidelity......................................................................... 50
Monthly haul-out probability.................................................................... 51
Within pupping season haul-out probability............................................. 52

ii
Estimating monthly abundance from re-sightings data............................ 52
Estimating abundance from count data..................................................... 53
Results................................................................................................................ 54
Residents................................................................................................... 55
Between-year fidelity to breeding sites..................................................... 56
Comparison of haul-out probabilities obtained from re-sightings data
and telemetry............................................................................................. 57
Monthly haul-out probabilities................................................................. 59
Comparison of abundance estimates obtained from analysis of re-
sightings and count data............................................................................ 62
Discussion.......................................................................................................... 64
References.......................................................................................................... 68
CHAPTER IV: An individual-based study of harbour seal survival and
reproductive fitness: insights into the regional decline or an exception to the
rule?.............................................................................................................................. 71
Introduction........................................................................................................ 72
Methods.............................................................................................................. 75
Species characteristics.............................................................................. 75
Study site and data collection................................................................... 75
Mark-recapture analysis..................................................................................... 76
Estimating sex-specific survival using a multistate model....................... 77
Estimating reproductive rate and costs of reproduction on survival
using the open robust design multistate model with misclassification..... 78
Population modelling................................................................................ 80
Results................................................................................................................ 80
Estimating sex-specific survival............................................................... 82
Estimating reproductive rate and costs of reproduction on survival......... 82
Population modelling................................................................................ 84
Discussion.......................................................................................................... 86
References.......................................................................................................... 91
CHAPTER V: Timing matters: the influence of breeding phenology on
lactation performance and offspring survival.......................................................... 97
Introduction........................................................................................................ 98
Methods.............................................................................................................. 100
Species characteristics.............................................................................. 100
Data collection.......................................................................................... 100
Estimation of the timing of pupping and lactation duration..................... 101
The consequences of variation in lactation duration on pup survival....... 102
Statistical analysis.............................................................................................. 102
Results................................................................................................................ 103
Discussion.......................................................................................................... 113
References.......................................................................................................... 119
CHAPTER VI: Balancing costs and benefits of a long-term individual-based
study of harbour seals................................................................................................. 124
Introduction........................................................................................................ 125
Methods.............................................................................................................. 126
Study area and current survey regime....................................................... 126

iii
Reduced survey regimes........................................................................... 127
Statistical analysis.............................................................................................. 128
Results................................................................................................................ 129
Success of reduced survey regimes........................................................... 129
Discussion.......................................................................................................... 133
References.......................................................................................................... 136
CHAPTER VII: General Discussion.......................................................................... 139
Individual-based approaches to understanding population dynamics.................... 141
Pupping phenology as an indicator of female investment and environmental
conditions................................................................................................................ 144
Population structure and management implications............................................... 145
Directions for future research................................................................................. 146
Conclusion.............................................................................................................. 147
References.............................................................................................................. 149
APPENDIX I................................................................................................................ 155
APPENDIX II.............................................................................................................. 187
APPENDIX III............................................................................................................ 188
APPENDIX IV............................................................................................................. 189

iv
AUTHOR’S DECLARATION
I declare that the work presented in this thesis has been composed by myself. I
carried out all photo-identification surveys during my M.Sc. degree and Ph.D. study, apart
from the 2006 data which were collected by Helen Wheeler. I collected the year-round
count data from 2008, whereas all earlier land-based and aerial count data were collected
by various researchers and staff at the Lighthouse Field Station and more recent aerial
survey data were provided by Callan Duck and Beth Mackey at the Sea Mammal Research
Unit, University of St. Andrews. I was also involved in the catching of harbour seals from
Loch Fleet for deploying GPS tags to investigate changes in foraging areas. I alone
analysed all mark-recapture and count data, incorporating advice from Alex Douglas,
University of Aberdeen, on generalised linear mixed modelling. Chapter II was published
in a peer-reviewed journal and therefore includes contributions from co-authors. No part of
this work has been accepted in any previous application for a degree. All quotations have
been distinguished by quotation marks and all sources of information have been
specifically acknowledged.
Line Cordes, 2011

v
SUMMARY
Worldwide harbour seal populations are showing differing and fluctuating trends in
abundance, but the drivers of change remain uncertain. Within the Moray Firth, NE
Scotland, count surveys carried out over the last 20 years highlighted the development of a
new breeding site, providing a unique opportunity to carry out an individual-based study of
harbour seal demography and pupping phenology using photo-identification techniques
within a mark-recapture framework.
Sightings of individual seals suggested that a large proportion of harbour seals are
year-round residents at haul-out sites. Both sexes displayed high levels of between-year
breeding site fidelity as well as seasonal variation in their haul-out behaviour. Apparent
sex-specific survival rates (0.89♂, 0.97♀) and birth rates (0.88) were high. There was a
strong correlation between lactation durations and the timing of pupping, suggesting that
shifts in pupping phenology are a result of energetic constraints. This highlights the
potential for using the timing of pupping as an indicator of ecosystem conditions.
This study provided the first concurrent real-time estimates of survival and
fecundity in a naturally regulated population of harbour seals. Demographic parameters
and physiological responses indicate that prevailing conditions within the Moray Firth are
favourable, and that this population should be recovering. However, observed patterns may
also be an artefact of the long-term decline having caused an increase in per capita food
availability through the reduction in intra-specific competition. This study highlights the
current and long-term importance of individual-based data in understanding population
dynamics. Through the identification of sentinel sites around the world, harbour seals
could provide a single-species indicator of coastal ecosystem conditions in the Northern
Hemisphere.

vi
ACKNOWLEDGEMENTS
First and foremost I would like to thank Paul Thompson for being the best
supervisor one could wish for. I am truly grateful to him for providing me with this
opportunity. Thank you for encouraging and trusting me to independently develop this
project, but at the same time always being there when I needed guidance. I believe we
made a great team over the last four years, and I hope we can continue this for many years
to come. I particularly enjoyed the advisory meeting on the Cairngorm ski slopes.
I want to give a special thanks to Graeme Shannon for his endless and
unconditional support. He was always there when the wheels were coming off, and
accepted all the grumpy days without question. Our adventures together in Africa created a
welcome distraction and break from work, and I will always carry those memories with
me. I look forward to our future together.
A warm thanks to everyone at the Lighthouse Field Station, especially to my close
friends, Barbara Cheney, Kate Brookes and Hera Sengers, for listening when I needed to
vent and for spending your weekends reading through all my chapters. I would also like to
thank Ailsa Hall, Simon Moss and Callan Duck for fun days catching seals in Loch Fleet,
and a special thanks to Callan for sharing recent count data, and inviting me along on an
aerial survey.
Also, thanks to Alex Douglas and Bill Kendall for statistical support. I am also very
grateful for being awarded a three year studentship by the University of Aberdeen, and
thanks to Scottish Natural Heritage for funding a commissioned report and the Scottish
Government for funding tagging work in 2009.
And finally, to mum and dad for caring so much and their continuous effort in
trying to understand what I have been doing over the last four years.
Et stort tak til alle for nogle dejlige år.

Chapter I
1
CHAPTER I
GENERAL INTRODUCTION

Chapter I
2
CHAPTER I
GENERAL INTRODUCTION
Marine ecosystems around the world have undergone dramatic changes over the
last few decades as a result of climate change (Walther et al. 2002), regime shifts (Edwards
& Richardson 2004; Perry et al. 2005), overfishing (Pauly et al. 1998; Heath 2005) and
other anthropogenic impacts such as pollution (Halpern et al. 2008; Doney 2010) or the
introduction of invasive species (Molnar et al. 2008). Several approaches have been
applied to monitor ecosystem health, from multispecies to entire ecosystem modelling, but
these have been met with mixed success due to the costs and challenges involved in
acquiring the necessary data (Yodzis 1998; Boyd, Wanless & Camphuysen 2006).
Marine top predators are now widely recognised as important indicators of
ecosystem condition and performance (Boyd, Wanless & Camphuysen 2006) particularly
as their demographic and behavioural responses are likely to reflect dynamics at lower
trophic levels (Wanless et al. 2007). Worldwide, populations of top predators are showing
varying population trends, with some suffering dramatic declines due to climate and
anthropogenic impacts (Baum et al. 2003; Myers & Worm 2003; Österblom et al. 2008).
This is of great concern in ecosystem management, as these species form a critical
component of ecosystem health and stability (Frank et al. 2005; Heithaus et al. 2008; Estes
et al. 2011). The use of marine top predators as bio-indicators often involves several
different species, which may occupy different regions, making within and between
ecosystem comparisons difficult to draw (Boyd, Wanless & Camphuysen 2006). Regional
multispecies approaches would be ideal, but this is often unrealistic for the same reasons
that fisheries and ecosystem modelling approaches have failed (Boyd, Wanless &
Camphuysen 2006). Alternatively, single species with wide distributions could provide
reliable indicators of environmental conditions across different geographical regions
(Frederiksen, Harris & Wanless 2005). One such top predator, the harbour seal, has a
circumpolar distribution across temperate regions in the northern hemisphere, and hence, is
the widest distributed pinniped.

Chapter I
3
Based on geographic distribution, the harbour seal comprises five subspecies, two of which
occur in the North Pacific, namely Phoca vitulina stejnegeri with a range that stretches
from Japan to the western Aleutians, and Phoca vitulina richardii, which occurs from the
eastern Aleutians to California. The three subspecies of the North Atlantic include Phoca
vitulina vitulina distributed along the European coast and also found in the Barents Sea,
Phoca vitulina concolor located along the east coast of the USA and Canada as well as
southern Greenland and Iceland, and finally Phoca vitulina mellonae which is found in
freshwater lakes and rivers in north-eastern Canada. Harbour seals therefore present an
interesting case study for worldwide single-species comparative studies.
The structure of harbour seal populations consist of clusters of subpopulations
which are made up of several smaller breeding groups. Early tagging studies were
restricted to pups and revealed some long distance movements (Thompson, Kovacs &
McConnell 1994), whereas later telemetry studies of adults showed more localised
movements indicating that subpopulations may be relatively discrete (Bonner & Thompson
1990; Lowry et al. 2001). However, as tags are shed during the annual moult these studies
are often confined to a single breeding season. Whereas the structure of subpopulations is
well understood, less information exists about the finer-scale dynamics of breeding groups,
constraining the ability to identify suitable functional units for describing population
dynamics (Härkönen & Harding 2001). A long-term study of freeze branded harbour seals
in Skagerak indicated both between-year site fidelity and a degree of natal site fidelity
(Härkönen & Harding 2001). This behaviour was stronger in females compared to males.
Gene flow within and between populations may therefore largely be due to male dispersal
(Greenwood 1980). However, this study was carried out during a period of population
growth where space was relatively unrestricted and there was no pressure to disperse.
Understanding age and sex-specific differences in migration rates have important
implications for conservation management, genetic diversity and the spread of diseases.
Worldwide genetic analyses have revealed differentiation between harbour seal
populations, both at the broad scale across the Pacific and Atlantic (Stanley et al. 1996;
Goodman 1998; Burg, Trites & Smith 1999; Westlake & O‟Corry-Crowe 2002), as well as
on the smaller scale, highlighting the implications of genetic differentiation within regions
for identifying appropriate management units (Westlake & O‟Corry-Crowe 2002;
Herremann et al. 2009).

Chapter I
4
Worldwide monitoring efforts
The utilisation of temperate coastlines by harbour seals has resulted in a long
history of conflict between seals and fisheries (Bonner 1989). More recently conservation
concerns have led to the protection of harbour seals under the Marine Mammal Protection
Act (MMPA) (1972) in the USA, and the Habitats Directive in Europe. These conflicts and
subsequent conservation efforts led to extensive monitoring programs of harbour seal
abundance. These indicate that populations worldwide have shown differing and
fluctuating trends in abundance as illustrated in Figure 1 and discussed in the sections
below. However, in spite of the extensive monitoring programs, the proximate causes of
change are often uncertain, due to the limited understanding of the dynamics of harbour
seal populations.
Figure 1. Map showing worldwide trends in abundance of harbour seal populations since the late
1960s.
Eastern North Pacific coast
Alaskan harbour seal populations have varied regionally over several decades,
some suffering dramatic losses of up to 85%, despite the implementation of the MMPA
(Pitcher 1990; Mathews & Pendleton 1997; Jemison & Kelly 2001; Small, Pendleton &
Pitcher 2003; Jemison et al. 2006; Mathews & Pendleton 2006; Small et al. 2008). Parallel
and contrasting trends in other marine top predators in Alaska indicated that this complex
system was driven by a number of factors, including larger scale oceanic processes and
inter-specific competition (Pitcher 1990; Jemison & Kelly 2001; Small, Pendleton &
Pitcher 2003; Mathews & Pendleton 2006; Small et al. 2008; Womble et al. 2010). In 1977
a climate-regime shift resulted in the replacement of a shrimp-dominated crustacean

Chapter I
5
community by a gadids and flatfish dominated community (Hirons, Schell & Finney 2001).
This led to the hypothesis that pinnipeds were feeding on leaner fish causing nutritional
stress, reduced body condition and lower fecundity (Trites & Donnelly 2003).
In contrast, most populations from south-eastern Alaska to California increased
post 1972, and some recovered to pre-bounty levels (Olesiuk, Bigg & Ellis 1990; Sydeman
& Allen 1999; Baird 2001; Jeffries et al. 2003; Grigg et al. 2004; Brown et al. 2005;
Mathews & Pendleton 2006; Womble et al. 2010). In south-eastern Alaska, one exception
was the animals in Glacier Bay (Mathews & Pendelton 2006), but genetic data suggests
this population may be demographically isolated (O‟Corry Crowe, Martien & Taylor 2003;
Matthews & Pendleton 2006; Herreman et al. 2009). Furthermore, and in contrast to
Alaskan populations, Brown et al. (2005) argued that the 1970s oceanic regime shift had
created more favourable conditions for harbour seal prey and the regions carrying capacity
had increased as a result.
Western North Atlantic coast
In the north-western North Atlantic harbour seal populations have also shown
contrasting and fluctuating trends in abundance. On Sable Island, Canada, the population
increased during the 1980s but suffered dramatic declines during the 1990s (Lucas &
Stobo 2000). Although the causes for the decline were not fully understood there were
several plausible hypotheses including increased predation by sharks, inter-specific
competition with grey seals and changing ocean temperatures causing a shift in the
distribution of prey fishes (Lucas & Stobo 2000; Bowen et al. 2003). Along the New
England coast, several pinniped populations, including harbour seals, have shown
exponential growth since the implementation of the MMPA (Baraff & Loughlin 2000;
Gilbert et al. 2005). Although harbour seals are present further north in the St. Lawrence,
Newfoundland and the coast of Labrador little is known about trends in abundance
(Stenson 1994; Gagnon 1998).
Northern European coast
In parts of Europe, harbour seals constituted an important resource during the 18th
and 19th
century and were hunted for fur and food. In addition, they were also considered
competitors by fisheries which resulted in long-term bounty programs whereby culling
depleted several local populations (Bjørge 1991; Bonner, Vaughan & Johnston 1973;
Heide-Jørgensen & Härkönen 1988; Bonner 1989; Reijnders 1994; Reijnders, van Dijk &
Kuiper 1995; Harding & Härkönen 1999). Only by the end of the 20th
century did hunting

Chapter I
6
cease due to a change in public opinion concerning marine mammals. However, the
conflict between fisheries and seals has persisted to this day and remains a concern for the
conservation of the species (Hansen & Harding 2006; Thompson et al. 2007; Butler et al.
2008). Following reduction in hunting, most harbour seal populations around mainland
Europe, Scandinavia and the Baltic started to recover (Heide-Jørgensen & Härkönen 1988;
Helander & Bignert 1992; Reijnders & Lankester 1990; Teilman, Rigét & Härkönen 2010),
although this was interrupted by the phocine distemper (PDV) outbreak in 1988 which
spread rapidly across Europe causing the death of approximately 18,000 seals or ~60% of
the population (Härkönen et al. 2006). Mortality varied regionally as populations in
Scotland and the Baltic only suffered minor losses (Thompson & Miller 1992; Härkönen et
al. 2006). Post epidemic, populations increased again until a second outbreak of PDV in
2002 (Reijnders et al. 1997; Härkönen et al. 2006; Teilman, Rigét & Härkönen 2010).
Mortality rates were generally lower compared with 1988, which could be a result of
increased immunity (Härkönen et al. 2006). In most areas recovery resumed with the
exception of the Wash and some areas in the Kattegat/Skagerak, which have remained at
reduced post epidemic levels (Thompson, Lonergan & Duck 2005; Teilman, Rigét &
Härkönen 2010).
In contrast to the general increase around mainland Europe, Scandinavia and the
Baltic, harbour seals in the westernmost area of the Wadden Sea declined from the 1950s
to the 1980s due to high hunting pressure until this ceased in the 1960s and 70s, pollution
causing reproductive failure (Reijnders 1985, 1986), and loss of habitat and disturbance
due to construction (Mees & Reijnders 1994; Reijnders 1994). The differing population
trends within the Wadden Sea may be a result of the population occupying coastlines of
three different countries causing distinct regional differences in anthropogenic impacts
(Reijnders 1981, 1983). Towards the northern limit of the species range recent information
on the abundance and distribution is somewhat limited. Norwegian populations appear to
have been stable during the 1970s and 1980s (Bjørge 1991), whereas Icelandic harbour
seals have shown a dramatic decline from 1976 to 2003 (Hauksson et al. 2006).
In northern parts of the United Kingdom, harbour seals have suffered long-term and
widespread declines over the last 10-20 years (Lonergan et al. 2007; Thompson et al.
2007), despite conservation measures being put in place for their protection (Baxter 2001).
The most dramatic declines occurred in Orkney and Shetland where the population was
reduced by 40% (Thompson, van Parijs & Kovacs 2001; Lonergan et al. 2007), similar in
magnitude to the declines previously observed in Iceland (Hauksson et al. 2006). On the
east coast of Scotland, the Moray Firth constitutes the largest colony of harbour seals and

Chapter I
7
this population has been studied intensively over the past 20 years (Thompson & Miller
1992; Thompson et al. 1996a, 1997a&b, 2007). Here numbers of seals declined by 2-5%
per year from the mid 1990s to 2005 (Thompson et al. 2007). Although the proximate
causes for the Scottish declines are not fully understood, the widespread nature suggests
that larger scale oceanic processes may be playing an important role (Lonergan et al.
2007). Other factors, such as culling due to conflict with fisheries (Thompson et al. 2007)
are also likely to have contributed locally.
Several of the European harbour seal populations are located around the boundaries
of the North Sea. This ecosystem has undergone dramatic changes over the last four
decades as a result of climate and fisheries altering the structure and function of food webs.
In the late 1970s and late 1980s regime shifts occurred within the wider North Sea as a
result of changes in salinity and temperature, respectively (Weijerman, Lindeboom & Zuur
2005). The 1980s shift was characterised by an inflow of warmer Atlantic nutrient rich
water. However, warmer sea surface temperatures led to a mismatch in the phenology of
temperature and light dependent planktonic cycles (Edwards & Richardson 2004). In
addition, warm winter temperatures cause poor sandeel recruitment, which is an important
prey item for seals (Thompson et al. 1996b; Tollit & Thompson 1996; Sharples,
Arrizabalaga, Hammond 2009), and several species of seabirds (Frederiksen et al. 2004b).
Intensive fisheries have operated in the North Sea for several decades and fishing down the
food web has significantly altered the abundance and structure of fish populations in many
systems (Pauly et al. 1998). Removal of large predatory fish resulted in increased
abundance of smaller prey fishes, such as sandeel. However, in the 1990s, sandeel became
the target of the largest single species fishery in the North Sea (ICES 2003), leading to
direct competition between fisheries and marine top predators (Frederisken et al. 2004b).
The breeding success of seabirds in this region is believed to have suffered as a result of
both climate change and the impacts of fisheries (Furness & Tasker 2000; Frederiksen et
al. 2004b).
Understanding drivers of population change
It is now widely accepted that individual-based studies offer important ecological
and evolutionary insights into the drivers of population dynamics (Clutton-Brock &
Sheldon 2010). Studies of passerine and seabirds in the 1950s and 1960s were the catalyst
of individual-based studies (Klujvier 1951; Dunnet et al. 1990) and today this approach is
being applied to a variety of species (Harris 1970; Goodall 1986; Clutton-Brock, Albon &
Guinness et al. 1988; Scott 1988; Festa-Bianchet 1989; Mann et al. 2000). Most long-term

Chapter I
8
studies have involved initial physical capture of individuals for marking and sample size is
therefore constrained by the number of individuals caught. Tags may also be lost over time
limiting the possibility for monitoring individual life histories. In contrast, photo-
identification techniques are now widely used on species with natural individual markings.
This involves species that accumulate nicks, cuts, or scrapes over time, such as elephants
(Moss 2001), manatees (Langtimm et al. 2004) and dolphins (Mann et al. 2000), and
species with natural consistent markings such as manta rays (Kitchen-Wheeler 2010),
tigers (Karanth et al. 2006), killer whales (Baird & Stacey 1988) and whale sharks
(Holmberg, Norman & Arzoumanian 2008). These offer unique opportunities for following
individuals over time as sightings can be carried out remotely, marks are consistent over
time, and all individuals present in the study area are available for sampling. Individual-
based studies of long-lived marine vertebrates present additional challenges due to their
aquatic lifestyle and potential for wide dispersal. However, the dependency and fidelity of
some species - such as pinnipeds and seabirds - on terrestrial sites during important stages
of their life history provide better opportunities to follow individuals over time.
For pinnipeds, long-term individual-based studies are generally biased towards
colonial otariids (e.g. Lunn, Boyd & Croxall 1994; Pendleton et al. 2006) and larger
phocids (e.g. Le Boeuf & Reiter 1988) that have extended nursing periods or remain on
land during lactation. All of these studies have depended on initial physical capture for
tagging or branding. Species of pinnipeds with natural markings are generally found within
the family Phocidae, but many of these occupy remote and inaccessible habitats in the
Arctic or Antarctic. The harbour seal, however, with its distinct markings in the pelage that
have previously proved successful for the identification of individuals (Cunningham et al.
2009; Hastings, Hiby & Small 2008; Mackey et al. 2008; Thompson & Wheeler 2008),
coupled with their wide temperate distribution, offer a suitable candidate species.
Nevertheless, individual-based studies of harbour seals are limited due to the fact that haul-
out sites are often inaccessible and, with the exception of Sable Island (Bowen et al. 2003),
easily disturbed. Furthermore, the use of inter-tidal breeding sites, results in mother-pup
pairs spending a significant amount of time in the water, and therefore not always available
for sighting. These factors have constrained the development of individual-based studies of
harbour seals and limited our understanding of their demography and behavioural
responses to environmental variation.

Chapter I
9
Harbour seal demography
Population rate of change in long-lived species is most sensitive to variation in
adult survival (Caswell 1978; Gaillard, Festa-Bianchet & Yoccoz 1998) and so obtaining
accurate measures of survival rates is critical for understanding longer-term changes in
population dynamics. Furthermore, fecundity and costs of reproduction have been shown
to vary in response to population density and weather conditions, where high population
density and poor weather conditions caused reduced fecundity and increased costs of
reproduction (Lunn, Boyd & Croxall 1994; Clutton-Brock et al. 1996; Coulson et al. 2001;
Barbraud & Weimerskirch 2005; Hadley, Rotella & Garrott 2007). Hence, these
parameters provide more sensitive and short-term indicators of population dynamics
(Lunn, Boyd & Croxall 1994; Clutton-Brock et al. 1996; Coulson et al. 2001; Barbraud &
Weimerskirch 2005; Hadley, Rotella & Garrott 2007). Harbour seals are long-lived
iteroparous mammals whereby females generally reproduce annually after the age of 4 to 6
years and due to their small body size females make short foraging trips during lactation in
order to sustain the energy demand of the pup (Boness, Bowen & Oftedal 1994).
For harbour seals, estimates of survival and fecundity have mainly been obtained
from analysis of teeth and ovaries from dead animals collected after disease outbreaks or
scientific harvesting (Boulva & McLaren 1979; Härkönen & Heide-Jørgensen 1990;
Heide-Jørgensen & Härkönen 1992). However, such samples of animals are rare and
constrained by ethical and conservation considerations. Furthermore, these instantaneous
and cross-sectional samples do not capture the temporal variation in survival and
reproductive rates that are crucial for understanding population dynamics. Despite long-
term individual-based work being carried out on Sable Island, Canada (e.g. Bowen, Oftedal
& Boness 1992, Bowen et al. 2001, 2003), no individual-based estimates of survival rates
are published for this population and the subsequent dramatic decline of harbour seals on
Sable Island prohibited the continuation of the research (Lucas & Stobo 2000). Mackey et
al. (2008) published the first photo-identification based estimate of survival for any
pinniped, which also represented the first ever survival estimate for UK harbour seals.
Unfortunately this study was not ideal for long-term monitoring because only a small
proportion of seals at the site were close enough to photograph, resulting in low recapture
rates, and preventing robust estimates of fecundity.
Shifting breeding phenology as an indicator of variation in environmental conditions
Climate change and environmental variation can cause shifts in the timing of
seasonal resources. Some species have shown the ability to plastically adjust their timing

Chapter I
10
of breeding accordingly using certain environmental and climatic cues (Forchhammer, Post
& Stenseth 1998; Réale et al. 2003; Frederiksen et al. 2004a; Møller, Flensted-Jensen &
Mardal 2006; Love et al. 2010), whereas others suffer reduced breeding success due to the
mismatch between resources and the arrival of offspring (Visser & Both 2005; Post &
Forchammer 2008).
Shifts in the timing of the seasonal activities of plants and animals, such as the
flowering of trees (Menzel & Fabian 1999), spawning of amphibians (Beebee 1995), the
emergence of butterflies (Roy & Sparks 2000) and the egg-laying of birds (Crick et al.
1997), may be some of the simplest processes in which to track species responses to
changes in the environment (Menzel & Fabian 1999; Walther et al. 2002). Temperate
regions are typically characterised by distinct seasonal peaks in resources and several long-
lived marine top predators (e.g. pinnipeds and seabirds) occupying these areas have
adapted a relatively short and synchronised breeding season that coincides with the time of
year when resources are most abundant or conditions most favourable for rearing
offspring. Seabirds synchronise egg-laying with distinct peaks in resources, such as the
timing of the spring plankton bloom (Vermeer 1981), herring migration (Durant, Anker-
Nilssen & Stenseth 2003) or peaks in sandeel abundance (Rindorf, Wanless & Harris
2000). For pinnipeds, the time of year when food availability is most important is more
difficult to determine, and may depend on their lactation strategy. Otariids generally forage
during an extended nursing period, and so food availability during this period is important.
Meanwhile, phocids fast throughout or during part of the nursing period and therefore must
gain the required fat stores during pregnancy. In addition to monitoring climate-induced
shifts in breeding phenology, it is also crucial to understand whether these responses have
consequences on breeding success and survival (Visser & Both 2005). Nutritional stress as
a result of variation in the abundance of resources or changes in population density can
also cause shifts in breeding phenology, whereupon the timing of breeding is typically
delayed during years of low food availability or high population density and offspring
survival is reduced (Clutton-Brock, Albon & Guinness 1988; Sydeman et al. 1991; Lunn,
Boyd & Croxall 1994; Boyd 1996; Catry, Ratcliffe & Furness 1998; Ratcliffe, Furness &
Hamer 1998). Furthermore, changes in the age-structure of populations of long-lived
mammals as a result of age-specific mortality from disease outbreaks or harvesting can
also shift the timing of breeding because older females tend to give birth earlier than
younger females (Lunn, Boyd & Croxall 1994; Loe et al. 2005).
In harbour seals, delayed implantation (whereby blastocyst implantation is initiated
by photoperiod) ensures a highly synchronised pupping season (Mead 1989; Temte 1993).
Chapter I
11
The timing of pupping in harbour seals varies geographically but this is likely an
adaptation to a seasonal environment (Temte 1994). Both individual- and population-level
studies of harbour seal pupping phenology in other parts of the world revealed significant
delays in the timing of pupping during population declines and advances during population
growth (Bowen et al. 2003; Jemison & Kelly 2001). Additionally, a recent study of
harbour seals in the southern part of the North Sea suggested the timing of pupping had
significantly advanced over the last 35 years due to an improved forage base (Reijnders et
al. 2010). This study used the timing of max pup count as an indicator of the actual timing
of pupping, but the use of such a proxy for the timing of pupping has not been tested.
Nevertheless, the proposed improved conditions for harbour seals in this area are of
particular interest as other populations in the North Sea have undergone long-term declines
during the same period (Lonergan et al. 2007).
Aims and objectives
The overall aim of this study was to gain insights into the population dynamics of
harbour seals by estimating demographic parameters and investigating between-year
variation in physiological responses. Below I detail the specific aims and objectives of
each chapter.
Chapter II aims to provide context for the individual-based approach through an
investigation of population-level changes in distribution and abundance within the study
area using 20 years of count data. This chapter also describes the study area in Loch Fleet
National Nature Reserve and the nearby Dornoch Firth and Morrich More Special Area of
Conservation. The objectives were to determine temporal changes in the relative use of
haul-out sites and associated foraging areas in relation to the long-term efficacy of Special
Areas of Conservation that were put in place to protect harbour seals.
Chapter III aims to acquire an understanding of the dynamics and stability of
harbour seal breeding groups by investigating site-use at the individual level. This chapter
outlines how photo-identification has been used at the Loch Fleet study site to collect the
individual-based data used throughout the thesis. The first objective of this chapter was to
use sightings of individual seals over five consecutive breeding seasons from 2006 to 2010,
and throughout the year in 2008 and 2009 to estimate sex-specific haul-out probability and
site fidelity at different temporal scales. Secondary objectives included investigating how
haul-out probabilities obtained from sightings of individuals compared with those
previously obtained from telemetry data, and examining the accuracy of count data in
depicting seasonal variation in the importance of haul-out sites by comparing these data

Chapter I
12
with novel mark-resight models that take into account individual variation in haul-out
probability.
Chapter IV aims to provide the first concurrent estimates of survival and
reproductive rate from a naturally regulated population of harbour seals. The objectives
were to use multistate and robust design analyses, which take into account individuals
occupying unknown states (unidentified sex or uncertainty in breeding state), for
estimating sex-specific survival rates, reproductive rates and costs of reproduction on
survival.
Chapter V aims to investigate the use of temporal variation in pupping dates and
lactation durations of individual harbour seals as an indicator of environmental conditions.
The objectives were to estimate the extent of variation in pupping dates and lactation
durations between years, to understand whether the timing of pupping had an influence on
lactation duration and to compare direct and indirect estimates of the timing of pupping.
Finally Chapter VI aims to develop a cost-effective sampling regime for the long-
term continuation of the study. The objectives were to estimate the costs and efficacy of
three reduced sampling regimes in estimating survival and reproductive rates as well as
detecting temporal variation in pupping dates.
The general discussion summarises the consequences of key findings in terms of
population dynamics and makes recommendations for the directions of future research.

Chapter I
13
References
Baird, R.W. (2001). Status of harbour seals, Phoca vitulina, in Canada. Canadian Field-
Naturalist 115, 663-675.
Baird, R.W., & Stacey, P.J. (1988). Variation in saddle patch pigmentation in populations
of killer whales (Orcinus orca) from British Columbia, Alaska, and Washington State.
Canadian Journal of Zoology 66, 2582-2585.
Baraff, L.S. & Loughlin, T.R. (2000). Trends and potential interactions between pinnipeds
and fisheries of New England and the U.S. west coast. Marine Fisheries Review 62, 1-38.
Barbraud, C., & Weimerskirch, H. (2005). Environmental conditions and breeding
experience affect costs of reproduction in blue petrels. Ecology 86, 682-692.
Baum, J.K., Myers, R.A., Kehler, D.G., Worm, B., Harley, S.J., & Doherty, P.A. (2003).
Collapse and conservation of shark populations in the northwest Atlantic. Science 299,
389-392.
Baxter, J.M. (2001). Establishing management schemes on marine Special Areas of
Conservation in Scotland. Aquatic Conservation: Marine and Freshwater Ecosystems 11,
261-265.
Beebee, T.J.C. (1995). Amphibian breeding and climate. Nature 374, 219-220.
Bjørge, A. (1991). Status of the harbour seal phoca vitulina L. in Norway. Biological
Conservation 58, 229-238.
Boness, D.J., Bowen, W.D. & Oftedal, O.T. (1994). Evidence of a maternal foraging cycle
resembling that of otariid seals in a small phocid, the harbor seal. Behavioural Ecology &
Sociobiology 34, 95-104.
Bonner, W.N., Vaughan, R.W. & Johnston, L. (1973). The status of common seals in
Shetland. Biological Conservation 5, 185-190.
Bonner, W.N. (1989). Seals and man – a changing relationship. Biological Journal of the
Linnean Society 38, 53-60.
Bonner, W.N. & Thompson, P.M. (1990). Common seal, Phoca vitulina. The Handbook of
British Mammals (eds S. Harris & G.B. Corbet), pp. 463-472. Blackwells, Oxford.
Boulva, J., & McLaren, I.A. (1979). Biology of the harbour seal, Phoca vitulina, in eastern
Canada. Bulletin of the Fisheries Research Board of Canada 200, 1-24.
Bowen, W.D., Oftedal, O.T., & Boness, D.J. (1992). Mass and energy transfer during
lactation in a small phocid, the harbor seal (Phoca vitulina). Physiological Zoology 65,
844-866.
Bowen, W.D., Ellis, S.L., Iverson, S.J., & Boness, D.J. (2001). Maternal effects on
offspring growth rate and weaning mass in harbour seals. Canadian Journal of Zoology 79,
1088-1101.

Chapter I
14
Bowen, W.D., Ellis, S.L., Iverson, S.J., & Boness, D.J. (2003). Maternal and newborn life-
history traits during periods of contrasting population trends: Implications for explaining
the decline of harbour seals (Phoca vitulina), on Sable Island. Journal of Zoology London
261: 155-163.
Boyd, I.L. (1996). Individual variation in the duration of pregnancy and birth date in
Antarctic fur seals: The role of environment, age, and sex of fetus. Journal of Mammalogy
77, 124-133.
Boyd, I.L., Wanless, S., & Camphuysen, C.J. (eds) (2006). Top predators in marine
ecosystems: their role in monitoring and management. Cambridge University Press,
Cambridge.
Brown, R.F., Wright, B.E., Riemer, S.D., & Laake, J. (2005). Trends in abundance and
current status of harbor seals in Oregon: 1977-2003. Marine Mammal Science 21, 657-670.
Burg, T.M., Trites, A.W., & Smith, M.J. (1999). Mitochondrial and microsatellite DNA
analyses of harbour seal population structure in the northeast Pacific Ocean. Canadian
Journal of Zoology 77, 930-943.
Butler, J.R.A., Middlemas, S.J., McKelvey, S.A., McMyn, A., Leyshon, B., Walker, I.,
Thompson, P.M., Boyd, I., Duck, C., Armstrong, J.D., Graham, I.M. & Baxter, J.M.
(2008). The Moray Firth Seal Management Plan: an adaptive framework for balancing the
conservation of seals, salmon, fisheries and wildlife tourism in the UK. Aquatic
Conservation 18, 1025-1038.
Caswell, H. (1978). A general formula for the sensitivity of population growth rate to
changes in life history parameters. Theoretical Population Biology 14, 215-230.
Catry, P., Ratcliffe, N., & Furness, R.W. (1998). The influence of hatching date on
different life-history stages of great skuas Catharacta skua. Journal of Avian Biology 29,
299-304.
Clutton-Brock, T.H. (1988). Reproductive Success, University of Chicago Press, IL, 538
pp.
Clutton-Brock, T.H., Albon, S.D., & Guinness, F.E. (1988). Reproductive success in male
and female red deer. In: Reproductive Success (T.H. Clutton-Brock), University of
Chicago Press, IL, pp. 325-343.
Clutton-Brock, T.H., Stevenson, I.R., Marrow, P., MacColl, A.D., Houston, A.I., &
McNamara, J.M. (1996). Population fluctuations, reproductive costs and life-history tactics
in female Soay sheep. Journal of Animal Ecology 65, 675-689.
Clutton-Brock, T., & Sheldon, B.C. (2010). Individuals and populations: the role of long-
term, individual-based studies of animals in ecology and evolutionary biology. Trends in
Ecology and Evolution 25, 562-573.
Coulson, T., Catchpole, E.A., Albon, S.D., Morgan, B.J.T., Pemberton, J.M., Clutton-
Brock, T.H., Crawley, M.J., & Grenfell, B.T. (2001). Age, sex, density, winter weather,
and population crashes in Soay sheep. Science 292, 1528-1531.

Chapter I
15
Crick, H.Q.P., Dudley, C., Glue, D.E., & Thomson, D.L. (1997). UK birds are laying eggs
earlier. Nature 388, 526.
Cunningham, L. (2009). Using computer-assisted photo-identifcation and capture-
recapture techniques to monitor the conservation status of harbour seals (Phoca vitulina).
Aquatic Mammals 35, 319-329.
Doney, S.C. (2010). The growing human footprint on coastal and open-ocean
biogeochemistry. Science 328, 1512-1516.
Dunnet, G.M., Furness, R.W., Tasker, M.L., & Becker, P.H. (1990). Seabird ecology in the
North Sea. Netherlands Journal of Sea Research 26, 387-425.
Durant, J.M., Anker-Nilssen, T. & Stenseth, N.C. (2003). Trophic interactions under
climate fluctuations: the Atlantic puffin as an example. Proceedings of the Royal Society
Biology 270, 1461-1466.
Edwards, M., & Richardson, A. (2004). Impact of climate change on marine pelagic
phenology and trophic mismatch. Nature 430, 881-883.
Estes, J.A., Terborgh, J., Brashares, J.S., Power, M.E., Berger, J., Bond, W.J., Carpenter,
S.R., Essington, T.E., Holt, R.D., Jackson, J.B.C, Marquis, R.J., Oksanen, L., Oksanen, T.,
Paine, R.T., Pikitch, E.K., Ripple, W.J., Sandin, S.A., Scheffer, M., Schoener, T.W.,
Shurin, J.B., Sinclair, A.R.E., Soulé, M.E., Virtanen, R., & Wardle, D.A. (2011). Trophic
downgrading of planet Earth. Science 333, 301-306.
Festa-Bianchet, M. (1989). Individual differences, parasites, and the costs of reproduction
for bighorn ewes (Ovis canadensis). Journal of Animal Ecology 58, 785-795.
Forchhammer, M.C., Post, E., & Stenseth, N.C. (1998). Breeding phenology and climate.
Nature 391, 29-30.
Frank, K.T., Petrie, B., Choi, J.S., & Leggett, W.C. (2005). Trophic cascades in a formerly
cod-dominated ecosystem. Science 308, 1621-1623.
Frederiksen, M., Harris, M.P., Daunt, F., Rothery, P., & Wanless, S. (2004a). Scale-
dependent climate signals drive breeding phenology of three seabird species. Global
Change Biology 10, 1214-1221.
Frederiksen, M., Wanless, S., Harris, M.P., Rothery, P., & Wilson, L.J. (2004b). The role
of industrial fisheries and oceanographic change in the decline of North Sea black-legged
kittiwakes. Journal of Applied Ecology 41, 1129-1139.
Frederiksen, M., Harris, M.P. & Wanless, S. (2005). Inter-population variation in
demographic parameters: a neglected subject? Oikos 111, 209-214.
Furness, R.W., & Tasker, M.L. (2000). Seabird-fisheries interactions: quantifying the
sensitivity of seabirds to reductions in sandeel abundance, and identification of key areas
for sensitive seabirds in the North Sea. Marine Ecology Progress Series 202, 253-264.

Chapter I
16
Gagnon, M. 1998. Regional Assessment: North Shore of the St. Lawrence Upper Estuary.
Priority Intervention Zones 15 and 16. Environment Canada – Quebec Region,
Environmental Conservation, St. Lawrence Centre. 67 pages.
Gaillard, J.-M., Festa-Bianchet, M., & Yoccoz, N.G. (1998). Population dynamics of large
herbivores: variable recruitment with constant adult survival. Trends in Ecology and
Evolution 13, 58-63.
Gilbert, J.R., Waring, G.T., Wynne, K.M. & Guldager, N. (2005). Changes in abundance
of harbor seals in Maine, 1981-2001. Marine Mammal Science 21, 519-535.
Goodall, J. (1986). Social rejection, exclusion, and shunning among the Gombe
chimpanzees. Ethology and Sociobiology 7, 227-236.
Goodman, S.J. (1998). Patterns of extensive genetic differentiation and variation among
European harbour seals (Phoca vitulina vitulina) revealed using microsatellite DNA
polymorphisms. Molecular Biology and Evolution 15, 104-118.
Greenwood, P.J. (1980). Mating systems, philopatry and dispersal in birds and mammals.
Animal Behaviour 28, 1140-1162.
Grigg, E.K., Allen, S.G., Green, D.E., & Markowitz, H. (2004). Harbor seal, Phoca
vitulina richardii, population trends in the San Francisco Bay estuary, 1970-2002.
California Fish and Game 90, 51-70.
Hadley, G.L., Rotella, J.J., & Garrott, R.A. (2007). Influence of maternal characteristics
and oceanographic conditions on survival and recruitment probabilities of Weddell seals.
Oikos 116, 601-613.
Halpern, B.S., Walbridge, S., Selkoe, K.A., Kappel, C.V., Micheli, F., D‟Agrosa, C.,
Bruno, J.F., Casey, K.S., Ebert, C., Fox, H.E., Fujita, R., Heinemann, D., Lenihan, H.S.,
Madin, E.M.P., Perry, M.T., Selig, E.R., Spalding, M., Steneck, R. & Watson, R. (2008). A
global map of human impact on marine ecosystems. Science 319, 948-952.
Hansen, B.J.L. & Harding, K.C. (2006). On the potential impact of harbour seal predation
on the cod population in the eastern North Sea. Journal of Sea Research 56, 329-337.
Harding, K.C. & Härkönen, T.J. (1999). Development in the baltic grey seal (Halichoerus
grypus) and ringed seal (Phoca hispida) populations during the 20th
century. Ambio 28,
619-627.
Harris, M.P. (1970). Territory limiting the size of the breeding population of the
oystercatcher (Haematopus ostralegus) – a removal experiment. Journal of Animal
Ecology 39, 707-713.
Hastings, K.K., Hiby, L.A., & Small, R.J. (2008). Evaluation of a computer-assisted
photograph-matching system to monitor naturally marked harbor seals at Tugidak Island,
Alaska. Journal of Mammalogy 89, 1201-1211.
Hauksson, E. (2006). Growth and reproduction in the Icelandic common seal (Phoca
vitulina L., 1758). Marine Biology Research 2, 59-73.

Chapter I
17
Heath, M.R. (2005). Changes in the structure and function of the North Sea fish foodweb,
1973-2000, and the impacts of fishing and climate. ICES Journal of Marine Science 62,
847-868.
Heide-Jørgensen, M.-P., & Härkönen, T.J. (1988). Rebuilding seal stocks in the Kattegat-
Skagerak. Marine Mammal Science 4, 231-246.
Heide-Jørgensen, M.P. & Härkönen, T. (1992). Long-term effects of epizootic in harbor
seals in the Kattegat-Skagerak and adjacent areas. Ambio 21, 511-516.
Heithaus, M.R., Frid, A., Wirsing, A.J., & Worm, B. (2008). Predicting ecological
consequences of marine top predator declines. Trends in Ecology and Evolution 23, 202-
210.
Helander, B. & Bignert, A. (1992). Harbor seal (Phoca vitulina) on the Swedish Baltic
coast: population trends and reproduction. Ambio 21, 504-510.
Herreman, J.K., Blundell, G.M., McDonald, D.B., & Ben-David, M. (2009). Asymmetrical
male-mediated gene flow between harbor seal (Phoca vitulina) populations in Alaska.
Canadian Journal of Zoology 87, 498-507.
Hirons, A.C., Schell, D.M. & Finney, B.P. (2001). Temporal records of δ 13C and δ 15 N
in North Pacific pinnipeds: inference regarding environemtal change and diet. Oecologia
129, 591-601.
Holmberg, J., Norman, B., & Arzoumanian, Z. (2008). Robust, comparable population
metrics through collaborative photo-monitoring of whale sharks Rhincodon typus.
Ecological Applications 18, 222-233.
Härkönen, T., & Heide-Jørgensen, M.-P. (1990). Comparative life histories of east Atlantic
and other harbour seal populations. Ophelia 32, 211-235.
Härkönen, T., & Harding, K.C. (2001). Spatial structure of harbour seal populations and
the implications thereof. Canadian Journal of Zoology 79, 2115-2127.
Härkönen, T., Dietz, R., Reijnders, P., Teilman, J., Harding, K., Hall, A., Brasseur, S.,
Siebert, U., Goodman, S.J., Jepson, P.D., Rasmussen, T.D. & Thompson, P. (2006). A
review of the 1988 and 2002 phocine distemper virus epidemics in European harbour seals.
Diseases of Aquatic Organisms 68, 115-130.
ICES (2003). Report of the Working Group on the Assessment of Demersal Stocks in the
North Sea and Skagerrak. ICES CM 2003/ACFM: 02. International Council for the
Exploration of the Sea, Copenhagen, Denmark.
Jeffries, S., Huber, H., Calambokidis, J., & Laake, J. (2003). Trends and status of harbor
seals in Washington State: 1978-1999. The Journal of Wildlife Management 67, 207-218.
Jemison, L.A. & Kelly, B.P. (2001). Pupping phenology and demography of harbour seals
(Phoca vitulina richardsi) on Tugidak Island, Alaska. Marine Mammal Science 17, 585-
600.

Chapter I
18
Jemison, L.A., Pendleton, G.W., Wilson, C.A. & Small, R.J. (2006). Long-term trends in
harbor seal numbers at Tugidak Island and Nanvak Bay, Alaska. Marine Mammal Science
22, 339-360.
Karanth, K.U., Nichols, J.D., Kumar, N.S., & Hines, J.E. (2006). Assessing tiger
population dynamics using photographic capture-recapture sampling. Ecology 87, 2925-
2937.
Kitchen-Wheeler, A.-M. (2010). Visual identification of individual manta ray (Manta
alfredi) in the Maldives Island, Western Indian Ocean. Marine Biology Research 6, 351-
363.
Kluijver, H.N. (1951). The population ecology of the great tit Parus m. Major (L). Ardea
39, 1-135.
Langtimm, C.A., Beck, C.A., Edwards, H.H., Fick-Child, K.J., Ackerman, B.B., Barton,
S.L., & Hartley, W.C. (2004). Survival estimates for Florida manatees from the photo-
identification of individuals. Marine Mammal Science 20, 438-463.
Le Boeuf, B.J., & Reiter, J. (1988). Lifetime reproductive success in northern elephant
seals. In: Reproductive Success (T.H. Clutton-Brock), University of Chicago Press, IL,
344-362.
Loe, L.E., Bonenfant, C., Mysterud, A., Gaillard, J.-M., Langvatn, R., Klein, F., Calenge,
C., Ergon, T., Pettorelli, N., & Stenseth, N.C. (2005). Climate predictability and breeding
phenology in red deer: timing and synchrony of rutting and calving in Norway and France.
Journal of Animal Ecology 74, 579-588.
Lonergan, M., Duck, C.D., Thompson, D., Mackey, B.L., Cunningham, L. & Boyd, I.L.
(2007). Using sparse survey data to investigate the declining abundance of British harbour
seals. Journal of Zoology (London) 271, 261-269.
Love, O.P., Gilchrist, H.G., Descamps, S., Semeniuk, C.A.D., & Bêty, J. (2010). Pre-
laying climatic cues can time reproduction to optimally match offspring hatching and ice
conditions in an Arctic marine bird. Oecologia 164, 277-286.
Lowry, L.F., Frost, K.J., Ver Hoep, J.M., & Delong, R.A. (2001). Movements of satellite-
tagged subadult and adult harbor seals in Prince William Sound, Alaska. Marine Mammal
Science 17, 835-861.
Lucas, Z. & Stobo, W.T. (2000). Shark-inflicted mortality on a population of harbour seals
(Phoca vitulina) at Sable Island, Nova Scotia. Journal of Zoology London 252, 405-414.
Lunn, N.J., Boyd, I.L., & Croxall, J.P. (1994). Reproductive performance of female
Antarctic fur seals: the influence of age, breeding experience, environmental variation and
individual quality. Journal of Animal Ecology 63, 827-840.
Mackey, B.L., Durban, J.W., Middlemas, S.J., & Thompson, P.M. (2008). A Bayesian
estimate of harbour seal survival using sparse photo-identification data. Journal of Zoology
274, 18-27.

Chapter I
19
Mann, J., Connor, R.C., Barre, L.M., & Heithaus, M.R. (2000). Female reproductive
success in bottlenose dolphins (Tursiops sp.): life history, habitat, provisioning, and group-
size effects. Behavioural Ecology 11, 210-219.
Mathews, E.A. & Pendleton, G.W. (1997). Estimation of trends in abundance of harbor
seals at terrestrial and glacial ice haul-outs in Glacier Bay National Park, Southeast Alaska,
1975-1996. Harbour seal investigations in Alaska, Annual Report, Alaska Department of
Fish and Game, 57-74.
Mathews, E.A. & Pendleton, G.W. (2006). Declines in harbor seal (Phoca vitulina)
numbers in Glacier Bay National Park, Alaska, 1992-2002. Marine Mammal Science 22,
167-189.
Mead, R. A. (1989). The physiology and evolution of delayed implantation in carnivores.
pp. 437-464 in J. L. Gittleman, ed. Carnivore behavior, ecology, and evolution. Cornell
University Press, New York.
Mees, J. & Reijnders, P.J.H. (1994). The harbour seal, Phoca vitulina, in the
Oosterschelde: decline and possibilities for recovery. Hydrobiologia 282-283, 547-555.
Menzel, A. & Fabian, P. (1999). Growing season extended in Europe. Nature 397, 659.
Molnar, J.L., Gamboa, R.L., Revenga, C. & Spalding, M.D. (2008). Assessing the global
threat of invasive species to marine biodiversity. Frontiers in Ecology and the
Environment 6, 485-492.
Moss, C.J. (2001). The demography of an African elephant (Loxodonta Africana)
population in Amboseli, Kenya. Journal of Zoology London 255, 145-156.
Myers, R.A. & Worm, B. (2003). Rapid worldwide depletion of predatory fish
communities. Nature 423, 280-283.
Møller, A.P., Flensted-Jensen, E., & Mardal, W. (2006). Rapidly advancing laying date in
a seabird and the changing advantage of early reproduction. Journal of Animal Ecology 75,
657-665.
O‟Corry Crowe, G.M., Martien, K.K., & Taylor, B.L. (2003). The analysis of population
genetic structure in Alaskan harbor seals, Phoca vitulina, as a framework for the
identification of management stocks. Administrative Report LJ-03-08, Southwest Fisheries
Science Center, National Marine Fisheries Service, NOAA, 8604 La Jolla Shores Drive, La
Jolla, CA 92037. 54pp.
Olesiuk, P.F., Bigg, M.A. & Ellis, G.M. (1990). Recent trends in the abundance of harbour
seals, Phoca vitulina, in British Columbia. Canadian Journal of Fisheries and Aquatic
Sciences 47, 992-1003.
Pauly, D., Christensen, V., Dalsgaard, J., Froese, R. & Torres Jr.,F. (1998). Fishing down
the marine food webs. Science 279, 860-863.
Pendleton, G.W., Pitcher, K.W., Fritz, L.W., York, A.E., Raum-Suryan, K.L., Loughlin,
T.R., Calkins, D.G., Hastings, K.K., & Gelatt, T.S. (2006). Survival of Steller sea lions in

Chapter I
20
Alaska: a comparison of increasing and decreasing populations. Canadian Journal of
Zoology 84, 1163-1172.
Perry, A.L., Low, P.J., Ellis, J.R., & Reynolds, J.D. (2005). Climate change and
distribution shifts in marine fishes. Science 308, 1912-1915.
Pitcher, K.W. (1990). Major decline in number of harbor seals, Phoca vitulina richardsi,
on Tugidak Island, Gulf of Alaska. Marine Mammal Science 6, 121-134.
Post, E., & Forchammer, M.C. (2008). Climate change reduces reproductive success of an
arctic herbivore through trophic mismatch. Philosophical Transactions of the Royal
Society Biology 363, 2367-2373.
Ratcliffe, N., Furness, R.W., & Hamer, K.C. (1998). The interactive effects of age and
food supply on the breeding ecology of great skuas. Journal of Animal Ecology 67, 853-
862.
Réale, D., McAdam, A.G., Boutin, S., & Berteaux, D. (2003). Genetic and plastic
responses of a northern mammal to climate change. Proceedings of the Royal Society
London Biology 270, 591-596.
Reijnders, P.J.H. (1981). Management and conservation of the harbour seal, Phoca
vitulina, population in the international Wadden Sea area. Biological Conservation 19,
213-221.
Reijnders, P.J.H. (1983). The effect of seal hunting in Germany on the further existence of
a harbour seal population in the Dutch Wadden Sea. Zeitschrift fuer Saeugetierkunde 48,
50-54.
Reijnders, P.J.H. (1985). On the extinction of the southern Dutch harbour seal population.
Biological Conservation 31, 75-84.
Reijnders, P.J.H. (1986). Reproductive failure in common seals feeding on fish from
polluted coastal waters. Nature 324, 456-457.
Reijnders, P.J.H. & Lankester, K. (1990). Status of marine mammals in the North Sea.
Netherlands Journal of Sea Research 26, 427-435.
Reijnders, P.J.H. (1994). Historical population size of the harbour seal, Phoca vitulina, in
the Delta area, SW Netherlands. Hydrobiologia 282-283, 557-560.
Reijnders, P.J., van Dijk, J., & Kuiper, D. (1995). Recolonization of the Dutch Wadden
Sea by the grey seal Halichoerus grypus. Biological Conservation 71, 231-235.
Reijnders, P.J.H., Ries, E.H., Tougaard, S., Nørgaard, N., Heidemann, G., Schwarz, J.,
Vareschi, E. & Traut, I.M. (1997). Population development of harbour seals Phoca vitulina
in the Wadden Sea after the 1988 virus epizootic. Journal of Sea Research 38, 161-168.
Reijnders, P.J.H., Brasseur, S.M.J.M., & Meesters, E.H.W.G. (2010). Earlier pupping in
harbour seals, Phoca vitulina. Biology Letters, 1-4.

Chapter I
21
Rindorf, A., Wanless, S. & Harris, M.P. (2000). Effects of changes in sandeel availability
on the reproductive output of seabirds. Marine Ecology Progress Series 202, 241-252.
Roy, D.B. & Sparks, T.H. (2000). Phenology of British butterflies and climate change.
Global Change Biology 6, 407-416.
Scott, D.K. (1988). Reproductive success in Bewick‟s swans. In: Reproductive Success
(T.H. Clutton-Brock), University of Chicago Press, IL, pp. 220-236.
Sharples, R.J., Arrizabalaga, B., Hammond, P.S. (2009). Seals, sandeels and salmon: diet
of harbour seals in St. Andrews Bay and the Tay Estuary, southeast Scotland. Marine
Ecology Progress Series 390, 265-276.
Small, R.J., Pendleton, G.W. & Pitcher, K.W. (2003). Trends in abundance of Alaska
harbor seals, 1983-2001. Marine Mammal Science 19, 344-362.
Small, R.J., Boveng, P.L., Byrd, G.V., & Withrow, D.E. (2008). Harbor seal population
decline in the Aleutian archipelago. Marine Mammal Science 24, 845-863.
Stanley, H.F., Casey, S., Carnahan, J.M., Goodman, S., Harwood, J., & Wayne, R.K.
(1996). Worlwide patterns of mitochondrial DNA differentiation in the harbor seal (Phoca
vitulina). Molecular Biology and Evolution 13, 368-382.
Stenson, G.B. (1994). The Status of pinnipeds in the Newfoundland region. Science
Council Studies 21, 115-119.
Sydeman, W.J., Huber, H.R., Emslie, S.D., Ribic, C.A., & Nur, N. (1991). Age-specific
weaning success of northern elephant seals in relation to previous breeding experience.
Ecology 72, 2204-2217.
Sydeman, W.J. & Allen, S.G. (1999). Pinniped population dynamics in Central California:
correlations with sea surface temperature and upwelling indices. Marine Mammal Science
15, 446-461.
Teilman, J., Rigét, F. & Härkönen, T. (2010). Optimizing survey design for Scandinavian
harbour seals: population trend as an ecological quality element. ICES Journal of Marine
Science 67, 952-958.
Temte, J.L. (1993). Latitudinal variation in the birth timing of captive California sea lions
and other captive North Pacific pinnipeds. Fisheries Bulletin 91, 710-717.
Temte, J.L. (1994). Photoperiod control of birth timing in the harbour seal (Phoca
vitulina). Journal of Zoology 233, 369-384.
Thompson, P.M. & Miller, D. (1992). Phocine distemper virus outbreak in the Moray Firth
common seal population: an estimate of mortality. Science of the Total Environment 115,
57-65.
Thompson, P.M., Kovacs, K.M. & McConnell, B.J. (1994). Natal dispersal of harbour
seals (Phoca vitulina) from breeding sites in Orkney. Journal of Zoology 234, 668-673.
Chapter I
22
Thompson, P.M., McConnell, B.J., Tollit, D.J., Mackey, A., Hunter, C. & Racey, P.A.
(1996a). Comparative distribution, movements and diet of harbour and grey seals from the
Moray Firth, N.E. Scotland. Journal of Applied Ecology 33, 1572-1584.
Thompson, P.M., Tollit, D.J., Greenstreet, S.P.R., Mackay, A., & Corpe, H.M. (1996b).
Between-year variations in the diet and behaviour of harbour seals Phoca vitulina in the
Moray Firth; causes and consequences. Aquatic Predators and their Prey (eds S.P.R.
Greenstreet & M.L. Tasker), pp. 44-52. Blackwell Scientific Publications, Oxford.
Thompson, P.M., Tollit, D.J., Corpe, H.M., Reid, R.J. & Ross, H.M. (1997a). Changes in
haematological parameters in relation to prey switching in a wild population of harbour
seals. Functional Ecology 11, 743-750.
Thompson, P.M., Tollit, D.J., Wood, D., Corpe, H.M., Hammond, P.S. & Mackay, A.
(1997b). Estimating harbour seal abundance and status in an estuarine habitat in north-east
Scotland. Journal of Applied Ecology 34, 43–52.
Thompson, P.M., van Parijs, S., & Kovacs, K.M. (2001). Local declines in the abundance
of harbour seals: implications for the designation and monitoring of protected areas.
Journal of Applied Ecology 38, 117-125.
Thompson, D., Lonergan, M. & Duck, C. (2005). Population dynamics of harbour seals
Phoca vitulina in England: monitoring growth and catastrophic declines. Journal of
Applied Ecology 42, 638-648.
Thompson, P.M., Mackey, B., Barton, T.R., Duck, C. & Butler, J.R.A. (2007). Assessing
the potential impact of salmon fisheries management on the conservation status of harbour
seals (Phoca vitulina) in north-east Scotland. Animal Conservation 10, 48-56.
Thompson, P.M., & Wheeler, H. (2008). Photo-ID-based estimates of reproductive
patterns in female harbor seals. Marine Mammal Science 24, 138-146.
Tollit, D.J. & Thompson, P.M. (1996). Seasonal and between-year variations in the diet of
harbour seals in the Moray Firth, Scotland. Canadian Journal of Zoology 74, 1110-1121.
Trites, A.W. & Donnelly, C.P. (2003). The decline of Steller sea lions Eumetopias jubatus
in Alaska: a review of the nutrional stress hypothesis. Mammal Review 33, 3-28.
Vermeer, K. (1981). The importance of plankton to Cassin‟s auklets during breeding.
Journal of Plankton Research 3, 315-329.
Visser, M.E., & Both, C. (2005). Shifts in phenology due to global climate change: the
need for a yardstick. Proceedings of the Royal Society Biology 272, 2561-2569.
Walther, G-R., Post, E., Convey, P., Menzel, A., Parmesan, C., Beebee, T.J.C., Fromentin,
J-M., Hoegh-Guldberg, O., & Bairlein, F. (2002). Ecological responses to recent climate
change. Nature 416, 389-395.
Wanless, S., Frederiksen, M., Daunt, F., Scott, B.E., & Harris, M.P. (2007). Black-legged
kittiwakes as indicators of environmental change in the North Sea: Evidence from long-
term studies. Progress in Oceanography 72, 30-38.

Chapter I
23
Weijerman, M., Lindeboom, H. & Zuur, A.F. (2005). Regime shifts in marine ecosystems
of the North Sea and Wadden Sea. Marine Ecology Progress Series 298, 21-39.
Westlake, R.L., & O‟Corry-Crowe, G.M. (2002). Macrogeographic structure and patterns
of genetic diversity in harbor seals (Phoca vitulina) from Alaska to Japan. Journal of
Mammalogy 83, 1111-1126.
Womble, J.N., Pendleton, G.W., Mathews, E.A., Blundell, G.M., Bool, N.M., & Gende,
S.M. (2010). Harbor seal (Phoca vitulina richardii) decline continues in the rapidly
changing landscape of Glacier Bay National Park, Alaska 1992-2008. Marine Mammal
Science 26, 686-697.
Yodzis, P. (1998). Local trophodynamics and the interaction of marine mammals and
fisheries in the benguela ecosystem. Journal of Animal Ecology 67, 635-658.
Österblom, H., Olsson, O., Blenckner, T., & Furness. R.W. (2008). Junk-food in marine
ecosystems. Oikos 117, 967-977.

Chapter II
24
CHAPTER II
LONG-TERM PATTERNS IN HARBOUR SEAL SITE-USE AND
THE CONSEQUENCES FOR MANAGING PROTECTED
AREAS
Cordes, L.S., Duck, C.D., Mackey, B.L., Hall, A.J., & Thompson, P.M.
Animal Conservation 14, 430-438.

Chapter II
25
CHAPTER II
LONG-TERM PATTERNS IN HARBOUR SEAL SITE-USE AND THE
CONSEQUENCES FOR MANAGING PROTECTED AREAS
Introduction
The designation of marine protected areas is commonly used as a management tool
in the conservation of threatened or declining animal populations (Hooker, Whitehead &
Gowans 1999; Balmford et al. 2004), but its success can be highly dependent upon the
factors considered during their design (Agardy 1994; Sala et al. 2002). Protected areas for
marine species offer unique challenges in their designation due to high levels of
connectivity between areas and widespread dispersal of individuals within a population
(Roberts 1997; Mora & Sale 2002). To maximize the conservation potential of protected
areas, it is necessary to understand the longer-term stability of distribution patterns of
target species (Grech & Marsh 2008).
Globally, many pinniped populations are declining or threatened, emphasizing the
need to improve conservation measures for these species (Reijnders et al. 1993; Estes et al.
2009). Harbour seals are the most widespread of pinnipeds. Their populations show
marked regional variations in their dynamics, with some populations increasing over recent
decades (Jeffries et al. 2003; Brown et al. 2005) whereas others have declined (Bowen et
al. 2003; Lonergan et al. 2007; Small et al. 2008). In Europe, harbour seals are protected
under the European Commission Habitats Directive (Council Directive 92/43/EEC),
requiring the designation of Special Areas of Conservation (SACs) to protect both their
terrestrial haul-out sites and associated foraging areas (Baxter 2001; Cunningham et al.
2009). Harbour seals have a wide distribution and come ashore (or „haul out‟) on a variety
of substrates such as inter-tidal sandbanks, skerries and ice floes. The dependence of seals
on terrestrial haul-out sites for resting (da Silva & Terhune 1988) and rearing pups
(Thompson 1989) has provided good opportunities for assessing patterns of terrestrial
distribution and abundance, underpinning the identification of key clusters of haul-out sites
for protection as SACs (Cunningham et al. 2009). Intensive short-term studies have shown

Chapter II
26
that harbour seals display high levels of site fidelity to such areas over periods of months to
years (Härkönen & Heide-Jørgensen 1990; Thompson et al. 1997; Cunningham et al.
2009). However, less is known about the stability of distribution patterns over decadal
scales that are more likely to be relevant to the long-term management of protected areas.
Furthermore, most attention has been paid to identifying and protecting key terrestrial sites
whereas little is known about their use of foraging areas. A number of studies have shown
that the seals‟ selection of haul-out sites can be influenced by changes in prey distribution
(Montgomery, Ver Hoef & Boveng 2007; Womble, Sigler & Willson 2009). Given this, an
understanding of the factors that may influence changes in the use of protected haul-out
sites also requires information on the seals‟ foraging areas.
In recent years, there have been marked declines of harbour seals across much of
Scotland (Lonergan et al. 2007). As with pinniped declines in other regions (e.g. Trites &
Donnelly 2003; Estes et al. 2009) the key drivers underlying these declines are uncertain,
but include factors such as predation (Springer et al. 2003; Bolt et al. 2009), human
persecution (Thompson et al. 2007), disease (Hall et al. 2006) and changes in food
availability (Trites & Donnelly 2003). The designation of SACs in response to the EU
Habitats Directive was put forward before this period of decline in Scottish harbour seal
populations. In north-east Scotland, the importance of the northern region of the Moray
Firth as a harbour seal breeding site during the 1990s led to the designation of the Dornoch
Firth and Morrich More SAC (see Fig. 1) in 2000 (Butler et al. 2008). However, the
abundance of harbour seals in this area has declined by 2–5% per year since the early
1990s (Thompson et al. 2007).
The Moray Firth is the only UK region where long-term harbour seal population
studies have been conducted in parallel with detailed studies of foraging ecology. We used
this unique opportunity to investigate long-term changes in the distribution and seasonal
use of haul-out sites over a 20-year period. In particular, we aimed to assess whether the
criteria used for SAC designation have adequately protected key pupping areas, and
whether observed changes in the use of pupping areas are likely to have been driven by
wider scale changes in their foraging areas or by local changes in conditions within haul-
out areas.

Chapter II
27
Materials and methods
Study area
The Dornoch Firth and Morrich More SAC covers 8700 ha and stretches 19km
inland from the mouth of the Firth to the westernmost haul-out site (Thompson et al. 2007;
http://www.jncc.gov.uk/ProtectedSites/SACselection). Systematic surveys between 1988
and 2008 have shown that harbour seals haul-out on 11 inter-tidal sandbanks within this
SAC (Fig. 1). For the purposes of this study, haul-out sites within the Dornoch Firth and
Morrich More SAC were grouped into three regions: the inner, mid and outer Dornoch
Firth (Fig. 1). Loch Fleet National Nature Reserve (NNR) is 10km north of the mouth of
the SAC (Fig. 1). This is a smaller site, covering just over 1000 ha and stretching only 2.5
km from the mouth to the innermost haul-out site. Seals haul-out regularly on two inter-
tidal sandbanks within Loch Fleet, whereas a third sandbank is used occasionally.
Figure 1. Map showing locations of inter-tidal haul-out sites in the Dornoch Firth and Morrich
More SAC (including sub-areas: inner■, mid● and outer▲) and Loch Fleet NNR.
Distribution of seals at terrestrial haul-out sites
At least two land-based counts of harbour seals in the SAC and Loch Fleet NNR
were carried out during each pupping season (15 June to 15 July) between 1988 and 2005
(see Thompson et al. 2007) and in 2008 (Table 1). In 2006 and 2007, comparable data
were collected from aerial surveys carried out during the same time-period (Table 1).
Detailed investigation of variability in these counts indicated that the CV of mean
estimates was <0.12 (Thompson et al. 2007). In the present study, these data were used to
investigate long-term changes in the relative abundance of seals at different haul-out sites
Chapter II
28
during the pupping season. Harbour seals typically continue to come ashore regularly at
local haul-out sites to rest throughout the year, although seasonal patterns of abundance
can differ between sites. To investigate whether there had been long-term changes in
seasonal patterns at these Moray Firth sites, we conducted twice-monthly year-round
surveys throughout 2008 for comparison with similar surveys that had been made in 1988
(Table 1). Full details of the methods used for these surveys are provided in Thompson et
al. (1996). In brief, low tide haul-out counts were made by experienced observers from the
nearest coastal vantage point using 30-80mm telescopes. These counts provided reliable
estimates of the total number of adult (i.e. non-pup) seals. In the SAC, the distance
between some haul-out sites and observer made it difficult to accurately estimate the
number of young pups as they could be obscured by their mothers. However, sandbanks in
Loch Fleet were close to shore (120–250 m); allowing pups to be counted accurately (see
Thompson & Wheeler 2008). Unless stated otherwise, all pupping season counts of seals
do not include pups of the year. Counts made outside the pupping season include seals of
all ages.
To provide accurate data on the number of pups born in all areas, aerial surveys
were carried out during the pupping seasons of 1989, 2006 and 2007 (Table 1). In 1989,
three surveys were carried out on 23 June, 29 June and 3 July. These surveys were made at
a height of c. 100m from a single-engine helicopter, and groups of seals were
photographed using oblique 35mm photography, a 75–300mm zoom lens and colour
transparency film. Numbers of pups with mothers, and all other seals >1 year of age were
later counted over a light table using a binocular microscope. In 2006, five surveys were
carried out, on 18 June, 23 June, 29 June, 7 July and 15 July. In 2007, four surveys were
carried out, on 15 June, 29 June, 8 July and 13 July. These surveys were made from a
height of 275m using a fixed wing aircraft and a digital SLR with a 70–300mm lens. All
surveys were carried out within two hours before and after low tide. In all 3 years, data on
the relative distribution of mothers and pups were based on the survey that contained the
highest pup count.
Identification of foraging areas
Foraging areas of individual female seals caught in the Dornoch Firth in 1989 and
females caught in Loch Fleet in 2009 were compared (Table 1). In 1989, five females were
caught and equipped with VHF radio tags during late May (Thompson et al. 1994). In
April 2009, five females were caught and equipped with GPS Fastloc/GSM tags (SMRU,
Scottish Oceans Institute, University of St Andrews, UK). The methods for catching and
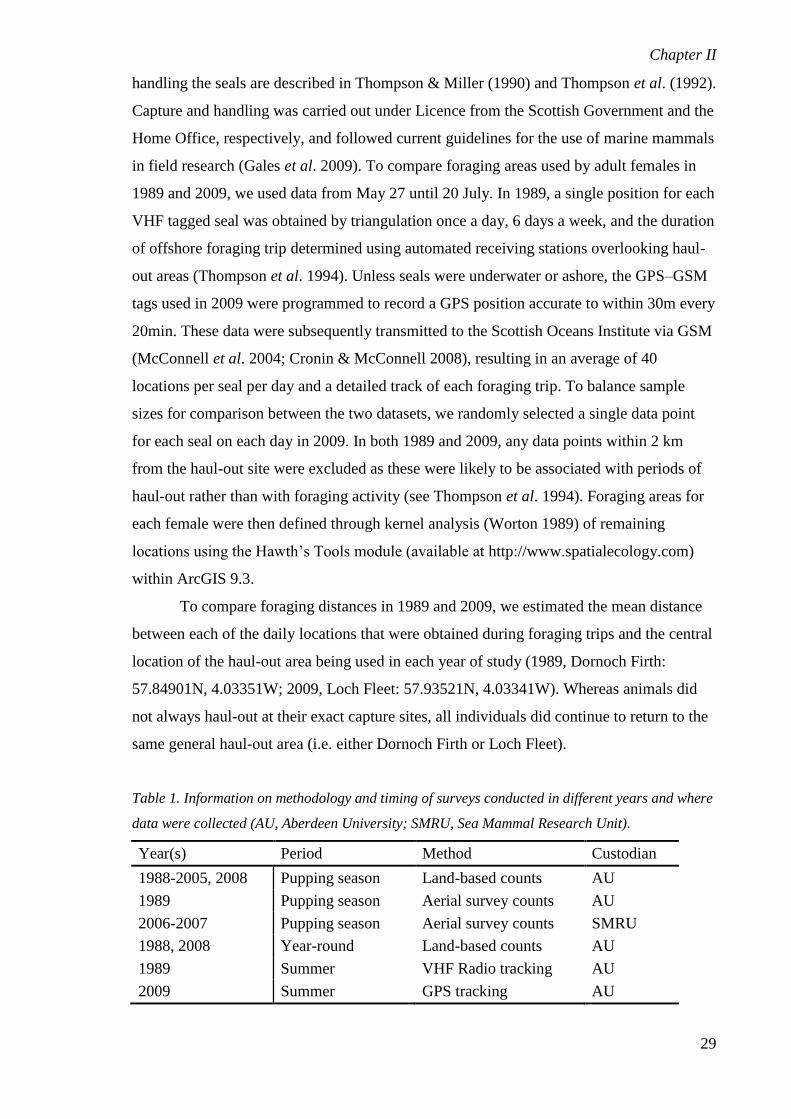
Chapter II
29
handling the seals are described in Thompson & Miller (1990) and Thompson et al. (1992).
Capture and handling was carried out under Licence from the Scottish Government and the
Home Office, respectively, and followed current guidelines for the use of marine mammals
in field research (Gales et al. 2009). To compare foraging areas used by adult females in
1989 and 2009, we used data from May 27 until 20 July. In 1989, a single position for each
VHF tagged seal was obtained by triangulation once a day, 6 days a week, and the duration
of offshore foraging trip determined using automated receiving stations overlooking haul-
out areas (Thompson et al. 1994). Unless seals were underwater or ashore, the GPS–GSM
tags used in 2009 were programmed to record a GPS position accurate to within 30m every
20min. These data were subsequently transmitted to the Scottish Oceans Institute via GSM
(McConnell et al. 2004; Cronin & McConnell 2008), resulting in an average of 40
locations per seal per day and a detailed track of each foraging trip. To balance sample
sizes for comparison between the two datasets, we randomly selected a single data point
for each seal on each day in 2009. In both 1989 and 2009, any data points within 2 km
from the haul-out site were excluded as these were likely to be associated with periods of
haul-out rather than with foraging activity (see Thompson et al. 1994). Foraging areas for
each female were then defined through kernel analysis (Worton 1989) of remaining
locations using the Hawth‟s Tools module (available at http://www.spatialecology.com)
within ArcGIS 9.3.
To compare foraging distances in 1989 and 2009, we estimated the mean distance
between each of the daily locations that were obtained during foraging trips and the central
location of the haul-out area being used in each year of study (1989, Dornoch Firth:
57.84901N, 4.03351W; 2009, Loch Fleet: 57.93521N, 4.03341W). Whereas animals did
not always haul-out at their exact capture sites, all individuals did continue to return to the
same general haul-out area (i.e. either Dornoch Firth or Loch Fleet).
Table 1. Information on methodology and timing of surveys conducted in different years and where
data were collected (AU, Aberdeen University; SMRU, Sea Mammal Research Unit).
Year(s) Period Method Custodian
1988-2005, 2008 Pupping season Land-based counts AU
1989 Pupping season Aerial survey counts AU
2006-2007 Pupping season Aerial survey counts SMRU
1988, 2008 Year-round Land-based counts AU
1989 Summer VHF Radio tracking AU
2009 Summer GPS tracking AU

Chapter II
30
Results
Temporal changes in distribution of seals during the breeding season
Although harbour seal counts in the northern region of the Moray Firth have been
declining since the mid 1990s (Thompson et al. 2007), trends within the Dornoch Firth and
Morrich More SAC and Loch Fleet differed markedly during this period (Fig. 2). During
the pupping season, mean counts at haul-out sites in the SAC declined by 4–7% per year.
In contrast, numbers in Loch Fleet increased by an average of 12% per year since the mid
1990s (Fig. 2). As a result there was a notable decline in the proportion of seals using the
SAC over the 20-year period. In 1988, 100% of animals were located within the SAC
whereas by 2008 only 70% used this area.
Figure 2. Trends in abundance of harbour seals within the Dornoch Firth and Morrich More SAC
▲ and Loch Fleet ○. Data are means (+/- 1SE) of counts made during land-based surveys carried
out between 15 June and 15 July in each year with the exception of 2006 and 2007 where data
were obtained from aerial surveys.
There was often considerable inter-annual variability in both abundance and the
relative importance of different sub-areas within the SAC (Fig. 3). Trends in the proportion
of animals in each sub-area were also examined. The lowest numbers of seals were
consistently counted in the inner Dornoch Firth, whereas the highest numbers of animals
were counted in the mid Dornoch Firth. Numbers of seals in the inner Dornoch Firth were
least variable over the 20-year period, whereas numbers in the mid and outer Dornoch
Firth showed more inter-annual variation. However, there was no indication of any long-
0
100
200
300
400
500
600
1985 1990 1995 2000 2005 2010
Mea
n C
ou
nt
(+/-
SE
)

Chapter II
31
term change in relative distribution within the Dornoch Firth during the 20-year period
(Fig. 3).
TREND RELATIVE USE
Figure 3. Trends in annual mean counts and relative usage of the a) inner Dornoch, b) mid
Dornoch and c) outer Dornoch. Data collected from land-based surveys carried out between 15
June and 15 July in each year apart from 2006 and 2007 where data were collected from aerial
surveys.
Long-term consistency of seasonal patterns
In 1988, year-round counts suggested that the inner Dornoch Firth was an
important area for harbour seals in both the pupping season and the winter (Fig. 4a). The
mid Dornoch Firth was used year-round but was especially important during the pupping
season (June and July) and moult (August and September) (Fig. 4b). The outer Dornoch
Firth did not show the same year-round use as the inner and mid Dornoch Firth, but was
characterized by a strong peak from the start of the pupping season through moult (Fig.
0
200
400
Mea
n c
ou
nt
(+/-
SE
)
a) Inner Dornoch
0.0
0.5
1.0
Pro
po
rtio
n
0
200
400
Mea
n c
ou
nt
(+/-
SE
)
b) Mid Dornoch
0.0
0.5
1.0
Pro
po
rtio
n
0
200
400
1985 1990 1995 2000 2005 2010
Mea
n c
ou
nt
(+/-
SE
)
c) Outer Dornoch
0.0
0.5
1.0
1985 1990 1995 2000 2005 2010
Pro
po
rtio
n

Chapter II
32
4c). In 1988, numbers in Loch Fleet were low, and this appeared to be used primarily as a
winter site (Fig. 4d).
1988 2008
Figure 4. Monthly mean counts from the a) inner Dornoch, b) mid Dornoch, c) outer Dornoch and
d) Loch Fleet in 1988 and 2008. Data collected from year-round twice-monthly land-based
surveys.
0
50
100
150
200
Mea
n C
ou
nt
(+/-
SE
) a) Inner Dornoch
0
100
200
300
400
Mea
n C
ou
nt
(+/-
SE
) b) Mid Dornoch
0
100
200
300
400
Mea
n C
ou
nt
(+/-
SE
) c) Outer Dornoch
0
25
50
75
100
J F M A M J J A S O N D
Mea
n C
ou
nt
(+/-
SE
)
J F M A M J J A S O N D
d) Loch Fleet

Chapter II
33
By 2008, numbers at all sites within the SAC had declined. In the inner Dornoch
Firth, there was a slight increase in abundance during the pupping season, but no evidence
of the winter peak seen in 1988 (Fig. 4a). In the mid Dornoch Firth, numbers remained
more similar throughout the year compared with 1988, with no obvious peak during the
pupping and moult seasons (Fig. 4b). The outer Dornoch Firth was still characterized by
one distinct peak. However, instead of being confined to the pupping and especially the
moult season, use of this area was higher in spring and autumn (Fig. 4c). In 2008, Loch
Fleet showed a considerable increase in numbers throughout the year. Seasonal usage was
highest from late winter, through the pupping season to the end of the moult, and then
decreased slightly through early winter (Fig. 4d).
Changes in the relative importance of different pupping sites
The maximum number of pups counted in the northern region of the Moray Firth
was similar in 1989 (n=84 pups, 29 June), 2006 (n=84 pups, 29 June) and 2007 (n=78
pups, 29 June). Data from aerial surveys indicated that in 1989 the SAC contained 100% of
the pups born within the northern region of the Moray Firth. However, by 2006 and 2007,
the importance of the SAC as a pupping site had fallen by c. 37% with max pup count
reduced to 54 in 2006 and 49 in 2007. This difference in the relative number of pups born
in the SAC and Loch Fleet was significant (Χ2=51.232, df=6, p<0.001).
Annual land-based counts at Loch Fleet were used to explore the development of
this new pupping site in more detail. In the late 1980s and early 1990s, no pups were
observed in this area. Since then pup production has increased steadily year by year (Fig.
5), indicating that there has been a gradual shift in importance from the SAC to Loch Fleet.

Chapter II
34
Figure 5. Maximum annual pup counts from Loch Fleet. Data were collected from land-based
surveys carried out between 15 June and 15 July in each year, although in 2006 and 2007 data
from aerial surveys were used.
Comparison of foraging areas in 1989 and 2009
Adult females foraged in broadly similar areas in 1989 and 2009. Individual seals
tagged in 1989 (n=5) showed some overlap in foraging areas, whereas seals caught in 2009
(n=5) displayed less overlap (Fig. 6). Analysis showed no significant difference in the
distance travelled by seals in 1989 (17–22 km) and 2009 (7–22 km) (Welch test, t=1.038,
df=5, p>0.05) (Table 2).
0
10
20
30
40
50
1985 1990 1995 2000 2005 2010
Max
pu
p c
ou
nt

Chapter II
35
Figure 6. Comparison of adult female foraging locations in 1989 (n=5) and 2009 (n=5). The solid
lines show the 50% contours for individual foraging areas as calculated by Kernel analysis.
Individuals 100 and 101 (1989), and 583 (2009) each had two separate 50% contours.

Chapter II
36
Table 2. Summary of the distance between haul-out and foraging areas for 10 females tagged in
1989 and 2009. n = the number of daily locations >2km from haul-out areas.
ID Year n Max Mean 95% CI
100 1989 14 25.8 16.5 13.0-20.0
101 1989 16 29.7 16.5 12.2-20.9
102 1989 20 25.1 18.4 16.5-20.3
107 1989 17 31.5 21.8 19.4-24.2
108 1989 20 27.4 19.3 16.7-21.9
580 2009 14 24.6 18.4 13.9-23.0
581 2009 19 38.4 21.9 18.5-25.3
582 2009 8 11.7 10.0 9.1-10.8
583 2009 35 18.9 7.3 5.3-9.2
584 2009 34 31.2 19.3 16.6-22.1
Discussion
Temporal changes in haul-out distribution
Observations in many regions have shown that harbour seal pupping sites are used
consistently in successive years (Frost, Lowry & Ver Hoef 1999; Small, Pendleton &
Pitcher 2003; Lonergan et al. 2007), despite high levels of disturbance or hunting at some
locations (Bonner, Vaughan & Johnston 1973). In contrast, zoo-archaeological and genetic
studies have provided evidence for longer-term changes in the abundance and distribution
of harbour seals in the Baltic region (Härkönen et al. 2005; Schmölcke 2008). However,
data on the consistency of site-use at the intermediate timescales of interest to conservation
biologists are sparse. Fine-scale studies of haul-out site use have typically been conducted
over only a few years, and longer time-series of abundance estimates generally present
aggregated data at larger scales (Jeffries et al. 2003; Brown et al. 2005; Lonergan et al.
2007) or use a sub-set of sites for trend monitoring (Frost et al. 1999; Small et al. 2003).
The results from this study are the first to present data on fine-scale patterns of harbour
seal haul-out site use over a period of two decades.
Previous studies have provided some evidence for the loss of certain haul-out sites
in industrialized estuaries (Allen 1991), but there is little information on whether these
represented previously important pupping areas, or sites that were used only occasionally.
In other pinniped populations, the developments of new pupping sites tend to have
occurred as a consequence of population growth (Payne 1977; Pomeroy, Twiss & Duck

Chapter II
37
2000). The changes in site-use observed in our study are of particular interest to
conservation managers because the development of the new pupping site occurred during a
period when harbour seal populations across this and many other parts of Scotland
underwent significant declines (Lonergan et al. 2007). Furthermore, over this same period,
there was a reduction in the importance of nearby pupping sites that had recently been
designated as an SAC to protect this species. An understanding of the mechanisms driving
changes in the relative importance of different sites within this intensively studied area
could provide important insights into the likely success of different management measures
at this and other protected haul-out areas. Unfortunately, an absence of individual-based
studies during the late 1990s mean that it is not possible to say whether the increase in pup
production in Loch Fleet resulted from an influx of new recruits, or whether adult females
from the SAC switched to new breeding sites. But whatever the proximate cause for this
change, there are several possible reasons why haul-out sites in Loch Fleet may now be
more attractive to adult females than the sites within the SAC.
Increases in anthropogenic disturbance have been shown to influence haul-out site
choice of harbour seals (Suryan & Harvey 1999). Shooting of seals is known to have
occurred regularly within the Dornoch Firth (Thompson et al. 2007), but is believed to
have been rare in Loch Fleet in recent decades. This may have driven observed changes in
site-use, although it does not explain why the increase in Loch Fleet did not occur until the
mid 1990s, well after shooting had been restricted in this area. Similarly, boat-based
mussel fisheries regularly operate close to the haul-out sites within the SAC, but this
fishery has been in operation for over 500 years and this also seems unlikely to explain
recent changes in distribution. The only major development in the area during this period
was the construction in 1991 of a bridge across the narrows between the inner and mid
Dornoch Firth that now carries over a million vehicles a year. Whereas it is impossible to
directly assess whether seals responded to this development, the lack of any other obvious
changes in habitat quality within the SAC suggests that the potential for in-air or
underwater traffic noise to influence seal movements and site-use deserves further
investigation at a broader range of sites.
Changes in the distribution and/or abundance of prey are other possible
explanations for the observed changes in site use within the northern Moray Firth. Changes
in prey distribution could cause seals to forage further offshore, potentially using haul-out
sites nearer those resources to reduce travel costs. However, although sample sizes were
small and individual variability high, foraging adult females were located in broadly
similar areas and travelled similar distances in 1989 and 2009. The relative local foraging

Chapter II
38
seen in both years is consistent with previous tracking work of harbour seals in the Moray
Firth (Tollit et al. 1998) and elsewhere (Lesage, Hammill & Kovacs 2004).
Long-term consistency of seasonal patterns
Typically, information on long-term trends in abundance and distribution are based
on summer surveys during either the pupping or moulting seasons. However, the use of
haul-out sites may vary seasonally, and the potential conservation importance of certain
sites may be overlooked when surveys are limited to one period of the year. Furthermore,
the assessment of potential impacts from new developments will also be constrained unless
there is a clear understanding of seasonal patterns in the seals‟ use of different protected
areas. We carried out year-round surveys at the beginning and end of our time series.
Comparison of these data suggests that harbour seals in the SAC have shown some
changes in their seasonal pattern of site-use over this period. For example, sites in the inner
Dornoch Firth previously showed a winter peak in abundance, whereas recent counts
peaked in the summer (Fig. 4a). Changes in seasonal patterns were also evident in Loch
Fleet. In the late 1980s, Loch Fleet was used primarily as a winter site, with any seals
present at other times typically being small groups of juveniles (P. M. Thompson,
Unpublished data). More recently, Loch Fleet has become increasingly important during
the summer. Pupping season and moult surveys will remain an important tool for
abundance estimates (Thompson et al. 1997; Small et al. 2003; Gilbert et al. 2005), but
year-round surveys are often also required to provide conservation managers with the
information needed to mitigate the impact of potential developments. Our results highlight
that seasonal patterns may vary over time, and care should be taken when drawing
conclusions from short-term or older survey data.
Management implications
The population dynamics of long-lived vertebrates are most sensitive to changes in
adult mortality (Caswell 1978; Gaillard, Festa-Bianchet & Yoccoz 1998) and efforts to
reduce mortality due to hunting, persecution or by-catch should be the first priority when
managing the restoration of declining populations. The development of a management plan
to control the numbers of seals shot in the Moray Firth (Butler et al. 2008) was therefore an
appropriate response to reported declines in this population, particularly as estimates of the
numbers of seals shot were sufficient to explain a large part of this decline (Thompson et
al. 2007). Nevertheless, wider scale declines in areas where there is little documented
persecution suggest that other drivers are involved (Lonergan et al. 2007; Hall & Frame

Chapter II
39
2010), and the development of SACs through the EU Habitats Directive offers a
framework for protecting key habitats and controlling other threats. The nature and extent
of these potential threats remain unclear, but reductions in the use of pupping sites within
the SAC suggest that subtle changes in the quality of these haul-out sites compared with
those in the adjacent Loch Fleet NNR have influenced female site choice. Of the monitored
sites in Scotland, Loch Fleet is the only site where pup production has increased.
Fortuitously, this area was designated as a NNR in 1998 due to its broad biodiversity
interest, and management of the NNR can be adapted to encompass the area‟s increasing
importance as a seal pupping site.
Efforts to designate protected areas for seal and seabird populations have
traditionally focussed on key terrestrial breeding sites, primarily due to the limited
information available on the foraging areas used by animals from these colonies. Methods
for following the at-sea movements of these marine top predators have been developed
only relatively recently, meaning that information on long-term variation in the use of
different feeding areas is rare. This can be a particular constraint when managing breeding
colonies, because it is unclear whether the site‟s importance depends upon its intrinsic
characteristics or its proximity to suitable feeding areas. Although sample sizes were small,
our results indicate that harbour seal foraging areas remained similar, despite changes in
their use of breeding sites. This does not rule out the possibility that broader scale changes
in haul-out site use may be driven by changes in foraging conditions. However, it does
suggest that subtle temporal and spatial changes in the characteristics of their breeding
sites, or surrounding tidal waters, have influenced site selection. In contrast, the key
features of these areas that affect the seals site selection remain elusive to conservation
managers. More detailed assessments of the environmental conditions at sites with
contrasting trends in pup production may now provide an opportunity to develop better site
selection criteria, and identify key management measures for conserving viable
populations within this and other harbour seal SACs.

Chapter II
40
References
Agardy, M.T. (1994). Advances in marine conservation: the role of marine protected areas.
Trends Ecology and Evolution 9, 267-270.
Allen, S.G. (1991). Harbour seal habitat restoration at Strawberry Spit, San Francisco Bay.
Report to the U.S. Marine Mammal Commision, No. MM2910890-9.
Balmford, A., Gravestock, P., Hockley, N., McClean, C.J. & Roberts, C.M. (2004). The
worldwide costs of marine protected areas. Proceedings of the National Academy of
Sciences 101, 9694-9697.
Baxter, J.M. (2001). Establishing management schemes on marine Specieal Areas of
Conservation in Scotland. Aquatic Conservation 11, 261-265.
Bolt, H.E., Harvey, P.V., Mandleberg, L. & Foote, A.D. (2009). Occurrence of killer
whales in Scottish inshore waters: temporal and spatial patterns relative to the distribution
of declining harbour seal populations. Aquatic Conservation 19, 671-675.
Bonner,W.N., Vaughan, R.W. & Johnston, L. (1973). The status of common seals in
Shetland. Biological Conservation 5, 185-190.
Bowen, W.D., Ellis, S.L., Iverson, S.J. & Boness, D.J. (2003). Maternal and newborn life-
history traits during periods of contrasting population trends: implications for explaining
the decline of harbour seals (Phoca vitulina), on Sable Island. Journal of Zoology London
261, 155-163.
Brown, R.F., Wright, B.E., Reimer, S.D. & Laake, J. (2005). Trends in abundance and
current status of harbour seals in Oregon: 1977-2003. Marine Mammal Science 21, 657-
670.
Butler, J.R.A., Middlemas, S.J., McKelvey, S.A., McMyn, A., Leyshon, B., Walker, I.,
Thompson, P.M., Boyd, I., Duck, C., Armstrong, J.D., Graham, I.M. & Baxter, J.M.
(2008). The Moray Firth Seal Management Plan: an adaptive framework for balancing the
conservation of seals, salmon, fisheries and wildlife tourism in the UK. Aquatic
Conservation 18, 1025-1038.
Caswell, H. (1978). A general formula for the sensitivity of population growth rate to
changes in life history parameters. Theoretical Population Biology 14, 215-230
Cronin, M.A. & McConnell B.J. (2008). SMS seal: A new technique to measure haul-out
behaviour in marine invertebrates. Journal of Experimental Marine Biology and Ecology
362, 43-48.
Cunningham, L., Baxter, J.M., Boyd, I.L., Duck, C.D., Lonergan, M., Moss, S.E. &
McConnell, B. (2009). Harbour seal movements and haul-out patterns: implications for
monitoring and management. Aquatic Conservation 19, 398-407.
da Silva, J. & Terhune, J.M. (1988). Harbour seal grouping as an antipredator strategy.
Animal Behaviour 36, 1309-1316.

Chapter II
41
Estes, J.A., Doak, D.F., Springer, A.M. & Williams, T.M. (2009). Causes and
consequences of marine mammal population declines in southwest Alaska: a food-web
perspective. Philosophical Transactions of the Royal Society London Series B Biological
Sciences 364, 1647-1658.
Frost, K.J., Lowry, L.F. & Ver Hoef, J.M. (1999). Monitoring the trend of harbor seals in
Prince William Sound, Alaska, after the Exxon Valdez oil spill. Marine Mammal Science
15, 494-506.
Gaillard, J-M., Festa-Bianchet, M. & Yoccoz, N.G. (1998). Population dynamics of large
herbivores: variable recruitment with constant adult survival. Trends in Ecology and
Evolution 13, 58-63.
Gales, N.J, Bowen, W.D., Johnston, D.W., Kovacs, K.M., Littnan, C.L., Perrin, W.F.,
Reynolds, J.E. III & Thompson, P.M. (2009). Guidelines for the treatment of marine
mammals in field research. Marine Mammal Science 25, 725-736.
Gilbert, J.R., Waring, G.T., Wynne, K.M. & Guldager, N. (2005). Changes in abundance
of harbour seals in Maine, 1981-2001. Marine Mammal Science 21, 519-535.
Grech, A. & Marsh, H. (2008). Rapid assessment of risks to a mobile marine mammal in
an ecosystem-scale marine protected area. Conservation Biology 22, 711-720.
Hall, A. J., Jepson, P.D., Goodman S.J. & Härkönen, T. (2006). Phocine Distemper Virus
in the North and European seas - Data and models, nature and nurture. Biological
Conservation 131, 221-229.
Hall, A.J. & Frame, E. (2010). Evidence of domoic acid exposure in harbour seals from
Scotland: A potential factor in the decline in abundance? Harmful Algae 9, 489-493.
Härkönen, T. & Heide-Jørgensen, M.P. (1990). Comparative life histories of East Atlantic
and other harbour seal populations. Ophelia 32, 211-235.
Härkönen, T., Harding, K.C., Goodman, S.J. & Johannesson, K. (2005). Colonization of
the Baltic harbour seals: integrating archaeological, behavioural, and genetic data. Marine
Mammal Science 21, 695-716.
Hooker, S.K., Whitehead, H. & Gowans, S. (1999). Marine protected area design and the
spatial and temporal distribution of cetaceans in a submarine canyon. Conservation
Biology 13, 592-602.
Jeffries, S., Huber, H., Calambokidis, J. & Laake, J. (2003). Trends and status of harbour
seals in Washington State: 1978-1999. Journal of Wildlife Management 67, 207-218.
Lesage, V., Hammill, M.O. & Kovacs, K.M. (2004). Long-distance movements of harbour
seals (Phoca vitulina) from a seasonally ice-covered area, the St. Lawrence River estuary,
Canada. Canadian Journal of Zoology 82, 1070–1081.
Lonergan, M., Duck, C.D., Thompson, D., Mackey, B.L., Cunningham, L. & Boyd, I.L.
(2007). Using sparse survey data to investigate the declining abundance of British harbour
seals. Journal of Zoology (London) 271, 261-269.

Chapter II
42
McConnell, B., Beaton, R., Bryant, E., Hunter, C., Lovell, P. & Hall, A. (2004). Phoning
home- a new GSM mobile phone telemetry system to collect mark-recapture data. Marine
Mammal Science 20, 274-283.
Montgomery, R.A., Ver Hoef, J.M. & Boveng, P.L. (2007). Spatial modelling of haul-out
site use by harbour seals in Cook Inlet, Alaska. Marine Ecology Progress Series 341, 257-
264.
Mora, C. & Sale, P.F. (2002). Are populations of coral reef fish open or closed? Trends in
Ecology and Evolution 17, 422-428.
Payne, M.R. (1977). Growth of a fur seal population. Philosophical Transactions of the
Royal Society of London series B Biological Science 279, 67-79.
Pomeroy, P.P., Twiss, S.D. & Duck, C.D. (2000). Expansion of a grey seal (Halichoerus
grypus) breeding colony: changes in pupping site use at the Isle of May, Scotland. Journal
of Zoology London 250, 1-12.
Reijnders P, Brasseur S, van der Toorn, J., van der Wolf, P., Boyd, I., Harwood, J.,
Lavigne, D. & Lowry, L. (eds) (1993) - "Seals, fur seals, sea lions and walrus: status
survey and conservation action plan". IUCN/SSC Seal Specialist Group. 88pp ISBN:2-
8317-0141-4.
Roberts, C.M. (1997). Connectivity and management of Caribbean coral reefs. Science
278, 1454-1457.
Sala, E., Aburto-Oropeza, O., Paredes, G., Parra, I., Barrera, J.C. & Dayton, P.K. (2002). A
general model for designing networks of marine reserves. Science 298, 1991-1993.
Schmölcke, U. (2008). Holocene environmental changes and the seal (Phocidae) fauna of
the Baltic Sea: coming, going and staying. Mammal Review 38, 231-246.
Scottish Natural Heritage (1995). Natura 2000: a guide to the 1992 EC Habitats Directive
in Scotland‟s marine environment. Scottish Natural Heritage, Battleby, Perth.
Small, R.J., Pendleton, G.W. & Pitcher, K.W. (2003). Trends in abundance of Alaska
harbour seals, 1983-2001. Marine Mammal Science 19, 344-362.
Small, R.J., Boveng, P.L., Byrd, G.V. & Withrow, D.E. (2008). Harbor seal population
decline in the Aleutian Archipelago. Marine Mammal Science 24, 845-863.
Springer, A.M., Estes, J.A., van Vliet, B., Williams, T.M., Doak, D.F., Danner, E.M.,
Forney, K.A. & Pfister, B. (2003). Sequential megafaunal collapse in the north Pacific
ocean: an ongoing legacy of industrial whaling? Proceedings of the National Academy of
Sciences USA 100, 12223-12228.
Suryan, R.M. & Harvey, J.T. (1999). Variability in reactions of Pacific harbor seals, Phoca
vitulina richardsi, to disturbance. Fisheries Bulletin 97, 332-339.
Thompson, P.M. (1989). Seasonal changes in the distribution and composition of common
seal (Phoca vitulina) haul-out groups. Journal of Zoology (London) 217, 281–294.

Chapter II
43
Thompson, P.M. & Miller, D. (1990). Summer foraging activity and movements of radio-
tagged common seals (Phoca vitulina L.) in the Moray Firth, Scotland. Journal of Applied
Ecology 27, 492-501.
Thompson, P.M., Cornwell, H.J.C., Ross, H.M. & Miller, D. (1992). Serologic study of
phocine distemper in a population of harbour seals in Scotland. Journal of Wildlife
Diseases. 28, 21-27.
Thompson, P.M., Miller, D., Cooper, R. & Hammond, P. S. (1994). Changes in the
distribution and activity of female harbour seals during the breeding season: implications
for their lactation strategy and mating patterns. Journal of Animal Ecology 63, 24-30.
Thompson, P.M., McConnell, B.J., Tollit, D.J., Mackey, A., Hunter, C. & Racey, P.A.
(1996). Comparative distribution, movements and diet of harbour and grey seals from the
Moray Firth, N.E. Scotland. Journal of Applied Ecology 33, 1572-1584.
Thompson, P.M., Tollit, D.J., Corpe, H.M., Reid, R.J. & Ross, H.M. (1997a). Changes in
haematological parameters in relation to prey switching in a wild population of harbour
seals. Functional Ecology 11, 743-750.
Thompson, P.M., Tollit, D.J., Wood, D., Corpe, H.M., Hammond, P.S. & Mackay, A.
(1997b). Estimating harbour seal abundance and status in an estuarine habitat in north-east
Scotland. Journal of Applied Ecology 34, 43–52.
Thompson, P.M., Mackey, B., Barton, T.R., Duck, C. & Butler, J.R.A. (2007). Assessing
the potential impact of salmon fisheries management on the conservation status of harbour
seals (Phoca vitulina) in north-east Scotland. Animal Conservation 10, 48-56.
Thompson, P.M. & Wheeler, H. (2008). Photo-ID-based estimates of reproductive patterns
in female harbour seals. Marine Mammal Science 24, 138-146.
Tollit, D.J., Greenstreet, S.P.R. & Thompson, P.M. (1997). Prey selection by harbour seals
Phoca vitulina in relation to variations in prey abundance. Canadian Journal of Zoology
75, 1508-1518.
Tollit, D.J., Black, A.D., Thompson, P.M., Mackay, A., Corpe, H.M., Wilson, B., van
Parijs, S.M., Grellier, K. & Parlane, S. (1998). Variations in harbour seal Phoca vitulina
diet and dive-depths in relation to foraging habitat. Journal of Zoology London 244, 209-
222.
Trites, A.W. & Donnelly, C.P. (2003). The decline of Steller sea lions Eumetopias jubatus
in Alaska: a review of the nutritrional stress hypothesis. Mammal Review 33, 3-28.
Womble, J.N., Sigler, M.F. & Willson, M.F. (2009). Linking seasonal distribution patterns
with prey availability in a central-place forager, the Steller sea lion. Journal of
Biogeography 36, 439-451.
Worton, B.J. (1989). Kernel methods for estimating the utilization distribution in home-
range studies. Ecology 70, 164-168.

Chapter III
44
CHAPTER III
AN INDIVIDUAL-BASED APPROACH TO ESTIMATING
FINE-SCALE SITE FIDELITY AND ABUNDANCE IN
HARBOUR SEALS: IMPLICATIONS FOR CONSERVATION
MANAGEMENT

Chapter III
45
CHAPTER III
AN INDIVIDUAL-BASED APPROACH TO ESTIMATING FINE-SCALE
SITE FIDELITY AND ABUNDANCE IN HARBOUR SEALS:
IMPLICATIONS FOR CONSERVATION MANAGEMENT
Introduction
Monitoring trends in the abundance of pinniped populations typically involves
counting seals at their terrestrial haul-out sites during the breeding season or moult when
seals are most likely to be hauled out (Bowen, McMillan & Mohn 2003; Jeffries, Huber &
Calambokidis 2003; Baker & Johanos 2004). At other times of the year, counts of seals are
generally lower (Sullivan 1980; Thompson et al. 1996, 1997), but it is largely unknown
whether fewer individuals are present, or whether temporal variation in counts reflects a
change in haul-out probability. Seasonal variation in the importance of haul-out sites may
therefore be misinterpreted, and management decisions based on count data alone could
have significant implications for the populations in question.
Broad conservation measures have been put in place to protect European harbour
seal populations, including the designation of protected areas in order to conserve their
vital habitat (Baxter 2001). Nonetheless, long-term monitoring of harbour seal abundance
at key haul-out sites during the pupping season indicates that the UK harbour seal
population has been declining over the last two decades for reasons that are not fully
understood (Thompson et al. 1997; Lonergan et al. 2007). The UK harbour seal population
consists of clusters of subpopulations (Lonergan et al. 2007), which may be relatively
discrete (Thompson et al. 1996). However, less is known about the structure and dynamics
of the breeding groups within these subpopulations.
High levels of site fidelity may have implications for the degree of genetic isolation
between potentially discrete breeding groups. Tagging and telemetry studies have shown
that individual harbour seals typically demonstrate high levels of site fidelity over the
course of a single breeding season (Thompson et al. 1997; Cunningham et al. 2009b)
particularly as adult females are likely to be constrained by the presence of a pup, whereas

Chapter III
46
adult males defend their mating territory. Other studies have found high levels of between-
year breeding site fidelity, as well as age and sex-specific differences (Härkönen &
Harding 2001; Mackey et al. 2008). Although Sharples, Mackenzie & Hammond (2009)
estimated haul-out probabilities throughout the year using telemetry, this did not involve
the same individuals and sample size was relatively small. Therefore, until now, no
estimates of continuous year-round haul-out probabilities exist for individual harbour seals.
Despite more attention often being paid to key demographic parameters, such as
survival and fecundity, site fidelity can provide equally important information on
population dynamics (Hestbeck, Nichols & Malecki 1991), including crucial insights into
levels of inbreeding as well as the mechanisms driving the spread of disease. Nevertheless,
a major constraint in developing long-term studies of site fidelity in harbour seals, as with
many other species, is that it requires the ability to follow individuals over time. Capture of
seals for tagging is logistically difficult, sample sizes are typically small, tags are shed
during the moult or lost over time, and recapturing the same individuals for re-tagging is
difficult. However, harbour seals have natural and distinctive individual markings which
offer a unique and low cost opportunity to follow individuals over time using photo-
identification techniques. Nevertheless, haul-out sites are often inaccessible or easily
disturbed, and only a few sites in the world have proved suitable for this type of data
collection (Hastings, Hiby & Small 2008; Mackey et al. 2008; Cunningham 2009a). On the
north east coast of Scotland, within the Moray Firth, Loch Fleet National Nature Reserve
has recently become a preferred haul-out and breeding site for harbour seals (Chapter II).
The proximity of the main sandbank within this estuary has permitted accurate
photographic identification of individual seals (Thompson & Wheeler 2008).
Here, I aim to estimate sex-specific site fidelity and haul-out probability of harbour
seals across a range of temporal scales that include within the breeding season, throughout
the year, and between years. I also investigate how haul-out probabilities obtained from re-
sightings of individuals compare with those previously obtained from tagging and
telemetry data. Finally, I use novel mark-resight models to examine the extent to which
count data provides a useful indicator of the seasonal variation in the number of seals that
used this site.

Chapter III
47
Methods
Photo-identification surveys
The study was carried out in Loch Fleet National Nature Reserve, a tidal estuary on
the north east coast of Scotland within the Moray Firth (see Chapter II). At low tide several
sandbanks were exposed, two of which were used frequently by harbour seals for resting,
giving birth and nursing pups. The proximity of the main sandbank to an onshore
observation point (130m) allowed individual seals to be recognised by photographic
identification (Fig. 1).
Figure 1. Map of the Loch Fleet study area illustrating movement of seals within and outside the
estuary.
Surveys were carried out using a digital camera (Nikon Coolpix 5100) attached to a
telescope (20-60x80mm Swarowski HD-ATS 80). The main sandbank was exposed prior
to low tide. However, surveys were started an hour after low tide to allow seals to settle on
the sandbank. Left and/or right side headshots were taken of all seals hauled out (Fig. 2),
and matched by eye to a catalogue containing left and right headshots of all seals
photographed at this site since 2006 (Appendix I). From 2006 to 2010, photo-identification
surveys were carried out on a daily basis during the pupping season from the end of May to
the end of July. During 2008 and 2009 one to five surveys (mean=3.2 ±0.3 SE) were
carried out each month throughout the year. August surveys were excluded because the
majority of individuals were moulting, making individual identification difficult and

Chapter III
48
inconsistent. During photo-identification surveys, counts of adult seals (defined as all
individuals except pups) were carried out simultaneously.
Figure 2. Original photographs indicating typical body positions of harbour seals for photo-
identification.
Re-sighting rates
The probability of detecting individuals during photo-identification surveys
depends upon a number of factors. Within Loch Fleet, sightings of individuals depend
upon the individual‟s preference for a particular sandbank, as well as the orientation of the
seals when hauled out on the main sandbank. On any particular low tide, individuals may
be in the water moving between banks and therefore not necessarily sighted despite being
in the study area. Individual seals may also be outside the study area, e.g. on foraging trips,
and therefore not available for sighting. While out foraging other haul-out sites may be
used occasionally for resting, such as Brora to the north or the Dornoch Firth to the south,
before returning to Loch Fleet. Recapture probabilities (p) from mark-recapture analyses
were used as a proxy for the minimum values of haul-out probabilities (within a breeding
season or month) and levels of site fidelity (between years).
Determining sex
Males and females were sexed from photographs of their ventral side. In addition to
the umbilical scar, the penile opening was visible on males, and the pair of nipples was
visible on females. Females were also sexed when seen with a pup between May - July
(Fig 3).
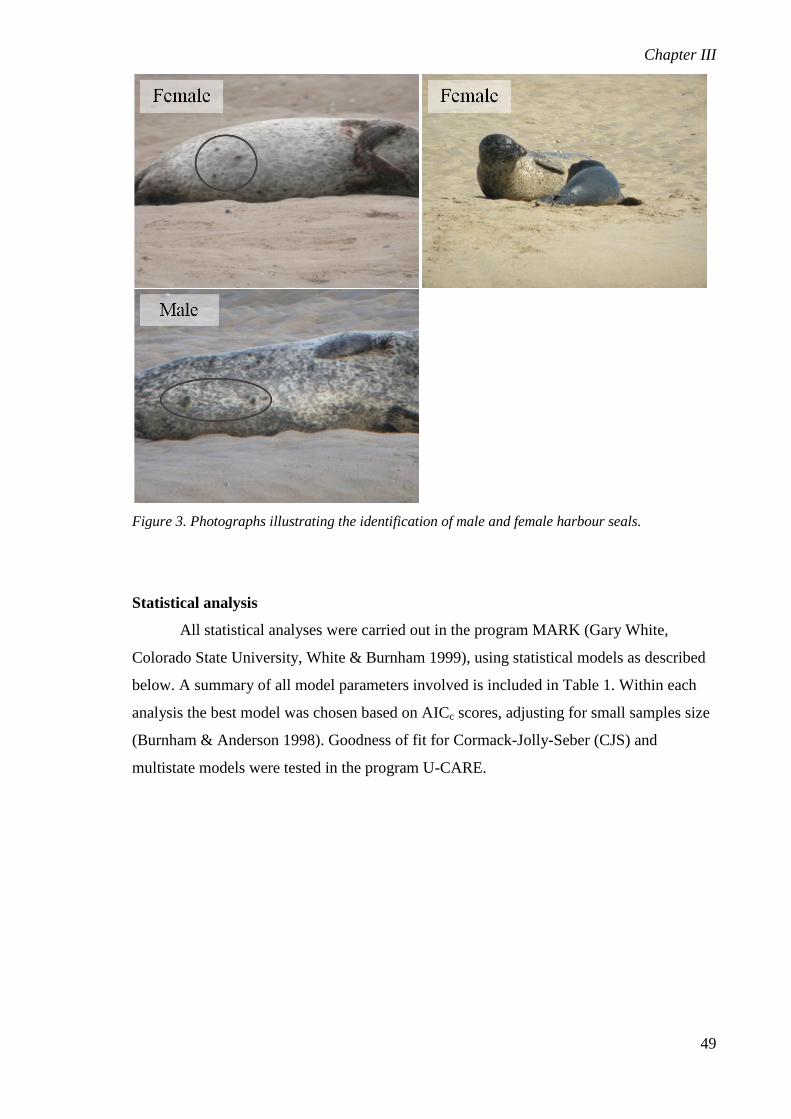
Chapter III
49
Figure 3. Photographs illustrating the identification of male and female harbour seals.
Statistical analysis
All statistical analyses were carried out in the program MARK (Gary White,
Colorado State University, White & Burnham 1999), using statistical models as described
below. A summary of all model parameters involved is included in Table 1. Within each
analysis the best model was chosen based on AICc scores, adjusting for small samples size
(Burnham & Anderson 1998). Goodness of fit for Cormack-Jolly-Seber (CJS) and
multistate models were tested in the program U-CARE.

Chapter III
50
Table 1. Summary of parameters in CJS and multistate models (Nichols et al. 2004; McClintock et
al. 2009).
CJS &
Multistate
Phi or Si Survival - Probability that an individual in sampling
period i survives to period i+1 and
remains part of the population
pi recapture - Probability that an individual alive and in
the population is sighted in period i
ψi Psi - Probability of an individual in a specific
state in period i will transition to another
state in period i+1
Mark-resight
Ui - Number of unmarked animals in the
population during primary occasions
αi alpha - Intercept for mean re-sighting rate during
primary occasions
σi2 zigma - Individual heterogeneity level
ϕi Phi - Apparent survival between primary
occasions
γi' Gamma‟ - Probability of transitioning from an
observable state to an unobservable state
γi'‟ Gamma‟‟ - Probability of remaining in an
unobservable state when at an
unobservable state
λi Lamda - Overall mean re-sighting rate for primary
occasions
Ni Ui+ni - Total population size during primary
occasions
Between-year site fidelity
There is a risk of positively biasing parameter estimates when using simple models
such as CJS in estimating sex-specific recapture rates when sex is not always known, as
known sex individuals are likely to be sighted more frequently (Nichols et al. 2004), and
CJS models do not take into account individuals changing states over time (i.e. from
unidentified sex to identified male or female). I therefore considered a multistate model
(Nichols et al. 2004) which yields unbiased and precise results for males and females, but
may include some bias for individuals of unknown sex due to the heterogeneous behaviour
of a group containing both males and females (Nichols et al. 2004). Capture histories of
individuals were constructed based on the individual‟s state, male (M), female (F) or of

Chapter III
51
unidentified sex (U). Sightings until the sex of an individual had been determined were
recorded as “U”. Once sex was determined (M or F) the individual remained in that state
for every future re-sighting (Table 2).
Table 2. Summary of the total number of males, females and individuals of unknown sex in the
catalogue for each year.
2006 2007 2008 2009 2010
Males 3 3 24 34 38
Females 42 49 60 72 73
Unknown 63 71 55 40 41
Total 108 123 139 146 152
The state (M, F, or U) of each individual in each of the five years, including non-
sightings (0), made up the individual sightings histories. The final data set contained 152
individuals, which had at least one sighting in one of the five years. Given the three states
an individual could occupy, SM
, SF and S
U were the probabilities of an individual in a
particular state surviving from time t to time t+1. Similarly, pM
, pF and p
U are the
probabilities that an individual in a particular state is recaptured from time t to time t+1.
Transitions between states were restricted to occur from “U” to either “M” or “F” (ψUM
,
ψUF
), whereas all other transitions were fixed to zero (ψMF
=0, ψFM
=0, ψFU
=0, ψMU
=0).
Since the sum of the ψ for each state should add up to one, a MLogit(x) link function was
applied to transition probabilities.
Monthly haul-out probability
A Cormack-Jolly-Seber (CJS) model was used to estimate overall monthly haul-out
probabilities for all individuals using the sightings (1) and non-sightings (0) from the year-
round surveys carried out in 2008 and 2009. To balance sample sizes, two surveys were
randomly selected for each month (using random number generator) and individual
sightings within months were pooled. The final data set consisted of sighting histories from
133 individuals. Survival (S) and recapture probabilities (p) were estimated from time t to
time t+1, and the importance of variation in recapture probabilities across time were
evaluated for both sexes. However, in time-dependent CJS models no estimate can be
obtained for the first occasion (January 2008).
Next, a multistate model was used to estimate sex-specific monthly haul-out
probabilities, using the same sighting histories as above but converting sightings into states
(M, F, U) alternative to 0-1 data. This analysis was similar to that estimating between-year

Chapter III
52
site fidelity (see details above). The data set consisted of sightings histories from 34 males,
66 females, and 33 individuals of unidentified sex.
Within pupping season haul-out probability
CJS models were used to estimate within pupping season haul-out probabilities of
males and females in each year from 2006 to 2010, using daily sighting histories from the
15 June to 15 July. In CJS models sightings and non-sightings are recorded as ones and
zeros which do not incorporate information on the individual sex, in contrast to multistate
model, and sex has to be defined as a grouping after the sightings histories. The final data
set included sighting histories from 35 males and 70 females. Estimated haul-out
probabilities were compared to estimates obtained from telemetry data from the same
period (Thompson et al. 1997).
Estimating monthly abundance from re-sightings data
Mark-resight models estimate abundance using sightings of known marked
individuals that transition between observable (individuals present in the study area) and
unobservable states (individuals outside the study area), while also incorporating
information on the number of unmarked seen and marked unidentified individuals
(McClintock & White 2010). In this study, a large proportion of the unmarked individuals
are juveniles which due to their coat characteristics are difficult to identify consistently.
Marked unidentified individuals include adults and some juveniles (with defined coat
patterns), which occasionally due to their position on the sandbank cannot be positively
identified as their markings are obscured. I chose the poisson-log normal mark-resight
model developed by McClintock et al. (2009) to estimate the monthly abundance of
harbour seals in Loch Fleet in 2008 and 2009. This model was selected because the number
of marked individuals in the population at any one time was not known. This is often the
case when individuals are recognised by natural markings rather than caught for tagging
prior to sampling. Seals could be photographed more than once both within secondary
(surveys) and primary occasions (months), also referred to as sampling with replacement.
This model assumed closure within primary occasions (month), whereas periods between
primary occasions were open to births, deaths, and movement. As seals were identified by
markings in their pelage, I assumed that no marks were lost over time. As harbour seals are
not highly sexually dimorphic or have obvious sex-specific characteristics, the sex of the
unmarked and marked unidentified individuals was not known, and abundance estimates
could not be obtained separately for males and females.

Chapter III
53
The sightings data from twice-monthly randomly selected surveys were used to
estimate monthly abundance and compare variation in monthly abundance between years.
The total number of unmarked individual sightings and marked but unidentified sightings
were summarized in Table 3. The mark-resight model included constancy for
parameterization of mean re-sighting rate, α(.), and individual heterogeneity, σ(.). The six
parameter model {alpha(.), sigma(.), U(.)} was used to estimate population size (N) for
each primary occasion (month), incorporating apparent survival, ϕ, and the transition
probabilities, γ‟ and γ‟‟ (Table 1).
Table 3. Summary of the total number of sightings of marked identified, marked unidentified and
unmarked individuals in each month of 2008 and 2009.
Month Marked identified Marked unidentified Unmarked seen
2008
Jan 19 0 0
Feb 25 5 3
Mar 46 3 4
Apr 36 0 4
May 50 3 11
Jun 53 4 14
Jul 37 3 14
Sep 36 0 3
Oct 44 6 2
Nov 26 4 3
Dec 21 3 4
2009
Jan 22 0 3
Feb 34 5 6
Mar 46 3 6
Apr 51 3 5
May 53 6 15
Jun 63 6 13
Jul 32 3 4
Sep 44 6 17
Oct 41 4 14
Nov 24 3 1
Dec 27 3 4
Estimating abundance from count data
In previous studies, breeding season abundance estimates have been produced for
the period 15 June to 15 July, by combining mean counts of adult seals with haul-out
probabilities estimated from telemetry data. See equation 1, where n is the mean low tide

Chapter III
54
count during the sampling period, and h1 and h2 are the proportion of low tides on which
tagged males (0.521) and females (0.698) were hauled out (from Thompson et al. 1997). In
2008 and 2009, mean counts were obtained from ten randomly selected surveys (random
number generator) carried out within the period 15 June to 15 July. Variation around the
abundance estimate was calculated using equation 2 (see Thompson et al. 1997).
Results
A total of 347 photo-identification and count surveys were carried out during the
course of the study. Surveys were most intensive during the breeding season from the end
of May to the end of July (Table 4).
Table 4. Summary of the number of visits (photo-identification surveys) and number of different
individuals identified in each month.
2006 2007 2008 2009 2010
Visits IDs Visits IDs Visits IDs Visits IDs Visits IDs
Jan 2 19 4 35
Feb 3 26 4 45
Mar 4 62 3 51
Apr 4 58 4 61
May 13 78 14 87 11 108 9 102 6 106
Jun 30 103 26 100 30 112 29 114 29 111
Jul 19 78 21 87 18 83 17 75 17 76
Aug 3 38 3 38
Sep 6 63 3 49
Oct 2 44 3 45
Nov 4 55 3 31
Dec 1 21 2 27
During these surveys I photographed between 159-162 individually identified
harbour seals, of which 147 had photographs of both left and right side. Of the individuals
with only one side photographed, 12 individuals had left-side head shots (2 males, 2
females, 8 of unknown sex), whereas only three individuals (unknown sex) had right-side
head shots. Thus there were a minimum of 159, and a maximum of 162 unique individuals.

Chapter III
55
A total of 74 females, 41 males and 47 individuals of unknown sex were identified during
the study. In summary, almost 80% of females were seen in all five years, whereas around
74% of males were seen in four or more years, and nearly 50% of the individuals of
unknown sex were seen in three or more years. However, not all individuals were seen
since the beginning of the study which may negatively bias these percentages. To explore
this, the number of years between sightings was plotted (Fig. 5). These data indicate that
the majority of individuals were seen in every year following their first sighting,
particularly females (81%) and males (72%).
Figure 5. Frequency distribution of the number of years between sightings of males, females and
individuals of unknown sex over the five-year study period.
Residents
Forty-three percent of individuals were sighted within the study area in ≥6 months
of the year. Of these, 64% were female, 27% male and 16% individuals of unidentified
sex. Most females were seen both during and outside the pupping season (n=65, 92%), and
there were no females sighted only outside the pupping season (Fig. 6). Similarly, most
males were seen both during and outside the pupping season (n=31, 78%), and only a few
were only seen outside the pupping season (n=3, 8%) (Fig. 6). In contrast to confirmed
males and females, a large proportion of individuals of unknown sex were only seen
outside the pupping season (n=13, 33%) (Fig. 6). These differences in sightings during and
outside the pupping season of males, females and individuals of unknown sex were
analysed in a 3x3 contingency table and showed a highly significant difference (Fisher‟s
0
20
40
60
0 1 2 3 4
Fre
quen
cy
Gap between annual sightings
Female
Male
Unknown sex

Chapter III
56
Exact Test, p<0.0001). However, to explore whether this was purely a result of the
unknown group, a 2x3 contingency table including only males and females was analysed.
This revealed a moderate significant difference (Fisher‟s Exact Test, p=0.03). These results
indicate that males and females behave differently compared to individuals of unknown
sex, whereas females also behave slightly differently compared to males.
Figure 6. The percentage of males, females and individuals of unknown sex that were seen during
and outside the pupping season, only seen during the pupping season, or only seen outside the
pupping season.
Between-year fidelity to breeding sites
The multistate model was applied to the sightings data. The most general model
that was fit was {S(g,t), p(g,t), ψ(g,t)}, allowing variation across states (g=M, F, U) and
time (t) for apparent survival (S), recapture probability (p) and transition probability (ψ).
Goodness of fit was tested in the program U-CARE and revealed a moderate lack of fit
with a variance adjustment factor, c-hat, of 2.19 (Χ2=46, df= 21), which was used to adjust
AICc scores and standard errors (Table 5).
0
25
50
75
100
During and outside
pupping season
Only during pupping
season
Only outside pupping
season
Per
centa
ge
%
Males
Females
Unknown sex

Chapter III
57
Table 5. Comparison of fit for multi-state models for estimating between-year site fidelity.
Model No. Par. ΔQAICc QAICc
Weight
Model
likelihood
S(.,.) p(g,.) ψ(.,.) 5 0.00 0.49 1.00
S(g,.) p(g,.) ψ(.,.) 6 0.12 0.46 0.94
S(.,.) p(.,.) ψ(.,.) 3 5.13 0.04 0.08
S(.,.) p(.,.) ψ(g,.) 4 7.04 0.01 0.03
S(g,.) p(.,.) ψ(g,.) 6 10.14 0.00 0.01
S(g,t) p(g,t) ψ(g,t) 24 15.20 0.00 0.00
The two top models were within one AICc score of each other, and far better than
any of the other models. The first top model was {S(.,.), p(g,.), ψ(.,.)} which included no
variation in survival across time or between states (.,.), variation in recapture probabilities
between states but not across time (g,.), and no variation in transition probabilities between
states (sexes) or across time (.,.), ΔQAICc=0.00. The second top model was {S(g,.), p(g,.),
ψ(.,.)} which in contrast to the first top model included variation in survival between states
(g,.), ΔQAICc=0.12. These two models accounted for 0.49 and 0.46 of the QAICc weight,
respectively. Recapture probabilities from the first model were pM
= 0.97 (±0.05 SE), pF
=
0.98 (±0.01 SE) and pU
= 0.84 (±0.05 SE), and for the second model pM
= 1.00 (±0.00 SE),
pF
= 0.98 (±0.02 SE) and pU
= 0.84 (±0.05 SE).
Comparison of haul-out probabilities obtained from re-sightings data and telemetry
CJS models were applied to sightings histories of males and females from the 15
June to 15 July in each year (Table 6). The most general model fit was {S(g,t), p(g,t)}
allowing variation in survival (S) and recapture probabilities (p) between groups (M, F)
and across time (t). Goodness of fit for each of the models were tested and the variance
adjustment factor (c-hat) used to adjust AICc scores and standard errors (Χ2=205, df=139,
c-hat2006=1.47; Χ2
=319, df=122, c-hat2007=2.61; Χ2
=259, df=119, c-hat2008=2.18; Χ2
=308,
df=124, c-hat2009=2.48; Χ2
=338, df=136, c-hat2010=2.49). The best fitting models were
selected based on AICc scores.

Chapter III
58
Table 6. Comparison of fit for CJS models in estimating within breeding season haul-out
probabilities for each year.
Model No. Par. ΔQAICc
QAICc
Weight
Model
likelihood
2006
S(g,.) p(g,.) 6 0.00 0.70 1.00
S(.,.) p(g,.) 4 1.78 0.29 0.41
S(g,.) p(.,.) 4 50.14 0.00 0.00
S(.,.) p(.,.) 2 56.56 0.00 0.00
2007
S(g,.) p(g,.) 6 0.00 0.81 1.00
S(.,.) p(g,.) 4 2.85 0.19 0.24
S(g,.) p(.,.) 4 39.93 0.00 0.00
S(.,.) p(.,.) 2 48.81 0.00 0.00
2008
S(.,.) p(g,.) 4 0.00 0.87 1.00
S(g,.) p(g,.) 6 3.83 0.13 0.15
S(g,.) p(.,.) 4 49.68 0.00 0.00
S(.,.) p(.,.) 2 55.99 0.00 0.00
2009
S(g,.) p(g,.) 6 0.00 0.50 1.00
S(.,.) p(g,.) 4 0.03 0.50 0.98
S(g,.) p(.,.) 4 57.55 0.00 0.00
S(.,.) p(.,.) 2 63.23 0.00 0.00
2010
S(.,.) p(g,.) 4 0.00 0.54 1.00
S(g,.) p(g,.) 6 0.28 0.46 0.87
S(g,.) p(.,.) 4 86.76 0.00 0.00
S(.,.) p(.,.) 2 92.31 0.00 0.00
In each year, the two top models were stronger than any of the others, and these
consistently supported variation in recapture probabilities (p) between sexes (Table 6). The
estimates of recapture probability for males and females are summarised and compared
with published estimates of haul-out probability from telemetry data for the same period
(Table 7; Thompson et al. 1997). Haul-out probabilities of females in 2009 and 2010 were
similar to telemetry estimates, whereas male haul-out probabilities were consistently much
lower (Table 7).

Chapter III
59
Table 7. Comparison of haul-out probabilities between 15 June and 15 July estimated in this study
using sightings of individual seals and estimates from radio tagged seals (from Thompson et al.
1997).
Male Female
Estimate SE Estimate SE
Telemetry 1993 0.52 0.04 0.70 0.04
Re-sightings
2006 0.22 0.03 0.47 0.02
2007 0.18 0.04 0.51 0.02
2008 0.24 0.03 0.51 0.02
2009 0.29 0.04 0.67 0.02
2010 0.22 0.04 0.65 0.02
Mean 0.23 0.04 0.56 0.02
Monthly haul-out probabilities
A CJS model was applied to the monthly sighting histories (Table 8). The most
general model that was fit was {S(t), p(t)} allowing variation in survival (S) and recapture
probabilities (p) across time (t). The model revealed a moderate lack of fit with a variance
adjustment factor of 1.91 (Χ2=174, df= 91), which was used to correct AICc scores and
standard errors. According to AICc, the top model {S(.), p(t)}, indicating variation in
recapture probabilities (p) across time (t), was far better than any of the others, accounting
for 0.99 of AICc weight (Table 8). This model gave strong support for variation in
recapture probabilities across months (Fig.7).
Table 8. Comparison of fit of CJS models for estimating overall monthly haul-out probabilities in
2008 and 2009.
Model No. Par. ΔAICc AICc
Weight
Model
likelihood
S(.) p(t) 22 0.00 0.99 1.00
S(.) p(.) 2 14.75 0.00 0.00
S(t) p(t) 41 30.89 0.00 0.00
S(t) p(.) 22 41.25 0.00 0.00
A multistate model was applied to the monthly sighting histories for males, females
and individuals of unidentified sex. The most general model was {S(g,t), p(g,t), ψ(g,t)}
allowing variation in survival (S), recapture probabilities (p) and transition probabilities (ψ)
between states (g=M, F, U) and across time (t). The model showed a good fit (c-hat=1.09).
The two top models were within one AICc score of each other, and far stronger than any of

Chapter III
60
the other models. These were {S(.,.), p(g,t), ψ(.,t)} with ΔQAICc=0.00, and {S(g,.), p(g,t),
ψ(.,t)} with ΔQAICc=0.89. Of the QAICc weight these two models accounted for 0.61 and
0.39, respectively. Both of these models indicate variation in recapture probabilities
between states (M, F, and U) and across time (t) (Table 9).
Table 9. Comparison of fit of multi-state models for estimating monthly haul-out probabilities of
males, females and individuals of unknown sex in 2008 and 2009.
Model No. Par. ΔQAICc QAICc
Weight
Model
likelihood
S(.,.) p(g,t) ψ(.,t) 169 0.00 0.61 1.00
S(g,.) p(g,t) ψ(.,t) 171 0.89 0.39 0.64
S(.,.) p(.,t) ψ(.,t) 127 34.88 0.00 0.00
S(g,.) p(g,t) ψ(g,t) 192 56.87 0.00 0.00
S(.,.) p(g,.) ψ(g,t) 130 66.80 0.00 0.00
S(g,t) p(g,t) ψ(g,t) 252 253.87 0.00 0.00
Both males (Fig. 8) and individuals of unknown sex (Fig. 10) showed more
variability in their levels of haul-out probabilities within months, compared to females
(Fig. 9). Male haul-out probability peaked in May (p2008=0.70 ± 0.1 SE; p2009=0.52 ± 0.1
SE), after which it dropped to its lowest levels at the onset of the mating season in July
(p2008=0.18 ± 0.1 SE; p2009=0.11 ± 0.1 SE) (Fig. 8). Similarly, haul-out probabilities of
individuals of unknown sex were also lowest during July (Fig. 10). Females displayed the
highest haul-out probability during June (p2008=0.68 ± 0.1 SE; p2009=0.85 ± 0.1 SE), the
month when all pups are born (Chapter V; Fig. 9).

Chapter III
61
Figure 7. CJS model output showing overall monthly haul-out probabilities (p) for all individuals
in 2008 and 2009.
Figure 8. Multistate model output showing monthly haul-out probabilities (p) for males in 2008
and 2009.
0.0
0.2
0.4
0.6
0.8
1.0
J F M A M J J S O N D J F M A M J J S O N D
Rec
aptu
re p
robab
ilit
y (
+/-
SE
)
2008 2009
0.0
0.2
0.4
0.6
0.8
1.0
J F M A M J J S O N D J F M A M J J S O N D
Rec
aptu
re p
robab
ilit
y (
+/-
SE
)
2008 2009

Chapter III
62
Figure 9. Multistate model output showing monthly haul-out probabilities (p) for females in 2008
and 2009.
Figure 10. Multistate model output showing monthly haul-out probabilities (p) for individuals of
unknown sex.
Comparison of abundance estimates obtained from analysis of re-sightings and count data
For comparison, twice monthly sightings and count data were used to estimate
monthly abundance of adult seals. Abundance estimates from both count data (Fig. 11) and
re-sightings data (Fig. 12) peaked during the early breeding season (May-June), although
0.0
0.2
0.4
0.6
0.8
1.0
J F M A M J J S O N D J F M A M J J S O N D
Rec
aptu
re p
robab
ilit
y (
+/-
SE
)
2008 2009
0.0
0.2
0.4
0.6
0.8
1.0
J F M A M J J S O N D J F M A M J J S O N D
Rec
aptu
re p
robab
ilit
y (
+/-
SE
)
2008 2009

Chapter III
63
counts of seals showed a less defined pattern. Monthly mark-resight abundance estimates
showed defined peaks during May and June in each year, but dropped in July.
Figure 11. Twice monthly mean count of harbour seals from land-based surveys.
Figure 12. Monthly abundance estimates from mark-resight model, using sightings data from
twice-monthly photo-identification surveys.
In 2008 and 2009, mean counts of adults between 15 June and 15 July were 61
(±3.3 SE) and 67 (±2.8 SE), respectively. Using equations 1 and 2, abundance from count
data was estimated at 100 seals (±23.39 SE) in 2008 and 110 seals (±25.67 SE) in 2009.
0
30
60
90
120
150
180
J F M A M J J S O N D J F M A M J J S O N D
Mea
n c
ount
(+/-
SE
)
2008 2009
0
30
60
90
120
150
180
J F M A M J J S O N D J F M A M J J S O N D
Abundan
ce e
stim
ate
(95%
CI)
2008 2009

Chapter III
64
For direct comparison, using sightings data from the same days that the count data was
obtained, the mark-resight model estimated abundance at 110 seals (±1.71 SE) in 2008 and
117 seals (±1.71 SE) in 2009.
Discussion
Site fidelity is characteristic of many colonial species, both sedentary and migratory
(Blancher & Robertson 1985; Cooch et al. 1993; Ganter & Cooke 1998; Pomeroy, Twiss
& Redman 2000; Matthiopoulos, Harwood, & Thomas 2005; Gamble, McGarigal &
Compton 2007). In the literature this concept is mainly described in relation to between or
within-year breeding season site fidelity, whereas less is known about the function and use
of these sites at other times of the year. This is less relevant for migratory species that
move to wintering grounds. However, many pinnipeds rely on terrestrial sites for resting
throughout the year. Here we present the first concurrent estimates of harbour seal site
fidelity and haul-out probability across a range of temporal scales.
Between-year breeding site fidelity was extremely high for both males (0.97 ±0.05
SE) and females (0.98 ±0.01 SE). Individual males showed more variation in their site
faithfulness than females, which could be a result of some males, particularly younger
ones, prospecting for other breeding sites (Dobson 1982; Burg, Trites & Smith 1999;
Herremann et al. 2009). Individuals of unidentified sex showed lower levels of site fidelity
compared to males and females (0.84 ±0.05 SE), but it may be that these individuals are
more faithful to other sandbanks within Loch Fleet, or are younger seals that naturally
display lower levels of site fidelity (Härkönen & Harding 2001). A previous photo-
identification study in the nearby Cromarty Firth revealed lower levels of breeding season
site fidelity (pF=0.71, and p
M=0.46; Mackey et al. 2008). However, these lower estimates
were likely to be at least partly due to the difficulty of getting close enough to the seals at
these sites (Mackey et al. 2008), resulting in a lower probability of detecting individuals
that were actually present. A long-term study of branded harbour seals in Swedish waters
revealed higher levels of breeding season site fidelity in older versus younger individuals,
and similar to this study, higher levels of site fidelity in females compared to males
(Härkönen & Harding 2001).
Almost all pinniped species have a synchronised annual breeding cycle and
aggregate in large colonies during the breeding season (Payne 1977; Pomeroy, Twiss &
Duck 2000). Both genetic and re-sighting studies of these species have shown evidence of
site fidelity or philopatry to certain sites or areas (Kretzmann et al. 1997; Pomeroy, Twiss
& Redman 2000; Fabiani et al. 2006; Hoffman, Trathan & Amos 2006; Campbell et al.

Chapter III
65
2008) as well as stronger site fidelity in females compared to males (Allen et al. 1995;
Burg, Trites & Smith 1999; Hoffman, Trathan & Amos 2006). These studies also indicate
that, although a population may appear continuous, sub-structuring and genetic
differentiation may still occur, which has implications for the efficacy of management if
this has not been identified (Hoffman, Trathan & Amos 2006).
A high percentage of individuals, particularly females, hauled out within the study
area throughout most of the year, indicating that it is not uncommon for harbour seals to be
year-round residents. Some individuals were only seen during the pupping season, or at
other times of the year. This may suggest that some individuals have adopted a different
strategy to those who remain residents by making inter-seasonal movements to other haul-
out sites. However, there was a difference in effort between pupping season surveys and
surveys at other times of the year, which may influence detection probabilities of
individuals outside the pupping season.
Male haul-out probability was highest during May, just before the onset of pupping,
after which male haul-out probability dropped reaching the lowest level in July (Fig. 8).
This pattern is likely to reflect the onset of the mating season when males spend more time
in the water near corridors or foraging areas where they are likely to encounter receptive
females (Van Parijs et al. 1997). Estimates of male haul-out probability obtained from
telemetry were much higher (Thompson et al. 1997) than those estimated in this study
using re-sightings (Table 7). This is likely due to the fact that estimates from telemetry
measure the individual likelihood of hauling out, whereas re-sightings in this study are site-
specific, not taking into account that males may be hauling out on the far sandbank or
using haul-out sites outside the study area. Over the course of the year females exhibited
the highest haul-out probability during June, the pupping period (Fig. 9). Haul-out
probabilities were lower during July, when females make short foraging trips during late
lactation or forage intensively to replenish depleted fat stores post weaning (Bowen,
Oftedal & Boness 1992; Boness, Bowen & Oftedal 1994; Thompson et al. 1994). Breeding
season haul-out probabilities of females estimated from re-sightings increased over the five
years, but only in recent years were they similar to those previously obtained from
telemetry (Thompson et al. 1997). Since older females tend to display higher levels of site
fidelity (Härkönen & Harding 2001), this increase in female haul-out probability over the
course of the study may indicate that females within this breeding group are ageing,
particularly as Loch Fleet is a recently established haul-out and breeding site (Chapter II).
Previously, Thompson et al. (1997) suggested that June and July was the optimal
timing for count surveys in this region, however, this sampling approach may no longer

Chapter III
66
capture the highest number of animals. The seasonal patterns in male and female haul-out
probabilities obtained here suggest that a surveys design covering the early part of the
breeding season in May and June would capture the highest number of individuals.
Furthermore, this peak in haul-out probabilities during the early part of the breeding season
also indicated that elevated breeding season counts may simply be the result of a seasonal
change in haul-out probability, rather than an actual increase in the number of individuals
using a site. Nevertheless, monthly abundance estimates using re-sightings data still
suggested that more individuals use the site during this period (May-June; Fig. 12). Re-
sightings abundance estimates showed a consistent and defined seasonal pattern in the
number of individuals using the site. Monthly mean counts displayed a similar pattern,
although the clarity varied between years (Fig. 11), highlighting the sensitivity and care
that should be taken when using sparse count data. Comparison of breeding season
abundance estimates from count and re-sightings data revealed similar results.
The tendency to remain faithful to one site may have consequences for genetic
structuring, particularly in declining or threatened populations, as this may reduce genetic
diversity and individual fitness (Westlake & O'Corry-Crowe 2002). Genetic analyses in
European harbour seals revealed six distinctly differentiated units, two of which were
located within the UK, namely Scotland-Ireland and the English east coast (Goodman
1998). The structure of the Scottish harbour seal population consists of clusters of
subpopulations (Longeran et al. 2007) within a metapopulation framework (Swinton et al.
1998). Tagging and telemetry studies have revealed that harbour seals generally only make
local movements up to 75km, indicating that subpopulations may be relatively discrete
(Thompson et al. 1996; Thompson et al. 1998; Sharples, Mackenzie and Hammond 2009),
although on the west coast of Scotland and in the Pacific, seals have shown occasional long
distance movements (Brown & Mate 1983; Yochem et al. 1987; Cunningham et al.
2009b). The high levels of fine-scale site fidelity observed here suggest that within
subpopulations, breeding groups may also be relatively discrete. Since pups and juveniles
are difficult to identify consistently, I was not able to investigate site fidelity or philopatry
in these younger seals, which would have more direct consequences for genetic structuring.
However, continued studies of site fidelity and individual histories will provide these
opportunities to investigate age-specific differences in site fidelity over time.
Indications of site fidelity from genetic studies suggested that structuring of
harbour seal populations occurs at a regional scale of several hundred kilometres
(Goodman 1998), and telemetry revealed that approximately 20% of harbour seal pups
travelled several hundred kilometres from the site they were born (Thompson, Kovacs &

Chapter III
67
McConnell 1994). The rapid spread of the phocine distemper virus across the whole of
northern Europe in both 1988 and 2002 (Härkönen et al. 2006) gave further indiciations of
the level of movement of seals. The disease was mainly thought to be transported by
juveniles and pups dispersing from natal grounds (Thompson, Kovacs & McConnell
1994), although grey seals where more likely responsible where larger geographical
“jumps” occurred (Härkönen et al. 2006). This level of regional philopatry and dispersal
should be sufficient in preventing genetic differentiation and inbreeding among breeding
groups.
Whereas breeding season counts are important for monitoring trends in abundance
(Bowen, McMillan & Mohn 2003; Jeffries, Huber & Calambokidis 2003; Baker & Johanos
2004), less is known about the use and function of haul-out sites at other times of the year.
Here we have shown that whereas counts and abundance estimates peak during the
breeding season, a large proportion of harbour seals remained faithful to haul-out sites
throughout the year. Furthermore, the high levels of site fidelity between years indicate
that breeding groups may be relatively discrete which could have implications for their
viability, growth and genetic fitness, and highlights the need for site-specific management.

Chapter III
68
References
Allen, P.J., Amos, W., Pomeroy, P.P., & Twiss, S.D. (1995). Microsatellite variation in
grey seals (Halichoerus grypus) shows evidence of genetic differentiation between two
British breeding colonies. Molecular Ecology 4, 653-662.
Baker, J.D. & Johanos, T.C. (2004). Abundance of the Hawaiian monk seal in the main
Hawaiian islands. Biological Conservation 116, 103-110.
Baxter, J.M. (2001). Establishing management schemes on marine Special Areas of
Conservation in Scotland. Aquatic Conservation 11, 261–265.
Blancher, P.J., & Robertson, R.J. (1985). Site consistency in kingbird breeding
performance: implications for site fidelity. Journal of Animal Ecology 54, 1017-1027.
Boness, D.J., Bowen, W.D., & Oftedal, O.T. (1994). Evidence of a maternal foraging cycle
resembling that of otariid seals in a small phocid, the harbour seals. Behavioural Ecology
and Sociobiology 34, 95-104.
Bowen, W.D., Oftedal, O.T., & Boness, D.J. (1992). Mass and energy transfer during
lactation in a small phocid, the harbour seals (Phoca vitulina). Physiological Zoology 65,
844-866.
Bowen, W.D., McMillan, J. & Mohn, R. (2003). Sustained exponential population growth
of grey seals at Sable Island, Nova Scotia. ICES Journal of Marine Science 60, 1265-1274.
Brown, R.F., & Mate, B.R. (1983). Abundance, movements, and feeding habits of harbor
seals, Phoca vitulina, at Netarts and Tillamook bays, Oregon. Fishery Bulletin 81, 291-
301.
Burg, T.M., Trites, A.W., Smith, M.J. (1999). Mitochondrial and microsatellite DNA
analyses of harbour seal population structure in the northeast Pacific Ocean. Canadian
Journal of Zoology 77, 930-943.
Burnham, K. P., & Anderson, D.R. (1998). Model selection and inference. Springer-
Verlag, New York, New York, USA.
Campbell, R.A., Gales, N.J., Lento, G.M., & Baker, C.S. (2008). Islands in the sea:
extreme female natal site fidelity in the Australian sea lion, Neophoca cinerea. Biology
Letters 4, 139-142.
Cooch, E.G., Jeffries, R.L., Rockwell, R.F., & Cooke, F. (1993). Environmental change
and the cost of philopatry: an example in the lesser snow goose. Oecologia 93, 128-138.
Cunningham, L. (2009a). Using computer-assisted photo-identification and capture-
recapture techniques to monitor the conservation status of harbour seals (Phoca vitulina).
Aquatic Mammals 35, 319-329.
Cunningham, L., Baxter, J.M., Boyd, I.L., Duck, C.D., Lonergan, M., Moss, S.E., &
McConnell, B. (2009b). Harbour seal movements and haul-out patterns: implications for

Chapter III
69
monitoring and management. Aquatic Conservation: Marine and Freshwater ecosystems
19, 398-407.
Dobson, F.S. (1982). Competition for mates and predominant juvenile male dispersal in
mammals. Animal Behaviour 30, 1183-1192.
Fabiani, A., Galimberti, F., Sanvito, S., & Hoelzel, A.S. (2006). Relatedness and site
fidelity at the southern elephant seal, Mirounga leonina, breeding colony in the Falkland
Islands. Animal Behaviour 72, 617-626.
Gamble, L.R., McGarigal, K., & Compton, B.W. (2007). Fidelity and dispersal in the pond
breeding amphibian, Ambystoma opacum: implications for spatio-temporal population
dynamics and conservation. Biological Conservation 139, 247-257.
Ganter, B., & Cooke, F. (1998). Colonial nesters in a deteriorating habitat: site fidelity and
colony dynamics of lesser snow geese. Auk 115, 642-652.
Goodman, S.J. (1998). Patterns of extensive genetic differentiation and variation among
European harbour seals (Phoca vitulina vitulina) revealed using microsatellite DNA
polymorphisms. Molecular Biology and Evolution 15, 104-118.
Hastings, K.K., Hiby, L.A., & Small, R.J. (2008). Evaluation of a computer-assisted
photograph-matching system to monitor naturally marked harbour seals at Tugidak Island,
Alaska. Journal of Mammalogy 89, 1201-1211.
Hestbeck, J.B., Nichols, J.D., & Malecki, R.A. (1991). Estimates of movement and site
fidelity using mark-resight data of wintering Canada geese. Ecology 72, 523-533.
Herremann, J.K., Blundell, G.M., McDonald, D.B., & Ben-David, M. (2009).
Asymmetrical male-mediated gene flow between harbour seal (Phoca vitulina) populations
in Alaska. Canadian Journal of Zoology 87, 498-507.
Hoffman,J.I., Trathan, P.N., & Amos, W. (2006). Genetic tagging reveals extreme site
fidelity in territorial male Antarctic fur seals Arctocephalus gazelle. Molecular Ecology 15,
3841-3847.
Härkönen, T. & Harding, K.C. (2001). Spatial structure of harbour seal populations and the
implications thereof. Canadian Journal of Zoology 79, 2115-2127.
Härkönen, T., Dietz, R., Reijnders, P., Teilmann, J., Harding, K., Hall, A., Brasseur, S.,
Siebert, U., Goddmann, S.J., Jepson, P.D., Rasmussen, T.D., & Thompson, P. (2006). A
review of the 1988 and 2002 phocine distemper virus epidemics in European harbour seals.
Diseases of Aquatic organisms 68, 115-130.
Jeffries, S., Huber, H., & Calambokidis, J. (2003). Trends and status of harbour seals in
Washington State: 1978-1999. The Journal of Wildlife Management 67, 207-218.
Kretzmann, M.B., Gilmartin, W.G., Meyer, A., Zegers, G.P., Fain, S.R., Taylor, B.F., &
Costa, D.P. (1997). Low genetic variability in the Hawaiian monk seal. Conservation
Biology 11, 482-490.

Chapter III
70
Lonergan, M., Duck, C.D., Thompson, D., Mackey, B.L., Cunningham, L. & Boyd, I.L.
(2007). Using sparse survey data to investigate the declining abundance of British harbour
seals. Journal of Zoology 271, 261-269.
Mackey, B.L., Durban, J.W., Middlemas, S.J., & Thompson, P.M. (2008). A Bayesian
estimate of harbour seal survival using sparse photo-identification data. Journal of Zoology
274, 18-27.
Matthiopoulos, J., Harwood, J., & Thomas, L. (2005). Metapopulation consequences of
site fidelity for colonially breeding mammals and birds. Journal of Animal Ecology 74,
716-727.
McClintock, B.T., White, G.C., Antolin, M.F. & Tripp, D.W. (2009). Estimating
abundance using mark-resight when sampling is with replacement or the number of
marked individuals is unknown. Biometric 65, 237-246.
McClintock, B.T. & White, G.C. (2010). From NOREMARK to MARK: software for
estimating demographic parameters using mark-resight methodology. Journal of
Ornithology.
Nichols, J.D., Kendall, W.L., Hines, J.E., & Spendelow, J.A. (2004). Estimation of sex-
specific survival from capture-recapture data when sex is not always known. Ecology 85,
3192-3201.
Payne, M.R. (1977). Growth of a fur seal population. Philosophical Transactions of the
Royal Society of London 279, 67-79.
Pomeroy, P.P., Twiss, S.D., & Redman, P. (2000). Philopatry, site fidelity and local kin
associations within grey seal breeding colonies. Ethology 106, 899-919.
Sharples, R.J., Mackenzie, M.L., & Hammond, P.S. (2009). Estimating seasonal
abundance of a central place forager using counts and telemetry data. Marine Ecology
Progress Series 378, 289-298.
Sullivan, R.M. (1980). Seasonal occurrence and haul-out use in pinnipeds along Humboldt
County, California. Journal of Mammalogy 61, 754-760.
Swinton, J., Harwood, J., Grenfell, B.T., & Gilligan, C.A. (1998). Persistence thresholds
for phocine distemper virus infection in harbour seal Phoca vitulina metapopulations.
Journal of Animal Ecology 67, 54-68.
Thompson, P.M., Kovacs, K.M., & McConnell, B.J. (1994). Natal dispersal of harbour
seals (Phoca vitulina) from breeding sites in Orkney, Scotland. Journal of Zoology London
234, 668-673.
Thompson, P.M., Miller, D., Cooper, R., & Hammond, P.S. (1994). Changes in the
distribution and activity of female harbour seals during the breeding season: implications
for their lactation strategy and mating patterns. Journal of Animal Ecology 63, 24-30.
Thompson, P.M., McConnell, B.J., Tollit, D.J., Mackey, A., Hunter, C., & Racey, P.A.
(1996). Comparative distribution, movements and diet of harbour and grey seals from
Moray Firth, N.E. Scotland. Journal of Applied Ecology 33, 1572-1584.

Chapter III
71
Thompson, P.M., Tollit, D.J., Wood, D., Corpe, H.M., Hammond, P.S. & Mackey, A.
(1997). Estimating harbour seal abundance and status in an estuarine habitat in north-east
Scotland. Journal of Applied Ecology 34, 43-52.
Thompson, P.M., Mackay, A., Tollit, D.J., Enderby, S., & Hammond, P.S. (1998). The
influence of body size and sex on the characteristics of harbour seal foraging trips.
Canadian Journal of Zoology 76, 1044-1053.
Thompson, P.M. & Wheeler, H. (2008). Photo-ID-based estimates of reproductive patterns
in female harbour seals. Marine Mammal Science 24, 138-146.
Van Parijs, S.M., Thompson, P.M., Tollit, D.J., & Mackey, A. (1997). Distribution and
activity of male harbour seals during the mating season. Animal Behaviour 54, 35-43.
Westlake, R.L. & O'Corry-Crowe, G.M. (2002). Macrogeographical structure and patterns
of genetic diversity in harbour seals (Phoca vitulina) from Alaska to Japan. Journal of
Mammalogy 83, 1111-1126.
White, G.C. & Burnham, K.P. (1999). Program MARK: Survival estimation from
populations of marked animals. Bird Study 46, 120-139.
Yochem, P.K., Stewart, B.S., DeLong, R.L., & DeMaster, D.P. (1987). Diel haul-out
patterns and site fidelity of harbour seals (Phoca vitulina richardsi) on San Miguel Island,
California, in autumn. Marine Mammal Science 3, 323-332.

Chapter IV
71
CHAPTER IV
AN INDIVIDUAL-BASED STUDY OF HARBOUR SEAL
SURVIVAL AND REPRODUCTIVE FITNESS: INSIGHTS INTO
THE REGIONAL DECLINE OR AN EXCEPTION TO THE
RULE?

Chapter IV
72
CHAPTER IV
AN INDIVIDUAL-BASED STUDY OF HARBOUR SEAL SURVIVAL
AND REPRODUCTIVE FITNESS: INSIGHTS INTO THE REGIONAL
DECLINE OR AN EXCEPTION TO THE RULE?
Introduction
The broad temporal scales at which demographic and ecological processes operate
present a key challenge in studies of population dynamics in long-lived species (Clutton-
Brock & Sheldon 2010). Long-term research of natural populations has therefore been
essential for understanding the ecological factors that drive demographic change in these
species (e.g. Clutton-Brock, Albon & Guinness 1987; Cooch et al. 1991; Boyd et al. 1995;
Clutton-Brock et al. 1996; Bronikowski et al. 2002). Whereas population-level studies are
important for monitoring species abundance and distribution, it is individual-based studies
that generally offer the greatest insights into the behavioural, physiological and life-history
responses of individuals to changes in the environment, which in turn can help understand
the drivers of population change (Grimm 1999; Clutton-Brock & Sheldon 2010).
As population rate of change in long-lived species is most sensitive to changes in
adult survival (Caswell 1978; Gaillard, Festa-Bianchet & Yoccoz 1998), obtaining accurate
measures of this demographic parameter is particularly important for understanding longer-
term changes in population dynamics. At the same time, variation in fecundity and costs of
reproduction can provide more sensitive indicators of short-term responses to
environmental change. High population density or poor weather conditions have been
shown to cause lower reproductive rates and increased costs of reproduction (Lunn, Boyd
& Croxall 1994; Clutton-Brock et al. 1996; Coulson et al. 2001; Barbraud &
Weimerskirch 2005; Hadley, Rotella & Garrott 2007). In the past, estimates of these
demographic parameters have typically been obtained from the analysis of dead animals
that have either been targeted directly for scientific purposes (Bjørge 1992), harvested or
culled (Harwood & Prime 1978; Boulva & McLaren 1979; Harwood, Smith & Melling
2000), or collected after disease outbreaks (Härkönen & Heide-Jørgensen 1990; Heide-

Chapter IV
73
Jørgensen & Härkönen 1992). Ethical and conservation considerations now constrain
studies of this type (Baker and Palumbi 1994). But even where such data are available, this
instantaneous and cross-sectional sampling is unlikely to capture temporal variation in
survival and reproductive rates. In contrast, following individuals throughout their lives as
they age, reproduce, and adapt within a naturally varying environment, provides a
continuous demographic record. Such individual-based studies have proved particularly
successful where populations exist in relatively discrete areas and the characteristics of the
study area or study population mean that all individuals can be detected regularly with a
relatively high probability. Typically these tend to be terrestrial species (Clutton-Brock,
Albon & Guinness 1988; Clutton-Brock et al. 1996), although some marine species, such
as seabirds and pinnipeds which return regularly to terrestrial breeding sites are amenable
to study (Dunnet & Ollason 1978; Le Boeuf & Reiter 1988; Boyd et al. 1995).
Of the individual-based studies of pinnipeds carried out to date, all have used initial
physical capture for tagging or branding as the primary means of following individuals
over time. Therefore age and sex-specific survival and age-specific reproductive rates can
only be estimated for the marked individuals in the population. Furthermore, tagging
studies have to correct for tag loss and sighting probabilities are often low (Croxall & Hiby
1983). Species with natural markings allow sightings and re-sightings to be obtained
remotely, and physical capture is therefore not required (Stevick et al. 2001). However, as
a consequence, particularly in species that do not exhibit pronounced sexual dimorphism,
sex is not always known. Incorporating this unknown proportion of the population in sex-
specific survival rate estimation has been shown to positively bias survival rates of known-
sex individuals (Nichols et al. 2004). Furthermore, in some pinnipeds, non-breeders are
often not present at breeding sites, and it is therefore assumed that any female not seen
during the pupping season is a non-breeder that has temporarily emigrated. This
framework may work well for otariids or fasting phocids that have extended nursing
periods or remain on land throughout lactation. However, for species with relatively short
lactation durations, where mother-pup pairs spend time in the water (Boness, Bowen &
Oftedal 1994) and are therefore not always observable, or where non-breeders may be
detected at the breeding site during pupping, this may not be the case. Indeed, this situation
requires more advanced models to obtain robust estimates of fecundity by incorporating
these females as occupying an uncertain breeding state.
Long-term individual-based studies of pinnipeds are biased towards a few species
of otariids and larger phocids (Le Boeuf & Reiter 1988; Boyd et al. 1995; Pistorius et al.
2004; Beauplet et al. 2006; Pendleton et al. 2006). These are typically species that haul-out

Chapter IV
74
in large social groups on land during the breeding season and either fast or have a
prolonged lactation period with short foraging bouts out to sea. Less is known about
smaller phocids such as harbour seals. The difficulty involved in studying harbour seals is
largely due to the nature of their haul-out sites, including inter-tidal sandbanks, skerries,
and ice floes, which are often remote, inaccessible or easily disturbed. Information on
harbour seal demography has therefore largely been derived from analysis of dead animals
(Boulva & McLaren 1979; Härkönen & Heide-Jørgensen 1990; Heide-Jørgensen &
Härkönen 1992). Long-term individual-based studies of harbour seal demography have
been limited to one study population on Sable Island, Canada. However, the dynamics of
this population are quite unique as mothers and pups remain on land throughout lactation
and may therefore not be directly comparable with other populations. Also, despite the
long-term individual-based work at this colony, no survival or reproductive rates have yet
been published. More recently, the Sable Island population suffered dramatic declines
constraining the continuation of the study (Bowen et al. 2003). Other harbour seal
populations around the world are showing varying trends in abundance (see Chapter I;
Gilbert et al. 2005; Jemison et al. 2006; Mathews & Pendleton 2006; Lonergan et al. 2007)
but the lack of information on temporal and spatial variation in survival and fecundity
hinders an understanding of the dynamics of these populations.
The UK harbour seal population has been declining over the past 10-20 years for
reasons that are not fully understood (Lonergan et al. 2007). The magnitude of the decline
suggested either a sustained high level of reproductive failure, increased mortality rates or
a combination of the two (Lonergan et al. 2007). The long history of conflict between seals
and salmon fisheries led to regular shooting of seals and is likely to have played a role in
some areas (Thompson et al. 2007). In the Moray Firth, for example, the harbour seal
population declined by 2-5% per year from 1993 to 2004 (Thompson et al. 2007). It was
believed that between 66 and 327 harbour seals were culled each year from 1994 to 2002,
which would have been sufficient to explain the magnitude of decline in this area.
However, uncertainty surrounding the species identity and the exact number of seals that
were shot means that other factors, such as changes in food availability and/or quality may
have played a contributing role (Thompson et al. 2007). In order to balance the
conservation of seals and salmon fisheries, the Moray Firth Seal Management Plan was
implemented in 2005 (Butler et al. 2008). The plan limited the number of harbour seals
that could be shot each year to 60, although from 2005 to 2009, this maximum limit was
not reached (Butler et al. 2008; The Scottish Government, Unpublished data).

Chapter IV
75
Here we use a unique site where individual harbour seals could be remotely
identified by their pelage patterns to obtain the first individual-based estimates of sex-
specific survival and reproductive rates. This study was carried out after shooting had been
restricted in the area, and I took this opportunity to model the influence of different
estimated levels of culling on population trends. I discuss whether these modelled
estimates help gain insights into the long-term decline or whether harbour seals in Loch
Fleet may be an exception to the rule.
Methods
Species characteristics
The harbour seal is a long-lived capital breeder. Females reach sexual maturity
between the ages of three to five years after which they generally produce one pup every
year during a highly synchronised pupping season. Females nurse their pups on fat rich
milk, but are not able to store sufficient energy to sustain the energy demands of the pup,
and often make foraging trips during the latter period of lactation (Boness, Bowen &
Oftedal 1994). This optimises the pup‟s chances of survival and reduces the risk of the
female compromising her own future survival and reproductive success. Nevertheless as
females can lose around 35% of their body mass during lactation some costs are likely to
be involved (Härkönen & Heide-Jørgensen 1990). Adult harbour seals show high levels of
site fidelity. However, these have mainly been estimated within year, typically during a
single pupping season (see Chapter III; Godsell 1988; Thompson et al. 1996; Cunningham
et al. 2009). Only on rare occasions has this been confirmed between years (see Chapter
III; Härkönen & Harding 2001; Mackey et al. 2008), and only once throughout the year
(see Chapter III).
Study site and data collection
The study was carried out in Loch Fleet National Nature Reserve in the Moray
Firth on the north-east coast of Scotland (Chapter II). During low tide several sandbanks
are exposed, separated by deep-water channels, two of which are regularly utilised by seals
for hauling out. During the pupping season the main sandbank within Loch Fleet is used
intensively by harbour seals for resting, giving birth and nursing pups. The proximity of
this sandbank to the shoreline observation point (approximately 130m) allowed individual
seals to be recognised using photo-identification (Thompson & Wheeler 2008).
Photographic-identification survey data were collected over five consecutive years (2006 –
2010). During each pupping season (from the end of May to the end of July) the site was

Chapter IV
76
visited daily, resulting in a total of 272 surveys (2006= 57, 2007= 54, 2008= 55, 2009= 54,
and 2010= 52). On each day photographs were taken to identify all the seals hauled out on
the main sandbank. Typically, seals hauled out soon after the sandbanks were exposed.
Surveys were therefore started an hour after low tide to allow seals to settle, and were
continued for two to three hours to ensure that photographs were obtained of all individuals
using the sandbank. Photographs were taken of the head and neck region using a digital
camera and a telescope (Nikon Coolpix 5100 camera, 20-60x80mm Swarowski HD-ATS
80 telescope). These photographs were matched against a catalogue of the best images (left
and right side of the head) of all seals photographed during the study. Sex was determined
from photographs of genetalia for both males and females, whereas females were also
sexed if seen with a pup. Photographs were also used to record whether or not individually
identified females were seen with or without a pup on each day. Visual observations of
females looking pregnant were recorded, but not used as an indication of her breeding
state.
Mark-recapture analysis
Sightings data were analysed in the program MARK (Gary White, Colorado State
University, White & Burnham 1999), using statistical models as described below. Models
were built including different scenarios of group (g) and/or time (t) effects of estimated
parameters. Model selection was based on AICc scores in agreement with the guidelines
for dealing with small sample sizes (Lebreton et al. 1992; Bolker et al. 2009). Definitions
of model parameters are included in Table 1. The goodness of fit of the global models was
tested in the program U-CARE and in the case of a lack of fit the c-hat (variance
adjustment factor or value of overdispersion parameter) was adjusted in MARK.

Chapter IV
77
Table 1. Summary of multistate and robust design model parameters (Kendall, Hines & Nichols
2003).
Si Survival - Probability that an individual in sampling period i
survives to period i+1 and remains part of the
population
pi recapture - Probability that an individual alive and in the
population is sighted in year i
ψ Transition - Probability of an individual in a specific state in
period i will transition to another specific state in
period i+1
πi pi - Proportion released in a specific state
ω State structure - Proportion of the population in the study area in
period i that occupy a given state
δ Delta - Probability of correctly classifying a specific state
pent - Probability of entry to the study area
Φ Phi - Probability of remaining on the study area
Estimating sex-specific survival using a multistate model
Studies of this kind typically use the Cormack-Jolly-Seber models to estimate sex-
specific survival (Croxall & Hiby 1983; Pistorius et al. 2004; Baker & Thompson 2007).
However, when sex is not always known, these simple models can positively bias survival
estimates and related parameters of males and females, as known-sex individuals are often
seen more frequently (Nichols et al. 2004). To reduce bias, we considered a multistate
model (Nichols et al. 2004) that contains three states: male (M), female (F) and unknown
(U). The multistate model yields unbiased and precise results for males and females, but
there may be some bias for individuals of unknown sex due to the heterogeneous behaviour
of a group containing both males and females (Nichols et al. 2004). Until the sex of an
individual had been determined, sightings were recorded as “U”. Once sex was determined
the individual remained in that state (M or F) for every future re-sighting. Sighting
histories were constructed for each individual including non-sightings (0). The final data
set consisted of sighting histories of 152 individuals. Given the three states, SF, S
M and S
U
are the probabilities of an individual surviving from time t to time t+1. Similarly, pF, p
M
and pU are the probabilities that an individual is recaptured from time t to time t+1.
Transitions between states were restricted to occur from U to either M or F (ψUM
, ψUF
),

Chapter IV
78
whereas all other transitions were fixed to zero. To ensure the sum of ψ for each state
added up to one, a MLogit(x) link function was applied to transition probabilities.
Estimating reproductive rate and costs of reproduction on survival using the open robust
design multistate model with misclassification
The nature of harbour seal breeding behaviour means that successful mothers may
not always be detected with their pup and therefore misclassified as non-breeders, similar
to that demonstrated by a study of manatees (Kendall, Hines & Nichols 2003, Kendall et
al. 2004). This is due to harbour seals using inter-tidal sites for breeding, meaning that
mothers and pups often spend a significant amount of time in the water. This may result in
some females only being sighted on a few occasions, apparently without a pup, but it is not
known whether they may in fact be suckling a pup on another sandbank. Furthermore, due
to their small body size, females also undertake short foraging trips during lactation to
sustain the energy demands of the pup, which may result in females being sighted alone
upon returning to the haul-out site. Similarly, some pups inevitably die or become
separated from their mother soon after birth, in which case the female may not be sighted
with the pup within that short period of time. All these scenarios can lead to breeders being
misclassified as non-breeders.
Consequently the use of traditional multistate models could cause reproductive
rates to be underestimated (Nichols et al. 1994) and mask differences in survival between
breeders and non-breeders (Kendall et al. 2004). To adjust for the probability of
misclassifying breeders as non-breeders, estimates of reproductive rate and costs of
reproduction on survival were obtained using the robust design multistate model with
misclassification (Kendall, Hines & Nichols 2003, Kendall et al. 2004). The “open” model
was chosen as capture probabilities of females varied with pupping date, whereby females
were seen occasionally pre-birth and post-weaning, and more regularly seen during
lactation. This also allows for the estimation of both conditional (the probability that a non-
breeder at time t, breeds at time t+1) and unconditional reproductive rates (the proportion
of females breeding).
To account for misclassification, multiple secondary occasions (daily surveys)
within each primary occasion (year) were used. However, due to the extensive number of
secondary occasions (>50 per primary occasion) these were reduced to weekly occasions,
resulting in six secondary occasions (week) for each of the five primary occasions (year).
Within the primary occasions (year) females could occupy one of two states, breeder (B) if
seen with pup on one or more occasions, and non-breeder (N) if seen without a pup on one

Chapter IV
79
or more occasions. When a female was seen without a pup but there was uncertainty
surrounding whether or not she actually had one, instead of recording the sighting as “N”,
a “u” was input instead. This is not an actual state as described in the multistate model, but
an unobservable event (Kendall, Hines & Nichols 2003). It was assumed that a pup could
not be assigned to the wrong female and there was no restriction on transition probabilities.
The ages of 12 females (estimated from tooth growth rings, Appendix II) and visual
observations indicated that not all females were reproductively mature from the start of the
study, but recruited into the breeding group over the course of the five years. Reproductive
rates were therefore likely to be underestimated for the first years. In 2009 and 2010, all
females had given birth to at least one pup, and estimates for these years were therefore
thought to give the best representation of reproductive rate.
A sighting history was constructed for each female. This consisted of its non-
sightings (0) and sightings with (B) or without a pup (N). Within each primary occasion,
females could only occupy one state across all secondary occasions, so if a female was
seen with a pup on just one occasion, all other sightings were recorded as “B”. The final
data set contained sighting histories of 65 females which had given birth to at least one
pup. Sightings of these females are summarised for each year in Table 2.
Table 2. Summary of the number of observed breeders, non-breeders and apparent non-breeders
(“unknowns”) in each year.
2006 2007 2008 2009 2010
Breeders 39 39 42 50 50
Non-breeders 5 7 6 8 7
“unknown” 3 2 3 4 4
Given the two states, SB and S
N are the probabilities that a female with or without a
pup at time t survives to time t+1. The conditional reproductive rate (ψNB
) is the
probability that a female without a pup at time t, survives from t to t+1, will be with a pup
at t+1. The state structure (ωB) represents the unconditional reproductive rate or its
complement depending on which state is presented first, describing the proportion of
females that are breeding. Delta illustrates the probability of correctly classifying breeders
and non-breeders.

Chapter IV
80
Population modelling
Population viability analysis was run in the program Vortex 9.99 using the
demographic parameters estimated in MARK to explore how different levels of culling
might influence population trends: 1) no culling, 2) maximum culling levels set by the
Moray Firth Seal Management Plan (60 harbour seals shot per year), 3) the most probable
average level of culling estimated in Thompson et al. 2007 (137 harbour seals shot per
year), 4) the average of the maximum level of culling (172 harbour seals shot per year), 5)
the maximum estimate of culling in any year (327 harbour seals shot per year).The models
were based on an initial population size of 1650 estimated for the Moray Firth (Thompson
et al. 1997). Vortex reports population growth rate as the exponential growth (r) rather than
the arithmetic growth rate (λ). The exponential growth rate indicates the percent increase
per year. The mean exponential growth rate over time is equal to the long-term r. The mean
growth rate is calculated from the mean population estimate in one year over the
population estimate from the previous year.
Results
In this study 152 individuals were identified, 73 of which were female, 38 were
male, and 41 individuals were not sexed. Of the 73 females, 66 were known to have
produced at least one pup. Re-sightings of individuals within each pupping season were
high averaging 12 sightings per individual per season, ranging from 1 to 42 sightings (Fig.
1).

Chapter IV
81
Figure 1. Sighting frequencies of individuals seen at least once during each pupping season from
2006 to 2010.
0
10
20
30
40
1-5 11-15 21-25 31-35 41-45
Fre
qu
ency
Number of captures
2006
0
10
20
30
40
1-5 11-15 21-25 31-35 41-45
Fre
qu
ency
Number of captures
2007
0
10
20
30
40
1-5 11-15 21-25 31-35 41-45
Fre
quen
cy
Number of captures
2008
0
10
20
30
40
1-5 11-15 21-25 31-35 41-45
Fre
quen
cy
Number of captures
2009
0
10
20
30
40
1-5 11-15 21-25 31-35 41-45
Fre
quen
cy
Number of captures
2010

Chapter IV
82
Estimating sex-specific survival
The multistate model was applied to the sightings data. The most general model
that was fit was {S(g,t), p(g,t), ψ(g,t)}, allowing variation across breeding and non-
breeding states (g=B or N) and time (t) for survival (S), recapture rate (p) and transition
probability (ψ). Goodness of fit was evaluated in the program U-CARE and revealed a
moderate lack of fit with a variance adjustment factor of 2.19 (Chi-square=46, df= 21).
This was used to adjust the AICc and standard errors. The best fitting models were selected
based on AICc scores (Table 3).
Table 3. Comparison of fit of multi-state models for estimating survival rate (c-hat=2.19).
Model No. Par. ΔQAICc QAICc Weight Model
likelihood
S(.,.) p(g,.) ψ(.,.) 5 0.00 0.69 1.00
S(g,.) p(g,.) ψ(.,.) 7 2.19 0.23 0.34
S(.,.) p(.,.) ψ(.,.) 3 5.13 0.05 0.08
S(.,.) p(.,.) ψ(g,.) 4 7.04 0.02 0.03
S(g,.) p(.,.) ψ(g,.) 6 10.14 0.00 0.01
S(g,t) p(g,t) ψ(g,t) 32 33.37 0.00 0.00
The two top models were within two AICc scores of each other, and far better than
any of the other models. The first model was {S(.,.), p(g,.), ψ(.,.)} with ΔQAICc=0.00. The
model indicated no variation in apparent survival between states (g) or across time (t),
variation in recapture probabilities between states but not across time, and no variation in
transition probabilities between states or across time. The second model was {S(g,.), p(g,.),
ψ(.,.)} with ΔQAICc=2.19. In contrast to the first model, this indicated variation in
apparent survival between states (g). Of the QAICc weight these two models accounted for
0.69 and 0.23, respectively. Apparent survival probability from the first model was SMFU
=
0.95 (±0.02 SE), and for the second model SM
= 0.89 (±0.06), SF = 0.97 (±0.02) and S
U =
0.95 (±0.02).
Estimating reproductive rate and costs of reproduction on survival
The maximum observed inter-birth interval was two years, but most females who
had become breeders tended to remain in that state the following year (Fig. 2).

Chapter IV
83
Figure 2. Frequency of years between observed breeding attempts of all mature females.
The most general model fitted was {S(g,t), ψ(g,t), π(g,t), ω(g,t), p(g,t), δ(g,t),
pent(g,t), Φ(g,t)}, which indicated state (g) and time (t) variation across all parameters
(Table 4). This model showed good fit with a variance adjustment factor of 0.85
(Χ2=16.78, df=20). The two top models accounted for most of the AICc weight, 0.96 and
0.04, respectively. According to AICc scores, the best supported model was {S(g,.), ψ(g,t),
π(g,t), ω(g,t), p(g,.), δ(g,.), pent(g,t), Φ(g,.)}, which indicates variation in survival between
breeders and non-breeders (g), as well as state and time variation on conditional (ψ) and
unconditional (ω) reproductive rates. The second best model {S(.,.), ψ(g,t), π(g,t), ω(g,t),
p(g,.), δ(g,.), pent(g,t), Φ(g,.)} was within seven AICc scores and indicated no variation
between states on survival. Although survival probabilities for breeders and non-breeders
appeared similar, 0.99 (±0.01 SE) and 0.99 (±0.02), there was more variation in the
confidence intervals surrounding survival probability of non-breeders (0.81-0.9995),
compared to breeders (0.95-0.996). Conditional (ψNB
) and unconditional reproductive rates
(ω) increased over time. However, this was most likely due to some females being
immature in the early years, but recruited into the breeding group over the course of the
study. This was consistent with ages obtained from teeth and visual observations of
females as juveniles. The inclusion of these immature females as non-breeders, when in
fact they were not capable of breeding, would ultimately bias reproductive rates low. By
2009, all females in the sample had given birth to at least one pup. Estimates of
reproductive rate in 2009 and 2010 were therefore thought to best represent the true
reproductive rate. In 2009, ψNB
= 0.94 (±0.06), and in 2010, ψNB
= 0.86 (±0.13).
Unconditional reproductive rates were ω09=0.87 (±0.04) and ω10=0.89 (±0.04). Since
0
50
100
150
1 2 3 4
Fre
qu
en
cy
Inter-birth interval (year)

Chapter IV
84
conditional reproductive rate does not include transitions from breeder to breeder, the
average unconditional reproductive rate from 2009 and 2010 was used as the reported
reproductive rate (0.88). DeltaN was 1 (±0.00) as expected as no non-breeders were
misclassified as breeders, whereas deltaB = 0.97 (±0.01), highlighting the misclassification
probability of breeders as non-breeders.
Table 4. Comparison of fit of open robust design multi-state models for estimating reproductive
rate.
Model No.
Par ΔAICc
AICc
Weight
Model
Likelihood
S(g,.) p(g,.) ψ(g,t) π(g,t) ω(g,t) δ(g,.) Φ(g,.) 75 0.00 0.96 1.00
S(.,.) p(g,.) ψ(g,t) π(g,t) ω(g,t) δ(g,.) Φ(g,.) 74 6.38 0.04 0.04
S(.,.) p(g,.) ψ(g,.) π(g,t) ω(g,t) δ(g,.) Φ(g,.) 68 12.51 0.00 0.00
S(g,.) p(g,.) ψ(g,.) π(g,.) ω(g,.) δ(g,.) Φ(g,.) 62 14.03 0.00 0.00
S(g,t) p(g,t) ψ(g,t) π(g,t) ω(g,t) δ(g,t) Φ(g,t) 241 212.31 0.00 0.00
Population modelling
The survival and reproductive rates estimated in MARK were included in the
population viability model to estimate population trends within the Moray Firth including
different levels of culling. Survival and reproductive rates were assumed stable on a
regional and temporal scale. Other harbour seal life-history information to be included in
the model was obtained from a variety of sources (Table 5).

Chapter IV
85
Table 5. Summary of life-history parameters (and sources) used for population modelling.
Parameter Values used Source
Initial population size 1650 Thompson et al. 1997
Age at first reproduction ♂ 5 ♂, 4 ♀ Härkönen & Heide-Jørgensen 1990
Inter-birth interval 1-2 years This study (Fig. 2)
Mating system Polygynous Boulva & McLaren 1979
Number of broods 1
Number of young 1
Sex ratio of young 0.5 Boulva & McLaren 1979
Reproductive rate 88% This study
Annual mortality (age 0-1) 25% ♂; 25% ♀
Harding et al. 2005; Härkönen &
Heide-Jørgensen 1990
Annual mortality (age 1-2) 11% ♂; 9% ♀
Annual mortality (age 2-3) 11% ♂; 9% ♀
Annual mortality (age 3-4) 11% ♂; 9% ♀
Annual mortality (age 4-5) 11% ♂; 3% ♀
Annual mortality (age 5-6) 11% ♂; 3% ♀
Annual mortality adults 11% ♂; 3% ♀ This study
Maximum age 25 Härkönen & Heide-Jørgensen 1990
Figure 3. Predicted population trends using the current survival and reproductive rates without
harvesting (grey ♦), with harvesting by the quota set in the Moray Firth Seal Management Plan
(60/yr, white ▲), with harvesting at most probable levels (137/yr, black ■), with maximum mean
harvesting (172/yr, white ●), and harvesting at the maximum number (327/yr, black ▲).
0
3000
6000
9000
12000
15000
0 5 10 15 20
Popula
tion t
rend (
+/-
SE
)
Years

Chapter IV
86
Without culling the harbour seal population within the Moray Firth should be
growing by ~12% per year (Fig. 3, Table 6). Even under the maximum levels of culling
introduced by the Moray Firth Seal Management Plan, the population growth was
estimated at ~11% per year (Fig. 3, Table 6). By increasing culling to the most probable
average level and average maximum level estimates during the period 1995-2005 the
population still increases, by ~8% and ~7% per year respectively (Fig. 3, Table 6). Only
when culling levels were increased to the maximum number of seals shot does the
population decline, by ~2% per year (Fig. 3, Table 6).
Table 6. Predicted population growth from population viability analysis.
Scenario Growth rate (r) Standard deviation
No harvesting 0.115 0.056
MFSMP harvesting quota (60/yr) 0.106 0.057
Most probable harvesting levels (137/yr) 0.079 0.061
Mean max harvesting levels (172/yr) 0.068 0.064
Maximum number harvested (327/yr) -0.015 0.113
Discussion
Here, I present the first concurrent real-time estimates of apparent survival and
reproductive rates obtained from harbour seals within a naturally regulated population.
Adult survival rates were high, particularly for females (0.89 ♂; 0.97 ♀). Individuals of
unknown sex showed high survival rates (0.95) similar to that of females indicating that a
large proportion of these may be sub-adult females that have not bred yet, and therefore not
sexed. The disparity in sample sizes of males and females is partly due to the bias in the
ability of determining sex. Females would be sexed either from photographs taken of their
ventral side or when seen in the presence of their pup. In contrast, males could only be
sexed from photographs taken of their ventral side. In addition, studies have shown that
harbour seal populations are typically female biased, like many other long-lived
polygynous mammals (Bigg 1969; Boulva & McLaren 1979; Clutton-Brock, Major &
Guinness 1985; Härkönen & Heide-Jørgensen 1990; Clutton-Brock & Lonergan 1994;
Clutton-Brock et al. 2002). The recapture rate of individuals of unknown sex was lower
than those estimated for males and females, indicating that these are individuals that either
typically use other haul-out sites, or are younger animals that naturally show lower levels
of site fidelity (Härkönen & Harding 2001).

Chapter IV
87
Estimates of survival and reproductive rates for harbour seals are sparse in the
published literature (Table 7). The only comparative sex-specific survival rates have been
obtained from analysis of dead animals collected after the northern European phocine
distemper virus outbreak in 1988 that resulted in the deaths of c. 23,000 harbour seals
(Härkönen & Heide-Jörgensen 1990; Heide- Jörgensen & Härkönen 1992). These survival
rates were estimated at 0.91 and 0.95 for males and females respectively, similar to those
estimated in this study. However, survival rates were estimated based on a known
population growth rate and pregnancy rates obtained from analysis of ovaries. Only one
other estimate of survival has been obtained from live harbour seals, also the first ever
estimate of survival obtained using photo-identification for any species of pinniped
(Mackey et al. 2008). This study was carried out in the Cromarty Firth, c. 50 km south of
Loch Fleet, from 1999 to 2002. The sample of individuals in this study was female biased
with 95 females, 10 males, and 57 individuals of unknown sex, creating too much
uncertainty to estimate male survival (Mackey et al. 2008). Recapture rates were low with
just eight females and one male seen in all four years. This was largely due to the relatively
long distance between observer and seals, weather limitations and only being able to
photograph seals hauled-out in a certain position. Due to the sparse data, a Bayesian
approach was implemented to estimate survival, although, with some uncertainty
surrounding estimated parameters. When using photo-identification data only, their model
estimated adult survival as 0.98, and when incorporating an informative prior distribution
from previously published survival estimates survival was estimated as 0.97.

Chapter IV
88
Table 7. Comparative survival and reproductive rates of harbour seals (n) in the literature.
Survival
Estimate Site Method Source
Male Female
0.89 (38) 0.97 (73) Loch Fleet,
Scotland Photo-ID This study
-- 0.97 (162) Cromarty Firth,
Scotland Photo-ID Mackey et al. 2008
0.91 0.95 Kattegat &
Skagerak Dead seals
Härkönen & Heide-Jørgensen
1990; Heide-Jørgensen &
Härkönen 1992
Reproductive rate
-- 0.88 (66) Loch Fleet,
Scotland Photo-ID This study
-- 0.92 Kattegat &
Skagerak Dead seals
Härkönen & Heide-Jørgensen
1990
-- 0.95 (38) Eastern Canada Dead seals Boulva & McLaren 1979
-- 0.93 (58) Svalbard,
Sweden
Live
captures Lydersen & Kovacs 2005
-- 0.90 (81) Norway Dead seals Bjørge 1992
The reproductive rate estimated for females in Loch Fleet (0.88) was only slightly
lower than those obtained from analysis of seals harvested in eastern Canada (0.95 for
prime-aged females; Boulva & McLaren 1979) as well as those collected after the 1988
epizootic in the Kattegat and Skagerak (0.92; Härkönen & Heide-Jørgensen 1990). These
previous estimates were obtained from counting placental scars, corpus luteum and corpus
albicans, which develop in the ovaries after ovulation (Boyd 1984). The reliability of
counting stained placental scars for estimating reproductive rates has been tested in
relatively few species (e.g. Strand, Skogland & Kvam 1995; Elmeros & Hammershøj
2006). Furthermore, as corpus albicans may originate from sources other than corpus
luteum of successful pregnancy, reproductive rates estimated using this method are likely
to be over rather than underestimated (Boyd 1984). Here, reproductive rate was obtained
from re-sightings of females with pups, and might therefore better represent birth rate.
Nevertheless, despite the difference in methodology, the use of re-sightings of females
with pups provided accurate and robust estimates of reproductive rate. One study in
Svalbard estimated reproductive rate from live captures at 0.93 (Lydersen & Kovacs 2005).
However, these females were caught during the pupping season, potentially causing bias in
the sample as lactating or heavily pregnant females are likely to be easier to catch or may
preferably use certain areas.

Chapter IV
89
Long-lived iteroparous mammals and birds are faced with the challenge of
balancing energy allocation between current reproduction and future survival, which often
varies with phenotype and environmental variation (Albon, Clutton-Brock & Guinness
1987; Clutton-Brock, Albon & Guinness 1987; Gomendio 1990). Under optimal
environmental conditions the costs of reproduction on survival are likely to be minimal,
particularly for prime-aged females. However, unfavourable environmental conditions (e.g.
low food availability, increased density) may incur increased costs, particularly in young
females that are still allocating energy into growth, and old senescent females that are more
susceptible to resource scarcity (Newcomb, Rodriguez and Johnson 1991; Clutton-Brock et
al. 1996; Mayor 2004; Tavecchia et al. 2005; Penn & Smith 2007; Descamps et al. 2009).
Studies of costs of reproduction in pinnipeds are limited to Antarctic fur seals (Boyd et al.
1995), Weddell seals (Hadley, Rotella & Garrott 2007) and sub-Antarctic fur seals
(Beauplet et al. 2006). Reproductive females of Antarctic fur seals and Weddell seals
suffered lower survival rates and reduced fecundity in the following year (Boyd et al.
1995; Hadley, Rotella & Garrott 2007). In Antarctic fur seals between 40-50% of mortality
was explained by pregnancy (Boyd et al. 1995). The opposite was observed in Sub-
Antarctic fur seals where non-breeders had lower survival rates than breeders and showed
higher probability of being non-breeders in the following year (Beauplet et al. 2006).
Females showed consistency in breeding performance over years, indicating that non-
breeding tended to occur among lower quality females (Beauplet et al. 2006). In this study,
breeders and non-breeders showed similar and very high survival rates, although for non-
breeders they were more variable. This suggests that there were no costs of reproduction
on survival, and that breeding may be an indication of quality (Aubry et al. 2011). Poor
condition, younger or older senescent females may skip years or abort their pregnancy as a
strategy for not compromising future survival and reproductive success.
The decline of harbour seals within the northern region of the Moray Firth may
have resulted in an increase in per capita food availability, thereby reducing intra-specific
competition. The improved forage conditions could explain the high adult survival rates at
Loch Fleet, although estimates of survival were similar at the Cromarty Firth during the
decline (Mackey et al. 2008), indicating that low pup and juvenile survival rates may have
played a significant role. Reproductive rates of ungulates have been shown to decline with
increasing population density, and females only conceived at higher body weights,
reducing the risk of dying from pregnancy or lactation as well as maximising the
probability of survival for their young (Albon, Mitchell & Staines 1983). In our study,
reproductive rates were also high, which would be expected due to the currently low

Chapter IV
90
population levels. Other factors such as a biased age-structure may also influence
reproductive rates. The harbour seal breeding site in Loch Fleet has only recently been
established and the number of pups did not begin to increase until the mid 1990s (Chapter
II). It is therefore possible that these individuals are biased towards young prime-aged
females. The lack of any costs of reproduction on survival could also be explained by
improved food availability after a reduction in intra-specific competition. Reproductive
rate and reproductive costs on survival may therefore provide more sensitive indicators of
environmental conditions (Lunn, Boyd & Croxall 1994; Clutton-Brock et al. 1996;
Coulson et al. 2001; Barbraud & Weimerskirch 2005; Hadley, Rotella & Garrott 2007).
The survival and reproductive rates obtained in this study provide important
information for understanding the current dynamics of harbour seal populations on the
north-east coast of Scotland. Given the overlap in foraging areas used by seals at other
haul-out sites in the Moray Firth (see Chapter II; Thompson et al. 1994; Thompson et al.
1996), these parameters are unlikely to vary significantly across the region, unless local
factors (e.g. shooting) have caused fine-scale variation in age-structure. However, the
changes in shooting pressure and intra-specific competition may have caused temporal
variation in survival and reproductive rates over the last few decades. Furthermore, harbour
seals co-habit with the larger grey seal and it is possible that inter-specific competition has
played a contributing role. However, the recent implementation of a limited quota of seals
which can be shot should have reduced mortality (Butler et al. 2008). The levels of
harvesting proposed in the Moray Firth Seal Management Plan (Butler et al. 2008) did not
appear to drastically affect population growth. Neither did the estimated most probable
levels of shooting from Thompson et al. 2007, apart from delaying the time in which
carrying capacity was reached. Only when culling levels were increased to the maximum
number estimated to have been shot in a single year did the population decline. This
indicates that if estimated mean harvesting levels are correct, then other processes, such as
variation in ecosystem conditions, must have contributed to the decline.
Chapter IV
91
References
Albon, S.D., Mitchell, B., & Staines, B.W. (1983). Fertility and body weight in female red
deer: a density-dependent relationship. Journal of Animal Ecology 52, 969-980.
Albon, S.D., Clutton-Brock, T.H., & Guinness, F.E. (1987). Early development and
population dynamics in red deer. II. Density-independent effects and cohort variation.
Journal of Animal Ecology 56, 69-81.
Aubry, L.M., Cam, E., Koons, D.N., Monnat, J.-Y., & Pavard, S. (2011). Drivers of age-
specific survival in a long-lived seabird: contributions of observed and hidden sources of
heterogeneity. Journal of Animal Ecology 80, 375-383.
Baker, C.S., & Palumbi, S.R. (1994). Which whales are hunted? A molecular genetic
approach to monitoring whaling. Science 265, 1538-1539.
Baker, J.D., & Thompson, P.M. (2007). Temporal and spatial variation in age-specific
survival rates of a long-lived mammal, the Hawaiian monk seal. Proceedings of the Royal
Society Biology 274, 407-415.
Barbraud, C., & Weimerskirch, H. (2005). Environmental conditions and breeding
experience affect costs of reproduction in blue petrels. Ecology 86, 682-692.
Beauplet, G., Barbraud, C., Dabin, W., Kϋssener, C., & Guinet, C. (2006). Age-specific
survival and reproductive performances in fur seals: evidence of senescence and individual
quality. Oikos 112, 340-441.
Bigg, M.A. (1969). The harbour seal in British Columbia. Fisheries Research Board
Canada Bulletin 172, 33.
Bjørge, A. (1992). The reproductive biology of the harbour seal, Phoca vitulina L., in
Norwegian waters. Sarsia 77, 47-51.
Bolker, B.M., Brooks, M.E., Clark, C.J., Geange, S.W., Poulsen, J.R., Stevens, M.H.H., &
White, J-S. (2009). Generalized linear mixed models: a practical guide for ecology and
evolution. Trends in Ecology and Evolution 24, 127-135.
Boness, D.J., Bowen, W.D., & Oftedal, O.T. (1994). Evidence of a maternal foraging cycle
resembling that of otariid seals in a small phocid, the harbour seal. Behavioural Ecology
Sociobiology 34, 95-104.
Boulva, J., & McLaren, I.A. (1979). Biology of the harbour seal, Phoca vitulina, in eastern
Canada. Bulletin of the Fisheries Research Board of Canada 200, 1-24.
Bowen, W.D., Ellis, S.L., Iverson, S.J., & Boness, D.J. (2003). Maternal and newborn life-
history traits during periods of contrasting population trends: implications for explaining
the decline of harbour seals (Phoca vitulina), on Sable Island. Journal of Zoology London
261, 155-163.

Chapter IV
92
Boyd, I.L. (1984). Development and regression of the corpus luteum in grey seal
(Halichoerus grypus) ovaries and its use in determining fertility rates. Canadian Journal of
Zoology 62, 1095-1100.
Boyd, I.L., Croxall, J.P., Lunn, N.J., & Reid, K. (1995). Population demography of
Antarctic fur seals: the costs of reproduction and implications for life-histories. Journal of
Animal Ecology 64, 505-518.
Bronikowski, A.M., Alberts, S.C., Altmann, J., Packer, C., Dee Carey, K., & Tatar, M.
(2002). The aging baboon: comparative demography in a non-human primate. Proceedings
of the National Academy of Sciences 99, 9591-9595.
Butler, J.R.A., Middlemas, S.J., McKelvey, S.A., McMyn, A., Leyshon, B., Walker, I.,
Thompson, P.M., Boyd, I., Duck, C., Armstrong, J.D., Graham, I.M. & Baxter, J.M.
(2008). The Moray Firth Seal Management Plan: an adaptive framework for balancing the
conservation of seals, salmon, fisheries and wildlife tourism in the UK. Aquatic
Conservation 18, 1025-1038.
Caswell, H. (1978). A general formula for the sensitivity of population growth rate to
changes in life history parameters. Theoretical Population Biology 14, 215-230.
Clutton-Brock, T.H., Major, M., & Guiness, F.E. (1985). Population regulation in male and
female red deer. Journal of Animal Ecology 54, 831-846.
Clutton-Brock, T.H., Albon, S.D., & Guinness, F.E. (1987). Interactions between
population density and maternal characteristics affecting fecundity and juvenile survival in
red deer. Journal of Animal Ecology 54, 857-871.
Clutton-Brock, T.H., Albon, S.D., & Guinness, F.E. (1988). Reproductive success in male
and female red deer. In: Reproductive Success (T.H. Clutton-Brock), University of
Chicago Press, IL, 325-343.
Clutton-Brock, T.H., & Lonergan, M.E. (1994). Culling regimes and sex ratio biases in
Highland red deer. Journal of Applied Ecology 31, 521-527.
Clutton-Brock, T.H., Stevenson, I.R., Marrow, P., MacColl, A.D., Houston, A.I., &
McNamara, J.M. (1996). Population fluctuations, reproductive costs and life-history tactics
in female Soay sheep. Journal of Animal Ecology 65, 675-689.
Clutton-Brock, T.H., Coulson, T.N., Milner-Gulland, E.J., Thomson, D., & Armstrong,
H.M. (2002). Sex differences in emigration and mortality affect optimal management of
deer populations. Nature 415, 633-637.
Clutton-Brock, T., & Sheldon, B.C. (2010). Individuals and populations: the role of long-
term, individual-based studies of animals in ecology and evolutionary biology. Trends in
Ecology and Evolution 25, 562-573.
Cooch, E.G., Lank, D.B., Rockwell, R.F., & Cooke, F. (1991). Long-term decline in body
size in a snow goose population: evidence of environmental degradation. Journal of
Animal Ecology 60, 483-496.

Chapter IV
93
Coulson, T., Catchpole, E.A., Albon, S.D., Morgan, B.J.T., Pemberton, J.M., Clutton-
Brock, T.H., Crawley, M.J., & Grenfell, B.T. (2001). Age, sex, density, winter weather,
and population crashes in Soay sheep. Science 292, 1528-1531.
Croxall, J.P., & Hiby, L. (1983). Fecundity, survival and site fidelity in Weddell seals,
Leptonychotes weddelli. The Journal of Applied Ecology 20, 19-32.
Cunningham, L., Baxter, J.M., Boyd, I.L., Duck, C.D., Lonergan, M., Moss, S.E., &
McConnell, B. (2009). Harbour seal movements and haul-out patterns: implications for
monitoring and management. Aquatic Conservation 19, 398-407.
Descamps, S., Boutin, S., McAdam, A.G., Berteaux, D., & Gaillard, J.-M. (2009). Survival
costs of reproduction vary with age in North American red squirrels. Proceedings of Royal
Society B 276, 1129-1135.
Dunnet, G.M., & Ollason, J.C. (1978). The estimation of survival rate in the fulmar,
Fulmarus glacialis. Journal of Animal Ecology 47, 507-520.
Elmeros, M., & Hammershøj, M. (2006). Experimental evaluation of the reliability of
placental scar counts in American mink (Mustela vison). European Journal of Wildlife
Research 52, 132-135.
Gaillard, J.-M., Festa-Bianchet, M., & Yoccoz, N.G. (1998). Population dynamics of large
herbivores: variable recruitment with constant adult survival. Trends in Ecology and
Evolution 13, 58-63.
Gilbert, J.R., Waring, G.T., Wynne, K.M., & Guldager, N. (2005). Changes in abundance
of harbour seals in Maine, 1981-2001. Marine Mammal Science 21, 519-535.
Godsell, J. (1988). Herd formation and haul-out behaviour in harbour seals (Phoca
vitulina). Journal of Zoology London 215, 83-98.
Gomendio, M. (1990). The influence of maternal rank and infant sex on maternal
investment trends in Rhesus Macaques: Birth sex ratios, inter-birth intervals and suckling
patterns. Behavioural Ecology and Sociobiology 27, 365-375.
Grimm, V. (1999). Ten years of individual-based modelling in ecology: What have we
learned and what could we learn in the future? Ecological Modelling 115, 129-148.
Hadley, G.L., Rotella, J.J., & Garrott, R.A. (2007). Influence of maternal characteristics
and oceanographic conditions on survival and recruitment probabilities of Weddell seals.
Oikos 116, 601-613.
Harding, K.C., Fujiwara, M., Axberg, Y., & Härkönen, T. (2005). Mass-dependent
energetic and survival in harbour seal pups. Functional Ecology 19, 129-135.
Harwood, J., & Prime, J.H. (1978). Some factors affecting the size of British grey seal
populations. Journal of Applied Ecology 15, 401-411.
Harwood, L.A., Smith, T.G., & Melling, H. (2000). Variation in reproduction and body
condition of the ringed seal (Phoca hispida) in western Prince Albert Sound, NT, Canada,
as assessed through a harvest-based sampling program. Arctic 53, 422-431.

Chapter IV
94
Heide-Jørgensen, M.-P., & Härkönen, T. (1992). Epizootiology of seal disease in the
eastern North Sea. Journal of Applied Ecology 29, 99-107.
Härkönen, T., & Heide-Jørgensen, M.-P. (1990). Comparative life histories of east Atlantic
and other harbour seal populations. Ophelia 32, 211-235.
Härkönen, T., & Harding. K.C. (2001). Spatial structure of harbour seal populations and
the implications thereof. Canadian Journal of Zoology 79, 2115-2127.
Jemison, L.A., Pendleton, G.W., Wilson, C.A., & Small, R.J. (2006). Long-term trends in
harbour seal numbers at Tugidak Island and Nanvak Bay, Alaska. Marine Mammal Science
22, 339-360.
Kendall, W.L., Hines, J.E., & Nichols, J.D. (2003). Adjusting multistate capture-recapture
models for misclassification bias: manatee breeding proportions. Ecology 84, 1058-1066.
Kendall, W.L., Langtimm, C.A., Beck, C.A., & Runge, M.C. (2004). Capture-recapture
analysis for estimating manatee reproductive rates. Marine Mammal Science 20, 424-437.
Le Boeuf, B.J., & Reiter, J. (1988). Lifetime reproductive success in northern elephant
seals. In: Reproductive Success (T.H. Clutton-Brock), University of Chicago Press, IL,
344-362.
Lebreton, J.-D., Burnham, K.P., Clobert, J., & Anderson, D.R. (1992). Modeling survival
and testing biological hypotheses using marked animals: a unified approach with case
studies. Ecological Monographs 62, 67-118.
Lonergan, M., Duck, C.D., Thompson, D., Mackey, B.L., Cunningham, L., & Boyd, I.L.
(2007). Using sparse survey data to investigate the declining abundance of British harbour
seals. Journal of Zoology 271, 261-269.
Lunn, N.J., Boyd, I.L., & Croxall, J.P. (1994). Reproductive performance of female
Antarctic fur seals: the influence of age, breeding experience, environmental variation and
individual quality. Journal of Animal Ecology 63, 827-840.
Lydersen, C., & Kovacs, K.M. (2005). Growth and population parameters of the world‟s
northernmost harbour seals Phoca vitulina residing in Svalbard, Norway. Polar Biology
28, 156-163.
Mackey, B.L., Durban, J.W., Middlemas, S.J., & Thompson, P.M. (2008). A Bayesian
estimate of harbour seal survival using sparse photo-identification data. Journal of Zoology
274, 18-27.
Mathews, E.A., & Pendleton, G.W. (2006). Declines in harbour seals (Phoca vitulina)
numbers in Glacier Bay National Park, Alaska, 1992-2002. Marine Mammal Science 22,
167-189.
Mayor, S. (2004). Pregnancy and childbirth are leading causes of death in teenage girls in
developing countries. British Medical Journal 328, 1152.

Chapter IV
95
Newcomb, W.W., Rodriguez, M., & Johnson, J.W.C. (1991). Reproduction in the older
gravid: a literature review. Journal of Reproductive Medicine 36, 839-845.
Nichols, J.D., Hines, J.E., Pollock, K.H., Hinz, R.L., Link, W.A. (1994). Estimating
breeding proportions and testing hypotheses about costs of reproduction with capture-
recapture data. Ecology 75, 2052-2065.
Nichols, J.D., Kendall, W.L., Hines, J.E., & Spendelow, J.A. (2004). Estimation of sex-
specific survival from capture-recapture data when sex is not always known. Ecology 85,
3192-3201.
Penn, D.J., & Smith, K.R. (2007). Differential fitness costs of reproduction between the
sexes. Proceedings of the National Academy of Science 104, 553-558.
Pendleton, G.W., Pitcher, K.W., Fritz, L.W., York, A.E., Raum-Suryan, K.L., Loughlin,
T.R., Calkins, D.G., Hastings, K.K., & Gelatt, T.S. (2006). Survival of Steller sea lions in
Alaska: a comparison of increasing and decreasing populations. Canadian Journal of
Zoology 84, 1163-1172.
Pistorius, P.A., Bester, M.N., Lewis, M.N., Taylor, F.E., Campagna, C., & Kirkman, S.P.
(2004). Adult female survival, population trend, and the implications of early primiparity
in a capital breeder, the southern elephant seal (Mirounga leonine). Journal of Zoology
London 263, 107-119.
Stevick, P.T., Palsbøll, Smith, T.D, Bravington, M.V., & Hammond, P.S. (2001). Errors in
identification using natural markings: rates, sources, and effects on capture-recapture
estimates of abundance. Canadian Journal of Fisheries and Aquatic Sciences 58, 1861-
1870.
Strand, O., Skogland, T., & Kvam, T. (1995). Placental scars and estimation of litter size:
an experimental test in the arctic fox. Journal of Mammalogy 76, 1220-1225.
Tavecchia, G., Coulson, T., Morgan, B.J.T., Pemberton, J.M., Pilkington, J.C., Gulland,
F.M.D., & Clutton-Brock, T.H. (2005). Predictors of reproductive cost in female Soay
sheep. Journal of Animal Ecology 74, 201-213.
Thompson, P.M., Miller, D. Cooper, R., & Hammond, P.S. (1994). Changes in the
distribution and activity of female harbour seals during the breeding season: Implications
for their lactation strategy and mating patterns. The Journal of Animal Ecology 63, 24-30.
Thompson, P.M., McConnell, B.J., Tollit, D.J., Mackay, A., Hunter, C., & Racey, P.A.
(1996). Comparative distribution, movements and diet of harbour and grey seals from the
Moray Firth, N.E. Scotland. Journal of Applied Ecology 33, 1572-1584.
Thompson, P.M., Tollit, D.J., Wood, D., Corpe, H.M., Hammond, P.S., & Mackay, A.
(1997). Estimating harbour seal abundance and status in an estuarine habitat in north-east
Scotland. Journal of Applied Ecology 34, 43-52.
Thompson, P.M., Mackey, B., Barton, T.R., Duck, C. & Butler, J.R.A. (2007). Assessing
the potential impact of salmon fisheries management on the conservation status of harbour
seals (Phoca vitulina) in north-east Scotland. Animal Conservation 10, 48-56.

Chapter IV
96
Thompson, P.M., & Wheeler, H. (2008). Photo-ID-based estimates of reproductive
patterns in female harbour seals. Marine Mammal Science 24, 138-146.
White, G.C., & Burnham, K.P. (1999). Program MARK: Survival estimation from
populations of marked animals. Bird Study 46, 120-139.

Chapter V
97
CHAPTER V
TIMING MATTERS: THE INFLUENCE OF BREEDING
PHENOLOGY ON LACTATION PERFORMANCE AND
OFFSPRING SURVIVAL

Chapter V
98
CHAPTER V
TIMING MATTERS: THE INFLUENCE OF BREEDING PHENOLOGY
ON LACTATION PERFORMANCE AND OFFSPRING SURVIVAL
Introduction
In temperate regions, many long-lived mammals and birds have adapted their
timing of breeding to occur when conditions are most favourable for rearing offspring.
However, climate change and environmental variation can cause shifts in the timing of
seasonal peaks in resources resulting in a potential mismatch with the birth of young
(Visser & Both 2005; Post & Forchammer 2008). A number of species of birds,
amphibians and mammals have shown the ability to plastically adjust their timing of
breeding in anticipation of such temporal shifts in resources (Forchhammer, Post &
Stenseth 1998; Réale et al. 2003; Frederiksen et al. 2004a; Møller, Flensted-Jensen &
Mardal 2006; Love et al. 2010;), whereas others, often mammals, face potential energetic
constraints and lower offspring survival (Post & Forchammer 2008). Similarly, variation in
food availability or population density can lead to a shift in the timing of breeding. For
example, a number of studies have shown that the timing of breeding was delayed during
years of limited food availability or high population density (Clutton-Brock, Albon &
Guinness 1988 (deer); Sydeman et al. 1991; Lunn, Boyd & Croxall 1994; Boyd 1996
(pinnipeds); Ratcliffe, Furness & Hamer 1998 (seabird)). The effects of these energetic
responses are likely to vary between species, depending on factors such as metabolic
demands, foraging costs, as well as the ability to switch diet (Furness & Tasker 2000). In
addition, age-specific culling or disease mortality can cause changes in population age-
structure which may also influence breeding phenology because older or more experienced
females typically give birth earlier than younger females (Lunn, Boyd & Croxall 1994; Loe
et al. 2005). Whereas shifts in breeding phenology have been well documented, less is
known about their long-term consequences on population dynamics, particularly when
these are caused by environmental variation or climate change (Walther et al. 2002;
Parmesan & Yohe 2003; Edwards & Richardson 2004).

Chapter V
99
The North Sea is a temperate region currently under significant pressure from both
climate change and anthropogenic impacts (Furness 2002; Edwards & Richardson 2004;
Perry et al. 2005). Warming sea temperatures over the last few decades have resulted in a
mismatch in the timing of different spring planktonic cycles upon which successive trophic
levels depend (Edwards & Richardson 2004; Perry et al. 2005), as well as a change in the
distribution, abundance and condition of demersal fish (Beaugrand et al. 2003; Perry et al.
2005). Furthermore, intensive fisheries have altered the abundance and structure of fish
populations as a result of fishing down the food web (Heath 2005). However, the dynamics
of plankton species and demersal fishes are often costly or difficult to monitor due to their
inconspicuous nature. In contrast, some marine top predators, such as seabirds and
pinnipeds rely on terrestrial sites for breeding, and during this period critical aspects of
their life history can be monitored. Consequently, these species are often considered to be
useful indicators of environmental conditions as their physiological and behavioural
responses are likely to reflect the dynamics at lower trophic levels (Boyd, Wanless &
Camphuysen 2006; Wanless et al. 2007). To date, most phenological studies of marine top
predators in the North Sea have focused on seabirds (Frederiksen et al. 2004a; Frederiksen
et al. 2004b; Wanless et al. 2007). However, Reijnders, Brasseur & Meesters (2010)
recently suggested that harbour seals in the southern North Sea have significantly advanced
their timing of pupping over the last 35 years due to an improved forage base. This study
lacked direct measures of the timing of pupping, but instead used the date on which the
maximum number of pups was counted as a proxy for annual variation in the timing of
births. Further work is therefore needed to test whether the maximum pup count does
provide a robust proxy of the timing of births. Regardless, individual-based studies are
required to explore whether observed phenological changes are due to individual responses
to changes in resource availability or whether they result from other factors such as a
change in population age-structure. The suggestion that harbour seal foraging conditions in
the southern North Sea have improved is of particular interest given that several other key
harbour seal populations in the North Sea have suffered long-term declines (Lonergan et
al. 2007). The causes of these declines are still poorly understood, but it has been argued
that their widespread nature suggests that the key drivers involve large scale environmental
processes (Lonergan et al. 2007).
Whereas the distribution and abundance of harbour seals in the UK is well studied,
an understanding of individual-level responses to environmental variation is required to
gain insights into their population dynamics. Studies of phenological variation can clearly
contribute to this understanding, but obtaining direct estimates of the timing of pupping in

Chapter V
100
harbour seals is extremely challenging as females do not remain ashore throughout the
breeding season. Here we use a rare opportunity to study variation in breeding phenology
and lactation performance of individual female harbour seals across multiple breeding
seasons. First, we test the key assumption underlying Reijnders, Brasseur & Meesters‟s
(2010) study by assessing whether there is a relationship between the timing of pupping
and the timing of maximum pup counts. We then describe inter-annual variation in the
timing of pupping and investigate the consequences of birth date on lactation duration and
offspring survival.
Methods
Species characteristics
Harbour seals depend on terrestrial haul-out sites, typically inter-tidal sandbanks
and skerries, for resting (da Silva & Terhune 1988), giving birth and nursing pups
(Thompson 1989). Female harbour seals mature at an age between three and five years old
(Ellis et al. 2000; Bowen et al. 2001a; Bowen et al. 2003), after which they generally
produce one pup each year. Female harbour seals nurse their pup for a relatively short
period of time (15-30 days; Muelbert & Bowen 1993) and due to their small body size
often make intermittent foraging trips during the latter part of lactation to sustain the
energy demands of the pup (Boness, Bowen & Oftedal 1994). Weaning is abrupt and
females mate shortly thereafter (Thompson 1988; Thompson et al. 1994). Delayed
implantation ensures a highly synchronised pupping season, whereby the fertilised egg
enters diapause before implanting in the uterus (Lindenfors, Dalén & Angerbjörn 2003).
Changes in photo-period initiate the timing of the blatocyst implantation, and this is
therefore assumed to take place at more or less the same time in all females (Mead 1989;
Temte 1993).
Data collection
The study was carried out in the Loch Fleet National Nature Reserve in the Moray
Firth, NE Scotland (see Chapter II & III). The proximity of the observation point to the
main sandbank used by harbour seals allowed individual animals to be recognised using
photo-identification (Thompson & Wheeler 2008). Data were collected daily during the
pupping season (late May to late July) from 2006 to 2010. Photographs were taken to
identify all the seals hauled out on the main sandbank. Typically, seals hauled out soon
after the sandbanks were exposed at low tide. Surveys were therefore started an hour after

Chapter V
101
low tide to allow seals to settle, and were continued for two to three hours to ensure that
photographs were obtained of all individuals using the sandbank. Photographs were taken
of the head and neck region using a digital camera and a telescope (Nikon Coolpix 5100
camera, 20-60x80mm Swarowski HD-ATS 80 telescope). These photographs were
matched against a catalogue of the best images (left and right side of the head) of all seals
photographed during the study. Photographs were also used to record whether or not
individually identified females were seen with or without a pup. On each day, repeated
counts of pups present on all sandbanks within the study area were carried out throughout
low tide depending on the level of movement and activity (between one and five times).
Estimation of the timing of pupping and lactation duration
Daily sightings and re-sightings of individual seals were recorded in a capture
history matrix (Appendix III), which included information on the status of individual
females (whether she was seen or not seen and, if seen, whether or not she was with a pup).
From this capture history, the pupping date and lactation duration for each female were
determined using the method described in Thompson and Wheeler (2008). In short,
pupping dates were calculated as the midpoint between the day that the female was last
seen alone and the day that she was first seen with pup. If this period was ≤ 3 days the
pupping dates was defined as accurate, if the period was longer than three days the pupping
date was not included in subsequent analyses. All pupping dates were converted to day of
the year (Julian day).
Reproductive investment of female phocid seals may be measured in several
different ways including the length of time the pup spends suckling (Bowen et al. 2001b),
pup growth rates (Bowen, Oftedal & Boness 1992) and variation in milk quality (Lang,
Iverson & Bowen 2005). However, it is challenging at most sites to acquire even the
simplest measure of reproductive investment in harbour seals as females and pups spend a
significant amount of time in the water. I was able to follow recognisable individuals
throughout the pupping season which provided the opportunity to use lactation duration as
a measure of female investment. Lactation duration was defined as the number of days
from the day the pup was born to the day the mother-pup pair was last seen together, after
which females typically leave the breeding site for several days to go on long foraging trips
(Thompson et al. 1994). Lactation durations were therefore only estimated for females
with accurate pupping dates. To ensure lactation durations were representative of weaned
pups, and not simply movement of mother-pup pairs to other sandbanks, I only used

Chapter V
102
lactation durations where the females were also seen alone shortly after (<10 days) being
last seen with their pup.
The consequences of variation in lactation duration on pup survival
The potential consequences of variation in lactation duration on pup survival were
estimated using data from other studies on pup growth during lactation (Bowen et al. 2003)
and the relationship between weaning mass and first year survival (Harding et al. 2005).
First, I used information on average pup birth weight (11kg) and rate of mass gain in pups
during lactation (0.6kg/day) obtained from studies on Sable Island, eastern Canada (Bowen
et al. 2003), to estimate the difference in weaning weight for pups with different lactation
durations:
The estimated weights of pups with different lactation durations were then used to compare
differences in survival rates using the following equation from Harding et al. (2005):
where w is the mass of individual j, and α and β describe the slope and intercept.
Statistical analysis
All analyses were carried out in R 2.11.1 (R Development Core Team, 2010). To
allow for correlation between observations as a result of repeated sampling of the same
individual females, generalised linear mixed modelling with a Poisson distribution was
used to analyse the relationship between pupping dates and lactation durations of
individual females using the nlme4 package. Due to potential variation in the timing of
pupping between years, pupping dates were centred on the annual median (relative
pupping dates). This also allowed for a more meaningful model intercept as pupping dates
in Julian day were located far from zero. Despite centring pupping dates, the relationship
between pupping dates and year was still confounding, and year was therefore included as
a random effect. To account for variation associated with repetitive measures of the same
individuals, individual ID was also included as a random effect. To correct for small

Chapter V
103
sample size (97 observations from 35 individual females), AICc scores were used to
compare models (Bolker et al. 2009). The initial model is given below.
Results
The frequency distribution of pupping dates was approximately normal but with a
slight left tail of premature pups which did not survive (Fig. 1). The overall median
pupping date was Julian day 166 (15 June).
Figure 1. Frequency histogram of pupping dates (n=166; light grey bars indicate premature pups).
The frequency distribution of lactation durations revealed large spread, and
suggested two separate biological groupings of lactation durations (Fig. 2). The first group
of short lactation durations (n=11) represent pups that were either born prematurely
(commonly seen with lanugo cover – the white coat shed prior to birth; see Bowen et al.
1994; Ellis et al. 2000) and died at birth or shortly after, or pups that were separated from
their mother shortly after birth, when females were typically seen searching for their pup
for several days without finding them. The larger group with longer lactation durations
(n=86) represents naturally weaned pups. The overall mean lactation duration for naturally
weaned pups was 23 days.
0
2
4
6
8
10
134 139 144 149 154 159 164 169 174 179
Fre
quen
cy
Pupping date (Julian day)

Chapter V
104
Figure 2. Frequency histogram of lactation durations (n=97; light grey bars indicate premature
pups, pups that died or were separated from the mother at or soon after birth).
Over the five years of this study, 66 females were recorded to have given birth at
least once, and 58 of these females had at least one accurate pupping date. This resulted in
a total of 166 pupping dates and 97 lactation durations (Table 1). Of these, 97 pupping
dates and lactation durations from 35 females were paired, i.e. obtained from the same
female in the same year.
Table 1. The number of females with between one and five pupping dates (n=58 females) and
lactation durations (n=35 females).
Number of years studied
One Two Three Four Five
Pupping dates 14 13 10 9 12
Lactation durations 6 12 5 8 4
In each year the detailed history of pupping dates was summarised as a pupping
curve including the daily maximum pup counts for comparison (Fig. 3; Appendix IV).
Towards the end of lactation daily max pup count became more variable, probably due to
pups spending more time in the water.
0
3
6
9
12
15
0 5 10 15 20 25 30 35
Fre
quen
cy
Lactation duration (days)

Chapter V
105
Figure 3. Pupping curve from 2010 showing cumulative number of pups born (─) and max pup
count on each day (●).
The percentages of the cumulative number of pups born in each year were used to
plot pupping curves, portraying relative differences in the timing of pupping between years
(Fig. 4).
Figure 4. Cumulative pupping curves signifying the timing of pupping in each year.
To test the use of „day of first pup‟, „day of max pup count‟ and „day of 50% max
pup count‟ as proxies for the actual timing of pupping (Table 2), a Spearman rank order
0
15
30
45
60
25-May 09-Jun 24-Jun 09-Jul 24-Jul
Num
ber
of
pups
0
25
50
75
100
14-May 01-Jun 19-Jun 07-Jul 25-Jul
Cum
ula
tive
no. of
pups
born
(%
)
2010
2009
2008
2007
2006

Chapter V
106
correlation was calculated. The date of first pup was defined as the date of the first pup
born in June, as pups born prior to this date were classified as premature. There was a
strong positive and significant association between median pupping date and the day of
first offspring (Fig. 5; Spearman rank order, rs=0.92, S=1.58, p=0.03).
Figure 5. The relationship between the date of first offspring and the median pupping date.
In contrast, the correlation between median pupping date and day of max pup count
revealed a weak negative association which was not significant (Fig. 6; Spearman rank
order, rs=-0.24, S=24.74, p=0.7).
Figure 6. The relationship between the timing of max pup count and median pupping date.
149
152
155
158
161
162 164 166 168 170 172
Fir
st p
uppin
g d
ate
Median pupping date
179
181
183
185
187
163 165 167 169 171
Day
of
max
pup c
ount
Median pupping date
2006
2009
2010 2007 2008
2006
2009
2010
2007
2008

Chapter V
107
There was a positive, although not significant, association between median pupping
date and day of 50% max pup count (Fig. 7; Spearman rank order, rs=0.68, S=6.32,
p=0.20).
Figure 7. The relationship between the timing of 50% max pup count and median pupping date.
The annual median timing of pupping ranged between 13 June and 19 June. The
number of pups born in each year increased over the course of the study, and the majority
of pups (90%) were typically born within a two week period (Table 2).
Table 2. Summary data for each year on the number of pups born, number of premature pups in
brackets, as well as the median, first and last pupping date, the period in which 90% of pups were
born, and the Julian day of max pup count and day of 50% of max pup count. (*2008 was a leap
year).
Year Number
of pups Median
First – last
birth date 90%
Day max
pup count
Day 50%
max pup
count
2006 34 (1) 170 (19 June) 159 – 179 17 181 170
2007 37 (0) 166 (15 June) 156 – 177 17 184 165
2008 41 (1) 168 (16* June) 157 – 176 13 180 168
2009 49 (3) 164 (13 June) 152 – 175 15 186 166
2010 51 (1) 164 (13 June) 156 - 174 13 180 166
163
165
167
169
171
163 165 167 169 171
Day
50%
max
pup c
ount
Median pupping date
2006
2009
2010
2007
2008

Chapter V
108
Individual females were generally consistent in their relative timing of pupping
within the pupping season (Fig. 8). The mean range between relative pupping dates for
individual females was seven days, with a minimum range of two days (across four years)
and a maximum range of 20 days (across four years).
Figure 8. The consistency of relative pupping dates for individual females (n=20) with ≥ 4 pupping
dates (2006=1, 2007=2, 2008=3, 2009=4, 2010=5).
There were significant differences in the median timing of pupping between years
(Kruskall-Wallis (for medians), df=4, Chi-squared = 16.706, p<0.005). Post hoc analysis
with a Tukey‟s honest significant difference test showed that the timing of pupping in 2006
was significantly different to both 2009 and 2010, indicating that seals pupped
significantly earlier in recent years (Fig. 9).

Chapter V
109
Figure 9. Annual median pupping dates (Julian day) with inter-quartile ranges.
There were significant differences in mean lactation durations between years (one-
way ANOVA (for means), df=4, F=2.811, p<0.05). This was due to differences in mean
lactation duration between 2010 and 2006 (Tukey‟s honest significance difference test),
indicating that seals are lactating significantly longer in recent years compared with the
beginning of the study (Fig. 10).
Figure 10. Mean lactation durations with 95% confidence intervals.
160
163
166
169
172
175
2006 2007 2008 2009 2010
Med
ian p
uppin
g d
ate
(I-Q
ran
ges
)
15
18
21
24
27
2006 2007 2008 2009 2010
Mea
n l
acta
tion d
ura
tion (
95%
CI)

Chapter V
110
There was a strong negative association, which was significant, between annual
mean lactation duration and median pupping date (Fig. 11; Spearman rank order, rs= -0.87,
S=37.44, p=0.05).
Figure11. Relationship between median pupping date and mean lactation duration.
Lactation duration and the number of days the female was seen during lactation
showed a strong positive correlation (Pearson product moment, r=0.687, df=95, p<0.0001;
Fig. 12).
15
20
25
30
163 165 167 169 171
Lac
tati
on d
ura
tion (
day
s)
Pupping date (Julian day)
2006
2010
2009
2007 2008

Chapter V
111
Figure 12. The relationship between lactation duration and the number of days the females were
seen during lactation. Dotted line represents a perfect one to one relationship.
The generalised linear mixed model showed a significant negative relationship
between lactation duration and relative pupping date (Table 3). This indicated that females
that pupped early during the breeding season had longer lactation durations (Fig. 13).
According to the model output, ID did not explain any of the variation in the data. This is
probably due to the model being over-parameterised as around half of the females had just
one or two accurate pupping dates. Individual ID was retained, despite the improvement of
the model fit by two AICc scores when removing it, because it reflected the study design
and may still account for some of the structure in the data. There was a slight indication of
underdispersion which is likely due to the limited range of lactation durations. Residuals
were plotted against fitted values and all explanatory variables and showed good model fit
(Fig. 14).
The optimal model was given by:
0
10
20
30
40
0 10 20 30 40
No. of
day
s se
en (
lact
atio
n)
Lactation duration (days)

Chapter V
112
Figure 13. The predicted relationship between relative pupping dates and lactation duration with
95% CI estimated as the variation for an average individual in an average year.
Table 3. Generalised linear mixed modelling results.
The influence of pupping date on female investment
Fixed effects Estimate Std. Error z value p-value
Intercept 3.133 0.037 85.760 <0.0001***
Relative pupping date -0.011 0.005 -2.330 0.02*
Random effects Variance Std. Dev
ID 0.000 0.000
Year 0.004 0.066
-10 -5 0 5 10
10
15
20
25
30
Relative pupping date
La
cta
tio
n d
ura
tio
n (
da
ys)
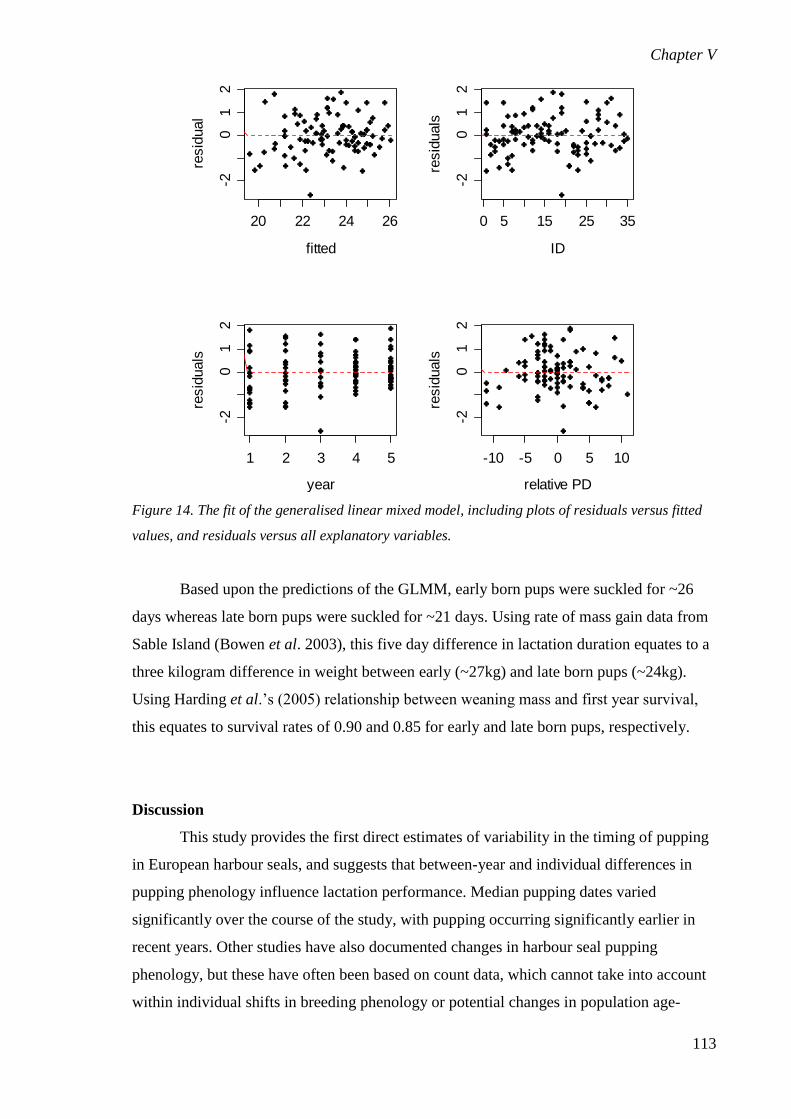
Chapter V
113
Figure 14. The fit of the generalised linear mixed model, including plots of residuals versus fitted
values, and residuals versus all explanatory variables.
Based upon the predictions of the GLMM, early born pups were suckled for ~26
days whereas late born pups were suckled for ~21 days. Using rate of mass gain data from
Sable Island (Bowen et al. 2003), this five day difference in lactation duration equates to a
three kilogram difference in weight between early (~27kg) and late born pups (~24kg).
Using Harding et al.‟s (2005) relationship between weaning mass and first year survival,
this equates to survival rates of 0.90 and 0.85 for early and late born pups, respectively.
Discussion
This study provides the first direct estimates of variability in the timing of pupping
in European harbour seals, and suggests that between-year and individual differences in
pupping phenology influence lactation performance. Median pupping dates varied
significantly over the course of the study, with pupping occurring significantly earlier in
recent years. Other studies have also documented changes in harbour seal pupping
phenology, but these have often been based on count data, which cannot take into account
within individual shifts in breeding phenology or potential changes in population age-
20 22 24 26-2
01
2
fitted
resid
ual
0 5 15 25 35
-20
12
ID
resid
uals
1 2 3 4 5
-20
12
year
resid
uals
-10 -5 0 5 10-2
01
2
relative PD
resid
uals

Chapter V
114
structure (Jemison & Kelly 2001; Reijnders, Brasseur & Meesters 2010). The mechanism
underlying these effects can only be reliably identified through repeated monitoring of the
same individuals. Results from this study show that the timing of pupping was highly
synchronised and that individual females were generally consistent in their timing of
pupping between breeding seasons (Fig. 8). This indicates that the population-level shifts
in pupping phenology that we recorded were the result of individuals responding in a
consistent manner, as observed in other colonial breeders (Reed et al. 2006). Individual
consistency in the timing of pupping in harbour seals has previously only been
demonstrated on Sable Island (Ellis et al. 2000) and in captivity (Temte 1991).
Consistency in the timing of pupping can be both a behavioural trait as well as genetically
determined, whereby individuals that are born late, breed late when reaching sexual
maturity (Le Boeuf and Reiter 1988; Price, Kirkpatrick & Arnold 1988). Ultimately, over
multiple generations, climate induced changes in breeding phenology may lead to a
selection for earlier or later breeding (Husby, Visser & Kruuk 2011).
The reproductive investment of females can be measured in several different ways,
but obtaining even the simplest measure in harbour seals is extremely difficult as females
and pups often spend a significant amount of time in the water where they cannot be
observed. By using lactation duration as an indication of female investment it was
important to ascertain whether females with long lactation durations foraged more
frequently and therefore spent less time with the pup, and whether females with short
lactation durations only made intermittent foraging trips and so suckled their pup more
intensely. Results demonstrated no difference in the proportion of days a female was seen
with her pup during lactation regardless of whether lactation duration was long or short
(Fig. 12). This confirms that differences in lactation were not simply due to differences in
the intensity of time the female spent with the pup and suggests that lactation duration
provides a good proxy for female investment.
Lactation durations were significantly longer in recent years compared with the
beginning of the study, suggesting that females are experiencing better conditions which
may be interpreted as an inter-annual or short-term response to improved environmental
conditions (Fig. 10). At the same time there was a strong negative association between
annual mean lactation duration and median pupping date (Fig. 11) indicating that shifts in
the timing of pupping are due to consequences of energetic constraints. Furthermore, this
highlights the use of timing of pupping as an indicator of lactation performance. There are
no parallel data available on food availability or foraging effort for this population over
this period, but I suggest that variability in the timing of pupping could provide an

Chapter V
115
immediate indicator of prevailing environmental conditions. This hypothesis is consistent
with studies of other pinnipeds, deer and birds, where the timing of breeding was typically
delayed and offspring survival low during years of low food availability (Clutton-Brock,
Albon & Guinness 1988; Lunn, Boyd & Croxall 1994; Boyd 1996; Ratcliffe, Furness &
Hamer 1998; Soto, Trites & Arias-Schreiber 2004; Loe et al. 2005). The Moray Firth
harbour seal population has declined by 2-5% per year since the mid 1990s (Thompson et
al. 2007) as seen across much of the UK (Lonergan et al. 2007). This reduction in density
may have resulted in an increase in per capita food availability, thereby reducing intra-
specific competition for reproductive females. Intra- and inter-specific competition have
also been suggested as the driving forces behind trends in breeding phenology of other
harbour seal populations elsewhere in the world (Jemison & Kelly 2001; Bowen et al.
2003). In contrast to these other studies, we have observed an advance in the timing of
pupping during a period of overall population decline. However, this study took place
towards the latter part of the decline when the density of harbour seals was already reduced
and where the population may in fact be recovering (Fig. 15; Sea Mammal Research Unit,
Unpublished Data).
Despite the timing of pupping appearing to have advanced over the five years of
this study, care should always be taken in interpreting trends in short-term phenological
studies as observed patterns may result purely from inter-annual variation, while trends
only become obvious on the decadal scale. Nevertheless, opportunities such as this are
rare, and highlight how individual-based studies of breeding performance provide a
sensitive indicator of population responses to environmental change.

Chapter V
116
Figure 15. Trend in mean counts (+/- SE) of harbour seals in the Moray Firth.
The climate and fisheries driven changes that have taken place within the North Sea
over the last few decades (Furness 2002; Edwards & Richardson 2004; Perry et al. 2005)
could have caused or contributed to the long-term widespread decline of UK harbour seals.
However, the current reduction in harbour seal density and intra-specific competition may
now be masking these pressures, hence the observed patterns in pupping phenology and
lactation performance. These results suggest that the timing of pupping in UK harbour
seals may have varied temporally over the last few decades.
The use of marine top predators as indicators of environmental variation has mainly
focussed on seabirds whose behavioural responses typically depend upon spring conditions
(Frederiksen et al. 2004a; Wanless et al. 2009; Love et al. 2010). Temporal variation in the
time of year when conditions are most likely to influence the breeding phenology of
marine top predators limits the extent to which inter-species comparisons may be drawn.
Although it is difficult to assess the exact time of year food availability is most important
for the condition of pregnant harbour seals, studies suggest that autumn and winter
conditions play a key role in the fitness of adult seals (Pitcher 1986). Within the Moray
Firth, key prey species have shown seasonal as well as inter-annual variation, and harbour
seals were shown to suffer reduced body condition following years of low winter prey
abundance (Thompson et al. 1996).
400
500
600
700
800
900
1000
1100
1200
1987 1992 1997 2002 2007 2012
Mea
n c
ount
(+/-
SE
)

Chapter V
117
Analysis confirmed that females who pupped early in the breeding season were
able to suckle their pups significantly longer (Fig. 13). Studies of pinnipeds and deer have
shown that older or larger females give birth earlier in the season (Clutton-Brock, Albon &
Guinness 1988; Le Boeuf and Reiter 1988; Sydeman et al. 1991; Lunn, Boyd & Croxall
1994; Pomeroy et al. 1999), and that offspring arriving early have higher chances of
survival than ones born late (Clutton-Brock, Albon & Guinness 1988; Sydeman et al.
1991; Catry et al. 1998). The observed difference in lactation duration between early and
late born pups equated only to a slight advantage in survival of early born pups (5%).
When estimating these survival rates we assumed that all pups were the same size at birth
and that all pups gained mass at the same rate during lactation. If, for example, Moray
Firth pups were smaller at birth and/or gained mass at a slower rate, the difference in
survival between early and late born pups would be much more pronounced (Harding et al.
2005). A study from Sable Island showed that harbour seal pups with older or larger
mothers were heavier at birth, which may have further survival advantages (Ellis et al.
2000). However, there did not appear to be a relationship between birth date and pup mass
(Ellis et al. 2000).
This individual-based study of harbour seal reproductive ecology was only possible
due to an easily accessible observation point being in close proximity to the undisturbed
breeding site within Loch Fleet. There are certainly other sites around the world where
important comparative work could be conducted. However, most key harbour seal
populations of conservation concern lack these individual-level research opportunities, and
available data are typically restricted to annual censuses. Instead, Reijnders, Brasseur &
Meesters 2010 used data on the timing of peak pup counts from a long-time series of
population censuses in the Dutch Wadden Sea as an indicator of phenological change.
Nevertheless, there was uncertainty surrounding the use of such a proxy. We found a
strong, but negative, association between the timing of max pup count and the median
timing of pupping (Fig. 6). Even though this correlation was not significant, we would
expect a positive association if the timing of peak pup count was to be used as a reliable
proxy for the timing of pupping. The timing of first offspring has been a successful proxy
for the timing of breeding in seabirds (Wanless et al. 2009). Here, day of first pup and the
median timing of pupping showed a strong positive and significant association (Fig. 5).
Although, sample sizes were small, day of first offspring seems likely to provide a better
proxy for the timing of pupping in harbour seals at locations where individual-based data
cannot be collected. However, pupping dates of premature pups were excluded from this
analysis as these observations are unlikely to represent healthy breeding attempts and are
Chapter V
118
also greatly influenced by survey effort prior to 1 June. Population-level studies will
therefore have to be designed to exclude these premature pups when using day of first pup
as a proxy for the timing of pupping. As an alternative I also tested the use of day of 50%
max pup count, which revealed a positive association. Although this association was not
significant, in the long-term this may provide a simpler, yet still reliable, proxy for the
timing of pupping.
Here I have shown that population-level shifts in harbour seal pupping phenology
are due to consistent individual-level energetic responses. The patterns observed in the
timing of pupping and lactation duration indicate that environmental conditions were
favourable for pregnant females during the study period, which is most likely due to the
reduction in intra-specific competition following the long-term population decline. This
study highlights the significance of harbour seal pupping phenology as an indicator of
environmental conditions. Long-term monitoring of pupping phenology as well as
identifying relevant environmental variables, such as winter sea surface temperature or
chlorophyll, could provide important information on the key drivers of harbour seal
population dynamics, particularly as the latest counts may indicate the beginning of a
recovery of this population.

Chapter V
119
References
Beaugrand, G., Brander, K.M., Lindley, J.A., Souissi, S., & Reid, P.C. (2003). Plankton
effect on cod recruitment in the North Sea. Nature 426, 661-664.
Bolker, B.M., Brooks, M.E., Clark, C.J., Geange, S.W., Poulsen, J.R., Stevens, M.H.H., &
White, S.-S.S. (2009). Generalized linear mixed models: a practical guide for ecology and
evolution. Trends in Ecology and Evolution 24, 127-135.
Boness, D.J., Bowen, W.D., & Oftedal, O.T. (1994). Evidence of a maternal foraging cycle
resembling that of otariid seals in a small phocid, the harbour seal. Behavioural Ecology &
Sociobiology 34, 95-104.
Bowen, W.D., Oftedal, O.T., & Boness, D.J. (1992). Mass and energy transfer during
lactation in a small phocid, the harbor seal (Phoca vitulina). Physiological Zoology 65,
844-866.
Bowen, W.D., Oftedal, O.T., Boness, D.J., & Iverson S.J. (1994). The effect of maternal
age and other factors on birth mass in the harbour seal. Canadian Journal of Zoology 72, 8-
14.
Bowen, W.D., Iverson, S.J., Boness, D.J., & Oftedal, O.T. (2001a). Foraging effort, food
intake and lactation performance depend on maternal mass in a small phocid seal.
Functional Ecology 15, 325-334.
Bowen, W.D., Ellis, S.L., Iverson, S.J., & Boness, D.J. (2001b). Maternal effects on
offspring growth rate and weaning mass in harbour seals. Canadian Journal of Zoology 79,
1088-1101.
Bowen, W.D., Ellis, S.L., Iverson, S.J., & Boness, D.J. (2003). Maternal and newborn life-
history traits during periods of contrasting population trends: Implications for explaining
the decline of harbour seals (Phoca vitulina), on Sable Island. Journal of Zoology London
261: 155-163.
Boyd, I.L. (1996). Individual variation in the duration of pregnancy and birth date in
Antarctic fur seals: The role of environment, age, and sex of fetus. Journal of Mammalogy
77, 124-133.
Boyd I.L., Wanless S., & Camphuysen C.J. (eds) (2006). Top predators in marine
ecosystems: their role in monitoring and management. Cambridge University Press,
Cambridge.
Catry, P., Ratcliffe, N., & Furness, R.W. 1998. The influence of hatching date on different
life-history stages of great skuas Catharacta skua. Journal of Avian Biology 29, 299-304.
Clutton-Brock, T.H., Major, M., Albon, S.D., & Guinness, F.E. (1987). Early development
and population dynamics in red deer. I. Density-dependent effects on juvenile survival.
Journal of Animal Ecology 56, 53-67.

Chapter V
120
Clutton-Brock, T.H., Albon, S.D., & Guinness, F.E. (1988). Reproductive success in male
and female red deer. In: Reproductive Success (T.H. Clutton-Brock), University of
Chicago Press, IL, pp. 325-343.
da Silva, J., & Terhune, J.M. (1988). Harbour seal grouping as an antipredator strategy.
Animal Behaviour 36, 1309-1316.
Edwards, M., & Richardson, A. (2004). Impact of climate change on marine pelagic
phenology and trophic mismatch. Nature 430, 881-883.
Ellis, S.L., Bowen, W.D., Boness, D.J., & Iverson, S.J. (2000). Maternal effects on
offspring mass and stage of development at birth in the harbour seal, Phoca vitulina.
Journal of Mammalogy 81, 1143-1156.
Forchhammer, M.C., Post, E., & Stenseth, N.C. (1998). Breeding phenology and climate.
Nature 391, 29-30.
Frederiksen, M., Harris, M.P., Daunt, F., Rothery, P., & Wanless, S. (2004a). Scale-
dependent climate signals drive breeding phenology of three seabird species. Global
Change Biology 10, 1214-1221.
Frederiksen, M., Wanless, S., Harris, M.P., Rothery, P., & Wilson, L.J. (2004b). The role
of industrial fisheries and oceanographic change in the decline of North Sea black-legged
kittiwakes. Journal of Applied Ecology 41, 1129-1139.
Furness, R.W., & Tasker, M.L. (2000). Seabird-fisheries interactions: quantifying the
sensitivity of seabirds to reductions in sandeel abundance, and identification of key areas
for sensitive seabirds in the North Sea. Marine Ecology Progress Series 202, 253-264.
Furness, R.W. (2002). Management implications of interactions between fisheries and
sandeel-dependent seabirds and seals in the North Sea. ICES Journal of Marine Science
59, 261-269.
Greenstreet, S.P.R., Spence, F.E., & McMillan, J.A. (1999). Fishing effects in northeast
Atlantic shelf areas: Patterns in fishing effort, diversity and community. V. Changes in
structure of the North Sea groundfish species assemblage between 1925 and 1996.
Fisheries Research 40, 153-183.
Harding, K.C., Fujiwara, M., Axberg, Y., & Härkönen, T. (2005). Mass-dependent
energetics and survival in harbour seal pups. Functional Ecology 19, 129-135.
Heath, M.R. (2005). Changes in the structure and function of the North Sea fish foodweb,
1973-2000, and the impacts of fishing and climate. ICES Journal of Marine Science 62,
847-868.
Husby, A., Visser, M.E., & Kruuk, L.E.B. (2011). Speeding up microevolution: the effects
of increasing temperature on selection and genetic variance in a wild bird population. PLoS
Biology 9, 1-9.
Jemison, L.A. & Kelly, B.P. (2001). Pupping phenology and demography of harbour seals
(Phoca vitulina richardsi) on Tugidak Island, Alaska. Marine Mammal Science 17, 585-
600.

Chapter V
121
Lang, S.L.C., Iverson, S.J., & Bowen, W.D. (2005). Individual variation in milk
composition over lactation in harbour seals (Phoca vitulina) and the potential
consequences of intermittent attendance. Canadian Journal of Zoology 83, 1525-1531.
Le Boeuf, B.J., & Reiter, J. (1988). Lifetime reproductive success in northern elephant
seals. In: Reproductive Success (T.H. Clutton-Brock), University of Chicago Press, IL,
344-362.
Lindenfors, P., Dalén, L., & Angerbjörn, A. (2003). The monophyletic origin of delayed
implantation in carnivores and its implications. Evolution 57, 1952-1956.
Loe, L.E., Bonenfant, C., Mysterud, A., Gaillard, J.-M., Langvatn, R., Klein, F., Calenge,
C., Ergon, T., Pettorelli, N., & Stenseth, N.C. (2005). Climate predictability and breeding
phenology in red deer: timing and synchrony of rutting and calving in Norway and France.
Journal of Animal Ecology 74, 579-588.
Lonergan, M., Duck, C.D., Thompson, D., Mackey, B.L., Cunningham, L., & Boyd, I.L.
(2007). Using sparse survey data to investigate the declining abundance of British harbour
seals. Journal of Zoology 271, 261-269.
Love, O.P., Gilchrist, H.G., Descamps, S., Semeniuk, C.A.D., & Bêty, J. (2010). Pre-
laying climatic cues can time reproduction to optimally match offspring hatching and ice
conditions in an Arctic marine bird. Oecologia 164, 277-286.
Lunn, N.J., Boyd, I.L., & Croxall, J.P. (1994). Reproductive performance of female
Antarctic fur seals: The influence of age, breeding experience, environmental variation and
individual quality. Journal of Animal Ecology 63, 827-840.
Mead, R. A. (1989). The physiology and evolution of delayed implantation in carnivores.
pp. 437-464 in J. L. Gittleman, ed. Carnivore behavior, ecology, and evolution. Cornell
University Press, New York.
Muelbert, M. M. C., & Bowen, W D. (1993). Duration of lactation and postweaning
changes in mass and body composition of harbour seal pups. Canadian Journal of Zoology
71,1405-1414.
Møller, A.P., Flensted-Jensen, E., & Mardal, W. (2006). Rapidly advancing laying date in
a seabird and the changing advantage of early reproduction. Journal of Animal Ecology 75,
657-665.
Parmesan, C., & Yohe, G. (2003). A globally coherent fingerprint of climate change
impacts across natural systems. Nature 421, 37-42.
Perry, A.L., Low, P.J., Ellis, J.R., & Reynolds, J.D. (2005). Climate change and
distribution shifts in marine fishes. Science 308, 1912-1915.
Price, T., Kirkpatrick, M., & Arnold, S.J. (1988). Directional selection and the evolution of
breeding date in birds. Science 240, 798-799.
Pitcher, K.W. (1986). Variation in blubber thickness of harbour seals in southern Alaska.
The Journal of Wildlife Management 50, 463-466.

Chapter V
122
Pomeroy, P.P., Fedak, M.A., Rothery, P., & Anderson, S. (1999). Consequences of
maternal size for reproductive expenditure and pupping success of grey seals at North
Rona, Scotland. Journal of Animal Ecology 68, 235-253.
Post, E., & Forchammer, M.C. (2008). Climate change reduces reproductive success of an
arctic herbivore through trophic mismatch. Philosophical Transactions of the Royal
Society Biology 363, 2367-2373.
R Development Core Team (2010). R: A language and environment for statistical
computing. R Foundation for Statistical Computing, Vienna, Austria. ISBN 3-900051-07-
0, URL http://www.R-project.org.
Ratcliffe, N., Furness, R.W., & Hamer, K.C. (1998). The interactive effects of age and
food supply on the breeding ecology of great skuas. Journal of Animal Ecology 67, 853-
862.
Réale, D., McAdam, A.G., Boutin, S., & Berteaux, D. (2003). Genetic and plastic
responses of a northern mammal to climate change. Proceedings of the Royal Society
London Biology 270, 591-596.
Reed, T.E., Wanless, S., Harris, M.P., Frederiksen, M., Kruuk, L.E.B., & Cunningham,
E.J.A. (2006). Responding to environmental change: plastic responses vary little in a
synchronous breeder. Proceedings of the Royal Society Biology 273, 2713-2719.
Reijnders, P.J.H., Brasseur, S.M.J.M., & Meesters, E.H.W.G. (2010). Earlier pupping in
harbour seals, Phoca vitulina. Biology Letters, 1-4.
Soto, K.H., Trites, A.W., & Arias-Schreiber, M. (2004). The effects of prey availability on
pup mortality and the timing of birth of South American sea lions (Otaria flavescens) in
Peru. Journal of Zoology London 264, 419-428.
Sydeman, W.J., Huber, H.R., Emslie, S.D., Ribic, C.A., & Nur, N. (1991). Age-specific
weaning success of northern elephant seals in relation to previous breeding experience.
Ecology 72, 2204-2217.
Temte, J.L. (1991). Precise timing of birth in captive harbour seals (Phoca vitulina) and
California sea lions (Zalophus californianus). Marine Mammal Science 7, 145-156.
Temte, J.L. (1993). Latitudinal variation in the birth timing of captive California sea lions
and other captive North Pacific pinnipeds. Fisheries Bulletin 91, 710-717.
Thompson, P. (1988). Timing of mating in the common seal (Phoca vitulina). Mammal
Review 18, 105-112.
Thompson, P.M. (1989). Seasonal changes in the distribution and composition of common
seal (Phoca vitulina) haul-out groups. Journal of Zoology London 217, 281–294.
Thompson, P.M., Miller, D., Cooper,R., & Hammond, P.S. (1994). Changes in the
distribution and activity of female harbour seals during the breeding season: implications
for their lactation strategy and mating patterns. Journal of Animal Ecology 63, 24-30.

Chapter V
123
Thompson, P.M., Tollit, D.J., Greenstreet, S., Mackay, A. & Corpe, H.M. (1996).
Between-year variations in the diet and behaviour of Moray Firth harbour seals; causes and
consequences. pp 44-52, In: Aquatic Predators and their Prey. (Eds: S.P.R. Greenstreet &
M.L. Tasker). Blackwells Scientific Publications, Oxford.
Thompson, P.M., Mackey, B., Barton, T.R., Duck, C. & Butler, J.R.A. (2007). Assessing
the potential impact of salmon fisheries management on the conservation status of harbour
seals (Phoca vitulina) in north-east Scotland. Animal Conservation 10, 48-56.
Thompson, P.M., & Wheeler, H. (2008). Photo-ID based estimates of reproductive patterns
in female harbour seals. Marine Mammal Science 24, 138-146.
Visser, M.E., & Both, C. (2005). Shifts in phenology due to global climate change: the
need for a yardstick. Proceedings of the Royal Society Biology 272, 2561-2569.
Walther, G-R., Post, E., Convey, P., Menzel, A., Parmesan, C., Beebee, T.J.C., Fromentin,
J-M., Hoegh-Guldberg, O., & Bairlein, F. (2002). Ecological responses to recent climate
change. Nature 416, 389-395.
Wanless, S., Frederiksen, M., Daunt, F., Scott, B.E., & Harris, M.P. (2007). Black-legged
kittiwakes as indicators of environmental change in the North Sea: Evidence from long-
term studies. Progress in Oceanography 72, 30-38.
Wanless, S., Frederiksen, M., Walton, J., & Harris, M.P. (2009). Long-term changes in
breeding phenology at two seabord colonies in the western North Sea. Ibis 151, 274-285.

Chapter VI
124
CHAPTER VI
BALANCING COSTS AND BENEFITS OF A LONG-TERM
INDIVIDUAL-BASED STUDY OF HARBOUR SEALS

Chapter VI
125
CHAPTER VI
BALANCING COSTS AND BENEFITS OF A LONG-TERM
INDIVIDUAL-BASED STUDY OF HARBOUR SEALS
Introduction
Long-term individual-based studies offer important insights into the ecological and
evolutionary processes that drive population dynamics (Clutton-Brock & Sheldon 2010).
More specifically, research of this sort provide an understanding of age-related changes in
life history parameters, causes of underlying variation in growth, reproductive success and
survival, the influence of social relationships on reproductive success and survival,
differences in reproductive success between individuals and their offspring, and the
influence of environmental variation on cohort performance (see Clutton-Brock & Sheldon
2010 for review). Passerine birds provided the initial focus of individual-based studies
(Kluijver 1951; Smith 1988; Grant, Grant & Petren 2001) and this approach was
subsequently extended to seabirds (Dunnet, Ollason & Anderson 1979) and other
shorebirds (Harris 1970; Scott 1988). Meanwhile, the first long-term studies of mammals
involved primates (Goodall 1986), followed by ungulates (Clutton-Brock, Albon &
Guinness et al. 1988; Festa-Bianchet 1989), carnivores (Packer et al. 1988), and later
moved on to marine mammals (Mann et al. 2000) and other smaller terrestrial mammals
(Kerth 2008).
Several methods have been applied to allow individual animals to be followed over
time, the majority of which involve an initial capture for tagging (soay sheep, Clutton-
Brock et al. 1996; weddell seal, Hadley, Rotella & Garrott 2007), branding (elephant seal,
Hindell 1991; grey seal, Schwarz & Stobo 2000), or ringing (birds, Dunnet, Ollason &
Anderson 1979; Reed et al. 2009). The disadvantage of this type of approach is that the
physical capturing of animals can be logistically challenging and costly both economically
and in some cases also in terms of the animal‟s survival (Saraux et al. 2011). Furthermore,
samples sizes are often limited, which may compromise the consistency and quality of the
data obtained. Tags and rings may also be lost over time limiting the possibility for
monitoring individual life histories. In contrast, species with natural distinct markings offer

Chapter VI
126
unique opportunities for long-term individual-based studies as all the individuals in the
study area are immediately available for sightings, and marks are often consistent
throughout their lives. For these species, photographic identification techniques have been
developed and are now used on a variety of taxa from fish (Arzoumanian, Holmberg &
Norman 2005; Marshall, Dudgeon & Bennett 2011) to both terrestrial (Moss 2001;
Karanth et al. 2006) and marine mammals (Pomeroy et al. 1999; Wilson, Hammond &
Thompson 1999). Nevertheless, running and maintaining long-term individual-based
studies is often challenging (Clutton-Brock & Sheldon 2010). Many study populations of
interest occupy remote areas which add logistic challenges in terms of accessibility (Lunn,
Boyd & Croxall 1994; Clutton-Brock et al. 1996; Pomeroy et al. 1999). To maintain data
quality over time repetitive sampling from a significant number of individual animals is
required. In addition, long-term data collection often involves several different people and
consistency may vary as a result. Furthermore, long-term studies are often costly and
maintaining funding can be difficult when key outputs take several years to produce.
The success of the individual-based research detailed throughout this thesis in
estimating key demographic parameters (Chapter IV) and obtaining direct measurements
of variation in physiological responses (Chapter V) provides a rare opportunity for
developing a new long-term individual-based study of harbour seals. However, this
requires an evaluation of the study‟s strength and limitations. In particular, the intensive
survey effort used to date may not be realistic or cost-effective for long-term monitoring of
temporal variation in survival and fecundity or developing trends in pupping phenology. I
therefore evaluate the effectiveness as well as the costs and benefits of reduced survey
regimes for the long-term continuation of this study.
Methods
Study area and full survey regime
The study was carried out in Loch Fleet National Nature Reserve, a tidal estuary on
the north-east coast of Scotland within the Moray Firth (see Chapters II & III). During low
tide, harbour seals haul-out on intertidal sandbanks for resting, giving birth and suckling
pups. The proximity of the main sandbank within Loch Fleet to an onshore observation
point (approximately 130m) allowed individual seals to be recognised using photographic
identification of the pelage patterns in the head and neck region. From 2006 to 2010, daily
photographic identification surveys were carried out of all harbour seals hauled out on the
main sandbank during each pupping season from the end of May to the end of July.
Sightings of individuals and females with pups were used to estimate survival and

Chapter VI
127
reproductive rates using mark-recapture analyses (Chapter IV). Individual sightings were
also used to determine pupping dates of individual females in order to investigate inter-
annual variation in pupping phenology (Chapter V). Furthermore, the extension of this
comprehensive survey regime into July also allowed the estimation of lactation durations
of individual females.
Reduced survey regimes
Whereas this intensive approach was appropriate for a PhD study, it may not be
realistic or cost-effective for the long-term continuation of this research. To explore the
consequences of reducing survey effort, I used the intensive survey data from 2006-2010 to
simulate three alternative survey protocols. The aim of these simulations was to compare
both the quality of the data they might produce and the relative costs of these programs.
The evaluation of the cost-effectiveness of the three sampling regimes was based on the
most costly scenario, i.e. the cost of hiring and running a research vehicle and the
employment of temporary field assistants based at the field station, which is one hour drive
from the study site.
Firstly, the long-term importance of different life history parameters was evaluated.
Over the next decade, assessing the consequences of individual covariates and key
environmental variables on individual survival, reproduction and breeding phenology will
help to understand temporal variation in population dynamics. Lactation duration was
considered a lower priority compared to the monitoring of demographic parameters and
pupping phenology, especially as pupping phenology may be used as an indicator of
lactation durations (Chapter V). Therefore, as the primary goal during the month of July
was to monitor lactation durations (Chapter V), this period of data collection was excluded.
From 2006 to 2010 all females gave birth within the month of June, apart from a few
premature pups born in May (Chapter V). The peak timing of pupping occurred between
the 13-19 June and therefore, to increase the chances of both sighting females with pups
and obtaining as many pupping dates as possible, the reduced survey regimes were centred
on 16 June, the overall median pupping date. In addition, both males and females showed
relatively high haul-out probabilities during June, which maximised the chances of sighting
individuals (Chapter III). In each year, all pups (excluding premature pups) were born
within 21 days (Chapter V), and survey regime 1 was therefore designed to encompass this
period through daily surveys for three weeks from the 6 to the 26 June (Table 1). Ninety
percent of pups were born within 14 days (Chapter V), which formed the basis for survey
regime 2, encompassing daily surveys for two weeks from the 10 to 23 June (Table 1).
Chapter VI
128
Finally, survey regime 3 was the lowest intensity approach, involving surveying every
other day but for an extended period (2 – 28 June) while relaxing the restriction on
estimating pupping dates from a three day to a five day window (the period between last
seen without a pup and first seen with a pup) (Table 1).
Table 1. Summary of conditions for reduced survey regimes.
Period Survey intensity
Regime 1 21 days (6 to 26 June) Daily
Regime 2 14 days (10-23 June) Daily
Regime 3 27 days (2-28 June) Every other day
Statistical analysis
To test the efficacy of the three sampling regimes in estimating sex-specific
survival rates and fecundity, the multistate model and open robust design multistate model
with misclassification were carried out again using the reduced data sets (see Chapter IV
for details). These results were then compared to survival and reproductive rates obtained
from the full data set (Chapter IV).
In short, multistate analyses for estimating sex-specific survival (S) included
sightings of individuals based on the state they occupy, male (M), female (F) or individual
of unidentified sex (U). Only sightings of individuals within the specified windows of each
survey regime were included in each analysis. Until the sex of an individual was identified
sightings were recorded as U, whereas after sex had been identified sightings were
recorded as either M or F. Transitions between states (ψ) were only allowed from U to
either M or F (ψUM
and ψUF
), whereas all other transitions (ψMF
, ψMU
and ψFU
) were fixed
at 0.
The robust design multistate analyses with misclassification for estimating
conditional and unconditional reproductive rates (ψNB
, ωB) included sightings of individual
females based on their breeding state, breeder (B) or non-breeder (N). Unobservable events
could also occur where the female‟s breeding state was uncertain and sightings were
recorded as “u” (not considered an actual state). The robust design incorporates additional
information in that this includes sightings within primary occasions (year or breeding
season). Therefore, for each of the reduced survey regimes there were consistently five
primary occasions (year or breeding season). However, the number of secondary occasions
(surveys) with each primary occasion varied as specified by the design of the reduced

Chapter VI
129
survey regime. Due to the intensive survey effort, secondary occasions were summarised
per week during the analysis of the full dataset, so six, instead of 42 secondary occasions
within each primary occasion (see Chapter IV). Regime 1 therefore had three, instead of
21, secondary occasions within each primary. Regime 2 had two, instead of 14, secondary
occasions, and finally, regime 3 had four, instead of 14, secondary occasions within each
primary.
Results
Success of reduced survey regimes
Regime 1 generally performed better than regime 2 & 3, capturing 91% of
individuals, 89% of females with pups, and 92% of pupping dates (Fig. 1) in comparison
with the full data set from this study.
Figure 1. Percentage of individuals, females with pups, and pupping dates detected by each of the
reduced survey regimes, compared to the full data set.
To test the actual efficacy of the three reduced sampling regimes in obtaining
robust estimates of survival, the multistate model was applied to the sightings data from
each of the reduced data sets (Table 2). The most general model fit was {S(g,t), p(g,t),
ψ(g,t)} which allowed variation in survival (S), recapture probability (p) and transition
probabilities (ψ) between states (g=male, female and unknown) and across time (t).
40
50
60
70
80
90
100
Individuals Females with pups Pupdates
Per
centa
ge
%
Regime 1
Regime 2
Regime 3

Chapter VI
130
Goodness of fit was tested in the program U-CARE and revealed a moderate lack of fit
within each of the three sampling regimes. The variance adjustment factors (c-hat) were
used to adjust the AICc scores and standard errors accordingly.
Table 2. Comparison of fit for multi-state models estimating sex-specific survival probabilities for
each of the three reduced survey regimes.
Regime 1 (c-hat=1.96) No. Par. ΔQAICc QAICc Weight Model
likelihood
S(.,.) p(g,.) ψ(.,.) 5 0.00 0.85 1.00
S(g,.) p(g,.) ψ(.,.) 7 3.78 0.13 0.15
S(.,.) p(.,.) ψ(.,.) 3 7.78 0.02 0.02
S(.,.) p(.,.) ψ(g,.) 4 9.73 0.01 0.01
S(g,.) p(.,.) ψ(g,.) 6 12.55 0.00 0.00
S(g,t) p(g,t) ψ(g,t) 32 37.44 0.00 0.00
Regime 2 (c-hat=2.00) No. Par. ΔQAICc QAICc Weight Model
likelihood
S(.,.) p(g,.) ψ(.,.) 5 0.00 0.89 1.00
S(g,.) p(g,.) ψ(.,.) 7 4.13 0.11 0.13
S(.,.) p(.,.) ψ(.,.) 3 13.34 0.00 0.00
S(.,.) p(.,.) ψ(g,.) 4 15.29 0.00 0.00
S(g,.) p(.,.) ψ(g,.) 6 17.83 0.00 0.00
S(g,t) p(g,t) ψ(g,t) 32 36.85 0.00 0.00
Regime 3 (c-hat=1.76) No. Par. ΔQAICc QAICc Weight Model
likelihood
S(.,.) p(g,.) ψ(.,.) 5 0.00 0.82 1.00
S(g,.) p(g,.) ψ(.,.) 7 3.15 0.17 0.21
S(.,.) p(.,.) ψ(.,.) 3 10.36 0.00 0.01
S(.,.) p(.,.) ψ(g,.) 4 12.36 0.00 0.00
S(g,.) p(.,.) ψ(g,.) 6 12.55 0.00 0.00
S(g,t) p(g,t) ψ(g,t) 32 35.41 0.00 0.00
For each of the three survey regimes, AICc consistently showed support for the two
top models. The first of the two top models within all sampling regimes was {S(.,.), p(g,.),
ψ(.,.)} which allowed no variation in survival between states (g=male, female, unknown)
or across time (t), variation in recapture probabilities between states but not across time,
and no variation in transition probabilities between states or across time. The second model
{S(g,.), p(g,.), ψ(.,.)}, consistently between regimes allowed variation in survival between
states. For all three of the reduced survey regimes, the survival rates with no variation
between states were similar (Table 3). However, survival rates including variation between
states (sex-specific) were less consistent, particularly as regime 2 seemed to overestimate
male survival (Table 3).

Chapter VI
131
Table 3. Summary of survival estimates from the full and three reduced sampling regimes.
Sall
SM
SF S
U
Full regime 0.95 (± 0.02) 0.89 (± 0.06) 0.97 (± 0.02) 0.95 (± 0.02)
Regime 1 0.96 (± 0.02) 0.92 (± 0.08) 0.96 (± 0.02) 0.96 (± 0.03)
Regime 2 0.97 (± 0.02) 0.97 (± 0.10) 0.97 (± 0.02) 0.96 (± 0.03)
Regime 3 0.95 (± 0.02) 0.90 (± 0.09) 0.96 (± 0.02) 0.94 (± 0.03)
The open robust design model with misclassification was applied to the sightings
from each of the three reduced data sets for estimating reproductive rate (Table 4). The
most general model was {S(g,t), ψ(g,t), π(g,t), ω(g,t), p(g,t), δ(g,t), pent(g,t), Φ(g,t)} which
allowed variation in all parameters between states (g=breeder, non-breeder) and across
time (t). Goodness of fit testing of the models revealed a good fit.
Table 4. Comparison of fit of open robust design multi-state models for estimating reproductive
rate using each of the three sampling regimes.
Regime 1 (c-hat=0.94) No. Par ΔQAICc QAICc
Weight
Model
Likelihood
S(.,.) p(g,.) ψ(g,t) π(g,t) ω(g,t) δ(g,.) ϕ(g,.) 44 0.00 0.55 1.00
S(g,.) p(g,.) ψ(g,t) π(g,t) ω(g,t) δ(g,.) ϕ(g,.) 45 1.79 0.23 0.41
S(.,.) p(g,.) ψ(g,.) π(g,t) ω(g,t) δ(g,.) ϕ(g,.) 38 3.07 0.12 0.22
S(g,.) p(g,.) ψ(g,.) π(g,.) ω(g,.) δ(g,.) ϕ(g,.) 32 3.38 0.10 0.18
S(g,t) p(g,t) ψ(g,t) π(g,t) ω(g,t) δ(g,t) ϕ(g,t) 125 115.10 0.00 0.00
Regime 2 (c-hat=0.87) No. Par ΔQAICc QAICc
Weight
Model
Likelihood
S(g,.) p(g,.) ψ(g,.) π(g,.) ω(g,.) δ(g,.) ϕ(g,.) 22 0.00 0.61 1.00
S(g,.) p(g,.) ψ(g,t) π(g,t) ω(g,t) δ(g,.) ϕ(g,.) 35 2.07 0.22 0.35
S(.,.) p(g,.) ψ(g,t) π(g,t) ω(g,t) δ(g,.) ϕ(g,.) 34 2.47 0.18 0.29
S(.,.) p(g,.) ψ(g,.) π(g,t) ω(g,t) δ(g,.) ϕ(g,.) 28 37.05 0.00 0.00
S(g,t) p(g,t) ψ(g,t) π(g,t) ω(g,t) δ(g,t) ϕ(g,t) 85 101.11 0.00 0.00
Regime 3 (c-hat=0.78) No. Par ΔQAICc QAICc
Weight
Model
Likelihood
S(.,.) p(g,.) ψ(g,t) π(g,t) ω(g,t) δ(g,.) ϕ(g,.) 54 0.00 0.75 1.00
S(g,.) p(g,.) ψ(g,t) π(g,t) ω(g,t) δ(g,.) ϕ(g,.) 55 2.26 0.24 0.32
S(g,.) p(g,.) ψ(g,.) π(g,.) ω(g,.) δ(g,.) ϕ(g,.) 42 11.98 0.00 0.00
S(.,.) p(g,.) ψ(g,.) π(g,t) ω(g,t) δ(g,.) ϕ(g,.) 47 37.69 0.00 0.00
S(g,t) p(g,t) ψ(g,t) π(g,t) ω(g,t) δ(g,t) ϕ(g,t) 165 81.69 0.00 0.00

Chapter VI
132
The two top models for regimes 1 and 3 were consistently {S(.,.), p(g,.), ψ(g,t),
π(g,t), ω(g,t), δ(g,.), ϕ(g,.)} and {S(g,.), p(g,.), ψ(g,t), π(g,t), ω(g,t), δ(g,.), ϕ(g,.)} both of
which allowed variation in conditional (ψNB
) and unconditional reproductive rates (ωB)
between states and across time. For regime 2, the second top model was the same, but the
first was {S(g,.), p(g,.), ψ(g,.), π(g,.), ω(g,.), δ(g,.), ϕ(g,.)} which did not allow variation
across time in reproductive rates. Only estimates of conditional and unconditional
reproductive rates from 2009 and 2010 were presented because by this time all females had
given birth to at least one pup, whereas in the earlier years not all females were
reproductively mature. This confirmed that all females were of reproductive age which
eliminated any bias from immature females. Regimes 1 and 3 produced similar estimates
of reproductive rate to that of the full regime (Table 5). However, regime 2 seemed to
underestimate reproductive rates in all cases (Table 5).
Table 5. Summary of unconditional (ωB) and conditional (ψ
NB) reproductive rates from the three
reduced sampling regimes in 2009 and 2010.
Full regime 0.87 (± 0.04) 0.89 (± 0.04) 0.94 (± 0.06) 0.86 (± 0.13)
Regime 1 0.87 (± 0.04) 0.88 (± 0.04) 0.94 (± 0.06) 0.85 (± 0.13)
Regime 2 0.82 (± 0.05) 0.82 (± 0.05) 0.87 (± 0.07) 0.50 (± 0.12)
Regime 3 0.87 (± 0.04) 0.88 (± 0.04) 0.94 (± 0.06) 0.83 (± 0.13)
Similarly, the annual median pupping dates from the reduced data sets were plotted
against the actual median timing of pupping (Fig. 2).

Chapter VI
133
Figure 2. Annual median pupping dates from each of the reduced sampling regimes compared to
the full regime.
Of the reduced survey regimes, regime 1 was more expensive than the other
reduced survey regimes, mainly due to the extended and more intensive use of a field
assistant and the research vehicle. More specifically, regime 1 was 50% more costly than
regime 2, and 40% more costly than regime 3. However, the cost of regime 1 was only
42% of the cost required for the full survey regime (Table 6).
Table 6. Costs involved in carrying out the full and reduced survey regimes.
Full Regime 1 Regime 2 Regime 3
No. of surveys 50 21 14 13
Days of person time 25 11 7 7
Temporary contract (~£65/day) 1625 715 455 455
Fuel costs (£20/survey) 1000 420 280 260
Vehicle rental 550 230 155 285
Total (£) ~3175 ~1365 ~890 ~1000
Discussion
Whereas short-term individual-based studies offer unique insights into present
population dynamics, long-term studies allow insights into the responses of individuals to
the dynamic environment which they occupy. However, the design and planning of long-
160
164
168
172
176
2005 2006 2007 2008 2009 2010 2011
Med
ian p
uppin
g d
ate
(I-Q
ran
ges
)
Full regime
Regime 1
Regime 2
Regime 3

Chapter VI
134
term individual-based studies require an understanding and assessment of its strengths and
limitations as well as its costs and benefits.
Obtaining accurate measures of adult survival is critical for explaining population
growth (Caswell 1978; Gaillard, Festa-Bianchet & Yoccoz 1998). Both regime 1 and 3
performed well in estimating accurate overall survival rates as well as sex-specific survival
rates, whereas regime 2 overestimated male survival. In addition, changes in fecundity
have proved useful in understanding shorter term responses to variation in population
density or food availability (Lunn, Boyd & Croxall 1994; Clutton-Brock et al. 1996;
Coulson et al. 2001; Barbraud & Weimerskirch 2005; Hadley, Rotella & Garrott 2007), but
obtaining estimates of reproductive rates require annual data collection, as comparisons are
based on individual reproductive histories. Regime 1 and 3 performed best in estimating
both conditional and unconditional reproductive rates, whereas regime 2 strongly
underestimated both conditional and unconditional reproductive rates in both 2009 and
2010.
Obtaining direct estimates of variation in breeding phenology provides more
immediate insights into the responses of individuals to the prevailing environmental
conditions (Clutton-Brock, Albon & Guinness 1988; Lunn, Boyd & Croxall 1994; Boyd
1996) as well as longer term responses to climate change (Forchhammer, Post & Stenseth
1998; Réale et al. 2003; Frederiksen et al. 2004; Møller, Flensted-Jensen & Mardal 2006).
However, obtaining annual pupping dates of individual females requires consistent and
repeated surveys of the same individuals within pupping seasons and between years, and,
within the pupping season the females have to be seen without a pup and subsequently
with a pup. In the long-term, however, the restriction of a three day window in estimating
pupping dates may be relaxed. Despite regime 1 being considerably better at detecting
pupping dates of individual females (Fig. 1), all of the reduced regimes performed
reasonably well in displaying the patterns in pupping phenology that were observed under
the full regime (Fig. 2).
This study overcame many of the usual challenges and costs faced by many
individual-based studies. Individual seals were recognised remotely by their natural
markings and no costs were therefore involved in “capturing” individuals. There were no
logistical challenges in terms of the study site‟s accessibility as the onshore observation
point was located by a public road. The most costly scenario for the continuation of this
study involved a field assistant on a temporary contract based at the field station, and
hiring and running a research vehicle for transportation to the study site. Although regime
1 was more expensive than regime 2 and 3, the extra cost seems negligible considering the

Chapter VI
135
accuracy of the data acquired. Less expensive scenarios should also be considered such as
finding accommodation near the study site to save the costs of the hire vehicle and reduce
the study‟s carbon footprint. Additionally, identifying suitable and interested local
volunteers are also a cost saving option.
Furthermore, new statistical approaches are being developed which require less
intensive survey regimes. For example, the “open” robust design multistate model with
misclassification was developed and programmed over the course of this study, which
meant that reproductive rates could be estimated using only data from June and all capture
history data from this month could be incorporated in a full robust design. This allowed
individuals to arrive and depart at staggered intervals, i.e. females‟ haul-out behaviour
differs pre-parturition and post-weaning compared to during lactation. Prior to the
development of the “open” model, the “closed” model could be used and forced to act like
an “open” model. However, this required data from both June and July to produce reduced
capture histories with only two occasions, one for each month. The “open” model was
therefore able to incorporate more detailed data from a shorter survey period in estimating
vital rates, compared to the “closed” model.
The initial intensive survey regime of this study provided the unique opportunity to
test the efficacy of reduced survey regimes to ensure that time and funds are used most
effectively while maintaining data quality. I have shown that the reduced and relatively
low cost survey regimes 1 and 3 both would be successful in maintaining consistency and
quality of data in the long-term. However, developing trends in the timing of pupping
would have to be taken into account over the years and the survey regime adjusted
accordingly. The long-term data that this site and these individuals are providing open up
unique opportunities for investigating harbour seal life history. More specifically, greater
knowledge of temporal variation in key demographic parameters and pupping phenology
in relation to individual covariates, population density and environmental processes would
improve our understanding of harbour seal population dynamics as well as improve and
inform conservation measures. Ideas and directions for future research are developed in
Chapter VII.

Chapter VI
136
References
Arzoumanian, Z., Holmberg, J., & Norman, B. (2005). An astronomical pattern-matching
algorithm for computer-aided identification of whale sharks Rhinocodon typus. Journal of
Applied Ecology 42, 999-1011.
Barbraud, C., & Weimerskirch, H. (2005). Environmental conditions and breeding
experience affect costs of reproduction in blue petrels. Ecology 86, 682-692.
Boyd, I.L. (1996). Individual variation in the duration of pregnancy and birth date in
Antarctic fur seals: The role of environment, age, and sex of fetus. Journal of Mammalogy
77, 124-133.
Caswell, H. (1978). A general formula for the sensitivity of population growth rate to
changes in life history parameters. Theoretical Population Biology 14, 215-230.
Clutton-Brock, T.H., Albon, S.D., & Guinness, F.E. (1988). Reproductive success in male
and female red deer. In: Reproductive Success (T.H. Clutton-Brock), University of
Chicago Press, IL, pp. 325-343.
Clutton-Brock, T.H., Stevenson, I.R., Marrow, P., MacColl, A.D., Houston, A.I., &
McNamara, J.M. (1996). Population fluctuations, reproductive costs and life-history tactics
in female Soay sheep. Journal of Animal Ecology 65, 675-689.
Clutton-Brock, T., & Sheldon, B.C. (2010). Individuals and populations: the role of long-
term, individual-based studies of animals in ecology and evolutionary biology. Trends in
Ecology and Evolution 25, 562-573.
Coulson, T., Catchpole, E.A., Albon, S.D., Morgan, B.J.T., Pemberton, J.M., Clutton-
Brock, T.H., Crawley, M.J., & Grenfell, B.T. (2001). Age, sex, density, winter weather,
and population crashes in Soay sheep. Science 292, 1528-1531.
Dunnet, G.M., Ollason, J.C., & Anderson, A. (1979). A 28-year study of breeding fulmars
Fulmarus glacialis in Orkney. Ibis 121, 293-300.
Festa-Bianchet, M. (1989). Individual differences, parasites, and the costs of reproduction
for bighorn ewes (Ovis canadensis). Journal of Animal Ecology 58, 785-795.
Frederiksen, M., Harris, M.P., Daunt, F., Rothery, P., & Wanless, S. (2004). Scale-
dependent climate signals drive breeding phenology of three seabird species. Global
Change Biology 10, 1214-1221.
Forchhammer, M.C., Post, E., & Stenseth, N.C. (1998). Breeding phenology and climate.
Nature 391, 29-30.
Gaillard, J.-M., Festa-Bianchet, M., & Yoccoz, N.G. (1998). Population dynamics of large
herbivores: variable recruitment with constant adult survival. Trends in Ecology and
Evolution 13, 58-63.
Goodall, J. (1986). Social rejection, exclusion, and shunning among the Gombe
chimpanzees. Ethology and Sociobiology 7, 227-236.

Chapter VI
137
Grant, P.R., Grant, B.R. & Petren, K. (2001). A population founded by a single pair of
individuals: establishment, expansion, and evolution. Genetica 112-113, 359-382.
Hadley, G.L., Rotella, J.J., & Garrott, R.A. (2007). Influence of maternal characteristics
and oceanographic conditions on survival and recruitment probabilities of Weddell seals.
Oikos 116, 601-613.
Harris, M.P. (1970). Territory limiting the size of the breeding population of the
oystercatcher (Haematopus ostralegus) – a removal experiment. Journal of Animal
Ecology 39, 707-713.
Hindell, M.A. (1991). Some life-history parameters of a declining population of sourthern
elephant seals, Mirounga leonina. Journal of Animal Ecology 60, 119-134.
Karanth, K.U., Nichols, J.D., Kumar, N.S., & Hines, J.E. (2006). Assessing tiger
population dynamics using photographic capture-recapture sampling. Ecology 87, 2925-
2937.
Kerth, G. (2008). Animal sociality: bat colonies are founded by relatives. Current Biology
18, 740-742.
Kluijver, H.N. (1951). The population ecology of the great tit Parus m. Major (L). Ardea
39, 1-135.
Lunn, N.J., Boyd, I.L., & Croxall, J.P. (1994). Reproductive performance of female
Antarctic fur seals: the influence of age, breeding experience, environmental variation and
individual quality. Journal of Animal Ecology 63, 827-840.
Mann, J., Connor, R.C., Barre, L.M., & Heithaus, M.R. (2000). Female reproductive
success in bottlenose dolphins (Tursiops sp.): life history, habitat, provisioning, and group-
size effects. Behavioural Ecology 11, 210-219.
Marshall, A.D., Dudgeon, C.L., & Bennett, M.B. (2011). Size and structure of a
photographically identified population of manta rays Manta alfredi in southern
Mozambique. Marine Biology 158, 1111-1124.
Moss, C.J. (2001). The demography of an African elephant (Loxodonta Africana)
population in Amboseli, Kenya. Journal of Zoology London 255, 145-156.
Møller, A.P., Flensted-Jensen, E., & Mardal, W. (2006). Rapidly advancing laying date in
a seabird and the changing advantage of early reproduction. Journal of Animal Ecology 75,
657-665.
Packer, C., Herbst, L., Pusey, A.E., Bygott, J.D., Hanby, J.P., Cairns, S.J., & Mulder, M.B.
(1988).Reproductive success of lions. In: Reproductive Success (T.H. Clutton-Brock),
University of Chicago Press, IL, pp. 363-383.
Pomeroy, P.P., Fedak, M.A., Rothery, P., & Anderson, S. (1999). Consequences of
maternal size for reproductive expenditure and pupping success of grey seals at North
Rona, Scotland. Journal of Animal Ecology 68, 235-253.

Chapter VI
138
Réale, D., McAdam, A.G., Boutin, S., & Berteaux, D. (2003). Genetic and plastic
responses of a northern mammal to climate change. Proceedings of the Royal Society
London Biology 270, 591-596.
Reed, T.E., Warzybok, P., Wilson, A.J., Bradley, R.W., Wanless, S., & Sydeman, W.J.
(2009). Timing of everything: flexible phenology and shifting selection in a colonial
seabird. Journal of Animal Ecology 78, 376-387.
Saraux, C., Le Bohec, C., Durant, J.M., Viblanc, V.A., Gauthier-Clerc, M., Beaune, D.,
Park, Y.-H., Yoccoz, N.G., Stenseth, N.C., & Le Maho, Y. (2011). Reliability of flipper-
banded penguins as indicators of climate change. Nature 469, 203-208.
Scott, D.K. (1988). Reproductive success in Bewick‟s swans. In: Reproductive Success
(T.H. Clutton-Brock), University of Chicago Press, IL, pp. 220-236.
Smith, J.N.M. (1988). Determinants of lifetime reproductive success in the song sparrow.
In: Reproductive Success (T.H. Clutton-Brock), University of Chicago Press, IL, pp. 154-
188.
Schwarz, C.J. & Stobo, W.T. (2000). Estimation of juvenile survival, adult survival, and
age-specific pupping probabilities for the female grey seal (Halichoerus grypus) on Sable
Island from capture-recapture data. Canadian Journal of Fisheries and Aquatic Sciences
57, 247-253.
Wilson, B., Hammond, P.S., & Thompson, P.M. (1999). Estimating size and assessing
trends in a coastal bottlenose dolphin population. Ecological applications 9, 288-300.

Chapter VII
139
CHAPTER VII
GENERAL DISCUSSION

Chapter VII
140
CHAPTER VII
GENERAL DISCUSSION
Globally, marine ecosystems are under pressure from climate change and
anthropogenic impacts (Walther et al. 2002; Heath 2005), which has caused adverse affects
on populations of top predators worldwide (Baum et al. 2003; Myers & Worm 2003;
Österblom et al. 2008). Apex predators are a key component of marine as well as terrestrial
and freshwater ecosystems and their removal has resulted in cascading effects throughout
the food web (Estes et al. 2011). Several marine top predators, from seabirds to polar bears
and pinnipeds, have proved to be important indicators of ecosystem conditions (Boyd,
Wanless & Camphuysen 2006). Harbour seals have the potential to provide a unique bio-
indicator amongst these top marine predators, due to their broad temperate distribution,
which offers the possibility for worldwide inter-population comparisons. Available data
indicate that harbour seal populations around the world are showing varying trends in
abundance but the causes of these changes are often uncertain (Reijnders et al. 1997; Lucas
& Stobo 2000; Jeffries et al. 2003; Small, Pendleton & Pitcher 2003; Brown et al. 2005;
Gilbert et al. 2005; Jemison et al. 2006; Lonergan et al. 2007; Teilman, Rigét & Härkönen
2010). This limited understanding of the drivers causing change is largely due to the lack
of individual-based studies of this species, leaving conservation efforts constrained and
uninformed. Indeed, individual-based studies of pinnipeds are generally biased towards
colonially breeding otariids (Boyd et al. 1995; Beauplet et al. 2006; Pendleton et al. 2006)
and large phocids (Pistorius et al. 2004; Baker & Thompson 2007; Hadley, Rotella &
Garrott 2007). In contrast, studies of smaller phocids are sparse, most likely due to nearly
half of the phocid species hauling out in remote inaccessible areas of the Arctic and
Antarctic. This study provided critical information on vital rates and reproductive ecology
of harbour seals in north-east Scotland, offering a better understanding of the current
dynamics of this population.
During the recent harbour seal declines in the UK (Lonergan et al. 2007), Loch
Fleet was the only monitored site in Scotland where numbers of harbour seals were

Chapter VII
141
increasing (Chapter II). Trends at this site were even contrasted with patterns observed just
10km south in the Dornoch Firth and Morrich More Special Area of Conservation (SAC)
(Chapter II). This raised the question whether patterns observed in Loch Fleet were
representative of the region, or whether different conditions at this site resulted in fine-
scale differences in demographic and behavioural patterns. Although local conditions such
as structural changes in sandbanks may have changed seals preference for haul-out sites
(Chapter II), I was unable to identify any reasons why demographic parameters within the
Moray Firth would vary between breeding groups. Variations in growth rates between
areas are more likely to result from differences in the behaviour and age and sex-specific
composition of the breeding group rather than actual differences in survival and
reproductive rates (Härkönen, Harding & Heide-Jørgensen 2002). However, behavioural
differences are unlikely to have caused the observed differences in growth rates,
particularly as seals in this region have been shown to forage in broadly similar areas
(Chapter II; Thompson et al. 1996a; Tollit et al. 1998). Differences in the age and sex-
specific composition of breeding groups due to localised age or sex-specific culling may
explain the observed differences in growth rates, as culling due to conflict with fisheries
has occurred in most areas outside Loch Fleet. However, these pressures should have
decreased after the designation of the Dornoch Firth and Morrich More SAC in 2000, and
especially after the implementation of the Moray Firth Seal Management Plan in 2005
(Butler et al. 2008). Demographics and behavioural responses observed in Loch Fleet
therefore appear to be representative of the wider Moray Firth region over the period of
this study (2006 to 2010).
Individual-based approaches to understanding population dynamics
This study presented the first concurrent estimates of survival and reproductive
rates of harbour seals within a naturally regulated population (Chapter IV). Apparent adult
survival and reproductive rates were high and there was no indication of any costs of
reproduction on survival. Survival rate was higher for females compared to males, which is
expected in populations that are naturally female biased (Bigg 1969; Boulva & McLaren
1979; Clutton-Brock, Major & Guinness 1985; Härkönen & Heide-Jørgensen 1990;
Clutton-Brock & Lonergan 1994; Clutton-Brock et al. 2002). Estimates were also
comparable to those obtained from dead animals (Härkönen & Heide-Jørgensen 1990;
Heide-Jørgensen & Härkönen 1992). Until now reproductive rates have mainly been
estimated from analysis of ovaries in dead females (Boulva & McLaren 1979; Härkönen &
Heide-Jørgensen 1990; Bjørge 1992). In this study, reproductive rate was estimated based

Chapter VII
142
on sightings of females with pups, which does not include information on pregnancy or
early abortions which are more likely to be preserved in ovarian scars. As a result, the
reproductive rate obtained in this study may better represent a “birth rate”. Despite the
difference in methodology, reproductive rates estimated here were only slightly lower than
those obtained from dead seals harvested in eastern Canada (Boulva & McLaren 1979) and
collected after the 1988 epizootic in the Kattegat and Skagerak (Härkönen & Heide-
Jørgensen 1990), highlighting the robustness of estimating reproductive rates based on
sightings of females with pups.
The timing of pupping occurred significantly earlier in recent years and females
nursed their pups significantly longer (Chapter V), suggesting that prevailing conditions
are good. This is consistent with other studies of long-lived mammals where shifts in the
timing of breeding were typically associated with variation in female condition and
offspring survival (Clutton-Brock, Albon & Guinness 1988; Sydeman et al. 1991; Lunn,
Boyd & Croxall 1994; Boyd 1996). Nevertheless, care must be taken in interpreting trends
in short-term phenological studies as observed patterns may purely result from inter-annual
variation while trends only become evident on the decadal scale.
Both the demographic parameters and physiological responses obtained in this
study suggest that conditions within this region are currently favourable. However, this
may purely be an artefact of the recent population decline resulting in an increase in per
capita food availability due to reduced intra-specific competition, rather than an actual
improvement in environmental conditions. Population viability analysis, using the
estimated vital rates, predicted that the Moray Firth population should currently be
growing. Recent increases in counts of harbour seals in the Moray Firth (Chapter IV)
appear to support this, but another 5 to 10 years of data are required before any firm
conclusions about a potential recovery can be made.
Finally, it is important to highlight that Loch Fleet is a newly developed haul-out
site, which has only become an important breeding site post 1995 (Chapter II). If the
growth in this area is supported by local recruitment, then the high survival and
reproductive rates may simply be a result of individuals being relatively young. Likewise,
as older females in species of mammals tend to give birth earlier than younger females
(Lunn, Boyd & Croxall 1994; Loe et al. 2005), the observed advance in the timing of
pupping could be explained by an ageing female population. Although this is a relatively
short study, an increase in five years of age is a significant proportion of a female‟s
reproductive life. However, the reduction in the relative use of the Dornoch Firth and
Morrich More SAC, and lack of any other nearby haul-out sites, indicate that some adult

Chapter VII
143
seals may have re-located to Loch Fleet over the years (Chapter II), indicating that
numbers of harbour seals in Loch Fleet are not purely supported by own recruitment
(Chapter II). Additional captures of known individuals will provide a better understanding
of the age-structure of this group. Similarly, continued photo-identification studies of new
recruits will provide further information on ages of females.
These estimates of contemporary demographic parameters and physiological
responses do not give insights into the causes for the past decline. Nevertheless, earlier
work within a different area of the Moray Firth, estimated survival rates similar to those in
this study (Mackey et al. 2008). If survival rates have not varied temporally, the decline
may have been caused by yearling/juvenile mortality. Unfortunately the coat
characteristics of yearlings and juveniles do not allow for consistent photo-identification,
and survival rates could not be estimated for these individuals. Larger scale ecosystem
changes have occurred within this region which may have resulted in less favourable
conditions for harbour seals. It is well documented that the North Sea ecosystem has
undergone dramatic changes over the last few decades through two or more regime shifts
since the late 1970s, causing changes in the salinity, temperature and the distribution and
abundance of demersal fishes (Beaugrand et al. 2003; Perry et al. 2005; Weijerman,
Lindeboom & Zuur 2005). In other temperate marine regions, regime shifts have altered
community structure, introducing an abundance of so-called “junk food”, resulting in top
predators suffering nutritional stress, reduced productivity and high juvenile mortality
(Trites & Donnelly 2003). There has also been evidence of this “junk food” hypothesis
within the Moray Firth, where physiological responses were evident in harbour seals as a
result of switching prey (Thompson et al. 1997). Seals were in poorer condition when
clupeid abundance was low and prey consumption was dominated by gadoids (Thompson
et al. 1996b). Studies within the North Sea have also documented adverse effects of
fisheries altering the abundance and structure of fish populations by fishing down the food
web and disrupting the predator-prey balance (Pauly et al. 1998). Long-term studies of
seabirds along the North Sea coast have provided mixed indications regarding the impacts
of fisheries and climate change, largely due to inter-species variation in sensitivity
resulting from differences in foraging ranges, costs of foraging, body size and ability to
switch prey (Furness & Tasker 2000). Despite the extensive fishing of sandeel in the 1990s
(ICES 2003), most studies of seabird breeding success are more concerned over the
impacts of warming temperatures and predatory fish on the recruitment and size of sandeel
(Furness 2002; Frederiksen et al. 2011). Sandeels and clupeids also form an important part
of the diet of harbour seals (Thompson et al. 1991; Tollit & Thompson 1996; Tollit et al.

Chapter VII
144
1998). Studies have shown that variation in the abundance of these key prey species
resulted in prey switching and a change in haul-out and foraging distribution. Increased
foraging costs and lower quality prey may ultimately have consequences on individual
fitness and larger scale population dynamics (Thompson et al. 1996b).
Pupping phenology as an indicator of female investment and environmental conditions
The apparent relationship between the timing of pupping and lactation duration
indicate that shifts in harbour seal pupping phenology are most likely due to the energetic
consequences of variation in food availability rather than plastic responses to
environmental variation (Chapter V). To date, most studies of breeding phenology as an
indicator of environmental conditions within the North Sea are biased towards seabirds
(Frederiksen et al. 2004a; Frederiksen et al. 2004b; Wanless et al. 2007). However, the use
of seabirds is constrained due to the plastic responses of some species (Grémillet &
Charmantier 2010) as well as their sandeel-specific prey preference, which does not give
an indication of the overall condition of the ecosystem. Harbour seals are generalist
foragers (Härkönen 1987; Hall, Watkins & Hammond 1998) and behavioural responses are
therefore more likely to reflect the overall conditions within the environment.
Simultaneous phenological studies of seabirds and seals could offer a multi-species
approach to understanding temporal variation in ecosystem conditions.
Despite harbour seal pupping phenology appearing to be a useful indicator of
environmental conditions and population fitness, its worldwide application remains limited
due to the lack of suitable sites where individual-based studies can be carried out. I had the
unique opportunity to test the use of the three proxies for determining the timing of
pupping in population-level studies, namely the timing of max pup count (as used by
Reijnders, Brasseur & Meesters 2010), the timing of 50% max pup count, and date of first
offspring (typically used in studies of birds, Wanless et al. 2009). There was a poor fit with
the timing of max pup count and median pupping date (Chapter V). In contrast, date of first
offspring gave the best correlation with median pupping date (Chapter V). However, dates
of premature pups were excluded in the analysis of date of first offspring, as these data are
highly influenced by survey effort prior to the breeding season. This makes the use of date
of first offspring more challenging in population-level studies as these would have to find a
way to identify and exclude premature pups. The day of 50% max pup count, although not
as good as day of first pup, may provide the simplest proxy for the timing of pupping in
population-level studies, although this requires frequent count surveys.

Chapter VII
145
Apart from the individual-based research on Sable Island which has been
discontinued due to the dramatic decline of this population in the late 1990s (Lucas &
Stobo 2000; Bowen et al. 2003), most other studies have used count data to estimate
variation in the timing of pupping of harbour seals (Jemison & Kelly 2001; Reijnders,
Brasseur & Meesters 2010). However, these population-level studies do not take into
account changes in age-structure of the population which influence the timing of pupping
as older females tend to breed earlier than younger females (Lunn, Boyd & Croxall 1994;
Loe et al. 2005). Nevertheless, both individual-based and population-level studies
documented delays in the timing of pupping of harbour seals during population decline and
advances in the timing of pupping during population growth (Jemison & Kelly 2001;
Bowen et al. 2003). This study observed an advance in the timing of pupping during, or
possibly immediately after a period of overall population decline. Shifts in pupping
phenology may therefore provide insights into the drivers of population decline. Delays in
the timing of pupping are most likely to occur as a result of nutritional stress, whereas
advances in the timing of pupping are likely either to result from per capita increases in
food availability, for example following predation or culling, or age-specific mortality.
Population structure and management implications
This study was the first to assess long-term patterns of site-use (Chapter II).
Harbour seals appeared to change their preference for sites over the course of two decades,
which may have resulted from localised changes in the structure of sandbanks. This
highlighted the importance of continued monitoring of harbour seal haul-out sites within
and around protected areas when assessing the efficacy of conservation measures over
time. Furthermore, whereas breeding season or moult surveys are useful as a standardised
approach for monitoring population trends, year-round monitoring is necessary to assess
the importance of specific sites throughout the year (Chapter II). Year-round individual-
based studies provide even more detailed information on the stability and structure of
harbour seal breeding groups. Sightings of adults revealed that a large proportion of
animals remained faithful to haul-out sites throughout the year, as well as between years
(Chapter III). This indicates a meta-population structure with multiple levels, where the
overall population is made up of clustered and relatively discrete subpopulations which in
turn are made up of relatively discrete breeding groups, at least regarding the dispersal of
adults. Gaining information on site fidelity is crucial for assessing the viability of breeding
groups in relation to age or sex-specific mortality through culling or severe disease
outbreaks as well as its impacts on genetic fitness.

Chapter VII
146
Directions for future research
One aim of this work was to evaluate the potential for developing a long-term
individual-based study of harbour seal life histories. Over the next decade, this could
enable a more extensive assessment of temporal variation in survival rates in relation to
observed trends in abundance. Furthermore, the influence of density dependent effects and
environmental conditions on between-year variation in reproductive rates and costs of
reproduction can be investigated in much greater detail. Over the last five years there has
been significant inter-annual variation in the timing of pupping, but, a longer time-series
will allow us to assess whether there is a clear trend in the timing of breeding as suggested
by Reijnders, Brasseur & Meesters (2010). Future work should also work on identifying
robust environmental variables to help explain the observed patterns in pupping phenology
and demography. These may also allow an examination of the exact periods of the year in
which environmental conditions are most important for pregnant females, and which
factors are likely to cause shifts in the timing of pupping. The continuation of this work
will be particularly valuable if it can be linked with efforts to catch seals in Loch Fleet and
investigate individual differences in foraging patterns and their consequences on breeding
success, as well as obtaining additional information on age, morphometrics, diet and
contaminant burdens to include in demographic and phenological analyses.
There are currently plans for the development of offshore wind farms in Europe,
several of which will be located within harbour seal foraging areas. Proposed wind farms
for the Moray Firth (Marine Scotland SEA 2010) are located close to the Dornoch Firth
and Morrich More SAC and the Loch Fleet NNR, and within a foraging area used by these
individuals. Concerns have been raised regarding the population consequences of acoustic
disturbance (PCAD) from piling noise during the construction of wind farms, either
through direct injury, mortality or displacement (Bailey et al. 2010; Lindeboom et al.
2011), or indirectly through changes in prey availability and distribution. The high levels
of site fidelity revealed in Chapter III, also has implications for the assessment of the
environmental impacts of these wind farms. Depending on the duration of their
construction there may be fitness or reproductive consequences for the animals if site
fidelity is constraining their movement out of the area, or alternatively, if avoidance
involves using lower quality sites, increased travel costs or exposure to increased
competition (Gill, Norris & Sutherland 2001). The impacts of disturbance may also be
overlooked if site fidelity prevents animals moving away from the area (Gill, Norris &
Sutherland 2001). However, due to the difficulties in obtaining relevant data, there are

Chapter VII
147
uncertainties over the threshold levels at which seals will be affected, as well as how to
assess the potential impacts. Displacement of seals is equally challenging to quantify
without long time series of count data as well as individual histories of site fidelity.
Avoidance of key foraging areas cannot be assessed unless previous work has identified
their location. And finally, fitness and reproductive consequences of disturbance may go
unnoticed without established individual-based studies monitoring their life histories. The
long-term monitoring of harbour seal distribution and abundance within the Moray Firth,
in addition to the continuation of the individual-based life history work in Loch Fleet – the
closest breeding site to the wind farm site – presents a unique opportunity to achieve a
detailed assessment and understanding of the impacts of piling noise and vessel traffic on
the use of haul-out sites and foraging areas as well as any consequences on key
demographic parameters of harbour seals.
Conclusion
Worldwide populations of harbour seals are showing varying and differing trends,
and the causes often remain uncertain (Reijnders et al. 1997; Lucas & Stobo 2000; Jeffries
et al. 2003; Small, Pendleton & Pitcher 2003; Brown et al. 2005; Gilbert et al. 2005;
Jemison et al. 2006; Lonergan et al. 2007; Teilman, Rigét & Härkönen 2010). Alaskan
populations are generally declining which is thought to be linked with nutritional stress
from a reduction in food quality or inter-specific competition (Pitcher 1990; Jemison &
Kelly 2001; Matthews & Pendleton 2006). In contrast, populations from south-eastern
Alaska to California are generally increasing, with some even reaching carrying capacity
as a result of the Marine Mammal Protection Act putting a closure to bounty programs
(Jeffries et al. 2003; Brown et al. 2005). This is similar to patterns observed on the east
coast of North America (Baraff & Loughlin 2000; Gilbert et al. 2005), with the exception
of Sable Island where the population has declined dramatically either as a result of shark
predation or inter-specific competition with a growing grey seal population (Lucas &
Stobo 2000; Bowen et al. 2003). In Europe, populations in the Wadden Sea and south and
eastern parts of Scandinavia have been increasing since the reduction in hunting pressure
(Reijnders & Lankester 1990; Helander & Bignert 1992; Teilman, Rigét & Härkönen
2010), but suffering periodic declines after disease outbreaks (Härkönen et al. 2006). In
more north-western areas, such as the UK and Iceland, populations have suffered long-
term declines either due to culling, inter-specific competition or changes in ecosystem
condition (Hauksson et al. 2004; Lonergan et al. 2007).

Chapter VII
148
The lack of understanding of the dynamics of these populations, particularly the
specific drivers of decline, call for new measures for monitoring harbour seal populations.
This study has highlighted the current and long-term importance of individual-based data
in understanding population dynamics of harbour seals. Accurate measures of survival and
fecundity, as well as direct measures of physiological responses, are critical for the
production of reliable information of population dynamics and the implementation of
effective conservation measures. Wherever possible, selected sentinel sites should be
identified in other regions to permit inter-population comparative studies, preferably at
sites exhibiting differing trends in abundance. Individual-based work is already being
carried out at Tugidak Island in Alaska (Hastings, Hiby & Small 2008), while one or two
sites in California may be suitable for the development of individual-based work (e.g.
Nicholson 1997; Yochem & Stewart 1998). At Sable Island a long record of individual-
based data already exists and the continuation of this study, albeit at a smaller scale, could
provide an understanding of the relative role of competition and predation in the recent
decline (e.g. Bowen et al. 2001 & 2003). Comparative individual-based studies of harbour
seal population dynamics at these sentinel sites would provide a global single-species
indicator of ecosystem conditions across temperate regions in the northern hemisphere.

Chapter VII
149
References
Bailey, H., Senior, B., Simmons, D., Rusin, J., Picken, G., & Thompson, P.M. (2010).
Assessing underwater noise levels during pile-driving at an offshore windfarm and its
potential effects on marine mammals. Marine Pollution Bulletin 60, 888-897.
Baker, J.D., & Thompson, P.M. (2007). Temporal and spatial variation in age-specific
survival rates of a long-lived mammal, the Hawaiian monk seal. Proceedings of the Royal
Society Biology 274, 407-415.
Baraff, L.S. & Loughlin, T.R. (2000). Trends and potential interactions between pinnipeds
and fisheries of New England and the U.S. west coast. Marine Fisheries Review 62, 1-38.
Baum, J.K., Myers, R.A., Kehler, D.G., Worm, B., Harley, S.J., & Doherty, P.A. (2003).
Collapse and conservation of shark populations in the northwest Atlantic. Science 299,
389-392.
Beaugrand, G., Brander, K.M., Lindley, J.A., Souissi, S., & Reid, P.C. (2003). Plankton
effect on cod recruitment in the North Sea. Nature 426, 661-664.
Beauplet, G., Barbraud, C., Dabin, W., Kϋssener, C., & Guinet, C. (2006). Age-specific
survival and reproductive performances in fur seals: evidence of senescence and individual
quality. Oikos 112, 340-441.
Bigg, M.A. (1969). The harbour seal in British Columbia. Fisheries Research Board
Canada Bulletin 172, 33.
Bjørge, A. (1992). The reproductive biology of the harbour seal, Phoca vitulina L., in
Norwegian waters. Sarsia 77, 47-51.
Boulva, J., & McLaren, I.A. (1979). Biology of the harbour seal, Phoca vitulina, in eastern
Canada. Bulletin of the Fisheries Research Board of Canada 200, 1-24.
Bowen, W.D., Iverson, S.J., Boness, D.J., & Oftedal, O.T. (2001). Foraging effort, food
intake and lactation performance depend on maternal mass in a small phocid seal.
Functional Ecology 15, 325-334.
Bowen, W.D., Ellis, S.L., Iverson, S.J., & Boness, D.J. (2003). Maternal and newborn life-
history traits during periods of contrasting population trends: Implications for explaining
the decline of harbour seals (Phoca vitulina), on Sable Island. Journal of Zoology London
261: 155-163.
Boyd, I.L., Croxall, J.P., Lunn, N.J., & Reid, K. (1995). Population demography of
Antarctic fur seals: the costs of reproduction and implications for life-histories. Journal of
Animal Ecology 64, 505-518.
Boyd, I.L. (1996). Individual variation in the duration of pregnancy and birth date in
Antarctic fur seals: The role of environment, age, and sex of fetus. Journal of Mammalogy
77, 124-133.

Chapter VII
150
Boyd I.L., Wanless S., & Camphuysen C.J. (eds) (2006). Top predators in marine
ecosystems: their role in monitoring and management. Cambridge University Press,
Cambridge.
Brown, R.F., Wright, B.E., Riemer, S.D., & Laake, J. (2005). Trends in abundance and
current status of harbor seals in Oregon: 1977-2003. Marine Mammal Science 21, 657-670.
Butler, J.R.A., Middlemas, S.J., McKelvey, S.A., McMyn, A., Leyshon, B., Walker, I.,
Thompson, P.M., Boyd, I., Duck, C., Armstrong, J.D., Graham, I.M. & Baxter, J.M.
(2008). The Moray Firth Seal Management Plan: an adaptive framework for balancing the
conservation of seals, salmon, fisheries and wildlife tourism in the UK. Aquatic
Conservation 18, 1025-1038.
Clutton-Brock, T.H., Major, M., & Guiness, F.E. (1985). Population regulation in male and
female red deer. Journal of Animal Ecology 54, 831-846.
Clutton-Brock, T.H., Albon, S.D., Guinness, F.E. (1988). Reproductive success in male
and female red deer. In: Reproductive Success (T.H. Clutton-Brock), University of
Chicago Press, IL, pp. 325-343.
Clutton-Brock, T.H., & Lonergan, M.E. (1994). Culling regimes and sex ratio biases in
Highland red deer. Journal of Applied Ecology 31, 521-527.
Clutton-Brock, T.H., Coulson, T.N., Milner-Gulland, E.J., Thomson, D., & Armstrong,
H.M. (2002). Sex differences in emigration and mortality affect optimal management of
deer populations. Nature 415, 633-637.
Estes, J.A., Terborgh, J., Brashares, J.S., Power, M.E., Berger, J., Bond, W.J., Carpenter,
S.R., Essington, T.E., Holt, R.D., Jackson, J.B.C, Marquis, R.J., Oksanen, L., Oksanen, T.,
Paine, R.T., Pikitch, E.K., Ripple, W.J., Sandin, S.A., Scheffer, M., Schoener, T.W.,
Shurin, J.B., Sinclair, A.R.E., Soulé, M.E., Virtanen, R., & Wardle, D.A. (2011). Trophic
downgrading of planet Earth. Science 333, 301-306.
Frederiksen, M., Harris, M.P., Daunt, F., Rothery, P., & Wanless, S. (2004a). Scale-
dependent climate signals drive breeding phenology of three seabird species. Global
Change Biology 10, 1214-1221.
Frederiksen, M., Wanless, S., Harris, M.P., Rothery, P., & Wilson, L.J. (2004b). The role
of industrial fisheries and oceanographic change in the decline of North Sea black-legged
kittiwakes. Journal of Applied Ecology 41, 1129-1139.
Frederiksen, M., Elston, D.A., Edwards, M., Mann, A.D. & Wanless, S. (2011).
Mechanisms of long-term decline in size of lesser sandeels in the North Sea explored using
a growth and phenology model. Marine Ecology Progress Series 432, 137-147.
Furness, R.W., & Tasker, M.L. (2000). Seabird-fishery interactions: quantifying the
sensitivity of seabirds to reductions in sandeel abundance, and identification of key areas
for sensitive seabirds in the North Sea. Marine Ecology Progress Series 202, 253-264.
Furness, R.W. (2002). Management implications of interactions between fisheries and
sandeel-dependent seabirds and seals in the North Sea. ICES Journal of Marine Science
59, 261-269.

Chapter VII
151
Gilbert, J.R., Waring, G.T., Wynne, K.M. & Guldager, N. (2005). Changes in abundance
of harbor seals in Maine, 1981-2001. Marine Mammal Science 21, 519-535.
Gill, J.A., Norris, K., & Sutherland, W.J. (2001). Why behavioural responses may not
reflect the population consequences of human disturbance. Biological Conservation 97,
265-268.
Grémillet, D., & Charmantier, A. (2010). Shifts in phenotypic plasticity constrain the value
of seabirds as ecological indicators of marine ecosystems. Ecological Applications 20,
1498-1503.
Hadley, G.L., Rotella, J.J., & Garrott, R.A. (2007). Influence of maternal characteristics
and oceanographic conditions on survival and recruitment probabilities of Weddell seals.
Oikos 116, 601-613.
Hall, A.J., Watkins, J., & Hammond, P.S. (1998). Seasonal variation in the diet of harbour
seals in the south-western North Sea. Marine Ecology Progress Series 170, 269-281.
Hastings, K.K., Hiby, L.A., & Small, R.J. (2008). Evaluation of a computer-assisted
photograph-matching system to monitor naturally marked harbor seals at Tugidak Island,
Alaska. Journal of Mammalogy 89, 1201-1211.
Hauksson, E. (2006). Growth and reproduction in the Icelandic common seal (Phoca
vitulina L., 1758). Marine Biology Research 2, 59-73.
Heath, M.R. (2005). Changes in the structure and function of the North Sea fish foodweb,
1973-2000, and the impacts of fishing and climate. ICES Journal of Marine Science 62,
847-868.
Heide-Jørgensen, M.-P., & Härkönen, T. (1992). Epizootiology of seal disease in the
eastern North Sea. Journal of Applied Ecology 29, 99-107.
Helander, B. & Bignert, A. (1992). Harbor seal (Phoca vitulina) on the Swedish Baltic
coast: population trends and reproduction. Ambio 21, 504-510.
Härkönen, T. (1987). Seasonal and regional variations in the feeding habits of the harbour
seal, Phoca vitulina, in the Skagerrak and the Kattegat. Journal of Zoology 213, 535-543.
Härkönen, T., & Heide-Jørgensen, M.-P. (1990). Comparative life histories of east Atlantic
and other harbour seal populations. Ophelia 32, 211-235.
Härkönen, T., Harding & Heide-Jørgensen, M.-P. (2002). Rates of increase in age-
structured populations: a lesson from the European harbour seals. Canadian Journal of
Zoology 80, 1498-1510.
Härkönen, T., Dietz, R., Reijnders, P., Teilman, J., Harding, K., Hall, A., Brasseur, S.,
Siebert, U., Goodman, S.J., Jepson, P.D., Rasmussen, T.D. & Thompson, P. (2006). A
review of the 1988 and 2002 phocine distemper virus epidemics in European harbour seals.
Diseases of Aquatic Organisms 68, 115-130.

Chapter VII
152
ICES (2003). Report of the Working Group on the Assessment of Demersal Stocks in the
North Sea and Skagerrak. ICES CM 2003/ACFM: 02. International Council for the
Exploration of the Sea, Copenhagen, Denmark.
Jeffries, S., Huber, H., Calambokidis, J., & Laake, J. (2003). Trends and status of harbor
seals in Washington State: 1978-1999. The Journal of Wildlife Management 67, 207-218.
Jemison, L.A. & Kelly, B.P. (2001). Pupping phenology and demography of harbour seals
(Phoca vitulina richardsi) on Tugidak Island, Alaska. Marine Mammal Science 17, 585-
600.
Jemison, L.A., Pendleton, G.W., Wilson, C.A. & Small, R.J. (2006). Long-term trends in
harbor seal numbers at Tugidak Island and Nanvak Bay, Alaska. Marine Mammal Science
22, 339-360.
Lindeboom, H.J., Kouwenhoven, H.J., Bergman, M.J.N., Bouma, S., Brasseur, S., Daan,
R., Fijn, R.C., de Haan, D., Dirksen, S., van Hal, R., Hille Ris Lambers, R., ter Hofstede,
R., Krijgsveld, K.L., Leopold, M., & Scheidat, M. (2011). Short-term ecological effects of
an offshore wind farm in the Dutch coastal zone; a compilation. Environmental Research
Letters 6, 1-13.
Lonergan, M., Duck, C.D., Thompson, D., Mackey, B.L., Cunningham, L. & Boyd, I.L.
(2007). Using sparse survey data to investigate the declining abundance of British harbour
seals. Journal of Zoology (London) 271, 261-269.
Loe, L.E., Bonenfant, C., Mysterud, A., Gaillard, J.-M., Langvatn, R., Klein, F., Calenge,
C., Ergon, T., Pettorelli, N., & Stenseth, N.C. (2005). Climate predictability and breeding
phenology in red deer: timing and synchrony of rutting and calving in Norway and France.
Journal of Animal Ecology 74, 579-588.
Lucas, Z. & Stobo, W.T. (2000). Shark-inflicted mortality on a population of harbour seals
(Phoca vitulina) at Sable Island, Nova Scotia. Journal of Zoology London 252, 405-414.
Lunn, N.J., Boyd, I.L., & Croxall, J.P. (1994). Reproductive performance of female
Antarctic fur seals: the influence of age, breeding experience, environmental variation and
individual quality. Journal of Animal Ecology 63, 827-840.
Marine Scotland Strategic Environmental Assessment (SEA) of Draft Plan for Offshore
Wind Energy in Scottish Territorial Waters (2010): Vol. 1: Environmental Report. Scottish
Government, Edinburgh, http://www.scotland.gov.uk/Resource/Doc/312161/0098588.pdf
Mackey, B.L., Durban, J.W., Middlemas, S.J., & Thompson, P.M. (2008). A Bayesian
estimate of harbour seal survival using sparse photo-identification data. Journal of Zoology
274, 18-27.
Mathews, E.A. & Pendleton, G.W. (2006). Declines in harbor seal (Phoca vitulina)
numbers in Glacier Bay National Park, Alaska, 1992-2002. Marine Mammal Science 22,
167-189.
Myers, R.A. & Worm, B. (2003). Rapid worldwide depletion of predatory fish
communities. Nature 423, 280-283.

Chapter VII
153
Nicholson, T. (1997). Underwater vocalization and subsequent social behavior of the
harbor seal (Phoca vitulina richardsi) near Hopkins Marine Station, Pacific Grove, CA.
Monterey Bay Aquarium Research Institute.
Pauly, D., Christensen, V., Dalsgaard, J., Froese, R. & Torres Jr.,F. (1998). Fishing down
the marine food webs. Science 279, 860-863.
Pendleton, G.W., Pitcher, K.W., Fritz, L.W., York, A.E., Raum-Suryan, K.L., Loughlin,
T.R., Calkins, D.G., Hastings, K.K., & Gelatt, T.S. (2006). Survival of Steller sea lions in
Alaska: a comparison of increasing and decreasing populations. Canadian Journal of
Zoology 84, 1163-1172.
Perry, A.L., Low, P.J., Ellis, J.R., & Reynolds, J.D. (2005). Climate change and
distribution shifts in marine fishes. Science 308, 1912-1915.
Pistorius, P.A., Bester, M.N., Lewis, M.N., Taylor, F.E., Campagna, C., & Kirkman, S.P.
(2004). Adult female survival, population trend, and the implications of early primiparity
in a capital breeder, the southern elephant seal (Mirounga leonina). Journal of Zoology
London 263, 107-119.
Pitcher, K.W. (1990). Major decline in number of harbor seals, Phoca vitulina richardsi,
on Tugidak Island, Gulf of Alaska. Marine Mammal Science 6, 121-134.
Reijnders, P.J.H. & Lankester, K. (1990). Status of marine mammals in the North Sea.
Netherlands Journal of Sea Research 26, 427-435.
Reijnders, P.J.H., Ries, E.H., Tougaard, S., Nørgaard, N., Heidemann, G., Schwarz, J.,
Vareschi, E. & Traut, I.M. (1997). Population development of harbour seals Phoca vitulina
in the Wadden Sea after the 1988 virus epizootic. Journal of Sea Research 38, 161-168.
Reijnders, P.J.H., Brasseur, S.M.J.M., & Meesters, E.H.W.G. (2010). Earlier pupping in
harbour seals, Phoca vitulina. Biology Letters, 1-4.
Small, R.J., Pendleton, G.W. & Pitcher, K.W. (2003). Trends in abundance of Alaska
harbor seals, 1983-2001. Marine Mammal Science 19, 344-362.
Sydeman, W.J., Huber, H.R., Emslie, S.D., Ribic, C.A., & Nur, N. (1991). Age-specific
weaning success of northern elephant seals in relation to previous breeding experience.
Ecology 72, 2204-2217.
Teilman, J., Rigét, F. & Härkönen, T. (2010). Optimizing survey design for Scandinavian
harbour seals: population trend as an ecological quality element. ICES Journal of Marine
Science 67, 952-958.
Thompson, P.M., Pierce, G.J., Hislop, J.R.G., Miller, D., & Diack, J.S.W. (1991). Winter
foraging by common seals (Phoca vitulina) in relation to food availability in the inner
Moray Firth, N.E. Scotland. Journal of Animal Ecology 60, 283-294.
Thompson, P.M., McConnell, B.J., Tollit, D.J., Mackey, A., Hunter, C., & Racey, P.A.
(1996a). Comparative distribution, movements and diet of harbour and grey seals from the
Moray Firth, N.E. Scotland. Journal of Applied Ecology 33, 1572-1584.

Chapter VII
154
Thompson, P.M., Tollit, D.J., Greenstreet, S.P.R., Mackay, A., & Corpe, H.M. (1996b).
Between-year variations in the diet and behaviour of harbour seals Phoca vitulina in the
Moray Firth; causes and consequences. Aquatic Predators and their Prey (eds S.P.R.
Greenstreet & M.L. Tasker), pp. 44-52. Blackwell Scientific Publications, Oxford.
Thompson, P.M., Tollit, D.J., Corpe, H.M., Reid, R.J., & Ross, H.M. (1997). Changes in
haematological parameters in relation to prey switching in a wild population of harbour
seals. Functional Ecology 11, 743-750.
Tollit, D.J. & Thompson, P.M. (1996). Seasonal and between-year variations in the diet of
harbour seals in the Moray Firth, Scotland. Canadian Journal of Zoology 74, 1110-1121.
Tollit, D.J., Black, A.D., Thompson, P.M., Mackey, A., Corpe, H.M., Wilson, B., Van
Parijs, S.M., Grellier, K., & Parlane, S. (1998). Variations in harbour seal Phoca vitulina
diet and dive-depths in relation to foraging habitat. Journal of Zoology London 244, 209-
222.
Trites, A.W. & Donnelly, C.P. (2003). The decline of Steller sea lions Eumetopias jubatus
in Alaska: a review of the nutritional stress hypothesis. Mammal Review 33, 3-28.
Wanless, S., Frederiksen, M., Daunt, F., Scott, B.E., & Harris, M.P. (2007). Black-legged
kittiwakes as indicators of environmental change in the North Sea: Evidence from long-
term studies. Progress in Oceanography 72, 30-38.
Wanless, S., Frederiksen, M., Walton, J., & Harris, M.P. (2009). Long-term changes in
breeding phenology at two seabird colonies in the western North Sea. Ibis 151, 274-285.
Walther, G-R., Post, E., Convey, P., Menzel, A., Parmesan, C., Beebee, T.J.C., Fromentin,
J-M., Hoegh-Guldberg, O., & Bairlein, F. (2002). Ecological responses to recent climate
change. Nature 416, 389-395.
Weijerman, M., Lindeboom, H. & Zuur, A.F. (2005). Regime shifts in marine ecosystems
of the North Sea and Wadden Sea. Marine Ecology Progress Series 298, 21-39.
Yochem, P.K., & Stewart, B.S. (1998). Behavioral Ecology and Demography of Seals and
Sea lions at the Seal Rock Marine Mammal Reserve. Hubbs-Sea World Technical Report
No. 98282. 11 pp.
Österblom, H., Olsson, O., Blenckner, T., & Furness. R.W. (2008). Junk-food in marine
ecosystems. Oikos 117, 967-977.

155
APPENDIX I – Loch Fleet harbour seal catalogue

156
157

158

159

160

161

162
163

164

165

166

167

168

169

170

171

172

173

174

175

176

177

178

179

180

181

182

183

184

185

186

187
APPENDIX II – Estimated ages of caught females from tooth
growth rings.
ID SEX CAUGHT BIRTH YEAR AGE IN 2006
002 F 2009 2002 – 2004 2 – 4
015 F 2008 1998 – 2001 5 – 8
030 F 2008 1995 11
042 F 2009 1999 7
046 F 2009 1992 – 1994 12 – 14
054 F 2008 1996 10
061 F 2008 2001 – 2002 4 – 5
076 F 2008 2003 3
149 F 2009 2003 – 2004 2 – 3
158 F 2008 2004 2
164 F 2009 2005 – 2006 0 – 1

188
APPENDIX III – Example section of a capture history
(1=seen, 2=seen with pup, x=stillbirth)
ID31-M
ay
01-J
un
02-J
un
03-J
un
04-J
un
05-J
un
06-J
un
07-J
un
08-J
un
09-J
un
10-J
un
11-J
un
12-J
un
13-J
un
14-J
un
15-J
un
16-J
un
17-J
un
18-J
un
19-J
un
20-J
un
21-J
un
22-J
un
23-J
un
24-J
un
25-J
un
26-J
un
27-J
un
1 1 1 1 1 1 1 2 2 2 2 2 2 2 2 2 2 2 2 2 2 2 2 2
2 1 1 2 2 1 1 1 1 1 1 1 1 1 1 1 1 1 1 1
3
4 1 1 1 1 2 2 2 2 2 1 1 1 2 ? 1 1 2 2 2 2 2 2 2 2
5 1 1 1 1 1 1 2 2 2 2 2 2
6 1 1 1 1 1 1 1 1
7 1 1 1 1 1 1 1 2 2 2 1 2 2 2 ? 1 2 2 1 2 2 1 2
8 1 1 1 1 1 1 1 1 1 1 1 1 2 2 2 2
9
10 1 1 1 1 1 1 1 1 2 2 2 2 2 2 2 2 2 2 2 2 2
11 1 1 1 1 2 2 2 2 2 2 1 1 2 1 1 S 2 2 2 2 2 2
12 1 1 2 2 2 2 2 1 1 1 1 1 1 1 1 1 1 1 1
13 1 1 1 1 1 1 1 1 2 2 2 2 2 2 2 1 2 2 2
14 1 1 1 1 1 1 1 2 2 2 1 2 2 2 2 1 2
15 1 1 1 1 1 1 1 1 2 2 2 2 2 2 2 2
16 1 1 1 1 2 2 2 2 1 2 2 2 2 1 2 2 2 2
17 1 1 1 1 1 1 1 1 2 1 2 2 2 2 2 2 2 2
20 1 1 1 1 1 1 1 1 1 1 2 2 2 2 2 2 2 2 2 2 2 2 2
21 1 1 1 1 1 1 1 1 1 2 2 1 2 2
23 1 1 1 1 1 2 2 2 1 2 2 2 1 2 2 2 2 2 2 1
24 1 1 2 2 2 2 2 2 2 2 2 2 2 2
27 1 1 1 1 1 2 2 2 1 2 2 2 1 1 2 2 1 1 2 2
28 1 1 1 1 1 1 2 2 2 2 2 2 2 2 2 2 2
30 1 1
31 1 1 1 1 1 1 1 1 1 1
33 1 1 1 1 1 1 1 1
35 1 1 1 1 1 2 2 2 2 2 2 2 2
42 1 1 1 1 1 1 1 1 2 2 2 2 2 2
46 1 1 1 1 1 1 1 1
47 1 X 1
48 1 1 1 1 1 1 1 1 1 1 2 2 2 2 2 2
52 1 1 1 1
53 1 1 1 1 1 1 1 1 1 1
54 1 1 1 1 1 2 2 2 2 2 2 2 2 2 2 2 2 2 2 2 2 2
56 1 1 1 1 1 1 1 1 1 1 1
59 1 1 1 1 1 1 1 1 1 1 1 1 1 1 1 1 1 1 1 1 1 1 1
61 1 1 1 2 2 2
62 1 1 1 1 1 1 1 1 1 1 1 2 1 1 1 1 1 1 1 1 1
63 1 1 1 1 1 2 2 2 2 2 2 2 2 2 2 1 1 2 2 1 2
65 1 1 1 1 1 1 1 1 1 1 2 1 1 2 2 1 1
66 1 1 1 2 2 2 2 2 2 2 2 2
67 1
70 1 1
71
72 1 1 1 1 1 1 1 1 1
73 1 1 1 1 1 1 1 1 1 1 1 1
74 1 1 1 1
75 1 1 1 1 1 1
76 1 1 1 1 1 1 1 1 1 1 1 1 1 1 1 1 1 1 1 1 1 1
77 1 1 1 1 1 2 2 2 2 2 2 2 2 2 2 2 2
78 1 1 1 1 1 1 1 2 2 2 2 2 2 2 2 2 2 2 2 2 2 2 S 2 2
79 1 1 1
80 1 1
81 1 2 2
82 1 1 1 1 1 1 1 1 1 1 1 1 1 1 1 1 1 1 1
83 1 1
84 1
85
86 1 1 1 1 1 1 1 1 1
87
90 1
92 1 1 1 1 1 1 1 1
93 1 1 1 1 1 1 1 1 1 1 1 1 1 1 1 1 1 1 1 1
94 1 1 1 1 1 1 1 1 1 1
95 1 1 1 1 1 1 1
96 1 1 1 1 1 1 1 1 1 1 1 1 1

189
APPENDIX IV – Annual pupping curves including daily max pup
count (•) and the cumulative number of pups born (-).
0
10
20
30
40
50
60
25-May 09-Jun 24-Jun 09-Jul 24-Jul
Num
ber
of
pups
2006
0
10
20
30
40
50
60
25-May 09-Jun 24-Jun 09-Jul 24-Jul
Num
ber
of
pups
2007

190
0
10
20
30
40
50
60
25-May 09-Jun 24-Jun 09-Jul 24-Jul
Num
ber
of
pups
2008
0
10
20
30
40
50
60
25-May 09-Jun 24-Jun 09-Jul 24-Jul
Num
ber
of
pups
2009
0
10
20
30
40
50
60
25-May 09-Jun 24-Jun 09-Jul 24-Jul
Num
ber
of
pups
2010


![Тайны советской демографии [The Secrets of Soviet Demography]](https://static.fdokumen.com/doc/165x107/633ca7f270f9415ce7029283/tayni-sovetskoy-demografii-the-secrets-of-soviet-demography.jpg)