vienna institute - of demography
25
VIENNA INSTITUTE OF DEMOGRAPHY Working Papers The Contributions of Diseases to Increasing Educational Mortality Differential in Austria Franz Schwarz Vienna Institute of Demography Austrian Academy of Sciences Prinz Eugen-Straße 8-10 · A-1040 Vienna · Austria E-Mail: [email protected] Website: www.oeaw.ac.at/vid 02 / 2006
-
Upload
khangminh22 -
Category
Documents
-
view
0 -
download
0
Transcript of vienna institute - of demography
VIENNA INSTITUTEOF DEMOGRAPHY
Working Papers
The Contributions of Diseases to Increasing Educational Mortality Differential in Austria
Franz Schwarz
Vienna Institute of DemographyAustrian Academy of Sciences
Prinz Eugen-Straße 8-10 · A-1040 Vienna · Austria
E-Mail: [email protected]: www.oeaw.ac.at/vid
02 / 2006

Abstract
This paper examines how much changing educational disparity for specific causes of death contributed to the change in overall educational mortality disparity between 1981/82 and 1991/92 among Austrian adults aged 30–74 years. Besides specific causes of death, the study also examines educational differentials for both avoidable causes of death and mortality amenable to medical intervention. The data source is based on a one-year mortality follow-up of the total Austrian census population. The data for the examined population is made up of individual records for people aged 30–74, totaling 3,805,208 for 1981/82 and 4,064,184 for 1991/92, from which 34,218 and 29,443, respectively, were on deceased persons. The study uses a new approach for decomposing the change in overall mortality differentials into contributions of specific causes to the change. For this purpose, it extends the regression-based Slope Index of Inequality. The findings suggest that educational inequalities in overall mortality have widened significantly in Austria, but more among men than among women. However, without the increase in the disparity for ischemic heart disease, between 1981/82 and 1991/92, there would have been a decline in absolute educational disparity in overall mortality among Austrian men and women. Also striking are the rising absolute and relative disparities for diabetes among females as well as the increasing disparities for colorectal cancer and digestive diseases among men. Increasing differentials in avoidable mortality essentially contributed to increased educational disparities in overall mortality. With regard to mortality amenable to medical treatment, the differentials increased considerably for men but not for women.
Keywords
Mortality, Socioeconomic Inequalities, Education, Relative Index of Inequality, Austria
Author
Franz Schwarz is research scientist at the Vienna Institute of Demography, Austrian Academy of Sciences. Mailing Address: Vienna Institute of Demography, Prinz Eugen Strasse 8, 2nd floor, 1040 Vienna, Austria. E-mail: [email protected]. Phone: +43 1-515-81-7720. Fax: +43 1-515-81-7730.
Acknowledgments
I would like to thank Alexia Fürnkranz-Prskawetz, Henriette Engelhardt, and Elsie Pamuk for their support, suggestions, and comments. Elsie Pamuk contributed a great deal to this paper. The paper would not have been possible without the data access at Statistics Austria. Special thanks go to Alexander Hanika, who supported me by dealing with my countless troubles involving the data processing at the complicated host-system computer. My thanks also go to Gabrielle Doblhammer and Roland Rau who initially merged the Austrian census 1981 and 1991, respectively, with the death register. I used their data-processing files and modified them to merge and aggregate the data for my application.
The Contributions of Diseases to Increasing Educational Mortality Differential in Austria
Franz Schwarz
1. Introduction
Recent studies from England and Wales, Finland, Norway, Sweden, Austria, Denmark, Italy, Spain, Russia, the USA, New Zealand, and Australia have all produced evidence indicating that social inequalities in all-cause mortality widened during the 1970s and 1980s (Pamuk 1985, Feldman et al. 1989, Dahl and Kjaersgaard 1993, Pappas et al. 1993, Preston and Elo 1995, Regidor et al. 1995, Drever and Buntig 1997, Harding et al. 1997, Shkolnikov et al. 1998, Schalick et al. 2000, Valkonen 2001, Turrell and Mathers 2001, Mackenbach 2003, Kunst et al. 2004, Blakely et al. 2005). In Austria, socioeconomic inequalities in all-cause and cause-specific mortality were reported for the years 1981/82 (Doblhammer 1997) and 1991/92 (Schwarz 2006). Between these two periods, educational differentials in all-cause mortality increased considerably among both sexes (Doblhammer et al. 2005, Schwarz 2005). With regard to changes in cause-specific mortality, Rau et al. (2006) have shown that, among Austrian males, differential developments in ischemic heart disease have been the main contributor to the widening gap in socioeconomic inequalities.1 The main focus of the present study is to examine how much the change in the disparity for specific causes of death contributed to the change in overall educational mortality disparity among both sexes between 1981/82 and 1991/92. In contrast to Rau’s et al. (2006) Austrian study, this study applies a regression-based inequality measure—the Relative Index of Inequality (RII)—that offers a more efficient presentation of mortality disparities than do rate ratios. More importantly, the RII allows calculation of exact cause-specific contributions to changes in overall mortality disparity. The issue is raised of the great connection between socioeconomic equalities and public health. Any reduction in the high mortality rates and disease prevalence among disadvantaged groups offers can potentially contribute much to improving the average population health status and raising its overall life expectancy. In addition, there is the question of social justice as relates to health inequalities: they can be seen not only as unjust but also as unnecessary and untimely. This is why analyzing cause-specific contributions to increasing differentials in overall mortality is so important. It not only reveals increasing mortality differentials due to specific causes, but more importantly it identifies which causes are most responsible for changes in overall mortality differentials. For example, any increase in the disparity for a rare disease would hardly contribute to widening educational disparity. As a result, such a rise would only have a minor effect on overall mortality, as well as on the average health status of a population. On the other
1 Unpublished paper from 1 March 2006 recently found on the website of the Population Association of America at www.popassoc.org for its 2006 annual meeting.
2
hand, increasing educational inequality in a very common cause of death would have a huge negative effect on overall mortality disparity. This effect comes about because the contribution of a cause to overall educational mortality disparity is a combination of the prevalence of a given cause and the magnitude of the disparity. Monitoring and keeping track of cause-specific contributions to changes in overall mortality differentials thus allows public-health officials to determine which diseases exert this kind of impact and to then intervene in time to avoid any further major negative effect on basic population health. In addition to analyzing specific causes of death, this study examines changes in educational mortality differentials for avoidable causes of death as well as for mortality amenable to medical intervention. Monitoring avoidable mortality is important because avoidable causes of death have the greatest capacity to potentially reduce mortality inequalities, since these causes can theoretically be avoided through prevention or treatment. Amenable mortality, on the other hand, concerns causes that, with currently available treatment, should not result in death, even when nothing is done to prevent the illness. Monitoring inequalities in amenable mortality is important because the ensuing results can provide information on changes in inequalities vis-à-vis health-service utilization.
2. Data and Methods
2.1. Data
To form a mortality follow-up study of the entire Austrian population, the census cohorts from 1981 and 1991 were linked with death register records of those who died within one year after the respective reference date for the census (census day). The data set contains for the examined population aged 30–74 in total 3,805,207 individual records for 1981/82 and 4,064,184 records for 1991/92 of which 37,064 and 29,443 were deceased. The Austrian census and the death registry were merged according to address, sex and birth date, as well as by marital status and year of marriage. In the death registry 90,693 records in total were registered between the census day 12 May 1981 and 13 May 1982, and 83,324 records between census day 15 May 1991 and 14 May 1992. In the Austrian provinces about 92% of these records were linked to the census; in Vienna, it was just around 88% in 1981/82 and 85% in 1991/92. This means that around 10% of the deaths in the death register could not be linked to the census. The merging rate depended on peoples’ mobility before death. Because old people often move to nursing homes or in with relatives due to their need for care, the merging rate decreases at a more advanced age. In Vienna, the number of old people living alone is higher than in the provinces, which partly may explain the lower success rate of merged cases. In addition, the higher proportion of foreigners in Vienna may also have caused a lower merging rate. A result of the missing merged death is that the calculated death rates are around 10% lower than actual death rates would be. Since principally just ratios of the death rates were considered, the missing deaths do only matter if the merging rates vary by level of
3
education. Thus, the present study assumes equal merging rates for each sub-population. Because of the high percentage of linked cases, however, the bias would be negligible even when more deaths of those with lower education were linked to the census than deaths among those with higher education.
2.2. Socioeconomic Status
For the assessment of social inequalities, educational level is one of the most important indicators of social stratification and has become the main social variable in epidemiological and demographic research, for two important reasons: Unlike occupation and income, education remains virtually constant throughout adulthood and is available for all adults, whether or not they are currently in the labor force. Furthermore, education is influenced less by health problems that develop in adulthood (Preston and Elo 1995, Davey Smith 1998). For these reasons, education was chosen as the indicator of social status in this study. The educational distribution in a country strongly depends on its educational system. Austria has a free public school and university system. Nine years of education (eight years before 1962)—are compulsory. This so called compulsory education consists normally of primary and lower-secondary school. Thereafter, many educational paths are possible, and thus, many types of higher educational attainment exist. To ensure a sufficient population size in each category, the levels of education were combined as follows:
1. Low: Compulsory education (8–9 years of schooling) 2. Middle: Apprenticeship or vocational school (10–11 years of schooling) 3. High: Upper-secondary school that ends with the Matura (university entrance
degree), a diploma from an academy or prep school, or a college or university degree (12 or more years of schooling).
Table 1 lists population and deaths according to education and sex for the working-age population (30–59 years) and for older people (60–74 years), with age at the time of the census. It shows that the educational distribution changed considerably from 1981/82 to 1991/92. While the proportion of those with less education declined, the percentage of those with more increased. Noticeable is the high percentage of less-educated females, while only a small proportion of females have a high level of education—especially among the older age group. This results in a very small number of deaths for highly educated females (3% in 1981/82), which causes great statistical variation. People older than 74 were excluded from the analyses because of diminishing socioeconomic inequalities in mortality with increasing age among men, resulting most likely from a systematic selection of robust individuals. Since the number of deaths also increases extensively, the results for a broader age group of, for example, 60–89-year-olds would be dominated by those who are very old. Hence, only a few educational mortality differentials would be observed for the entire group aged 60–89, even if large differentials existed for those aged 60–74. Furthermore, because of co-morbidity at a more advanced age, it becomes increasingly difficult to accurately determine the main cause of death. Another reason to limit the maximum age to 74 concerns average life expectancy, which in 1991 was around 75 years for both sexes together. By referring to this period-lifetable
4
concept, the study can be interpreted as an examination of educational disparity in premature mortality among adults.
Table 1: Percentage of population and deaths in each educational category, by sex and age group, Austria, 1981/82 and 1991/92
Education Population Deaths2
Males Females Males Females
1981/82 1991/92 1981/82 1991/92 1981/82 1991/92 1981/82 1991/92
Low 37.5 28.5 63 50.6 48.7 42.8 76.1 68.6
Middle 49.1 54.7 29.7 37.9 43.1 47.9 20.1 25.7
High 13.4 16.9 7.2 11.5 8.2 9.3 3.7 5.7
N 1,755,907 1,946,435 2,049,300 2,117,749 21,424 17,520 15,640 11,923
2.3. Causes of Death
The causes of death explored in this study are listed in Table 2. The study analyzes differentials for the four most important cancers that made up about 50% of total cancer mortality in the age group 30–74. Among the diseases of the circulatory system, the two most important—ischemic heart disease and cerebrovascular diseases—are considered separately. Because of the strong association with health behavior, diabetes mellitus and alcohol-related causes of death were of particular interest. The study also presents results for mortality amenable to medical intervention and potentially avoidable mortality. Amenable causes of death are those that, with current medical treatment, should not result in death. Fatality can be minimized through health care even when the disease is not prevented. Avoidable causes of death are also amenable to medical intervention but they additionally could theoretically have been avoided through prevention, given the current understanding of causative factors and available means of prevention (Blakely et al. 2005). Because of the high prevalence of co-morbidity among older people, avoidable and amenable mortality is only defined for people up to the age of 75. The attribution of causes of death as either avoidable or non-avoidable was first proposed by Rutstein et al 1976, and the first widely used list of causes of avoidable mortality was assembled by Charlton et al 1983 (Blakely et al. 2005). The list of causes of avoidable and amenable mortality is occasionally updated to reflect developments in prevention and treatment. The list of avoidable causes of death used in this study (Table 3) was updated by Tobias and Glover (unpublished) and published by Blakely et al. (2005). Amenable causes include diseases where only 50% of cases are designated as amenable, i.e. ischemic heart and cerebrovascular disease. In such cases, only half of the individuals who died as a result of these causes were randomly selected for inclusion. This procedure may constitute a source of bias, since the selected proportions may vary by level of education. To minimize the bias, the random selection process was performed ten times; each time, the age-specific death rate was calculated for amenably mortality, and, finally 2 Merged deaths only; The actual number of deaths is around 5-10% higher.
5

the average of these ten age-specific death rates. Nonetheless, the results for differentials in amenable mortality should still be treated with caution.
Table 2: Causes of death, icd-9 codes3, and number of deaths by sex, Austrian population aged 30–74, 1981/82 and 1991/92
Number of deaths
Males Females Cause of death ICD-9
1981/82 1991/92 1981/82 1991/92
Neoplasms 140–239 5757 5569 5178 4654
Malignant neoplasm of the stomach 151 742 472 493 319
Malignant neoplasm of the colon and rectum 153, 154 674 709 676 579
Malignant neoplasm of the lung 162 1614 1587 389 453
Malignant neoplasm of the breast 174 (females only) - - 885 983
Other neoplasm 2725 2801 2735 2320
Diseases of the circulatory system 390–459 9598 6855 6923 4639
Ischemic heart disease (IHD) 410–414 4818 3778 2426 1940
Cerebrovascular disease 430–438 2066 1213 2034 1121
Other circulatory disease 2714 1864 2463 1578
Other diseases 001–139, 240-389, 460–799 3901 3433 2696 1981
Diabetes mellitus 250 248 306 353 321
Disease of the respiratory system 460–519 882 708 525 355
Disease of the digestive system 520–579 w/o 535.3, 571.0–571.3, 577 1594 1429 851 659
Alcohol-associated disease4 291, 303, 305.0, 452.5, 535.3, 571.0–571.3, 577 286 389 106 94
Other 891 601 861 552
External causes E800–E999 2168 1663 843 649
Unintentional injury and poisoning E800–E949, E960–979, E990–E999 1261 905 458 350
Suicide E950–E959, E980–E989 907 758 385 299
Avoidable c.f. Appendix Table 2 16260 13473 11027 8662
Amenable c.f. Appendix Table 2 6170 4758 5867 4538
Non-amenable 10090 8715 5160 4124
Non-avoidable 5164 4047 4613 3261
All causes 21424 17520 15640 11923
3 Causes of death were coded according to the International Classification of Diseases (9th ed. or ICD-9). 4 Alcohol dependence syndrome, alcohol abuse, alcoholic cardiomyopathy, alcoholic gastritis, alcoholic chronic liver disease and cirrhosis. Diseases of the pancreas are also included since Zilker et al. (2004) suggest that in 40-95% of the cases, chronic pancreatitis is causes by chronic abuse of alcohol.
6
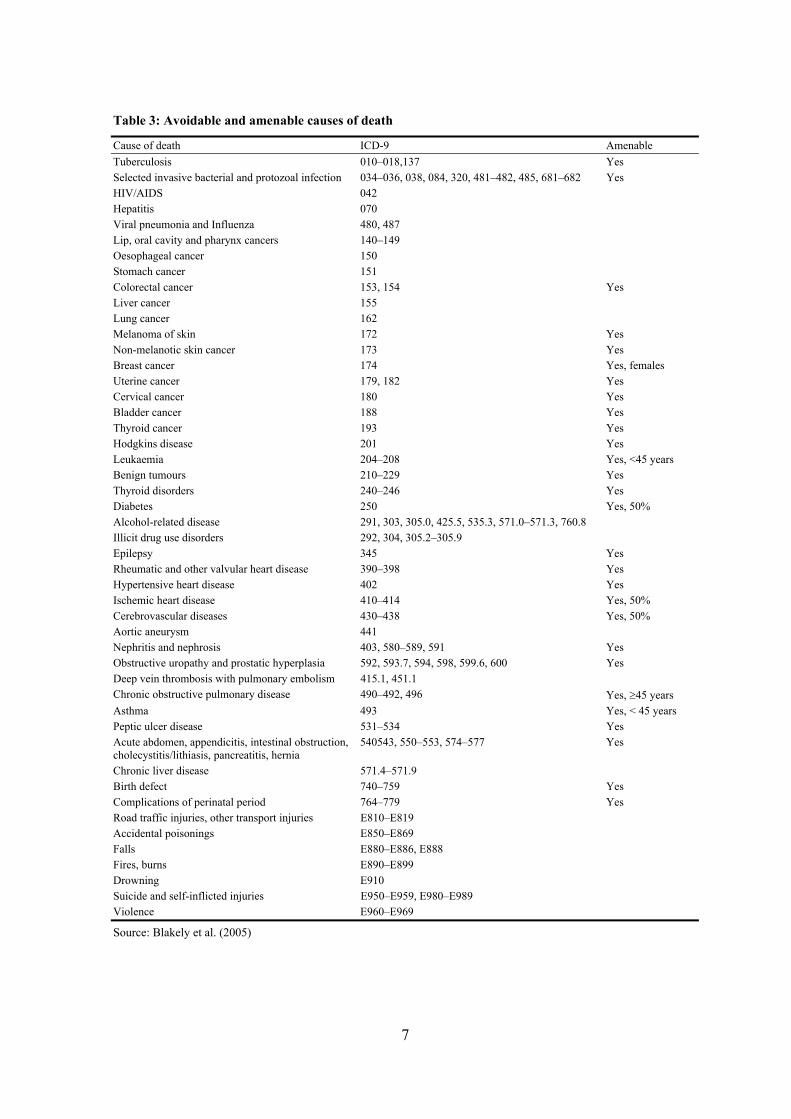
Table 3: Avoidable and amenable causes of death
Cause of death ICD-9 Amenable Tuberculosis 010–018,137 Yes Selected invasive bacterial and protozoal infection 034–036, 038, 084, 320, 481–482, 485, 681–682 Yes HIV/AIDS 042 Hepatitis 070 Viral pneumonia and Influenza 480, 487 Lip, oral cavity and pharynx cancers 140–149 Oesophageal cancer 150 Stomach cancer 151 Colorectal cancer 153, 154 Yes Liver cancer 155 Lung cancer 162 Melanoma of skin 172 Yes Non-melanotic skin cancer 173 Yes Breast cancer 174 Yes, females Uterine cancer 179, 182 Yes Cervical cancer 180 Yes Bladder cancer 188 Yes Thyroid cancer 193 Yes Hodgkins disease 201 Yes Leukaemia 204–208 Yes, <45 years Benign tumours 210–229 Yes Thyroid disorders 240–246 Yes Diabetes 250 Yes, 50% Alcohol-related disease 291, 303, 305.0, 425.5, 535.3, 571.0–571.3, 760.8 Illicit drug use disorders 292, 304, 305.2–305.9 Epilepsy 345 Yes Rheumatic and other valvular heart disease 390–398 Yes Hypertensive heart disease 402 Yes Ischemic heart disease 410–414 Yes, 50% Cerebrovascular diseases 430–438 Yes, 50% Aortic aneurysm 441 Nephritis and nephrosis 403, 580–589, 591 Yes Obstructive uropathy and prostatic hyperplasia 592, 593.7, 594, 598, 599.6, 600 Yes Deep vein thrombosis with pulmonary embolism 415.1, 451.1 Chronic obstructive pulmonary disease 490–492, 496 Yes, ≥45 years Asthma 493 Yes, < 45 years Peptic ulcer disease 531–534 Yes Acute abdomen, appendicitis, intestinal obstruction, cholecystitis/lithiasis, pancreatitis, hernia
540543, 550–553, 574–577 Yes
Chronic liver disease 571.4–571.9 Birth defect 740–759 Yes Complications of perinatal period 764–779 Yes Road traffic injuries, other transport injuries E810–E819 Accidental poisonings E850–E869 Falls E880–E886, E888 Fires, burns E890–E899 Drowning E910 Suicide and self-inflicted injuries E950–E959, E980–E989 Violence E960–E969
Source: Blakely et al. (2005)
7

2.4. Measures
2.4.1. Index of Inequality
There are various indices to measure social-class inequalities (Wagstaff et al. 1991, Kunst 1997, Mackenbach and Kunst 1997). In principle, one can divide them into simple and more sophisticated measures. Simple measures, such as the rate ratio, have the advantage of easy calculation and straightforward interpretation. However, they usually must be calculated separately for each category and may ignore parts of the available information. On the other hand, more sophisticated indices, i.e. regression-based measures, are more complicated to calculate and more difficult to interpret. The present study will apply both, namely simple measures such as death rates, rate ratios and rate differences, and the more sophisticated Slope Index of Inequality and Relative Index of Inequality. The age-standardized mortality rates in this study were calculated with the direct method for each sex and year of death (1981/82 and 1991/92), using the total population 1991/92 as the standard population and 5-year age groups. Rate ratios and rate differences were calculated directly by dividing, or subtracting respectively, the age-standardized rates of the two groups. The age standardized death rates and rate ratios, as well as relative and absolute changes in the death rates from 1981/82 to 1991/92 are shown in Appendix 1, while the more sophisticated measures can be found in the result sections of the chapters. A disadvantage of the rate-ratio measure is that it does not include other levels of education than those of the two opposing groups. Therefore, the rate ratio of the least vs. the most educated neglects those at the middle level. In the case of clearly hierarchical categories, the regression-based Slope Index of Inequality (SII) and its relative counterpart, the Relative Index of Inequality (RII) explain inequalities with one single value that comprises all categories at once. The basic concept of these inequality measures was introduced by Preston, Haines and Pamuk in 1981 (c.f. Pamuk 1985, Preston and Elo 1995). The SII and RII take into account the relative position and size of the educational groups, which is very useful when populations differ in their distribution with respect to the inequality variable, or when the distribution changes over time. In Austria, for example, the educational distributions of men and women differ substantially. The SII is obtained by arranging the education groups from lowest to highest on a horizontal axis and computing the cumulative proportionate distribution of the population. As a result, each group covers a range on the x-axis proportional to its population size on a scale from 0 to 1. Then the age-standardized death rate of each education group is plotted against the midpoint of the percentile range of the respective education group (c.f. Figure 1). The regression line for the relation between the death rates y and the midpoints on the cumulative education distribution x has the form y = α + βx. The regression slope β is then the SII (Pamuk 1985, Hayes and Berry 2002). The values x = 0 and 1 represent extreme hypothetical subgroups and do not correspond to the lowest and highest categories.
8
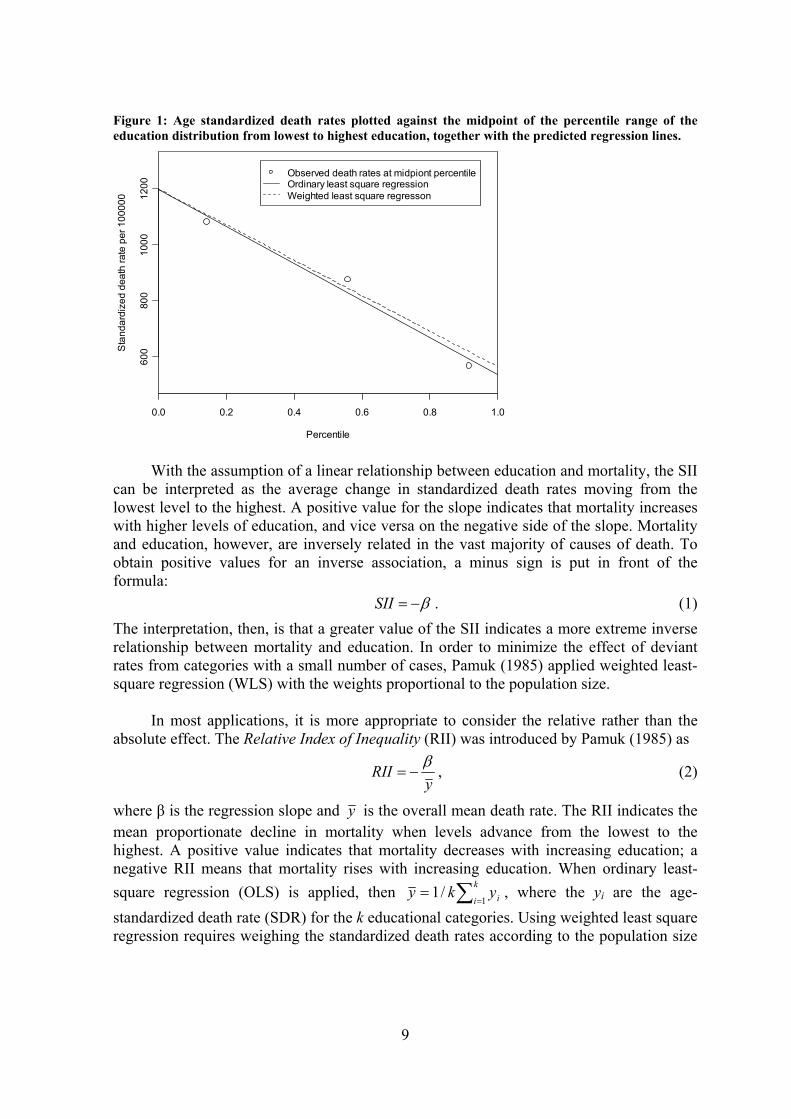
Figure 1: Age standardized death rates plotted against the midpoint of the percentile range of the education distribution from lowest to highest education, together with the predicted regression lines.
0.0 0.2 0.4 0.6 0.8 1.0
600
800
1000
1200
Percentile
Sta
ndar
dize
d de
ath
rate
per
100
000
Observed death rates at midpiont percentileOrdinary least square regressionWeighted least square regresson
With the assumption of a linear relationship between education and mortality, the SII can be interpreted as the average change in standardized death rates moving from the lowest level to the highest. A positive value for the slope indicates that mortality increases with higher levels of education, and vice versa on the negative side of the slope. Mortality and education, however, are inversely related in the vast majority of causes of death. To obtain positive values for an inverse association, a minus sign is put in front of the formula: β−=SII . (1) The interpretation, then, is that a greater value of the SII indicates a more extreme inverse relationship between mortality and education. In order to minimize the effect of deviant rates from categories with a small number of cases, Pamuk (1985) applied weighted least-square regression (WLS) with the weights proportional to the population size. In most applications, it is more appropriate to consider the relative rather than the absolute effect. The Relative Index of Inequality (RII) was introduced by Pamuk (1985) as
y
RII β−= , (2)
where β is the regression slope and y is the overall mean death rate. The RII indicates the mean proportionate decline in mortality when levels advance from the lowest to the highest. A positive value indicates that mortality decreases with increasing education; a negative RII means that mortality rises with increasing education. When ordinary least-square regression (OLS) is applied, then ∑=
=k
i iyky1
/1 , where the yi are the age-standardized death rate (SDR) for the k educational categories. Using weighted least square regression requires weighing the standardized death rates according to the population size
9
n, ∑==
k
i ii nyky1
/1 . In that case, y is approximately equal to the overall age-standardized death rate for all educational categories combined.
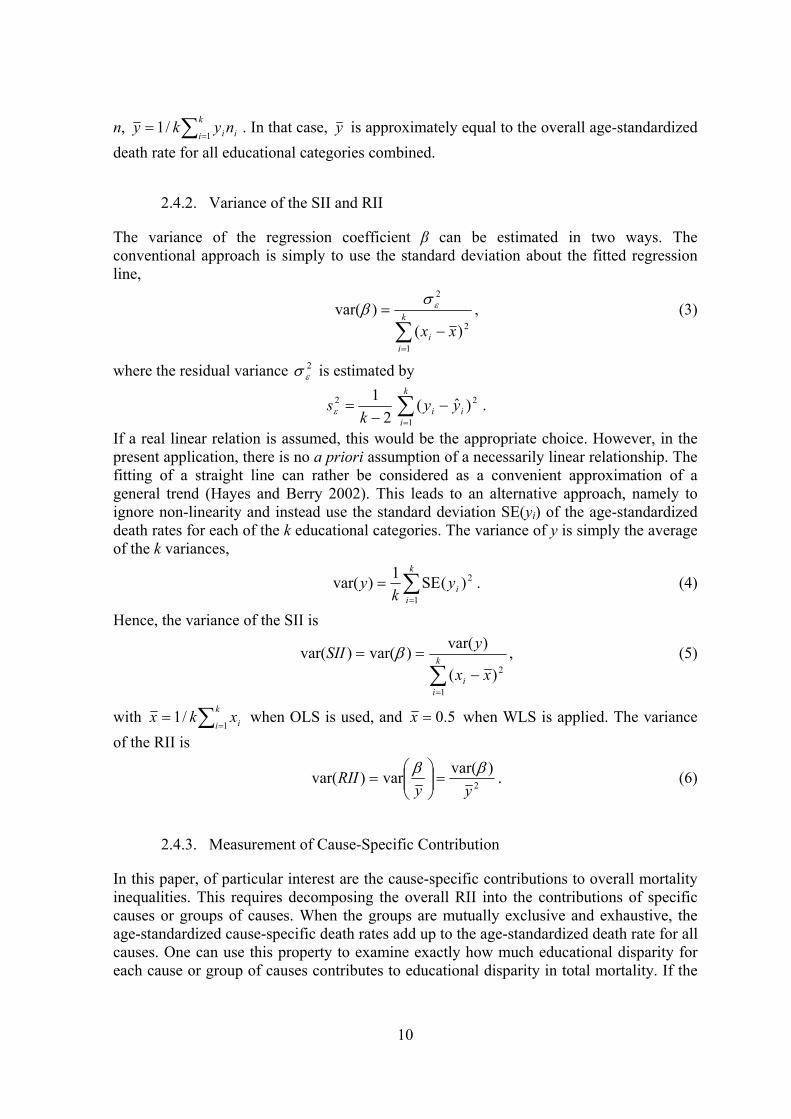
2.4.2. Variance of the SII and RII
The variance of the regression coefficient β can be estimated in two ways. The conventional approach is simply to use the standard deviation about the fitted regression line,
∑=
−= k
ii xx
1
2
2
)()var( εσβ , (3)
where the residual variance is estimated by 2εσ
∑=
−−
=k
iii yy
ks
1
22 )ˆ(2
1ε .
If a real linear relation is assumed, this would be the appropriate choice. However, in the present application, there is no a priori assumption of a necessarily linear relationship. The fitting of a straight line can rather be considered as a convenient approximation of a general trend (Hayes and Berry 2002). This leads to an alternative approach, namely to ignore non-linearity and instead use the standard deviation SE(yi) of the age-standardized death rates for each of the k educational categories. The variance of y is simply the average of the k variances,
∑=
=k
iiy
ky
1
2)(SE1)var( . (4)
Hence, the variance of the SII is
∑=
−== k
ii xx
ySII
1
2)(
)var()var()var( β , (5)
with ∑==
k
i ixkx1
/1 when OLS is used, and 5.0=x when WLS is applied. The variance of the RII is
2
)var(var)var(yy
RII ββ=
= . (6)
2.4.3. Measurement of Cause-Specific Contribution
In this paper, of particular interest are the cause-specific contributions to overall mortality inequalities. This requires decomposing the overall RII into the contributions of specific causes or groups of causes. When the groups are mutually exclusive and exhaustive, the age-standardized cause-specific death rates add up to the age-standardized death rate for all causes. One can use this property to examine exactly how much educational disparity for each cause or group of causes contributes to educational disparity in total mortality. If the
10
groups of causes are mutually exclusive and exhaustive, the SIIs for each cause of death j will add to the SII for all causes (Elsie Pamuk, e-mail to the author, 19 December 2005): ∑=
jjall SIISII . (7)
An application of this relationship was found in Blakely et al. (2005). The RII for all causes is simply the weighted average of the RIIs for each cause j, with the weight being the age-standardized cause-specific rate SDRj for all educational categories combined. (Elsie Pamuk, e-mail to the author, 19 December 2005):
∑ ⋅=j
jjall
all SDRRIISDR
RII 1 (8)
Hence, the contribution Cj for a cause or group of causes j is
allall
jj
all
jj SDRRII
SDRRIISIISII
C⋅⋅
== (9)
The change in the indices over time decomposes in just the same way as does the index for a particular time (Elsie Pamuk, e-mail to the author, 10 January 2006). This means that the change in the SIIs for each cause of death j will add to the change in the SII for all causes, . The contribution C to the change in the SII for a cause j
and a change from period 1 to period 2 is then ∑ ∆=∆
j jall SIISII
12
12
allall
jj
all
jj SIISII
SIISIISIISII
C−
−=
∆
∆= . (10)
3. Results
Table 4 and Table 5 show absolute and relative educational differentials in mortality by causes of death for men and women aged 30–74 years in 1981/82 and 1991/92, along with any changes that took place during those ten years. For both genders, differentials in all-cause mortality and for many causes of death increased sharply during the 1980s in absolute terms, as was measured by the Slope Index of Inequality (SII), as well as in relative terms, as was measured by the Relative Index of Inequality (RII). Among men, the educational disparity in all-cause mortality was 570 deaths per 100,000 person-years in 1981/82, between the hypothetically least and most educated people.5 Between 1981/82 and 1991/92, the SII increased by 74 deaths per 100,000, to 644 deaths per 100,000. In relative terms, the RII increased from 0.51 to 0.72.
5 Rate differences in association with the SII always concern the disparity between the hypothetically least and most educated persons
11
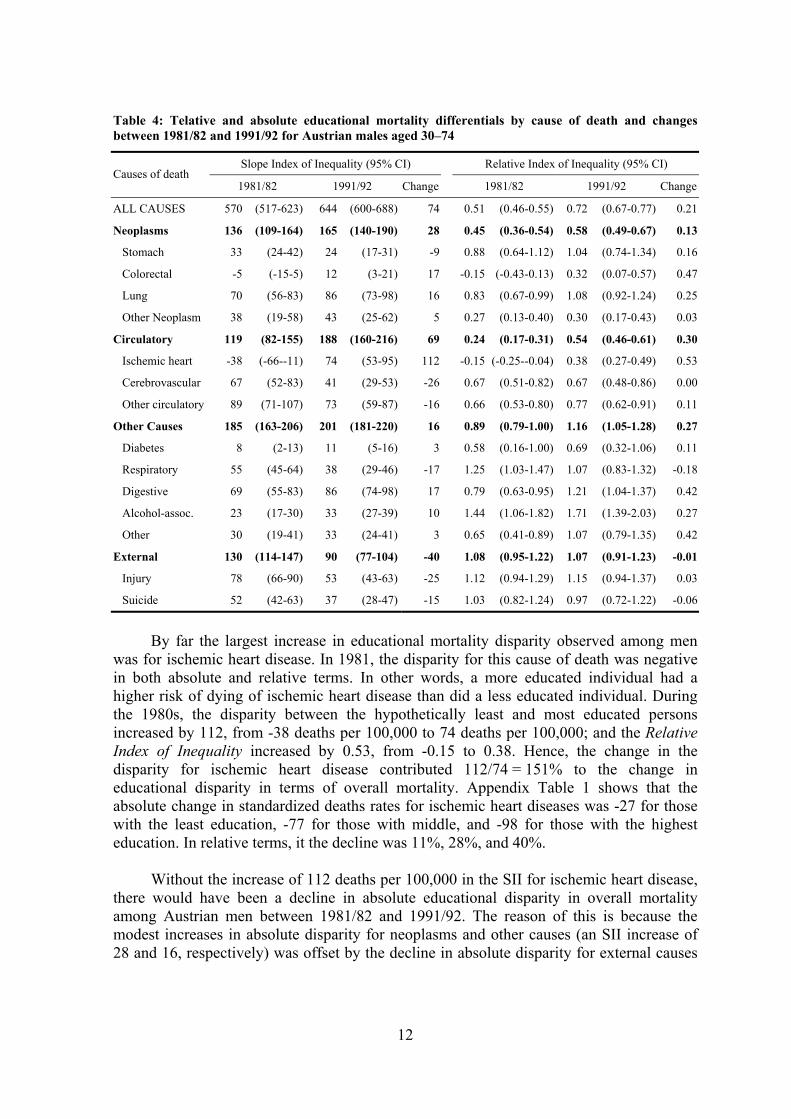
Table 4: Telative and absolute educational mortality differentials by cause of death and changes between 1981/82 and 1991/92 for Austrian males aged 30–74
Slope Index of Inequality (95% CI) Relative Index of Inequality (95% CI) Causes of death
1981/82 1991/92 Change 1981/82 1991/92 Change
ALL CAUSES 570 (517-623) 644 (600-688) 74 0.51 (0.46-0.55) 0.72 (0.67-0.77) 0.21
Neoplasms 136 (109-164) 165 (140-190) 28 0.45 (0.36-0.54) 0.58 (0.49-0.67) 0.13
Stomach 33 (24-42) 24 (17-31) -9 0.88 (0.64-1.12) 1.04 (0.74-1.34) 0.16
Colorectal -5 (-15-5) 12 (3-21) 17 -0.15 (-0.43-0.13) 0.32 (0.07-0.57) 0.47
Lung 70 (56-83) 86 (73-98) 16 0.83 (0.67-0.99) 1.08 (0.92-1.24) 0.25
Other Neoplasm 38 (19-58) 43 (25-62) 5 0.27 (0.13-0.40) 0.30 (0.17-0.43) 0.03
Circulatory 119 (82-155) 188 (160-216) 69 0.24 (0.17-0.31) 0.54 (0.46-0.61) 0.30
Ischemic heart -38 (-66--11) 74 (53-95) 112 -0.15 (-0.25--0.04) 0.38 (0.27-0.49) 0.53
Cerebrovascular 67 (52-83) 41 (29-53) -26 0.67 (0.51-0.82) 0.67 (0.48-0.86) 0.00
Other circulatory 89 (71-107) 73 (59-87) -16 0.66 (0.53-0.80) 0.77 (0.62-0.91) 0.11
Other Causes 185 (163-206) 201 (181-220) 16 0.89 (0.79-1.00) 1.16 (1.05-1.28) 0.27
Diabetes 8 (2-13) 11 (5-16) 3 0.58 (0.16-1.00) 0.69 (0.32-1.06) 0.11
Respiratory 55 (45-64) 38 (29-46) -17 1.25 (1.03-1.47) 1.07 (0.83-1.32) -0.18
Digestive 69 (55-83) 86 (74-98) 17 0.79 (0.63-0.95) 1.21 (1.04-1.37) 0.42
Alcohol-assoc. 23 (17-30) 33 (27-39) 10 1.44 (1.06-1.82) 1.71 (1.39-2.03) 0.27
Other 30 (19-41) 33 (24-41) 3 0.65 (0.41-0.89) 1.07 (0.79-1.35) 0.42
External 130 (114-147) 90 (77-104) -40 1.08 (0.95-1.22) 1.07 (0.91-1.23) -0.01
Injury 78 (66-90) 53 (43-63) -25 1.12 (0.94-1.29) 1.15 (0.94-1.37) 0.03
Suicide 52 (42-63) 37 (28-47) -15 1.03 (0.82-1.24) 0.97 (0.72-1.22) -0.06
By far the largest increase in educational mortality disparity observed among men was for ischemic heart disease. In 1981, the disparity for this cause of death was negative in both absolute and relative terms. In other words, a more educated individual had a higher risk of dying of ischemic heart disease than did a less educated individual. During the 1980s, the disparity between the hypothetically least and most educated persons increased by 112, from -38 deaths per 100,000 to 74 deaths per 100,000; and the Relative Index of Inequality increased by 0.53, from -0.15 to 0.38. Hence, the change in the disparity for ischemic heart disease contributed 112/74 = 151% to the change in educational disparity in terms of overall mortality. Appendix Table 1 shows that the absolute change in standardized deaths rates for ischemic heart diseases was -27 for those with the least education, -77 for those with middle, and -98 for those with the highest education. In relative terms, it the decline was 11%, 28%, and 40%. Without the increase of 112 deaths per 100,000 in the SII for ischemic heart disease, there would have been a decline in absolute educational disparity in overall mortality among Austrian men between 1981/82 and 1991/92. The reason of this is because the modest increases in absolute disparity for neoplasms and other causes (an SII increase of 28 and 16, respectively) was offset by the decline in absolute disparity for external causes
12

(a decline of 40 in the SII), as well as a decline in all other cardiovascular diseases (a decline of 26 and 16, respectively, in the SII). For colorectal cancer, the Relative Index of Inequality increased among men by 0.47, from -0.15 to 0.32—which was almost the same as for ischemic heart disease. In absolute terms, the SII also increased considerably, by 17 deaths per 100,000, rising from -5 to 12. The increasing disparity for colorectal cancer contributed by 17/74 = 23% to the changes in all-cause mortality. Since colorectal cancer is a much less common cause of death than ischemic heart disease, its contribution was much lower. An increase in absolute and relative terms was also observed for digestive diseases (17 deaths per 100,000 and an increase in the RII of 0.42), lung cancer (16 deaths per 100,000 and an RII increase of 0.25), and alcohol-related causes of death (10 deaths per 100,000 and an RII increase of 0.27). The contribution to the rise in overall mortality disparity was 23% for digestive diseases, 22% for lung cancer, 14% for alcohol-related causes, and 7% for other neoplasms. For educational inequalities in external causes among men, the SII decreased by 40, from 130 to 90 deaths per 100,000 between the hypothetically least and most educated; however, the RII remained unchanged at a very high level. Here, less-educated individuals benefited more from the decline in death rates between 1981/82 and 1991/92, but only in absolute terms. Because the SII for external causes decreased to about the same extent as did death rates for all educational levels combined, there was no change in relative terms. A decline in the SII among men was also observed for respiratory diseases (-17 deaths per 100,000), cerebrovascular diseases (-26), other circulatory diseases (-16), and stomach cancer (-9). For the residual category ‘other,’ the SII remained at about the same level, though the RII increased sharply by 0.42, from 0.65 to 1.07. As shown in Table 5, for all-cause mortality the educational disparity among females between the hypothetically least and most educated increased only slightly. The SII increased by 11 deaths per 100,000, from 245 in 1981/82 to 256 in 1991/92; and the RII rose by 0.1, from 0.36 to 0.46. The major changes occurred rather in cause-specific mortality. Similarly to men, the largest rise in disparity could be seen for ischemic heart disease. The SII increased by 21 deaths per 100,000, or from 44 to 65—which made up around 200% of the total change in the SII. The RII also increased sharply, by 0.32 from 0.43 to 0.75. Compared to men, the increase in the differentials for ischemic heart disease among women was much smaller. Since in 1981/82 educational inequality for ischemic heart disease was already at a high level among females, there was probably less space for such a large increase than was observed among men, where the SII and RII was negative in 1981/82. By far the largest increase in relative terms among females, however, could be found for diabetes. The RII increased significantly, from 0.41 to 1.35. In absolute terms, the disparity rose by 12 deaths per 100, or from 6 to 18. Even though complications from diabetes were a relatively rare cause of death, the increasing disparity contributed by 100% to the change in all-cause mortality. Without the decrease in diabetes and ischemic heart disease together, there would have been a strong decline in the mortality differentials among females.
13
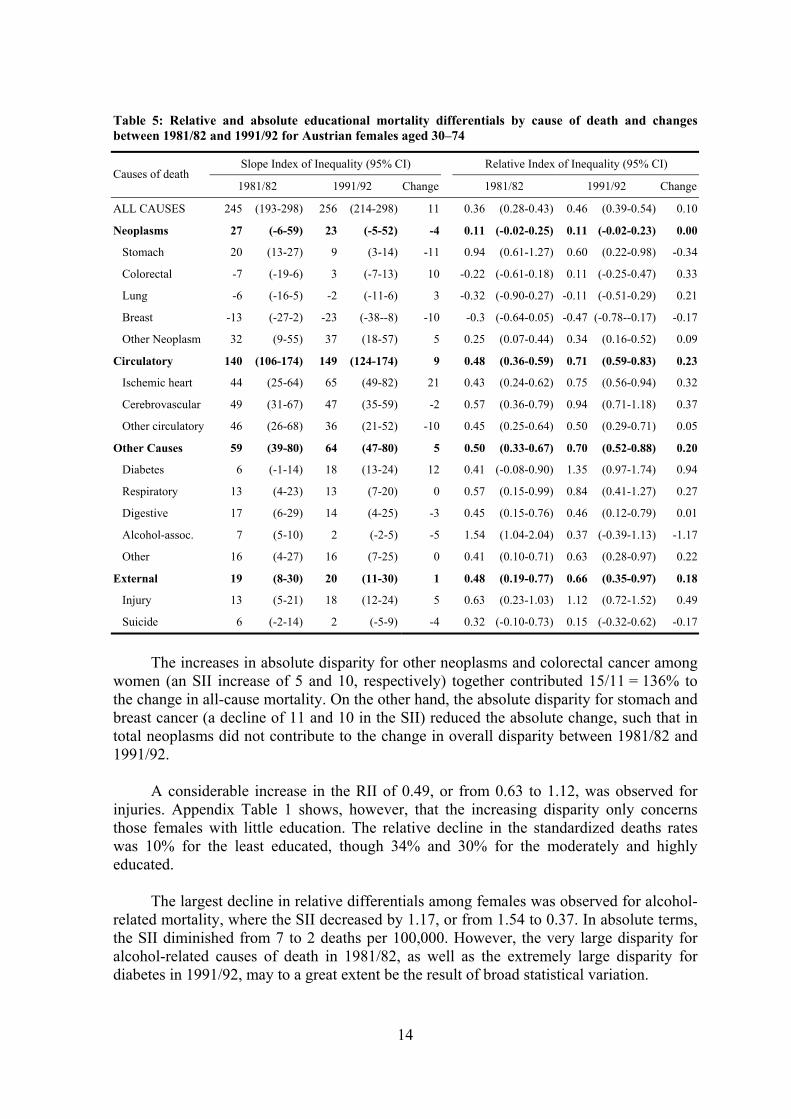
Table 5: Relative and absolute educational mortality differentials by cause of death and changes between 1981/82 and 1991/92 for Austrian females aged 30–74
Slope Index of Inequality (95% CI) Relative Index of Inequality (95% CI) Causes of death
1981/82 1991/92 Change 1981/82 1991/92 Change
ALL CAUSES 245 (193-298) 256 (214-298) 11 0.36 (0.28-0.43) 0.46 (0.39-0.54) 0.10
Neoplasms 27 (-6-59) 23 (-5-52) -4 0.11 (-0.02-0.25) 0.11 (-0.02-0.23) 0.00
Stomach 20 (13-27) 9 (3-14) -11 0.94 (0.61-1.27) 0.60 (0.22-0.98) -0.34
Colorectal -7 (-19-6) 3 (-7-13) 10 -0.22 (-0.61-0.18) 0.11 (-0.25-0.47) 0.33
Lung -6 (-16-5) -2 (-11-6) 3 -0.32 (-0.90-0.27) -0.11 (-0.51-0.29) 0.21
Breast -13 (-27-2) -23 (-38--8) -10 -0.3 (-0.64-0.05) -0.47 (-0.78--0.17) -0.17
Other Neoplasm 32 (9-55) 37 (18-57) 5 0.25 (0.07-0.44) 0.34 (0.16-0.52) 0.09
Circulatory 140 (106-174) 149 (124-174) 9 0.48 (0.36-0.59) 0.71 (0.59-0.83) 0.23
Ischemic heart 44 (25-64) 65 (49-82) 21 0.43 (0.24-0.62) 0.75 (0.56-0.94) 0.32
Cerebrovascular 49 (31-67) 47 (35-59) -2 0.57 (0.36-0.79) 0.94 (0.71-1.18) 0.37
Other circulatory 46 (26-68) 36 (21-52) -10 0.45 (0.25-0.64) 0.50 (0.29-0.71) 0.05
Other Causes 59 (39-80) 64 (47-80) 5 0.50 (0.33-0.67) 0.70 (0.52-0.88) 0.20
Diabetes 6 (-1-14) 18 (13-24) 12 0.41 (-0.08-0.90) 1.35 (0.97-1.74) 0.94
Respiratory 13 (4-23) 13 (7-20) 0 0.57 (0.15-0.99) 0.84 (0.41-1.27) 0.27
Digestive 17 (6-29) 14 (4-25) -3 0.45 (0.15-0.76) 0.46 (0.12-0.79) 0.01
Alcohol-assoc. 7 (5-10) 2 (-2-5) -5 1.54 (1.04-2.04) 0.37 (-0.39-1.13) -1.17
Other 16 (4-27) 16 (7-25) 0 0.41 (0.10-0.71) 0.63 (0.28-0.97) 0.22
External 19 (8-30) 20 (11-30) 1 0.48 (0.19-0.77) 0.66 (0.35-0.97) 0.18
Injury 13 (5-21) 18 (12-24) 5 0.63 (0.23-1.03) 1.12 (0.72-1.52) 0.49
Suicide 6 (-2-14) 2 (-5-9) -4 0.32 (-0.10-0.73) 0.15 (-0.32-0.62) -0.17
The increases in absolute disparity for other neoplasms and colorectal cancer among women (an SII increase of 5 and 10, respectively) together contributed 15/11 = 136% to the change in all-cause mortality. On the other hand, the absolute disparity for stomach and breast cancer (a decline of 11 and 10 in the SII) reduced the absolute change, such that in total neoplasms did not contribute to the change in overall disparity between 1981/82 and 1991/92. A considerable increase in the RII of 0.49, or from 0.63 to 1.12, was observed for injuries. Appendix Table 1 shows, however, that the increasing disparity only concerns those females with little education. The relative decline in the standardized deaths rates was 10% for the least educated, though 34% and 30% for the moderately and highly educated. The largest decline in relative differentials among females was observed for alcohol-related mortality, where the SII decreased by 1.17, or from 1.54 to 0.37. In absolute terms, the SII diminished from 7 to 2 deaths per 100,000. However, the very large disparity for alcohol-related causes of death in 1981/82, as well as the extremely large disparity for diabetes in 1991/92, may to a great extent be the result of broad statistical variation.
14

Table 6 shows changes in educational disparities for avoidable causes of death and for mortality amenable to medical intervention. Among men, the disparity for avoidable mortality increased by 128, or from 384 to 512 deaths per 100,000, between the hypothetically least and most educated. Conversely, disparities in non-avoidable mortality decreased by 54, or from 186 to 132 deaths per 100,000. This means that avoidable causes of death contributed a staggering 173% to the change in overall mortality disparity, while non-avoidable mortality contributed negatively with -54/74 = -73%. The rise in disparity for avoidable mortality was also observed in relative terms, where the RII increased significantly by 0.30, or from 0.45 to 0.75. The increase in the differential for mortality amenable to medical treatment was 52 deaths per 100,000 among men, or a contribution of 70%, while the contribution to the change for non-amenable mortality was around 100%. For both amenable and non-amenable mortality, the RII increased by 0.3 to strikingly large values of 0.57 for amenable and 0.85 for non-amenable mortality. Among females, there would have been a strong decline in the SII in overall mortality without the increase in avoidable mortality of 26 deaths per 100,000. On the other hand, absolute disparity for non-avoidable mortality declined considerable by 15 deaths per 100,000. With regard to mortality amenable to treatment, there was little change in both relative and absolute terms. Only the increase in the SII for non-amenable mortality contributed to the increase in absolute overall mortality disparity. In relative terms, the RII for non-amenable mortality increased by 0.23, or from 0.36 to 0.59.
Table 6: Relative and absolute educational differentials in avoidable/amenable mortality and changes between 1981/82 and 1991/92 among the Austrian population aged 30–74
Slope Index of Inequality (95% CI) Relative Index of Inequality (95% CI)
1981/82 1991/92 Change 1981/82 1991/92 ChangeCauses of death
Males
ALL CAUSES 570 (517-623) 644 (600-688) 74 0.51 (0.46-0.55) 0.72 (0.67-0.77) 0.21
Avoidable 384 (337-430) 512 (474-551) 128 0.45 (0.39-0.50) 0.75 (0.69-0.80) 0.30
Amenable 86 (57-116) 139 (115-162) 52 0.27 (0.18-0.36) 0.57 (0.47-0.67) 0.30
Non-amenable 297 (261-333) 373 (343-404) 76 0.55 (0.49-0.62) 0.85 (0.78-0.92) 0.30
Non-avoidable 186 (161-212) 132 (110-153) -54 0.71 (0.61-0.80) 0.64 (0.53-0.74) -0.07
Females
ALL CAUSES 245 (193-298) 256 (214-298) 11 0.36 (0.28-0.43) 0.46 (0.39-0.54) 0.10
Avoidable 166 (122-210) 192 (156-227) 26 0.34 (0.25-0.43) 0.48 (0.39-0.57) 0.14
Amenable 84 (51-116) 80 (53-107) -4 0.32 (0.20-0.45) 0.38 (0.25-0.51) 0.06
Non-amenable 83 (53-112) 112 (88-135) 29 0.36 (0.23-0.49) 0.59 (0.47-0.72) 0.23
Non-avoidable 79 (51-107) 64 (41-87) -15 0.39 (0.25-0.53) 0.42 (0.27-0.57) 0.03
15
4. Discussion
The findings suggest that educational inequalities in overall mortality become significantly wider in Austria, though more among men than among women. However, without the increase in the disparity for ischemic heart disease, between 1981/82 and 1991/92 there would have been a decline in absolute educational disparity in overall mortality for Austrian men and women. The modest increases in absolute disparity among men for colorectal cancer, lung cancer, other neoplasms, digestive diseases, and alcohol-associated causes was offset by the decline in absolute disparity for external causes of death, stomach cancer, cerebrovascular diseases, other circulatory diseases, and respiratory diseases. Among females, the change in the disparity for ischemic heart also contributed most to the increase in absolute overall mortality differentials; but as well did diabetes and colorectal cancer. Also striking are the large increasing relative disparities for diabetes among females, as well as for colorectal cancer and digestive diseases among males. As the Introduction mentioned, the contribution of any given cause to overall educational mortality disparity is a combination of the prevalence of that cause and the magnitude of the disparity. The same principal applies to any changes in disparity from one period to the next. Since ischemic heart disease is the most common cause of death in Austria and because, the magnitude of the disparity underwent a great increase, the contribution of this cause of death to the change in overall mortality was indeed immense. Ischemic heart disease, otherwise known as coronary artery disease, is a condition that affects the supply of blood to the heart. A series of studies have examined risk factors for ischemic heart disease, e.g. the Framingham Heart Study in the USA and the PROCAM Study in Germany. They found hypercholesterolemia (elevated blood cholesterol levels), arterial hypertonia, diabetes mellitus, and smoking to be most responsible for coronary heart diseases (Schächinger and Zeiher 2004). Additionally, genetic predisposition is an important factor that affects the prevalence of ischemic heart disease. Stress is also thought to be a risk factor, though lately there has been a great deal of debate on this (WebHealthCentre.com 2006). Behavioral risk factors such as a high-fat diet, smoking, a sedentary lifestyle, and stress are to be avoided, as they are the main areas of focus for preventive activities. Avoiding foods rich in saturated fats is vital for reducing lipid levels in the blood and for preventing arteriosclerosis. A proper amount of regular physical activity is also essential. Diabetes mellitus and hypertension should be kept under adequate control with proper treatment. (WebHealthCentre.com 2006). With regard to these behavioral factors, Schwarz (2003) shows that, among the Austrian adult population in 1999, less educated people are much less likely to follow a healthy diet and to engage in regular physical activity, are much more likely to be overweight or obese, and are much more likely to smoke. Such behavioral differentials may explain an essential part of mortality inequalities for most causes of death. Findings from other European countries (Valkonen 2001), the USA (Feldman et al. 1989), and New Zealand (Blakely et al. 2005) also suggest that the increase in social differentials for mortality stemming from heart disease was in great part responsible for the trend related to such disparities in all-cause mortality. In all the countries observed, there was a strong decline in death rates from ischemic heart disease among those with a higher
16
socioeconomic status but not among those on the lower end of the social scale. Such a huge drop suggests, however, that ischemic heart disease is largely preventable. So far, upper-class socioeconomic groups have apparently benefited more from the trend in declining cardiovascular disease mortality because they tend to have complied with the recommended health behavior more quickly with regard to diet, smoking, and physical activities; In addition, they seem to have had better access to new medical treatments (Feldman et al. 1989, Valkonen 2001). Valkonen (2001) suggests that the lower-class groups may yet adopt the same health behavior as the higher classes and could thus also benefit from modern medical treatments once these become standard. As a result, the mortality gap may decline in the future. Since ischemic heart disease is such a common cause of death, a decline in this kind of disparities would contribute greatly to any decline in disparity for all-cause mortality. The decline in the absolute disparity for injuries among men is a very positive development, most likely caused by improved safety measures and a decreasing amount of dangerous occupational tasks. These improvements were apparently very effective, not only in reducing the overall death rate for injuries but also in reducing absolute disparities. Since people who have less education undergo greater exposure to hazards that will cause injuries, this group has benefited more in absolute terms from the introduction of safety measures and improved working conditions. In relative terms, all educational levels benefited proportionally from the decline in the death rates. Avoidable mortality had a substantial impact on the change in overall mortality differential—for both sexes. The increasing inequalities and the sizeable contribution to the increase in overall educational disparity in avoidable causes of death, though, can be seen from both a positive and a negative perspective. The negative view is that differences in health behavior and access to medical treatment have increased between the educational groups, and that this is hardly to reverse. The positive view is that the disparity in overall mortality could potentially be reduced, since theoretically avoidable causes of death could be avoided through prevention. Taking action through preventive and educational measures promoting good health would not only reduce the mortality gap between social classes but would also have a great positive on average health status. The same also applies to amenable mortality. Amenable causes of death are those that, with currently available medical treatment, should not result in death, even when no preventive steps were taken. Providing all educational groups with equal access to medial treatment could theoretically also reduce the mortality gap in overall mortality. However, in Austria, a free and equally accessible health-care system has been in place for a long time. In this system, almost everybody is entitled to medical treatment, free medicines (with a small co-payment), preventive physicals, basic dental treatment, nursing care at home or as an in-patient, paid ambulance services, etc. Regardless of all these positive conditions, among men the differentials in mortality amenable to medical intervention have nevertheless increased significantly. With regard to the relationship between socioeconomic mortality differentials and the health-care system, Pamuk (1985) showed that, in England, inequalities in all-cause mortality have been on the increase despite the introduction of the National Health Service in 1948. The Social Security Act that
17

established Medicare and Medicaid in the USA in 1965 has not been able to prevent increasing disparities in mortality, either (Feldman et al. 1989). All in all, the finding that inequalities in all-cause mortality and for many causes of death have increased for both men and women in Austria over the decade under study is indeed dramatic. However, merely examining two points in time does not give sufficient grounds to speak of any trends. For causes of death with a small number of cases, statistical variation can also produce striking results. Cause-specific trend analyses by education will show whether or not the present outcomes will hold true over the next decade via future analyses when census data merged with death registries from 2001/02 becomes available.
18

Appendix
19

MALES
20
Neoplasms 336 (323-349) 302 (290-315) 209 (190-228) -3 (-22,1
Stomach 47 (42-52) 36 (32-40) 18 (13-24) -15 (-21,-
Colorectal 32 (28-36) 41 (36-45) 30 (23-38) 6 (-0,1
Lung 102 (95-110) 83 (76-89) 40 (32-48) 4 (-7,1
Other Neoplasms 154 (146-163) 143 (135-152) 120 (106-134) 2 (-11,1
Circulatory 521 (505-537) 501 (485-517) 400 (374-426) -120 (-141,-9
Ischemic heart 239 (228-249) 278 (267-290) 243 (223-264) -27 (-42,-1
Cerebral 121 (113-128) 96 (89-102) 66 (55-77) -46 (-56,-
Other circulatory 162 (153-170) 127 (119-135) 91 (78-103) -47 (-59,-3
Other Causes 261 (249-272) 191 (182-201) 112 (98-126) -17 (-34,-
Diabetes 15 (12-18) 13 (11-16) 7 (4-11) 3 (-1,
Respiratory 61 (55-66) 37 (33-41) 20 (14-26) -12 (-19,-
Digestive 104 (97-112) 86 (79-93) 41 (32-50) -4 (-15,
Alcohol-associated 24 (20-28) 13 (10-15) 8 (4-12) 8 (2,1
Other 57 (51-62) 42 (38-47) 36 (28-43) -13 (-20,-
External 159 (149-168) 110 (103-117) 54 (44-63) -42 (-55,-2
Injury 93 (85-100) 63 (58-69) 30 (23-37) -29 (-39,-
Suicide 66 (60-72) 47 (42-51) 24 (17-30) -13 (-21,-
Avoidable 956 (934-977) 859 (839-880) 598 (566-630) -111 (-142,-8
Amenable 342 (329-355) 326 (313-338) 256 (235-277) -56 (-74,-3
Non-amenable 614 (596-631) 534 (518-550) 342 (318-367) -55 (-80,-3
Non-avoidable 321 (308-333) 245 (234-256) 176 (159-194) -71 (-89,-5
App
endi
x T
able
1: A
ge-s
tand
ardi
zed
deat
h ra
tes f
or 1
981/
82 p
er 1
00,0
00 p
erso
n-ye
ars b
y le
vel o
f edu
catio
n an
d ca
use
of d
eath
, as w
ell a
s rel
ativ
e an
dab
solu
te c
hang
e fr
om 1
981/
81 to
199
1/92
am
ong
the
Aus
tria
n po
pula
tion
aged
30–
74 y
ears
(95%
con
fiden
ce in
terv
als i
n pa
rent
hese
s)
5) -18 (-34,-1) -12 (-38,13) -1 (-6,5) -6 (-11,-1) -6 (-17,6)
9) -14 (-19,-9) -6 (-13,2) -32 (-43,-20) -39 (-49,-27) -30 (-55,10)
2) -2 (-8,4) -4 (-13,6) 18 (-1,40) -5 (-18,11) -12 (-37,23)
4) -4 (-13,4) -3 (-14,8) 4 (-6,15) -5 (-15,5) -8 (-31,22)
5) 3 (-9,14) 0 (-19,19) 2 (-6,10) 2 (-6,10) 0 (-15,18)
8) -142 (-162,-122) -160 (-192,-129) -23 (-27,-19) -28 (-32,-25) -40 (-46,-34)
1) -77 (-92,-62) -98 (-123,-73) -11 (-17,-5) -28 (-32,-23) -40 (-48,-32)
36) -35 (-44,-27) -25 (-38,-12) -38 (-44,-31) -37 (-44,-30) -37 (-51,-20)
5) -30 (-40,-20) -38 (-53,-23) -29 (-35,-22) -23 (-30,-16) -42 (-53,-28)
1) -30 (-42,-17) -25 (-43,-7) -7 (-13,-0) -16 (-21,-9) -22 (-35,-7)
8) 2 (-1,6) 2 (-3,7) 23 (-4,58) 17 (-9,50) 27 (-31,137)
4) -4 (-10,1) 0 (-8,8) -19 (-30,-7) -12 (-25,4) -1 (-33,46)
7) -17 (-26,-9) -9 (-20,1) -4 (-14,7) -20 (-28,-11) -23 (-43,4)
3) 5 (1,8) -2 (-6,3) 31 (6,63) 37 (7,75) -23 (-61,49)
5) -15 (-21,-9) -16 (-25,-6) -22 (-34,-9) -36 (-45,-24) -44 (-60,-21)
8) -30 (-39,-22) -7 (-19,6) -26 (-33,-19) -28 (-34,-21) -12 (-31,12)
19) -19 (-26,-12) -9 (-18,0) -31 (-40,-22) -30 (-38,-20) -29 (-50,0)
4) -12 (-17,-6) 2 (-6,11) -19 (-30,-6) -25 (-35,-13) 9 (-23,54)
0) -178 (-204,-152) -172 (-212,-132) -12 (-15,-8) -21 (-23,-18) -29 (-34,-23)
8) -83 (-99,-67) -84 (-110,-58) -16 (-21,-11) -26 (-30,-21) -33 (-41,-24)
0) -95 (-116,-74) -88 (-119,-58) -9 (-13,-5) -18 (-21,-14) -26 (-33,-18)
4) -42 (-56,-28) -32 (-55,-10) -22 (-27,-17) -17 (-22,-12) -18 (-29,-6)
Standardized death rates per 100-000 in 1981/82 Absolute change from 1981/82 to 1991/92 Relative change from 1981/82 to 1991/92 in %
Causes of death Low Middle High Low Middle High Low Middle High
ALL CAUSES 1276 (1251-1301) 1105 (1082-1128) 774 (738-811) -182 (-218,-147) -220 (-250,-190) -204 (-250,-159) -14 (-17,-12) -20 (-22,-18) -26 (-31,-21)

21
Neoplasms 241 (233-249) 233 (219-247) 213 (186-241) -17 (-28,-6)
Stomach 25 (22-27) 17 (13-21) 8 (2-13) -9 (-12,-6)
Colorectal 30 (27-32) 34 (29-39) 31 (20-41) -2 (-6,2)
Lung 17 (15-19) 19 (15-23) 24 (14-33) 4 (0,7)
Breast 40 (37-43) 45 (39-51) 49 (37-62) 3 (-2,8)
Other Neoplasms 130 (124-136) 118 (108-128) 102 (83-122) -13 (-21,-4)
Circulatory 319 (310-328) 262 (247-276) 209 (180-238) -73 (-85,-61)
Ischemic heart 111 (106-116) 95 (86-104) 71 (54-87) -8 (-15,-1)
Cerebral 94 (90-99) 73 (65-81) 59 (43-74) -33 (-39,-27)
Other circulatory 113 (108-119) 93 (84-102) 80 (62-97) -32 (-39,-25)
Other Causes 130 (124-135) 107 (98-116) 79 (62-96) -23 (-31,-15)
Diabetes 16 (14-18) 14 (11-18) 10 (3-16) 2 (-1,5)
Respiratory 25 (23-28) 19 (15-23) 17 (9-25) -6 (-9,-2)
Digestive 41 (38-44) 35 (29-40) 25 (16-35) -6 (-11,-1)
Alcohol-associated 6 (5-7) 3 (1-4) 1 (-0-2) -2 (-3,0)
Other 41 (38-45) 36 (30-41) 26 (17-36) -12 (-16,-7)
External 43 (40-47) 35 (30-40) 30 (20-39) -7 (-12,-2)
Injury 23 (21-26) 17 (13-20) 16 (9-23) -2 (-6,1)
Suicide 20 (17-22) 18 (14-22) 14 (8-20) -5 (-8,-2)
Avoidable 517 (506-528) 452 (433-471) 379 (342-417) -73 (-89,-56)
Amenable 274 (266-283) 240 (226-254) 208 (180-236) -45 (-56,-33)
Non-amenable 243 (235-251) 212 (199-225) 171 (146-196) -28 (-39,-17)
Non-avoidable 216 (209-223) 185 (173-197) 151 (127-175) -48 (-59,-38)
FEMALES
Standardized death rates per 100-000 in 1981/82 Absolute change from 1981/82 to 1991/92 Relative change from 1981/82 to 1991/92 in %
Causes of death Low Middle High Low Middle High Low Middle High
ALL CAUSES 733 (720-747) 637 (614-660) 531 (486-575) -121 (-140,-102) -127 (-156,-98) -111 (-166,-56) -17 (-19,-14) -20 (-24,-16) -21 (-29,-11)
-11 (-30,7) -17 (-52,19) -7 (-12,-2) -5 (-12,3) -8 (-22,10)
-1 (-6,3) -3 (-9,3) -36 (-46,-24) -9 (-33,24) -41 (-79,64)
-6 (-13,1) -8 (-21,5) -7 (-19,6) -18 (-34,3) -26 (-55,19)
7 (1,12) -6 (-18,6) 21 (2,44) 36 (4,77) -25 (-57,31)
7 (-2,15) 11 (-7,29) 7 (-5,21) 15 (-4,36) 23 (-12,70)
-17 (-30,-4) -11 (-35,14) -10 (-16,-3) -14 (-24,-4) -10 (-30,16)
-78 (-96,-59) -71 (-106,-37) -23 (-26,-19) -30 (-35,-24) -34 (-46,-20)
-19 (-31,-8) -15 (-36,6) -7 (-13,-1) -20 (-30,-9) -21 (-43,9)
-33 (-42,-23) -29 (-47,-11) -35 (-40,-29) -45 (-53,-35) -50 (-67,-25)
-26 (-37,-14) -27 (-48,-6) -28 (-34,-23) -27 (-37,-17) -34 (-52,-9)
-28 (-40,-16) -18 (-39,4) -18 (-24,-12) -26 (-35,-16) -22 (-42,4)
-4 (-8,1) -5 (-12,2) 12 (-6,34) -27 (-49,5) -52 (-82,29)
-6 (-11,-1) -6 (-16,4) -23 (-35,-10) -32 (-50,-7) -36 (-68,27)
-7 (-14,0) 1 (-12,13) -15 (-25,-3) -20 (-35,0) 3 (-38,69)
2 (-1,4) 1 (-1,4) -27 (-48,3) 60 (-15,201) 133 (-59,1222)
-13 (-20,-7) -8 (-20,3) -29 (-37,-19) -37 (-50,-20) -32 (-60,14)
-10 (-16,-3) -5 (-17,7) -17 (-27,-6) -28 (-41,-11) -18 (-47,27)
-6 (-10,-1) -5 (-13,4) -10 (-24,6) -34 (-52,-9) -30 (-63,31)
-4 (-9,1) -1 (-9,8) -25 (-39,-8) -22 (-41,4) -5 (-48,74)
-82 (-107,-57) -82 (-129,-36) -14 (-17,-11) -18 (-23,-13) -22 (-32,-10)
-45 (-63,-27) -35 (-70,0) -16 (-20,-12) -19 (-25,-12) -17 (-30,-0)
-37 (-54,-20) -47 (-78,-17) -12 (-16,-7) -18 (-24,-10) -28 (-41,-11)
-45 (-61,-29) -29 (-59,1) -22 (-27,-18) -24 (-31,-17) -19 (-35,0)
App
endi
x T
able
1 c
ontin
ued

References
Blakely, T., Fawcett, J., Atkinson, J., Tobias, M. and Cheung, J. 2005. Decades of
Disparity II: Socioeconomic mortality trends in New Zealand, 1981-1999. Public Health Intelligence Occasional Bulletin 25. New Zealand: Ministry of Health.
Dahl, E. and Kjaersgaard, P. 1993. Trends in socioeconomic mortality differentials in post-war Norway: evidence and interpretations. Sociology of Health and Illness, 15(5), pp. 587-611.
Davey Smith, G., et al. 1998. Educational and occupational social class: which is the more important indicator of mortality risk? Journal of Epidemiology and Community Health, 52, pp. 153-190.
Doblhammer, G. 1997. Socioeconomic differentials in Austrian adult mortality. A study based on linked census and death records for the years 1981/82. PhD Thesis. Institut für Statistik. University of Vienna
Doblhammer, G., Rau, R. and Kytir, J. 2005. Trends in educational and occupational differentials in all-cause mortality in Austria between 1981/82 and 1991/92. Wiener Klinische Wochenschrift. The Middle European Journal of Medicine, 117(13-14), pp. 468-479.
Drever, F. and Buntig, J. 1997. Patterns and trends in male mortality. In Drever, F. and Whitehead, M. (Eds.) Health Inequalities. Decennial Supplement, Series DS No. 15. London: Office for National Statistics.
Feldman, J. J., Makuc, D. M., Kleinman, J. C. and Cornoni-Huntley, J. 1989. National trends in educational differentials in mortality. American Journal of Epidemiology, 129(5), pp. 919-933.
Harding, S., Bethune, A., Maxwell, R. and Brown, J. 1997. Mortality trends using the Longitudinal Study. In Drever, F. and Whitehead, M. (Eds.) Health Inequalities. Decennial supplements, Series DS No. 15. London: Office for National Statistics.
Hayes, L. J. and Berry, G. 2002. Sampling variability of the Kunst-Mackenbach relative index if inequality. Journal of Epidemiology and Community Health, 56, pp. 762-765.
Kunst, A. E. 1997. Cross-national comparisons of socio-economic differences in mortality. PhD Thesis. Erasmus University Rotterdam
Kunst, A. E., Bos, V., Andersen, O., Cardano, M., Costa, G. and Harding, S. 2004. Monitoring of trends in socioeconomic inequalities in mortality: Experiences from a European project. Demographic Research, S2(9), pp. 232-254.
Mackenbach, J. P., et al. 2003. Widening socioeconomic inequalities in mortality in six Western European countries. International Journal of Epidemiology, 32, pp. 830-837.
Mackenbach, J. P. and Kunst, A. E. 1997. Measuring the magnitude of socio-economic inequalities in health: an overview of available measures illustrated with two examples from Europe. Social Science and Medicine, 44(6), pp. 757-771.
Pamuk, E. R. 1985. Social Class Inequality in Mortality from 1921 to 1972 in England and Wales. Population Studies, 39, pp. 17-31.
22

Pappas, G., Queen, S., Hadden, W. and Fisher, G. 1993. The increasing disparity in mortality between socioeconomic groups in the United States, 1960 and 1986. The New England Journal of Medicine, 329(2), pp. 103-109.
Preston, S. H. and Elo, I. T. 1995. Are Educational Differentials in Adult Mortality Increasing in the United States. Journal of Aging and Health, 7(4), pp. 476-496.
Rau, R., Doblhammer, G., Romo, V. C. and Zhang, Z. 2006. Which Causes of Death Contribute to the Widening Gap in Socioeconomic Inequalities in Austrian Adult Male Mortality? : Max Planck Institute for Demographic Research.
Regidor, E., Guitierrez-Fisac, J. L. and Rodriguez, C. 1995. Increased socioeconomic differences in mortality in eight Spanish provinces. Social Science and Medicine, 41, pp. 801-807.
Schächinger, V. and Zeiher, A. M. 2004. Koronare Herzerkrankung. In: Classen, M., Diehl, V. and Kochsiek, K. (Eds.) Innere Medizin. 5 ed.: Urban & Fischer.
Schalick, L. M., Hadden, W. C., Pamuk, E., Navarro, V. and Pappas, G. 2000. The Widening Gap in Death Rates among Income Groups in the United States from 1967-1986. International Journal of Health Services, 30(1), pp. 13-26.
Schwarz, F. 2003. Socioeconomic Inequalities in Health Behavior in Austria. OIF Working Paper 32-2003. Vienna: Institute for Family Studies.
Schwarz, F. 2005. Widening educational differentials in mortality: Analysis for Austria with international comparisons. VID Working paper 07/2005. Vienna: Vienna Institute of Demography, Austrian Academy of Sciences.
Schwarz, F. 2006. Cause-specific contributions to educational mortality differentials in Austria. Vienna: Vienna Institute of Demography, Austrian Academy of Sciences.
Shkolnikov, V., Leon, D. A., Adamets, S., Andreev, E. and Deev, A. 1998. Educational level and adult mortality in Russia : an analysis of routine data 1979 to 1994. Social Science & Medicine, 47, pp. 357-369.
Turrell, G. and Mathers, C. 2001. Socioeconomic inequalities in all-cause and specific-cause mortality in Australia: 1985-1987 and 1995-1997. International Journal of Epidemiology, 30(2), pp. 231-239.
Valkonen, T. 2001. Trends in differentials mortality in European countries. In Vallin, J., Meslé, F. and Valkonen, T. (Eds.) Trends in mortality and differential mortality. Strasbourg: Council of Europe Publishing.
Wagstaff, A., Paci, P. and van Doorslaer, E. 1991. On the measurement of inequalities in health. Social Science and Medicine, 33, pp. 545-557.
WebHealthCentre.com, 2006, Ischaemic Heart Disease, www.webhealthcentre.com [accessed 25 January 2006]
Zilker, T. 2004. Sucht. In: Classen, M., Diehl, V. and Kochsiek, K. (Eds.) Innere Medizin. 5 ed.: Urban & Fischer.
23

VIENNA INSTITUTE OF DEMOGRAPHY
Working Papers
Anne Goujon, Vegard Skirbekk, Katrin Fliegenschnee and Pawel Strzelecki. New Times, Old Beliefs: Projecting the Future Size of Religions in Austria. VID Working Papers 01/2006. Vienna: Vienna Institute of Demography.
Dalkhat M. Ediev. Long-Term Effects of Childbearing Postponement. VID Working Papers 09/2005. Vienna: Vienna Institute of Demography.
Dimiter Philipov, Zsolt Spéder, and Francesco C. Billari. Now or Later? Fertility Intentions in Bulgaria and Hungary and the Impact of Anomie and Social Capital. VID Working Papers 08/2005. Vienna: Vienna Institute of Demography.
Franz Schwarz. Widening Educational Differentials in Mortality: Analysis for Austria with International Comparisons. VID Working Papers 07/2005. Vienna: Vienna Institute of Demography.
Kim, Jungho, Henriette Engelhardt, Alexia Prskawetz, and Arnstein Aassve. Does Fertility Decrease the Welfare of Households? An Analysis of Poverty Dynamics and Fertility in Indonesia. VID Working Papers 06/2005. Vienna: Vienna Institute of Demography.
Kim, Jungho. Women's Education in the Fertility Transition: The Reversal of the Relationship Between Women's Education and Birth Spacing in Indonesia. VID Working Papers 05/2005. Vienna: Vienna Institute of Demography. Kim, Jungho. Learning by Doing and Learning from Others in Contraceptive Technology. VID Working Papers 04/2005. Vienna: Vienna Institute of Demography. Heiland, Frank, Alexia Prskawetz, and Warren C. Sanderson. Do the More-Educated Prefere Smaller Families? VID Working Papers 03/2005. Vienna: Vienna Institute of Demography. Henriette Engelhardt und Alexia Prskawetz. Arbeitsmarkt und Demographie. VID Working Papers 02/2005. Vienna: Vienna Institute of Demography. The Vienna Institute of Demography Working Paper Series receives only limited review.
Views or opinions expressed herein are entirely those of the authors.


![Тайны советской демографии [The Secrets of Soviet Demography]](https://static.fdokumen.com/doc/165x107/633ca7f270f9415ce7029283/tayni-sovetskoy-demografii-the-secrets-of-soviet-demography.jpg)