Institutions and Business Cycles
31
Electronic copy available at: http://ssrn.com/abstract=1832407 Institutions and Business Cycles Sumru Altug, Ko¸ c University and CEPR Mustafa Emin, Bocconi University Bilin Neyapti, Bilkent University * May 1, 2011 Abstract This paper investigates the relationship between the main business cycles features and the institutional and structural characteristics of countries in which they are observed. Using the nonparametric Harding-Pagan approach, we derive the business cycle charac- teristics of 63 countries that includes industrial, emerging and formerly centrally planned economies from all continents. Our analysis reveals that institutional factors have signifi- cant associations with the main business cycle characteristics. In addition, we examine the determinants of business cycle synchronization for the countries in our sample. In contrast to earlier studies which seek to account for such synchronization using gravity arguments as well as trade intensity and bilateral financial linkages only, we also consider the proximity of their institutional and policy environments. Keywords: Institutions, business cycles, synchronization, nonparametric analysis JEL Codes: C32, E32, E37 * We are grateful to Sumru ¨ Oz for her comments on an earlier version of this paper and to Erhan Uluceviz for his help with some of the data used in this study. 1
Transcript of Institutions and Business Cycles

Electronic copy available at: http://ssrn.com/abstract=1832407
Institutions and Business Cycles
Sumru Altug, Koc University and CEPRMustafa Emin, Bocconi UniversityBilin Neyapti, Bilkent University∗
May 1, 2011
Abstract
This paper investigates the relationship between the main business cycles features andthe institutional and structural characteristics of countries in which they are observed.Using the nonparametric Harding-Pagan approach, we derive the business cycle charac-teristics of 63 countries that includes industrial, emerging and formerly centrally plannedeconomies from all continents. Our analysis reveals that institutional factors have signifi-cant associations with the main business cycle characteristics. In addition, we examine thedeterminants of business cycle synchronization for the countries in our sample. In contrastto earlier studies which seek to account for such synchronization using gravity arguments aswell as trade intensity and bilateral financial linkages only, we also consider the proximityof their institutional and policy environments.
Keywords: Institutions, business cycles, synchronization, nonparametric analysis
JEL Codes: C32, E32, E37
∗We are grateful to Sumru Oz for her comments on an earlier version of this paper and to Erhan Ulucevizfor his help with some of the data used in this study.
1

Electronic copy available at: http://ssrn.com/abstract=1832407
1 Introduction
This paper investigates the relationship between the main business cycles features and theinstitutional and structural characteristics of countries in which they are observed. The roleof institutional in determining macroeconomic outcomes has been discussed extensively in theliterature. There are numerous studies that show that good governance has positive effectson economic performance (see, for example, Knack and Keefer, 1995), Hall and Jones, 1999,Easterly and Levine, 2003, and Rodrik et al., 2002). Sawyer (2010) provides an analysis thatrelates underlying determinants of economic growth such as total factor productivity for LatinAmerica. There is also an extensive literature on the effect of central bank independence oninflation (see, for example, Bade and Parkin, 1988, Alesina, 1988 and 1989, Grilli et al., 1991,Cukierman et al., 1992 and 2002, and Eijffinger and Schaling, 1993). Neyapti and Dincer(2005) show that there is a significant relationship between the legal quality of bank regulationand supervision and GDP growth in transition economies. Allen and Gale (2007) and De Haanand Shehzad (2010) show that regulatory intensity reduces banking crises. Dincer and Neyapti(2010) also show that bank regulation is associated with better bank performance.
Yet there has been relatively little work that examines the institutional underpinnings ofbusiness cycle fluctuations. Krainer (2000) relates corporate governance structures to the fi-nancial business cycle characteristics of the G-7 countries. As a recent contribution in thisregard, Giannone, Lenza and Reichlin (2010) relate the extent of market liberalization to theseverity of the recent global financial crisis. They consider the relationship between variousrating and regulatory indices and GDP growth during 2008-2009 for 102 countries. Even af-ter controlling for the effects of such variables as income per capita, financial market depth,banking competition, liquidity, and financial macroeconomic imbalances, they find that the setof policies that favor credit market liberalization correlate negatively with countries’ resilienceto the current financial crisis. Imbs (2010) examines the joint dynamics of bilateral businesscycle correlations and observed changes in goods and financial trade. He seeks to understandthe factors influencing the distribution of business cycle correlations over time. He uses indus-trial production data for 39 countries and seeks to quantify the proportion of business cyclesynchronization that can be explained by goods and asset trade. He finds that the degree ofbusiness cycle synchronization is unprecedented in three decades. He also finds that financialopenness is correlated with this shift for the OECD countries while the weaker shift for thedeveloping economies tends to occur for trade partners.
The business cycle literature has employed alternative approaches to determining businesscycle characteristics. Hamilton (1989) proposed a simple nonlinear regime-switching frame-work for modeling postwar US GDP growth. In his framework, recessions and expansions aremodeled in terms of a regime-switching variable that governs the permanent component of theseries. The multivariate version of the Markov switching model is due to Krolzig (1997). Kimand Nelson (1999) proposed an alternative form of asymmetry that can generate recessionsand expansions. This is known as the “plucking model” of business cycles where recessionsoccur as temporary deviations from the long-run level of GDP as occasional “plucks” whereasexpansions reflect permanent shocks. Factor models or vector autoregression models with afactor structure can also be used to derive measures of cycles that are common across regions.See, for example, Kose, Otrok and Whiteman (2003) or more recently, Canova (2010). Hardingand Pagan (2002a,b) have argued that such parametric approaches which directly specify a
2

statistical model for the series in question may produce different business cycle characteristicsrelative to linear models depending on assumed features such as conditional heteroscedasticity,persistence, and non-normality of the process. They have advocated a nonparametric approachto characterizing business cycles that has closer parallels with the Burns-Mitchell methodology.Harding and Pagan (2002b) have proposed a modification to the Bry-Boschan algorithm – theso-called BBQ algorithm – that can be used to identify the peaks and troughs of the classicalcycle at a quarterly frequency.
In this paper we extend Altug and Bildirici’s (2010) results 63 developed and developingcountries to a variety of institutional, structural and macroeconomic factors. First, we extendAltug and Bildirici’s (2010) to a mixed sample of countries that includes industrial, emerg-ing and formerly centrally planned economies from all continents. We use the nonparametricHarding-Pagan approach to examine the business cycle characteristics of 63 countries in termsof the turning points of the business cycle for each country, the duration and amplitude mea-sures for each phase of the business cycle as well as synchronization of business cycles acrosscountries. The period ranges from the 1960’s until 2009, depending on data availability foreach country. Second, we relate such business cycle characteristics to a set of institutional,structural and macroeconomic factors. We consider how the different factors affect businesscycle characteristics in the expansionary and recessionary phases separately. Since the businesscycle features are obtained as averages over relatively long sample periods, our approach to thisempirical investigation does not seek to assign causality. An additional feature of our analysisis that we examine the determinants of business cycle synchronization across countries. Theearlier work has concentrated on gravity arguments as well as the role of trade intensity andbilateral financial linkages. While we also control for such variables, we examine the impact ofproximity in their institutional and policy environments. To our knowledge, our paper is thefirst to quantitatively analyze how such factors affect the synchronization of business cyclesacross countries.
The remainder of this paper is organized as follows. Section 2 describes the derivation ofthe business cycle characteristics used in our study. Section 3 describes the institutional, struc-tural and macroeconomic variables used in our study while Section 4 describes the regressionresults used to correlate business cycle characteristics with the institutional, structural andmacroeconomic variables. Section 5 provides evidence on the determinants of business cyclesynchronization while Section 6 concludes.
2 Business cycle characteristics
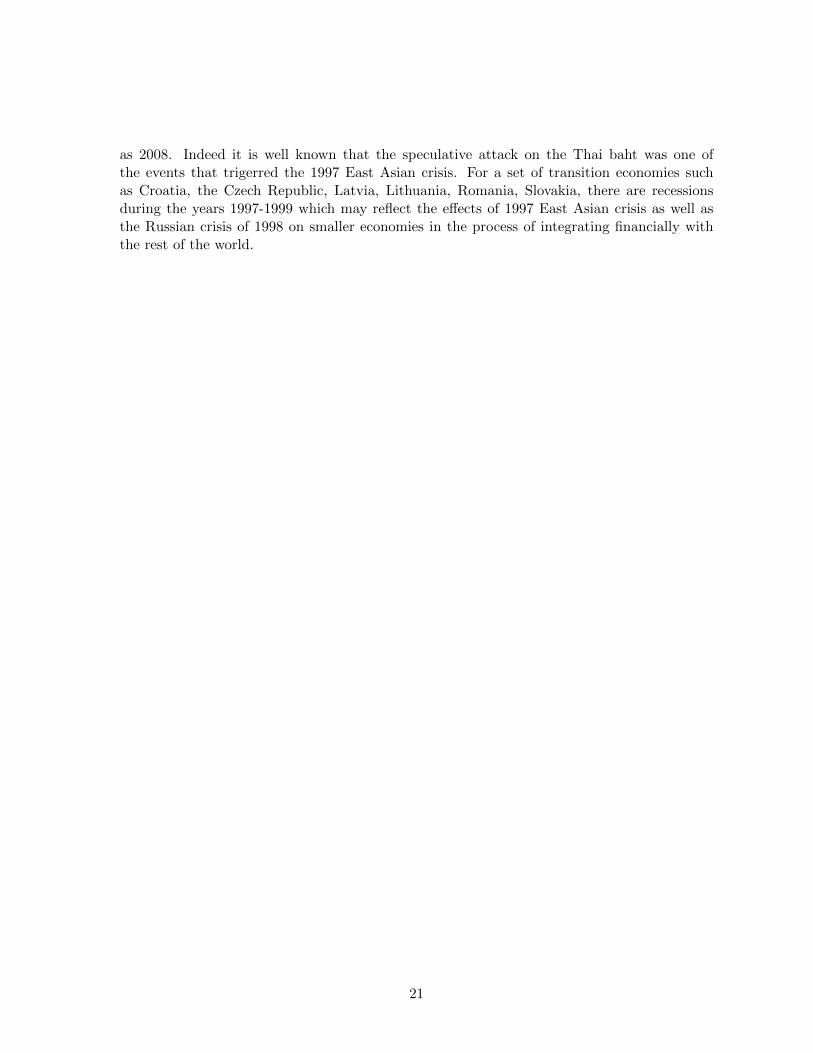
The data used to derive the business cycle characteristics for our study is comprised of arepresentative set of developed and developing countries. Appendix provides the data sourcesand some specific observations on the sample countries. Table A.1 presents the list of countriesused in our study as well as the sample period in question. We used the nonparametric Bry-Boschan procedure to obtain the dates of business cycles and business cycle characteristics forthe countries in our sample. Let yi,t = ln(Yi,t) where Yi,t denotes real GDP of country i inquarter t.1 As in the NBER approach, the nonparametric approach to characterizing business
1Since the BBQ algorithm makes use of quarterly growth rates, we used the level data and removed seasonaleffects by taking four-quarter rolling averages of the levels.
3

cycles is based on identifying the peaks and troughs of economic activity. Specifically, theBBQ algorithm identifies a trough at time t if {∆2yt < 0,∆yt < 0,∆yt+1 > 0,∆2yt+2 > 0}where ∆2yt = yt − yt−2 and a peak if {∆2yt > 0,∆yt > 0,∆yt+1 < 0,∆2yt+2 < 0}. Theseconditions yield the turning points for classical cycles, as defined by the NBER methodology.A natural requirement that is imposed is that peaks and troughs alternate. In the event thatthis condition fails, the least pronounced of the adjacent turning points is deleted.
Harding and Pagan (2002b) have proposed a variety of measures to examine the charac-teristics of the phases of a business cycle based on the implementation of the BBQ algorithm,which is also used here. These include the duration and amplitude as well as a concordanceindex.2 Once the turning points have been determined according to this data-based approach,the different measures of business cycle activity can be computed. To describe these measures,let Di be the duration of a business cycle phase, say a recession or an expansion, and let Ai
denote its amplitude. If the consecutive turning points fall on the dates t and t + d, thenDi = d and Ai = yt+d − yt = ∆dyt.
3
The results of implementing this algorithm are described in the Appendix. Table A.2provides the business cycle dates for all the countries in our sample. As we discuss in theAppendix, some countries in our sample do not display multiple recessionary experiences.Hence, it does not make sense to calculate such measures as the average duration, amplitude,and excess cumulated movements across contractions and expansions for these countries. Forthe remaining countries, we examine the business cycle characteristics of the countries acrossseveral broad groupings. These are as follows:
• G7 consisting of the US, the UK, Japan, Canada, France, Germany and Italy;
• the EU countries comprising Austria, Belgium, Denmark, Finland, Greece, the Nether-lands, Spain, and Sweden;;
• other industrialized countries such as Australia, Hong Kong, Israel, Malta, New Zealand,Singapore, S. Korea, Switzerland and Taiwan;
• the Central and Eastern European (CEE) countries of the Czech Republic, Estonia,Latvia, Lithuania, Romania, and Russia;
• the Latin American countries of Argentina, Brazil, Chile, Mexico, Peru, Uruguay andVenezuela;
• other emerging economies such as Botswana, Jamaica, Morocco, Malaysia, S. Africa,Thailand, and Turkey.
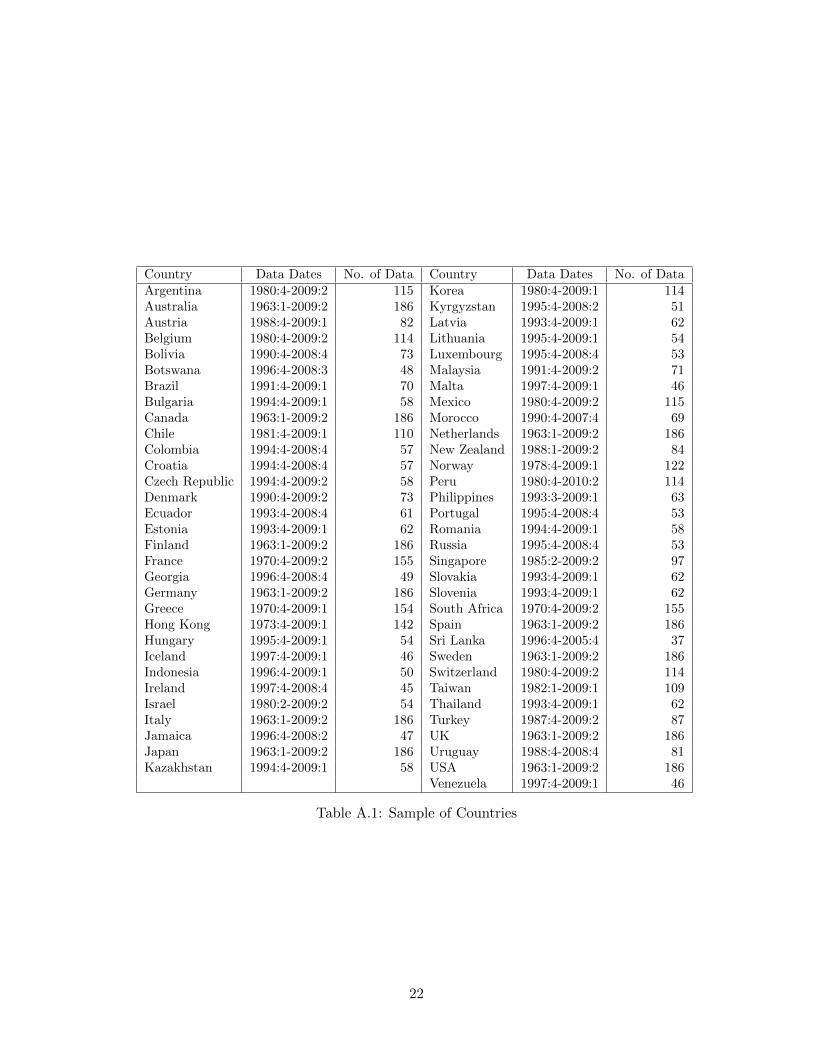
Figures 1 through 4 show the duration and amplitude of contractions and expansions forall of the countries that have multiple of recessions and expansions. Second, as a way of sum-marizing the individual county data, Table 1 also shows the average duration and amplitude
2we discuss the calculation of measures of business cycle synchronization in Section 5.3Harding and Pagan (2002b) also provide a measure that describes the shape of each phase of the business
cycle. If the duration and amplitude are thought to form a triangle, then the area of the triangle measuresthe loss (gain) of a recession (expansion). The difference between the actual cumulated movements and thetriangle approximation as a percentage of the actual cumulated movements id denoted as the excess cumulatedmovements.
4

Recession Expansionduration† amplitude‡ duration† amplitude‡
G7 3.53 -1.77 37.92 25.00EU 4.07 -2.00 40.96 27.00Industrialized 4.25 -3.00 30.05 29.00CEE 5.05 -5.22 22.59 28.23Latin American 6.02 -8.30 17.26 19.00Emerging 4.47 -4.33 17.99 22.91† in quarters; † in percent
Table 1: Summary of Business Cycle Characteristics
of recessions and expansions for the six different country groupings described above. There areseveral ways of examining these results. If we compare the durations of contractions versusexpansions, we note that expansions tend to display more heterogeneous behavior relative tocontractions. There is also significant heterogeneity in the amplitude of expansions comparedto contractions but this finding is not as pronounced as it is in the case of the durations ofthe different phases. These findings are consistent with the findings of Canova, Ciccarelli,and Ortega (2007), who show that expansions tend to have large idiosyncratic componentswhereas declines in economic activity have common timing and dynamics, both within andacross countries. Likewise, Altug and Bildirici (2010) show that there is a wide variety ofexperiences characterizing the cyclical behavior of different countries, but that their behaviorappears more closely correlated during recessions. These preliminary findings will have im-portant ramifications for our subsequent analysis regarding the determinants of business cyclecharacteristics across the different phases.
Further viewing Figures 1 through 4 and Table 1, we can also contrast the business cyclecharacteristics for the developed versus developing countries. A striking finding that emerges isthe long duration of contractions for the developing countries. Likewise, we find that expansionstend to be longer for the developed countries. Examining the results according to the sixcountry groupings described above, the G7 countries have the shortest and mildest recessionscompared to the EU and other developed countries. However, as Figure 1 shows, part of thereason for our finding of more severe recessions for the EU countries is the experience of Finlandand Sweden, which suffered sharp and prolonged declines in GDP during the Nordic bankingcrisis of the 1990’s. (See, for example, Drees and Pazarbasıoglu, 1998.) Using quarterlyGDP data to estimate univariate and multivariate Markov Switching models for Germany,UK, France, Italy, Austria, and Spain for the period 1970-1996, authors such as Krolzig andToro (2005) find recessions tend to be milder in the “core” EU countries relative to the otherdeveloped countries such as the US. We also observe that the duration of expansions in the EUcountries are longer than those for the G7 or other industrialized countries.4 The amplitude ofexpansions tends to be similar across the G7, EU and other industrialized countries. However,the industrialized countries outside of the G7 and the EU tend to have greater amplitudesduring expansions. This finding partly reflects the experience of countries such as S. Korea
4This finding may be due to the experience of Finland and Sweden, which suffered sharp contractions butalso enjoyed long expansions over the sample period.
5

and Taiwan, which have experienced strong growth in the postwar period.5
Turning to the developing countries, we note that the Latin American countries have theworst measures across business cycle characteristics - the longest and deepest recessions aswell as the shortest and weakest expansions. These measures reflect more fully the experienceof countries such as Argentina, Mexico, Peru, Uruguay and Venezuela. Countries such asBrazil and Chile have slightly differing characteristics, though. Brazil appears to be amongthe most volatile countries but its recessions tend to be shorter and milder than the other LatinAmerican countries.6 Likewise, Chile has long expansions characterized by large output gains.The highly heterogeneous group of emerging market economies tend to have only slightly betterbusiness cycle characteristics than those of the Latin American countries. However, there aredisparities among this group of countries as well. The Southeast Asian countries of Malaysiaand Thailand tend to have longer and/or stronger expansions. Turkey tends to experienceshort recessions amid short expansions. Third, the CEE countries have longer and more severerecessions than the emerging economies but also experience longer and more robust expansions.
3 Determinants of business cycle characteristics
3.1 The model
The literature on the determinants of business cycles is vast. In this section, we seek tounderstand the role of institutional factors in determining business cycle characteristics whileallowing for the separate effects of structural and macroeconomic factors. As Reichlin et al(2010) state: “In principle market orientation, a stable political system and good governanceshould make countries more resilient to large shocks and thereby mitigate output losses due torecessions.” We could also conjecture that such characteristics should lead to more stable andprolonged expansions, which appear to be a concomitant aspect of the process of convergenceof per capita incomes that has been studied so extensively in the growth literature.
Our aim is to understand the association of institutional factors and business cycle char-acteristics. However, such factors may be correlated with many other variables, making itdifficult to identify their separate effects. As an example, the new institutionalist literaturehas argued that institutions cause growth. However, there may exist reverse causality in thatcountries with higher income may have also developed better and more resilient institutions.Hence, we need to control for the effects of a variable such as per capita income. Likewise, therole of trade and financial integration has been extensively studied as determinants of businesscycle characteristics. To control for such effects, we also include a set of macroeconomic andstructural variables in our analysis.
To describe the model that we estimate, let bci = Eduri, Eampli, Cduri, Campli denoteaverage business cycle characteristics under study such as the average duration and amplitudeof expansions and contractions, respectively, for country i over the relevant sample period.
5One could argue that countries such as S. Korea and Taiwan should be grouped with the emerging economiesbased on their initial per capita income over the sample period. However, their cyclical dynamics are more similarto the other industrialized countries when we consider the entire sample period.
6Our sample period reflects the end of the hyperinflationary experiences in Brazil. See Chauvet (2010) for afurther discussion of the determinants of business cycles in Brazil.
6

Then
bci = α1 + α2macroi + α3struci + α4insti + α5regi + εi, (3.1)
where macroi, struci, insti are vectors of macroeconomic, structural, and institutional variablesand regi are regional dummies, and αi, i = 1, . . . , 5 are coefficient vectors conformable to thevectors of variables.
3.2 Data
3.2.1 Institutional variables
We consider two sets of institutional variables. The first set of these variables correspond to ageneral notion of governance. Several indices of governance have been developed in the recentliterature seeking to quantify the effect of institutional quality on economic outcomes.
• The Worldwide Governance Index (Gov) computed by the World Bank (see Kaufman,Kraay and Mastruzzi, 2009) provides a widely used aggregate measure of governance.This measures different dimensions of governance such as (i) voice and accountability,(ii) political stability and absence of violence/terrorism, (iii) government effectiveness,(iv) regulatory quality, (v) rule of law, and (vi) control of corruption.7
• The Institutional Profiles Database 2009 (IPD) developed by the French DevelopmentAgency8 presents a set of indicators on the institutional characteristics of 123 developedand developing countries covering 96% of the world population and 99% of world GDP.The database covers a broad spectrum of institutional characteristics and goes beyondmeasuring governance.
Of the IPD indicators, we particularly focus on the level of development of labor and cap-ital markets (denoted lm and km, respectively). Briefly, the index of labor markets andlabor relations examines such characteristics as freedom of association and trade unionpluralism, flexibility in the labor market, retraining and reskilling measures, adaptiveeducation system, respect for workers’ rights, weak employment contract rigidity, wagebargaining at the individual level, strikes, management of labor as well as characteristicspertaining to labor market segmentation and mobility.
The index of capital markets encompasses such characteristics as privatizations and na-tionalizations in the financial sector since 2006, competition and regulation in the bankingsystem, financial information and financial openness, amongst others.
• The Civil Liberties Index prepared by the Freedom House (FH).9
In their study pertaining to the factors that may account for the large drops in GDP duringthe recent global financial crisis, Reichlin et al focus on one of the subindicators of the World-wide Governance Index, namely, regulatory quality. Since our aim is to understand average
7This indicator is constructed for 212 countries and territories bi-annually for 1996, 1998, 2000 and annuallyfor 2002-2008.
8See http://www.cepii.fr/anglaisgraph/bdd/institutions.htm9Note that unlike the rest of the institutional indicators, greater values of the FH index indicate less freedom
or lower quality of governance.
7

behavior of longer periods, the use of the aggregate measure of governance to overcome possiblemeasurement errors seems more appropriate.
The recent macroeconomic literature has also emphasized the role of monetary and regula-tory institutions in affecting economic stability. For this purpose, we include indicators of thequality of monetary policy institutions given by
• indices of central bank independence (CBI) provided by Cukierman et al. (1992 and2002) and Arnone et al. (2007)
• dummies for inflation targeting (IT ) or currency boards regimes (CU)10
• an indicator of bank regulation and supervision intensity (RS) constructed by Neyaptiand Dincer (2005) and Dincer and Neyapti (2008)
3.2.2 Macroeconomic and structural variables
The remaining variables are intended to capture the role of macroeconomic policies and theunderlying structural characteristics of the different economies. The source of data for themacroeconomic variables is the World Bank’s World Economic Indicators. We include fivemacroeconomic variables given by
• inflation (D)11
• current account deficit as a ratio to GDP denoted (ca/Y )
• (log of) income per capita (lnY )
• the ratio of FDI to GDP (fdi/Y )
• credit extended to the private sector as a ratio to GDP (cr/Y ).
The variables D and ca/Y are considered to capture the (lack of) soundness of economicpolicy in general and hence, its (lack of) ability to mitigate business cycles. The remainingthree variables are income level, FDI exposure, and the level of development of the financialmarkets, respectively. However, the role of FDI flows and financial market development inpromoting growth has been extensively studied. It is generally assumed that the relationshipbetween the level of financial market development and long-term economic growth is positive(see, for example, Levine, 2005). The impact of FDI flows has typically been assumed todepend on the recipient country’s characteristics (see, for example, Balasubramanyam, Salisuand Sapford, 1996; Borenztein, De Gregorio and Lee, 1998). Reichlin et al (2010) argue thatcredit market liberalization which goes hand in hand with financial market development mayactually amplify the effects of certain types of shocks. We conjecture that FDI flows maymitigate business cycles as it is usually observed to flow to countries with a good investmentenvironment.
Finally, the structural variables included in the model are
10See Neyapti (2009) for the list of countries under these regimes.11Following Cukierman et al. (1992), we use a transformed version of inflation, defined as inflation
rate/(1+inflation rate). This transformation is to eliminate the estimation problems that may arise from thelarge range of inflation values in the data set.
8

• openness (open) measured as the sum of exports and imports as a percentage of GDP
• income share of industrial value added (Ind)
• regional dummies
The sign of open may depend on whether the shocks are aggravated or mitigated throughtrade and financial linkages. It has been noted that greater openness may help reduce theseverity of national business cycles by providing more risk sharing opportunities. On the otherhand, economies that are more integrated may also be more affected by shocks that occurelsewhere.12 The second variable is used to test whether the extent of industrialization helpsto reduce cyclical fluctuations, which is a proposition that is based on the relatively greatershock proneness of the traditional sector compared to the industrial sector. Our analysis inSection 2 suggests that there are important differences in business cycle characteristics acrossthe various country groupings, especially the developing ones. The regions whose effects arecontrolled via dummies are the Group of Seven (G7), Central and Eastern European states(CEE), Latin American countries (LA), other industrialized countries (DC) and emergingmarket economies (Emerg).
Appendix Table A.3 shows the correlations between the main features of expansions (de-noted by prefix E) and contractions (denoted by prefix C), namely duration and amplitude(denoted by dur and ampl, respectively) and the macroeconomic, structural and institutionalvariables. What stands out in the table is that governance (measured by both Gov and theIPD indices) is positively correlated with the duration of expansions and the amplitude of thecontractions; inflation is negatively correlated with Edur (duration of expansions); and finally,while, Eampl is positively related with the duration of expansions (Edur), the case is reversefor contractions. It should be also noted that per capita GDP is positively correlated withmany of the institutional indicators.
In what follows, we perform a regression analysis to investigate the significance of associa-tions of business cycle characteristics with these variables. To determine the data range of themacroeconomic variables, we consider the period of coverage that leads to the measurementof business cycle features reported in Figures 1-4. Hence, all the macroeconomic variables, aswell as open and Ind are in averages over the time period indicated for each country, whereavailable.13 The coverage of the institutional variables needs some compromising, however,since many of these variables are not available in a time series format during the period in-vestigated in the current analysis. The index of CBI (and RS) is used when the date of thecentral bank (the banking law) covers the majority of the period considered; the data are codedas “non-available” otherwise. This leads to loss of many data points in the case of RS. The
12In their study, Reichlin et al control for the effects of openness using both real and financial indicators.Specifically, they measure openness using four alternative indicators, (i) current account balance as a percent ofGDP, (ii) the sum of exports and imports as a percentage of GDP in 2007, (iii) the sum of external assets andliabilities to GDP, and (iv) FDI as a percentage of GDP. As we show below, the correlation between our measureof openness and current account balance as a percent of GDP, namely, (i) and (ii), is only 0.46. Furthermore,the current account balance as a percent of GDP also provides additional information relative to (ii) in termsof the financing of the external balance. However, regardless of these issues, we consider below a measure thataggregates all of the macroeconomic variables using a principal components approach.
13The averages are taken to represent the period so long as sufficient data points exists; if most of the dataare unavailable, the variable is reported as non-available.
9

variable Gov is calculated in averages of the period from 1996 to 2007, whereas IPD data areonly available for 2009. FH, on the other hand is available since 1972, and hence does notgenerate a problem in this regard but is nevertheless excluded from the analysis to gain a fewmore data points.14
One way of reconciling for these data deficiencies is that especially informal institutions,such as Gov, change very slowly over time. As a further means of reconciling for these defi-ciencies, we use the first principal component resulting from the factor analysis of the set ofinstitutional variables (IT , CBI, CU , lm, km and Gov) in addition to the baseline regressionswhere we use all the available information. In addition, we report the estimation results bothwith and without RS since its inclusion restricts the degrees of freedom substantially (almostby half).
Since the business cycle features are measured in average terms, the data are cross-sectional.The estimations are performed using OLS method with White-heteroskedasticity correctederror terms for possible heterogeneity in the cross-sectional data.
4 Regression Results
Tables 2 and 3 report the estimation results. Since most of the macroeconomic variablesreported in Table 2 are not individually significant, we also run alternative set of regressionsthat use the first principal component of these variables (reported as MacroFactors) andreport those results in Table 3, gaining some degrees of freedom. The estimations with theinclusion of RS are performed using a more limited sample, which is nonetheless a balancedmixture of developed, developing and transition economies.15 Those results are also reportedin Table 3.
The estimations reported in Table 2 include all of the macroeconomic, structural andinstitutional factors, with the exception of FH as discussed above. They are based on 38countries. The main findings can be summarized as follows.16 Among the macroeconomicfactors, inflation is the most significant variable and is negatively related with the durationas well as amplitude of expansions. This can be interpreted as saying that if an expansionis associated with inflationary financing, it lasts shorter than the average expansion periodand has a smaller amplitude. This observation also indicates that the lack of macroeconomicprudence hinders expansionary episodes.
Next, we find that the ratio of FDI flows to GDP is negatively associated with the averageduration of contractions but it is positively associated with the amplitude of contractions, in-dicating that a healthy investment environment helps to mitigate contractions.17 We find that
14Just to gain the data on France, South Africa and Turkey, FH, which is not available for these countries,is not included in the factor analysis for the institutional data. When included in the estimations, it is usuallyinsignificant.
15Argentina, Belgium, Brazil, Czech Republic, Estonia, Finland, France, Germany, Greece, S.Korea, Latvia,Lithuania, Malaysia, Netherlands, Russia, Singapore, South Africa, Spain, Sri Lanka, Switzerland and Turkey.
16We also derived results that included the macroeconomic and structural variables and the institutionalfactors separately. However, the main findings did not change substantially relative to what is reported in Table2.
17Since the amplitude of contractions is measured as the percentage decline in GDP over the contractionaryphase, a positive effect of a variable suggests that a smaller percentage decline in GDP is associated with thisvariable.
10

both GDP per capita and FDI flows relative to GDP are negatively associated with the ampli-tude of expansions. The former finding may be explained by the convergence process, wherebycountries with lower GDP per capita tend to display higher growth rates. The latter findingsuggests that countries that are recipients of significant FDI flows experience less volatility dur-ing their expansionary phases. However, neither the current account nor the private credit toGDP ratios are significant after controlling for the effects of the other macroeconomic variables.
As for the structural factors, openness tends to increase the amplitude of expansions sig-nificantly. The impact of openness is also to magnify output fluctuations during recessions butthis effect is not significant. By contrast, the income share of industrial value-added is notsignificant except for a borderline positive effect on the duration of recessions.
Even after controlling for the macroeconomic and structural factors, we find that the in-stitutional variables have significant associations with business cycle characteristics. In par-ticular, both the inflation targeting regime and better governance are associated with longerexpansions. Likewise, the governance indicator is positively associated with the amplitude ofexpansions. Interestingly, we also find that central bank independence reduces the length ofrecessions significantly, indicating that CBI’s impact on price stability also feeds into economicstability on the real side. Greater labor market development, on the other hand, tends to in-crease the duration of recessions. The last finding might be explained in terms of labor marketinstitutions and social safety nets that tend to accompany more developed labor markets. De-velopment of capital markets, on the other hand, does not show a significant association withany of the business cycle characteristics. In addition, we observe that G-7, other developedcountries and CEE have recessions that last significantly shorter than average, whereas theemerging countries and CEE have higher recession amplitudes than average.
Table 3 reports the regressions after replacing the macroeconomic variables with their firstprincipal component; to this list, we also add one of the structural variables: Ind, since it is notobserved to have a significant effect individually. In addition, we omit the variable km from therest of the explanatory variables, because it is found consistently insignificant in the regressionsreported in Table 2. We also consider region dummies for broader groups by combining theG-7 and other industrialized countries into one group (D1), the Latin American and emergingeconomies into a second group (D2), and retaining the Central and Eastern European (CEE)countries as a third group. Hence, the goodness of fit slightly increases in these specifications.These estimations are performed in a sample of 38 and 19 countries respectively, where thelatter set is determined mainly by the availability of RS data for the existing sample. Inthe regressions with the restricted sample, we also omit the variable denoting currency boardregimes (CU) as there are no observations corresponding to this indicator.
Table 3 shows that macroeconomic factors as a whole (represented by their first principalcomponent) do not appear to exhibit a significant association with business cycle character-istics, except for the negative effect on the amplitude of expansions when RS is included. Bycontrast, many of the institutional and structural attributes do. Not only does governanceincrease the duration and amplitude of expansions, Edur and Eampl, respectively, it also hasthe marginal effect of reducing the amplitude of contractions, Campl. The first two effects holdfor both the unrestricted and restricted samples, suggesting that the positive association ofbetter governance with stronger expansions is a robust finding. Openness also tends to amplifyexpansions and to reduce the duration and amplitude of contractions in the first and second(including RS) samples, respectively. In contrast, labor market development is observed to
11

be negatively associated with the amplitude of expansions, Eamp.18 The positive associationof IT with the duration of expansions is also confirmed, and so is the aggravation of busi-ness cycles in the CEE countries. CEE countries also exhibit longer than average duration ofexpansions.
The additional observation in the restricted sample is that RS has a mitigating effect onexpansions, possibly via preventing above-normal credit expansions that prove to be destabi-lizing. In the restricted sample, the negative association of expansions with the macroeconomicset of variables is in accord with the formerly reported negative significance of inflation, D, andthe ratio of FDI flows to GDP, FDI. Representing the set of institutional variables with theirfirst principal component costs some explanatory power and the goodness of fit; hence theyare not reported. Those regressions, however, also indicate that institutions especially exhibitpositive associations with the duration of expansions as well as, interestingly, the amplitude ofcontractions. The significance of both openness and CEE is retained.
To summarize, our empirical analysis reveals that governance, monetary institutions suchas IT , and openness are positively associated with expansions. By contrast, recessions appearmore country- or region-specific, although they are also significantly correlated with variablessuch as openness and CBI.19 Our approach of examining the determinants of expansions andcontractions separately thus finds justification in the nature of the empirical results. It alsolends credence to regime switching models which seek to describe business cycle dynamics interms of the differing characteristics of the associated regimes. In this paper, we do not directlyestimate the probability of such regimes switches. However, we go beyond the simple regimeswitching approach by trying to identify the determinants of business cycle dynamics in thedifferent cyclical phases.
5 Business cycle synchronization
In this section, we turn to another characteristic of business cycles across countries, and thathas to do with the synchronization of business cycles. In the earlier literature, Frankel andRose (1998) show that international business cycle synchronization as measured by the Pearsoncorrelation coefficient of growth rates is positively related to trade intensity across countriesand over time. Imbs (2004, 2006) finds that measures of bilateral financial integration alsocorrelate with such synchronization measures. Imbs (2010) shows that the recent global crisishas been accompanied by an unprecedented synchronization of business cycles across countries.He relates measures of business cycle synchronization across countries to trade and financialintegration. In line with the approach in this paper, we examine the association betweenbusiness cycle synchronization and a set of structural and institutional factors more broadly.In contrast to the earlier literature, however, we define business cycle synchronization followingthe approach in Harding and Pagan (2006), which dichotomizes the phases of economic activity
18As we noted from the outset, our analysis does not permit a causal interpretation to the results of thereported regressions. The finding regarding labor market development and the amplitude of expansions maybe especially prone to this criticism, as developed countries will tend to display lower average growth rates andalso have greater labor market development simultaneously.
19An alternative way of expressing this finding is that the impact of institutional and structural factors ismore evident in the behavior of expansions whereas contractions or recessions typically arise from shocks thatare not directly related to such factors.
12

according to recession and expansion.Specifically define the random variable Sit as
Sit =
{0 if county i is in a recessionary phase1 otherwise.
(5.2)
Thus, Sit is a binary random variable that is associated with the phases of the business cycle.Following Harding and Pagan (2006), we can say that the business cycle in countries i and jare perfectly positively synchronized if Pr(Sit = 1, Sjt = 0) = 0 and Pr(Sit = 0, Sjt = 1) = 0for i 6= j. Likewise, they are perfectly negatively synchronized if Pr(Sit = 1, Sjt = 0) = 1 andPr(Sit = 0, Sjt = 1) = 1 for i 6= j. More generally, we can examine the correlation coefficientbetween Sit and Sjt which, given the binary nature of Sit and Sjt, is defined as
ρij = Corr(Sit, Sjt) =Pr(Sit = 1, Sjt = 1)− [Pr(Sit = 1)Pr(Sjt) = 1]√Pr(Sit = 1)Pr(Sit = 0)
√Pr(Sjt = 1)Pr(Sjt = 0)
.20 (5.3)
We hypothesize that the synchronization between the business cycles of countries i and jis associated with a set of structural and institutional variables. Following the literature ongravity models in international trade, we first consider the logarithm of the distance betweencountry i and j or the distance between their capital cities, dij as the first determinant ofbusiness cycle synchronization. (See, for example, Baxter and Kouparitsas, 2005.) As Imbs(2010) emphasizes, many authors have found a strong role for trade intensity as a determinantof synchronization of international economic activity. Trade intensity between countries i andj is defined as
Tij =Xij +Xji
Xi +Xj, (5.4)
where Xij denotes total merchandise exports from country i to j and Xi =∑
j Xij .21 Data
on bilateral trade linkages are provided on an annual basis between 1980 and 2009. However,these data are not available for every country for each year of the sample. Hence, we computethe measure of bilateral trade linkages between country i and j for the years in which thesedata are available, and then take an average across the years. By contrast, Imbs (2010) usestime variation in the measure of bilateral trade linkages to examine the time variation in thecorrelation of economic activity between country i and j.
The literature on international business cycles has stressed that business cycle synchroniza-tion across countries may also derive from increased financial activity between them. Hence,we consider a third variable that has to do with bilateral financial linkages. We make us of the
20Notice that E(Sit = 1)×Pr(Sit = 1)+0×Pr(Sit = 0) = Pr(Sit) and V ar(Sit) = Pr(Sit = 1)×(1−Pr(Sit =1))2 + Pr(Sit = 0)(0 − Pr(Sit = 1))2 = Pr(Sit = 1)[1 − Pr(Sit = 1) − Pr(Sit = 1(1 − Pr(Sit − 1))] + Pr(Sit =0)Pr(Sit = 1)2 = Pr(Sit = 1)Pr(Sit = 0).
21These data are obtained from the IMF’s Direction of Trade database, and show the exports of each countryi to countries j for 61 countries. These countries are given by USA, UK, Austria, Belgium, Denmark, France,Germany, Italy, Luxembourg, Netherlands, Norway, Sweden, Switzerland, Canada, Japan, Finland, Greece,Iceland, Ireland, Malta, Portugal, Spain, Turkey, Australia, New Zealand, South Africa, Argentina, Bolivia,Brazil, Chile, Colombia, Ecuador, Mexico, Peru, Uruguay, Venezuela, Jamaica, Israel, Sri Lanka, Hong Kong,Indonesia, S. Korea, Malaysia, Philippines, Singapore, Thailand, Morocco, Georgia, Kazakhstan, Krygyzstan,Bulgaria, Russia, Czech Republic, Slovakia, Estonia, Latvia, Hungary, Lithuania, Croatia, Slovenia, Romania.
13

bilateral locational banking statistics from the Bank of International Settlements to generatea measure of bilateral financial linkages as22
φij =Fij + Fji
Fi + Fj, (5.5)
where Fij denotes the consolidated foreign claims of reporting banks, reported on individualcountries by nationality of the reporting banks, and Fi =
∑j Fij . These data are available
quarterly and semi-annually between December, 1983 and September, 2010. We construct anexact measure of the bilateral financial linkage between county i and j at each date for whichthe relevant data are available, and average the resulting measures to obtain the time-invariantmeasure used in our study. These measures are the analogues of the bilateral trade intensitymeasures. However, they are only available for 25 countries.23
As the novel feature of our analysis, we also consider the differences between the insti-tutional and macroeconomic/structural indicators as a measure of proximity between all thedifferent country pairs for estimating for their business cycle synchronization. Imbs (2010) an-alyzes the changes in the correlation coefficient of GDP growth across a large set of countriesover time. To control for the impact of the size of the economies on the correlation coefficient,he includes the sum of their respective GDP’s. While we do not analyze changes in businesscycle synchronization, we conjecture that business cycle synchronization on average may alsobe related to the size of the respective economies. Hence, we include the logarithm of the sumof the GDP of county i and country j, ln(GDPi +GDPj). The basic model that we estimateis given by:
ρij = α1 + α1dij + α2Tij + α3φij + α4 ln(GDPi +GDPj) + δ′∆macroij + γ′∆inst
ij + εij , (5.6)
where ∆macroij and ∆inst
ij are vectors of the differences of the macroeconomic/structural andinstitutional variables across countries i and j.
Table 4 reports our results regarding the determinants of business cycle synchronization.In columns (I), (II), and (III), we report the results by replacing the institutional and macroe-conomic/structural variables with their principal components. The first three columns showthat distance and trade intensity are significant and enter with correct signs. Specifically, wefind that the distance between countries i and j reduces business cycle synchronization andtrade intensity tends to increase it. Column (II) shows that our measure of financial linkagesalso tends to increase business cycle synchronization. However, the coefficient on this variableis not significantly estimated. Furthermore, the sample size is reduced since the variable thatmeasures bilateral financial linkages is available for only a subset of the countries in our study.
In columns (I)-(III), we also include differences between the principal components of themacroeconomic/structural and institutional factors. Proximity of the institutional variableshas the correct sign; that is, the larger the distance between the institutional variables of
22See BIS Locational Banking Statistics, Table 9B.23These include Australia, Austria, Belgium, Brazil, Canada, Chile, Chinese Taipei, Denmark, Finland,
France, Germany, Greece, Ireland, Italy, Japan, Mexico, Netherlands, Panama, Portugal, Spain, Sweden,Switzerland, Turkey, the United Kingdom, and the United States. These variables are available at quarterly andsemi-annual rates between December 1983 and September 2010. Imbs (2010) creates an approximate measureof bilateral financial linkages by using information on the gross (unconsolidated) assets and liabilities of banksfor a larger set of countries. This measure is based on the notion that countries that are both open to capitalflows will tend to be open to each other.
14

countries i and j, the lower the business cycle synchronization between them. However, thecoefficients on the distance between the institutional variables and the distance between themacroeconomic/structural factors are not significantly estimated. By contrast, the size of theeconomies matters for business cycle synchronization. The coefficient on the sum of the GDPfor countries i and j is positive and significant. This finding accords with the notion thatsynchronization of business cycle activity is driven by the behavior of the larger economies ina given region or the world.
In column (III), we add dummy variables to capture the interaction between such variablesas trade intensity as well as institutional characteristics such as inflation targeting while incolumn (IV) we consider a specification where specific macroeconomic and institutional fac-tors are used in place of their principal components.24 Column (II) shows that proximity ofthe macroeconomic and institutional factors (on the aggregate) do not matter for businesscycle synchronization. However, Columns (III) and (IV) reveal that certain macroeconomicand institutional factors matter more than others do. Besides the distance and the size ofthe economies involved in trade, what seem to especially matter are the size of the pairs ofeconomies considered and their relative inflation performance. If the size of at least one ofthe countries in the considered pair of countries is large ln(GDPi + GDPj), or is developed(Tij×DC), greater business cycle synchronization is observed. The difference in the inflationperformance (DD) of the trade partners reduces their business cycle synchronization; simi-larity in the institutional arrangements to contain inflation, on the other hand, increases it(BOTHIT).
Combining with the results reported in Tables 2 and 3, inflation and inflation targetingseem to be the most important macroeconomic and institutional attributes of the countries thatnot only explain the duration of expansions, but they also appear as important determinantsof the business cycle synchronization between them.
6 Conclusion
In this paper, we have examined the business cycle characteristics of a large group of countriesthat includes industrial, emerging and transition economies from all continents and relatedthem to a variety of institutional, macroeconomic and structural factors. Our study providesone of the few studies to examine the business cycle characteristics of such a large set ofcountries. It also provides an original effort that seeks to understand the role of institutionalfactors on such characteristics.
We have demonstrated significant differences in business cycle characteristics across broadcountry groupings as well as heterogeneity within such groups. Using cross sectional regressionsthat relate average business cycle characteristics to institutional, macroeconomic and struc-tural factors, we have also demonstrated that business cycle characteristics during expansionsshow significant association with such factors as a broadly defined measure of governance andmonetary institutions such as inflation targeting. We have also examined the determinants ofbusiness cycle synchronization for the countries in our sample. In common with other studies,we have found a strong role for distance between countries, as stipulated by gravity models,
24We considered different specifications with the individual macroeconomic and institutional factors includedseparately. Aside from those factors reported in Table 4, these factors were either insignificantly estimated ortheir estimated coefficients switched signs.
15

as well as the effect of bilateral trade intensity. However, we could not find a significant rolefor bilateral financial linkages using a subset of the countries. Our results also suggest thatthe size of the respective economies and whether trade is conducted with a developed economymatters, confirming the notion that business cycle activity tends to be driven by the behaviorof the larger, more developed economies. In terms of the institutional factors, we find thatmonetary institutions such as inflation targeting are important in determining business cyclecharacteristics during expansions as well as being a primary determinant of business cyclesynchronization.
Several recent studies have tried to identify the determinants of output declines as well aschanges in business cycle synchronization during the financial crisis of 2007-2008. Reichlin etal. (2010) claim that the measures of financial market liberalization correlate most stronglywith countries’ exposure to the financial crisis. Likewise, Imbs (2010) finds that increases inbusiness cycle synchronization during the financial crisis can be attributed to financial linkagesfor the developed countries whereas developing countries were affected primarily through tradelinkages and the decline in overall trade. In our study, we have not separated out this episodefor specific study. However, many commentators have argued that one of the important lessonsto be drawn from the recent financial crisis is the need to impose macro-prudential measuresthat have the effect of safeguarding the financial system as a whole (see Hanson, Kashyap, andStein, 2010). The Basel Committee on Banking Supervision (2010) has also made significantrecommendations – the so-called “Basel III” process – regarding new banking and financialregulation. Undoubtedly such recommendations have injected a new dimension into the policydebate that go beyond earlier policy discussions and reforms such as inflation targeting andcentral bank independence. However, to the extent that they point to further strengthening ofthe international monetary and financial architecture, they broadly accord with our findingsregarding the importance of monetary institutions in affecting economic performance.
16

References
Alesina, A. (1988). “Macroeconomics and Politics,” NBER Macroeconomics Annual 3, 13-52.
Alesina, A. (1989). “Politics and Business Cycles in the Industrial Democracies,” EconomicPolicy 8, 57-98.
Alesina, A. and L. Summers (1993). Central Bank Independence and Macroeconomic Perfor-mance: Some Comparative Evidence, Journal of Money, Credit and Banking 25, 151-162.
Allen and Gale (2007). “An Introduction to Financial Crises,” Wharton Financial InstitutionsCenter Working Paper No. 07-20
Altug, S. and M. Bildirici (2010). “Business Cycles around the Globe: A Regime-switchingApproach,” No. 7968 CEPR/EABCN No. 53/2010.
Arnone, M., B. Laurens, J-F. Segalotto and M. Sommer (2007). “Central Bank Autonomy:Lessons From Global Trends,” IMF Working Paper 07/88.
Balasubramanyam, V., M. Salisu and D. Sapford (1996). “Foreign Direct Investment andGrowth in EP and IS Countries,” it Economic Journal 106, 92-105.
Basel Committee on Banking Supervision (2010). “The Basel Committee’s Response to theFinancial Crisis: Report to the G20,” October, hpp://www.bis.org/publ/bcbs179.pdf.
Baxter, M. and M. Kouparitsas (2005). “Determinants of Business Cycle Co-movement: ARobust Analysis,” Journal of Monetary Economics 52, 113157.
Benczur, P. and A Ratfai (2010). “Business Cycles around the Globe,” manuscript.
Borensstein, E., J. De Gregorio and J-W. Lee (1998). “How Does Foreign Direct InvestmentAffect Economic Growth?” Journal of International Economics 45, 115-135.
Canova, F. (2010). “Business Cycles in the Mediterranean Basin: Similarities, Convergence,Spillovers,” Paper presented at the 6’th Eurostat Colloquium on Modern Tools of Busi-ness Cycle Analysis, Luxembourg, September 26-29.
Chauvet, M. and I. Morais (2010). “Predicting Recessions in Brazil,” Paper presented at the6’th Eurostat Colloquium on Modern Tools of Business Cycle Analysis, Luxembourg,September 26-29.
Cukierman, A., S. Webb, and B. Neyapti (1992).“ Measuring the Independence of CentralBanks and Its Effect on Policy Outcomes,” The World Bank Economic Review 6, 353-0398.
Diamond, D. and R. Rajan (2009). “The Credit Crisis: Conjectures about Causes andRemedies,” American Economic Review 99, 606-610.
Dincer, N. and B. Neyapti (2008). “Legal Quality of Bank Regulation and Supervision andIts Determinants: A Mixed Sample,” Contemporary Economic Policy 26, 607-622.
17

Dincer, N. and B. Neyapti (2010). “Macroeconomic Impact of Bank Regulation and Super-vision: A cross-country investigation,” Bilkent University Discussion Paper.
Drees, B. and C. Pazarbasıoglu (1998). “The Nordic Banking Crisis: Pitfalls in FinancialLiberalization,” IMF Occasional Paper 161.
Easterly, W. and R. Levine (2003). “Tropics, Germs, and Crops: How Endowments InfluenceEconomic Development,” Journal of Monetary Economics, 50, 3-39.
Eijffinger, S. and E. Schaling (1993).“ Central Bank independence in Twelve Industrial Coun-tries,” Banca Nazionale del Lavoro Quarterly Review 184, 64-68.
Frankel, J. and A. Rose (1998). “The Endogeneity of the Optimum Currency Area Criteria,”Economic Journal, 108, 1009-1025.
Giannone, G., M. Lenza and L. Reichlin (2010). “Market Freedom and the Global Recession,”CEPR Discussion Paper 7884.
Grilli, V., D. Masciandro and G. Tabellini (1991). “Political and Monetary Institutions andPublic Financial Policies in the Industrial Countries,” Economic Policy 13, 341-392.
Hall, R., and C. Jones (1999). “Why Do Some Countries Produce So Much More Output perWorker Than Others?” Quarterly Journal of Economics, 114, 83-116.
Hamilton, J. (1989) “A New Approach to the Economic Analysis of Nonstationary TimeSeries and the Business Cycle,” Econometrica 57, 357-384.
Hanson, S., A. Kashyap and J. Stein (2011). “A Macroprudential Approach to FinancialRegulation,” Journal of Economic Perspectives 25, 3-28.
Harding, D. and A. Pagan (2002a). “A Comparison of Two Business Cycle Dating Methods,”Journal of Economic Dynamics and Control 27, 1681-1690.
Harding, D. and A. Pagan (2002b). “Dissecting the Cycle: A Methodological Investigation,”Journal of Monetary Economics 49, 365-381.
Harding. D. and A. Pagan (2005). “A Suggested Framework for Classifying the Modes ofCycle Research,” Journal of Applied Econometrics 20, 151-159.
Imbs, J. (2004). “Trade, Finance, Specialization and Synchronization,” Review of Economicsand Statistics, 86, 723-734.
Imbs, J. (2006). “The Real Effects of Financial Integration,” Journal of International Eco-nomics, 68(2).
Imbs, J. (2010). “The First Global Recession in Decades,” CEPR Discussion Paper No. 7973.
Kaufmann, D., A. Kraay and M. Mastruzzi (2009). “Governance Matters VIII: Aggregateand Individual Governance Indicators, 1996-2008,” World Bank Policy Research WorkingPapers, No.4978.
18

Knack, S. and P. Keefer (1995). “Institutions and Economic Performance: Cross-CountryTests Using Alternative Institutional Measures,” Economics and Politics, 7(3), 207-27.
Kose, A., C. Otrok and C. Whiteman (2003). “International Business Cycles: World, Region,and Country-specific Factors,” American Economic Review 93, 1216-1239.
Krainer, R. (2000). “Corporate Governance and Business Cycles in the G-7 Countries: DoInstitutions Really Matter?” Manuscript, University of Wisconsin.
Krolzig, H.-M. (1997). “Markov Switching Vector Autoregressions: Modeling, StatisticalInference, and Application to Business Cycle Analysis: Lecture Notes in Mathematicaland Statistical Systems,” 454, Springer-Verlag: Berlin.
Krolzig, H.-M. and J. Toro (2005). “Classical and Modern Business Cycle Measurement: TheEuropean Case,” Spanish Economic Review 7, 1-21.
Levine, R. (2005). “Finance and Growth: Theory and Evidence,” IN Handbook of EconomicGrowth, P. Aghion and S. Durlauf (eds.), Vol. 1 of Handbook of Economic Growth, Ch.12, 865-934, Elsevier.
Neyapti, B. and N. Dincer (2005). “Measuring the Quality Of Bank Regulation and Super-vision, with an Application to Transition Economies,” Economic Inquiry 43, 79-99.
Neyapti, B. (2009). “Performance of Monetary Institutions: Comparative Evidence,” BilkentUniversity Discussion Paper 09-02.
Rand, J. and F. Tarp (2002) “Business Cycles in Developing Countries: Are They Different?”World Development 30, 2071.2088.
Rodrik, D., A. Subramanian, and F. Trebbi (2002). “Institutions Rule: The Primacy ofInstitutions Over Geography and Integration in Economic Development,” IMF WorkingPaper 02/189 (Washington: International Monetary Fund).
Sawyer, C. (2010). “Institutional Quality and Economic Growth in Latin America,” BE PressGlobal Economy Journal, 10(4), Article 2.
Sichel, D. (1993). “Business Cycle Asymmetry,” Economic Inquiry 31, 224-236.
19

A Appendix
Table A.1 provides the list of countries used in our study as well as the sample period inquestion. We characterize national business cycles in these countries using quarterly GDP atconstant prices measured in units of the national currency.25 The GDP data are availablefrom a variety of sources. For EU countries such as Austria, Belgium, Denmark, Finland,Greece, Ireland, Luxembourg, Netherlands, Portugal, Spain, Sweden, France, Germany, Italy,and the UK, the quarterly GDP data are from Eurostat. For Australia, Canada, Norway,Iceland, S. Korea, New Zealand, Switzerland, Mexico, and Cyprus, the quarterly GDP dataare from the OECD. For a set of developing countries, the GDP data obtained from theInternational Financial Statistics (IFS) of the IMF. These include Kazakhstan, KyrgyzstanBotswana, Morocco, and Sri Lanka. The data for S. Africa, Thailand, Turkey, Brazil, Chile,Ecuador, Jamaica, Peru, and Uruguay are obtained from their central banks while the data forIndonesia, Malaysia, and Singapore are available from the Bank of International Settlements(BIS). The data for the remaining countries are obtained from the relevant statistical offices.
Table A.2 provides the recession dates or equivalently the dates of the peaks and troughs ofbusiness cycles for all 63 countries in our study. One finding that we observe from these tablesis that a subset of the countries display a single recessionary experience. This is most likelydue to the short sample for these countries. For countries such as Bolivia, Bulgaria, Croatia,Ecuador, Indonesia, Kyrgyzstan, Norway, the Philippines, and Sri Lanka, the single recessionoccurs in the mid-sample. For Southeast Asian countries such as Indonesia and the Phillipines,the single recession occurs around the time of the 1997 East Asian crisis. Likewise, Boliviaand Ecuador experience recessions in the period surrounding the Brazilian crisis of 1999. Foranother subset of the countries, the only recession that registers is the one associated withthe 2007-2008 financial crisis. These are typically European countries which were exposed tothe financial shock through banks portfolios and credit market conditions such as Hungary,Iceland, Ireland, Luxembourg, and Slovenia, though a country such as Georgia is also adverselyaffected. The fact that some emerging economies such as Indonesia were able to avoid the worsteffects of the 2007-2008 crisis is due to their relative lack of exposure as well as the lessonslearned by emerging market economies in previous crises as noted by Diamond and Rajan(2009).
The remaining countries in our sample display multiple recessionary experiences. Theseexperiences have been studied extensively in the literature. Altug and Bildirici (2010) provide areview and discussion of the business cycle responses of 27 developing and developing countriesand describe the major recessions over time. These include the oil shocks of the 1973-1975 and1980-1982, the global recession of 1990, the ERM crisis of 1992, the 2001 global crisis, and the2007-2008 financial crisis. They also discuss the emerging market crises in the 1990’s, includingthe impact of the 1997 East Asian crisis, the Russian crisis of 1998 and the various LatinAmerican crises such as the Argentinian sovereign debt default. The additional countries whichare not part of their study also display the effects of these global and more specific recessionsand crises. Among the developed economies, Belgium and Switzerland display recessions duringthe early 1980’s as well as during the ERM crisis of 1992. Likewise, Portugal and Switzerlandare affected by the growth slowdown that occurred in the euro area in 2001-2002. In termsof the emerging or developing economies, Thailand experiences recessions during 1997 as well
25These data have been derived from a dataset used by Benczur and Ratfai (2010).
20
as 2008. Indeed it is well known that the speculative attack on the Thai baht was one ofthe events that trigerred the 1997 East Asian crisis. For a set of transition economies suchas Croatia, the Czech Republic, Latvia, Lithuania, Romania, Slovakia, there are recessionsduring the years 1997-1999 which may reflect the effects of 1997 East Asian crisis as well asthe Russian crisis of 1998 on smaller economies in the process of integrating financially withthe rest of the world.
21
Country Data Dates No. of Data Country Data Dates No. of DataArgentina 1980:4-2009:2 115 Korea 1980:4-2009:1 114Australia 1963:1-2009:2 186 Kyrgyzstan 1995:4-2008:2 51Austria 1988:4-2009:1 82 Latvia 1993:4-2009:1 62Belgium 1980:4-2009:2 114 Lithuania 1995:4-2009:1 54Bolivia 1990:4-2008:4 73 Luxembourg 1995:4-2008:4 53Botswana 1996:4-2008:3 48 Malaysia 1991:4-2009:2 71Brazil 1991:4-2009:1 70 Malta 1997:4-2009:1 46Bulgaria 1994:4-2009:1 58 Mexico 1980:4-2009:2 115Canada 1963:1-2009:2 186 Morocco 1990:4-2007:4 69Chile 1981:4-2009:1 110 Netherlands 1963:1-2009:2 186Colombia 1994:4-2008:4 57 New Zealand 1988:1-2009:2 84Croatia 1994:4-2008:4 57 Norway 1978:4-2009:1 122Czech Republic 1994:4-2009:2 58 Peru 1980:4-2010:2 114Denmark 1990:4-2009:2 73 Philippines 1993:3-2009:1 63Ecuador 1993:4-2008:4 61 Portugal 1995:4-2008:4 53Estonia 1993:4-2009:1 62 Romania 1994:4-2009:1 58Finland 1963:1-2009:2 186 Russia 1995:4-2008:4 53France 1970:4-2009:2 155 Singapore 1985:2-2009:2 97Georgia 1996:4-2008:4 49 Slovakia 1993:4-2009:1 62Germany 1963:1-2009:2 186 Slovenia 1993:4-2009:1 62Greece 1970:4-2009:1 154 South Africa 1970:4-2009:2 155Hong Kong 1973:4-2009:1 142 Spain 1963:1-2009:2 186Hungary 1995:4-2009:1 54 Sri Lanka 1996:4-2005:4 37Iceland 1997:4-2009:1 46 Sweden 1963:1-2009:2 186Indonesia 1996:4-2009:1 50 Switzerland 1980:4-2009:2 114Ireland 1997:4-2008:4 45 Taiwan 1982:1-2009:1 109Israel 1980:2-2009:2 54 Thailand 1993:4-2009:1 62Italy 1963:1-2009:2 186 Turkey 1987:4-2009:2 87Jamaica 1996:4-2008:2 47 UK 1963:1-2009:2 186Japan 1963:1-2009:2 186 Uruguay 1988:4-2008:4 81Kazakhstan 1994:4-2009:1 58 USA 1963:1-2009:2 186
Venezuela 1997:4-2009:1 46
Table A.1: Sample of Countries
22

Country Recession Dates Country Recession Dates Country Recession Dates Country Recession DatesArgentina 1980:4-1982:3 Greece 1974:1-1974:4 Mexico 2001:2-2002:1 Taiwan 2001:2-2002:1Argentina 1984:4-1985:4 Greece 1980:3-1981:2 Mexico 2008:3 - Taiwan 2008:3 -Argentina 1988:1-1990:2 Greece 1982:2-1983:2Argentina 1995:1-1996:1 Greece 1986:2-1987:4 Morocco 1992:1-1993:4 Thailand 1997:1-1999:1Argentina 1998:3-2002:4 Greece 1992:4-1993:4 Morocco 1994:4-1995:4 Thailand 2008:4 -
Morocco 1997:1-1997:4Australia 1974:3-1975:1 Hong Kong 1974:3-1975:1 Morocco 1999:2-1999:4 Turkey 1988:3-1989:2Australia 1982:2-1983:3 Hong Kong 1985:1-1985:3 Turkey 1990:4-1991:2Australia 1990:3-1991:4 Hong Kong 1997:4-1999:1 Netherlands 1974:4-1975:3 Turkey 1994:1-1995:1
Hong Kong 2001:2-2002:1 Netherlands 1980:2-1981:1 Turkey 1998:3-1999:4Austria 1992:4-1993:2 Hong Kong 2008:3 - Netherlands 1981:3-1983:1 Turkey 2000:4-2001:4Austria 2001:2-2001:4 Netherlands 2008:3 - Turkey 2008:4 -
Hungary 2008:3 -Belgium 1982:3-1983:2 New Zealand 1989:2-1990:2 UK 1973:4-1974:2Belgium 1992:3-1993:3 Iceland 2008:2 - New Zealand 1990:4-1991:4 UK 1975:1-1975:4Belgium 2008:3 - New Zealand 1998:1-1998:3 UK 1980:1-1981:3
Indonesia 1997:4-1999:1 New Zealand 2008:2-2008:4 UK 1990:3-1992:2Bolivia 1999:1-1999:3
Ireland 2007:4 - Norway 1988:1-1989:1 Uruguay 1995:2-1995:4Botswana 2001:4-2002:2 Uruguay 1999:1-2003:2Botswana 2005:4-2006:2 Peru 1982:1-1984:2
Israel 1982:1-1982:3 Peru 1985:2-1986:1 USA 1974:1-1975:2Brazil 1991:4-1992:4 Israel 2001:2-2002:3 Peru 1987:4-1989:3 USA 1980:1-1980:4Brazil 1995:3-1996:1 Israel 2008:4-2009:2 Peru 1990:2-1991:2 USA 1981:4-1982:4Brazil 1998:3-1999:3 Peru 1992:1-1993:1 USA 1990:4-1991:3Brazil 2001:3-2002:1 Italy 1964:3-1965:1 Peru 1998:1-1999:3 USA 2008:3 -
Italy 1974:3-1975:3 Peru 2000:3-2001:2Bulgaria 1995:4-1997:2 Italy 1982:3-1983:2 Peru 2009:2-2009:4 Venezuela 1998:2-1999-4
Italy 1992:3-1993:3 Venezuela 2001:4-2003:3Canada 1981:4-1983:1 Italy 2003:1-2003:3 Philippines 1998:1-1998:4Canada 1990:2-1991:4 Italy 2008:2 -Canada 2008:3 - Portugal 2002:3-2003:3
Jamaica 1996:4-1998:4 Portugal 2008:3 -Chile 1982:3-1984:2 Jamaica 2001:4-2002:2Chile 1998:3-1999:3 Jamaica 2004:3-2005:1 Romania 1996:4-1998:1Chile 2008:3 - Jamaica 2007:3 - Romania 1999:2-2000:4Chile 2008:3 -
Japan 1973:4-1974:4 Russia 1995:4-1997:2Colombia 1998:2-1999:4 Japan 1979:4-1980:4 Russia 1998:1-1999:1Colombia 2008:4 - Japan 1993:1-1993:3
Japan 1997:3-1999:1 Singapore 1985:2-1986:1Croatia 1998:3-1999:3 Japan 2001:2-2002:2 Singapore 1998:2-1998:4
Japan 2008:2 - Singapore 2001:2-2002:1Czech Rep. 1997:1-1998:4 Singapore 2008:3 -Czech Rep. 2008:3 - Kazakhstan 1998:2-1998:4
Kazakhstan 2008:4 - Slovakia 1999:2-2000:1Denmark 2003:1-2003:3 Slovakia 2008:4 -Denmark 2008:2 - Korea 1997:4-1998:4
Korea 2008:3 - Slovenia 2008:3 -Ecuador 1998:4-2000:1
Kyrgyzstan 2001:4-2002:2 S. Africa 1982:1-1983:3Estonia 1993:4-1995:1 S. Africa 1984:4-1986:1Estonia 1998:4-1999:3 Latvia 1996:3-1997:1 S. Africa 1990:1-1993:1Estonia 2008:1-2009:1 Latvia 2008:1 - S. Africa 2009:1 -
Finland 1975:2-1976:2 Lithuania 1999:2-1999:4 Spain 1978:3-1979:1Finland 1990:1-1993:1 Lithuania 2008:3-2009:1 Spain 1980:3-1981:1Finland 2008:3 - Spain 1991:4-1993:4
Luxembourg 2008:2 - Spain 2008:3 -France 1974:4-1975:3France 1992:4-1993:4 Malaysia 1997:4-1999:1 Sri Lanka 2001:1-2001:4France 2008:3 - Malaysia 2001:2-2001:4
Malaysia 2008:4 - Sweden 1971:2-1971:4Georgia 2008:2 - Sweden 1976:3-1977:4
Malta 2001:1-2001:4 Sweden 1990:4-1993:3Germany 1966:4-1967:3 Malta 2002:4-2003:3 Sweden 2008:3 -Germany 1974:3-1975:3 Malta 2004:2-2004:4Germany 1982:1-1983:1 Malta 2008:3 - Switzerland 1981:4-1982:4Germany 1992:4-1993:4 Switzerland 1990:4-1991:4Germany 2002:3-2003:3 Mexico 1982:2-1983:4 Switzerland 1992:3-1993:2Germany 2008:3 - Mexico 1985:4-1987:1 Switzerland 2002:3-2003:3
Mexico 1994:4-1995:4 Switzerland 2008:3 -
Table A.2: Business Cycle Dating
23

Edur Eamp Cdur Camp cr/Y open Infl lnY Ind ca/Y fdi/Y CBI IT CU CB RS Gov FH lm kmEdur 1.00Eamp 0.67 1.00Cdur 0.08 -0.24 1.00Camp 0.17 0.13 -0.73 1.00cr/Y 0.12 -0.12 -0.22 0.32 1.00open 0.12 0.38 -0.34 0.29 0.37 1.00Infl -0.51 -0.38 0.21 -0.31 -0.37 -0.35 1.00lnY 0.45 -0.08 0.04 0.29 0.58 0.23 -0.43 1.00Ind -0.11 -0.08 0.33 -0.40 0.27 0.16 -0.08 -0.22 1.00ca/Y -0.18 -0.36 0.06 -0.10 0.59 0.46 -0.10 0.44 0.36 1.00fdi/Y 0.23 0.31 -0.32 0.42 0.17 0.81 -0.22 0.25 -0.14 0.23 1.00CBI 0.23 0.12 -0.03 0.29 -0.17 -0.39 -0.24 0.15 -0.50 -0.61 -0.19 1.00IT 0.29 -0.28 0.20 0.14 0.18 -0.32 -0.02 0.54 -0.14 0.08 -0.23 0.01 1.00CU 0.39 -0.18 0.18 0.06 0.06 -0.17 -0.26 0.55 -0.25 0.06 -0.06 0.36 0.61 1.00CB 0.00 0.34 -0.33 0.21 -0.31 0.11 -0.12 -0.26 -0.19 -0.55 0.19 0.35 -0.39 -0.24 1.00RS 0.17 -0.16 0.07 0.16 0.34 0.16 -0.22 0.53 0.17 0.16 0.10 0.30 0.27 0.54 0.12 1.00Gov 0.70 0.28 -0.09 0.43 0.55 0.28 -0.56 0.87 -0.25 0.15 0.27 0.34 0.41 0.52 0.00 0.57 1.00FH -0.60 -0.21 -0.13 -0.30 0.00 0.33 0.13 -0.44 0.47 0.43 0.01 -0.67 -0.37 -0.34 -0.22 -0.20 -0.58 1.00lm 0.55 0.11 0.07 0.48 0.20 0.03 -0.42 0.64 -0.15 0.05 0.19 0.42 0.42 0.41 0.06 0.43 0.69 -0.70 1.00km 0.29 0.01 -0.26 0.35 0.31 0.03 -0.42 0.58 -0.44 0.30 -0.01 0.26 0.39 0.62 -0.39 0.08 0.52 0.24 0.40 1.00
Table A.3: Correlations
24

Expansion ContractionDependent variable Duration Amplitude Duration Amplitude
constant 82.90 1.68∗∗ 3.70 -0.22(1.26) (2.22) (0.29) (-0.99)
Macroeconomic factorsPrivate credit/GDP 0.02 0.000 -0.002 0.00
(0.35) (0.76) (0.22) (0.20)FDI/GDP -0.53 -0.01∗∗ -0.17∗∗∗ 0.003∗∗
(-1.00) (-2.16) (-2.64) (2.36)Inflation (D) -31.1∗∗∗ -0.24∗ -1.09 0.03
(-2.60) (-1.67) (-0.31) (0.42)Current Account/GDP -0.27 0.00 -0.15 0.002
(-0.24) (0.03) (-1.13) (0.83)ln(GDP) -15.1 -0.41∗∗ -1.56 0.06
(-1.11) (-2.32) (-0.63) (1.25)Institutional/Structural Factors
IT 9.13∗∗ 0.03 -0.20 0.02(2.47) (0.83) (-0.25) (1.19)
CU 12.9 0.05 0.65 -0.006(1.64) (0.81) (0.82) (-0.50)
CBI -3.66 0.24 -6.61∗∗∗ 0.01(-0.17) (1.09) (-3.07) (0.34)
Labor Markets -1.02 -0.08 2.82∗∗ -0.03(-0.08) (0.70) (2.17) (-1.48)
Capital Markets -5.8 -0.04 0.10 0.005(-1.06) (-0.58) (0.12) (0.31)
Governance (WB) 32.60∗ 0.58∗∗ -1.32 0.09(1.68) (2.46) (-0.30) (1.22)
Openness 0.04 0.001∗∗ 0.006 -0.0001(1.00) (2.43) (1.09) (-1.36)
Industrial Value Added -0.05 -0.003 0.13 -0.002(-0.10) (-0.50) (1.56) (-1.04)
G-7 7.75 0.08 -1.79∗∗∗ 0.02∗∗
(1.04) (1.34) (-2.59) (1.97)LA 1.97 0.02 0.86 -0.006
(0.16) (0.19) (0.53) (-0.20)CEE 6.71 0.23∗ -2.42∗ 0.07∗∗
(0.46) (1.58) (-1.86) (2.29)DC -3.63 0.12 -2.84∗∗∗ 0.01
(-0.30) (1.00) (-3.23) (0.80)Emerg -9.69 -0.07 -1.68 0.04∗
(-1.00) (-0.83) (-1.34) (1.78)d.f. 19 19 19 19R2 0.23 0.33 -0.05 0.20
Table 2: Determinants of Business Cycle Characteristics
25

Expansion Contraction Expansion ContractionDependent Variable Duration Amplitude Duration Amplitude Duration Amplitude Duration Amplitude
constant 13.07 0.39 6.55∗∗ -0.16∗∗∗ -39.28 -0.19 1.51 -0.18∗∗∗
(0.41) (0.86) (2.13) (-3.41) (-1.18) (-0.50) (0.32) (-2.63)Macro Factors 5.16 -0.04 -0.23 0.02 -12.62 -0.24∗∗∗ -1.74 0.21
(1.00) (-0.69) (-0.25) (1.61) (-1.02) (-2.58) (-1.16) (0.94)Institutional/
Structural FactorsIT 8.79∗∗ 0.07 0.10 0.008 1.20 -0.01 -1.00 0.02
(2.23) (1.57) (0.10) (0.63) (0.26) (-0.18) (-0.80) (1.31)CU 13.44 0.007 0.24 0.004 - - - -
(1.88) (0.12) (0.29) (0.34)CBI 6.09 0.22 -5.64∗ 0.07 -17.56 0.07 -8.73∗ 0.15∗∗
(0.28) (0.87) (-1.74) (1.34) (-0.67) (0.16) (-1.72) (2.01)Labor Markets -9.30 -0.25∗∗ 1.18 -0.008 1.54 -0.30∗ 2.77 0.02
(-0.81) (-2.25) (0.78) (-0.34) (0.10) (1.82) (1.24) (0.70)Governance (WB) 40.00∗ 0.69∗∗ -2.45 0.11∗ 131.62∗∗∗ 2.10∗∗∗ 1.08 -0.03
(1.86) (2.66) (-0.70) (1.87) (3.59) (5.36) (0.17) (-0.35)Openness 0.00005 0.0008∗∗∗ -0.006∗∗ 0.0000 -0.04 0.0003 -0.008 0.0002∗∗
(0.003) (4.56) (-2.00) (0.25) (-0.67) (0.58) (-1.36) (2.09)D1 3.20 0.04 0.12 0.02 5.45 0.23∗∗ -1.23 0.02
(0.34) (1.52) (0.11) (0.96) (0.43) (2.07) (-1.02) (1.16)D2 6.00 0.10∗ -1.36∗ 0.02∗ ‘ 14.15 0.26∗∗∗ -1.73∗∗ 0.01
(0.83) (1.76) (-1.85) (1.92) (1.54) (4.18) (2.53) (0.99)CEE 16.07∗∗ 0.29∗∗∗ -0.59 0.05∗∗∗ 6.72 0.32∗∗ -1.74 0.02
(2.30) (3.12) (-0.49) (2.95) (0.44) (2.34) (-0.72) (0.59)RS - - - - -45.92∗ -0.80∗ 4.95 -0.09
(-1.80) (-1.92) (1.21) (-1.41)d.f. 26 26 26 26 8 8 8 8R2 0.29 0.28 -0.06 0.34 0.27 0.56 -0.51 -0.16
Table 3: Determinants of Business Cycle Characteristics (Using Principal Components)
26

Dependent Variable Business Cycle Synchronization Index (ρij)(I) (II) (III) (IV)
constant -0.151 -0.473 -0.064 0.103(0.178) (0.346) (0.177) (0.164)
Trade Intensity (Tij) 0.005∗∗∗ 0.006 (0.004) 0.006∗∗
(0.0025) (0.0036) (0.0027) (0.002)Financial Linkages (φij) - 0.169 - -
(0.357)Distance (Dij) -0.055∗∗∗ -0.026∗ -0.055∗∗∗ -0.445∗∗∗
(0.009) (0.014) (0.009) (0.009)Macro Factors† 0.003 -0.008 0.002 -
(0.009) (0.016) (0.009)Institutional Factors† -0.011 -0.028∗ -0.009 -
(0.008) (0.016) (0.008)ln(GDPi +GDPj) 0.171∗∗∗ 0.188∗∗∗ 0.145∗∗∗ 0.095∗∗∗
(0.032) (0.063) (0.032) (0.030)Tij×DC - - 0.014∗∗
(0.006)BothIT - - 0.091∗∗∗
(0.019)Inflation (DD) - - - -0.070∗∗∗
(0.016)Labor Markets - - - -0.016
(0.013)d.f. 633 159 631 784R2 0.12 0.15 0.15 0.19
† Using principal components
Table 4: Determinants of Business Cycle Synchronization
27

Figure 1: Duration of Contractions
28

Figure 2: Amplitude of Contractions
29
Figure 3: Duration of Expansions
30

Figure 4: Amplitude of Expansions
31