MEASURING GLOBALIZATION BY MEANS OF BUSINESS CYCLES SYNCHRONIZATION. A FUZZY CLUSTER FRAMEWORK
19
Silvia PALAȘCĂ, PhD Student E-mail: [email protected] Sebastian ENEA, PhD Student E-mail: [email protected] Alexandru Ioan Cuza University of Iasi Faculty of Economics and Business Administration Professor Elisabeta JABA, PhD E-mail: [email protected] Professor Mihai ROMAN, PhD E-mail: [email protected] Bucharest University of Economic Studies Faculty of Economic Cybernetics, Statistics and Informatics MEASURING GLOBALIZATION BY MEANS OF BUSINESS CYCLES SYNCHRONIZATION. A FUZZY CLUSTER FRAMEWORK Abstract. Given its complex and dynamic nature, globalization proposes the intriguing challenge to develop new or alternative methods that can estimate its effects at an international scale. The double purpose of the paper is to employ both hard and fuzzy cluster analysis in order to evaluate business cycle transmission among of 55 countries over the time span 1992 – 2011, in order to estimate the effects of globalization, be means of the linkage which exists between the growth rate of the GDP and FDI flows. The results use the enhanced performance of the fuzzy clustering technique and show an increased tendency towards economic convergence, as a result of the globalization process but also due to exogenous events, such as economic and financial crises. The future directions of research will target a broader analysis, using a bigger number of variables and an extensive time span. Keywords: business cycle synchronization, foreign direct investments, fuzzy clusters, globalization, JEL classification: E32, E37, F21, F44 1. Introduction Considered by the national and international literature to be one of the most important contemporary phenomena, globalization represents a key research issue within in the academic field. Used, as a term, for the first time in 1983 in order to describe the changes which occurred in the modern economy, in terms of rapid distribution of production, trade, investments and technology (Levitt, 1983), globalization can be perceived as the integration process of national
-
Upload
independent -
Category
Documents
-
view
0 -
download
0
Transcript of MEASURING GLOBALIZATION BY MEANS OF BUSINESS CYCLES SYNCHRONIZATION. A FUZZY CLUSTER FRAMEWORK

Silvia PALAȘCĂ, PhD Student
E-mail: [email protected]
Sebastian ENEA, PhD Student
E-mail: [email protected]
Alexandru Ioan Cuza University of Iasi
Faculty of Economics and Business Administration
Professor Elisabeta JABA, PhD
E-mail: [email protected]
Professor Mihai ROMAN, PhD
E-mail: [email protected]
Bucharest University of Economic Studies
Faculty of Economic Cybernetics, Statistics and Informatics
MEASURING GLOBALIZATION BY MEANS OF
BUSINESS CYCLES SYNCHRONIZATION. A FUZZY
CLUSTER FRAMEWORK
Abstract. Given its complex and dynamic nature,
globalization proposes the intriguing challenge to develop new or
alternative methods that can estimate its effects at an international
scale. The double purpose of the paper is to employ both hard and
fuzzy cluster analysis in order to evaluate business cycle transmission
among of 55 countries over the time span 1992 – 2011, in order to
estimate the effects of globalization, be means of the linkage which
exists between the growth rate of the GDP and FDI flows. The results
use the enhanced performance of the fuzzy clustering technique and
show an increased tendency towards economic convergence, as a
result of the globalization process but also due to exogenous events,
such as economic and financial crises. The future directions of
research will target a broader analysis, using a bigger number of
variables and an extensive time span.
Keywords: business cycle synchronization, foreign direct
investments, fuzzy clusters, globalization,
JEL classification: E32, E37, F21, F44
1. Introduction
Considered by the national and international literature to be
one of the most important contemporary phenomena, globalization
represents a key research issue within in the academic field. Used, as a
term, for the first time in 1983 in order to describe the changes which
occurred in the modern economy, in terms of rapid distribution of
production, trade, investments and technology (Levitt, 1983),
globalization can be perceived as the integration process of national

economies within the international economy, through trade flows,
foreign direct investments, short capital flows, technological flows
and labour force (Bhagwati, 2004).
The most important and intriguing challenge that globalization
proposes, as a result of its complex, dynamic, controversial and
multidimensional nature, is that of developing alternative methods that
can evaluate its impact on the international economy.
The increasing process of integration among countries within
regional economic and politic structures, in the context of a globalized
economy, has impelled the interest to better understand and estimate
the transmission of business cycle fluctuations across national borders.
In general, business cycle transmission is considered to occur
when two or more countries experience a similar economic growth,
both in absolute value and in the same direction.
In this regard, an analysis founded on the idea that business
cycles synchronization represents a direct effect of globalization offers
the possibility to better grasp the nature and dynamics of these two
vast processes and offer a way to simultaneously measure the
occurrence and effects of both phenomena.
The emergence of economical and financial unions and
agreements raised the importance of assessing the transmission of the
fluctuations between countries, as recent papers (Artis M., Okubo T.,
2009), suggest.
The aim of this article is bivalent. The first goal consists in
comparing two clustering methods, namely k-means hard clusters and
c-means fuzzy clusters, in their performance to assess business cycle
transmission. This result will be further used to estimate the
synchronization of business cycles, perceived as an effect of
globalization, on the basis of the relationship that exists between the
growth rate of the GDP and inflows and outflows of foreign direct
investments (FDI).
The remaining part of the article is structured as follows.
Section 2 deals with the display of previous literature, Section 3
presents the data and the methodology employed in the study, while
Section 4 comprises the results provided by the model and their
discussion. The last part of the article offers the authors’ conclusions
and further research directions.
2. Literature review
In recent years, there has been an increasing amount of
literature that has focused extensively on the issue of business cycles
synchronization and its connections with globalization. Numerous
studies have attempted to assess global synchronization patterns by
means of the GDP (Fidrmuc & Korhonend, 2010), (Darvas & Szapary,
2004), (Artis M. , 2003), (Li & Liu, 2004), (Otto, Voss, & Willard,
2001). In this regards it is important to also mention the seminal work

of Burns and Mitchell (1946), a technique further employed by other
authors (Artis M., Okubo T., 2009), (Krolzig, 2003).
Several studies have underlined the fact that the GDP alone
cannot explain transformations which occur when national economies
tend to become more synchronized. Thus they have tried to employ in
the analysis other macroeconomic indicators, such as foreign direct
investments.
In 1994, Blomström et al. (1994) highlighted the importance
of FDI for a national economy, by stressing out the fact that a high
level or per capita income can induce positive effects of foreign
investments on economic growth. A further research was conducted
by De Mello (1997), where he describes the two paths by which these
types of international financial flows can determine economic growth,
namely the implementation of new, innovative production
technologies by means of foreign technological spillovers and know-
how transfers. This idea is supported by a more recent article (Liu,
2002) that considers that FDI have a significant spillover effect that
raises the productivity growth rate.
A number of papers have showed the importance of the FDI
channel by analysing it in opposition with the traditional trade
channel. Thus, Artis (2003), Bordo and Helbling (2010), Inklaar,
Jong-A-Pin, and De Haan (2005), and also Darvas and Szapary (2004)
have proven the important role foreign investments play within
national economies.
A general conclusion regarding the importance of foreign
direct investments is offered by Hsu et al. (2011) that states that the
relation between FDI and GDP offer a better explanation of business
cycles synchronization patters that any other variables.
The methods employed for the study of the business cycle
synchronization cover a wide range of statistical approaches, including
cluster analysis and more specifically, fuzzy cluster (Tsangarides &
Qureshi, 2008), which is considered a more realistic option due to the
fact that one country can share a number of characteristics in common
with a certain group and other features to be more similar with another
group.
Although fuzzy analysis is widely used in other scientific
areas, like image processing (Bezdek, Keller, & Pal, 2004) or decision
making (Bellman & Zadeh, 1970), it was bypassed in the study of
economic convergence with a few exceptions, like the seminal paper
of Boreiko (2003), and that of Artis and Zhang (2002), which both
study the EMU readiness of aspiring countries. There are just a few
studies (Welfens, 2009) on globalization which employ the fuzzy
cluster approach, thus leaving an opening which deserves to be
explored.
3. Research population, Data and Methodology
3.1. Research population

The research population is represented by countries from
Europe, North and South America, Asia and Oceania, out of which we
have selected a number of 26 European Union members, all of the
NAFTA, MERCOSUR, ASEAN and BRICS members (taking into
account the fact that Brazil is member in both MERCOSUR and
BRICS), as well as 9 other countries, such as Australia, Japan, South
Korea, Norway, Switzerland etc, thus comprising a sample of 55
entities. The motivation for choosing this particular sample resides in
the fact that they almost all members of regional, supranational
economic structures, which in turn are considered to be the main
advocates of global economic relations. What is more, the trade
registered between them accounts for more than two thirds of the
annual international commerce.
In addition to this, the regional structures mentioned above
depict strong financial linkages. For example, before the 2007-2008
economic crisis, the European Union was considered to be the most
important FDI source for NAFTA, especially the United States.
Currently China, due to its large financial reserves, holds this
prestigious position.
Therefore, based on the above-mentioned ideas, the analysis
sample was constructed in order to estimate patterns of
synchronization between regional groups and separate entities, based
on foreign direct investment flows, thus emphasizing close connection
between business cycles synchronization and the phenomenon of
globalization.
Some entities were deliberately excluded from this analysis
either on lack of relevant data (Macedonia, Montenegro, Serbia,
Kosovo, Albania, Bosnia and Herzegovina, Iceland, Myanmar,
Korean Republic) or a very different economical situation, leading to
outliers (Malta, Luxembourg, Lichtenstein, Vatican).
3.2. Data
The data for the analyzed population was acquired from the
World Bank database, and it comprises the following: GDP ti% , - the
annual percentual growth of the GDP in country and region i at time t;
FDIin
ti, - Foreign Direct Investments, net inflows (% of GDP); FDIout
ti, -
Foreign Direct Investments, net outflows (% of GDP). The motivation
for taking into account the GDP is based on two main reasons. The
first one is that the GDP represents an aggregate indicator that
comprises the activity in every economic sector, smoothing out
specific shocks, and the second one refers to the fact that the growth
rate provides a way to employ a cross-country comparison.
The values were standardized in order to capture the core
behaviour of the series and eliminate some of the variation, which
could have interfered with the results (Jaba E. , Statistică, 2002).
3.3. Methodology - cluster analysis

Pattern recognition is usually done by cluster analysis in
various scientific domains (Jaba, Balan, Roman, Viorică, & Roman,
2008). In this paper we make use of this technique in order to assess
the similarity between countries and form homogenously subsets,
regarding the transmission of their business cycles, measured
indirectly by the variation of the GDP. The transmission of the
business cycle is judged by the affiliation to a certain cluster or the
change in cluster membership.
Two related but different clustering techniques, namely hard
k-means clustering and fuzzy c-means clustering are exploited in order
to evaluate business cycle transmission and to predict future changes.
Clustering stands for the partition of a set of objects,
Rxxxq
nX ,...,, 21 in c sub-sets, nc 1 , such as the elements in
each subset define a natural structure. This partition can easily by
represented as a matrix, uM ikcxn UU ; , where uik defines the
membership of the element xi to the cluster with number k.
Hard (or crisp) clusters are defined by the following set of
rules:
ckniuik ,1;,1;1,0 (1)
c
kik niu
1
,1;1
(2)
n
iik cknu
1
,1;0
(3)
while for fuzzy clusters, (1) becomes:
ckniuik ,1;,1;1,0 (1’)
The main difference between hard and fuzzy clusters is stated
by rules (1) and (1’), namely whereas in the hard clusters’ case, each
object is assigned to only one cluster, in the fuzzy approach, each
object can belong to all clusters, up to a certain degree.
From an economic point of view, this is an important
relaxation of the first assumption, because in general, the simultaneous
influences of various factors do not allow a clear demarcation, it is
much more plausible the hypothesis of a degree of membership to
each cluster. Even more, a change in this degree could be the signal of
a change in the structural behaviour, resulting even in a change of
cluster.
The cluster assignment algorithms represent, for both cases,
optimization problems, solved usually in an iterative manner. The k-
means hard clustering algorithm is based on the minimization of the
Euclidean distance between each item and the centre of the cluster
(Lloyd, 1982), while the FCM algorithm (Bezdek J. , 1981) for fuzzy
clusters is concerned about the function
vxdu ki
n
i
c
kikF ;2
1 1
2

(4’)
where
n
iikij
n
iikkj uxuv
1
2
1
2 / .
Both hard and fuzzy clustering methods need a user defined
number of clusters, which could be potentially one of the main
difficulties of this method. Choosing the right number of clusters right
from the beginning is crucial for the rest of the endeavour.
The validation of the necessary number of clusters is made
through cluster silhouette analysis (Rousseeuw, 1987). This method
combines the ideas of both cohesion and separation. Namely, one
computes for each point, xi from cluster k,
1|; uxxx jkjii da (5)
1|;min uxxx jkjii db (6)
xx
xxx
ii
iii
ba
abs
,min
(7)
A xis close to 1 means that the data is appropriately
clustered, while a value close to -1 shows that xi was better matched
in its neighbouring cluster. An xis near zero means that the datum is
on the border of two natural clusters, making room for the fuzzy
cluster approach.
Computations were performed in MATLAB 7.1 and the role
of the theoretical variable xi was played in the first part of the paper
by the GDP growth rate ( GDP ti% , ) for each of the chosen years as to
compare the hard and fuzzy cluster approaches. In the second part of
the study, xi consisted of a three dimensional vector,
FDIFDIGDPxoutti
intitii ,,, ,,% which was subject only to the FCM
algorithm to asses globalization by means of the FDI.
The number of clusters chosen for each year is depicted in
Table 3, namely 4 for 1992, 3 for 1997, and 2 for the rest of the years,
highlighting the idea of increased business cycles synchronization,
measured by an increased similarity between countries, reinforcing the
concept of globalization.
The differences between clusters for each of the studied years
can be observed in the plots from Table 4, ranging from divergent
behaviour at the beginning of the study and moving towards increased
convergence in the final years of analysis.
3. Results and discussions
3.1. Fuzzy clustering versus hard clustering
Cluster analysis performed on the selected population revealed
the membership degree of each country depicted in Table 5. The
chosen years are 1992 as the first relevant year after the
dismemberment of the Soviet Union, 1997 as the beginning of the
Asian crisis, 2000 as the year following the adoption of the euro
currency, 2005 as the year following the EU enlargement, 2008 and
2011 as peaks of the business cycle (Euro Area Business Cycle Dating
Committee, 2013).
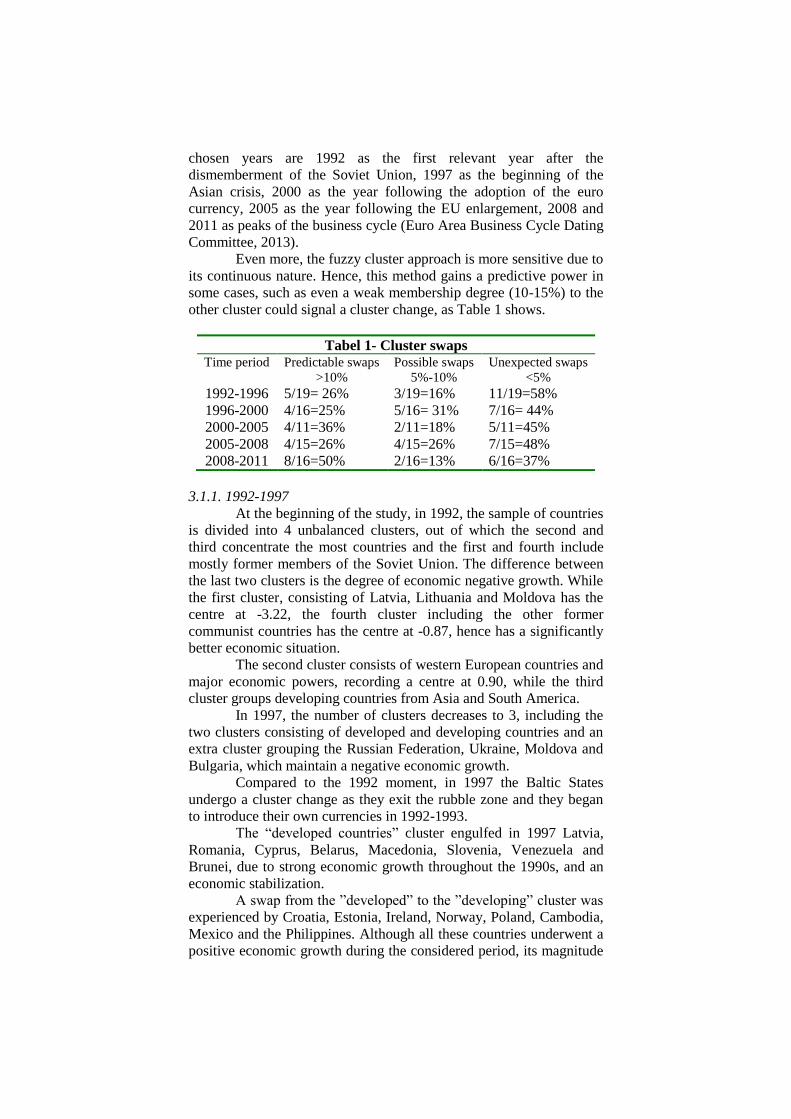
Even more, the fuzzy cluster approach is more sensitive due to
its continuous nature. Hence, this method gains a predictive power in
some cases, such as even a weak membership degree (10-15%) to the
other cluster could signal a cluster change, as Table 1 shows.
Tabel 1- Cluster swaps Time period Predictable swaps
>10%
Possible swaps
5%-10%
Unexpected swaps
<5%
1992-1996 5/19= 26% 3/19=16% 11/19=58%
1996-2000 4/16=25% 5/16= 31% 7/16= 44%
2000-2005 4/11=36% 2/11=18% 5/11=45%
2005-2008 4/15=26% 4/15=26% 7/15=48%
2008-2011 8/16=50% 2/16=13% 6/16=37%
3.1.1. 1992-1997
At the beginning of the study, in 1992, the sample of countries
is divided into 4 unbalanced clusters, out of which the second and
third concentrate the most countries and the first and fourth include
mostly former members of the Soviet Union. The difference between
the last two clusters is the degree of economic negative growth. While
the first cluster, consisting of Latvia, Lithuania and Moldova has the
centre at -3.22, the fourth cluster including the other former
communist countries has the centre at -0.87, hence has a significantly
better economic situation.
The second cluster consists of western European countries and
major economic powers, recording a centre at 0.90, while the third
cluster groups developing countries from Asia and South America.
In 1997, the number of clusters decreases to 3, including the
two clusters consisting of developed and developing countries and an
extra cluster grouping the Russian Federation, Ukraine, Moldova and
Bulgaria, which maintain a negative economic growth.
Compared to the 1992 moment, in 1997 the Baltic States
undergo a cluster change as they exit the rubble zone and they began
to introduce their own currencies in 1992-1993.
The “developed countries” cluster engulfed in 1997 Latvia,
Romania, Cyprus, Belarus, Macedonia, Slovenia, Venezuela and
Brunei, due to strong economic growth throughout the 1990s, and an
economic stabilization.
A swap from the ”developed” to the ”developing” cluster was
experienced by Croatia, Estonia, Ireland, Norway, Poland, Cambodia,
Mexico and the Philippines. Although all these countries underwent a
positive economic growth during the considered period, its magnitude

did not allow them to remain in the leading cluster. For example,
Norway and Poland have experienced a steady GDP growth, and
Philippine’s economy recovered dramatically during the years 1993-
1997 by President’ Ramos Social Reform Agenda (SRA).
Some of these cluster swaps were quite predictable by the
fuzzy cluster membership degree held by an entity in 1992, while the
majority were unexpected.
3.1.2. 1997-2000
Between 1997 and 2000 there is a new cluster contraction,
triggered by the increased process of globalization which leads to
business cycle transmission. This period is marked by two important
economic events, namely the introduction of the euro and the Asian
Financial Crisis, both with an important potential impact on the
studied population.
The first notable change is the dissolution of the Russian
influenced cluster, which in mostly absorbed by the developing
countries cluster, except Moldova. Belarus and Latvia were forced to
swap to the developing cluster. Latvia’s recovery was interrupted
twice, first by a banking crisis while for Belarus the period between
1997 and 2000 was also characterized by significant financial distress,
as a result of the financial and economic crisis in Russia.
The developed countries cluster welcomed during this period
states like Croatia, Norway, Poland, Lithuania, India, Indonesia,
Philippines, Thailand and Uruguay.
In order to minimize the damage of the Asian crisis, the
Indonesian government took custody of a significant portion of private
sector assets through the acquisition of nonperforming bank loans and
corporate assets through the debt restructuring process. Despite these
setbacks, the Philippine economy performed better than that of some
of its Asian neighbors, like Thailand. In India, the fundamental
reforms started in 1991 and their renewal in the 2000’s, triggered the
progress towards a free market economy.
The European countries underwent this shift as a result of
intense commercial linkages with countries from the first cluster and a
reorientation away from the former soviet bloc.
It can be inferred that, as the number of clusters decreases, so
does the swap of countries and furthermore, the fact that it becomes
more predictable.
3.1.3. 2000-2005
The time span 2000-2005 comprises mostly moments of
economic growth, although not with the same intensity for all
countries. In this regard, some countries, such as the Czech Republic,
India, Lithuania, Moldova, Paraguay, the Slovak Republic and
Venezuela migrate from the ”developed” cluster and are found, in
2005, in the ”developing” cluster.

In the Czech Republic, as well as in the Slovak republic, the
economic growth between 2000 and 2005 was supported by exports to
the EU, primarily to Germany, and a strong recovery of foreign and
domestic investment. Paraguay’s situation depends on internal
regulation, while in India, although the economic reforms picked up
pace in 2000-04, the economic growth was not as intense as the other
members of the cluster.
The “developing” cluster lost Ireland, Malaysia, Mexico and
Ukraine due to higher economic growth of these countries.
The most important change in this period is that of Ukraine,
which went through the historic Orange Revolution during the course
of the last two months of 2004. It is interesting to note that some of
the measures taken by the Malaysian government in response to the
Asian crisis, such as the ban on short selling, were swiftly
implemented by the very countries that had previously been critical of
the Malaysian response.
The number of swaps during this period is lower, suggesting a
more stable economic environment, and, simultaneously, the number
of predictable swaps increases.
3.1.4. 2005-2008
The most notable economic event of this period is the
beginning of the late 2000’s economic and financial crisis in the USA
and its spread towards Europe and the other continents.
The year 2008 witnesses a dramatic change of the
“developed” cluster, which, for the first time has a negative centre (-
0.72), a sign of the generalized downturn of the economy, while the
second cluster maintains a positive centre (0.92), showing that the
propagation of the crisis is delayed.
The first cluster loses Australia, South American countries,
like Bolivia and Brazil, Asian countries, such as Malaysia and
Philippines and some European states which have a strong economic
growth like Cyprus, Poland, Romania, Slovenia and Macedonia.
This is due to the fact that, while the core of the first cluster is
affected in late 2007 and 2008 by the financial and economic crisis,
the Polish economy is one of the fastest growing economies in
Europe, with a yearly growth rate of over 3.0% before the late 2000s
recession. Poland is the only member country of the European Union
to have avoided a decline in the GDP.
Estonia, Latvia, Turkey and Singapore are subject to the
opposite cluster change, due to high correlations with leading
economies.
The number of cluster swaps increases and most of them are
unpredictable changes, due to the unpredictable nature of the
economic crisis.
3.1.5. 2008-2011

The period between 2008 and 2011 includes the economic
crisis considered to be the most severe after the Great Depression of
1929-1933. In 2011 the first cluster regains its positive centre, while
the second cluster has a negative one, accounting for the delayed
impact of the crisis.
A high degree of membership to the second cluster in 2008
shows that the respective country has not been affected by the crisis
(like Australia, China, India), or the effect is delayed (Romania,
Slovenia, the Slovak Republic). The cluster changes in 2011 account
for the results of the crisis, namely the recovery of some countries
(Cyprus, Czech Republic) and the downturn of others (Estonia, Latvia,
Turkey, Ukraine).
Notable cluster changes are those from the second cluster to
the first one, signalling a strong economic recovery.
For example, Brazil was one of the first emerging markets to
begin a recovery. Bulgaria marked a decline in its economy of 5.5% in
2009, but quickly restored its positive growth to 0.2% in 2010, in
contrast to other Balkan countries.
At the opposite end, Ukraine was greatly affected by the
economic crisis of 2008 together with the Estonian economy which
was greatly affected by the financial crisis, primarily as a result of an
investment and consumption slump.
The number of swaps is not considerably different from the
other periods but there is an increased tendency towards the
predictability of the swaps, for the first time since the beginning of the
study. This fact suggests that, even in an unstable economic
environment, like that created by the crisis, there is an increased
convergence of countries’ economies determined by globalization.
3.2. Measuring globalization by means of fuzzy cluster
analysis
An overview of the results of the study, presented in Table 2,
highlights a couple of key issues as regards to the entities’ behavior in
relation to the two clusters.
The first aspect which needs to be taken into account is the
fact that, within the analyzed period, the two clusters present a very
high dynamic in terms of swaps between the key years employed in
the study. What is more, during the entire period, the two clusters are
somewhat unbalanced, with the first cluster encompassing more
countries. Related to this situation, we have to add the fact the United
States and Germany are the only countries that do not migrate, acting
as attractor of the first cluster. This underlines the role that these two
states play in the international economy in terms of economic
integration based on foreign direct investment flows.
Second of all, surprisingly one might say, a membership
degree of 0.1 to 0.3 to a cluster can denote in some cases the future
swap to the other one, thus signifying that a high membership degree,

at one moment, does not imply the fact that the entity will remain in
the same cluster during the next years of analysis.
Between 1992 and 1997, no more than 29 countries have
swapped to another cluster. From the first to the second cluster we
have three large groups of states that have migrated, namely the
Baltic, the Scandinavian and ex-Soviet states (Latvia, Estonia,
Lithuania, Moldova, Belarus, Finland and Sweden), two south-
American countries (Uruguay and Mexico) and three Asian ones (the
Philippines, Cambodia and Laos). The first group can be characterized
by large FDI inflows, between 5 and 10 % of the GDP, supported by
high levels of economic growth. Uruguay and Mexico migrate to the
second cluster due to the fact that they record high, sustainable levels
of economic growth (6 – 8%). The Philippines, Cambodia and Laos
change the cluster because they register a sustained economic growth
and average inflows of FDI.
On the other hand, we can see a large number of European and
Asian countries that migrate to the first cluster. Most of the European
states (Switzerland, Denmark, France, the United Kingdom, and Spain
etc.) migrate to the first cluster because it is characterized by a
moderate and sustainable economic growth, as well as average levels
for the FDI flows.
A very peculiar situation is that of Brunei, which receives over
10% of FDI inflows and registers an economic decrease of -1.5%, thus
highlighting the first effects of the 1997 Asian financial crisis, also
true for Thailand, which registered a decrease of the GDP of -1.40 %.
Singapore migrated to the first cluster due to the fact that it reported
very high levels of both FDI inflows and outflows. This situation can
be explained by the fact that, since 1995, Singapore has represented a
preferred destination for FDI flows from North America, Europe and
Asia.
From 1997 to 2000 no more than 8 European countries,
including France, Denmark, Switzerland, Belgium etc., have migrated
to the second cluster, mainly because they have made large
investments abroad, reporting FDI outflows of over 10% of the GDP.
The second cluster is left behind by most of the countries that
do not register important values of the FDI flows. The countries that
have a higher membership degree are Ireland and Singapore on the
one hand, mainly because they have received very large inflows of
FDI (15 – 21%), and on the other hand, Belarus, which maintained a
good economic growth.
What is more, the effects of the Asian financial crisis became
more visible, in terms of a decrease in the FDI flows towards the rest
of the Asian countries.
During the period from 2000 to 2005 the two clusters
reestablish themselves to the structures from 1997. Here we are more
interested in the changes from the second cluster. It is emptied by all
the developed countries, which migrate to the first one, and receives
three large groups of states. At first we find the Baltic states and

countries from central and Eastern Europe, such as the Czech
Republic, Slovenia, Bulgaria, Moldova, Russia etc. due to the fact that
they received large inflows of FDI that generate economic growth.
The second group comprises five MERCOSUR members,
namely Venezuela, Bolivia, Argentina, Uruguay and Paraguay,
countries that have registered a high economic growth, but low levels
of foreign direct investments inflows. This same situation is
characteristic to the third group of states, which contains Indonesia,
India, Laos, China, Cambodia and Malaysia, countries that have
registered a sustainable economic growth, but based on previous FDI
inflows.
The 2005 – 2008 period was considered to be an economic
boom for numerous national economies. The countries that have made
the swap between the first and the second cluster are the ones that
have registered high levels for one or more of the variables included in
the analysis. National economies such as Poland, Romania, Bolivia
and Brazil have reported increased levels of economic growth,
between 5 and 8 %, while other like Cyprus and Croatia have received
high levels of either FDI inflows of outflows. Belgium is a very
peculiar case, because, even though it has a modest GDP growth rate
(less that 1%), it reports levels of FDI inflows and outflows above
35%, respectively 40%, meaning that Belgium plays a double role,
both as an foreign investment attractor, as well as an important
international investor.
The migrations from the second to the first cluster are
comprised of the Baltic States, mainly due to the decrease of the GDP
growth rate, perceived as a direct effect of the economic crisis.
Turkey, on the other hand, migrates to the first cluster because it
cannot support the 2005 economic growth rate, given the fact that it
relies very much on international commercial flows, which suffered a
decrease as a result of the crisis.
From 2008 to 2011 the effects of the economic depression are
visible the countries that remain in the first cluster. The economies
that migrated to the second cluster are those that recovered very fast
after the crisis. Brunei registered a GDP growth level of 2.5 to 5%,
while Singapore reported 8% economic growth and 21% FDI inflows,
meaning that it still is considered a very attractive country for the
European, North American and Asian investment flows.
Ukraine is another example of swap to the second cluster, due
to its very high economic growth level (5.2%), higher that the
European average. This situation can be explained by the fact that the
Ukrainian economy has very strong commercial relations with both
the European Union and the Russian Federation.
On the other hand, the first cluster receives those countries
that were mildly affected or are trying to recover from the effects of
the economic crisis, but still register an average GDP growth rate and
FDI flows.

4. Conclusions and further directions of research
One of the most important challenges that globalization
proposes is to develop alternative methods which can be useful for
assessing its influence on the international economy. Furthermore, an
analysis based on the idea that business cycles synchronization
represents a direct effect of globalization offers the possibility to
better grasp the nature and dynamics of these vast processes.
The relevance of the research resides on the fact that it is one
the few studies that brings together the concepts of globalization and
business cycles synchronization via fuzzy cluster analysis. On the
basis of the bilateral relationship that exists between the two
phenomena (Artis M., Okubo T., 2009), the present study brings its
contribution by explaining the integration processes, for national
economies, in regional economic blocs, i.e. the European Union,
NAFTA, MERCOSUR, ASEAN or associations of emerging
countries, i.e. BRIC, and also the amount of time needed by each
country to synchronize its national business cycle with core cycle of
the region.
What is more, the novelty the study brings forward is the use
of fuzzy cluster analysis in assessing the business cycle transmission,
considered to be a step closer towards globalization.
The justification resides in the fact that a degree of
membership is more plausible from an economic perspective,
especially with respect to a phenomenon as difficult to measure as the
business cycle and its transmission among countries, either as a
borderline effect or as a result of trade and common policy
agreements.
This study has provided results which corroborate the findings
of a number of previous researches conducted on globalization and
business cycles synchronization, such as the work of Fidrmuc and
Martin (2011) that consider the fact that, in CESEE countries, the
inward FDI flows determine economic growth and a higher degree of
synchronization. What is more, the paper comes to support the
opinions of Fidrmuc and Korhonend (2010) regarding the Asian
economies, namely the fact they had registered different business
cycles, decoupling from the OECD countries, and also that the recent
economic crisis has made them more synchronized with the global
macro-cycles.
The results of the research reveal synchronization patterns not
only between the entities that comprise regional economic structures,
but also patterns between these supranational entities, therefore
underlining the idea that the global economy presents macro business
cycles. Furthermore, the use of foreign direct investments as a
synchronization vector emphasizes these synchronization patterns, due
to their retency over a longer period of time within national
economies, and also because of the role they play in the international

economy as transmission channels for symmetric and asymmetric
shocks.
The idea comes to support previous researches that state that
“globalization reduces the differences between countries in their
business cycle experiences” (Artis M., Okubo T., 2009), and also the
fact that “globalization increases the degree of synchronization of
business cycles” (Kose, 2003).
The drawback of the current study resides in the choice of the
years that could be regarded as arbitrary, and the usage of the
Euclidean distance for clusters.
Further study will focus on the conditions under which the
fuzzy clustering method has predictive power. The development
includes both an extended number of countries and an annual study.
Another direction could be the replacement of the Euclidian distance
with a more appropriate one and the motivation thereof.
Acknowledgements This work was supported by the European Social Fund through
Sectoral Operational Programme Human Resources Development
2007 – 2013, project number POSDRU/159/1.5/S/134197, project title
“Performance and Excellence in Doctoral and Postdoctoral Research in
Economic Sciences Domain in Romania.
References [1]. Artis M., Okubo T. (2009). Globalisation and Business Cycle
Transmission. The North American Journal of Economics and
Finance, 20(1), 91-99.
[2]. Artis, M. (2003). Is there a european business cycle? Cesifo
Working Paper.
[3]. Artis, M. J., & Zhang, W. (2002). Membership of EMU: a
fuzzy clustering analysis of alternative criteria. Journal of
economic integration, 17(1), 54-79.
[4]. Bellman, R. E., & Zadeh, L. A. (1970). Decision-making in a
fuzzy environment. Management science, 17(4).
[5]. Bezdek, J. (1981). Pattern Recognition with Fuzzy Objective
Function Algorithms. New York: Plenum.
[6]. Bezdek, J. C., Keller, J. K., & Pal, N. R. (2004). Fuzzy models
and algorithms for pattern recognition and image processing
(Vol. 4). Springer.
[7]. Bhagwati, J. (2004). In Defence of Globalization. New York:
Oxford University Press.
[8]. Blomstrom, M., Lipsey, R. E., & Zejan, M. (1994). What
explains developing country growth? NBER Working Papers.
[9]. Bordo, M., & Helbling, T. (2010). International Business
Cycle Synchronzation in Historical Perspetive. NBER
Working Papers.

[10]. Boreiko, D. (2003). EMU and accession countries: Fuzzy
cluster analysis of membership. International Journal of
Finance & Economics,, 8(4), 309-325.
[11]. Burns, A., & Mitchell, C. (1946). Measuring Business
Cycles. New York: NBER.
[12]. Caetano, J., & Caleiro, A. (2005). Corruption and Foreign
Direct Investments. What kind of relationship is there? .
[13]. Darvas, Z., & Szapary, G. (2004). Business cycle
synchronization in the enlarged eu: comovements in the new
and old members. Mnb Working Paper.
[14]. De Mello, L. (1997). Foreign direct investment in
developing countries and growth: A selective survey. The
Journal of Development Studies, 1-34.
[15]. Eickmeier, S. (2007). Business cycle transmission from the
US to Germany—A structural factor approach. European
Economic Review, 51(3), 521-551.
[16]. Enea, S., & Palașcă, S. (2012). Globalization versus
Segregation - Business Cycles Synchronization in Europe.
CES Working Papers, 4, 668-692.
[17]. Euro Area Business Cycle Dating Committee. (2013).
Business Cycles. London: CEPR.
[18]. Fidrmuc, J., & Korhonend, I. (2010). The impact of the
global financialcrisis on business cycles in Asian emerging
economies. Journal of Asian Economics, 21(1), 293-303.
[19]. Hsu, C.-C., Wu, J.-Y., & Yau, R. (2011). Foreign direct
investment and business cycle co-movements: The panel data
evidence. Journal of Macroeconomics, 33(4), 770-783.
[20]. Inklaar, R., Jong-A-Pin, R., & De Haan, J. (2005). Trade and
business cycle synchronization in oecd countries. A re-
examination. Cesifo working papers.
[21]. Jaba, E. (2002). Statistică (3 ed.). București: Editura
Economică.
[22]. Jaba, E., Balan, C., Roman, M., Viorică, D., & Roman, M.
(2008). Employment rate prognosis on the basis of the
development environment trend displayed by years-clusters.
Economic Computations and Economic Cybernetics Studies
and Research(3-4), 123-137.
[23]. Krolzig, H.–M. (2003). Constructing turning point
chronologies with Markov-switching vector autoregressive
models: the euro-zone business cycle. Colloquium on Modern
Tools for Business Cycle Analysis. Luxembourg.
[24]. Levitt, T. (1983, May). The Globalization of Markets.
Harvard Business Review.
[25]. Li, X., & Liu, X. (2005). Foreign Direct Investment and
Economic Growth: An Increasingly Endogenous Relationship.
World Development, 33(3), 393-407.

[26]. Liu, Z. (2002). Foreign direct investment and technology
spillover: evidence from China. Journal of comparative
Economics, 579-602.
[27]. Lloyd, S. (1982). Least squares quantization in PCM. IEEE
Transactions on Information Theory , 28(2), 129-137.
[28]. Otto, G., Voss, G., & Willard, L. (2001). Understanding
OECD output correlations. Reserve Bank of Australia.
[29]. Rousseeuw, P. (1987). Silhouettes: a Graphical Aid to the
Interpretation and Validation of Cluster Analysis.
Computational and Applied Mathematics, 20, 53–6.
[30]. Tsangarides, C. G., & Qureshi, M. S. (2008). Monetary
union membership in West Africa: A cluster analysis. World
Development, 36(7), 1261-1279.
[31]. Welfens, P. J. (2009). EU-ASEAN: facing economic
globalisation. Springer.
[32]. World Bank. (2013). World Bank database. Retrieved from
http://data.worldbank.org/indicator/NY.GDP.MKTP.KD.ZG

Tabel 2-Fuzzy membership degrees by GDP and FDI
Country 92_f1 92_f2 97_f1 97_f2 00_f1 00_f2 05_f1 05_f2 08_f1 08_f2 11_f1 11_f2
Argentina 0.29 0.71 0.23 0.77 0.74 0.26 0.06 0.94 0.06 0.94 0.18 0.82
Australia 0.24 0.76 0.95 0.05 0.99 0.01 0.56 0.44 0.23 0.77 0.80 0.20
Austria 0.64 0.36 0.94 0.06 0.96 0.04 0.97 0.03 0.85 0.15 0.73 0.27
Belarus 0.81 0.19 0.33 0.67 0.93 0.07 0.12 0.88 0.18 0.82 0.19 0.81
Belgium 0.39 0.61 0.51 0.49 0.34 0.66 0.68 0.32 0.51 0.49 0.52 0.48
Bolivia 0.42 0.58 0.31 0.69 0.83 0.17 0.58 0.42 0.05 0.95 0.05 0.95
Brazil 0.97 0.03 0.83 0.17 0.99 0.01 0.83 0.17 0.06 0.94 0.59 0.41
Brunei 0.47 0.53 0.46 0.54 0.83 0.17 0.83 0.17 0.86 0.14 0.52 0.48
Bulgaria 0.86 0.14 0.67 0.33 0.88 0.12 0.42 0.58 0.36 0.64 0.78 0.22
Cambodia 0.80 0.20 0.18 0.82 0.73 0.27 0.23 0.77 0.09 0.91 0.15 0.85
Canada 0.83 0.17 0.70 0.30 0.51 0.49 0.99 0.01 0.97 0.03 0.93 0.07
China 0.27 0.73 0.19 0.81 0.76 0.24 0.16 0.84 0.17 0.83 0.21 0.79
Croatia 0.93 0.07 0.42 0.58 0.98 0.02 0.72 0.28 0.54 0.46 0.82 0.18
Cyprus 0.41 0.59 0.47 0.53 0.81 0.19 0.77 0.23 0.51 0.49 0.85 0.15
Czech R. 0.93 0.07 0.77 0.23 0.90 0.10 0.29 0.71 0.44 0.56 0.71 0.29
Denmark 0.45 0.55 0.90 0.10 0.18 0.82 0.82 0.18 0.93 0.07 0.91 0.09
Estonia 0.57 0.43 0.28 0.72 0.62 0.38 0.44 0.56 0.79 0.21 0.34 0.66
Finland 0.82 0.18 0.54 0.46 0.16 0.84 0.98 0.02 0.89 0.11 0.78 0.22
France 0.34 0.66 0.90 0.10 0.41 0.59 0.88 0.12 0.97 0.03 0.93 0.07
Germany 0.75 0.25 0.90 0.10 0.70 0.30 0.89 0.11 0.85 0.15 0.71 0.29
Greece 0.89 0.11 0.82 0.18 0.96 0.04 0.84 0.16 0.89 0.11 0.68 0.32
Hungary 0.35 0.65 0.34 0.66 0.98 0.02 0.73 0.27 0.90 0.10 0.92 0.08
India 0.78 0.22 0.78 0.22 0.96 0.04 0.12 0.88 0.18 0.82 0.11 0.89
Indonesia 0.55 0.45 0.67 0.33 0.89 0.11 0.34 0.66 0.08 0.92 0.08 0.92
Ireland 0.15 0.85 0.31 0.69 0.36 0.64 0.53 0.47 0.74 0.26 0.60 0.40
Italy 0.92 0.08 0.89 0.11 0.96 0.04 0.89 0.11 0.89 0.11 0.94 0.06
Japan 0.91 0.09 0.86 0.14 0.89 0.11 0.84 0.16 0.91 0.09 0.83 0.17
Lao PDR 0.72 0.28 0.11 0.89 0.94 0.06 0.16 0.84 0.11 0.89 0.12 0.88
Latvia 0.59 0.41 0.20 0.80 0.86 0.14 0.13 0.87 0.80 0.20 0.05 0.95
Lithuania 0.66 0.34 0.21 0.79 0.96 0.04 0.00 1.00 0.41 0.59 0.03 0.97
Malaysia 0.38 0.62 0.13 0.87 0.69 0.31 0.56 0.44 0.27 0.73 0.46 0.54
Mexico 0.72 0.28 0.31 0.69 0.90 0.10 0.89 0.11 0.80 0.20 0.41 0.59
Moldova 0.55 0.45 0.41 0.59 0.90 0.10 0.08 0.92 0.10 0.90 0.04 0.96
Netherlands 0.84 0.16 0.68 0.32 0.87 0.13 0.76 0.24 0.87 0.13 0.84 0.16
Norway 0.07 0.93 0.51 0.49 0.95 0.05 0.81 0.19 0.86 0.14 0.75 0.25
Paraguay 0.65 0.35 0.86 0.14 0.66 0.34 0.09 0.91 0.27 0.73 0.18 0.82
Philippines 0.95 0.05 0.47 0.53 0.99 0.01 0.66 0.34 0.16 0.84 0.32 0.68
Poland 0.07 0.93 0.42 0.58 0.73 0.27 0.88 0.12 0.11 0.89 0.55 0.45
Portugal 0.93 0.07 0.44 0.56 0.83 0.17 0.78 0.22 0.63 0.37 0.78 0.22
Romania 0.83 0.17 0.64 0.36 0.90 0.10 0.62 0.38 0.10 0.90 0.66 0.34
Russia 0.72 0.28 0.90 0.10 0.67 0.33 0.25 0.75 0.04 0.96 0.50 0.50
Singapore 0.28 0.72 0.45 0.55 0.30 0.70 0.48 0.52 0.75 0.25 0.49 0.51
Slovak R. 0.87 0.13 0.80 0.20 0.64 0.36 0.19 0.81 0.01 0.99 0.51 0.49
Slovenia 0.89 0.11 0.69 0.31 0.96 0.04 0.88 0.12 0.29 0.71 0.82 0.18
Spain 0.19 0.81 0.85 0.15 0.33 0.67 0.95 0.05 0.95 0.05 0.94 0.06
Sweden 0.94 0.06 0.57 0.43 0.08 0.92 0.76 0.24 0.84 0.16 0.64 0.36
Switzerland 0.47 0.53 0.60 0.40 0.18 0.82 0.62 0.38 0.73 0.27 0.72 0.28
Thailand 0.36 0.64 0.76 0.24 0.99 0.01 0.61 0.39 0.61 0.39 0.93 0.07
Turkey 0.79 0.21 0.51 0.49 0.87 0.13 0.06 0.94 0.87 0.13 0.17 0.83
Ukraine 0.81 0.19 0.72 0.28 0.94 0.06 0.68 0.32 0.53 0.47 0.04 0.96

Tabel 3 - Cluster silhouettes
1992 1997 2000
2005 2008 2011
Tabel 4 – GDP growth statistics by cluster
1992 1997
2000 2005
2008 2011
UK 0.30 0.70 0.65 0.35 0.12 0.88 0.79 0.21 0.92 0.08 0.90 0.10
USA 0.76 0.24 0.85 0.15 0.99 0.01 0.80 0.20 0.96 0.04 0.95 0.05
Uruguay 0.70 0.30 0.46 0.54 0.71 0.29 0.05 0.95 0.08 0.92 0.07 0.93
Venezuela 0.22 0.78 0.12 0.88 0.98 0.02 0.13 0.87 0.17 0.83 0.34 0.66
Vietnam 0.32 0.68 0.20 0.80 0.88 0.12 0.04 0.96 0.17 0.83 0.09 0.91

Table 5 Hard cluster membership by GDP
Country 92c 97c 00c 05c 08c 11c Country 92c 97c 00c 05c 08c 11c
Argentina 3 3 1 2 2 2 Latvia 1 3 2 2 1 2
Australia 2 3 1 1 2 1 Lithuania 1 1 1 2 2 2
Austria 2 3 1 1 1 1 Malaysia 3 1 2 1 2 2
Belarus 4 3 2 2 2 2 Mexico 2 1 2 1 1 2
Belgium 2 3 1 1 1 1 Moldova 1 2 1 2 2 2
Bolivia 2 3 1 1 2 2 Netherlands 2 3 1 1 1 1
Brazil 2 3 1 1 2 1 Norway 2 1 1 1 1 1
Brunei 3 3 1 1 1 1 Paraguay 2 3 1 2 2 2
Bulgaria 4 2 2 2 2 1 Philippines 2 1 1 1 2 2
Cambodia 2 1 2 2 2 2 Poland 2 1 1 1 2 2
Canada 2 3 1 1 1 1 Portugal 2 3 1 1 1 1
China 3 1 2 2 2 2 Romania 4 3 1 1 2 1
Croatia 2 1 1 1 1 1 Russia 4 2 2 2 2 2
Cyprus 3 3 1 1 2 1 Singapore 3 1 2 2 1 2
Czech R. 2 3 1 2 2 1 Slovak R. 4 1 1 2 2 1
Denmark 2 3 1 1 1 1 Slovenia 4 3 1 1 2 1
Estonia 2 1 2 2 1 2 Spain 2 3 1 1 1 1
Finland 2 3 1 1 1 1 Sweden 2 3 1 1 1 2
France 2 3 1 1 1 1 Switzerland 2 3 1 1 1 1
Germany 2 3 1 1 1 1 Thailand 3 1 1 1 1 1
Greece 2 3 1 1 1 1 Turkey 3 1 2 2 1 2
Hungary 2 3 1 1 1 1 Ukraine 4 2 2 1 1 2
India 3 1 1 2 2 2 UK 2 3 1 1 1 1
Indonesia 3 1 1 1 2 2 USA 2 3 1 1 1 1
Ireland 2 1 2 1 1 1 Uruguay 3 1 1 2 2 2
Italy 2 3 1 1 1 1 Venezuela 3 3 1 2 2 2
Japan 2 3 1 1 1 1 Vietnam 3 1 2 2 2 2
Lao PDR 3 1 2 2 2 2