Large-scale proteomics analysis of human ovarian cancer for biomarkers
11
Large-Scale Proteomics Analysis of Human Ovarian Cancer for Biomarkers Sofia Bengtsson, Morten Krogh, Cristina Al-Khalili Szigyarto, ‡ Mathias Uhlen, ‡ Kjell Schedvins, § Claes Silfverswa 1 rd, | Stig Linder, | Gert Auer, | Ayodele Alaiya, |,⊥ and Peter James* , Department of Protein Technology and Department of Computational Biology and Biological Systems, Lund University, BMC D13, 221 84 Lund, Sweden, The Human Proteome Resource, Department of Biotechnology, Royal Institute of Technology, Stockholm, Sweden, Department of Woman and Child Health, Division of Obstetrics and Gynaecology, and Department of Oncology and Pathology, Karolinska Hospital, Stockholm, Sweden, and Department of Biological and Medical Research, King Faisal Specialist Hospital and Research Centre, Riyadh, Saudi Arabia Received November 10, 2006 Ovarian cancer is usually found at a late stage when the prognosis is often bad. Relative survival rates decrease with tumor stage or grade, and the 5-year survival rate for women with carcinoma is only 38%. Thus, there is a great need to find biomarkers that can be used to carry out routine screening, especially in high-risk patient groups. Here, we present a large-scale study of 64 tissue samples taken from patients at all stages and show that we can identify statistically valid markers using nonsupervised methods that distinguish between normal, benign, borderline, and malignant tissue. We have identified 217 of the significantly changing protein spots. We are expressing and raising antibodies to 35 of these. Currently, we have validated 5 of these antibodies for use in immunohistochemical analysis using tissue microarrays of healthy and diseased ovarian, as well as other, human tissues. Keywords: Biomarkers • Ovarian cancer • DIGE • Proteomics • Statistical analysis Introduction Epithelial ovarian carcinomas account for 85-90% of all cancers of the ovaries with the major subtypes being serous/ seropapillary and mucinous tumors. The tumors range from benign to aggressive malignant including an intermediate class referred to as borderline carcinomas. 1 The prognosis of the disease is strongly dependent on tumor classification and early detection. Tumors are classified based on a subjective histo- pathological evaluation. Immunostaining can be used to determine the expression of various diagnostic markers and may increase reproducibility. Almost 70% of patients with ovarian cancer have an advanced stage (stage III-IV) at diagnosis. The 5-year survival rate for these patients is about 30%. In contrast, those patients diagnosed with stage I disease have a survival rate of over 90%, and in these cases, the disease may be cured by surgery alone. 2 CA125 is the most thoroughly assessed biomarker for ovarian cancer. Elevated levels of CA125 are found in >90% of the advanced-stage disease, but it lacks sensitivity for early stage diagnosis, as increased expression is only seen in approximately 50% of stage I disease. 3 The concentration of CA125 is also found to be elevated in women with benign gynecologic conditions such as ovarian cysts, endometriosis, and uterine fibroids, as well as in other cancers (breast, bladder, pancreatic, liver, lung). 4 The lack of sensitivity and specificity of CA125 has restricted its use in Sweden to monitoring for recurrence of the disease. 2 The comparative analysis of ovarian cancer development may lead to new diagnostics, prognostics, and treatment approaches. Proteins are the logical targets, both for use as biomarkers for screening, as well as drug targets, and the best cancer markers known to date (e.g., prostate-specific antigen, R-fetoprotein, carcinoembryonic antigen) are tumor- derived proteins. These are present in serum at very low concentrations (1-10 ng/mL). Searching for new markers in diseased tissue where the marker protein is present at a much higher concentration facilitates protein identification, and these highly expressed proteins are the ones most likely to be found being released into blood in amounts accessible for testing. Two-dimensional electrophoresis (2-DE) is the method that is most applicable to high-throughput analysis of highly expressed proteins in tissue, since samples can be run in parallel and multiplexed. 5 It has been previously shown that cluster analysis of 2-DE protein expression data can be used for objective and accurate molecular classification of tumors. 6 Differential in-Gel Electrophoresis, DIGE, greatly improves * Author for correspondence; Peter James, Protein Technology, BMC D13, Lund University, SE-221 84 Lund, Sweden. E-mail, [email protected]; fax, +46 46 222 1495. Lund University. ‡ Royal Institute of Technology. § Department of Woman and Child Health, Division of Obstetrics, Karolinska Hospital. | Department of Oncology and Pathology, Karolinska Hospital. ⊥ King Faisal Specialist Hospital and Research Centre. 10.1021/pr060593y CCC: $37.00 xxxx American Chemical Society Journal of Proteome Research XXXX, X, XXXX-XXXX A PAGE EST: 10.3 Published on Web 02/22/2007
Transcript of Large-scale proteomics analysis of human ovarian cancer for biomarkers

Large-Scale Proteomics Analysis of Human Ovarian Cancer for
Biomarkers
Sofia Bengtsson,† Morten Krogh,† Cristina Al-Khalili Szigyarto,‡ Mathias Uhlen,‡
Kjell Schedvins,§ Claes Silfverswa1rd,| Stig Linder,| Gert Auer,| Ayodele Alaiya,|,⊥ andPeter James*,†
Department of Protein Technology and Department of Computational Biology and Biological Systems,Lund University, BMC D13, 221 84 Lund, Sweden, The Human Proteome Resource, Department of
Biotechnology, Royal Institute of Technology, Stockholm, Sweden, Department of Woman and Child Health,Division of Obstetrics and Gynaecology, and Department of Oncology and Pathology, Karolinska Hospital,
Stockholm, Sweden, and Department of Biological and Medical Research, King Faisal Specialist Hospital andResearch Centre, Riyadh, Saudi Arabia
Received November 10, 2006
Ovarian cancer is usually found at a late stage when the prognosis is often bad. Relative survival ratesdecrease with tumor stage or grade, and the 5-year survival rate for women with carcinoma is only38%. Thus, there is a great need to find biomarkers that can be used to carry out routine screening,especially in high-risk patient groups. Here, we present a large-scale study of 64 tissue samples takenfrom patients at all stages and show that we can identify statistically valid markers using nonsupervisedmethods that distinguish between normal, benign, borderline, and malignant tissue. We have identified217 of the significantly changing protein spots. We are expressing and raising antibodies to 35 of these.Currently, we have validated 5 of these antibodies for use in immunohistochemical analysis using tissuemicroarrays of healthy and diseased ovarian, as well as other, human tissues.
Keywords: Biomarkers • Ovarian cancer • DIGE • Proteomics • Statistical analysis
Introduction
Epithelial ovarian carcinomas account for 85-90% of allcancers of the ovaries with the major subtypes being serous/seropapillary and mucinous tumors. The tumors range frombenign to aggressive malignant including an intermediate classreferred to as borderline carcinomas.1 The prognosis of thedisease is strongly dependent on tumor classification and earlydetection. Tumors are classified based on a subjective histo-pathological evaluation. Immunostaining can be used todetermine the expression of various diagnostic markers andmay increase reproducibility. Almost 70% of patients withovarian cancer have an advanced stage (stage III-IV) atdiagnosis. The 5-year survival rate for these patients is about30%. In contrast, those patients diagnosed with stage I diseasehave a survival rate of over 90%, and in these cases, the diseasemay be cured by surgery alone.2
CA125 is the most thoroughly assessed biomarker for ovariancancer. Elevated levels of CA125 are found in >90% of the
advanced-stage disease, but it lacks sensitivity for early stagediagnosis, as increased expression is only seen in approximately50% of stage I disease.3 The concentration of CA125 is alsofound to be elevated in women with benign gynecologicconditions such as ovarian cysts, endometriosis, and uterinefibroids, as well as in other cancers (breast, bladder, pancreatic,liver, lung).4 The lack of sensitivity and specificity of CA125 hasrestricted its use in Sweden to monitoring for recurrence ofthe disease.2 The comparative analysis of ovarian cancerdevelopment may lead to new diagnostics, prognostics, andtreatment approaches. Proteins are the logical targets, both foruse as biomarkers for screening, as well as drug targets, andthe best cancer markers known to date (e.g., prostate-specificantigen, R-fetoprotein, carcinoembryonic antigen) are tumor-derived proteins. These are present in serum at very lowconcentrations (1-10 ng/mL). Searching for new markers indiseased tissue where the marker protein is present at a muchhigher concentration facilitates protein identification, and thesehighly expressed proteins are the ones most likely to be foundbeing released into blood in amounts accessible for testing.
Two-dimensional electrophoresis (2-DE) is the method thatis most applicable to high-throughput analysis of highlyexpressed proteins in tissue, since samples can be run inparallel and multiplexed.5 It has been previously shown thatcluster analysis of 2-DE protein expression data can be usedfor objective and accurate molecular classification of tumors.6
Differential in-Gel Electrophoresis, DIGE, greatly improves
* Author for correspondence; Peter James, Protein Technology, BMC D13,Lund University, SE-221 84 Lund, Sweden. E-mail, [email protected];fax, +46 46 222 1495.
† Lund University.‡ Royal Institute of Technology.§ Department of Woman and Child Health, Division of Obstetrics,
Karolinska Hospital.| Department of Oncology and Pathology, Karolinska Hospital.⊥ King Faisal Specialist Hospital and Research Centre.
10.1021/pr060593y CCC: $37.00 xxxx American Chemical Society Journal of Proteome Research XXXX, X, XXXX-XXXX APAGE EST: 10.3 Published on Web 02/22/2007

reproducibility.7,8 We report the use of this technique to createprotein expression maps for a set of sporadic epithelial ovariantumors. The tumors were classified into three different groupsbased on histological evaluation: benign, borderline, andmalignant tumors. In addition, prophylactic oophorectomiesfrom healthy patients with a known BRCA1 mutation wereincluded as a normal reference group after histological evalu-ation. Sixty-four samples were run in duplicate, and we candistinguish between benign and malignant tumors usingunsupervised clustering. When supervised methods are used,these data sets can be separated into the four biological groups.We report proteins that are differentially expressed betweenbenign, malignant, and borderline tumors as well as thehistologically normal ovaries. These proteins can potentiallybe used as tumor markers for diagnosis. Most of the proteinsidentified in this study have not previously been reported tobe involved in ovarian cancer, and we show that these areeffective in immunohistochemical evaluation of tissue samples.We have produced antibodies against 5 of these biomarkersand show their specificity in distinguishing between malignantand benign tissue. A further 30 antibodies are in productionand will be used to test their effectiveness in diagnosis usingblood samples.
Materials and Methods
Materials and Reagents. Cy2, Cy3, Cy5, immobilized pHgradient strips, and Pharmalytes were purchased from GEHealthcare (Uppsala, Sweden). Acrylamide, urea, Tris, magne-sium acetate, DTT, iodoacetamide, and the Protein assay kitwere bought from Sigma Aldrich (Buchs, Switzerland). Proteindesalting spin columns were obtained from Pierce (Boule,Huddinge, Sweden).
Extraction of Tumor Cells. Tissues were collected at theKarolinska Hospital and made anonymous after informedconsent and approval by the Ethics committee. The resectedsample was put on ice, and tumor cells were enriched aspreviously described.9 A pathologist first examined all samplesto obtain representative, viable, and non-necrotic tumor tissue.One part of the tissue was used for sample preparation for2-DE, and the adjacent tissue was formalin-fixed and paraffin-embedded for histological characterization. A two-phase nylonmesh filter with 250 and 100 µm pore sizes was used to removetissue fragments and connective tissues. Cell suspensions wereunderlaid with 2 mL of ice-cold Percoll/PBS solution (54.7%and density 1.07 g/mL) and then centrifuged at 1000g for 10min at +4 °C using low acceleration and retardation in swing-out buckets. The cells at the interface were collected andwashed twice with PBS in the presence of protease inhibitors.The interphase layer was transferred into a preweighed Ep-pendorf tube, mixed with PBS and protease inhibitors, and thencentrifuged at 800g for 3 min at +4 °C. The cell pellet wasresuspended in PBS with protease inhibitors and centrifugedat 2700g at +4 °C for 5 min. The supernatant was discarded,and the remaining liquid on the wall of the tube was carefullyremoved. The wet weight (WW) was recorded, and the pelletwas then stored at -80 °C until further processing. Thehistopathological characterization of all samples was doneusing hemeatoxylin-eosin-stained sections of formalin-fixed,paraffin-embedded specimens, and tumors were classifiedaccording to the WHO guidelines. Both histological andcytological smears of all the analyzed samples showed that thepreparations usually contained more than 90% tumor cells. Thenontumor tissue was treated in the same way and gave a purity
of over 90% epithelial cells. The samples were kept on ice atall times, and no degradation was observed.
Sample Preparation for 2D-PAGE Analysis. Each cell pelletwas thawed on ice and resuspended in 1.89 µL of mQ waterper mg WW (1.89 × WW µL) with PMSF and EDTA added (0.2and 1.0 mM, respectively). The suspension was then frozen andthawed four times to break the cells. A volume of (0.089 × WW)µL of 10% SDS/33.3% mercaptoethanol was added, and thesample was incubated 5 min on ice after addition of 0.329 ×WW µL of DNAse I (0.144 mg/mL 20 mM Tris-HCl with 2 mMCaCl2 × 2H2O, pH 8.8) and RNAse A (0.0718 mg/mL Tris).Samples were then frozen and lyophilised, and sample bufferincluding PMSF (0.2 mM), EDTA (1.0 mM), NP-40 (0.5%), andCHAPS (25 mM) was added (6 × WW, or 3 × WW if WW < 10mg) carefully, mixed for 3 h, centrifuged for 15 min at 12 000rpm to remove insoluble material, and finally stored at -80 °C.Duplicate or triplicate 1-µL samples were taken for microscaleprotein determination. Protein Desalting Spin Columns fromPierce were equilibrated with lysis buffer, containing 8 M urea,30 mM Tris, 5 mM magnesium acetate, and 4% CHAPS, pH8.5, according to the manufacturer’s buffer exchange procedureprotocol. A total of 160 µg of protein lysate was added to thecolumn. In case the volume was smaller than the required 30µL, additional lysis buffer was added up to 30 µL. The proteinswere eluted from the column, and the protein concentrationwas determined using Protein Assay Kit (Sigma) and stored at-80 °C. The procedure was repeated for all 64 samples. All 64samples were thawed and labeled with Cy2 and Cy3, indepen-dently, according to the manufacturer’s protocol. A total of 600pmol of dye per 50 µg of protein was used. Equal amounts ofprotein from each sample were mixed to form a pool. The poolwas labeled with Cy5 as above. The samples were stored inthe -80 °C freezer. The samples were thawed, and 30 µg ofprotein from each dye was combined and mixed with rehy-dration buffer (8M urea, 2% CHAPS, 0.002% bromophenol blue,18.2 mM DTT, 0.5% Pharmalyte (pH 4-7)), left at roomtemperature for 30 min, and centrifuged for 10 min before itwas applied to a 24 cm immobilized pH gradient strip (pH 4-7)for overnight rehydration.
2D DIGE and Image Analysis. First-dimension isoelectricfocusing was carried out on an Amersham Biosciences IPG-phor with a total focusing time of 67 kVh. Afterward, the stripswere equilibrated in 15 mL equilibration solution (6 M urea,75 mM Tris (pH 8.8), 30% (w/v) glycerol, 2% (w/v) SDS, and0.002% bromophenol blue) and reduced with 65 mM DTT for15 min, followed by 15 min equilibration in equilibrationsolution with 135 mM iodoacetamide added. The IPG-stripswere then loaded and run on a 12.5% SDS-PAGE gel overnight(25 °C) at 1 W/gel until the bromophenol blue dye front hadrun off the base of the gel. The gels were fixed in 30% ethanoland 10% acetic acid for 30 min, and then kept in water. Thegels were scanned with Amersham Biosciences Typhoon 9400variable imager and the robotic equipment as describedpreviously,10 using automated prescanning.11 Spot detectionwas carried out in DeCyder DIA for each gel. The estimatednumber of spots was set to 2500, and a small area filter (area<200) was applied. Matching was done in DeCyder BVA usingapproximately 100 manual landmarks.
Supervised Classification and Spot Selection. Classificationwas done between pairs of groups; benign versus borderline,borderline versus malignant, BRCA1 versus borderline, BRCA1versus malignant, benign versus malignant, malignant (alive)versus malignant (dead), and mucinous (benign + borderline)
research articles Bengtsson et al.
B Journal of Proteome Research

versus serous (benign + borderline). First, a t test between thegroups is performed for each spot using a training set. Onlyspots with p-values below a cutoff are used in the ensuing naiveBayesian classifier. Seven cutoff parameter values were tested(between 1 and 0.000001) to find the optimum point. The naı̈veBayesian classifier assumes that the data within each of thetwo groups follows a Gaussian distribution with a diagonalcovariance matrix. The means and variances of the distributionsare estimated from the training set, and the samples in the testset are assigned odds of belonging to the two groups. The logodds ratio is calculated as the logarithm of the ratio betweenthe odds of belonging to the two groups. Leave-one-out crossvalidation was employed, and the resulting log odds ratios wereused to form the receiver operating characteristic (ROC) curves.The p-values of the final ROC areas were Bonferroni-corrected.All spots that satisfied at least one of the following criteria inany pairwise comparison between groups were selected formass spectrometry analysis: (1) among the 50 spots with lowestp-values in a t test; (2) fold change between the groups above2.5; (3) t-test p-value below 0.01; and (4) Mann-Whitney U-testp-value below 0.05. The software used for the Sammon maps,clustering, Pearson correlations, and statistical tests werewritten in the statistical language R. Supervised classificationwas done using a program written in Perl.
Mass Spectrometry Analysis. Proteins were identified byeither peptide fingerprinting or LC-MS/MS from spots digestedfrom preparative gels run with 500-700 µg of protein loadedand stained with ruthenium bathrenolate.12 The spot picking,destaining, digestion, extraction, sample preparation, andspotting on MALDI target plates were carried out using a spothandling workstation (ETTAN Spot handling workstation, GEHealthcare) and a standard protocol provided by GE Health-care. An aliquot of 0.5 µL was applied to a clean MALDI targetslide surface and allowed to dry. A total of 0.5 µL of matrixsolution (5 mg/mL of R-cyano-4-hydroxy-cinnamic acid in 50%acetonitrile containing 0.05% TFA) and another 0.5 µL ofsample were added and dried before being used for analysison a MALDI-TOF (M@LDI LRHT, Waters, Manchester, U.K.)mass spectrometer. The nonredundant IPI human databaseversion 2.3013 was searched using Piums software14 with car-bamidomethylation as a fixed modification and methionineoxidation as variable. Multiple searches were done whereautomated batch filtering and recalibration was used.15 Expec-tation values of below 0.05 and a minimum of three peptideswere required for a hit. The proteins that could not be identifiedwere analyzed by MS/MS with a QToF Ultima API (Waters,Manchester, U.K.) coupled with a CapLC HPLC. The digestswere separated on a reversed-phase analytical column (Atlantis,C18, 75 µm × 150 mm, 3 µm, 100 Å, Waters) using a 60 minlinear gradient. Dynamic data acquisition scanning was usedover the mass range m/z from 400 to 1600 for MS and from 50to 1800 for MS/MS. Only spectra from ions with charge state 2and 3 were acquired. Database searches were done using boththe MASCOT (version 1.0) with a parent mass tolerance of 0.1Da and an MS/MS tolerance of 0.1 Da) and Sequest (TurboSE-QUEST v. 27) search engines against the nonredundant IPIhuman database version 2.38.13 Up to one missed cleavage wasallowed, and searches were performed with fixed carbamido-methylation of cysteines and variable oxidation of methioneresidues. A Mascot score over 41, corresponding to a p-valueof 0.005 was required for a positive hit.
Immunohistochemistry. We have described the design andproduction of the antibodies in detail previously as well as the
immunohistochemistry regime used.16 In general, the poly-clonal antibodies were affinity-purified on an antigen column,and the concentration of the recovered material was adjustedto 0.1 mg/mL. The antibodies were used at a dilution of 1:250.The scoring was based on overall staining, congruity in stainingbetween triplicate/duplicate samples, and validation of immu-nohistochemical staining, as well as staining intensity, fractionof immunoreactive cells, and pattern and localization ofimmunoreactivity.
Results
Cases. Sixty-four epithelial ovarian tissues were analyzedusing 2D-DIGE to identify potential biomarkers for stageclassification and for the detection of early stage ovarian cancer.The clinical and histopathological characteristics of all samplesare presented in Table 1. The tumors were classified based onhistological evaluation and included 12 benign, 17 borderline,and 27 malignant samples. In addition, 8 prophylactic oophorec-tomies from healthy patients with a known BRCA1 mutationwere included as a normal reference group (referred to asBRCA1). All samples were run in duplicate on separate gelsusing dye swapping of duplicates on separate gels (Cy2 andCy3), and a pool constructed from all samples labeled with Cy5was included on every gel. Equal amounts of protein (30 µg)were loaded for each dye, and an average of 2200 spots weredetected. The intra-gel matching was against the pool sample,and then, the intergel matching occurred using the pool samplein each gel, dramatically improving match quality, normaliza-tion, and relative quantitation.
Reproducibility. The reproducibility of duplicates of thesamples was high; pairwise Pearson correlations betweenduplicates ranged between 0.71 and 0.98. The median of thecorrelations was 0.94, and 53 out of 64 samples had a correla-tion above 0.90. All samples cluster nearest to its pairedduplicate. For each of the 64 samples, a merged set ofexpression values was constructed by averaging the twoduplicate values. When one of the two values was missing, theavailable measurement was used. When both values weremissing, the sample was assigned a missing value for that spot.The resulting data set comprised 2264 spots measured in 64samples.
Statistical Analysis of the Gel Images. Pearson correlationsbetween all samples were calculated using the spots withoutany missing values. The locations of the malignant and benignsamples are shown in a two-dimensional Sammon map inSupporting Information Figure 1. There is a clear separationbetween malignant and benign samples. Since no preselectionof spots took place, this shows that malignancy is one of thestrongest signals in the data set. The borderline and BRCA1samples separate from the other groups to some extent, butnot as strongly as the malignant versus benign separation.
A naive Bayesian classifier was employed for pairwisecomparisons of the four diagnostic groups. Leave-one-out crossvalidation was used to assess the performance of the classifier.Table 2 shows the area under the receiver operating charac-teristic (ROC) curve for the seven pairwise comparisons. Thearea under the curve is 1 when the classification is perfect,whereas an area of 0.5 would be expected by chance. Thep-value for obtaining a specific area or higher by chance is alsolisted. The strongest separation is between the malignant andbenign groups, which are perfectly separated, though all thegroups are very well separated (Supporting Information, Figure1). A Mann-Whitney U-test and an equal variance t test were
Ovarian Cancer Biomarkers research articles
Journal of Proteome Research C

performed for all seven pairwise comparisons. The up- anddown-regulated spots with t-test p-values below 0.01 aredescribed in Supporting Information Table 1 for all 6 pairwise
comparisons. All spots that were significant or highly changedbetween any two diagnostic groups were selected for massspectrometry. The selection resulted in a list of 428 spots: 62spots from the benign versus borderline comparison, 57 spotsfrom borderline versus malignant, 80 from BRCA1 versusmalignant, 79 from BRCA1 versus borderline, 42 spots from theserous versus mucinous comparison, 22 spots from the ma-lignant (alive) versus malignant (dead), and 95 from the benignversus malignant group comparison.
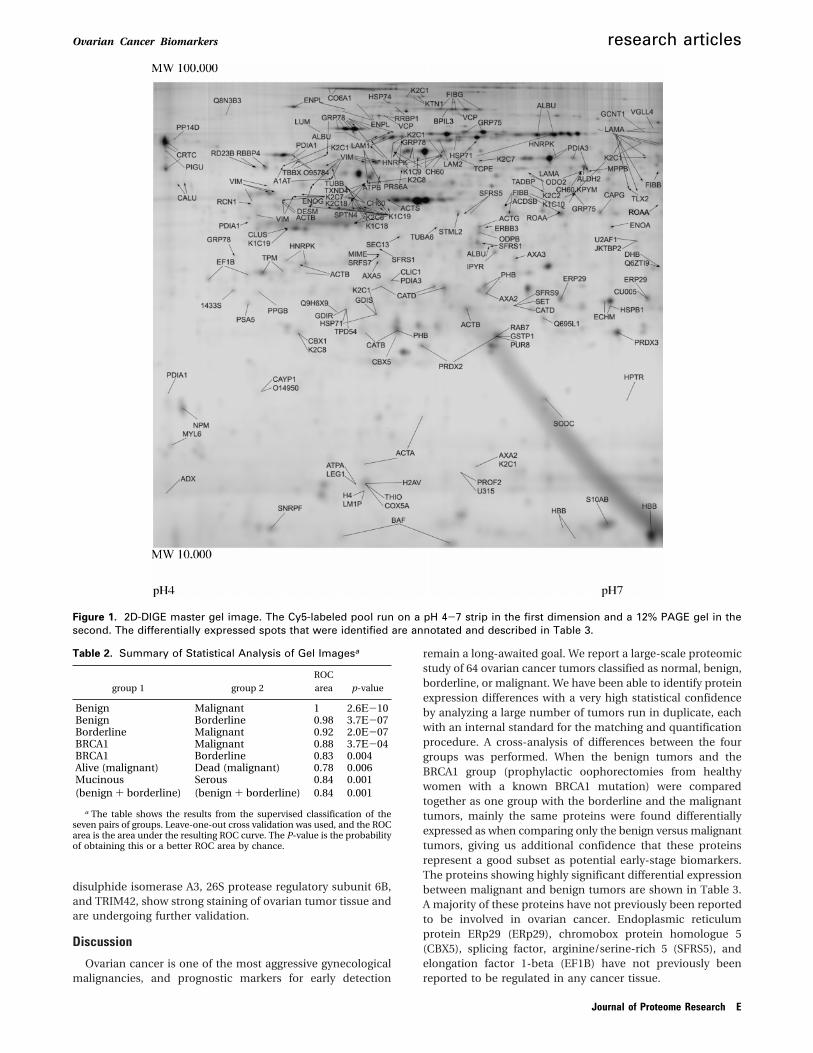
Differentially Expressed Proteins. Of the differentially ex-pressed proteins that serve to distinguish between the variouspathological states, a total of 96 spots was identified using MS,and 144 spots were identified with MS/MS. Out of this set ofidentified spots, 97 unique proteins were found. Figure 1 showsall the proteins identified, annotated on the master gel, andthe scoring is described in Supporting Information Table 2afor those identified by MS and Table 2b for those identified byMS/MS. Identified proteins that are differentially expressedbetween malignant and benign tumors are given in Table 3.The proteins are grouped by function except for spots withmultiple proteins that are shown at the bottom of the table.Thirty-eight spots were identified as coming from one protein,and 11 spots contained more than one protein. Almost all ofthe proteins found to be differentially expressed between themalignant and benign groups were up-regulated in the malig-nant cases. Three proteins with unknown functions wereidentified: protein KIAA0586, ‘similar to testis expressedsequence 13A’, and SNRPF protein. The only identified proteinsdown-regulated in malignant tumors compared to the benigngroup were collagen alpha 1(VI) chain and a hypotheticalprotein KIAA0586. A majority of the proteins reported in Table3 have not previously been reported to be differentiallyexpressed in ovarian cancer tissue.
When comparing benign and borderline tumors, 27 spotsshowing differential expression were identified. All the spotsexcept for one, vimentin, were up-regulated in the borderlinegroup. Many proteins that were found to be up-regulated inthe malignant tumors when compared to the benign ones werealso up-regulated in the borderline tumors. A number ofkeratins were found up-regulated in the borderline tumorscompared to benign ones, the main one being keratin type Icytoskeletal 19. In the malignant versus borderline comparison,33 spots were identified, and out of those, 6 spots were up-regulated in the borderline group. Four of these spots containedLamin A/C, and the other two were Heat-shock protein beta-1and Haptoglobin-related protein, respectively.
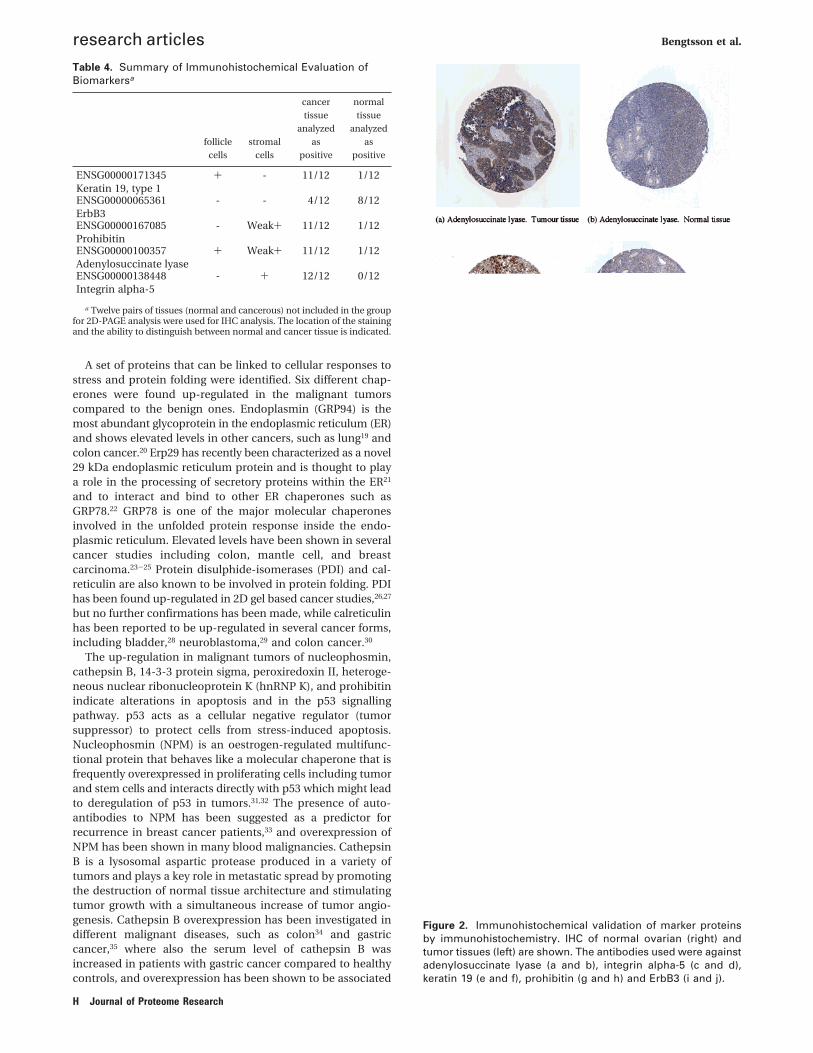
Confirmatory Studies. Two proteins have been demon-strated in earlier studies using immunohistochemistry to showdifferential expression pattern between benign and malignantovarian cancer tumors, collagen alpha 1(VI)17 and cathepsinB.18 We decided to validate our proteomic analysis and havestarted producing proteins and raising antibodies against these.We have described the design and production of the antibodiesin detail previously, as well as the immunohistochemistryregime used.16 We have currently raised and validated fiveantibodies that are listed in Table 4 and show the immuno-histochemical images in Figure 2 (the complete set of all 35antibodies raised and their IHC images will be released on theHuman Proteome Resource Web site 6 months after they areall completed). The images show a clear differentiation betweentumor and normal tissue, and Table 4 shows that this has beenverified with a dozen independent tumors. Initial studies haveshown that five more proteins, contactin-3, caspase-3, protein
Table 1. Histopathological Criteria of Cases Used for theOvarian Tumor Studya
casenumber
sampletype
pathological diagnosisand grade/(DNA ploidy)
lesionsize
patientstatus
Normal cm
OC 157LN Normal BRCA-1 positive 5 AliveOC 157R N Normal BRCA-1 positive 5 AliveNOC 175L Normal BRCA-1 positive AliveNOC 175R Normal BRCA-1 positive AliveOC1788N Normal BRCA-1 positive 8 AliveOC179N Normal BRCA-1 positive 5 AliveOC188N Normal BRCA-1 positive AliveOC191N Normal BRCA-1 positive 4 Alive
OC29 Benign Mucinous cystadenoma IIA 15 AliveOC38 Benign Serous cystadenoma IA 8 AliveOC53 Benign Cystadenoma IA 8 AliveOC66 Benign Serous cystadenoma IA 15 AliveOC76 Benign Mucinous cystadenoma IIA 6 AliveOC78B Benign Cystadenoma IA 9 AliveOC86B Benign Serous cystadenoma IA 15 AliveOC87 Benign Mucinous cystadenoma IIA 30 AliveOC90 Benign Serous Cystadenofibroma IA 8 AliveOC92B Benign Mucinous cystadenoma IIA 25 AliveOC95L Benign Serous cystadenoma IA AliveOC109A Benign Mucinous cystadenoma IIA 30 Alive
OC21A Borderline Mucinous IIB 18 AliveOC39A Borderline Seropapillary IB 20 AliveOC46 Borderline Seropapillary IB AliveOC50 Borderline Seropapillary IB AliveOC59B Borderline Mucinous IIB AliveOC68A Borderline Mucinous IIB AliveOC72A Borderline Serous IB AliveOC77A Borderline Serous IB AliveOC96L Borderline Serous IB Dead*OC97A Borderline Mucinous IIB AliveOC110R Borderline Serous IB AliveOC113 Borderline Serous IB AliveOC115L Borderline Serous IB AliveOC117 Borderline Mucinous IIB AliveOC126 Borderline Mucinous IIB AliveOC141 Borderline Mucinous IIB AliveOC169R1 Borderline Serous IB Alive
OC04A Malignant Mixed tumor (A) 25 DeadOC06 Malignant Clear cell tumor IVC (A) 10 AliveOC07 Malignant Serous pap. adenocarcinoma IC (A) 8 DeadOC08 Malignant Serous pap. adenocarcinoma IC (A) 9 DeadOC09 Malignant Serous pap. adenocarcinoma IC (A) 8 DeadOC20L Malignant Serous pap. adenocarcinoma IC (A) 11 DeadOC27 Malignant Clear cell tumor IVC (A) 16 DeadOC30R Malignant Bil. serous pap adenocarcinoma IC (A) 14 DeadOC33A Malignant Endometrioid carcinoma IIIC (D+T) 16 AliveOC40L Malignant Bil. serous pap.adenocarcinoma IC (A) DeadOC43 Malignant Bil. serous pap.adenocarcinoma IC (A) 12 DeadOC49 Malignant Endometrioid carcinoma IIIC (D) 16 AliveOC51D Malignant Clear cell tumor IVC AliveOC55 Malignant Serous pap. adenocarcinoma IC AliveOC56 Malignant Endometrioid carcinoma IIIC DeadOC57 Malignant Serous pap. adenocarcinoma IC AliveOC60A Malignant Granulosa Cell Tumor AliveOC62B Malignant Endometrioid carcinoma IIIC AliveOC73 Malignant Serous pap. adenocarcinoma IC (A) 16 DeadOC74 Malignant Endometrioid carcinoma IIIC (A) 17 AliveOC79 Malignant Serous papillary adenocarcinoma IC DeadOC81B Malignant Mixed tumor AliveOC84 Malignant Clear cell tumor IVC (A) 7 DeadOC89 Malignant Serous pap. adenocarcinoma IC (D) 7 AliveOC99 Malignant Endometrioid carcinoma IIIC AliveOC111L Malignant Serous pap. adenocarcinoma IC (A) 6 DeadOC112R-A Malignant Endometrioid carcinoma IIIC Dead
a The samples were graded as normal, benign, borderline, or malignantbased on size, ploidy, and histopathological examination. The status of thepatient at (on average) 5 year follow up is given. P, papillary; Bil, bilateral.Ploidy is indicated in bold, A, aneuploid; D, diploid; T, triploid. *Non-cancerrelated death.
research articles Bengtsson et al.
D Journal of Proteome Research
disulphide isomerase A3, 26S protease regulatory subunit 6B,and TRIM42, show strong staining of ovarian tumor tissue andare undergoing further validation.
Discussion
Ovarian cancer is one of the most aggressive gynecologicalmalignancies, and prognostic markers for early detection
remain a long-awaited goal. We report a large-scale proteomicstudy of 64 ovarian cancer tumors classified as normal, benign,borderline, or malignant. We have been able to identify proteinexpression differences with a very high statistical confidenceby analyzing a large number of tumors run in duplicate, eachwith an internal standard for the matching and quantificationprocedure. A cross-analysis of differences between the fourgroups was performed. When the benign tumors and theBRCA1 group (prophylactic oophorectomies from healthywomen with a known BRCA1 mutation) were comparedtogether as one group with the borderline and the malignanttumors, mainly the same proteins were found differentiallyexpressed as when comparing only the benign versus malignanttumors, giving us additional confidence that these proteinsrepresent a good subset as potential early-stage biomarkers.The proteins showing highly significant differential expressionbetween malignant and benign tumors are shown in Table 3.A majority of these proteins have not previously been reportedto be involved in ovarian cancer. Endoplasmic reticulumprotein ERp29 (ERp29), chromobox protein homologue 5(CBX5), splicing factor, arginine/serine-rich 5 (SFRS5), andelongation factor 1-beta (EF1B) have not previously beenreported to be regulated in any cancer tissue.
Figure 1. 2D-DIGE master gel image. The Cy5-labeled pool run on a pH 4-7 strip in the first dimension and a 12% PAGE gel in thesecond. The differentially expressed spots that were identified are annotated and described in Table 3.
Table 2. Summary of Statistical Analysis of Gel Imagesa
group 1 group 2
ROC
area p-value
Benign Malignant 1 2.6Ε-10Benign Borderline 0.98 3.7Ε-07Borderline Malignant 0.92 2.0Ε-07BRCA1 Malignant 0.88 3.7Ε-04BRCA1 Borderline 0.83 0.004Alive (malignant) Dead (malignant) 0.78 0.006Mucinous(benign + borderline)
Serous(benign + borderline)
0.840.84
0.0010.001
a The table shows the results from the supervised classification of theseven pairs of groups. Leave-one-out cross validation was used, and the ROCarea is the area under the resulting ROC curve. The P-value is the probabilityof obtaining this or a better ROC area by chance.
Ovarian Cancer Biomarkers research articles
Journal of Proteome Research E

Table 3. Summary of Proteins Differentially Expressed between the Malignant and Benign Tumor Groupsa
protein name spot noshortname
Swiss-Prot/TrEMBL
ROCarea
ROCp-value
foldchange trend description
Chaperone78 kDaglucose-regulatedprotein
381 GRP78 P11021 0.87 1.10E-04 3.1 M>B Involved in the folding and assembly of proteins in theendoplasmic reticulum (ER)
454 0.89 3.20E-05 2.5 M>B461 0.86 1.70E-04 2.7 M>B466 0.92 6.70E-06 2.3 M>B
1377 0.88 6.70E-05 2.0 M>BCalreticulin 584 CRTC P27797 0.86 1.70E-04 2.7 M>B Promoting folding, oligomeric assembly and quality control
in the ER826 0.88 6.40E-05 2.5 M>B
Endoplasmicreticulum protein ERp29
1464 ERP29 P30040 0.84 4.10E-04 2.1 M>B Processing of secretory proteins within the ER
Endoplasmin 324 ENPL P14625 0.90 1.50E-05 2.1 M>B Functions in the processing and transport of secreted proteins325 0.91 1.00E-05 2.2 M>B
Protein disulfide-isomerase
738 PDIA1 P07237 0.85 3.10E-04 1.8 M>B Catalyzes the rearrangement of -S-S- bonds in proteins
Protein disulfide-isomerase A3
722 PDIA3 P30101 0.88 7.60E-05 2.2 M>B Catalyzes the rearrangement of -S-S- bonds in proteins
Cytoskeletal RegulationActin, cytoplasmic 1 1367 ACTB P60709 0.93 5.30E-04 3.3 M>B Involved in cell motility, structure and integrityActin, cytoplasmic 2 1202 ACTG P63261 0.79 4.60E-03 2.6 M>B Involved in cell motility, structure and integrityMacrophagecapping protein
1110 CAPG P40121 0.86 1.70E-04 2.4 M>B Calcium sensitive, blocks the barbed ends of actin filaments
Tropomyosinalpha 3 chain
1366 TPM3 P06753 0.89 3.80E-05 2.4 M>B Binds to actin filaments
Tropomyosinalpha 4 chain
1366 TPM4 P67936
Tropomyosin betachain
1366 TPM2 P07951
Vimentin 1130 VIME P08670 0.87 5.50E-03 2.7 M>B Class-III intermediate filamentsCollagen alpha1(VI) chain
20 CO6A1 P12109 0.88 9.00E-04 3.0 B>M Cell-binding protein
21 0.79 8.80E-03 2.8 B>MMetabolism
Dihydrolipoyllysine-residuesuccinyltransferasecomponent of2-oxoglutaratedehydrogenase
871 ODO2 P36957 0.88 1.60E-04 2.1 M>B Catalyzes the overall conversion of 2-oxoglutarate tosuccinyl-CoA and CO(2)
Inorganicpyrophosphatase
1290 IPYR Q15181 0.86 2.00E-04 3.0 M>B Phosphate metabolism of cells
Pyruvatedehydrogenase E1component betasubunit
1225 ODPB P11177 0.75 1.90E-02 2.7 M>B Catalyzes the conversion of pyruvate to acetyl-CoA andCO(2)
Superoxidedismutase [Cu-Zn]
1716 SODC P00441 0.89 4.60E-05 1.8 M>B Destroys radicals
Nuclear FunctionChromobox proteinhomologue 5
1618 CBX5 P45973 0.90 3.00E-02 3.2 M>B Component of heterochromatin. Mediates gene silencing
Lamin B1 543 LAM1 P20700 0.77 5.80E-03 2.5 M>B Involved in nuclear stability, chromatin structure and geneexpression
Lamin B2 585 LAM2 Q03252 0.90 3.50E-04 1.9 M>B Involved in nuclear stability, chromatin structure and geneexpression
Proliferation14-3-3 proteinsigma
1435 1433S P31947 0.91 5.90E-05 2.3 M>B p53-regulated inhibitor of G2/M progression
Cathepsin B 1585 CATB P07858 0.90 8.00E-05 2.4 M>B Participate in degradation and turnover of proteins, hasbeen implicated in tumor invasion and metastasis
Heterogeneousnuclearribonucleoprotein K
1319 HNRPK P61978 0.84 9.40E-03 2.5 M>B pre-mRNA binding protein, binds PKC, telomere maintenance
1331 0.83 9.80E-04 3.2 M>BNucleophosmin 1730 NPM P06748 0.76 8.70E-03 2.6 M>B Bind single-stranded nucleic acids. May function in the
assembly and/or transport of ribosome.Peroxiredoxin 2 1636 PRDX2 P32119 0.91 1.20E-05 2.6 M>B Cytoplasmic antioxidant, may have a proliferative effectProhibitin 1421 PHB P35232 0.87 9.00E-05 2.0 M>B Negative regulator of cell proliferation, may be a tumor
suppressorReceptortyrosine-proteinkinase erbB-3
1211 ERBB3 P21860 0.90 8.20E-05 2.2 M>B Involved in pathways which lead to cell proliferation ordifferentiation.
SignalingFibrinogen gammachain
259 FIBG P02679 0.83 7.10E-04 2.9 M>B Forms fibrins and act as a cofactor in platelet aggregation.
265 0.86 1.80E-04 3.3 M>B266 0.90 1.50E-05 3.8 M>B267 0.91 1.20E-05 3.9 M>B
Protein SynthesisSplicing factor,arginine/serine-rich 5
1116 SFRS5 Q13243-1 1.00 7.00E-03 2.5 M>B Plays a role in constitutive splicing and can modulatethe selection of alternative splice sites
Elongation factor1-beta
1393 EF1B P24534 0.91 8.20E-06 2.3 M>B Translation elongation factor involved in the transfer ofaminoacylated tRNAs to the ribosome
research articles Bengtsson et al.
F Journal of Proteome Research

Table 3. (Continued)
protein name spot noshortname
Swiss-Prot/TrntEMBL
ROCarea
ROCp-value
foldchange trend description
TransportHemoglobin betasubunit
2145 HBB P68871 0.92 1.10E-03 6.0 M>B oxygen transport from the lung to the various peripheraltissues
2167 0.90 4.70E-03 2.8 M>BLysosomal protective protein 1444 PPGB P10619 0.95 6.00E-06 1.7 M>B Glycoprotein which associates with lysosomal enzymesSerum albumin 521 ALBU P02768 0.86 2.00E-04 2.2 B>M Carrier protein for steroids, fatty acids, and thyroid
hormones and stabilizes extracellular fluid volumeTransitional endoplasmicreticulum ATPase
306 TERA P55072 0.94 1.40E-03 2.8 M>B Vesicle transport and a role in mitosis
338 0.89 3.80E-05 1.7 M>BUnknown
Protein KIAA0586 457 K0586 Q9BVV6 0.84 1.90E-03 2.6 B>MSimilar to testis expressedsequence 13A
467 IPI00046437 0.92 6.60E-06 2.7 M>B
SNRPF protein 2115 Q6IBQ1; Q6P4I0 0.86 0.00017 2.5 M>BSpots with Multiple Proteins Identified
Fibrinogen gamma chain 260 FIBG P02679 0.85 1.50E-02 3.0 M>BTransitional endoplasmicreticulum ATPase
260 TERA P55072
Serum albumin 525 ALBU P02768 0.89 4.60E-05 2.5 B>MHeat shock 70 kDaprotein 1
525 HSP71 P08107
60 kDa heat shockprotein
688 CH60 P10809 0.95 2.10E-05 2.7 M>B
Heterogeneous nuclearribonucleoprotein K
688 HNRPK P61978
Keratin, type Icytoskeletal 9
688 K1C9 P35527
Keratin, type IIcytoskeletal 1
688 K2C1 P04264
Protein disulfide-isomerase 694 PDIA1 P07237 0.88 3.00E-04 2.1 M>BFc fragment of IgGbinding protein
694 O95784;Q9Y6R7
Endoplasmin 694 ENPL P14625Hypothetical proteinDKFZp761K0511
694 Q9H6X 9;Q9NTK6
Lamin A/C 902 LAMA P02545 0.92 7.50E-05 2.0 M>BProtein disulfide-somerase A3
902 PDIA3 P30101
60 kDa heat shockprotein
1005 CH60 P10809 0.88 5.40E-05 2.8 M>B
Actin, cytoplasmic 1 1005 ACTB P60709Keratin, type IIcytoskeletal 7
1005 K2C7 P08729
Keratin, type Icytoskeletal 18
1005 K1C18 P05783
Keratin, type Icytoskeletal 19
1005 K1C19 P08727
Fibrinogen betachain
1118 FIBB P02675 0.88 5.40E-05 3.1 M>B
Heterogeneousnuclearribonucleoprotein A/B
1118 ROAA Q99729-2
Actin, cytoplasmic 1 1347 ACTB P60709 0.82 6.80E-03 2.5 M>BHeterogeneousnuclearribonucleoprotein K
1347 HNRPK P61978
ATP synthase betachain
1347 ATPB P06576
Prohibitin 1453 PHB P35232 0.87 1.10E-04 1.9Annexin A2 1453 ANXA2 P07355Rho GDP-dissociationinhibitor 1
1508 GDIR P52565 0.90 9.30E-05 2.1 M>B
heat shock 70 kDaprotein 1B
1508 HSP71 P08107
Tumor protein D54 1508 TPD54 O43399Heterogeneousnuclearribonucleoprotein K
1508 HNRPK P61978
Cathepsin B 1591 CATB P07858 0.82 1.20E-03 2.7 M>BProhibitin 1591 PHB P35232Ras-related proteinRab-7
1616 RAB7 P51149 0.90 1.50E-05 2.9 M>B
GlutathioneS-transferase P
1616 GSTP1 P09211
Peroxiredoxin 2 1616 PRDX2 P32119Adenylosuccinatelyase
1616 PUR8 P30566
a The protein accession number for each spot is given together with the ROC and p-value indicating the degree of confidence that can be allocated to thespot when used to distinguish between benign and malignant. The fold change indicated the direction and magnitude of the change in expression levelbetween the two states as well as a description of the function of the protein if known.
Ovarian Cancer Biomarkers research articles
Journal of Proteome Research G
A set of proteins that can be linked to cellular responses tostress and protein folding were identified. Six different chap-erones were found up-regulated in the malignant tumorscompared to the benign ones. Endoplasmin (GRP94) is themost abundant glycoprotein in the endoplasmic reticulum (ER)and shows elevated levels in other cancers, such as lung19 andcolon cancer.20 Erp29 has recently been characterized as a novel29 kDa endoplasmic reticulum protein and is thought to playa role in the processing of secretory proteins within the ER21
and to interact and bind to other ER chaperones such asGRP78.22 GRP78 is one of the major molecular chaperonesinvolved in the unfolded protein response inside the endo-plasmic reticulum. Elevated levels have been shown in severalcancer studies including colon, mantle cell, and breastcarcinoma.23-25 Protein disulphide-isomerases (PDI) and cal-reticulin are also known to be involved in protein folding. PDIhas been found up-regulated in 2D gel based cancer studies,26,27
but no further confirmations has been made, while calreticulinhas been reported to be up-regulated in several cancer forms,including bladder,28 neuroblastoma,29 and colon cancer.30
The up-regulation in malignant tumors of nucleophosmin,cathepsin B, 14-3-3 protein sigma, peroxiredoxin II, heteroge-neous nuclear ribonucleoprotein K (hnRNP K), and prohibitinindicate alterations in apoptosis and in the p53 signallingpathway. p53 acts as a cellular negative regulator (tumorsuppressor) to protect cells from stress-induced apoptosis.Nucleophosmin (NPM) is an oestrogen-regulated multifunc-tional protein that behaves like a molecular chaperone that isfrequently overexpressed in proliferating cells including tumorand stem cells and interacts directly with p53 which might leadto deregulation of p53 in tumors.31,32 The presence of auto-antibodies to NPM has been suggested as a predictor forrecurrence in breast cancer patients,33 and overexpression ofNPM has been shown in many blood malignancies. CathepsinB is a lysosomal aspartic protease produced in a variety oftumors and plays a key role in metastatic spread by promotingthe destruction of normal tissue architecture and stimulatingtumor growth with a simultaneous increase of tumor angio-genesis. Cathepsin B overexpression has been investigated indifferent malignant diseases, such as colon34 and gastriccancer,35 where also the serum level of cathepsin B wasincreased in patients with gastric cancer compared to healthycontrols, and overexpression has been shown to be associated
Table 4. Summary of Immunohistochemical Evaluation ofBiomarkersa
follicle
cells
stromal
cells
cancer
tissue
analyzed
as
positive
normal
tissue
analyzed
as
positive
ENSG00000171345Keratin 19, type 1
+ - 11/12 1/12
ENSG00000065361ErbB3
- - 4/12 8/12
ENSG00000167085Prohibitin
- Weak+ 11/12 1/12
ENSG00000100357Adenylosuccinate lyase
+ Weak+ 11/12 1/12
ENSG00000138448Integrin alpha-5
- + 12/12 0/12
a Twelve pairs of tissues (normal and cancerous) not included in the groupfor 2D-PAGE analysis were used for IHC analysis. The location of the stainingand the ability to distinguish between normal and cancer tissue is indicated.
Figure 2. Immunohistochemical validation of marker proteinsby immunohistochemistry. IHC of normal ovarian (right) andtumor tissues (left) are shown. The antibodies used were againstadenylosuccinate lyase (a and b), integrin alpha-5 (c and d),keratin 19 (e and f), prohibitin (g and h) and ErbB3 (i and j).
research articles Bengtsson et al.
H Journal of Proteome Research

with the stage of disease.18 Peroxiredoxin II was found down-regulated in malignant skin tumors compared to benign ones,36
while it is indicated to be up-regulated in breast cancers.37
14-3-3 protein sigma was up-regulated in malignant tumorscompared to benign, as well as in the borderline casescompared to the benign (Supporting Information). This proteinis located downstream in the p53 pathway and is suggested toact as tumor suppressive factor.38 This protein is down-regulated in some cancers such as prostate,39 while the oppositeis seen in pancreatic cancer.40 Moreira et al.41 suggest that lossof expression of 14-3-3 sigma protein is not a frequent eventin breast tumorogenesis. Our findings are confirmed by Ka-neuchi et al.42 who showed positive staining of 14-3-3 sigmaprotein in the majority of serous, endometrioid, and mucinousovarian adenocarcinoma tissues. Xiao et al.43 found 14-3-3protein sigma was down-regulated in plasma from patients withearly-stage lung cancer as is the case for patients with early-stage breast cancer.16 Heterogeneous nuclear ribonucleoproteinK (hnRNP K) is an RNA binding protein that appears toinfluence the mRNA metabolism and transport, can binddirectly to the promoter region of the human c-myc gene, andfunctions as a transcription factor.44 It is induced by DNAdamage and serves as a cofactor for p53 and, thus, plays a keyrole in transcriptional responses to DNA damage.45 An earlierstudy showed a noticeable nuclear overexpression of hnRNPK in tumors when compared with normal lung.46 Prohibitin(PHB) has been shown to colocalize with pRb, p53, and E2F invarious cell lines and is localized to many cellular compart-ments, having a distinct function in each, a chaperone protein,a tumor suppressor, an anti-proliferative protein, a regulatorof cell-cycle progression, and a function in apoptosis.47 Pro-hibitin has been suggested as a potential biomarker in 2D-gelbased cancer studies.48
The membrane protein ErbB3 is encoded by the HER-3oncogene that is a member of the epidermal growth factor(EGF) receptor (EGFR) family of receptor tyrosine kinases.ErbB2/ErbB3 heterodimers have been demonstrated to bepotent in mitogenic signalling .49 Amplification of the ErbB2gene and overexpression of its protein have been reported innumerous cancers, including breast and ovarian tumors. Thisis the basis for the use of Trastuzumab (Herceptin, an anti-ErbB2 antibody), a successful immunotherapeutic agent fortreatment of breast cancer. A recent study showed promisingresults when treating human breast cancer cell lines with anti-HER3 antibodies,50 while Lee et al. only found 3 of 103 tumorspositively stained for Her-3 in surface epithelial ovarian cancer.51 This is in line with our observations. The amount of ErbB2increases in malignant tumors when analyzed by 2D-PAGE.However it is seen to be decreased when looking at the IHCimages. Since membrane proteins are not commonly found on2D-PAGE gels, it may be we are looking at an increase of asoluble form of the protein, which lacks the transmembraneportion and is being excreted into the local extracellularenvironment.
Another area that has become increasingly interesting astarget for anticancer therapies is anti-angiogenic therapy.Proliferation and migration of microvascular endothelial cellsare essential for tumor growth and metastasis, and theseprocesses have been likened to wound healing.52 In this study,fibrinogen gamma chain was found to be highly up-regulatedin four different spots as well as in one of the spots with twoproteins. Fibrin(ogen) plays an important role in tissue repairby providing an initial matrix that can stabilize wounds and
support local cell proliferation and migration and cytoskeletalrearrangements. We found upregulation in malignant tumorsof cytoplasmic actin 1 and 2, as well as tropomyosin alpha 3and alpha 4 chains, tropomyosin beta chain, and macrophagecapping protein, implicating alterations of the cytoskeleton.These proteins were also up-regulated in borderline tumorscompared to the benign ones. Collagen alpha I (IV) was founddown-regulated in two spots in malignant tumors. Vimentinis another protein coupled with the cytoskeleton and belongingto the intermediate filaments. Expression of vimentin has beenseen in several forms of cancers, but the trend is contradictory.Lang et al.53 showed presence of vimentin in tissue sectionsfrom prostate cancer, and it correlated positively to poorlydifferentiated cancers, while decreased expression of vimentinhas been shown in endometrial hyperplasia and neoplasiaswith increasing malignancy.54
Conclusions
Our data indicate that two-dimensional gel electrophoresisis useful to identify proteins that can be tested as potentialblood markers. In this study, a majority of the identifiedproteins have not previously been reported in ovarian cancer.Some of the proteins are, however, involved also in othercancers, and finding such generic proteins is to be expected.The most important point, however, is the great variancebetween patients and hence the need to use large samplenumbers to obtain statistically valid data. This confirms theneed to develop multiparameter tests for diagnostic andprognostic use, since individual proteins are too variable to givehigh confidence results. The proteins must be chosen carefullyto ensure that they are truly independent of one another andmust be validated by immunohistochemistry before moving toblood test development. We have currently raised 5 antibodiesagainst defined proteins, and another 35 are underway. Thedevelopment of tissue microarray will allow us to verify theusefulness of the antibodies by screening against a large varietyof normal and pathogenic tissue types.
Abbreviations: DIGE, differential in-gel electrophoresis.
Acknowledgment. This work was supported by grantsfrom Cancerfonden (to S.B. and P.J.), and the Swedish ScienceFoundation funding to CREATE Health (P.J.) and from the Knutand Alice Wallenberg Foundation (to M.K., M.U., and P.J.).
Supporting Information Available: Figures and tablesshowing the statistical analysis of the differentiation betweenall the sample groups using a 2D Sammon plot as well a tablesummarizing the pairwise statistical analysis of the four sampletypes: normal, benign, borderline, and malignant; the ROCcurves for each of the comparisons; and the details of the dataused for the protein identification. This material is availablefree of charge via the Internet at http://pubs.acs.org.
References
(1) Feeley, K. M.; Wells, M. Precursor lesions of ovarian epithelialmalignancy. Histopathology 2001, 38 (2), 87-95.
(2) Jacobs, I. J.; Menon, U. Progress and challenges in screening forearly detection of ovarian cancer. Mol. Cell. Proteomics 2004, 3(4), 355-366.
(3) Fritsche, H. A.; Bast, R. C. CA 125 in ovarian cancer: advancesand controversy. Clin. Chem. 1998, 44 (7), 1379-1380.
(4) Sjovall, K.; Nilsson, B.; Einhorn, N. The significance of serum CA125 elevation in malignant and nonmalignant diseases. Gynecol.Oncol. 2002, 85 (1), 175-178.
Ovarian Cancer Biomarkers research articles
Journal of Proteome Research I

(5) Gorg, A.; Weiss, W.; Dunn, M. J. Current two-dimensionalelectrophoresis technology for proteomics. Proteomics 2004, 4(12), 3665-3685.
(6) Alaiya, A. A.; Franzen, B.; Hagman, A.; Dysvik, B.; Roblick, U. J.;Becker, S.; Moberger, B.; Auer, G.; Linder, S. Molecular classifica-tion of borderline ovarian tumors using hierarchical clusteranalysis of protein expression profiles. Int. J. Cancer 2002, 98 (6),895-899.
(7) Unlu, M.; Morgan, M. E.; Minden, J. S. Difference gel electro-phoresis: a single gel method for detecting changes in proteinextracts. Electrophoresis 1997, 18 (11), 2071-2077.
(8) Gharbi, S.; Gaffney, P.; Yang, A.; Zvelebil, M. J.; Cramer, R.;Waterfield, M. D.; Timms, J. F. Evaluation of two-dimensionaldifferential gel electrophoresis for proteomic expression analysisof a model breast cancer cell system. Mol. Cell. Proteomics 2002,1 (2), 91-98.
(9) Alaiya, A. A.; Franzen, B.; Fujioka, K.; Moberger, B.; Schedvins,K.; Silfversvard, C.; Linder, S.; Auer, G. Phenotypic analysis ofovarian carcinoma: polypeptide expression in benign, borderlineand malignant tumors. Int. J. Cancer 1997, 73 (5), 678-683.
(10) Back, P.; Nagard, F.; Bolmsjo, G.; Bengtsson, S.; James, P.Automating gel image acquisition. J. Proteome Res. 2003, 2 (6),662-664.
(11) Back, P.; Bengtsson, S.; James, P. Automated prescan functionfor scanning fluorescently stained 2D-PAGE gels. J. Proteome Res.2005, 4 (5), 1511-1515.
(12) Rabilloud, T.; Strub, J. M.; Luche, S.; van Dorsselaer, A.; Lunardi,J. A comparison between Sypro Ruby and ruthenium II tris(bathophenanthroline disulfonate) as fluorescent stains for pro-tein detection in gels. Proteomics 2001, 1 (5), 699-704.
(13) Kersey, P. J.; Duarte, J.; Williams, A.; Karavidopoulou, Y.; Birney,E.; Apweiler, R. The International Protein Index: an integrateddatabase for proteomics experiments. Proteomics 2004, 4 (7),1985-198.
(14) Samuelsson, J.; Dalevi, D.; Levander, F.; Rognvaldsson, T. Modularscriptable and automated analysis tools for high-throughputpeptide mass fingerprinting. Bioinformatics 2004, 20 (18), 3628-3635.
(15) Levander, F.; Rognvaldsson, T.; Samuelsson, J.; James, P. Auto-mated methods for improved protein identification by peptidemass fingerprinting. Proteomics 2004, 4 (9), 2594-2601.
(16) Rui, Z.; Jian-Guo, J.; Yuan-Peng, T.; Hai, P.; Bing-Gen, R. Use ofserological proteomic methods to find biomarkers associated withbreast cancer. Proteomics 2003, 3 (4), 433-439.
(17) Bar, J. K.; Grelewski, P.; Popiela, A.; Noga, L.; Rabczynski, J. TypeIV collagen and CD44v6 expression in benign, malignant primaryand metastatic ovarian tumors: correlation with Ki-67 and p53immunoreactivity. Gynecol. Oncol. 2004, 95 (1), 23-31.
(18) Scorilas, A.; Fotiou, S.; Tsiambas, E.; Yotis, J.; Kotsiandri, F.;Sameni, M.; Sloane, B. F.; Talieri, M. Determination of cathepsinB expression may offer additional prognostic information forovarian cancer patients. Biol. Chem. 2002, 383 (7-8), 1297-1303.
(19) Wang, Q.; He, Z.; Zhang, J.; Wang, Y.; Wang, T.; Tong, S.; Wang,L.; Wang, S.; Chen, Y. Overexpression of endoplasmic reticulummolecular chaperone GRP94 and GRP78 in human lung cancertissues and its significance. Cancer Detect. Prev. 2005, 29 (6), 544-551.
(20) Wang, X. P.; Qiu, F. R.; Liu, G. Z.; Chen, R. F. Correlation betweenclinicopathology and expression of heat shock protein 70 andglucose-regulated protein 94 in human colonic adenocarcinoma.World J. Gastroenterol. 2005, 11 (7), 1056-1059.
(21) Hubbard, M. J.; McHugh, N. J. Human ERp29: isolation, primarystructural characterisation and two-dimensional gel mapping.Electrophoresis 2000, 21 (17), 3785-3796.
(22) Park, S.; You, K. H.; Shong, M.; Goo, T. W.; Yun, E. Y.; Kang, S.W.; Kwon, O. Y. Overexpression of ERp29 in the thyrocytes ofFRTL-5 cells. Mol. Biol. Rep. 2005, 32 (1), 7-13.
(23) Xing, X.; Lai, M.; Wang, Y.; Xu, E.; Huang, Q. Overexpression ofglucose-regulated protein 78 in colon cancer. Clin. Chim. Acta2006, 364 (1-2), 308-315.
(24) Antonucci, F.; Chilosi, M.; Parolini, C.; Hamdan, M.; Astner, H.;Righetti, P. G. Two-dimensional molecular profiling of mantlecell lymphoma. Electrophoresis 2003, 24 (14), 2376-2385.
(25) Fernandez, P. M.; Tabbara, S. O.; Jacobs, L. K.; Manning, F. C.;Tsangaris, T. N.; Schwartz, A. M.; Kennedy, K. A.; Patierno, S. R.Overexpression of the glucose-regulated stress gene GRP78 inmalignant but not benign human breast lesions. Breast CancerRes. Treat. 2000, 59 (1), 15-26.
(26) Chahed, K.; Kabbage, M.; Ehret-Sabatier, L.; Lemaitre-Guillier,C.; Remadi, S.; Hoebeke, J.; Chouchane, L. Expression of fibrino-gen E-fragment and fibrin E-fragment is inhibited in the humaninfiltrating ductal carcinoma of the breast: the two-dimensionalelectrophoresis and MALDI-TOF-mass, spectrometry analyses.Int. J. Oncol. 2005, 27 (5), 1425-1431.
(27) Lexander, H.; Franzen, B.; Hirschberg, D.; Becker, S.; Hellstrom,M.; Bergman, T.; Jornvall, H.; Auer, G.; Egevad, L. Differentialprotein expression in anatomical zones of the prostate. Proteom-ics 2005, 5 (10), 2570-2576.
(28) Kageyama, S.; Isono, T.; Iwaki, H.; Wakabayashi, Y.; Okada, Y.;Kontani, K.; Yoshimura, K.; Terai, A.; Arai, Y.; Yoshiki, T. Identi-fication by proteomic analysis of calreticulin as a marker forbladder cancer and evaluation of the diagnostic accuracy of itsdetection in urine. Clin. Chem. 2004, 50 (5), 857-866.
(29) Hsu, W. M.; Hsieh, F. J.; Jeng, Y. M.; Kuo, M. L.; Chen, C. N.; Lai,D. M.; Hsieh, L. J.; Wang, B. T.; Tsao, P. N.; Lee, H.; Lin, M. T.;Lai, H. S.; Chen, W. J. Calreticulin expression in neuroblastoma-anovel independent prognostic factor. Ann. Oncol. 2005, 16 (2),314-321.
(30) Brunagel, G.; Shah, U.; Schoen, R. E.; Getzenberg, R. H. Identi-fication of calreticulin as a nuclear matrix protein associated withhuman colon cancer. J. Cell. Biochem. 2003, 89 (2), 238-243.
(31) Li, J.; Zhang, X.; Sejas, D. P.; Pang, Q. Negative regulation of p53by nucleophosmin antagonizes stress-induced apoptosis in hu-man normal and malignant hematopoietic cells. Leuk. Res. 2005,29 (12), 1415-1423.
(32) Colombo, E.; Marine, J. C.; Danovi, D.; Falini, B.; Pelicci, P. G.Nucleophosmin regulates the stability and transcriptional activityof p53. Nat. Cell Biol. 2002, 4 (7), 529-533.
(33) Brankin, B.; Skaar, T. C.; Brotzman, M.; Trock, B.; Clarke, R.Autoantibodies to the nuclear phosphoprotein nucleophosminin breast cancer patients. Cancer Epidemiol., Biomarkers Prev.1998, 7 (12), 1109-1115.
(34) Talieri, M.; Papadopoulou, S.; Scorilas, A.; Xynopoulos, D.;Arnogianaki, N.; Plataniotis, G.; Yotis, J.; Agnanti, N. CathepsinB and cathepsin D expression in the progression of colorectaladenoma to carcinoma. Cancer Lett. 2004, 205 (1), 97-106.
(35) Ebert, M. P.; Kruger, S.; Fogeron, M. L.; Lamer, S.; Chen, J.; Pross,M.; Schulz, H. U.; Lage, H.; Heim, S.; Roessner, A.; Malfertheiner,P.; Rocken, C. Overexpression of cathepsin B in gastric canceridentified by proteome analysis. Proteomics 2005, 5 (6), 1693-1704.
(36) Lee, S. C.; Na, Y. P.; Lee, J. B. Expression of peroxiredoxin II invascular tumors of the skin: a novel vascular marker of endot-helial cells. J. Am. Acad. Dermatol. 2003, 49 (3), 487-491.
(37) Karihtala, P.; Mantyniemi, A.; Kang, S. W.; Kinnula, V. L.; Soini,Y. Peroxiredoxins in breast carcinoma. Clin. Cancer Res. 2003, 9(9), 3418-3424.
(38) Hermeking, H.; Lengauer, C.; Polyak, K.; He, T. C.; Zhang, L.;Thiagalingam, S.; Kinzler, K. W.; Vogelstein, B. 14-3-3 sigma is ap53-regulated inhibitor of G2/M progression. Mol. Cell 1997, 1(1), 3-11.
(39) Cheng, L.; Pan, C. X.; Zhang, J. T.; Zhang, S.; Kinch, M. S.; Li, L.;Baldridge, L. A.; Wade, C.; Hu, Z.; Koch, M. O.; Ulbright, T. M.;Eble, J. N. Loss of 14-3-3sigma in prostate cancer and itsprecursors. Clin. Cancer Res. 2004, 10 (9), 3064-3068.
(40) Cao, D.; Maitra, A.; Saavedra, J. A.; Klimstra, D. S.; Adsay, N. V.;Hruban, R. H. Expression of novel markers of pancreatic ductaladenocarcinoma in pancreatic nonductal neoplasms: additionalevidence of different genetic pathways. Mod. Pathol. 2005, 18 (6),752-761.
(41) Moreira, J. M.; Ohlsson, G.; Rank, F. E.; Celis, J. E. Down-regulation of the tumor suppressor protein 14-3.-3sigma is asporadic event in cancer of the breast. Mol. Cell. Proteomics 2005,4 (4), 555-569.
(42) Kaneuchi, M.; Sasaki, M.; Tanaka, Y.; Shiina, H.; Verma, M.; Ebina,Y.; Nomura, E.; Yamamoto, R.; Sakuragi, N.; Dahiya, R. Expressionand methylation status of 14-3-3 sigma gene can characterize thedifferent histological features of ovarian cancer. Biochem. Biophys.Res. Commun. 2004, 316 (4), 1156-1162.
(43) Xiao, T.; Ying, W.; Li, L.; Hu, Z.; Ma, Y.; Jiao, L.; Ma, J.; Cai, Y.;Lin, D.; Guo, S.; Han, N.; Di, X.; Li, M.; Zhang, D.; Su, K.; Yuan,J.; Zheng, H.; Gao, M.; He, J.; Shi, S.; Li, W.; Xu, N.; Zhang, H.;Liu, Y.; Zhang, K.; Gao, Y.; Qian, X.; Cheng, S. An approach tostudying lung cancer-related proteins in human blood. Mol. Cell.Proteomics 2005, 4 (10), 1480-1486.
(44) Michelotti, E. F.; Michelotti, G. A.; Aronsohn, A. I.; Levens, D.Heterogeneous nuclear ribonucleoprotein K is a transcriptionfactor. Mol. Cell. Biol. 1996, 16 (5), 2350-2360.
research articles Bengtsson et al.
J Journal of Proteome Research

(45) Moumen, A.; Masterson, P.; O’Connor, M, J.; Jackson, S. P. hnRNPK: an HDM2 target and transcriptional coactivator of p53 inresponse to DNA damage. Cell 2005, 123 (6), 1065-1078.
(46) Pino, I.; Pio, R.; Toledo, G.; Zabalegui, N.; Vicent, S.; Rey, N.;Lozano, M. D.; Torre, W.; Garcia-Foncillas, J.; Montuenga, L. M.Altered patterns of expression of members of the heterogeneousnuclear ribonucleoprotein (hnRNP) family in lung cancer. LungCancer 2003, 41 (2), 131-143.
(47) Mishra, S.; Murphy, L. C.; Nyomba, B. L.; Murphy, L. J. Prohib-itin: a potential target for new therapeutics. Trends Mol. Med.2005, 11 (4), 192-197.
(48) Wang, K. J.; Wang, R. T.; Zhang, J. Z. Identification of tumormarkers using two-dimensional electrophoresis in gastric carci-noma. World J. Gastroenterol. 2004, 10 (15), 2179-2183.
(49) Alimandi, M.; Romano, A.; Curia, M. C.; Muraro, R.; Fedi, P.;Aaronson, S. A.; Di Fiore, P. P.; Kraus, M. H. Cooperative signalingof ErbB3 and ErbB2 in neoplastic transformation and humanmammary carcinomas. Oncogene 1995, 10 (9), 1813-1821.
(50) van der Horst, E. H.; Murgia, M.; Treder, M.; Ullrich, A. Anti-HER-3 MAbs inhibit HER-3-mediated signaling in breast cancercell lines resistant to anti-HER-2 antibodies. Int. J. Cancer 2005,115 (4), 519-527.
(51) Lee, C. H.; Huntsman, D. G.; Cheang, M. C.; Parker, R. L.; Brown,L.; Hoskins, P.; Miller, D.; Gilks, C. B. Assessment of Her-1, Her-2, and Her-3 expression and Her-2 amplification in advancedstage ovarian carcinoma. Int. J. Gynecol. Pathol. 2005, 24 (2), 147-152.
(52) Chang, H. Y.; Sneddon, J. B.; Alizadeh, A. A.; Sood, R.; West, R.B.; Montgomery, K.; Chi, J. T.; van de Rijn, M.; Botstein, D.; Brown,P. O. Gene expression signature of fibroblast serum responsepredicts human cancer progression: similarities between tumorsand wounds. PLoS Biol. 2004, 2 (2), E7.
(53) Lang, S. H.; Hyde, C.; Reid, I. N.; Hitchcock, I. S.; Hart, C. A.;Bryden, A. A.; Villette, J. M.; Stower, M. J.; Maitland, N. J.Enhanced expression of vimentin in motile prostate cell lines andin poorly differentiated and metastatic prostate carcinoma.Prostate 2002, 52 (4), 253-263.
(54) Papadopoulos, N.; Kotini, A.; Cheva, A.; Jivannakis, T.; Lam-bropoulou, M.; Bobos, M.; Vavetsis, S.; Tamiolakis, D. Immuno-histochemical expression of vimentin and secretory componentantigens in endometrial hyperplasia and neoplasia. Eur. J. Gy-naecol. Oncol. 2002, 23 (5), 411-414.
PR060593Y
Ovarian Cancer Biomarkers research articles
PAGE EST: 10.3 Journal of Proteome Research K