Comprehensive Serum Profiling for the Discovery of Epithelial Ovarian Cancer Biomarkers
10
Comprehensive Serum Profiling for the Discovery of Epithelial Ovarian Cancer Biomarkers Ping Yip 1 , Tzong-Hao Chen 1 , Partha Seshaiah 1 , Laurie L. Stephen 2 , Karri L. Michael-Ballard 2 , James P. Mapes 2 , Brian C. Mansfield 1¤ , Greg P. Bertenshaw 1 * 1 Correlogic Systems, Inc., Germantown, Maryland, United States of America, 2 Rules-Based Medicine, Inc., Austin, Texas, United States of America Abstract FDA-cleared ovarian cancer biomarkers are limited to CA-125 and HE4 for monitoring and recurrence and OVA1, a multivariate panel consisting of CA-125 and four additional biomarkers, for referring patients to a specialist. Due to relatively poor performance of these tests, more accurate and broadly applicable biomarkers are needed. We evaluated the dysregulation of 259 candidate cancer markers in serum samples from 499 patients. Sera were collected prospectively at 11 monitored sites under a single well-defined protocol. All stages of ovarian cancer and common benign gynecological conditions were represented. To ensure consistency and comparability of biomarker comparisons, all measurements were performed on a single platform, at a single site, using a panel of rigorously calibrated, qualified, high-throughput, multiplexed immunoassays and all analyses were conducted using the same software. Each marker was evaluated independently for its ability to differentiate ovarian cancer from benign conditions. A total of 175 markers were dysregulated in the cancer samples. HE4 (AUC = 0.933) and CA-125 (AUC= 0.907) were the most informative biomarkers, followed by IL-2 receptor a, a1-antitrypsin, C- reactive protein, YKL-40, cellular fibronectin, CA-72-4 and prostasin (AUC.0.800). To improve the discrimination between cancer and benign conditions, a simple multivariate combination of markers was explored using logistic regression. When combined into a single panel, the nine most informative individual biomarkers yielded an AUC value of 0.950, significantly higher than obtained when combining the markers in the OVA1 panel (AUC 0.912). Additionally, at a threshold sensitivity of 90%, the combination of the top 9 markers gave 88.9% specificity compared to 63.4% specificity for the OVA1 markers. Although a blinded validation study has not yet been performed, these results indicate that alternative biomarker combinations might lead to significant improvements in the detection of ovarian cancer. Citation: Yip P, Chen T-H, Seshaiah P, Stephen LL, Michael-Ballard KL, et al. (2011) Comprehensive Serum Profiling for the Discovery of Epithelial Ovarian Cancer Biomarkers. PLoS ONE 6(12): e29533. doi:10.1371/journal.pone.0029533 Editor: Xin-yuan Guan, The University of Hong Kong, China Received June 6, 2011; Accepted November 30, 2011; Published December 21, 2011 Copyright: ß 2011 Yip et al. This is an open-access article distributed under the terms of the Creative Commons Attribution License, which permits unrestricted use, distribution, and reproduction in any medium, provided the original author and source are credited. Funding: This study was supported with funds in part from the National Cancer Institute, National Institutes of Health, Department of Health and Human Services, under Contract Numbers HHSN261200700037C and HHSN261200800045C. The funders had no role in study design, data collection and analysis, decision to publish, or preparation of the manuscript. Competing Interests: The authors have read the journal’s policy and have the following conflicts: All authors are employees of Correlogic Systems, Inc. or Rules- Based Medicine, Inc. This does not alter their adherence to all the PLoS ONE policies on sharing data and materials. * E-mail: [email protected] ¤ Current address: Section on Cellular Differentiation, Program on Developmental Endocrinology and Genetics, National Institute of Child Health and Human Development, National Institutes of Health, Bethesda, Maryland, United States of America, and Foundation Fighting Blindness, Columbia, Maryland, United States of America Introduction Ovarian cancer is the most deadly gynecological cancer in the US with an estimated 21,880 new cases detected in 2010 [1]. When diagnosed and treated early, intervention is generally successful, with a 5-year survival rate of 93.5% [2]. Unfortunately, only 15% of ovarian cancers are found early, with the majority of cases detected at late stages where the outcome is far less favorable. For patients with distant malignancies, the 5-year survival rate is only 27.6%. As a result, approximately 14,000 women die each year from this cancer in the US [1]. Complicating diagnosis, ovarian cancer has an incidence of just 12.6 per 100,000 women [2]. Therefore, there is a pressing clinical need for a test that exhibits a high sensitivity for malignancies but also a high specificity to minimize the number of false positives that occur in such a low incidence disease. Clinically, multiple lines of evidence are examined to assess the possibility of an individual having ovarian cancer. Typically, these include the presence of a pelvic mass, family history, and other symptoms (e.g. pelvic and abdominal pain, urinary urgency/ frequency, abdominal bloating, and difficulty eating), supported by a physical examination, a radiographic evaluation, and laboratory findings. However, none of these assessments are specific for ovarian cancer and none differentiate well between cancerous and benign conditions [3]. Though radiographic evidence can help in the detection and diagnosis of a pelvic mass, the commonly used imaging techniques are interpreted subjectively and tend to have a low specificity in routine use [4]. Some reports suggest ultrasound alone or in combination with other prognostic variables may be significantly more informative in the hands of an ovarian ultrasound expert [5,6]. However, many patients lack access to such specialized imaging services. There are no US Food and Drug Administration (FDA)-cleared biomarkers for ovarian cancer screening. For the narrower application of monitoring disease recurrence and therapeutic response, two markers have been FDA-cleared: cancer antigen PLoS ONE | www.plosone.org 1 December 2011 | Volume 6 | Issue 12 | e29533
-
Upload
independent -
Category
Documents
-
view
5 -
download
0
Transcript of Comprehensive Serum Profiling for the Discovery of Epithelial Ovarian Cancer Biomarkers
Comprehensive Serum Profiling for the Discovery ofEpithelial Ovarian Cancer BiomarkersPing Yip1, Tzong-Hao Chen1, Partha Seshaiah1, Laurie L. Stephen2, Karri L. Michael-Ballard2, James P.
Mapes2, Brian C. Mansfield1¤, Greg P. Bertenshaw1*
1 Correlogic Systems, Inc., Germantown, Maryland, United States of America, 2 Rules-Based Medicine, Inc., Austin, Texas, United States of America
Abstract
FDA-cleared ovarian cancer biomarkers are limited to CA-125 and HE4 for monitoring and recurrence and OVA1, a multivariatepanel consisting of CA-125 and four additional biomarkers, for referring patients to a specialist. Due to relatively poorperformance of these tests, more accurate and broadly applicable biomarkers are needed. We evaluated the dysregulation of259 candidate cancer markers in serum samples from 499 patients. Sera were collected prospectively at 11 monitored sitesunder a single well-defined protocol. All stages of ovarian cancer and common benign gynecological conditions wererepresented. To ensure consistency and comparability of biomarker comparisons, all measurements were performed on asingle platform, at a single site, using a panel of rigorously calibrated, qualified, high-throughput, multiplexed immunoassaysand all analyses were conducted using the same software. Each marker was evaluated independently for its ability todifferentiate ovarian cancer from benign conditions. A total of 175 markers were dysregulated in the cancer samples. HE4(AUC = 0.933) and CA-125 (AUC = 0.907) were the most informative biomarkers, followed by IL-2 receptor a, a1-antitrypsin, C-reactive protein, YKL-40, cellular fibronectin, CA-72-4 and prostasin (AUC.0.800). To improve the discrimination betweencancer and benign conditions, a simple multivariate combination of markers was explored using logistic regression. Whencombined into a single panel, the nine most informative individual biomarkers yielded an AUC value of 0.950, significantlyhigher than obtained when combining the markers in the OVA1 panel (AUC 0.912). Additionally, at a threshold sensitivity of90%, the combination of the top 9 markers gave 88.9% specificity compared to 63.4% specificity for the OVA1 markers.Although a blinded validation study has not yet been performed, these results indicate that alternative biomarkercombinations might lead to significant improvements in the detection of ovarian cancer.
Citation: Yip P, Chen T-H, Seshaiah P, Stephen LL, Michael-Ballard KL, et al. (2011) Comprehensive Serum Profiling for the Discovery of Epithelial Ovarian CancerBiomarkers. PLoS ONE 6(12): e29533. doi:10.1371/journal.pone.0029533
Editor: Xin-yuan Guan, The University of Hong Kong, China
Received June 6, 2011; Accepted November 30, 2011; Published December 21, 2011
Copyright: � 2011 Yip et al. This is an open-access article distributed under the terms of the Creative Commons Attribution License, which permits unrestricteduse, distribution, and reproduction in any medium, provided the original author and source are credited.
Funding: This study was supported with funds in part from the National Cancer Institute, National Institutes of Health, Department of Health and HumanServices, under Contract Numbers HHSN261200700037C and HHSN261200800045C. The funders had no role in study design, data collection and analysis,decision to publish, or preparation of the manuscript.
Competing Interests: The authors have read the journal’s policy and have the following conflicts: All authors are employees of Correlogic Systems, Inc. or Rules-Based Medicine, Inc. This does not alter their adherence to all the PLoS ONE policies on sharing data and materials.
* E-mail: [email protected]
¤ Current address: Section on Cellular Differentiation, Program on Developmental Endocrinology and Genetics, National Institute of Child Health and HumanDevelopment, National Institutes of Health, Bethesda, Maryland, United States of America, and Foundation Fighting Blindness, Columbia, Maryland, United Statesof America
Introduction
Ovarian cancer is the most deadly gynecological cancer in the
US with an estimated 21,880 new cases detected in 2010 [1].
When diagnosed and treated early, intervention is generally
successful, with a 5-year survival rate of 93.5% [2]. Unfortunately,
only 15% of ovarian cancers are found early, with the majority of
cases detected at late stages where the outcome is far less favorable.
For patients with distant malignancies, the 5-year survival rate is
only 27.6%. As a result, approximately 14,000 women die each
year from this cancer in the US [1]. Complicating diagnosis,
ovarian cancer has an incidence of just 12.6 per 100,000 women
[2]. Therefore, there is a pressing clinical need for a test that
exhibits a high sensitivity for malignancies but also a high
specificity to minimize the number of false positives that occur in
such a low incidence disease.
Clinically, multiple lines of evidence are examined to assess the
possibility of an individual having ovarian cancer. Typically, these
include the presence of a pelvic mass, family history, and other
symptoms (e.g. pelvic and abdominal pain, urinary urgency/
frequency, abdominal bloating, and difficulty eating), supported by
a physical examination, a radiographic evaluation, and laboratory
findings. However, none of these assessments are specific for
ovarian cancer and none differentiate well between cancerous and
benign conditions [3]. Though radiographic evidence can help in
the detection and diagnosis of a pelvic mass, the commonly used
imaging techniques are interpreted subjectively and tend to have a
low specificity in routine use [4]. Some reports suggest ultrasound
alone or in combination with other prognostic variables may be
significantly more informative in the hands of an ovarian
ultrasound expert [5,6]. However, many patients lack access to
such specialized imaging services.
There are no US Food and Drug Administration (FDA)-cleared
biomarkers for ovarian cancer screening. For the narrower
application of monitoring disease recurrence and therapeutic
response, two markers have been FDA-cleared: cancer antigen
PLoS ONE | www.plosone.org 1 December 2011 | Volume 6 | Issue 12 | e29533

125 (CA-125) in 1987, and more recently, human epididymis
protein-4 (HE4) in 2008 [7,8,9,10]. Despite this, CA-125 is
frequently used off-label for initial diagnosis. However in this
setting, the performance of CA-125 varies widely, depending on
the cut-off selected, and the patient population, with sensitivities
ranging from 29–100%. A further complication is that CA-125
gives many false positives in a wide variety of normal, benign and
other malignancies, leading to low specificity [11,12,13].
Many approaches have been taken to improve the performance
of CA-125. Improved specificity has been reported in a
retrospective study using serial CA-125 measurements interpreted
by a Risk of Ovarian Cancer Algorithm (ROCA). Initial reports
suggest that the accuracy may be inadequate for initial diagnosis
[14], although more definitive results are expected upon
completion of a prospective clinical investigation in late 2011
[15]. Many other strategies have sought to combine CA-125 with
additional markers [16,17,18,19,20]. OvaCheckH combines CA-
125 with seven other markers and has 81.1% sensitivity and 85.4%
specificity as determined in a double-blinded clinical validation
study [21]. However, the test performance needs to be validated
on a non-specialist population (e.g. obstetrician-gynecologist). The
Risk of Ovarian Malignancy Algorithm (ROMA) combines
measurements of both CA-125 and HE4 [22]. The Risk of
Malignancy Index (RMI) attempts to improve specificity by
combining CA-125 with an imaging score and menopausal status
[23]. However, ROMA and RMI do not appear to increase
performance significantly over CA-125 alone [24,25,26]. Another
multimarker test, OvPlexTM, which combines CA-125 with C-
reactive protein, serum amyloid A (SAA), interleukin 6 (IL-6), and
IL-8, was reported to have 94.1% sensitivity and 93.1% specificity
[27]. However, case and control samples were not from the same
patient population, raising significant concerns that selection
biases inflated the reported performance. Similarly, a Yale
developed test, OvaSureTM, combines leptin, prolactin, osteopon-
tin, insulin-like growth factor II and macrophage inhibitory factor
with CA-125 and has a reported sensitivity of 95.3% and a
specificity of 99.4% [28]. However multiple concerns about the
study design and validation population have also challenged the
validity of the markers selected and the significance of the reported
performance [29,30].
In 2009, an ovarian cancer multivariate test was FDA-cleared,
but not for screening [31]. The test, based on the measurements of
CA-125 with transthyretin, apolipoprotein AI, transferrin, and b2
microglobulin, was approved for the very limited population of
women for whom surgery is already planned for an ovarian
adnexal mass, when they have not yet been referred to an
oncologist, and when the physician’s independent clinical and
radiological evaluation does not indicate malignancy. The
performance of OVA1 depends on the source of the surgical
patient population (specialist or non-specialist oncologist) and the
menopausal status of the patient [31,32]. For the intended use
population (women in the care of a non-specialist and negative for
malignancy by clinical assessment) the reported sensitivity was
70.0% (14/20) and the specificity 50.3% (82/163). For all patients
under the care of a non-specialist, when OVA1 was added to
clinical assessment, the reported sensitivity increased from 72.2%
to 91.7% [31]. However, in conjunction with the 19.5% increase
in sensitivity, there was a dramatic 41.1% decrease in specificity
(82.7% to 41.6%) and an associated 24.0% decrease in PPV
(60.5% to 36.5%).
In a recent series of publications involving multiple groups
coordinated by the Early Detection Research Network (EDRN) of
the US National Cancer Institute (NCI), it was shown that for
early detection, 49 promising biomarkers could not improve the
performance over CA-125, whether alone or in combinations
[33,34,35]. In conclusion, simple, broadly applicable, clinical tests
for the detection of ovarian cancer remain elusive, and there is a
need for a wider search for novel, informative, cancer markers and
combinations. In a previous report, we profiled 104 common
serum biomarkers, 44 autoimmune markers and 56 infectious-
disease markers [36] and reported on their individual ability to
discriminate ovarian cancer from normal and benign conditions.
In related studies, we built panels of biomarkers to improve the
performance of the individual biomarkers ([21,37]). The final
panel, OvaCheck, was intended to be used to refer women with
symptoms of ovarian cancer to a gynecologic oncologist. We
hypothesized that by profiling additional biomarkers, we might
discover new and informative biomarkers, that could be used to
modify the existing OvaCheck panel and improve its overall
performance. We proposed to address this in two distinct steps.
First, in the current study, we have extended the biomarker
discovery work, with an additional 155 biomarkers discovered
primarily through cancer research. In the second step, yet to be
undertaken, we will evaluate the modified panel, using a new,
prospectively collected, blinded validation set of samples. We now
report on a 259 serum biomarker survey of almost 500 new
patients with ovarian cancer or benign conditions. Our samples
were drawn from a large, prospective clinical study of adnexal
masses performed across 11 independent sites, with sera drawn
under a uniform protocol, prior to surgical intervention, and prior
to knowledge of disease status. To ensure consistency, all assays
and samples were performed on a single platform at a single site
and all analyses were conducted using the same software. We have
analyzed the data for evidence of useful single markers of ovarian
cancer across disease subtype and stage. Our findings point to the
absence of a single diagnostic marker, and support the increasing
emphasis on the development of multivariate assays using logistic
regression or more sophisticated algorithms.
Materials and Methods
Study CohortSera were from a prospective collection undertaken by
Correlogic Systems, Inc. specifically to develop and validate the
performance of an ovarian cancer test [21]. All samples were
collected under a uniform protocol from 11 different sites, which
were monitored for adherence. The Western Institutional Review
Board (Olympia, WA) and the IRBs of the individual sites
approved the studies under FDA Investigational Device Exemp-
tion (IDE) number G050132. The collection sites (and IRBs) were:
Cedars-Sinai Medical Center, Los Angeles, CA (Cedars-Sinai
Institutional Review Board); Florida Gynecologic Oncology, Fort
Meyers, FL (Lee Memorial Health System Institutional Review
Committee); Florida Hospital Cancer Institute, Orlando, FL
(Florida Hospital Institutional Review Board); The Harry and
Jeanette Weinberg Cancer Institute at Franklin Square Hospital,
Baltimore, MD (MedStar Research Institute Georgetown Oncol-
ogy Institutional Review Board); Holy Cross Hospital, Silver
Spring, MD (Holy Cross Institutional Review Board); North Shore
– Long Island Jewish Health System, Manhasset, NY (Institutional
Review Board North Shore-Long Island Jewish Health System);
SUNY at Stony Brook, NY, Stony Brook, NY (Committee on
Research Involving Human Subjects SUNY Stony Brook);
University of Alabama at Birmingham, Birmingham, AL (The
University of Alabama at Birmingham Institutional Review Board
for Human Use); University of Southern California, Norris Cancer
Center, Los Angeles, CA and Women’s and Children’s Hospital,
Los Angeles, CA (University of Southern California Health
Ovarian Cancer Biomarkers
PLoS ONE | www.plosone.org 2 December 2011 | Volume 6 | Issue 12 | e29533
Sciences Campus Institutional Review Board); Wake Forest
University Health Sciences, Winston-Salem, NC (Institutional
Review Board Wake Forest University School of Medicine); and
Women and Infants Hospital of Rhode Island, Providence, RI
(Institutional Review Board Women and Infants’ Hospital of
Rhode Island). The study inclusion criteria were women, at least
18 years of age, symptomatic of ovarian cancer according to the
National Comprehensive Cancer Network (NCCN) Ovarian
Cancer Treatment Guidelines for Patients [3], which includes
women with or without a pelvic mass. Participants had to be
scheduled for gynecologic surgery based on concern they had
ovarian cancer, and post-surgical pathological evaluation of the
ovaries and excised tissues was required to establish clinical truth
of disease status. Exclusion criteria were women who did not meet
the inclusion criteria, could not provide informed consent, were
pregnant, or previously treated for ovarian cancer. Written
informed consent was obtained for each participant in the study.
All data were de-identified and no results were returned to the
physicians or patients.
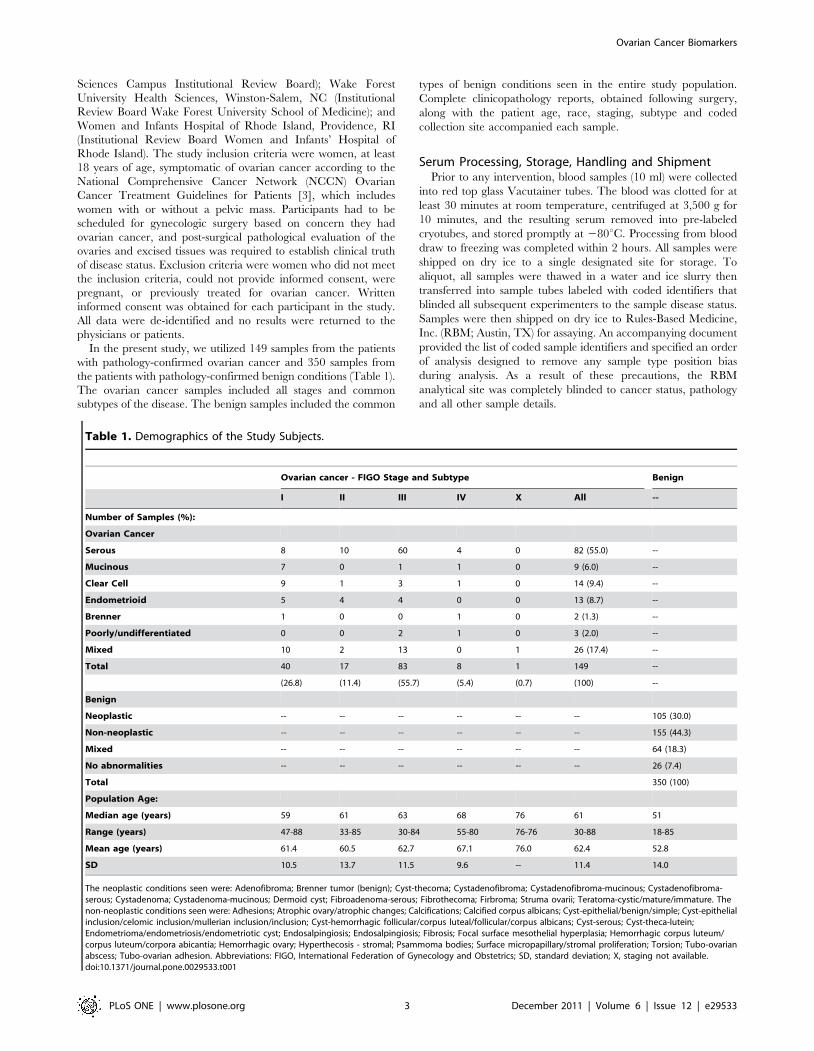
In the present study, we utilized 149 samples from the patients
with pathology-confirmed ovarian cancer and 350 samples from
the patients with pathology-confirmed benign conditions (Table 1).
The ovarian cancer samples included all stages and common
subtypes of the disease. The benign samples included the common
types of benign conditions seen in the entire study population.
Complete clinicopathology reports, obtained following surgery,
along with the patient age, race, staging, subtype and coded
collection site accompanied each sample.
Serum Processing, Storage, Handling and ShipmentPrior to any intervention, blood samples (10 ml) were collected
into red top glass Vacutainer tubes. The blood was clotted for at
least 30 minutes at room temperature, centrifuged at 3,500 g for
10 minutes, and the resulting serum removed into pre-labeled
cryotubes, and stored promptly at 280uC. Processing from blood
draw to freezing was completed within 2 hours. All samples were
shipped on dry ice to a single designated site for storage. To
aliquot, all samples were thawed in a water and ice slurry then
transferred into sample tubes labeled with coded identifiers that
blinded all subsequent experimenters to the sample disease status.
Samples were then shipped on dry ice to Rules-Based Medicine,
Inc. (RBM; Austin, TX) for assaying. An accompanying document
provided the list of coded sample identifiers and specified an order
of analysis designed to remove any sample type position bias
during analysis. As a result of these precautions, the RBM
analytical site was completely blinded to cancer status, pathology
and all other sample details.
Table 1. Demographics of the Study Subjects.
Ovarian cancer - FIGO Stage and Subtype Benign
I II III IV X All --
Number of Samples (%):
Ovarian Cancer
Serous 8 10 60 4 0 82 (55.0) --
Mucinous 7 0 1 1 0 9 (6.0) --
Clear Cell 9 1 3 1 0 14 (9.4) --
Endometrioid 5 4 4 0 0 13 (8.7) --
Brenner 1 0 0 1 0 2 (1.3) --
Poorly/undifferentiated 0 0 2 1 0 3 (2.0) --
Mixed 10 2 13 0 1 26 (17.4) --
Total 40 17 83 8 1 149 --
(26.8) (11.4) (55.7) (5.4) (0.7) (100) --
Benign
Neoplastic -- -- -- -- -- -- 105 (30.0)
Non-neoplastic -- -- -- -- -- -- 155 (44.3)
Mixed -- -- -- -- -- -- 64 (18.3)
No abnormalities -- -- -- -- -- -- 26 (7.4)
Total 350 (100)
Population Age:
Median age (years) 59 61 63 68 76 61 51
Range (years) 47-88 33-85 30-84 55-80 76-76 30-88 18-85
Mean age (years) 61.4 60.5 62.7 67.1 76.0 62.4 52.8
SD 10.5 13.7 11.5 9.6 -- 11.4 14.0
The neoplastic conditions seen were: Adenofibroma; Brenner tumor (benign); Cyst-thecoma; Cystadenofibroma; Cystadenofibroma-mucinous; Cystadenofibroma-serous; Cystadenoma; Cystadenoma-mucinous; Dermoid cyst; Fibroadenoma-serous; Fibrothecoma; Firbroma; Struma ovarii; Teratoma-cystic/mature/immature. Thenon-neoplastic conditions seen were: Adhesions; Atrophic ovary/atrophic changes; Calcifications; Calcified corpus albicans; Cyst-epithelial/benign/simple; Cyst-epithelialinclusion/celomic inclusion/mullerian inclusion/inclusion; Cyst-hemorrhagic follicular/corpus luteal/follicular/corpus albicans; Cyst-serous; Cyst-theca-lutein;Endometrioma/endometriosis/endometriotic cyst; Endosalpingiosis; Endosalpingiosis; Fibrosis; Focal surface mesothelial hyperplasia; Hemorrhagic corpus luteum/corpus luteum/corpora abicantia; Hemorrhagic ovary; Hyperthecosis - stromal; Psammoma bodies; Surface micropapillary/stromal proliferation; Torsion; Tubo-ovarianabscess; Tubo-ovarian adhesion. Abbreviations: FIGO, International Federation of Gynecology and Obstetrics; SD, standard deviation; X, staging not available.doi:10.1371/journal.pone.0029533.t001
Ovarian Cancer Biomarkers
PLoS ONE | www.plosone.org 3 December 2011 | Volume 6 | Issue 12 | e29533
Multiplex ImmunoassaysTwo hundred and fifty nine serum biomarkers were measured
using a set of proprietary multiplexed immunoassays (Human
DiscoveryMAPH v1.0 and Human OncologyMAPH v1.0; Table
S1) at RBM in their Luminex-based CLIA-certified laboratory.
Each assay was calibrated using an 8-point standard curve,
performed in duplicate. Median Fluorescence Intensity (MFI)
measurements were interpolated into final protein concentrations
using RBM’s proprietary curve-fitting software. Assay perfor-
mance was verified using quality control (QC) samples at low,
medium and high levels for each analyte in duplicate. All standard
and QC samples were in a complex serum-based matrix to match
the sample background matrix. Since sera were analyzed at a
previously optimized dilution, any reading above the maximum
concentration of the calibration curve was assigned the concen-
tration of the highest standard, whereas any below the minimum
concentration was assigned the value 0. For analysis, the sample
run order was randomized to avoid any sequential bias due to
presence or absence of disease, subtype or stage of disease, patient
age, or age of serum sample.
Data AnalysisDescriptive statistics, Receiver Operating Characteristic (ROC)
curves and graphical displays (dot plots) for serum analyte
concentrations were performed using GraphPad Prism version
5.0a (GraphPad Software, Inc., San Diego, CA). Statistical
differences were determined using the nonparametric Kruskal-
Wallis test (ANOVA) followed by Dunn’s multiple comparison
post-test. For all statistical comparisons a P-value ,0.05 was
interpreted as statistically significant. A Pearson correlation matrix
was created using the proprietary multi-spectral analysis applica-
tion SpectraViewerTM (Correlogic Systems).
Logistic RegressionMultivariate models were built by logistic regression using an in-
house developed python script.
Results and Discussion
Using multiplexed immunoassays, we measured simultaneously
the levels of 259 molecules in sera from 149 patients with
pathology-confirmed epithelial ovarian cancer and 350 individuals
with benign ovarian conditions (Table 1). Since we were interested
in the ability of biomarkers to differentiate between symptomat-
ically similar cancer and benign gynecological conditions, all
samples were obtained from the same clinical population – women
presenting for surgery primarily based on the presence of an
adnexal mass. All samples were collected before any intervention
and before the disease status was known. Disease status was
subsequently identified by pathology exams of the excised tissue.
Sera were collected using a single sample collection protocol that
was monitored for compliance. The study was conducted
prospectively at 11 sites that were also monitored for protocol
adherence. This assured sample quality and removed the
possibility of any collection, processing or biological biases in the
sample set, a concern for many other studies [30]. No normal
healthy samples were used in this study, as they are typically easier
to classify than benign conditions [21] and introduce confounding
factors such as lower stress levels compared to patients facing
surgery [38]. As expected, the median patient age was higher in
individuals with ovarian cancer (61 years) than those with benign
conditions (51 years) and increased with the stage of disease
present (Table 1; [28,36]). The distribution of the ovarian cancer
subtypes was similar to the distribution seen for all ovarian cancer
cases in the US population as a whole, with a larger proportion of
serous carcinoma (55%) than other subtypes (Table 1). The benign
controls in the study were representative of common benign
ovarian conditions including cystadenoma, cystadenofibroma and
fibroma.
To ensure consistency and aid in biomarker comparisons, all
259 markers and 499 samples were measured on a single platform
at a single site using a panel of rigorously qualified, high-
throughput, multiplexed immunoassays. This survey built on our
previous profiling of 104 serum biomarkers [36]. The majority of
the additional 155 serum biomarkers in the present study were
developed as part of two NCI-funded Small Business Innovative
Research (SBIR) awards specifically targeted at markers that had
reasonable literature support to suggest a significant role in cancer
biomarker. The selected biomarkers covered a broad range of
biological functions, primarily implicated in cancer including
cancer antigens, hormones, clotting factors, tissue modeling
factors, lipoprotein constituents, proteases and protease inhibitors,
markers of cardiovascular risk, growth factors, cytokine/chemo-
kines, soluble forms of cell-signaling receptors, and inflammatory
and acute phase reactants (Table S1). To our knowledge, the
present study is the broadest and most consistent single study of
immunoassay profiling of molecules using fully characterized,
quality-controlled samples.
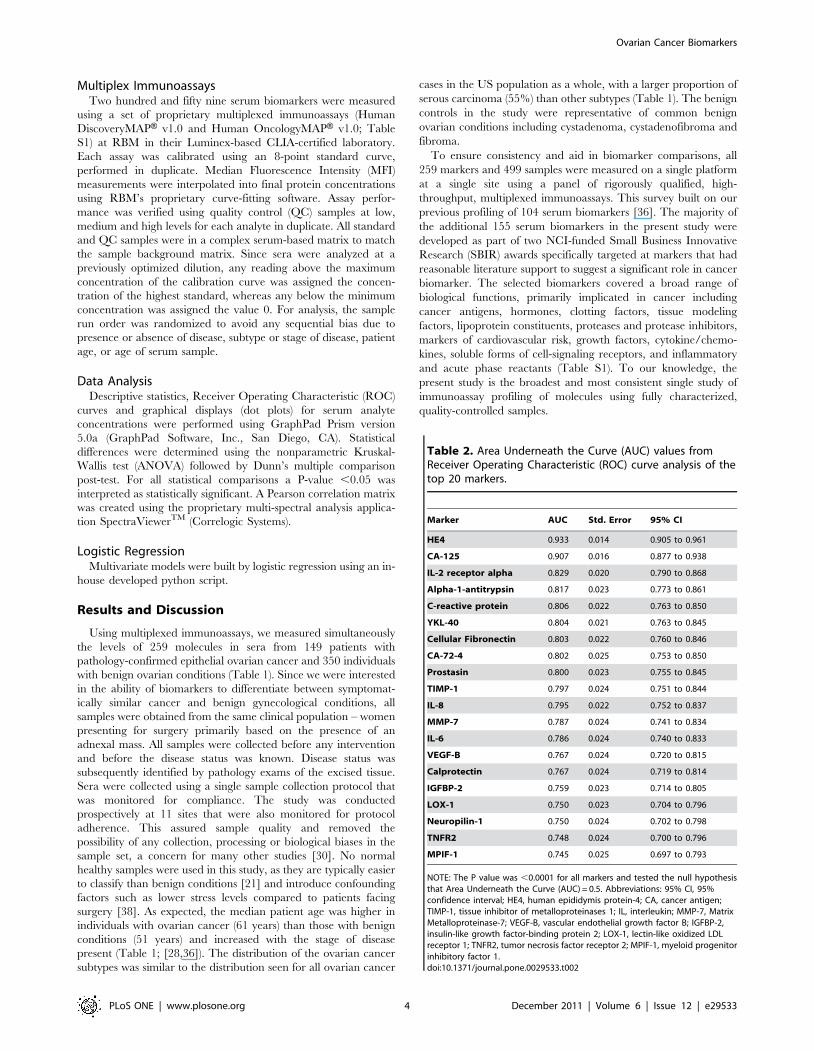
Table 2. Area Underneath the Curve (AUC) values fromReceiver Operating Characteristic (ROC) curve analysis of thetop 20 markers.
Marker AUC Std. Error 95% CI
HE4 0.933 0.014 0.905 to 0.961
CA-125 0.907 0.016 0.877 to 0.938
IL-2 receptor alpha 0.829 0.020 0.790 to 0.868
Alpha-1-antitrypsin 0.817 0.023 0.773 to 0.861
C-reactive protein 0.806 0.022 0.763 to 0.850
YKL-40 0.804 0.021 0.763 to 0.845
Cellular Fibronectin 0.803 0.022 0.760 to 0.846
CA-72-4 0.802 0.025 0.753 to 0.850
Prostasin 0.800 0.023 0.755 to 0.845
TIMP-1 0.797 0.024 0.751 to 0.844
IL-8 0.795 0.022 0.752 to 0.837
MMP-7 0.787 0.024 0.741 to 0.834
IL-6 0.786 0.024 0.740 to 0.833
VEGF-B 0.767 0.024 0.720 to 0.815
Calprotectin 0.767 0.024 0.719 to 0.814
IGFBP-2 0.759 0.023 0.714 to 0.805
LOX-1 0.750 0.023 0.704 to 0.796
Neuropilin-1 0.750 0.024 0.702 to 0.798
TNFR2 0.748 0.024 0.700 to 0.796
MPIF-1 0.745 0.025 0.697 to 0.793
NOTE: The P value was ,0.0001 for all markers and tested the null hypothesisthat Area Underneath the Curve (AUC) = 0.5. Abbreviations: 95% CI, 95%confidence interval; HE4, human epididymis protein-4; CA, cancer antigen;TIMP-1, tissue inhibitor of metalloproteinases 1; IL, interleukin; MMP-7, MatrixMetalloproteinase-7; VEGF-B, vascular endothelial growth factor B; IGFBP-2,insulin-like growth factor-binding protein 2; LOX-1, lectin-like oxidized LDLreceptor 1; TNFR2, tumor necrosis factor receptor 2; MPIF-1, myeloid progenitorinhibitory factor 1.doi:10.1371/journal.pone.0029533.t002
Ovarian Cancer Biomarkers
PLoS ONE | www.plosone.org 4 December 2011 | Volume 6 | Issue 12 | e29533

For each biomarker, an ROC curve was generated and its area
under the curve (AUC) value compared to that of an uninforma-
tive marker (AUC = 0.500). A total of 175 biomarkers were
dysregulated (P-values.0.05) in the ovarian cancer samples
relative to the benign gynecological conditions. Of these, 136
biomarkers were up-regulated and 39 down-regulated (Table 2
and Table S2). The biomarkers with the greatest AUC values were
predominantly up-regulated in ovarian cancer (Table 2, Fig. 1 and
Table S2) with values ranging from 0.599 to 0.933. The most up-
regulated markers were, not surprisingly, HE4 and CA-125 with
AUC values of 0.933 and 0.907, respectively, followed by
interleukin-2 receptor a (IL-2 receptor a), a1-antitrypsin, C-
reactive protein, YKL-40, cellular fibronectin, cancer antigen 72-4
(CA-72-4) and prostasin, with AUC values between 0.829 and
0.800 (Table 2). The remaining 127 up-regulated biomarkers had
a continuum of AUC values from 0.797 to 0.556 (Table S2).
Thirty-four of the remaining 127 markers had AUC values above
0.700. For down-regulated biomarkers, the AUC values ranged
from 0.556 to 0.745 (Table S2). The two most informative of these
stood out as transthyretin (0.745) and apolipoprotein A-IV (0.713),
while the remaining biomarkers had AUC values below 0.700.
Thirteen of the twenty biomarkers with the highest AUC values,
namely HE4, IL-2 receptor a, YKL-40, cellular fibronectin, CA
72-4, prostasin, MMP-7, VEGF-B, Calprotectin, IGFBP-2, LOX-
1, neuropilin-1 and MPIF-1 were not present in our previous study
(Table 2; [36]). Therefore, the literature-based selection criteria for
biomarkers appears to have been successful. While implicated in
cancers before [22,39], this is the first time that these molecules
have been accurately quantified together, on a coherent set of
samples, under uniformly controlled analytical conditions, to
determine their discriminative power for ovarian cancer. We
believe this approach improves biomarker comparisons and should
aid in the selection of biomarkers in the development of multi-
biomarker panels.
We compared the informativeness of the biomarkers that were
measured in both our current and previous study. CA-125 was the
most informative biomarker that was measured in both studies, and
had remarkably similar AUC values of 0.907 (current) and 0.906
(previous). However, while the same biomarkers emerged in both
studies as informative, AUC values across the studies varied. For
example, the most informative biomarkers, a-1-antitrypsin (0.817
versus 0.642), C-reactive protein (0.806 versus 0.756), TIMP-1
(0.797 versus 0.701), IL-8 (0.795 versus 0.717), IL-6 (0.786 versus
0.693) and TNFR2 (0.748 versus 0.625) all had AUC values that
were considerably higher in the current study. In addition, IL-10
(0.665 versus 0.725), EGFR (0.635 versus 0.733) and insulin (0.626
versus 0.671) had AUC values that were considerably lower in the
current study. There are three potential reasons for the differences
Figure 1. Receiver Operating Characteristic curves for the nine most informative biomarkers with area underneath the curve valuesgreater than 0.800.doi:10.1371/journal.pone.0029533.g001
Ovarian Cancer Biomarkers
PLoS ONE | www.plosone.org 5 December 2011 | Volume 6 | Issue 12 | e29533
in AUC values. First, the two studies used different patient samples
from different sources. The previous study used samples from the
National Cancer Institute–funded Gynecologic Oncology Group
(GOG) whereas in the current study we used samples from our own
prospective collection, which may also have been more actively
monitored for strict protocol compliance. Second, the non-ovarian
cancer samples in the previous study were not completely restricted
to benign conditions but also included samples from normal healthy
individuals (19.7%) and individuals with other cancers (9.5%).
Third, the sample preparation methods differed, the GOG samples
were clotted on ice as opposed to room temperature in the current
study, a difference known to be important for consistent levels of
serum markers [40,41]. The differences seen between the studies
highlight the critical importance of complete control of sample
collection, handling and population selection when performing and
interpreting biomarker studies.
As a comparison between the two most informative biomarkers
in this study, the sensitivity for HE4 and CA-125 was determined
over a range of specificity values. In addition, the optimal cut-off
value, defined as that yielding the greatest sum of specificity and
sensitivity was calculated for each biomarker. The sensitivity for
HE4 alone decreased from 89.0% to 57.1% as specificity increased
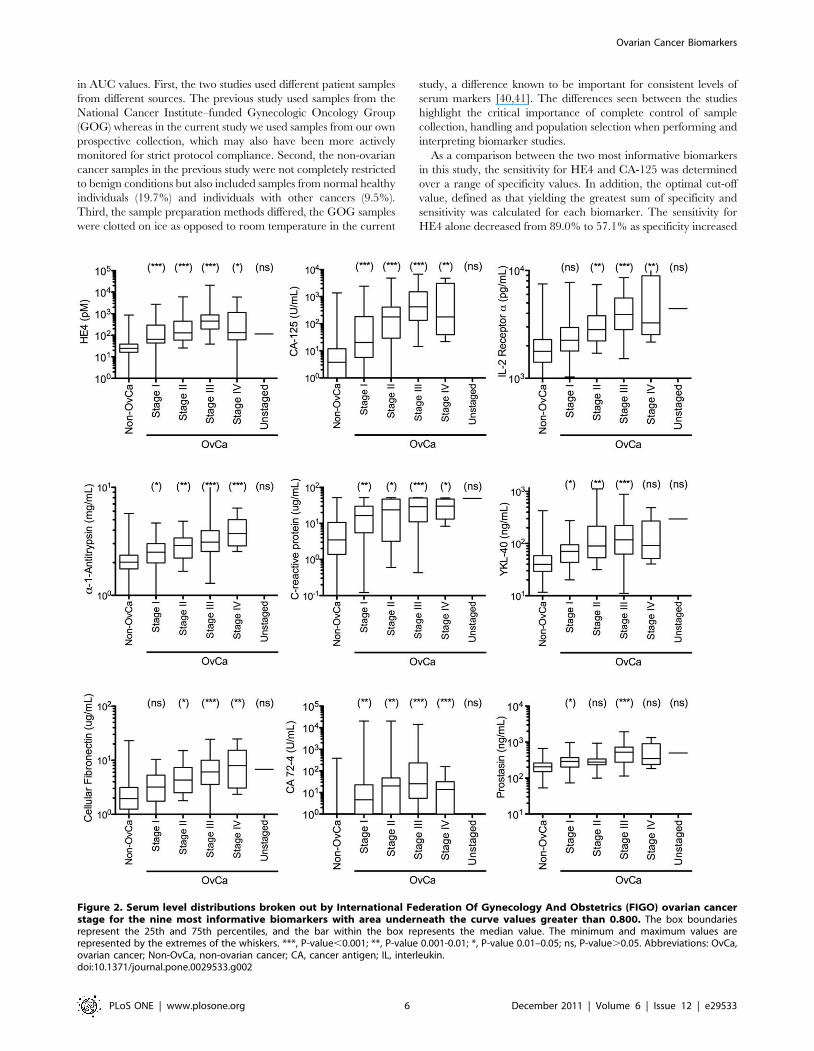
Figure 2. Serum level distributions broken out by International Federation Of Gynecology And Obstetrics (FIGO) ovarian cancerstage for the nine most informative biomarkers with area underneath the curve values greater than 0.800. The box boundariesrepresent the 25th and 75th percentiles, and the bar within the box represents the median value. The minimum and maximum values arerepresented by the extremes of the whiskers. ***, P-value,0.001; **, P-value 0.001-0.01; *, P-value 0.01–0.05; ns, P-value.0.05. Abbreviations: OvCa,ovarian cancer; Non-OvCa, non-ovarian cancer; CA, cancer antigen; IL, interleukin.doi:10.1371/journal.pone.0029533.g002
Ovarian Cancer Biomarkers
PLoS ONE | www.plosone.org 6 December 2011 | Volume 6 | Issue 12 | e29533
from 80% to 99.6%, while for CA-125 alone the sensitivity
decreased from 85.2% to 30.2%. The optimal cut-off for HE4 and
CA-125 was 54.8 pM and 52.5 U/mL, respectively giving
sensitivity values of 86.6% and 74.5%, respectively, and specificity
values of 89.4% and 93.7%, respectively. As expected from ROC
curves, there are trade-offs when no individual biomarker shows
high specificity at a predetermined high sensitivity value. For
example, at 100% sensitivity, both HE4 and CA-125 were 0%
specific. At 98% sensitivity, HE4 had 30.6% specificity and CA-
125 had 35.4% specificity. However, to see relatively good
specificity values, the sensitivities had to be lowered to approxi-
mately 95%. At 95% sensitivity, HE4 had 50.9% specificity and
CA-125 had 45.4% specificity. These values, along with the AUC
values, indicated that on this population, HE4 performed slightly
better than CA-125. In addition, these results show that none of
the biomarkers in this study are sufficiently informative as
standalone ovarian cancer biomarkers for broad applications
and that biomarker panels may be needed to improve perfor-
mance to clinically acceptable levels.
To determine if some biomarkers might have greater discrim-
ination for different stages of cancer, especially early stage, we
compared the nine biomarkers with AUC values above 0.800 on
FIGO stage I and II samples where there is the greatest need for
marker-based detection (Fig. 2). For FIGO stage I samples, both
HE4 and CA-125 were highly discriminative (P-values,0.001),
followed in descending order by C-reactive protein and CA 72-4
(P-values 0.001–0.01) then a1-antitrypsin, YKL-40 and prostasin
(P-values 0.01–0.05). For IL2-receptor a and cellular fibronectin,
there were no statistical differences between stage I cancer and
benign conditions (P-values.0.05). For FIGO stage II samples,
both HE4 and CA-125 were again highly discriminative (P-
values,0.001), followed by for IL2-receptor a, a1-antitrypsin,
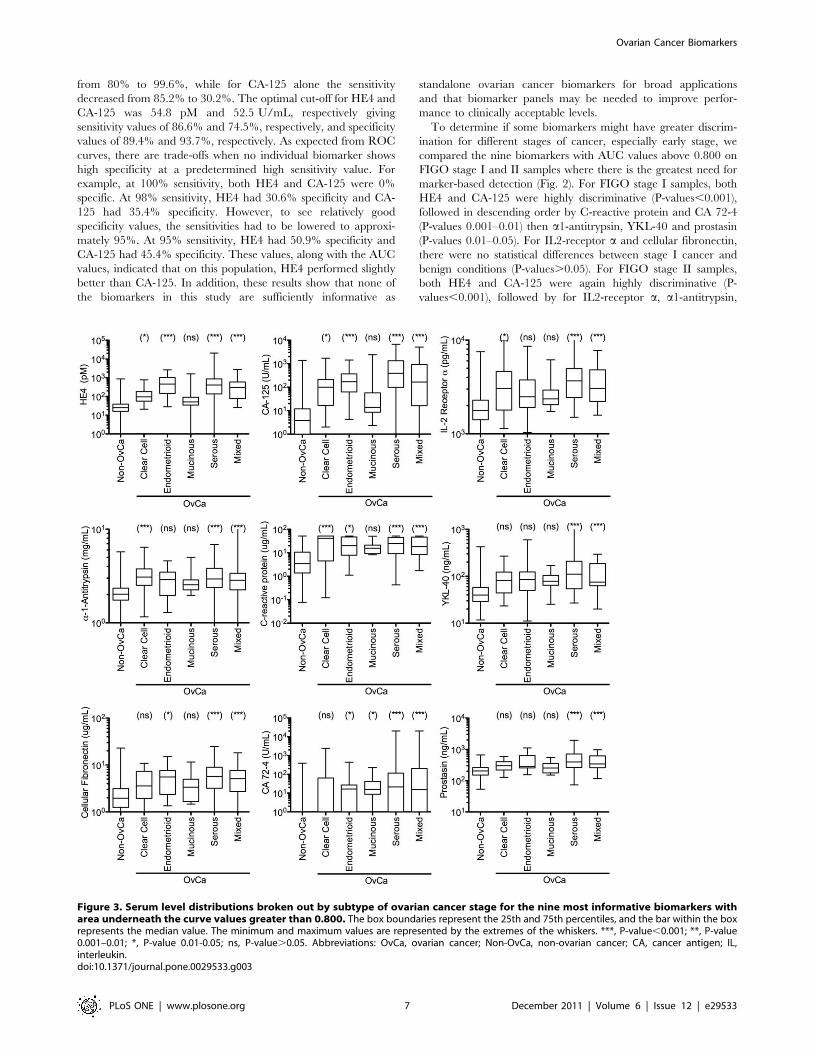
Figure 3. Serum level distributions broken out by subtype of ovarian cancer stage for the nine most informative biomarkers witharea underneath the curve values greater than 0.800. The box boundaries represent the 25th and 75th percentiles, and the bar within the boxrepresents the median value. The minimum and maximum values are represented by the extremes of the whiskers. ***, P-value,0.001; **, P-value0.001–0.01; *, P-value 0.01-0.05; ns, P-value.0.05. Abbreviations: OvCa, ovarian cancer; Non-OvCa, non-ovarian cancer; CA, cancer antigen; IL,interleukin.doi:10.1371/journal.pone.0029533.g003
Ovarian Cancer Biomarkers
PLoS ONE | www.plosone.org 7 December 2011 | Volume 6 | Issue 12 | e29533
YKL-40 and CA 72-4 (P-values 0.001–0.01) and then C-reactive
protein and cellular fibronectin (P-values 0.01–0.05). For prosta-
sin, there was no statistical difference (P-value.0.05).
For the same nine biomarkers we also determined if there were
statistically significant differences between samples from women
with benign conditions and women with each individual subtype
of ovarian cancer (Fig. 3). For clear cell carcinomas, a1-antitrypsin
and C-reactive protein were highly discriminatory (P-val-
ues,0.001), followed in descending order by HE4, CA-125 and
IL2-receptor a (P-values 0.01–0.05). For YKL-40, cellular
fibronectin, CA 72-4 and prostasin there were no statistical
differences (P-value.0.05). For endometrioid carcinomas, there
were highly significant differences for HE4 and CA-125 (P-
values,0.001) and significant differences for C-reactive protein,
cellular fibronectin, CA 72-4 (P-values 0.01–0.05). For a1-
antitrypsin, IL2-receptor a, YKL-40 and prostasin there were no
statistical differences (P-values.0.05). For mucinous carcinomas,
only CA 72-4 had a significant difference (P-value 0.01–0.05). For
serous and mixed carcinomas, all nine biomarkers had highly
significant differences (P-value,0.001). Therefore, with the
exception of mucinous carcinomas, the nine biomarkers are
informative for all common ovarian cancer subtypes, however,
their different discriminative powers suggests that different
combinations of markers may be useful for different subtypes.
While it would have been preferential to find more informative
biomarkers for the mucinous subtype, it is relatively rare. Indeed,
only 6.0% of the cancers in the study were of mucinous subtype
(Table 1).
For simplicity and cost effectiveness, the use of a single
biomarker is preferred over multiple biomarkers. However, it is
clear that single biomarkers may not be able to capture the
inherent diversity of complexes diseases such as ovarian cancer.
An informative test seeks to combine multiple biomarkers in a way
that each marker adds a different type of discrimination either to
the entire patient population or the population subdivisions made
by the other markers. Simply put, markers with poor correlation
with one another have a greater chance of individually
contributing to a panel than markers with strong correlation with
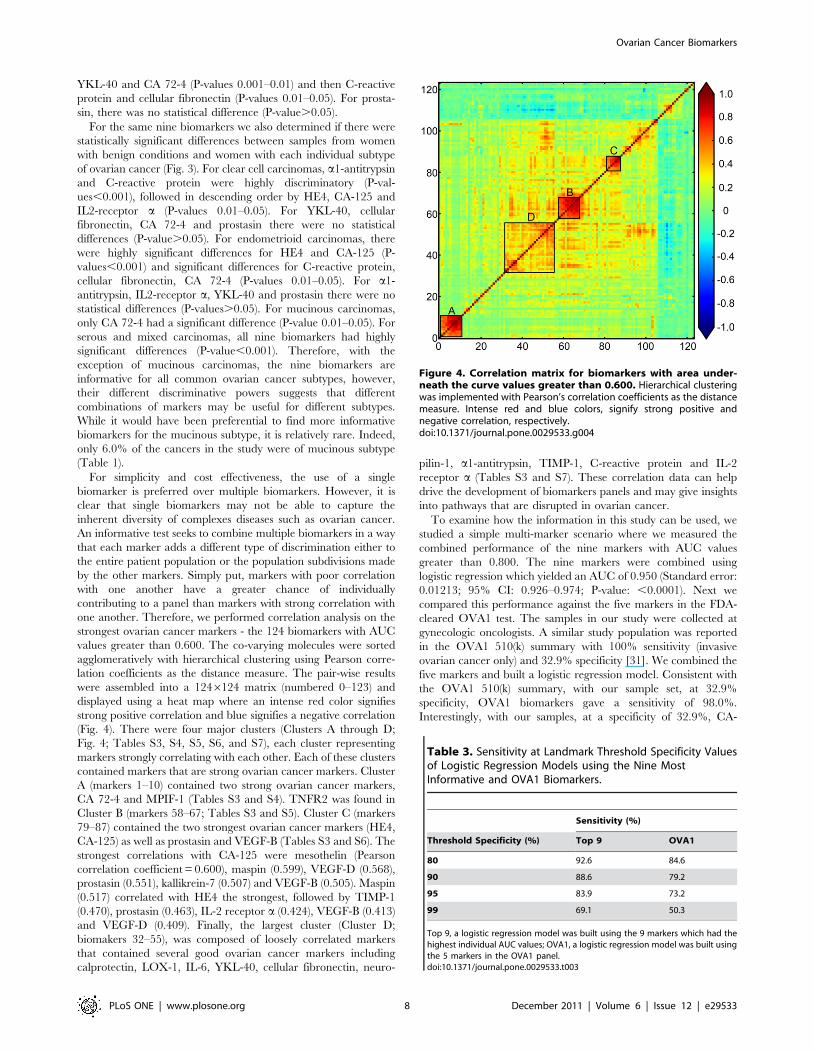
one another. Therefore, we performed correlation analysis on the
strongest ovarian cancer markers - the 124 biomarkers with AUC
values greater than 0.600. The co-varying molecules were sorted
agglomeratively with hierarchical clustering using Pearson corre-
lation coefficients as the distance measure. The pair-wise results
were assembled into a 1246124 matrix (numbered 0–123) and
displayed using a heat map where an intense red color signifies
strong positive correlation and blue signifies a negative correlation
(Fig. 4). There were four major clusters (Clusters A through D;
Fig. 4; Tables S3, S4, S5, S6, and S7), each cluster representing
markers strongly correlating with each other. Each of these clusters
contained markers that are strong ovarian cancer markers. Cluster
A (markers 1–10) contained two strong ovarian cancer markers,
CA 72-4 and MPIF-1 (Tables S3 and S4). TNFR2 was found in
Cluster B (markers 58–67; Tables S3 and S5). Cluster C (markers
79–87) contained the two strongest ovarian cancer markers (HE4,
CA-125) as well as prostasin and VEGF-B (Tables S3 and S6). The
strongest correlations with CA-125 were mesothelin (Pearson
correlation coefficient = 0.600), maspin (0.599), VEGF-D (0.568),
prostasin (0.551), kallikrein-7 (0.507) and VEGF-B (0.505). Maspin
(0.517) correlated with HE4 the strongest, followed by TIMP-1
(0.470), prostasin (0.463), IL-2 receptor a (0.424), VEGF-B (0.413)
and VEGF-D (0.409). Finally, the largest cluster (Cluster D;
biomakers 32–55), was composed of loosely correlated markers
that contained several good ovarian cancer markers including
calprotectin, LOX-1, IL-6, YKL-40, cellular fibronectin, neuro-
pilin-1, a1-antitrypsin, TIMP-1, C-reactive protein and IL-2
receptor a (Tables S3 and S7). These correlation data can help
drive the development of biomarkers panels and may give insights
into pathways that are disrupted in ovarian cancer.
To examine how the information in this study can be used, we
studied a simple multi-marker scenario where we measured the
combined performance of the nine markers with AUC values
greater than 0.800. The nine markers were combined using
logistic regression which yielded an AUC of 0.950 (Standard error:
0.01213; 95% CI: 0.926–0.974; P-value: ,0.0001). Next we
compared this performance against the five markers in the FDA-
cleared OVA1 test. The samples in our study were collected at
gynecologic oncologists. A similar study population was reported
in the OVA1 510(k) summary with 100% sensitivity (invasive
ovarian cancer only) and 32.9% specificity [31]. We combined the
five markers and built a logistic regression model. Consistent with
the OVA1 510(k) summary, with our sample set, at 32.9%
specificity, OVA1 biomarkers gave a sensitivity of 98.0%.
Interestingly, with our samples, at a specificity of 32.9%, CA-
Figure 4. Correlation matrix for biomarkers with area under-neath the curve values greater than 0.600. Hierarchical clusteringwas implemented with Pearson’s correlation coefficients as the distancemeasure. Intense red and blue colors, signify strong positive andnegative correlation, respectively.doi:10.1371/journal.pone.0029533.g004
Table 3. Sensitivity at Landmark Threshold Specificity Valuesof Logistic Regression Models using the Nine MostInformative and OVA1 Biomarkers.
Sensitivity (%)
Threshold Specificity (%) Top 9 OVA1
80 92.6 84.6
90 88.6 79.2
95 83.9 73.2
99 69.1 50.3
Top 9, a logistic regression model was built using the 9 markers which had thehighest individual AUC values; OVA1, a logistic regression model was built usingthe 5 markers in the OVA1 panel.doi:10.1371/journal.pone.0029533.t003
Ovarian Cancer Biomarkers
PLoS ONE | www.plosone.org 8 December 2011 | Volume 6 | Issue 12 | e29533
125 alone had a sensitivity of 98.0%. This indicated that the
additional OVA1 markers contributed little, if any, to the overall
classification. Indeed, the AUC value for the five OVA1
biomarkers was 0.912 (Standard error: 0.0157; 95% CI: 0.881–
0.943; P-value: ,0.0001), barely higher than CA-125 alone which
had an AUC of 0.907 (Standard error: 0.01571; 95% CI: 0.877–
0.938; P-value: ,0.0001). We compared the two models further
by determining the sensitivity of models at fixed specificity values
and the specificity of models at fixed sensitivity values (Tables 3
and 4). In general, the logistic regression model built on the top 9
markers outperformed the model built on OVA1 markers at all
points of the ROC curve. At fixed specificity values between 80
and 95%, the top 9 model was 8 to 10% more sensitive that the
model built on the OVA1 markers. At higher specificity (99%), the
top 9 model was approximately 19% more sensitive. At fixed
sensitivity between 80 and 99%, the top 9 model was between 8
and 25% more specific than the model built on the OVA1
markers.
In addition to the simple logistic regression approach described
above, it will be interesting to utilize the correlation data from this
study to help build more accurate multivariate models. For
example, a panel composed of the strongest markers from each
cluster as well as markers that were not found in any of the
clusters, such as IL-8, MMP-7 and IGFBP2 may be even more
accurate. However, these types of analyses are extensive, with
many possible combinations to characterize, are beyond the scope
of this initial publication and will form the basis of future work.
As both the top nine and OVA1 panels contained markers that
may perform differently for pre- and post-menopausal women, we
separately analyzed the performance of the two panels by
menopausal status. For the top nine panel, the AUC value for
pre-menopausal women was lower (0.937) than for post-meno-
pausal women (0.953). This is consistent with the individual
marker analysis that demonstrated that the top three individual
markers (HE4, CA-125 and IL2-Ra) all performed better for the
post-menopausal women (0.927, 0.927 and 0.824, respectively;
Table S8) than for the pre-menopausal women (0.912, 0.907 and
0.812, respectively). For the OVA1 panel, the AUC value for pre-
menopausal women was slightly lower (0.920) than for post-
menopausal women (0.924). Again, this is consistent with the
individual marker analysis that demonstrated that CA-125, the
marker that appears to drive the performance of the OVA1 panel,
performed worse for the group of pre-menopausal women (0.907)
than for post-menopausal women (0.927).
In conclusion, we have identified new biomarkers that are
capable of discriminating between samples drawn from women
with benign ovarian conditions and those from women with
ovarian cancer. Preliminary multivariate analysis, using a logistic
regression model on the nine most informative biomarkers
appeared to have significantly improved performance over the
OVA1 biomarkers. Our analysis indicates that our data have the
potential to improve on OVA1 and other tests. However, our
study does not include a blinded validation set of samples.
Therefore, we plan additional assessments on other, independent,
well-characterized sample sets to independently validate these
findings.
Supporting Information
Table S1 Biomarkers Assayed in Study.
(DOC)
Table S2 Informative Biomarkers with Area Under-neath the Curve (AUC) Values Statistically Greater than0.5.
(DOC)
Table S3 Identity of Markers in Clusters A Through D.
(DOC)
Table S4 Correlation of Markers in Cluster A.
(DOC)
Table S5 Correlation of Markers in Cluster B.
(DOC)
Table S6 Correlation of Markers in Cluster C.
(DOC)
Table S7 Correlation of Markers in Cluster D.
(DOC)
Table S8 Area Underneath the Curve (AUC) values fromReceiver Operating Characteristic (ROC) curve analysisof the top 20 markers broken out by menopausal status.
(DOC)
Acknowledgments
We wish to thank the principal investigators at the collection sites for their
participation in the sample collection. The investigators and sites are
described elsewhere [21].
Author Contributions
Conceived and designed the experiments: PY T-HC PS LLS KLM-B JPM
BCM GPB. Performed the experiments: PY T-HC LLS GPB. Analyzed
the data: PY T-HC LLS JPM GPB. Contributed reagents/materials/
analysis tools: PY T-HC PS LLS JPM BCM. Wrote the paper: PY T-HC
PS LLS KLM-B JPM BCM GPB.
References
1. American Cancer Society (2010) Cancer Facts and Figures 2010. Atlanta:
American Cancer Society.
2. Howlader N, Noone AM, Krapcho M, Neyman N, Aminou R, et al. (2011) SEER
Cancer Statistics Review, 1975-2008. National Cancer Institute Bethesda, MD based
on November 2010 SEER data submission, posted to the SEER web site, 2011.
3. American Cancer Society (2007) NCCN Ovarian Cancer Treatment Guidelines
for Patients. Version III.
4. Myers ER, Bastian LA, Havrilesky LJ, Kulasingam SL, Terplan MS, et al.
(2006) Management of Adnexal Mass. Agency for Healthcare Research and
Quality. 130 130.
Table 4. Specificity at Landmark Threshold Sensitivity Valuesof Logistic Regression Models using the Nine MostInformative and OVA1 Biomarkers.
Specificity (%)
Threshold Sensitivity (%) Top 9 OVA1
80 96.3 88.3
90 88.9 63.4
95 62.3 52.9
99 20.6 7.1
Top 9, a logistic regression model was built using the 9 markers which had thehighest individual AUC values; OVA1, a logistic regression model was built usingthe 5 markers in the OVA1 panel.doi:10.1371/journal.pone.0029533.t004
Ovarian Cancer Biomarkers
PLoS ONE | www.plosone.org 9 December 2011 | Volume 6 | Issue 12 | e29533
5. Timmerman D, Testa AC, Bourne T, Ferrazzi E, Ameye L, et al. (2005) Logistic
regression model to distinguish between the benign and malignant adnexal mass
before surgery: a multicenter study by the International Ovarian Tumor
Analysis Group. J Clin Oncol 23: 8794–8801.
6. Van Calster B, Timmerman D, Bourne T, Testa AC, Van Holsbeke C, et al.
(2007) Discrimination between benign and malignant adnexal masses by
specialist ultrasound examination versus serum CA-125. J Natl Cancer Inst 99:
1706–1714.
7. Klug TL, Bast RC, Jr., Niloff JM, Knapp RC, Zurawski VR, Jr. (1984)
Monoclonal antibody immunoradiometric assay for an antigenic determinant
(CA 125) associated with human epithelial ovarian carcinomas. Cancer Res 44:
1048–1053.
8. Rose PG, Fusco N, Fluellen L, Rodriguez M (1998) Second-line therapy with
paclitaxel and carboplatin for recurrent disease following first-line therapy with
paclitaxel and platinum in ovarian or peritoneal carcinoma. J Clin Oncol 16:
1494–1497.
9. Schilthuis MS, Aalders JG, Bouma J, Kooi H, Fleuren GJ, et al. (1987) Serum
CA 125 levels in epithelial ovarian cancer: relation with findings at second-look
operations and their role in the detection of tumour recurrence. Br J Obstet
Gynaecol 94: 202–207.
10. Anastasi E, Marchei GG, Viggiani V, Gennarini G, Frati L, et al. (2010) HE4: a
new potential early biomarker for the recurrence of ovarian cancer. Tumour
Biol 31: 113–119.
11. Buamah P (2000) Benign conditions associated with raised serum CA-125
concentration. J Surg Oncol 75: 264–265.
12. Kalantri Y, Naik G, Joshi SP, Jain A, Phatak S, et al. (2007) Role of cancer
antigen-125 from pleural & ascitic fluid samples in non malignant conditions.
Indian J Med Res 125: 25–30.
13. Miralles C, Orea M, Espana P, Provencio M, Sanchez A, et al. (2003) Cancer
antigen 125 associated with multiple benign and malignant pathologies. Ann
Surg Oncol 10: 150–154.
14. Skates SJ, Menon U, MacDonald N, Rosenthal AN, Oram DH, et al. (2003)
Calculation of the risk of ovarian cancer from serial CA-125 values for
preclinical detection in postmenopausal women. J Clin Oncol 21: 206s–210s.
15. Greene MH, Piedmonte M, Alberts D, Gail M, Hensley M, et al. (2008) A
Prospective Study of Risk-Reducing Salpingo-oophorectomy and Longitudinal
CA-125 Screening among Women at Increased Genetic Risk of Ovarian
Cancer: Design and Baseline Characteristics: A Gynecologic Oncology Group
Study. Cancer Epidemiol Biomarkers Prev 17: 594–604.
16. Fung ET, Hogdall C, EEngelholm SA, Petri AL, Nedergaard L, et al. Novel
biomarkers to aid in the differential diagnosis of a pelvic mass; 2006 14 - 18
October; Santa, Monica, CA.
17. Gorelik E, Landsittel DP, Marrangoni AM, Modugno F, Velikokhatnaya L,
et al. (2005) Multiplexed immunobead-based cytokine profiling for early
detection of ovarian cancer. Cancer Epidemiol Biomarkers Prev 14: 981–987.
18. Petricoin EF, Ardekani AM, Hitt BA, Levine PJ, Fusaro VA, et al. (2002) Use of
proteomic patterns in serum to identify ovarian cancer. Lancet 359: 572–577.
19. Skates SJ, Horick N, Yu Y, Xu FJ, Berchuck A, et al. (2004) Preoperative
sensitivity and specificity for early-stage ovarian cancer when combining cancer
antigen CA-125II, CA 15-3, CA 72-4, and macrophage colony-stimulating
factor using mixtures of multivariate normal distributions. J Clin Oncol 22:
4059–4066.
20. Yurkovetsky ZR, Linkov FY, E Malehorn D, Lokshin AE (2006) Multiple
biomarker panels for early detection of ovarian cancer. Future Oncol 2:
733–741.
21. Seshaiah P, Bertenshaw GP, Chen TH, Bergstrom K, Zhao J, et al. (2010)
Validation of a Multivariate Serum Profile for Epithelial Ovarian Cancer Using
a Prospective Multi-Site Collection. Nature Precedings website. Available:
http://hdlhandlenet/10101/npre201046671. Accessed 2011 Nov 30.
22. Moore RG, McMeekin DS, Brown AK, DiSilvestro P, Miller MC, et al. (2009)
A novel multiple marker bioassay utilizing HE4 and CA125 for the prediction ofovarian cancer in patients with a pelvic mass. Gynecol Oncol 112: 40–46.
23. Jacobs I, Oram D, Fairbanks J, Turner J, Frost C, et al. (1990) A risk of
malignancy index incorporating CA 125, ultrasound and menopausal status forthe accurate preoperative diagnosis of ovarian cancer. Br J Obstet Gynaecol 97:
922–929.24. FDA (2008) Briefing Document Immunology Devices Panel Meeting December
3, 2008.
25. Moore RG, Jabre-Raughley M, Brown AK, Robison KM, Miller MC, et al.(2010) Comparison of a novel multiple marker assay vs the Risk of Malignancy
Index for the prediction of epithelial ovarian cancer in patients with a pelvicmass. Am J Obstet Gynecol 203: 228 e221–226.
26. Van Gorp T, Cadron I, Despierre E, Daemen A, Leunen K, et al. (2011) HE4and CA125 as a diagnostic test in ovarian cancer: prospective validation of the
Risk of Ovarian Malignancy Algorithm. Br J Cancer 104: 863–870.
27. Edgell T, Martin-Roussety G, Barker G, Autelitano DJ, Allen D, et al. (2010)Phase II biomarker trial of a multimarker diagnostic for ovarian cancer. J Cancer
Res Clin Oncol 136: 1079–1088.28. Visintin I, Feng Z, Longton G, Ward DC, Alvero AB, et al. (2008) Diagnostic
markers for early detection of ovarian cancer. Clin Cancer Res 14: 1065–1072.
29. Coates RJ, Kolor K, Stewart SL, Richardson LC (2008) Diagnostic markers forovarian cancer screening: not ready for routine clinical use. Clin Cancer Res 14:
7575–7576. author reply 7577–7579.30. McIntosh M, Anderson G, Drescher C, Hanash S, Urban N, et al. (2008)
Ovarian cancer early detection claims are biased. Clin Cancer Res 14: 7574.author reply 7577-7579.
31. FDA (2009) 510(k) Substantial Equivalence Determination Decision Summary,
510(k) Number: k081754.32. Miller RW, Smith A, Desimone CP, Seamon L, Goodrich S, et al. (2011)
Performance of the American College of Obstetricians and Gynecologists’Ovarian Tumor Referral Guidelines With a Multivariate Index Assay. Obstet
Gynecol.
33. Zhu CS, Pinsky PF, Cramer DW, Ransohoff DF, Hartge P, et al. (2011) AFramework for Evaluating Biomarkers for Early Detection: Validation of
Biomarker Panels for Ovarian Cancer. Cancer Prev Res (Phila) 4: 375–383.34. Mai PL, Wentzensen N, Greene MH (2011) Challenges related to developing
serum-based biomarkers for early ovarian cancer detection. Cancer Prev Res(Phila) 4: 303–306.
35. Cramer DW, Bast RC, Jr., Berg CD, Diamandis EP, Godwin AK, et al. (2011)
Ovarian cancer biomarker performance in prostate, lung, colorectal, andovarian cancer screening trial specimens. Cancer Prev Res (Phila) 4: 365–374.
36. Bertenshaw GP, Yip P, Seshaiah P, Zhao J, Chen TH, et al. (2008) Multianalyteprofiling of serum antigens and autoimmune and infectious disease molecules to
identify biomarkers dysregulated in epithelial ovarian cancer. Cancer Epidemiol
Biomarkers Prev 17: 2872–2881.37. Amonkar SD, Bertenshaw GP, Chen TH, Bergstrom KJ, Zhao J, et al. (2009)
Development and preliminary evaluation of a multivariate index assay forovarian cancer. PLoS ONE 4: e4599.
38. Thorpe JD, Duan X, Forrest R, Lowe K, Brown L, et al. (2007) Effects of bloodcollection conditions on ovarian cancer serum markers. PLoS One 2: e1281.
39. Polanski M, Anderson NL (2007) A list of candidate cancer biomarkers for
targeted proteomics. Biomark Insights 1: 1–48.40. Skogstrand K, Ekelund CK, Thorsen P, Vogel I, Jacobsson B, et al. (2008)
Effects of blood sample handling procedures on measurable inflammatorymarkers in plasma, serum and dried blood spot samples. J Immunol Methods
336: 78–84.
41. Lomholt AF, Frederiksen CB, Christensen IJ, Brunner N, Nielsen HJ (2007)Plasma tissue inhibitor of metalloproteinases-1 as a biological marker? Pre-
analytical considerations. Clin Chim Acta 380: 128–132.
Ovarian Cancer Biomarkers
PLoS ONE | www.plosone.org 10 December 2011 | Volume 6 | Issue 12 | e29533