Clinical Proteomics - Broad Institute
40
Clinical Proteomics Michael A. Gillette Broad Institute of MIT and Harvard Massachusetts General Hospital
-
Upload
khangminh22 -
Category
Documents
-
view
0 -
download
0
Transcript of Clinical Proteomics - Broad Institute

Clinical Proteomics
Michael A. Gillette Broad Institute of MIT and Harvard Massachusetts General Hospital

“Clinical proteomics” encompasses a spectrum of activity from pre-clinical discovery to applied diagnostics
• Proteomics applied to clinically relevant materials – “Quantitative and qualitative profiling of proteins and peptides that are
present in clinical specimens like human tissues and body fluids”
• Proteomics addressing a clinical question or need – Discovery, analytical and preclinical validation of novel diagnostic or
therapy related markers
• MS-based and/or proteomics-derived test in the clinical laboratory and informing clinical decision making – Clinical implementation of tests developed above – Emphasis on fluid proteomics – Includes the selection, validation and assessment of standard
operating procedures (SOPs) in order that adequate and robust methods are integrated into the workflow of clinical laboratories
– Dominated by the language of clinical chemists: Linearity, precision, bias, repeatability, reproducibility, stability, etc.
Ref: Apweiler et al. Clin Chem Lab Med 2009

MS workflow allows precise relative quantification of global proteome and phosphoproteome across large numbers of samples
11,000 – 12,000 distinct proteins/sample 25,000 - 30,000 phosphosites/sample
Tissue, cell lines, biological fluids

Longitudinal QC analyses of PDX breast cancer sample demonstrate stability and reproducibility of complex analytic workflow

Deep proteomic and phosphoproteomic annotation for 105 genomically characterized TCGA breast cancer samples
The Cancer Genome Atlas
• ~25 Cancer types
• 500 – 1000 tumors / cancer
• Comprehensive genomic characterization
• WES or WGS • Array-based mRNA
profiling or RNA Seq • CNV • DNA methylation • miRNA
• Protein characterization limited to RPPA
11,000 – 12,000 distinct proteins/tumor 25,000 - 30,000 phosphosites/tumor

Proteogenomic mapping using personalized databases facilitates functional annotation of genetic alterations in clinical samples
• 0.2-‐4.0% of frameshi1s, alterna6ve splices & single AA variants observable by proteomics • For unobserved altera6ons, mRNA may be untranslated or translated at low abundance, or product
may be unstable or targeted for degrada6on • Proteome coverage is deep but incomplete • ~30% of altera6ons would NOT be observable by proteomics (tryp6c pep6de length < 6 or >30)

(Phospho)proteomic data have comparable dimensionality to mRNA data
total average per tumor
Genes (mRNA) 17,814 17,811 Proteins quan6fied 12,529 11,307 Phosphosites quan6fied 79,767 27,779
RNA-Protein correlation is statistically significant and almost exclusively positive
9,302 proteins/genes Median correlation = 0.39
IQR=[0.21, 0.59] Mean = 0.39
66.7% of all proteins/genes
correlate*
*Jovanovic et al., Science 2015: “RNA levels explain 59-68% of protein abundance in baseline state” & “ribosomal proteins are regulated via post-transcriptional mechanisms”

Certain areas of biology, such as signaling pathways containing E3 ligases and proteases, do not correlate on RNA and protein level
Genes

Major breast cancer driver genes can be accurately quantified on the protein and phosphorylation level

Significant positive CIS effects
64% of CNA x RNA 31% of CNA x Protein 20% of CNA x Phosphoprotein
“Hot spots” of significant trans effects were found on chromosomes 5q, 10p, 12, 16q, 17q, and 22q
• CNA/protein correlations are a reduced representation of CNA/mRNA correlations in both CIS and TRANS • Established oncogenes & tumor suppressors were significantly more likely to have both CNA/mRNA and CNA/protein correlation • Correlations with CNA are more likely to be positive at the protein level
CNVs correlate positively with both mRNA and protein expression in CIS, and show many TRANS effects

Comparison with LINCS knockdown data on ~3800 genes identifies SKP1 and CETN3 as causal candidates in 5Q deletion region Both negatively regulate EGFR expression
Regulated in CMap modT FDR<0.1
• Top 5q candidates were CETN3 (part of TREX-2 complex; functions in mRNA export and chromatin positioning) and SKP1 (part of a complex that mediates ubiquitination of proteins involved in cell cycle, signal transduction, and transcription)
• In a recent human interaction proteome study SKP1 and FBOX7 were interaction partners

K-means clustering of proteome data yields three major groups Clustering on pathways from phosphopeptide-based ssGSEA yields a modified breast cancer taxonomy
Basal- enriched
Luminal- enriched
Stroma- enriched
- Stroma-enriched proteomics subtype is highly enriched for Reactive I RPPA subtype - Proteome clustering resembles PAM50 classification when instead of the most
variable the most RNA/protein-correlated proteins are selected

“Pircos” plots map outlier kinase values onto genome, transcriptome and proteome and help nominate candidate drivers from CNA regions

Pre-analytical variability could have profound effects on posttranslational modifications
• Time between ligation, excision and freezing for the TCGA samples varied from minutes to ca. 1 hour
• Effects of ischemia on PTMs not well studied
• Activated kinases and phosphatases can act in seconds-minutes • Alterations in phosphosignaling in cancer well established
Samples: Four patient-derived ovarian cancer tumors and two xenografted human breast cancer tumors (basal-like; luminal-like; pools of 10 tumors) Collection: excision prior to ligation; immediate LN2 Analysis: 4-plex iTRAQ on high-performance MS instrumentation

Cold ischemia times up to 1 hour cause no change in proteome but up to 24% change in phosphoproteome
Fuzzy c-means clusters of regulated phosphosites Enriched GO Biological Process terms for temporal profiles
Mertins et al; Mol Cell Proteomics 2014
Regulation of autophagy
Stress-activated MAPK cascade
Regulation of transcription factor activity
Rho protein signal transduction
n"tumor"samples" Total"
average"per"tumor"
overlap"in"at"least"(n21)""
kine6cs2based"regression"test*"
moderated"F2test*"
union"of"both"tests*"
%"regulated"**"
Phosphoproteome" #up/#down" #up/#down" #up/#down" #up/#down"
Ovarian"Cancer" 4" 23607" 13156" 9443" 307/97" 386/63" 432/111" 4.6/1.2"Basal"Breast"Cancer" 3" 38366" 27668" 26211" 1252/948" 1156/633" 1493/1027" 5.7/3.9"Luminal"Brst"Cancer" 3" 34327" 25814" 25102" 4153/820" 4220/962" 4977/1139" 19.8/4.5"
Proteome"Ovarian"Cancer" 4" 9498" 7550" 6985" 0/0" 0/0" 0/0" 0/0"
Basal"Breast"Cancer" 3" 17158" 14989" 14970" 0/0" 0/0" 0/0" 0/0"Luminal"Brst"Cancer" 3" 14224" 12641" 12679" 0/0" 0/0" 0/0" 0/0"

“Clinical proteomics” encompasses a spectrum of activity from pre-clinical discovery to applied diagnostics
• Proteomics applied to clinically relevant materials – “Quantitative and qualitative profiling of proteins and peptides that
are present in clinical specimens like tissues and body fluids”
• Proteomics addressing a clinical question or need – Analytical and clinical validation and implementation of novel
diagnostic or therapy related markers identified in preclinical studies
• MS-based and/or proteomics-derived test in the clinical laboratory and informing clinical decision making – Emphasis on fluid proteomics – Includes the selection, validation and assessment of standard
operating procedures (SOPs) in order that adequate and robust methods are integrated into the workflow of clinical laboratories

Fit-for-Purpose Guidelines have been established for MS-based assays
Targeted Peptide Measurements in Biology and Medicine: Best Practices for Mass Spectrometry-based Assay Development Using a Fit-for-Purpose Approach. Carr et al. MCP, 2014

Biomarkers have tremendous clinical utility Investment in new candidates has been vast
Clinical Symptoms
Normal Health Early Detection
Time (months / years)
Screening
Prognosis
Pharmacogenomics
Monitoring
Predisposition
Monitoring
Sym
ptom
Sev
erity
Selection of Therapy
Patient Stratification and prediction
Cardiac damage TnI, CK-MB, Mb, MPO, BNPCancer PSA, CA-125, Her-2Inflammation CRP, SAA, cytokines, RFLiver Damage ALT, ALP, AST, GGT (enzyme assays)Coagulation AT-III, proteins C&S, fibrinogen, VWFAllergy IgE against various antigensInfectious disease HIV-1, Hepatitis BsAg
Period Decades
Number of tests > 10 million/yr
Instruments Ca. 100,000 machines in hospitals, labs
Accuracy CV ~5-10% worldwide at ≥100pg/ml
“Biomarker" Publications in Pubmed by Year
41,086 papers in 2013 > 370,000 in the past decade Pharmaceutical Intelligence 2014
NIH Biomarker Related Grants by Year
Protein biomarkers have been introduced to clinical practice at a rate of
< 2 per year for decades.
Contemporary proteomics has not to date improved upon this dismal record.

• Biology – • it is hard to find differences that are predictive • it is very hard to find predictive markers in accessible fluids • it is ridiculously hard to find accessible predictive markers that
are not affected by related diseases -Josh LaBaer
Factors leading to biomarker development failure
Candidate Biomarker
Verified Biomarker
Validated Biomarker
Observed Difference
Sample Selection
Sample Analysis
Ref: Rifai N, Gillette MA, and Carr SA. Nature Biotechnol. (2006) 24: 971-983

Clinical proteomics demands a particular mindset
• If your clinical proteomics project focuses only on the proteomics, it will probably fail.
• You may get publications. You will not help patients.
• If you want to do clinical proteomics, THINK ABOUT THE CLINICAL BEFORE YOU THINK ABOUT THE PROTEOMICS

Start with a clinical question or need that is Important, Specific and Tractable
Important • What do the end users (typically clinicians) need to know? • What would be the expected clinical impact of knowing it?
– Impact per patient – Total patients affected
Specific • What sort of test is required?
– Screening – Diagnostic – Prognostic
• What is the final diagnostic material? – Blood – Urine – Tissue
• What would happen based on a positive test? – Follow-on imaging – Invasive diagnostic procedure – Surgical intervention
Tractable • Resources available for discovery and development • Route to implementation

Start with a clinical question or need that is Important, Specific and Tractable
Ovarian Cancer Survival By Stage (SEER) Ovarian Cancer Stage at Presentation
0
10
20
30
40
50
60
70
80
Localized Regional Distant Unstaged
StagePe
rcen
t
Ovarian Cancer • 5th leading cause of cancer death among women • 1.4% of women affected • >14,000 US women will die of ovarian cancer in 2014 • No functional early detection method
“I’ll find biomarkers for ovarian cancer”

Start with a clinical question or need that is Important, Specific and Tractable. Involve all stakeholders.
Specific • Type of test / material / initial follow-up: (Oncologist): Screening blood
test to select patients for trans-vaginal ultrasound • Consequence of positive test (Biomarker + ultrasound): Surgical biopsy • Acceptable performance: (Oncological surgeon): 1 cancer / 5 biopsies • Biomarker specifications: 98% specificity; maximize sensitivity
Tractable (Primary care physician; public health / policy expert; insurers) • Annual / semiannual blood test on routine clinical visit
Ovarian cancer marker panel with Sensitivity 100%, Specificity 90% Annual incidence of ovarian cancer 1:2500 women Positive Predictive Value = 0.4% => NOT CLINICALLY ACTIONABLE = USELESS!
(4772) 206772_at [PTH2R] rank=85STAN estimates: mu1= 4.75, mu2= 8.43, sig1= 0.43, sig2= 1.2, theta= 0.24, sens98= 0.725
log2expression
Den
sity
stan_cut = 5.91stan_sens98(med) = 0.725stan_sens98(mean) = 0.729stan_sens98(95%CI) = [0.619,0.846]
1 2 3 4 5 6 7 8 9 10 11 12 13 14 15 16
−2−1
01
2
stan_t5mix_hierControls (N=10)
Cases (N=53)

“Based on a hierarchical mixture model of marker distribution, identify candidate markers that maximize sensitivity at 98% specificity at least one year prior to clinical diagnosis of serous ovarian cancer in longitudinal plasma samples”
Clinical questions that are Important, Specific and Tractable drive meaningful biomarker candidate discovery
Immunoaffinity Depletion
Processing Labeling
Fractionation
MS Analysis
OCF TIF
Discovery (Proximal Fluids)
Verification (Plasma)
Biomarker Candidate for Validation
Native (12C) peptide Heavy Stnd (13C) peptide
MRM spectrum(light and heavy)
10 ms
Targeted MS/MS(MRM-MS)
Full scan (MS/MS)spectrum
100 ms
Data dependent MS/MSa
b
Fluo
resc
ence
Retention time (min)
Fluo
resc
ence
Retention time (min)
Q2 Q3
Ionize allpeptides
Mass selectpeptide ion
Fragmentpeptide ion
Detect allfragment ions
Q1
Q2 Q3
Ionize allpeptides
Mass selectpeptide ion
Fragmentpeptide ion
Monitor ≥3fragment ions
Q1
Endogenous analyte peptideSynthetic isotope-labeled peptide(a.k.a. “internal standard”)
Collisiongas
Electrosprayemitter
Cancer / Control Plasma
p Anti-Peptide Abs
Surrogate Peptides
MS
Automated Processing
Capture

“Samples of convenience” are rarely ideal and often inadequate. They may be tolerable for discovery but should generally be avoided for verification.
Sample Type, Quality and Suitability are of preeminent importance
• Type: Robust difference signal detectable with unbiased approach – Often not the same material as that for the final clinical test
• Quality refers to minimization of pre-analytical variability and maximization of the degree to which the sample represents native biology – Time of day – Position of patient – Technique of acquisition – Suitability and standardization of processing – Timing and technique of storage
• Suitability refers to the degree to which the samples reflect the population to which the clinical test would be applied – Suitability applies to cases and controls and emphasizes avoidance of
systematic bias – Suitability includes sufficiency of sample annotation

Siemens
PTCA.org
In-hospital mortality by time from symptom onset to PTCA
Improved markers of early myocardial injury are needed

Left Atrium
Right Atrium
LV IVS
Planned therapeutic
MI by alcohol ablation
Coronary Sinus Samples Time (min): Baseline, 10, 60
Femoral Vein Samples Time (min): Baseline, 10, 60, 120, 240, 1440
Coronary sinus
Plasma-based Discovery Using a Human Model of Myocardial Injury
Hypertrophic Obstructive Cardiomyopathy (HOCM)
Collaboration with Robert Gerszten, MGH and Marc Sabatine, BWH
PLASMA as a proximal fluid

Reduce, Alkylate, Digest
1st Dimension Frac/ona/on 60 SCX frac&ons/&mepoint = 240 frac&ons
Optimized plasma processing has become at least 6X faster and 4X less expensive
Abundant Protein Deple6on
Pa6ent Plasma (PMI) Baseline 60min 10min 240min
iTRAQ label, mix
1st Dimension Frac/ona/on 30 BRP frac&ons, total
Pa6ent Plasma (PMI) Baseline 60min 10min 240min
114 115 116 117
LC-‐MS/MS on Q Exac6ve LC-‐MS/MS on Orbitrap Classic 28 days 5 days
IgY14 IgY14
SMix
< 1000 proteins / sample < 700 proteins measured in all samples
Troponins not quantified
~ 5000 proteins / sample 3800 proteins measured in all samples
Troponins robustly quantified
… and performs better

AEBP1 FHL1 MYL3 TMP1
MRM-MS assays (“Tier 2”) for four novel candidate biomarkers of MI in peripheral plasma of PMI patients showed promising temporal profiles
Patient 1
Patient 2
Patient 3
• All at low ng/mL range • 4 time points/patient • CVs for biological replicates under 20%
Addona et al. Nature Biotechnology (2011) 29: 635

23-plex immunoMRM assay for CV disease biomarker candidates used to assay 522 patient samples in 2 months
Protein Peptide LOD
(fm/ul) LOQ (fm/
ul) LOQ (ng/
mL) Troponin I NITEIADLTQK 0.16 0.48 11.60
IL 33 TDPGVFIGVK 0.07 0.21 6.56
VLLSYYESQHPSNESGDGVDGK 0.07 0.22 6.62 ACLP Aortic carboxypeptidase-like
protein 1 ILNPGEYR 0.04 0.11 14.33 DTPVLSELPEPVVAR 0.60 1.81 237.21
FHL1 four and a half LIM domains 1 isoform 5
AIVAGDQNVEYK 0.03 0.10 3.26 NPITGFGK 0.04 0.13 4.39
MYL3 Myosin light chain 3 AAPAPAPPPEPERPK 1.79 5.38 118.02 ALGQNPTQAEVLR 0.06 0.19 4.16 HVLATLGER 0.23 0.70 15.43
TPM1 Isoform 4 of Tropomyosin alpha-1 chain
LVIIESDLER 0.08 0.25 8.23 SIDDLEDELYAQK na na na HIAEDADR 0.05 0.15 4.85
ITGB1 Isoform Beta-1C of Integrin beta-1
GEVFNELVGK na na na TAGLN2 Transgelin-2 ENFQNWLK 0.08 0.23 5.05 TAGLN1 Transgelin-1 AAEDYGVIK 0.07 0.22 5.06
FGL2 Fibroleukin ELESEVNK 0.07 0.20 9.98 EEINVLHGR 0.20 0.59 29.69
SCUBE2 Signal peptide GSVACECRPGFELAK 0.05 0.15 16.41
FSTL1 Follistatin-related protein 1 IQVDYDGHCK 0.59 1.77 61.76 LDSSEFLK 0.62 1.85 64.66
SPON1 Spondin-1 VEGDPDFYKPGTSYR 0.04 0.11 9.91 AQWPAWQPLNVR 0.13 0.39 35.30
Blood Draws
Baseline (pre-heparin)
10 min 1 hrs 4 hrs Baseline (post-heparin)
2 hrs 24 hrs
Planned MI patient samples: 252
MI patient samples 198
Blood Draws
Baseline 4 hrs 24 hrs
Cath. Control patient samples 72
Blood Draws
Baseline (pre-heparin)
10 min 1 hrs
ABI 4000QTRAP
Immunoaffinity enrichment
LC-MRM Desalt
Desalt using
vacuum manifold
KingFisher
Overnight capture using
Labquake
Bravo
RCM, Digest
LOQ range in 23-plex iMRM assay: 3 -230ng/mL Median CV: 15%

“Clinical proteomics” encompasses a spectrum of activity from pre-clinical discovery to applied diagnostics
• Proteomics applied to clinically relevant materials – “Quantitative and qualitative profiling of proteins and peptides that
are present in clinical specimens like tissues and body fluids”
• Proteomics addressing a clinical question or need – Analytical and clinical validation and implementation of novel
diagnostic or therapy related markers identified in preclinical studies
• MS-based and/or proteomics-derived test in the clinical laboratory and informing clinical decision making – Emphasis on fluid proteomics – Includes the selection, validation and assessment of standard
operating procedures (SOPs) in order that adequate and robust methods are integrated into the workflow of clinical laboratories

Validation requirements for a “Level 1 Clinical Assay” set a very high bar
Simplified example of what might be acceptable to FDA: Precision: <8% within-day variability, <12% between-day
variability
Bias: <5% on each of five days
Calibration curve slope: <5% difference over five days
Interference and Matrix effects: Blank samples (with no spiked internal standard peptide) and double blanks (with no spiked peptide or spiked internal standard peptide) contribute less than 5% of LLOQ signal, recovery of analyte spiked into 60 samples is 85-115% for all samples, three transitions monitored and the two transition ratios are within 25% of mean for all 60 samples and are monitored for all samples in production as QA
A. Hoofnagle

Simplified example of what might be acceptable to FDA (cont'd):
LLOQ validation: A sample run consecutively for 25 days at a level 50% above the LLOQ has a precision <15%
Carryover: Blank samples run after a matrix-matched highest calibrator have less than 5% of the signal at the LLOQ for the endogenous peptide and internal standard channels
Stability and sample type: different collection and storage conditions are evaluated for the effect on the measurement of the endogenous anlayte concentration, no effect is >15%
Clinical validation: safe and effective (PMA, 100s-1000s of samples), equivalence (510k, 100s of samples)
Somewhat lower levels of analytical validation could be clinically implemented under CLIA (Clinical Laboratory Improvement Amendments)
A. Hoofnagle

Hoofnagle, JCEM, 2013
Thyroglobulin, ng/mL (Immuno-MRM)
Clinical iMRM assay for thyroid cancer marker to address interference from autoantibodies
Thyr
oglo
bulin
, ng/
mL
(Imm
unoa
ssay
)
Assay was replicated at National Reference Labs with high interlaboratory concordance
ARUP Quest
Kushnir, Clin Chem, 2013 Clarke, J Inv Med, 2012
Thyroglobulin, ng/mL (Immuno-MRM)
Thyr
oglo
bulin
, ng/
mL
(Imm
unoa
ssay
)
0
50
100
150
200
0 50 100 150 200LC-‐M
S/MS UW, ng/m
LLC-‐MS/MS eval, ng/mL
Ass
ay 1
Assay 2
Interlaboratory concordance
Hoofnagle, personal communication

Observed Difference
Candidate Biomarker
Verified Biomarker
Validated Biomarker
Utility Validated
Inappropriate samples and/or poorly selected controls
Failure to develop a robust and reproducible assay
Underpowered study
Failure to account for overfitting or false discovery in ‘omics studies
Discovery without defining clinical need
Inappropriate statistics
Approved Biomarker
No validation studies performed
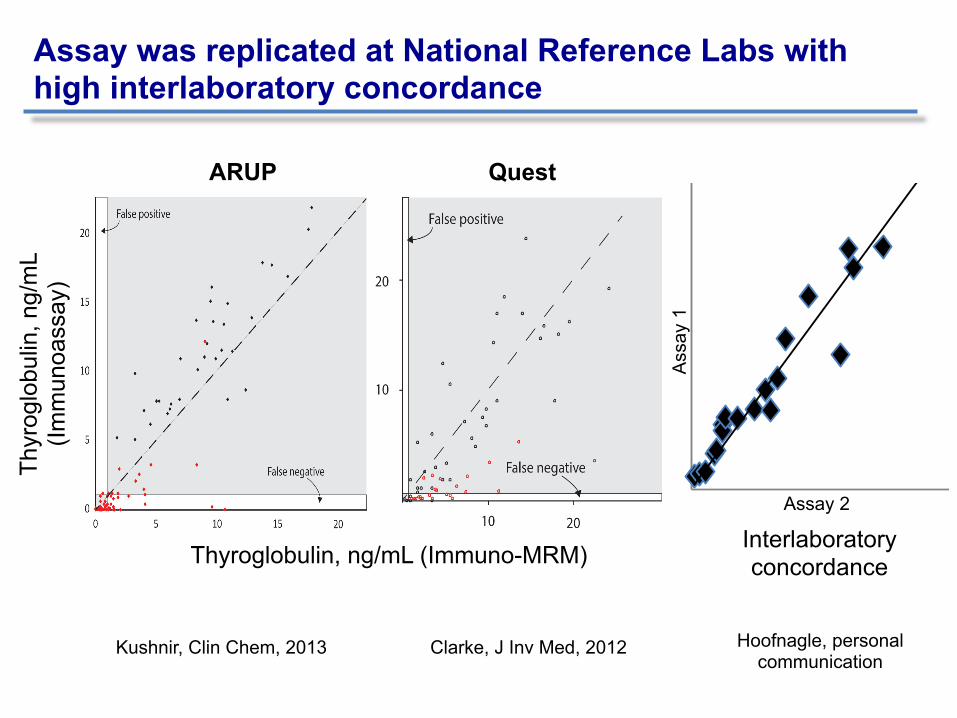
Biomarker development is fraught with common pitfalls
Modified from Josh LaBaer
Observed Difference
Candidate Biomarker
Verified Biomarker
Validated Biomarker
Utility Validated
Inappropriate samples and/or poorly selected controls
Failure to develop a robust and reproducible assay
Underpowered study
Failure to account for overfitting or false discovery in ‘omics studies
Discovery without defining clinical need
Inappropriate statistics
Approved Biomarker
No utility studies performed
No validation studies performed
Biomarker development is fraught with common pitfalls
Modified from Josh LaBaer
Regulatory agencies lack guidelines
What is the business model for biomarker development and deployment?

Clinical proteomics is hard, but it’s not as hard as this. We’ll succeed if we systematically identify and address the challenges.

Conclusions
– Clinical proteomics begins with “Clinical” – invest in defining the question or need and finding the right samples
– Modern proteomic approaches and technologies when coherently integrated can yield new biological insights and novel, sufficiently credentialed biomarker candidates that merit real clinical evaluation
– New, targeted MS-based methods enable highly specific and sensitive quantitative measurement of proteins and their modifications in high multiplex
– MRM-MS is becoming the new workhorse technology – Broad availability of this resource will change paradigms for how
experiments are planned and executed – With technological evolution, convergence of discovery and
verification is likely

Acknowledgements
Funding Agencies Women’s Cancer Research Fund, EIF Susan G. Komen for the Cure NIH: NCI and NHLBI Bill and Melinda Gates Foundation
Broad Proteomics Steve Carr
- Sue Abbatiello - Rushdy Ahmad - Michael Burgess - Karl Clauser - Amanda Creech - Lola Fagbami - Emily Hartmann - Jake Jaffe - Hasmik Keshishian - Eric Kuhn - D.R. Mani - Philipp Mertins - Jinal Patel - Lindsay Pino - Jana Qiao - Monica Schenone - Tanya Svink - Namrata Udeshi - Janice Williamson
FHCRC - Amanda Paulovich - Jeff Whiteaker - Lei Zhao - Regine Shoenherr - Pei Wang
University of Washington - Michael MacCoss - Brendan MacLean - Andy Hoofnagle
Mass. General Hospital - Robert Gerszten - Nir Hacohen - Nicolas Chevrier
Broad Institute • Cancer Program • Chemical Biology • Epigenomics Initiative
Dana Farber Cancer Center - Bill Hahn - Ben Ebert - Bill Kaelin
MIT - Alice Ting - Richard Hynes
Brigham and Womens Hospital - Marc Sabatine