Databases for antibody-based proteomics ERIK BJÖRLING
68
Databases for antibody-based proteomics ERIK BJÖRLING Royal Institute of Technology School of Biotechnology Stockholm 2008
-
Upload
khangminh22 -
Category
Documents
-
view
4 -
download
0
Transcript of Databases for antibody-based proteomics ERIK BJÖRLING

1
Databases for antibody-based proteomics
ERIK BJÖRLING
Royal Institute of Technology
School of Biotechnology
Stockholm 2008

© Erik Björling
Stockholm 2008
Royal Institute of Technology
School of Biotechnology
Albanova University Center
SE-106 91 Stockholm
Sweden
ISBN 978-91-7415-161-9
TRITA-BIO Report 2008:24 ISSN 1654-2312
Printed at US-AB, November 2008, Stockholm

Erik Björling (2008): Databases for antibody-based proteomics. School of Biotechnology, Royal Institute of Technology (KTH), Stockholm, Sweden.
Abstract Humans are believed to have ~20,500 protein-coding genes and much effort has over the last years been put into the characterization and localization of the encoded proteins in order to understand their functions. One such effort is the Human Proteome Resource (HPR) project, started in Sweden 2003 with the aim to generate specific antibodies to each human protein and to use those antibodies to analyze the human proteome by screening human tissues and cells.
The work reported in this thesis deals with structuring of data from antibody-based proteomics assays, with focus on the importance of aggregating and presenting data in a way that is easy to apprehend. The goals were to model and build databases for collecting, searching and analyzing data coming out of the large-scale HPR project and to make all collected data publicly available. A public website, the Human Protein Atlas, was developed giving all end-users in the scientific community access to the HPR database with protein expression data. In 2008, the Human Protein Atlas was released in its 4th version containing more than 6000 antibodies, covering more than 25% of the human proteins. All the collected protein expression data is searchable on the public website. End-users can query for proteins that show high expression in one tissue and no expression in another and possibly find tissue specific biomarkers. Queries can also be constructed to find proteins with different expression levels in normal vs. cancer tissues. The proteins found by such a query could identify potential biomarkers for cancer that could be used as diagnostic markers and maybe even be involved in cancer therapy in the future.
Validation of antibodies is important in order to get reliable results from different assays. It has been noted that some antibodies are reliable in certain assays but not in others and therefore another publicly available database, the Antibodypedia, has been created where any antibody producer can submit their binders together with the validation data in order for end users to purchase the best antibody for their protein target and their intended assay.
Keywords: proteomics, antibodies, database, biomarker, website


List of publications This thesis is based upon the following four papers, which are referred to in the text by their roman numerals (I-IV). The four papers are found in the appendix.
i. Uhlén M, Björling E, Agaton C, Szigyarto CA, Amini B, Andersen E, Andersson AC, Angelidou P, Asplund A, Asplund C, Berglund L, Bergström K et al. A human protein atlas for normal and cancer tissues based on antibody proteomics. Mol Cell Proteomics. Dec 2005; 4(12):1920-32.
ii. Björling E, Lindskog C, Oksvold P, Linné J, Kampf C, Hober S, Uhlén M, Pontén F. A web-based tool for in silico biomarker discovery based on tissue-specific protein profiles in normal and cancer tissues. Mol Cell Proteomics. May 2008; 7(5):825-44.
iii. Björling E*, Berglund L*, Oksvold P, Fagerberg L, Asplund A, Al-Khalili Szigyarto C, Persson A, Ottosson J, Wernérus H, Nilsson P, Lundberg E, Sivertsson Å, Navani S, Wester K, Kampf C, Hober S, Pontén F, Uhlén M. A gene-centric human protein atlas for expression profiles based on antibodies. Mol Cell Proteomics. Oct 2008; 7:2019-2027.
iv. Björling E, Uhlén M. Antibodypedia - a portal for sharing antibody and antigen validation data. Mol Cell Proteomics. Oct 2008; 7:2028-2037.
* These authors contributed equally to this work.
All papers are reproduced with permission from the copyright holders.

List of other publications, not included in this thesis
Berglund L*, Björling E*, Jonasson K, Rockberg J, Fagerberg L, Al-Khalili Szigyarto C, Sivertsson Å, Uhlén M. A whole-genome bioinformatics approach to selection of antigens for systematic antibody generation. Proteomics. Jul 2008;8(14):2832-9.
Barbe L, Lundberg E, Oksvold P, Stenius A, Lewin E, Björling E, Asplund A, Pontén F, Brismar H, Uhlén M, Andersson-Svahn H. Toward a confocal subcellular atlas of the human proteome. Mol Cell Proteomics. Mar 2008;7(3):499-508.
Nilsson P, Paavilainen L, Larsson K, Ödling J, Sundberg M, Andersson AC, Kampf C, Persson A, Al-Khalili Szigyarto C, Ottosson J, Björling E, Hober S, Wernérus H, Wester K, Pontén F, Uhlén M. Towards a human proteome atlas: high-throughput generation of mono-specific antibodies for tissue profiling. Proteomics. Nov 2005;5(17):4327-37.
Mathivanan S, Ahmed M, Ahn NG, Alexandre H, Amanchy R, Andrews PC, Bader JS, Balgley BM, Bantscheff M, Bennett KL, Björling E, et al. Human Proteinpedia enables sharing of human protein data. Nat Biotechnol. Feb 2008; 26(2):164-7.
Kampf C, Andersson A-C, Wester K, Björling E, Uhlén M, Pontén F. Antibody-based tissue profiling as a tool for clinical proteomics. Clinical Proteomics, Sep 2004; 1:285-9.9

Table of Contents INTRODUCTION..................................................................................9
LIFE...................................................................................................... 11
OMEANDOMICS.............................................................................. 13GENOME................................................................................................ 13GENOMICS...........................................................................................................13TRANSCRIPTOME.................................................................................. 14TRANSCRIPTOMICS............................................................................................14PROTEOME ........................................................................................... 14PROTEOMICS ......................................................................................................14SEPARATION.......................................................................................................15IDENTIFICATION ................................................................................................16QUANTIFICATION ..............................................................................................17ANTIBODYBASEDPROTEOMICS.......................................................... 20ANTIBODYTYPES...............................................................................................20THEHUMANPROTEOMERESOURCE................................................... 22VISION .................................................................................................................22PIPELINE .............................................................................................................22ANTIGENSELECTION ........................................................................................23CLONING..............................................................................................................24PROTEINEXPRESSIONANDPURIFICATION ...................................................24IMMUNIZATION..................................................................................................24ANTIBODYRETRIEVAL......................................................................................24IMMUNOHISTOCHEMISTRY ..............................................................................25IMAGEACQUISITION..........................................................................................26ANNOTATION .....................................................................................................27IMMUNOFLUORESCENCE ..................................................................................29
INFORMATIONTECHNOLOGY..................................................... 30THETRANSITIONFROMSINGLESCIENTISTAPPLICATIONSTOWARDSDATABASES ........................................................................................... 30REASONSFORDATABASEBASEDRESEARCH ...................................... 30DATABASESWITHINTHEGENOMICSFIELD......................................... 31DATABASESWITHINTHETRANSCRIPTOMICSFIELD .......................... 31DATABASESWITHINTHEPROTEOMICSFIELD .................................... 32
PRESENTINVESTIGATION ........................................................... 35OBJECTIVES .......................................................................................... 37WHYDIDTHEHPRPROJECTNEEDALIMS?..................................... 38DEVELOPINGDATABASEBASEDSOLUTIONSFORSCIENCE ................ 39CHOICEOFBUILDINGASYSTEMORBUYINGAPRODUCT............................40CHOICEOFARCHITECTURE..............................................................................41CHOICEOFSERVERPLATFORM .......................................................................42CHOICEOFDATABASE.......................................................................................43CHOICEOFDEVELOPMENTLANGUAGE ..........................................................44CHOICEOFSOFTWAREDEVELOPMENTMETHODOLOGY.............................44CHOICEOFDATABASEDESIGN ........................................................................45HPRASAHUGESTATE‐MACHINE ..................................................................46WORK‐ORDERSANDBATCHES........................................................................47PREPARINGFORPUBLICRELEASEOFTHEHPRDATA ....................... 47PAPERIPROTEINATLAS(2005) .................................................... 51PROTEINATLASVERSION2.............................................................................53PAPERIIADVANCEDSEARCHOFTHEPROTEINATLAS(2007) .... 53PAPERIIIPROTEINATLAS4(2008).............................................. 54PAPERIV–ANTIBODYPEDIA(2008)................................................ 55
CONCLUDINGREMARKSANDFUTUREPERSPECTIVES ...... 59
ACKNOWLEDGEMENTS ................................................................. 61
REFERENCES..................................................................................... 63

Introduction


Life It is believed that the first life came to light about 3.8 billion years ago in the form of a prokaryote cell (cell without a nucleus), 750 million years after the formation of the earth, through spontaneous formation of simple organic molecules into macromolecules (Miller 1953). About one billion years later, 2.7 billion years ago, the first eukaryote cells (cells with a nucleus), which are the building block of today’s plants and animals, were developed. And another billion years later, 1.7 billion years ago, the first multi-cellular organisms had evolved. With increasing cell specialization the true multi-cellular organisms developed where different sets of cells share the labor.
The first traces of you, the human in today’s form, Homo sapiens, are about 200,000 years old. The human is a highly developed species and is built up from about 200 differentiated cell-types (Cooper and Hausman 2004), most of them organized in tissues, which make up the organs. The blueprint for the development from the egg to the cell-types, tissues and organs into the complete human body is stored in the deoxyribonucleic acid (DNA) of the cells. The knowledge of the existence of DNA, its composition, role and related processes has for decades been of high interest to researchers. The main process related to DNA is the production of proteins within the cells when segments of DNA are, as a first step, transcribed into RNA and, in a second step, RNA is translated into amino acids forming a protein. Every bit of new knowledge within this area would give us better understanding of how normal development should look like and why and how diseases develop and could also reveal which types of disease development are caused by heritage or by external factors in the environment. This understanding is believed to give us the possibility to develop better drugs and treatments and even personalized drugs when needed (Ratain 2007) (Lesko 2007).
The first steps in the field of genomics, the study of genomes, involved the discovery of the DNA-molecule’s basic elements hydrogen, carbon, oxygen, nitrogen and phosphorus back in the 1870’s by the Swiss physician Friedrich Miescher (Miescher 1871). He called the newly discovered DNA-molecule “nuclein” and this term is still preserved in today’s term, deoxyribonucleic acid. The original term is also preserved for the four component molecules of DNA, the nucleotides guanine, cytosine, adenine and thymine.

In 1953, Watson and Crick described the helix shaped DNA-molecule (Watson and Crick 1953). This was an important step forward for researchers to start to analyze the genome sequence of organisms. The main process within the cells, the flow of genetic information from DNA via RNA and finally to proteins, also known as the central dogma of molecular biology, was described by Crick in 1958 (Crick 1958).
The proteins are fundamental macromolecules involved in functions both inside and outside the cell e.g. transport, signaling, storage, protection, regulation, structure and catalyzation. As proteins are involved in those major functions of living organisms, proteins are also involved in malfunction or disease. The disease diabetes is for example caused by deficiency of the protein insulin. Diabetes has been treated by injections of insulin since the 1920’s (Banting 1937). For the last 25 years, the insulin has been recombinately produced (Leader, Baca et al. 2008).
In the development of cancer, a single cell loses it growth control system through inactivation of suppressor genes due to a genetic damage, caused by environmental or inherited factors. The inactivation of suppressor genes leads to that the affected cell starts to grow in uncontrolled proportions and divides rapidly into a group of cells making up a tumor. Characteristics of tumor cells are that they demonstrate uncontrolled growth, invasion of neighboring tissues and/or metastasis. The uncontrolled growth hinders them from natural cell death (apoptosis). This could lead to invasion and destruction of surrounding tissues. Cells from a tumor can invade the lymphatic or the blood vessels, which could cause the tumor to spread to multiple distant locations (metastasis) (Hanahan and Weinberg 2000).
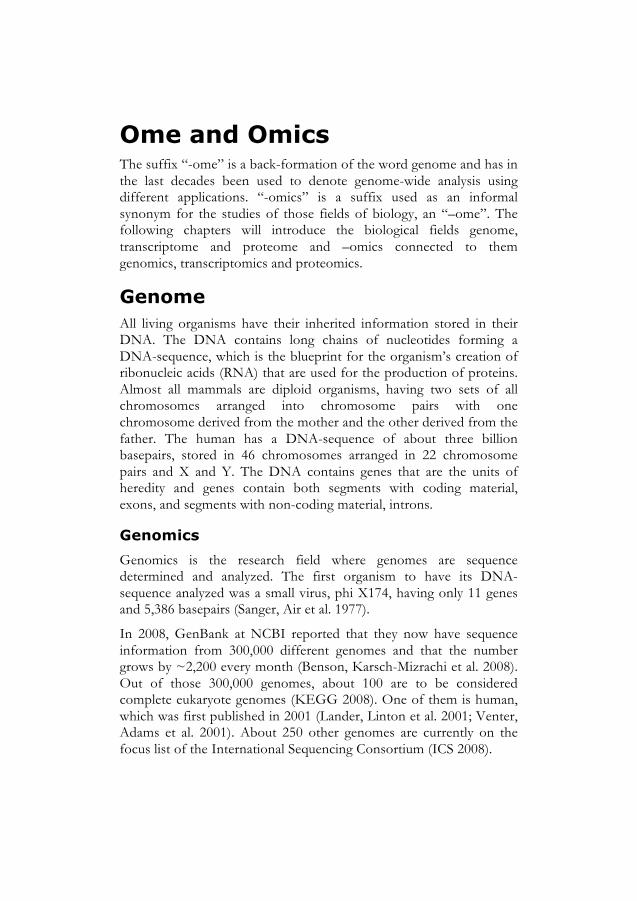
Ome and Omics The suffix “-ome” is a back-formation of the word genome and has in the last decades been used to denote genome-wide analysis using different applications. “-omics” is a suffix used as an informal synonym for the studies of those fields of biology, an “–ome”. The following chapters will introduce the biological fields genome, transcriptome and proteome and –omics connected to them genomics, transcriptomics and proteomics.
Genome All living organisms have their inherited information stored in their DNA. The DNA contains long chains of nucleotides forming a DNA-sequence, which is the blueprint for the organism’s creation of ribonucleic acids (RNA) that are used for the production of proteins. Almost all mammals are diploid organisms, having two sets of all chromosomes arranged into chromosome pairs with one chromosome derived from the mother and the other derived from the father. The human has a DNA-sequence of about three billion basepairs, stored in 46 chromosomes arranged in 22 chromosome pairs and X and Y. The DNA contains genes that are the units of heredity and genes contain both segments with coding material, exons, and segments with non-coding material, introns.
Genomics
Genomics is the research field where genomes are sequence determined and analyzed. The first organism to have its DNA-sequence analyzed was a small virus, phi X174, having only 11 genes and 5,386 basepairs (Sanger, Air et al. 1977).
In 2008, GenBank at NCBI reported that they now have sequence information from 300,000 different genomes and that the number grows by ~2,200 every month (Benson, Karsch-Mizrachi et al. 2008). Out of those 300,000 genomes, about 100 are to be considered complete eukaryote genomes (KEGG 2008). One of them is human, which was first published in 2001 (Lander, Linton et al. 2001; Venter, Adams et al. 2001). About 250 other genomes are currently on the focus list of the International Sequencing Consortium (ICS 2008).

Transcriptome When the cell synthesizes proteins, segments of the DNA-sequence are transcribed to RNA, ribonucleic acid, and the term transcriptome represents an organism’s complete set of RNA molecules in a given cell sample at a given timepoint. One gene-coding segment in the DNA-sequence is transcribed into messenger RNA-molecules (mRNA), also referred to as transcripts.
Transcriptomics
Transcriptomics is the research field where the transcriptome is studied, usually via large array experiments where the relative levels of many transcripts can be determined in a sample in one run. The transcriptome and the levels of mRNA at a certain timepoint is the “wish list” of proteins that a certain cell needs to produce. The study of the levels of mRNA-transcripts is therefore interesting in cells in different development stages or from different organisms, tissues, diseases, treatments etc.
Proteome The term proteome represents the entire set of an organisms proteins and was first coined in 1994 by Mark Wilkins (Wasinger, Cordwell et al. 1995). The determination of the DNA-sequence of several important organisms, such as the human and many model organisms, has opened up the possibilities for the scientific community to determine the proteome of these organisms. Since proteins are fundamental molecules regulating cells and cell signaling, the characterization and localization of an organism’s all proteins would give the research community a much better understanding of the active processes in the organism.
Proteomics
The research field of proteomics aims at comprehensive analysis and determination of protein expression in an organism in general but also the changes in protein expression in stages of diseases and under the influence of drug treatment. The measurements of mRNA levels in the transcriptomics world is an indirect measurement since mRNA is only a temporary and disposable message whilst protein expression levels is the closest to the functional level of cells that can be determined today with existing methods (Anderson and Anderson

1998). Cellular functions can also operate completely by changes of the proteins without any involvement of mRNA.
The proteome is more complex to analyze than the genome and transcriptome due to two major facts. Firstly, many proteins have post-translational modifications (PTMs) where for example sugar or phosphor molecules are attached which could alter the function and/or localization of the protein. Secondly, the protein abundance in biological samples ranges from single molecules to several millions of molecules per cell, and in complex samples such as serum 1010–fold difference in protein concentration has been detected (Anderson and Anderson 2002).
The traditional approach within proteomics is to separate the proteins in the biological sample, identify them and quantify them in order to define which proteins that were present in the sample. If one tissue sample is taken from a group of patients, all of them can be analyzed, and from the quantification data achieved, proteins that are up-regulated and down-regulated when comparing the patient samples can be found. Or, if samples are taken from a single patient over time, the change in protein expression levels can be determined and used to study a disease. As an example, prostate specific antigen (PSA) is a protein that is produced by cells in the prostate gland and can be detected in human serum. The PSA protein is often expressed at elevated levels from patients with a prostatic disease, such as cancer (Kuriyama, Wang et al. 1980; Catalona, Smith et al. 1991). Today, the PSA-test is a standard test routinely used in hospitals to detect if patients have potential prostate cancer. The PSA-test is approved as a diagnostic biomarker (FDA 1994) and hopefully more proteins with this kind of particular expression pattern will be discovered in the future through proteomics research.
Separation
Separation of the proteins in the biological sample is the first step within traditional proteomics. The goal of the separation is to take a complex protein mixture from a biological sample and fractionate it in such a way that all the individual proteins or at least several groups of them can be identified and analyzed further. The separation is based on the physical and chemical differences of proteins that cause them to behave differently when being exposed to different environments.
The human has about 20,500 protein-coding genes (Clamp, Fry et al. 2007) but due to post-translational modifications a sample from a single cell could contain 100,000 or more different types of proteins

and therefore it is important to have high resolution in the separation. This requirement has led to that most separations are performed in two dimensions based on two properties, e.g. charge and mass, instead of a linear separation only based on one property.
The two dominating separation techniques are two-dimensional gel electrophoresis (2DGE) (Gorg, Postel et al. 1988) and liquid chromatography (LC) (Martin and Synge 1941), which are both compatible with mass spectrometry for the identification part. A third separation technique used within the proteomics field is Western blot (Burnette 1981) where different biological samples are loaded at one end of a gel in separate lanes, followed by separation of the proteins by electricity. Smaller proteins move faster than larger ones through the gel and when the electricity is turned off the proteins will have spread out in the gel. In addition, a marker lane containing proteins of known molecular weight is used to determine the weight of a protein of interest. After separation, the proteins are transferred from the gel to a membrane where they are stained, usually with an antibody in order to identify a protein of interest (figure 1A).
Identification The separation step will only give vague information about the proteins in the sample even though their molecular mass and iso-electric point (pI) could in less complex samples be noted directly on the two-dimensional gel. Another yet simple, but sometimes useful, procedure is to count the different proteins after the separation step, anonymously. In most cases this level of information is not enough since it only reveals the characteristics of the proteins in the complex sample rather than their identity. The actual identification step can for example be performed by mass spectrometry, affinity proteomics or chemical degradation.
Mass spectrometry is a method that can determine the mass/charge ratio (m/z) of ionized molecules in a sample by passing the particles through electrical and magnetic fields towards a detector. This technology stems from the late 19th century when first the physicist Eugen Goldstein managed to get streams of particles in gas to bend when passed through an electric field (Goldstein 1898) and later Wilhelm Wien managed to separated the rays with both an electric and a magnetic field (Wien 1904). With this method, high quality identification of proteins can be performed in parallel with quantification (Aebersold and Mann 2003). Mass spectrometry can be used in sequential runs, called tandem mass spectrometry (McLafferty

1981), where the first run consists of only a separation where molecules of a certain mass are selected and the second run is the identification of the selected set. The obtained spectrum is finally compared to a spectrum library to identify the proteins, or the spectrum is converted from a mass/charge-ratio spectrum to a mass spectrum to identify the proteins by molecular weight and note their abundance in the sample. Mass spectrometry is used in larger and larger studies but still the analytical challenges with comprehensive identification and relative quantification have been difficult to overcome for studies of complete proteomes (de Godoy, Olsen et al. 2008).
Affinity-based proteomics, see also the section about antibodies below, is the field of proteomics where the identification of the proteins in a sample is performed by binding molecules targeted to bind only a certain protein. The binding molecule can either be labeled with a fluorophore that can be detected or have a region that can be targeted by another labeled binding molecule in a sandwich assay. There are several types of affinity-based molecules, e.g. monoclonal-antibodies (Kohler and Milstein 1975), mono-specific antibodies (Nilsson, Paavilainen et al. 2005; Uhlen and Ponten 2005), recombinant antibodies (Liu, Huang et al. 2002; Lipovsek and Pluckthun 2004), affibodies (Nord, Gunneriusson et al. 1997; Nygren and Skerra 2004), and aptamers (Brody and Gold 2000). Unfortunately, binding molecules are today not available for all the proteins of the organisms in focus for proteomics researchers e.g. humans and rodents.
Chemical degradation is a group of methods that focus on breaking the protein down to its amino acid components and elute them to detect the amounts of the different ones. Some degradation methods do not have the ability to detect the order of the amino acids in the protein sequence and therefore this has to be matched and predicted towards proteome sequence databases. One of the methods, the Edman degradation, invented back in 1949 (Edman 1949), has the possibility to elute one amino acid at a time and this method can therefore be used for protein sequencing, but it is not suitable for larger proteins or larger proteomics projects (Twyman 2007).
Quantification
One important objective within the proteomics field is to discover proteins that have a difference in abundance between multiple samples. The changes in protein expression can be due to differences
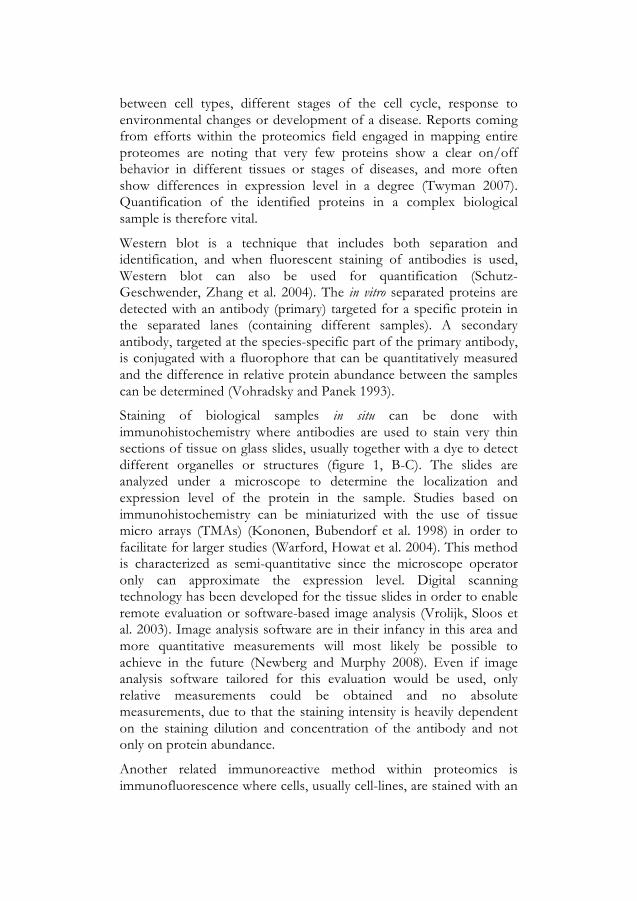
between cell types, different stages of the cell cycle, response to environmental changes or development of a disease. Reports coming from efforts within the proteomics field engaged in mapping entire proteomes are noting that very few proteins show a clear on/off behavior in different tissues or stages of diseases, and more often show differences in expression level in a degree (Twyman 2007). Quantification of the identified proteins in a complex biological sample is therefore vital.
Western blot is a technique that includes both separation and identification, and when fluorescent staining of antibodies is used, Western blot can also be used for quantification (Schutz-Geschwender, Zhang et al. 2004). The in vitro separated proteins are detected with an antibody (primary) targeted for a specific protein in the separated lanes (containing different samples). A secondary antibody, targeted at the species-specific part of the primary antibody, is conjugated with a fluorophore that can be quantitatively measured and the difference in relative protein abundance between the samples can be determined (Vohradsky and Panek 1993).
Staining of biological samples in situ can be done with immunohistochemistry where antibodies are used to stain very thin sections of tissue on glass slides, usually together with a dye to detect different organelles or structures (figure 1, B-C). The slides are analyzed under a microscope to determine the localization and expression level of the protein in the sample. Studies based on immunohistochemistry can be miniaturized with the use of tissue micro arrays (TMAs) (Kononen, Bubendorf et al. 1998) in order to facilitate for larger studies (Warford, Howat et al. 2004). This method is characterized as semi-quantitative since the microscope operator only can approximate the expression level. Digital scanning technology has been developed for the tissue slides in order to enable remote evaluation or software-based image analysis (Vrolijk, Sloos et al. 2003). Image analysis software are in their infancy in this area and more quantitative measurements will most likely be possible to achieve in the future (Newberg and Murphy 2008). Even if image analysis software tailored for this evaluation would be used, only relative measurements could be obtained and no absolute measurements, due to that the staining intensity is heavily dependent on the staining dilution and concentration of the antibody and not only on protein abundance.
Another related immunoreactive method within proteomics is immunofluorescence where cells, usually cell-lines, are stained with an

antibody directed towards a target protein and fused with a fluorophore together with a set of organelle-specific markers. The stained cells are analyzed in a confocal microscope that was invented back in 1957 by Minsky (Minsky 1961) where specimens could be optically sectioned and viewed separately. Within proteomics, confocal microscopy is used to determine the sub-cellular localization of the target protein in situ (with support from the organelle-markers) and to measure the intensity from the fluorescence that is interpreted as the relative quantity of the target protein (Jubb, Landon et al. 2003) (Camp, Chung et al. 2002) (figure 1D).
Figure 1. Examples of images captured from different proteomics experiments. All experiments are from the antibody HPA006240 that is directed towards the RNA-binding protein 9 (RBM9). A. The separation assay Western blot with six lanes; Leftmost, the marker lane with proteins corresponding to the molecular weights: 229, 112, 83.5, 47.9, 32.3, 26.5, 17.2kDa followed by a lane with the cell-line RT-4, lane with the cell-line U-251MG sp, human plasma, human liver and a last lane with human tonsil. B. Identification, localization and quantification with immunohistochemical staining of human cerebellum shows strong nuclear and cytoplasmic staining. C. Identification, localization and quantification with immunohistochemical staining of the human brain cell-line U-87MG. D. Sub-cellular localization and quantification with immunofluorescence staining of the human cell-line U-2 OS shows strong positivity of the nucleus but not the nucleoli.

As this thesis is solely based on proteomics data derived from affinity-based methods involving antibodies, the remainder of this thesis will focus on this particular field.
Antibody-based proteomics Antibodies are the primary affinity-based reagents and antibodies are well suited for the identification step within proteomics, but also well suited for the quantification step when antibodies are conjugated with a fluorophore or radioactive molecule. Antibodies are today not available for all human proteins but large-scale efforts, both academic and commercial, will lead to an increased number of antibodies (Blow 2007). Antibodies are molecules that bind to target molecules, the antigens, at a binding site, the epitope. Antibodies can be classified into four categories, which are described in the next section.
Antibody types
• Polyclonal antibodies (pAbs) are antibodies generated in the immune system of a host species, usually rabbit, mouse or hen, as a response to immunization of an antigen. The antigen is the protein or part of a protein that is the intended target of the antibody. Serum, blood or spleen is taken from the host and is purified to retrieve the antibodies. The cells in the immune system of the host can react to different parts of the immunized antigen and therefore a spectrum of antibodies with different epitopes are generated. The mixture of antibodies retrieved could therefore be seen as multi-epitope binding antibodies or polyclonal antibodies. The major drawback of polyclonal antibodies is that only a small fraction of the antibodies are directed towards the target. Another drawback is that they are not a renewable resource since every re-immunization of the antigen can give varied amounts of antibodies with a different spectrum of epitopes even though they are still directed to the same target as from the first immunization. In some assays it is beneficial to have a multi-epitope binding reagent to increase the likelihood of accessing the exposed regions of the target protein. Polyclonal antibodies are relatively inexpensive to produce.
• Monoclonal antibodies (mAbs) are generated by a selected B-cell from the immune system of the host, producing a single-epitope antibody. This B-cell is usually fused with an immortal cell-line and produces the same antibody over and

over again in vitro (Kohler and Milstein 1975). Monoclonal antibodies are a renewable resource and can be produced in great amounts and can, if well characterized, be used in diagnostic and therapeutic applications. The production of monoclonal antibodies is time-consuming and therefore they are relatively expensive to produce.
• Mono-specific antibodies (msAbs) (Nilsson, Paavilainen et al. 2005) are polyclonal antibodies that have been purified towards the immunized antigen after retrieval of serum from the host. As mentioned for the polyclonal antibodies, mono-specific antibodies have a mixture of epitopes and when purified against the intended antigen, the antibodies towards the intended target can be retrieved separately. The benefit is that since the mono-specific antibodies are targeting multiple epitopes on the target antigen they can be used in a variety of applications where the protein is present in different forms. Since mono-specific antibodies are based on polyclonal antibodies they are relatively inexpensive to produce.
• Recombinant antibodies (recAb) are produced by phage display technologies (Bradbury and Marks 2004) and no host animal is needed in the antibody generation process. Scientific efforts are trying to scale up the production to a proteome-wide level (Liu, Huang et al. 2002).
A selection of assays within the field of antibody-based proteomics is presented in the following chapter, where a large-scale proteomics project is described. This research project entails antibodies and is the project on which this doctoral thesis is based.

The Human Proteome Resource The Human Proteome Resource (HPR) is a large academic research project, started in Sweden, that aims to systematically explore the human proteins (Nilsson, Paavilainen et al. 2005). The HPR-project was started in the year 2003 with funding from the Knut and Alice Wallenberg foundation. At present it involves about 90 researchers at four different sites: Royal Institute of Technology KTH in Stockholm, Uppsala University, Malmö University Hospital and Mumbai in India.
The KTH-site is responsible for the generation of the antibodies, the Uppsala University-site for the screening of the human tissues and cells using the antibodies, and the Mumbai-site for determination of the protein expression levels through annotation of the resulting images. A small group at Malmö University Hospital is engaged in extended studies of proteins found to have expression patterns of clinical or research interest.
Vision The vision of the HPR project is to generate antibodies towards human gene-products, the proteins, and to use these antibodies to analyze the expression levels and localizations of the proteins in the human body. The resulting map of the human proteins will act as the first draft of the human proteome (Uhlen and Ponten 2005).
Ultimately the goal of the HPR project is to generate at least one validated antibody (or other affinity reagent) towards each human protein. The human is believed to have about 20,500 non-redundant proteins (Clamp, Fry et al. 2007). The project has now reached a production rate of 3,000 antibodies per year, which suggests that the first complete analysis could be finished by the year 2014.
The HPR-project is, together with other producers of affinity reagents towards the human proteins, engaged in the Human Proteome Organization (HUPO), which is a global proteomics community that supports and coordinates the international efforts to characterize the human proteome.
Pipeline
The HPR-project is unlike most regular research projects organized in a more factory-like fashion with producing modules responsible for different parts of the process (figure 2).

Figure 2. The HPR-pipeline. The starting point for the antibody factory is the antigen selection (PrEST-design) followed by cloning in the molecular biology module, cultivation and purification in the protein factory and antibody generation in host species. Four expression and validation analyzes are performed in HPR: immunofluorescence staining and capturing of confocal images, Western blotting, Immunohistochemistry on human tissues and cells and protein array experiments to determine specificity. All data generated in the project is published on the projects public website, the Human Protein Atlas.
Antigen selection
The starting point of the HPR-project’s pipeline is to select groups or classes of proteins to produce antibodies towards. Each selected protein is analyzed by numerous bioinformatics approaches. Berglund et al. describe the entire in silico antigen selection process (Berglund, Bjorling et al. 2008). The major concern in the antigen selection process is to ensure that the antibodies raised towards the antigen are specific i.e. only binding the intended protein. In order to achieve this, the sequence identity of every part of the selected protein towards all other human proteins is calculated and the regions of the target protein showing the lowest sequence identity to all other proteins are used for antigen production.
Another aspect of antigen selection is accessibility of the antigen in the intended assay and in this aspect trans-membrane regions and

signal peptides should be avoided in order for the antibody to able to bind the target protein.
The selected antigens within the HPR-project are usually between 25-150 amino acids long and are chosen as unique non-overlapping fragments of the full-length proteins.
The end-point of the antigen selection module is to order pairs of primers used for cloning of the gene fragment by RT-PCR in the molecular biology module (Agaton, Galli et al. 2003).
Cloning The molecular biology module amplifies the selected gene fragments from pools of human RNA, derived from tissues and cell-lines and the amplified products are ligated into a plasmid vector prior to transformation into the bacteria E. coli. The inserted fragments are sequence verified in order to omit clones with mutations and the approved clones are purified and delivered to the protein factory for protein expression and purification.
Protein expression and purification The protein factory module induces expression of protein fragments from the E. coli bacteria containing the human DNA-fragment and purifies the proteins. Quality assurance is performed to verify protein concentration, purity and solubility. Finally, quality assurance is performed through comparison of the mass spectrometry measured molecular weight towards the calculated molecular weight of the protein fragment.
Immunization The produced human protein fragments are immunized into rabbits thereby triggering their immune system to generate polyclonal antibodies towards the selected antigen.
Antibody retrieval
The polyclonal serum retrieved from the rabbits is in this module affinity purified towards the initial human protein fragment used for immunization (Nilsson, Paavilainen et al. 2005). This is done in order to obtain solely mono-specific antibodies directed towards the target protein and remove other antibodies and proteins from the serum. The purified antibodies are validated on protein arrays spotted with 384 PrEST-protein fragments from the same production batch. The

antibodies must show high specificity towards the target protein and low cross-reactivity towards any other protein in order to pass the validation. Antibodies that pass the protein array assay are furthermore tested in a Western blot validation assay.
Immunohistochemistry
Two major goals of the HPR-project are to generate mono-specific antibodies to all human proteins and to use these antibodies to screen the human body in order to locate and quantify the proteins. Apart from the HPR-generated antibodies, a large number of antibodies have been retrieved from external suppliers, in most cases commercial antibody producers. At present, the set of external antibodies comprise about 50% monoclonal and 50% polyclonal antibodies.
The screening of the human body is performed on tissue micro array slides (TMA) (Kononen, Bubendorf et al. 1998) where samples from 48 normal tissues and 20 different forms of cancer are assembled (Kampf, Andersson et al. 2004). In total, 576 cores of tissue are arranged on eight TMA-slides together with one slide containing 132 cores from 66 cell-lines and primary patient cells (Andersson, Stromberg et al. 2006). The diameter of the tissue cores is 1mm and the cell cores 0.6mm (figure 3). A TMA-slide with cell-lines and primary cells, sometimes called cell micro array (CMA), is added in order to be able to study some diseases only found in blood, e.g. leukemia, and some cancers where tissue samples are difficult to obtain, e.g. small cell lung cancer (Andersson, Stromberg et al. 2006).
Every antibody is used to stain the set of nine TMA-slides together with a hematoxylin counterstaining in order to visualize the nucleus of each cell. Hematoxylin is a dye staining nucleic acids purple blue. Since the primary antibody is invisible, a secondary antibody, anti-rabbit, is used to detect the primary antibody. The secondary antibody is coupled to a peroxidase conjucated dextranpolymer that reacts to the added 3,3’-diaminobenzidine (DAB) which produces a dark brown color.

Figure 3. A. The TMA-block containing 8x9 cores of tissue with two marker-spots on top. Each core is 1mm in diameter. The TMA-block can usually be sectioned 200-300 times in 4µm thick sections that are placed on microscope slides. B. In order to optimize the workflow two independent TMA-blocks are used on each TMA-slide. With this technology 144 different tissue samples can be analyzed on a single slide for one particular protein. The physical size of the TMA-slide is 25x75mm (1” x 3”).
Image acquisition
The TMA-slides, stained with antibody and dye, are scanned in microscope scanners by Aperio (Aperio Technologies, Inc., Vista, CA, USA) in 20x resolution for tissues and 40x resolution for cells. The TMA-slides are scanned as stripes when the motor controlled stage swipes under the lens. Around 100 image stripes are generated per TMA-slide. A custom-made software assembles the stripe images into a whole-slide image and an image-analysis software locates the circular tissue- and cell-cores within the image and crops them out to individual images, one per tissue/cell sample. During this entire process, the images are kept uncompressed from any degrading compression algorithm and are saved as a TIFF-image (Tagged Image

File Format). The evaluation of the images is conducted in a web-based tool, why JPEG (Joint Photographic Experts Group) versions of the images viewable via web-browsers are generated in large, medium and small variants. The JPEG compression level is set at a medium level (50 on the scale 1-100) where pathologists in the project are not able to note the difference by eye between the compressed and uncompressed images.
Annotation In order to generate a complete map of the human proteins, the expression level of the analyzed protein has to be determined in each image. This is done using a web-based annotation system for the tissue micro arrays where the protein expression level and localization in all major cell-types of each tissue is determined. The protein expression level consists of two parameters, both noted for each annotated cell-type, intensity and quantity. Quantity represents the fraction of stained cells and is estimated to one of four levels: rare, <25%, 25%-75% and >75%. The intensity of the expression is noted in a four-level based scoring system: negative, weak, moderate or strong. A screenshot of the web based annotation tools is shown in figure 4.
The cell arrays are evaluated on the automated image analysis platform TMAx (Beecher Instruments, Sun Prairie, WI, USA), where the cells in each image are counted, classified as stained or not stained (meaning expressing the protein or not) and each cell and each cellular area is classified as negative, weak, moderate and strong staining (Stromberg, Bjorklund et al. 2007).

Figure 4. The annotation tool (Oksvold et al. unpublished). In the top row, the name of the antibody is shown together with the tissue name, gender and age of the patient, and the T-number (topology) and M-number (morphology) of the tissue sample according to SNOMED (Systematized Nomenclature of Medicine) (Hibbard 1979). On the top left, more information about the protein can be shown, the entire TMA is visualized and the annotator can jump to different parts and different tissues to check expression patterns. On middle left is a shortcut for jumping to the other samples of the same tissue. There are also shortcut buttons to clear the annotation, annotate it as “white” (meaning negative/very weak indistinct) or “yellow” (meaning weak uncertain). A text-box for comments allows for local comments of particular findings. The lower part shows a list of cell-types (in this case trophoblastic and decidual) that are annotated for this tissue (placenta). For each cell type the annotator has to note if the cell type is present or not, determine the intensity (strong, moderate, weak, negative), determine the quantity (>75%, 75-25%, <25% or rare amount of stained cells), and note the sub-cellular localization (nuclear, cytoplasmic, membrane and/or extra cellular). There is also a possibility to note if this is a finding of particular interest. At bottom left is the annotation summary, which is a written text summary of the entire protein expression in all tissues. In the middle is the captured image of the tissue.
In the manual annotation of tissues only one common annotation is done based on three samples for normal tissues and two samples for cancer tissues. The methodology is to annotate the strongest finding and if there is any image of bad quality, bad focus or in other ways

discordant it is omitted. In the automated image analysis for the cells every image gets it individual annotation created and stored.
Between one and four cell-types have been pre-selected for annotation for the normal tissues, and tumor cells are annotated for the cancer samples.
Immunofluorescence The overall goal of the HPR-project is to determine the expression levels and localization of proteins in human tissues and cells but lately a new effort has been started focusing on determining also the sub-cellular localization of the human proteins (Barbe, Lundberg et al. 2008). The physical limitations of the ordinary pipeline (IHC on TMA-slides and bright field scanning) do not allow for a comprehensive analysis of the sub-cellular distribution pattern of the proteins. The immunofluorescence staining in combination with image capturing in a confocal microscope gives possibilities to have multiple staining dyes at different wavelengths, higher dynamic range and greater sensitivity. The current setup with multiple dyes targeted for different organelles emitting light at different wavelengths enables the end user to turn different channels on and off, giving a better possibility to determine the sub-cellular distribution of the targeted protein. Three different cell-lines have been chosen as the biological samples for the analysis of all antibodies in this module, an epidermoid (skin) carcinoma cell line (A-431) (Giard, Aaronson et al. 1973), an osteosarcoma (bone) cell line (U-2 OS) (Ponten and Saksela 1967) and an glioblastoma (brain) cell line (U-251MG) (Westermark 1973).

Information Technology There are few publications related to the information technology (IT) aspects within the field of antibody-based proteomics. Most single scientists or smaller groups of scientists performing experiments with affinity reagents save their data in laboratory notebooks or maybe in electronic versions thereof.
Within other fields of proteomics, e.g. the mass spectrometry field, IT-solutions for both capture and analysis of data have been developed. The increased possibilities of data analysis by efficient software packages have made it feasible for the mass spectrometry field to evolve towards the analysis of more complex samples and increased accuracy (Malmstrom, Lee et al. 2007).
The transition from single-scientist applications towards databases According to Gray et al. (Gray, Liu et al. 2005), a long list of problems and fears are presented when a research community or research group is about to adopt or develop a suiting database system. The main arguments are related to hesitance to the shift from their current tools used to collect and explore data to something new that will take time and cost money to implement when the benefits are unclear. Another fear is that a newly developed database system replacing an older single-user application will have limited functionality compared to the older system. Researchers have in many cases also tried some database for their data, but found them to be too slow or not supporting their data types or their access patterns. Another aspect mentioned in this paper is that the implementation of a database-based system would require an expensive database administrator.
Reasons for database-based research The most common reasons for going from a single-scientist usage of an application to a multi-user database-based software solution is that the data collected comes from different sources, different parts of the data-analysis is performed by different persons, the analysis or experiments are being scaled up and/or that the increased labor is shared by multiple laboratories or that the amount of collected data is increasing immensely. Experiments within the proteomics field tend to generate a lot of data, and it is, among other fields of

biotechnology, astronomy and particle physics, the research field that produces the largest amounts of data (Gray, Liu et al. 2005). Today, proteomics is facing the challenge of managing petabytes (1 petabyte=1000 terabytes=1,000,000 gigabytes) of data (Cochrane, Akhtar et al. 2008) and it tends to double every year (Gray, Liu et al. 2005).
Databases within the genomics field The field of genomics has been around for a longer time than proteomics and has been scaled-up by numerous research groups to multi-site, production-like groups. Therefore, it has been inevitable to develop and adopt well-suited IT-systems for data storage and analysis (Venter, Adams et al. 2001). The sequencing of the human genome forced the genomics groups to face the problem of distributing large sets of data to the scientific community and the public (Church and Pruitt 2002).
On the genomics side, three large centers have formed a collaboration, the International Nucleotide Sequence Database Collaboration, where each center collects new sequences from researchers and exchange them on a daily bases. The three centers in this collaboration are the European Molecular Biology Laboratory Nucleotide Sequence Database (EMBL-Bank) (Kulikova, Akhtar et al. 2007), the DNA Database of Japan (DDJB) (Sugawara, Ogasawara et al. 2008) and GenBank at the National Center for Biotechnology Information (NCBI) (Benson, Karsch-Mizrachi et al. 2008) in the US. The collaboration has led to the development of standards, routines and tools to explore and exchange data. The Ensembl-team from the European Bioinformatics Institute (EBI) and the Sanger Institute in the UK performs predictions of genes and proteins from the genome sequences of organisms. In their latest published version they support 41 species (Flicek, Aken et al. 2008).
Databases within the transcriptomics field ArrayExpress (Brazma, Parkinson et al. 2003; Parkinson, Kapushesky et al. 2007) is a public repository for storage of transcriptomics data at the European Bioinformatics Institute. ArrayExpress also constitutes a data warehouse of gene expression profiles from the repository, which is accessible for queries.

Gene Expression Omnibus, (GEO), (Edgar, Domrachev et al. 2002) is a public repository for submission, storage and retrieval of gene expression data by the National Center for Biotechnology Information (NCBI).
CIBEX, Center for Information Biology gene Expression Database, is a public database for submission and retrieval of microarray data by the DNA Data Bank of Japan (DDJB) (Ikeo, Ishi-i et al. 2003).
Oncomine is a microarray database and data mining platform focused on experiments involving cancer provided by the University of Michigan Medical School (Rhodes, Yu et al. 2004).
Databases within the proteomics field As late as in 2002, researchers within the proteomics field had difficulty in publishing their findings (Mann 2002). Databases for computationally predicted proteomes had been around for a while, as well as databases for manually annotated proteins from literature, but there was no central repository for storing experimental results. Today, proteomics databases are online, and in several of them researchers can upload their results.
UniProt (UniProt 2008) is a repository for protein information (sequence and annotation) and it consists of two parts, one manually annotated dataset of proteins called SwissProt (Bairoch, Boeckmann et al. 2004), and one software predicted dataset called TrEMBL (Bairoch and Apweiler 1996). UniProt is a collaboration between European Bioinformatics Institute (EBI), the Swiss Institute of Bioinformatics (SIB) and Protein Information Resource (PIR). SwissProt has focused on human proteins and claimed by the 2nd of September 2008 that they had completed a first draft of the human proteome (UniProt 2008).
PRIDE, PRoteomics IDEntifications database (Martens, Hermjakob et al. 2005), has focused on the problem where protein identifications from proteomics experiments are mentioned in scientific publications but are not searchable in a database manner. When a scientist identifies a protein, by a mass spectrometry experiment, they could upload their data into the PRIDE database, together with the specific experimental setup, enabling search possibilities.
PeptideAtlas is a public resource for upload and analysis of data from mass spectrometry experiments in order to identify and quantify proteins (Desiere, Deutsch et al. 2006; Deutsch, Lam et al. 2008). PeptideAtlas contains a collection of software that facilitates the

identification of peptides, statistical validation, accurate mapping towards eukaryote genomes and enables comparison between data sets from different experiments and/or laboratories.
Human Protein Reference Database (HPRD) (Mishra, Suresh et al. 2006) is a manually annotated database with information about protein domains, post-translational modifications (PTMs), interaction networks and disease association in the human proteome.
Human Proteinpedia (Mathivanan, Ahmed et al. 2008), developed in close collaboration with HPRD, is a proteomics community resource that enables sharing and uploading of proteomics data. The submitted data is mapped to the proteins within HPRD, which enables combined presentation of results proteomics experiments and selected literature for each protein. More than 75 laboratories have now submitted data from 2710 experiments from many types of underlying experiments, such as mass spectrometry, protein expression in tissues and sub-cellular data (Kandasamy, Keerthikumar et al. 2008).
The Protein Data Bank (PDB) (Berman, Henrick et al. 2003) is a repository for 3D-structures of biological molecules including proteins. The PDB was founded back in 1971, containing only seven protein structures. Today (October 2008) more than 50,000 structures have been submitted to the PDB and are available to search, view or download.
Knowing the 3D-structure is one important piece in the puzzle to understand the function of proteins and in an effort to illustrate the bridge between structure and function the Proteopedia web portal has been developed (Hodis, Prilusky et al. 2008).
InterPro (Apweiler, Attwood et al. 2001) is the database of the InterPro Consortium that holds collections of protein domain-specific characteristics from several underlying resources. The characteristics are usually in the form of signature sequences for domains, which can be aligned to a query protein sequence to determine association to any known family. Other domain-specific characteristics are stored in the form of hidden Markov models (HMMs) which are statistical models describing a pattern of a protein domain or family. One such resource is the Pfam, protein families database (Sonnhammer, Eddy et al. 1997).


Present investigation


Objectives The objectives of this thesis have been:
1. To create a laboratory information management system (LIMS) to handle all the data generated as a result of the Human Proteome Resource (HPR) project (unpublished).
2. To create a public database portal in order to present localization and expression levels of the human proteins, the Human Protein Atlas (HPA) (Paper I).
3. To create a search tool that allows for queries based on protein expression levels in different tissues and cancers (Paper II).
4. To change the structure of the Human Protein Atlas to a gene-centric instead of an antibody-centric view (Paper III).
5. To create a web portal, Antibodypedia, for validated antibodies and other affinity reagents with validation data from various experimental types (Paper IV).

Why did the HPR-project need a LIMS? Affinity proteomics is one of the major methods used to explore the proteins. A large academic research project, the Human Proteome Resource, was started at the Royal Institute of Technology, KTH, in Stockholm and at Uppsala University in 2003, aiming at developing mono-specific antibodies towards the human proteins and screening of normal and disease tissues in order to determine the expression of the human proteome. The production time of each antibody was about 12 months before they could be used for screening of protein expression in a large set of normal and disease tissue samples.
The size and high ambitions of the projects led to a clear separation of the personnel into dedicated groups, each responsible for a couple of related steps in the production pipeline. In the beginning, different production steps were noted on paper in laboratory notebooks and some were stored in Excel-sheets on desktop computers. The pipeline-like setup of the HPR-project led to an increased demand of possibilities to store and share data about the laboratory experiments conducted in each step and also between the groups. The initiative to build a custom-made laboratory information management system (LIMS) was taken not long after the production had started.

Developing database-based solutions for science When any of the five reasons listed below has been triggered, a move to a database-based solution for a research project is justified (Gray, Liu et al. 2005):
• Data comes from different sources. • Different parts of the data analysis are performed by different
persons/groups. • The analysis or experiments are being scaled up and/or
multiple laboratories share the increased labor. • The amount of collected data is increasing immensely. • More complex data analysis has to be performed, which leads
to filtering before analysis of the data or the engagement of clusters or grids.
At the starting point of the Human Proteome Resource project we were initially faced with the first three reasons in the list, and further on also with the last two.

When the decision has been made to go to a database-based solution, a couple of choices have to be made, namely developing vs. buying, type of architecture, server platform, database vendor and design, development language and methodology.
Choice of building a system or buying a product
Approach Description Benefits Drawback
Buy a product
Survey the market, try demonstration versions, and finally purchase and install a commercial system.
Extensive functionality from the start.
Impossible or expensive to customize through consultants.
Usually only on one platform (Windows).
Difficult to setup for multi-site usage.
Expensive to purchase and annual licensing fees.
Develop a system
Survey the scientific project, collect and prioritize the requirements. Develop the system from scratch.
Possibility to tailor for specific needs.
Possibility to build interfaces to instruments.
Freedom to choose architecture.
Slow start, takes weeks/months before first functionality is achieved.
Hard to estimate cost.
Difficult to recruit IT-personnel that understands the nature of the science.
Develop a product
Develop a system for the needs of the intended project, but build it in such a way that it can be customized for any similar project. Release it and sell it as a product.
Possibility to tailor for specific needs.
Possibility to build interfaces to instruments.
Freedom to choose architecture.
Possibility to sell or license the product to others.
Great possibilities to tailor the system for changes in the current project due to built-in high level of tailorization.
Slow start, takes weeks/months before first functionality is achieved.
Hard to estimate cost.
Difficult to recruit IT-personnel that understands the nature of the science.
Difficult to develop, due to the need of built in level of customization for other customers.
Table 1. Three different approaches in order to get an IT-system in place.

Three different approaches can be used when acquiring a new IT-system (table 1). For a scientific project any of the approaches above are plausible. However, we chose the second approach, to build a system, due to that the HPR-project was so large and complex and the need for tailored solutions for each module in combination with the need for a multi-site usage were of great importance. There were two major reasons for not building a product that could be used for others. Firstly, the project was of such a unique character that it was believed that the market would be to small or even non-existent. Secondly, there was such urgency in getting some of the first functionality in place that no time could be put a side for building the system in such a way that it could be re-modeled for other research projects (potential customers).
Choice of architecture
Architecture Description Benefits Drawback
Client-Server Application
Client applications communicating with a server application hosting the database.
Immense user interface possibilities (layout and interactivity).
Local installation of clients needed.
Most likely only developed for one platform.
Difficult to setup a multi-site solution.
Web portal Web server connected to a database. All access through web-clients
Works on all platforms (Win, Mac & Linux). No local installation (part of operative system installation)
Limited to the HTML-level of layout and JavaScript-level of interaction.
Table 2. Different alternatives for architecture.
One major decision that has to be made in any software development project is to select which architecture you should use to deliver the intended solution (table 2). In many cases this is already decided based on previous choices for existing systems within the customer/user-organization. For example, if all existing systems within an organization are web-based it would be difficult and inefficient to develop a non-web-based system due to that the users are well aware

of the technology. The systems administrators are also used to the technology and the network and server environments have been set up accordingly. For the new LIMS we chose the web-platform due to the suitability for multiple sites and possibilities for multiple platforms.
Choice of server platform
Type/Vendor Benefits Drawback
A commercial vendor like for example Microsoft Windows Server, together with Internet Information Server as webserver, Microsoft SQL Server or Oracle as database and Active Server Pages.
“Of the shelf”-solution.
Support from real suppliers.
Expensive.
Limited to one supplier. Hard to change anything at a later stage.
LAMP (Linux, Apache, MySQL, PHP (or Perl)).
Open source, meaning no cost for academic use.
Higher level of customization and external add-ons.
The entire system could be moved to e.g. other operative system or database changed with minor changes.
Difficult to setup and maintain.
Table 3. Major alternatives for server platforms for a web-based system.
Different server platforms have their own benefits and drawbacks (table 3). Based mainly on economical considerations, we decided to choose the Open Source path with the LAMP-stack as platform. It was also clear that the webserver in the LAMP-stack, Apache, was the most popular at the time, October 2003, and that it was getting even more popular, see figure 5 (Netcraft 2003).

Figure 5. Statistics of webserver applications used for 43 million websites. Apache is the A in LAMP-stack and the most popular, and also increasing (Netcraft 2003).
Choice of database
Figure 6. Database usage as reported by database developers. Many databases show a decreasing usage (even more when including the ‘others’ category) and only a few show an increase in usage. Figure reprinted with kind permission from JoinVision (JoinVision 2008).
Choosing a database vendor is an important decision. If custom functions within the chosen database are used and not only standard

structured query language (SQL), a change to another database is difficult.
We chose MySQL since it was one of the cornerstones of the LAMP stack, and since it was an Open Source product that could be used for free within the academic field. It was at the time the database vendor with the most rapid increase in usage, see figure 6. We used only standard SQL (Eisenberg, Melton et al. 2004) in order to have the possibility to change database in the future.
Choice of development language Having chosen three out of the four parts of the LAMP-stack it was not a very debatable decision to also choose the P in LAMP as either PHP (PHP: Hypertext Preprocessor) or Perl (Practical Extraction and Reporting Language). PHP, when compared to Perl, has adapted more functionality for web development. At the time, PHP was used by 52% of all Apache-based webservers and Perl was only used by 19% (SecuritySpace 2003). PHP, with a lot of syntax from Java and C, was also mentioned as more easy to learn than Perl, faster than Perl, and with built in database connectivity etc. (Spencer 2002).
Choice of software development methodology In order to develop a database for a process within an organization or for the entire organization, the first step is to identify all stakeholders in the process. The second step is to gather requirements from the stakeholders about the process that is about to be reflected in the new database. In modern systems development, iterative methodologies have by many been judged to be the most efficient and agile and therefore customer-friendly (Huo, Verner et al. 2004).
One iterative system development methodology is the Dynamic Systems Development Method (DSDM), which is based on the Rapid Application Development methodology (RAD) introduced by James Martin in 1991 (Martin 1991). DSDM was developed in the UK by the DSDM-consortium in 1994 and first published in 1995 (Millington and Stapleton 1995).
Iterative system development is generally an approach where the most important requirements are solved first and then presented to the customer/user in a demonstration event. After the demonstration all requirements that are left are reprioritized, and the ones with high priority are solved in the second wave and are presented to the customer at the next demonstration event.

One iterative requirements process is MoSCoW (Must have, Should have, Could have and Won’t have in this version), first coined by Clegg in 1994 (Clegg and Barker 1994), which is one of the cornerstone of DSDM. Another important part of DSDM is that the project time is divided into timeboxes with fixed delivery dates. The developers work with the highest prioritized requirements (the Musts) and show the results at the delivery date, i.e. the end of each timebox. At the delivery date the “prototype”, the parts of the system that the developers have accomplished so far, is shown and discussed together with the stakeholders of the customer. After the demonstration of the prototype, reprioritization of the requirements is done in order to define what is most important from here on. This approach is beneficial for the customer due to the fact that it is usually very hard for the customer to write a complete formal requirements specification at the beginning of a development project. Through the iterative process the users are able to fine-tune their requirements as the prototype evolves towards the final product.
One major principle of DSDM is that according to the 80/20-rule, 80% of the business benefits come from 20% of the design requirements, which is why the beneficial 20% should be identified and built first.
The first words of the five-year development project described in this thesis were “How would you go about capturing a couple million tissue images at high resolution?”. DSDM was chosen for this development project since the end product was very unclear at project start and the concept of prototyping towards the final product was very appealing.
Choice of database design
A popular approach for design of database models is ER-modeling (Entity-Relationship) invented by Peter Chen in 1976 (Chen 1976). An entity is an identifiable object having an independent existence. Entities are objects, nouns, such as a car or horse, but also events, such as a trip or a ride. Entities have relationships to each other, verbs, such as own, perform, stem from. Two entities, an employee and a department, would naturally have the relationship ‘works at’ - an employee works at a department. Both entities and relationships have attributes, the entity person could have the attributes birthdate, name etc. and the relationship ‘works at’ could have the attribute start date.

With this ER-modeling methodology we began to model the LIMS for the HPR-project by writing long list of all entities and defining their attributes. Thereafter a process of defining the relationship between all entities was undertaken. When the most important requirements were included in the model (the Musts) the prototyping began.
The entities, such as proteins and antibodies, became tables within the database and the parameters, such as concentration and volume, became columns within the tables. Some relationships (many-to-many) become tables as well, connecting the entities to each other, and some relationships (one-to-many) became foreign keys within the entity tables.
Through numerous iterations a biobank-part, a scanning-part, a staining-part and finally an annotation-part had been created for the Uppsala-part of the project and the work moved on the Stockholm-part, using the same methodology.
All choices mentioned above mainly reflect the work with the first system developed for the HPR project, the LIMS, and it was named HPR-LIMS. The internal HPR-LIMS was an ad hoc and customized system but still with a flat, non-object oriented model enabling radical changes when triggered by fundamental changes in the project.
HPR as a huge state-machine The flow of information within the HPR-LIMS was designed as a state-machine from the mathematical concept of finite state machines (FSM) (Huffman 1954; Gill 1962). The fundamentals of the state-machine model is that a finite number of states are defined, e.g. opened and closed, and actions can be taken that trigger a transition from one state to the other. We designed the HPR-production pipeline as an assembly line in the same fashion as an assembly line of a car factory. The objects to track in the HPR-pipeline were decided to be the PrESTs (protein fragments) and the antibodies. By this model we were able to define a complex state-machine with all states, all possible actions and all possible transitions for the two main objects as they were passed through the pipeline. The two main objects do not share any state, therefore the model can in more detail be defined as two state-machines connected to each other. The first state-machine, for the PrESTs, ends with a purification-state of the serum (containing antibodies raised towards the PrEST) received from the host animals. This serum is purified into mono-specific antibodies, which is the start-state of the state-machine for antibodies.

Thereafter the PrESTs are no longer allowed to move in their state-machine and are considered to be finished. This strategy has led to that all entities in the pipeline are only in one state at a time and the history about every transition is stored. In the current version of the HPR-LIMS, 184 different production states have been defined.
Work-orders and batches With the development of a custom-made LIMS gradually covering group-by-group, the demand for data storage and retrieval was solved and more functions were added along the way. A transition from working sample by sample to working with larger groups of samples in batches was also introduced for increased efficiency.
Preparing for public release of the HPR data In late 2004, an increased interest in accessing the first findings from the HPR-project by the scientific community and the public arose both internally and from external parties. The basic idea was to release the collected protein expression data from the experiments performed with antibodies that had passed the validation assays on a public website. Images of the antibody-stained tissues were collected in microscope scanners and in total 708 images per antibody were captured; 144 normal tissue samples, 432 cancer tissue images and 132 images from cell-lines and primary cell samples.
Two fundamental and related questions arose: Can you present data from affinity-proteomics studies of a human protein by displaying 708 complex tissue images on a website? And can you present data from hundreds or even thousands such studies by listing the experiments on a website?
The answer was yes, you can, but it will not be easy to apprehend by the end-user. There was a need to aggregate the data from the large and complex tissue images in such a way that the actual protein findings would be easy to grasp. One problem was that the complex tissue images were not easy to evaluate by the average proteomics researcher and pathologists had to be engaged in the interpreting of the tissue samples. An annotation web system was developed where the pathologists remotely could look through each of the 576 tissue images from each antibody, determining the localization of the protein in the tissues.

The goal of the tissue screening was not only to determine the localization of each target protein in the set of tissues but also to determine in which cell-types and in which part of the cells the protein was present. Furthermore, an estimation of the staining intensity in a four-graded scale could be done (Negative, Weak, Moderate or Strong staining). Another estimation that also could be done was to determine the amount of cells that showed the noted protein expression. This estimate was also categorized in a four-graded scale (rare, <25%, 25%-75% or >75% fraction of stained cells). The protein expression levels collected through the annotation process were aggregated into a more simple color-coded scale in order to visualize the map of the human proteins in a more easy to grasp-way (table 4).
Intensity Fraction of stained cells Score - color
Strong >75% Red
Strong 25-75% Red
Strong <25% Orange
Strong Rare Orange
Moderate >75% Orange
Moderate 25-75% Orange
Moderate <25% Yellow
Moderate Rare Yellow
Weak >75% Yellow
Weak 25-75% Yellow
Weak <25% White
Weak Rare White
Negative >75% White
Negative 25-75% White
Negative <25% White
Negative Rare White
Table 4. The intensity of staining, corresponding to the protein expression level, and the fraction of stained cells are converted into a simple color-coded scale ranging from white (no protein expression) to red (strong protein expression)

With this aggregation methodology, a comprehensive image comprising thousands of cells of different types could be displayed in an efficient way with representative pie-chart-like markers (figure 7).
Figure 7. A captured image of a human kidney stained with the antibody CAB002491 targeted at the TDGF1 protein. Strong staining (brownish staining) is observed in the cells of the glomeruli, which is displayed as a red pie-chart-like marker in the aggregated view, below the image. The cells of the tubules have no staining (no brownish staining) leading to a white marker in the aggregated view.
Representing the entire images with the pie-chart-like markers solved the presentation problem and the entire proteomics evaluation of one protein in all human tissues, at least the extensive set used in this study, could be presented in one single web page (figure 8). The idea of the pie-chart-like markers enabled the possibility to represent all three images from the triplicate samples (from three different patients) used for each tissue. The three images captured were annotated as one, and if one or more were non-representative, of bad quality or out of focus, it was marked as ‘not representative’ and depicted as a black part of the pie-chart marker.

Figure 8. A screenshot of the noted protein expression in all the included normal tissues stained with the antibody CAB002491 targeted at the TDGF1-protein. The view is based on 144 high-resolution images.
The cancer tissues were taken from 12 different patients (four for a few cancer types) and collected as duplicate samples for each cancer type. The images of the cancer samples were captured in the same way as the normal samples. The annotation of the cancer tissues was made on the tumor cells and the annotations were aggregated in the same fashion as the normal tissues leading to pie-chart-like markers spliced into two parts. The duplicate samples from each patient were given the same annotation, or one or both of them were marked as ‘not representative’ and shown in black (figure 9).

Figure 9. An overview of the 20 most common forms of cancer, here stained with the antibody CAB002973 targeted at the tumor suppressing protein p53. In total, 432 high-resolution images are aggregated into a single page that will only occupy part of a regular web page.
Paper I - Protein Atlas (2005) By the summer of 2005, 700 antibodies towards 500 different human proteins, representing about 2.5% of the human proteome, had been analyzed in the HPR-project. 443 antibodies were from commercial suppliers and 275 were in-house made in the HPR-project. At the time, pathologists had annotated more than 400,000 images from the immunohistochemistry screening of the antibodies on the 576 normal and cancer tissue samples.
The antibodies had not only been screened on the large panel of tissues, they had also been put to test in a set of validation assays. The in-house produced antibodies were first tested in a novel protein array experiment where the specificity of the antibodies could be measured towards a panel of 1,440 other PrEST protein fragments. Western blot analysis was also performed on the antibodies in order to determine their specificity towards the intended target protein.
An overall comparison of the protein expression pattern observed from the tissue panels against the knowledge from external databases based on literature and bioinformatics predictions was done where the antibodies received their final verdict and a validation score. The validation score high, indicating that the antibody shows high specificity to its intended target protein, was given 47 of the 275 in-house produced antibodies. The validation score medium, indicating that the antibody shows specificity to its intended target protein but

with a non-perfect validation or some discrepancy to external sources, was given to 68 of the 275 in-house produced antibodies. The validation score low, indicating that the antibody shows specificity to its intended target protein but with a much less clear validation or more severe discrepancy to external sources, was given to 160 of the 275 in-house produced antibodies. In total, about 50% of the antibodies tested passed the combination of test assays. This dataset was decided to be the first version of the Human Protein Atlas, and it was released at the 4th annual HUPO-meeting in Munich, Germany the 29th of August 2005.
The release of the Protein Atlas showed that it is possible to do large-scale proteomics studies based on antibodies and tissues. It also showed that the technologies used, relatively inexpensive mass production of monospecific antibodies and tissue micro arrays, can be scaled up in a way that it can be envisioned that entire proteomes of organisms can be characterized in this fashion. In order to do this, an international antibody-based proteomics effort needs to be formed where as many as ~50,000 affinity reagents, two for each protein, should be generated. The production of such a collection of reagents would not only be used to screen tissues for an expansion of the Protein Atlas, they would be an invaluable resource for more in-depth biological and clinical studies.
When the first version of the Protein Atlas was about to be developed, a potential problem was identified. The HPR-LIMS had grown to about 250 database tables with a more complex level of ER-modeling than needed for presenting the data to the public. To navigate from a scanned image to get to the information about which age and sex the underlying patient had, the path would include going from the image to the scan-event to the TMA-slide to the TMA-block to position to tissue-block and finally to the patient. A more simplified model was envisioned where tissue information and patient information could be grouped together with the image information. Making a simplified database, as a selection and aggregation of data from the internal production system would give benefits like higher performance and simplified development of the public system. A loader was written in Java were selected data from the 250 different tables in the HPR-LIMS was boiled down to 25 tables of the Protein Atlas database. The loader was scheduled to run every night or on demand.

Protein Atlas version 2
In the fall of 2006 a new Protein Atlas, version 2, was released where the number of antibodies was doubled to 1514. The balance between in-house produced antibodies and commercial antibodies was evened out to about 50/50 as the internal production systems were optimized and therefore picking up in speed. In this release, a new dataset was introduced from an additional TMA containing 47 cell-lines and 12 primary cells. This was done since some tissues such as brain and some samples from diseases were hard to find or non-tissue based such as leukemia. In total, more than one million images were now published on the Protein Atlas.
Paper II - Advanced search of the Protein Atlas (2007) In 2007, the personnel in the HPR project had been producing proteomics data through antibody-based screening of tissues for four years and the total number of approved antibodies had passed 3,000, representing more than 2,600 human proteins. A greater demand had now arose, both internal and from the scientific community, to be able to search the collected proteomics data in a more extensive manner. More than 2.8 million images had been captured and the collected annotation data representing the quest for a specific protein in a certain tissue could thus be seen as a great collection of protein expression profiles.
The desire was now to be able to search the expression profiles with queries like “list all antibodies that show a strong staining in normal breast tissue but no or weak staining in breast cancer tissue”. Such a list would contain antibodies targeted at proteins that show a drop in expression as the tumor progresses, and thus could be a list of potential candidate biomarkers for diagnostics of patients. The candidates must of course be further validated by more extensive studies containing much larger panels of tissue samples taken from patients with known diagnosis and preferably in different stages of the disease. There are different kinds of biomarkers and in this study tissue-specific, cell-type specific, tumor-type specific, markers of malignancy and prognostic markers were sought for with specific queries for each type. The resultsets retrieved from the cancer-related queries contained proteins known to be involved in cancer, which is reassuring, e.g. the tumor suppressor p53 and the proliferation marker Ki-67, but both unknown proteins and proteins with a previously unknown cancer-involvement were also discovered.

The search functionality in the previous versions of the Protein Atlas allowed for queries based on gene id, protein name etc. and thus had to be extended in order to allow for searches based on the annotation data. This addition was developed in a fashion where a dynamic number of tissue-based criteria could be included.
In the fall of 2007 a new Protein Atlas, version 3, was released, again doubling the content to 3015 antibodies targeted at 2618 human proteins, representing 11.5% if the human proteome. The new advanced search function was released enabling the end-users to construct their own queries based on protein expression levels and to retrieve a list of proteins matching the requested pattern. The internal production rate of antibodies in the HPR-project had increased and the balance between internal and external antibodies was now 60/40.
Paper III - Protein Atlas 4 (2008) By mid 2008, the HPR project had produced ~9,000 antibodies in-house and obtained ~5,500 antibodies from external sources. All of them had been submitted to the validation pipeline for testing and the overall success rate of the antibody validation was about 50%.
With this number of affinity reagents towards the human proteome the decision was taken to re-model both the internal systems as well as the public Protein Atlas from an antibody-centric structure to a gene-centric structure. The previous antibody-centric structure had been the natural starting point for HPR since one or two attempts (PrEST-proteins) were started on each human protein-coding gene and in the end between zero and two antibodies towards the target protein were ready for release on the Protein Atlas. The more antibodies approved, the more proteins got covered. Changing the central logic of the internal systems and including every human protein-coding gene gave a couple of benefits:
• Protein classes could be introduced and all human proteins categorized according to lists of classes retrieved from external sources like UniProt, the Plasma Proteome Institute, InterPro and others.
• The progress of the HPR project could more easily be monitored by classifying the genes as not initiated, started, finished or failed. More efforts could be put on genes where all attempts had failed, through iteration.
• The balance between non-started and iterated genes could be measured and maintained at a specific level, which hopefully

would keep the producing laboratory modules at a more even production rate.
The public Protein Atlas also went through the change where all protein-coding genes were included even though information from an affinity reagent was not yet available. The transition was an important message to the scientific community, indicating that we aim to cover the whole human proteome. Previously when an end-user searched the site for a protein not yet included they would retrieve no hits, telling them either that the protein name is misspelled or no longer a part of the human proteome. By including all proteins, the end-users would get results from their queries also when there was no protein expression data available yet.
In addition to the gene-centric change of the Protein Atlas, 50 protein classes were added as a new feature where all the human proteins could be tagged by one or more protein classes. This feature was added as a new parameter to the advanced search function from the previous release, now enabling complex queries based on protein expression levels, free-text, chromosomal location and/or protein classes.
In the fall of 2008 a new Protein Atlas, version 4, was released, again doubling the amount of antibodies to 6120 towards 5067 human proteins. This meant that about 25% of the human proteins had been analyzed and the results together with all the underlying data were published on the project’s public website. In addition, the antigen sequence used in the production of the antibody was published for all the internally produced antibodies, which was an important feature that the scientific community had been asking for. The ratio between internal and external antibodies was in this release 63/37.
Paper IV – Antibodypedia (2008) As the HPR project generated more antibodies and also retrieved more antibodies from other commercial and academic sources, it became evident that one binder can perform nicely in one validation assay but poorly in another. The results from validation of commercially available antibodies demonstrated that approximately 50% of the antibodies failed our standardized set of validation experiments. Releasing all validation data on an open-access web portal with the possibility for everyone in the community to publish their own binders accompanied with validation data and/or submitting validation from their experiments would bring us closer to

the overall goal of having one (or preferably two independent) well characterized binder towards each human protein.
It is beneficial for the scientific community to list all the binders and all existing validation data to, in the case where multiple binders exists towards one target, be able to chose a binder with the best validation results for their intended assay. The number of affinity reagents towards the human proteome has increased greatly over the last years. This and the increasing amounts of results from other proteomics efforts have significantly extended the lists of interesting targets to be further explored. As antibodies could be useful as tools for in-depth studies of candidate biomarkers they have to be well validated. The validation of the binders has to be application-specific and preferably repeatable by different labs. The goal of the new validation web portal, Antibodypedia, was to act as a host for storage and presentation of data from validation experiments of those affinity reagents.
When the Antibodypedia was about to be developed, a lot of lessons had been learned about building databases for the proteomics field. One such lesson was that a lot of attributes had been incorrectly defined or erroneously placed on entities in the past due to vague understanding of the underlying terminology within the proteomics field among the system developers. There was a clear need of a more dynamic ER-model where attributes could be added on entities after the system had been taken into use without any re-coding. The new model was designed as a template-based model where an entity is of a certain entity type and every entity type has a long list of possible attributes. Each entity can thereafter be tagged to have one or more of the attributes from the template and it can be changed at any time. Attributes can also be added to the template at a later stage and thus become selectable for the entities. With this setup it was envisioned that the newly created entity affinity reagent that was of the entity type binder which had a set of mandatory attributes also could be customized with a set of non-mandatory attributes. This architecture was implemented completely on all types of entities in the Antibodypedia leading to a very dynamic system, even post-release.
The new site was developed within the EU research infrastructure coordination action ProteomeBinders (Taussig, Stoevesandt et al. 2007) and was intended as the first version of a front-end web portal for presentation of affinity reagents and related experimental data. One major part of the EU ProteomeBinders initiative has been to try to standardize the parameter sets from experiments and results within

the affinity proteomics world. The first version of the web portal Antibodypedia contained parameter sets that have been proposed as the major ones for each binder type within the scientific community. It is important to note that these sets of parameters will evolve and more will be added in coming versions and/or current ones will be modified or maybe removed. The binder experiments have also been given a set of result parameters each. The parameters for each binder type or experiment type can be set as mandatory or optional.
One novel feature of the Antibodypedia is that the list of possible results for one type of experiment is classified and aggregated into a more high-level classification in order to simplify and to give the end-user an easy to grasp overview of the experiments conducted with the binders. The individual result scores from the experiments are all classified into the three categories: supportive, uncertain and non-supportive.
All binders submitted to the Antibodypedia have to be available, i.e. they have to be for sale or freely distributed as an academic research reagent to others, and a web link to where the binder can be obtained has to be submitted with each binder.
The Antibodypedia was designed for three different user-groups:
• Binder producers, who can submit new binders together with gene/protein data and results from the validation experiments conducted accompanied with the actual raw data (usually as images).
• Reviewers, who will review newly submitted or modified binders or data from validation experiments to ensure that they adhere to the defined validation scoring system. The reviewer also has to approve the comments and external experiments submitted by the public.
• The public, who can browse the binders either by chromosome, gene or protein name in order to check for available binders towards their favorite proteins, and to review the validation scores and underlying validation data. The end-users of the binders can after conducting their own experiments submit their results as comments accompanied by their raw data.
Binder producers can either upload one binder at a time through web forms and upload the accompanying validation data or chose to upload larger sets of binders in a XML-format (eXtensible Markup

Language) with all accompanying validation data in a ZIP-file (compressed file).

Concluding remarks and future perspectives The human proteome can be defined at the two extremes, either as one representative protein from every gene or as all protein splice variants and PTMs for all genes. By the first definition about 20,500 different human proteins need to be experimentally verified and located in the human body for proteome coverage. By the second definition, several millions or more human protein variants need to be experimentally verified and located.
In order to complete a first draft of the human proteome, the HPR effort had to adopt the first definition, to analyze one protein from each human gene. This effort is estimated to take another five years (Uhlen 2007), which will be ten years after the release of the first version of the Human Protein Atlas. There is also a need for at least a second affinity reagent towards each human protein in order to validate the first one. However, many researchers in the scientific community are interested in the variants of many proteins and therefore there is a need to persistently continue with the production of affinity reagents for those targets, which will probably take many years.
A possible extension to the HPR-project and the Human Protein Atlas is the inclusion of other tissues than those in the standard panels, e.g. more brain and other diseases than cancer. A pilot project has recently begun within HPR to analyze proteins in rodent brain tissue and compare the sequence identity of the target proteins between humans and rodents. Another tissue related extension is to include larger patient cohorts of disease tissues, e.g. large sets of tumors taken from patients with known diagnosis. Those larger panels would be excellent for evaluation of candidate biomarkers identified on the standard panels.
The advanced search function in the current version of the Protein Atlas could be extended in many ways or even opened up for end-users to enter their own queries. Such a system could also make it possible for the end-users to select which data columns they would like to retrieve and the result could be sent to them as a data file. There are also plans to release the expression database in order for researchers to download all underlying data and set it up at their laboratory. The benefits here are that they could work more with

refinement of their queries and also more efficiently compare the HPR-data with their own in a database-manner.
Another way of making the data available and more accessible is via data-integration with other proteomics and genomics databases. When a scientist is using his or her regular resource to look for information about a protein he or she will get more information since it is collected from numerous databases and presented in a single view. It could also be envisioned that combined queries could be executed involving multiple datasets.
The annotation of the images could be extended in many directions. Firstly, the annotation could be deeper, where more cell types could be annotated for each tissue. Secondly, two independent annotators could perform the annotation of each antibody and the corresponding IHC-stained tissues in order to minimize any inter-personal differences. Differences between the two annotations could thereafter be merged, measured and normalized by a curator. Thirdly, automated computer image analysis software are getting better in this area and it could be envisioned that they soon could be used for some tasks within the annotation, such as the measurement of staining intensity where all negative images could automatically be excluded from the manual annotation in order to save time.
The Antibodypedia should be transformed to a gene-centric model in order to indicate more clearly to the scientific community where new binders are needed. The Antibodypedia could, when demanded from the scientific community, be extended to be able to have validation data from more assay-types. The search functions could be developed further also on this portal. A higher level of adherence to newly developed community standards for exchange of binder and validation data is also on the to-do list.
Acknowledgements TACK
Mathias Uhlén, Sveriges mest energiske professor som har superkoll på det mesta. Trots trippelbokningar i kalendern finns det oftast en minut över någonstans för kvalitativ konsultation.
Fredrik Pontén, för att du head-huntade mig till projektet med alla miljoner bilder, och den trygga känsla det ger att ha en läkare i projektet, det borde alla projekt ha!
Sophia Hober, för att du håller ordning på allt och alla inom HPR-KTH på ett bra sätt.
Caroline Kampf, för uppbyggnaden och vidareutvecklingen av HPR-UU och många roliga resor.
Anja Persson, Jenny Ottosson, Henrik Wernérus, Peter Nilsson, Emma Lundberg, Kenneth Wester och Anna Asplund för att ni så framgångsrikt driver de olika delarna av HPR-projektet mot alla mål, gamla som nya, fasta som rörliga.
Dr. Sanjay Navani, and the entire HPR-Mumbai team for a great collaboration and millions of high-quality clicks. A few broken mice won’t stop the enthusiasm of the Indian spirit.
Marianne Hansson, och hela Atlas Antibodies AB för att ni jobbar så hårt och framgångsrikt med att få ut våra antikroppar på världsmarknaden.
HPRs alla projektmedlemmar, gamla som nya, för att ni är med och skapar vetenskapshistoria.
Per-Åke Nygren, för sansade och givande spontan-diskussioner kring nya rön, idéer och oklarheter.
Stefan Ståhl, för skön och avslappnad styrning av Skolan för Bioteknologi.
KTH-PIs, för att ni delat med er av forskningen på de andra delarna av biotekniken.
Mattias Forsberg, för att du håller bra ordning på alla miljoner bilder och vår, över två meter höga, trave med servrar.
Kalle Jonasson, för effektivt kodande av allt mellan PrESTar och råtthjärnor.

Per Oksvold, för utvecklandet av snygga system och viktiga insatser under sena timmar.
Martin Zwahlen, för nya och bra IT-grepp på de viktiga delarna i HPR-KTH-produktionen
”Seglingsgängets” gamla och nya deltagare, en vecka per år med er på galna upptåg på haven och diverse öar är en mycket uppskattad kontrast till de resterande 51 veckorna på året!
Björlingar från förr, som tassat runt i KTHs korridorer i över 100 år, det hade inte varit riktigt samma känsla utan er.
Mamma, för evigt stöd i alla lägen. Pappa och Kalle.
Dr. Lisa, för ett oändligt spektrum av kommentarer kring detta avhandlingsarbete. Tack för utomordentlig basservice under denna tid, nu känns det som vi är klara med stora och betungande projekt, åtminstone för i år! PUSS !
Detta arbete har huvudsakligen finansierats med anslag från Knut och Alice Wallenberg Stiftelse

References Aebersold, R. and M. Mann (2003). "Mass spectrometry-based proteomics."
Nature 422(6928): 198-207. Agaton, C., J. Galli, et al. (2003). "Affinity proteomics for systematic protein
profiling of chromosome 21 gene products in human tissues." Mol Cell Proteomics 2(6): 405-14.
Anderson, N. L. and N. G. Anderson (1998). "Proteome and proteomics: new technologies, new concepts, and new words." Electrophoresis 19(11): 1853-61.
Anderson, N. L. and N. G. Anderson (2002). "The human plasma proteome: history, character, and diagnostic prospects." Mol Cell Proteomics 1(11): 845-67.
Andersson, A. C., S. Stromberg, et al. (2006). "Analysis of protein expression in cell microarrays: a tool for antibody-based proteomics." J Histochem Cytochem 54(12): 1413-23.
Apweiler, R., T. K. Attwood, et al. (2001). "The InterPro database, an integrated documentation resource for protein families, domains and functional sites." Nucleic Acids Res 29(1): 37-40.
Bairoch, A. and R. Apweiler (1996). "The SWISS-PROT protein sequence data bank and its new supplement TREMBL." Nucleic Acids Res 24(1): 21-5.
Bairoch, A., B. Boeckmann, et al. (2004). "Swiss-Prot: juggling between evolution and stability." Brief Bioinform 5(1): 39-55.
Banting, F. G. (1937). "Early Work on Insulin." Science 85(2217): 594-596. Barbe, L., E. Lundberg, et al. (2008). "Toward a confocal subcellular atlas of
the human proteome." Mol Cell Proteomics 7(3): 499-508. Benson, D. A., I. Karsch-Mizrachi, et al. (2008). "GenBank." Nucleic Acids
Res. Berglund, L., E. Bjorling, et al. (2008). "A whole-genome bioinformatics
approach to selection of antigens for systematic antibody generation." Proteomics 8(14): 2832-9.
Berman, H., K. Henrick, et al. (2003). "Announcing the worldwide Protein Data Bank." Nat Struct Biol 10(12): 980.
Blow, N. (2007). "Antibodies: The generation game." Nature 447(7145): 741-4.
Bradbury, A. R. and J. D. Marks (2004). "Antibodies from phage antibody libraries." J Immunol Methods 290(1-2): 29-49.
Brazma, A., H. Parkinson, et al. (2003). "ArrayExpress--a public repository for microarray gene expression data at the EBI." Nucleic Acids Res 31(1): 68-71.
Brody, E. N. and L. Gold (2000). "Aptamers as therapeutic and diagnostic agents." J Biotechnol 74(1): 5-13.
Burnette, W. N. (1981). ""Western blotting": electrophoretic transfer of proteins from sodium dodecyl sulfate--polyacrylamide gels to
unmodified nitrocellulose and radiographic detection with antibody and radioiodinated protein A." Anal Biochem 112(2): 195-203.
Camp, R. L., G. G. Chung, et al. (2002). "Automated subcellular localization and quantification of protein expression in tissue microarrays." Nat Med 8(11): 1323-7.
Catalona, W. J., D. S. Smith, et al. (1991). "Measurement of prostate-specific antigen in serum as a screening test for prostate cancer." N Engl J Med 324(17): 1156-61.
Chen, P. (1976). "The Entity-Relationship Model - Toward a Unified View of Data." ACM Transactions on Database Systems: 9-36.
Church, D. and K. D. Pruitt (2002). "Accessing the human genome." Curr Protoc Hum Genet Chapter 6: Unit 6 9.
Clamp, M., B. Fry, et al. (2007). "Distinguishing protein-coding and noncoding genes in the human genome." Proc Natl Acad Sci U S A 104(49): 19428-33.
Clegg, D. and R. Barker (1994). CASE Method Fast-track: A RAD Approach, Oracle.
Cochrane, G., R. Akhtar, et al. (2008). "Petabyte-scale innovations at the European Nucleotide Archive." Nucleic Acids Res.
Cooper, G. and R. Hausman (2004). The Cell - A molecular Approach. Crick, F. H. (1958). "On protein synthesis." Symp Soc Exp Biol 12: 138-63. de Godoy, L. M., J. V. Olsen, et al. (2008). "Comprehensive mass-
spectrometry-based proteome quantification of haploid versus diploid yeast." Nature 455(7217): 1251-4.
Desiere, F., E. W. Deutsch, et al. (2006). "The PeptideAtlas project." Nucleic Acids Res 34(Database issue): D655-8.
Deutsch, E. W., H. Lam, et al. (2008). "PeptideAtlas: a resource for target selection for emerging targeted proteomics workflows." EMBO Rep 9(5): 429-34.
Edgar, R., M. Domrachev, et al. (2002). "Gene Expression Omnibus: NCBI gene expression and hybridization array data repository." Nucleic Acids Res 30(1): 207-10.
Edman, P. (1949). "A method for the determination of amino acid sequence in peptides." Arch Biochem 22(3): 475.
Eisenberg, A., J. Melton, et al. (2004). "SQL:2003 Has Been Published." SIGMOD 33(1).
FDA. (1994). "FDA approves test for prostate cancer." from http://www.fda.gov/bbs/topics/ANSWERS/ANS00598.html.
Flicek, P., B. L. Aken, et al. (2008). "Ensembl 2008." Nucleic Acids Res 36(Database issue): D707-14.
Giard, D. J., S. A. Aaronson, et al. (1973). "In vitro cultivation of human tumors: establishment of cell lines derived from a series of solid tumors." J Natl Cancer Inst 51(5): 1417-23.
Gill, A. (1962). Introduction to the Theory of Finite-state Machines. New York, McCraw-Hill.

Goldstein, E. (1898). "Ueber eine noch nicht untersuchte Strahlungsform an der Kathode inducirter Entladungen." Annalen der Physik 300(1): 38-48.
Gorg, A., W. Postel, et al. (1988). "The current state of two-dimensional electrophoresis with immobilized pH gradients." Electrophoresis 9(9): 531-46.
Gray, J., D. Liu, et al. (2005). "Scientific Data Management in the Coming Decade." Association for Computing Machinery.
Hanahan, D. and R. A. Weinberg (2000). "The hallmarks of cancer." Cell 100(1): 57-70.
Hibbard, V. (1979). "What is SNOMed?" Med Rec News 50(4): 90-1. Hodis, E., J. Prilusky, et al. (2008). "Proteopedia - a scientific 'wiki' bridging
the rift between three-dimensional structure and function of biomacromolecules." Genome Biol 9(8): R121.
Huffman, D. A. (1954). "The Synthesis of Sequential Switching Circuits." Journal of the Franklin Institute. Massachusetts Institute of Technology 257(3).
Huo, M., J. Verner, et al. (2004). "Software Quality and Agile Methods." IEEE from http://ieeexplore.ieee.org/stamp/stamp.jsp?arnumber=01342889.
ICS, I. S. C. (2008). "Sequencing Project Database." from http://www.intlgenome.org/viewDatabase.cfm.
Ikeo, K., J. Ishi-i, et al. (2003). "CIBEX: center for information biology gene expression database." C R Biol 326(10-11): 1079-82.
JoinVision. (2008). "Open Source on the Fast Lane." from http://www.joinvision.com.
Jubb, A. M., T. H. Landon, et al. (2003). "Quantitative analysis of colorectal tissue microarrays by immunofluorescence and in situ hybridization." J Pathol 200(5): 577-88.
Kampf, C., A.-C. Andersson, et al. (2004). "Antibody-based tissue profiling as a tool for clinical proteomics." Clinical Proteomics Volume 1(September 2004): 285-299.
Kandasamy, K., S. Keerthikumar, et al. (2008). "Human Proteinpedia: a unified discovery resource for proteomics research." Nucleic Acids Res.
KEGG. (2008). "Complete Genomes in KEGG." from http://www.genome.jp/kegg/catalog/org_list.html.
Kohler, G. and C. Milstein (1975). "Continuous cultures of fused cells secreting antibody of predefined specificity." Nature 256(5517): 495-7.
Kononen, J., L. Bubendorf, et al. (1998). "Tissue microarrays for high-throughput molecular profiling of tumor specimens." Nat Med 4(7): 844-7.
Kulikova, T., R. Akhtar, et al. (2007). "EMBL Nucleotide Sequence Database in 2006." Nucleic Acids Res 35(Database issue): D16-20.

Kuriyama, M., M. C. Wang, et al. (1980). "Quantitation of prostate-specific antigen in serum by a sensitive enzyme immunoassay." Cancer Res 40(12): 4658-62.
Lander, E. S., L. M. Linton, et al. (2001). "Initial sequencing and analysis of the human genome." Nature 409(6822): 860-921.
Leader, B., Q. J. Baca, et al. (2008). "Protein therapeutics: a summary and pharmacological classification." Nat Rev Drug Discov 7(1): 21-39.
Lesko, L. J. (2007). "Personalized medicine: elusive dream or imminent reality?" Clin Pharmacol Ther 81(6): 807-16.
Lipovsek, D. and A. Pluckthun (2004). "In-vitro protein evolution by ribosome display and mRNA display." J Immunol Methods 290(1-2): 51-67.
Liu, B., L. Huang, et al. (2002). "Towards proteome-wide production of monoclonal antibody by phage display." J Mol Biol 315(5): 1063-73.
Malmstrom, J., H. Lee, et al. (2007). "Advances in proteomic workflows for systems biology." Curr Opin Biotechnol 18(4): 378-84.
Mann, M. (2002). "A home for proteomics data?" Nature 420: 21. Martens, L., H. Hermjakob, et al. (2005). "PRIDE: the proteomics
identifications database." Proteomics 5(13): 3537-45. Martin, A. J. and R. L. Synge (1941). "A new form of chromatogram
employing two liquid phases: A theory of chromatography. 2. Application to the micro-determination of the higher monoamino-acids in proteins." Biochem J 35(12): 1358-68.
Martin, J. (1991). Rapid Application Development, Macmillan Pub. Co. Mathivanan, S., M. Ahmed, et al. (2008). "Human Proteinpedia enables
sharing of human protein data." Nat Biotechnol 26(2): 164-7. McLafferty, F. W. (1981). "Tandem mass spectrometry." Science 214(4518):
280-7. Miescher, F. (1871). "Ueber die chemische Zusammensetzung der
Eiterzellen." Med.-Chem. Unters. 4: 441– 460. Miller, S. L. (1953). "A production of amino acids under possible primitive
earth conditions." Science 117(3046): 528-9. Millington, D. and J. Stapleton (1995). "Developing a RAD standard." IEEE
Software(September). Minsky, M. (1961). Microscopy apparatus. US patent US. Mishra, G. R., M. Suresh, et al. (2006). "Human protein reference database--
2006 update." Nucleic Acids Res 34(Database issue): D411-4. Netcraft. (2003). "October 2003 Web Server Survey." from
http://news.netcraft.com/. Newberg, J. and R. F. Murphy (2008). "A framework for the automated
analysis of subcellular patterns in human protein atlas images." J Proteome Res 7(6): 2300-8.
Nilsson, P., L. Paavilainen, et al. (2005). "Towards a human proteome atlas: high-throughput generation of mono-specific antibodies for tissue profiling." Proteomics 5(17): 4327-37.

Nord, K., E. Gunneriusson, et al. (1997). "Binding proteins selected from combinatorial libraries of an alpha-helical bacterial receptor domain." Nat Biotechnol 15(8): 772-7.
Nygren, P. A. and A. Skerra (2004). "Binding proteins from alternative scaffolds." J Immunol Methods 290(1-2): 3-28.
Parkinson, H., M. Kapushesky, et al. (2007). "ArrayExpress--a public database of microarray experiments and gene expression profiles." Nucleic Acids Res 35(Database issue): D747-50.
Ponten, J. and E. Saksela (1967). "Two established in vitro cell lines from human mesenchymal tumours." Int J Cancer 2(5): 434-47.
Ratain, M. J. (2007). "Personalized medicine: building the GPS to take us there." Clin Pharmacol Ther 81(3): 321-2.
Rhodes, D. R., J. Yu, et al. (2004). "ONCOMINE: a cancer microarray database and integrated data-mining platform." Neoplasia 6(1): 1-6.
Sanger, F., G. M. Air, et al. (1977). "Nucleotide sequence of bacteriophage phi X174 DNA." Nature 265(5596): 687-95.
Schutz-Geschwender, A., Y. Zhang, et al. (2004) "Quantive, Two-color Western Blot Detection With Infrafred Fluorescence." Volume, DOI:
SecuritySpace. (2003). "Apache Module Report." 2003, from http://www.securityspace.com/s_survey/data/man.200310/apachemods.html.
Sonnhammer, E. L., S. R. Eddy, et al. (1997). "Pfam: a comprehensive database of protein domain families based on seed alignments." Proteins 28(3): 405-20.
Spencer, S. (2002). "PHP versus Perl comparison." 2003, from http://www.netconcepts.com/php-versus-perl/.
Stromberg, S., M. G. Bjorklund, et al. (2007). "A high-throughput strategy for protein profiling in cell microarrays using automated image analysis." Proteomics 7(13): 2142-50.
Sugawara, H., O. Ogasawara, et al. (2008). "DDBJ with new system and face." Nucleic Acids Res 36(Database issue): D22-4.
Taussig, M. J., O. Stoevesandt, et al. (2007). "ProteomeBinders: planning a European resource of affinity reagents for analysis of the human proteome." Nat Methods 4(1): 13-7.
Twyman, R. M. (2007). Principles of Proteomics. York, UK, Taylor & Francis Group.
Uhlen, M. (2007). "Mapping the human proteome using antibodies." Mol Cell Proteomics 6(8): 1455-6.
Uhlen, M. and F. Ponten (2005). "Antibody-based proteomics for human tissue profiling." Mol Cell Proteomics 4(4): 384-93.
UniProt. (2008). "First draft of the complete human proteome available in UniProtKB/Swiss-Prot." Retrieved 10-30, 2008, from http://www.expasy.ch/sprot/relnotes/spwrnew.html.
UniProt (2008). "The universal protein resource (UniProt)." Nucleic Acids Res 36(Database issue): D190-5.

Venter, J. C., M. D. Adams, et al. (2001). "The sequence of the human genome." Science 291(5507): 1304-51.
Vohradsky, J. and J. Panek (1993). "Quantitative analysis of gel electrophoretograms by image analysis and least squares modeling." Electrophoresis 14(7): 601-12.
Vrolijk, H., W. Sloos, et al. (2003). "Automated acquisition of stained tissue microarrays for high-throughput evaluation of molecular targets." J Mol Diagn 5(3): 160-7.
Warford, A., W. Howat, et al. (2004). "Expression profiling by high-throughput immunohistochemistry." J Immunol Methods 290(1-2): 81-92.
Wasinger, V. C., S. J. Cordwell, et al. (1995). "Progress with gene-product mapping of the Mollicutes: Mycoplasma genitalium." Electrophoresis 16(7): 1090-4.
Watson, J. D. and F. H. Crick (1953). "Molecular structure of nucleic acids; a structure for deoxyribose nucleic acid." Nature 171(4356): 737-8.
Westermark, B. (1973). "The deficient density-dependent growth control of human malignant glioma cells and virus-transformed glia-like cells in culture." Int J Cancer 12(2): 438-51.
Wien, W. (1904). "On the differential equations of the electrodynamics for moving bodies." Annalen der Physik 4(13).