Experimental Comparison of Graph Databases
10
Experimental Comparison of Graph Databases * Vojt ˇ ech Kolomiˇ cenko Department of Software Engineering, Charles University in Prague, Czech Republic [email protected] Martin Svoboda Department of Software Engineering, Charles University in Prague, Czech Republic [email protected] Irena Holubová (Mlýnková) Department of Software Engineering, Charles University in Prague, Czech Republic [email protected] ABSTRACT In the recent years a new type of NoSQL databases, called graph databases (GDBs), has gained significant popularity due to the increasing need of processing and storing data in the form of a graph. The objective of this paper is a research on possibilities and limitations of GDBs and conducting an experimental comparison of selected GDB implementations. For this purpose the requirements of a universal GDB bench- mark have been formulated and an extensible benchmarking tool, called BlueBench, has been developed. Categories and Subject Descriptors I.7.1 [Document and Text Processing]: Document and Text Editing – languages, document management General Terms Measurement, Algorithms Keywords graph databases, NoSQL databases, benchmarking, experi- mental comparison 1. INTRODUCTION Recently, there has been a huge increase of importance to store and analyze data in the form of a graph. Be it social networks, Web graphs, recommendation systems or biological networks, these graphs have at least two things in common – they are highly interconnected and huge, and so is the complexity of algorithms used for their processing and analysis of their characteristics. Unlike other types of data, networks contain lots of information in the way how par- ticular objects are connected; in other words, the relations between the objects. * This work was supported by the GAUK grant no. 4105/2011 and SVV grant no. SVV-2013-267312. Permission to make digital or hard copies of all or part of this work for personal or classroom use is granted without fee provided that copies are not made or distributed for profit or commercial advantage and that copies bear this notice and the full citation on the first page. To copy otherwise, to republish, to post on servers or to redistribute to lists, requires prior specific permission and/or a fee. iiWAS’13, December 2–4, 2013, Vienna, Austria. Copyright 2013 ACM 978-1-4503-2113-6/13/12 ...$5.00. Graph database management systems (GDBs) have emer- ged to fill the gap in the market by providing solutions to the problem of storing and working with large graphs. A vari- ety of GDB implementations has been appearing, and most of the systems are usually accompanied with biased pro- prietary tests claiming that their performance is somewhat superior. Nevertheless, a large scale unbiased benchmark comprising the most substantial graph database functional- ity and putting a higher number of GDBs into a compar- ison has not been conducted yet. We believe that this is most likely to be the reason of the versatility of interfaces of particular GDB engines, their configuration specifics and different capabilities. The objective of this paper is to summarize the back- ground behind the graph databases family and describe a cho- sen set of GDB representatives. Next, a benchmarking suite, called BlueBench, is created and the performance of a se- lected set of GDBs experimentally evaluated. The tested databases are carefully chosen so that BlueBench compares not only the most popular GDB engines, but less conven- tional representatives as well. Hence, we have implemented a simple wrapper around a selected relational database, which provides the basic functionality expected from GDBs. The rest of the paper is structured as follows: In Sec- tion 2 we describe the existing graph database systems. In Section 3 we overview related work. In Section 4 we describe the architecture of BlueBench. In Section 5 we provide re- sults of the tests. And we conclude in Section 6. 2. GRAPH DATABASE SYSTEMS In recent years a new family of databases known as NoSQL has gained lots of popularity, particularly because of the need of storing and effectively retrieving huge volumes of data. Graph databases belong into this family despite their slightly higher complexity. In contrast to the other NoSQL implementations, in a graph database the relations between the objects are of primary importance. Graph databases support a graph model which allows for a direct persistent storing of the particular objects in the database together with the relations between them. In addition, a GDB should provide an access to query methods that not only deal with the stored objects, but also with the graph structure itself. The best known example of such an operation is traversal, which in its most simple form can be used to obtain the neighbors of a specified object, that is, the objects that the specified object is directly related to. The advantage of having a direct access to heavily in- terconnected data comes at the cost of very complicated
-
Upload
independent -
Category
Documents
-
view
1 -
download
0
Transcript of Experimental Comparison of Graph Databases

Experimental Comparison of Graph Databases∗
Vojtech KolomicenkoDepartment of Software
Engineering,Charles University in Prague,
Czech [email protected]
Martin SvobodaDepartment of Software
Engineering,Charles University in Prague,
Czech [email protected]
Irena Holubová(Mlýnková)
Department of SoftwareEngineering,
Charles University in Prague,Czech Republic
ABSTRACTIn the recent years a new type of NoSQL databases, calledgraph databases (GDBs), has gained significant popularitydue to the increasing need of processing and storing data inthe form of a graph. The objective of this paper is a researchon possibilities and limitations of GDBs and conducting anexperimental comparison of selected GDB implementations.For this purpose the requirements of a universal GDB bench-mark have been formulated and an extensible benchmarkingtool, called BlueBench, has been developed.
Categories and Subject DescriptorsI.7.1 [Document and Text Processing]: Document andText Editing – languages, document management
General TermsMeasurement, Algorithms
Keywordsgraph databases, NoSQL databases, benchmarking, experi-mental comparison
1. INTRODUCTIONRecently, there has been a huge increase of importance
to store and analyze data in the form of a graph. Be itsocial networks, Web graphs, recommendation systems orbiological networks, these graphs have at least two things incommon – they are highly interconnected and huge, and sois the complexity of algorithms used for their processing andanalysis of their characteristics. Unlike other types of data,networks contain lots of information in the way how par-ticular objects are connected; in other words, the relationsbetween the objects.
∗This work was supported by the GAUK grant no.4105/2011 and SVV grant no. SVV-2013-267312.
Permission to make digital or hard copies of all or part of this work forpersonal or classroom use is granted without fee provided that copies arenot made or distributed for profit or commercial advantage and that copiesbear this notice and the full citation on the first page. To copy otherwise, torepublish, to post on servers or to redistribute to lists, requires prior specificpermission and/or a fee.iiWAS’13, December 2–4, 2013, Vienna, Austria.Copyright 2013 ACM 978-1-4503-2113-6/13/12 ...$5.00.
Graph database management systems (GDBs) have emer-ged to fill the gap in the market by providing solutions to theproblem of storing and working with large graphs. A vari-ety of GDB implementations has been appearing, and mostof the systems are usually accompanied with biased pro-prietary tests claiming that their performance is somewhatsuperior. Nevertheless, a large scale unbiased benchmarkcomprising the most substantial graph database functional-ity and putting a higher number of GDBs into a compar-ison has not been conducted yet. We believe that this ismost likely to be the reason of the versatility of interfacesof particular GDB engines, their configuration specifics anddifferent capabilities.
The objective of this paper is to summarize the back-ground behind the graph databases family and describe a cho-sen set of GDB representatives. Next, a benchmarking suite,called BlueBench, is created and the performance of a se-lected set of GDBs experimentally evaluated. The testeddatabases are carefully chosen so that BlueBench comparesnot only the most popular GDB engines, but less conven-tional representatives as well. Hence, we have implementeda simple wrapper around a selected relational database, whichprovides the basic functionality expected from GDBs.
The rest of the paper is structured as follows: In Sec-tion 2 we describe the existing graph database systems. InSection 3 we overview related work. In Section 4 we describethe architecture of BlueBench. In Section 5 we provide re-sults of the tests. And we conclude in Section 6.
2. GRAPH DATABASE SYSTEMSIn recent years a new family of databases known as NoSQL
has gained lots of popularity, particularly because of theneed of storing and effectively retrieving huge volumes ofdata. Graph databases belong into this family despite theirslightly higher complexity. In contrast to the other NoSQLimplementations, in a graph database the relations betweenthe objects are of primary importance. Graph databasessupport a graph model which allows for a direct persistentstoring of the particular objects in the database togetherwith the relations between them. In addition, a GDB shouldprovide an access to query methods that not only deal withthe stored objects, but also with the graph structure itself.The best known example of such an operation is traversal,which in its most simple form can be used to obtain theneighbors of a specified object, that is, the objects that thespecified object is directly related to.
The advantage of having a direct access to heavily in-terconnected data comes at the cost of very complicated
partitioning of the database. To be able to efficiently par-tition the graph data onto a number of separate machines,the graph must be reorganized so that the smallest possi-ble amount of relations crosses the boundaries of a singlemachine in the cluster. Algorithms for performing this op-eration and then keeping the database in the same stateafter further data changes have not been successfully putinto practice; therefore, the problem of efficient partitioningof graph data remains open [13].
2.1 TinkerPop StackTinkerPop1 has been developing a stack of applications
designed to simplify and unite the way of working with graphdatabases engines. Most of the software is created in Java,which is also meant to be the primary accessing language;nevertheless, interfaces in other languages are provided aswell. Majority of the best known GDBs support the Tin-kerPop. A brief description of the most significant partsfollows.
Blueprints2 is a set of interfaces enabling applications totake advantage of the complete functionality provided byTinkerPop.The interfaces are designed to be very transpar-ent and offer mostly elementary methods which can, how-ever, be combined to build much more complicated queries.Blueprints works with the property graph model; conse-quently, if a GDB exposes a stronger model, that extra func-tionality can only be utilized via its own native methods.
Rexster3 is a configurable graph server which exposes anyBlueprints-compliant graph database via the REST HTTPprotocol. A binary protocol, called RexPro, is also supportedfor better performance on a single machine. Dog House isa browser-based user interface also offered by Rexster.
TinkerGraph4 is a lightweight in-memory implementationof the property graph model, and is part of the Blueprintspackage. TinkerGraph does not have any support for trans-actions; it primarily serves only as a reference implementa-tion for Blueprints and its graph model. However, indexingof elements based on their properties is implemented usinga HashMap collection.
Finally, Gremlin5 is graph query language designed foriterative traversing of the graph which is controlled by theapplication in a procedural manner. In addition, it sup-ports graph manipulation and all other functionality fromBlueprints, because it directly utilizes its methods.
2.2 DEX
DEX 6 is a closed-source commercial graph database writ-ten in Java with a C++ core. It was first released in 2007and its goal is to be a high-performance and scalable solutionfor working with very large graphs [9]. DEX is currently thethird most popular graph DBMS today [10].
The graph model this database exposes is called “Labeledand directed attributed multi-graph” because the edges canbe either directed or undirected, all elements belong to arbi-trary types and there can exist more than one edge betweentwo vertices. DEX provides a native API for Java, C++ and
1http://www.tinkerpop.com/.2https://github.com/tinkerpop/blueprints/wiki3https://github.com/tinkerpop/rexster/wiki4https://github.com/tinkerpop/blueprints/wiki/TinkerGraph5https://github.com/tinkerpop/gremlin/wiki6http://www.sparsity-technologies.com/dex
.NET platforms; in addition, it is compliant with Blueprintsinterface and the database server can be remotely accessedvia REST methods. The database can therefore be used ina variety of applications.
DEX uses its own bitmap-based highly compressed nativepersistent storage which should be very effective and havea small memory footprint thanks to the light and indepen-dent data structures [11]. The fundamental data structureused is a “Link” which is a combination of a map and a num-ber of bitmaps that enables fast conversion between an ob-ject identifier and its value and vice versa. When object’svalue is needed, the map is used; whereas the bitmap canreturn all object identifiers associated with a specified value.The whole graph can then be stored as the following combi-nation of links: one link for each element type, one link foreach element attribute, two links for each edge type.
The structure used for the maps is a B+ tree7, the val-ues are stored as UTF-8 strings and the element identifiersare 37 bit unsigned integers. The identifiers are groupedand compressed in order to significantly reduce the size ofthe structure [11]. Attribute values can be indexed whenrequired by the application to accelerate the speed of theelement scan based on properties; this is ensured by addingthe index on the values in the appropriate attribute link.
DEX offers a partial ACID transaction support, called“aCiD”, because the isolation and atomicity cannot be al-ways guaranteed [9]. The transaction concurrency model isbased on the N-readers 1-writer model.
2.3 InfiniteGraph
InfiniteGraph8 is another commercial graph database writ-ten in Java with a C++ core. It was initially released in2009. The priorities of this graph database system lie in scal-ability, distributed approach, parallel processing and graphpartitioning [12].
InfiniteGraph uses a “Labeled directed multigraph” modelwhich also includes bidirectional edges. The database can beexposed through an API in various languages (Java, C++,C#, Python) and provides a distinct Traverser interfacewhich can also be used for distributed traversal queries. Thisis accompanied with Blueprints support; as a consequence,the database can also be accessed using Rexster or Gremlinfacilities.
The database system conforms to a full ACID model. Inaddition, it also offers relaxing of the consistency for accel-erated temporary ingests of data [14]. The graph databaseuses Objectivity/DB as a backend; and thus adopts its dis-tributed properties allowing scaling and replication.
2.4 Neo4j
Neo4j 9 is written completely in Java, it is an open-sourceproject and its first release dates back to 2007. Neo4j isa very well known graph database system, in fact currentlythe most popular one by a great margin [12].
Neo4j features a graph model called “Property graph”which is in reality very similar to the models the afore men-tioned databases offer. The native API is exposed througha whole range of different languages, e.g. Java, Python,Ruby, JavaScript, PHP, .NET, etc. There also are manykinds of ways how to query the database, for example via
7http://www.seanster.com/BplusTree/BplusTree.html8http://www.objectivity.com/InfiniteGraph9http://www.neo4j.org/

the native Traverser API, or using SPARQL or Cypher querylanguages10. The database system also implements the Blue-prints interface and a native REST interface to further ex-pand the versatility of ways how to communicate with thedatabase. Neo4j also supports custom indexes on elements’properties using external indexing engines, currently em-ploying Apache Lucene11 as the default engine.
Persistency of Neo4j database is provided by a nativegraph storage back-end mainly using adjacency lists archi-tecture. The three main components of the graph (i.e. ver-tices, edges and element properties) are stored in three sep-arate store files. Vertices are stored with a pointer to theirfirst edge and the first property. Properties store is a groupof linked lists, where there is one linked list per vertex. Fi-nally, edges are stored as two double-linked lists (one foreach endpoint of the edge) along with the edge’s type andpointers to the current edge’s endpoints and first property.
Full ACID transactions is supported by Neo4j achievedby having in-memory transaction logs and a lock managerapplying locks on any database objects altered during thetransaction.
Neo4j database can be distributed on a cloud of servers us-ing the Master/Slave replication model and utilizing ApacheZookeeper to manage the process. As a consequence, thedatabase consistency property is loosen to eventual consis-tency while the rest of ACID characteristics stays the same.However, the database distribution solution applies only toreplication of the data which helps the system to handlehigher read load; at the moment Neo4j does not supportsharding of the graph [15].
2.5 OrientDB
OrientDB12 is a wide-range NoSQL solution providinga key/value store, document-oriented database and a graphdatabase. It is written solely in Java and has become verypopular shortly after its initial release in 2010 [12].
The GDB system adopts “Property graph” as its graphmodel and provides API in many programming languages.Many approaches can also be used to query the database,namely the native Traverser API for Java embedded solu-tions, REST interface for remote access or an SQL-like querylanguage which is called Extended SQL and has been devel-oped alongside OrientDB. The database is also Blueprintscompliant and thus several other ways of accessing the en-gine are available. In addition, unlike the majority of otherGDB systems, OrientDB provides support for basic securitymanagement which is based on the users and roles model.
OrientDB ’s graph database is built atop the documentdatabase for which a native model of a persistent storagewas created. It uses its own data structure also for indexingproperties of elements. It is an innovative algorithm calledMVRB-Tree which is a combination of a B+ tree and a Red-Black tree13 and which consumes only half as much memoryas a Red-Black tree while keeping the speed of balancing thestructure after an insert or update [16]. The caching mech-anism is also quite sophisticated and is spread over severallevels; from caches exclusive to a single application thread
10http://docs.neo4j.org/chunked/stable/cypher-query-lang.html
11http://lucene.apache.org/core/12http://www.orientdb.org/13http://cs.wellesley.edu/~cs231/fall01/red-black.pdf
to caches on the physical storage level.Transactions in OrientDB have all ACID properties which
are ensured by utilizing the MVCC 14 method. Thanks tothis approach, there can be concurrent reads and writes onthe same records without the need to lock the database; how-ever, all the records must carry their version so that the ageof the record can be checked on a transaction commit [17].The resolution of any transaction conflicts is left up to theapplication.
This database system can also be distributed across a num-ber of servers in a cluster, using Hazelcast15 for the clus-tering management. Amongst the nodes in the cluster theMulti Master16 replication method is supported. Therefore,all of the servers are allowed to perform read and write oper-ations on their own replicas of the database while notifyingthe rest of the nodes in the cluster. Such notification can besynchronous or asynchronous, the latter being faster, how-ever guaranteeing only eventual consistency property.
2.6 Titan
Titan17 is one of the newest graph database systems asit has emerged very recently, in 2012. Similarly to otherGDB engines, Titan is written in Java and it is an open-source project. The authors claim that it is a highly scalablesolution specialized on handling graphs distributed acrossa cluster of many servers [19].
The “Property graph” model used by Titan can be ac-cessed via two provided interfaces. Titan can either be runas a standalone server which should be queried by RESTmethods, or be embedded in the user’s Java application forwhich case it supports the Blueprints interface. Compli-ance to Blueprints also naturally opens up the Rexster andGremlin possibilities. Furthermore, to index elements bytheir properties users can choose between two external in-dexing engines depending on the application needs. Specif-ically, the engines are Apache Lucene and ElasticSearch18
which can be used to perform effective full-text searches ornumeric-range and geo searches respectively [20].
As a backend, Titan supports three particular key-valueor column-family databases which have a contrasting influ-ence on the transaction and scalability properties of the re-sulting system. Therefore, it is possible to choose betweenCassandra19, HBase20 and Berkeley DB21 depending on theapplication’s business requirements.
In order to store the graph to a persistent storage Titanuses adjacency lists data structure. Namely, one columnfamily in the underlying backend represents one vertex’s ad-jacency list with a row key equal to the vertex’s identifier.Moreover, each element property and edge is stored in a sin-gle column with the edge direction, label, or key saved as thecolumn prefix [22]. An index can be created on any vertexproperty so that the vertex can be retrieved faster when theproperty’s key-value pair is provided.
14http://clojure.org/refs15http://www.hazelcast.com/16Multi server architecture where all servers have an equalrole and are allowed to modify the stored data.
17http://thinkaurelius.github.com/titan/18http://www.elasticsearch.org/19http://cassandra.apache.org/20http://hbase.apache.org/21http://www.oracle.com/technetwork/products/berkeleydb

3. RELATED WORKNaturally, the idea of comparing and benchmarking of
graph databases is not completely new. In this section wedescribe and compare various existing works.
3.1 GraphDB-Bench
GraphDB-Bench22 is an extensible graph database bench-marking framework built on the TinkerPop stack, heavilyusing Blueprints, and Gremlin in order to be easily exe-cuted on any Blueprints enabled graph database system. Itprovides an interface for user-defined graph database testingoperations, automatically measures their execution time andlogs all results. GraphDB-Bench also contains scripts forautomatic generation of synthetic graphs and then plottingbenchmark results, using the iGraph23 library. In case theusers want to provide own graph data, thanks to Blueprints,input files in the GraphML24 notation are accepted.
In the currently accessible package, the framework comesout with a sample benchmark (and with its results) com-prising breadth first search traversals, loading graph datafrom a GraphML file, performance of writing into an index,and reading from an index. All the tests are run againsta data set of a varying size, from a tiny graph of a thousandvertices to a large graph consisting of a million of vertices.Nonetheless, the benchmark itself claims the results shouldnot be taken too seriously but as the framework’s proof ofconcept.
TinkerGraph, OrientDB and Neo4j were tested in thisbenchmark. TinkerGraph, which is only an in-memory im-plementation of the Blueprints interface, was much fasterin almost all tests. Apart from that, Neo4j surpassed Ori-entDB in graph loading and reading from the index. On theother hand, OrientDB was faster during index writes. Inter-esting situation arrived during the test measuring the per-formance of traversals. Neo4j was faster in traversals whenthe depth was up to four and OrientDB began to dominatewhen the traversal depth was higher than five.
3.2 HPC-SGAB
In paper [1] the authors describe and implement guidelinesfrom the High Performance Computing Scalable Graph Anal-ysis Benchmark (HPC-SGAB) [2] which is normally used toassess the performance of graph algorithm libraries.
The benchmark consists of four testing scenarios wherethe execution time is measured – loading the graph intothe database, query against the database which ignores anyrelations, a traversing query, and a query which traversesthe whole graph. The graph data used in this benchmarkdo not come from a real environment but are artificiallycreated using the R-MAT generator [3].
Four databases were selected for the benchmark, namelyNeo4j, DEX, Jena25 and HypergraphDB26. Regarding theresults, DEX was shown to be the best performing of theanalyzed engines in almost all of the tests. Apart from that,Neo4j performed much better than Jena during traversingoperations, and Jena surpassed Neo4j in the first two tests(loading the graph and scanning the edges). HypergraphDB
22https://github.com/tinkerpop/tinkubator/tree/master/graphdb-bench
23http://igraph.sourceforge.net/24http://graphml.graphdrawing.org/25http://jena.apache.org/26http://www.hypergraphdb.org/
could not be assessed on most of the operations because itwas not possible to load the graph into the database formajority of the initial data set sizes in time.
3.3 Benchmarking Traversal OperationsPaper [4] provides a thorough description of a benchmark
created by the same authors. The benchmark is imple-mented in Java, uses Blueprints API, and most importantly,heavily utilizes GraphDB-Bench27 framework. Graph dataused for the testing are synthesized via the LFR-Bench-mark [5] generator which produces graphs with propertiessimilar to those of the real world graphs. It generates net-work data sets with power law distribution property andwith artificial communities implanted within the networks [4].
The following tests are described in the paper and theirexecution time is measured by the benchmark: loading thegraph into the database, computing the local clustering coef-ficient of ten thousand randomly chosen vertices, performingbreadth first search traversals, and running an algorithm fordetection of connected components.
The benchmark is run against these GDB systems: Neo4j,DEX, OrientDB, NativeSail and SGDB (which is their ownresearch prototype of a GDB). The results of the bench-mark are preliminary and not very clear, but SGDB seemedto perform significantly better than the rest of the systems.However, SGDB is only a research prototype with some con-currency issues and not a ready product [7]. Amongst therest of the engines, DEX and Neo4j showed to be more effi-cient than OrientDB and NativeSail for most of the testedoperations.
3.4 Graph vs. Relational DatabaseIn paper [6] a comparison between a chosen graph database
and a more traditional relational database is described indetail. Not only do the authors compare the systems ob-jectively using a benchmark, they also provide a subjectiveview on other aspects of the systems, such as quality of doc-umentation, support, level of security, ease of programmingetc. For the data generation of the benchmark, they come upwith their own generator of random directed acyclic graphs.Those graphs, however, do not seem to be satisfying any ofthe real world graphs’ properties (e.g., power law distribu-tion property, small diameter, high clustering coefficient).
The following operations were tested and measured in thisbenchmark. They can be divided into two groups, traver-sal and non-traversal queries: finding all vertices with theincoming and outgoing degree being equal to zero, traversethe graph to a depth of 4 from a single starting point, thesame as the previous test with the depth of 128, count allnodes having their random integer payload equal to/lowerthan some value, and count all nodes whose string payloadcontains some search string.
For the non-traversal part of the queries, a few differenttypes of payloads were tried one by one. The authors alsoconsidered various sizes of the random graph to point outhow the database systems scale. In addition, they measuredthe physical size of the DB once all data were loaded; inother words they compared the systems in terms of diskusage efficiency. On the other hand, the loading times ofthe data into the DB were not covered at all.
Neo4j was selected as a representative of graph databases
27http://code.google.com/p/graphdb-bench/

and MySQL28 (accessed via JDBC) was chosen for relationaldatabase systems. Regarding the results, Neo4j clearly out-performed MySQL in the traversal tests. Performance re-sults of the non-traversing queries were mixed because MySQLwas faster with integer payload handling, in contrast tostring payloads where Neo4j was faster in most cases.
4. BLUEBENCH ARCHITECTUREBlueBench is implemented in Java and the database en-
gines are run in the same JVM as the benchmark itself ifpossible. In addition, BlueBench heavily utilizes Blueprintsas the main but not only interface to access the tested GDBsystems. The latest version of Blueprints at the time ofwriting the benchmark suite was 2.2.0.
BlueBench is divided into three different standalone bench-marks which, however, share most of the input data andmost of the tested operations. That way the individual oper-ations in the particular benchmarks can be compared acrossbenchmarks while the consistency and fairness is guaran-teed. Each benchmark consists of operations which haveclearly defined boundaries and execution time of which isalways measured. Each operation gets the Blueprints graph(hiding the actual database system implementation) andwhen it is done, it must leave the database in a consistentstate. Every operation can receive any number of argumentswhich are prepared by the benchmark itself. The set of oper-ations has been selected to reflect most of the requirementsfrom a graph database system and to incorporate operationsfrom very complicated ones to very trivial one:
1. DeleteGraph. This operation completely clears thedatabase along with the data and indexes from thedisk to ensure that the database is in its initial state.
2. CreateIndexes. Indexing of vertices by selected prop-erty key to be performed before any elements are loadedinto the database.
3. LoadGraphML. This operation inserts elements intothe database according to a GraphML input file.
4. Dijkstra. The shortest paths between a randomly se-lected vertex and all other reachable vertices in thegraph are computed.
5. Traversal. A simple breadth first search traversal tothe depth of five from a given starting vertex is con-ducted.
6. TraversalNative. As opposed to the Traversal opera-tion, the native API of the underlying GDB engine isused instead of the standard Blueprints API wheneverpossible.
7. ShortestPath. This operation computes the shortestpath between two vertices. An important differencebetween Traversal and ShortestPath operations is thatthe former one uses getVertices() Blueprints methodwhereas the latter utilizes getEdges(), whose imple-mentation and thus performance might be significantlydifferent.
28http://www.mysql.com/
8. ShortestPathLabeled. The same as the previous op-eration; however, only edges with a certain label areconsidered.
9. FindNeighbors. This is the most primitive traversaloperation – it only finds the closest neighbors of a ran-domly selected vertex.
10. FindEdgesByProperty. This is the first of the non-traversing operations and it browses the graph databasewhile looking for all edges with a certain property equalto some string value. The value is not random but itis chosen from a dictionary of all the values that theedges could posses.
11. FindVerticesByProperty. Precisely the same as theprevious operation, with the difference that the searchis conducted for vertices instead of edges.
12. UpdateProperties. This operation tests how efficientlythe database engine updates properties of elements. Apredefined set of vertices is firstly selected, then thisset is divided into pairs, and finally, every two verticesin each pair swap their properties.
13. RemoveVertices. By contrast, this operation tests theperformance in deleting vertices.
The three benchmarks that are a part of BlueBench con-stitute of individual operations as it is depicted in Table 1.Each benchmark focuses on measuring of different aspects ofthe GDB system’s performance and the choice of operationsreflects it. As most of the operations are shared amongstthe benchmarks, eventually the results could be comparedBlueBench wide.
Operation Labeled Property Indexed
DeleteGraph Yes Yes YesCreateIndexes YesLoadGraphML Yes Yes Yes
Dijkstra Yes YesTraversalNative Yes Yes Yes
Traversal Yes Yes YesShortestPath Yes Yes Yes
ShortestPathLabeled Yes Yes YesFindNeighbors Yes Yes Yes
FindEdgesByProperty Yes YesFindVerticesByProperty Yes Yes
UpdateProperties Yes YesRemoveVertices Yes Yes Yes
Table 1: Operations performed in the benchmarks
Labeled Graph Benchmark.As the name of the benchmark suggests, an input graph
with only labels (i.e. without properties) is accepted. Theperformance of basic traversals on the graph where elementshave no payload is measured and an analysis of speed ofloading and deleting the vertices is included. Labels aretaken into account during the traversing.
Property Graph Benchmark.Property graph benchmark accepts the same format of in-
put data; however, it expects that the elements have certainproperties to be able to run tests based on them. These tests

include traversing queries working with properties (e.g. Di-jkstra) and also non-traversing queries where the relation-ships between vertices could be ignored (e.g. FindEdges-ByProperty). The UpdateProperties operation is also in-cluded not only to measure how quickly the DB systemscan read properties, but also write. All the traversing testsfrom the Labeled graph benchmark are left in place to beable to observe whether the presence of properties in thegraph will have any effect on the performance.
Indexed Graph Benchmark.This benchmark will be run on the precisely same data
as the Property graph benchmark. The only noticeable, al-though substantial, difference is the inclusion of the Cre-ateIndexes operation which sets the database engines tostart indexing values on some of the properties. This stepshould presumably influence the performance of most of thesuccessive operations, either positively or negatively. Forexample, tests working directly with properties (e.g. Find-EdgesByProperty) should be completed much faster; on theother hand, tests directly changing the indexed data (e.g.LoadGraphML) will have to take the indexes into considera-tion and thus be noticeably slowed down. When the execu-tion of the benchmark is finished, it is possible to comparethe results.
Blueprints supports two ways of indexing elements’ prop-erties in the database through IndexableGraph and KeyIn-dexableGraph interfaces [8]. The former one is less automaticand supports specific querying techniques with added pa-rameters, e.g. to achieve case insensitive searching. Nonethe-less, it is implemented by fewer database systems than KeyIn-dexableGraph, which is why we had to select KeyIndexable-Graph interface to facilitate indexing of the elements in thegraph database.
5. BLUEBENCH RESULTSAll the BlueBench tests were executed on a computer
equipped with a single core Intel Xeon E5450 running at3.00 GHz and 16GB of RAM, with Ubuntu Server 12.1029.The Java Virtual Machine of version 1.7 was started us-ing the default parametrization except for the starting andmaximum heap size, set to 12GB. The remaining 4GB ofmemory were left for other running system processes and,most importantly, for two of the tested DB systems whichcould not be run inside the JVM.
5.1 Input DataIn BlueBench both artificially generated data and real
graph data sets were used to fill up the tested databases.Specifically, the first benchmark which completely ignoreshow the databases handle properties was run twice. Once onsynthesized data and then on data collected from Amazon’sco-purchasing network30 as it looked like in the year 2003.This network forms a directed graph consisting of more than260.000 vertices and about 1.234.000 edges, where verticesrepresent products and a directed edge from product a toproduct b means that product a was frequently purchasedtogether with the product b.
For the rest of the benchmarks, which also work with ver-tex and edge properties, no real data sets of suitable size
29http://www.ubuntu.com/30http://snap.stanford.edu/data/amazon0302.html
and containing applicable property types were found, so ar-tificially generated graphs were used. The generation wasperformed with the iGraph library, namely the synthesizerimplementing the Barabasi-Albert model. String labels wereadded to all edges once the graph had been constructed. Af-terwards, for all the benchmarks with the exception of thefirst one, several properties were appended to the edges andvertices of the graph so that all elements had one string andone integer property.
All the benchmarks were executed on artificial directedgraphs having 1, 50, 100 and 200 thousand vertices and anapproximate mean vertex degree equal to 5 and 10. Thisgives the total of eight different graphs with sizes rangingfrom only about 6.000 elements to as many as 2.200.000elements.
5.2 Assessed DB SystemsDuring the first benchmark, where properties are ignored,
the following DB systems were assessed: DEX 4.7.0, In-finiteGraph 3.0.0, MongoDB 2.2.331, our own prototype My-sqlGraph, NativeSail 2.6.4, Neo4j 1.8.1, OrientDB 1.3.0,TinkerGraph 2.2.0 and Titan 0.2.0. Thanks to the size ofthis set none of the best known DB systems are left out,and several different technologies are represented (e.g. typ-ical GDB, RDF32 store, Document database, ...). In therest of BlueBench all of these databases except NativeSailwere benchmarked as it is not possible to naturally workwith element properties in NativeSail DB. As with any otherRDF store, element properties would have to be simulatedby adding custom vertices and connecting those with theoriginal element required to contain the property.
5.3 Results of the TestsWe examined the performance of the graph database sys-
tems on the operations listed in Section 4, with the excep-tion of DeleteGraph and CreateIndexes. These two opera-tions were excluded from BlueBench assessments for a num-ber of reasons. First, it would be complicated to run thetests multiple times, which is necessary to guarantee a bet-ter precision. Or, such functionality is not needed to be runvery often in any kind of application; and when it is run,the execution speed is not a factor. Each operation exceptLoadGraphML was executed ten times, two fastest and twoslowest times were discarded, and then the rest was aver-aged.
Graph Loading.The insertion speed was measured as loaded objects per
second (LOPS) so that results from data sets of differentsizes can be directly compared.
Figure 1 depicts the LOPS value as it was measured in theLabeled Graph Benchmark. DEX was the fastest system,closely followed by Neo4j, both steadying at about 35.000LOPS. InfiniteGraph and OrientDB placed on the other sideof the spectrum, with performance an order of magnitudelower. This shows quite a difference in insertion speed ofthe assessed systems; however, the results also show thatmost of the GDBs scale regularly with growing size of thenetwork – the decrease of LOPS is only sub-linear.
The situation changes when element properties are in-
31http://www.mongodb.org/32http://www.w3.org/RDF/

Sheet1
Page 1
1000x550000x5
100000x5200000x5
amazon1000x10
50000x10100000x10
200000x10
0
5000
10000
15000
20000
25000
30000
35000
40000
45000
50000
DEX
InfiniteGraphMongoDB
MysqlGraphNativeSailNeo4j
OrientDBTitan
Graph size
LO
PS
Figure 1: LOPS in Labeled Graph Benchmark.
volved in the second benchmark as displayed in Figure 2.The overall speed understandably diminishes by nearly halfand Neo4j surpasses the rest of the systems by a big mar-gin. There is no noticeable slowdown of Titan, and thus itgets on par with DEX. The rest of the GDBs remain muchslower. Another change occurs when the graph elementsare set to be indexed before the start of the loading (In-dexing Benchmark). Specifically, Neo4j gets behind Titanand DEX which both do not seem influenced by the indexesat all. The reason of Titan’s result is trivial, it does notsupport indexing over properties of edges; therefore the in-sertion is constrained with much less burden. By contrast,it will be seen in the forthcoming test results that DEX doesnot take advantage of the indexes at all – and they evidentlyare ignored during the insertion phase as well.Sheet1
Page 1
1000x550000x5
100000x5200000x5
1000x1050000x10
100000x10200000x10
0
5000
10000
15000
20000
25000
30000
DEXInfiniteGraph
MongoDBMysqlGraphNeo4j
OrientDBTitan
Graph size
LO
PS
Figure 2: LOPS in Property Graph Benchmark.
Traversal.The performance of a breadth-first search traversal which
follows the edge direction was monitored. To better estimatehow the GDBs scale with growing data size, the results wereexpressed as the traversed edges per second (TEPS). Figure 3shows an absolute dominance of Neo4j on sparser graphswith TEPS getting as high as 300.000. It is followed byDEX, Titan and NativeSail. On the other hand, MongoDBand InfiniteGraph do not seem to be optimized for this kindof query at all, giving out TEPS of only around 1.000 whichis further decreasing with the growing graph size.
The set of denser graphs brought Neo4j much closer tothe rest of the systems, mainly to the benefit of DEX. As itcan be seen in the plot, Neo4j ’s TEPS values have a decreas-ing tendency as the data get larger, whereas DEX ’s perfor-mance is gradually growing. We would probably see DEXsurpassing Neo4j if the operation was tested on even big-ger data. Meanwhile, Titan and NativeSial became roughly
twice slower than DEX, but still clearly separated from theremaining GDBs.
Sheet1
Page 1
1000x550000x5
100000x5200000x5
amazon1000x10
50000x10100000x10
200000x10
0
50000
100000
150000
200000
250000
300000
350000
DEX
InfiniteGraphMongoDB
MysqlGraphNativeSailNeo4j
OrientDBTitan
Graph size
TE
PS
Figure 3: TEPS in Labeled Graph Benchmark.
The native implementation of the traversal algorithm pro-vided by a subset of the tested engines was executed with thesame parameters within the TraversalNative operation. Theperformance is compared to the results of the conventionalmethods in Figure 4. Apart from Neo4j, the GDBs showedsome improvement after using the native method; especiallyInfiniteGraph, TEPS values of which are up to four timeshigher. A healthy margin in favor of the native method isnoticeable in DEX ’s results also. However, we still concludethat once an application uses Blueprints to work with thedatabase, it is not worth making the effort to accommodatethe native interface, because the differences in performanceare not extensive. Sheet1
Page 1
1000x550000x5
100000x5200000x5
amazon1000x10
50000x10100000x10
200000x10
0
50000
100000
150000
200000
250000
300000
350000
DEXDEX-BP
InfiniteGraphInfiniteGraph-BPNeo4j
Neo4j-BP
Graph size
TE
PS
Figure 4: Native traversal implementations vs. theircounterparts in Blueprints (Labeled Graph Bench-mark).
The execution times of the Traversal operation when runin the three benchmarks were very similar; in other words, itwas shown that the presence of element properties or customindexes on these properties does not have any noteworthyeffect on the efficiency of traversal queries.
A very similar situation occurred in the FindNeighborsoperation; after all, the two operations are implemented us-ing the same getVertices() method from the Blueprints in-terface. Only NativeSail struggled and yielded surprisinglyhigh results reaching hundreds of milliseconds for the largestgraphs. This behavior was most probably caused by theFindNeighbors operation fetching all neighbors, even in theopposite direction, in contrast to Traversal operation whereedge direction is respected. Besides that, the rest of the en-gines showed little or none growth of the response time withthe increasing graph data size.

Shortest Path.The breadth-first search and the shortest path algorithms
both count as traversals and so they could be expected toexhibit a similar performance diversity. However, getVer-tices() method was used for Traversal operation implemen-tation, whereas ShortestPath employs getEdges() BlueprintsAPI. The mechanism underlying these two methods can beseparate; in addition, the different algorithms imply differ-ent query patterns, and thus dissimilar caching techniquescan be used. Two versions of the shortest path operationwere executed, the first without considering edge labels andthe second following only edges having a label which waspreviously selected at random. We again cannot confirmany degradation of performance caused by properties or in-dexes attached to the elements; consequently, only resultsfrom the first benchmark are discussed.
Figure 5 depicts the results of ShortestPathLabeled oper-ation. Their difference from those of ShortestPath is negli-gible, with the exception of Titan, which performed muchbetter in the labeled version due to its vertex-centric indexesoptimization (the index could be used to quickly obtain onlythe edges having the right label). In general, the results aredistinct from those of Traversal operation; namely, DEX isnot the nearly best performing system as it was with searchtraversals, as opposed to Titan which clearly improved. Onthe other hand, InfiniteGraph, MongoDB and MysqlGraphremained to be very inefficient, like they were in the Traver-sal operation.
Sheet1
Page 1
1000x550000x5
100000x5200000x5
amazon
0
2000
4000
6000
8000
10000
12000
14000
16000
18000
DEX
InfiniteGraph
MongoDB
MysqlGraph
NativeSail
Neo4j
OrientDB
TinkerGraph
Titan
Graph size
Tim
e (
ms)
1000x1050000x10
100000x10200000x10
0
50
100
150
200
250
300
350
400
450
500
DEX
InfiniteGraph
MongoDB
MysqlGraph
NativeSail
Neo4j
OrientDB
TinkerGraph
Titan
Graph size
Tim
e (
ms)
Figure 5: Run times of ShortestPathLabeled in La-beled Graph Benchmark.
The ShortestPath test results yield another interesting ob-servation. As it is clearly noticeable from the plotted runtimes, the GDBs took much longer to execute the opera-tion on the Amazon data set than on the synthesized graphdata, in spite of the graph size being of similar magnitude.This was caused by the fact that there mostly is not an ex-isting oriented path between any two vertices randomly se-lected from a graph generated by the Barabasi-Albert model.Therefore, the executed algorithms usually finished prema-turely and rather quickly. By contrast, the network obtainedfrom Amazon is well connected, and thus the operations of-ten ran until the path was completed, taking much moretime to return. This suggests that the graphs created bythe selected generator do not necessarily resemble real net-works in every possible aspect.
As opposed to ShortestPath, Dijkstra operation representsa complex query requiring the traversal of the completegraph, and making use of both element properties and edgelabels. Therefore, it is more complicated for the GDBs totake advantage of their caches as they would normally do
during simpler traversals. This is likely to be the reasonof MysqlGraph’s acceptable performance in relation to theother systems and, equally importantly, in relation to itsperformance in ShortestPath.
Neo4j is the most efficient engine for this task; it evenoutperforms TinkerGraph by a recognizable margin (by al-most 30%). Given that TinkerGraph works only in memoryand can avoid any delays caused by persistent storages, anexplanation could be that Neo4j managed to load the entiregraph into its caches and calculated the algorithm there.The results of Dijkstra operation are plotted in Figure 6.
Sheet1
Page 1
1000x550000x5
100000x5200000x5
0
5000
10000
15000
20000
25000
DEX
InfiniteGraph
MongoDB
MysqlGraph
Neo4j
OrientDB
TinkerGraph
Titan
Graph size
Tim
e (
ms)
1000x1050000x10
100000x10200000x10
0
10000
20000
30000
40000
50000
60000
70000
80000
90000
100000
DEX
InfiniteGraph
MongoDB
MysqlGraph
Neo4j
OrientDB
TinkerGraph
Titan
Graph size
Tim
e (
ms)
Figure 6: Performance of Dijkstra’s algorithm inProperty Graph Benchmark.
Only TinkerGraph’s efficiency was hindered by the pres-ence of element indexes; otherwise the GDBs were practi-cally unaffected. Besides, with respect to the understand-able sovereignty of TinkerGraph in all above operations, itsperformance in Dijkstra is surprising. Apparently, the algo-rithms and data structures in TinkerGraph engine are op-timized for less demanding tasks. However, the Dijkstra’salgorithm appeared not to be the best possible choice ofa complex operation for GDB assessment. Considerable por-tions of the run time were spent inside the algorithm itself,leaving only limited room for the differences in the underly-ing systems to be fully revealed.
Non-traversing Queries.In this test the performance of two operations which ig-
nore relations between vertices was analyzed; namely, Find-EdgesByProperty and FindVerticesByProperty. Both theoperations filter the graph’s elements according to a stringrandomly chosen from a set of strings which are stored inthe elements’ attribute. Therefore, the operation requiresthe database systems to iterate through all the objects inthe graph and perform string comparisons on the specifiedattribute of the objects. In Indexed Graph Benchmark theGDBs are encouraged to use their indexing mechanisms.
Analysis of FindEdgesByProperty operation’s executiontimes and the comparison between plain and indexed bench-mark versions is depicted in Figure 7. Once the indexes areused, an apparent performance improvement can be seen foralmost all the systems except for Titan, which does not sup-port indexing edges, MysqlGraph, where indexes are usedpermanently, and DEX – which is the only surprising case.The experiments clearly show that DEX completely ignoresthe assigned index. This problem, in addition to DEX ’s al-ready slow one-by-one filtering, renders the database systemvery impractical for this type of queries. In fact, the index-ing problem can be caused only by the implementation ofthe Blueprints interface and not by the DEX engine itself,accuracy of which we could not verify.
The most efficient persistent GDB for this operation isNeo4j, being at least twice as fast as the other systems.Such a big difference is astonishing since this purely non-traversing query should definitely be handled at least equallyefficiently by MongoDB, OrientDB, InfiniteGraph and Ti-tan, which have their backends based on standalone NoSQLdatabases (as described in Section 2). MysqlGraph’s rapidgrowth of response time can be explained by the need of anexecution of a join to merge the tables where the edges andtheir properties are stored.
Sheet1
Page 1
1000x1050000x10
100000x10200000x10
0
1000
2000
3000
4000
5000
6000
7000
8000
9000
10000
DEX
InfiniteGraph
MongoDB
MysqlGraph
Neo4j
OrientDB
TinkerGraph
Titan
Graph size
Tim
e (
ms)
1000x1050000x10
100000x10200000x10
0
1000
2000
3000
4000
5000
6000
7000
8000
9000
10000
DEX
InfiniteGraph
MongoDB
MysqlGraph
Neo4j
OrientDB
TinkerGraph
Titan
Graph size
Tim
e (
ms)
Figure 7: FindEdgesByProperty in Property Graph(left) and Indexed Graph Benchmark (right).
FindVerticesByProperty operation provided similar resultsin most cases. However, MysqlGraph does not need to jointables to return vertices; thus, it is slightly faster than mostof the other engines in the Indexed Graph Benchmark. More-over, Titan could use the index this time which made its per-formance considerably better. Finally, Neo4j again excelledamongst the persistent GDBs, being about twice faster thanthe second best performing engine.
Manipulation Queries.Last but not least, extensive data manipulation queries
were executed on the databases through UpdatePropertiesand RemoveVertices operations in order to observe how thesystems cope with situations when data need to be changed,or deleted respectively.
Performance of modifying properties in the second andthird benchmark is compared in Figure 8. The presenceof indexes evidently has very negative influence on the ef-ficiency of updating data in all the systems, especially inInfiniteGraph, MongoDB, Neo4j and also slightly on Ori-entDB. The other systems, however, did not have to con-sider indexes for various reason discussed above. In con-clusion, Neo4j showed very good performance in updatingdata for being more than three times faster than the secondbest performing system; and it also handled indexes quitecomfortably. OrientDB and InfiniteGraph ended up on theother end of the scale because the former was more than anorder of magnitude slower when the data was indexed andthe latter was very slow throughout the entire test.
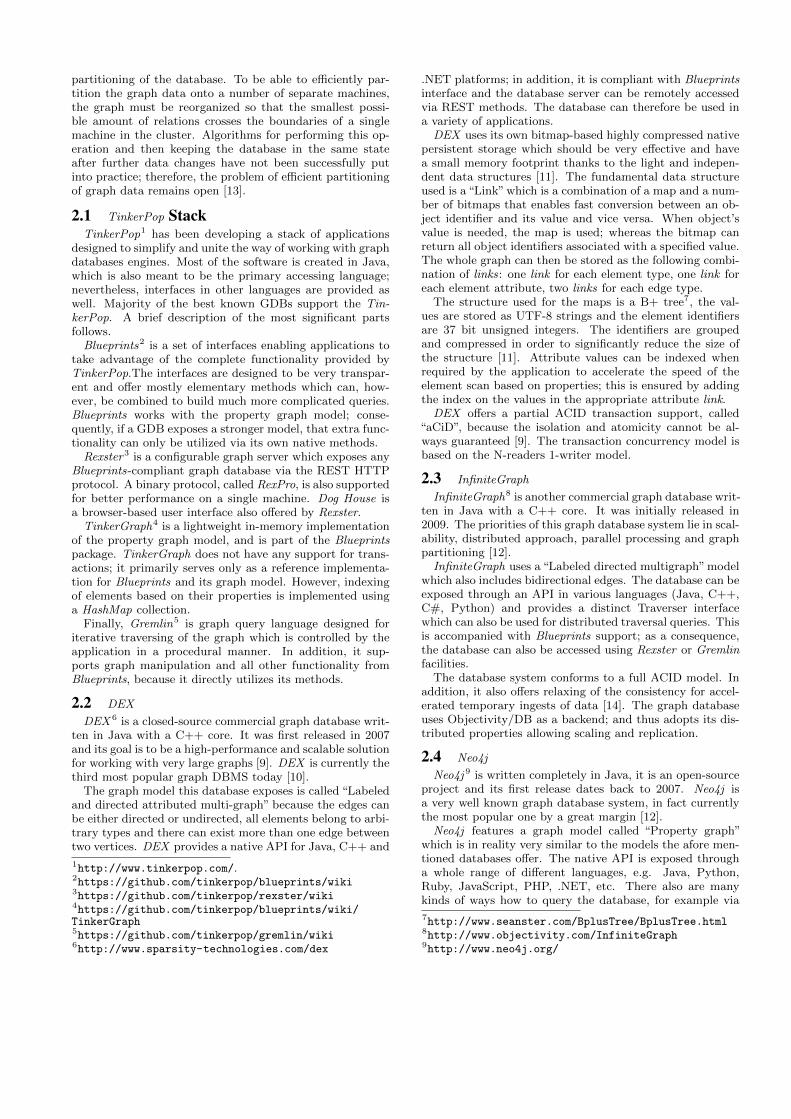
Deleting a vertex is a rather expensive operation becauseit requires any edges incident with the vertex to be deletedalso. Since RemoveVertices was always removing a signifi-cant part of the graph in one go, the execution times reachedtens of seconds for the slower systems. Therefore, as it canbe seen in Figure 9, the density of the graph substantiallyinfluenced the performance. Neo4j, DEX and Titan couldcope with the situation much more efficiently than the otherGDBs. When the same operation was run in Indexed GraphBenchmark, all engines apart from MongoDB and Tinker-
Sheet1
Page 1
1000x1050000x10
100000x10200000x10
0
200
400
600
800
1000
1200
1400
1600
1800
DEX
InfiniteGraph
MongoDB
MysqlGraph
Neo4j
OrientDB
TinkerGraph
Titan
Graph size
Tim
e (
ms)
1000x1050000x10
100000x10200000x10
0
200
400
600
800
1000
1200
1400
1600
1800
DEX
InfiniteGraph
MongoDB
MysqlGraph
Neo4j
OrientDB
TinkerGraph
Titan
Graph size
Tim
e (
ms)
Figure 8: UpdateProperties in Property Graph (left)and Indexed Graph Benchmark (right).
Graph ended up suspiciously unaffected. This observationsuggests that the indexes must have been updated in an-other thread after the method had returned, as opposed toUpdateProperties, where the deceleration was clear.
RemoveVertices was also executed in the first benchmark,where InfiniteGraph and MysqlGraph did not exhibit suchbig problems with graph density as they did in ProperyGraph Benchmark ; therefore, it is apparent that the pro-cess of deleting too many edge attributes was the true causeof their slowdown. Finally, NativeSail is part of the La-beled Graph Benchmark and was tested on this operation,too; only to expose a surprisingly inefficient implementationof the vertex removal method. To sum up, Neo4j was thefastest engine for deleting vertices from the sparser versionof the graph, while DEX performed slightly better on thedenser graph.
Sheet1
Page 1
1000x550000x5
100000x5200000x5
0
500
1000
1500
2000
2500
3000
DEX
InfiniteGraph
MongoDB
MysqlGraph
Neo4j
OrientDB
TinkerGraph
Titan
Graph size
Tim
e (
ms)
1000x1050000x10
100000x10200000x10
0
5000
10000
15000
20000
25000
30000
DEX
InfiniteGraph
MongoDB
MysqlGraph
Neo4j
OrientDB
TinkerGraph
Titan
Graph size
Tim
e (
ms)
Figure 9: Run times of RemoveVertices in PropertyGraph Benchmark.
5.4 Summary of the ResultsWe divided the operations into several groups to make
the analysis more comprehensible: graph loading, traversalqueries, non-traversal queries and data manipulation. It issurprising to observe that the groups of experiments pro-vided results that are quite alike; in other words, the GDBs’relative performance was similar although it was measuredin entirely different scenarios.
Arguably the strongest reason for GDBs to exist is theneed of efficient implementation of traversal operations onpersistent graph data. In this area Neo4j and DEX clearlyoutperform the rest of the systems, mainly because of thespecialization of their backends for exactly this type of queries.Neo4j was constantly achieving the best performance evenin the other tests, followed by DEX and Titan. These re-sults are in contrast with [2] which was written four years

ago and favored DEX over Neo4j. Clearly, Neo4j has madea lot of progress over the years.
On the other hand, it was shown that directly using a do-cument-oriented database or even relational database forgraph operations is not very efficient. MysqlGraph and es-pecially MongoDB performed well only in tests which wereeither lightly or not graph related at all. Finally, Infinite-Graph was revealed to be the least performing implementa-tion with notoriously slow traversals; often struggling withscenarios where the final execution time was barely accept-able. However, it must be stated that InfiniteGraph is fo-cused on distributed solutions with horizontal scaling, notprimarily addressing performance on a single machine.
The experiments also helped to discover an important dif-ference between the synthesized and real-world data. Thegraphs generated by the Barabasi-Albert model exhibitedlow oriented interconnection of vertices and higher proba-bility of nodes with an extensive degree; although the latterfeature could be altered by setting an appropriate parameterbefore running the graph generation.
6. CONCLUSIONThis paper addresses the need of creating a complex and
fair benchmark for an experimental assessment of variousGDB implementations. We have elaborated on the specificrequirements of such a benchmark, and analyzed all possibleways of accessing the databases and conducting the experi-ments. The result of our efforts, BlueBench, can be run bothon real and generated graph data sets and is composed ofa number of testing scenarios which reflect the wide rangeof use-cases that GDBs have to face today.
Although lots of effort was put into selecting the set ofaspects to be tested by BlueBench, there is much morework still to be done. For example, the performance of thedatabase systems was measured only on a single machineunder convenient conditions, i.e. the systems had as muchmemory as they needed. Many interesting results couldbe obtained from executing the benchmarks on a cluster ofnodes where the GDBs would be replicated and a concurrentaccess (with intentional conflicts) performed.
7. REFERENCES[1] Dominguez-Sal, Urbon-Bayes, Gimenez-Vano,
Gomez-Villamor, Martınez-Bazan, Larriba-Pey.Survey of Graph Database Performance on the HPCScalable Graph Analysis Benchmark. Springer BerlinHeidelberg, 2010, Pages 37–48. ISBN978-3-642-16720-1.
[2] Bader, Feo, Gilbert, Kepner, Koester, Loh,Madduri, Mann, Meuse, Robinson. HPC ScalableGraph Analysis Benchmark. 2009. (http://www.graphanalysis.org/benchmark/index.html)
[3] Chakrabarti, Zhan, Faloutsos. R-MAT: ARecursive Model for Graph Mining. 2004.(http://repository.cmu.edu/compsci/541/)
[4] Ciglan, Averbuch, Hluchy. Benchmarkingtraversal operations over graph databases. 2012. (http://ups.savba.sk/~marek/papers/gdm12-ciglan.pdf)
[5] Lancichinetti, Fortunato. Benchmarks for testingcommunity detection algorithms on directed andweighted graphs with overlapping communities. Phys.Rev. E 80, 016118, 2009. (https:
//sites.google.com/site/andrealancichinetti/
benchmark2.pdf?attredirects=0)
[6] Vicknair, Macias, Zhao, Nan, Chen, Wilkins. Acomparison of a graph database and a relationaldatabase: a data provenance perspective. 2010, ACMSE ’10, Article No. 42. ISBN: 978-1-4503-0064-3.
[7] Ciglan. SGDB3 – Simple Graph Database.(http://ups.savba.sk/~marek/sgdb.html)
[8] TinkerPop. Blueprints – Graph Indices.(https://github.com/tinkerpop/blueprints/wiki/Graph-Indices)
[9] sparsity technologies. Why DEX.(http://www.sparsity-technologies.com/dex)
[10] DB-Engines. Ranking of Graph DBMS.(http://db-engines.com/en/ranking/graph+dbms)
[11] sparsity technologies. DEX – A High-PerformanceGraph Database Management System.(http://www.sparsity-technologies.com/dex)
[12] Angles Renzo. Say hi to GraphDB-Bench. 2012.(http://dcc.utalca.cl/~rangles/files/gdm2012.pdf)
[13] Robinson, Webber, Eifrem. Graph Databases. 2013,O’Reilly Media. (http://graphdatabases.com/)
[14] Objectivity inc.. Understanding Accelerated Ingest.(http://wiki.InfiniteGraph.com/3.0/w/index.php?title=Understanding_Accelerated_Ingest)
[15] Redmond, Wilson. Seven Databases in Seven Weeks.2012, O’Reilly Media. ISBN: 978-1-934356-92-0.(http://it-ebooks.info/book/866/)
[16] NuvolaBase Ltd. OrientDB.(https://github.com/nuvolabase/orientdb)
[17] NuvolaBase Ltd. OrientDB – Concepts – RecordVersion.(https://github.com/nuvolabase/orientdb/wiki/Concepts#record-version)
[18] NuvolaBase Ltd. OrientDB – Transactions.(https://github.com/nuvolabase/orientdb/wiki/Transactions)
[19] Aurelius. Titan.(https://github.com/thinkaurelius/titan/wiki)
[20] Aurelius. Titan – Indexing Backend Overview.(https://github.com/thinkaurelius/titan/wiki/Indexing-Backend-Overview)
[21] Aurelius. Titan – Storage Backend Overview.(https://github.com/thinkaurelius/titan/wiki/Storage-Backend-Overview)
[22] Broecheler Matthias. Big Graph Data.(http://www.slideshare.net/knowfrominfo/big-graph-data)
[23] Rodriguez Marko. The Rise of Big Graph Data.(http://www.slideshare.net/slidarko/titan-the-rise-of-big-graph-data)
[24] Erdos, Renyi. On random graphs. Mathematicae 6,1959, Pages 290–297.
[25] Leskovec, Lang, Dasgupta, Mahoney. Statisticalproperties of community structure in large social andinformation networks. ACM Press 2008. Pages695–704. ISBN. 978-1-60558-085-2.
[26] Barabasi, Albert. Emergence of scaling in randomnetworks. Science. 2008. Vol. 286, no. 5439. Pages509–512.