Basic Principles in Proteomics & Metabolomics - Weatherall ...
45
Basic Principles in Proteomics & Metabolomics Darragh P. O’Brien, PhD Target Discovery Institute, University of Oxford United Kingdom [email protected] Weatherall Institute for Molecular Medicine DPhil Course 2019 Tuesday, November 19th, 2019
-
Upload
khangminh22 -
Category
Documents
-
view
0 -
download
0
Transcript of Basic Principles in Proteomics & Metabolomics - Weatherall ...
Basic Principles in
Proteomics & Metabolomics
Darragh P. O’Brien, PhD
Target Discovery Institute,
University of Oxford
United Kingdom
Weatherall Institute for Molecular Medicine DPhil Course 2019
Tuesday, November 19th, 2019

http://www.tdi.ox.ac.uk/mass-spectrometry
Target Discovery Institute

Mass Spec @ Old Road Campus
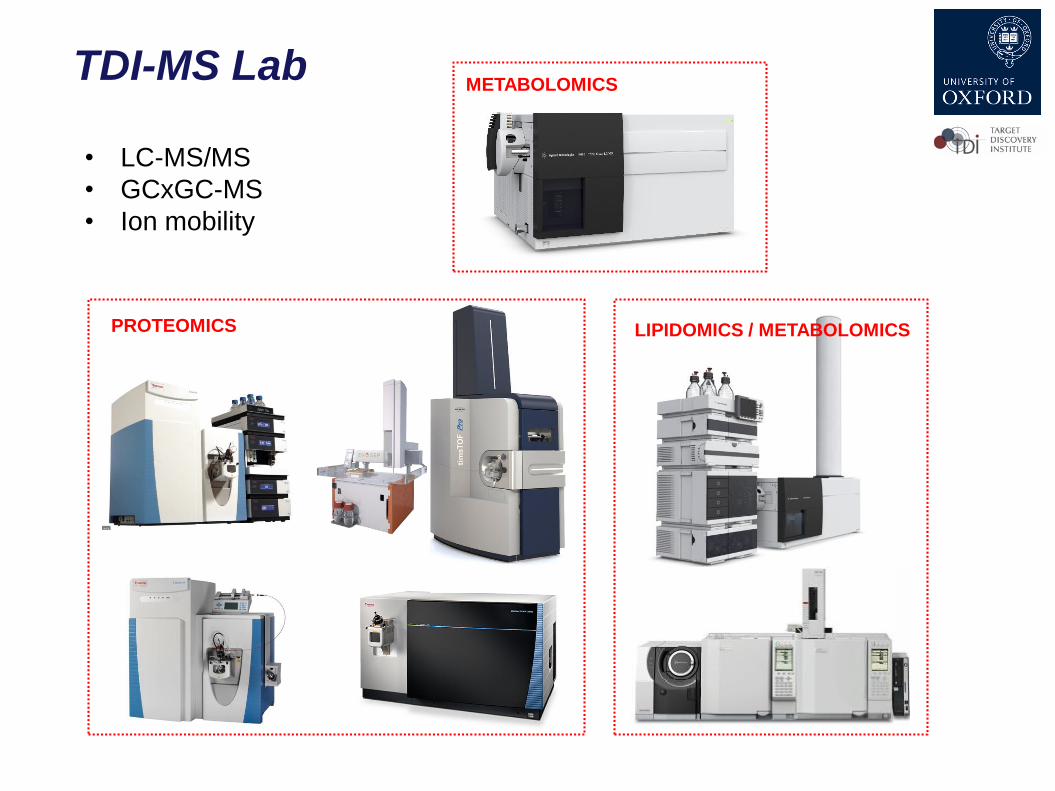
TDI-MS Lab
PROTEOMICS LIPIDOMICS / METABOLOMICS
METABOLOMICS
• LC-MS/MS
• GCxGC-MS
• Ion mobility

Data Analysis
CBRG/Dunn School/Biochemistry
.
Mohammed Shabaz
CPF Dunn School/Biochem
Orbitraps
Iolanda Vendrell
ORCRB
LC-MS/MS (ETD)
Rod Chalk
SGC
LC-MS
Mass Profiler Professional
Proteome Discoverer
Protein Pilot / PEAKS
James McCullagh
Carol Robinson
LC-MS , LC-MS/MS,
MALDI

Molecules as marker candidates:
Metabolites
Drugs
Peptides
Proteins
Lipids
DNA/mRNA
Proteomics
Metabolomics
Transcriptomics
Sources:
Serum/Plasma
Urine
Blood
Synovial fluid
Tears
Other body fluids
Defined cell populations
Cell supernatants
Biopsy material
Semen
Endometrial Lavage
Endometrium / lesion
Tissues
Clinical Proteomics
Lipidomics
Proteins/Peptides as Biomarkers:
Clinical Proteomics
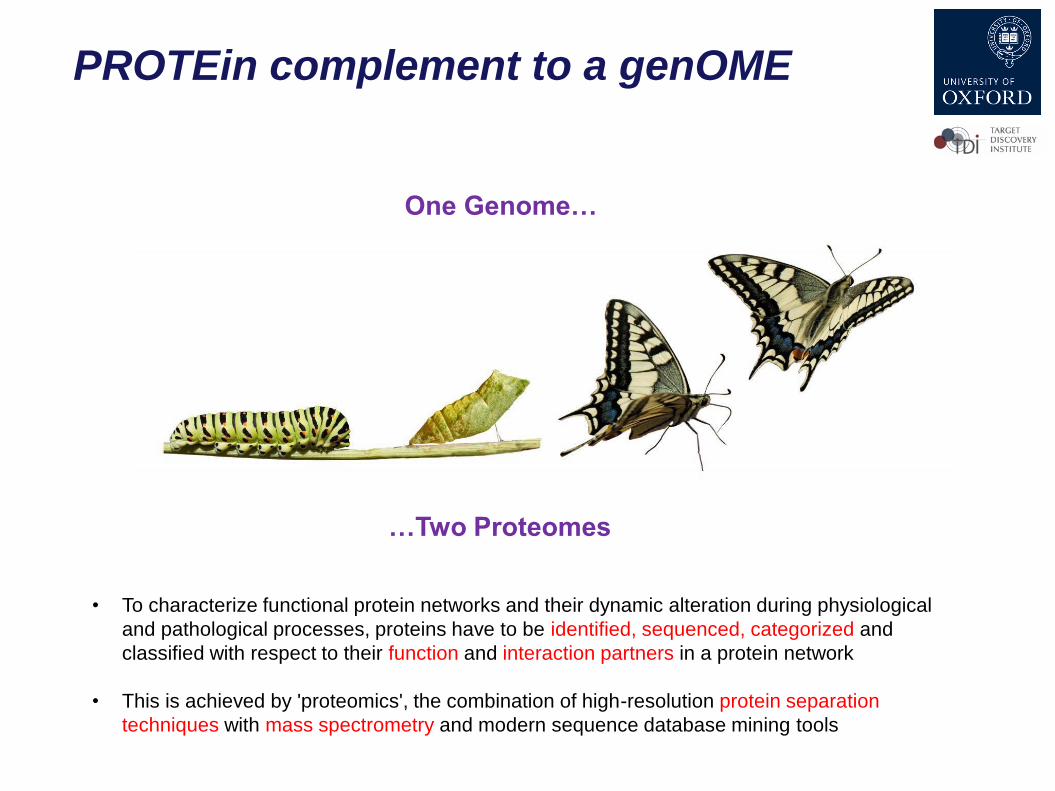
One Genome…
…Two Proteomes
• To characterize functional protein networks and their dynamic alteration during physiological
and pathological processes, proteins have to be identified, sequenced, categorized and
classified with respect to their function and interaction partners in a protein network
• This is achieved by 'proteomics', the combination of high-resolution protein separation
techniques with mass spectrometry and modern sequence database mining tools
PROTEin complement to a genOME

3 1 0.1
0.0
3
0.0
1
0.0
03
0.0
01
1.551550
0.5
0.1
5
0.0
5
0.0
15
pmole
mg
BSA68kDa
Coomassie blue Silver Stain
3x10⁹ molecules
Western Blotting
Detection limit = pg!
Detection limit by mass spectrometry:
Sodium Dodecylsulfate Gel-Electrophoresis: protein separation by molecular
Weight along an electric gradient, molecules travel through a poly-acrylamide polymer
kDa
-
+
10
3 1 0.1
0.0
3
1.5515
50 0.5
15
0
Se
pa
rati
on
by m
ole
cu
lar
we
igh
t
-
+
50
100
37
25
20
15
10
Protein Analysis by SDS-PAGE

GeneChip array of
young and aged muscle
M. Altun, E.Edström, E.Spooner, A. Flores-Moralez E. Bergman, P. Tollet-Egnell, G.Norstedt, B. Kessler and B.Ulfhake. Muscle & Nerve, 2007, 36(2): 223-33.
2D-gel profile of
young and aged muscle
Gene versus Protein Expression

• LUMINEX (different protein families: cytokines, kinome, growth factors etc.)
• Protein arrays
• Antibody arrays
• Nucleic Acid Programmable Protein Array (NAPPA)
• Peptide arrays
Protein and Antibody Microarraysh
ttp
://w
ww
.bio
scie
nce
no
tes.c
om
/elisa
-en
zym
e-l
inke
d-i
mm
un
oso
rbe
nt-
assa
y/

• Standard proteome analysis
• Analysis of Multi-Protein Complexes
• Analysis of post-translational modifications (PTMs)
> 400 known modifications
Phosphorylation, Acetylation, Methylation, Ubiquitination
Glycosylation, Hydroxylation, Lipid modification
Protein Tagging, Tandem Affinity Purification (TAP)
MW, Protein ID
• Quantitative Analysis of proteins in health and disease
Clinical Proteomics
• Systems Biology
Proteomics Applications
Combining large proteomic & genomic datasets
Mathematical modelling

• 2D gel
• Silver stain
• Spot isolation
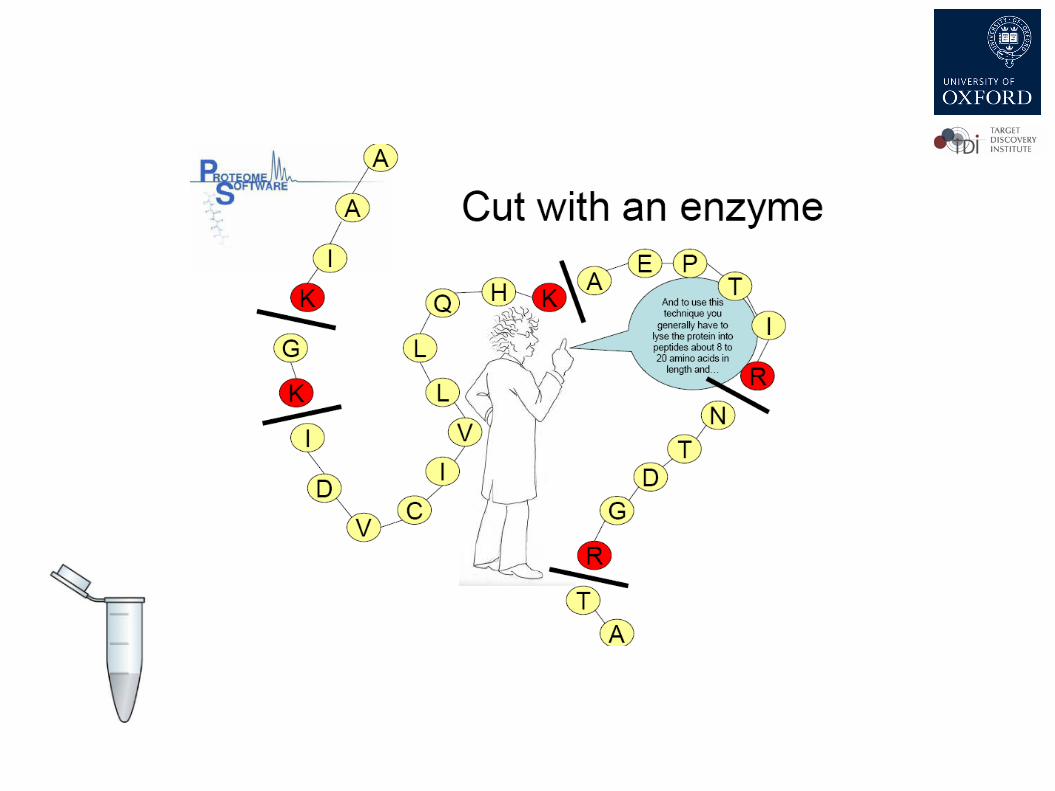
• Enzymatic digestion (Trypsin)
• Chromatography
MALDI-TOF
LC-MS/MS ?
Standard Proteome Analysis Protein identification by MS
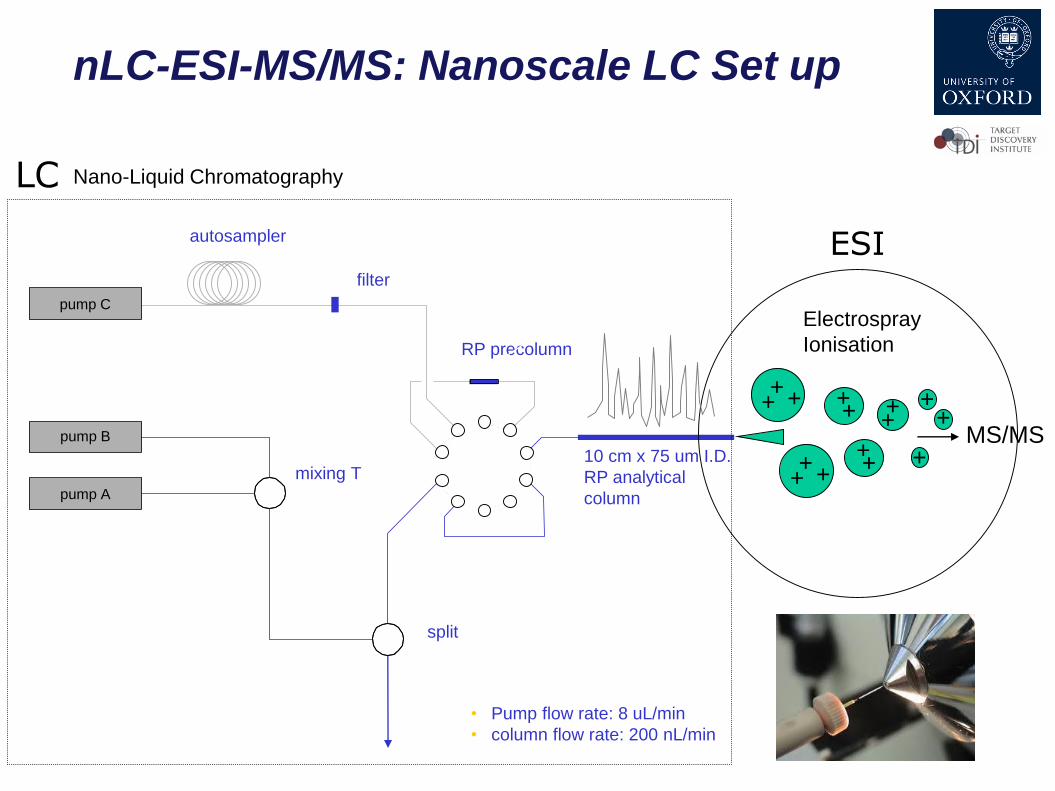
split
autosampler
mixing T
RP precolumn
filter
10 cm x 75 um I.D.
RP analytical
column
pump B
pump A
pump C
• Pump flow rate: 8 uL/min
• column flow rate: 200 nL/min
Electrospray
Ionisation
MS/MS
+++ +
+ +
+
++ +
+++
++
Nano-Liquid ChromatographyLC
ESI
nLC-ESI-MS/MS: Nanoscale LC Set up

Quadrupole Time-of-flight (QTOF)
Orbitrap
Resolution 20,000-40,000
Mass Accuracy 1-5ppm
Sensitivity 1fmol
Resolution 50,000-500,000
Mass Accuracy <1ppm
Sensitivity <1fmol
Tandem Mass Spectrometers

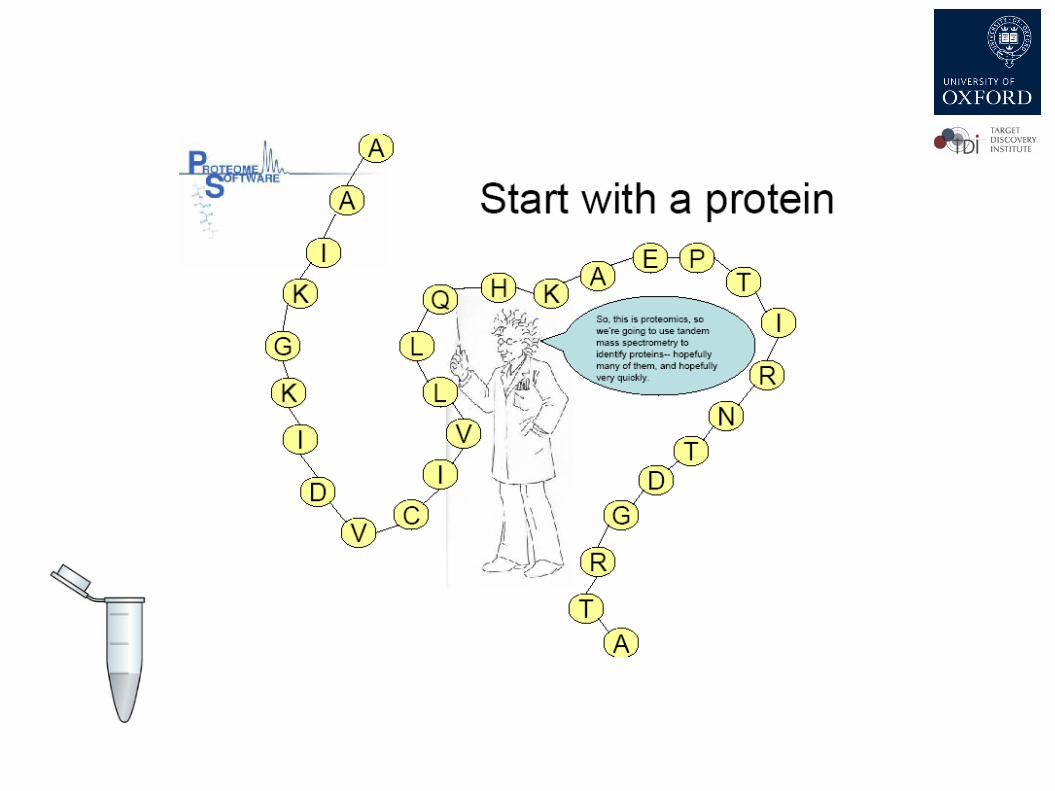
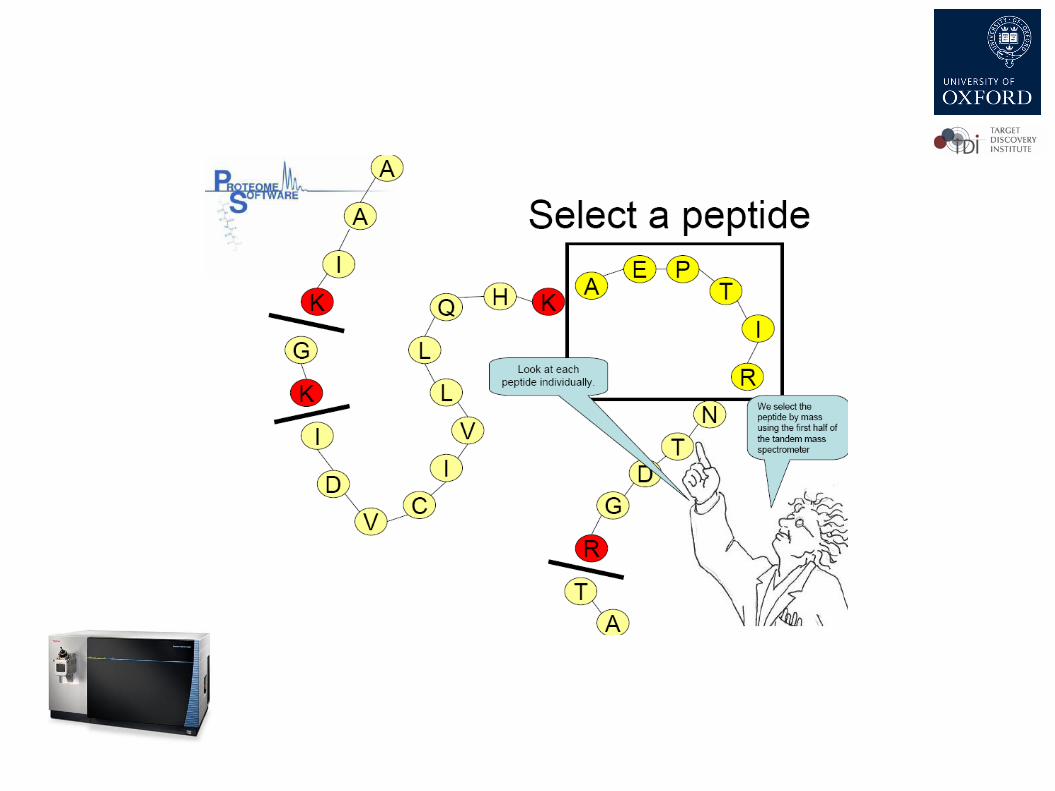
How a mass spectrometer works:

• Data analysis
• Theoretical sequences from a defined mass
• Generation of a theoretical spectrum
• Matching with the acquired spectrum
• De novo sequencing
Protein Identification by MS/MS

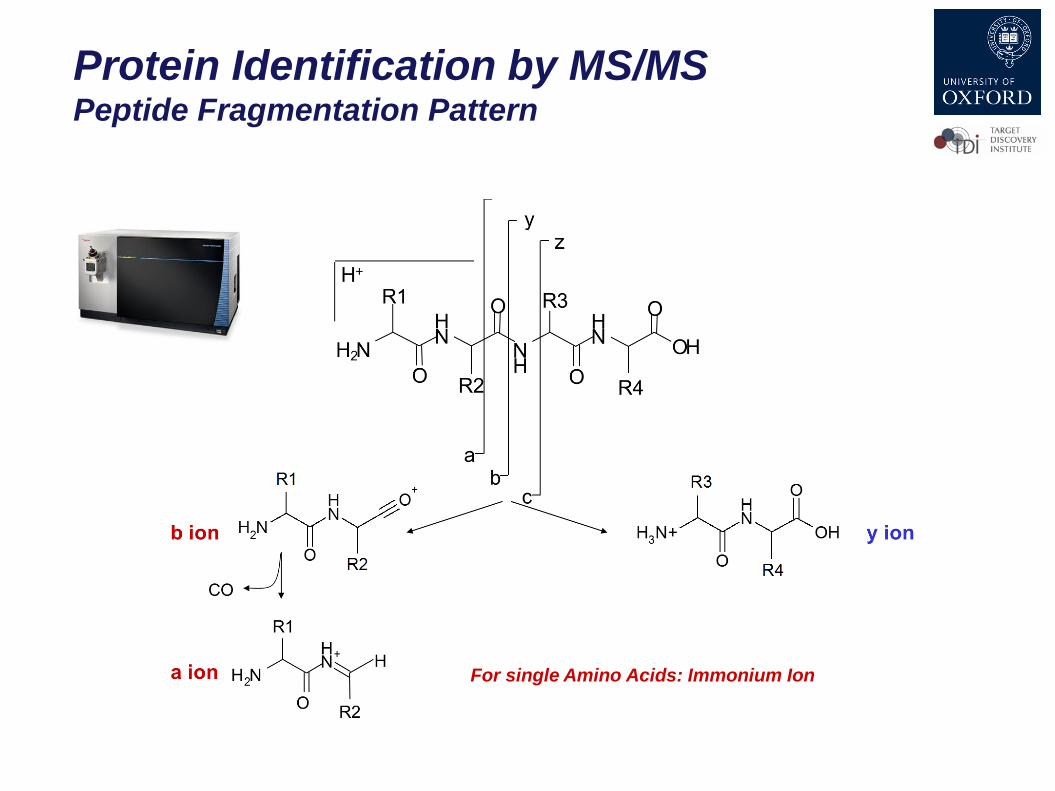
For single Amino Acids: Immonium Ion
Protein Identification by MS/MS Peptide Fragmentation Pattern


…Is The Basis for Sequence
Information
IQQEIAVQNPLVSER
y2y3y4y6y7y8y9y10y11y12y13
b3b4b5 b6 b7 b8 b9 b11b12 b13 b14
Batycka and Kessler, 2005

Human Protein Atlas (tissue based map of human proteome)
>17,005 unique proteins, 217 tissues
(www.proteinatlas.org)
Human Proteome Map (HPM)
>17,294 proteins (84% of human genes, 17 adult, 7 fetal tissues)
(http://humanproteomemap.org)
“Proteomes” of 11 cell lines analysed
(~10,500 proteins each; >90% of the total proteome ??)
(Geiger T et al., MCP 2012)
>50,000 phosphorylation sites known
>16,000 acetylation sites known
>6,000 glycosylation sites known
(www.phosida.com)
>17,000 ubiquitylation sites known
(https://gygi.med.harvard.edu/ggbase)
>8,000 proteins known in human plasma
Proteomic inventory & quantity ~2,000 (Farrah et al., MCP 2011)
Progress in Proteome Analysis“Proteome/Sub-Proteome Screens”

Cutillas P & Kessler BM. 2017, OTCB. In press
Modern Biological MS

Method Protein amount Protein groups Time
‘Ultra depth’
Multi Enzyme, Liquid
Chromatography High-pH
reverse phase pre-fractionation,
less demanding fraction
concatenation.
2 – 5 mg
>108 cells
10,000 – 13,000 ++++++…
‘High depth’
Liquid Chromatography high-pH
reverse phase pre-fractionation,
demanding fraction
concatenation.
500 µg – 1 mg
20-50x107 cells
8,000 – 10,000 ++++
‘Medium depth’
Spin column or StageTip based
high-pH pre-fractionation. No
concatenation
10 µg – 400 µg (spin column)
500,000 to few million cells
4,000 – 8,000 ++
‘Single shot’
No pre-fractionation.
< 10 µg
Few thousand cells
3,000 – 4,000 +
Protein group numbers: ~20% less for SILAC experiments
Proteome Depth

Quantitation of Differentially-Regulated
Proteins
Healthy
Disease
Healthy
Disease
Mass Peptide Protein
TIC
TIC
HighLow LCMS Peptide ID List
Compare
HighLow LCMS Peptide ID List
Peptide ID List
Up R
egula
ted
No C
hange
Do
wn R
egula
ted
Mass Peptide Protein
Mass Peptide Protein
Mass Peptide Protein
Mass Peptide Protein
0L
og (
Rat
io H
/D)
Up Regulated
No Change
Down Regulated
LC/MS/MSE
LC/MS/MSE

• MS for quantitative Information
(peak Intensities)
• MSE for identification (assignment of
precursor and fragment ions)
• Experiment performed in triplicate
• Each peak defined by: exact Mass +
retention Time (EMRT)
Xu D, Suenaga N, Edelmann MJ, Fridman R, Muschel RJ, Kessler BM. Mol Cell Proteomics 2008 7(11): 2215-2228
Label-Free Quantitation by MSE

Amino Acids:
Lys 13C62H2
Arg 13C615N4
Other MS Quant Methods:
LFQ
iTRAQ / TMT
SWATH
PRM/MRM
AQUA
SILACStable isotope labeling of amino acids in cell culture


Mehul Desai, Norman Stockbridge, Robert Temple. The AAPS Journal 2006; 8 (1) Article 17
Examples of Biomarkers

Geyer et al., Mol Sys Biol 2017
Classical Clinical Proteomics (Triangular Approach)

Geyer et al., Mol Sys Biol 2017
Classical Clinical Proteomics (Triangular Approach)

Geyer et al., Mol Sys Biol 2017
Advanced Clinical Proteomics (Rectangular Approach)

Geyer et al., Mol Sys Biol 2017
More Accurate Prediction of
Diagnosis / Treatment
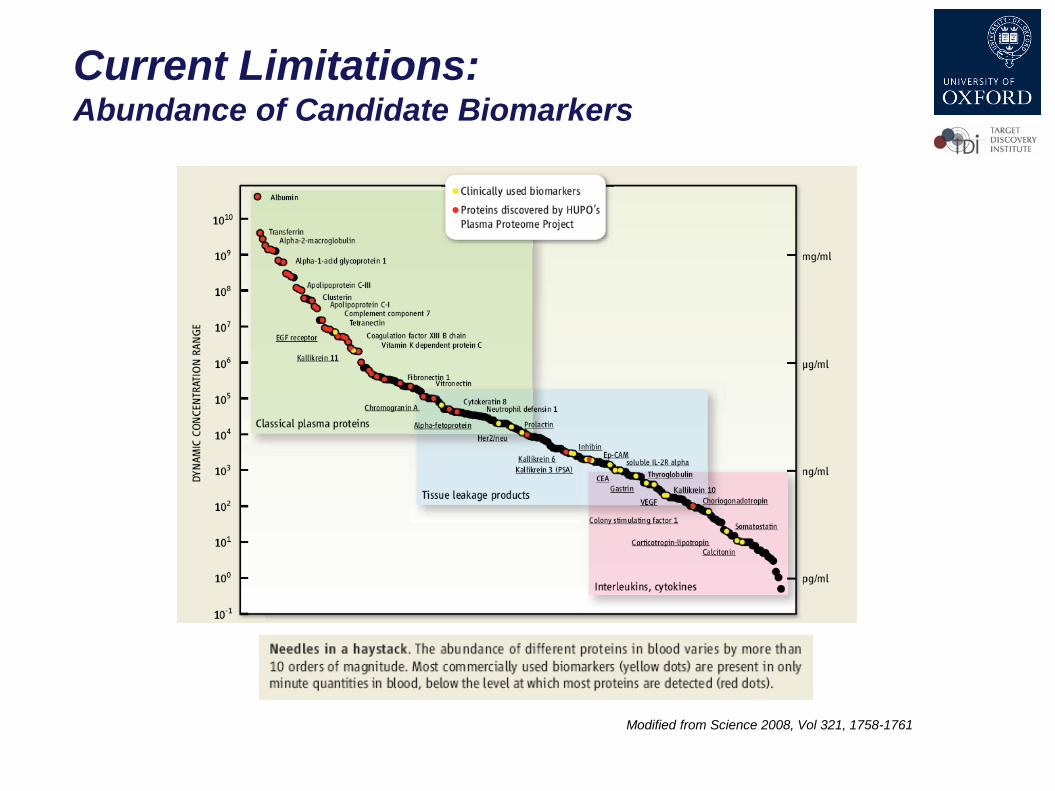
Modified from Science 2008, Vol 321, 1758-1761
Current Limitations: Abundance of Candidate Biomarkers

• Not discovery, but targeted
proteomics!
• Available at the WIMM
Sean C et al., Nature Biotechnology 2012
Single Cell Proteomics – CyTOF

• Human Genome: 20,300 proteins
Genetic variants
Isoforms
PTMs
• Human Metabolome: ca. 3,000 endogenous metabolites
Subjected to many variations
Complexity of Metabolic Pathways
and Cellular Processes

C18 Reversed Phase positive mode
C18 Reversed Phase negative mode
C18 Ion pairing (pH 4.95) negative mode
HILIC Luna NH2 negative mode
P Peptides
Fatty acids
Lipids, Prostaglandies
Aromatic compounds
Steroids
Nucleotides
Hydrophobic
Negatively charged
compounds
TCA metabolites Glycolysis
metabolitesGlycolysis
metabolitesTCA metabolites
Polar -ve charged
compounds
Fatty acids, lipids
Aromatic compounds
Steroids
Glycolysis
Metabolites?
TCA metabolites?
Discovery metabolomics
(AMRT, MS/MS)
Targeted metabolomics
(MRM/SRM)
LC-MS Strategies for Metabolomics
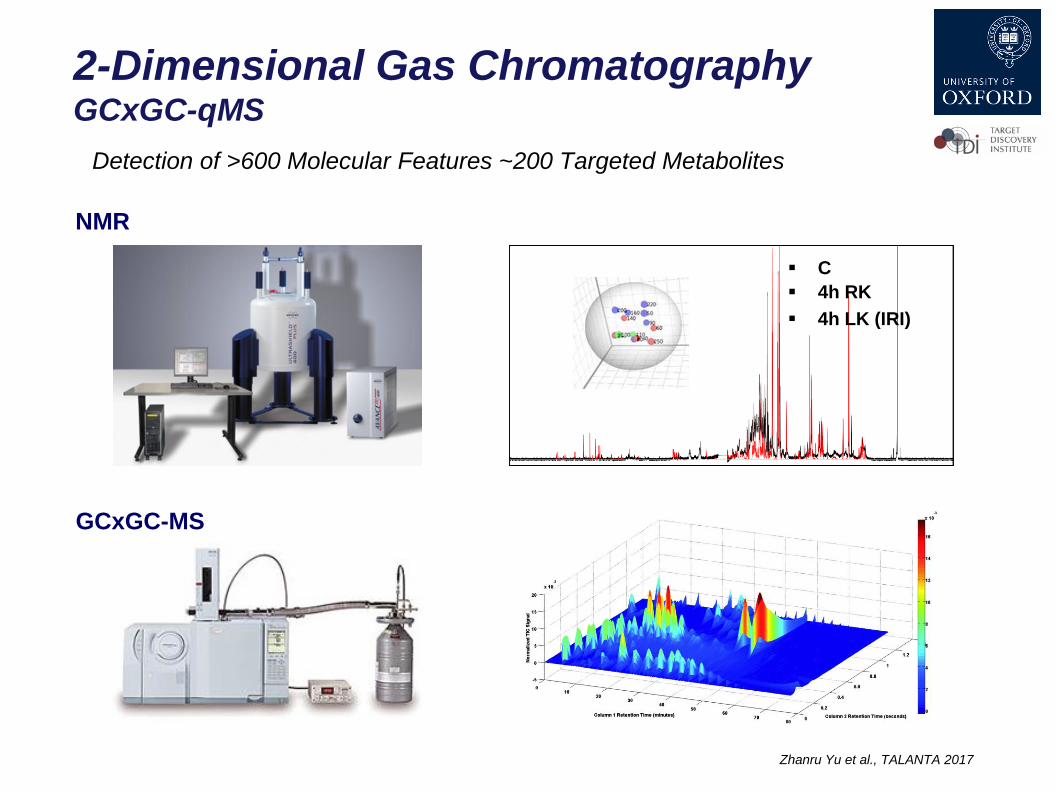
Detection of >600 Molecular Features ~200 Targeted Metabolites
C
4h RK
4h LK (IRI)
NMR
Zhanru Yu et al., TALANTA 2017
2-Dimensional Gas Chromatography GCxGC-qMS
GCxGC-MS

VERY DIFFICULT !!
Fischer et al., Mol. Cell. Proteomics, 2012
Metabolite Profiling & Identification

Aebersold AR, Goodlett DR
Mass spectrometry in proteomics ; Chem Rev. 2001 Feb;101(2):269-95. Review.
Steen H, Mann M.
The ABC's (and XYZ's) of peptide sequencing; Nat Rev Mol Cell Biol. 2004
Sep;5(9):699-711. Review.
Low TY, Heck AJ Reconciling proteomics with next generation sequencing.
Curr Opin Chem Biol. 2015 Nov 16;30:14-20.
Stable isotope labeling by amino acids in cell culture for quantitative proteomics.
Ong SE, Mann M.
Methods Mol Biol. 2007;359:37-52.
*
Generating and navigating proteome maps using mass spectrometry.
Ahrens CH, Brunner E, Qeli E, Basler K, Aebersold R.
Nat Rev Mol Cell Biol. 2010 Nov;11(11):789-801. Review
* Cravatt BF, Simon GM, Yates JR 3rd
The biological impact of mass-spectrometry-based proteomics.
Nature 2007; Dec 13; 450 (7172):991-1000. Review
*
Please feel free to get in contact to discuss questions/experiments:
Email: [email protected]
http://www.tdi.ox.ac.uk/mass-spectrometry
Further Reading