Genetical metabolomics of flavonoid biosynthesis in Populus : a case study
Upload
independentCategory
view
0download
0
Predicting Network Activity from High ThroughputMetabolomicsShuzhao Li1,2*, Youngja Park3,4, Sai Duraisingham1,2, Frederick H. Strobel5, Nooruddin Khan1,2,
Quinlyn A. Soltow3, Dean P. Jones3, Bali Pulendran1,2
1 Emory Vaccine Center, Emory University, Atlanta, Georgia, United States of America, 2 Yerkes National Primate Research Center, Emory University, Atlanta, Georgia,
United States of America, 3 Department of Medicine, Emory University, Atlanta, Georgia, United States of America, 4 College of Pharmacy, Korea University, Seoul, South
Korea, 5 Mass Spectrometry Center, Emory University, Atlanta, Georgia, United States of America
Abstract
The functional interpretation of high throughput metabolomics by mass spectrometry is hindered by the identification ofmetabolites, a tedious and challenging task. We present a set of computational algorithms which, by leveraging thecollective power of metabolic pathways and networks, predict functional activity directly from spectral feature tableswithout a priori identification of metabolites. The algorithms were experimentally validated on the activation of innateimmune cells.
Citation: Li S, Park Y, Duraisingham S, Strobel FH, Khan N, et al. (2013) Predicting Network Activity from High Throughput Metabolomics. PLoS Comput Biol 9(7):e1003123. doi:10.1371/journal.pcbi.1003123
Editor: Christos A. Ouzounis, The Centre for Research and Technology, Hellas, Greece
Received November 7, 2012; Accepted May 15, 2013; Published July 4, 2013
Copyright: � 2013 Li et al. This is an open-access article distributed under the terms of the Creative Commons Attribution License, which permits unrestricteduse, distribution, and reproduction in any medium, provided the original author and source are credited.
Funding: Work supported by grants from US National Institutes of Health AG038746, ES016731 (to DPJ); U19AI090023, U54AI057157, R37AI48638, R37DK057665,U19AI057266, PO1A1096187 (to BP); Scripps CHAVI-ID Award (UM1AI100663 to BP); and the Bill and Melinda Gates Foundation (to BP). The funders had no role instudy design, data collection and analysis, decision to publish, or preparation of the manuscript.
Competing Interests: The authors have declared that no competing interests exist.
* E-mail: [email protected]
Introduction
Knowledge of many metabolic pathways has accumulated over
the past century. For instance, glycolysis, citric acid cycle and
oxidative phosphorylation fuel cellular processes through the
generation of adenosine triphosphate; glycans and cholesterols not
only serve as structural blocks but also mediate intercellular
communication. In fact, metabolites pervade every aspect of life
[1,2]. Their roles are increasingly appreciated, as advancing tools
allow deeper scientific investigations. The most notable progresses
in recent years come from metabolomics and genome-scale
metabolic models.
Metabolomics is the emerging field of comprehensive profiling
of metabolites. As metabolites are the direct readout of functional
activity, metabolomics fills in a critical gap in the realm of systems
biology, complementing genomics and proteomics [3–6]. The
technical platforms of metabolomics are mainly based on mass
spectromety and nuclear magnetic resonance [4,7]. Among them,
untargeted LC/MS (liquid chromatography coupled mass spec-
trometry), especially on high resolution spectrometers, produces
unparalleled throughput, measuring thousands of metabolite
features simultaneously [5,8–10].
On the other hand, genome-scale metabolic models have been
largely driven by genomics, as the total list of metabolic enzymes of
a species can be derived from its genome sequence [11,12]. The
reconstruction of microbial metabolic network models is an
established process [13,14]. Intense manual curation, however,
was required in the building of two high-quality human models
[15,16], which were followed by a number of derivatives [17–20].
The coverage of these metabolic models greatly exceeds the
conventional pathways.
Even though they are a perfect match in theory, metabolomics
and genome-scale metabolic models have had little overlap so far.
The use of metabolomics in building metabolic models is rare [21],
due to the scarcity of well annotated metabolomics data. The
application of genome-scale metabolic models to metabolomics
data is not common either [22]. The limited throughput of
targeted metabolomics usually does not motivate large scale
network analysis. Untargeted metabolomics cannot move onto
pathway and network analysis without knowing the identity of
metabolites.
A typical work flow of untargeted metabolomics is illustrated in
Figure 1A. After ionized molecules are scanned in the spectrom-
eter, the spectral peaks are extracted, quantified and aligned into a
feature table. At this point, each feature is identified by a mass-to-
charge ratio (m/z) and retention time in chromatography, but its
chemical identity is not known. To assign a spectral feature to a
bona fide metabolite, it usually involves tandem mass spectrometry
to examine the fragmentation pattern of a specific feature, or
coelution of isotopically labeled known references - both are
inherently low throughput. Considerable effort is needed to build a
spectral library, which is often of limited size and interoperability.
Thus, metabolite identification forms the bottleneck of untargeted
metabolomics [23].
A number of informatics tools have been developed for LC/MS
metabolomics, ranging from feature extraction [24–26], pathway
analysis and visualization [27–29] to work flow automation [30–
32]. Yet, whereas pathway and network analysis is concerned, the
existing tools require identified metabolites to start with. Compu-
tational prediction of metabolite identity, based on m/z alone, is
deemed inadequate as a single m/z feature can match multiple
metabolites even with high instrumental accuracy [33,34], and
PLOS Computational Biology | www.ploscompbiol.org 1 July 2013 | Volume 9 | Issue 7 | e1003123

multiple forms of the same metabolite often exist in the mass
spectra [35]. Although automated MS/MS (tandem mass spec-
trometry) search in databases is improving the efficiency of
metabolite identification [36,37], this requires additional targeted
experiments and relies on extensive databases, where data from
different platforms often do not match. How to bring untargeted
metabolomics data to biological interpretation remains a great
challenge.
In this paper, we report a novel approach of predicting network
activity from untargeted metabolomics without upfront identifica-
tion of metabolites, thus greatly accelerating the work flow. This is
possible because the collective power in metabolic networks helps
resolve the ambiguity in metabolite prediction. We will describe
the computational algorithms, and demonstrate their application
to the activation of innate immune cells.
Results
Full MS scan in an untargeted metabolomics experiment gives
the most power of high throughput profiling, producing several
thousand of features routinely. Our goal is to predict biological
activity in a network of metabolites directly from the feature table,
bypassing the bottleneck of metabolite identification (Figure 1A).
As illustrated in Figure 1B, each spectral feature can match to
several metabolite candidates, albeit the true identity is not known.
The conventional work flow is to identify each metabolite
experimentally before mapping them onto metabolic pathways/
networks. Instead of treating metabolite identification and
metabolic pathway/network analysis as two separate steps, we
argue that there is collective power in the organization of
metabolic networks, which can be leveraged when the two steps
are unified under one theoretical framework. In other words, if a
list of significant spectral features reflects a biological activity, the
true metabolites they represent should show enrichment on a local
structure in the metabolic network [22], while the falsely matched
metabolites are distributed more randomly. This gives us a means
to predict functional activities without upfront identification of
metabolites (Figure 1C).
The software implementation of our approach is named
mummichog (mummichog is an American Indian term for by groups,
Figure 1. Mummichog redefines the work flow of untargeted metabolomics. A) In the work flow of untargeted metabolomics, theconventional approach requires the metabolites to be identified before pathway/network analysis, while mummichog (blue arrow) predictsfunctional activity bypassing metabolite identification. B) Each row of dots represent possible matches of metabolites from one m/z feature, red thetrue metabolite, gray the false matches. The conventional approach first requires the identification of metabolites before mapping them to themetabolic network. C) mummichog maps all possible metabolite matches to the network and looks for local enrichment, which reflects the trueactivity because the false matches will distribute randomly.doi:10.1371/journal.pcbi.1003123.g001
Author Summary
Mass spectrometry based untargeted metabolomics cannow profile several thousand of metabolites simultaneous-ly. However, these metabolites have to be identified beforeany biological meaning can be drawn from the data.Metabolite identification is a challenging and low through-put process, therefore becomes the bottleneck of the filed.We report here a novel approach to predict biologicalactivity directly from mass spectrometry data without apriori identification of metabolites. By unifying networkanalysis and metabolite prediction under the samecomputational framework, the organization of metabolicnetworks and pathways helps resolve the ambiguity inmetabolite prediction to a large extent. We validated ouralgorithms on a set of activation experiment of innateimmune cells. The predicted activities were confirmed byboth gene expression and metabolite identification. Thismethod shall greatly accelerate the application of highthroughput metabolomics, as the tedious task of identi-fying hundreds of metabolites upfront can be shifted to ahandful of validation experiments after our computationalprediction.
Functional Analysis for Metabolomics
PLOS Computational Biology | www.ploscompbiol.org 2 July 2013 | Volume 9 | Issue 7 | e1003123

also name of a small fish which live by groups). From user input,
mummichog requires two lists of m/z features, the significant list Lsig
(e.g. selected by univariate statistics) and the reference list Lref (all
features detected in the MS experiment). From the m/z features in
Lsig, mummichog computes all possibly matched metabolites, and
searches the reference metabolic network for all the modules that
can be formed by these tentative metabolites. Random lists of m/z
features are drawn from Lref many times to estimate the null
distribution of module activities. The statistical significance of
modules from Lsig can then be calculated on this null distribution.
In return, the predicted metabolites in these significant modules
(and similarly for pathways) are more likely to be true, and they
form the ‘‘activity network’’ for this particular experiment.
Details of module analysis, pathway analysis and activity
network are given below, after a treatment of the reference
metabolic network model.
The reference metabolic network modelThe genome-scale human metabolic network in mummichog is
based on KEGG [38], UCSD Recon1 [15] and Edinburgh human
metabolic network [16]. The integration process was described
previously [39]. The organization of metabolic networks has been
described as hierarchical and modular [40]. When we perform a
hierarchical clustering on the metabolic reactions in our network,
its modular structure is clear (Figure 2A). This modular
organization, as reported previously [41], often but not always
correlates with conventional pathways (Figure 2B).
The module definition in this work is adopted from Newman
and Girvan [42,43], where a module is a subnetwork that shows
more internal connections than expected randomly in the whole
network. Modules are less biased than pathways, which are
defined by human knowledge and conventions, and outgrown by
genome-scale metabolic networks. Activity of modules may exist
within and in between pathways. Deo et al [22] convincingly
demonstrated the advantage of unbiased module analysis over
pathways. On the other hand, pathways have built-in human
knowledge, which may be more sensitive under certain scenarios.
Pathway analysis and module analysis are rather complementary,
and both are included in mummichog.
The reference metabolic network model contains both metab-
olites and enzymes. Since metabolomics only measures metabo-
lites, the model is converted to a metabolite centric network for
statistical analysis. Enzymes are only added later in the visualiza-
tion step to aid user interpretation.
Module analysisWithin the predefined reference metabolic network model M,
mummichog searches for all modules that can be built on user input
data, and compute their activity scores. This process is repeated
many times for the permutation data to estimate the background
null distribution. Finally, the statistical significance of modules
based on user data is calculated on the null distribution. The
specific steps are as follows:
1. A list of ‘‘input metabolites’’ is tentatively computed from the
significant list of m/z features, Lsig. The m/z - metabolite
matching considers all common isotopic derivatives and
adducts.
2. From M, all subnetworks that can connect the input
metabolites from Step 1 within one reaction are extracted.
This is repeated for subnetworks within two, three and four
reactions (by four steps M should be exhausted, see Figure 2C).
These subnetworks contain both ‘‘input metabolites’’ and other
metabolites from M.
3. Structural modules are identified within these subnetworks
according to Newman’s spectral split algorithm [43]. This
creates many modules of different sizes.
4. Both subnetworks from Step 2 and modules from Step 3 are
compiled into a set of candidate modules (graphs),
G1,G2,:::,Gn. Each graph is cleaned of protruding edges if
such edges do not connect input metabolites therefore not
contributing to the activity score.
5. The activity score should reflect both the enrichment of ‘‘input
metabolites’’ and the modularity. Activity score of a candidate
module is computed as follows: For a subgraph G, activity
score
AA~Q:NI ,G
NG
, ð1Þ
where NG is the number of metabolites in G, NI ,G the number
of ‘‘input metabolites’’ in G, Q the adjusted Newman-Girvan
modularity:
Q~
ffiffiffiffiffiffiffiNI
NG
r:(
EG
m{X
i,j
ki
2m
kj
2m) , i,j[G ð2Þ
where ki is the network degree of metabolite i, m the total
number of edges in the metabolic network M, EG the total
number of edges in G, NI the number of ‘‘input metabolites’’.
The original Newman-Girvan modularity has a bias towards
larger modules. The
ffiffiffiffiffiffiffiNI
NG
ris added to reduce this bias.
6. A list of permutation features (equal length to Lsig) is generated
by randomly sampling Lref . The activity scores of modules
from this permutation list are computed as in Steps 1–5.
7. Repeat Step 6 many times to populate a list of scores from
random modules. Using maximum likelihood estimation, these
scores are modeled as a Gamma distribution (this is the null
distribution), and a cumulative distribution function (CDF) is
calculated.
8. The p-value for each module from input metabolites is
calculated on the CDF of null distribution.
Pathway analysisThe basic test for pathway enrichment here is Fisher’s exact test
(FET), which is widely used in transcriptomic analysis. The
concept of FET is, when we select k features (Lsig) from a total of
N features (Lref ), and find m of the k features present on a
pathway of size P, the chance of getting m in theory can be
estimated by enumerating the combinations of k, N and P.
To apply FET to an enrichment test of metabolic features on
pathways, we need to understand the additional layer of
complexity. Our metabolic features can be enumerated either in
the m/z feature space or in the metabolite (true compound) space.
Since metabolic pathways are defined in the metabolite space,
either way needs to factor in the many-to-many mapping between
m/z features and metabolites (Figure S1). This mapping is
effectively covered in our permutation procedure, which starts
from the m/z features and reruns the mapping every time. The
overall significance of a pathway enrichment is estimated based on
a method by Berriz et al [44], which ranks the p-value from real
data among the p-values from permutation data to adjust for type
I error. Finally, a more conservative version of FET, EASE, is
adopted to increase the robustness [45]. The key idea of EASE is
Functional Analysis for Metabolomics
PLOS Computational Biology | www.ploscompbiol.org 3 July 2013 | Volume 9 | Issue 7 | e1003123

to take out one hit from each pathway, thus preferentially penalize
pathways with fewer hits. The specific steps are as follows:
1. A list of permutation features (equal length to Lsig) is generated
by randomly sampling Lref . This list is mapped to a list of
tentative metabolites. These metabolites are looked up in each
metabolic pathway. For each pathway, a FET right-tail p-value
is calculated.
2. Repeat Step 1 many times to populate a list of p-values of all
pathways under all permutations (null distribution). Slightly
different from Berriz et al [44], all p-values not just the minimal
p-values in each permutation are used. This is because the size
and organization of metabolic pathways vary greatly, a
different situation from the large gene categories in Berriz et
al. Using maximum likelihood estimation, these p-values are
modeled as a Gamma distribution (this is the null distribution),
and a cumulative distribution function (CDF) is calculated.
3. Perform Step 1 on the significant feature list Lsig, and calculate
FET p-value and EASE score for each pathway. An adjusted p-
value per pathway is calculated based on the EASE score and
CDF from Step 2. Both FET p-value and adjusted p-value are
reported for each pathway.
Data driven activity networkBoth the module analysis and pathway analysis above serve
as a framework to estimate the significance of functional
activities. In return, the predicted metabolites in significant
Figure 2. Modular organization of human metabolic network. A) Hierarchical clustering of the network by the steps between 4204 metabolicreactions, where the warmer color codes for fewer steps. Each red island represents a cluster of closely connected reactions. B) An insert by the whilearrow in A. This demonstrates that network modules and pathways correlate with but not equate to each other. C) When measured by reaction stepsbetween metabolites, most metabolites are connected in no more than four steps. This serves as a practical guide in searching subnetworks in thetotal metabolic network.doi:10.1371/journal.pcbi.1003123.g002
Functional Analysis for Metabolomics
PLOS Computational Biology | www.ploscompbiol.org 4 July 2013 | Volume 9 | Issue 7 | e1003123
activities are more likely to be real. Mummichog collects these
metabolites, and look up all their isotopic derivatives and
adducts in Lref . A confidence rating system is applied to filter
for qualified metabolites. For instance, if both the single-
charged 12C form M+H[1+] and the 13C form M(C13)+H[1+]
are present, this metabolite prediction carries a high confi-
dence. All the qualified metabolites carry over their connec-
tions in the reference metabolic network, and form the
‘‘activity network’’ for this specific experiment (e.g. Figure 3).
The activity network gears towards a quality and clear view of
user data, as modules and pathways can be redundant and
fragmented. It also accentuates the activity in a specific
experimental context, in contrast to the generic nature of the
reference metabolic network.
We next illustrate the application of these algorithms to a novel
set of immune cell activation data, and two published data sets on
human urinary samples and yeast mutants.
Application to the activation of innate immune cellsThe innate immunity plays a critical role in regulating the
adaptive immunity, and the field was recognized by the 2011
Nobel Prize in Physiology or Medicine [46]. According to the
nature of stimuli, innate immune cells direct different
downstream molecular programs, which are still under
intense scientific investigation [47,48]. In this study, we
examine the metabolome of human monocyte-derived den-
dritic cells (moDC) under the stimulation of yellow fever virus
(YF17D, a vaccine strain). We have shown previously that
yellow fever virus activates multiple toll-like receptors, and
induces cellular stress responses [49–51]. This data set is, to
our knowledge, the first high throughput metabolomics on
any immune cells (macrophages were previously studied by
limited throughput).
The cell extracts from our activation experiment were
analyzed by LC/MS metabolomics, and yielded 7,995 spectral
features (denoted as Lref ) after quality control. Among them,
601 features were significantly different between the infected
samples and both the baseline and time-matched mock controls
(pv0:05, student t-test; denoted as Lsig ). Using Lsig and Lref ,
mummichog computes significant pathways and modules and the
activity network.
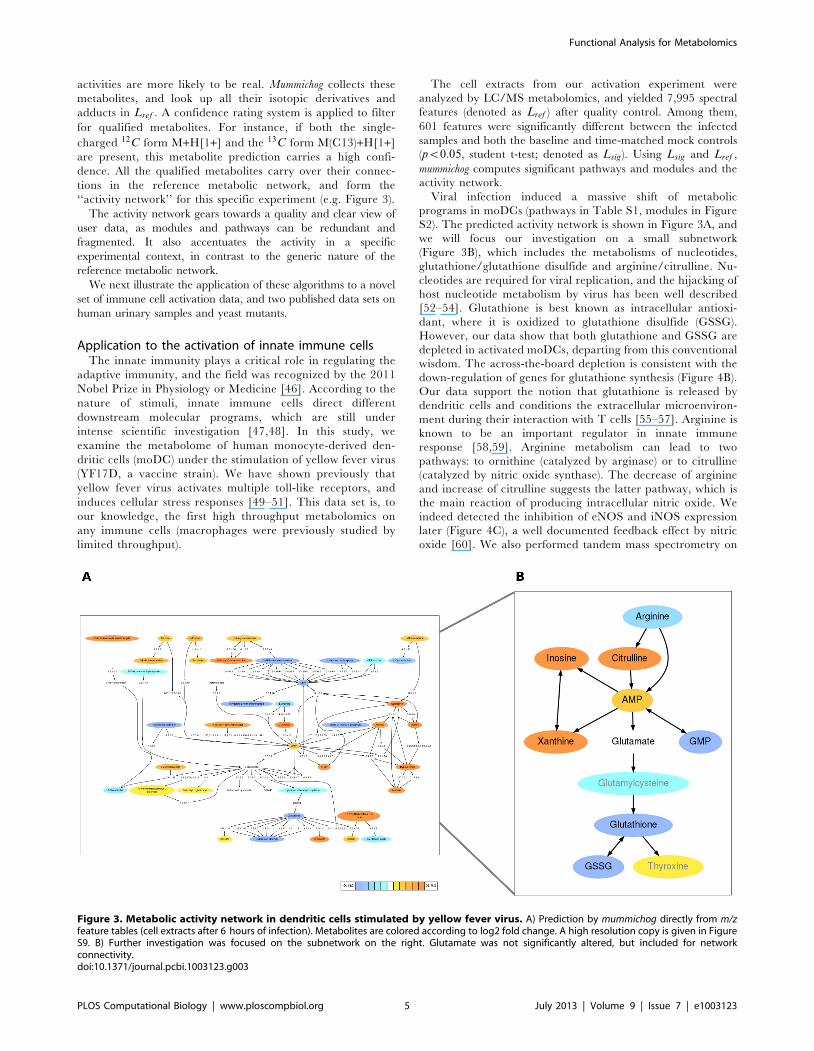
Viral infection induced a massive shift of metabolic
programs in moDCs (pathways in Table S1, modules in Figure
S2). The predicted activity network is shown in Figure 3A, and
we will focus our investigation on a small subnetwork
(Figure 3B), which includes the metabolisms of nucleotides,
glutathione/glutathione disulfide and arginine/citrulline. Nu-
cleotides are required for viral replication, and the hijacking of
host nucleotide metabolism by virus has been well described
[52–54]. Glutathione is best known as intracellular antioxi-
dant, where it is oxidized to glutathione disulfide (GSSG).
However, our data show that both glutathione and GSSG are
depleted in activated moDCs, departing from this conventional
wisdom. The across-the-board depletion is consistent with the
down-regulation of genes for glutathione synthesis (Figure 4B).
Our data support the notion that glutathione is released by
dendritic cells and conditions the extracellular microenviron-
ment during their interaction with T cells [55–57]. Arginine is
known to be an important regulator in innate immune
response [58,59]. Arginine metabolism can lead to two
pathways: to ornithine (catalyzed by arginase) or to citrulline
(catalyzed by nitric oxide synthase). The decrease of arginine
and increase of citrulline suggests the latter pathway, which is
the main reaction of producing intracellular nitric oxide. We
indeed detected the inhibition of eNOS and iNOS expression
later (Figure 4C), a well documented feedback effect by nitric
oxide [60]. We also performed tandem mass spectrometry on
Figure 3. Metabolic activity network in dendritic cells stimulated by yellow fever virus. A) Prediction by mummichog directly from m/zfeature tables (cell extracts after 6 hours of infection). Metabolites are colored according to log2 fold change. A high resolution copy is given in FigureS9. B) Further investigation was focused on the subnetwork on the right. Glutamate was not significantly altered, but included for networkconnectivity.doi:10.1371/journal.pcbi.1003123.g003
Functional Analysis for Metabolomics
PLOS Computational Biology | www.ploscompbiol.org 5 July 2013 | Volume 9 | Issue 7 | e1003123

the metabolites in Figure 3B, using authentic chemicals as
references. All the metabolites, except glutamylcysteine and
thyroxine, were confirmed (Figure 5, Figure S3).
The depletion of arginine and accumulation of citrulline in
moDC was also triggered by dengue virus but not by
lipopolysaccharide (LPS, Figure S4). It is known that iNOS is
induced in dendritic cells by LPS but not by virus [47,61]. Our
data suggest a different nitric oxide pathway in viral infection,
driven by constitutive nitric oxide synthases. The intracellular
nitric oxide has a fast turnover and we did not detect its
accumulation by fluoremetric assays (data not shown). We
previously demonstrated that the phosphorylation of EIF2A was
induced by YF17D [50]. An upstream mechanism is now
suggested by this metabolomic experiment, as both the produc-
tion of nitric oxide and depletion of arginine induce the activity of
EIF2A kinases [62].
Evaluation on human urine data and yeast dataThe nature of metabolomics data often varies by platforms and
sample types. We thus extend our mummichog approach to two
published data sets on human urinary samples [63] and on yeast
cell extracts [64]. Both data sets carry metabolite annotation by
the original authors, which can be used to evaluate the prediction
by mummichog.
The human urinary data contained both formal identifica-
tion by matching to local library of chemical references and
putative identification by combining multiple public resources
[63]. We used mummichog to investigate the gender difference in
this data set, and predicted an activity network of 45
metabolites. Among them, 13 were not found in the original
annotation. For the remaining metabolites, 97% (31/32) were
agreed between mummichog and the original annotation
(Figure 6). There is an option in mummichog to enforce the
presence of M+H[+] form (for positive mode, M2H[2] for
negative mode) in metabolite prediction. With this option, 3
out of 44 metabolites were not in the original annotation, and
the remaining 41 metabolites were in 100% agreement.
The mummichog algorithms are not tied to a specific metabolic
model. We adopted the yeast metabolic model from BioCyc
database [11] for the yeast data [64], to predict an activity network
contrasting mutant and wild type strains. This data set was only
annotated for 101 metabolites through the authors’ local library.
As a result, the majority of metabolites in the predicted network by
mummichog were not found in the original annotation. Out of the
remaining 28 metabolites, 24 (86%) were agreed between
mummichog and the original annotation (Figure 6). Enforcing
the presence of primary ion M2H[2] (data collected in negative
ion mode) had little effect to the result, since the original
annotation was already biased to metabolites that are ionized
easily.
These results show that the prediction by mummichog is robust
cross platforms and sample types.
Discussion
We have described the computational method of mummichog and
its application to three case studies. While the description was
intended to be concise, computational metabolomics is compli-
cated and facing challenges from many fronts. Quantification and
feature selection, the steps upstream of mummichog, can still be
problematic. Data from in vivo studies often involve multivariate
analysis, where validation is particularly challenging. In this
Figure 4. Gene expression confirms the activity network. A) Cytokines secreted after infection (ELISA) indicate the activation of innateimmune programs. B) Down-regulation of transcripts of GCLC, GCLM (subunits of gamma-glutamylcysteine synthetase) and GSS (glutathionesynthetase), the key enzymes for glutathione synthesis. C) Nitric oxide has feedback inhibition on the expression of eNOS and iNOS (nNOS was notdetected). Gene expression was assayed by quantitative RT-PCR. Infected samples were compared to mocks by student’s t-test (n = 3).doi:10.1371/journal.pcbi.1003123.g004
Functional Analysis for Metabolomics
PLOS Computational Biology | www.ploscompbiol.org 6 July 2013 | Volume 9 | Issue 7 | e1003123

section, we discuss several confounding factors that are relevant to
our approach.
Impact of metabolic modelsCritical to the success of mummichog is the integration of genome-
scale metabolic models. We have used in this study a recent
human metabolic model. An alternative human model from
BioCyc [11] produced comparable results (Figure S6). The
coverage of the models in all three case studies is shown in
Table 1. These genome-scale metabolic models are more extensive
than conventional pathways, and were shown to capture activities
in between pathways [22]. The pathway organizations differ
between the two human models, as the BioCyc model tends to use
smaller pathways. This creates some model dependency in the
pathway analysis, but little effect to the ‘‘activity network’’, as
mummichog is more network centric. The two test cases in Figure 6
also indicate that these models tend to capture more information
than conventional annotations.
However, as mentioned earlier, the new data from metabolomic
studies are yet to be integrated into these genome-scale metabolic
models. For example, a number of metabolites in metabolomics
databases [36,65,66] are not in any of these metabolic models. In
general, the features from a high resolution profiling experiment
by far exceed the current annotations in metabolite databases.
This leads to a de facto filtering when data are run on mummichog
(similiar situation in database searches). Meanwhile, the features
Figure 5. Identification of metabolites by tandem mass spectrometry. Arginine is shown as an example while the full data are given inFigure S3. From top to bottom: the fragmentation pattern (MS2 followed by MS3 on peak 157) from biological sample, from biological samplespiked with authentic chemical and from authentic chemical reference.doi:10.1371/journal.pcbi.1003123.g005
Functional Analysis for Metabolomics
PLOS Computational Biology | www.ploscompbiol.org 7 July 2013 | Volume 9 | Issue 7 | e1003123

that can be mapped to the current metabolic model are more
likely to be biologically relevant. This ‘‘filtering’’ is pertinent to the
metabolic model, not to mummichog algorithms - mummichog still has
to choose the true metabolites from multiple possible candidates
(Figure S1B).
It will be an important future direction to advance metabolic
modeling with the chemical data. We also expect the metabolic
models to improve on lipid annotation, physiological context and
tissue specificity.
Robust design of the algorithmsAs lessons learned from transcriptomics, pathway and network
analysis not only provides functional context, but also the
robustness to counteract noises at individual feature level, which
are commonly seen in omics experiments. Similarly, the prediction
on activity by mummichog is tolerant to errors at individual feature
level. In the moDC data, we chose Lsig by a cutoff value p~0:05.
When we vary this cutoff from 0:001 to 0:2, the program returned
networks of a stable set of metabolites (Figure S7).
The module finding procedure in the program was designed to
extensively sample subnetwork structures. Among the modules will
be many variations, but the subsequenct ‘‘activity network’’ will
collapse on stable results. In deed, we tested an alternative
algorithm of modularization [67], and it returned almost identical
predicted networks, in spite of moderately different intermediate
modules (Figure S8).
In theory, there are merits to incorporate a statistical matrix
from the feature selection step prior to mummichog’s analysis and
mass flow balance of metabolic reactions [22,68]. While these are
appealing directions for future research, the current version of
mummichog confers some practical robustness, such as tolerance to
technological noise and biological sampling limitation. For
example, mass balance is almost impossible within serum or urine
samples, because the reactions producing these metabolites are
likely to occur in other tissues.
The number of overlap metabolites is used in the enrichment
calculation in both module analysis and pathway analysis.
Sometimes, a single m/z feature may match to several metabolites
in the same module/pathway, inflating the overlap number. Thus,
mummichog always compares the number of overlap metabolites
and the number of corresponding m/z features, and uses the
smaller number for enrichment calculation, since the smaller
number is more likely to be true.
The size of each metabolic pathway is defined by the number of
metabolites in the pathway. mummichog uses only the metabolites
that can be matched in Lref to define a pathway size, because this
reflects the analytical coverage of the experiment and Lsig is
confined by the same coverage. Overall, mummichog uses the whole
feature list from an experiment for resampling, therefore the
computation of statistical significances effectively circumvents
analytical biases.
Figure 6. Application of mummichog to additional data sets.Metabolite prediction by mummichog is in good agreement withannotation in the original studies, 97% for the human urine data [63]and 86% for the yeast data [64]. The metabolites not in the originalannotation (yellow) can not be compared. The ‘‘-z’’ option inmummichog enforces the presence of primary ion (M+H[+] for positivemode, M2H[2] for negative mode). This shifts the coverage in thehuamn data set, but not much for the yeast data of limited annotation.doi:10.1371/journal.pcbi.1003123.g006
Table 1. How metabolomics data match metabolic models.
human model human model (BioCyc) yeast model (BioCyc)
number of reactions 4204 2091 1034
metabolite edges 18504 14100 6962
number of metabolites 3565 1536 811
number of metabolites with exact mass 2016 1308 742
case moDC: reference features 7713 7713
case moDC: tentatively matched metabolites 1384 874
case urine: reference features 10248 10248
case urine: tentatively matched metabolites 1453 930
case yeast: reference features 5366
case yeast: tentatively matched metabolites 533
The top section gives statistics of each of the three metabolic models. The bottom section gives the specific number of measured features and tentative metabolitematches in each study case. These tentative matches contain excessive ambiguity, which mummichog aims to resolve.doi:10.1371/journal.pcbi.1003123.t001
Functional Analysis for Metabolomics
PLOS Computational Biology | www.ploscompbiol.org 8 July 2013 | Volume 9 | Issue 7 | e1003123

Acceleration of untargeted metabolomicsIn spite of the fantastic progress in mass spectrometry, these are
the early days of metabolomics. Effective computational integra-
tion of resources, the combination of cheminformatics and
bioinformatics, will greatly benefit the field [69,70]. As data
accumulate, further method refinement will become possible.
Mummichog presents a practical solution of one-step functional
analysis, bypassing the bottleneck of upfront metabolite identifi-
cation. It trades off some sensitivity in the conventional approach
for the much accelerated work flow of high throughput LC/MS
metabolomics. Mummichog is not designed to replace tandem mass
spectrometry in metabolite identification. It is the biological
activity not metabolites per se that mummichog predicts. Even with
some errors on individual metabolites, as long as the biology is
pinpointed to a subnetwork structure, investigators can focus on a
handful of validations, steering away from the lengthy conven-
tional work flow.
In conclusion, we have demonstrated that mummichog can
successfully predict functional activity directly from a spectral
feature table. This benefits from the convergence of genome-scale
metabolic models and metabolomics. Mummichog will continue to
improve as the metabolic network models evolve. We expect this
method to greatly accelerate the application of high throughput
metabolomics. The mummichog software is available at http://atcg.
googlecode.com.
Methods
Cell culture and infectionHuman peripheral blood mononuclear cells (PBMCs) were
isolated from Buffy coats by separation over a Lymphoprep
gradient. CD14+ monocytes were isolated from the PBMCs with
MACS beads (Miltenyi Biotec, Auburn, CA) and cultured for 7
days with 20 ng/ml GM-CSF and 40 ng/ml IL-4 (Peprotech,
Rocky Hill, NJ). MoDCs were then harvested, washed twice and
resuspended in serum-free medium.
MoDCs (2:106) were stimulated in triplicate in 48-well plates in
a 200 mL volume with Yellow Fever virus (M.O.I. of 1), or mock
infected. After 2 hrs, 800 mL of 10% FBS-RPMI was added to all
wells. MoDCs were harvested at 6 hr or 24 hr after infection and
centrifuged. Supernatants were aspirated, and dry cell pellets were
frozen at 280uC. Supernatants of moDC cultures were assayed for
the concentration of IL-6 and TNF using ELISA kits (BD, San
Diego, CA). Three biological replicates were used for LC/MS and
QPCR.
Mass spectrometryFull scan LC/MS (m/z range 85–2000) was performed
essentially as previously described [8]. Cell extracts or superna-
tants were treated with acetonitrile (2:1, v/v) and centrifuged at
14,0006 g for 5 min at 4uC to remove proteins. Samples were
maintained at 4uC in an autosampler until injection. A Thermo
Orbitrap-Velos mass spectrometer (Thermo Fisher, San Diego,
CA) coupled with anion exchange chromatography was used for
data collection, via positive-ion electrospray ionization (ESI).
Metabolites of interest were identified by tandem mass spectrom-
etry on a LTQ-FTMS, where the biological sample, biological
sample spiked in with authentic chemical and authentic chemical
reference were run sequentially. The MS2 and MS3 were done in
the ion trap of the LTQ-FTMS, with an isolation width of 1 amu
and a normalized collision energy of 35 eV.
The LC/MS data were processed with apLCMS program [25]
for feature extraction and quantification. Significant features were
also verified by inspecting the raw data (Figure S5). Features were
removed if their intensity is below 10,000 in every sample class.
Missing intensity values were imputed to 1000. The intensities
were log2 transformed. Low quality features were further filtered
out if their averaged in-class coefficient of variation was greater
than 0.2. Averaged ion intensity over three machine replicates was
used for subsequent analysis. These 7,995 features constituted the
reference list Lref . No normalization was used because total ion
counts in all samples were very similar. Student’s t-test was used to
compare infected samples (at 6 hr) versus mock infections (at 6 hr),
and infected samples (at 6 hr) versus baseline controls (at 0 hr).
Features with pv0:05 in both tests were included in the significant
list Lsig. The feature table, Lref , Lsig and predictions are given in
Dataset S1.
Gene expression by QPCRFor gene expression quantification, mRNA was extracted by
RNeasy Mini Kit (Qiagen) according to manufacturer’s protocol,
where the cell lysate was homogenized by QIAshredder spin
columns. Reverse transcription was performed with SuperScript
III reverse transcriptase and oligo-dT (Invitrogen) according to
manufacturer’s recommendation. Real-time PCR was performed
on a MyiQ Icycler (BioRad), using SYBR Green SuperMix
(Quanta Biosciences). The PCR protocol used 95uC 3 mins; 40
cycles of 95uC 30 seconds and 60uC for 60 seconds. The amplicons
were verified by melting curves. Quantafication was performed by
the DCt method, normalized by b2 microglobulin levels. The
primer sequences are given in Table S2.
Analysis of human urine and yeast dataData on human urinary samples [63] were retrieved from
MetaboLights server [71]. The positive ion feature table for study
‘‘439020’’ contained 14,720 features. A feature is only included if
its ion intensity is above 100,000 in 5 or more samples. This leaves
11,086 features, which consist Lref for this study. Data were
normalized by total ion counts. We next compared the metabolite
difference between females (8 samples of low testosterone
glucuronide level) and males (11 samples of high testosterone
glucuronide level). Lsig is consisted of 524 features (pv0:01 by
student t-test). The original authors annotated 3,689 metabolite
features, and their annotation was used to compare with the
prediction by mummichog.
The yeast data [64] were downloaded from MAVEN website
[32] in mzXML format. Feature extraction was performed in
MAVEN through two approaches: targeted approach and
untargeted approach. The targeted approach used chemical
library from the same lab and produced 177 annotated features,
which corresponded to 101 metabolites. The untargeted approach
extracted 6318 features without annotation. After the same
processing procedure as in our moDC data, Lref contained 5707
features. We thus used mummichog to predict on the untargeted
data, and compared the result to MAVEN annotation. The Lsig
consisted of 426 features that were significantly different between
the prototrophic wild type and the auxotrophic mutant (pv10{4
by student t-test). The yeast metabolic model was compiled from
BioCyc data [11].
Supporting Information
Dataset S1 Metabolomics feature table and mummichogpredictions. This file contains LC/MS Metabolomics feature table
from the moDC experiment, Lsig, Lref and predicted metabolites in
the activity networks of moDC activation. Metabolite predictions on
the human urine data and yeast data are also included.
(ZIP)
Functional Analysis for Metabolomics
PLOS Computational Biology | www.ploscompbiol.org 9 July 2013 | Volume 9 | Issue 7 | e1003123

Figure S1 Many-to-many relationship in m/z feature tometabolite matching. A) Among m/z features in Lref, about
1400 can be matched to various metabolites. B) For the 77
metabolites in the activity network (Figure 3A), on average, about
five metabolites share the same m/z features. Mummichog chooses
the most likely metabolites based on their network activities and
spectral patterns.
(TIF)
Figure S2 Example of module analysis. Five significant
modules were identified (pv0:05, default parameters) in moDC
infected by yellow fever virus for 6 hours. This shows module 1,
with 34 metabolites, p = 5.19E-7. This is one of the figures
automatically generated by mummichog, metabolites colored by
log2 fold change, with connecting enzymes shown as EC numbers.
(TIF)
Figure S3 Tandem mass spectrometry data for the
metabolites in Figure 3B. MS2 on the left and MS3 on the
right. Each run contained sequentially: top) the candidate
metabolite in cell extract, middle) cell extract spiked in with pure
chemical reference, bottom) pure chemical reference alone. MS3
data were also obtained for major MS2 peaks except for Inosine.
Elution peaks of these samples in liquid chromatography were also
matched.
(PDF)
Figure S4 The depletion of arginine and accumulationof citrulline was also observed in moDCs stimulated bydengue virus, but not by LPS. Cells and supernatant were
collect after 6 hours of infection and measured by LC/MS.
Representative of two experiments.
(TIF)
Figure S5 Verification of metabolite quantification.Glutathione is used as an example (m/z 308.0896, M+H[1+]).
Left panel shows intensities of three biological replicates. The
arrows point to the corresponding signals in plots of LC retention
time (x-axis) vs m/z (y-axis), where a large peak is seen in YF17D
sample but missing in Mock sample. In the LC-m/z plots, each dot
represents a raw data point in a single scan; warmer color codes
for higher ion intensity.
(TIF)
Figure S6 Validation of mummichog on the humanurine data set (Roux et al 2012), using metabolic modelfrom BioCyc database. Mummichog predicts a network of 60
metabolites, in which 19 are not found in the original annotation.
Thirty nine of the remaining 41 are agreed to the original
annotation. By enforcing the presence of M+H[+] ion (-z option),
the predicted network contains 43 metabolite. The numbers of
agreed to and not in the original annotation are 39 and 4,
respectively.
(TIF)
Figure S7 The prediction of mummichog is robust fromthe cutoff of input significant features, Lsig. The x-axis
shows the different number of input features by varying p-values.
The 601 features by pv0:05 were presented in the main text, and
are used as reference here. The y-axis shows the number of
metabolites in predicted networks. All blue bars show the number
of overlap metabolites in predicted networks, compared to those
from pv0:05.
(TIF)
Figure S8 Details of module analysis. Using the moDC
data with default parameters, mummichog produces 22 modules
from user data and 2406 random modules by permutation. A)
shows the distribution of all module sizes. B) Black horizontal bars
show the distribution of activity scores from random modules, and
the black line is the fitted Gamma distribution. The red vertical
bars show the activity scores of modules from user data, where
those on the right are more statistically significant. C) and D)
follow the same format as A) and B), but use an alternative
algorithm for module finding [67], which produces 84 modules
from user data and 5097 random modules by permutation.
(TIF)
Figure S9 High resolution copy of Figure 3A.
(TIF)
Table S1 Pathway analysis by mummichog revealed anumber of pathways activated in the infection of moDCsby yellow fever virus. Activities in many of these pathways are
also identified in the significant network modules.
(PDF)
Table S2 Primer sequences and references for quanti-tative PCR.
(PDF)
Acknowledgments
We thank Bill Liang, ViLinh Tran, Raghu Tadagavadi, Rajesh Nair, and
Young-Mi Go for technical assistance.
Author Contributions
Conceived and designed the experiments: SL DPJ BP. Performed the
experiments: SL YP SD FHS NK QAS. Analyzed the data: SL FHS.
Contributed reagents/materials/analysis tools: DPJ BP. Wrote the paper:
SL. Developed mummichog algorithms and software: SL Participated in
software design: FHS QAS DPJ.
References
1. Biswas S, Mantovani A (2012) Orchestration of metabolism by macrophages.
Cell metabolism 15: 432–437.
2. DeBerardinis R, Thompson C (2012) Cellular metabolism and disease: what do
metabolic outliers teach us? Cell 148: 1132–1144.
3. Breitling R, Vitkup D, Barrett M (2008) New surveyor tools for charting
microbial metabolic maps. Nature Reviews Microbiology 6: 156–161.
4. Kaddurah-Daouk R, Kristal B, Weinshilboum R (2008) Metabolomics: a global
biochemical approach to drug response and disease. Annu Rev Pharmacol
Toxicol 48: 653–683.
5. Patti G, Yanes O, Siuzdak G (2012) Metabolomics: the apogee of the omics
trilogy. Nature Reviews Molecular Cell Biology 13: 263–269.
6. Bordbar A, Mo M, Nakayasu E, Schrimpe-Rutledge A, Kim Y, et al. (2012)
Model-driven multi-omic data analysis elucidates metabolic immunomodulators
of macrophage activation. Molecular Systems Biology 8: 558.
7. Kind T, Wohlgemuth G, Palazoglu M, Barupal D, Shahbaz S, et al. (2010)
Managing complexity-how many platforms do we need for metabolomics?
Journal of Biomolecular Techniques 21: S6.
8. Soltow Q, Strobel F, Mansfield K, Wachtman L, Jones D (2011) High-
performance metabolic profiling with dual chromatography-fourier-transform
mass spectrometry (dc-ftms) for study of the exposome. Metabolomics 9: 132–
143.
9. Park Y, Lee K, Soltow Q, Strobel F, Brigham K, et al. (2012) High-performance
metabolic profiling of plasma from seven mammalian species for simultaneous
environmental chemical surveillance and bioeffect monitoring. Toxicology 295:
47–55.
10. Roede J, Park Y, Li S, Strobel F, Jones D (2012) Detailed mitochondrial
phenotyping by high resolution metabolomics. PloS ONE 7: e33020.
11. Caspi R, Altman T, Dreher K, Fulcher C, Subhraveti P, et al. (2012) The
metacyc database of metabolic pathways and enzymes and the biocyc collection
of pathway/genome databases. Nucleic Acids Research 40: D742–D753.
12. Oberhardt M, Palsson B, Papin J (2009) Applications of genome-scale metabolic
reconstructions. Molecular Systems Biology 5: 320.
13. Thiele I, Palsson B (2010) A protocol for generating a high-quality genome-scale
metabolic reconstruction. Nature Protocols 5: 93–121.
Functional Analysis for Metabolomics
PLOS Computational Biology | www.ploscompbiol.org 10 July 2013 | Volume 9 | Issue 7 | e1003123

14. Henry C, DeJongh M, Best A, Frybarger P, Linsay B, et al. (2010) High-
throughput generation, optimization and analysis of genome-scale metabolicmodels. Nature Biotechnology 28: 977–982.
15. Duarte N, Becker S, Jamshidi N, Thiele I, Mo M, et al. (2007) Global
reconstruction of the human metabolic network based on genomic and bibliomicdata. Proceedings of the National Academy of Sciences 104: 1777.
16. Ma H, Sorokin A, Mazein A, Selkov A, Selkov E, et al. (2007) The edinburghhuman metabolic network reconstruction and its functional analysis. Molecular
Systems Biology 3: 135.
17. Livnat Jerby T, Ruppin E (2010) Computational reconstruction of tissue-specificmetabolic models: application to human liver metabolism. Molecular Systems
Biology 6: 401.18. Sigurdsson M, Jamshidi N, Steingrimsson E, Thiele I, Palsson B (2010) A
detailed genome-wide reconstruction of mouse metabolism based on humanrecon 1. BMC Systems Biology 4: 140.
19. Bordbar A, Feist A, Usaite-Black R, Woodcock J, Palsson B, et al. (2011) A
multi-tissue type genome-scale metabolic network for analysis of whole-bodysystems physiology. BMC Systems Biology 5: 180.
20. Agren R, Bordel S, Mardinoglu A, Pornputtapong N, Nookaew I, et al. (2012)Reconstruction of genome-scale active metabolic networks for 69 human cell
types and 16 cancer types using init. PLoS Computational Biology 8: e1002518.
21. Plata G, Hsiao T, Olszewski K, Llinas M, Vitkup D (2010) Reconstruction andux-balance analysis of the plasmodium falciparum metabolic network. Molecular
Systems Biology 6: 408.22. Deo R, Hunter L, Lewis G, Pare G, Vasan R, et al. (2010) Interpreting
metabolomic profiles using unbiased pathway models. PLoS ComputationalBiology 6: e1000692.
23. Dunn W, Erban A, Weber R, Creek D, Brown M, et al. (2012) Mass appeal:
metabolite identification in mass spectrometry-focused untargeted metabolo-mics. Metabolomics 9: 44–66.
24. Smith C, Elizabeth J, O’Maille G, Abagyan R, Siuzdak G (2006) Xcms:processing mass spectrometry data for metabolite profiling using nonlinear peak
alignment, matching, and identification. Analytical chemistry 78: 779–787.
25. Yu T, Park Y, Johnson J, Jones D (2009) aplcmsadaptive processing of high-resolution lc/ms data. Bioinformatics 25: 1930–1936.
26. Pluskal T, Castillo S, Villar-Briones A, Oresic M (2010) Mzmine 2: modularframework for processing, visualizing, and analyzing mass spectrometry-based
molecular profile data. BMC bioinformatics 11: 395.27. Xia J, Wishart D (2010) Metpa: a web-based metabolomics tool for pathway
analysis and visualization. Bioinformatics 26: 2342–2344.
28. Cottret L, Wildridge D, Vinson F, Barrett M, Charles H, et al. (2010)Metexplore: a web server to link metabolomic experiments and genome-scale
metabolic networks. Nucleic acids research 38: W132–W137.29. Gao J, Tarcea V, Karnovsky A, Mirel B, Weymouth T, et al. (2010) Metscape: a
cytoscape plug-in for visualizing and interpreting metabolomic data in the
context of human metabolic networks. Bioinformatics 26: 971–973.30. Xia J, Wishart D (2011) Web-based inference of biological patterns, functions
and pathways from metabolomic data using metaboanalyst. Nature Protocols 6:743–760.
31. Kastenmuller G, Romisch-Margl W, Wagele B, Altmaier E, Suhre K (2010)metap-server: a web-based metabolomics data analysis tool. Journal of
Biomedicine and Biotechnology 2011.
32. Melamud E, Vastag L, Rabinowitz J (2010) Metabolomic analysis andvisualization engine for lcms data. Analytical chemistry 82: 9818–9826.
33. Kind T, Fiehn O (2006) Metabolomic database annotations via query ofelemental compositions: mass accuracy is insufficient even at less than 1 ppm.
BMC bioinformatics 7: 234.
34. Kind T, Fiehn O (2007) Seven golden rules for heuristic filtering of molecularformulas obtained by accurate mass spectrometry. BMC bioinformatics 8: 105.
35. Brown M, Dunn W, Dobson P, Patel Y, Winder C, et al. (2009) Massspectrometry tools and metabolite-specific databases for molecular identification
in metabolomics. Analyst 134: 1322–1332.
36. Wishart D, Knox C, Guo A, Eisner R, Young N, et al. (2009) Hmdb: aknowledgebase for the human metabolome. Nucleic Acids Research 37: D603–
D610.37. Tautenhahn R, Cho K, Uritboonthai W, Zhu Z, Patti G, et al. (2012) An
accelerated workow for untargeted metabolomics using the metlin database.Nature Biotechnology 30: 826–828.
38. Kanehisa M, Goto S, Hattori M, Aoki-Kinoshita K, Itoh M, et al. (2006) From
genomics to chemical genomics: new developments in KEGG. Nucleic AcidsResearch 34: D354.
39. Li S, Pozhitkov A, Ryan R, Manning C, Brown-Peterson N, et al. (2010)Constructing a fish metabolic network model. Genome Biology 11: R115.
40. Ravasz E, Somera A, Mongru D, Oltvai Z, Barabasi A (2002) Hierarchical
organization of modularity in metabolic networks. Science 297: 1551–1555.41. Ma H, Zhao X, Yuan Y, Zeng A (2004) Decomposition of metabolic network
into functional modules based on the global connectivity structure of reactiongraph. Bioinformatics 20: 1870–1876.
42. Newman M, Girvan M (2004) Finding and evaluating community structure innetworks. Physical Review E 69: 26113.
43. Newman M (2006) Modularity and community structure in networks.Proceedings of the National Academy of Sciences 103: 8577–8582.
44. Berriz G, King O, Bryant B, Sander C, Roth F (2003) Characterizing gene setswith funcassociate. Bioinformatics 19: 2502–2504.
45. Hosack D, Dennis Jr G, Sherman B, Lane H, Lempicki R, et al. (2003)Identifying biological themes within lists of genes with ease. Genome Biol 4:
R70.
46. Paul W (2011) Bridging innate and adaptive immunity. Cell 147: 1212–1215.
47. Amit I, Garber M, Chevrier N, Leite A, Donner Y, et al. (2009) Unbiased
reconstruction of a mammalian transcriptional network mediating pathogenresponses. Science 326: 257.
48. Pulendran B, Li S, Nakaya H (2010) Systems vaccinology. Immunity 33: 516–529.
49. Querec T, Bennouna S, Alkan S, Laouar Y, Gorden K, et al. (2006) Yellow fevervaccine yf-17d activates multiple dendritic cell subsets via tlr2, 7, 8, and 9 to
stimulate polyvalent immunity. The Journal of experimental medicine 203: 413–
424.
50. Querec T, Akondy R, Lee E, Cao W, Nakaya H, et al. (2009) Systems biology
approach predicts immunogenicity of the yellow fever vaccine in humans.Nature Immunology 10: 116–125.
51. Pulendran B (2009) Learning immunology from the yellow fever vaccine: innateimmunity to systems vaccinology. Nature Reviews Immunology 9: 741–747.
52. Lembo D, Gribaudo G, Hofer A, Riera L, Cornaglia M, et al. (2000) Expression
of an altered ribonucleotide reductase activity associated with the replication ofmurine cytomegalovirus in quiescent fibroblasts. Journal of virology 74: 11557–
11565.
53. Gribaudo G, Riera L, Lembo D, De Andrea M, Gariglio M, et al. (2000) Murine
cytomegalovirus stimulates cellular thymidylate synthase gene expression inquiescent cells and requires the enzyme for replication. Journal of virology 74:
4979–4987.
54. Vastag L, Koyuncu E, Grady S, Shenk T, Rabinowitz J (2011) Divergent effects
of human cytomegalovirus and herpes simplex virus-1 on cellular metabolism.
PLoS Pathogens 7: e1002124.
55. Peterson J, Herzenberg L, Vasquez K, Waltenbaugh C (1998) Glutathione levels
in antigen-presenting cells modulate th1 versus th2 response patterns.Proceedings of the National Academy of Sciences 95: 3071.
56. Angelini G, Gardella S, Ardy M, Ciriolo M, Filomeni G, et al. (2002) Antigen-presenting dendritic cells provide the reducing extracellular microenvironment
required for t lymphocyte activation. Proceedings of the National Academy of
Sciences 99: 1491–1496.
57. Yan Z, Garg S, Kipnis J, Banerjee R (2009) Extracellular redox modulation by
regulatory t cells. Nature chemical biology 5: 721–723.
58. Bronte V, Zanovello P (2005) Regulation of immune responses by l-arginine
metabolism. Nature Reviews Immunology 5: 641–654.
59. Morris Jr S (2010) Arginine: master and commander in innate immune
responses. Science Signalling 3: pe27.
60. Kopincova J, Puzserova A, Bernatova I (2011) Biochemical aspects of nitric
oxide synthase feedback regulation by nitric oxide. Interdisciplinary toxicology
4: 63–68.
61. Serbina N, Salazar-Mather T, Biron C, Kuziel W, Pamer E (2003) Tnf/inos-
producing dendritic cells mediate innate immune defense against bacterialinfection. Immunity 19: 59–70.
62. Tong L, Heim R, Wu S (2011) Nitric oxide: A regulator of eukaryotic initiationfactor 2 kinases. Free Radical Biology and Medicine 50: 1717–1725.
63. Roux A, Xu Y, Heilier JF, Olivier MF, Ezan E, et al. (2012) Annotation of thehuman adult urinary metabolome and metabolite identification using ultra high
performance liquid chromatography coupled to a ltq-orbitrap mass spectrom-
eter. Analytical Chemistry 84: 6429–37.
64. Clasquin MF, Melamud E, Singer A, Gooding JR, Xu X, et al. (2011)
Riboneogenesis in yeast. Cell 145: 969–980.
65. Smith C, Maille G, Want E, Qin C, Trauger S, et al. (2005) Metlin: a metabolite
mass spectral database. Therapeutic drug monitoring 27: 747.
66. Cui Q, Lewis I, Hegeman A, Anderson M, Li J, et al. (2008) Metabolite
identification via the madison metabolomics consortium database. Nature
biotechnology 26: 162–164.
67. Rivera CG, Vakil R, Bader JS (2010) Nemo: network module identification in
cytoscape. BMC bioinformatics 11: S61.
68. Dittrich MT, Klau GW, Rosenwald A, Dandekar T, Muller T (2008) Identifying
functional modules in protein–protein interaction networks: an integrated exactapproach. Bioinformatics 24: i223–i231.
69. Rogers S, Scheltema RA, Girolami M, Breitling R (2009) Probabilisticassignment of formulas to mass peaks in metabolomics experiments. Bioinfor-
matics 25: 512–518.
70. Gaquerel E, Kuhl C, Neumann S (2013) Computational annotation of plantmetabolomics profiles via a novel network-assisted approach. Metabolomics doi:
10.1007/s11306-013-0504-2.
71. Haug K, Salek RM, Conesa P, Hastings J, de Matos P, et al. (2013)
Metabolightsan open-access general-purpose repository for metabolomics studiesand associated meta-data. Nucleic Acids Research 41: D781–D786.
Functional Analysis for Metabolomics
PLOS Computational Biology | www.ploscompbiol.org 11 July 2013 | Volume 9 | Issue 7 | e1003123
Copyright © 2022 FDOKUMEN