Basic Principles in Proteomics & Metabolomics - Weatherall ...


Reiner Westermeier, Tom Naven,
and Hans-Rudolf Hçpker
Proteomics in Practice
Proteomics in Practice. A Guide to Successful Experimental Design 2nd Ed.Reiner Westermeier, Tom Naven, and Hans-Rudolf HçpkerCopyright � 2008 WILEY-VCH Verlag GmbH & Co. KGaA, WeinheimISBN: 978-3-527-31941-1

Related title from Wiley-VCH
Hamacher, M., Marcus, K., St�hler, K., van Hall, A., Warscheid, B.,Meyer, H. E. (eds.)
Proteomics in drug Research
2006
ISBN 978-3-527-31226-9
Liebler, D. C., Petricoin, E. F., Liotta, L. A. (eds.)
Proteomics in Cancer Research
2005
ISBN 9780-471-44476-3
Hamdan, M. H., Righetti, P. g., Desiderio, D. M., Nibbering, N. M.
Proteomics TodayProtein Assessment and Biomarkers Using Mass Spectrometry,2D Electrophoresis, and Microarray Technology
2005
ISBN 978-0-471-64817-8
Sanchez, J.-C., Corthals, G. L., Hochstrasser, D. F. (eds.)
Biomedical Applications of Proteomics
2004
ISBN 978-3-527-30807-1

Reiner Westermeier, Tom Naven, andHans-Rudolf Hçpker
Proteomics in Practice
A Guide to Successful Experimental Design
Second, Completely Revised Edition

The Authors
Dr. Reiner WestermeierGE Healthcare Life SciencesOskar-Schlemmer-Str. 1180807 M�nchenGermany
Dr. Tom NavenGE Healthcare UK LimitedPollards WoodNightingales LaneChalfont St GilesBucks HP8 4SPUnited Kingdom
Hans-Rudolf HçpkerWeberweg 679183 WaldkirchGermany
& All books published by Wiley-VCH arecarefully produced. Nevertheless, authors,editors, and publisher do not warrant theinformation contained in these books,including this book, to be free of errors.Readers are advised to keep in mind thatstatements, data, illustrations, proceduraldetails or other items may inadvertently beinaccurate.
Library of Congress Card No.:applied for
British LibraryCataloguing-in-PublicationDataAcatalogue record for this book is availablefrom theBritish Library.
Bibliographic information published by theDeutsche NationalbibliothekDie Deutsche Nationalbibliothek lists thispublication in the Deutsche Nationalbiblio-grafie; detailed bibliographic data are avail-able on the Internet at <http://dnb.d-nb.de>.
� 2008 Wiley-VCH Verlag-GmbH & Co.KGaA, Weinheim
All rights reserved (including those oftranslation in other languages). No part ofthis book may be reproduced in any form –by photoprinting, microfilm, or any othermeans – nor transmitted or translated into amachine language without written permis-sion from the publisher. Registered names,trademarks, etc. used in this book, evenwhen not specifically marked as such, arenot to be considered unprotected by law.
Composition K�hn & Weyh, SoftwareGmbH, FreiburgPrinting Betz-Druck GmbH, DarmstadtBookbinding Litges & Dopf GmbH,Heppenheim
Printed in the Federal Republic of GermanyPrinted on acid-free paper.
ISBN 978-3-527-31941-1

V
Preface XI
Foreword XIII
Abbreviations, Symbols, Units XV
Introduction 1
1 History 1
2 Critical Points 8
2.1 Challenges of the Protein Samples 8
2.1 Challenges of the Analysis Systems 11
3 Proteomics Strategies 12
3.1 Proteome Mapping 12
3.2 Differential Analysis 12
3.3 Time Point Experiments 13
3.4 Verification of Targets or Biomarkers 13
3.5 Integration of Results into Biological Context 13
3.6 Systems Biology 13
4 Concept of Experimental Planning 14
4.1 Biological Replicates 14
4.2 Pooling of Samples: Yes or No? 14
4.3 Pre-fractionation of Samples: Yes or No? 14
4.4 Which is the Best Workflow to Start With? 15
Part I: Proteomics Technology
1 Electrophoretic Techniques 19
1.1 The Principle of Electrophoresis and Some MethodologicalBackground 19
1.1.1 Free Flow Electrophoretic Methods 20
1.1.2 Gels for Electrophoretic Techniques 21
1.1.3 Electroendosmosis Effects 21
1.2 Polyacrylamide Gel Electrophoresis 22
Contents
Proteomics in Practice. A Guide to Successful Experimental Design 2nd Ed.Reiner Westermeier, Tom Naven, and Hans-Rudolf HçpkerCopyright � 2008 WILEY-VCH Verlag GmbH & Co. KGaA, WeinheimISBN: 978-3-527-31941-1

VI
1.2.1 The Polyacrylamide Gel 22
1.2.2 SDS Polyacrylamide Gel Electrophoresis 27
1.2.3 Blue Native Electrophoresis 32
1.2.4 Cationic Detergent Electrophoresis 34
1.3 Blotting 35
1.3.1 Electrophoretic Transfer 36
1.3.2 Protein Detection on the Membrane 36
1.4 Isoelectric Focusing 38
1.4.1 Theoretical Background 39
1.4.2 Preparation of IEF Gels 44
1.4.3 Isoelectric Focusing in Proteomics 45
1.5 Two-dimensional Electrophoresis 53
1.5.1 Sample Preparation 53
1.5.2 Pre-labeling of Proteins for Difference Gel Electrophoresis 68
1.5.3 First Dimension: Isoelectric Focusing in IPG Strips 77
1.5.4 Second Dimension: SDS Electrophoresis 100
1.5.5 Detection of Protein Spots 119
1.6 Image Analysis 125
1.6.1 Image Acquisition 125
1.6.2 Image Analysis and Evaluation 129
1.6.3 Use of 2-D Electrophoresis Data 137
1.7 Spot Handling 137
1.7.1 Spot Picking 139
1.7.2 Protein Cleavage 141
2 Liquid Chromatography Techniques 151
2.1 Basic Principles of Important Liquid ChromatographyTechniques 151
2.1.1 Ion Exchange Chromatography 153
2.1.2 Reversed Phase Chromatography 162
2.1.3 Affinity Chromatography 167
2.1.4 Gel Filtration 172
2.2 Strategic Approach and General Applicability 174
2.3 Liquid Chromatography Techniques and Applications in ProteomeAnalysis 176
2.3.1 Peptide Separation 176
2.3.2 2DLC Peptide Separation 179
2.3.3 Affinity Chromatography and LC-MS/MS 187
2.3.4 Protein Pre-fractionation 189
2.4 Practical Considerations and Application of LC-based ProteinPre-fractionation 194
2.4.1 Sample Extraction and Preparation 196
2.4.2 Experimental Setup 197
2.4.3 Ion Exchange Chromatography andProtein Pre-fractionation 198
Contents

VII
2.4.4 Reversed Phase Chromatography andProtein Pre-fractionation 205
2.4.5 Fraction Size and Number of Fractions 210
2.5 Critical Review and Outlook 211
3 Mass Spectrometry 215
3.1 Ionization 218
3.1.1 Matrix Assisted Laser Desorption Ionization 218
3.1.2 Electrospray Ionization 222
3.2 Ion Separation 225
3.2.1 Time-of-Flight Analyzer 225
3.2.2 Triple Quadrupole Analyzer 227
3.2.3 Quadrupole Ion Trap 228
3.2.4 Quadrupole Time-of-Flight 230
3.2.5 Hybrid Triple Quadrupole Linear Ion Trap 231
3.2.6 TOF/TOF Analyzer 231
3.2.7 Fourier Transform Ion Cyclotron 232
3.2.8 Orbitrap 233
3.3 Generating MS Data for Protein Identification 233
3.3.1 Peptide Mass Fingerprint 234
3.3.2 Peptide Mass Fingerprint Combined With CompositionInformation 237
3.3.3 Peptide Mass Fingerprint Combined With Partial SequenceInformation 238
3.3.4 Tandem Mass Spectrometry 242
3.4 Protein Characterization 258
3.4.1 Phosphorylation Analysis 259
3.4.2 Affinity Chromatography 260
3.4.3 Chemical Derivatization 261
3.4.4 Glycosylation 263
3.5 Protein Quantification Using Mass Spectrometry 264
3.5.1 Stable Isotope Labeling Approaches 264
3.5.2 Isotope-coded Affinity Tags 265
3.5.3 Stable Isotope Labeling with Amino Acids in Cell Culture 266
3.5.4 AQUA 267
3.5.5 iTRAQ 267
3.5.6 Non-labeling Software Approaches 268
3.6 MS Strategies 271
3.6.1 Bottom up Approach 271
3.6.2 Top down Approach 272
4 Functional Proteomics: Studies of Protein–Protein Interactions 273
4.1 Non-immunological Methods 273
4.1.1 Separation of Intact Multi-protein Complexes 273
4.1.2 Probing with Interaction Partners 273
Contents

4.1.3 Surface Plasmon Resonance 274
4.2 Antibody-based Techniques 275
4.2.1 Western Blotting and Dot Blots 275
4.2.2 Protein Microarrays 276
Part II: Practical Manual of Proteome Analysis 279
Equipment, Consumables, Reagents 281
Step 1: Sample Preparation 287
Step 2: Fluorescence Difference Gel Electrophoresis 299
Step 3: Isoelectric Focusing 309
Step 4: SDS Polyacrylamide Gel Electrophoresis 323
Step 5: Scanning of Gels Containing Pre-labeled Proteins 357
Step 6: Staining of Gels 361
Step 7: Image Analysis and Evaluation of DIGE Gels 373
Step 8: Spot Excision 383
Step 9: Sample Destaining 387
Step 10: Protein Digestion 389
Step 11: Microscale Desalting and Concentrating of Sample 393
Step 12: Chemical Derivatization of the Peptide Digest 397
Step 13: MS Analysis 399
Step 14: Calibration of MALDI-ToF MS 403
Step 15: Preparing for a Database Search 407
Part III: Trouble Shooting 411
1 Two-dimensional Electrophoresis 413
1.1 Sample Preparation 413
1.2 Isoelectric focusing in IGPG strips 414
1.3 SDS PAGE 416
1.4 Staining 417
ContentsVIII

1.5 DIGE Fluorescence Labeling 418
1.6 Results in 2-D Electrophoresis 421
2 Mass Spectrometry 429
References 433
Glossary of Terms 461
Index 473
Legal Statements 481
Contents IX


XI
More than a decade after the beginning of the “Proteomics Rush” themethodological and systematic approaches for the analysis of pro-teomes have evolved from being holistic and non-hypothesis drivento phenomenon-based, dedicated protein studies. Importantly andcorrectly so, it has been widely reported that it is very difficult toobtain all necessary information from one single workflow, e.g. 2-Dgel-mass spectrometry; and that different workflows deliver comple-mentary information rather than similar, overlapping results. There-fore it is necessary to make additions to the manuscript for the sec-ond edition of Proteomics in Practice and include a comprehensivedescription of chromatography methods, written mainly by Hans-Rudolf Hçpker.
The objective of the second edition of Proteomics in Practice is toprovide the reader with a comprehensive reference and practicalguide for the successful analysis of proteins by 2-D electrophoresis,chromatography and mass spectrometry. The book includes a theoret-ical introduction into the most-applied methodologies, a practical sec-tion complete with worked examples, a unique troubleshooting sec-tion and a thorough reference list to guide the interested reader tofurther details.
The theoretical section introduces the fundamentals behind thetechniques applied in proteomics and describes how the techniquesare used for proteome analysis. However, the practical aspects of thebook focus on 2D-DIGE technology and mass spectrometry. 2-DDIGE is increasingly cited for studying differential protein expressionand, as such, a considerable section of the text is dedicated to thistechnique. The core components of 2D-DIGE, sample preparationand labeling, 2-D electrophoresis and image analysis are addressed inconsiderable detail. Further, the importance of mass spectrometry,sequence databases and search engines for successful protein identi-fication are discussed.
The practical section of the book is, in principle, a course manual,which has been optimized over a number of years. The experimental
Preface
Proteomics in Practice. A Guide to Successful Experimental Design 2nd Ed.Reiner Westermeier, Tom Naven, and Hans-Rudolf HçpkerCopyright � 2008 WILEY-VCH Verlag GmbH & Co. KGaA, WeinheimISBN: 978-3-527-31941-1

Preface
section describes how to achieve consistent, reliable and reproducibleresults using a single instrumental setup, instead of presenting awide choice of techniques and instruments.
Fundamentally, the book celebrates the attention to detail that isnecessary to perform proteome analysis routinely, with confidence.
As the technical developments in this field are proceeding quickly,the contents of the book will need to be updated every few months.The reader can have access to a web-site at http://www.wiley-vch.de/books/info/3-527-31941-7/index.html/, which will contain theupdated chapters and recipes.
The authors would like to thank Professor Richard Simpson, LICRin Melbourne, for writing the foreword, and Dr. Axel Parbel, GEHealthcare in Munich, for critical reading of the manuscript and de-livering valuable contributions to the LC MS sections.
Reiner WestermeierTom NavenHans-Rudolf Hçpker January 2008
Further thanks to:Philippe BogardJosef B�llesMatrixscience.comStaffan RenlundG�nter ThesselingJenny Samskoog
XII

XIII
Biological macromolecules are the main actors in the makeup of life.To understand biology and medicine at a molecular level, we need tovisualize the activity and interplay of large macromolecules such asproteins. To study protein molecules, the principles of their separa-tion, quantitation, and determination of their individual characteris-tics had to be developed. One of the most important separation tech-niques used today for the characterization and analysis of proteins iselectrophoresis: a separation technique involving the movement ofcharged species through a matrix under the influence of an appliedelectric field. In 1948, the Nobel Prize in Chemistry was awarded toArne Tiselius “for his research on electrophoresis and adsorptionanalysis, especially for his discoveries concerning the complex natureof the serum proteins”. This acknowledgement followed his seminalwork in 1937, which led to the development of an apparatus purpo-sely designed for the separation of serum proteins – the Tiselius mov-ing-boundary apparatus. Explosive developments in electrophoresisoccurred in the 1940s and 1950s when, in addition to zone electro-phoresis, two other electrophoretic techniques emerged: isolectricfocusing and isotachophoresis. Concomitant with these discoverieswas the development of the matrices employed for these techniques(e.g., paper, polymer gels, such as agar or starch, and in 1959, polyac-rylamide gels), each yielding distinct advantages for different sam-ples. Of these, acrylamide gel support media emerged as the mostwidely used in the separation of proteins, in particular SDS-polyacryl-amide gel electrophoresis (SDS-PAGE) and two-dimensional gel elec-trophoresis, independently discovered in 1975 by Joachim Klose andPatrick O'Farrell. Today, electrophoresis still remains the seminaltechnique in the armory of methods that biologists apply to proteinseparation and characterization problems.
More and more, as students and experienced researchers from dif-ferent disciplines delve into intricate biological questions that requireprotein chemistry input, they are confronted with the pressing needto learn fundamental protein separation methods and techniques.
Foreword
Proteomics in Practice. A Guide to Successful Experimental Design 2nd Ed.Reiner Westermeier, Tom Naven, and Hans-Rudolf HçpkerCopyright � 2008 WILEY-VCH Verlag GmbH & Co. KGaA, WeinheimISBN: 978-3-527-31941-1

Foreword
Often, finding suitable resources to accomplish this task may presentas big a challenge as mastering the subject field itself. In 2002, ReinerWestermeier and Tom Naven accomplished this formidable task bycondensing background information, electrophoretic theory, didacticprotocols, complete source lists for the tested materials, practical tips,and information resources into a single volume: Proteomics in Prac-tice – A Laboratory Manual of Proteome Analysis. Of immense valueare the sections that cover sample preparation (considered the“Achilles’ heel” of proteomics) and the development of purificationstrategies. Given the ever-broadening landscape of proteomic tech-nique development, Reiner Westermeier and his coauthors TomNaven and Hans-Rudolf Hçpker have now completely rewritten mostparts of the First Edition according to the new developments whichhave happened since 2002.
Proteomics in Practice – A Guide to Successful ExperimentalDesign (Second, completely revised edition) by Reiner Westermeier,Tom Naven and Hans-Rudolf Hçpker is an invaluable informationresource both for the experienced protein chemist venturing into cut-ting-edge electrophoretic separation methodologies tailored for amass spectrometric protein identification endpoint and for research-ers from diverse biological fields who are novices to analytical proteinchemistry. This volume represents an essential tool for every laborato-ry involved in contemporary proteomics research.
Richard SimpsonMember, Ludwig Institute for Cancer Research, MelbourneProfessor, University of Melbourne
XIV

XV
1D electrophoresis One-dimensional electrophoresis2D electrophoresis Two-dimensional electrophoresis1D-LC One-Dimensional liquid chromatography2D-LC Two-Dimensional liquid chromatography12C Monoisotopic peak in a peptide isotopic
envelope
A AmpereAC Affinity chromatographyA,C,G,T Adenine, cytosine, guanine, thymineAEBSF Aminoethyl benzylsulfonyl fluorideAIEX Anion exchange� �ngstrçmANOVA Analysis of varianceAPI Atmospheric pressure ionizationAPS Ammonium persulfateAsn-Xxx-Ser/Thr N-linked glycosylation sequon,
where Asn= Asparagine, Ser = Serine, andThr = Threonine
AU Absorbance units
16-BAC Benzyldimethyl-n-hexadecylammoniumchloride
BAC BisacryloylcystamineBis N, N¢-methylenebisacrylamideBLAST Basic local alignment search toolBN Page Blue native polyacrylamide gel electrophoresisbp Base pairBPB Bromophenol blueBSA Bovine serum albumin
C Crosslinking factor (%)CAF Chemically assisted fragmentation
Abbreviations, Symbols, Units
Proteomics in Practice. A Guide to Successful Experimental Design 2nd Ed.Reiner Westermeier, Tom Naven, and Hans-Rudolf HçpkerCopyright � 2008 WILEY-VCH Verlag GmbH & Co. KGaA, WeinheimISBN: 978-3-527-31941-1

Abbreviations, Symbols, Units
CAM Co-analytical modificationCAPS 3-(cyclohexylamino)-propanesulfonic acidCBB Coomassie brilliant blueCCD Charge-coupled deviceCF ChromatofocusingCHAPS 3-(3-cholamidopropyl)dimethylammonio-1-
propane sulfonateCIEX Cation exchangeCE Capillary electrophoresisCID Collision induced dissociationconc ConcentratedCM CarboxylmethylCMOS Complementary metal oxide semiconductorCMW Collagen molecular weight markerconst. ConstantCSF Cerebrospinal fluidCTAB Cetyltrimethylammonium bromideCV Column volume
Da DaltonDALPC Direct analysis of protein complexesDB DatabaseDBM DiazobenzyloxymethylDDRT Differential display reverse transcriptionDEA DiethanolamineDEAE DiethylaminoethylDGGE Denaturing gradient gel electrophoresis2,5-DHB 2,5-dihydroxybenzoic acidDIGE Difference gel electrophoresisDisc DiscontinuousDMF Dimethyl formamideDMSO DimethylsulfoxideDNA Desoxyribonucleic aciddpi dots per inchDTE DithioerythreitolDTT Dithiothreitol
E Field strength in V/cmECD Electron capture dissociationEDTA Ethylenediaminetetraacetic acidESI Electrospray ionizationEST Expressed sequence tag
FAB Fast atom bombardmentFDR False discovery rate
XVI

FT-ICR Fourier transform – Ion cyclotron resonance
GF Gel filtrationGLP Good laboratory practiceGMP Good manufacturing practice
h HourH3PO4 Phosphoric acidHCCA a-cyano-4-hydroxycinnamic acidHED HydroxyethyldisulfideHeNe Helium neonHEPES N-2-hydroxyethylpiperazine-N¢-2-ethanane-
sulfonic acidHFBA Heptafluorobutyric acidHMW High Molecular WeightHPLC High Performance Liquid ChromatographyHUPO Human Proteome Organization
I Current (A, mA)ICAT Isotope coded affinity tagsi.d. Internal diameterID IdentificationIEF Isoelectric focusingIEP Isoelectric pointIEX Ion exchangeIgG Immunoglobulin GIMAC Immobilized metal affinity chromatographyIP ImmunoprecipitationIPAS Intact protein analysis systemIPG Immobilized pH gradientsIRMPD Infra red multiphoton dissociationITP Isotachophoresis
kB KilobasekDa Kilodalton
L LiterLC Liquid chromatographyLC-MS/MS Liquid chromatography tandem mass
spectrometryLMW Low molecular weightLOD Limit of detectionLWS Laboratory workflow system
XVIIAbbreviations, Symbols, Units

Abbreviations, Symbols, Units
M massmA MilliampereMALDI Matrix assisted laser desorption ionizationMDLC Multidimensional liquid chromatographymin Minutemol/L Molecular mass per litermr Relative electrophoretic mobilitymRNA messenger RNAMS Mass spectrometryMSn Multistage tandem mass spectrometry where n
is greater than 2MS/MS Tandem mass spectrometryMr Relative molecular massMudPIT Multi dimensional protein identification
technologym/z mass/charge ratio (x-axis in a mass spectrum)
Nonidet Non-ionic detergentNEPHGE Non equilibrium pH gradient electrophoresisNHS N-hydroxy succinimideNPS Non-porous silicaNR Non-redundantNSE Neuron-specific enolaseNTA Nitrilotriacetic acid
O.D. Optical density
P Power (W)PAG Polyacrylamide gelPAGE Polyacrylamide gel electrophoresisPAGIEF Polyacrylamide gel isoelectric focusingPBS Phosphate-buffered salinePC Peak capacityPEG Polyethylene glycolPEEK Polyetherether ketonePFPA Pentafluoroproprionic acidpI Isoelectric pointpK value Dissociation constantPMF Peptide mass fingerprintPMSF Phenylmethyl-sulfonyl fluoridePPA PiperidinopropionamidePPF Protein pre-fractionationppm Parts per million (measure of mass accuracy)PSA Prostate-specific antigenPSD Post-source decay
XVIII

Abbreviations, Symbols, Units
PTM Post-translational modificationPVC PolyvinylchloridePVDF Polyvinylidene difluoride
QTOF quadrupole time-of-flight
r Molecular radiusRf value Relative distance of migrationRm Relative electrophoretic mobilityRNA Ribonucleic acidRP Reversed PhaseRPC Reversed phase chromatographyrpm Revolutions per minuteRuBPS Ruthenium II tris (bathophenanthroline
disulfonate)
s SecondSAX Strong anion exchangeSCX Strong cation exchangeSDS Sodium dodecyl sulfateSILAC Stable isotope labeling of amino acids in cell
cultureS/N Signal/noise ratioSOP Standard operation procedureSP Sulfopropyl
T Total acrylamide concentration (%)t Time (h, min, s)TAP Tandem affinity purificationTBP TributylphosphineTBS Tris-buffered salineTCA Trichloroacetic acidTCEP Tris(2-carboxyethyl) phosphineTEMED N,N,N¢,N¢-tetramethylethylenediamineTFA Trifluoroacetic acidTHPP Tris(hydroxypropyl)phosphineTiO2 Titanium dioxideTNF Tumor necrose factorTOF Time of flightTricine N,tris(hydroxymethyl) methyl glycineTris Tris(hydroxymethyl) aminoethane
U VoltUV Ultraviolet
XIX

Abbreviations, Symbols, Units
V Volume (L)v Speed of migation (m/s)v/v Volume per volume
W Wattw/v Weight per volume (mass concentration)
ZiO2 Zirconium dioxide
XX

1
Introduction
In a living cell, most activities are performed by proteins. Thereforeproteins are the subject of intense research in life science. “Proteo-mics” is the study of quantitative changes of protein expression levelsand their application to drug discovery, diagnostics and therapy.Thereby it is important to apply the correct strategy to discoverinduced biological changes against the background of inherent biolo-gical variations of the sample sources.Proteomics research has many different application areas: Pharma-
ceutical companies search for faster identification of new drug targetsin transformed cell lines or diseased tissues. Also the validation ofthe detected targets, in vitro and in vivo toxicology studies, and checksfor side effects can be performed with this approach. Clinicalresearchers want to compare normal versus disease samples, dis-eased versus treated samples, find molecular markers in body fluidsfor diagnosis and prognosis, monitor diseases and their treatments,determine and characterize post-translational modifications. In clini-cal chemistry it would be interesting to subtype individuals to predictresponse to therapy. Biologists study basic cell functions and molecu-lar organizations. Another big field is microbiology for variousresearch areas. Proteomics is also applied for plant research for manydifferent purposes, for instance for breeding plants of higher bacter-ial, heat, cold, drought, and other resistances, increasing the yield ofcrop and many more.
1History
The original definition of the “Proteome” analysis means “The analy-sis of the entire PROTEin complement expressed by a genOME, or bya cell or tissue type” (Wasinger et al. 1995). Originally the technolo-gies behind proteome analysis were two-dimensional electrophoresisand identification of proteins by subsequent MALDI mass spectrome-
Proteomics in Practice. A Guide to Successful Experimental Design 2nd Ed.Reiner Westermeier, Tom Naven, and Hans-Rudolf HçpkerCopyright � 2008 WILEY-VCH Verlag GmbH & Co. KGaA, WeinheimISBN: 978-3-527-31941-1
Wasinger VC, Cordwell SJ,Cerpa-Poljak A, Yan JX, GooleyAA, Wilkins MR, Duncan MW,Harris R, Williams KL,Humphery-Smith I. Electro-phoresis 16 (1995) 1090–1094.

Introduction2
try with peptide mass fingerprinting. Therefore the proteins spots ofinterest were picked from the gel and digested with trypsin. In caseof failure of identification the peptide mixtures were submitted tosequencing by tandem mass spectrometry. Although the concept ofProteome analysis is older than the phrase, it only began to becomewidely employed, because several prerequisites came real at the sametime:
. Availability of genomic sequence information
. Development of novel techniques of mass spec-trometry.
. Availability of computing power, memory, anddatabase accessibility.
. Improvement of separation technologies.
Furthermore it became obvious that the genomic sequence and pro-tein function cannot be directly correlated: Co- and post-translationalprotein modifications cannot be predicted from the genomesequence. And it is known, they play a very important role in causingdiseases. However, the DNA sequence can be “in silico” translatedinto the protein sequence, and therefore genome databases can beused for identification.As an example a plot of the molecular masses versus the isoelectric
points of the theoretically expressed proteins of the yeast genome isshown in Figure 1. There are many reasons, why this picture looksvery different from the result of a 2-D electrophoresis of a yeast cellextract (see Figure 2):
Fig. 1: Theoretical two-dimensional map of masses and isoelectricpoints calculated from the protein sequences which have been “in silico”translated from the open reading frames of the yeast genome(from Wildgruber et al. 2000).
There are more definitions tofind. Often they are linked tothe application area.
The theoretical 2-D maps ofother organisms look in prin-ciple similar; they differ mainlyin the complexity.
Wildgruber R, Harder A, Ober-maier C, Boguth G, Weiss W,Fey SJ, Larsen PM, Gçrg A.Electrophoresis 21 (2000)

1 History 3
. A proteome reflects the actual metabolic state ofa cell. It is a highly dynamic object and stronglydependent on many parameters.
. The plot cannot reflect the protein expressionlevels.
. Not all possible proteins are expressed.
. Many proteins are expressed in low copy num-bers, often they are below the detection limit.Particularly proteins in the basic area, like regu-latory proteins, transcription factors, and otherDNA-binding proteins are mostly missed.
. A number of proteins have become modified indifferent ways during or after translation.
. A number of proteins are outside the workingrange of 2-D electrophoresis.
Fig. 2: Two-dimensional electrophoresis of yeast proteins asshown on the SWISS-2DPAGE database on the free accessibleExpasy server (from Sanchez et al. 1996).
Sanchez JC, Golaz O, FrutigerS, Schaller D, Appel RD,Bairoch A, Hughes GJ, Hoch-strasser DF. Electrophoresis 17(1996) 556–565.

Introduction4
A view on the working range of 2-D electrophoresis – as displayed inFigure 3 – can explain, why 2-D electrophoresis had been selected asthe first choice of separation methods for the analysis of proteomes.Still the separation according to two completely independent physico-chemical parameters of proteins, isoelectric point and size, offers thehighest resolution. Several thousands of proteins can be separated,displayed and stored in one gel. Proteins in the size range from10 kDa to 200 kDa and with isoelectric points between 3 and 11 canbe analyzed. Because the separation takes place under completelydenaturing conditions, also quite hydrophobic proteins are includedin the work range. It seems like two-dimensional electrophoresis willremain the major separation technique, because its resolution andthe advantage of storing the isolated proteins in the gel matrix untilfurther analysis is unrivalled by any of the alternative techniques.
Fig. 3: Estimated working range of 2-D electrophoresis forseparating highly complex protein mixtures.
However, there also some shortcomings of 2-D electrophoresis:. Small, very large, very basic, and very hydropho-bic proteins are widely excluded.
. 2-D electrophoresis is rather complex, not auto-mated, labor-intensive, and therefore dependenton the skills of the operator.
. Even optimal separations show gel-to-gel varia-tions. This results in difficult image analysis pro-cedures.
. The peptide yield after in-gel digestion of pro-teins is considerably lower than in liquid phase.This leads to limited sensitivity in the subse-quent mass spectrometry analysis.
A large 2-D electrophoresis gelof 20 � 20 cm has a theoreticalseparation space of about10,000 proteins.

1 History 5
Therefore proteomics researchers started to look for alternatives toeither replace or – at least – to complement the results acquired withthe 2D gel-based workflow. The most successful approach employstryptic digestion of the entire protein mixture and analysis of the pep-tides with the combination of nanoscale liquid chromatography andelectrospray mass spectrometry. This procedure was either calledDALPC (Direct analysis of protein complexes, see Link et al. 1999) orMudPIT (Multidimensional protein identification technology, seeWashburn et al. 2001). The major advantages of the LC-based work-flows are the superior sensitivity and the possibility of automation byan LC-ESI MS via on-line connection. Several orthogonal separationtechniques are combined to MDLC (Multi Dimensional Liquid Chro-matography).At the present time, most multi-dimensional LC applications in
proteomics deal with the separation of tryptic peptides. A variety ofsemi-automated off-line and fully automated on-line, as well as high-throughput configurations are available as commercial systems orcan be customized according to the individual needs and preferencesof the operators. Although this type of advanced tryptic peptideseparation is often referred as multi-dimensional, actually it only uti-lizes two dimensions, namely ion exchange chromatography – cationexchange chromatography preferred – in combination with reversedphase chromatography.Still in its infancy, multi-dimensional chromatography is enjoying
more and more acceptance as a sample preparation tool for the pre-fractionation of intact proteins further upstream the proteomicsworkflow. The techniques and methods applied in protein pre-fractio-nation have been derived and adapted from protein purification,which are in use since decades with great success and reliability.Finally, the orthogonal, high resolution separation at both protein
and peptide level would deserve the term multidimensional liquidchromatography (MDLC).Practice has shown that these different workflows develop different
subsets of the same proteome with surprisingly little overlaps. A typi-cal example can be found in the paper by Vanrobaeys et al. (2005).Thus none of them can be replaced by the other one. But it has beenrecognized that several complementary workflows need to beemployed in order to keep the number of missed proteins as low aspossible.Furthermore, another important aspect is stated in a paper by
Chamrad and Meyer (2005): Today . . . “there are no basic rules onhow to perform a proteomic study and manuscripts can frequently befound that publish results from single . . . experiments without anyrepetition, which can become problematic for further independentvalidation steps. Thus, search strategies and data evaluation methods
Link AJ, Eng J, Schieltz DM,Carmack E, Mize GJ, MorrisDR, Garvik BM, Yates JR III.Nature Biotech 17 (1999)676–682.
Washburn MP, Wolters D,Yates JR III. Nature Biotech 19(2001) 242–247.
Vanrobaeys F, Van Coster R,Dhondt G, Devreese B, VanBeeumen J. J Proteome Res 4(2005) 2283 – 2293.There are even differenceswithin the same workflows,caused by different design ofequipment.
Chamrad D, Meyer HE. NatMethods 2 (2005) 647–648.
Elias JE, Haas W, Faherty BK,Gygi SP. Nat Methods 2(2005) 667–675.

Introduction6
in . . . proteome studies must be improved, and the manuscript byGygi and colleagues gives some very useful directions . . .”.Other combinations than 2-D gel-MS and LC-MS have been intro-
duced, which deliver highly satisfying results for special samples andexperiments. For instance, very frequently one-dimensional SDSPAGE followed by tryptic digestion of proteins with subsequent LC-MS is employed. Also for separations on the peptide level electro-phoretic alternatives have been developed to complement liquid chro-matography, at least in the first stage. Furthermore, it becameobvious that pre-fractionation of the highly complex protein mixturesleads to more successful protein identifications than direct analysis ofcrude samples. Figure 4 shows an overview of analysis modulesapplied in proteomics, which can be assembled to various workflows.
Fig. 4: Toolbox for proteome analysis. The modules can be combinedto various workflows in different ways. The functions and features of thetechniques displayed here will be described in more detail in the followingbook chapters. On the right hand side the chronological order of theanalysis is indicated. Note the important division between protein andpeptide level.

1 History 7
These technologies and their combinations will be described in thefirst part of the book.Since the start of the “Proteomics Era” huge progress has been
made in the instrumental development for improved nanoscale liquidchromatography, higher resolution and more sensitive mass spectro-meters, evaluation software, and peripherical technologies.A great step forward is the concept of difference gel electrophoresis
(DIGE). With this method, introduced by �nl� et al. (1997), proteinsamples are pre-labeled with modified cyanine dyes (CyeDye�), mixed,and separated together in the same gel. The co-migrated protein spotsof the different samples are detected by scanning at different wave-lengths; their abundance ratios are determined with dedicated soft-ware, which employs a spot co-detection algorithm. This approachmakes it now possible to use an internal standard in 2-D gel electro-phoresis (Alban et al. 2003). In this way gel-to-gel variations are com-pensated, which leads to highly confident quantitative and qualitativeresults. The technique has been applied on almost all different sam-ple types, and during the last couple of years the number of paperson the DIGE method has increased exponentially (see Figure 5).
Fig. 5: Graphical representation of the number of published papers in DIGEuntil end of the year 2006.
At present, some major projects and developments are pursued,which raise high expectations for proteomics. Here are a few exam-ples:
. The systematic exploration of the human pro-teome with Affinity (Antibody) Proteomics togenerate quality assured antibodies to all non-redundant human proteins (Uhl�n and Ponten,2005).
�nl� M, Morgan EM, MindenJS. Electrophoresis 19 (1997)2071–2077.
Alban A, David S, Bjorkesten L,Andersson C, Sloge E, Lewis S,Currie I. Proteomics 3 (2003)36–44.
Uhl�n M, Ponten F. Mol CellProteomics 4 (2005) 384–393.

Introduction8
. The combination of DIGE labeling, liquid chro-matography of proteins, SDS PAGE and LC-MSfor finding biomarkers in samples with verywide dynamic ranges of protein expression levels(Misek et al. 2005).
. The further developments for the top-downapproach with FT-ICR mass spectrometry.
. The development of protein arrays.
During the first few years of the proteomics era holistic approaches,mostly not hypothesis driven, were preferred in order to study com-plete proteomes at once by high-throughput methods. It wasassumed that a proteome could be analyzed in a similar way like agenome, just with a higher effort. Unfortunately it turned out thatthese protein samples have more challenges in store than expected.Thus it can be observed that Proteomics is now evolving from a high-throughput industrial-scale concept (“shotgun proteomics”) to care-fully planned experiments and hypothesis driven analyses in order toanswer certain biological questions.
2Critical Points
2.1Challenges of the Protein Samples
Usually the complexity of the protein and/or peptide mixture liesbeyond the theoretical separation space of any separation method.This issue can only be solved by intelligent pre-fractionation of thesample and analyzing smaller protein subsets. But it should be notedthat the more separation steps are involved, the more proteins canget lost due to technical reasons. Furthermore, the analysis of onecomplex sample can take quite a long time.Five steps with 80% recovery each – which is not too bad – gives
less than 40% overall recovery (see Figure 6). It becomes obvious, ifnot choosing a proper strategy, that there is a high risk of losing theentire sample.
Misek DE, Kuick R, Wang H,Galchev V, Deng B, Zhao R,Tra J, Pisano MR, AmunugamaR, Allen D, Walker AK, StrahlerJR, Andrews P, Omenn GS,Hanash SM. Proteomics 5(2005) 3343–3352.
The generation of small subsetsof intact proteins is still a chal-lenge.
Many of these critical pointswill be described in thefollowing sub-chapter.
As many steps as necessary, butas little as possible!
Example: the human genomecontains about 22,000 genes.With PTMs a few hundredthousand human proteins canbe expected.

2 Critical Points 9
Fig. 6: Graph showing the dependence of overall recovery versus number of steps.
& Note: The way of sample acquisition andsample preparation prior to the separationneeds to be optimized for each sample type.This optimization work can take up to severalmonths.
The concentrations of proteins are not evenly distributed within asample. It is very difficult for all separation methods and for massspectrometry to detect and analyze very low concentrated proteins inthe presence of highly abundant proteins. While regulatory proteinsand transcription factors are expressed in very low copy numbers(a few proteins per cell), house keeping proteins exist in some millioncopies per cell: e.g. b-actin in 15 million molecules per cell (Kis-lauskis et al. 1997). The protein concentrations in human plasmaeven span over ten orders of magnitude (Anderson and Anderson2002).Often the complex protein samples have limited stability. Because
many proteins exhibit biological activities, some of them start to mod-ify other proteins in the sample mixture immediately during andafter taking the sample. Some enzymes, like proteases are even activeunder “denaturing” conditions. The measures for sample stabiliza-tion need to be optimized for different sample types. Only when thesample acquisition and sample preparation is under control, it isworth to invest time and money in a major experiment.
In tissue samples proteinconcentrations span a dynamicrange of six orders of magni-tudes.
Kislauskis EH, Zhu X, SingerRH. Cell Biol 136 (1997)1263–1270.
Anderson NL, Anderson NG.Mol Cell Proteomics 1 (2002)845–867.
Enzyme inhibitors can onlypartly stabilize the sample.

Introduction10
Many parameters influence the composition of a proteome. In aproteomics experiment it is critical to distinguish between inducedbiological changes and inherent biological variations. Those are, forinstance, genetic differences, gender and age of patients, slightly dif-ferent cell or plant growth conditions. Therefore it is important toalways analyze several biological replicates. The required number ofreplicates can be different for different sample types. Some guide-lines can be found in the paper by Hunt et al. 2005.The expression level differences of target proteins and biomarkers
associated with induced biological changes are mostly subtle, asshown for instance in the paper by Moumen et al. (2005). On and offeffects are very rare. Therefore it is very important to be able to detectand prove the significance of the experimental effect over the back-ground of bio-variability of the sample source and the “noise” of theanalytical tool with high statistical confidence. Also this fact greatlyinfluences the required sample size (number of replicates).Membrane proteins are very difficult to solubilize, highly hydro-
phobic, and they can get easily lost during sample preparation andseparation by sticking to a surface or by aggregation.Post-translational modifications like phosphorylation and glycosyla-
tion require sophisticated analysis tools like MSn (MS/MS/MS),where the peptide ions get several times fragmented. At presentabout 350 different ways of post-translational modifications are pub-lished (see Delta mass database: http://www.abrf.org/index.cfm/dm.home). It is very difficult to keep the overview and have all toolsavailable for their identification and characterization.The presently available detection methods are not sufficiently sensi-
tive. It is desirable to reach down to a LOD of one protein expressedin a cell. Should the protein detection method be sensitive enough,then there is still another limitation of detection in mass spectrome-try for protein identification.When the proteome analysis starts on the peptide level, as it is
nowadays still the case for the MudPIT type of workflow, any type ofcorrelation to the parent proteins such as information on post-transla-tional modifications and different protein isoforms can easily get lostor is difficult to trace.Automation as much as possible or available is desirable, in order
to keep the results independent of differences of human skills and toincrease the sample throughput.
Statisticians would demand atleast five replicates, in manycases three replicates canalready deliver highly confidentresults. In clinical proteomicsthe numbers of requiredpatients are much higher.
Hunt SMN, Thomas MR,Sebastian LT, Pedersen SK,Harcourt RL, Sloane AJ,Wilkins MR. J Proteome Res. 4(2005) 809–819.
Moumen A, Masterson P,O’Connor MJ, Jackson SP. Cell123 (2005) 1065–1078.
It is often necessary to applyspecial methods, which aresuited for membrane proteinanalysis, like for instance bluenative electrophoresis.
. . .not to mention the manydifferent possibilities of glycosy-lation types.
Alternative identification strate-gies like, for instance, westernblotting need to be furtherdeveloped.

2 Critical Points 11
2.2Challenges of the Analysis Systems
Depending on their methodological focus proteomics researchershave different points of view on the analytical steps:
. Mass spectrometry experts call every technologyused prior to mass spectrometry “Sample pre-paration”; this includes also electrophoresis,chromatography, and protein arrays.
. Separation technologists sometimes call massspectrometry “Detection”.
There are inherent variabilities in each analysis system, from pre-frac-tionation and separation to detection and mass spectrometry. Themajor sources of variations are: gel-to-gel variations in 2-D electro-phoresis, protein losses inherent with each analysis step, retentiontime drifts and shifts in liquid chromatography, and ionization differ-ences in mass spectrometry. Therefore of each biological replicateseveral analytical replicates are required.Most of the techniques employed in proteomics are quite demand-
ing for hands-on skills, or they are highly sophisticated to operate.Good operator skills and knowledge are at least as important as theperformance of the equipment. Education programs and tutorialshave become an indispensable part of the various proteomics socie-ties, which have been established almost everywhere around theworld.Because of the points described above, there are standards needed
for quality control of the results. Development of standards for pro-teomics is on the way. There is the International Proteome Standardi-zation Initiative (PSI), and the relevant scientific journals regularlyreview their instructions to the authors.For the top-down approach of analysis of intact proteins with high
resolution mass spectrometry, the resolving power of the sample pre-paration procedure should be as high as possible. Polyacrylamide gelelectrophoresis would be the preferred method of choice. However, itis very difficult to elute intact proteins from the polyacrylamide gelmatrix.Quantitative proteomics is based on relative quantifications. Abso-
lute quantification would be desirable, but is still not possible.Univariate statistics like Student’s t-test and ANOVA (Analysis of
variance between groups) need to be applied to analyze whether thedetected biological event is significant or not.The application of multivariate statistical tools like principal com-
ponent analysis (PCA), hierarchical clustering, and K-means cluster-
This should be kept in mind,when methodical issues arediscussed.
Statisticians would demand atleast five replicates, in manycases three replicates canalready deliver highly confidentresults.
Also this book is intended as acontribution.
Even with very sophisticatedequipment and highly devel-oped analysis concepts, errorslike mixing up samples orwrong annotation cannot becompletely avoided.

Introduction12
ing on large experimental data sets help to discover errors and deliververy important information:
. They can reveal experimental errors like wrongsample annotation, for instance by detecting out-liers.
. They find proteins with similar expression pro-files, prognostic or diagnostic markers, and clas-sifiers without bias of the operator.
3Proteomics Strategies
In short the following proteomics strategy is pursued: At first targetproteins are identified, characterized and correlated with biochemicalpathways. This part is often called “Classical Proteomics” or “Expres-sion Proteomics”. Once some structural information is known, smal-ler subsets of proteins are analyzed with milder separation and mea-suring techniques: for instance, some proteins are fished out of a celllysate with affinity chromatography and then proteins with intact ter-tiary structure, or protein–protein complexes are studied. This iscalled “Functional Proteomics”.
3.1Proteome Mapping
As already mentioned above, non-hypothesis-driven proteomicsexperiments do not deliver meaningful results. In contrast to a gen-ome a proteome is never static. Therefore a snapshot of a proteinexpression status without any biological context cannot contain valu-able information. However, proteome maps are necessary for estab-lishing databases for protein identification and characterization.
3.2Differential Analysis
Differential analysis between wild type and mutant, diseased andhealthy material, treated and control, is a powerful approach to detectsignificant changes in protein expression levels. In practice it is veryrare that a protein is either present or completely absent. In mostcases only partly up- and down-regulations of certain proteins areobserved. These quantitative changes should be determined with pre-cision and confidence.When samples are pre-labeled with spectrally distinct fluorescent
dyes, mixed, and separated together under completely identical condi-
See for instance Swiss-prot(now Uni-prot) and TrEMBL.
And it is very helpful to havesoftware tools available whichare dedicated to differentialdisplay analysis.
In such a case the proteindetection is carried out with amultifluorescence imager atdifferent wavelengths.

3 Proteomics Strategies 13
tions (like in 2-D DIGE), possible protein losses will be qualitativelyand quantitatively the same for the different samples. This makes thedifferential analysis highly reliable.In order to study protein functions and pathways, cells can be sti-
mulated for instance by heat or cold, applications of chemicals ordrugs, oxygen or nutrients withdrawal. This can result in up-regula-tion of certain proteins, which are otherwise not expressed.
3.3Time Point Experiments
In pharmaceutical drug development it is very interesting to watchchanges in protein expression levels over a certain time period. Withthe help of statistical tools for pattern analysis proteins with similarexpression profiles can be detected and grouped together.
3.4Verification of Targets or Biomarkers
The functions of the detected targets or biomarkers must be provenby a second entirely independent analysis method.
3.5Integration of Results into Biological Context
The major goal of all proteomics research is the acquisition of knowl-edge on the function of the identified protein. With the help of exter-nal databases and the literature it is studied in what pathways andprocesses the protein is involved, also depending on the location inthe cell.
3.6Systems Biology
Eventually proteomics data will be linked to genomics, transcrip-tomics, and metabolomics data. The goal is to develop mathematicalmodels to describe complex biological systems (Aebersold et al. 2000;Souchelnytskyi, 2005).
This strategy is often performedin microbial proteomics.
This type of analysis needs high-throughput methods.
In most cases Western Blottingis employed for this task.
Aebersold R, Hood LE, WattsJD. Nature BioTech 18 (2000)359.
Souchelnytskyi S. Proteomics 5(2005) 4123–4137.

Introduction14
4Concept of Experimental Planning
4.1Biological Replicates
For cell cultures, animal and plant experiments usually three biologi-cal experiments tend to be sufficient to detect induced biological var-iations on the background of inherent biological variations. However,for analyzing patients in clinical studies, the situation is more com-plex: it is advised to analyze at least six patients for control, diseased,and treated samples, in special cases many more.
4.2Pooling of Samples: Yes or No?
It is not advised to pool samples for analysis. Each sample should beanalyzed separately. If samples have been pooled, the results cannotbe traced back any longer. It would be impossible to differentiatebetween inherent biological variations, methodological, and inducedbiological variation.
4.3Pre-fractionation of Samples: Yes or No?
No single separation or detection device is capable of deciphering anentire proteome. Only the smartest combination of techniques andmethods will deliver superior results. Depending on the complexityof the initial sample, in order to obtain significant and reproducibledata, it might be inevitable to consider the application of pre-fractio-nation.In general every manipulation applied on a complex protein mix-
ture will lead to some unspecific losses of proteins. This fact wouldsuggest that any pre-fractionation of a protein mixture for proteomeanalysis should be avoided. However, the practical experience col-lected over the last couple of years shows that there is anyhow noworkflow existing, which offers a complete coverage of an entire pro-teome. For instance, protein detection and identification using differ-ent workflows, the protein 2-D gel-based and the peptide chromato-graphy-based, are complementary with only small overlaps. Becauseeach analysis method covers only a part of a proteome, the claim toacquire a complete proteome with one procedure is anyhow obsolete.Thus, also from this aspect, pre-fractionation can be seen as a valu-able tool in proteomics.
The more stringent the condi-tions for the biological experi-ment can be controled, the lessbiological replicates arerequired.
Pooling of samples is onlyperformed for creating aninternal standard for DIGE(see page 73 ff ).
Reducing the complexity of aproteome by pre-fractionationconsiderably increases thenumber of identifications(see page 189 ff ).

4 Concept of Experimental Planning 15
4.4Which is the Best Workflow to Start With?
2-D gels allow high-throughput analysis on the protein level. It isadvisable to optimize first the biological experimental conditions with2-D gels, and only at a second step apply the slow and cost-intensiveLC-MS based workflow.As all major workflows, if executed properly with all their modifica-
tions and adaptations lead to valuable results, it can be good advice tobegin with those techniques that are already successfully establishedin a laboratory. Once good results have been obtained in a reproduci-ble and repeatable fashion complementary techniques can be trainedand introduced.

17
Part I:Proteomics Technology
The following chapters describe selected techniques, which in theeyes of the authors form the “mainstream” in proteomics researchwith respect to future developments. Recently introduced methodicalmodifications and improvements are also included. If you are lookingfor a very comprehensive collection of methods with detailed descrip-tion of the particular steps, it is highly recommended to look into thetwo books by Richard Simpson, issued in 2003.As already mentioned above, it was the approach of using 2-D elec-
trophoresis in combination with mass spectrometry which triggeredthe introduction “proteome analysis” and “proteomics”. Therefore webegin the chapter of proteomics technology with a description of theelectrophoresis methods.
Proteomics in Practice. A Guide to Successful Experimental Design 2nd Ed.Reiner Westermeier, Tom Naven, and Hans-Rudolf HçpkerCopyright � 2008 WILEY-VCH Verlag GmbH & Co. KGaA, WeinheimISBN: 978-3-527-31941-1
Simpson RJ. Proteins andproteomics. A laboratorymanual. Cold Spring HarborLaboratory Press, Cold SpringHarbor, New York (2003).
Simpson RJ, Ed. Purifyingproteins for proteomics: alaboratory manual. Cold SpringHarbor Laboratory Press, ColdSpring Harbor, New York(2003).

19
1Electrophoretic Techniques
In the presently applied proteomics workflows various electrophoretictechniques are employed: for protein pre-fractionation, for high reso-lution separation of proteins and peptides prior to direct mass spec-trometry or LC-MS, and for verification of results.
1.1The Principle of Electrophoresis and Some Methodological Background
The principle of electrophoresis is the migration of charged particlesin an electric field. Because different particles have different sizesand net charges, they migrate with different velocities and formtherefore distinct zones. The higher the net charge and the smallerthe molecule, the faster is its electrophoretic migration. Electrophor-esis methods can be applied for the separation of the components ofa mixture, but also for creating characteristic images of a substratefor differential analysis.In proteomics mostly protein and peptide molecules are analyzed;
but also intact cell organelles and native protein complexes are sepa-rated with electrophoretic methods.Proteins and peptides are amphoteric substances: they can become
positively or negatively charged, depending on the pH value of theirenvironment. Thus they will migrate towards the cathode or theanode respectively. Electrophoretic separations are carried out in buf-fers with precise pH value and a constant ionic strength. The condi-tions are most frequently chosen in such a way that all moleculesbecome charged in the same direction to achieve migration into thesame direction.In the electric field also the buffer ions are migrating: negatively
charged ions towards the anode, positively charged ions towards thecathode. To guarantee constant pH and buffer conditions the suppliesof electrode buffers must be large enough. The buffer ion migrationtransports the electric current: the more ions the higher the current.
Proteomics in Practice. A Guide to Successful Experimental Design 2nd Ed.Reiner Westermeier, Tom Naven, and Hans-Rudolf HçpkerCopyright � 2008 WILEY-VCH Verlag GmbH & Co. KGaA, WeinheimISBN: 978-3-527-31941-1
For anionic electrophoresis verybasic and for cationic electro-phoresis very acidic buffers areused.
Yet a minimum buffering capa-city is required so that the pHvalue of the samples analyzeddoes not have any influence onthe system.

1 Electrophoretic Techniques20
The ionic strength should be as low as possible to keep Joule heatdevelopment to a minimum. And, the higher the ionic strength ofthe buffer, the lower will be the mobilities of the sample ions.In isoelectric focusing a different buffer concept is applied: either
amphoteric buffering components migrate to an endpoint in the sys-tem and become decharged, or the buffering groups are fixed to thestatic separation medium.Another special case is free flow electrophoresis (FFE).
1.1.1Free Flow Electrophoretic Methods
In the free-flow approach, originally developed by Hannig (1982), acontinuous stream of buffer flows in a 0.5–1.0 mm wide layer insidea cooled glass cuvette. The buffer is supplied to the cuvette over theentire width. At one end the sample is injected at a defined spot, andat the other end the fractions are collected in an array of tubes. Theelectrical field is applied perpendicular to the buffer flow.The varying electrophoretic mobilities perpendicular to the flow
lead to differently strong but constant deviations of the components,so that they reach the end of the separation chamber at differentthough stable positions (see Figure 1.1).
Fig. 1.1: Schematic drawing ofcontinuous free flow electrophor-esis, according to Wagner et al.(1989).
Isoelectric focusing will bedescribed later in detail.
In contrast to all other methodsFFE is a continuous system.
Hannig K. Electrophoresis. 3(1982) 235–243.
Wagner H, Kuhn R, HofstetterS. In: Wagner H, Blasius E. Ed.Praxis der elektrophoretischenTrennmethoden. Springer-Verlag, Heidelberg (1989)223–261.

1.1 The Principle of Electrophoresis and Some Methodological Background 21
Different separation methods can be applied: zone electrophoresis inhomogeneous and discontinuous buffer systems, and isoelectricfocusing (see below).Discontinuous field electrophoresis is a specialty of free flow electro-
phoresis with a zone concentration effect: The sample solution is sup-plied in a wide zone through the central openings, the buffer solu-tions on the right and on the left hand side have a twenty timeshigher conductivity than the sample solution. The sample ions aremore or less strongly deflected towards the anode or the cathode,depending on their charges. When they reach the borderline betweensample and buffer stream, their electrophoretic mobility is consider-ably reduced, resulting in a concentration of the fraction at the bor-derline.Free flow electrophoresis is the method of choice for separating
large particles like sub cellular components, as shown in the paper byZischka et al. (2003).
1.1.2Gels for Electrophoretic Techniques
Most electrophoretic separations in proteomics are performed in gelmatrices. There are basically two types of gels: granulated and com-pact gels. Granulated gels, like dextranes, are almost exclusively usedfor chromatography, compact gels for electrophoretic techniques.There is just one exception: dextrane gels are well suited for prepara-tive applications and pre-fractionation according to charge, as shownbelow. A detailed description for working with dextrane gels for pre-parative IEF can be found elsewhere (Westermeier, 2004).The authors are not aware of any proteomics applications in agar-
ose gels; therefore we describe only polyacrylamide gels.
1.1.3Electroendosmosis Effects
This phenomenon occurs, when fixed charges belonging to the gelmatrix or to glass surfaces are present in an electric field. Those arefor instance carboxylic groups in gels and silicium oxide groups onthe glass surface. These groups become ionized in basic and neutralbuffers: in the electric field they will be attracted by the anode. Asthey are fixed in the matrix, they cannot migrate. In order to maintainthe physico-chemical balance, this will be compensated by the coun-terflow of H3O+ ions towards the cathode. This effect is called electro-endosmosis. In practice, this phenomenon is observed as a waterflow towards the cathode, which carries proteins along with it andcauses blurred zones and streaking. As described further below, it
All these separations areperformed in a continuous flow.
This one of the rare methodswhere a high buffer concentra-tion is employed for trappingsample components in acertain zone.
Zischka H, Weber G, WeberPJA, Posch A, Braun RJ,B�hringer D, Schneider U,Nissum M, Meitinger T,Ueffing M, Eckerskorn C.Proteomics 3 (2003) 906–916.
Westermeier R: In Cutler P. Ed.Protein Purification Protocols.Second edition. Methods inMolecular Biology, Volume244, Humana Press, Totowa,NJ (2004) 225–232.

1 Electrophoretic Techniques22
can also cause difficulties during the transfer of proteins betweenIPG strips and the second-dimension gel.
1.2Polyacrylamide Gel Electrophoresis
1.2.1The Polyacrylamide Gel
Polyacrylamide gels are polymerized from acrylamide monomers anda cross-linking reagent – usually N,N'-methylenebisacrylamide. Thereaction is started with ammonium persulfate as catalyst; TEMEDprovides the tertiary amino groups to release the radicals. The poresize can be exactly and reproducibly controlled by the total acrylamideconcentration T and the degree of cross-linking C:
T ¼ ðaþ bÞ · 100V
½%�;C ¼ b · 100aþ b
½%�:
a is the mass of acrylamide (g),b the mass of methylenebisacrylamide (g),V the volume (mL).
When C remains constant and T increases, the pore size decreases.When T remains constant and C increases, the pore size follows aparabolic function: at high and low values of C the pores are large.For T = 10% the minimum lies at C = 4%; with higher C values thegels become are brittle and relatively hydrophobic. For T = 16% theminimum lies at C = 6%; these gels are used for separation of smallpeptidesFor protein and peptide separations T values between 4% and 16%
T are used. It has been observed that higher T values can cause pro-tein degradation. In practice the applied C values are 2.5–3.0% forzone electrophoresis and 3% for isoelectric focusing.Polyacrylamide gels must be polymerized in closed cassettes to
exclude oxygen, which would interrupt the polymer chain formation.Often the monomer solutions are degassed with the help of a vacuumpump for optimal polymerization effectiveness. The polymerizationefficiency is additionally influenced by the monomer concentration,the quality of the reagents, temperature, and pH value. The polymer-ization is exothermic. Particularly, when a highly concentrated gelsolution polymerizes, a substantial amount of heat is generated. Thehigher the temperature, the faster and more efficient is the polymeri-zation.
When the monomer concentra-tion is very low and the pHvalue very high, the gel will notpolymerize. For instance, itwould be very difficult to poly-merize a 4%Tgel with a pH of8.8.

1.2 Polyacrylamide Gel Electrophoresis 23
The standard catalyst system with TEMED and ammonium persul-fate works only for gels containing neutral and basic buffers. Acidicgels are polymerized with alternative reagents, like ascorbic acid andferrous sulfate together with hydrogen peroxide. Preparation of acidicgels is not trivial, because polymerization occurs very quickly and isdifficult to control.
1.2.1.1 Silent Polymerization
It should be noted that after the crude gel has formed, there is a silentpolymerization following, which takes several hours and completesthe formation of the final matrix. Therefore the gels should not beused immediately after preparation, and they should not be placedinto a refrigerator or a cold room. The gels need to be left at roomtemperature for a couple of hours or overnight. After this they can beused or stored in the cold. Gels containing an alkaline buffer have alimited shelf life, because at high pH values the matrix begins tohydrolyze after a few weeks.
& Practical tip: In order to get reproducible gels,the concentrations of the catalysts have to bebalanced in favor of a higher TEMED and alower ammonium persulfate concentration. Atbasic pH, ammonium persulfate can react withthe Tris; this effect is minimized by adding moreTEMED, and by reducing the ammoniumpersulfate content.
1.2.1.2 Vertical and Horizontal Gels
In a classic setup polyacrylamide gels are run in vertical chamberswhile they are still in the casting cassettes. The samples are appliedinto wells formed with a comb during polymerization (see Figure1.2). As an alternative, the gels can be run with an open surface on ahorizontal flatbed system. Here the sample wells are positionedwithin the stacking gel area (see Figure 1.4).Laboratory-made horizontal gels are usually run with liquid buf-
fers, connected to the gel with paper wicks. The electrodes are thenplaced into the buffer tanks. The Laemmli buffers are used. Ready-made horizontal gels contain a different buffer (see below). Horizon-tal gels can also be run without the buffer tanks: either thick filtercardboard, soaked with a concentrated buffer, or ready-made poly-acrylamide buffer strips, which contain the necessary buffer ions forone run, are placed on the edges of the gel (see also page 108). In thiscase electrode wires are placed on top of these electrode strips. The
If a gel is not perfectly polymer-ized it will become particularlyobvious during mass spectro-metry analysis of tryptic digestsof cut-out protein bands orspots. Incompletely polymer-ized gels cause high back-ground in the massspectrogram.
A comprehensive guide how toprepare and run horizontalpolyacrylamide gels can befound in “Electrophoresis inPractice” (WILEY VCH).
Kleine B, Lçffler G, KaufmannH, Scheipers P, Schickle HP,Westermeier R, Bessler WG.Electrophoresis 13 (1992) 73–75.

1 Electrophoretic Techniques24
buffer strip concept reduces chemical and radioactive liquid wasteconsiderably (Kleine et al. 1992).
1.2.1.3 Discontinuous Gels
In order to prevent aggregations of proteins or other sample mole-cules during entering the gel matrix, usually a stacking gel is poly-merized on top of the resolving gel. The stacking gel contains a differ-ent buffer composition and has larger pore sizes than the resolvinggel. Figure 1.2 shows how such discontinuous gels are prepared. Thestacking gel is poured about one hour before electrophoresis.
Fig. 1.2: Preparation of a discontinuous polyacrylamide gel. The resolvinggel is polymerized for at least 5 hours or overnight at room temperature.The stacking gel is poured about one hour before electrophoresis.
Stacking gels are used for one-dimensional separation, when theapplied sample molecules are in liquid phase, like in 1-D SDS electro-phoresis, cationic detergent acidic electrophoresis, and Blue nativeelectrophoresis.
1.2.1.4 Gradient Gels
Porosity gradients are prepared by continuously changing the acryla-mide concentration in the polymerization solution while pouring thegel, so that the concentration in the casting cassette decreases frombottom to top. The density of the highly concentrated solution is sup-plemented with glycerol so that the layers in the cassette will not mix.In principle a concentration gradient is poured. For casting linear gra-dients the law of the communicating vessels is followed: when thelevel in one of the tubes decreases, liquid will flow through the con-
The mode of functioning of thestacking gel is in detaildescribed in “Electrophoresis inPractice” fourth edition 2004,page 34ff.
For 2-D electrophoresis invertical systems the stacking gelis not necessary.
The easiest is to use gravitationto create the liquid flow; thevelocity can be controlled byplacing the gradient maker ona certain level and opening theclamp only partly. In somelaboratories the support of aperistaltic pump is preferred.

1.2 Polyacrylamide Gel Electrophoresis 25
necting channel until the level is equal. The light solution will beimmediately mixed with the heavier solution in the mixing chamber.Figure 1.3 shows casting of a single gel in two different ways: on theleft hand side the solution is poured from the top of the cassette. Inthis case the mixing chamber contains the dense solution, the reser-voir the light solution. A compensation rod is placed into the reser-voir for volume and density compensation. Alternatively the mono-mer solution can be introduced through the bottom, then the solu-tions are swapped, the compensation bar is not inserted (see righthand side of Figure 1.3). This option is also preferred for casting mul-tiple gels.Exponential gradient gels are prepared by placing a stopper into
the mixing chamber, thus keeping the volume of the mixing chamberfixed. Exponential gradients are not often used.In the field of proteomics gradient gels are used as immobilized
pH gradients for isoelectric focusing, or as porosity gradients in BlueNative Electrophoresis, and sometimes for SDS gel electrophoresis.
Fig. 1.3: Preparing a linear acrylamide gradient.Left side: pouring from the top. In the beginning the mixingchamber contains only dense solution, when the liquid leveldecreases; light solution from the reservoir flows in and is mixedwith the liquid in the mixing chamber.Right side: pouring from the bottom. The solutions are swapped;the gel solution is introduced through a hole in the bottom ofthe casting stand. The magnetic bar is rotated with a magneticstirrer (not shown).
This procedure is described in“Electrophoresis in Practice”fourth edition 2004, page 37.

1 Electrophoretic Techniques26
1.2.1.5 Gel Sizes
Proteomics requires large gels, because highly complex protein mix-tures have to be separated as efficiently as possible. Large gels alsooffer more space for highly abundant proteins; they have a higherdynamic range. Some expert laboratories work with gel sizes of40�30 cm (Klose and Kobalz, 1995). But in general, the standard sizefor a large 2-D gel is 25�20 cm, because there are upper limits forpractically handling the gels. Also, the prices for scanners increaseexponentially, when a size of letter format or A4 is exceeded. For verti-cal systems mostly the gels are 1 mm thick. Some laboratories prefer1.5 mm thick gels because those have a higher mechanical stability.However, staining of these thicker gels takes longer and is in somecases less sensitive. Horizontal gels are usually 0.5 mm thin.There are two other standard gel sizes for vertical systems:
16�16 cm and 8�8 cm (minigels); these gels are much easier to han-dle, however for 2-D electrophoresis they suffer from limited resolu-tion. Their major application area in proteomics is 1-D SDS electro-phoresis and blotting. For 1-D separations in horizontal flatbed sys-tems 25 cm wide and 11 cm long gels are used for running multiplesamples.
1.2.1.6 Mechanically Supported Polyacrylamide Gels
Although polyacrylamide gels have a much better mechanical stabi-lity than agarose gels, they can swell, shrink, and become fragile afterthey have been removed from the cassettes. Particularly during stain-ing gels can easily break into many pieces. Some laboratories usetherefore gel strengtheners, which are either acrylamide derivativesor supplements to acrylamide monomer solutions.As an alternative, gels can be bound to one of the cassettes glass
plates, which has been pretreated with Bind-Silane. This procedure isparticularly useful, when selected bands or spots have to be cut outwith an automated spot picker. In this case the spot picker cuts thespots from the gel while using the information on the spot positioncoordinates from the image analysis results. This concept would notwork, when the gel would shrink or swell between scanning and spotpicking.Instead of binding a gel to a glass plate, it can be cast on a film sup-
port. This has become a standard for gels, which are run on a hori-zontal flatbed apparatus, but is also applied for vertical gels. Latelynew supporting films have been developed, which do not exhibitfluorescent background anymore. Furthermore these films are trea-ted with a novel binding chemistry, which does not increase the gelpore sizes near the film surface.
Klose J, Kobalz U. Electrophor-esis 16 (1995) 1034–1059.
Nevertheless many laboratoriesare satisfied with the resolutionof 2-D separations in smallergels.
Gels with improved mechanicalstrength and elasticity areobtained with these reagents,however on cost of resolutionand pattern quality.
If the gel has to be stained, thereagents and dyes can diffuseinto the gel only from the openside, which can lead to longerstaining time and to lowersensitivity, for instance for silverstaining.
Gels on film supports are easierto ship, handle and store thanglass plate supported gels.

1.2 Polyacrylamide Gel Electrophoresis 27
1.2.1.7 Reversible Polyacrylamide Gels
Practical experiences in mass spectrometry analysis of peptide mix-tures show that better signals are obtained from samples digested inliquid phase rather than in gel plugs. Besides methylenebisacryla-mide a number of other cross-linking reagents exist, listed and com-pared by Righetti (1983). Some of them possess a cleavage site, whichallows solubilization of the gel matrix after electrophoresis (seeTable 1.1).
Tab. 1.1: Alternative crosslinkers for polyacrylamide gels (examples).
Substance Cleavage site Cleavage agent Comment
N,N¢-methylenebisacrylamide(Bis)
None Not possible Standard crosslinker
N,N¢-(1,2-Dihydroxyethylene)bisacrylamide(DHEBA)
1,2-diol Periodic acid
N,N¢-Diallyl-ditartardiamine(DATD)
Ester bonds Hydrolysis witha base
Problems with inefficientpolymerization
N,N¢-Bisacryloylcystamine(BAC)
Disulfide bond Thiol reagents DTT in the sample mustbe completely scavengedby iodoacetamide
Furthermore, reversible polyacrylamide gels can become very inter-esting as a sample preparation method for the “top-down” approachin proteomics, where intact proteins are directly analyzed with veryhigh resolution mass spectrometry like FT-ICR and orbitraps (seepage 232 f).
1.2.2SDS Polyacrylamide Gel Electrophoresis
In general this is the mostly applied electrophoretic method for pro-tein analysis. In proteomics SDS PAGE of proteins is employed formany different purposes:
. Second dimension in high-resolution 2-D elec-trophoresis;
. 1-D protein separation prior to tryptic digestionand LC-MS of peptides;
. Second dimension for “dual detergent” electro-phoresis (after separation with 16-BAC orCTAB);
. Second dimension for Blue native electrophor-esis;
. Third dimension in IPAS.
Righetti PG.: Isoelectricfocusing: theory, methodologyand applications. ElsevierBiomedical Press, Amsterdam(1983).

1 Electrophoretic Techniques28
1.2.2.1 Theoretical Background
Sodium dodecyl sulfate (SDS) is a very strong anion detergent, andsolubilizes all proteins including the very hydrophobic ones. It dena-tures proteins by dissolving hydrogen bonds and unfolds the tertiaryand secondary structures. SDS and proteins form complexes with anecklace-like structure composed of protein-decorated micelles con-nected by short flexible polypeptide segments (Ibel et al. 1990). As aresult of the necklace structure large amounts of SDS are incorpo-rated in the SDS–protein complex in a ratio of approximately 1.4 gSDS/g protein. SDS masks the charge of the proteins themselves andthe formed anionic complexes have a reasonably constant net nega-tive charge per unit mass. Usually a reducing agent such as DTT isadded to the sample to cleave the disulfide bridges between cysteines.Then the polypeptides become completely unfolded, all quaternarystructures are dissolved.With SDS PAGE (SDS–polyacrylamide gel electrophoresis) the
polypeptides are separated according to their molecular weights (Mr).All proteins – also those with basic pIs – will migrate towards theanode. The electrophoretic mobility of proteins treated with SDS andDTTdepends largely on the molecular weight of the protein. At a cer-tain polyacrylamide percentage there is an approximately linear rela-tionship between the logarithm of the molecular weight and the rela-tive migration distance of the SDS–polypeptide complexes of a cer-tain molecular weight range. The molecular weights of the sampleproteins can be estimated with the help of co-migrated standardswith known molecular weights.
& Note: SDS PAGE cannot deliver the exactmolecular mass of a protein, it allows onlyestimation.
1.2.2.2 Sample Preparation
In the standard sample preparation procedure for 1-D SDS electro-phoresis the proteins are boiled for 3 minutes in the sample buffercontaining 2% SDS, 50 mmol/L Tris-Cl pH 8.8, 0.01% Bromophenolblue, and 1% (w/v) DTT. For vertical gels the sample buffer must con-tain 25% glycerol to prevent mixing of the sample with the upper buf-fer. When the sample has cooled down, back folding and aggregatingof subunits must be prevented: either by adding the same amount ofreductant again or by alkylating the cysteines with 2.5% (w/v) iodo-acetamide. Alkylation has several advantages: higher stability of thesamples, prevention of artifactual lines across the gel and for down-
Ibel K, May RP, Kirschner K,Szadkowski H, Mascher E,Lundahl P. Eur J Biochem 190(1990) 311–318.
For complex protein mixturesmostly gels with T values of 12to 13 are used for the optimalseparation in the rangebetween 10 kDa and 100 kDa.
Exact masses can only be deter-mined with mass spectrometry.
It should be noted that duringelectrophoresis the polypeptidesbecome partly alkylating byacrylamide. For databasesearches after mass spectro-metry it is very important thateither none or all cysteines arealkylated.

1.2 Polyacrylamide Gel Electrophoresis 29
stream analysis with mass spectrometry ensuring alkylation of allcysteines.For some clinical applications, or for the detection of antibodies by
blotting, sometimes non-reduced samples are applied, in order tomaintain the quaternary structure of the immunoglobulins. In thiscase the molecular weights cannot be determined, because the disul-fide bridges are still intact, many of the polypeptides are still folded.Non-reduced samples must not be boiled; this would cause fragmen-tation of some polypeptides.
1.2.2.3 Buffers and Gels
Tris-chloride / Tris-glycine The standard buffer system for SDSPAGE is based on the discontinuous Tris-chloride / Tris-glycine sys-tem described by Laemmli (1970). With this buffer system, reproduci-ble and well resolved patterns are obtained even with high proteinloads. It should be noted that different laboratories prepare the buf-fers in slightly different ways, this can cause differences of the run-ning conditions. When the gel buffer is titrated with a pH meter, themeasuring electrode should be well calibrated. Some laboratoriesmeasure the added hydrochloric acid by the volume.The running buffer and the gels contain 0.1% SDS. Sometimes the
gels are cast without SDS, because the SDS migrating into the gelfrom the cathodal buffer is sufficient. During electrophoresis thenegatively charged chloride, SDS and glycine ions migrate towardsthe anode, the positively charged Tris ions migrate towards the cath-ode. The buffer reservoirs of the electrophoresis chamber must belarge enough to prevent depletion of the buffer ions.
& Note: Use only Tris base for making the buffers,not “Tris buffer”. The gel buffers are made withTris and HCl, they contain only chloride. Thecathodal running buffer must not contain anychloride; only SDS, Tris and glycine. Do nottitrate the upper running buffer to adjust thepH!
Because of the very alkaline pH 8.8 in the gel of the Laemmli system,the polyacrylamide matrix becomes hydrolyzed during storage. Aftertwo months the sieving property of the matrix is almost completelygone. In the standard laboratory practice this is not a big issue,because the gels are consumed within one week after preparation.The situation is different, when ready-made gels are used.
Some people call this “native”SDS electrophoresis.
L�mmli UK. Nature 227(1970) 680–685.
Adding HCl to the upperrunning buffer eliminates thestacking effect and causesextended running time.
The problem is not only thelimitation in shelf life, but alsothe lack of reproducibilitybecause of the ongoing hydro-lysis of the matrix.

1 Electrophoretic Techniques30
Long shelf life SDS gels For long shelf life, the pH value of the gelbuffer has to be reduced to or below pH 7. This requires a modifica-tion of the buffer composition.
Tris-acetate / Tris-tricine Tris-acetate buffer with a pH of 6.7 has pro-ven to have a good storage stability and separation capacity for flatbedgels. Glycine has to be replaced by tricine as the terminating ion.Since tricine is more expensive, it is only used in the cathodal buffer.The anodal buffer contains Tris-acetate. The running buffer can beapplied as polyacrylamide electrode strips, instead of connecting thegels to liquid buffers in tanks, see also page 108. The molecular weightdistribution of proteins obtained with this buffer system is slightlydifferent from that achieved with the Laemmli system. This buffersystem is also applied by rehydratization of pre-polymerized, washedfilm-supported gels for SDS in horizontal flatbed chambers (Clean-Gel). Figure 1.4 shows a SDS electrophoresis result in a 10% Tgel.
Fig. 1.4: SDS electrophoresis in a CleanGel 10% T.Samples: plant seed proteins andMr standards.Hot Coomassie brilliant blue staining.
Bis-Tris / Bis-Tris-tricine This is similar to the above system. Tris isreplaced by Bis-Tris to obtain improved buffer capacity at neutral pH(Wiltfang et al. 1991). Also with this buffer system the spot patternsare different from Laemmli buffer patterns.
Because of the tricine in thecathodal buffer, these gels showa very good separation of smallpeptides, when a gradient gel ora 15% Tgel is used.
Wiltfang J, Arold N, Neuhoff V.Electrophoresis 12 (1991)352–366.

1.2 Polyacrylamide Gel Electrophoresis 31
PPA-chloride / Tris-glycine Here the Tris in the gel is replaced byPPA (piperidino propionamide) and titrated with hydrochloric acid topH 7. This gel buffer can be combined with the standard runningbuffer Tris-glycine in the cathodal buffer. For the anodal buffer PPAwould be required instead of Tris. Because this compound is ratherexpensive, the large volume anodal buffer usually contains a cheapercompound: diethanolamine-acetate (DEA).
Tris-borate for improved separation of glycoproteins Glycoproteinsmigrate slower than pure polypeptides, since the sugar moiety doesnot bind SDS. When a Tris-borate-EDTA buffer is used, borate sticksto the sugars, the sugar moieties become also negatively charged:therefore the speed of migration will increase (Poduslo, 1981). Theglycine in the running buffer is simply replaced by boric acid. Theuse of gradient gels is also beneficial for better MW estimations. Seealso cationic detergent electrophoresis on page 34 f.
Homogeneous gels Usually a homogeneous gel with 12.5% T and3% C is used; the proteins of major interest in the size range from 10kDa to 100 kDa are optimally resolved. Only in special cases thematrix concentration is modified to increase the resolution in certainmolecular size ranges.The rule of thumb is:
. Lower T value: better resolution for high molecu-lar weight proteins.
. Higher T value: better resolution for low molecu-lar weight proteins.
Gradient gels Gradient gels offer a broader separation interval thanhomogeneous gels, also the linear relation interval between the loga-rithm of Mr and the migration distance is wider than for homoge-neous gels. And they exhibit a zone sharpening effect.
Peptide gels The resolution of peptides below 10 kDa is not suffi-cient in conventional Tris-chloride / Tris-glycine systems. The pep-tides smaller than 10 kDa co-migrate with the SDS front. A numberof modifications of the standard gel and buffer system have been pro-posed, for instance the addition of 8 mol/L urea to the gel by Hashi-moto et al. (1983), and, additionally, increasing the Tris concentrationin the gel to 1 mol/L by Anderson et al. (1983). The most efficienttechnique has been developed by Sch�gger and von Jagow (1987):The resolving gel has a composition of 16% T and 6% C; the gel buf-fer concentration is increased to 1 mol/L Tris-chloride; the pH is low-ered to 8.4; and tricine is used as terminating ion instead of glycine.In this way the destacking of peptides and SDS is much more effi-
The Mr distribution is verysimilar to Laemmli gels.
Poduslo JF. Anal Biochem 114(1981) 131–139.
Hashimoto F, Horigome T,Kanbayashi M, Yoshida K,Sugano H. Anal Biochem 129(1983) 192–199.
Anderson BL, Berry RW, TelserA. Anal Biochem 132 (1983)365–275.
Sch�gger H, von Jagow G. AnalBiochem 166 (1987) 368–379.

1 Electrophoretic Techniques32
cient than in the standard Tris-glycine system. This method yields lin-ear resolution from 100 kDa to 1 kDa.The Sch�gger system requires long running time because of the
high buffer concentration in the gel, which would otherwise becomeoverheated with high electric power. By adding 30% v/v ethylenegly-col to the monomer solution, the buffer concentration can be reducedto 0.7 mol/L (Westermeier, 2004). The resolution is still very goodand cracking of glass plates and smiling effects are avoided.
1.2.3Blue Native Electrophoresis
Blue Native polyacrylamide electrophoresis has been developed bySch�gger and von Jagow (1991) for the separation of membrane pro-teins and hydrophobic protein complexes in enzymatically activeform. Membrane proteins and complexes are extracted with the helpof a mild non-ionic detergent like Triton X-100, dodecyl-b-D-malto-side, or digitonin. The gel buffer is composed of e-amino caproic acidand Bis-Tris and titrated to the physiological pH 7.4. The anode bufferis Bis-Tris titrated to pH 7.0 with HCl, the cathodal buffer tricine, Bis-Tris and Coomassie blue dye. The anionic dye Coomassie brilliantblue G-250 is added to the sample and the cathodal buffer. The dyebinds to the hydrophobic proteins and complexes without disturbingprotein–protein interactions and provides negative charges to themindependently of their original net charge. Thus under the mild con-dition of pH 7.4 all sample components migrate into the anodal direc-tion, and they are visible during the separation. In fact the dye–pro-tein complexes are soluble in the detergent-free buffer medium.Because all protein and complex surfaces are negatively charged, theyrepel each other, and they will not aggregate. In the middle of therun, the cathodal buffer is exchanged with a non-dye-containing buf-fer, in order to achieve a clear background. The gels do not need to bestained, because the Coomassie dye is still bound to hydrophobic pro-teins and the complexes. Valuable hints for performing Blue nativePAGE including a trouble shooting guide can be found in a recentlypublished review by Wittig et al. (2006).Porosity gradient gels from 4.5% T to 16% T are used, to allow large
super-complexes to enter and to prevent smaller molecules and com-plexes to leave the gel on the end. Very sharp zones can be observed,because the complexes migrate until the gel network gets too tightfor further migration. The working range is between 10 kDa and10,000 kDa. A stacking gel with the same buffer, but with a slightlylower concentration than the end of the gradient of 4% T is used foroptimum sample entry.
Westermeier R. Electrophoresisin Practice. WILEY-VCH, Wein-heim (2004) 242–245.
Sch�gger H, von Jagow G. AnalBiochem 199 (1991) 223–231.
Wittig I, Braun H-P, Sch�ggerH. Nat Protocols 1 (2006)419–428.
Blue Native electrophoresis isoften run in minigels ormedium gel format. In theproteomics environment largegel systems are preferred with25�20 cm gels in the seconddimension.

1.2 Polyacrylamide Gel Electrophoresis 33
In order to determine the complex partners the lanes are cut out,these polyacrylamide strips are equilibrated in SDS buffer and placedon top of a SDS gel. Thereby the complexes become dissociated intothe single proteins, which are separated in a second dimension.Because in SDS electrophoresis the Coomassie dye will separate fromthe proteins and migrate in the front, the gels need to be stainedafterwards, which is mostly performed with Coomassie blue (Gran-vogl et al. 2006).Figure 1.5 shows an example of two-dimensional electrophoresis
employing Blue Native electrophoresis in the first dimension (fromEubel et al. 2003) and SDS electrophoresis in the second.
Fig. 1.5: Blue Native PAGE / SDS PAGE electrophoresis of mitochondrialcomplexes of Arabidopsis thaliana (from Eubel et al. 2003). The complexeswere solubilized with digitonin and they are annotated with Roman numerals.I+III is a super complex composed of complexes I and III. Coomassie brilliantblue post-staining of the SDS gel.
The technique is applied in two major areas of proteomics:. Analysis of very hydrophobic proteins, like mem-brane proteins.
. Functional proteomics: analysis of protein com-plexes and super-complexes.
A comprehensive review on applications of Blue native PAGE can befound in the paper by Krause (2006).For differential analysis of complexes it is very useful to apply the
DIGE concept. The complexes can easily be labeled with the CyDyesafter solubilization, prior to adding the Coomassie dye (Perales et al.2005).
Granvogl B, Reisinger V,Eichacker LA. Proteomics 6(2006) 3681–3695.
Eubel H, J�nsch L Braun H.Plant Physiol 133 (2003)274–286.
Krause F. Electrophoresis 27(2006) 2759–2781.
Perales M, Eubel H, Heine-meyer J, Colaneri A, ZabaletaE, Braun H-P. J Mol Biol 350(2005) 263–277.

1 Electrophoretic Techniques34
When digitonin is used for extraction, even the big super-com-plexes are kept together and intact during the separation. After cut-ting out the lanes and equilibration in a less mild detergent, namelydodecyl maltoside containing buffer, the single complexes can beseparated in a second-dimension Blue Native gel. In the resulting pat-tern the composition on the super-complexes is displayed. With activ-ity staining, a zymogram technique, its function can be assigned tothe particular spot. All this is nicely demonstrated in a paper by Sun-derhaus et al. (2006). In this paper these complexes are also directlyvisualized by single particle electron microscopy.
Three-dimensional electrophoresis The analysis of smaller subsets ofprotein mixtures frequently provides improved pattern and allows todetect proteins which otherwise do not enter the gel. A possible pro-cedure is the three-dimensional electrophoresis procedure introducedby Werhan and Braun (2002). The first dimension is the separation ofprotein complexes by blue native polyacrylamide electrophoresis. Thevisible bands are eluted electrophoretically from the gel, destained,and further analyzed by standard denaturing 2-D electrophoresis:IEF/SDS PAGE. Interestingly, this method reveals also proteins withhigh hydrophobicity; most probably due to the considerable reductionof complexity of the protein mixture.Stegemann et al. (2005) have introduced a three-dimensional gel
block for performing blue native electrophoresis and SDS electro-phoresis in one go.
1.2.4Cationic Detergent Electrophoresis
Another possibility for getting poorly soluble proteins separated andanalyzed is the combination of two electrophoretic separations in pre-sence of two different ionic detergents. Usually the extraction andseparation with a cationic detergent is selected as the first dimension,because cationic detergents are less denaturing than SDS. The pro-tein–detergent micelles migrate towards the cathode. The separationpattern is different from that obtained with SDS electrophoresis. Pro-teins are either solubilized with cetyltrimethylammonium bromide(CTAB) or benzyldimethyl-n-hexadecylammonium chloride (16-BAC)and applied on an acidic polyacrylamide gel containing the respectivedetergent. A sodium or potassium phosphate buffer pH 2.1 with astacking gel pH 4.1 is used. It has been observed that membrane gly-coproteins are separated much better in acidic CTAB electrophoresisthan in basic SDS electrophoresis (Buxbaum, 2003).
Sunderhaus S, Dudkina N,J�nsch L, Klodmann J, Heine-meyer J, Perales M, ZabaletaE, Boekema E, Braun H-P.J Biol Chem 281 (2006)6482–6488.
This procedure can also be cate-gorized into pre-fractionationwith Blue native electrophoresisfollowed by 2-D electrophoresis.
Werhahn W, Braun H-P. Elec-trophoresis 23 (2002) 640–646.
Stegemann J, Ventzki R,Schrodel A, de Marco A.Proteomics 5 (2005)2002–2009.
Buxbaum E. Cationic electro-phoresis and electro transfer ofmembrane glycoproteins. AnalBiochem 314 (2003) 70–76.

1.3 Blotting 35
For 2-D electrophoresis the first dimension is either run in indivi-dual gel rods in thin glass tubes or carried out in slab gels, which arecut into strips for the second dimension (see Figure 1.6). After thefirst dimension the strip is equilibrated in SDS sample buffer andapplied on the second-dimension gel (MacFarlane, 1989).
Fig. 1.6: Schematic representation of 2-D electrophoresis withcation detergent / SDS PAGE. Here the first dimension is performedin a vertical slab gel.
Hartinger et al. (1996) were the first to use the technique to success-fully separate integral membrane proteins. Usually the patternsachieved with this technique are not easy to compare. However, whenthe samples are prelabeled with different CyDyes, mixed and appliedtogether on the gel, the same proteins of the different samples willco-migrate, and the patterns can be analyzed with a spot co-detectionalgorithm. It was shown by Helling et al. (2006) that very scarce sam-ples can be analyzed in this way by pre-labeling the cysteines of theproteins with saturation dyes. In this approach the first dimensionwas performed with CTAB in narrow gel rods instead of slab gels.
1.3Blotting
Blotting is the transfer of macromolecules on immobilizing mem-branes for specific and sensitive detection. The electrophoretic trans-fer of electrophoretically separated proteins onto a membrane withsubsequent immuno detection was introduced by Towbin et al.(1979). This method is frequently called “Western blotting”. For pro-tein blotting either nitrocellulose or PVDF is used as membranematerial. PVDF membranes have a higher binding capacity for pro-teins than nitrocellulose, but nitrocellulose binds small proteinsbetter.
Large gel formats are preferredfor this technique, because thespots are crowded along thediagonal axis and require ashigh resolution as possible.
MacFarlane DE. Anal Biochem132 (1983) 231–235.
Hartinger J, Stenius K, Hoge-mann D, Jahn R. AnalBiochem 240 (1996) 126–133.
Helling S, Schmitt E, JoppichC, Schulenborg T, M�llner S,Felske-M�ller S, WiebringhausT, Becker G, Linsenmann G,Sitek B, Lutter P, Meyer HE,Marcus K. Proteomics 6 (2006)4506–4513.
Towbin H, Staehlin T, GordonJ. Proc Natl Acad Sci USA. 76(1979) 4350–4354.
The term Western Blotting isderived from the name ofEdwin Southern, who intro-duced the first blotting tech-nique: the transfer of DNAonto nitrocellulose by capillaryforces for subsequent hybridiza-tion (Southern EM. J Mol Biol.98 (1975) 503–517).

1 Electrophoretic Techniques36
Usually SDS polyacrylamide electrophoresis is employed for theseparation, because all proteins have been solubilized and migrate inthe same direction, and the epitopes are easier accessible due to thedenaturing effect of SDS. Proteins are too big to elute quantitativelyfrom a SDS polyacrylamide gel by diffusion or capillary forces, there-fore they are transferred electrophoretically.
1.3.1Electrophoretic Transfer
As shown in Figure 1.7 there are several ways to perform the electro-phoretic transfer: tank blotting, semi-dry blotting and semi-wet blot-ting. All three have in common that the gel and the membrane forma sandwich with a stack of filter papers on both sides.
Fig. 1.7: Blotting transfer methods.
If isoelectric focusing is used for the separation of the proteins, it ismore efficient to transfer the proteins by diffusion with pressure blot-ting (Towbin et al. 2001).
1.3.2Protein Detection on the Membrane
After the transfer, which can take about an hour (semidry blotting) toovernight (tank blotting), the free binding sites of the membrane isblocked with a protein mixture, which will not interfere with the sub-sequent probing with an antibody. After some washes this “primaryantibody” is detected with a secondary antibody, which recognizesthis particular antibody. This secondary antibody is conjugated with aset of specific molecules, which can be easily detected with a subse-quent development procedure with high sensitivity. The most sensi-tive detection methods are using enhanced chemiluminescence(ECL): the antibody–horseradish conjugate recognizes the primaryantibody; the substrate reaction is coupled with a secondary reaction
For blotting small or mediumsized gels are preferred, in thisway the volume of expensiveantibody solutions is kept to aminimum.
Towbin H, �zbey �, Zingel O.Electrophoresis. 22 (2001)1887–1893.
More detection techniques aredescribed in “Electrophoresis inPractice”.

1.3 Blotting 37
which causes chemiluminescent light emission for a certain time per-iod. This light signal is accumulated by exposing the membrane onan X-ray film, or by placing it into an absolutely dark cabinet wherethe signal is recorded with a sensitive CCD camera. With a specialvariant of ECL down to 1 pg of a protein band is detectable. Figure 1.8shows an example for detection of a single protein with ECL versus aCoomassie blue-stained gel showing all proteins.
Fig. 1.8: Comparison of a gel with total proteins Coomassieblue-stained versus a blot membrane with one protein detectedwith ECL. Note the high sensitivity of blotting detection.
The proteins on a blotting membrane can be reprobed for severaltimes after stripping the antibodies off and washing the membrane.For this case it is recommended to use PVDF membranes or sup-ported nitrocellulose.
Multiplex detection on blots As an alternative to enzyme–substratedetection methods fluorescent dyes, like CyDye, can be conjugated tothe secondary antibody. In this case the fluorescent signal is directlyrecorded with a fluorescent scanner. This procedure offers almost thesame sensitivity like enhanced chemiluminescence, and with differ-ent fluorescence-conjugated secondary antibodies several differentantigens can be probed in one procedure without the need for strip-ping antibodies off from the membrane. Besides multiplex detectionthis allows also a relative quantification of changes of expressionlevels of an antigen, when the second primary antibody is directedagainst a protein with stable expression level.
Blotting from 2-D electrophoresis gels There are many papers pub-lished where immunoblotting was successfully performed after 2-D
For this method low fluorescentmembranes must be used.
Blotting from 2-D electrophor-esis gels had been the standardfor protein identification, untilmass spectrometry became sosensitive that it detected toomany constituents of the blot-ting membranes.

1 Electrophoretic Techniques38
electrophoresis. However, it is frequently observed that an antibodydoes not recognize a protein anymore, when the sample had beenseparated with 2-D electrophoresis; but the same protein can easilybe detected on a blot after 1-D SDS electrophoresis. It is still notknown, what causes this effect. There is a hypothesis that focusing aprotein at its isoelectric point and/or the presence of high molar ureain the first dimension causes a different and stronger denaturationfor some proteins than SDS treatment alone.
Non-immunological detection procedures There are a number ofgeneral protein staining techniques for blot membranes, which arereversible or will not interfere with the subsequent specific detectionmethods. The most practical are the fluorescent dyes, which are intro-duced below in the context of staining of 2-D gels on page 119 ff.Specific proteins can be detected with other ligands than antibo-
dies. For instance, glycoproteins are detected with high specificityusing lectins coupled to very sensitive avidin–biotin detection proce-dures. This method is the most reliable specific detection of glycosy-lated proteins, as the glyco-specific staining methods often producesome wrong positive signals. For the detection of protein–proteinligands there is a method called “Far Western Blotting”: The probingprotein is tagged with a labeled antibody for detection (Burgess et al.2000).In proteomics blotting is mostly employed for the verification of a
biomarker or drug target. When the new approach of antibody proteo-mics has succeeded with delivering antibodies against each humanprotein, blotting will gain increasing importance for the identificationof very low abundant proteins.
1.4Isoelectric Focusing
In proteomics isoelectric focusing is mainly applied for the followingpurposes:
. First dimension in high-resolution 2-D electro-phoresis of complex protein mixtures.
. Pre-fractionation of complex protein mixturesaccording to charge.
. For the separation of very heterogeneous mix-tures of tryptic peptides instead of strong cationexchange chromatography in MDLC-MS.
Burgess R, Arthur TM, PietzBC. Methods Enzymol. 328(2000) 141–157.
The application of blotting forN-terminal sequencing or massspectrometry analysis hasalmost been completely aban-doned.

1.4 Isoelectric Focusing 39
1.4.1Theoretical Background
Isoelectric focusing is performed in a pH gradient. Proteins areamphoteric molecules with acidic and basic buffering groups. Thosebecome protonated or deprotonated depending on the pH environ-ment. In basic environment the acidic groups become negativelycharged, in acidic environment the basic groups become positivelycharged. The net charge of a protein is the sum of all negative or posi-tive charges of the amino acid side chains. When net charges of pro-teins are plotted over the pH scale, each protein has an individual netcharge curve. The intersection of the net charge curve with the x axisis the isoelectric point – the pH value where the net charge is zero.This is shown for two model proteins in Figure 1.9.When a protein is applied on a certain pH value of the gradient,
and an electric field is applied, it will start to migrate towards the elec-trode of the opposite sign of its charge. Because it migrates inside agradient, it will arrive at a pH value of its isoelectric point (see Figure1.9) after some time. At its pI it has no net charge anymore and stopsmigrating. Should it diffuse away above or below its pI it will becomecharged again and migrate back to its pI. This is called the “focusingeffect”, which results in very high resolution.
Fig. 1.9: The principle of isoelectric focusing.Left: Net charge curves of two model proteins A and B. At the point ofapplication, A will have two positive, B will have one negative charge(s).Right:Migration of A and B to their pIs in the pH gradient of an isoelectricfocusing gel.
& In principle: Isoelectric focusing is a very highresolution separation method, and the pI of aprotein can be measured.

1 Electrophoretic Techniques40
1.4.1.1 Titration Curve Analysis
The net charge curves are also called “titration curves”. The titrationcurves of proteins can be displayed by a simple method (Rosengrenet al. 1976): A square gel – containing carrier ampholytes, but no sam-ples – is submitted to an electric field until the carrier ampholytesform a pH gradient from 3 to 10. Then the gel is rotated by 90degrees, the sample proteins are pipetted into a groove in the gelacross the pH gradient. Now an electric field is applied perpendicularto the pH gradient: the carrier ampholytes are uncharged at their pIsand will not move. But, as shown in Figure 1.10, the proteins willmigrate towards the cathode or the anode according to their chargesign and mobility, and will thus form titration curves (net chargecurves).
Fig. 1.10: Titration curves of a mixture of pI marker proteinsunder native conditions. The steeper the curve, the faster will bethe migration of a protein in IEF. Note that some proteins havea flatter curve above their pI.
The proteins possess very individually shaped curves also under dena-turing conditions. Practical experience has shown that more proteinshave a steeper curve below their pI. This is the reason, why mostlysample application close to the anode results in better pattern.
1.4.1.2 pH Gradients
In practice there are two ways to establish a pH gradient in a gel:. pH gradients which are formed in the electricfield by amphoteric buffers, the carrier ampho-lytes;
Rosengren A, Bjellqvist B,Gasparic V. In: Radola BJ,Graesslin D. Ed. Electro-focusing and isotachophoresis.W. de Gruyter, Berlin (1977)165–171.

1.4 Isoelectric Focusing 41
. Immobilized pH gradients in which the buffer-ing groups are part of the gel medium.
Carrier ampholytes generated pH gradients This was the first devel-oped technique for isoelectric focusing. Svensson (1961) has designedthe theoretical basis for preparing “natural” pH gradients, while thepractical realization is the work of Vesterberg (1969): the synthesis ofa heterogeneous mixture of isomers of aliphatic oligoamino-oligocar-boxylic acids. The result is a spectrum of low molecular weightampholytes with closely neighboring isoelectric points, and with highbuffering power at their pI.The general chemical formula is the following:–CH2–N–(CH2)x–N–CH2–
I I(CH2)x (CH2)x
I INR2 COOH
R = H or –(CH2)x–COOH, x = 2 or 3
These carrier ampholytes possess the following properties:. High buffering capacity and solubility at the pI;. Good and regular electric conductivity at the pI;. Absence of biological effects;. Low molecular weight.
Naturally occurring ampholytes such as amino acids and peptideshave only low or no buffering capacity at their isoelectric point. Theycan therefore not be used.The pH gradient is established by the electric field. At the begin-
ning, the gel with carrier ampholytes has a uniform mean pH value.Almost all the carrier ampholytes are charged: those with the higherpI positively, those with the lower pI negatively.When an electric field is applied, the negatively charged carrier
ampholytes migrate towards the anode, the positively charged ones tothe cathode, with velocities depending on their net charges. The car-rier ampholytes align themselves in between the two electrodesaccording to their pI and will determine the pH of their environment.A (relatively) stable and gradually increasing pH gradient results; forinstance from 3 to 10. The carrier ampholytes lose a great part of theircharge, so the conductivity of the gel decreases substantially.Because these are mixtures of buffers, the gradient profile will
never be perfectly linear. By adding narrow range gradient mixturesto wide gradient mixtures the final shape of the gradient can be mod-ified according to special resolution requirements.
Svensson H. Acta Chem Scand15 (1961) 325–341.
Vesterberg, O. Acta Chem.Scand 23 (1969) 2653–2666.
Alternative synthesis chemis-tries have been developed later.The chemical structures ofother amphoteric buffers aredifferent. Their function is thesame, but the properties of thegradients can be different.
By controlling the synthesis andthe use of a suitable mixturethe composition can be moni-tored for the preparation ofregular and linear gradient.
The anodal end becomes acidicand the cathodal side basic.

1 Electrophoretic Techniques42
To maintain a gradient as stable as possible, electrode solutions areapplied between the gel and the electrodes, an acid at the anode and abase at the cathode. Should, for example, an acidic carrier ampholytereach the anode, its basic buffering group would acquire a positivecharge from the medium and it would be attracted back by the elec-tric field.Isoelectric focusing in carrier ampholytes generated pH gradients
can be performed in various media:. In free liquid phase in capillaries, free flow elec-trophoresis apparatus and rotating tubing;
. In gels made from agarose with very low electro-endosmosis;
. In granulated dextrane gels (Sephadex�);
. In polyacrylamide slab gels or individual gelrods in glass or plastic tubes.
Carrier ampholytes as solvents for proteins Carrier ampholytes haveanother very important function: they help to solubilize proteins,which stay in solution only in presence of buffering compounds.Therefore they are also needed for the immobilized pH gradient tech-nique.
Limitations of carrier ampholyte pH gradients Isoelectric focusing is arelatively slow separation method, because proteins have only verylow net charges when they come close to their isoelectric points, andtherefore low mobility. High spatial resolution requires long separa-tion distance, which causes a long migration time under a high elec-tric field strength.Because the carrier ampholytes are in free solution, the gradient
will become instable during long IEF time: the gradient drifts. Thepattern becomes time-dependent and most of the basic proteins aredrifting out of the gel together with the basic part of the gradient.Another problem: proteins of the sample behave like additional car-rier ampholytes and modify the profile of the gradient. Thus the gra-dient shape becomes also sample-dependent.
Immobilized pH gradients These problems are solved with the appli-cation of immobilized pH gradients, generated by buffering acryla-mide derivatives copolymerized with the gel matrix (Bjellqvist et al.1982). The acrylamide derivatives containing the buffering groups arecalled Immobilines�. An Immobiline is a weak acid or weak basedefined by its pK value.
Particularly under denaturingconditions the matrix is highlyviscous leading to slow migra-tion. Additionally, unfoldedpolypeptides migrate slower inthe gel than native proteins.
Carrier ampholyte generatedgradients are also influenced bythe sample load and saltcontents in the sample.
Bjellqvist B, Ek K, Righetti PG,Gianazza E, Gçrg A, Wester-meier R, Postel W. J BiochemBiophys Methods 6 (1982)317-339.

1.4 Isoelectric Focusing 43
The general structure of an Immobiline is the following:CH2=CH–C–N–R
II IO H
R contains either a carboxylic or an amino group.The acidic substances have dissociation constants in the range
from pK 0.8 to pK 4.6, the basic from pK 6.2 to pK 12. In order tobuffer at precise pH values, at least two different Immobilines arenecessary, an acid and a base. Figure 1.11 shows a diagram of a poly-acrylamide gel with polymerized Immobilines, the pH value isdefined by the ratio of the Immobilines in the mixture.
Fig. 1.11: Immobilized pH buffer. Schematic drawing of apolyacrylamide network with co-polymerized buffering groups.
A pH gradient is obtained by continuously varying the ratio ofImmobilines. The principle is that of an acid/base titration, and thepH value at each stage is defined by the Henderson–Hasselbalchequation:
pH ¼ pKB þ logCB � CA
CA
when the buffering Immobiline is a base.CA and CB are the molar concentrations of the acid and basic
Immobiline, respectively.
The wider the pH gradient, themore different Immobilinehomologues are needed.
This concept generates an abso-lutely continuous pH gradient.

1 Electrophoretic Techniques44
If the buffering Immobiline is an acid, the equation becomes:
pH ¼ pKA þ logCB
CA � CB
Celentano et al. (1986) and Altland (1990) developed PC programsfor the calculation and simulation of immobilized pH gradients forthe optimization of buffering power and ionic strength distribution.Practice shows that a pre-calculated pH gradient recipe does not auto-matically result in a usable IEF gel. Every recipe has to be tested andoptimized with practical experiments.
Further reading There are two books by P.G. Righetti which dealexclusively with isoelectric focusing in theory and applications.
1.4.2Preparation of IEF Gels
Carrier ampholyte gels Casting of such homogeneous polyacryl-amide gels is very simple: the monomer solution containing the car-rier ampholytes is mixed with the catalysts and pipetted into a poly-merization cassette, or into glass or plastic tubes. The carrier ampho-lyte concentration is mostly 2% (w/v), the gel concentration 4% T and3% C. To exclude oxygen the solution is carefully overlaid with dis-tilled water.The preparation of granulated gels is more intricate, because it is
very important to achieve the optimum liquid content (Westermeier,2004).
Immobilized pH gradients Immobiline stock solutions with concen-trations of 0.2 mol/L are used. Two solutions with acrylamide mono-mers, crosslinker, and catalysts are required to prepare an immobi-lized pH gradient: one contains the Immobiline cocktail for the acidicend, the other the cocktail for the basic end. The gel forming mono-mers are diluted to 4% T and 3% C. The acidic solution is made den-ser by adding glycerol. The gel is prepared by linear mixing of the twodifferent monomer solutions with a gradient maker (see Figure 1.12),like for pore gradients. In principle a concentration gradient ispoured. 0.5 mm thick Immobiline gels, polymerized on a supportfilm have proved most convenient. During polymerization, the buffer-ing carboxylic and amino groups covalently bind to the gel matrix.Because of the low electric conductivity of immobilized pH gradients,all contaminating compounds, like acrylamide monomers and thecatalysts, have to be removed by washing the gels several times withdeionized water.
Celentano F, Gianazza E, DossiG, Righetti PG. ChemometrIntel Lab Systems 1 (1987)349–358.
Altland K. Electrophoresis 11(1990) 140–147.
Righetti PG. In: Work TS, Ed.Burdon RH. Elsevier Biome-dical Press, Amsterdam (1983).
Righetti PG. In: Burdon RH,van Knippenberg PH. Ed. Else-vier, Amsterdam (1990).
Westermeier R. In Cutler P. Ed.Protein Purification Protocols.Second edition. Methods inMolecular Biology, Volume244, Humana Press, Totowa,NJ (2004) 225–232.

1.4 Isoelectric Focusing 45
Fig. 1.12: Preparing an immobilized pH gradient.Pouring a gradient into a gel cassette.
1.4.3Isoelectric Focusing in Proteomics
1.4.3.1 IEF Based on Carrier Ampholyte Gradients
Free flow IEF The free flow electrophoresis apparatus describedabove can also be used for isoelectric focusing. Either carrier ampho-lytes or multi-components buffers, which are mixtures of amphotericand non-amphoteric buffers, are added. The latter mixture cannotdevelop linear pH gradients, but they reduce the costs. With IEF ahigher number of fractions can be obtained than with the discontinu-ous field electrophoresis.Free flow electrophoresis and isoelectric focusing has successfully
been applied for fractionation and proteins in proteomics workflows(Hoffmann et al. 2001; Obermaier et al. 2005). Lately it has also beenused for the separation of peptide mixtures as a replacement ofstrong cation exchange chromatography (Xie et al. 2005). Free flowIEF is a very reliable and reproducible technique, however goodoperator skills and highly sophisticated instrumentation is required.
Liquid phase isoelectric focusing systems Several types of IEF sys-tems in liquid phase are on the market, which employ membranesfor the separation of the fraction compartments. Temperature differ-
Hoffmann P, Ji H, Moritz RL,Connolly LM, Frecklington DF,Layton MJ, Eddes JS, SimpsonRJ. Proteomics 1 (2001) 807–818.
Obermaier, C, Jankowski V,Schmutzler C, Bauer J, Wild-gruber R, Infanger M, Kohrle J,Krause E, Weber G, Grimm D.Electrophoresis 26 (2005)2109–2116.
Xie H, Bandhakavi S, GriffinTJ. Anal Chem 77 (2005)3198–3207.

1 Electrophoretic Techniques46
ences and sticking of proteins are tried to be avoided either by con-tinuously streaming fluids or rotation. The instrumental efforts areless than with free flow apparatus, but there is always the danger thathydrophobic proteins stick to membranes.
IEF in a granulated gel bed Gçrg et al. (2002) have developed a veryquick, reproducible and efficient pre-fractionation method: pre-separation of complex protein mixtures by carrier ampholyte IEF in agranulated gel bed. The procedure is performed on standard flatbedelectrophoresis equipment at an exactly adjusted temperature of20 �C. The technique is simple: the sample is mixed with low electro-endosmosis Sephadex, which has been reswollen with rehydrationsolution containing urea, CHAPS, DTT and carrier ampholytes. Forthe visualization of pH value zones after IEF a mixture of non-proteinamphoteric dyes is added. The slurry is pipetted into a trough andcovered with a thin layer of silicone oil. After 4 hours the proteins arefocused at their isoelectric points. The pH gradient can be deter-mined by interpolation between the colored marker zones. As shownin Figure 1.13, the pH fractions are removed with a spatula anddirectly applied onto rehydrated IPG strips. In the electric field theproteins migrate out from the granulated gel into the polyacrylamidegel of the IPG strip. The fractions can also be stored in a freezer at–70 �C.This technique has several advantages:
. Standard laboratory equipment is used.
. The technique is easy to carry out.
. The separation is quick.
. Denaturing sample pre-fractionation accordingto pI in presence of urea, detergents, etc.
. No protein losses.
. It can be done with high and low proteinamounts
. It is also desalting the sample – no microdialysisis required.
Subsequent separations of the pH fractions in the respective narrowpH interval IPG strips show a considerable increase in spot number.Many more of the lower expressed proteins can be detected in thisway.
Gçrg A, Boguth G, Kçpf A, ReilG, Parlar H, Weiss W. Proteo-mics 2 (2002) 1652–1657.

1.4 Isoelectric Focusing 47
Fig. 1.13: Pre-fractionation of a complex protein mixture withisoelectric focusing in Sephadex.
Isoelectric focusing in gel rods for 2-D electrophoresis In the originalhigh resolution 2-D electrophoresis method the first dimension is car-ried out in thin gel rods in glass or plastic tubes. The history of thistechnique goes back to a paper in German language by Stegemann(1970), combining isoelectric focusing (IEF) and SDS polyacrylamidegel electrophoresis. The resolution of 2-D electrophoresis was consid-erably increased by the introduction of denaturing conditions duringsample preparation and isoelectric focusing by O’Farrell in the year1975. With this modification the method gained a wide acceptance.The gel rods contain urea, detergent, reductant and carrier ampho-
lytes to form the pH gradient in the electric field. Usually the sampleis loaded onto the cathodal side of the gel rod, which becomes thebasic end of the gradient in the electric field. This “O’Farrell” techni-que has been used for about two decades – and is still used by somelaboratories – without major modifications. The potential of themethod for a systematic approach to create a protein database hadbeen recognized very soon. Anderson and Anderson (1978) havedesigned instruments and operation procedures to prepare and runmultiple 2-D gels under the most reproducible conditions, in order todevelop a “Human protein index” (Anderson and Anderson, 1982).Gels with about 20�20 cm have become standard for an adequate
spatial resolution. If one assumes that up to 100 bands can beresolved in a 20 cm long one-dimensional gel, a theoretical separationspace of 10,000 proteins could be reached in such a gel. In practiceseveral thousands of proteins can be detected.
Stegemann H. Angew Chem82 (1970) 640.
O’Farrell PH. J Biol Chem 250(1975) 4007–4021.
Anderson NG, Anderson NL.Anal Biochem 85 (1978)331–354.
Anderson NG, Anderson NL.Clin Chem 28 (1982)739–748.

1 Electrophoretic Techniques48
Due to the high concentration of urea the viscosity in the gel is veryhigh. The denatured proteins are unfolded and thus highly retardedby the gel matrix. Therefore long migration times are needed, whichlead to a destabilization of the gradient. The soft, thin, and long gelrods demand high experimental skill. Between pH 6.7 and 7 there isvery often a lack of buffering power, leading to mechanical instabilityof the thin gel rods, and an empty area in the spot pattern. The hand-ling of the technique was rather cumbersome; in many cases the pat-terns were not reproducible enough. Besides the influence of thesample composition also batch to batch variations of the carrierampholyte mixtures were the reasons for differences in the profiles ofthe pH gradients. Gradient drift with prolonged isoelectric focusingtime lead to losses of almost all basic and some of the acidic proteins.A remedy had soon been found for the display of basic proteins:
O’Farrell et al. (1977) have introduced a modification of the firstdimension run: NEPHGE (non-equilibrium pH gradient electrophor-esis). Here the sample is loaded onto the acidic end of the gel and theproteins are separated while the gradient drifts towards the cathode.The run is stopped after a defined time period, which is approxi-mately one third of the regular focusing time. However, due to thetime factor it is hard to achieve a good reproducibility. The proteinsare not focused like in IEF; the resolution is limited by the number ofdifferent carrier ampholyte homologues.Meanwhile most laboratories prefer to use the technique of IEF in
individual IPG strips according to Gçrg et al. (2000), which will belowbe described in detail. In these gels all proteins are strongly focusedat their isoelectric points.There are indications that it is not always an advantage, when pro-
teins are tightly focused at their isoelectric points. High molecularweight and hydrophobic proteins aggregate with themselves whenthey are too tightly focused, and cannot migrate out from the firstdimension gel anymore. This can explain, why sometimes proteinsare missing in an IPG strip 2-D gel, but they are present after a 2-Delectrophoresis run with the traditional NEPHGE procedure.Some laboratories employ isoelectric focusing in gel rods and
immobilized pH gradient for 2-D electrophoresis side by side as com-plementary methods.
1.4.3.2 IEF Based on Immobilized pH Gradients
Immobilized pH gradient strips Generally it is very useful to run dif-ferent samples in completely separated individual gels. ImmobilizedpH gradient gels are the only electrophoresis slab gels, which do notshow any edge effects during the run, when they are cut into strips.The gels are cut after they have been dried down on the film. Instruc-
Because of the technical limita-tions, mainly acidic proteinscould be studied in the past.
2-D electrophoresis had some-times been seen as a technique,which produces operator-dependent results.
O’Farrell PZ, Goodman HM,O’Farrell PH. Cell 12 (1977)1133–1142.
The proteins are not focused,but stacked between thedifferent carrier ampholytehomologues.
Gçrg A, Obermaier C, BoguthG, Harder A, Scheibe B, Wild-gruber R, Weiss W. Electrophor-esis 21 (2000) 1037–1053.
This observation has beenmade particularly withmembrane proteins.
Gçrg A, Weiss W. In RabilloudT, Ed. Proteome research: Two-dimensional gel electrophoresisand identification methods.Springer, Berlin HeidelbergNew York (2000) 107–126.

1.4 Isoelectric Focusing 49
tions and pH gradient recipes for preparing immobilized pH gradientstrips in the laboratory can be found in several book chapters: Gçrgand Weiss (2000 and 2005) and Westermeier (2004). However, this isa multistep procedure, which needs some expertise and skill.Much more reproducible results are obtained, when ready-made
IPG strips are used. Commercially produced strips are preparedaccording to GMP industry standards, and they are quality controlled.A wide choice of different gradients and strip lengths is available onthe market. Additional gradients are being developed for achievinghigher resolution.
Gel sizes The commercial strips are 3 mm wide and have to bereconstituted to the original thickness of 0.5 mm with rehydrationsolution prior to IEF. Thicker and wider strips would have a higherprotein loading capacity. This would, however, not be an advantage,because the SDS polyacrylamide gel of the second dimension wouldshow overloading effects of proteins and a high detergent back-ground. In theory this could be compensated by using SDS gelsthicker than the conventional 1 to 1.5 mm. However, staining of suchthick gel slabs would be very time consuming and not allow a high-throughput approaches.Strips are available in several different lengths from 7 cm to 24 cm.
In proteomics usually 18 and 24 cm strips are used, because the high-est possible resolution is required for proteome analysis. Miniformatstrips with 7 cm length are ideal for optimization of the sample pre-paration method.When spatial resolution does not have the highest priority, like for
protein identification with western blotting, small gel formats from 7to 13 cm are sufficient.
pH gradient types One of the advantages of immobilized pH gradi-ents is the possibility to reproducibly produce linear gradients frompH 3 to pH 10. However, there are samples with an uneven distribu-tion of the proteins over the pH gradient from 3 to 10. The non-lineargradient pH 3–10 is flat in the acidic range to accommodate more dif-ferent and higher concentrations of acidic proteins. So far the widestgradient was designed and applied by Gçrg et al. (1999): pH 3–12. Forincreased resolution and higher protein loads acidic (pH 4–7, pH3–7) and basic (pH 6–11, pH 6–9, pH 7–11) gradients are employed.Narrow intervals with only one or two pH units allow very high pro-tein loads and excellent spatial resolution. The narrowest intervals, socalled “ultra zoom gels” with 0.5 pH units, have been applied to 2-Delectrophoresis by Hoving et al. (2000).
Gçrg A, Weiss W. In: CellBiology. A Laboratory Manual,Vol. IV, Ch. 23, 3rd edition. (JECelis, Ed.), Elsevier Science &Academic Press (2005) pp.175–188.
Westermeier R. Electrophoresisin Practice. WILEY-VCH, Wein-heim (2004).
It is very annoying, when thevaluable sample is not sepa-rated well, just because of alittle mistake occurring in thelaboratory.
With miniformat gels resultsare obtained after a few hours.
Gçrg A, Obermaier C, BoguthG, Weiss W. Electrophoresis 20(1999) 712–717.
Hoving S, Voshol H, vanOostrum J. Electrophoresis 21(2000) 2617–2621.
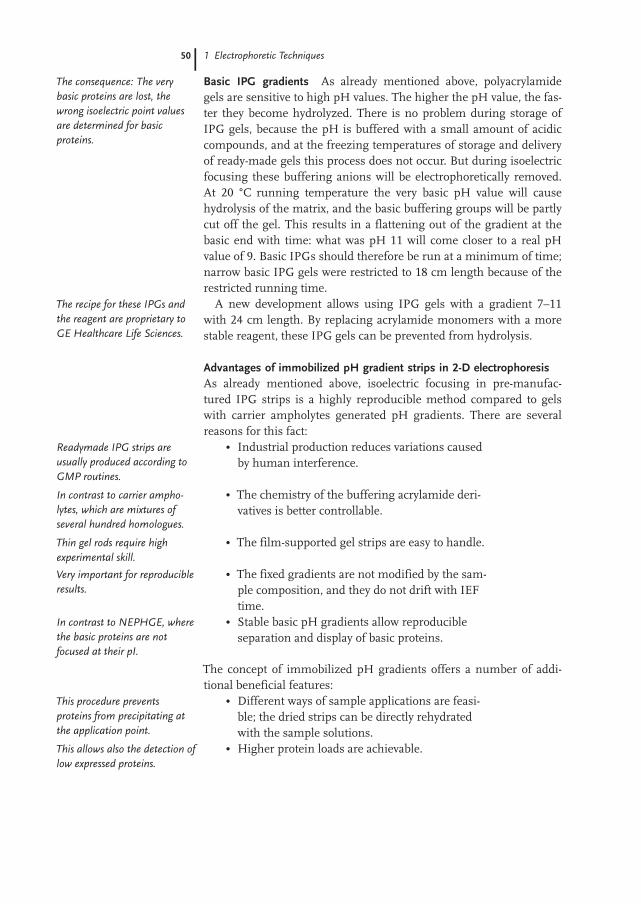
1 Electrophoretic Techniques50
Basic IPG gradients As already mentioned above, polyacrylamidegels are sensitive to high pH values. The higher the pH value, the fas-ter they become hydrolyzed. There is no problem during storage ofIPG gels, because the pH is buffered with a small amount of acidiccompounds, and at the freezing temperatures of storage and deliveryof ready-made gels this process does not occur. But during isoelectricfocusing these buffering anions will be electrophoretically removed.At 20 �C running temperature the very basic pH value will causehydrolysis of the matrix, and the basic buffering groups will be partlycut off the gel. This results in a flattening out of the gradient at thebasic end with time: what was pH 11 will come closer to a real pHvalue of 9. Basic IPGs should therefore be run at a minimum of time;narrow basic IPG gels were restricted to 18 cm length because of therestricted running time.A new development allows using IPG gels with a gradient 7–11
with 24 cm length. By replacing acrylamide monomers with a morestable reagent, these IPG gels can be prevented from hydrolysis.
Advantages of immobilized pH gradient strips in 2-D electrophoresisAs already mentioned above, isoelectric focusing in pre-manufac-tured IPG strips is a highly reproducible method compared to gelswith carrier ampholytes generated pH gradients. There are severalreasons for this fact:
. Industrial production reduces variations causedby human interference.
. The chemistry of the buffering acrylamide deri-vatives is better controllable.
. The film-supported gel strips are easy to handle.
. The fixed gradients are not modified by the sam-ple composition, and they do not drift with IEFtime.
. Stable basic pH gradients allow reproducibleseparation and display of basic proteins.
The concept of immobilized pH gradients offers a number of addi-tional beneficial features:
. Different ways of sample applications are feasi-ble; the dried strips can be directly rehydratedwith the sample solutions.
. Higher protein loads are achievable.
The consequence: The verybasic proteins are lost, thewrong isoelectric point valuesare determined for basicproteins.
The recipe for these IPGs andthe reagent are proprietary toGE Healthcare Life Sciences.
Readymade IPG strips areusually produced according toGMP routines.
In contrast to carrier ampho-lytes, which are mixtures ofseveral hundred homologues.
Thin gel rods require highexperimental skill.
Very important for reproducibleresults.
In contrast to NEPHGE, wherethe basic proteins are notfocused at their pI.
This procedure preventsproteins from precipitating atthe application point.
This allows also the detection oflow expressed proteins.

1.4 Isoelectric Focusing 51
. Various additives, like detergents and reductants,can be added to the rehydration solution.
. Less proteins are lost during equilibration inSDS buffer, because the fixed charged groups ofthe gradient hold the proteins back like a weakion exchanger (Righetti and Gelfi, 1984).
. Probably the most powerful feature is the possi-bility to reach almost unlimited spatial resolu-tion with very narrow pH intervals. This isneeded for protein identification and characteri-zation.
& Dried gel strips can be stored at –20 �C to –80 �Cfrom months to years before reconstitution.
Fractionation between buffering isoelectric membranes The principleof this technique is based on the concept of immobilized pH gradi-ents. The separation occurs in the liquid phase in a multi-compart-ment apparatus, which is divided by buffering isoelectric membraneswith defined pIs (Wenger et al. 1987). The electrodes are located inthe two outer segments. The membranes are prepared by polymeriz-ing a polyacrylamide gel layer with basic and acidic Immobilinesaround a micro fiber filter or polyester grid. The amounts of Immobi-lines needed for a certain pH value are precalculated in the same waylike for the immobilized pH gradients. Figure 1.14 shows the princi-ple of fractionation with isoelectric membranes.
Fig. 1.14: Pre-fractionation of a protein mixture in liquid phasewith isoelectric membranes.
Some of them would inhibit gelpolymerization.
Righetti PG, Gelfi C. J BiochemBiophys Methods. 9 (1984)103–119.
Gradients can be engineeredaccording to special needs; theyare absolutely continuous.
Wenger P, de Zuanni M, JavetP, Righetti PG. J BiochemBiophys Methods 14 (1987)29–43.

1 Electrophoretic Techniques52
In a mixture the sample proteins are charged. In the electric field,a protein with a high pI is protonated and migrates through the com-partments towards the cathode until it reaches a membrane with ahigher pI. It cannot pass through this membrane, because it willbecome deprotonated. If it will get a negative net charge there, it willmigrate back towards the anode until it reaches the previous mem-brane with a lower pI. There it will become protonated again, and soon. It is thus trapped in the compartment.Herbert and Righetti (2000) as well as Speicher and Zuo (2000)
could show that sample prefractionation via multicompartment elec-trolyzers with isoelectric membranes greatly enhances the loadability,resolution and detection sensitivity of 2-D maps in proteome analysis.In contrast, it has been reported that sometimes sticking of hydro-phobic proteins to the membranes are causing electroendosmoticeffects and clogging of the membrane pores.
Off-Gel� isoelectric focusing in a multicompartment device The pro-teins or peptides are separated according to their isoelectric point in amultiwell device, which is connected to immobilized pH gradientstrips (Michel et al. 2003). The separation occurs in liquid phase, notin the gel. The protein fractions are directly recovered in solution forfurther analysis.
Isoelectric focusing followed directly by mass spectrometry Analo-gous to the 1-D SDS electrophoresis LC-MS approach the proteinscan be digested directly after isoelectric focusing in IPG strips withsubsequent LC-MS (Giorgianni et al. 2003).
Isoelectric focusing of peptides Essader et al. (2005) have found thatthe use of narrow range immobilized pH gradients pH 3.5–4.5 forpeptide separation in the first dimension yielded 13% more proteinidentifications than the optimized off-line strong-cation-exchangechromatography as a first dimension in shotgun proteomics. In thiswork greater than 11,500 peptides and 3,700 proteins were identifiedwith high statistical confidence. The approach has a second advan-tage: Accurate pI prediction can then be employed using currentlyavailable algorithms to very effectively filter data for peptide/proteinidentification, and thus lowering the false-positive rate for standardpeptide identification algorithms.
Herbert B, Righetti PG. Elec-trophoresis 21 (2000)3639–3648.
Speicher DW, Zuo X. AnalBiochem. 284 (2000)266–278.
Michel PE , Reymond F,Arnaud IL, Josserand J, GiraultHH, Rossier JS. Electrophoresis24 (2003) 3–11.
Giorgianni F, Desiderio DM,Beranova-Giorgianni S. Electro-phoresis 24 (2003) 253–259.
Essader AS, Cargile BJ, BundyJL, Stephenson JL. Proteomics5 (2005) 24–34.

1.5 Two-dimensional Electrophoresis 53
1.5Two-dimensional Electrophoresis
As already mentioned above, high-resolution two-dimensional elec-trophoresis is still the mainly applied separation technique in proteo-mics. The separation according to two completely independent phy-sico-chemical parameters of proteins, isoelectric point and size, offersthe highest resolution. Several thousand proteins can be separated,displayed and stored in one gel without degradation.It is often tried to compare a 2-D gel result of a certain sample with
a 2-D pattern displayed on a website or in a scientific paper. Thatdoes not work, because there are too many variables. There are stan-dardization initiatives on the way, which try to design recommendedprocedures for sample preparation and running conditions. The con-ditions for these procedures must be highly stringent; otherwise pat-tern comparisons across different laboratories will never be possible.However, a protein can never securely be identified by its spot posi-
tion in a 2-D gel. The spot has to be excized from the gel, the proteinhas to be digested with a proteolytic enzyme, and the peptides have tobe analyzed with mass spectrometry.
1.5.1Sample Preparation
The sample treatment is the key to adequate results. The protein com-position of the cell lysate or tissue must be reflected in the pattern ofthe 2-D electrophoresis gel without any losses or modifications. Ofcourse, the sample must not be contaminated with proteins and pep-tides not belonging to the sample. “Co-analytical modifications”(CAM) of proteins need to be avoided. This is not trivial, because var-ious protein–protein interactions may happen in such a complex mix-ture, and pre-purification of the sample can lead to uncontrolledlosses of some of the proteins.The key points for appropriate sample acquisition and preparation
for 2-D electrophoresis in proteomics are:. Avoid uncontrolled loss of proteins;
. Disrupt all aggregates and complexes
. Prevent enzyme activities;
. Remove disturbing compounds without remov-ing proteins.
With higher protein loadssample preparation becomeseven more critical, because alsothe contaminants concentra-tions are increased.
The lost protein might be themost important ones
Because they are too big toenter the gel
Proteases and phosphatases arealso active under denaturingconditions
Such as salts, lipids, polysac-charides, nucleic acids, polyphe-nols

1 Electrophoretic Techniques54
1.5.1.1 Sample Acquisition
It should be mentioned that the way, how samples are collected andstored, is very important. It is relatively easy for body fluids andlysates from cultured cells, because the proteins are evenly distribu-ted. Strict rules have been designed and are followed for collectingclinical samples to prevent degradation. Some samples are particu-larly critical. It has, for instance, been reported that the protein com-position of brain cells starts to change dramatically immediately afterdeath. Skçld et al. (2002), for instance, keep the time between removalof a total rat brain and having it completely frozen at –80 �C below3 minutes.When patient tissue material is studied, the cells to be analyzed
must be well defined. A highly selective procedure for tissue analysisis needle dissection or laser capture micro dissection under themicroscope (Banks et al. 1999), where diseased cells and control cellsare separately collected to gain enough material for a 2-D electrophor-esis.As a rule of thumb about 107 to 108 cells – or about 100 mg protein
– are required for a silver- or fluorescent dye-stained 2-D gel. If thesample material has to be collected with laser capture or needle microdissection of tissue cells under the microscope, it can take severaldays to a week to obtain enough protein sample for a 2-D electrophor-esis.
1.5.1.2 Sample Treatment
To avoid protein losses, the treatment of the sample must be kept to aminimum; to avoid protein modification, the sample should be keptas cold as possible; to avoid losses and modifications, the time shouldbe kept as short as possible.Too much salt in the sample disturbs isoelectric focusing and leads
to streaky patterns. Amphoteric buffers in cell cultures, like HEPES,overbuffer the gradient in the areas of their pIs, which results in ver-tical narrow areas without protein spots. The chemicals used must beof the highest purity.The proteins have to be extracted from cells or tissue material.
Liquid samples have to be denatured to prevent the formation of poly-peptide oligomers, aggregates and interactions. Some material con-tains proteolytic enzymes, which are still active under denaturingconditions. Phosphatases have to be inhibited to maintain the post-translational modifications to be determined.
Skçld K, Svensson M, KaplanA, Bjçrkesten L, �strçm J,Andren PE. Proteomics 2(2002) 447–454.
Banks R. Dunn MJ, Forbes MA,Stanly A, Pappin DJ, Naven T,Gough M, Harnden P, SelbyPJ. Electrophoresis 20 (1999)689–700.
Pre-labeling of cysteines withCyDyes increases the sensitivityof detection substantially, andtherefore reduces the amountof required cells considerably.

1.5 Two-dimensional Electrophoresis 55
1.5.1.3 Denaturing Conditions
A frequently expressed wish of proteomics researchers is the possibi-lity to separate the protein mixtures under native conditions, in orderto conserve the three-dimensional structures of the proteins. Thereare a number of reasons, why high molar urea, a reductant, and non-ionic or zwitterionic detergents must be present in a sample for high-resolution 2-D electrophoresis:
. Aggregates and complexes between proteins andproteins, polysaccharides, and lipids would betoo big to enter a gel matrix. They are usuallydisintegrated by the addition of high urea con-centrations and reduction of the sample.
. Under native conditions, a great part of the pro-teins exists in several different conformations.This would lead to even more complex 2-D pat-tern, which could not be evaluated. The proteinshave to be denatured in order to display them insingle conformations.
. Different oxidation steps must be prevented bythe addition of a reducing agent.
. All proteins, also the hydrophobic ones, have tobe brought into solution. Because buffers andsalt ions would disturb isoelectric focusing, non-charged chaotropes, like urea and thiourea, anddetergents have to be used for the solubility ofall proteins.
. Protein–protein interactions are avoided byapplying denaturing conditions.
. For the analysis of the proteome, it should bepossible to match the theoretically calculated iso-electric point of a polypeptide with pI position inthe 2-D map. This is only possible, when thethree-dimensional structure is cancelled and allbuffering groups are exposed to the medium.Bjellqvist et al. have shown that this is possiblewith immobilized pH gradients.
& Composition of the standard lysis solution:9 mol/L urea, 4% (w/v) CHAPS, 1% (w/v) DTT,2% (v/v) carrier ampholytes, 0.002% (w/v)Bromophenol blue.
Unfortunately it is impossibleto separate complex proteinmixtures under native condi-tions.
Sometimes the sample needs tobe treated by precipitation todissolve strongly coherentcomplexes.
In presence of more than 7mol/L urea most polypeptidesexist only in one single config-uration.
Also the addition of carrierampholytes supports the solubi-lity of hydrophobic proteins.
In the three-dimensional config-uration some buffering groupsare hidden, which causes a shiftof the pI.
Bjellqvist B, Hughes GJ,Pasquali C, Paquet N, RavierF, Sanchez J-C, Frutiger S,Hochstrasser D. Electrophoresis14 (1993) 1023–1031.

1 Electrophoretic Techniques56
Urea The high urea concentration is needed to convert proteins intosingle conformations by canceling the secondary and tertiary struc-tures, to get and keep hydrophobic proteins in solution, and to avoidprotein–protein interactions. Only in special cases a second, strongerdenaturing chaotrope has to be added to urea in order to increase thesolubility of very hydrophobic proteins, like membrane proteins:thiourea. The purity of urea is very critical: Isocyanate impurities andheating must be avoided, because these would cause carbamylationof the proteins, resulting in artifactual spots.
Detergent CHAPS is a zwitterionic detergent, and preferred to non-ionic polyol mixtures like Triton X-100 and Nonidet NP-40, becauseof its higher purity. It increases the solubility of hydrophobic pro-teins.
Reducing agents The reductants DTT or DTE prevent different oxi-dation steps of the proteins. Both are interchangeable. 2-mercap-toethanol should not be used, because of its buffering effect abovepH 8 (Righetti et al. 1982). This would cause horizontal streaks in thearea between pH 8 and 9. Also, keratin contaminations, seen withmass spectrometry, have been traced back to contaminated 2-mercap-toethanol (Parness and Paul-Pletzer, 2001).Unfortunately DTT as well as DTE can become ionized above their
pK of 8 and migrate towards the anode during IEF in basic pH gradi-ents after some time. The cysteines are no longer protected, whichleads to back folding and aggregation of some of the polypeptides,resulting in modifications of their pIs and thus horizontal streaks.Additionally, non-specific reactions of cysteines with urea cause arti-factual spots.Tributylphosphine (TBP), introduced into 2-D electrophoresis by
Herbert et al. (1998), is generally not recommended as a replacement,because of its poor stability in the electric field. Also its replacementby Tris(2-carboxyethyl) phosphine (TCEP) does not improve theseparation. As a remedy Herbert et al. (2001) have then proposed alky-lation of proteins prior to IEF, particularly for separations in basic pHgradients. Also this procedure cannot be recommended, becausecomplete alkylation of all proteins in a complex mixture is not easy tocontrol. Therefore additional artifactual spots are observed, resultingfrom incomplete alkylation. Furthermore, the pIs of the basic pro-teins become modified, which is another disadvantage.The phenomenon of streaking and appearance of artifactual spots
in basic regions is abolished, when the first dimension IEF is runwith an excess of hydroxyethyldisulfide (HED, “DeStreak”) accordingto Olsson et al. (2002). For rehydration of the IPG strip the reductantis replaced by 100 mmol/L HED (“DeStreak�”). The proteins are
Urea is not stable in solution,repeated freeze – thawing mustbe avoided.
Mass spectrometry is particu-larly sensitive to contamina-tions coming from detergentslike Triton X-100.
Righetti PG, Tudor G,Gianazza E. J Biochem BiophysMethods 6 (1982) 219–22.
Parness J, Paul-Pletzer K. AnalBiochem 289 (2001) 98–99.
Herbert BR, Molloy MP,Gooley AA, Walsh BJ, BrysonWG, Williams KL Electrophor-esis 19 (1998) 845–851.
Herbert B, Galvani M,Hamdan M, Olivieri E,MacCarthy J, Pedersen S,Righetti PG. Electrophoresis 22(2001) 2046–2057.
Olsson I, Larsson K, PalmgrenR, Bjellqvist B. Proteomics 2(2002) 1630–1632.

1.5 Two-dimensional Electrophoresis 57
extracted in the conventional way with a reductant like DTT or DTE;also alternative reductants like 2-mercaptoethanol, TBP, or TCEP canbe used. The lysis solution must not contain DeStreak. When thereduced proteins electrophoretically enter the IPG strip, the HEDimmediately oxidizes the protein cysteinyl groups to mixed disulfides.In this way all thiol groups are converted into one defined form,which will not react anymore. Back folding and aggregation of subu-nits are thus prevented. Non-specific reactions of cysteines with ureacannot happen anymore. The resulting pattern shows round spots,the number of spots is reduced compared to separations in presenceof reductant, and there is a light shift of the basic pIs towards basicpH because of the missing negative charges of the thiols.When DeStreak (HED) is used, it is highly recommended to use
cup- or paper bridge-loading at the anodal end of the IPG stripinstead of rehydration loading. More information can be found onpages 79 and 85 where rehydration and sample loading is explained.If rehydration loading is needed, the DTT content of the final rehy-dration solution (sample diluted with rehydration solution) must notcontain more than 1 mmol/L DTT.An alternative way to adequate and reproducible 2-D pattern in
basic gradients has been suggested by Hoving et al. (2001): the addi-tion of higher amounts of DTT to the gel, adding more DTT to a cath-odal paper strip, and a few more measures described later in the iso-electric focusing chapter.
Carrier ampholytes Carrier ampholytes, which had been designedfor generating pH gradients, improve the solubility of proteins con-siderably by substituting ionic buffers. In a mixture they are charged.They do not disturb IEF like buffer addition, because they migrate totheir pIs, where they become uncharged. Dedicated pH intervals, pre-pared for the addition to immobilized pH gradients, are called IPGbuffers.Various IPG buffer mixtures are designed for the respective pH gra-
dients. Sometimes in practice, the use of carrier ampholyte mixturesfor wide gradients, like Pharmalytes pH 3–10, instead of dedicatedIPG buffers, has shown better results for narrow gradients.
Dyes The anionic dye Bromophenol blue is very useful as a controlfor the start and running conditions. The low amounts used do notdisturb the analysis.
If DeStreak is mixed with areductant, it will becomereduced to 2-mercaptoethanol.As described above, 2-mercap-toethanol causes horizontalstreaking.
Hoving S, Gerrits B, Voshol H,M�ller D, Roberts RC, vanOostrum J. Proteomics 2(2002) 127–134.
Note: The composition ofcarrier ampholytes or IPGbuffers used will influence theresult.
This should be checked in apractical optimization experi-ment for a different sampletype.
Bromophenol blue can be inter-changed with Orange G.

1 Electrophoretic Techniques58
1.5.1.4 Alternative Lysis Solutions
Thiourea / urea solution For the extraction and solubilization ofhighly hydrophobic proteins like membrane proteins a combinationof 7 mol/L urea plus 2 mol/L thiourea lysis solution can be very help-ful to get more proteins into solution (Rabilloud, 1998).
& Composition of the alternative lysis solution:7 mol/L urea, 2 mol/L thiourea, 4% (w/v)CHAPS, 1% (w/v) DTT, 2% (v/v) carrierampholytes, 0.002% (w/v) Bromophenol blue.
Generally, extraction with urea and thiourea combined increases thenumber of spots considerably. It can be observed in the literature thatmany researchers have started to use this combination of chaotropesfor all types of samples. However artifacts can be observed as well.Figure 1.15 shows the results of 2-D electrophoresis of rat liverextracts: the lysis buffer differed only in the chaotropes used. Thethiourea-containing sample shows many more spots, but also a phe-nomenon typical for thiourea gels: a vertical streak in the acidic areaand blurred spots in the pH range below the streak. This effectbecomes more pronounced with increased focusing times. So far aremedy for this effect has not been found.
Fig. 1.15: 2-D electrophoresis of rat liver extracts.A: Lysis solution contained 8 mol/L urea.B: Lysis solution contained 7 mol/L urea and 2 mol/L thiourea.Gels: IEF in 18 cm IPG 3–10 non-linear, SDS PAGE in 20�20 cmgels of 12.5% T, 1 mm thick. Silver staining.
SDS procedure In some cases the anionic detergent SDS can beemployed for sample preparation: up to 2% SDS has been used.Before the sample is applied to denaturing isoelectric focusing theSDS sample has to be at least 20-fold diluted with urea and a non- or
Rabilloud T. Electrophoresis 19(1998) 758–760.
This streak and the blurredspots are not sample-specific. Itseems that thiourea starts tofocus itself.
The precipitation clean-upprocedure described below canalso remove the SDS from theproteins.

1.5 Two-dimensional Electrophoresis 59
zwitterionic detergent containing solution. In the electric field theSDS will separate from the proteins and migrate into the anode. Themajor reasons for using SDS are:
. In human serum and plasma the formation ofoligomers are only prevented by boiling the sam-ple in SDS.
. Organisms with tough cell walls sometimesrequire extraction with 1% SDS before they arediluted with lysis buffer.
. Some very hydrophobic proteins may requireextraction with high percentage of SDS.
. It is also applied for plant protein extraction (seebelow).
Unfortunately SDS does not always completely separate from the pro-teins, even under high field strength. This can result in the shift ofsome isoelectric points to a more acidic value.
New zwitterionic detergents and sulfobetains A series of novel zwit-terionic detergents (Chevallet et al. 1998) and non-detergent sulfobe-tains (Vuillard et al. 1995) have been tried. Some hydrophobic mem-brane proteins could be solubilized, which otherwise would havebeen lost. Molloy (2000) has reported that membrane proteins go bet-ter in solution with 7 mol/L urea plus 2 mol/L thiourea and alterna-tive zwitterionic detergents like ASB 14 or sulfobetain in the lysissolution. Nevertheless, up to now none of these additives has per-formed so well in general that it has replaced CHAPS in the standardcocktail. A perfect solution has not yet been found.
1.5.1.5 Protease Inactivation
Some proteases are also active in presence of urea and detergents.Protease inhibitors can inactivate most of the proteolytic activities,however in some cell lysates not completely. PMSF is frequently used(8 mmol/L), but it is a toxic compound. It has to be added to the sam-ple prior to the reductant, because thiols deactivate PMSF. Pefabloc(AEBSF) applied as 5 to 10 mmol/L is less toxic, but might lead tocharge modifications of some proteins (Dunn, 1993). This can alsohappen with application of protease “cocktails”. Some proteases areinhibited by the denaturing conditions, some by basic pH. ThereforeTris base – below 40 mmol/L – is sometimes added to the lysis solu-tion.Proteases can be inactivated by boiling the sample in SDS buffer
for a few seconds prior to the addition of urea-containing lysis solu-tion. Completely irreversible protease inactivation is only obtained
Hughes GJ, Frutiger S, PaquetN, Ravier F, Pasquali C,Sanchez JC, James R, Tissot JD,Bjellqvist B, Hochstrasser DF.Electrophoresis 13 (1992) 707–714.
Gçrg A, Drews O, Weiss W. InSimpson RJ, Ed. Purifyingproteins for proteomics: Alaboratory manual. Cold SpringHarbor Laboratory Press, ColdSpring Harbor, New York(2003) 407.
Chevallet M, Santoni V, PoinasA, Rouquie D, Fuchs A, KiefferS, Rossignol M, Lunardi J,Gerin J, Rabilloud T. Electro-phoresis 19 (1998)1901–1909.
Vuillard L, Marret N, RabilloudT. Electrophoresis 16 (1995)295–297.
Molloy MP. Anal Biochem 280(2000)1–10.
There are no protease inhibi-tors, which can stop allprotease activities completely.
Dunn MJ. Gel electrophoresisof proteins. Bios ScientificPublishers Alden Press, Oxford(1993).
In practice the sample isextracted with a protease inhi-bitor cocktail, and then thesample is precipitated.

1 Electrophoretic Techniques60
with immediate precipitation of the extracted proteins. This can bedone with a 2-D cleanup kit, with the methanol chloroform method,or at –20 �C with TCA acetone (see below).
1.5.1.6 Phosphatase Inactivation
The determination of phosphorylations and their locations on theprotein molecule reveals very valuable information on biochemicalprocesses. This is done with tandem mass spectrometry with severalfragmentations of the tryptic peptides. To maintain the phosphoryla-tion status two phosphatase inhibitors are added: 1–10 mmol/LNa3VO4, a phospho-tyrosine inhibitor, and 1–10 mmol/L NaF, whichis a phospho-serine/threonine inhibitor.
1.5.1.7 Alkaline Conditions
Tris base up to 40 mmol/L or 25 mmol/L spermine base (Rabilloudet al. 1994) is sometimes added to the lysis buffer to maximize proteinextraction, precipitate nucleic acids, or to keep protease activities low.This should not be done, when basic proteins are of interest andmust be displayed in the gel. Care should be taken when preparativesample loads need to be analyzed: the ionic contamination canbecome too high.For labeling with modified CyDye fluors for fluorescence 2-D differ-
ence gel electrophoresis (DIGE), the pH of the sample must behigher than pH 8. This is achieved by adding 30 mmol/L Tris to thelysis solution. Sometimes the sample solution pH is adjusted to pH8.5 with NaOH solution. This pH value is the optimum for dye label-ing (Yan et al. 2002).
1.5.1.8 Frequently Applied Sample Treatments
Cell washing For the analysis of cell extracts washing of cells withPBS (phosphate buffered saline) is proposed. Unfortunately PBS con-taminates the cell surfaces with salt, which leads to horizontal streak-ing. Either it is possible to remove the PBS solution completely, orthe cells are washed with Tris-buffered sucrose solution (10 mmol/LTris, 250 mmol/L sucrose, pH 7). Often cells are first washed withPBS solution, and then as a last washing step Tris-buffered sucrosesolution is used.
Cell disruption The choice of disruption methods is dependent onthe type of sample. The easiest way is osmotic lysis of cultured cells,using the standard lysis solution defined above. Sometimes lyophi-lized cells are brought into solution with lysis solution. For analytical
Rabilloud T, Valette C, Lawr-ence JJ. Electrophoresis 15(1994) 1552–1558.
Yan JX, Devenish AT, Wait R,Stone T, Lewis S, Fowler S.Proteomics 2 (2002)1682–1698.
It is important that thewashing solution containsenough osmoticum to avoidcell lysis at this stage. Sorbitoldoes not work as well assucrose.
1.5 Two-dimensional Electrophoresis 61
applications 5 to 10�106 cell equivalents are usually applied. Bacteriacells can be extracted by repeated freezing at –20 �C and thawing. Forsome organisms detergent lysis or sometimes even enzymatic lysis isnecessary, for instance for tough cell walls of yeast and fungi. Whensamples are treated with the anionic detergent SDS, the solutionmust be diluted with lysis solution to a less than 0.1% (w/v) SDS withat least 8 � the concentration of zwitterionic detergent prior to IEF.Sonication with a probe is very helpful for solubilization. French pres-sure cells and mechanical homogenizers, like bead beaters, areemployed to burst tough cell walls from yeast or plant cells.Tissues and samples with tough cell walls are often treated with
mortar and pestle at sub-zero temperatures. The handling of smallsample amounts requires smaller tools. A new sample grinding kit isdesigned for the effective grinding of small samples for the purposeof protein extraction. The kit consists of microcentrifuge tubes eachcontaining a small quantity of abrasive grinding resin suspended inwater. Extraction solution of choice is added to the tube along withthe sample to be ground. A grinding pestle is used to grind the sam-ple. Cellular debris and grinding resin are removed by centrifugation.Intracellular organelles are also disrupted, resulting in the liberationand extraction of all proteins soluble in the extraction solution.
General The disruption method used can influence the 2-D pattern.Therefore it has to be employed in a reproducible way and be thor-oughly described in the analysis protocol.
1.5.1.9 Removal of Contaminants
A crude extract can be contaminated with salt ions, phospholipidsand nucleic acids, leading to disturbances or background streaking.
Nucleic acids Nucleic acids are visible after silver staining as dis-turbing horizontal streaks in the acidic part of the gel. Furthermore,they can precipitate with the proteins when the sample has to beapplied on the basic end of the IEF gel. They can be removed withDNAse and RNAse treatment, or with benzonase. The easiest techni-que is sonication, which breaks nucleic acids into little fragments.Precipitation also removes nucleic acids.
Lipids Lipids are removed with an excess of detergent (>2%) or withprecipitation. Proteases are irreversibly inactivated by precipitation.Solid material is removed by spinning it down by centrifugation. Saltscan be dialyzed away or removed by precipitation. In the followingpages the procedures are explained more detailed.
When a sonicator is used, theprocedure should be performedon ice. Only short bursts shouldbe applied in order to avoidheating of the urea.
Heating must be avoided whensonicating. Proteins are notdestroyed with sonication.

1 Electrophoretic Techniques62
Salts When a sample contains too much salt, the conductivity willbe too high for isoelectric focusing.
Microdialysis Desalting with microdialysis tubes shows less proteinlosses than with gel filtration. A mini dialysis kit has been designedfor the dialysis of small samples with minimal handling and withoutsample loss. Each dialysis tube consists of a sample tube with a capthat incorporates a dialysis membrane. Usually the membrane with amolecular cut-off of 8,000 Da is used. The sample is pipetted into thetube, which is capped and inverted in a beaker containing urea–deter-gent solution. The tubes are held in place with floats. Salts and mole-cules smaller than the molecular weight cut-off of the dialysis mem-brane rapidly exchange through the membrane. Following dialysis,the tube is centrifuged briefly to recover the contents. Then the reduc-tant and IPG buffer are added to the sample again. Dialysis time is 2hours to overnight.
Electrophoretic desalting There are some cases where the samplemust not be dialyzed. For example: Proteins in halobacteria lysatewill not be soluble if the salt is removed. Another example: if theextraction solution containing bovine vitreous proteins would bedesalted, they would form a gel. Gçrg et al. (1995) showed that thesample can be electrophoretically desalted during the first IEF phasein the immobilized pH gradient strip: the applied voltage has to belimited to 100 V for 5 hours.
1.5.1.10 Precipitation Methods
There are several reasons to apply a protein precipitation procedure:. Concentration of low concentrated proteins, likein plant tissue;
. Removal of several disturbing compounds at thesame time;
. Irreversible inhibition of protease activity;
. Disintegration of complexes;
. Removal of endogeneous small peptides, whichwould interfere with DIGE labeling.
The proteins are precipitated while interfering substances such asdetergents, salts, lipids, phenols, and nucleic acids are left behind insolution. The proteins are then resuspended in lysis solution.
Method by Wessel and Fl�gge (1984) Methanol and chloroform areadded to the sample. After adding water the phases are separated and
Gçrg A, Boguth G, ObermaierC, Posch A, Weiss W. Electro-phoresis 16 (1995) 1079–1086.
Note: Protein losses can neverbe completely prevented.
Wessel D, Fl�gge UI. AnalBiochem 138 (1984) 141–143.

1.5 Two-dimensional Electrophoresis 63
the proteins are precipitated at the chloroform–methanol–water inter-phase. Excess methanol is added, followed by centrifugation. Thisprecipitation method holds one of the best yields.
Method by Damerval et al. (1986) The frozen plant material isground in a pre-frozen mortar. The powder is mixed with 10% TCAin cold acetone (–20 �C) containing 0.07% 2-mercaptoethanol. Preci-pitation occurs overnight in a freezer, followed by centrifugation andrepeated washing with acetone (–20 �C) containing 0.07% 2-mercap-toethanol. The pellet is resuspended in lysis buffer. The disadvantageis, however, that some acidic proteins get lost with this procedure,because they are not precipitated into the pellet. The yield of proteinswith pIs higher than pH 7 is much higher when extracted underacidic conditions than with lysis buffer. Gçrg et al. (1997, 1998) havetherefore employed this procedure – with slight modifications – toextract more basic proteins from bacterial cells, yeast, and animal tis-sue. They used 20% TCA and replaced the 2-mercaptoethanol by0.2% DTT.
Method by Mastro and Hall (1999) This procedure is applied fordelipidation and precipitation of lipid-rich samples. Biologicalextracts with a lipid content of over 20% of dry matter are delipidatedand precipitated with a mixture of tri-n-butyl phosphate, acetone andmethanol at 4 �C, centrifuged, washed with the same mixture and air-dried.
2-D clean-up kit This procedure can be completed in one hour anddoes not result in spot gain or loss. The principle is similar to themethod by Damerval et al. (1986), but with a detergent co-precipitantproteins are more efficiently and completely removed from the solu-tion. The wash buffer contains some organic additives that allowrapid and complete resuspension of the proteins with lysis buffer.The first experiences using this procedure were reported in a paperby Stasyk et al. (2001): The spot resolution is improved and the num-ber of spots higher compared to crude extracts or other precipitationmethods. In extreme cases no sample proteins at all can migrate intothe IPG strip because of aggregating proteins and contaminatingmolecules. Figure 1.16 shows such a case: only after a clean-up proce-dure is a 2-D protein pattern obtained. When the crude sample wasapplied, the Bromophenol blue band did not start to migrate in theelectric field, indicating a very high salt content.
Damerval C, DeVienne D, ZivyM, Thiellement H. Electrophor-esis 7 (1986) 53–54.
Gçrg A, Obermaier C, BoguthG, Csordas A, Diaz J-J, MadjarJ-J. Electrophoresis 18 (1997)328–337.
Gçrg A, Obermaier C, BoguthG, Harder A, Scheibe B, Wild-gruber R, Weiss W: Electrophor-esis 21 (2000) 1037–1053.
Mastro R, Hall M. AnalBiochem 273 (1999) 313–315.
Stasyk T, Hellman U, Souchel-nytskyi S. Life Science News 9(2001) 9–12.

1 Electrophoretic Techniques64
Fig. 1.16: 2-D electrophoresis of rat tongue tissue.IPG 3-10L 13 cm. Silver staining.A: Crude extract of rat tongue tissue.B: Rat tongue tissue extract after treatment with the 2-D clean-up kit.
Resolubilization In practice the 2-D clean-up kit and the methodaccording to Wessels and Fl�gge hold the highest yield among theprecipitation methods. Nevertheless, there are sometimes difficultiesto get all precipitated proteins solubilized again. In the practical PartII on page 295 a number of procedures are proposed for getting theprotein pellet completely back into solution.
Immunoprecipitation A widely used procedure to reduce the proteincomplexity for subsequent 2-D electrophoresis is immunoprecipita-tion (IP) with agarose beads-bound antibodies. Elution with ureasolution should be avoided, because with this measure antibodies canget removed from the beads. The standard elution buffer is200 mmol/L glycine, titrated to pH 3 with HCl.
1.5.1.11 High Molecular Weight Proteins
It seems that this subject may not fit into the sample preparationpart, because nothing can be done here to improve the performanceof 2-D electrophoresis for displaying high molecular weight proteinswith sizes above 150 kDa. It is known that HMW proteins can get lostduring the isoelectric focusing step or between the first and seconddimensions. But they are included, when they are just run in a one-dimensional SDS gel.In general the number of HMW sample is not so high that they
could not be resolved in a one-dimensional SDS PAGE separation. IfHMW proteins are of interest, there is the possibility to prepare a por-tion of the sample with SDS sample buffer and run it as a 1-D sam-ple, either on the 2-D gel together with the IPG strip or on a separateSDS gel.
The pellet must never becomecompletely dry; this is the mostfrequent reason for problemswith resolubilization.
The transfer of HMW proteinsfrom the first to the seconddimension is improved, whenthe electric field is kept very lowduring the first two hours (seebelow).

1.5 Two-dimensional Electrophoresis 65
1.5.1.12 Overloading Effects
When a sample contains one or a few highly abundant proteins, anoverloading effect can occur: When the electric field focuses the pro-tein at the isoelectric point, the gel will build a high ridge at thispoint. When the amount of a protein is too high, the focusing forcewill exudate a part of the protein through the gel surface of an IPGstrip. The protein will diffuse over the surface (see Figure 1.17). Theeffect will be visible as strong horizontal streaks over the 2-D gel.This phenomenon is particularly intensified, when the IPG strip is
run with the surface downward, because there is additional mechan-ical pressure acting on the ridges.
Fig. 1.17: Effect from overloading a protein in an IPG strip.
1.5.1.13 Quantification Methods
The usually applied additives, like urea, detergents, and reductants,interfere with the standard protein assays (e.g. Bradford, Biuret,Lowry). False values often lead to over- or under-estimation of the pro-tein load applied on gels. Ramagli (1999) had modified an existingmethod to a relatively reliable procedure by acidifying the samplewith 0.1 mol/L HCl.A more reliable protein assay is based on precipitation to get rid of
the additives. The subsequent assay is based on the specific bindingof copper ions to protein. Precipitated proteins are resuspended in acopper-containing solution and unbound copper is measured with acolorimetric agent. The color density is inversely related to the pro-tein concentration. The assay has a linear response to protein in therange of 0 mg to 50 mg.Another possible method is the labeling of the proteins with a
fluorescent tag and dotting a dilution series on a low fluorescentblotting membrane (Mackintosh et al. 2005). The membranes arewashed, and then scanned with a fluorescence imager.For a reliable comparison of 2-D gels the protein load should be
similar for all IPG strips run in one gel. Therefore the proteinamount needs to be checked. Variations of protein loads must be incertain limits to allow for corrections by the normalization functionof image analysis (see pages 131 and 133). The knowledge of the pro-tein content of a sample is very useful to avoid under- or overloading.
Therefore estimation of theprotein content in the sample isvery important.
Ramagli LS. In Link AJ. (Ed) 2-D Proteome Analysis Protocols.Methods in Molecular Biology112. Humana Press, Totowa,NJ (1999) 99–103.
The precipitation reagents arethe same like in the 2-D clean-up kit.
Mackintosh JA, Veal DA,Karuso P. Proteomics 5 (2005)4673–4677.
If possible, these highly abun-dant proteins should bedepleted with affinity media, orthe sample should be pre-frac-tionated.

1 Electrophoretic Techniques66
However, when the protein composition is unbalanced, this informa-tion does not help very much. A typical example is serum or plasma,where albumin makes up ca. 60% and the gamma globulins ca. 20%of the total protein. These highly abundant proteins can easily causeoverloading effects (see above). Thus for such sample types the totalprotein loading capacity of an IPG strips is considerably reduced.
1.5.1.14 Analytical Versus Preparative Sample Load
Sample loads are often classified into analytical or preparative loads.In practice it is not easy to differentiate clearly between these terms:A strong protein spot in an analytical gel can contain enough materialfor further analysis whereas a weak spot in a preparative gel can beinsufficient. Roughly, when 50 to 150 mg of total protein is applied ona gel, and silver or sensitive fluorescent staining methods need to beemployed, it is an analytical gel. Preparative gels are loaded with500 mg to 1 mg total protein or more. These gels are usually stainedwith Coomassie brilliant blue, medium sensitive fluorescent dyes, orzinc–imidazol.
1.5.1.15 Special Cases
Human body fluids Body fluids are an important source for detec-tion and monitoring of disease markers. The Anderson group hadstarted many years ago to collect data for the Human protein indexwith 2-D electrophoresis, for instance analyzing plasma and urinaryproteins (Anderson et al. 1977, 1979). A plasma protein map pro-duced with immobilized pH gradients has been published by Hugheset al. (1992).Besides plasma and serum, cerebrospinal fluid is frequently used
as a sample for detecting and monitoring prognostic and diagnosticmarkers. Here is a selection of papers on 2-D electrophoresis of cere-brospinal fluid: Harrington and Merrill (1988), Yun et al. (1992), Zerret al. (1996), Burkhard et al. (2001).Unfortunately most of the body fluids are loaded with some highly
abundant proteins and salt ions, which interfere with the first dimen-sion. Microdialysis and/or low-voltage start conditions for isoelectricfocusing are required to avoid distorted patterns.
Albumin For serum and plasma usually the high abundance of albu-min and globulins limit the loading capacity for the rest of the pro-teins. When the albumin and IgG content in samples like plasma,serum, and cerebrospinal fluid are removed with affinity media, thesensitivity of detection for other proteins is considerably improved(see, for instance, Chromy et al. 2004). However, as albumin is a
Anderson L, Anderson NG.Proc Nat Acad Sci USA. 74(1977) 5421–5425.
Anderson NG, Anderson NL,Tollaksen SL. Clin Chem. 25(1979) 1199–1210.
Hughes GJ, Frutiger S, PaquetN, Ravier F, Pasquali C,Sanchez JC, James R, Tissot JD,Bjellqvist B, Hochstrasser DF.Electrophoresis 13 (1992)707–714
Harrington MG, Merrill C. JChromatogr 429 (1988)345–358.
Yun M, Mu W, Hood L,Harrington MG. Electrophor-esis 13 (1992) 1002–1013.
Zerr I, Bodemer M, Otto M,Poser S, Windl O, KretzschmarHA, Gefeller O, Weber T.Lancet 348 (1996) 846–849.
Burkhard PR, Rodrigo N, MayD, Sztajzel R, Sanchez J-C,Hochstrasser DF, Shiffer E,Reverdin A, Lacroix JS. Electro-phoresis 22 (2001) 1826–1833.
Chromy BA et al. J ProteomeRes , 3 (2004) 1120–1127.

1.5 Two-dimensional Electrophoresis 67
transport protein, other proteins, which stick to albumin, areremoved at the same time (Granger et al. 2005). Some researchgroups have already started to study the so called “Albuminome”(Gundry et al. 2007). Currently there is no procedure available to getrid of albumin without losses of other proteins.
Plant proteins Sample preparation from plant tissues is particularlytroublesome, because interfering substances such as polysaccharides,nucleic acids, lipids and phenolic compounds are present in highconcentrations, whereas the proteins exist in low abundance. Theclassic procedure for protein extraction from plant tissue is the preci-pitation with TCA and acetone according to Damerval et al. (seeabove). Meanwhile some more work has been invested for more effi-cient extraction procedures for recalcitrant plant tissue (Giavaliscoet al. 2003; M�chin et al. 2003; Carpentier et al. 2005). Relatively elabo-rate procedures are also required for the analysis of plant membraneproteins (Hurkman and Tanaka, 1986). Here the protein pellet has tobe extensively washed before it can be resuspended in lysis buffer forIEF. Delaplace et al. (2006) could show for the example of potato tuberproteins that the phenolic phase extraction method according toHurkman and Tanaka and an extraction with SDS lysis solution arecomplementary regarding the Mr range of preferentially extractedproteins.Another challenge for plant proteomics researchers is the high
abundance of Rubisco (ribulose-1,5-bisphosphate), the most abun-dant enzyme on earth, and making up about 60% of soluble leaf pro-tein.
1.5.1.16 Integration of Sample Preparation into a Laboratory WorkflowSystem
It is very important to link the sample preparation procedure to theresult data even down to mass spectrometry analysis. A good examplecase for this need is described in the – already mentioned – paper byParness and Paul-Pletzer (2001), where the origin of the keratin ofthe protein spots has been found in the reductant.Peculiar results in mass spectrometry analysis must initiate an
automated search in the entire laboratory workflow. Therefore alldata, including the source and the LOTnumber of each reagent used,have to be entered together with the sample code into the database ofthe laboratory workflow system.
Granger J, Siddiqui J, CopelandS, Remick D. Proteomics 5(2005) 4713–4718.
Gundry RL, Fu Q, Jelinek CA,Van Eyk JE, Cotter RJ. Proteo-mics Clin Appl 1 (2007)73–88.
M�chin V, Consoli L, Le Guil-loux M, Damerval C. Proteo-mics 3 (2003) 1299–1302.
Giavalisco P, Nordhoff E,Lehrach H, Gobom J, Klose J.Electrophoresis 24 (2003)207–216.
Carpentier SC, Witters E,Laukens K, Deckers P,Swennen R, Panis B. Proteo-mics 5 (2005) 2497–2507.
Hurkman WJ, Tanaka CK.Plant Physiology 81 (1986)802–806.
Delaplace P, van der Wal F,Dierick J-F, Cordewener JHG,Fauconnier M-L, du Jardin P,America AHP. Proteomics 6(2006) 6494–6497.
Parness J, Paul-Pletzer K. AnalBiochem 289 (2001) 98–99.

1 Electrophoretic Techniques68
1.5.1.17 Further Developments in Sample Preparation Procedures
Whereas the methodology for the separation and further analysis ofthe proteins has become much easier, reliable, and reproducible,there is still a substantial wish list for improvements of sample pre-paration:
. A very important goal in for creating reliabledata is a certain standardization of sample pre-paration and a systematic reduction of proteincomplexity prior to 2-D electrophoresis.
. A wider choice of detergents and other additives,which support the solubility of hydrophobic pro-teins, and would reduce the losses of proteins.
. Multiple automated sample preparation willreduce the manual influence and allow higherthroughput. Because most of the problems inpractice are created by contaminants of all differ-ent kind, the 2-D clean-up precipitation and reso-lubilization method should be applied to manysample types.
. Pre-fractionation of proteins according to theirisoelectric points into defined packages, whichare applied on narrow pH interval gels can sub-stantially reduce the load of sample not dis-played in these gels, and in this way reducelosses of proteins.
. More efficient methods for depletion of highlyabundant proteins need to be developed.
1.5.2Pre-labeling of Proteins for Difference Gel Electrophoresis
With the difference gel electrophoresis (DIGE) approach the proteinsof several samples are labeled prior to the electrophoretic separationwith different – spectrally distinct – fluorescent dyes. The samplesare mixed together and run on the same 2-D gel. In this way the pro-teins of different samples are migrating under identical conditions,because the gel-to-gel variations are eliminated. For this method thecyanine dyes (CyDye) are chemically modified in a way that they bindto proteins and allow precise co-migration of the same proteins inboth dimensions (nl� et al. 1997). After electrophoresis the gels arescanned with a fluorescent imager at different wavelengths. There isa linear relation between a labeled protein and the signal measuredwith the imager, because on excitation of the dye by monochromatic
The separation conditions forlabeled proteins are exactly thesame as for non-labeled.
�nl� M, Morgan EM, MindenJS. Electrophoresis 19 (1997)2071–2077.

1.5 Two-dimensional Electrophoresis 69
light, the dye emits light in proportion to the amount of labeled com-pound in the sample.Three spectrally distinct dyes are available: Cy2, Cy3 and Cy5. They
can be excited with a blue, red and green laser, respectively. In thescanner the emitted light is amplified with photomultiplier tubes andrecorded with the computer. As an alternative a white light sourcecan be used, and the monochromatic light is created with particularnarrow band pass excitation filters. In this case the emitted light iscollected with a scanning CCD camera. In order to prevent crosstalkbetween the different sample signals, in both cases the differentchannels are scanned sequentially, and narrow band pass emissionfilters are inserted for the respective fluorophores.The images can be displayed on a computer screen in a false color
representation. This allows a preview on the results. Using an image-editing program the false color pattern can be overlaid, which is aneasy way to visualize differences in protein expression. Figure 1.18shows such an overlay for two samples. Yellow spots indicate equalexpression levels, green or red spot up- and down-regulations respec-tively. This visual inspection is very useful as a control over theseparation quality and for optimization of sample preparation andlabeling. For the final evaluation of the results dedicated image analy-sis software, DeCyder�, has to be employed.
Fig. 1.18: False color representation of 2-D electrophoresisseparations of two samples labeled with Cy3 and Cy5. The overlayimage visualizes up and down-regulated proteins.
Two different ways of labeling are employed: lysine and cysteine tag-ging. The by far mostly applied method is labeling of the lysine,because its e-amino side group is easily accessible without derivatiza-tion of the proteins. Also, lysine is one of the most frequently presentamino acids in proteins. The labeling occurs via NHS ester chemistry.Prior to cysteine labeling the disulfide bridges have to be cleaved witha reductant. In this case maleimide chemistry is applied. However,cysteine is markedly less frequently present than lysine.
Laser scanners with photomul-tipliers are more expensive thanwhite light images with CCDcameras, but they are moreprecise and sensitive, and havea broader dynamic range.
Often the differences are subtle;they are not detectable with theeye.

1 Electrophoretic Techniques70
1.5.2.1 Lysine Labeling (Minimal Labeling)
It must be avoided to block all lysines of the proteins with a label,because the proteins would become very hydrophobic and would notstay in solution. Therefore only a small portion of the proteins islabeled. In practice only 400 pmol/L of dye is added to 50 mg of pro-tein. In this way only 3 to 5% of the proteins will receive a tag; theother 95–97% proteins remain unlabeled. This measure, which iscalled “minimal labeling”, prevents also the appearance of multiplelabels: the occurrence of multiple labels on proteins with severallysines will statistically be so low that these molecules are below thelimit of detection. Overlabeling with minimal dyes could be recog-nized very easily in the false color image (see above): Two and moredye molecules per protein would cause vertical streaking due toincreased molecular weight of a part of the molecules of the labeledprotein.It is, however, very important that these dyes are charge and size
matched. Therefore a basic buffering group is added to each of thedyes, thus the isoelectric points are not changing. Also in the seconddimension the proteins migrate to the same point independently oftheir label, because the molecular weights added are in the rangebetween 434 and 464 for the three dyes Cy2, Cy3, and Cy5. This littledifference cannot be resolved by SDS electrophoresis. The 2-D pat-tern obtained with minimal labeling does not differ from a pattern ofpost-stained 2-D gels of non-labeled proteins.The sensitivity of minimal labeling is comparable to good quality
silver staining, however exhibiting a much wider dynamic range andlinearity. It is very rare that a protein does not pick up a label or doesnot contain any lysine. To be on the safe side it is recommended tostain a gel with a sensitive fluorescent dye to detect such proteins.In order to make the method reliable and reproducible, the labeling
has to be performed under optimum conditions and needs to be wellcontrolled (see Figure 1.19). The proteins are solubilized and dena-tured with high molar urea or thiourea/urea. The optimal concentra-tion of the protein lysate is between 5 and 10 mg/mL. But also sam-ples containing from 1 mg/mL to 20 mg/mL have been successfullylabeled. If the sample is too diluted, labeling will be less efficient.Lysine labeling is performed on ice and in absence of IPG buffers orcarrier ampholytes and reductants: The primary amino groups ofamphoteric buffers would be labeled as well; the reductant wouldinterfere with the reaction. These compounds are added after labelinghad been completed. A sample pH value above pH 8.0 is essential,the optimum lies at pH 8.5. Therefore the sample solution shouldalways contain 30 mmol/L Tris-base. Samples, which have been
In downstream analysis thenon-labeled peptides are in agreat majority versus thelabeled ones, therefore only thenon-modified peptides will bedetected with mass spectro-metry.
In the lower molecular weightarea of the SDS gel an offset ofnon-labeled from labeledprotein spots can be observed.Therefore, when spot picking isintended, it is recommended tostain the gel after scanning witha fluorescent dye and matchthe spots with the labeled spotsusing the spot matching algo-rithm of the evaluation soft-ware.
Underlabeling is not an issue: ifmore protein is labeled with thesame amount of dye, thescanned image will be thesame. However, when proteinsare overlabeled, multiple labelscan become visible, particularin the cathodal area of the 2-Dgel.
The distribution of dyes isuniformly and quantitativeacross all the different proteins.

1.5 Two-dimensional Electrophoresis 71
extracted with TCA acetone or have been cleaned up with precipita-tion, are often very acidic. In this case it can be necessary to adjustthe pH value by adding 50 mmol/L NaOH solution. The reaction iscarried out on ice for 30 minutes and stopped by adding a 0.1% (w/v)lysine solution.
Fig. 1.19: Simplified diagram of lysine labeling for DIGE.No derivatization is needed, because the e-amino group ofthe lysine is readily accessible.
Subsequently the samples are combined and either submitteddirectly to 2-D electrophoresis or stored in a deep freezer until use.
1.5.2.2 Cysteine Labeling (Saturation Labeling)
In contrast to lysine labeling here all available cysteines will betagged. Labeling the cysteines is pH neutral and does not increasethe hydrophobicity. However the resulting 2-D electrophoresis pat-tern looks different from those originating from minimal labeled ornon-labeled proteins: proteins with many cysteines will pick up manylabels, which results in slower migration in the SDS gel and a muchstronger light emission signal. The increase of molecular weight is650 Da per label. Because of multiple labels, here it is particularlyimportant that the dyes are size matched. Not all proteins containcysteine. It is estimated that in human, animal, and plant proteomesabout 95% of the proteins possess at least one cysteine, and can there-fore be detected with this method.The sensitivity of this method is very high. The application of down
to 1,000 human cells (equal to 2.5 mg protein) provides still very good2-D gels, as shown in a paper by Sitek et al. (2005).Cysteine labeling requires more work than lysine labeling. First the
disulfide bridges are cleaved with the reductant TCEP, thereafter the
However, there are bacteriaspecies, which do not contain asingle cysteine. Needless to say,the method cannot be appliedfor those.
Sitek B, L�ttges J, Marcus K,Klçppel G, Schmiegel W, MeyerHE, Hahn SA, St�hler K.Proteomics 5 (2005) 2665–2679
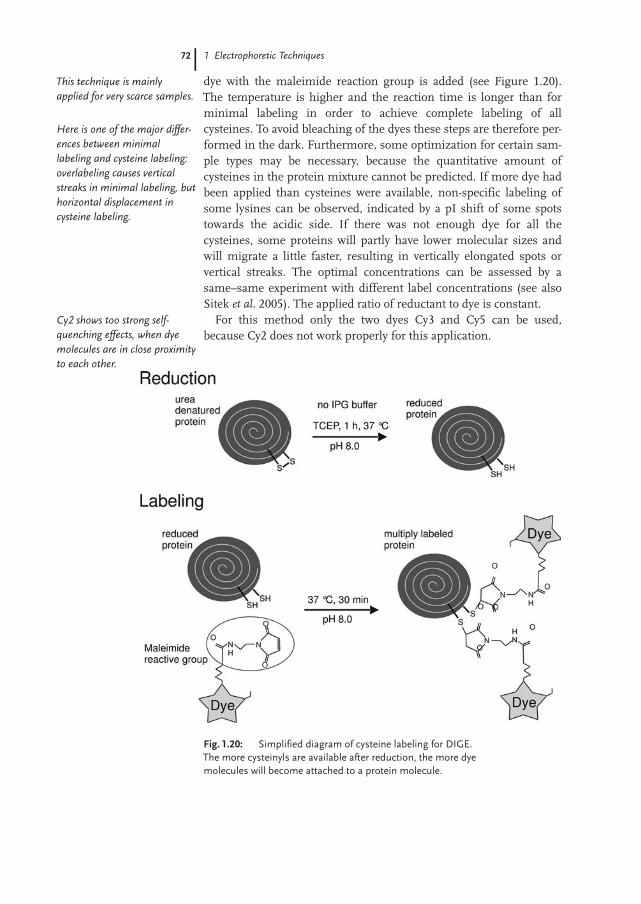
1 Electrophoretic Techniques72
dye with the maleimide reaction group is added (see Figure 1.20).The temperature is higher and the reaction time is longer than forminimal labeling in order to achieve complete labeling of allcysteines. To avoid bleaching of the dyes these steps are therefore per-formed in the dark. Furthermore, some optimization for certain sam-ple types may be necessary, because the quantitative amount ofcysteines in the protein mixture cannot be predicted. If more dye hadbeen applied than cysteines were available, non-specific labeling ofsome lysines can be observed, indicated by a pI shift of some spotstowards the acidic side. If there was not enough dye for all thecysteines, some proteins will partly have lower molecular sizes andwill migrate a little faster, resulting in vertically elongated spots orvertical streaks. The optimal concentrations can be assessed by asame–same experiment with different label concentrations (see alsoSitek et al. 2005). The applied ratio of reductant to dye is constant.For this method only the two dyes Cy3 and Cy5 can be used,
because Cy2 does not work properly for this application.
Fig. 1.20: Simplified diagram of cysteine labeling for DIGE.The more cysteinyls are available after reduction, the more dyemolecules will become attached to a protein molecule.
This technique is mainlyapplied for very scarce samples.
Here is one of the major differ-ences between minimallabeling and cysteine labeling:overlabeling causes verticalstreaks in minimal labeling, buthorizontal displacement incysteine labeling.
Cy2 shows too strong self-quenching effects, when dyemolecules are in close proximityto each other.

1.5 Two-dimensional Electrophoresis 73
For downstream analysis the spots could in principle be pickeddirectly from the image file (see spot picking below). However,because the method is so sensitive, there will not be enough proteinmaterial in a spot for mass spectrometry analysis. Therefore a pre-parative 2-D gel of a reference proteome loaded containing about300 mg protein has to be run. Also for this gel the cysteines mustcarry a label; otherwise the spots to be excised cannot be matchedwith the spots in the analytical gel. The selection of the optimal refer-ence proteome, which should show the most similarities with theanalytical sample, is dependent on the type of sample. Labeling of thepreparative sample proteins is performed with Cy3.
1.5.2.3 The Internal Standard
The multiplex feature of DIGE offers the unique possibility to reserveone channel for an internal standard. Some papers are describing theapplication of a mix of labeled commercial standard proteins. How-ever, by far the greatest effect is obtained, when the internal standardis a pool of aliquots taken from each sample of an experiment, andlabeling this mixture with one of the dyes. This concept is shown in asimplified schematic diagram in Figure 1.21. Of course, “control” and“treated” can be replaced by “healthy” and “diseased” or by “wild type”and “mutant”.
Fig. 1.21: Simplified schematic representation showing how tocreate a pooled internal standard in difference gel electrophoresis(DIGE). The sample proteins are labeled with Cy3 and Cy5, theinternal standard with Cy2. From Westermeier and Scheibe (2007).
Because in this case allcysteine-containing proteins aremodified, the molecular weightadded to the cysteines needs tobe entered into the databasesearch definitions, analogous toalkylation of cysteines.
Westermeier R, Scheibe B. InPosch A. Ed. Sample Prepara-tion for 2D PAGE. Methods inMolecular Biology, HumanaPress, Totowa, NJ (2007) inpress.

1 Electrophoretic Techniques74
In reality it makes no sense to run only two samples in an experi-ment. As already mentioned in the introduction, in order to find sig-nificant protein changes with acceptable statistical confidence, at leastthree biological replicates are required. This means that the internalstandard will be composed of aliquots from six samples: three con-trols plus three treated. It is important to create enough pooled inter-nal standard to be able to apply it on every gel. With minimal labelingeach gel contains two samples and one standard, with saturationlabeling only one sample and the standard are run together.Because the proteins are co-migrating in the gel, no spot matching
is needed within the gel. The sample spot volumes can directly becompared to the spot volumes of the standard, which is the mixtureof all samples. The dedicated software, DeCyder, does this automati-cally, employing a co-detection algorithm. The result is expressed inspot volume ratios. For the comparison of several gels the spot match-ing procedure is highly facilitated, because the images of the standardare matched, which originate from the identical protein composition.In this way it is possible to perform a fully automated evaluation of ahigh number of images. Furthermore image analysis can be carriedout fully automatically with a batch processor, which reduces the userbias to a minimum.
& Note: the result issued by DeCyder consists ofspot volume ratios to the internal standardinstead of absolute spot volumes. In this wayartifactual spot volume variations caused by gel-to-gel variations are eliminated.
The use of the pooled internal standard makes the evaluation of theresults much easier and considerably more reliable:
. Every protein in the population must appear onthe standard image in each gel, otherwise it willnot be included in the result.
. The sample spot volumes are normalized againstthe internal standard.
. Variations of spot volumes due to gel-to-gel varia-tions are eliminated.
. Each sample is compared internally with thesame standard.
. It enables fully automated accurate spot statis-tics.
. Gel-to-gel matching becomes much easier.
When minimal labeling isemployed, the standard isalways labeled with Cy2, forsaturation labeling it is Cy3.
All this will be described inmore detail in the chapter onimage analysis.
Artifactual spot volume varia-tion can be caused by slightdifferent conditions duringsample application.

1.5 Two-dimensional Electrophoresis 75
1.5.2.4 Experimental Design
First of all, the pooled internal standard should be labeled with oneand the same dye within an experiment. For spot matching it isimportant that the conditions for the internal standard are identical.In order to obtain statistically significant results, the distribution of
the labels among samples has to be well planned. For instance, anypreferred labeling of certain proteins by one of the dyes must be sta-tistically excluded. If the experiment consists only of a small numberof samples, it is recommended to run the samples two times, butwith inverse labeling. For larger experiments, no replicates arerequired, but a “planned” randomization of the labels and sampleapplication is proposed:
. The two available dyes should be evenly distribu-ted between treated sample and control.
. Treated sample and control from separate originsshould be applied to each gel.
An example for randomization of sample application and inverselabeling is shown in Table 3.1 on page 309.To minimize methodical variation all samples of an experiment
should be run together in one instrument in the first and also the sec-ond dimension.Typically the amount of three times 50 mg protein is applied, which
means 150 mg total sample load. Because the detection is very sensi-tive, it is possible that a small spot does not contain enough proteinfor mass spectrometry analysis. If more protein is required in a gel, itis suggested to spike non-labeled pooled standard into the 150 mglabeled sample to the desired protein amount.It should also be mentioned that the DIGE technique is very useful
for checking the quality of sample preparation:. First the same sample is labeled with two differ-ent dyes and separated in one gel;
. In a second step three sample preparation repli-cates of the same sample source labeled withthree different dyes are run in a gel.
1.5.2.5 Major Benefits of 2-D DIGE
In short the advantages of the DIGE approach over conventional 2-Delectrophoresis are ranked in the order of their importance to prac-tice:
. It saves time: differentially expressed proteinsare detected very rapidly.
For 3-color experiments thestandard is labeled with Cy, for2-color experiments with Cy3.
The statistics algorithms of theDeCyder� software take thesemeasures in calculation.
Experiments with more than 12gels at a time are more difficultto evaluate.
The original suggestion to run aseparate preparative gel is lesspractical.
Some samples contain proteinindividuals with peculiar beha-vior. Those are detected withthis strategy.
These points have been rankedaccording the comments of anadequate number of DIGEusers.
No gel replicates, automatedimage analysis.

1 Electrophoretic Techniques76
. It saves work: a smaller number of gels has to berun, because samples are combined on gels, andno gel replicates are necessary.
. It eases handling of gels: the gels are analyzedwhile they are still in the cassettes.
. It simplifies the evaluation: image analysis withDeCyder software runs automatically and is sim-ple to carry out.
. It improves the quality of the results: gel-to-gelvariations are eliminated from the result becauseit measures spot volume ratios relative to thepooled internal standard, which is included ineach gel.
. It delivers quantitative values: the internal stan-dard and the wide linear dynamic range of thefluorescent dyes allow the quantitative measure-ment of minor changes of expression levels withhigh statistical confidence.
. It affords very sensitive detection: with cysteinelabeling samples containing less than 1 mg totalprotein can be analyzed with 2-D electrophor-esis.
The DIGE concept is not limited to high resolution 2-D electrophor-esis with immobilized pH gradients: it has also been successfullyapplied on 2-D gels based on carrier ampholytes IEF (Sitek et al.2006), blue native electrophoresis (Perales et al. 2005), and acidic elec-trophoresis with cationic detergent (Helling et al. 2006).
1.5.2.6 Specific Labeling of Cell Surface Proteins
Usually the proteins of cell or tissue lysates are labeled. It is, however,possible to label the proteins on the surface of the intact cell (Mayr-hofer et al. 2006). In a GE Healthcare Application Note (2005) it isshown that after cell lysis and 2-D electrophoresis only the specificallylabeled surface proteins are visualized. The proteins inside the cell donot become labeled, because of unfavorable conditions: the pH valuein the cytosol of an intact cell is usually below pH 7.4; the labelingtime is short and performed on ice. This approach is much easier tocarry out than using the standard protocol of biotin labeling. Asshown in Figure 1.22, the differential comparison of cell surface pro-teins and whole cell lysate labeled with the second dye in the samegel, is a very straightforward way to identify outer membrane proteinsagainst the background of the total proteins.
This reduces also costs forconsumables, equipment, andlabor.
Gels do not swell, shrink, orbreak.
Image analysis is the bottleneck in conventional 2-D elec-trophoresis
In contrast replicate conven-tional gels do not eliminatethese variations, they justaverage them.
Note that those are still relativequantitative results.
Sitek B, Scheibe B, Jung K,Schramm A, St�hler K. In:Proteomics in Drug Research(M Hamacher et al. Eds.)Wiley-VCH, Weinheim (2006)pp 33–55.
Perales M, Eubel H, Heine-meyer J, Colaneri A, ZabaletaE, Braun H-P. J Mol Biol 350(2005) 263–277.
Helling S, Schmitt E, JoppichC, Schulenborg T, M�llner S,Felske-M�ller S, WiebringhausT, Becker G, Linsenmann G,Sitek B, Lutter P, Meyer HE,Marcus K. Proteomics 6 (2006)4506–4513.
Mayrhofer C, Krieger S,Allmaier G, Kerjaschki D.Proteomics 6 (2006) 579–585.
GE Healthcare ApplicationNote: Selective labeling of cell-surface proteins using CyDyeDIGE Fluor minimal dyes.(2005) 11-0033-92.

1.5 Two-dimensional Electrophoresis 77
Fig. 1.22: False color representation of 2-D gel images of aCHO-K1 Cy5 cell-surface labeled sample (green spots) and aCy3 sample (red spots) labeled according to standard EttanDIGE protocol run in the same 2-D gel. From GE HealthcareApplication Note 11-0033-92.
& Note: The multiplex approach of DIGE has someadditional benefits for the conditions duringisoelectric focusing: the conductivity differencesbetween the strips are lower, because severalsamples are mixed together. This leads to morereproducible spot pattern across the gels.
1.5.3First Dimension: Isoelectric Focusing in IPG Strips
IPG strips are available with many different lengths and gradients.Optimally the resolution of the two-dimensional gel should be suffi-cient to get every protein separated from each other. If a protein spotcontains more than one protein, the proteins can still be identifiedand characterized with mass spectrometry, however quantitativeassessments are not possible. Therefore large gel formats are pre-ferred. If the resolution of such a gel is insufficient, the sample canbe applied on several IPG strips with narrow, overlapping pH gradi-ents. Most frequently wide gradients with pH 3 to 10 or 3 to 11 arerun. When higher resolution is required, a combination of an acidicgradient pH 4 to 7 (or 3 to 7) and a basic gel pH 7 to 11 are employed.IPG strips with printed serial numbers are very useful for tracing thesamples through the 2-D electrophoresis procedure.
When detection is performedwith western blotting, smallformats are preferred.

1 Electrophoretic Techniques78
For proteomics studies large formats with 18 or 24 cm strip lengthsare preferred because of several reasons:
. To reach sufficient resolution.
. To be able to load higher protein concentrationsfor detection of as many spots as possible andsubsequent mass spectrometry analysis of spots.
. To obtain sufficient evaluative gel area.
1.5.3.1 Rehydration
The dry IPG strips need to be reconstituted to their original thicknessof 0.5 mm with rehydration solution before use. There are two possi-bilities:
. Pre-rehydration of the strip without sample; thesample is loaded either on the anodal or cathodalend of the IPG strip with a cup or paper bridge.
. Rehydration with the sample mixed into therehydration solution.
& Composition of the standard “rehydrationsolution”: 8 mol/L urea, 0.5% (w/v) CHAPS,0.2% (w/v) DTT, 1.25% (v/v) carrier ampholytes,10% (v/v) glycerol, 0.002% Bromophenol blue.
. Glycerol reduces electroendosmotic effects, pre-vents drying of the gel, and urea crystallization.It is not always necessary.
. The concentrations of the additives are lowerthan in the lysis buffer, in order to reduceunwanted side effects like:– Crystallization of urea;– Instability of the patterns due to conflicts ofthe buffering groups, caused by overloadingwith carrier ampholytes;
– Formation of micelles between the differentdetergents in the second dimension, whichcan cause dark and dirty background withsome of the staining techniques (Gçrg et al.1987a);
. Bromophenol blue allows a good control of theliquid distribution during rehydration.
When a sample has been extracted with urea and thiourea, the rehy-dration solution must also contain thiourea.
Ideally one protein/spot.
Abundant proteins need morespace.
The smaller the gel, the higherthe fringe effect.
This solution is suitable forsamples without thiourea.
For electroendosmosis seepage 21 f or glossary.
See also page 79 for choice ofIPG buffers or carrier ampho-lytes.
Gçrg A, Postel W, Weser J,G�nther S, Strahler JR,Hanash SM, Somerlot L. Elec-trophoresis. 8 (1987a) 45–51.

1.5 Two-dimensional Electrophoresis 79
& Composition of the thiourea rehydrationsolution: 7 mol/L urea, 2 mol/L thiourea, 0.5%(w/v) CHAPS, 0.2% (w/v) DTT, 1.25% (v/v)carrier ampholytes, 0.002% (w/v) Bromophenolblue.
Samples without thiourea can also be applied to strips rehydratedwith such a solution.
Basic pH gradients It is not recommended to apply rehydrationloading to basic pH gradient strips. Obviously some proteins start toaggregate in presence of high pH values. The samples are loaded atthe anodal end of the strip with a cup or paper bridge. As alreadyexplained above in context with the reductant (see page 56 f), the bestremedy against horizontal streaking in basic gels is the rehydrationof IPG strips with HED (“DeStreak�”) instead of a reductant.
& Composition of the DeStreak rehydrationsolution: 7 mol/L urea, 2 mol/L thiourea, 0.5%(w/v) CHAPS, 100 mmol/L DeStreak reagent,1.25% (v/v) carrier ampholytes, 10% (v/v)glycerol, 0.002% Bromophenol blue.
Ready-made rehydration solution containing the DeStreak reagentand all other additives except the IPG buffer are available. This iscalled “DeStreak solution”.For the SDS electrophoresis in the second dimension the IPG
strips are equilibrated in the conventional way with SDS, Tris-Cl,urea, glycerol, and reduced with DTT, followed by alkylation withiodoacetamide.
Rehydration cassette In the original rehydration procedure, which isstill in use in some laboratories, the strips are placed into a glass cas-sette, in order to control the gel thickness to prevent over swelling(see Figure 1.23). An additional U-shaped gasket cut from 0.2 mmthick film is added to achieve 0.5 mm thick gels on the 0.2 mm thickfilm support.With this procedure many strips can be rehydrated under identical
conditions. The disadvantages of the cassette method:. High volume of rehydration solution is needed.. Cassettes sometimes leak because of the ureaand the detergent in the liquid.
. Rehydration loading of different samples is notpossible.
This is the more universal rehy-dration solution.
At the anodal end of the stripthere are milder pH conditionsfor the protein mixtures. Rehy-dration loading on basic stripsleads to loss of proteins, whichstay outside of the gel.
This solution can also be usedfor broad pH gradients, like pH3–10 and pH 3–11.
The IPG buffer must be chosenaccording to the used pHgradient.
If this U-shaped film is notadded, the pore size of thestrips will be too small for high-molecular-weight proteins toenter the gel.
Some laboratories claim thatthey obtain the best resultswhen they rehydrate the stripswith this method.

1 Electrophoretic Techniques80
Fig. 1.23: Rehydration cassette with 0.5 mm gasket. Note theprotruding ends of the U-shaped film added to achieve 0.5 mmthick gels on film supports.
Reswelling tray The disadvantages of the cassette technique areavoided when using a reswelling tray (see Figure 1.24), as suggestedby Sanchez et al. (1997). The liquid volume offered to the strips mustbe exactly controlled:
. If the liquid volume is too big, the strip will pre-ferably reswell with the low molecular weightcompounds and leave compounds with higherviscosity and higher molecular weights outside.There would not be any control over the reagentconcentrations inside the strip.
. If the liquid volume is too small, the resultingpore size will be too small to allow high molecu-lar weight proteins to enter the gel.
Sanchez J-C, Rouge V, PisteurM, Ravier F, Tonella L, Moos-mayer M, Wilkins MR, Hoch-strasser DF. Electrophoresis 18(1997) 324–327.
Over-swelling of a strip resultsin liquid exudation during IEF.This would cause protein trans-port to the surface, resulting inbackground smearing.
And the separation time will belonger.

1.5 Two-dimensional Electrophoresis 81
According to a theoretical calculation the volumes for the 3 mm wideand 0.5 mm thin strips would be 360 mL for a 24 cm and 270 mL foran 18 cm strip. In practice the optimal reswelling volumes are:
7 cm strip 125 mL18 cm strip 340 mL24 cm strip 450 mL
The solutions are pipetted into the grooves as streaks; the strips areplaced on top of the solutions, and are covered with cover fluid (paraf-fin oil) to prevent crystallization of the urea. Reswelling is performedat room temperature, because the urea would crystallize in a coldroom. Figure 1.24 shows a reswelling tray for up to 12 strips of differ-ent strip lengths up to 24 cm.
Fig. 1.24: IPG Dry strip reswelling tray for rehydration ofIPG strips in individual grooves.
Cover fluid The gel strips are covered with paraffin oil during rehy-dration and IEF to prevent drying of the strips, crystallization of theurea, and oxygen and carbon dioxide uptake. It has never beenobserved that hydrophobic proteins change over from the rehydrationsolution into the oil phase.
Rehydration time As mentioned above, there are two ways to applythe sample to these immobilized pH gradient strips rehydration load-ing and loading the samples on pre-rehydrated IPG strips.
Rehydration time:
Without sample >6 h
Including sample >12 h or overnight *)
These values are empirical andhave been determined andoptimizes with practical experi-ments.
Silicon oil is not recommended,because it can contain dissolvedoxygen and it is not easy toremove from the instrumentsand the benches.
*) The large protein moleculesneed a long time to diffuse intothe strip.

1 Electrophoretic Techniques82
1.5.3.2 Sample Application onto IPG Strips
As shown in Figure 1.25, there are several ways to apply the sampleto immobilized pH gradient strips:
. Rehydration loading. The extracted or solubilizedsample is diluted with rehydration solution tothe wanted amount of protein. Rehydration of astrip can be carried out in an individual stripholder or in a reswelling tray in an individualgroove with a defined volume (see above, rehy-dration). The dry gel matrix takes up the fluidtogether with the proteins. Because the pores arevery small in the beginning, the smaller mole-cules (water, urea, detergent, and reductant) gointo the gel matrix faster than the proteins.Many of the proteins diffuse into the fully rehy-drated gel later. This is the reason for the muchlonger rehydration time required for rehydrationloading (see above). IEF can be performed withthe gel surface up or down depending on theaccessory or equipment used. Figure 1.29 showsthe strip holder concept, where active rehydra-tion (rehydration under low voltage) can be per-formed, and the voltage steps and gradients forIEF can automatically applied.
. Cup loading. The strip is pre-rehydrated withrehydration solution. The sample is applied intoa loading cup either on the anodal or the catho-dal end. Depending on the equipment a maxi-mum of 100 mL or 150 mL sample can be applied.The optimal application point is critical, and hasto be determined for each sample type and thegradient used. The proteins are transported intothe strip electrophoretically. In this case IEF isalways performed with the gel surface up.Between the electrodes and the IPG strip endsfilter paper pads are applied. The electrode padsare soaked with distilled water and blotted with atissue paper to become damp, not wet.
. Paper bridge loading. For application of very highsample volumes a modification of the cup load-ing principle has been proposed: paper bridgeloading. Solution containing up to 5 mg proteincan be loaded on an 18 cm long narrow pH
Note: the more diluted thesample, the easier the proteinsenter the gel.
Sabounchi-Sch�tt F, Astrçm J,Olsson I, Eklund A, GrunewaldJ, Bjellqvist B. Electrophoresis21 (2000) 3649–3656.

1.5 Two-dimensional Electrophoresis 83
range IPG strip (Sabounchi-Sch�tt et al. 2000). Alarge sample volume requires that a large paperpad be applied at the other end of the IPG stripto absorb excess water. Figure 1.25 D shows thearrangement used when sample is applied to apaper bridge positioned between the anode andan IPG strip. The electrode pads are soaked withdistilled water and blotted with a tissue paper tobecome damp, not wet. Sample solution isapplied to the paper bridge (500 mL). With anodicapplication the anode is positioned as far out aspossible in the electrode holder, while the cath-ode is positioned close to the end of the IPGstrip to ensure good contact between electrodepad and IPG strip.
Fig. 1.25: Schematic representation of the different ways of sampleapplication on an IPG strip: A. Rehydration loading in a strip holderfor active rehydration and impress the voltage on it for IEF. B. Passiverehydration loading in a reswelling tray. C. Cup-loading for up to150 mL sample solution. D. Paper bridge loading for up to 500 mLsample solution. For C and D anodal application is shown, for somesamples and gradients it might be better to apply the sample at thecathodal end.

1 Electrophoretic Techniques84
Kane et al. (2006) have reported that for basic pH gradients they getconsistently better results with paper bridge loading than with cup-loading. Furthermore, the proteins with lower isoelectric points stayin the paper bridge and can be reloaded on acidic IPG strips – withapplication at the cathodal side. In this way it is possible to apply pre-cious, but limited samples onto several gels with different pH ranges.
& Note: The application point (anodal orcathodal) is of importance to obtain goodresults.
The way of sample loading will have an effect on the 2-D electrophor-esis pattern. This is easy to understand: Each protein has an individu-ally shaped titration curve; the mobility of the protein is usually differ-ent, depending on whether it is negatively or positively charged.
. Rehydration loading: Each protein exists in bothionic forms: negatively and positively charged,the proteins approach their pI from both sideswith different mobilities.
. Cup or paper bridge loading: All proteins arecharged in the same way, all proteins approachtheir pIs from the same side.
These facts can explain why some samples show better results withcup loading compared to rehydration loading.The following table lists the advantages and disadvantages of the
two methods.
Tab. 1.2: Comparison of rehydration and cup / paper bridge loading.
Rehydration loading Cup loading and paper bridge loading
Pro Pro
The proteins are distributed evenlyover the gradient, precipitation atthe sample application point cannothappen.
IEF in very acidic narrow gradients,in basic pH gradients, and HEDcontaining strips work much better.
Rehydration, sample application andIEF can be combined to one singlestep, resulting in less manipulationsteps.
The sample gets faster transported intothe gel and becomes separated, thus thechances of protein interactions arereduced.
When the sample is diluted, a highersample volume can be applied.
If necessary, the proteins can be loadedonto both ends of the strip in order toinclude proteins with pIs close to thepH of their application points.
Voltage can be applied duringrehydration, which improves theentry of high molecular weightproteins.
For some sample types it is beneficial,when all proteins are charged in thesame way, the molecules repel eachother and do not form aggregates.
Kane LA, Yung CK, Agnetti G,Neverova I, Van Eyk JE. Proteo-mics 6 (2006) 5683–5687.
See page 40: titration curves.
See Table 1,2 below, under“Pro, cup loading”

1.5 Two-dimensional Electrophoresis 85
Rehydration loading Cup loading and paper bridge loading
Con Con
When basic gradients like pH 6–9,pH 6–11, or pH 7–11 are employed,rehydration loading leads to severeprotein losses, because severalproteins aggregate in basic environ-ment.
Proteins with isoelectric points close tothe pH of the application point have lowmobility and solubility, they tend toprecipitate on the surface and build avertical streak in the second-dimensiongel.
If DeStreak is added to the rehydra-tion solution, the final concentrationof DTT must not be higher than1 mmol/L the use of reductant isthus limited.
The procedure is more laborious andtakes longer time than rehydrationloading.
The protein mixture is kept for manyhours at room temperature, thus thedanger of exposure to proteaseactivities can increase.
Also when proteins are applied on bothends, proteins precipitate at the appli-cation points.
During the rehydration process theprotein concentration outside the gelstrip increases, which can lead toaggregation of proteins; those cannotenter the gel. Often they becomevisible in the 2nd dimension as hori-zontal streaks.
During the first phase of IEF theproteins become concentrated at thepoint of entry and can form aggregatesand precipitate.
In several papers the statement can be found that higher proteinloads can be applied with rehydration loading than with cup loading.This should be checked for each sample type, for some samples itmight be vice versa.A strategy for selection of the optimal procedure is described later.
1.5.3.3 IEF Conditions
In general, separation conditions have to be adjusted to the natureand composition of the sample. Horizontal streaking in the 2-D pat-tern, for instance, can have many different reasons: overloadingeffects, too short focusing time, too long focusing time (some pro-teins became unstable at their pIs), oxidation of cysteines, too muchsalt, nucleic acids, phospholipids etc.
Gel surface up or down Running IPG strips with the gel surface up– as shown in Figure 1.25B, C, D – has the advantage of employingfilter pads at the gel ends, which take up salt ions and proteins withpIs lying outside the pH gradient of the IPG strip. Another benefit isthe open surface just covered with paraffin oil: when highly abundant
Gels with high protein loadsshould always be run with thesurface up, also when rehydra-tion loading is performed, seepage 95.
See page 97.
For some sample types optimi-zation by a series of pre-experi-ments can be necessary.
This can reduce horizontalstreaking considerably.

1 Electrophoretic Techniques86
proteins form ridges, there will not be any mechanical pressure onthem (see Figure 1.32).
Temperature It is very important to run IEF at a defined tempera-ture, even when the proteins are denatured. It had been demon-strated that spot positions of certain proteins can vary along the x axisof the gel dependent on the temperature (Gçrg et al. 1991). Runningthe strips at 20 �C is optimal, because it is above the temperaturewhere crystallization of urea can be critical, and it is below overheat-ing temperature, which can cause carbamylation of proteins duringIEF. Even, when the applied electric power, the product of currentand voltage, is very low in IPG strips, it is not sufficient to run IEFjust in a thermostated room with 20 �C. Active temperature control isnecessary to dissipate local heat developed at the ion fronts in thestrips (“hot spots”, see Figure 1.26). Aluminum oxide ceramics hasthe best thermal conductivity, and affords far the best temperaturedissipation. It is therefore the preferable material for strip holdersand manifold accessories.
Fig. 1.26: Schematic representation of the distribution of salt andbuffer ions in an IPG strip during IEF and the resulting electric fieldstrength. The ion fronts are migrating slowly towards the electrodes.V = voltage, E = electric field strength, d = electrode distance.
Hot spots: In an IPG strip, there are always remains of salt and buf-fer ions present, which have not been washed out. They are bound tothe buffering groups of the immobilized pH gradient. Additionallythere are ions, which originate from ionic sample contaminants.In the electric field they start to migrate towards the electrodes with
the opposite signs. During the run they are forming visible ion frontsbetween the region with low ion concentration and the regions withhigh ion concentrations (Figure 1.26), which are moving towards theelectrodes. Immobilized pH gradients have very low conductivity,because the buffering groups of the gradient are fixed and cannot dif-
Gçrg A, Postel W, Friedrich C,Kuick R, Strahler JR, HanashSM. Electrophoresis 12 (1991)653–658.
Electric conditions andtemperature control are closelyrelated.
In IEF, all non-amphotericcompounds are transported outof the gradient towards theelectrodes.

1.5 Two-dimensional Electrophoresis 87
fuse. Because of the differences in conductivity, the electric fieldstrength in these regions is varying considerably. Punctual heat devel-opment can be observed at these fronts, so called “hot spots”.
Electric conditions As already mentioned above, immobilized pHgradients have very low conductivity. The current is usually limited at50 to 70 mA per strip. Higher current settings are not recommended,because the strips could start to overheat and burn in certain areas ofthe gradient. The strips should never be prefocused, because thehigher conductivity produced by salt and buffer ions in the beginningis advantageous for sample entry and for the start conditions of pro-teins.The electric conditions are controlled with the voltage setting. First
low voltage is applied in order to avoid sample aggregation and preci-pitation in the loading cup or overheating in some strip areas. Thevoltage is slowly raised to reach electric field strength as high as pos-sible in the focusing phase.
& Note: The set current can limit the achievablevoltage, when the sample contains too muchsalt, or when buffers are included in therehydration or lysis solution.
The voltage changes are either programmed in steps or with ramping,applying voltage gradients.Often the instructions supplied with ready-made IPG strips suggest
relatively high voltage start conditions, like 500 V for an hour. Thesesettings can work well for various samples like rat liver extract or E.coli lysate, but there are a number of samples which require lowerand slower starting conditions. Particularly samples with high con-tents of high molecular weight and hydrophobic proteins require alow electric field for a relatively long time in the beginning. This istrue for all ways of sample application: rehydration, cup, and paperbridge loading.When a new sample type is separated for the first time, it is highly
recommended to apply the safest settings. In Figure 1.30 and in thepractical part of this book (see page 314 ff) low voltage settings overlonger time are suggested. They represent the “worst case” forunknown samples based on experiences by Burghardt Scheibe.The electric conditions change sometimes dramatically during the
first phase as shown in Figure 1.27:
Burghardt Scheibe: personalcommunication.

1 Electrophoretic Techniques88
Fig. 1.27: Development of the actual voltage course during thefirst IEF phase in an IPG strip.
The separation can be speed up with applying higher electric fieldstrength. For these high voltages the instruments have to be designedto comply with a high safety level.
Volt hours The complete voltage load is defined in volt hour inte-grals (Vh): the amount of voltage applied over a certain time. Forexample: 5,000 Vh (5 kVh) can be 5,000 V in one hour or 1,000 V overfive hours.
. The Vh definition corrects the running condi-tions for different conductivities in differentstrips caused by different protein compositionsand salt loads.
. In many cases increasing the voltage gradients(ramping) rather than in steps improves theresult considerably. In order to apply comparablevoltage loads, the Vh value is a good measure-ment.
Underfocusing When the applied volt hours are insufficient, not allspots are round. Horizontal streaks are produced instead. Higher volthours loads are needed for samples containing a higher number ofhigh molecular weight proteins, more hydrophobic proteins and forpreparative runs.
Overfocusing When the proteins are focused too long, some othernegative effects can happen:
. Cysteines become oxidized, the pI of the proteinchanges.
. Some proteins become instable at their isoelec-tric point. The modified proteins or its frag-ments have different pI and start to migrate
These effects are result of toolong time, not of too highvoltage.

1.5 Two-dimensional Electrophoresis 89
again. The result: some horizontal streaks com-ing out from a few spots.
. Basic narrow gradients are particularly sensitiveto over focusing. Additionally to possible proteinbreakdowns, the basic extreme (> pH 10) of thegel can become instable because of the very highpH.
& For basic pH gradients the best results areobtained with a focusing phase as short aspossible at a voltage as high as possible.
Should the optimal Volt hours have been achieved during the nightor another time of no attendance, the separation will stop after theprogrammed value has been reached. Instead of applying a low“cruising voltage” no voltage should be applied on the strip. Prior toremoval the strips from the strip holders the highest possible voltageis applied for 15 minutes, in order to refocus the slightly diffusedbands.
Sample entry effects During the first phase of IEF with the cup load-ing procedure complex phenomena are observed:
. If the voltage setting in the beginning is low(100 V, 18 cm IPG strip), the proteins enter thegel, but a part of them precipitates or gets stuckwithin the first few cm of the strip, when the vol-tage is raised too quickly after this phase. As aresult of this a vertical streak can be found in thesecond-dimension gel, which is displaced a fewcentimeters from the application point.
. If the voltage setting for the start is high (like500 V on a 18 cm IPG strip), a part of the pro-teins accumulate and precipitate on the surfaceof the application point and show a verticalstreak in the second dimension. Sometimes theprecipitated proteins at the application point arewashed off during equilibration: and then nostreak is visible.
& These matters are critical: the voltage level duringsample entrance and the beginning of proteinmigration, and the duration of the focusing phaseat high voltage.
Some manuals suggestapplying a low “cruising”voltage of 500 V to maintainthe band sharpness. This is notthe optimal procedure.
Josef B�lles, personal commu-nication.
It should be continued to uselow voltage during the first fewhours.
In the second case the 2-Dseparation shows a clearerpattern than in the first.

1 Electrophoretic Techniques90
1.5.3.4 Instrumentation
The Multiphor Originally the IPG procedures were optimized on theMultiphor chamber (see Figure 1.28). With this equipment, rehydra-tion can only be performed in the reswelling tray or a rehydration cas-sette outside the instrument. The separation is performed in a trayfor up to twelve strips. Due to safety regulations the maximum vol-tage allowed is 3,500 V, because in the modular set-up power supplyand cooling device are connected to the chamber via cables and tub-ing. The handling of the IPG strips and the entire IEF procedurewere improved by developing a dedicated instrument for IEF in IPGstrips for 2-D electrophoresis.
Fig. 1.28: Multiphor chamber with tray for IEF in IPG strips.An external programmable power supply for high voltages anda thermostatic circulator is required.
The IPGphor In the instrument shown in Figure 1.29, rehydrationand IEF can be combined. In this case the IPG strips are run facingdown. The high thermal conductivity of the ceramics material is veryimportant to remove the locally developed heat from some areas ofthe IPG strips efficiently. The programmable power supply, whichgenerates up to 10,000 V, and a Peltier cooling system are integratedinto the electrophoresis chamber.
When everything is integratedin one instrument, much highervoltages can be applied than onmodular systems with separatepower supplies and thermo-static circulators.

1.5 Two-dimensional Electrophoresis 91
The strip holders contain platinum contacts at fixed distances. Theelectric field is applied at the gel strips through these contacts, whichare positioned on the respective contact area of the cooling plate. Theanodal contact area is large to accommodate all different lengths ofstrip holders or – alternatively – a Manifold.At the back of the apparatus – in the older versions at the bottom –
is a serial port for possible software updates and to connect a compu-ter or serial printer to the instrument. In this way a report on the elec-tric conditions is obtained after every five minutes of the run. Withthis interface the instrument can be integrated into the laboratoryworkflow system and allow procedures according to GLP (goodlaboratory practice).
& It is not recommended to run strips with differentlengths and different pH gradients at the sametime. Also, the temperature setting of 20 �Cshould not be modified (see above).
Fig. 1.29: IPGphor strip holder and IPGphor chamber for IEF in IPG strips.
Ideally the electric settings of the IPG strip IEF system are con-trolled and monitored by an external computer. In this way it is possi-ble to see from the running conditions, whether the isoelectric focus-ing run will give good or bad 2-D results. Figure 1.30 shows twoscreen dumps of the programmed and monitored running conditionsof two real IPG strip runs. In both cases the current was limited to 50mg per strip. On the upper graph the really applied voltage followedexactly the programmed voltage, because all samples were well pre-pared, and thus the running conditions were never limited by maxi-mum current. On the lower graph one or more samples containedtoo many salt ions: the high conductivity in one or more stripsresulted in reaching the current limit several times. The second pro-
Up to 14 regular strip holdersfit into the instrument.
For optimization of runningconditions the report of theactual electric parameters isvery useful.
Monitoring the IPG strip runs isa valuable tool to control thequality of sample preparation.In some cases the graph canindicate that it is not worth-while to continue with asecond-dimension run. There-fore this function can save a lotof work time and material.

1 Electrophoretic Techniques92
tocol indicates suboptimal isoelectric focusing conditions, which willresult in disturbances in the 2-D gel pattern.
Fig. 1.30: Monitored voltage and current graphs from two IEFruns in IPG strips. For more details see text.

1.5 Two-dimensional Electrophoresis 93
Strip holders Figure 1.31 shows the procedure how to apply thesample and IPG strips. The trays, made from specially treated alumi-num oxide ceramics are placed on the thermostated electrode contactareas of the power supply. Rehydration as well as the IEF separationis carried out at +20 �C.Ceramics material is the optimum choice; plastic does not have a
good thermal conductivity. Other materials are not usable, becausethey exhibit electric conductivity, bind proteins, or show EEO effects.The advantages of strip holders with platinum contacts are:
. The number of manipulations and hands-onsteps is reduced.
. Up to an entire day can be saved.
. Active rehydration loading can be performedunder low voltage (30–60 V) for 10 hours, whichfacilitates the entry of high molecular weightproteins larger than 150 kDa into the strips(Gçrg et al. 1998).
Fig. 1.31: Rehydration loading into IPG strips in individualstrip holders of the IPGphor.
The pressure blocks on the cover lids hold the strips down, in orderto maintain the contact also when electrolysis gas is produced duringIEF. The bars of the safety lid of the chamber press the coverlidsdown. The most reproducible results are obtained when the acidicend of the strip is always placed in direct contact with the anodal endof the tray.
In most laboratories thismethod has become the defaultprocedure.
Gçrg A, Boguth G, ObermaierC, Harder A, Weiss W. LifeScience News 1 (1998) 4–6.
The distance between theplatinum contact and the endof the tray is shorter at theanodal end.

1 Electrophoretic Techniques94
Cleaning of the strip holders The strip holders must be carefullycleaned after each IEF run. The solutions must never dry in the stripholder. Cleaning is very effective, if the strip holders are first soaked afew hours in a solution of 2–5% of the specially supplied detergent inhot water.Usually the strip holder slot is vigorously brushed with a tooth-
brush using a few drops of undiluted IPGphor Strip Holder CleaningSolution. Then it is rinsed with deionized water.Sometimes protein deposits are left on the bottom of the strip holder
after IEF. This happens when highly abundant proteins have beensqueezed out of the gel surface at their isoelectric points (see Figure1.32). It is not always easy to remove these proteins from the stripholder, particularly when they are sticky like serum albumin. In thiscase the strip holders should be boiled in 2% (w/w) SDS with 1% (w/v)DTT for 30minutes before the slot is cleaned with the toothbrush.
& Important: Strip holders may be baked, boiledor autoclaved. But, because of the speciallytreated surface they must not be exposed tostrong acids or bases, including alkalinedetergents.
& Note: The strip holder must be completely drybefore use.
For most analytical applications this procedure works very well anddelivers qualitative good and highly reproducible results. However,there are a few situations, where running the strips gel side up worksbetter. In some cases cup loading delivers the best results (see alsocomparison on page 84 f).
Preparative runs It has been observed that when the sample loads areincreased from analytical (ca. 100 mg) to preparative (> 1 mg) amounts,the quality of the 2-D pattern decreases, when the strips are run withthe surface down. This phenomenon can be caused by the increasingamount of some highly abundant proteins. In the end phase of IEFevery focused protein forms a little ridge. These little ridges can beeasily seen on the surface of the strips after IEF. When very high abun-dant proteins are focused, they formmuch higher ridges than the otherproteins. In the case of regular strip holders the weight of the stripsrests on these ridges, and the proteins are partly squeezed out. Theseproteins diffuse along the interface between the gel surface and thestrip holder bottom (see Figure 1.32), and create a smear. When thestrips are run with the surface up, no pressure is applied on the ridges.Thus, the results are better, when preparative runs are performed withthe surface up, like in theManifold (see below, Figure 1.33).
Clean strip holders should behandled with gloves to avoidcontamination.
SDS solution in absence ofbuffer has a neutral pH.
For cup loading the gels arealways run gel side up.
Another advantage of runningpreparative samples with thesurface up is that the electrodesare easier accessible for theinsertion of filter paper padsbetween the electrodes and thestrip. In this way salt and bufferions as well as proteins withisoelectric points outside the pHrange of the strip’s gradient canbe collected in the paper pads.

1.5 Two-dimensional Electrophoresis 95
Fig. 1.32: Schematic representation of the running conditionsfor IPG strips with high protein loads. Comparison of runs withthe surface down and with the surface up.
Narrow pH gradients High sample load also means high load ofcontaminants. This is particularly important for runs in narrow pHintervals. The advantage of narrow pH gradients is the high spatialresolution, but also the high loading capacity. Most of the proteinload, however, will accumulate at the electrodes, because most pro-teins have isoelectric points outside the pH range of the strip. If theseproteins cannot migrate out of the gel, they will precipitate there.Because they are charged, they can cause electroendosmotic effects:the resulting local water transport pushes non-precipitated proteinstowards the gel center, which are visible as horizontal streaks at thelateral sides of the 2-D gel. As a remedy is suggested to apply filterpaper pads soaked with water (damp, not wet) between the electrodecontacts and the ends of the strip after the rehydration has been com-pleted or a few hours before the end of the separation.If the sample has to be electrophoretically desalted (see page 62)
the filter pads have to be exchanged several times for new ones.
Manifold The manifold (Figure 1.33) is designed for being usedwith cup loading or paper bridge loading; but also IPG strips afterrehydration loading in the reswelling tray. It is highly recommendedto use a manifold made from aluminum oxide ceramics. Plastic mate-rial exhibits lower temperature conductivity, and is less efficient inheat dissipation. A few degrees difference between IPG strips cancause some protein spots to change positions, leading to false conclu-sions.
. As already mentioned, for basic and very acidicgradients, and for DeStreak-containing IPGstrips cup loading should be applied. The sam-ples are applied at the area of the milder pH.
It cannot be used for rehydra-tion of IPG strips, because thegrooves are too wide.

1 Electrophoretic Techniques96
. High sample loads (>1 mg) often require runswith the gel surface facing up. Several ways ofsample applications are possible:– Rehydration loading in the external reswellingtray (Figure 1.24);
– Rehydration loading in strip holders;– Cup loading;– Paper bridge loading.
. Because of its geometry, up to 100 mA per IPGstrip can be applied, which also facilitates pre-parative separations.
Fig. 1.33: Manifold for running up to twelve IPG strips withcup or paper bridge-loading. IPG strips containing already thesample from rehydration loading in the reswelling tray are runwith the gel surface up.
Protrusions along the grooves inside the Manifold align the rehy-drated IPG strips, keeping them straight and centered when placedinside the manifold. Filter paper pads are soaked in deionized waterand inserted between the electrodes and the IPG strips to trap saltions, and those proteins, which possess pIs above and below the pHgradient. After the loading cups are put into position 100 mL paraffinoil is carefully poured into the Manifold, around the cups. This is apractical way to control whether there is a leaking cup. In the manual,which comes with the instruction, it is recommended to pour the oilin first; in this case it is very important to rehydrate the strips withsufficient Bromophenol blue.
Active rehydration loading canbe very useful, but it is onlypossible in the strip holders.
The high volume of oil is alsoneeded, when only a few stripsare applied, because it shouldbe avoided that some strips arerun with a dry surface.

1.5 Two-dimensional Electrophoresis 97
The electrode assembly has electrode teeth on one side and hold-down teeth for paper bridge-loading on the other side. Therefore thelength of the paper bridge is important (see also page 319 f).
Cleaning of the manifold Cleaning of the manifold is less criticalthan for the strip holder, because the gel surface and the proteins donot have direct contact with its surface. It is – like the strip holder –brushed with a toothbrush using a few drops of undiluted IPGphorstrip holder cleaning solution. Then it is rinsed with deionized water.The loading cups can be reused for most of the samples after thor-ough cleaning with laboratory detergent.
1.5.3.5 Strategy for IEF Optimization
In the following an example is given how to plan optimization workand to check the reliability of the analysis. Details on running condi-tions are given in the protocol Step 3: Isoelectric Focusing, page 317.18 cm or 24 cm IPG strips should be used from the beginning.
Shorter strips do not exhibit sufficient resolution.
Tab. 1.3: Strategy for IEF.
1 Wide gradientpH 3–10 linear or non-linear
Application of ca. 100 mg total proteinby rehydration loading at 50 V for12 hours.
2 Wide gradientpH 3–10 linear or non-linear
Rehydration loading in reswelling trayand IEF in cup loading strip holder.
3 Wide gradientpH 3–10 linear or non-linear
Cup loading on pre-rehydrated strip:one application at the anodal end andone on the cathodal end.
Decision point: selection of the best procedure
4 Semi-wide gradientspH 4–7, pH 6–11, etc.
Way of loading is dependent on theresults in the wide gradients; on basicstrips.
5 Narrow gradients,like one pH unit
Way of loading is dependent on theresults in the wide gradients.
6 Basic gradients No rehydration loading; sample is ap-plied at the anodal end.
7 Preparative runs The strips must be run with the gelsurface up.
& In general it can be said that the Manifold is themore versatile accessory for the IPGphor.
Start with very low voltagesettings for a long time period!
The only downside is that activerehydration loading cannot bedone in the reswelling tray.

1 Electrophoretic Techniques98
Methodology check If the result is not satisfying – streaky andsmeary pattern, only few or no spots – it is important to find outwhether the problem is caused by inadequate sample preparation orby certain issues during the separation. The trouble shooting guidein the appendix of this book can be very useful here. But a completerun with a test sample – E. coli lyophilizate – is highly recommended.
Reproducibility check When the optimal conditions have beenfound, samples must be run in at least doublets or triplets, in order tocheck, whether observed pattern differences are caused by the noiseof the system or by variations between different samples.
After IEF Either the strips containing the focused proteins are equi-librated in SDS buffer and run on the second dimension right away,or they are stored at –60 �C to –80 �C in a deep-freezer.
Staining of an IPG strip (Acid violet 17) Sometimes it can be useful tocheck whether the separation in the first dimension worked wellbefore all the work with the second-dimension run is started. Becauseof the high urea and detergent concentrations in the gel silver andCoomassie brilliant blue staining produce a dark background. Themost sensitive technique is Acid violet 17 staining according to Pates-tos et al. (1988). The bands are visible after 40 minutes, during thistime the proteins in the other strips can be kept focused with theapplication of a medium high voltage, like 2000 V.
1.5.3.6 Measurement of the pI
The pH gradient in an IPG strip cannot be determined with a surfaceelectrode, because the conductivity is too low. The calculation of thepH gradient based on the pK values and the concentrations of theImmobilines is rather complex, because the presence of urea and therunning temperature has to be taken in account. The addition of pro-tein standards is generally not recommended, because absolute purityof these proteins would be required, and adding additional proteinsto a complex mixture can easily lead to errors in interpretation of thepattern.Two different ways of pI measurement are proposed for 2-D electro-
phoresis.
Method 1. pH gradient graphs Graphs of operational pH gradientprofiles are published in a data file by GE Healthcare Life Sciences(2003) as a basis for pI estimation. More information and larger
Replicate gels are highly recom-mended for statistically reliableresults.
–20 �C to –40 �C are notenough: some proteins becomemodified.
Patestos NP, Fauth M, RadolaBJ. Electrophoresis 9 (1988)488–496.
Of course, the stained strip doesno longer release the proteinsinto the second-dimension gel.

1.5 Two-dimensional Electrophoresis 99
graphs can be found at this website: http://www.gehealthcare.com/lifesciencesThese gradients are the calculated target pH gradients at 20 �C in
presence of 8 mol/L urea. The pH values are plotted over the gellength given in per cent. Two examples are shown in Figure 1.34.
Fig. 1.34: pH gradients in IPG strips 3–10 and 3–10 NL.Downloaded from the following website:http://www.gehealthcare.com/lifesciences
The pI of a protein is estimated by relating the position of the pro-tein in the SDS gel to its original position in the IPG strip, plottingthe band position versus pH, and read out the pI. The strips do notcontain pH plateaus at the ends: the graph must be aligned from onestrip end to the other. Typical standard deviations for differentbatches of commercial IPG strips are given in the data file, men-tioned above, and website.This procedure is usually carried out with the image analysis soft-
ware as a “1-D calibration”.
Method 2. Interpolation between identified sample proteins with knownpI Prominent spots showing up in each 2-D map of a sample typecan be analyzed for identification and amino acid sequence informa-tion. The theoretical pIs can then be used as keystones for interpolat-ing the pIs of the other proteins. Bjellqvist et al. (1993) have success-fully correlated the calculated pIs from the amino acid sequences ofproteins with the protein position in immobilized pH gradients andput the procedure into practice for human cells (Bjellqvist et al. 1994).The second procedure is performed with the image analysis soft-
ware as “2-D calibration”.This subject will be further explained in the chapter on image ana-
lysis of 2-D electrophoresis gels.
GE Healthcare Life Sciences(18-1177-60): ImmobilineDryStrip gels (2004).
Note: Different strip lengthsare used, and non-backed gelscan swell or shrink.
Bjellqvist B, Hughes GJ,Pasquali C, Paquet N, RavierF, Sanchez J-C, Frutiger S,Hochstrasser D. Electrophoresis14 (1993) 1023–1031.
Bjellqvist B, Basse B, Olsen E,Celis JE. Electrophoresis 15(1994) 529–539.

1 Electrophoretic Techniques100
1.5.4Second Dimension: SDS Electrophoresis
1.5.4.1 Gel Types
Homogeneous gels For 2-D separations mostly a homogeneous gelwith 12.5% T and 3% C is used; the proteins of major interest in thesize range from 10 to 100 kDa are optimally resolved. For specialcases a table with optimal gel concentrations for different protein sizeranges can be found in the GE Healthcare 2-D Handbook (2005).However, as demonstrated by Langen et al. (1997), it is not easy topredict the optimal acrylamide concentration according to a mathe-matical function: In an example shown in this paper a group of pro-teins with ca. 50 kDa, which were co-migrating in 9–16% T gradientgels were best resolved in a gel with 7.5% T. This shows that a try anderror procedure must be applied for optimization, when certain pro-tein groups need to be completely resolved.
Gradient gels Generally, in gradient gels the overall separation inter-val is wider; also the linear relation interval between the logarithm ofMr and the migration distance is wider than for homogeneous gels.Also the spots are sharper because the pore sizes are continuouslydecreasing. This effect can be very useful for separating proteins,which are highly glycosylated. However, when homogeneous gels arerun under optimal conditions, resolution and spot definition is highenough: a gradient gel is not necessary.Gradient gels have the following shortcomings:
. The preparation of gradient gels is much morework.
. It is more difficult to obtain reproducible gelproperties than for homogeneous gels.
. The gels swell unevenly during staining, andshow uneven background intensity.
Horizontal flatbed gels Because the IPG strip is just placed on thesurface of the horizontal gel, a stacking gel with low acrylamide con-centration is necessary for optimal protein transfer and separation(Gyenes and Gyenes, 1987). Resolving and stacking gel is usuallypolymerized in one piece. These gels can only be cooled from oneside; rarely gels thicker than 0.5 mm are used. These gels are poly-merized onto a support film.Laboratory-made gels are usually run with liquid buffers, con-
nected to the gel with paper wicks. The electrodes are then placedinto the buffer tanks. The Laemmli buffers are used. Instructions and
GE Healthcare Handbook. GEHealthcare Life Sciences 80-6429-60 (2005).
Langen H, Rçder D, JuranvilleJ-F, Fountoulakis M. Electro-phoresis 18 (1997) 2085–2090.
Gyenes T, Gyenes E. AnalBiochem 165 (1987) 155–160.
Gçrg A, Weiss W. In RabilloudT, Ed. Proteome research: Two-dimensional gel electrophoresisand identification methods.Springer Berlin Heidelberg NewYork (2000) 107–126.

1.5 Two-dimensional Electrophoresis 101
recipes for preparing gels for flatbed systems in the laboratory can befound in several books: Gçrg et al. (2000) and Westermeier (2004).
Vertical gels For 2-D electrophoresis in vertical systems the stackinggel is not needed, because:
. The proteins are already pre-separated by IEFand will therefore not aggregate while they enterthe resolving gel.
. The proteins migrate from a gel into another gel,and not from a liquid phase into a gel.
Still a discontinuous buffer system is employed: the gel buffer com-position is different from the running buffer. The spots are wellresolved, because there is a stacking effect happening between thehighly mobile chloride in the gel and the lowly mobile glycine in therunning buffer.Omitting the stacking gel solves a few technical problems and
makes the procedure easier:. The edge between the stacking and resolvinggels contains incompletely polymerized acryla-mide monomers and oligomers, which stick toproteins and partly modify proteins.
. Some proteins get caught between the stackingand resolving gels.
. One of the problems sources with reproducibil-ity is abolished.
. Ready-made gels cannot contain a stacking gelwith a buffer different from the resolving gelbecause of diffusion.
. The additional step of polymerizing a stackinggel short before the run is abolished.
The standard thicknesses of SDS slab gels run in vertical equipmentare 1.0 mm and 1.5 mm. Thinner gels cannot be used, because theIPG strip including the film support is 0.7 mm thick, and it swellsduring equilibration with SDS buffer.
Tab. 1.4: Comparison of gel thicknesses.
Advantages of 1.0 mm gels: Advantages of 1.5 mm gels:
Faster separations possible, leading to sharperspots
Higher loading capacity
Detection methods faster and more sensitive Higher mechanical stability
Protein / gel volume ratio more favorable fortryptic digestions resulting in higher peptide yield
Westermeier R. Electrophoresisin Practice. WILEY-VCH, Wein-heim (2004).
Therefore the upper runningbuffer must not contain anychloride ions.
The IPG strip is placed onto theSDS gel sideways.

1 Electrophoretic Techniques102
1.5.4.2 Gel Casting
First of all, it is very important to clean glass plates and equipmentvery thoroughly. Mass spectrometry analysis is very sensitive, andevery contamination will show up in the mass spectrogram andmight lead to wrong results. Keratin stemming from hair and skin isthe most frequently found protein contamination; sometimes even inreagents purchased from a supplier. It has become general practice inmost proteomics laboratories to filter each monomer and buffer solu-tion through a membrane filter before use.Also for the SDS PAGE step only high-quality chemicals should be
used. Particularly for such a sophisticated and multistep procedurelike 2-D electrophoresis the search for trouble causing sources is verycumbersome and time-consuming.When the sample proteins have been pre-labeled with fluorescent
dyes, the gels are scanned inside the cassette. Therefore only low-fluorescent glass is used for DIGE experiments.For accurate spot picking the gel have to be fixed to one of the glass
plates, the glass plate without the spacers is therefore treated withBind-Silane prior to assembling the cassettes. If the Bind-Silane treat-ment is performed long time before the cassettes are assembled, non-treated and treated glass plates should be kept separate. It has beenobserved that Bind-Silane molecules diffuse towards the non-treatedglass surface and cause strong adherence of the gel to the secondglass plate.
& Meticulously cleaned instruments and glass platesas well as high-quality reagents are of highimportance.
Gels for miniformat and medium size instruments can be cast as sin-gle gels (see Figure 1.35) as well as in multicasters, which are builtsimilar to those used for large gels (see Figure 1.37).Large format gels, which are usually used in proteomics, can only
be prepared in multicasters, because the glass plates of the cassetteswould bend out and form a bulbous gel with a higher thickness inthe center than along the edges.For the handling of multiple gels it is not very practical to use glass
plates with separate spacers and clamps. Therefore the cassettes con-tain fixed spacers and a hinge on one side, as shown in Figure 1.36.However, when the gel is to be fixed to one of the glass plates withBind-Silane for spot picking, non-hinged cassettes are used, with thespacers attached to the second glass plates.
The author of this chaptercould write a detective story onpitfalls caused by dirty or oldreagents.
For a high throughput methodanyhow multiple gels areneeded.
For multiple gels it is practicalto insert a little piece of paperwith a key number for easyidentification of the sample.

1.5 Two-dimensional Electrophoresis 103
Fig. 1.35: Casting single miniformat and medium size SDSpolyacrylamide gels for 2-D electrophoresis
Fig. 1.36: Glass cassette for multiple SDS gel castersand instruments. Spacers are fixed; glass plates areconnected with a hinge.
Depending on how many gels to be cast at a time, different types ofmultiple gel casters have been designed. During pouring the mono-mer solution into the caster the liquid will not only flow between thespacers, but also between the cassettes. For easy separation after thepolymerization plastic sheets have to be inserted between the cas-settes. Originally they are designed to introduce the monomer solu-tion into the cassettes from the bottom. This is necessary when gradi-ent gels are prepared.As already mentioned, the polymerization process is an exothermic
reaction. When multiple-gel casters are used, the composition of cata-lysts in the polymerization solution is more critical than for single gel
Without the plastic sheets, thecassettes would stick togetherbecause of the polymerized gellayers.
This practical hint is mentionedhere, because some instructionsincorrectly suggest the oppositeprocedure.

1 Electrophoretic Techniques104
casting. If the polymerization runs too fast, very much heat is pro-duced in the center of the multicasters, leading to thermal convec-tion, which results in curved gel edges and irregular polymerization.It is very practical to add the TEMED to the other constituents alreadywhen the monomer solution is mixed together. It will not cause anystart of polymerization. The ammonium persulfate, however, mustnot be added before pouring the gel.It must be avoided that the start of polymerization begins while the
monomer solution is still flowing. Furthermore the multiple solu-tions in the cassettes need a certain time to level out following theprinciple of the communicating vessels. The monomer solutionshould be degassed with a vacuum pump and then precooled in arefrigerator at 4–8 �C. This measure reduces the heat developmentand delays the start of the polymerization. It has several advantages:
. The solution has time enough to level outbetween the cassettes and settle until the solu-tion starts to polymerize: this prevents irregulargel composition and variation in gel lengths.
. Local overheating is avoided, which can result inlocal variations of sieving properties of the gels.
. Gels properties are more reproducible indepen-dent of the seasonal temperatures in the labora-tory.
When the room temperature is higher than 20 �C, the multicastershould – like the monomer solution(s) – be pre-cooled in a cold roomor a refrigerator.For homogeneous gels it is quicker to fill the caster from the top by
pouring the solution directly into the cassettes (see Figure 1.37A).Before the polymerization starts, 0.1% (w/v) SDS–water solution is
sprayed into the cassettes with a finger-pumped plant sprayer toachieve straight upper gel edges (see Figure 1.37B). The very smalldetergent solution droplets glide down on the glass surface veryquickly and will not mix with the monomer solution, because theyare very small and have a low density. This procedure gives muchstraighter edges than pipetting water-saturated butanol or 70% (v/v)isopropanol into the cassettes, as it is proposed in most instructions.Pipetting produces larger drops, alcoholic solutions have a high affi-nity to the vinyl spacer material and can cause bent surfaces.
& Note: It is very important to obtain a straightgel surface, because the IPG strip is placed onthe gel edge-to-edge: in this direction the filmsupport is absolutely rigid and cannot be bent tofollow a curved edge.
Most of the stock solutions areanyhow kept in the refrigerator.
When alcoholic overlay solu-tions are used, they need to beremoved an hour later, becausethey gnaw at the plastic surfaceof the caster box. SDS solutiondoes not need to be removed.

1.5 Two-dimensional Electrophoresis 105
Fig. 1.37: Casting multiple homogeneous SDS gels.A. Pouring the monomer solution directly into the cassettes.B. Overlaying the edges by spraying 0.1% (w/v) SDS–watersolution into the cassettes.
One should not forget that the quality and the age of chemicals, parti-cularly the catalysts, greatly influence the polymerization efficiency ofthe monomer solution. For instance: The TEMED can be stable forseveral years, but it can suddenly decay within a week. Therefore it isadvisable to replace the TEMED every year with a new bottle.
Gradient gels For the preparation of gradient gels a gradient makerhas to be connected to the gel caster. Here there is no other way thancasting the gels from the bottom. The gradient solution has to bedelivered to the box slowly to avoid mixing – taking 5–10 minutes.The speed can be adjusted by using a laboratory peristaltic pump, orby selecting a certain level for the liquid beaker and reducing the dia-meter of the tubing with a pinchcock clamp (see Figures 4.4 and 4.6on pages 334 and 341).
Gels for spot picking After the 2-D patterns have been comparedwith image analysis software, proteins of interest have to be identifiedand characterized. For these further analyses the gel plugs containingthese proteins have to be cut out of the gel slab. For high accuracy,reliability, and automation of this procedure robotic spot pickers areemployed (see pages 138 and 140 f). The most accurate and reliableway is to use the x/y coordinates of the respective spots from theimage analysis results in the automatic spot cutter. It is, however,important that the gel does not change its shape by shrinking or swel-ling. Therefore gel slabs have to be fixed to a rigid film or glass platebacking.
Note: The quality of the edge isinfluenced by the quality of thechemicals.
Using a pump means a lot ofwork. Everything has to be setup very quickly, because thecasting and the overlayingprocedure must be finishedbefore the gel solution starts topolymerize. The casting proce-dure must be as exact aspossible to prepare reproduciblegels.

1 Electrophoretic Techniques106
Gels fixed to a glass plate Because it is not easy to bind a gel to aglass plate after staining, gels are covalently bound to a film supportor glass plate during polymerization. Laboratory made gels areusually polymerized onto a glass plate, which has been treated withBind-Silane. Because staining solutions can diffuse into the gel onlyfrom one side, the gel should be as thin as possible for fast and effi-cient staining. These gels are usually 1.0 mm thick. Fluorescencelabeled or fluorescence stained gels must be attached to non-fluores-cent glass. Because this type of glass is very expensive, the gel layer isremoved from the glass plate after all analysis has been done. Whenthe glass plates are reused, the gel layer is removed with a plastic scra-per. Remaining gel pieces disappear after vigorous treatment with adishwashing brush.Meanwhile a non-fluorescent support film material has been devel-
oped, which allows using ready-made gels for the combination fluor-escent detection – spot picking.
Ready-made gels for vertical systems Ready-made gels are moreexpensive than laboratory-cast gels. However, one should not forgetthat gel casting is a lot of work – particularly for cleaning the equip-ment – and working time costs money as well. Commercially pro-duced gels are prepared according to GMP industry standards, andthey are quality controlled.There are two different concepts:
. Gels in glass or plastic cassettes. The handling doesnot differ from that of laboratory-cast gels. Theglass cassettes are either sent back to the produ-cer or they are disposed of.
. Gels on film-support. The 1 mm thick gels areinserted into specially designed re-usable cas-settes (Figure 1.38). Conventional glass cassettes,as shown in Figure 1.36, cannot be used,because air pockets between the glass plate andthe backing develop mechanical pressure on thegel, leading to an irregular front.
These 12.5% homogeneous polyacrylamide gels contain PPA-chloridepH 7.0 instead of the standard Tris-chloride buffer pH 8.8, in order toachieve a long shelf life. Because polymerization at pH 7.0 is moreefficient than at pH 8.8, the gels have a very high mechanical stability,and the patterns are highly reproducible. Bis-Tris buffer containinggels are a practical alternative (see above). The gels are packed airtightin flexible aluminum bags.
It is not easy to produce thesevertical gels on a film support inthe laboratory, because thepolyester films are flexible. Toset up a casting system for film-supported gels would mean abig investment in equipment.
It is very annoying, when thevaluable sample is not sepa-rated well, just because of alittle mistake occurring whilepreparing gels.
The sieving properties of a12.5% T PPA gel are compar-able to those of 14% Tpoly-merized with a Laemmli buffer.

1.5 Two-dimensional Electrophoresis 107
Fig. 1.38: Support cassette and ready-made film-backedvertical gel. The gel is shorter at the upper side toaccommodate the IPG strip.
Kits with buffer concentrates and agarose sealing solutions areavailable. The kit for the film-backed PPA gels contains also a bottlewith the gel buffer. The best way to insert the gel into the cassette isto apply a streak of 1 mL of the gel buffer onto the glass plate alongthe spacer of the closing side, and placing the gel on the glass platefirst touching the buffer streak with the respective edge. The gel posi-tion can be easily adjusted that the edge at this side is in contact alongthe entire spacer and the lower gel edge is flush with the edge of theglass plate. When the gel is lowered on the rest of the glass plate care-fully, no air bubbles are caught between gel surface and glass plate.The liquid near the closing side and some air bubbles – mostly closeto the hinged side – are squeezed out with a roller.A narrow gap of less than 1 mm remains between one spacer and
the gel edge: this will be sealed with hot agarose solution after theIPG strip has been inserted.For Western blotting analysis or for high sensitivity fluorescent
staining the support film has to be removed. It can be cut off with asimple instrument using a steel wire (see Figure 1.39). The large for-mat gels are easy to handle also without the film-backing becausethey are well polymerized.This procedure works only with flexible support films, not with
rigid, Bind-Silane treated glass plates.
Of course, also these cassetteshave to be thoroughly cleanedbefore and after each use toavoid contaminations.
A liquid layer between gelsurface and glass plate has tobe avoided. It would causeblurred spots.
Note: For those who have onlyused film-backed gels, handlingof non-backed slab gels requiressome practice and skill.

1 Electrophoretic Techniques108
Fig. 1.39: Film remover for complete removal of a flexiblefilm-backing from the gel.
1.5.4.3 Instrument and Gel Setup for the Second Dimension
Figure 1.40 shows a Multiphor flatbed chamber used as SDS PAGEinstrument and a mini vertical electrophoresis system for miniformatgels. These two instrument types are not for high throughput andthus mostly employed for optimization work.
Fig. 1.40: Flatbed and vertical mini electrophoresis apparatus for SDS PAGE.
In the flatbed apparatus the standard gel size is 25�19 cm. The elec-trode distances can be adjusted to shorter separation distances. Forexample, SDS electrophoresis of three miniformat IPG strips with7 cm length can be run together in one gel under identical conditions(see Figure 1.41).

1.5 Two-dimensional Electrophoresis 109
Fig. 1.41: Three miniformat 2-D separations run in one flatbed gel.IEF in three 7 cm IPG strips 4 to 7, SDS PAGE in a 25�11 cm gel witha stacking zone of 5% T and a homogeneous resolving area of12.5% T, 0.5 mm thick. Silver staining.
Ready-made gels for vertical miniformat chambers are available fromseveral suppliers. An alternative is to run also several short IPG stripstogether on a larger vertical gel. Some vertical systems can also beequipped with shorter glass plates.
Tab. 1.5: Comparison of the properties of flatbed and verticalsystems.
Flatbed Systems Vertical Systems
One gel per instrument. Multiple gels runs are possible.
Can also be used for IEF in IPGs. Dedicated for SDS electrophoresis.
Gel thickness is limited, because coolingis only possible from one side.
Higher protein loading capacity,because thicker gels can be used,which are cooled from both sides.
Very versatile for different gel sizesand methods.
Gel sizes fixed by glass plate sizes.
Thin layer gels can be used, easyapplication of the IPG strips.
Thin gels cannot be used, becausethe IPG strip would not fit betweenthe glass plates.
Buffer strips (polyacrylamide or filterpaper) can be used instead of largevolumes of liquid buffers.
Blotting is easier because of highergel thickness.
The IPG strip has to be removed fromthe SDS gel after 40 minutes becauseof EEO effects.
The IPG strip does not have to beremoved.
Gçrg et al. (1995) have performed a systematic comparison ofresults, obtained with a flatbed and a vertical system for the same
Up to 3 mm thick gels can beused in vertical systems
Very thin gels show higher sensi-tivity of detection, they areeasier and quicker to stain.
With flatbed systems there isreduced chemical and radioac-tive liquid waste.
EEO occurs in both systems,therefore urea, glycerol in theequilibration buffer and lowinitial voltages are needed.
Gçrg A, Boguth G, ObermaierC, Posch A, Weiss W. Electro-phoresis 16 (1995) 1079–1086.

1 Electrophoretic Techniques110
sample: The spot patterns are very similar. It is demonstrated thatsharper spots are obtained in thinner gels, which can be employed inthe flatbed system, but not in a vertical setup.
Design of vertical instruments The following functions are needed inthe instrument for the second dimension:
. High throughput;
. Large gel cassettes;
. Efficient cooling for fast runs with straight front;
. Leakage free;
. Reproducible results independent from gel posi-tion;
. Different gel thickness should be possible;
. Easy handling;
. Buffer consumption not too high.
The first high-throughput chamber had been developed by Andersonand Anderson (1978): the DALT box, where the gel cassettes are tiltedby 90 degrees and inserted between insulating rubber flaps (see Fig-ure 1.42). In contrast to conventional vertical systems, the migrationdirection of the proteins is from left to right instead of from the topto the bottom. Handling of the instrument is easy. As only one singletank is used, there is no problem of buffer leakage from an upper to alower tank.
Fig. 1.42: Schematic drawing of the traditional DALT chamberfor multiple SDS PAGE runs. The migration direction is from theleft to the right. Insulating rubber flaps prevent current flowbetween the cassettes.
The gels are usually run overnight, because the cooling efficiencyis limited. The entire box is filled with Tris-glycine buffer. The buffer
Anderson NG, Anderson NL.Anal Biochem 85 (1978)341–354.
The buffer volume of 20 L israther high.

1.5 Two-dimensional Electrophoresis 111
should not be used more than once, because it will become enrichedwith chloride ions from the gel buffer. When the Tris-glycine buffercontains chloride ions, the initial stacking effect is disturbed – result-ing in a loss of resolution – and the running time is extended.A limitation is the design of the buffer tank: the cathodal and ano-
dal buffer reservoir is identical. This makes peptide separations withTris-tricine buffer very expensive. And – the stable PPA buffer systemcannot be applied, because it would require two completely separatetanks for the anodal and the cathodal buffer.For vertical instruments with completely separate tanks, several
construction concepts are possible. Figure 1.43 shows three differentdesigns.
Fig. 1.43: Three different designs of vertical chambers.All of them can be cooled.A. Buffer-backed chamber.B. Chamber with tight upper buffer tank.C. Chamber for fast multiple runs.
Vertical electrophoresis chambers. In the buffer-back chambers (Figure 1.43, typeA) the gels are cooled via the cathodal buffer.Notched glass or aluminum oxide ceramicsplates are used to enable the contact between thecathodal buffer and the gel.
When the buffer tanks arecompletely separate, theanodal buffer can be usedrepeatedly, because chlorideions do not disturb there.
Maximal two gels can be run;therefore the principle is mostlyapplied on miniformat appa-ratus.

1 Electrophoretic Techniques112
. The medium sized chamber with tight upperbuffer tank (Figure 1.43, type B) can accommo-date up to four gels at the same time, whennotched glass plates are inserted between eachtwo gel pairs. The gels are cooled via the anodalbuffer.
. Multiple runs with large gels can be performedin chambers of type C in Figure 1.43. It is, how-ever, important to fill upper and lower buffer tothe same level to avoid buffer mixing. The heatremoval in this chamber type is very efficient,because the cooling anodal buffer is vigorouslypumped around in the lower tank.
The concept of pumping the anodal buffer around the cassettes isemployed for large gel systems: stand-alone instruments (Figure1.44A) and in integrated systems for running up to 12 gels (Figure1.44B).
Fig. 1.44: Electrophoresis instruments for large cassettes.A: Stand-alone instrument for up to six gels.B: Integrated apparatus Ettan DALT twelve for multiple 2-D PAGE.The programmable power supply controls also the Peltier coolingsystem and the pump for circulating the lower buffer.
At the rear of the separation unit of the integrated system sits adraining valve for convenient removal of used buffer. At the backpanel of the control unit of the Ettan DALT twelve there is a serial portfor possible software updates and to connect a computer or serialprinter to the instrument for a report on the electric conditions afterevery five minutes of the run. With this interface the instrument can
In this concept the edges of theglass plates must be absolutelyintact to prevent leakage of theupper tank.
The buffer concentration for theupper tank must usually bedoubled to prevent depletion ofthe cathode buffer.

1.5 Two-dimensional Electrophoresis 113
be integrated into the laboratory workflow system and allow proce-dures according to GLP (good laboratory practice).
& Note: for optimally reproducible 2-D patterns allgels of an experiment should be run together inone chamber.
The following hint goes for all vertical chambers with separate tanks:When the lower – anodal – buffer is mixed with the used upper –cathodal – buffer after each run, the Tris concentration is highenough for repeated use as anodal buffer. This saves work andreagent costs. Of course, the cathodal buffer must be new for eachelectrophoresis.
1.5.4.4 Equilibration of IPG Strips
Prior to the run in the second dimension the strips have to be equili-brated with SDS buffer to transform the focused proteins into SDS–protein complexes, which are completely unfolded and carry negativecharges only. The following conditions have been optimized by Gçrget al. (1987b).
& Equilibration stock solution: 2% (w/v) SDS, 50mmol/L Tris HCl pH 8.8, 0.01% (w/v)Bromophenol blue, 6 mol/L urea, 30% (v/v)glycerol
Equilibration is performed twice on a shaker:
15 min 10 mL equilibration stock solution Plus 1% (w/v) DTT
15 min 10 mL equilibration stock solution Plus 2.5% (w/v) iodoacetamide
Sodium dodecyl sulfate With the amount of 2% SDS there is usuallysufficient SDS for preparative protein loads. Some laboratories use 3–6% SDS to facilitate the migration of focused hydrophobic proteins.
Tris HCl buffer pH 8.8 In former protocols it was proposed to add thestacking gel buffer pH 6.8, because the use of a stacking gel was stan-dard procedure. However, it is better to add the more basic resolvinggel buffer with a pH of 8.8 to improve the alkylation of the cysteines.
Bromophenol blue This tracking dye allows a control of the runningconditions, the shape of the migration front, and the separation time.
Running gels of one experimentin different chambers makesspot matching more difficult.
The Tris moves from the anodalto the cathodal buffer. Glycinemoves from the cathodal toanodal buffer, it is not neededin the anodal buffer.
Gçrg A, Postel W, Weser J,G�nther S, Strahler JR,Hanash SM, Somerlot L. Elec-trophoresis 8 (1987b) 122–124
Note: with iodoacetamide thesolution can easily becomeacidic. This would disturb theformation of the SDS–proteincomplexes.

1 Electrophoretic Techniques114
Urea and glycerol These additives have been introduced to keepelectroendosmotic effects (see above) as low as possible. Urea is alsosupporting the solubility of hydrophobic proteins.
Dithiothreitol After the proteins have been focused they have to betreated with the reductant again. When very high protein loads areanalyzed, the concentration of DTTneeds to be increased.
Iodoacetamide The alkylation agent has several functions:. Complete alkylation of the cysteines, to avoidpartial modification by acrylamide for increasedspot sharpness and improved protein identifica-tion with mass spectrometry.
. Elimination of point streaking as described byGçrg et al. (1987b).
. Avoidance of the artifactual horizontal linesacross the SDS gel in the size range of 40–50 kDa.
When the cysteines had been pre-labeled with saturation dye forDIGE, the iodoacetamide step is omitted.
Equilibration time Two times 15 minutes seems to be a rather longtime, and some might fear considerable losses of proteins due to dif-fusion. As already mentioned on page 51, immobilized pH gradientskeep proteins back like a weak ion exchanger. Thus, only a littleamount of proteins – those from the surface – are washed out.The long equilibration time is necessary for the complete formation
of SDS–protein complexes, because the negatively charged SDS isrepelled by the negative charges on the carboxylic groups of thestrips. It has been observed that a too short equilibration leads to ver-tical streaks and losses of high molecular weight proteins.
Modified equilibration Although Hedberg et al. (2005) claim thatafter running the first dimension with DeStreak under oxidative con-dition equilibration can be shortened and both, equilibration and thesecond-dimension run can be performed under oxidative conditions,it is not recommended. This procedure is limited just to a few pHgradients. Practice has shown that this method does not give wellresolved spot patterns for all sample types.There are cases where increased SDS content facilitates the transfer
of hydrophobic proteins from the first to the second dimension. Oneexample is described by McDonough and Marbn, where 10% (w/v)SDS in the equilibration buffer was the only way to move a highlyhydrophobic protein into the second-dimension gel.
This is valid also after runningIEF with DeStreak.
The iodoacetamide functions asscavenger of the excess reduc-tant.
However, the equilibrationtime must not be extended toofar, because this leads to lossesof low molecular weightproteins due to diffusion.
Hedberg JJ, Bjerneld EJ, Cetin-kaya S, Goscinski J, GrigorescuI, Haid D, LaurinY, Bjellqvist B.Proteomics 5 (2005) 3088–3096.
McDonough J, Marbn E.Proteomics 5 (2005) 2892–2895.

1.5 Two-dimensional Electrophoresis 115
1.5.4.5 Transfer of the IPG Strip and Running the SDS Gel
In order to make examination and evaluation of 2-D maps easier, thefirst and second dimensions should always be set together in a stan-dardized way. The majority of the scientific world agrees that it makessense to orientate the gel in the style of a Cartesian coordinate sys-tem: the low values are located at the left bottom and the high valuesat the right top.
& The IEF gel should always be placed on the SDSgel in a standard orientation: low pH to the left,high pH to the right.
Flatbed system It is highly recommended to use the strip positionerplate as shown in Figure 1.40A for:
. Improved alignment of the electrode strips;
. Preventing the electrode strips to slide away;
. Reproducible positioning of the electrode stripsand the IPG strip on the SDS gel;
. Achieving a straight front, because the gel sur-face is covered.
The gels are placed directly on a cooling plate, which is connected toa thermostatic circulator. Usually the running temperature is 15 �C.After equilibration of the IPG strip, the excess buffer is removed byblotting it slightly with clean filter paper. The strip is placed – gel sur-face down – parallel to and 5 mm apart from the cathodal electrodestrip. The acidic end of the strip points to the left side.Mr marker proteins are applied with IEF sample application pieces
as shown in Figure 1.45.After 40 minutes of low voltage – for sample entry – the IPG strip
is removed from the gel; the cathodal electrode strip is moved fromits original position to the contact area of the IPG strip. This measureprevents drying out and burning of the SDS gel along this contactline. The separation can now be continued with higher voltage set-tings.
No agarose sealing solution isneeded.
In the flatbed system EEO hasstronger effects, because thewater is transported out of theSDS gel surface, causing dryingof the SDS gel.

1 Electrophoretic Techniques116
Fig. 1.45: Application of the IPG strip on the different types ofsecond-dimension gels.
Vertical system The IPG strip is placed onto the edge of the SDS gelsideways, with its support film touching one glass plate. Hot agaroseembedding solution, pipetted onto the strip has several functions:
. Achieve a gel continuity;
. Prevent air bubbles between the gels;
. Avoid floating of the strip in buffer solution;
. Reduce electroendosmotic effects at very highand very low pH values of the IPG strips;
. Seal the gaps between cassettes spacers and theready-made gels.
& Note: The agarose solution should not be hotterthan 60 �C; it could cause carbamylation of someproteins because of the presence of urea.
& Composition of the agarose embeddingsolution: 0.5% (w/v) agarose, SDS cathodebuffer (1� concentration), 0.01% (w/v)Bromophenol blue
Ca. 2 mL of agarose embed-ding solution is necessary pergel.

1.5 Two-dimensional Electrophoresis 117
Molecular weight marker proteins.
& Tip: Best results are obtained when themolecular weight marker proteins have the samestart conditions like the proteins from the IPGstrips: a IPG strip is rehydrated in the markerprotein solution, cut into small pieces, which canbe stored in a deep freezer or applied directly tothe SDS gel together with the IPG strips of thefirst dimension.
The alternative is to apply the markers to an IEF sample applicationpiece directly, in a volume of 15–20 mL and let it dry.
1.5.4.6 Running Conditions for Vertical Gels
Electric conditions Also vertical gels must be run with low voltage atleast for the first two hours to reduce the electroendosmosis effects(see page 21). When immobilized pH gradient gels are equilibratedin basic buffers, they become deprotonated: The carboxylic groupsbecome negatively charged, the amino groups are neutral. Thus theIPG strips acquire negative net charges during equilibration with theSDS buffer. It has been observed already during the first approachesutilizing immobilized pH gradients in 2-D electrophoresis that thiscan cause electroendosmotic effects (Westermeier et al. 1983). Thoseresult in protein losses due to a water flow towards the cathode. Thewater transport is minimized by adding urea and glycerol to the equi-libration solution and reducing the electric field during the phase ofprotein transfer into the second-dimension gel (Gçrg et al.1985,2003):
& Phase 1: apply only 5 mA (» 0.2 W) per gel for2 hours
& Phase 2: continue with normal SDSelectrophoresis settings for fast or overnight runs
In discontinuous buffer systems, first the conductivity is high,because the gel contains a lot of chloride ions, which have high mobi-lity. When more of the glycine or tricine ions – with low mobilities –are migrating into the gel, the conductivity decreases, and the fieldstrength increases. In order to avoid the production of too much Jouleheat at the end of the run, the gels are usually run at low current set-tings. A possibility to speed up the separation is to adjust the currentsetting from time to time.
Westermeier R, Postel W, WeserJ, Gçrg A. J Biochem BiophysMethods 8 (1983) 321–330.
Gçrg A, Postel W, G�nther S,Weser J. Electrophoresis 6(1985) 599–604.
Gçrg A, Drews O, Weiss W. InSimpson RJ, Ed. Purifyingproteins for proteomics: Alaboratory manual. Cold SpringHarbor Laboratory Press, ColdSpring Harbor, New York(2003) 391–430.

1 Electrophoretic Techniques118
Ideally the power supply offers the feature to run the separation atconstant power. Then the current is high at the beginning and low atthe end without overheating the gels and the buffers. In this way aseparation can be run faster than under conventional conditions.
Temperature Multiple gels produce a substantial amount of Jouleheat, which has to be removed. If this is not efficient enough the gelsshow the “smiling effect”: faster migration in the center than on thelateral sides. It was the general opinion that SDS gels should becooled to 10–15 �C to remove the heat efficiently enough to obtain astraight front. Systematic studies in chambers with more powerfulbuffer circulation have shown that better results and faster runs areobtained when the gels are run at 25 �C. Of course there are also cer-tain limits how much temperature can be removed from the gels andthe buffers.
Benefits of quick runs Fast separations of large gels – within a fewhours instead of overnight – result in less diffused spots compared toovernight runs. This is particularly obvious in the low molecularweight area. Less diffused spots have three advantages:
. Increased spatial resolution in homogeneousgels;
. Increased detection sensitivity;
. Improved enzyme kinetics during tryptic in-geldigestion.
1.5.4.7 Molecular Weight Determination
For the determination of molecular weights in 2-D electrophoresisgels two different procedures are used.
Method 1. Co-running molecular weight standard proteins Molecularweight marker proteins can be applied as a separate track to the 2-Dgel. The molecular weights of the proteins in the 2-D map are theninterpolated with the molecular weight curve obtained from the posi-tions of the marker proteins. This procedure is usually carried outwith the image analysis software as “1-D calibration”.The problem with this method is its limited accuracy. The markers
have to be applied at the lateral sides of the gels. Often the space isvery limited and the bands are curved because of the edge effects inSDS PAGE. Furthermore, the estimation of molecular weights withSDS PAGE is not accurate at all.
The high settings are appliedafter the 2 hours proteintransfer.
Less need for gradient gels.
In comparative experimentsover 50% more spots could bedetected in these gels.
Because of the higher proteinconcentration in the gel plug.

1.5 Two-dimensional Electrophoresis 119
Method 2. Interpolation between identified sample proteins with knownMr values Prominent spots showing up in each 2-D map of a sam-ple type can be analyzed for identification and amino acid sequenceinformation. The theoretical Mr values can then be used as keystonesfor interpolating the Mr values of the other proteins. The second pro-cedure is performed with the image analysis software as “2-D calibra-tion”. This method is much more exact than the method describedabove.
1.5.5Detection of Protein Spots
There is a demand list of properties required for the ideal spot detec-tion technique in 2-D gels in proteomics: it should:
. Be sensitive enough for low copy numberproteins;
. Allow quantitative analysis;
. Have a wide linearity;
. Have a wide dynamic range;
. Be compatible with mass spectrometry;
. Be non-toxic;
. Be environment-friendly;
. Be affordable.
Unfortunately there is no method that affords all these featurestogether. Lately some reviews on detection techniques in proteomicshave been published: a “minireview” by Westermeier and Marouga(2005), and a very elaborate compilation by Miller et al. (2006). Thefollowing table gives an overview over currently used detection princi-ples and their features. Several different protocols exist for most ofthese methods. Those of major importance are quoted in the table.
1.5.5.1 Comparison of Detection Methods
Tab. 1.6: Detection methods for protein spots.
Method Advantages Disadvantages
Coomassie brilli-ant blue staining(colloidal)
Steady state method, goodquantification, inexpensive,mass spectrometrycompatible
Medium sensitivity: LODca. 20 ng of BSA; the moresensitive, the slower
Westermeier R, Marouga R.Bioscience Reports 25 (2005)19–32.
Miller I, Crawford J, GianazzaE. Proteomics 6 (2006) 5385–5408.
Neuhoff V, Arold N, Taube Dand Ehrhardt W. Electrophor-esis 9 (1988) 255–262.

1 Electrophoretic Techniques120
Method Advantages Disadvantages
Coomassie brilli-ant blue staining(alcohol free, hot,monodisperse)
Steady state method, fast,good quantification, inexpen-sive, very environmentfriendly, mass spectrometrycompatible
Low sensitivity: LOD onlyca. 100 ng of BSA, back-ground destaining necessary
Zinc imidazolreverse staining
Medium sensitivity: LODca. 15 ng of BSA, fast, verygood compatible with massspectrometry
Bad for quantification, nega-tive staining not easy fordocumentation
Silver staining(silver nitrate)
High sensitivity: LODca. 0.2 ng, can be mademass spectrometrycompatible
Poor dynamic range, limitedquantification possibilities,poor reproducibility becauseof no endpoint, multistepprocedure
Silver staining(silver diamine)
High sensitivity: LODca. 0.2 ng, stains basicproteins better than theprotocol above
Poor dynamic range, limitedquantification possibilities,poor reproducibility becauseof no endpoint, multistepprocedure, high silver nitrateconsumption
Fluorescentstaining withRuBPS
Medium to high sensitivity:LOD ca. 0.4 ng of BSA,very good for quantification,wide dynamic range
Overnight procedure, fluor-escence imager necessary,dye particles can cause pro-blems in image analysis, is-sues with mass spectrometry
Fluorescentstaining withDeep Purple�
Medium to high sensitivity:LOD ca. 0.4 ng of BSA,very good for quantification,wide dynamic range, massspectrometry compatible
Fluorescence imager neces-sary
DIGE:Fluorescentminimallabeling
High sensitivity: LODca. 0.5 ng, direct comparisonof up to three samples in onegel, good for quantification,wide dynamic range, massspectrometry compatible
Fluorescence imagernecessary
DIGE:fluorescentsaturationlabeling
Very high sensitivity: LODbelow pg, direct comparisonof up to two samples in onegel, good for quantification,wide dynamic range, massspectrometry compatible
Labeling protocols must beoptimized for different sam-ple types, fluorescence ima-ger necessary
Jochen Heukeshoven, personalcommunication.
Fernandez-Patron C, Castel-lanos-Serra L, Hardy E, GuerraM, Estevez E, Mehl E, FrankRW. Electrophoresis 19 (1998)2398–2406.
Heukeshoven J, Dernick R.Electrophoresis 6 (1985)103–112.
Rabilloud T. Electrophoresis 13(1992) 429–439.
Rabilloud T, Strub J-M, LucheS, van Dorsselaer A, Lunardi J.Proteomics 1 (2001) 699–704.
Mackintosh JA, Choi H-Y, BaeS-H, Veal DA, Bell PJ, FerrariBC, Van Dyk DD, Verrills NM,Paik Y-K, Karuso P. Proteomics3 (2003) 2273–2288.
�nl� M, Morgan ME, MindenJS. Electrophoresis 18 (1997)2071–2077.
Sitek B, L�ttges J, Marcus K,Klçppel G, Schmiegel W, MeyerHE, Hahn SA, St�hler KProteomics 5 (2005) 2665–2679.

1.5 Two-dimensional Electrophoresis 121
Method Advantages Disadvantages
Radioactivelabeling
High sensitivity: LOD belowpg, good quantification, verywide dynamic range withphosporimager
Limited to living cells, gelshave to be dried, phosphorimager necessary, radioactiv-ity needed
Stable isotopelabeling
High sensitivity: LOD belowpg, wide dynamic range,good quantification
Methods still under develop-ment also for 2-D electro-phoresis, expensive, massspectrometer needed
Western blotting Ideal for highly sensitive andselective detection of specificproteins, general proteinstaining is also possible,proteins are well accessibleon the blotting membrane
Additional electrophoresisstep, uneven transfer of pro-teins, limited mass spectro-metry compatibility becauseof membrane material, spe-cific detection works onlywhen antibodies are available
In practice the mostly applied techniques in proteomics labora-tories are Coomassie brilliant blue, silver and fluorescence labelingand staining.
1.5.5.2 Staining with Visible Dyes
It is very important to know that different staining techniques attachto proteins differently. There are proteins, which do not stain at allwith Coomassie brilliant blue, but with silver and vice versa. Also dif-ferent silver staining protocols deliver different patterns of the samesample.
Zinc imidazol negative staining When image analysis of the patternis not an issue, and mass spectrometry analysis of some spots is themajor goal, this procedure can be recommended.
Coomassie blue staining The “classic” alcohol/acetic acid Coomassieblue staining recipes should not be used for 2-D electrophoresis,because during destaining with the alcohol-containing solution theprotein spots are partly destained as well. Some proteins – forinstance collagen – lose the dye before the background of the gel isdestained. Because no steady state is reached, quantification is notreliable and not reproducible.
Colloidal Coomassie blue staining Colloidal Coomassie blue stainingaccording to Neuhoff et al. (1988) contains also alcohol, but in pre-sence of ammonium sulfate. Ammonium sulfate increases thestrength of hydrophobic interactions between proteins and dye. The
Johnston RF, Pickett SC, BarkerDL. Electrophoresis 11 (1990)355–360.
Smolka M, Zhou H, AebersoldR. Mol Cell Proteomics 1(2002) 19–29.
Dunn MJ. In. Link AJ. Ed. 2-DProteome analysis protocols.Methods Mol Biol 112 (1999)319–329.
The alcohols used are:methanol, ethanol, and isopro-panol.
Anderson NL, Esquer-Blasco R,Hofmann J-P, Anderson NG.Electrophoresis 12 (1991)907–930.

1 Electrophoretic Techniques122
methanol allows a much faster staining process. Coomassie G-250 isused. Repeated staining overnight alternated by fixing during the daywith 20% ammonium sulfate in water for several times gives a sensi-tivity approaching that of silver staining. But this procedure takes avery long time and needs many steps; it is not ideal for high through-put. An easier “walk-away” protocol has been developed by Andersonet al. (1991), but it is not quicker.
Hot Coomassie blue staining Much quicker results are achieved witha direct fixing/staining procedure using alcohol-free Coomassie R-350 in 10% acetic acid at elevated temperature. The easiest way is toheat the solution to 80–90 �C on a heating stirrer and to pour thissolution over the gel, which lies in a stainless steel tray placed on arocking platform. Staining takes 10 minutes. The gel has to bedestained with 10% acetic acid at room temperature for several hours.Staining as well as destaining solutions can be used repeatedly. Thedye can be removed from the destainer by adding paper towels to thedestainer or filtering it through activated carbon pellets.No loss of sensitivity has been observed, when glass- or film-backed
gels are stained with Coomassie blue. Coomassie blue also exhibitsfluorescence. It is possible to scan Coomassie blue-stained gels with afluorescence imager, when all emission filters are removed.
Silver staining The silver nitrate protocol is mostly preferred to thesilver diamine protocol, because it needs only 10% of the amount ofsilver nitrate, and it is less dangerous to get a silver mirror on the gelsurface. When glass- or film-backed gels are stained, the stainingsteps have to be prolonged, and, unfortunately there is a loss of sensi-tivity, because the backing blocks one side of the gels for the solu-tions.Silver staining often produces a pattern different from the pattern
achieved with Coomassie blue and other staining procedures likewith Sypro� Ruby (Gçrg et al. 2000). Prestaining a gel with Coomas-sie blue intensifies the signal of silver staining, resulting in improveddetection sensitivity. Another advantage is that double stainingobviously prevents negative silver staining. When the Coomassie bluestaining is fast, it can almost compete with a conventional fixing pro-cedure for silver staining.
1.5.5.3 Detection with Fluorescence
Fluorescence labeling Several fluorescent pre-labeling procedureshave been proposed, for instance, the method using monobromobi-mane according to Urwin and Jackson (1993). However the most suc-cessful approach is the DIGE technique, which employs different
This is the most environmentfriendly staining procedure, andit is well compatible with massspectrometry analysis.
Colloidal Coomassie stainingshows the same pattern like thehot staining procedure.
Gçrg A, Obermaier C, BoguthG, Harder A, Scheibe B, Wild-gruber R, Weiss W. Electrophor-esis 21 (2000) 1037–1053.
Note: the best silver stainingresults are obtained when fixingis performed overnight.
Urwin V, Jackson P. Anal.Biochem 209 (1993) 57–62.

1.5 Two-dimensional Electrophoresis 123
charge and size matched fluorescent tags and allows multiplex detec-tion of co-migrated proteins. This method is described in detail inChapter 1.5.2 Pre-labeling of proteins for difference gel electrophoresis onpage 68 ff and page 132 ff.Uniquely fluorescent dyes can be scanned while the gels are still in
the cassette. Sometimes the work cycle does not allow immediatescanning. In this case it is recommended to place the cassettes into acold room or refrigerator. The diffusion of spots will be only minor.Although it has been proposed in some publications to open the cas-settes and fix the gels with an acidic solution, this procedure is notadvised, because this will reduce the strength of the fluorescent sig-nal.As already mentioned above, in the low molecular weight area the
spots of minimal labeled and non-labeled proteins are resolved.When low molecular weight spots have to be picked from the gel, thegel needs to be post-stained with a fluorescent dye in order to pick thespots containing the 97% non-labeled proteins.
Fluorescence staining A number of fluorescence dyes are available.They exhibit a wide dynamic range of about four orders of magnitude,and they are therefore very well suited for quantification of proteins.The most sensitive dyes are Sypro Ruby, RuBPS solution, FlamingoPink�, and Deep Purple. All these stains can be used in gels as wellas on blots. While the first four dyes are chemically synthesized andbased on heavy metal atoms, Deep Purple is a natural occurring fluor-ophor produced by the fungal species Epicoccum nigrus, and it is fullybiodegradable. Because its attachment to proteins is reversible, it ishighly compatible with downstream analysis like mass spectrometry(Coghlan et al. 2005).
Specific staining of post-translational modifications Two types of post-translational modified proteins can be visualized by staining the gelor a blot membrane with specific fluorescent dyes: “Pro-Q�-Dia-mond” and Phos-Tag� for specific detection of phosphorylated pro-teins (Steinberg et al. 2003), and “Pro-Q�-Emerald” for glycosylatedproteins (Hart et al. 2003). Because the dyes exhibit different excita-tion and emission wavelengths, multiplex detection can be performedin a gel or a blot (Wu et al. 2005). Pro-Q-Emerald is based on the peri-odic acid Schiff’s reagent procedure according to Zacharius et al.(1969), thus wrong positive detections cannot be completely excluded.For specific determinations of glycoproteins blotting and detectionwith lectins in various glycan kits is still the more reliable way.
All other gel-staining methodsrequire a fixing step.
Coghlan DR, Mackintosh JA,Karuso P. Org Lett 7 (2005)2401–2404.
Steinberg TH, Agnew BJ, GeeKR, Leung W-Y, Goodman T,Schulenberg B, Hendrickson J,Beechem JM, Haugland RP,Patton WF. Proteomics 3(2003) 1128–1144.
Wu J, Lenchik NJ, Pabst MJ,Solomon SS, Shull J,GerlingIC. Electrophoresis 26(2005) 225–237.
Hart C, Schulenberg B, Stein-berg TH, Leung WY, PattonWF. Electrophoresis 24 (2003)588–598.
Zacharius RM, Zell TE,Morrison JH, Woodlock JJ. AnalBiochem 30 (1969) 148–152.

1 Electrophoretic Techniques124
1.5.5.4 Mass Spectrometry Compatibility
Coomassie brilliant blue-stained gels are usually compatible withmass spectrometry analysis, because the dye can be completelyremoved from the proteins. It is important to use a dye with goodquality to avoid contaminants showing up in the mass spectrogram.For hot staining, shown in the two figures above, a very pure Coomas-sie brilliant blue R-350 dye was used, which is available in tabletform.A spot, which is visible with Coomassie blue staining, contains
enough protein for identification and characterization with massspectrometry. Therefore many proteomics laboratories use this stain-ing procedure in their routine work.Silver staining can be modified for mass spectrometry compatibility
by omitting glutardialdehyde from the sensitizing solution, and for-maldehyde from the silver solution (Shevchenko et al. 1996, Yan et al.2000). The detection sensitivity decreases to about one-fifth of thenon-modified procedure. The silver–protein complexes are locatedonly on the surface of the gel, the remaining proteins inside the gellayer can be further analyzed.
In practice, however, it happens very frequently that silver stainedspots show no signals in mass spectrometry. There might be manyreasons for this, for instance too long development time resulting intoo much contact of proteins with formaldehyde, or the proteinamount in the spot is simply too low.Fluorescent dyes are becoming more important for protein detec-
tion. The CyDye fluors used in the DIGE approach do not interferewith mass spectrometry: when minimal dyes are used, the highmajority of the proteins are not modified at all; for cysteine labels themolecular mass of the added molecule has to be entered into thesearch software like it is done for alkylated cysteines. However, it hasbeen reported that heavy metal-containing fluorescent dyes can inter-fere with mass spectrometry analysis (Laane and Panfilov, 2005).Tannu et al. (2006) have directly compared the effect of stainingreagents on peptide mass fingerprinting from in-gel trypsin diges-tions and conclude that the DeepPurple stain can result in increasedpeptide recovery compared to heavy metal containing dyes.
They use usually colloidalstaining.
Shevchenko A, Wilm M, VormO. Mann M. Anal Chem 68(1996) 850–858.
Yan JX, Wait R, Berkelman T,Harry RA, Westbrook JA,Wheeler CH, Dunn MJ. Electro-phoresis 21 (2000) 3666–3672.
At the present state of develop-ment it is a fact that you are onthe safe side with Coomassieblue staining, whereas spotanalysis of silver stained spots isstill an adventure.
Laane B, Panfilov O. JProteome Res 4 (2005)175–179.
Tannu NS, Sanchez-BrambilaG, Kirby P, Andacht TM.Electrophoresis 27 (2006)3136–3143.

1.6 Image Analysis 125
1.6Image Analysis
The evaluation and comparison of the complex 2-D patterns with theeye is impossible. Therefore, the gel images have to be converted intodigital data with a scanner or camera, and analyzed with a computer.Modern imaging systems such as the Typhoon� create very wide
dynamic range images of 0–100,000 levels of signal resolution. How-ever, the most commonly used file for images is a 16 bit TIFF (taggedimage file format), which corresponds to 65,536 levels. For a conver-sion the image analysis “.gel” format uses a square root algorithm tocompress the possible 100,000 levels of an image into the levels avail-able. The square root compression provides higher signal resolutionat the low end where changes in signal are more critical. Thus, with a“.gel” file it is possible to differentiate between more subtle differ-ences in low activity samples. Software packages like ImageMaster�Platinum, DeCyder and ImageQuant� TL take this conversion intoaccount.Usually a pixel format of 100 mm is applied for scanning. Higher
pixel resolution does not improve image analysis.
& Note: If the resolution is too high, the image fileswill become too big to become processed in areasonable time and take up a lot of space onthe hard disk.
Preparing the gels for spot picking When the gels should be placedinto an automatic spot picker after image analysis, the gels must befixed to a glass plate with Bind-Silane or to a plastic film support.Two self-adhesive reference markers – available also with fluorescenceand radioactive signals – are glued to the bottom of this support. Thepositions of these markers are roughly predetermined to make iteasier for the spot picker camera to find them automatically. Thereference markers are scanned together with the spots. Picking afterthe spot coordinates acquired with image analysis is the most accu-rate procedure. But it requires gels, which are fixed to glass or filmsurfaces.
1.6.1Image Acquisition
1.6.1.1 Still CCD camera systems
Chemoluminescence detection on blot membranes requires accumu-lation of the signal, therefore a fixed CCD camera in a dark cabinet isemployed.
Picking from unbacked gels isdescribed on page 140 inSection 1.7 Spot handling.
For high sensitivity the CCDcameras must be cooled.

1 Electrophoretic Techniques126
Scanners for visible dyes Gels with visible spots have to be scannedin transmission mode. Otherwise quantification of spots would beincorrect. This is possible with high-end, liquid-insulated desktopline scanners. For appropriate image analysis it is important to scanthe gels in grayscale mode with at least 16 bit signal depth. Blot mem-branes are scanned in reflectance mode. It is usually the scanningarea, which sets the limit for the 2-D gel sizes. An A3 format scannercosts considerably more than a standard A 4 format instrument.The scanner must be calibrated using a gray step tablet. The mea-
sured dimensionless intensity is converted into OD values (or absor-bance units, AU).New desktop scanners afford quick scanning with wide linear
range from 0 OD to 3.6 OD in transmission mode and with high spa-tial resolution. In practice the offered resolution of down to 20 mmcannot be applied, because the image file would become too big.Scanning a 20�20 cm gel with 300 dpi takes 30 seconds to 1 minute.Film- or glass-plate backed gels are placed on the scanning area
with the gel surface down, with a thin layer of water in between.Therefore the standard desktop scanners have to be modified by seal-ing the scanning area against liquid leakage.For accurate picking of spots according to the data of image analy-
sis the x/y positions need to be absolutely correct in the mm tolerancerange. Usually the x/y data have to be calibrated for each scannerwith the help of a grid. These calibration data have to be importedinto the spot picker computer for each scanner used.
Fluorescence imagers As already mentioned above, the signals offluorescent dyes exhibit a wide linearity and wide dynamic range, upto four orders of magnitude. This advantage should, of course, be uti-lized to the full extent. But this is only possible, when the dynamicrange of the imager can cope with it. The selection of an adequateimager is therefore important.
Laser scanners The functions for storage phosphor imaging andmulticolor fluorescence detection can be combined in one instru-ment. Lasers with different wavelengths are combined with differentfilters for the various scanning modes. The detectors are usually verysensitive photomultipliers. The dynamic range of such an instru-ment, shown in Figure 1.46, extends to five orders of magnitude.Radiolabeling provides the most sensitive signals. Storage phos-
phor screen scanners have a much wider linear dynamic range thanX-ray films. The detection is much faster. After the exposure of adried gel or a blotting membrane, the storage screen is scanned witha HeNe laser at 633 nm. For reuse, the screen is exposed to extra-bright light to erase the image.
For the definition of OD seeglossary.
Differentially labeled samplescan be analyzed in thefollowing way: with direct expo-sure both 35S and 32 P signalsare recorded; with a secondexposure through a thin copperfoil only 32P labeled proteinsare detected.

1.6 Image Analysis 127
Fig. 1.46: Variable mode laser scanner Typhoon.
Staining or labeling proteins with fluorescent dyes shows similaror even higher sensitivity than silver staining and a much wider lin-ear dynamic range. Modern instruments have a confocal scan head tocancel signals from scattered excitation light, and to reduce fluores-cence background coming from glass plates and other supportingmaterial. The laser light excites the fluorescent label or bound fluor-escent dye; the emitted light of an offset wavelength is bundled witha collection lens and transported to the detector through a fiber opticcable (see Figure 1.47). Signals emitted from bands or spots, whichare excited by stray light, are focused out, they will not hit the “peephole”, and will thus not be conducted by the fiber optic cable.
Fig. 1.47: Schematic diagram of the principle of fluorescencedetection with confocal optics.
A second feature of confocaloptics is the adjustment of thefocusing depth. For instance,when gels are scanned as insidetheir cassettes, the scan head isadjusted to focus at 3 mmabove the platen. For scanningblot membranes it is switchedto the platen level.

1 Electrophoretic Techniques128
State of the art instruments are equipped with up to three laserswith wavelengths of, for instance, 532 nm (green), 633 nm (red), and457 nm and 488 nm (blue). Many aspects of fluorescence imagingare described in detail in the fluorescence imaging handbook by GEHealthcare (2002).The scanning sensitivity is adjusted by modifying the voltage of the
photomultiplier tubes after a quick prescan. In order to facilitate theimaging of DIGE gels in cassettes, hardware accessories and littlesoftware tools are available to facilitate scanning and organizing theimages for subsequent image analysis. The glass platen is big enoughto accommodate two large gel cassettes.Scanners with confocal optics deliver very exact geometric data,
therefore x/y calibration for accurate spot picking is not required.
Scanning CCD cameras Scanning CCD cameras with white lightsource can also provide adequate quantitative and qualitative mea-surements. Figure 1.48 shows a schematic diagram of such a system.By filtering the white light with an excitation filter monochromaticlight is created for selectively exciting just one of the fluorophores.For an even distribution of the light on the sample it is divided byglass fibers and guided into a ring light. A particular low band passemission filter is used to avoid crosstalk between the sample chan-nels, which are recorded by a CCD camera.
Fig. 1.48: Schematic representation of the mode of functioning of amulti-fluorescence imager based on white light and scanning CCD camera.
The CCD camera should scan and read out on the fly. Conventionalsystems with CCD cameras, which needed to stop for the readout,have delivered the images in patches, which had to be stitchedtogether with special computer programs. Novel systems use a timedelay integration technique, which precisely synchronizes image
GE Healthcare Handbook:Fluorescence imaging: Princi-ples and Methods GE Health-care Life Sciences (2002) 63-0035-28.
Instruments of this type are lessexpensive than laser multifluor-escence scanners.

1.6 Image Analysis 129
acquisition and CCD readout rate. The sensitivity can be adjusted byselecting the optimum scanning velocity. Such new systems are avail-able with a dynamic range of 3.5 orders of magnitude.
Practical hints for imaging DIGE gels Because fluorescence is tem-perature dependent, the gels should be scanned at room temperature.Gels from the refrigerator or cold room should be allowed to warm toroom temperature prior to scanning (Rozanas and Loyland, 2006).It is important to crop the DIGE images with the scanner software
tool to exclude the poorly resolved marginal areas and to achieve per-fect pattern overlays. The CyDyes have different signal strengths. Inorder to obtain comparable patterns, the images are normalized withthe DeCyder software after the definition of spot and area exclusionsparameters has been carried out.
1.6.2Image Analysis and Evaluation
The evaluation of the spot patterns is the most demanding part of the2-D electrophoresis technique. The application and control of theimage analysis software tools take a lot of time. And manual spot edit-ing, spot splitting and other human interventions are influenced bybias of an individual. Ideally the images would be analyzed and com-pared fully automatically.Image analysis of 2-D gels has to deliver various types of informa-
tion:. Comparison of 2-D pattern of treated with non-treated samples;
. Interpolation of isoelectric points and molecularsizes;
. Detection of novel, missing, or modified pro-teins;
. Quantification of protein spots;
. Detection of up- or down-regulated proteins;
. Definition of spot positions for spot cutting;
. Detection and characterization of proteinfamilies and pathways;
. Statistical analysis of experimental results;
. Enabling database queries;
. Linkage of 2-D data to mass spectrometry data;
. Integration of the image data with a laboratoryworkflow system.
Rozanas CR, Loyland SM. In:Liu BCS, Ehrlich JR, Eds. TissueProteomics: Approaches forPathways, Biomarkers, andDrug Discovery. HumanaPress, Totowa, NJ (2006) inpress.

1 Electrophoretic Techniques130
The development of software for 2-D electrophoresis gel image analy-sis is a continuously ongoing process. The functions become morereliable, reproducible and automated from year to year. With the lat-est developed program it is already possible to compare gels of differ-ent sizes, shapes, and even damaged gels. However, irreproducibleresults cannot be fixed, even not by the most sophisticated software.On the contrary: the highly developed programs recognize inconsis-tencies between different patterns. Exact and tidy laboratory work isstill requested. The software cannot turn bad separation results intogood results.There are two types of 2-D imaging software on the market:
. Cheap to free of charge tools for basic imageanalysis;
. Professional programs, which evaluate with highreproducibility and offer many valuable func-tions for image analysis, statistical evaluation,and reporting.
& The most critical parts in image analysis are spotdetection and background subtraction. Manualspot editing and background definitions arealways user-biased.
Furthermore it is very important that the image analysis programdoes not modify the raw data.There are two different concepts of 2-D electrophoresis, which
require different approaches for image analysis and evaluation:. One sample per gel separations;. Multiplex separations like achieved with DIGE.
1.6.2.1 Traditional One Sample Per Gel Analysis
The following brief description is based on the concept of one of themost advanced software packages, which is available under the nameImageMaster Platinum, also known under the previous name “Mela-nie”. The goal is to apply automatic procedures wherever possible, toexclude manual editing and human interference.
Spot detection The most important step is spot detection, where dif-ferent parameters have to be optimized:
. With a “smooth” factor splitting of spots can beinfluenced.
. The selection of a certain “minimal area” elimi-nates spots below the set threshold.
This can vary with differentsample types, pH gradients, gelsize and composition, detectiontechniques.

1.6 Image Analysis 131
. The definition of “saliency” discriminatesbetween real spots and artifacts (real spots havehigher saliency values).
These parameters are defined in a selected enlarged restricted areaand then applied on all gels of an experiment. Properly optimizedspot detection reduces spot editing close to zero.
Background correction A background subtraction function can easilylead to errors. After many years of experience with spot volume quan-tification it has been found that by defining the spot boundary at 75%of the peak maximum and calculating the spot volume for only forthe values above the boundary, the relative spot volume quantificationcomes very close to the real situation and ensures a very high repro-ducibility.
Normalization Normalization takes care of the variation in proteinloading and staining. The spot volumes are normalized against thetotal spot volume of the gel fully automatically without any user inter-action.
pI and Mr calibration There are two ways to calibrate the image forpI andMr annotation (see also pages 98 and 118):
. 1-D calibration. Calibration curves are derivedfrom IPG pH gradient graphs for pI determina-tion for one dimension and from the positionsof co-run molecular weight markers for the sec-ond dimension by importing a ladder.
. 2-D calibration. pI andMr values are calibrated atthe same time by interpolating between knownvalues. These values usually come from massspectrometry analysis. A number of spots withknown protein properties are selected, the pIandMr information are imported from therespective protein lists belonging to these spots.
Gel viewing For visual inspection the spots they can be viewed intwo- and three-dimensional view.
Matching For differential analysis it is important to be able to super-impose the spot patterns. This cannot be done directly, because typi-cally there are local distortions caused by imperfections in gel matrix,variations in gel running conditions, temperature effects, unevenfocusing, and polymerization issues. Formerly spot matching tried tofind corresponding spots in pairs of gels. However for automatic
For controlling the matchingefficiency vectors between thespots of the gel pair aredisplayed. The directions andlengths of the vectors betweenthe corresponding spots make iteasy to detect mismatches.

1 Electrophoretic Techniques132
matching it is more efficient to search for pairs of features, usingspot clusters, spot shapes, sizes, and positions together. Even this fea-ture-based matching can sometimes produce mismatches. Thereforeit is necessary to control this process by visual inspection, and per-form corrections with setting landmarks.
Data analysis 2-D gel patterns are compared to detect qualitativeand/or quantitative protein expression changes between individualsamples or different populations. As already mentioned in the intro-duction, the challenge is to find biologically significant changesbetween different samples against the background of inherent biolo-gical variations, induced variations during sample preparation, andgel-to-gel variations.Populations of replicate gels are compared to each other with so
called “match sets”. Arbitrary reference gels are no longer employed.The match sets can be organized in various ways; this allows creatingdifferent groups of gels.Several statistical tools and clustering techniques are available to
extract results and to discover similarities or significant differences.
Preparing the spot picking list The x/y positions of the selected spots,including the reference markers, are exported into a table. The num-bers of the reference markers are automatically named “IR1” and“IR2” (internal reference).
Reporting and exporting of data The results can be printed out inimages with or without annotations and tables. The files can also beexported into Excel and other office software.
1.6.2.2 The Analysis of DIGE Gels
DIGE gels are obtained by labeling the proteins in different sampleswith different, spectrally distinct fluorescent dyes, the CyDye fluors,and running the mixed samples together in the same gel. Because ofthe multiplex feature and the co-migration of the proteins to the iden-tical spot coordinates, DIGE gels can be analyzed in a completely dif-ferent way than traditional gels. This analysis runs almost fully auto-matically.The main philosophy in the differential approach of the DeCyder
software is the assumption that the protein compositions of differentsamples within an experiment are very similar; that there are only afew changes in protein expression levels, which are significant andshould be detected.
This reduces the user bias to aminimum.

1.6 Image Analysis 133
The key points for the evaluation of DIGE gels are:. The co-detection of spots;. The co-separation of the pooled internal standardin each gel;
. Utilizing the internal standard for in-gel normal-ization.
Co-detection As already mentioned before, because of the co-migra-tion of the same proteins the spots do not need to be matched withina gel. Thus the sample spot volumes can be directly related to thestandard spot volumes, which are originating from protein mixturesof all samples. DeCyder does this automatically by employing a co-detection algorithm. Co-detection means that for the definition andassessment of a spot the information of all three channels is com-bined. Each particular spot receives the identical spot boundaryacross all three channels. In this way the relative spot volume calcula-tion becomes very accurate, and splitting of double or multiple spotsis more reliable than manual splitting. If co-detection would not beavailable, the operator of the software, as the supervisor of evaluation,would detect the spot shoulders and perform manual splitting. Figure1.49 shows a typical situation. With triple co-detection the correctspot boundaries are applied. Single detection would lead to erroneousspot matching.
Fig. 1.49: Comparison of spot boundary definition with tripleco-detection and single detection. On the left hand side thethree-dimensional view of all three channels; on the right handside the two-dimensional view of the Cy3 channel.From Josef B�lles with kind permission.
With the help of the internal standard the software can automati-cally normalize the spot volumes.

1 Electrophoretic Techniques134
Linking the images of different gels via the internal standard A 2-Delectrophoresis experiment always consists of more than one gel.Therefore the spot volume ratios have also to be compared across dif-ferent gels. In this case a spot matching procedure has to be carriedout, because there are always some gel-to-gel variations, which do notallow direct superimposing of the images. However, in each gel onechannel contains the image of the pooled internal standard. Becausethese standard images originate from the identical sample mix, spotmatching is greatly facilitated. Figure 1.50 shows how the spotvolume ratios are compared across different gels with the help of theinternal standard.
Fig. 1.50: Schematic diagram showing the linking of data fromseveral gels via the internal standard images. Note also the reversedlabeling and the planned randomization of sample application.
With a batch processor a high number of images are evaluated fullyautomatically, which saves hands-on time and keeps user bias to aminimum. The significance of changes and quantitative differencesbetween protein expression levels can easily be checked with severalinbuilt statistical tools: Student’s t-test, one- and two-way ANOVA,and false discovery rate adjustment. Differences in protein expressionlevels of less than 10% can be detected with over 95% confidence.
The unique difference of thisapproach to other programs isthe very high evaluation speedfrom importing the images to areliable result.

1.6 Image Analysis 135
Two examples By using the internal standard concept gel-to-gel var-iations and technical variations of software are considerablydecreased. Alban et al. (2003) have demonstrated the power of incor-porating the pooled internal standard using an experimental model.They generated a model for a time / dose experiment by spiking fourdifferent commercial proteins into E. coli lysate: eight samples havebeen prepared with different levels of the spikes. These samples wereanalyzed with conventional one color 2-D electrophoresis and with 2-D DIGE employing the pooled internal standards. The ability of bothmethods to measure abundance changes and monitor trends in pro-tein expression were compared. Besides the fact that the conventionalmethod is much slower, is more work intensive and needs more gels,the results were inaccurate and the trends were incorrect when com-pared to the defined spiking amounts and the results achieved withthe DIGE concept using the internal standard.In the paper by Friedman et al. (2004) a very good real life example
for the usefulness of the internal standard is presented: In this studyhealthy and tumor tissue of six patients were analyzed with 2-DDIGE. Image analysis and data evaluation of the obtained resultswere performed two times, with and without taking the internal stan-dard in respect. Without the internal standard ten significant differ-ences between the healthy and the tumor samples were found; butusing the internal standard revealed in total 52 significant differ-ences.
Statistical evaluation Some valuable statistical aspects on differencegel analysis can be found in a book chapter on DIGE applications inclinical research (Sitek et al. 2006).
Extended data analysis Although 2-D DIGE in conjunction with thepowerful image analysis program can be applied for rather complexexperiments like multifactorial time/dose studies, there is a limita-tion of the sample number contained in one experiment. Also, whentoo many samples are analyzed in one experiment, one-time eventscan be diluted out of the internal standard. For this reason and inorder to extract as much information as possible from a series ofexperiments some additional multivariate statistical tools have beenmade available:
. Principal component analysis (PCA) reduces thedimensionality of the data, in order to find theunderlying sources of variation. It is a usefultool to find initial groupings of the data anddetect outliers.
. Different clustering techniques reveal proteinswith similar expression profiles to find complex
Alban A, David S, Bjçrkesten L,Andersson C, Sloge E, Lewis S,Currie I. Proteomics 3 (2003)36–44.
Friedman DB, Hill S, Keller JW,Merchant NB, Levy SE, CoffeyRJ, Caprioli RM. Proteomics 4(2004) 793–811.
Sitek B, Scheibe B, Jung K,Schramm A, St�hler K. In:Proteomics in Drug Research(M Hamacher et al. Eds.)Wiley-VCH, Weinheim (2006)pp 33–55.

1 Electrophoretic Techniques136
partners and proteins which function together incertain biological pathways.
. With discriminant analysis proteins are found,which could serve as classifiers as well as diag-nostic or prognostic markers. With unsupervisedclustering unknown samples can be classifiedwithout user bias.
Fig. 1.51: Application of DeCyder�EDA: (A) False-colored representativegel containing three differentiallylabeled samples. Cy2-labeled internalstandard (blue), Cy3-labeled controlNo. 1 (green), and Cy5-labeled iron-starved No. 1 (red) are overlaid. (B)Unsupervised PCA properly groups the16 individual DIGE expression mapsdifferentiated by two principle compo-nents (PC1 and PC2) and demonstrateshigh reproducibility between the repli-cate samples within each group.(C) Composites of DIGE expressionpatterns representing the five proteins
that increase abundance in the presenceof hemin, the 29 Class II proteinfeatures negatively affected by Fur andiron, and the 30 Class III proteinfeatures positively affected by Fur andiron. (D) Unsupervised hierarchicalclustering of 16 individual DIGE expres-sion maps (groups, shown along top)and of individual proteins (shown onthe left), with relative expression valuesfor each protein displayed as a heatmap using a relative scale ranging from–0.5 (green) to +0.5 (red). From: DOI:10.1371/journal.ppat.0020087.g001

1.7 Spot Handling 137
Friedman et al. (2006) have applied these multivariate statistical toolson their study on the influences of Staphylococcus aureus on the cen-tral metabolism of the host. Figure 1.51 shows combined images ofthe 2-D electrophoresis result in false color representation, a PCAgrouping, K-means cluster, and a heat map of unsupervised hierarch-ical clustering.It is very useful, when the images of the results and the 2-D DIGE
experiment can be directly linked. The add-on software packageDeCyder EDA is programmed in such a way that the original experi-mental data are directly available via a hyperlink by clicking on a PCAspot or a band on the heat map.
Spot picking list Because the fluorescent dyes are not visible withthe eye, it is particularly useful to pick the spots from 2-D DIGE gelsaccording the x/y data of the image file.
1.6.3Use of 2-D Electrophoresis Data
Most of the image analysis software includes a web browser to checkresults of other laboratories in the World Wide Web. Because there isno standardization for sample preparation and for running 2-D elec-trophoresis, the spot patterns of different laboratories are not easy tocompare in practice.A protein cannot be identified on the basis of its position in the gel
alone. Identification is only possible by further analysis of the pro-tein, for instance with mass spectrometry. It is furthermore incorrectto conclude that a protein is up or down regulated, just using theinformation from growing or shrinking spot intensity. It is also possi-ble that another protein had changed its pI due to phosphorylation oranother post-translational modification, and is now sitting on top ofthe protein observed.Therefore proteins of interest have to be analyzed further. This is
done mainly with mass spectrometry: The gel plugs containing theprotein are cut out of the gel slab subsequently to image analysis.
1.7Spot Handling
Between image analysis and further analysis the gels can be kept in arefrigerator for several weeks. It is also possible to dry the gels for sto-rage and soak them in water before spot cutting.In high-throughput proteomics it is very important to keep track of
each sample and of each protein to be analyzed. Before the proteins
Friedman DB, Stauff DL, Pish-chany G, Whitwell CW, TorresVJ, Skaar EP.
PLoS Pathog 2 (2006):e87. DOI:10.1371/journal.ppat.0020087
In this way the results can betraced back very easily.

1 Electrophoretic Techniques138
contained in the spots can be analyzed with mass spectrometry a ser-ies of steps have to be performed:
. Spot picking;
. Destaining and washing of the gel plug;
. In-gel digestion;
. Peptide extraction;
. Spotting of peptides on MALDI target slides.
During this procedure mix-ups and contaminations have to be pre-vented to avoid wrong conclusions.In order to keep control over all these steps and parallel processes,
as well as the results, two things are necessary:. Automation;. Workflow database.
Therefore a workstation has been developed, which handles all stepsautomatically. Figure 1.52 shows a schematic drawing of such an inte-grated system. In the fully automated system a robotic arm transportsgels, microtiter plates and target slides between the stations. Theworkstation is controlled by a laboratory workflow system software.This software can control the entire proteome analysis workflowincluding sample tracing.
imageanalysis
2-D Gelfixed on a filmor glass plate
digester
spot picker
gel hotel
spotter
drying ovenroboticarm
incubatorrefrigerator
trypsin
MALDI ToF MS
Fig. 1.52: Schematic drawing of an automated workstation forspot picking, in-gel digestion, and spotting peptides on aMALDI target slide.
The gels are identified with the help of barcodes on the supportfilms and the trays. After spot picking the gel is transported back tothe gel hotel. Many moves are needed for the digestion step. Spot

1.7 Spot Handling 139
picking and spotting are combined to be carried out by the sameinstrument.The laboratory workflow system can be extended to include all
instruments and software involved in the entire proteomics analysis,from sample preparation to mass spectrometry.In most of the laboratories the different steps are performed by
stand-alone instruments.
1.7.1Spot Picking
Picking spots from a gel manually is a very cumbersome job. Thespots, marked in the printout of the image analysis for further analy-sis, have to be found in the gel again and transferred to the correctreaction tube or well of a microtiter plate. Sample tracing is not easyand errors can easily occur. Additionally, contaminations with keratinand other stuff must be avoided. This is a typical work for a laboratoryrobot.Robotic spot pickers are much more reliable for excising selected
spots from the gel slab and transferring them to defined wells ofmicrotiter plates. This automated picking can be controlled with aCCD camera or by transferring the pixel coordinates from image ana-lysis into the machine coordinates of the picker instrument.For the second technique, the gel has to be immobilized on a rigid
support – a glass plate or a plastic film – prior to scanning. Two self-adhesive reference markers, glued onto the support plate or film, arenecessary to enable the machine to recalculate the x/y positions ofthe proteins from the imported picking list. The two markers areautomatically recognized by the camera and used as calculationpoints for the spot positions. This procedure provides a very highpicking efficiency and accuracy, because it utilizes the high resolutionand sensitivity of the scanning device. Furthermore, using the imageanalysis data, also fluorescent, non-stained and radioactive labeledspots can be excised.
& Note: For this approach it is necessary and veryimportant that the image analysis software doesnot modify the raw data.
Figure 1.53 shows the assembly of a robotic spot picker workingaccording this concept. The gel is placed into a liquid-containing trayto prevent drying during the picking process. The glass plate or filmsupport is fixed at the bottom of the tray.A picking file has to be created to assign the spot position to the
respective microtiter plate well.
The camera in this system hasonly the function to find thepositions of the two referencemarkers.

1 Electrophoretic Techniques140
Fig. 1.53: Schematic drawing of an automatic spot picker, whichcuts the spots according to an imported picking list and transfersthe gel plugs to microtiter plates.
The picking head is coated with a hydrophobic layer to prevent gelplugs sticking to it and protein cross-contamination. The gel plugsare cut out by punching down to the backing plate or film, followedby two side movements to shear the plug off the backing. Betweeneach spot removal the cutting head cleans itself in a rinsing station toavoid cross contamination of proteins.Such an instrument can also be operated in a semi-automated way
in order to cut out a few spots with eye control. In this case the cam-era is also employed to find the spot to be removed from the gel.
1.7.1.1 Picking from Non-backed Gels
In practice it can happen that such an automated spot picker shouldalso be used for picking from non-backed gels. In order to preventshrinking or swelling of the gel it has to be stabilized during scan-ning and spot picking. This can be done with a little accessory kit andCellophane� film following a procedure, which has been developedby Burghardt Scheibe: A cellophane sheet is soaked in water andclamped into a set of drying frames. The upper cellophane side isdried with lint-free tissue paper and the reference markers are stuckto the cellophane. The frame-cellophane assembly is turned upsidedown to form a tray. The gel slab is soaked in water to swell as muchas possible and placed onto the cellophane. The gel is allowed to dryon the cellophane for about 15 minutes. Then the gel is scanned, theimage is evaluated, and a picking list is created. When the gel–cello-phane assembly is covered with a glass plate, the gel will not dry andthe assembly can be stored for several hours. A dark plastic plate isplaced into the spot picker instead of the tray as shown in Figure1.54. The camera is recalibrated, because of the lower picking level.
GE Healthcare User Manual:Ettan Spot Picker NonbackedGel Kit. GE Healthcare LifeSciences (2003) 11-0002-69.

1.7 Spot Handling 141
The frame with the gel is placed on the plastic plate and the spots arepicked like from a film- or glass-supported gel. In order to preventcurling up of the gel edges, every half hour a few milliliters of waterneed to be pipetted on the gel. A more detailed instruction can befound in the GE Healthcare User Manual.
Fig. 1.54: Schematic drawing how to pick from unbacked gelswith an automatic spot picker.
1.7.2Protein Cleavage
As the mass spectrometers become ever more sensitive, deliveringthe sample of interest to the mass spectrometer in a manner whichtakes advantage of the innate high sensitivity of the mass spectro-meter will become increasingly crucial.The most commonly used strategies for protein identification by
mass spectrometry require the protein of interest to be cleaved, pro-teolytically or chemically, into its constituent peptides (assembly ofamino acids, see Table 1.7). In the pathway highlighted in this bookprotein cleavage is performed by proteolysis after the protein hasbeen separated by two-dimensional gel electrophoresis. This has beensuccessfully applied to a wide range of proteome projects such as the
Langen H. Takcs B, Evers S,Berndt P, Lahm HW, Wipf B,Gray C, Fountoulakis M.Electrophoresis 21 (2000)411–429.

1 Electrophoretic Techniques142
analysis of the Haemophilus influenzae proteome (Langen et al. 2000).Other methods have described the use of proteolysis without separa-tion of the proteins by 2-D electrophoresis (see Section 2).
Tab. 1.7: 6 Twenty common amino acids detailing structure, molecular weights, symbols andcommon modifications.
Residue
(3 & 1 letter symbols)
Residue structure
(R = side-chain)
Average
mass
Monoisotopic
mass
Common modifications
(and nominal molecular
weight additions)
Glycine(Gly & G)
CHOC NH
H
57.05 57.02146
Alanine(Ala & A)
CHOC NH
CH3
71.08 71.03711
Serine(Ser & S)
CHOC NH
CH2OH
87.08 87.03203 Phosphorylation (80)Glysosylationa
Proline(Pro & P)
CH NOC 97.12 97.05276
Valine(Val & V)
CHOC NH
CH2CH
2CH
3
99.13 99.06841
Threonine(Thr & T)
CHOC NH
CH(OH)CH3
101.11 101.04768 Phosphorylation (80)Glysosylation (O-linkedsugars)
Cysteine(Cys & C)
CH NH
CH2SH
OC 103.15 103.00919 Carbamidomethylb (57)S-propionamidec (71)S-pyridylethyld (105)
Leucine(Leu & L)
CHOC NH
CH2CH(CH
3)2
113.16 113.08406
Isoleucine(Ile & L)
CHOC NH
CH(CH3)CH
2CH
3
113.16 113.08406

1.7 Spot Handling 143
Residue
(3 & 1 letter symbols)
Residue structure
(R = side-chain)
Average
mass
Monoisotopic
mass
Common modifications
(and nominal molecular
weight additions)
Asparagine(Asn & N)
CHOC NH
CH2C
O
NH2
114.10 114.04293 N-linked glycosylatione
(Sequon Asn-X-Ser/Thr)
Aspartic acid(Asp & D)
CHOC NH
CH2C
O
OH
115.09 115.02694 Esterification, methylesterf (14)
Glutamine(Gln & Q)
CHOC NH
CH2CH
2C
O
NH
128.13 128.05858
Lysine(Lys & K)
CHOC NH
(CH2)4NH
2
128.17 128.09496 Acetylationg (42)
Homo-arginine (42)
Glutamic acid(Glu & E)
CHOC NH
CH2CH
2C
O
OH
129.16 129.04259 Esterification, methylesterf (14)
Methionine(Met & M)
CHOC NH
CH2CH
2SCH
3
131.20 131.04049 Oxidationh (16)
Histidine(His & H)
CHOC NH
CH2N
H
N
137.14 137.05891
Phenylalanine(Phe & F)
CHOC NH
CH2
147.18 147.06841
Arginine(Arg & R)
CHOC NH
(CH2)3HN
C NHNH2
156.19 156.10111

1 Electrophoretic Techniques144
Residue
(3 & 1 letter symbols)
Residue structure
(R = side-chain)
Average
mass
Monoisotopic
mass
Common modifications
(and nominal molecular
weight additions)
Tyrosine(Tyr & Y)
CHOC NH
OH
CH2
163.18 163.06333 Phosphorylation (80)
Tryptophan(Trp & W)
CHOC NH
CH2
NH
186.21 186.07931 Oxidation (16)
Key:a O-linked glycosylation – a range of sugars can link to Ser/Thr, including pentoses (C5H10O5),hexoses (C6H12O6) and N-acetylhexosamines
b Modification of cysteine residue with iodacetamide
cModification of cysteine residue with acrylamide monomer
d Modification of cysteine residue with 4-vinylpyridine
e N-linked glycosylation – a pentasaccharide core linked to the Asn residue, with a variety ofstructures extending from this core
f Also esterification of the C-terminal carboxyl group of each peptide
g Also acetylation of the a-amino group at the n-terminus of each peptide
h Oxidation of methionine to the sulfoxide and the sulfone
1.7.2.1 Protein Cleavage – Proteolysis
Proteolysis has become the routine method of protein cleavage usedin proteomics with a range of enzymes available (see Table 1.8). Pro-teolysis offers several practical advantages; including high specificity,minimal side reactions and good cleavage efficiency. Important prac-tical considerations for protein digestion include the digestion bufferand its pH, the enzyme:substrate ratio, temperature and time.Of all the enzymes available, the most commonly used enzyme is
trypsin. Trypsin has well defined specificity, yields tryptic peptides ofan appropriate size for efficient MS analysis and locates the basic resi-dues at the terminus of the peptide. Though trypsin is commonlyused there may be occasions where digestion with an alternativeenzyme will be advantageous, specifically post-translational studiessuch as phosphorylation analysis. The specific site of phosphorylationmay not reside on a tryptic fragment that is appropriate size for effi-cient MS analysis.
Restricting the basic residues tothe c-terminus enables efficientpeptide fragmentation duringan MS/MS product ion experi-ment, see Section 3.3.4.
Patterson S, Aebersold R. Elec-trophoresis 16 (1995) 1791–1814.
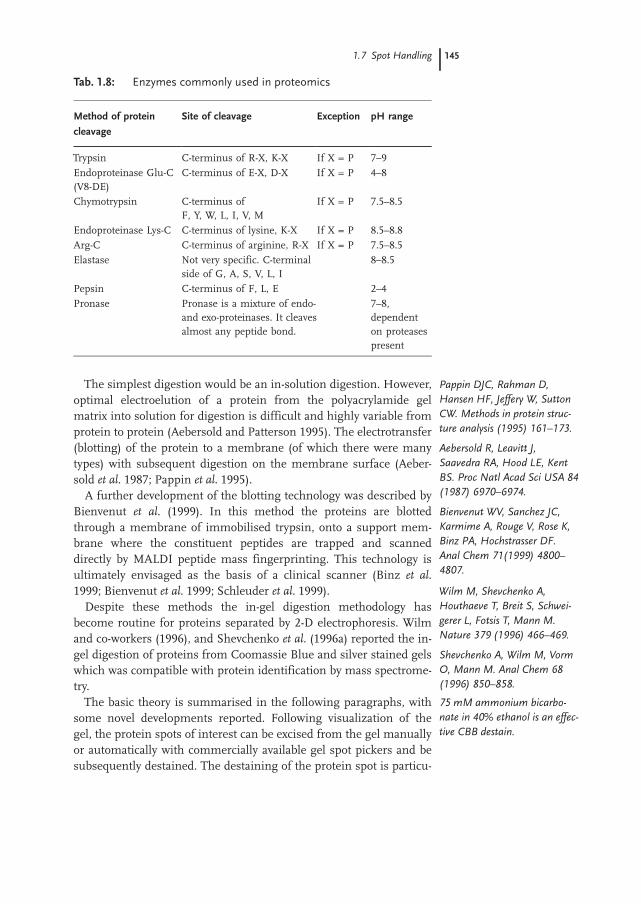
1.7 Spot Handling 145
Tab. 1.8: Enzymes commonly used in proteomics
Method of protein
cleavage
Site of cleavage Exception pH range
Trypsin C-terminus of R-X, K-X If X = P 7–9
Endoproteinase Glu-C(V8-DE)
C-terminus of E-X, D-X If X = P 4–8
Chymotrypsin C-terminus ofF, Y, W, L, I, V, M
If X = P 7.5–8.5
Endoproteinase Lys-C C-terminus of lysine, K-X If X = P 8.5–8.8
Arg-C C-terminus of arginine, R-X If X = P 7.5–8.5
Elastase Not very specific. C-terminalside of G, A, S, V, L, I
8–8.5
Pepsin C-terminus of F, L, E 2–4
Pronase Pronase is a mixture of endo-and exo-proteinases. It cleavesalmost any peptide bond.
7–8,dependenton proteasespresent
The simplest digestion would be an in-solution digestion. However,optimal electroelution of a protein from the polyacrylamide gelmatrix into solution for digestion is difficult and highly variable fromprotein to protein (Aebersold and Patterson 1995). The electrotransfer(blotting) of the protein to a membrane (of which there were manytypes) with subsequent digestion on the membrane surface (Aeber-sold et al. 1987; Pappin et al. 1995).A further development of the blotting technology was described by
Bienvenut et al. (1999). In this method the proteins are blottedthrough a membrane of immobilised trypsin, onto a support mem-brane where the constituent peptides are trapped and scanneddirectly by MALDI peptide mass fingerprinting. This technology isultimately envisaged as the basis of a clinical scanner (Binz et al.1999; Bienvenut et al. 1999; Schleuder et al. 1999).Despite these methods the in-gel digestion methodology has
become routine for proteins separated by 2-D electrophoresis. Wilmand co-workers (1996), and Shevchenko et al. (1996a) reported the in-gel digestion of proteins from Coomassie Blue and silver stained gelswhich was compatible with protein identification by mass spectrome-try.The basic theory is summarised in the following paragraphs, with
some novel developments reported. Following visualization of thegel, the protein spots of interest can be excised from the gel manuallyor automatically with commercially available gel spot pickers and besubsequently destained. The destaining of the protein spot is particu-
Pappin DJC, Rahman D,Hansen HF, Jeffery W, SuttonCW. Methods in protein struc-ture analysis (1995) 161–173.
Aebersold R, Leavitt J,Saavedra RA, Hood LE, KentBS. Proc Natl Acad Sci USA 84(1987) 6970–6974.
Bienvenut WV, Sanchez JC,Karmime A, Rouge V, Rose K,Binz PA, Hochstrasser DF.Anal Chem 71(1999) 4800–4807.
Wilm M, Shevchenko A,Houthaeve T, Breit S, Schwei-gerer L, Fotsis T, Mann M.Nature 379 (1996) 466–469.
Shevchenko A, Wilm M, VormO, Mann M. Anal Chem 68(1996) 850–858.
75 mM ammonium bicarbo-nate in 40% ethanol is an effec-tive CBB destain.

1 Electrophoretic Techniques146
larly important. For instance, Coomassie brilliant blue binds to pro-teins via ionic and hydrophobic interactions. The ionic interactionsbetween the sulfonic acid group of the CBB and the basic residues ofproteins (arginine and lysine residues) affect the trypsin digestionefficiency, and the presence of CBB in the final sample can hamperMS performance. This destaining step also allows the removal ofunwanted detergents such as SDS from the digestion procedure andthe MS analysis (in which detergents ionize very efficiently).The presence of glutardialdehyde in many silver stain procedures
precluded the stained protein from subsequent analysis, as the glutar-dialdehyde reacted with free amino groups in the protein. However,Shevchenko et al. (1996) demonstrated that this component could beomitted from the staining procedure and still realize high sensitivevisualization and successful MS analysis; Yan et al. (2000) also pub-lished a silver stain method compatible with mass spectrometry.The residual silver ions from the silver stain procedure can also be
removed using the method reported by Gharahdaghi et al. (1999).At this stage many methods have reported the reduction and alkyla-
tion of cysteine residues contained within the protein embedded inthe gel piece (Rosenfield et al. 1992; Moritz et al. 1996; Shevchenkoet al. 1996b; Gevaert and Vandekerckhove 2000). The derivatizationcomprises two steps: reduction of the disulfide bonds and alkylationof the subsequent thiol side chain of the cysteine. This step isincluded to improve the detection of cysteine containing peptides andhence improve the potential protein coverage. However, the cysteinethiol group can become modified as it passes through the PAGE gelwith free acrylamide monomer. Sechi and Chait (1998) noted that themethods referred to above do not generally label the cysteine residuespost electrophoresis with the same mass addition that occurs withinthe gel, hence potentially producing a heterogeneous derivatistion ofcysteine residues making protein identification complicated, as thecysteine residues have effectively been labelled with differentreagents.However, the 2D-electrophoresis method described in this book
includes a quantitative reduction and alkylation derivatization step ofthe cysteine residues prior to the second dimension SDS-PAGE. Ifthe procedure is repeated post-electrophoresis and prior to digestion,then the same reagent should be used.
Yan JX, Wait R, Berkelman T,Harry RA, Westbrook JA,Wheeler WH, Dunn MJ. Elec-trophoresis 21 (2000) 3666–3672.
Gharahdaghi F, Weinberg CR,Meagher DA, Imai BS, MischeSM. Electrophoresis 20 (1999)601–605.
Additionally, the negative zinc/imadazol stain is compatiblewith mass spectrometricanalysis.
Rosenfield J, Capdevielle J,Guillemot JC, Ferrara P. AnalBiochem 203 (1992) 173–179.
Shevchenko A, Jensen ON,Podtelejnikov A, Sagliocco F,Wilm M, Vorm O, MortensenP, Shevchenko A, Boucherie H,Mann M. Proc Natl Acad SciUSA 93 (1996) 1440–1445.
Moritz RL, Eddes JS, Reid GE,Simpson RJ. Electrophoresis 17(1996) 907–917.
Gevaert K, Vandekerckhove J.Electrophoresis 21 (2000)1145–1154.
Sechi S, Chait BT. Anal Chem70 (1998) 5150–5158.
The cysteine residues becomemodified with acrylamidemonomer to form the b-propio-namide derivative, a massdifference of 71 Da. The modi-fication of the cysteine withiodoacetamide (a mass differ-ence of 57 Da) and 4-vinylpyri-dine, a mass difference of 105is generally performed (seeTable 1.7).

1.7 Spot Handling 147
The in-gel digestion of the embedded protein can be performedeither manually or automatically. Staudenmann et al. (1998) reportedthat the digestion of proteins above 10 pmol was routine, giving fewproblems. However, once the concentration dropped below the 5pmol level the number and yield of the peptides drops significantly,suggesting sample loss onto vessel surfaces and digestion efficiencyas potential reasons for the disparity.Some major considerations involved with in-gel digestion that ulti-
mately affect MS performance may include:. Digestion efficiency:– Substrate-enzyme kinetics;– Delivering the enyme to the protein whilstminimizing autolysis.
. Extraction efficiency of peptides from the polya-crylamide gel matrix after digestion;
. Sample handling;
. Losses during the digestion procedure, for exam-ple onto the walls of vessels;
. Presence of detergents or staining agent;
. Minimizing contamination with other proteins,such as keratin.
Before addition of the enzyme to the gel plug, the gel plug (contain-ing the embedded protein) is dehydrated using successive washes ofacetonitrile and subsequent dried under vacuum. The dehydration ofthe gel plug to a completely dry dust-like material will enable efficientuptake of the enzyme when the gel plug is rehydrated. A sufficientvolume of the enzyme in the digestion buffer (volatile buffer at theoptimum pH for enzyme activity) is applied to rehydrate the gel plug.The enzyme has to passively diffuse through the gel matrix and digestthe protein before autolysis has a significant effect. The rehydrationstep of the digestion procedure can be performed on ice (Shevchenkoet al. 1996) presumably to minimize autolysis of the trypsin whilst itdiffuses through the gel during the rehydration step. Additionally, themodified form of the enzyme can be purchased to minimize autoly-sis.Upon completion of the digest reaction, between 3 and 24 hours,
the resultant digested peptides need to be extracted from the gelmatrix. To enhance peptide recovery, the inclusion of detergents suchas SDS, Tween 20, Triton X-100 or NP-40 in the extraction buffer hasbeen reported. However, the presence of detergent was detrimental toMS analysis, both for matrix-assisted laser desorption ionization andelectrospray ionization (see Section 3.1). Instead, high peptide recov-ery can be obtained from the gel matrix by passive diffusion using
Staudenmann W, Dainese-Hatt P, Hoving S, Lehman A,Kertesz M, James P. Electro-phoresis 19 (1998) 901–908.
Shevchenko A, Jensen ON,Podtelejnikov A, Sagliocco F,Wilm M, Vorm O, MortensenP, Shevchenko A, Boucherie H,Mann M. Proc Natl Acad SciUSA 93 (1996) 1440–1445.

1 Electrophoretic Techniques148
acidic and organic solvents, namely solutions of trifluoroacetic acidand acetonitrile.Once extracted the peptides have to be delivered to the mass spec-
trometer in a form, which enables optimal MS performance. Asdescribed in Section 3.1 though MALDI and ESI MS are highlyapplicable to the analysis of biomolecules they are considerably differ-ent techniques, requiring different sample preparation approaches.MALDI involves the analysis of the sample from a remote, solid sur-face after co-crystallization with the matrix, whilst ESI is a liquid inletsystem requiring the sample to be presented in the liquid state. ThusESI is effectively coupled with separation techniques such as capillaryelectrophoresis and particularly high performance liquid chromato-graphy (HPLC).Unfortunately, the extracted peptides tend to be in a large volume
after extraction (>50 mL) and this is not ideal for MALDI or ESI analy-sis, especially if the sample is low in abundance. Hence the sampleneeds to be concentrated. However, extraction of the digested pep-tides also extracts unwanted material from the gel which may hamperMS ionization and reduce MS performance.. Simply concentratingthe gel extracts is insufficient, as both the contaminants and analytewill be concentrated. Also, concentrating the sample by drying invacuum or by lyophilization can be problematic because of irrecover-able sample loss on the walls of the digestion vessel; this is particu-larly relevant for high sensitivity analysis.An efficient approach to removing the salts, buffers and unwanted
contaminants from the digestion process is to use reversed phasechromatography (RP-HPLC) off line prior to MALDI MS. In such amethod using a RP 300 mm � 15 cm column, the peptides of interestcan generally be eluted into two or three fractions in a concentratedvolume (~4–5 mL) for subsequent MALDI MS analysis. In addition,the eluate, if eluted with the correct solvent, is ideally suited for ESIMS analysis.A quicker solution for both MALDI and ESI analysis can be
achieved by binding the digested peptides to small amounts ofreversed phase resin packed into gel-loader pipette tips in a micro-scale purification. This not only has the desired effect of desalting,but also concentrates the sample in a suitable volume for the MALDIanalysis (Kussmann et al. 1997) Similarly, this approach can beapplied to on-target desalting, a method described by Gevaert et al.(1998).Stensballe and Jensen (2001) described a methodology where the
digestion and MALDI analysis was performed on the MALDI target,minimizing sample manipulation and losses.Alternatively a small aliquot (<0.5 mL) can be spotted directly from
the digestion mixture onto a pre-formed layer of matrix (a-cyano-4-
Kussmann M, Nordhoff E,Rahbek-Nielsen H, Haebel S,Rossel-Larsen M, Jakobsen L,Gobom J, Mirgorodskaya E,Kroll Kristensen A, Palm L,Roepstorff P. J Mass Spectrom32 (1997) 593–601.
Gevaert K, De Mol H,Sklyarova T, Houthaeye T,Vandekerckhove J. Electrophor-esis 19 (1998) 909–917.
Stensballe A, Jensen ON.Proteomics 1 (2001) 955–966.
Vorm O, Roepstorff P, MannM. Anal Chem 66 (1994)3281–3287.

1.7 Spot Handling 149
hydroxy-cinnamic acid) and nitrocellulose. After the sample hasdried, the salts from the digestion reaction can be effectively removedby washing with 0.1%TFA (Vorm et al. 1994; Jensen et al. 1996).
1.7.2.2 Protein Cleavage – Chemical Methods
Chemical methods of protein cleavage are complementary to proteo-lysis, though not used as commonly. They are often used for specificapplications where no enzyme is available or proteolysis is not appro-priate, such as cyanogen bromide cleavage of insoluble or membraneproteins. In this instance, a chemical fragmentation in an organic sol-vent capable of solubilizing the proteins is an attractive alternative(Wasburn et al. 2001). Cyanogen bromide cleaves specifically atmethionine residues yielding relatively large peptides. Similarly largepeptides can be expected if cleavage at tryptophan residues is per-formed with 2(2-nitrophenylsulfonyl-3-indolenine) (BNPS-skatole).Acid hydrolysis of proteins with a mild formic acid solution has
been reported to be an effective method. The formic acid solution is agood solvent for a whole range of proteins, and yields a specific clea-vage at aspartyl residues.See Table 1.9 for further examples of chemical methods of protein
cleavage
Tab. 1.9: Chemical reagents for protein cleavage
Chemical reagent Site of cleavage
Cyanogen bromide C-terminus of methionine
Acid hydrolysis Cleavage at aspartyl residues
Hydroxylamine Cleavage of asparagine–glycine bonds
BNPS-skatole Cleavage at tryptophan
Jensen ON, Podtelejnikov A,Mann M. Rapid CommunMass Spectrom 10 (1996)1371–1378.
Washburn MP, Wolters D,Yates JR. Nat Biotechnol 19(2001) 242–247.
Li A, Sowder RC, HendersonLE, Moore SP, Garfinkel DJand Fisher RJ. Anal Chem 73(2001) 5395–5402.


151
2Liquid Chromatography Techniques
This chapter gives inspiration, hints and ideas on how to tackle thechallenges in proteomics by applying the tools of liquid chromatogra-phy (LC), a complementary approach to the already well establishedgel-based workflow.It is obvious that the capabilities of liquid chromatography are
investigated (Link et al. 1999). There is evidence that LC-based meth-ods can close some of the gaps and deliver supplementary informa-tion if we state that 2D electrophoresis is the established standardmethod. However, we have always to keep in mind that proteinseparation is not just a tool by itself rather than an important inter-mediate step towards protein identification and characterization bymass spectrometry.
2.1Basic Principles of Important Liquid Chromatography Techniques
Proteins are separated using chromatography techniques accordingto differences in their specific properties, as shown in Table 2.1. Thefollowing chapter is based on information for protein purificationand adapted to the requirements of protein pre-fractionation in pro-teome analysis.
Tab. 2.1: Separation principles in protein chromatography.
Property Technique
Charge Ion exchange chromatography,chromatofocusing
Size Gel filtration
Hydrophobicity Reversed phase chromatography,hydrophobic interaction chromatography
Biorecognition (ligand specificity) Affinity chromatography
Proteomics in Practice. A Guide to Successful Experimental Design 2nd Ed.Reiner Westermeier, Tom Naven, and Hans-Rudolf HçpkerCopyright � 2008 WILEY-VCH Verlag GmbH & Co. KGaA, WeinheimISBN: 978-3-527-31941-1
In order to overcome some ofthe existing limitations of 2Delectrophoresis the need forcomplementary approachesbecomes apparent.
Link AJ, Eng J, Schieltz DM,Carmack E, Mize GJ, MorrisDR, Garvik BM, Yates JR III.Nature Biotech 17 (1999)676–682.
GE Healthacre “ProteinSeparations’ Handbook Collec-tion”

2 Liquid Chromatography Techniques152
Knowing that there exist numerous methods for protein separa-tion, the following chapters cover only the most relevant LC techni-ques for protein pre-fractionation.Besides personal preferences for one or the other chromatography
technique there are more objective selection criteria available (seeTable 2.2). It is not only important to look at the performance of a sin-gle technique, but also it is even more important to plan and considerhow to best interconnect the methods in order to bypass avoidableintermediate steps that bare the risk of sample losses that lead to anunwanted reduction in protein recovery.
Tab. 2.2: Selection criteria of LC methods for protein pre-fractionationin proteomics.
IEX RPC AC GF
Enrichment High High Very high Dilution
Loadability Very high Medium Very high Low
Peak capacity Medium High N/A Low
Desalting capability N/A Yes N/A Yes
Raw sample compatibility Very good Limited Excellent Good
Running costs (column/ eluents) High/low Moderate/high
Low/low toexcessive/high
High/low
Volatile buffer No Yes No Possible
Unless there are meaningful affinity columns or media available(e.g. high-abundancy protein depletion for serum, selective glyco- orphospho-protein enrichment) ion exchange chromatography is thefirst choice to apply the initial sample.No matter what sample concentration, volume or amount, IEX
works perfectly at any scale. Columns in all different dimensionspacked with the same identical material are available to enable seam-less up- or down-scalability. Diluted samples are efficiently concen-trated and separated with high resolution and reasonable peak capa-city. The method can easily be performed under native or denaturingand/or reducing conditions, depending on the requirements of thesample.
& In proteome analysis, the preservation ofbiological activity could be of minor importance,as long as recovery is high.
Due to its triple functionality RPC concentrates diluted samples andefficiently releases samples from salt, urea or other additives prior to
Originally developed for thepurpose of protein purification,these methods are also of para-mount importance to pre-frac-tionate and de-complexifycrude samples in proteomeanalysis.
Ion exchange chromatographyis the first choice.
Columns for protein separa-tions are somewhat cost inten-sive, but with a favorable lifetime if handled with care.

2.1 Basic Principles of Important Liquid Chromatography Techniques 153
separating the proteins at highest possible resolution and is thereforean excellent consecutive step for all salt containing fractions. Further-more, due to the use of volatile solvents RPC fractions can directly beevaporated or lyophilized, prior to tryptic digestion, in the same vesselor microtiter plate without unnecessary sample transfer steps.Affinity chromatography is one of the most selective and specific
separation techniques. Numerous ligands, both commercial and self-made, are available to isolate or remove a variety of proteins and pro-tein classes. Dealing with this subject in detail would go beyond theaim of this book. Some dedicated proteomics applications, as theenrichment of phospho- and glyco-proteins or peptides as well as thedepletion of high-abundant plasma proteins are described below.Gel filtration is probably the most simple to perform LC technique.
But, due to its low loadability, low resolution and peak capacity, incombination with its diluting rather than concentrating character it isnot one of the first methods to consider in proteome analysis. Never-theless, under special conditions it might be worth to consider.
2.1.1Ion Exchange Chromatography
Ion exchange chromatography (IEX) for the separation of proteinswas introduced in the 1960s and continues to play a major role in theseparation of proteins. Today, IEX is one of the most frequently usedtechniques for the separation of proteins and peptides offering highresolution and loading capacity. The technique is capable of separat-ing molecular species that have only minor differences in theircharge properties, for example two proteins differing by one chargedamino acid. These features make IEX well suited for concentration,enrichment, isolation and fractionation.This chapter provides a general introduction to the theoretical prin-
ciples that underlie every ion exchange separation. An understandingof these principles will enable the separation power of ion exchangechromatography to be fully appreciated.Practical aspects of performing IEX separations related to proteome
analysis are covered in Chapter 2.3.
2.1.1.1 Charge on Proteins
The charge on proteins arises from some of the amino acid side-chains, as well as the carboxyl and amino termini, bound ions, andsome prosthetic groups.The charge on amino acid side-chains depends on the pH of the
solution and the pKA of the side-chains. It is also affected by themicroenvironment around a side-chain. We assume the following:
IEX is used from micro-scaleseparations and analysisthrough to fractionation ofmicrograms, milligrams, gramsof sample and more.
IEX separates molecules on thebasis of differences in their netsurface charge.

2 Liquid Chromatography Techniques154
pKA values for ionizable groups on the protein and that the side-chains will have the same pKA values regardless of their environmentwithin the protein (Table 2.3). We also assume that the separation isbased on the total net charge of the protein. Therefore, a protein witha charge of –15 will bind more tightly to an anion exchanger than aprotein with a charge of –10.
Tab. 2.3: pKA values of charged amino acids, C- and N-terminus.
Group pKA
Acids
Carboxyl terminus 3.1
Aspartate 4.4
Glutamate 4.4
Cysteine 8.5
Tyrosine 10.0
Bases
Amino terminus 8.0
Lysine 10.0
Arginine 12.0
Histidine 6.5
The charge on these proteins can be calculated. In brief, when thepH is less than the pKA of a group, the protonated form of the grouppredominates. This leaves the acidic side-chains with a chargeapproaching 0 and the basic side-chains with a charge approaching alimiting value of +1. Conversely, when the pH is greater than the pKA
of a group, the deprotonated form predominates, giving acidic side-chains a charge approaching –1 and basic side-chains a chargeapproaching 0. The charge on the protein is the sum of the chargeson the individual amino acid side-chains.Molecules vary considerably in their charge properties and will
exhibit different degrees of interaction with charged chromatographymedia according to differences in their overall charge, charge densityand surface charge distribution. The charged groups within a mole-cule that contribute to the net surface charge possess different pKA
values depending on their structure and chemical microenviron-ment.Since all molecules with ionizable groups can be titrated, their net
surface charge is highly pH dependent. In the case of proteins, whichare built up of many different amino acids, containing weak acidicand basic groups.Each protein has its own unique net charge versus pH relationship
which can be visualized as a titration curve. Their net surface charge

2.1 Basic Principles of Important Liquid Chromatography Techniques 155
will change gradually as the pH of the environment changes as pro-teins are amphoteric. The titration curve reflects how the overall netcharge of the protein changes according to the pH of the surround-ings. Figure 2.1 illustrates some theoretical protein titration curves(these curves can be generated using an isoelectric focusing gel, butin practice titration curves are rarely used).
Fig. 2.1: Theoretical protein titration curves, showinghow net surface charge varies with pH.
IEX chromatography takes advantage of the fact that the relationshipbetween net surface charge and pH is unique for a specific protein.In an IEX separation reversible interactions between charged mole-cules and oppositely charged IEX media are controlled in order tofavor binding or elution of specific molecules and achieve separation.However, at a pH above its isoelectric point, a protein will bind to a
positively charged medium (anion exchanger) and, at a pH below itspI to a negatively charged medium (cation exchanger). In addition tothe ion exchange interaction, other types of binding may occur. Theseeffects are mainly due to van der Waals forces and non-polar interac-tions, which occurs frequently with hydrophobic proteins and pep-tides.
2.1.1.2 Steps in an IEX Separation
An IEX column comprises a matrix of ideally spherical particles sub-stituted with ionic groups that are negatively (cationic) or positively(anionic) charged (see Figure 2.2).The matrix is usually porous to give a high internal surface area. In
small- and micro-scale separations also non-porous media are used.The medium is filled into a column to form a packed bed. The bed
is then equilibrated with buffer which fills the pores of the matrixand the space in between the particles.
A protein that has no netcharge at a pH equivalent to itsisoelectric point (pI) will notinteract with a chargedmedium.

2 Liquid Chromatography Techniques156
Fig. 2.2: Principles of an anion exchange separation.

2.1 Basic Principles of Important Liquid Chromatography Techniques 157
The pH and ionic strength as well as the other composition of theequilibration buffer are selected to ensure that, when sample isloaded, proteins of interest bind to the column. The proteins whichbind are effectively concentrated onto the column while proteins thatdo not have the correct surface charge pass through the column withthe flow of buffer, eluting during or just after sample application.
& Note: The condition of the sample is veryimportant in order to achieve the most effectivehigh-resolution separations and make the mostof the high loading capacity. Ideally, samplesshould be in the same condition as the startingbuffer.
When the entire sample has been loaded and the column washed sothat all non-binding proteins have passed through the column (i.e.the UV signal has returned to baseline), conditions are altered inorder to elute the bound proteins.As ionic strength increases, the salt ions (typically Na+ or Cl–) com-
pete with the bound proteins for charges on the surface of the med-ium and one or more of the bound species begin to elute and movedown the column. The proteins with the lowest net charge at theselected pH will be the first ones eluted from the column as ionicstrength increases. Similarly, the proteins with the highest charge ata certain pH will be most strongly retained and will be eluted last.By controlling changes in ionic strength using different forms of
gradient, proteins are eluted differentially in a purified, concentratedform. A wash step with very high ionic strength buffer removes mosttightly bound proteins and impurities at the end of an elution. Thecolumn is then re-equilibrated in start buffer before applying anothersample in the next run.
2.1.1.3 Selectivity
Good selectivity (the degree of separation between peaks) is a moreimportant factor than high efficiency in determining resolution (seeFigure 2.3) and depends not only on the nature and number of thefunctional groups on the matrix, but also on the experimental condi-tions, such as pH (influencing the protein charge), ionic strength andelution conditions. It is the ease and predictability with which theseexperimental conditions can be manipulated, when using a suitablydesigned chromatography medium, which gives IEX the potential ofextremely high resolution.
Most frequently, proteins areeluted by increasing the ionicstrength (salt concentration) ofthe buffer.
The higher the net charge of theprotein, the higher the ionicstrength that is needed forelution.

2 Liquid Chromatography Techniques158
Fig. 2.3: Effect of selectivity and efficiency on resolution.From GE Healthcare handbook: “Hydrophobic Interactionand Reversed Phase Chromatography. Principles and Methods”.
2.1.1.4 Selectivity and pH
In protein separation good selectivity is achieved by performing IEXseparations at pH values carefully selected to maximize the differ-ences in net charge of the components of interest. Optimum selectiv-ity can be expected at a pH where there is maximum separationbetween the titration curves for the individual proteins (i.e. the differ-ence in net charges between the species is greatest) and when usingan ion exchanger with a charge opposite to the charge of the proteinsat the particular pH. The order in which proteins are eluted cannotalways be predicted with absolute certainty since a titration curve(produced in practice by measuring electrophoretic mobility in a gel)reflects the total net charge on a protein and IEX chromatographydepends on the net charge on the surface of the protein.For the purpose of protein pre-fractionation where in principle all
proteins must be isolated, which in practice is impossible, a pH isselected with regard to protein stability and recovery for all, or at leastthe majority of the proteins.
2.1.1.5 Selectivity and Elution
The figures below illustrate the most common forms of IEX separa-tion in which proteins are eluted by increasing the ionic strength of abuffer (typically with NaCl) using linear gradient or step elution. TheUV absorbance and conductivity traces show the elution of proteinpeaks and the changes in salt concentration, respectively, during elu-tion.
A pH interval of plus/minus1.5 pH unit apart from thephysiological pH seems to bereasonable.

2.1 Basic Principles of Important Liquid Chromatography Techniques 159
Buffer volumes used during sample application, elution, washingand re-equilibration are expressed in column volumes, for example 5CV=5 mL for a column with a 1 mL bed volume.Using column volumes to describe a separation profile facilitates
method development and transfer of methods to columns of differentdimensions when scaling-up or scaling-down.Gradient elution is used when starting with an unknown sample
(as many components as possible are bound to the column and eluteddifferentially to see a total protein profile) and for high-resolutionseparation that are required in protein pre-fractionation.
2.1.1.6 Components of Ion Exchange Media
Chromatography media for ion exchange are made from porous ornon-porous matrices, chosen for their physical stability, their chemi-cal resistance to stringent cleaning conditions and their low level ofnon-specific interaction. The matrices are substituted with functionalgroups that determine the charge of the medium.
Matrix. High porosity offers a large surface area coveredby charged groups and so ensures a high bind-ing capacity. High porosity is also an advantagewhen separating large proteins. Non-porousmatrices are preferable for extremely high-reso-lution separations when diffusion effects mustbe kept to a minimum.
. An inert matrix minimizes non-specific interac-tions with sample components.
. High physical stability ensures that the volumeof the packed medium remains constant despiteextreme changes in salt concentration or pH,thus improving reproducibility and avoiding theneed to repack columns.
. High physical stability and uniformity of particlesize facilitate high flow rates, particularly duringcleaning or re-equilibration steps, to improvethroughput and productivity.
. High chemical stability ensures that the matrixcan be cleaned using stringent cleaning solu-tions if required.
. Modern IEX media use polymer-based matricesto fulfill not only the requirements for highbinding capacity, chemical and physical stability,

2 Liquid Chromatography Techniques160
but to generate media with suitable particle sizesfor a range of applications (Table 2.4).
Tab. 2.4: Ion exchange matrices.
Product Form Mean particle size
MiniBeads� Polystyrene/divinyl benzene 3 mmMonoBeads� Polystyrene/divinyl benzene 10 mmSOURCE� 15 Polystyrene/divinyl benzene 15 mm
MiniBeads is a matrix made from polystyrene, with divinyl benzeneas cross-linker, to produce highly spherical (monodispersed), verysmall (3 mm), non-porous particles that facilitate micro-preparative oranalytical separations when extremely high resolution is more impor-tant than high binding capacity or high flow rates.MonoBeads and SOURCE are matrices made from polystyrene
with divinyl benzene to produce highly spherical (monodispersed),small (10–15 mm), porous particles
Functional groups The functional groups substituted onto a chroma-tographic matrix (Table 2.5) determine the charge of an IEX mediumi.e. a positively charged anion exchanger or a negatively chargedcation exchanger.
Tab. 2.5: Functional groups used on ion exchangers.
Anion exchanger Functional group
Quaternary ammonium (Q), strong –O–CH2N+(CH3)3Diethylaminoethyl (DEAE), weak –O–CH2CH2N+H(CH2CH3)2
Cation exchanger Functional group
Sulfopropyl (SP), strong –O–CH2CHOHCH2OCH2CH2CH2SO3–
Methyl sulfonate (S), strong –O–CH2CHOHCH2OCH2CHOHCH2SO3–
Carboxymethyl (CM), weak –O–CH2COO–
The terms strong and weak refer to the extent that the ionizationstate of the functional groups varies with pH.Strong ion exchangers show no variation in ion exchange capacity
with change in pH. These exchangers do not take up or lose protonswith changing pH and so have no buffering capacity, remaining fully
The most suitable matrix canbe selected according to thedegree of resolution, bindingcapacity and flow rates desiredfor the separation.
The terms strong and weak donot refer to the strength withwhich the functional groupsbind the proteins.

2.1 Basic Principles of Important Liquid Chromatography Techniques 161
charged over a broad pH range. Strong ion exchangers include Q(anionic), S and SP (cationic).There are several advantages to working with strong ion exchan-
gers:. Development and optimization of separations isfast and easy since the charge characteristics ofthe medium do not change with pH.
. The mechanism of interaction is simple sincethere are no intermediate forms of charge inter-action.
. Sample loading (binding) capacity is maintainedat high or low pH since there is no loss of chargefrom the ion exchanger.
& The majority of proteins have isoelectric pointswithin the range 5.5 to 7.5, i.e. the first choicewould be to start with a strong anion exchangerat physiological or slightly basic pH. Tris with a pKof 8.3 is ideal for buffers with a pH between 7.2and 9.0.
2.1.1.7 Binding Capacity and Recovery
The capacity of an IEX medium is a quantitative measure of its abilityto take up counter-ions (proteins or other charged molecules). Thetotal ionic capacity is the number of charged functional groups permL medium, a fixed parameter of each medium. Of more practicalrelevance is the actual amount of protein which can bind to an IEXmedium, under defined experimental conditions. This is referred toas the available capacity of a medium for a specific protein. If thedefined conditions include the flow rate at which the medium wasoperated, the amount bound is referred to as the dynamic capacity forthe medium. The available and dynamic capacities depend upon theproperties of the protein, the IEX medium and the experimental con-ditions.The capacity of an IEX medium will vary according to the molecu-
lar size of the specific protein (which affects its ability to enter all thepores of the matrix) and its charge/pH relationship (the protein mustcarry the correct net charge at a sufficient surface density at the cho-sen pH). With earlier ion exchange media, larger proteins had limitedaccess to the functional groups, significantly reducing the bindingcapacity. Nowadays, state-of-the-art macroporous polymer-based ionexchange matrices have exclusion limits for globular proteins inexcess of 1�106 and are therefore suitable for the majority of biomole-cule separations. Binding capacities will still vary according to the
In practice, in order to achievebest possible performance, aprotein load of 10 to 20% ofthe dynamic capacity is recom-mended.

2 Liquid Chromatography Techniques162
molecular size of the proteins. For example, a matrix with a highdegree of small pores will exhibit a higher binding capacity for smal-ler molecules. Experimental conditions such as pH, ionic strength,counter-ion, flow rate and temperature should all be considered whencomparing binding capacities of different IEX medium. Modern IEXmedia show very low levels of non-specific adsorption so that samplerecovery under suitable separation conditions is very high, typicallybetween 90–100%.
2.1.2Reversed Phase Chromatography
The following section on reversed phase chromatography (RPC) isbased on information material included in the GE Handbook“Reversed Phase Chromatography” and modified to the requirementsof protein pre-fraction in proteome analysis.In the presence of non-polar solvents proteins are more likely to
lose activity than peptides. The interaction of proteins or polypeptideswith a hydrophobic surface in the presence of organic solvents gener-ally leads to some loss of tertiary structure, often giving rise to differ-ent conformational states that may interact differently with an RPCmedium. However, denaturation and consequent loss of activity canbe minimized by returning the protein to conditions that favor thenative structure, as demonstrated by the widespread use of RPC forlarge-scale purification of recombinant and synthetic proteins andpeptides, such as insulin and growth hormone.Adsorption chromatography depends on the chemical interactions
between solute molecules and specifically designed ligands chemi-cally grafted to a chromatography matrix. Over the years, many differ-ent types of ligands have been immobilized to chromatography sup-ports for biomolecule separation, exploiting a variety of biochemicalproperties ranging from electric charge to biological affinity. Animportant addition to the range of adsorption techniques for prepara-tive chromatography of proteins has been reversed phase chromato-graphy in which the binding of mobile phase solute to an immobi-lized n-alkyl hydrocarbon or aromatic ligand occurs via hydrophobicinteraction.Reversed phase chromatography has found both analytical and pre-
parative applications in the area of biochemical separation and purifi-cation. Molecules that possess some degree of hydrophobic character,such as proteins and peptides, can be separated by reversed phasechromatography with excellent resolution and recovery. In addition,the use of ion pairing modifiers in the mobile phase allows reversedphase chromatography of charged solutes such as hydrophilic pep-tides. Preparative reversed phase chromatography has found applica-
GE Handbook “Reversed PhaseChromatography, Principlesand Methods”
GE Handbook “HydrophobicInteraction and Reversed PhaseChromatography, Principlesand Methods”
Unless precipitation occurs,denaturation is not a problemwhen using RPC to separateproteins or peptides for primarystructure determination andproteome analysis.

2.1 Basic Principles of Important Liquid Chromatography Techniques 163
tions ranging from micropurification of protein fragments forsequencing by mass spectrometry to process scale purification ofrecombinant protein products.
2.1.2.1 Theory and Mechanism of Reversed Phase Chromatography
The actual nature of the hydrophobic binding interaction itself is amatter of a heated debate, but the conventional wisdom assumes thebinding interaction to be the result of a favorable entropy effect. Theinitial mobile phase binding conditions used in reversed phase chro-matography are primarily aqueous which indicates a high degree oforganized water structure surrounding both the solute molecule andthe immobilized ligand (see Figure 2.4). As solute binds to the immo-bilized hydrophobic ligand, the hydrophobic area exposed to the sol-vent is minimized. Therefore, the degree of organized water structureis diminished with a corresponding favorable increase in systementropy. In this way, it is advantageous from an energy point of viewfor the hydrophobic moieties, i.e. solute and ligand, to associate.
Fig. 2.4: Interaction of a solute with a typical reversedphase medium. Water adjacent to hydrophobic regions ispostulated to be more highly ordered than the bulk water.
Reversed phase chromatography is an adsorptive process by experi-mental design, which relies on a partitioning mechanism for smallpeptides, in combination with an “on/off” adsorption effect for intactbigger proteins to accomplish the separation. The solute moleculespartition (i.e. an equilibrium is established) between the mobilephase and the stationary phase. The distribution of the solutebetween the two phases depends on the binding properties of themedium, the hydrophobicity of the solute and the composition of the
The separation mechanism inreversed phase chromatographydepends on the hydrophobicbinding interaction between thesolute molecule in the mobilephase and the immobilizedhydrophobic ligand, i.e. thestationary phase.
2 Liquid Chromatography Techniques164
mobile phase. Initially, experimental conditions are designed to favoradsorption of the solute from the mobile phase to the stationaryphase. Subsequently, the mobile phase composition is modified tofavor desorption of the solute from the stationary phase back into themobile phase. In this case, adsorption is considered the extreme equi-librium state where the distribution of solute molecules is essentially100% in the stationary phase. Conversely, desorption is an extremeequilibrium state where the solute is essentially 100% distributed inthe mobile phase.While proteins strongly adsorb to the surface of a reversed phase
matrix under aqueous conditions, they desorb from the matrix withina very narrow window of organic modifier concentration. Along withthese high-molecular-weight proteins with their unique adsorptionproperties, the typical biological sample usually contains a broad mix-ture of proteins with a correspondingly diverse range of adsorptionaffinities. The only practical method for reversed phase separation ofcomplex biological samples, therefore, is gradient elution. In sum-mary, separations in reversed phase chromatography depend on thereversible adsorption/desorption of solute molecules with varyingdegrees of hydrophobicity to a hydrophobic stationary phase. Themajority of reversed phase separation experiments are performed inseveral fundamental steps.The first step in the chromatographic process is to equilibrate the
column packed with the reversed phase medium under suitableinitial mobile phase conditions of pH, ionic strength and polarity(mobile phase hydrophobicity). The polarity of the mobile phase iscontrolled by adding organic modifiers such as acetonitrile. Ion-pair-ing agents, such as trifluoroacetic acid (TFA) or formic acid (FA), areused in the majority of all protein and peptide separations with RPC.The polarity of the initial mobile phase (usually referred to as mobilephase A) must be low enough to dissolve the partially hydrophobicsolute yet high enough to ensure binding of the solute to the reversedphase chromatographic column.In the second step, the sample containing the solutes to be sepa-
rated is applied. Ideally, the sample is dissolved in the same mobilephase used to equilibrate the stationary phase. The sample is appliedto the column at a flow rate where optimum binding will occur.Once the sample is applied, the chromatographic column is
washed further with mobile phase A in order to remove any unboundand unwanted solute molecules. Bound solutes are next desorbedfrom the reversed phase medium by adjusting the polarity of themobile phase so that the bound solute molecules will sequentiallydesorb and elute from the column.In reversed phase chromatography this usually involves decreasing
the polarity of the mobile phase by increasing the percentage of
Reversed phase chromato-graphy of proteins generallyuses gradient elution instead ofisocratic elution.

2.1 Basic Principles of Important Liquid Chromatography Techniques 165
organic modifier in the mobile phase. This is accomplished by main-taining a high concentration of organic modifier in the final mobilephase (mobile phase B). Generally, the pH of the initial and finalmobile phase solutions remains the same.The gradual decrease in mobile phase polarity (increasing mobile
phase hydrophobicity) is achieved by an increasing linear gradientfrom 100% initial mobile phase A containing little or no organicmodifier to 100% (or less) mobile phase B containing a higher con-centration of organic modifier. The bound solutes desorb from thereversed phase medium according to their individual hydrophobici-ties.The fourth step in the process involves removing substances not
previously desorbed. This is generally accomplished by changingmobile phase B to near 100% organic modifier in order to ensurecomplete removal of all bound substances prior to re-using the col-umn.The fifth step is re-equilibration of the chromatographic medium
from 100% mobile phase B back to the initial mobile phase condi-tions.The degree of solute molecule binding to the reversed phase med-
ium can be controlled by manipulating the hydrophobic properties ofthe initial mobile phase. Although the hydrophobicity of a solutemolecule is difficult to quantitate, the separation of solutes that varyonly slightly in their hydrophobic properties is readily achieved.Because of its excellent resolving power, reversed phase chromatogra-phy is an indispensable technique for the high-performance separa-tion of complex biological samples.Typically, a reversed phase separation is initially achieved using a
broad range gradient from 100% mobile phase A to 100% mobilephase B. The amount of organic modifier in both the initial and finalmobile phases can also vary greatly.
& For peptide separations routine percentages oforganic modifier are 5% or less in mobile phase Aand 80% or more in mobile phase B. For intactprotein separations starting with 25% organicmodifier in mobile phase A and 75% or more inmobile phase B can be generally recommended. Inmost cases, acetonitrile is the organic modifier ofchoice.
The technique of reversed phase chromatography allows great flexibil-ity in separation conditions so that the researcher can choose to bindthe solute of interest, allowing the contaminants to pass unretardedthrough the column, or to bind the contaminants, allowing thedesired solute to pass freely. Generally, it is more appropriate to bind
Separation in reversed phasechromatography is due to thedifferent binding properties ofthe solutes present in thesample as a result of the differ-ences in their hydrophobicproperties.

2 Liquid Chromatography Techniques166
the solute of interest because the desorbed solute elutes from thechromatographic medium in a concentrated state. Additionally, sincebinding under the initial mobile phase conditions is complete, thestarting concentration of desired solute in the sample solution is notcritical allowing dilute samples to be applied to the column. Ionicbinding may sometimes occur due to ionically charged impuritiesimmobilized on the reversed phase chromatographic medium, espe-cially for non- or insufficiently end-capped silica-based media.The combinations of hydrophobic and ionic binding effects are
referred to as mixed-mode retention behavior. Ionic interactions canbe minimized by judiciously selecting mobile phase conditions andby choosing reversed phase media with end-capping or based on poly-mers which are commercially produced with high batch-to-batchreproducibility and stringent quality control methods.
2.1.2.2 RPC of Peptides, Polypeptides and Proteins
The separation of peptides involves continuous partitioning betweenthe mobile and stationary phase. Polypeptides and proteins, however,are too large to partition into the hydrophobic layer; instead, theyadsorb to the hydrophobic phase after entering the column andremain adsorbed until the concentration of the mobile phase reachesthe critical concentration necessary to cause desorption. They thenadsorb and interact only slightly with the stationary phase as theyelute down the column.
& Desorption takes only place within a very narrowwindow of organic modifier concentration. Thisresults in complete retention until the criticalmobile phase concentration is reached andsudden desorption of the protein takes place. Thissudden desorption produces sharp peaks.
The “hydrophobic foot” of a polypeptide or protein which is responsi-ble for the separation, is very sensitive to molecular confirmation. Itcan be observed that proteins with intact tertiary structure elute ear-lier than expected compared to denatured proteins because the“hydrophobic foot” is involved in the interaction, while the rest of theprotein is in contact with the mobile phase. After desorption very lit-tle interaction takes place between the protein and the reversed phasesurface and subsequent interactions have little effect on the separa-tion, i.e. column can be kept short, as column length has little effecton the separation. Short columns in combination with shallow gradi-ents can be used very effectively to separate similar proteins. Becauseproteins diffuse slowly, RPC results in broader peaks than obtainedwith peptides.

2.1 Basic Principles of Important Liquid Chromatography Techniques 167
Column dimensions The adsorption/desorption of proteins respon-sible for their separation takes place almost entirely near the top ofthe column. Therefore, column length does not significantly affectseparation and resolution of proteins. Consequently, short columnsof £5 cm in length are often used for protein separation.
Mobile phase considerations
& Since decades, all in all acetonitrile as organicmodifier and TFA as ion-pairing reagent hasproven to be best compromise for reversed phasechromatography of peptides and proteins. Fordirect coupling of LC to mass spectrometry aceticor formic acid are giving better overall results dueto significant higher ionization efficiency.
Propanol-2 is often used for large or very hydrophobic proteins. Themajor drawback of propanol-2 is its high viscosity, especially in mix-tures with water. To reduce the viscosity of propanol-2, while main-taining its hydrophobic characteristics, it is recommended using mix-ture of 50:50 with acetonitrile. Adding 1 to 3% propanol-2 to acetoni-trile has shown to increase protein recovery in some cases.Propanol-2 is the best solvent for retaining biological activity. Etha-
nol and methanol are slightly worse. Acetonitrile causes the greatestloss of biological activity, however, for protein pre-fractionation of pro-teomic samples this is of no importance, as long as the primary struc-ture of the molecule remains unaffected and the recovery is suffi-cient.In rare cases trifluoroacetic acid (TFA) can be replaced by penta-
fluoropropionic acid (PFPA) or heptafluorobutyric acid (HFBA).However, the effect is minimal to non-visible.
2.1.3Affinity Chromatography
Affinity chromatography (AC) separates proteins on the basis of areversible interaction between a protein or a group of proteins and aspecific ligand coupled to a chromatography matrix, as illustrated anddescribed in full detail in the GE Handbook “Affinity Chromatrogra-phy, Principles and Methods”.The technique offers high selectivity, hence high resolution, and
usually high capacity for the protein(s) of interest. Enrichment can bein the order of several thousand-fold and recoveries of active materialare generally very high.
There is no good reason todeviate from TFA as the ion-pairing reagent and invest timeand money to evaluate exoticreagents. RPC coupled to MSor MS/MS may be seen as anexception and it is worth tryingother ion pairing reagents toobtain a better performance inMS.

2 Liquid Chromatography Techniques168
Affinity chromatography is unique in separation technology sinceit is the only technique that enables the purification of a biomoleculeon the basis of its biological function or individual chemical struc-ture. Purification that would otherwise be time-consuming, difficultor even impossible using other techniques can often be easilyachieved with affinity chromatography. The technique can be used toseparate active proteins from denatured or functionally differentforms, to isolate, concentrate and enrich pure substances present atlow concentration in large volumes of crude sample and also toremove specific contaminants, such as the depletion of high-abun-dant proteins from plasma or serum, prior to proteome analysis.
2.1.3.1 Affinity Chromatography in Brief
Affinity chromatography separates proteins on the basis of a reversi-ble interaction between a protein or a group of proteins and a specificligand coupled to a chromatography matrix.The technique is ideal for concentration or enrichment steps as
well as for a depletion or elimination in a separation protocol and canbe used whenever a suitable ligand is available for the protein(s) ofinterest. With high selectivity, hence high resolution, and high capa-city for the protein(s) of interest, purification levels in the order ofseveral thousand-fold with high recovery of active material are achiev-able.Biological interactions between ligand and target molecule can be a
result of electrostatic or hydrophobic interactions, and/or hydrogenbonding. To elute the target molecule from the affinity medium theinteraction can be reversed, either specifically using a competitiveligand, or non-specifically, by changing the pH, ionic strength orpolarity. Figure 2.5 describes the mode of action of affinity chromato-graphy. In a single step, affinity purification can offer immense time-saving over less selective multi-step procedures. The concentratingeffect enables large volumes to be processed. Target molecules can beseparated from complex biological mixtures, native forms can beseparated from denatured forms of the same substance and smallamounts of biological material can be purified from high levels ofcontaminating substances.
GE Handbook “Affinity Chro-matography, Principles andMethods” (2002) 18-1022-29

2.1 Basic Principles of Important Liquid Chromatography Techniques 169
Fig. 2.5: Schematic representation of the mode of operation ofaffinity chromatography and a typical affinity chromatogram.
Successful affinity purification requires a biospecific ligand that canbe covalently attached to a chromatography matrix. The coupledligand must retain its specific binding affinity for the target mole-cules and, after washing away unbound material, the bindingbetween the ligand and target molecule must be reversible to allowthe target molecules to be removed in an active form. Any componentcan be used as a ligand to purify its respective binding partner. Sometypical biological interactions, frequently used in affinity chromato-graphy for proteomics, are listed below:
. Antibody–antigen: for efficient IgG and albumindepletion from plasma or serum samples;
. Lectins: selective glycoprotein enrichment;

2 Liquid Chromatography Techniques170
. Metal ions: selective enrichment of phosphory-lated peptides and proteins, native proteins withhistidine, cysteine and/or tryptophan residueson their surfaces (IMAC).
2.1.3.2 Immuno-affinity Chromatography
Immuno-affinity chromatography utilizes antigens or antibodies asligands (sometimes referred to as adsorbents, immunoadsorbents orimmunosorbents) to create highly selective media for the depletion ofe.g. the most high-abundant plasma proteins. Antibodies, immobi-lized to a column are also extremely useful as ligands and can beused as baits for the isolation of special proteins.Especially for the depletion of albumin, immuno-affinity columns
are superior compared to immobilized Cibacron blue, which is lessselective and also binds other classes of proteins rather than albumin.Albumin, as a transporter protein, also has a strong affinity to theproteins to be transported. It is assumed that these proteins remainbound to albumin and will at least partially get lost during the deple-tion step.Recently, a new discipline called “Albuminomics” was founded,
which deals with the analysis of proteins and peptides that are boundto albumin.The availability of commercial products is growing constantly. User
of these products for the depletion of high-abundancy proteins gener-ally state a good performance but at the same time criticize high pur-chase and running costs as well as too low a capacity.Occasionally a leakage of the immobilized antibodies is reported,
which results in high amounts of peptides leading to identification ofimmunoglobulins after MS analysis and affecting the analysis of low-abundant proteins.
2.1.3.3 Lectin Affinity Chromatography
Glycoproteins and polysaccharides react reversibly, via specific sugarresidues, with a group of proteins known as lectins (see Table 2.6). Asligands for separation columns, lectins are used to isolate and sepa-rate glycoproteins, as well as other glycosylated molecules. Glycopro-teins bound to the lectin column are resolved by using a gradient ofionic strength or of a competitive binding substance.
The high selectivity of affinitychromatography enables manyseparations to be achieved in asingle, simple step.
Gundry RL, Fu Q, Jelinek CA,Van Eyk JE, Cotter RJ. Proteo-mics Clin Appl 1 (2007) 73–88.

2.1 Basic Principles of Important Liquid Chromatography Techniques 171
Tab. 2.6: Specificity of selected lectins.
Lectin Specificity
Mannose/glucose binding lectins
Con A,Canavalia ensiformis
Branched mannoses, carbohydrates with terminalmannose or glucose (aMan > aGlc > GlcNAc).
Lentil lectin,Lens culinaris
Branched mannoses with fucose linked a(1,6) toN-acetyl-glucosamine, (aMan > aGlc > GlcNAc).
N-acetylglucosamine binding lectins
Wheat germ lectin,Triticum vulgare
Chitobiose core of N-linked oligosaccharides,[GlcNAc(b1,4GlcNAc)1–2> bGlcNac].
In addition to the phosphoproteins, glycoproteins representanother important group of proteins for the study of post-transla-tional modifications. Although the basics and theory of using lectinsto selectively isolate glycoproteins is known since decades, its applica-tion proteome analysis is still underdeveloped. The study of post-translational modifications in glycoproteins is hampered by the lackof well established methods. Recently a paper was presented thatapplied a multilectin affinity column for the enrichment of plasmaand serum proteins coupled prior to digestion and LC-MS.
2.1.3.4 Immobilized Metal Affinity Chromatography
Immobilized metal affinity chromatography (IMAC is a special kindof affinity chromatography that is not based on biospecific recogni-tion. A metal-chelating group [e.g. iminodiacetic acid, nitrilotriaceticacid (NTA)] is immobilized to the stationary phase of the column.Originally used for the purification of proteins and peptides withexposed amino acids, His, Cys, Trp, and/or with affinity for metalions, IMAC today is an indisputable tool for the purification ofrecombinant poly-His fusion proteins.Proteins and peptides that have an affinity for metal ions can be
separated using immobilized metal affinity chromatography. Themetals are immobilized onto a chromatographic medium by chela-tion. Certain amino acids, e.g. histidine and cysteine, form complexeswith the chelated metals around neutral pH (pH 6–8) and it is pri-marily the histidine content of a protein which is responsible for itsbinding to a chelated metal. Metal chelate affinity chromatography isexcellent for purifying recombinant (His)6 fusion proteins as well asmany natural proteins. Before use the column is loaded with a solu-tion of divalent metal ions such as Ni2+, Zn2+, Cu2+, Ca2+, Co2+ orFe2+. The binding reaction between the ligand and the target protein
Yang Z, Hancock WS, ChewTR, Bonilla L. Proteomics 5(2005) 3353–3366.
Recently IMAC has beenapplied successfully in proteo-mics for the isolation of phos-phorylated peptides andproteins in order to study thenature of post-translationalmodifications (PTM).

2 Liquid Chromatography Techniques172
is based on coordination chemistry (chelate) and therefore pH depen-dent. Bound sample is, most commonly, eluted by reducing the pHand increasing the ionic strength of the buffer or by including EDTAor imidazole in the buffer.The study of post-translational modifications is complicated by the
lack of appropriate methods for a group-selective enrichment of intactphosphoproteins and -peptides. Today, IMAC can be applied success-fully for their isolation at high recovery. Furthermore, this techniqueis both compatible with 2D electrophoresis and liquid chromatogra-phy as well as MS and can be applied to cell cultures, tissues andother samples.Any continuative general recommendations as binding conditions,
like metal ion selection, and elution conditions cannot be given here,because it would go beyond the aim of this book. These have to becustomized depending on the nature and origin of the sample duringthe method-development phase.
2.1.4Gel Filtration
For more than forty years since the introduction of Sephadex�, gelfiltration (GF) has played a key role in the purification of enzymes,polysaccharides, nucleic acids, proteins and other biological macro-molecules.This technique is also known as size exclusion chromatography
(SEC) or gel permeation chromatography (GPC).The technique can be applied in two distinct ways:
. Group separations: the components of a sampleare separated into two major groups according tosize range. A group separation can be used toremove high- or low-molecular-weight contami-nants (such as phenol red from culture fluids) orto desalt and exchange buffers after tryptic diges-tion.
. High-resolution fractionation of proteins: thecomponents of a sample are separated accordingto differences in their molecular size. High-reso-lution fractionation can be used to isolate one ormore components or to separate monomersfrom complexes or randomly formed aggregates.
Gel filtration separates molecules according to differences in size asthey pass through a gel filtration medium packed in a column.Unlike ion exchange or affinity chromatography, molecules shouldnot bind to the chromatography medium. Consequently, a significant
Dubrovska A, Souchelnytskyi S.Proteomics 5 (2005) 4678–4683.
Phosphoprotein PurificationHandbook, Qiagen, 2002
Morrice N. In: The Encyclo-pedia of Mass Spectrometry,Volume 8, HyphenatedMethods in The Encycopedia ofMass Spectrometry, (NiessenWMA, Ed), Elsevier,Amsterdam, Netherlands(2006) 930–939.
In practice immobilized NTA isreported to be superior overother groups.
Gel filtration is the simplestand mildest of all the chroma-tography techniques and sepa-rates molecules on the basis ofdifferences in size.

2.1 Basic Principles of Important Liquid Chromatography Techniques 173
advantage of gel filtration is that conditions can be varied to suit thetype of sample or the requirements for further purification, analysisor storage without altering the separation.Gel filtration is well suited for proteins that may be sensitive to
changes in pH, concentration of metal ions or co-factors and harshenvironmental conditions. Separations can be performed in the pre-sence of essential ions or cofactors, detergents, urea, guanidinehydrochloride, at high or low ionic strength, at 37 �C or in the coldroom according to the requirements of the experiment. Purified pro-teins can be collected in any chosen buffer.To perform a separation, gel filtration medium is packed into a col-
umn to form a packed bed. The medium is a porous matrix in theform of spherical particles that have been chosen for their chemicaland physical stability, and inertness (lack of reactivity and adsorptiveproperties). The packed bed is equilibrated with buffer, which fills thepores of the matrix and the space in between the particles. The liquidinside the pores is sometimes referred to as the stationary phase andthis liquid is in equilibrium with the liquid outside the particles,referred to as the mobile phase. It should be noted that samples areeluted isocratically, i.e. there is no need to use different buffers dur-ing the separation. However, a wash step using the running buffer isusually included at the end of a separation to facilitate the removal ofany molecules that may have been retained on the column and to pre-pare the column for a new run.Figure 2.6 shows the most common terms used to describe the
separation and Figure 2.7 illustrates the separation process of gel fil-tration.
Fig. 2.6: Common terms in gel filtration.Ve: elution volume is measured from the chro-matogram and relates to the molecular sizeof the molecule; Vo: void volume is the elutionvolume of molecules that are excluded fromthe gel filtration medium because they arelarger than the largest pores in the matrix andpass straight through the packed bed; Vt:total column volume is equivalent to thevolume of the packed bed (also referred to asCV).
Gelfitration is not the firstchoice of technique in proteinpre-fractionation as resolutionand loading capacity is limitedand the initial sample is dilutedsignificantly.

2 Liquid Chromatography Techniques174
Fig. 2.7: Separation process of gel filtration.
2.2Strategic Approach and General Applicability
It is undisputable that proteomics would not be possible without themajor achievements in mass spectrometry during the last decade.Nevertheless, it is unfair to call the high-performance separation tech-niques further up-stream in the workflow as just sample preparation.The separation performance prior to MS has a very significant impactto the overall success rate in proteome analysis.A remarkable simulation by computer modeling, performed by
Eriksson and Fenyo (2007), disclosed some of the secrets of success-ful proteome analysis. Factors influencing the success rate of pro-teome analysis (listed in order of importance):
. Initial sample amount;
. Number of proteins in mixture (ideally ~30 to<300);
. Power of protein and peptide separation;
. Mass spectrometric dynamic range.
Surprisingly, the three most important success factors are not relatedto sensitivity, resolution and dynamic range of the MS instrumenta-
Eriksson J, Fenyo D. NatureBiotech 25 (2007) 651–655.

2.2 Strategic Approach and General Applicability 175
tion. Reducing sample complexity, loading more sample amount – ifavailable – and better separation performance on protein and peptidelevel are the most crucial elements in the workflow. Implementing allthese factors can ideally be achieved with state-of-the-art separationtools like e.g. liquid chromatography alone, but also in combinationwith electrophoretic techniques.Since the mid nineties of the last century, especially in North Amer-
ica, LC methods like two-dimensional liquid chromatography(2DLC), an intelligent combination of ion exchange (IEX) andreversed phase chromatography (RPC), also described as MudPITbegan to catch more and more attention, while the majority of Eur-opean scientists continued to rely more or less exclusively on 2DE.Today the majority of scientists worldwide take advantage from LC-based methods in order to obtain more complete information com-plementary to 2DE. It was just logical and consequent that research-ers started to compare 2DE with 2DLC.2D or not 2D? Is that the question? In fact it is not, as it is compar-
ing apples and oranges; because 2DE separates intact proteins,whereas 2DLC separates peptides (digested proteins).The picture below (Figure 2.8) clearly illustrates where the
strengths of the various separation techniques –electrophoresis andliquid chromatography – are.
Fig. 2.8: Separation capacity of different methodsdepending on the molecular mass of the analytes.Modified from Lottspeich and Engels (2007).
Occasionally, there have been attempts to use LC-based methods forthe separation at protein level in order to replace 2DE as well. How-ever, until today, protein chromatography techniques cannot competewith 2DE in terms of resolution, peak capacity, and last but not least,
2D or not 2D? Is that the ques-tion?
Lottspeich F, Engels JW (Eds.)Bioanalytik, 2. Auflage, Else-vier, Spektrum AkademischerVerlag (2006)

2 Liquid Chromatography Techniques176
the visualization of the separation, post translational modificationsand protein isoforms included.However, for sample preparation purposes, such as depletion of
high-abundant proteins, concentration of low-abundant proteins,group-specific enrichment, or any other type of sample de-complexifi-cation or pre-fractionation, LC is the method of choice, even for sam-ple preparation prior to subsequent electrophoretic separations. It isobvious that reversed phase chromatography and ion exchange chro-matography – or the combinations of both – are the methods ofchoice for the separation of digested proteins: peptides.
2.3Liquid Chromatography Techniques and Applications in ProteomeAnalysis
2.3.1Peptide Separation
For more than 20 years reversed phase chromatography (RPC) hasbeen the most frequently used technique for peptide separations;playing a key role in protein identification and characterization. Dur-ing the zenith of Edman sequencing, a technique called peptide map-ping routinely used chromatography to aid protein identification andcharacterization. However, the development of two powerful massspectrometry (MS) ionization techniques and subsequent instrumentevolution (see Chapter 3), meant mass spectrometry and not EdmanSequencing became the key tool for proteomics applications. Alongside this MS evolution, chromatography did not stand still either. Theminiaturization of LC and the availability of robust, commerciallyavailable columns and instrumentation enabled peptide separation tobe performed at a very high sensitivity (<100 fmol with UV detection).The reduction in column internal diameter (i.d.) to sub 100 mm speci-fications and the availability of nano LC systems, which could becoupled with nano electrospray sources, have been the main driverstowards higher sensitivity (see Table 2.7). This level of performanceenabled the detection of much smaller amounts (<<1 fmol) of sam-ple.Peptide separation on-line to tandem mass spectrometry equipped
with electrospray for peptide sequence analysis is routine, but appli-cation and sample dependent. The incorporation of a chromatogra-phy step has been key to achieving this and the commonly used pep-tide chromatographic technique is a single dimension of RPC. Inrecent years it has also been possible to combine an RPC peptideseparation with MALDI ToF (see Section 3.1.1 on pages 220 f).

2.3 Liquid Chromatography Techniques and Applications in Proteome Analysis 177
Tab. 2.7: Relationship between column i.d. and sensitivity.
Scale Column i.d.
(mm)
Typical flow rate
(mL/min)
Theoretical gain in
sensitivity
Analytical 4.6 1,000 1
Narrow 2.1 200 5
Micro 1 40 21
Capillary 0.3 4 237
Nano 0.075 0.2 3,322
If the sample of interest is rather simple, e.g. a tryptic digest of agel spot, ideally containing a single or a few proteins, successful pro-tein identification with a very high sequence coverage can be routi-nely achieved with a single dimension of RPC separation prior to MS.However, as a sample becomes more complex the required resolu-
tion of the RPC separation prior to tandem mass spectrometrysequence analysis also needs to increase. In this instance, a singleRPC separation prior to MS analysis may still generate a significantnumber of protein identifications, but the sequence coverage maydrop considerably (for instance an immunoaffinity pull down experi-ment, followed by digestion of the 1DE gel bands – see introductionand figure 4). The question becomes, does the MS have sufficienttime to analyze the peptides (i.e. perform sequence analysis) as theyco-elute from the column? One possibility to address the co-elution isto employ extra high-resolution RPC with very long columns, wherethe system pressure approaches 10,000 psi (700 bar; 6,895 kPa). Inone such publication, Shen et al. (2001) demonstrated that a singlehigh-resolution RPC separation prior to tandem mass spectrometrywith an FT-ICR instrument, yielded the identification of over 1,000yeast proteins. Instead of following the approach with very long col-umns, which has never got a wide acceptance, one could use shortercolumns packed with very small particles (1–2 mm) instead. Such astrategy, marketed as UPLC, is more promising and is currently gain-ing some popularity. Both, columns and dedicated instrumentation,are commercially available.If the sample complexity exceeds a certain level, such as with a
sample deriving from of a whole cell lysate digest, the ability to effi-ciently separate the mixture into manageable fractions with onedimension only becomes effectively impossible. This is critical as theability of the MS to analyze the co-eluting peptides will be seriouslyimpaired; not only will the sequence coverage of identified proteinsbe reduced, but insufficient peptides will be detected and analyzed todeliver unambiguous protein identifications, significantly reducing
Ideally, such a simple samplecould be analyzed with nano-spray alone.
A high-speed MS analyzer isbeneficial.
Shen Y, Zhao R, Belov ME.Anal Chem 73 (2001) 1766–1775.
Alternatively, the resolution ofan RPC step can be enhancedby simply increasing the lengthof the RPC gradient withincertain limits (0.25% acetoni-trile/min increase should be theflattest gradient).
This is particularly importantfor the analysis of peptidesderiving from low-abundantproteins.

2 Liquid Chromatography Techniques178
the number of proteins identified. Consequently, a second dimensionof peptide separation is required to increase the resolution of thegiven sample, effectively giving the MS more time to analyze the pep-tides as they elute from the column.An example of how varying the LC conditions can impact on the
MS performance is given in Figure 2.9. The figure represents howthe sequence coverage obtained for a particular protein in a mixtureof six proteins can vary according to the LC configuration used. Thesummary of this exercise is that increasing the resolution of the chro-matographic separation, aids the MS performance, which ultimatelytranslates to increased sequence coverage obtained for a particularprotein.
& The appropriate chromatographic separationreduces sample complexity, which resultantly hasa positive impact on protein identification successrates i.e. more proteins can be identified.
Fig. 2.9: Graph representing how the sequence coverage obtainedfor a particular protein in a mixture of six proteins can vary accordingto the LC configuration used. Courtesy of M. Berg, M-Scan.
The commonly used additional separation dimension is ion exchangechromatography (IEX), specifically strong cation exchange (SCX) andthe coupling together of these two techniques is routinely known as2DLC (IEX/RPC). The technique utilizes a peptide's unique physicalproperties of charge and hydrophobicity to enhance separation. The

2.3 Liquid Chromatography Techniques and Applications in Proteome Analysis 179
following rule of thumb can be used to calculate the required degreeof separation power:
. 1DLC (RPC) (1–50 proteins) 50–2,500 peptides
. 2DLC (IEX/RPC) (10–500 proteins) 500–25,000 peptides
2.3.22DLC Peptide Separation
Peptide 2DLC is the key component of MudPIT (MultidimensionalProtein Identification Technology), a strategy for protein identifica-tion whereby an non-separated complex protein mixture is digestedprior to LC-MS/MS analysis. The technique was pioneered for proteo-mics applications by Yates and co-workers (Link et al., 1999). Thegroup initially described the combination of IEX and RPC mediasequentially packed into a pulled capillary column on-line to an MSequipped with ESI (see Figure 2.10). The chromatography proceededin steps, each step consisting of an increasing, specific salt concentra-tion, which eluted peptides off the strong cation exchange media ontothe RPC compartment. In one reported example 1,484 proteins wereidentified in a single experiment (Wasburn et al. 2001).
Fig. 2.10: A schematic of the MudPIT technique reported byLink et al. for the analysis of complex mixtures.
The technique is a non-gel based approach, and it has often beenargued that it can be used as a replacement for 2DE. In reality, thetechnique is a powerful complementary tool to the 2DE approach asthey both allow the detection of different subsets of the proteome.A key advantage of the technique being once the sample was loaded
onto the column, no manual sample handling was required. Essentialmethod developments included identifying salt containing buffers
Link AJ, Eng J, Schieltz DM,Carmack E, Mize GJ, MorrisDR, Garvik BM, Yates JR 3rd.Nat Biotechnol. 7 (1999) 676–682.
Washburn MP, Wolters D,Yates JR 3rd. Nat Biotechnol. 3(2001) 242–247

2 Liquid Chromatography Techniques180
that were compatible with MS analysis, typical IEX buffers such assodium chloride and potassium chloride are not. Ammonium chlor-ide, which is volatile, was identified as a compatible buffer.Following its introduction, the technique has evolved and a number
of commercial systems have been developed, the key difference beingthat separate SCX and RPC columns are used. Still, the technique isrelatively straightforward (see Figure 2.11). The complex protein sam-ple is denatured, (cysteine residues) reduced and alkylated and theproteins digested, typically, with trypsin. The peptide mixture is sub-sequently acidified and loaded onto the SCX column. As in a typicalIEX separation, positively charged peptides bind to the IEX columnand the uncharged and negatively charged peptides pass in the flowthrough and bind to a reversed phase trap column. The peptides aresubsequently eluted onto a nano (75 mm i.d.) RPC column, separatedand eluted into a tandem mass spectrometer for peptide sequenceanalysis. Subsequently, the salt concentration is increased, either in aseries of steps or via a salt gradient (see below), displacing furtherpeptides from the IEX column onto the RP trap column and thenonto the nano RPC column for elution into the MS. Each RPC separa-tion generates multiple protein identifications in the MS analysis.Two common variations have evolved (and supported commer-
cially), each with its own benefits and drawbacks (see Figure 2.11),which are discussed below.
Fig. 2.11: Schematics of the two common methods for 2DLCseparation of complex peptide mixtures prior to MS analysis.From GE Healthcare application note: Comparison of methodsfor two-dimensional liquid chromatography of peptides usingEttan microLC System. (2003) 18-1170-93.

2.3 Liquid Chromatography Techniques and Applications in Proteome Analysis 181
2.3.2.1 On-line 2DLC with Salt Plugs
This configuration offers convenient, easy-to-use, and automated ana-lysis of moderately complex protein mixtures. On-line salt-plug injec-tion employs a combination of SCX in the first-dimension separationwith RPC in the second dimension. Elution from the SCX column isperformed using discrete salt plugs of increasing salt concentration.Eluted proteins are bound to the RPC trap column (while efficientdesalting and concentration takes place) and subsequently separatedon the second-dimension RPC column using a nanoflow gradientelution with organic solvent. Unfortunately, optimal SCX separationof peptides requires a certain concentration of acetonitrile in the buf-fer (as high as 30%). However this level of acetonitrile is incompatiblewith the RPC second dimension as the more hydrophilic peptideswill not bind to the column (see Figure 2.12). As a compromise, theacetonitrile concentration in SCX is reduced to 5%, which is morecompatible – by no means perfect – not for SCX nor for the subse-quent RPC step. One major drawback of this method is often that thesame peptide(s) elute in subsequent fractions, which generatesredundant data in the MS as the same peptide is analyzed repeatedly.This observation has been made and reported by numerous labora-tories.
. Advantages:– Fully automated operation;– On-line desalting and sample concentration;– Potentially greater sensitivity due to reducedsample loss.
. Disadvantages:– Sub-optimal running conditions for both SCXand RPC;
– Binding behavior of peptides to SCX columnunpredictable as strongly influenced by unspe-cific side effects;
– Loss of small, hydrophilic peptides as they donot bind to the RPC trap column;
– Distribution (smearing) of one and the samepeptide to several runs;
– Difficult to consolidate data;– Need to perform always a combined analysisof all runs to get a picture from a particularprotein.

2 Liquid Chromatography Techniques182
Fig. 2.12: The effect of acetonitrile used in the IEX gradient forretention and recovery of peptides in 2DLC analysis. Note that hydrophilicpeptides get lost if starting with 5% acetonitril in eluent A, becausethey will not be bound by the RPC trap column. From GE Healthcareapplication note: Comparison of methods for two-dimensional liquidchromatography of peptides using Ettan microLC System. (2003) 18-1170-93.
2.3.2.2 Off-line 2DLC
This semi-automated off-line method gives the best overall perfor-mance in terms of protein ID and sequence coverage. This methodallows greater flexibility in terms of total amount of sample loaded,column dimension, and flow rate in the first-dimension SCX step.Separation under optimal conditions for each dimension with nolosses of small hydrophilic peptides. Fractions are collected after SCXprior to the RPC step. The off-line SCX/RPC method enables greaterfreedom to choose selected fractions of interest for further analysis byMS/MS. The key advantages of this configuration are that the SCXand RPC separations can be optimized individually, not compromisedand there is minimal overlap of peptides between fractions whichresults in less redundant data.
. Advantages:– Best conditions for maximum resolution andpeak capacity at both dimensions;
– Free choice of buffer system and samplevolume can be adapted to RPC;
– Higher resolution compared to salt step ordual-gradient elution;
– Fast method despite being an off-line method,SCX is a single, continuous run;
– Minimal overlap of peptides between frac-tions;

2.3 Liquid Chromatography Techniques and Applications in Proteome Analysis 183
– Store SCX fraction for re-analysis;– Higher sample load on the SCX dimension,allows for higher sensitivity.
– When the first dimension SCX is finished,priority fractions can be selected (e.g. throughvisual inspection of the UV trace) and movedforward to LC-MS
. Disadvantages:– Not fully automated, requires an acetonitrileevaporation (e.g. SpeedVac�) or dilution stepprior to the injection on to the second dimen-sion RPC trap column.
A comparison between high-throughput 1D RPC and the two com-mon 2D-LC variations has been performed in the analysis of rat sper-matozoa. The rat spermatozoa proteome is estimated, from the num-ber of spots observed in 2D-PAGE analysis, to consist of about 2,000proteins.Chromatograms from the three configurations are shown in Figure
2.13.
Fig. 2.13: Chromatograms obtained for the analysis of ratspermatozoa using high-throughput 1D RPC, on-line 2DLC,and off-line 2DLC. Courtesy of GE Healthcare.
By adding an orthogonal separation technique (typically IEX) to RPC,the separation power of the method increases substantially. One wayto describe separation power is to use peak capacity.Peak capacity for a one-dimensional separation is defined as:
PC = (tlast – tfirst)/w1/2
Orthogonal means the combi-nation of consecutive separa-tion techniques according todifferent independent physico-chemical properties of proteins/ peptides.
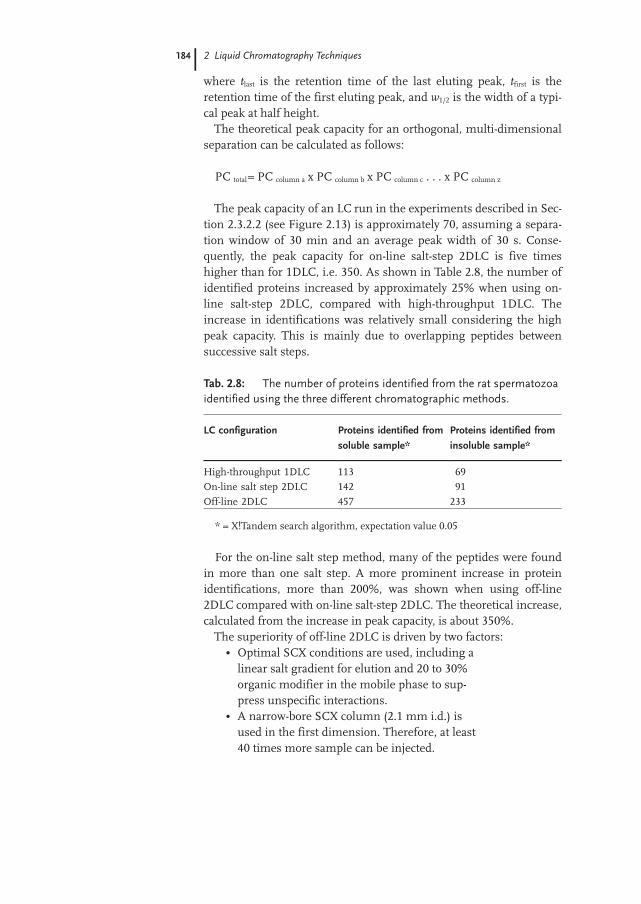
2 Liquid Chromatography Techniques184
where tlast is the retention time of the last eluting peak, tfirst is theretention time of the first eluting peak, and w1/2 is the width of a typi-cal peak at half height.The theoretical peak capacity for an orthogonal, multi-dimensional
separation can be calculated as follows:
PC total= PC column a x PC column b x PC column c . . . x PC column z
The peak capacity of an LC run in the experiments described in Sec-tion 2.3.2.2 (see Figure 2.13) is approximately 70, assuming a separa-tion window of 30 min and an average peak width of 30 s. Conse-quently, the peak capacity for on-line salt-step 2DLC is five timeshigher than for 1DLC, i.e. 350. As shown in Table 2.8, the number ofidentified proteins increased by approximately 25% when using on-line salt-step 2DLC, compared with high-throughput 1DLC. Theincrease in identifications was relatively small considering the highpeak capacity. This is mainly due to overlapping peptides betweensuccessive salt steps.
Tab. 2.8: The number of proteins identified from the rat spermatozoaidentified using the three different chromatographic methods.
LC configuration Proteins identified from
soluble sample*
Proteins identified from
insoluble sample*
High-throughput 1DLC 113 69
On-line salt step 2DLC 142 91
Off-line 2DLC 457 233
* = X!Tandem search algorithm, expectation value 0.05
For the on-line salt step method, many of the peptides were foundin more than one salt step. A more prominent increase in proteinidentifications, more than 200%, was shown when using off-line2DLC compared with on-line salt-step 2DLC. The theoretical increase,calculated from the increase in peak capacity, is about 350%.The superiority of off-line 2DLC is driven by two factors:
. Optimal SCX conditions are used, including alinear salt gradient for elution and 20 to 30%organic modifier in the mobile phase to sup-press unspecific interactions.
. A narrow-bore SCX column (2.1 mm i.d.) isused in the first dimension. Therefore, at least40 times more sample can be injected.

2.3 Liquid Chromatography Techniques and Applications in Proteome Analysis 185
At first glance the off-line configuration seems to be time consumingas it is not fully automated. The total analysis time for the three differ-ent configurations, not including data analysis and sample prepara-tion, is 60 min for high-throughput 1DLC, 300 min for on-line salt-step 2DLC, and 2000 min for off-line 2DLC. However, the productiv-ity, expressed as time/positive identification ratio is by far superiorfor the off-line approach.In total, a large number of proteins, approximately 600, were iden-
tified in rat spermatozoa using the off-line configuration. The typesof proteins that were identified are shown in Figure 2.14. Soluble pro-teases were found in higher number in the soluble sample comparedwith the insoluble sample, whereas the opposite was true for redoxand structural proteins, which are often hydrophobic/membrane pro-teins. Table 2.8 shows the top score proteins when the off-line 2DLCconfiguration was used.
Fig. 2.14: Functional classification of proteins identified by the2DLC analysis of rat spermatozoa. Courtesy of GE Healthcare.
In summary, the rat spermatozoa proteome was analyzed using thethree preprogrammed LC configurations: high-throughput 1DLC, on-line salt-step 2DLC and off-line 2DLC. The combination of a largesample load, optimal SCX conditions, and sensitive nanoscale LC-MS/MS using the off-line 2DLC–MS/MS approach resulted in nearly600 identified proteins.
The off-line 2DLC methodfeatures superior productivity interms of number of proteinidentifications

2 Liquid Chromatography Techniques186
& For in-depth proteome profiling of a complexsample, the off-line 2DLC–MS/MS configurationis recommended. If the sample is less complex,and analysis time and automation are issues,1DLC with lengthened gradient time or on-linesalt-step 2DLC is recommended.
Type of instrumentation Compared to the general HPLC supply thenumber of vendors offering dedicated nanoLC systems is moreclearly arranged. In the majority of cases a nanoLC system is usedexclusively front-end to a nano electrospray mass spectrometer or,with increasing popularity, to a spotter which collects fractions forMALDI MS analysis on a MALDI target. In the past, flow rates in therange of a few hundred nano-liters per minute, typically 200 nL/minfor a 75 mm I.D. column, could only be generated with the help of aflow splitter. Still today, most of the commercially available nano LCsystems are using this somewhat outmoded operation principle.Once such systems are well run-in they offer a very acceptable degreeof reliability and performance. However, troubleshooting on a splitterbased system can be a time-consuming challenge.Today, splitter-less systems are entering the market.Elimination of flow-splitting overcomes the inaccuracies and
plumbing problems caused by splitter-based systems. Consequentminiaturization leads to the complete absence of check valves and thereduction of moveable parts to the absolute minimum and makesnanoLC more rugged and reliable. The spread of splitter-less systemshas already begun and will continue. Such state-of-the-art instru-ments are very likely to dominate the market in the near future.During the purchase process of a nanoLC system it is recom-
mended to define the current and future needs carefully as it preventsfrom frustrations and from spending too much money for featuresand extras that are not needed in real life.Quite frequently, UV detection appears on the wish list, however, it
is very rarely used in practice as it contributes to additional andunwanted dead volumes and delay times and results in broaderpeaks. As nanoLC systems in proteomics are normally working atextreme sensitivity, UV detection will hardly detect any peak of inter-est as it far too insensitive to generate a useful UV chromatogram.In practice the most suitable nanoLC system consists of an auto-
sampler to allow unattended operation of a larger set of samples anda valve arrangement that provides the use of two alternating trap col-umns in order to optimize the time per analysis and productivity.Besides a gradient pump that generates the nano flow an additionalpump that facilitates the transfer of the sample from the autosampler

2.3 Liquid Chromatography Techniques and Applications in Proteome Analysis 187
to the trap column is strongly recommended. Real-time flow and gra-dient monitoring is absolutely essential.All nanoLC systems are small in flow rate, but some of them are
large in weight and footprint. A big and heavy cabinet is not necessa-rily a quality feature, rather than concealing outdated technology.From time to time, e.g. for troubleshooting or maintenance, thenanoLC system has to be disconnected from the mass spec andmoved away. In such cases a small light-weight with a low balancepoint is desired.Last, but not least, the nanoLC system of choice should be capable
of communicating with the control software of all major MS systemsaround, in order to maintain a smooth and seamless single-point con-trol of the entire nanoLC-MS system.
COFRADIC� In this “COmbined FRActional DIagonal Chromato-graphy” (COFRADIC�) approach, according to Gevaert et al. (2003),the complex peptide mixture of a tryptic digest of the protein sampleis first separated in reversed phase chromatographic run and col-lected in fractions. In every fraction a subset of peptides is modifiedby the use of a specific reaction, for instance by oxidizing the methio-nine-containing peptides with a H2O2 solution. The modified pep-tides show altered properties, when they are rerun in the same chro-matographic system, and elute at a different time than the unmodi-fied peptides. Only the modified peptides are further analyzed bymass spectrometry.
2.3.3Affinity Chromatography and LC-MS/MS
Increasing numbers of studies demonstrate that proteins involved incell mechanisms rarely act on their own, but in complexes of two ormore proteins. The yeast two-hybrid technology has enabled thedetection of interactions between two proteins (Fields and Song,1989) and the technology has been applied to the comprehensive ana-lysis of Saccharomyces cerevisiae (Uetz et al. 2000; Ito et al. 2001). Addi-tional method developments have enabled the efficient affinity basedisolation of multiple interactions and subsequent analysis of the pro-tein interactions by mass spectrometry (Neubauer et al. 1998; Rigautet al. 1999; Husi et al. 2000).
Gevaert K, Goethals M,Martens L, van Damme J,Staes A, Thomas, GR, Vande-kerckhove J. Nature Biotech-nology 21 (2003) 566–569.
Diagonal means using thesame physico-chemical propertyof a protein / peptide forseparation on the same mediawith a modification step of theanalyte in between (in contrastto orthogonal).
Fields S, Song O. Nature 340(1989) 245–246; Uetz et al.Nature 403 (2000) 623–627.
Ito et al. Proc Natl Acad SciUSA. 98 (2001) 459–474.
Neubauer G, King A, Rapp-silber J, Calvio C, Watson M,Ajuh P, Sleeman J, Lamond A,Mann M. Nature Genet 20(1998) 46–50.
Rigaut G, Shevchenko A, RutzB, Wilm M, Mann M, SeraphinB. Nature Biotechnol 17(1999) 1030–1032.
Husi H, Ward M, ChoudharyJS, Blackstock WP, GrantSGN. Nature Neurosci 3(2000) 661–669.
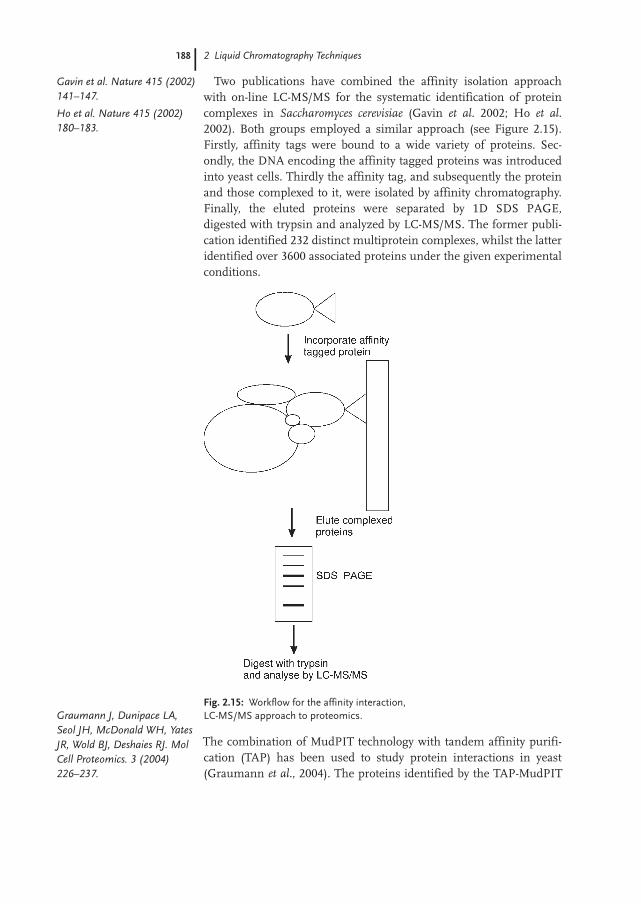
2 Liquid Chromatography Techniques188
Two publications have combined the affinity isolation approachwith on-line LC-MS/MS for the systematic identification of proteincomplexes in Saccharomyces cerevisiae (Gavin et al. 2002; Ho et al.2002). Both groups employed a similar approach (see Figure 2.15).Firstly, affinity tags were bound to a wide variety of proteins. Sec-ondly, the DNA encoding the affinity tagged proteins was introducedinto yeast cells. Thirdly the affinity tag, and subsequently the proteinand those complexed to it, were isolated by affinity chromatography.Finally, the eluted proteins were separated by 1D SDS PAGE,digested with trypsin and analyzed by LC-MS/MS. The former publi-cation identified 232 distinct multiprotein complexes, whilst the latteridentified over 3600 associated proteins under the given experimentalconditions.
Fig. 2.15: Workflow for the affinity interaction,LC-MS/MS approach to proteomics.
The combination of MudPIT technology with tandem affinity purifi-cation (TAP) has been used to study protein interactions in yeast(Graumann et al., 2004). The proteins identified by the TAP-MudPIT
Gavin et al. Nature 415 (2002)141–147.
Ho et al. Nature 415 (2002)180–183.
Graumann J, Dunipace LA,Seol JH, McDonald WH, YatesJR, Wold BJ, Deshaies RJ. MolCell Proteomics. 3 (2004)226–237.

2.3 Liquid Chromatography Techniques and Applications in Proteome Analysis 189
technique were involved in 102 previously known and 279 potentialphysical interactions.For some applications, it will be true that a 2DLC peptide separa-
tion is still insufficient to provide the resolution necessary for the MSanalysis. At this level of complexity, a tier of protein level separationis needed in addition to the peptide separation; this tier if oftenreferred to as protein pre-fractionation.For slightly complex samples with a total number of a few thou-
sand of proteins proteomics investigations can start directly at thedigested protein – peptide – level. However, if sample complexityexceeds a certain level, it is essential to start the separation on thebasis of intact proteins and not at peptide level alone.
2.3.4Protein Pre-fractionation
If sample complexity exceeds a certain level, it is essential to start theseparation at intact protein level.
& From recent studies we know that the complexityof a resulting peptide mixture after proteindigestion can be much higher (ten-fold) thanexpected, due to miscleavages, truncations, etc.
Presumably, after tryptic digestion of an average protein the peptidemixture does not only contain 60 but 600 peptides. For reasons ofcomprehensive planning it might be useful to make a rough calcula-tion in order to match sample amount, complexity and realisticallyexpected recovery with the general performance and sensitivity of theentire workflow, including the MS system in use.Random or specific protein and peptide losses during separation,
unavoidable intermediate steps and digestion have to be considered,too. For that reason it is essential to start the separation on the basisof whole proteins [protein pre-fractionation (PPF)] and not straight atpeptide level. If sample complexity exceeds a certain level, 2DLC(IEX/RPC) on peptide level is no longer sufficient. It becomes neces-sary to add more dimensions at protein level prior to digestion.A kind of resurgence of LC approaches is happening right now.
& Note: Starting at protein level offers theadvantage to correlate an identified peptidewith the intact protein with all its post-translational modifications or at least with thefraction where it has been collected.
Proteomics studies of complexsamples such as plasma/serumor cell tissue require an intelli-gent protein pre-fractionation.
This is very much in line withthe statement of a famouspioneer in proteomics whobelieves that the challenge inproteomics it is not the massspec rather than the chemistryand the separations.

2 Liquid Chromatography Techniques190
The first step in protein pre-fractionation can still be regarded as sam-ple preparation for the purpose of eliminating irrelevant proteinssuch as albumin and immuno-globulins and other high-abundancyproteins in plasma or serum where affinity chromatography is themethod of choice. The flow-through fraction is then subject to intelli-gent multidimensional protein pre-fractionation and sample de-com-plexification, while the remaining proteins on the column will bestored for other investigations or simply discarded during columnequilibration and cleaning.And that is going to require development of new technologies as
well as the refinement of already existing tools, like e.g. affinity chro-matography. It can be efficiently used to simplify protein samples byenriching subsets of the proteome such as phosphorylated proteinsby IMAC, glycoproteins on lectin columns, just to mention the mostfrequently used applications. In this case the retained proteins are ofmain interest and the flow-through fraction is less important butmight be stored for continuative investigations.Samples that do not contain any major contaminating proteins can
be processed directly. For reasons of simplicity and clarity the follow-ing explanations are covering two-dimensional separations only,which in practice will be relevant in most cases.
& Note: Too many steps can result in anunacceptable loss of proteins. In this case lesscan be more. As much separation as necessary,but as little as possible. Sticking to the “keep itsimple” rule can be a good advice and aconsideration for success.
See also Figure 6 on page 9.Even with the most sophisticated strategy, and the best analysis
techniques, it will – for the foreseeable future – not be possible to iso-late all proteins in a complex proteomics sample.In order to identify and characterize proteins present at very low
concentrations, it is inevitably to start with large sample amountsand/or volumes in order to assure their presence in sufficient concen-tration. One of the most exiting samples is probably blood. Dealingjust with complex samples is already difficult enough; however, if thecomposition of a sample is similar to plasma, the challenges areincreasing exponentially. About 90% of the amount of plasma pro-teins is albumin and IgG and just 25 high-abundant proteins repre-sent 99% of the total amount. The remaining thousands (or mil-lions?) of proteins are distributed over a huge concentration range(see Figure 2.16).
Post-translational modificationsare perhaps the largest frontierfor proteomics.
Sample complexity anddynamic range

2.3 Liquid Chromatography Techniques and Applications in Proteome Analysis 191
& Plasma is the largest and deepest version of thehuman proteome: Largest, i.e. most proteins(estimates range from >30,000 to >10,000,000).Deepest, i.e. widest dynamic range (>109). Seepaper by Anderson and Anderson (2002).
Fig. 2.16: The analogy with an iceberg illustrates the challenges inproteomics in terms of sensitivity and dynamic range. In order todetect a biomarker present at a concentration of 1 fmol/L, theoreticallya sample volume of 1L is required, if the LOD of the MS equipmentis 1fmol.
Currently there is research ongoing for developing strategies on howto tackle this demanding dynamic range and sensitivity challenge.Key to this task is to get rid of as many of the low-interest high-
abundant proteins as possible (tip of the iceberg), without losing toomany of the free low-abundant proteins and those bound to carrierproteins like e.g. albumin. High-abundant protein affinity depletionfollowed by a 2DLC (IEX, RPC) strategy on protein level as describedfurther down seems to be the most promising approach. As much aspossible a sample load combined with high-recovery/low-loss separa-tion steps and a high-sensitivity mass spectrometer are essential pre-requisites for the successful deciphering of at least parts of thehuman plasma proteome.A simple calculation may help to highlight the current limits and
limitations. Let us assume that a state-of-the-art mass spectrometercan routinely operate at the low femtomole level. If you start with1 milliliter of sample you theoretically can come to the 10–12 mmol/L
Anderson NL, Anderson NG.Mol Cell Proteomics 1 (2002)845–867.

2 Liquid Chromatography Techniques192
range in the iceberg picture, providing a 100% recovery, which is veryunlikely, since complex separations cannot be performed quantita-tively. Although this is a question of simple mathematics, it is notalways appreciated. A possible solution might be to apply more sam-ple, if possible or available, or improve techniques, methods, andskills in order to attack the atto- or even zeptomolar range. Suchresults are published these days and achievable by the top researchlabs of the world.Theoretically, applying 1 L of serum or a zeptomolar sensitivity
mass spec, or better both, would provide the desired performance of a12 to 15 orders of magnitude dynamic range.LC-MS manufactures claim that the combination of nanoLC and
nanoESI at peptide level covers a dynamic range of 104 (see Figure2.17). A typical peak volume at this scale is ideally in the range of100 nL. Closing the gap with the desired dynamic range is only possi-ble if more sample can be acquired at the very beginning and concen-trated in an intelligently designed workflow with high recovery. Themore we (can) load, the more we see.
Fig. 2.17: Expanding the overall dynamic range by increasingthe initial sample load.
The HUPO organization currently promotes a series of differentinitiatives to work on the proteomes of plasma (discussed above),brain, liver, and more are expected to follow soon. For all these com-plex samples in principle – with specific and dedicated sample pre-paration – very similar strategies can be applied. A schematic generalworkflow is shown in Figure 2.18.

2.3 Liquid Chromatography Techniques and Applications in Proteome Analysis 193
Fig. 2.18: Schematic flow diagram showing the separationsteps on protein and peptide level.
Peak capacities and separation performance in proteinpre-fractionation
& Today, even with the most sophisticated tools andintelligent separation strategies it is impossible toachieve high purity for each protein in aproteomics sample.
Human plasma consists of at least some 100,000 proteins, post trans-lational modifications, splice variants and isoforms not yet included.A pre-fractionation into 1,000 fractions still results in more than 100proteins per fraction in average, but each single fraction probablysimple enough to be identified and characterized after digestion bypeptide 2DLC-MS. Literature reports of capacities for just 1D RPC of200 to 500 peaks; however, in practice under normal lab conditions
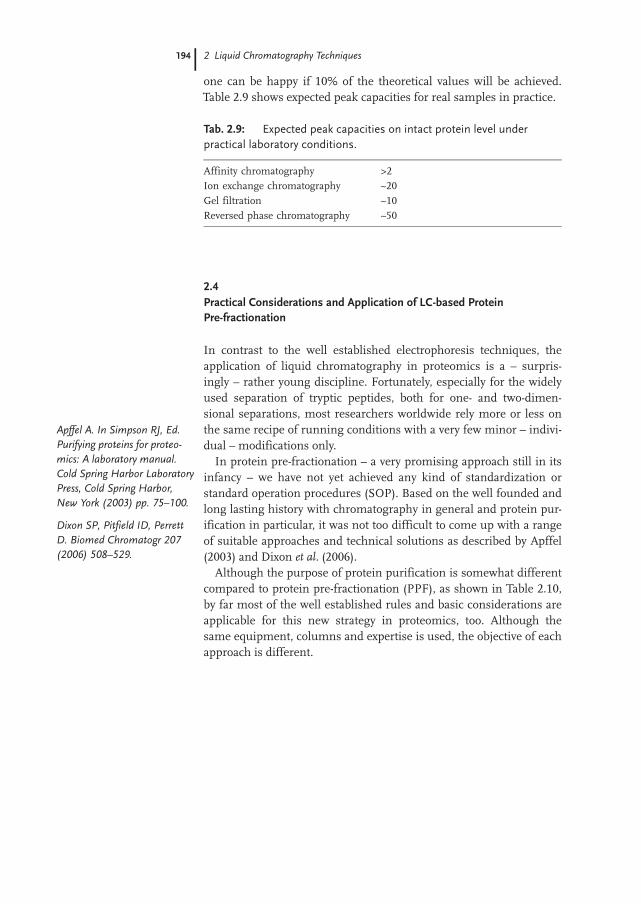
2 Liquid Chromatography Techniques194
one can be happy if 10% of the theoretical values will be achieved.Table 2.9 shows expected peak capacities for real samples in practice.
Tab. 2.9: Expected peak capacities on intact protein level underpractical laboratory conditions.
Affinity chromatography >2
Ion exchange chromatography ~20
Gel filtration ~10
Reversed phase chromatography ~50
2.4Practical Considerations and Application of LC-based ProteinPre-fractionation
In contrast to the well established electrophoresis techniques, theapplication of liquid chromatography in proteomics is a – surpris-ingly – rather young discipline. Fortunately, especially for the widelyused separation of tryptic peptides, both for one- and two-dimen-sional separations, most researchers worldwide rely more or less onthe same recipe of running conditions with a very few minor – indivi-dual – modifications only.In protein pre-fractionation – a very promising approach still in its
infancy – we have not yet achieved any kind of standardization orstandard operation procedures (SOP). Based on the well founded andlong lasting history with chromatography in general and protein pur-ification in particular, it was not too difficult to come up with a rangeof suitable approaches and technical solutions as described by Apffel(2003) and Dixon et al. (2006).Although the purpose of protein purification is somewhat different
compared to protein pre-fractionation (PPF), as shown in Table 2.10,by far most of the well established rules and basic considerations areapplicable for this new strategy in proteomics, too. Although thesame equipment, columns and expertise is used, the objective of eachapproach is different.
Apffel A. In Simpson RJ, Ed.Purifying proteins for proteo-mics: A laboratory manual.Cold Spring Harbor LaboratoryPress, Cold Spring Harbor,New York (2003) pp. 75–100.
Dixon SP, Pitfield ID, PerrettD. Biomed Chromatogr 207(2006) 508–529.

2.4 Practical Considerations and Application of LC-based Protein Pre-fractionation 195
Tab. 2.10: The differences between protein purification and pre-fractionation.
Protein purification „ protein pre-fractionation
The aim of protein purification is toobtain a single fraction with a singlepure protein for continuative studies.
The protein pre-fractionation procedurein proteomics results in very manyfractions with each still containing tensto hundreds of proteins
During the purification process thenumber of target protein containingfractions decreases.
During the pre-fractionation process thenumber of fractions increases exponen-tially.
The fractions containing contaminantproteins are discarded.
All fractions are of the same high value.
Knowing that within the next future a lot of new and probably evenmore successful approaches will enter the scene, this section willonly cover one protein pre-fractionation workflow as a typical exam-ple. This universal two-dimensional workflow combines ion-exchangewith reversed phase chromatography (see Figure 2.19). With someindividual modifications only, it can be used for a variety of samples.
Fig. 2.19: Schematics of the protein part of the LC-basedproteome analysis workflow.

2 Liquid Chromatography Techniques196
2.4.1Sample Extraction and Preparation
In principle exactly the same methods for sample preparation asdescribed in Section 1.5.1 can be applied. As liquid chromatographydeals with UV detection the purity requirements for the reagents canbe significantly higher compared to electrophoresis.
& Note: Very hydrophobic proteins, e.g. membraneproteins, are not solubilized with this type ofbuffers and are thus not accessible with themethods described below.
2.4.1.1 Plasma, Serum, CSF, and other Body Fluids
A special sample preparation step for the removal of the highest-abundant proteins is required in most of the cases. Such a depletionstep can be performed by applying immuno-affinity techniques.Despite its unique selectivity immuno-affinity chromatography doesnot meet the requirements for loading capacity or economy. Just afew microliters of plasma can be loaded and the running costs arehigh. In addition, caused by unavoidable leaking effects, smallamounts of antibodies can be released into the elution buffer thatmight result in ambiguous protein identification further downstreamin the workflow.Recently, a hypothesis is under discussion that claims that the low-
molecular-weight region of the blood proteome, which is a mixture ofsmall intact proteins plus fragments of the large proteins, representsall classes of proteins. As stated by Liotta et al. (2003) and Tirumalaiet al. (2003) this fraction is expected to be the ideal source for biomar-ker discovery.Such an approach, described by Tanaka et al. (2006), suggests to
cut-off the high-molecular-weight and concentrate the low-molecular-weight proteins by dedicated membrane or hollow-fiber devices andto continue the analysis with the low-molecular-weight fraction only.Another remarkable paper by Wagner et al. (2002) describes the
application of protein mapping of biological samples of humanhemofiltrate for the analysis of proteins and peptides with a molecu-lar weight below 20 kDa.Once the sample has been extracted and prepared in a suitable way,
a two-dimensional protein pre-fractionation – ion-exchange chroma-tography in combination with reversed phase chromatography – willfollow.
Liotta LA, Ferrari M, PetricoinE. Clinical proteomics: writtenin blood. Nature 425 (2003)905.
Tirumalai RS, Chan KC, PrietoDA, Issaq HJ, Conrads TP,Veenstra TD. Mol Cell Proteo-mics 2 (2003) 1096–1103.
Tanaka Y, Akiyama H, Kuroda1T, Jung G, Tanahashi K, SugayaH, Utsumi J, Kawasaki H,Hirano H. Proteomics 6(2006) 4845–4855.
Wagner K, Miliotis T, Marko-Varga G, Bischoff R, Unger KK.Anal Chem 74 (2002) 809–820.

2.4 Practical Considerations and Application of LC-based Protein Pre-fractionation 197
& Before starting with the most valuable anddifficult sample it is strongly recommended tolearn and establish the new method in thelaboratory by using a well known simple standardsample first. This period can take or save severalweeks and months but is a basic prerequisite forthe application of each new technique.
2.4.2Experimental Setup
2.4.2.1 Scale of Operation
As mentioned earlier in Section 2.2 it is advantageous to start with ahigher initial amount of protein in order to extend the overalldynamic range, enable access to lower-abundant proteins and last butnot least to compensate for the inevitable losses in each of the indivi-dual steps in the entire workflow until the sample finally enters themass spectrometer.Protein pre-fractionation as described here permits the separation
of initial sample loads between » 100 mg and » 100 mg of protein.Protein pre-fractionation at an even higher, industrial scale has beenreported.
2.4.2.2 Type of Instrumentation
In principle any kind of biocompatible HPLC system equipped with afraction collector can be used to perform protein pre-fractionation.However, for the efficient separation of proteins and peptides it isvery often necessary to use buffers with high salt concentrations atvery acidic or basic pH that are extremely corrosive to stainless steelcomponents which are commonly used in conventional HPLC equip-ment. Besides contaminating the sample with corrosion productsthat are released from the metal surfaces it may also result in a mod-ifications of the proteins and finally in increased maintenance andreplacement costs for the instrumentation.
& It is recommended to use a dedicatedbiocompatible, high-performance bio moleculeseparation system. Such systems have acompletely bio-inert flow path and can withstandthe even most aggressive buffers, solvents andhigh salt concentrations (like 8 mol/L urea).
Rose K, et al. Proteomics 2004,4, 2125–2150.
Conventional HPLC systemsare intended for small moleculeanalytical rather than bio mole-cule preparative use.

2 Liquid Chromatography Techniques198
For convenience and ease-of-use the fraction collector should be com-patible with all different kind of vessels including microtiter plates.�KTA� and Ettan� LC have proven to be suitable for protein pre-
fractionation and can be recommended without any restriction orlimitation.
2.4.2.3 Choice of Chromatography Column
The number of HPLC columns on the market is huge and unma-nageable. It is recommended to use columns that have proven to per-form well for protein separations. Except for RPC it is essential thatthe columns are made of biocompatible material such as glass,PEEK� or other suitable plastic material.
& Packing material that is based on silica is notrecommended as it is unstable at pH above 7.5. Inorder to avoid cross-contamination from onesample to another the column must survive acleaning-in-place (CIP) process, i.e. the columnmust tolerate wash steps with 1 mol/L NaOH orHCl. A column packed with porous polymer basedmaterial is recommended.
Non-porous (NPS) columns show superior resolution but offer onlylow loading capacity. Besides a good separation performance proteinrecovery is a key feature.
2.4.2.4 Monitoring Each Separation Step, Monitoring Each Dimension
In general, but especially during the method development process itis beneficial to monitor progress and performance of each proteinpre-fractionation step by analyzing each, or representative fractionsby SDS electrophoresis, and – if appropriate or necessary – optimizethe procedure, as outlined in the poster of K. Marcus et al. (2005).
2.4.3Ion Exchange Chromatography and Protein Pre-fractionation
An ideal technique to deal with samples of crude protein extracts –small to large amounts or volumes, native, denaturing or reducingconditions – is ion exchange chromatography. This technique can beoperated at any scale, from micro to macro scale. Due to its adsorptivemode diluted protein solutions can be concentrated and separatedwith high resolution in less than an hour. Its ease of use and its logi-
Good batch-to-batch reproduci-bility and long-term availabilityis best with big and well estab-lished manufactures.
K. Marcus, et al. “A novelapproach towards differentialproteomics with multidimen-sional intact protein prefractio-nation of brain samples” Posterat the HUPO 4th AnnualWorld Congress Munich(2005).

2.4 Practical Considerations and Application of LC-based Protein Pre-fractionation 199
cal, directly adaptable theory made IEX the most widely used techni-que for protein separations.In order to benefit from the concentration effect all proteins should
bind to the column. In theory this can be achieved by loading thesample at very low pH (e.g. glycine/HCl buffer) to a cation, or at veryhigh pH (e.g. piperidine/HCl buffer) to an anion exchange column.However, these extreme pH conditions are not compatible with pro-tein stability. Physiological pH or slightly basic conditions (Tris/HClbuffer) are more favorable conditions for high protein recovery.In cases, where AIEX does not give satisfying results, or in the tan-
dem IEX approach, see below in Figure 2.20, the application of CIEXshould be considered.Recently, another technique based on charge, or more precisely, on
isoelectric point (IEP, or pI) had its renaissance in the area of proteinpre-fractionation: chromatofocusing (CF). CF can be regarded as theLC analogue to isoelectric focusing in electrophoresis, however, with-out achieving its separation performance. Although the theory is veryconvincing, in practice this technique is suffering from a veryrestricted pH range, protein precipitation at the isoelectric point,high running costs and the necessity to remove the pH gradientcreating ampholytic reagents (Polybuffer) after the separation. It isquite unlikely that CF will have a major breakthrough in the nearfuture.
Fig. 2.20: Potential operating area for charge- and pI-based proteinseparation (theoretical spot map modified from Link et al. 1997).
Experience from severaldecades indicates that anionexchange chromatography isthe first choice for the separa-tion of intact proteins.
In general anion-exchange-chromatography is the firstchoice for the separation ofintact proteins.
Link AJ, Robison K, ChurchGM. Electrophoresis 18 (1997)1259–1313.

2 Liquid Chromatography Techniques200
2.4.3.1 IEX under Denaturing Conditions
As the most efficient sample extraction takes place under denaturingconditions it is a natural choice to maintain these conditions also dur-ing ion-exchange chromatography. Inter and intra protein interac-tions are widely suppressed and solubility of proteins is improved.The addition of protein inhibitors reduces protease activities andmaintains the integrity of the sample. Low percentages of organicmodifier (e.g. 6% propanol-2) or the presence of DTTmight be advan-tageous (Wiegand et al. 2002). Ion exchange chromatography (IEX) isthe natural choice for the first dimension in protein pre-fractionation.Figure 2.21 illustrates the schematic flow path for the IEX separation.
Fig. 2.21: IEX (first dimension) flow path with single sample injection.
Even small IEX columns have a significant loading capacity for highprotein amounts in the range of 5–10 mg/mL for best possible perfor-mance. The volume loading capacity in principle is unlimited, i.e.even large volumes of 100 mL and more of diluted sample can beapplied.Applications of high sample volumes, of samples with high protein
concentrations or samples with high viscosity have to be handledwith care.
& During sample introduction it is recommended toconsiderably reduce the flow rate in order not toexceed the pressure limit of the column.
The adsorbed proteins are eluted from the column with an ascendingsalt gradient and collected in a fraction collector. A fraction size
Wiegand G, Parbel A, SeifertMHJ, Holak TA, Reuter W. EurJ Biochem 269 (2002) 5046–5055.
IEX is a retentive techniquewhere proteins can be effec-tively concentrated.

2.4 Practical Considerations and Application of LC-based Protein Pre-fractionation 201
approximately three times the base peak width of a typical proteinpeak is a good initial setting.
& Try the following setup, before wasting time withbuffer development or column testing.
ColumnsRESOURCE� Q 1 mL (strong anion exchanger, SAX);or Mono Q� 5/5, slightly better resolution;or Mini Q� 4.6/5.
Buffer compositionA: 20 mmol/l Tris, 8 mol/L urea, 6% (v/v) propanol-2, pH 8.5
(HCl).B: 20 mmol/L Tris, 8 mol/L urea, 6% (v/v) propanol-2, 1 mol/L
NaCl, pH 8.5 (HCl).Degas both buffers prior to use.As it is recommended to use denaturing conditions for protein
extraction, it is natural and good practice that the consecutive stepalso takes place in the presence of chaotropic agents. In contrast toelectrophoresis thiourea is not suitable in chromatography, because itmakes UV detection troublesome. The use of propanol-2 as an addi-tive is intended to eliminate unspecific interactions between station-ary phase and hydrophobic proteins and maintains its solubility.The flow-through fraction, before the gradient starts, contains (the-
oretically) the basic proteins with a pI > 8.5. Although they do notbind to the column they are not lost and will be transferred as all theother fractions to the next dimension.
2.4.3.2 The Tandem IEX Approach
Depending on the origin and composition of the sample the distribu-tion between acidic, neutral and basic proteins can differ consider-ably. In order to obtain a preferably even pI distribution of proteins inthe different fractions it might be beneficial to apply the tandemarrangement of anion- and cation-exchanger. At a given pH, e.g. 8.5,negatively charged proteins, anions, bind to the anion-exchanger,while the other proteins will pass the column with no interaction.While the adsorbed proteins will be concentrated the other proteinsin the flow-through fraction are even more diluted than before sam-ple application. By connecting an additional cation-exchanger afterthe anion-exchanger all proteins, also the positively charged cationswill be adsorbed. Only the species with a net charge of zero, i.e. witha pI equal or near the pH of the buffer, will not bind to either col-umn.
Cost effective, try this first.
The industry standard.
Highest possible resolution forsmall sample amounts.
Dissolving urea in water takes along time; a heated magneticstirrer may help to acceleratethis job.
No filtering throughmembranes due to the risk ofintroducing PEG into thesample.Prepare fresh at least once aweek.
With this approach most of theproteins will be adsorbed andconcentrated, and the numberof proteins in the flow-throughfraction will be significantlyreduced.

2 Liquid Chromatography Techniques202
In principle every suitable HPLC system, preferably bio-inert, thatis capable to control two additional pressure- or motor-actuated six-port Rheodyne�- or Valco�-valves, can be used. Figure 2.22 illustratesthe schematic flow path.In general, there is no need for an autosampler for the first dimen-
sion, as in IEX only one sample can be run at a time (a third INVvalve will be needed if the autosampler is skipped). It is more impor-tant to cover a wide dynamic range of injection volumes and to becapable of introducing higher volumes (£150 mL) of diluted proteinextracts.
Fig. 2.22: Tandem IEX (first dimension).Step 1: Sample injection – loading on stacked SAX/SCX columns.
During sample injection both IEX columns are connected in series.In principle the order of columns does not matter. However, as thetandem column approach is derived from the single column SAX lay-out, the SCX column is installed after the SAX column. As it is notpossible, or at least not so easy to compose a buffer that is equallygood for both modes, it has proven to be acceptable to take the samebuffer as for the SAX column, knowing that it is sub-optimal for theSCX column. After a sufficient long wash period, until both UV andconductivity have leveled out, both columns will be separated fromeach other by the switching of valve 2 (see Figure 2.23).
The flow path, as outlinedbelow, has been developed onEttan LC controlled byUNICORN� software.

2.4 Practical Considerations and Application of LC-based Protein Pre-fractionation 203
Fig. 2.23: Tandem IEX (1st dimension). Step 2: SAX gradient elution.
Now, only the SAX column is in the flow path, while the SCX columnis “parking” in a stand-by position.In order to achieve a good separation and a minimum of band
broadening at a comparably low flow rate and a shallow salt gradientwill be applied and the eluting proteins are collected preferably inmicro-titer plates, which are directly compatible with the autosamplerfor the consecutive 2nd dimension RPC separation. After a full cycle,including washing, regeneration and re-equilibration, until both UVand conductivity have leveled out again, both valves switch and con-nect the SCX column in the flow path, while the SAX columnremains in a parking position (see Figure 2.24).Now, the SCX column is in the flow path, while the SAX column is
idling in a stand-by position. The same gradient as for the SAX col-umn will be applied and the eluting proteins are collected in the frac-tion collector. When the cycle is completed, before another samplecan be loaded, it is recommended to remove remaining proteins andcontaminants from the system and the columns by washing accord-ing to the data sheet supplied with the columns. After washing outthe cleaning reagents quantitatively the system is ready for the nextsample. Figure 2.25 shows two typical chromatograms.
Best separation at a minimumof band broadening is achievedat comparably low flow rateand a shallow gradient.

2 Liquid Chromatography Techniques204
Fig. 2.24: Tandem IEX (1st dimension). Step 3: SCX gradient elution.
Fig. 2.25: Elution profile of the SAX and SCX column, using a10 mg sample of E. coli in 8 mol/L urea. Please note the goodrepresentation of the expected theoretical ratio between acidicand basic proteins in the two chromatograms.
In order to cope with the desired productivity it is convenient to haveone system dedicated to the first dimension IEX and another systemwith for the 2nd dimension RPC separation. Both systems can easilybe controlled from the same computer.

2.4 Practical Considerations and Application of LC-based Protein Pre-fractionation 205
2.4.4Reversed Phase Chromatography and Protein Pre-fractionation
Fundamental information on this topic can be found in a chapter byCarr and Moritz in the laboratory manual edited by Richard Simpson(2003).Reversed phase chromatography is the ideal subsequent step for
any technique that release samples with a high salt concentration,such as the fractions that have been processed by ion exchange chro-matography before. The early eluting peaks (flow-through) containno or very little salt, whereas the late eluting peaks contain typicallyup to 500 mmol/L NaCl (or more) and all together huge amounts ofurea.All the very hydrophilic, inorganic buffer constituents as well as
the urea do not interact with the stationary phase and pass throughthe column, while the proteins of interest bind to the column – espe-cially under aqueous, acidic conditions – and get concentrated againin a sharp narrow zone on the top of the column. In contrast to theseparation mechanism of peptides on an RPC column, which isbelieved to be a mixed mode between partition and adsorption phe-nomena, proteins behave more in a “digital” on/off mode, where des-orption just takes place in a very narrow range of organic modifierpresent. This observation implies that column length does not reallymatter.In practice there is no significant difference in resolution between
a 150 and a 50 mm column.In addition to shorter separation times also the washing and re-
equilibration periods can be minimized in order to achieve a betteroverall throughput. Furthermore, the exposure time of proteins withthe stationary phase is shorter, which also yields in a better recovery.In general, the life time of RPC columns in protein pre-fractiona-
tion is fairly high. This might be due to the fact that the sample hasalready passed the IEX column(s) in the first dimension whereunwanted contaminations and impurities have been removed.Ideally, the trap column is packed with exactly the same RPC media
as the separation column and has the same inner diameter (i.d.), butcan be much shorter (£ 5 mm). Figure 2.26 shows the flow path of asystem that can process all the fractions from a previous IEX or tan-dem run in a fully automated and unattended way. After RP desaltingand separation the fractions are collected preferably in microtiterplates, ready for lyophilization or evaporation and tryptic digestion.In principle every suitable HPLC system, preferably bio-inert or
bio-compatible, that is equipped with an autosampler, fraction collec-tor and capable to control two additional pressure- or motor-actuatedsix-port Rheodyne- or Valco-valves can be used. The detailed flow
Carr CD, Moritz RL. inSimpson RJ, Ed. Purifyingproteins for proteomics: Alaboratory manual. Cold SpringHarbor Laboratory Press, ColdSpring Harbor, New York(2003) pp 179–208.
An RPC column deals withsuch samples in a perfect dualway, the combination ofdesalting and high-performanceseparation.
For protein pre-fractionation itis recommended to select theshortest column available.
The installation of a so calledtrap column on top of theseparation column can furtherextend the life time and robust-ness of the whole setup.

2 Liquid Chromatography Techniques206
path diagrams as outlined below have been operated on Ettan LC con-trolled by UNICORN.During step 1 the pump is pumping acidic eluent A that contains
no organic modifier through the sample loop of the autosampler(A-905) to the trap column. The proteins bind to the top of the col-umn while salts and urea pass through the column via the conductiv-ity monitor to waste (W). The conductivity signal confirms to theoperator whether the desalting process was successful (or not). Inthis constellation the RPC separation column is by-passed.
Fig. 2.26: RPC (2nd dimension). Step 1: Sample loading and desalting.
During step 2 (see Figure 2.27) both valves switch to the next positionand after a short, but sufficient wash period the gradient elutionstarts in order to desorb the proteins. Now the trap column is flownthrough in reverse direction, i.e. the proteins are transported on theshortest possible way – with a minimum of band broadening – to theconnected separation column followed by the UV monitor and thefraction collector. In order to minimize the gradient delay volumeand to get shortest possible cycle times from sample injection to sam-ple injection, the whole autosampler with the sample loop is by-passed.After washing and re-equilibration the system switches back to
position 1 and the next cycle can start again and again until all theIEX fractions have been desalted, separated by RPC and collected(typical examples are shown in Figure 2.28.

2.4 Practical Considerations and Application of LC-based Protein Pre-fractionation 207
Fig. 2.27: RPC (2nd dimension). Step 2: Sample elution – reversed flow.
Fig. 2.28: A: Stitched SAX/SCX chromatograms.B: Typical RPC chromatogram of the SAX/SCX flow-through fraction.The flow-through fraction is a pool from six consecutive injections of atotal of 10 mg of E. coli lysate.C: typical RPC chromatogram of SAX fraction no. 3,same conditions as B.D: typical RPC chromatogram of SCX fraction no. 5,same conditions as B.RPC columns: BioBasic4, 1�100 mm, trap column, 1�10 mm,flow rate 40 mL/min, gradient 25%B to 75%B in 84 min(blue: 280 nm; magenta: 214 nm).
Please note the excellent peakshape and resolution of thisintact protein RPC separation.From: Hoepker HR, Renlund S,Edblad N, Wadensten H,Mascher E, �strçm, Fenyç D.Protein pre-fractionation:Passing phase or forward-looking approach? HUPO 4thAnnual World Congress,Munich (2005).

2 Liquid Chromatography Techniques208
Although high-performance columns and media should be preferred,an acceptable compromise between resolution and recovery shouldbe envisaged.There is some evidence that polymer based resins, especially
macro-porous resins, offer superior recovery – compared with wide-pore silica based stationary phases – in combination with a fairlygood separation power and resolution. Furthermore, polymer-basedcolumns are resistant to very extreme pH values, a prerequisite forefficient column cleaning in order to avoid unwanted memory effectscaused by sticky contaminations between the different samples.Recently, very impressive protein separations on monolytic col-
umns were published. Peak shapes are extremely narrow and runtimes are short. Up to now there are no long term data about life-times and recoveries available; loadability normally is (too) low for theapplication of protein pre-fractionation, where a reasonable loadingcapacity is required.
Columns The following columns have been used successfully andcan be recommended:
. RESOURCE RPC 1 ml (desalting/trap column);
. RESOURCE RPC 6 ml (separation column);
. SOURCE 5RPC, 4.6 , with custom-packed trapcolumns;
. BioBasic� 4, available in 1.0, 2.1 and 4.6 mmi.d., including trap columns.
& If, no stationary phase with exactly the sameselectivity is available for custom-packed trapcolumns, it might be beneficial to have a trapcolumn with slightly higher retentioncharacteristics.
Although, not specifically tested for the purpose of protein pre-frac-tionation columns from other manufacturers like GRACE-Vydac,Agilent, Merck, Dionex, etc. are also suitable.In the column market, especially for RPC, the offering is over-
whelming. If in doubt what product to buy, or before spending/wast-ing valuable time for column testing it is recommended to screen theliterature; or – even better – ask an experienced colleague in yourneighborhood for good advice.
Eluent compositionA: 0.065% (v/v) TFA, sequential grade, in water.B: 0.050% (v/v) TFA, sequential grade, in 84% (v/v) acetonitrile and
16% water.
In protein pre-fractionationrecovery should have a higherpriority than resolution.
For micro-scale protein separa-tions monolytic columns mightbe a promising alternative.
Cost-effective, try this combina-tion first.
Same selectivity as RESOURCERPC, resolution comparable tosilica-based material.
Excellent resolution, suspect toreduced recovery.
Prepare fresh at least once aweek.
These eluents will provide asmooth and stable baselineeven at low wavelengths (210to 220 nm) and high sensitivity.

2.4 Practical Considerations and Application of LC-based Protein Pre-fractionation 209
& Note: 84% acetonitrile in water is an azeotropicmixture, i.e. if this mixture evaporates, e.g. insummer in a non-air conditioned laboratory, thecomposition of the mixture remains widelyunchanged (Handbook of Chemistry and Physics1997).
Column dimensions and loading capacity With complex samplessuch as proteins from cell cultures, tissues or even plasma it isimpossible to separate all the proteins. However, it is essential thatindividual proteins are not spread over too many fractions. Keepingthe overlap small is of paramount importance, i.e. it is required toperform the chromatography under high-resolution conditions inorder to avoid peak broadening and distribution of proteins over toomany fractions. According to a simulation it can be achieved thatunder ideal conditions an individual protein is present in not morethan three adjoining fractions.In order to be able to publish large numbers, many column manu-
facturers specify loading capacities as dynamic loading capacity for asingle standard protein. Under such conditions the column is com-pletely filled with protein. However, such data are not at all useful forhigh-performance separations, where overloading must be avoided.For example, although dynamic capacity is very high (e.g.
10 mg/ml for albumin to 50 mg/ml for insulin) these figures are oflimited use for high-resolution conditions. As a rule of thumb, load-ing capacity under high-resolution conditions is at least ten timeslower than the dynamic capacity.When increasing amounts of protein are loaded on an RPC col-
umn, the peak width remains nearly constant. After a certain pointpeak width and asymmetry start to increase and retention timesbecome shorter. The loading limit of a column is normally defined asthe maximum amount of sample that can be chromatographed withnot more than 10% increase in peak width. This point is called the“overload point”. In practice the overload point will vary for differentsamples. If the peaks are distributed over the effective elution rangeof the gradient, more sample material can be injected, and each peakmay have a similar loading capacity compared to standard proteins.While the effective elution range of the gradient reaches for pro-
teins between 25 to 75% of organic modifier only, the effective peakcapacity per column is finite.Carried forward to the application area of protein pre-fractionation
the following practical loading capacities, as shown in Table 2.11, canbe expected. It can be assumed that the capacity for multi-peak sam-ples is higher.
Handbook of Chemistry andPhysics, 78th edition, Lide DR(Ed. in chief ) CRC press, BocaRaton, Florida (1997).
Serious manufactures givefigures for the practical loadingcapacity which often is just10% of the theoretical capa-city.
The higher the molecular massof a protein, the lower thecapacity.

2 Liquid Chromatography Techniques210
Tab. 2.11: Examples of loading capacities fordifferent columns diameters.
Column i.d. Practical loading capacity
6.4 mm 200–400 mg4.6 mm 100–200 mg2.1 mm 20–40 mg1.0 mm 4–8 mg
Because – for protein RPC – the loading capacity under high-reso-lution conditions is not a function of the column volume, it is neces-sary to increase the column diameter, if more loading capacity isrequired.
2.4.5Fraction Size and Number of Fractions
Ideally a biological sample is pre-fractionated in such a way that eachfraction contains only one protein and that each protein is present inone fraction only. Although practically not at all achievable, thiswould lead to as many fractions as proteins, far too much to managefor a complex biological sample with tens to hundreds of thousandsof proteins.However, it is feasible to aim for the presence of any given protein
in not more than two fractions with a negligible overlap to the pre-vious and subsequent fractions. An ideal chromatographic peak, asshown in Figure 2.29, has a certain width at the base and at halfheight that can be expressed in time or volume and can be calculatedand printed by state-of-the-art LC evaluation software packages.For IEX this calculation results in some ten fractions: fraction 1 to
collect the flow-through of the unbound proteins, fraction 2 to 9 dur-ing gradient elution and fraction 10 while washing down the remain-ing proteins with high salt concentration.In RPC, with its sharper peaks, some fifteen to twenty fractions
will be sufficient.By applying the recommendations from the introduction in Section
2.2 – ideally 30 to 300 proteins per sample (=fraction) – a sample withsome 100,000 proteins would require approximately 300 to 400 frac-tions, which is well in-line with the performance of the LC techniquesand the equipment used in protein pre-fractionation.Naturally, less complex samples like yeast or E. coli with 4,000 to
6,000 proteins require a lower degree of protein pre-fractionation.
GraceVydac, The Handbook ofAnalysis and Purification ofPeptides and Proteins byReversed-Phase HPLC, 3rd edn(2002).
Decreasing the fraction sizefurther, results in too manyfractions, and an enormoussuccessive workload withoutany tangible benefit.

2.5 Critical Review and Outlook 211
Fig. 2.29: In order to estimate the optimal fraction size for a proteinpre-fractionation experiment a fraction size of twice to three times thepeak width at half height can be recommended. If the apex of a peak isin the middle of a fraction, this fraction contains almost the entire peakvolume. If a fraction change occurs at the peak maximum the peak issplit in equal parts in not more than two fractions.
2.5Critical Review and Outlook
An internal comparison run with an E. coli sample (unpublisheddata, work still in progress) has disclosed that identification rates andsequence coverage raises significantly when using protein pre-fractio-nation rather than applying shotgun approaches at peptide level only.A preliminary interpolation claims that a complete analysis of all frac-tions would give in the order of 2,000 identified proteins, a figurematching the entire E. coli proteome.Furthermore, protein pre-fractionation has additional benefits:
. Subdivides complex protein mixtures into man-ageable fractions;
. Offers a wide dynamic range ;
. Low mg to high mg initial sample load;
. Very small to very large sample volumes;
. Maintains the correlation between intact parentproteins and their tryptic peptides;

2 Liquid Chromatography Techniques212
. Facilitates convenient up-scaling of individualfractions if more material is required, e.g. forbiomarker discovery;
. Generates more and more confident proteinidentification.
A sample that has undergone protein pre-fractionation, generallydoes not require – after tryptic digestion – another multi-dimensionalseparation at peptide level. Typically, a high-resolution one-dimen-sional nanoRPC separation, followed by MSn analysis, will be themethod of choice. Figure 2.30 illustrates such a workflow.
Fig. 2.30: Complete LC-based workflow after the sample hasundergone a substantial de-complexification at protein level.
In the middle of the nineties of the last century there was hype forhigh-throughput approaches in proteome analysis. Now, some tenyears later the success stories are still quite rare. Obviously, the chal-lenges and requirements for meaningful proteomics have beenunderestimated. It seems as if there are no quick achievements insight. However, time was not wasted as scientists have characterized

2.5 Critical Review and Outlook 213
and cataloged thousands of proteins in data bases, strong and undis-putable foundations for the future work in proteomics.The extra workload associated with running multiple replicates of
protein and peptide separations – electrophoresis or chromatography– has not always been appreciated. However, recently several paperscan be found, which are requesting and proposing pre-fractionationstrategies and techniques in order to cope with the enormous com-plexity of human samples for the deciphering of significant biomar-kers; for instance the publications by Righetti et al., Guerrier et al.,Wang and Hanash (all from 2005).The strategies and application examples as outlined in the chapter
above, if performed properly, are somewhat more time consumingcompared to traditional concepts. It has proven that “quick and dirty”approaches can only give access to the “low hanging fruit”. From arational and logical standpoint it appears more likely that more intel-ligent sample preparation methods as e.g. protein pre-fractionationwill fractionate and de-complexify samples to such an extent that con-secutive separation- and detection-devices will be enabled to analyzethe sample to the desired level. (This will – of course – require a cer-tain amount of time and work effort.)
Righetti PG, Castagna A, Anto-nioli P, Boschetti E. Electro-phoresis 26 (2005) 297–319.
Guerrier L, Lomas L, BoschettiE. J Chromatogr. 1073 (2005)25–33.
Wang H, Hanash S. Mass SpecReviews 24 (2005) 413– 426.


215
3Mass Spectrometry
This section discusses the use of mass spectrometry (MS) for proteo-mics applications; protein identification, characterization and quanti-fication. The section addresses key parameters for protein identifica-tion and the systems available to perform the listed applications.As explained in previous chapters, large format two-dimensional
gel electrophoresis enables the resolution of several thousand pro-teins in a reproducible fashion in a relatively short period of time.The instrumental developments in two-dimensional gel electrophor-esis offered the momentum for proteomics. Similarly, technologyadvancement for protein identification was essential if proteomicswas going to expand into the dominating field we know today. Edmansequencing was the principal method of protein identification andthough it was used with considerable success for routine proteinidentification, the method was relatively slow (one or two peptidesper day) and relatively insensitive (upper fmol to low pmol amounts;Pappin et al. 1995). Developments in the field of mass spectrometryaddressed speed and sensitivity issues, which enabled biomolecularanalysis, particularly the analysis of peptides and proteins to be per-formed routinely with confidence. Together with the development ofdatabase search engines and the population of sequence databases,researchers have employed MS with great success in proteomics. Theevolution of MALDI and ESI ionization sources has impacted sensi-tivity significantly and mass analyzer development continues toextend the boundaries of mass accuracy, resolution and functionality.Mass spectrometry is an analytical technique that measures the
mass-to-charge ratio (m/z) of ions based upon their motion in an elec-tric or magnetic field. Sample molecules are converted into ions inthe gas phase and separated according to their m/z ratio; positivelyand negatively charged ions can be formed. This technique is per-formed by a mass spectrometer, which typically consists of three com-ponents (see Figure 3.1) and these components dictate the level ofperformance and the type of analysis a mass spectrometer can per-form.
Proteomics in Practice. A Guide to Successful Experimental Design 2nd Ed.Reiner Westermeier, Tom Naven, and Hans-Rudolf HçpkerCopyright � 2008 WILEY-VCH Verlag GmbH & Co. KGaA, WeinheimISBN: 978-3-527-31941-1
Pappin DJC, Rahman D,Hansen HF, Bartlet-Jones M,Jeffery W, Bleasby AJ. MassSpectrometry in the biologicalsciences. (1996) 135–150

3 Mass Spectrometry216
Fig. 3.1: A schematic indicating the three regions of a massspectrometer: Ion source: the component which ionizes thesample in question, i.e. ESI and MALDI. Mass analyzer: the componentthat separate the ions according to their m/z ratio. Detector: thefinal component which records the signal produced by an ion.
Ions produced in the source are separated in the analyzer accordingto their mass-to-charge ratio (m/z) and the analyzer, to a large degree,determines the MS performance and functionality. Resolution, andmass accuracy are standard MS instrument specifications and tan-dem mass spectrometry is an essential functionality. All three are keyfor successful protein identification (ID) and characterization.For instance, the higher the mass accuracy a mass spectrometer
can afford, then the greater the tolerance limits can be set for data-base searches and ultimately the greater the confidence in the subse-quent results. Resultantly, for protein identification and characteriza-tion it is essential to assign the mass of a given peptide as accuratelyas possible and as such a differentiation between the average andmonoisotopic mass needs to be made.
Average and Monoisotopic Mass Assignment Amino acids consist ofthe elements carbon, hydrogen, nitrogen and oxygen, and to a lesserextent sulfur. Each of these elements exists naturally as a mixture ofisotopes. For instance, carbon exists as a mixture of the 12C isotope(98.9%) and the 13C isotope (1.1%). As such the abundance of the twoisotopes in a given compound will be reflected in a mass spectrum bythe isotope envelope of the compound. There are two types of massmeasurement for a given compound:
. Average mass: the measurement which reflectsthe contribution of the isotopes in an isotopicenvelope. The average mass is taken at the cen-troid of the isotopic envelope.
. Monoisotopic mass: is the sum of the masses ofthe atoms in a molecule using the principle iso-tope mass of each atom instead of the isotopeaveraged atomic mass. In practice, this is the

217
mass of the first peak in a peptide isotopic envel-ope. With respect to carbon, this is termed the12C peak.
Figure 3.2 illustrates the predicted isotope distribution of the peptideHLKTEAEMK at resolution 5000 (FWHM).
Fig. 3.2: Predicted isotope distribution of the peptideHLKTEAEMK at resolution 5000 (FWHM).
The spectrum demonstrates the resolution of the 12C and 13C iso-topes. As a result the monoisotopic mass, 12C peak, can be clearlyassigned.The mass difference between the average and monoisotopic masses
is 0.73 Da.Resolution and mass accuracy specifications are determined in a
large part by the analyzer technology. Improvements in analyzer per-formance have enabled the mono-istopic mass of a peptide, ratherthan the average mass of a peptide, to be almost exclusively used forprotein identification, characterization and quantification. Mass mea-surement accuracies of less than 2 ppm have been reported in theroutine analyzes of complex peptide mixtures and intact proteins. Itis possible to increase this further with internal mass calibration, asdescribed by Matthias Mann and co-workers, with mass accuracies ofless than 1 ppm (r.m.s.) reported.
3 Mass Spectrometry
The second peak in theenvelope represents the peptidestructure where one of thecarbon atoms in the peptide isnow a 13C atom.
This is a significant differencewhich can be capitalized on forprotein identification by redu-cing the error tolerances fordatabase searches.
Yates JR, Cociorva D, Liao J,Zabrouskov V. Anal Chem 78(2006) 493–500.Macek B, Waanders, L, OlsenJV, Mann M. Mol Cell Proteo-mics 5 (2006) 949–958.Olsen JV, de Godoy LMF, Li G,Macek B., et al.; Mol CellProteomics 4 (2005) 2010–2021.

3 Mass Spectrometry218
3.1Ionization
The ion source is the region of the mass spectrometer where the gasphase ions are produced from sample molecules. The method of pro-ducing the ions is termed the ionization technique. Several ionizationtechniques have been developed; the earliest incarnations includeelectron impact and chemical ionization, which are useful for ioniz-ing small molecular weight molecules, but less applicable for larger(bio)molecules. The first example of ionizing larger biomolecules wasreported by MacFarlane and Torgerson in 1976 using the techniqueplasma desorption. The introduction of fast atom bombardment in1981 (Barber et al. 1981) enabled the ionization and detection of arange of intact biomolecules with relatively good sensitivity. The FABsource was coupled with a magnetic sector analyzer, enabling biomo-lecule tandem mass spectrometry analysis to be performed with rela-tively good sensitivity, high resolution for the first time.However, FAB was supplanted by two ionization techniques devel-
oped in the late 1980s. Karas and Hillenkamp introduced matrixassisted laser desorption ionization (MALDI) in 1988 as a techniquethat could readily ionize (large) biomolecules in a very sensitive man-ner. MALDI is a pulsed ionization technique which utilizes theenergy from a laser to desorb and ionize the analyte molecules in thepresence of a light absorbing matrix. In another breakthrough, Fennand co-workers demonstrated that electrospray ionization could alsoionize large biomolecules with high sensitivity.
3.1.1Matrix Assisted Laser Desorption Ionization
Matrix Assisted Laser Desorption Ionization (MALDI) ions are cre-ated by mixing the analyte with a small, organic molecule whichabsorbs light at the wavelength of the laser, the matrix. The analytebecomes incorporated into the crystal lattice of the matrix and is thenirradiated with a laser. The laser causes desorption and ionization ofthe matrix and analyte, either by protonation or cationation (positivelycharged ions) or by deprotonation (negatively charged ions; see Fig-ure 3.3). The ions are then accelerated into the MS analyzer (see Sec-tion 3.2)
& MALDI produces predominantly singly chargedions.
McFarlane R, Torgerson DF.Science 191 (1976) 920–925.
Barber M, Bordoli RS, Sedg-wick RD, Tyler AN. Nature 293(1981) 270–271.
These two ionization techniqueshave become the standard forionization of protein andpeptide samples.
Fenn JB, Mann M, Meng CK,Wong SK, Whitehouse C.Science 246 (1989) 64–71.
Tanaka K, Ido Y, Akita S,Yoshida Y, Yoshida T. 35-kaiShitsuryo Bunseki RengoToronkai, Yoshishu (1987)22–23.Karas M Hillenkamp F. AnalChem 60 (1988) 2299–2301.

3.1 Ionization 219
Fig. 3.3: Schematic of the MALDI process.
For a tryptic digest, a-cyano-4-hydroxy cinnamic acid is typically thestandard matrix of choice (Beavis and Chait 1989). The matrix affordshigh sensitivity for the detection of peptides (and proteins) and exhi-bits negligible matrix adduction. A second matrix, 2,5-dihydoxyben-zoic acid (DHB) initially described by Strupat et al. 1991; enables pep-tide analysis, detection of high molecular weight proteins and theanalysis of oligosaccharides released from glycoproteins (Mock et al.1991; Stahl et al. 1991; Harvey 1993).
Tab. 3.1: Common MALDI matrices used in biological applications.
Matrix Matrix Structure Application
a-Cyano-4-hydroxy-cinnamic acid
OH
CH
CN
COOHUV laser: peptide analy-sis and protein digests.Analytes <10 kDa
Sinapinic acid(4-hydroxy-3,5-di-methoxycinnamic acid)
CH
OMeCH3O
OH
COOH
Analysis of large poly-peptides and proteins>10 kDa
2,5-Dihydroxybenzoicacid (2,5 DHB) COOH
OH
OH
UV laser: protein di-gests and proteins, oli-gosaccharides releasedfrom glycoproteins
Beavis, RC, Chait BT. RapidCommun Mass Spectrom3(1989) 432–435.Strupat K, Karas M, Hillen-kamp F. Int J Mass SpectromIon Proc 111 (1991) 89–102.
Mock KK, Davy M, Cottrell JS.Biochem Biophys Res Commun177 (1991) 644–651.
Stahl B, Steup M, Karas M,Hillenkamp F. Anal Chem 63(1991) 1463–1466.
Harvey DJ. Rapid CommunMass Spectrom 7 (1993) 614–619.
Beavis RC, Chaudhary T, ChaitBT. Org Mass Spectrom 27(1992) 156–158
Beavis RC, Chait BT. RapidCommun Mass Spectrom 3(1989) 432–435.
Strupat K, Karas M, Hillen-kamp F. Int J Mass SpectromIon Proc 111 (1991) 89–102.

3 Mass Spectrometry220
Matrix Matrix Structure Application
2,4,6-Trihydroxyaceto-phenone (THAP)
CH3O
OH
OH
OH
UV laser: oligo-nucleotides <3 kDa
3-Hydroxy picolinicacid
NCOOH
OH
UV laser: Oligo-nucleotides >3 kDa
Due to the pulsed nature of MALDI, it has been predominantlycoupled with the pulsed, time-of-flight (TOF) analyzer or configura-tions thereof. This combination, with its simple operation, ease ofautomation and robust performance has meant that MALDI-TOFinstruments are common place for routine protein identificationsuch as in the 2D PAGE-MS workflow where protein spots are pickedfrom a 2DE gel (see Section 1.7.1). The use of MALDI-TOF for pep-tide mass fingerprinting (PMF) is more than sufficient for proteinidentification from these simple samples.However, MALDI PMF is not a suitable method for protein identifi-
cation when a complex mixture is under investigation. For the analyisof more complex samples, tandem mass spectrometry (MS/MS) isalmost exclusively required and there is an absolute need to couple achromatographic step with MS. MALDI has long been incompatiblewith liquid chromatography and as such a chromatographic step hastypically been coupled with electrospray ionization equipped massspectrometers for MS/MS applications. However, the innate featuresof MALDI still make it a very attractive and accessible technique.Thus, the introduction of the MALDI TOF/TOF configuration withits high performance MS/MS specifications and recent developmentsin liquid handling systems enabling nano-scale chromatography pep-tide separations to be coupled with MALDI system capable ofMS/MS, have been a welcome addition to the proteomics toolbox.Importantly, this configuration supports both high performance PMFand MS/MS in a single system.In this offline method, LC-MALDI, peptides are eluted from a
nano-LC column in the standard fashion, but are then mixed with amatrix prior to spotting onto a MALDI plate. In a standard configura-
Pieles U, Zurchner W, ScharM, Moser HE. Nucleic AcidsRes 21 (1993) 3191–3196.

3.1 Ionization 221
tion, such an LC-MALDI spotter will consist of a T-piece, syringepump, and micro fan. A low dead-volume PEEK-T and mixer (deadvolume <50 nL) connect the capillaries from the syringe pump andUV cell to the sample needle, providing reproducible mixing beforespotting. The syringe pump delivers the matrix solution with contin-uous flow rates down to a few nanoliters per minute. Different syr-inge barrel sizes can be employed, eliminating the need for frequentrefilling of small syringes. The length of the capillary connectionsfrom the UV cell and the syringe pump are short, resulting in a delaytime as short as 3 minutes. Commercial LC-MALDI spotters are pro-vided by a number of vendors.
& An LC-MALDI spotter is significantly different tothe conventional MALDI spotter available as partof the 2D PAGE-MS workflow for MALDI PMF.
LC-MALDI affords some attractive benefits to the researcher:. Fixation of samples to the MALDI target, allowslonger data collection and sample re-interroga-tion at any time, removing the temporal con-straints of the LC dimension.
. An RPC separation will reduces the complexityof the sample as discussed previously, which willaid minimization of ion suppression.
. Conservation of samples.
. Probable separation of isobaric peptides (i.e. pep-tides with the same apparent molecular weight),which might have different hydrophobicities andwould therefore be resolved by LC.
. Increased sequence coverage for higher confi-dence in protein identification.
The LC-MALDI technique is a powerful adjunct to ESI based massspectrometers, with MALDI and ESI often providing complementaryprotein identification information; Bodnar WM et al. 2004. This pub-lication reported a “significant degree of overlap” (63%) was observedbetween the proteins identified in the LC/ESI/MS/MS and LC/MALDI/MS/MS data sets in the analysis of mammalian mitochron-drial ribosomes. However, unique peptides and proteins were identi-fied by each method; indicating that improved proteome coverage canbe obtained using a combination of these ionization techniques.The technique has been applied to a number of challenging and
topical proteomics applications including the identification of mem-brane proteins (Zhang et al. 2004); identification and quantification
Bodnar WM, Blackburn RK,Krise JM, Moseley MA. J AmSoc Mass Spectrom 14 (2003)971–979.
Zhang N, Li N, Li L. JProteome Res 3 (2004)719–727.

3 Mass Spectrometry222
using differential stable isotope labeling (Ji and Li 2005) and theincorporation of high speed, high-resolution monolithic capillary col-umns into the technique. In this publication, 384 unique peptideswere identified in a single 10 minute LC run from 2000 resolved com-ponents (Chen et al. 2005).
3.1.2Electrospray Ionization
Fenn et al. (1989); described the use of electrospray ionization (ESI)for ionizing large biomolecules in 1989.Electrospray (ESI) ions are produced at atmospheric pressure by
applying sample dissolved in solvent to a narrow capillary tube, whichis under the influence of an electric field. A potential difference is cre-ated between the capillary and the inlet of the mass spectrometer gen-erating a force extending the liquid to form a cone from the capillarytip, from which a fine mist of droplets will emerge (Taylor cone; Tay-lor 1964). The cone is formed as a result of repulsive coulombic forcesbetween the like charges. Subsequently, evaporation of the dropletsreduces droplet size whilst the charge on the droplet remains con-stant. Eventually, the surface coulombic forces exceed the surface ten-sion and the droplets fission into smaller droplets (the Rayleighlimit). This process continues until nanometer-sized droplets are pro-duced (Figure 3.4).The charges are statistically distributed over the analyte’s potential
charge sites, enabling the formation of multiply charged ions. Eachmultiply charged ion can be termed a charge state, and a distributionof charge states is characteristic of large macromolecules during ESIanalysis.
& ESI produces predominantly multiply chargedions.
Fig. 3.4: Schematic of ESI.
Ji C, Li L. J Proteome Res 4(2005) 734–742.
Chen HS, Rejtar T, Andreev V,Moskovets E, Karger BL. AnalChem 77 (2005) 2323–2331.
Fenn JB, Mann M, Meng CK,Wong SK, Whitehouse CM.Science 246 (1989) 64–71.
Taylor G. Proc R. Soc LondA280 (1964) 383–397.

3.1 Ionization 223
This unique feature of ESI, multiple charging of analyte molecules,yields an effectively reduced mass for the analyte of interest. Simply,the observable mass range is lowered offering significant advantagesfor the analysis of large molecular weight analytes, particularly pro-teins. Figure 3.5 demonstrates the multiply charging of 150 KDa pro-tein. With respect to proteins the resolution of each multiply chargedion is insufficient to determine the number of charges the ion pos-sesses, from which can be determined its true mass. Therefore, themasses of at least two of the multiply charged ions in the envelopeare used in a deconvolution algorithm to give the mass of the wholeprotein (lower panel).
Fig. 3.5: Characteristic multiple charging of a full-length proteinacquired using ESI. Upper panel: true mass of protein after deconvolution.Lower panel: multiple-charged spectrum. Note the number of chargestates observed for this 150 kDa protein.
Note the mass range and thenumber of charges (z value inm/z) on the protein in the spec-trum).
Its mass is known from thespectrum, but without knowl-edge of the charge state, thereal mass of the analyteremains unknown.

3 Mass Spectrometry224
With respect to peptides, the charge state of the multiple-charged ioncan be readily determined due to the resolution capability of currentmass spectrometers, see Figure 3.6. The mass difference between theadjacent 12C and 13C isotopes is indicative of the charge state. For asingle-charged ion, the mass difference between the 12C and 13C iso-topes of a peptide isotopic envelope will be 1 Da. In the case of a dou-ble-charged peptide ion (m/z = m/2) the mass difference between the12C and 13C isotopes will be 0.5 Da, for a triple-charged peptide (m/z= m/3) the mass difference between the 12C and 13C will be 0.33 Daand so on. With knowledge of the charge state, an accurate mass ofthe peptide can be determined.
Fig. 3.6: Characteristic multiple charging of tryptic peptides:triple-charged neurotensin protein acquired using ESI.
Electrospray generates flow rates ranging from tens of microliters tohundreds of microliters per minute. The resultant high consumptionrate was problematic for proteomic applications with respect to sensi-tivity and analysis time (high amount of sample is consumed in ashort amount of time). In the early nineties, reductions in ESI lowrates were reported; sub-microliter flow rates using continuous infu-sion affording significant increases in sensitivity (Emmett andCaprioli 1994). Wilm and Mann reported the use of a nanospray ioni-zation source. (Wilm and Mann 1996) This miniaturization of electro-spray generated flow rates in the order of tens of nanoliters per min-ute (typically 25–40 nL/min), by spraying the solvent from a narrow

3.2 Ion Separation 225
bore coated needle (sub 10 mm tip diameter). This was a crucial devel-opment; delivering higher sensitivity and longer analysis times,enabling multiple MS/MS experiments to be performed per run.Though nanospray generates flows of 25–40 nL/min, nanoLC (at
least 75 mm i.d columns) only generates flow rates of 200 nL/min.
3.2Ion Separation
A wide range of analyzers, compatible with both MALDI and ESI, areused for proteomics applications
3.2.1Time-of-Flight Analyzer
The time-of-flight (TOF) analyzer is a pulsed analyzer and as such isroutinely coupled with a MALDI ion source. (see Figure 3.7).
Fig. 3.7: Schematic of a reflectron TOF analyzer. This analyzer istypically coupled with MALDI to perform peptide mass fingerprinting.
Mass measurement is determined by measuring the time-of-flight ofan ion in the analyzer region; the time-of-flight of an ion is propor-tional to the square root of its mass/charge ratio, given a constantaccelerating voltage: Time of flight k
ffiffiffiffiffiffiffiffiffim=z
p.
The linear TOF analyzer is the simplest form and exhibits the lowerperformance with respect to resolution and mass accuracy. A linearTOF instrument is incapable of resolving the 12C and 13C isotopes ofthe peptide isotopic envelope across the range of the protein digest,700–3500 Da, subsequently mass accuracy is poorer as the averagemass, not the mono-isotopic mass, tends to be used for databasesearching.
Emmett MR, Caprioli RM. JAm Soc Mass Spectrom 5(1994) 605–613.
Wilm M, Mann M. Anal Chem68 (1996) 1–8.
Thus, the smaller the moleculethe faster it will travel thedistance of the flight tube tothe detector.

3 Mass Spectrometry226
The performance of TOF analyzers with respect to resolution andmass accuracy was vastly improved following two developments inthe 1990s: delayed extraction and incorporation of a reflectron.
Delayed extraction Resolution is improved by delaying the extractionof ions from the source for a short period of time. Wiley and McLa-ren, 1953; reported the method time lag focusing and noted theincreased resolution. This was revisited by Brown and Lennon, Vestalet al. Whittal and Li in 1995 by applying it to MALDI. They observedthat by delaying the extraction of ions from the source, a much tighterpacket of ions arrive at the detector giving significantly higher resolu-tion and mass accuracy.
Incorporation of a reflectron A reflectron (Mamyrin 2001) improvesresolution in two ways: (1) by acting as an ion mirror reversing thetrajectory of the ions in the flight tube, effectively increasing thelength of the flight tube; (2) by reducing an ion’s kinetic energyspread. Ions of the same mass formed in the source can have differ-ent kinetic energies when they leave the source depending upon theirposition in the source when the accelerating voltage was applied, con-sequently, ions of the same mass arrive at the detector at differenttimes, thus reducing resolution and mass accuracy. A reflectron canaccommodate these small differences in kinetic energy with theresult that ions of the same mass are better time-focused at the detec-tor, greatly improving resolution and subsequently mass accuracy.Delayed extraction coupled with a reflectron can routinely achieve
resolutions greater than 10,000 (FWHM; Figure 3.8). This level ofperformance enabled MALDI-TOF to become established as theprinciple method of protein ID in the 2D PAGE-MS workflow (Sec-tion 1.7).Reflectrons are incorporated as standard in most commercial TOF
mass spectrometers and the different configurations include a con-ventional linear field reflectron, the curved field reflectron (Cornishand Cotter, 1994) and the harmonic or quadratic field described byAnderson et al. 1998.Although a TOF analyzer is commonly coupled with a pulsed
MALDI source it has also been combined with electrospray, in theESI-TOF instrument (Boyle and Whitehouse 1992; Mirgorodskayaet al. 1994; Verentchikov et al. 1994).A reflectron TOF instrument is typically used in MS mode, though
a technique called post source decay (PSD) has been considered apseudo MS/MS technique (see Section 3.3.4.4).
Wiley WC , McLaren IH. RevSci Instrum. 26 (1955) 1150–1157.
Brown R, Lennon JJ. AnalChem. 67 (1995) 1998–2003.
Whittal RM, Li L. Anal Chem67 (1995) 1950–1954.
Vestal ML, Juhasz P, MartinSA. Rapid Commun MassSpectrom 9 (1995) 1044–1050.
Mamyrin BA. Int J Mass Spec-trom 206 (2001) 251–266.
Protein database search confi-dence using MALDI TOF PMFdata is improved with increasedmass accuracy
Cornish TJ, Cotter RJ. RapidCommun Mass Spectrom 8(1994) 781–785.Anderson UN, Colburn AW,Makarov AA, Raptakis EN,Reynolds DJ, Derrick PJ, DavisSC, Hoffman AD , Thomson S.Rev Sci Instrum 69 (1998)1650–1660.
Boyle JG, Whitehouse CM.Anal Chem 64 (1992)2084–2089.
Mirgorodskaya OA, Shev-chenko AA, Chernushevich IV,Dodonov AF, Miroshnikov AI.Anal Chem. 66 (1994)99–107.
Verentchikov AN, Ens W,Standing KG. Anal Chem 66(1994) 126–133.

3.2 Ion Separation 227
Fig. 3.8: Delayed extraction coupled with a reflectron canroutinely achieve resolutions greater than 10,000 (FWHM).
3.2.2Triple Quadrupole Analyzer
The quadrupole analyzer consists of four parallel hyperbolic rods,through which the gas phase ions have to achieve a stable trajectory.The analyzer is operated by the application of a voltage (DC) and anoscillating voltage (radio frequency, rf) to one pair of rods and DC vol-tage of opposite polarity and rf voltage of different phase to the oppo-site pair of rods. The alternating electric field helps to stabilize anddestabilize the passing ions. The ions traverse through the spacebetween the rods, and only at specific voltages applied to the rods willcertain m/z values be allowed to pass through the rods and reach thedetector. The voltages are scanned to allow a wide mass range to beobserved.A single quadrupole analyzer has negligible benefits for proteomic
analysis, but if three quadrupoles are arranged in sequence, the sub-sequent triple quadrupole analyzer coupled with ESI has beendemonstrated to be very useful for proteomics (von Haller et al. 2001)This configuration is almost exclusively used to provide structuralinformation by tandem mass spectrometry (see Section 3.3.4). Herethe first and third quadrupoles operate as the mass filters describedabove, with the second quadrupole operating as a collision cell (wherethe structural information is produced). The analyzer can be operated
von Haller PD, Donohoe S,Goodlett DR, Aebersold R,Watts JD. Proteomics 1 (2001)1010–1021.

3 Mass Spectrometry228
in three different ways to perform MS/MS experiments (see Section3.3.4.1) and is typically used in MS/MS mode (see Figure 3.9).
Fig. 3.9: Schematic of a triple quadrupole analyzer. Coupled withESI, it can perform a range of MS/MS techniques including production, precursor ion and neutral loss scans.
3.2.3Quadrupole Ion Trap
The quadrupole ion trap is based on the same theory as the quadru-pole analyzer, with the quadrupole field generated within a threedimensional trap. The ion trap itself is filled with helium and com-prises a ring electrode and two end cap electrodes, creating the threedimensional electric field by applying a large RF voltage to the ringelectrode. The orbiting motion of the ions in the trap is governed bythe large rf voltage and the cooling effects of collisions with thehelium gas (the helium gas reduces the kinetic energy of the ionsand helps focus the ions in the center of the trap). A mass spectrumis acquired by sequentially ejecting fragment ions from low m/z tohigh m/z. This is performed by scanning the rf voltage to make iontrajectories sequentially become unstable, the mass selective instabil-ity mode developed by Stafford et al. (1984). Ions are ejected anddetected at the detector (see Figure 3.10).
Fig. 3.10: Schematic of the fundamental operation of a 3D iontrap analyzer. Commonly coupled with ESI for proteomics applications.
Stafford GC, Kelley PE, SykaJEP, Reynolds WE, Todd, JFJ.Int J Mass Spectrom Ion Proc60 (1984) 85–98.

3.2 Ion Separation 229
A product ion MS/MS spectrum is obtained via resonance excitation.The precursor ion is isolated by the application of a waveform signalto the endcap electrodes. Fragmentation of the precursor ion iscaused by the application of a small voltage across the endcap electro-des and collisions with helium gas. The resultant fragmentation issimilar to that observed from a triple quadrupole mass spectrometer;a low-energy collisional regime with fragmentation predominantly atthe peptide amide bonds (see Section 3.3.4.1). A drawback of theinstrument for the acquisition of product ion MS/MS spectra is thatthe fragment ions in the lower third of the mass range (approximately1/3rd of the mass of the precursor ion) will not be detected.An additional advantage of quadrupole ion traps and FT-ICR MS
(see Section 3.2.7) is the unique ability to perform multiple stages ofmass spectrometry (MSn) (see Section 3.3.4.5). For a detailed reviewsee Jonscher and Yates (1997).The performance characteristics of a quadrupole ion trap make it a
highly attractive instrument for proteomic applications, particularlyfor tandem mass spectrometry applications, either interfaced withnanospray (Hoess et al. 1999) LC-MS/MS (Ho et al. 2002) 2DLC-MS/MS (Washburn et al. 2001) or MALDI (Qin et al. 1996). The iontrap is predominantly used in MS/MS mode.Developments in ion trap technology have delivered the linear
quadrupole ion trap, where ions are trapped in a two-dimensionalquadrupole field, instead of a three-dimensional quadrupole field.Such a configuration affords significant benefits for protein ID andcharacterization including rapid cycle time which enables more infor-mation to be obtained from a sample in less time with high sensitiv-ity (Yates et al. 2006). The linear ion traps also offer additional tandemmass spectrometry functionality (Macek et al. 2006). In addition, toMSn, commercial ion trap systems are available that can perform anovel fragmentation technique, electron transfer dissociation or ETD(Thermo LTQ and Bruker Esquire HCT Ultra), see section 3.3.4.6.ETD, a peptide and protein fragmentation technique that preservesmodifications, has found applications in PTM analysis such as phos-phorylation or glycosylation and in top down proteomics. The techni-que extends the capability of the user with respect to protein sequen-cing and identification of type and location of various PTMs. Thecommon approach is to use both collision induced dissociation andETD, generating non-redundant sequence information.
Jonscher KR, Yates JR III. AnalBiochem 211 (1997) 1–15.
Hoess M et al. 1999; WashburnMP, Wolters D, Yates JR.Nature Biotech 19 (2001)242–247.
Qin J, Steenvorden RJJM, ChaitBT. Anal Chem. 68 (1996)1784–1791.
Hoess M, Robins P, Naven TJP,Pappin DJC, Sgouros T, LindahlT. EMBO J 18 (1999)3868–3875.
Macek B, Waander L, Olse, JV,Mann M. Mol Cell Proteomics5 (2006) 949–958.
Yates JR, Cociorva D, Liao J,Zabrouskov V. Anal. Chem. 78(2006) 493–500.

3 Mass Spectrometry230
3.2.4Quadrupole Time-of-Flight
Initially described in 1996 (Morris et al. 1996) for oligosaccharide ana-lysis and more recently by Lobada et al. (2000), these quadrupoletime-of-flight (QTOF) instruments rapidly became the instrumentstandard for MS/MS applications within proteomics. By combining amass filtering quadrupole analyzer and a collision cell (rf-only quad-rupole) with a non-scanning reflectron TOF analyzer, the user is ableto acquire MS and, most notably MS/MS data with high mass accu-racy, resolution and sensitivity. The instrument is typically coupledwith HPLC (Bell et al. 2001; Gavin et al. 2002) and is predominantlyused in MS/MS mode (see Figure 3.11).
Fig. 3.11: Schematic of a quadrupole TOF hybrid analyzer.It is commonly coupled with ESI for proteomics applications.
Morris HR, Paxton T, Dell A,Langhorne J, Berg M, BordoliRS, Hoyes J, Bateman RH.Rapid Commun Mass Spec-trom 10 (1996) 889–896.
Shevchenko A, ChemushevichIV, Ens W, Standing KG,Thomson B, Wilm M, MannM. Rapid Commun Mass Spec-trom 11 ( 1997) 1015–1024.
Bell AW, Ward MA, BlackstockWP, Freeman HNM,Choudhary JS, Lewis AP,Chotai D, Fazel A, Gushue JN,Paiement J. J Biol. Chem 276(2001) 5152–5165.
Gavin et al. Nature 415 (2002)141–147.

3.2 Ion Separation 231
Later developments have seen a MALDI ion source coupled with ahybrid instrument enabling similar MS/MS performance to beattained from singly charged ions produced by MALDI. (Lobada et al.2000; Shevchenko et al. 2000; Baldwin et al. 2001).This configuration enables a peptide mass fingerprint and MS/MS
data with high resolution and mass accuracy to be acquired using thesame instrument. A similar approach has been developed with theTOF/TOF analyzer.
3.2.5Hybrid Triple Quadrupole Linear Ion Trap
As the name suggests, the hybrid triple quadrupole linear ion trap(QTRAP) instrument combines the features of a triple quadrupoleand a linear ion trap analyzer. For proteomics applications, thisequates to fast scans with high sensitivity, accurate quantification andcomplete product ion, precursor ion and neutral loss tandem massspectrometry functionality. The additional scan functionality hasbeen shown to be useful for post translational modification analysis(Sandra et al. 2004).The QTRAP is predominantly used in MS/MS mode.
3.2.6TOF/TOF Analyzer
A TOF/TOF analyzer coupled with a MALDI ion source (Medzih-radszky et al. 2000) enables the generation of peptide mass finger-print data and peptide sequence data in a single instrument. Basi-cally, two TOF analyzers are separated by a collision cell, with the firstTOF analyzer, used for precursor ion selection. (see Figure 3.12).High energy collisions occur within the collision cell, and the secondTOF analyzer resolves the ions. The configuration allows for highsensitivity and high resolution in both MS and MS/MS modes, and iscapable of reducing protein identification to a one tier process. Whencoupled with nano-LC using an LC-MALDI spotter, this configurationis a powerful tool for the proteomics researcher.
Lobada A, Krutchinsky A,Bromirski M, Ens W, StandingKG. Rapid Commun MassSpectrom 14 (2000)1047–1057.
Shevchenko A, Loboda A,Shevchenko A, Ens W,Standing KG. Ana. Chem 72(2000) 2132–2141.
Baldwin MA, MedzihradszkyKF, Lock CM, Fisher B, Setti-neri TA, Burlingame AL. AnalChem 73( 2001) 1707–1720.
Sandra K, Devreese B, VanBeeumen J, Stals I, ClaeyssensM. J Am Soc Mass Spectrom15 (2004) 413–423.
Medzihradszky KF, CampbellJM, Baldwin MA, Falick AM,Juhasz P, Vestal ML, Burlin-game AL. Anal Chem 72(2000) 552–558.
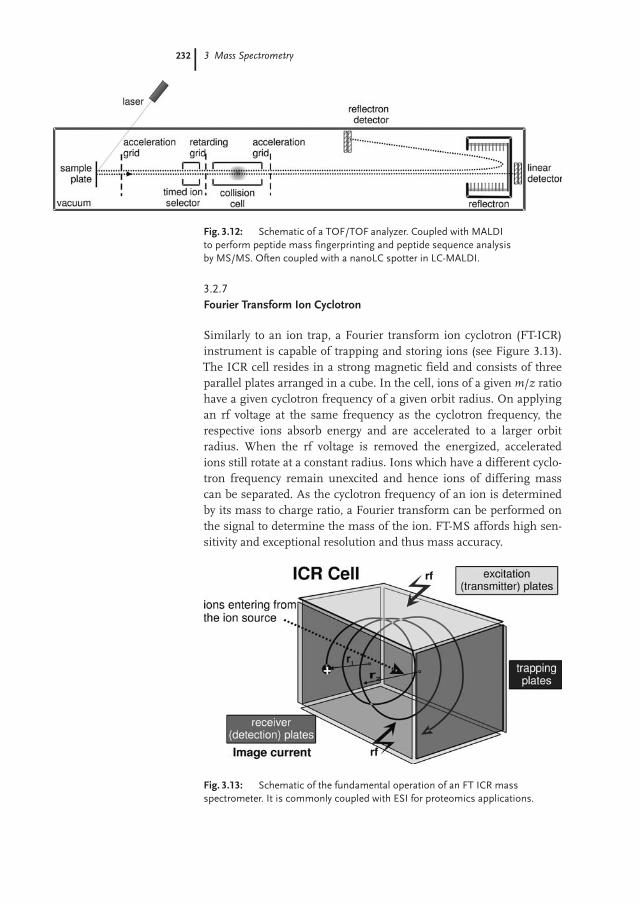
3 Mass Spectrometry232
Fig. 3.12: Schematic of a TOF/TOF analyzer. Coupled with MALDIto perform peptide mass fingerprinting and peptide sequence analysisby MS/MS. Often coupled with a nanoLC spotter in LC-MALDI.
3.2.7Fourier Transform Ion Cyclotron
Similarly to an ion trap, a Fourier transform ion cyclotron (FT-ICR)instrument is capable of trapping and storing ions (see Figure 3.13).The ICR cell resides in a strong magnetic field and consists of threeparallel plates arranged in a cube. In the cell, ions of a given m/z ratiohave a given cyclotron frequency of a given orbit radius. On applyingan rf voltage at the same frequency as the cyclotron frequency, therespective ions absorb energy and are accelerated to a larger orbitradius. When the rf voltage is removed the energized, acceleratedions still rotate at a constant radius. Ions which have a different cyclo-tron frequency remain unexcited and hence ions of differing masscan be separated. As the cyclotron frequency of an ion is determinedby its mass to charge ratio, a Fourier transform can be performed onthe signal to determine the mass of the ion. FT-MS affords high sen-sitivity and exceptional resolution and thus mass accuracy.
Fig. 3.13: Schematic of the fundamental operation of an FT ICR massspectrometer. It is commonly coupled with ESI for proteomics applications.

3.3 Generating MS Data for Protein Identification 233
3.2.8Orbitrap�
The Orbitrap� analyzer is the most recently of developed analyzers(commercially available from Thermo Scientific since 2005). It is nota conventional ion trap, in that there is no RF or magnet to hold theions in the cell. The analyzer traps ions in an electrostatic field, withthe attraction towards a central electrode. The electrode confines theions so that they move or orbit in complex spiral patterns (Makarov2002, and Hardman and Makarov, 2003). A Fourier Transform isused to extract the masses accurately from the oscillation frequenciesThis type of analyzer affords high resolution, high mass accuracy andan increased dynamic range, similar in performance to an FT-ICRinstrument and high sensitivity (Olsen et al. 2005). This type of massspectrometer can be used in both MS and MS/MS modes.The Orbitrap� has recently been coupled with a linear ion trap
(Finnigan LTQ-Orbitrap�, Thermo) (see Figure 3.14). This config-uration is a hybrid consisting of the two mass analyzers, both capableof detecting ions and recording spectra: the two analyzers can beused independently or in conjunction. The instrument can be usedfor both bottom up (peptide based approach to protein ID) and topdown (protein based approach to protein ID) approaches (see Section3.6.2).
Fig. 3.14: Schematic of the hybrid LTQ-Orbitrap� analyzer.
3.3Generating MS Data for Protein Identification
Generally, two different approaches, or combinations thereof, can beused for protein identification (ID): peptide mass fingerprinting andtandem mass spectrometry (MS/MS). In the first instance, the mass/charge ratio (m/z) of the analytes are measured and the calculatedmasses are indicative of the composition of the individual analytes.
Hardman M, Makarov A. AnalChem 75 (2003) 1699–1705.
Makarov A. Anal Chem 72(2000) 1156–1162.
Olsen JV, de Godoy LMF, Li G,Macek B, Mortensen P, PeschR, Makarov A, Lange O,Horning S, Mann M. Mol CellProteomics 4 (2005) 2010–2021.

3 Mass Spectrometry234
In the second instance, tandem mass spectrometry (MS/MS) is usedto acquire peptide sequence information, which is used to identifyand characterize proteins with high specificity (see Figure 3.15).
Fig. 3.15: Schematic of the methods of protein identificationusing a mass spectrometer: Peptide mass fingerprinting is performedin MS mode and peptide sequence analysis in MS/MS mode.
3.3.1Peptide Mass Fingerprint
The technique originally described in 1993 comprises protein diges-tion, MALDI TOF analysis and sequence database search algorithms.(Pappin et al. 1993; Henzel WJ et al. 1993; Mann et al. 1993; Yates etal. 1993; James et al. 1993).Simply, every protein in the protein database (or in the genome
under investigation) is theoretically digested with the cleavagereagent used in the digestion reaction, generating many hundreds ofthousands of theoretical peptides. The experimental peptide massesderived from the MS spectrum, the peptide mass fingerprint (PMF)is then compared to the theoretical peptide masses and a score is cal-culated and assigned. The score reflects the match between the theo-retically and experimentally determined masses; the protein identi-fied as the most probable is the one that gives the best match betweenthe experimental and the theoretical peptides. The number of pep-tides observed in the PMF and the accuracy to which they are mea-sured determines the confidence of the protein identification.
Pappin DJC, H jrup P, BleasbyA. Curr Biol 3 (1993) 327–332.
Henzel WJ, Billeci TM, StultsJT, Wong SC, Grimley C, Wata-nabe C. Proc Natl Acad SciUSA 90 (1993) 5011–5015.
Mann M, Hojrup P, RoepstorffP. Biol Mass Spectrom 22(1993) 338–345.
Yates JR III, Speicher S, GriffinPR, Hunkapiller T. AnalBiochem 214 (1993) 397–408.
James P, Quadroni M, CarafoliE, Gonnet G. Biochem BiophysRes Commun 195 (1993)58–64.

3.3 Generating MS Data for Protein Identification 235
The incorporation of reflectron technology and delayed extraction(timed delay ion extraction) into MALDI-TOF instrumentation hasenhanced the performance of peptide mass fingerprinting consider-ably. The 12C isotope of the peptide isotopic envelope, the mass usedin a PMF search, can be unambiguously assigned across the peptidemass range of interest, significantly enhancing mass measurementof this peak (sub 50 ppm mass accuracy is routine). The improvedmass accuracy further constrains the database search, reducing thepotential for ambiguous protein identifications (Jensen et al. 1996;Clauser et al. 1999).Several programs are available to perform this type of search, vary-
ing in the execution of the task (including MASCOT at www.matrix-science.com; and Phenyx at http://phenyx.vital-it.ch/pwi/login/login.jsp). Accuracy, reliability and speed determine the program ofchoice. Regardless which program is used, four user variables areimportant for a PMF search:
. Peptide mass list.
. Specification of the cleavage agent.
. Error tolerance. The accuracy of mass measure-ment is determined by the calibration, thehigher the mass accuracy the greater the specifi-city.
. Knowledge of peptide modifications i.e. methio-nine oxidation.
For this approach to give an unambiguous result, a significant num-ber of experimentally determined peptide masses have to match theexperimental masses, the peptides have to be a result of the correctcleavage specificity of the cleavage agent used and the protein inquestion has to exist in the protein database. As a result, the PMFapproach is highly suited to highly characterized genomes and hasbeen a core proteomics technique. Shevchenko et al. (1996) demon-strated that up to 90% of proteins selected from a 2D gel of an E colilysate were identified by peptide mass fingerprinting.Although an unambiguous match may be returned from a database
search, not all the peptides within the peptide mass fingerprint maybe identified. It is important to identify the remaining unidentifiedpeptide peaks, which may arise from:
. The presence of other digested proteins withinthe sample (in the case of 2D gel, comigration tothe same spot);
. Peptides arising from the simultaneous diges-tion of contaminant proteins such as keratin;
Jensen ON, Podtelejnikov A,Mann M. Rapid CommunMass Spectrom 10 (1996)1371–1378.
Clauser KR, Baker P, Burlin-game AL. Anal Chem 71(1999) 2871–2882.
Shevchenko A, Jensen ON,Podtelejnikov A, Sagliocco F,Wilm M, Vorm O, MortensenP, Shevchenko A, Boucherie H,Mann M. Proc Natl Acad SciUSA 93 (1996) 1440–1445.
Though many keratin peaks arecommonly known and thesepeptides, if present, can besubsequently omitted from thesearch.

3 Mass Spectrometry236
. Incorrect cleavage, protease acting in a non-pre-dicted fashion;
. Post-translationally modified peptides, alteringthe mass of the native peptide rendering itunrecognizable in the database search;
. The identified protein may be (highly) homolo-gous to the protein under study, but not exactlythe same and thus unmatched peptides willexist.
MALDI-TOF PMF is fast and simple method of protein identification,but the success of the method can be compromised in a number ofways:
. Insufficient peptides are observed in the peptidemass fingerprint to submit to a database search,i.e. insufficient information to identify the pro-tein.
. The sample maybe a mixture of proteins.Although it is possible to analyze simple mix-tures (Axelsson et al. 2001) there may not be asignificant number of peptides from each pro-tein component in the mixture to yield a success-ful identification. As several peptides arerequired to give a statistical match, this approachis not readily suited to complex mixtures
. Excessive post-translational modifications of theprotein can result in masses, which are not pre-dicted in the theoretical digestion of the proteinsin the database as well as precluding peptidesfrom the fingerprint.
. Very little homology can be found with anotherprotein in the database or the protein in questionmay not actually exist in the protein database.
. If the above is true, peptide mass fingerprintingcannot be used with confidence for searchingagainst the ESTdatabases (which is the nextstage of protein identification if a search of theprotein database is unsuccessful). The probabil-ity that a significant number of peptides fromthe peptide mass fingerprint will find matcheswith a single EST yielding an unique proteinidentification is small.
If any of these situations arise, then more specific information isrequired to identify the protein.
Common for small molecularweight proteins, basic proteinsif digested with trypsin lowabundant proteins.
Axelsson J, Boren M, NavenTJP, Fenyç D. Proceedings ofthe 49th ASMS conference onmass spectrometry and alliedtopics, Chicago ( 2001).

3.3 Generating MS Data for Protein Identification 237
3.3.2Peptide Mass Fingerprint Combined With Composition Information
Historically, it has been possible to combine PMF information withcompositional information. This was a common technique prior tothe introduction of delayed extraction and reflectron technology. Thecomposition information provided orthogonal information whichprovided additional specificity for a database search by enablingfurther constraints on that search (Fenyç et al. 1998). For instance,this publication demonstrated that with the knowledge of the pre-sence of a cysteine residue in a tryptic peptide of mass 2000 Da (mea-sured to 0.5 Da mass accuracy) the number of matching proteins in Scerevisiae was reduced by a factor of five. A number of approacheshave been employed to gain compositional information. In one exam-ple reported by Pappin, a PMF is acquired and the peptide massesnoted. A subsequent methyl esterification reaction is performed on asmall aliquot of the sample esterifying the carboxyl side-chain of theacidic residues, glutamic and aspartic acid, and the carboxylic groupof the C-terminal residue present in each peptide of the digest. APMF spectrum is re-acquired. The subsequent mass changes betweencorresponding peptides are indicative of the number of acidic groupseach peptide contains. This information was combined with the origi-nal PMF using a MOWSE composition search potentially increasingsearch discrimination by orders of magnitude (Pappin et al. 1995).The number of exchangeable hydrogens within a peptide offers
composition information. Again, this procedure requires the acquisi-tion of a PMF, subsequent labeling of the mixture with a deuteriumsolution (D2O) and finally re-acquisition of a second spectrum. Themass increase of each peptide by the number of exchangeable hydro-gens is indicative of amino acid composition (Sepetov et al. 1993;James et al. 1994).Moreover Goodlett et al. (2000) demonstrated composition informa-
tion and high mass accuracy can be very specific information forunambiguously identifying proteins. By labeling cysteine residueswith a specific isotopic label, IDEnT (the tag contained chlorine,which has a specific isotopic profile owing to the relative abundanceof 35Cl and 37Cl) the distinctive isotopic pattern of the labeled peptidecould be simply recognized. With this specific composition informa-tion and mass accuracy measured to within 1 ppm using an FT-ICRMS, the mass of a single peptide was sufficient to unambiguouslyidentify a protein from the whole yeast database (1 peptide from apossible in ~345,000 peptides).
Fenyç D, Qin J, Chait BT. Elec-trophoresis 19 (1998) 998–1005.
Pappin D, Rahman D, HansenHF, Bartlet-Jones M, Jeffrey W,Bleasby AJ. Methods in Biolo-gical Sciences (1996) 135–150.
Sepetov NF, Issakova OL, LebiM, Swiderek K, Stahl DC, LeeTD. Rapid Commun MassSpectrom. 7 (1993) 58–62.
James P, Quadroni M, CarafoliE, Gonnet G. Protein Sci 3(1994) 1347–1350.
Goodlett DR, Bruce JE,Anderson GA, Rist B, Pasa-Tolic L, Fiehn O, Smith RD,Aebersold R. Anal Chem 72(2000) 1112–1118.
Cysteine was chosen as thelabeled residue because it is oneof the rarest amino acid resi-dues, allowing constraineddatabase searching.

3 Mass Spectrometry238
The isotopical labeling of cysteine residues has also been exploitedfor extra composition information. Sechi and Chait (1998) reported amethod for the modification of the cysteinyl thiol group with isotopi-cally labeled acrylamide.Additionally, composition information can be inferred from immo-
nium ions contained within a MALDI PSD spectrum, this is particu-larly discriminating information. Immonium ions present in aMALDI PSD spectrum indicate the presence of certain amino acidresidues; again this can be included in a composition search asdescribed above. (Clauser et al. 1999). This information is also avail-able in a product ion MS/MS spectrum acquired with a MALDIQTOF or TOF/TOF instrument.However, with the ubiquitous MS/MS functionality available in
many laboratories, these approaches are seldom used today.
3.3.3Peptide Mass Fingerprint Combined With Partial Sequence Information
Again, historically, supplementing PMF data with some partialsequence has been an attractive approach; PMF and sequence infor-mation can be used in the same search using the sequence queryfunction with the MASCOT search engine. An unsuccessful search ofthe protein database with the peptide mass fingerprint data may beoverturned with some partial sequence if the protein exists in the pro-tein database.The data required for this type of database search can be obtained
with a MALDI-TOF instrument capable of post-source decay. Post-source decay (PSD) is a technique performed on a MALDI TOFinstrument equipped with a reflectron, though not genuine MS/MS,it can generate stretches of peptides sequence which can be used in asearch engine querry of a protein database. A worked example isdemonstrated below whereby a PMF is acquired prior to the chemicalderivatization of the peptide digest with chemically assisted fragmen-tation (CAF; see Section 3.3.4.4) reagent and subsequent CAF-PSD isperformed.An unsuccessful result was obtained from the PMF search (Figure
3.16). Following chemical derivatization, PSD was performed on twoof the derivatized peptides. The spectra of each peptide include sev-eral sequence specific C-terminal fragment ions (Figures 3.17a,3.18a), which is indicative of partial amino acid sequence can beinferred for both peptides from. Each sequence is combined with thepeptide mass fingerprint in a sequence query search using MASCOT.
Sechi S, Chait BT. Anal Chem70 (1998) 5150–5158.
Clauser KR, Baker P, Burlin-game AL. Anal Chem 71(1999) 2871–2882.

3.3 Generating MS Data for Protein Identification 239
Combining the interpreted sequence derived from the PSD spectrumof peptide m/z 1569.79 with the original PMF in a database sequencequery search, yields an unambiguous match (Figure 3.18b). Similarly,an unambiguous match is returned when the determined sequencefrom the second peptide (peptide m/z 1157.57) is combined with thePMF in a sequence query search (Figure 3.18c). When both sets ofsequence data are combined with the peptide mass fingerprint theconfidence in the match returned from the database search increasesdramatically (Figure 3.18c). Close inspection of the PSD spectrademonstrated that the sequence can readily determined using theCAF chemistry. The CAF reagent generates only C-terminal fragmentions (see Section 3.3.4.4), which makes the sequence relatively simpleto interpret. In the case of the second peptide, there is some ambigu-ity whether the residue is a glutamine or a glutamic acid (experimen-tally measured difference 128.7 Da) in part of the determinedsequence. However, the MASCOT search query allows both aminoacid residues to be inputted into the search query (see Step 15 onpage 407). As the figures demonstrate a short stretch of determinedsequence combined with the PMF is a powerful approach for re-ducing ambiguous protein identifications; particularly if genuineMS/MS analysis is not an option.
Fig. 3.16: An unsuccessful PMF search of the protein database.

3 Mass Spectrometry240
a)
b)
Fig. 3.17: (a) PSD spectrum of the derivatized peptide, m/z 1569.79. The sequence – A[IL]EAwas determined from the spectrum and combined with the PMF as before. The result of thecombined search is demonstrated in Figure 3.17b. An unambiguous result is returned from thesearch. (b) MASCOTsearch result from the combined PMF and partial sequence determinedfrom the PSD spectrum in Figure 3.17a.

3.3 Generating MS Data for Protein Identification 241
a)
b)

3 Mass Spectrometry242
c)
Fig. 3.18: (a) PSD spectrum of the derivatized peptide,m/z 1157.57.The sequence – SAV[IL]EA was determined from the spectrum andcombined with the PMF as before. The result of the combined searchis demonstrated in Figure 3.18b. An unambiguous result is returnedfrom the search. (b) MASCOTsearch result from the combined PMFand partial sequence determined from the PSD spectrum in Figure 3.17a.(c) MASCOTsearch result of the combined PMF and partial sequencefrom two peptides.
3.3.4Tandem Mass Spectrometry
Tandem mass spectrometry (or MS/MS) is performed with a certaintype of mass spectrometer. Such an instrument needs to be capableof selecting ions of a particular m/z value and subjecting the selectedions to fragmentation within the mass spectrometer. Generally, theseexperiments are performed successfully on two types of instrument;those where analyzers are in series (tandem in space) such as the tri-ple quadrupole and hybrid quadrupole-TOF configurations describedearlier in this section; and secondly those instruments which employion trapping mechanisms such as the quadrupole ion trap and FT-ICR analyzer (tandem in time).
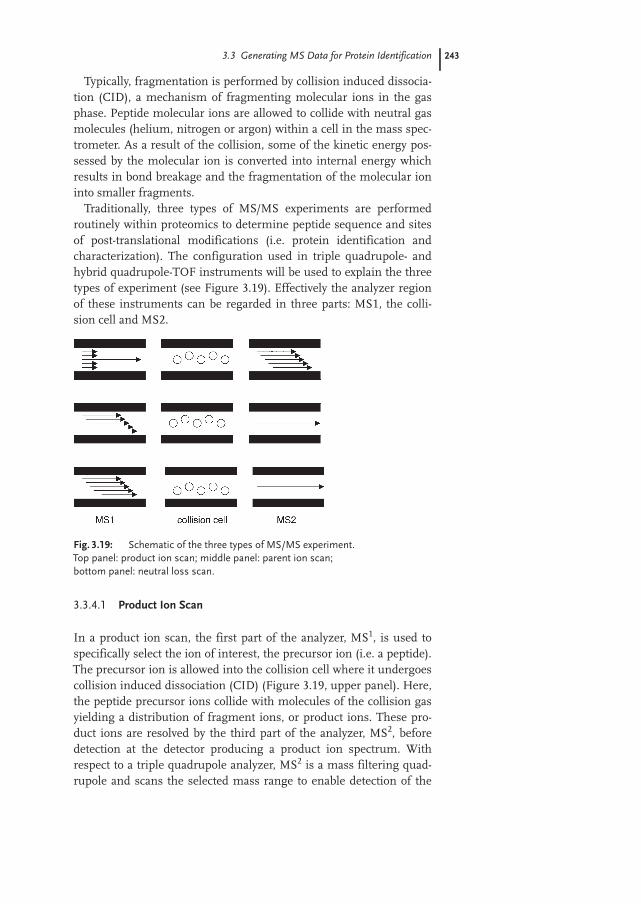
3.3 Generating MS Data for Protein Identification 243
Typically, fragmentation is performed by collision induced dissocia-tion (CID), a mechanism of fragmenting molecular ions in the gasphase. Peptide molecular ions are allowed to collide with neutral gasmolecules (helium, nitrogen or argon) within a cell in the mass spec-trometer. As a result of the collision, some of the kinetic energy pos-sessed by the molecular ion is converted into internal energy whichresults in bond breakage and the fragmentation of the molecular ioninto smaller fragments.Traditionally, three types of MS/MS experiments are performed
routinely within proteomics to determine peptide sequence and sitesof post-translational modifications (i.e. protein identification andcharacterization). The configuration used in triple quadrupole- andhybrid quadrupole-TOF instruments will be used to explain the threetypes of experiment (see Figure 3.19). Effectively the analyzer regionof these instruments can be regarded in three parts: MS1, the colli-sion cell and MS2.
Fig. 3.19: Schematic of the three types of MS/MS experiment.Top panel: product ion scan; middle panel: parent ion scan;bottom panel: neutral loss scan.
3.3.4.1 Product Ion Scan
In a product ion scan, the first part of the analyzer, MS1, is used tospecifically select the ion of interest, the precursor ion (i.e. a peptide).The precursor ion is allowed into the collision cell where it undergoescollision induced dissociation (CID) (Figure 3.19, upper panel). Here,the peptide precursor ions collide with molecules of the collision gasyielding a distribution of fragment ions, or product ions. These pro-duct ions are resolved by the third part of the analyzer, MS2, beforedetection at the detector producing a product ion spectrum. Withrespect to a triple quadrupole analyzer, MS2 is a mass filtering quad-rupole and scans the selected mass range to enable detection of the

3 Mass Spectrometry244
product ions. In the case of a hybrid quadrupole TOF analyzer, MS2 isa reflectron TOF analyzer, in which the entire mass range is notscanned, but collected simultaneously with significant improvementsin sensitivity and resolution. With respect to the TOF/TOF configura-tion, the first TOF acts as MS1 and the second TOF acts as MS2. Fig-ure 3.20 demonstrates the experimental workflow, where an ion ofinterest is selected and isolated by MS1 and fragmented, yielding theproduct ion MS/MS spectrum.
Fig. 3.20: Product ion MS/MS experimental workflow.
Collision induced dissociation (CID) can be further defined by theenergy of the collisions observed in the collision cell. Fragmentationwithin triple quadrupole, quadrupole ion trap and hybrid quadrupoleTOF analyzers occurs at collisional energies in the order of 10–100 eVrange, whilst fragmentation within a magnetic sector or TOF/TOFanalyzer occurs at collisional energies at least an order of magnitudehigher in the keV range. The former is described as low-energy CIDwhilst the latter is described as high-energy CID.As a result of the low-energy collisional fragmentation, the peptide
precursor ion fragments predictably at each peptide amide bondalong the peptide backbone yielding a distribution of product ions intwo complementary ion series forming a ladder which is indicative ofthe peptide sequence. This fragmentation nomenclature wasdescribed by Roepstorff and Fohlman (1984; see Figure 3.21). Thetwo complementary ion series are:
. N-terminal ion series, or b-ion series. The ionsof the n-terminal ion series will contain theN-terminal amino acid and extensions from thisresidue (Figure 3.22 and Table 3.2).

3.3 Generating MS Data for Protein Identification 245
. C-terminal ion series, or y-ion series. The ions ofthe C-terminal ion series will contain the C-ter-minus of the peptide and extensions from thisresidue (Figure 3.21 and Table 3.2).
Fig. 3.21: Fragmentation nomenclature acc. to Roepstorff and Fohlmann.
Fig. 3.22: Structure of the observed b, y, a., c, and z. ions andd, w, and v side-chain fragment ions. R2¢ and R3¢ represent partialside-chain loss (from. Cournoyer et al. 2005).
Roepstorff P, Fohlman J.Biomed Mass Spectrom 11(1984) 601.
Cournoyer JJPittman JL, IvlevaVB, Fallows E, Waskell L, Cost-ello CE, O'Connor PB. ProteinSci. 14 (2005) 452–463.

3 Mass Spectrometry246
Tab. 3.2: Common fragment ions formed during low-energy CID andthe respective formulae to calculate the mass of each ion.
Fragment ion Formula
a-ion Total residue mass of the amino acids present –28(for the loss of CO)
b-ion Total residue mass of the amino acids present
y-ion Total residue mass +18 +1
At higher collisional energies, the peptide is additionally fragmen-ted at the amino acid side-chains (Johnson et al. 1988), the subse-quent fragmentation pattern can be used to differentiate the isobaricreisudes, leucine and isoleucine. Similarly, electron capture dissocia-tion, an alternative fragmentation technique, delivers similar side-chain specific fragmentation. (see Section 3.3.4.7).With the knowledge of how peptides fragment within a mass spec-
trometer, the subsequent sequence information derived from production MS/MS (or PSD experiments) can be used in three ways:
. Manual interpretation of the sequence (generallyfrom the b- and y-ion series of fragment ions)where the determined sequence can be inputtedas a search query (Perkins et al. 1999).
. Manual interpretation of a short stretch ofsequence used together with the accurate massof the precursor ion and the masses of the firstand last fragment ions in the stretch of thesequence (knowledge of these two masses, givesthe masses of the uninterpreted sequence in thepeptide), a method termed the peptide sequencetag (Mann and Wilm 1994).
. The automatic, uninterpreted MS/MS search(Eng et al. 1994; Yates et al. 1995; Perkins et al.1999). The process of selecting, isolating andfragmenting ions of interest is now routinelyperformed in an automated fashion, followingearlier publications demonstrating the ability toperform data dependent fragmentation (Spahret al. 2000).
Johnson RS, Martin SA,Biemann K. Int J Mass Spec-trom Ion Proc 86 (1988)137–154.
Perkins DN, Pappin DJC,Creasy DM, Cottrell JS. Electro-phoresis 20 (1999) 3551–3567.
Mann M, Wilm M. Anal Chem66 (1994) 4390–4399.
Eng JK, McCormack AL, YatesJR III. J Am Soc Mass Spec-trom. 5 (1994) 976–989; YatesJR III, Eng JK, McCormack AL,Schieltz D. Anal Chem 67(1995) 1426–1436.
Spahr CS, Susin SA, Bures EJ,Robinson JH, Davis MT,McGinley MD, Kroemer G,Patterson SD. Electrophoresis21 (2000) 1635–1650.

3.3 Generating MS Data for Protein Identification 247
As sequence information is significantly more discriminating than amolecular mass alone, a few peptides of sufficient length are suffi-cient to identify a protein from a well characterized genome (Susinet al. 1999; Shevchenko et al. 2000).Using product ion MS/MS as a protein ID tool, less peptides are
generally required to unambiguously identify a protein from a knowngenome than with MALDI PMF. Resultingly, today’s proteomicsresearch uses this particular MS/MS technique in almost all proteinidentification strategies which generate peptide sequence informa-tion.However, even a product ion MS/MS analysis may not generate
unambiguous protein identification from a protein database searchquery. In these cases, a further tool for protein identification is theexpressed-sequence tag (EST) databases (Mann, 1996). ESTs are shortstretches of nucleotide sequence, which peptide sequence data can beused to search against. Peptide sequence data can be used to searchthe EST databases if a search against the protein database is unsuc-cessful. A PMF search against the EST database is inappropriate, as itwould not be sufficiently discriminating for unambiguous identifica-tion.In the rarer instances, whereby a protein is not identified from any
database search query then genuine de novo sequencing needs to beperformed.De novo sequencing requires the analysis of a peptide fragmenta-
tion spectrum without recourse to a protein database. Other applica-tions for de novo sequencing include the characterization of splice var-iants. Though the peptide sequences probably exist in the database,they may not exist in a consecutive order. Thus the sequencing ofpeptides, which span two exons, could be very useful for determiningsplice variants (B. K�ster, personal communication).However, this is not a straightforward task. The fragmentation pat-
tern of a peptide in a product ion MS/MS spectrum is indicative of itssequence. If a significant number of continuous residues can bedetermined from the spectrum (greater than 12 residues) oligonu-cleotide probes can be developed. However, under low-energy CIDconditions the peptide precursor ion fragments to yield y- and b-ionseries of varying lengths. Neither series may be long enough to gener-ate the sufficient stretch of continuous residues required for subse-quent oligonucleotide probe construction. In such circumstances it isimportant to detect both ion series in the spectrum, as they are com-plementary. For instance, the residue indicated by the first b-ion, theN-terminal residue, b1, is the same residue indicated by the final y-ion and vice versa. In this manner, the complementary ion series canbe used to fill in the gaps that may exist in the sequence of one of theion series.
Once a CID spectrum has beenmatched, a theoretical trypticdigest of the identified proteincan be generated and thepresence of other trypticpeptides can be checked andconfirmed.
Susin SA, Lorenzo HK,Zamzami N, Marzo I, BrothersG, Snow B, Jacotot E, Constan-tini P, Larochette N, GoodlettDR, Aebersold R., Pietu G,Prevost MC, Siderovski D,Penninger J, Kroemer G.Nature 397 (1999) 441–446.
Shevchenko A, Loboda A,Shevchenko A, Ens W,Standing KG. Anal Chem 72(2000) 2132–2141.
Mann M. Trends Biol Sci. 21(1996) 494–495.
This is often the case if thegenome of the organism inquestion is not fully sequencedor poorly characterized.

3 Mass Spectrometry248
However, the presence of two ion series can complicate the inter-pretation of the spectrum, even though they are complementary.Thus, for efficient de novo sequencing it is very important, if notessential, to be able to differentiate these two series. Once this hasbeen achieved the presence of the two ion series is not a burden, theinterpretation of the spectrum is simplified significantly.A range of different approaches have been taken to perform de novo
sequencing by mass spectrometry. The first report of peptide de novosequencing by ESI mass spectrometry was described by Hunt andcolleagues as early as 1986, where tryptic peptides of apolipoprotein Bwere successfully sequenced using FAB-triple quadrupole mass spec-trometry (Hunt et al. 1986). In this method, the group used differen-tial modification of the peptides to differentiate each ion series, sim-plifying interpretation and confirming the peptide sequence. Specifi-cally, product ion MS/MS spectra were acquired of the native pep-tides. Subsequently the peptide fractions underwent methyl esterifi-cation, and the product ion MS/MS spectra of the corresponding deri-vatized peptides were acquired. This reaction esterified the C-termi-nus of each peptide (and all subsequent acidic resides in each pep-tide, aspartic and glutamic acids). Resultantly, the starting point ofthe y-ion series (C-terminal containing ions), y1, was shifted by 14 Da(and hence the remainder of the y-ion series) whilst the starting pointof the b-ions series remained unchanged (unless the n-terminal resi-due, b1-ion was a glutamic or aspartic acid). Hence, the y-ion seriesbecame recognizable and the two ion series could be differentiated.A second approach described the incorporation of an isotopic label
during the peptide digestion. Specifically, the protein of interest isdigested as normal but in a 1:1 mixture of 16O:18O digestion buffer.Subsequently all peptides will appear as 16O:18O isotope doublets;with the label being incorporated into the carboxyl group of theC-terminal residue. When this isotopic doublet is fragmented duringa product ion MS/MS experiment, all C-terminal product ions, they-ion series, will exhibit this isotopic doublet and hence can be imme-diately differentiated from the b-ion series and other non C-terminalcontaining fragment ions.Wilm and co-workers developed this approach further, combining
the isotopic labeling with a technique calling differential scanningenabling improved assignment of the y-ion series (Uttenweiller et al.2001). The method requires two product ion MS/MS spectra to beacquired; one where the whole 16O:18O peptide envelope is selectedfor fragmentation and the second where only the 18O labeled ions areselected for fragmentation. Using a software algorithm the y-ion ser-ies can be filtered automatically.However, both approaches do not affect the fragmentation pattern
and hence the b-and y-ion series still fragment in the same manner.
Hunt DF, Yates JR III, Shaba-nowitz J, Winston S, Hauer CR.Proc Natl Acad. Sci USA 83(1986) 6233–6237.
However, with this method thesample has too be split and twoproduct ion MS/MS experi-ments are required for eachpeptide. The presence ofaspartic or glutamic residuesinternal to the sequence wouldalso change by the esterifyingmass, and subsequent y- andb-ions internal to the sequence
Schnolzer M, Jedrzejewski P,Lehman WD. Electrophoresis17 (1996) 945–953.
Qin J, Herring CJ, Zhang X.Rapid Commun. Mass Spec-trom 12 (1998) 209–216.
Shevchenko A, ChemushevichIV, Ens W, Standing KG,Thomson B, Wilm M, MannM. Rapid Commun Mass Spec-trom 11 (1997) 1015–1024.
Uttenweiler-Joseph S,Neubauer G, Christoforidis S,Zerial M, Wilm W. Proteomics1 (2001) 668–682.

3.3 Generating MS Data for Protein Identification 249
Furthermore, both approaches are only applicable to enzymatic meth-ods and to proteins which can be digested; it is not applicable to thosesamples that are presented, such as MHC class peptides.A wide range of peptide derivatization protocols have been reported
for altering the peptide fragmentation pattern and fragmentation effi-ciency in order to aid interpretation of product ion MS/MS spectra.Derivatization of the peptide digest at the N-terminus with phospho-nium quaternary tags improved sensitivity and yielded a single ionseries, the b-ion series (Roth et al. 1998); Munchbach et al. 2000;described a derivatization protocol to aid the de novo sequencing ofpeptides.Keough and co-workers developed a strategy to obtain a single y-ion
series, particularly for PSD analysis, with impressive results (see Sec-tion 3.3.4.4). Long stretches of consecutive y-ions from the y-ion ser-ies can be readily observed with this technique and has the potentialto be useful for de novo sequencing. However, as only one of the ionseries is observed a long uninterrupted sequence is necessary.Another derivatization approach to facilitate de novo sequence ana-
lysis is the derivatization of peptide digests with basic NHS esters.Pyridyl quaternary NHS ester reagents were reported for the derivati-zation of peptide digests for PSD analysis facilitating charge localiza-tion at the N-terminus, subsequently yielding only the b-ion series.(Spengler et al. 1997; Cardenas et al. 1997). These NHS ester reagentswere further developed to produce a series of gas phase basic reagentsto quantitatively label the peptide digest (N-succinimidyl morpholinoacetate and N-succinimidyl pyridyl acetate; SMA and SPA respec-tively). Each of these tags defined the starting points for both the b-and y-ion series, enabled the observation of often complete y-ion ser-ies for tryptic peptides (the final y-ion is observed in all cases) andlong stretches of the b-ion series. Hence, both the starting and endpoints of the peptide are known and the ion series are subtley differ-entiated. Armed with these pieces of information de novo sequencingis significantly simplified. Furthermore, because the two ion seriesare complementary the determined sequence can be readily checkedin each ion series. This proved highly beneficial for uninterpreted,automated MS/MS database searching and essential for de novosequencing (Tugal et al. 1998; Kondo et al. 1997; Hoess et al. 1999).In today’s research, MS suppliers provide automated de novo
sequencing software to support this application. Automated de novosequencing is supported considerably by high mass accuracy andhigh resolution improves considerably the results, providing higherconfidence in assignment of the correct amino acid sequence.
Roth KDW, Huang ZH, Sada-gopan N, Throck Watson J.Mass Spectrom Reviews 17(1998) 255–274.
Munchbach M, Quadroni M,James P. Anal Chem 72 (2000)4047–405.
Spengler B, Luetzenkirchen F,Metzger S, Chaurand P, Kauf-mann R, Jeffrey W, Bartlet-Jones M, Pappin DJC. Int JMass Spectrom Ion Proc 169(1997) 127–140.
Cardenas MS, Van der Heeft E,De Jong APJM. Rapid communMass Spectrom. 11 (1997)1271–1278.
Tugal T, Zou-Yang XH, GavinK, Pappin D, Canas B,Kobayashi R, Hunt T, StillmanB. J Biol Chem 273 (1998)32421–32429.
Kondo H, Rabouille C,Newman R, Levine TP, PappinD, Freemont P, Warren G.Nature 388 (1997) 75–78.
Hoess M, Robins P, Naven TJP,Pappin DJC, Sgouros T, LindahlT. EMBO J 18 (1999) 3868–3875.

3 Mass Spectrometry250
3.3.4.2 Precursor Ion Scan
For proteomics applications, a precursor ion scan is employed tolocate sites of protein modifications, such as phosphorylation. In thisexperiment the first part of the MS analyzer, MS1, is set to transmitall the components of the mixture in to the collision cell to undergoCID. The third part of the analyzer, MS2, is fixed at a specific massvalue, so that only analytes, which fragment to give a fragment ion ofthis specific mass will be detected at the detector (see Figure 3.19,middle panel). In this manner, the precursor ion scan can be used toselectively identify certain species in a complex mixture, such as pep-tides containing a phosphorylated residue.The presence of serine, threonine or tyrosine phosphorylated pep-
tide in a complex peptide digest can be determined using a precursorion scan. A phosphorylated peptide fragments during low-energy col-lisional fragmentation to give a fragment ion of 79 Da (the PO3
–
group). Therefore to specifically identify phosphorylated peptides in amixture the third part (MS2) of the analyzer is set to 79. Thus, onlyspecies which fragment to give a fragment ion of 79 are detected andhence indicate the presence of a phosphorylated residue (Wilm et al.1996; Carr et al. 1996; Annan et al. 2001).This experiment has been historically restricted to a triple quadru-
pole instrument, but recent applications have been demonstratedusing a hybrid quadrupole TOF instruments (Steen et al. 2001). Themethod has been exploited for the specific detection of tyrosine phos-phorylated peptides in complex mixtures.
3.3.4.3 Neutral Loss Scan
Similarly, a neutral loss scan is employed in proteomics applicationsto locate peptides containing a protein modification. In this techni-que, the 1st and 3rd parts of the analyzer are scanned synchronously,but with a specific m/z offset. Once more the second part of the ana-lyzer is used as the collision cell and the entire mixture is allowed toenter the collision cell, only those species which fragment to yield afragment ion with the same mass as the offset will be detected (seeFigure 3.20). For instance, serine and threonine phosphorylated pep-tides readily lose phosphoric acid during low-energy CID. Phosphoricacid has a mass of 98 Da, thus the offset for a doubly charged peptidewould be set at 49. Hence any species which loses 49 Da from a dou-bly charged ion would be observed at the detector and be indicative ofa phosphorylated peptide (Covey et al. 1991; Schlosser et al. 2001).This type of experiment is typically carried out with a triple quad orQ-TOF type instrument. Phosphopeptide analysis in an ion trap is
Wilm M, Neubauer G, MannM. Anal Chem. 68 (1996)527–533.
Carr SA, Huddleston MJ,Annan RS. Anal Biochem 239(1996) 180–192.
Annan RS, Huddleston MJ,Verna R, Deshaies RJ, Carr SA.Anal Chem 73 (2001) 393–404.
Steen H, K�ster B, MFernandez, Pandy A, Mann M.Proceedings of the 49th ASMSconference on mass spectro-metry and allied topics,Chicago ( 2001).
Covey TR, Huang EC, HenionJD. Anal Chem 63 (1991)1193–1200.
Schlosser A, Pipkorn R, Bosse-meyer D, Lehman WD. AnalChem 73 (2001) 170–176.

3.3 Generating MS Data for Protein Identification 251
typically performed with a MS3 approach. Both approaches have dif-ferent specific benefits, which are not pointed out here.
3.3.4.4 MALDI-TOF Post Source Decay
Though not a genuine MS/MS technique, MALDI-TOF post sourcedecay (PSD) is capable of generating sequence specific information,which can be used for protein identification. Described by Spenglerand co-workers in the 1990s (Spengler 1997; Chaurand et al. 1999),this technique demonstrated some reasonable success as a proteinidentification tool. The quality of data is less than that acquired withconventional MS/MS instruments, as described earlier (Silles et al.2000; Gevaert et al. 2001), though still sufficient for protein ID fromrelatively simple samples such as those derived from a 2D PAGE gel.In the technique, the peptide of interest is specifically selected
from a complex mixture using an ion gate. In a conventional linearreflectron, the configuration can only accommodate a small range ofKE differences i.e the reflectron will only be able to focus those ionsthat are similar in mass to the parent ion (Figure 3.23). In thisinstance, only PSD ions that are close in mass to the precursor ionwill be mass measured correctly. Thus, to perform PSD with a con-ventional reflectron the voltage on the reflectron has to drop sequen-tially to allow the fragment ions of lower mass (and lower KE) tobecome focussed at the detector. This is termed stepping the reflec-tron. In a conventional reflectron, several different voltages or seg-ments, (as many as 12 segments may be required) are required tofocus the entire mass range of product ions (Figure 3.24a). The indi-vidual segments are then "stitched" together using the instrumentsoftware, generating the complete product ion spectrum. (Figure3.24b).The use of a quadratic field reflectron for PSD analysis attempts to
address the issue of stepping the reflectron. It is capable of accommo-dating ions of widely different kinetic energies in a single spectrum(Figures 3.22–3.23), because in a quadratic field reflectron anincreased voltage is applied, non-linearly, to create a perfect quadraticfield across the reflectron. Resultantly, all the product ions createdduring the post source decay of a particular precursor ion are focusedat the detector, irrespective of their energy, over the entire range ofm/z. Hence, a complete PSD spectrum is obtained under the sameexperimental conditions with each pulse of the laser, without theneed for data stitching.
Spengler B. J Mass Spectrom.32 (1997) 1019–1036.
Chaurand P, Luetzenkirchen F,Spengler B. J Am Soc MassSpectrom 10 (1999) 91–103.
Silles E, Mazon MJ, Gevaert K,Goethals M, Vandekerckhove,Lebr R, Sandoval IV. J BiolChem. 275 (2000) 34054–34059.
Gevaert K, Demol H, MartensL, Hoorelbeke B, Puype M,Goethals M, Van Damme J, DeBoeck S, Vandekerckhove J.Electrophoresis 22 (2001)1645–1651.

3 Mass Spectrometry252
Fig. 3.23: Schematic demonstrating the passage of the precursor ion andproduct ion through two types of reflectron. Upper panel: conventional linearreflectron. Lower panel: quadratic field reflectron.
Under typical timed ion delay MALDI conditions, peptide fragmenta-tion observed during PSD is reduced (Kauffman et al. 1996). Keoughand co workers described a derivatization method for peptidesequence analysis by MALDI PSD that facilitated fragmentation dur-ing PSD, increasing sensitivity significantly. The tag was designed topromote efficient charge-site initiated fragmentation of the peptidebonds. Consequently, only a single ion series, the y-ion series, isobserved in the PSD spectrum, simplifying interpretation.The theory proposed that under MALDI ionization conditions, the
strong basic residue at the C-terminus of tryptic peptides (arginine)would be protonated and the strong acidic group at the C-terminuswould be deprotonated (Figure 3.25). The additional proton (almostexclusively MALDI ions in the peptide mass range are singly charged)would then be free to randomly ionize and subsequently fragmentthe peptide amide bonds of the peptide backbone. Hence, when thefragment ions are formed only the y-ions are observed because, theformal positive charge typical of a b-ion is neutralized by the negativecharge on the sulfonic acid group, hence b-ions are not observed.
Kauffman R, Chaurand P,Kirsch D, Spengler B. RapidCommun Mass Spectrom 10(1996) 1199–1208.
Keough T, Youngquist RS,Lacey MP. Proc Natl Acad SciUSA 96 (1999) 7131–7136.
Keough T, Lacey MP, FienoAM, Grant RA, Sun Y, BauerMD, Begley KB. Electrophoresis21 (2000) 2252–2265.

3.3 Generating MS Data for Protein Identification 253
Fig. 3.24: Schematic of the time focusing of a conventional andquadratic field reflectron.Upper panel: only a small segment of the mass range can befocussed at one time with a conventional linear reflectron.Middle panel: multiple segments acquired to obtain the wholemass range of fragment ions using a conventional linearreflectron.Lower panel: quadratic field reflectron allows the focussing ofthe mass range in a single TOF spectrum.
–O3S–A–A–A–A–A–R+ (a)–O3S–CHR–CO+ [H2NCHR–CO2H]+ (b)
b1 ion y1 ion
(R = guanidino side-chain of arginine)
Fig. 3.25: The effect of a strongly acidic group at the N-terminusof an arginine C-terminating peptide.

3 Mass Spectrometry254
In the original method, the peptide digest was derivatized with 2-sul-fonyl acetyl chloride, labeling the a-amino group at the N-terminus ofeach peptide (and the e-amino group of the each lysine side-chain)with the very strong acid, sulfonic acid (pKa<2).Labeling of arginine-terminating tryptic peptides greatly facilitates
fragmentation, particularly fragmentation by MALDI PSD. Figure3.26 demonstrates the extent of fragmentation during a PSD experi-ment. In the case of this synthetic peptide, 16 consecutive residuescan be readily determined. The derivatization technique is compatiblewith protein digests derived from 2D gels (see Sections 3.4.3–3.4.4).
Fig. 3.26: PSD spectrum of a CAF derivatized synthetic peptideacquired with the Ettan MALDI-TOF Pro (250 fmol applied to the target).The 16 consecutive residues are readily determined. Though Leucine (L)is specified in the sequence, this cannot be determined from theexperiment (Isoleucine and leucine are isobaric). dMH+ is the precursorion. Note the intensity of the precursor ion. In a typical PSD experiment,fragment ion abundance is a very low percentage of the precursor ionabundance.

3.3 Generating MS Data for Protein Identification 255
As the derivatization strategy also causes the derivatization of thee-amino group of the lysine side-chain, therefore labeling the lysinewith a strong acidic group, PSD of lysine C-terminating peptidesbecomes inefficient. To extend the applicability of this method tolysine terminating peptides, the lysine must first be modified to thehomo-arginine derivative. This has recently been reported by a num-ber of groups to increase lysine tryptic peptide detection in peptidemass fingerprinting (Brancia et al. 2000; Keough et al. 2000). If thismodification of the lysine peptides is performed prior to the sulfona-tion reaction then the sulfonation methodology is equally applicableto lysine C-terminating peptides.The sulfonation method has further been improved with the devel-
opment of a water stable sulfonic NHS ester reagent (Figure 3.27;Liminga et al. 2001). Subsequent PSD spectra acquired from peptidesderivatized in this manner is termed chemically assisted fragmenta-tion (CAF).
N
O
O
O
O
RS
O
O
OH NH2 Pep S
O
OOH
R
O
NH
Pep+
Fig. 3.27: Reaction scheme for the water stable sulfonic NHS ester reagent.
One of the drawbacks of the original method was the hygroscopic nat-ure of the acetyl chloride reagent, requiring the derivatization proce-dure to be performed under stringent conditions in a non-aqueousenvironment. The novel watersoluble reagent allows the quantitativederivatization of the peptide digest at sub pmol quantities of startingmaterial and is compatible with the lysine modification step affordinga one pot derivatization (see Step 10). The derivatization step is amen-able to automation. This derivatization approach enables peptidemass fingerprinting data and subsequent sequence information to beacquired on the same instrument with good sensitivity (see Section3.5.1).This derivatization strategy is equally applicable to any MS/MS
instrument, which employs MALDI as the ionization source,enabling the simple interpretation of the peptide sequence from thefragmentation of a singly charged ion.Despite the efforts to improve the performance of MALDI PSD, the
development of MALDI TOF/TOF systems and the performance andautomation of LC-ESI-MS/MS systems, the use of MALDI PSD hasbecome considerably reduced.
Brancia FL, Oliver SG, GaskellSJ. Rapid Commun Mass Spec-trom 14 (2000) 2070–2073.
Keough T, Lacey MP, Young-quist RS. Rapid Commun MassSpectrom 14 (2000) 2348–2356.
Liminga M, Bor�n M, �strçmJ, Carlsson U, Keough T,Maloisel JL, Palmgren R,Youngquist S. ProceedingsASMS conference on massspectrometry and allied topics,Chicago, USA (2001).

3 Mass Spectrometry256
3.3.4.5 Multi-stage Tandem Mass Spectrometry
Multi-stage tandem mass spectrometry (MSn) involves multiplestages of mass selection, separated by some form of fragmentation.This type of fragmentation experiment is restricted to quadrupole iontraps and FT-ICR MS. A fragment ion produced in the product ionMS/MS spectrum can be selected, isolated and fragmented a secondtime generating even further sequence information in a third spec-trum. This spectrum is called an MS/MS/MS product ion spectrum,or MS3 (see Figure 3.28; Louris et al. 1989). This type of experiment isuseful for identification of phosphorylated or glycosylated residues ifsufficient material exists. This process can be repeated a number oftimes, resulting in a series of MSn spectra where �n’ represents thenumber of times the fragmentation cycle has been performed.
Fig. 3.28: Schematic demonstrating the workflow in an MS3 experiment.
3.3.4.6 Electron Transfer Dissociation
Electron transfer dissociation (ETD) is a new fragmentation techni-que that fragments peptides by transferring electrons to positivelycharged peptides, yielding a strech of sequence ions derived from
Louris JN, Amy JW, Ridley TYand Cooks RG. Int J MassSpectrom Ion Proc 88 (1989)97–111

3.3 Generating MS Data for Protein Identification 257
cleavage at the amide groups along the peptide backbone. Due to itsnon-ergodic nature, amino acid side-chains and important modifica-tions such as phosphorylation are not fragmented and thereforeimportant discriminatory information is maintained. The techniquealso has the potential to analyze large peptides and proteins andtherefore support the top dpwn approach to proteomics. ETD is nowavailable in two commercially available ion traps.
3.3.4.7 Electron Capture Dissociation
Electron capture dissociation (ECD) is an alternative fragmentationmethod to CID, but it is restricted to FT-ICR instruments (Zubarevet al. 1998; McLafferty et al. 2000). In the ECD method, multiplycharged ions are irradiated with low-energy electrons produced by anemitter cathode located behind the ICR cell. Upon capture of elec-trons, reduced radical cations [M+nH](n–1)+ are generated which dis-sociate by fast and facile fragmentation of the N–Ca bond of the pep-tide chain, producing mainly c and z fragment ions. The ECDmechanism exhibits extensive peptide cleavage, retention of sites ofmodification (Shia et al. 2001) and side-chain specific cleavageenabling the differentiation of isobaric residues such as leucine andisoleucine (Kjeldsen et al. 2003) by producing predominantly c and ztype fragment ions (Cooper et al. 2005); again it is non-ergodic in nat-ure and in that sense similar to ETD.The technique supports the top down approach to proteomics (Sec-
tion 3.6.2), where intact protein molecular ions are fragmentedwithin the mass spectrometer enabling protein sequence and PTMinformation to be acquired without performing proteolysis.The top-down proteomics approach is further supported by the
infra red multiphoton dissociation (IRMPD) dissociation technique(Breuker et al. 2002). This technique is used for ion activation prior toECD. Ion activation prior to ECD in this fashion, results in greaterfragmentation of the protein backbone enabling more sequence infor-mation to be determined.Generation of the product ion MS/MS spectra alone does not iden-
tify the protein, this requires a database search query using one of thecommon search engines. MS experiments for protein identificationrely heavily on computational data analysis and database searchingalgorithms. These algorithms have been developed to assign peptidesequences based on automated interpretation of MS/MS spectra (Enget al. 1994; Perkins et al. 1994; Fenyo et al. 2002; Creasy et al. 2002).
Zubarev RA, Kelleher NL,McLafferty FW. J Am ChemSoc 120 (1998) 3265–3266.
McLafferty FW, Horn DM,Breuker K, Ge Y, Lewis MA,Cerda B, Zubarev RA,Carpenter BK. J Am Soc MassSpectrom. 12 (2001) 245–249.
Shi SDH, Hemling ME, CarrSA, Horn DM, Lindh I, McLaff-erty FW. Anal Chem. 73(2001) 19–22.
Kjeldsen F, Haselmann K F,Sorensen ES, Zubarev RA..Anal. Chem. 75 (2003) 1267–1274.
Cooper HJ, H�kansson K,Marshall AG. Mass Spectrum.Reviews 24 (2005) 201–222.
Breuker K, Oh H, Horn DM,Cerda B, McLafferty, FW. J AmChem Soc 124 (2002) 6407–6420.
Eng JK, McCormack AL andYates JR 3rd, J Am Soc MassSpectrom 5 (1994) 976–989.
Perkins DN, Pappin DJC,Creasy DM, Cottrell JS. Electro-phoresis 20 (1999) 3551–3567.
Fenyo D, Beavis RC.TrendsBiotechnol. 20 (2002) 35–38.
Creasy DM, Cottrell JS. Proteo-mics 2 (2002) 1426–1434.

3 Mass Spectrometry258
Automated analysis of peptide MS/MS spectra is now routine withhundreds of MS/MS spectra being analyzed in a single LC-MS run.However, with hundreds of assignments being returned by the searchquery for every LC-MS run it is important to be confident that theassignment is correct and not a false identification. For a comprehen-sive review of database mining for proteomics applications, pleaserefer to the monography of Lisacek.
3.4Protein Characterization
Protein characterization extends further than simply protein identifi-cation and often refers to the identification and location of post-trans-lational modifications (PTMs). PTM analysis is one of the pillars onwhich proteomics is built, as PTM information cannot be determinedat the DNA level. Post-translational modification of proteins is anessential route to modify the function/activity of that particular pro-tein, with the process being governed by a series of enzymes includ-ing kinases and phophatases. There are several hundred examples ofpost-translational modifications (Garavelli, 2004), but the most com-mon modifications studied are reversible phosphorylation and glyco-sylation Specifically, reversible phosphorylation of proteins is a keymechanism for the regulation of major cellular processes such as pro-liferation, differentiation or apoptosis through highly dynamic andcomplex signalling pathways. It has been estimated that 100,000potential phosphorylation sites exist in the human proteome, withthe large majority poorly characterized (Zhang et al. 2002).The key challenges in PTM analysis are to isolate/enrich for the
modified protein/peptide from a complex mixture, to quantify thephospoprotein expression, determine the stoichiometry or occupancyand to pinpoint the site of modification. To further complicate theanalysis, post-translationally modified proteins are often expressedwith low abundance. Traditionally, PTMs have been identified usingradiolabeling and Edman sequence analysis, amino acid analysis andimmunochemistry. However, due to the low protein expression of tar-get proteins and the complexity of starting samples methods withgreater sensitivity of detection for PTMs are required.As we have described previously in this chapter, the evolution of
mass spectrometry instrumentation over the last 20 years has had asigificant impact on protein ID and proteomics. Moreover, mass spec-trometry is well placed to support the identification of PTMs.
Lisacek, F. A guide of goodpractices for protein-centricbioinformatics. WILEY-VCH,Weinheim (2007).
Garavelli JS. Proteomics 4(2004) 1527–1533.Zhang H, Zha X, Tan Y, Horn-beck PV, Mastrangelo AJ, AlessiDR, Polakiewicz RD, CombMJ. J Biol Chem 277 (2002)39379–39387.

3.4 Protein Characterization 259
& MS provides the sensitivity needed to study PTMs,though the sample preparation prior to MS isabsolutely essential to benefit from this sensitivitycapability.
As a post-translational modification will cause a change in the massof protein, specifically to the amino acid it is attached to, mass spec-trometry can detect this. Further, tandem mass spectrometry techni-ques such as a precursor ion scan and a neutral loss scan can be usedto identify peptides that contain a certain PTM within a complex mix-ture. Once the PTM containing peptide has been detected, a production tandem mass spectrometry scan can be performed to determinethe location of the PTM within that particular peptide (see Fig. 3.19).
3.4.1Phosphorylation Analysis
Protein phosphorylation is arguably the most studied PTM. UnlikeN-linked glycosylation, there is no specific sequon which indicatesphosphorylation, though phosphorylation commonly occurs on ser-ine, threonine and tyrosine and less commonly on histidine residues.Many methods have been reported and examples exist where the stateof phosphorylation of a single protein has been determined. However,the mapping of an entire phosphoproteome and relative quantitativeanalysis of phosphoproteins could be considered something of a holygrail in current proteomics method development and here has beenconsiderable development in pursuit of this goal (Sachon et al. 2006;Goshe et al. 2001; Blagoev et al. 2004; Gruhler et al. 2004; Tao et al.2005; Zhou et al. 2001; Reinders et al. 2005).Strategies that are specifically designed to identify sites of phos-
phorylation, attempt to isolate or at least enrich for phosphopeptidesor phosphoproteins upstream of tandem mass spectrometry.
& Tandem mass spectrometry is the key tool foridentifying the site of phosphorylation.
The isolation/enrichment method is either based on an affinity chro-matography step or a chemical derivatization approach and mostapproaches to date are applied at peptide level (Figure 3.29).
Sachon E, Mohammed S,Bache N, Jensen ON. Rapid-Commun Mass Spectrom 20(2006) 1127–1134.
Goshe MB, Conrads TP,Panisko EA, Angell NH, Veen-stra TD, Smith RD. Anal Chem73 (2001) 2578–2586.
Blagoev B, Ong SE, Kratch-marova I, Mann M. NatBiotechnol 22 (2004) 1139–1145.
Gruhler A, Olsen JV,Mohammed S, Mortensen P,Færgeman NJ, Mann M,Jensen ON. Mol Cell Proteo-mics 4 (2005) 310–327.
Tao WA, Wollscheid B, O’BrienR, Eng JK, Xiao-jun L, Boden-miller B, Watts JD, Hood L,Aebersold R Quantitative phos-phoproteome analysis using adendrimer conjugation chem-istry and tandem mass spectro-metry. Nat Methods 2 (2005)591–598.Zhou H, Watts JD, AebersoldR. Nat Biotechnol. 19 (2001)375–337.Reinders J, Sickmann A.Proteomics 5 (2005) 4052–4061.Though for some simplersamples, it maybe possible toemploy a shotgun method,fractionating the sample priorto tandem mass spectrometry.

3 Mass Spectrometry260
Fig. 3.29: Schematic of the methods used for phosphorylationanalysis. Unless the sample is very simple and abundant, thenenrichment of the phosphopeptide(s) is necessary prior to MS analysis.
The enrichment step is potentially very important, as unfractionatedphosphorylated peptides often suffer from signal suppression in posi-tive ion ESI MS analysis (Mann et al. 2002).
3.4.2Affinity Chromatography
Again there are many studies which highlight the use of affinity chro-matography for phospopeptide isolation/enrichment, with varyingspecificities. These techniques, of which common examplesdescribed below, have been specifically applied to phosphopeptides.
3.4.2.1 Immobilized Metal Ion Affinity Chromatography
Immobilized metal ion affinity chromatography (IMAC) is a techni-que that can be used to selectively enrich phosphopeptides in proteindigests, which resultantly increases the sensitivity of phosphopeptidedetection by MS. Traditional IMAC typically involves two compo-nents: an immobilized chelating group and a metal species. The che-lating group binds to and presents one face of the metal, allowinginteraction and separation of phosphorylated species. A variety ofmetals have been immobolized, with Ga3+ and Fe3+ proving to be themost effective. The technique has been reported on many occasionsfor the enrichment of phosphorylated peptide (Nuwaysir et al. 1993;Posewitz et al. 1999; Zhou et al. 2000; Stensballe et al. 2001).In the technique, protein samples are reduced, alkylated and
digested, typically with trypsin. The peptide mixture is then appliedto an immobilized metal affinity chromatography column under
Mann M, Ong SE, GronborgM, Steen H, Jensen ON,Pandey A.. Trends Biotechnol.20 (2002) 261–268.
Nuwaysir LM, Stults JT. J AmSoc Mass Spectrom 4 (1993)662–669.
Posewitz MC, Tempst P. AnalChem 71 (1999) 2883–2892.
Zhou W, Merrick BA, KhalediMG, Tomer KB. J Am Soc MassSpectrom. 11 (2000) 273–282.
Stensballe A, Jensen ON.Proteomics 1 (2001) 955–966.

3.4 Protein Characterization 261
acidic conditions (pH 2.5–3.5), unbound nonphosphopeptides areremoved from the column with an acidic wash solution and phospho-peptides are eluted under alkaline conditions. Posewitz et al. evalu-ated a variety of metals, including Fe3+,Ga3+,Al3+ and Zr3+, for immo-bilized metal affinity chromatography enrichment of phosphopep-tides. Optimal performance, with respect to selectivity and recoverywas observed with iminodiacetate (IDA) resins complexed with Ga3+.Selectively, enrichment and recovery of phosphopeptides using
IMAC depends heavily on the the metal ion and the chelating resinand is biased towards multiply phosphorylated peptides (Heydonet al. 2003). The technique is often affected by the non-selectiveenrichment of acidic peptides, though this can be addressed withmethyl esterification of the peptide samples, improving the selectivityof enrichment (Ficarro et al. 2002).
3.4.2.2 Titanium Dioxide
Several papers have been published demonstrating the ability of tita-nium dioxide (TiO2) to selectively enrich for phosphopeptides fromcomplex peptide digests, via bidentate binding at the TiO2 surface(Pinkse et al. 2004; Larsen et al. 2005). When combined with multipleprotein digests and LC-MS/MS, titanium dioxide enrichment has suc-cessfully been used for site identification at a low fmol scale.
3.4.2.3 Zirconium Dioxide
Porous zirconium dioxide (ZiO) provides high selectivity for phos-phopeptides under an acidic binding condition (pH 2; Kweon et al.2006).
3.4.3Chemical Derivatization
Several methods have been reported for the enrichment of phopsho-peptides. One common method exploits the characteristic that phos-phoserine and phosphothreonine undergo undergo b-elimination,losing the phosphate group which renders them susceptible to attackby a range of nucleophilic reagents. These reagents are designed witha tag to either enable enrichment prior to MS or to aid detection of
Increased binding of nonpho-sphopeptides maybe observedwhen loading is performedoutside the pH 2.0–3.5 rangeor if overloading is allowed.
Heydon CE, Eyers PA, LaurenD. Aveline-Wolf, Resing KA,Maller JL and Ahn NG. MolCell Proteomics 2 (2003) 1055.
Ficarro SB, McCleland ML,Stukenberg PT, Burke DJ, RossMM, Shabanowitz J, Hunt DF,White FM. Nat Biotechno. 20(2002) 301–305.
Phosphopeptides with severalbasic amino acids have beenshown to have a lower affinityfor titanium dioxide:
Pinkse MWH, Uitto PM,Hilhorst MJ, Ooms B, HeckAJR. Anal Chem 76 (2004)3935–3943.Larsen MR, Thingholm TE,Jensen ON, Roepstorff P,Jorgensen TJ. Mol Cell Proteo-mics 4 (2005) 873–886.Schlosser A, Vanselow JT,Kramer A. Anal Chem 77(2005) 5243–5250.Kweon HK, Hakansson K.Selective zirconium dioxide-based enrichment of phos-phorylated peptides for massspectrometric analysis. AnalChem 78 (2006) 1743–1749.
A similar b-eliminationapproach could also be used toisolate O-glycoylated Serineand Threonine, though itbecome difficult to distinguishbetween the two PTMs

3 Mass Spectrometry262
the phosphopeptide in the mass spectrometer (Oda et al. 2001; Knightet al. 2003 and Goshe MB et al,. 2001). The advantage of using a che-mical derivatization approach is that stable isotopes can be incorpo-rated into the mass tag, enabling relative quantification. However,several steps are typically involved in these derivatization strategies.Another approach, reported by Tao and colleagues, enables the
selection of methylated phosphotyrosine peptides as well as methy-lated phosphoserine and phosphothreonine residues using anamended, solid phase derivatization approach which reduces thenumber of steps involved. With this method, the phosphate groupremains on the peptide, which supports identifying the point of mod-ification within the peptide. Methy esterification is a key step in themethod as it protects carboxyl groups from becoming modified dur-ing the reaction and enables stable isotopes to be incorporated forrelative quantification studies. As a result, non-phosphorylated resi-dues are not retained on the support and selectivity for phosporylatedspecies is high.Following any of these enrichment steps, the phosphopeptide sam-
ple(s) are typically analyzed by LC-MS/MS. It is advantageous if theparticular system can perform the full range of tandem mass spectro-metry techniques: product ion scan for peptide identification andPTM site location and neutral loss and precursor ion scanes to detectthe peptides containing the modification. As explained previously amass spectrometer can be configured to detect certain diagnosticfragment ions during the fragmentation or CID process.
3.4.3.1 Precursor Ion Scan
With respect to phosphorylation analysis, a precursor ion scan can beperformed on the fragment ion 79. In this experiment, effectively thewhole sample is allowed to pass into the collsion cell to undergo frag-mentation. Only peptides which fragment to generate a fragment ionof 79 Da will be detected at the detector. Such a fragment is indicativeof a phosphate group and as such is diagnostic of a phosphorylatedpeptide. This is a sensitive method for identifying phosphorylatedpeptides and its application has been reported on a number of occa-sions (Neubauer and Mann, 1999).
3.4.3.2 Neutral Loss Scan
With respect to phosphorylation, a neutral loss scan can be performedto detect the loss of phosphoric acid (H3PO4) during the fragmenta-tion process. The mass spectrometer is configured to detect this,using knowledge of the probable charge states of the peptide (i.e. fordoubly charged phosphorylated peptides the figure should be set to
Oda Y, Nagasu T, Chait BT.Nat Biotechnol 19 (2001)379–382.
Knight ZA, Schilling B, RowRH, Kenski DM, Gibson BW,Shokat KM. Nat Biotechnol 21(2003) 1047–1054.
Goshe MB, Conrads TP,Panisko EA, Angell NH, Veen-stra TD, Smith RD. Anal Chem73 (2001) 2578–2586.
Zhou H, Watts JD, AebersoldR. Nat Biotechnol. 19 (2001)375–37.
No detectable interferencefrom other modifications suchas glycosylation was reported.
Tao WA, Wollscheid B, O'BrienR, Eng JK, Xiao-jun L, Boden-miller B, Watts JD, Hood L,Aebersold R. Nat Methods 2(2005) 591–598.
Neubauer G, Mann M. AnalChem 71 (1999) 235–242.

3.4 Protein Characterization 263
49; 98/2). This same fragmentation process can be utilized in amulti-stage, MS3, tandem mass spectrometry experiment (Beausoleilet al. 2004, Chang et al. 2004).A recent publication comprehensively compared several affinity
methods for phosphoproteome wide analysis (Bodemiller et al. 2007).The paper described the use of IMAC, titanium oxide, zirconium dox-ide, and a solid phase chemical derivatization method for the analysisof a cytosolic fraction of Drosophila melanogaster Kc167 cells.They discovered that each of the methods enriched for phospho-
peptides with an acceptable level of reproducibility. However, eachmethod essentially enriched for different phosphopeptides, thoughthere was some partial overlap, which were not detectable without theenrichment step. Using all the methods, a total of 887 unique phos-phorylation sites were identified; ~62% of these were identified in theIMAC samples, ~60% in the chemical derivatisated samples, ~41% inthe pTiO2 samples and ~17% in dhbTiO2 samples. Roughly 1/3rd ofthe identified phosphorylation sites were identical between chemi-cally derivatized and IMAC, 1/3rd beween chemically derivatized andpTiO2 and 1/3rd between IMAC and pTiO2. They concluded that noneone method could exhaustively represent or analyze a whole phos-phoproteome.
3.4.4Glycosylation
Glycosylation is an important PTM, with the composition of the gly-cans crucial for the function of many proteins in cell signalling andhost–pathogen interactions. A number of factors make it a particu-larly challenging PTM to analyze, including glycoprotein enrichment,sensitivity of MS analysis, heterogeneity, occupancy, isobaric massesfor many of the sugar residues and, arguably limited chemical deriva-tization potential (compared to phosphorylation). Glycosylation iseither N-linked or O-linked. N-linked glycosylation occurs at a veryspecific sequon: Asn-Xxx-Ser/Thr, where Xxx is any residue except aproline. In addition, N-linked glycans all have a common basic struc-ture. On the other hand, O-linked glycosylation does not have a speci-fic sequon, otherthan it occurs at serine or threonine residues.Once more, identifying glycoproteins in a complex mixture can be
challenging. Glycoproteins have long been enriched using lectin affi-nity chromatography (Gabius et al. 2002). Alternatively, digestion ofthe sample in question, followed by precursor ion scanning, asdescribed above, can be used to locate glycosylated peptides using thediagnostic fragment ions of hexoses and hexosamines, 163 and 204respectively (Huddleston et al. 1993).
Beausoleil SA, Jedrychowski M,Schwartz D, Elias JE, Vill�n J,Li J, Cohn MA, Cantley LC,Gygi SP. Proc Natl Acad SciUSA 101 (2004) 12130–12135.
Chang EJ, Archambault V,McLachlin D., Krutchinsky AN,Chait, BT. Anal Chem 76(2004) 4472–4483.
Bodenmiller B, Mueller LN,Mueller M, Domon B, Aeber-sold R. Nature Methods 4(2007) 231–237.
Gabius HJ, Andre S, Kaltner H,Siebert HC. Biochim BiophysActa 1572 (2002) 165–177.
Huddleston MJ, Bean MF, CarrSA. Anal. Chem. 65 (1993)877–884.

3 Mass Spectrometry264
Methods combining glycoprotein enrichment with glycoproteindigestion and tandem mass spectroimetry analysis have successfullyidentified sites of glycosylation. Kaji et al. (2003) utilized lectin affi-nity chromatography and glycoprotein digestion in 18O-labeled waterfor site-specific analysis; whilst Hagglund et al. (2004) employed lec-tin affinity for glycoprotein enrichment and hydrophilic interactionchromatography (HILAC) for glycopeptide enrichment prior to diges-tion and MS/MS analysis.The use of the enzyme PNGase F can be used to pinpoint the site
of N-linked glycosylation. This enzyme will cleave off the N-linkedglycans from every site in the protein and in the process convert theaspartamine residue to aspartic acid, a 1 Da mass difference. A sim-ple peptide map will then identify the peptide(s) that contained thesite of N-linked glycoyslation. Additionally, the cleaved N-linked gly-cans can then be analyzed by MALDI-TOF to highlight the heteroge-neity of N-linked glycosylation for that specific protein.Methods for investigating O-linked glycosylation include b-elimina-
tion as described for phosphorylation. Wells et al. (2002) describedO-linked analysis using affinity enrichment and tandem mass spec-trometry.
3.5Protein Quantification Using Mass Spectrometry
Protein quantification by mass spectrometry is an exciting applica-tion. To qualify, this is using mass spectrometry to detect the differ-ence in protein expression between two samples. This can be per-formed using stable isotope labeling or by a non-labeling, softwareapproach.
3.5.1Stable Isotope Labeling Approaches
Stable isotope labeling is a technique that has long been used inmass spectrometry. Mass spectrometry exploits the characteristic thatchemically identical analytes with a different stable isotope composi-tion can be separated on a mass spectrometer, due to the mass differ-ence associated with the different isotopes. The ratio of the differentanalytes signal intensity is indicative of their relative abundance.Many methods have been reported for just such an analysis of proteinexpression. Stable isotopes have been incorporated into the protein/peptide analyte using digestion in 18O labeled water (Yao et al. 2001);via metabolic labeling using heavy amino acid acids (Conrads et al.2002); using isotope coded affinity tags (ICAT�) (Gygi et al. 1999)
Kaji H, Saito H, Yamauchi Y,Shinkawa T, Taoka M, Hira-bayashi J, Kasai K, TakahashiN, Isobe T. Nat Biotechnol 21(2003) 667–672.
H�gglund P, Bunkenborg J,Elortza F, Jensen ON, Roep-storff P. J Prot Research 3(2004) 556–566.
Unfortunately, if there is norethan one N-linked site, thespecific heterogeneity at eachsite cannot be assigned.
Wells L, Vosseller K, Cole RN,Cronshaw JM, Matunis MJ,Hart GW. Mol Cell Proteomics1 (2002) 791–804.
Yao X, Freas A, Ramirez J,Demirev PA & Fenselau C. AnalChem 73 (2001) 2836–2842.
Conrads TP, Issaq HJ & Veen-stra TD. Biochem Biophys ResCommun 290 (2002) 885–890
Gygi SP, Rist B, Gerber SA,Turecek F, Gelb MH, Aerber-sold R. Nature Biotechnol 17(1999) 994–999.

3.5 Protein Quantification Using Mass Spectrometry 265
and more recently with isobaric mass tags (iTRAQ�) which enablesboth relative and absolute quantification (Ross et al. 2004). The tag-ging of proteins as described in the latter examples have proven to bethe most common methods used, though SILAC, stable isotope label-ing with amin acids in cell culture is a prominant method (Ong et al.2002). Two further methods, AQUA according to Stemman et al.(2001) and Gerber et al. (2003), and QconCAT according to Pratt et al.(2006) have been reported for absolute quantification.
& Importantly, all the methods except iTRAQ�measure the relative abundance in MS mode,whereas iTRAQ measures the relative abundancein MS/MS product ion mode.
3.5.2Isotope-coded Affinity Tags
This technique was reported by Gygi et al. (1999) describing the site-specific labeling of cysteine residues with isotope-coded affinity tags(ICAT�; Figure 3.30). The reagent has three constituent groups; firstbiotin which provides affinity for binding with an avidin column, sec-ond a linker which incorporates stable isotopes, and third a reactivegroup, iodoacetamide, which labels cysteine residues.
NH
OO
O NH
NHNH
S
O
OX
X
X
X XX
I
OXX
X is either hydrogen (light chain) or deuterium (heavy chain)
Biotin
Reactive group
Two tags exist, one with no deuteriums in the linker (light) and onewith eight deuteriums in the linker (heavy). The strategy requiresthat a two protein mixture, control and test are labeled with the light
Ross PL, Huang YLN,Marchese JN, Williamson B,Parker K, Hattan S, KhainovskiN, Pillai S, Dey S, Daniels S,Purkayastha S, Juhasz P,Martin S, Bartlet-Jones M, HeF, Jacobson A, Pappin DJ. MolCell Proteomics 3 (2004)1154–1169.Ong S-E, Blagoev B, Kratch-marova I, Kristensen DB, SteenH, Pandey A. Mann M. MolCell Proteomics 1 (2002) 376–386.
Pratt JM, Simpson DM,Doherty MK, Rivers J, GaskellSJ, Beynon RJ. Nat Protocols 1(2006) 1029–1043.
Stemmann O, Zou H, GerberSA, Gygi SP, Kirschner MW.Cell 107 (2001) 715–726
Gerber SA, Rush J, StemmanO, Kirschner MW, Gygi SP.Proc Natl Acad Sci USA 100(2003) 6940–6945.
Gygi SP, Rist B, Gerber SA,Turecek F, Gelb MH, Aerber-sold R. Nat Biotechnol 17(1999) 994–999.

3 Mass Spectrometry266
and heavy tag respectively. The two derivatized fractions are thencombined and digested before affinity isolated using an avidin col-umn. The cysteine labeled peptides are separated by RP-HLPLC andeluted into the mass spectrometer. The two forms of the same peptidewill differ in mass by 8 Da, and the ratio between the two determinesthe relative quantification. Using data dependent analysis the production MS/MS spectrum is acquired to identify the protein from thederivatized peptide.
Fig. 3.30: ICAT reagent and workflow.
3.5.3Stable Isotope Labeling with Amino Acids in Cell Culture
Stable isotope labeling with amino acids in cell culture (SILAC) is asimple approach for in vivo incorporation of a label into proteins forMS-based quantitative proteomics. This technique reported by Onget al. describes the metabolic labeling of two cell states, with the incor-poration of amino acids with substituted stable isotopic nuclei (e.g.deuterium, 13C, 15N); for instance normal and deuterated amino acidleucine.When this labeled analog is provided to cells in culture, it is incor-
porated into all newly synthesized proteins. After a number of celldivisions, each instance of this particular amino acid will be replacedby its isotope labeled analog. As there is negligable chemical differ-ence between the labeled amino acid and the natural amino acid iso-topes, cells behave normally.In the experimental design, the samples are mixed, digested and
analyzed by LC-MS/MS. Relative abundance is derived from leucine-
Ong S-E, Blagoev B, Kratch-marova I, Kristensen DB, SteenH, Pandey A. Mann M. MolCell Proteomics 1 (2002) 376–386.

3.5 Protein Quantification Using Mass Spectrometry 267
containing peptides, which will appear as heavy and light peaks,representing those leucine-containing peptides that contain deuiter-ium and those containing hydrogen. A key limitation is that it canonly be used on cultured cells.
3.5.4AQUA�
In contrast to the strategies described above, AQUA� provides abso-lute quantification by employing synthetic peptides containing stableisotopes. The authors describe the steps: selection of the internal pep-tide standard selection. The peptide is selected on its amino acidsequence and then synthesized with one of the residues beingreplaced with the “heavy” version which contains the stable isotopes.Resultantly, this peptide is chemically identical to its counterpart inquestion, but distinguishable in the MS.The AQUA peptide is analyzed by LC-MS/MS to study its fragmen-
tation pattern, which is identical to its counterpart peptide. Subse-quent LC–MS/MS analysis using an SRM experiment produceshighly accurate measurement of both the internal standard and ana-lyte.
3.5.5iTRAQ
The iTRAQ reagents are designed to allow labeling of up to four sam-ples with four reagents of the same mass (isobaric).The reagent consists of three components: an N-hydroxysuccini-
mide (NHS) ester group which reacts with primary amines at theamino-termini and lysine side-chains (alpha and epsilon aminogroups):
a balance group;a reporter group.
Fragmentation of these four tags in product ion tandem massspectrometry, produces four reporter ions (m/z 114.1, 115.1, 116.1,117.1 Da) which are used for quantification of the four samples. As aresult, up to four different biological samples may be labeled simulta-neously. iTRAQ reagents label the alpha amino group of digestedpeptides and epsilon amino group of the lysine side-chain. Resul-tantly, a greater coverage of peptides is observed (also non-cysteinecontaining proteins can be detected). The design of the tag and work-flow are shown in Figure 3.31.
Stemmann O, Zou H, GerberSA, Gygi SP, Kirschner MW.Cell 107 (2001) 715–726.
Gerber SA, Rush J, StemmanO, Kirschner MW, Gygi SP.Proc Natl Acad Sci USA 100(2003) 6940–6945
Ross PL, Huang YLN,Marchese JN, Williamson B,Parker K, Hattan S, KhainovskiN, Pillai S, Dey S, Daniels S,Purkayastha S, Juhasz P,Martin S, Bartlet-Jones M, HeF, Jacobson A, Pappin DJ. MolCell Proteomics 3 (2004)1154–1169.

3 Mass Spectrometry268
Fig. 3.31: iTRAQ� workflow for 2 samples.
3.5.6Non-labeling Software Approaches
All of the above methods require a degree of sample manipulation todeliver relative and absolute quantification. It can be argued that suchsample preparation can introduce error and as a result the methodscould be measuring experimental variation rather than real biologicalvariation. A number of software approaches have been developedwhich attempt to perform relative quantification without any labelingby comparing consecutive LC-MS profiles: Non-commercial (likeMSight) and commercial. Such a software package, DeCyder� MS,is provided by GE Healthcare. This novel software integrates visuali-zation, detection, comparison, and statistical tools. It simplifies theevaluation of large LC-MS and LC-MS/MS data sets for the relativequantification of peptides, based on profile MS spectra. DeCyde MSconverts a conventional LC-MS chromatogram into a two- and three-dimensional intensity map, as displayed in Figures 3.32 and 3.34respectively. Identification results from the MS/MS spectra can beimported into the software and used for simple sorting of peptidesbelonging to the same protein.
This software package is basedon similar algorithms like theDecyder 2D software for theevaluation of DIGE gels, whichare described in Section1.6.2.2.

3.5 Protein Quantification Using Mass Spectrometry 269
Fig. 3.32: Two-dimensional intensity map of an LC-MS run generatedby DeCyder MS. The inset illustrates a zoomed section where thecharge states of detected peptides can be seen as well as the MS/MSevents (red stars). Courtesy of A. Parbel GE Healthcare.
DeCyder� MS performs two main analysis procedures:. Peptide detection. The PepDetect module pro-vides accurate m/z signal detection, backgroundsubtraction, isotope and charge-state deconvolu-tion, and reporting of the eluted peptides fromthe column. Relative quantification is obtainedby summing up the relevant peak volumes foreach peptide in all charge states.
. Run-to-run matching. The PepMatch modulealigns the individual charge states from thesame peptide in different runs. According to theexperimental setup ratio values and statisticalsignificance for each of the peptides is calcu-lated. Various normalization and filtering techni-ques can be applied to report easily the requestedresults.
A workflow is highlighted in Figure 3.33, and an example of differ-ence in protein expression is shown in Figure 3.34. This intensitymap approach also acts as a valuable visualization tool enabling quali-tative analysis of an LC-MS run as shown in Figure 3.35.

3 Mass Spectrometry270
Fig. 3.33: The workflow for DeCyder MS. DeCyder MS usesdata derived from an electrospray MS experiment.
Fig. 3.34: DeCyder MS PepMatch module (matching module)showing the different expression of one particular peptide inthree repeats (courtesy of A. Parbel GE Healthcare).

3.6 MS Strategies 271
Fig. 3.35: Comparison of traditional LC-MS profile to that ofDeCyder MS, whereby peptide components can be clearly detectedwith DeCyder� MS. This visualization of an LC-MS profile in thisfashion is useful for a range of troubleshooting and monitoring needs.(courtesy of A.Parbel GE Healthcare).
3.6MS Strategies
Effectively there are two strategies, bottom up and top down. The dif-ference, essentially, is what is the state of the sample when it entersthe mass spectrometer i.e. is it a peptide or a protein?
3.6.1Bottom up Approach
In this approach, separated proteins or complex protein mixtures aredigested and the resultant peptides analyzed by MS in order to iden-tify the native protein. The MS analysis is carried out either by pep-tide mass fingerprinting or by sequence analysis using tandem massspectrometry. This is probably historical: 2D PAGE separated pro-teins can only be extracted from the gel by digestion; high resolution,nanoscale RPC of peptides supports high sensitivity MS analysis andthe performance and specification of mass spectrometers withrespect to peptides was higher than that for proteins. Fragmentationof peptides, rather than whole proteins, has been more practical with

3 Mass Spectrometry272
mass spectrometers and mass accuracy greater for peptide analysis.However, it does have its limitations. Acquiring complete or extensivesequence coverage can be an issue, which can make protein charac-terization problematic. Furthermore, the digestion process is largelylimited to trypsin, due to the fact that it locates basic residues to theC-terminus of the peptide which is beneficial for fragmentation andsensitivity, using CID tandem mass spectroscopy.
3.6.2Top down Approach
This approach utilizes whole proteins and not digested peptides. Thisapproach is performed with mass spectrometers equipped with ETDand ECD fragmentation. These techniques enable fragmentation oflarge polypeptides and proteins.Using this approach, accurate measurement of the molecular
weight and extensive sequence information can be acquired in oneanalysis. Additionally, PTM information can be generated.

273
4Functional Proteomics: Studies of Protein–ProteinInteractions
It is well known that the biological function cannot be linked to a sin-gle protein. In fact proteins act in complexes and interact with otherproteins. Therefore the next step after expression proteomics is theanalysis of protein interactions. A few selected approaches aredescribed in brief in the following section. Many of these technolo-gies, including SPR, are described in much more detail in the book“Protein microarray technology” edited by Kambhamti (2003).
4.1Non-immunological Methods
4.1.1Separation of Intact Multi-protein Complexes
Because it provides a higher resolution than sucrose gradient centri-fugation, the electrophoretic separation of intact protein complexeswith attached Coomassie brilliant blue dye in native polyacrylamidegels has become well established in many proteomics laboratories.Blue native PAGE had been developed by Sch�gger and von Jagow(1991) for the separation of mitochondrial membrane proteins andcomplexes in the mass range of 1,000 kDa to 10,000 kDa. Details onthe technique can be found in Section 1.2.3. In an alternative andcomplementary approach multi-protein complexes are analysed byelectrospray ionization mass spectrometry (Lamond and Mann 1997).
4.1.2Probing with Interaction Partners
“Far Western blotting” according to Burgess et al. (2000) is a non-anti-body-based detection method for specific complex partners with apurified bait protein after a native or a denaturating electrophoreticseparation.
Proteomics in Practice. A Guide to Successful Experimental Design 2nd Ed.Reiner Westermeier, Tom Naven, and Hans-Rudolf HçpkerCopyright � 2008 WILEY-VCH Verlag GmbH & Co. KGaA, WeinheimISBN: 978-3-527-31941-1
Kambhampti, D (ed) ProteinMicroarray Technology. Wiley-VCH, Weinheim (2003)
Sch�gger H, von Jagow G. AnalBiochem. 199 (1991) 223–231.
Lamond AI, Mann M. TrendsCell Biol 7 (1997) 139–142.
Burgess R, Arthur TM, PietzBC. Methods Enzymol. 328(2000) 141–157.

4 Functional Proteomics: Studies of Protein–Protein Interactions274
4.1.3Surface Plasmon Resonance
Surface plasmon resonance (SPR) measures biomolecular bindingevents in real time without the use of labels by detecting mass con-centration changes on a sensor surface. SPR has become an estab-lished technique for measuring biomolecular interaction, in particu-lar protein interactions. SPR occurs when surface plasmon waves areexcited at a metal/liquid interface (the sensor surface). Light is directedat, and reflected from, the side of the surface not in contact with sam-ple. SPR causes a reduction in the reflected light intensity at a speci-fic combination of angle and wavelength (generating a refractive index-dependent SPR signal). Molecules binding to the sensor surface causechanges in the refractive index close to the surface which are detectedas changes in the SPR signal. Specifically, in an SPR experiment areactant (ligand) is immobilized on a surface and its interaction witha second component (the analyte) is measured. Effectively the asso-ciation and dissociation of the ligand–analyte interaction is measured(F�gerstam et al. 1992; see Figure 4.1). An SPR detector is capable ofmeasuring real time label-free biomolecular interactions.
Fig. 4.1: SPR principal of detection. SPR is used to measurethe change in refractive index as the analyte binds to the ligand(from Biacore seminar).
A number of applications have been developed for the SPR analysisof proteins with the objective of further characterizing protein inter-actions. In particular, real time binding data is often essential tounderstand the dynamic interactions between proteins and other bio-molecules that drive and regulate biological processes. Specific ques-tions may include what does the protein of interest bind with or to,where does it bind, when does it bind and how does it bind? Interest-ingly, studies with SPR can elucidate binding strength (affinity) speci-
F�gerstam LG, Frostell-Karlsson�, Karlsson R, Persson, B,Rçnnberg, I. J Anal Chromato-graphy 597 (1992) 397–410.

4.2 Antibody-based Techniques 275
ficity of interaction and the rates at which interactants bind and dis-sociate or kinetics (on and off rates).Using SPR, complex association and dissociation are detected in
real time and data are presented graphically in an interaction profileknown as a sensorgram, which is rich in information on dynamics ofmolecular interactions (see Figure 4.2). A typical experiment takesabout 30 minutes to immobilize or capture a ligand protein, 3 min-utes for sample injection and kinetic binding measurement, and 1minute for regeneration. The latter two steps are repeated for a seriesof analyses.
Fig. 4.2: Typical sensorgram of a label-free protein interaction analysiswith SPR. The signal height (measured in RU) is also prortional to themass of protein binding to the ligand.
Application areas in proteomics include the studies of protein com-plexes, cell adhesion, signal transduction pathways, transcription,regulation, and antibody recognition.
4.2Antibody-based Techniques
4.2.1Western Blotting and Dot Blots
The procedure of “Western blotting” is intensely described in Section1.3. In many cases the efforts of electrophoretic separation of thesamples and transfer of the separated proteins onto the blotting
The major benefit of SPR tech-nology is the informationgained from the kinetics of theinteraction.
However without pre-fractiona-tion of the proteins cross-reac-tions during the detectionprocedure cannot completelybe excluded.

4 Functional Proteomics: Studies of Protein–Protein Interactions276
membrane is not necessary: The sample mixture possibly containingthe protein to be detected can also be applied directly on a blottingmembrane as a dot using dot blot or slot blot manifolds. The probingfor proteins is performed as described in Section 1.3.2. These dotblots allow parallel screening of many samples.
4.2.2Protein Microarrays
The concept described above, also called a “macroarray”, has mean-while evolved into microarray technologies, using microscope slideformat (25�75 mm). The basic technology for microarrys had beendeveloped for nucleic acid analysis in genomics and transcriptomicsstudies. Similar methodologies are applied on expression profiling ofproteins in non-fractionated mixtures: Proteins are arrayed on mem-branes or on microscope glass slides (protein chips) in very lowvolumes in tiny spots using instruments similar to inkjet printers.Either antibodies are printed on the carrier to capture specific ana-lytes from body fluids, cell and tissue lysates; or – vice versa – thesample lysates are immobilized on the carrier and antibodies areused to detect specific sample components. Detection is usually per-formed with a secondary antibody labeled with a fluorescent tag, likecyanine dyes as used in the DIGE approach. In this way multiplexedprotein expression profiling can be carried out in a single assay; andrelative quantification is enabled. The spotting is fully automated byemploying pipetting robots, which apply the solutions from 384-wellplates. The images require high resolution multifluorescence scan-ners.Protein microarrays allow studying many biological events simulta-
neously with very small sample volumes, resulting in molecular fin-gerprints on the protein level. Protein microarrays show still somemethodological limitation, however there is a huge potential for awide area of applications from high-throughput proteomics to clinicaldiagnostics. Figure 4.3 shows a typical microarray image after scan-ning with different wavelength fluorescence detection.
A critical step is the immobili-zation of the proteins onto thesupport. Random orientation ofthe proteins can cause lossofbiological activity and/ orrecognition of its epitope by theantibody.
Also their ease of use and theirpossibility of automationprotein microarrays pledge tobe more suitable for diagnosticapplications than the classicproteomic separation technolo-gies.

4.2 Antibody-based Techniques 277
Fig. 4.3: Typical microarray image using Cy3 and Cy5fluorescent labels after scanning with a high-resolutionversion Typhoon multifluorescence scanner.


279
Part II:Practical Manual of Proteome Analysis
Equipment, Consumables, Reagents 281
Step 1: Sample Preparation 287
Step 2: Fluorescence Difference Gel Electrophoresis 299
Step 3: Isoelectric Focusing 309
Step 4: SDS Polyacrylamide Gel Electrophoresis 323
Step 5: Scanning of Gels Containing Pre-labeled Proteins 357
Step 6: Staining of Gels 361
Step 7: Image Analysis and Evaluation of DIGE Gels 373
Step 8: Spot Excision 383
Step 9: Sample Destaining 387
Step 10: Protein Digestion 389
Step 11: Microscale Desalting and Concentrating of Sample 393
Step 12: Chemical Derivatization of the Peptide Digest 397
Step 13: MS Analysis 399
Step 14: Calibration of MALDI-ToF MS 403
Step 15: Preparing for a Database Search 407
Proteomics in Practice. A Guide to Successful Experimental Design 2nd Ed.Reiner Westermeier, Tom Naven, and Hans-Rudolf HçpkerCopyright � 2008 WILEY-VCH Verlag GmbH & Co. KGaA, WeinheimISBN: 978-3-527-31941-1

281
Equipment, Consumables, Reagents
Sample Preparation
Instrumentation
Freezer –20 �C, –80 �CLaboratory centrifuge for 1.5 mL tubes, at least 13,000 rpmHeating block for 1.5 mL tubes, at least 95 �CMicropipettes adjustable from 2 mL to 1,000 mL
Optional (not always needed):
Sonicator probe
Consumables
Disposable powder free gloves
Reagents
Urea, thiourea, CHAPS, Dithiothreitol (DTT), Bromophenol blue,SDS, Tris-base, Glycerol (85%), Pharmalytes pH 3–10 (~40% w/v),IPG buffer,
Ettan� 2D cleanup kitIodoacetamide
Optional (not always needed):Molecular grinding kit,PlusOne� microdialysis kitEttan� 2D quantification kitDesoxyribonuclease I (DNase I)Ribonuclease I (RNase A and RNase B)Ribonuclease I “A” (RNase A)Protease inhibitor mixPhosphatase inhibitors: Na-vanadate, NaFSulfobetains
Proteomics in Practice. A Guide to Successful Experimental Design 2nd Ed.Reiner Westermeier, Tom Naven, and Hans-Rudolf HçpkerCopyright � 2008 WILEY-VCH Verlag GmbH & Co. KGaA, WeinheimISBN: 978-3-527-31941-1

Equipment, Consumables, Reagents282
2-D DIGE
Instrumentation
Typhoon� 9400, Trio multifluorescence and phosphoimagingscanner
or:Ettan� DIGE Imager (EDI)
Reagents
DimethylformamideCyDyes for minimal labeling, lysineCyDyes for saturation labeling, HCEP
2-D Electrophoresis
Instrumentation
IPGphor� IEF system for 2-D electrophoresisRegular strip holders18 cm, 24 cm
for standard IEF in Immobiline DryStrips
Ceramic Manifold24 cm
for basic gradients and very high sampleloads
Reswelling tray for rehydrating 12 IPG strips 7–24 cmEttan� DALT twelve SDS PAGE system for high-throughput 2-D
electrophoresisEttan� DALTsix SDS PAGE system for medium-throughput
2-D electrophoresiswith:Multitemp� III thermostatic circulatorEPS 3501 XL programmable power supply 3,500 Vor:EPS 600 power supply 600 VGel caster for 14 gelsGel caster for 6 gelsPrecast gel cassette 1.0 mmGel casting cassette 1.0 mmGel casting cassetteslow-fluorescence(for DIGE gels)
1.0 mm
Gel casting cassette 1.5 mmBlank cassette insertSeparator sheets 0.5 mm

Equipment, Consumables, Reagents 283
Filler sheets 1.0 mmCassette rackEquilibration tube set 24 cmThin plastic ruler (300–500 mm)
Heating block for 1.5 mL tubes, at least 95 �CMagnetic stirrerLaboratory shakerRing standHand roller, scissors, spatulas, forceps with bent pointed tipsAssorted glassware: beakers, measuring cylinders, erlenmeyers, testtubes etc.
Magnetic stirrer bars in different sizesSqueeze bottle, finger-pumped plant sprayer (ca. 500 mL)Graduated pipettes of 5 mL and 10 mL + pipetting device(e.g. Peleus ball)
Micropipettes adjustable from 2 mL to 1,000 mLWaterproof pen, black, like Edding 3000
Optional:
FilmRemover apparatus for removing gels from supportfilms
Gradient maker for multiple gel casterLaboratory platform, adjustable, Pinchcock clamp
Consumables
Paper electrode strips, paper bridge pads, loading cups,Disposable gloves, tissue paper, filter paper, pipette tips, microcentri-fuge tubes, test tubes with screw caps 15 mL and 50 mL,
Reagents
IPG DryStrips, 18 cm or 24 cm, different pH gradientsDeStreak� (HED)IPG cover fluidIPGphor� strip holder cleaning solution (neutral detergent)
Ettan� DALT II gels and buffer kit:DALT II Gel 12.5% homogeneous 6/pkDALT II buffer kitUrea, thiourea, CHAPS, Dithiothreitol (DTT), Bromophenol blue,SDS, Tris, Pharmalytes� pH 3–10 (~40% w/v), IPG buffers

Equipment, Consumables, Reagents284
Acrylamide IEF solution (40%T, 3%C), or Acrylamide PAGE 40%solution, N,N¢-methylenebisacrylamide (Bis), Glycerol (85%),Ammonium persulfate, TEMED, Glycine, GelSeal silicone grease,Agarose NA
Molecular weight markers range 14,400–94,000IEF sample application piecesGel labels cut from a printed paper or overhead filmBind-Silane, Decon� 90Thiourea, alternative detergents, sulfobetains, isopropanolAcid violet 17, phosphoric acid, trichloroacetic acid, imidazole, zincsulfate, EDTA-Na2
Staining
Instrumentation
Processor Plus withlarge tray
apparatus for automated silver staining
Staining kit with setof trays
for multiple gel staining
Orbital shakerStainless steel staining trays (for Coomassie and silver staining)Heating stirrerKitchen foil welding apparatusDark plastic tray (for Deep Purple�)Gel dryer gel drying frames and loading platform
Consumables
Disposable glovesTransparent smooth sheetprotectors
A4 or letter format
Reagents
PhastGel blue tablets Coomassie brilliant blue R-350Acetic acidPlusOne silver staining kitCoomassie brilliant blue G-250, Tris, o-phosphoric acid, ammoniumsulfate, methanol
Deep Purple

Equipment, Consumables, Reagents 285
Evaluation
Instrumentation
ImageScanner desk top scanner modified for electro-phoresis gels
Typhoon 9000 multifluorescence and phosphoimagingscanner
Ettan DIGE Imager (EDI)Computer (Windows NT , 2000 or XP)Printer
Software
DeCyder� 2D evaluation software for DIGE gelsDeCyder� EDA Extended data analysis with multivariate
statistical toolsImageMaster�Platinum
2D evaluation software
Gray step tablet
Spot Picking
Instrumentation
Ettan� spot picker
Consumables
Powder-free gloves500 mL Eppendorff tubesScalpelSurgical needles
Reagents
Ammonium bicarbonateAcetonitrileMilliQ water
Digestion
Instrumentation
Ettan� digester

Equipment, Consumables, Reagents286
Consumables
Reagents
DDTIodoacetamideSequence grade trypsinAmmonium bicarbonateTrifluoro-acetic acidAcetonitrileMilliQ water
Mass Spectrometry
Instrumentation
Ettan� MALDI-ToF Pro
Consumables
Ettan� MALDI-ToF Pro target slidesGel loader pipette tipsZipTips
Reagents
a-Cyano-4-hydroxycinnamic acid2,5 Dihydroxybenzoic acidHeptafluorobutryic acidRP resinTrifluoroacetic acidAcetonitrileMethanolFormic acidMilliQ water

287
Step 1: Sample Preparation
To explain here all ways of sample preparation in detail would be toomuch for this book. Therefore the following instructions should beseen as a starting point. For instance very hydrophobic proteins orplant proteins require more sophisticated extraction procedures.Sample preparation is the most sensitive step in the entire proce-
dure. Proteins, which got lost here, cannot be identified. Modifica-tions of proteins lead to wrong conclusions in proteome analysis.
. To avoid protein losses, the treatment of the sam-ple must be kept to a minimum.
. To avoid protein modifications, the sampleshould be kept as cold as possible.
. To avoid losses and modifications, the prepara-tion time should be kept as short as possible.
It should also be noted that there are more than one possible proce-dure to treat a sample. A 100% representation of the proteins con-tained in a cell will never be obtained in practice. Usually the method,which will display the highest number of different proteins, is cho-sen. When there is special interest in a certain group of proteins,which are under-represented with the default method, an alternativeprocedure has to be applied.Example: When – for a given sample – the highest number of pro-
teins gets extracted under alkaline conditions, a number of basic pro-teins will not be included, because their solubility close to their iso-electric points is low. This means: For the analysis of the basic pro-teins acidic extraction conditions have to be employed.
1.1Washing of Cells
Washing of cells is a critical step, where salt ions can be introducedinto the sample. PBS is the standard washing solution. If it is not pos-
Proteomics in Practice. A Guide to Successful Experimental Design 2nd Ed.Reiner Westermeier, Tom Naven, and Hans-Rudolf HçpkerCopyright � 2008 WILEY-VCH Verlag GmbH & Co. KGaA, WeinheimISBN: 978-3-527-31941-1
The procedure described forbasic proteins in this chapter isbased on a procedure devel-oped for optimal extraction andconcentration of plant proteins.

Step 1: Sample Preparation288
sible to remove the PBS solution completely, it is better to wash thecells with Tris-buffered sucrose (10 mmol/L Tris, 250 mmol/Lsucrose, pH 7), or to use this alternative washing solution as a lastwashing step.
Tris-buffered sucrose washing solution: 1.21 g Tris, 85.6 g sucrose, fillup to 1 L with H2Odist, titrate to pH 7 with 4 mol/L HCl.First the default procedure and lysis solution is described (see
Tables 1.2, 1.3, 1.4). Alternative or additional reagents should only beused, when the results are not sufficiently good.The first dimension, isoelectric focusing, is relatively sensitive to
salts and other ionic contaminations. Thus the use of ionic buffersmust be avoided as much as possible.The detection methods listed in Table 1.1 describe categories of
sample loads. For facts and comments on detection methods see page50 and Step 4: Staining of gels.
Tab. 1.1: Protein loads (on large gels, using 18 cm and 24 cm strips).
Radiolabeled 1 mg – 50 mg “Analytical”
Silver stain 20 mg – 200 mg “Analytical”
CyDye labeled (lysine) 50 mg to 450 mg “Analytical to preparative”
CyDye labeled (cysteine) 500 ng – 300mg “Analytical to preparative”
Deep Purple stain 100 mg – 700 mg “Analytical”
Zinc imidazol negative stain 200 mg – 500 mg “Analytical”
Coomassie blue stain 500 mg – 2 mg “Preparative”
Coomassie blue stain 1 mg – 10 mg “Preparative” on narrowpH intervals
The maximum applicable sample loads depend on the length of theIPG DryStrip and the kind of pH gradient.
& Note: A sample for 2-D electrophoresis is veryprecious, only high purity reagents should beused.
1.2Stock Solutions
Disposable gloves must be worn during each step to avoid contamina-tion of the sample.For the sake of reproducibility it is proposed to use exact concentra-
tions of Bromophenol blue.
Pharmalytes and IPG buffersare amphoteric and acquire anet charge of zero during IEF.

1.2 Stock Solutions 289
1% (w/v) Bromophenol blue solution:
Bromophenol blue 1% (w/v) 100 mg
Tris-base 60 mg
Water, deionized Dissolve 10 mL
Tab. 1.2: Standard solubilization cocktail “lysis solution, lysis buffer”(10 mL).
9 mol/L urea 5.4 g
4% (w/v) CHAPS 400 mg
1% (w/v) DTT (= 65 mmol/L) 100 mg
2% (v/v) Pharmalytes pH 3 to 10 *) 200 mL0.002% Bromophenol blue **) 10 mLWater, deionized, make up to 10 mL
*) or IPG buffer of respective pH interval
**) from 1% Bromophenol blue solution
& Important: Prepare the solution freshly, shake todissolve the urea, do not warm it higher than30 �C to avoid carbamylation.
Removal of isocyanateIf the purity of the urea is in doubt:
. Dissolve 5.7 g urea in deionized water, fill up to10 mL.
. Warm the tube to get the urea completely insolution: Do not exceed 37 �C.
. Add 100 mg mixed bed ion exchanger AmberliteIRN-150. Stir for 10 min.
. Filter through paper.
. Add the other additives according to Table 1.2.
1.2.1Optional Additives
Protease inhibition Add protease inhibitor cocktail in lysis solutionuntil 10 mL/mL is reached.
1% Bromophenol blue does notgo into solution without Tris
The inhibitor cocktail inhibitsmost proteases during extrac-tion; irreversible inhibition isonly obtained upon precipita-tion of the sample.

Step 1: Sample Preparation290
Phosphatase inhibition Add Na-vanadate and NaF until 1 mmol/Luntil 1 mmol/L of each is reached.The lysis solution can be produced in larger quantities – without
DTT – and stored frozen in aliquots at a temperature deeper than–60 �C.
Tab. 1.3: Standard rehydration solution.
8 mol/L urea 4.8 g
0.5% (w/v) CHAPS 50 mg
0.28% (w/v) DTT 28 mg
10% (v/v) glycerol 1.2 mL
1.25% (v/v) Pharmalytes pH 3–10 *) 125 mL0.002% Bromophenol blue **) 10 mLWater, deionized, make up to 10 mL
*) or IPG buffer of respective pH interval
**) from 1% Bromophenol blue solution
Removal of isocyanate If the purity of the urea is in doubt:. Dissolve 4.8 g urea in deionized water contain-ing 10% (v/v) glycerol, fill up to 10 mL.
. Warm the tube to get the urea completely insolution: Do not exceed 37 �C.
. Add 100 mg mixed bed ion exchanger AmberliteIRN-150. Stir for 10 minutes.
. Filter through paper.
. Add the other additives according to Table 1.3.
The rehydration solution can be produced in larger quantities – with-out DTT – and stored frozen in aliquots at a temperature at –20 �C orcolder.
1.2.2Liquid Samples
To analyze protein solutions such as serum, plasma etc. the solubiliz-ing mixture is diluted to the desired protein concentration with rehy-dration solution.
Diluted samples In general, the lower additive concentration like inthe rehydration solution should be adequate. However, some samplesmight need higher concentrations, indicated on the right half of Table1.4.
Repeated freeze thawing mustbe avoided. Add DTT shortlybefore use.
Repeated freeze thawing mustbe avoided. Add DTT shortlybefore use.
Very diluted samples like cellculture supernatant need to beprecipitated, usually with 100%(w/v) TCA.

1.3 Examples 291
Tab. 1.4: Amounts of additives to 1 mL sample.
Sample 1 mL Sample 1 mL
8 mol/L urea 0.75 g 9 mol/L urea 0.94 g
0.5% (w/v) CHAPS 8 mg 2% (w/v) CHAPS 36 mg
0.28% (w/v) DTT 5 mg 1% (w/v) DTT 18 mg
1.25% (v/v) Pharmalytes 3–10*) 20 mL 2% (v/v) Pharmalytes 3–10*) 36 mL0.002% Bromophenol blue**) 2 mL 0.002% Bromophenol blue**) 2 mLTotal volume 1.6 mL 1.85 mL
*) or IPG buffer of respective pH interval
**) from 1% Bromophenol blue solution
1.3Examples
The volumes are given for 24 cm IPG strips only. For paper bridgeloading 18 cm strips are recommended. The sample would be dilutedin 450 mL for anodal and 350 mL for cathodal loading.
Example 1: Escherichia coli extract (ideal as test sample) Sample:lyophilized cells of E. coli strain B (ATCC 11303), Sigma EC-11303
Lyophilized E. coli 30 mg Measured protein content
Lysis solution 1 mL ~12 mg protein/mL
Freeze (–20 �C) and thaw two times in a microcentrifuge tube.Centrifuge for 10 min with 13,000 rpm.
24 cm IPG strip Sample supernatant Rehydration solution
Analytical run: (~180 mg protein)
Rehydration loading 15 mL mix with 435 mLCup loading 15 mL*) at anodal side 450 mL (>6 h pre-rehydration)
Preparative run: (~1 mg protein)
Rehydration loading 83 mL mix with 367 mLCup loading 83 mL at anodal side 450 mL (>6 h pre-rehydration)
*) Mix with 50 mL rehydration solution before you apply it.
Figure 1.1 shows a typical 2-D electrophoresis pattern of an E. coliextract applied with rehydration loading.

Step 1: Sample Preparation292
Fig. 1.1: E. coli extract (~600 mg protein), IPG DryStrip,pH 3–10, Ettan DALTgel, fast Coomassie staining.
Example 2: Saccharomyces cerevisiae (yeast cell lysate)
Lyophilized yeast 300 mg
lysis solution 2.5 mL
Sonicate for 10 min at 0 �C.Centrifuge for 10 min at 10 �C with 42,000 g.
24 cm IPG strip Sample supernatant rehydration solution
Analytical run:
Rehydration loading 30 mL mix with 420 mLCup loading 30 mL*) at anodal side 450 mL (>6 h pre-rehydration)
Preparative run:
Rehydration loading 300 mL mix with 150 mLCup loading 100 mL at anodal side 450 mL (>6 h pre-rehydration)
*) Mix with 50 mL rehydration solution before you apply it.
Tissue The tissue of interest is sliced with a scalpel to obtain anappropriately sized piece. It can be frozen with liquid nitrogen andbroken into small fragments in a mortar and pestle.

1.4 Microdialysis 293
Example 3: calf liver Liver acetone powder, calf, Sigma L-7876
Acetone powder 10 mg
Lysis solution 1 mL
For small tissue amounts a disposable grinding kit is very useful(see Figure 1.2).
Fig. 1.2: Grinding of tissue material.Typically 5 mg of the acetone powder or 20–50 mg of animal orplant tissue are ground in 500 mL of lysis solution.
24 cm IPG strip Sample supernatant Rehydration solution
Analytical run:
Rehydration loading 30 mL mix with 420 mLCup loading 30 mL *) at anodal side 450 mL (>6 h pre-rehydration)
Preparative run:
Rehydration loading 300 mL mix with 150 mLCup loading 100 mL at anodal side 450 mL (>6 h pre-rehydration)
*) Mix with 50 mL rehydration solution before you apply it.
1.4Microdialysis
Dialysis of the sample is usually not recommended, because largemembrane areas can cause adsorption of proteins. Less protein getslost with specially designed minidialysis tubes. The fastest removal ofsmall ions is achieved with an 8 kDa cut-off membrane.Salt and buffer ions can be removed efficiently by dialyzing 2-D
samples against at least 40� sample volume of 8 mol/L urea / 1%DTT solution for 2 hours to overnight. The 2-D sample should be pre-pared in lysis buffer. Other, more expensive additives such as CHAPS
In the Tris-glycine buffer systempeptides smaller than 10 kDaanyhow co-migrate with thefront; they are not displayed inthe gel.

Step 1: Sample Preparation294
and carrier ampholytes do not need to be included in the dialysissolution. These components are afterwards added back, in the origi-nal concentrations.
1.5Precipitation
A crude extract can contain contaminations with phospholipids andnucleic acids, which are visualized with silver staining as horizontalstreaks in the acidic part of the gel. Protein precipitation is thereforeoften employed to remove the contaminating substances. Protein pre-cipitation is also used to concentrate proteins from samples that aretoo dilute for effective 2-D analysis.
1.5.1TCA Acetone
Sometimes the TCA and/or the salt from the sample are not comple-tely removed, which can be observed by horizontal streaking in the2-D gel. Practice has shown that washing with ice-cold 10% water /90% acetone instead of pure acetone removes ionic components veryefficiently without any negative effects. Therefore the original proto-col of Damerval et al. (1986) has been modified here. Furthermorethe modifications according to Gçrg et al. (2000) are implementedhere.
. Freeze plant material – or other material – inliquid nitrogen.
. Grind it with a pestle in a pre-frozen mortar.
. To 30 mg add 5 mL of 20% TCA in cold acetone(–20 �C) containing 0.2% (w/v) DTT.
. Precipitate overnight in a freezer.
. Centrifuge at +20 �C with 13,000 rpm for10 minutes.
. wash with 90% acetone / 10% water (–20 �C)containing 0.2% (w/v) DTT.
. Centrifuge again.
. Resuspend the pellet in lysis buffer.
. Carefully sonicate.
. Centrifuge at +20 �C with 13,000 rpm for10 minutes.
For protein precipitation from a liquid the precipitation fluid must beat least three times larger than the volume of the sample.
For precipitation of proteinsfrom a cell culture supernatantoften a 100% (w/v) TCA solu-tion is employed.
Damerval C, DeVienne D, ZivyM, Thiellement H. Electrophor-esis 7 (1986) 53–54.
Gçrg A, Obermaier C, BoguthG, Harder A, Scheibe B, Wild-gruber R, Weiss W. Electrophor-esis 21 (2000) 1037–1053.
Avoid heating!

1.5 Precipitation 295
The disadvantage is, however, that some acidic proteins get lostwith this procedure, because they are not precipitated into the pellet.
1.5.2Ettan� 2-D Cleanup Kit
The Ettan 2-D cleanup kit procedure uses a combination of a uniqueprecipitant and co-precipitant to quantitatively precipitate the sampleproteins. The proteins are pelleted by centrifugation and the precipi-tate is washed to further remove non-protein contaminants. The mix-ture is centrifuged again and the resultant pellet is resuspended intothe lysis buffer.The sample can contain 1 mg to 1 mg protein in a volume of 1 to
100 mL. Protein can be processed from larger volumes by scaling upthe procedure.
1.5.3Resolubilization
In practice the 2-D cleanup kit and the method according to Wesselsand Fl�gge hold the highest yield among the precipitation methods.Nevertheless, there are sometimes difficulties reported to get the pel-let back into solution. Here are a few important hints how to get thepellet completely redissolved:
. Take care that the pellet does not become com-pletely dry!
. Pipette repeatedly lysis solution over the pellet,but do not vortex!
. Resolubilization can take several hours or over-night at room temperature. Proteases have beencompletely inactivated by precipitation.
. If this does not work, carefully sonicate with thesample being placed on ice, with short burstsand breaks in between.
. Or use PlusOne Molecular grinding kit toincrease the surface of the pellet
. Or freeze pellet with lysis solution at –20 �C for15 minutes.
. If none of the above measures work, use SDSsolution (2% SDS, hot) and then dilute with 9mol/L urea / 4% CHAPS to an SDS concentra-tion below 0.1%. Also, as a rule of thumb, theCHAPS to SDS ratio must be 8:1 in the samplebefore application on the IPG strip.
This procedure has the highestyield of precipitated proteinsand proteins coming back intosolution.
Vortexing can cause oxidationof some proteins, and then theywill not dissolve anymore.
Do not vortex!
Avoid heating of sample
Particularly useful, whenseveral mg of proteins havebeen precipitated.
Urea crystals will develop,which break up the pellet
See also “SDS procedure”below

Step 1: Sample Preparation296
1.6Very Hydrophobic Proteins
1.6.1Thiourea Procedure
For membrane proteins and other very hydrophobic proteins a combi-nation urea/thiourea in the solubilization solution can be very helpfulto get more proteins into solution (Rabilloud, 1998). The modifiedlysis solution is then composed as follows:
7 mol/L urea 4.2 g
2 mol/L thiourea 1.5 g
With H2Odist fill up to 9.5 mL
Removal of isocyanate:. Warm the tube to get the urea and thiourea com-pletely in solution: Do not exceed 37 �C.
. Add 100 mg mixed bed ion exchanger AmberliteIRN-150. Stir for 10 min.
. Filter through paper.
. Add the other additives:
4% CHAPS 400 mg
1% (w/v) DTT 100 mg
2% (v/v) Pharmalytes pH 3 to 10*) 500 mL0.002% Bromophenol blue**) 10 mL
*) or IPG buffer
**) from 1% Bromophenol blue solution
& Important: Prepare the solution freshly, shake todissolve the urea, do not warm it higher than30 �C to avoid carbamylation.
This lysis solution can also be produced in larger quantities – withoutDTT – and stored frozen in aliquots at a temperature lower than–60 �C.
Always treat thiourea-containing solutions withmixed bed ion exchanger.
Repeated freeze-thawing mustbe avoided. Add DTT shortlybefore use.

1.7 Quantification 297
1.6.2SDS Procedure
. Formation of oligomers can be prevented.
. Organisms with tough cell walls sometimesrequire boiling for 5 minutes in 1–2% SDSbefore they are diluted with lysis solution.
. Very hydrophobic proteins might require extrac-tion with high percentage of SDS.
& Note: The SDS-containing sample solution mustbe diluted with lysis solution (9 mol/L urea / 4%CHAPS) to an SDS concentration below 0.1%.Also, as a rule of thumb, the CHAPS:SDS ratiomust be 8:1 in the sample before application onthe IPG strip.
Example: human plasma According to Sanchez et al. (1995):
10 mL human plasma Mix with 6.25 mL 10% SDS, 2.3% DTT
Heat for 5 min at 95 �C
Dilute with 500 mL lysis solution
& Note: SDS does not always completely separatefrom the proteins during IEF, even under highfield strength. SDS can also be removed byprecipitation with the cleanup kit.
1.7Quantification
The most reliable protein quantification for 2-D IEF samples isobtained with the Ettan� 2-D Quant kit, which is based on precipita-tion. This procedure is compatible with such common sample pre-paration reagents as 2% SDS, 1% DTT, 8 mol/L urea, 2 mol/Lthiourea, 4% CHAPS, 2% Pharmalytes and 2% IPG Buffer. The pre-cipitated proteins are resuspended in a copper-containing solution;the unbound copper is measured with a colorimetric agent. The colordensity is inversely related to the protein concentration. The volumerange of the assay is 1–50 mL and the linear range for quantificationis 0–50 mg. The assay has a sensitivity threshold of 0.5 mg.
Sanchez J-C, Appel RD, GolazO, Pasquali C, Ravier F,Bairoch A, Hochstrasser DF.Electrophoresis. 16 (1995)1131–1151.

Step 1: Sample Preparation298
1.8SDS Samples for 1-D SDS Electrophoresis
SDS sample buffer:
2% (w/v) SDS 2 g
25% Glycerol (v/v) 85% solution 30 mL
50 mmol/L Tris HCl, pH 8.8 1.5 mol/L stock solution 3.5 mL
0.01% Bromophenol blue 10 mg
Water, deionized Make up to 100 mL
Store at room temperature.. Dissolve 50 mg of DTT in 100 mL deionizedwater.
. Dissolve 20 mg of iodoacetamide in 100 mL deio-nized water.
. Add 10 mL DTT solution to 100 mL SDS samplebuffer.
. Mix 25 mL sample extract with 25mL SDS samplebuffer.
. Heat at 60 �C for 5 min.
. Add 10 mL iodoacetamide solution to the 50 mLSDS sample solution. Leave it at room tempera-ture for 30 min.
. Apply 20 mL of this solution on the SDS gel.
The glycerol is added toincrease the density to preventmixing with upper buffer.
Do not heat it, when thesample contains urea!

299
Step 2: Fluorescence Difference Gel Electrophoresis
2.1Experimental Design
The experiment setup should be properly designed: Biological repli-cates ensure that induced biological changes are not mixed up withinherent biological differences. Gel replicates are only necessarywhen an experiment consists of a low number of samples, like two tosix samples. In this case one-time gel replicates are run, which con-tain inverse labeled samples. Experiments with higher numbers ofsamples do not require gel replicates.Optimally all samples of an experiment should be run together in
the first and second dimension to minimize methodical variation.This means that an experiment should not consist of more than 12gels, if possible.
. Prepare a chart for planned randomization ofthe samples and the internal standard amongthe gels, like the example in Table 2.1.
Tab. 2.1: Example for “randomized” sample labeling and applicationfor 12 samples.
Gel Cy2 standard Cy3 Cy5
1 All 12 samples Control 1 Treated 3
2 All 12 samples Control 2 Treated 1
3 All 12 samples Control 3 Treated 2
4 All 12 samples Treated 4 Control 5
5 All 12 samples Treated 5 Control 6
6 All 12 samples Treated 6 Control 4
Disposable gloves must be worn during each step to avoid contam-ination of the sample.
Proteomics in Practice. A Guide to Successful Experimental Design 2nd Ed.Reiner Westermeier, Tom Naven, and Hans-Rudolf HçpkerCopyright � 2008 WILEY-VCH Verlag GmbH & Co. KGaA, WeinheimISBN: 978-3-527-31941-1
The pooled internal standard isalways labeled with one andthe same CyDye: Cy2 for 3-color experiments and Cy3 for2-color experiments.
Running gels of one experimentin different chambers makesspot matching more difficult.

Step 2: Fluorescence Difference Gel Electrophoresis300
2.2Sample Preparation
In the standard labeling protocol, proteins are first denatured in alysis buffer; that will eliminate all secondary and tertiary structures ofproteins. The protein concentration should then be determined usingthe Ettan 2-D Quant kit procedure. The fluorescent properties of Cy2,Cy3 and Cy5 can be adversely affected by exposure to light: keep theexposure of protein labeled with CyDye to all light sources to a mini-mum.
& During labeling the samples must not containprimary amines (IPG buffers, carrier ampholytes)and reductants.
Appropriate sample preparation is crucial for good results. Practicehas shown that labeling efficiency is much higher after samplecleanup based on precipitation of the proteins. This measure will notonly remove disturbing contaminants like lipids, polysaccharides, saltions, and nucleic acids, but also endogeneous peptides from the sam-ple. Peptides contain also lysines and cysteines, which would belabeled with a CyDye fluor as well. In a standard buffer system thesmall peptides migrate in the front of the second dimension, andwould not be resolved.
2.2.1Stock Solutions
Sample lysis solutions for DIGE:Lysis solution 1: 9 mol/L urea, 4% (w/v) CHAPS, 30 mmol/LTris.Lysis solution 2: 2 mol/L thiourea, 7 mol/L urea, 4% (w/v) CHAPS,30 mmol/LTris.
For pH adjustment: 50 mmol/L NaOH solution. Solubilize the protein samples either in samplelysis solution 1 or 2.
. Check the protein concentration in the samples:optimally it would be between 5 mg/mL and 10mg/mL. But 1 mg/mL to 20 mg/mL are tolerablefor successfully labeling.
. Check the pH carefully: pipette 2 mL sample on apH indicator paper. Read out the pH valueimmediately, because the color will shift withtime.
These compounds are addedafter labeling had beencompleted by adding a 2�sample solution.

2.3 Reconstitution of the CyDyes 301
. If necessary adjust the pH value with adding50 mmol/L NaOH solution.
& Note: Proteins have some inherent bufferingcapacity and may have decreased the pH valueof the lysis solution below pH 8. Samples whichhave been cleaned up with TCA acetone or the2-D cleanup kit can be quite acidic.
2.3Reconstitution of the CyDyes
Use 99.8% anhydrous Dimethylformamide (DMF) less than 3months old from day of opening. The quality of the DMF is critical toensure that the protein labeling is successful. The DMF must beanhydrous and every effort should be used to ensure it is not con-taminated with water. DMF after opening, over a period of time, willdegrade with amine compounds being produced. Amines will reactwith the NHS ester CyDye reducing the concentration of dye availablefor protein labeling. Adding a 4 � molecular sieve to DMF during sto-rage is a good measure to prolong the useful lifetime of DMF.
2.3.1For Minimal Labeling of Lysines
CyDye fluors for minimal labeling are available in different packagesizes. Figure 2.1 shows a schematic overview over dye reconstitutionand labeling for the smallest package size (5 nmol).
Dye stock solution: CyDye DIGE Fluor minimal dyes solid com-pounds are reconstituted in Dimethylformamide (DMF) giving a con-centration of 1 nmol/mL (e.g. 25 mL DMF to 25 nmol/L of dye). Thestock solution of Cy2 will have a deep yellow, Cy3 a deep red, and Cy5a deep blue color.
. Take a small volume of DMF from its originalcontainer and dispense into a microcentrifugetube.
. Take the CyDye from the –20 �C freezer andleave to warm for 5 minutes at room tempera-ture
. After 5 minutes add 25 mL of the DMF to eachnew vial of CyDye.
. Replace the cap on the dye microcentrifuge tubeand vortex vigorously for 30 seconds.
The quality of the DMF is themajor source of error for inade-quate labeling.
The solutions are stable at–20 �C for several months.

Step 2: Fluorescence Difference Gel Electrophoresis302
. Centrifuge the microcentrifuge tube for 30 sec-onds at 12,000 g in a benchtop microcentrifuge.
. The dye can now be used.
& Note: When dyes are not being used they shouldbe returned to the –20 �C freezer as soon aspossible and stored in the dark.
Fig. 2.1: Schematic overview over CyDye reconstitutionand labeling for 5 nmol packages for minimal labeling.
Dye working solution: Dilute 1 volume of the stock CyDye in 1.5�volumes of high grade DMF.
. Briefly spin down dye stock solution in a micro-centrifuge.
. Add 7.5 mL of DMF to a sterile microcentrifugetube.
. Add 5 mL of the stock dye solution.
Now there are 5,000 pmol CyDye in 12.5 mL; therefore 1 mL contains400 pmol.
& Note: CyDye in the diluted form is only stablefor 2 weeks at –20 �C.
10 mmol/L lysine solution:
Reagent Quantity Final concentration
L-Lysine (MW 182.6) 18 mg 10 mmol/L
Make up to 10 ml with distilled water
Store at –20 �C. Stable for 6 months.
After reconstitution CyDye isonly stable and useable untilthe expiry date listed on thetube.

2.4 Minimal Labeling of Lysines 303
& Note: The pipetting error should be kept to aminimum. Therefore, depending on the numberof samples to be labeled, the dyes can be directlyreconstituted to a working solution.
2.3.2For Saturation Labeling of Cysteines
Dye solution: In principle the procedure is like with minimal dyes,just with different amounts.
. CyDye DIGE Fluor saturation dyes solid com-pounds are reconstituted in dimethylformamidegiving a concentration of 2 mmol/L (50 mL DMFto 100 nmol of dye). The stock solution of Cy3has a deep red and Cy5 a deep blue color. It isstable at –20 �C for two months maximum. Herethe solution is not further diluted for labeling.
2 mmol/L TCEP (Tris carboxyethyl phosphine):
Reagent Quantity Final concentration
TCEP (MW 286.7) 5.7 mg 2 mmol/L
Make up to 10 mL with distilled water
2.4Minimal Labeling of Lysines
Conditions:. For efficient labeling the cell lysate (protein sam-ple) should have optimally pH 8.5.
. Labeling temperature is 0 �C.
. The protein concentration should be between5 mg/mL and 10 mg/mL.
. Sample must be free of IPG buffers or carrierampholytes and reductants.
Preparing the pooled internal standard: Take the same amount ofaliquot from each sample and mix them together. A minimum of anequivalent of 50 mg protein internal standard per gel is required.If mass spectrometry analysis requires a higher protein load than
150 mg in a gel, a higher volume of standard is collected and divided
For the example in Figure 2.1the dye would be directly recon-stituted with 12.5 mL DMF.
The stock solution is used asworking solution.
It must be above pH 8.0.
It must be between 1 mg/mland 20 mg/ml.

Step 2: Fluorescence Difference Gel Electrophoresis304
into two portions: one is labeled with Cy2; the other portion is leftunlabeled. The required amount of unlabeled standard is later onspiked into the mixture of labeled samples and standard before appli-cation on the IPG strip.Samples and dyes must be mixed well by rigorously pipetting.
Insufficient mixing could lead to preferential labeling of some pro-teins. The sample must not get frozen, because this would cause pre-ferential labeling of some proteins. Since cell lysates are viscous, it isimportant to mix samples thoroughly in all mixing steps to avoidnon-uniform labeling.
Internal standard labeling with Cy2:. Add a volume of internal standard equivalent ton� 50 mg protein to a sterile microcentrifugetube.
. Add n mL of diluted Cy2 to the microcentrifugetube containing the pooled standard (i.e. 300 mgof protein is labeled with 2,400 pmol of dye).
. Mix and centrifuge briefly in a microcentrifuge.Leave on ice for 30 minutes in the dark.
. Add n mL of 10 mmol/L lysine to stop the reac-tion. Mix and spin briefly in a microcentrifuge.Leave for 10 minutes on ice in the dark.
. Labeling is now finished.
. Standards can now be stored for at least threemonths at –70 �C in the dark.
Sample labeling with Cy3 and Cy5:. Add a volume of sample equivalent to 50 mg pro-tein to a sterile microcentrifuge tube.
. Add 1 mL of diluted CyDye to the microcentri-fuge tube containing the protein sample (i.e.50 mg of protein is labeled with 400 pmol of dye).
. Mix and centrifuge briefly in a microcentrifuge.Leave on ice for 30 minutes in the dark.
. Add 1 mL of 10 mmol/L lysine to stop the reac-tion. Mix and spin briefly in a microcentrifuge.Leave for 10 minutes on ice in the dark.
. Labeling is now finished.
. Samples can now be stored for at least 3 monthsat –70 �C in the dark.
Vortexing is not recommended.
n is the number of gels in theexperiment.

2.5 Saturation Labeling of Cysteines 305
2.5Saturation Labeling of Cysteines
The complete procedure takes about 2 hours.
Conditions:. For efficient labeling the cell lysate (protein sam-ple) must have pH 8.0.
. Labeling temperature is 37 �C.
. The reductant TCEP: dye concentration ratio isalways kept at a 1:2 ratio to ensure efficient label-ing.
. The protein concentration should be 0.55–10 mg/mL.
. For samples containing proteins with highcysteines content, more TCEP and dye areneeded.
Mostly 5 mg sample proteins are labeled and analyzed as proposedbelow. However in the paper by Sitek et al. (2005) labeling of 2.5 mgprotein – corresponding to 1,000 pancreatic tissue cells – with therecommended amounts of reductant–dye has been described.
Preparing the pooled internal standard: Take the same amount of ali-quot from each sample and mix them together. For cysteine labelingmostly an equivalent of 5 mg protein internal standard per gel is used.For the internal standard as well as for the preparative gel Cy3 is
preferred to Cy5, because Cy3 shows lower self-quenching effects inthe high molecular weight region than Cy5. Therefore the image ofthe preparative gel will be more similar to the image of the pooledstandard for optimal spot picking.Samples and dyes must be mixed well by rigorously pipetting.
Insufficient mixing could lead to preferential labeling of some pro-teins. The sample must not get frozen, because this would cause pre-ferential labeling of some proteins. Since cell lysates are viscous, it isimportant to mix samples thoroughly by snipping at the tube in allmixing steps to avoid non-uniform labeling.
Internal standard labeling with Cy3:. Add a volume of internal standard equivalent ton� 5 mg to a sterile microcentrifuge tube.
. Make up to n� 9 mL with lysis solution.
. Add n� 1 mL of 2 mmol/LTCEP.
Vortexing is not recommended.
n is the number of gels in theexperiment.
Assuming a cysteine content of2%.

Step 2: Fluorescence Difference Gel Electrophoresis306
. Mix vigorously by pipetting and spin.
. Incubate at 37 �C for 1 hour in the dark.
. Add n� 2 mL of 2 mmol/L Cy3 saturation dyesolution.
. Mix vigorously by pipetting and spin.
. Incubate at 37 �C for 30 minutes in the dark.
. Stop the reaction by adding an equal volume of2� sample solution.
. Mix vigorously by pipetting and spin.
. Labeling is now finished.
. The labeled samples can be stored for 1 monthat –70 �C in the dark.
Sample labeling with Cy5:. Add a volume of protein sample equivalent to 5mg to a microcentrifuge tube.
. Make up to 9 mL with lysis solution.
. Add 1 mL of 2 mmol/LTCEP.
. Mix vigorously by pipetting and spin.
. Incubate at 37 �C for 1 hour in the dark.
. Add 2 mL of 2 mmol/L Cy5 saturation dye solu-tion.
. Mix vigorously by pipetting and spin.
. Incubate at 37 �C for 30 minutes in the dark.
. Stop the reaction by adding an equal volume of2� sample solution.
. Mix vigorously by pipetting and spin.
. Labeling is now finished.
. The labeled samples can be stored for 1 monthat –70 �C in the dark.
Preparative sample labeling with Cy3: The protein amount of thereference proteome applied on the preparative gel is usually 300 mg.
. Add a volume of protein sample equivalent to300 mg to a microcentrifuge tube.
. Add 60 mL of 2 mmol/LTCEP.
. Mix vigorously by pipetting and spin.
& Note: Cell lysates are viscous. Therefore it isimportant to mix samples thoroughly in this andall following mixing steps to avoid non-uniformlabeling.
. Incubate at 37 �C for 1 hour in the dark.
Corresponding to n� 4 nmol/L.
Assuming a cysteine content of2%.
Corresponding to 4 nmol/L.
Assuming a cysteine content of2%.

2.6 Preparation for Loading the Samples onto IPG Strips 307
. Add 120 mL of 2 mmol/L Cy3 saturation dyesolution.
. Mix vigorously by pipetting and spin.
. Incubate at 37 �C for 30 minutes in the dark.
. Stop the reaction by adding an equal volume of2� sample solution.
. Mix vigorously by pipetting and spin.
. Labeling is now finished.
. The labeled samples can be stored for 1 monthat –70 �C in the dark.
Saturation labeling optimization: Because it is impossible to predictthe cysteines content of the protein mixture contained in a sampletype, it may be necessary to optimize the amount of reductant–dyeper protein. In a “same/same experiment” aliquots of the pooled sam-ples are labeled with the same amounts of the different CyDyes, com-bined, and separated with a 2-D gel. After scanning the images of theCy3 and Cy5 channel, the patterns are overlaid with ImageQuant�or PaintShop Pro� and inspected in a false color image:
. When the spots are matching perfectly, theamount of reductant–dye is correct for this parti-cular sample type.
. When red spots are visible, which are horizon-tally offset from some of the green spots, overla-beling has occurred: there is some unspecificlabeling of lysines which alter the isoelectricpoint.
. When there are vertical spot trains and/orstreaks, some proteins have been underlabeled:partially labeled proteins migrate faster in SDSelectrophoresis than more or fully labeled pro-teins.
The reductant–dye amount needs to be corrected accordingly. Whensufficient pooled sample material is available, a dilution series experi-ment can be performed, usually in the range from 1 nmol reductantfor 2 nmol dye to 4 nmol/L reductant for 8 nmol dye.
2.6Preparation for Loading the Samples onto IPG Strips
2� Sample solutions: The Pharmalytes 3–10 work very well for widepH gradients and the pH gradient 4–7. For basic gradients or narrow
When the sample is verylimited, a reference proteomehas to be found for performingthe optimization procedure.
The little size differences are notresolved.
The pI is not affected.

Step 2: Fluorescence Difference Gel Electrophoresis308
gradients the Pharmalytes 3–10 are replaced by the related IPG buf-fers.
2� Sample solution 1: 9 mol/L urea, 2% (w/v) CHAPS, 1% (v/v)Pharmalytes pH 3–10 (or IPG buffer respective to the pH gradient),2% (w/v) dithiothreitol (DTT), 0.01% (w/v) Bromophenol blue.
2� Sample solution 2: 2 mol/L thiourea, 7 mol/L urea, 2% (w/v)CHAPS, 1% (v/v) Pharmalytes pH 3-10 (or IPG buffer respective tothe pH gradient), 2% (w/v) dithiothreitol (DTT), 0.01% (w/v) Bromo-phenol blue.
. After the protein samples have been CyDye-labeled, add an equal amount of 2� sample solu-tion and leave on ice for 10 minutes.
. Combine the labeled samples and pooled inter-nal standards according to the experimentaldesign.
. Apply them onto the IPG strip as explained inthe next Chapter.

309
Step 3: Isoelectric Focusing
Disposable gloves must be worn during each step to avoid contamina-tion of the sample.
& Note: It is very important that each sample iscentrifuged before application onto the IPGstrip!
Choose 18 cm IPG strips instead of 24 cm strips, when molecularweight markers and 1-D samples should be applied onto the SDS gel.The “worst case” conditions are given here for running the strip.These “worst case” conditions are applied when a novel sample typehas to be separated, whose behavior in the electric field is unknown.IPG strips with printed serial numbers are very useful for tracing
the samples through the 2-D electrophoresis procedure.. Generally, create a table with a list of all IPGstrip numbers used, and fill in which samplewill be applied on which IPG strip, as shown inTable 3.1.
Tab. 3.1: IPG strip numbers and sample trace chart (example).
IPG strip number Sample with
Cy3 label
Sample with
Cy5 label
Internal standard
with Cy2 label
197 514 Control 1 Treated 6 All 24 samples
197 515 Control 2 Treated 5 All 24 samples
197 516 Control 3 Treated 4 All 24 samples
197 517 Control 4 Treated 3 All 24 samples
197 518 Control 5 Treated 2 All 24 samples
197 519 Control 6 Treated 1 All 24 samples
197 520 Treated 7 Control 12 All 24 samples
197 521 Treated 8 Control 11 All 24 samples
197 522 Treated 9 Control 10 All 24 samples
197 523 Treated 10 Control 9 All 24 samples
197 524 Treated 11 Control 8 All 24 samples
197 525 Treated 12 Control 7 All 24 samples
Proteomics in Practice. A Guide to Successful Experimental Design 2nd Ed.Reiner Westermeier, Tom Naven, and Hans-Rudolf HçpkerCopyright � 2008 WILEY-VCH Verlag GmbH & Co. KGaA, WeinheimISBN: 978-3-527-31941-1
We assume that the reader ofthis book is starting with 2-Delectrophoresis or looking forsome advice to improve thequality of the 2-D patterns.

Step 3: Isoelectric Focusing310
3.1Reswelling Tray
This device is used for both, “passive” rehydration loading of samplesdirectly into the IPG strips or pre-rehydration of IPG strips for cuploading.The next three tables list rehydration solutions optimized for differ-
ent sample and pH gradient types.
Tab. 3.2: Standard rehydration solution.
8 mol/L urea 4.8 g
0.5% (w/v) CHAPS 50 mg
10% (v/v) glycerol 1.2 mL
1.25% (v/v) Pharmalytes 3–10 *) 125 mL0.002% Bromophenol blue **) 10 mLWater, deionized, fill up to 10 mL
*) or IPG buffer of respective pH interval
**) from 1% Bromophenol blue solution
The rehydration solution can be produced in larger quantities with-out the DTT and stored frozen in aliquots at a temperature at –20 �Cor colder.The DTT should be added before use: 0.28% (w/v).
& Note: If the sample was extracted or solubilizedin presence of thiourea, the rehydration solutionmust also contain thiourea.
Tab. 3.3: Hydrophobic proteins rehydration solution.
7 mol/L urea 4.2 g
2 mol/L thiourea 1.5 g
0.5% (w/v) CHAPS 50 mg
10% (v/v) glycerol 1.2 mL
1.25% (v/v) Pharmalytes 3–10 *) 125 mL0.002% Bromophenol blue **) 10 mLWater, deionized, fill up to 10 mL
*) or IPG buffer of respective pH interval
**) from 1% Bromophenol blue solution
The DTT should be added before use: 0.28 % (w/v).For rehydration loading dilute sample accordingly.As described in Section 1.5.1, Sample preparation, on pages 56 and
79 for basic gels, the addition of DeStreak instead of a reductant pre-
Passive rehydration loadingmeans without applying anelectric field.
Repeated freeze thawing mustbe avoided.
For acidic pH gradients theaddition of DeStreak has novalue.

3.1 Reswelling Tray 311
vents the streaking caused depletion of the reductant. This measurecan also improve wide pH gradient separations.
Tab. 3.4: Basic gradients pre-rehydration solution.
7 mol/L urea 4.2 g
2 mol/L thiourea 1.5 g
15 mg/mL DeStreak reagent 120 mL0.5% (w/v) CHAPS 50 mg
10% (v/v) glycerol 1.2 mL
1.25% (v/v) IPG buffer according to pH gradient 125 mL0.002% Bromophenol blue*) 10 mLWater, deionized, fill up to 10 mL
*) From 1% Bromophenol blue solution
& Note: Do not mix sample containing reductantand rehydration solution containing DeStreak!
Be sure that the reswelling tray has been carefully cleaned and driedbefore use.
. Adjust the feet to level the tray horizontally,using the inbuilt spirit level as a control (see Fig-ure 3.1).
. Pipette rehydration solution containing the sam-ple according to Table 3.5 into the grooves asstreaks slightly shorter than the strips to be rehy-drated.
Tab. 3.5: Rehydration volumes.
7 cm strip 125 mL18 cm strip 340 mL24 cm strip 450 mL
. Remove the cover film from the IPG strip start-ing at the acidic (+) end.
. Place the strip into the slot with the dried gelside down, avoiding air bubbles.
. Check whether the serial number of the stripcan be read correctly.
. Remove air bubbles by lifting the strip up againwith a forceps.
Such a rehydration solution isavailable as ready-mademixture (DeStreak solution),however, without the IPGbuffer added; see page 79
Starting at the basic end mightdamage the – usually softer –basic gel surface.
If the number is mirror-converted, the gel surface isturned upside.

Step 3: Isoelectric Focusing312
If some of the sample flows onto the back of the film, it will bepushed down around the edge of the strip when the paraffin oil ispipetted onto it.
. Pipette 2 mL paraffin oil over the strip, startingat both ends of the strip and moving to the cen-ter.
. Repeat this procedure for all samples to be ana-lyzed.
. Close the tray with the sliding coverlid.
. Leave to rehydrate at room temperature accord-ing to Table 3.6.
Fig. 3.1: Rehydration of IPG strips in individual grooves in the reswelling tray.
Tab. 3.6: Rehydration times.
Without sample >6 hours
Including sample >12 hours or overnight *)
The grooves are numbered 1–12 to allow sample identification.However, ideally the IPG strips have serial numbers printed on theback of the film support, which are used for tracking the samples.
To avoid urea crystallizationand oxygen contact.
*) The large protein moleculesneed a long time to diffuse intothe strip.

3.2 Rehydration Loading and IEF in IPGphor Strip Holders 313
After rehydration. Rinse the surface of the strips with distilledwater using a squeeze bottle and then placethem for a few seconds on their edges on adamp filter paper to drain excess liquid, so thatthe urea on the surface does not crystallize out.
The strips can be run on the Multiphor flatbed chamber in the Immo-biline DryStrip Kit (tray for up to 12 strips) or on the IPGphor in themanifold.
Cleaning of the reswelling tray The reswelling tray is thoroughlycleaned with detergent, using a toothbrush or Q-tips for the slots.After rinsing it with deionized water it must be completely dry beforethe next use.
3.2Rehydration Loading and IEF in IPGphor Strip Holders
The IPGphor chamber must be horizontally leveled on the bench.Rehydration and IEF separation are carried out at 20 �C.It is highly recommended to connect the IPGphor to an external
computer via the serial port. In this way the electrical conditions canbe monitored. This allows one to judge from the shape of the graphs,whether the separation will give good or bad 2-D results.
. Be sure that the strip holders are carefullycleaned and dried.
. Place strip holders on the cooled electrode con-tact areas of the power supply with the pointedend on the anodal contact area.
. Pipette rehydration solution mixed with sampleinto the strip holder as a streak from electrodecontact to electrode contact (see Figure 3.2).
. Remove the cover film from the IPG-strip start-ing at the acidic (+) end.
. Starting at the anodal side, place the IPG stripwith the acidic end into the strip holder – driedgel side down. Slowly lower the basic end intothe strip holder.
Should an air bubble be caught, lift the strip up with forceps andslowly lower it down again. You might need to repeat this procedure.
See Section 1.5.3.4 on page91 f for further explanations.
Never use new strip holderswithout cleaning them beforethe first run.
Starting at the basic end mightdamage the – usually softer –basic gel surface.
The distance from the platinumcontact to the end of the tray isshorter at the anodal side.

Step 3: Isoelectric Focusing314
Fig. 3.2: Rehydration loading of the sample solution in thestrip holder of the IPGphor.
When some of the sample flows onto the back of the film, it will bepushed down around the edge of the strip when the paraffin oil ispipetted on it.
. Pipette 2 mL paraffin oil over the strip by start-ing on both ends of the strip, moving to the cen-ter.
. Place the plastic cover on the strip holder.
. Close the safety lid.
. Enter the running conditions (see Table 3.7).
Tab. 3.7: “Worst case” conditions for active rehydration loading in stripholders.
Rehydration time 0 h20 �C50 mA
Temperature
Current per strip
Strip length 18 cm 24 cm
pH gradient 3–10 L 3–10 NL 3–10 L 3–10 NL
Step 1 60 V 12 h step and hold 12 h step and hold
Step 2 150 V 3 h step and hold 3 h step and hold
Step 3 300 V 3 h step and hold 3 h step and hold
Step 4 1,000 V 6 h gradient 6 h gradient
Step 5,analytical
10,000 V 20 kVh2 h 20 mingradient
20 kVh2 h 20 mingradient
40 kVh4 h gradient
40 kVh4 h gradient
Total time 16 h 20 min 16 h 20 min 18 h 18 h
The cover fluid prevents ureacrystallization and oxygencontact.

3.2 Rehydration Loading and IEF in IPGphor Strip Holders 315
When a new sample type has to be analyzed or the 2-D patterns arenot optimal, it is recommended to apply the following “worst condi-tions”. Generally, active rehydration provides the best results. Foractive rehydration the “rehydration time” in the program is set to “0”,it is performed as a voltage step.For preparative sample loads (>1 mg) increase the final focusing
step by 15% of the proposed volt hours.When an overnight run is finished early in the morning, refocus
the proteins by applying 8,000 V on the strips for 15 minutes beforeequilibration, staining, or storage of the strips.
Observations during the run In each IPG strip the Bromophenolblue tracking dye slowly starts to build a band at the cathodal end,which migrates towards the anode. When all samples have the samesalt content, they run almost at the same level. There is no reason toworry, when the Bromophenol blue bands of a few samples migrateslower, this can always happen.During the final few hours you will observe a strong black, some-
times also an additional yellow band at the anode: this is Bromophe-nol blue collecting here, and at the very end it becomes very acidic,turning the Bromophenol blue to yellow.
. Before the run is finished: place a tray withdetergent solution next to the instrument for thestrip holders.
Cleaning of the strip holders The strip holders must be carefullycleaned after each IEF. The solutions must never dry in the stripholder. Cleaning is very effective, if the strip holders are first soaked afew hours in a solution of 2–5% of the specially supplied (non-alkali)detergent in hot water.The strip holder slot should be vigorously brushed with a tooth-
brush using a few drops of undiluted IPGphor Strip Holder CleaningSolution. Then it is rinsed with deionized water.Sometimes protein deposits are left on the bottom of the strip
holder after IEF. This happens when highly abundant proteins havebeen squeezed out of the gel surface at their isoelectric point (see Fig-ure 1.32 on page 95). It is not always easy to remove these proteins,particularly when they are sticky like serum albumin. In this case thestrip holders should be boiled in 1% (w/w) SDS with 1% (w/v) DTTfor 30 minutes before the slot is cleaned with the toothbrush.
& Important: Strip holders may be baked, boiled orautoclaved. But, because of the specially treatedsurface they must not be exposed to strong acidsor basis, including alkaline detergents.
Passive rehydration (with noelectric field applied duringrehydration) can be performedin the reswelling tray.
Clean strip holders should behandled with gloves to avoidcontamination.
SDS solution in absence ofbuffer has a neutral pH.

Step 3: Isoelectric Focusing316
& Note: The strip holder must be completely drybefore use.
3.3IEF of Rehydration Loaded Strips in the Manifold
The IPGphor chamber must be horizontally leveled on the bench.IEF separation is carried out at 20 �C.It is highly recommended to connect the IPGphor to an external
computer via the serial port. In this way the electrical conditions canbe monitored. This allows one to judge from the shape of the graphs,whether the separation will give good or bad 2-D results.
. Be sure that the manifold is carefully cleanedand dried.
. Place manifold on the cooled electrode contactareas of the power supply.
. Starting at the basic side, place the IPG strip –gel side facing up – into the manifold with theacidic end towards the anode side (see Figure3.3).
. Soak electrode pads with deionized water. Blotthem on filter paper and place them on top ofthe ends of the strip. The pads should sit com-pletely on the gel surface. If longer strips arerequired for removal of salt, there must be anoverlapping of at least 5 mm.
. Pour 100 mL Drystrip cover fluid (paraffin oil)over the strips and electrode pads.
. The electrode assembly has electrode teeth onone side and hold-down teeth (for paper bridge-loading) on the other side. It is important tochoose the correct orientation, to get contactwith the electrode pads.
. Place the electrode assemblies on the pads.Secure them in place with the cams.
. Close the safety lid.
. Enter the running conditions (see Table 3.8).
See Section 1.5.3.4 on page91 f for further explanations.
Aligner protrusions along thegrooves inside the manifoldalign the rehydrated IPG strips,keeping them straight andcentered when placed inside themanifold.
I there are no ready-cut elec-trode pads available, cut 5 mmlong pads from IEF electrodestrips. The pads must be damp,not wet.
The cover fluid prevents ureacrystallization and oxygencontact.

3.3 IEF of Rehydration Loaded Strips in the Manifold 317
Fig. 3.3: Using the manifold for running rehydration-loaded IPG strips.
Tab. 3.8: “Worst case” conditions for the manifold (cup, paper bridge,rehydration loading).
Rehydration time 0 h20 �C
up to 100 mATemperature
Current per strip
Strip length 18 cm 24 cm
pH gradient 3–10 L 3–10 NL 3–10 L 3–10 NL
Step 1 Step and hold 150 V 3 h 3 h
Step 2 Step and hold 300 V 3 h 3 h
Step 3 Gradient 1,000 V 6 h 6 h
Step 4 Gradient 10,000 V 1 h 1 h
Step 5 Step and hold 10,000 V 16 kVhfor 2 h
16 kVhfor 2 h
24 kVhfor 3 h
24 kVhfor 3 h
Total time 14 h 14 h 15 h 15 h
For preparative sample loads (>1 mg) increase the final focusingstep by 15% of the proposed volt hours.When an overnight run is finished early in the morning, refocus
the proteins by applying 10,000 V on the strips for 15 minutes beforeequilibration, staining, or storage of the strips.

Step 3: Isoelectric Focusing318
3.4Cup Loading IEF
It is highly recommended to connect the IPGphor to an external com-puter via the serial port. In this way the electrical conditions can bemonitored. This allows you to judge from the shape of the graphs asto whether the separation will give good or bad 2-D results.The IPGphor chamber must be horizontally leveled on the bench.
IEF separation is carried out at 20 �C.Figure 3.4 shows all the parts needed and the proper placements of
strips, pads, sample cups, and electrodes.. Be sure that the manifold is carefully cleanedand dried.
. Place the manifold on the cooled electrode con-tact areas of the power supply.
. Starting at the basic side, place the IPG strip –gel side facing up – into the strip holder with theacidic end towards the anode side. Be sure thatthe protruding film at the basic end touches theend of the groove.
. Apply the loading cups at correct side of thestrip. Press them down to prevent leakage.
& Note: The cup can straddle on the alignmentprotrusions, if necessary.
. Soak electrode pads with deionized water. Blotthem on filter paper and place them on top ofthe ends of the strip. The pads should sit com-pletely on the gel surface. If longer pads arerequired for removal of salt, there must be anoverlapping of at least 5 mm.
. Pour 100 mL Drystrip cover fluid (paraffin oil)over the strips, around the cups. With this mea-sure leakages are detected, because oil wouldflow into a cup.
. Dilute samples with rehydration solution to50–100 mL for optimum protein entry.
. Pipette samples into the cups.
. Pipette 20 mL paraffin oil on each sample.
. The electrode assembly has electrode teeth onone side and hold-down teeth (for paper bridge-loading) on the other side. It is important to
See Section 1.5.3.4 on page91 f for further explanations.
For the course: use analyticalprotein load here.
Never use new manifoldwithout cleaning them beforethe first run.
Aligner protrusions along thegrooves inside the manifoldalign the rehydrated IPG strips,keeping them straight andcentered when placed inside themanifold.
Mostly anodal sample applica-tion is employed.
If there are no ready-cut elec-trode pads available, cut 5 mmlong pads from IEF electrodestrips. The pads must be damp,not wet.
The cover fluid prevents ureacrystallization and oxygencontact.
In higher concentrated samplesmore proteins would tend toaggregate and precipitate.

3.5 Paper Bridge Loading 319
choose the correct orientation, to get contactwith the electrode pads.
. Place the electrode assemblies on the pads.Secure them on place with the cams.
. Close the safety lid.
. Enter the running conditions (see Table 3.8).
Fig. 3.4: Using the manifold for cup loading.
3.5Paper Bridge Loading
There are pre-cut paper bridges on the market. If there are no ready-cut bridges available, cut 5 cm long and 0.8 mm wide pieces fromvery clean filter card board material. They should have pointed 3 mmwide ends as shown in Figure 3.5. The electrode assembly has elec-trode teeth on one side and hold-down teeth for paper bridge loadingon the other side. Therefore the length of the paper bridge is impor-tant.The procedure works in principle as described for rehydration
loaded IPG strips. The only difference: the paper bridges, soaked in500 mL sample solution are placed between IPG strip end and theelectrode pad, as shown in Figure 3.5. If this would give a betterseparation, the paper bridge can also be placed at the cathodal side.As described in the paper by Kane et al. (2006) the paper bridge canbe sequentially applied on different narrow pH gradients.
Kane LA, Yung CK, Agnetti G,Neverova I, Van Eyk JE. Proteo-mics 6 (2006) 5683–5687.

Step 3: Isoelectric Focusing320
Fig. 3.5: Schematic drawing of the shape of a paper bridge andpaper bridge loading for the example of anodal sample application.Note: The paper bridge is not shown to scale! Use the dimensionsgiven in the text.
For running conditions choose the settings in Table 3.5.
Cleaning of the manifold The manifold must be carefully cleanedafter each IEF. The solutions must never dry in the manifold. Clean-ing is very effective, if the manifold is first soaked for a few hours in asolution of 2–5% of the specially supplied detergent in hot water.The manifold grooves should be vigorously brushed with a tooth-
brush using a few drops of undiluted IPGphor Strip Holder CleaningSolution. Then it is rinsed with deionized water.
& Important: The manifold may be baked, boiledor autoclaved. But, because of the speciallytreated surface they must not be exposed tostrong acids or basis, including alkalinedetergents.
& Note: The manifold must be completely drybefore use.
The IPG strips are directly transferred to equilibration in SDS bufferfor the second dimension run or stored in a deep freezer at –60 �C to–80 �C.When the IPGphor is connected to an external computer via the
serial port, the electrical conditions are monitored. The shapes of thegraphs indicate whether the separation will give good or bad 2-Dresults.Alternatively some of the strips can be stained for inspection as to
whether the IEF step was successful.
Cleaning of the manifold iseasier than the regular stripholder.
The clean manifold should behandled with gloves to avoidcontamination.
See Section 1.5.3.4 on page91 f for further explanations.

3.6 Staining of IPG Strips 321
3.6Staining of IPG Strips
3.6.1Acid Violet 17 Staining of IPG Strips
3% (v/v) phosphoric acid 21 mL 85% H3PO4 Make up to 1 L withH2Odeion
11% (v/v) phosphoric acid 76.1 mL 85% H3PO4 Make up to 1 L withH2Odeion
1% (w/v) stock dye solution 1 g Acid violet 17 In 100 mL H2Odeion
Heat to 50 �C onmagnetic stirrer
0.1% (w/v) staining solution 1 mL 1% (w/v) stocksolution
Plus 9 mL of 11%phosphoric acid
Staining procedure. Fix for 20 minutes in 20% (w/v) TCA.. Wash for 1 minutes in 3% (v/v) phosphoric acid.. Stain for 10 minutes in 0.1% (w/v) Acid violet 17staining solution.
. Destain with 3% (v/v) phosphoric acid untilbackground is clear.
. Wash three times (1 minute each time) withH2Odeion.
. Impregnate with 5% (v/v) glycerol, air dry.
& Note: This staining is notreversible!

323
Step 4: SDS Polyacrylamide Gel Electrophoresis
This chapter describes casting and running of large vertical gels.Small vertical gels and horizontal flatbed gels on film supports aredescribed in detail in “Electrophoresis in Practice”.Wear disposable gloves during the entire procedure.
4.1Casting of SDS Polyacrylamide Gels
Laboratory-made gels are cast in glass cassettes using relatively sim-ply designed equipment. Casting gels on support films requires moresophisticated equipment. Film-backed gels are therefore only pre-pared in industrial scale. The preparation of gels with two differentgel casters is described, and how to cast gradient gels without apump. The following protocols are limited to the preparation of1 mm thick gels, for 1.5 mm gels one-third more monomer volumeis used; there is space for a lower number of cassettes in the casters.The large cassettes are built from 3 mm thin glass plates. It is
important to prepare such gels in multicasters, because this preventsthe cassettes from bulging, which would lead to uneven gel thickness.However, as the polymerization process is an exothermal reaction,care must be taken to prevent overheating in multicasters.
4.1.1Stock Solutions
Use a ready-made acrylamide, Bis stock solution containing 40% T,3% C.Or prepare:
Proteomics in Practice. A Guide to Successful Experimental Design 2nd Ed.Reiner Westermeier, Tom Naven, and Hans-Rudolf HçpkerCopyright � 2008 WILEY-VCH Verlag GmbH & Co. KGaA, WeinheimISBN: 978-3-527-31941-1
Westermeier R. Electrophoresisin Practice. Fourth Edition.WILEY-VCH, Weinheim(2004).
1 mm gels are anyhow advan-tageous for downstreamanalysis with mass spectro-metry, because the yield for thetryptic digestion is higher.
Casting single gels requires asupport by thick glass or plasticplates.
Much safer than weighing acry-lamide and Bis powder.

Step 4: SDS Polyacrylamide Gel Electrophoresis324
Acrylamide, Bis solution (40% T, 3% C):
40% Acrylamide PAGE solution 40% T 1 L
Bis 3% C 12 g
Mix thoroughly in the supplied bottle
Store in the refrigerator.
& Caution! Acrylamide and Bis are toxic in themonomer form. Avoid skin contact and disposeof the remains ecologically. Polymerize theremains with an excess of ammonium persulfate.
1.5 mol/L gel buffer Tris-Cl pH 8.8 (4� concentrated):
Tris base 1.5 mol/L 181.8 g
SDS 0.4% (w/v) 4 g
Water, deionized dissolve 800 mL
4 mol/L HCl titrate to pH 8.8
Water, deionized make up to 1 L
Store in the refrigerator.
Ammonium persulfate solution (APS):
Ammonium persulfate 10% (w/v) 1 g
Water, deionized Dissolve 10 mL
Prepare fresh.TEMED is used undiluted as 100%, because it is added to the
monomer solution at the beginning.
1 % (w/v) Bromophenol blue solution:
Bromophenol blue 1% (w/v) 100 mg
Tris base 60 mg
Water, deionized dissolve 10 mL
Displacing solution:
Tris-Cl (1.5 mol/L, pH 8.8), SDS 0.375 mol/L 60 mL
85%Glycerol (v/v) 50% (v/v) 142 mL
1% Bromophenol blue (w/v)) 0.002% 480 mLWater, deionized Make up to 240 mL
Prepare fresh.
Acrylamide powder could alsobe used, but is not recom-mended because of healthhazards during weighing.
A 10% solution is mixing morehomogeneously with themonomer solution than a 40%solution.
1% Bromophenol blue does notgo completely into solutionwithout Tris

4.1 Casting of SDS Polyacrylamide Gels 325
Overlay spraying solution:
SDS 0.1% (w/v) 1 g
Water, deionized Dissolve 1 L
Gel storage solution:
Tris-Cl (1.5 mol/L, pH 8.8), SDS 0.375 mol/L 500 mL
Water, deionized Make up to 2 L
Store in the refrigerator.
4.1.2Cassettes for Laboratory-made Gels
It is very important to have absolutely clean glass plates and cassettesat hand. Therefore the tips for cleaning the glass plates at the end ofthis chapter are very important. To be on the safe side and to removeany dust particles, clean glass plates again before use with distilledwater and lint-free tissue.
Hinged cassettes The standard cassettes are hinged on one side foreasy handling. Note that one of the class plates are offset to makeapplication of the IPG strip easier.
Separate and low fluorescence glass plates For spot picking, the gelsneed to be covalently bound to one glass plate. In this case hingedcassettes are not useful, and separate glass plates are used – one withspacers and one without.For pre-labeling fluorescence detection methods like DIGE, special
borosilicate glass plates are needed, which are usually not hinged.
Treating glass plates with Bind-Silane The gel will be bound to theglass plate without spacers; this one has to be treated with Bind-Silane.
& Note: It is important that glass plates areproperly clean.
Before re-use, the plates are placed in a 5% (v/v) Decon� 90 solutionovernight. Do not leave plates standing in this solution for a longertime, because this will cause etching due to the alkali nature ofDecon.
. Thoroughly wash the plate to be treated. Any gelfragments from previous gels must be removed.
Inspect the cassettes carefullyfor any dirt or dust particles.
If Decon 90 is not available,just use 5% (w/v) potassiumhydroxide.

Step 4: SDS Polyacrylamide Gel Electrophoresis326
The careful cleaning of the glass plates beforecasting is important, to ensure a uniform coat-ing with the Bind-Silane and to avoid keratincontamination.
. Thoroughly rinse the plates with deionized waterto remove Decon.
. Dry the plate using a lint-free tissue or leavethem to air dry.
. Apply two internal reference (IR) markers (self-adhesive, fluorescent) onto the middle of theglass plate, each approximately 3.5 cm awayfrom the lateral edges.
Bind-Silane working solution:
Ethanol 8 mL
Acetic acid 200 mLBind-Silane 10 mLWater, deionized 1.8 mL
. Pipette 4 mL of the Bind-Silane solution ontothe plate and distribute equally over the platewith a lint-free tissue. Cover the plate to preventdust contamination and leave to air dry on thebench for 1 hour.
. Polish the plate with a lint-free tissue, moistenedwith a small amount of deionized water or etha-nol.
. The gels will stay attached to the glass duringelectrophoresis, staining procedures, scanning,spot picking, and storage.
Prepare the cassettes with gel labels cut from printed paper or over-head film placed at the corner on the opposite of the filling side (seeFigure 4.1).
The IR markers must also becoated with Bind-Silane.
Note that a too thick layer ofBind-Silane can create a highbackground in fluorescentdetection.
This is not necessary for DIGEruns, when IPG strips withprinted numbers are used: thestrip is scanned together withthe SDS gel in the cassette.

4.1 Casting of SDS Polyacrylamide Gels 327
Fig. 4.1: Hinged cassette with gel label made from paperor overhead film (the label is not needed when IPG stripswith printed numbers and the DIGE method are employed).
4.1.3Multiple Gel Caster (Up to 14 Gels)
4.1.3.1 Preparation of the Gel Caster
The gel caster should be set up in a tray, just in case any liquid over-flows. Never forget to place the plastic separator sheets between thecassettes; they would firmly stick to each other after gel polymeriza-tion. When less than 14 gels are being prepared, block the non-usedspace with blank cassettes, placing separator sheets between eachplate.Be sure that gel caster, separator sheets, and cassettes are perfectly
clean and dry.. Place the gel caster in a tray. Tip it back, so itrests on the support legs.
According to the instruction manual the hinged cassettes should beplaced into the caster with the opening edges to the filling side, someproteomics teams have experienced to get a straighter gel surface,when they are inserted with the hinged edge to the filling side.
. Start with a separator sheet.
. Assemble non-hinged cassettes outside of thecaster before you place them into the caster box.
Dirty cassettes cause verticalstreaking in silver-stained gels.
For non-hinged cassettes theorientation does not matter.

Step 4: SDS Polyacrylamide Gel Electrophoresis328
. Place the cassettes alternating with separatorsheets into the caster as shown in Figure 4.2,with the offset edges of the cassettes up.
Fig. 4.2: A. Placing cassettes and separator sheets into thecaster. Here the hinged edges are oriented towards the filling side.B. Closing the gel caster.
. Press strongly on the spacers areas on both sidesto ensure that the spacers and the glass platesstick well together.
Finally a separator sheet and a filling plate are inserted to completethe stack up to the edge of the caster. Do not overfill it. This wouldcause pressure on the gels during polymerization, when the solutionstarts to get warm.
. Place the foam gasket into the groove of thefront plate. Do not cover it with grease.
. Turn the first four screws into the bottom holesand place the front plate on the caster with thebottom slots on the screws. Apply the rest of thescrews and tighten them evenly. Do not use toomuch force; the sealing gasket should be com-pressed evenly to prevent leakage.
. Tip the caster to the front.
. Level the gel caster horizontally.
. Prepare 120 mL of displacing solution.
When the room temperature is higher than 20 �C, the caster should –like the monomer solution(s) – be pre-cooled in a cold room or arefrigerator.
4.1.3.2 Homogeneous Gels
Very good results are usually obtained with homogeneous gels (e.g.monomer solutions). Gradient gels need to be prepared in specialcases.
Always take the foam gasketout of the front plate after gelcasting.

4.1 Casting of SDS Polyacrylamide Gels 329
For monomer solutions the ammonium persulfate should not beadded before everything is in place, because there are only about 10minutes left to pour the gel until it starts to gel.
Monomer solutions with selected % T, and 3% C for 14 gels with1 mm thickness, 900 mL:
7.5% T 10% T 12.5% T 15% T
Acrylamide, Bis solution (40% T, 3% C) 169 mL 225 mL 281 mL 338 mL
1.5 mol/L Tris-Cl, pH 8.8, 0.4% SDS 225 mL 225 mL 225 mL 225 mL
TEMED (100%) 450 mL 450 mL 450 mL 450 mLWater, deionized, make up to 900 mL 900 mL 900 mL 900 mL
Mix and degas with a water jet pump
10% ammonium persulfate 3.6 mL 3.6 mL 3.6 mL 3.6 mL
The amounts of TEMED and ammonium persulfate are based onthe author’s experience. In order to get reproducible gels with astraight edge, the concentration of TEMED is higher and the concen-tration of ammonium persulfate is lower than in the instrumentinstruction. Furthermore, at basic pH, ammonium persulfate canreact with the Tris; this effect is minimized by adding more TEMEDand reducing the ammonium persulfate content.
. Degas and precool the monomer solution.
. Add the ammonium persulfate to the monomersolution and mix.
. Pour the gel solution directly into the balancechamber, avoiding air bubbles (see Figure 4.3A).
. Stop pouring when the level reaches 3 cm belowthe upper edges of the casting cassettes.
. Pour the dense displacing solution to fill theV-chamber and the sloped bottom of the caster.The gel solution level will rise to 1 cm below thecassette edges. A thin blue layer should be visi-ble at the bottom of the cassettes.
Should the volume of the displacing solution in the balance chambernot be sufficient to produce the thin blue layer in the entire area ofthe caster bottom, top more displacing solution into the balancechamber until the blue layer has distributed over the entire bottomarea. This saves you from cutting off protruding gel pieces at the bot-tom edge of each cassette.
. Immediately spray 0.1% SDS solution overlaysolution over the cassettes (see Figure 4.3C).
. Cover the caster with a cling film.
Add ammonium persulfateshortly before gel casting.
It is important to use only high-quality TEMED and ammo-nium persulfate.
And it prevents a too strongcontraction of the gel duringpolymerization, which cancause a gap between gel andspacer on the side of the gelswhere the solution is introducedfrom the bottom.
Spraying with SDS solution isbetter than pipetting water-saturated butanol on the edge.

Step 4: SDS Polyacrylamide Gel Electrophoresis330
Fig. 4.3: Casting homogeneous gels in a 14-gel caster.A. Pouring the monomer solution into the balance chamber.B. Pouring the displacement solution into the balance chamber.C. Overlaying the gel solution by spraying 0.1% SDS solution.
About 50 mL monomer solution should be left over. Let it polymerizein a small beaker before you discard it.
. Let the gel polymerize overnight at room tem-perature.
. During unloading rinse the cassettes to removeexcess polyacrylamide.
& Note: When enough displacing solution hadbeen used, there is no need to cut off protrudinggel pieces at the bottom edge of each cassette.
. Inspect each gel cassette for eventual air bub-bles. Gels with air bubbles should not be used.
. Store the usable gels in an airtight containerwith about 100 mL gel storage solution. When
Because the silent polymeriza-tion must be completed.

4.1 Casting of SDS Polyacrylamide Gels 331
the gels are not used during the next day, placethe container with the gels into a cold room or arefrigerator.
. Take the foam gasket out of the front plate andrinse it with deionized water.
. Rinse the gel caster and the separator sheetswith mild detergent and then with deionizedwater.
. Let them dry in the air.
4.1.3.3 Gradient Gels
Gradient gels are more complicated to prepare than homogeneousgels. When homogeneous gels are run for a short time only, theyachieve comparable resolution. However, for some samples, gradientgels may show a better spot distribution. Most instructions describehow to cast gradient gels with a peristaltic pump. The author hasexperienced that very reproducible gels are achieved without a pump,which safes a lot of work with calibrating, setting up and cleaning.Instead of a pump, gravitation is used; the flow rate is controled bythe level of the laboratory platform carrying the gradient maker andwith a pinchcock clamp on the tubing. A pinchcock clamp can closethe tubing completely or reduce the opening of the tubing in severalsteps, thus reducing the flow rate.
Gradient maker set up. Place the clean and dry gradient maker with amagnetic stirrer on an adjustable laboratory plat-form or on a shelf board: the level must be atleast 10 cm above the edge of the caster.
& Note: For reproducible gels, use always exactlythe same level for the gradient maker position.Use always the same shelf board or measure andnote the position height of the gradient maker.
. Insert the plastic tube into the hole in the hydro-static balance chamber.
. Place a pinchcock clamp on the flexible connec-tion tubing, and close it completely.
. Connect the plastic tube with the flexible tubingto the gradient maker.
. Fill the hydrostatic balance chamber with100 mL of the displacing solution.
. Place a magnetic stirring bar – 2 cm to 3 cmlong – into the mixing chamber.
Do not leave it in the groove,because it would lose its sealingproperty.
Pinchcock clamps are availablein different sizes.
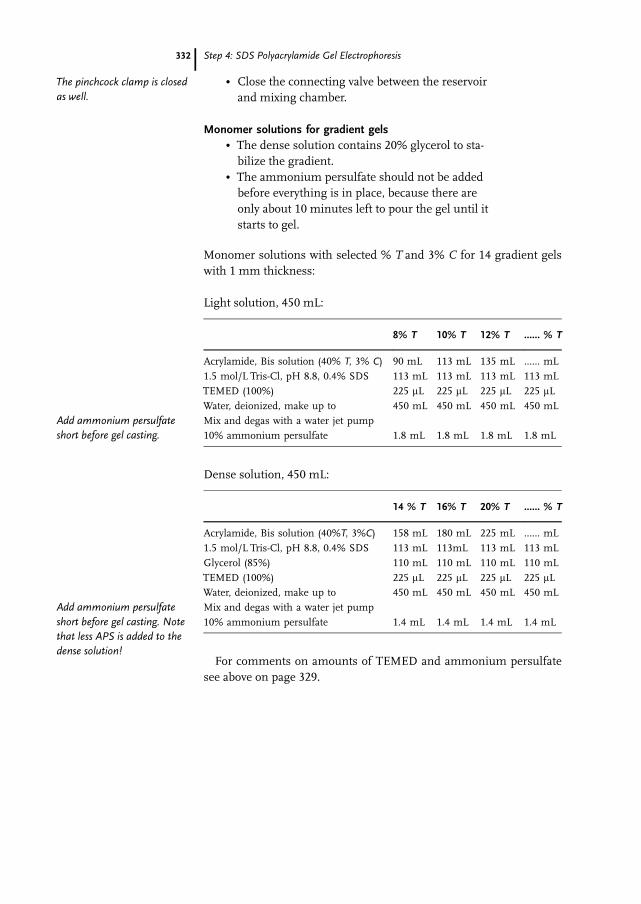
Step 4: SDS Polyacrylamide Gel Electrophoresis332
. Close the connecting valve between the reservoirand mixing chamber.
Monomer solutions for gradient gels. The dense solution contains 20% glycerol to sta-bilize the gradient.
. The ammonium persulfate should not be addedbefore everything is in place, because there areonly about 10 minutes left to pour the gel until itstarts to gel.
Monomer solutions with selected % T and 3% C for 14 gradient gelswith 1 mm thickness:
Light solution, 450 mL:
8% T 10% T 12% T ...... % T
Acrylamide, Bis solution (40% T, 3% C) 90 mL 113 mL 135 mL ...... mL
1.5 mol/L Tris-Cl, pH 8.8, 0.4% SDS 113 mL 113 mL 113 mL 113 mL
TEMED (100%) 225 mL 225 mL 225 mL 225 mLWater, deionized, make up to 450 mL 450 mL 450 mL 450 mL
Mix and degas with a water jet pump
10% ammonium persulfate 1.8 mL 1.8 mL 1.8 mL 1.8 mL
Dense solution, 450 mL:
14 % T 16% T 20% T ...... % T
Acrylamide, Bis solution (40%T, 3%C) 158 mL 180 mL 225 mL ...... mL
1.5 mol/L Tris-Cl, pH 8.8, 0.4% SDS 113 mL 113mL 113 mL 113 mL
Glycerol (85%) 110 mL 110 mL 110 mL 110 mL
TEMED (100%) 225 mL 225 mL 225 mL 225 mLWater, deionized, make up to 450 mL 450 mL 450 mL 450 mL
Mix and degas with a water jet pump
10% ammonium persulfate 1.4 mL 1.4 mL 1.4 mL 1.4 mL
For comments on amounts of TEMED and ammonium persulfatesee above on page 329.
The pinchcock clamp is closedas well.
Add ammonium persulfateshort before gel casting.
Add ammonium persulfateshort before gel casting. Notethat less APS is added to thedense solution!
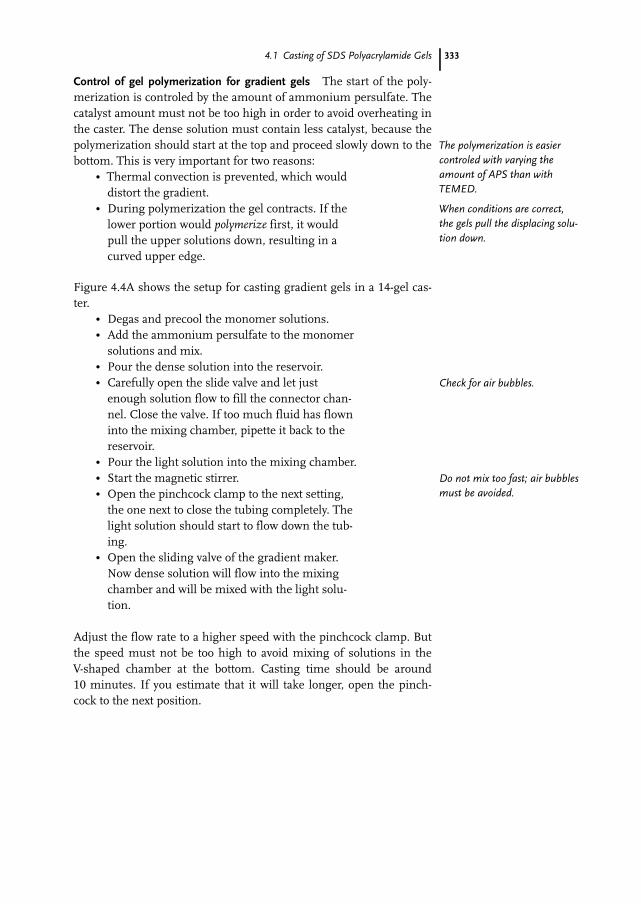
4.1 Casting of SDS Polyacrylamide Gels 333
Control of gel polymerization for gradient gels The start of the poly-merization is controled by the amount of ammonium persulfate. Thecatalyst amount must not be too high in order to avoid overheating inthe caster. The dense solution must contain less catalyst, because thepolymerization should start at the top and proceed slowly down to thebottom. This is very important for two reasons:
. Thermal convection is prevented, which woulddistort the gradient.
. During polymerization the gel contracts. If thelower portion would polymerize first, it wouldpull the upper solutions down, resulting in acurved upper edge.
Figure 4.4A shows the setup for casting gradient gels in a 14-gel cas-ter.
. Degas and precool the monomer solutions.
. Add the ammonium persulfate to the monomersolutions and mix.
. Pour the dense solution into the reservoir.
. Carefully open the slide valve and let justenough solution flow to fill the connector chan-nel. Close the valve. If too much fluid has flowninto the mixing chamber, pipette it back to thereservoir.
. Pour the light solution into the mixing chamber.
. Start the magnetic stirrer.
. Open the pinchcock clamp to the next setting,the one next to close the tubing completely. Thelight solution should start to flow down the tub-ing.
. Open the sliding valve of the gradient maker.Now dense solution will flow into the mixingchamber and will be mixed with the light solu-tion.
Adjust the flow rate to a higher speed with the pinchcock clamp. Butthe speed must not be too high to avoid mixing of solutions in theV-shaped chamber at the bottom. Casting time should be around10 minutes. If you estimate that it will take longer, open the pinch-cock to the next position.
The polymerization is easiercontroled with varying theamount of APS than withTEMED.
When conditions are correct,the gels pull the displacing solu-tion down.
Check for air bubbles.
Do not mix too fast; air bubblesmust be avoided.

Step 4: SDS Polyacrylamide Gel Electrophoresis334
Fig. 4.4: A. Casting gradient gels in a 14-gels caster.B. Removing the tube and overlaying the gel solution byspraying 0.1% SDS solution.

4.1 Casting of SDS Polyacrylamide Gels 335
. Close the pinchcock clamp before the connec-tion tubing runs empty, but not later than whenthe liquid level reaches 3 cm below the upperedges of the cassettes.
. Remove the plastic tube with the connection tub-ing from the balance chamber and rinse themagnetic stirrer.
If monomer solution is left, fill it in a measuring cylinder; next time,adjust the volumes of the monomers solutions to the appropriateamount. The gels will this time have a slightly flatter gradient slopethan intended, but the separation quality will not suffer much.The dense displacing solution will now flow down the connecting
tube and fill the V-chamber and the sloped bottom of the caster. Thegel solution level will rise to 1 cm below the cassette edges. A thinblue layer should be visible at the bottom of the cassettes.Should the volume of the displacing solution in the balance cham-
ber not be sufficient to produce the thin blue layer in the entire areaof the caster bottom, top more displacing solution into the balancechamber until the blue layer has distributed over the entire bottomarea. This saves you from cutting off protruding gel pieces at the bot-tom edge of each cassette.
. Immediately spray 0.1% SDS solution overlaysolution over the cassettes (see Figure 4.4B).
. Cover the caster with a cling film.
. Let the gel polymerize overnight at room tem-perature.
. During unloading rinse the cassettes to removeexcess polyacrylamide.
& Note: When enough displacing solution hadbeen used, there is no need to cut off protrudinggel pieces at the bottom edge of each cassette.
. Inspect each gel cassette for eventual air bub-bles. Gels with air bubbles should not be used.
. Store the usable gels in an airtight containerwith about 100 mL gel storage solution. Whenthe gels are not used during the next day, placethe container with the gels into a cold room or arefrigerator.
. Take the foam gasket out of the front plate andrinse it with deionized water.
. Rinse the gel caster and the separator sheet withmild detergent and then with deionized water.
. Let them dry in the air.
Spraying with SDS solution isbetter than pipetting water-saturated butanol on the edge.
Because the silent polymeriza-tion must be completed.
Do not leave it in the groove,because it would lose its sealingproperty.

Step 4: SDS Polyacrylamide Gel Electrophoresis336
4.1.4Gel Caster for up to Six Gels
4.1.4.1 Preparation of the Gel Caster
Large gel formats require a casting box, also when only a few gels areprepared. Otherwise the cassettes would bulge; the gels would bethicker in the center. Never forget to place the plastic separator sheetsbetween the cassettes; they would firmly stick to each other after gelpolymerization. When less than 6 gels should be prepared, do notblock the non-used space with blank cassettes: cast six gels and dis-card the non-used gels, or store them for another experiment.Be sure that gel caster, separator sheets and cassettes are perfectly
clean and dry. The filling channel in the back wall of the caster hasoriginally been designed for casting homogeneous gels. However it ismuch easier and faster to pour the solution directly onto the cassettesin the caster as shown in Figure 4.5. Gradient gels are pouredthrough the filler port at the bottom of the front plate. For castinghomogeneous gels, leave the V-shaped rubber insert in place; for gra-dient gels, remove it.
. Lay the caster flat on the bench for loading.
. Start loading with a separator sheet.
. Place the cassettes alternating with separatorsheets into the caster, with the offset edges ofthe cassettes up.
. Assemble non-hinged cassettes outside of thecaster before you place them into the caster box.
. Press strongly on the spacers areas on both sidesto ensure that the spacers and the glass platesstick well together.
Finally a separator sheet and – if necessary – filling sheets areinserted to complete the stack up to the edge of the caster. Do notoverfill it. This would cause pressure on the gels during polymeriza-tion, when the solution starts to get warm.
. Place the foam gasket into the groove of thefront plate. Do not cover it with grease.
. Turn the two screws into the bottom holes andplace the front plate on the caster with the bot-tom slots on the screws. Apply the six clampsand tighten the screws evenly. Do not use toomuch force; the sealing gasket should be com-pressed evenly to prevent leakage.
. For casting, place the gel caster upright in a tray,for the occasional case that liquid is overflowing.
Dirty cassettes cause verticalstreaking in silver-stained gels.
Always take the foam gasketout of the front plate after gelcasting.

4.1 Casting of SDS Polyacrylamide Gels 337
When the room temperature is higher than 20 �C, the caster should –like the monomer solution(s) – be pre-cooled in a cold room or arefrigerator.
4.1.4.2 Homogeneous Gels
Very good results are usually obtained with homogeneous gels. Gradi-ent gels need to be prepared only in special cases.
. Close the filler port at the bottom of the frontplate with the cap or with a piece of tubing and apinchcock clamp.
. For monomer solutions the ammonium persul-fate should not be added before everything is inplace, because there are only about 10 minutesleft to pour the gel until it starts to gel.
Monomer solutions with selected % T and 3% C for six gels with1 mm thickness, 450 mL:
7.5% T 10% T 12.5% T 15% T
Acrylamide, Bis solution (40% T, 3% C) 84 mL 113 mL 141 mL 169 mL
1.5 mol/L Tris-Cl, pH 8.8, 0.4% SDS 113 mL 113 mL 113 mL 113 mL
TEMED (100%) 225 mL 225 mL 225 mL 225 mLWater, deionized, make up to 450 mL 450 mL 450 mL 450 mL
Mix and degas with a water jet pump
10% ammonium persulfate 1.8 mL 1.8 mL 1.8 mL 1.8 mL
For comments on amounts of TEMED and ammonium persulfatesee above on page 329.
. Degas and precool the monomer solution.
. Add the ammonium persulfate to the monomersolution and mix.
. Pour the gel solution directly into the box, avoid-ing air bubbles (see Figure 4.5A).
. Stop pouring when the level has reached 3 cmbelow the upper edges of the casting cassettes.
. Immediately spray 0.1% SDS solution overlaysolution over the cassettes (see Figure 4.5B).
. Cover the caster with a cling film.
. Let the gel polymerize overnight at room tem-perature.
. During unloading rinse the cassettes to removeexcess polyacrylamide.
. Inspect each gel cassette for eventual air bub-bles. Gels with air bubbles should not be used.
Add ammonium persulfateshortly before gel casting.
Spraying with SDS solution isbetter than pipetting water-saturated butanol on the edge.
Because the silent polymeriza-tion must be completed.

Step 4: SDS Polyacrylamide Gel Electrophoresis338
Fig. 4.5: A. Casting homogeneous gels in a six-gel caster.B. Overlaying the gel solution by spraying 0.1% SDS solution.
. Store the usable gels in an airtight containerwith about 100 mL gel storage solution. Whenthe gels are not used during the next day, placethe container with the gels into a cold room or arefrigerator.
. Take the foam gasket out of the front plate andrinse it with deionized water.
. Rinse the gel caster and the separator sheet withmild detergent and then with deionized water.
. Let them dry in the air.
Monomer solution, which has been left over, is polymerized in a smallbeaker before it is discarded.
4.1.4.3 Gradient Gels
For comments on gradient gels see above on page 331.For gradient gels the monomer solution has to be introduced
through the filling port on the bottom of the front plate. In this casewe need to fill the dead volume of the V-shaped chamber in the bot-tom of the caster with displacing solution.
. Remove the V-shaped rubber insert from the caster.
. Prepare 200 mL of displacing solution.
Gradient maker set up. Place the clean and dry gradient maker with amagnetic stirrer on an adjustable laboratory plat-form or on a shelf board: the level must be atleast 10 cm above the edge of the caster.
Do not leave it in the groove,because it would lose its sealingproperty.

4.1 Casting of SDS Polyacrylamide Gels 339
& Note: For reproducible gels, use always exactlythe same level for the gradient maker position.Use always the same shelf board or measure andnote the position height of the gradient maker.
. Place a pinchcock clamp on the flexible connec-tion tubing, and close it completely.
. Connect the filling port with the flexible tubingto the gradient maker.
. Place a magnetic stirring bar – 2 cm to 3 cmlong – into the mixing chamber.
. Close the connecting valve between the reservoirand mixing chamber.
Monomer solutions for gradient gels. The dense solution contains 20% glycerol to sta-bilize the gradient.
. The ammonium persulfate should not be addedbefore everything is in place, because there areonly about 10 minutes left to pour the gel until itstarts to gel.
Monomer solutions with selected % T and 3% C for 6 gradient gelswith 1 mm thickness:
Light solution, 211 mL:
8% T 10% T 12% T ... % T
Acrylamide, Bis solution (40% T, 3% C) 42 mL 53 mL 63 mL ... mL
1.5 mol/L Tris-Cl, pH 8.8, 0.4% SDS 53 mL 53 mL 53 mL 53 mL
TEMED (100%) 105 mL 105mL 105 mL 105 mLWater, deionized, make up to 210 mL 210 mL 210 mL 210 mL
Mix and degas with a water jet pump
10% ammonium persulfate 840 mL 840 mL 840 mL 840 mL
Dense solution, 211 mL:
14% T 16% T 20% T ... % T
Acrylamide, Bis solution (40% T, 3% C) 74 mL 84 mL 105 mL ... mL
1.5 mol/L Tris-Cl, pH 8.8, 0.4% SDS 53 mL 53 mL 53 mL 53 mL
Glycerol (85%) 50 mL 50 mL 50 mL 50 mL
TEMED (100%) 105 mL 105 mL 105 mL 105 mLWater, deionized, make up to 210 mL 210 mL 210 mL 210 mL
Mix and degas with a water jet pump
10% ammonium persulfate 670 mL 670 mL 670 mL 670 mL
The pinchcock clamp is closedas well.
Add ammonium persulfateshortly before gel casting.
Add ammonium persulfateshort before gel casting. Notethat less APS is added to thedense solution!

Step 4: SDS Polyacrylamide Gel Electrophoresis340
For comments on amounts of TEMED and ammonium persulfatesee above on page 329.
Control of gel polymerization for gradient gels The start of the poly-merization is controled with the amount of ammonium persulfate.The catalyst amount must not be too high in order to avoid overheat-ing in the caster. The dense solution must contain less catalyst,because the polymerization should start at the top and proceed slowlydown to the bottom. This is very important for two reasons:
. Thermal convection is prevented, which woulddistort the gradient.
. During polymerization the gel contracts. If thelower portion would polymerize first, it wouldpull the upper solutions down, resulting in acurved upper edge.
Figure 4.6 shows the setup for casting a gradient gel in the caster forsix gels.
. Degas and precool the monomer solutions.
. Add the ammonium persulfate to the monomersolutions and mix.
. Pour the dense solution into the reservoir.
. Carefully open the slide valve and let justenough solution flow to fill the connector chan-nel. Close the valve. If too much fluid has flowninto the mixing chamber, pipette it back to thereservoir.
. Pour the light solution into the mixing chamber.
. Start the magnetic stirrer.
. Open the pinchcock clamp to the next setting,the one next to close the tubing completely. Thelight solution should start to flow down the tub-ing.
. Open the sliding valve of the gradient maker.Now dense solution will flow into the mixingchamber and will be mixed with the light solu-tion.
Adjust the flow rate to a higher speed with the pinchcock clamp. Butthe speed must not be too high to avoid mixing of solutions in the V-shaped chamber at the bottom. Casting time should be around 10minutes. If you estimate that it will take longer, open the pinchcockto the next position.
The polymerization is moreeasily controled with varyingthe amount of APS than withTEMED.
When conditions are correct,the gels pull the displacing solu-tion down.
Check for air bubbles.
Do not mix too fast; air bubblesmust be avoided.

4.1 Casting of SDS Polyacrylamide Gels 341
Fig. 4.6: A. Casting gradient gels in a 6-gels caster.B. Overlaying the gel solution by spraying 0.1% SDS solution.
. Close the pinchcock clamp before the connec-tion tubing runs empty.
. Close the sliding valve between the mixingchamber and the reservoir.
. Pour 200 mL displacing solution into the mixingchamber of the gradient maker.
. Open the pinchcock clamp to the same positionlike casting the gradient.
. When the monomer solutions have reached thedesired level, which is 1 cm below the upperedges of the cassettes, close the pinchcockclamp.
The displacing solution – visible because of the added Bromophenolblue – should fill the V-shaped chamber completely. This saves youfrom cutting off protruding gel pieces at the bottom edge of each cas-sette.
. Immediately spray 0.1% SDS solution overlaysolution over the cassettes (see Figure 4.6B).
. Cover the caster with a cling film.
. Let the gel polymerize overnight at room tem-perature.
. During unloading rinse the cassettes to removeexcess polyacrylamide.
. Inspect each gel cassette for eventual air bub-bles. Gels with air bubbles should not be used.
Spraying with SDS solution isbetter than pipetting water-saturated butanol on the edge.
Because the silent polymeriza-tion must be completed.

Step 4: SDS Polyacrylamide Gel Electrophoresis342
. Store the usable gels in an airtight containerwith about 100 mL gel storage solution. Whenthe gels are not used during the next day, placethe container with the gels into a cold room or arefrigerator.
. Take the foam gasket out of the front plate andrinse it with deionized water.
. Rinse the gel caster and the separator sheet withmild detergent and then with deionized water.
. Let them dry in the air.
4.2Inserting Ready-made Gels into Cassettes
Ready-made gels on a film support are supplied in airtight aluminumbags and need to be inserted into specially designed reusable cas-settes. They are run in a vertical mode in the vertical systems for largegels.
. Place the cassette for ready-made gels on thebench top with the hinge down, plastic frame tothe left. Clean the inner side of the glass platethoroughly with a 2% (w/v) SDS water solution,rinse it with water and dry it completely with alint-free tissue paper. Pipette 1 ml deionizedwater onto the glass plate as a streak along thespacer of the closing side (see Figure 4.7).
Fig. 4.7: Application of 1 mL deionized water on the glassplate along the spacer of the closing side.
. Open the gel package by cutting around the gelon three sides at about 1 cm from the edge toavoid cutting the gel or the support film.Remove the gel from the package.
Do not leave it in the groove,because it would lose its sealingproperty.
Do not use more than 1 mL,because excess liquid betweengel surface and glass plate hasto be removed completely witha roller.

4.2 Inserting Ready-made Gels into Cassettes 343
The gel is cast onto a plastic support film and does not cover the filmentirely. The support film protrudes approximately 15 mm beyondthe top (cathodal) edge of the gel and approximately 5 mm at the lat-eral sides.
. Remove the protective plastic sheet from the gel.Handling the gel only by the side support filmmargins, hold it, gel-side down, over the glassplate. Align the right edge of the gel with theinner edge of the side spacer next to the openingside, flex the gel downward slightly and lower itslowly toward the glass plate from right to left(see Figure 4.8). Take care that the bottom edgeof the gel is flush of the bottom edge of the glassplate. The protruding side support film margins(not the gel) should rest on top of the sidespacers.
Fig. 4.8: Placing the film-backed gel into the cassette.
With this procedure almost no air bubbles are caught between glassplate and gel surface. The gel edge near to the opening side will takeup a few microliters of gel buffer; this prevents eventual current leak-age at the closing side, when gel edge should be slightly thinner thanthe cassette spacer.
. Press out any bubbles or liquid from betweenthe gel and the glass with a roller (Figure 4.9).Press firmly against the plastic support film withthe roller and roll over the entire gel.
. Snap the plastic frame to the glass plate andpress the edges tightly together. Ensure that thecassette is closed completely: an incompletelyclosed cassette causes a strongly curved frontbecause of current leakage.
. Keep them in the cassette rack upside down toprevent drying of the upper edge, to which theIPG strip will be applied.

Step 4: SDS Polyacrylamide Gel Electrophoresis344
Fig. 4.9: Removing excess water and air bubbles with a roller.
Fig. 4.10: The cassettes are placed into the rack upsidedown to prevent drying of the surface.
4.3Preparation of SDS Electrophoresis Equipment
4.3.1Stock Solutions for Running Buffers
The cathodal buffer is identical for laboratory-made gels containingTris-Cl pH 8.8 and ready-made gels containing PPA-Cl pH 7.0.
Cathodal buffer (5� to 10� concentration) = “Laemmli buffer”:
Tris base 0.25 mol/L 30.4 g
Glycine 1.92 mol/L 144.0 g
SDS 1% (w/v) 10 g
Water, deionized Make up to 1L
Store at room temperature.Do not titrate the Tris-glycinebuffer!

4.3 Preparation of SDS Electrophoresis Equipment 345
& Note: When the instruments are loaded withmore than half of the possible gel number, use2� cathodal buffer instead of 1� buffer toprevent buffer depletion.
1� cathodal buffer is usually used as anodal buffer for Tris-Cl pH 8.8gels. When care is taken that anodal and cathodal buffers do not mixduring electrophoresis, the anodal buffer concentrate can be com-posed as follows.
Anodal buffer (10� concentration) for Tris-Cl buffered gels:
Tris base 0.25 mol/L 30.4 g
SDS 1% (w/v) 10 g
Water, deionized Make up to 800 mL
4 mol/L HCl Titrate to pH 8.4
Water, deionized Make up to 1 L
Store at room temperature.When the anodal buffer is mixed with the used cathodal buffer
after the run, there will be enough Tris in the buffer for repeated useas anodal buffer. This saves work and reagent costs. Of course, thecathodal buffer must be new for each electrophoretic run.The ready-made gels contain PPA-Cl. For this buffer system, the
anodal buffer must be completely free of Tris ions. In a buffer kit 75mL of the 100� concentrated buffer are supplied, which is enough forone run in the high-throughput instrument and two runs in theinstrument for up to six gels.
Anodal buffer (100� concentration) for PPA-Cl buffered gels:
Diethanolamine 5 mol/L 167 mL
Acetic acid 5 mol/L 100 mL
Water, deionized Make up to 300 mL
Store at room temperature.
4.3.2Setting up the Integrated High-throughput Instrument
. Place the separation unit on a leveled bench.Check with a spirit level. If necessary, adjust thelevel with inserting plastic sheets below somefeet of the separation unit.
In the standard procedure thesame running buffer for theanode and cathode tank isused.
This saves costs, particularlywhen large volumes of anodalbuffer are used.
Also in this case, care must betaken that anodal and cathodalbuffers do not mix during therun.
Note, this is a highly viscousfluid.

Step 4: SDS Polyacrylamide Gel Electrophoresis346
. Turn the pump valve at the back of the separa-tion unit to “circulate”.
. Pour 750 mLTris-containing anodal buffer or –when running ready-made gels is intended –75 mL DEA-containing buffer concentrate intothe lower buffer tank.
. Fill the tank up to the mark 7.5 L with deionizedwater; in this way you rinse the buffer concen-trate off the buffer seal tubing.
When identical buffers are used for the anode and the cathode, youcan pour 950 mL buffer concentrate into the tank and fill up to themark 9.5 L with deionized water.
. Switch the control unit on, set the temperatureto 25 �C, and set the pump to “ON”. The pumpstarts to circulate the liquid, mixes the concen-trate with the water and the buffer temperaturewill be adjusted to 25 �C.
4.3.3Setting up the Six-gel Instrument
. Take the cassette carrier and the upper bufferchamber out of the instrument.
. Connect the tubing to a circulating thermostat,which has been set to 25 �C.
. Pour 450 mLTris-containing anodal buffer or –when running ready-made gels is intended –45 mL DEA-containing buffer concentrate intothe lower buffer tank.
. Fill 4 L deionized water into the tank.
. Plug the cable for the pump in. The pump startsto circulate the liquid, mixes the concentratewith the water.

4.4 Equilibration of IPG Strips and transfer to SDS Gels 347
4.4Equilibration of IPG Strips and transfer to SDS Gels
4.4.1Equilibration
Equilibration stock solution:
6 mol/L urea 180 g
30% glycerol (v/v) 85% solution 176 mL
50 mmol/L Tris-Cl pH 8.8 1.5 mol/L stock solution 17 mL
0.01% Bromophenol blue 50 mg
Water, deionized Make up to 500 mL
Dissolve completely
Then add
2% (w/v) SDS 10.0 g
Store in 50 mL aliquots in a freezer at –20 �C or below.. Equilibrate all strips together in the manifoldwith 100 mL equilibration buffer for each step.
Or, when the IEF is run in individual strip holders:. Place each IPG strip into an individual equilibra-tion tube and equilibrate with 10 mL buffer.
Equilibration:
15 min 10 mL equilibration stock solution Plus 100 mg DTT
15 min 10 mL equilibration stock solution Plus 250 mg iodoacetamide
& Note: When samples have been pre-labeled atthe cysteines with saturation dyes for a DIGEexperiment, the second equilibration step withiodoacetamide is omitted.
4.4.2Application of IPG Strips onto SDS Gels
Agarose sealing solution:
0.5% agarose NA 0.5 g
0.01% Bromophenol blue 10 mg
SDS cathode buffer (1� concentration) 100 mL
Do not add the SDS from thebeginning; urea and SDStogether would need a longtime to become dissolved.

Step 4: SDS Polyacrylamide Gel Electrophoresis348
. Heat on a heating stirrer or in a microwave ovenuntil agarose is completely dissolved. Prepare ali-quots for storage; store them at room tempera-ture. Do not melt the agarose repeatedly. Forready-made gels aliquoted sealing solutions aresupplied with the buffer kit.
Both types of cassettes (those for lab-cast and for pre-cast gels) haveone “longer” glass plate.
. Pour a few milliliters of deionized water on theupper gel edge using a squeeze bottle.
. Lay the cassette on the bench with the longerglass plate down, the protruding edge orientedtowards the operator.
. Place the strip with the acidic end to the left, gelsurface up onto the protruding edge of thelonger glass plate as shown in Figure 4.11.When the strip is applied gel surface up, withthe acidic end to the left side, the gels areassembled correctly in the standard orientationas indicated on page 115.
For film-backed gels it is important to slide the IPG strip into the cas-sette with its film-side towards the glass and its gel surface towardsthe film backing. This does not matter for the laboratory-made gelcassettes; however, a standardized orientation should always beapplied.
Fig. 4.11: Application of the equilibrated IPG strip into the SDS gel cassette for:A. laboratory-made gels and B. ready-made gels on film support.
. With the forceps move the strip into the cassetteslot.
. Place the cassette into the rack, now with theIPG strip-supporting edge upside.
. With a thin plastic ruler, gently push the IPGstrip down so that the entire lower edge of the
This greatly facilitates insertionof the IPG strip into thecassette.

4.4 Equilibration of IPG Strips and transfer to SDS Gels 349
IPG strip is in contact with the top surface of theSDS gel (see Figure 4.12). Do not push the IPGstrip down too hard, it would force a gapbetween gel surface and glass plate and damagethe gel.
. Tilt the cassette by 90 degrees to get rid of thewater.
Fig. 4.12: IPG strip application on a two-dimensional gel.A. Pushing the IPG strip onto the SDS gel with a ruler.B. Sealing the strip and the 1-D sample pads in place withhot agarose.
4.4.3Application of Molecular Weight Marker Proteins and 1-D Samples
If molecular weight markers and 1-D samples should be applied,choose 18 cm IPG strips instead of 24 cm strips. They should beplaced at least 1.5 cm apart from the spacers to achieve straightbands. The markers should contain 200 ng to 1000 ng of each compo-nent for Coomassie staining and about 10 ng to 50 ng of each compo-nent for silver or sensitive fluorescent staining.
. Rehydrate an IPG strip with molecular weightmarker protein solution.
. Cut it into small pieces, which are stored in adeep freezer.
Close to the spacers there arealways some edge effects,which cause bent zones.

Step 4: SDS Polyacrylamide Gel Electrophoresis350
Alternatively:. Apply 15 mL molecular weight marker proteinsolution on a IEF sample application piece andlet it dry.
. For less volume, cut the sample application pieceproportionally.
. Pick up the application piece with forceps andapply to the top surface of the gel next to oneend of the IPG strip.
4.4.4Seal the IPG Strip and the SDS Gel
. Melt each aliquot as needed in a 100 �C heatingblock (each gel will require about 2 mL). Allowthe agarose to cool until the beaker or tube canbe hold by fingers (60 �C) and then slowly pip-ette the amount required to seal the IPG strip inplace. Pipetting slowly avoids introducing bub-bles.
For ready-made gels the agarose will also seal the narrow gap betweenthe spacer near the hinge and the gel edge. The agarose must not betoo hot, otherwise it will run down through the gap before it gels.Also, in general, carbamylation of proteins must be avoided.
4.5The SDS Electrophoresis Run
4.5.1The Integrated High-throughput Instrument
& Note: Never switch the pump on without liquidin the tank.
. Check whether the instrument has been pre-pared as described above in Section 4.3.2.
. Wet the tubing of the buffer seal with 0.1% SDSwater.
. Insert the cassettes between the tubing of thebuffer seal, starting at the back. Slide themdown to the bottom.
Carbamylated peptides wouldcause problems for proteinidentification in mass spectro-metry.
Spray with the plant sprayerused for overlaying the geledges.

4.5 The SDS Electrophoresis Run 351
Do not force the cassettes down; this could damage the buffer seal.Take care that the silicone tubing are not bent and stretched down;this would cause current leakage and buffer mixing. If you detectedbent tubing, move the upper edges of the two neighboring cassettesslightly back and forward, to release the tubing.
. When fewer than 12 gels are run, insert blankcassettes into the free positions. In the front,however, a gel cassette should be inserted: thismakes it easier to watch the migration of theBromophenol blue front during the run.
When all cassettes are in place, the level of the anodal buffer shouldbe 3 mm to 5 mm below the lower buffer seal edge. If the level islower, remove one cassette, add some anodal buffer or deionizedwater (for PPA buffer system for ready-made gels), and slide the cas-sette in again.If the level is higher, and you use the identical running buffer, it
does not matter. If you use an anodal buffer different from the catho-dal buffer: open the draining valve for a very short time and close itagain immediately to pump the excess liquid out.
. Make up 2.5 L cathodal buffer by diluting andmixing the concentrate:– 1� cathodal buffer for 1–6 gels (250 mL con-centrate plus 2.25 L deionized water);
– 2� cathodal buffer for more than 6 gels, to pre-vent buffer depletion (500 mL concentrateplus 2 L deionized water).
. Pour the 2.5 L cathodal buffer into the uppertank.
. Close the safety lid, which contains the cathodalelectrodes.
The running conditions are the same for both ready-made and labora-tory-made SDS gels.Setting of the programmable power supply (set temperature to
25 �C):
Overnight runs:
Step 1 5 mA per gel »0.2 W 2 hours
Step 2 25 mA per gel 1 W Overnight
Turn ready-made gel cassetteswith the glass plates to thefront, because the plasticframes are not transparent.

Step 4: SDS Polyacrylamide Gel Electrophoresis352
Fast runs:
Step 1 5 mA per gel »0.2 W 2 hours
Step 2 40 mA per gel 15 W 4–6 hours
In a warm laboratory the buffer temperature can rise to 30 �C. Thisdoes not create a problem. When the temperature gets higher, thepower setting should be reduced.
& Note: The running time is also dependent on thewater quality. Water with more ions causesslower runs.
After the run. Switch off the electric field.. Open the safety lid.. Remove the cassettes.
For DIGE DIGE gels are scanned while they are in the low fluores-cent glass cassettes. If they cannot be scanned within the next coupleof hours, place the cassettes into a refrigerator or into a cold room.
. Do not fix the gels, because acidic fixation wouldreduce the fluorescent signal considerably.
For staining the gels. Open the cassettes only with a piece of plastic,like a Wonderwedge�.
. Remove the gels from the cassette; be very care-ful, when gels are not attached to a glass plate ora support film. Place the gels immediately intofixing solution or the hot Coomassie blue solu-tion (see next chapter).
. Rinse the cassettes with mild detergent, tapwater and deionized water and let them dry inthe air.
. Pump the used buffer out by opening the valve:Be sure that the end of the tubing is placed intoa bucket or a sink. Switch the pump off immedi-ately when the tank is empty.
When the anodal buffer should be re-used (only possible for Tris-Clgels), pump only 2.5 L out. When the PPA-Cl gels are run, the buffercannot be re-used. The Tris ions have to be completely removed fromthe lower buffer tank by filling several times a few liters of water inand pumping it out.
If you use metal spatulas orknives, you can damage theglass plates.
Or dry them with lint-freetissue paper.
Do not walk away during thisprocedure!

4.5 The SDS Electrophoresis Run 353
. Rinse the cathode panels on the hinged safetylid with deionized water.
. Wash the lower buffer tank several times withtap water and then with deionized water toremove any disturbing ions.
4.5.2The Six-gel Instrument with Standard Power Supply
& Note: Never plug the pump cable in withoutliquid in the tank.
. Check whether the instrument has been pre-pared as described above in Section 4.3.3.
. Wet the buffer seal of the upper buffer chamberwith 0.1% SDS water.
. Insert the cassettes into the cassette carrier andplace it into the tank.
. When fewer than six gels are run, insert blankcassettes into the free positions. In the front,however, a gel cassette should be inserted: thismakes it easier to watch the migration of theBromophenol blue front during the run.
When all cassettes are in place, the level of the anodal buffer shouldhave reached the mark “LBC start fill”. If necessary, add anodal bufferor deionized water (for PPA buffer system for ready-made gels) toreach the mark. The filling procedure is shown in detail in Figure4.13.
. Make up 1.2 L cathodal buffer by diluting andmixing the concentrate:– 1� cathodal buffer for running 1–3 gels (120mL concentrate plus 1,080 mL deionizedwater).
– 2� cathodal buffer for more than 3 gels, to pre-vent buffer depletion (240 mL concentrateplus 960 mL deionized water).
When a pump runs dry, it getsdestroyed.
Spray with the plant sprayerused for overlaying the geledges.
Turn ready-made gel cassetteswith the glass plates to thefront, because the plasticframes are not transparent.

Step 4: SDS Polyacrylamide Gel Electrophoresis354
Fig. 4.13: Schematic drawing of the filling steps for the six-gelchamber. It is important to have a hydrostatic balance betweenupper and lower buffer.
. Pour 1.2 L cathodal buffer into the upper tank.
. Immediately fill more water or buffer into thelower buffer chamber to adjust the liquid level tothe level in the upper buffer. The hydrostatic bal-ance is necessary to prevent leakage of the upperbuffer tank and mixing of the buffers (see Figure4.13).
. Put the safety lid containing the cathodal electro-des in place and connect the cables to the powersupply.
The running conditions are the same for both ready-made gels andlaboratory-made SDS gels:
Overnight runs:
Step 1 5 mA per gel »0.2 W 2 hours
Step 2 25 mA per gel 1 W Overnight
Fast runs:
Step 1 5 mA per gel »0.2 W 2 hours
Step 2 40 mA per gel 15 W 4–6 hours
Water is for ready-made gels /buffer, for other gels buffer ispoured in.
External thermostat is set to25 �C.

4.6 The SDS Electrophoresis Run 355
& Note: The running time is also dependent on thewater quality. Water with more ions causesslower runs.
After the run. Switch off the power supply and unplug the con-necting cables.
. Unplug the pump cable.
. Remove the safety lid.
. Remove the entire cassette carrier and carry it toa sink. Then remove the upper buffer tank andthe cassettes from the carrier.
When the anodal buffer is required for re-use (only possible for Tris-Cl gels), the upper buffer must be collected and poured into the ano-dal buffer in order to bring the Tris ions back.
For DIGE DIGE gels are scanned while they are in the low fluores-cent glass cassettes. If they cannot be scanned within the next coupleof hours, place the cassettes into a refrigerator or into a cold room.
. Do not fix the gels, because acidic fixation wouldreduce the fluorescent signal considerably.
For staining the gels. Open the cassettes only with a piece of plastic,like a Wonderwedge�.
. Remove the gels from the cassette; be very care-ful, when gels are not attached to a glass plate ora support film. Place the gels immediately intofixing solution or the hot Coomassie blue solu-tion (see next Chapter).
. Clean the glass plates as soon as possible (seebelow)!
. Pour the buffer out and wash the lower buffertank several times with tap water and then withdeionized water to remove any disturbing ions.
When the PPA-Cl gels are run, the buffer cannot be re-used. The Trisions have to be completely removed from the lower buffer tank by fill-ing several times a few liters of water in and pumping it out.
. Rinse the cathode panels on the safety lid withdeionized water.
Fixing of gels causes quantita-tively and qualitatively modi-fied results.
If you use metal spatulas orknives, you can damage theglass plates.

Step 4: SDS Polyacrylamide Gel Electrophoresis356
4.6Cleaning the Glass Plates
Normal cleaning. Rinse the cassettes with 0.5% (w/v) SDS solu-tion.
. Wash them with tap water.
. Rinse them with deionized water.
. Let them dry in the air.
Removal of Bind-Silane bound gels from glass plates. Soak the glass plates overnight in a 5% (v/v)Decon 90 solution.
. Remove any gel fragments attached to the platefrom previous gels.
If Decon is not available. Pour a few mL of 0.5 mol/L KOH on the glassplate, distribute the solution evenly over the sur-face.
. Wait for a few minutes, wipe the gel off with apaper.
. Wash with tap water.
. Rinse with deionized water.
. Store the glass plates and cassettes in a dust-freecabinet.
Or dry them with lint-freetissue paper.
Longer time can cause etchingof the surface.
357
Step 5: Scanning of Gels Containing Pre-labeledProteins
Gels containing fluorescence pre-labeled proteins can be scannedwhile they are inside the cassette. It is important, that cassettes aremadefrom low-fluorescent glass plates. Two types of imagers can be used:
. Laser scanners with photomultiplier tubes;
. White light sources with excitation filters and ascanning CCD camera.
The key point is the prevention of crosstalk between the different dyechannels. Therefore the quality of the narrow band pass emission fil-ters is of high importance.For correct positioning the cassettes and avoiding the development
of Newton’s rings, the way of cassettes placement is very important.In the Typhoon laser scanner the cassettes are placed on an assemblyof alignment guides, which provide an opening of 200 mm betweenthe platen and the cassette glass plate to prevent the formation ofNewton rings. The position of the cassettes is easily recognized bythe software as a pre-defined tray area. For the scanning CCD cameraspecial carrier cassettes are provided, which have an open bottom forthis application.2-D gels are always scanned in a defined – and the same – orienta-
tion, in order to evaluate and display the image with the low isoelec-tric points on the left hand side and the low molecular weights pro-teins at the bottom. The print on the IPG strips is very useful to findthe correct orientation.The standard resolution for adequate evaluation with DeCyder soft-
ware is a pixel size of 100 mm. The scanner computer should containa software package ImageQuant to overlay the different images forvisual control of the separation results and cropping the images.
. Wipe off fluorescent contaminations on thescanner glass platen and glass plates with lint-free tissue paper soaked in 10 % (v/v) H2O2 andrinse with double-distilled water.
Proteomics in Practice. A Guide to Successful Experimental Design 2nd Ed.Reiner Westermeier, Tom Naven, and Hans-Rudolf HçpkerCopyright � 2008 WILEY-VCH Verlag GmbH & Co. KGaA, WeinheimISBN: 978-3-527-31941-1
According to a Cartesian coor-dinate system.
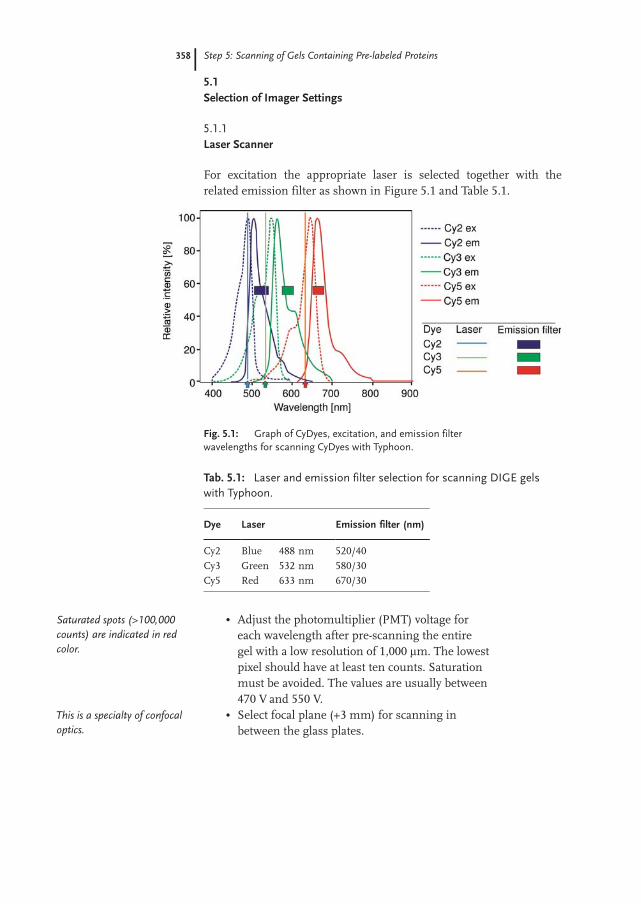
Step 5: Scanning of Gels Containing Pre-labeled Proteins358
5.1Selection of Imager Settings
5.1.1Laser Scanner
For excitation the appropriate laser is selected together with therelated emission filter as shown in Figure 5.1 and Table 5.1.
Fig. 5.1: Graph of CyDyes, excitation, and emission filterwavelengths for scanning CyDyes with Typhoon.
Tab. 5.1: Laser and emission filter selection for scanning DIGE gelswith Typhoon.
Dye Laser Emission filter (nm)
Cy2 Blue 488 nm 520/40
Cy3 Green 532 nm 580/30
Cy5 Red 633 nm 670/30
. Adjust the photomultiplier (PMT) voltage foreach wavelength after pre-scanning the entiregel with a low resolution of 1,000 mm. The lowestpixel should have at least ten counts. Saturationmust be avoided. The values are usually between470 V and 550 V.
. Select focal plane (+3 mm) for scanning inbetween the glass plates.
Saturated spots (>100,000counts) are indicated in redcolor.
This is a specialty of confocaloptics.

5.2 After Scanning 359
5.1.2Scanning CCD Camera
For the white light source imager the excitation and emission filtershave to be selected as shown in Figure 5.2 and Table 5.2.
Fig. 5.2: Graph of CyDyes, excitation, and emission filter wavelengthsfor scanning CyDyes with EDI scanning CCD camera imager.
Tab. 5.2: Excitation and emission filter selection for scanning DIGEgels with EDI scanning CCD camera imager.
Dye Excitation filter (nm) Emission filter (nm)
Cy2 480/30 530/40
Cy3 540/25 595/25
Cy5 635/30 680/30
. For the CCD camera adjust the exposure timesettings for each wavelength (between 0.15 sec-onds and 4.0 seconds) after a pre-scan of a smallscanning area.
5.2After Scanning
The files are saved as 16 bit TIFF files. The software saves the differ-ent channels in two formats: *.ds and *.gel, to which it adds automa-tically the suffix Cy2, Cy3, or Cy5, and for the selected internal stan-dard channel it also adds the suffix STANDARD. The *.ds files allowthe scanned images to be overlaid in ImageQuant.
Usually settings are 0.9 secondsor below to keep scanning timedown. Weaker signals needlonger exposure.

Step 5: Scanning of Gels Containing Pre-labeled Proteins360
If the cassettes have been scanned in the wrong orientation, thiscan be corrected with the scanner software, which includes tools forrotating and flipping images.

361
Step 6: Staining of Gels
Only a selection of staining techniques will be described, those whichare most useful for fast results, good sensitivity, image analysis, quan-tification, and mass spectrometry compatibility.
6.1Visible Stains
6.1.1Sensitive Stepwise Coomassie Brilliant Blue Colloidal Staining
According to Neuhoff et al. (1988).
6.1.1.1 Solutions
Stock staining solution A:. 10% (w/v) ammonium sulfate, 2% (w/v) phos-phoric acid in 100 mL deionized water.
Stock staining solution B:. 5% (w/v) Coomassie brilliant blue G-250 in de-ionized water.
Staining solution:. Mix 2 mL of stock solution B with 80 ml of stocksolution A. Add 20 mL of methanol into the ABmix.
& Note: The staining solution should never befiltered because the colloidal dye particlesformed are retained on the filter.
Proteomics in Practice. A Guide to Successful Experimental Design 2nd Ed.Reiner Westermeier, Tom Naven, and Hans-Rudolf HçpkerCopyright � 2008 WILEY-VCH Verlag GmbH & Co. KGaA, WeinheimISBN: 978-3-527-31941-1
Neuhoff V, Arold N, Taube Dand Ehrhardt W. Electrophor-esis 9 (1988) 255-262.

Step 6: Staining of Gels362
Fixation solution:. 20% (w/v) ammonium sulfate in water.
Neutralization buffer:. 0.1 mol/LTris base, adjust pH to 6.5 with phos-phoric acid.
6.1.1.2 Staining Procedure
. Briefly wash the gel with distilled water.
. Stain the gel with the staining solution overnightor one day.
. Transfer gel into neutralization buffer for 1–3minutes.
. Wash gel with 25% (v/v) methanol for less than1 minute.
. Transfer gel into fixation solution and fix pro-teins overnight or for 1 day
. For further staining, just repeat the last foursteps. Three times staining should be enough;which takes about 1 week
& This procedure involves many steps and takesalmost a week. However, the sensitivity of themethod comes close to the sensitivity of silverstaining.
6.1.2Sensitive “Walk-away” Coomassie Brilliant Blue Colloidal Staining
According to Anderson et al. (1991), modified by Sjouke Hoving,Novartis.
. Fix the gel at least 3 hours in 50% ethanol / 3%phosphoric acid (1.5 L for ten gels: 750 mL etha-nol, 45 mL of 85% H3PO4)
. Wash 3 � 20 minutes in distilled water
. Pre-incubate for 1 hour in 34% (v/v) methanol /3% (w/v) phosphoric acid / 17% (w/v) ammo-nium sulfate solution:– First dissolve the ammonium sulfate in water/phosphoric acid.
– Then add slowly the methanol.– For 1.5 L (sufficient for ten gels): 45 mL of85% H3PO4, 860 mL water, 255 g ammoniumsulfate; then add 510 mL methanol.
Gel can stay in stain or fixationsolution over a weekendwithout any effect on theresults.
It is said that sensitivity close toa good silver staining procedurecan be achieved with repeatedstaining.
Anderson NL, Esquer-Blasco R,Hofmann J-P, Anderson NG.Electrophoresis 12 (1991)907–930.

6.1 Visible Stains 363
. Add 0.53 g Coomassie brilliant blue G-250 pow-der per 1.5 L solution and stain for 4–5 days onan orbital shaker.
. Wash the gels a few times in water to removebackground stain.
6.1.3Hot Coomassie Brilliant Blue Staining
Staining Solution: 0.025% (w/v) Coomassie R-350. Dissolve one PhastGel Blue tablet in 1.6 L of10% acetic acid.
Staining Procedure. Place the gel in a stainless steel tray.. Heat the solution to 90 �C and pour it over thegel in the tray.
. Place the tray on a laboratory shaker for 10 min.
Destaining. On a rocking table in 10% acetic acid for at least2 h at room temperature.
. Change solution several times; recycle it by pour-ing it through a filter filled with activated char-coal.
Staining and destaining solutions can be used repeatedly.The gels can now be scanned and evaluated. The selected spots can
be cut out with a spot picker.
6.1.4Silver Staining
6.1.4.1 Quality of Reagents
Water For silver staining the water quality must be adequate. Some-times it is thought, that MilliQ quality is a guarantee for good results.It happens, however, frequently, that the cartridges are not exchangedfor a long period of time.There is a simple test: Mix a few droplets of the water with a few
droplets of the silver nitrate solution (from a commercial silver stain-ing kit or laboratory-made). When the water contains chloride, themixture becomes immediately turbid: This water cannot be used.
After 1 day the spots are visible,the end-point is reached after4–5 days
Placing a paper towel into thedestaining solution adsorbs theCoomassie dye.
Sometimes, deionized water isbetter for silver staining thanMilliQ water.
In case of emergency: buy deio-nized water from the super-market.

Step 6: Staining of Gels364
Ethanol If pure ethanol is not available or too expensive, there aretwo possibilities:
. Buy a commercial 40% stock solution in a super-market. For fixing just add the acetic acid.
. Use MEK denatured ethanol (methylethyl-ketone).
Other reagents The reagent quality is very important for goodresults. The quality of silver nitrate and formaldehyde is most critical.The following modification of the silver nitrate technique,
described in Table 6.1, is based on the method by Heukeshoven andDernick (1986), and is probably the most sensitive and reproducibleone, when the quality of the chemicals and the water is high, andwhen the timing of the steps is exactly kept. The sensitivity of thismethod is of approximately 0.05–0.1 ng/mm2.If only a few gels have to be stained, an automated stainer (see Fig-
ure 6.1) is very useful. Automatic staining is more reproducible thanmanual staining.
Fig. 6.1: Automated gel stainer.
Also known under the nameVodka.
Do not use otherwise denaturedethanol, do not use methanol.
Never store the 37% formalde-hyde in the refrigerator or in thecold room.
Heukeshoven J, Dernick R.Electrophoresis. 6 (1985)103–112.

6.1 Visible Stains 365
Tab. 6.1: Silver staining according to Heukeshoven and Dernick (1986).
Step Solution Volume (mL) Time for gel type
Manual or
in automated
stainer
Laboratory-made solutions or silver
staining kit for proteins
0.5 mm backed or
1 mm unbacked
(min)
1 mm on film or
glass support or
1.5 mm unbacked
(min)
Fixing 10% acetic acid;40% ethanol;with deionized water to
2� 250 2� 15 2� 60
Sensitizing 75 mL ethanol;10 mL Na-thiosulfate (5% w/v);17 g Na-acetate;1.25 mL glutardialdehyde;with deionized water to
250 30 60
Washing Deionized water 3� to 5� 250 3� 15 5� 8
Silver 25 mL silver nitrate ( 2.5%);100 mL formaldehyde;with deionized water to
250 20 60
Washing Deionized water 2� to 4� 250 2� 1 4� 1
Developing 6.25 g Na-carbonate;100 mL formaldehyde;7 mL Na-thiosulfate (5% w/v);with deionized water to
250 4 6
Stopping 3.65 g EDTA;with deionized water to
250 10 40
Washing Deionized water 2� to 3� 250 3� 5 2� 30
The addition of a tiny amount of Na-thiosulfate is particularly help-ful to reduce the background when thick gels and film-supported1 mm thick gels are stained.
& Note: When silver stained spots should befurther analyzed with mass spectrometry, somemodifications of this protocol have to be made:. No glutardialdehyde in the sensitizer and no
formaldehyde in the silver solution;. No Na-thiosulfate in the developer.. The staining tray must be covered with a lid
to prevent contamination with keratin.

Step 6: Staining of Gels366
6.1.4.2 Staining of Multiple Gels
Up to four gels can be stained at a time with a special set of stainingtrays on an orbital shaker, as shown in Figure 6.2. One tray is perfo-rated to allow easy changing of staining liquids without breaking thegels. 1.5 L solution is needed for each step.
Fig. 6.2: Staining of multiple large format gels on anorbital shaker. Up to four gels, with or without film-backingcan be stained together in one set.
6.1.4.3 Double Staining
By staining gels sequentially in Coomassie blue and silver stain, thesensitivity of detection can be increased. However, the background ofthe Coomassie blue stain must be completely clear. Because the spotsare fixed and the buffer components are already removed, the fixingsteps can be omitted, and the procedure starts with the sensitizingstep.
6.1.5Scanner Settings for Visible Dyes
. Activate in the Scanner Options: “Always useTWAIN controls.”
. Press “Scan”, set the scanning parameters in thesubmenu in the Scanner Control Window:– If necessary, choose light source color;For instance: Yellow-brown
silver stained spots are bestscanned with blue color.

6.1 Visible Stains 367
– Transmission mode;– Gray scale;– Bits per pixel as high as possible, e.g. 16 bits;– Resolution 300 dpi or lower;
– Gamma correction.
If the value is set above “1”, the intensity resolution will be higher forthe strong signals, if it is set below “1”; the weaker signals are dis-played with a higher intensity resolution.
. These parameters are saved under “Settings”.
6.1.5.1 Calibration of the Scanner
At first the measured dimensionless intensity has to be convertedinto optical density (O.D.) values by calibration of the scanner with agray step tablet.
. Choose “Recalibrate” in the program.
. Set the units, usually: “Optical Density”
. Scan a gray step tablet, available for instancefrom Kodak, shown in Figure 6.3.
Fig. 6.3: Calibration of the scanner with the help of a gray step tablet.
Otherwise you cannot performproper quantification.
Important for quantification.
To limit the size of the resultingfile.
A tool for intensity adjustmentat selected level.
Note: It is much easier to cali-brate the scanner than cali-brating each gel after scanning.

Step 6: Staining of Gels368
. Enter the step wedge intensities into the stepwedge list.
. Identify the step wedge points, when a value isused, it is indicated in the image window. Thesoftware will produce a string of points, whichcan be stretched to fit the steps.
. Select “Cubic spline”. This curve will be saved asthe default calibration, which can be loaded foreach scan.
6.2Fluorescent stains
6.2.1SYPRO Ruby� or RuBPS Staining
For highest sensitivity with Sypro Ruby or RuBPS the following pro-cedure is recommended by Rabilloud et al. (2001).The volumes of the staining solutions are optimized for a single
1 mm thick Ettan Dalt gel, which has a volume of approximately50 mL. For 1.5 mm thick gels the volumes should be multiplied by1.5. The backing must be nonfluorescent glass or film.
Tab. 6.2: SYPRO Ruby�/RuBPS staining.
Step Solution Volume (mL) Time for gel type
In dark covered
plastic tray
Freshly made 1 mm unbacked 1 mm on film or
glass support or
1.5 mm unbacked
Fixation 20% (v/v) ethanol,7% (v/v) acetic acid in deionized water
500 1 hour 2 hours
Washing 20% (v/v) ethanol 500 4� 30 minutes 4� 45 minutes
Staining SYPRO Ruby or RuBPS 700 Overnight Overnight
Washing Deionized water 500 2� 10 minutes 2� 30 minutes
Stain and store the gels in dark plastic containers. Do not use steelor glass trays.
Rabilloud T, Strub J-M, LucheS, van Dorsselaer A, Lunardi J.Proteomics 1 (2001) 699–704.

6.2 Fluorescent stains 369
Tab. 6.3: Laser and emission filter selection for scanning withTyphoon.
Dye Laser Emission filter (nm)
SYPRO Ruby or RuBPS Green 532 nm 620
6.2.2Deep Purple� Staining
The volumes of the staining solutions are optimized for one 1 mmthick Ettan Dalt gel, which has a volume of approximately 50 mL. For1.5 mm thick gels the volumes should be multiplied �1.5. The back-ing must be non fluorescent glass or film.
Tab. 6.4: Deep Purple staining.
Step Solution Volume (mL) Time for gel type
In dark
covered
plastic tray
Freshly made [mL] 1 mm unbacked 1 mm on film or
glass support or
1.5 mm unbacked
Fixation 15% (v/v) ethanol,1% (w/v) acetic acid(approx. pH 2.3) in deionized water
1,000 1 hour or overnight 2 hours
Staining 0.5% (v/v) Deep Purple in100 mmol/L sodium borate,pH 10.5–10.8 in deionized water *)
700 1–4 hours **) 1.5–4 hours **)
Washing 15% (v/v) ethanol indeionized water
700 30 minutes 45 minutes
Acidification 15% (v/v) ethanol,1% (w/v) acetic acid (approx. pH 2.3)in deionized water
250 30 minutes Repeat or extend upto overnight
Storage Recycled staining solution,pH adjusted to 2.4 by additionof 5% (w/v) citric acid and filtered
700
*) Dissolve 6.2g boric acid in 800 mL deionized water and adjust pH to 10.5
with NaOH [approx. 5 mL of a 50% (w/v) solution], then make to 1 L.
The volume of staining solution should be 10–20 times that of the gel.
**) Extending the staining time up to 4 hours does not adversely affect
results. There is some loss in fluorescence intensity if the staining time
is greater than 5 hours.

Step 6: Staining of Gels370
Stain and store the gels in dark plastic containers at 4 �C in the sto-rage solution. Do not use steel or glass trays.Prior to imaging rinse the gels 2� 15 minutes in washing solution.
Tab. 6.5: Laser and emission filter selection for scanning withTyphoon.
Dye Laser Emission filter
Deep Purple Green 532 nm 580/30 nm
For scanning Deep Purple-stained DIGE gels it is better to scanwith a blue (457 nm) laser with a red (610 nm) band pass filter toavoid cross-talk.
Tab. 6.6: Excitation and emission filter selection for scanning with EDIscanning CCD camera imager.
Dye Excitation filter Emission filter
Deep Purple 540/25nm Green 595/25 nm Orange
For scanning Deep Purple-stained DIGE gels it is better to use theviolet excitation filter (390/20 nm) with the orange emission filter(595/25 nm) to avoid cross-talk.
6.3Preserving and Drying of Gels
Film-backed gels can be stored in a sealed sheet protector. The openside is simply closed by sealing it with a kitchen foil welding appara-tus.Gels without film support can be dried between two sheets of cello-
phane, which are clamped into specially designed frames, as shownin Figure 6.4. The cellophane must be prewetted with 10% glycerol /water without alcohol.During staining gels tend to swell. When a gel does not fit into
such a frame anymore, it has to be re-shrunk to its original size with30% ethanol / 10% glycerol.

6.3 Preserving and Drying of Gels 371
Fig. 6.4: Drying of a polyacrylamide gel between two sheetsof cellophane using two plastic frames. A. From the bottom:Loading platform – smaller frame – pre-wetted cellophane –gel – pre-wetted cellophane – larger frame. B. The two clampedframes with the sandwich are removed from the platform; andthe screws are turned by 90 degrees.
This drying procedure can also be applied on film-supported gels.

373
Step 7: Image Analysis and Evaluation of DIGE Gels
As already mentioned above in the overview part in section 1.6.2,image analysis and evaluation is the bottle neck in the traditional 2-Delectrophoresis workflow. For the conventional one sample per gel ana-lysis and evaluation there are various software packages on the mar-ket, which follow different philosophies. The general concept isdescribed in this section.Also DIGE gels can – in principle – be evaluated with several differ-
ent algorithms. However, in order to get the full advantage of all fea-tures of the DIGE concept, it is highly recommended to apply theDeCyder 2-D software package, which is dedicated to this type of ana-lysis.In the following section the workflow for image analysis of Differ-
ence Gel electrophoresis gels with DeCyder� software is described.The scanned images are saved as 16 bit tiff files in two formats:
*.ds and *.gel. They carry the suffixes Cy2, Cy3, or Cy5 according tothe scanning channel, the internal standard channel additionally thesuffix STANDARD. The *.ds files allow the scanned images to beoverlaid in ImageQuant.
7.1Cropping of Images
The images of the different channels are overlaid with ImageQuantor PaintShop Pro� and inspected in a false color image. It is impor-tant to crop the overlay images as *.ds file to exclude the marginalareas of the pattern. The cut-away areas usually show disturbances,the IPG strip and the spacers, and will not contribute any usefulinformation for the 2-D pattern evaluation (see Figure 7.1).
Proteomics in Practice. A Guide to Successful Experimental Design 2nd Ed.Reiner Westermeier, Tom Naven, and Hans-Rudolf HçpkerCopyright � 2008 WILEY-VCH Verlag GmbH & Co. KGaA, WeinheimISBN: 978-3-527-31941-1
The DIGE concept withDeCyder image analysis consid-erably accelerates and improvesthe evaluation of 2-D gels.
Cropping the overlay will guar-antee identical cropping of allchannels.

Step 7: Image Analysis and Evaluation of DIGE Gels374
Fig. 7.1: Raw scan image (*.ds file) of a DIGE gel, indicatingthe cropped area for further evaluation.
The raw images provide some valuable information:. The tracking number of the IPG strip;. Whether there are proteins which did not leavethe IPG strip;
. Quality of the separation.
The images can now be analyzed using appropriate software, whichsupports spots co-detection and the use of the pooled internal stan-dard.
7.2Image Loading
Up to 500 gels can be loaded into one experiment.. Create groups according to the experimentdesign.
. Move images into the relevant groups.
7.3Difference Analysis Within a Gel
This type of analysis can be applied for small sample sets up to threesamples, which are run together in one gel. It can easily be employedfor a spot volume ratio calculation of up- and down-regulated pro-
For sample tracing.
Important for methodical opti-mization
Important for optimization ofsample preparation andlabeling
Similar to a Windows explorersystem

7.3 Difference Analysis Within a Gel 375
teins. With triple spot co-detection information from three channelsis acquired together, which improves detection of weak spots andsplitting. Corresponding spots have the same boundary. This ensuresexact spot volume ratios. In most practical cases a gradual increase ordecrease of a protein will happen.In some situations, however, a protein spot can be completely miss-
ing in one of the images. If a protein spot is completely absent in onesample, the volume ratio calculation will always be based on a smallvolume of the background (> 10 counts).However, in most cases difference analysis within one gel serves as
a preliminary analysis for setting the correct parameters later on inthe batch processor. An experiment will usually consist of more thantwo samples, therefore in the real analysis several gels will be ana-lyzed together.
. Enter the number of estimated spots, e.g. 3,000.
. Start calculation “difference in gel analysis(DIA)”of the Cy3 and the Cy5 image.
At this stage the spot patterns will be normalized on the basis of totalincluded spots. The logarithms of the spot ratios of the standard andthe sample are used. The use of logarithms tightens the data enablingaccurate fitting of a Gaussian normal distribution curve. The logratios follow a normal distribution, assuming that the majority of pro-teins between two samples remain unchanged. This normalizationmeasure eliminates variations from different total protein loads, scansettings, and dye intensities.
. After the first DIA calculation a divided screencan be selected as displayed in Figure 7.2. All thescreen areas are linked together.
. Adjust parameters:– Setting the threshold to a higher value reducesthe number of up- and down-regulated spots.The software also calculates the two-modelstandard deviation (2 SD). The value is dis-played close to the graph view as indicated inFigure 7.2 with a red ellipse. The value dis-played should provide a base for the thresholdminimum level. For instance, if a 2 SD of 1.93is shown, select 2.0 for threshold.
– Excluding spots with a very small area (num-ber of pixels < 100), small volume (< 30,000),strong slope, and low peak height reduces thenumber of detected spots.
A division through 0 cannotoccur.
In order to obtain usableresults, several biological repli-cates need to be analyzed.
Spot detection is done fullyautomatically.
See also the graph area inFigure 7.2
Small area and high slope indi-cate a dust particle.

Step 7: Image Analysis and Evaluation of DIGE Gels376
Fig. 7.2: Computer screen of DeCyder difference analysis withina gel. Clockwise, this is divided into: the gel view of both images(enlargement of a certain area), the graph area showing spots plottedover the log volume ratios (green is equal; red is down-, blue isup-regulated), a data table indicating similar and differing spots,and a three-dimensional representation of a selected spot withthe spot boundary, which is identical within a gel.
– When the number of spots is modified bysuch a filtering process, the normalization isnewly recalculated and is now based on thenew – reduced – spot pattern.
The major applications of the DIA tool are:. Semi-quantitative evaluation of up to three sam-ples;
. Determination of the optimal number of esti-mated spot;
. Checking of correct cropping;
. Determination of appropriate filter parameters.
For instance for optimization ofsample preparation

7.4 Multi-gel Analysis with a Batch Processor 377
However, these filtering functions do not need to be employed tooextensively, because dust signals are filtered out during spot match-ing.
7.4Multi-gel Analysis with a Batch Processor
This is the quantitative evaluation of the images, performed with thebatch processor. The internal standard images of the different gelsare matched, and statistical analysis of the spots across multiple gelsis performed. For this analysis the pooled internal standard plays avery important role for spot matching and spot volume normalization(the second normalization step). This normalization to the internalstandard eliminates gel-to-gel variations.Univariate statistical analysis tools like Student’s t-test and ANOVA
are very important for the automatic selection of spots with signifi-cant changes. At the same time the statistical confidence for thechanges is given.When Typhoon or Edi is employed for image acquisition, in the
“DIGE naming format” Cy2 should be selected as internal standard,to which the spots of the internal standard images of the other gelswill be matched.
. Select the groups to be analyzed.
. Enter the parameters found in the preliminarydifference analysis within one gel.
. Select the desired statistical tests.
. Start the automated evaluation of the batch pro-cessor.
Figure 7.3 shows the computer screen with the views of two selectedgels, a graph indicating the abundances of a selected spot across allthe analyzed gels, this spot’s data highlighted in the data table and itsthree-dimensional view. By clicking on another spot, all the views arechanged and the data related to this spot is displayed.
Dust particles will not match,because they are positioned inrandomly scattered positions.

Step 7: Image Analysis and Evaluation of DIGE Gels378
Fig. 7.3: Computer screen of DeCyder biological variationanalysis across multiple gels. Clockwise, this is divided into: thegel view of two selected images (enlargement of a certain area),the graph area showing protein abundances of a time course, adata table indicating spot abundance ratios and their statisticalvalues, and a three-dimensional representation of a selected spotwith its spot boundary, which varies from gel to gel.
. Check the automatic matches by visual inspec-tion in the MTmode. Matching vectors (linesbetween spots) indicate which spots are relatedto the master spots.
. If the matching vectors are crossed over or donot point into similar directions, the matchingprocess can be manually edited. After introdu-cing one or a few landmarks the matching pro-cess can be repeated with a result shown in Fig-ure 7.4.

7.5 Preparation for Spot Picking 379
Fig. 7.4: Partial computer screen of DeCyder showing matchingvectors across four gels in the gel view. In this case a second matchinghas been performed after manually introducing a landmark (purpleboundary). The broken matches are kept as negative landmarks(orange boundary).
7.5Preparation for Spot Picking
With a pick filter protein spots for further downstream analysis withmass spectrometry are chosen, see Figure 7.5. The spot coordinatesare exported together with the coordinates of the reference markersto a file, which is uploaded to the spot picking computer.

Step 7: Image Analysis and Evaluation of DIGE Gels380
Fig. 7.5: Computer screen of DeCyder for the preparation ofspot picking. Clockwise, this is divided into: the gel view of twoselected images showing the spots selected for picking in one gel(enlargement of a certain area), the graph view showing proteinabundances after normalization against the standard, a data tableindicating similar spots selected for picking, and a three-dimensionalrepresentation of a selected spot showing the portion to be picked.
7.6Further Data Analysis
Add-on software packages like DeCyder EDA (Extended data analysis)can be employed to answer remaining questions, for instance:
. Grouping of results.
. Controling appropriate sample annotation
. Finding spots which are characteristic for a bio-logical state.
2-D results are usually quitecomplex.
When working with a highnumber of samples the impor-tance of such a control shouldnot be underestimated.

7.6 Further Data Analysis 381
. Finding proteins with similar expression pro-files.
. Finding proteins which serve as biomarkers,drug targets, classifiers, etc.
. Finding how many different groups are in anexperiment in an unbiased way.
. Linking data from multiple experiments.
. Linking data with data from other experimentaltechniques.
The major multivariate statistical tools employed for these tasks are:
. Principal component analysis (PCA);
. K-means;
. Heuristic clustering (supervised and unsuper-vised);
. Discriminant analysis.
A very useful feature of DeCyder EDA is the direct linkage betweenthe images of the results and the 2-D DIGE experiment: by clickingon a PCA spot or a band on the heat map of heuristic clustering theoriginal experimental data are directly available with a hyperlink. Inthis way the result can be traced back to the separation and the sam-ple.
Those need to be validatedsubsequently by a differentexperiment, like Western blot-ting.
Examples are shown on page136.

383
Step 8: Spot Excision
Following the selection of the spots of interest, the protein spots haveto be excised from the gel. This step is performed manually or auto-matically with commercially available spot pickers.The procedure must be performed in clean environment such as a
Laminar flow hood in order to minimize or most preferably excludecontaminating proteins such as keratin entering the protein identifi-cation workflow at this stage. The keratin(s) will be digested in thesame way as the target protein(s), with keratin peptides included inthe PMF spectrum, complicating the subsequent dataset. This is par-ticularly problematic for low abundant samples. See Tables 8.1–8.4for lists of keratin peptides commonly observed in MALDI peptidemass fingerprinting (courtesy of www.matrixscience.com).Keratin contamination can be introduced into the workflow by poor
sample handling at any stage between conclusion of the electrophor-esis step and digestion of the target protein. Furthermore, keratincontamination is almost certainly present in the starting acrylamidesolutions and solvents; all of which need to be filtered before use.Even the staining unit should be used solely for applications leadingto mass spectrometric analysis. All eppendorf tubes to be used shouldbe rinsed with MilliQ water (or at least doubly distilled water), espe-cially if the tubes have been in lying around in drawers before use.This step will remove any residual dust from the tubes, which maycontain keratins.
& All possible measures need to be taken to avoidkeratin contamination.
Peptides from four common keratins have been reported to contami-nate many mass spectra. The commonly observed keratin tryptic pep-tides from these four keratin proteins are tabulated below.
Proteomics in Practice. A Guide to Successful Experimental Design 2nd Ed.Reiner Westermeier, Tom Naven, and Hans-Rudolf HçpkerCopyright � 2008 WILEY-VCH Verlag GmbH & Co. KGaA, WeinheimISBN: 978-3-527-31941-1

Step 8: Spot Excision384
Tab. 8.1: K2C1 Human: keratin, type II cytoskeletal 1 (K1 skin).Nominal mass (Mr): 65847; calculated pI value: 8.16.
Position in
sequence
Experimental
mass [M+H]+Theoretical
mass [M]+Sequence
185–196 1382.68 1383.69 SLNNQFASFIDK
211–222 1474.75 1473.74 WELLQQVDTSTR
417–431 1716.85 1715.84 QISNLQQSISDAEQR
223–238 1993.98 1992.97 THNLEPYFESFINNLR
518–548 2383.95 2382.94 GGGGGGYGSGGSSYGSGGGS-YGSGGGGGGGR
549–587 3312.31 3311.30 GSYGSGGSSYGSGGGSYGSGG-GGGGHGSYGSGSSSGGYR
Tab. 8.2: K2E keratin (Dandruff), 67K type II epidermal – human.Nominal mass (Mr): 65825; calculated pI value: 8.07.
Position in
sequence
Experimental
mass [M+H]+Theoretical
mass [M]+Sequence
245–253 1037.50 1036.49 YLDGLTAER
381–390 1193.60 1192.59 YEELQVTVGR
46–61 1320.60 1319.59 HGGGGGGFGGGGFGSR
71–92 1838.90 1837.89 GGGFGGGSGFGGGSGFGGGSGFS-GGGFGGGGFGGGR
93–128 2831.20 2830.19 SISISVAGGGGGFGAAGGFGGR
Tab. 8.3: K.9. keratin 9 (skin), type I, cytoskeletal – human. Nominalmass (Mr): 61950; calculated pI value: 5.14.
Position in
sequence
Experimental
mass [M+H]+Theoretical
mass [M]+Sequence
233–239 897.40 896.39 MTLDDFR
224–232 1060.60 1059.59 TLLDIDNTR
242–249 1066.50 1065.49 FEMEQNLR
449–471 2510.10 2509.09 0 EIETYHNLLEGGQEDFESSGAGK
63–94 2705.20 2704.19 GGGSFGYSYGGGSGGGF-SASSLGGGFGGGSR

Step 8: Spot Excision 385
Tab. 8.4: K10 (dandruff) keratin 10, type I, cytoskeletal – human.Nominal mass: 59492; calculated pI value: 5.17.
Position in
sequence
Experimental
mass [M+H]+Theoretical
mass [M]+Sequence
442–450 1165.60 1164.59 LENEIQTYR
323–333 1365.60 1364.59 SQYEQLAEQNR
166–177 1381.64 1380.63 ALEESNYELEGK
41–59 1707.80 1706.79 GSLGGGFSSGGFSGGSFSR
423–439 2024.94 2023.93 AETECQNTEYQQLLDIK
208–228 2366.26 2365.25 NQILNLTTDNANILLQIDNAR
Manual procedure Wearing powder-free gloves, use a clean scalpelblade to cut around the protein spot of interest. Attempt to take aslittle of the surrounding gel as possible. Using a surgical needletransfer the excised gel piece to a pre-rinsed 500-mL Eppendorf tube.

387
Step 9: Sample Destaining
Generally three methods are used for gel staining of 2-D gels. Coo-massie brilliant blue, silver and Sypro Ruby.
9.1Coomassie Blue-stained Protein Spots
The CBB will heavily suppress signal in both MALDI and ESI analy-sis. CBB will be easier to remove before digestion rather than after,because after digestion the CBB will be concentrated along with thepeptide digest during the extraction stage. The CBB will be very diffi-cult to remove by a microscale purification step (see Step 10).Add 25 mL of 75 mmol/L ammonium bicarbonate (40% ethanol) to
the excised Coomassie stained gel plug. Vortex and leave to stand.The supernatant will rapidly turn blue, remove supernatant after tenminutes and replace with a further aliquot of the destain solutionuntil the excised spot is destained. The gel plug is now ready fordigestion.
9.2Silver-stained Protein Spots
The silver staining method has to be compatible with MS analysis.Sensitive silver stain methods, in the order of 1–10 ng per proteinspot (Rabilloud, 1999), typically required the use of glutardialdehydeas part of the sensitization process. However, glutardialdehyde reactswith the amino groups of proteins, both e-amino (lysine side chain)and the a-amino, cross-linking the protein to the gel. This step needsto be eliminated for optimal MS analysis (Shevchenko et al. 1996; Yanet al. 2000; Sinha et al. 2001). Further optimization to the procedurewas reported by Gharahdaghi et al. (1999) by removing the silver ionsprior to digestion.
Proteomics in Practice. A Guide to Successful Experimental Design 2nd Ed.Reiner Westermeier, Tom Naven, and Hans-Rudolf HçpkerCopyright � 2008 WILEY-VCH Verlag GmbH & Co. KGaA, WeinheimISBN: 978-3-527-31941-1
The length of time required todestain will be dependant onthe intensity of the stain.

Step 9: Sample Destaining388
1. Prepare fresh solutions of potassium ferricy-anide (30 mmol/L) and sodium thiosulfate(100 mmol/L).
2. Prepare a 1:1 solution of the above reagents andimmerse the excised spots in this newly pre-pared solution.
3. Once the dark stain has been removed, wash thespot with water.
4. Equilibrate the excised spot in ammoniumbicarbonate (200 mmol/L) for 15 minutes,remove supernatant and replace with a secondaliquot of ammonium bicarbonate and leavefor 15 minutes.
5.The gel plug is now ready for digestion.
Volume used depends on thesize of the excised gel plug.

389
Step 10: Protein Digestion
10.1In-gel Digestion
Perform the reduction and alkylation step prior to digestion. Remem-ber to use the same alkylation reagent as was used between the firstand second dimensions of 2-D electrophoresis.
1. Reduction. Add 10 mL of dithiothreitol solution(5 mmol/L in 25 mmol/L ammonium bicarbo-nate) to the gel plug (or sufficient to cover thegel piece) and incubate for 30 minutes at 60 �C.
2. Alkylation. Add 10 mL of iodoacetamide(55 mmol/L in 25mmol/L ammonium bicarbo-nate) to the gel plug and stand at room tempera-ture for 30 minutes in the dark.
3. Remove the supernatant, wash with ammo-nium bicarbonate (25 mmol/L), remove super-natant and wash with acetonitrile.
4. Take the excised gel plug and cut into smallerpieces with the scalpel (2–4 mm2). Press downon the gel plug with the surgical needle holdingthe gel plug in place; allowing the cutting of theplug. Transfer the gel plug pieces to the rinsedEppendorf tube.
5. Dehydration step. Dehydrate gel plug with acet-onitrile (3�25 mL, 10 minutes each). The gelplug will begin to look white, after three washesit will be completely white.
6. Dry plug further in a speed vac or drying cham-ber, until gel plug appears “dust like.”
7. Rehydration step. Apply enzyme in buffer(10 mL at 40 ng/mL in 50 mmol/L ammoniumbicarbonate) to the dried gel plug and incubateon ice for 45 minutes.
Proteomics in Practice. A Guide to Successful Experimental Design 2nd Ed.Reiner Westermeier, Tom Naven, and Hans-Rudolf HçpkerCopyright � 2008 WILEY-VCH Verlag GmbH & Co. KGaA, WeinheimISBN: 978-3-527-31941-1

Step 10: Protein Digestion390
8. Digestion. After 45 minutes remove superna-tant and add enough buffer solution (withoutenzyme) to cover the hydrated gel piece.
9. Incubate at 30 �C, for between 1 hour and over-night (a preliminary peptide mass fingerprintcan be obtained after 1 hour by sampling fromthe digestion mixture).
10. Extraction step. Add 20 mL of 50 mmol/Lammonium bicarbonate and sonicate for10 minutes. Add 20 mL of acetonitrile : 5% TFA(1:1) and sonicate for 10 minutes. Removesupernatant and dispense into a separate tube.
11. Add 20 mL of acetonitrile : 5% TFA (1:1) andsonicate for 10 minutes. Combine supernatantextracts. Repeat one further time.
12. Add 10 mL acetonitrile and sonicate. Removeand combine with earlier supernatant extracts.
10.2Non-gel Digestion
Two methods can be considered.A. Split the sample in to two fractions, 4% CHAPS-soluble and 4%
CHAPS insoluble. The samples can then prepared according to thefollowing procedure:
1. Dissolve approximately 1 mg of protein in 1 mLof 9 M urea with 50 mmol/L DTT, and thenincubate for 60 min at 20 �C.
2. Add 1 mL of 8 M urea, 250 mM TrisHCl, pH8.8, and 125 mM iodoacetamide, and then incu-bate for 60 min at 20 �C.
3. Buffer exchange 1 mL of the mixture with20 mmol/L ammonium bicarbonate, pH 7.8, ona NAP-10 desalting column.
4. Digest the desalted protein sample with trypsin(concentration ratio of 50:1) for 2 h at 37 �C.
5. Inactivate the trypsin by adding formic acid tothe sample.

10.2 Non-gel Digestion 391
B. Alternatively:1. Denature sample by dissolve it in 0.5 mL
8 mol/L (GUA-HCl) 50 mM ammonium bicar-bonate,
2. Reduce by adding 20 mL 0.8 M PlusOne DTT(10 min at 37 �C) and alkylate with 25 mL0.5 mol/L iodoacetic acid (10 min at 37 �C).
3. Exchange the buffer to 50 mM ammoniumbicarbonate on NAP-5 desalting columns anddigest using Ettan Trypsin sequencing grade, atpH 8.4 for12 h at 37 �C.

393
Step 11: Microscale Desalting andConcentrating of Sample
The sample preparation for MALDI (and ESI) is a crucial step. Theanalyte must be incorporated into the matrix crystals, a process thatis significantly upset by the presence of contaminating salts and buf-fers (see table 1 for MALDI salt/buffer compatibility). Sample pre-paration can be tailored to a particular matrix. For instance a-cyano-4-hydroxycinnamic acid is insoluble in water. Sampling directly fromthe digestion mixture, the analyte solution can be spotted onto a pre-formed thin layer of matrix on the MALDI target (thin film method).Once the dried spot has formed, the spot can undergo significantwashing with 0.1% TFA solution on the target surface, removing thesalt contamination. As the analyte has been incorporated into thematrix crystal, it is preferably bound during the washing step (Vormet al. 1994). Addition of nitrocellulose to the matrix solution allowsfor improved desalting and improved binding on the MALDI target(Shevchenko et al. 1996).In contrast, 2,5-dihydroxybenzoic acid is a water soluble matrix. It
is possible to sample directly from the digest mixture without anysample clean up (on target washing is not applicable) as the matrixexcludes the contaminants from the crystallization processHowever if sampling from the digest mixture is not applicable (or
if this approach is not attractive) then the peptides are extracted asdetailed in the section above. However, the combined extract volume(~100 mL) may be too dilute for successful analysis of the peptide mix-ture; in these instances the sample must be concentrated prior to ana-lysis. Discussed earlier, simply concentrating the sample will concen-trate all the contaminants as well, hence a clean up step is recom-mended. Kussman et al. (1997) described the use of microscale purifi-cation columns using RP resin.
Proteomics in Practice. A Guide to Successful Experimental Design 2nd Ed.Reiner Westermeier, Tom Naven, and Hans-Rudolf HçpkerCopyright � 2008 WILEY-VCH Verlag GmbH & Co. KGaA, WeinheimISBN: 978-3-527-31941-1
Kussman et al. J Mass Spec-trom 32 (1997) 593-601.

Step 11: Microscale Desalting and Concentrating of Sample394
Tab. 11.1: Salt/buffer compatibility with MALDI analysis.
Type of impurity Concentration
Phosphate buffers <20 mmol/L
Tris buffer <50 mmol/L
Detergents <0.1%
Alkali metal salts <1 mol/L
Guanidine <1 mol/L
Ammonium bicarbonate <30 mmol/L
Glycerol To be avoided
SDS To be avoided
Sodium azide To be avoided
Microscale Desalting and Concentration1. Take a gel-loader pipette tip and very carefully
pinch the tapered lower end of the tip with apair of flat armed tweezers.
2. Prepare a suspension of reversed phase resin inmethanol.
3. Add 50 mL of methanol to the pipette tip, fol-lowed by 2–3 mL of the suspension.
4. A pipette can then be used to gently push themethanol though the column. The RP resinforms a small column at the end of the tip.
5. Equilibrate the column with 0.1% TFA (20 mL).6. At this stage ensure the acetonitrile concentra-
tion of the peptide extracts is sufficiently low toallow good retention of the peptides on the col-umn. Hence dry the peptide extracts to avolume of approximately 10 mL.
7. Further improve the retention of the peptidemixture by acidifying the mixture with hepta-fluorobutyric acid (HFBA). Add 9 mL of waterand 1 mL of HFBA to the semi-dried peptideextracts, creating a 55% concentration (v:v) ofHFBA.
8. Load the acidified peptide extracts onto the col-umn using a pipette. Gently push through thesolution with a pipette. Apply the eluate back tothe column; repeat five times to improve reten-tion of the peptides.
Prevents the packing frombeing eluted during preparationand use.
Complete drying or lyophiliza-tion not recommended, exten-sive sample loss.
Heptafluorobutyric acid is avery hydrophobic ion-pairingreagent and will make thedigested peptides “very sticky”improving there retention on areversed phase C18 column.

Step 11: Microscale Desalting and Concentrating of Sample 395
9. Wash the column with 0.1%TFA (20 mL).10. Elute peptides with 3–5 mL of MeCN: 0.5% for-
mic acid (1:1, v:v).
Alternatively, these columns are available commercially (ZipTipTM).Follow the manufacturers instructions, which are similar to theabove.

397
Step 12: Chemical Derivatization of the Peptide Digest
12.1Guanidation and Sulfonation of the Peptide Digest
This method (Keough et al. 1999; 2000a 2000b) describes the proce-dure for the guanidation of lysine residues and the subsequent sulfo-nation of the a-amino group at the N-terminus of peptides in thedigest mixture. The sulfonation reagent, 2-chlorosulfonyl acetylchlor-ide is highly hygroscopic and strenuous precautions must be made toensure that water (including moisture in the atmosphere) is absentfrom the reagents and reaction vessel.
1. Take combined peptide extracts and concentratein a speed vac to a volume of 20 mL.
2. Guanidate the lysine side chain. Mix 2mL O-methylisoureahydrogen sulfate solution (86mg/mL MilliQ H2O) with 8 mL 0.25 mol/LNaHCO3, pH 11.5 and add to digest. Place it inthe oven at 37 �C for 2h. (The reaction can alsobe performed at room temperature overnight orat 70 �C for 10 minutes).
3. Remove reagents using a reversed phase micro-scale desalting and concentration column asdescribed in Step 9 above, elute peptide digestand evaporate solvent to dryness.
4. Reconstitute in 10 mLTHF:DIEA 19:1.5. Add 2 mL sulfonation reagent (2 mL neat mate-
rial in 1 mLTHF)6. React for 1–2 min. at room temperature.7. Dry completely to remove organics and excess
base.8. Reconstitute in 5–10 mL of 0.1% TFA.9. Apply to MS target as described in Step 11. 2,5
DHB is the preferred matrix of choice, thougha-cyano 4 hydroxy cinnamic acid can be used.
Proteomics in Practice. A Guide to Successful Experimental Design 2nd Ed.Reiner Westermeier, Tom Naven, and Hans-Rudolf HçpkerCopyright � 2008 WILEY-VCH Verlag GmbH & Co. KGaA, WeinheimISBN: 978-3-527-31941-1

Step 12: Chemical Derivatization of the Peptide Digest398
12.2Sulfonation of the Peptide Digest Using CAF Chemistry
This method describes sulfonation of the a-amino group at the n-ter-minus of peptides in the digest using a novel, modified water-stablereagent. Steps 2 and 3 can be omitted if guanidation of the lysinegroups in the peptide digest is not favored.
1. Apply peptide digest extracts to a reversed phasemicroscale desalting and concentration columnas described in Step 9 and dry down extract to aminimal volume. Alternatively the peptide canbe dried down to a minimal volume and pro-ceed from step 2 (or step 4 if the guanidationstep is to be omitted).
2. Reconstitute peptide digest in the guanidationreagent [mix 2 mL O-methylisoureahydrogensulfate solution (86 mg/mL MilliQ H2O) with8 mL 0.25 mol/L NaHCO3, pH 11.5].
3. Place it in 37 �C for 2 h. (The reaction can alsobe performed at room temperature overnight orat 70 �C for 10 minutes)
4. Prepare fresh reagent. Dissolve the CAF reagentin 0.25 M NaHCO3, pH 9.4 (10mg/100 mL).
5. Apply 10 mL of the CAF-reagent solution to thesample and leave for 15 minutes.
6. Add 1 mL 50% hydroxylamine solution. Reversestyrosine modifications at the hydroxyl group.
7. Add 8 mL water and 1 mL HFBA to the digestsolution and apply to a reversed phase C18 col-umn as described in section Step 9
8. Elute derivatized peptides in aceonitrile: 0.5%formic acid (1:1, v:v) 1–5 mL
9. Apply to the MALDI target as described inSection 13.1.

399
Step 13: MS Analysis
13.1Sample Preparation for MALDI
Three matrices are generally used for peptide and protein analysis. Avariety of methods have been described, particularly for the use ofa-cyano-4-hydroxy-cinnamic acid for peptide analysis. Notably, Vormet al. described the thin film method and Jensen et al. 1996 incorpo-rated nitrocellulose into a similar method for improved performance.This section will describe the dried droplet method, probably firstchoice for most applications for each of the three matrices concerned.It is important in each case to keep the size of the target spot as smallas possible. Remember the width of the laser beam is very narrow(~20 microns) and as such the majority of the sample will not beablated with the laser from a large sample spot.
& Do not use non-volatile solvents (e.g. glycerol,polyethyleneglycol, DMSO, Triton X or2-mercaptoethanol) with this method.
13.2a-Cyano-4-hydroxy-cinnamic acid. Analysis of Peptides and PeptideDigests
1. Prepare a fresh solution of a-cyano-4-hydroxy-cinnamic acid in acetonitrile:0.1 %TFA (1:1, v:v;10 mg/mL). Prepare a fresh solution of matrixwherever possible.
2. Take 0.2–0.5 mL matrix and mix with 0.2–0.5 mLof sample. Mix thoroughly by uptaking and dis-placing the volume from a pipette several times.For reproducible analysis, thorough mixing ofthe matrix and analyte is necessary.
Proteomics in Practice. A Guide to Successful Experimental Design 2nd Ed.Reiner Westermeier, Tom Naven, and Hans-Rudolf HçpkerCopyright � 2008 WILEY-VCH Verlag GmbH & Co. KGaA, WeinheimISBN: 978-3-527-31941-1
Vorm O, Roepstorff P, MannM. Anal Chem 66 (1994)3281-3287.
Jensen ON, Podtelejnikov A,Mann M. Rapid CommunMass Spectrom 10 (1996)1371–1378.
Loading the sample in highorganic content (high methanolor acetonitrile causes thedroplet to spread uncontrollablyacross the target surface.
It is important to keep the pHof the matrix solution below pH4, using 0.1% TFA maintainsand ensures this.
If the analyte concentration issufficiently large then 1–2 mLcan be mixed with several mL ofmatrix and subsequentlyvortexed before applying to thetarget.

Step 13: MS Analysis400
3. Apply to the target and leave to dry at room tem-perature.
4. Insert target into mass spectrometer.
13.32,5 Dihydroxybenzoic Acid. Analysis of Peptide Digests
1. Prepare a solution of 2,5-dihydroxybenzoic acidin 0.1% TFA (10mg/mL).
2. Take 0.2–0.5 mL matrix and mix with 0.2–0.5 mLof sample. Mix thoroughly by uptaking and dis-placing the volume from a pipette several times.For reproducible analysis, thorough mixing ofthe matrix and analyte is necessary.
3. Apply to the target and leave to dry.4. Insert target into mass spectrometer.
2,5-Dihydroxybenzoic acid is commonly used for the analysis of oligo-saccharides released from glycoproteins, the above method can be fol-lowed by the analysis of oligosaccharides.
Tip – oligosaccharide analysis Since 2,5-DHB forms long needle-likecrystals, homogeneity of the sample can be increased by redissolvingthe dried matrix-sample with ethanol. Apply 0.1 mL of ethanol to thedried spot.
13.4Sinapinic Acid. Analysis of Proteins
1. Prepare a solution of sinapinic acid in acetoni-trile and 0.1% TFA (60:40, v:v; 10mg/mL).
2. Take 0.2–0.5 mL matrix and mix with 0.2–0.5 mLof sample. Mix thoroughly by uptaking and dis-placing the volume from a pipette several times.For reproducible analysis, thorough mixing ofthe matrix and analyte is necessary.
3. Apply to the target and leave to dry.4. Insert target into mass spectrometer.
Do not heat the sample targetto speed up drying process(place on a hot plate).
The concentration of acetoni-trile can be increased up to30%.
Dried droplets are quite stable;they can be kept in a drawer orin vacuum for days.

13.5 Sample Preparation for ESI MS 401
13.5Sample Preparation for ESI MS
Nanospray In electrospray mass spectrometry the presence of salts,involatile buffers and polymeric material in a sample is often detri-mental to the analysis. High amount of salts often result in partial orcomplete blocking of the needle orifice resulting with, at best, anintermittent and instable spray. Subsequently, sensitivity is reducedand the spectrum can be complicated with salt adducts. The ingredi-ents in a protein digest reaction, salts and possibly detergents, arepresent in millimolar amounts and they have to be removed beforeanalysis. As with MALDI analysis, a microscale desalting and concen-tration step often eliminates this problem and at the same timeallows a concentration of the analyte(s).A microscale desalting and purification column is prepared as
explained in step 9. Peptides are eluted into the nanospray needleusing 50% methanol:0.5% formic acid, or eluted into a sample tubeand pipetted into a nanospray needle.
LC-MS/MS Following the in-gel digestion step redissolve the digestextract in 5 mL water. (Optional, 0.5 mL can be used for MALDI MSanalysis). The remaining 4.5 mL is mixed with 4.5 mL of a 0.1% aqu-eous formic acid solution for subsequent ESI LC-MS/MS analysis.The remainder of the digest extract solution can be loaded on an auto-sampler, from which 5 mL are injected into a nano-HPLC (or alterna-tively manually injected). Separation is typically performed using a75 mm � 150 mm silica C18 (3 mm particle size) PepMap column(LCPackings, Amsterdam, The Netherlands) with 0.1% formic acid inwater as solvent A and 0.08% formic acid in 80% acetonitrile / 20%water as solvent B by starting after equilibration with 5% solvent Blinearly increasing it to 40% within 32 min using a flow rate of200 nL/min. The nano-HPLC is directly coupled to a tandem massspectrometer equipped with electrospray ionization. This methodwas supplied by Dr Rainer Cramer, Ludwig Institute for CancerResearch.
A microscale desalting andconcentration may be lesssuccessful for removing deter-gents.

403
Step 14: Calibration of MALDI-ToF MS
The MALDI peptide mass fingerprint can be calibrated internally orexternally.
14.1Internal Calibration for Peptide Analysis
Trypsin autolysis during the digestion of the target protein(s) can bevery useful for calibration purposes. However, it is important to knowwhich species the trypsin is derived from, porcine or bovine. It is for-tunate that the two major porcine trypsin autolysis peaks present inthe peptide mass fingerprint actually bracket the majority of the massrange of interest. The internal calibration procedure will be depen-dent on the MS in use, but the suggested two peptides to use are:
Trypsin II 842.509 [M+H]+
Trypsin IV 2211.104 [M+H]+
Both of these molecular weights are the monoisotopic C12 isotope,protonated form of each peptide. Other porcine trypsin autolysispeaks observed in a MALDI PMF include 515.32, 1045.56, 2283.17,and 2299.17 (2283.17 with oxidized Met).Using an internal calibration, high-mass accuracy is achievable
(sub 25 ppm).The expected peptides from a theoretical trypsin digest of porcine
and bovine trypsin are listed in Tables 14.1 and 14.2.
Proteomics in Practice. A Guide to Successful Experimental Design 2nd Ed.Reiner Westermeier, Tom Naven, and Hans-Rudolf HçpkerCopyright � 2008 WILEY-VCH Verlag GmbH & Co. KGaA, WeinheimISBN: 978-3-527-31941-1

Step 14: Calibration of MALDI-ToF MS404
Tab. 14.1: Theoretical tryptic peptides of porcine trypsin, TRYP_PIG(protonated monoisotopic 12C mass, unprotonated average mass).
Position in
sequence
Monoisotopic
mass [M+H]+Average
mass [M]+Sequence
52–53 262.14 261.28 SR
54–57 515.32 514.63 IQVR
108–115 842.50 842.01 VATVSLPR
209–216 906.50 906.05 NKPGVYTK
148–157 1006.48 1006.15 APVLSDSSCK
98–107 1045.56 1045.16 LSSPATLNSR
134–147 1469.72 1469.68 SSGSSYPSLLQCLK
217–231 1736.84 1736.97 VCNYVNWIQQTIAAN
116–133 1768.79 1768.99 SCAAAGTECLISGWGNTK
158–178 2158.02 2158.48 SSYPGQITGNMICVGFLEGGK
58–77 2211.10 2211.42 LGEHNIDVLEGNEQFINAAK
78–97 2283.17 2283.63 IITHPNFNGNTLDNDIMLIK
179–208 3013.32 3014.33 DSCQGDSGG...SWGYGCAQK
9–51 4475.09 4477.04 IVGGYTCAA...VVSAAHCYK
9–51 4489.11 4491.07 IVGGYTCAA...VVSAAHCYK
Tab. 14.2: Theoretical tryptic peptides of bovine trypsin, TRY1_BOVIN(protonated monoisotopic 12C mass, unprotonated average mass).
Position in
sequence
Monoisotopic
mass [M+H]+Average
mass [M]+Sequence
110–111 260.19 259.35 LK
157–159 363.20 362.49 CLK
238–243 633.31 632.67 QTIASN
64–69 659.38 658.76 SGIQVR
112–119 805.41 804.86 SAASLNSR
221–228 906.50 906.05 NKPGVYTK
160–169 1020.50 1020.17 APILSDSSCK
229–228 1111.55 1111.33 VCNYVSWIK
146–156 1153.57 1153.25 SSGTSYPDVLK
207–220 1433.71 1433.65 LQGIVSWGSGCAQK
191–206 1495.61 1495.61 DSCQGDSGGPVVCSGK
70–89 2163.05 2163.33 LGEDNINVVEGNEQFISASK
170–190 2193.99 2194.47 SAYPGQITSNMFCAGYLEGGK
90–109 2273.15 2273.60 SIVHPSYNSNTLNNDIMLIK
120–145 2552.24 2552.91 VASISLPTS...LISGWGNTK
21–63 4551.12 4553.14 IVGGYTCGA...VVSAAHCYK
Obtained with permissionfrom: www.matrixscience.com.
Obtained with permissionfrom: www.matrixscience.com.

14.2 External Calibration for Peptide Analysis 405
The practice of adding synthetic peptides to the peptide digest toperform an internal calibration is not recommended for two reasons.First, it is difficult to estimate the concentration of calibrants to add;too high concentration may suppress the ionization of the peptides ofinterest. Second, the calibrants may co-incide with peptides of inter-est, therefore precluding these peptides from the subsequent data-base search.
14.2External Calibration for Peptide Analysis
When one or both of the autolysis peaks are absent from the spec-trum, an external calibration has to be performed. This is normallyachieved by calibrating a spectrum acquired from the sample spotadjacent to the sample spot whose spectrum needs to be calibrated.Hence it is often useful to have a calibration sample alongside eachsample, or at least every two samples. Hence an internal calibration isperformed on the calibration mixture, the calibration file saved andthen applied to the spectrum of interest (the procedure will dependupon the MS instrument used). This is a useful fallback method incase successive spectra cannot be calibrated internally from the tryp-sin autolysis peaks.As opposed to the internal calibration where only two autolysis
peaks act are used as the calibrants, the external calibration mixturecan contain several calibrants defining the calibration curve more effi-ciently. A table of potential calibrants is listed below.
Tab. 14.3: Suggested peptides for use in an external calibration mixture(All molecular weights are 12C monoisotopic values).
Peptide Monoisotopic mass [M+H]+
Angiotensin I 1296.678
Angiotensin II 1046.535
Substance P 1347.728
[Glu]-fibrinogen b 1570.670
Renin substrate 1759.932
Apamin 2026.887
HACTH clip 18–39 2465.188
HACTH clip 7–38 3657.922
& Each combination of instrument mode (detectionmode (linear/reflectron), accelerating potential)needs individual calibrations.
Obviously a calibration fileobtained from the internal cali-bration using both trypsin auto-lysis peaks can be applied tothe spectrum acquired from anadjacent spot, without havingto use a calibration mixturesuch as this.

407
Step 15: Preparing for a Database Search
This section describes the function of each category observed on acommonly used search engine web browser for peptide mass finger-printing and peptide sequence analysis.
15.1Number of Missed Cleavages
The number to be input is dependent on the efficiency of the diges-tion. If the digestion is ideal then the enzyme cleaves at the correctsite every time, affording the highest discrimination. However,enzymes rarely act in such an ideal fashion and partial peptides canbe observed in the peptide mass fingerprint. Typically, one missedcleavage is selected as this. Selecting a higher number than this canreduce discrimination, as the experimental peptide mass list will besearched against more theoretical peptides.
15.2Choice of Cleavage Agent
Table 1.8 in Section 1.7.2.1 lists a range of enzymes available for pro-teolytic digestion. However, not all of the listed enzymes are suitablefor subsequent protein ID. Enzymes with low specificity, particularlythose generating small peptides should be avoided. Trypsin is themost commonly used enzyme as it yields peptides across a suitablemass range, relatively high specificity and locates the basic residuesat the c-terminus of the peptide. This is useful for subsequent MSand MS/MS analysis.
Proteomics in Practice. A Guide to Successful Experimental Design 2nd Ed.Reiner Westermeier, Tom Naven, and Hans-Rudolf HçpkerCopyright � 2008 WILEY-VCH Verlag GmbH & Co. KGaA, WeinheimISBN: 978-3-527-31941-1

Step 15: Preparing for a Database Search408
15.2.1Choice of Amino Acid Modification
Proteins can be modified as a result of cellular processes, specificallypost-translational modications; a sample preparation, includingmethionine oxidation and/or directly as part of an analytical methodsuch as the reduction and alkylation of cysteine residues.These modifications can be regarded as complete or partial for a
database search. For instance, if there is uncertainty about the quanti-tative modification of a particular residue, or whether a modificationof a particular residue exists at all then the partial modification optioncan be used. In this instance, the search engine uses the masses ofboth the native amino acid and the modified amino acid in thesearch. For example, when a protein is applied to the second dimen-sion the methionine residues present in the protein are prone to oxi-dation due to the conditions of electrophoresis. Oxidation of amethionine residue results in a mass increase of 16 Da (nominalmass). Therefore, selecting a partial modification of the methionineenables both forms to be identified if they are present.Second, if all cysteine disulfide bonds were quantitatively reduced
and the resulting cysteine residues alkylated with iodoacetamide priorto the second dimension, and the procedure repeated prior to in gel-digestion then theoretically all cysteine amino acids will now have amass of 160 Da and not 103 Da (nominal mass). For a databasesearch, the search engine requires this information if it is to correctlyidentify any cysteine containing peptides.It is very difficult to predict the presence of post-translational mod-
ifications. A particular example is phosphorylation. It would beunwise to simply use a partial phosphorylation calculation on all thepotential residues.
15.3Peptide Mass Fingerprint
This is where the masses from the PMF are manually inputted. Atrypsin digestion yields useful peptides in the 800–3500 Da massrange. Select peptides that fall within this mass range. Using massesmuch below this range is unadvisable as they be matrix related or toosmall to be significant in the search. Further, Fenyo et al. (1998)demonstrated that a high mass peptide was useful for constrainingthe database. The number of peptides submitted to the search shouldalso be considered. Too many peptides can be as problematic as toofew peptides (see Figure 3.16 in Section 3.3.3). Peptide masses whichcannot be matched with the correct protein contribute to the num-

15.6 Error Tolerance 409
bers of random matches, and it is possible that proteins with a num-ber of random matches may achieve a significantly high score.
15.4Charge State
In the case of MALDI all the peptides are singly charged. The choiceis to input the protonated form, the measured mass given in the spec-trum, or the deprotonated form of the peptide. It is important thatwhatever option is chosen, it matches the masses used in the masslist. If these two pieces of information are different then there is a 1-Da discrepancy, and this trivializes the performance of the instru-ment and significantly reduces the discrimination of the databasesearch.
15.5Monoisotopic Mass or Average Mass
It is important to select whether the peptide masses are the monoiso-topic or average masses. If the incorrect option is selected then thepeptide masses have an error of 1 Da, again trivializing the perfor-mance of the instrument and significantly reducing the discrimina-tion of the database search.
15.6Error Tolerance
This option will determine the stringency of the database search andwill be dependant on the mass accuracy of masses measured withinthe peptide mass fingerprint. Choose an error tolerance (ppm value)that allows all the peptides in your peptide mass fingerprint to beincluded in the search.If the error tolerance is too stringent then a peptide mass measure
to a greater error than the tolerance limit contributes nothing towardsthe score, even though it may be a peptide from the protein of inter-est. However, if the error tolerance is too lenient then the number ofspurious matches also increases, reducing the specificity.

Step 15: Preparing for a Database Search410
& Hint: If a 100 ppm error tolerance is selectedthen a window of 100 ppm will be applied to allthe theoretical masses in the database, only theexperimental masses which have an error100 ppm or less will have be accepted by thesearch.
Extra information Any additional information may help to constrainthe search, enhancing the discrimination. Thus molecular weightand pI may be important. It may be useful to remember though thatmany proteins may be post-translationally modified or alternativelyspliced, altering the mass and/or the pI.
15.7Taxonomy
If the origin of the sample is known then the search can be limited tothat particular species or groups of species. This is useful for fullysequenced and well characterized genomes. However if the species isnot fully sequenced then it may well be useful not to restrict thesearch engine to just search against this species. For instance if thespecies of origin is mouse, it may also be advantageous to also searchagainst rat and human; a homologous protein may be matched.

411
Part III
Trouble Shooting
Proteomics in Practice. A Guide to Successful Experimental Design 2nd Ed.Reiner Westermeier, Tom Naven, and Hans-Rudolf HçpkerCopyright � 2008 WILEY-VCH Verlag GmbH & Co. KGaA, WeinheimISBN: 978-3-527-31941-1

Additional trouble shooting guides for 2-D electrophoresis are foundin: GE Healthcare Handbook: 2-D Electrophoresis. Principles andMethods. GE Healthcare Life Sciences (2005); 80-6429-60.
Trouble shooting guides for one-dimensional electrophoresis andblotting are found in: Westermeier R. Electrophoresis in Practice, 4thedition. Wiley-VCH, Weinheim (2004).
1.1Sample Preparation
Symptom Cause Remedy
Cleanup based onprecipitation: pelletcannot be seen aftercentrifugation.
A small protein pellet isnot always easy to see.
Always follow theinstruction stringentlyincluding the directionof the hinges during cen-trifugation.
Cleanup based onprecipitation: pellet doesnot go back into solutionduring resolubilization.
Vortexing has been per-formed.
Do not vortex! Follow thehints in Part II, Chapter1: Sample preparation.
Quantification: the sig-nal is drifting.
Color reaction influ-enced by timing.
Follow a well organizedtime schedule, as indi-cated in the instruction.
413
1
Two-dimensional Electrophoresis
Proteomics in Practice. A Guide to Successful Experimental Design 2nd Ed.Reiner Westermeier, Tom Naven, and Hans-Rudolf HçpkerCopyright � 2008 WILEY-VCH Verlag GmbH & Co. KGaA, WeinheimISBN: 978-3-527-31941-1
Including images of bad gels.

1.2Isoelectric focusing in IPG strips
Symptom Cause Remedy
Rehydration solution isdistributed unevenlywithin the gel strip.
Some coating in the stripholder or reswelling tray.
Wash strip holder andreswelling tray withdetergent, rinse with de-ionized water.
Uneven pipetting of therehydration solution.
Pipette the solution asan even streak.
Reswelling tray or IPG-phor not leveled.
Adjust the level of thereswelling tray or theIPGphor on the bench.
Rehydration liquid is leftin the reswelling tray orstrip holder.
Rehydration time tooshort.
Rehydrate at least for 6hours without and 12hours with sample.
Liquid volume too high. Follow the recommenda-tions on the package.
IPG strips improperlystored.
Always store IPG stripsin the freezer, do notleave them on the benchat room temperature fortoo long a time.
Basic part of the gelcomes off during rehy-dration.
Surface has been dam-aged during removal ofcover film.
Always start at the acidicside to remove the coverfilm.
Voltage too low (8 kV or10 kV not reached).
Short strips (7 cm and11 cm) are used, 8 kV isreached in those stripsonly with some samplesunder exceptional condi-tions.
Nothing to worry about.
Poor quality of urea and/or thiourea.
Use high quality ureaand thiourea; removeions with a mixed bedion exchanger.
Trouble Shooting414

Symptom Cause Remedy
Too much salt in thesample.
Remove salts by micro-dialysis or precipitation;replace PBS for cellwashing with somethingnon-ionic like 250mmol/L sucrose/1mmol/LTris.
TCA left in the samplefrom precipitation.
Use 10% water/90% ace-tone for washing insteadof pure acetone.
Bromophenol blue bandstops and does notmigrate completely intothe anode.
Too much salt in thesample.
See above.
Strip starts to burn at acertain position.
Too much salt in thesample.
See above.
Visible brown banddevelops.
Tris-chloride in the sam-ple and rehydration solu-tion.
Run the sample in theManifold.
Cover fluid (paraffin oil)leaks out of the cup load-ing strip holder duringIEF.
High protein and saltload cause water trans-port that carries the oilwith it.
Reduce the initial voltageand prolong the firstlow-voltage steps. Or,alternatively use theManifold, which is moretolerant to high proteinand salt concentrations.
The basic part of thestrip swells during IEFand becomes mechani-cally unstable.
Many cations in the sam-ple, for instance Tris.
Avoid adding too muchTris-base, replace it byadding 25 mmol/L sper-mine base, treat the sam-ple with microdialysis;apply IEF strips soakedwith deionized water be-tween gel and electrodeto accommodate ions.
Urea crystallized andIPG strip dried duringIEF.
Not enough cover fluidused.
Use 3 mL cover fluid for18 cm and 24 cm stripholder and 105 mL forthe manifold.
Cover fluid has beenmoved around in thestrip and leaked out.
Reduce the initial voltageand prolong the firstlow-voltage steps.
1 Two-dimensional Electrophoresis 415

Symptom Cause Remedy
Running temperaturewas incorrect.
Set the rehydration andseparation temperatureto 20 �C.
1.3SDS PAGE
Symptom Cause Remedy
Gel casting with 14-gelmulticaster: formation ofa gap between gel andspacer on the side wherethe solution is intro-duced from the bottom.
Contraction of monomersolution during polymer-ization in the bottom res-ervoir.
Pour sufficient displa-cing solution in the bal-ance chamber to producethe thin blue layer in theentire area of the casterbottom.
Unequal gel levels in amulticaster.
Polymerization hasstarted before solutionshave been leveled outcompletely.
Pre-cool the monomersolution in the refrigera-tor.
Uneven or curved upperedge.
Improper overlay. Affini-ty of overlay solution tothe spacer material.
Spray 0.1% (w/v) SDSover the edges with aplant sprayer instead ofoverlaying water-saturat-ed butanol or isopropa-nol.
Casting gradient gels:curved upper edge.
Polymerization started atthe bottom, and causedthermal convection, anduneven contraction ofthe gel.
Make sure that the poly-merization starts at thetop by adding less cata-lyst to the dense solu-tion.
The gel becomes opaqueduring polymerization.
The cross-linking factoris too high.
Check the bisacrylamidecontent. Use ready-madeacrylamide/Bis solution.
Upper buffer tank isleaking.
Hydrostatic balance be-tween the buffers is notachieved.
Fill enough buffer intothe lower tank accordingto the instruction.
Migration of dye front istoo slow.
Poor quality of reagentsand water.
Make sure that you useonly high quality ofreagents, check thewater.
Trouble Shooting416

Symptom Cause Remedy
Upper buffer containschloride ions.
Do not titrate the run-ning buffer.
PPA buffer system:upper and lower bufferhave mixed because ofleakage of upper buffertank.
Fill enough buffer intothe lower tank accordingto the instruction. Donot overfill lower andupper chamber.
The dye front is notstraight in the begin-ning.
Uneven conductivityacross the IPG stripsoriginating from thefixed pH gradient.
Nothing to worry about.The dye front willbecome straight when itreaches about the middleof the cassette.
The dye front becomescurved during the run.
Current leakage in theready-made gel cassette.
Remove all excess bufferor water with the roller.Close the cassette prop-erly.
Irregular dye front. Poorly polymerized gels. Optimize catalystamounts and use highquality reagents.
Smiling effect because ofoverheating.
Use cooling during therun and/or reduce thepower setting.
1.4Staining
Symptom Cause Remedy
Background formed likea “sail” in the basic partof the gel.
Complexes between SDSand basic carrier ampho-lyte.
Increase fixing time ordestaining time. Tryalternative IPG buffer orcarrier ampholytes.
Silver staining: negativespots.
Dependent on structureof protein.
Stain briefly with Coo-massie blue first.
Silver staining: “donut"-shaped spots.
Happens with highlyabundant proteins.
Stain briefly with Coo-massie blue first.
Silver staining: darkbackground.
Silver nitrate reduced bysulfuric compounds, likesofteners.
Use glass or stainlesssteel trays only.
1 Two-dimensional Electrophoresis 417

Symptom Cause Remedy
Bad water quality. Check water with a fewdrops of silver nitrate so-lution before you use itfor silver staining.
Sypro Ruby, RuBPS, orDeep Purple staining:dye precipitates.
Not sufficiently washedgel or wrong tray mate-rial.
Wash the gels after stain-ing, use only dark poly-propylene containers.
1.5DIGE Fluorescence Labeling
Symptom Cause Remedy
The pH of the proteinlysate is less than pH 8prior to labeling.
The lysis of the cells hascaused a drop in the pH.
1. Increase the bufferingcapacity of your lysisbuffer to 40 mmol/LTris.2. Increase the pH of thelysis buffer by the addi-tion of a small volume of50 mmol/L NaOH. Oradd an equal volume ofthe lysis buffer that is atpH 9.5.
The cell wash buffer wasnot completely removedprior to addition of thelysis buffer.
The samples have beenstored or shipped on dryice, CO2 has diffusedinto the samples, createdcarbonic acid.
Seal reagent tubes verythoroughly with addingParafilm
�
between cupand cap, and placingthem into several layersof plastic bags in the dry-ice box.
The fluorescent signal isweak when scanned on a2D gel.
The dyes after reconstitu-tion have a fixed lifetimein DMF that may havebeen exceeded.
Check the expiry date onCyDye.
Trouble Shooting418

Symptom Cause Remedy
The DMF used to recon-stitute CyDye was ofpoor quality or has beenopened for longer than 3months.
Always use the 99.8%anhydrous DMF toreconstitute your CyDye.Breakdown products ofDMF include amineswhich compete with theprotein for the CyDyelabeling
CyDye has been exposedto light for long periodsof time.
Always store CyDye inthe dark.
CyDye has been left outof the –20 �C freezer fora long period of time.
Always store CyDye at–20� C and only removethem for short periods toremove a small aliquot.
The pH of the proteinlysate is less than pH 8.
Increase the pH of thelysis buffer by the addi-tion of a small volume of50 mmol/L NaOH. Oradd an equal volume ofthe lysis buffer that is atpH 9.5.
Insufficient mixing ofdye and protein sample.
Click fingers against thereaction tube duringlabeling from the firstmoment on.
Problems specifically with
minimal labeling (lysine
labeling).
The fluorescent signal isweak when scanned on a2D gel.
Primary amines such asPharmalytes or ampho-lytes are present in thelabeling reaction com-peting with the proteinfor CyDye.
Omit all exogenous pri-mary amines from thelabeling reaction.
1 Two-dimensional Electrophoresis 419

Symptom Cause Remedy
DTTor other substancessuch as SDS are presentin the labeling reactionat too high a concentra-tion.
Remove the substancesfrom the labeling reac-tion if not essential. Ifthey are essential test ifthe reduction in labelingefficiency can be coun-terbalanced by increas-ing CyDye concentra-tion.
The protein lysate con-centration is too low, i.e.less than 2 mg/mL.
Make a new batch of pro-tein lysate reducing thevolume of lysis buffer toincrease the protein con-centration. Or precipitatethe proteins and resus-pend them in a smallervolume of lysis buffer;check the pH and con-centration of the newsample before labeling.
Vertical streaks and/orvertical spot arraysmainly in the basic area.
Multiple lysine labelscaused by overlabeling,too high CyDye/proteinratio.
Reduce amount ofCyDye, increase amountof proteins, and improveprotein quantificationprocedure.
Problems specifically with
saturation labeling
(cysteine labeling)
Spots shifting in hori-zontal direction.
Overlabeling, too highlabel/cysteine ratio inthe particular sampletype.
Decrease amount ofreductant and CyDye forthis particular sampletype. Optimize proce-dure with same–sameexperiment.
Spots elongated in verti-cal direction and verticalstreaking.
Underlabeling, too lowlabel/cysteine ratio inthe particular sampletype.
Increase amount ofreductant and CyDye forthis particular sampletype. Optimize proce-dure with same–sameexperiment.
Trouble Shooting420

Symptom Cause Remedy
Dark fluorescent back-ground.
Too much Bind-Silaneapplied.
Work strictly accordingto the instruction andremove excess of Bind-Silane with lint-free tis-sue.
Many dust particles. Powder from gloves. Use only powder-freegloves.
Fluorescent streaks and/or areas not correlated tothe front.
Contaminations with theink of a pen.
Do not write on cassettesor casting box with apen, also not with awaterproof pen.
The IPG strips appearwith high background.
The cassette has beenscanned with the film-support of the IPG stripdown.
Apply the cassette withthe correct orientation,in spite of the possibilityof correcting the imagelater by flipping it withthe image analysis pro-gram.
1.6Results in 2-D Electrophoresis
Symptom Cause Remedy
No or very few spots. Low protein content. Check with reliablequantification method;check your entire proce-dure with a standard,like E. coli lyophylisate;try alternative sampleextraction procedure.
Proteins have formedcomplexes and did notmigrate into the gel.
Check sample prepara-tion procedure, applycleanup based on precip-itation.
1 Two-dimensional Electrophoresis 421

Symptom Cause Remedy
Problem(s) with silverstaining.
Check, whether all thesolutions have beenmade correctly, the timefor each step has beencorrect, and no step hasbeen forgotten. Do notuse plastic trays, butglass or stainless steel.
Horizontal line acrossthe gel a few cm belowthe upper edge with noor blurred protein spotsbetween the upper edgeand the line.
Depletion of glycine. Use 2� SDS Tris-glycinebuffer in the upper buff-er tank, fill enough buff-er into the upper bufferchamber
Missing protein spots inthe high molecularweight area.
High molecular weightproteins did not enterthe IPG strip.
Perform active rehydra-tion with 50 V applied tothe IPG strip for 12hours.
High molecular weightproteins formed aggre-gates in the first phase ofisoelectric focusing.
Apply “worst case condi-tions” during isoelectricfocusing, which meanslower starting voltagesover longer time periods.
Equilibration of IPGstrip was too short.
Increase equilibrationsteps to 2� 20 minutes
Equilibration of IPGstrips was not efficient.
Increase SDS concentra-tion in the equilibrationbuffer to 6% (w/v).
Poor transfer of proteinsfrom the IPG strips tothe SDS gel.
Prolong the proteintransfer phase at lowpower setting before youswitch to the separationconditions.
Missing proteins. Sample application onIPG strips was not opti-mized.
Try all alternatives, alsocup loading on differentsides.
Equilibration was notefficient enough.
Increase SDS content inequilibration buffer from2% to 6%.
422 Trouble Shooting

Symptom Cause Remedy
Vertical streaking. Dirty glass cassettes. Clean glass plates thor-oughly, touch them onlywith gloves.
Inefficient equilibrationof the IPG strip.
Equilibrate at least 2� 15minutes. Use iodoaceta-mide in the second equi-libration step.
Electroendosmoticeffects during first phaseof SDS electrophoresis.
Prolong the proteintransfer phase at lowpower or current settingbefore you switch to theseparation conditions.
Equilibration under oxi-dative conditions.
Equilibrate first for 15minutes in presence ofDTTand then 15 min-utes in presence ofiodoacetamide.
Spots elongated in thevertical direction.
Depletion of the upperbuffer, because of insuf-ficient volume.
Fill enough buffer intothe upper buffer cham-ber: 1.2 L into the EttanDALT 6 and 2.5 L intothe Ettan DALT 12.
Depletion of the upperbuffer
Use 2� SDS Tris-glycinebuffer in the upper buff-er chamber.
Poor quality of chemi-cals.
Use only high-qualitychemicals. In case ofdoubt try reagents froman alternative supplier.
High glycoprotein con-tent.
Use gradient gels andTris-borate in the catho-dal chamber instead ofTris-glycine.
Vertical streak andblurred pattern in theacidic area, whenthiourea was used in thefirst dimension.
Contaminated reagent. Try another batch ofthiourea.
4231 Two-dimensional Electrophoresis

Symptom Cause Remedy
Focusing of thiourea to-gether with some otherreagents.
Reduce the volt-hoursapplied to the IPG strip.Follow the instructionssupplied with the IPGstrips, sometimes apply-ing lower volt-hours.
Vertical perturbation inthe center of the gel, par-ticularly in gels cast closeto the back of the six-gelcaster.
Heat development in thesolution feeding channelduring polymerizationcauses local modifica-tions in gel structure.
Pre-cool the monomersolution in the refrigera-tor.
Blurred or twinnedspots.
Gel strengthener wasused, gel composition ismodified.
Be careful when usinggel strengtheners.
Vertical gap(s). Air bubbles between firstand second dimensiongel.
Place the IPG strip care-fully on the SDS gel andseal it carefully withagarose.
Amphoteric buffer in thecell culture, for instanceHEPES, occupies a partof the pH gradient.
Avoid amphoteric buf-fers.
Double spots in verticaldirection.
IPG strip not applied inthe correct way.
Plastic film has to be incontact with the glassplate.
Multiple spots in verticaldirection in preparativegels.
Insufficient DTTamount.
Increase amount of DTTduring the first equili-bration step.
Clouds of spots in thelowMr area.
Proteins partly digestedinto peptides.
Add protease inhibitorsduring protein extrac-tion; use cup loading,paper bridge loading, oractive rehydration load-ing under voltage. Treatthe sample with acleanup procedure basedon precipitation.
Horizontal streaking. Particles in the samplesolution.
Always centrifuge thesample before applica-tion on the IPG strip. Ifnecessary, prolong cen-trifugation.
424 Trouble Shooting

Symptom Cause Remedy
Underfocusing. Prolong the volt-hours inthe last IEF step.
Overfocusing: labile pro-teins are degrading attheir pI. This happensparticularly in the basicrange.
Shorten the volt-hours inthe last IEF step.
Urea and/or detergentconcentration too low.
Increase concentrationsof urea to 9 mol/L andCHAPS to 2% or 4%.
Wrong precipitation pro-cedure was applied.
Do not apply ammo-nium sulfate precipita-tion. Either use cleanupkit based on precipita-tion or apply the proce-dure according to Wes-sels and Fl�gge (1984)(methanol/chloroform).
Incomplete rehydrationof the IPG strip.
Check the rehydrationconditions.
TCA was not completelyremoved from pelletafter precipitationcleanup.
Add two or three wash-ing steps with ice-cold10% water/90% acetone.
Instability of some pro-teins because of wrongsample application.
Try alternatives, like cuploading at the acidic orbasic end of the IPGstrip.
Highly abundant pro-teins formed ridges andwere squeezed out, andthen became distributedover the surface.
Run IPG strips contain-ing highly abundant pro-teins only with gel sur-face up.
Horizontal streaking inthe acidic area.
Nucleic acids in the sam-ple.
Apply a cleanup proce-dure based on precipita-tion. Alternatively addbenzonase or DNAseand RNAse before add-ing the urea (andthiourea).
4251 Two-dimensional Electrophoresis

Symptom Cause Remedy
Horizontal streaking inthe basic area.
DTTdepletion in the ba-sic part of the gradient.
Pre-rehydrate the stripswith DeStreak solutionand apply reduced pro-teins via cup-loading onthe anodal side.
Samples prepared withDeStreak solution orreagent.
Never treat the samplewith DeStreak. Treatsamples with a reduc-tant. DeStreak is onlyused in the IPG strip,not in the sample.
DeStreak and reductanthas been mixed, result-ing in the formation of2-mercaptoethanol.
Never mix DeStreak anda reductant, see above.
Horizontal streaking inthe acidic area and thebasic areas with goodseparation in the center.
Salt content is too high. Treat the sample withmicrodialysis or cleanupwith precipitation.
Electroendosmosiseffects at the ends ofIPG strips. IPG stripshave not been embeddedwith agarose.
Always embed IPGstrips with agarose; thisequalizes the differencesof charged groups in theIPG strip.
Electroendosmosiseffects at the ends of nar-row interval IPG stripsbecause of accumulatedproteins of higher andlower pIs.
Place filter paper padssoaked in deionizedwater between electrodesand gel during the lastIEF step.
Horizontal streaking inthe center with good sep-aration in the acidic areaand the basic areas.
Uneven rehydration ofthe IPG strip, incom-plete rehydration in themiddle.
During rehydration ofthe strip, take care thatthe liquid is distributedevenly over the entirestrip length. Alterna-tively, use a vertical rehy-dration cassette for rehy-dration of IPG strips.
426 Trouble Shooting

Symptom Cause Remedy
Protein spots arrangedlike a string of beads inhorizontal direction.
Differential carbamyla-tion of some proteinsbecause of presence ofisocyanate.
Do not heat sample. Donot store urea andthiourea solutions atroom temperature. Useonly high quality ureaand thiourea. Removeionic compounds withmixed bed ion exchan-ger.
Storage proteins in plantseed extracts, differen-tially glycosylated.
No artifact. Nothing toworry about.
Cloudy background and/or front.
Micelles between SDSand the nonionic or zwit-terionic detergent haveformed.
Reduce content ofCHAPS or alternativedetergent in the rehydra-tion solution for the IPGstrip (e.g. maximum 2%CHAPS).
Blurred and streaky spotpattern in preparativegels.
Insufficient IEF condi-tions.
Prolong the volthours inthe last IEF step by 15%.
DTTdepletion in prepar-ative basic gels.
Add 2.5% DTT, 20% iso-propanol, 5% glycerol tothe rehydration solution,apply paper wick soakedin rehydration solutionplus 3.5% DTTat thecathode. Or applyDeStreak concept (seeabove).
Blurred spot pattern inready-made gels.
Liquid and/or bubblesbetween surface ofready-made gel and glassplate.
Use only low amount ofgel buffer and roll outexcess buffer and airbubbles completely.
Very basic proteins arelost.
Too many volt-hoursapplied on basic gradi-ents, autohydrolysis ofbasic buffering groupsin the gel.
Shorten the volt-hours inthe last IEF step. ApplypH 7–11 NL strip, thisone is stabilized againsthydrolysis.
4271 Two-dimensional Electrophoresis

Symptom Cause Remedy
,,Wrong” proteins com-ing from other organ-isms, which should notbe present, have beenidentified in the gel.
Contamination with pre-vious sample or proteinsfrom the laboratory envi-ronment.
Use only highly purereagents; clean equip-ment thoroughly, partic-ularly reswelling trayand strip holders for IPGstrips; filter solutionsthrough a membrane fil-ter.
428 Trouble Shooting

Symptom Cause Remedy
No signal in reflectronmode MALDI MS.
No accelerating voltage. Check read out fromelectronics gate.
Laser not firing. Contact supplier.
Laser not firing in cor-rect place.
Re-alignment of laser re-quired.
Laser power far too low. Increase laser power.
Potentially a detector oramplifier problem.
Check signal in linearmode.
Poor analyte signal. Insufficient protein pres-ent in gel plug for diges-tion.
Run a new gel with ahigher protein load.
Trypsin inactivity. Prepare trypsin fresh onice. Perform rehydrationstep on ice. Ensure cor-rect buffer for trypsinactivity.
Sample concentrationtoo low.
Use 0.1–10 pmol/mLfinal concentration.
Sample concentrationtoo high.
Sample signal may besuppressed. Dilute sam-ple to 0.1–10 pmol/mLfinal concentration.
Poor crystallization,presence of salt/buffer.
Use a higher concentra-tion on TFA (up to 1%)to improve ionization.Avoid phosphorylated/sulfated buffers.
4292 Mass Spectrometry
2
Mass Spectrometry

Symptom Cause Remedy
Poor crystallization,presence of salt/buffer.
Microscale purificationto remove contaminants.
Poor crystallization,presence of nonvolatilecontaminants.
Eliminate nonvolatilecomponents from sam-ple before analysis. Donot use nonvolatile com-ponents to solubilizesample.
Poor crystallization,presence of visualizationagent, i.e. CBB.
Destain gel plug prior todigestion.
Laser power below re-quired threshold.
Increase laser power.
Old matrix. Prepare fresh matrix.
Unsuitable matrix. See Table 3.1 for correctmatrix selection.
Known contaminants,keratin, dominate andsuppress analyte signal.
Address sample hand-ling prior to digestion.See Step 8, page 179 ff.
Poor digestion andextraction efficiency.
Improve digestion andextraction procedure.
Poor resolution acrossmass range of interest.
Pulse time and voltagenot optimized for massrange of interest.
See manufacturer’srecommendations.
Laser poor far abovethreshold level.
Reduce laser power tooptimal point.
Incorrect reflectron volt-age.
See manufacturer’srecommendations.
Poor mass accuracyacross mass range ofinterest.
Poor resolution, unableto select 12C peak of theisotopic envelope.
Improve resolution, seeabove.
Unable to calibrate, oneor both internal cali-brants absent.
Perform external calibra-tion. In worst case sce-nario, respot samplewith calibrants added tothe mixture.
Incorrectly calibrated. Check internal calibrantsand their masses.
430 Trouble Shooting

Symptom Cause Remedy
Unsuccessful or ambigu-ous protein ID fromPMF.
Insufficient peptides. Acquire more specificinformation; combinePMF with compositionor partial sequence.Acquire actual sequence.
Protein does not exist inthe database or lowhomology with otherproteins.
Acquire sequence datafrom product ion MS/MS or PSD experiments.
Sample is a mixture. Acquire more specificinformation.
Error tolerance too highdue to poor mass accu-racy.
Constrain the databasesearch by improvingmass accuracy.
Keratin contamination. Remove known keratinpeaks from mass list (seeStep 8) and repeatsearch.
Incorrect databasesearch settings.
Check settings: enzyme,error tolerance, fixed andpotential modifications,taxonomy, charge stateand mono-isotopic oraverage masses.
12C isotope not selectedfrom mass list.
Non-quantitative deriva-tization CAF.
Reagent not freshly pre-pared.
Always prepare reagentfreshly and use immedi-ately.
Residual ammoniumbicarbonate.
Perform a micro-scalepurification.
Incorrect ratio of reagentto sample.
Ensure reaction condi-tions.
Reaction pH not opti-mal.
Ensure correct reactionconditions.
Reaction pH not opti-mal.
Ensure correct reactionconditions.
4312 Mass Spectrometry

433
Aebersold R, Hood LE, Watts JD. Equipping Scientists for the New Biology. Na-ture BioTech 18 (2000) 359.
Alban A, David S, Bjçrkesten L, Andersson C, Sloge E, Lewis S, Currie I. A novelexperimental design for comparative two-dimensional gel analysis: Two-dimensional difference gel electrophoresis incorporating a pooled internalstandard. Proteomics 3 (2003) 36–44.
Altland K. IPGMAKER: A program for IBM-compatible personal computers tocreate and test recipes for immobilized pH gradients. Electrophoresis 11(1990) 140–147.
Anderson BL, Berry RW, Telser A. A sodium dodecyl sulfate-polyacrylamide gelelectrophoresis system that separates peptides and proteins in the molecularweight range of 2,500 to 90,000. Anal Biochem 132 (1983) 365–275.
Anderson L, Anderson NG. High resolution two-dimensional electrophoresis ofhuman plasma proteins. Proc Nat Acad Sci USA 74 (1977) 5421–5425.
Anderson NG, Anderson NL. Analytical techniques for cell fractions XXI. Two-dimensional analysis of serum and tissue proteins: multiple isoelectric focus-ing. Anal Biochem 85 (1978) 331–340.
Anderson NG, Anderson NL. Analytical techniques for cell fractions XXII. Two-dimensional analysis of serum and tissue proteins: multiple gradient-slabelectrophoresis. Anal Biochem 85 (1978) 341–354.
Anderson NG, Anderson NL, Tollaksen SL. Proteins of human urine. I. Concen-tration and analysis by two-dimensional electrophoresis. Clin Chem 25 (1979)1199–1210.
Anderson NG, Anderson NL. The human protein index. Clin Chem 28 (1982)739–748, 1210.
Anderson L, Seilhamer J.A Comparison of selected mRNA and protein abun-dances in human liver. Electrophoresis 18 (1997) 533–537.
Anderson NL, Anderson NG. Proteome and proteomics: new technologies, newconcepts and new words. Electrophoresis 19 (1998) 1853–1861.
Anderson NL, Anderson NG. The human plasma proteome. History, character,and diagnostic prospects. Mol Cell Proteomics 1 (2002) 845–867.
Anderson NL, Esquer-Blasco R, Hofmann J-P, Anderson NG. A two-dimensionalgel database of rat liver proteins useful in gene regulation and drug effectstudies. Electrophoresis 12 (1991) 907–930.
Anderson UN, Colburn AW, Makarov AA, Raptakis EN, Reynolds DJ, Derrick PJ,Davis SC, Hoffman AD, Thomson S. In-series combination of a magnetic-sec-tor mass spectrometer with a time-of-flight quadratic-field ion mirror. Rev SciInstrum 69 (1998) 1650–1660.
References
Proteomics in Practice. A Guide to Successful Experimental Design 2nd Ed.Reiner Westermeier, Tom Naven, and Hans-Rudolf HçpkerCopyright � 2008 WILEY-VCH Verlag GmbH & Co. KGaA, WeinheimISBN: 978-3-527-31941-1

References
Annan RS, Huddleston MJ, Verna R, Deshaies RJ, Carr SA; A multidimensionalelectrospray MS-based approach to phosphopeptide mapping. Anal Chem 73(2001) 393–404.
Apffel A. Multidimensional chromatography of intact proteins. In Simpson RJ,Ed. Purifying proteins for proteomics: A laboratory manual. Cold Spring Har-bor Laboratory Press, Cold Spring Harbor, New York (2003) pp. 75–100.
Arnold U, Ulbrich-Hofmann R. Quantitative protein precipitation from guani-dine hydrochloride-containing solutions by sodium deoxycholate/trichloroace-tic acid. Anal Biochem 271 (1999) 197–199.
Axelsson J, Boren M, Naven TJP, Fenyç D. Stringency in database searches forprotein identification: determining the level of mass error at which searchresults are incorrect. Proceedings of the 49th ASMS conference on mass spec-trometry and allied topics, Chicago (2001).
Baldwin MA, Medzihradszky KF, Lock CM, Fisher B, Settineri TA, BurlingameAL. Matrix-assisted laser desorption/ionisation coupled with quadrupole/or-thogonal acceleration time-of-flight mass spectrometry for protein discovery,identification and structural analysis. Anal Chem 73 (2001) 1707–1720.
Banks R. Dunn MJ, Forbes MA, Stanly A, Pappin DJ, Naven T, Gough M, Harn-den P, Selby PJ.The potential use of laser capture microdissection to selctivelyobtain distinct populations of cells for proteomic analysis. – preliminary find-ings. Electrophoresis 20 (1999) 689–700.
Barber M, Bordoli RS, Sedgwick RD, Tyler AN. Fast atom bombardment of sol-ids as an ion source in mass spectrometry. Nature 293 (1981) 270–271.
Barrett T, Gould HJ. Tissue and species specifity on non-histone chromatin pro-teins. Biochim Biophys Acta 294 (1973) 165–170.
Beausoleil SA, JedrychowskiM, SchwartzD, EliasJE, Vill�nJ, LiJ, CohnMA, Can-tleyLC, GygiSP. Large-scale characterization of HeLa cell nuclear phosphopro-teins. Proc Natl Acad Sci USA 101 (2004) 12130–12135.
Beavis, RC, Chait BT. Cinnamic acid derivatives as matrices for ultraviolet laserdesorption mass spectrometry of proteins; Rapid Commun Mass Spectrom 3(1989) 432–435.
Beavis RC, Chaudhary T, Chait BT; a-cyano-4-hydroxycinnamic acid as a matrixfor matrix assisted laser desorption mass spectrometry. Org Mass Spectrom27 (1992) 156–158.
Bell AW, Ward MA, Blackstock WP, Freeman HNM, Choudhary JS, Lewis AP,Chotai D, Fazel A, Gushue JN, Paiement J. Proteomics characterisation ofabundant Golgi membrane proteins. J Biol. Chem 276 (2001) 5152–5165.
Berggren KN, Schulenberg B, Lopez MF, Steinberg TH, Bogdanova A, SmejkalG, Wang A, Patton WF. An improved formulation of SYPRO Ruby protein gelstain: Comparison with the original formulation and with a ruthenium II tris(bathophenanthroline disulfonate) formulation. Proteomics 2 (2002) 486–498.
Bienvenut WV, Sanchez JC, Karmime A, Rouge V, Rose K, Binz PA, Hochstras-ser DF. Toward a clinical molecular scanner for proteome research: parallelprotein chemical processing before and during western blot. Anal Chem 71(1999) 4800–4807.
Bjellqvist B, Ek K, Righetti PG, Gianazza E, Gçrg A, Westermeier R, Postel W.Isoelectric focusing in immobilized pH gradients: principle, methodology,and some applications. J Biochem Biophys Methods 6 (1982) 317–339.
Bjellqvist B, Hughes GJ, Pasquali C, Paquet N, Ravier F, Sanchez J-C, Frutiger S,Hochstrasser D. The focusing positions of polypeptides in immobilized pHgradients can be predicted from their amino acid sequences. Electrophoresis14 (1993) 1023–1031.
434

References
Bjellqvist B, Sanchez J-C, Pasquali C, Ravier F, Paquet N, Frutiger S, Hughes GJ,Hochstrasser D. Micropreparative two-dimensional electrophoresis allowingthe separations of samples containing milligram amounts of proteins. Electro-phoresis 14 (1993) 1375–1378.
Bjellqvist B, Basse B, Olsen E, Celis JE. Reference points for comparisons of two-dimensional maps of proteins from different human cell types defined in apH scale where isoelectric points correlate with polypeptide compositions.Electrophoresis 15 (1994) 529–539.
Blagoev B, Ong SE, Kratchmarova I, Mann M. Temporal analysis of phosphotyr-osine-dependent signaling networks by quantitative proteomics. Nat Biotech-nol 22 (2004) 1139–1145.
Blomberg A, Blomberg L, Norbeck J, Fey SJ, Larsen PM, Roepstorff P, DegandH, Boutry M, Posch A, Gçrg A. Interlaboratory reproducibility of yeast proteinpatterns analized by immobilized pH gradient two-dimensional gel electro-phoresis. Electrophoresis 16 (1995) 1935–1945.
Bodenmiller B, Mueller LN, Mueller M, Domon B, Aebersold R Reproducibleisolation of distinct, overlapping segments of the phosphoproteome. NatureMethods 4 (2007) 231–237.
Bodnar WM, Blackburn RK, Krise JM, Moseley MA. Exploiting the complemen-tary nature of LC/MALDI/MS/MS and LC/ESI/MS/MS for increased pro-teome coverage. J Am Soc Mass Spectrom 14 (2003) 971–979.
Boutry M, Posch A, Gçrg A. Interlaboratory reproducibility of yeast protein pat-terns analyzed by immobilized pH gradient two-dimensional gel electrophore-sis. Electrophoresis 16 (1995) 1935–1945.
Boyle JG and Whitehouse CM. Time-of-flight mass spectrometry with an electro-spray ion beam. Anal Chem 64 (1992) 2084–2089.
Brancia FL, Oliver SG, Gaskell SJ. Improved matrix-assisted laser desorptionmass spectrometric analysis of tryptic hydrolysates of proteins following gua-nidation of lysine-containing peptides. Rapid Commun Mass Spectrom 14(2000) 2070–2073.
Breuker K, Oh H, Horn DM, Cerda B, McLafferty, FW. Detailed unfolding andfolding of gaseous ubiquitin ions characterized by electron capture dissocia-tion. J Am Chem Soc 124 (2002) 6407–6420.
Brookes PS, Pinner A, Ramachandran A, Coward L, Barnes S, Kim H, Darley-Usmar VM. High throughput two-dimensional blue-native electrophoresis: Atool for functional proteomics of mitochondria and signaling complexes. Pro-teomics 2 (2002) 969–977.
Brown RS and Lennon JJ. Mass resolution improvement by incorporation ofpulsed ion extraction/ionisation linear time-of-flight mass spectrometry. AnalChem 67 (1995) 1998–2003.
Burlingame AL, Carr SA, Eds, Mass spectrometry in biological sciences.Humana press, Totowa, New Jersey (1996).
Burgess R, Arthur TM, Pietz BC. Mapping protein–protein interaction domainsusing ordered fragment ladder far-western analysis of hexahistidine-taggedfusion proteins. Meth Enzymol. 328 (2000) 141–157.
Burkhard PR, Rodrigo N, May D, Sztajzel R, Sanchez J-C, Hochstrasser DF, Shif-fer E, Reverdin A, Lacroix JS. Assessing cerebrospinal fluid rhinorrhea: A two-dimensional electrophoresis approach. Electrophoresis 22 (2001) 1826–1833.
Buxbaum E. Cationic electrophoresis and electrotransfer of membrane glycopro-teins. Anal Biochem 314 (2003) 70–76.
Camacho-Carvajal MM, Wollscheid B, Aebersold R, Steimle V, and SchamelWWA. Two-dimensional blue native/SDS gel electrophoresis of multi-protein
435

References
complexes from whole cellular lysates: A proteomics approach. Mol Cell Pro-teomics 3 (2004) 176–182.
Candiano G, Bruschi M, Musante L, Santucci L, Ghiggeri GM, Carnemolla B,Orecchia P, Zardi L, Righetti PG. Blue Silver: A very sensitive colloidal Coo-massie G-250 staining for proteome analysis. Electrophoresis 25 (2004) 1327–1333.
Cargile BJ, Talley DL, Stephenson Jr JL. Immobilized pH gradients as a firstdimension in shotgun proteomics and analysis of the accuracy of pI predict-ability of peptides. Electrophoresis 25 (2004) 936–945.
Carpentier SC, Witters E, Laukens K, Deckers P, Swennen R, Panis B. Prepara-tion of protein extracts from recalcitrant plant tissues: An evaluation of differ-ent methods for two-dimensional gel electrophoresis analysis. Proteomics 5(2005) 2497–2507.
Carr SA, Huddleston MJ, Annan RS. Selective detection and sequencing of phos-phopeptides at the femtomole level by mass spectrometry. Anal Biochem 239(1996) 180–192.
Carr CD, Moritz RL. Role of reversed-phase high-performance liquid chromatog-raphy in protein isolation and purification. In Simpson RJ, Ed. Purifying pro-teins for proteomics: A laboratory manual. Cold Spring Harbor LaboratoryPress, Cold Spring Harbor, New York (2003) pp 179–208.
Celentano F, Gianazza E, Dossi G, Righetti PG. Buffer systems and pH gradientsimulation.Chemometr Intel Lab Systems 1 (1987) 349–358.
Chamrad D, Meyer HE. Valid data from large-scale proteomics studies. NatMethods 2 (2005) 647–648.
Chang EJ, Archambault V, McLachlin D., Krutchinsky AN, Chait, BT. Analysis ofprotein phosphorylation by hypothesis-driven multiple-stage mass spectrome-try. Anal Chem 76 (2004) 4472–4483.
Chaurand P, Luetzenkirchen F, Spengler B. Peptide and protein identificationby matrix assisted laser desorption and MALDI post-source decay time-of-flight mass spectrometry. J Am Soc Mass Spectrom 10 (1999) 91–103.
Chen HS, Rejtar T, Andreev V, Moskovets E, Karger BL. High speed, high resolu-tion monolithic LC-MALDI MS using an off-line continuous deposition inter-face for proteome analysis. Anal Chem 77 (2005) 2323–2331.
Chevallet C, Santoni V,. Poinas A, Rouquie D, Fuchs A, Kieffer S, Rossignol M,Lunardi J, Gerin J, Rabilloud T. New zwitterionic detergents improve the anal-ysis of membrane proteins by two-dimensional electrophoresis. Electrophore-sis 19 (1998) 1901–1909.
Chromy BA, Gonzales AD, Perkins J, Choi MW, Corzett MH, Chang BC, CorzettCH, McCutchen-Maloney SL. Proteomic analysis of human serum by two-dimensional differential gel electrophoresis after depletion of high-abundantproteins. J Proteome Res 3 (2004) 1120–1127.
Clauser KR, Baker P, Burlingame AL. Role of accurate mass measurement (€10ppm) in protein identification strategies employing MS or MS/MS and data-base searching. Anal Chem 71 (1999) 2871–2882.
Cleland WW. Dithiothreitol, a new protective reagent for SH groups. Biochemis-try 3 (1964) 480–482.
Coghlan DR, Mackintosh JA, Karuso P. Mechanism of reversible staining of pro-tein with epicocconone. Org Lett 7 (2005) 2401–2404.
Cooper HJ, H�kansson K, Marshall AG. The role of electron capture dissociationin biomolecular analysis. Mass Spectrum. Reviews 24 (2005) 201–222.
Conrads TP, Issaq HJ & Veenstra TD. New tools for quantitative phosphopro-teome analysis. Biochem Biophys Res Commun 290 (2002) 885–890.
436

References
Cornish TJ and Cotter RJ. A curved field reflectron time-of-flight mass spectrom-eter for the simultaneous focusing of metastable ions. Rapid Commun MassSpectrom 8 (1994) 781–785.
Cournoyer JJ, Pittman JL, Ivleva VB, Fallows E, Waskell L, Costello CE, O’Con-nor PB. Deamidation: Differentiation of aspartyl from isoaspartyl products inpeptides by electron capture dissociation. Protein Sci. 14 (2005) 452–463.
Covey TR, Huang EC, Henion JD. Structural characterisation of protein trypticpeptides by liquid chromatography, mass spectrometry and collision induceddissociation of their doubly charged molecular ions. Anal Chem 63 (1991)1193–1200.
Creasy DM, Cottrell JS. Error tolerant searching of uninterpreted tandem massspectrometry data. Proteomics 2 (2002) 1426–1434.
Damerval C, DeVienne D, Zivy M, Thiellement H. Technical improvements intwo-dimensional electrophoresis increase the level of genetic variationdetected in wheat-seedling protein. Electrophoresis 7 (1986) 53–54.
Delaplace P, van der Wal F, Dierick J-F, Cordewener JHG, Fauconnier M-L, duJardin P, America AHP. Potato tuber proteomics: comparison of two comple-mentary extraction methods designed for 2-DE of acidic proteins. Proteomics6 (2006) 6494–6497.
Devreese B, Vanrobaeys F, Smet J, Van Beeumen J, Van Coster R. Mass spectro-metric identification of mitochondrial oxidative phosphorylation subunits sep-arated by two-dimensional blue-native polyacrylamide gel elctrophoresis. Elec-trophoresis 23 (2002) 2525–2533.
Dixon SP, Pitfield ID, Perrett D. Comprehensive multi-dimensional liquid chro-matographic separation in biomedical and pharmaceutical analysis: a review.Biomed Chromatogr 207 (2006) 508 – 529.
Donoghue PM, McManus CA, O’Donoghue NM, Pennington SR, Dunn MJ.CyDye Immunoblotting for Proteomics: Co-detection of specific immunoreac-tive and total protein profiles. Proteomics 6 (2006) 6400–6404.
Dreger M. Subcellular proteomics. Mass Spec Rev 22 (2003) 27–56.Dubrovska A, Souchelnytskyi S. Efficient enrichment of intact phosphorylated
proteins by modified immobilized metal-affinity chromatography. Proteomics5 (2005) 4678–4683.
Dunbar BS. Two-dimensional electrophoresis and immunological techniques.Plenum Press, New York (1987).
Dunn MJ, Burghes AHM. High-resolution two-dimensional polyacrylamide gelelectrophoresis. I. Methodological procedures. Electrophoresis 4 (1983a) 97–116.
Dunn MJ, Burghes AHM. High-resolution two-dimensional polyacrylamide gelelectrophoresis. II. Analysis and applications. Electrophoresis 4 (1983b) 173–189.
Dunn MJ. Gel electrophoresis of proteins. Bios Scientific Publishers AldenPress, Oxford (1993).
Dunn MJ. Detection of total proteins on western blots of 2-D polyacrylamidegels. In. Link AJ. Ed. 2-D Proteome Analysis Protocols. Methods in MolecularBiology 112. Humana Press, Totowa, NJ (1999) 319–329.
Dunn MJ, Ed. From genome to proteome. Advances in the practice and applica-tion of proteomics. WILEY-VCH, Weinheim (1999).
Elias JE, Haas W, Faherty BK, Gygi SP. Comparative evaluation of mass spec-trometry platforms used in large-scale proteomics investigations. Nat Methods2 (2005) 667–675.
437

References
Emmett MR and Caprioli RM. Micro-electrospray mass spectrometery: ultrahigh sensitivity analysis of peptides and proteins. J Am Soc Mass Spectrom 5(1994) 605–613.
Eng JK, McCormack AL, Yates JR III. An approach to correlate tandem massspectra data of peptides with amino acid sequences in protein databases. J AmSoc Mass Spectrom 5 (1994) 976–989.
Eriksson J, Fenyo D. Improving the success rate of proteome analysis by model-ing protein-abundance distributions and experimental designs. Nature Bio-tech 25 (2007) 651–655.
Essader AS, Cargile BJ, Bundy JL, Stephenson JL. A comparison of immobilizedpH gradient isoelectric focusing and strong-cation-exchange chromatographyas a first dimension in shotgun proteomics. Proteomics 5 (2005) 24–34.
Eubel H, J�nsch L Braun H. New insights into the respiratory chain of plantmitochondria: supercomplexes and a unique composition of complex II. PlantPhysiol 133 (2003) 274–286.
F�gerstam LG, Frostell-Karlsson �, Karlsson R, Persson, B, Rçnnberg, I. Biospe-cific interaction analysis using surface plasmon resonance detection appliedto kinetic site and concentration analysis. J Anal Chrom 597 (1992) 397–410.
Fenn JB, Mann M, Meng CK, Wong SK, Whitehouse CM. Electrospray ionisa-tion for mass spectrometry of large biomolecules. Science 246 (1989) 64–71.
Fenyç D, Qin J, Chait BT. Protein identification using mass spectrometric infor-mation. Electrophoresis 19 (1998) 998–1005.
Fenyo D, Beavis RC Informatics and data management in proteomics. TrendsBiotechnol. 20 (2002) 35–38.
Fernandez-Patron C, Castellanos-Serra L, Hardy E, Guerra M, Estevez E, Mehl E,Frank RW. Understanding the mechanism of the zinc-ion stains of biomacro-molecules in electrophoresis gels: Generalization of the reverse-staining tech-nique. Electrophoresis 19 (1998) 2398–2406.
Field S, Song O. A novel genetic system to detect protein–protein interactions.Nature 340 (1989) 245–246.
Ficarro SB, McCleland ML, Stukenberg PT, Burke DJ, Ross MM, Shabanowitz J,Hunt DF, White FM.. Phosphoproteome analysis by mass spectrometry andits application to Saccharomyces cerevisiae. Nat Biotechno. 20 (2002) 301–305.
Fountoulakis M, Takacs B, Langen H. Two-dimensional map of basic proteins ofHaemophilus influenza. Electrophoresis 19 (1998) 761–766.
Friedman DB, Hill S, Keller JW, Merchant NB, Levy SE, Coffey RJ, Caprioli RM.Proteome analysis of human colon cancer by two-dimensional difference gelelectrophoresis and mass spectrometry. Proteomics 4 (2004) 793–811.
Friedman DB, Stauff DL, Pishchany G, Whitwell CW, Torres VJ, Skaar EP. Sta-phylococcus aureus redirects central metabolism to increase iron availability.PLoS Pathog 2 (2006): e87. DOI: 10.1371/journal.ppat.0020087
Friedman DB, Wang SE, Whitwell CW, Caprioli RM, Arteaga CL. Multivariabledifference gel electrophoresis and mass spectrometry. A case study on trans-forming growth factor- and ErbB2 signaling. Mol Cell Proteomics 6 (2007)150–169.
Gabius HJ, Andre S, Kaltner H, Siebert HC. The sugar code: functional lecti-nomics. Biochim Biophys Acta 1572 (2002) 165–177.
Garavelli JS. The RESID database of protein modifications as a resource andannotation tool. Proteomics 4 (204) 1527–1533.
Gavin AC, Bçsche M, Krause R, Grandi P, Marzioch M, Bauer A, Schultz J, RickJM, Michon AM, Cruciat CM, Remor M, Hçfert C, Schelder M, Brajenovic M,Ruffner H, Merino A, Klein K, Hudak M, Dickson D, Rudi T, Gnau V, BauchA, Bastuck S, Huhse B, Leutwein C, Heurtier MA, Copley RR, Edelmann A,
438

References
Querfurth E, Rybin V, Drewes G, Raida M, Bouwmeester T, Bork P, SeraphinB, Kuster B, Neubauer G, Superti-Furga G. Functional organisation of theyeast proteome by systematic analysis of protein complexes. Nature 415(2002) 141–147.
GE Healthcare Handbook: “Affinity Chromatography, Principles and Methods”(2002) 18-1022-29.
GE Healthcare Handbook: “Fluorescence imaging: Principles and Methods”(2002) 63-0035-28.
GE Healthcare User Manual: “Ettan Spot Picker Nonbacked Gel Kit” (2003) 11-0002-69.
GE Healthcare “Protein Separations' Handbook Collection” (2004).GE Healthcare Handbook: “2-D Electrophoresis. Principles and Methods”
(2005). 80-6429-60.GE Healthcare Application Note: “Comparison of methods for two-dimensional
liquid chromatography of peptides using Ettan microLC System.” (2003) 18-1170-93.
GE Healthcare Application Note: “Selective labeling of cell-surface proteinsusing CyDye DIGE Fluor minimal dyes” (2005) 11-0033-92.
GE Healthcare Handbook. “Hydrophobic Interaction and Reversed Phase Chro-matography. Principles and Methods” (2006) 11-0012-69.
Gerber SA, Rush J, Stemman O, Kirschner MW, Gygi SP. Absolute quantifica-tion of proteins and phosphoproteins from cell lysates by tandem MS. ProcNatl Acad Sci USA 100 (2003) 6940–6945.
Gevaert K, De Mol H, Sklyarova T, Houthaeye T, Vandekerckhove J. A peptideconcentration and purification method for protein characterisation in the sub-picomole range using matrix assisted laser desorption/ionisation-postsourcedecay (MALDI-PSD) sequencing. Electrophoresis 19 (1998) 909–917.
Gevaert K, Eggermont L, Demol H, Vandekerckhove J. A fast and convenientMALDI-MS based proteomic approach; identification of components scaf-folded by the actin cytoskeleton of activated human thrombocytes. J Biotech-nol 78 (2000) 259–269.
Gevaert K, Demol H, Martens L, Hoorelbeke B, Puype M, Goethals M, VanDamme J, De Boeck S, Vandekerckhove J. Protein identification based onmatrix assistedd laser desorption/ionisation-post source decay-mass spectrom-etry. Electrophoresis 22 (2001) 1645–1651.
Gevaert K, Goethals M, Martens L, van Damme J, Staes A, Thomas, GR, Vande-kerckhove J. Exploring proteomes and analyzing protein processing by massspectrometric identification of sorted amino terminal peptides. Nature Bio-technology 21 (2003) 566–569.
Gharahdaghi F, Weinberg CR, Meagher DA, Imai BS, Mische SM; Mass spectro-metric identification of proteins from silver-stained ployacrylamide gel: Amethod for the removal of silver ions to enhance sensitivity. Electrophoresis20 (1999) 601–605.
Giavalisco P, Nordhoff E, Lehrach H, Gobom J, Klose J. Extraction of proteinsfrom plant tissues for two-dimensional electrophoresis analysis. Electrophore-sis 24 (2003) 207–216.
Giorgianni F, Desiderio DM, Beranova-Giorgianni S. Proteome analysis usingisoelectric focusing in immobilized pH gradient gels followed by mass spec-trometry. Electrophoresis 24 (2003) 253–259.
Goodlett DR, Bruce JE, Anderson GA, Rist B, Pasa-Tolic L, Fiehn O, Smith RD,Aebersold R. Protein identification with a single accurate mass of a cysteine-containing peptide and constrained database searching. Anal Chem 72 (2000)1112–1118.
439

References
Goshe MB, Conrads TP, Panisko EA, Angell NH, Veenstra TD, Smith RD. Phos-phoprotein isotope-coded affinity tag approach for isolating and quantitatingphosphopeptides in proteome-wide analyses. Anal Chem 73 (2001) 2578–2586.
Gçrg A, Postel W, G�nther S, Weser J. Improved horizontal two-dimensionalelectrophoresis with hybrid isoelectric focusing in immobilized pH gradientsin the first dimension and laying-on transfer to the second dimension. Elec-trophoresis 6 (1985) 599–604.
Gçrg A, Postel W, Weser J, G�nther S, Strahler JR, Hanash SM, Somerlot L.Horizontal two-dimensional electrophoresis with immobilized pH gradientsin the first dimension in the presence of nonionic detergent. Electrophoresis8 (1987a) 45–51.
Gçrg A, Postel W, Weser J, G�nther S, Strahler JR, Hanash SM, Somerlot L.Elimination of point streaking on silver stained two-dimensional gels by addi-tion of iodoacetamide to the equillibration buffer. Electrophoresis 8 (1987b)122–124.
Gçrg A, Postel W, Weser J, G�nther S, Strahler JR, Hanash SM, Somerlot L,Kuick R. Approach to stationary two-dimensional pattern: Influence of focus-ing time and Immobiline/carrier ampholytes concentrations. Electrophoresis9 (1988a) 37–46.
Gçrg A, Postel W, G�nther S, Friedrich C. Horizontal two-dimensional electro-phoresis with immobilized pH gradients using PhastSystem. Electrophoresis9 (1988b) 57–59.
Gçrg A, Postel W, G�nther S. Review. The current state of two-dimensional elec-trophoresis with immobilized pH gradients. Electrophoresis 9 (1988c) 531–546.
Gçrg A, Postel W, Friedrich C, Kuick R, Strahler JR, Hanash SM. Temperature-dependent spot positional variability in two-dimensional polypeptide patterns.Electrophoresis 12 (1991) 653–658.
Gçrg A, Boguth G, Obermaier C, Posch A, Weiss W. Two-dimensional polyacryl-amide gel electrophoresis with immobilized pH gradients in the first dimen-sion (IPG-Dalt): The state of the art and the controversy of vertical versus hor-izontal systems. Electrophoresis 16 (1995) 1079–1086.
Gçrg A, Obermaier C, Boguth G, Csordas A, Diaz J-J, Madjar J-J: Very alkalineimmobilized pH gradients for two-dimensional electrophoresis of ribosomaland nuclear proteins. Electrophoresis 18 (1997) 328–337.
Gçrg A, Boguth G, Obermaier C, Harder A, Weiss W: 2-D electrophoresis withimmobilized pH gradients using IPGphor isoelectric focusing system. LifeScience News 1 (1998) 4–6.
Gçrg A, Boguth G, Obermaier C, Weiss W: Two-dimensional electrophoresis ofproteins in an immobilized pH 4-12 gradient. Electrophoresis 19 (1998) 1516–1519.
Gçrg A, Obermaier C, Boguth G, Weiss W: Recent developments in two-dimen-sional gelectrophoresis with immobilized pH gradients: wide pH gradients upto pH 12, longer separation distances and simplified procedures. Electropho-resis. 20 (1999) 712–717.
Gçrg A, Obermaier C, Boguth G, Harder A, Scheibe B, Wildgruber R, Weiss W:The current state of two-dimensional electrophoresis with immobilized pHgradients. Electrophoresis 21 (2000) 1037–1053.
Gçrg A, Weiss W. Two-dimensional electrophoresis with immobilized pH gradi-ents. In Rabilloud T, Ed. Proteome research: Two-dimensional gel electropho-resis and identification methods. Springer, Berlin Heidelberg New York(2000) 57–106.
440

References
Gçrg A, Boguth G, Kçpf A, Reil G, Parlar H, Weiss W. Sample prefractionationwith Sephadex isoelectric focusing prior to narrow pH range two-dimensionalgels. Proteomics 2 (2002) 1652–1657.
Gçrg A, Drews O, Weiss W. Separation of proteins using two-dimensional gelelectrophoresis. In Simpson RJ, Ed. Purifying proteins for proteomics: A labo-ratory manual. Cold Spring Harbor Laboratory Press, Cold Spring Harbor,New York (2003) 391–430.
Gçrg A, Weiss W, Dunn MJ. Current two-dimensional electrophoresis technolo-gy for proteomics. Proteomics 4 (2004) 3665–3685.
Gçrg A, Weiss W. High resolution two-dimensional electrophoresis with immo-bilized pH gradients for proteome analysis. In: Cell Biology. A LaboratoryManual, Vol. IV, Ch. 23, 3rd edition. (JE Celis, Ed.), Elsevier Science & Aca-demic Press (2005) pp. 175–188.
Goshe MB, Conrads TP, Panisko EA, Angell NH, Veenstra TD, Smith RD. Phos-phoprotein isotope-coded affinity tag approach for isolating and quantitatingphosphopeptides in proteome-wide analyses. Anal Chem 73 (2001) 2578–2586.
Granger J, Siddiqui J, Copeland S, Remick D. Albumin depletion of humanplasma also removes low abundance proteins including the cytokines. Proteo-mics 5 (2005) 4713–4718.
Granvogl B, Reisinger V, Eichacker LA. Mapping the proteome of thylakoidmembranes by de novo sequencing of intermembrane peptide domains. Pro-teomics 6 (2006)3681–3695.
Graumann J, Dunipace LA, Seol JH, McDonald WH, Yates JR, Wold BJ,Deshaies RJ. Applicability of tandem affinity purification MudPIT to pathwayproteomics in yeast. Mol Cell Proteomics. 3 (2004) 226–237.
Gruhler A, Olsen JV, Mohammed S, Mortensen P, Færgeman NJ, Mann M, Jen-sen ON. Quantitative phosphoproteomics applied to the yeast pheromone sig-naling pathway. Mol Cell Proteomics 4 (2005) 310–327.
Guerrier L, Lomas L, Boschetti E. A simplified monobuffer multidimesnionalchromatography for high-throughput protome fractionation. J Chromatogr.1073 (2005) 25–33.
Gundry RL, Fu Q, Jelinek CA, Van Eyk JE, Cotter RJ. Investigation of an albu-min-enriched fraction of human serum and its albuminome. Proteomics ClinAppl 1 (2007) 73–88.
Gyenes T, Gyenes E. Effect of “stacking” on the resolving power of ultrathin-layer two-dimensional gel electrophoresis. Anal Biochem 165 (1987) 155–160.
Gygi SP, Rist B, Gerber SA, Turecek F, Gelb MH, Aebersold R. Quantitative anal-ysis of complex protein mixtures using isotope-coded affinity tags. Nature Bio-tech 17 (1999) 994–999.
H�gglund P, Bunkenborg J, Elortza F, Jensen ON, Roepstorff P. A new strategyfor identification of N-glycosylated proteins and unambiguous assignment oftheir glycosylation sites using HILIC enrichment and partial deglycosylation.J Prot Research 3 (2004) 556 –566.
Hanash SM, Strahler JR, Neel JV, Hailat N, Melham R, Keim D, Zhu XX,Wagner D, Gage DA, Watson JT. Highly resolving two-dimensional gels forprotein sequencing. Proc Natl Acad Sci USA 88 (1991) 5709–5713.
Handbook of Chemistry and Physics, 78th edition, Lide DR (Ed. in chief) CRCpress, Boca Raton, Florida (1997)
Hannig K. New aspects in preparative and analytical continuous free-flow cellelectrophoresis. Electrophoresis 3 (1982) 235–243.
Hardman M, Makarov A. Interfacing the orbitrap mass analyzer to an electro-spray ion source. Anal Chem 75 (2003) 1699–1705.
441

References
Hardy E, Santana H, Sosa AE, Hernandez L, Fernandez-Patron C, Castellanos-Serra L. Imidazole-sodium dodecyl sulphate-zinc (reverse stain) on sodiumdodecyl sulphate gels. Anal Biochem 240 (1996) 150–152.
Harrington MG, Merrill C. Cerebrospinal fluid protein analysis in diseases ofthe nervous system. J Chromatogr 429 (1988) 345–358.
Hartinger J, Stenius K, Hogemann D, Jahn R. 16-BAC/SDS PAGE: a two dimen-sional gel electrophoresis system suitable for the separation of integral mem-brane proteins. Anal Biochem 240 (1996) 126–133.
Hart C, Schulenberg B, Steinberg TH, Leung WY, Patton WF. Detection of glyco-proteins in polyacrylamide gels and on electroblots using Pro-Q Emerald 488dye, a fluorescent periodate Schiff-base stain. Electrophoresis 24 (2003) 588–598.
Harvey DJ. Quantitative aspects of the matrix-assisted laser desorption massspectrometry of complex oligosaccharides. Rapid Commun Mass Spectrom 7(1993) 614–619.
Hashimoto F, Horigome T, Kanbayashi M, Yoshida K, Sugano H. An improvedmethod for separation of low-molecular weight polypeptides by electrophore-sis in sodium dodecyl sulfate-polyacrylamide gel. Anal Biochem 129 (1983)192–199.
Hedberg JJ, Bjerneld EJ, Cetinkaya S, Goscinski J, Grigorescu I, Haid D,LaurinY, Bjellqvist B. A simplified 2-D electrophoresis protocol with the aid ofan organic disulfide. Proteomics 5 (2005) 3088–3096.
Helling S, Schmitt E, Joppich C, Schulenborg T, M�llner S, Felske-M�ller S,Wiebringhaus T, Becker G, Linsenmann G, Sitek B, Lutter P, Meyer HE, Mar-cus K. 2-D differential membrane proteome analysis of scarce protein sam-ples. Proteomics 6 (2006) 4506–4513.
Henzel WJ, Billeci TM, Stults JT, Wong SC, Grimley C, Watanabe C. Identifyingproteins from two-dimensional gels by molecular mass searching of peptidefragments in protein sequence databases. Proc Natl Acad Sci USA 90 (1993)5011–5015.
Herbert BR, Molloy MP, Gooley AA, Walsh BJ, Bryson WG, Williams KLImproved protein solubility in two-dimensional electrophoresis using tributylphosphine as reducing agent. Electrophoresis 19 (1998) 845–851.
Herbert B, Righetti PG. A turning point in proteome analysis: Sample prefractio-nation via multicompartment electrolyzers with isoelectric membranes. Elec-trophoresis 21 (2000) 3639–3648.
Herbert B, Galvani M, Hamdan M, Olivieri E, MacCarthy J, Pedersen S, RighettiPG. Reduction and alkylation of proteins in preparation of two-dimensionalmap analysis: why, when, and how? Electrophoresis 22 (2001) 2046–2057.
Herbert B, Hopwood F, Oxley D, McCarthy J, Laver M, Grinyer J, Goodall A,Williams K, Castagna A, Righetti PG. An unexpected artefact in proteomeanalysis. Proteomics 3 (2003) 826–831.
Heukeshoven J, Dernick R. Simplified method for silver staining of proteins inpolyacrylamide and the mechanism of silver staining. Electrophoresis 6(1985) 103–112.
Heydon CE, Eyers PA, Lauren D. Aveline-Wolf, Resing KA, Maller JL and AhnNG. Identification of novel phosphorylation sites on Xenopus laevis Aurora Aand analysis of phosphopeptide enrichment by immobilized metal-affinitychromatography.Mol Cell Proteomics 2 (2003) 1055.
Ho Y, Gruhler A, Heilbut A, Bader GD, Moore L, Adams SL, Taylor P, BennettK, Boutilier K, Yang L, Wloting C, Donaldson I, Schandorff S, Shewarane J,Vo M, Taggart J, Goudreault M, Muskat B, Alfarano C, Dewar D, Lin Z, Micha-lichova K, Wilems AR, Sassi H, Nielsen PA, Rasmussedn KJ, Anderson JR,
442

References
Johansen LE, Hansen LH, Jespersen H, Podtelejnikov A, Nielsen E, CrawfordJ, Poulsen V, Sørensen BD, Matthiesen J, Hendrickson RC, Gleeson F, Paw-son T, Moran MF, Durocher D, Mann M, Hogue CWV, Figeys D, Tyers M.Systematic identification of protein complexes in Saccharomyces cerevisiae bymass spectrometry. Nature 415 (2002) 180–183.
Hoess M, Robins P, Naven TJP, Pappin DJC, Sgouros T, Lindahl T. A humanDNA editing enzyme homologous to the E coli DnaQ/MutD protein. EMBO J18 (1999) 3868–3875.
Hoffmann P, Ji H, Moritz RL, Connolly LM, Frecklington DF, Layton MJ, EddesJS, Simpson RJ. Continuous free-flow electrophoresis separation of cytosolicproteins from the human colon carcinoma cell line LIM 1215: A non two-dimensional gel electrophoresis-based proteome analysis strategy. Proteomics1 (2001) 807–818.
Hoving S, Voshol H, van Oostrum J. Towards high performance two-dimen-sional gel electrophoresis using ultrazoom gels. Electrophoresis 21 (2000)2617–2621.
Hoving S, Gerrits B, Voshol H, M�ller D, Roberts RC, van Oostrum J. Prepara-tive two-dimensional gel electrophoresis at alkaline pH using narrow rangeimmobilized pH gradients. Proteomics 2 (2002) 127–134.
Huber LA, Pfaller K, Vietor I. Organelle Proteomics. Implications for subcellularfractionation in proteomics. Circ Res 92 (2003) 962–968.
Huddleston MJ, Bean MF, Carr SA. Collisional fragmentation of glycopeptidesby electrospray ionization LC/MS and LC/MS/MS: methods for selectivedetection of glycopeptides in protein digests. Anal.Chem. 65 (1993) 877–884.
Hughes GJ, Frutiger S, Paquet N, Ravier F, Pasquali C, Sanchez JC, James R,Tissot JD, Bjellqvist B, Hochstrasser DF. Plasma protein map: an update bymicrosequencing. Electrophoresis 13 (1992) 707–714.
Hunt DF, Yates JR III, Shabanowitz J, Winston S, Hauer CR. Protein sequencingby tandem mass spectrometry. Proc Natl Acad Sci USA 83 (1986) 6233–6237.
Hunt SMN, Thomas MR, Sebastian LT, Pedersen SK, Harcourt RL, Sloane AJ,Wilkins MR. Optimal replication and the importance of experimental designfor gel-based quantitative proteomics. J Proteome Res. 4 (2005) 809 – 819.
Hurkman WJ, Tanaka CK. Solubilization of plant membrane proteins for analy-sis by two-dimensional gel electrophoresis. Plant Physiology 81 (1986) 802–806.
Husi H, Ward M, Choudhary JS, Blackstock WP, Grant SGN. Proteomic analysisof NMDA receptor-adhesion protein signalling complexes. Nature Neurosci 3(2000) 661–669.
Ibel K, May RP, Kirschner K, Szadkowski H, Mascher E, Lundahl P. Protein-decorated micelle structure of sodium-dodecyl-sulfate protein complexes asdetermined by neutron scattering. Eur J Biochem 190 (1990) 311–318.
Ito T, Chiba T, Ozawa R, Yoshido M, Hattori M, Sakaki Y. A comprehensive two-hybrid analysis system to explore the yeast protein interactome. Proc NatlAcad Sci USA 98 (2001) 4569–4574.
Iglesias T, Cabrera-Poch N, Mitchell MP, Naven TJP, Rozengurt E, Schiavo G.Identification and cloning of Kidind220, a novel neuronal substrate of proteinkinase D. J Biol Chem 275 (2000) 40048–40056.
James P, Quadroni M, Carafoli E and Gonnet G. Protein identification by massprofile fingerprinting. Biochem Biophys Res Commun 195 (1993) 58–64.
James P, Quadroni M, Carafoli E, Gonnet G. Protein identification in DNA data-bases by peptide mass fingerprinting. Protein Sci 3 (1994) 1347–1350.
443

References
Jensen ON, Podtelejnikov A, Mann M. Delayed extraction improves specificity indatabase searches by matrix-assited laser desorption/ionisation peptide maps.Rapid Commun Mass Spectrom 10 (1996) 1371–1378.
Ji C, Li L. Quantitative proteome analysis using differential stable isotope label-ing using microbore LC MALDI MS and MS/MS. J Proteome Res 4 (2005)734–742.
Johnson RS, Martin SA, Biemann K. Collision-induced fragmentation of (M +H)+ ions of peptides. Side chain specific sequence ions. Int J Mass SpectromIon Proc 86 (1988) 137–154.
Johnston RF, Pickett SC, Barker DL. Autoradiography using storage phosphortechnology. Electrophoresis 11 (1990) 355–360.
Jonscher KR, Yates JR3rd, The quadrupole ion trap mass spectrometer – a smallsolution to a big challenge. Anal Biochem 244 (1997) 1–15.
Kaji H, Saito H, Yamauchi Y, Shinkawa T, Taoka M, Hirabayashi J, Kasai K, Taka-hashi N, Isobe T. Lectin affinity capture, isotope-coded tagging and mass spec-trometry to identify N-linked glycoproteins. Nat Biotechnol 21 (2003) 667–672.
Kambhampti, D (ed) Protein Microarray Technology. Wiley-VCH, Weinheim(2003).
Kane LA, Yung CK, Agnetti G, Neverova I, Van Eyk JE. Optimization of paperbridge loading for 2DE analysis of the mitochondrial subproteome in thebasic pH region. Proteomics 6 (2006) 5683–5687.
Karas M, Hillenkamp F. Laser desorption of proteins with molecular massesexceeding 10000 daltons. Anal Chem 60 (1988) 2299–2301.
Kauffman R, Chaurand P, Kirsch D, Spengler B. Post-source decay and delayedextraction in matrix-assited laser desorption/ionisation-reflectron time-of-flight mass spectrometry. Are there trade-offs? Rapid Commun Mass Spec-trom 10 (1996) 1199–1208.
Kauffman R, Kirsch D, Spengler B. Sequencing of peptides in a time-of-flightmass spectrometer: evaluation of post-source decay following matrix-assistedlaser desorption ionisation (MALDI). Int J Mass Spectrom Ion Proc 131(1994) 355–385.
Kellner R, Lottspeich F, Meyer H, Eds. Microcharacterization of proteins. Secondedition. WILEY-VCH Weinheim (1999).
Keough T, Youngquist RS, Lacey MP. A method for high sensitivity peptidesequencing using postsource decay matrix-assisted laser desorption ionisationmass spectrometry. Proc Natl Acad Sci USA 96 (1999) 7131–7136.
Keough T, Lacey MP, Fieno AM, Grant RA, Sun Y, Bauer MD, Begley KB. Tan-dem mass spectrometry methods for definitive protein identification in pro-teomics research. Electrophoresis 21 (2000) 2252–2265.
Keough T, Lacey MP, Youngquist RS. Derivatisation procedures to facilitate denovo sequencing of lysine-terminated tryptic peptides using post-source decaymatrix-assisted laser -desorption/ionisation mass spectrometry. Rapid Com-mun Mass Spectrom 14 (2000a) 2348–2356.
Kislauskis EH, Zhu X, Singer RH. b-Actin messenger RNA localization and pro-tein synthesis augment cell motility. J Cell Biol 136 (1997) 1263–1270.
Kjeldsen F, Haselmann KF, Sorensen ES, Zubarev RA. Distinguishing of Ile/Leu amino acid residues in the PP3 protein by (hot) electron capture dissocia-tion in Fourier transform ion cyclotron resonance mass spectrometry. AnalChem 75 (2003) 1267–1274.
Kleine B, Lçffler G, Kaufmann H, Scheipers P, Schickle HP, Westermeier R,Bessler WG. Reduced chemical and radioactive liquid waste during electro-phoresis using polymerized electrode gels. Electrophoresis 13 (1992) 73–75.
444
References
Klose J, Kobalz U. Two-dimensional electrophoresis of proteins: an updated pro-tocol and implications for a functional analysis of the genome. Electrophoresis16 (1995) 1034–1059.
Knight ZA, Schilling B, Row RH, Kenski DM, Gibson BW, Shokat KM. Phos-phospecific proteolysis for mapping sites of protein phosphorylation. Nat Bio-technol 21 (2003) 1047–1054.
Koller A, Washburn MP, Lange BM, Andon NL, Deciu C, Haynes PA, Hays L,Schieltz D, Ulaszek R, Wei J, Wolters D, Yates III JR. Proteomic survey ofmetabolic pathways in rice. Proc Natl Acad Sci USA 99 (2002) 11969–11974.
Kondo H, Rabouille C, Newman R, Levine TP, Pappin D, Freemont P, WarrenG. p47 is a cofactor for p97-mediated membrane fusion. Nature 388 (1997)75–78.
Krause F. Detection and analysis of protein–protein interactions in organellarand prokaryotic proteomes by native gel electrophoresis: (Membrane) proteincomplexes and supercomplexes. Electrophoresis 27 (2006) 2759–2781.
Kussmann M, Nordhoff E, Rahbek-Nielsen H, Haebel S, Rossel-Larsen M,Jakobsen L, Gobom J, Mirgorodskaya E, Kroll Kristensen A, Palm L, Roep-storff P. Matrix-assisted laser desorption/ionisation mass spectrometry sam-ple preparation techniques for various peptide and protein analysis. J MassSpectrom 32 (1997) 593–601.
Kweon HK, Hakansson K. Selective zirconium dioxide-based enrichment ofphosphorylated peptides for mass spectrometric analysis. Anal Chem 78(2006) 1743–1749.
Laane B, Panfilov O. Protein staining influences the quality of mass spectraobtained by Peptide mass fingerprinting after separation on 2-D gels. A com-parison of staining with coomassie brilliant blue and sypro ruby. J ProteomeRes 4 (2005) 175–179.
Laiko VV, Baldwin MA, Burlingame AL. Atmospheric pressure matrix-assistedlaser desorption/ionisation mass spectrometry. Anal Chem 72 (2000) 652–657.
L�mmli UK. Cleavage of structural proteins during the assembly of the head ofbacteriophage T4. Nature 227 (1970) 680–685.
Lamanda A, Zahn A, Rçder D, Langen H. Improved Ruthenium II tris (batho-phenantroline disulfonate) staining and destaining protocol for a better sig-nal-to-background ratio and improved baseline resolution. Proteomics 4(2004) 509–608.
Lamond AI, Mann M. Cell biology and the genome projects – a concerted strat-egy for characterizing multi-protein complexes using mass spectrometry.Trends Cell Biol 7 (1997) 139–142.
Langen H, Rçder D, Juranville J-F, Fountoulakis M. Effect of protein applicationmode and acrylamide concentration on the resolution of protein spots separat-ed by two-dimensional gel electrophoresis. Electrophoresis 18 (1997) 2085–2090.
Langen H, Rçder D. Separation of human embryonic kidney cells on narrowrange pH strips. Life Science News 3 (1999) 6–8.
Langen H, Tak�cs B, Evers S, Berndt P, Lahm H-W, Wipf, B, Gray C, Fountoula-kis M. Two-dimensional map of the proteome of haemophilus influenzae.Electrophoresis 21 (2000) 411–429.
Larsen MR, Thingholm TE, Jensen ON, Roepstorff P, Jorgensen TJ. Highlyselective enrichment of phosphorylated peptides from peptide mixtures usingtitanium dioxide microcolumns. Mol Cell Proteomics 4 (2005) 873–886.
445

References
Li A, Sowder RC, Henderson LE, Moore SP, Garfinkel DJ and Fisher RJ. Chemi-cal cleavage at aspartyl residues for protein identification. Anal Chem 73(2001) 5395–5402.
Liang, P, Pardee AB. Differential display of eukaryotic messenger RNA bymeans of the polymerase chain reaction. Science 257 (1992) 967–971.
Liminga M, Bor�n M, �strçm J, Carlsson U, Keough T, Maloisel JL, Palmgren R,Youngquist S. Water-stable chemistry for improved amino acid sequencing byderivatization post-source decay (dPSD) using Ettan MALDI-ToF with a quad-ratic field reflectron. Proceedings ASMS conference on mass spectrometryand allied topics, Chicago, US (2001).
Link AJ, Carmack E, Yates JR III. A strategy for the identification of proteinslocalised to subcellular spaces: application to E. coli periplasmic proteins. Int JMass Spectrom Ion Proc 160 (1997) 303–316.
Link AJ, Robison K, Church GM. Comparing the predicted and observed proper-ties of proteins encoded in the genome of Escherichia coli K-12. Electrophore-sis 18 (1997) 1259–1313.
Link AJ. (Ed.) 2-D Proteome Analysis Protocols. Methods in Molecular Biology112. Humana Press, Totowa, NJ (1999).
Link AJ, Eng J, Schieltz DM, Carmack E, Mize GJ, Morris DR, Garvik BM, YatesJR III. Direct analysis of protein complexes using mass spectrometry. NatureBiotech 17 (1999) 676–682.
Liotta LA, Ferrari M, Petricoin E. Clinical proteomics: written in blood. Nature425 (2003) 905.
Lisacek, F. A guide of good practices for protein-centric bioinformatics. WILEY-VCH, Weinheim (2007).
Lobada A, Krutchinsky A, Bromirski M, Ens W, Standing KG. A tandem quadru-pole/time-of-flight mass spectrometer with a matrix-assisted laser desorption/ionisation source: design and performance. Rapid Commun Mass Spectrom14 (2000) 1047–1057.
Lottspeich F, Engels JW (Eds.) Bioanalytik, 2. Auflage. Elsevier, Spektrum Akade-mischer Verlag (2006)
Louris, JN, Amy, JW, Ridley, TY and Cooks, RG. Injection of ions into a quadru-pole ion trap mass spectrometer. Int J Mass Spectrom Ion Proc 88 (1989) 97–111.
Luche S, Diemer H, Tastet C, Chevallet M, Van Dorsselaer A, Leize-Wagner E,Rabilloud T. About thiol derivatization and resolution of basic proteins in two-dimensional electrophoresis. Proteomics 4 (2004)551–561.
Macek B, Waanders L, Olsen JV, Mann M. Top-down protein sequencing andMS3 on a hybrid linear quadrupole ion trap-orbitrap mass spectrometer. MolCell Proteomics 5 (2006) 949–958.
MacFarlane DE. Use of benzyldimethyl-n-hexadecylammonium chloride (“16-BAC”), a cationic detergent, in an acidic polyacrylamide gel electrophoresissystem to detect base labile protein methylation in intact cells. Anal Biochem132 (1983) 231–235.
MacFarlane DE. Two dimensional benzyldimethyl-n-hexadecylammonium chlo-ride – sodium dodecyl sulfate preparative polyacrylamide gel electrophoresis:a high capacity high resolution technique for the purification of proteins fromcomplex mixtures. Anal Biochem 176 (1989) 457–463.
Mackintosh JA, Choi H-Y, Bae S-H, Veal DA, Bell PJ, Ferrari BC, Van Dyk DD,Verrills NM, Paik Y-K, Karuso P. A fluorescent natural product for ultra sensi-tive detection of proteins in one-dimensional and two-dimensional gel electro-phoresis. Proteomics 3 (2003) 2273–2288.
446

References
Mackintosh JA, Veal DA, Karuso P. FluoroProfile, a fluorescence based assay forrapid and sensitive quantification of proteins in solution. Proteomics 5 (2005)4673–4677.
Makarov A. Electrostatic axially harmonic orbital trapping: a high-performancetechnique of mass analysis. Anal Chem 72 (2000) 1156–1162.
Mann M, Højrup P, Roepstorff P. Use of mass spectrometric molecular weightinformation to identify proteins in sequence databases. Biol Mass Spectrom22 (1993) 338–345.
Mann M, Wilm M. Error-tolerant identification of peptides in sequence data-bases by peptide sequence tags. Anal Chem 66 (1994) 4390–4399.
Mann M. A shortcut to interesting human genes: peptide sequence tags,expressed-sequence tags and computers. Trends Biol Sci 21 (1996) 494–495.
Mann M, Ong SE, Gronborg M, Steen H, Jensen ON, Pandey A. Analysis of pro-tein phosphorylation using mass spectrometry: deciphering the phosphopro-teome. Trends Biotechnol. 20 (2002) 261–268.
Marcus K, Lohaus C, Dombert T, Schmidt O, Hoepker HR, Meyer HE, SchaeferH. A novel approach towards differential proteomics with multidimensionalintact protein prefractionation of brain samples. Poster at the HUPO 4thAnnual World Congress, Munich (2005).
Martin SE, Shabonowitz J, Hunt DF, Marto JA. Subfemtomole MS and MS/MSpeptide sequencing using nano-HPLC micro-ESI fourier transform ion cyclo-tron mass spectrometry. Anal Chem 72 (2000) 4266–4274.
Mastro R, Hall M. Protein delipidation and precipitation by Tri-n-butylpho-sphate, acetone, and methanol treatment for isoelectric focusing and two-dimensional gel electrophoresis. Anal Biochem 273 (1999) 313–315.
Matsui NM, Smith DM, Clauser KR, Fichmann J, Andrews LE, Sullivan CM,Burlingame AL, Epstein LB. Immobilized pH gradient two-dimensional gelelectrophoresis and mass spectrometric identification of cytokine-regulatedproteins in ME-180 cervical carcinoma cells. Electrophoresis 18 (1997) 409–417.
Mayrhofer C, Krieger S, Allmaier G, Kerjaschki D. DIGE compatible labelling ofsurface proteins on vital cells in vitro and in vivo. Proteomics 6 (2006) 579–585.
McCormack AL, Schieltz DM, Goode S, Yang G, Barnes D, Drubin D, Yates JRIII. Direct analysis and identification of proteins in mixtures by LC-MS/MSand database searching at the low femtomole level. Anal Chem 69 (1997) 767–776.
McDonough J, Marb�n E. Optimization of IPG strip equilibration for the basicmembrane protein mABC1. Proteomics 5 (2005) 2892–2895.
McFarlane RD, Torgerson DF. Californium-252 plasma desorption mass spec-troscopy. Science 191 (1976) 920–925.
McGillivray J, Rickwood D. The heterogeneity of mouse-chromatin nonhistoneproteins as evidenced by two-dimensional polyacrylamide-gel electrophoresisand ion-exchange chromatography. Europ J Biochem 41 (1974) 181–190.
McLafferty FW, Horn DM, Breuker K, Ge Y, Lewis MA, Cerda B, Zubarev RA,Carpenter BK. Electron capture dissociation of gaseous multiply charged ionsby Fourier-transform ion cyclotron resonance. J Am Soc Mass Spectrom. 12(2001) 245–249.
M�chin V, Consoli L, Le Guilloux M, Damerval C. An efficient solubilizationbuffer for plant proteins focused in immobilized pH gradients. Proteomics 3(2003) 1299–1302.
Medzihradszky KF, Campbell JM, Baldwin MA, Falick AM, Juhasz P, Vestal ML,Burlingame AL. The characteristics of peptide collision-induced dissociation
447

References
using a high performance MALDI-TOF/TOF tandem mass spectrometer.Anal Chem 72 (2000) 552–558.
Merrill CR, Switzer RC, Van Keuren ML. Trace polypeptides in cellular extractsand human body fluids detected by two-dimensional electrophoresis and ahighly sensitive silver stain. Proc Nat Acad Sci 76 (1979) 4335–4339.
Michel PE, Reymond F, Arnaud IL, Josserand J, Girault HH, Rossier JS. Proteinfractionation in a multicompartment device using Off-Gel� isoelectric focus-ing. Electrophoresis 24 (2003) 3–11.
Miller I, Crawford J, Gianazza E. Protein stains for proteomic applications:Which, when, why? Proteomics 6 (2006) 5385–5408.
Mirgorodskaya OA, Shevchenko AA, Chernushevich IV, Dodonov AF, Miroshni-kov AI. Electrospray ionisation time-of-flight mass spectrometry in proteinchemistry. Anal Chem 66 (1994) 99–107.
Misek DE, Kuick R, Wang H, Galchev V, Deng B, Zhao R, Tra J, Pisano MR,Amunugama R, Allen D, Walker AK, Strahler JR, Andrews P, Omenn GS,Hanash SM. A wide range of protein isoforms in serum and plasma uncov-ered by a quantitative intact protein analysis system. Proteomics 5 (2005)3343–3352.
Mock KK, Davy M, Cottrell JS. The analysis of underivatised oligosaccharides bymatrix-assisted laser desorption mass spectrometry. Biochem Biophys ResCommun 177 (1991) 644–651.
Molloy MP. Two-dimensional electrophoresis of membrane proteins usingimmobilized pH gradients. Anal Biochem 280 (2000) 1–10.
Molloy MP, Brzezinski EE, Hang J, McDowell MT, VanBogelen RA. Overcomingtechnical variation and biological variation in quantitative proteomics. Proteo-mics 3 (2003) 1912–1919.
Moritz RL, Eddes JS, Reid GE, Simpson RJ. S-pyridylethylation of intact polyac-rylamide gels and in situ digestion of electrophoretically separated proteins: arapid mass spectrometric method for identifying cysteine-containing peptides.Electrophoresis 17 (1996) 907–917.
Morris HR, Paxton T, Dell A, Langhorne J, Berg M, Bordoli RS, Hoyes J, Bate-man RH. High sensitivity collisionally-activated decomposition tandem massspectrometry on a novel quadrupole/orthogonal-acceleration time-of-flightmass spectrometer. Rapid Commun Mass Spectrom 10 (1996) 889–896.
Morrice N. “LC-MS strategies in the characterisation of phosphorylation of pro-teins"In: The Encyclopedia of Mass Spectrometry, Volume 8, HyphenatedMethods in The Encycopedia of Mass Spectrometry, (Niessen WMA, Ed), Else-vier, Amsterdam, Netherlands (2006) 930–939.
Moumen A, Masterson P, O’Connor MJ, Jackson SP. hnRNP K: An HDM2 tar-get and transcriptional coactivator of p53 in response to DNA damage. Cell123 (2005) 1065–1078.
Munchbach M, Quadroni M, James P. Quantitation and facilitated de novosequencing of proteins by isotopic N-terminal labelling of peptides with afragmentation directing moiety. Anal Chem 72 (2000) 4047–4057.
Neubauer G, King A, Rappsilber J, Calvio C, Watson M, Ajuh P, Sleeman J,Lamond A, Mann M. Mass spectrometry and ESTdatabase searching allowscharacterisation of the multi-protein spliceosome complex. Nature Genet 20(1998) 46–50.
Neubauer G, Mann M. Mapping of phosphorylation sites of gel-isolated proteinsby nanoelectrospray tandem mass spectrometry: potentials and limitations.Anal Chem 71 (1999) 235–242.
Neuhoff V, Arold N, Taube D, Ehrhardt W. Improved staining of proteins in poly-acrylamide gels including isoelectric focusing gels with clear backgroud at
448

References
nanogram sensitivity using Coomassie Brilliant Blue G-250 and R-250. Elec-trophoresis 9 (1988) 255–262.
Nielsen PA, Olsen JV, Podtelejnikov AV, Andersen JR, Mann M, Winiewski JR.Proteomic mapping of brain plasma membrane proteins. Mol Cell Proteomics4 (2005) 402–408.
Nuwaysir LM, Stults JT. Electrospray ionization mass spectrometry of phospho-peptides isolated by on-line immobilized metal-ion affinity chromatography JAm Soc Mass Spectrom 4 (1993) 662–669.
Obermaier, C, Jankowski V, Schmutzler C, Bauer J, Wildgruber R, Infanger M,Kohrle J, Krause E, Weber G, Grimm D. Free-flow isoelectric focusing of pro-teins remaining in cell fragments following sonication of thyroid carcinomacells. Electrophoresis 26 (2005) 2109–2116.
Oda Y, Nagasu T, Chait BT. Enrichment analysis of phosphorylated proteins as atool for probing the phosphoproteome. Nat Biotechnol 19 (2001) 379–382.
O’Farrell PH. High-resolution two-dimensional electrophoresis of proteins. JBiol Chem 250 (1975) 4007–4021.
O’Farrell PZ, Goodman HM, O’Farrell PH. High resolution two-dimensionalelectrophoresis of basic as well as acidic proteins. Cell 12 (1977) 1133–1142.
Oda Y, Huang K, Cross FR, Cowburn D, Chait BT. Accurate quantitation of pro-tein expression and site specific phosphorylation. Proc Ntl Acad Sci USA 96(1999) 6591–6596.
Ohlmeier S, Scharf C, Hecker M. Alkaline proteins of Bacillus subtilis: first stepstowards a two-dimensional alkaline master gel. Electrophoresis 21 (2000)3701–3709.
Olsen JV, de Godoy LMF, Li G, Macek B, Mortensen P, Pesch R, Makarov A,Lange O, Horning S, Mann M. Parts per million mass accuracy on an orbitrapmass spectrometer via lock mass injection into a C-trap. Mol Cell Proteomics4 (2005) 2010–2021.
Olsson I, St�lberg R. A new semi-dry method for horizontal electrophoresis inultrathin polyacrylamide gels. In Electrophoresis ’86. Proceedings of the fifthmeeting of the international Electrophoresis Society. Dunn MJ. (Ed.) VCHVerlagsgesellschaft, Weinheim. (1986) 230–232.
Olsson I, Larsson K, Palmgren R, Bjellqvist B. Organic disulfides as a means togenerate streak-free two-dimensional maps with narrow range basic immobi-lized pH gradient strips as first dimension. Proteomics 2 (2002) 1630–1632.
Ong S-E, Blagoev B, Kratchmarova I, Kristensen DB, Steen H, Pandey A. MannM. Stable isotope labeling by amino acids in cell culture, SILAC, as a simpleand accurate approach to expression proteomics. Mol Cell Proteomics 1(2002) 376–386.
Pandey A, Mann M. Proteomics to study genes and genomes. Nature 405 (2000)837–846.
Pappin DJC, Højrup P, Bleasby AJ. Rapid identification of proteins by peptidemass fingerprinting. Curr Biol 3 (1993) 327–332.
Pappin DJC, Rahman D, Hansen HF, Bartlet-Jones M, Jeffery W, Bleasby AJ.Chemistry, mass spectrometry and peptide-mass databases. Evolution ofmethods for the rapid identification and mapping of cellular proteins. InMass Spectrometry in the Biological Sciences. Burlingame AL, Carr SA. (Eds.)(1996) 135–150.
Pappin DJC, Rahman D, Hansen HF, Jeffery W, Sutton CW. Peptide mass fin-gerprinting as a tool for the rapid identification and mapping of cellular pro-teins. In Appella E, Atassi MZ. (Eds.) Methods in protein structure analysis.Kluwer Academic/Plenum Publishers, Dordrecht (1995) 161–173.
449

References
Pardo M, Ward M, Bains S, Molina M, Blackstock W, Gil C, Nombela C. A pro-teomic approach for the study of Saccharomyces cerevisiae cell wall biogen-esis. Electrophoresis 21 (2000) 3396–3410.
Parness J, Paul-Pletzer K. Elimination of keratin contaminant from 2-mercap-toethanol. Anal Biochem 289 (2001) 98–99.
Pasa-Tolic L. High throughput proteome-wide precision measurements of pro-tein expression using mass spectrometry. J Am Chem Soc 121 (1999) 7949–7950.
Patestos NP, Fauth M, Radola BJ. Fast and sensitive protein staining with colloi-dal Acid Violet 17 following isoelectric focusing in carrier ampholyte gener-ated and immobilized pH gradients. Electrophoresis 9 (1988) 488–496.
Patterson SD, Aebersold R. Mass spectrometric approaches for the identificationof gel-separated proteins. Electrophoresis 16 (1995) 1791–1814.
Patterson SD. How much of the proteome do we see with discovery-based pro-teomics methods and how much do we need to see? Curr proteomics 1 (2004)3–12.
Patton W. Detecting proteins in polyacrylamide gels and on electroblot mem-branes. In Proteomics: from protein sequence to function. Pennington SR,Dunn MJ. (Eds.) Bios Scientific Publishers Ltd. (2001) 65–86.
Pennington K, McGregor E, Beasley CL, Everall I, Cotter D, Dunn MJ. Optimiza-tion of the first dimension for separation by two-dimensional gel electrophore-sis of basic proteins from human brain tissue. Proteomics 4 (2004)27–30.
Pennington SR, Wilkins MR, Hochstrasser DR, Dunn MJ. Proteome analysis:from protein characterization to biological function. Trends Cell Biol 7 (1997)168–173.
Pennington SR, Dunn MJ. (Eds.) Proteomics from protein sequence to function.BIOS Scientific Publishers Limited, Oxford (2001).
Perales M, Eubel H, Heinemeyer J, Colaneri A, Zabaleta E, Braun H-P. Disrup-tion of a nuclear gene encoding a mitochondrial gamma carbonic anhydrasereduces complex I and supercomplex ICIII2 levels and alters mitochondrialphysiology in Arabidopsis. J Mol Biol 350 (2005) 263–277.
Perkins DN, Pappin DJC, Creasy DM, Cottrell JS. Probability-based protein iden-tification by searching sequence databases using mass spectrometry data.Electrophoresis 20 (1999) 3551–3567.
Petricoin E, Wulfkuhle J, EspinaV, Liotta LA. Clinical proteomics: revolutioniz-ing disease detection and patient tailoring therapy. J Proteome Res 3 (2004)209–217.
Pieles U, Zurchner W, Schar M, Moser HE. Matrix-assisted laser desorptiontime-of-flight mass spectrometry: a powerful tool for the mass and sequenceanalysis of natural and modified oligonucleotides. Nucleic Acids Res 21 (1993)3191–3196.
Pinkse MWH, Uitto PM, Hilhorst MJ, Ooms B, Heck AJR. Selective isolation atthe femtomole level of phosphopeptides from proteolytic digests using 2D-nanoLC-ESI-MS/MS and titanium oxide precolumns. Anal Chem 76 (2004)3935–3943.
Poduslo JF. Glycoprotein molecular-weight estimetion using sodium dodecylsulfate – pore gradient electrophoresis: comparison of Tris-glycine and Tris-borate buffer system. Anal Biochem 114 (1981) 131–139.
Posch A, van den Berg BM, Burg HCJ, Gçrg A. Genetic variability of carrot seedproteins analyzed by one- and two-dimensional electrophoresis with immobi-lized pH gradients. Electrophoresis 16 (1995) 1312–1316.
Posewitz MC, Tempst P. Immobilized gallium(III) affinity chromatography ofphosphopeptides. Anal Chem 71 (1999) 2883–2892.
450

References
Pratt JM, Simpson DM, Doherty MK, Rivers J, Gaskell SJ, Beynon RJ. Multi-plexed absolute quantification for proteomics using concatenated signaturepeptides encoded by QconCATgenes. Nature Protocols 1 (2006) 1029 – 1043.
Pretlow, TG, Pretlow, T.P. Sedimentation for the separation of cells. Methods: ACompanion to Methods in Enzymology 2 (1991) 183–191.
Qin J, Herring CJ, Zhang X. De novo peptide sequencing in an ion trap massspectrometer with 18O labelling. Rapid Commun Mass Spectrom 12 (1998)209–216.
Qin J, Steenvorden RJJM, Chait BT. A practical ion trap mass spectrometer forthe analysis of peptides by matrix-assisted laser desorption/ionisation. AnalChem 68 (1996) 1784–1791.
Rabilloud T, Gianazza E, Catt N, Righetti PG. Amidosulfobetaines, a family ofdetergents with improved solubilization properties: Application for isoelectricfocusing under denaturing conditions. Anal Biochem 185 (1990) 94–102.
Rabilloud T. A comparison between low background silver diammine and silvernitrate protein stains. Electrophoresis 13 (1992) 429–439.
Rabilloud T, Vuillard L, Gilly C, Lawrence JJ. Silver staining of proteins in poly-acrylamide gels: a general overview. Cell Mol Biol 40 (1994) 57–75.
Rabilloud T. Use of thiourea to increase the solubility of membrane proteins intwo-dimensional electrophoresis. Electrophoresis 19 (1998) 758–760.
Rabilloud T. Silver staining of 2-D electrophoresis gels. Methods Mol Biol 112(1999) 297–305.
Rabilloud T, Blisnick T, Heller M, Luche S, Aebersold R, Lunardi J, Braun-BretonC. Analysis of membrane proteins by two-dimensional electrophoresis: Com-parison of the proteins extracted from normal or Plasmodium falciparum -infected erythrocyte ghosts. Electrophoresis 20 (1999) 3603–3610.
Rabilloud T, Chevallet M. Solubilization of proteins in two-dimensional electro-phoresis. In Rabilloud T. (Ed.) Proteome research: Two-dimensional gel elec-trophoresis and identification methods. Springer, Berlin Heidelberg New York(2000) 9–29.
Rabilloud T, Charmont S. Detection of proteins on two-dimensional electropho-resis gels. In Rabilloud T. (Ed.) Proteome research: Two-dimensional gel elec-trophoresis and identification methods. Springer, Berlin Heidelberg New York(2000) 107–126.
Rabilloud T, Strub J-M, Luche S, van Dorsselaer A, Lunardi J. A comparison be-tween Sypro Ruby and ruthenium II tris (bathophenanthroline disulfonate) asfluorescent stains for protein detection in gels. Proteomics 1 (2001) 699–704.
Ramagli LS. Quantifying protein in 2-D PAGE solubilization buffers. In Link AJ.(Ed) 2-D Proteome Analysis Protocols. Methods in Molecular Biology 112.Humana Press, Totowa, NJ (1999) 99–103.
Ramsby ML, Makowski GS, Khairallah EA. Differential detergent fractionationof isolated hepatocytes: biochemical, immunochemical and two-dimensionalgel electrophoresis characterization of cytoskeletal and nonskeletal compart-ments. Electrophoresis 15 (1994) 265–277.
Regula JT, Ueberle B, Boguth G, Gçrg A, Schnçlzer M, Herrmann R, Frank R.Towards a two-dimensional proteome map of Mycoplasma pneumoniae. Elec-trophoresis 21 (2000) 3765–3780.
Reinders J, Sickmann A. State-of-the-art in phosphoprotomics. Proteomics 5(2005) 4052–4061.
Righetti PG, Tudor G, Gianazza E. Effect of 2-mercaptoethanol on pH gradientsin isoelectric focusing. J Biochem Biophys Methods 6 (1982) 219–227
Righetti PG. In: Work TS, Burdon RH. (Ed.) Isoelectric focusing: theory, meth-odology and applications. Elsevier Biomedical Press, Amsterdam (1983).
451

References
Righetti PG, Gelfi C. Immobilized pH gradients for isoelectric focusing. III: pre-parative separations in highly diluted gels. J Biochem Biophys Methods 9(1984) 103–119.
Righetti PG. In: Burdon RH, van Knippenberg PH. (Eds.) Immobilized pH gra-dients: theory and methodology. Elsevier, Amsterdam (1990).
Righetti PG, Castagna A, Antonioli P, Boschetti E. Prefractionation techniquesin proteome analysis: The mining tools of the third millennium. Electrophore-sis 26 (2005) 297–319.
Rimpilainen M, Righetti PG. Membrane protein analysis by isoelectric focusingin immobilized pH gradients. Electrophoresis 6 (1985) 419–422.
Roepstorff P and Fohlman J, Proposal for a common nomenclature for sequenceions in mass spectra of peptides. Biomed Mass Spectrom 11 (1984) 601.
Rose K, Bougueleret L, Baussant T, Bçhm G, Botti P, Colinge J, Cusin I, Gaert-ner H, Gleizes A, Heller M, Jimenez S, Johnson A, Kussmann M, Menin L,Menzel1 C, Ranno F, Rodriguez-Tom� P, Rogers J, Saudrais C, Villain M,Wetmore D, Bairoch A, Hochstrasser D. Industrial-scale proteomics: Fromliters of plasma to chemically synthesized proteins. Proteomics 4 (2004) 2125–2150.
Rosenfield J, Capdevielle J, Guillemot JC, Ferrara P. In-gel digestion of proteinsfor internal sequence analysis after one- or two-dimensional electrophoresis.Anal Biochem 203 (1992) 173–179.
Rosengren A, Bjellqvist B, Gasparic V. A simple method for choosing optimumpH conditions for electrophoresis. In: Radola BJ, Graesslin D. Ed. Electrofo-cusing and isotachophoresis. W. de Gruyter, Berlin (1977) 165–171.
Ross PL, Huang YLN, Marchese JN, Williamson B, Parker K, Hattan S, Khai-novski N, Pillai S, Dey S, Daniels S, Purkayastha S, Juhasz P, Martin S, Bart-let-Jones M, He F, Jacobson A, Pappin DJ. Multiplexed protein quantitation inSaccharomyces cerevisiae using amine-reactive isobaric tagging reagents. MolCell Proteomics 3 (2004) 1154–1169.
Roth KDW, Huang ZH, Sadagopan N, Throck Watson J. Charge derivatisation ofpeptides for analysis by mass spectrometry. Mass Spectrom Reviews 17 (1998)255–274.
Rozanas CR, Loyland SM. Capabilities using 2-D DIGE in proteomics research:The new gold standard for two-dimensional gel electrophoresis. In: Liu BCS,Ehrlich JR. (Eds.) Tissue Proteomics: Approaches for Pathways, Biomarkers,and Drug Discovery. Humana Press, Totowa, NJ (2006) in press.
Sabounchi-Sch�tt F, Astrçm J, Olsson I, Eklund A, Grunewald J, Bjellqvist B.An Immobiline DryStrip application method enabling high-capacity two-dimensional gel electrophoresis. Electrophoresis 21 (2000) 3649–3656.
Sachon E, Mohammed S, Bache N, Jensen ON. Phosphopeptide quantitationusing amine-reactive isobaric tagging reagents and tandem mass spectrome-try: application to proteins isolated by gel electrophoresis. Rapid CommunMass Spectrom 20 (2006) 1127–1134.
Sanchez J-C, Appel RD, Golaz O, Pasquali C, Ravier F, Bairoch A, HochstrasserDF. Inside SWISS-2DPAGE database. Electrophoresis 16 (1995) 1131–1151.
Sanchez JC, Golaz O, Frutiger S, Schaller D, Appel RD, Bairoch A, Hughes GJ,Hochstrasser DF. The yeast SWISS-2DPAGE database. Electrophoresis 17(1996) 556–565.
Sanchez J-C, Rouge V, Pisteur M, Ravier F, Tonella L, Moosmayer M, WilkinsMR, Hochstrasser DF. Improved and simplified in-gel sample applicationusing reswelling of dry immobilized pH gradients. Electrophoresis 18 (1997)324–327.
452

References
Sandra K, Devreese B, Van Beeumen J, Stals I, Claeyssens M. The Q-Trap massspectrometer, a novel tool in the study of protein glycosylation. J Am Soc MassSpectrom 15 (2004) 413–423.
Santoni V, Molloy M, Rabilloud T. Membrane proteins and proteomics: Unamour impossible? Electrophoresis 21 (2000) 1054–1070.
Sch�gger H, von Jagow G. Tricine-sodium dodecyl sulfate-polyacrylamide gelelectrophoresis for the separation of proteins in the range from 1 to 100 kDa.Anal Biochem 166 (1987) 368–379.
Sch�gger H, Aquila H, von Jagow G. Coomassie blue-sodium dodecyl sulphate-polyacrylamide gel electrophoresis for direct visualisation of polypeptides dur-ing electrophoresis. Anal Biochem. 173 (1988) 201–205.
Sch�gger H, von Jagow G. Blue native electrophoresis for isolation of membraneprotein complexes in enzymatically active form. Anal Biochem. 199 (1991)223–231.
Sch�gger H. Electrophoretic techniques for isolation and quantification of oxida-tive phosphorylation protein complexes from human tissues. In: Attardi GM,Chomyn A. (Eds.) Methods in Enzymology 264 (1996) 555–566.
Scheele GA. Two-dimensional gel analysis of soluble proteins. Characterizationof guinea pig exocrine pancreatric proteins. J Biol Chem 250 (1975) 5375–5385.
Schlosser A, Pipkorn R, Bossemeyer D and Lehman WD; Analysis of proteinphosphorylation by a combination of elastase digestion and neutral loss massspectrometry. Anal Chem 73 (2001) 170–176.
Schlosser A, Vanselow JT, Kramer A. Mapping of phosphorylation sites by amulti-protease approach with specific phosphopeptide enrichment andnanoLC-MS/MS analysis. Anal Chem 77 (2005) 5243–5250.
Schnolzer M, Jedrzejewski P, Lehman WD. Protease-catalysed incorporation of18O into peptide fragments and its application for protein sequencing by elec-trospray and matrix-assisted laser desorption/ionisation mass spectrometery.Electrophoresis 17 (1996) 945–953.
Sechi S and Chait BT. Modification of cysteine residues by alkylation. A tool inpeptide mapping and protein identification. Anal Chem 70 (1998) 5150–5158.
Shaw J, Rowlinson R, Nickson J, Stone T, Sweet A, Williams K, Tonge R. Evalua-tion of saturation labelling two-dimensional difference gel electrophoresisfluorescent dyes. Proteomics 3 (2003) 1181–1195.
Shen Y, Zhao R, Belov ME. Packed capillary reversed phase liquid chromatogra-phy with high-performance electrospray ionization Fourier transform ioncyclotron resonance mass spectrometry for proteomics. Anal Chem 73(2001)1766–75.
Shevchenko A, Wilm M, Vorm O, Mann M. Mass spectrometric sequencing ofproteins silver-stained polyacrylamide gels. Anal Chem 68 (1996a) 850–858.
Shevchenko A, Jensen ON, Podtelejnikov A, Sagliocco F, Wilm M, Vorm O, Mor-tensen P, Shevchenko A, Boucherie H, Mann M. Linking genome and pro-teome by mass spectrometry: large scale identification of yeast proteins fromtwo dimensional gels. Proc Natl Acad Sci USA 93 (1996b) 1440–1445.
Shevchenko A, Chemushevich IV, Ens W, Standing KG, Thomson B, Wilm M,Mann M. Rapid 'de novo' peptide sequencing by a combination of nanoelec-trospray, isotopic labelling and a quadrupole/time-of-flight mass spectrometerRapid Commun Mass Spectrom 11 (1997) 1015–1024.
Shevchenko A, Loboda A, Shevchenko A, Ens W, Standing KG. MALDI quadru-pole time-of-flight mass spectrometry: A powerful tool for proteomic research.Anal Chem 72 (2000) 2132–2141.
453

References
Shi SDH, Hemling ME, Carr SA, Horn DM, Lindh I, McLafferty FW. Phospho-peptide/phosphoprotein mapping by electron capture dissociation mass spec-trometry. Anal Chem 73 (2001) 19–22.
Silles E, Mazon MJ, Gevaert K, Goethals M, Vanderkerckhove, Lebr R, SandovalIV. Targeting of aminopeptidase I to the yeast vacuole is mediated by Ssa1p, acytosolic member of the 70 kDa stress protein family. J Biol Chem 275 (2000)34054–34059.
Simpson RJ. Proteins and proteomics. A laboratory manual. Cold Spring HarborLaboratory Press, Cold Spring Harbor, New York (2003).
Simpson RJ. (Ed.) Purifying proteins for proteomics: A laboratory manual. ColdSpring Harbor Laboratory Press, Cold Spring Harbor, New York (2003).
Sinha P, Kçttgen E, Westermeier R, Righetti PG. Immobilized pH 2.5–11 gradi-ents for two-dimensional electrophoresis Electrophoresis 13 (1992) 210–214.
Sinha P, Poland J, Schnolzer M, Rabilloud T. A new silver staining apparatusand procedure for matrix-assisted laser desorption/ionisation-time of flightanalysis of proteins after two-dimensional electrophoresis. Proteomics 1(2001) 835–840.
Sitek B, L�ttges J, Marcus K, Klçppel G, Schmiegel W, Meyer HE, Hahn SA,St�hler K. Application of fluorescence difference gel electrophoresis satura-tion labelling for the analysis of microdissected precursor lesions of pancreaticductal adenocarcinoma. Proteomics 5 (2005) 2665–2679.
Sitek B, Scheibe B, Jung K, Schramm A, St�hler K. Difference Del Electrophore-sis (DIGE): the next generation of two-dimensional gel electrophoresis forclinical research. In: Proteomics in Drug Research (M Hamacher et al. Eds.)Wiley-VCH, Weinheim (2006) pp 33–55.
Skilling J, Cottrell J, Green B, Hoyes J, Kapp E, Landgridge J, Bordoli B; Auto-mated de novo peptide sequencing using Q-Tof ESI-MS/MS and softwareinterpretation of the data. Proc. 47th ASMS conference Mass spectrometry andallied topics, Dallas (1999).
Skçld K, Svensson M, Kaplan A, Bjçrkesten L, �strçm J, Andren PE. A neuro-proteomic approach to targeting neuropeptides in the brain. Proteomics 2(2002) 447–454.
Smolka M, Zhou H, Aebersold R. Quantitative protein profiling using two-dimensional gel electrophoresis, isotope coded affinity tag labeling and massspectrometry. Mol Cell Proteomics 1 (2002) 19–29.
Souchelnytskyi S. Bridging proteomics and systems biology: what are the roadsto be traveled? Proteomics 5 (2005) 4123–4137.
Southern EM. Detection of specific sequences among DNA fragments separatedby gel electrophoresis. J Mol Biol. 98 (1975) 503–517.
Speicher DW, Zuo X. A method for global analysis of complex proteomes usingsample prefractionation by solution isoelectrofocusing prior to two-dimen-sional electrophoresis. Anal Biochem. 284 (2000) 266–278.
Spengler B, Luetzenkirchen F, Metzger S, Chaurand P, Kaufmann R, Jeffrey W,Bartlet-Jones M, Pappin DJC. Peptide sequencing of charged derivatives bypostsource decay MALDI mass spectrometry. Int J Mass Spectrom Ion Proc169/170 (1997) 127–140.
Spengler B; Post-source decay analysis in matrix-assisted laser desorption/ion-ization mass spectrometry of biomolecules. J Mass Spectrom 32 (1997) 1019–1036.
Stafford GC, Kelley PE, Syka JEP, Reynolds WE, Todd, JFJ. Recent improve-ments in, and analytical applications of advanced ion trap technology. Int JMass Spectrom Ion Proc 60 (1984) 85–98.
454

References
Stahl B, Steup M, Karas M, Hillenkamp F. Analysis of neutral oligosaccharidesby matrix-assisted laser desorption/ionisation mass spectrometry. Anal Chem63 (1991) 1463–1466.
Stasyk T, Hellman U, Souchelnytskyi S. Optimizing sample preparation for 2-Delectrophoresis. Life Science News 9 (2001) 9–12.
Staudenmann W, Dainese-Hatt P, Hoving S, Lehman A, Kertesz M, James P.Sample handling for proteome analysis. Electrophoresis 19 (1998) 901–908.
Steen H, K�ster B, M Fernandez, Pandy A, Mann M. Characterisation of STAM2using a new method for tyrosine phosphorylation analysis by tandem massspectrometry. Proceedings of the 49th ASMS conference on mass spectrome-try and allied topics, Chicago (2001).
Stegemann H. Proteinfraktionierungen in Polyacrylamid und die Anwendungauf die genetische Analyse bei Pflanzen. Angew Chem 82 (1970) 640.
Stegemann J, Ventzki R, Schrodel A, de Marco A. Comparative analysis of pro-tein aggregates by blue native electrophoresis and subsequent sodium dodecylsulfate-polyacrylamide gel electrophoresis in a three-dimensional geometrygel. Proteomics 5 (2005) 2002–2009.
Steinberg TH, Hangland RP, Singer VI. Applications of SYPRO Orange andSYPRO Red protein gel stains. Anal Biochem 239 (1996) 238–245.
Steinberg TH, Agnew BJ, Gee KR, Leung W-Y, Goodman T, Schulenberg B, Hen-drickson J, Beechem JM, Haugland RP, Patton WF. Global quantitative phos-phoprotein analysis using multiplexed proteomics technology. Proteomics 3(2003) 1128–1144.
Stemmann O, Zou H, Gerber SA, Gygi SP, Kirschner MW. Dual inhibition ofsister chromatid separation at metaphase. Cell 107 (2001) 715–726.
Stensballe A, Jensen ON. Simplified sample preparation method for proteinidentification by matrix-assisted laser desorption/ionisation mass spectrome-try: In-gel digestion on the probe surface. Proteomics 1 (2001) 955–966.
Strahler JR, Hanash SM, Somerlot L, Weser J, Postel W, Gçrg A. High-resolutiontwo-dimensional polyacrylamide gel electrophoresis of basic myeloid polypep-tides: Use of immobilized pH gradients in the first dimension. Electrophore-sis 8 (1987) 165–173.
Strahler JR, Hanash SM, Somerlot L, Bjellqvist B, Gçrg A. Effect of salt on theperformance of immobilized pH gradient isoelctric focusing gels. Electropho-resis 9 (1988) 74–80.
Strupat K, Karas M, Hillenkamp F. 2,5-Dihydroxybenzoic acid: a new matrix forlaser desorption–ionisation mass spectrometry. Int J Mass Spectrom Ion Proc111 (1991) 89–102.
Sutton CW, Pemberton KS, Cottrell JS, Corbett JM, Wheeler CH, Dunn MJ, Pap-pin DJ. Identification of myocardial proteins from two-dimensional gels bypeptide mass fingerprinting. Electrophoresis 16 (1995) 308–316.
Svensson H. Isoelectric fractionation , analysis and characterization of ampho-lytes in natural pH gradients. The differential equation of solute concentra-tions as a steady state and its solutin for simple cases. Acta Chem Scand 15(1961) 325–341.
Switzer RC, Merril CR, Shifrin S. A highly sensitive silver stain for detectingproteins and peptides in polyacrylamide gels. Anal Biochem 98 (1979) 321–327.
Tabuse Y, Nabetani T, Tsugita A. Proteomic analysis of protein expression pro-files during Caenorhabditis elegans development using two-dimensional dif-ference gel electrophoresis. Proteomics 5 (2005) 2876–2891.
Tanaka K, Ido Y, Akita S, Yoshida Y, Yoshida T. Development of laser ionizationtime of flight mass spectrometer IV – Generation of quasi-molecular ions
455

References
from high mass organic compound (in Japanese) 35-kai Shitsuryo BunsekiRengo Toronkai, Yoshishu (1987) 22–23.
Tanaka Y, Akiyama H, Kuroda1 T, Jung G, Tanahashi K, Sugaya H, Utsumi J,Kawasaki H, Hirano H. A novel approach and protocol for discovering ex-tremely low-abundance proteins in serum. Proteomics 6 (2006) 4845–4855.
Tannu NS, Sanchez-Brambila G, Kirby P, Andacht TM. Effect of staining reagenton peptide mass fingerprinting from in-gel trypsin digestions: A comparisonof SyproRuby� and DeepPurple�. Electrophoresis 27 (2006) 3136–3143.
Tao WA, Wollscheid B, O’Brien R, Eng JK, Xiao-jun L, Bodenmiller B, Watts JD,Hood L, Aebersold R Quantitative phosphoproteome analysis using a dendri-mer conjugation chemistry and tandem mass spectrometry. Nat Methods 2(2005) 591–598.
Taylor G. Disintegration of water drops in an electric field. Proc R Soc LondA280 (1964) 383–397.
Thiellement H, Bahrman N, Damerval C, Plomion C, Rossignol M, Santoni V,de Vienne D, Zivy M. Proteomics for genetic and physiological studies inplants. Electrophoresis 20 (1999) 2013–2026.
Tirumalai RS, Chan KC, Prieto DA, Issaq HJ, Conrads TP, Veenstra TD. Charac-terization of the low molecular weight human serum proteome. Mol Cell Pro-teomics 2 (2003) 1096–1103.
Towbin H, Staehlin T, Gordon J. Electrophoretic transfer of proteins from polyac-rylamide gels to nitrocellulose sheets: procedure and some applications. ProcNatl Acad Sci USA. 76 (1979) 4350–4354.
Towbin H, zbey , Zingel O. An immunoblotting method for high-resolutionisoelectric focusing of protein isoforms on immobilized pH gradients. Electro-phoresis. 22 (2001) 1887–1893.
Tugal T, Zou-Yang XH, Gavin K, Pappin D, Canas B, Kobayashi R, Hunt T, Still-man B. The Orc4p and Orc5p Subunits of the Xenopus and human originrecognition complex are related to Orc1p and Cdc6p. J Biol Chem 273 (1998)32421–32429.
Uetz P, Giot L, Cagney G, Mansfield TA, Judson RS, Knight JR, Lockson D,Narayan V, Srinivasan M, Pochart P, Qureshi-Emili A, Li Y, Godwin B, Con-over D, Kalbfleisch T, Vijayadamodar G, Yang M, Johnston M, Fields S, Roth-berg JM. A comprehensive analysis of protein–protein interactions in Sacchar-omyces cerevisiae. Nature 403 (2000) 623–627.
Uhl�n M, Ponten F. Antibody-based proteomics for human tissue profiling. MolCell Proteomics 4 (2005) 384–393.
�nl� M, Morgan EM, Minden JS. Difference gel electrophoresis: a single gelmethod for detecting changes in protein extracts. Electrophoresis 19 (1997)2071–2077.
Urwin V, Jackson P. Two-dimensional polyacrylamide gel electrophoresis of pro-teins labeled with the fluorophore monobromobimane prior to first-dimen-sional isoelectric focusing: imaging of the fluorescent protein spot patternsusing a cooled charge-coupled device. Anal. Biochem 209 (1993) 57–62.
Uttenweiler-Joseph S, Neubauer G, Christoforidis S, Zerial M, Wilm W. Auto-mated de novo sequencing of proteins using the differential scanning tech-nique. Proteomics 1 (2001) 668–682.
Vandahl BB, Birkelund S, Demol H, Hoorelbeke B, Christiansen G, Vandekerc-khove J, Gevaert K. Proteome analysis of the Chlamydia pneumoniae elemen-tary body. Electrophoresis 22 (2001) 1204–1223.
Vandekerckhove J, Bauw G, Puype M, Van Damme J, Van Montegu M. Proteinblotting on polybrene coated glass-fiber sheets: a basis for acid hydrolysis andgas phase sequencing of picomole quantities of protein previously separated
456

References
on sodium dodecyl sulfate polyacrylamide gel. Eur J Biochem 152 (1985) 9–19.
Vanrobaeys F, Van Coster R, Dhondt G, Devreese B, Van Beeumen J. Profiling ofmyelin proteins by 2D-gel electrophoresis and multidimensional liquid chro-matography coupled to MALDI TOF-TOFmass spectrometry. J Proteome Res4 (2005) 2283–2293.
Verentchikov AN, Ens W, Standing KG. Reflecting time-of-flight mass spectrom-eter with an electrospray ion source and orthogonal extraction. Anal Chem 66(1994) 126–133.
Vestal ML, Juhasz P, Martin SA. Delayed extraction matrix-assisted laser desorp-tion time-of-flight mass spectrometry. Rapid Commun Mass Spectrom 9(1995) 1044–1050.
Vesterberg, O. Synthesis and isoelectric fractionation of carrier ampholytes. ActaChem. Scand 23 (1969) 2653–2666.
von Haller PD, Donohoe S, Goodlett DR, Aebersold R, Watts JD. Mass spectro-metric characterisation of proteins extracted from Jurkat T cell detergent-resis-tant membrane domains. Proteomics 1 (2001) 1010–1021.
Vorm O, Roepstorff P, Mann M. Improved resolution and very high sensitivity inMALDI-TOF of matrix surfaces made by fast evaporation. Anal Chem 66(1994) 3281–3287.
Vuillard L, Marret N, Rabilloud T. Enhancing protein solubilization with nonde-tergent sulfobetains. Electrophoresis 16 (1995) 295–297.
Wagner H, Kuhn R, Hofstetter S. Praxis der pr�perativen Free-Flow-Elektrophor-ese. In: Wagner H, Blasius E. (Eds.) Praxis der elektrophoretischen Tren-nmethoden. Springer-Verlag, Heidelberg (1989) 223–261.
Wagner K, Miliotis T, Marko-Varga G, Bischoff R, Unger KK. An automated on-line multidimensional HPLC system for protein and peptide mapping withintegrated sample preparation. Anal Chem 74 (2002) 809 –820.
Wang H, Hanash S. Intact-protein based sample preparation strategies for pro-teome analysis in combination with mass spectrometry. Mass Spec Reviews24 (2005) 413–426.
Washburn MP, Wolters D, Yates JR III. Large scale analysis of the yeast pro-teome by multidimensional protein identification technology. Nature Biotech-nol 19 (2001) 242–247.
Wasinger VC, Cordwell SJ, Cerpa-Poljak A, Yan JX, Gooley AA, Wilkins MR,Duncan MW, Harris R, Williams KL, Humphery-Smith I. Progress with gene-product mapping of the mollicutes:Mycoplasma genitalium. Electrophoresis16 (1995) 1090–1094.
Weber K, Osborn M. The reliability of molecular weight determinations by do-decyl sulphate–polyacrylamide gel electrophoresis. J Biol Chem 244 (1968)4406–4412.
Weiss W, Vogelmeier C, Gçrg A. Electrophoretic characterization of wheat grainallergens from different cultivars involved in bakers asthma. Electrophoresis14 (1993) 805–816.
Wells L, Vosseller K, Cole RN, Cronshaw JM, Matunis MJ, Hart GW. Mappingsites of O-GlcNAc modification using affinity tags for serine and threoninepost-translational modifications. Mol Cell Proteomics 1 (2002) 791–804.
Wenger P, de Zuanni M, Javet P, Righetti PG. Amphoteric, isoelectric Immobi-line membranes for preparative isoelectric focusing. J Biochem Biophys Meth-ods 14 (1987) 29–43.
Werhahn W, Braun H-P. Biochemical dissection of the mitochondrial proteomefrom Arabidopsis thaliana by three-dimensional gel electrophoresis. Electro-phoresis 23 (2002) 640–646.
457

References
Wessel D, Fl�gge UI. A method for the quantitative recovery of protein in dilutesolution in the presence of detergents and lipids. Anal Biochem 138 (1984)141–143.
Westermeier R, Postel W, Weser J, Gçrg A. High-resolution two-dimensionalelectrophoresis with isoelectric focusing in immobilized pH gradients. J Bio-chem Biophys Methods 8 (1983) 321–330.
Westermeier R. Electrophoresis in Practice. Fourth Edition. WILEY-VCH, Wein-heim (2004).
Westermeier R, Gçrg A. Two-dimensional Electrophoresis in Proteomics. In Pro-tein Purification. Third edition (JC Janson , L Ryd�n, Eds) WILEY-VCH, NewYork (2006) in press.
Westermeier R. Isoelectric focusing. In Cutler P. (Ed.) Protein Purification Proto-cols. Second edition. Methods in Molecular Biology, Volume 244, HumanaPress, Totowa, NJ (2004) 225–232.
Westermeier R, Marouga R. Protein detection methods in proteomics research.Bioscience Reports 25 (2005) 19–32.
Westermeier R, Scheibe B. Difference gel electrophoresis based on lys/cys tag-ging. In Posch A. Ed. Sample Preparation for 2D PAGE. Methods in Molecu-lar Biology, Humana Press, Totowa, NJ (2007) in press.
Whittal RM, Li L. High resolution matrix-assisted laser desorption ionisation ina linear time-of-flight mass spectrometer. Anal Chem 67 (1995) 1950–1954.
Wiegand G, Parbel A, Seifert MHJ, Holak TA, Reuter W. Purification, crystalliza-tion, NMR spectroscopy and biochemical analyses of peptides. Eur J Biochem269 (2002) 5046–5055.
Wildgruber R, Harder A, Obermaier C, Boguth G, Weiss W, Fey SJ, Larsen PM,Gçrg A. Towards higher resolution: Two-dimensional electrophoresis of Sac-charamyces cerevisiae proteins using overlapping narrow immobilized pHgradients. Electrophoresis 21 (2000) 2610–2616.
Wiley WC and McLaren IH. Time-of-flight mass spectrometer with improvedresolution. Rev Sci Instrum 26 (1955) 1150–1157.
Williams RCJ, Shah C, Sackett D. Separation of tubulin isoforms by isoelectricfocusing on immobilized pH gradient gels. Anal Biochem 275 (1999) 265–267.
Wilm M, Mann M. Analytical properties of the nanoelectrospray source. AnalChem 68 (1996) 1–8.
Wilm M, Neubauer G, Mann M. Parent ions scans of unseparated peptide mix-tures. Anal Chem 68 (1996) 527–533.
Wilm M, Shevchenko A, Houthaeve T, Breit S, Schweigerer L, Fotsis T, Mann M.Femtomole sequencing of proteins from polyacrylamide gels by nano-electro-spray mass spectrometry. Nature 379 (1996) 466–469.
Wiltfang J, Arold N, Neuhoff V. A new multiphasic buffer system for sodiumdodecyl sulfate-polyacrylamide gel electrophoresis of proteins and peptideswith molecular masses 100 000 – 1000, and their detection with picomolarsensitivity. Electrophoresis 12 (1991) 352–366.
Wittig I, Braun H-P, Sch�gger H. Blue native PAGE. Nature Protocols 1 (2006)419–428.
Wu J, Lenchik NJ, Pabst MJ, Solomon SS, Shull J, Gerling IC. Functional charac-terization of two-dimensional gel-separated proteins using sequential stain-ing. Electrophoresis 26 (2005) 225 – 237
Yao X, Freas A, Ramirez J, Demirev PA & Fenselau C. Proteolytic 18O labelingfor comparative proteomics: model studies with two serotypes of adenovirus.Anal Chem 73 (2001) 2836–2842.
458
References
Xie H, Bandhakavi S, Griffin TJ.Evaluating preparative isoelectric focusing ofcomplex peptide mixtures for tandem mass spectrometry-based proteomics: acase study in profiling chromatin-enriched subcellular fractions in Saccharo-myces cerevisiae. Anal Chem 77 (2005) 3198–3207.
Yan JX, Harry RA, Spibey C, Dunn MJ. Postelectrophoretic staining of proteinsseparated by two-dimensional gel electrophoresis using SYPRO dyes. Electro-phoresis 21 (2000) 3657–3665.
Yan JX, Devenish AT, Wait R, Stone T, Lewis S, Fowler S. Fluorescence 2-D Dif-ference Gel Electrophoresis and mass spectrometry based proteomic analysisof Escherichia coli. Proteomics 2 (2002) 1682–1698.
Yan JX, Wait R, Berkelman T, Harry RA, Westbrook JA, Wheeler CH, Dunn MJ.A modified silver staining protocol for visualization of proteins compatiblewith matrix-assisted laser desorption/ionization and electrospray ionization–mass spectrometry. Electrophoresis 21 (2000) 3666–3672.
Yang Z, Hancock WS, Chew TR, Bonilla L. A study of glycoproteins in humanserum and plasma reference standards (HUPO) using multilectin affinitychromatography coupled with RPLC-MS/MS. Proteomics 5 (2005) 3353–3366.
Yates JR III, Speicher S, Griffin PR, Hunkapiller T. Peptide mass maps: a highlyinformative approach to protein identification. Anal Biochem 214 (1993) 397–408.
Yates JR III, Eng JK, McCormack AL, Schieltz D; Method to correlate tandemmass spectra of modified peptides to amino acid sequences in the proteindatabase. Anal Chem 67 (1995) 1426–1436.
Yates JR, Cociorva D, Liao J, Zabrouskov V. Performance of a linear ion trap-orbi-trap hybrid for peptide analysis. Anal Chem 78 (2006) 493–500.
Yun M, Mu W, Hood L, Harrington MG. Human cerebrospinal fluid proteindatabase: edition 1992. Electrophoresis 13 (1992) 1002 –1013.
Zerr I, Bodemer M, Otto M, Poser S, Windl O, Kretzschmar HA, Gefeller O,Weber T. Diagnosis of Creutzfeldt–Jacob disease by two-dimensional gel elec-trophoresis of cerebrospinal fluid. Lancet 348 (1996) 846–849.
Zhang H, Zha X, Tan Y, Hornbeck PV, Mastrangelo AJ, Alessi DR, PolakiewiczRD, Comb MJ. Phosphoprotein analysis using antibodies broadly reactiveagainst phosphorylated motifs. J Biol Chem 277 (2002) 39379–39387.
Zhang N, Li N, Li L. Liquid chromatography MALDI MS/MS for membrane pro-tein analysis. J Proteome Res 3 (2004) 719–727.
Zhou W, Merrick BA, Khaledi MG, Tomer KB. Detection and sequencing ofphosphopeptides affinity bound to immobilized metal ion beads by matrix-assisted laser desorption/ionization mass spectrometry. J Am Soc Mass Spec-trom. 11 (2000) 273–282.
Zhou H, Watts JD, Aebersold R. A systematic approach to the analysis of proteinphosphorylation. Nat Biotechnol. 19 (2001) 375–337.
Zhou S, Bailey MJ, Dunn MJ, Preedy VR, Emery PW. A quantitative investiga-tion into the losses of proteins at different stages of a two-dimensional gelelectrophoresis procedure. Proteomics 5 (2005) 2739–2747.
Zischka H, Weber G, Weber PJA, Posch A, Braun RJ, B�hringer D, SchneiderU, Nissum M, Meitinger T, Ueffing M, Eckerskorn C. Improved proteomeanalysis of Saccharomyces cerevisiae mitochondria by free-flow electrophore-sis. Proteomics 3 (2003) 906–916.
Zubarev RA, Kelleher NL, McLafferty FW. Electron capture dissociation of multi-ply charged protein cations. A nonergodic process. J Am Chem Soc. 120(1998) 3265–3266.
459


461
Term Definition
General
Analysis of variance(ANOVA)
Statistical tool to test differences among severalgroup means, whether they are different enoughnot to have occurred by chance.
Background subtraction The process in which the background (chemicaland detector noise) is subtracted, leaving the peaksabove the noise at the base level.
Dalton (Da) According to the guidelines of the SI, the use of theterm Dalton for 1.6601 � 10–27 kg is no longerrecommended. However it is still a current unit inbiochemistry.
Dendrogram A tree diagram to display data sets partitioned intoclusters.
Expression proteomics The massive parallel study of highly heterogeneousprotein mixtures with high throughput techniqueslike 2-D electrophoresis and MALDI mass spec-trometry or MDLC-ESI MS.
Functional proteomics This research is only possible with non-denaturedcell extracts and requires different tools than 2-Delectrophoresis and MALDI MS. A smaller subsetof proteins is isolated from the highly heteroge-neous protein lysate and analyzed with mild tech-niques that do not affect protein complexes andthree-dimensional structures.
Heat map A two-dimensional diagram to display data sets par-titioned into clusters indicated by false color repre-sentation.
Glossary of Terms
Proteomics in Practice. A Guide to Successful Experimental Design 2nd Ed.Reiner Westermeier, Tom Naven, and Hans-Rudolf HçpkerCopyright � 2008 WILEY-VCH Verlag GmbH & Co. KGaA, WeinheimISBN: 978-3-527-31941-1

Glossary of Terms
Term Definition
False discovery rate(FDR)
Statistical tool to determine new thresholds forlarge numbers of Student’s t-tests, to be 95% surethat a change is real.
K-means Statistical algorithm for clustering. In proteomics itcan be employed to produce clusters of proteinswhich vary in similar ways over time.
Laboratory workflowsystem
Database and computer network for the integratedlaboratory to control the entire workflow in the pro-teomics factory.
Molecular mass (Mr) The relative molecular mass is dimensionless. Inpractice and in publication the dimension Da (Dal-ton) is used. Particularly in electrophoresis the term“molecular weight” is frequently used.
Normalization All peaks are reported with peak heights relative tothe highest peak height or area in the spectrum.
Optical Density (O.D.) The unit O.D. for the optical density is mostly usedin biology and biochemistry and is defined as fol-lows: 1 O.D. is the amount of substance, which hasan absorption of 1 when dissolved and measured in1 mL in a cuvette with a thickness of 1 cm.
Post-translationalmodification (PTM)
Over 800 modifications of proteins have been iden-tified, common examples include phosphorylationand glycosylation. PTM analysis is an integral partof proteomics.
Principal componentanalysis (PCA)
Statistical tool for visualization of multidimensionaldata by reducing the dimensionality of the data set.
Proteome The complete profile of proteins expressed in a giv-en tissue, cell or biological system at a given time.
Proteomics Systematic analysis of the protein expression ofhealthy and diseased, or treated and untreated cells,tissues or biological fluids.
Quantification In many papers the term “quantitation” is used,which is incorrect. In gel electrophoresis only rela-tive quantification is possible, but the adjective “rel-ative” is omitted in most papers on this subject.
Surface plasmaresonance
A technique which measures biomolecular bindingevents in real time without the use of labels and hasbecome an established technique for measuringbiomolecular interactions
462

Glossary of Terms
Term Definition
Student’s t-test A statistical tool to check, whether the means of twogroups are statistically different from each other.
Electrophoresis
Analytical 2-D electro-phoresis
Proteins are loaded in amounts of 10–100 lg.Mostly broad pH intervals are used in the firstdimension.
Electroendosmosis(EEO)
In an electric field, fixed charges on the gelmatrix oron a glass surface are attracted by the electrode ofopposite sign. As they are fixed, they cannotmigrate.This results in a compensation by the counterflow ofH3O
+ ions towards the cathode for negative orOH-
ions towards the anode for positive charges. In gels,this effect is observed as a water flow.
Immobilized pHgradients
Polyacrylamide gels, which contain an in-built pHgradient, created by acrylamide derivatives, whichcarry acidic and basic buffering groups. Because animmobilized pH gradient is absolutely continuous,narrow pH intervals can be prepared, which allowunlimited resolution.
Isoelectric point (pI) The pH value where the net charge of an ampho-teric substance is zero. Because the pK values ofbuffering groups are temperature-dependent, this isvalid also for the pI. The pI of a protein that can bemeasured.
Phosphate-bufferedsaline (PBS)
140 mol/L NaCl, 2.7 mmol/L KCl, 6.5 mmol/LNa2HPO4, 1.5 mmol/L KH2PO4, pH 7.4.
Preparative 2-D electro-phoresis
Proteins are loaded in the lower mg amounts.Mostly narrow pH intervals are used in the firstdimension.
Rehydration The correct word is “rehydratation". Because thisword is a tongue-twister and is used many times forthe methodical description of the first dimensionseparation, the incorrect term “rehydration” is gen-erally used.
Two-dimensionalelectrophoresis
There are more than one possibility to combine twodifferent electrophoretic separation principles. Ifnot further specified, 2-D electrophoresis meansisoelectric focusing under denaturing conditionsfollowed by SDS polyacrylamide gel electrophoresis.
463

Glossary of Terms
Term Definition
Western blotting Electrophoretic transfer of separated proteins froman electrophoresis gel onto the surface of a proteinbinding membrane for immuno-detection.
Chromatography
IMAC IMAC is a technique for the enrichment of phos-phopeptides from complex mixtures.
Mass Spectrometry
Adduct peak Results from the photochemical breakdown of thematrix into more reactive species, which can add tothe polypeptide. Can also result from salt ions, Na+,etc., that are embedded in the matrix.
Average molecularweight
<2093.8>
average molecular weight
The mass of a molecule of a given empirical for-mula calculated using the average atomic weightsfor each element. An average mass is obtained inMALDI-TOF-MS when a peak is not isotopicallyresolved (see mono-isotopic molecular weight).
AQUA A method for absolute quantitation, employing syn-thetic peptides containing stable isotopes.
Base peak The most intense peak in a mass spectrum. A massspectrum is usually normalized so that this peakhas an intensity of 100%.
Bottom-up proteomics A strategy for protein ID within proteomics. In thisapproach separated proteins or complex proteinmixtures are digested and the resultant peptidesanalyzed by MS in order to identify the native pro-tein.
Calibrant A compound used for the calibration of an instru-ment.
Calibration A process where known masses are assigned toselected peaks. The purpose is to improve the massaccuracy of an MS instrument.
464

Glossary of Terms
Term Definition
Centroided mass peak The centroided mass peak is located at the weightedcentre of mass of the profile peak.
Collision induceddissociation (CID)
A process whereby an ion of interest, the precursorion, is selected, isolated, excited and fragmented bycollisions with an inert gas within the mass spec-trometer.
Daughter ion (seeproduct or fragment ion)
An ion resulting from CID performed on a precur-sor ion during a product ion MS/MS spectrum.
Digestion Cleavage of subject protein by proteolytic enzymes,including trypsin and chymotrypsin.
Dried droplet method Sample preparation method for MALDI-TOF MSapplicable to peptides, protein digests, and full-length proteins.
Electrospray ionization(ESI)
An ionization technique which enables the forma-tion of ions from molecules directly from samplesin solution. The ions formed in this process are pre-dominantly multiply charged. Commonly coupledwith analyzers capable of tandem mass spectrome-try (MS/MS). It is readily coupled with HPLC orcapillary electrophoresis.
Electron capturedissociation
An alternative fragmentation method to CID, whichgenerates peptide and protein sequence informa-tion, but is restricted to FT-ICR MS
Electron transferdissociation
A new fragmentation technique, non-ergodic in na-ture, that fragments peptides by transferring elec-trons to positively charged peptides and generatespeptide sequence information
External calibration A calibration is performed with a known calibrationmixture. The resultant calibration constants (file)are then applied to a separate sample.
Fragment ion (productor daughter ion)
See product ion.
Fragmentation A physical process of dissociation of molecules intofragments in a mass spectrometer. The resultantspectrum of fragments is unique to the molecule orion. Fragmentation data can be used to sequencepeptides and resultantly provide data for proteinidentification.
465

Glossary of Terms
Term Definition
Full length protein An intact polypeptide chain, constituting a proteinin its native or denatured state. The molecularweight of which can be determined accurately withMALDI and ESI MS.
ICAT Site specific labelling of cysteine residues with iso-tope-coded affinity tags for quantitative analysis
In-gel digestion The embedded protein in the gel is cleaved usingenzymes of known specificity. During the process,peptides are formed, which are extracted from thegel for subsequent analysis.
Internal calibration Calibration where known masses in each spectrumare used to calibrate that spectrum. Greater massaccuracy than an external calibration.
Ion detector A detector that amplifies and converts ions into anelectrical signal.
Ion gate Typically an electrical deflector that permits certainions through to later stages of ion optics (open), ordeflects unwanted ions out of the way of the laterstages of the mass spectrometer. Commonly usedin post-source decay (PSD) analysis for the selectionof a precursor ion.
Ion source Region of the mass spectrometer where gas phaseions are produced.
Ion transmissionefficiency
Refers to the fraction of the ions produced in thesource region that actually reaches the detector.
Ionization The process of converting a sample molecule intoan ion in a mass spectrometer.
Isotope Atoms of the same element having different massnumbers due to differences in the number of neu-trons.
Isotope abundance The relative amount in nature of certain atomic iso-topes.
ITRAQ labeling of up to primary amino groups with isoba-ric mass tags for quantitative analysis.
Linear time-of-flight(TOF) mass analyzer
Simplest TOF analyzer, consisting of a flight tubewith an ion source at one end and a detector at theother.
Mass accuracy The ability to assign the actual mass of an ion. Thisis typically expressed as an error value.
466

Glossary of Terms
Term Definition
Mass analyzer Second part of the mass spectrometer, separatingthe ions forms in the ion source according to theirm/z value. Examples of mass analyzers include iontrap, quadrupole, time-of-flight and magnetic sec-tor.
Mass range The area of interest to be measured in an experi-ment. Or the capability of the analyzer.
Mass spectrometer An instrument that measures the mass to-chargeratio (m/z) of ionized atoms or molecules. Com-prises three parts: an ion source, a mass analyzer,and an ion detector.
Mass spectrometry (MS) A technique for analyzing the molecular weight ofmolecules based upon the motion of a charged par-ticle in an electric or magnetic field.
Mass spectrum A plot of ion abundance (y-axis) against mass-to-charge ratio (x-axis).
Mass-to-charge ratio(m/z)
A quantity formed by dividing the mass of an ion(Da) by the number of charges carried by the ion.
Matrix Necessary for the ionization of sample molecules byMALDI. A small, organic compound which absorbslight at the wavelength of the laser.
Matrix-assisted laser de-sorption/ionization(MALDI)
Ionization technique, commonly used for the ion-ization of biological compounds. Sample is incorpo-rated into the crystal structure of the matrix andirradiated with the light from a laser.
Metastable ion An ion that decomposes into fragment ions and/orneutral species, during its passage through themass spectrometer.
MSn or MS/MS/MS Multistage tandem mass spectrometry where n isgreater than 2 and is used for further characteriza-tion, such as identifying sites of phosphorylation.
467

Glossary of Terms
Term Definition
Monoisotopic molecularweight
2092
.6
monoisotopic molecular weight
The mass of a molecule containing only the mostabundant isotopes, calculated with exact atomicweights. With respect to peptide analysis, themono-isotopic peak is the 12C peak, i.e. the firstpeak in the peptide isotopic envelope.
Multiple-charged ion Ion possessing more than a single charge. Charac-teristic of ESI.
Neutral loss scan A type of MS/MS experiment. Useful for the indica-tion of individual components in a complex mix-ture.
N-terminal amino acid The amino acid residue at the end of a polypeptidechain containing the free amino group.
Parent ion (precursorion)
Refers to the peak of an ion that will be selected forfragmentation in a product ion MS/MS or PSDspectrum.
Newton’s rings Interference pattern caused by light reflection be-tween a flat surface surface and an adjacent imper-fectly flat (slightly spherical) surface. It appears as aseries of concentric rings centered at the point ofcontact.
Peptide-mass finger-printing
Technique for searching protein databases for pro-tein ID. Subject protein is cleaved and the resultantcleaved peptide masses are used for a databasesearch.
Peak area The area bounded by the peak and the base line.Can be calculated by integrating the abundancesfrom the peak start to the peak end.
Peak height The distance between the peak maximum and thebaseline.
Peak resolution The extent to which the peaks of two componentsoverlap or are separated. Compare with FWHM.
468

Glossary of Terms
Term Definition
Peak width The width of a peak at a given height.
Post-source decay (PSD) A technique describing fragmentation of a precur-sor ion that occurs in the first field free region ofthe TOF before the reflectron.
Precursor ion (parention)
Ion selected to undergo fragmentation within themass spectrometer in a product ion MS/MS or PSDspectrum.
Precursor ion scan A type of MS/MS experiment. Useful for the indica-tion of individual components in a complex mix-ture.
Product ion (seedaughter ion)
An ion resulting from CID performed on a precur-sor ion during a product ion MS/MS spectrum.
Product ion scan The principle MS/MS experiment. Involves theselection of a precursor ion to undergo fragmenta-tion within the MS.
Protein characterization The identification of structural aspects of a protein.Includes amino acid sequence, molecular weight,three-dimensional structure, post-translationalmodifications and biologic activity of a particularprotein.
Protein sequencing The determination of the order of amino acids in asubject protein or peptide.
Pulsed mass analyzer Includes time-of-flight, ion cyclotron resonance,and quadrupole ion traps. An entire mass spectrumis collected from a single pulse of ions.
Reflectron Improves resolution of a mass spectrometer by act-ing act as an ion mirror. Compensates for the distri-bution of kinetic energy, ions of the same massexperience in the source.
469

Glossary of Terms
Term Definition
Resolution
10 % valley
10 %
m∆
Refers to the separation of two ions where resolu-tion, R = m/m. For a single peak made up of singlycharged ions at mass m in a mass spectrum, theresolution maybe expressed as m/where m is thewidth of the peak at a height that is a specified frac-tion of the maximum peak height (for instance fullwidth at half maximum height; FWHM). A seconddefinition for defining resolution is 10% valley. Twopeaks of equal height in a mass spectrum at massesm and m–m are separated by a valley that at its low-est point is just 10% of the height of either peak.
Resolving power (mass)
5000
5001
mass resolution
The ability to distinguish between ions differingslightly in mass-to-charge ratio.
Sample preparation A crucial stage to achieve efficient, optimal ioniza-tion.
SDS electrophoresis Proteins are separated in a polyacrylamide gel asnegatively charged protein–detergent micelles. Sec-ondary, tertiary, quaternary structures and the indi-vidual charges of the proteins are cancelled. Themigration distances of the resulting zones from theorigin correlate roughly to the logarithm of theMr
of the respective protein.
Seeded microcrystallinefilm method
A sample preparation method. First, a thin layer ofsmall matrix crystals is formed on the sample slide.Then a droplet containing the analyte is placed ontop of this layer. This is left to dry. The deposit iswashed before the sample slide is inserted into themass spectrometer. Is a direct replacement of thedried droplet method.
470

Glossary of Terms
Term Definition
Signal-to-noise ratio(S/N)
The ratio of the signal height and the noise height.An indication of the sensitivity of an instrument oranalysis.
SILAC Stable isotope labeling with amino acids in cell cul-ture (SILAC) is an approach to in vivo incorporationof a label into proteins for MS-based quantitativeproteomics.
Slow crystallizationmethod
A sample preparation method. Here, large matrixcrystals are grown. The analyte is added to a saturat-ed matrix solution. Microcrystals are formed. Thesupernatant is removed and a slurry of crystals ismade. The slurry is then applied to the sampleslide, allowed to dry and inserted into the massspectrometer. Can be used when the dried dropletmethod has failed.
Tandem massspectrometry (MS/MS)
Used to elucidate structure within the mass spec-trometer. Three types of MS/MS experiment can beperformed.
Thin layer method A sample preparation method. Applying the matrixonto the substrate creates a very thin layer of matrix.A droplet of the analyte is then dried onto this layer.Contaminants can now be washed away before in-troducing the sample into the mass spectrometer. Avariant of the dried droplet method.
Threshold fluence The lowest laser fluence at which analyte can be ob-served in MALDI, fluence for optimal resolution.
Time-ion extraction(time lag focussing ordelayed extraction)
Improved resolution is obtained for a specifiedmass range by applying a controlled delay betweenion formation and acceleration, also called delayedextraction.
Time-of-flight (TOF)analyzer
Separates ions in time as they travel down a flighttube.
Top down proteomics A strategy for protein ID within proteomics. In thisapproach, proteins are fragmented directly by MSin order to identify the native protein.
Tuning The process of optimizing the MALDI instrument’slaser power and target position to obtain the bestpossible sensitivity and signal-to-noise ratio for aspecific type of experiment.
Unit resolution Distinguishes between ions separated by 1 m/zunit.
471

Glossary of Terms
Term Definition
Western blotting Electrophoretic transfer of separated proteins froman electrophoresis gel onto the surface of a proteinbinding membrane for immuno-detection.
472

473
1-D calibration 99, 118, 1311-D protein separation 272-D calibration 99, 119, 1312-D clean-up 632-D electrophoresis 3
aa-ion 246acid violet 17 98acidic electrophoresis 76acidic gels 23acrylamide 22acrylamide derivatives 42active rehydration 84active rehydration loading 93activity staining 34additives 78affinity chromatography 167–172, 190,
194, 196affinity chromatography and LC-MS/MS
187agarose 42agarose embedding 116agarose sealing 107albumin 66, 169–170, 190–191, 209alkylation 28, 56, 113–114aluminum oxide ceramics 86amino acid 153–154amino acid sequence 119amino acids 154, 171ammonium persulfate 22amphoteric 19amphoteric buffers 54amphoteric molecules 39analytical applications 61analytical gel 66analytical replicates 11anion exchanger 154antibodies 170, 196
antibody proteomics 7application point 84automated, sample preparation 68automated spot picker 26average mass 216azeotropic mixture 209
bb-ion 246
series 244, 24916-BAC 27, 34backed gels 126background 78background subtraction 131backing, film or glass 105band broadening 203, 206barcodes 138basic IPG gradients 50basic pH gradients 50, 79, 84, 89basic proteins 48, 56, 60batch processor 74Bind-Silane 26, 106biocompatible 197–198biological activity 152biological replicate 11biological variations 10biomarkers 10biorecognition 151biospecific recognition 171biotin labeling 76blot membranes 126blotting 35, 37, 107blue native electrophoresis 27, 32, 76body fluids, human 66bottom up 271Bromophenol blue 57, 113buffer concentration 112buffer ions 19buffer leakage 110
Index
Proteomics in Practice. A Guide to Successful Experimental Design 2nd Ed.Reiner Westermeier, Tom Naven, and Hans-Rudolf HçpkerCopyright � 2008 WILEY-VCH Verlag GmbH & Co. KGaA, WeinheimISBN: 978-3-527-31941-1

474 Index
buffer tank 112buffering capacity 41buffers 29
c12C isotope 216, 23513C isotope 216calibration, scanner 126capacity 161carbon dioxide 81carrier ampholytes 41, 57Cartesian coordinate system 115catalyst 22cationic detergent electrophoresis 34CCD camera 125, 128Cell disruption 60cell equivalents 61cell surface proteins 76cell walls 59, 61cellophane sheet 140ceramics 93cerebrospinal fluid 66chaotrope 56characterization 151charge 153charge state 224chelate 171chemical derivatization 262chemical methods 149chemicals, quality 102chromatofocusing 199chromatography media 154CID 243cleaning 94
strip holders 94clustering 135co-detection 74, 133COFRADIC 187collision induced dissociation 229, 243complex 33, 53, 62complexity 189–190, 213composition information 237concentration 153conductivity 87confocal optics 128contaminants 61contamination, keratin 102contaminations, keratin 56, 139continuous infusion 224conventional linear reflectron 251–252cooling efficiency 110Coomassie brilliant blue 32, 98, 121
colloidal 119, 121hot staining 120, 122
cross-contamination 198cross-linker 22
alternatives 27polyacrylamide gels 27
crosstalk 69crystallization, urea 78, 81CTAB 27, 34C-terminal ion series 245cup loading 57, 82, 84–85, 89, 95current, electric 87curved field reflectron 226cyanogen bromide 149CyDyes 35, 68
labeling 60cysteine tagging 69cysteines 114
dde novo sequencing 248–249deep-freezer 98delayed extraction 226, 235denaturing 152denaturing conditions 55, 200–201depletion 68, 152, 168–170, 176, 191, 196depletion of the buffer 29derivatization 249, 252, 255desalting 152, 205–206, 208DeStreak 56–57, 114detergent 32, 55, 56, 87, 173
zwitterionic 56dextrane gels 42dialysis membrane 62difference gel electrophoresis 68differential analysis 12differentially labeled samples 126DIGE 7, 33, 68, 122, 132digestion, in-gel 138digitonin 34discontinuous buffer 29discontinuous field electrophoresis 21disruption 61disulfide bridges 28dithiothreitol 114DNAse, sample preparation 61dodecyl maltoside 34draining valve 112Drosophila melanogaster 263dynamic capacity 161dynamic range 123, 125, 174, 190–192,
197, 202, 211
eE.coli 98ECL 36

475Index
Edman sequence analysis 258Edman sequencing 215electric conditions
IEF 87SDS gels 117
electric field 41electric field strength 87–88electroendosmosis 21, 46electroendosmotic effects 52, 78, 114, 116electron transfer dissociation 256electrophoresis 19, 151, 155, 172, 175,
194, 196, 199, 201, 213electrophoretic desalting 62, 95electrophoretic mobility 28electrospray 5electrospray ionization 218, 222eluent 208elution 157emission filters 69enhanced chemiluminescence 36enrichment 152–153, 167Epicoccum nigrus 123equilibration 98, 113ESTdatabases 236estimation, of pI 99ethyleneglycol 32evaluation, 2-D gels 125exchangeable hydrogens 237excitation filters 69experimental design 75exponential gradient 25expressed sequenced tag (EST) 247Expression Proteomics 12
ffalse color image 70false color representation 69Far Western Blotting 38, 273fast atom bombardment 218fiber optic 127film remover 108film support 26
for gels 106film-supported gel strips 50filtering 269flatbed apparatus 108flatbed system 109, 115flow-through 190, 201, 205, 207, 210fluorescence 60
labeling, staining 106, 120, 122, 123fluorescence imagers 126fluorescence imaging 128fluorescent dyes 124, 126fluorescent minimal labeling 120
fluorescent saturation labeling 120focusing effect 39focusing time 85, 89Fourier transform ion cyclotron (FT-ICR)
232fraction size 210fractionation 153, 172, 190, 197fractions 153fragmentation 242fragmentation nomenclature 244free flow electrophoresis 20, 42free flow IEF 45FT-ICR MS 256Functional Proteomics 12
ggel casting 102gel filtration 153, 172–173, 194gel hotel 138gel permeation chromatography 172gel plug 105, 138gel rods 47–48gel size 26, 49, 108gel strengtheners 26gel thickness 101, 109gel-to-gel variations 76genomic sequence 2glutardialdehyde 124, 146glycerol 28glycine 29, 117glycoproteins 31, 123, 170–171, 190, 219glycosylated proteins 38, 100glycosylation 10, 229, 256, 258, 263gradient 157gradient drift 42, 48gradient gel 24, 31–32, 45, 100, 105gradient maker 105granulated gel 46
hhelium 243Henderson–Hasselbalch equation 43high molecular weight proteins 31, 64, 80high-abundancy 152high-abundancy proteins 168, 170, 176,
190–191high-energy CID 244high-throughput 110, 137highly abundant proteins 94homo-arginine 255homogeneous gel 31, 100homogeneous polyacrylamide gels 106horizontal gel 100horizontal streaking 85

476 Index
human plasma 9hybrid analyzers (quadrupole time-of-
flight) 230hydrolysis 29hydrolyzed 29hydrophobic 70, 155hydrophobic proteins 58, 68, 167, 196,
201hydrophobicity 34, 151hydroxyethyldisulfide 56
iidentification 151, 170, 196, 211IgG 169, 190IMAC 171–172, 190Image acquisition 125image analysis 125, 129Immobiline 43immobilized metal affinity
chromatography 171, 260immobilized pH gradients 42, 49–50immunoblotting 37immunoglobulin 66, 190immunoprecipitation 64in-gel digestion 145, 147injection volumes 202intact proteins 175, 189, 196, 199intensity 126intermediate steps 152, 189internal reference 132internal standard 7, 73–74, 134iodoacetamide 114ion exchange chromatography 151–153,
194, 198, 200ion exchanger 51ion separation 225ion source 218ionic strength 157Ionization 218IPG buffer 57IPG strip 77, 98isocyanate 56isoelectric focusing 36, 38, 42, 48, 77, 199
principle 39isoelectric membranes 51isoelectric point 39, 41, 155, 199isolation 153Isotope-coded affinity tags (ICAT) 265isotopes 216isotopic label 237, 248
jJoule heat 20
kkeratin 102, 235
llaboratory robot 139laboratory workflow system 67, 129, 138
IEF 91SDS PAGE 113
Laemmli buffers 23laser, scanner 128laser capture micro dissection 54LC-based 151, 175LC-MALDI 221LC-MS 171, 192lectin 170–171lectin affinity chromatography 263lectins 38, 170–171linear range 126lipid 63liquid chromatography 5, 151, 172, 175–
176, 194, 196loadability 52, 152–153, 208loading capacity 49, 153, 157, 173, 196,
198, 200, 208–210long shelf life 30low concentrated proteins 62low molecular weight 118, 172, 196low molecular weight proteins 31low-abundancy proteins 176, 191low-energy CID 244lysine labeling 70lysis solution 55, 58
mMALDI matrices 219MALDI-TOF 220maleimide 69manifold 94–95marker proteins 115mass accuracy 225–226, 235, 237mass spectrometry 2, 23, 53, 137, 151,
163, 174, 215mass spectrometry analysis 75mass spectrometry compatibility 124matrix 155, 157, 159–162, 164, 167–169,
173, 218matrix assisted laser desorption ionization
(MALDI) 218MDLC 5measurement, of pI 99membrane proteins 10, 32–33, 196
plant 67memory effects 2082-mercaptoethanol 56

477Index
metabolic labeling 266methyl esterification 237micelles 28microdialysis 62miniformat 49miniformate 111minimal labeling 70miscleavages 189mobility 85molecular mass 28molecular size 161, 172molecular weight 28
determination 118molecular weight marker 117monochromatic light 69, 128monoisotopic mass 216monolytic columns 208monomer solution, precooling 104MOWSE 237MS 170, 172, 174, 189, 191, 193MS/MS mode 229MSn 229, 256MudPIT 5multi-compartment 51multicompartment electrolyzers 52multiple gel runs 109multiplex 73, 123multiplex detection 37multiply charged ion 222, 223multiprotein complexes 188multivariate statistical tools 137m/z ratio 215m/z value 242
nN-terminal ion series 244nano-LC 231nanospray ionization 224narrow pH gradients 95narrow pH intervals 51native 152native conditions 55NEPHGE 48net charge 154–155, 157–158,
161, 201net charge curves 40neutral loss scan 243, 250, 262NHS ester 69nitrocellulose 35non-backed gels 140non-fluorescent support film 106non-ionic detergent 56non-labeling software approaches 268non-linear gradient 49
normalization 269nucleic acids, sample preparation 61
ooligomers 59overfocusing 88overload point 209overloading, proteins 65overswelling 79
ppaper bridge loading 57, 82, 84–85, 95paraffin oil 81parameters, spot detection 130parent ion scan 243PBS, cell washing 60peak capacity 152–153, 175, 194, 209peak volume 192, 211Peltier cooling 90, 112peptide detection 269peptide isotopic envelope 235peptide level 175, 189, 192–193, 212peptide mass fingerprint 234peptide mass fingerprint combined with
composition information 237, 238peptide separation 164–165, 174, 213
in gels 31peptides IEF 52peristaltic pump 105pH gradient 39–41
measurement 98pH gradient graphs 98pH gradient strips 48, 52phosphatase inactivation 60phosphatases 54phosphopeptide 260phosphoproteins 171–172phosphorylated proteins 123, 190phosphorylation 10, 229, 250, 256, 258pI, measurement 99pI prediction 52picking head 140picking list 139pinchcock clamp 105pixel format 125pKA values 154plant protein 59, 67plasma 168–171, 189–193, 196, 209plasma desorption 218polyacrylamide 42polyacrylamide buffer strips 23polyacrylamide gels 22polyacrylamide percentage 28polymer 159, 161, 198, 208

478 Index
pooled standard 75pooling 14pore size 22porosity gradients 24Post Source Decay (PSD) 251post-translational modifications 10, 54,
137, 171–172, 189, 236, 258power supply 90, 118PPF 189, 194pre-fractionation 6, 46, 152, 158–159, 167,
173, 176, 189–190, 193–200, 205,208–213
pre-fractionation of proteins 68pre-labeling 68precipitation 62, 68
during sample application 84precursor ion 243precursor ion scan 250, 262preparative 2-D gel 73preparative gels 66preparative IEF 21preparative protein loads 113pressure blotting 36principal component analysis 135principle of electrophoresis 19product ion MS/MS sequence data 234product ion scan 243product ion spectrum 243product ions 243productivity 159, 204protease inactivation 59protease inhibitors 59proteases 9protein arrays 8protein assay 65protein characterization 258protein cleavage 149
proteolysis 144trypsin 144
protein complexes 32protein concentrations 78protein detection 36protein digestion 189protein families 129protein identification 233, 247protein loading 109protein loads 95protein pre-fractionation 152protein purification 151–152, 194–195protein quantification 264protein separation 152proteome 1proteome analysis 151–153, 162, 168, 171,
174, 176, 195, 212
proteome maps 12Proteomics 1proteomics strategy 12proteomics workflows 19PSD 238, 249, 251PSD experiments 246PSD spectrum 240, 242pump, buffer circulation 112PVDF 35
qquadratic field 226quadratic field reflectron 238, 251–253quadrupole ion trap 228, 256quality, chemicals 102quantification 65, 126, 129quantitative 76quick runs 118
rradioactive labeling 121radioactive waste 24radiolabeling 126, 258randomization 134Rayleigh limit 222re-equilibration 159, 165, 203, 205–206ready-made gels 106ready-made IPG strips 49recovery 152, 158, 161–162, 167–168, 172,
189, 191–192, 198–199, 205, 208reducing 152reducing agent 28reductants 56reduction and alkylation 146reference proteome 73reflectron 226, 235
conventional linear field reflectron 226rehydration 51, 78, 90rehydration cassette 79–80rehydration loading 82, 84–85rehydration solution 78replicates 10reproducibility 29, 98resolubilization 64resolution 78, 152–153, 157–160, 162,
167–168, 172–175, 198, 201, 205,207–210, 226SDS gels 31
resolving gel 101reswelling tray 80reversed phase chromatography 148,
151, 162–165, 167, 175–176, 194–196,205, 210
reversible polyacrylamide gels 27

479Index
RNAse, sample preparation 61Rubisco 67run-to-run matching 269
sSaccharomyces cerevisiae 188same–same experiment 72sample amount 174, 189, 190, 201sample application 82sample complexity 175, 189sample extraction 196sample load 75, 191–192, 211sample preparation 28, 53, 174, 176, 190,
192, 196, 213sample size 10sample volume 84saturation dyes 35saturation labeling 71scanner 69, 126scanning CCD cameras 128SDS, sample preparation 58SDS electrophoresis 100SDS PAGE 6, 27SDS–protein complex 28selectivity 157–158semi-dry blotting 36semi-wet blotting 36sensitivity 120, 174, 189, 191–192, 209separation capacity 175separation power 153, 208separation times 205sequence coverage 211sequence information 247serial port 91, 112serum 152, 168–169, 171, 189–190, 192,
196shelflife, of gels 29shotgun proteomics 8sieving property 29silent polymerization 23silica 166, 198, 208silver staining 70, 120, 122, 124single particle electron microscopy 34size exclusion chromatography 172sodium dodecyl sulfate 28software, image analysis 130solubility 56, 85sonication, sample preparation 61specific staining 123spermine base 60spot cutting 138spot detection 119spot picking 125spot picking list 132, 137
spot positions 86for spot cutting 129
spotting 138sprayer 104stability 9stable isotope labeling 121, 264stable isotopes 262stacking gel 24, 101staining 98standard operation procedures 194standard sample 197standardization 137
sample preparation 68statistical analysis 129statistical tools 134statistics 11stepping the reflectron 251storage, run IPG strips 98storage phosphor imaging 126storage stability, of gels 30strategy, IEF optimization 97sub-microliter flow rates 224subcellular components 21success factors 174sulfobetain 59sulfonation 2552-sulfonly acetyl chloride 254super-complexes 33support cassette 107synthetic peptides 267systems biology 13
ttandem 199, 201–202, 205tandem IEX 199, 201tandem mass spectrometry 227, 234tank blotting 36target proteins 10TEMED 22, 105temperature 115, 118, 129
isoelectric focusing 86test sample 98theoretical isoelectric point 55theoretically expressed 2thermal conductivity 90thermal convection 104thiourea 58–59, 79three-dimensional electrophoresis 34throughput 159, 205, 212time delay integration 128time lag focusing 226time-of-flight analyzer 225timed delay ion extraction 235tissue analysis 54

480 Index
tissues 61titanium dioxide 261titration 43titration curve 40, 84, 154–155, 158titration curve analysis 40TOF/TOF 231top down 271top down proteomics 229top-down approach 8tracking dye 113transfer of hydrophobic proteins 114transfer steps 153transmission mode 126trap column 205–208tributylphosphine 56tricine 31, 117triple quadrupole analyzer 227Tris base 59truncations 189tryptic digestion 153tryptic peptides 5, 194, 211two-dimensional electrophoresis 53
uunderfocusing 88up-regulation 13urea 56, 114, 152, 173, 201, 204–206
in SDS gels 31UV detection 196, 201
vvan der Waals forces 155vertical chambers 111
vertical gels 101vertical Systems 109visible dyes 126volatile buffer 152volatile solvents 153voltage 87voltage ramping 87volthour integrals 88
wwater stable sulfonic NHS ester reagent
255web browser, imaging 137Western blotting 35, 49, 121workflow 15, 151, 174–175, 189, 192,
195–197, 212workstation, spot handling 138
xX-ray films 126
yy-ion 246y-ion series 245, 249, 252yeast two-hybrid technology 187
zzinc imidazol, negative staining 121zirconium dioxide 261zwitterionic detergents 59zymogram 34

481
GE and GE Monogram are trademarks of General Electric Company.Amersham Biosciences, BioDirectory, CAF, CleanGel, Cy, CyDye,DeCyder, Deep Purple, DeStreak, ECL, ECL Plex, Ettan, ExcelGel,Hoefer, Hybond, ImageMaster, ImageQuant, ImageScanner, Immo-biline, IPGphor, Labscan, Multiphor, MultiTemp, Personal Densit-ometer, Pharmalyte, PlusOne, Processor Plus, Rainbow, RESOURCE,Ruby, Sephadex, Sepharose, Sephacryl, SpinTrap, Superose, Super-dex, Typhoon, Typhoon Trio, UNICORN, and Drop Design are trade-marks of GE Healthcare Limited. Coomassie is a trademark of ICIplc. Crew is a trademark of Kimberly-Clark. Decon is a trademark ofDecon Laboratories Ltd. Excel, Microsoft and Windows are trade-marks of Microsoft Corp. GelBond is a trademark of FMC Corp. Non-idet is a trademark of Shell International Petroleum Co. Ltd. Pefablocis a trademark of Roche Group. Pyrex is a trademark of Corning, Inc.Sypro is a trademark of Molecular Probes, Inc. Triton is a trademarkof Union Carbide Chemicals & Plastic Co. Tween is a trademark ofICI Americas Inc.
2-D Fluorescence Difference Gel Electrophoresis (2-D DIGE) tech-nology is covered by US patent numbers 6,043,025, 6,127,134 and6,426,190 and equivalent patents and patent applications in othercountries and exclusively licensed from Carnegie Mellon University.
CyDye or portions thereof is manufactured under license from Car-negie Mellon University under US patent numbers 5,569,587,5,627,027 and equivalent patents in other countries. The purchase ofCyDye DIGE Fluors includes a limited license to use the CyDyeDIGE Fluors for internal research and development, but not for anycommercial purposes. A license to use the CyDye DIGE Fluors forcommercial purposes is subject to a separate license agreement withGE Healthcare.
GE Healthcare has patent applications pending relating to itsDeCyder software technology, including European patent applicationnumber 1,234,280. Deep Purple Total Protein Stain is non-exclusivelylicensed to GE Healthcare from Fluorotechnics Pty Ltd. Deep Purple
Legal Statements
Proteomics in Practice. A Guide to Successful Experimental Design 2nd Ed.Reiner Westermeier, Tom Naven, and Hans-Rudolf HçpkerCopyright � 2008 WILEY-VCH Verlag GmbH & Co. KGaA, WeinheimISBN: 978-3-527-31941-1

Legal Statements
Total Protein Stain may only be used for applications in life scienceresearch.
Ettan CAF MALDI Sequencing Kits are protected by patentsowned by Procter &Gamble Company and exclusively licensed to GEHealthcare and by joint patents issued to both companies. The pur-chase of Ettan CAF MALDI Sequencing Kits includes a limitedlicense to use the technology for internal research and development,but not for any commercial purposes. No right to perform or offercommercial services or products of any kind using the SequencingKits is hereby granted. A license to use the technology for commercialpurposes is subject to a separate license agreement with GE Health-care. Please contact the Product Director, Mass Spec. & SampleHandling, GE Healthcare, Bjçrkgatan 30, SE-75184, Uppsala, Swedenfor details about how to obtain such a license.
482
Copyright © 2022 FDOKUMEN