Global quantitative phosphoprotein analysis using Multiplexed Proteomics technology

Novel Pathophysiological Markers are Revealed by iTRAQ-based
Quantitative Clinical Proteomics Approach in Vascular Dementia
Arnab Datta1†, Jingru Qian2†, Ruifen Chong1, Raj N. Kalaria3,
Paul Francis4, Mitchell K.P. Lai1,5, Christopher P. Chen1,5*, Siu
Kwan Sze2*
1Department of Pharmacology, Yong Loo Lin School of Medicine,
National University of Singapore, Singapore
2School of Biological Sciences, Nanyang Technological
University, Singapore
3Institute for Ageing and Health, Newcastle University, Campus
for Ageing and Vitality, Newcastle upon Tyne, UK
4Wolfson Centre for Age-related Diseases, King’s College
London, London, UK
5Memory, Aging and Cognition Centre, National University Health
System, Singapore
†Equal contribution
*Corresponding authors
Correspondence:
1
2
3
4
5
6
7
8
9
10
11
12
13
14
15
16
17
18
19
Christopher P. Chen, FRCP, Tel.: +65 65163264, Fax: +65
67730579, Email: [email protected]
Siu Kwan Sze, PhD, Tel.: +65 65141006, Fax: +65 67913856, E-
mail: [email protected]
Running title: Quantitative Clinical Proteomics of Vascular Dementia
Keywords: vascular dementia; clinical proteomics; mass spectrometry; iTRAQ; vascular dysfunction; oxidative stress
20
21
22
23
24
2526
2728
ABSTRACT
Vascular dementia (VaD) is a leading cause of dementia in
adults together with Alzheimer’s disease with limited
treatment options. Poor understanding of the pathophysiology
underlying VaD is hindering the development of new therapies.
Hence, to unravel its underlying molecular pathology, an
iTRAQ-2D-LC-MS/MS strategy was used for quantitative analysis
of pooled lysates from Brodmann area 21 of well-characterized
cases of VaD and matched non-neurological control. A total of
144 differentially perturbed proteins out of 2281 confidently
identified proteins (false discovery rate = 0.3%) were
shortlisted for bioinformatics analysis. Western blot analysis
of selected proteins using samples from individual patients (n
= 10 per group) showed statistically significant increase in
the abundance of SOD1 and NCAM and reduced ATP5A in the VaD
cortex. This suggested a state of hypometabolism and vascular
insufficiency along with an inflammatory condition during VaD.
Elevation of SOD1 and increasing trend for iron-storage
proteins (FTL, FTH1) may be indicative of an oxidative
imbalance that is accompanied by an aberrant iron metabolism.
The synaptic proteins did not display a generalized decrease
29
30
31
32
33
34
35
36
37
38
39
40
41
42
43
44
45
46
47
48
49

in abundance (e.g. syntaxin) in the VaD subjects. This
reported proteome will offer a reference data set for future
basic or translational studies on VaD.
50
51
52

INTRODUCTION
Vascular dementia (VaD) is the second most common cause of
age-related dementia after Alzheimer’s disease (AD) [1].
Significantly extended life expectancy coupled with the
sedentary lifestyle is predicted to increase the incidence of
type 2 diabetes, hypertension and hyperlipidemia, all of which
are risk factors for vascular disease and subsequent vascular
cognitive impairment. The worldwide number of patients with
vascular causes of dementia is expected to rise assuming no
effective prevention strategies or curative treatments are
developed and implemented [2].
Knowledge of VaD pathophysiology has been lagging behind AD
for a number of reasons. The lack of suitable animal models
and difficulties in obtaining well-characterized clinical
samples has hampered the progress of basic and translational
research on VaD. Immunohistochemical, neurochemical and
electron microscopic studies using post-mortem clinical
samples remained the mainstay of mechanistic research [3-5].
Neuroimaging together with clinical observation in patients
has provided vital complementary information that forms the
basis for the current understanding of VaD [6]. Multiple
53
54
55
56
57
58
59
60
61
62
63
64
65
66
67
68
69
70
71
72
73

clinicopathologic substrates have been implicated in the
pathogenesis (e.g. cortical or subcortical microinfarcts,
demyelination of white matter, cribriform change of basal
ganglia and white matter), that links cerebrovascular changes
to cognitive impairment, independent of Alzheimer’s type
pathology [7]. However, the molecular events that drive these
vascular and parenchymal changes in the brain are still poorly
understood. Given the complexity and heterogeneity of
cerebrovascular disorder and the presence of co-morbidities in
VaD patients, it is likely that rather than an individual or
small number of proteins, multiple candidate proteins present
in networks are perturbed leading to the spectrum of cognitive
and behavioral symptoms.
The advent of quantitative proteomic technologies using
isobaric labeling strategy has made it possible to quantify
several proteins in a single experiment for comparative study
of global protein regulation across various biological
samples. Isobaric tag for relative and absolute quantification
(iTRAQ) is one of the most commonly used in vitro isotopic
labeling strategies in different areas of biological science
and medicine for simultaneously quantifying 4- or 8-plex
74
75
76
77
78
79
80
81
82
83
84
85
86
87
88
89
90
91
92
93
94
samples [8]. Clinical proteomics of dementia have flourished
in the recent times with a rapid increase in the number of
studies analyzing different parts of the post-mortem brain of
AD patients for expression profiling studies [9, 10]. Apart
from the well-known β-amyloid and tau hypothesis, the
involvement of pathological events such as excitotoxicity,
oxidative stress and inflammation has been highlighted. Post-
translational modifications such as carbonylation and
phosphorylation of various key proteins have also been found
to contribute to AD.
Despite having immense potential to elucidate disease
mechanisms, proteomic studies of VaD using preclinical or
clinical samples are lacking. Recently, we have successfully
applied an iTRAQ-based shotgun neuroproteomic strategy in the
area of ischemic stroke to study validated pre-clinical models
[11, 12], and ischemic infarcts from autopsied human brain
[13]. Here, we apply a similar iTRAQ-two dimensional-liquid
chromatography-tandem mass spectrometry (iTRAQ-2D-LC-MS/MS)
based quantitative proteomic approach on post-mortem VaD and
matched non-demented control specimens from Brodmann area
21(BA21) of the temporal lobe for better understanding of the
95
96
97
98
99
100
101
102
103
104
105
106
107
108
109
110
111
112
113
114
115
underlying molecular mechanism of VaD. We focused on the
temporal lobe because medial temporal lobe atrophy is a common
finding in dementia and our recent study suggested that there
is a vascular basis for neurodegeneration [14]. The temporal
lobe is also relatively free of large infarcts thus making it
ideal to detect the survival response of the demented brain
[15]. The iTRAQ experiment identified differentially expressed
proteins from the pooled lysates of the two groups.
Bioinformatics analysis of the proteomic data set revealed the
aberrant regulation of proteins related to multiple cellular
or subcellular events associated with VaD such as vascular
dysfunction and oxidative stress. Some representative
deregulated proteins were further validated by Western
Blotting (WB) using individual patients. This study is the
first quantitative proteomic investigation to reveal the
differential global proteomes between VaD and age-matched
control brain that provide a valuable data set for future
basic or translational studies with individual proteins to
propose potential therapeutic targets or biomarkers of VaD.
MATERIALS AND METHODS
Reagents
116
117
118
119
120
121
122
123
124
125
126
127
128
129
130
131
132
133
134
135
136
Unless indicated, all reagents and assay kits were purchased
from Sigma-Aldrich (St. Louis, MO, USA).
Patients and Clinical Assessments
We obtained frozen brain tissues from 10 non-demented elderly
controls and 10 age-matched VaD subjects. The tissues were
obtained from the Newcastle Brain Tissue Resource, Institute
for Ageing and Health, Newcastle University. Demographic
details of the subjects can be found in summarized form in
Table 1 and for individual subjects in the Supplemental Table
1. For this study, we assessed samples of the grey and white
matter from BA21 area of the temporal lobe. VaD was clinically
diagnosed using National Institute of Neurological Disorders
and Stroke and Association Internationale pour la Recherché et
l'Enseignement en Neurosciences criteria [16]. Pathological
diagnosis of VaD was defined by the presence of multiple or
cystic infarcts involving cortical and sub-cortical
structures, border-zone infarcts, lacunae (<15 mm), micro-
infarcts (visible by microscopy only) and small vessel disease
in sub-cortical structures in the general absence of
neurofibrillary tangles [15]. Clinical evidence of dementia
along with the same type or a combination of these lesions at
137
138
139
140
141
142
143
144
145
146
147
148
149
150
151
152
153
154
155
156
157

three different coronal levels was considered diagnostic for
VaD. None of the VaD cases exhibited tangle burden diagnostic
for AD or more than ‘sparse’ neuritic plaques as defined by
Consortium to Establish a Registry for Alzheimer’s Disease
(CERAD) [17, 18]. The cognitive assessments were made using
Mini-Mental State Examination (MMSE) [19]. MMSE is a 30-point
scale to evaluate the cognitive functions that cover
orientation, memory, and attention. MMSE also includes the
subject’s ability to follow verbal and written commands. All
control subjects were cognitively normal and they did not have
any history of dementia, neurological disease or psychiatric
conditions. The control participants did not qualify for the
neuropathological diagnostic criteria of AD as none of the
subjects had higher than Braak stage III/IV tangle burden or
more than ‘‘sparse’’ plaque counts by CERAD criteria.
Demographic and disease variables of the control and VaD
patients indicated comparable samples for analysis (Table 1,
Supplemental Table 1).
Ethical approval was granted by local research ethics
committees for this study (Newcastle upon Tyne Hospitals
Trust, UK) and permission for post-mortem research using brain
158
159
160
161
162
163
164
165
166
167
168
169
170
171
172
173
174
175
176
177
178
tissue was granted for this project. Additional approval for
this study was obtained from the Institutional Review Board of
the National University of Singapore. Informed consent was
also obtained from the guardians of the patients prior to
donation of brain tissues.
Experimental Design
The experimental design is described in Figure 1 and Table
1.Overall, it was divided into two phases, discovery and
validation phase. The major challenge of expression profiling
studies is to discriminate disease-specific changes from
individual variations. To discover a consensus proteomic
signature predictive of VaD and to gather enough amount of
starting material, equal weight of tissues were pooled group-
wise from 10 individual samples for the iTRAQ analysis in the
discovery phase. Pooling has been suggested to get rid of the
outliers or aberrant individual variations while highlighting
most consistent disease-specific changes [20]. The tryptic
digest from pooled control and VaD (n=10 for each group)
samples were labeled by two iTRAQ tags (114: control, 115:
VaD) of the 4-plex iTRAQ kit. The iTRAQ experiment was
repeated thrice (experimental replicate = 3, iTRAQ-1, iTRAQ-2,
179
180
181
182
183
184
185
186
187
188
189
190
191
192
193
194
195
196
197
198
199

iTRAQ-3) using the pooled digest. Injection for LC-MS/MS was
performed thrice (technical replicate = 3) for iTRAQ-1 and
iTRAQ-2 and four times (technical replicate=4) for iTRAQ-3 as
multiple injections give better coverage of the target
proteome with superior statistical consistency [21]. Thus, a
total of 10 (=3+3+4) MS injections were performed to generate
ten individual data sets that will allow for the calculation
of technical as well as experimental variations arising from
individual iTRAQ experiments. Post-proteomic validation of
selected proteins from the iTRAQ data set were performed on
individual patients (biological replicate =10 for control and
VaD group) using a separate tissue specimen from the BA21 area
of the same individual by WB analysis to measure the extent of
biological variation.
Proteomics
Sample Preparation
Sample processing including centrifugation and sonication were
performed at 4 °C unless mentioned otherwise. A biphasic
chloroform/methanol extraction coupled with acetone
precipitation was adopted with slight modifications as
200
201
202
203
204
205
206
207
208
209
210
211
212
213
214
215
216
217
218
219

described previously [22, 23]. This is to maximize the
recovery of various macromolecules and matabolites from scarce
clinical specimens suitable for downstream processing through
different –omics platforms. Briefly, equal quantities of
frozen tissues (w/w) were pooled in a group-wise manner and
grounded into fine powder using liquid nitrogen before being
suspended in a mixture of methanol (Merck KGaA, Darmstadt,
Germany), chloroform and water (J.T.Baker, Center Valley, PA,
USA) (1:1:2). The suspension was mixed for 1 h and
subsequently centrifuged (15 000 xg, 2 min) to obtain the
pellet. The non-polar chloroform fractions were kept for
separate studies. The previous step was repeated using a
mixture of methanol, chloroform and water (4:1:3) for washing
the pellet. The polar methanol-water phase was combined from
consecutive steps and mixed with acetone (overnight, 4 volumes
of acetone, -20°C) followed by centrifugation (15 000 xg,
5min) to precipitate the residual proteins. Methanol was used
subsequently to wash the protein containing pellets and remove
contaminants that were followed by centrifugation (15 000 xg,
2 min). Protein pellets were dissolved in 8M urea with
protease inhibitor cocktail (Complete (Roche; Mannheim,
220
221
222
223
224
225
226
227
228
229
230
231
232
233
234
235
236
237
238
239
240
Germany)) by intermittent sonication for 20 s (amplitude, 30%)
using a Vibra Cell high intensity ultrasonic processor (Jencon
Scientific Ltd.; Leighton Buzzard, Bedfordshire, U.K.). It was
subsequently centrifuged (20 000 xg for 30 min) to collect the
supernatant. The protein concentration of the supernatant was
determined by the bicinchoninic acid assay.
In-gel Tryptic Digestion and Isobaric Labeling
The samples (250 µg of proteins/ condition) were then reduced
(5 mM tris-(2-carboxyethyl) phosphine, 30 °C, 3 h) and
alkylated (20 mM methyl methanethiosulfonate in isopropanol,
room temperature, 45 min in dark) followed by a two-step
digestion (16 h + 4 h) at 30 °C with sequencing-grade modified
trypsin (Promega, Madison, WI, USA) at a ratio of 1:100
(trypsin: sample) in 50 mM triethylammonium bicarbonate
(TEAB). The tryptic digested peptides were desalted using Sep-
Pak C18 cartridges (Waters, Milford, MA, USA) and dried in a
vacuum centrifuge. The dried peptides were reconstituted into
0.5 M TEAB and labeled with respective isobaric tags of 4-plex
iTRAQ reagents (Applied Biosystems, Foster City, CA, USA) as
follows: control, 114; VaD, 115 (Figure 1). The labeled
241
242
243
244
245
246
247
248
249
250
251
252
253
254
255
256
257
258
259
260
peptides were combined and dried in a vacuum centrifuge. The
iTRAQ sample was desalted using Sep-Pak C18 cartridges and
dried before fractionation. Three batches of experimental
replicates were prepared separately as showed in the
experimental design.
Electrostatic Repulsion and Hydrophilic Interaction
Chromatography (ERLIC)
The mixture of iTRAQ-labeled peptides was fractionated using a
PolyWAX LP anion-exchange column (4.6 × 200 mm, 5 μm, 300 Å)
(PolyLC, Columbia, MD, USA) on a Prominence UFLC system
(Shimadzu, Kyoto, Japan) and monitored at the wavelength of
280 nm. Thirty five fractions were collected during a 60 min
gradient of 100% buffer A (0.1% acetic acid, and 10 mM
ammonium acetate in 85% acetonitrile (ACN)) for 5 min, 0-36%
of buffer B (0.1% formic acid (FA) in 30% ACN) for 25 min, 36-
100% of buffer B for 20 min, and 100% of buffer B for the last
10 min at a flow rate of 1 ml/min [24, 25]. Eluted fractions
were pooled into 26 fractions depending on the peak
intensities. They were dried in a vacuum centrifuge and
redissolved in 0.1% FA in 3% ACN for LC-MS/MS analysis.
261
262
263
264
265
266
267
268
269
270
271
272
273
274
275
276
277
278
279
280
Reverse Phase LC-MS/MS Analysis using QSTAR
Each fraction of redissolved iTRAQ-labeled peptides was
sequentially injected in triplicate and separated in a home-
packed nanobore C18 column with a picofrit nanospray tip (75
µm ID × 15 cm, 5 µm particles) (New Objectives, Woburn, MA,
USA) on a Tempo nano-MDLC system coupled with a QSTAR Elite
Hybrid MS (Applied Biosystems/MDS-SCIEX). Each fraction was
independently analyzed by the LC-MS/MS over a gradient of 90
min with the constant flow rate of 300 nl/min. Data
acquisition in QSTAR Elite was set to positive ion mode using
Analyst QS 2.0 software (Applied Biosystems). The precursors
with a mass range of 300-1600 m/z and calculated charge from
+2 to +5 were selected for fragmentation. For each MS
spectrum, 5 most abundant peptides at most above a 5-count
threshold were selected for MS/MS, and the selected precursor
was dynamically excluded for 20s with a mass tolerance of 0.1
Da. Smart information-dependent acquisition was activated with
automatic collision energy and automatic MS/MS accumulation.
The fragment intensity multiplier was set to 20 and maximum
accumulation time was 2s.
Mass Spectrometric Raw Data Analysis
281
282
283
284
285
286
287
288
289
290
291
292
293
294
295
296
297
298
299
300
301

Spectra acquired from each of the technical and experimental
replicates were submitted alone and together to ProteinPilot
Software (v 3.0, Revision Number: 114 732, Applied Biosystems)
for peak list generation, protein identification and
quantification against the concatenated target-decoy Uniport
human database (downloaded on 12 March 2012). User defined
parameters in ProteinPilot software were con gured asfi
described previously [11] with minor modifications as follows:
(i) Special factors, urea denaturation; (ii) Specify
Processing, quantitate, bias and background correction.
Default precursor and MS/MS tolerance for QSTAR ESI-MS
instrument were adopted automatically by the software. The
false discovery rates (FDR) of both peptide and protein
identi cation were set to be less than 1% (FDR =fi
2.0*decoy_hits/total_hits).
Bioinformatics Analysis
The open-source software Panther and David were used for the
enrichment analysis in various categories like Gene Ontology
and pathways by submitting Uniprot accession numbers of the
short-listed proteins [26, 27]. The human proteome was used as
a default background for David. The enrichment analysis in
302
303
304
305
306
307
308
309
310
311
312
313
314
315
316
317
318
319
320
321
322
David identifies overrepresentation of certain phenotype (i.e.
a group of proteins common to a specific pathway, class,
location, function, disease or any other attribute) from long
list of regulated proteins that did not occur only by chance.
Significances were expressed by fold of enrichment and p-value
before and after corrections with Benjamini-Hochberg or
modified Fisher’s exact test. Any phenotype was considered
enriched when the p-value was less than 0.01 and FDR less than
1% after corrections with both the above-mentioned methods.
Post-proteomic Validation
Sample Processing
The samples were briefly thawed on ice and manually dissected
to remove meninges and exclude the blood vessels and white
matter. Cleaned samples were then homogenized at 50 mg
tissue/ml in an ice cold cell lysis buffer (20 mM tris-HCl,
150 mM NaCl, pH 7.5) (Cell Signaling Technology, Danvers, MA,
USA). Protease inhibitor cocktail (Complete (Roche)) was added
immediately before use. Protein concentrations were measured
using a 2-D Quant kit (Amersham Biosciences, Piscataway, NJ,
USA).
323
324
325
326
327
328
329
330
331
332
333
334
335
336
337
338
339
340
341
342
WB Analysis
WB was performed after SDS-PAGE by probing with primary
antibodies at the indicated dilutions: anti-ACTB (beta-actin,
1:10000, mouse monoclonal; Millipore, Billerica, MA, USA),
anti-BCL2 (B-cell CLL/lymphoma 2, 1:1000, mouse monoclonal;
Santa Cruz Biotech, Santa Cruz, CA, USA), anti-ferritin
(1:4000, rabbit polyclonal; Abcam, Cambridge, UK), anti-HSPA4
(heat shock 70 kDa protein 4, 1:5000, mouse monoclonal;
Abcam), anti-ICAM5 (intercellular adhesion molecule 5, 1:1000,
rabbit polyclonal; Abcam), anti-NCAM (neural cell adhesion
molecule, 1:10000, rabbit polyclonal; Santa Cruz Biotech),
anti-PEA15 (phosphoprotein enriched in astrocytes, 1:800,
rabbit polyclonal; Abcam), anti-SOD1 (superoxide dismutase 1,
1:2000, rabbit polyclonal; Abcam), anti-syntaxin (1:10000,
mouse monoclonal; Milipore), anti-SYNPO (synaptopodin, 1:1000,
rabbit polyclonal; Abcam) and anti-VDAC1 (voltage-dependent
anion channel 1, 1:5000, mouse monoclonal; Santa Cruz
Biotech). Immunoblotting of ACTB was used as a loading
control. Apart from that, two commercially available antibody
cocktails were used; Mitoprofile Total OXPHOS Human WB
Antibody Cocktail (1:2000, mouse monoclonal, MS601;
343
344
345
346
347
348
349
350
351
352
353
354
355
356
357
358
359
360
361
362
363
Mitoscience, Eugene, Oregon) and Apoptosis Western Blot
Cocktail (1:250, MS1107; Mitoscience). MS601 consisted of five
antibodies targeting key proteins of oxidative phosphorylation
(i.e. NADH dehydrogenase [ubiquinone] 1 beta subcomplex
subunit 8, mitochondrial (NDUFB8); Cytochrome c oxidase
subunit 2 (MT-CO2), Succinate dehydrogenase [ubiquinone] iron-
sulfur subunit, mitochondrial (SDHB); Cytochrome b-c1 complex
subunit 2, mitochondrial (UQCRC2) and ATP synthase subunit
alpha, mitochondrial (ATP5A)). MS1107 detects 32 kDa pro-
caspase 3, 17 kDa active caspase 3, 89 kDa apoptosis-specific
cleaved Poly [ADP-ribose] polymerase 1 (PARP) along with
muscle actin which is incorporated as a loading control. This
cocktail does not react with full-length PARP. Twenty to forty
micrograms of proteins were used for WB depending on the
sensitivity of the specific antibody. Immunoreactivity was
detected by using an HRP chemiluminescent substrate reagent
kit (Invitrogen, Carlsbad, CA). A pooled sample was used to
normalize the inter-gel variation between repeated runs for
the same protein.
Statistical Analysis
364
365
366
367
368
369
370
371
372
373
374
375
376
377
378
379
380
381
382
383
All statistical analyses were performed using SPSS 13.0 for
Windows software (SPSS Inc.). Normality of data was first
checked using the Kolmogorov–Smirnov test. Independent sample
t-test was used to compare the means of control and VaD group.
Equal variances were assumed for the calculation of p-values
as the two groups had equal number of subjects (n = 10). Non-
parametric Mann-Whitney U Test was used for comparing non-
normal distributions. Correlations involving only continuous
data (i.e. age, post-mortem interval, and protein abundance)
were analyzed by Pearson’s product moment correlation.
Spearman’s rank correlation was used when one of the variables
are ordinal in nature (i.e. MMSE score, Braak staging, CERAD
score). Experimental data for WB analysis were presented as
mean ± SEM. Statistical significance was accepted at *p < 0.05
and **p < 0.01.
RESULTS
To understand the global proteomic change in VaD, pooled
tissue extracts were compared between groups of age-matched
control and VaD subjects by iTRAQ experiment.
Quality Control of iTRAQ Data Set
384
385
386
387
388
389
390
391
392
393
394
395
396
397
398
399
400
401
402
403

A strict cutoff of unused ProtScore ≥ 2 was used as the
qualification criteria to minimize the false positive
identification of proteins. With this criteria, 1569, 2039 and
1525 proteins were identified from the three iTRAQ experiments
with a FDR of <0.8%. To improve the confidence of
identification and quantification, all ten individual
injections from the three iTRAQ experiments were combined for
subsequent analysis. The combined data set had 2281 proteins
with a FDR of 0.3% using the ProtScore cut-off mentioned above
(Supplemental Table 2). The average number of unique peptides
(having a confidence level of ≥95%) detected per protein was
21.8. More than 55% of the proteins (1260 proteins) had ≥5
unique peptides, while around 14% of proteins were identified
with a single peptide. The average %coverage for the combined
data set was 28.2%, whereas around 39.4% of the proteins (901
proteins) had % coverage more than the average level.
Intriguingly, some proteins were identified with 100% sequence
coverage (e.g. Hemoglobin subunit beta (HBB), Gamma-synuclein,
and Fructose-bisphosphate aldolase C) (Supplemental Table 2).
This result is better than our previously published report
where a single iTRAQ experiment was performed to study the
404
405
406
407
408
409
410
411
412
413
414
415
416
417
418
419
420
421
422
423
424
regulated proteome [12]. To the best of our knowledge, this
data set is likely the biggest neuroproteomics data set from
similar iTRAQ based quantitative clinical proteomic study.
Next, the ratios were sorted using a p-value cut-off of 0.05 to
shortlist a set of 171 significantly perturbed proteins for
further analysis.
Estimation of threshold for Confidently Defining Perturbed
Proteins
To determine the cut-off for up- or down-regulation, the
deviation of ratios (i.e. 115/114) of individual proteins
between various technical and experimental replicates were
measured as described previously [11, 12]. The proteins that
have been confidently identified in at least 3 injections were
included. Accordingly, geometric mean, standard deviation and
%coefficient of variation (%CV) of 1878 proteins were
determined. The average %CV was around 13%. The %CV was less
than 20% and 40% for more than 84% and 98% of the proteins
(Figure 2). Based on this, the regulation threshold was set at
1.4 fold; ratio >1.40 or <0.71 was considered as up- or down-
regulated respectively. This resulted in a list of 144
425
426
427
428
429
430
431
432
433
434
435
436
437
438
439
440
441
442
443
444
proteins (6.3% of initial hits); where 72 each were up- and
down-regulated (Supplemental Table 3). This was advanced to
the next stage for bioinformatics analysis to retrieve hidden
biological trends.
Bioinformatics Analysis
Bioinformatics analysis revealed up-regulation of various
neurotransmitter signaling pathways (e.g. glutamate and
acetylcholine) while glycolysis, tricarboxylic acid cycle, ATP
synthesis and pyruvate metabolism were featured among the
down-regulated pathways. Recently, the up-regulation of GluR2
subunit of glutamatergic α-amino-3-hydroxy-5-methyl-4-
isoxazolepropionic acid receptor was reported in the BA22 area
of the VaD brain when compared with age-matched control and
mixed AD/VaD cases, which is concordant with the trends
observed in our study [28]. Proteins related to metabolic,
immune system process, cell adhesion and apoptosis exhibited
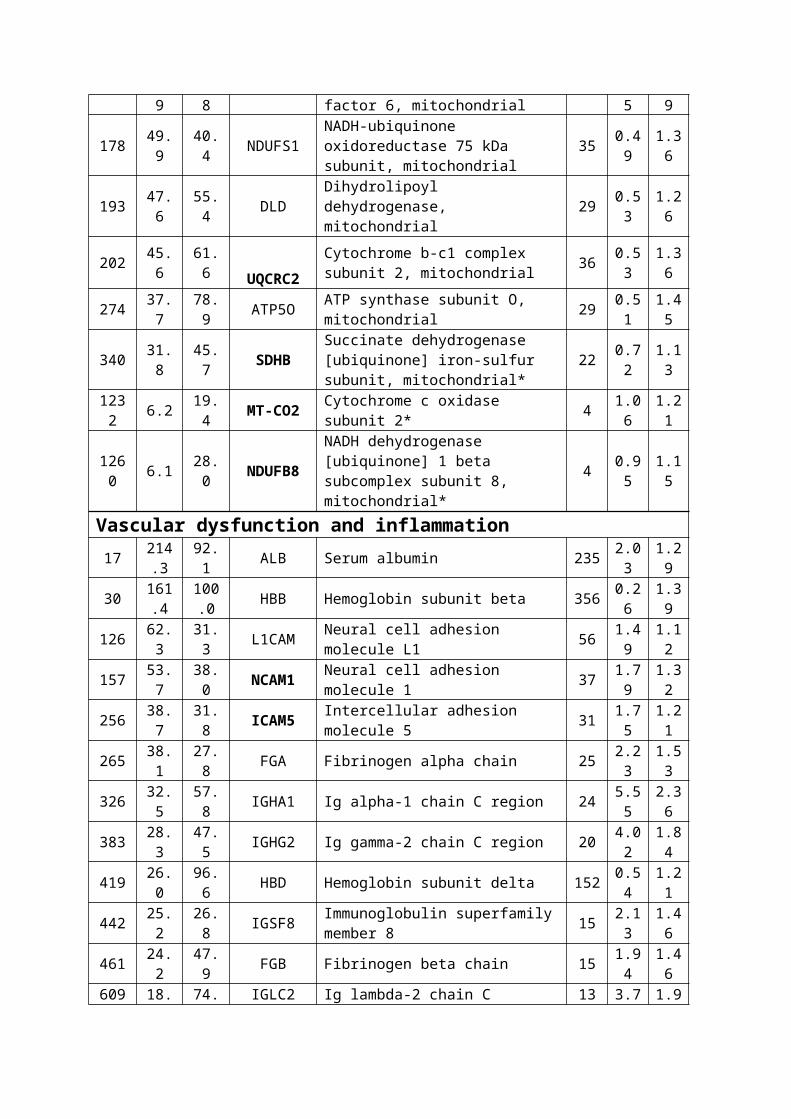
mixed trends. Majority of metabolic proteins (77.9%, 60/77)
were decreased in the VaD brain, while proteins linked to cell
adhesion (90.9%, 10/11) and immune system processes (61.1%,
11/18) were elevated. This is consistent with a recent RNA
microarray study reporting the up-regulation of genes
445
446
447
448
449
450
451
452
453
454
455
456
457
458
459
460
461
462
463
464
465

associated with cell adhesion and immune response in the deep
subcortical white matter lesion [29]. The levels of most of
the perturbed extracellular proteins (87.5%, 7/8) including
FGB, COL6A3, NCDN, VCAN, and NFASC were increased. Among the
perturbed protein classes, the calcium binding proteins (80%,
4/5; SLC25A3, SPTBN2, SPTBN1, PLEC) and chaperones (71.4%,
5/7; HSPB1, HSPA5, STIP1, CCT8, TBCA) were mainly elevated
while all proteases (5/5; e.g. NPEPPS, PREP and PSMA6) were
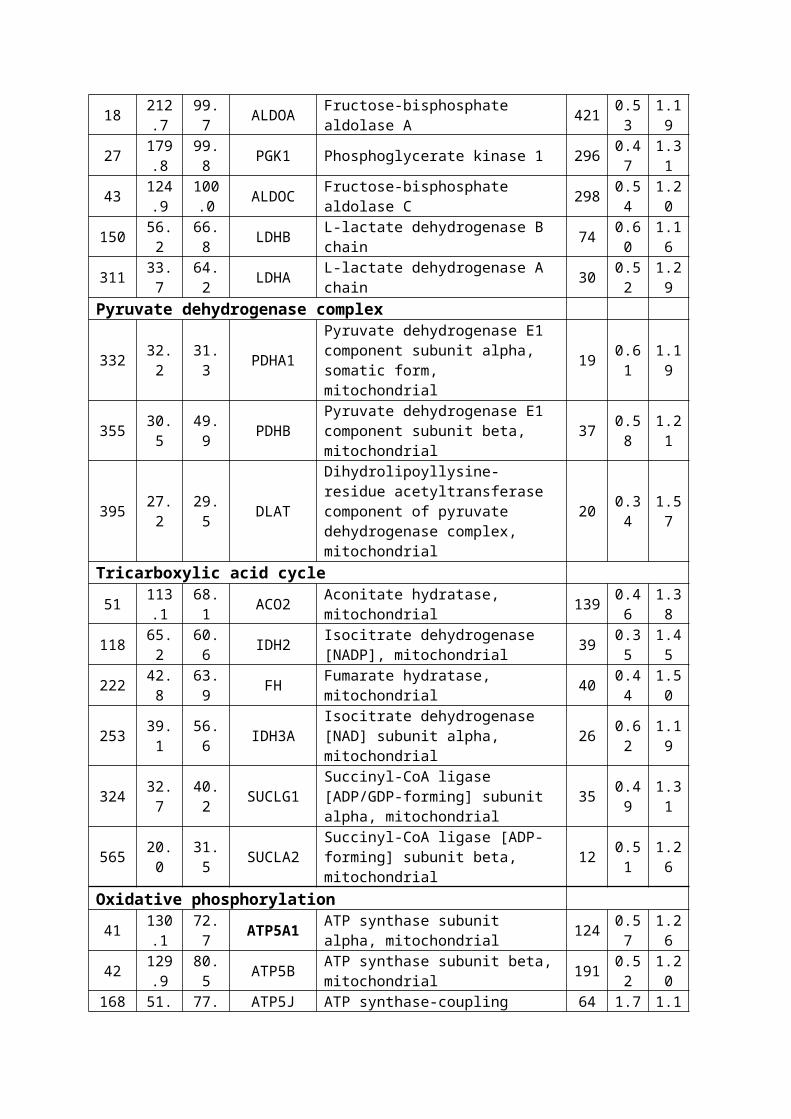
reduced in the VaD brain. Finally, guided by the above trends,
the selected list of proteins was manually classified into
various functional categories with additional proteins taken
from the complete data set based on their relevance with the
respective categories (Table 2).
Post-proteomic Validation by WB Analysis
Eleven proteins (i.e. SOD1, NCAM, ATP5A, UQCRC2, SYNPO, HSPA4,
VDAC1, ferritin, PEA15, ICAM5 and syntaxin) were selected from
the list of 171 significantly regulated proteins to perform
the validation on twenty subjects individually (Figure 3).
They were selected from a wide range of molecular functions
according to the bioinformatics analysis, such as energy
metabolism (e.g. ATP5A, UQCRC2), oxidative stress (e.g. SOD1,
466
467
468
469
470
471
472
473
474
475
476
477
478
479
480
481
482
483
484
485
486

ferritin), inflammation (e.g. NCAM, ICAM5), synaptic
transmission (e.g. SYNPO, syntaxin) and apoptosis (e.g. HSPA4,
PEA15, VDAC1). In addition, three more candidates (i.e. SDHB,
MT-CO2 and NDUFB8) related to oxidative phosphorylation were
also included as negative control to check the reliability of
the relative quantization as none of them were significantly
(p > 0.05) regulated in the proteomics result (Table 2). It
should be noted here that unlike iTRAQ experiment, which was
performed on pooled lysates, the p-value in the WB analysis is
an estimate of the biological variation based on the cohort of
twenty individuals.
The abundance of SOD1 (p = 0.014) and NCAM (p = 0.018) were
significantly higher whereas ATP5A (p = 0.047) and UQCRC2 (p =
0.006) were significantly lower in the VaD brain compared to
the control group. SYNPO (p = 0.062), HSPA4 (p = 0.100) and
VDAC1 (p = 0.168) showed a decreasing trend unlike ferritin (p
= 0.192), PEA15 (p = 0.114) and ICAM5 (p = 0.578) that showed
an increasing trend in the VaD group. A poor p-value for WB
analysis is related to higher individual variation in the
expression of a protein within the same group. Hence,
increasing the number of subjects per group could have
487
488
489
490
491
492
493
494
495
496
497
498
499
500
501
502
503
504
505
506
507
resulted in a statistically significant difference for some of
the above mentioned candidates. Considering the groups were
not gender-matched, individual abundances of all proteins from
WB results were compared between male (n = 9) and female (n =
11) to evaluate the influence of gender as a potential
confounding factor. The levels of UQCRC2 were found to be
significantly lower (p = 0.027) in male compared to female
subjects thus excluding it from further discussion.
Syntaxin did not exhibit any difference in between VaD and
control group during WB, although it was found to be up-
regulated (i.e. STX1A and STX1B, ~1.8 fold) in the iTRAQ
result (Table 2). This ambiguity can be related to the
sampling of an independent piece of tissue for proteomic and
WB validation experiment or may have arisen from the different
sample processing protocols. The three negative controls
(SDHB, MT-CO2 and NDUFB8) did not show difference between VaD
and control brain tissues in both WB and iTRAQ, indicating the
reliability of the sample pooling strategy in the discovery
phase. Overall, a consistent trend was observed with the iTRAQ
result for the selected proteins with the exception of
syntaxin.
508
509
510
511
512
513
514
515
516
517
518
519
520
521
522
523
524
525
526
527
528
Correlation Analyses
One of the major confounding factors for studies involving
post-mortem specimens of geriatric subjects is sampling
artifact that may alter pattern or magnitude of protein
expression [30]. Correlation analysis was performed for two
groups of subjects individually and in combination in order to
study linear associations between the immunoreactivities of
the key perturbed proteins and available neuropathological or
clinical variables. Individual abundances of none of the
proteins used for WB validation correlated with age or post-
mortem interval of the recruited subjects thereby excluding
the presence of systematic bias related to the sample
collection. Moderate to strong correlations were obtained in
between the abundances of various proteins selected for
validation. Notably, immunoreactivities of two significantly
elevated proteins in the VaD brain (i.e. SOD1 and NCAM) were
positively correlated with various mitochondrial proteins such
as VDAC1 (SOD1, r = 0.86, p < 0.01), SDHB (SOD1, r = 0.76, p <
0.05; NCAM, r = 0.65, p < 0.05), and MT-CO2 (SOD1, r = 0.71, p
< 0.05; NCAM, r = 0.80, p < 0.01) and were negatively
correlated with the synaptic protein, syntaxin (SOD1, r = -
529
530
531
532
533
534
535
536
537
538
539
540
541
542
543
544
545
546
547
548
549
0.77, p < 0.05; NCAM, r = - 0.69, p < 0.05). No association
was found between the protein levels and MMSE scores for the
VaD group. Detailed results of the correlation analysis can be
found in the Supplemental Table 4.
DISCUSSION
To our knowledge, this is the first comparative proteomic
profiling of post-mortem brain tissues of VaD and control
subjects by combining the attributes of biphasic
chloroform/methanol extraction for sample preparation,
multiplex isobaric labeling with iTRAQ reagent chemistry, two
dimensional liquid chromatography, nano-electrospray
ionization and high resolution tandem mass spectrometry
(iTRAQ-2D-LC-MS/MS).
Unraveling the Pathophysiology of VaD – A Systems Biological Perspective
To ensure specificity of dementia due to vascular cause and
not due to the presence of co-morbidities, extensive
neuropathological characterization was performed to exclude
confounding from two other possible causes of dementia (e.g.
AD and dementia with Lewy bodies (DLB)). The subjects of VaD
group did not have significant Alzheimer’s type of pathology
550
551
552
553
554
555
556
557
558
559
560
561
562
563564
565
566
567
568
569
570
as the neuritic plaques are confined to only entorhinal areas
of the brain (stage I-II) (Table 1). These stages are
generally considered to be without symptoms or be associated
with little evidence of dementia [31]. Additionally,
immunoreactivity of none of the tested fourteen candidates’
correlated with the Braak staging (n = 17), MMSE score (n = 7)
and CERAD score (n = 10) thus excluding probable etiological
association between key perturbed proteins with Alzheimer’s
pathology (Supplemental Table 4). Neuropathological data also
confirmed the absence of Lewy body pathology in the selected
subjects (data not shown). Hence, the presence of cognitive
impairment as seen by the low MMSE scores in the VaD group
(Table 1) is most likely to be related to cerebrovascular
pathology through the deregulation of different functional
classes of proteins found in the current data set.
Cortical Hypoperfusion and Vascular Dysfunction in VaD
The plasma proteins in our filtered data set may allow better
understanding of the perfusion status of the brain in VaD
subjects. The significantly up-regulated list of proteins in
the proteomic data set was dominated by different isoforms of
immunoglobins (e.g. IGHA1, IGHG2, IGSF8, IGLC2 and IGKC) and
571
572
573
574
575
576
577
578
579
580
581
582
583
584
585
586
587
588
589
590
591
other known plasma proteins (e.g. FGB). Intriguingly, HBB was
the protein with maximum fold of down-regulation. HBD also
showed significant down-regulation albeit with lesser
magnitudes (Table 2, Figure 4). Hemoglobins (i.e. HBB and HBD)
generally remained entrapped in the erythrocytes, which does
not extravasate beyond the circulation unless there is a
hemorrhage. The decreased presence of hemoglobin may be
indicative of a perfusion failure in the VaD cortex along with
a diffuse leakage of the blood brain barrier (BBB) that is
manifested by an apparent increase in the levels of several
proteins of circulatory source. In addition, we observed
significant down-regulation of a key component of oxidative
phosphorylation (i.e. ATP5A) while HSPA4 and mitochondrial
protein VDAC1 showed down-ward trends during WB validation
indicating a state of hypometabolism and mitochondrial failure
(Figure 3). Further, the up-regulation of an isoform of
collagen (i.e. COL6A3) in the iTRAQ result may indicate
accumulation of extracellular matrix components that could
cause collagenosis and vascular stenosis thus aggravating the
perfusion failure [32]. The unraveled molecular events from
our unbiased quantitative proteomic study may offer a
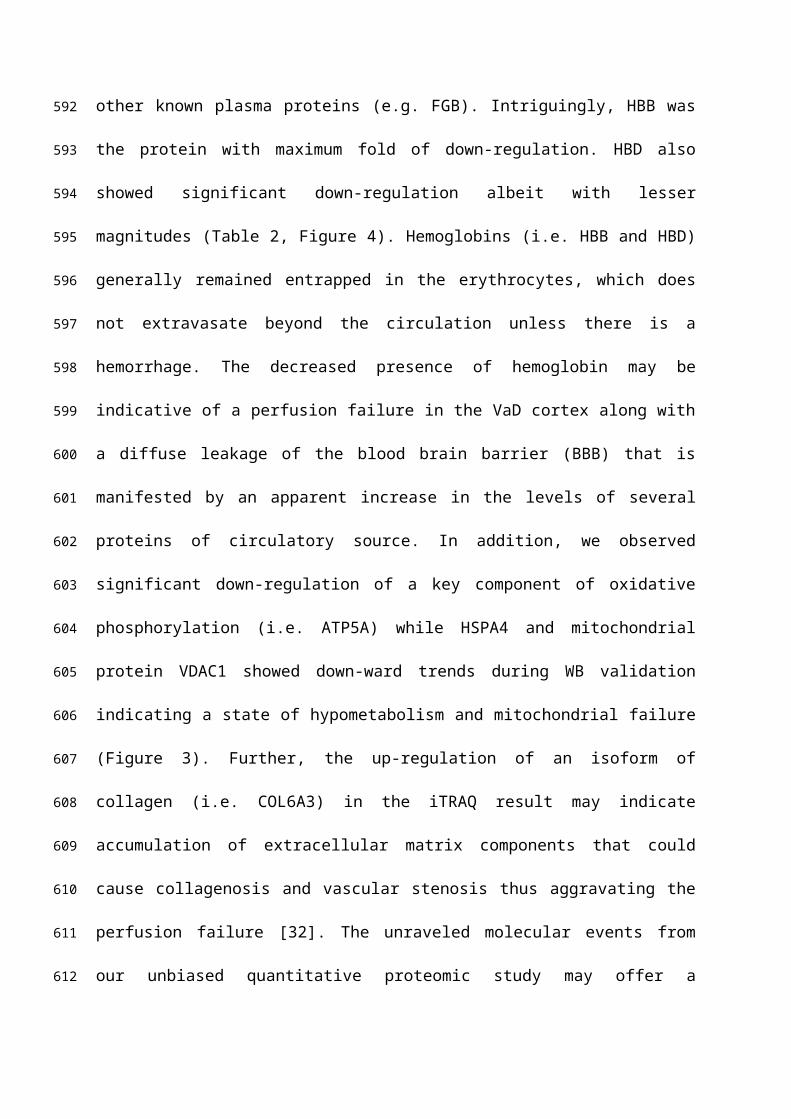
592
593
594
595
596
597
598
599
600
601
602
603
604
605
606
607
608
609
610
611
612

mechanistic explanation for previous observations from
neuroimaging and neuropathologic studies. The disruption of
BBB in small vessel disease has been documented using dynamic
contrast-enhanced magnetic resonance imaging in live patients
and through immunohistochemistry of immunoglobulins and
fibrinogen of brain tissue [33, 34]. Cortical hypometabolism
and hypoperfusion have been detected with functional imaging
like positron emission tomography in patients of VaD in
comparison with healthy controls [35] and by two-dimensional
xenon-133 inhalation technique in the ipsilateral fronto-
parietal cortex in the presence of sub-cortical infarcts [36].
Considering chronic leakage of fluid and macromolecules, a
likely consequence will be induction of an inflammatory
response in the temporal cortex of VaD brain. Subsequently,
curating the proteomic data set for other hallmarks of
inflammation identified few adhesion molecules (e.g. L1CAM,
NCAM1, ICAM5) showing an up-regulation in the VaD group (Table
2, Figure 3, 4). The decrease in HSPA4, which normally
functions as a chaperone and protects cells from inflammation
during cerebral ischemic injury, may further worsen the
inflammatory condition [37]. The levels of L1CAM and NCAM were
613
614
615
616
617
618
619
620
621
622
623
624
625
626
627
628
629
630
631
632
633
found to be higher in the cerebrospinal fluid (CSF) of VaD, AD
and MIX dementia patients compared to non-demented controls
[38]. Soluble form of ICAM5 has been detected in the serum
within the first 48 h of cerebral hypoxic-ischemic injury of
mice, where shredded neuronal ICAM5 could act as an anti-
inflammatory agent by suppressing the T-cell activation [39,
40].
Deregulation of Iron Metabolism and Oxidative Stress
In the human brain, iron is ubiquitous and is responsible for
the activity of key enzymes (e.g. cytochromes, mitochondrial
non-haem iron proteins) and for the synthesis of
neurotransmitters. Most of the total iron in healthy brain is
sequestered by ferritin thus limiting its pro-oxidant
potential. Brain ferritin-associated iron levels increase with
age. Abnormal elevation of brain iron and ferritin has been
reported in the neurodegenerative dementias (i.e. AD, PD and
dementia with Lewy Bodies) suggesting that increased iron
levels may contribute to the misfolding and subsequent
deposition of key proteins [41]. Although consistent
correlation between iron accumulation and cognitive
dysfunction has been documented in animal or clinical studies
634
635
636
637
638
639
640
641
642
643
644
645
646
647
648
649
650
651
652
653
654
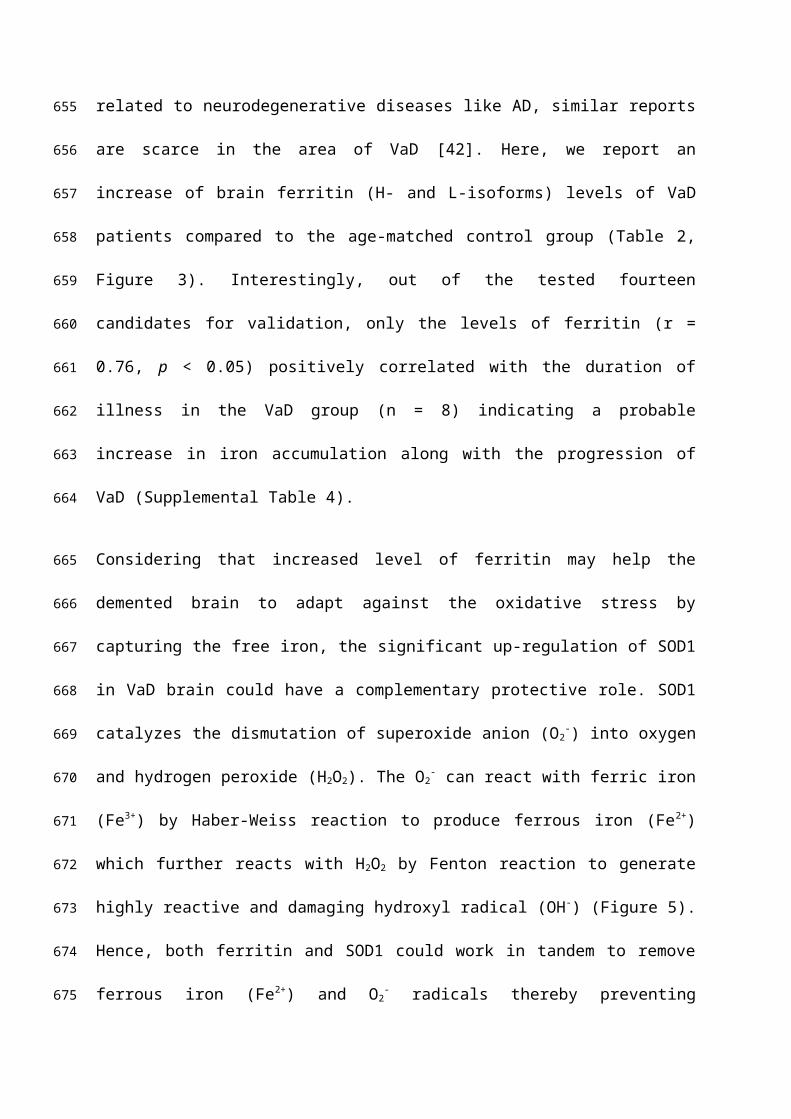
related to neurodegenerative diseases like AD, similar reports
are scarce in the area of VaD [42]. Here, we report an
increase of brain ferritin (H- and L-isoforms) levels of VaD
patients compared to the age-matched control group (Table 2,
Figure 3). Interestingly, out of the tested fourteen
candidates for validation, only the levels of ferritin (r =
0.76, p < 0.05) positively correlated with the duration of
illness in the VaD group (n = 8) indicating a probable
increase in iron accumulation along with the progression of
VaD (Supplemental Table 4).
Considering that increased level of ferritin may help the
demented brain to adapt against the oxidative stress by
capturing the free iron, the significant up-regulation of SOD1
in VaD brain could have a complementary protective role. SOD1
catalyzes the dismutation of superoxide anion (O2-) into oxygen
and hydrogen peroxide (H2O2). The O2- can react with ferric iron
(Fe3+) by Haber-Weiss reaction to produce ferrous iron (Fe2+)
which further reacts with H2O2 by Fenton reaction to generate
highly reactive and damaging hydroxyl radical (OH-) (Figure 5).
Hence, both ferritin and SOD1 could work in tandem to remove
ferrous iron (Fe2+) and O2- radicals thereby preventing
655
656
657
658
659
660
661
662
663
664
665
666
667
668
669
670
671
672
673
674
675
oxidative injury in the demented brain. Nevertheless, we also
observed an upward trend for GPX in the proteomic data set, an
enzyme that reduces H2O2 to water using reduced glutathione
(GSH). Several studies with animal models of ischemic stroke
(focal or global cerebral ischemia) have demonstrated the
neuroprotective potential of SOD1 [43]. In line with that, we
have seen reduced levels of SOD1 and elevated levels of
ferritin in the ischemic infarcts (i.e. core of injury), when
compared with matched control subjects [13]. Recently, SOD1
has been selected to genetically modify neural stem cells as
its overexpression has improved their survival following
intracerebral administration in rodent models of ischemic
stroke. This is consistent with the probable protective role
of SOD1 as discussed above [44].
Mechanisms of Cell Death in VaD
Inflammatory and oxidative stress mechanisms as discussed
above are suggested to precede apoptosis that finally causes
cell death in the demented brain [7, 29]. Recent studies have
demonstrated neuronal apoptosis as one of the contributing
pathways of cell death in the neocortex of cerebral autosomal-
dominant arteriopathy with subcortical infarcts and
676
677
678
679
680
681
682
683
684
685
686
687
688
689
690
691
692
693
694
695
696

leukoencephalopathy [45]. Hence, to elucidate the pathways
that seal the fate of the stressed cells in this group of VaD
patients, we had tested the expression of well-known apoptotic
markers that include pro-caspase 3, p17 subunit of active
caspase 3, cleaved PARP along with anti-apoptotic BCL2
protein. Pro-caspase 3 forms activated caspase 3 at the
initiation of apoptotic cascade that proteolytically cleaves
the DNA repair enzyme, PARP to generate the 89 kDa apoptosis-
specific PARP fragment. However, no significant differential
expression of pro-caspase-3 and BCL2 between VaD and control
subjects was observed (Figure 6). The PARP fragment and p17
subunit of caspase 3 remained undetected in either group
following WB analysis indicating absence of significant
degradation of the PARP enzyme by active caspase 3. Therefore,
our data points toward the involvement of non-apoptotic
pathways of cell death in the cortex of the studied VaD
patients. However, there is tantalizingly little data on the
underlying mechanisms of cell death in VaD and the
participation of autophagy has been speculated [7].
Overall, our quantitative proteomic approach documents the up-
regulation of seemingly protective and deleterious pathways
697
698
699
700
701
702
703
704
705
706
707
708
709
710
711
712
713
714
715
716
717
simultaneously in the temporal cortex of the VaD subjects. An
inflammatory condition (i.e. NCAM1) or vascular insufficiency
(e.g. HBB) and a decline in the energy metabolism (i.e.
ATP5A1) are accompanied by the up-ward trend for anti-
inflammatory (i.e. ICAM5), anti-apoptotic protein (i.e. PEA15)
or proteins related to iron storage (i.e. FTL, FTH1) or anti-
oxidative function (i.e. SOD1) (Figure 4). This penumbra-like
condition is not surprising considering the presence of
predominant sub-cortical lesions in these VaD subjects as we
deliberately sampled one neocortical area (i.e. BA21) that is
located at a distance from the epicenter of the vascular
injury. Accordingly, the synaptic proteins (e.g. syntaxin) did
not show an unanimous reduced expression indicating no
generalized synaptic decline as seen in case of AD affected
brain [5]. Hence, our proteomic result was able to identify
the key molecular substrates behind different pathological
processes that work in concert to cause the demise of the
brain cells in VaD. Further studies on larger cohort of
patients and with pre-clinical models could better explain
these aberrant regulations and their interactions with the
718
719
720
721
722
723
724
725
726
727
728
729
730
731
732
733
734
735
736
737
existing supportive therapies of VaD like cholinesterase
inhibitors, antioxidants or vasodilators.
LIMITATIONS
Being a study performed using PM specimens; the data
interpretation is limited by the availability of samples. The
groups were not matched by sex and gender was found to be a
confounding factor for one of the candidate proteins (i.e.
UQCRC2) shortlisted for WB validation. However, all other
proteins including pro-caspase-3 and BCL2 did not show
significant difference between male and female group. The
age of onset of VaD is variable among individuals along with
their different lifestyle and genetic backgrounds. Details of
co-morbidities, risk factors, medications and exact cause of
death are not available. Despite these limitations, they had
similar clinical and neuropathological presentations in a
group-wise manner that made the proteomic comparison of pooled
samples of identical brain location possible.
Our experimental design doesn’t include groups of subjects
with clinically or biochemically overlapping pathologies such
as AD, DLB or ischemic stroke for a comparative validation of
the short-listed candidates. Hence, conclusions of this study
738
739
740
741
742
743
744
745
746
747
748
749
750
751
752
753
754
755
756
757
758

are necessarily limited to VaD only as we are unable to
comment on the specificity of the reported candidates in the
context of other dementias or degenerative diseases. It would
be worthwhile to follow up the current work with samples from
other types of dementia or vascular pathologies to address the
question of individual protein’s specificity to the pathology
of interest.
Although confident identification of around 10% of human
proteome indicates the analytical sensitivity of the current
experimental design, cellular or subcellular localization and
distribution of the regulated proteins among different cell-
types are not clear from our experiment. We tried to partially
address this by selecting relatively cell-type specific
candidates (i.e. PEA15, syntaxin) for data interpretation and
validation. Immunohistochemical studies on similar samples
targeting some of the regulated candidates will be
complementary to this approach.
CONCLUSIONS
Our study is the first quantitative clinical proteomic study
demonstrating the deregulated proteome of the BA21 area of
759
760
761
762
763
764
765
766
767
768
769
770
771
772
773
774
775
776
777
778
temporal cortex of VaD patients in comparison with matched
non-demented control subjects. We have successfully applied a
novel sample preparation method compatible with the systems
approach to confidently identify 2281 proteins by iTRAQ
experiment using a group-wise sample pooling strategy. The
majority of the deregulated proteome has never been reported
in context of VaD or dementia. In addition, we were able to
obtain statistically significant difference of three candidate
proteins (SOD1, NCAM and ATP5A) between VaD and control brain
based on the WB analysis of twenty individual subjects. Some
of the key proteins that play crucial roles in the progressive
parenchymal and vascular changes during VaD, like cortical
hypoperfusion, hypometabolism, inflammation and oxidative
stress were identified in a single experiment. The parallel
aberrant regulation of multiple proteins may indicate an early
degenerative changes or an actively ongoing adaptive process
that can only be captured by a systems biological tool like
proteomics. The tissue samples represent the most proximal
source to determine the pathologic alteration of proteome that
could eventually be reflected in the CSF or plasma. Thus, the
up-regulated proteome could provide a list of potential
779
780
781
782
783
784
785
786
787
788
789
790
791
792
793
794
795
796
797
798
799
candidates for future exploration of biomarkers from body
fluids by targeted analysis in clinically similar cohorts of
VaD patients. Detailed understanding of these pathologic
events and their correlation with dementia and cerebrovascular
pathology through follow-up studies could provide potential
therapeutic targets for VaD.
ASSOCIATED CONTENT
Supporting Information
Supplemental Table 1. Demographics and Disease Variables of
Individual Patients for Groups of Control and VaD patients
Supplemental Table 2. Complete information of the full list of
the qualified proteins obtained from the bias and background
corrected iTRAQ data set
Supplemental Table 3. The List of Up- and Down-regulated
Proteins Short-listed Following a Two-step Filtering (p-value
< 0.05, cut-off = 1.4 fold) of the Complete List of
Confidently Identified Proteins
Supplemental Table 4. The List of Significant Correlations
Obtained through Pearson’s product moment Correlation
800
801
802
803
804
805
806
807
808
809
810
811
812
813
814
815
816
817
818
Performed Individually on VaD and Control Groups as well as on
Combined VaD/Control Group
ACKNOWLEDGEMENT
We are grateful to the patients, families and clinical house
staff for their co-operation in the investigation of this
study. We thank Michelle Widdrington, Carein Todd, Jean Scott,
Deborah Lett and Anne Nicholson for assistance in managing the
cases. Our work is supported by grants to Newcastle Centre for
Brain Ageing and Vitality (BBSRC, EPSRC, ESRC and MRC, LLHW),
and Alzheimer’s Research (ARUK). Tissue for this study was
collected by the Newcastle Brain Tissue Resource, which is
funded in part by a grant from the UK MRC (G0400074), by the
Newcastle NIHR Biomedical Research Centre in Ageing and Age
Related Diseases award to the Newcastle upon Tyne Hospitals
NHS Foundation Trust, and by a grant from the Alzheimer’s
Society and ARUK as part of the Brains for Dementia Research
Project. We thank Peter T.-H. Wong, Jasinda H. Lee, Chai Yuek
Ling for helpful discussions and experimental assistance. This
research is supported by the Singapore National Research
Foundation under its CBRG (NMRC/CBRG/0004/2012) and
819
820
821
822
823
824
825
826
827
828
829
830
831
832
833
834
835
836
837
838

administered by the Singapore Ministry of Health’s National
Medical Research Council.
CONFLICT OF INTEREST
None for this study.
REFERENCES
[1] O'Brien JT, Erkinjuntti T, Reisberg B, Roman G, Sawada T,
Pantoni L, et al. Vascular cognitive impairment. Lancet
Neurology. 2003;2:89-98.
[2] Kalaria RN, Maestre GE, Arizaga R, Friedland RP, Galasko
D, Hall K, et al. Alzheimer's disease and vascular dementia in
developing countries: prevalence, management, and risk
factors. Lancet Neurol. 2008;7:812-26.
[3] Kirvell SL, Elliott MS, Kalaria RN, Hortobagyi T, Ballard
CG, Francis PT. Vesicular glutamate transporter and cognition
in stroke: a case-control autopsy study. Neurology.
2010;75:1803-9.
[4] Elliott MS, Ballard CG, Kalaria RN, Perry R, Hortobagyi T,
Francis PT. Increased binding to 5-HT1A and 5-HT2A receptors
is associated with large vessel infarction and relative
preservation of cognition. Brain. 2009;132:1858-65.
839
840
841
842
843
844
845
846
847
848
849
850
851
852
853
854
855
856
857
858
[5] Clare R, King VG, Wirenfeldt M, Vinters HV. Synapse loss
in dementias. J Neurosci Res. 2010;88:2083-90.
[6] Roman G, Pascual B. Contribution of neuroimaging to the
diagnosis of Alzheimer's disease and vascular dementia. Arch
Med Res. 2012;43:671-6.
[7] Kalaria RN. Cerebrovascular disease and mechanisms of
cognitive impairment: Evidence from clinicopathological
studies in humans. Stroke. 2012;43:2526-34.
[8] Ross PL, Huang YN, Marchese JN, Williamson B, Parker K,
Hattan S, et al. Multiplexed protein quantitation in
Saccharomyces cerevisiae using amine-reactive isobaric tagging
reagents. Mol Cell Proteomics. 2004;3:1154-69.
[9] Zellner M, Veitinger M, Umlauf E. The role of proteomics
in dementia and Alzheimer's disease. Acta Neuropathol.
2009;118:181-95.
[10] Korolainen MA, Nyman TA, Aittokallio T, Pirttilä T. An
update on clinical proteomics in Alzheimer's research. J
Neurochem. 2010;112:1386-414.
[11] Datta A, Park JE, Li X, Zhang H, Ho ZS, Heese K, et al.
Phenotyping of an in vitro model of ischemic penumbra by
859
860
861
862
863
864
865
866
867
868
869
870
871
872
873
874
875
876
877
878
iTRAQ-based shotgun quantitative proteomics. J Prot Res.
2010;9:472-84.
[12] Datta A, Jingru Q, Khor TH, Teo MT, Heese K, Sze SK.
Quantitative neuroproteomics of an in vivo rodent model of
focal cerebral ischemia/reperfusion injury reveals a temporal
regulation of novel pathophysiological molecular markers. J
Prot Res. 2011;10:5199-213.
[13] Datta A, Akatsu H, Heese K, Sze SK. Quantitative Clinical
Proteomic Study of Autopsied Human Infarcted Brain Specimens
to Elucidate the Deregulated Pathways in Ischemic Stroke
Pathology. J Proteomics. 2013;91:556-68.
[14] Gemmell E, Bosomworth H, Allan L, Hall R, Khundakar A,
Oakley AE, et al. Hippocampal neuronal atrophy and cognitive
function in delayed poststroke and aging-related dementias.
Stroke. 2012;43:808-14.
[15] Kalaria RN, Kenny RA, Ballard CG, Perry R, Ince P,
Polvikoski T. Towards defining the neuropathological
substrates of vascular dementia. J Neurol Sci. 2004;226:75-80.
[16] Roman GC, Tatemichi TK, Erkinjuntti T, Cummings JL,
Masdeu JC, Garcia JH, et al. Vascular dementia: diagnostic
879
880
881
882
883
884
885
886
887
888
889
890
891
892
893
894
895
896
897
898
criteria for research studies. Report of the NINDS-AIREN
International Workshop. Neurology. 1993;43:250-60.
[17] Braak H, Braak E. Neuropathological stageing of
Alzheimer-related changes. Acta Neuropathol. 1991;82:239-59.
[18] Mirra SS, Heyman A, McKeel D, Sumi SM, Crain BJ, Brownlee
LM, et al. The Consortium to Establish a Registry for
Alzheimer's Disease (CERAD). Part II. Standardization of the
neuropathologic assessment of Alzheimer's disease. Neurology.
1991;41:479-86.
[19] Folstein MF, Folstein SE, McHugh PR. "Mini-mental state".
A practical method for grading the cognitive state of patients
for the clinician. J Psychiatr Res. 1975;12:189-98.
[20] Weinkauf M, Hiddemann W, Dreyling M. Sample pooling in 2-
D gel electrophoresis: A new approach to reduce nonspecific
expression background. Electrophoresis. 2006;27:4555-8.
[21] Chong PK, Gan CS, Pham TK, Wright PC. Isobaric tags for
relative and absolute quantitation (iTRAQ) reproducibility:
Implication of multiple injections. J Prot Res. 2006;5:1232-
40.
899
900
901
902
903
904
905
906
907
908
909
910
911
912
913
914
915
916
917
[22] Wessel D, Flugge UI. A method for the quantitative
recovery of protein in dilute solution in the presence of
detergents and lipids. Anal Biochem. 1984;138:141-3.
[23] Schmidt SA, Jacob SS, Ahn SB, Rupasinghe T, Krömer JO,
Khan A, et al. Two strings to the systems biology bow: Co-
extracting the metabolome and proteome of yeast. Metabolomics.
2013;9:173-88.
[24] Zhang H, Guo T, Li X, Datta A, Park JE, Yang J, et al.
Simultaneous characterization of glyco- and phosphoproteomes
of mouse brain membrane proteome with electrostatic repulsion
hydrophilic interaction chromatography. Mol Cell Proteomics.
2010;9:635-47.
[25] Hao P, Guo T, Li X, Adav SS, Yang J, Wei M, et al. Novel
application of electrostatic repulsion-hydrophilic interaction
chromatography (ERLIC) in shotgun proteomics: comprehensive
profiling of rat kidney proteome. J Prot Res. 2010;9:3520-6.
[26] Thomas PD, Campbell MJ, Kejariwal A, Mi H, Karlak B,
Daverman R, et al. PANTHER: A library of protein families and
subfamilies indexed by function. Genome Res. 2003;13:2129-41.
918
919
920
921
922
923
924
925
926
927
928
929
930
931
932
933
934
935
936
[27] Huang DW, Sherman BT, Lempicki RA. Systematic and
integrative analysis of large gene lists using DAVID
bioinformatics resources. Nat Protoc. 2009;4:44-57.
[28] Mohamed NE, Zhao Y, Lee JH, Tan MG, Esiri MM, Wilcock GK,
et al. Upregulation of AMPA receptor GluR2 (GluA2) subunits in
subcortical ischemic vascular dementia is repressed in the
presence of Alzheimer's disease. Neurochem Int. 2011;58:820-5.
[29] Simpson JE, Hosny O, Wharton SB, Heath PR, Holden H,
Fernando MS, et al. Microarray RNA expression analysis of
cerebral white matter lesions reveals changes in multiple
functional pathways. Stroke. 2009;40:369-75.
[30] Crecelius A, Götz A, Arzberger T, Fröhlich T, Arnold GJ,
Ferrer I, et al. Assessing quantitative post-mortem changes in
the gray matter of the human frontal cortex proteome by 2-D
DIGE. Proteomics. 2008;8:1276-91.
[31] Esiri MM, Nagy Z, Smith MZ, Barnetson L, Smith AD,
Joachim C. Cerebrovascular disease and threshold for dementia
in the early stages of Alzheimer's disease. Lancet.
1999;354:919-20.
[32] Lammie GA. Pathology of small vessel stroke. Br Med Bull.
2000;56:296-306.
937
938
939
940
941
942
943
944
945
946
947
948
949
950
951
952
953
954
955
956
957
[33] Taheri S, Gasparovic C, Huisa BN, Adair JC, Edmonds E,
Prestopnik J, et al. Blood-brain barrier permeability
abnormalities in vascular cognitive impairment. Stroke.
2011;42:2158-63.
[34] Akiguchi I, Tomimoto H, Suenaga T, Wakita H, Budka H.
Blood-brain barrier dysfunction in Binswanger's disease; An
immunohistochemical study. Acta Neuropathol. 1998;95:78-84.
[35] Capizzano AA, Schuff N, Amend DL, Tanabe JL, Norman D,
Maudsley AA, et al. Subcortical ischemic vascular dementia:
assessment with quantitative MR imaging and 1H MR
spectroscopy. AJNR Am J Neuroradiol. 2000;21:621-30.
[36] Hojer-Pedersen E, Petersen OF. Changes of blood flow in
the cerebral cortex after subcortical ischemic infarction.
Stroke. 1989;20:211-6.
[37] Geraci F, Turturici G, Sconzo G. Hsp70 and its molecular
role in nervous system diseases. Biochem Res Int. 2011;art.
no. 618127
[38] Strekalova H, Buhmann C, Kleene R, Eggers C, Saffell J,
Hemperly J, et al. Elevated levels of neural recognition
molecule L1 in the cerebrospinal fluid of patients with
958
959
960
961
962
963
964
965
966
967
968
969
970
971
972
973
974
975
976
977
Alzheimer disease and other dementia syndromes. Neurobiol
Aging. 2006;27:1-9.
[39] Guo H, Tong N, Turner T, Epstein LG, McDermott MP,
Kilgannon P, et al. Release of the neuronal glycoprotein ICAM-
5 in serum after hypoxic-ischemic injury. Ann Neurol.
2000;48:590-602.
[40] Tian L, Lappalainen J, Autero M, Hanninen S, Rauvala H,
Gahmberg CG. Shedded neuronal ICAM-5 suppresses T-cell
activation. Blood. 2008;111:3615-25.
[41] Bartzokis G, Tishler TA, Lu PH, Villablanca P, Altshuler
LL, Carter M, et al. Brain ferritin iron may influence age-
and gender-related risks of neurodegeneration. Neurobiol
Aging. 2007;28:414-23.
[42] Schröder N, Figueiredo LS, De Lima MNM. Role of brain
iron accumulation in cognitive dysfunction: Evidence from
animal models and human studies. J Alzheimers Dis.
2013;34:797-812.
[43] Kinouchi H, Epstein CJ, Mizui T, Carlson E, Chen SF, Chan
PH. Attenuation of focal cerebral ischemic injury in
transgenic mice overexpressing CuZn superoxide dismutase. Proc
Natl Acad Sci USA. 1991;88:11158-62.
978
979
980
981
982
983
984
985
986
987
988
989
990
991
992
993
994
995
996
997
998
[44] Sakata H, Niizuma K, Wakai T, Narasimhan P, Maier CM,
Chan PH. Neural stem cells genetically modified to overexpress
cu/zn-superoxide dismutase enhance amelioration of ischemic
stroke in mice. Stroke. 2012;43:2423-9.
[45] Gray F, Polivka M, Viswanathan A, Baudrimont M, Bousser
MG, Chabriat H. Apoptosis in cerebral autosomal-dominant
arteriopathy with subcortical infarcts and
leukoencephalopathy. J Neuropathol Exp Neurol. 2007;66:597-
607.
999
1000
1001
1002
1003
1004
1005
1006
1007
1008
1009
1010

Figure Legends
Figure 1. Schematic representation of experimental design showing discovery
and validation phase
Figure 2. Percent variation in iTRAQ ratios (115/114) between the same
protein found in various technical and experimental replicates following
MS. The primary vertical axis represents the corresponding number of the
proteins (bars) having different % co-efficient of variation (%CV) that was
plotted in the horizontal axis. The secondary vertical axis represents the
cumulative % of the counted proteins (lines) where 100% equals to 1878
proteins. These proteins have confidently been identified in at least 3 out
of 10 MS runs. Ninety eight percent of the proteins had less than 40% of
%CV. Accordingly; the regulation cut-off was set at 1.4-fold.
Figure 3. Post-proteomic validation of the selected proteins using
individual patients from control and VaD groups by WB analysis. Equal
amount of protein was loaded as measured by the 2D Quant kit. A)
Representative immunoblots showing the protein levels in B21 area of all
twenty patients (n = 10 per group). Details of the patients can be found in
the Supplemental Table 1. ACTB was used as a loading control. B) Bar chart
of densitometric analysis for comparing the protein expression levels by
the statistical analysis. SOD1 and NCAM were significantly increased
whereas ATP5A was reduced significantly in the VaD brain. Trends were
observed for SYNPO, HSPA4, VADC1, ferritin, PEA15 and ICAM5 without
reaching a statistical significance. Data was presented as mean ± SEM (n
1011
1012
1013
1014
1015
1016
1017
1018
1019
1020
1021
1022
1023
1024
1025
1026
1027
1028
1029
1030
1031
1032
1033
=10), where *p <0.05, significantly different from control using
independent-sample t-test.
Figure 4. Schematic diagram showing the interplay of various vascular and
parenchymal events during the evolution of VaD.↑, up-regulation;↓, down-
regulation.
Figure 5. Schematic diagram showing the probable involvement of SOD1 and
ferritin (FTL, FTH1) in detoxifying the demented brain cells from iron
overload and oxidative imbalance.
Figure 6. A. Representative immunoblots showing the levels of important
markers of apoptosis in the temporal cortex of control and VaD patients. B.
Bar chart of band densities (in arbitrary units) involving all twenty
individuals and normalized with the expression of muscle actin, which was
used as a loading control. There were no statistically significant
difference in the abundance of BCL2 and pro-caspase 3 between control and
VaD group. Data was presented as mean ± SEM (n =10), where *p < 0.05,
significantly different from control using independent-sample t-test.
Figures
Figure 1
1034
1035
1036
1037
1038
1039
1040
1041
1042
1043
1044
1045
1046
1047
1048
1049
105010511052

Figure 2
1053
1054
1055
1056
1057
1058
1059
1060
1061
1062
1063
1064
1065

Figure 3
1066
1067
1068

Figure 4
1069
1070
1071
1072
1073
1074
1075
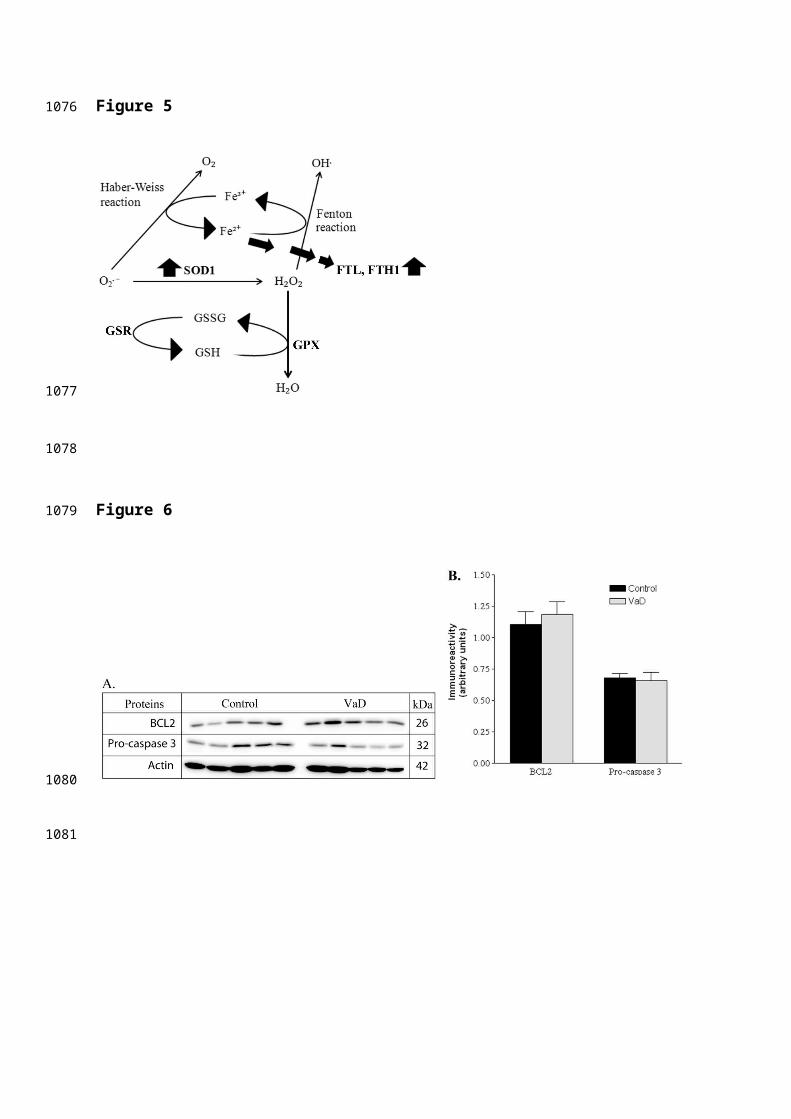
Figure 5
Figure 6
1076
1077
1078
1079
1080
1081
Tables
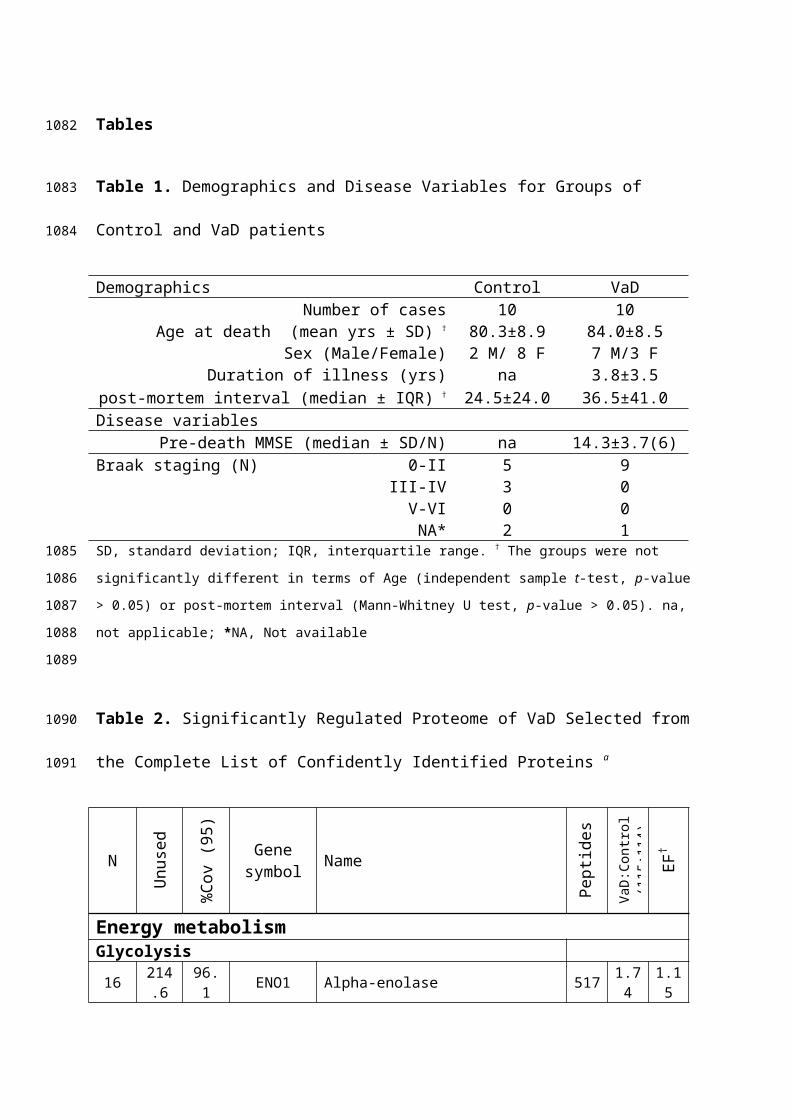
Table 1. Demographics and Disease Variables for Groups of
Control and VaD patients
Demographics Control VaDNumber of cases 10 10
Age at death (mean yrs ± SD) † 80.3±8.9 84.0±8.5Sex (Male/Female) 2 M/ 8 F 7 M/3 F
Duration of illness (yrs) na 3.8±3.5post-mortem interval (median ± IQR) † 24.5±24.0 36.5±41.0Disease variables
Pre-death MMSE (median ± SD/N) na 14.3±3.7(6)Braak staging (N) 0-II 5 9
III-IV 3 0V-VI 0 0NA* 2 1
SD, standard deviation; IQR, interquartile range. † The groups were not
significantly different in terms of Age (independent sample t-test, p-value
> 0.05) or post-mortem interval (Mann-Whitney U test, p-value > 0.05). na,
not applicable; *NA, Not available
Table 2. Significantly Regulated Proteome of VaD Selected from
the Complete List of Confidently Identified Proteins a
N
Unused
%Cov (
95)
Genesymbol Name
Pept
ides
(95%
)VaD:Control
(115:114)
EF†
(115:1
14)
Energy metabolismGlycolysis16 214
.696.1 ENO1 Alpha-enolase 517 1.7
41.15
1082
1083
1084
1085
1086
1087
1088
1089
1090
1091
18 212.7
99.7 ALDOA Fructose-bisphosphate
aldolase A 421 0.53
1.19
27 179.8
99.8 PGK1 Phosphoglycerate kinase 1 296 0.4
71.31
43 124.9
100.0 ALDOC Fructose-bisphosphate
aldolase C 298 0.54
1.20
150 56.2
66.8 LDHB L-lactate dehydrogenase B
chain 74 0.60
1.16
311 33.7
64.2 LDHA L-lactate dehydrogenase A
chain 30 0.52
1.29
Pyruvate dehydrogenase complex
332 32.2
31.3 PDHA1
Pyruvate dehydrogenase E1 component subunit alpha, somatic form, mitochondrial
19 0.61
1.19
355 30.5
49.9 PDHB
Pyruvate dehydrogenase E1 component subunit beta, mitochondrial
37 0.58
1.21
395 27.2
29.5 DLAT
Dihydrolipoyllysine-residue acetyltransferase component of pyruvate dehydrogenase complex, mitochondrial
20 0.34
1.57
Tricarboxylic acid cycle51 113
.168.1 ACO2 Aconitate hydratase,
mitochondrial 139 0.46
1.38
118 65.2
60.6 IDH2 Isocitrate dehydrogenase
[NADP], mitochondrial 39 0.35
1.45
222 42.8
63.9 FH Fumarate hydratase,
mitochondrial 40 0.44
1.50
253 39.1
56.6 IDH3A
Isocitrate dehydrogenase [NAD] subunit alpha, mitochondrial
26 0.62
1.19
324 32.7
40.2 SUCLG1
Succinyl-CoA ligase [ADP/GDP-forming] subunit alpha, mitochondrial
35 0.49
1.31
565 20.0
31.5 SUCLA2
Succinyl-CoA ligase [ADP-forming] subunit beta, mitochondrial
12 0.51
1.26
Oxidative phosphorylation41 130
.172.7 ATP5A1 ATP synthase subunit
alpha, mitochondrial 124 0.57
1.26
42 129.9
80.5 ATP5B ATP synthase subunit beta,
mitochondrial 191 0.52
1.20
168 51. 77. ATP5J ATP synthase-coupling 64 1.7 1.1
9 8 factor 6, mitochondrial 5 9
178 49.9
40.4 NDUFS1
NADH-ubiquinone oxidoreductase 75 kDa subunit, mitochondrial
35 0.49
1.36
193 47.6
55.4 DLD
Dihydrolipoyl dehydrogenase, mitochondrial
29 0.53
1.26
202 45.6
61.6 UQCRC2
Cytochrome b-c1 complex subunit 2, mitochondrial 36 0.5
31.36
274 37.7
78.9 ATP5O ATP synthase subunit O,
mitochondrial 29 0.51
1.45
340 31.8
45.7 SDHB
Succinate dehydrogenase [ubiquinone] iron-sulfur subunit, mitochondrial*
22 0.72
1.13
1232 6.2 19.
4 MT-CO2 Cytochrome c oxidase subunit 2* 4 1.0
61.21
1260 6.1 28.
0 NDUFB8
NADH dehydrogenase [ubiquinone] 1 beta subcomplex subunit 8, mitochondrial*
4 0.95
1.15
Vascular dysfunction and inflammation17 214
.392.1 ALB Serum albumin 235 2.0
31.29
30 161.4
100.0 HBB Hemoglobin subunit beta 356 0.2
61.39
126 62.3
31.3 L1CAM Neural cell adhesion
molecule L1 56 1.49
1.12
157 53.7
38.0 NCAM1 Neural cell adhesion
molecule 1 37 1.79
1.32
256 38.7
31.8 ICAM5 Intercellular adhesion
molecule 5 31 1.75
1.21
265 38.1
27.8 FGA Fibrinogen alpha chain 25 2.2
31.53
326 32.5
57.8 IGHA1 Ig alpha-1 chain C region 24 5.5
52.36
383 28.3
47.5 IGHG2 Ig gamma-2 chain C region 20 4.0
21.84
419 26.0
96.6 HBD Hemoglobin subunit delta 152 0.5
41.21
442 25.2
26.8 IGSF8 Immunoglobulin superfamily
member 8 15 2.13
1.46
461 24.2
47.9 FGB Fibrinogen beta chain 15 1.9
41.46
609 18. 74. IGLC2 Ig lambda-2 chain C 13 3.7 1.9

4 5 regions 7 6
734 14.5
90.6 IGKC Ig kappa chain C region 20 4.4
12.17
1256 6.1 3.0 COL6A3 Collagen alpha-3(VI) chain 8 1.7
91.29
Synaptic transmission9 266
.699.8 ENO2 Gamma-enolase 586 1.5
81.14
26 181.9
98.4 PEBP1 Phosphatidylethanolamine-
binding protein 1 342 1.57
1.17
119 65.0
39.9 ATP1A3
Sodium/potassium-transporting ATPase subunit alpha-3
45 2.96
1.53
121 63.7
80.1 RPS27A Ubiquitin-40S ribosomal
protein S27a 55 3.87
1.74
133 60.1
43.8 SYNPO Synaptopodin* 46 0.7
31.10
141 58.2
52.8 PPP3CA
Serine/threonine-protein phosphatase 2B catalytic subunit alpha isoform
52 0.57
1.27
218 43.3
49.2 ABAT
4-aminobutyrate aminotransferase, mitochondrial
26 0.59
1.21
244 40.1
40.5 ALDH9A1
4-trimethylaminobutyraldehyde dehydrogenase
29 0.56
1.26
345 31.6
65.0 SNAP25 Synaptosomal-associated
protein 25 34 1.64
1.20
358 30.3
36.5 STX1B Syntaxin-1B 23 1.8
91.29
463 24.1
14.3 SLC1A2 Excitatory amino acid
transporter 2 22 2.63
1.51
667 16.5
29.5 STX1A Syntaxin-1A 9 1.8
51.26
783 13.3
26.0 ATP1A2
Sodium/potassium-transporting ATPase subunit alpha-2
32 2.21
1.60
Oxidative stress
6399.0
99.3 SOD1
Superoxide dismutase [Cu-Zn] 188 3.0
21.72
13459.8
82.5 FTH1 Ferritin heavy chain 135 2.0
51.41
15255.4
63.4 FTL Ferritin light chain 80 2.2
11.41
208 44. 85. PRDX6 Peroxiredoxin-6 48 0.4 1.4

5 7 1 5
27937.2
84.7 GPX1 Glutathione peroxidase 1* 30 1.1
81.13
89811.0
14.2 GSR
Glutathione reductase, mitochondrial* 8 0.6
31.26
Chaperonic function70 90.
860.9 HSPA5 78 kDa glucose-regulated
protein 94 1.42
1.12
72 88.6
61.1 HSP90AA1 Heat shock protein HSP 90-
alpha 79 0.43
1.45
92 76.2
67.2 STIP1 Stress-induced-
phosphoprotein 1 61 1.45
1.15
132 60.2
53.5 HSPA4 Heat shock 70 kDa protein
4 40 0.46
1.42
255 38.7
96.1 HSPB1 Heat shock protein beta-1 63 1.7
71.17
330 32.3
44.0 CCT8 T-complex protein 1
subunit theta 19 1.80
1.29
656 17.0
80.6 TBCA Tubulin-specific chaperone
A 16 1.57
1.20
Others71 90.
637.6 NFASC Neurofascin 72 1.7
51.26
73 87.9
96.1 VDAC1
Voltage-dependent anion-selective channel protein 1
91 0.56
1.17
84 80.6 100 SNCG Gamma-synuclein* 91 1.0
81.04
200 46.0
33.4 NPEPPS Puromycin-sensitive
aminopeptidase 27 0.42
1.47
203 45.4
97.7 PEA15 Astrocytic phosphoprotein
PEA-15 42 1.56
1.15
651 17.2
15.1 PREP Prolyl endopeptidase 10 0.5
81.20
799 12.8
37.4 PSMA6 Proteasome subunit alpha
type-6 8 0.64
1.26
a The list of proteins qualified through the preset selection criteria
(unused prot score > 2.0, p <0.05, regulation cut-off : 1.4 fold compared
to the control group) along with their relative quantitative values. The
gene symbols of the proteins selected for WB validation are shown in bold.
The proteins have been classified based on their respective primary
function/pathway. The energy metabolism category is sub-divided into four
1092
1093
1094
1095
1096
1097
groups. Majority of the proteins related to energy metabolism were down-
regulated, while proteins related to inflammation (immune response and cell
adhesion) were up-regulated. Proteins participating in synaptic
transmission and chaperonic function displayed a mixed trend. * Proteinsincorporated in the list due to their close association with the regulated
proteins although they did not meet the above-mentioned preset selection
criteria. For example, the fold of down-regulation was <1.4 fold for SYNPO,
while others (e.g. SDHB, SNCG) doesn’t have a significant p-value (i.e. p
>0.05). † EF; error factor. It is a measure of the certainty of the average
ratio. The true ratio for the protein is expected to be found between
(reported ratio) ÷ EF and (reported ratio) * EF for 95% of the time.
1098
1099
1100
1101
1102
1103
1104
1105
1106
1107
1108
1109
Copyright © 2022 FDOKUMEN