High-throughput multiplexed fluorescence-activated droplet ...
Upload
independentCategory
view
2download
0
Thomas H. SteinbergBrian J. AgnewKyle R. GeeWai-Yee LeungTerrie GoodmanBirte SchulenbergJill HendricksonJoseph M. BeechemRichard P. HauglandWayne F. Patton
Molecular Probes,Eugene, OR, USA
Global quantitative phosphoprotein analysis usingMultiplexed Proteomics technology
Systematic parallel analysis of the phosphorylation status of networks of interactingproteins involved in the regulatory circuitry of cells and tissues is certain to drive re-search in the post-genomics era for many years to come. Reversible protein phospho-rylation plays a critical regulatory role in a multitude of cellular processes, includingalterations in signal transduction pathways related to oncogene and tumor suppressorgene products in cancer. While fluorescence detection methods are likely to offer thebest solution to global protein quantitation in proteomics, to date, there has been nosatisfactory method for the specific and reversible fluorescent detection of gel-sepa-rated phosphoproteins from complex samples. The newly developed Pro-Q Diamondphosphoprotein dye technology is suitable for the fluorescent detection of phos-phoserine-, phosphothreonine-, and phosphotyrosine-containing proteins directly insodium dodecyl sulfate (SDS)-polyacrylamide gels and two-dimensional (2-D) gels.Additionally, the technology is appropriate for the determination of protein kinase andphosphatase substrate preference. Other macromolecules, such as DNA, RNA, andsulfated glycans, fail to be detected with Pro-Q Diamond dye. The staining procedureis rapid, simple to perform, readily reversible and fully compatible with modern micro-chemical analysis procedures, such as matrix-assisted laser desorption/ionization-time of flight (MALDI-TOF) mass spectrometry. Pro-Q Diamond dye technology candetect as little as 1–2 ng of �-casein, a pentaphosphorylated protein, and 8 ng ofpepsin, a monophosphorylated protein. Fluorescence signal intensity correlates withthe number of phosphorylated residues on the protein. Through combination of Pro-QDiamond phosphoprotein stain with SYPRO Ruby protein gel stain, Multiplexed Pro-teomics technology permits quantitative, dichromatic fluorescence detection of pro-teins in 2-D gels. This evolving discovery platform allows the parallel determination ofprotein expression level changes and altered post-translational modification patternswithin a single 2-D gel experiment. The linear responses of the fluorescence dyesutilized, allow rigorous quantitation of changes over an unprecedented 500–1000-fold concentration range.
Keywords: Heat shock protein 90 / Phosphopeptides / Phosphoproteome / Phosphoproteins /Phosphoproteomics / Signal transduction PRO 0434
1 Introduction
The reversible phosphorylation of serine, threonine, andtyrosine residues is arguably one of the most importantcovalent post-translational modifications regulating thefunctional status of proteins and peptides in eukaryoticorganisms. Tools and techniques for determining the
phosphorylation status of proteins and peptides thusplay a prominent role in the investigation of diverse bio-logical phenomena including signal transduction, celldivision, cell motility, apoptosis, metabolism, differentia-tion, gene regulation, and carcinogenesis. Cultured cellsare typically labeled with 32P or 33P prior to protein isola-tion or these radioisotopes are incorporated into subcel-lular fractions using protein kinases after their isolation [1].The phosphoproteins are then usually detected by auto-radiography using film or storage phosphor imagingscreens. The labeling methods generally use radioactiveinorganic phosphate, ATP or GTP and are restricted toa limited range of biological specimens, such as tissueculture samples. Since in vitro radiolabeling only providesa measure of the phosphate groups attached during theactual labeling period, no information is provided with
Correspondence: Dr. Wayne F. Patton, Proteomics Section,Molecular Probes, Inc., 29851 Willow Creek Road, Eugene, OR,97402, USAE-mail: [email protected]: +1-541-344-6504
Abbreviations: DDAO, 9H-(1,3-dichloro-9,9-dimethyl-acridin-2-one-7-yl); Hsp90, heat shock protein 90; MBP, myelin basic pro-tein; MP, Multiplexed proteomics
1128 Proteomics 2003, 3, 1128–1144
2003 WILEY-VCH Verlag GmbH & Co. KGaA, Weinheim 0173-0835/03/0707–1128 $17.50�.50/0
DOI 10.1002/pmic.200300434

Proteomics 2003, 3, 1128–1144 Fluorescence detection of phosphoproteins 1129
respect to the physiological phosphorylation status of theproteins [2]. Recent studies have demonstrated thatmetabolically incorporating radiolabels such as 32P and33P, using standard doses and time-courses, inducesDNA fragmentation, elevates p53 tumor suppressor pro-tein levels, alters cell/nuclear morphology and results incell cycle arrest or apoptosis [3–5]. Radiolabeling phos-phoproteins presents challenges for the high-throughputautomation of proteomics investigations as well, due tosafety issues associated with handling the material andcontamination of instrumentation [6]. Thus, experimentaldesign considerations, economic issues, and safety con-cerns related to disposal of radioactive waste continue tocreate demand for nonradioactive alternatives to radiola-beling for phosphoprotein analysis in biomedical re-search. Consequently, a number of alternatives to 32P or33P radiolabeling have been developed over the years.
Phosphoproteins may be detected using standard West-ern blotting procedures [7, 8]. Although high-quality anti-bodies to phosphotyrosine residues are commerciallyavailable, antibodies that specifically recognize phospho-serine and phosphothreonine residues are typically sensi-tive to amino acid sequence context and do not provideuniversal detection of proteins post-translationally phos-phorylated at these sites. Immunoblotting is best per-formed after blocking unoccupied sites on the transfermembrane with protein solutions, which interferes withsubsequent microchemical analyses. Removal of theantibody and stain require relatively harsh treatments,such as heating to 65�C and incubation with 0.1% SDSand 1 mM DTT. This also creates problems for ensuinganalysis of the protein by Edman sequencing and massspectrometry.
“Stains-All” (1-ethyl-2-[3-(3-ethylnaphtho[1,2d]thiazolin-2-ylidene)-2-methylpropenyl]-naphtho[1,2d]thiazolium bro-mide) is a cationic carbocyanine dye that stains RNA,DNA, and highly acidic proteins (phosphoproteins andcalcium-binding proteins) a blue hue while less acidic pro-teins are stained a red hue [9–16]. Stains-All has not beenused routinely to detect phosphoproteins because it doesnot specifically discriminate between phosphorylated andunphosphorylated proteins and is not particularly sensitive.Stains-All is at least 10 times less sensitive than Coomas-sie Brilliant Blue stain and several orders of magnitude lesssensitive than 32P-autoradiography.
Phosphoproteins may be selectively detected in gels bymethods involving the alkaline hydrolysis of serine orthreonine monophosphate esters, precipitation of thereleased inorganic phosphate with calcium, formation ofan insoluble phosphomolybdate complex and then visu-alization of the complex with a dye such as malachitegreen, methyl green or rhodamine B [17, 18]. The detec-
tion sensitivity of the staining method is considerablypoorer than Coomassie Blue staining, with 80–160 ng ofphosvitin, a protein containing roughly 100 phospho-serine residues, being detectable. Also, the staining pro-cedure is somewhat complex as it involves seven differ-ent reagents. The alkaline hydrolysis step requires heatinggels to 65�C, which causes the polyacrylamide gel matrixto begin hydrolyzing and consequently to swell enor-mously. Moreover, since phosphotyrosine residues arenot hydrolyzed by the alkaline treatment step, proteinsphosphorylated at this amino acid residue are not detect-able by the method.
Derivatization and fluorophore labeling of phosphoserineresidues has been accomplished through blocking offree sulfhydryl groups with performate or iodoacetate,alkaline �-elimination of the phosphate residue, additionof ethanedithiol at the site of the eliminated phosphategroup, and then reaction of the resulting free sulfhydrylgroup with 6-iodoacetamidofluorescein [19, 20]. Thereaction scheme has been employed in two differentcircumstances; for the detection of phosphoproteins bycapillary electrophoresis using laser-induced fluores-cence detection and for the visualization of phosphopro-teins on sequencing membranes [19, 20]. In neitherinstance were phosphoproteins detected directly in gels,but the labeling of cysteine residues by similar chemistryhas been established, indicating that the prederivatizationof phosphoproteins by this chemistry could conceivablybe achieved [20]. One overall problem with the method isthat a delicate balance must be struck between the baseand the ethanedithiol in order to achieve elimination ofthe phosphate group from the serine residue and additionof the ethanedithiol to the resulting dehydroalanine resi-due without hydrolysis of the peptide backbone [19].Unfortunately, phosphothreonine and phosphotyrosineresidues are not labeled by the cited procedure.
Instrument-based methods have been developed fordetermining protein phosphorylation as well, such asEdman-based protein sequencing [21, 22], 31P NMR [23–25] and mass spectrometry [2, 26–28]. Certainly theseprocedures can accurately characterize the phosphoryl-ation status of proteins and peptides, but they are notoptimal for high-throughput global screening of phos-phorylated protein substrates. The methods are usuallyemployed after a phosphoprotein has already been iden-tified by autoradiography or immunoblotting with anti-phosphotyrosine antibody. Although mass spectrometry-based procedures have recently been devised that direct-ly quantify the relative abundance of phosphoproteins intwo different samples through culturing different cellpopulations in 14N-enriched and 15N-enriched culturemedium, the linear dynamic range of such methods is

1130 T. H. Steinberg et al. Proteomics 2003, 3, 1128–1144
only approximately 10-fold [28]. Additionally, an isotope-coded affinity tagging method for the differential quantita-tion of phosphopeptides by �-elimination and subse-quent addition of biotinyl-iodoacetamidyl-3,6-dioxaocta-nediamine containing either four alkyl hydrogen or fouralkyl deuterium atoms has been developed [29]. Ion sup-pression phenomena, a matrix-and sample-dependentreduction in peptide ionization efficiency associatedwith mass spectrometry, prevents stoichiometric com-parison of different phosphoproteins by such tech-niques. The feasibility of directly measuring phosphor-ous as m/z 31 signal liberated from �-casein using laserablation inductively coupled plasma-mass spectrometryhas also been demonstrated on electroblot membranes[30]. Though 16 pmol of the pentaphosphorylated pro-tein was detectable on blots, the technique could notbe successfully performed from dried polyacrylamidegels.
Two mass spectrometry-based methods for the chemicalderivatization and enrichment of phosphopeptides havebeen described recently as well [31, 32]. One approachrequires proteolytic digestion of the sample, reductionand alkylation of cysteine residues, N-terminal and C-ter-minal protection of the peptides, formation of phosphora-midate adducts at phosphorylated residues by carbodii-mide, condensation with cystamine, capture of the phos-phopeptides on glass beads coupled to iodoacetate,elution with trifluoroacetic acid and evaluation by massspectrometry [31]. The other approach involves oxidationof cysteine residues with performic acid, alkaline hydroly-sis to induce �-elimination of phosphate groups fromphosphoserine and phosphothreonine residues, additionof ethanedithiol, coupling of the resulting free sulfhydrylresidues with biotin, purification of phosphoproteins byavidin affinity chromatography, proteolytic digestion ofthe eluted phosphoproteins, a second round of avidin pu-rification and then analysis by mass spectrometry [32].The phosphoprotein �-casein was used to validate bothprocedures, and each correctly identified the mono-phosphorylated trypsin peptide fragment, but failed todetect the tetraphosphorylated peptide fragment fromthe test protein [31, 32].
Pro-Q Diamond phosphoprotein gel stain is a novel fluo-rescence-based detection system suitable for monitoringthe phosphorylation status of proteins directly in poly-acrylamide gels. Pro-Q Diamond phosphoprotein stainallows sensitive fluorescence detection of phosphopro-teins in SDS-polyacrylamide and two-dimensional (2-D)gels. Gels are fixed and then stained by simple incubationin a single solution. After staining, gels are destained andvisualized using any of a variety of laser-based gel scan-ners or xenon-arc lamp-based gel scanners. Pro-Q Dia-
mond dye can quantify protein loads ranging from 1 ngto 1 �g on a single electrophoresis gel. Pro-Q Diamondphosphoprotein stain is fully compatible with matrix-assisted laser desorption – time of flight-mass spectrom-etry, thus facilitating protein identification after gel electro-phoresis. The dye may be used in combination with a totalprotein stain, such as SYPRO Ruby protein gel stain,allowing protein phosphorylation levels and expressionlevels to be monitored in the same gel. The staining tech-nology is also suitable for detection of phosphorylatedproteins and peptides on protein microarrays [33]. Pro-QDiamond dye is a unique fluorescence-based detectionsystem for the specific and sensitive analysis of proteinand peptide phosphorylation status.
2 Materials and methods
2.1 Materials
Chicken egg ovalbumin, bovine �-casein, dephosphory-lated bovine �-casein, bovine �-casein, porcine pepsin,myelin basic protein, barium hydroxide octahydrate,magnesium chloride hexahydrate, recombinant humanprotein kinase C assay kit, diacylglycerol, phosphatidyl-serine, Tris base, sodium dodecyl sulfate, Tween 20 deter-gent and bovine serum albumin (BSA) for electroblottingwere from Sigma-Aldrich (St. Louis, MO, USA). BSA forelectrophoresis was from Sigma Diagnostics (St. Louis,MO, USA) or from Roche Biochemicals (Indianapolis, IN,USA). Broad-range protein molecular weight standards,6�9 cm�1 mm 12% precast Ready Gels and liquidacrylamide/N,N’-methylene bisacrylamide solution werefrom Bio-Rad Laboratories (Hercules, CA, USA). Lyso-zyme, soybean trypsin inhibitor, and calf intestine alkalinephosphatase were from Calzyme Corporation (San LuisObispo, CA, USA). Rabbit anti-phosphoserine polyclonalantibody was from Zymed Laboratories (South San Fran-cisco, CA, USA). Pro-Q Diamond phosphoprotein gelstain, SYPRO Ruby protein gel stain, CandyCane glyco-protein molecular weight standards, alkaline phospha-tase conjugated goat anti-rabbit antibody, DTT and 9H-(1,3-dichloro-9, 9-dimethylacridin-2-one-7-yl) phosphate(DDAO phosphate) were from Molecular Probes (Eugene,OR, USA). Sodium acetate trihydrate, acetonitrile, and 1,2-propanediol was from EM Science (Gibbstown, NJ,USA). Sequencing-grade modified trypsin was obtainedfrom Promega (Madison, WI, USA). IPG strips, 18 cm pH4–7, were obtained from Amersham Life Sciences (Pis-cataway, NJ, USA). GelCode Phosphoprotein StainingKit was obtained from Pierce Chemical (Rockland, IL,USA). The Jurkat T lymphocyte cell line was from Ameri-can Type Culture Collection (ATCC) (Manassas, VA, USA).Heat shock protein-90 (Hsp90) from human HeLa cells

Proteomics 2003, 3, 1128–1144 Fluorescence detection of phosphoproteins 1131
was obtained from StressGen Laboratories (Victoria, Brit-ish Columbia, Canada). MOWIOL 4-88 was obtained fromHoechst-Celanese (Charlotte, NC, USA).
2.2 Fluorescence spectroscopy
Fluorescence excitation and emission spectra were ob-tained for Pro-Q Diamond phosphoprotein stain using aHitachi FL 4500 spectrophotometer (Hitachi, Tokyo,Japan). The undiluted stain was used for the measure-ments. The emission spectrum of Pro-Q Diamond dyewas collected using a fixed excitation at 530 nm andscanning emission from 540–700 nm. The excitationspectrum of Pro-Q Diamond dye was collected using afixed emission at 605 nm and scanning emission from400–600 nm. In some experiments ovalbumin or lyso-zyme were added to the stain at a 10-fold molar excessrelative to the dye and emission profiles determined inthe same manner as the stain alone.
2.3 Electrophoresis and staining
SDS polyacrylamide gel electrophoresis was performedby standard methods utilizing 4% T, 2.6% C stackinggels, pH 6.8 and 13% T, 2.6% C separating gels, pH 8.8[34]. % T is the total monomer concentration expressedin grams per 100 mL and % C is the percentage cross-linker. As is standard with SDS-polyacrylamide gel elec-trophoresis, the stacking gel buffer concentration was0.125 M Tris-HCl, pH 6.8, the separating gel buffer con-centration was 0.375 M Tris-HCl, pH 8.8, and the reservoirbuffer concentration was 0.025 M Tris, 0.192 M glycine,pH 8.3. One-dimensional separating gels were 6 cm�9 cm�0.75 mm minigels or were 12% Tris-HCl ReadyGels Bio-Rad (Hercules, CA, USA). Proteins were heatedfor 5 min at 95�C in SDS loading buffer consisting of 10%glycerol, 2% SDS, 100 mM DTT, 0.07% bromophenolblue, and 60 mM Tris-HCl, pH 6.8. These samples werecooled to room temperature before gel loading andelectrophoresis. Fluorescent staining of 1-D SDS-poly-acrylamide minigels using Pro-Q Diamond phosphopro-tein gel stain was performed by fixing the gels in 45%methanol, 5% acetic acid (100 mL, 90 min to overnight),washing with water (100 mL, two changes, 10–20 min perwash), incubating with Pro-Q Diamond phosphoproteinstain (25–50 mL, 75–120 min), and destaining with suc-cessive washes of 50 mM sodium acetate, pH 4.0, or50 mM sodium acetate, pH 4.0, 4% acetonitrile (100 mL,3 washes), or 50 mM sodium acetate, pH 4.0, 15% 1,2-propanediol. The latter two washes were found to be su-perior to the former one. Useful images can be obtained1 h after staining, employing two successive destainingwashes. For minigels, optimal results can be obtained
with two successive washes of 60 min each, followed bya third, longer wash (1–4 h). Gels can be washed over-night, with some loss of signal, but good contrast andlow nonspecific staining. Following image acquisition,gels were stained for total protein with SYPRO Ruby pro-tein gel stain [35, 36] for serial dichromatic detection, per-mitting comparison of phosphoprotein and total proteinprofiles. Colorimetric staining of phosphoproteins usingthe GelCode phosphoprotein stain kit was performedaccording to manufacturer’s recommendations.
2.4 Gel-based assays to demonstrate stainselectivity
Barium hydroxide catalyzed �-elimination of phosphoser-ine was performed as previously described [37]. All solu-tions were treated with argon gas to remove atmosphericcarbon dioxide and prevent the formation of insolublebarium carbonate. A saturated barium hydroxide solution(31.5 g per 100 mL argon gas-treated water) was centri-fuged to remove insoluble material, in order to obtainroughly a 0.155 M Ba(OH)2 solution, which was treatedwith argon gas, brought to 50�C, and mixed with an equalvolume of 50�C argon gas-treated water. After electro-phoresis, the gel was washed with water and incubated30 min in the diluted Ba(OH)2 solution at 50�C under argongas with slow mixing. The reaction was stopped by add-ing sufficient glacial acetic acid to reduce the solution pHto 4.0 (�3 mL for 50 mL barium hydroxide solution). Gelswere fixed overnight and stained with Pro-Q Diamondphosphoprotein gel stain. For alkaline phosphatase cata-lyzed dephosphorylation of phosphoproteins, 15 �g pro-tein and 650 ng enzyme were incubated in 30 �L of 10 mM
Tris-HCl, 1 mM MgCl2, pH 9.5, at 37�C for 30 min. Controlsamples were incubated as above with no enzyme. Reac-tions were stopped by adding equal volume of 2�SDSloading buffer and heating for 5 min at 95�C. Proteinswere loaded pairwise, control and treated samples, at1.25 �g protein per lane, separated by electrophoresis,stained with Pro-Q Diamond phosphoprotein gel stain,imaged, and then stained with SYPRO Ruby protein gelstain. Recombinant human protein kinase C, �-isozyme(PKC�) catalyzed phosphorylation of a protein substrate,bovine brain myelin basic protein (MBP), was performedin 21 mM HEPES, pH 7.4, 10 mM MgCl2, 0.1 mM CaCl2,0.1 mM ATP, 100 �g/mL phosphatidylserine, 20 �g/mLdiacylglycerol, 0.03% Triton X-100, 2 mg/mL MBP, and100 ng enzyme. Time course reactions were performedin parallel, in 100 �L volumes, at 30�C, with one tube(0 time) containing no enzyme. Reactions were stoppedwith addition of an equal volume of 2�SDS buffer andheating at 95�C for 3–4 min. Proteins were loaded onduplicate gels, 800 ng MBP per lane, flanked by a lane

1132 T. H. Steinberg et al. Proteomics 2003, 3, 1128–1144
of broad-range molecular weight standards at roughly190 ng per protein band. Electrophoresis was performedand one gel was stained with Pro-Q Diamond dye asabove, while the other was stained with SYPRO Orangeprotein gel stain [38, 39].
2.5 Western blotting
Following electrophoresis, proteins were electroblottedto PVDF membranes for 90 min using the Investigatorsemi-dry blotter (Genomic Solutions, Ann Arbor, MI) anda transfer buffer consisting of 10 mM Tris, 96 mM glycine,10% methanol, pH 8.3, according to the manufacturer’sinstructions. Antigen detection was as previously de-scribed [40]. The air-dried blots were washed with 20 mM
Tris-HCl, 150 mM NaCl, pH 7.6 (TBS) for 5–10 minutes,blocked with TBS plus 0.1% Tween 20, 0.2% MOLWIOL4–88, 3% BSA for 150 min, washed with TBS plus 0.1%Tween 20 (TBST) twice for 5 min per, and incubated for90 min in TBST plus 3% BSA at room temperature with1.5 �g/mL of the primary antibody directed againstphosphoserine, washed 3 times with TBST (5 min per),and incubated with 0.13 �g/mL of the secondary anti-body, alkaline phosphatase conjugated goat anti-rabbitantibody, in TBST plus 3% BSA. The blot was washedwith three changes of TBST (5 min per), then once withTBS, and the blot developed with 1.25 �g/mL DDAOphosphate for 20 min and the image acquired with a Fuji-film FLA 3000 laser scanner (Fuji Photo Film, Tokyo,Japan) using 633 nm excitation source and a 675 nmlong pass filter.
2.6 Two-dimensional gel electrophoresis
For 2-D gel electrophoresis, whole cell lysates of Jurkatcells were prepared according to the procedure for mam-malian cells given in the Investigator 2-D ElectrophoresisSystem manual (Genomic Solutions). Proteins were quan-tified by the bicinchoninic acid (BCA) solution assaymethod using bovine serum albumin as the standard pro-tein [41]. All samples were precipitated before 2-D gelelectrophoresis to minimize unspecific staining due tophospholipids and other cell constituents. Approximately150 �g protein sample was applied to each pH 4–7 Immo-biline Drystrip immobilized pH gradient gel (AmershamLife Sciences, Piscataway, NJ, USA) by the in-gel rehy-dration method. All proteins were focused for 80 000 Vhusing a pHaser IEF focusing unit (Genomic Solutions).After completion, 12.5% large-format SDS-polyacryl-amide gel electrophoresis was performed using an Inves-tigator system (Genomic Solutions).
2.7 Detection of proteins
Images were acquired on a Fujifilm FLA 3000 laser scan-ner (Fuji Photo Film) following Pro-Q Diamond dye stain-ing, with 532 nm excitation and 580 nm bandpass emis-sion filter, and with 473 nm excitation and 580 nm band-pass emission filter following SYPRO Ruby dye staining.Data were displayed and analyzed using the ImageGauge Analysis software. With this software, fluorescentprotein signals were displayed as dark bands or, in thecase of 2-D gels, dark spots. For 2-D gels, computer-gen-erated differential display maps of protein phosphoryla-tion and protein expression patterns were generatedusing Z3, Version 1.5 software (Compugen, Tel-Aviv,Israel) [42, 43]. Z3 is a Microsoft Windows-based softwarepackage for analyzing 2-D electrophoresis images. Unlikemany commercially available software packages, Z3 usesraw-image-based computation of registration, region-based matching, and a complementary pseudocolorvisualization technique. With the system, spots of thereference gel appear green and those of the comparativegel appear magenta. When images are aligned, similarlyexpressed spots in the overlay image appear gray orblack, while those that differ in expression levels appeargreen or magenta. This facilitates identification of differ-entially expressed protein spots by simple visual inspec-tion.
2.8 MALDI-TOF-MS
After detecting proteins in polyacrylamide gels with Pro-QDiamond phosphoprotein gel stain and staining withSYPRO Ruby protein gel stain, 500 ng protein bandswere subjected to trypsin digestion and MS as describedpreviously [44, 45]. Briefly, protein bands were excisedfrom the polyacrylamide gel, washed twice with 50%acetonitrile/25 mM ammonium bicarbonate, washed oncewith 100% acetonitrile and dried. The cysteine residuesin proteins were subsequently reduced and alkylatedusing first 100 mM DTT followed by 100 mM iodoacet-amide. Excess reagent was washed out with 50% aceto-nitrile, 50 mM ammonium bicarbonate before completedehydration in 100% acetonitrile. After drying the gelpieces, approximately 20 �L of 20 �g/mL trypsin (se-quencing-grade modified; Promega) prepared in 50 mM
ammonium bicarbonate, 5% acetonitrile was added tothe dried residue and the sample was incubated over-night at 37�C. Peptides were subsequently extractedwith 50 �L of 10% acetonitrile/5% trifluoroacetic acid(TFA) for 30 min, followed by another 50 �L of 50%acetonitrile/5% TFA for 30 min. All supernatants werecombined and dried using a SpeedVac (Savant Instru-ments, Holbrook, NY, USA) concentrator. The peptides

Proteomics 2003, 3, 1128–1144 Fluorescence detection of phosphoproteins 1133
were then resuspended in 10 �L of 10% acetonitrile/0.1% TFA and 0.5 �L was spotted onto a plate of anAxima CFR MALDI-TOF mass spectrometer (KratosAnalytical, Chestnut Ridge, NY, USA). Before the spotdried, 0.5 �L of 10 mg/mL �-cyanocinnamic acid (in50% acetonitrile, 0.1% TFA) was applied to the spotand mixed with the sample before it was air dried atroom temperature prior to acquiring mass spectra. MSwas performed using an accelerating voltage of 20 kVand profiles were calibrated using trypsin fragments.Peptide mass fingerprinting data were evaluated usingthe Launchpad analysis package (Kratos Analytical)and the Protein Prospector database from the Universityof San Francisco.
3 Results
3.1 Spectral characteristics of Pro-Q Diamondphosphoprotein gel stain
Excitation and emission spectra of Pro-Q Diamond phos-phoprotein gel stain are shown in Fig. 1. The fluorescenceexcitation maximum was determined to be 555 nm, andthe fluorescence emission maximum was determined tobe 580 nm (Fig. 1A). Thus, the dye is readily imaged usinglaser-based gel scanners equipped with 532 nm excita-tion sources, such as the Fuji FLA 3000 fluorescent ima-ger or the Bio-Rad Fx Molecular Imager. Additionally, thestain is readily imaged using xenon-arc lamp-based CCDcamera imaging systems equipped with appropriate exci-tation/emission filters, such as the ProXPRESS system(formerly the Arthur Multi-Wavelength Fluorimager) (Per-kin-Elmer Life Sciences, Cambridge, England). CCD-camera-based gel imaging systems with UV transillumi-nation sources, such as the Roche Lumi-Imager or Bio-Rad Fluor-S Max imager may also be used to visualizePro-Q Diamond dye (data not shown). Long exposuretimes of 15–30 s are required with these instruments,however.
The mechanism of differential staining between phospho-proteins and unphosphorylated proteins was examined insolution. When the Pro-Q Diamond reagent was com-bined with a 10-fold molar excess of ovalbumin (twophosphate residues per protein) or lysozyme (no phos-phate residues per protein), the emission maximumremained centered at 580 nm with minimal change inoverall signal intensity (Fig. 1B). Thus, just as with SYPRORuby protein gel stain but unlike SYPRO Orange proteingel stain, the selectivity of Pro-Q-Diamond phosphopro-tein stain toward phosphoproteins is chiefly due to differ-ential binding rather than through fluorescence enhance-ment upon binding [35, 36, 38, 39].
Figure 1. Fluorescence excitation/emission spectra ofPro-Q Diamond phosphoprotein gel stain. (A) Excitation/emission profile of Pro-Q Diamond phosphoprotein gelstain. (B) Emission profiles of Pro-Q Diamond phospho-protein gel stain alone, or in the presence of the proteinsovalbumin or lysozyme. Binding of Pro-Q Diamond dye tophosphoproteins is not accompanied by an increase influorescence intensity.
3.2 Detection of phosphoproteins inSDS-polyacrylamide gels
To demonstrate the selectivity of the phosphoproteinstain, two different protein mixtures, as well as a dilutionseries of �-casein, were separated by SDS-polyacryl-amide gel electrophoresis, stained with Pro-Q Diamonddye, imaged (Fig. 2A), and then stained with SYPRORuby protein gel stain and imaged again (Fig. 2B). Themolecular weight standards were loaded at 500–600 ngper protein band, and �-casein was loaded as a 4-folddilution series (500, 125, 32, 8, and 2 ng of protein). Thebroad-range molecular weight standards included myo-sin heavy chain, �-galactosidase, phosphorylase b, oval-bumin (two phosphate residues per protein), carbonicanhydrase, soybean trypsin inhibitor, lysozyme, and apro-tinin. CandyCane molecular weight standards (a mixtureof glycosylated and unglycosylated proteins) contained�2-macroglobulin, phosphorylase b, glucose oxidase,
1134 T. H. Steinberg et al. Proteomics 2003, 3, 1128–1144
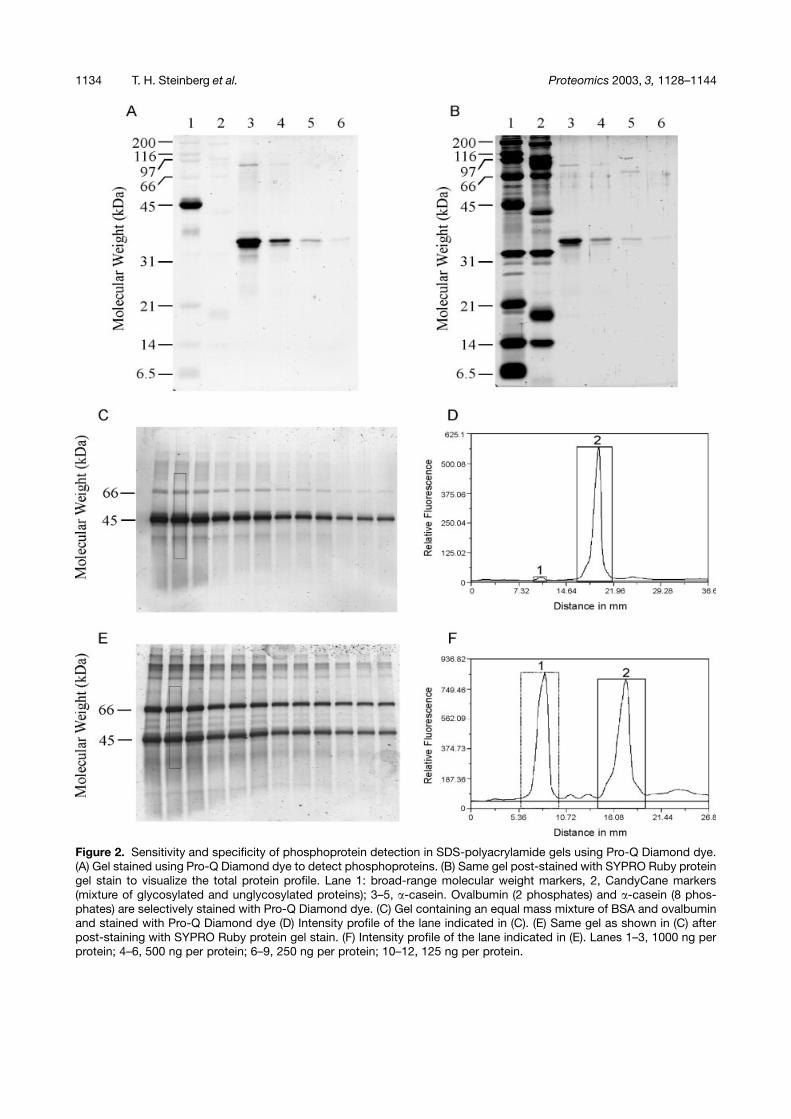
Figure 2. Sensitivity and specificity of phosphoprotein detection in SDS-polyacrylamide gels using Pro-Q Diamond dye.(A) Gel stained using Pro-Q Diamond dye to detect phosphoproteins. (B) Same gel post-stained with SYPRO Ruby proteingel stain to visualize the total protein profile. Lane 1: broad-range molecular weight markers, 2, CandyCane markers(mixture of glycosylated and unglycosylated proteins); 3–5, �-casein. Ovalbumin (2 phosphates) and �-casein (8 phos-phates) are selectively stained with Pro-Q Diamond dye. (C) Gel containing an equal mass mixture of BSA and ovalbuminand stained with Pro-Q Diamond dye (D) Intensity profile of the lane indicated in (C). (E) Same gel as shown in (C) afterpost-staining with SYPRO Ruby protein gel stain. (F) Intensity profile of the lane indicated in (E). Lanes 1–3, 1000 ng perprotein; 4–6, 500 ng per protein; 6–9, 250 ng per protein; 10–12, 125 ng per protein.

Proteomics 2003, 3, 1128–1144 Fluorescence detection of phosphoproteins 1135
bovine serum albumin, �1 acid glycoprotein, carbonicanhydrase, avidin, and lysozyme. On the basis of compar-ison of Fig. 2A and B, Pro-Q Diamond stain was deter-mined to preferentially bind to phosphorylated proteinscompared with a range of proteins with different physico-chemical properties, such as proteins with hydrophobicbinding pockets (e.g., BSA), glycosylated proteins (e.g.,�2-macroglobulin, glucose oxidase, and avidin), acidicproteins (e.g., soybean trypsin inhibitor), and basic pro-teins (e.g., lysozyme and aprotonin). Weak, nonspecificstaining of the unphosphosphorylated proteins wasnoted, particularly with those of basic isoelectric point.A quantitative comparison of nonspecific staining andphosphoprotein staining was determined using an equalmass mixture of BSA and ovalbumin stained with Pro-QDiamond dye (Fig. 2C), followed by SYPRO Ruby dye(Fig. 2E). The gel profiles obtained with the Image GaugeAnalysis software (Fuji Photo Film) of the indicated lane(1000 ng of each protein) are shown (Fig. 2D and F). Theratio of the ovalbumin to BSA signal for the phosphopro-tein stain was determined to be 77.0� 12.2 (n = 8), whilethe ratio of the ovalbumin to BSA signal using the totalprotein stain was determined to be 0.99� 0.13 (n = 8).The relatively high standard deviation in the phosphopro-tein stain ratio measurements arose from the difficulty inquantifying the very low nonspecific staining of BSA. This65–90-fold selectivity in staining is impressive consider-ing that many colorimetric staining technologies in usetoday, such as silver stain and Coomassie Blue stain,only offer a 10- to 40-fold working range of detection[46]. Additionally, 500 ng amounts of DNA, RNA or the sul-fated glycoprotein, Tamm-Horsfall glycoprotein, failed tobe detected with Pro-Q Diamond dye (data not shown).
3.3 Detection sensitivity and linear dynamicrange
Proteins were loaded in twofold dilution series on SDS-polyacrylamide minigels. Each protein sample was evalu-ated using replicate gels (n = 4). Gels were fixed, stained,washed, and images obtained as described for Fig. 2. Thephosphoproteins evaluated were �-casein (7–8 phos-phate residues); dephosphorylated �-casein (1–2 phos-phate residues); �-casein (5 phosphate residues); ovalbu-min (2 phosphate residues), and pepsin (1 phosphateresidue). The unphosphorylated protein evaluated wasBSA. Quantitative data were manually determined withthe Image Gauge Analysis software (Fuji Photo Film) andgraphed. The integrated fluorescence intensity data wasplotted against the nanograms of protein and showedlinearity over two to three orders of magnitude for eachprotein (Fig. 3A). The fluorescence data was also plottedas a function of the pmoles of protein (data not shown)
Figure 3. Detection sensitivity and linear dynamic rangefor various phosphoproteins separated by SDS-poly-acrylamide gel electrophoresis and visualized using Pro-Q Diamond dye. All data points were determined in quad-ruplicate. Twofold serial dilutions of various phosphopro-teins were separated by SDS-polyacrylamide gel electro-phoresis, stained with Pro-Q Diamond dye, and quanti-fied using the Fuji FLA-3000 Fluorescent Imager. (A)Comparison of the staining of model proteins with Pro-QDiamond dye. The proteins analyzed were �-casein (8phosphate residues/protein), �-casein (5 phosphate resi-dues/protein), dephosphorylated �-casein (2 phosphateresidues/protein), ovalbumin (2 phosphate residues/pro-tein), pepsin (1 phosphate residue/protein), and BSA (nophosphate residues/protein). (B) Integrated intensity datafrom (A) were replotted as a function of pmoles proteinand the slopes of the lines for each protein were thenplotted against the known number of phosphate residuesper protein, demonstrating a strong correlation betweenthe parameters.
and the slopes of the lines were then replotted against theknown number of phosphate residues per protein(Fig. 3B). Though not a linear relationship, a strong corre-lation was observed between the slopes and the numberof phosphate residues per protein. Based upon the datain Fig. 3 it was established that the fluorescent phospho-protein dye technology can detect as little as 1–2 ng of�-casein, a pentaphosphorylated protein, and 8 ng ofpepsin, a monophosphorylated protein. The linear re-sponses of the fluorescent dye allow rigorous quantitationof changes over a 500–1000 fold concentration range.

1136 T. H. Steinberg et al. Proteomics 2003, 3, 1128–1144
3.4 Comparison of Pro-Q Diamondphosphoprotein gel stain with otherphosphoprotein detection methods
To begin with, Pro-Q Diamond phosphoprotein gel stainwas compared with a commercialized colorimetric phos-phoprotein stain (GelCode Phosphoprotein Staining Kit,Pierce Chemical Company). This colorimetric stain wasdeveloped for the specific detection of phosphorylatedproteins directly in SDS-polyacrylamide gels [17]. Thestaining procedure depends upon hydrolysis of the phos-phomonoester bond of phosphoserine and phospho-threonine residues using 0.5 N sodium hydroxide, while inthe presence of calcium ions. The calcium ions precipi-tate the released inorganic phosphate. The gel containingthe newly formed, insoluble calcium phosphate is thenexposed to ammonium molybdate in dilute nitric acid.The resultant insoluble nitrophospho-molybdate complexis subsequently visualized with Methyl Green dye. Phos-photyrosine residues can not be hydrolyzed by the citedmethod and thus phosphoproteins containing these resi-dues are not detectable. It was determined, that unlikethe Pro-Q Diamond dye staining method, the colorimetricmethod was incapable of detecting the test phosphopro-teins in the low- to mid-nanogram concentration range(data not shown). �-casein was only detected in gelswhen present in 500 ng amounts, while even 1–2 �gamounts of pepsin could not be detected using the colori-metric stain. In the absence of the availability of a phos-phoprotein gel stain of comparable sensitivity to Pro-QDiamond dye, the capabilities of the fluorescent stainwere compared with the immunodetection of serine-phosphorylated proteins that have been electroblotted toPVDF membrane. Immunoblotting was performed usinga commercially available monoclonal antibody directedagainst proteins containing phosphorylated serine resi-dues, alkaline phosphatase-conjugated secondary anti-body and a fluorogenic alkaline phosphatase substrate,DDAO phosphate. Dilution series of �-casein and pepsin(4-fold dilutions, 2000–2 ng) and one lane of broad rangemarkers (�250 ng per band) were loaded onto SDS-poly-acrylamide gels. After electrophoresis, the proteins werestained in the gel with Pro-Q Diamond phosphoproteingel stain or electroblotted to PVDF membrane for anti-body-based detection. The results shown in Fig. 4demonstrate the selectivity and sensitivity of the anti-phosphoserine antibody compared with the fluorescentphosphoprotein stain. Pro-Q Diamond phosphoproteingel stain was found to provide detection sensitivity ingels that was superior to the anti-phosphoserine antibodyblotting technique on transfer membranes. Pro-Q Dia-mond dye was capable of detecting as little as 2 ng of�-casein, while the immunoblotting method detectedonly 32 ng of the protein. Anti-phosphoserine antibodies
Figure 4. Detection sensitivity of Pro-Q Diamond phos-phoprotein gel stain in SDS-polyacrylamide gels com-pared with immunoblotting using a commercially avail-able antibody directed against proteins containing phos-phorylated serine residues. Fourfold serial dilutions of �-casein and pepsin were separated by electrophoresis and(A) stained with Pro-Q Diamond dye or (B) electroblottedto PVDF membrane and probed with an antibody to phos-phoserine, alkaline phosphatase-conjugated secondaryantibody, and DDAO phosphate. Lane 1, broad-rangemolecular weight standards (�250 ng per band); 2–7, �-casein, 2000, 500, 125, 32, 8, 2 ng; 8–13, pepsin, 2000,500, 125, 31, 8, 2 ng.
are known to depend upon sequence context surround-ing the phosphorylated serine residue and this is readilyapparent in Fig. 4, as pepsin was readily detected at the8 ng level by the Pro-Q Diamond dye, but even 2 �g of theprotein was not readily detectable by the antibody-basedmethod.
3.5 Establishing the chemical selectivity forphosphoprotein staining throughbase-catalyzed �-elimination of phosphateresidues
The treatment of phosphoproteins or phosphopeptideswith a strong base (e.g., 0.1 M NaOH or 0.1 M BaOH2)quantitatively eliminates phosphoric acid from phospho-

Proteomics 2003, 3, 1128–1144 Fluorescence detection of phosphoproteins 1137
Figure 5. Establishment of theselectivity of staining of phos-phoproteins through chemicaldephosphorylation by base-cat-alyzed �-elimination. Serial dilu-tions of broad range molecularweight markers (lanes 1–5), con-taining the phosphoprotein ov-albumin, as well as serial dilu-tions of pepsin (lanes 6–10)were separated by SDS-poly-acrylamide gel electrophoresis.Gels were either stained (A) di-rectly with Pro-Q Diamond dyeor (C) incubated with bariumhydroxide as described in Sec-tion 2, prior to staining withPro-Q Diamond dye. Gels weresubsequently post-stained withSYPRO Ruby dye to verify pro-tein loads (B, D).
Figure 6. Monitoring phospho-rylation changes in proteins aris-ing from their dephosphoryla-tion with alkaline phosphataseor phosphorylation with proteinkinase C �. (A, B) Monitoringthe dephosphorylation of phos-phoproteins incubated withalkaline phosphatase. Lanes 1,2, �-casein (8 phosphate resi-dues); 3, 4, lysozyme (no phos-phate residues); 5, 6, ovalbumin(2 phosphate residues); 7, 8,pepsin (1 phosphate residue).Odd numbered lanes were treat-ed with alkaline phosphatase.(A) Visualization of the phospho-rylation profile using Pro-Q Dia-mond dye. (B) Visualization ofthe total protein profile usingSYPRO Ruby dye. (C, D) Moni-toring the phosphorylation ofMBP incubated with human,
recombinant protein kinase C � isozyme. Lane 1, broad-range molecular weight standards (�190 ng per band); 2–8, thephosphorylation time course. 800 ng of substrate protein was loaded per lane: lane 2, no enzyme; 3–7, 1, 2, 5, 10, 20 minincubation with protein kinase C, respectively. (C) Visualization of the phosphorylation profile using Pro-Q Diamond dye.(D) Visualization of the total protein profile in a parallel gel using SYPRO Orange protein gel stain.

1138 T. H. Steinberg et al. Proteomics 2003, 3, 1128–1144
serine and phosphothreonine residues. Phosphoserineor phosphothreonine residues are attacked by the base,removing a hydrogen from the �-carbon and causingelimination of the phosphate from the �-carbon to pro-duce dehydroalanine and dehydroalanine-2-butyrate,respectively. Ovalbumin and pepsin contain phospho-serine residues that are susceptible to base-catalyzed�-elimination. Barium hydroxide was employed for thein-gel dephosphorylation of phosphoproteins in order toestablish that the staining of ovalbumin and pepsin byPro-Q Diamond dye depended upon their phosphoserineresidues. Duplicate gels containing dilution series ofbroad-range molecular weight markers and of pepsinwere separated by SDS-polyacrylamide gel electrophore-sis. One gel was stained with Pro-Q Diamond phospho-protein gel stain (Fig. 5A) while the other gel was treatedwith barium hydroxide before staining (Fig. 5B). The gelswere then stained with SYPRO Ruby protein gel stain(Fig. 5B and D) to assess total protein profiles. In the con-trol gel, Pro-Q Diamond dye preferentially stained ovalbu-min and pepsin but not the unphosphorylated proteins inthe molecular weight marker mix (Fig. 5A). The gel treatedwith barium hydroxide showed no phosphoprotein stain-ing (Fig. 5C). Subsequent staining with SYPRO Ruby pro-tein gel stain revealed that the same protein profiles werepresent within both gels.
3.6 Monitoring phosphorylation changes inproteins using alkaline phosphatase andprotein kinase C �
Detection of the enzymatic removal or incorporation ofphosphate into proteins was demonstrated by gel elec-trophoresis of the relevant substrates and Pro-Q Diamonddye staining. Total protein staining was performed in par-allel or following the phosphoprotein stain. Alkaline phos-phatase treatment was shown to decrease Pro-Q Dia-mond dye staining of �-casein, ovalbumin, and pepsinrelative to the controls (Fig. 6A, compare lanes 1 and 2, 5and 6, 7, and 8), and did not affect the faint, nonspecificstaining of lysozyme (Fig. 6A, lanes 3 and 4). Subsequentstaining with SYPRO Ruby protein gel stain (Fig. 6B)demonstrated that the loss of Pro-Q Diamond dye signalshown in Fig. 6A was not due to proteolysis of the phos-phoproteins. Pro-Q Diamond phosphoprotein gel stainwas also used to detect changes in phosphorylation aris-ing from PKC�-catalyzed addition of phosphate to MBP(Fig. 6C, lanes 2–7). The fluorescent signal was found toincrease with incubation time, as expected with such anenzymatic reaction. Staining of a parallel gel with SYPROOrange dye confirmed that protein content of the assaytubes did not vary in the experiment (Fig. 6D, lanes 2–7).
3.7 Detection of phosphoproteins by 2-D gelelectrophoresis and multiplexed imaging
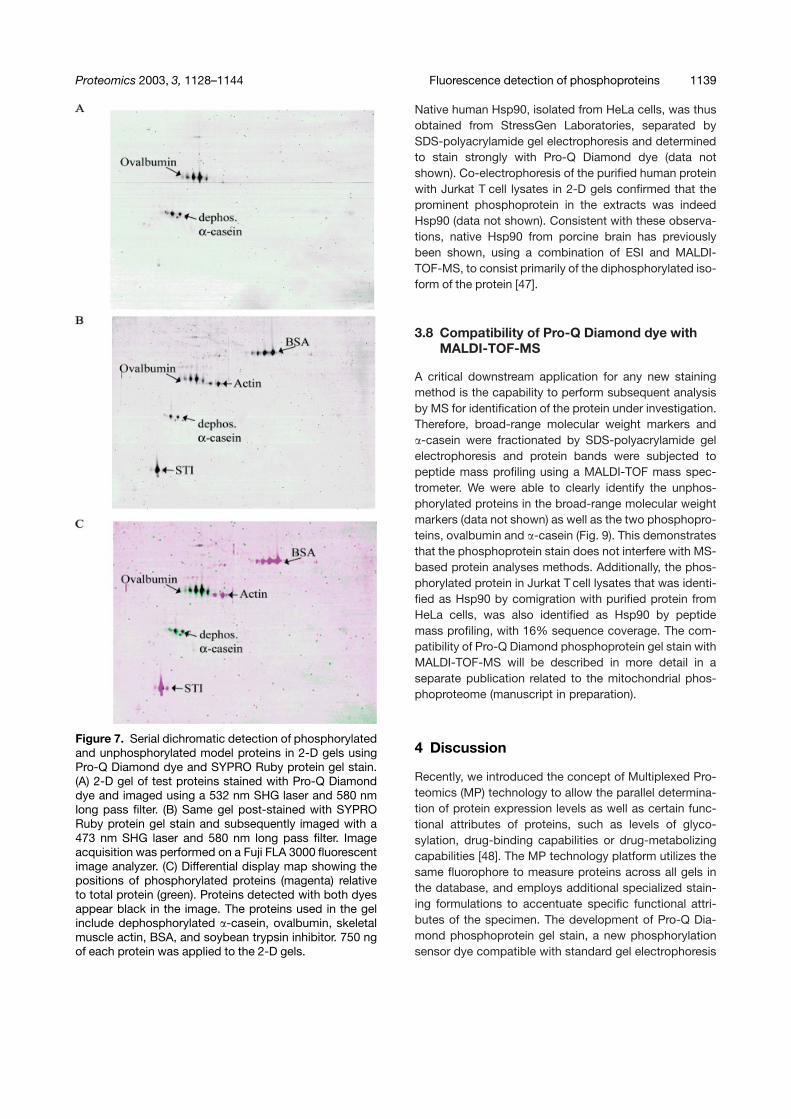
Model proteins were separated by 2-D gel electrophore-sis in order to assess the specificity of staining in this gelformat. Dephosphorylated �-casein (2 phosphate resi-dues per protein), ovalbumin (2 phosphate residues perprotein), soybean trypsin inhibitor, skeletal muscle actinand bovine serum albumin were used in the analysis. Theimages obtained after Pro-Q Diamond dye staining andafter SYPRO Ruby dye staining were overlaid usingCompugen’s Z3 software (Tel Aviv, Israel). The gel imageswere automatically matched by computer, after addingsome manual anchor points to facilitate the process.Gel images were then redisplayed as a single pseudoco-lored map, allowing visual inspection of profile differ-ences. The total protein profile was pseudocolored ingreen whereas the specific phosphoprotein pattern wasshown in magenta. Spots detected by both stains ap-peared as gray or black in the map. As demonstrated inFig. 7, the phosphoproteins were specifically detectedusing Pro-Q Diamond dye. Actin and serum albumin,two proteins that are often present in very high amountsin biological samples, were not stained by the Pro-Q Dia-mond dye.
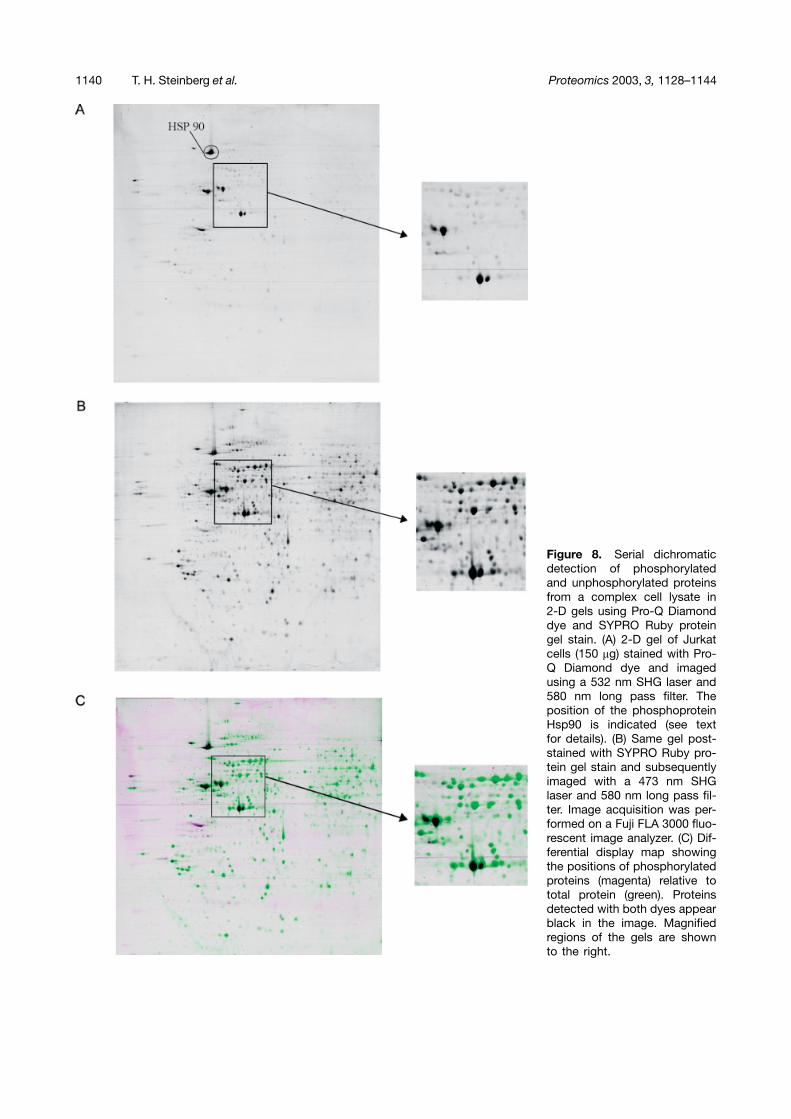
Specific staining of phosphoproteins was obtained on2-D gels of complex cell lysates, as demonstrated inFig. 8. It is readily apparent after generating the differen-tial display map that only a limited number of phos-phorylated proteins are detectable in the Jurkat T cellextracts. It can be clearly seen that most spots only stainwith the total protein stain even though some spots arepresent at high abundances, while a subset of proteinsstain with both Pro-Q Diamond phosphoprotein gel stainand SYPRO Ruby protein gel stain. Minimal backgroundstaining of unphosphorylated proteins is observed usingPro-Q Diamond stain as demonstrated in the magnifiedgel regions. This weak staining facilitates matching ofthe 2-D gel profiles and can readily be distinguishedfrom low abundance phosphoproteins by comparisonwith the SYPRO Ruby dye staining profile. We havefound that using 10% TCA, 50% methanol instead of5% acetic acid, 45% methanol as a fixative for 2-D gelseliminates any low nonspecific staining of proteins. Sub-fractionation of complex samples would be advisable inorder to enrich for the low-abundance phosphoproteinsand further aid in distinguishing between specific andnonspecific staining.
Comparison of the human Jurkat T cell phosphorylationmap generated using Pro-Q Diamond dye with publishedmaps of 32P-labeled MRC-5 human lung fibroblasts sug-gested that one of the prominent phosphoproteins in theJurkat T cell line was heat shock protein-90 (Hsp90) [1].
Proteomics 2003, 3, 1128–1144 Fluorescence detection of phosphoproteins 1139
Figure 7. Serial dichromatic detection of phosphorylatedand unphosphorylated model proteins in 2-D gels usingPro-Q Diamond dye and SYPRO Ruby protein gel stain.(A) 2-D gel of test proteins stained with Pro-Q Diamonddye and imaged using a 532 nm SHG laser and 580 nmlong pass filter. (B) Same gel post-stained with SYPRORuby protein gel stain and subsequently imaged with a473 nm SHG laser and 580 nm long pass filter. Imageacquisition was performed on a Fuji FLA 3000 fluorescentimage analyzer. (C) Differential display map showing thepositions of phosphorylated proteins (magenta) relativeto total protein (green). Proteins detected with both dyesappear black in the image. The proteins used in the gelinclude dephosphorylated �-casein, ovalbumin, skeletalmuscle actin, BSA, and soybean trypsin inhibitor. 750 ngof each protein was applied to the 2-D gels.
Native human Hsp90, isolated from HeLa cells, was thusobtained from StressGen Laboratories, separated bySDS-polyacrylamide gel electrophoresis and determinedto stain strongly with Pro-Q Diamond dye (data notshown). Co-electrophoresis of the purified human proteinwith Jurkat T cell lysates in 2-D gels confirmed that theprominent phosphoprotein in the extracts was indeedHsp90 (data not shown). Consistent with these observa-tions, native Hsp90 from porcine brain has previouslybeen shown, using a combination of ESI and MALDI-TOF-MS, to consist primarily of the diphosphorylated iso-form of the protein [47].
3.8 Compatibility of Pro-Q Diamond dye withMALDI-TOF-MS
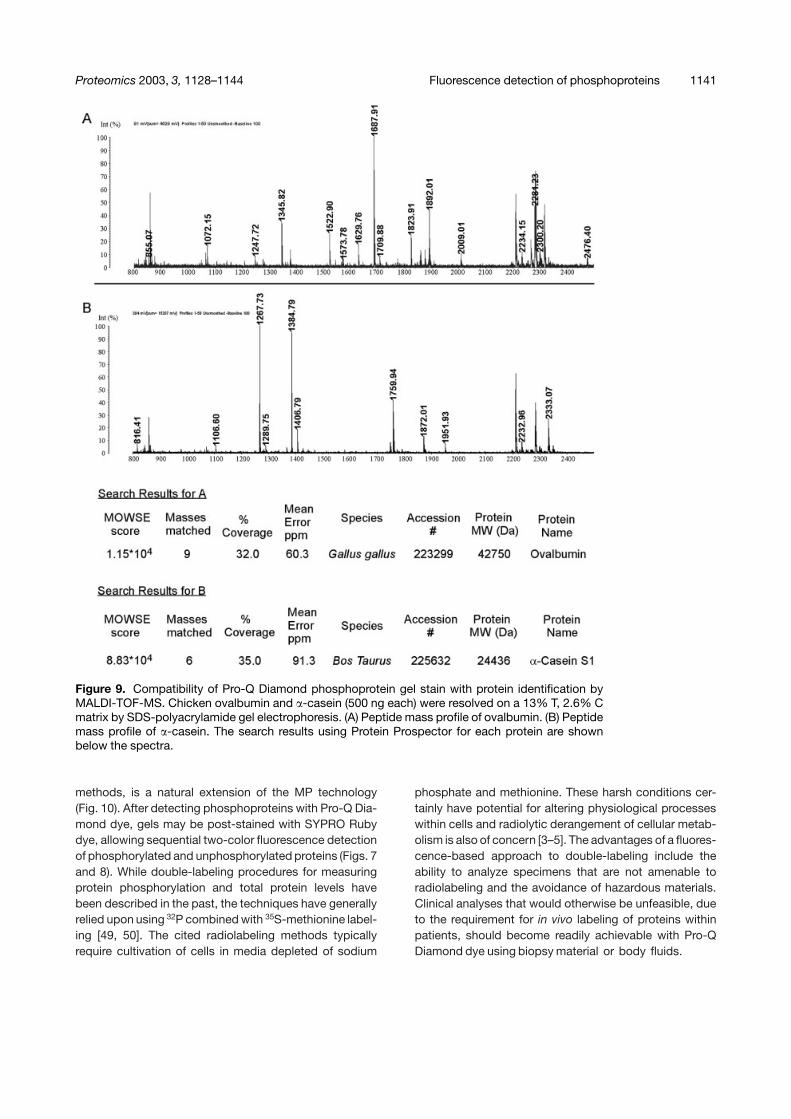
A critical downstream application for any new stainingmethod is the capability to perform subsequent analysisby MS for identification of the protein under investigation.Therefore, broad-range molecular weight markers and�-casein were fractionated by SDS-polyacrylamide gelelectrophoresis and protein bands were subjected topeptide mass profiling using a MALDI-TOF mass spec-trometer. We were able to clearly identify the unphos-phorylated proteins in the broad-range molecular weightmarkers (data not shown) as well as the two phosphopro-teins, ovalbumin and �-casein (Fig. 9). This demonstratesthat the phosphoprotein stain does not interfere with MS-based protein analyses methods. Additionally, the phos-phorylated protein in Jurkat T cell lysates that was identi-fied as Hsp90 by comigration with purified protein fromHeLa cells, was also identified as Hsp90 by peptidemass profiling, with 16% sequence coverage. The com-patibility of Pro-Q Diamond phosphoprotein gel stain withMALDI-TOF-MS will be described in more detail in aseparate publication related to the mitochondrial phos-phoproteome (manuscript in preparation).
4 Discussion
Recently, we introduced the concept of Multiplexed Pro-teomics (MP) technology to allow the parallel determina-tion of protein expression levels as well as certain func-tional attributes of proteins, such as levels of glyco-sylation, drug-binding capabilities or drug-metabolizingcapabilities [48]. The MP technology platform utilizes thesame fluorophore to measure proteins across all gels inthe database, and employs additional specialized stain-ing formulations to accentuate specific functional attri-butes of the specimen. The development of Pro-Q Dia-mond phosphoprotein gel stain, a new phosphorylationsensor dye compatible with standard gel electrophoresis
1140 T. H. Steinberg et al. Proteomics 2003, 3, 1128–1144
Figure 8. Serial dichromaticdetection of phosphorylatedand unphosphorylated proteinsfrom a complex cell lysate in2-D gels using Pro-Q Diamonddye and SYPRO Ruby proteingel stain. (A) 2-D gel of Jurkatcells (150 �g) stained with Pro-Q Diamond dye and imagedusing a 532 nm SHG laser and580 nm long pass filter. Theposition of the phosphoproteinHsp90 is indicated (see textfor details). (B) Same gel post-stained with SYPRO Ruby pro-tein gel stain and subsequentlyimaged with a 473 nm SHGlaser and 580 nm long pass fil-ter. Image acquisition was per-formed on a Fuji FLA 3000 fluo-rescent image analyzer. (C) Dif-ferential display map showingthe positions of phosphorylatedproteins (magenta) relative tototal protein (green). Proteinsdetected with both dyes appearblack in the image. Magnifiedregions of the gels are shownto the right.
Proteomics 2003, 3, 1128–1144 Fluorescence detection of phosphoproteins 1141
Figure 9. Compatibility of Pro-Q Diamond phosphoprotein gel stain with protein identification byMALDI-TOF-MS. Chicken ovalbumin and �-casein (500 ng each) were resolved on a 13% T, 2.6% Cmatrix by SDS-polyacrylamide gel electrophoresis. (A) Peptide mass profile of ovalbumin. (B) Peptidemass profile of �-casein. The search results using Protein Prospector for each protein are shownbelow the spectra.
methods, is a natural extension of the MP technology(Fig. 10). After detecting phosphoproteins with Pro-Q Dia-mond dye, gels may be post-stained with SYPRO Rubydye, allowing sequential two-color fluorescence detectionof phosphorylated and unphosphorylated proteins (Figs. 7and 8). While double-labeling procedures for measuringprotein phosphorylation and total protein levels havebeen described in the past, the techniques have generallyrelied upon using 32P combined with 35S-methionine label-ing [49, 50]. The cited radiolabeling methods typicallyrequire cultivation of cells in media depleted of sodium
phosphate and methionine. These harsh conditions cer-tainly have potential for altering physiological processeswithin cells and radiolytic derangement of cellular metab-olism is also of concern [3–5]. The advantages of a fluores-cence-based approach to double-labeling include theability to analyze specimens that are not amenable toradiolabeling and the avoidance of hazardous materials.Clinical analyses that would otherwise be unfeasible, dueto the requirement for in vivo labeling of proteins withinpatients, should become readily achievable with Pro-QDiamond dye using biopsy material or body fluids.

1142 T. H. Steinberg et al. Proteomics 2003, 3, 1128–1144
Figure 10. Schematic diagramdepicting the overall strategyof the MP technology platform.Two different samples are runon two different 2-D gels. Gelsare stained for phosphorylationusing Pro-Q Diamond phos-phoprotein gel stain, and thenimaged. Gels are next stainedfor total protein expressionusing SYPRO Ruby protein gelstain and imaged again. Theimages resulting from phospho-protein staining and the imagesresulting from total protein stain-ing are then matched by com-puter-assisted rubber sheetingand overlay methods, signalsare normalized (if necessary)and spots are quantified. Differ-ences in phosphorylation andprotein expression are identifiedby evaluation of pseudocoloredimages and data spreadsheets.MP technology can evaluatesets of 2-D gels with respect totwo or three different functionalattributes (protein expression,post-translational modifications,drug-binding capability, drug-metabolizing capability [48].
Since the most labor intensive component of 2-D gelelectrophoresis is the actual running of the gels, the abilityto monitor multiple parameters in a single gel shouldimprove the workflow of proteomics laboratories, whileconserving precious samples. In fact, phosphorylationlevels, glycosylation levels and protein expression levelsmay all be measured using the same gel, when Pro-QEmerald glycoprotein stain is employed as well [51, 52].Additionally, use of Pro-Q Diamond dye and SYPRORuby dye in gel electrophoresis provides a straight for-ward method for measurement of the induction of phos-phorylation in different samples, such as those obtainedas immunoprecipitates, while controlling for the quantityof protein being applied to each gel lane.
Many biomedical investigations such as those involvingthe analysis of drug dose-response curves, monitoringthe kinetics of changes in tissue/cell proteomes, asses-
sing different stages of cancer progression and perform-ing epidemiological studies of global protein expressionpatterns, require large cohorts of 2-D gels. Thus, methodsare needed that facilitate rigorous and reliable matchingof proteins across a database. With the MP platform, aset of 2-D gels is fluorescently stained and imaged toreveal some functional attribute of the proteins, such asdrug-binding capability, or a particular post-translationalmodification, such as phosphorylation or glycosylation.Then, protein expression levels are revealed in the samegels using SYPRO Ruby protein gel stain. Differential dis-play comparisons are made by computer using imageanalysis software [48]. All gels are imaged using thesame excitation/emission filter sets and resulting imagesare then automatically matched, with the option of addingsome manual anchor points to facilitate the process. Anytwo images can then be redisplayed as a single pseudo-colored map, permitting the visual inspection of profile

Proteomics 2003, 3, 1128–1144 Fluorescence detection of phosphoproteins 1143
differences (Figs. 7C and 8C). In addition, quantitativeinformation can readily be obtained in tabular form,with differential expression data calculated. One of thestrengths of the MP technology platform is that similarprofiles, such as total protein patterns, are matched bycomputer from different gels, while dissimilar ones, suchas total protein patterns and phosphoprotein patterns,are matched by computer from the same gel. Thus,though few landmarks may be shared between the totalprotein profiles and the phosphorylation profiles, theimages may readily be matched by superimposition any-way.
Difference gel electrophoresis (DIGE) is an alternativemethod for multiplexing 2-D gel experiments that em-ploys succinimidyl esters of the cyanine dyes, Cy2, Cy3,and Cy5 to fluorescently label as many as three differentcomplex protein populations prior to mixing them to-gether and running them simultaneously on the same2-D gel [53, 54]. A clear advantage of MP technologyover DIGE is that it provides a much broader bandwidthof information, since large number of gels may be evalu-ated with respect to a number of distinct functional attri-butes. Methods for linking different two-color DIGE gelstogether in a multi-gel experiment have been reportedthat rely upon using pooled Cy3-labeled samples to serveas internal controls for different experimental groupslabeled with Cy5 dye, but to date methods for highlightingcritical post-translational modifications have not beendevised for the platform [55].
Proteome analysis, as currently implemented, falls shortof examining the total complement of proteins expressedby a genome, especially when the rich array of post-translational modifications are considered. Many biologi-cal responses, especially signal transduction events,occur on a time-scale of seconds to min, without tran-scription or translation changing the overall abundanceof protein products. While it should be possible to usetotal protein stains in order to detect phosphorylationevents as alterations in the abundances of protein iso-electric point variants in 2-D gels, assignment of theseabundance shifts as bona fide phosphorylation eventsrequires treatment of the specimens with a phosphataseand monitoring protein positional shifts to more alkalinepH values [56]. Pro-Q Diamond phosphoprotein gel stainprovides a direct approach to visualizing the phosphopro-teome. The staining is rapid, simple to perform, readilyreversible, and fully compatible with modern microchemi-cal analysis procedures, such as MALDI-TOF-MS. Phos-phoproteins are considered as key to the functional regu-lation of biological processes and Pro-Q Diamond dyeprovides the capability to quantify protein phosphoryla-tion status on a proteome-wide scale.
The authors are grateful to Karen Martin, Tamara Nyberg,Courtenay Hart, Brad Arnold and Jay Gregory, of Molecu-lar Probes, Inc. for intellectual contributions to this pro-ject. Their input was critical to the success of the re-search. This research was supported in part by NationalCancer Institute grant 1 R33 CA093292-01, awarded toMolecular Probes, Incorporated. SYPRO is a registeredtrademark of Molecular Probes, Inc.
Received January 9, 2003
5 References
[1] Guy, G., Philip, R., Tan, Y., Electrophoresis 1994, 15, 417–440.
[2] Wind, M., Edler, M., Jakubowski, N., Linscheid, M. et al.,Anal. Chem. 2001, 73, 29–35.
[3] Yeargin, J., Hass, M., Curr. Biol. 1995, 5, 423–431.
[4] Hu, V., Heikka, D., Dieffenbach, P., Ha, L., FASEB J. 2001,15, 1562–1568.
[5] Hu, V., Heikka, D., FASEB J. 2000, 14, 448–454.
[6] Conrads, T., Issaq, H., Veenstra, T., Biochem. Biophys. Res.Commun. 2002, 290, 885–890.
[7] Moore, D., Sefton, B., Current Protocols in Molecular Bio-logy, Vol. 3, Wiley, New York 1995, pp. 18.0.3–18.4.5.
[8] Kaufmann, H., Bailey, J., Fussenegger, M., Proteomics2001, 1, 194–199.
[9] Dahlberg, A., Dingman, C., Peacock, A., J. Mol. Biol. 1969,41, 139–147.
[10] Green, M., Pastewka, J., Peacock, A., Anal. Biochem. 1973,56, 43–51.
[11] McCurdy, S., Clarkson, B., Speirs, R., Feagin, F., Arch. Oral.Biol. 1990, 35, 347–357.
[12] Myers, J., Veis, A., Sabsay, B., Wheeler, A., Anal. Biochem.1996, 240, 300–302.
[13] Goldberg, H., Warner, K., Anal. Biochem. 1997, 251, 227–233.
[14] Fisher, J., Sharma, Y., Iuliano, S., Piccioti, R. et al., Prot.Expr. Purif. 2000, 20, 66–72.
[15] Yamakoshi, Y., Tanabe, T., Oida, S., Hu, C. et al., Arch. OralBiol. 2001, 46, 1005–1014.
[16] Lait, C., Zwiazek, J., Physiol. Plant 2001, 112, 460–469.
[17] Cutting, J., Roth, T., Anal. Biochem. 1973, 54, 386–394.
[18] Debruyne, I., Anal. Biochem. 1983, 133, 110–115.
[19] Fadden, P., Haystead, T., Anal. Biochem. 1995, 225, 81–88.
[20] Hsi, K., O’Neill, S., Dupont, D., Yuan, P., Anal. Biochem.1998, 258, 38–47.
[21] Aebersold, R., Watts, J., Morrison, H., Bures, E., Anal. Bio-chem. 1991, 199, 51–60.
[22] McDonald, J., Mackey, A., Pearson, W., Haystead, T., Mol.Cell. Proteomics 2002, 1, 314–322.
[23] Brauer, M., Sykes, B., Methods Enzymol. 1984, 107, 36–81.
[24] Swiderek, K., Jaquet, K., Meyer, H., Schachtele, C. et al.,Eur. J. Biochem. 1990, 190, 575–582.
[25] Belloque, J., De La Fuente, M., Ramos, A., J. Dairy Res.2000, 67, 529–539.
[26] Affolter, M., Watts, J., Krebs, D., Aebersold, R., Anal. Bio-chem. 1994, 223, 74–81.

1144 T. H. Steinberg et al. Proteomics 2003, 3, 1128–1144
[27] Liao, P., Leykam, J., Andrews, P., Gage, D. et al., Anal. Bio-chem. 1994, 219, 9–20.
[28] Oda, Y., Huang, K., Cross, F., Cowburn, D. et al., Proc. Natl.Acad. Sci. USA 1999, 96, 6591–6596.
[29] Goshe, M., Conrads, T., Panisko, E., Angell, N. et al., Anal.Chem. 2001, 73, 2578–2586.
[30] Marshall, P., Heudi, O., Bains, S., Freeman, H. et al., Analyst2002, 127, 459–461.
[31] Zhou, H., Watts, J., Aebersold, R., Nature Biotechnol. 2001,19, 375–378.
[32] Oda, Y., Nagasu, T., Chait, B., Nature Biotechnol. 2001, 19,317–382.
[33] Martin, K., Steinberg, T., Cooley, L., Gee, K. et al., Proteom-ics 2003, 3, 1226–1237.
[34] Laemmli, U., Nature 1970, 227, 680–685.[35] Berggren, K., Schulenberg, B., Lopez, M., Steinberg, T. et al.,
Proteomics 2002, 2, 486–498.[36] Berggren, K., Chernokalskaya, E., Steinberg, T., Kemper, C.
et al., Electrophoresis 2000, 21, 2509–2521.[37] Byford, M., Biochem. J. 1991, 280, 261–265.[38] Steinberg, T., Haugland, R., Singer, V., Anal Biochem. 1996,
239, 238–245.[39] Steinberg, T., Jones, L., Haugland, R., Singer, V., Anal. Bio-
chem. 1996, 239, 223–237.[40] Pretty On Top, K., Hatleberg, G., Berggren, K., Ryan, D. et al.,
Electrophoresis 2001, 22, 896–905.[41] Smith, P., Krohn, R., Hermanson, G., Mallia, A. et al., Anal.
Biochem. 1985, 150, 76–85.
[42] Smilansky, Z., Electrophoresis 2001, 22, 1616–1626.[43] Raman, B., Cheung, A., Marten, M., Electrophoresis 2002,
23, 2194–2202.[44] Lopez, M., Berggren, K., Chernokalskaya, E., Lazarev, A.
et al., Electrophoresis 2000, 21, 3673–3683.[45] Berggren, K., Chernokalskaya, E., Lopez, M., Beechem, J.,
Patton, W., Proteomics 2001, 1, 54–65.[46] Patton, W., J. Chromatogr. B 2002, 771, 3–31.[47] Garnier, C., Lafitte, D., Jorgensen, T., Jensen, O. et al., Eur.
J. Biochem. 2001, 268, 2402–2407.[48] Patton, W., Beechem, J., Curr. Opin. Chem. Biol. 2002, 6,
63–69.[49] Capps, G., Zuniga, M., BioTechniques 1990, 8, 62–69.[50] Lee, K., Harrington, M., in: Link, A. (Ed.), 2-D Proteome Anal-
ysis Protocols, Humana Press, Totowa, NJ1990, pp. 291–305.
[51] Steinberg, T., Pretty On Top, K., Berggren, K., Kemper, C.et al., Proteomics 2001, 1, 841–855.
[52] Schulenberg, B., Beechem, J., Patton, W., J. Chromatogr. B2003, in press.
[53] Unlu, M., Morgan, M., Minden, J., Electrophoresis 1997, 18,2071–2077.
[54] Tonge, R., Shaw, J., Middleton, B., Rowlinson, R. et al., Pro-teomics 2001, 1, 377–396.
[55] Yan, J., Devenish, A., Walt, R., Stone, T. et al., Proteomics2002, 2, 1682–1698.
[56] Yamagata, A., Kristensen, D., Takeda, Y., Miyomoto, Y. et al.,Proteomics 2002, 2, 1267–1276.
Copyright © 2022 FDOKUMEN