FunPat: function-based pattern analysis on RNA-seq time series data
Upload
khangminh22Category
view
0download
0
OPEN
ARTICLE
Combination of iTRAQ proteomics and RNA-seqtranscriptomics reveals multiple levels of regulation inphytoplasma-infected Ziziphus jujuba MillXia Ye1,2, Huiyu Wang1,2, Peng Chen1, Bing Fu1, Mengyang Zhang1, Jidong Li1, Xianbo Zheng1, Bin Tan1 and Jiancan Feng1
Jujube witches’ broom (JWB) is caused by infection with a phytoplasma. A multi-omics approach was taken during graft infection ofjujube by JWB-infected scion through the analysis of the plant transcriptome, proteome and phytohormone levels. A high numberof differentially expressed genes (DEGs) were identified 37 weeks after grafting (WAG), followed by observation of typicalsymptoms of JWB at 48 WAG. At 37 WAG, the majority of the upregulated DEGs and differentially expressed proteins (DEPs) wererelated to flavonoid biosynthesis, phenylalanine metabolism and phenylpropanoid biosynthesis. Two of the four upregulatedproteins were similar to jasmonate-induced protein-like. Among the downregulated genes, the two most populated GO terms wereplant–pathogen interaction and plant hormone signal transduction (mainly for tryptophan metabolism). Moreover, phytoplasmainfection resulted in reduced auxin content and increased jasmonate content, indicating that auxin and jasmonic acid haveimportant roles in regulating jujube responses during the first and second stages of phytoplasma infection. At 48 WAG, the twolargest groups of upregulated genes were involved in phenylpropanoid biosynthesis and flavonoid biosynthesis. Both genes andproteins involved in carbon metabolism and carbon fixation in photosynthetic organisms were downregulated, indicating thatphotosynthesis was affected by the third stage of phytoplasma infection.
Horticulture Research (2017) 4, 17080; doi:10.1038/hortres.2017.80; Published online 27 December 2017
INTRODUCTIONJujube (Ziziphus jujuba Mill.) is a major fruit crop cultivated in India,Russia, the Middle East, southern Europe and, especially, China.1
Among the diseases of jujube trees, jujube witches’ broom (JWB)is currently the most destructive and devastating disease in Asia.2,3
JWB is caused by a phytoplasma that can be transmitted by insectvectors and grafting. The typical symptoms of a phytoplasma-infected jujube include excessive stem production from a singlepoint (witches’ broom), yellowing and floral organs turning intoleaf-like structures (phyllody).2
Phytoplasmas are important agricultural pathogens4 and havebeen found in over 1000 plant species worldwide.5 Recently,phytoplasma effector proteins have been shown to targettranscription factors, phytohormone receptors and other compo-nents of phytohormone signaling in the host plant in order tomodulate plant development.6–11 For example, overexpression ofthe phytoplasma effector SAP54 induces indeterminate leaf-likeflower development in Arabidopsis plants.6 The effector SAP11from Aster Yellows Witches’ Broom (AY-WB) Phytoplasma altersArabidopsis morphology, destabilizes Arabidopsis CINCINNATA(CIN)-related TEOSINTE BRANCHED1, CYCLOIDEA and the PRO-LIFERATING CELL FACTORS 1 and 2 (TCP) transcription factors, andreduces lipoxygenase (LOX2) gene expression and jasmonate (JA)synthesis.7 The TENGU effector causes Arabidopsis sterility bydownregulating the JA and auxin pathways.10 Together, theseresults indicate that phytoplasma effectors have vital roles inphytoplasma pathogenesis and host–pathogen interaction. How-ever, phytoplasma effectors have not been identified in woody
plants, and it was unknown whether the phytoplasmas that infecttrees carry effectors and whether these effectors have similarfunctions as those in Arabidopsis.The plant response to phytoplasma infection has also been
studied at the physiological and biochemical levels. These studieshave shown that phytoplasma infection affects photosyntheticactivity,12 increases antioxidant enzyme levels and reduces thecontents of chlorophyll, total soluble sugars and auxin in infectedplants.13,14 An imbalance in phytohormones has been suggestedto be a main reason for development of phytoplasma-associatedsymptoms, such as stunting, proliferation and witches’ broom.14
Previous studies indicated that biosynthetic pathways for suchsecondary metabolites as terpenoid indole alkaloids and phenyl-propanoids were stimulated by phytoplasma infection.15 A fewstudies have focused on the molecular mechanisms of plantreactions. Using suppressive subtraction hybridization, defensegenes such as Peroxidase, Thaumatin-like protein, PR10 and Proline-rich protein, and eEF1A protein were predicated to have animportant function in a resistant jujube cultivar in response tophytoplasma infection.3,16
On the basis of previous reports, it is clear that the responses ofhost plants to phytoplasma infection are complex. However, thephysiological and molecular mechanisms during disease symptomdevelopment are still poorly understood. In this study, weanalyzed changes in the transcriptome, proteome and phytohor-mone levels in response to grafting a phytoplasma-infected sciononto a susceptible cultivar of jujube. The large-scale, multi-omicsdata set allowed identification of jujube genes and proteins that
1College of Horticulture, Henan Agricultural University, Zhengzhou 450002, China.Correspondence: J Feng ([email protected])2These authors contributed equally to this work.Received: 7 August 2017; Revised: 16 October 2017; Accepted: 5 December 2017
Citation: Horticulture Research (2017) 4, 17080; doi:10.1038/hortres.2017.80
www.nature.com/hortres

respond early to phytoplasma infection. Further, we explored thecorrelation between the phytoplasma-responsive transcriptomeand proteome, which can serve as the foundation for furtherphytoplasma pathogenesis and response mechanism studies.
MATERIALS AND METHODSPlant materialsTwo-year-old jujube (Ziziphus jujuba Mill. ‘Huizao’) plants were grown inpots in an insect-free net-house at Henan Agricultural University,Zhengzhou, China. Leaves of each jujube plants were collected at threetimes during spring-summer. DNA was extracted from leaf samples usingCTAB17 for direct and nested polymerase chain reaction (PCR) using theuniversal phytoplasma-specific primer sets P1/P7 (ref. 18) and R16F2n/R16R2 (ref. 19) to diagnose phytoplasma infection. Jujube plants that werenegative for phytoplasma infection after all three rounds of PCRexamination were selected as healthy material for grafting experiments.Buds from JWB-infected adult plants (Ziziphus jujuba Mill. ‘Huizao’) weresampled and grafted onto healthy 2-year-old jujube plants on 13 August2014 in the net-house. In order to analyze the migration of JWBphytoplasma within the host jujube plant, leaves were sampled every3 days in the first month after grafting and then each week from thesecond month after grafting (WAG) until JWB symptoms were seen ingrafted jujube plants in October 2015.
PCR analysisPCR products from the diagnosis PCR using P1/P7 (ref. 18) and R16F2n/R16R2 (ref. 19) primers were sequenced. Primers specific to the 16S rRNA of
JWB phytoplasma were designed based on the sequencing results (F1:CGCTAAAGTCCCCACCATTA and R1:CACATTGGGACTGAGACACG). PCRreactions contained 1 μl primer mix (0.5 μM F1 and R1 JWB-specificprimers), 100 ng template DNA, 10 μL PCR Master Mix (TaKaRa, Dalian,China) and purified H2O water in a total volume of 25 μL. Reactions wereconducted using the following thermal cycling conditions: 94 °C for 6 min,followed by 35 cycles of denaturation for 45 s at 94 °C, annealing for 45 sat 56 °C, extension for 1 min at 72 °C and a final extension at 72 °C for10 min. PCR products (827 bp) were detected using 1.5% agarose gelelectrophoresis.
Sample collection and transcriptome analysisAccording to PCR results and symptom observation of grafted plants(Supplementary Figure S1 and Figure 1), leaf samples at six stages aftergrafting and from healthy plants at the same stages were collected for RNAextraction and transcriptome analysis. The six stages of infection were setat 0 WAG (13 August 2014), 2 WAG (23 August 2014), 37 WAG (27 May2015), 39 WAG (10 June 2015), 48 WAG (13 August 2015) and 52 WAG (16September 2015). Three trees in one replicate and three biologicalreplicates were set, and in total nine healthy and nine infected trees weresampled in each treatment. Three or four leaves from each plant wereindividually collected at each stage, frozen in liquid nitrogen and thenstored in − 80 °C.For RNA extraction and transcriptome analysis, nine healthy and nine
grafted plants with similarly developing characteristics were selected frommore than 100 healthy and JWB-infected jujube plants for this experiment.Three samples were prepared for the following experiments. Total RNAwas extracted from the above infected and healthy leaves using theRNAprep Pure Plant Kit (DP441, TianGen, Beijing, China). RNA quality and
Figure 1. Symptoms of jujube infected by grafted buds carrying JWB phytoplasma at different stages. (a) Zero weeks after grafting (WAG); (b)2 WAG; (c) 37 WAG; (d) 39 WAG; (e) 48 WAG; (f) 52 WAG. Red arrow: grafting position. The dotted circle: symptoms began to appear.
iTRAQ proteomics and transcriptomics analyses of phytoplasma-infected jujubeX Ye et al.
2
Horticulture Research (2017)

quantity were determined in a NanoDrop 2000c spectrophotometer(Thermo Scientific, Waltham, MA, USA), and the RNA integrity was assessedby electrophoresis in 1.0% agarose gel. Total RNA was digested with DnaseI to remove DNA. The purified RNA with an A260/A280 ratio of 1.8–2.0 wasused for transcriptome sequencing. The libraries were constructed andsequenced in an Illumina Hiseq 2500 platform.Clean data were obtained by removing the two ends of sequences with
low quality (threshold value: 30), removing adapter contamination andremoving reads with length less than 60 bp. The resulting reads werealigned to the Z. jujuba genome20 and the mapped results were thensubjected to BLAST against the UniProtKB database (www.uniprot.org).Annotation information was obtained and differentially expression genes(DEGs) were screened based on having a fold change ⩾ 2 and a P valueo0.05.
iTRAQ labeling and MS analysisFor iTRAQ proteomics analysis, protein from the above three individual leafsamples (the same as in section 2.3) collected from healthy and diseasedplants at 37 WAG and 48 WAG was extracted using SDT lysis and FASPmethod,21 and the detailed procedures were described as follows.
Protein extraction. The samples were ground into powder in liquidnitrogen, and then added to trichloroacetic acid (TCA)/acetone (1:9)solution by five-time volume and mixed by vortex. The mixture was placedat − 20 °C for 4 h, and centrifuged at 6000 g for 40 min at 4 °C, and thenthe supernatant was discarded. The precipitation was washed with pre-cooling acetone for three times, and then air-dried. The obtained powderwas added to 30 times volume of SDT buffer (4% sodium dodecyl sulfate(SDS), 1 mM dithiothreitol (DDT) and 100 mM Tris-HCl, pH 7.6), mixed andboiled for 5 min. The lysate was sonicated and then boiled for 15 min,followed by centrifugation at 14 000 g for 40 min.22
After the protein extraction, the protein was filtered with 0.22 μm filters,and the filtrate was quantified with the bicinchonininc acid Protein AssayKit (Bio-Rad, Hercules, CA, USA). Proteins (20 μg) were mixed with 5 ×loading buffer boiled for 5 min, and then separated on 10% SDS-PAGE gel(constant current 14 mA, 90 min) to detect protein purity. Protein bandswere visualized with Coomassie Blue R-250 staining.
Filter-aided sample preparation (FASP Digestion). Protein solution (30 μl)was taken and DTT was added to a 10 mM final concentration, and boiledfor 5 min, and then cooled to room temperature. UA buffer (200 μl; 8 Murea, 150 mM Tris-HCl, pH 8.0) was added and centrifuged at 14 000 g for15 min for two times. UA buffer (100 μl; 100 mM iodoacetamide in UA) wasadded by vortex at 600 r.p.m. for 1 min. The samples were incubated for30 min in darkness, and centrifuged at 14 000 g for 15 min. Dissolutionbuffer (100 μl; AB SCIEX, Foster City, CA, USA; DS buffer) was added andcentrifuged at 14 000 g for 15 min for two times. Proteins for each samplewere incorporated into 30 μl SDT buffer. Then, 100 μl iodoacetamide(100 mM indole-3-acetic acid in UA buffer) was added to block reducedcysteine residues. Finally, the protein suspensions were digested with 4 μgTrypsin (Promega, Madison, WI, USA) in 40 μl DS buffer overnight at 37 °C,and the resulting peptides were collected as a filtrate.23 The filtratedpeptides of each sample were desalted on C18 Cartridges (Empore SPECartridges C18, bed I.D. 7 mm, volume 3 mL, Sigma, St Louis, MO, USA),concentrated by vacuum centrifugation and reconstituted in 40 μL of 0.1%(v/v) formic acid. The peptide content was estimated by ultraviolet lightspectral density at 280 nm using an extinction coefficient of 1.1 of 0.1%(g L− 1) solution.
iTRAQ labeling and strong cation exchange fractionation. The resultingpeptide mixture from each sample was labeled using iTRAQ reagentaccording to the manufacturer’s instructions (Applied Biosystems, FosterCity, CA, USA). The leaf samples collected from healthy plants at 37 WAGand 48 WAG were labeled as respective controls.The iTRAQ-labeled peptides were fractionated by strong cation
exchange (SCX) chromatography using the AKTA Purifier system (GEHealthcare, Uppsala, Sweden) by the following steps: reconstituted andacidified the labeled peptides with buffer A (10 mM KH2PO4 in 25% ofacetonitrile, pH 3.0), and then loaded onto a PolySULFOETHYL4.6 × 100 mm column (5 μm, 200 Å, PolyLC Inc, Colombia, MD, USA) andeluted at a flow rate of 1 ml min− 1 with a gradient of 0–8% buffer B(500 mM KCl, 10 mM KH2PO4 in 25% of acetonitrile, pH 3.0) for 22 min,followed by 8–52% buffer B during 22–47 min, 52–100% buffer B during47–50 min, 100% buffer B during 50–58 min and finally buffer B was reset
to 0% after 58 min. The elution was monitored by measuring theabsorbance at 214 nm, and fractions were collected at every 1 min. Theeluted peptides were desalted with C18 Cartridges (Empore SPE CartridgesC18, bed I.D.7 mm, volume 3 mL, Sigma) and concentrated by vacuumcentrifugation.
Mass spectrometry. Each obtained fraction was injected for nano Liquidchromatography-mass spectrometry analysis. The peptide mixture inbuffer A (0.1% formic acid) was loaded onto a reverse phase trap column(Acclaim PepMap100, 100 μm×2 cm, nanoViper C18, Thermo Scientific)connected to the C18-reversed phase analytical column (Easy Column,10 cm long, 75 μm inner diameter, 3 μm resin, Thermo Scientific). Then, thepeptide was separated with a linear gradient of buffer B (84% acetonitrileand 0.1% formic acid) at a flow rate of 300 nl min− 1 controlled byIntelliFlow technology. The linear gradient was: 0–35% buffer B for 50 min,35–100% buffer B for 5 min and hold in 100% buffer B for 5 min.LC-MS/MS analysis was performed on a Q Exactive mass spectrometer
(Thermo Scientific). MS data were obtained from the survey scan (300–1800 m/z) for higher-energy-collisional dissociation fragmentation. Auto-matic gain control target was set to 3e6 and maximum inject time to10 ms. Dynamic exclusion duration was 40 s. Survey scans were acquired ata resolution of 70 000 at 200 m/z and resolution for higher-energy-collisional dissociation spectra was set to 17 500 at 200 m/z, and isolationwidth was 2 m/z. Normalized collision energy was 30 eV and the underfillratio was defined as 0.1%.
Data analysis. MS/MS spectra were searched against the UniProtKBdatabase (www.uniprot.org) using the MASCOT engine (Matrix Science,London, UK; version 2.2) embedded into Proteome Discoverer 1.4. Relativeparameters was set as follows: trypsin was chosen as the enzyme, andCarbamidomethyl (C), iTRAQ 4/8 plex (N-term) and iTRAQ 4/8 plex (K) asfixed modifications; Oxidation (M) and iTRAQ 4/8plex (Y) as variablemodifications; peptide mass tolerance: ± 20 mg/l and fragment masstolerance: 0.1 Da. To reduce the probability of false peptide identification(false discovery rate (FDR)), only peptides with FDR of 1% at the proteinlevel were counted as the identified protein and each identified proteinhad at least one unique peptide. For protein quantification, the proteinratios are calculated as the median of only unique peptides of the protein.The thresholds of unique peptide were determined by FDR o0.01, andprotein was considered as a differentially expressed protein (DEP) if its foldchange was at least 1.2 and its P value o0.05 (Student’s t-test).
Correlation analysis of transcriptome and proteomeCorrelation between the expression levels of a gene in the transcriptomeand its corresponding protein in the proteome was evaluated usingSpearman’s correlation test.24 The results were divided into threecategories: the same expression trend, the opposite expression trendand no expression difference.
Bioinformatics analysisAnnotation analysis of Gene Ontology (GO) was performed for thescreened DEGs with the Blast2GO software (http://www.geneontology.org). Following three ontologies for GO annotation of DEGs were included:molecular function, cellular component and biological process. GOenrichment analysis was carried out according to all GO terms that weresignificantly enriched by the DEGs. For each GO term, the number of geneswas calculated before the hypergeometric test to find significantlyenriched GO terms based on the input list of DEGs.25
KEGG (Kyoto Encyclopedia of Genes and Genomes) databases (http://www.genome.jp/kegg/pathway.html) were used to perform pathwayenrichment analysis of the DEGs.26
Phytohormone quantificationThe above leaf samples collected at 0 WAG, 37 WAG and 48 WAG werefurther analyzed for free JA and salicylic acid content using HPLC -MS/MS(high performance liquid chromatography-MS/MS) (SCIEX-6500Qtrap,Applied Biosystems, Foster City, CA, USA) as described.27 Phytohormoneconcentration was analyzed using SPSS 17.0 with three replications, andthe Duncan’s multiple range test was applied at P=0.05 probability level toevaluate the significant differences among treatments.
iTRAQ proteomics and transcriptomics analyses of phytoplasma-infected jujubeX Ye et al.
3
Horticulture Research (2017)

Real-time PCR analysisComplementary DNA (cDNA) sequences of DEGs were downloaded fromtranscriptome sequence data, and real-time PCR primers were designed byPrimer Express 3.0 (ABI; Supplementary Table S1). Total RNA was reverse-transcribed using PrimeScript RT reagent kit (TaKaRa), and then cDNAsolution was diluted to 80–100 μL according to their concentration withRnase-free water. Real-time PCR was performed with SYBR Premix Ex Taq IIkit (TaKaRa) using an ABI PRISM 7500 FAST Sequence Detection System(Applied Biosystems). Reactions of 20 μL total volume contained 1 μLdiluted cDNA template, 2 μL primers (0.4 μM each forward and reverseprimer), 10 μL SYBR Premix Ex Taq II solution and 7 μL water. Theamplification reaction was conducted at 95 °C for 30 s, 40 cycles of 95 °Cfor 5 s, 60 °C for 31 s and a final dissociation step at 95 °C for 15 s, 60 °C for1 min and 95 °C for 15 s. Each experiment was repeated three times withthree biological replicates.Relative expression levels of DEGs at 37 WAG infected versus
noninfected scions were measured using the ΔΔCT method, and actingene was used as a reference gene for data normalization.
RESULTSTranscriptome and proteome differences during earlyphytoplasma infection via graftingPCR analysis (Supplementary Figure S1) was used to determine theinfection stages in jujube plants receiving infected bud grafts. Thetranscriptome of leaf samples from these six stages after graftingindicated that the highest number of DEGs occurred at 37 WAG.Typical symptoms of JWB were observed at 48 WAG (Figure 1).Therefore, leaf samples from the above two stages were sampledfor protein analysis using iTRAQ during phytoplasma infection.Through transcriptome analysis, 25 067 genes were identified at
both 37 WAG and 48 WAG (Table 1). Of these, 16 703 and 21 367genes were annotated in the SwissProt and TrEMBL databases,respectively. At 37 WAG, 1994 genes were significantly differen-tially expressed in JWB-grafted plants compared with uninfectedplants, with 693 of these upregulated and 1301 of thesedownregulated (fold change 42.0 and P values o0.05 in t-test(Supplementary Tables S2 and S3)). At 48 WAG, 2401 DEGs weredetected, with 808 genes upregulated and 1593 genes down-regulated compared with the uninfected controls (SupplementaryTables S4 and S5).The iTRAQ analysis resulted in a total of 583 908 spectra, with
41 465 of these matching known peptides. Among them, 37 992unique peptides were identified, and 6748 proteins were explored.At 37 WAG, 5378 proteins were identified, and at 48 WAG 5377were identified (Table 1). At 37 WAG, a total of 289 differentiallyexpressed proteins (DEPs) were observed, with 176 proteinsupregulated and 113 proteins downregulated compared with theuninfected control (fold change 41.2 and FDR o0.01). At 48WAG, a total of 753 DEPs were detected, with 358 proteinsupregulated and 395 proteins downregulated compared with theuninfected control.
GO analysis of DEGs and DEPsOf the 25 067 genes identified in the transcriptome analysis,18 926 genes (75.5%) were annotated via GO analysis. At 37 WAGthe category with the most DEGs was cellular components, with693 genes upregulated with the main functions defined aschloroplast (119 genes) and chloroplast stroma (55 genes). In themolecular function category, most of the upregulated genes wereinvolved in metal ion binding (80 genes) and iron ion binding (29genes). In the biological process category, 28 upregulated geneswere involved in flavonoid biosynthetic process (SupplementaryTable S2). Among the 1301 downregulated genes (SupplementaryTable S3), 82 genes were involved in response to biotic stimulus,and more than 137 genes were involved in phytohormoneregulation (Supplementary Table S3). The top hormone-relatedfunctions were auxin-activated signaling pathway (66 genes),response to SA (44 genes) and response to jasmonic acid (27genes; Supplementary Table S3). Three genes (XLOC_013752,XLOC_013753 and XLOC_021944) related to JA O-methyltransfer-ase activity were also downregulated (Supplementary Table S3).At 48 WAG there were 808 upregulated genes (Supplementary
Table S4). The categories with the most DEGs were cellularcomponents, such as the 214 genes encoding integral compo-nents of the membrane, 197 genes related to the plasmamembrane and 105 genes related to the plasmodesma. Amongthe 1593 downregulated genes (Supplementary Table S5), thecellular component category was again the most represented,such as the 342 genes involved in chloroplasts, 211 genes relatedto membranes and 121 genes involved in the chloroplast stroma.Together, this means that the expressions of most genes in thephotosynthetic system were affected by phytoplasma infection.At 37 WAG, 289 DEPs were classified into 43 categories according
to their biological process, molecular function or cellular compo-nent (Supplementary Figure S2 and Supplementary Table S6). Therewere 176 proteins upregulated and 113 proteins downregulatedcompared with the uninfected control (fold change 41.2 and Pvalue o0.05 in t-test). Among the upregulated DEPs, there werefour proteins with abundance changes of more than twofold,namely a JA-induced protein-like (4.38-fold, TCONS_00019449), agranule-bound starch synthase (3.29-fold, TCONS_00052666),a phosphoenolpyruvate carboxykinase-like protein (2.14-fold,TCONS_00033847) and another JA-induced protein-like (2.01-fold,TCONS_00032059; Table 2). Two of the top four DEPs were relatedto JA-induced protein, in which the co-expression with the JAbiosynthesis enzyme (allene oxide synthase) is accompanied by arise in JAs.28 Proteins related to flavonoid biosynthesis (1.89-foldand 1.77-fold higher) and phenylalanine metabolism pathways(1.81-fold) were also upregulated in the leaves of the infectedjujube (Table 2). Of the downregulated DEPs, the one withthe most change, at more than threefold, was GRF1-interactionfactor 1 protein (Table 2), which is a component of the pathwaycontrolling leaf growth by regulating cell proliferation in atransverse direction.In leaves at 48 WAG, 753 DEPs were detected, with 358 proteins
upregulated and 395 proteins downregulated compared withthe uninfected control (Supplementary Figure S2 andSupplementary Table S7). Among the upregulated proteins, threeof the top 10 DEPs were L-gulonolactone oxidase-like proteins(TCONS_00033106: 3.63-fold, TCONS_00033103: 2.98-fold andTCONS_00033097: 2.73-fold), which are enzymes that producevitamin C (Table 3). Two of the top 10 upregulated proteins wereJA-induced protein-like (TCONS_00032059: 3.16-fold andTCONS_00006683: 2.78-fold). Of the downregulated proteins, amore than sixfold decrease of the linoleate 13S-lipoxygenase2-like protein (LOX2) was observed in the leaf sample at 48 WAGcompared with the control, and two of the top five DEPs wereJA-induced protein-like proteins (TCONS_00050299: 0.344 and
Table 1. Summary of the number of proteins and mRNA detectedduring phytoplasma infection of Ziziphus jujuba Mill.
Category Proteins mRNAs
37 WAG 48 WAG 37 WAG 48 WAG
Unique protein/gene detected 5378 5377 25 067 25 067
Significantly changed proteins/genes
289 753 1994 2401
Upregulated 176 358 693 808Downregulated 113 395 1301 1593
Abbreviation: WAG, weeks after grafting.
iTRAQ proteomics and transcriptomics analyses of phytoplasma-infected jujubeX Ye et al.
4
Horticulture Research (2017)

TCONS_00019449: 0.370), which means JA was an importantfactor during phytoplasma infection of jujube (Table 3).
KEGG pathway analysis for DEGs and DEPsOf the 25 067 genes from the transcriptome analysis, 10 104 genes(40.3%) were annotated by KEGG analysis. At 37 WAG in plantsgrafted with JWB-infected scions, 20 of the upregulated genes wereinvolved in flavonoid biosynthesis, 11 in phenylpropanoid biosynth-esis and 10 genes in phenylpropanoid metabolism (SupplementaryTable S8). Among the downregulated genes, the two most
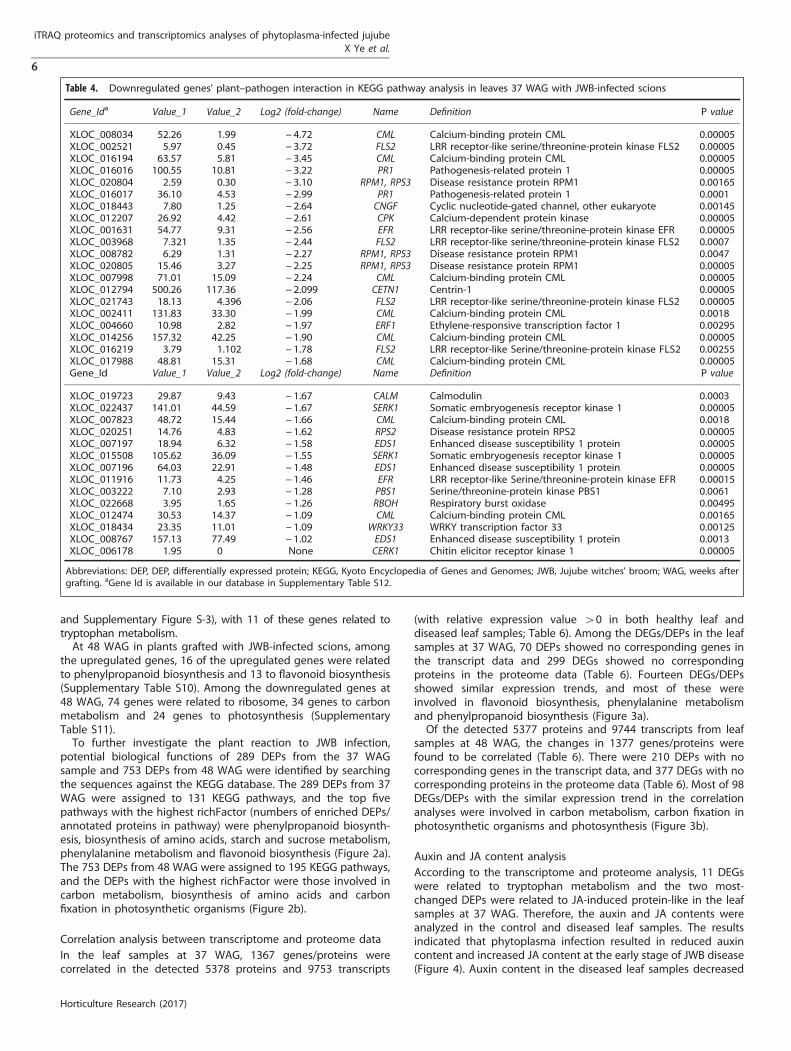
populated groups were related to plant–pathogen interaction andplant hormone signal transduction (Supplementary Table S9 andSupplementary Figures S3 and S4). Three to four downregulatedgenes were involved in plant–pathogen interactions (Table 4 andSupplementary Figure S4), with five of these genes representing twocalcium-binding proteins (CML), one LRR receptor-like serine/threonine-protein kinase (FLS2), pathogenesis-related protein 1(PR1) and the disease resistance protein RPM1 expressed at levelseightfold lower than in the control. A total of 28 genes involved inplant hormone signal transduction were downregulated (Table 5
Table 2. Summary of the top 10 DEPs at 37 WAG with phytoplasma infecting scion
Accessiona Sequence description Fold change (37 WAG/CK) KEGG term (Map name) P value
TCONS_00019449 23 kDa jasmonate-induced –like 4.38 α-Linolenic acid metabolism 0.0419TCONS_00052666 Granule-bound starch synthase 3.29 Starch and sucrose metabolism 0.0014TCONS_00033847 Phosphoenolpyruvate carboxykinase [ATP]-like 2.14 None 0.0102TCONS_00032059 23 kDa jasmonate-induced –like 2.014 α-Linolenic acid metabolism 0.0083TCONS_00024299 Dihydroflavonol 4-reductase 1.89 Flavonoid biosynthesis 0.0152TCONS_00048113 Phenylalanine ammonia lyase 1.819 Phenylalanine metabolism 0.0124TCONS_00021256 Flavonoid 3-hydroxylase 1.77 Flavonoid biosynthesis 0.0128TCONS_00025885 Aspartic proteinase nepenthesin-2 1.77 None 0.0049TCONS_00014361 Superoxide dismutase [Fe] chloroplastic-like 1.77 MAPK signaling pathway 0.0094TCONS_00030498 Desacetoxyvindoline 4 1.75 None 0.0012TCONS_00008208 GRF1 interaction factor 1 0.31 None 0.0020TCONS_00000288 DNA replication licensing factor MCM6-like 0.45 DNA replication 0.0395TCONS_00025058 Nitrate reductase 0.52 Nitrogen metabolism 0.0257TCONS_00045226 Abscisic acid receptor PYR1-like 0.60 MAPK signaling pathway 0.0019TCONS_00030214 Sieve element occlusion a 0.61 None 0.0302TCONS_00034614 Subtilisin-like protease-like 0.61 None 0.0001TCONS_00022334 Cytochrome P450 71A1-like 0.62 None 0.0054TCONS_00022924 Movement-binding isoform 1 0.631 None 0.0163TCONS_00000768 BRG-1 associated 0.65 None 0.0485TCONS_00009541 125 kDa kinesin-related-like 0.65 None 0.0039
Abbreviations: DEP, differentially expressed protein; KEGG, Kyoto Encyclopedia of Genes and Genomes; MAPK, mitogen-activated protein kinase; WAG, weeksafter grafting; CK, controls. aAccession numbers in our database was available in Supplementary Table S13.
Table 3. Summary of the top 10 DEPs at 48 WAG with phytoplasma-infected scion
Accessiona Sequence description Fold change (37 WAG/CK) KEGG term (Map name) Pathway ID P value
TCONS_00023218 B-cell receptor-associated 31-like 4.08 None None 0.0113TCONS_00033106 L-gulonolactone oxidase-like 3.63 None None 0.0005TCONS_00042803 Beta expansin-like 3.26 None None 0.0062TCONS_00032059 23 kDa jasmonate-induced-like 3.16 None None 0.0003TCONS_00033103 L-gulonolactone oxidase-like 2.98 None None 0.0022TCONS_00055463 Adenylate kinase B-like 2.91 Purine metabolism K00939 0.0072TCONS_00022833 1,3-beta-D-glucanase GH17_44 2.84 None None 0.0110TCONS_00006683 23 kDa jasmonate-induced-like 2.78 None None 0.0005TCONS_00033097 L-gulonolactone oxidase-like 2.73 None None 0.0495TCONS_00033649 E3 ubiquitin-ligase HERC2-like 2.66 None None 0.0478TCONS_00008624 Linoleate 13S-lipoxygenase 2-like 0.16 Linoleic acid metabolism K00454 0.0009TCONS_00050299 23 kDa jasmonate-induced-like 0.34 None None 0.0019TCONS_00028902 Sieve element occlusion b Zeatin 0.36 None None 0.0047TCONS_00015275 O-glucosyltransferase-like 0.36 None None 0.0001TCONS_00019449 23 kDa jasmonate-induced-like 0.37 None None 0.0077TCONS_00007094 Dehydrodolichyl diphosphate synthase 2-like 0.38 Terpenoid backbone
biosynthesisK11778 0.0153
TCONS_00010120 Tetratricopeptide repeat-like 0.39 None None 0.0075TCONS_00022334 Cytochrome P450 71A1-like presequence
protease0.39 None None 0.0011
TCONS_00009593 Chloroplastic/mitochondrial-like 0.39 None None 0.0109TCONS_00028899 Sieve element occlusion a n characterized
protein0.42 None None 0.0016
TCONS_00000655 Ycf23-like 0.42 None None 0.0088
Abbreviations: DEP, differentially expressed protein; KEGG, Kyoto Encyclopedia of Genes and Genomes; WAG, weeks after grafting. aAccession numbers in ourdatabase are available in Supplementary Table S13.
iTRAQ proteomics and transcriptomics analyses of phytoplasma-infected jujubeX Ye et al.
5
Horticulture Research (2017)
and Supplementary Figure S-3), with 11 of these genes related totryptophan metabolism.At 48 WAG in plants grafted with JWB-infected scions, among
the upregulated genes, 16 of the upregulated genes were relatedto phenylpropanoid biosynthesis and 13 to flavonoid biosynthesis(Supplementary Table S10). Among the downregulated genes at48 WAG, 74 genes were related to ribosome, 34 genes to carbonmetabolism and 24 genes to photosynthesis (SupplementaryTable S11).To further investigate the plant reaction to JWB infection,
potential biological functions of 289 DEPs from the 37 WAGsample and 753 DEPs from 48 WAG were identified by searchingthe sequences against the KEGG database. The 289 DEPs from 37WAG were assigned to 131 KEGG pathways, and the top fivepathways with the highest richFactor (numbers of enriched DEPs/annotated proteins in pathway) were phenylpropanoid biosynth-esis, biosynthesis of amino acids, starch and sucrose metabolism,phenylalanine metabolism and flavonoid biosynthesis (Figure 2a).The 753 DEPs from 48 WAG were assigned to 195 KEGG pathways,and the DEPs with the highest richFactor were those involved incarbon metabolism, biosynthesis of amino acids and carbonfixation in photosynthetic organisms (Figure 2b).
Correlation analysis between transcriptome and proteome dataIn the leaf samples at 37 WAG, 1367 genes/proteins werecorrelated in the detected 5378 proteins and 9753 transcripts
(with relative expression value 40 in both healthy leaf anddiseased leaf samples; Table 6). Among the DEGs/DEPs in the leafsamples at 37 WAG, 70 DEPs showed no corresponding genes inthe transcript data and 299 DEGs showed no correspondingproteins in the proteome data (Table 6). Fourteen DEGs/DEPsshowed similar expression trends, and most of these wereinvolved in flavonoid biosynthesis, phenylalanine metabolismand phenylpropanoid biosynthesis (Figure 3a).Of the detected 5377 proteins and 9744 transcripts from leaf
samples at 48 WAG, the changes in 1377 genes/proteins werefound to be correlated (Table 6). There were 210 DEPs with nocorresponding genes in the transcript data, and 377 DEGs with nocorresponding proteins in the proteome data (Table 6). Most of 98DEGs/DEPs with the similar expression trend in the correlationanalyses were involved in carbon metabolism, carbon fixation inphotosynthetic organisms and photosynthesis (Figure 3b).
Auxin and JA content analysisAccording to the transcriptome and proteome analysis, 11 DEGswere related to tryptophan metabolism and the two most-changed DEPs were related to JA-induced protein-like in the leafsamples at 37 WAG. Therefore, the auxin and JA contents wereanalyzed in the control and diseased leaf samples. The resultsindicated that phytoplasma infection resulted in reduced auxincontent and increased JA content at the early stage of JWB disease(Figure 4). Auxin content in the diseased leaf samples decreased
Table 4. Downregulated genes’ plant–pathogen interaction in KEGG pathway analysis in leaves 37 WAG with JWB-infected scions
Gene_Ida Value_1 Value_2 Log2 (fold-change) Name Definition P value
XLOC_008034 52.26 1.99 − 4.72 CML Calcium-binding protein CML 0.00005XLOC_002521 5.97 0.45 − 3.72 FLS2 LRR receptor-like serine/threonine-protein kinase FLS2 0.00005XLOC_016194 63.57 5.81 − 3.45 CML Calcium-binding protein CML 0.00005XLOC_016016 100.55 10.81 − 3.22 PR1 Pathogenesis-related protein 1 0.00005XLOC_020804 2.59 0.30 − 3.10 RPM1, RPS3 Disease resistance protein RPM1 0.00165XLOC_016017 36.10 4.53 − 2.99 PR1 Pathogenesis-related protein 1 0.0001XLOC_018443 7.80 1.25 − 2.64 CNGF Cyclic nucleotide-gated channel, other eukaryote 0.00145XLOC_012207 26.92 4.42 − 2.61 CPK Calcium-dependent protein kinase 0.00005XLOC_001631 54.77 9.31 − 2.56 EFR LRR receptor-like serine/threonine-protein kinase EFR 0.00005XLOC_003968 7.321 1.35 − 2.44 FLS2 LRR receptor-like serine/threonine-protein kinase FLS2 0.0007XLOC_008782 6.29 1.31 − 2.27 RPM1, RPS3 Disease resistance protein RPM1 0.0047XLOC_020805 15.46 3.27 − 2.25 RPM1, RPS3 Disease resistance protein RPM1 0.00005XLOC_007998 71.01 15.09 − 2.24 CML Calcium-binding protein CML 0.00005XLOC_012794 500.26 117.36 − 2.099 CETN1 Centrin-1 0.00005XLOC_021743 18.13 4.396 − 2.06 FLS2 LRR receptor-like serine/threonine-protein kinase FLS2 0.00005XLOC_002411 131.83 33.30 − 1.99 CML Calcium-binding protein CML 0.0018XLOC_004660 10.98 2.82 − 1.97 ERF1 Ethylene-responsive transcription factor 1 0.00295XLOC_014256 157.32 42.25 − 1.90 CML Calcium-binding protein CML 0.00005XLOC_016219 3.79 1.102 − 1.78 FLS2 LRR receptor-like Serine/threonine-protein kinase FLS2 0.00255XLOC_017988 48.81 15.31 − 1.68 CML Calcium-binding protein CML 0.00005Gene_Id Value_1 Value_2 Log2 (fold-change) Name Definition P value
XLOC_019723 29.87 9.43 − 1.67 CALM Calmodulin 0.0003XLOC_022437 141.01 44.59 − 1.67 SERK1 Somatic embryogenesis receptor kinase 1 0.00005XLOC_007823 48.72 15.44 − 1.66 CML Calcium-binding protein CML 0.0018XLOC_020251 14.76 4.83 − 1.62 RPS2 Disease resistance protein RPS2 0.00005XLOC_007197 18.94 6.32 − 1.58 EDS1 Enhanced disease susceptibility 1 protein 0.00005XLOC_015508 105.62 36.09 − 1.55 SERK1 Somatic embryogenesis receptor kinase 1 0.00005XLOC_007196 64.03 22.91 − 1.48 EDS1 Enhanced disease susceptibility 1 protein 0.00005XLOC_011916 11.73 4.25 − 1.46 EFR LRR receptor-like Serine/threonine-protein kinase EFR 0.00015XLOC_003222 7.10 2.93 − 1.28 PBS1 Serine/threonine-protein kinase PBS1 0.0061XLOC_022668 3.95 1.65 − 1.26 RBOH Respiratory burst oxidase 0.00495XLOC_012474 30.53 14.37 − 1.09 CML Calcium-binding protein CML 0.00165XLOC_018434 23.35 11.01 − 1.09 WRKY33 WRKY transcription factor 33 0.00125XLOC_008767 157.13 77.49 − 1.02 EDS1 Enhanced disease susceptibility 1 protein 0.0013XLOC_006178 1.95 0 None CERK1 Chitin elicitor receptor kinase 1 0.00005
Abbreviations: DEP, DEP, differentially expressed protein; KEGG, Kyoto Encyclopedia of Genes and Genomes; JWB, Jujube witches' broom; WAG, weeks aftergrafting. aGene Id is available in our database in Supplementary Table S12.
iTRAQ proteomics and transcriptomics analyses of phytoplasma-infected jujubeX Ye et al.
6
Horticulture Research (2017)
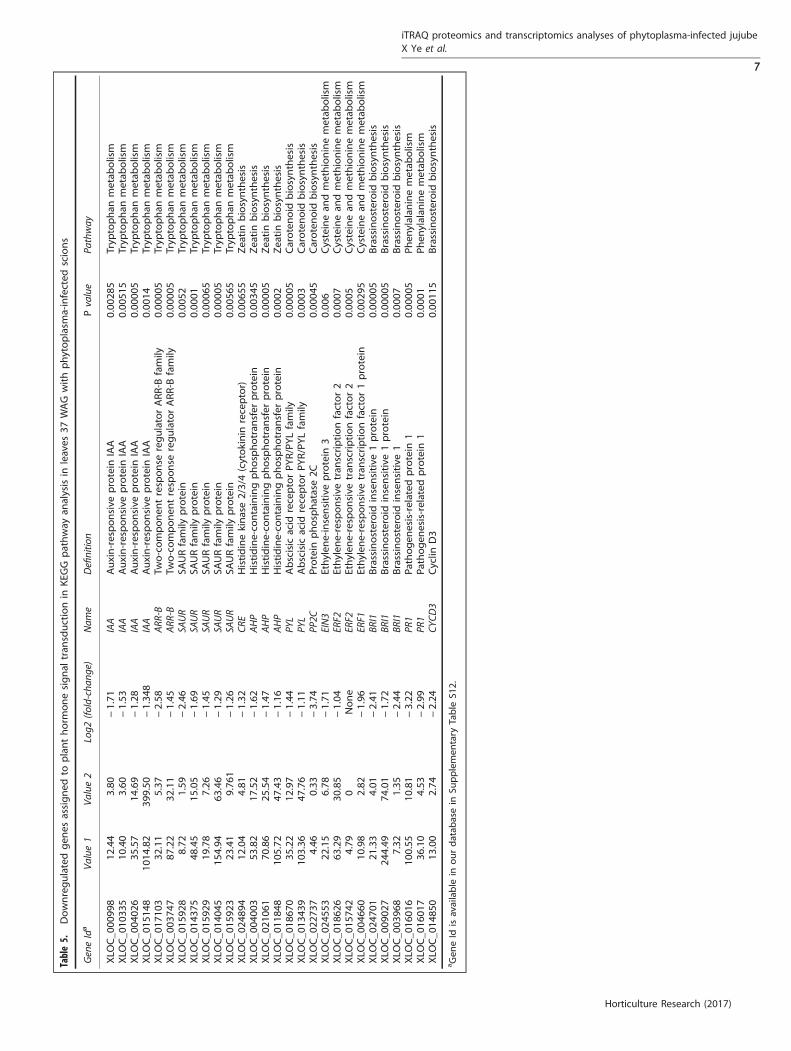
Table5.
Downregulatedgen
esassigned
toplanthorm
onesignal
tran
sductionin
KEG
Gpathway
analysisin
leaves
37WAGwithphytoplasm
a-infected
scions
GeneIda
Value1
Value2
Log2
(fold-chan
ge)
Nam
eDefinitio
nPvalue
Pathway
XLO
C_0
0099
812
.44
3.80
−1.71
IAA
Auxin-responsive
protein
IAA
0.00
285
Tryp
tophan
metab
olism
XLO
C_0
1033
510
.40
3.60
−1.53
IAA
Auxin-responsive
protein
IAA
0.00
515
Tryp
tophan
metab
olism
XLO
C_0
0402
635
.57
14.69
−1.28
IAA
Auxin-responsive
protein
IAA
0.00
005
Tryp
tophan
metab
olism
XLO
C_0
1514
810
14.82
399.50
−1.34
8IAA
Auxin-responsive
protein
IAA
0.00
14Tryp
tophan
metab
olism
XLO
C_0
1710
332
.11
5.37
−2.58
ARR
-BTw
o-componen
tresponse
regulatorARR-B
family
0.00
005
Tryp
tophan
metab
olism
XLO
C_0
0374
787
.22
32.11
−1.45
ARR
-BTw
o-componen
tresponse
regulatorARR-B
family
0.00
005
Tryp
tophan
metab
olism
XLO
C_0
1592
88.72
1.59
−2.46
SAUR
SAURfamily
protein
0.00
52Tryp
tophan
metab
olism
XLO
C_0
1437
548
.45
15.05
−1.69
SAUR
SAURfamily
protein
0.00
01Tryp
tophan
metab
olism
XLO
C_0
1592
919
.78
7.26
−1.45
SAUR
SAURfamily
protein
0.00
065
Tryp
tophan
metab
olism
XLO
C_0
1404
515
4.94
63.46
−1.29
SAUR
SAURfamily
protein
0.00
005
Tryp
tophan
metab
olism
XLO
C_0
1592
323
.41
9.76
1−1.26
SAUR
SAURfamily
protein
0.00
565
Tryp
tophan
metab
olism
XLO
C_0
2489
412
.04
4.81
−1.32
CRE
Histidinekinase2/3/4(cytokinin
receptor)
0.00
655
Zeatinbiosynthesis
XLO
C_0
0400
353
.82
17.52
−1.62
AHP
Histidine-co
ntainingphosphotran
sfer
protein
0.00
345
Zeatinbiosynthesis
XLO
C_0
2106
170
.86
25.54
−1.47
AHP
Histidine-co
ntainingphosphotran
sfer
protein
0.00
005
Zeatinbiosynthesis
XLO
C_0
1184
810
5.72
47.43
−1.16
AHP
Histidine-co
ntainingphosphotran
sfer
protein
0.00
02Zeatinbiosynthesis
XLO
C_0
1867
035
.22
12.97
−1.44
PYL
Abscisic
acid
receptorPY
R/PYLfamily
0.00
005
Carotenoid
biosynthesis
XLO
C_0
1343
910
3.36
47.76
−1.11
PYL
Abscisic
acid
receptorPY
R/PYLfamily
0.00
03Carotenoid
biosynthesis
XLO
C_0
2273
74.46
0.33
−3.74
PP2C
Protein
phosphatase2C
0.00
045
Carotenoid
biosynthesis
XLO
C_0
2455
322
.15
6.78
−1.71
EIN3
Ethylen
e-insensitive
protein
30.00
6Cysteinean
dmethioninemetab
olism
XLO
C_0
1862
663
.29
30.85
−1.04
ERF2
Ethylen
e-responsive
tran
scriptionfactor2
0.00
07Cysteinean
dmethioninemetab
olism
XLO
C_0
1574
24.79
0None
ERF2
Ethylen
e-responsive
tran
scriptionfactor2
0.00
05Cysteinean
dmethioninemetab
olism
XLO
C_0
0466
010
.98
2.82
−1.96
ERF1
Ethylen
e-responsive
tran
scriptionfactor1protein
0.00
295
Cysteinean
dmethioninemetab
olism
XLO
C_0
2470
121
.33
4.01
−2.41
BRI1
Brassinosteroid
insensitive
1protein
0.00
005
Brassinosteroid
biosynthesis
XLO
C_0
0902
724
4.49
74.01
−1.72
BRI1
Brassinosteroid
insensitive
1protein
0.00
005
Brassinosteroid
biosynthesis
XLO
C_0
0396
87.32
1.35
−2.44
BRI1
Brassinosteroid
insensitive
10.00
07Brassinosteroid
biosynthesis
XLO
C_0
1601
610
0.55
10.81
−3.22
PR1
Pathogen
esis-related
protein
10.00
005
Phen
ylalan
inemetab
olism
XLO
C_0
1601
736
.10
4.53
−2.99
PR1
Pathogen
esis-related
protein
10.00
01Ph
enylalan
inemetab
olism
XLO
C_0
1485
013
.00
2.74
−2.24
CYCD
3Cyclin
D3
0.00
115
Brassinosteroid
biosynthesis
a Gen
eId
isavailable
inourdatab
asein
Supplemen
tary
Table
S12.
iTRAQ proteomics and transcriptomics analyses of phytoplasma-infected jujubeX Ye et al.
7
Horticulture Research (2017)

Figure 2. The top 20 enriched KEGG pathways based on DEPs in leaves of jujube during JWB phytoplasma infection. (a) 37 WAG infectedversus noninfected scions; (b) 48 WAG infected versus noninfected scions.
iTRAQ proteomics and transcriptomics analyses of phytoplasma-infected jujubeX Ye et al.
8
Horticulture Research (2017)

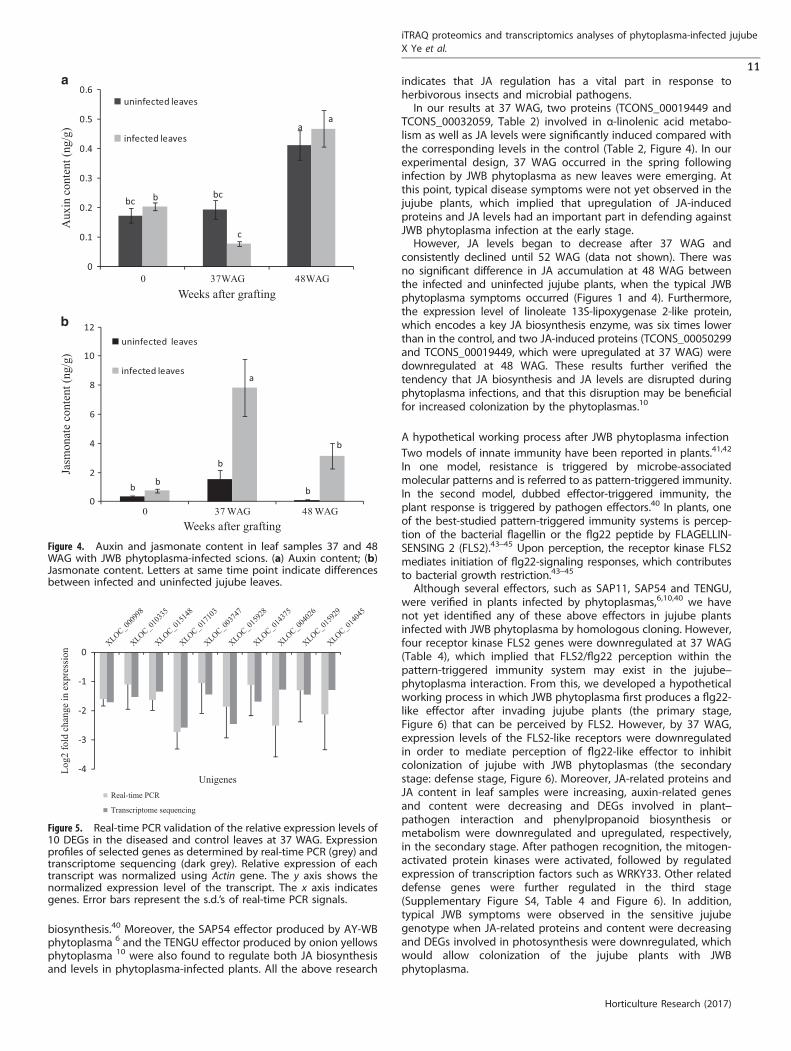
by 2.5-fold compared with the control sample; however, there wasno difference in auxin content at 48 WAG between the infectedjujube and the corresponding control (Figure 4a). The JA contentwas higher in the infected jujube at both 37 and 48 WAG,although the amplitudes were different. The JA content in the leafsamples at 37 WAG was more than five times than that in thecontrol; however, there was not a significant difference in JAcontent between the infected and control samples at 48 WAG(Figure 4b).
Confirmation of qRT-PCRIn order to evaluate our transcriptome-sequencing data, 10 DEGsin the tryptophan metabolism pathway were selected forquantitative reverse transcriptase PCR (qRT-PCR). The results ofqRT-PCR and the transcriptome-sequencing analyses indicatedthat all tested 10 DEGs showed similar trends in the relativeexpression levels (Figure 5). For instance, log2 fold change ofrelative expression levels from XLOC_000998 gene was close to− 1.7 in both qRT-PCR and transcriptome-sequencing data, whichsuggested that the gene expression changes detected bytranscriptome-sequencing analysis were reliable.
DISCUSSIONGenes or proteins involved in phenylpropanoid biosynthesis ormetabolism were upregulated in the early stages after JWBphytoplasma infectionPhenylpropanoid compounds are induced in response to micro-bial attack and can inhibit the growth of attacking pathogens.29
Phenylpropanoids include lignins, flavonoids and phenolic com-pounds that are products of multiple branches of the phenylpro-panoid pathway.29,30 In the transcriptome of paulownia infectedwith witches’ broom phytoplasma, numerous phenylpropanoidmetabolism genes were upregulated, including phenylalanineammonia lyase (PAL), cinnamate 4-hydroxylase and 4-coumarate-CoA ligase.30 In our study, 22 genes involved in phenylpropanoidbiosynthesis or metabolism were upregulated in the diseased leafsample at 37 WAG compared with the uninfected control. Forinstance, expression levels of PAL (XLOC_022321) cinnamoyl-CoAreductase (XLOC_001983) and caffeoyl shikimate esterase(XLOC_003432) were significantly higher than those in the control(Supplementary Tables S8 and S12). This differential expressioncorrelated to the change at 37 WAG in the protein level of PAL(TCONS_00048113) in infected leaves compared with the control(Table 4), which further verifies that phenylpropanoid compoundshave important roles in the defense against phytoplasmainfection.
Flavonoids are a diverse group of phenolic secondary metabolitesand have important roles in plant defenses against both abiotic andbiotic stresses.29 Flavonoids can function as passive or induciblebarriers, and both flavonoid content and expression of genes in theflavonoid biosynthesis pathway increase in response to pathogenattack.31,32 In previous transcriptome analyses of phytoplasmainfection, flavonoid metabolism-related genes are activated inphytoplasma-infected plants.30,33 In our study, more than 20 genesinvolved in flavonoid biosynthesis were upregulated in the diseasedleaf sample at 37 WAG compared with the control. For instance, therelative expression of flavonoid 3'-monooxygenase (XLOC_008694)and anthocyanidin reductase (XLOC_000417) were roughly eighttimes higher than those in the control (Supplementary Table S8 andSupplementary Table S12). The enzymes dihydroflavonol 4-reductase(TCONS_00024299) and flavonoid 3-hydroxylase (TCONS_00021256),both involved in flavonoid biosynthesis, were also upregulated(Table 2), which further supports that flavonoid biosynthesis has arole in early defense responses against biotic stress.32
Genes involved in tryptophan metabolism and auxin productionand signaling were downregulated in the early stages after JWBphytoplasma infectionAuxin imbalance has been suggested as a key factor in thedevelopment of symptoms during phytoplasma infection.14 Forexample, levels of indole-3-acetic acid are reduced in mulberryinfected with mulberry dwarf phytoplasma.34 Furthermore, spray-ing of 1-naphthaleneacetic acid on periwinkle infected withphytoplasma accelerated symptom development, which led to theconclusion that auxin may suppress expression of genes such asPATHOGENESIS-RELATED 1 in phytoplasma-infected plants andthus allow more rapid symptom development.14 In contrast, whenin vitro-grown periwinkle shoots infected with ‘CandidatusPhytoplasma’ were treated with IAA and indole-3-butyric acid,both auxins induced recovery of phytoplasma-infected periwinkle,which implies that auxin may delay some species ofphytoplasma.35 This result was further verified when pretreatmentof 1-naphthaleneacetic acid also effectively enhanced plantresistance against phytoplasma.14 In addition, the phytoplasmavirulence factor TENGU was found to repress auxin response factor6 (ARF6) and ARF8, which then resulted in downregulation ofauxin levels.10
In this study, 12 genes related to auxin signaling weredownregulated at 37 WAG (Table 5), and auxin content declinedby 2.5-fold in the phytoplasma-infected leaf samples comparedwith the control (Figure 4a). At 48 WAG, when typical JWBphytoplasma symptoms were visible, there were no significantdifferences in the relative expression of genes related to auxinsignaling or in auxin content. These results implied that auxinimbalance was a key factor in the early, but not later, stages ofJWB phytoplasma infection.
Levels of JA-induced proteins and JA were altered during JWBphytoplasma infectionThe activation of phytohormone signaling pathways is a universaldefense response employed by plants in response to biotic orabiotic stress,36 and JA has central roles in regulating plantresponses to herbivorous insects and microbial pathogens.37,38 Forexample, when Nicotiana attenuata is attacked by M. sexta larvae,there is a sustained JA burst ninefold above control levels.36
Fusarium oxysporum pathogens appear to utilize JAs as effectors,promoting both infection in roots and development of symptomsin shoots.39 In the Arabidopsis plants infected by AY-WBphytoplasma, the secreted AY-WB protein 11 (SAP11) is aneffector that interferes with JA biosynthesis by binding anddestabilizing class II CIN-TCP (CINCINNATA-RELATED-TEOSINTEBRANCHED1, CYCLOIDEA, PCF) transcription factors, which nor-mally act as positive regulators of the LOX2 gene involved in JA
Table 6. Correlation of DEGs and DEPs detected during phytoplasmainfection of Z. jujuba Mill.
Category 37 WAG 48 WAG
Total numbers of detected transcriptsa 9753 9744Total numbers of detected protein 5378 5377Numbers of correlated genes/proteins 1367 1377Shared DEPs/DEGs with the similar expressiontrend
14 98
Shared DEPs/DEGs with the opposite expressiontrend
23 12
DEPs with no corresponding DEGs 70 210DEGs with no corresponding DEPs 299 377
Abbreviations: DEG, differentially expressed gene; DEP, differentiallyexpressed protein; WAG, weeks after grafting. aNumber of transcripts withrelative expression value 40 in both healthy leaf and diseased leafsamples.
iTRAQ proteomics and transcriptomics analyses of phytoplasma-infected jujubeX Ye et al.
9
Horticulture Research (2017)
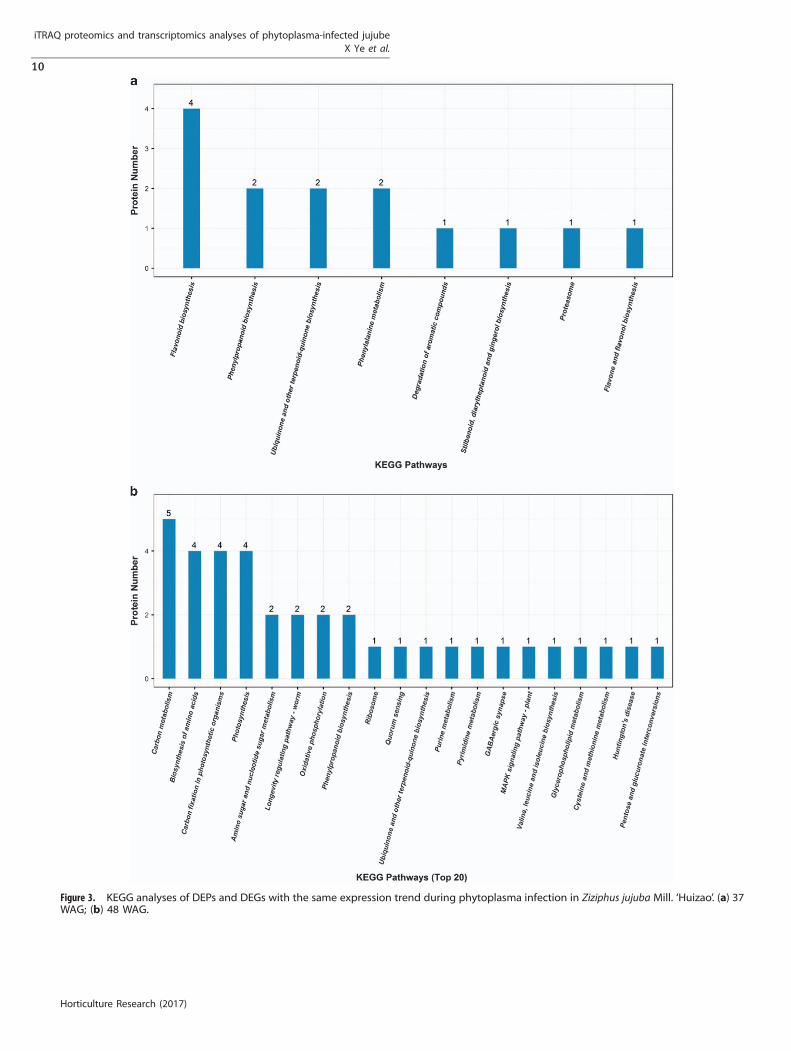
Figure 3. KEGG analyses of DEPs and DEGs with the same expression trend during phytoplasma infection in Ziziphus jujuba Mill. ‘Huizao’. (a) 37WAG; (b) 48 WAG.
iTRAQ proteomics and transcriptomics analyses of phytoplasma-infected jujubeX Ye et al.
10
Horticulture Research (2017)
biosynthesis.40 Moreover, the SAP54 effector produced by AY-WBphytoplasma 6 and the TENGU effector produced by onion yellowsphytoplasma 10 were also found to regulate both JA biosynthesisand levels in phytoplasma-infected plants. All the above research
indicates that JA regulation has a vital part in response toherbivorous insects and microbial pathogens.In our results at 37 WAG, two proteins (TCONS_00019449 and
TCONS_00032059, Table 2) involved in α-linolenic acid metabo-lism as well as JA levels were significantly induced compared withthe corresponding levels in the control (Table 2, Figure 4). In ourexperimental design, 37 WAG occurred in the spring followinginfection by JWB phytoplasma as new leaves were emerging. Atthis point, typical disease symptoms were not yet observed in thejujube plants, which implied that upregulation of JA-inducedproteins and JA levels had an important part in defending againstJWB phytoplasma infection at the early stage.However, JA levels began to decrease after 37 WAG and
consistently declined until 52 WAG (data not shown). There wasno significant difference in JA accumulation at 48 WAG betweenthe infected and uninfected jujube plants, when the typical JWBphytoplasma symptoms occurred (Figures 1 and 4). Furthermore,the expression level of linoleate 13S-lipoxygenase 2-like protein,which encodes a key JA biosynthesis enzyme, was six times lowerthan in the control, and two JA-induced proteins (TCONS_00050299and TCONS_00019449, which were upregulated at 37 WAG) weredownregulated at 48 WAG. These results further verified thetendency that JA biosynthesis and JA levels are disrupted duringphytoplasma infections, and that this disruption may be beneficialfor increased colonization by the phytoplasmas.10
A hypothetical working process after JWB phytoplasma infectionTwo models of innate immunity have been reported in plants.41,42
In one model, resistance is triggered by microbe-associatedmolecular patterns and is referred to as pattern-triggered immunity.In the second model, dubbed effector-triggered immunity, theplant response is triggered by pathogen effectors.40 In plants, oneof the best-studied pattern-triggered immunity systems is percep-tion of the bacterial flagellin or the flg22 peptide by FLAGELLIN-SENSING 2 (FLS2).43–45 Upon perception, the receptor kinase FLS2mediates initiation of flg22-signaling responses, which contributesto bacterial growth restriction.43–45
Although several effectors, such as SAP11, SAP54 and TENGU,were verified in plants infected by phytoplasmas,6,10,40 we havenot yet identified any of these above effectors in jujube plantsinfected with JWB phytoplasma by homologous cloning. However,four receptor kinase FLS2 genes were downregulated at 37 WAG(Table 4), which implied that FLS2/flg22 perception within thepattern-triggered immunity system may exist in the jujube–phytoplasma interaction. From this, we developed a hypotheticalworking process in which JWB phytoplasma first produces a flg22-like effector after invading jujube plants (the primary stage,Figure 6) that can be perceived by FLS2. However, by 37 WAG,expression levels of the FLS2-like receptors were downregulatedin order to mediate perception of flg22-like effector to inhibitcolonization of jujube with JWB phytoplasmas (the secondarystage: defense stage, Figure 6). Moreover, JA-related proteins andJA content in leaf samples were increasing, auxin-related genesand content were decreasing and DEGs involved in plant–pathogen interaction and phenylpropanoid biosynthesis ormetabolism were downregulated and upregulated, respectively,in the secondary stage. After pathogen recognition, the mitogen-activated protein kinases were activated, followed by regulatedexpression of transcription factors such as WRKY33. Other relateddefense genes were further regulated in the third stage(Supplementary Figure S4, Table 4 and Figure 6). In addition,typical JWB symptoms were observed in the sensitive jujubegenotype when JA-related proteins and content were decreasingand DEGs involved in photosynthesis were downregulated, whichwould allow colonization of the jujube plants with JWBphytoplasma.
Figure 4. Auxin and jasmonate content in leaf samples 37 and 48WAG with JWB phytoplasma-infected scions. (a) Auxin content; (b)Jasmonate content. Letters at same time point indicate differencesbetween infected and uninfected jujube leaves.
Figure 5. Real-time PCR validation of the relative expression levels of10 DEGs in the diseased and control leaves at 37 WAG. Expressionprofiles of selected genes as determined by real-time PCR (grey) andtranscriptome sequencing (dark grey). Relative expression of eachtranscript was normalized using Actin gene. The y axis shows thenormalized expression level of the transcript. The x axis indicatesgenes. Error bars represent the s.d.’s of real-time PCR signals.
iTRAQ proteomics and transcriptomics analyses of phytoplasma-infected jujubeX Ye et al.
11
Horticulture Research (2017)

CONCLUSIONSTo understand the responses and defenses of jujube plants tophytoplasma infection, a multi-omics analysis of transcriptome,proteome and phytohormone levels was conducted during JWBinfection. Our results indicated that an increase in the number ofDEGs occurred by 37 WAG, but that JWB typical symptoms werenot observed until 48 WAG.At 37 WAG, 1994 genes were significantly differentially
expressed. Among the upregulated genes at 37 WAG, 20 geneswere assigned to flavonoid biosynthesis and 21 to phenylpropa-noid biosynthesis and metabolism. Among the downregulatedgenes, the top two groups were related to plant–pathogeninteraction and plant hormone signal transduction. At 37 WAG,289 DEPs were observed. Among the upregulated DEPs at 37 WAGwere proteins related to JA-induced protein, flavonoid biosynth-esis and phenylalanine metabolism. Fourteen DEGs/DEPs wereshown to share similar expression trends by correlation analyses,and most of these were involved in flavonoid biosynthesis,phenylalanine metabolism and phenylpropanoid biosynthesis.Moreover, phytoplasma infection resulted in reduced auxincontent and increased JA content during the early stage ofphytoplasma infection.At 48 WAG, 2401 DEGs were detected. Among the 808
upregulated genes, many were involved in phenylpropanoidbiosynthesis and flavonoid biosynthesis. Among the 1593 down-regulated genes, most were related to photosynthesis and carbonmetabolism. At 48 WAG, 753 DEPs were detected. Of the 395downregulated proteins, LOX2 were decreased by sixfold, and twoJA-induced proteins were greatly reduced. Moreover, DEPsinvolved in carbon metabolism, biosynthesis of amino acids andcarbon fixation in photosynthetic organisms were also down-regulated. At 48 WAG, most of 98 DEGs/DEPs of similar expressiontrends in the correlation analyses were involved in carbonmetabolism, carbon fixation in photosynthetic organisms andphotosynthesis.
CONFLICT OF INTERESTThe authors declare no conflict of interest.
ACKNOWLEDGEMENTSWe thank Anita K Snyder for critical reading of the manuscript. The work was finishedin Henan Provincial Key Laboratory of Fruit and Cucurbit Biology and supported byMajor Science and Technology Project in Henan Province (151100110900).
REFERENCES1 Ma C, Ye X, Chen Y, Feng J, Shang X, Li J. Anatomical observations of adventitious
bud regeneration from leaf explants of Ziziphus jujuba Mill. ‘Huizao’. Hort EnvironBiotechnol 2012; 53: 316–319.
2 Lee S, Kim CE, Cha B. Migration and distribution of graft-inoculated jujube wit-ches'-broom phytoplasma within a Cantharanthus roseus plant. Plant Pathol J2012; 28: 191–196.
3 Liu ZG, Wang Y, Xiao J, Zhao J, Liu MJ. Identification of genes associated withphytoplasma resistance through suppressive subtraction hybridization inChinese jujube. Physiol Mol Plant Pathol 2014; 86: 43–48.
4 Strauss E. Phytoplasma research begins to bloom. Science 2009; 325: 388–390.5 Streten C, Gibb KS. Phytoplasma diseases in sub-tropical and tropical Australia.
Aust Plant Pathol 2006; 35: 129–146.6 MacLean AM, Sugio A, Makarova OV, Findlay KC, Grieve VM, Toth R. Phytoplasma
effector SAP54 induces indeterminate leaf-like flower development inArabidopsis plants. Plant Physiol 2011; 157: 831–841.
7 Sugio A, Kingdom HN, MacLean AM, Grieve VM, Hogenhout SA. Phytoplasmaprotein effector SAP11 enhances insect vector reproduction by manipulatingplant development and defense hormone biosynthesis. Proc Natl Acad Sci USA2011a; 108: 1254–1263.
8 Sugio A, Maclean AM, Kingdom HN, Grieve VM, Manimekalai R, Hogenhout SA.Diverse targets of phytoplasma effectors: from plant development to defenseagainst insects. Annu Rev Phytopathol 2011b; 49: 175–195.
9 Sugio A, Hogenhout SA. The genome biology of phytoplasma: modulators ofplants and insects. Curr Opin Microbiol 2012; 15: 247–254.
10 Minato N, Himeno M, Hoshi A, Maejima K, Komatsu K, Takabayashi Y. The phy-toplasmal virulence factor TENGU causes plant sterility by downregulating of thejasmonic acid and auxin pathways. Sci Rep 2014; 4: 7399.
11 Kazan K, Lyons R. Intervention of phytohormone pathways by pathogen effectors.Plant Cell 2014; 26: 2285–2309.
Figure 6. A hypothetical working process after JWB phytoplasma infection. During the primary stage, the phytoplasma is invading the plantand early perception has been activated. Phytoplasma gene could be detected by PCR. By the secondary stage the plant has mounted itsdefense response. JA-related proteins and JA levels are increasing, whereas auxin-related genes and levels are decreasing. There is a generaldownregulation of genes involved in plant–pathogen interaction and upregulation of genes involved in phenylpropanoid biosynthesis ormetabolism. In the third stage, symptoms appear in the sensitive phenotype, concomitant with decreases in JA-related proteins and JA levelsand photosynthesis-related genes. ↑ represented upregulation, ↓ represented downregulation.
iTRAQ proteomics and transcriptomics analyses of phytoplasma-infected jujubeX Ye et al.
12
Horticulture Research (2017)

12 Liu Z, Zhao J, Liu M. Photosynthetic responses to phytoplasma infection inChinese jujube. Plant Physiol Biochem 2016; 105: 12–20.
13 Zafari S, Niknam V, Musetti R, Noorbaskhsh SN. Effect of phytoplasma infection onmetabolite content and antioxidant enzyme activity in lime (Citrus aurantifolia).Acta Physiol Plantarum 2012; 34: 561–568.
14 Tai CF, Lin CP, Sung YC, Chen JC. Auxin influences symptom expression andphytoplasma colonization in periwinkle infected with periwinkle leaf yellowingphytoplasma. Ann Appl Biol 2013; 163: 420–429.
15 Choi YH, Tapias EC, Kim HK, Lefeber AW, Erkelens C. Metabolic discrimination ofCatharanthus roseus leaves infected by phytoplasma using 1H-NMR spectroscopyand multivariate data analysis. Plant Physiol 2004; 135: 2398–2410.
16 Xie N, Yuan Z, Zhang L, Zhao J, Liu MJ. Molecular cloning and expression of anovel eukaryotes elongation factor1A gene (ZjeEF-1α) from Chinese jujube inresponse to phytoplasma infection. Physiol Mol Plant Pathol 2016; 96: 101–108.
17 Namba S, Kato S, Iwanami S, Oyaizu H, Shiozawa H, Tsuchizaki T. Detection anddifferentiation of plant-pathogenic mycoplasmalike organisms using polymerasechain reaction. Phytopathology 1993; 83: 786–791.
18 Deng S, Hiruki C. Amplification of 16S rRNA genes from culturable and non-culturable mollicutes. J Microbiol Methods 1991; 14: 53–61.
19 Gundersen DE, Lee IM. Ultrasensitive detection of phytoplasmas by nested-PCRassays using two universal primer pairs. Phytopathol Mediterr 1996; 35: 144–151.
20 Liu MJ, Zhao J, Cai QL et al. The complex jujube genome provides insights intofruit tree biology. Nature Commun 2014; 5: 5315.
21 Wisniewski JR, Zougman A, Nagaraj N, Mann M. Universal sample preparationmethod for proteome analysis. Nat Methods 2009; 6: 359–362.
22 Hervé T, Michel Z, Catherine D, Valerie M. Plant Proteomics: Methods and Protocols.Totowa: Humuana Press. 2007.
23 Wiśniewski JR, Zougman A, Nagaraj N, Mann M. Universal sample preparationmethod for proteome analysis.[J]. Nat Methods 2009; 6: 359–362.
24 Xiao C, Ye J, Esteves RM, Rong C. Using Spearman's correlation coefficients forexploratory data analysis on big dataset. Concurr Comput Pract Exp 2016; 28:3866–3878.
25 Boyle EI, Weng S, Gollub J, Jin H, Bostein D, Cherry JM. GO: Term Finder-opensource software for accessing Gene Ontology information and finding sig-nificantly enriched Gene Ontology terms associated with a list of genes. Bioin-formatics 2004; 20: 3710–3715.
26 Kanehisa M, Goto S, Furumichi M, Tanabe M, Hirakawa M. KEGG for representationand analysis of molecular networks involving diseases and drugs. Nucleic Acids Res2010; 38: 355–360.
27 Chen ML, Fu XM, Liu JQ, Ye TT, Hou SY, Huang YQ. Highly sensitive and quanti-tative profiling of acidic phytohormones using derivatization approach coupledwith nano-LC-ESI-Q-TOF-MS analysis. J Chromatogr B Anal Technol Biomed Life Sci2012; 905: 67–74.
28 Hause B, Maier W, Miersch O, Kramell R, Strack D. Induction of jasmonate biosynthesisin arbuscular mycorrhizal barley roots. Plant Physiol 2002; 130: 1213–1220.
29 Dixon RA, Achnine L, Kota P, Liu C, Reddy MS. The phenylpropanoid pathway andplant defence—a genomics perspective. Mol Plant Pathol 2002; 3: 371.
30 Fan G, Xu E, Deng M, Zhao Z, Niu S. Phenylpropanoid metabolism, hormonebiosynthesis and signal transduction-related genes play crucial roles in theresistance of Paulownia fortunei to paulownia witches’ broom phytoplasmainfection. Genes Genomics 2015; 37: 913–929.
31 Dixon RA, Paiva NL. Stress-induced phenylpropanoid metabolism. Plant Cell 1995;7: 1085–1097.
32 Koskimäki JJ, Hokkanen J, Jaakola L, Suorsa M, Tolonen A, Mattila S. Flavonoidbiosynthesis and degradation play a role in early defence responses of bilberry(Vaccinium myrtillus ) against biotic stress. Eur J Plant Pathol 2009; 125: 629–640.
33 Hren M, Nikolić P, Rotter A, Blejec A, Terrier N. 'Bois noir' Phytoplasma inducessignificant reprogramming of the leaf transcriptome in the field grown grapevine.BMC Genomics 2009; 10: 460–476.
34 Ji X, Gai Y, Zheng C, Mu Z. Comparative proteomic analysis provides new insightsinto mulberry dwarf responses in mulberry (Morus alba L.). Proteomics 2009; 9:5328–5339.
35 Curković CM. Auxin-treatment induces recovery of phytoplasma-infected peri-winkle. J Appl Microbiol 2008; 105: 1826–1834.
36 Ziegler J, Keinänen M, Baldwin IT. Herbivore-induced allene oxide synthasetranscripts and jasmonic acid in Nicotiana attenuata. Phytochemistry 2001; 58:729–738.
37 Browse J. Jasmonate passes muster: a receptor and targets for the defense hor-mone. Annu Rev Plant Biol 2009; 60: 183–205.
38 Zhang F, Yao J, Ke J, Zhang L, Lam VQ, Xin XF. Structural basis of JAZ repression ofMYC transcription factors in jasmonate signalling. Nature 2015; 525: 269–273.
39 Cole SJ, Yoon AJ, Faull KF, Diener AC. Host perception of jasmonates promotesinfection by Fusarium oxysporum formae speciales that produce isoleucine-andleucine-conjugated jasmonates. Mol Plant Pathol 2014; 15: 589–600.
40 Schommer C, Palatnik JF, Aggarwal P, Chételat A, Cubas P, Farmer EE et al. Controlof jasmonate biosynthesis and senescence by miR319 targets. PLoS Biol 2008; 6:e230.
41 Jones JD, Dangl JL. The plant immune system. Nature 2006; 444: 323–329.42 Yi SY, Shirasu K, Moon JS, Lee SG, Kwon SY. The activated SA and JA signaling
pathways have an influence on flg22-triggered oxidative burst and callosedeposition. PLoS ONE 2014; 9: e88951.
43 Chinchilla D, Bauer Z, Regenass M, Boller T, Felix G. The Arabidopsis receptorkinase FLS2 binds flg22 and determines the specificity of flagellin perception.Plant Cell 2006; 18: 465–476.
44 Robatzek S, Bittel P, Chinchilla D, Kochner P, Felix G, Shiu SH. Molecular identi-fication and characterization of the tomato flagellin receptor LeFLS2, an ortho-logue of Arabidopsis FLS2 exhibiting characteristically different perceptionspecificities. Plant Mol Biol 2007; 64: 539–547.
45 Smith JM, Salamango DJ, Leslie ME, Collins CA, Heese A. Sensitivity to Flg22 ismodulated by ligand-induced degradation and de novo synthesis of the endo-genous flagellin-receptor FLAGELLIN-SENSING2. Plant Physiol 2014; 164: 440.
This work is licensed under a Creative Commons Attribution 4.0International License. The images or other third party material in this
article are included in the article’s Creative Commons license, unless indicatedotherwise in the credit line; if the material is not included under the Creative Commonslicense, users will need to obtain permission from the license holder to reproduce thematerial. To view a copy of this license, visit http://creativecommons.org/licenses/by/4.0/
© The Author(s) 2017
Supplementary Information for this article can be found on the Horticulture Research website (http://www.nature.com/hortres)
iTRAQ proteomics and transcriptomics analyses of phytoplasma-infected jujubeX Ye et al.
13
Horticulture Research (2017)
Copyright © 2022 FDOKUMEN