Comparative transcriptomics in the Triticeae
17
BioMed Central Page 1 of 17 (page number not for citation purposes) BMC Genomics Open Access Research article Comparative transcriptomics in the Triticeae Andreas W Schreiber* 1 , Tim Sutton 1 , Rico A Caldo 2 , Elena Kalashyan 1 , Ben Lovell 1 , Gwenda Mayo 1 , Gary J Muehlbauer 3 , Arnis Druka 4 , Robbie Waugh 4 , Roger P Wise 2,5 , Peter Langridge 1 and Ute Baumann 1 Address: 1 Australian Centre for Plant Functional Genomics, Univ of Adelaide, PMB 1 Glen Osmond, SA 5064, Australia, 2 Dept. of Plant Pathology and Center for Plant Responses to Environmental Stresses, Iowa State Univ., Ames, IA 50011-1020, USA, 3 Dept. of Agronomy and Plant Genetics, Univ of Minnesota, St. Paul, MN 55108, USA, 4 Scottish Crop Research Institute, Invergowrie, Dundee DD2 5DA, UK and 5 Corn Insects and Crop Genetics Research, USDA-ARS, Iowa State Univ, Ames, IA 50011-1020, USA Email: Andreas W Schreiber* - [email protected]; Tim Sutton - [email protected]; Rico A Caldo - [email protected]; Elena Kalashyan - [email protected]; Ben Lovell - [email protected]; Gwenda Mayo - [email protected]; Gary J Muehlbauer - [email protected]; Arnis Druka - [email protected]; Robbie Waugh - [email protected]; Roger P Wise - [email protected]; Peter Langridge - [email protected]; Ute Baumann - [email protected] * Corresponding author Abstract Background: Barley and particularly wheat are two grass species of immense agricultural importance. In spite of polyploidization events within the latter, studies have shown that genotypically and phenotypically these species are very closely related and, indeed, fertile hybrids can be created by interbreeding. The advent of two genome-scale Affymetrix GeneChips now allows studies of the comparison of their transcriptomes. Results: We have used the Wheat GeneChip to create a "gene expression atlas" for the wheat transcriptome (cv. Chinese Spring). For this, we chose mRNA from a range of tissues and developmental stages closely mirroring a comparable study carried out for barley (cv. Morex) using the Barley1 GeneChip. This, together with large-scale clustering of the probesets from the two GeneChips into "homologous groups", has allowed us to perform a genomic- scale comparative study of expression patterns in these two species. We explore the influence of the polyploidy of wheat on the results obtained with the Wheat GeneChip and quantify the correlation between conservation in gene sequence and gene expression in wheat and barley. In addition, we show how the conservation of expression patterns can be used to elucidate, probeset by probeset, the reliability of the Wheat GeneChip. Conclusion: While there are many differences in expression on the level of individual genes and tissues, we demonstrate that the wheat and barley transcriptomes appear highly correlated. This finding is significant not only because given small evolutionary distance between the two species it is widely expected, but also because it demonstrates that it is possible to use the two GeneChips for comparative studies. This is the case even though their probeset composition reflects rather different design principles as well as, of course, the present incomplete knowledge of the gene content of the two species. We also show that, in general, the Wheat GeneChip is not able to distinguish contributions from individual homoeologs. Furthermore, the comparison between the two species leads us to conclude that the conservation of both gene sequence as well as gene expression is positively correlated with absolute expression levels, presumably reflecting increased selection pressure on genes coding for proteins present at high levels. In addition, the results indicate the presence of a correlation between sequence and expression conservation within the Triticeae. Published: 29 June 2009 BMC Genomics 2009, 10:285 doi:10.1186/1471-2164-10-285 Received: 18 February 2009 Accepted: 29 June 2009 This article is available from: http://www.biomedcentral.com/1471-2164/10/285 © 2009 Schreiber et al; licensee BioMed Central Ltd. This is an Open Access article distributed under the terms of the Creative Commons Attribution License (http://creativecommons.org/licenses/by/2.0 ), which permits unrestricted use, distribution, and reproduction in any medium, provided the original work is properly cited.
-
Upload
independent -
Category
Documents
-
view
0 -
download
0
Transcript of Comparative transcriptomics in the Triticeae

BioMed CentralBMC Genomics
ss
Open AcceResearch articleComparative transcriptomics in the TriticeaeAndreas W Schreiber*1, Tim Sutton1, Rico A Caldo2, Elena Kalashyan1, Ben Lovell1, Gwenda Mayo1, Gary J Muehlbauer3, Arnis Druka4, Robbie Waugh4, Roger P Wise2,5, Peter Langridge1 and Ute Baumann1Address: 1Australian Centre for Plant Functional Genomics, Univ of Adelaide, PMB 1 Glen Osmond, SA 5064, Australia, 2Dept. of Plant Pathology and Center for Plant Responses to Environmental Stresses, Iowa State Univ., Ames, IA 50011-1020, USA, 3Dept. of Agronomy and Plant Genetics, Univ of Minnesota, St. Paul, MN 55108, USA, 4Scottish Crop Research Institute, Invergowrie, Dundee DD2 5DA, UK and 5Corn Insects and Crop Genetics Research, USDA-ARS, Iowa State Univ, Ames, IA 50011-1020, USA
Email: Andreas W Schreiber* - [email protected]; Tim Sutton - [email protected]; Rico A Caldo - [email protected]; Elena Kalashyan - [email protected]; Ben Lovell - [email protected]; Gwenda Mayo - [email protected]; Gary J Muehlbauer - [email protected]; Arnis Druka - [email protected]; Robbie Waugh - [email protected]; Roger P Wise - [email protected]; Peter Langridge - [email protected]; Ute Baumann - [email protected]
* Corresponding author
AbstractBackground: Barley and particularly wheat are two grass species of immense agricultural importance. In spite ofpolyploidization events within the latter, studies have shown that genotypically and phenotypically these species are veryclosely related and, indeed, fertile hybrids can be created by interbreeding. The advent of two genome-scale AffymetrixGeneChips now allows studies of the comparison of their transcriptomes.
Results: We have used the Wheat GeneChip to create a "gene expression atlas" for the wheat transcriptome (cv.Chinese Spring). For this, we chose mRNA from a range of tissues and developmental stages closely mirroring acomparable study carried out for barley (cv. Morex) using the Barley1 GeneChip. This, together with large-scaleclustering of the probesets from the two GeneChips into "homologous groups", has allowed us to perform a genomic-scale comparative study of expression patterns in these two species. We explore the influence of the polyploidy of wheaton the results obtained with the Wheat GeneChip and quantify the correlation between conservation in gene sequenceand gene expression in wheat and barley. In addition, we show how the conservation of expression patterns can be usedto elucidate, probeset by probeset, the reliability of the Wheat GeneChip.
Conclusion: While there are many differences in expression on the level of individual genes and tissues, we demonstratethat the wheat and barley transcriptomes appear highly correlated. This finding is significant not only because given smallevolutionary distance between the two species it is widely expected, but also because it demonstrates that it is possibleto use the two GeneChips for comparative studies. This is the case even though their probeset composition reflectsrather different design principles as well as, of course, the present incomplete knowledge of the gene content of the twospecies. We also show that, in general, the Wheat GeneChip is not able to distinguish contributions from individualhomoeologs. Furthermore, the comparison between the two species leads us to conclude that the conservation of bothgene sequence as well as gene expression is positively correlated with absolute expression levels, presumably reflectingincreased selection pressure on genes coding for proteins present at high levels. In addition, the results indicate thepresence of a correlation between sequence and expression conservation within the Triticeae.
Published: 29 June 2009
BMC Genomics 2009, 10:285 doi:10.1186/1471-2164-10-285
Received: 18 February 2009Accepted: 29 June 2009
This article is available from: http://www.biomedcentral.com/1471-2164/10/285
© 2009 Schreiber et al; licensee BioMed Central Ltd. This is an Open Access article distributed under the terms of the Creative Commons Attribution License (http://creativecommons.org/licenses/by/2.0), which permits unrestricted use, distribution, and reproduction in any medium, provided the original work is properly cited.
Page 1 of 17(page number not for citation purposes)

BMC Genomics 2009, 10:285 http://www.biomedcentral.com/1471-2164/10/285
BackgroundConsiderable divergence has occurred between breadwheat (Triticum aestivum) and barley (Hordeum vulgare)since evolution from a common ancestor 10–14 millionyears ago. Since then, these two members of the Triticeaehave been subjected to largely parallel processes of culti-vation and domestication, starting in the fertile crescentover 10,000 years ago [1]. Barley has remained diploidwith a base chromosome number of 7 (HH genome, 2n =2x = 14) while bread wheat is the product of a series ofhybridization events between related species that hasresulted in an allo-hexaploid genome with three homoe-ologous sets of 7 chromosome pairs (AABBDD genome,2n = 6x = 42 [2]). Despite these major genomic perturba-tions during its evolution, genetic mapping [3] anddetailed structural genomic studies [4] have shown thatthe wheat and barley genomes are highly conserved.Indeed, barley chromosomes can even be substituted forwheat chromosomes [5]. As a consequence of its simpli-fied genetics, many have suggested that barley is a goodgenetic model for its genetically more complex cousin.This assertion is supported by the broad range of commonmorphological and developmental characteristics sharedby both species, though fundamental biological differ-ences do exist (such as spike and spikelet morphology).
Polyploidization is common across the plant kingdomand the process has been associated with a range ofchanges in newly synthesized hybrids of several species.These include the genome-wide removal of some (but notall) duplicated, and hence redundant, genetic informa-tion, sub- and/or neo-functionalization of duplicatedgenes, pseudogenization, differential cytosine methyla-tion and epigenetic reprogramming of gene expression(silencing and activation), and transposable element acti-vation (reviewed in [6]). Levy and Feldman [7] summa-rized some of the major consequences resulting from therecent polyploidization of the wheat genome. In commonwith other plant species, the outcome for wheat was morethan simply the additive combination of genomes andincluded many of the features described across the speciesrange [8-10].
Wheat is an important species for studying the impact ofpolyploidization because it is a relatively recent poly-ploid. Moreover, the outcomes can be studied in veryearly generations because it is possible to artificially re-synthesize polyploids from their diploid and tetraploidrelatives. In such cases, epigenetic silencing of duplicatedgenes appears to be a common response, with indicationsof reciprocal silencing in different organs an early sign ofsub-functionalization [11-15]. Gene activation or silenc-ing may also occur as a result of transcriptional interfer-ence associated with stochastic rearrangements of non-coding RNA [8]. Over longer time frames, the evolution-
ary consequences of such events are better observed inancient polyploids. In Arabidopsis (an ancient tetra-ploid), for example, Blanc and Wolfe [16] reported thatmore than half of the observed gene pairs retained in thegenome exhibited differential transcript abundance in dif-ferent tissues. An immediate impact of polyploidy istherefore to provide the raw genetic material for adapta-tion and the evolution of phenotype.
The close evolutionary relationship between wheat andbarley, reflected in largely parallel morphological anddevelopmental patterns, makes a comparison of theirtranscriptomes particularly intriguing. It may provideinsight, for example, into consequences of speciation andpolyploidization. Ideally a genomic-scale comparison ofthis sort would be carried out once the genomes havebeen sequenced. This would permit the reliable disentan-glement of the evolutionary relationships between indi-vidual genes and also provide the foundation on which tobuild dependable expression analysis platforms. Regretta-bly, the size and complexity of the wheat and barleygenomes has been a major impediment to full-scalesequencing, so that even the diploid barley genome is notexpected to be available before 2012 http://barleygenome.org/. In short, among plants comparative transcrip-tomics is rare: comprehensive pair-wise comparisons haveso far only been carried out in rice and Arabidopsis [17],various cotton species [18] and in poplar and Arabidopsis[19]. Recently, a three-way study between Arabidopsis,poplar and rice has also appeared [20].
Compared to genome-wide studies, comparisons ofexpression patterns of individual orthologous gene pairs,individual gene families and/or in connection with a par-ticular phenotypic characteristic are more frequent. Forexample, Mangelsen et al. [21] compared, within anumber of tissues, expression patterns of members of theWRKY transcription factor family among barley, rice andArabidopsis and found that, at least within this gene fam-ily, coordinated conservation of expression patterns andsequence. Horvath et al. [22] found that groups of genesassociated with cell division were consistently expressedpreferentially in shoot apices in Arabidopsis, wild oats,poplar and leafy spurge. Differential gene expression, onthe other hand, has been observed in some members ofthe ZIP and NAS metal homeostatis gene families in twoclosely related Arabidopsis species when exposed to bothlow and high Zn levels, presumably associated with differ-ent Zn accumulation patterns in these two species [23].Analogously, differential time-dependent expression of asmall number genes in response to salt stress in both bar-ley (relatively salt tolerant) and rice (relatively salt sensi-tive) were studied by Ueda et al. [24], while Taji et al. [25]performed a similar comparative study in salt cress (toler-ant) and Arabidopsis (intolerant).
Page 2 of 17(page number not for citation purposes)

BMC Genomics 2009, 10:285 http://www.biomedcentral.com/1471-2164/10/285
Comprehensive Affymetrix GeneChip platforms havenow been developed for both wheat and barley, based onextensive EST collections for both species (Ref. [26]; http://www.plexdb.org/index.php). The Barley1 GeneChip hasalready been used to develop an atlas of gene expressioncovering the entire developmental cycle of the barley cul-tivar Morex [27] and intra-species varietal comparisonshave been carried out both for Morex and Golden Promise[27,28] as well as Morex and Steptoe [29,30]. Takingadvantage of these resources, we have sampled a similarset of biological material collected through the develop-mental cycle of wheat (Chinese Spring), grown undernear-identical conditions to those in Druka et al. [27].This permits the first comprehensive comparison of devel-opmental expression patterns in these two important cropspecies. We report on this transcriptome-wide compari-son here. At the same time, in order to facilitate moredetailed studies of individual homologous genes moti-vated, say, by particular phenotypic differences as in [21-25], we make available a convenient web-based compara-tive tool enabling access to the developmental expressionprofiles of any individual wheat and barley homologsprobed by the two GeneChips.
It is well known that meaningful comparative expressionanalyses using microarray platforms based solely on ESTcollections can be difficult because of the frequent andconfounding presence of multiple splice forms, paralogsand orthologs, as well as, in the case of polyploids,homoeologs with near-identical sequence [31]. Becauseof this, we have also investigated, in some detail, the spe-cificity of the Wheat GeneChip to individual homoeologsand expended considerable effort to avoid misidentifica-tion of orthologs in the two species.
ResultsGene expression measurements were carried out on adevelopmental tissue series for wild-type wheat (cv. Chi-nese Spring) using the Affymetrix Wheat GeneChip. Tis-sues and developmental stages were chosen to match thebarley (cv. Morex) tissue series of Druka et al. [27],employing the Barley1 GeneChip, as closely as possible.They consisted of root tissue at two different developmen-tal stages, leaf, crown, caryopsis, anther, pistil, inflores-cence, bracts, mesocotyl, endosperm, embryo andcoleoptile (for details, see Materials and Methods: Micro-array experiment). This wheat expression dataset may beobtained from and visualized at PLEXdb http://www.plexdb.org, experiment TA3, or GEO http://www.ncbi.nlm.nih.gov/projects/geo, ExperimentGSE12508. Because the 61,115 probesets on the WheatGeneChip reflect the complete collection of publicallyavailable wheat ESTs at the time of design of the chip, thisdataset serves as an 'expression atlas' for hexaploid wheat.While in this paper we concentrate on the comparison of
the barley and wheat transcriptomes, the comprehensivenature of the dataset means that it may be used by wheatresearchers seeking to explore correlations in transcriptlevels across tissues to discover putatively co-regulatedand/or functionally related genes and it provides a base-line against which transcription in biotically or abioticallystressed plants, other cultivars and mutants may be com-pared.
Using single varieties as representatives for both barleyand wheat may to some extent be an oversimplification asit is known that considerable variation can exist amongvarieties of the same species. Indeed, extensive intra-spe-cies variation in barley has been used (employing theBarley1 GeneChip) as a genotyping tool for a crossbetween the barley varieties Steptoe and Morex [29,32]and for expression polymorphisms among Morex, Step-toe, OWB REC, OWB DOM, Barke, Haruna Nijo, GoldenPromise and Optic (PLEXdb accession BB20, ArrayExpressE-TABM-113). We compared the relative importance ofintra- and interspecies variation by making use of a com-mon series of 6 tissues from the barley cultivars GoldenPromise and Morex (taken from Ref. [27]).
For the purpose of the comparison of the transcriptomesof the two species, we found it convenient to define a setof probesets, obtained by eliminating those probesets thatwere potentially unreliable for various reasons (fordetails, see Table 1 and Materials and Methods: The WheatGeneChip). This set of probesets will be referred to as the"high quality" set throughout this paper. This resulted inan expression dataset for 13,822 wheat probesets thatcould be compared, across 13 tissues, with the equivalentdataset obtained with 12,549 barley probesets hybridizedby Druka et al. [27].
Polyploidy and the Wheat GeneChipA comparison of the transcriptomes of barley and wheatis complicated by the fact that the latter is a hexaploid, butthe design of the probesets on the wheat GeneChip didnot specifically take this polyploidy into account. Hence,depending on the stringency of the probeset design, an
Table 1: Summary of the types of probesets present on the Affymetrix Wheat GeneChip.
Probeset typea Number of probesets
Total number of probesets 61115Cross-hybridizing (_s_at,_x_at,_a_at) 12704Ambiguous orientation (A1) 10643Members of 5' (i.e. "prune") set 32578"High quality" probesets 13822
aThe total number of probesets does not include reporters and controls. Note that there is some overlap among the various probeset groups in this table.
Page 3 of 17(page number not for citation purposes)
BMC Genomics 2009, 10:285 http://www.biomedcentral.com/1471-2164/10/285
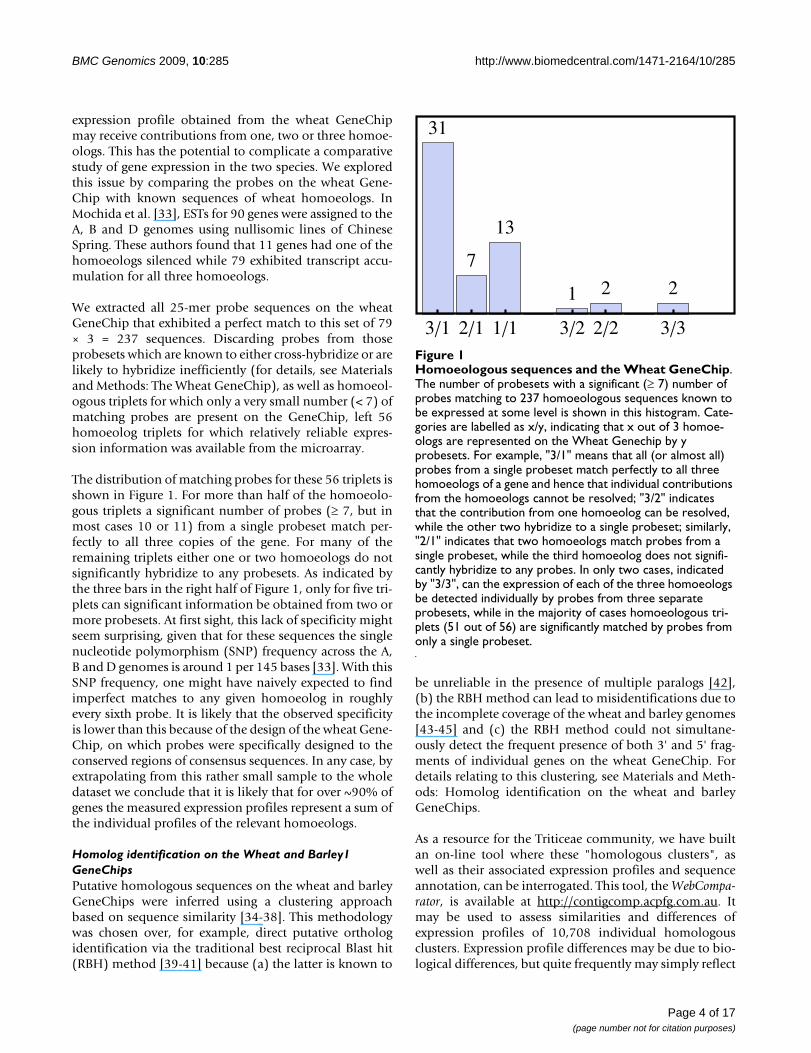
expression profile obtained from the wheat GeneChipmay receive contributions from one, two or three homoe-ologs. This has the potential to complicate a comparativestudy of gene expression in the two species. We exploredthis issue by comparing the probes on the wheat Gene-Chip with known sequences of wheat homoeologs. InMochida et al. [33], ESTs for 90 genes were assigned to theA, B and D genomes using nullisomic lines of ChineseSpring. These authors found that 11 genes had one of thehomoeologs silenced while 79 exhibited transcript accu-mulation for all three homoeologs.
We extracted all 25-mer probe sequences on the wheatGeneChip that exhibited a perfect match to this set of 79× 3 = 237 sequences. Discarding probes from thoseprobesets which are known to either cross-hybridize or arelikely to hybridize inefficiently (for details, see Materialsand Methods: The Wheat GeneChip), as well as homoeol-ogous triplets for which only a very small number (< 7) ofmatching probes are present on the GeneChip, left 56homoeolog triplets for which relatively reliable expres-sion information was available from the microarray.
The distribution of matching probes for these 56 triplets isshown in Figure 1. For more than half of the homoeolo-gous triplets a significant number of probes (≥ 7, but inmost cases 10 or 11) from a single probeset match per-fectly to all three copies of the gene. For many of theremaining triplets either one or two homoeologs do notsignificantly hybridize to any probesets. As indicated bythe three bars in the right half of Figure 1, only for five tri-plets can significant information be obtained from two ormore probesets. At first sight, this lack of specificity mightseem surprising, given that for these sequences the singlenucleotide polymorphism (SNP) frequency across the A,B and D genomes is around 1 per 145 bases [33]. With thisSNP frequency, one might have naively expected to findimperfect matches to any given homoeolog in roughlyevery sixth probe. It is likely that the observed specificityis lower than this because of the design of the wheat Gene-Chip, on which probes were specifically designed to theconserved regions of consensus sequences. In any case, byextrapolating from this rather small sample to the wholedataset we conclude that it is likely that for over ~90% ofgenes the measured expression profiles represent a sum ofthe individual profiles of the relevant homoeologs.
Homolog identification on the Wheat and Barley1 GeneChipsPutative homologous sequences on the wheat and barleyGeneChips were inferred using a clustering approachbased on sequence similarity [34-38]. This methodologywas chosen over, for example, direct putative orthologidentification via the traditional best reciprocal Blast hit(RBH) method [39-41] because (a) the latter is known to
be unreliable in the presence of multiple paralogs [42],(b) the RBH method can lead to misidentifications due tothe incomplete coverage of the wheat and barley genomes[43-45] and (c) the RBH method could not simultane-ously detect the frequent presence of both 3' and 5' frag-ments of individual genes on the wheat GeneChip. Fordetails relating to this clustering, see Materials and Meth-ods: Homolog identification on the wheat and barleyGeneChips.
As a resource for the Triticeae community, we have builtan on-line tool where these "homologous clusters", aswell as their associated expression profiles and sequenceannotation, can be interrogated. This tool, the WebCompa-rator, is available at http://contigcomp.acpfg.com.au. Itmay be used to assess similarities and differences ofexpression profiles of 10,708 individual homologousclusters. Expression profile differences may be due to bio-logical differences, but quite frequently may simply reflect
Homoeologous sequences and the Wheat GeneChipFigure 1Homoeologous sequences and the Wheat GeneChip. The number of probesets with a significant (≥ 7) number of probes matching to 237 homoeologous sequences known to be expressed at some level is shown in this histogram. Cate-gories are labelled as x/y, indicating that x out of 3 homoe-ologs are represented on the Wheat Genechip by y probesets. For example, "3/1" means that all (or almost all) probes from a single probeset match perfectly to all three homoeologs of a gene and hence that individual contributions from the homoeologs cannot be resolved; "3/2" indicates that the contribution from one homoeolog can be resolved, while the other two hybridize to a single probeset; similarly, "2/1" indicates that two homoeologs match probes from a single probeset, while the third homoeolog does not signifi-cantly hybridize to any probes. In only two cases, indicated by "3/3", can the expression of each of the three homoeologs be detected individually by probes from three separate probesets, while in the majority of cases homoeologous tri-plets (51 out of 56) are significantly matched by probes from only a single probeset.
31
7
13
1 2 2
3�1 2�1 1�1 3�2 2�2 3�3
Page 4 of 17(page number not for citation purposes)

BMC Genomics 2009, 10:285 http://www.biomedcentral.com/1471-2164/10/285
problems with hybridization efficiencies for individualprobesets. The tool, therefore, is also useful in assessingthe reliability of individual probesets on the AffymetrixWheat and Barley1 GeneChips. Apart from similaritiesand differences in expression profiles of genes in individ-ual homologous clusters, underlying global patterns areobservable in the two datasets and it is those on which wefocus here.
Gene expression in wheat and barley is highly correlatedDirect gene-by-gene comparison of expression profiles inwheat and barley is complicated by the ambiguities asso-ciated with the many-to-many relationships characteristicof the homologous clusters. However, for the class of clus-ters consisting of exactly one wheat probeset and one bar-ley probeset, ortholog association is less ambiguous: apartfrom the aforementioned general insensitivity to individ-ual wheat homoeologues, one would expect this class tobe enriched for probesets targeting single-copy and single-spliceform genes. Using only the "high quality" probesets(Table 1), this group of clusters consists of 1,875 sequencepairs.
Transcript profiles for these probesets are shown as heatmaps in Figure 2 where probesets have been sortedaccording to a hierarchical clustering for the barley data-set, defined via a single linkage correlation measure. Thesame pattern of gene expression is clearly visible in boththe barley and wheat heat maps indicating that, by andlarge, gene expression in the two species is highly con-served. The same conclusion can be reached by inspection
of the correlation distribution shown in Figure 3. Theaverage correlation of the expression profile pairs in these1,875 homologous clusters is 0.66.
Systematic relative shifts in expression levels are frequent in wheat and barleyWhile expression profiles in wheat and barley are highlycorrelated, it is also of interest to know whether the overalllevel of expression is similar. In this case the Euclideandistance between corresponding expression profilesshould be small. Indeed, the accumulation of points nearthe origin of the Euclidean distance plot shown in Figure4A confirms this to be generally true. However, there arealso a significant number of sequence pairs whose profilesare of similar shape but offset by significant amounts(boxed region in Figure 4A). An example of this, whereexpression in barley is roughly 8 times that in wheat, isshown in Figure 4C. The fact that there are many morepoints in the upper half of the boxed region in Figure 4Aas compared to the lower half shows that if profiles areoffset in this way, it is generally barley that exhibits ahigher signal intensity than wheat. For comparison, Figure4B presents an analogous plot to Figure 4A, involving thetwo barley cultivars Morex and Golden Promise (datataken from Ref. [27]). Comparison to Figure 4A showsthat, on the whole, differences between these two barleyvarieties are negligible when compared to the differencesbetween the two species.
If this unexpected difference of signal intensities in wheatand barley were to reflect an underlying difference in
Large-scale comparison of barley and wheat transcriptomeFigure 2Large-scale comparison of barley and wheat transcriptome. These heat maps provide a comparative overview of gene expression for 1875 barley (left) and wheat (right) sequences. The same pattern of low (blue) and high (yellow) expression is clearly seen in both datasets. For this plot, expression profiles were centered and then sorted according to a hierarchical clus-tering of the barley data using single linkage and a correlation distance measure. Tissue abbreviations: gem – mesocotyl, rad – radicle, roo – root, col – coleoptile, cro – crown, lea – leaf, brc – bracts, inf – inflorescence, ant – anther, pst – pistil, car5 – caryopsis, end22 – endosperm, dem22 – embryo. Developmental time points are as described in [27] and include 2 day old embryos (gem, rad, col), 10 cm seedlings (roo, cro, lea), prior to anthesis (brc, inf, ant, pst) as well as 5 (car5) and 22 days (end22, dem22) after pollination. (see also Materials and Methods: Microarray Experiment).
gemrad
roo colcro lea brc
infant
pstcar5
end22dem22
Prob
eset
s
Barley
gemrad
roo colcro lea brc
infant
pstcar5
end22dem22
Wheat
Page 5 of 17(page number not for citation purposes)

BMC Genomics 2009, 10:285 http://www.biomedcentral.com/1471-2164/10/285
mRNA levels for these genes it would be of interest tocompare the corresponding protein levels in these twospecies. This might indicate a surprising shift of regulatorycontrol from the transcriptional to the translational level.However, because overall shifts in signal intensities asmeasured by two different platforms can easily have atechnical origin we have sought to independently verifythe effect using quantitative real-time PCR (QPCR). Theresults are shown in Figure 5, where microarray signalintensities are plotted against expression levels as meas-ured by QPCR for a number of different sequence pairs(for details, see Materials and Methods: Quantitative RT-PCR (QPCR) verifications). Four wheat and four barleysequences where the overall microarray fluorescenceintensity in wheat is significantly higher than in barley areindicated by "W". Three wheat and four barley sequenceswhere the microarray results for barley is significantlyhigher than wheat are marked by "B". Five sequence pairswhere microarray fluorescence intensities are roughly thesame for the two species are indicated as plain data pointsand were used to generate a calibration curve for the twotypes of measurements. The uncertainty of this calibra-tion, in the form of single prediction 95% confidence lim-its, is indicated by shaded regions in Figure 5.
We first concentrate on those data points, marked by a"W", where the wheat profile obtained with the microar-ray is significantly higher than the corresponding barleyprofile. Expression data for barley (Panel A, Figure 5)show that these sequences exhibit a microarray fluores-cence intensity that is significantly at odds with thatexpected from the corresponding QPCR signal. At the
same time there is no sign of anomalous differencesbetween the QPCR and microarray measurements for thecorresponding wheat expression (Panel B, Figure 5). Weconclude from this that for those orthologous pairs forwhich microarray measurements indicate expression inbarley to be systematically lower than in wheat (i.e. thelower boxed portion in Figure 4A) the differences arelikely to be due to a deficient signal obtained from thebarley microarray, and not due to enhanced expression inwheat. We defer comment on the likely origin of this defi-ciency to the Discussion section.
For sequence pairs where the barley profile is systemati-cally higher than its wheat counterpart (i.e. those shownin the upper boxed portion of Figure 4A and marked witha "B" in Figure 5) the situation is less clear. These datapoints do fall mostly within the calculated 95% confi-dence limits for a consistent QPCR and microarray signaland the data is, therefore, consistent with the conclusionthat for a significant number of genes the transcriptionalactivity in wheat is indeed below that in barley. We cau-tion, however, that at this stage one also cannot rule outthat the discrepancy may be due to simultaneous smallshifts of technical rather than biological origin, causingthe barley fluorescence in the microarray data to be sys-tematically increased and at the same time the wheat flu-orescence to be systematically decreased somewhat fromwhat they should be.
5' Probesets on the Wheat GeneChip hybridize unpredictablyThe comparison of expression information betweenwheat and barley provides a unique opportunity to assessthe reliability of the hybridization signal from the wheatGeneChip. This is important because the wheat microar-ray contains, apart from the usual probesets designed forsequences for which there is good evidence that they arenear the 3' end of the gene (such as the presence of a poly-A tail), a large number of probesets for which this evi-dence does not exist (see Materials and Methods: TheWheat GeneChip; for convenience, we refer to the latter as"5' probesets"). Because of mRNA degradation away fromthe 3' end, one might expect the latter to lead to a reducedsignal.
Individual 3' and 5' probesets can be inferred to corre-spond to the same gene if they both show strong sequencesimilarity to a barley sequence but at the same time do nothave a significant similarity with each other. Indeed, ofthe approximately 5,300 consensus sequences from the 5'set homologous to a barley sequence, 78% can be associ-ated to a wheat 3' sequence in this way. A subset of thesesequences is contained in the class of homologous clustersshown in Figure 6A. There are 1,590 clusters of this typein our dataset.
Correlation of barley and wheat expression profilesFigure 3Correlation of barley and wheat expression profiles. The correlation distribution of 1,875 barley and wheat expression profiles is shown. Expression for putatively orthologous genes in barley and wheat tends to be highly correlated, with an average correlation of 0.66.
�0.5 0.0 0.5 1.00
50
100
150
200
250
Correlation
No.
ofpr
obes
ets
Page 6 of 17(page number not for citation purposes)

BMC Genomics 2009, 10:285 http://www.biomedcentral.com/1471-2164/10/285
The distribution of correlations of the expression profilesfrom this set of 3' and 5' wheat sequences is shown in Fig-ure 6B. The typical correlation between the 3' wheat andbarley profile is quite high (mean = 0.57), while the cor-relation between the 5' wheat and barley profiles tends tobe considerably lower (mean = 0.32). It appears from thisthat while some 5' wheat probesets might very well give areliable signal, on average the reliability is significantlylower than that of the 3' wheat probesets. Additional evi-dence to support this conclusion is shown in Figure 6Cwhere the distribution in actual expression levels for both
the wheat 3' and wheat 5' probesets is shown along withthe expression levels in barley. It appears from this plotthat the signal from the 5' probesets is consistently sub-stantially lower than the signal from the barley probesets.Finally, a cursory inspection of profiles for any homolo-gous cluster using the WebComparator http://contigcomp.acpfg.com.au/ shows that probesets from the 5' setoften don't show any significant hybridization. We con-clude that one needs to interpret the signal from theseprobesets with great care and for this reason we shall notinclude them in our comparative analyses.
Similarities and differences between wheat and barley profilesFigure 4Similarities and differences between wheat and barley profiles. Panel A shows the Euclidean distance between wheat and barley expression profiles (x-axis) plotted against the Euclidean distance between their 'centered' profiles (y-axis) for the 1,875 "high quality" sequence pairs. In a centered profile, expression is measured relative to the average across tissues. Positive y-values correspond to average expression in barley greater than in wheat while negative y-values indicate average expression in wheat greater than barley. Expression profiles which have the same shape and overall magnitude of expression fall close to the origin of this plot, while expression profiles which have the same shape but are offset from each other simultaneously exhibit a small relative distance but large absolute distance (boxed region). For comparison, Panel B shows the analogous plot, on the same scale, for two barley cultivars Morex and Golden Promise (albeit over 6 rather than 13 tissues); data taken from Ref. [27]). Panel C shows a typical barley (solid line) and wheat (dashed line) expression profile identified from the boxed region in Panel A to be of similar shape but differing by an offset. In this case the offset corresponds to a signal intensity 8 times higher in barley than wheat. The particular example shown here corresponds to the wheat contig TaAffx.78909.1.S1_at and the barley Contig16549_at, annotated as a MYB transcription factor.
Page 7 of 17(page number not for citation purposes)

BMC Genomics 2009, 10:285 http://www.biomedcentral.com/1471-2164/10/285
Conservation and divergence of gene function in wheat and barleyGene and protein expression studies indicate that, in gen-eral, sequence divergence after duplication events is asso-ciated with a divergence of functionality in the resultingparalogs, presumably because of reduced selection pres-sure after duplication [46,47]. In fact, it is widely believedthat gene duplication – either individually or as part ofgenome-scale duplication events – is crucial for providingthe resource for the subsequent evolution of genes withnew functions [48,49]. Genome-wide studies of thissequence divergence have mostly been undertaken insequenced organisms separated by reasonably large evolu-tionary distances. The wheat and barley tissues series per-mit such a study in these more closely related grassspecies. Consider homologous clusters of the type pre-sented in Figure 7. The type of cluster shown in Figure 7Ais consistent with a gene duplication event in wheat, withsubsequent sequence divergence of sequence W2. Simi-larly, Figure 7B is consistent with a gene duplication inbarley, with subsequent sequence divergence of sequenceB2. The "high quality" dataset contains 24 and 94 exam-ples of this type of cluster, respectively.
A measure of functional divergence, on the other hand, isonce more provided by the correlation between wheatand barley expression profiles. For the cluster shown inFigure 7A, if the correlation between the profile for thebarley sequence B and the wheat sequence W1 (C(B, W1))is similar to the correlation between B and W2(C(B, W2)),one would conclude that there is little relation between
functional and sequence divergence. On the other hand,C(B, W2) <C(B, W1) would indicate a possible relation-ship. The results of these comparisons are presented inTable 2. The average correlation between the profiles for Band W1 is higher than that for B and W2, and similarly theprofiles for W and B1 are on average more correlated thanthose for W and B2. While the sample sizes are small, theP-values associated with a Wilcoxon signed-rank test indi-cate that these differences are likely to be significant. Inshort, wheat and barley apparently exhibit a correlationbetween divergence of gene function and gene sequenceakin to that found in less closely related species.
Dosage constraints in wheat and barleyWhile gene duplication provides opportunities for theevolution of new gene function, it has also been arguedthat selective pressure can maintain original function aftera duplication event. This might occur if the gene codes forpart of a protein complex [50], thus imposing strong sto-ichiometric constraints, or if 'buffering' of crucial func-tions [51] is required. In addition, studies in yeast [52]and Paramecium [53] indicate that dosage constraintsmay account for the inhibition of divergence of dupli-cated genes. These authors found that, at least in these twospecies, duplicate copies of genes are more likely to beretained if the expression level is high than if it is low, pre-sumably in order to maintain high transcript levels.
We have compared the wheat and barley transcriptomesto see if such a correlation between maintenance of genefunction and expression level persists in these two species.
Validation of selected barley and wheat expression profiles via QPCRFigure 5Validation of selected barley and wheat expression profiles via QPCR. A comparison of logarithmic fluorescence intensities, as measured on the microarrays, with logarithmic QPCR expression levels is shown. Barley data is shown in Panel A and wheat data in Panel B. Four wheat and four barley sequences where the average microarray fluorescence intensity for wheat is greater than barley give rise to the expression levels labelled by "W" (This comparison is carried out individually for each of the eleven tissues, hence there are a total of 44 points marked "W"). Three wheat and four barley sequences where the microarray fluorescence intensity for wheat is less than barley are marked by "B". Plain black data points indicate five sequence pairs where the microarray fluorescence intensities for wheat and barley are comparable. Data from these five sequence pairs were used to generate a calibration curve between the QPCR and microarray data in the form of a straight line fit (solid line) and associated 95% single prediction confidence limits (shaded region).
���
�
��
��
�
�
����
�
��
�� �
�
� ���
��
��
��
����
��
���
�
���
���
�
�� ����
�B
B
B
B
B
B
B B
B
B
B
BB
B
BB
B B
B BB
B
B
BB BBB B
B
B
BB
WWWWWW
W
WW
W
WW
WWWW
W
W
WW
W
WW
WWWW
WW
W
W
WW
WWW WW
W
WW
W
W
W
BB
B
B
B
B B
B
BB
B
A
���
�
��
��
�
�
����
�
��
�� �
�
� ���
��
��
��
����
��
���
�
���
���
�
�� ����
�B
B
B
B
B
B
B B
B
B
B
BB
B
BB
B B
B BB
B
B
BB BBB B
B
B
BB
WWWWWW
W
WW
W
WW
WWWW
W
W
WW
W
WW
WWWW
WW
W
W
WW
WWW WW
W
WW
W
W
W
BB
B
B
B
B B
B
BB
B
A
5 6 7 8 9 10 11 12
10
12
14
16
18
20
22
Microarray
QPC
R
Barley
�����
� �
��
��
����
���
���
������
�
�����
�� ����
�
��� �
�����
� �
����B
BB BB
BB
BB
BB
B BBB
BBB B
BBB
BB B
BBB B BBB
B
WWWWW
WW WW
WW
WWW
WW
W
WWW
W
W
WWWW
WW
WWW
WW
WW
W
WW
W
W
WW
W
W
B
�����
� �
��
��
����
���
���
������
�
�����
�� ����
�
��� �
�����
� �
����B
BB BB
BB
BB
BB
B BBB
BBB B
BBB
BB B
BBB B BBB
B
WWWWW
WW WW
WW
WWW
WW
W
WWW
W
W
WWWW
WW
WWW
WW
WW
W
WW
W
W
WW
W
W
B
4 6 8 10 126
8
10
12
14
16
18
Microarray
QPC
R
Wheat
Page 8 of 17(page number not for citation purposes)

BMC Genomics 2009, 10:285 http://www.biomedcentral.com/1471-2164/10/285
Again, we use conservation of the expression profiles (i.e.the correlation) between wheat and barley genes as anindirect measure of conservation of function. The results,using all wheat and barley probesets from the "high qual-ity" set linked by a reciprocal Blast hit, are shown in Figure8A. Genes that are expressed at a higher level tend to begenes which have more correlated expression profiles. Inorder to make sure that this is not an artefact of noisewashing out underlying correlations at low expression lev-els we confirmed that the trends shown in Figure 8A per-sist even if genes with low expression levels (e.g. less than7) in any tissue are left out of the analysis. Finally, onesees that the same correlation persists if one uses sequencesimilarity instead of profile similarity as a measure forconservation of gene function (Figure 8B). We conclude,therefore, that for wheat and barley the maintenance ofhigh expression levels is a significant driver in maintain-ing gene function.
DiscussionGene expression in wheat and barley is highly correlatedOur results (Figures 2 and 3) indicate highly correlatedgene expression for the subset of barley and wheat genesin the 'high-quality set' that belong to homologous clus-ters with exactly one member from each species. Whilethis restriction makes ortholog identification relativelyunambiguous, it also leads to a biased sample: by con-struction, this selection is enriched for genes that are notmembers of gene families and/or genes where thesequence differences between homoeologs are small (oronly one of the homoeologs is functional). It is quite pos-sible, even plausible, that the average correlation of abroader gene set that includes members of gene familiesmay differ from the value 0.66 observed in our morerestricted set. Indeed, if the presence of gene family mem-bers is taken to indicate increased redundancy, one mightwell expect that the average correlation of expression lev-
Expression differences between wheat 3' and 5' probesetsFigure 6Expression differences between wheat 3' and 5' probesets. Comparison of expression profiles for wheat and barley allows an assessment of the reliability of the wheat 5' probesets. Homologous clusters of the type shown in Panel A suggest the simultaneous presence of both a 3' (W1) and 5' (W2) wheat probeset for the same gene that, at the same time, is homologous to a particular barley gene. The correlation of the expression profiles of these 3' and 5' probesets are shown in Panel B. On average, the profiles obtained from the 5' probesets show significantly lower correlation with that of their barley homologs than do the 3' probesets. This can also be seen in the distribution of the expression values themselves in Panel C. In general, expression values as measured by the 5' probesets tends to be much lower than those of their barley counterparts (solid line), while the signal from the corresponding 3' probesets shows a distribution roughly similar to that of the barley homologs.
A
W2�5’�W1�3’�
barley
B
W2�5’�
W1�3’�
�0.5 0.0 0.5 1.00
100
200
300
400
Correlation
Num
ber
ofpr
obes
ets C W2�5’�
W1�3’�
barley
0 2 4 6 8 10 12 140
500
1000
1500
2000
2500
3000
3500
Expression
Num
ber
ofpr
obes
ets
Page 9 of 17(page number not for citation purposes)

BMC Genomics 2009, 10:285 http://www.biomedcentral.com/1471-2164/10/285
els might reduce. While, given the lack of reliablesequence information, it is not feasible to test this conjec-ture at present, it is interesting to note that our restrictedsample of 1875 sequence pairs exhibits, on average,higher expression levels than the complete "high-qualityset": expression levels in barley appear increased margin-ally by 37%, while in wheat they are roughly doubled.
Conservation and divergence of gene function in wheat and barleyThe evolution of new functional roles for duplicated genescan depend on a number of mechanisms. Most directly,accumulation of sequence changes in coding regions canlead to changes in protein structure, either by substitutionof amino acids or through the evolution of new splice var-iants. This type of sequence divergence after gene duplica-tion is well documented [47]. Numerous studies haveobserved the expected decreased selective pressure onsequence conservation after duplication through compar-isons of synonymous and non-synonymous nucleotide
substitutions [54]. A second mechanism is providedthrough alteration of gene regulation imparted throughmutation in cis-acting elements and/or alterations oftrans-acting factors. This alters a gene's expression reper-toire even in the absence of changes in its sequence. Therelationship between these two mechanisms also shedslight on the importance of selective pressure in the evolu-tionary process; random drift under a neutral modelwould result in unrelated expression and sequencechanges, while strong selective pressure would be reflectedby a positive correlation.
The results in Table 2 provide an indication that geneactivity patterns across tissues and accumulation ofsequence changes after gene duplication are positivelycorrelated in wheat and barley, as one would expect in thepresence of selective pressure [55]. This finding is in agree-ment with some of the studies in model species such asyeast [56], C. elegans [57], Drosophila [58] and primates[59]. However, these results are by no means universaland in other studies no clear correlation is observed [60].For example, no [61] or weak [16] correlation wasobserved in two studies using the model plant Arabidopsis.It is likely that the lack of agreement reflects differences inapproach; for example, in some studies sequence diver-gence is measured on the protein level, in others it isquantified through the rate of non-synonymous substitu-tions and others through the rate of synonymous substi-tutions. In some studies tandem duplications areseparated out from ancient segmental duplications, whilein others (including ours) they are not. Expression diver-gence, on the other hand, will clearly depend on thenumber and types of different temporal, spatial and envi-ronmental conditions which are probed.
We believe that at present the results shown in Table 2should be seen as indicative only. Gene duplication andsubsequent divergence is only one possible source for theapparently correlated divergence of sequence and expres-sion. A second source for this correlation might be foundin the generation of new alternative splice forms ratherthan new genes, with the original splice form maintainingits expression pattern but the new one diverging.
Furthermore, as opposed to the species mentioned above,wheat and barley do not have sequenced genomes andthis naturally has an influence on the reliability of theavailable sequence and expression information. Heresequence divergence was assessed purely on the basis ofthe existence (for W1 and B1 in Figure 7) and absence (W2and B2) of a Blast hit of sufficient quality. This is a crudermeasure than a count of synonymous substitutions, andother effects such as a reduced sequence length of W2 andB2 due to incomplete EST information could easily impacton this. In addition, our sample size is quite small because
Homologous clusters exhibiting greater intra-species than inter-species sequence similaritiesFigure 7Homologous clusters exhibiting greater intra-species than inter-species sequence similarities. These types of clusters are indicative of a gene duplication having occurred in wheat (Panel A) or barley (Panel B). The absence of a sig-nificant Blast hit between W2 and B (or B2 and W) is consist-ent with subsequent sequence drift of one member of the duplicated pair.
A
W2�3’�W1�3’�
B B
B2B1
W�3’�
Table 2: Expression profile conservation versus sequence conservation.
Gene pair <C> N P-Value
B – W1 0.3324 0.012
B – W2 0.15
W – B1 0.5194 0.087
W – B2 0.43
The correlation of gene expression profiles in wheat and barley increases with similarity of gene sequence. Gene pairs refer to those shown in Figure 7A (top two rows) and 7B (bottom two rows). <C> refers to the average Pearson correlation for the expression profiles of these gene pairs. N is the sample size and the P-value is calculated using the Wilcoxon signed-rank test.
Page 10 of 17(page number not for citation purposes)

BMC Genomics 2009, 10:285 http://www.biomedcentral.com/1471-2164/10/285
it includes only those homologous graphs that we consid-ered to be the most reliable, i.e. those containing the Blasthits of the type shown in Figure 7. Notwithstanding thesequalifications, these latter issues would tend to reduce anyunderlying correlation, so the presence of these in Table 2may actually be relatively robust. We also note that anyremaining cross-hybridization between W1 and W2 (or B1and B2), which we have sought to eliminate by consider-ing only the "high-quality" dataset that doesn't contain"_x,s,a_at" probesets, would also tend to reduce any dif-ference in the correlation signal. Improved knowledge ofthe sequence content of these two species will increase thereliability of the signal that we have observed.
A second effect apparent in Table 2 should be treated witheven more caution. The expression profiles of duplicatedwheat genes appear to be considerably less similar to thatof their barley ortholog (correlation coefficients ~0.33 &0.15) than duplicated barley genes and their wheatortholog (correlation coefficients ~0.51 & 0.43). Thesecorrelations can be compared to those 1,875 sequencepairs discussed earlier where there is no evidence of geneand/or splice form duplication (correlation ~0.66). Whileit might be tempting to conclude that expression patternsin wheat evolve faster than their counterparts in barley,this signal is sensitive to any asymmetry in design of thetwo GeneChips. In particular, as discussed in [26] and athttp://www.affymetrix.com, the EST clustering proceduresused in the construction of the Barley1 and Wheat Gene-chips was rather different, particularly in their treatmentof potential splice-variants. It could well be these differ-
ences has led to differing proportions of probesets on thetwo GeneChips designed to individual splice forms.
Because both alternative splice forms as well as geneduplications potentially contribute to the asymmetries inTable 2, a differing admixture of the two could easily beresponsible for this asymmetry between the species.
Highly expressed genes show correlated expression in wheat and barleyNumerous studies have shown that genes transcribed athigh levels tend to evolve more slowly than genes tran-scribed at low levels [62-64]. As already mentioned above,the "rate of evolution" in this type of study is quantifiedby sequence divergence, either on the DNA level by count-ing synonymous and/or non-synonymous substitutionsor on the protein level by counting amino acid changes.The results shown in Figure 8B show that this correlationbetween sequence conservation and mean expressionlevel can clearly be seen in the wheat and barley transcrip-tomes, even though we use the comparatively roughmeasure of a Blast hit E-value to quantify sequence simi-larity.
Systematic shifts in expression levels and platform dependant biasesWhile differential hybridization signal (i.e. fluorescence)intensities in a select number of tissues are highly likely tobe indicative of true biological differences between wheatand barley, great care must be taken in interpreting overallshifts of fluorescence levels in the same way. The RNA
Dosage constraints on gene evolutionFigure 8Dosage constraints on gene evolution. In Panel A, the correlation between expression profiles of wheat and barley genes linked by reciprocal Blast hits in the homologous clusters is plotted against the overall mean expression level for these gene pairs. The profiles exhibit higher correlation if the actual expression levels themselves are high, suggesting that gene function tends to be more conserved for highly expressed genes. In Panel B, the mean expression is plotted against sequence similarity (i.e. E-values of the Blast hits), indicating that there is an analogous correlation between the level of expression and sequence similarity.
A
4 5 6 7 8 9 10 11 12 130.45
0.50
0.55
0.60
0.65
0.70
0.75
0.80
Mean Expression
Cor
rela
tion
B
4 5 6 7 8 9 10 11 12 13�110
�100
�90
�80
�70
�60
�50
Mean Expression
Log�E�
valu
e�
Page 11 of 17(page number not for citation purposes)

BMC Genomics 2009, 10:285 http://www.biomedcentral.com/1471-2164/10/285
extractions for these experiments were performed in twodifferent laboratories and, of course, with different speciesusing GeneChips with two different design philosophies.RNA hybridization to the GeneChips, on the other hand,was performed at the same facility in a virtually identicalmanner. Even issues such as the poor hybridization effi-ciency of the large number of wheat 5' probesets are likelyto have an impact on the relative normalization. Withoutan absolute standard, a rigorous relative calibration of thetwo datasets therefore seems very difficult, if not impossi-ble. Our approach to this issue was two-fold: firstly, whileone might not be able to control the overall normaliza-tion uncertainty one can attempt to estimate its impor-tance and secondly, as described, we performedadditional QPCR measurements in an attempt to verifyinteresting outcomes.
An estimate of the overall normalization uncertainty isprovided by the data shown in Figure 4A. For these data,the average difference in (logarithmic) fluorescence levelsis around 0.8, indicating that on average the fluorescencelevels for the barley data are about 75% higher than thecorresponding levels for the wheat data. Under theassumption that the true average expression level in thetwo species is similar one would conclude that overallnormalization issues may account for a factor of around 2between the datasets. The differences, often 10-fold ormore, of the observed fluorescence levels shown in Fig-ures 4C and 5 makes this an unlikely explanation.
For those probesets where there is a systematic decrease inthe observed fluorescence levels in barley as compared towheat, the barley QPCR results do not confirm the barleymicroarray results. This indicates that for these probesets,at least, the difference has a technical rather than biologi-cal origin. An obvious possibility for a lack of signal is thepossible presence of single feature polymorphisms (SFPs;see Ref. [28]) between the probes on the Barley1 array andthe Morex mRNA being hybridized to it. If this is the case,the rough consistency of QPCR and microarray results forwheat, for those probesets with enhanced microarray flu-orescence levels in barley, would indicate that the SFPs donot play as much of a role in the hybridization of ChineseSpring to the wheat GeneChip as they do for the hybridi-zation of Morex to the Barley1 GeneChip.
There is corroborating evidence supporting this conjec-ture. The Barley1 GeneChip was designed using the ESTscollected from 84 libraries, originating from EST projectsin Japan, Finland, Germany, Scotland, and the US, respec-tively. Five major and a few minor cultivars were used,representing the favorite from each project. In the end, themajority of these ESTs were from Barke (Germany) and, toa lesser extent, Morex (US) [26]; in total, only about 1 in7 ESTs used to design Barley1 came from Morex [28]. Thedominant cultivar in the EST collections used to design
the wheat GeneChip, on the other hand, is ChineseSpring. One would, therefore, expect a greater prevalenceof SFPs between Morex mRNA and the probes on theBarley1 GeneChip as compared to SFPs between ChineseSpring mRNA and the probes on the wheat GeneChip. Wehave compared the sequences in current publicly availableEST collections against the probe sequences on the twoGeneChips and find that this is indeed the case: from thiscomparison, we estimate that the probability of any mis-match between a 25mer barley probe and Morex sequenceto be around 2.9% while for the wheat GeneChip theprobability of a mismatch between a probe and a ChineseSpring sequence is around 1.5%. Assuming independ-ence, this implies that in Figure 4A of the order of ten orso Barley1 GeneChip probesets may contain more thantwo SFPs when compared to Morex sequences, while forChinese Spring the effect is negligible. In other words,SFPs between the two cultivars and their respective Gene-Chips may indeed be responsible, qualitatively and quan-titatively, for the discrepancies between the QPCR andmicroarray results observed for barley but not wheat.
ConclusionWe have performed a comparative study of gene expres-sion in barley and hexaploid wheat, using 13 different tis-sues and developmental stages. The comparison has beenachieved through the clustering of almost 84,000 wheatand barley sequences represented on the Affymetrix wheatand barley GeneChips into homologous clusters, withover 10,700 clusters containing more than one sequence.Detailed comparisons of expression profiles for all ofthese sequences have been made available at http://contigcomp.acpfg.com.au and individually the two geneexpression atlases can be explored further at http://www.plexdb.org, accession numbers BB3 and TA3.
We have established that on the whole there are strongsimilarities between expression patterns of homologousgenes in the two species. This conclusion could only bereached, however, by first taking into account the differingdesigns of the two GeneChips. Among several confound-ing factors, the most significant is the presence of over32,000 probesets on the wheat GeneChip not clearlyanchored to the 3' end of gene sequences. The expressionprofiles obtained with these probesets and, particularly,the comparison to expression profiles of homologous bar-ley sequences clearly shows that most lead to a signifi-cantly compromised signal. In this way, our comparativeresults provide a significant resource aiding the interpreta-tion of the hybridization signal from individual probesetsin future experiments employing the wheat GeneChip.
Our results indicate that the hybridization signal obtainedfrom the wheat GeneChip generally does not differentiatebetween wheat homoeologs. Detailed study of homoe-olog expression patterns across tissues awaits the con-
Page 12 of 17(page number not for citation purposes)

BMC Genomics 2009, 10:285 http://www.biomedcentral.com/1471-2164/10/285
struction of microarray platforms that specifically targetregions of homoeolog sequence divergence and/or studiesemploying direct transcriptome sequencing.
Finally, we have used several high-quality subsets of ourexpression datasets to investigate some of the more prom-inent, but nevertheless comparatively small, systematicdifferences between the wheat and barley data. As is to beexpected, we found that great care must be taken to distin-guish genuine differences in the transcriptomes from arti-factual differences due either to the dissimilar design ofthe GeneChips and/or the disparity in our current knowl-edge of the wheat and barley genomes. Examples of thelatter include a systematic shift in absolute expressionfound in a significant number of wheat and barley puta-tive orthologs. On the other hand, we also found a com-paratively clear indication that highly expressed wheatand barley genes tend to be evolutionarily conserved,both in sequence as well as transcriptional activity. Thisobservation for these two grasses is in agreement withresults from previous studies of model species.
MethodsExperiment designWild-type wheat (Triticum aestivum L. cv. Chinese Spring)was grown in a temperature-controlled growth room with16 h light (22°C) and 8 h dark (16°C) at approximately80% humidity. Thirteen plant tissues were selected to rep-resent the major stages of wheat development and to mir-ror the experiment of Ref. [27] for barley (cv. Morex). Thenumber of plants harvested and the developmental stagesselected are as described in [27], with the following excep-tion: while in the latter samples were collected for threestages of caryopsis (namely, 5, 10 and 16 DAP), for wheatonly caryopsis 3–5 DAP was used. Three independent bio-logical samples (replicates) represented a tissue type.
RNA isolation and quality checking were performed asdescribed in Ref. [27]. Labeling and hybridization to theAffymetrix wheat GeneChip was carried out at the IowaState University GeneChip facility http://www.biotech.iastate.edu/facilities/genechip/Genechip.htm. Back-ground subtraction and normalization for both experi-ments was performed using the RMA normalizationprocedure [65,66] and the three biological replicates wereaveraged. The data is expressed on a logarithmic scale(base 2), as usual.
Data accessAll detailed data and protocols from these experimentshave been deposited in PLEXdb http://www.plexdb.org/,a unified public resource for gene expression for plantsand plant pathogens. Files are categorized under accessionTA3 for the wheat gene atlas and BB3 for the barley geneatlas. TA3 has also been deposited at NCBI-GEO as acces-sion GSE12508.
The Wheat GeneChipIt is crucial to take into account the different design phi-losophies of the Affymetrix wheat and barley GeneChipswhen comparing the transcriptome data obtained withthem. In order to maximize the reliability of results weimpose rigorous constraints to arrive at a set of probesetsthat may be judged to be reliable. The design of theBarley1 GeneChip has already been discussed in detail inRef. [26]. Additional information on both GeneChips canbe found in the technical support section of http://www.affymetrix.com. Here we briefly summarize the rele-vant details of the wheat GeneChip. This GeneChip con-tains, apart from a small number of reporters andcontrols, 61,115 probesets. All but 73 of these are madeup of 11 25-mer perfect-match (and accompanying mis-match) probes. As is usual for these GeneChips, there area number of probesets where one or more probes areknown to cross-hybridize in one way or another (fordetails, see Appendix B of the "GeneChip Expression anal-ysis manual" available at http://www.affymetrix.com):their names are suffixed by "_s_at" (2617 probesets),"_x_at" (6766 probesets) and "_a_at" (3321 probesets).Because of the danger of unwanted cross-hybridizationcomplicating ortholog identification across the two spe-cies, as well as the fact that in any case these probesets areoften provided in addition to uniquely hybridizingprobesets, we do not include them in the comparativeanalysis carried out in this paper. For the same reason, theresults presented here only make use of those probesetsfrom the Barley1 GeneChip for which ESTs could beassembled into a contig. Singleton ESTs tend to haveshorter sequence, increasing the chance that confusionarises when trying to match them to a particular sequencepresent on the other GeneChip. Finally, in our compara-tive analysis we also disregard the 10,643 probesetsmarked with the suffix ".A1" because they are predomi-nantly of the wrong orientation.
Furthermore, the wheat GeneChip includes a considera-ble number of probesets not clearly anchored to the 3' end(32,578 out of 61,115; Close and Davies, personal com-munication). These form part of the so-called "prune" setin Affymetrix's design pipeline and are usually used forchecking probes for potential cross hybridizationThroughout this paper we refer to these as "5' sequences".This type of sequence was not included on the Barley1GeneChip because, while they may be useful for gene dis-covery, their hybridization efficiency is unreliable. Unlessexplicitly indicated otherwise, we do not consider them inour comparative analysis.
Finally, as discussed below, an additional quality controlon the GeneChip sequences was obtained by demandingthat the relative orientation of the consensus sequenceson the barley and wheat GeneChips should be the same.
Page 13 of 17(page number not for citation purposes)

BMC Genomics 2009, 10:285 http://www.biomedcentral.com/1471-2164/10/285
Our comparative analysis leaves out sequences withopposite or inconsistent orientation on the two chips.
After all these cuts, 13,822 wheat probesets and 12,549barley probesets remained and it was this set that we used.We stress, however, that expression results from allprobesets have been included in the data contained in theWebComparator http://contigcomp.acpfg.com.au.
Homolog identification on the Wheat and Barley GeneChipsWe identified putative wheat and barley homologs usingthe following approach
1) After constructing non-redundant sets of consensusand exemplar sequences for the wheat and barley Gene-Chips, respectively, we performed all possible wheat-bar-ley, barley-wheat, wheat-wheat and barley-barleysequence comparisons using NCBI's gapped Blastn [67]algorithm. The intra-species comparisons were performedin order to avoid, as much as possible, issues associatedwith the incomplete representation of the wheat and bar-ley genomes on the two GeneChips.
2) A directed graph was constructed from the results ofthese sequence comparisons, with the nodes consisting ofthe non-redundant sequences. A directed edge starting atnode i (being a sequence from genome I) and ending atnode j (a sequence from genome J) was defined to exist ifa) node j was the best Blast hit to node i when sequence iwas compared to genome J and this Blast hit had an E-value better than the cut-off C = 10-50, or b) if the Blast hithad an E-value within a tolerance T = 10-5 of that of thebest Blast hit (if the best Blast hit had an E-value of 0 thenthis limit was taken to be within 10-5 of machine precisioninstead). Note that keeping Blast hits which are close tothe best Blast hit is useful if several homoeologs with near-identical sequence are present and/or if probesets havebeen tiled to both the 3' and 5' end of the same sequence,as was done for the wheat GeneChip.
3) Finally, the resulting graph was decomposed into con-nected sub-graphs (termed "homology graphs"), withthose sequences contained within a sub-graph defining aputative "homologous cluster".
The results are quite insensitive to the choices for C and T;the precise value of C tends to be immaterial becauseeither I = J (i.e. an intra-species comparison), in whichcase the best Blast hit naturally almost always links thesequence back to itself with an E-value of 0, or – if I ≠ J (aninter-species comparison) – the general similaritybetween wheat and barley sequences ensures that if ahomolog is present at all it tends to have a similarity verymuch better than E ~ 10-50. The precise value of T, on theother hand, is not critical for a similar reason; most Blasthits are found to be either very close to the best Blast hit(usually with an E-value within a factor of 100 or so of thebest E-value) or considerably further removed. In otherwords, while we have not attempted to distinguishhomoeologs, paralogs and orthologs (only a phylogenetictreatment can do this), by using the above approach thedetection of homologs in general is relatively unambigu-ous.
Typically, the homology graphs are rather small: only 105out of a total of 10,708 non-trivial homology graphs con-tain more than 10 vertices. A much larger number of thesegraphs, just over 40,000, are found to be 'trivial' in thesense that they contain only 1 node, i.e. for thesesequences, the Blast searches did not result in a significanthit to any other sequences. This should not be interpretedto mean that there are large numbers of genes in wheatand barley having no counterpart in the other species.Rather, inspection of the trivial graphs shows that about57% of them correspond to 5' wheat sequences (presum-ably not having a significant overlap with the typicallylonger barley sequences) and slightly less than 10% corre-spond to short barley ESTs rather than longer contigs. It isto be expected that most of the remaining 13,000sequences or so are unmatched because the two Gene-Chips do not represent the entire complement of genesfrom the two species. In principle, the number of trivialgraphs could be reduced by increasing C considerably;however, we did not do so in order not to increase thenumber of false positive associations.
Quantitative RT-PCR (QPCR) verificationscDNA was synthesized from the same RNA that washybridized to the wheat and barley GeneChips for 11 ofthe 13 tissues (excluding anthers and pistils). While three
Table 3: Q-PCR primer pairs used for the wheat control gene.
Gene Forward primer Reverse primer Product size (bp)
ELF1 CAGATTGGCAACGGCTACG CGGACAGCAAAACGACCAAG 227GAPDH TTCAACATCATTCCAAGCAGCA CGTAACCCAAAATGCCCTTG 220Cyclophilin CAAGCCGCTGCACTACAAGG AGGGGACGGTGCAGATGAA 227Actin GACAATGGAACCGGAATGGTC GTGTGATGCCAGATTTTCTCCAT 236
Primer sequence details for the control genes used in the Q-PCR verification of selected wheat expression profiles and the size of the corresponding RNA products.
Page 14 of 17(page number not for citation purposes)

BMC Genomics 2009, 10:285 http://www.biomedcentral.com/1471-2164/10/285
independent RNA samples were used in the microarrayexperiment, the QPCR cDNA was prepared for only one ofthe three RNA samples. Results from this sample werecompared to the microarray results from the same sample.Templates of 5 μg total RNA for barley and 0.5 μg totalRNA for wheat were used for the cDNA synthesis reactionwith Superscript III RNAse H-Reverse Transcriptase (Invit-rogen, Australia) according to the manufacturer's proto-col.
Four control genes were assessed (actin, GAPdH, EFA andcyclophilin). The primers for the barley control genes aredescribed in Ref. [68], while the wheat primers are listedin Table 3. The selection of barley and wheat probesetsused for the comparison of microarray and QPCR resultswas drawn from the boxed region indicated in Figure 4Aand is summarized in Table 4. Three groups of sequenceswere examined: two of these involved sequences (mostlysequence pairs) giving rise to intensity profiles similar tothose shown in Figure 4C, with either wheat or barley hav-ing a higher overall intensity, while the third group con-sisted of sequence pairs whose fluorescence intensityprofiles did not show significant intensity differences inthe microarray experiments. These were either sequencepairs that did not show significant intensity differences in
the microarray experiments or individual sequences usedas internal controls for the QPCR experiments. Primersequences designed from the corresponding consensussequences are also shown in Table 4. Normalization fac-tors were calculated from the three best control genes asdescribed by Vandesompele et al. [69]. The QPCR was car-ried out as described by Crismani et al. [70].
Authors' contributionsAWS conceived and performed the analysis and draftedthe manuscript. TS and GM grew the plants and extractedthe mRNA. RAC and RPW organized and carried out themicroarray hybridizations. EK created the WebComparatorsoftware application. BL performed the QPCR verifica-tions. GJM, AD, RW, RPW and PL conceived, organizedand obtained the funding for the collaborations behindwheat and barley tissues series. UB participated in theanalysis and QPCR verification and together with RW par-ticipated in drafting the manuscript. All authors reviewedand edited the manuscript.
AcknowledgementsWe would like to thank Prof. Y. Ogihara for providing us with the homoe-ologous sequences of (Mochida et al., 2003). Funding for this research was provided by USDA Initiative for Future Agriculture and Food Systems (IFAFS) grant no. 2001-52100-11346 (RPW), USDA-ARS CRIS Project
Table 4: Q-PCR primer pairs used to amplify selected barley and wheat transcripts.
Probeset Forward primer Reverse primer Product size (bp)
Barley1Contig8230 TACATGCTCTTGTTTGGTGCTACTG AAGGTAAGTAGGCAGCAGTGAAGGT 204Contig6943 GGGGAAATCCCAGGTCGTCGAT GGCTTGCTGCTAGGGTTTTCAG 266Contig7925 CGAACCGTAGAATGTGTAAGGG GGGAGGAAAGATACACGCTT 114Contig3031 TTACTATGCTGGATATGGACAAGGG TCTCATCTCATGTCTGGAAGACCC 190Contig4668 CCCCCCACAAGTACCTGAAGA CGTTGGCTTGCTTAGCTCTTCC 286Contig7671 CTAAGCGACCTTGCATCTTTTGAC AACGCTAGTGCTACTGGCAGGA 213Contig20269 GAAGGCTCAGAAAGTTGCTGCTAT GCAAAATCATTCACTGCTTCCAGAG 224Contig5740 GAGGCTGTTCAGCAACTGGACTG CAAGGATCCCAGCCACATACTG 227Contig15148 GATCTCTTCGTGGTGGATCACATAC GCTTGATGTCCTATGCTTTCCAA 221Contig11660 ACCTCATCAACCTCTGCGGC TTCCAGAGAACGGAGGCAGG 210Contig14399 AGAAAGAGAGATTTTGAAGCTTGGC AATCCATCGCCATGCCAACT 213Contig15147 GGCGGGGCACTTTTGAGGACAT CGAGCCTGCGACGGGTTATT 182Contig2400 AAGCATGCCGCCATCCCGTT CCCAACCTGACAACTCCACCTAGA 244WheatTa.3039.1 ACGTCCATAACGATGGTCTTCATTG GTAGTGGCCTCAGCATCACCATTGC 170Ta.13729.1 TTTTCTACATGCTCTTGTTTGGTGC AAAAGATCAACCCATGTGCTGCTCC 265Ta.27013.1 CGAAGCGTGTATCTTTCCTC CAGACACAAACGAAAATGAC 183Ta.7602.1 AGCCCCCCACAAGTACCTGATGATG GTCGTCATCCTCGTCACCATCTTCC 201Ta.27369.1 TTACTATGCTGGATATGGACAAGGC TGCTACAACATTAGCCTTGACAGTG 230Ta.9536.1 GCCCTAAACGACCTTGCATCTTTTG AAACTGAAGCACTAACCTACGACGC 236Ta.968.1 ATGTGCTGCGTCGTCAGATACATAG TACCCTCCTCGACTTCCTTGTGATC 204Ta.4425.1 GATGCCATCAGATCCTCCAATT GCCACTCCGTTGTGTCATAATATGG 235Ta.27038.1 CGAAGCGTGTATCTTTCCTC CAGACACAAACGAAAATGAC 151Ta.7256.1 CATCTCATGGTACCTGACTGTCGA GCAACAGACTGCCACCAGCA 264TaAffx.46790.1 TCATGTCAGTTTATTGCAAGG CAGTGACACTATAACAATACAGTTCT 240TaAffx.128707.1 GAAAAGGTTGTAGTTCAGAAGG TTGCTCTGGACTACTGTCTTC 259
Primer sequence details used in the Q-PCR verification of selected barley and wheat expression profiles and the size of the corresponding RNA products.
Page 15 of 17(page number not for citation purposes)

BMC Genomics 2009, 10:285 http://www.biomedcentral.com/1471-2164/10/285
3625-21000-049-00D (RPW), the Grains Research and Development Cor-poration of Australia as well the Australian Research Council.
References1. Feuillet C, Langridge P, Waugh R: Cereal breeding takes a walk
on the wild side. Trends Genet 2008, 24:24-32.2. Zohary D, Hopf M: Domestication of plants in the Old World 3rd edition.
New York: Oxford University Press; 2001. 3. Devos KM, Gale MD: Comparative genetics in the grasses. Plant
Mol Biol 1997, 35:3-15.4. Ramakrishna W, Dubcovsky J, Park YJ, Busso C, Emberton J, San-
Miguel P, Bennetzen JL: Different types and rates of genomeevolution detected by comparative sequence analysis oforthologous segments from four cereal genomes. Genetics2002, 162:1389-1400.
5. Islam AKMR, Shepherd KW, Sparrow DHB: Isolation and charac-terization of euplasmic wheat-barley chromosome additionlines. Heredity 1981, 46:161-174.
6. Adams KL, Wendel JF: Polyploidy and genome evolution inplants. Curr Opin Plant Biol 2005, 8:135-141.
7. Levy AA, Feldman M: Genetic and epigenetic reprogrammingof the wheat genome upon allopolyploidization. Biol J Linn Soc2004, 82:607-613.
8. Kashkush K, Feldman M, Levy AA: Transcriptional activation ofretrotransposons alters the expression of adjacent genes inwheat. Nat Genet 2003, 33:102-106.
9. He P, Friebe B, Gill B, Zhou J-M: Allopolyploidy alters geneexpression in the highly stable hexaploid wheat. Plant Mol Biol2003, 52:401-414.
10. Paterson A, Bowers JE, Chapman BA: Ancient polyploidizationpredating divergence of the cereals, and its consequences forcomparative genomics. Proc Natl Acad Sci USA 2004,101:9903-9908.
11. Adams KL, Cronn R, Percifield R, Wendel JF: Genes duplicated bypolyploidy show unequal contributions to the transcriptomeand organ-specific reciprocal silencing. Proc Natl Acad Sci USA2003, 100:4649-4654.
12. Feldman M, Levy AA: Allopolyploidy-a shaping force in the evo-lution of wheat genomes. Cytogenet Genome Res 2005,109:250-258.
13. Bottley A, Xia GM, Koebner RMD: Homoeologous gene silencingin hexaploid wheat. Plant J 2006, 47:897-906.
14. Bottley A, Koebner RMD: Variation for homoeologous genesilencing in hexaploid wheat. Plant J 2008, 56:297-302.
15. Kashkush K, Feldman M, Levy AA: Gene loss, silencing, and acti-vation in a newly synthesized wheat allotetraploid. Genetics2002, 160:1651-1659.
16. Blanc G, Wolfe KH: Functional divergence of duplicated genesformed by polyploidy during Arabidopsis evolution. Plant Cell2004, 16:1679-1691.
17. Ma L, Chen C, Liu X, Jiao Y, Su N, Li L, Wang X, Cao M, Sun N, ZhangX, et al.: A microarray analysis of the rice transcriptome andits comparison to Arabidopsis. Genome Res 2005, 15:1274-1283.
18. Flagel L, Udall J, Nettleton D, Wendel J: Duplicate gene expres-sion in allopolyploid Gossypium reveals two temporally dis-tinct phases of expression evolution. BMC Biology 2008, 6:16.
19. Quesada T, Li Z, Dervinis C, Li Y, Bocock PN, Tuskan GA, Casella G,Davis JM, Kirst M: Comparative analysis of the transcriptomesof Populus trichocarpa and Arabidopsis thaliana suggestsextensive evolution of gene expression regulation inangiosperms. New Phytologist 2008, 180:408-420.
20. Krom N, Ramakrishna W: Comparative analysis of divergentand convergent gene pairs and their expression patterns inrice, Arabidopsis, and Populus. Plant Physiol 2008,147:1763-1773.
21. Mangelsen E, Kilian J, Berendzen KW, Kolukisaoglu ÜH, Harter K,Jansson C, Wanke D: Phylogenetic and comparative geneexpression analysis of barley (Hordeum vulgare) WRKYtranscription factor family reveals putatively retained func-tions between monocots and dicots. BMC Genomics 2008, 9:194.
22. Horvarth DP, Schaffer R, West M, Wisman E: Arabidopsis micro-arrays identify conserved and differently expressed genesinvolved in shoot growth and development from distantlyrelated plant species. Plant J 2003, 34:125-134.
23. Becher M, Talke IN, Krall L, Krämer U: Cross-species microarraytranscript profiling reveals high constitutive expression ofmetal homeostasis genes in shoots of the zinc hyperaccumu-lator Arabidopsis halleri. Plant J 2004, 37:251-268.
24. Ueda A, Kathiresan A, Bennet J, Takabe T: Comparative transcrip-tome analyses of barley and rice under salt stress. Theor ApplGenet 2006, 112:1286-1294.
25. Taji T, Seki M, Satou M, Sakurai T, Kobayashi M, Ishiyama K, NarusakaY, Narusaka M, Zhu J-K, Shinozaki K: Comparative genomics insalt tolerance between Arabidopsis and Arabidopsis-relatedhalophyte salt cress using Arabidopsis microarray. Plant Phys-iol 2004, 135:1697-1709.
26. Close TJ, Wanamaker SI, Caldo RA, Turner SM, Ashlock DA, Dicker-son JA, Wing RA, Muehlbauer GJ, Kleinhofs A, Wise RP: A newresource for cereal genomics: 22K barley GeneChip comesof age. Plant Physiol 2004, 134:960-968.
27. Druka A, Muehlbauer G, Druka I, Caldo R, Baumann U, Rostoks N,Schreiber A, Wise R, Close T, Kleinhofs A, Graner A, Schulman A,Langridge P, Sato K, Hayes P, McNicol J, Marshall D, Waugh R: Anatlas of gene expression from seed to seed through barleydevelopment. Funct Integr Genomics 2006, 6:202-211.
28. Rostoks J, Borevitz JO, Hedley PE, Russell J, Mudie S, Morris J, CardleL, Marshall DF, Waugh R: Single-feature polymorphism discov-ery in the barley transcriptome. Genome Biol 2005, 6:R54.
29. Potokina E, Druka A, Luo Z, Wise R, Waugh R, Kearsey M: Geneexpression quantitative trait locus analysis of 16 000 barleygenes reveals a complex pattern of genome-wide transcrip-tional regulation. Plant J 2008, 53:90-101.
30. Potokina E, Druka A, Luo Z, Moscou M, Wise R, Waugh R, KearseyM: Tissue-dependent limited pleiotropy affects gene expres-sion in barley. Plant J 2008, 56:287-296.
31. Poole R, Barker G, Wilson ID, Coghill JA, Edwards KJ: Measuringglobal gene expression in polyploidy; a cautionary note fromallohexaploid wheat. Funct Integr Genomics 2007, 7:207-219.
32. Luo ZW, Potokina E, Druka A, Wise R, Waugh R, Kearsey MJ: SFPgenotyping from Affymetrix arrays is robust but largelydetects cis-acting expression regulators. Genetics 2007,176:789-800.
33. Mochida K, Yamazaki Y, Ogihara Y: Discrimination of homoeolo-gous gene expression in hexaploid wheat by SNP analysis ofcontigs grouped from a large number of expressedsequences tags. Mol Genet Genomics 2003, 270:371-377.
34. Tatusov RL, Galperin MY, Natale DA, Koonin EV: The COG data-base: a tool for genome-scale analysis of protein functionsand evolution. Nucl Acids Res 2000, 28:33-36.
35. Tatusov RL, Natale DA, Garkavtsev IV, Tatusova TA, ShankavaramUT, Rao BS, Kiryutin B, Galperin MY, Fedorova ND, Koonin EV: TheCOG database: new developments in phylogenetic classifica-tion of proteins from complete genomes. Nucl Acids Res 2001,29:22-28.
36. Tatusov RL, Fedorova ND, Jackson JD, Jacobs AR, Kiryutin B, KooninEV, Krylov DM, Mazumder R, Mekhedov SL, Nikolskaya AN, Rao BS,Smirnov S, Sverdlov AV, Vasudevan S, Wolf YI, Yin JJ, Natale DA: TheCOG database: an updated version includes eukaryotes.BMC Bioinformatics 2003, 4:41.
37. Lee Y, Sultana R, Pertea G, Cho J, Karamycheva S, Tsai J, Parvizi B,Cheung F, Antonescu V, White J, Holt I, Liang F, Quackenbush J:Cross-referencing eukaryotic genomes: TIGR orthologousgene alignments (TOGA). Genome Res 2002, 12:493-502.
38. O'Brien KP, Remm M, Sonnhammer EL: Inparanoid: a compre-hensive database of eukaryotic orthologs. Nucleic Acids Res2005, 33:D476-480.
39. Tatusov RL, Mushegian AR, Bork P, Brown NP, Hayes WS, Boro-dovsky M, Rudd KE, Koonin EV: Metabolism and evolution ofHaemophilus influenzae deduced from a whole-genome com-parison with Escherichia coli. Curr Biol 1996, 6:279-291.
40. Hirsh AE, Fraser HB: Protein dispensability and rate of evolu-tion. Nature 2001, 411:1046-1049.
41. Jordan IK, Rogozin IB, Wolf YI, Koonin EV: Essential genes aremore evolutionarily conserved than are nonessential genesin bacteria. Genome Res 2002, 12:962-968.
42. Wall DP, Fraser HB, Hirsh AE: Detecting putative orthologs. Bio-informatics 2003, 19:1710-1711.
43. Tatusov RL, Koonin EV, Lipman DJ: A genomic perspective onprotein families. Science 1997, 278:631-637.
Page 16 of 17(page number not for citation purposes)
http://www.ncbi.nlm.nih.gov/entrez/query.fcgi?cmd=Retrieve&db=PubMed&dopt=Abstract&list_uids=9291955
http://www.ncbi.nlm.nih.gov/entrez/query.fcgi?cmd=Retrieve&db=PubMed&dopt=Abstract&list_uids=8805245
http://www.ncbi.nlm.nih.gov/entrez/query.fcgi?cmd=Retrieve&db=PubMed&dopt=Abstract&list_uids=9381173
BMC Genomics 2009, 10:285 http://www.biomedcentral.com/1471-2164/10/285
Publish with BioMed Central and every scientist can read your work free of charge
"BioMed Central will be the most significant development for disseminating the results of biomedical research in our lifetime."
Sir Paul Nurse, Cancer Research UK
Your research papers will be:
available free of charge to the entire biomedical community
peer reviewed and published immediately upon acceptance
cited in PubMed and archived on PubMed Central
yours — you keep the copyright
Submit your manuscript here:http://www.biomedcentral.com/info/publishing_adv.asp
BioMedcentral
44. Remm M, Storm CEV, Sonnhammer ELL: Automatic clustering oforthologs and in-paralogs from pairwise species compari-sons. J Mol Biol 2001, 314:1041-1052.
45. Zhang P, Gu Z, Li WH: Different evolutionary patternsbetween young duplicate genes in the human genome.Genome Biol 2003, 4:R56.
46. Fulton DL, Li YY, Laird MR, Horsman BGS, Roche FM, Brinkman FSL:Improving the specificity of high-throughput ortholog pre-diction. BMC Bioinformatics 2006, 7:270.
47. Lynch M, Conery JS: The evolutionary fate and consequences ofduplicate genes. Science 2000, 290:1151-1155.
48. Ohno S: Evolution by gene duplication Heidelberg, Germany: SpringerVerlag; 1970.
49. Taylor JS, Raes J: Duplication and divergence: The evolution ofnew genes and old ideas. Ann Rev Genet 2004, 38:615-43.
50. Papp B, Pal C, Hurst LD: Dosage sensitivity and the evolution ofgene families in yeast. Nature 2003, 424:194-197.
51. Chapman BA, Bowers JE, Feltus FA, Paterson AH: Buffering of cru-cial functions by paleologous duplicated genes may contrib-ute cyclicality to angiosperm genome duplication. Proc NatlAcad Sci USA 2005, 103:2730-2735.
52. Seoighe C, Wolfe KH: Yeast genome evolution in the post-genome era. Curr Opin Microbiol 1999, 2:548-554.
53. Aury J-M, Jaillon O, Duret L, Noel B, Jubin C, et al.: Global trendsof whole-genome duplications revealed by theciliate Para-mecium tetraurelia. Nature 2006, 444:171-178.
54. Zhang J: Evolution by gene duplication: an update. Trends EcolEvol 2003, 18:292-298.
55. Li W-H, Yang J, Gu X: Expression divergence between dupli-cate genes. Trends Genet 2005, 21:602-607.
56. Gu Z, Nicolae D, Lu HH-S, Li W-H: Rapid divergence in expres-sion between duplicate genes inferred from microarray data.Trends Genet 2002, 18:609-613.
57. Castillo-Davis CI, Hartl DL, Achaz G: cis-regulatory and proteinevolution in orthologous and duplicate genes. Genome Res2004, 14:1530-1536.
58. Nuzhdin SV, Wayne ML, Harmon KL, McIntyre LM: Common pat-tern of evolution of gene expression level and proteinsequence in Drosophila. Mol Biol Evol 2004, 21:1308-1317.
59. Makova KD, Li W-H: Divergence in the spatial pattern of geneexpression between human duplicate genes. Genome Res 2003,13:1638-1645.
60. Wagner A: Decoupled evolution of coding regions and mRNAexpression patterns after gene duplication: implications forthe neutralist-selectionist debate. Proc Natl Acad Sci USA 2000,97:6579-6584.
61. Haberer G, Hindemitt T, Meyers BC, Mayer KFX: Transcriptionalsimilarities, dissimilarities and conservation of cis-elementsin duplicated genes of Arabidopsis. Plant Physiol 2004,136:3009-3022.
62. Pal C, Papp B, Hurst LD: Highly expressed genes in yeast evolveslowly. Genetics 2001, 158:927-931.
63. Drummond DA, Bloom JD, Adami C, Wilke CO, Arnold FH: Whyhighly expressed proteins evolve slowly. Proc Natl Acad Sci USA2005, 102:14338-14343.
64. Choi JK, Kim SC, Seo J, Kim S, Bhak J: Impact of transcriptionalproperties on essentiality and evolutionary rate. Genetics2007, 175:199-206.
65. Irizarry RA, Hobbs B, Collins F, Beazer-Barclay YD, Antonellis KJ,Scherf U, Speed TP: Exploration, normalization and summariesof high density oligonucleotide array probe level data. Biosta-tistics 2003, 4:249-264.
66. Bolstad BM, Irizarry RA, Astrand M, Speed TP: A comparison ofnormalization methods for high density oligonucleotidearray data based on bias and variance. Bioinformatics 2003,19:185-193.
67. Altschul S, Madden T, Schaffer A, Zhang J, Zhang Z, Miller W, LipmanD: Gapped BLAST and PSI-BLAST: a new generation of pro-tein database search programs. Nucleic Acids Res 1997,25:3389-3402.
68. Lunde C, Baumann U, Shirley NJ, Drew DP, Fincher GB: Gene struc-ture and expression pattern analysis of three monodehy-droascorbate reductase (Mdhar) genes in Physcomitrellapatens: Implications for the evolution of the MDHAR familyin plants. Plant Mol Biol 2006, 60:259-75.
69. Vandesompele J, De Preter K, Pattyn F, Poppe B, Van Roy N, DePaepea A, Speleman F: Accurate normalization of real-timequantitative RT-PCR data by geometric averaging of multi-ple internal control genes. Genome Biol 2002,3(7):RESEARCH0034.
70. Crismani W, Baumann U, Sutton T, Shirley N, Webster T, Spangen-berg G, Langridge P: Microarray expression analysis of meiosisand microsporogenesis in hexaploid bread wheat. BMCGenomics 2006, 7:267-284.
Page 17 of 17(page number not for citation purposes)
http://www.ncbi.nlm.nih.gov/entrez/query.fcgi?cmd=Retrieve&db=PubMed&dopt=Abstract&list_uids=9254694