Comparative transcriptomics of human multipotent stem cells during adipogenesis and...
14
BioMed Central Page 1 of 14 (page number not for citation purposes) BMC Genomics Open Access Research article Comparative transcriptomics of human multipotent stem cells during adipogenesis and osteoblastogenesis Marcel Scheideler 1 , Christian Elabd †2 , Laure-Emmanuelle Zaragosi †2 , Chiara Chiellini 2 , Hubert Hackl 1 , Fatima Sanchez-Cabo 1,3 , Sunaina Yadav 1 , Kalina Duszka 1 , Gerald Friedl 4 , Christine Papak 1 , Andreas Prokesch 1 , Reinhard Windhager 4 , Gerard Ailhaud 2 , Christian Dani 2 , Ez-Zoubir Amri* 2 and Zlatko Trajanoski* 1 Address: 1 Institute for Genomics and Bioinformatics and Christian Doppler Laboratory for Genomics and Bioinformatics, Graz University of Technology, Petersgasse 14, 8010 Graz, Austria, 2 ISBDC, Université de Nice Sophia-Antipolis, CNRS, 28 avenue de Valrose, 06100 Nice, France, 3 Genomics Unit, Centro Nacional de Investiganciones Cardiovasculares, Madrid, Spain and 4 Department of Orthopaedics, Medical University of Graz, Graz, Austria Email: Marcel Scheideler - [email protected]; Christian Elabd - [email protected]; Laure-Emmanuelle Zaragosi - [email protected]; Chiara Chiellini - [email protected]; Hubert Hackl - [email protected]; Fatima Sanchez-Cabo - [email protected]; Sunaina Yadav - [email protected]; Kalina Duszka - [email protected]; Gerald Friedl - [email protected]; Christine Papak - [email protected]; Andreas Prokesch - [email protected]; Reinhard Windhager - [email protected]; Gerard Ailhaud - [email protected]; Christian Dani - [email protected]; Ez- Zoubir Amri* - [email protected]; Zlatko Trajanoski* - [email protected] * Corresponding authors †Equal contributors Abstract Background: A reciprocal relationship between bone and fat development in osteoporosis is clinically well established. Some of the key molecular regulators involved in this tissue replacement process have been identified. The detailed mechanisms governing the differentiation of mesenchymal stem cells (MSC) – the key cells involved – are however only now beginning to emerge. In an attempt to address the regulation of the adipocyte/osteoblast balance at the level of gene transcription in a comprehensive and unbiased manner, we performed a large-scale gene expression profiling study using a unique cellular model, human multipotent adipose tissue-derived stem cells (hMADS). Results: The analysis of 1606 genes that were found to be differentially expressed between adipogenesis and osteoblastogenesis revealed gene repression to be most prevalent prior to commitment in both lineages. Computational analyses suggested that this gene repression is mediated by miRNAs. The transcriptional activation of lineage-specific molecular processes in both cases occurred predominantly after commitment. Analyses of the gene expression data and promoter sequences produced a set of 65 genes that are candidates for genes involved in the process of adipocyte/osteoblast commitment. Four of these genes were studied in more detail: LXRα and phospholipid transfer protein (PLTP) for adipogenesis, the nuclear receptor COUP-TF1 and one uncharacterized gene, TMEM135 for osteoblastogenesis. PLTP was secreted during both early and late time points of hMADS adipocyte differentiation. LXRα, COUP-TF1, and the transmembrane protein TMEM135 were studied in primary cultures of differentiating bone Published: 17 July 2008 BMC Genomics 2008, 9:340 doi:10.1186/1471-2164-9-340 Received: 12 March 2008 Accepted: 17 July 2008 This article is available from: http://www.biomedcentral.com/1471-2164/9/340 © 2008 Scheideler et al; licensee BioMed Central Ltd. This is an Open Access article distributed under the terms of the Creative Commons Attribution License (http://creativecommons.org/licenses/by/2.0 ), which permits unrestricted use, distribution, and reproduction in any medium, provided the original work is properly cited.
-
Upload
independent -
Category
Documents
-
view
1 -
download
0
Transcript of Comparative transcriptomics of human multipotent stem cells during adipogenesis and...

BioMed CentralBMC Genomics
ss
Open AcceResearch articleComparative transcriptomics of human multipotent stem cells during adipogenesis and osteoblastogenesisMarcel Scheideler1, Christian Elabd†2, Laure-Emmanuelle Zaragosi†2, Chiara Chiellini2, Hubert Hackl1, Fatima Sanchez-Cabo1,3, Sunaina Yadav1, Kalina Duszka1, Gerald Friedl4, Christine Papak1, Andreas Prokesch1, Reinhard Windhager4, Gerard Ailhaud2, Christian Dani2, Ez-Zoubir Amri*2 and Zlatko Trajanoski*1Address: 1Institute for Genomics and Bioinformatics and Christian Doppler Laboratory for Genomics and Bioinformatics, Graz University of Technology, Petersgasse 14, 8010 Graz, Austria, 2ISBDC, Université de Nice Sophia-Antipolis, CNRS, 28 avenue de Valrose, 06100 Nice, France, 3Genomics Unit, Centro Nacional de Investiganciones Cardiovasculares, Madrid, Spain and 4Department of Orthopaedics, Medical University of Graz, Graz, Austria
Email: Marcel Scheideler - [email protected]; Christian Elabd - [email protected]; Laure-Emmanuelle Zaragosi - [email protected]; Chiara Chiellini - [email protected]; Hubert Hackl - [email protected]; Fatima Sanchez-Cabo - [email protected]; Sunaina Yadav - [email protected]; Kalina Duszka - [email protected]; Gerald Friedl - [email protected]; Christine Papak - [email protected]; Andreas Prokesch - [email protected]; Reinhard Windhager - [email protected]; Gerard Ailhaud - [email protected]; Christian Dani - [email protected]; Ez-Zoubir Amri* - [email protected]; Zlatko Trajanoski* - [email protected]
* Corresponding authors †Equal contributors
AbstractBackground: A reciprocal relationship between bone and fat development in osteoporosis isclinically well established. Some of the key molecular regulators involved in this tissue replacementprocess have been identified. The detailed mechanisms governing the differentiation ofmesenchymal stem cells (MSC) – the key cells involved – are however only now beginning toemerge. In an attempt to address the regulation of the adipocyte/osteoblast balance at the level ofgene transcription in a comprehensive and unbiased manner, we performed a large-scale geneexpression profiling study using a unique cellular model, human multipotent adipose tissue-derivedstem cells (hMADS).
Results: The analysis of 1606 genes that were found to be differentially expressed betweenadipogenesis and osteoblastogenesis revealed gene repression to be most prevalent prior tocommitment in both lineages. Computational analyses suggested that this gene repression ismediated by miRNAs. The transcriptional activation of lineage-specific molecular processes in bothcases occurred predominantly after commitment. Analyses of the gene expression data andpromoter sequences produced a set of 65 genes that are candidates for genes involved in theprocess of adipocyte/osteoblast commitment. Four of these genes were studied in more detail:LXRα and phospholipid transfer protein (PLTP) for adipogenesis, the nuclear receptor COUP-TF1and one uncharacterized gene, TMEM135 for osteoblastogenesis. PLTP was secreted during bothearly and late time points of hMADS adipocyte differentiation. LXRα, COUP-TF1, and thetransmembrane protein TMEM135 were studied in primary cultures of differentiating bone
Published: 17 July 2008
BMC Genomics 2008, 9:340 doi:10.1186/1471-2164-9-340
Received: 12 March 2008Accepted: 17 July 2008
This article is available from: http://www.biomedcentral.com/1471-2164/9/340
© 2008 Scheideler et al; licensee BioMed Central Ltd. This is an Open Access article distributed under the terms of the Creative Commons Attribution License (http://creativecommons.org/licenses/by/2.0), which permits unrestricted use, distribution, and reproduction in any medium, provided the original work is properly cited.
Page 1 of 14(page number not for citation purposes)

BMC Genomics 2008, 9:340 http://www.biomedcentral.com/1471-2164/9/340
marrow stromal cells from healthy donors and were found to be transcriptionally activated in thecorresponding lineages.
Conclusion: Our results reveal gene repression as a predominant early mechanism before finalcell commitment. We were moreover able to identify 65 genes as candidates for genes controllingthe adipocyte/osteoblast balance and to further evaluate four of these. Additional studies willexplore the precise role of these candidate genes in regulating the adipogenesis/osteoblastogenesisswitch.
BackgroundThat the decrease in bone volume associated with oste-oporosis is accompanied by an increase in marrow adi-pose tissue is clinically well known [1]. Pharmacologicalinhibition of this tissue replacement process could pro-vide a novel mode of treatment for this disorder. Arational approach to drug development requires knowl-edge of the underlying molecular mechanisms. For bothadipogenesis and osteoblastogenesis, many key regulatorshave been identified using established cell model systems.The detailed mechanisms that control the differentiationof mesenchymal stem cells (MSC) – the key cell typeinvolved – are however only beginning to emerge.
Adipogenesis is a highly regulated process in which acoordinated cascade of transcription factors leads to theformation of mature adipocytes [2,3]. This cascade beginswith the transient expression of CCAAT/enhancer bindingprotein β (C/EBPβ) and C/EBPδ which activate C/EBPαand peroxisome proliferator-activated receptor γ (PPARγ).C/EBPα and PPARγ together coordinate the expression ofadipogenic genes underlying the phenotype of terminallydifferentiated adipocytes. This terminal differentiation ischaracterised by the induction of genes including glycerol-3-phosphate dehydrogenase (GPDH), hormone-sensitivelipase (HSL), fatty acid synthase (FASN), fatty acid bind-ing proteins (FABPs), perilipin (PLIN), and the produc-tion and secretion of adipokines such as leptin (LEP),adiponectin (ADIPOQ), adipsin (CFD), tumor necrosisfactor alpha (TNFα), visfatin (NAMPT) and retinol bind-ing protein 4 (RBP4). Additional transcription factors,such as sterol-regulatory element binding transcriptionfactor 1 (ADD1/SREBP1) can further modulate this termi-nal differentiation process [3].
Osteoblastogenesis is also a highly coordinated processand is initiated by the transcription factors runt-relatedtranscription factor 2 (RUNX2) and osterix (OSX), whoseexpression is regulated by β-catenin, the homeobox pro-tein MSX2, and a transcriptional coactivator with PDZ-binding motif (TAZ) coactivating CBFA1 and repressingPPARγ [4,5]. Bone morphogenetic proteins (BMPs) pro-mote bone formation by stimulating the proliferation anddifferentiation of osteoblasts [6]. BMPs elicit their cellulareffects via specific type I and II serine/threonine receptors
[7]. This cascade leads to the terminal osteoblast pheno-type that is characterised by calcification of the extracellu-lar matrix (ECM). The genes involved in thismineralization process include noggin (NOG), osteonec-tin (SPARC), osteoprotegerin (OPG), collagens COL1A1and COL1A2, matrix Gla protein (MGP), matrilin-3(MATN), and estrogen receptor 1 (ESR1) which are differ-entially expressed in the developing human bone [8-14].
Despite intensive research efforts focusing on the individ-ual differentiation pathways, little is known about themolecular mechanisms that drive final lineage commit-ment. The small number of candidate genes identified todate include MSX2 and C/EBPβ which are involved in thereciprocal switch between adipocyte and osteoblast differ-entiation [15,16], and FKBP5 which is up-regulated in adifferentiation-independent manner in mesenchymal lin-eages [17]. These genes were identified either using estab-lished cell lines or bone marrow and adipose tissue-derived multipotent MSCs able to differentiate into mul-tiple cell lineages including chondrocytes, osteoblasts andadipocytes [18,19]. Both types of model systems haveassociated advantages and disadvantages. Cell lines forinstance represent a single genetic background but arekaryotypically heterogeneous. Primary cells on the otherhand have normal karyotypes but are genetically hetero-geneous since they are derived from multiple donors.
In an attempt to address the transcriptional regulation ofthe adipocyte/osteoblast balance in a comprehensive andunbiased manner we have applied large-scale gene expres-sion profiling to a human multipotent adipose-derivedstem (hMADS) cell-derived cell line that exhibits a normalkaryotype, high self-renewal capacity and an ability to dif-ferentiate into different cell types including adipocytesand osteoblasts and to support in vivo regenerative proc-esses [20-23]. We asked the question if the global expres-sion profiles were different between the stages before andafter lineage commitment. In a first step we performed adetailed characterization of the model and then usedmicroarrays and in-depth bioinformatics analyses to com-prehensively study gene expression changes associatedwith osteoblastogenic and adipogenic differentiation. Forboth lineages genes and biological processes were foundto be predominantly down-regulated prior to commit-
Page 2 of 14(page number not for citation purposes)

BMC Genomics 2008, 9:340 http://www.biomedcentral.com/1471-2164/9/340
ment. We were able to provide computational evidencethat this repression is mediated by miRNA. We furtheridentified novel candidate genes involved in the switchbetween adipocyte and osteoblast differentiation andconfirmed their lineage-dependent transcriptional activa-tion in human primary cells.
ResultshMADS cells represent a unique model for the study of adipogenesis and osteoblastogenesisTo characterize the hMADS cell model, quantitative RT-PCR assays were performed for 33 selected genes usingRNA harvested at the reference time point and at the timepoints 5, 7, and 8 for both differentiation pathways(materials and methods).
Adipocyte differentiation of hMADS cells resulted in analtered cell morphology as shown in Figure 1. Centralplayers of the adipogenesis-specific transcriptional net-work including C/EBPβ, C/EBPδ, PPARγ2, C/EBPα, andSREBP1c were found to be regulated in a differentiation-dependent manner (see Additional file 1). In addition,genes characteristic of the terminally differentiated phe-notype were found to be up-regulated. These includedGPDH, HSL, FABP4, FABP5, PLIN, FASN (genes involvedin lipid metabolism), FXR (a regulator of cholesterolhomeostasis), GLUT4 (associated with systemic glucosehomeostasis), PEPCK (associated with adipocyte glycero-
neogenesis) and the genes encoding adipokines LEP, ADI-POQ, CFD, TNFα, NAMPT, and RBP4 (see Additional file1).
Osteoblastic differentiation of hMADS cells resulted incalcium deposition in the extracellular matrix (Figure 1).Transcriptional activators known to be expressed in theosteogenic lineage including CBFA1 and MSX2 were con-sistently up-regulated during osteoblast differentiation.BMP4 and BMP6, members of the protein family thatinduce bone formation at extracellular sites, and the BMPreceptors BMPR1B and BMPR2 were induced. Genesinvolved in the development and homeostasis of the cal-cification of the ECM including NOG, SPARC, OPG,COL1A1, COL1A2, MGP, MATN3, and ESR1 (see Addi-tional file 1) were also found to be up-regulated.
Hence, the normal karyotype, evidence for transcriptionalactivation of the master regulators, and the biochemicalconfirmation of the differentiated phenotypes, confirmhMADS cells as a powerful model for the study of the adi-pocyte/osteoblast balance.
Lineage-specific molecular processes are predominantly activated after commitmentExpression profiles were generated during differentiationin both lineages and the expression data validated usingRT-PCR (see Additional file 2). 41 genes indicative for the
Adipocyte and osteoblast differentiation of hMADS cellsFigure 1Adipocyte and osteoblast differentiation of hMADS cells. Time points for reference and sample harvesting are indi-cated. Differentiation in both lineages was monitored including oil red O staining of lipid droplets in terminal adipocyte differ-entiation and Alizarin red staining of calcium deposition in the extracellular matrix in terminal osteoblast differentiation.
75% confl. 100 % adipocyte differentiation
75% confl. 100 % osteoblast differentiation
ref tp1 tp2 3 tp4 tp5 tp6 tp7 tp8
d-3 d-2 d0 +8h d+1 d+2 d+5 d+10 d+15
sample harvest
d-3 d-2 d0 +8h d+1 d+2 d+8 d+15 d+24 before after commitment
commitment
before after commitment
tp4 tp5 tp6 tp7 tp8 tp8 (Oil Red O)
tp4 tp5 tp6 tp7 tp8 tp8 (Alizarin Red)
Page 3 of 14(page number not for citation purposes)
BMC Genomics 2008, 9:340 http://www.biomedcentral.com/1471-2164/9/340
adipogenic lineage, 22 genes indicative for the osteogeniclineage, and 37 genes potentially involved in self-renewalwith common expression profiles were studied. A highdegree of correlation was found (r2 = 0.81), similar to aprevious study [24], thus confirming the validity of themicroarray data. An overview of the expression profiles ofthe differentiating cells and GO term analysis are pre-sented in Figure 2A. A subset of genes which had at least13 out of 16 present expression values (eight time pointsper differentiation experiment) for both differentiation
studies were chosen for further analysis. Out of this sub-set, a total of 1606 genes could be identified as signifi-cantly differentially expressed after induction ofdifferentiation (see Methods section, Microarray dataanalysis; see Additional file 2). These genes were clusteredaccording to adipogenic-related (ARG), osteogenic-related (ORG), and differentiation-independent (DIG)profiles in both lineages (Figure 2A). Our gene expressiondata demonstrated an equal percentage of genes to be spe-cifically regulated during adipocyte and osteoblast differ-
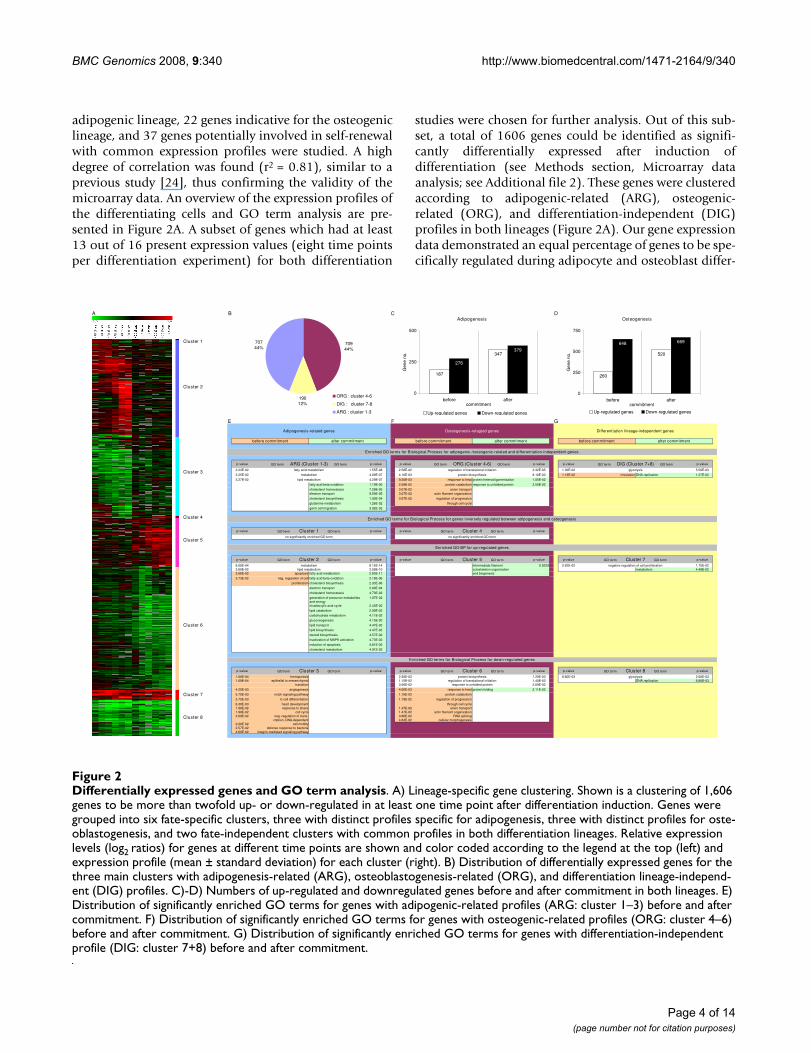
Differentially expressed genes and GO term analysisFigure 2Differentially expressed genes and GO term analysis. A) Lineage-specific gene clustering. Shown is a clustering of 1,606 genes to be more than twofold up- or down-regulated in at least one time point after differentiation induction. Genes were grouped into six fate-specific clusters, three with distinct profiles specific for adipogenesis, three with distinct profiles for oste-oblastogenesis, and two fate-independent clusters with common profiles in both differentiation lineages. Relative expression levels (log2 ratios) for genes at different time points are shown and color coded according to the legend at the top (left) and expression profile (mean ± standard deviation) for each cluster (right). B) Distribution of differentially expressed genes for the three main clusters with adipogenesis-related (ARG), osteoblastogenesis-related (ORG), and differentiation lineage-independ-ent (DIG) profiles. C)-D) Numbers of up-regulated and downregulated genes before and after commitment in both lineages. E) Distribution of significantly enriched GO terms for genes with adipogenic-related profiles (ARG: cluster 1–3) before and after commitment. F) Distribution of significantly enriched GO terms for genes with osteogenic-related profiles (ORG: cluster 4–6) before and after commitment. G) Distribution of significantly enriched GO terms for genes with differentiation-independent profile (DIG: cluster 7+8) before and after commitment.
A B C D
E F G
p-value p-value p-value p-value p-value p-value
2.23E-02 1.55E-08 2.58E-02 2.32E-05 1.30E-02 5.50E-03
3.25E-02 4.09E-07 4.10E-03 8.10E-03 1.13E-02 circulation DNA replication 1.27E-02
3.27E-02 4.29E-07 9.20E-03 response to heat protein heterooligomerization 1.05E-02
fatty acid beta-oxidation 1.19E-05 2.58E-02 protein catabolism response to unfolded protein 2.50E-02
cholesterol homeostasis 7.28E-05 3.07E-02 anion transportelectron transport 9.59E-05 3.07E-02 actin filament organization
cholesterol biosynthesis 1.00E-04 3.67E-02 regulation of progression
glutamine metabolism 1.26E-02 through cell cycle
germ cell migration 3.92E-02
p-value p-value p-value p-value
p-value p-value p-value p-value p-value p-value
6.00E-04 8.15E-14 intermediate filament 0.0229 2.62E-02 1.75E-023.60E-02 2.58E-10 cytoskeleton organization metabolism 4.48E-023.66E-02 apoptosis fatty acid metabolism 2.83E-11 and biogenesis
3.73E-02 neg. regulation of cell fatty acid beta-oxidation 2.18E-06
proliferation cholesterol biosynthesis 2.33E-06
electron transport 2.00E-04
cholesterol homeostasis 4.70E-03
generation of precursor metabolites and energy
1.07E-02
tricarboxylic acid cycle 2.43E-02
lipid catabolism 2.90E-02
carbohydrate metabolism 4.11E-02
gluconeogenesis 4.15E-02
lipid transport 4.47E-02
lipid biosynthesis 4.47E-02
steroid biosynthesis 4.57E-02
inactivation of MAPK activation 4.73E-02
induction of apoptosis 4.81E-02
cholesterol metabolism 4.91E-02
p-value p-value p-value p-value p-value p-value
1.00E-04 hemopoiesis 2.30E-03 1.20E-03 8.60E-03 2.00E-031.00E-04 epithelial to mesenchymal 1.15E-02 1.40E-03 DNA replication 6.80E-03
transition 3.56E-02 2.09E-02
4.20E-03 angiogenesis 4.00E-03 response to heat protein folding 2.11E-02
5.70E-03 notch signaling pathway 1.15E-02 protein catabolism
5.70E-03 b-cell differentiation 1.19E-02 regulation of progression
6.30E-03 heart development through cell cycle1.90E-02 response to stress 1.47E-02 anion transport1.99E-02 cell cycle 1.47E-02 actin filament organization2.09E-02 neg. regulation of trans- 3.86E-02 RNA splicing
cription, DNA-dependent 4.84E-02 cellular morphogenesis2.20E-02 cell motility2.57E-02 defense response to bacteria4.69E-02 integrin-mediated signaling pathway
Adipogenesis-related genes Osteogenesis-relagted genes
Enriched GO terms for Biological Process for adipogenic-/osteogenic-related and differentiation-independent genes
after commitment
regulation of translational initiation
before commitment after commitment
GO term ORG (Cluster 4-6) GO term
glycolysis
GO term ARG (Cluster 1-3) GO term GO term DIG (Cluster 7+8) GO term
fatty acid metabolism
before commitment after commitment before commitment
Differentiation lineage-independent genes
negative regulation of cell proliferation
protein biosynthesis
GO term Cluster 6 GO term
GO term Cluster 5 GO term
response to unfolded protein
GO term Cluster 2 GO term
lipid metabolism
GO term Cluster 3 GO term
metabolism
Enriched GO terms for Biological Process for down-regulated genes
GO term Cluster 7 GO term
GO term Cluster 8 GO term
regulation of translational initiationglycolysis
Enriched GO terms for Biological Process for genes inversely regulated between adipogenesis and osteogenesis
Enriched GO-BP for up-regulated genes
metabolism
GO term Cluster 1 GO term GO term Cluster 4 GO term
no significantly enriched GO term no significantly enriched GO term
lipid metabolism
protein biosynthesis
70944%
70744%
19012%
ARG : cluster 1-3DIG : cluster 7-8ORG : cluster 4-6
Adipogenesis
347
276
379
187
0
250
500
before aftercommitment
Gen
e no
.
Up-regulated genes Down-regulated genes
Osteogenesis
520
648 669
260
0
250
500
750
before aftercommitment
Gen
e no
.
Up-regulated genes Down-regulated genes
Cluster 1
Cluster 2
Cluster 3
Cluster 4
Cluster 5
Cluster 6
Cluster 7
Cluster 8
70744%
70944%
19012%
ORG : cluster 4-6
DIG : cluster 7-8
ARG : cluster 1-3
B
Page 4 of 14(page number not for citation purposes)

BMC Genomics 2008, 9:340 http://www.biomedcentral.com/1471-2164/9/340
entiation (44%), with 12% of genes sharing a commonprofile in both differentiation lineages (Figure 2B). A largeproportion of all 1606 differentially expressed genes werefound to be down-regulated (Figure 2C–D, see Additionalfile 3).
hMADS cells have the ability to differentiate into adi-pocytes or osteoblasts. After induction towards one ofthese lineages, they retain the ability to be committed tothe other one by changing the differentiation mediumand cocktail for a limited time. A medium and cocktailchange at or later than time point 6 did not switch the dif-ferentiation pathways indicating that the final and irre-versible commitment to a given lineage takes placebetween time points 5 and 6 (data not shown). We there-fore analyzed the expression profiles between the earlystages of differentiation prior to commitment (timepoints 3 to 5) and at the late stages of differentiation aftercommitment (time points 6 to 8). Genes in each clusterwere sub-categorized according to their differentialexpression before and/or after commitment.
In order to characterize the lineage-specific and lineage-independent gene expression clusters, we categorized thegenes in each cluster with available RefSeq annotationand Gene Ontology (GO) terms and extracted the GOterms for biological processes which are significantly over-represented (Figure 2E–G). Surprisingly, of the largenumber of genes found to be differentially expressed dur-ing both differentiation pathways, only a small number ofsignificantly enriched GO terms were found before com-mitment. As expected, ARG are involved in metabolism,fatty acid and lipid metabolism, fatty acid beta-oxidation, andcholesterol biosynthesis and homeostasis.
Thus, although a large number of genes were found to bedifferentially expressed during differentiation, lineage-specific molecular processes were transcriptionally up-reg-ulated only after commitment.
Predominant gene repression before commitment in adipocyte and osteoblast differentiation pathwaysGenes involved in the hematopoietic system, angiogenesis, B-cell differentiation and epithelial to mesenchymal transitionwere repressed during adipocyte differentiation, (cluster3). Interestingly, genes involved in notch signaling, whosedown-regulation is commonly considered to be a prereq-uisite for the adipogenic pathway, were significantlyenriched [1]. This gene repression appeared exclusivelybefore commitment to the adipogenic lineage.
During osteoblast differentiation, the GO terms proteinbiosynthesis, regulation of translational initiation, andresponse to unfolded protein were enriched by genesrepressed before and after commitment (cluster 6). Inter-
estingly, only protein folding was found to be down-regu-lated after commitment, whereas response to heat, proteincatabolism, regulation through cell cycle, anion transport, actinfilament organization, RNA splicing and cellular morphogene-sis were repressed before commitment to the osteogeniclineage.Glycolysis was statistically over-represented forgenes down-regulated before and after commitment,whereas DNA replication only after commitment (cluster8).
Taken together, the results show that the majority of geneswere down-regulated, with this down-regulation occur-ring both before and after commitment. Down-regulatedgenes were predominant prior to commitment for genesin all of the three main categories, ARG, ORG, and DIG.On the other hand, the number of up-regulated genesdoubled from early to late differentiation stages.
Computational analyses reveal that miRNA targeting corresponds with prevalent down-regulation of genes before commitmentWe have recently shown that during adipogenesis a largenumber of mRNAs might be potential targets for microR-NAs (miRNAs) [24]. miRNAs are an abundant class ofendogenous, small non-coding RNAs (19–25 nucle-otides) that negatively regulate gene expression at thepost-transcriptional level by base pairing with the 3'-untranslated region (3'-UTR) of target messenger RNAs.Several studies have demonstrated the involvement ofmiRNAs in gene regulation, metabolism, cell differentia-tion, and development [25-30]. Well over one third ofmammalian genes appear to be conserved miRNA targets[31]. Rules for target recognition, for instance the seven-nucleotide (7-nt) miRNA seed sequence, defined as posi-tions 2–8 at the 5' end of the miRNA, combined with fea-tures of site context, were applied to predict and discoverhuman miRNA targets [31,32].
We performed a miRNA binding site analysis to identifymiRNAs potentially targeting genes regulated during adi-pocyte or osteoblast differentiation and significantly over-represented miRNA targets in the eight distinct gene clus-ters. Out of the 1606 genes identified as being differen-tially expressed during differentiation the 3'-UTRsequence could be obtained for 1147 of them. All of thesehad at least one exact antisense match with the 7-nt seed(base 2–8 at the 5' end) from the 470 human miRNAsequences (19–25 base pairs). 915 genes (79.8%) had atleast one match for significantly over-represented miRNAswhose 7-nt seed exactly matched only to 16844 genes(71.3%) among the entire 23.611 3'-UTR sequence set.The distribution of statistically enriched 3'-UTR miRNAmotifs varied across the clusters, with genes in cluster 1having no detectable motifs and genes in cluster 5 havingthe most miRNA motifs. In summary, 80% of all genes
Page 5 of 14(page number not for citation purposes)

BMC Genomics 2008, 9:340 http://www.biomedcentral.com/1471-2164/9/340
with a unique 3'-UTR that were differentially expressedduring adipocyte and osteoblast differentiation are poten-tial targets for 30 miRNAs with significantly over-repre-sented motifs (see Additional file 5).
We performed the analysis of significantly over-repre-sented miRNA binding sites for genes regulated beforeand after commitment for both differentiation pathways.Within all clusters, we found that the ratio of the numberof genes containing a miRNA seed match in the 3'-UTRbefore and after commitment was comparable with theratio for all genes regulated before and after commitmentin a cluster (see Additional file 4).
Novel candidate genes for the lineage commitment revealed by gene expression and promoter analysesGenes that are differentially expressed at a specific timepoint may be involved in lineage commitment. We there-fore extracted genes that were differentially expressedfrom time points 5 to 6 specifically in one differentiationpathway. In support of the time point selection, we foundTAZ, a known transcriptional coactivator of bone devel-opment and repressor of adipocyte differentiation [34],derepressed at the time of commitment in osteoblast-ogenesis, but with delay in adipogenesis after the commit-ment. 26 genes regulated in this manner were identifiedfor the adipogenic lineage and 39 for the osteogenic line-age (Figure 3). Interestingly, each cluster contained anuclear receptor: NR1H3 (liver X receptor alpha; LXRα)for adipogenic commitment, and NR2F1 (chicken ovalbu-min upstream promoter transcription factor 1; COUP-
Genes differentially expressed during commitment between time point 5 and 6Figure 3Genes differentially expressed during commitment between time point 5 and 6. A) 26 genes specifically up-regu-lated between time point 5 and 6 during adipocyte differentiation. B) 39 genes specifically up-regulated between time point 5 and 6 during osteoblast differentiation.
Page 6 of 14(page number not for citation purposes)

BMC Genomics 2008, 9:340 http://www.biomedcentral.com/1471-2164/9/340
TF1), an orphan nuclear receptor acting predominantly asa transcription repressor [35] for osteogenic commitment.To examine co-regulation, we screened the promotersequences available for these 65 genes for statisticallyover-represented transcription factor binding sites (TFBS).Significantly enriched TFBS were found in both gene clus-ters. For adipogenesis the promoters of 26 genes had over-represented TFBS for 20 transcription factors and forosteoblastogenesis promoters of 39 genes had overrepre-sented TFBS for 11 transcription factors. (see Additionalfiles 6 + 7). In the adipogenic commitment cluster, sixgenes were found to contain the PPARγ DR1 response ele-ment and two genes to contain an LXR response element,providing evidence for the potential co-regulation of theseco-expressed genes. Strikingly, seven adipogenic-relatedgenes were found to contain a COUP-TF1 binding sitewith the highest significance. In a reciprocal manner, fivegenes in the osteogenic commitment cluster contained abinding site for SREBP, a transcription factor also found tobe up-regulated during early adipogenesis.
During adipogenic commitment, we identified the phos-pholipid transfer protein (PLTP), an important moleculein the regulation of phospholipid, cholesterol and HDLmetabolism [36]. Interestingly, the computational analy-sis of the promoter of PLTP showed a KROX response ele-ment (see Additional file 4, significant rank #3). Duringthe osteogenic commitment, the hypothetical proteinFLJ22104 (TMEM135) was found to contain 11 signifi-cantly enriched TFBS, the highest number of TFBS in agiven gene an representing more than 50% of all signifi-cant TFBS found. Based on the results of in-depth proteinsequence analysis, TMEM135 is a multi-transmembraneprotein with 7 transmembrane helices of high confidence.The N-terminal transmembrane region (3 helices) and theC-terminal region (4 helices) are separated by a mixedcharged cluster (amino acid (aa): 200–250)) with a highKRED content (43%). Homologies exist with the trans-membrane region of similar to frizzled 4 (XP_788346; aa:153–447; E-value = 1E-53), a component of the Wnt sig-naling pathway [37]. Less extensive homologies exist toperoxisomal protein 4 (NP_757377; E-value = 6E-37; 5thpsi-blast round) and TIM17 (pfam02466; rps-blast E-value = 0.028), a mitochondrial translocator.
Validation studies on selected candidate genesThe 4 selected candidate genes, LXRα, PLTP (adipogene-sis), COUP-TF1 and TMEM135 (osteoblastogenesis), weresubjected to additional validation experiments. Westernblot analysis of the supernatant from differentiatinghMADS after 3 days in culture revealed that PLTP issecreted during adipocyte differentiation but not duringosteoblast differentiation (Figure 4). After two weeks, theprotein expression levels were very high in the adipocyteculture medium whereas a lower level was detected in the
osteoblast culture medium suggesting that adipocytessecreted PLTP more than osteoblasts.
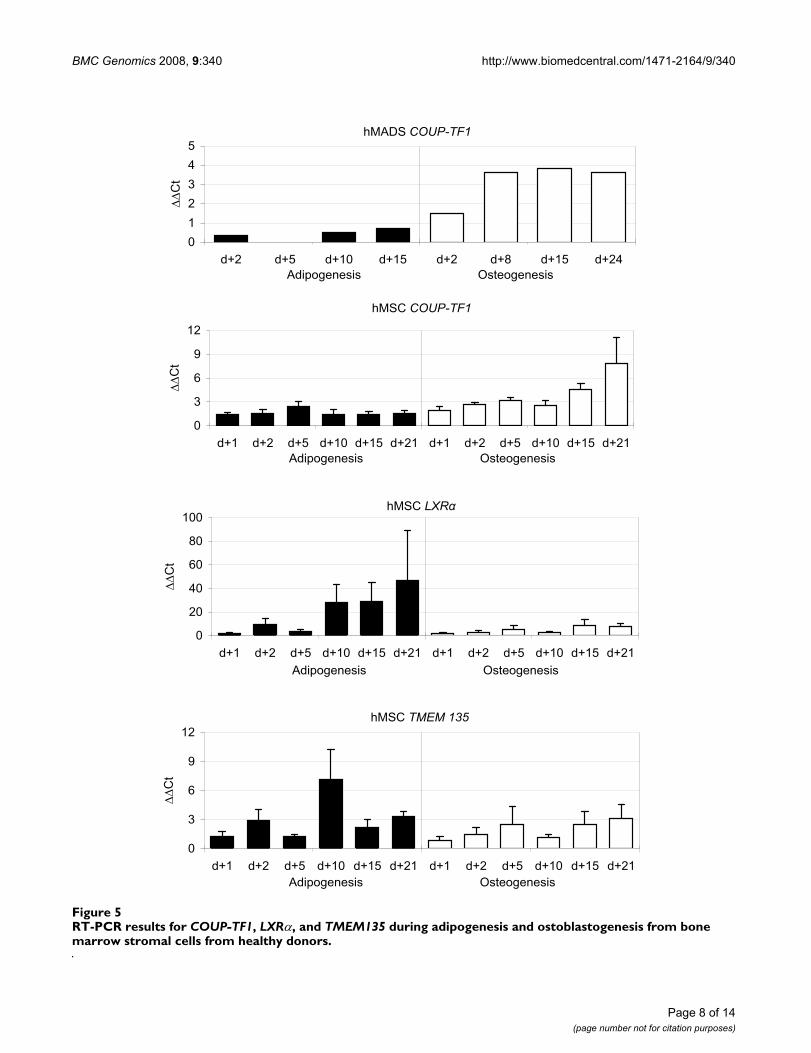
To obtain validation data for the other candidate genes,primary hMSC obtained from healthy donors were differ-entiated and expression levels analyzed by RT-PCR (Figure5). COUP-TF1 exhibited higher expression levels duringosteoblastogenesis. The expression level of COUP-TF2was the same in both cell models and differentiation lin-eages (data not shown). LXRα was expressed at an eight-fold higher level in adipocytes than in osteoblasts andTMEM135 expression was on average 2-fold higher in adi-pocytes than in osteoblasts.
This data provide additional evidence for an involvementof the selected candidate genes, PLTP, LXRα, COUP-TF1,and the transmembrane protein TMEM135 respectively inadipocyte and osteoblast differentiation. PLTP wassecreted at both early and late time points of adipocytedifferentiation of hMADS. LXRα, COUP-TF1, andTMEM135 were transcriptionally activated in differentiat-ing bone marrow stromal cells from healthy donors in alineage-dependent manner.
DiscussionIn this study we have used a unique model and large-scalegene expression profiling to study the transcriptional reg-ulation of biological processes occurring during the differ-entiation of multipotent stem cells. The data presentedhere and the bioinformatics analyses considerably aug-ment previous studies of early adipocyte and osteoblastdifferentiation. Our comprehensive and unbiasedapproach resulted in the identification of 1606 differen-tially expressed genes and suggests several important bio-logical conclusions.
Firstly, the gene down-regulation was most prevalent inboth adipogenesis and osteoblastogenesis. The extent of
PLTP secretion during differentiation of hMADS cells to adi-pocytes and osteoblastsFigure 4PLTPsecretion during differentiation of hMADS cells to adipocytes and osteoblasts. The expression of PLTP in the secretion media of hMADS cells at day 0, and during dif-ferentiation at days 3 and 14 adipocytes (HAD) or osteob-lasts (HOD) after 6 h of incubation.
100
HAD HOD
72
Days in culture
0 3 14
MW
(kD
a)
HAD HOD
Page 7 of 14(page number not for citation purposes)
BMC Genomics 2008, 9:340 http://www.biomedcentral.com/1471-2164/9/340
Page 8 of 14(page number not for citation purposes)
RT-PCR results for COUP-TF1, LXRα, and TMEM135 during adipogenesis and ostoblastogenesis from bone marrow stromal cells from healthy donorsFigure 5RT-PCR results for COUP-TF1, LXRα, and TMEM135 during adipogenesis and ostoblastogenesis from bone marrow stromal cells from healthy donors.
������������
�
�
��
�� �� �� ��� ��� ��� �� �� �� ��� ��� ���� ��������������������������������������������������������
���
�������
�
��
��
�
��
���
�� �� �� ��� ��� ��� �� �� �� ��� ��� ���� ��������������������������������������������������������
���
������ � ���
�
�
��
�� �� �� ��� ��� ��� �� �� �� ��� ��� ���� ��������������������������������������������������������
���
�������������
������
�� �� ��� ��� �� �� ��� ���� ��������������������������������������������������������
���

BMC Genomics 2008, 9:340 http://www.biomedcentral.com/1471-2164/9/340
gene repression varied before and after commitment andwas more pronounced in osteoblastogenesis. Surpris-ingly, GO term analysis showed that only few significantlyenriched biological processes were transcriptionally up-regulated prior to commitment. This contrasts with ourprevious study in which many molecular processes werefound to be modulated [24]. The results of the currentstudy suggest that repression of diverse sets of genes is ageneral phenomenon during early differentiation of stemcells. It is also tempting to speculate that committed cellscan undergo transdifferentiation because of the lack ofactivation of specific cellular processes. It has been shownfor example that white adipocytes can be transdifferenti-ated to brown adipocytes [3]. Further studies are necessaryto identify both the length of the time window for thetransdifferentiation and the appropriate stimuli.
Secondly, computational analyses of the 3'UTR of the dif-ferentially expressed genes support the hypothesis thatgene repression is modulated by miRNAs. Several miR-NAs have been shown to affect late stages of adipocyte dif-ferentiation, and the expression of other miRNAs hasbeen reported during osteoblast differentiation [38-41].Here we provide data showing that miRNAs might beinvolved in gene regulation during the early stages of bothlineages. Using conservative criteria for the miRNA bind-ing sites, over 80% of the genes with unique 3'UTR werefound to contain at least one exact antisense match for the7-nt seed and are thus potential target for 30 miRNAs.Although the number of false positives in this analysis isdifficult to estimate, it is likely that many miRNAs repressa large number of genes. This observation has implica-tions for therapeutic targeting using antisense strategies.Further studies will be required to identify the most prom-ising candidates.
Thirdly, gene expression data and promoter analysis ofthe differentially expressed genes identified 26 that mayplay a role in adipogenic and 39 in osteoblastogenic com-mitment. From these, we selected four candidates: LXRα,and PLTP for adipogenesis, and COUP-TF1 andTMEM135 for osteoblastogenesis. Validation studies pro-vided additional evidence that these genes are involved indetermining the balance between adipocyte and osteob-last differentiation.
The nuclear hormone receptor and transcription factor,LXRα, is known to play a major role in the regulation ofcholesterol catabolism, inflammatory gene expressionand the switch between glucose metabolism and fatty acidsynthesis [42-44]. PLTP is believed to be a direct targetgene of LXRs which is consistent with our results demon-strating specific activation of LXRα and PLTP at the timeof commitment and secretion of PLTP in a differentiation-dependent manner [45]. The finding that PLTP contains a
KROX response element as a significantly enriched TFBSand the very early transcriptional up-regulation of PLTPcompared to LXRα however indicates that PLTP is alsoactivated by additional, LXRα-independent regulatorymechanisms.
Our finding that COUP-TF1 is transcriptionally activatedat the time of osteogenic commitment is consistent withloss of function studies in mice revealing bone fusion inoccipital bones in 98% of the null mutants [46]. Tran-scriptional repression by the orphan receptor COUP-TF1is known to play a critical role in several developmentalprocesses including neurogenesis, angiogenesis and heartdevelopment [35]. Strikingly, we identified its bindingsite in seven genes of the adipogenic commitment clusterwith the highest significance suggesting a major role ofCOUP-TF1 in lineage commitment involving suppressionof adipogenic and promotion of osteogenic differentia-tion. Interestingly, in a recent study it was shown thatCOUP-TF2 suppresses adipogenesis [47]. It should benoted that in this study committed mouse cells were usedwhereas in our study uncommitted human cells wereinvestigated. Given this experimental evidence in differingspecies and commitments, and the high degree of similar-ity to binding sites for the COUP-TFs, we hypothesize thatthe orphan nuclear receptor family COUP-TF are criticalregulators of adipogenesis and osteoblastogenesis. Theidentification of exogenous COUP-TF ligands will enablethe exploration of therapeutic opportunities involvingmodulation of COUP-TF.
Finally, we have also investigated the role of TMEM135, agene previously identified in a human lung adenocarci-noma cell line cDNA library [48] in osteogenesis. Basedon its sequence structure and homologies with other geneproducts, TMEM135 is likely to be a channel (chargedcluster in the middle) or a receptor (charged cluster to thesurface). With the highest number of significantlyenriched TFBS, e.g. for COUP-TF1, PPARγ, KROX, GATA-3,and LXR, TMEM135 is an interesting candidate forinvolvement in lineage commitment, an hypothesis thatmust nevertheless be validated by further studies.
In conclusion, our study on gene expression signaturesduring adipogenic and osteoblastogenic differentiation ofhMADS cells showed common global transcriptional pat-terns for both lineages. Our results reveal gene repressionas a predominant early mechanism before final cell com-mitment indicating that gene repression may have a largerfunctional role in controlling the cell fate. This repressionis likely to be controlled by miRNAs. We were moreoverable to identify 65 genes as candidates for genes control-ling the adipocyte/osteoblast balance and to further eval-uate four of these. Additional studies will explore the
Page 9 of 14(page number not for citation purposes)

BMC Genomics 2008, 9:340 http://www.biomedcentral.com/1471-2164/9/340
precise role of these candidate genes in regulating the adi-pogenesis/osteoblastogenesis switch.
MethodshMADS cell culturehMADS cells were grown in Dulbecco's Modified Eagle'sMedium (DMEM low glucose) containing 10% fetal calfserum (FCS), and 100 U/ml penicillin and streptomycin.After reaching 80% confluence, adherent cells weredetached with 0.25% trypsin EDTA and seeded at a den-sity of 4500 cells per cm2. hMADS cells were maintainedin proliferation medium supplemented with 2 ng/mlfibroblast growth factor 2 (FGF2) [21].
For adipocyte differentiation, two days after confluence(referred to as day 0), cells were cultured in DMEM/Ham'sF12 medium supplemented with 10 μg/ml transferrin,0.86 μM insulin, 0.2 nM of triiodothyronine, 1 μM dex-amethasone, 100 μM isobutyl-methylxanthine, and 100nM rosiglitazone. Three days later, the medium waschanged (dexamethasone and isobutyl-methylxanthinewere omitted). Neutral lipid accumulation was assessedby oil red O staining as described previously [49].
For osteoblast differentiation, cells were cultured for 24days in α-MEM containing 10% FCS, 50 μg/ml L-ascorbicacid phosphate, 10 mM β-glycerophosphate, and 100 nMdexamethasone. Alizarin red staining was performed aspreviously described [50]. All media were changed everyother day.
hMSC cell cultureThe mononuclear cell fractions were derived from bonemarrow from four donors who gave consent after fullinformation and approval by the hospital ethical commit-tee (No. 12-091). hMSC were grown in Dulbecco's modi-fied Eagle's medium (high glucose) containing 10% fetalbovine serum PAN, 2 mM L-glutamine, 100 U/ml penicil-lin and streptomycin, 100 μg/ml normocin (InvivoGen)under standard conditions. Adipocyte differentiation wasinduced on the third day after the cells reached confluencewith medium containing 1 μM dexamethasone, 0.5 mMisobutylmethylxantine, 60 μM indomethacine, 1 μM ros-iglitazone and 10 μg/ml insulin. After 2–3 days the cellswere refed with medium was containing only 10 μg/mlinsulin for a period of 24 h. This cycle was repeated a totalof 3 times. During the final 7 days of differentiation thecells were cultured in medium containing 10 μg/ml insu-lin. Differentiation was confirmed by oil red O staining.
Osteoblast differentiation was triggered 24 h after cellseeding with medium containing 0.1 μM dexamethasone,10 mM glycerophosphat and 100 mM L-ascorbic acidphosphate. The different time period compared tohMADS is due to the differences of the origins of cells
(adipose tissue vs. bone marrow) and the differences inthe the cultivation media. The medium was changed 2–3times a week over a total period of 21 days. Differentia-tion was confirmed by alizarin red staining.
Sample preparation and microarray hybridizationThree independent cell culture experiments were per-formed as biological replicates for both adipocyte andosteoblast differentiation. Cells were harvested at the pre-confluent stage as reference and at eight subsequent timepoints (adipocyte differentiation: day -2 (tp1) and 0 (tp2)before differentiation induction, and 8 hours (tp3), 1(tp4), 2 (tp5), 5 (tp6), 10 (tp7), and 15 days (tp8) afterinduction of differentiation; osteoblast differentiation:day -2 (tp1) and 0 (tp2) before differentiation induction,and 8 hours (tp3), 1 (tp4), 2 (tp5), 8 (tp6), 15 (tp7), and24 days (tp8) after induction of differentiation). For eachtime point of each independent experiment RNA waspooled from 6 different 100 mm culture dishes. ReferenceRNA was harvested from 48 dishes of cells at the precon-fluent stage.
Total RNA was isolated using TRIzol reagent (Invitrogen,Carlsbad, CA, USA) or Tri-Reagent (Euromedex, Mun-dolsheim, France) according to the manufacturer'sinstructions. The quality of the RNA was checked usingAgilent 2100 Bioanalyzer RNA assays (Agilent Technolo-gies, Palo Alto, CA, USA). 20 μg of total RNA was used forindirect labeling with Cy3 and Cy5. Human microarraysspotted with 29550 oligonucleotides and the representedgenes identified with RefSeq IDs were produced andhybridized as previously described [51]. All hybridiza-tions were repeated with reversed dye assignment (dye-swap). Hybridized slides were scanned with a GenePix4000B microarray scanner (Axon Instruments, Sunnyvale,CA, USA) at 10 μm resolution and the resultant TIFFimages analysed with GenePix Pro 4.1 software (AxonInstruments).
Real-time RT-PCR41 genes indicative for the adipogenic lineage, 22 genesindicative for the osteogenic lineage, and 37 genes poten-tially involved in self-renewal have been validated byreverse transcription polymerase chain reaction (RT-PCR)analysis of total RNA as described previously [20]. Analiquot of the PCR product was analyzed on a 2% ethid-ium bromide-stained agarose gel. For quantitative PCR,the final reaction volume was 25 μl, including specificprimers (0.2–0.4 μM), 5–12 ng of reverse-transcriptionproduct and 9–12.5 μl of SYBR green master mix (Euro-gentec, Angers, France). Quantitative PCR was carried outas follows: 2 minutes at 50°C; 10 minutes at 95°C; and 35cycles of 15 seconds at 95°C and 1 minute at 60°C. Real-time PCR assays were run on an ABI Prism 7000 real-timePCR machine (Applied Biosystems, Foster City, CA, USA).
Page 10 of 14(page number not for citation purposes)

BMC Genomics 2008, 9:340 http://www.biomedcentral.com/1471-2164/9/340
Efficiency was estimated using LinReg software (refer-ence). Relative expression was calculated with the ddCtmethod [52].
Western blottingAfter 6 hours of incubation for each condition, secretionmedia (6 ml, corresponding to 2 dishes of 100 mm diam-eter) were collected on ice, centrifuged, filtered to removecell debris and supplemented with complete proteaseinhibitor cocktail. The samples were concentrated beforeanalysis by ultra-filtration (Millipore, Centricon, 5 kDacut-off). Equal volumes of secretion media were separatedby SDS-PAGE, transferred to PVDF membrane and proc-essed for the expression of PLTP using specific anti-humanantibodies (provided by M. Jauhiainen) [53]. Immunore-active signal was visualized with the ECL chemilumines-cence detection kit (Amersham) according to themanufacturer's instructions.
RNA isolationCells were collected in TRIzol (Invitrogen) before and 24h, 48 h, 5, 10, 15, 21 days after differentiation induction.Total RNA was isolated according to the manufacturer'sinstructions. The quality of the RNA was examined usingAgilent 2100 Bioanalyzer RNA assays (Agilent Technolo-gies).
Microarray data analysisGlobal mean and dye swap normalization were appliedusing ArrayNorm [54]. The resulting ratios were log2transformed and averaged over three independent experi-ments. All experimental parameters, images, and raw andtransformed data were uploaded to the microarray data-base MARS [55] and submitted via MAGE-ML export to apublic repository (ArrayExpress [56], accession number A-MARS 3 and E-MARS 10).
Statistical analysisThe aim was to identify genes with a significant change inexpression before induction (tp1 and tp2) compared tothe expression level after induction (time points 3 to 8).To that end we calculated the difference in expressionbetween time point 1 and all time points after induction(tp3.tp8), and the same was done for time point 2. Foreach gene, we considered the maximum of all these differ-ences (in absolute values) as an estimate of its change inexpression before and after induction. If that log-ratio waslarger than +/-1 (2 fold change) we consider the gene asdifferentially expressed after differentiation induction. Wecategorized these differentially expressed genes accordingto the following profiles: a) Opposite expression, b) line-age-specific expression and c) similar expression in theadipocyte and osteoblast differentiation pathways. Forthose genes differentially expressed in either HAD orHOD experiments, the Pearson correlation coefficient
(scale-invariant) was calculated and its significance wasassessed using the permutation test implemented in the Rpermax package http://www.r-project.org. This analysisyielded a total of eight clusters: three for adipogenic-related genes (ARG) (HAD-HOD; 1: up-down; 2: up-non;3: down-non), three clusters for osteogenic-related genes(ORG) (HAD-HOD; 4: down-up; 5: non-up; 6: non-down), and two clusters for differentiation-independentgenes (DIG) (HAD-HOD; 7: up-up; 8: down-down).
Gene Ontology classificationGene Ontology (GO) terms for biological processes werederived from the Gene Ontology database (Gene Ontol-ogy Consortium) using the RefSeq accession numbers. Allcluster analyses and visualizations were performed usingGenesis [57].
Identification of miRNA target sites in the 3'-UTRAll available 3'-UTR sequences (23,611) for human geneswere extracted using the human genome version hg18(NCBI build 36.1) from the USCS Genome Browser [58]and genomic coordinates for human genes from the Ref-seq database [59]. A total of 470 human miRNAsequences were derived from mirBase [60]. The 3'-UTRsequences were searched for perfect antisense matches tothe designated seed region of each miRNA (bases 2–8from the 5' end). Significantly over-represented miRNAmotifs in the 3'-UTRs of genes in each cluster and for thefull set of differentially regulated genes that were signifi-cantly over-represented compared with the motifs in thewhole 3'-UTR sequence set were determined using theone-sided Fisher's exact test (p < 0.05). To account formultiple testing p-values were adjusted controlling for thefalse discovery rate (FDR < 5%) as proposed by Benjaminiand Hochberg [61].
Promoter analysisPromoter analysis was performed using CRSD, a compre-hensive web server for composite regulatory signature dis-covery [62]. Iterative enrichment analysis was conductedbased on putative promoter and TRANSFAC databases.Transcription factor binding sites were selected as statisti-cally over-represented with a significance level of the cor-rected P-value < 0.1.
Protein domain analysisProtein sequences were annotated de novo using the morethan 40 prediction tools that are integrated in the ANNO-TATOR, a novel protein sequence analysis system includ-ing composition, TM region, motif and homologyanalysis [63,64].
Authors' contributionsMS designed and performed the experiments, and ana-lyzed and interpreted the data. CE and L–EZ participated
Page 11 of 14(page number not for citation purposes)

BMC Genomics 2008, 9:340 http://www.biomedcentral.com/1471-2164/9/340
to most biological and validation experiments and ana-lyzed the data. CC collected hMADS secretion media andperformed Western blot analysis for PLTP expression. SYhybridized the microarrays. KD and AP performed theqPCR analysis of the primary cells. HH performed the bio-informatics analyses. FS–C was responsible for the statis-tical analyses. GF isolated the bone marrow aspirates. CP,AP, and MS developed and produced the microarrays. RWwas responsible for the clinical studies. GA participated inanalysing and interpretating the data. CD participated todesign of cell experiments and analysis of the data. E–ZAparticipated to conception of the research program anddata analysis. ZT was responsible for the overall concep-tion, project coordination, and data interpretation.
Additional material
AcknowledgementsWe thank Reinhard Kofler for the microarray oligonucleotide library, Rob-ert Rader for the microarray database support, Thomas R. Burkard for the protein domain analysis, and Matti Jauhiainen for the anti-PLTP antibody. This work was supported by the GEN-AU projects BIN, GOLD, and Iden-tification of MiRNAs Targeting Early Human Adipogenesis, by the FWF SFB project Lipotoxicity, by the Centre Nationale de la Recherche Scientifique, by a grant from 'Equipe FRM, soutenue par la Fondation pour la Recherche Medicale', by INCa (grant PL 079), and by the Amadée programme of the Austrian Exchange Service (OEAD). CC is a recipient of a fellowship from Fondation pour la Recherche Médicale.
References1. Nuttall ME, Gimble JM: Controlling the balance between oste-
oblastogenesis and adipogenesis and the consequent thera-peutic implications. Curr Opin Pharmacol 2004, 4:290-294.
2. Rosen ED: The transcriptional basis of adipocyte develop-ment. Prostaglandins Leukot Essent Fatty Acids 2005, 73:31-34.
3. Sethi JK, Vidal-Puig AJ: Thematic review series: adipocyte biol-ogy. Adipose tissue function and plasticity orchestrate nutri-tional adaptation. J Lipid Res 2007, 48:1253-1262.
4. Komori T: Regulation of osteoblast differentiation by tran-scription factors. J Cell Biochem 2006, 99:1233-1239.
5. Hong JH, Hwang ES, McManus MT, Amsterdam A, Tian Y, KalmukovaR, Mueller E, Benjamin T, Spiegelman BM, Sharp PA, Hopkins N, YaffeMB: TAZ, a transcriptional modulator of mesenchymal stemcell differentiation. Science 2005, 309:1074-1078.
6. ten Dijke P: Bone morphogenetic protein signal transductionin bone. Curr Med Res Opin 2006, 22 Suppl 1:S7-11.
7. ten Dijke P, Korchynskyi O, Valdimarsdottir G, Goumans MJ: Con-trolling cell fate by bone morphogenetic protein receptors.Mol Cell Endocrinol 2003, 211:105-113.
8. Gazzerro E, Gangji V, Canalis E: Bone morphogenetic proteinsinduce the expression of noggin, which limits their activity incultured rat osteoblasts. J Clin Invest 1998, 102:2106-2114.
9. Brekken RA, Puolakkainen P, Graves DC, Workman G, Lubkin SR,Sage EH: Enhanced growth of tumors in SPARC null mice isassociated with changes in the ECM. J Clin Invest 2003,111:487-495.
10. Simonet WS, Lacey DL, Dunstan CR, Kelley M, Chang MS, Luthy R,Nguyen HQ, Wooden S, Bennett L, Boone T, Shimamoto G, DeRoseM, Elliott R, Colombero A, Tan HL, Trail G, Sullivan J, Davy E, BucayN, Renshaw-Gegg L, Hughes TM, Hill D, Pattison W, Campbell P,Sander S, Van G, Tarpley J, Derby P, Lee R, Boyle WJ: Osteoprote-gerin: a novel secreted protein involved in the regulation ofbone density. Cell 1997, 89:309-319.
11. Karsenty G, Park RW: Regulation of type I collagen genesexpression. Int Rev Immunol 1995, 12:177-185.
12. Luo G, Ducy P, McKee MD, Pinero GJ, Loyer E, Behringer RR,Karsenty G: Spontaneous calcification of arteries and carti-
Additional file 1Real-time RT-PCR of 19 adipogenic and 14 osteogenic marker genes dur-ing adipocyte and osteoblast differentiation. A) Expression profiles of 21 adipogenic marker genes during adipocyte differentiation are displayed for the time points 5 (day+2), 7 (day+10), and 8 (day+15) after differenti-ation induction; B) Expression profiles of 14 osteogenic marker genes dur-ing osteoblast differentiation are displayed for the time points 5 (day+2), 7 (day+15), and 8 (day+24) after differentiation induction.Click here for file[http://www.biomedcentral.com/content/supplementary/1471-2164-9-340-S1.pdf]
Additional file 2Real-time RT-PCR and microarray data. Real-time RT-PCR and microar-ray data of 41 adipogenic, 22 osteogenic marker genes, and 37 potential self renewal-related genes with common profile during adipocyte and oste-oblast differentiation.Click here for file[http://www.biomedcentral.com/content/supplementary/1471-2164-9-340-S2.pdf]
Additional file 3Heat map of expression data. Expression values for 1,606 genes in eight distinct clusters.Click here for file[http://www.biomedcentral.com/content/supplementary/1471-2164-9-340-S3.png]
Additional file 4miRNA motifs in up- and down-regulated gene clusters. Number of miRNA motifs in up- and down-regulated gene clusters in both lineages before and after commitment.Click here for file[http://www.biomedcentral.com/content/supplementary/1471-2164-9-340-S4.pdf]
Additional file 5Significantly over-represented miRNA motifs. Significantly over-repre-sented miRNA motifs.Click here for file[http://www.biomedcentral.com/content/supplementary/1471-2164-9-340-S5.pdf]
Additional file 6Significantly over-represented transcription factor binding sites. Signifi-cantly over-represented transcription factor binding sites of 26 genes with a specific profile for the adipogenic commitment.Click here for file[http://www.biomedcentral.com/content/supplementary/1471-2164-9-340-S6.pdf]
Additional file 7Significantly over-represented transcription factor binding sites. Signifi-cantly over-represented transcription factor binding sites of 39 genes with a specific profile for the osteogenic commitment.Click here for file[http://www.biomedcentral.com/content/supplementary/1471-2164-9-340-S7.pdf]
Page 12 of 14(page number not for citation purposes)
http://www.ncbi.nlm.nih.gov/entrez/query.fcgi?cmd=Retrieve&db=PubMed&dopt=Abstract&list_uids=9854046
http://www.ncbi.nlm.nih.gov/entrez/query.fcgi?cmd=Retrieve&db=PubMed&dopt=Abstract&list_uids=9854046
http://www.ncbi.nlm.nih.gov/entrez/query.fcgi?cmd=Retrieve&db=PubMed&dopt=Abstract&list_uids=9854046
http://www.ncbi.nlm.nih.gov/entrez/query.fcgi?cmd=Retrieve&db=PubMed&dopt=Abstract&list_uids=9108485
http://www.ncbi.nlm.nih.gov/entrez/query.fcgi?cmd=Retrieve&db=PubMed&dopt=Abstract&list_uids=9108485
http://www.ncbi.nlm.nih.gov/entrez/query.fcgi?cmd=Retrieve&db=PubMed&dopt=Abstract&list_uids=9108485
http://www.ncbi.nlm.nih.gov/entrez/query.fcgi?cmd=Retrieve&db=PubMed&dopt=Abstract&list_uids=7650420
http://www.ncbi.nlm.nih.gov/entrez/query.fcgi?cmd=Retrieve&db=PubMed&dopt=Abstract&list_uids=7650420

BMC Genomics 2008, 9:340 http://www.biomedcentral.com/1471-2164/9/340
lage in mice lacking matrix GLA protein. Nature 1997,386:78-81.
13. Wagener R, Ehlen HW, Ko YP, Kobbe B, Mann HH, Sengle G, Pauls-son M: The matrilins--adaptor proteins in the extracellularmatrix. FEBS Lett 2005, 579:3323-3329.
14. Bord S, Horner A, Beavan S, Compston J: Estrogen receptorsalpha and beta are differentially expressed in developinghuman bone. J Clin Endocrinol Metab 2001, 86:2309-2314.
15. Ichida F, Nishimura R, Hata K, Matsubara T, Ikeda F, Hisada K, YataniH, Cao X, Komori T, Yamaguchi A, Yoneda T: Reciprocal roles ofMSX2 in regulation of osteoblast and adipocyte differentia-tion. J Biol Chem 2004, 279:34015-34022.
16. Wiper-Bergeron N, St Louis C, Lee JM: C/EBP{beta} abrogatesretinoic acid-induced osteoblast differentiation via repres-sion of Runx2 transcription. Mol Endocrinol 2007.
17. Liu TM, Martina M, Hutmacher DW, Hui JH, Lee EH, Lim B: Identi-fication of common pathways mediating differentiation ofbone marrow- and adipose tissue-derived human mesenchy-mal stem cells into three mesenchymal lineages. Stem Cells2007, 25:750-760.
18. Prockop DJ: Marrow stromal cells as stem cells for nonhemat-opoietic tissues. Science 1997, 276:71-74.
19. Zuk PA, Zhu M, Ashjian P, De Ugarte DA, Huang JI, Mizuno H,Alfonso ZC, Fraser JK, Benhaim P, Hedrick MH: Human adiposetissue is a source of multipotent stem cells 7. Mol Biol Cell 2002,13:4279-4295.
20. Rodriguez AM, Elabd C, Delteil F, Astier J, Vernochet C, Saint-MarcP, Guesnet J, Guezennec A, Amri EZ, Dani C, Ailhaud G: Adipocytedifferentiation of multipotent cells established from humanadipose tissue. Biochem Biophys Res Commun 2004, 315:255-263.
21. Zaragosi LE, Ailhaud G, Dani C: Autocrine fibroblast growth fac-tor 2 signaling is critical for self-renewal of human multipo-tent adipose-derived stem cells. Stem Cells 2006, 24:2412-2419.
22. Elabd C, Chiellini C, Massoudi A, Cochet O, Zaragosi LE, Trojani C,Michiels JF, Weiss P, Carle G, Rochet N, Dechesne CA, Ailhaud G,Dani C, Amri EZ: Human adipose tissue-derived multipotentstem cells differentiate in vitro and in vivo into osteocyte-like cells. Biochem Biophys Res Commun 2007, 361:342-348.
23. Rodriguez AM, Pisani D, Dechesne CA, Turc-Carel C, Kurzenne JY,Wdziekonski B, Villageois A, Bagnis C, Breittmayer JP, Groux H, Ail-haud G, Dani C: Transplantation of a multipotent cell popula-tion from human adipose tissue induces dystrophinexpression in the immunocompetent mdx mouse. J Exp Med2005, 201:1397-1405.
24. Hackl H, Burkard TR, Sturn A, Rubio R, Schleiffer A, Tian S, Quack-enbush J, Eisenhaber F, Trajanoski Z: Molecular processes duringfat cell development revealed by gene expression profilingand functional annotation. Genome Biol 2005, 6:R108.
25. Johnson SM, Grosshans H, Shingara J, Byrom M, Jarvis R, Cheng A,Labourier E, Reinert KL, Brown D, Slack FJ: RAS is regulated bythe let-7 microRNA family. Cell 2005, 120:635-647.
26. Grosshans H, Johnson T, Reinert KL, Gerstein M, Slack FJ: The tem-poral patterning microRNA let-7 regulates several tran-scription factors at the larval to adult transition in C.elegans. Dev Cell 2005, 8:321-330.
27. Bentwich I: A postulated role for microRNA in cellular differ-entiation. FASEB J 2005, 19:875-879.
28. Wienholds E, Kloosterman WP, Miska E, Alvarez-Saavedra E,Berezikov E, de Bruijn E, Horvitz HR, Kauppinen S, Plasterk RH:MicroRNA expression in zebrafish embryonic development.Science 2005, 309:310-311.
29. Wienholds E, Plasterk RH: MicroRNA function in animal devel-opment. FEBS Lett 2005, 579:5911-5922.
30. Krutzfeldt J, Stoffel M: MicroRNAs: a new class of regulatorygenes affecting metabolism. Cell Metab 2006, 4:9-12.
31. Lewis BP, Burge CB, Bartel DP: Conserved seed pairing, oftenflanked by adenosines, indicates that thousands of humangenes are microRNA targets. Cell 2005, 120:15-20.
32. John B, Enright AJ, Aravin A, Tuschl T, Sander C, Marks DS: HumanMicroRNA targets. PLoS Biol 2004, 2:e363.
33. Grimson A, Farh KK, Johnston WK, Garrett-Engele P, Lim LP, BartelDP: MicroRNA Targeting Specificity in Mammals: Determi-nants beyond Seed Pairing. Mol Cell 2007, 27:91-105.
34. Hong JH, Hwang ES, McManus MT, Amsterdam A, Tian Y, KalmukovaR, Mueller E, Benjamin T, Spiegelman BM, Sharp PA, Hopkins N, Yaffe
MB: TAZ, a transcriptional modulator of mesenchymal stemcell differentiation 4. Science 2005, 309:1074-1078.
35. Zhang Y, Dufau ML: Gene silencing by nuclear orphan recep-tors. Vitam Horm 2004, 68:1-48.
36. Stein O, Stein Y: Lipid transfer proteins (LTP) and atheroscle-rosis. Atherosclerosis 2005, 178:217-230.
37. Robitaille J, MacDonald ML, Kaykas A, Sheldahl LC, Zeisler J, DubeMP, Zhang LH, Singaraja RR, Guernsey DL, Zheng B, Siebert LF,Hoskin-Mott A, Trese MT, Pimstone SN, Shastry BS, Moon RT, Hay-den MR, Goldberg YP, Samuels ME: Mutant frizzled-4 disruptsretinal angiogenesis in familial exudative vitreoretinopathy.Nat Genet 2002, 32:326-330.
38. Kajimoto K, Naraba H, Iwai N: MicroRNA and 3T3-L1 pre-adi-pocyte differentiation. RNA 2006, 12:1626-1632.
39. Esau C, Kang X, Peralta E, Hanson E, Marcusson EG, Ravichandran LV,Sun Y, Koo S, Perera RJ, Jain R, Dean NM, Freier SM, Bennett CF,Lollo B, Griffey R: MicroRNA-143 regulates adipocyte differen-tiation. J Biol Chem 2004, 279:52361-52365.
40. Luzi E, Marini F, Carbonell SS, Tognarini I, Galli G, Luisa BM: Osteo-genic Differentiation of Human Adipose Tissue-DerivedStem Cells is Modulated by the miR-26a Targeting theSMAD1 Transcription Factor. J Bone Miner Res 2007.
41. Mizuno Y, Yagi K, Tokuzawa Y, Kanesaki-Yatsuka Y, Suda T, KatagiriT, Fukuda T, Maruyama M, Okuda A, Amemiya T, Kondoh Y, TashiroH, Okazaki Y: miR-125b inhibits osteoblastic differentiation bydown-regulation of cell proliferation. Biochem Biophys Res Com-mun 2008.
42. Repa JJ, Turley SD, Lobaccaro JA, Medina J, Li L, Lustig K, Shan B, Hey-man RA, Dietschy JM, Mangelsdorf DJ: Regulation of absorptionand ABC1-mediated efflux of cholesterol by RXR het-erodimers. Science 2000, 289:1524-1529.
43. Joseph SB, Castrillo A, Laffitte BA, Mangelsdorf DJ, Tontonoz P:Reciprocal regulation of inflammation and lipid metabolismby liver X receptors. Nat Med 2003, 9:213-219.
44. Mitro N, Mak PA, Vargas L, Godio C, Hampton E, Molteni V, KreuschA, Saez E: The nuclear receptor LXR is a glucose sensor.Nature 2007, 445:219-223.
45. Cao G, Beyer TP, Yang XP, Schmidt RJ, Zhang Y, Bensch WR, Kauff-man RF, Gao H, Ryan TP, Liang Y, Eacho PI, Jiang XC: Phospholipidtransfer protein is regulated by liver X receptors in vivo. J BiolChem 2002, 277:39561-39565.
46. Tsai SY, Tsai MJ: Chick ovalbumin upstream promoter-tran-scription factors (COUP-TFs): coming of age. Endocr Rev 1997,18:229-240.
47. Xu Z, Yu S, Hsu CH, Eguchi J, Rosen ED: The orphan nuclearreceptor chicken ovalbumin upstream promoter-transcrip-tion factor II is a critical regulator of adipogenesis. Proc NatlAcad Sci U S A 2008, 105:2421-2426.
48. Liu F, Li Y, Yu Y, Fu S, Li P: Cloning of novel tumor metastasis-related genes from the highly metastatic human lung aden-ocarcinoma cell line Anip973. J Genet Genomics 2007,34:189-195.
49. Abderrahim-Ferkoune A, Bezy O, Chiellini C, Maffei M, Grimaldi P,Bonino F, Moustaid-Moussa N, Pasqualini F, Mantovani A, Ailhaud G,Amri EZ: Characterization of the long pentraxin PTX3 as aTNFalpha-induced secreted protein of adipose cells. J LipidRes 2003, 44:994-1000.
50. Halvorsen YD, Franklin D, Bond AL, Hitt DC, Auchter C, Boskey AL,Paschalis EP, Wilkison WO, Gimble JM: Extracellular matrix min-eralization and osteoblast gene expression by human adi-pose tissue-derived stromal cells. Tissue Eng 2001, 7:729-741.
51. Kulterer B, Friedl G, Jandrositz A, Sanchez-Cabo F, Prokesch A, PaarC, Scheideler M, Windhager R, Preisegger KH, Trajanoski Z: Geneexpression profiling of human mesenchymal stem cellsderived from bone marrow during expansion and osteoblastdifferentiation. BMC Genomics 2007, 8:70.
52. Pfaffl MW: A new mathematical model for relative quantifica-tion in real-time RT-PCR. Nucleic Acids Res 2001, 29:e45.
53. Desrumaux CM, Mak PA, Boisvert WA, Masson D, Stupack D, Jauhi-ainen M, Ehnholm C, Curtiss LK: Phospholipid transfer protein ispresent in human atherosclerotic lesions and is expressed bymacrophages and foam cells. J Lipid Res 2003, 44:1453-1461.
54. Pieler R, Sanchez-Cabo F, Hackl H, Thallinger GG, Trajanoski Z:ArrayNorm: comprehensive normalization and analysis ofmicroarray data. Bioinformatics 2004, 20:1971-1973.
Page 13 of 14(page number not for citation purposes)
http://www.ncbi.nlm.nih.gov/entrez/query.fcgi?cmd=Retrieve&db=PubMed&dopt=Abstract&list_uids=9052783
http://www.ncbi.nlm.nih.gov/entrez/query.fcgi?cmd=Retrieve&db=PubMed&dopt=Abstract&list_uids=9082988
http://www.ncbi.nlm.nih.gov/entrez/query.fcgi?cmd=Retrieve&db=PubMed&dopt=Abstract&list_uids=9082988
http://www.ncbi.nlm.nih.gov/entrez/query.fcgi?cmd=Retrieve&db=PubMed&dopt=Abstract&list_uids=9101138

BMC Genomics 2008, 9:340 http://www.biomedcentral.com/1471-2164/9/340
Publish with BioMed Central and every scientist can read your work free of charge
"BioMed Central will be the most significant development for disseminating the results of biomedical research in our lifetime."
Sir Paul Nurse, Cancer Research UK
Your research papers will be:
available free of charge to the entire biomedical community
peer reviewed and published immediately upon acceptance
cited in PubMed and archived on PubMed Central
yours — you keep the copyright
Submit your manuscript here:http://www.biomedcentral.com/info/publishing_adv.asp
BioMedcentral
55. Maurer M, Molidor R, Sturn A, Hartler J, Hackl H, Stocker G, Proke-sch A, Scheideler M, Trajanoski Z: MARS: microarray analysis,retrieval, and storage system. BMC Bioinformatics 2005, 6:101.
56. Brazma A, Parkinson H, Sarkans U, Shojatalab M, Vilo J, Abeyguna-wardena N, Holloway E, Kapushesky M, Kemmeren P, Lara GG,Oezcimen A, Rocca-Serra P, Sansone SA: ArrayExpress--a publicrepository for microarray gene expression data at the EBI.Nucleic Acids Res 2003, 31:68-71.
57. Sturn A, Quackenbush J, Trajanoski Z: Genesis: cluster analysis ofmicroarray data. Bioinformatics 2002, 18:207-208.
58. Kent WJ, Sugnet CW, Furey TS, Roskin KM, Pringle TH, Zahler AM,Haussler D: The human genome browser at UCSC. GenomeRes 2002, 12:996-1006.
59. Pruitt KD, Tatusova T, Maglott DR: NCBI Reference Sequence(RefSeq): a curated non-redundant sequence database ofgenomes, transcripts and proteins. Nucleic Acids Res 2005,33:D501-D504.
60. Griffiths-Jones S, Grocock RJ, van Dongen S, Bateman A, Enright AJ:miRBase: microRNA sequences, targets and gene nomencla-ture. Nucleic Acids Res 2006, 34:D140-D144.
61. Benjamini Y, Hochberg Y: Controlling the False Discovery Rate- A Practical and Powerful Approach to Multiple Testing.Journal of the Royal Statistical Society Series B-Methodological 1995,57:289-300.
62. Liu CC, Lin CC, Chen WS, Chen HY, Chang PC, Chen JJ, Yang PC:CRSD: a comprehensive web server for composite regula-tory signature discovery. Nucleic Acids Res 2006, 34:W571-W577.
63. Large Scale Sequence Annotation System, Research Insti-tute of Molecular Pathology (IMP), Bioinformatics Group,Vienna 2005 [http://annotator.imp.univie.ac.at/].
64. Schneider G, Wildpaner M, Kozlovszky M, Kubina W, Leitner F,Novatchkova M, Schleiffer A, Sun T, Eisenhaber F: The ANNOTA-TOR software suite. 2005 [http://www.iscb.org/ismb2005/demos/15.pdf].
Page 14 of 14(page number not for citation purposes)