Portuguese and Greek Experiences with Guaranteed Minimum Income (GMI) in Comparative Perspective
Upload
khangminh22Category
view
0download
0
ეკონომიკური განვითარება
შედარებით პერსპექტივაში
Economic Development –
Comparative Perspective
რიდერი
მომზადებულია ტატო ხუნდაძის მიერ
1.1Development in a global-historical context
Ruth Craggs
IntroductionMany texts locate the origins of development in the post-1945 era, alongside theemergence of the United States and the Soviet Union as global superpowers, anti-colonial movements, and decolonisation in much of the world. Although developmenta s global project and academic discipline may have begun in this period, manyscholars now argue that the ideas and practices that underpinned post-wardevelopment had their origins earlier, in the late colonial period. From thisperspective,
the post-war crusade to end world poverty represented not so much a novelproposal marking the dawn of a new age, as the zenith of decades, if not centuries,of debate over the control and use of the natural and human resources of colonizedregions.
(Hodge, 2007: 3)
If the campaign against poverty, so often thought to begin after World War II, in facthas its roots in earlier colonial development projects, then it is valuable to explorehow these earlier incarnations of development were practiced and with what effects.As colonialism is often understood as a causal factor in contemporary poverty,inequality, and violence, it is crucial to understand the connections between colonialand postcolonial development.
This chapter provides the global-historical context for the development theories andpractices explored in the rest of this volume. It explains the relevance of the colonialhistories of places and people caught up in the nexus of development – as donors andrecipients, ideologues and practitioners – to the ways that development was imagined,funded, practised, and received. It begins by exploring colonialism as development. Itexamines the ways in which colonial rule was presented as premised on the idea ofdeveloping and modernising colonies. This section highlights the ideologies oftrusteeship and modernisation that underlay imperial rule and shaped colonialterritories. The second section explores the material legacies of colonialism in thedeveloping world and the continuing influence of colonial thought and practice in
33

postcolonial development. For reasons of brevity , the focus falls on the British Empire(and its decolonisation), though some of the same trends can also be seen in otherEuropean contexts.
Colonialism as developmentEnlightenment ideas of ‘improvement’ – or making a more efficient and orderly useof land – accompanied and legitimated colonial rule from at least the eighteenthcentury (Hodge, 2007). Potential colonial land was understood as fair quarry forexpanding European empires; cast as empty or ill exploited, it was seen as ripe forimprovement by those with the expertise through which to make thesetransformations. Improvement entailed the development of infrastructure (wherelinked to European trade or settlement), the increase in economic output (benefittingmetropolitan interests and markets) and the augmentation of the population withEuropean settlers. In the nineteenth century, medical research aimed to bolster thecolonial sy stem by protecting the health of colonial servants, armies, and settlerpopulations and prevent the ‘degeneration’ caused by tropical climates.Improvements were oriented towards metropolitan interests, rather than towardsincreasing the quality of life of local communities.
The late nineteenth and early twentieth century period saw a new model ofimperialism in the French, British, and Dutch colonies, which placed more emphasison development on humanitarian grounds for native colonial communities. Thispolicy became known as ‘trusteeship’. As Power (2003: 131) explains, ‘Trusteeship incolonial administration was all about the mission to civilise others, to strengthen theweak, to give experience to the “childlike” colonial peoples who required supervision’.It therefore provided the mandate for European powers to help these territoriesdevelop through following a path towards Western modernity. In Britain, officialpolicy was enshrined in the 1929 Colonial Development Act, providing British fundingfor economic development overseas for the first time, and the 1940 ColonialDevelopment and Welfare Act, which ushered in state-led large-scale developmentfor the purposes of improving welfare. Thus the 1930s onwards witnessed anincreasing move towards interventionist development policies in colonial territories,resulting in a dramatic growth in the number, scale, and funding of colonialdevelopment projects. This trajectory became even more marked in the immediatepost-World War II era, a period that has been called, as a result, the second colonialoccupation (Low and Lonsdale, 1976).
Hodge (2007: 8) argues that this new push towards humanitarian development‘helped to reinvigorate and morally rearm the imperial mission in the late colonialepoch’, providing continued legitimacy for empire in a rapidly changing geopoliticallandscape between 1930 and 1950. This new sty le of imperialism was linked to anincreasing concern over the poor conditions in the colonies, but also aimed to support
34
the colonial sy stem. Development hoped to stabilise colonial populations through thecreation of an indigenous middle class invested in the colonial state, and to soothegrowing local unrest during the period of depression. By creating products forEuropean markets and markets for European goods, development also contributed tostruggling European economies. As colonial planners began publically to discusseventual decolonisation once colonies had ‘progressed’ enough, development policiesbecame even more important, both as contributor to this colonial progress, and toensure the creation of stable and amenable newly independent states.
Development projects in the late colonial period were closely allied with a belief inmodernisation. This involved the linear progress of states towards a developed,modern (Western) society and economy. Official British colonial films of this erashowcase this discourse of development as modernisation (seewww.colonialfilm.org.uk). Projects were based on a growing faith in the role ofscience and technology to combat poverty and disease and focused on infrastructuralimprovement and the technical enhancement of agriculture, industry, and healthcarethrough new innovations. Higher y ielding seeds, new crops, and intensivemonoculture were encouraged (and indeed enforced), disease eradicationprogrammes were rolled out, and new mining technology was introduced (Tilley,2011). Late colonial housing and building projects drew on new materials such asconcrete, scientific construction techniques and modernism in architectural design,imbricating notions of progress into the design of colonial landscapes (Crinson, 2003).
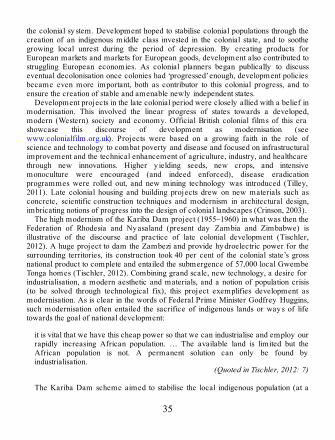
The high modernism of the Kariba Dam project (1955–1960) in what was then theFederation of Rhodesia and Nyasaland (present day Zambia and Zimbabwe) isillustrative of the discourse and practice of late colonial development (Tischler,2012). A huge project to dam the Zambezi and provide hydroelectric power for thesurrounding territories, its construction took 40 per cent of the colonial state’s grossnational product to complete and entailed the submergence of 57,000 local GwembeTonga homes (Tischler, 2012). Combining grand scale, new technology, a desire forindustrialisation, a modern aesthetic and materials, and a notion of population crisis(to be solved through technological fix), this project exemplifies development asmodernisation. As is clear in the words of Federal Prime Minister Godfrey Huggins,such modernisation often entailed the sacrifice of indigenous lands or ways of lifetowards the goal of national development:
it is vital that we have this cheap power so that we can industrialise and employ ourrapidly increasing African population. … The available land is limited but theAfrican population is not. A permanent solution can only be found byindustrialisation.
(Quoted in Tischler, 2012: 7)
The Kariba Dam scheme aimed to stabilise the local indigenous population (at a
35

time of increasing African nationalism) and to boost migration from Britain to CentralAfrica. Providing evidence of the Federation’s modernisation, it was hoped the dammight cement the position of the white European settler community in the territory.As with earlier schemes of colonial improvement, the project laid claim to landthrough the notion of making it productive (Tischler, 2012).
36

Figure 1.1.1 The Kariba Dam
Development became one of the fundamental tenets of colonial policy in thetwentieth century. It aimed to both support colonialism and to improve the welfare oflocal populations, although it often failed on both counts, dispossessing people of landand contributing to anti-colonial critiques emerging in both colony and metropole.Although colonial development was imagined as a rational modernisation planned inEurope and put into practice in the colonies, this was never the case. Developmentpolicies were shaped by the specificities of colonial locations and reworked inconnection to local knowledge and practices (Tilley, 2011). Development discourseand practice was constructed in negotiation in a colonial sy stem.
We now turn to the legacies of colonialism in poorer nations that were once part ofEuropean empires, and to the legacies of colonialism present in contemporarydevelopment discourse and practice.
37

Legacies of colonialism in developmentIssues that many contemporary development policies and programmes attempt toameliorate have their roots, at least in part, in colonialism. Border disputes wherecolonial boundaries were pushed through previously united communities, ethnictensions stoked by policies of ‘divide and rule’, and trauma from bloody wars ofdecolonisation are all elements of a legacy of colonialism. Many other issues can betraced back more specifically to colonial development policies, for example,unsustainable and environmentally damaging agricultural sy stems, polluting industrialsectors and inadequate workers rights, big infrastructure projects which disruptedcommunities and ecosystems, and arguments over land dispossession.
Less obvious are the colonial legacies that have shaped postcolonial developmentpractice and ideology. The focus of state-led development in late colonialism fed intothe postcolonial planning and policies of newly independent governments who oftenpursued vigorous large-scale state controlled development projects in areas of health,housing, industrial development, and power infrastructure. In addition, manypostcolonial states relied, for the implementation of their development policies, on theinput of colonial experts of various kinds – such as agriculturalists, other technicaladvisors, and colonial district officers (Hodge, 2007; Kothari, 2006a). Theseprofessionals were employed by the governments of newly independent states andmade up a large proportion of the staff of international organisations formed in thewake of World War II such as the World Health Organisation, the United NationsDevelopment Programme, the World Bank, the Commonwealth DevelopmentCorporation, and the government departments of former colonial powers, such as theMinistry of Overseas Development in the UK. They were also integral to theformation and staffing of the first development studies departments in UK universities(Hodge, 2007; Kothari, 2006a). They therefore also contributed to the shaping of thediscipline of development as an academic subject in the second half of the twentiethcentury .
These continuities in policy and personnel underpinned – and were underpinned by– a continuation in broader development discourse. Crisis narratives aboutoverpopulation and environmental degradation produced by late colonial expertsfundamentally shaped postwar development as discipline and practice (Hodge,2007). Problems continued to be depoliticised, and their solutions cast as scientific ortechnocratic. Ideologies which coded the West as developed and the rest asdeveloping, Western as normal and non-Western as other, and which constructed alinear temporal path of development along which the West had travelled furthercontinued (and continue) to hold sway after decolonisation. Ideologies of partnershipand responsibility in development have replayed older colonial notions withrelationships between donors and recipients, which continue to be less than equal(Noxolo, 2006). Power (2003: 131) has gone as far as to argue that ‘Colonial
38

humanitarianism has been reinvented after the formal end of colonial and imperialrule’ as international development. Moreover, just as within colonialism, ‘whitenessand the West provide symbols of authority, expertise and knowledge’, in thepostcolonial era, expertise continued (and continues) to be coded as Western andwhite, providing fundamental challenges for the theory and practice of development(Kothari, 2006b: 10).
Finally, although modernisation has now been discredited in much developmentdiscourse, it has continuing effects. As Ferguson (1999: 14) notes for the experienceof Zambians living on the Copperbelt, ‘the breakdown of certain teleologicalnarratives of modernity … has occurred not only in the world of theory, but in thelived understandings of those who received such my ths as a kind of promise’. Even ifmodernisation was always a my th, it was one that late colonial academics,policy makers, and ordinary people invested in, shaping experiences and imaginedfutures. Ferguson illustrates the devastating consequences when this idea ofmodernisation was ‘turned upside down, shaken, and shattered’ (1999: 13).
ConclusionThough conceived and practiced differently within and between European empires,development was central to the colonial project, particularly from the late nineteenthand early twentieth centuries. Many of the ideas, policies, and priorities ofpostcolonial development can trace their genealogies to the colonial era, where theywere shaped through metropolitan concerns to maintain and modernise colonies, andthrough contact with the local people, knowledge, and conditions. Colonialismtherefore not only contributed to the material economic and social conditions inwhich development takes place today, but also fundamentally shaped the project ofdevelopment itself, through continuities between the ideologies, people, and practicesof colonial and postcolonial development.
ReferencesCrinson, M. (2003) Modern Architecture and the End of Empire. Aldershot: Ashgate.Ferguson, J. (1999) Expectations of Modernity: Myths and Meanings of Urban Life on
the Zambian Copperbelt. London: University of California Press.Hodge, J. M. (2007) Triumph of the Expert: Agrarian Doctrines of Development and
the Legacies of British Colonialism. Athens: Ohio University Press.Kothari, U. (2006a) ‘From Colonialism to Development: Reflections of Former
Colonial Officers’ Commonwealth and Comparative Politics 44(1) 118–136.Kothari, U. (2006b) ‘An agenda for thinking about “race” in development’ Progress in
Development Studies 6(1) 9–23.Low, D. A. and Lonsdale, J. M. (1976) ‘Introduction: Towards the New Order 1945–
39

1963’ in D. A. Low and A. Smith (eds) History of East Africa, Volume III . Oxford:Clarendon Press.
Noxolo, P. (2006) ‘Claims: a postcolonial geographical critique of “partnership” inBritain’s development discourse’ Singapore Journal of Tropical Geography 27(3)254–269.
Power, M. (2003) Rethinking Development Geographies. London: Routledge.Tilley , H. (2011) Africa as Living Laboratory: Empire, Development, and the Problem
of Scientific Knowledge, 1870–1950. Chicago: Chicago University Press.Tischler, J. (2012) ‘Negotiating Development: The Kariba Dam Scheme in the
Central African Federation’ in P. Bloom, T. Manuh, and S. Miescher (eds)Revisiting Modernization in Africa. Bloomington: Indiana University Press.
Further readingAshton, S. R. and Stockwell, S. E. (eds) (1996) Imperial Policy and Colonial Practice
1925–1945, Part II: Economic Policy, Social Policies and Colonial Research(British Documents on the End of Empire, Series A, Volume 1) . London: HMSO. Aselection of primary sources drawn from British official archives which documentthe evolution and practice of British Colonial Development Policy between 1925and 1945.
Websiteswww.colonialfilm.org.uk/theme/empire-and-development. Films about the British
colonies and development, with 150 available to view online. Many haveaccompany ing critical essays analy sing their contribution to understanding Britishcolonialism.
40

1.2The Third World, developing countries, the South, emerging
markets and rising powers
Klaus Dodds
The power of wordsIn 2012, James Sidaway asked an important question in a short article in the journalProfessional Geographer. He opined, ‘Today, how useful is it to talk about thegeography of development or of developing countries? What are and what remainsof the geography of development and of the Third World?’ Words, and in particularplace-based labels, continue to matter but do so in a variety and at times bewilderingmanner. A generation of political and development geographers, often inspired bypostcolonial and critical geopolitical theorising, continue to examine and interrogatethe implications of terms such as Third World, middle- and low-income countries,majority world, southern periphery, two-thirds world, and/or rising powers withparticular reference to countries such as Brazil, China and India (Slater 1993,Sidaway 2012).
In the midst of the cold war, the term ‘Third World’ was coined to signify a newgeopolitical imagination based on a geography of global politics divided into threecamps – the United States and its allies, the Soviet Union and the Communist worldand a ‘Third World’ of postcolonial states in Africa, Asia and Latin America.Underpinned by an investment in technology and an ideological faith in free marketsand enterprise, this tripartite division reflected American hegemony in a post-warfinancial and political international sy stem US administrations helped to construct.
This chapter seeks to remind readers of this period characterised by cold war andsuperpower competition and consider how the fate of the Third World has changedover the last six decades. With the ending of the cold war, it was widely hoped thatquestions pertaining to development, poverty reduction and debt cancellation wouldenjoy a greater political profile. This has been achieved but not led to the profoundchanges hoped by many activists, campaigners and governments in the Third Worldand bey ond. While the 2000s were dominated, in part, by the US-led War on Terrorthe most profound change has come with the emergence of China as a worldeconomic power. Since reforms in 1978, China’s ascent remains breathtaking in scaleand scope. It is estimated that by 2020 China is likely to be the largest economy in theworld, and thus anyone authoring an introductory chapter such as this will be
41

concentrating, I suspect, increasingly on Chinese narratives about world politics andspecifically development agendas (for a readable account of China’s economictransformation see Fenby 2012).
The invention of the Third WorldIn the aftermath of the Korean conflict (1950–1953 and arguably ongoing), a newgeopolitical imagination began to emerge as the conflict between the Soviet Unionand the United States spread across the globe. Key geographical designations such as‘First World’ and ‘Third World’ were deployed by Western social scientists in anattempt to highlight the profound differences between the United States and the SovietUnion. Newly decolonised countries in South Asia, Africa and Asia were seen asproviding opportunities for both sides to project influence, extend trading opportunitiesand recruit for the purpose of defending particular parts of the earth’s surface fromthe influence of the ideologies of either communism (in the case of the Soviets) orliberal democracy and capitalism (in the case of the United States). Billions of dollarsand roubles were spent over the next fifty years in pursuit of that geopoliticalobjective. Both sides used the existence of this cold war to plan and implementdevelopment programmes, aid assistance, volunteer groups, trade stimulation,academic exchanges and/or arms sales.
During the cold war, the experiences of the Third World were never uniform assome countries and regions received greater attention than others (Westad 2005). Inthe case of Latin America, for instance, American administrations were adamantfollowing the 1959 Cuban Revolution in particular that they would not tolerate anyfurther socialist governments in the hemisphere. President Johnson ordered 20,000US Marines to overthrow the government of the Dominican Republic in 1965 andPresident Nixon approved the overthrow of the socialist President of Chile, SalvadorAllende, on 11 September 1973. During the 1960s, countless efforts were made eitherto assassinate or overthrow Cuba’s Fidel Castro, especially in the aftermath of theBay of Pigs fiasco, which witnessed US-backed anti-Castro forces being routed bythe armed forces loyal to the socialist leader. When the United States was notattempting to promote revolution and/or turmoil, it was content to support violent anti-communist military regimes in Argentina, Brazil, Chile and Uruguay. In other partsof the world, regional allies such as Israel, Pakistan, South Korea and Taiwanreceived substantial financial and military forms of assistance because they werejudged to be significant in the wider struggle to prevent the Soviet Union fromextending its global influence.
While certainly not unique to the United States, the Soviets were also engaged in aprogramme of aid, development and intervention in an attempt to project a globalcommunist revolution. Some Third World states welcomed Soviet largesse – Indiawas one such beneficiary and many of its citizens were subsequently trained in
42
Soviet universities and institutions. Soviet allies such as Cuba also assisted in this globalmission – Cubans were based in Angola and played a vital role in buttressing thenational security capability of the country in the 1970s when it faced South Africanforces who used South West Africa (Namibia) to launch covert raids against thecountry, which was consumed by civil war for much of its postcolonial existence.Elsewhere, the Soviet Union provided support for revolutionary movements inCentral America, South East Asia and sub-Saharan Africa for much of the cold warperiod.
Not surprisingly, many members of the expanding Third World did not welcomethe intensification of the cold war. In 1961, the Non-Aligned Movement (NAM) wascreated after an earlier Afro-Asian conference in Indonesia. NAM was important inso far as it signalled a resistance to the bipolar strictures of the cold war. Recentlydecolonised states resented and resisted pressures from the superpowers to align withone side or another. The purpose of NAM was to find a ‘third way ’, one whichavoided the plutocratic structures of the West and party -based authoritarianism of theEast. It also sought to promote a different vision of development based on fairness,information and technological exchange and a reformed international politicalsy stem. By the early 1970s, NAM was joined by the so-called ‘Group of 77’ in theUnited Nations and advocates of a New International Economic Order (NIEO). TheNIEO was, alongside the term ‘Third World’, an expression of resistance againsthistoric and contemporary forms of colonialism and oppression. Unfortunately forthose campaigners, the early 1970s were turbulent years as rich countries such as theUnited States were rattled by oil shortages, the Vietnam debacle and the Watergatecrisis.
It was evident by the latter stages of the cold war that the ‘Third World’ was ahighly diverse group of countries that had enjoyed very different colonial-development trajectories. The political-economic condition of oil-producing statessuch as Nigeria, Saudi Arabia and Venezuela differed markedly from South EastAsian states such as Singapore and Taiwan. sub-Saharan Africa and Central Americaprobably contained some of the poorest states in the world, which were alsoimmersed in damaging civil wars and/or damaged by corrupt and violentdictatorships and military regimes. The cold war provided an opportunity for theseschisms and uncertainties to be exploited by the rich countries as they sought toextend ideological and economic influence. Tragically, millions perished as basicneeds such as access to clean drinking water proved less politically attractive thanexpenditure on the latest tank, ship and/or missile. This meant, ultimately, that thepotency associated with the NIEO/Third World movements dissipated and new termssuch as ‘the global South’ found favour (Prashad 2007).
The global South
43

Amidst a general feeling of despair and pessimism amongst many developmentadvocates and Third World academics, the United Nations-sponsored BrandtCommission reported on the state of the world in 1980 and 1983. Significantly, theCommission depicted a world divided between North and South and not a First,Second and Third World. In other words, whatever the ideological differencesbetween the Soviet Union and the United States and their respective allies, the worldwas really divided between the rich North and poor South. The Commission calledfor the North in particular to recognise that the world was more interdependent thanever before (globalisation had not been coined as a term at that stage) and to promotea more equitable form of global political economy. The message of the two reports,although hard-hitting and significant, was a victim of geopolitical timing.
With the Soviet invasion of Afghanistan in 1979, the cold war appeared to haveentered a new and more dangerous phase. A new US president, Ronald Reagan, wascommitted to confronting what he described as the ‘evil empire’. American andSoviet military spending increased and American financial assistance was used tofund anti-Soviet forces in Afghanistan and anti-communist movements in places suchas Nicaragua. The decision to fund anti-Soviet forces in Central Asia was particularlysignificant and arguably contributed to the emergence of the Al-Qaeda terrornetwork in the 1980s and 1990s (Johnson 2000). What all this meant for the South wasfairly straight forward – American and Soviet energies were directed towards thisglobal struggle and any thought of reconstructing the world-economy and globaldevelopment strategies was an irrelevance.
By the late 1980s, the Soviet Union was bankrupt and regimes in Eastern andCentral Europe were crumbling. In 1989, Germans on both sides of the divide toredown the Berlin Wall, the most practical and symbolic illustration of a dividedEurope. The so-called Velvet Revolution led to the undoing of all those formercommunist governments including the more brutal ones in Romania and EastGermany. Elsewhere, military regimes in Latin America were crumbling anddemocratic governments emerged. The ending of the cold war was apparentlycompleted when the Soviet Union folded in 1991. Some analy sts such as FrancisFukuy ama were swift to declare ‘the end of history ’ in so far as it signalled thetriumph of liberal democracy and market-based capitalism over state socialism andglobal communism (Fukuyama 1989). Whether or not that claim was justifiable, theending of the cold war did begin to bring to an end a confrontation that had claimedmillions of lives through proxy wars, government intervention and/or bombings.Democratic change in the 1990s was widespread and owed as much to the ending ofthe cold war as it did to a host of circumstances specific to particular places andregions.
Emerging markets and rising powers
44
Notwithstanding expressions of optimism regarding a global democratic revolution,the 1990s brought to the fore a stark realisation – the world remained highly divideddespite all the attempts of governments and policy advocates to promotedevelopment. Endeavours to promote poverty reduction and/or inequalities weremodest in scope and extent. Over the last twenty years, far more attention has beendevoted towards inequalities and mal-development but the results have been mixed.On the one hand, international organisations such as the International Monetary Fund(IMF) have promoted structural adjustment and good governance in return foreconomic assistance and aid spending. The 1996 initiative designed to promote debtrelief for a select number of Highly Indebted Poor Countries (HIPC) was criticisedfor demanding a range of measures such as privatisation in return for modest debtcancellation. This has led to accusations that these agencies are exercising a neo-colonial influence on countries in the global South. On the other hand, interest hasgrown in what was initially described as ‘emerging markets’ and later rising powerswith particular emphasis on Brazil, Russia, India and China (the so-called BRICs).
‘Emerging markets’ was first used by the World Bank in the 1990s and laterembraced by investment banks and fund managers. A decade later, the term onceapplied to countries such as Brazil and China transmogrified to another genericcategory ‘rising powers’ and then more specifically BRICs highlighting a small groupof countries either possessing substantial resources such as oil and gas and/ordemanding ever-greater resources as part of their national development trajectories.In the case of China, an export-led economic strategy also contributed to an ever-greater accumulation of foreign earnings and sponsor of foreign direct investment inAsia and Africa. China’s investment in Africa has grown markedly – in 2010 tradewas worth US$127 billion and Chinese investment valued at $40 billion (Fenby 2012:256). In return for access to natural resources, China invests in infrastructuralprojects and lends money, unlike the World Bank, with minimal conditions andwithout having to take responsibility for the colonial and cold war legacies bequeathedby the United States and European countries such as Britain.
While it is possible to overstate China’s economic power in the world, there is asense, however, that the BRICs are beginning to make their presence felt not only inplaces like Africa but also in the very institutional architecture created by the UnitedStates in the late 1940s. It is now common to speak of G20 meetings rather than theG7 or G8. In July 2009, the first BRIC summit was held in Russia and in March 2012the parties gathered again in India to discuss areas of common concern. One sucharea will be the dollar-centred monetary and financial international regime. Ifany thing, the ongoing financial slowdown (2008 onwards) in North American andEuropean economies stands in stark contrast to the economic performance ofcountries such as Brazil and China in particular.
What is noteworthy about the BRICs is their willingness to put forward alternative
45

visions for the international economic order in the future. New words, new labels andnew narratives are circulating with ever-greater force. In March 2009, for example,the governor of the People’s Bank of China proposed that the US dollar should bereplaced by a common currency created and managed by member countries. Theintent was to help promote a more productive investment regime and stimulateeconomic growth more widely. While North American and European economiescontinue to grapple with financial slowdown and investment paraly sis, the BRICs arebecoming ever-more confident in their reformist agenda to the point that officialsattached to the World Bank have warned that it will have to be taken very seriouslyindeed. The ‘Third World’, or at least part of it, has struck back. So-called ‘emergingmarkets’ such as Brazil and China are very much ‘emerged’ now.
ConclusionsThere is a great deal more to be said on this topic and this short chapter has onlytouched on the cold war origins of development and the subsequent connectionsbetween North and South including contemporary interest in rising powers, BRICsand emerging markets (Power 2003). The ending of the cold war did not bring theprofound changes that many campaigners hoped for in respect of substantial reformsin the terms and conditions of international trade and generous debt reduction. Anti-globalisation campaigners, alongside others such as Make Poverty History and theJubilee Campaign, have helped to capture global media attention and pressuriseNorthern governments into making concessions on debt, trade and aid spending.However, these concessions are often modest and then often cancelled out by theterms and conditions attached to aid and debt cancellation. But this is only one part ofthe story regarding terms such as ‘Third World’ and more recent incarnations.
Coinciding with the financial crisis affecting North America and Europe (2008onwards), there has been the most profound change involving countries such asBrazil, China and India. While terms such as ‘emerging markets’ and BRICs havebeen used in the last two decades to chart and classify their rising economic andpolitical profile, their presence in the world is clearly being felt in terms ofinvestment, production and consumption. These countries, with their owndevelopmental strategies, are creating new patterns of engagement with the ‘ThirdWorld’ and with what was once thought to be the ‘First World’. Moreover, it is strikingto note how Chinese military and intelligence gathering Western defence analy sts, ina manner reminiscent of the Soviet Union, are now tracking capabilities increasinglycarefully in the 1970s and 1980s.
Let me conclude by introducing yet more labels, but these are my currentfavourites when it comes to making sense of a changing geopolitical landscape. TheBulgarian writer, Tzvetan Todorov, describes what he terms ‘appetite’ states such asChina and ‘anxiety ’ states such as the United States (Todorov 2010). This captures
46

well, from a Western perspective at least, some of the ongoing concern about whatthese rapacious states might yet do in terms of consuming non-renewable resourcessuch as oil and gas as well as changing the basic terms and conditions of theinternational financial and political order. All of this helps to remind us, especiallythose of us who have grown up in the shadow of American geopolitical power and theprimacy of the English-speaking world, that there are other ways of knowing andmaking sense of the world around us.
ReferencesFenby , J. (2012) Tiger Head, Snake Tails. New York: Simon Schuster.Fukuy ama, F. (1989) ‘The end of history ’. National Interest. Available online at
www.wesjones.com/eoh.htmJohnson, C. (2000) Blowback: The Costs and Consequences of American Empire. New
York: Henry Holt.Power, M. (2003) Rethinking Development Geographies. London: Routledge.Prashad, V. (2007) The Darker Nations: A People’s History of the Third World . New
York: New Press.Sidaway, J. (2012) ‘Geographies of development: New maps, new visions’.
Professional Geographer 64: 49–62.Slater, D. (1993) ‘The geopolitical imagination and the enframing of development
theory ’. Transactions of the Institute of British Geographers 18: 419–437.Todorov, T. (2010) The Fear of the Barbarians. Cambridge: Polity .Westad, O. (2005) The Global Cold War. Cambridge: Cambridge University Press.
Further readingJacques, M. (2009) When China Rules the World . London: Verso. On the impact of
China and its presence in the world.Power, M. (2003) Rethinking Development Geographies. London: Routledge. For an
insightful guide to development geographies and the contested geopolitics ofneoliberalism.
Westad, O. (2005) The Global Cold War . Cambridge: Cambridge University Press.An excellent account of the impact of the cold war on the Third World.
WebsitesG8: www.g8.co.ukMake Poverty History : www.makepovertyhistory .orgWorld Trade Organisation: www.wto.org
47

1.3The nature of development studies
Robert B. Potter
The development of development studies: An overviewThe development of development studies as an academic subject that can be studiedat university dates from the 1960s. In a review of the history of the field, Harriss(2005) puts its origins in a number of mainly British economists and other socialscientists who were unhappy with the insights that were being provided at that time byexisting social science subjects, notably traditional or classical economics. Thesetraditional approaches basically emphasised the importance of quantitative paths tothe study of societies and economies. These approaches were seen as reflecting alogical positivist orthodoxy that dominated the social sciences at that time, and whichstressed the importance of hypothesis testing and statistical verification as theparamount sources for knowledge and advancement.
It was at this precise juncture in the 1960s that the ‘new universities’ were beingestablished in the United Kingdom. These new tertiary educational institutions werepremised on the idea of ‘doing things differently ’. In particular, the new universitieswere keen to promote multi- and inter-disciplinary studies that cut across theboundaries of existing, traditional disciplines. Changes in both thinking and practice atthis point were also closely linked with the growth of radical Marxist approaches inthe 1960s within society as a whole (Harriss, 2005; Kothari, 2005).
The Institute of Development Studies was established at the University of Sussex in1966 and represented a founding institution. Seven years later in 1973, the firstundergraduate teaching programme in the field of development studies opened at theUniversity of East Anglia. In the meantime, development studies has spread as anacademic discipline to other universities such as Oxford, Manchester, Bath, SOASLondon, LSE and Birmingham among others, and has remained quite strongly British.In the words of Harriss (2005: 18): ‘[d]evelopment studies has been, institutionally, adistinctively British and to a lesser extent other European field of study.’ Of course,over the y ears, scholars from developing countries have made fundamentalcontributions. Even to this day , the field means relatively little in the United States, forexample, although similar issues are studied in cognate fields such as internationalrelations, politics, economics and geography (see Potter et al. 2012).
It can be argued that, rather than being either inter- or multidisciplinary,
48

development studies can make a strong claim to be cross-disciplinary in nature in thatit serves to bring together a large number of fields in the study of poverty andinequality. This is represented in graphical summary form in Figure 1.3.1. Thecentral concern of development studies may be regarded as the existence andseemingly inexorable deepening of global poverty and inequality .
Figure 1.3.1 The various disciplines contributing to the cross-disciplinary field ofdevelopment studies
In its early stages, ‘break-away’ economists were strongly involved in the rise ofdevelopment studies. Reflecting this in the core discipline, a distinct sub-disciplinewithin economics can be recognised that is now conventionally referred to as‘development economics’ ( Figure 1.3.1). Geographers, with their strong tradition ofregional and area studies represented another area of involvement and interest. In thesame manner as in the case of economics, the rise of ‘development geography ’ as adistinct field can be recognised.
Other mainstream social science disciplines, such as politics and sociology, alsocontributed to the rise of development studies and, equally, came to be characterisedby home disciplinary patches, known respectively as the sociology of developmentand the politics of development (Figure 1.3.1). Attesting to the truly cross-disciplinarycharacter of the field, subjects such as demography, international relations,anthropology and history, as well as urban and regional planning should also beidentified as making a distinct contribution to development studies (Figure 1.3.1).
49
The evolution of thinking about development in relation to the development of thesocial sciences since the 1940sNotwithstanding the mixed disciplinary genealogy of development studies, there isfrequently a tendency to link its development to the evolution of human geography.For example, this was expressed by the alignment of the field of development studiesas a sub-discipline of geography in successive research assessment exercises in theUK until 2008.
In a recent essay, Potter and Conway (2011) have attempted to summarise theevolution of thinking about development in relation to the advancement of geographyand other social sciences since the 1940s. Presented in summary terms, such anaccount serves to stress the similarities and differences in focus that havecharacterised development practice, development geography and developmentstudies over the past sixty years. In the account below, which draws on Potter andConway (2011), we look at this decade by decade.
The 1940s
The modern roots of development practice can be traced to the immediate post-Second World War period and to the inaugural speech made by United StatesPresident Truman in 1947. In this Truman stated that it was the responsibility of richnations to develop poorer countries in their own image. In this period, during whichdevelopment was emerging, geography was characterised by forms ofdevelopment-oriented enquiry that might be described as ‘colonial’, ‘military ’,‘tropical’ and ‘regional’ geographies. Interest in the ‘great overseas’ had beenstimulated initially by consideration of the countries making up the British empireunder colonialism. Then, between 1939 and 1945, a number of British geographerstravelled to countries such as Singapore, Egypt, India and Cey lon (present-day SriLanka) as part of their wartime military service. The main statement on developmentcame with the publication of the French geographer Pierre Gourou’s (1947) textTropical Geography. In addition, aspects of development had always formed part ofthe bread and butter of geography, in the guise of regional geography. But as alreadynoted, there was no recognisable field of development studies per se at this juncture.
The 1950s
The decade of the 1950s was strongly involved with post-Second World Warreconstruction and economic development. The ultimate goal was seen as theapplication of the historical-development experience of the rich nations in thedevelopment of the poorer nations. Development policy came to be stronglyassociated with classical economic theory during this period. This emphasised theimportance of ‘liberalising’, or freeing-up trade at the global level. At the national
50
level, the approach mainly advocated concentrating development around naturalgrowth poles. At this time, underdevelopment was regarded as an initial state beyondwhich Western industrial nations had managed to progress. It was envisaged that theexperience of the West could assist other countries in catching up by sharing capitaland technology. Thus, the approach was very much a Western one and was top-down. In the field of geography, the period was associated with the spread of what isstill referred to as the ‘new geography ’. This was based on the search for generalisedexplanations of the real world by means of the development of models and the use ofquantitatively derived generalisations and laws. There was still no separate field ofdevelopment studies as such.
The 1960s
The 1960s saw the emergence of radical political perspectives within both society asa whole as well as within mainstream social science subjects, albeit to a greater orlesser extent. A major development was the emergence of what came to be called‘dependency theory ’, which had its roots in Latin American and Caribbeandevelopment. Dependency theory essentially argued that the global pattern ofWestern-dominated development had served to keep the poor world poor, rather thanserving to aid its accelerated development. Dependency theory thereby representedan almost complete rebuttal of classical and neo-classical economic approaches tothe challenges of development, based on the ‘spread’ of the Western model. It arguedthat less developed countries would do better to de-link from the developed world andto follow an alternative development path. Despite this radical ferment in the widersocial sciences in the 1960s, by contrast, it was the quantitative revolution that wascoming to fruition in geography . But, by this time, the seeds were already being sownfor the development of cross-disciplinary development studies, as already noted interms of the establishment of the Institute for Development Studies at the Universityof Sussex in 1966.
The 1970s
It was the early 1970s that saw the emergence of more radical approaches in thefield of geography. A landmark publication was David Harvey ’s Social Justice andthe City in 1973. Harvey ’s and others’ analy ses gave rise to an increasing acceptanceof political-economic, or structuralist approaches in human geography by the mid-1970s. Such an orientation was more encouraging to the emergence of a distinctdevelopment geography as a sub-discipline, although the term itself was little used atthat stage. In a further series of developments, dissatisfaction with the quantitativerevolution gave rise to avowedly humanistic approaches, which stressed thesubjectivity of phenomena and knowledge. At the same time, alternative and more
51

humanistically oriented approaches were coming to influence thinking aboutdevelopment practice, in what is often referred to as the emergence of ‘anotherdevelopment’. This was anchored in a growing critique of urban-based, top-down,centre-out neo-classically inspired development policies. Moreover, it was at thisvery juncture that, as noted before, the first development studies undergraduatedegree programme was introduced at the University of East Anglia in 1973.
The 1980s
In the 1980s, development practice and policy were broadly characterised by therise of what can be referred to as the ‘New Right’ in Europe and ‘Neoconservatism’ inthe United States. This is also referred to as the rise of the neoliberal agenda, thestrong view that liberal free trade and unregulated free markets should be left to makeeconomic decisions and that they will do so rationally and effectively. Thus the NewRight sung the praises of the unrestrained power of the unregulated free market. InBritain, full-blown neoliberalism came in the form of Margaret Thatcher’s ‘popularcapitalism’, and in the United States it was witnessed by President Reagan’s‘Reaganomics’. Both Thatcher and Reagan pushed for the extension of privatemarket-inspired controls into the public sector. While development studies can beseen to have started consolidating as a field during the 1980s, and despite theemergence of common concerns between geography and development studies at thistime, the focus of geography remained firmly in the fields of cultural and historicalgeography and the accent was mainly placed on Europe and North America.Survey s carried out at the time showed that what could be recognised as developmentgeography was at best taught by one specialist member of staff in the majority ofBritish geography departments (Potter and Unwin, 1988; Unwin and Potter, 1992).
The 1990s
Postmodernism emerged as an alternative paradigm for the social sciences at thestart of the decade. The approach was associated with the rejection of meta-theoriesand meta-narratives – that is the big explanations that had come to be associated withmodernising as the inevitable path to development. Instead, postmodernism suggestedthat emphasis should be placed on a wide range of possibly discordant and evencontradictory views, voices and discourses. Thus, ‘development’ was one of the verymeta-narratives that was to be questioned, giving rise to what have been referred toas ‘anti-’, ‘post-’ and ‘beyond-’ development stances. In particular, at this juncture, thequestion asked was whether the ‘development mission’ as posed in the 1940s, 1950sand bey ond, could ever have been successful given its essentially Eurocentric stanceand origins in Western experience and thought. In short, the move toward a distinctlypostmodern turn might be interpreted as having given rise to doubts, uncertainties and
52

reflections in both development studies and the social sciences in general. In thatsense, the 1990s might be seen as having given rise to something of a greater degreeof possible commonality between geography and development studies as academicfields. However, there is a critical, alternative interpretation of postmodernity, onethat argues it is nothing more than the next logical stage in the progress of modernity.Such a view sees postmodernity as the latest manifestation of late capitalism, seeingindividual and group choice being hailed and promoted in an essentially free-marketsetting.
The 2000s onward
Potter and Conway (2011) argue from the point of view of geography as an overalldiscipline, that since the turn of the new millennium, matters seem to have beenchanging for the better, and that there have emerged some grounds for optimism,both within the discipline and the development establishment more generally. Thus,there have been definite signs of a more positive view of development-related issuesin geography as a discipline, albeit borne out of the pressing global developmental-geopolitical crises the world currently faces: ‘(t)he world is now so deeply unequalthat the need for a truly global geography has never been greater’ (Potter andConway, 2011). There are signs that the geographical study of critical development-oriented issues is starting to become more valued and central to geography as awhole. This certainly needs to be the case in the twenty -first century as an era thatfaces the pressing realities of the global financial crisis, the other geographicalrealities of unregulated and unruly globalisation, transnationality, global conflict andenvironmental change and, in particular, climate change.
Bibliography and Further ReadingGourou, P. (1947) Les Pays Tropicaux: Principes d’une Geographie Humaine et
Economique. Paris: Presses Universitaires de France.Harriss, J. (2005) ‘Great promise, hubris and recovery : A participant’s history of
development studies’. In U. Kothari (ed.) A Radical History of DevelopmentStudies: Individuals, Institutions and Ideologies. London: Zed Books, pp. 17–46.
Harvey , D. (1973) Social Justice and the City. London: Arnold.Kothari, U. (ed.) (2005) A Radical History of Development Studies: Individuals,
Institutions and Ideologies. London: Zed Books.Kothari, U. (2005) ‘A radical history of development studies: Individuals, institutions
and ideologies’. In A Radical History of Development Studies: Individuals,Institutions and Ideologies. London: Zed Books, pp. 1–14.
Potter, R. and Conway, D. (2011) ‘Development’. In J. A. Agnew and D. N.Livingstone (eds) The Sage Handbook of Geographical Knowledge. London: Sage,
53

pp. 595–609.Potter, R. B. and Unwin, T. (1988) ‘Developing areas research in British geography ’.
Area 20: 121–126.Potter, R. B., Conway, D., Evans, R. and Lloy d-Evans, S. (2012) Key Concepts in
Development Geography. Los Angeles: Sage.Unwin, T. and Potter, R. B. (1992) ‘Undergraduate and postgraduate teaching on the
geography of the Third World’. Area 24: 56–62.
54

1.4The impasse in development studies
Frans J. Schuurman
IntroductionDevelopment studies is a relatively new branch of the social sciences. Coming intobeing in the late 1960s and early 1970s, it inherited many features of post-SecondWorld War developments within the social sciences. Modernization theorycontributed to its developmental orientation and its comparative methodology. Fromdependency theory it inherited its normative and progressive political character andits interdisciplinary conceptual frameworks.
In the 1970s, with dependency theory denouncing modernization theory as cry pto-imperialist and modernization theorists hitting back by accusing dependency authorsof being populist pseudo-scientists, development studies found fertile ground and grewinto an increasingly accepted new discipline of the social sciences. Universities –often under pressure from leftist professors and students – created Third WorldCentres. Debates about the nature and impact of development assistance becamepopular, and the existence of many dictatorial regimes in the South led to numeroussolidarity committees in the North. In the 1980s, things started to change fordevelopment studies. A number of occurrences in that decade, which will be dealtwith in the following paragraphs, led to an increasingly uneasy feeling within thediscipline that old certainties were fading away. It was felt that development theoriesin the sense of a related set of propositions of the ‘if … then’ kind, could ever lessadequately explain experiences of development and underdevelopment. Whether itconcerned modernization theories or neo-Marxist dependency theories, both sets ofdevelopment theories were losing out in terms of their explanatory power. From themid-1980s onwards, the so-called ‘impasse in development studies’ was talked about.The contours of this impasse were sketched for the first time in a seminal article byDavid Booth in 1985. In the y ears that followed, other authors continued thediscussion, which took on new dimensions with the end of the cold war and the debateon globalization.
Reasons for the impasseThree reasons can be held responsible for having changed the panorama fordevelopment studies to such an extent that it created this theoretical impasse.
55

Chronologically they were: (a) the failure of development in the South and thegrowing diversity of (under)development experiences; (b) the postmodernist critiqueon the social sciences in general and on the normative characteristics of developmentstudies in particular and, finally ; (c) the rise of globalization in its discursive as well asin its ontological appearance. Each of these issues is considered in the account thatfollows.
The failure of development in the South
Although until the 1980s developing countries realized average improvements in lifeexpectancy, child mortality and literacy rates, more recent statistics have shown,however, that these improvements were less valid for the poorest of these countriesand, more specifically, for the lowest income groups. In fact, in the 1980s there wasa reversal in some of the development indicators. It was realized that given thegrowth rates of that time, it would take another 150 years for Third World countries toachieve even half the per capita income of Western countries. Modernization theoriesfailed to account for these figures and trends. Instead of a self-sustained growth (amuch favoured concept of modernization), many developing countries were up totheir ears in debt, which served to paraly se development initiatives.
Problems such as unemployment, poor housing, human rights offences, povertyand landlessness were increasing at alarming rates. UNICEF estimated a fall of 10–15 per cent in the income of the poor in the Third World between 1983 and 1987. In1978, the Third World received 5.5 per cent of the world’s income; in 1984 this hadfallen to 4.5 per cent. The ‘trickle-down’ process (another favoured concept ofmodernization) had failed miserably. In 1960, the income ratio between the world’srich and poor countries was 20 : 1; in 1980 it increased to 46 : 1; and in 1989, the ratiowas as high as 60 : 1.
Although dependency theory could certainly not be accused of an over-optimisticview concerning the developmental potentials of developing countries, it could notreally account for the growing difference between Third World countries, nor werethe developmental experiences of so-called socialist countries particularly enviable.In addition, Marxist and neo-Marxist development theories were dealt a heavy blowwhen the fall of the Berlin Wall meant the delegitimization of socialism as a politicalproject of solving the problem of underdevelopment.
The postmodernist critique of the social sciences
The 1980s witnessed the advancement of postmodernism within the social sciences,bringing with it a tendency to undermine the ‘great narratives’ of capitalism,socialism, communism and so forth. The basic argument was that there is nocommon reality outside the individual. As such, political alternatives, which alway s
56

exist by the grace of a minimum of common perception, were manoeuvred out ofsight. Development theories based on meta-discourses or on the role of a collectiveemancipatory agency lacked, according to the postmodern logic, a sound basis. TheEnlightenment ideal of the emancipation of humanity (shared by modernization anddependency theory alike) had not been achieved nor could it be achieved. In addition,in its quest for hidden metaphors, the postmodern method of deconstruction revealedthat the notion of development contained a number of hidden and unwarrantedevolutionist, universalist and reductionist dimensions which would definitely leadany one working with this notion down the wrong path. As such, development studiesbecame a direct target for a wide range of views furthering the notion of ‘alternativedevelopment’. Under postmodernist, or perhaps better put, anti-modernist pressures,the central object of development studies – unequal access to power, to resources, toa humane existence – became increasingly substituted by something like‘socioeconomic diversity ’. Apparently, the notion of diversity was considered toavoid the hidden universalist (read: Western or imperialist) and reductionistdimensions which inequality brought with it. At the same time, others considered thisswitch to a voluntarist and pluralist approach to the development problem not only asanathema, but also as inferior to a universalistic emancipation discourse.
Globalization
In the 1990s, the forces which had led to the impasse in development theories werejoined by the discourse on globalization. Although the most recent factor, it probablyrepresents the most important positive challenge to development studies. Whetherglobalization is a real phenomenon (cf. Hirst and Thompson, 1996), or nothing morethan a discourse to legitimize neoliberal market logic, it is undeniable that it has had amajor influence on development studies in the 1990s. To understand why this is so, itis important to realize the significance of the (nation-)state for social science theoriesin general, and for development studies in particular.
It is the declining, or at least changing, position and status of the (nation-)statewhich has been, and still is, at the core of the literature on globalization. As aninterdisciplinary branch of the social sciences, theories within development studiestry to connect economic, political and cultural aspects of inequality and developmenttrajectories. The connection between these aspects is realized by using the (nation-)state as a linchpin. As such, theories of economic development became focusedupon the workings of the national market and on economic relations betweencountries. In theories of political development, the role of the state and the process ofnation-building were central objects of study. In more culturalistic developmenttheories, the notion of a national identity was crucial in understanding the differencesbetween development trajectories. This importance of the (nation-)state becamevisible in modernization theories, in neo-Marxist and Marxist development theories
57

12
3
alike. Globalization changed all that. Many authors writing about globalization agreeon the decreasing, or at least the changing, economic, political and culturalimportance of (nation-) states. The central role of the state, it is said, is beinghollowed out from above as well as from below. In a political sense, there is theincreasing importance of international political organizations which interferepolitically and also militarily in particular states. In this way, they relegate to the pastthe Westphalian principles about the sovereignty of (nation-)states and theirmonopoly on the use of institutionalized violence within their borders. The nationalstate is hollowed out from below by the growing phenomenon of decentralization andlocal government.
Economically, the state is seen as disappearing as an economic actor throughprivatization supported by deregulation. Also, there is the growing importance of theglobal financial market where about $1,500 billion is shifted daily around the globe.Culturally, the idea of national identity as the central element in identity constructionfor individuals or groups is quickly eroding, in favour of cosmopolitanism on the onehand and/or the fortification of ethnic, regional and religious identities on the other.
It is not only that the globalization debate gives reason to suppose that the role of the(nation-) state has been, and still is, declining but also that, as a consequence, theformer conjunctive dy namic (i.e. following the same spatial and time paths) ofeconomy, polity and culture – on which the interdisciplinary character of many adevelopment theory was based – has been replaced by a disjunctive dynamic (cf.Appadurai, 1990). Development studies has yet to redefine its object and its subject –as have the other social sciences – vis-à-vis globalization but this quest presents muchmore of a challenge than the former impasse ever did.
ConclusionThe impasse in development studies can in fact be traced back to a crisis ofparadigms. The three reasons which were mentioned as being responsible for theimpasse and its deepening – the lack of development and increasing diversity in theSouth, the postmodernist critique on ‘grand narratives’, and globalization – challenged,respectively , three post-Second World War developmental paradigms. These were:
The essentialization of the Third World and its inhabitants as homogeneous entities;The unconditional belief in the enlightenment concepts of progress and the‘makeability ’ of society ;The importance of the (nation-)state as an analy tical frame of reference and apolitical and scientific confidence in the state to realize progress.
Each of these paradigms came in for criticism, one after the other. Developmenttheories related to these paradigms (such as modernization and dependency theories)
58

became automatically tainted as well, initiating the so-called impasse in developmentstudies.
However, in spite of this impasse, an important number of authors in the field ofdevelopment studies have continued their work, some using more grounded theories,others try ing to elaborate on new concepts like civil society, global governance andglobal social movements. Many feel that the growing inequality between, as well aswithin, North and South is enough of a reason to continue with development studies.To fit this effort in with the new reality shaped by globalization presents a new andexciting challenge, and one which relegates the impasse to a past period.Nevertheless, from well into the twenty -first century looking back upon the impasse,development studies has never been the same since. The aforementioned crisis in thethree post-Second World War developmental paradigms served as academicwarning flags, which, since the impasse, led to an almost continuous process ofrethinking that needs to be explained, and the various explanations that have been usedin development studies.
ReferencesAppadurai, A. (1990) ‘Disjuncture and difference in the global cultural economy ’, in
M. Featherstone (ed.) Global Culture, Nationalism, Globalization and Modernity,London: Sage, pp. 295–311.
Booth, D. (1985) ‘Marxism and development sociology : interpreting the impasse’,World Development 13: 761–87.
Hirst, P. and Thompson, G. (1996) Globalization in Question, Cambridge: PolityPress.
Further readingCorbridge, S. (1989) ‘Marxism, post-Marxism and the geography of development’, in
R. Peet and N. Thrift (eds) New Models in Geography, Vol. 1, London: UnwinHyman, pp. 224–54; identifies and elaborates upon three dimensions in Booth’scritique of neo-Marxist development theories, that is, essentialism, economism andepistemology .
Edwards, M. (1989) ‘The irrelevance of development studies’, Third World Quarterly11(1): 116–36; approaches development theories from the point of view of thepractitioner.
Hearn, D. (ed.) (1999) Critical Development Theory: Contributions to a NewParadigm, London: Zed Books.
Ley s, C. (1996) The Rise and Fall of Development Theory, London: James Currey ;especially chapter 1 (pp. 3–45) provides a seminal overview of the post-SecondWorld War development theories.
59

Munck, R. and O’Hearn, D. (eds) (1999) Critical Development Theory: Contributionsto a New Paradigm, London: Zed Books.
Schuurman, Frans J. (ed.) (1993) Beyond the Impasse: New Directions inDevelopment Theory, London: Zed Books; provides a general overview of thedimensions of the impasse and the attempts to develop new theories as well as theproblems and possibilities of these attempts.
Simon, D. and Närman, A. (eds) (1999) Development as Theory and Practice:Current Perspectives on Development and Development Co-operation, Harlow:Longman.
Vandergeest, P. and Buttel, F. (1998) ‘Marx, Weber, and development sociology :Bey ond the impasse’, World Development 16(6): 683–95; focuses on Booth’scritique upon the underly ing meta-theoretical assumptions of Marxism, pointing outthe necessity of looking within the heterogeneity of developing countries forcommon denominators.
Willis, K. (2005) Theories and Practices of Development, London: Routledge.
60

1.5Development and economic growth
A. P. Thirlwall
The economic and social development of the world’s poorest countries is perhaps thegreatest challenge facing society at the present time. Over one billion of the world’sseven billion population live in absolute poverty ; the same number suffer variousdegrees of malnutrition, and millions have no access to safe water, healthcare oreducation. This poverty is concentrated largely in countries described as ‘developing’,and coexists with the affluence enjoyed by the vast majority of people in countriesdescribed as ‘developed’.
The standard of living of people is commonly measured by the total amount ofgoods and services produced per head of the population, or what is called grossdomestic product (GDP) per capita (or gross national product (GNP) per capita if netincome from abroad is added). This, in turn, is determined by the number of peoplewho work, and their productivity . The basic proximate cause of the poverty of nationsis the low productivity of labour associated with low levels of phy sical and humancapital (education) accumulation, and low levels of technology .
Income per head in a country is naturally measured in units of its own currency,but if international comparisons of living standards are to be made, each country ’sper capita income has to be converted into a common unit of account at some rate ofexchange. The convention is to take the US dollar as the unit of account and converteach country ’s per capita income into dollars at the official exchange rate. Acountry ’s official exchange rate, however, is not necessarily a good measure of therelative purchasing power of currencies, because it only reflects the relative prices ofgoods that enter into international trade. But many goods that people buy are nottraded, and the relative price of these non-traded goods tends to be lower the poorerthe country is, reflecting much lower relative labour costs. An exchange rate isrequired which reflects the purchasing power parity (PPP) of countries’ currencies,and this is now provided by various international organizations, such as the WorldBank, which uses US$1.25 per day measured at PPP to define the level of absolutepoverty .
The economic growth of countries refers to the increase in output of goods andservices that a country produces over an accounting period, normally 1 year. If acountry is said to be growing at 5 per cent per annum, it means that the total volumeof its domestic output (GDP) is increasing at this rate. If population is growing at 2 per
61

cent per annum, this means that output per head (or the average standard of living) isgrowing at 3 per cent per annum.
Economic growth, however, is not the same as economic development. Theprocess of economic (and social) development must imply a growth in livingstandards, but it is a much wider concept than the growth of per capita income alone.Growth, it might be said, is a necessary condition for the economic and socialdevelopment of nations, but it is not a sufficient condition because an aggregatemeasure of growth or per capita income pay s no attention to how that output isdistributed amongst the population; it say s nothing about the composition of output(whether the goods are consumption goods, investment goods or public goods such aseducation and health provision), and it gives no indication of the physical, social andeconomic environment in which the output is produced. In short, the growth rates ofnations cannot be taken as measures of the increase in the welfare of societiesbecause the well-being of people is a much more inclusive concept than the level ofincome alone.
If the process of economic and social development is defined in terms of anincrease in society ’s welfare, a concept of development is required which embracesnot only economic variables and objectives, but also social objectives and values forwhich societies strive. Many economists and other social scientists have attempted toaddress this issue, and here we mention the ideas of two prominent thinkers in thefield: Denis Goulet and Amartya Sen (who in 1998 won the Nobel Prize forEconomics for his work on the interface between welfare and developmenteconomics).
Goulet (1971) distinguishes three basic components or core values that he arguesmust be included in any true meaning of development which he calls life sustenance,self-esteem and freedom. Life sustenance is concerned with the provision of basicneeds. No country can be regarded as fully developed if it cannot provide all itspeople with such basic needs as housing, clothing, food and minimal education. Acountry may have a relatively high average standard of living and an impressivegrowth performance over several y ears, but still have a poor provision of basicneeds, leaving large sections of the population in an underdeveloped state. This issueis closely related to the distribution of income in societies measured by the share oftotal income going to the richest and poorest sections of society. The distribution ofincome is much more unequal in poorer developing countries than in richerdeveloped countries, and it is perfectly possible for a poor country to be growing fast,y et its distribution of income to be worsening because the fruits of growth accrue tothe rich. Such a country would have grown, but it would not have developed if theprovision of basic needs for the poorest groups in the community had not improved.
Self-esteem is concerned with the feeling of self-respect and independence. Acountry cannot be regarded as fully developed if it is exploited by others, or cannot
62

conduct economic relations on equal terms. In this sense, the colonization of largeparts of Africa, Asia and South America kept the countries in these regions of theworld in an underdeveloped state. Colonialism has now virtually ended, but somewould argue that there are modern equivalents of colonialism, equally insidious andanti-developmental. For example, the International Monetary Fund (IMF) and WorldBank dominate economic policy -making in many developing countries, and many ofthe policies that the countries are forced to pursue are detrimental to development.Also, multinational corporations that operate in many developing countries oftenintroduce consumption patterns and techniques of production which are inappropriateto the stage of development of the countries concerned, and to that extent impairwelfare. In international trade, poor and rich countries do not operate on a levelplay ing field, and the strong may gain at the expense of the weak. The distribution ofthe gains from trade are not equitably distributed, not least because the terms of tradeof primary producing developing countries (i.e. the price of their exports relative tothe price of imports) tends to deteriorate through time (at an average rate of about 0.5per cent per annum for at least the last century ).
Freedom refers to the ability of people to determine their own destiny. No personis free if they are imprisoned on the margin of subsistence with no education and noskills. The great benefit of material development is that it expands the range of choiceopen to individuals and to societies at large. For the economic and social developmentof a country, however, all must participate and benefit from the process of growth,not just the richest few. If the majority are left untouched, their choices remainlimited; and no person is free if they cannot choose.
Sen (1983, 1999) argues in a similar vein to Goulet that economic growth shouldnot be viewed as an end in itself, but as the means to the achievement of a muchwider set of objectives by which economic and social development should bemeasured. Development should focus on, and be judged by, the expansion ofpeople’s ‘entitlements’, and the ‘capabilities’ that these entitlements generate, andincome is not always a good measure of entitlements. Sen defines entitlements as ‘theset of alternative commodity bundles that a person can command in a society usingthe totality of rights and opportunities that he or she faces’. For most people, thecrucial determinants of their entitlements depend on their ability to sell their labourand on the price of commodities. Employment opportunity, and the level ofunemployment, must therefore be included in any meaningful definition ofdevelopment. Entitlements also depend on such factors as what individuals canextract from the state (in the form of welfare provision); the spatial distribution ofresources and opportunities, and power relations in society. Sen (1984) has analy sedmajor world famines using the concept of entitlements and finds that several famineshave not been associated with a shortage of food, but rather with a lack ofentitlements because the food supply has been withdrawn from certain parts of the
63

country or sections of society , or food prices have risen.The thinking of Goulet, Sen and others has led to the construction of alternative
measures of economic and social development to supplement statistics on growthrates and levels of per capita income of countries. The most notable of thesemeasures are the Human Development Index (HDI) and the Human Poverty Index(HPI) compiled by the United Nations Development Programme (UNDP) andpublished in its annual Human Development Report. These alternative indices of theeconomic well-being of nations do not alway s correlate well with per capita income.The same growth rate and per capita income of countries can be associated withvery different levels of achievement in other spheres such as life expectancy, deathrates, literacy and education. As the UNDP says in its 1997 Report: ‘although GNPgrowth is absolutely necessary to meet all essential human objectives, countriesdiffer in the way that they translate growth into human development’.
The UNDP’s Human Development Index is based on three variables: lifeexpectancy at birth; educational attainment, measured as the geometric mean of theaverage and expected y ears of schooling; and the standard of living measured byreal per capita income measured at PPP (see earlier). These variables are combinedin a composite index that ranges from 0 to 1 (see Thirlwall, 2011, for details).Comparing the ranking of developing countries by their HDI and per capita incomeshow some interesting divergences. Many oil-producing countries, for example, havemuch lower HDI rankings than their per capita income rank, while some poorcountries rank relatively high by their HDI because they have deliberately devotedscarce resources to human development. Countries such as Cuba, Venezuela,Jamaica and some former states of the Soviet Union fall into this category .
The UNDP’s multidimensional Human Poverty Index is based on indices ofeducation; nutrition; child mortality ; and access to safe water, sanitation andelectricity. The ranking of countries by their HPI also shows some striking contrastswith their ranking by per capita income. The UNDP has calculated that the cost oferadicating poverty across the world is relatively small compared to global income –not more than 0.3 per cent of world GDP – and that political commitment, notfinancial resources, is the real obstacle to poverty eradication.
To conclude, economic growth is not the same as economic development. Theannual growth rate of a country is a very precise measure of the growth of the totalvolume of goods and services produced in a country during a year but say s nothingabout its composition or distribution. Growth is a necessary condition for real incomeper head to rise, but it is not a sufficient condition for economic development to takeplace because development is a multi dimensional concept which embracesmultifarious economic and social objectives concerned with the distribution ofincome, the provision of basic needs, and the real and psychological well-being ofpeople. Many poor countries in the last 30 y ears have experienced quite a
64

respectable rate of growth in living standards – averaging 2–3 per cent per annum –but the absolute number in poverty has continued to rise, and the distribution ofincome has become more unequal. Equally , at the global level, there is little evidenceof the convergence of per capita incomes across nations. The poor countries havebeen growing, but the rich countries have been growing as fast, if not faster, in percapita terms. While the eradication of poverty, and the narrowing of the rich–poorcountry divide, remains one of the great challenges of the new millennium,economic growth in poor countries is not enough by itself for economic and socialdevelopment to take place when viewed in a broader perspective.
BibliographyGoulet, D. (1971) The Cruel Choice: A New Concept on the Theory of Development,
New York: Atheneum.Sen, A. (1983) ‘Development: which way now?’, Economic Journal, December.Sen, A. (1984) Poverty and Famines: An Essay in Entitlement and Deprivation,
Oxford: Clarendon Press.Sen, A. (1999) Development as Freedom: Human Capability and Global Need, New
York: Knopf.Thirlwall, A. P. (2011) Economics of Development: Theory and Evidence (9th edn),
London: Palgrave-Macmillan.United Nations Development Programme (1997 and 1999) Human Development
Report, New York: Oxford University Press.
65

1.6Development and social welfare/human rights
Jennifer A. Elliott
Critical development studiesIt is currently well-established that human well-being, including individual civil andpolitical liberties, as well as meeting the physical and material needs of humansociety, are key concerns for development, both as outcomes and conditions forsustained progress. Issues of economic and social justice, democracy,empowerment, ethics and human dignity suffuse development theory and theactivities of many institutions including the United Nations and the World Bank, donororganisations, NGOs and social movements alike. Understanding of poverty as ahuman rights issue, for example, has risen with recognition of the growing social andeconomic disparities at all scales and the multidimensional nature of poverty asencompassed within the Millennium Development Goals. Many different groups nowuse the discourse of human rights to shape their agendas and practices indevelopment such as with women’s rights and indigenous rights. For those adopting arights-based approach to development, the overarching goal is the realisation of allhuman rights for all people. In short, there has been the ‘insertion of a criticalsensibility ’ (Radcliffe, 1999: 84) into development studies in recent decades throughwhich ‘many new problems as well as old ones’ (Sen, 1999: xi, emphasis added) arebeing widely conceptualised in terms of human rights and freedoms. This chapteridentifies some of the key changes through which the discourses and practice ofdevelopment can be considered to have become more morally informed.
Rights and development as separate concernsAlthough human rights and well-being were undoubtedly concerns in the 1940s and1950s within international institutions, amongst governments of newly independentcountries and in the emergent discipline of development studies, it has been arguedthat the predominant ideas and practices of development at that time were oftendevoid of ethical considerations and separate from those ‘marked out fordevelopment’ (Corbridge, 1999: 69). For example, ideas of progress during thatperiod were generally sy nonymous with economic growth and the modernisation oftraditional societies. In so far as welfare and rights issues were considered, it wasassumed that these would follow as outcomes of processes of economic
66

development.The integration of human rights into development practice was also significantly
compromised by the cold war. Whilst the 1948 Universal Declaration on HumanRights emphasised the universality of rights, the collective goal for humanity ofrealising those rights and the range of civil, political, economic, social and culturalrights for all, ideological divisions between Western liberal democracies and theEastern bloc led to a separation of human rights activities within the UN itself andbetween countries. In 1966, for example, two separate international conventions(through which the states’ accountability for human rights obligations was establishedin international law) were agreed; one referring to civil and political rights (CP) andanother to economic, social and cultural rights (ESC). CP rights refer to the right tolife, liberty and security, for example; the right to vote, to a free press and freedomof speech and on legal rights such as to due process of law and the presumption ofinnocence until proven guilty. ESC rights include the right to an adequate standard ofliving, the right to education, to work and equal pay, and the right of minorities toenjoy their own culture, religion and language. In short, Western countriesemphasised CP rights and work towards the ratification and inscription of these intoconstitutional and legal frameworks. In contrast, socialist countries (and manydeveloping nations) prioritised ESC rights, emphasising economic and socialdevelopment and self-determination and ‘criticizing the richest Western countries fortheir failure to secure these rights for all citizens’ (United Nations DevelopmentProgramme [UNDP], 2000: 3).
The basic needs approachBy the end of the 1960s, there was growing disillusionment with the practices andoutcomes of development. Mounting evidence of increasing income inequality andrising poverty in many developing countries (despite overall economic growth insome) suggested that a more direct approach was required for the delivery of humanwelfare outcomes. What became known as the basic needs approach (BNA) drewtogether theorists and practitioners from a range of traditions, academic centres andinstitutions of development that searched for more human-centred and locallyrelevant processes and patterns of development. In short under the BNA,development was redefined as a broad-based, people-oriented and endogenousprocess, as a critique of modernisation and as a break with past development theory .
As a result of the influence of the BNA, the 1970s saw a wide variety ofprogrammes focused on households and covering aspects of health, education,farming and reproduction practices designed to create a minimum level of welfarefor the weakest groups in society. Development practice became characterised bydistrict and regional planning (supported by major international donor institutions), byproliferating field bureaucracies and by development solutions through targeting (of
67

social groups – particularly women and children – of sectors and of regions) toovercome the recognised inadequacies of the ‘planning fantasies of the 1960s’(Chambers, 1993: 108).
Buying and selling welfareHowever, whilst the BNA did much to put poverty, human needs and rights ontoofficial development agendas in the 1970s, many assert that the decade of the 1980swas one of development ‘reversals’ rather than achievements with evidence,particularly within Africa, of falling school enrolments, literacy levels and lifeexpectancies, for example. Similarly, development theory was proposed to havereached an ‘impasse’ (see Schuurman, 1993) as both modernisation thinking and neo-Marxist dependency theorists struggled to explain the growing diversity ofdevelopment experiences on the ground. In the late 1980s, neoliberal developmentideas became increasingly prominent and powerful (see Simon, 1999) withdevelopment policies promoting increased private sector and reduced direct stateinvolvement. Progressively through the subsequent decade, basic human rights suchas access to safe water and sanitation became ‘commodities subject to the rigours ofthe market’ (Bell, 1992: 85). Donors, for example, came under increasing pressure tofind new methods of financing and providing welfare both ‘at home’ and abroad andgovernments of developing nations were required to cut state expenditures underconditions of structural adjustment programmes and for access to multilateraldevelopment finance. Whilst these pressures opened up spaces for new project ty pes,processes and programmes in development, it has been suggested that the moreradical aspects of the original BNA philosophies were often devalued in practice,‘reducing them from agendas for change and empowerment into little more thanshopping lists that are hawked to donors for implementation, commonly more in linewith donors’ than recipients’ priorities’ (Simon, 1999: 27). For many governmentswithin developing countries, their capacity to protect economic and social rights suchas to ensure access to education became weakened.
Converging agendas through the 1990sIn 1986, the United Nations adopted the UN Declaration on the Right to Development,within which development itself was identified as an inalienable human right. Thearticles that supported the Declaration drew on wider debates about development atthat time, in particular through engaging with the emerging critique of neoliberalism,with understandings of the uneven impacts and limits of globalisation and in thestrengthening of notions of ‘people centred’ development and human empowerment(Manzo, 2003). Across many arenas of development, interest in working with andstrengthening civil society rose very markedly through the 1990s (see Edwards andGaventa, 2001) with civil society becoming for many ‘the best hope for development
68

and the improvement of human rights protection’ (UNDP, 2000: 355).An important contribution to understanding the meaning of and means for
development through the decade came through the work of the UNDP and theirreporting within their annual Human Development Reports. In short, developmentbecame strongly re-conceptualised in terms of components of ‘human’ development;the aspects of human well-being ‘bey ond income’ and the processes through whichpeople are empowered to shape their own development priorities and are able toexercise their human rights. The UNDP draws heavily on the work of Amartya Sen(1981, 1999). Sen considers human development in terms of individuals’ capabilitiesto achieve, to flourish and live lives they have reason to value. In turn, poverty isconsidered as a set of interrelated ‘unfreedoms’ that constrain people’s choices andopportunity to exercise their individual agency .
In 1990, the UNDP introduced the Human Development Index (HDI), a compositeindex designed to reflect achievements in the most basic human capabilities definedas leading a long life, being knowledgeable and enjoy ing a decent standard of living.In 1995, the Gender-related Human Development Index (GDI) and genderempowerment measure (GEM) were introduced encompassing the recognition thatgender equality is a measure of and means for human and national development.Since 1997, the Human Poverty Index (HPI) has measured and monitoreddeprivation worldwide, in terms of the percentage of population not expected to liveuntil the age of 40, illiteracy rates, the percentage of people lacking access to healthservices and safe water, and the percentage of children under five y ears who aremoderately or severely underweight. In 2010, further measures were added‘adjusting’ the HDI and GDI to expose the losses in human development occurringcurrently through inequality and disadvantage and confirming how issues of equityand empowerment are essential means for ensuring sustained human developmentfor future generations.
It was within the 2000 Human Development Report, entitled Human Rights andHuman Development that a significant step in understanding the relationship betweenthe development and human rights agendas was made. It detailed how and whypoverty was a human rights concern and how human rights are critical to achievingdevelopment and ‘are not as has sometimes been argued a reward of development’(UNDP, 2000: iii). The turn of the millennium was also a point at which the UN wasmore broadly engaging in a process of internal reform. The Secretary General, KofiAnnan (2000), had committed to reassert the original mandate of the organisation asassisting in the realisation of human rights and fundamental freedoms and to worktowards the mainstreaming of human rights as inalienable, interdependent andindivisible concerns throughout the work of the organisation. Such commitments werealso central in the launch of the ‘Millennium Development Goals’ in the same year.Table 1.6.1 displays a number of quotations illustrating the converging agendas of
69

human welfare and humans rights in international development into the twenty -firstcentury .
Contemporary challengesIt has not been possible in this short chapter to do justice to the decades of work donein the fields of poverty, participation, gender and democracy, for example, whichhave all been extremely important in bringing about a more holistic and moralagenda within development. However, this brief analy sis has confirmed that suchagendas require a shift in focus away from determining any particular means or‘specially chosen list of instruments’ (Sen, 1999: 3) for development, towards moreconcern for the overarching ends of development and the processes through whichthese are defined and secured. Critically, these ends are necessarily plural and fluidas evidenced within continuing questions of the universality of human rights in thecontext of cultural diversity. But rather than debating the primacy of one humanright, good, opportunity or resource over another, contemporary concerns are nowmore regularly focused on questions of appropriate entry points or sequencing indevelopment interventions in recognition of the reinforcing and interdependent natureof these issues. As Sen has highlighted, the (interrelated) sources of people’s‘unfreedoms’ may be extremely varied. Development involves expanding thesefreedoms, as liberties to be valued in their own right and as the principal means (freeagency, capability and choice) through which the overarching goals of development,for individuals to ‘lead the kinds of lives they have reason to value’ (Sen, 1999: 10),will be achieved.
Table 1.6.1 The multidimensional and interdependent nature of human rights andhuman development
• ‘Political freedoms (in the form of free speech and elections) help to promoteeconomic security . Social opportunities (in the form of education and healthfacilities) facilitate economic participation. Economic facilities (in the form ofopportunities for participation in trade and production) can help to generate personalabundance as well as public resources for social facilities. Freedoms of differentkinds can strengthen one another’ (Sen, 1999: 11).
• ‘Civil and social education will help people better understand their rights andincrease their choices and income-earning capacity . At the same time, developingand implementing equal opportunity laws will empower people to gain moreequitable access to productive resources’ (UNDP, 1998: 10).
• ‘Sustainable human development and human rights will be undone in a repressiveenvironment where threat or disease prevails, and both are better able to promotehuman choices in a peaceful and pluralistic society ’ (UNDP, 1998: 6).
70

• ‘A fundamental human freedom is freedom from want. Poverty is a human rightsviolation, and freedom from poverty is an integral and inalienable right’ (UNDeclaration on the Right to Development, 1986).
• ‘Every step taken towards reducing poverty and achieving broad-based economicgrowth is a step towards conflict prevention’ (Annan, 2000: 45).
ReferencesAnnan, K. (2000) ‘We the Peoples’: The Role of the United Nations in the Twenty-first
Century, Washington: United Nations.Bell, M. (1992) ‘The water decade valedictory, New Delhi 1990: Where pre- and
post-modern met’, Area 24(1): 82–89.Chambers, R. (1993) Challenging the Professions: Frontiers for Rural Development,
London: Intermediate Technology Publications.Corbridge, S. (1999) ‘Development, post-development and the global political-
economy ’, in P. Cloke, P. Crang and M. Goodwin (eds) Introducing HumanGeographies, London: Edward Arnold, pp. 67–75.
Edwards, M. and Gaventa, J. (2001) Global Citizen Action, London: Earthscan.Manzo, K. (2003) ‘Africa in the rise of rights-based development’, Geoforum 34: 437–
456. A paper that explores the rise of rights-based development (particularly withinthe critique of neoliberalism), the debate surrounding the concept and the contestedways in which it is endorsed by prominent organisations like DFID, the World Bankand the United Nations.
Radcliffe, S. A. (1999) ‘Re-thinking development’, in P. Cloke, P. Crang and M.Goodwin (eds) Introducing Human Geographies, London: Edward Arnold, pp. 84–92.
Schuurman, F. (ed.) (1993) Beyond the Impasse: New Directions in DevelopmentTheory, London: Zed Books.
Sen, A. (1981) Poverty and Famine: An Essay on Entitlement and Deprivation,Oxford: Clarendon.
Sen, A. (1999) Development as Freedom, Oxford: Oxford University Press.Simon, D. (1999) ‘Development revisited’, in D. Simon and A. Narman (eds)
Development as Theory and Practice, Harlow: Longman, pp. 17–54.United Nations Development Programme (UNDP) (1998) Integrating Human Rights
with Sustainable Human Development, New York: UNDP.United Nations Development Programme (UNDP) (2000) Human Development
Report: Human Rights and Human Development, New York.United Nations General Assembly (1986) ‘Declaration on the Right to Development’.
Resolution 41/128.
71

Further readingBurnell, P. and Randall, V. (eds) (2008) Politics in the Developing World (2nd edn),
Oxford: Oxford University Press. Chapter 18 by Michael Freeman on HumanRights (pp. 353–372) provides a clear exposition of the history and detail of theinternational human rights regime and considers explicitly the problems ofapply ing the concept of human rights to developing countries.
Mikkelsen, B. (2005) Methods for Development Work and Research (2nd edn),London: Sage. This book in chapter 6 provides a very good description of theorigins and meaning of a rights-based approach to development, how this differsfrom a (more commonly found) rights-based perspective and how this approach isbeing put into practice within development.
The Office of the High Commissioner for Human Rights (OHCHR) is the departmentof the UN Secretariat that is mandated to promote and protect all rights establishedin the Charter of the United Nations and in international human rights laws andtreaties. Their work can be followed via www.ohchr.org
Wolfe, M. (1996) Elusive Development, London: Zed Books. A readable book thatreflects in some detail on the successes and failures of the Basic Needs Approachto development.
72

1.7Development as freedom
Patricia Northover
Amartya Sen and the development imaginaryThe discourse on ‘development’ – a central motif of narratives of modernity –addresses a highly contentious problem field and offers neither stable signifiers normuch common ground on the nature, tendencies, ethics and politics of a process ofdevelopment in our contemporary world. Nevertheless, certain strands of thinkinghave been able to exercise a dominant influence on this discourse and have thus ledthe way in delineating the possibilities for imagining and even encounteringdevelopment (Escobar 1995).
Development as Freedom (1999), the seminal text authored by the 1998 NobelLaureate economist, Amarty a Kumar Sen, expresses one such emergent dominantnarrative that has found a global resonance in the twenty -first century. Therevolutionary uprisings in the Middle East in 2011, for example, were predominantlyseen as being driven by the aspirations for freedom, democracy and social justice;themes strongly embedded in the work of Sen. In Development as Freedom Senargues for development as the expansion of the ‘real freedoms’ that people mayenjoy and have reason to value. In the text, he rehearses his longstanding challengesto competing views on the meaning of social welfare and development and offers hiswork as a better analy tical frame, than, for example, Utilitarian, Rawlsian, Marxist,or rights centric libertarian standpoints on development. Indeed, Sen posits that thisframework of ‘development as freedom’ should act as a foundational and universalprinciple for all peoples in order to better facilitate the aspirations of the multifacetedforms of social contestation, protest and resistance against inequality – from race andgender struggles for equal freedoms, to de-colonial and popular uprisings for localand global social justice.
Practically and politically, Sen’s conceptual and methodological approaches forassessing and valuing human well-being, and his message of ‘development asfreedom’ have had an enormous impact on the development industry. His work, forexample, has helped to underpin the rise of new development indicators, such as theHuman Development Index, the Human Poverty Index and the GenderEmpowerment Index, championed and developed through the UN DevelopmentProgram (UNDP), and promoted through their Human Development Reports. Sen’s
73

work has also infused the theoretical study of gender and development, poverty,famine, social justice and democracy. The idea of Development as Freedom,moreover lends its weight to the transition to the Post-Washington Consensus from theso-called ‘Washington Consensus’ aid regime. The latter was a package of neoliberalaid reforms focused on ‘getting the prices right’ through a narrowly focused set ofeconomic stabilization and structural adjustment policies, introduced under thecontext of economic crises to largely developing economies, and intended to returnthese countries to economic growth and neoliberal economic market equilibria. In thePost-Washington Consensus era – which focuses on a pro-poor and participatoryapproach to development, as well as on the institutions for ‘good governance’ – Sen’stext, Development as Freedom, could easily become the new bible for guiding thecurrent agenda for aid and development. Such is the power of this text.
‘Development as capability expansion’ – the road to Development as Freedom
Sen’s influential work thus cuts across theoretical, philosophical and practicaldevelopment domains, to espouse the powerful message of ‘development asfreedom’. This freedom is, in part, to be indexed by a capability approach to humandevelopment, where capabilities are more than skill sets, but rather speak to ‘valuablebeings and doings’ that agents have reason to value and, most critically, are free tochoose. This focus on capabilities or ‘capability freedom’ is represented as the keydeparture from utilitarian thought, and neo-classical strands of economic thoughtsteeped in this tradition, where the focus is placed on either subjective desires andmental states of being, such as happiness, pleasure and desire fulfilment in theassessment of well-being. The capability approach to human development, is alsodistinguished from early growth and modernization theories for development andRawls’s theory of justice, since these other approaches to the developmentproblematic tend to focus more on the commodities that can be marshalled, through aprocess of market driven growth, to support either consumption desires and needs orbaskets of primary goods and resources.
However, as Sen has continuously emphasized, income is not necessarilycorrelated with well-being. In an earlier essay, where development was seen ascapability expansion, Sen (1989) noted, for example, that income rich South Africascored poorly in terms of quality of life for its citizens, as evident in lower lifeexpectancy, while income poor China did much better on this development score.Although the later Sen (1999) seeks to set a higher development standard for Chinawith his shift to the view of ‘development as freedom’, he has consistently sought tobring attention to the issue of human well-being, as the quality of life enjoy ed througha specific set of valued activities for individual agents.
In particular, for Sen, human well-being must rely on both a more objective and a
74

personal criteria of welfare, and to achieve this he draws on the Aristotelian notion of‘functionings’. Functionings describe various doings and beings that a person actuallyexperiences or realizes. A specific functioning vector indicates which actual states ofdoing (e.g. reading or eating) and being (e.g. being well nourished, being literate,being part of a community and appearing without shame) have been realized. As Senemphasizes, functionings can thus vary from elementary states to more complexones. However, Sen has been reluctant, as Alkire (2002: 29) and Nussbaum (2003)have highlighted, to establish a list of human capability priorities or even tosy stematically defend a set of basic functionings, or capabilities, in line with basicneeds (Alkire 2002: 157). This allows him to side-step the thorny issue of judgingamongst valuable states of being and doing, but leaves his approach open to chargesof policy impracticability, since no clear guidelines bey ond an appeal for dialogueand participation are offered.
Sen’s emphasis on Aristotelian functionings as the foundation for assessing well-being is furthermore deliberately (and problematically ) set apart from a basic needsstrategy for development (Alkire 2002: 166–174). Thus, rather than encouraging afocus on resources for needs to be met, attention is instead placed on a person’s‘capability’ defined as ‘a set of vectors of functioning, reflecting a person’s freedomto live one type of life or another’ (Sen 1992: 40). Capabilities reflect then ‘effectivepossibilities’: they describe what people could do and what could be achieved even ifthey are not actually chosen. Pay ing attention to human capabilities, or a person’scapability set, helps one to distinguish between the unfreedom and deprivation of astarving child, and the liberty of the fasting monk, since despite the similar states offunctioning experienced (i.e. a starving hunger), they reflect different states ofcapability and relatedly the presence/absence of choice.
A capability approach, however, also allows one to better and more equitablyattune resources to support desired functioning vectors, as simply allocating the samebasket of primary goods or resources to heterogeneous persons would not beequivalent to supporting equal well-being. This is because persons will differ in theirability to translate resources into functionings. The pregnant woman and disabledperson would thus need different stocks of resources to attain their valuedfunctionings, in comparison to the able-bodied man. Sen sharply illustrates the criticalpower of this capability approach to human development, when he demonstrates thatthere are around 60–100 million missing women in the world due to sy stematic genderdiscrimination (sex selective abortion, neglect for female health and nutritionespecially during early childhood) resulting in severe capability deprivation forwomen (Sen 1999: 104–107).
Agency and power in Development as Freedom
In elaborating upon his ideas for promoting human and social well-being, which
75

culminated in the text Development as Freedom, Sen is also keen to establish what heconsiders to be foundational analy tical distinctions in how we may approach anunderstanding of well-being through a valuing of individual agency. He sets out hisfour elementary concepts as well-being achievement, well-being freedom, agencyachievement and agency freedom, which are themselves derivative from the ideasof the ‘well-being aspect’ and the ‘agency aspect’ of a person (Sen 1992: 56–57;Alkire 2002: 9).
For well-being achievement, one looks only at the actual states of valuedfunctionings that one realizes, while for well-being freedom one assesses theontological or real context of power in which the achievement regarding one’s ownwell-being is carried out. In other words, in assessing a state of well-being freedom,the relevant question to ask would be: was the agent operating in a context of freedom,so that choice reflects a real power that the agent can do, and could have doneotherwise? If so, then we have well-being freedom, or a ‘real opportunity toaccomplish what we value’ as wellness of being (Sen 1992: 31). Consider here againthe distinction between the starving child and the fasting monk; the monk hasexercised a well-being freedom whereas the child has exercised no such freedom,despite the similarity of well-being states. For grasping well-being freedom, one hasto analy se then well-being per se, as well as agency – the ability of an agent to pursueand bring about certain goals – and finally the real context of power those actions areembedded in, and dependent on.
In contrast to well-being achievement, agency achievement is to be assessed on awider set of objectives than personal well-being, and so can include other goals, suchas seeking the independence of one’s or another’s country, that may conflict withindividual welfare. In addition, like well-being freedom, agency freedom, which Sendefines as ‘one’s ability to promote goals that one has reason to promote’ (1992: 60),is also to be assessed by referring to the context of power in which one’s agency isexercised. In this case, however, the context of power, needed here for agencyfreedom to be recognized as something distinct from mere agency achievements,seems sy nonymous with the libertarian view of human freedom as a space ofliberty. Agency freedom appears then to be calibrated by a liberal context thataffords both negative liberty – absence from interference – and positive liberty –one’s own power to achieve a desired goal or end state. This affinity between agencyfreedom and liberty reinforces Sen’s persistent promotion of libertarian politicalideals; ideals which he seeks to ground in something more than just a focus on rights,by including a concern for more objective moral considerations and consequences,such as individual advantage or well-being and the inequalities in the space of‘capability freedoms’. This is an important step as it allows Sen to avoid the complaintthat libertarian priorities on rights ignore substantive inequalities in the command over
76

resources and feasible well-being achievements. As Sen highlights in his discussion offamines, a concern with rights alone is insufficient to prevent human catastrophes(1999: 65–66).
In line with these conceptual and philosophical orientations, Sen thus emphasizeswhat he refers to as instrumental freedoms, five in all, that are vital to the project ofpromoting Development as Freedom. These instrumental freedoms are (a) politicalfreedoms, (b) economic facilities, (c) social opportunities, (d) transparencyguarantees and (e) protective security (Sen 1999: 10, 38–40). These are conceived ofas ‘distinct sets of rights and opportunities’ that help to ‘advance the general capabilityof a person’ (Sen 1999: 10). All in all then, Sen advances his thesis of Development asFreedom by advocating that the expansion of freedom is not only (a) the primaryend but also (b) the principal means of development (1999: 36). Development thus‘consists in the removal of various ty pes of unfreedoms that leave people with littlechoice and little opportunity to exercise their reasoned agency ’ (1999: xii).
Critiques and limit pointsSen insists that the impulse to freedom and for freedom is not a peculiarly Westerntradition, which is being copied by other peoples across time and space. And whileSen wishes to distance himself from the previous standard of ‘development asmodernization’ that informed programs of development especially in the post-warperiod, he still seems rather wedded to the institutional scaffolding of Western liberaldemocracy and its plural economic freedoms entrenched in a capitalist marketsociety. Yet, is Sen correct in making an empirical claim that development isinvariably twinned with Liberal Freedoms in a capitalist market society ? Sen seems tothink so and argues the case based, in part, on his examination of the correlation hedetects between famines and democratic freedom, and in particular the presence ofa ‘free press’ (Sen 1999: 16, chapter 7). Others, such as Corbridge (2002), Selwy n(2011) and Northover (2012), arguing from rather different perspectives, suggest thatit may indeed not be so well linked.
Why not? Well, first, as Corbridge (2002) highlights, because the evidence suggeststhat substantive well-being and structural transformations are often made underauthoritarian sy stems, such as those in East Asia – China being the most striking casein point. Should such experiences not count as development? And have such outcomesnot hinged on the presence of what is now commonly referred to as the‘developmental state’? That is, a state that has the capacity to exercise its authority toresolve and manage conflicts and direct the use of resources to promote broaddevelopment objectives.
Second, from the Marxian standpoint as embraced by Selwy n (2011), it may beargued that under capitalism one can only maintain a façade of liberty or insecuresubstantive freedoms in the context of commodity fetishism, labour exploitation and
77

alienation, and the dialectical contradictions shaping the social relations of production.As such, capitalism itself is seen as a force that undermines the real freedomspossible in the present sy stem due to the nature of capitalist relations of power.Indeed, rather than being linked to the absence of democratic institutions, famines aremore associated with the historical conditions of structural inequality attendant withthe real dispossessions needed for the creation and continued reproduction of a classof wage-labourers with the hegemonic rise of a capitalist world sy stem. And finally,from a post-structuralist inflected critique of Sen, Northover (2012) suggests thatSen’s thesis of development as freedom may be premised on a racial philosophy ofplace, that produces ‘agency freedom’ through a politics of abjection mirrored in thelinks between capitalism and slavery and with ongoing complex racializationprocesses. It is not surprising then that the message coming from some feministcritiques is that Sen has placed an undue emphasis on the abstract qualities offreedom, for example, qualities such as ‘freedom of the people’ and ‘agencyfreedom’ – Liberalism’s liberty – which is hard to justify as Des Gasper and VanStaveren (2003) argue.
In the end, although Sen’s message to the world and ‘development community ’ isvery attractive – especially in the present time of postcolonial and contemporaryworld crises given the events of 9/11 and the ongoing global economic crises sparkedin 2008. In addition, despite Sen’s intense and prolific efforts in popularizing thiscurrent narrative of development, his thesis of Development as Freedom may not holdthe key to a brave new world, given the problematic history of freedom and itsongoing violent contexts of power.
ReferencesAlkire, S. (2002) Valuing Freedoms: Sen’s Capability Approach and Poverty
Reduction, Oxford: Oxford University Press.Corbridge, S. (2002) ‘Development as Freedom: The spaces of Amarty a Sen’,
Progress in Development Studies, 2(3): 183–217.Escobar, A. (1995) Encountering Development: The Making and Unmaking of the
Third World, Princeton, NJ: Princeton University Press.Gasper, D. and Van Staveren, I. (2003) ‘Development as Freedom and as what else?’,
Feminist Economics, 9(2–3): 137–161.Northover, P. (2012) ‘Abject blackness, hauntologies of development, and the
demand for authenticity : A critique of Sen’s Development as Freedom’, The globalSouth, 6(1): 66–86.
Nussbaum, M. (2003) ‘Capabilities as fundamental entitlements: Sen and socialjustice’, Feminist Economics, 9(2–3): 33–59.
Selwy n, B. (2011) ‘Liberty limited? A sy mpathetic re-engagement with Amartya
78

Sen’s Development as Freedom’, Economic and Political Weekly, 46(10): 68–76.Sen, A. (1989) ‘Development as capability expansion’, Journal of Development
Planning, 19: 41–58, reprinted in Sakiko Fukuda-Parr and A. K. Shiva Kumar (eds)(2003), Readings in Human Development (pp. 3–16). New York: Oxford UniversityPress.
Sen, A. (1992) Inequality Reexamined, Cambridge, MA: Harvard University Press.Sen, A. (1999) Development as Freedom, New York: Anchor Books.
Further readingFor a collection of Sen’s foundational work on economic development issues, see Sen(1987) Resources, Values and Development , Cambridge, MA: Harvard UniversityPress. This collection gathers his path breaking writings on institutions, socialinvestment, ethics and well-being.
For a selection of critical perspectives on Sen and his relevance to feministeconomics, see the (2003) special issue of Feminist Economics, edited by BinaAgarwal, Jane Humphries, Irene Robey ns. Irene Robeyns has also provided a criticaltheoretical overview of the capabilities approach in Journal of Human Development(2005), 6(1): 94–114.
For a useful collection of readings on the Human Development and CapabilityApproach, largely based on the Human Development Reports of the last decade, seeS. Fukuda-Parr and A. Kumar (eds) (2005) Readings in Human Development:Concepts, Measures and Policies for a Development Paradigm, New York: OxfordUniversity Press.
WebsitesThe Oxford Poverty and Human Development Initiative (OPHI), established in 2007,is an economic research centre within the Oxford Department of InternationalDevelopment, University of Oxford. The centre is led by Sabina Alkire. This siteprovides an excellent repository for many central works and research programmeson poverty and human development (available online at www.ophi.org.uk/).
The website of the Human Development and Capability Association, whichpromotes multidisciplinary research on poverty, justice and well-being (availableonline at www.capabilityapproach.com/index.php).
79

1.8Race and development
Denise Ferreira da Silva
Forged in the late 1940s and early 1950s, the assemblage of the developmentapparatus coincided with the unfolding of the cold war, the decolonization in Asia andAfrica, and the proliferation of military regimes in Latin America. Towards its goal,development mobilized personnel and institutions (financial, governmental,educational, etc.) to explain and solve the social, cultural, and economic troubles ofthe Third World – namely, overpopulation, the threat of famine, poverty, illiteracy,and so on (Escobar 1994). Both as a practical and an academic enterprise targetingthe global space after WWII and decolonization (Power 2006), the developmentproject included three aspects: (a) a programme for intervention involving a varietyof institutions and international bodies, such as nation-states, banks, privatecorporations, the Bretton Woods’s organizations (such as the IMF and the WorldBank), funding agencies (such as the Ford and Rockefeller Foundations), and, at times,military forces; (b) the delineation of the object of knowledge rely ing on the conceptof the cultural which, in the 1950s, would support sociology as a properly scientificfield of inquiry, with a conceptual-methodological framework (structuralfunctionalism) that linked the structural (institutional) and cultural (meanings)dimensions of the social; and finally (c) its objective of the development project, theelimination of the ills of underdevelopment.
Formulations of research questions, policy and strategies implicitly assumed racialand cultural difference, in the formulation of the meaning and direction for thedevelopment project, as its fulfilment required both structural and cultural change inthe ‘Third World’ to make it more like the ‘First’. Nevertheless, scholars in the fieldagree that silence dominates the theme of race and development but they do notprovide a definite explanation as to why this is the case (White 2002; Kothari 2006b;Power 2006). Engaging this problematic, this chapter takes steps to delineate apossible reason for this silencing. First, it reviews critiques of development that exposethe discontinuities and continuities between development and colonialism. Second, ittraces the relationship between race, as a socially and historically constructedcategory (Omi and Winant 1994), and development back to the Enlightenment morallexicon. What these steps show is how breaking the silence requires tracing theoperations of racial power within the development project.
80

Beneath development as discourseA productive move in critiques of development as discourse is to relate the operationsof racial power to its relationship with colonialism. Focusing on the ideological level,such critiques highlight the intersection of the development and the colonial project intwo moments. On the one hand, this highlights the programmes for intervention andobjectives: as part of this scholar’s focus on development as a practice and note howracial meanings reproduce a distinction that sustains the power differential necessaryfor the justification of both projects (White 2002; Goudge 2003). On the other hand,regarding the object of investigation and objectives of the development project,critiques of development as discourse expose the workings of colonial constructswithin development (Crewe and Fernando 2006; Escobar 1994; Kothari 2006b). Bothmoments register deployments of racial meanings to construct postcolonial Asia,Africa, and Latin America (the ‘Third World’) as an ‘Other’, one whose differenceresides in its inability on its own to reach the same levels of scientific, technological,and economic development as white/Europeans and their descendants. Poverty,illiteracy, famine, and so on, become the identifiers of a ‘Third World society ’, thatis, one in need of intervention to foster cultural change and the economic growthnecessary to resolve these social ills (Escobar 1994; Kothari 2006b).
These works reveal two truths in development discourse and show how, like itspredecessor (the colonial project), the development project relies on an ethical and apolitical aspect. From the ethical point of view, establish: (a) moral deficiency – thetarget of the project (the ‘Third World’) emerges as inherently unable to achieve theobjective to develop, to move forward, by themselves as they have a moraldeficiency (registered in a lack of scientific knowledge and technological advances);and (b) an ethical imperative – both moments of the development project,intervention and investigation, assume that the movement is unidirectional; that is, thatthe difference between developed white/European and underdeveloped Third World(Asia/African/Latin American) ‘others’ is a difference of capacity, hence the formerhas the obligation to employ its superior capacity in order to help the latter (Escobar1994). From the political point of view, these truths respond to how the developmentproject reproduces global power differentials, that is, the socioeconomic inequalitiesthat result from colonial, neo-colonial, and imperial relations between Europe and(later) the United States, and Third World countries: (a) the diagnostic that the ‘ThirdWorld’ is intellectually deficient registers the ‘First World’s’ superior power, alsoexpressed in scientific and technological achievements and economic prosperity and(b) the directive that it is the responsibility of the First World to help its neighbours tothe South and to the East to catch up economically by providing them with aprogramme and the scientific, technological, personnel, educational, and financialmeans for economic development. Precisely these ‘findings’ raise a question about
81

the workings of racial meanings: if the relationship is immediately traceable, why thissilence? A possible answer: it results from the notion that development and the ‘racialmeanings’ identified in these works are correlated.
For the most part, critiques of development as discourse do not elaborate onprecisely how ‘racial meanings’ sustain the distinction between the West and the restand justify power differentials in the postcolonial order. How racial differenceoperates in the development project – and hence within the developmentdiscourse/practice equation – becomes clear through a genealogy that refers bothconcepts to the post-Enlightenment moral lexicon. As another word for progress,development refers to the Enlightenment view of the human’s both necessary(because of human nature) and morally desirable ability to use its unique intellectualabilities to transform the natural environment, thus improving conditions of life. Forthe philosopher Immanuel Kant, the ‘natives’ of the Americas, Asia, Africa, and thePacific Islands are the ‘natural men’, lacking the basic moral traits that would allowthem to transcend the forces at work in their immediate (natural) environment(Spivak 1998); they were ‘affectable’ minds (Silva 2007). Around the same timenatural history ’s descriptive tools for measurement and classification articulated the‘others of Europe’s’ mental (intellectual and moral) deficiency, which it associatedwith the phy sical traits and their continents of origin. Somewhat later, anotherGerman philosopher, G. W. F. Hegel, postulated that progress is the direction ofhistory, but only among European peoples and places. Inhabitants of the Americasand Africa, he stated, were outside the temporal movement of history (the trajectoryof progress) and Asians were stuck in the early phases of historical development.None could move forward in time to realize, to materialize, humanity ’s superiorattributes because they lacked moral traits, such as an experience and understandingof freedom and universality (Silva 2007).
Gathered in the arsenal of racial knowledge assembled in the mid-nineteenthcentury, the science of man, these speculative and descriptive truths became thebasis for a scientific project for the knowledge of man and society, which includedconcepts (‘racial ty pe’) and measures (‘facial index’) designed to show that they areindeed natural (scientific) truths, that is, expressions of how the laws of naturedetermine human phy sical and mental conditions. Early in the twentieth century thescience of man came into disrepute, the concept of the cultural became the mainreferent of intellectual and moral difference, as it is expressed in language, religion,technologies, and social (legal, religious, economic) institutions. Nevertheless, bodilytraits separate out those not born in Europe and/or of non-European descent, in regardto the ‘others of Europe’ and their descendants everywhere. Thus, racial differencewould remain the first, immediate, signifier of cultural (moral and intellectual) traits.By the time the development apparatus was deployed, the ideas of racial and culturaldifference, developed by anthropologists in the nineteenth and early twentieth
82

century, were already part of political, sociological, and common sense views.Because they view phy sical and territorial characteristics as expressions of mental(intellectual and moral) traits. That is, racial and cultural difference defining thespecificities of European ‘civilization’ were linked to bodily traits (whiteness), and toself-claimed intellectual superiority ; thus explaining capacity (or lack of) for progress(to move forward, develop) as natural attributes of persons and places. This view alsoimmediately prevented considerations of present and historical relationships, such asconquest and slavery. The wall of silence in race and development is a reflection ofracial power/knowledge, as racial and cultural difference identifies the very subjects,objects, and sites for the development project.
How then to break this constitutive wall of silence? It should be evident now that thesilence does not result from a lack of correspondence but from the opposite, namely,the excess of correspondence characteristic of a discursive situation in which oneterm (race) gives significance (meaning) to the other (development). For both raceand development are referents of progress. First, race (as racial difference orcultural difference) allows the distinction between those who can and will and thosewho cannot and will not move forward (progress or develop). That is, racial (orcultural) difference explains why the Third World lacks the intellectual and moralcapacity for developing. Second, development (progress) is precisely that which,according to philosophical and scientific statements, is the privilege of Europeans andtheir descendants elsewhere. Third, because development is the historical destiny ofevery human being, it is their (white/European) moral obligation to help others (wholack the capacity ) to catch up with them. Every iteration of progress (as economicgrowth/cultural change) of the past 150 y ears or so repeats these racial truths: theidea of civilization (as in the civilizing mission), modernization (which named theknowledge aspect of development in the early y ears), and now globalization (which ischaracterized by many things, including the demand that the state stay s away fromeconomic affairs). To speak of race and development, then, is not to speak about twodifferent concepts or two different discourses. For race operates within development.To speak of this relationship, we need to describe how racial discourse functions as acondition of possibility for every order of operation (project of intervention, object ofinvestigation, objective) of the development project.
ConclusionFraming of the development project, after WWII, became possible because racialdifference and cultural difference functioned as discursive shortcuts, immediatelycommunicating three necessary ethical and political truths: (a) the targets of thedevelopment project (illiteracy, poverty, famine) resulted from certain peoples’ andplaces’ natural incapacity to move forward on their own, (b) those who coulddevelop, namely white/Europeans, had the moral obligation to help those (Asians,
83

Africans, Latin Americans, and Pacific Islanders) who could not develop, and (c) thenaturalization of the Third World’s incapacity for development pre-empts attributionsof the failures of the development project either to existing mechanisms of economicexploitation or to the effects of previous (colonial or imperial) unequal economicrelations. Existing analy ses of race and development show that ‘racial meanings’operate in development discourse and practice. This chapter merely adds an accountof how racial meanings (as referent to racial and cultural difference) work within thedevelopment project. These natural (biological or cultural) truths, which are signifiedin bodies and territories, serve to naturalize the effects of (past) colonial and (present)global capitalist architectures of economic exploitation.
BibliographyCrewe, Emma and Fernando, Priy anthi (2006) ‘The elephant in the room: Racism in
representations, relationships, and rituals’. Progress in Development Studies 6(1):40–54.
Escobar, Arturo (1994) Encountering Development. Princeton, NJ: PrincetonUniversity Press.
Goudge, Paulette (2003) The Whiteness of Power: Racism in Third WorldDevelopment and Aid. London: Lawrence & Wishart.
Kothari, Uma (2006a) ‘Critiquing “race” and racism in development discourse andpractice’. Progress in Development Studies 6(1): 1–7.
Kothari, Uma (2006b) ‘An agenda for thinking about race and development’.Progress in Development Studies 6(1): 9–23.
Omi, Michael and Winant, Howard (1994) Racial Formation in the United States:From the 1960s to the 1990s. New York: Routledge.
Power, Marcus (2006) ‘Anti-racism, deconstruction and “overdevelopment”’.Progress in Development Studies 6(1): 24–39.
Silva, Denise Ferreira da (2007) Toward a Global Idea of Race . Minneapolis:University of Minnesota Press.
Spivak, Gay atri C. (1998) Critique of Postcolonial Reason. Cambridge, MA: HarvardUniversity Press.
White, Sarah (2002) ‘Thinking race, thinking development’. Third World Quarterly23(3): 407–419.
84

1.9Culture and development
Susanne Schech
Up until the 1980s, culture played an important role in underpinning modernizationtheory but was rarely scrutinized. Development was equated with modernization andassumed to be culture-neutral – anyone, anywhere could experience modernization(Watts, 2003: 434). Then the ‘cultural turn’ finally arrived in development studies,having swept through other disciplines and created new fields of enquiry such ascultural studies and postcolonial studies along the way. Armed with new approachesand analy tical tools, development scholars began to question the role of culture indevelopment. It is now widely acknowledged that culture is intrinsic to economic,political, and social processes; indeed, we cannot understand development andchange without taking ‘the cultural factor’ into account (Radcliffe and Laurie, 2006;Schech and Haggis, 2000). This applies to processes of change that are immanent tocapitalist development and to intentional development, or the efforts to guideprocesses of change towards desirable outcomes through policies and projects. Thereare, however, different views about how culture matters, based on different ideasabout the meaning of culture.
Modernization and cultureSome development scholars argue that cultural values, attitudes, orientations andopinions are a key variable in determining economic progress. According to thisview, the developmental success of Western countries is based on the distinctivecultural institutions of Western civilization, and other countries should emulate theseas much as possible. In the 1960s, Gunnar Myrdal (1968) painted a picture of Asiabeset by abject poverty and corruption, which can only be rescued throughinternational development assistance and the widespread adoption of themodernization ideals and attitudes. In his account, ‘modern man’ is defined by a set ofattitudes including rationality, efficiency, orderliness, preparedness for change,energetic enterprise, integrity and self-reliance. Myrdal understood these ‘modern’attitudes to be Western imports or impositions that would eventually displace thecultural traditions of Asia, albeit against popular resistance (Myrdal, 1968: 61–62).Like other modernization theorists, he perceived modern attitudes and patterns ofsocial relations as a ‘universal social solvent’.
85

From a modernization perspective, culture is what other societies possess, and is inmost cases an obstacle to development (Watts, 2003). Traditional/modern isunderstood to be a hierarchical relationship whereby traditional cultural traits aredestined to die out, or be ‘bred out’ of a people through more or less well-meaningpolicy interventions (Schech and Haggis, 2000: 18–19). Culture, in this view, isbounded and static, like a box handed down from one generation to the next that mustbe cast aside if it stands in the way of progress. Traditional societies exist outside ofhistory, and any society that resists modernization and clings to tradition will remainunderdeveloped. Only societies willing to give up their traditional values, institutionsand cultural practices, or which happen to possess cultural traits that are favourable tomodernization, will succeed in their quest for development (Harrison and Huntington,2000).
Culture as a resource for developmentOther scholars refute the proposition that culture is bounded and static. Amartya Sen(2004: 43) conceives culture as constantly changing, and any attempt to tie it down asfutile. Cultural determinism, he argues, ‘often takes the hopeless form of try ing to fixthe cultural anchor on a rapidly moving boat’. Cultures do not evolve in isolation asseparate boxes but always through interaction with other cultures. Culturalinterconnections go back far into history, produced by migration, conquest, trade,exploration, and pilgrimage. In the current era of globalization, the boundaries ofpeople’s lived experience are more permeable than ever before, informed by anawareness of other circumstances, experiences, images, and ways of living.
If the cultures of the global South are neither fixed nor internally homogeneous, itmakes no sense to regard them as an obstacle to change. Indeed, many developmentscholars and practitioners see culture as a resource (Nederveen Pieterse, 2010). Forsome dependency theorists, selective traditions become the roots of a nationalculture, which will inspire an independent development path. From a neoliberalperspective, cultural practices generate stuff that can be marketed, such as IndianBolly wood films or African ‘world music’. Culture can be used to brand a country ina competitive global market, or to shape human capital in ways that foster economicgrowth, through religious values, kinship networks, and reciprocal relationships.
Some post-development theorists see culture as a resource that empowers locallybased opposition and alternatives to Western development interventions. For example,Indian scholar and activist Vandana Shiva argues that water cultures, or traditionalindigenous knowledge about water as the source of all life, can help communitiesresist pressures to privatize water and defend fresh water sources as a public good(Opel and Shiva, 2008). Shiva and other post-development scholars have beencriticized for romanticizing indigenous knowledge, portray ing these knowledgesystems as somehow outside of history, and ignoring the often very oppressive class
86

and caste relations within which subsistence lifesty le and culture is placed (Schechand Haggis, 2000). Also working with the notion of culture as a resource, but one thatis malleable, Appadurai (2004) argues that cultural practices can empower the poor.He gives the example of a pro-poor alliance of housing activists in India using housingexhibitions as a public space where poor people discuss their housing needs withpoliticians, donor agencies, local planners, architects, and professional builders. Byemploy ing what is essentially an upper-class cultural form and placing slum residentsat its centre, the alliance enhances their visibility and recognition, as well as cleverlysubverting the dominant class cultures in India.
The shift towards viewing culture as a resource for development has encouraged avariety of development actors to add culture to their development toolbox. In thesocial capital approach to development, culture is treated as a kind of glue that holdssocieties together and gives them a coherent structure that can be used fordevelopment interventions. The Danish development agency is one of many tosubscribe to a culture and development approach, which affirms the right to culturaldifference and the need to integrate culture into development programmes. Theunderpinning definition of culture ‘as the total complex of spiritual, material,intellectual and emotional features that characterize a society or social group’(Danida, 2002: 5), however, does not sufficiently account for change andcontestation.
Development as a cultural constructScholars who regard the resource approach as too limited turn to the new fields ofcultural studies, postcolonial studies, and globalization for a much more expansive anddy namic definition of culture as:
involved in all those practices … which carry meaning and value for us, whichneed to be meaningfully interpreted by others, or which depend on meaning fortheir effective operation. Culture, in this sense, permeates all of society .
(Hall, 1997: 3)
Culture, from this perspective, is an active force in the production and reproduction ofsocial life. Rather than seeing culture as one factor that shapes society alongsidemany others, such as class, gender, economic sy stems, and institutionalarrangements (Sen, 2004), a constructivist approach considers all of these factors tobe aspects of social life and thus culturally constructed. Development itself is aconstruct, a set of culturally embedded practices and meanings that are contested andchanged over time.
This view of culture and development pays close attention to representation andpower. From a cultural studies perspective, European colonization involved not only
87

economic and political domination of the New World but also cultural domination:‘Europe brought its own cultural categories, languages, images, and ideas into theNew World in order to describe and represent it’ (Hall, 1992: 293–294). In hislandmark contribution to postcolonial studies, Edward Said (1978) analy sesOrientalism as not just a Western way of knowing the Orient but also ‘a Western sty leof dominating, restructuring, and having authority over the Orient’. Colonialrepresentations have long-lasting effects. They continue to frame how the world isseen through Western eyes and legitimize contemporary economic and geopoliticalinterventions (McEwan, 2009).
Arturo Escobar (1995) employs this approach in his analy sis of development as aWestern discourse that is globalized and constantly reproduced through powerfulinstitutions. The World Bank, for example, presents itself as a knowledge bank capableof providing the (Western) knowledge and information required to dispel the darknessof poverty in the rest of the world. According to its statistics, countries are rankedfrom ‘very high income’ to ‘low income’ and ‘least developed’ and the latter aredesignated as needing development assistance. Their progress towards developmentgoals is constantly monitored, like a patient in intensive care. In this construction ofunderdevelopment, citizens are represented as helpless victims living in ignoranceand unable to do any thing for themselves, and their governments are portrayed asincapable, fragile, corrupt, and requiring reform.
Culture and development nowConstructivist approaches to development are employed in the growing literature ongovernmentality. A good example is Tania Li’s study of World Bank-fundedcommunity development programmes in Indonesia. Poor communities are treated asnatural spaces for development interventions, and poor people as subjects who mustbe empowered to take responsibility for their own improvement. Poverty is renderedas a technical issue that can be solved through participatory planning and bettergovernance. This leaves the unequal relations of production and appropriation outsidethe frame of view and intervention, and capitalist enterprise is seen ‘only as a solutionto poverty , not as a cause’ (Li, 2007: 267).
Development scholars have started to engage with the shifting geographies andgeopolitics of development. The rise of China, India and other countries of the Southas global economic powers challenges the monopoly of the West on what it means tobe modern and developed (Sidaway, 2012). It raises questions about the ways inwhich countries mobilize cultural power commensurate with their growing economicmight on the global stage, and how cultural imagery is employed in rebrandingthemselves as prosperous nations. Other studies reveal how Northern economic ideasand policies travel and how they are interpreted, adapted, and resisted in the South(Ferguson, 2006). Bringing the economic together with culture and development
88

challenges the assumption that economics is a science separate and immune frompolitical and cultural enquiries (Pollard et al., 2011). These studies of culture anddevelopment anchor culture within an analy sis of the machinations of power andcapitalism in development.
Other current work on culture and development involves detailed case studies thatexamine where, when, and how culture and development interact, and who isinvolved in these interactions. One fruitful place is the edges of development(Bhavnani et al., 2009). The edges can be marginal positions from which anydevelopment interventions or programmes are experienced as a distant echo, or asacts of dispossession and oppression. They can also be liminal, or between, locationswhere new cultural meaning is created. They are inhabited by people who negotiate,contest, and blur the boundaries of modernity and tradition in their everyday lives.Such case studies show development as always cultural, specific, and culture as aterrain of struggle.
ReferencesAppadurai, A. (2004) ‘The capacity to aspire: Culture and the terms of recognition’,
in V. Rao and M. Walton (eds), Culture and public action. Stanford, CA: StanfordUniversity Press, 59–84.
Bhavnani, K.-K., Foran, J., Kurian, P. and Munshi, D. (eds). (2009) On the edges ofdevelopment: Cultural interventions. New York: Routledge.
Danida. (2002) Culture and development: Strategies and guidelines. Copenhagen:Danish Ministry of Foreign Affairs.
Escobar, A. (1995) Encountering development: The making and unmaking of the ThirdWorld. Princeton, NJ: Princeton University Press.
Ferguson, J. (2006) Global shadows: Africa in the neoliberal world order. Durham,NC: Duke University Press.
Hall, S. (1992) ‘The West and the rest: Discourse and power’, in S. Hall and B. Gieben(eds), Formations of modernity. Cambridge: Polity Press/Open University Press,274–311.
Hall, S. (1997) ‘The work of representation’, in S. Hall (ed.), Representation: Culturalrepresentations and signifying practices. London: Sage, 15–51.
Harrison, L. E. and Huntington, S. P. (eds). (2000) Culture matters: How values shapehuman progress. New York: Basic Books.
Li, T. M. (2007) The will to improve: Governmentality, development, and the practiceof politics. Durham, NC: Duke University Press.
McEwan, C. (2009) Postcolonialism and development. London: Routledge.My rdal, G. (1968) Asian drama: An inquiry into the poverty of nations (3 vols).
89

Harmondsworth, UK: Penguin.Nederveen Pieterse, J. (2010) Development theory. Thousand Oaks, CA: Sage.Opel, A. and Shiva, V. (2008) ‘From water crisis to water culture’. Cultural Studies,
22(3–4): 498–509.Pollard, J., McEwan, C. and Hughes, A. (eds). (2011) Postcolonial economies.
London: Zed Books.Radcliffe, S. A. and Laurie, N. (2006) ‘Culture and development: Taking culture
seriously in development for Andean indigenous people’. Environment andPlanning D: Society and Space, 24(2): 231–248.
Said, E. W. (1978) Orientalism: Western conceptions of the Orient . New York:Pantheon Books.
Schech, S. and Haggis, J. (2000) Culture and development: A critical introduction.Oxford: Blackwell.
Sen, A. (2004) ‘How does culture matter?’, in V. Rao and M. Walton (eds), Cultureand public action. Stanford, CA: Stanford University Press, 37–58.
Sidaway, J. D. (2012) ‘Geographies of development: New maps, new visions?’. TheProfessional Geographer, 64(1): 49–62.
Watts, M. (2003) ‘Alternative modern – development as cultural geography ’, in K.Anderson (ed.), Handbook of cultural geography. Thousand Oaks, CA: Sage, 433–453.
Further readingLi, T. M. (2007) The will to improve: Governmentality, development, and the practice
of politics. Durham, NC: Duke University Press. For an ethnographic study ofdevelopment practices as forms of governmentality .
McEwan, C. (2009) Postcolonialism and development. London: Routledge. Anaccessible account of post colonial theory and its implications for developmentstudies.
Schech, S. and Haggis, J. (2000) Culture and development: A critical introduction.Oxford: Blackwell. For an overall introduction to the topic.
90

1.10Ethics and development
Des Gasper
The field of development ethics explores questions and debates concerning what isgood development of societies and of the world, and good development for individualpersons. Generations of experience suggest the inadequacy of the assumption thatsocietal, world or personal development can be equated to economic growth andwealth. That assumption neglects issues of equity, security, personal relationships,natural environment, identity, culture and meaningfulness. In particular, equatingnational development to national economic growth neglects the welfare and rights ofmany groups of already disadvantaged people. Over ten million people a year, forexample, are displaced from their home due to economic expansion, frequently withlittle or no compensation (Penz et al. 2011). An important alternative conception ofdevelopment is ‘human development’, meaning achievement with respect to a widerange of well-reasoned values, not only those measured in money, and advancementof people’s ability to achieve such well-reasoned values (Haq 1999; Nussbaum 2011).Development ethics tries to identify and sy stematically reflect on values and value-choices present in, or relevant to, cases and processes in the development of societies,persons, regions, and the globe.
Topics in development ethics include, amongst others: meanings and evolution ofthe idea of ‘development’, and the values that these meanings can contain about whatis acceptable and desirable; concepts and evidence about human well-being and ill-being; assumptions and gaps in conventional economic evaluation; meanings andvarieties of ‘equity ’, and how equity can be neglected; and the significance of variousty pes of human vulnerability and security (Goulet 1971), and their relationships toeconomic growth. Practically oriented development ethics looks at how and whichvalues are or can be incorporated in sy stems of policy, laws, social routines, andpublic and individual actions.
Ethics of development: Why?‘Development’ sounds self-evidently desirable. Why did a field of ethics ofdevelopment arise? First, because of persistent undeserved removable poverty,sickness, insecurity and unhappiness despite economic growth. Rise of averageincomes does not necessarily benefit ordinary and especially poor people. Despite
91

enormous growth in human powers and economic turnover, hundreds of millions ofpeople remain undernourished, leading to their physical and mental stunting, illnessand premature death. As of 2004, UNICEF estimated that 30,000 babies and childrenunder five y ears died every day from poverty -related causes; a third of the world’speople lacked basic sanitation, almost a billion adults were illiterate, and 170 millionchildren were engaged in hazardous work. Most of the people affected – including thebabies and children – were not to blame for their own situation and had little unaidedresponse-ability. As Nussbaum (e.g. 2011) asks: how far should the chance of beingborn in one nation rather than another determine the life chances of a baby?
Second, many people become harmed even within processes of economicdevelopment: they are made to bear the costs without sharing in the benefits, as forexample in uncompensated displacement from their homes and livelihoods. Thepeople displaced are nearly always poor, moved in order to clear the way forprojects that very largely benefit people who are already better off. So, not only dosome groups not share in benefits, they may be deliberately harmed, as weregenerations of slaves and many other workers. Even when not deliberatelysacrificed, many suffer through increased exclusion and marginalisation. Issues ofdistribution and harm involve also future generations, notably in relation to damage tothe natural environment, especially through human-induced climate change (UNDP2007).
Development ethics looks at implications of the interconnections and in-builtconflicts in socioeconomic development, within countries and internationally andover time. Increased carbon emissions, a core feature of modern development,indirectly eventually damage people in vulnerable environments around the world.Investment for future generations can be at the expense of present-day poor people;construction of infrastructure for some people’s benefit results in displacement ofothers, ty pically with major economic, social and psychological disruption; andwithin markets, the increased wealth of some people competes away resources frompoorer people, by forcing up the prices of goods such as land, housing and food.Famines and malnutrition have often been caused less by shortage of supply than bythis mechanism, whereby wealth draws in resources from around the world (Davis2001). Increased pressures of most sorts typically affect women especially, for theyare the main caregivers and ‘shock absorbers’ in a society, that get noticed only whenbroken. The disproportionate concentration of costs of development upon somegroups has been used as a mechanism of transformation – ‘breaking eggs in order tomake omelettes’, in the words of Britain’s Colonial Secretary Joseph Chamberlain andmany others; industrialisation and the transformation of agriculture have typicallypartly occurred through processes by which many small agricultural, industrial andartisanal producers are forced out of business. In recent years around a quarter-million Indian farmers have committed suicide due to accumulation of unrepayable
92

debts – here a case not of exclusion from modernisation processes, but of vulnerablepeople who are induced and/or choose to participate in types of economicmodernisation and who then sometimes suffer severely when the risks and the ‘smallprint’ prove to be more than they can cope with.
Third, the gains in well-being through policy approaches that equate developmentto economic growth are sometimes very questionable. When and how far doesacquisition of and preoccupation with material comforts and conveniences bring, orjeopardise, a fulfilling and meaningful life (Gasper 2007)? The French economistLouis-Joseph Lebret (1897–1966), who helped to found the subject of developmentethics, spoke thus not only of ‘development for all persons’ but of ‘development of allthe person’ and of ‘putting the economy at the service of man’.
Fourth, besides outcomes, major questions arise about democratic participation inprocesses of decision-making (e.g. Chambers 1997; Ellerman 2005) and aboutresponsibilities in relation to harm and undeserved suffering: who has responsibilitiesand to do what – to help, prevent, refrain, compensate – including in light of pastinjustices (such as slavery ) and their consequences for present-day undeservedadvantages and disadvantages?
Issues of development ethics become relevant because of arguments that betteralternatives are possible compared to what has happened, and that real choices existfor the future too. Evidence of such alternatives may lie in the experiences of othercountries (Drèze and Sen 1989) – for example, some East Asian countries that havecombined a rapid climb out of poverty with a relatively high degree of populationinclusion and sharing in benefits. Financial and economic calculations are alsorelevant; for example, that to attain the $2 per day per person income line forevery one would cost around 1.2 per cent of the gross national products of high-income countries, vastly less than they spend on military forces. A recent estimate ofthe extra costs required to achieve universal primary education equated to four daysof the world’s military spending.
Ethics in development: What and how?The agenda of development ethics includes: to explore how the content of the idea of‘development’ as societal improvement is value-relative; to highlight who bears thecosts of various types of ‘development’, and to examine the value-choices that areimplied and should be considered in development policy, programmes and projects;to present well-reasoned alternatives to mainstream habits regarding those choices, inparticular to clarify the values behind evaluative and prescriptive arguments fromeconomics, query the narrowness of using only values from the marketplace,introduce other relevant values and query therefore an automatic superior status foreconomics arguments, in relation, for example, to human rights arguments. The rootconcerns of development ethics – the insistence on not equating societal improvement
93
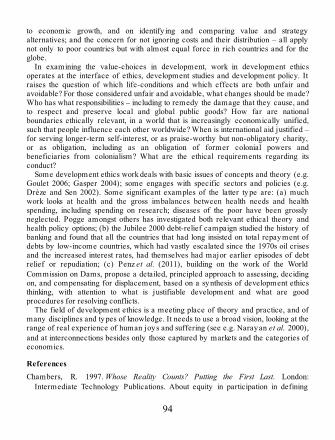
to economic growth, and on identify ing and comparing value and strategyalternatives; and the concern for not ignoring costs and their distribution – all applynot only to poor countries but with almost equal force in rich countries and for theglobe.
In examining the value-choices in development, work in development ethicsoperates at the interface of ethics, development studies and development policy. Itraises the question of which life-conditions and which effects are both unfair andavoidable? For those considered unfair and avoidable, what changes should be made?Who has what responsibilities – including to remedy the damage that they cause, andto respect and preserve local and global public goods? How far are nationalboundaries ethically relevant, in a world that is increasingly economically unified,such that people influence each other worldwide? When is international aid justified –for serving longer-term self-interest, or as praise-worthy but non-obligatory charity,or as obligation, including as an obligation of former colonial powers andbeneficiaries from colonialism? What are the ethical requirements regarding itsconduct?
Some development ethics work deals with basic issues of concepts and theory (e.g.Goulet 2006; Gasper 2004); some engages with specific sectors and policies (e.g.Drèze and Sen 2002). Some significant examples of the latter type are: (a) muchwork looks at health and the gross imbalances between health needs and healthspending, including spending on research; diseases of the poor have been grosslyneglected. Pogge amongst others has investigated both relevant ethical theory andhealth policy options; (b) the Jubilee 2000 debt-relief campaign studied the history ofbanking and found that all the countries that had long insisted on total repayment ofdebts by low-income countries, which had vastly escalated since the 1970s oil crisesand the increased interest rates, had themselves had major earlier episodes of debtrelief or repudiation; (c) Penz et al. (2011), building on the work of the WorldCommission on Dams, propose a detailed, principled approach to assessing, decidingon, and compensating for displacement, based on a synthesis of development ethicsthinking, with attention to what is justifiable development and what are goodprocedures for resolving conflicts.
The field of development ethics is a meeting place of theory and practice, and ofmany disciplines and types of knowledge. It needs to use a broad vision, looking at therange of real experience of human joys and suffering (see e.g. Narayan et al. 2000),and at interconnections besides only those captured by markets and the categories ofeconomics.
ReferencesChambers, R. 1997. Whose Reality Counts? Putting the First Last. London:
Intermediate Technology Publications. About equity in participation in defining
94

situations and providing information.Davis, M. 2001. Late Victorian Holocausts: El Niño Famines and the Making of the
Third World. London: Verso. A study of the implications and interactions of globalpower sy stems, global markets, and global climate sy stems in the late nineteenthcentury , especially the disastrous implications for vulnerable population groups.
Drèze, J. and A. Sen. 1989. Hunger and Public Action. Oxford: Clarendon. Anoverview of feasible public action to address basic human needs, under a varietyof different political setups.
Drèze, J. and A. Sen. 2002. India: Development and Participation. Delhi: OxfordUniversity Press. An illustration of a treatment of development policy evaluationand design that is sy stematically guided by an ethical standpoint – here, Sen’scapability approach.
Ellerman, D. 2005. Helping People to Help Themselves: From the World Bank to anAlternative Philosophy of Development Assistance. Ann Arbor: University ofMichigan Press.
Gasper, D. 2004. The Ethics of Development. Edinburgh: Edinburgh University Press.Gasper, D. 2007. ‘Uncounted or Illusory Blessings? Competing Responses to the
Easterlin, Easter-brook and Schwartz Paradoxes of Well-Being’. Journal ofInternational Development, 19(4): 473–492.
Goulet, D. 1971. The Cruel Choice. New York: Atheneum.Goulet, D. 2006. Development Ethics at Work: Explorations 1960–2002 . New York:
Routledge. By a leading figure in formation of the field of development ethics.Haq, M. 1999. Reflections on Human Development, 2nd edn. Oxford: Oxford
University Press.Naray an, D., R. Chambers, M. K. Shah and P. Petesch. 2000. Voices of the Poor:
Crying Out for Change. New York: Oxford University Press. From over 10,000interviews around the world.
Nussbaum, M. C. 2011. Creating Capabilities: The Human Development Approach.Cambridge, MA: Harvard University Press.
Penz, P., J. Dry dyk and P. Bose. 2011. Displacement by Development: Ethics, Rightsand Responsibilities. Cambridge: Cambridge University Press.
UNDP. 2007. Human Development Report 2007/8 – Fighting Climate Change: HumanSolidarity in a Divided World . New York: United Nations DevelopmentProgramme.
Further readingGasper, D. and A. L. St. Clair (eds). 2010. Development Ethics. Aldershot, UK:
Ashgate. A collection of 28 papers from the last 35 years.
95

Pogge, T. 2008. World Poverty and Human Rights, 2nd edn. Cambridge: Polity Press.Schwenke, C. 2008. Reclaiming Value in International Development: The Moral
Dimensions of Development Policy and Practice in Poor Countries. Portsmouth,NH: Greenwood Press. A practically oriented textbook.
WebsitesHuman Development and Capability Association, HDCA:www.capability approach.comInternational Development Ethics Association, IDEA: http://developmentethics.org/
96

1.11New institutional economics and development
Philipp Lepenies
New Institutional Economics (NIE) is an expansion of neo-classical economictheory. Its merits stem from the fact that it has identified efficient institutions to be aprerequisite for development. Yet, as neo-classical economics is increasinglyrejected as a useful basis for social analy sis, the prominent role of NIE indevelopment will probably diminish over time. However, NIE still stronglyinfluences development policy. Thus, it is useful to understand the theoretical contextof NIE as well as its shortcomings.
What is NIE?NIE attempted to incorporate a theory of institutions into economics. It was adeliberate attempt to make neo-classical economic theory more ‘realistic’. Neo-classical economic theory assumed that information flows freely between the actorsin competitive markets and that, as a result, institutions do not matter. In contrast, NIEpostulated that information is distributed asymmetrically (asymmetrical information)and that market transactions come at a cost (i.e. the cost of gathering information ortransaction costs). Consequently , institutions had to be formed to reduce these costs.
NIE retained the neo-classical assumptions that individuals seek to maximise theirutility from scarce resources subject to budget constraints and that collectiveoutcomes rest on the choices made by rational individuals (i.e. methodologicalindividualism). However, it discards the concept of instrumental rationality, whichimplies that the choices made by each individual are completely foreseeable. Withall information readily available to everyone (perfect information), there is nouncertainty in human actions. Institutions become unnecessary and efficient marketscharacterise economies.
The necessity for a modification of neo-classical theory arose from the fact thatso-called social dilemmas could not be explained by it. Social dilemmas are situationsin which the choices made by rational individuals y ield outcomes that are sociallyirrational. This is obvious in the case of market failures that can be caused by negativeexternalities (i.e. a cost arising from an activity which does not accrue to the personor organisation carry ing on the activity, e.g. pollution) and public goods (i.e. goodsthat are open to all, free of charge and thus not usually supplied by the market), but
97

••
•
also applies to cases of asymmetrical or imperfect information (i.e. information is notfully available to everyone). Imperfect information might cause moral hazards (i.e.the danger that one of two parties of a contract knowingly alters her behaviour inorder to maximise her utility at the other party ’s expense), adverse selection (e.g.imperfect health insurance contracts attract those who have high health risks) and/orprincipal-agent dilemmas (i.e. the problem of how a ‘principal’ can motivate an‘agent’ to act for the principal’s benefit rather than following his or her self-interest).
NIE’s core argument is that institutions provide the mechanisms whereby rationalindividuals can transcend social dilemmas and economise on transaction costs (Bates1995: 29). Institutions are thus
the rules of the game of society … the humanly devised constraints that structurehuman interaction. They are composed of formal rules (statute law, common law,regulations), informal constraints (conventions, norms of behaviour and self-imposed rules of conduct), and the enforcement characteristics of both.
(North 1995: 23)
The term ‘New Institutional Economics’ was coined in the 1970s by OliverWilliamson to distinguish it from an earlier attempt to incorporate institutions intoeconomic theory at the beginning of the twentieth century, the so-called ‘(Old)Institutional Economics’ whose main authors were Thorstein Veblen and John R.Commons.
NIE came into being in 1937, when Ronald Coase explained the existence of firms.Ironically, neo-classical theory could not explain why firms existed and why markettransactions were not carried out solely by individuals as methodologicalindividualism suggests. Coase departed from the Walrasian notion of markettransactions being made costless on the spot by an invisible and omniscient auctioneer– that is, the idea of perfect information. Instead he assumed that ‘the main reasonwhy it is profitable to establish a firm would seem to be that there is a cost of usingthe price mechanism’ (Coase 1937: 390). Transactions thus involve the cost ofdiscovering what the relevant prices are.
With time, the idea of transaction costs, probably the single-most importantconcept of NIE, was developed further. Some authors distinguish different transactioncosts in accordance with the three big areas of analy sis within NIE, that is, themarket, the firm and the State. Thus, there are:
market transaction costs, which are those described by Coase;management transaction costs within a firm that come as a result of administrativeprocedures, strategic planning as well as supervision of the work force;political transaction costs, which are the costs of establishing, enforcing and utilising
98

a political sy stem.
Others identify transaction costs according to the process of transacting, that is,information and search costs, costs of negotiating contracts and the costs of enforcingthem. Yet, all transaction costs ‘have in common that they represent resources lostdue to lack of information’ (Dahlman 1979: 148).
It is important to point out that the NIE is not a homogeneous school of thought.Rather, it consists of a variety of theoretical writings by a large number of differentauthors. NIE includes research on transaction costs, political economy, contracttheory , property rights, hierarchy and organisations, public choice and development.
NIE and developmentSince the 1990s, NIE has had a tremendous impact on development policy andtheory. This can be demonstrated by tracing out the obvious influence that NIE hashad on the World Bank, by presenting Douglass C. North’s NIE-inspired theory ofdevelopment and by describing the relevance of NIE for development practitioners.
NIE and the World Bank
Since free markets alone cannot be relied upon to ensure development, NIEemphasises the necessity for development policy to design favourable growth-inducing institutional settings. This was reflected in the new role ascribed to the Statein the World Bank’s World Development Report (WDR) The State in a ChangingWorld (1997). Therein, the State, after having been viewed as an obstacle to thefunctioning of competitive markets in the years before, was suddenly identified as animportant facilitator of favourable institutional arrangements.
The appointment of Joseph Stiglitz, a major theorist of the NIE, as chief economistof the World Bank, also reflected the influence of the NIE on the Bank’s policy. In1986, Stiglitz stated that the assumptions of neo-classical economics were ‘clearlyirrelevant’ for the analy sis of developing countries. Instead, he showed thatasy mmetrical information prevailed in most markets (Stiglitz 1986: 257). During hisspell as chief economist of the World Bank, the bank began to define itself as a‘knowledge bank’ whose responsibility was to gather and disseminate informationtransparently on a global scale. NIE dominated the WDR 1998/1999 Knowledge forDevelopment, which highlighted the general importance of overcomingasy mmetrical information in development (World Bank 1998). The influence of NIEwas also obvious in the WDR 1999/2000 Entering the 21st Century, whichsummarised the lessons learnt from the last 50 years of global development policy.One lesson plainly read: ‘Institutions matter’ (World Bank 1999: 1).
99

Explaining institutional change and underdevelopment
A major branch of NIE is concerned with the analy sis of institutional change andunderdevelopment. Its most prominent author is Douglass C. North who added ahistorical perspective to neo-classical economics. Historically, societies had to learnhow to solve the problem of scarcity .
The key … is the kind of learning that organisations acquired to survive. If theinstitutional framework made the highest pay -offs for organizations piracy, thenorganizational success and survival dictated that learning would take the form ofbeing better pirates. If on the other hand productivity raising activities had thehighest pay -off, then the economy would grow.
(North 1995: 21)
Thus, developmental outcomes in the world differ according to how people learnt tocope with scarce resources.
For North, the Western capitalist sy stem has been flexible enough to adapt itself tothe institutional necessities induced by the higher division of labour, minutespecialisation, impersonal exchange and worldwide interdependence. However, in acountry with inefficient institutions, only a process of internal re-contracting canchange the institutional setting. As long as those holding the bargaining power have anincentive to defend the status quo, and inefficiencies are perceived to be rewarding,the situation will not improve (path dependence). This is a major deviation from theneo-classical notion of long-term equilibrium – and a more pessimistic one whereunderdevelopment becomes plausible.
The still existing practical relevance of NIE for development
The practical relevance of NIE is twofold. First, concepts such as ‘asymmetricalinformation’, ‘transaction costs’, ‘adverse selection’, ‘moral hazard’ and ‘principal-agent dilemmas’ are currently widely used tools for socioeconomic analysis. Second,they also serve as the basis for individual project design. ‘Institution-building’ itself hasbecome the raison d’être of many development projects in the last decade.
Parting from the definition of ‘institutions’, any attempt to establish ‘rules of thegame’ and their enforcement characteristics (be it new laws, regulations orgovernance structures, etc.) can consequently be seen as an application of NIE.
A prominent case where concepts of NIE are used is that of the analy sis offinancial services for the poor. The banking sector usually does not offer financialservices to the informal sector because information is asymmetrically distributedbetween the potential borrower and lender. The lender does not have sufficientinformation on the borrower whom he does not know personally, who usually does
100

not keep written accounts or business plans and who cannot offer physical collateral.Thus, the lender cannot calculate the risk of default. As a result, credit to the informalsector is rationed since lenders are reluctant to give out credit. If financial services tothe poor are to be provided, these problems have to be addressed with adequateinstitutional design.
In the absence of physical collateral, for instance, group-based lending could be aninstitutional design option to overcome the problems of asymmetrical information.By introducing peer-monitoring as a control mechanism of the borrowers and bylinking future payments to group members to the repayment performance of theentire group during monitored weekly meetings, the risks posed by the lack ofinformation described above are minimised.
However, just as NIE is a heterogeneous theory, there is also no such thing as aclear-cut NIE-approach to development. Few development practitioners or theoristswho make use of NIE concepts would define themselves as being ‘of the NIE’. Yet,the fact that elements of NIE are used so widely and that the importance ofinstitution-building has been generally acknowledged is arguably the strongest sign ofhow much NIE has already become commonplace in development.
Critique and conclusionNIE has ‘challenged the dominant role ascribed to the market … [by highlighting that]neither State nor market is invariably the best way in which to organise the provisionof goods and services’ and that efficient institutions are the key to successfuldevelopment (Harris, Hunter and Lewis 1995: 1). It is, without a doubt, the strongestmerit of NIE to have put the issue of institutions on the development agenda.
However, NIE is not without limitations. As noted before, NIE is an attempt tochange neo-classical economics ‘from within’. This alone is praiseworthy. Yet, as itmaintains the basic assumption that individuals rationally pursue the maximisation oftheir utility at all times, little or no room is given to any behaviour which might not beguided by the individual’s rationally calculated quest for utility -maximisation. Hence,NIE is still not realistic enough as it maintains a simplistic and incomplete model ofhuman behaviour.
The major flaw of the NIE, be it in development or elsewhere, is that manyconcepts of NIE are hard to measure, sometimes even hard to define as ‘a clear cutdefinition of transaction costs does not exist’ (Eggertsson 1990: 14). From this derivesthe difficulty in measuring exactly what transaction costs are. The same applies tothe notion of asymmetrical information or the simple question, what ‘information’means – especially when one takes into account that ‘information’ might meandifferent things to different people. Research which utilises concepts of NIE mightthus bring forth insights for a special case. Nevertheless, it is often not comparablewith other findings.
101
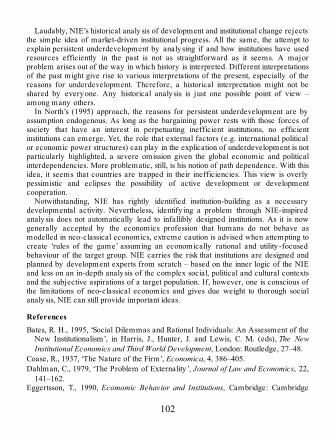
Laudably, NIE’s historical analy sis of development and institutional change rejectsthe simple idea of market-driven institutional progress. All the same, the attempt toexplain persistent underdevelopment by analy sing if and how institutions have usedresources efficiently in the past is not as straightforward as it seems. A majorproblem arises out of the way in which history is interpreted. Different interpretationsof the past might give rise to various interpretations of the present, especially of thereasons for underdevelopment. Therefore, a historical interpretation might not beshared by every one. Any historical analy sis is just one possible point of view –among many others.
In North’s (1995) approach, the reasons for persistent underdevelopment are byassumption endogenous. As long as the bargaining power rests with those forces ofsociety that have an interest in perpetuating inefficient institutions, no efficientinstitutions can emerge. Yet, the role that external factors (e.g. international politicalor economic power structures) can play in the explication of underdevelopment is notparticularly highlighted, a severe omission given the global economic and politicalinterdependencies. More problematic, still, is his notion of path dependence. With thisidea, it seems that countries are trapped in their inefficiencies. This view is overlypessimistic and eclipses the possibility of active development or developmentcooperation.
Notwithstanding, NIE has rightly identified institution-building as a necessarydevelopmental activity. Nevertheless, identify ing a problem through NIE-inspiredanaly sis does not automatically lead to infallibly designed institutions. As it is nowgenerally accepted by the economics profession that humans do not behave asmodelled in neo-classical economics, extreme caution is advised when attempting tocreate ‘rules of the game’ assuming an economically rational and utility -focusedbehaviour of the target group. NIE carries the risk that institutions are designed andplanned by development experts from scratch – based on the inner logic of the NIEand less on an in-depth analy sis of the complex social, political and cultural contextsand the subjective aspirations of a target population. If, however, one is conscious ofthe limitations of neo-classical economics and gives due weight to thorough socialanaly sis, NIE can still provide important ideas.
ReferencesBates, R. H., 1995, ‘Social Dilemmas and Rational Individuals: An Assessment of the
New Institutionalism’, in Harris, J., Hunter, J. and Lewis, C. M. (eds), The NewInstitutional Economics and Third World Development, London: Routledge, 27–48.
Coase, R., 1937, ‘The Nature of the Firm’, Economica, 4, 386–405.Dahlman, C., 1979, ‘The Problem of Externality ’, Journal of Law and Economics, 22,
141–162.Eggertsson, T., 1990, Ecomomic Behavior and Institutions, Cambridge: Cambridge
102

University Press.Harris, J., Hunter, J. and Lewis, C. M., 1995, ‘Introduction: Development and
Significance of NIE’, in Harris, J., Hunter, J. and Lewis, C. M. (eds), The NewInstitutional Economics and Third World Development, London: Routledge, 1–13.
North, D. C., 1995, ‘The New Institutional Economics and Third WorldDevelopment’, in Harris, J., Hunter, J. and Lewis, C. M. (eds), The New InstitutionalEconomics and Third World Development, London: Routledge, 17–26.
Stiglitz, J. E., 1986, ‘The New Development Economics’, World Development , 14,257–265.
World Bank, 1997, World Development Report 1997: The State in a Changing World ,Oxford: Oxford University Press.
World Bank, 1998, World Development Report 1998/1999: Knowledge forDevelopment, Oxford: Oxford University Press.
World Bank, 1999, World Development Report 1999/2000: Entering the 21st Century ,Oxford: Oxford University Press.
Further readingFurubotn, E. G. and Richter, R., 1998, Institutions and Economic Theory: The
Contribution of the New Institutional Economics, Ann Arbor: Michigan UniversityPress. A very thorough and detailed analy sis of practically all aspects of NIE.
103

1.12Measuring development
From GDP to the HDI and wider approaches
Robert B. Potter
Both researchers and policy makers in the field of development studies have sought tofind methods to measure levels and rates of change in development. Naturally, theapproaches used to measure development have reflected directly the principalconceptualisations of development as a process that have been emphasised at varioustimes.
During the 1950s through to the early 1980s, development was generally measuredin terms of economic growth, and in particular, the growth of production and income.In the late 1980s, through to the 1990s, changes in the way development was beingenvisioned were directly recognised in the promotion of wider indices of humandevelopment and change. This trend towards recognising the multidimensional natureof development has been continued from the 1990s through to the start of the twenty -first century, whereby wider sets of factors, reflecting more subjective andqualitative dimensions, have increasingly been employed to define development.These have included wider measures of social welfare and human rights.
These three approaches to deriving measures of development provide theframework for this chapter, which looks specifically at: (i) measuring development interms of economic growth, by means of GDP and GNP per capita; (ii) measuringdevelopment in terms of human development: the Human Development Index(HDI); and (iii) measuring development in terms of wider dimensions, includinghuman rights and freedoms. Throughout, the account is strongly based on thatrecently provided in Potter et al. (2012).
Development as economic growth: GDP and GNP per capita as measures ofdevelopmentExplained in simple terms, this approach uses ‘income’ per head of the population asa measure of development, suggesting that the higher the income of a country orterritory, the greater its development. The approach sees development as beingessentially the same thing as economic growth. During the era of unilineardevelopment models and theories, the growth of GDP/GNP was taken as thesurrogate measure of development. More accurately, in this approach, the standard
104

of living of a country is used as a summary measure of development (Thirlwall,2011). The GDP/GNP of a territory is directly affected both by the number ofpeople working within a country and their overall level of productivity .
Gross Domestic Product (GDP) per capita – measures the value of all goods andservices produced by a nation or a territory, whether by national or foreigncompanies. When calculated, the national total is divided by the total population, togive the value of goods and services produced per head of the population.
Gross National Product (GNP) per capita – this is Gross Domestic Product to whichnet income derived from overseas is added. In other words, income which isgenerated abroad is added, and pay ments made overseas are subtracted. This totalis also then divided by the population. In recent years, international organisationslike the World Bank have increasingly referred to this measure more directly asGross National Income (GNI) per capita.
Through time from the 1950s, GDP and GNP/GNI have been used as measures ofdevelopment. The measure has been popular as it makes possible the internationalcomparison of living standards by using per capita incomes, customarily measured inUnited States dollars. Employ ing such an approach, the basic causes of poverty ofany given nation are seen as the low productivity of labour that is associated with lowlevels of phy sical capital (natural resources) and human capital (for example,education) accumulation and low levels of technology. The economic growth ofcountries is measured by the increase in output of goods and services (GDP/GNP)that occurs over a given time period, normally a year (Thirlwall, 2011).
Development as human development: The Human Development Index (HDI) as awider measure of developmentBut development is far wider than the growth of income alone. First, GDP/GNP takesno account of the distribution of national wealth and output between different groupsof the population, or between different areas/regions. Further, such income-basedmeasures do not take into acount the wider well-being of people, which includes morethan goods, money and material well-being.
In the 1980s, it was increasingly recognised that non-economic factors areinvolved in the process of development. Reflecting this, in 1989, the United NationsDevelopment Programme (UNDP) promoted the Human Development Index (HDI)as a wider measure of development. HDI data were published for the first time in1990 in the inaugural Human Development Report (UNDP, 1990). In the original HDIthe emphasis was placed on assessing human development as a more roundedphenomenon. There was still a measure of economic standing, but this was only oneof three principal dimensions identified:
105

1
2
3
A long and healthy life (longevity ) – originally measured by life expectancy atbirth in years.Education and knowledge – initially measured by the adult literacy rate and thegross enrolment ratio (the combined percentage of the population in primary,secondary and tertiary education).A decent standard of living – originally measured by Gross Domestic Product percapita in US dollars, as outlined in the previous section.
In the Human Development Report 2010 (UNDP, 2010), the formula was changedsomewhat. The three dimensions of health, education and living standard aretranslated into four indicators: life expectancy, mean years of schooling, expectedyears of schooling and Gross National Income per capita. These are then summed togive a single Human Development Index. In the case of all the indicators, themeasures are then transformed into an index ranging from 0 to 1, from the lowest tothe highest levels of assessed human development, to allow equal weighting betweeneach of the three dimensions.
Since 1990, the Human Development Report has been published by the UNDPevery y ear. Within these reports, the HDI has been used to divide nations into whathas come to be referred to as high-, middle- and low levels of human development.Recently, the classification has been extended to also include a very high-humandevelopment category .
It should be stressed that the HDI is a summary , and not a comprehensive measureof development. For example, over the y ears since its introduction, variousmethodological refinements and spin-offs have been made by the United Nations,including the Human Poverty Indexes 1 and 2, the Gender-related DevelopmentIndex and the Gender Empowerment Measure. These are all variations on the basicHuman Development Index. In each case, additional variables were brought in toreflect the revised index.
The use of HDI scores and their difference from GDP/GNP are shown if we lookat some examples taken from the Human Development Report 2009 (UNDP, 2009;see Potter et al., 2012 for fuller coverage). The country with the highest HDI isNorway (0.971). Although its GDP was high, at US$53,433, this was not the highestby any means. Norway ’s first place standing on the HDI was a reflection of its highlife expectancy at birth (80.5 years) and its high overall enrolment in education (96.6per cent). In comparison, the USA was ranked as the 13th most developed nation(HDI = 0.956). Its GDP per capita was a little lower than that for Norway atUS$45,592 per capita, but both life expectancy (79.1 years) and enrolment ineducation (92.4 per cent) were lower than for Norway. Both Norway and the USAfall into the very high development category .
Lower down in the overall HDI country listing, and falling into the high
106

1
23456
development category, some might be surprised to see Cuba in 51st place. Althoughits GDP at US$6,876 per capita is low for such a ranking, Cuba is pulled up by virtueof its relatively high life expectancy (78.5 y ears) and educational enrolment (100 percent), levels that are very high for a nation with a relatively low income. In the lowdevelopment category, Niger is to be found in 182nd place (HDI = 0.340). Not onlyis Niger’s GDP per capita extremely low at US$627 per capita, its life expectancystands at only 50.8 years at birth, and its combined educational enrolment is as low as27.2 per cent.
Measuring development in terms of wider dimensions, including human rights andfreedomsA number of writers, have stressed the importance of self-esteem, basic freedomsand human rights as components of the development equation (e.g. Goulet, 1971; Sen,1999). Such views represent specific recognition that wider aspects of developmentare vital, particularly those that relate to the quality of peoples’ daily lives, theirfreedom from various inequalties, and the attainment of human rights and basicfreedoms.
The Millennium Development Goals (MDG) are designed as instruments to steerthe world to enhanced levels of development. For each MDG there are associatedtargets and detailed indicators. The indicators can be seen as dimensions that can beemployed in order to assess the progress of nations and regions towards the goals andtargets, and thereby represent measures of the wider dimensions of development,covering issues such as:
eradicating extreme poverty and hunger – measured by the percentage of thepopulation living on less than $1 or $2 per day (now $1.25 and $2.50 per day );achieving universal primary education;promoting gender equality and empowering women;reducing child mortality ;improving maternal welfare;combatting diseases.
An impression of how such indicators can be used as measures of progress indevelopment can be gained from the national reports covering progress with theMDGs that are available on the UNDP website. The 94 page report for India in 2009,for example, shows in considerable detail the mixed success achieved on the twelvetargets that apply to it.
In terms of basic human rights, an interesting approach is to chart the extent towhich countries have ratified the six major human rights conventions and covenants(for example, the Rights of the Child, Against Torture , etc.; see Potter et al., 2008). In
107

a similar manner, the United Nations Human Development Report 2010 introducedthe HDI-derived Gender Inequality Index (GII). The statistics input to the GII includethe national female and male shares of parliamentary seats, and educationalattainment. The GII also includes female participation in the labour market. Thereby,the GII represents a direct effort to measure the progress made by countries inadvancing the standing of women in wider political and economic developmentalterms.
BibliographyChant, S. and McIlwaine, C. (2009) Geographies of Development in the 21st Century:
An Introduction to the global South, London: Edward Elgar.Goulet, D. (1971) The Cruel Choice: A New Concept on the Theory of Development,
London: Routledge.Potter, R. B., Binns, T., Elliott, J. and Smith, D. (2008) Geographies of Development,
3rd edn, London: Pearson-Prentice Hall.Potter, R. B., Conway, D., Evans, R. and Lloyd-Evans, S. (2012) Key Concepts in
Development Geography, London: Sage.Sen, A. (1999) Development as Freedom: Human Capacity and Global Need, Oxford:
Oxford University Press.Thirlwall, A. P. (2011) Economics of Development: Theory and Evidence, 9th edn,
London: Palgrave Macmillan.UNDP (1990) Human Development Report 1990, New York: Oxford University
Press.UNDP (2009) Human Development Report 2009, New York: Oxford University
Press.UNDP (2010) Human Development Report 2010, New York: Oxford University
Press.Willis, K. (2005) Theories and Practices of Development, London: Routledge.
Further reading and websitePotter, R., Conway, D., Evans, R. and Lloyd-Evans, S. (2012) Key Concepts in
Development Geography, London: Sage. An extended treatment is providedincluding a table showing HDI and GDP data for a range of 17 countries amongthe various HDI categories and specifically showing the difference in rank forcountries on the HDI and GDP (see table 1.2.1, p. 32)
UNDP website: http://hdr.undp.org/en/statistics/indices/gdi_gem/. This is a currentsource for the United Nations Development Programme’s (UNDP) annual HumanDevelopment Reports. These explain in detail how the Human Development Index
108

is calcuated, and also list the relevant data for the world’s nations.Further summary treatments are to be found in Geographies of Development in the21st Century by Sy lvia Chant and Cathy McIlwaine (2009) and Theories andPractices of Development by Katie Willis (2005), in both cases in the introductorychapter 1.
109

1.13The measurement of poverty
Howard White
IntroductionThe importance of the task of poverty reduction means that we must be clear as towhat we mean by poverty, who the poor are and the best way to help them escapepoverty. This chapter is concerned with the first of these points – the meaning andmeasurement of poverty. The next section outlines key concepts which underpin thevarious poverty measurements discussed in the subsequent section. Finally, somedata on poverty trends are presented.
Poverty conceptsIn everyday usage the term ‘poverty ’ is sy nonymous with a shortage of income. Butthe development literature stresses the multidimensionality of poverty. In addition tomaterial consumption, both physical and mental health, education, social life,environmental quality, spiritual and political freedom, and general well-being(‘happiness’) all matter. Deprivation with respect to any one of these can be calledpoverty .
Some dispute the use of multidimensionality , arguing that income-poverty (i.e. lackof material well-being) is what really matters. Arguments supporting this viewinclude the high correlation between income and other measures of well-being suchas health and education status and the view that governments can do something aboutincome (i.e. support growth) but are less able to enhance spiritual well-being.
But there are good arguments in defence of multidimensionality. First, thecorrelation with income is not that strong for some indicators. Second, poor peoplethemselves often rank other dimensions as being more important than income. Mostfamously, Jodha (1988) showed with Indian data that the welfare of the poor hadrisen by measures they considered important – such as wearing shoes and separateaccommodation for people and livestock – whereas surveys showed their income tohave fallen. Participatory approaches to poverty measurement seek to identify thethings that matter to poor people. Different perceptions matter since the povertyconcept adopted will influence policy. When poverty is defined solely in terms ofincome, then it is unsurprising that economic growth is found to be the most effectiveway to reduce poverty. But if basic needs such as health and education are valued
110

then the development strategy is likely to put more emphasis on social policy. In thelast few y ears governments of both developed and developing countries have soughtto broaden summary measures of national welfare bey ond income, the mostextreme case being Bhutan in which the Planning Ministry has been renamed theMinistry of Happiness, a refocusing which also can prompt changes in social policytoward, for example, promoting social cohesion rather than merely income security .
Two further conceptual issues are: absolute versus relative poverty ; and temporaryversus permanent poverty. Absolute poverty is measured against some benchmark –such as the cost of getting enough food to eat or being able to write y our own namefor literacy. Relative poverty is measured against societal standards; in developingcountries the basket of ‘essentials’ comprises food and a few items of clothing,whereas in developed countries it includes Christmas presents and going out once amonth.
The distinction between the temporarily and the permanently poor is linked to thenotion of vulnerability . The vulnerable are those at risk of falling into poverty . If thereare poverty traps – such that once someone falls into poverty they cannot get outagain – then there is a good case for anti-poverty interventions to prevent thishappening.
Poverty measuresNational-level measures
The most commonly reported development statistic is a country ’s GNP per capita.While a case may be made for using GNP as an overall development measure, it isnot a good measure of poverty for two reasons. First, as an average, the statistic takesno account of distribution. Hence two countries can have the same level of GNP percapita, but in one of the two a far greater proportion of the population fall below thepoverty line if income is less equally distributed. Second, GNP is of course anincome measure which ignores other dimensions of poverty .
The most common income-poverty measure is the headcount, that is, thepercentage of the population falling below the poverty line. However, this measuretakes no account of how far people are below the poverty line – so that a rise in theincome of the poor which leaves them in poverty appears to have no effect. Henceanother measure, the poverty gap, is often used, which can be variously interpretedas the product of the headcount and the average distance of the poor below thepoverty line (expressed as a percentage of the poverty line) and the benefit ofperfect targeting. The poverty severity index is a similar measure which puts greaterweight on those furthest below the poverty line. These three measures – theheadcount, the poverty gap and the poverty severity index – are known collectivelyas the Foster-Greer-Thorbecke poverty measures and labelled P0, P1 and P2
111

respectively .Over the years a number of composite measures of development have been
proposed – a composite being an average of a number of different measures. Aprevious measure, the Phy sical Quality of Life Index (PQLI), has been supersededin recent years by the UNDP’s Human Development Index (HDI). The HDI is acomposite of GDP per capita, life expectancy and a measure of educationalattainment (which is an average of literacy and average enrolment rate for primary,secondary and tertiary education). However, just as income per capita takes noaccount of distribution neither does the HDI: schooling can increase by the alreadywell educated extending their university education rather than expanding accessamongst those with little or no education. However, UNDP has also proposed aHuman Poverty Index (HPI), which focuses on deprivation. Specifically, the HPI iscalculated as the average of the percentage of the population not expected to live to40, the percentage who are illiterate and what is called the ‘deprivation in livingstandard’ (the average of those without access to water and healthcare, and thepercentage of under-fives who are underweight).
Although the HDI is widely used there have been criticisms of its construction(which were summarized in a technical appendix to the 1996 Human DevelopmentReport), one of which concerns problems in using a composite. There are three mainproblems: which variables to put in the index; the necessarily arbitrary choice ofweights in constructing the average; and that information is lost by combining three orfour pieces of data into a single number. Thus it may be preferable to report a smallrange of social indicators, such as life expectancy, infant and child mortality andliteracy , rather than attempt to combine these in to an overall poverty index.
The measurement of income povertyThe income poverty headcount is the percentage of the population whose income isbelow the poverty line. This calculation is fraught with difficulties.
First, poverty lines must be defined (it is common practice to use two lines), whichis done either absolutely with reference to the cost of a basket of goods or relativelyto mean income or a certain share of the population. In the former case the basketcan be calculated either as the cost of acquiring a certain number of calories or of abasket of goods and services. In the first example, the resulting poverty line (foodpoverty line) is often used as the line for the extreme poor. It is then divided by theshare of food in the budget of the poor (or the population as a whole, though strictlydefined it should be that of a person on the poverty line) to get the upper poverty line.
In apply ing the poverty line, consumption (expenditure) is commonly used ratherthan income. First, because survey respondents will have a far clearer idea of theirexpenditure than their income. Second, when income is uneven households willsmooth consumption (i.e. even it out over time) so that at any point in time current
112

consumption is likely to be a more accurate measure of well-being than currentincome.
In practice, data are collected at the level of the household rather than theindividual. Doing so ignores problems of intra-household allocation. There are no dataon the number of women or children living in poverty (despite the tendency of someinternational organizations to report such figures), only data on the percentage ofwomen and children living in households whose income is below the poverty line.The use of household-level data introduces problems of household composition andsize. Household composition matters since the consumption requirements of differentindividuals varies – specifically children consume less than adults and, morecontroversially, women may need to consume less than men. This problem iscatered for by the use of an adult equivalents scale, which expresses the consumptionneeds of women and children as a fraction of those of an adult male. Household sizematters as there are economies of scale in household consumption – that is, two canlive together more cheaply than they could apart as there are shared expenses (livingspace, utilities and many household items). Failure to take account of theseeconomies will overstate poverty in large households.
Finally, prices vary across time and space. Allowance must be made for theseprice differences in order for the poverty line to be comparable. There are evengreater difficulties in comparing between countries, partly since market exchangerates do not reflect differences in purchasing power. Rather, purchasing power parity(PPP) exchange rates should be used, which are not uniformly available.
Comparisons across time and space also require that consumption is measured in acomparable way. If survey designs differ greatly then ‘aggregate consumption’ maymean quite different things. It is commonly recognized that own-production should bemeasured as this is an important part of total consumption. But ‘wild foods’ (collectedin nature) and festivals can also form an important source of food and are commonlyoverlooked. Similarly, sources of income from common property or the provision offree social services varies between countries and so introduces another source ofincomparability .
It may seem from this discussion that measurement of income poverty is sodifficult that it may be better to stick to some other measure. Certainly a small surveyshould stick to a proxy for income, at least in countries in which formal sectoremployment is low, such as housing quality and ownership of a few household items.But other indicators are not without problems; indeed data quality is far worse formany social indicators than it is for income/expenditure.
113

114

Figure 1.13.1 ‘Dollar a day ’ poverty by region, 1981–2005
Source: World Bank 2010 Poverty Estimates http://go.worldbank.org/4K0EJIDFA0(accessed 17/6/12)
115

116
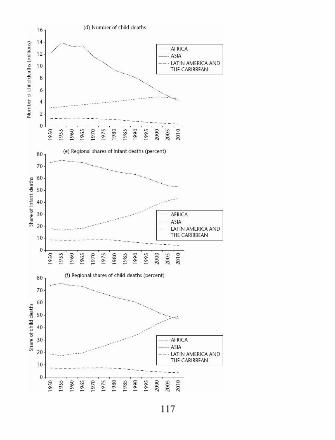
117

Figure 1.13.2 Trends in infant and child mortality
Source: Based on UN Population Projections 2010 revision(http://esa.un.org/wpp/Excel-Data/population.htm)
Some dataEstimates of ‘dollar a day ’ poverty are calculated only for the developing world, andare now available for poverty lines ranging from US$1 to US$2.50 per day. Thelower threshold is used here. The proportion of absolutely poor in developed countriesby this measure is nil or negligible. Figure 1.13.1 shows the evolution of ‘dollar a day ’poverty since the early 1980s. The most striking trend is the dramatic fall in povertyin East Asia, powered largely by reductions in the number of poor in the world’s mostpopulous country, China, but assisted by more recent declines in neighbouringVietnam. There has been a slower, but still marked, decline in the poverty headcountin South Asia, including in the world’s second largest country, India. Asia thus makesup the vast bulk of poverty reduction in the closing decades of the twentieth century.During the 1990s, global poverty fell from 29.8 per cent in 1990 to 20.3 per cent in2003, but excluding China these figures were 24.4 and 20.7 per cent respectively.That is, over half the fall in poverty came from China alone. Indeed, sub-SaharanAfrica, which has suffered economic hardship since the 1970s, saw a rise in incomepoverty in the 1990s, with close to half the people on the sub-continent living on lessthan a dollar a day in 1999, though the share had declined to just under 40 per cent by2005.
From 1981 to 2005 the absolute number of poor fell dramatically in East Asia (922to 176 million), and somewhat in South Asia (387 to 351 million people). But theseglobal gains were partially offset by the rise in sub-Saharan Africa from 169 to 304million people; and to a lesser extent by a rise in Europe and Central Asia from 3 to10 million. Hence sub-Saharan Africa’s share of those living on less than a dollar aday grew from just a tenth (11 per cent) in 1981 to over a third (35 per cent) by2005.
These downward overall trends have been set back by the global recession whichbegan with the 2008–2009 financial crisis. In the three years following the crisis over50 million people are estimated to have fallen below the US$1.25 a day poverty line.
The Africanization of poverty is also evident when considering other povertymeasures. Health is commonly measured by infant mortality (the number ofchildren who die before their first birthday per 1,000 live births) and child mortality(deaths between first and fifth birthday s per 1,000 children); these two indicators arecombined to make under-five mortality. The United Nations Population Divisionreports population data, including mortality, from 1950, with projections to 2050,though only those to 2010 are shown here. The positive news is that, in line with the
118

long-run improvement in social indicators across the developing world, mortalityrates have been falling across the world (Figure 1.13.2), though some Africancountries experienced a reversal in the 1990s as a result of HIV/AIDS and worseninghealth sy stems after three decades of economic decline. In Africa as a whole, thedecline in mortality rates has been insufficient to keep up with population growth, sothat the number of deaths continued to rise until very recently. But it is expected thatthe situation in Africa will improve less than that elsewhere, so the continent willaccount for close to two-thirds of the world’s under-five deaths in the comingdecades.
BibliographyBaulch, B. (1996) ‘The new poverty agenda: A disputed consensus’, IDS Bulletin 27:
1–10.Black, Richard and Howard White (2004) Targeting Development: Critical
Perspectives on the Millennium Development Goals, London: Routledge.Chambers, Robert (1995) ‘Poverty and livelihoods: Whose reality counts?’ Discussion
paper 347, Brighton: Institute of Development Studies.Chen, Shaohua and Martin Ravallion (2010) ‘The developing world is poorer than we
thought, but no less successful in the fight against poverty ’, The Quarterly Journal ofEconomics, November: 1577–1625.
Gordon, David and Paul Spicker (eds) (1999) International Glossary on Poverty,London: Zed Books.
Jodha, N. S. (1988) ‘Poverty debate in India: A minority view’, Economic andPolitical Weekly 22(45–47): 2421–2428.
Ravallion, M. (1992) ‘Poverty comparisons: A guide to concepts and methods’, LSLSWorking Paper 88, Washington DC: World Bank.
White, Howard (1999) ‘Global poverty reduction: Are we heading in the rightdirection?’, Journal of International Development 11: 503–519.
Further readingMost of the literature on poverty measurement concerns income poverty, the mostcomprehensive, though technical, treatment being Ravallion (1992). A critique ofincome measures is given by Jodha (1988) and a discussion of alternatives inChambers (1995). More general analy ses of both concepts and measurement isavailable in Baulch (1996) and White (1999). For a broader coverage of povertyissues consult the series of poverty briefings produced by ODI, including ‘Themeaning and measurement of poverty ’ by Simon Maxwell; these are available fromwww.odi.org/briefing. Finally , Gordon and Spicker (1999) is a useful resource.
119

The main data sources are the UNDP’s Human Development Report and the WorldBank’s World Development Indicators , both of which are published annually andavailable on-line. Past issues of the HDR contain discussions of the various indicespresented, including the HDI and HPI, whilst WDI contains useful information ondata sources. The World Bank’s poverty data are available fromhttp://go.worldbank.org/4K0EJIDFA0; see also www.worldbank.org/poverty whichincludes many useful links to poverty -related material.
120

1.14The millennium development goals
Jonathan Rigg
Deriving the goalsThe Millennium Development Goals (MDGs) were adopted by the GeneralAssembly of the United Nations on 18 September 2000. More than 190 countrieshave since signed up to the resolution. The eight goals, to be achieved by 2015, arelinked to 18 targets and these, in turn, to 48 indicators (Table 1.14.1 ). The collectiveagreement by over 190 countries to strive to meet these goals was unprecedented.The MDGs arose from a wish that at the turn of the Millennium good intentions had tobe matched by concrete actions. Under ‘values and principles’, the UN GeneralAssembly agreed that:
We believe that the central challenge we face today is to ensure that globalizationbecomes a positive force for all the world’s people … only through broad andsustained efforts to create a shared future, based upon our common humanity in allits diversity, can globalization be made fully inclusive and equitable. … We arecommitted to making the right to development a reality for everyone and tofreeing the entire human race from want.
(http://childrenandarmedconflict.un.org/keydocuments/english/unitednationsmil13.html)
At the time of the Millennium Summit, United Nations Secretary -General KofiAnnan stated that: ‘We will have time to reach the Millennium Development Goals –worldwide and in most, or even all, individual countries – but only if we break withbusiness as usual’.
Progress towards the MDGsMore than a decade has passed since the MDGs were adopted, and the target date of2015 is fast approaching. This provides us with an opportunity to assess whether andwhere the goals are likely to be achieved. Has the world community broken with‘business as usual’? The baseline year for measuring progress towards most of thetargets is 1990 and the latest data come from 2005–2007 for some indicators and2009–2011 for others. On this basis, the answer to the question of whether the goalswill be achieved is that while there has been significant progress with respect to some
121

1.
of the goals, and in some parts of the world, there remain major gaps and shortfalls.Table 1.14.2 summarises progress in 2011 towards goals 1–8 in nine regions of the
world. Aggregating the data reveals that in only 40 per cent of cases are the targetslikely to be met by 2015 at current rates of progress; in 47 per cent of cases, thetarget is not expected to be met given prevailing trends; while in 13 per cent there hasbeen a deterioration in progress. The aggregate picture, however, is considerablymore favourable than that painted in the first edition of this volume, based on 2005data. At that time, the balance between the three progress categories was 16 : 47 : 37,while in 2011 it was 40 : 47 : 13. The number of regions showing a reversal of trendsis sharply down, and those likely to meet the targets significantly up (Table 1.14.2).
What the aggregated data in Table 1.14.2 do not show is how this story of success,stagnation and failure unfolds in regional terms. Table 1.14.3 shows that there is aclear regional pattern to achievement and failure, which falls into three categories:those regions where progress towards the MDGs has been broad-based (North Africaand East Asia); those where progress has been substantial but with significant gaps(Southeast Asia, South Asia, Latin America, and the Caucasus and Central Asia); andthose regions where the majority of targets and goals will not be met at prevailingrates of progress (sub-Saharan Africa, West Asia and Oceania). Importantly, whatwe cannot tell are within country variations, which are significant even in countriesmaking good progress. As the 2011 MDG report puts it, ‘despite real progress, we arefailing to reach the most vulnerable … the poorest of the poor and thosedisadvantaged because of their sex, age, ethnicity, or disability ’ (UN 2011: 4).‘Disparities in progress between urban and rural areas’, the report continues, ‘remainsdaunting’ (p. 4).
It is goal 8, relating to the derivation of a global partnership for development and itsassociated indicators and targets, which directs attention at the responsibility of thewider international community and, particularly, richer countries. This is where thenormativity of the MDGs is clearest. Again, the view from 2011 is more positive thanit was in 2005, but with caveats. Aid has increased significantly in real terms (to 0.32per cent of developed countries’ GDP in 2010, or US$129 billion), although not byenough to meet the pledges made at the G8 summit in Gleneagles in 2005; there hasbeen a modest reduction in tariffs in developed markets for goods produced indeveloping countries, but tariffs in emerging markets remain and are often growing insignificance; and debt service payments as a proportion of export revenues declinedsignificantly across all regions between 2000 and 2009.
Table 1.14.1 The MDGs, 1990–2015: 8 goals, 18 targets (and 48 indicators)
Goals (8) Targets (18)
Halve the proportion of people living on less than a
122
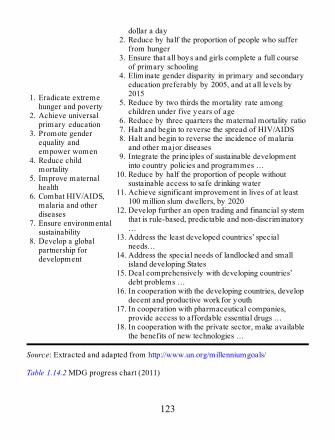
1.
2.
3.
4.
5.
6.
7.
8.
2.
3.
4.
5.
6.7.8.
9.
10.
11.
12.
13.
14.
15.
16.
17.
18.
Eradicate extremehunger and povertyAchieve universalprimary educationPromote genderequality andempower womenReduce childmortalityImprove maternalhealthCombat HIV/AIDS,malaria and otherdiseasesEnsure environmentalsustainabilityDevelop a globalpartnership fordevelopment
dollar a dayReduce by half the proportion of people who sufferfrom hungerEnsure that all boys and girls complete a full courseof primary schoolingEliminate gender disparity in primary and secondaryeducation preferably by 2005, and at all levels by2015Reduce by two thirds the mortality rate amongchildren under five y ears of ageReduce by three quarters the maternal mortality ratioHalt and begin to reverse the spread of HIV/AIDSHalt and begin to reverse the incidence of malariaand other major diseasesIntegrate the principles of sustainable developmentinto country policies and programmes …Reduce by half the proportion of people withoutsustainable access to safe drinking waterAchieve significant improvement in lives of at least100 million slum dwellers, by 2020Develop further an open trading and financial sy stemthat is rule-based, predictable and non-discriminatory…Address the least developed countries’ specialneeds…Address the special needs of landlocked and smallisland developing StatesDeal comprehensively with developing countries’debt problems …In cooperation with the developing countries, developdecent and productive work for youthIn cooperation with pharmaceutical companies,provide access to affordable essential drugs …In cooperation with the private sector, make availablethe benefits of new technologies …
Source: Extracted and adapted from http://www.un.org/millenniumgoals/
Table 1.14.2 MDG progress chart (2011)
123

124

Note: The information is taken from the 2011 MDG progress report downloadablefrom:http://www.un.org/millenniumgoals/pdf/(2011E)_MDReport2011_ProgressChart.pdf.
Table 1.14.3 Progress chart by region (2011)
Source: Extracted fromhttp://www.un.org/millenniumgoals/pdf/(2011E)_MDReport2011_ProgressChart.pdf
Criticising the self-evidently desirableFew would contest that the objectives of the MDGs are creditable – they are self-evident ‘goods’, ‘unimpeachably worthwhile’ (Poku and Whitman 2011: 4). Thus,scholars have tended to shy away from their criticism. Critics have, however,questioned whether, first, the MDGs are ‘fit for purpose’; second, whether we havethe available data to measure the achievement of the targets identified; third, whetherthe targets adequately assess the goals to be achieved; fourth, whether the broadmeans set to achieve the goals are laudable; and, finally, whether there is amechanism in place – bey ond exhortation and moral persuasion – to support andpropel the achievement of the MDGs, especially in relation to goal 8. It is significantthe degree to which some world leaders appear to see the MDGs themselves causingprogress. Secretary -General Ban Ki-Moon in the 2011 MDG report wrote that
125

‘already, the MDGs have helped to lift millions of people out of poverty, save livesand ensure that children attend school’ (UN 2011: 3).
James (2006) directs his criticism at a failure to distinguish between means andends, or between actual achievements and potential achievements. Some of the MDGtargets are ends manifested and measurable at the level of the individual. This appliesto the targets associated with goals 4, 5 and 6 (all health related) and target 2 undergoal 1 (referring to hunger) (see Table 1.14.1 ). But many of the other goals aremeans rather than ends. So, for example, James draws a distinction betweencompleting primary school (target 3 under goal 2) and the acquisition of basicliteracy and numeracy. The former (primary school education) may lead to thelatter (literacy and numeracy ), but if schooling is inadequate, as it so often is in thepoorest countries, then this may not be achieved. In other words, the mere meeting ofa target may not deliver the desired end of an adequate education.
In defence of this means-based approach, it has been suggested that cross-countrydata are simply not available to target ends and means-based measures are anacceptable proxy. But even here there are reasons to be cautious. Doubts have beenexpressed about whether we have sufficiently robust data to assess the achievementof the targets set, which is most acute in the poorest countries. Satterthwaite (2003:184–185) writes of ‘nonsense’ statistics, such as the levels of urban poverty and urbanservice provision in Africa (linked to goal 7, targets 10 and 11).
A related criticism is whether the rather mechanical, target-based approach placesa characteristically instrumentalist gloss on the achievement of the goals. Thepoverty target, for example (goal 1, target 1), is income-based and related to officialdata and basic needs ascertained by ‘experts’. Other forms of deprivation (linked tosocial exclusion, political marginality and cultural rights) are ignored and inequalitiesin power overlooked (Satterthwaite 2003: 182). Moreover, it is not just what is done –reducing poverty, eradicating hunger, reducing maternal mortality – but how it isdone. The general criticism that development has become a technocratic projectinformed by experts, driven by governments and multilateral agencies, and based onmeasures of success that pay little heed to local desires is equally apposite to theMDG initiative. Radical commentators would also draw attention to the market-basedlogic (free trade, private enterprise) that informs the MDG initiative.
SummaryThe MDGs represent the first collective and integrated attempt to highlight the lifeconditions and life chances of the world’s poor. With only a handful of y ears to rununtil 2015, it seems that most of the targets will not be met for most regions of theworld. Some commentators choose to focus on the successes (the ‘half-full’contingent) and others on the failures (the ‘half-empties’). There is also a morefundamental debate about the goals themselves, the way that the targets have been
126
framed and the reliability of the data on which progress is assessed. Morefundamentally still, there is the question of whether the MDGs represent a set ofappropriate measures of the achievement of development. These issues will beimportant when it comes to the question of whether there will be an MDG II.
ReferencesJames, Jeffrey (2006) ‘Misguided investments in meeting Millennium Development
Goals: A reconsideration using ends-based targets’, Third World Quarterly 27(3):443–458.
Poku, Nana and Whitman, Jim (2011) ‘The Millennium Development Goals:Challenges, prospects and opportunities’, Third World Quarterly 32(1): 3–8.
Satterthwaite, David (2003) ‘The Millennium Development Goals and urban povertyreduction: Great expectations and nonsense statistics’, Environment andUrbanization 15(2): 181–190.
UN (2011) The Millennium Development Goals report 2011 , New York: UnitedNations. Available online atwww.un.org/millenniumgoals/pdf/(2011_E)%20MDG%20Report%202011_Book%20LR.pdf
Further readingJones, Phillip W. (2008) ‘The impossible dream: Education and the MDGs’, Harvard
International Review 30(3): 34–38.A great deal of valuable material on the MDGs can be gleaned from the UN,
World Bank, UNDP and other websites. Two journal special issues have recentlybeen published that focus on the MDGs: ‘The Millennium Development Goals:challenges, prospects and opportunities’ in Third World Quarterly (2011, 32, number1) and ‘Old Challenges and New Opportunities for the MDGs: Now and Bey ond 2015’in the Journal of the Asia Pacific Economy (2011, 16, 4).
WebsitesThe main UN MDG website with background information on the initiative, the UN
resolution, progress charts, the Secretary -General’s interventions, supporting statistics,and annual reports can be found at www.un.org/millenniumgoals/.
The World Bank and UNDP also have web pages devoted to the MDGs with links torelevant studies, available online at www.worldbank.org/mdgs/ andwww.undp.org/content/undp/en/home/mdgoverview.html respectively .
127

1.15BRICS and development
José E. Cassiolato
OriginsOn 29 March 2012 the leaders of Brazil, Russia, India, China and South Africa(BRICS), met in India, to lead the Fourth BRICS Summit. Only three day s before, anarticle in the International Herald Tribune had dismissed BRICS as “an artificial blocbuilt on a catchphrase.”
Analy sts in BRICS countries, however, point out that the joint declaration of thesummit “contains not only the most comprehensive criticism of the failures of theWest that has been voiced by any group of countries since the end of the Cold War,but also the outlines of an alternative blueprint for managing our increasinglyinterdependent world” (Jha 2012).
A Goldman Sachs team published a report in 2003 which conceived the acronymBRICs (Brazil, Russia, China and India) and suggested that this group of countrieswould become the future “engines of growth and spending power” of the worldeconomy, with a total GDP by 2040 similar to the combined one of the G6 countries.These countries presented excellent investment opportunities with their large potentialdomestic markets characterized by the prospective growth of their middle classes.Since then the acrony m has attracted international attention with its explicitrecognition of the bleak growth prospects of developed countries.
Also in 2003, the foreign ministers of India, Brazil and South Africa (IBSA) met toset up a forum to promote cooperation between themselves and other developingcountries. Although they had conflicting interests in trade, they decided to negotiatejointly within the WTO. But IBSA aimed at much more, namely to act as “acoordinating mechanism among three emerging countries, three multiethnic andmulticultural democracies, which are determined to contribute to the construction ofa new international architecture” (Brasilia Declaration, item 6).
In 2006 a parallel initiative started with the four BRIC states mentioned in theGoldman Sachs report. It culminated in 2009 with the first formal meeting of thegovernments of these countries, now focusing on the reform of international financialinstitutions and improvement of the world economic situation, which was rapidlydeteriorating with the onset of the financial crisis.
Both arrangements evolved in parallel until 2011 (the BRIC nations focusing on
128

economic matters and the IBSA countries targeting social goals), when South Africawas formally included in the economic group. The new BRICS agenda advancedrapidly to include cooperation in innovation and technological development and, mostimportant, proposals and actions and concrete economic initiatives. These includedthe development of a sy stem of international pay ments among the members thatby passed the dollar and the creation of an alternative international bank, with the shortrun objective of shielding their economies from the currency instability of the Westand the long-term political purpose of freeing themselves from the Westerndominated international banking sy stem.
The economic and social importance of BRICSBRICS, collectively, were home to 42.2 per cent of the world population in 2010 andaccounted for approximately 30 per cent of the earth’s surface, holding significantreserves of natural resources such as energy and mineral resources, water and fertilelands. BRICS account for 24.3 per cent of world biodiversity : Brazil alone embraces9.3 per cent of the total.
All BRICS are federal states, but Brazil is the only one with a common language.Three are democracies: India and South Africa are parliamentary democracies andBrazil is a presidential democracy. Russia’s democracy is increasingly authoritarianand China is a one-party political sy stem which rules a communist people’s republicmarked by state-controlled capitalism.
In 2002, BRICS accounted for 25.9 per cent of world GDP in PPP as compared to14.5 per cent in 1990. The IMF estimates that by 2017 they will account for morethan 30 per cent of world GDP. The economic performance of BRICS, however, hasvaried widely during the last few decades. China and India have been the fastestgrowing economies worldwide. Russia, after the severe 1990s crisis that resulted in adecline of 40 per cent in its real GDP, has recovered well. Brazil and South Africahave shown an irregular performance. However, they are all growing at higher ratesthan the developed countries in general.
Different performances were accompanied by significant changes in theirproductive structure, reflecting dissimilar development strategies. While in China theshare of industry in GDP value added grew substantially to reach 48 per cent in 2009(21.2% of world manufacturing, up from 3.2% in 1990) in India it remained around26 per cent, while in the other nations it declined: in Brazil from 41.7 per cent in theearly 1980 to 25.4 per cent in 2009, in Russia from 44.6 per cent to 32.9 per cent in2009, in South Africa from 48.4 per cent to 31.4 per cent in 2009. In China, this wasaccompanied by a significant diversification of its industrial sy stem with the share oftechnologically intensive sectors in total value added of the manufacturing industryreaching 42 per cent in 2009. In the other BRICS this share is around 15 per cent.
In Brazil, the high growth of services (from 50% to 68.5% in the same period) was
129

accompanied by a renewed importance of agricultural goods and minerals, whilealthough Russia’s economy is heavily dependent on oil and gas, the defence-relatedindustrial complex is significant together with non-electric machinery .
The Indian economy is essentially service-led, with a well-known capacity in ICT.Skills in the manufacturing sector are relatively modest and are concentrated in non-durable consumer goods and in the chemical-pharmaceutical and auto complexes.
Services (particularly finance and tourism) have an important role in the SouthAfrican economy. Its economy is heavily based on natural resources and miningremains important with respect to employ ment and foreign trade.
The share of BRICS in total merchandise trade value more than doubled in theshort period between 2000 and 2010, with exports rising from 7.5 to 16.4 per cent andimports from 6.2 to 14.9 per cent of the world total, in terms of value. China’s exportsmounted from 3.9 per cent to 10.4 per cent and imports increased from 3.4 per centto 9.1 per cent of the world total in the same period. With the exception of SouthAfrica, all other BRICS increased their share of world exports. Other than India andSouth Africa, the remaining BRICS countries managed to keep a surplus in theirmerchandise trade by 2010.
Although bilateral trade flows between BRICS countries have been relativelyrestricted in the past, since the first half of the 2000s there was a widespread increaseof export and import flows between them. China is already the main trade partner ofBrazil and South Africa and the second main trade partner of India and Russia. Theopposite does not hold, however, as these four economies are neither the top importsuppliers nor export destinations for China.
Investment rates differ significantly among BRICS. Pushed by governmentinvestment, a closed financial sy stem and intertwined with high growth rates, Chinastands out by virtue of its investment rate constantly growing – from 37.4 per cent ofGDP in 1992 to 48.3 per cent in 2011. India also experienced growing rates ofinvestment in this period. The other BRICS, Brazil in particular, suffer from lowinvestment rates.
The intensity and role of foreign direct investment (FDI) differs among BRICS.Brazil received the greatest share of FDI of all BRICS until the first half of the 1980s.Although China has surpassed Brazil since 1985, Brazil continued to be a majordestination for FDI during the 1990s, most notably during the process of privatization.Since 2000, Russia and India have been strengthening their position as FDI inflowdestinations. With the exception of South Africa, BRICS countries more than tripledtheir FDI outflows from 2005 to 2010, raising their participation in the world totalfrom 3.6 per cent to 11.1 per cent.
The avowed FDI role and policies for the various members of BRICS also differ.In Brazil and South Africa, where the policy is more open towards FDI, its role isvery significant, with transnational corporations (TNCs) dominating internal
130

production in most industrial sectors (particularly in the auto and IT complex). InChina, and India to a lesser extent, the role of FDI has alway s been subsidiary todevelopment. In both countries the capital account was not liberalized and thefinancial sector remains controlled by state capital. As the ultimate goal of Chinesepolicy is to strengthen domestic firms (most with explicit or implicit tight links to thegovernment), the state imposes stringent conditions that have to be met beforesubsidiaries are allowed to operate in the country. India still maintains significantrestrictions in the operations of transnational capital. Brazil, Russia and South Africa(countries that liberalized their economies with few restrictions) got more portfolioinvestment, but most of the FDI received recently was used to buy up localcompanies.
The total foreign exchange reserves of BRICS are significant (about 40% of theworld total in 2010) which is important given the independence it gives to monetaryauthorities to protect the local economy against the instability of global financialmarkets.
Such positive economic evolution was accompanied by increases in inequalitylevels in all BRICS with the exception of Brazil. Affirmative social policy in Brazil,however, did not prevent it from being, together with South Africa, still among thecountries with the worst distribution of income. In addition, India and Russia areamong those with the largest percentage of the population living below the povertyline.
Problems associated with high levels of poverty and the perverse distribution ofincome are common to the five countries, where a significant portion of thepopulation lacks access to essential goods and services. This situation is reflected inthe poor human development index scores recorded by the BRICS countries. Theother undeniable challenges faced by BRICS are unemploy ment, poor qualityemploy ment and increasing informality of the economy .
Very large regional disparities and a big gap between the rural and urbanpopulation are also common problems. The wealthier regions are those that are moreindustrialized: the Brazilian southeast, the Chinese coastal provinces, the South AfricanGauteng province and Cape Town, the larger Russian cities such as Moscow and thesouthern regions of India.
The negative environmental impact of recent growth is another challenge to befaced by BRICS countries. In 2008, they were responsible for emitting 35.3 per centof the total volume of CO2, with China being the world’s largest emitter.
The geo-politics of BRICSThere are marked differences between the insertions and interests of the BRICSnations within the worldwide sy stem. The military and economic expansion of the2000s already placed Russia among the great powers, with a growing intervention in
131

conflicts in Central Asia and the Middle East and with the position of arms andmilitary technology supplier to several countries.
China and India between them have 3,200 kilometers of common frontier. Theyhave territorial disputes and are both atomic powers. Brazil and South Africa do nothave territorial disputes, do not face internal or external threats to their security andare not relevant military powers. Since its democratization, South Africa has beeninvolved in almost all peace negotiations in Africa, and has not ever presented anexpansionary threat. Brazil has never been a state with expansionary objectives.
Russia has maintained its military arsenal and its seat on the UN Security Council,and was quickly incorporated into the G8. After 2000, Putin’s governmentrecentralized internal power, accelerated economic growth and is tenaciouslychasing its restoration as a world power. After the 1990s China and India entered theworld sy stem as economic and military powers, and have clear hegemonicaspirations in their respective regions.
Despite these differences, the respective nations set up the BRICS forum stressingthe need for changes in the rules of “management” of the world sy stem and in itshierarchical and unequal distribution of power. They share a reforming agenda inrelation to the UN Sy stem and to the composition of its Security Council andmultilateral and trade liberalizing positions within WTO and the G20. So, their positionas the epicentre for dy namizing the world economy that has been almost paraly sedby the inadequacies of financial capitalism give them, collectively, more clout in theinternational arena. In other words, it is the disorganization of the world economycaused by finance-dominated globalization that has permitted the upsurge of BRICSas a collective geopolitical structure.
The BRICS nations have an important role to play in producing a reformist worldagenda, as pointed out by India’s President Singh at the 2011 BRICS summit in China:if we can cooperate, “our positions on some key areas such as sustainabledevelopment, balanced growth, energy and food security, reform of internationalfinancial institutions and balanced trade … will be to our advantage”.
China will probably have a more prominent role in this respect as it is changing its“sy stem of innovation” in order to address sustainability and social andenvironmental imbalances. China’s emerging “high-growth with low-carbon”strategy has been emphasized by recent policy decisions, in particular, its indigenousinnovation strategy to make China less reliant on foreign technology through linkinginnovation to domestic needs and by giving increased priority to domesticconsumption. For the other BRIC nations, Chinese success may lead to theidentification of strategies towards strengthening domestic technological capabilitiesand fostering the technologies needed for the identification of a new techno-economic paradigm.
132

BibliographyArmijo, L. (2007) The BRICS countries as analy tical category : Mirage or insight?
Asian Perspective, 31(4): 7–42.Cassiolato, J. E. and Vitorino, V. (2010) BRICS and Development Alternatives:
Innovation Systems and Policies. London: Anthem Press.Jha, P. (2012) Delhi could be a turning point. The Hindu, 10 April.O’Neill, J., Lawson, S. and Purushothaman, R. (2004) The BRICs and global markets:
Crude, cars and capital. CEO Confidential, October.
133

Part 2
Theories and strategies of development
Editorial introductionIt is generally appreciated that ideas about how development can be put into practicehave long been both controversial and highly contested. Development involves arange of actors, from international agencies, through the state, various organizations,down to the individual, all of whom have a vested interest in how change anddevelopment should proceed. Thus, all facets of development not only depend onpolitical ideology, but on moral and ethical judgements and prescriptions too. Thus,ideas about development over time have tended to accumulate and accrue, ratherthan fade away . Right-wing, left-wing and liberal views remain whatever the politicalhegemony current at the time. These sorts of ideas are considered at the outset in thispart of the book, before turning to some of the major theories and strategies ofdevelopment that have been followed and popularized.
Right-wing stances on development can be regarded as having their origins in theEnlightenment and the era of modernity that followed. The eighteenth-centuryEnlightenment period saw an increasing emphasis placed on science, rationality anddetailed empiricism. It also witnessed the establishment of the ‘West’ and ‘Europe’ asthe ideal. It was during this period that the classical economists, Adam Smith andDavid Ricardo, writing in the 1700s, developed ideas surrounding the concept ofcomparative advantage, which stressed the economic efficacy of global free tradeand, in many senses, gave rise to the earliest capitalist strategies of economicdevelopment. The approach envisaged little or no government restrictions on theoperation of the economy .
Such approaches were followed by a plethora of dualistic and linearconceptualizations of the development process, including modernization theory,unbalanced and unequal growth, and top-down and hierarchical formulations.Together, such paths are generally referred to as ‘neo-classical’ or top-downdevelopment. Whatever one’s critical view of modernization, the framework usefullypinpointed the salience of change as a necessary factor in the development equation.
These classically inspired approaches are, of course, still alive and kicking, in theform of the lineage of the so-called ‘new right’ orthodoxy of the 1980s, involving the‘magic of the market’ and the neoliberal policies of structural adjustment, and morerecently, poverty reduction strategies. The rise of so-called neoliberalism followed
134
the global recession of 1978–1983, which witnessed a clear turn away from the ideasof Key nes, who in the Great Depression of the 1930s had argued that governmentsshould spend their way out of recession. Policies of privatization, deregulation andpublic sector cutbacks, and the withdrawal of the state became the order of the dayunder the global influence of President Reagan and Prime Minister Thatcher in the1980s. The IMF and World Bank enforced essentially the same generic types ofpolicies on those developing nations seeking development assistance, in the form ofstructural adjustment programmes. While some analy sts have inferred that the 2008global economic recession has witnessed something of a break in the hegemony ofthe long wave of neoliberalism and right-wing development, other commentators aremore circumspect in concluding that neoliberalism has survived and will continue todominate the global economy .
The antithesis to classical and neo-classical views was provided by radical-dependency approaches in the 1960s. It is a reflection of the Eurocentricity ofdevelopment theory that Andre Gunder Frank, a German-born and American-trainedeconomist, has become the name most closely associated with dependency theory.This is despite the fact that the dependency approach essentially stemmed from thewritings of structuralists working in Latin America and the Caribbean. In respect ofprocess, dependency theory was couched in terms of inverted cascading globalchains of surplus extraction, and it was again all too easy to reduce this to simpledichotomous terms, involving polar opposites such as ‘core–periphery ’, ‘rich–poor’,‘developed–underdeveloped’, and ‘metropole–satellite’.
Although today many may reject pure dependency theory as an overblownreaction to right-wing free market orthodoxy, it is tempting to suggest that such ideascan inform decisions about development strategies in the ‘more-realistic’ setting ofthe mixed economy. For example, if tourism is followed as an explicit developmentstrategy, how much dependence should be placed on foreign ownership andmultinational capital? How much should local indigenous resources and capital betargeted in order to stimulate the indigenous economy? These are real developmentchoices that need to be made even in a mixed economy context and one can arguethat these choices are better understood in light of pure dependency theory .
It was left to world sy stems theory to stress that contemporary development hasinvolved the emergence of a substantial semi-periphery in addition to the core andperiphery identified by classic dependency theory. This semi-periphery largelyconsists of the newly industrializing countries (NICs) of East Asia and Latin America.
From the 1970s onward, what may be regarded as ‘alternative views’ ondevelopment were espoused in many quarters, including the need for participatorydevelopment and the need to listen to indigenous voices in development in the form ofindigenous environmental knowledge. The era of postmodernity – stressing therejection of high modernism – may not be regarded as fitting the realities of the
135

developing world or poor countries in all respects, but the existence of these notionscannot be ignored in the analy sis of the conditions faced by such nations. Earlystandpoints that took a less generic, less monumental and less linear view of thedevelopment process included what are referred to under the headings ‘bottom-up’and ‘agropolitan’ approaches, which have come to include ideas of ‘another’development. All these approaches stressed the importance of local indigenousknowledge and ways of doing things rather than running with the market.
More recently, the wider ‘postist’ stance afforded by postcolonialism has beenadded to the critique. This argues that the production of Western knowledge has beeninseparable from the exercise of Western power, and critiques the outcomes ofcolonialism that have underpinned Eurocentric worldviews on development. It isstressed that colonialism has been associated with insensitivity to the views, practicesand conditions of other cultures. Post-development as an approach is similarlysceptical about the whole manner in which development has been framed in terms ofgrand narratives, suggesting that the whole question of development needs to beclosely questioned, problematized and possibly rejected. Under such a perspectivedevelopment is seen as contradictory at best. Finally, it is notable that evolvingconceptualizations of the role of social capital underpin continuing debates concerningdevelopment theory and practice.
136

PART ONE Principles and Concepts
Every nation strives after development. Economic progress is an essential com-ponent, but it is not the only component. As noted in Chapter 1, development is not purely an economic phenomenon. In an ultimate sense, it must encompass more than the material and financial side of people’s lives, to expand human freedoms. Development should therefore be perceived as a multidimensional process involving the reorganization and reorientation of entire economic and social systems. In addition to improvements in incomes and output, it typically involves radical changes in institutional, social, and administrative structures as well as in popular attitudes and even customs and beliefs. Finally, although development is usually defined in a national context, its more widespread real-ization may necessitate modification of the international economic and social system as well.
In this chapter, we explore the historical and intellectual evolution in scholarly thinking about how and why development does or does not take place. We do this by examining four major and often competing development theories. You will see that each offers valuable insights and a useful per-spective on the nature of the development process. Some newer models of development and underdevelopment draw eclectically on the classic theories, and we consider them in Chapter 4.
Approaches to the analysis of economic growth are introduced throughout this review of alternative theories of development and are then amplified in three chapter appendixes.
Classic Theories of Economic Growth and Development
There is no Economic Theory of Everything,—Robert Solow, Nobel laureate in economics
[In] modern economic growth…the rate of structural transformation of the economy is high.
—Simon Kuznets, Nobel laureate in economics
3
118

119CHAPTER 3 Classic Theories of Economic Growth and Development
3.1 Classic Theories of Economic Development: Four Approaches
The classic post–World War II literature on economic development has been dominated by four major and sometimes competing strands of thought: (1) the linear-stages-of-growth model, (2) theories and patterns of structural change, (3) the international-dependence revolution, and (4) the neoclassical, free-market counterrevolution. In recent years, an eclectic approach has emerged that draws on all of these classic theories.
Theorists of the 1950s and 1960s viewed the process of development as a series of successive stages of economic growth through which all countries must pass. It was primarily an economic theory of development in which the right quantity and mixture of saving, investment, and foreign aid were all that was necessary to enable developing nations to proceed along an economic growth path that had historically been followed by the more developed countries. Devel-opment thus became synonymous with rapid, aggregate economic growth.
This linear-stages approach was largely replaced in the 1970s by two competing schools of thought. The first, which focused on theories and patterns of struc-tural change, used modern economic theory and statistical analysis in an attempt to portray the internal process of structural change that a “typical” developing country must undergo if it is to succeed in generating and sustaining rapid eco-nomic growth. The second, the international-dependence revolution, was more radical and more political. It viewed underdevelopment in terms of international and domestic power relationships, institutional and structural economic rigidities, and the resulting proliferation of dual economies and dual societies both within and among the nations of the world. Dependence theories tended to emphasize external and internal institutional and political constraints on economic development. Emphasis was placed on the need for major new policies to eradicate poverty, to provide more diversified employment opportunities, and to reduce income inequal-ities. These and other egalitarian objectives were to be achieved within the context of a growing economy, but economic growth per se was not given the exalted status accorded to it by the linear-stages and structural-change models.
Throughout much of the 1980s and 1990s, a fourth approach prevailed. This neoclassical (sometimes called neoliberal) counterrevolution in economic thought emphasized the beneficial role of free markets, open economies, and the privati-zation of inefficient public enterprises. Failure to develop, according to this theory, was not due to exploitive external and internal forces as expounded by depen-dence theorists. Rather, it was primarily the result of too much government inter-vention and regulation of the economy. Today’s eclectic approach draws on all of these perspectives, and we will highlight the strengths and weaknesses of each.
3.2 Development as Growth and the Linear-Stages Theories
When interest in the poor nations of the world really began to materialize following World War II, economists in the industrialized nations were caught

120 PART ONE Principles and Concepts
off guard. They had no readily available conceptual apparatus with which to analyze the process of economic growth in largely agrarian societies that lacked modern economic structures. But they did have the recent experience of the Marshall Plan, under which massive amounts of U.S. financial and tech-nical assistance enabled the war-torn countries of Europe to rebuild and mod-ernize their economies in a matter of years. Moreover, was it not true that all modern industrial nations were once undeveloped agrarian societies? Surely their historical experience in transforming their economies from poor agricul-tural subsistence societies to modern industrial giants had important lessons for the “backward” countries of Asia, Africa, and Latin America. The logic and simplicity of these two strands of thought—the utility of massive injections of capital and the historical experience of the now developed countries—was too irresistible to be refuted by scholars, politicians, and administrators in rich countries, to whom people and ways of life in the developing world were often no more real than UN statistics or scattered chapters in anthropology books. Because of its emphasis on the central role of accelerated capital accu-mulation, this approach is often dubbed “capital fundamentalism.”
Rostow’s Stages of Growth
The most influential and outspoken advocate of the stages-of-growth model of development was the American economic historian Walt W. Rostow. According to Rostow, the transition from underdevelopment to development can be described in terms of a series of steps or stages through which all coun-tries must proceed. As Rostow wrote in the opening chapter of The Stages of Economic Growth:
This book presents an economic historian’s way of generalizing the sweep of modern history.…It is possible to identify all societies, in their economic dimen-sions, as lying within one of five categories: the traditional society, the pre-conditions for takeoff into self-sustaining growth, the take-off, the drive to maturity, and the age of high mass consumption.…These stages are not merely descriptive. They are not merely a way of generalizing certain factual observations about the sequence of development of modern societies. They have an inner logic and continuity.…They constitute, in the end, both a theory about economic growth and a more general, if still highly partial, theory about modern history as a whole.1
The advanced countries, it was argued, had all passed the stage of “takeoff into self-sustaining growth,” and the underdeveloped countries that were still in either the traditional society or the “preconditions” stage had only to follow a certain set of rules of development to take off in their turn into self-sustaining economic growth.
One of the principal strategies of development necessary for any takeoff was the mobilization of domestic and foreign saving in order to generate suf-ficient investment to accelerate economic growth. The economic mechanism by which more investment leads to more growth can be described in terms of the Harrod-Domar growth model,2 today often referred to as the AK model because it is based on a linear production function with output given by the capital stock K times a constant, often labeled A. In one form or another, it has frequently been applied to policy issues facing developing countries, such as in the two-gap model examined in Chapter 14.
Stages-of-growth model of development A theory of economic development, associated with the American economic historian Walt W. Rostow, according to which a country passes through sequential stages in achieving development.
Harrod-Domar growth modelA functional economic rela-tionship in which the growth rate of gross domestic product (g) depends directly on the national net savings rate (s)and inversely on the national capital-output ratio (c).

121CHAPTER 3 Classic Theories of Economic Growth and Development
The Harrod-Domar Growth Model
Every economy must save a certain proportion of its national income, if only to replace worn-out or impaired capital goods (buildings, equipment, and materials). However, in order to grow, new investments representing net addi-tions to the capital stock are necessary. If we assume that there is some direct economic relationship between the size of the total capital stock, K, and total GDP, Y—for example, if $3 of capital is always necessary to produce an annual $1 stream of GDP—it follows that any net additions to the capital stock in the form of new investment will bring about corresponding increases in the flow of national output, GDP.
Suppose that this relationship, known in economics as the capital-output ratio, is roughly 3 to 1. If we define the capital-output ratio as k and assume further that the national net savings ratio, s, is a fixed proportion of national output (e.g., 6%) and that total new investment is determined by the level of total savings, we can construct the following simple model of economic growth:
1. Net saving (S) is some proportion, s, of national income (Y) such that we have the simple equation
S = sY (3.1)
2. Net investment (I) is defined as the change in the capital stock, K, and can be represented by ΔK such that
I = ΔK (3.2)
But because the total capital stock, K, bears a direct relationship to total national income or output, Y, as expressed by the capital-output ratio, c,3
it follows thatKY
= c
orΔKΔY
= c
or, finally,
ΔK = cΔY (3.3)
1/c is a measure of the efficiency of capital utilization.
3. Finally, because net national savings, S, must equal net investment, I, we can write this equality as
S = I (3.4)
But from Equation 3.1 we know that S = sY, and from Equations 3.2 and 3.3 we know that
I = ΔK = cΔY
It therefore follows that we can write the “identity” of saving equaling investment shown by Equation 3.4 as
S = sY = cΔY = ΔK = I (3.5)
Capital-output ratio A ratio that shows the units of capital required to produce a unit of output over a given period of time.Net savings ratio Savingsexpressed as a proportion of disposable income over some period of time.

122 PART ONE Principles and Concepts
or simply as
sY = c∆Y (3.6)
Dividing both sides of Equation 3.6 first by Y and then by c, we obtain the following expression:
∆YY
=sc
(3.7)
Note that the left-hand side of Equation 3.7, ∆Y>Y, represents the rate of change or rate of growth of GDP.
Equation 3.7, which is a simplified version of the famous equation in the Harrod-Domar theory of economic growth, states simply that the rate of growth of GDP (∆Y>Y) is determined jointly by the net national savings ratio, s, and the national capital-output ratio, c. More specifically, it says that in the absence of government, the growth rate of national income will be directly or positively related to the savings ratio (i.e., the more an economy is able to save—and invest—out of a given GDP, the greater the growth of that GDP will be) and inversely or negatively related to the economy’s capital-output ratio (i.e., the higher c is, the lower the rate of GDP growth will be). Equation 3.7 is also often expressed in terms of gross savings, sG, in which case the growth rate is given by
∆YY
=sG
c- δ (3.7’)
where δ is the rate of capital depreciation.4
The economic logic of Equations 3.7 and 3.7’ is very simple. To grow, economies must save and invest a certain proportion of their GDP. The more they can save and invest, the faster they can grow. But the actual rate at which they can grow for any level of saving and investment—how much additional output can be had from an additional unit of investment—can be measured by the inverse of the capital-output ratio, c, because this inverse, 1>c, is simply the output-capital or output-investment ratio. It follows that multiplying the rate of new investment, s = I>Y, by its productivity, 1>c, will give the rate by which national income or GDP will increase.
In addition to investment, two other components of economic growth are labor force growth and technological progress. The roles and functioning of these three components are examined in detail in Appendix 3.1. In the context of the Harrod-Domar growth model, labor force growth is not described explicitly. This is because labor is assumed to be abundant in a developing-country context and can be hired as needed in a given proportion to capital investments (this assumption is not always valid). In a general way, techno-logical progress can be expressed in the Harrod-Domar context as a decrease in the required capital-output ratio, giving more growth for a given level of investment, as follows from Equation 3.7 or 3.7’. This is obvious when we realize that in the longer run, this ratio is not fixed but can change over time in response to the functioning of financial markets and the policy environment. But again, the focus was on the role of capital investment.

123CHAPTER 3 Classic Theories of Economic Growth and Development
Obstacles and Constraints
Returning to the stages-of-growth theories and using Equation 3.7 of our simple Harrod-Domar growth model, we learn that one of the most funda-mental strategies of economic growth is simply to increase the proportion of national income saved (i.e., not consumed). If we can raise s in Equation 3.7, we can increase ∆Y>Y, the rate of GDP growth. For example, if we assume that the national capital-output ratio in some less developed country is, say, 3 and the aggregate net saving ratio is 6% of GDP, it follows from Equation 3.7 that this country can grow at a rate of 2% per year because
∆YY
=sc=
6%3
= 2% (3.8)
Now if the national net savings rate can somehow be increased from 6% to, say, 15%—through some combination of increased taxes, foreign aid, and general consumption sacrifices—GDP growth can be increased from 2% to 5% because now
∆YY
=sc=
15%3
= 5% (3.9)
In fact, Rostow and others defined the takeoff stage in precisely this way. Countries that were able to save 15 to 20% of GDP could grow (“develop”) at a much faster rate than those that saved less. Moreover, this growth would then be self-sustaining. The mechanisms of economic growth and development, therefore, would be simply a matter of increasing national savings and investment.
The main obstacle to or constraint on development, according to this theory, is the relatively low level of new capital formation in most poor coun-tries. But if a country wanted to grow at, say, a rate of 7% per year and if it could not generate savings and investment at a rate of 21% of national income (assuming that c, the final aggregate capital-output ratio, is 3) but could only manage to save 15%, it could seek to fill this “savings gap” of 6% through either foreign aid or private foreign investment.
Thus, the “capital constraint” stages approach to growth and development became a rationale and (in terms of Cold War politics) an opportunistic tool for justifying massive transfers of capital and technical assistance from the developed to the less developed nations. It was to be the Marshall Plan all over again, but this time for the nations of the developing world.
Necessary versus Sufficient Conditions: Some Criticisms of the Stages Model
Unfortunately, the mechanisms of development embodied in the theory of stages of growth did not always work. And the basic reason they didn’t work was not because more saving and investment isn’t a necessary condition for accelerated rates of economic growth but rather because it is not a sufficient condition. The Marshall Plan worked for Europe because the European countries receiving aid possessed the necessary structural, institutional, and
Necessary condition A con-dition that must be present, although it need not be in itself sufficient, for an event to occur. For example, capital formation may be a necessary condition for sustained eco-nomic growth (before growth in output can occur, there must be tools to produce it). But for this growth to continue, social, institutional, and attitudinal changes may have to occur.
Sufficient condition Acondition that when present causes or guarantees that an event will or can occur; in economic models, a condition that logically requires that a statement must be true (or a result must hold) given other assumptions.

124 PART ONE Principles and Concepts
attitudinal conditions (e.g., well-integrated commodity and money markets, highly developed transport facilities, a well-trained and educated workforce, the motivation to succeed, an efficient government bureaucracy) to convert new capital effectively into higher levels of output. The Rostow and Harrod-Domar models implicitly assume the existence of these same attitudes and arrangements in underdeveloped nations. Yet, in many cases, they are lacking, as are complementary factors such as managerial competence, skilled labor, and the ability to plan and administer a wide assortment of development projects. There was also insufficient focus on another strategy for raising growth that is apparent from Equation 3.7: reducing the capital-output ratio, c,which entails increasing the efficiency with which investments generate extra output—a theme we take up later.
3.3 Structural-Change Models
Structural-change theory focuses on the mechanism by which underde-veloped economies transform their domestic economic structures from a heavy emphasis on traditional subsistence agriculture to a more modern, more urbanized, and more industrially diverse manufacturing and service economy. It employs the tools of neoclassical price and resource allocation theory and modern econometrics to describe how this transformation process takes place. Two well-known representative examples of the structural-change approach are the “two-sector surplus labor” theoretical model of W. Arthur Lewis and the “patterns of development” empirical analysis of Hollis B. Chenery and his coauthors.
The Lewis Theory of Economic Development
Basic Model One of the best-known early theoretical models of development that focused on the structural transformation of a primarily subsistence economy was that formulated by Nobel laureate W. Arthur Lewis in the mid-1950s and later modified, formalized, and extended by John Fei and Gustav Ranis.5 The Lewis two-sector model became the general theory of the development process in surplus-labor developing nations during most of the 1960s and early 1970s, and it is sometimes still applied, particularly to study the recent growth expe-rience in China and labor markets in other developing countries.6
In the Lewis model, the underdeveloped economy consists of two sectors: a traditional, overpopulated, rural subsistence sector characterized by zero marginal labor productivity—a situation that permits Lewis to classify this as surplus labor in the sense that it can be withdrawn from the traditional agri-cultural sector without any loss of output—and a high-productivity modern, urban industrial sector into which labor from the subsistence sector is grad-ually transferred. The primary focus of the model is on both the process of labor transfer and the growth of output and employment in the modern sector. (The modern sector could include modern agriculture, but we will call the sector “industrial” as a shorthand). Both labor transfer and modern-sector employment growth are brought about by output expansion in that sector. The speed with which this expansion occurs is determined by the rate
Structural-change theoryThe hypothesis that underde-velopment is due to underuti-lization of resources arising from structural or institutional factors that have their origins in both domestic and interna-tional dualism. Developmenttherefore requires more than just accelerated capital for-mation.
Structural transformationThe process of transforming an economy in such a way that the contribution to national income by the manufacturing sector eventually surpasses the contribution by the agricultural sector. More generally, a major alteration in the industrial composition of any economy.
Lewis two-sector model Atheory of development in which surplus labor from the traditional agricultural sector is transferred to the modern industrial sector, the growth of which absorbs the surplus labor, promotes industrial-ization, and stimulates sus-tained development.
Surplus labor The excess supply of labor over and above the quantity demanded at the going free-market wage rate. In the Lewis two-sector model of economic devel-opment, surplus labor refers to the portion of the rural labor force whose marginal produc-tivity is zero or negative.

125CHAPTER 3 Classic Theories of Economic Growth and Development
of industrial investment and capital accumulation in the modern sector. Such investment is made possible by the excess of modern-sector profits over wages on the assumption that capitalists reinvest all their profits. Finally, Lewis assumed that the level of wages in the urban industrial sector was constant, determined as a given premium over a fixed average subsistence level of wages in the traditional agricultural sector. At the constant urban wage, the supply curve of rural labor to the modern sector is considered to be perfectly elastic.
We can illustrate the Lewis model of modern-sector growth in a two-sector economy by using Figure 3.1. Consider first the traditional agricultural sector portrayed in the two right-hand diagrams of Figure 3.1b. The upper diagram shows how subsistence food production varies with increases in labor inputs. It is a typical agricultural production function in which the total output or product (TPA) of food is determined by changes in the amount of
Production function A tech-nological or engineering rela-tionship between the quantity of a good produced and the quantity of inputs required to produce it.
FIGURE 3.1 The Lewis Model of Modern-Sector Growth in a Two-Sector Surplus-Labor Economy
L1
KM3 > KM2 > KM1
D1 (KM1) = MPLM
D1
D2
D3
MPLA
MPLA
APLA
APLA
LA
D2 (KM2)
D3 (KM3)
TPM (KM1)
TPM (KM2)
TPM (KM3)
TPA (KA)TPA
TPM 3
TPM 2
TPM 1
WMSL
WAWA
L2 L3
L1 L2
F G H
L3
QLM LA
LA
= WA
QLA
TPA
0
0 0
0
Tota
l pro
du
ct (
man
ufa
ctu
res)
Rea
l wag
e (=
MP
LM)
Quantity of labor (QLM) (thousands) Quantity of labor (QLA) (millions)
Tota
l pro
du
ct (
foo
d)
Ave
rage
(m
argi
nal
) p
rod
uct
sTPM = f(LM,KM,tM)KM3 > KM2 > KM1
–
–
–TPA = f(LA,KA,tA)
– –
(a) Modern (industrial) sector (b) Traditional (agricultural) sector
Surplus labor

126 PART ONE Principles and Concepts
the only variable input, labor (LA), given a fixed quantity of capital, KA , and unchanging traditional technology, tA. In the lower-right diagram, we have the average and marginal product of labor curves, APLA and MPLA, which are derived from the total product curve shown immediately above. The quantity of agricultural labor (QLA) available is the same on both horizontal axes of the right-hand side of the figure and is expressed in millions of workers, as Lewis is describing an underdeveloped economy where much of the population lives and works in rural areas.
Lewis makes two assumptions about the traditional sector. First, there is surplus labor in the sense that MPLA is zero, and second, all rural workers share equally in the output so that the rural real wage is determined by the average and not the marginal product of labor (as will be the case in the modern sector). Metaphorically, this may be thought of as passing around the family rice bowl at dinnertime, from which each person takes an equal share (this need not be literally equal shares for the basic idea to hold). Assume that there are LA agri-cultural workers producing TPA food, which is shared equally as WA food per person (this is the average product, which is equal to TPA>LA). The marginal product of these LA workers is zero, as shown in the bottom diagram of Figure 3.1b; hence the surplus-labor assumption applies to all workers in excess of LA(note the horizontal TPA curve beyond LA workers in the upper-right diagram).
The upper-left diagram of Figure 3.1a portrays the total product (production function) curves for the modern industrial sector. Once again, output of, say, manufactured goods (TPM) is a function of a variable labor input, LM, for a given capital stock KM and technology, tM. On the horizontal axes, the quantity of labor employed to produce an output of, say, TPM1, with capital stock KM1, is expressed in thousands of urban workers, L1. In the Lewis model, the modern-sector capital stock is allowed to increase from KM1 to KM2 to KM3 as a result of the reinvestment of profits by industrial capitalists. This will cause the total product curves in Figure 3.1a to shift upward from TPM(KM1) to TPM(KM2) to TPM(KM3). The process that will generate these capitalist profits for reinvestment and growth is illustrated in the lower-left diagram of Figure 3.1a. Here we have modern-sector marginal labor product curves derived from the TPM curves of the upper diagram. Under the assumption of perfectly competitive labor markets in the modern sector, these marginal product of labor curves are in fact the actual demand curves for labor. Here is how the system works.
WA in the lower diagrams of Figures 3.1a and 3.1b represents the average level of real subsistence income in the traditional rural sector. WM in Figure 3.1a is therefore the real wage in the modern capitalist sector. At this wage, the supply of rural labor is assumed to be unlimited or perfectly elastic, as shown by the horizontal labor supply curve WMSL. In other words, Lewis assumes that at urban wage WM above rural average income WA, modern-sector employers can hire as many surplus rural workers as they want without fear of rising wages. (Note again that the quantity of labor in the rural sector, Figure 3.1b, is expressed in millions, whereas in the modern urban sector, Figure 3.1a, units of labor are expressed in thousands.) Given a fixed supply of capital KM1 in the initial stage of modern-sector growth, the demand curve for labor is deter-mined by labor’s declining marginal product and is shown by the negatively sloped curve D1(KM1) in the lower-left diagram. Because profit-maximizing modern-sector employers are assumed to hire laborers to the point where their
Average product Total output or product divided by total factor input (e.g., the average product of labor is equal to total output divided by the total amount of labor used to produce that output).
Marginal product Theincrease in total output resulting from the use of one additional unit of a variable factor of production (such as labor or capital). In the Lewis two-sector model, surplus laboris defined as workers whose marginal product is zero.

127CHAPTER 3 Classic Theories of Economic Growth and Development
marginal physical product is equal to the real wage (i.e., the point F of inter-section between the labor demand and supply curves), total modern-sector employment will be equal to L1. Total modern-sector output, TPM1, would be given by the area bounded by points 0D1FL1. The share of this total output paid to workers in the form of wages would be equal, therefore, to the area of the rectangle 0WMFL1. The balance of the output shown by the area WMD1F would be the total profits that accrue to the capitalists. Because Lewis assumes that all of these profits are reinvested, the total capital stock in the modern sector will rise from KM1 to KM2. This larger capital stock causes the total product curve of the modern sector to shift to TPM(KM2), which in turn induces a rise in the mar-ginal product demand curve for labor. This outward shift in the labor demand curve is shown by line D2(KM2) in the bottom half of Figure 3.1a. A new equi-librium modern-sector employment level will be established at point G with L2 workers now employed. Total output rises to TPM2 or 0D2GL2, while total wages and profits increase to 0WMGL2 and WMD2G, respectively. Once again, these larger (WMD2G) profits are reinvested, increasing the total capital stock to KM3, shifting the total product and labor demand curves to TPM(KM3) and to D3(KM3), respectively, and raising the level of modern-sector employment to L3.
This process of modern-sector self-sustaining growth and employment expansion is assumed to continue until all surplus rural labor is absorbed in the new industrial sector. Thereafter, additional workers can be withdrawn from the agricultural sector only at a higher cost of lost food production because the declining labor-to-land ratio means that the marginal product of rural labor is no longer zero. This is known as the “Lewis turning point.” Thus, the labor supply curve becomes positively sloped as modern-sector wages and employment continue to grow. The structural transformation of the economy will have taken place, with the balance of economic activity shifting from tra-ditional rural agriculture to modern urban industry.
Criticisms of the Lewis Model Although the Lewis two-sector development model is simple and roughly reflects the historical experience of economic growth in the West, four of its key assumptions do not fit the institutional and economic realities of most contemporary developing countries.
First, the model implicitly assumes that the rate of labor transfer and employment creation in the modern sector is proportional to the rate of modern-sector capital accumulation. The faster the rate of capital accumu-lation, the higher the growth rate of the modern sector and the faster the rate of new job creation. But what if capitalist profits are reinvested in more sophisticated laborsaving capital equipment rather than just duplicating the existing capital, as is implicitly assumed in the Lewis model? (We are, of course, here accepting the debatable assumption that capitalist profits are in fact reinvested in the local economy and not sent abroad as a form of “capital flight” to be added to the deposits of Western banks.) Figure 3.2 reproduces the lower, modern-sector diagram of Figure 3.1a, only this time the labor demand curves do not shift uniformly outward but in fact cross. Demand curve D2(KM2) has a greater negative slope than D2(KM1) to reflect the fact that additions to the capital stock embody laborsaving technical progress—that is, KM2 technology requires much less labor per unit of output than KM1technology does.
Self-sustaining growthEconomic growth that continues over the long run based on saving, investment, and complementary private and public activities.

128 PART ONE Principles and Concepts
We see that even though total output has grown substantially (i.e., 0D2EL1is significantly greater than 0D1EL1), total wages (0WMEL1) and employment (L1) remain unchanged. All of the extra output accrues to capitalists in the form of profits. Figure 3.2 therefore provides an illustration of what some might call “antidevelopmental” economic growth—all the extra income and output growth are distributed to the few owners of capital, while income and employment levels for the masses of workers remain largely unchanged. Although total GDP would rise, there would be little or no improvement in aggregate social welfare measured, say, in terms of more widely distributed gains in income and employment.
The second questionable assumption of the Lewis model is the notion that surplus labor exists in rural areas while there is full employment in the urban areas. Most contemporary research indicates that there is little surplus labor in rural locations. True, there are both seasonal and geographic exceptions to this rule (e.g., at least until recently in parts of China and the Asian subcontinent, some Caribbean islands, and isolated regions of Latin America where land ownership is very unequal), but by and large, development economists today agree that Lewis’s assumption of rural surplus labor is generally not valid.
The third dubious assumption is the notion of a competitive modern-sector labor market that guarantees the continued existence of constant real urban wages up to the point where the supply of rural surplus labor is exhausted. Prior to the 1980s, a striking feature of urban labor markets and wage deter-mination in almost all developing countries was the tendency for these wages to rise substantially over time, both in absolute terms and relative to average rural incomes, even in the presence of rising levels of open modern-sector unemployment and low or zero marginal productivity in agriculture. Institu-tional factors such as union bargaining power, civil service wage scales, and
FIGURE 3.2 The Lewis Model Modified by Laborsaving Capital Accumulation: Employment Implications
D1
L1
D2
ES
AD1 (KM1)
WM
D2 (KM2)
Quantity of labor
0
Rea
l wag
e (=
MP
LM)

129CHAPTER 3 Classic Theories of Economic Growth and Development
multinational corporations’ hiring practices tend to negate competitive forces in modern-sector labor markets in developing countries.
The fourth concern with the Lewis model is its assumption of dimin-ishing returns in the modern industrial sector. Yet there is much evidence that increasing returns prevail in that sector, posing special problems for devel-opment policymaking that we will examine in Chapter 4.
We study the Lewis model because, as many development specialists still think about development in this way either explicitly or implicitly, it helps stu-dents participate in the debates. Moreover, the model is widely considered rel-evant to recent experiences in China, where labor has been steadily absorbed from farming into manufacturing, and to a few other countries with similar growth patterns. The Lewis turning point at which wages in manufacturing start to rise was widely identified with China’s wage increases starting in 2010 (see the case study for Chapter 4).
However, when we take into account the laborsaving bias of most modern technological transfer, the existence of substantial capital flight, the wide-spread nonexistence of rural surplus labor, the growing prevalence of urban surplus labor, and the tendency for modern-sector wages to rise rapidly even where substantial open unemployment exists, we must acknowledge that the Lewis two-sector model—though valuable as an early conceptual portrayal of the development process of sectoral interaction and structural change and a description of some historical experiences, including some recent ones such as China—requires considerable modification in assumptions and analysis to fit the reality of most contemporary developing nations.
Structural Change and Patterns of Development
Like the earlier Lewis model, the patterns-of-development analysis of struc-tural change focuses on the sequential process through which the economic, industrial, and institutional structure of an underdeveloped economy is trans-formed over time to permit new industries to replace traditional agriculture as the engine of economic growth. However, in contrast to the Lewis model and the original stages view of development, increased savings and investment are perceived by patterns-of-development analysts as necessary but not suf-ficient conditions for economic growth. In addition to the accumulation of capital, both physical and human, a set of interrelated changes in the economic structure of a country are required for the transition from a traditional eco-nomic system to a modern one. These structural changes involve virtually all economic functions, including the transformation of production and changes in the composition of consumer demand, international trade, and resource use as well as changes in socioeconomic factors such as urbanization and the growth and distribution of a country’s population.
Empirical structural-change analysts emphasize both domestic and inter-national constraints on development. The domestic ones include economic constraints such as a country’s resource endowment and its physical and popu-lation size, as well as institutional constraints such as government policies and objectives. International constraints on development include access to external capital, technology, and international trade. Differences in development level among developing countries are largely ascribed to these domestic and
Patterns-of-developmentanalysis An attempt to identify characteristic fea-tures of the internal process of structural transformation that a “typical” developing economy undergoes as it gen-erates and sustains modern economic growth and devel-opment.

130 PART ONE Principles and Concepts
international constraints. However, it is the international constraints that make the transition of currently developing countries differ from that of now industrialized countries. To the extent that developing countries have access to the opportunities presented by the industrial countries as sources of capital, technology, and manufactured imports, as well as markets for exports, they can make the transition at an even faster rate than that achieved by the indus-trial countries during the early periods of their economic development. Thus, unlike the earlier stages model, the structural-change model recognizes the fact that developing countries are part of an integrated international system that can promote (as well as hinder) their development.
The best-known model of structural change is the one based largely on the empirical work of the late economist Hollis B. Chenery and his colleagues, who examined patterns of development for numerous developing countries during the postwar period. (This approach also built on research by Nobel laureate Simon Kuznets on modern economic growth of developed countries.)7 Their empirical studies, both cross-sectional (among countries at a given point in time) and time-series (over long periods of time), of countries at different levels of per capita income led to the identification of several characteristic features of the development process. These included the shift from agricultural to industrial production, the steady accumulation of physical and human capital, the change in consumer demands from emphasis on food and basic necessities to desires for diverse manufactured goods and services, the growth of cities and urban indus-tries as people migrate from farms and small towns, and the decline in family size and overall population growth as children lose their economic value and parents substitute what is traditionally labeled child quality (education) for quantity (see Chapter 6), with population growth first increasing and then decreasing in the process of development. Proponents of this school often call for development specialists to “let the facts speak for themselves” rather than get bogged down in the arcana of theories such as the stages of growth. This is a valuable counter-balance to empty theorizing, but it also has its own limits.
Conclusions and Implications
The structural changes that we have described are the “average” patterns of development that Chenery and his colleagues observed among countries in time-series and cross-sectional analyses. The major hypothesis of the structural-change model is that development is an identifiable process of growth and change, whose main features are similar in all countries. However, as mentioned earlier, the model does recognize that differences can arise among countries in the pace and pattern of development, depending on their particular set of circum-stances. Factors influencing the development process include a country’s resource endowment and size, its government’s policies and objectives, the availability of external capital and technology, and the international trade environment.
One limitation to keep in mind is that by emphasizing patterns rather than theory, this approach runs the risk of leading practitioners to draw the wrong conclusions about causality—in effect, to “put the cart before the horse.” Observing developed-country patterns such as the decline of the share of the labor force in agriculture over time, many developing-country policymakers have been inclined to neglect that vital sector. But as you will see in Chapter 9,

131CHAPTER 3 Classic Theories of Economic Growth and Development
that is precisely the opposite conclusion to the one that should be drawn. Observing the important role of higher education in developed countries, policymakers may be inclined to emphasize the development of an advanced university system even before a majority of the population has gained basic literacy, a policy that has led to gross inequities even in countries at least nom-inally committed to egalitarian outcomes, such as Tanzania.
Empirical studies on the process of structural change lead to the conclusion that the pace and pattern of development can vary according to both domestic and international factors, many of which lie beyond the control of an indi-vidual developing nation. Yet despite this variation, structural-change econo-mists argue that one can identify certain patterns occurring in almost all coun-tries during the development process. And these patterns, they argue, may be affected by the choice of development policies pursued by governments in developing countries as well as the international trade and foreign-assistance policies of developed nations. Hence, structural-change analysts are basically optimistic that the “correct” mix of economic policies will generate beneficial patterns of self-sustaining growth. The international-dependence school to which we now turn is, in contrast, much less sanguine and is in many cases downright pessimistic.
3.4 The International-Dependence Revolution
During the 1970s, international-dependence models gained increasing support, especially among developing-country intellectuals, as a result of growing disen-chantment with both the stages and structural-change models. While this theory to a large degree went out of favor during the 1980s and 1990s, versions of it have enjoyed a resurgence in the twenty-first century as some of its views have been adopted, albeit in modified form, by theorists and leaders of the antiglo-balization movement.8 Essentially, international-dependence models view devel-oping countries as beset by institutional, political, and economic rigidities, both domestic and international, and caught up in a dependence and dominancerelationship with rich countries. Within this general approach are three major streams of thought: the neocolonial dependence model, the false-paradigm model, and the dualistic-development thesis.
The Neocolonial Dependence Model
The first major stream, which we call the neocolonial dependence model, is an indirect outgrowth of Marxist thinking. It attributes the existence and con-tinuance of underdevelopment primarily to the historical evolution of a highly unequal international capitalist system of rich country–poor country relation-ships. Whether because rich nations are intentionally exploitative or uninten-tionally neglectful, the coexistence of rich and poor nations in an international system dominated by such unequal power relationships between the center(the developed countries) and the periphery (the developing countries) renders attempts by poor nations to be self-reliant and independent difficult and some-times even impossible.9 Certain groups in the developing countries (including landlords, entrepreneurs, military rulers, merchants, salaried public officials, and
Dependence The reliance of developing countries on developed-country economic policies to stimulate their own economic growth. Dependence can also mean that the developing countries adopt developed-country education systems, technology, economic and political systems, attitudes, consumption pat-terns, dress, and so on.
Dominance In international affairs, a situation in which the developed countries have much greater power than the less developed countries in decisions affecting important international economic issues, such as the prices of agricul-tural commodities and raw materials in world markets.
Neocolonial dependence model A model whose main proposition is that underdevelopment exists in developing countries because of continuing exploitative eco-nomic, political, and cultural policies of former colonial rulers toward less developed countries.
Underdevelopment Aneconomic situation charac-terized by persistent low levels of living in conjunction with absolute poverty, low income per capita, low rates of economic growth, low con-sumption levels, poor health services, high death rates, high birth rates, dependence on foreign economies, and limited freedom to choose among activities that satisfy human wants.
Center In dependence theory, the economically developed world.
Periphery In dependence theory, the developing countries.

132 PART ONE Principles and Concepts
trade union leaders) that enjoy high incomes, social status, and political power constitute a small elite ruling class whose principal interest, knowingly or not, is in the perpetuation of the international capitalist system of inequality and conformity in which they are rewarded. Directly and indirectly, they serve (are dominated by) and are rewarded by (are dependent on) international special-interest power groups, including multinational corporations, national bilateral-aid agencies, and multilateral assistance organizations like the World Bank or the International Monetary Fund (IMF), which are tied by allegiance or funding to the wealthy capitalist countries. The elites’ activities and viewpoints often serve to inhibit any genuine reform efforts that might benefit the wider population and in some cases actually lead to even lower levels of living and to the per-petuation of underdevelopment. In short, the neo-Marxist, neocolonial view of underdevelopment attributes a large part of the developing world’s continuing poverty to the existence and policies of the industrial capitalist countries of the northern hemisphere and their extensions in the form of small but powerful elite or comprador groups in the less developed countries.10 Underdevelopment is thus seen as an externally induced phenomenon, in contrast to the linear-stages and structural-change theories’ stress on internal constraints, such as insufficient savings and investment or lack of education and skills. Revolutionary struggles or at least major restructuring of the world capitalist system is therefore required to free dependent developing nations from the direct and indirect economic control of their developed-world and domestic oppressors.
One of the most forceful statements of the international-dependence school of thought was made by Theotonio Dos Santos:
Underdevelopment, far from constituting a state of backwardness prior to capitalism, is rather a consequence and a particular form of capitalist development known as dependent capitalism.…Dependence is a conditioning situation in which the econ-omies of one group of countries are conditioned by the development and expansion of others. A relationship of interdependence between two or more economies or between such economies and the world trading system becomes a dependent rela-tionship when some countries can expand through self-impulsion while others, being in a dependent position, can only expand as a reflection of the expansion of the dom-inant countries, which may have positive or negative effects on their immediate devel-opment. In either case, the basic situation of dependence causes these countries to be both backward and exploited. Dominant countries are endowed with technological, commercial, capital and sociopolitical predominance over dependent countries—the form of this predominance varying according to the particular historical moment—and can therefore exploit them, and extract part of the locally produced surplus. Dependence, then, is based upon an international division of labor which allows industrial development to take place in some countries while restricting it in others, whose growth is conditioned by and subjected to the power centers of the world.11
A similar but obviously non-Marxist perspective was expounded by Pope John Paul II in his widely quoted 1988 encyclical letter (a formal, elaborate expression of papal teaching) Sollicitudo rei socialis (The Social Concerns of the Church), in which he declared:
One must denounce the existence of economic, financial, and social mechanisms which, although they are manipulated by people, often function almost auto-matically, thus accentuating the situation of wealth for some and poverty for the rest. These mechanisms, which are maneuvered directly or indirectly by the more
Comprador group In depen-dence theory, local elites who act as fronts for foreign investors.

133CHAPTER 3 Classic Theories of Economic Growth and Development
developed countries, by their very functioning, favor the interests of the people manipulating them. But in the end they suffocate or condition the economies of the less developed countries.
The False-Paradigm Model
A second and less radical international-dependence approach to development, which we might call the false-paradigm model, attributes underdevelopment to faulty and inappropriate advice provided by well-meaning but often uninformed, biased, and ethnocentric international “expert” advisers from developed-country assistance agencies and multinational donor organizations. These experts are said to offer complex but ultimately misleading models of development that often lead to inappropriate or incorrect policies. Because of institutional factors such as the central and remarkably resilient role of tradi-tional social structures (tribe, caste, class, etc.), the highly unequal ownership of land and other property rights, the disproportionate control by local elites over domestic and international financial assets, and the very unequal access to credit, these policies, based as they often are on mainstream, neoclassical (or perhaps Lewis-type surplus-labor or Chenery-type structural-change) models, in many cases merely serve the vested interests of existing power groups, both domestic and international.
In addition, according to this argument, leading university intellectuals, trade unionists, high-level government economists, and other civil servants all get their training in developed-country institutions where they are unwit-tingly served an unhealthy dose of alien concepts and elegant but inappli-cable theoretical models. Having little or no really useful knowledge to enable them to come to grips in an effective way with real development problems, they often tend to become unknowing or reluctant apologists for the existing system of elitist policies and institutional structures. In university economics courses, for example, this typically entails the perpetuation of the teaching of many “irrelevant” Western concepts and models, while in government policy discussions, too much emphasis is placed on attempts to measure capital-output ratios, increase savings and investment ratios, privatize and deregulate the economy, or maximize GDP growth rates. As a result, proponents argue that desirable institutional and structural reforms, many of which we have discussed, are neglected or given only cursory attention.
The Dualistic-Development Thesis
Implicit in structural-change theories and explicit in international-dependence theories is the notion of a world of dual societies, of rich nations and poor nations and, in the developing countries, pockets of wealth within broad areas of poverty. Dualism is the existence and persistence of substantial and even increasing divergences between rich and poor nations and rich and poor peoples on various levels. Specifically, although research continues, the tradi-tional concept of dualism embraces four key arguments:12
1. Different sets of conditions, of which some are “superior” and others “inferior,” can coexist in a given space. Examples of this element of dualism
False-paradigm model Theproposition that developing countries have failed to develop because their devel-opment strategies (usually given to them by Western economists) have been based on an incorrect model of development, one that, for example, overstresses capital accumulation or market liber-alization without giving due consideration to needed social and institutional change.
Dualism The coexis-tence of two situations or phenomena (one desirable and the other not) that are mutually exclusive to dif-ferent groups of society—for example, extreme poverty and affluence, modern and traditional economic sectors, growth and stagnation, and higher education among a few amid large-scale illiteracy.
134 PART ONE Principles and Concepts
include Lewis’s notion of the coexistence of modern and traditional methods of production in urban and rural sectors; the coexistence of wealthy, highly educated elites with masses of illiterate poor people; and the dependence notion of the coexistence of powerful and wealthy indus-trialized nations with weak, impoverished peasant societies in the interna-tional economy.
2. This coexistence is chronic and not merely transitional. It is not due to a temporary phenomenon, in which case, time could eliminate the dis-crepancy between superior and inferior elements. In other words, the in-ternational coexistence of wealth and poverty is not simply a historical phenomenon that will be rectified in time. Although both the stages-of-growth theory and the structural-change models implicitly make such an assumption, to proponents of the dualistic development thesis, growing international inequalities seem to refute it.
3. Not only do the degrees of superiority or inferiority fail to show any signs of diminishing, but they even have an inherent tendency to increase. For example, the productivity gap between workers in developed countries and their counterparts in most developing countries seems to widen.
4. The interrelations between the superior and inferior elements are such that the existence of the superior elements does little or nothing to pull up the inferior element, let alone “trickle down” to it. In fact, it may actually serve to push it down—to “develop its underdevelopment.”
Conclusions and Implications
Whatever their ideological differences, the advocates of the neocolonial-dependence, false-paradigm, and dualism models reject the exclusive emphasis on traditional neoclassical economic theories designed to accelerate the growth of GDP as the principal index of development. They question the validity of Lewis-type two-sector models of modernization and industrialization in light of their questionable assumptions and developing-world history. They further reject the claims made by Chenery and others that there are well-defined empirical patterns of development that should be pursued by most poor countries. Instead, dependence, false-paradigm, and dualism theorists place more emphasis on international power imbalances and on needed fundamental economic, political, and institutional reforms, both domestic and worldwide. In extreme cases, they call for the outright expropriation of privately owned assets in the expectation that public asset ownership and control will be a more effective means to help eradicate absolute poverty, provide expanded employment opportunities, lessen income inequalities, and raise the levels of living (including health, education, and cultural enrichment) of the masses. Although a few radical neo-Marxists would even go so far as to say that economic growth and structural change do not matter, the majority of thoughtful observers recognize that the most effective way to deal with these diverse social problems is to accelerate the pace of economic growth through domestic and international reforms, accompanied by a judicious mixture of both public and private economic activity.

135CHAPTER 3 Classic Theories of Economic Growth and Development
Dependence theories have two major weaknesses. First, although they offer an appealing explanation of why many poor countries remain underde-veloped, they give no insight into how countries initiate and sustain devel-opment. Second and perhaps more important, the actual economic experience of developing countries that have pursued revolutionary campaigns of indus-trial nationalization and state-run production has been mostly negative.
If we are to take dependence theory at face value, we would conclude that the best course for developing countries is to become entangled as little as possible with the developed countries and instead pursue a policy of autarky,or inwardly directed development, or at most trade only with other devel-oping countries. But large countries that embarked on autarkic policies, such as China and, to a significant extent, India, experienced stagnant growth and ultimately decided to open their economies, China beginning this process after 1978 and India, after 1990. At the opposite extreme, economies such as Taiwan and South Korea, and China more recently, which have most empha-sized exports to developed countries, have grown strongly. Although in many cases close ties to metropolitan countries during the colonial period appar-ently produced damaging outcomes—as in Peru under Spain, the Congo under Belgium, India under Great Britain, and West Africa under France—in a majority of cases, this relationship appeared to have significantly altered during the postcolonial period. Clearly, however, conflicts of interest between the developed and developing worlds, such as took center stage at the Copen-hagen climate summit in December 2009 and have played a role in recent WTO and G20 meetings, are genuine and cannot be ignored.
We next consider the view that the keys to development are found in free markets. For perspective, as will be noted in later chapters, governments can succeed or fail just as markets can; the key to successful development perfor-mance is achieving a careful balance among what government can success-fully accomplish, what the private market system can do, and what both can best do working together.
While the international-dependence revolution in development theory was capturing the imagination of many Western and developing country scholars, a reaction was emerging in the late 1970s and early 1980s in the form of a neo-classical free-market counterrevolution. This very different approach would ultimately dominate Western (and to a lesser extent developing country) the-ories of economic development during the 1980s and early 1990s.
3.5 The Neoclassical Counterrevolution: Market Fundamentalism
Challenging the Statist Model: Free Markets, Public Choice, and Market-Friendly Approaches
In the 1980s, the political ascendancy of conservative governments in the United States, Canada, Britain, and West Germany came with a neoclassicalcounterrevolution in economic theory and policy. In developed nations, this counterrevolution favored supply-side macroeconomic policies, rational expec-tations theories, and the privatization of public corporations. In developing
Autarky A closed economy that attempts to be completely self-reliant.
Neoclassical counterrevolutionThe 1980s resurgence of neoclassical free-market ori-entation toward development problems and policies, counter to the interventionist depen-dence revolution of the 1970s.

136 PART ONE Principles and Concepts
countries, it called for freer markets and the dismantling of public ownership, statist planning, and government regulation of economic activities. Neoclas-sicists obtained controlling votes on the boards of the world’s two most pow-erful international financial agencies—the World Bank and the International Monetary Fund. In conjunction and with the simultaneous erosion of influence of organizations such as the International Labor Organization (ILO), the United Nations Development Programme (UNDP), and the United Nations Conference on Trade and Development (UNCTAD), which more fully represent the views of delegates from developing countries, it was inevitable that the neoconservative, free-market challenge to the interventionist arguments of dependence theorists would gather momentum.
The central argument of the neoclassical counterrevolution is that under-development results from poor resource allocation due to incorrect pricing policies and too much state intervention by overly active developing-nation governments. Rather, the leading writers of the counterrevolution school, including Lord Peter Bauer, Deepak Lal, Ian Little, Harry Johnson, Bela Balassa, Jagdish Bhagwati, and Anne Krueger, argued that it is this very state intervention in economic activity that slows the pace of economic growth. The neoliberals argue that by permitting competitive free markets to flourish, privatizing state-owned enterprises, promoting free trade and export expansion, welcoming investors from developed countries, and eliminating the plethora of government regulations and price distortions in factor, product, and financial markets, both economic efficiency and economic growth will be stimulated. Contrary to the claims of the dependence theorists, the neo-classical counterrevolutionaries argue that the developing world is underde-veloped, not because of the predatory activities of the developed world and the international agencies that it controls, but rather because of the heavy hand of the state and the corruption, inefficiency, and lack of economic incentives that permeate the economies of developing nations. What is needed, therefore, is not a reform of the international economic system, a restructuring of dualistic developing economies, an increase in foreign aid, attempts to control popu-lation growth, or a more effective development planning system. Rather, it is simply a matter of promoting free markets and laissez-faire economics within the context of permissive governments that allow the “magic of the market-place” and the “invisible hand” of market prices to guide resource allocation and stimulate economic development. They point both to the success of econ-omies like South Korea, Taiwan, and Singapore as “free-market” examples (although, as we shall see later, these Asian Tigers are far from the laissez-faire neoconservative prototype) and to the failures of the public-interventionist economies of Africa and Latin America.13
The neoclassical counterrevolution can be divided into three component approaches: the free-market approach, the public-choice (or “new political economy”) approach, and the “market-friendly” approach. Free-market analysisargues that markets alone are efficient—product markets provide the best signals for investments in new activities; labor markets respond to these new industries in appropriate ways; producers know best what to produce and how to produce it efficiently; and product and factor prices reflect accurate scarcity values of goods and resources now and in the future. Competition is effective, if not perfect; technology is freely available and nearly costless to absorb; information
Free markets The system whereby prices of com-modities or services freely rise or fall when the buyer’s demand for them rises or falls or the seller’s supply of them decreases or increases.
Free-market analysis Theo-retical analysis of the prop-erties of an economic system operating with free markets, often under the assumption that an unregulated market performs better than one with government regulation.

137CHAPTER 3 Classic Theories of Economic Growth and Development
is also perfect and nearly costless to obtain. Under these circumstances, any gov-ernment intervention in the economy is by definition distortionary and counter-productive. Free-market development economists have tended to assume that developing-world markets are efficient and that whatever imperfections exist are of little consequence.
Public-choice theory, also known as the new political economy approach,goes even further to argue that governments can do (virtually) nothing right. This is because public-choice theory assumes that politicians, bureaucrats, citizens, and states act solely from a self-interested perspective, using their power and the authority of government for their own selfish ends. Citizens use political influence to obtain special benefits (called “rents”) from gov-ernment policies (e.g., import licenses or rationed foreign exchange) that restrict access to important resources. Politicians use government resources to consolidate and maintain positions of power and authority. Bureaucrats and public officials use their positions to extract bribes from rent-seeking cit-izens and to operate protected businesses on the side. Finally, states use their power to confiscate private property from individuals. The net result is not only a misallocation of resources but also a general reduction in individual freedoms. The conclusion, therefore, is that minimal government is the best government.14
The market-friendly approach is a variant on the neoclassical counter-revolution associated principally with the 1990s writings of the World Bank and its economists, many of whom were more in the free-market and public-choice camps during the 1980s.15 This approach recognizes that there are many imperfections in developing-country product and factor markets and that governments do have a key role to play in facilitating the oper-ation of markets through “nonselective” (market-friendly) interventions—for example, by investing in physical and social infrastructure, health care facilities, and educational institutions, and by providing a suitable climate for private enterprise. The market-friendly approach also differs from the free-market and public-choice schools of thought by accepting the notion that market failures (see Chapters 4 and 11) are more widespread in devel-oping countries in areas such as investment coordination and environmental outcomes. Moreover, phenomena such as missing and incomplete infor-mation, externalities in skill creation and learning, and economies of scale in production are also endemic to markets in developing countries. In fact, the recognition of these last three phenomena gives rise to newer schools of development theory, the endogenous growth approach, to which we turn in Appendix 3.3 at the end of this chapter, and the coordination failure approach, discussed in Chapter 4.
Traditional Neoclassical Growth Theory
Another cornerstone of the neoclassical free-market argument is the assertion that liberalization (opening up) of national markets draws additional domestic and foreign investment and thus increases the rate of capital accumulation. In terms of GDP growth, this is equivalent to raising domestic savings rates, which enhances capital-labor ratios and per capita incomes in capital-poor developing countries.
Public-choice theory (new political economy approach)The theory that self-interest guides all individual behavior and that governments are inefficient and corrupt because people use gov-ernment to pursue their own agendas.
Market-friendly approachThe notion historically pro-mulgated by the World Bank that successful development policy requires governments to create an environment in which markets can operate efficiently and to intervene only selectively in the economy in areas where the market is inefficient.
Market failure A market’s inability to deliver its theo-retical benefits due to the exis-tence of market imperfections such as monopoly power, lack of factor mobility, sig-nificant externalities, or lack of knowledge. Market failure often provides the justification for government intervention to alter the working of the free market.
Capital-labor ratio Thenumber of units of capital per unit of labor.

138 PART ONE Principles and Concepts
The Solow neoclassical growth model in particular represented the seminal contribution to the neoclassical theory of growth and later earned Robert Solow the Nobel Prize in economics.16 It differed from the Harrod-Domar formulation by adding a second factor, labor, and introducing a third independent variable, technology, to the growth equation. Unlike the fixed-coefficient, constant-returns-to-scale assumption of the Harrod-Domar model, Solow’s neoclassical growth model exhibited diminishing returns to labor and capital separately and constant returns to both factors jointly. Technological progress became the residual factor explaining long-term growth, and its level was assumed by Solow and other neoclassical growth theorists to be determined exogenously, that is, independently of all other factors in the model.
More formally, the standard exposition of the Solow neoclassical growth model uses an aggregate production function in which
Y = Kα1AL21-α (3.10)
where Y is gross domestic product, K is the stock of capital (which may include human capital as well as physical capital), L is labor, and A represents the productivity of labor, which grows at an exogenous rate. For developed countries, this rate has been estimated at about 2% per year. It may be smaller or larger for developing countries, depending on whether they are stagnating or catching up with the developed countries. Because the rate of techno-logical progress is given exogenously (at 2% per year, say), the Solow neo-classical model is sometimes called an “exogenous” growth model, to be con-trasted with the endogenous growth approach (discussed in Appendix 3.3). In Equation 3.10, α represents the elasticity of output with respect to capital (the percentage increase in GDP resulting from a 1% increase in human and physical capital). Since α is assumed to be less than 1 and private capital is assumed to be paid its marginal product so that there are no external econ-omies, this formulation of neoclassical growth theory yields diminishing returns both to capital and to labor.
The Solow neoclassical growth model implies that economies will con-verge to the same level of income per worker “conditionally”—that is, other things equal, particularly savings rates, depreciation, labor force growth, and productivity. The Solow neoclassical growth model is examined in detail in Appendix 3.2.
According to traditional neoclassical growth theory, output growth results from one or more of three factors: increases in labor quantity and quality (through population growth and education), increases in capital (through saving and investment), and improvements in technology (see Appendix 3.1). Closed economies (those with no external activities) with lower savings rates (other things being equal) grow more slowly in the short run than those with high savings rates and tend to converge to lower per capita income levels. Open economies (those with trade, foreign investment, etc.), however, experience income convergence at higher levels as capital flows from rich countries to poor countries where capital-labor ratios are lower and thus returns on investments are higher. Consequently, by impeding the inflow of foreign investment, the heavy-handedness of many developing countries’ governments, according to neoclassical growth theory, will retard growth
Closed economy Aneconomy in which there are no foreign trade transactions or other economic contacts with the rest of the world.
Open economy An economy that practices foreign trade and has extensive financial and nonfinancial contacts with the rest of the world.
Solow neoclassical growth model Growth model in which there are diminishing returns to each factor of pro-duction but constant returns to scale. Exogenous techno-logical change generates long-term economic growth.

139CHAPTER 3 Classic Theories of Economic Growth and Development
in the economies of the developing world. In addition, openness is said to encourage greater access to foreign production ideas that can raise the rate of technological progress.
Conclusions and Implications
Whereas dependence theorists (many, but not all, of whom were economists from developing countries) saw underdevelopment as an externally induced phenomenon, neoclassical revisionists (most, but not all, of whom were Western economists) saw the problem as an internally induced phenomenon of developing countries, caused by too much government intervention and bad economic policies. Such finger-pointing on both sides is not uncommon in issues so contentious as those that divide rich and poor nations.
But what of the neoclassical counterrevolution’s contention that free markets and less government provide the basic ingredients for development? On strictly efficiency (as opposed to equity) criteria, there can be little doubt that market price allocation usually does a better job than state intervention. The problem is that many developing economies are so different in structure and organization from their Western counterparts that the behavioral assump-tions and policy precepts of traditional neoclassical theory are sometimes questionable and often incorrect. Competitive free markets generally do not exist, nor, given the institutional, cultural, and historical context of many developing countries, would they necessarily be desirable from a long-term economic and social perspective (see Chapter 11). Consumers as a whole are rarely sovereign about what goods and services are to be produced, in what quantities, and for whom. Information is limited, markets are fragmented, and much of the economy in low-income countries is still nonmonetized.17
There are widespread externalities of both production and consumption as well as discontinuities in production and indivisibilities (i.e., economies of scale) in technology. Producers, private or public, have great power in deter-mining market prices and quantities sold. The ideal of competition is typi-cally just that—an ideal with little substance in reality. Although monopolies of resource purchase and product sale are pervasive in the developing world, the traditional neoclassical theory of monopoly also offers little insight into the day-to-day activities of public and private corporations. Decision rules can vary widely with the social setting so that profit maximization may be a low-priority objective, especially in state-owned enterprises, in comparison with, say, the creation of jobs or the replacement of foreign managers with local personnel. Finally, the invisible hand often acts not to promote the general welfare but rather to lift up those who are already well-off while failing to offer opportunities for upward mobility for the vast majority.
Much can be learned from neoclassical theory with regard to the impor-tance of elementary supply-and-demand analysis in arriving at “correct” product, factor, and foreign-exchange prices for efficient production and resource allocation. However, enlightened governments can also make effective use of prices as signals and incentives for influencing socially optimal resource allocations. Indeed, we will often demonstrate the usefulness of various tools of neoclassical theory in our later analysis of problems such as population growth, agricultural stagnation, unemployment and underemployment,

140 PART ONE Principles and Concepts
child labor, educational demands, the environment, export promotion versus import substitution, devaluation, project planning, monetary policy, microfinance, and economic privatization. Nevertheless, the reality of the institutional and political structure of many developing-world economies—not to mention their differing value systems and ideologies—often makes the attainment of appropriate economic policies based either on markets or on enlightened public intervention an exceedingly difficult endeavor. In an environment of widespread institutional rigidity and severe socioeconomic inequality, both markets and governments will typically fail. It is not simply an either-or question based on ideological leaning; rather, it is a matter of assessing each individual country’s situation on a case-by-case basis. Devel-oping nations need to adopt local solutions in response to local constraints.18
Development economists must therefore be able to distinguish between textbook neoclassical theory and the institutional and political reality of con-temporary developing countries.19 They can then choose the traditional neo-classical concepts and models that can best illuminate issues and dilemmas of development and discard those that cannot. Approaches to making these distinctions and choices in key policy applications will feature centrally in Parts Two and Three.
3.6 Classic Theories of Development: Reconciling the Differences
In this chapter, we have reviewed a range of competing theories and approaches to the study of economic development. Each approach has its strengths and weaknesses. The fact that there exists such controversy—be it ideological, theoretical, or empirical—is what makes the study of economic development both challenging and exciting. Even more than other fields of economics, development economics has no universally accepted doctrine or paradigm. Instead, we have a continually evolving pattern of insights and under-standings, reflecting in part improved data and emergence of new technol-ogies and new institutions, that together provide the basis for examining the possibilities of contemporary development of the diverse nations of Africa, Asia, and Latin America.
You may wonder how consensus could emerge from so much disagreement. Although it is not implied here that such a consensus exists today or will ever emerge when such sharply conflicting values and ideologies prevail, we do suggest that something of significance can be gleaned from each of the four approaches that we have described. For example, the linear-stages model emphasizes the crucial role that saving and investment play in promoting sus-tainable long-run growth. The Lewis two-sector model of structural change underlines the importance of transfers of resources from low-productivity to high-productivity activities in the process of economic development, attempting to analyze the many linkages between traditional agriculture and modern industry, and clarifying recent growth experiences such as that of China. The empirical research of Chenery and his associates seeks to doc-ument precisely how economies undergo structural change while identifying

141CHAPTER 3 Classic Theories of Economic Growth and Development
the numerical values of key economic parameters involved in that process. The thoughts of international-dependence theorists alert us to the importance of the structure and workings of the world economy and the many ways in which decisions made in the developed world can affect the lives of millions of people in the developing world. Whether or not these activities are deliber-ately designed to maintain developing nations in a state of dependence is often beside the point. The very fact of their dependence and their vulnerability to key economic decisions made in the capitals of North America, western Europe, or Japan (not to mention those made by the IMF and the World Bank) forces us to recognize the importance of some of the insights of the interna-tional-dependence school. The same applies to arguments regarding the dual-istic structures and the role of ruling elites in the domestic economies of the developing world.
Although a good deal of conventional neoclassical economic theory needs to be modified to fit the unique social, institutional, and structural circumstances of developing nations, there is no doubt that promoting efficient production and distribution through a proper, functioning price system is an integral part of any successful development process. Many of the arguments of the neoclassical counterrevolutionaries, especially those related to the inefficiency of state-owned enterprises and the failures ofdevelopment planning (see Chapter 11), and the harmful effects of government-induced domestic and international price distortions (see Chapters 7, 12, and 15), are as well taken as those of the dependence and structuralist schools. By contrast, the unquestioning exaltation of free markets and open economies along with the universal disparagement of public-sector lead-ership in promoting growth with equity in the developing world is open to serious challenge. As the chapters in Parts Two and Three reveal, successful development requires a skillful and judicious balancing of market pricing and promotion where markets can exist and operate efficiently, along with intelligent and equity-oriented government intervention in areas where unfettered market forces would lead to undesirable economic and social outcomes. Great strides have been made in modern development economic analysis in clarifying the logic of how well-formulated government policy can facilitate the development of markets and shared growth, as will be explained in Chapter 4.
In summary, each of the approaches to understanding development has something to offer. Their respective contributions will become clear later in the book when we explore in detail both the origins of and possible solutions to a wide range of problems such as poverty, population growth, unemployment, rural development, international trade, and the environment. They also inform contemporary models of development and underdevel-opment, to which we turn in the next chapter.

142 PART ONE Principles and Concepts
142
Case Study 3
Schools of Thought in Context: South Korea and Argentina
Acloser examination of two countries confirms the conclusion that each of the first four broad
approaches to development—stages of growth, structural patterns of development, dependence, and neoclassical—provides important insights about development processes and policy. South Korea and Argentina are reasonably well matched for such a comparison; for example, both are midsize in pop-ulation (41 million in Argentina and 50 million in South Korea in 2011), and both were long classified as middle-income countries. But South Korea, now designated by the World Bank as a high-income country with about $31,000 PPP in 2008, has nearly double the per capita income of Argentina, with about $17,000 PPP in 2011, whereas 30 years earlier the reverse was true. Can the four classic approaches to development explain this reversal?
South KoreaStages of Growth South Korea confirms some linear-stages views, albeit in a limited way. Its share of investment in national income has been among the highest in the world, and this is a crucial part of the explanation of the nation’s rapid ascent. To under-stand just how rapid this ascent has been, consider that the country did not even rate a mention in Ros-tow’s Stages of Economic Growth in 1960, when the book was published, and few of the “preconditions for takeoff” were in place. Investment has been very high since then, but as a share of GNI, the investment ratio, at 15%, was still below takeoff levels in 1965. Yet it rose dramatically to 37% of GNI by 1990 and remained close to 40% in the 2000–2007 period (though the ratio has fallen in the last few years). Still, South Korea’s ascent has seemed to epitomize Ros-tow’s notion of an economy in the midst of a “drive to
maturity,” well on its way toward mastering the range of currently available technologies; and appears to be entering an “age of high mass consumption.”
Rostow claimed that maturity is attained some 60 years after takeoff begins, but he never denied unique experiences for each country, and it may well be that the gap between traditional and advanced tech-nology can actually be crossed more quickly at later stages of development. The larger the productivity gap is between countries, the quicker income can grow once takeoff has been achieved. South Korea certainly meets the “maturity” criterion of becoming integrated with the world economy through new types of exports and imports. Although the fact that India, rather than South Korea, was picked by Rostow for takeoff shows the limits of the predictive powers of the stages theory, the case of South Korea nonetheless offers some confirmation of their value.
Structural Patterns South Korea also confirms some patterns-of-development structural-change models. In particular, South Korea’s rise over the past gen-eration has been characterized by rapidly increasing agricultural productivity, shifts of labor from agri-culture to industry, the steady growth of the capital stock and of education and skills, and the demo-graphic transition from high to low fertility. These changes have occurred while South Korea’s per capita income has grown by more than 7% annually for the whole 1965–1990 period. Even in the 1990–2002 period, as a more mature economy and in the face of the Asian financial crisis of 1997–1998, the economy grew at a 5.8% rate. In 2002–2011, it grew at less than 4% on average, still substantially higher than most other high-income countries. In the late 1940s and 1950s, South Korea carried out a thorough-going land reform, so agriculture was not neglected;
142
143CHAPTER 3 Classic Theories of Economic Growth and Development
but otherwise its growth through rapid expansion of the percentage of the labor force in industry has broadly conformed with the Lewis model of devel-opment. After about 1970, productivity growth in agriculture also increased rapidly, owing in part to a successful integrated rural development program.
Dependence Revolution But South Korea poses a serious challenge to the dependence revolution models. Here is a poor country that became tied in with the international economy: It was strongly dependent in international relations—it was a Japanese colony until 1945 and thereafter wholly dependent on maintaining the goodwill of the United States for defense against invasion by North Korea. It received a large part of its national budget in the form of U.S. aid in the 1950s and both exported and imported a great deal from developed countries, especially the United States and Japan. The shape of the nation’s development was thus “conditioned” in large part by export opportunities to developed countries, and dependence theory would predict that retarded development opportunities should result. Yet South Korea today is an OECD member and is widely considered a “graduate” to developed-country status. Of course, dependence theorists could and do claim that South Korea is an exception because of the magnitude of aid it received and the self-interests of the advanced countries in seeing its full successful development because of its role as a bulwark against communism. And the Korean gov-ernment pursued some particular policies that the dependence school would by and large applaud, including carrying out an extremely active industrial upgrading policy, sharply limiting the role of multi-national corporations and deliberately establishing indigenous industries as an alternative, and using debt rather than direct foreign equity investment to finance extraordinary levels of investment. South Korea also implemented one of the most ambitious land reform programs in the developing world and placed strong emphasis on primary rather than university education, two policies of exceptional importance. But this does not explain how South Korea was able to adopt such policies to break out of dependence in the first place.
Neoclassical Counterrevolution South Korea likewise poses a strong challenge to the neoclas-sical counterrevolution models. The nation was highly interventionist at home and in international trade,
with the government making extensive use of devel-opment planning, using a wide range of tax breaks and incentives to induce firms to follow government direc-tives and interventions, setting individual company export targets, orchestrating efforts in various indus-tries to upgrade the average technological level, coor-dinating foreign technology licensing agreements, using monopoly power to get the best deal from com-peting multinationals, and generally inducing firms to move rapidly up the ladder of (dynamic) com-parative advantage (see Chapter 12). These policies addressed real technology and skill-raising market failure problems of development, and at least prior to the 1997 Asian currency crisis, from which Korea quickly recovered, very few cases of glaring gov-ernment failure can be pointed to in this experience. Of course, it does confirm that firms respond to economic incentives. But it may also be claimed with at least equal force that South Korea provides a compelling example of government’s role in overcoming coordi-nation failures, as examined in Chapter 4 and applied to South Korea in the end-of-chapter case study for Chapter 12.
ArgentinaIn contrast, for Argentina, stages and patterns the-ories illuminate relatively little economic history, whereas the dependence revolution and neoclas-sical counterrevolution theories together offer important insights. It remains unclear whether Argentina has now relaunched onto a new growth episode following its 2002 default, as growth has been erratic, foreign exchange reserves falling, and political uncertainty returning.
Stages of Growth The history of Argentina poses a strong challenge to the linear-stages approach. Rostow defined takeoff as “the interval when the old blocks and resistances to steady growth are finally overcome.…Growth becomes its normal condition.” In 1870, Argentina ranked 11th in the world in per capita income (ahead of Germany); today, it is not even in the top 60. Although Rostow said that in determining a country’s stage, tech-nology absorption, not income per inhabitant, is what matters, he dated Argentina’s preconditions for takeoff as an extended period before 1914 and con-cluded that takeoff “in some sense” began in World War I, but “in the mid 1930s…a sustained takeoff was inaugurated, which by and large can now [1960] be
143

144 PART ONE Principles and Concepts
judged to have been successful,” concluding that “in Latin America the takeoff has been completed in two major cases (Mexico and Argentina).” Rostow attri-butes the fact that preconditions were there for some time before takeoff to excessive import of foreign capital over too long a period without increasing domestic savings. (But South Korea was also a heavy foreign borrower until recently.) Argentina certainly met Rostow’s criterion of developing manufacturing sectors at a rapid rate.
But now let’s look at what happened in Argentina since Rostow put the country forward as an example. According to World Bank data, Argentina had a neg-ative growth rate throughout the 1965–1990 period, and in the 1980s, domestic investment shrank at a −8.3% rate, falling back well below Rostow’s threshold takeoff investment levels. Although Argentina grew at 3.6% in 1990–2001, it defaulted on its debt in 2002, and the economy shrank 11%, followed by a recovery and resumed if erratic growth. Argentina’s share of investment in GDP from 2000 to 2007 was 17%, well under half that of South Korea. Like many other Latin American and African countries in the 1970s, 1980s, and 1990s, Argentina demonstrated that development progress is not irreversible and that sustained growth can come to an end. It remains unclear whether Argentina has now relaunched onto a new growth episode following its 2002 default, as growth has been erratic, foreign exchange reserves falling, and political uncertainty returning.
Structural Patterns Argentina did exhibit many of the usual structural patterns of development as agri-cultural productivity rose, industrial employment grew (albeit slowly), urbanization took place, fertility fell, and so on. But the fact that many structural regu-larities of development were observed even as living standards in the country stagnated illustrates some of the shortcomings of relying too much on selected pieces of data without the assistance of guiding theory on how the parts fit together.
Dependence Revolution In contrast to South Korea, the case of Argentina offers some vindi-cation for dependence theories in that the country relied to a large extent on exporting primary goods, and the real prices of these goods fell compared to imports. Multinational corporations played a large role, and Argentina was unable to create its own viable manufacturing export industries, ultimately having to submit to stringent structural-adjustment
programs, sell state industries to foreign com-panies, and other constraints. Dependence theorists can claim with some justification that Argentina’s conditioned development fell victim to developed-country economic interests, especially those of British and American corporations.
Neoclassical Counterrevolution But Argentina also offers some vindication for neoclassical coun-terrevolution theory in that faulty interventionist restrictions, inefficient state enterprise, bias against production for exports, and unnecessary red tape ended up hurting industry and entrepreneurship. Government policy consistently seemed to support privileged interests rather than broad goals of devel-opment, and government failure was usually worse than market failure in the country. In the mid-1990s, a large-scale liberalization and privatization program seemed to be beginning to reinvigorate growth in Argentina. Unfortunately, by 2002, four years of recession culminated in economic implosion as the economy collapsed under the weight of rising internal fiscal and external trade deficits, caused in part by the linking of the peso to a strong U.S. dollar. Dependence theorists claimed vindication. The recovery and com-paratively rapid growth since 2004, despite Argen-tina’s 2002 debt default, showed that single explana-tions for development success and failure are rarely adequate. Yet Argentina’s economic recovery remains vulnerable—for example, growth dropped from about 9% in 2010 and 2011 to under 2% in 2012—and political institutions remain somewhat unsettled.
SummaryIt is interesting that as South Korea provides a chal-lenge to both dependence and neoclassical theory—the starkest opposites in many ways—Argentina can be viewed more as a vindication for these two theories. And whereas South Korea serves more to confirm linear stages of growth and conclusions about structural patterns of development, Argentina poses challenges to their universal importance. Yet each of these four approaches has added some-thing vital to our understanding of development experiences and prospects in just these two coun-tries. South Korea also illustrates the role of gov-ernment in overcoming coordination failures, while Argentina illustrates how government can become part of a bad equilibrium, topics explored in depth in the next chapter. ■
144

145CHAPTER 3 Classic Theories of Economic Growth and Development
SourcesFishlow, Albert, et al. Miracle or Design? Lessons from the
East Asian Experience. Washington, D.C.: Overseas Development Council, 1994.
Heston, Alan, Robert Summers, and Bettina Aten. PennWorld Table, version 6.3. Center for International Com-parisons of Production, Income and Prices, Univer-sity of Pennsylvania, August 2009, http://pwt.econ.upenn.edu/php_site/pwt63/pwt63_form.php.
Porter, Michael. Competitive Advantage of Nations. New York: Free Press, 1990.
Rodrik, Dani. “Coordination failures and government policy: A model with applications to East Asia and
Eastern Europe.” Journal of International Economics 40 (1996): 1–22.
Rostow, Walt W. The Stages of Economic Growth: A Non-Communist Manifesto. London: Cambridge University Press, 1960.
Smith, Stephen C. Industrial Policy in Developing Countries: Reconsidering the Real Sources of Expert-Led Growth.Washington, D.C.: Economic Policy Institute, 1991.
Thurow, Lester. Head to Head. New York: Morrow, 1992.World Bank. Korea: Managing the Industrial Transition.
Washington, D.C.: World Bank, 1987.World Bank, World Development Indicators, various years.World Bank, World Development Reports, various years.
Concepts for Review
AutarkyAverage productCapital-labor ratioCapital-output ratioCenterClosed economyComprador groupsDependenceDominanceDualismFalse-paradigm modelFree marketFree-market analysis
Harrod-Domar growth modelLewis two-sector modelMarginal productMarket failureMarket-friendly approachNecessary conditionNeoclassical counterrevolutionNeocolonial dependence modelNet savings ratioOpen economyPatterns-of-development
analysisPeriphery
Production functionPublic-choice theorySelf-sustaining growthSolow neoclassical growth
modelStages-of-growth model
of developmentStructural-change theoryStructural transformationSufficient conditionSurplus laborUnderdevelopment
Questions for Discussion
1. Explain the essential distinctions among the stages-of-growth theory of development, the structural-change models of Lewis and Chenery, and the theory of international dependence in both its neo-Marxist and false-paradigm con-ceptualizations. Which model do you think pro-vides the best explanation of the situation in most developing nations? Explain your answer.
2. Explain the meaning of dualism and dual societies.Do you think that the concept of dualism ade-quately portrays the development picture in most developing countries? Explain your answer.
3. Some people claim that international dualism and domestic dualism are merely different manifestations
of the same phenomenon. What do you think they mean by this, and is it a valid conceptualization? Explain your answer.
4. What is meant by the term neoclassical counterrevo-lution? What are its principal arguments, and how valid do you think they are? Explain your answer.
5. Given the diversity of developing countries, do you think that there could ever be a single, unified theory of development? Explain your answer.
6. Is the neoclassical, free-market theory necessarily incompatible with dependence theory? How might these two approaches work together?
7. In what ways do developing countries depend on rich countries? In what ways is the opposite true?
145

146 PART ONE Principles and Concepts
Notes
1. The Stages of Economic Growth: A Non-Communist Manifesto, 3rd Edition by W. W. Rostow. Copy-right © 1960, 1971, 1990 Cambridge University Press. Reprinted with permission.
2. This model is named after two economists, Sir RoyHarrod of England and Professor Evesey Domar of the United States, who separately but concur-rently developed a variant of it in the early 1950s.
3. In traditional presentations, including of this text, the symbol k has been used for this capital-outputratio, rather than the symbol c as used here. However, we use the symbol c to make sure it is not misidentified with the use (also traditional) of the symbol k in the Solow growth model (which stands there for the capital-labor ratio), discussed later in this chapter. Note also that in practice a developing economy may utilize capital ineffi-ciently, that is, more than strictly required from an engineering standpoint.
4. To see this simply, note that Y K>c, so ΔY (1>c)ΔK. But ΔK by definition is net investment, IN, which is given by gross investment, IG, less allowance for depreciation, which in turn is given by the rate of depreciation times the capital stock, δK. That is, Δ K
IG 2 δ K. But gross investment is identically equal to gross savings, SG. So Δ Y (1>c)[SG 2 δK]. (Note that the gross savings rate, sG, is given by SG>Y.) Dividing both sides by Y and simplifying gives Δ Y>Y sG>c 2 δ, the result in the text.
5. W. Arthur Lewis, “Economic development with unlimited supplies of labour,” Manchester School22 (1954): 139–191; John C. H. Fei and Gustav Ranis, Development of the Labor Surplus Economy: Theory and Policy (Homewood, Ill.: Irwin, 1964). See also Ragnar Nurkse, Problems of Capital For-mation in Underdeveloped Countries (New York: Oxford University Press, 1953).
6. For interesting applications to the recent growth experience of China, see Nazrul Islam and Kazuhiko Yokota, “Lewis growth model and China’s industri-alization,” Asian Economic Journal 22 (2008): 359–396; Xiaobo Zhang, Jin Yang, and Shenglin Wang, “China has reached the Lewis turning point,” IFPRI discussion paper No. 977 (Washington, D.C.: Inter-national Food Policy Research Institute, 2010). Cai
Fang, “A turning point for China and challenges for further development and reform,” Zhongguo shehui kexue (Social Sciences in China), 3 (2007) 4–12; and Huang Yiping and Jiang Tingsong, What Does the Lewis Turning Point Mean for China? A Com-putable General Equilibrium Analysis, China Center for Economic Research Working Paper 2010-03, March 2010. See also Gary Fields, “Dualism in the labor market: A perspective on the Lewis model after half a century,” Manchester School 72 (2004): 724–735. Research on models of structural change continues; for an interesting contribution, see Douglas Gollin, Stephen L. Parente, and Richard Rogerson, “The food problem and the evolution of international income levels,” Journal of Monetary Economics 54 (2007): 1230–1255.
7. See Hollis B. Chenery, Structural Change and Devel-opment Policy (Baltimore: Johns Hopkins Uni-versity Press, 1979); Hollis B. Chenery and Moshe Syrquin, Patterns of Development, 1950–70 (London: Oxford University Press, 1975); Moshe Syrquin, “Patterns of structural change,” in Handbook of Development Economics, eds. Hollis B. Chenery and T. N. Srinivasan (Amsterdam: Elsevier, 1989), vol. 1, pp. 205–273; and Hollis B. Chenery, Sherman Robinson, and Moshe Syrquin, Industrializationand Growth: A Comparative Study, (New York: Oxford University Press, 1986). For a succinct summary of research by Simon Kuznets, see his “Modern economic growth, findings and reflec-tions,” American Economic Review 63 (1973): 247–258.
8. See, for example, Sarah Anderson, John Cavanagh, Thea Lee, and the Institute for Policy Studies, FieldGuide to the Global Economy (New York: New Press, 2000); Robin Broad, ed., Global Backlash: Citizen Initiatives for a Just World Economy (Lanham, Md.: Rowman & Littlefield, 2002); and John Gray, FalseDawn: The Delusions of Global Capitalism (New York: New Press, 2000).
9. See Paul Baran, The Political Economy of Neo-Colonialism (London: Heinemann, 1975). An out-standing literature review is contained in Keith Griffin and John Gurley, “Radical analysis of imperialism, the Third World, and the transition to socialism: A survey article,” Journal of Economic

147CHAPTER 3 Classic Theories of Economic Growth and Development
Literature 23 (1985): 1089–1143. See also Ted C. Lewellen, Dependency and Development: An Intro-duction to the Third World (Westport, Conn.: Bergin & Garvey, 1995).
10. A provocative and well-documented application of this argument to the case of Kenya can be found in Colin Leys, Underdevelopment in Kenya: The Political Economy of Neo-Colonialism (London: Heinemann, 1975).
11. Theotonio Dos Santos, “The crisis of development theory and the problem of dependence in Latin America,” in Underdevelopment and Development,ed. Henry Bernstein (Harmondsworth, England: Penguin, 1973), pp. 57–80. See also Benjamin J. Cohen, The Question of Imperialism: The Political Economy of Dominance and Dependence (New York: Basic Books, 1973).
12. Hans W. Singer, “Dualism revisited: A new approach to the problems of dual societies in developing countries,” Journal of Development Studies 7 (1970): 60–61. Domestic dualism models continue to be developed. For example, see Arup Banerji and Sanjay Jain, “Quality dualism,” Journal of Development Economics 84 (2007): 234–250. For an interesting empirical study, see Niels-Hugo Blunch and Dorte Verner, “Shared sec-toral growth versus the dual economy model: Evidence from Côte d’Ivoire, Ghana, and Zimbabwe,” African Development Review 18, No. 3 (2006): 283–308; Jonathan Temple and Ludger Woessmann, “Dualism and cross-country growth regressions,” Journal of Economic Growth, 11, No. 3 (2006): 187–228.
13. For examples of the literature of neoclassical coun-terrevolutionaries, see Peter T. Bauer, Reality and Rhetoric: Studies in the Economics of Development(London: Weidenfield & Nicolson, 1984); Deepak Lal, The Poverty of Development Economics (Cam-bridge, Mass.: Harvard University Press, 1985); Ian Little, Economic Development: Theories, Policies, and International Relations (New York: Basic Books 1982); and any mid-1980s issue of the World Bank’s World Development Report and the International Monetary Fund’s Annual World Economic Outlook.An outstanding critique of this literature can be found in John Toye, Dilemmas of Development: Reflections on the Counter-Revolution in Development Theory and Policy (Oxford: Blackwell, 1987). See also
Ziya Onis, “The limits of neoliberalism: Toward a reformulation of development theory,” Journal of Economic Issues 29 (1995): 97–119; Lance Taylor, “The revival of the liberal creed: The IMF and the World Bank in a globalized economy,” World Devel-opment 25 (1997): 145–152; and Alexandro Portes, “Neoliberalism and the sociology of development: Emerging trends and unanticipated facts,” Popu-lation and Development Review 23 (1997): 229–259.
14. For a good explication of the tenets of the public-choice theory, see Merilee S. Grindle and John W. Thomas, Public Choices and Public Policy Change: The Political Economy of Reform in Developing Coun-tries (Baltimore: Johns Hopkins University Press, 1991). The classic article in the field is by Nobel laureate James M. Buchanan, “Social choice, democracy and free markets,” Journal of Political Economy 62 (1954): 114–123. For a critique, see Paul P. Streeten, “Markets and states: Against mini-malism,” World Development 21 (1993): 1281–1298, and Amartya Sen, “Rationality and social choice,” American Economic Review 85 (1995): 1–24.
15. See any of the 1990s World Development Reports. For a critique of this approach, see Ajit Singh, “State intervention and ‘market-friendly’ approach to development: A critical analysis of the World Bank theses,” in The States, Markets and Development, eds. Amitava K. Dutt, Kwan S. Kim, and Ajit Singh (London: Elgar, 1994). The World Bank has since added further nuance to its approach, for example, by encouraging use of the “growth diagnostics” approach described at the end of Chapter 4.
16. The Solow model is set forth in Robert Solow, “A contribution to the theory of economic growth,” Quarterly Journal of Economics 70 (1956): 65–94.
17. For a discussion of these and related issues, see Heinz W. Arndt, “’Market failure’ and under-development,” World Development 16 (1988): 210–229.
18. On identifying and addressing local constraints, see Ricardo Hausmann, Dani Rodrik, and Andrés Velasco, “Growth diagnostics,” One Economics, Many Recipes: Globalization, Institutions, and Eco-nomic Growth, by Dani Rodrik (Princeton, N.J.: Princeton University Press, 2007). See Chapter 4 for more details.
19. An additional approach, reviewed in Chapter 2, is the new institutionalism. It has been alternatively

148 PART ONE Principles and Concepts
viewed as a component of the neoclassical counter-revolution or of the postneoclassical mainstream development economics. The institutions include property rights, prices and market structures, money and financial institutions, firms and indus-trial organization, and relationships between gov-ernment and markets. The basic message of the new institutionalism is that even in a neoclassical world, the success or failure of development efforts will depend on the nature, existence, and proper func-tioning of a country’s fundamental institutions. The origins of the new institutionalism can be found in the theory of institutions pioneered by the work of Nobel laureate Ronald Coase. See Ronald H.
Coase, “The institutional structure of production,” American Economic Review 82 (1992): 713–719; Oliver E. Williamson, “The institutions and governance of economic development and reform,” in Proceedings of the World Bank Annual Conference on Development Economics, 1994 (Washington, D.C.: World Bank, 1995); and Jean-Jacques Laffont, “Competition, con-formation and development,” Annual World Bank Conference on Development Economics, 1998 (Wash-ington, D.C.: World Bank, 1999). Writings of Nobel laureate Douglass North have been particularly influential, notably Institutions, Institutional Change, and Economic Performance (New York: Cambridge University Press, 1990).

149CHAPTER 3 Classic Theories of Economic Growth and Development
Appendix 3.1
Components of Economic Growth
Three components of economic growth are of prime importance:
1. Capital accumulation, including all new investments in land, physical equipment, and human resources through improvements in health, edu-cation, and job skills
2. Growth in population and hence eventual growth in the labor force
3. Technological progress—new ways of accomplishing tasks
In this appendix, we look briefly at each.
Capital Accumulation
Capital accumulation results when some proportion of present income is saved and invested in order to augment future output and income. New factories, machinery, equipment, and materials increase the physical capital stock of a nation (the total net real value of all physically productive capital goods) and make it possible for expanded output levels to be achieved. These directly productive investments are supplemented by investments in what is known as social and economic infrastructure—roads, electricity, water and sanitation, communications, and the like—which facilitates and integrates economic activities. For example, investment by a farmer in a new tractor may increase the total output of the crops he can produce, but without adequate transport facilities to get this extra product to local commercial markets, his investment may not add anything to national food production.
There are less direct ways to invest in a nation’s resources. The instal-lation of irrigation systems may improve the quality of a nation’s agricultural land by raising productivity per hectare. If 100 hectares of irrigated land can produce the same output as 200 hectares of nonirrigated land using the same other inputs, the installation of such irrigation is the equivalent of doubling the quantity of nonirrigated land. Use of chemical fertilizers and the control of insects with pesticides may have equally beneficial effects in raising the productivity of existing farmland. All these forms of investment are ways of improving the quality of existing land resources. Their effect in raising the total stock of productive land is, for all practical purposes, indistinguishable from the simple clearing of hitherto unused arable land.
Similarly, investment in human resources can improve its quality and thereby have the same or even a more powerful effect on production as an increase in human numbers. Formal schooling, vocational and on-the-job training programs, and adult and other types of informal education may all be made more effective in augmenting human skills as a result of direct invest-ments in buildings, equipment, and materials (e.g., books, film projectors, personal computers, science equipment, vocational tools, and machinery such as lathes and grinders). The advanced and relevant training of teachers, as
Capital accumulationIncreasing a country’s stock of real capital (net investmentin fixed assets). To increase the production of capital goodsnecessitates a reduction in the production of consumer goods.
Capital stock The total amount of physical goods existing at a particular time that have been produced for use in the production of other goods and services.
Economic infrastructureThe amount of physical and financial capital embodied in roads, railways, waterways, airways, and other transpor-tation and communications, plus other facilities such as water supplies, financial insti-tutions, electricity, and public services such as health and education.

150 PART ONE Principles and Concepts
well as good textbooks in economics, may make an enormous difference in the quality, leadership, and productivity of a given labor force. Improved health can also significantly boost productivity. The concept of investment in human resources and the creation of human capital is therefore analogous to that of improving the quality and thus the productivity of existing land resources through strategic investments.
All of these phenomena and many others are forms of investment that lead to capital accumulation. Capital accumulation may add new resources (e.g., the clearing of unused land) or upgrade the quality of existing resources (e.g., irrigation), but its essential feature is that it involves a trade-off between present and future consumption—giving up a little now so that more can be had later, such as giving up current income to stay in school.
Population and Labor Force Growth
Population growth, and the associated eventual increase in the labor force, have traditionally been considered a positive factor in stimulating economic growth. A larger labor force means more productive workers, and a large overall population increases the potential size of domestic markets. However, it is questionable whether rapidly growing supplies of workers in developing countries with a surplus of labor exert a positive or a negative influence on economic progress (see Chapter 6 for an in-depth discussion of the pros and cons of population growth for economic development). Obviously, it will depend on the ability of the economic system to absorb and productively employ these added workers—an ability largely associated with the rate and kind of capital accumulation and the availability of related factors, such as managerial and administrative skills.
Given an initial understanding of these first two fundamental components of economic growth and disregarding for a moment the third (technology), let us see how they interact via the production possibility curve to expand soci-ety’s potential total output of all goods. For a given technology and a given amount of physical and human resources, the production possibility curve por-trays the maximum attainable output combinations of any two commodities—say, rice and radios—when all resources are fully and efficiently employed. Figure A3.1.1 shows two production possibility curves for rice and radios.
Initial possibilities for the production of rice and radios are shown by the curve PP. Now suppose that without any change in technology, the quantity of physical and human resources were to double as a result of either invest-ments that improved the quality of the existing resources or investment in new resources—land, capital, and, in the case of larger families, labor. Figure A3.1.1 shows that this doubling of total resources will cause the entire pro-duction possibility curve to shift uniformly outward from PP to P′P′. More radios and more rice can now be produced.
Because these are assumed to be the only two goods produced by this economy, it follows that the gross domestic product (the total value of all goods and services produced) will be higher than before. In other words, the process of economic growth is under way.
Note that even if the country in question is operating with underuti-lized physical and human resources, as at point X in Figure A3.1.1, a growth
Production possibility curveA curve on a graph indicating alternative combinations of two commodities or categories of commodities (e.g., agri-cultural and manufactured goods) that can be produced when all the available factors of production are efficiently employed. Given available resources and technology, the curve sets the boundary between the attainable and the unobtainable.
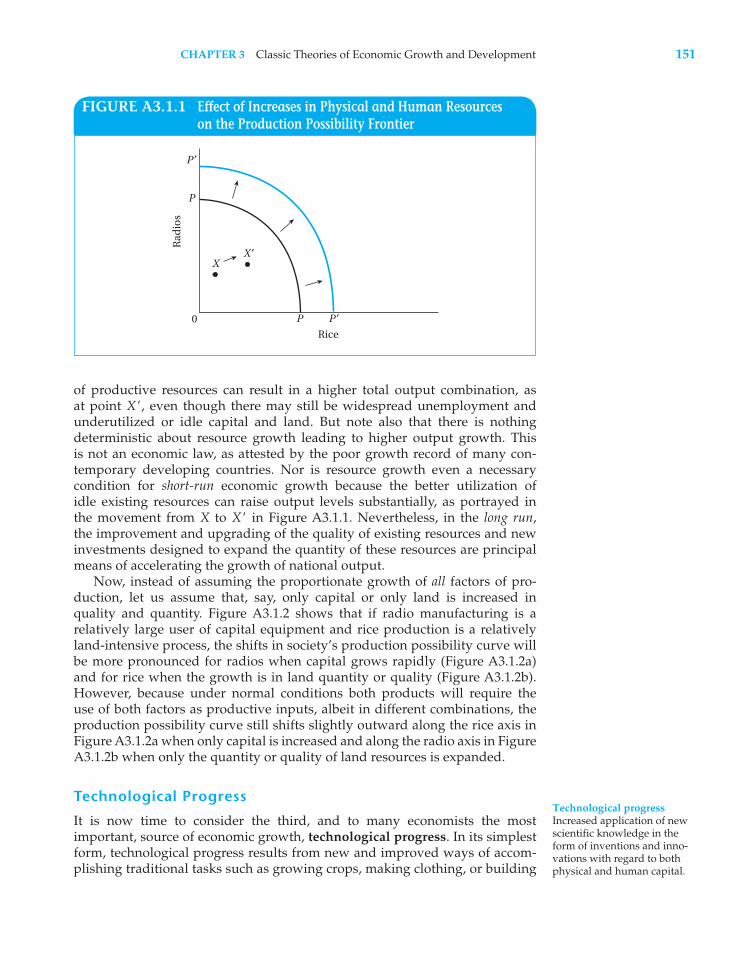
151CHAPTER 3 Classic Theories of Economic Growth and Development
of productive resources can result in a higher total output combination, as at point X′, even though there may still be widespread unemployment and underutilized or idle capital and land. But note also that there is nothing deterministic about resource growth leading to higher output growth. This is not an economic law, as attested by the poor growth record of many con-temporary developing countries. Nor is resource growth even a necessary condition for short-run economic growth because the better utilization of idle existing resources can raise output levels substantially, as portrayed in the movement from X to X′ in Figure A3.1.1. Nevertheless, in the long run,the improvement and upgrading of the quality of existing resources and new investments designed to expand the quantity of these resources are principal means of accelerating the growth of national output.
Now, instead of assuming the proportionate growth of all factors of pro-duction, let us assume that, say, only capital or only land is increased in quality and quantity. Figure A3.1.2 shows that if radio manufacturing is a relatively large user of capital equipment and rice production is a relatively land-intensive process, the shifts in society’s production possibility curve will be more pronounced for radios when capital grows rapidly (Figure A3.1.2a) and for rice when the growth is in land quantity or quality (Figure A3.1.2b). However, because under normal conditions both products will require the use of both factors as productive inputs, albeit in different combinations, the production possibility curve still shifts slightly outward along the rice axis in Figure A3.1.2a when only capital is increased and along the radio axis in Figure A3.1.2b when only the quantity or quality of land resources is expanded.
Technological Progress
It is now time to consider the third, and to many economists the most important, source of economic growth, technological progress. In its simplest form, technological progress results from new and improved ways of accom-plishing traditional tasks such as growing crops, making clothing, or building
FIGURE A3.1.1 Effect of Increases in Physical and Human Resourceson the Production Possibility Frontier
P
P P ′
X ′X
Rad
ios
Rice
P ′
0
Technological progressIncreased application of new scientific knowledge in the form of inventions and inno-vations with regard to both physical and human capital.

152 PART ONE Principles and Concepts
a house. There are three basic classifications of technological progress: neutral, laborsaving, and capital-saving.
Neutral technological progress occurs when higher output levels are achieved with the same quantity and combinations of factor inputs. Simple innovations like those that arise from the division of labor can result in higher total output levels and greater consumption for all individuals. In terms of production possibility analysis, a neutral technological change that, say, doubles total output is conceptually equivalent to a doubling of all productive inputs. The outward-shifting production possibility curve of Figure A3.1.1 could therefore also be a diagrammatic representation of neutral technological progress.
By contrast, technological progress may result in savings of either labor or capital (i.e., higher levels of output can be achieved with the same quantity of labor or capital inputs). Computers, the Internet, automated looms, high-speed electric drills, tractors, mechanical ploughs—these and many other kinds of modern machinery and equipment can be classified as products of laborsaving technological progress. Technological progress since the late nineteenth century has consisted largely of rapid advances in laborsaving technologies for producing everything from beans to bicycles to bridges.
Capital-saving technological progress is a much rarer phenomenon. But this is primarily because most of the world’s scientific and technological research is conducted in developed countries, where the mandate is to save labor, not capital. In the labor-abundant (capital-scarce) developing coun-tries, however, capital-saving technological progress is what is needed most. Such progress results in more efficient (lower-cost) labor-intensive methods of production—for example, hand- or rotary-powered weeders and threshers, foot-operated bellows pumps, and back-mounted mechanical sprayers for small-scale agriculture. The indigenous development of low-cost, efficient, labor-intensive (capital-saving) techniques of production is one of the essential
FIGURE A3.1.2 Effect of Growth of Capital Stock and Land on the Production Possibility Frontier
P
P P ′
Rad
ios
Rice
P ′
0
(a) Growth in capital stock
P
P P ′
Rad
ios
Rice
P ′
0
(b) Growth in land resources
Neutral technological progress Higher output levels achieved with the same quantity or combination of all factor inputs.
Laborsaving technological progress The achievement of higher output using an unchanged quantity of labor inputs as a result of some invention (e.g., the com-puter) or innovation (such as assembly-line production).
Capital-saving technological progress Technological progress that results from some invention or inno-vation that facilitates the achievement of higher output levels using the same quantity of inputs of capital.

153CHAPTER 3 Classic Theories of Economic Growth and Development
ingredients in any long-run employment-oriented development strategy (see Appendix 5.1).
Technological progress may also be labor- or capital-augmenting. Labor-augmenting technological progress occurs when the quality or skills of the labor force are upgraded—for example, by the use of videotapes, televisions, and other electronic communications media for classroom instruction. Similarly, capital-augmenting technological progress results in the more productive use of existing capital goods—for example, the substitution of steel for wooden plows in agricultural production.
We can use our production possibility curve for rice and radios to examine two very specific examples of technological progress as it relates to output growth in developing countries. In the 1960s, agricultural scientists at the International Rice Research Institute in the Philippines developed a new and highly productive hybrid rice seed, known as IR-8, or “miracle rice.” These new seeds, along with later further scientific improvements, enabled some rice farmers in parts of South and Southeast Asia to double or triple their yields in a matter of a few years. In effect, this technological progress was “embodied” in the new rice seeds (one could also say it was “land-augmenting”), which per-mitted higher output levels to be achieved with essentially the same comple-mentary inputs (although more fertilizer and pesticides were recommended). In terms of our production possibility analysis, the higher-yielding varieties of hybrid rice could be depicted, as in Figure A3.1.3, by an outward shift of the curve along the rice axis with the intercept on the radio axis remaining essen-tially unchanged (i.e., the new rice seeds could not be directly used to increase radio production).
In terms of the technology of radio production, the invention of tran-sistors has probably had as significant an impact on communications as the development of the steam engine had on transportation. Even in the remotest parts of Africa, Asia, and Latin America, the transistor radio has become a prized possession. The introduction of the transistor, by obviating the need
Labor-augmentingtechnological progressTechnological progress that raises the productivity of an existing quantity of labor by general education, on-the-job training programs, and so on.
Capital-augmentingtechnological progressTechnological progress that raises the productivity of capital by innovation and inventions.
FIGURE A3.1.3 Effect of Technological Change in the Agricultural Sector on the Production Possibility Frontier
P
P P ′
Rad
ios
Rice
0

154 PART ONE Principles and Concepts
for complicated, unwieldy, and fragile tubes, led to an enormous growth of radio production. The production process became less complicated, and workers were able to increase their total productivity significantly. Figure A3.1.4 shows that as in the case of higher-yielding rice seeds, the tech-nology of the transistor can be said to have caused the production possibility curve to rotate outward along the vertical axis. For the most part, the rice axis intercept remains unchanged (although perhaps the ability of rice paddy workers to listen to music on their transistor radio while working may have made them more productive!).
Conclusion
The sources of economic progress can be traced to a variety of factors, but by and large, investments that improve the quality of existing physical and human resources, increase the quantity of these same productive resources, and raise the productivity of all or specific resources through invention, inno-vation, and technological progress have been and will continue to be primary factors in stimulating economic growth in any society. The production pos-sibility framework conveniently allows us to analyze the production choices open to an economy, to understand the output and opportunity cost impli-cations of idle or underutilized resources, and to portray the effects on eco-nomic growth of increased resource supplies and improved technologies of production.
FIGURE A3.1.4 Effect of Technological Change in the IndustrialSector on the Production Possibility Frontier
P
P
P ′
Rad
ios
Rice
0

155CHAPTER 3 Classic Theories of Economic Growth and Development
Appendix 3.2
The Solow Neoclassical Growth Model
The Solow neoclassical growth model, for which Robert Solow of the Massachu-setts Institute of Technology received the Nobel Prize, is probably the best-known model of economic growth.1 Although in some respects Solow’s model describes a developed economy better than a developing one, it remains a basic reference point for the literature on growth and development. It implies that economies will conditionally converge to the same level of income if they have the same rates of savings, depreciation, labor force growth, and productivity growth. Thus, the Solow model is the basic framework for the study of convergence across countries (see Chapter 2). In this appendix, we consider this model in further detail.
The key modification from the Harrod-Domar (or AK) growth model, con-sidered in this chapter, is that the Solow model allows for substitution between capital and labor. In the process, it assumes that there are diminishing returns to the use of these inputs.
The aggregate production function, Y = F(K, L) is assumed characterized by constant returns to scale. For example, in the special case known as the Cobb-Douglas production function, at any time t we have
Y1t2 = K1t2α1A1t2L1t221-α (A3.2.1)
where Y is gross domestic product, K is the stock of capital (which may include human capital as well as physical capital), L is labor, and A(t) represents the productivity of labor, which grows over time at an exogenous rate.
Because of constant returns to scale, if all inputs are increased by the same amount, say 10%, then output will increase by the same amount (10% in this case). More generally,
γY = F1γK, γL)
where γ is some positive amount (1.1 in the case of a 10% increase).Because γ can be any positive real number, a mathematical trick useful in
analyzing the implications of the model is to set γ = 1>L so that
Y>L = f1K>L, 12 or y = f1k2 (A3.2.2)
Lowercase variables are expressed in per-worker terms in these equations. The concave shape of ƒ(k)—that is, increasing at a decreasing rate—reflects dimin-ishing returns to capital per worker, as can be seen in Figure A3.2.1.2 In the Harrod-Domar model, this would instead be a straight, upward-sloping line.
This simplification allows us to deal with just one argument in the production function. For example, in the Cobb-Douglas case introduced in Equation A3.2.1,
y = Akα (A3.2.3)
This represents an alternative way to think about a production function, in which everything is measured in quantities per worker. Equation A3.2.3 states that output per worker is a function that depends on the amount of capital per worker. The more capital with which each worker has to work, the more output that worker can produce. The labor force grows at rate n per year, say,

156 PART ONE Principles and Concepts
and labor productivity growth, the rate at which the value of A in the pro-duction function increases, occurs at rate λ. The total capital stock grows when savings are greater than depreciation, but capital per worker grows when savings are also greater than what is needed to equip new workers with the same amount of capital as existing workers have.
The Solow equation (Equation A3.2.4) gives the growth of the capital-labor ratio, k (known as capital deepening), and shows that the growth of k depends on savings sf(k), after allowing for the amount of capital required to service depre-ciation, δk, and after capital widening, that is, providing the existing amount of capital per worker to net new workers joining the labor force, nk. That is,
∆k = sf1k2 - 1δ + n2k (A3.2.4)
Versions of the Solow equation are also valid for other growth models, such as the Harrod-Domar model.
For simplicity, we are assuming for now that A remains constant. In this case, there will be a state in which output and capital per worker are no longer changing, known as the steady state. (If A is increasing, the corresponding state will be one in which capital per effective worker is no longer changing. In that case, the number of effective workers rises as A rises; this is because when workers have higher productivity, it is as if there were extra workers on the job.) To find this steady state, set ∆k = 0:
sf1k*2 = 1δ + n2k* (A3.2.5)
The notation k* means the level of capital per worker when the economy is in its steady state. That this equilibrium is stable can be seen from Figure A3.2.1.3
The capital per worker k* represents the steady state. If k is higher or lower than k*, the economy will return to it; thus k* is a stable equilibrium. This sta-bility is seen in the diagram by noting that to the left of k*, k < k*. Looking at the diagram, we see that in this case, 1n + δ2k < sf(k). But now looking at the Solow equation (Equation A3.2.4), we see that when (n + δ)k < sf(k), ∆k > 0. As a result, k in the economy is growing toward the equilibrium point k*. By similar reasoning to the right of k*, (n + δ)k > sf(k), and as a result, ∆k < 0
FIGURE A3.2.1 Equilibrium in the Solow Growth Model
(n + δ)k
kk*
y = f(k)
f(k)
sf(k)

157CHAPTER 3 Classic Theories of Economic Growth and Development
(again refer to Equation A3.2.4), and capital per worker is actually shrinking toward the equilibrium k*.4 Note that in the Harrod-Domar model, sf(k) would be a straight line, and provided that it was above the (n + δ)k line, growth in capital per worker—and output per worker—would continue indefinitely.
Equation (A3.2.5) has an interpretatation that the savings per worker, sf(k*), is just equal to δk*, the amount of capital (per worker) needed to replace depreciating capital, plus nk*, the amount of capital (per worker) that needs to be added due to population (labor force) growth.
The Solow model has a (single) equilibrium income per worker, again given by Equation (A3.2.5) above. In contrast, the Harrod Domar equilibrium is (constant, balanced) growth—there is no equilibrium income per worker. Essentially, this is because f(k)—and hence sf(k)—does not exhibit diminishing returns; rather, it is a straight line. That is, growth continues as long as the line sf(k) stays above the line (δ + n)k.
It is instructive to consider what happens in the Solow neoclassical growth model if we increase the rate of savings, s. A temporary increase in the rate of output growth is realized as we increase k by raising the rate of savings. We return to the original steady-state growth rate later, though at a higher level of output per worker in each later year. The key implication is that unlike in the Harrod-Domar (AK) analysis, in the Solow model an increase in s will not increase growth in the long run; it will only increase the equilibrium k*. That is, after the economy has time to adjust, the capital-labor ratio increases, and so does the output-labor ratio, but not the rate of growth. The effect is shown in Figure A3.2.2, in which savings is raised to s′. In contrast, in the Harrod-Domar model, an increase in s raises the growth rate. (This is because in the Harrod-Domar model, sf(k) becomes a straight line from the origin that does not cross (n + δ)k; and so, as we assume that sf(k) lies above (n + δ)k, growth continues at the now higher Harrod-Domar rate—a result that was repre-sented, for example, in the comparison of Equations 3.8 and 3.9.)
Note that the neoclassical growth model (Equation A3.2.5 and Figure A3.2.1) implies that while economies will (conditionally) converge to the same level of income per worker other things equal, it does not imply unconditional convergence. This can be seen clearly in Figure A3.2.2: We can interpret the alternative savings rates (s and s’) in the figure as corresponding to those pre-vailing in two different countries; the country with the higher savings rate converges to a higher equilibrium income per worker.
Note carefully that in the Solow model, an increase in s does raise equi-librium output per person—which is certainly a valuable contribution to development—just not the equilibrium rate of growth. And the growth rate does increase temporarily as the economy kicks up toward the higher equi-librium capital per worker. Moreover, simulations based on cross-national data suggest that if s is increased, the economy may not return even halfway to its steady state for decades.5 That is, for practical purposes of policymaking in developing countries, even if the Solow model is an accurate depiction of the economy, an increase in savings may substantially increase the growth rate for many decades to come. (Both theoretically and empirically, the link between the rate of savings and the rate of growth remains controversial.)
Finally, it is possible that the rate of savings (and hence investment) is posi-tively related to the rate of technological progress itself so that the growth of A depends on s. This could be the case if investment uses newer-vintage

158 PART ONE Principles and Concepts
capital and hence is more productive, if investment represents innovation in that it solves problems faced by the firm, and if other firms see what the investing firm has done and imitate it (“learning by watching”), generating externalities. This leads to a model between the standard Solow model and the endogenous growth models such as the one examined in Appendix 3.3.
FIGURE A3.2.2 The Long-Run Effect of Changing the Savings Rate in the Solow Model
f(k)
s'f(k)
kk* k*�
y
(n + δ)k
sf(k)
1. Robert M. Solow, “A contribution to the theory of economic growth,” Quarterly Journal of Economics70 (1956): 65–94.
2. Note that the symbol k is used for K>L and not for K>Y, as it is used in many expositions (including previous editions of this text) of the AK or Harrod-Domar model.
3. Readers with more advanced mathematical training may note that Figure A3.2.1 is a phase diagram, which applies given that the Inada conditions hold: that the marginal product of k goes to infinity as k goes to zero and goes to zero as k goes to infinity (this follows from Inada conditions assumed sepa-rately for capital and labor inputs). This diminishing-returns feature drives results of the Solow model.
4. Note that in the Solow model with technological progress, that is, growth of A, the capital-labor ratio grows to keep pace with the effective labor force, which is labor power that is augmented by its increasing productivity over time.
5. See N. Gregory Mankiw, David Romer, and David N. Weil, “A contribution to the empirics of eco-nomic growth,” Quarterly Journal of Economics107 (1992): 407–437. This article shows that when human capital is accounted for, as well as physical capital, the Solow model does a rather good job of explaining incomes and growth across countries. For a critical view, see William Easterly and Ross Levine, “It’s not factor accu-mulation: Stylized facts and growth models,” World Bank Economic Review 15 (2001): 177–219, with the reply by Robert M. Solow, “Applying growth theory across countries,” World Bank Economic Review 15 (2001): 283–288. For time-series evidence that the Solow model does a good job of explaining even the case of South Korean growth, see Edward Feasel, Yongbeom Kim, and Stephen C. Smith, “Investment, exports, and output in South Korea: A VAR approach to growth empirics,” Review of Devel-opment Economics 5 (2001): 421–432.
Notes

159CHAPTER 3 Classic Theories of Economic Growth and Development
Appendix 3.3
Endogenous Growth Theory
Motivation for Endogenous Growth Theory
The mixed performance of neoclassical theories in illuminating the sources of long-term economic growth has led to dissatisfaction with traditional growth theory. In fact, according to traditional theory, there is no intrinsic characteristic of economies that causes them to grow over extended periods of time. The literature is instead concerned with the dynamic process through which capital-labor ratios approach long-run equilibrium levels. In the absence of external “shocks” or technological change, which is not explained in the neoclassical model, all economies will converge to zero growth. Hence, rising per capita GNI is considered a temporary phenomenon resulting from a change in technology or a short-term equilibrating process in which an economy approaches its long-run equilibrium.
Any increases in GNI that cannot be attributed to short-term adjustments in stocks of either labor or capital are ascribed to a third category, commonly referred to as the Solow residual. This residual is responsible for roughly 50% of historical growth in the industrialized nations.1 In a rather ad hoc manner, neoclassical theory credits the bulk of economic growth to an exogenous or completely independent process of technological progress. Though intuitively plausible, this approach has at least two insurmountable drawbacks. First, using the neoclassical framework, it is impossible to analyze the determinants of technological advance because it is completely independent of the decisions of economic agents. And second, the theory fails to explain large differences in residuals across countries with similar technologies.
According to neoclassical theory, the low capital-labor ratios of devel-oping countries promise exceptionally high rates of return on investment. The free-market reforms impressed on highly indebted countries by the World Bank and the International Monetary Fund should therefore have prompted higher investment, rising productivity, and improved standards of living. Yet even after the prescribed liberalization of trade and domestic markets, many developing countries experienced little or no growth and failed to attract new foreign investment or to halt the flight of domestic capital. The frequently anomalous behavior of developing-world capital flows (from poor to rich nations) helped provide the impetus for the development of the concept of endogenous growth theory or, more simply, the new growth theory.
The new growth theory provides a theoretical framework for analyzing endogenous growth, persistent GNI growth that is determined by the system governing the production process rather than by forces outside that system. In contrast to traditional neoclassical theory, these models hold GNI growth to be a natural consequence of long-run equilibrium. The principal motivations of the new growth theory are to explain both growth rate differentials across countries and a greater proportion of the growth observed. More succinctly, endogenous growth theorists seek to explain the factors that determine the size of λ, the rate of growth of GDP that is left unexplained and exogenously deter-mined in the Solow neoclassical growth equation (i.e., the Solow residual).
Solow residual The pro-portion of long-term economic growth not explained by growth in labor or capital and therefore assigned primarily to exogenous technological change.
Endogenous growth theory (new growth theory)Economic growth gen-erated by factors within the production process (e.g., increasing returns or induced technological change) that are studied as part of a growth model.

160 PART ONE Principles and Concepts
Models of endogenous growth bear some structural resemblance to their neo-classical counterparts, but they differ considerably in their underlying assump-tions and the conclusions drawn. The most significant theoretical differences stem from discarding the neoclassical assumption of diminishing marginal returns to capital investments, permitting increasing returns to scale in aggregate production, and frequently focusing on the role of externalities in determining the rate of return on capital investments.2 By assuming that public and private investments in human capital generate external economies and productivity improvements that offset the natural tendency for diminishing returns, endog-enous growth theory seeks to explain the existence of increasing returns to scale and the divergent long-term growth patterns among countries. And whereas technology still plays an important role in these models, exogenous changes in technology are no longer necessary to explain long-run growth.
A useful way to contrast the new (endogenous) growth theory with tra-ditional neoclassical theory is to recognize that many endogenous growth theories can be expressed by the simple equation Y = AK, as in the Harrod-Domar model. In this formulation, A is intended to represent any factor that affects technology, and K again includes both physical and human capital. But notice that there are no diminishing returns to capital in this formula, and the possibility exists that investments in physical and human capital can generate external economies and productivity improvements that exceed private gains by an amount sufficient to offset diminishing returns. The net result is sus-tained long-term growth—an outcome prohibited by traditional neoclassical growth theory. Thus, even though the new growth theory reemphasizes the importance of savings and human capital investments for achieving rapid growth, it also leads to several implications for growth that are in direct con-flict with traditional theory. First, there is no force leading to the equilibration of growth rates across closed economies; national growth rates remain con-stant and differ across countries, depending on national savings rates and technology levels. Furthermore, there is no tendency for per capita income levels in capital-poor countries to catch up with those in rich countries with similar savings and population growth rates. A serious consequence of these facts is that a temporary or prolonged recession in one country can lead to a permanent increase in the income gap between itself and wealthier countries.
But perhaps the most interesting aspect of endogenous growth models is that they help explain anomalous international flows of capital that exacerbate wealth disparities between developed and developing countries. The poten-tially high rates of return on investment offered by developing economies with low capital-labor ratios are greatly eroded by lower levels of complementary investments in human capital (education), infrastructure, or research and development (R&D).3 In turn, poor countries benefit less from the broader social gains associated with each of these alternative forms of capital expen-diture.4 Because individuals receive no personal gain from the positive externalities created by their own investments, the free market leads to the accumulation of less than the optimal level of complementary capital. (We examine these issues further in Chapter 4.)
Where complementary investments produce social as well as private ben-efits, governments may improve the efficiency of resource allocation. They can do this by providing public goods (infrastructure) or encouraging private
Complementary investmentsInvestments that complement and facilitate other productive factors.

161CHAPTER 3 Classic Theories of Economic Growth and Development
investment in knowledge-intensive industries, where human capital can be accumulated and subsequent increasing returns to scale generated. Unlike the Solow model, new growth theory models explain technological change as an endogenous outcome of public and private investments in human capital and knowledge-intensive industries. Thus, in contrast to the neoclassical counter-revolution theories examined in Appendix 3.2, models of endogenous growth suggest an active role for public policy in promoting economic development through direct and indirect investments in human capital formation and the encouragement of foreign private investment in knowledge-intensive indus-tries such as computer software and telecommunications.
The Romer Model
To illustrate the endogenous growth approach, we examine the Romer endog-enous growth model in detail because it addresses technological spillovers (in which one firm or industry’s productivity gains lead to productivity gains in other firms or industries) that may be present in the process of industri-alization. Thus, it is not only the seminal model of endogenous growth but also one of particular relevance for developing countries. We use a simplified version of Romer’s model that keeps his main innovation—in modeling tech-nology spillovers—without presenting unnecessary details of savings deter-mination and other general equilibrium issues.
The model begins by assuming that growth processes derive from the firm or industry level. Each industry individually produces with constant returns to scale, so the model is consistent with perfect competition; and up to this point it matches assumptions of the Solow model. But Romer departs from Solow by assuming that the economy-wide capital stock, K, positively affects output at the industry level so that there may be increasing returns to scale at the economy-wide level.
It is valuable to think of each firm’s capital stock as including its knowledge. The knowledge part of the firm’s capital stock is essentially a public good,like A in the Solow model, that is spilling over instantly to the other firms in the economy. As a result, this model treats learning by doing as “learning by investing.” You can think of Romer’s model as spelling out—endogenizing—the reason why growth might depend on the rate of investment (as in the Harrod-Domar model). In this simplification, we abstract from the household sector an important feature of the original model, in order to concentrate on issues concerning industrialization.5 Formally,
Yi = AK αi L1-α
i K β (A3.3.1)
We assume symmetry across industries for simplicity, so each industry will use the same level of capital and labor. Then we have the aggregate production function:
Y = AK α+βL1-α (A3.3.2)
To make endogenous growth stand out clearly, we assume that A is con-stant rather than rising over time; that is, we assume for now that there is
Romer endogenous growth model An endogenous growth model in which technological spillovers are present; the economy-wide capital stock positively affects output at the industry level, so there may be increasing returns to scale at the econ-omy-wide level.
Public good An entity that provides benefits to all individuals simultaneously and whose enjoyment by one person in no way diminishes that of anyone else.

162 PART ONE Principles and Concepts
1. Oliver J. Blanchard and Stanley Fischer, Lectures on Macroeconomics (Cambridge, Mass.: MIT Press, 1989).
2. For a short history of the evolution of theoretical models of growth, see Nicholas Stern, “‘The deter-minants of growth,” Economic Journal 101 (1991): 122–134. For a more detailed but technical dis-cussion of endogenous growth models, see Robert
Barro and Xavier Sala-i-Martin, Economic Growth,2nd ed. (Cambridge, Mass.: MIT Press, 2003), and Elhanan Helpman, “Endogenous macroeconomic growth theory,” European Economic Review 36 (1992): 237–268.
3. See Paul M. Romer, “Increasing returns and long-run growth,” Journal of Political Economy 94 (1986): 1002–1037; Robert E. Lucas, “On the mechanics of
no technological progress. With a little calculus,6 it can be shown that the resulting growth rate for per capita income in the economy would be
g - n =βn
1 - α - β(A3.3.3)
where g is the output growth rate and n is the population growth rate. Without spillovers, as in the Solow model with constant returns to scale, β = 0, and so per capita growth would be zero (without technological progress).7
However, with Romer’s assumption of a positive capital externality, 1β 7 02 , we have that g - n 7 0 and Y>L is growing. Now we have endog-enous growth, not driven exogenously by increases in productivity. If we also allowed for technological progress, so that λ in the Solow model is greater than zero, growth would be increased to that extent.8
Criticisms of Endogenous Growth Theory
An important shortcoming of the new growth theory is that it remains dependent on a number of traditional neoclassical assumptions that are often inappropriate for developing economies. For example, it assumes that there is but a single sector of production or that all sectors are symmetrical. This does not permit the crucial growth-generating reallocation of labor and capital among the sectors that are transformed during the process of structural change.9 Moreover, economic growth in developing countries is frequently impeded by inefficiencies arising from poor infrastructure, inadequate institutional structures, and imperfect capital and goods markets. Because endogenous growth theory overlooks these very influential factors, its applicability for the study of economic development is limited, especially when country-to-country comparisons are involved. For example, existing theory fails to explain low rates of factory capacity utilization in low-income countries where capital is scarce. In fact, poor incentive structures may be as responsible for sluggish GNI growth as low rates of saving and human capital accumulation. Allocational inefficiencies are common in economies undergoing the transition from traditional to commercialized markets. However, their impact on short- and medium-term growth has been neglected due to the new theory’s emphasis on the determinants of long-term growth rates. Finally, empirical studies of the predictive value of endogenous growth theories have to date offered only limited support.10
Notes

163CHAPTER 3 Classic Theories of Economic Growth and Development
economic development,” Journal of Monetary Eco-nomics 22 (1988): 3–42; and Robert Barro, “Gov-ernment spending in a simple model of endog-enous growth,” Journal of Political Economy 98 (1990): 5103–5125.
4. For a concise technical discussion of the impor-tance of human capital as a complementary input, see Robert B. Lucas, “Why doesn’t capital flow from rich to poor countries?” AEA Papers and Pro-ceedings 80 (1990): 92–96.
5. The specific functional form in Equation A3.3.1, known as Cobb-Douglas production functions, will be assumed for simplicity.
6. By the chain rule,
Y#=
dYdt
=0Y0K
0K0t
+0Y0L
0L0t
By the exponent rule, we know that
0Y0K
= A(α + β)Kα+β-1L1-α
0Y0L
= AKα+β(1 - α)L1-α-1
Combining these three equations, we have
Y#= dY>dt = 3AKα+βL1-α4 c (α + β)
K#
K+ (1 - α)
L#
Ld
The first term in brackets in the preceding expression is of course output, Y. For a steady state, K
#>K, L
#>L, and Y
#>Y are all constant. From
earlier discussion of the Harrod-Domar and Solow models, we know that
K#= I - δK = sY - δK
where δ stands for the depreciation rate.
Dividing this expression through by K, we have
K#
K=
sYK
- δ
For K#>K constant in the preceding expression, we
must have Y>K constant. If this ratio is constant, we have
K#
K=
Y#
Y= g, a constant growth rate
So from the expression for dY>dt above, for the aggregate production function, with L
#>L = n,
which is also a constant, we have
Y#
Y= (α + β)
K#
K+ (1 - α)
L#
LS g
= (α + β)g + (1 - α)n S g - n
= c(1 - α) + (α + β) - 1
1 - (α + β)dn
which is Equation A3.3.3. This may also be expressed as
g =n(1 - α)
1 - α - β
7. Recall that there is no technological progress, so λin the Solow model is zero.
8. In a more complex model, decisions about, and effects of, factors such as research and devel-opment investment can be modeled explicitly. Firms would decide on general investment and R&D investment. The effect of the latter on overall output would enter in a manner similar to K in Equation A3.3.1. For a discussion and references, see Gene M. Grossman and Elhanan Helpman, “Endogenous innovation in the theory of growth” in the symposium on new growth theory in the Journal of Economic Perspectives 8 (1994): 3–72.
9. Syed Nawab Haider Naqvi, “The significance of development economics,” World Development 24 (1996): 977.
10. For an excellent review and empirical critique of the new growth theory, see Howard Pack, “Endogenous growth theory: Intellectual appeal and empirical shortcomings,” Journal of Eco-nomic Perspectives 8 (1994): 55–72. See also articles by Paul M. Romer and Robert M. Solow in the same issue. For an argument that endogenous theory performs well in explaining differences in growth rates among countries, see Barro and Sala-i-Martin, Economic Growth. An excellent survey of quantitative growth research disputing this claim and indicating widening gaps between rich and poor countries can be found in Jonathan Temple, “The new growth evidence,” Journal of Economic Literature 37 (1999): 112–156.

After more than a half century of experience with attempting to encourage modern development, we have learned that development is both possible and extremely difficult to achieve. Thus, an improved understanding of impedi-ments and catalysts of development is of the utmost importance. Since the late 1980s, significant strides have been made in the analysis of economic devel-opment and underdevelopment. In some cases, ideas of the classic theories reviewed in Chapter 3 have been formalized, and in the process, their logi-cal structure and their significance for policy have been clarified and refined. At the same time, the analysis has also led to entirely new insights into what makes development so hard to achieve (as witnessed in sub-Saharan Africa) but also possible to achieve (as witnessed in East Asia). Indeed, this is what makes the study of economic development so very important: It does not hap-pen automatically; it requires systematic effort. But development is far from a hopeless cause; we know it can be done. Theory helps us think systematically about how to organize our efforts to help achieve development—a goal sec-ond to none in its importance to humanity.
In this chapter, we review a sample of some of the most influential of the new models of economic development. In some ways, these models show that development is harder to achieve, in that it faces more barriers than had previously been recognized. But greater understanding itself facilitates improvements in development strategy, and the new models have already influenced development policy and modes of international assistance. The
164
Contemporary Models of Development and Underdevelopment
Individuals need not make the right tradeoffs. And whereas in the past we thought the implication was that the economy would be slightly distorted, we now understand that the interaction of these slightly distorted behaviors may produce very large distortions. The consequence is that there may be multiple equilibria and that each may be inefficient.
—Karla Hoff and Joseph E. Stiglitz, Frontiers in Development Economics, 2002
Governments can certainly deter entrepreneurship when they try to do too much; but they can also deter entrepreneurship when they do too little.
—Dani Rodrik, One Economics, Many Recipes, 2007
4

Part 2
Theories and strategies of development
Editorial introductionIt is generally appreciated that ideas about how development can be put into practicehave long been both controversial and highly contested. Development involves arange of actors, from international agencies, through the state, various organizations,down to the individual, all of whom have a vested interest in how change anddevelopment should proceed. Thus, all facets of development not only depend onpolitical ideology, but on moral and ethical judgements and prescriptions too. Thus,ideas about development over time have tended to accumulate and accrue, ratherthan fade away . Right-wing, left-wing and liberal views remain whatever the politicalhegemony current at the time. These sorts of ideas are considered at the outset in thispart of the book, before turning to some of the major theories and strategies ofdevelopment that have been followed and popularized.
Right-wing stances on development can be regarded as having their origins in theEnlightenment and the era of modernity that followed. The eighteenth-centuryEnlightenment period saw an increasing emphasis placed on science, rationality anddetailed empiricism. It also witnessed the establishment of the ‘West’ and ‘Europe’ asthe ideal. It was during this period that the classical economists, Adam Smith andDavid Ricardo, writing in the 1700s, developed ideas surrounding the concept ofcomparative advantage, which stressed the economic efficacy of global free tradeand, in many senses, gave rise to the earliest capitalist strategies of economicdevelopment. The approach envisaged little or no government restrictions on theoperation of the economy .
Such approaches were followed by a plethora of dualistic and linearconceptualizations of the development process, including modernization theory,unbalanced and unequal growth, and top-down and hierarchical formulations.Together, such paths are generally referred to as ‘neo-classical’ or top-downdevelopment. Whatever one’s critical view of modernization, the framework usefullypinpointed the salience of change as a necessary factor in the development equation.
These classically inspired approaches are, of course, still alive and kicking, in theform of the lineage of the so-called ‘new right’ orthodoxy of the 1980s, involving the‘magic of the market’ and the neoliberal policies of structural adjustment, and morerecently, poverty reduction strategies. The rise of so-called neoliberalism followed
134

the global recession of 1978–1983, which witnessed a clear turn away from the ideasof Key nes, who in the Great Depression of the 1930s had argued that governmentsshould spend their way out of recession. Policies of privatization, deregulation andpublic sector cutbacks, and the withdrawal of the state became the order of the dayunder the global influence of President Reagan and Prime Minister Thatcher in the1980s. The IMF and World Bank enforced essentially the same generic types ofpolicies on those developing nations seeking development assistance, in the form ofstructural adjustment programmes. While some analy sts have inferred that the 2008global economic recession has witnessed something of a break in the hegemony ofthe long wave of neoliberalism and right-wing development, other commentators aremore circumspect in concluding that neoliberalism has survived and will continue todominate the global economy .
The antithesis to classical and neo-classical views was provided by radical-dependency approaches in the 1960s. It is a reflection of the Eurocentricity ofdevelopment theory that Andre Gunder Frank, a German-born and American-trainedeconomist, has become the name most closely associated with dependency theory.This is despite the fact that the dependency approach essentially stemmed from thewritings of structuralists working in Latin America and the Caribbean. In respect ofprocess, dependency theory was couched in terms of inverted cascading globalchains of surplus extraction, and it was again all too easy to reduce this to simpledichotomous terms, involving polar opposites such as ‘core–periphery ’, ‘rich–poor’,‘developed–underdeveloped’, and ‘metropole–satellite’.
Although today many may reject pure dependency theory as an overblownreaction to right-wing free market orthodoxy, it is tempting to suggest that such ideascan inform decisions about development strategies in the ‘more-realistic’ setting ofthe mixed economy. For example, if tourism is followed as an explicit developmentstrategy, how much dependence should be placed on foreign ownership andmultinational capital? How much should local indigenous resources and capital betargeted in order to stimulate the indigenous economy? These are real developmentchoices that need to be made even in a mixed economy context and one can arguethat these choices are better understood in light of pure dependency theory .
It was left to world sy stems theory to stress that contemporary development hasinvolved the emergence of a substantial semi-periphery in addition to the core andperiphery identified by classic dependency theory. This semi-periphery largelyconsists of the newly industrializing countries (NICs) of East Asia and Latin America.
From the 1970s onward, what may be regarded as ‘alternative views’ ondevelopment were espoused in many quarters, including the need for participatorydevelopment and the need to listen to indigenous voices in development in the form ofindigenous environmental knowledge. The era of postmodernity – stressing therejection of high modernism – may not be regarded as fitting the realities of the
135

developing world or poor countries in all respects, but the existence of these notionscannot be ignored in the analy sis of the conditions faced by such nations. Earlystandpoints that took a less generic, less monumental and less linear view of thedevelopment process included what are referred to under the headings ‘bottom-up’and ‘agropolitan’ approaches, which have come to include ideas of ‘another’development. All these approaches stressed the importance of local indigenousknowledge and ways of doing things rather than running with the market.
More recently, the wider ‘postist’ stance afforded by postcolonialism has beenadded to the critique. This argues that the production of Western knowledge has beeninseparable from the exercise of Western power, and critiques the outcomes ofcolonialism that have underpinned Eurocentric worldviews on development. It isstressed that colonialism has been associated with insensitivity to the views, practicesand conditions of other cultures. Post-development as an approach is similarlysceptical about the whole manner in which development has been framed in terms ofgrand narratives, suggesting that the whole question of development needs to beclosely questioned, problematized and possibly rejected. Under such a perspectivedevelopment is seen as contradictory at best. Finally, it is notable that evolvingconceptualizations of the role of social capital underpin continuing debates concerningdevelopment theory and practice.
136

2.1Theories, strategies and ideologies of development
An overview
Robert B. Potter
IntroductionA major characteristic of the multi-, inter- and cross-disciplinary field ofdevelopment studies since its establishment in the 1940s has been a series of sea-levelchanges in thinking about the process of development itself. This search for newtheoretical conceptualizations of development has been mirrored by changes in thepractice of development in the field. Thus, there has been much debate andcontroversy about development, with many changing views as to its definition, andthe strategies by means of which, however development is defined, it may bepursued. In short, the period since the 1950s has seen the promotion and application ofmany varied views of development. And the literature on development theory andpractice has burgeoned (see, for example, Hettne, 1995; Preston, 1996; Cowen andShenton, 1996; Potter et al., 2008; Peet and Hartwick, 2009; Chant and McIlwaine,2009; Nederveen Pieterse, 2010; Thirlwall, 2011; Potter et al., 2012). A major themeis that ideas about development have long been controversial and highly contested.
It is also necessary to stress that development covers both theory and practice, thatis, both ideas about how development should or might occur, and real-world efforts toput various aspects of development into practice. This is conveniently mapped intothe nomenclature suggested by Hettne in his overview of Development Theory andthe Three Worlds (1995). In reviewing the history of development thinking, hesuggested that ‘development’ involves three things: development theories,development strategies and development ideologies.
Development theoriesIf a theory is defined as a set of logical propositions about how some aspect of thereal world is structured, or the way in which it operates, development theories maybe regarded as sets of ostensibly logical propositions, which aim to explain howdevelopment has occurred in the past, and/or how it should occur in the future (Potteret al., 2008). Development theories can either be normative, that is they can
137

generalize about what should happen or what should be the case in an ideal world; orpositive in the sense of dealing with what has generally been the case in the past. Thisimportant distinction is broadly exemplified in the figure that accompanies thisaccount (see Figure 2.1.1). Hettne (1995) remarks that ‘development studies isexplicitly normative’, and that teachers, researchers and practitioners in the field‘want to change the world, not only analy se it’ (Hettne, 1995: 12). The arena ofdevelopment theory is primarily, although by no means exclusively, to beencountered in the academic literature, that is, in writing about development. It is,therefore, inherently controversial and contested.
Development strategiesOn the other hand, development strategies can be defined as the practical paths todevelopment which may be pursued by international agencies, states, non-government organizations and community -based organizations, or indeed individuals,in an effort to stimulate change within particular areas, regions, nations andcontinents. Thus, Hettne (1995) provides a definition of development strategies asefforts to change existing economic and social structures and institutions in order tofind enduring solutions to the problems facing decision-makers. As such, Hettneargues that the term ‘development strategy ’ implies an actor, normally the state. Inorder to sound less top-down, it is necessary to think in terms of a wider set ofdevelopment-oriented actors, including all those listed above.
138

Figure 2.1.1 A framework for considering development theories
Source: Potter et al. 1999 Figure 3.2
Development ideologiesDifferent development agendas will reflect different goals and objectives. Thesegoals will reflect social, economic, political, cultural, ethical, moral and evenreligious influences. Thus, what may be referred to as different developmentideologies may be recognized. For example, both in theory and in practice, earlyperspectives on development were almost exclusively concerned with promotingeconomic growth. Subsequently, however, the predominant ideology within the
139

academic literature changed to emphasize wider sets of political, social, ethnic,cultural, ecological and other dimensions of the wider human processes ofdevelopment and change. Theories in development are distinctive by virtue of thefact that they involve the intention to change society in some defined manner. One ofthe classic examples is the age-old battle between economic policies which increasegrowth but widen income disparities, and those wider policy imperatives which seekprimarily to reduce inequalities within society. All such efforts to effect changereflect some form of ideological base.
Development thinkingPerhaps the sensible approach is to follow Hettne (1995) and to employ theoverarching concept of development thinking in our general deliberations. Theexpression ‘development thinking’ may be used as a catch-all phrase indicating thesum total of ideas about development, that is, including pertinent aspects ofdevelopment theory, strategy and ideology. Such an all-encompassing definition isnecessary due to the nature of thinking about development itself. As noted at theoutset, development thinking has shown many sharp twists and turns during thetwentieth century. The various theories that have been produced have notcommanded attention in a strictly sequential-temporal manner. In other words, as anew set of ideas about development has come into favour, earlier theories andstrategies have not been totally abandoned and replaced. Rather, theories andstrategies have tended to stack up, one upon another, coexisting, sometimes in whatcan only be described as very convoluted and contradictory manners. Thus, indiscussing development theory, Hettne (1995: 64) has drawn attention to the‘tendency of social science paradigms to accumulate rather than fade away’.
Development studies and disciplinary revolution/evolutionThe characteristics of development studies as a distinct field of enquiry can beconsidered in a somewhat more sophisticated manner by referring to Thomas Kuhn’sideas on the structure of scientific revolutions. Kuhn (1962) argued that academicdisciplines are dominated at particular points in time by communities of researchersand their associated methods, and they thereby define the subjects and the issuesdeemed to be of importance within them. He referred to these as ‘invisible colleges’,and he noted that these serve to define and perpetuate research which confirms thevalidity of the existing paradigm or ‘supra-model’, as he referred to it. Kuhn calledthis ‘normal science’. Kuhn noted that only when the number of observations andquestions confronting the status quo of normal science becomes too large to be dealtwith by means of small changes to it, will there be a fundamental shift. However, ifthe proposed changes are major and a new paradigm is adopted, a scientific
140

revolution can be said to have occurred, linked to a period of what Kuhn referred toas ‘extraordinary research’.
In this model, therefore, scientific disciplines basically advance by means ofrevolutions in which the prevailing normal science is replaced by extraordinaryscience and, ultimately, a new form of normal science develops. In dealing withsocial scientific discourses, it is inevitable that the field of development theory ischaracterized by evolutionary, rather than revolutionary change. Evidence of thepersistence of ideas in some quarters, years after they have been discardedelsewhere, will be encountered throughout the development literature. Given thatdevelopment thinking is not just about the theoretical interpretation of facts, but ratherabout values, aspirations, social goals, and ultimately that which is moral, ethical andjust, it is understandable that change in development studies leads to the parallelevolution of ideas, rather than revolution. Hence, conflict, debate, contention,positionality and even moral outrage are all inherent in the discussion of developmentstrategies, and associated plural and diverse theories of development.
Approaches to development thinkingThere are many ways to categorize development thinking through time. Broadlyspeaking, it is suggested here that four major approaches to the examination ofdevelopment thinking can be recognized, and these are shown in Figure 2.1.1 (seePotter et al., 2008). The framework first maps in the distinction previously madebetween normative development theories (those focusing on what should be the case),a nd positive theories (those which ponder on what has actually been the case).Another axis of difference between theories is seen as relating to whether they areholistic or partial, and most partial theories emphasize the economic dimension. Thisis also intimated in the figure.
These two axes can be superimposed on one another to y ield a simple matrix orframework for the consideration of development thinking, strategies or theories, asshown. Following Potter et al. (2008: ch. 3), as noted, four distinct groupings ofdevelopment theory can be recognized by virtue of their characteristics with regardto the dimensions of holistic–economic and normative–positive. The approaches arereferred to here as: (i) the classical–traditional approach; (ii) the historical–empiricalapproach; (iii) the radical political economy–dependency approach; and, finally, (iv)bottom-up and alternative approaches. Following the argument presented in the lastsection, each of these approaches may be regarded as expressing a particularideological standpoint, and can also be identified by virtue of having occupied thecentre stage of the development debate at particular points in time. Classical–traditional theory, embracing dualism, modernization theory, top-downconceptualizations, the new right and neoliberal imperatives, is seen as stressing the
141

economic and, collectively, existing midway between the normative and positivepoles. In direct contrast, according to this framework, radical–dependencyapproaches, embracing neo-Marxism, and the articulation of the modes ofproduction, are seen as being more holistic. At the positive end of the spectrum existthose theories which are basically historical in their formulation, and which purport tobuild upon what has happened in the past. These include core–periphery frameworks,cumulative causation and models of transport evolution, especially the mercantilemodel. In contrast, once again, are theories which stress the ideal, or what should bethe case. These are referred to as ‘alternative approaches’, and basic needs, neo-populism, ‘another development’, ecodevelopment and sustainable development maybe included in this category .
ConclusionMany diverse and varied approaches to development remain in currency today, andin many different quarters. Hence, in development theory and academic writing,left-of-centre socialist views may well be more popular than classical and neo-classical formulations, but in the area of practical development strategies andpolicies, the 1980s and beyond have seen the implementation of neoliberalinterpretations of classical theory, stressing the liberalization of trade, along withpublic-sector cut-backs. Such plurality and contestation are an everyday part of thefield of development studies. In the words of Hettne (1995: 15), ‘theorizing aboutdevelopment is therefore a never-ending task’.
ReferencesChant, S. and McIlwaine, C. (2009) Development Geographies in the 21st Century,
London: Edward Elgar.Cowen, M. P. and Shenton, R. (1996) Doctrines of Development, London: Routledge.Hettne, B. (1995) Development Theory and the Three Worlds: Towards an
International Political Economy of Development (2nd edn), Harlow, UK: Longman.Kuhn, T. (1962) The Structure of Scientific Revolutions, Chicago: University of
Chicago Press.Nederveen Pieterse, J. (2010) Development Theory (2nd edn), London: Sage.Peet, R. and Hartwick, E. (2009) Theories of Development: Contentions, Arguments,
Alternatives (2nd edn), London: Guilford Press.Potter, R. B., Binns, T., Elliott, J. and Smith, D. (2008) Geographies of Development:
An Introduction to Development Studies (3rd edn), New York: Pearson-PrenticeHall.
Potter, R. B., Conway, D., Evans, R. and Lloyd-Evans, S. (2012) Key Concepts in
142
Development Geography, London: Sage.Preston, P. W. (1996) Development Theory: An Introduction, Oxford: Blackwell.Thirlwall, A. P. (2011) Economics of Development: Theory and Evidence (9th edn),
London: Palgrave Macmillan.
Further readingHettne, B. (1995) Development Theory and the Three Worlds: Towards an
International Political Economy of Development (2nd edn), Harlow, UK: Longman.Briefly introduces the concepts of development theories, strategies and ideologies(pp. 15–16), before presenting an overview of Eurocentric development thinking,the voice of the ‘other’, globalization and development theory, and ‘anotherdevelopment’.
Peet, R. and Hartwick, E. (2009) Theories of Development: Contentions, Arguments,Alternatives (2nd edn), London: Guilford Press. The two substantive sections,making up chapters 2–7, review what are referred to as conventional (Keynesianeconomics to neoliberalism, modernization) and non-conventional/critical(Marxism, socialism, post-structural, postcolonialism, feminist) theories ofdevelopment.
Potter, R. B., Binns, T., Elliott, J. and Smith, D. (2008) Geographies of Development(3rd edn), Harlow, UK: Prentice Hall. Seeks to stress the plural and contestednature of development theory and practice. Chapter 3 overviews theories andstrategies of development, stressing their diversity and value-laden character. Thestructure of the account is based on the figure employed in the present chapter.
Preston, P. W. (1996) Development Theory: An Introduction, Oxford: Blackwell. Thefirst part of the book treats social theory in general terms. Thereafter,contemporary theories of development are summarized followed by what arereferred to as new analy ses of complex change.
143
2.2Smith, Ricardo and the world marketplace, 1776 to 2012
Back to the future and beyond
David Sapsford
IntroductionWhy do countries trade with one another? What determines the terms on which tradebetween countries is conducted in the world marketplace? These two questions areperhaps the most fundamental to be considered in any analy sis of international trade,be it trade between developed and developing countries or trade amongst countries ineither the developing or the developed world. These questions are of specialimportance in the context of economic development, since if there are ‘gains fromtrade’ to be had, the distribution of such gains between trading partners carriesimportant implications for living standards and economic welfare within theparticipating countries.
The classical economists, most notably Adam Smith (1723–90) and David Ricardo(1772–1823) considered these two questions, and their analy ses are outlined in thefollowing section. Subsequent sections consider the available evidence regarding thechanges that have occurred over the long run in the terms on which trade betweendeveloped and developing nations has been conducted, and explore the implicationsof this for economic development in the Third World.
Absolute and comparative advantageThe foundations of the economic theory of international trade were laid by AdamSmith in The Wealth of Nations (1776). Smith’s analy sis of division of labour is wellknown and to a large extent he saw the phenomenon of international trade as a logicalextension of this process, with particular regions or countries (rather than particularindividuals) specializing in the production of particular commodities. Smith’s view isclearly demonstrated by the following quotation:
It is the maxim of every prudent master of a family, never to attempt to make athome what it will cost him more to make than buy … What is prudence in theconduct of every private family, can scarce be folly in that of a great kingdom. Ifa foreign country can supply us with a commodity cheaper than we ourselves can
144

make it, better buy of them with some part of the produce of our own industry,employ ed in a way in which we have some advantage.
(Smith, 1776: 424)
Thus, according to Smith, countries engage in trade with one another in order toacquire goods more cheaply than they could produce them domestically, pay ing forthem with some proportion of the output that they produce domestically byspecializing according to their own ‘advantage’. Central to this view is the notion thatrelative prices determine trade patterns, with countries buy ing abroad when foreignprices are below domestic ones. In addition, Smith argued that by expanding the sizeof the market, international trade permits greater specialization and division of labourthan would otherwise have been possible. This is perhaps one of the earliestarguments in favour of globalization as a process by which the size of the worldmarketplace is increased.
Economics textbooks abound with simple two-country /two-good examples thatillustrate Smith’s argument. Suppose that the world consists of only two countries(say, the UK and the USA) and only two goods (say, food and clothing). Within this(over)simplified framework let us assume that the USA is more efficient than the UKat producing food (in the sense that fewer resources are needed to produce a unit offood in the USA than in the UK) and (in the same least resource-cost sense) that theUK is more efficient than the USA at producing clothing. In economists’ terminology ,this example represents the case where the UK possesses absolute advantage in theproduction of clothing, while the USA possesses absolute advantage in the productionof food. To further simplify, let us assume that labour is the only factor of productionand that within each country it is mobile between the two industries. Assume also thatwages are the same in both countries and that transport costs are zero. Based on thisbattery of assumptions, the USA will be the cheaper source of food and the UK ofclothing. It is a matter of simple arithmetic to show that if both countries are initiallyproducing some of each good, it is always possible to increase output of both goods ifeach country specializes in the production of that good for which it possesses absoluteadvantage. It also follows that by trading, each country can consume the bundle ofclothing and food that it consumed in the absence of trade (that is, under autarky)while still leaving some of each product over! Each country thus has the potential toincrease its consumption of both goods and, assuming that more of each good ispreferable to less, trade can, in principle, allow both trading partners to increase theireconomic welfare. As already noted, the distribution of this surplus (that is, thedistribution of the gains from trade) between the two countries is an important matter,especially in the context of economic development. We return to this issue in thefollowing section.
The case analy sed by Adam Smith considered, quite naturally at the time he was
145

writing, the situation where one country possesses absolute advantage in theproduction of one good, while the other country possesses it in the production of theother good. Writing four decades later, David Ricardo considered the rather moretricky analy tical case in which one of the two countries (say the UK) is moreefficient at producing both goods. According to Adam Smith’s absolute advantageargument, both goods should be produced by the UK. However, this situation canclearly not represent a feasible state of affairs in the long run since although the USAwill seek to purchase both goods from the UK, the UK will not wish to buy any thingfrom the USA in return. Ricardo (1817) was the first economist to provide a formalanaly sis of this case and by so doing he derived his famous Law of ComparativeAdvantage.
Table 2.2.1 Labour requirements matrix
Labour per unit of output
UK USA
Food 5 6Clothing 2 12
According to Ricardo’s Law of Comparative Advantage, which encompassesAdam Smith’s analy sis of absolute advantage as a special case, world output andtherefore (on the basis of the assumption discussed above) world economic welfarewill be increased if each country specializes in the production of that good for whichit possesses comparative advantage. The concept of comparative advantage isbasically concerned with comparative efficiency and Ricardo’s law follows fromrecognizing the fact that differences in the relative prices of the two goods betweenthe two countries opens up the possibility of mutually beneficial trade. To take aconcrete example, suppose that the labour required to produce 1 unit of each good ineach country is as set out in Table 2.2.1. Notice that the UK requires less labour thanthe USA in both industries.
On the basis of these figures (and assuming that labour productivity in eachindustry does not alter with the level of output) we can see that in the absence of tradeeach unit of food within the UK trades for 2.5 units of clothing since each isequivalent to the output of five people. Likewise in the USA 1 unit of food trades for0.5 unit of clothing, each being the output of six people. It is the difference betweenthese two relative prices (or internal terms of trade) that opens up the possibility formutually beneficial trade. For example, if US prices prevail in the world outside theUK, a British person in possession of 1 unit of food can exchange this within the UK
146

for 2.5 units of clothing, which could then be sold in the USA for 5 units of food;thereby providing a gain equal to 4 units of food. Likewise, if British relative pricesprevail, an American producer employ ing 12 people to make 1 unit of clothing couldswitch to the food industry and thereby produce 2 units of food, which could then besold in the UK for 5 units of clothing; thus realizing a gain of 4 units of clothing. Atintermediate relative prices (or terms of trade) both countries can gain from trade,although not to the extent shown in the respective examples given above.
In a nutshell, according to Ricardo’s analy sis each country shifts its production mixtowards the good for which it possesses comparative advantage. In our example, theUK has comparative advantage in the production of clothing, whereas the USA’scomparative advantage is in food, where it is less inefficient. Reading across the rowsin Table 2.2.1 we see that this follows because the UK requires five-sixths of US unitinputs in food, but only one-sixth in clothing.
Who gains from trade?While the elegance of Ricardo’s analy sis and its logical correctness within theconfines of its own assumptions can not be faulted, it does beg a question that is vitallyimportant in the context of trade that takes place between countries of thedeveloped/industrialized world and countries of the Third World. While the analy sisdemonstrates quite clearly the potential benefits to trading partners from engaging ininternational trade in the world marketplace, it has nothing whatsoever to say aboutthe division of these potential gains between them. As we saw in the precedingexample, if relative prices in the world marketplace were equal to US relative pricesthen the UK would effectively appropriate all of the gains from trade for herselfwhereas, at the opposite end of the spectrum, the USA would scoop all of the gains ifBritish relative prices prevailed.
In order to focus ideas let us consider trade between the countries of thedeveloped/industrialized world and those of the developing world and, for simplicity,assume that the former produce manufactured goods while the latter produceprimary commodities. The fact that Ricardo’s analy sis did not shed any light on theissue of how the potential gains from trade are shared out in practice did not seem toconstitute a problem in the minds of classical economists since in a related contextRicardo, like Smith before him, had argued that as an inevitable consequence of thetwin forces of diminishing returns in the production of primary commodities from afixed stock of land (including mineral resources) as population increased, and thedownward pressures on production costs in manufacturing generated by themoderating influences of surplus population and urbanization upon wages, the price ofprimary products would rise over the long run in relation to the price ofmanufactured goods, thereby giving rise to an upward drift in the net barter terms oftrade between primary commodities and manufactured goods. On the above
147

1
2
3
4
assumptions, this movement will translate into an improvement in the terms of tradeof developing countries vis-à-vis the developed countries. On the basis of thisargument there was little, if any, reason to be concerned about the plight ofdeveloping countries in the context of their trading relations with the industrializedworld since it predicted that over the long run, the terms of trade would shift steadilyin their favour, with the result that they would enjoy an increasing proportion of thepotential gains from trade.
However, in the early 1950s the classical prediction of a secular improvement waschallenged by both Prebisch (1950) and Singer (1950). Both argued forcefully that indirect contravention of the then still prevailing classical prediction, the terms of tradehad actually, as a matter of statistical fact, been historically subject to (and could beexpected to continue to be subject to) a declining trend. Both analy ses thereforeimplied that contrary to the classical view, developing countries were actuallyobtaining a falling proportion of the potential gains from their trade with the countriesof the developed world. Recent statistical evidence (Sapsford, Bloch andPfaffenzeller, 2010) indicates that the declining trend observed by both Prebisch andSinger persisted into the first decade of the twenty -first century .
A number of theoretical explanations have been put forward in the literature toaccount for the observed downward trend in the terms of trade of developingcountries, relative to developed countries, and these can be conveniently summarizedunder the following four headings:
differing elasticities of demand for primary commodities and manufactured goods(with the inelastic nature of the former resulting in a tendency for increases in theconditions of commodity supply to be felt more strongly in price decreases than inquantity increases);differing rates of growth in the demands for primary commodities and manufacturedgoods (with the demand for primaries expanding less rapidly than the demand formanufactures due to their lower income elasticity of demand – especially so in thecase of agricultural commodities due to the operation of Engel’s Law – plus thedevelopment of synthetic substitutes and the occurrence in manufacturing oftechnical progress of the raw materials-saving sort);technological superiority (the argument being that the prices of manufacturedgoods rise relative to those of primaries because they embody both a so-calledSchumpeterian rent element for innovation, plus an element of monopolistic profitarising from the monopoly power of multinational producers);asymmetries in market structure (the argument here is that differences in marketstructure – with primary commodities typically being produced and sold undercompetitive conditions, while manufacturing in industrialized countries is oftencharacterized by a high degree of monopoly by organized labour and monopoly
148

producers – mean that while technical progress in the production of primarycommodities results in lower prices, technical progress in manufacturing leads toincreased factor incomes as opposed to lower prices).
Policy implicationsAlthough space constraints do not allow the discussion in any detail of the policyimplications of the observed worsening trend in the terms on which trade is conductedin the world marketplace between primary commodity -producing countries andmanufacturing countries, it is important to note that the Prebisch–Singer hypothesis issometimes advanced as one argument in favour of development policies of theimport-substituting industrialization as opposed to export promotion variety (Sapsfordand Balasubramanyam, 1994). However, the policy issues here are not clear-cut andthe fact that all four of the above explanations relate as much, if not more, to thecharacteristics of different types of countries as to the characteristics of differentty pes of traded goods highlights the need to devise and implement policies thataddress differences and imbalances of the former as opposed to the latter sort.
It is now the case that at least some of the international agencies involved in theworld trading sy stem have come to accept that primary commodity producers indeveloping countries do face real and significant uncertainties and risks regarding theprices that they will actually receive for their products when they come to the worldmarket. See Morgan (2001) and Toye (2010) for useful discussions of the array of,largely unimplemented or failed, schemes that have been put forward over the lastseven decades in order to address the price risks and volatilities faced by primarycommodity producers in developing countries.
1776 to 2012: Back to the future?Some 236 y ears have elapsed since Adam Smith laid the initial foundations of tradetheory as we know it today. It is testament to the logical correctness of his analy sis,especially as extended by Ricardo, that this theoretical framework is still pivotal totwenty -first century thinking in both trade theory and policy formulation. As we haveseen, the central prediction of this approach is that provided the world terms of tradelie within the limits imposed by domestic opportunity cost ratios, internationalspecialization and exchange via trade provides an opportunity for both tradingpartners to benefit from increased output (and therefore economic welfare) withgiven resource/factor endowments. However, we have also seen that there is a schoolof thought surrounding the Prebisch–Singer hypothesis suggesting that in practice, theactual terms of trade have drifted, within the range delineated by the Ricardiananaly sis, in favour of the industrialized (manufacturing) nations to such an extent thatthese nations have appropriated for themselves the lion’s share of the gains fromtrade, leaving only small pickings for the (primary commodity dependent) poorer
149

countries of the developing world.What does current experience tell us in relation to the fundamental question of
‘who has gained what from participating in international trade’? The basic structure ofinternational institutions that currently oversee/govern the day -to-day conduct ofinternational trade and commerce were laid down in 1944 at the famous Bretton-Woods Conference. Prominent amongst these institutions is what is now known as theWorld Trade Organisation1 (WTO) whose mission, in a nutshell, is to provide anarena and set of processes and rules designed to achieve multilateral reductions intrade barriers. The underly ing philosophy here, squarely in the spirits of both Smithand Ricardo, is to maximize the potential global gains from trade by minimizing (ifnot completely eliminating) impediments to free trade, such as import tariffs, quotasand so on.
We have now accumulated almost seven decades of experience of the operationof this process of tariff reduction via multilateral trade negotiations under the auspicesof the WTO and its predecessors. Although advocates of free trade see the WTO ashaving achieved considerable success in its mission to reduce average tariff levels,experience over the last decade or so might be interpreted as suggesting an altogetherless rosy picture when one comes to ask the important question as to who has actuallyharvested the global gains generated by this move closer to free trade in the senseunderstood by Smith and Ricardo. Although a detailed discussion of the operation ofthe WTO is bey ond the scope of the current chapter, it should be noted that it seeks toachieve multilateral reductions in tariff (and other non-tariff) barriers via a series ofnegotiating rounds. In 1994, the trade deal that came out of the so-called Uruguayround of negotiations was signed, although the negotiations did appear to be on theverge of collapse as late as 1990. One major factor that surfaced during the Uruguayround was the view of poor, primary commodity dependent countries that theproposed package would bestow substantial benefits upon the industrialized countries,while offering them very little. In 1999, pressure to offer a better deal to poorcountries lead to a summit meeting in Seattle, which ended in failure (accompaniedby public disorder). In 2001, in an attempt to reinvigorate the process of multilateraltariff reductions, WTO members agreed to launch fresh talks, known as the DohaDevelopment Round. However, despite this initiative, the 2003 ministerial summit inCancun, Mexico, collapsed in acrimony over the developed countries’ intransigencyover the issue of removal of subsidies paid to their farmers. Despite severalsubsequent attempts to inject new life into the Doha round the process has,effectively , ground to a halt.
What is to be made of this tale? At the time of writing (March 2012) the picture isclearly one where the very continued existence of the process of tariff reductions viamultilateral negotiations is hanging by little more than a thread. The current stumblingblock from the perspective of the poor countries is the persistent refusal of the major
150

developed countries (including both the EU and US) to remove the trade barrierimposed by the still substantial subsidies paid to their farmers. However, there is awider view, according to which this particular issue is but a symptom of a morefundamental problem: namely that after participating in the process of multilateraltariff reduction for at least half a century, the poor countries of the world havecontinually seen the gains from the trade being appropriated by their richer tradingpartners. Indeed, some commentators are predicting that such is their degree ofdissatisfaction with a process which has delivered so little to them relative to theirricher trading partners, that group(s) of poor countries are on the verge ofwithdrawing altogether from the process in favour of going it alone.
Whether the thread eventually breaks altogether remains to be seen!
BeyondIn primary commodity markets, as in life, things can – and sometimes do – changevery rapidly. Today ’s world economy is a very different place to that which existedat the turn of the twenty -first century. Three factors have been at work: first, thespectacular growth rates achieved by China and India (plus Brazil) since 2005;second, the sub-prime loans/credit crunch crisis of 2008; and third, the post-2010eurozone debt crisis. Each of these factors carries major implications for developingcountries dependent on primary commodity exports and it remains to be seen howthey will interact and work out in the future years and decades. However, a numberof implications are already clear (Sapsford, Bloch and Pfaffenzeller, 2010). Notsurprisingly, the spectacular growth rates of China and India led to marked upwardmovements in the real price of primary commodities in both 2006 and 2007,especially strongly in the cases of raw materials and metals. What is, however,surprising is the speed at which these gains in terms of trade of commodity dependentdeveloping countries evaporated in the wake of the 2008 credit crunch. InternationalMonetary Fund data indicate that while commodity prices peaked in March 2008they fell with alarming rapidity thereafter. Between March and November 2008, aperiod of only eight months, the IMF’s index of non-fuel primary commodity pricesfell by 32 per cent, with corresponding falls in the prices of industrial inputs and foodand beverages equalling 35 and 28 per cent respectively ! This is a truly breathtakingrate of collapse – clearly good times can disappear as quickly as they arrive. Bymid-2011, these falls had been largely reversed but as the eurozone crisis unfoldedprices seem to be moving downwards again. It remains to be seen where theeurozone crisis will ultimately end but if, as does not seem unlikely, Greece exits theEuro then it is not inconceivable that the ensuing downward effects on industrialoutput in both the eurozone and elsewhere may well generate price falls of a similarmagnitude to those observed in 2008.
It remains to be seen whether this order of increased volatility in the primary
151

commodity terms of trade, with all of the associated difficulties it raises for primarycommodity dependent LDCs, will become a feature of twenty -first centuryeconomic life.
I wonder what Adam Smith and David Ricardo would make of this!
Note1 Previously known as the General Agreement on Tariffs and Trade (GATT),
although originally named (by Keynes as the principal architect of the Bretton-Woods sy stem) the International Trade Organisation (ITO). See Chen andSapsford (2005).
ReferencesChen, J. and Sapsford, D. (eds) (2005) Global Development and Poverty Reduction:
The Challenge For International Institutions, Cheltenham, UK: Edward Elgar.Morgan, W. (2001) ‘Commodity futures markets in LDCs: A review and prospects’,
Progress in Development Studies 1(2): 139–50.Prebisch, R. (1950) ‘The economic development of Latin America and its principal
problem’, UN ECLA; also published in Economic Bulletin for Latin America 7(1)(1962): 1–22.
Ricardo, D. (1817) On the Principles of Political Economy and Taxation , London:Penguin (reprinted 1971).
Sapsford, D. and Balasubramanyam, V. N. (1994) ‘The long-run behavior of therelative price of primary commodities: Statistical evidence and policyimplications’, World Development 22(11): 1737–45.
Sapsford, D., Bloch, H. and Pfaffenzeller, S. (2010) ‘Commodities still in crisis?’ In M.Nissanke and G. Mavrotas (eds), Commodities, Governance and EconomicDevelopment under Globalization, London: Palgrave Macmillan, pp. 99–115.
Singer, H. (1950) ‘The distribution of gains between investing and borrowingcountries’, American Economic Review, Papers and Proceedings 40: 473–85.
Smith, A. (1776) The Wealth of Nations, London: Penguin (reprinted 1961).Toy e, J. (2010) ‘Commodities, cooperation and world economic development: The
mission of Alfred Maizels, 1996–2006’. In M. Nissanke and G. Mavrotas (eds),Commodities, Governance and Economic Development under Globalization,London: Palgrave Macmillan, pp. 3–17.
Further readingDetailed discussion of both the theoretical arguments and statistical evidence
underly ing the declining trend in terms of trade hypothesis can be found in the
152

following:Bloch, H. and Sapsford, D. (2011) ‘Terms of trade movements and the global
economic crisis’, International Review of Applied Economics 25(5): 503–17.Sapsford, D. (2008) ‘Terms of trade and economic development’. In A. Dutt and J.
Ros (eds), International Handbook of Development Economics, Cheltenham, UK:Edward Elgar, pp. 16–29.
Sapsford, D., Sarkar, P. and Singer, H. (1992) ‘The Prebisch–Singer terms of tradecontroversy revisited’, Journal of International Development 4(3): 315–32.
Singer, H. (1987) ‘Terms of trade and economic development’. In J. Eatwell, M.Milgate and P. Newman (eds), The New Palgrave: A Dictionary of Economics,London: Macmillan, pp. 626–8.
Spraos, J. (1983) Inequalizing Trade? Oxford: Oxford University Press.A comprehensive discussion of a wide range of issues relating to the relationship
between economic development and international trade may be found in thefollowing:
Greenaway, D. (ed.) (1988) Economic Development and International Trade,London: Macmillan.
Highly accessible discussion of the main issues involved in the globalization debate,seen from either side of the fence, can be found in the following two references:
Bhagwati, J. (2004) In Defense of Globalization, London: Oxford University Press.Stiglitz, J. (2003) Globalization and its Discontents, London: Penguin Books.
153

2.3Enlightenment and the era of modernity
Marcus Power
Introduction: The ‘rough and tumble’ of early industrialismJust as light cuts through darkness, the philosophy of the Enlightenment was seen assomething that would open the eyes of the world’s poor and free them from unjustrule. The ‘age of Enlightenment’ is most often traced to the eighteenth century andrepresented a cataly st for the development of particular sty les of social thought in theform of a movement or a programme in which reason was used in order to achievefreedom and progress, and during which hostility to religion was omnipresent. In itssimplest sense, the Enlightenment was the creation of a new framework of ideas andsecure ‘truths’ about the relationships between humanity, society and nature whichsought to challenge traditional worldviews dominated by Christianity. Science, andthe scientific approach, became the tool to investigate the world, instead oftheological dogmas. According to Gay (1973: 3), at this time educated Europeansexperienced ‘an expansive sense of power over nature and themselves: the pitilesscy cles of epidemics, famines, risky life and early death, devastating war and uneasypeace – the treadmill of human existence – seemed to be y ielding at last to theapplication of critical intelligence’. Fear of change began to give way to fear ofstagnation. It was a century of commitment to enquiry and criticism, of a decline inmy sticism, of growing hope and trust in effort and innovation (Hampson, 1968). Oneof the primary interests was social reform, and the progression and development ofsocieties built around an increasing secularism and a growing willingness to take risks(Gay , 1973).
There is no monolithic ‘spirit of the age’ that can be discerned, however, and theEnlightenment does not represent a set of ideas which can be clearly demarcated,extracted and presented as a list of essential definitions. There were, however, manycommon threads to this patchwork of Enlightenment thinking: the primacy ofreason/rationalism, a belief in empiricism, the concept of universal science andreason, the idea of progress, the championing of new freedoms, the ethic ofsecularism and the notion of all human beings as essentially the same (Hall andGieben, 1992: 21–2). Thinkers such as Kant, Voltaire, Montesquieu, Diderot, Hume,Smith, Ferguson, Rousseau and Condorcet found a receptive audience for their ‘newsty le of life’ (Hampson, 1968) producing a large collection of novels, plays, books,
154

••••
pamphlets and essays for the consumption of nobles, professionals (especiallylawy ers), academics and the clergy. New cultural innovations in writing, painting,printing, music, sculpture and architecture, and new technological innovations inwarfare, agriculture and manufacture had a major impact on the philosophes, thefree-thinking intellectuals or ‘men of letters’ that had brokered this enlightenedawakening in France. The philosophes sought to redefine what was considered associally important knowledge, to bring it outside the sphere of religion and to provideit with a new meaning and relevance. For Hall and Gieben (1992: 36) four mainareas distinguish the thought of the philosophes from earlier intellectual approaches:
anti-clericalism;a belief in the pre-eminence of empirical, materialist knowledge;an enthusiasm for technological and medical progress;a desire for legal and constitutional reform.
There is thus clearly a risk of apply ing the term ‘the Enlightenment’ too loosely ortoo widely, as if it had touched every intellectual society and every intellectual eliteof this period equally. The Enlightenment is thus best considered as an amorphous,dy namic and variegated entity (Porter, 1990). More than simply a predominantlyFrench movement centred around a small group of philosophes, scholars haverecently begun to consider the complex spatiality of ‘the Enlightenment’ as acosmopolitan process, to view it in its international context (where its key ideas andviews were transmitted across borders) and thus to identify a number of different‘Enlightenments’. Reaching its climax in the mid-eighteenth century in Paris andScotland, but with foundations in many countries (including several outside of Europesuch as the USA), ‘the Enlightenment’ was thus a sort of intellectual fashion or ‘atendency towards critical inquiry and the application of reason’ (Black, 1990: 208)rather than a singular coherent intellectual movement or institutional project. Thephilosophes of the eighteenth-century Enlightenment in France, for example, did notact in concert and neither should they be seen as a unified family for their viewswere too disparate (Porter, 1990).
It is also important to remember that the new ‘sty le of life’ championed byEnlightenment intellectuals was in the main reserved for the fortunate and thearticulate – the rural and urban masses had little share. It was not until the eve of theFrench Revolution in the 1780s that a new social group emerged concerned withpopularizing Enlightenment ideas. Similarly, though many women played a majorpart in the development and diffusion of Enlightenment ideas, apply ing such ideas totheir social conditions meant negotiating a number of contradictory positions withinpatriarchal societies. The emancipatory potential of this knowledge thus turned out tobe limited in that it was conceived of as abstract and utilitarian, as a mastery over
155

nature which thus becomes characterized by power. As Doherty (1993: 6) hasargued:
Knowledge is reduced to technology, a technology which enables the illusion ofpower and of domination over nature. It is important to stress that this is an illusion.This kind of knowledge does not give actual power over nature…. What it does givein the way of power is, of course, a power over the consciousness of others whomay be less fluent in the language of reason…. Knowledge thus becomes caughtup in a dialectic of mastery and slavery .
(Emphasis in original)
The Enlightenment was also closely linked to the rise of modernity and provided animportant crucible for the invention of the modern idea of ‘development’ whichbegan to emerge ‘amidst the throes of early industrial capitalism in Europe’ (Cowenand Shenton, 1996: 5). The metaphor of the ‘light of reason’ shining brightly into allthe dark recesses of ignorance and superstition in ‘traditional’ societies was a powerfuland influential one at this time. In Europe, the light that the process of ‘development’brought was intended to ‘construct order out of the social disorders of rapid urbanmigration, poverty and unemploy ment’ (Cowen and Shenton, 1996: 5). ManyEnlightenment thinkers also viewed the remedy for the disorder brought on byindustrialization as related to the ‘capacity ’ to use land, labour and capital in theinterests of society as a whole. Only certain kinds of individuals could be ‘entrusted’with such a role (Cowen and Shenton, 1996). Property, for example, needed to beplaced in the hands of ‘trustees’ who would decide where and how society ’s resourcescould be most effectively utilized. In eighteenth-century France, the prevailing socialorders were represented as three ‘estates’ – clergy, nobility and the ‘third estate’,which comprised everyone else, from wealthiest bourgeois to poorest peasant (Hall,1992). This ‘dialectic of mastery and slavery ’ and this gap between the philosophes(who were often members of the second estate) and the peasantries of Europeaneighteenth-century societies, are both important parts of the historical context ofEnlightenment thinking. Although they appeared to represent a threat to theestablished order, these ideas and writings sought evolutionary rather thanrevolutionary change, arguing that progress and development could come aboutwithin the existing social order through the dissemination of ideas among ‘men ofinfluence’ (Hall and Gieben, 1992).
‘Modernity’ and the rise of the social sciencesThe influential economist John May nard Keynes (1936: 570), once wrote that‘practical men, who believe themselves to be quite exempt from any intellectualinfluences, are usually the slaves of some defunct economist’. So it is with much
156

AroundthethirteenthcenturytheFlorentines,Pisans,Amalfitans,VenetiansandGenoesebeganadoptingadifferentpolicy forenhancing theirwealthandpowerbecause theynoticed that the sciences, the cultivation of land,theapplicationoftheartsandofindustry,andtheintroductionofextensivetrade could produce a large population, provide for their countless needs,sustaingreat luxuryandgain immense richeswithouthaving toaddmoreterritories.
SebastianoFranci,MilaneseEnlightenmentreformer,1764
Anewviewoftheworld:fromzero-sumgametoinnovationandgrowth
SincetimeimmemorialthemajorityoftheEarth'sinhabitantshavelivedsimplelives,inrelativepoverty,inanoftenfragilebalancebetweenpopulationsizeandtheresourcesavailabletothem.AsAlfredMarshall,oneofthefoundersofneo-classicaleconomics,expressedit,allmigrationsinhistoryhavebeencreatedbydiminishing returns: an increasing density of population set off against anunchangedavailabilityofnaturalresourcesandunchangedtechnology.WefindthismechanismdescribedintheBible(Genesis13:6)whenthetribesofIsraelhad topartbecause`the landwasnotable tobear them, that theymightdwelltogether: for their substancewas great, so that they could not dwell together'.Although luxury goods gradually came into being, thesewere for the selectedfew,andrichesweremainlygainedbytheconquestofnewterritories.
In such a world, wealth and poverty were a zero-sum game; wealth wasbasicallyacquiredbyalreadyexistingricheschangingowners.Thisviewoftheworld, whichmust also have existed from time immemorial, was codified byAristotle and shaped the worldview of scholasticism, the philosophy of latemedievalEurope.`Oneman'sbenefitisanotherman'sloss,'confirmsStJerome(c.341-420). As late as 1643 the Englishman Sir Thomas Browne (1605-82)
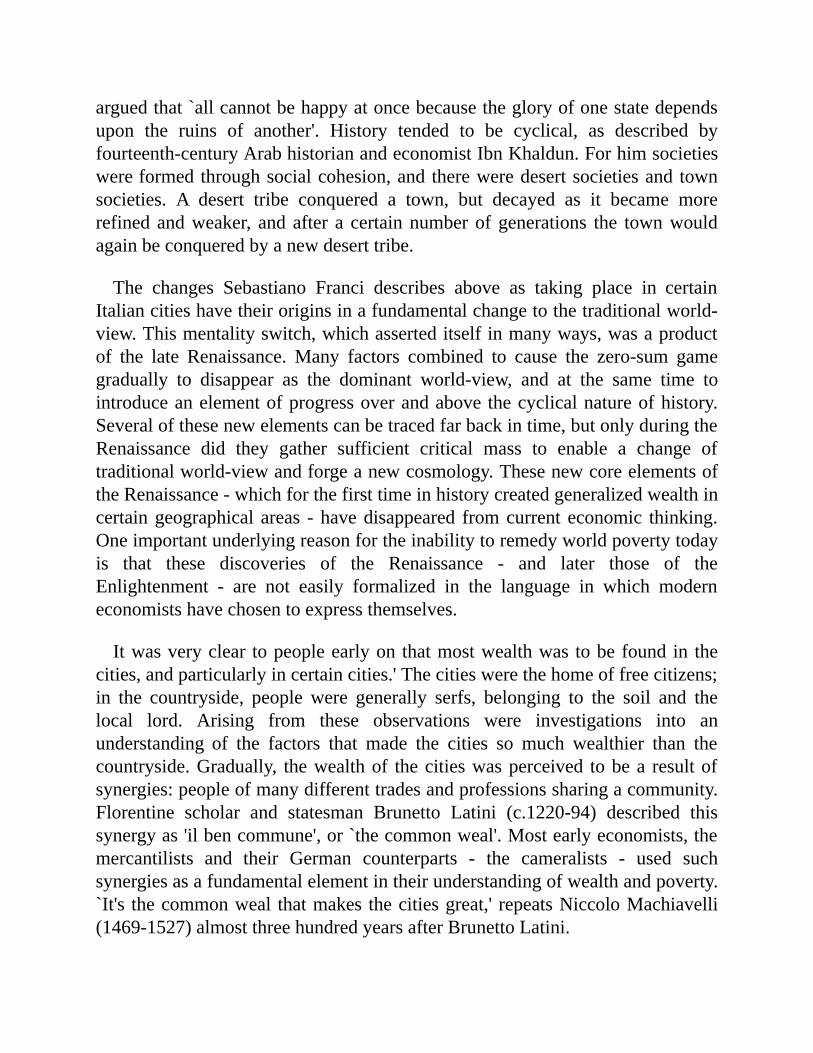
arguedthat`allcannotbehappyatoncebecausethegloryofonestatedependsupon the ruins of another'. History tended to be cyclical, as described byfourteenth-centuryArabhistorianandeconomistIbnKhaldun.Forhimsocietieswereformedthroughsocialcohesion,andthereweredesertsocietiesand townsocieties. A desert tribe conquered a town, but decayed as it became morerefinedandweaker, andafter a certainnumberof generations the townwouldagainbeconqueredbyanewdeserttribe.
The changes Sebastiano Franci describes above as taking place in certainItaliancitieshavetheiroriginsinafundamentalchangetothetraditionalworld-view.Thismentalityswitch,whichasserteditselfinmanyways,wasaproductof the late Renaissance.Many factors combined to cause the zero-sum gamegradually to disappear as the dominant world-view, and at the same time tointroduceanelementofprogressoverandabovethecyclicalnatureofhistory.Severalofthesenewelementscanbetracedfarbackintime,butonlyduringtheRenaissance did they gather sufficient critical mass to enable a change oftraditionalworld-viewandforgeanewcosmology.ThesenewcoreelementsoftheRenaissance-whichforthefirsttimeinhistorycreatedgeneralizedwealthincertaingeographical areas -havedisappeared fromcurrent economic thinking.Oneimportantunderlyingreasonfortheinabilitytoremedyworldpovertytodayis that these discoveries of the Renaissance - and later those of theEnlightenment - are not easily formalized in the language in which moderneconomistshavechosentoexpressthemselves.
Itwasveryclear topeopleearlyon thatmostwealthwas tobefound in thecities,andparticularlyincertaincities.'Thecitieswerethehomeoffreecitizens;in the countryside, people were generally serfs, belonging to the soil and thelocal lord. Arising from these observations were investigations into anunderstanding of the factors that made the cities so much wealthier than thecountryside.Gradually, thewealthof thecitieswasperceived tobea resultofsynergies:peopleofmanydifferenttradesandprofessionssharingacommunity.Florentine scholar and statesman Brunetto Latini (c.1220-94) described thissynergyas'ilbencommune',or`thecommonweal'.Mostearlyeconomists,themercantilists and their German counterparts - the cameralists - used suchsynergiesasafundamentalelementintheirunderstandingofwealthandpoverty.`It's thecommonweal thatmakes thecitiesgreat,' repeatsNiccoloMachiavelli(1469-1527)almostthreehundredyearsafterBrunettoLatini.

Withthissocialunderstandingofwealthasaphenomenonthatcouldonlybeunderstood as a collective phenomenon, the Renaissance rediscovered andflagged the importance and creativity of the individual.Without keeping boththeseperspectives inmind - thecommonwealand the roleof the individual -neither the Renaissance view of society nor the phenomenon of economicgrowthcanbeunderstood.Thistheoreticalambivalence,keepingtheinterestsofboth society and the individual in mind as units of analysis, characterizedcontinental European economic theory, particularlyGerman, up to the SecondWorldWar, buthas subsequently almostdisappeared. In the twentieth century,analysesof thispoint led to importantdebates about the relationshipsbetweendifferent formsof freedom(for instance, the trade-offbetween the right of theindividualtocarryweaponsversustherightoftherestofsocietynottobeshot).Thelossofthisdualtheoreticalperspective-exemplifiedbyMargaretThatcher's`There is no such thing as society' - seriously inhibits our understanding ofpoverty and failing states. The methodology of standard economics too oftenmakesitblindtogenuinesynergies.
Aristotle's view of the world as a zero-sum game slowly gave way to anincreasingunderstandingthatnewwealthcouldbecreated-notonlyconquered- through innovationandcreativity.Thegradual change in themeaningof theword`innovation'elucidatesthisdevelopment.In1277RogerBacon(c.1214-94)wasarrestedinOxfordfor`suspectinnovations',aheresyconsistingofsearchingfor knowledge outside theBible and theworks ofAristotle.When, about 300years later, Francis Bacon (1561-1626) wrote an essay, Of Innovations,innovationswereacceptedascarriersofincreasedhumanwealthandhappiness.Inhisutopianvision,TheNewAtlantis,FrancisBacondescribesastatewhereinnovation holds the seat of honour and people have invented self-propellingvehicles, submarines, microphones and medicines to prolong life. Bacon alsodescribes the world's first `national research council', Salomon's House. Thegrowth of manufacturing activities broke the vicious circles of diminishingreturns,creatingwhatwasforaverylongtimetheexclusiveprivilegeofcities:increasing returns. As previously mentioned, increasing returnsmeans that asproductionexpands-evenwithouttechnicalchange-thecostofproductionperunit falls. Antonio Serra (1613) formulates the recipe for a wealthy state asconsisting of increasing returns combined with a large division of labour, inotherwordsinmaximizingthenumberofdifferentprofessionsandactivitiesinthecity.

England's story is theprototypeofhowacountrygoes frompoor to rich. Itwaspolicybeforeitbecamewrittentheory,butevenin1581authorJohnHalesunderstood the importanceof themanufacturingmultiplier fornationalwealth:`Whatgrosenessofwitsbeweof...thatwillsufferorownecommoditiestogoandsetstraungersatworke,andthenbuythemagaineattheyrhandes.'2Thisisthe basic insight found in all countries that, one after the other, industrialized.ThesameprincipleswereappliedinJapanandKoreainthesecondhalfofthetwentiethcentury.
Underconditionsoffallingcostswithincreasingoutput-whatwehavecalledincreasingreturnsoreconomiesofscale-alargepopulationwasnolongerseenasaproblemforseventeenthcenturyeconomists.Onthecontrary,economiesofscaleinproductionanddivisionoflabouramongallthenewcraftsmadealargepopulation a condition for economic growth.' Not only was it a necessaryprecondition for wealth to have a large and growing population, theconcentration of this population was also exceedingly important. EnglisheconomistWilliamPetty (1623-87) therefore suggestedmoving thepopulationofScotlandandotherthenperipheralareastoLondon,wherethepeoplewouldcontribute much more to economic growth than they were able to do in theemptyfringesoftheisland.Notuntilafter1798,whenThomasMalthus(1766-1834) reconstructed an economic theory built on diminishing returns inagriculture (noton innovation andeconomiesof scale inmanufacturing)did agrowingpopulationoncemore,as inthebiblicalGenesis,cometoberegardedas a problem. Malthus and his friend Ricardo's reintroduction of diminishingreturnsasacore featureofeconomics,and thesimultaneousdismissalofbothincreasing returns and innovations had dramatic consequences becausewith itthepreviousunderstandingofwealthasajointproductofsynergies,increasingreturnsand innovations,was lost.Theemphasisondiminishing returnsgainedRicardo'seconomicsthenamea`dismalscience'anditstradetheoryconstitutes,tothisveryday,boththemainexcuseforcolonialismandneo-colonialismandthe core of the mechanisms that keep poor countries poor. Also lost was animportant feature ofEnlightenment science: understanding differences throughthecreationofclassificationsystemsortaxonomies.
Early modern Europe also saw a marked connection between discoveries -geographical and scientific - and innovations, between development of theoryanddevelopmentofpractice.Agrowingunderstandingofaninfiniteuniversein

constantexpansionwasaconditionforthemercantilistworld-view:asthewholecosmoscouldexpandendlessly,socouldtheeconomy.GiordanoBruno(1548-1600),thescientistandhermeticmaguswhowasburnedatthestakeinRomeon1July1600for,amongotherthings,holdingtheuniversetobeinfinite,thusalsocontributedimportantlytotheopeningupofEurope'seconomiccosmology.
At the very core of the process of economic progress is the dynamiccombination of synergies and innovations under conditions of a substantialspecializationanddivisionoflabour.Thiswasclearlyunderstoodbyeconomistsas early as the seventeenth century.Laterwe shall seehow such an economicgrowthsystemwastofunctionintheDutchtownofDelft.
Religionwas slowly loosening its universal grip on society and at the sametimeopeningitselfuptoinnovation,resultinginaradicalshiftinthemeaningofthe termand the attitude towards it, as exemplified by the treatment ofRogerBacon in the thirteenth century and Francis Bacon in the early sixteenthcentury.4When Constantinople, the capital of the western Roman Empire ofByzantium, fell to theTurks in 1453,many philosophersmoved to Italy; as aresultWesternphilosophyandtheWesternChurchbecameheavilyinfluencedbytheEasternChurch.IntheprocessamoredynamicversionofGenesis-thestoryofCreation-gainedafoothold.Thereasoningwentroughlylikethis:ifmaniscreatedintheimageofGod,itisourdutytotrytoemulateGod.What,then,isGod'smosttypicalattribute?IthastobeHiscreativityandHisinnovations;HehadcreatedbothHeavenandEarth.GraduallyitbecameobviousthatourroleonthisEarthoughttobemorethanthatofgardenersandmaintenanceworkers inGod'sCreation.Godhadspentsixdayscreating,andhadthenlefttherestofthecreation to humankind. Consequently, to create and to innovate became ourpleasurable duty. It is our duty to populate the Earth, and as with humanpropagationGodhadalsointroducedincentivesforustoinnovateinthejoyofdiscovering new things. Alexandre Koyre (1892-1964) puts it this way:humankind had graduated `from being a spectator into being an owner andmaster of nature." Humankind had set out on an expedition to collect newknowledge,andnomatterhowmuchwisdomwasabsorbed,wewouldkeeponpushingthenever-endingfrontiersofknowledge.
That, briefly, is the storyof the evolutionof theunderstandingof economicgrowth as a joint product of synergies, a large division of labour, increasingreturns and new knowledge. As we shall see, it was also understood that the

potential for achieving growth was, at any time, limited to certain economicactivities. Inotherwords, economicgrowthwas activity-specific.This holisticunderstanding,alsotakingqualitativedifferencesintoaccount,isatbestfoundinapiecemeal fashion in today's rulingeconomic theory.Elementsof the story -suchasincreasingreturns-areoccasionally,andindividuallybroughtback,butno longerareall theelements in theirself-reinforcing totalitybrought togetherconvincingly enough to influence the economic policy that we allow poorcountriestofollow.Poorcountriestodayarethosewheretheseelementsarenotyet found to a sufficient degree. Colonies were regions where this kind ofsynergeticinteractionwasnotintendedtotakeplace,andRicardiantradetheorywas the first theory that made colonialism morally defensible. Although theprohibitionofmanufacturingindustries-whetherexplicitordefacto-isthekeyelementinanycolonialandneo-colonialpolicy,standardRicardiantradetheorysaysthisdoesnotmatter.Butourworldeconomicorderisbasedonthistheory,atheorythatpredictsthateconomicintegrationbetweenanindigenoustribeintheAmazonandSiliconValleywilltendtomakebothcommunitiesequallyrich.
Emulation:strategiceconomicpolicycomesintobeingwithHenryVIIofEngland(1485)
ThatEurope's `islandsofwealth'wereoftenalso islands inageographicsensewas not lost on early economists. The wealth of a city or nation appeared,somewhatparadoxically, tobeinverselyrelated to itsnaturalwealth.Themostimportant areas, like Holland and Venice, had little arable land. They hadthereforebeenforced into specializing inmanufacturing industry andoverseastrade. In Florence, the most important European city-state not situated on acoast,thebiglandownershadbeenforcenturieskeptfromhavinganypoliticalpower. Consequently, as in the coastal states, the interests of craftsmen,manufacturers and traders dominated the life of the city. Florence understoodveryearlythebasicmechanismsthatcreatedwealthandpoverty.ForcenturiesthelandownersformedaperennialthreattotheFlorentinesaspotentialalliesoftheenemiesof thestate.Keepingthe landownersawayfrompowerhadadualpurposeforthecitizensofFlorence:itsecuredbotheconomicpowerandwealththrough the establishment of manufacturing and political power. To avoidspeculationandprevent shortagesof food,Florencevehementlyprohibited thetransport of food outwards from the city storage places. Economic power andpatronagejoinedincreatingaflourishingof theartsasacharacteristicofnon-

feudal societies. This historically crucial link between political structure andeconomicstructure-betweendemocracyandaneconomydiversifiedawayfromdependenceonagricultureandrawmaterials-isanothercrucialhistoricallessonlost today when we, with great violence and at great expense, attempt toestablish democracies in nationswhere the economic structures are essentiallyfeudalandpre-capitalist.
For Europe's poor nations it became clear that there was an importantconnectionbetween theproductionstructureof thefewwealthycity-statesandtheir riches. The wealthiest city-states - Venice and those in Holland - haddominantmarketpowerinthreedifferentareas.Ineconomictermstheyenjoyedthe type of rents we have referred to earlier, allowing increasing profits, realwagesand taxable income.Both hadvery large anddiversifiedmanufacturingandcraftsectors.Intheearly1500smanufacturingrepresentedabout30percentofallemploymentinHolland.Venicehad40,000menemployedintheshipyards(thearsenale)alone.Eachcontrolledanimportantmarketforarawmaterial,saltinVeniceandfishinHolland.Eveninitsearlystagesofdevelopment,andstillrelativelypoor,Venicealwaysfoughthard tokeep itsdominantposition in thesaltmarkets. InHolland the invention of salted and pickled herring (an earlyfourteenth-centuryinvention)hadcreatedahugemarketthatwascontrolledbytheDutch.Third, bothhadbuilt up a veryprofitable overseas trade.This firstprosperityinEuropewasbasedontriplerents-atriplemarketpowerintypesofeconomic activities thatwere all conspicuously absent in the poorer Europeanstates: manufacturing, a virtual monopoly in an important raw material andprofitableoverseastrade.Wealthhadbeencreatedandmaintainedbehindhugebarrierstoentrycreatedbysuperiorknowledge,bypossessingalargevarietyofmanufacturing activities that created systemic synergies, bymarket power, bylowcostscreatedthroughinnovationsandincreasingreturns-bothinindividualindustriesandassystemiceffects-bythesheerscaleoftheiroperations,andbythe economies of scale in the use of military might. After 1485, Englandemulatedthetriplerentstructurethathadbeencreatedintheresourcelesscity-states of Europe. Through very heavy-handed economic intervention, Englandcreateditsowntriplerentsystem:manufacturing,long-distancetradeandaraw-material rentbasedonwool.The successofEnglandwouldeventually lead tothedemiseofthecity-statesandthegrowthofthenation-states:synergiesfoundinthecity-stateswereextendedtoalargergeographicalarea.ThiswastobetheessenceofthemercantilistprojectinEurope.6

To go back briefly to economic theory: before Adam Smith it was oftenunderstood that economic development was based on collective rent-seeking,originatinginsynergiesofincreasingreturns,innovationsanddivisionoflabourthatwere foundclusteredonly in thecities.This is theoppositeof theperfectcompetition postulated by today's standard textbook economics. Ever sinceRicardo'swritings, fromthepinnacleofan industrializedEngland in1817, thepatternisthesame:wealthynationskeeppoorcountriespoorbasedontheoriespostulating thenon-existenceof theveryfactors thatcreated theirownwealth.As we shall see, countries that have got rich after 1485 have all done so indefianceofRicardo'seconomictheories.
History's first deliberate large-scale industrial policy was based on anobservation of what made the rich areas of Europe rich: that technologicaldevelopmentinonefieldinonegeographicareacouldextendwealthtoanentirenation.KingHenryVIIofEngland,whocametopowerin1485,hadspenthischildhood and youth with an aunt in Burgundy. There he observed greataffluence in an area with woollen textile production. Both the wool and thematerial used to clean it (Fuller's Earth or aluminium silicate) were importedfromEngland.WhenHenrylatertookoverhisdestituterealmwithseveralyears'future wool production mortgaged to Italian bankers, he remembered hisadolescence on theContinent. InBurgundynot only the textile producers, butalsothebakersandtheothercraftsmenwerewelloff.Englandwasinthewrongbusiness,thekingrecognizedanddecidedonapolicytomakeEnglandintoa'textile-producingnation,notanexporterofrawmaterials.
HenryVIIcreatedquiteanextensiveeconomicpolicy toolbox.His firstandmost important tool was export duties, which ensured that foreign textileproducers had to process more expensive raw materials than their Englishcounterparts. Newly established woolmanufacturers were also guaranteed taxexemptionforaperiod,andweregivenmonopoliesincertaingeographicalareasfor certain periods. There was also a policy to attract craftsmen andentrepreneursfromabroad,especiallyfromHollandandItaly.AsEnglishwool-manufacturing capacity grew, so did the export duties, until England hadsufficientproductioncapacitytoprocessallthewooltheyproduced.Then,abouta hundred years later, Elizabeth I could place an embargo on all raw woolexports from England. In the eighteenth century Daniel Defoe and otherhistorianssawthewisdominthisstrategy,whichtheylabelledthe`TudorPlan',

afterthekingsandqueensfromthatfamily.LikeVeniceandHolland,andbythesame methods, England had acquired the same triple rent situation: a strongindustrialsector,arawmaterialmonopoly(wool),andoverseastrade.
Several English historians point out that the industrial policy plan of theTudorswas the real foundation ofEngland's later greatness.On theContinentthisplanwas tohave significant consequences.Florencewasoneof the stateshardest hit by theEnglish competition.The Florentines tried tomake dowithSpanishwool,andtheytriedtodiversify fromwoolproduction tosilk,but theEnglishpolicywassosuccessfulthatthegoldenageofFlorencewasdefinitelyover.
SpanishwoolproducerswereEngland'smaincompetitorsasproducersofrawmaterialsandin1695theEnglisheconomistJohnCarysuggestedthatEnglandoughttobuyallSpanishwoolonthemarketinordertoburnit.Englanddidnothave sufficient capacity to process this wool, but to remove the rawmaterialfromthemarketwouldstrengthentheirmarketpower:
WecouldpromoteaContractwiththeSpaniardforall(wool)hehath;andif it should be objected thatwe should then have toomuch, 'tis better toburntheOverplusattheChargeofthePublic(astheDutchdotheirSpices)thantohaveitwroughtupabroad,whichwecan'totherwiseprevent,seeingalltheWoolofEuropeisManufacturedsomewhere.'
Thetradewarwasreallyafighttobeabletocarryouttheactivitiesyieldingthehighestprofits,payingthehighestwagesand/orthatcouldbetaxedthemost.Itwas clear to all participants that strategic trade policywas, in effect, `war byothermeans'.
ForseveralhundredyearsEurope'stradepolicywasbasedontheprincipleofmaximizingtheindustrialsectorsofeachcountry,whileoftenat thesametimedamaging the industry of other countries.As theGerman economist FriedrichList put it in 1841: for several hundred years England's economic policywasbasedonasimplerule:importofrawmaterialsandexportofindustrialproducts.Tobewealthy, countries like England and Francewould have to emulate andcopy the economic structures ofVenice andHolland, but not necessarily theireconomic policies. Countries already wealthy could afford a very differentpolicyfromthoseofcountriesstillpoor.Infact,onceacountryhadbeensolidly

industrialized, thevery same factors that required initialprotection - achievingincreasing returns and acquiring new technologies - now required bigger andmoreinternationalmarketsinordertodevelopandprosper.Successfulindustrialprotection thus carries the seeds of its own destruction: when successful, theprotection that was initially required becomes counterproductive. As ananonymous Italian traveller inHolland said in 1786: `Tariffs are as useful forintroducing the arts [manufacturing] in a country, as they are damaging oncethese are established.'9 Here lies the key to understanding the timing of freetrade. Again, this is an insight which is lost in today's economic theory asappliedtolargepartsoftheworld.
The fundamental principles of Henry VIPs economic policy toolbox have,sincethen,beenmandatoryingredientsintheeconomicpoliciesofallcountriesthat haveworked theirwayup frompoverty towealth.Theexceptions to thisrulearefew.Asmallcity-statedevoidofresourcesbutwithahugehinterland,likeHongKong,maygetrichinthesame`natural'wayasVeniceandHollanddid.Studyingtheinnermechanismsofsuchstates,however,makesitclearthattheprincipleofwealthcreation-fromthecostofataxilicenceinHongKongtothecity'shugecorporations-isnotperfectcompetition,butrentseeking,thatis,profitingfromimperfectratherthanfromperfectcompetition.
The first US Secretary of the Treasury, AlexanderHamilton, with his 1791Report on the Manufactures of the United States, recreated a toolbox verysimilar to that of Henry VII. Hamilton's stated goals were the same: a largerdivision of labour and a larger manufacturing sector. The same toolbox wasemployed by virtually all continental European countries in the nineteenthcentury, including my own country Norway in the European periphery. ThetheoriesofGermaneconomistFriedrichList-whohadlivedlongenoughintheUnitedStatestobecomeanAmericancitizen-werethemaininspirationfortheEuropeannationsthatfollowedEngland'spoliciesandpathtoindustrialization.List's writings were translated into many languages and the same `Listian'toolboxwasusedinJapanfromtheMeijirestorationinthe1860sandinKorea-a country poorer than Tanzania in 1950 - from the 1960s onwards. Poorcountriesarethosewhohavenotemployedthistoolbox,orhaveemployeditfortoo short a period and/or in a static way that has prevented the competitivedynamics from taking root. The comparison between `good' and `bad'protectionism in Appendix IV highlights the qualitative differences between

protectionistpractices.
Thetoolboxofeconomicemulationanddevelopment
...thefundamentalthingsapply,astimegoesby.
Sam,thepianist,inCasablanca
1. Observation of wealth synergies clustered around increasing returns'activities and continuous mechanization in general. Recognition that`We are in the wrong business'. Conscious targeting, support andprotectionoftheseincreasingreturns'activities.
2.Temporarymonopolies/patents/protectiongiventotargetedactivitiesinacertaingeographicalarea.
3. Recognition of development as a synergic phenomenon, andconsequently the need for a diversified manufacturing sector('maximizingthedivisionoflabour',Serra,1613).
4. A manufacturing sector solves three policy problems endemic to theThirdWorld simultaneously: increasing national value added (GDP),increasingemploymentandsolvingbalanceofpaymentsproblems.
5.Attractingforeignerstoworkintargetedactivities(historically,religiouspersecutionshavecontributedtothisinanimportantway).
6. Relative suppression of landed nobility and other groups with vestedinterestsbased in theproductionofrawmaterials(fromHenryVII inthe1480stoKoreainthe1960s).Physiocracy,theoriginatoroftoday'sneo-classical economics, represented the rebellion of the landowningclassagainstthepoliciesonthislistinpre-RevolutionaryFrance.TheAmerican CivilWar is a prototype conflict between free traders andraw materials exporters (the South) on the one hand and theindustrializingclass(theNorth)ontheother.Today'spoorcountriesarethenationswhere`theSouth'haswon thepoliticalconflictsandcivilwars.Openinguptooearlyforfreetrademakes`theSouth'thepoliticalwinners. Standard economics and the conditionalities of the

Washington institutions de facto represent unconditional support for`theSouth'inallpoorcountries.
7.Taxbreaksfortargetedactivities.
8.Cheapcreditfortargetedactivities.
9.Exportbountiesfortargetedactivities.
10.Strongsupport for theagricultural sector, in spiteof this sectorbeingclearly seen as incapable of independently bringing the nation out ofpoverty.
11.Emphasisonlearning/education(UKapprenticesystemunderElizabethI,FrancisBacon'sNewAtlantis,scientificacademies,bothinEnglandandontheContinent).
12.Patentprotectionforvaluableknowledge(Venicefrom1490s).
13.Frequentexporttax/exportbanonrawmaterialsinordertomakerawmaterials more expensive to competing nations. (This started withHenry VII in the late 1400s, whose policy was very efficient inseverelydamagingthewoollenindustryinMediciFlorence.)
Spainasafrighteningexampleofwhatnottodo
From the mid-1500s the theatre of Europe provided further elucidation ineconomictheoryandpolicy,settinganexampleofwhatacountryshouldnotdo.Spain had long been an important industrial state. `In Europe, to describe thebestsilkoneoncesaid"thequalityofGranada".Todescribethebesttextilesoneoncesaid"thequalityofSegovia",'wroteaPortugueseeconomistinthe1700s.By then Spanishmanufacturing industrywas history and themechanisms thathaddiminisheditsmanufacturingcapacityanditswealthintandemwereeagerlystudiedacrossEurope.Theirconclusionsonwhathadhappenedwerevirtuallyunanimous.
Thediscoveryof theAmericas led to immensequantities of gold and silverflowingintoSpain.Thesehugefortuneswerenotinvestedinproductivesystems

but actually led to the de-industrialization of the country. The landownersprimarily profited from the `funnel of gold' from theAmericas, as they had amonopoly on the export of oil and wine to the growing markets of the NewWorld.Thesupplyofsuchgoodsishighlyinelastic,andsubjecttodiminishingrather than increasing returns.10 To increase production, particularly to makenew olive trees yield as old ones, takes a long time. This expansion wouldproduce the opposite of increasing returns, that is, diminishing returns whichcause the cost of production per unit to rise rather than fall. The result of theincreaseddemandwasconsequentlyasharpincreaseinthepriceofagriculturalproducts.Atthesametime,nobilityowninglandwereexemptfrompayingmosttaxes,sothetaxburdenfellincreasinglyontheartisansandmanufacturers.Theircompetitivenesswas,ontheotherhand,alreadybeingsqueezedbytherapidriseofpricesofagriculturalgoodsinSpain.Thisundidthesynergiesanddivisionoflabour in Spanish cities, causing a de-industrialization fromwhich Spain onlyfinally recovered in the nineteenth century. Successful states protectedmanufacturing industry, unsuccessful Spain protected agriculture to the extentthatitkilledmanufacturing.
Politically,the`civilwar'betweenmodernurbanandtraditionalruralactivitieshadalreadybeenpartlylostinSpainduringandaftertheso-calledGuerradelosComunerosof1520-21.ThisprototypeofamodernEuropeanrevolutionhadthelong-term effect of seriously damaging Spanish manufacturing cities likeSegovia.Thestrongpoliticalpowerofthesheep-owners'organization,LaMesta-towhichtheSpanishthroneowedmoney-addedtoSpain'spro-rawmaterialandanti-modernizingeconomicpoliciesatthetime.TheMestainfactmanagedtowield itspower insuchaway that theirsheepwereevenallowed to invadeagricultural land, and some agricultural land in Spain was converted back tograzing.A comparison of Spain andEngland in the 1500s provides uswith ausefulandearlyexampleoftheimportanceofwherepoliticalpowerlies:inthehands of those who have a vested interest in producing raw materials (as inSpain)orwiththosewhohavevestedinterestsinmanufacturing(asinEngland).Thisisnotto imply that thosewhohave theirvested interest inmanufacturingarebetterorlessgreedyindividualsthanthosewhosevestedinterestslieintheproduction of raw materials. As always, capitalism must essentially beunderstood as a system of unintended consequences, and the unintendedconsequences of making profits from manufacturing are different from thosefoundinnationswhereeverybodymakestheirprofitsfromrawmaterials.Once
thesemechanisms are understood it is possible - as itwas forHenryVII - toproduce the desired effects throughwise economic policies. Such policies arenowoutlawedbytheWashingtonConsensus.
Just asVenice andHollandwere regarded as examples to be copied, in thesixteenthcenturySpaingraduallycametobeseenasanexampleofthetypeofeconomic policy and economic effects a nation should avoid at all costs. Itbecameclear that the riches from thecolonieshad in fact impoverished ratherthanenrichedSpain'sowncapacitytoproducegoodsandservices.IncontrasttoEngland - which ever since Henry VII came to power in 1485 had activelyprotected and encouraged her industry - Spain protected her agriculturalproduction, like oil and wine, against foreign competition. By the end of thesixteenthcentury,Spain,whohadhadaconsiderableindustrialproduction,wasseverelyde-industrialized.
Itwascleartotheobserversatthetimethattheenormouswealth,allthegoldandsilverflowingintoSpain,justflowedoutagainandendedupinacoupleofplaces-VeniceandHolland.Likeaslow-movingtsunami,itispossibletostudythe giant wave of inflation that spread through Europe with its epicentre insouthernSpain.Butwhydidthisflowofgoldandsilverfinallyendupinverylimited geographical areas?What distinguishedVenice andHolland,where somuch of the flow of Spanish gold and silver came to a halt, from the rest ofEurope?Theanswerwasthattheyhadextensiveanddiversifiedindustry,andatthesametimehardlyanyagriculture.TherealizationspreadthroughEuropethatthe real gold mines of the world were not the physical gold mines, butmanufacturingindustry.WefindthefollowingobservationinGiovanniBotero'sworkonwhatcausesthewealthofcities:`SuchisthepowerofindustrythatnomineofsilverorgoldinNewSpainorPerucancomparewithit,andthedutiesfrom themerchandise ofMilan areworthmore to theCatholicKing than theminesofPotosiandJalisco."Italyisacountryinwhich...thereisnoimportantgoldorsilvermine,andsoisFrance:yetbothcountriesarerichinmoneyandtreasurethankstoindustry.'12
Invariousforms, thestatement thatmanufacturingwas therealgoldmineisfoundalloverEuropefromthe late1500s throughthe1700s.AfterBoterowefind thisexpressedbyTommasoCampanella (1602)andAntonioGenovesi (inthe1750s)inItaly,byGeronimodeUztarizinSpain(1724/1751)andbyAndersBerch(1747), thefirsteconomicsprofessoroutsideGermany, inSweden: `The
realgoldminesarethemanufacturingindustries'.13
In pre-Smithian economics the establishment of manufacturing came to beseenaspartofawidermissionofcivilizingsociety.Capitalismwasadvancedasan argument for repressing and harnessing the passions of humankind, forchannelling the energies of human beings into something creative.14 Italianeconomist Ferdinando Galiani (1728-87) stated that `from manufacturing youmay expect the two greatest ills of humanity, superstition and slavery, to behealed'.15Thisbecame theprincipleonwhichEuropeaneconomicpolicywasfounded, and which industrialized European nations one by one over a longperiod. Building `civilization', building a manufacturing sector, and laterbuilding democracy,were seen as inseparable parts of the same process. ThisconventionalwisdomwasalsoquotedbyFrenchstatesmanandpoliticalwriterAlexisdeTocqueville(1805-59)in1855:`Idonotknowifonecanciteasinglemanufacturing and commercial nation from theTyrians to the Florentines andtheEnglish, that has not also been free.Therefore a close tie and a necessaryrelationexistsbetweenthosetwothings:freedomandindustry."'
Around1550,manySpanisheconomistsbegantorealizewhatwashappeningin their country, and produced both good analysis and sound advice. AsAmerican historian Earl Hamilton, an expert on Spanish economy andeconomics of this period, points out: `History records few instances of eithersuchablediagnosisoffatalsocialillsbyanygroupofmoralphilosophersorofsuchutterdisregardbystatesmenofsoundadvice."'In1558,Spain'sMinisterofFinance,LuisOrtiz,describesthesituationinamemorandumtoKingPhilipII:
FromtherawmaterialsfromSpainandtheWestIndies-particularlysilk,iron and cochinilla (a red dye) - which cost them only 1 florin, theforeigners produce finished goods which they sell back to Spain forbetween 10 and 100 florins. Spain is in this way subject to greaterhumiliationsfromtherestofEuropethanthosetheythemselvesimposeontheIndians.InexchangeforgoldandsilvertheSpaniardsoffertrinketsofgreater or lesser value; but bybuyingback their own rawmaterials at anexorbitantprice,theSpaniardsaremadethelaughingstockofallEurope.'I
The fundamental idea here - that a finished productmight cost from ten to ahundredtimesthepriceoftherawmaterialneededfortheproduct-wouldrecurforcenturiesinEuropeanliteratureoneconomicpolicy.Betweenrawmaterials

and thefinishedproduct liesamultiplier:an industrialprocessdemandingandcreating knowledge, mechanization, technology, division of labour, increasingreturns and - above all - employment for the masses of underemployed andunemployed that always characterizes poor countries. Today, the economicmodels of the World Bank assume full employment in developing countries,even though insomeplacesnomore than20-30percentof theworkforcehaswhatwewould call a `job'. Those who were involved in economic policy inearliertimesrecognizedtheextentoftheunemployment,theunderemploymentand thevagrancy,andunderstood that the labour involved in transformingrawmaterials into finished products in and of itself would increase the wealth ofcitiesandofnations.Themainpoint,however,wasthattheeconomicactivitiescoming into existence when the raw materials were refined into finishedproducts followed different economic laws than did raw material production.The `manufacturing multiplier' was the key both to progress and politicalfreedom.
From the end of the fifteenth century until after the SecondWorldWar themainthemeineconomicpolicy-ifnotineconomictheory-wasthereforewhatwe can call `the cult of manufacturing industry'. This involved talking about`planting'industryinthesamewayonewould`plant'usefulspeciesfromforeignlands.Twodifferent institutionsservingsimilarpurposeswerebothestablishedin the late 1400s: the protection of new knowledge through patents and thetransfer of the same knowledge into new geographical areas through tariffprotection.Bothwerebasedontheverysametypeofeconomicunderstanding:thecreationandgeographicspreadofnewknowledgethroughtheinstigationofimperfect competition. An indispensable part of this process of developmentwere the institutions that `got the priceswrong' compared towhat themarketwouldhavedoneifleftalone:thepatentsthatcreatedatemporarymonopolyfornewinventionsand the tariffs thatdistorted theprices formanufacturedgoodsandenablednew technologies andnew industries tobeestablishedawayfromtheplacetheywerefirstinvented.
These inventionsand innovationswerecreated inaway thatmarkets, left tothemselves,wouldneverbeabletoreproduce.Today'seconomicpolicyandtheWashington institutions vigorously defend only one of these institutions - thepatents that create ever-increasing income flows to very few and very richcountries-whiletheverysameWashingtoninstitutionsvehementlyprohibitthe
toolsthatallowthegeographicalspreadofimperfectcompetitionintheformofnew industries to other countries. Protecting imperfect competition in the richcountriesisaccepted,butnotinthepoor.ThisiswhatIhavereferredtoasthe`assumption-juggling'ofeconomictheory:othertheoriesareusedathomethanthosethatareallowedintheThirdWorld,followingtheoldcolonialpattern.TheeconomicpowergamealwaysresultsinthesameGoldenRuleprinciple:theonewhohasthegoldmakestherules.
Intheearly1700saruleofthumbdevelopedforeconomicpolicyinbilateraltrade, a rule that rapidly spread throughout Europe.When a country exportedraw materials and imported industrial goods, this was considered bad trade.When thesamecountry imported rawmaterials and exported industrial goods,thiswas considered good trade.19 It is particularly interesting to observe thatwhenacountryexportedindustrialgoodsinexchangeforotherindustrialgoods,thiswasconsideredgoodtradeforbothparties.TouseatermonceemployedbyUNCTAD:symmetricaltradeisgoodforallparties,asymmetricaltradedoesnotbenefitthepoorcountries.
This was why the most eager advocates of industrialization - for tariffprotection-likeFriedrichList,werealsothemosteageradvocatesoffreetradeand globalization after all countries had industrialized. As early as the 1840sFriedrich List had a recipe for `good globalization':20 if free trade developedafterallcountriesof theworldhad industrialized, free tradewouldbe thebestforeveryone.Theonly thingwedisagreeabout is the timingforadopting freetrade, and the geographical and structural sequence inwhich the developmenttowardsfreetradetakesplace.
AslateasduringthereconstructionofEuropeaftertheSecondWorldWar,wefindthatthistypeofeconomicunderstandingwasstillpresent.Afterthewar,USindustrywas vastly superior to the industry of Europe. Yet nobody suggestedthatEuropeshouldfollowitsowncomparativeadvantageinagriculture-onthecontrary, everythingwas done to re-industrialize Europe through theMarshallPlan.Thiswasessentiallyaplantore-industrializeEuropeusingthetraditionalpolicy toolbox, including heavy protection of manufacturing industries. Onedifferencefromprevious centurieswas that inpost-SecondWorldWarEuropefarming also had to be protected. It is, however, of crucial importance tounderstand that twentieth-century protection of agriculture was for entirelydifferent reasons from the protection of manufacturing. Developing a

manufacturing base was aggressive protection aimed towards industrializationand higher real wages, whereas the protection of agriculture was defensiveprotectionism aimed at preventing the income of the agricultural sector fromfalling too far behind, as successful aggressive protectionism forced up thewagesinthenon-agriculturalsectorsoftheeconomy.Inotherwords,protectingmanufacturingindustrythatallowsthecreationofnewjobsandmakesnationalwagesriseisbasedonaverydifferentlogicfromtheprotectionofemploymentin agriculture from its competitors in poorer countries. The first type ofprotectionismistoincreasethewagelevelinthewholecountrybymeansofthesynergiesthatarecreated,thesecondtypehelpsfarmersandtheregionswherefarmingdominates.Theneedforthesetwodifferentkindsofprotectionismwillonlybefullyunderstoodwhenthequalitativedifferencesbetweenmanufacturingandagricultureareexplainedinthenextchapter.
GermanyfollowsinEngland'sfootsteps(1648)
France andother countrieswere soon imitating theEnglish strategies that hadbeen so successful under the Tudors. These strategies became nation-buildingprojectsatatimewhenthesmallcity-stateshadirretrievablylosttheirpowertonationsthathadmanagedtoconsolidateandenlarge`thecommonweal'tolargergeographical areas with larger markets. In France, the famous statesman jeanBaptisteColbert(1619-83)developedtheindustryand the infrastructurewhichunitedthecountry.Thegoalwastounitethecountrywith`perfectcompetition'inside and protect its increasing returns and labour intensive industries fromforeigncompetition.Throughouttheeighteenthcentury,inEurope,Colbertwasgenerallyreferredtoas`thegreatColbert'.
Nowweshall takeacloser lookatEurope's `delayednation',Germany.VeitLudwigvonSeckendorff(1626-92)wasthefounderofGermaneconomics.Histimeswere characterized bywar andmisery.TheThirtyYearsWar (1618-48)hadwipedoutasmuchas70percentofthecivilianpopulationinsomepartsofGermany. The war had started as an internal religious war, but graduallyinvolved many of the great powers of Europe at the time, including Spain,France,DenmarkandSweden.Thewarhadnowinners,but itbecameclear tomanyGermansthattherealloserwascivilizationitself.WhenSeckendorffwassixteen,hisfather-aGermanservingintheSwedisharmy-wasbeheadedasapresumed spy in aNorthGerman town.WhenSeckendorff died at the age of
sixty-six,thearmyofLouisXIVofFrancehadjustlaidwastetheGermanstateof theRhineland-Palatinate. In themeantimeGermanyhadhadawarwith theTurks,whobesiegedandalmostmanagedtoconquerVienna,andtwomorewarswithFrance.Thishad led toStrasbourg,whereSeckendorffhadstudied,beinglosttoFrance.ThePeaceofWestphalia(1648)-attheendof theThirtyYearsWar-leftaGermanyfragmentedintomorethan300smallstates.ImentionthisbecauseinmyviewGermany'swayoutofthiswar-tornbarbarismalsocontainsimportant lessons for today's failed and failing states.Germany'swayoutwasbasedonaproductionstrategy,abuildingupoftradeand industryconsciouslydiversifiedfromagricultureandrawmaterialproduction.Thekeytosuccesswasto emulate the economic structure of a country where peace and prosperityreigned-andtheexampletofollowwastheDutchone.21
With help from his father's colleagues Seckendorff found employmentwithanother ex-officer of the Swedish army, Duke Ernest of Saxe-Gotha, calledErnest the Pious. Among other duties, Seckendorff's responsibility was theenormous library thatDukeErnest had acquired, originally from the spoils ofwar.22ThislibrarycanstillbevisitedintheimpressivecastleandadministrativebuildingestablishedbyDukeErnestinGotha.ThustheyoungSeckendorffhadaccess toall themost importantwritings ineconomicsandpolitical scienceofhistimes,andoneofhistaskswastopresentsummariesofmanyofthemtohisDuke. In 1656, at thirty years old, Seckendorff published his most importantwork,Der Teutsche Fiirstenstaat (TheGerman principality),whose thesiswasbasedaroundtwoold traditions:adetaileddescriptionofacountry,itshistory,people,administration, institutionsandresources thathadbeencustomaryeversince thirteenth-century Italy, and secondly the old German Furstenspiegel(literallythe`king'smirror')textbooksor`owner'smanuals'forkingsandprincesonhowtoruletheircountries.Seckendorff'sbookremainedinprintforthenextninety-eightyears-averylonglifeforatextbook.
Some years later Seckendorff travelled to the Dutch Republic with DukeErnest.Aswasthecasewithsomanyotherobserversofthetime,theaffluence,peace,freedomandtoleranceheexperiencedinHollandmadeadeepandlastingimpressiononSeckendorff.Whenhereturnedhome,hefelttheneedtoelaborateon his advice for German princes with a supplement, Additiones, whichwaspublishedin1664,andsubsequentlyalwaysprintedwiththemainbook.Inthissupplement we get Seckendorff's most important economic insights. His

experiences in Holland confirmed the theory he had formulated in the Gothalibrary,abouttheimportanceofcitiesandindustryinthecreationofwealth.TheworksofItalianeconomistGiovanniBotero,whosemostfamouswork,OntheGreatness of Cities, was originally published in 1588, are today found in theGotha library in thirty different editions all published before 1655. We canassumethatmostofthemwerealreadythereinSeckendorff'stime.
Seckendorff understood the importance of havingmany different trades andcraftsrepresentedinthecities,andthatcraftsmenmovefromthecountrysidetothecities,wheretheycanearnmore.Atthesametimeheismoderninhisworryover the lack of competition among the craftsmen. Duke Ernest invested ininfrastructure,andarelativelyunsuccessfulattemptwasmadetomaketheriversof the principality as navigable as Dutch canals. The policies of Seckendorffenabledpeopletomovemorefreely,byremovingdutiesandtaxes,andinthemwefindthebeginningsofawelfarestate,withthestatetakingonresponsibilityforhelpingtheoldandthesick.
WhatdidSeckendorffandothereconomistsofthetimeseeintheNetherlandsthatmadesuchadeepimpression?Weknowquitealotaboutindustryandtradein the Dutch city of Delft at the time Seckendorff visited the country, andwithout knowing whether he ever visited Delft, we can use this city as anexample. German economist Werner Sombart's theories about war23 andluxury24caninDelftbeseenrepresentedbytheNavyandbytheartofpaintingasstrongincentivesinthedevelopmentofcapitalism.Butwithitsmicroscope-makers-turned-scientists the city also confirmed the Norwegian-AmericaneconomistThorsteinVeblen'sviewthatidlecuriosity-alsoindependentofprofitmotives-isanotherstrongmovingforceofcapitalism.Delftintheseventeenthcentury exemplified how maritime warfare, art as a luxury product, andscientificcuriositycancreateinnovationsandaffluenceinthesame,verywidelydiversifiedclustersofproduction.The importanceofdiversityperse -anotherfactor lost in today's standard economics - is stressed by virtually all foreignobserversof theNetherlandsat the time.Centrally in theDelftclusterwe findthemanufacturersofglasslenses-magnifyinglenses-thatwereusedforqualitycontrolinthetextileindustry.
BythefifteenthcenturyFlemishandDutchpainterswerepioneersintheuseofoil-basedpaintoncanvas,whereItalianpainterspaintedalfrescowithwater-basedpaintonfreshlyplasteredwalls.TheDutchpaintersobtainedtheirlinseed

oilandtheirlinenandhempcanvasfromtheNavyandmerchantmarine,wherethesematerialswereusedinthetreatmentofwoodandintheproductionofsails.Inthe1600sDelfttookoverfromFlorenceasEurope'sforemostmanufacturerofglassforscientificuses.Asmentioned,handheldlenseswereusedinthetextileindustry, but the lensmanufacturers also found other fields of use. TheNavyneeded binoculars and telescopes, and some of the glass lens manufacturersstarted producing microscopes. Sometimes these microscope producersthemselves became scientists, describing the new world revealed by themicroscopes. Delft's great microscope manufacturer and scientist, Antoni vanLeeuwenhoek (1632-1723), created a synergy between textile industry,microscopeproductionandnaturalscience,focusedaroundtheglasslenses.Toregisterhisfindings,heemployedartistsasillustrators.ThepainterJanVermeer(1632-75), who lived right around the corner from van Leeuwenhoek, startedusing a sort of primitive camera with glass lenses, a camera obscura, in hispainting.ArecentmovieaboutVermeershowsthis.25Thelinksbetweenartandscience are strengthened when Vermeer, before his death, named vanLeeuwenhoekasexecutorofhiswill.
Another result of theNavy'soperationswas theneed formaps.Thesemapshave a conspicuous place in many of Vermeer's paintings; indeed, one of hisbiographers comments on his `mapmania'. In Italy, maps had generally beenproduced as woodcuts. Now the Dutch started producing copperplateengravings. Copper and brass were materials used both to produce the Navybinocularsandthescientificmicroscopes, thuscreatingonemore linkbetweenscience,artandnavalwarfare.AnotherDutchman,alsobornin1632,whoalsostartedhiscareerasaglasslensproducerwasBaruchSpinoza,thephilosopher.Figure 5 illustrates the `national innovation system' that people could observewhenvisitingHollandintheperiodimmediatelyfollowingtheThirtyYearsWar.Knowledge developed in one sector would `jump' to apparently unconnectedsectors,proving thepoint thatnewknowledge iscreatedby linkingpreviouslyunconnected facts or events.Diversity per se came to be understood as a keyingredient in economic growth, and this diversity was not to be found inagricultural communities where people tended to produce the same things.26This has been recognized as one of the problems of areas producing rawmaterials:theyhavelittletotradebetweenthem.

Figure5Delft,Holland,1650s:aninnovationsystembasedondiversity
TheNetherlandsatthistimewasalaboratorywhereitwaspossibletoobservethe mechanics of economic development. To the contemporary observers itseemed clear that innovations and affluence were the results of the manywindowsofopportunitiesforinventionoutsideagriculture,thefallingunitcostsofproductionandtheincreasingreturnsfoundinurbancityactivities,theextentofdivisionoflabourandthemanydifferentprofessionscreatingaffluenceasaproductof synergies.Basedonobservationof the samephenomena inVenice,Serra describes these three principles clearly in hiswork of 1613, adding that`one factor gives strength to the other'; in other words he describes a self-catalysingsystemofeconomicgrowth.Serraalsoincludesachapteronthekindofeconomicpolicyastateneedstocreatewealthbasedonthistypeofsystem.Itisasifthesetheoristssaid:ifyouwishtoestimatethewealthofacity,countthenumber of professions found within its walls. The larger the number ofprofessions, thewealthier the city. The diversity of economic activities was agoalinitselfthatmadeitpossiblefornewknowledgeto`jump'fromonesectorto the other aswe have observed in Figure 5. These theoretical developmentscontinuedthetraditionofBrunettoLatini'sthirteenth-centurybencommune,or

commonweal.
The goal for economic policy thus became the emulation of the economicstructure found in Venice and in Holland, the bringing together of as manydiverse professions as possible, all subject to increasing returns andtechnological change.Copying the economicpoliciesofVenice and theDutchRepublic was never an issue. Economists at the time understood that theireconomic structures had come into being as a result of a strategic geographicpositionformaritimepurposes,andthescarcityofarable land.Inotherwords,the development strategy of Europe became one of benchmarking andemulation. Appendix V sets out the nine-point strategy of another Germaneconomist of the same century as Seckendorff, PhilippWilhelm von Hornigk(1638-1712), the principles that had to be followed by the laggard German-speaking states in order to emulate the economic structures of rich Europeancountries.ItisworthnoticingthatthisstrategywasdirectedprimarilyatAustriaandfirstpublished in1684,onlyoneyearafter the lastsiegeofViennaby theTurks.Hornigk'sbookwent through sixteeneditionsand remained inprint formorethanahundredyears.Theeditionpublishedonthehundredthanniversaryofthebook,in1784,reiterateditsimportanceincreatingtheeconomicsuccessof Austria. Typically, this is not a book mentioned in standard histories ofeconomicthought.
Veryearlyonwefindtheobservationthataproximitytocitiesalsoimprovesagriculturalpractices.AccordingtoBotero:`TheDutchsheepproducethreeorfourlambsatatime,andthecowsoftentwocalves;thecowsproducesomuchmilk that one who has not seen it would not believe it.'27 However, the keyimportanceofthesynergiesbetweencitiesandcountryside- theargument thatonly farmers sharing a labour market with a manufacturing city could everachievewealth-onlyrosetorealprominenceduringtheEnlightenment.
Josiah Child (1630-99), a governor of the British East India Company,encapsulatestheattitudetoworldsemulatingeconomicpolicybyarguing,`IfweintendtohavetheTradeoftheWorld,wemustimitatetheDutch,whomaketheworst aswell as thebestof allmanufactures, thatwemaybe in a capacityofserving allMarkets, and all Humours'. Similarly, Child opens his 1668 book,BriefObservationsConcerningTradeandInterestofMoney,withacommenton`theprodigiousincreaseoftheNetherlanders'whichis`theenvyofthepresentandmaybethewonderofallfuturegenerations'.`Andyet,'headds,`themeans

wherebytheyhavethusadvancedthemselves,aresufficientlyobvious,andinagreat measure imitable by most other nations ..., which I shall endeavour todemonstrate in the following discourse'. What was obvious to Josiah Child,however,hasbeenlosttostandardtextbookeconomics.
TheGermanswerealsoaware that,at least in theshort term, theycouldnotemulate the more democratic political system of the Netherlands or Venice.Therewasaclearconnectionbetweentheeconomicstructureofastateanditspoliticalstructure.29IntheshorttermGermanyhadtolivewiththerulersithad.The way to develop the country was to convince the rulers to change theireconomicpolicy,which in turn - in the long term -wouldchange the formofgovernmentinamoredemocraticdirection.ThedespotismoftherulerswastodevelopintowhatWilhelmRoscherlatercalledanenlighteneddespotism(1868)andphilosophersandeconomists, fromaround1648,slowlyworked tochangetheperceptionoftherulersastowhatconstitutedasuccessfulkingdom.
SeckendorffwasanearlyproponentofthisschoolofeconomistsandpoliticalwriterswhoweretodominateEuropeinthenextcentury,writerswhoconvincedthe kings and rulers that their right to rule a country also entailed a duty todevelop the state. These were the first developmental states, predecessors ofKorea and Taiwan in the late twentieth century. The enlightened ruler - the`philosopherking' in Christian Wolff's terms - was in charge of this'developmental dictatorship', and the role of the economists followingSeckendorffwastoadvise,assist,guide,correct,flatterandcajoletherulersintodoing their jobs properly. Many economists also acted as one-man researchcouncilsandentrepreneursoflastresortforthekings,activities that frequentlygotthemintofinancialtrouble.Thelogicthatemergedwas`thebettertheruler,thewealthierthepeople'.Insteadofjudginghissuccessbyhisownwealth,theruler'ssuccesswastobebasedonthewealthandhappinessofhispeople.
The firstprofessorof economics in theworldwasSimonPeterGasser,whoreceivedhischairof`Economics,PolicyandCameralSciences'attheUniversityof Halle, Germany, in 1727. Almost one hundred years would pass beforeEnglandgotherfirstprofessorshipineconomics(AdamSmithwasaprofessorofmoralphilosophy).Thefirsteconomics textbookwrittenby theworld's firstprofessor of economics, Introduction to the Economic, Political and CameralSciences,startsoutwithapoemwrittenbySeckendorff,whichdescribestheoldidealsofakingtobeanablehunter,horsemanandfencer,andthengoesonto

describethemodernkingwhosesuccessismeasuredbythewelfareandjusticefoundinhisrealm.3o
Irelandlearningfromthepast
InJuly1980WilhelmRoscher's`enlighteneddespotism'cametomymind.AfterfinishingmyPh.D. I had landedmy first job in anAmerican consulting firm,Telesis.At the start ofmy first assignment I foundmyself, in the companyofTelesis'smanaging director, in Irish PrimeMinister Charles Haughey's office.Justthethreeofus.TheassignmentwastoevaluateIrishindustrialpolicyafterthe SecondWorldWar and to make recommendations for the future, and weweretoreportdirectlytothePrimeMinister'soffice.
Haughey, who was an accountant by profession, had made the followingstatementtotheIrishnationon9Januaryofthesameyear:
Iwishtotalktoyouthiseveningaboutthestateofthenation'saffairsandthe picture I have to paint is not, unfortunately, a very cheerful one. Thefigureswhichare justnowbecomingavailable tousshowone thingveryclearly.Asacommunityweare livingwaybeyondourmeans ...wehavebeenlivingataratewhichissimplynotjustifiablebytheamountofgoodsand serviceswe are producing. Tomake up the differencewe have beenborrowing enormous amounts of money, borrowing at a rate which justcannotcontinue.Afewsimplefigureswillmakethisveryclear...wewilljusthavetoreorganizegovernmentspendingsothatwecanonlyundertakethosethingswecanafford.
IrelandhadjoinedtheEuropeanCommunityin1973,andmassiveECfundshadfloated into itsagriculturalsector.However, thishadcreatedover-capacityandhighly indebted farmers in a very difficult market. My recollection of themeeting is thatHaugheyhadavision: `Out there isanew technologycoming,andIwantyoutohelpIrelandbenumberoneinthattechnology'.Haugheywasreferringtoinformationtechnologyandhisvisionwasoneofemulatingtherichcountries,ofcatchingupwiththemandforgingaheadwiththenewtechnology.Iwas theonlyeconomiston the teaminIreland,andouradvicewas latermadealongthelinesofbusinessanalysis.3'
Today,Haughey is creditedwith the extremely successful transformation of

the Irish economy from the 1980s onwards, based on an early move intoinformation technology.After awhile realwages in Ireland surpassed the realwages in England, the old colonial master. With his vision and leadership,Haughey had played the same role as the enlightened despots of eighteenth-centuryEurope.
Much of the year followingmy initial meetingwith Haugheywas spent inDublin.FrommyIrishcolleaguesandfromTrinityCollegeLibraryIlearnedofIreland'sindustrialpast.Inthelate1600s,Ireland-aBritishcolony-wasaboutto take the lead in themost important industry of the time, the production ofwoollen cloth. A flow of skilled Catholic immigrants from the Continent hadcontributed to this development. English producers ofwoollen cloth -who intheir turnwere fighting awinning battlewith thewool industry of Florence -could not afford to lose her competitive edge to the Irish. They successfullypetitionedtheEnglishkingtoprohibitallexportsofwoollenclothfromIrelandfrom1699.
This was before Ricardo's trade theory, so everyone knew that killing themanufacturingsectorandforcingtheIrishtosendtheirrawwooltoEnglandwastantamount to reducing the country to poverty. Such practices were normallydefendedbyreferencetothefactthatallEuropeanpowersdidthesametotheircolonies.We have already referred to the English economist John Cary whodiscussedthewisdomof`freetradeandthedeathpenaltyfortheexportofrawmaterials'. The same John Cary was engaged in stopping the Irish export ofwoollenproducts.Hisargumentwasbasedontheeconomicmetaphorinuseatthetime,thatofthehumanbody.CaryarguedthatEnglandwastheheadofthebodyoftheCommonwealth,whileIrelandwasaperipherallimb.Whenconflictsarose within the body of the common weal, the interests of the head had toprevail.This of course causedbitter resentment in Ireland,where theDean ofTrinity College, John HelyHutchinson (1724-94), wrote a book on how thecommercial restraints of Ireland from 1699 had reduced her to poverty (TheCommercialRestraintsof IrelandConsidered inaSeriesofLetters to aNobleLord).Thebook,publishedanonymously,wascondemned tobeburnedby thecommonhangmanforitsseditiousdoctrines.ItwasthelastbookinEnglandtosufferthisfate.
In nineteenth-century America, Irish immigrant workers were keenlysupporting the `AmericanSystemofManufactures', the protective system that

allowedthecountrytoindustrialize.TheyrememberedthatIrelandhadhadherindustrystolenfromher,anddidnotwanttheirnewcountrytobesubjecttothesame treatment by England (who vehemently protested against Americanindustrialization for more than a hundred years). The situation was a bit likeprohibitingSiliconValleyfromexportingelectronicsduringthe1990s.In1699Irelandhadbeenpreventedfromemulating;in1980thecountryhaditsrevengewhenitembarkedonastrategytoconquerwhatwouldbecomethedominatingworld technology for future decades - information technology. This wouldproduceaproductivityexplosionthatwastocatapultnationalwagelevelsabovethatoftheformercolonialpower.MaybeIamattributingtoomuchimportanceto this, but there is almost an epic quality in the contrast between colonialIreland in 1699beingprohibited fromusing themost important technologyofthat time - for the production ofwoollen cloth - for export, and its vindictivesuccess 300 years later in the technology of our own time - informationtechnology.

533
29. The Nordic route to developmentLars Mjøset
The label ‘Nordic model’ is applied in increasingly diverse ways, but the following account concentrates on one of the classic uses: the suggestion that the development of the Nordic countries can serve as a role model for the development of developing coun-tries aiming to catch up with the leading economies. The label ‘Norden’ here refers to the five larger Nordic countries: Denmark, Finland, Iceland, Norway and Sweden, the main members of the regional organization, the Nordic Council. While many actors – such as the Nordic agencies of development assistance – claim that there are Nordic policy ideas that may be transferred, my point of departure is a detailed historical and comparative investigation of Nordic development patterns since the industrial revolution and on to the 1970s. For experience to be transferred, I provide a lot of historical experiences, but the crux of the matter is that there can only be learning if there is symmetric contextuali-zation at the receiving end. I return to this topic in the conclusion.
This chapter has two major points of departure. First, my use of the term ‘model’ as a social science concept applies to large units, such as nation- states, phases of the world economy, regions (in the world economy or within countries), or international regimes. In the following, I deal with nation- states and regional clusters of such states. I rely on social science research leading to case- based macro- comparisons between countries, but of course not disregarding their integration into a broader world- economic setting.
Second, the study of institutions plays a crucial role. These may be of national scope, at other times broader (Western world), at other times again regional, or even local. In par-ticular, my reasoning is in line with the historical- institutionalist tradition (Mahoney and Rueschemeyer 2003; Mjøset 2015). This converges with non- neoclassical institutional economics, which may be seen as an integral part of case- based comparisons as a broader approach, one which pursues the study of large processes in historical contexts. It is important that research on institutions exploits the full potential of macro- comparative methods. Alternative development theory must rely on case- based social science (Mjøset 2009).
THE LAYERING OF INSTITUTIONS IN NORDIC DEVELOPMENT
Local research frontiers are taken to indicate properties of development, and they point to domains (issue areas) in which institutions are formed (Mjøset 2009, 60–64). These frontiers provide keys to the properties it is necessary to distinguish in order to make ana-lytically precise comparisons. They must be related to one core category. In the following, this is socio- economic development. I use this term as a shorthand for economic, political and social development – the core concerns of development studies as an academic field. While this is my core category, other local research frontiers can be relied upon, partly
REINERT_97817825444661_t.indb 533REINERT_97817825444661_t.indb 533 03/10/2016 11:3703/10/2016 11:37
Erik S. Reinert, Jayati Ghosh and Rainer Kattel - 9781782544661Downloaded from Elgar Online at 03/31/2017 12:04:16PM
via University College London

534 Handbook of alternative theories of economic development
by defining their outcomes as properties, partly by relying on their analysis of shared properties. I shall employ a terminology based on the institutionalist study of varieties of capitalism (Mjøset 2015). I shall present the main terms with reference to the periodiza-tion in Table 29.1.
The first two columns provide an external periodization of the world economic and geopolitical context that influenced the Nordic countries. The basis is a historical timeline drawn from Perez’s (2002) periodization of five long surges since the earliest industrial revolution. The techno- economic paradigms implied (the leading capitalist economy is given in brackets) are: the cotton textiles- based first industrial revolution since the 1770s (Britain), the age of steam and railways since the 1830s (Britain), the age of steel, electric-ity and heavy engineering since the 1870s (Britain, United States, Germany), the age of oil, the automobile and mass production since the early twentieth century (United States), and the age of information and telecommunications since the 1970s (United States). All the small Nordic economies were exposed to international trends that were threatening but that also implied options for development. For instance, as Pax Britannica reached its peak in the 1840s and 1850s, the Nordic countries felt British economic competition but could also benefit from the new technologies (textiles, railways) that were diffused from the core of the world economy.
Perez’s framework works well in situations of full hegemony in the world economy (Pax Britannica, Pax Americana), but must be modified for periods marked by extensive uneven development and fragmenting warfare in the world economy, that is from the 1870s to World War II (WWII). I refer to three features characterizing the international context: diffusion of leading technologies, phases of openness and closure in interna-tional economic relations (trade, capital flows), as well as geopolitical relations (war or peace).
In the second column of Table 29.1, the period 1914–1945 is neutrally defined as the war/interwar period. Perez lets her fourth surge of Fordist mass production, mass con-sumption extend from 1908 to 1974. But due to uneven development, the United States (US) was clearly ahead of the Nordic countries at that time. Perez’s periodization does not capture the Nordic countries in the first half of the twentieth century. They were still busy industrializing on the heavy engineering platform, and despite the growing number of cars and the more generous consumption levels in some urban areas, the economic situation was difficult for both workers and peasants. The broad surge of mass consump-tion was a post- war phenomenon.
The third column depicts the political system with reference to the state of democracy: a first long period is prior to democracy, then there is the breakthrough of mass democ-racy, followed by two varieties of routinized democracy. With this property added, the periodization traces what Rokkan (1999) calls the interaction of the industrial and demo-cratic revolutions in the Western European area. It traces the mobilization of the main social movements in a macro- situation marked by an international context of evolving techno- economic paradigms and international institutions, and national- level processes of democratization connected to state formation and nation- building.
Starting with the fourth column, I define six Nordic periods corresponding to the six world- economic periods. For each of these periods, the fifth column indicates one or more main areas of institutional development, based on social scientific and histori-cal studies of the various institutions that have influenced the economic, political and
REINERT_97817825444661_t.indb 534REINERT_97817825444661_t.indb 534 03/10/2016 11:3703/10/2016 11:37
Erik S. Reinert, Jayati Ghosh and Rainer Kattel - 9781782544661Downloaded from Elgar Online at 03/31/2017 12:04:16PM
via University College London

535
Tabl
e 29
.1
Peri
ods o
f N
ordi
c ca
pita
lism
in a
wor
ld- e
cono
mic
and
geo
polit
ical
con
text
1.L
ong
surg
es2.
Inte
rnat
iona
lizat
ion
3.Po
litic
al sy
stem
4.Ty
pe o
f N
ordi
c ca
pita
lism
5.In
stitu
tions
6.A
ggre
gate
d7.
Dyn
amic
s
Prec
ondi
tions
Mer
cant
ilist
stru
ctur
ing
of th
e w
orld
eco
nom
yA
utho
ritar
ian
abso
lutis
tFa
mily
farm
s, ch
urch
, sta
te a
nd
dom
inan
t exp
ort s
ecto
rs1.
Text
iles
17
80s−
Nap
oleo
nic
war
s (p
rote
ctio
n, b
lock
ade,
then
ope
ning
)
Pred
emoc
ratic
Tran
sitio
nal,
agra
rian
Edu
catio
nal a
nd o
ther
inst
itutio
ns
of sk
ill fo
rmat
ion
Lib
eral
Pe
asan
ts
2. R
ailw
ays
18
30s−
B
ritish
heg
emon
y Pa
x B
ritan
nica
Agr
aria
n, p
easa
nt
mob
iliza
tion
Inst
itutio
ns o
f lo
cal g
over
nanc
e
3. H
eavy
engi
neer
ing
1870
s−
Wea
ker B
ritish
he
gem
ony;
inte
rnat
iona
l go
ld st
anda
rd
Em
ergi
ng m
ass
polit
ics
Pate
rnal
istPa
tern
alist
inst
itutio
ns a
t the
firm
le
vel;
early
soci
al p
rote
ctio
nC
orpo
rate
Wor
kers
3/4.
War
/ int
er-
w
ar p
erio
d 19
10s−
Inte
rnat
iona
l fr
agm
enta
tion,
col
laps
e of
wor
ld tr
ade
Turb
ulen
t mas
s po
litic
sC
apita
lism
with
fr
agile
dem
ocra
cyIn
stitu
tions
of
soci
al p
artn
ersh
ip.
Soci
al p
rote
ctio
n in
stitu
tions
re
vise
d4.
Mas
s
cons
umpt
ion
19
45−
Pax
Am
eric
ana;
pea
k of
U
S he
gem
ony;
ope
n fo
r tr
ade,
tight
regu
latio
n of
fina
ncia
l flo
ws
Rou
tiniz
ed
dem
ocra
tic m
ass
polit
ics
Em
bedd
edIn
stitu
tions
of
soci
al p
rote
ctio
n an
d so
cial
par
tner
ship
gen
eral
ized
; in
stitu
tions
of
expe
rt k
now
ledg
e
Inte
rven
tioni
stN
ew m
iddl
e cl
asse
s
5. IC
T 1
975−
US
wea
keni
ng –
cop
ing
with
fina
ncia
l ope
nnes
sIn
tern
atio
naliz
ed
wel
fare
Reg
ulat
ory
inst
itutio
ns m
itiga
ting
glob
al/ n
atio
nal p
roce
sses
Not
es:
Lon
g su
rges
(tec
hno-
econ
omic
par
adig
ms)
follo
w P
erez
(200
2).
‘7. D
ynam
ics’
indi
cate
s elit
e/m
ovem
ent d
ynam
ic.
REINERT_97817825444661_t.indb 535REINERT_97817825444661_t.indb 535 03/10/2016 11:3703/10/2016 11:37
Erik S. Reinert, Jayati Ghosh and Rainer Kattel - 9781782544661Downloaded from Elgar Online at 03/31/2017 12:04:16PM
via University College London

536 Handbook of alternative theories of economic development
social developments of the Nordic countries. In the sixth column, I sketch an even more aggregate periodization, combining the six periods into three pairs, defining three broad periods of Nordic capitalism: liberal, corporate and interventionist. The seventh column roughly indicates that the dynamics between social elites and social movements can be seen as drivers of institutional change.
Liberal capitalism in Norden was marked by peasant mobilization, corporate capi-talism was marked by working- class mobilization, and interventionist capitalism was marked by middle- class mobilization. Given the institutionalist perspective, this dynamic can be discussed with reference to a modern term such as ‘institutional design’. The insti-tutional complexes analysed are not generally the result of conscious designs. They are responses in distinct historical conjunctures by collective actors with limited foresight. Still, the sequence suggested above may be reformulated as follows: it is as if an initial elite blueprint for institutional design is countered by mass mobilization that envisions institutional designs in which the role of the mobilizing group is greater than in the initial blueprint. This entails the assumption that in times of major social change, elites start to work on institutional designs early on, while movements need time to organize and move into positions of influence. One therefore often finds a pattern marked by elite offensives that are later countered by mobilization from below.
Institutional frameworks consist of layers of different historical vintage that can be located along the periodized historical timeline. Moving through historical periods towards the present, the institutional framework consists of an increasing number of institutional complexes. Roughly speaking, this chapter studies three types of institu-tional complexes: capacity institutions (schools, other skills- related organizations, inno-vation and technology policies), short for capacity- building institutions, including what is called systems of innovation or ‘systems of competence building’ (Miettinen 2013; Lorenz and Lundvall 2009); social protection institutions (health, age, family, social policies; Esping- Andersen 1990, 1999; Huber and Stephens 2001); and social partnership institutions (routines, formal agreements and legal provisions related to incomes policies; Vartiainen 2011; Moene and Wallerstein 2008).
In analysing the relationship between these complexes, the concepts of complemen-tarity and co- evolution are useful. Complementarity indicates the degree to which institutions – due to co- evolution – match each other, thereby coming together to produce the outcomes studied. In this case, this outcome is socio- economic development, understood as the combination of growth and social development, where the latter indi-cates that the benefits of growth are distributed in ways that avoid social polarization, in terms of strongly skewed distribution of income and other resources, chronic economic strife between groups (defined in ethnic, religious or other terms), and/or authoritarian breakdown of democratic political institutions.
Co- evolution indicates adjustment processes between older and more recent institu-tional complexes. The closer the co- evolution, the stronger the complementarities. The more incoherence between various institutions and institutional complexes, the weaker the complementarities. The theoretical foundations of this perspective can be elaborated with reference to historical institutionalism (Thelen 2014), varieties of capitalism (Iversen and Soskice 2012) and heterodox, institutional economics (Hodgson 2004).
Patterns of institutional complementarity are consolidated as elite and movement rep-resentatives interact – in more or less conflictual ways – to face structural changes in the
REINERT_97817825444661_t.indb 536REINERT_97817825444661_t.indb 536 03/10/2016 11:3703/10/2016 11:37
Erik S. Reinert, Jayati Ghosh and Rainer Kattel - 9781782544661Downloaded from Elgar Online at 03/31/2017 12:04:16PM
via University College London

The Nordic route to development 537
small state, depending entirely on its open economy. One might be tempted to conclude that in the Nordic cases, the resulting ‘institutional design’ has strengthened complemen-tarities between institutions of various vintages.
The question of institutional complementarities must be raised anew for each period. The moulding of institutional complementarities is not always frictionless. Co- evolution may lead to stronger or looser institutional complementarities. Some ‘projects of insti-tutional design’ have threatened to undermine elements of the historically established complementarities. As will be seen, there have been periods of instability, and some major institutional developments have not been retained; they have proven to be non- complementary, and quite different institutional solutions have emerged (see the section on ‘Paternalist Capitalism’ below).
In retrospect, the Nordic sequence of institutional co- evolution appears as cases of ‘successful’ development. But the closer focus on three different institutional areas and six periods at least shows that the recent virtuous circles – most recently visible in the fact that all case countries except Iceland had no problems during the financial meltdown of 2008 – should not be identified with overall success. A period of conflicts may reach a productive solution (for example, Nordic labour- market constitutions in the interwar period) and thus yield virtuous development in a longer- term perspective. It is important to note – and I intend to show this below – that there have been projects of institutional design that have been undermined by social mobilization processes.
In six sections below, I provide brief portraits of each historical phase since the late eighteenth century. I start with the international context, then focus on the institutional area in which the most significant new developments take place. I also provide some – however selective and partial – analyses of the co- evolution of the older institutions with the most recent institutional complexes.
For a short chapter like this, there are major limits to how much detail can be provided. A more comprehensive treatment could start from the comparative differences, thereafter specifying limited generalizations for each period. That would yield distinct comparative portraits. The short account here cannot provide such portraits, but at least it can illus-trate important institutional features in the history of Nordic capitalism. The conclusion will refer to these historical features in light of challenges for present- day developing countries.
PRECONDITIONS
As Rokkan (1999) made clear in his analysis of democratization in Western Europe, processes of state formation after the industrial revolution were partly determined by specific sets of preconditions. I shall briefly summarize the most important ones, given this chapter’s focus on political- economic development.
Family Form
The oldest precondition worth mentioning is the family form. Historical demography claims that a North- Western European family form emerged some time between 1000 and 1300 (Hajnal 1965; Laslett 1976). The geographical extent of the North- Western
REINERT_97817825444661_t.indb 537REINERT_97817825444661_t.indb 537 03/10/2016 11:3703/10/2016 11:37
Erik S. Reinert, Jayati Ghosh and Rainer Kattel - 9781782544661Downloaded from Elgar Online at 03/31/2017 12:04:16PM
via University College London

538 Handbook of alternative theories of economic development
European family form when it first emerged was roughly: England, Scandinavia (except Finland), Germany, Poland, Northern France, Benelux, Switzerland, Austria and parts of Bohemia (Oesterdiekhoff 2008, 87).
This form can be contrasted with the patrilineal extended family, which still exists in several varieties across the world. The latter has unilinear affiliation (descent is traced through the father’s lineage), while the North- Western European form is cognatic (line of descent is arbitrary). The partilineal form has the extended family as the main unit, while the North- Western form is based on the parent couple. Marriage patterns differ signifi-cantly. In the patrilineal form young men marry early, and the proportion of unmarried men is relatively low; the North- Western European form, in contrast, is marked by a high age at marriage and a high proportion of unmarried men. In the patrilineal form, the wife moves in with her husband’s family; while in the North- Western European form marriage depends on whether a new household – under the given economic conditions – can be formed. As an ideal type, it includes only two generations (parents and children) living in a separate household. The new family is socially, legally and economically self- reliant. It is not part of a complex, larger family group or clan.
In the North- Western form, then, women are co- founders of self- reliant households, not just a new element introduced into the husband’s family. Both spouses contribute inheritance, savings and capabilities. Varieties of the patrilineal extended family tend to accept polygamy, and divorce on the male initiative is generally allowed. The North- Western European form, in contrast, tends towards strict monogamy and prohibition of divorce (except for specific circumstances, such as infertility of the wife). Uniquely, the widow is allowed to remarry if the husband dies. Thus, it often takes the form of ‘successive polygamy’, and in this way, the unity of family, household and business is maintained. The consequence is that, before the industrial revolution, the status of women was better than in any other known civilization, and patriarchalism was weaker (Oesterdiekhoff 2008, 92–93, 99–100). Both women and children were better protected from death and misery in hard times.
This long- term historical difference is a relative one. It does not contradict the obvious fact that even in Northern Europe, there were marked elements of patriarchalism. But the strong position of women in the present- day Nordic model should be seen in light of these longer- term features. Note, however, that the analysis above relates to families in an agricultural and craftwork setting. With industrialization, household and production are separated, and the two- generation nuclear family spreads in urban, industrialized areas across the world. Obviously different European and non- European roots still play a role through institutions, both informal ones such as customs and norms connected to marriage and family life, and formal ones, particularly family law (regulating inheritance, rights at divorce; Bradley 1996). The challenge is to understand the precise processes whereby such historical roots are reproduced under industrial capitalism, both as norma-tive and legal structures.
Protestantism
Another cluster of preconditions can be linked to Protestant religion. The Reformation started in the early sixteenth century. Lutheran propaganda reached Denmark in the 1520s. Its impact in Sweden was less direct, linked to Sweden’s warfare with Denmark.
REINERT_97817825444661_t.indb 538REINERT_97817825444661_t.indb 538 03/10/2016 11:3703/10/2016 11:37
Erik S. Reinert, Jayati Ghosh and Rainer Kattel - 9781782544661Downloaded from Elgar Online at 03/31/2017 12:04:16PM
via University College London

The Nordic route to development 539
There were more High Church elements in Sweden and this church retained more inde-pendence of the state than in Denmark/Norway (Thorkildsen 1997, 139ff.). Despite these differences, in both cases church and state became very close. In Catholic Europe the church ‘remained supraterritorial and did not to the same extent prove an agency of nation- building’ (Rokkan 1999, 144). The North European ‘break with Rome not only nationalised religion, it legitimised the national vernacular standards as languages of worship as well as of statecraft’ (Rokkan 1999, 164f.). The next three preconditions are specifications of this Protestant legacy.
Administrative Traditions
There were important differences between Danish and Swedish bureaucracy during absolutism. In Denmark, the King – in alliance with the merchant bourgeoisie – kept the nobility out of his administration (Østerud 1981). In the eighteenth century, Pietists were given priority as administrators under the Danish King. There was strong inspira-tion from Prussia, where the Kaiser relied on administrators from Pietist universities (Sørensen 1998, 368). In Sweden, nobility remained a part of the state apparatus much longer than in Denmark. Thus, the Danish tradition was more meritocratic (Mungiu- Pippidi 2011).
Early Reading Skills
In the seventeenth century, steps were taken ‘to enforce elementary education in the vernacular for all children. The established national churches simply became agents of the state’ (Rokkan 1999, 286f.). Johansson (1977, 29) noted three main features. First, in the Nordic area, the ability to read came much earlier than writing skills. These did not need to develop together. Second, reading skills were promoted from above; in Sweden, for instance, by the Church Law of 1686 under King Charles XI. All across Norden, this development preceded industrialization. Third, reading campaigns were enforced without schools. The state placed the responsibility on the parents, and the church would conduct yearly examinations at the household or village levels, testing reading abilities and knowledge of the Bible. This institutional complex entailed strong social pressure. No person could be confirmed until they could read and repeat the catechism. Only confirmed people could get married, and give their oath in a court of justice (Johansson 1977, 30).
In sum, the Nordic countries had high literacy rates early on. The least- developed and smallest member of the Nordic group, Iceland, was particularly early, since it also had an ‘unbroken literary heritage’ (Johansson 1977, 34). By the 1780s, around 90 per cent of the population above 12 years was literate (Karlsson 2001, 171). The Nordic indicators are extreme, but literacy figures were relatively high for the whole Reformist- Protestant area. For all of Protestant Europe, the estimate is that about 35–45 per cent (of the total population) could read in the late eighteenth century (Cipolla 1964, 61). This may be related to the North- Western European family form (its extension mostly converges with that of Protestantism), and the church’s emphasis on the national vernacular. However, I cannot explore these features in more depth here.
REINERT_97817825444661_t.indb 539REINERT_97817825444661_t.indb 539 03/10/2016 11:3703/10/2016 11:37
Erik S. Reinert, Jayati Ghosh and Rainer Kattel - 9781782544661Downloaded from Elgar Online at 03/31/2017 12:04:16PM
via University College London

540 Handbook of alternative theories of economic development
Early Social Mobilization
The Protestant state churches in Denmark and Sweden exerted an elite influence from above, but there was also the unanticipated consequence of religiously charged mobiliza-tion from below: small, unofficial religious meetings of laypeople, conventicles, multi-plied. They practiced religious worship led by lay preachers, thus requesting the right to assemble without consulting the Protestant state church, represented by the local parish preacher. In the Nordic eighteenth- century agrarian societies, Pietism emphasized the individual’s faith and the autonomy of the congregation. These family gatherings and broader congregations can be seen as early promotion of an independent civil society, although couched entirely in religious terms. The mobilization of these revivalist move-ments allude to core topics in the mobilization of later, more secular movements, such as the right to assemble and freedom of opinion. Pre- political and political vocabularies were intertwined (Nielsen 2009; Thorkildsen 1998). The state had required its citizens to read, but by the mid- eighteenth century, the state actually had to pass conventicle ordinances, restricting the activity of the revivalists. In Sweden, the state and the church clearly considered Pietism a disturbing element, issuing a strict ordinance in 1726. In Denmark, Pietism was influential even in the state, so its law (1741) was milder.
In line with a general sociological multi- level approach, I have so far – using Rokkan’s (1999) terms – covered culture and politics. It is also necessary to look at economic preconditions.
Dominant Export Sectors
One set of such preconditions are the staple export sectors, as analysed in economic geography. All the countries had experience with exports of staple goods: Iceland and Norway were traditionally major suppliers of dried fish; Norway, Sweden and Finland were major exporters of timber; Sweden also had a major tradition of iron exports, due to its rich iron ore deposits; Denmark, finally, was a major corn exporter (Senghaas 1985 [1982]; Berend and Ranki 1982; Mjøset et al. 1986; Mjøset 2007). Denmark/Norway, and even Sweden, were also important in shipping.
Transformation of Agriculture
Another set of economic preconditions concerns the social structure of agriculture. In all these countries, a development towards a family farm structure had started before the Napoleonic Wars. The process started first in Norway (late seventeenth century), where a degree of peasant ownership already existed. In the late seventeenth and early eighteenth centuries, freehold was established in Norway as well as Sweden/Finland (starting in the 1720s), mainly linked to developments in other trades: forestry, mining and fishing. In Sweden/Finland peasants could buy land from the King, becoming crown peasants, and after 1789, non- nobles could buy land from noblemen. In Denmark, peasants were legally emancipated in the late eighteenth century. Feudal ties (stavnsbånd) were abolished in 1788. Some peasants could acquire land but often became heavily indebted. In Sweden, the legal system of the estate society and its system of taxation (jordnatur) defined owner-ship and rights connected to the possession of a property, which was a function of the
REINERT_97817825444661_t.indb 540REINERT_97817825444661_t.indb 540 03/10/2016 11:3703/10/2016 11:37
Erik S. Reinert, Jayati Ghosh and Rainer Kattel - 9781782544661Downloaded from Elgar Online at 03/31/2017 12:04:16PM
via University College London

The Nordic route to development 541
owner’s position in the social hierarchy. This system was revised, stripped of differential privileges, becoming more like a regular property register (Østerud 1978, 150). At this time, there was considerable population growth, and enclosures were implemented as a response. These processes continued into the nineteenth century.
The Development of Nordic Capitalism
I have provided a list of preconditions for socio- economic development in the Nordic area. One can think of them as elements of a conjuncture: the family form possibly co- evolved with agrarian transformations, and the state with its state church after the Reformation interacted with religious individualism and autonomous organizations of revivalist movements. However, there is no space here to specify such an analysis. I shall leave my loose sketch of the historical preconditions, in order to investigate how Nordic capitalism developed under the long- term influence of the industrial and democratic revolutions that diffused through Europe from the late eighteenth century.
TRANSITIONAL, AGRARIAN CAPITALISM, 1780s–1830s
The British industrial revolution transformed the textiles industry, with cotton as the most important input. But soon the European state system exploded in more than 20 years of the French Revolutionary Wars (1792–1802) and the Napoleonic Wars (1803–1815), including naval blockades. The two Nordic units ended up on opposite sides in the war. As a consequence, Sweden (siding with Britain) lost Finland to Russia (1809), while Denmark (siding with France) lost Norway to Sweden (1814) (Mjøset 2003). With the region plagued by war and blockade, not many technological impulses were spread before post- war reconstruction began after 1814 (Vienna Congress). When Britain emerged as the dominant centre of the world economy, the Nordics, in close geographical proximity just across the North Sea, benefited from the diffusion of technologies. When the economy picked up again after a first post- war slump, the institutional legacies from the eighteenth century proved important.
The institutional feature noted in Table 29.1 – mainly education, the most crucial part of capacity institutions at the time – represents the coming- together of the economic, administrative and cultural preconditions. Literacy as well as relatively good health conditions (low infant mortality; Thorvaldsen et al. 2008) indicate a capacity to adapt to external impulses.
In a contribution of central relevance to the comparative study of Nordic development, Senghaas (1985 [1982]) claimed that the key feature was the (relatively) egalitarian distri-bution of land and income. Secondary employment in forests and fisheries secured some cash incomes to even the poorest farms, so there was rudimentary domestic demand for simple manufacturing goods, such as stoves for the households. Senghaas sees this as an early and basic generative structure behind the virtuous circle of economic development in the Nordic area. This structure was fertile ground for backward and forward linkages based on the dominant staple- export sector (Senghaas 1985 [1982]; with reference to Hirschman’s staple theory of economic development).
In Denmark/Norway, Hans Nielsen Hauge (1771–1824) was a lay preacher who also
REINERT_97817825444661_t.indb 541REINERT_97817825444661_t.indb 541 03/10/2016 11:3703/10/2016 11:37
Erik S. Reinert, Jayati Ghosh and Rainer Kattel - 9781782544661Downloaded from Elgar Online at 03/31/2017 12:04:16PM
via University College London

542 Handbook of alternative theories of economic development
founded businesses. He created the largest religious revival ever to have occurred in Norway. With a huge reading public, Hauge naturally focused on the paper and printing trades, but also engaged in the traditional Norwegian staple trade in fish. He was also active in farming, as well as in salt production along the coast during the harshest years of blockade. Hauge organized conventicles as collectives that could produce material goods in order to earn money for further religious mobilization. He engaged in what Max Weber termed ‘worldly asceticism’: believers should engage in production, thereby challenging the rich producers. In his movement, women were largely on an equal footing with men (Furseth 2002). This is one case of preconditions coming together: literacy, entrepreneurship, religious mobilization, pushing for the right to speak one’s own faith and to publish in a public sphere. The setting was a non- democratic one, and Hauge’s deeds led to his imprisonment.
Considerable elite restructuring took place during and at the end of the war (Sweden/Finland 1809, Norway 1814). The Vienna treaty established a European framework, and this was the context for elite offensives. As noted, Denmark and Sweden’s administrative systems differed: the relatively meritocratic Danish system contrasted with Sweden’s Vasa state, which united the interests of the King, parts of the nobility, and the freeholders. Sweden oscillated between full absolutism and old- style representative rule (Rokkan 1981, 56–58), and its bureaucracy remained unreformed for many decades: offices were sold, but such excesses were counterbalanced thanks to the long tradition of including lower strata in political structures (Knutsen and Rothstein 1994). However, peasants were uniquely represented as a separate (fourth) estate in the estates system until the parlia-mentary reform of 1866, and they also held a favourable position thereafter.
The two new states, Norway and Finland, had most of their old regimes cut off, being ruled by a state elite of bureaucrats with considerable autonomy. As a separate grand duchy within Russia, Finland was allowed to retain its Swedish legislation. In Norway, similarly, there was home rule, based on a constitution rushed through in 1814. The new elites had to accommodate the freeholding peasants, as they were represented in the parliament, established by the constitution. Norway’s ties to Sweden were weaker than Finland’s ties to Russia; the personal union through the Swedish King above all affected foreign policies. In both these countries, the bureaucrats had more autonomy vis- à- vis the King or Czar than in the older states (Sweden and Denmark).
The end of the European wars was followed by a post- war downturn, but as soon as economic activity picked up again, the above- mentioned elites basically aimed to restore their dominance, facing the new situation of agrarian restructuring and early industrial-izing impulses from Britain. Towards the end of this period and into the next, elites faced a growing wave of associations.
In Denmark and Finland, rulers were highly sceptical of voluntary associations (reli-gious, temperance). Religious mobilization was largely co- opted by the state church. In Norway and Sweden, in contrast, such mobilization flourished on the margins and outside of that organization (Jansson 1988). Iceland was only exposed to conservative versions of Pietist revivalism through the Danish colonial administration. But in that case, there was no bottom- up, radical revivalist response; rather, there was a more direct, nationalist response (Pétursson 1992).
As noted, a structure of freeholder family farms emerged before and through the Napoleonic Wars. Peasants constituted the majority of inhabitants in all these cases.
REINERT_97817825444661_t.indb 542REINERT_97817825444661_t.indb 542 03/10/2016 11:3703/10/2016 11:37
Erik S. Reinert, Jayati Ghosh and Rainer Kattel - 9781782544661Downloaded from Elgar Online at 03/31/2017 12:04:16PM
via University College London

The Nordic route to development 543
I covered some trends in the section on ‘Preconditions’, but the organization of the agrarian sector still differed considerably: Norway’s freeholder system was old; while in Denmark, these peasant farmers gained dominance step by step through the early nine-teenth century. The various elite offensives through this period all were attempts by the old and more recent elites to stem the pressure from a literate peasant class who knew how to legitimate their claims in religious terms.
INDUSTRIALIZING AGRARIAN CAPITALISM WITH PEASANT MOBILIZATION, 1830s–1870s
From the 1830s on, Europe experienced the high tide of Pax Britannica. Given British technological superiority, they considered free trade beneficial, and even exports of machinery were allowed (1842). Nordic neighbours across the North Sea benefited from the diffusion of the leading textiles and railways technologies that had been pioneered in Britain. The adaptive capabilities noted as a main institutional feature of the earlier period now facilitated industrial transformation – in a still agrarian society – on a British model.
Scattered textiles firms had been established earlier; a pioneer was the English producer Findlayson with a Finnish textile plant producing for the St Petersburg market, benefit-ing from the customs zone (1811) between Russia and Finland. But the main expansion of textiles production was in the 1830s. Early on, local workers needed instruction from travelling British specialists to make the various idiosyncratic mechanical technologies work (Bruland 1989).
During the mid- Victorian boom (1850s and 1860s), the first railway lines were con-structed: in Denmark from 1847, in Norway from 1854, in Sweden from 1856 and in Finland from 1861 (Mitchell 1978, 315ff.). While state capacity had mainly related to territorial integrity, domestic order and safeguarding of economic resources (Rose 1976), the first main addition to this was infrastructure (roads, canals), and above all railways, connected to postal and telegraph services in this part of the nineteenth century.
In this agrarian society with pockets of industrialization, the essential new institutions are related to the mobilization of the broad masses of peasants. I can here provide only a very rough comparative sketch of the particular set of institutions formed under the influence of peasant mobilization from the 1830s and onwards.
In Denmark, peasants were not represented at any level, but step by step the freeholders (gårdmenn) gained influence. The relatively ‘reformed’ bureaucracy of the late- absolutist King – an absolutism guided by ‘public opinion’ (Seip 1958) – responded to peasant mobilization, and clearly also took into account the mobilization going on elsewhere in Europe. Danish peasants gained influence at the local level in the early 1830s, achieving close to full manhood suffrage in 1849. Denmark then got one of the most liberal con-stitutions in Europe, and revolutionary riots were avoided. Norway’s freeholders could vote since 1814, but it took some decades before they returned their own candidates to parliament. By action ‘from above’ they secured influence in local government through new laws in this field (Norway’s local government laws, Formannskapslovene, 1837).
In Sweden and Finland, freeholders were integrated in the estates system, and it is harder to discern separate peasant movements in these countries. In Sweden, the estates
REINERT_97817825444661_t.indb 543REINERT_97817825444661_t.indb 543 03/10/2016 11:3703/10/2016 11:37
Erik S. Reinert, Jayati Ghosh and Rainer Kattel - 9781782544661Downloaded from Elgar Online at 03/31/2017 12:04:16PM
via University College London

544 Handbook of alternative theories of economic development
system co- opted the peasants until 1866. In Finland, elite response to popular support for the European revolts of 1830 and 1848 led to a fierce response from the Czar. In 1850, he banned all publications in Finnish ‘with the exception of religious and economic lit-erature’, and Finland experienced a period of ‘dark reaction’ (Puntila 1975, 33).
It seems that peasant mobilization in this period was less extensive in Sweden and Finland. But in all countries the impact of the religious revival movements grew stronger. Despite regional differences (north/south, coast/inland), they were all rural movements, and they were ‘primarily movements of the peasantry’, excluding the landless agrarian population. The clergy (and especially the lower clergy) was the ‘connecting link’ with the upper classes (Soulinna 1981, 601). This indicates that the reasoning of the rural population was mainly couched in religious terms. In Sweden and Finland, this was the dominant style of mobilization, while Norway and Denmark also had more overt mobi-lization with direct reference to peasant interests. In Iceland, peasant mobilization was more directly nationalist.
More broadly, the period was marked by a ‘spirit of association’. Among the main cases were the temperance movement (Anglo- American influence, for example via the American preacher Robert Baird in the 1830s and 1840s) and the free churches. Jansson (1988) shows that Sweden and Norway proved particularly open to the growth of associ-ations. Neither Norway’s bureaucratic state nor Sweden’s more aristocratic state worried much about these associations. The Swedish elites seemed happy that they would relieve the state of a number of responsibilities.
In Denmark and Finland, where autocrats (King, Czar) still strove to strengthen their control of municipal institutions to dampen lower- class pleas for national representation, most voluntary organizations were banned well into the nineteenth century. At least, the state was more eager to control them, aiming to co- opt the religious ones (such as the various missionary movements) into the state church. Another cross- cutting differ-ence related to the fact that the Swedish and Finnish church retained more High Church elements.
A liberal vision of possessive individualism spread from Britain during the textiles and railways phase of Swedish and Norwegian capitalism. It was also very influential in Denmark after the last remnants of absolutism withered away in 1849. A peculiar version of such liberalism also spread among many of the peasant groups gaining political influ-ence, as they wanted a very slim state. This view conflicted with the bureaucrat elites and – as will be seen – also with the emerging bourgeoisie, as soon as it came to discover the ‘Arbeiterfrage’.
It is important to note that this was the age of nationalism, voiced mainly by a small intelligentsia of writers and academics, and with particular force in the three countries that were still subjected to rule from the outside. I have already noted the Czar’s harsh actions in Finland in the mid- century. Furthermore, Denmark had similar problems with war on the southern front, eventually losing areas in North Germany, events that generated a brief period of intellectual ‘Scandinavianism’. Pétursson (1992) sees Iceland’s nationalist mobilization since the 1830s as a functional equivalent to radical revivalism, which was lacking in that country.
As early industrialization picked up, conditions for mobilization were clearly most dif-ficult in Finland, while Denmark became increasingly open to mobilization, and associa-tionism flourished most significantly in Sweden and Norway. Given this differentiation,
REINERT_97817825444661_t.indb 544REINERT_97817825444661_t.indb 544 03/10/2016 11:3703/10/2016 11:37
Erik S. Reinert, Jayati Ghosh and Rainer Kattel - 9781782544661Downloaded from Elgar Online at 03/31/2017 12:04:16PM
via University College London
The Nordic route to development 545
one can still conclude that in the nineteenth century, Nordic states became open to mobi-lization. In the earliest cases, this was more than 50 years before fully democratized mass politics. The peasant populations were not turned into clients, represented by various elite patrons. They were at the core of the religious revivalism, based on a reading public that conceived faith as an individual matter. In various fashions, the freeholders also influenced local government. These associations and organizations formed the backbone of an evolving civil society. By the mid- nineteenth century, the peasants had influence, to varying degrees, in their own local ‘peasant republics’.
A crucial feature here is the element of trust between the elites and the rural peasant population, incarnated above all in the institutions of local government. Many concepts have been used to characterize this relationship between state institutions and citizens: trust is one (Aubert 1989), ‘statist individualism’ is another one (Trädgårdh 1997), and ‘embedded autonomy’ (Evans 1995) could also be used. The main activity of the local governments was poor relief, compensating for some of the most glaring rural inequali-ties. The fact that the agrarian structure was egalitarian compared to non- Nordic cases should not obscure the fact that that there was much poverty, as population growth led to differentiation in the countryside between freeholders, landless peasants (crofters) and free- floating rural labour.
A main element of co- evolution pertained to the school system, developing further the reading capacity already existing as a precondition. Capacity institutions were upgraded. Denmark had already introduced general compulsory schooling in 1814. This was one concession to the peasants, decades before they were granted full representation. Most of the early school reforms – comprehensive primary school – fall in this period. Schools were now organized in relative autonomy from the church. Denmark extended its school to seven years on six days of the week in 1849, Norway introduced it in 1827 (extended to seven years, six days, in 1889), Sweden in 1842 (six years, six days, 1878). Finland’s earli-est legislation was in 1866 (transferring responsibility from the church to communes) and in 1898 (an Act establishing the principle of compulsory schooling). Iceland was the last in 1907, but on the basis of continuous literacy for more than 100 years (Sysiharju 1981; Flora 1983, 567, 608, 613, 572).
PATERNALIST CAPITALISM, 1870s TO 1910s
Roughly counted, each of the four large Nordic countries had about 100 km of railway lines by the end of the 1850s. By 1890, this had increased twentyfold in Denmark, Finland and Norway (to around 2000 km), and eightyfold in Sweden (8000 km; Mitchell 1978, 315ff.). This extension of the transport infrastructure indicates a much broader industrialization than in the earlier periods. There were numerous linkage effects on small firms and workshops reflecting the capacity of the literate population to acquire skills, producing various inputs and spin- offs (Amsden 2004; Bruland 1989).
Sweden’s pace of railroadization was four times that of the others. Sweden’s transition into the new techno- economic paradigms – heavy engineering industry based on basic natural science, especially electricity and chemistry – was also particularly rapid (Krantz 2001). By the end of the 1870s, Sweden’s Sandviken firm was the largest pig- iron pro-ducer in the Nordics, producing heat- change- resistant Bessemer steel for cannons and as
REINERT_97817825444661_t.indb 545REINERT_97817825444661_t.indb 545 03/10/2016 11:3703/10/2016 11:37
Erik S. Reinert, Jayati Ghosh and Rainer Kattel - 9781782544661Downloaded from Elgar Online at 03/31/2017 12:04:16PM
via University College London
546 Handbook of alternative theories of economic development
steel plate for shipbuilding. From the 1890s, production was upgraded to more flexible and tougher Martin steel. The firm founded several subsidiaries abroad to resist protec-tionism. A further case is ASEA, founded in the 1890s, which became Sweden’s leading producer in its field, developing a three- phase system for electrical power transfer, includ-ing generators, transformers and motors. This firm was thus crucial in the extension of an electricity grid, another huge infrastructure, following – with a lag – the construction of the railway infrastructure. This shows how the earlier and the most recent techno- economic paradigms interacted (Schybergson 2001; Fellman et al. 2008).
Another Swedish firm, Separator, patented the separator, a machine separating cream from milk by centrifugal force, a highly relevant tool in the upgrading of the family farms. Founded in the early 1880s, the firm soon expanded internationally, and by 1900 it was the most specialized of all Swedish machine shops. Only when separation was centralized to dairies in the late 1920s did it go into decline. This case illustrates how areas of innova-tion were linked to the transformation of agriculture, the very sector upon which earlier social mobilization had been based (Edquist and Lundvall 1993).
Sweden is the most prominent case, but the earliest industrializer, Denmark, kept up despite its dependence on export agriculture. By the late 1870s, B&W was the largest industrial enterprise in Denmark, producing steam engines, mill machinery, steamships and supplies to postal services and the navy. It entered the separator business around 1900, competing with Separator. B&W had acquired the diesel motor patent in 1898 and gained international leadership in diesel engines for ships in the 1910s, as oil was now replacing coal. Like ASEA, it also produced standardized production for power stations. As a response to the cheap corn brought by the railroad transportation revolu-tion, Denmark saw a major transition of its agricultural exports from corn to dairy and slaughterhouse products.
In Norway and Finland, the transition to heavy engineering was concentrated in the paper and pulp business. Finland’s leading firm, Gutzeit, was founded by a Norwegian in 1872, and one of the firm’s advantages was its command of a transport infrastructure for timber, connecting several large lakes to export harbours. In the early twentieth century, Norway also developed linkages in connection with the development of hydro- powered foundries producing, for example, aluminium. Iceland was clearly the laggard, but a major transformation of its fisheries started with the introduction of internal combus-tion motors on the fishing vessels.
Agriculture lost much of its dominance. The labour force in agriculture dropped below 50 per cent (of the total labour force) in Denmark in 1887, in Norway in 1895, in Sweden in 1909, in Iceland in 1916, but in Finland as late as 1949 (Alestalo and Kuhnle 1987; Mjøset et al. 1986, 336f.). Note, however, that on the tiny island of Iceland, urban concentrations did not emerge until the early twentieth century. Most of the population lived on farms (but some farms were mainly engaged in fisheries), and the local church was the main cultural and social centre. In other Nordic countries, the agricultural sector supplied labour both to industry and to emigration, which was highest in the 1880s and 1900–1910 for Norway and Sweden, for Finland only in 1900–1910 (Mjøset 1992, Table 4.5; Svalestuen 1971). Productivity increased due to technical progress.
Throughout this heavy industrialization, capacity institutions were extended and upgraded. Given the relationship to natural science, basic research capacity evolved in the few universities that existed, and engineering high schools and technical universities
REINERT_97817825444661_t.indb 546REINERT_97817825444661_t.indb 546 03/10/2016 11:3703/10/2016 11:37
Erik S. Reinert, Jayati Ghosh and Rainer Kattel - 9781782544661Downloaded from Elgar Online at 03/31/2017 12:04:16PM
via University College London

The Nordic route to development 547
were founded. However, there is insufficient space to analyse this co- evolution in more detail here.
Earlier elites consisted of leading state personnel (with lawyers and priests as the main professions), organizers of the traditional export trades, and whatever there was of an aristocracy. As the Nordic countries were able to renew their adaptive capacities and as heavy industry technologies became available, a new fraction of the bourgeoisie developed: owners of larger factories, organizing not just workers, but also hierarchies of managers and engineers. Some of these firms were family firms, others were controlled by financier families. A main case of the latter is Sweden’s Wallenberg family, from the 1850s onwards. Most of the firms that became permanent features of Nordic capitalism were eventually organized according to the model of managerial capitalism (Fellman et al. 2008).
The growing size of factories implied a concentration of workers. More complex work environments added to risks, such as the danger of work accidents. There was an ascend-ing labour movement. The founding years for labour parties and trade union federa-tions (in Nordic: LO, Landsorganisasjoner), respectively, were: Denmark 1871 and 1898; Norway 1887 and 1899; Sweden 1889 and 1898; Finland 1897–1899 and 1907; Iceland 1916 and 1916. The timings show that only by about 1900 (Denmark somewhat earlier) were there both central union movements and labour parties. Furthermore, at that time there were very few labour members of parliament (MPs).
This implies that for most of this period there was a business- elite offensive to organ-ize work conditions in the factories. There were elements of paternalist thinking. The company would care for the workers, providing services and benefits that would make it unnecessary for them to fight for their rights by means of an external organization. Workers would act collectively at the local level, in line with the spirit of associationism. To varying extents, they set up funds that would serve as insurance for new risks, such as work accidents and unemployment. These distinct working- class risks were investigated in factory law and social insurance commissions appointed in the 1870s and 1880s. The question, then, was whether employers, with or without state encouragement, should join in the financing of these funds.
Some employers wanted to be like parents to the workers, the firm would be like a home for them as long as they were able to work (occupational welfare). There were ele-ments here of an institutional design for paternalist capitalism. But once hit by accident or sickness (which may be unrelated or related to the work environment), employers needed state help.
Across Europe, states began to admit responsibility for a set of tasks that went beyond the defence of the territory: they had to consider policies and institutions that addressed the risks that wage earners encountered in the work situation (Baldwin 1990, 93 uses the term ‘statutory generosity’). This social question was also political, since workers at the time did not enjoy full political rights, so they might well organize and threaten social order. Also in the Nordic area, we observe the first, however moderate, efforts to develop institutions of social protection. The state would support a social security net, subsidiz-ing the workers who would also save to prepare for the new risks connected to periods when they might be without work, due to accidents, disease, unemployment or ageing. These were largely local initiatives, as neither capitalists nor workers were organized in comprehensive national associations. Basically, this was a constellation between the state,
REINERT_97817825444661_t.indb 547REINERT_97817825444661_t.indb 547 03/10/2016 11:3703/10/2016 11:37
Erik S. Reinert, Jayati Ghosh and Rainer Kattel - 9781782544661Downloaded from Elgar Online at 03/31/2017 12:04:16PM
via University College London

548 Handbook of alternative theories of economic development
bourgeois employers and engineers, and a working class whose organizational efforts were at an early stage.
These questions were raised in Denmark even before Bismarck. But from the 1880s, all of Europe looked to Bismarck’s German model of compulsory insurance for workers organized along occupational lines: sickness in 1883; accident in 1884; old age and dis-ability in 1889. This also inspired the Nordic commissions in the mid- 1880s. In the fol-lowing, I briefly survey the various early social protection schemes, with unemployment insurance added to Bismarck’s triad.
As for sickness insurance, Sweden (1891) and Denmark (1892) granted subsidies to existing voluntary sickness funds. This was also proposed at the time in Norway, but not passed. The model was an English one, supporting already existing (collective, local) self- help efforts. While Sweden and Denmark had many such voluntary funds, there were fewer in Norway. Thus Norway later (1909) chose the Bismarckian model of state- organized compulsory insurance.
Similarly, in the case of accident insurance, Denmark (1898) and Sweden (1901) estab-lished voluntary, employer- financed accident insurance laws; while Norway (1894) again chose the compulsory, Bismarckian version; and Finland (1895) a semi- compulsory one (Kuhnle 1981, 401f.). These schemes were restricted to the working class (sometimes even to only the most accident- prone groups among the workers), fitting the framework of paternalist capitalism.
As for unemployment insurance, the background was that any worker who lost their wage would soon become poor. The first discussions about social protection of the unem-ployed considered them in light of the much longer experience with the rural poor. As peasants were represented in the political system, their experience was that they had to carry all expenses when support was granted to the rural poor. In Norway’s 1863 poor law, the able- bodied did not deserve assistance. According to the iron law of wages, able people had to work for the wage offered. Poor relief would only bid agricultural wages up. This rural experience clashed with the experience of the new working class, risking invol-untary unemployment due to unfavourable business cycle movements. In Norway (1900) and Sweden (1918) revised poor laws offered work at low wages in public workhouses.
Schemes reflecting the experiences of unemployed workers in heavy industry devel-oped in the field between political parties and labour movements. There were two models. The Ghent model was like the sickness funds: voluntary, union- managed funds were sup-ported by the state, mostly administered together with public labour exchanges (Hatland 2013, 131). The alternative model was Britain’s 1911 system of compulsory, state- financed unemployment relief. The Ghent model was the first choice in all the Nordic countries. It suited the labour unions, which had already begun to organize funds on their own, but appreciated state support as funds were vulnerable in economic downturns and periods of financial instability. The system was established in Denmark in 1901, in Norway in 1906, and in Finland in 1917. In the next period some interesting differences evolved, as I shall show below.
Finally, I turn to age insurance, which in later developments would be the most impor-tant type of insurance. Bismarck’s triad of early social security arrangements did not include unemployment relief, but it did include (old- age) pensions. Comparing Denmark, Sweden and Norway, there is no convergence, and the pattern differs from the sickness, accident and unemployment schemes. In 1890, Iceland was the first Nordic country
REINERT_97817825444661_t.indb 548REINERT_97817825444661_t.indb 548 03/10/2016 11:3703/10/2016 11:37
Erik S. Reinert, Jayati Ghosh and Rainer Kattel - 9781782544661Downloaded from Elgar Online at 03/31/2017 12:04:16PM
via University College London
The Nordic route to development 549
to establish old- age pensions, but it was a very weak system, just a somewhat more legitimate system of poor relief. It was paid for and organized by local government. In Norway, liberal politicians held on to a Bismarckian approach in which the state would introduce compulsory insurance. Denmark and Sweden deviated; in 1891, Denmark introduced a system that the Norwegian liberal and peasant elites rejected: a compulsory, tax- financed system. Unlike any Bismarckian system, it was not restricted to certain working- class groups. It was universal, relating to the whole social formation, not just to the specific capitalist relations between labour and capital. Any citizen could potentially receive it, dependent on a means test. In 1913, Sweden passed a similar scheme that was even more explicitly universal.
In the post- war period, under different political constellations, means- testing was abolished, making Nordic old- age pensions universal. Thus, the potential universality of these early schemes started a path- dependent development. According to Baldwin (1990), it was the result of farmers pursuing their interests in the pre- democratic parliaments. He also notes that this was long before the (post- war) era of progressive income and wealth taxes. The basis of state finances was the central state’s indirect consumption levies. Poor relief, which was organized at the local level, was underwritten by local land taxes, paid only by farmers and peasants. Discussions on tax and welfare reform brought major class interests to the fore, and peasant politicians hoped that a system which included the rural poor under a universal, means- tested system would imply savings on land taxes, since it would be financed by state levies. Since they feared being trapped as distributional losers, peasant politicians pushed for a universalist, tax- financed, non- contributory old- age pension system. To Baldwin (1990, 93) this is the ‘cornerstone of the unique Scandinavian welfare edifice’, and the Danish decision (1891) was certainly taken at a time when labour interests hardly had a strong representation in Danish political institu-tions. Baldwin claims that the Swedish 1913 scheme can be explained in the same way.
All these systems were means- tested. The low benefits accrued only to citizens whose income was demonstrably under a poverty line. Those who received poor relief were not covered. Note also that ageing was a limited problem. Life expectancy of males at the age of 20, by 1900, was roughly 45 years, except for Finland, where it was 42 (Flora 1987, 98 f., 105 f.). None of these early age- pension schemes were much more than a less stigmatizing poor- relief system.
Apart from this, the other early cases of social protection – also with low benefits – targeted workers specifically. To the extent that working- class organizations were involved, they were junior partners. They had more to say regarding unemployment relief, since by the end of the period their position was stronger.
The working- class- related cases of social protection can be seen as institutional designs implying complementarity between state- sponsored social insurance schemes and employer–worker relations at the firm level, in matters such as wages and working conditions. I hypothesize this as a major elite offensive, starting during the great depres-sion of the 1870s–1880s, continuing into the belle époque, the new economic upturn that started ahead of World War I (WWI).
The early universalism of the old- age pension arrangements in Denmark (1891) and Sweden (1913) was less compatible with the paternalist approach to labour rela-tions. Peasant influence (Baldwin 1990) was here due to the role that these groups had gained in local and national politics, thanks to mobilization since the earlier period. In
REINERT_97817825444661_t.indb 549REINERT_97817825444661_t.indb 549 03/10/2016 11:3703/10/2016 11:37
Erik S. Reinert, Jayati Ghosh and Rainer Kattel - 9781782544661Downloaded from Elgar Online at 03/31/2017 12:04:16PM
via University College London

550 Handbook of alternative theories of economic development
macroeconomic terms, these old- age pensions were surely unimportant, but they marked a turning point, since in the longer term – especially in the early post- war period, as will be seen – the remaining working- class- related pensions were made universal, too. Only unemployment insurance was organized differently, as I show below. Social protection went through several phases, located at various points on the historical time line. The laws would be revised, extending coverage (for example, of types of accidents and diseases) and eligibility (groups eligible for relief), also stepping up benefit levels. The various branches of this social safety- net were administratively coordinated to ensure efficiency. In my analysis of post- war embedded capitalism, I shall discuss the peculiar influence of labour parties and of inter- Nordic learning on the universalist pensions.
At the end of this period, and into the first decades of the twentieth century, mobi-lization was broadened, consolidating the major political institution of parliamentary democracy. This became the era of big and well- organized popular movements: the temperance movement, the free church movement, the youth movement, the sports movement, the women’s movement – in addition to the labour movement. They differed in most respects, but agreed to one common goal: universal voting rights. When that goal was achieved, they split along party- political lines (Soulinna 1981, 604f.). First male, then universal suffrage was established right at the threshold of the next period. The next section will show how universal suffrage, the core of mass politics, and parliamentarism, became the crucial political framework for twentieth- century developments, particularly in the areas of social protection and social partnership.
CAPITALISM WITH FRAGILE DEMOCRACY, 1910s TO 1940s
As noted in connection with Table 29.1, the periodization in terms of new techno- economic complexes does not work for the interwar period. Economic problems in a fragmenting world economy led to the breakthrough of a new techno- economic para-digm (Fordist mass production and mass consumption) in the US only, while Europe was hampered by institutional inertia and persistent social tensions. Certainly, after 1917, we find a consumer culture spreading in Norden too, but mainly in the upper layers of the middle classes.
The extension of the railway infrastructure reached its peak in this period. Maximum railway infrastructure (in kilometres) was reached in Denmark in 1930, in Sweden and Finland in 1939, and in Norway in 1960. Sweden peaked at roughly three times the range (in kilometres) compared to the others (Mitchell 1978, 315ff.). Only in Iceland, with no railway infrastructure, was a modern infrastructure developed entirely for automotive transport. In the other Nordics, cars and lorries became an alternative to railway trans-port, but the real improvements of that infrastructure happened in the post- war period.
As for the development of the core sectors (heavy industry) of Nordic capitalism, the contraction of world trade caused grave trouble for the small, open economies. Many firms were already vulnerable because of the financial instabilities during the 1920s defla-tion. I cannot here provide an overview across countries and sectors, but will just note that in some sectors, exports did keep up even under the difficult circumstances in the 1930s. The years of protectionism were also years of escalation towards a new world war. Most of the successful exports were directly or indirectly defence- related products, based
REINERT_97817825444661_t.indb 550REINERT_97817825444661_t.indb 550 03/10/2016 11:3703/10/2016 11:37
Erik S. Reinert, Jayati Ghosh and Rainer Kattel - 9781782544661Downloaded from Elgar Online at 03/31/2017 12:04:16PM
via University College London

The Nordic route to development 551
on strategic raw materials (metals). This was possibly of greatest importance to Sweden. Furthermore, given the rise in protectionism, some amount of import substitution also played a role.
Within the heavy engineering complex, one new feature was the development of a furnace sector based on hydro- electricity in Norway after 1905. In Sweden, the engineer-ing firm SKF expanded spectacularly, producing its patented ‘spherical, double- rowed and self- regulating’ ball- bearing (Schybergson 2001, 117). Soon the firm had subsidiaries in Germany, France, the United Kingdom, and even in the US, where in 1923, it received a huge order from Ford for ball- and roller- bearings. With this latter subsidiary, SKF became an integral part in Fordism’s early breakthrough in the US. It was SKF that pro-vided Volvo with production facilities and capital. In 1935, Volvo became independent, the first big Swedish firm to produce cars, a main feature of Fordist mass production and mass consumption. None of the others developed car production. The great depression created big problems for SKF as a producer of business- to- business products, but still, its share of the entire world market (ball- bearings) in 1934 was nearly 20 per cent, and it had 70 per cent of global exports, enjoying huge demand from the armaments industry (Schybergson 2001).
From the earliest years of this period (strictly speaking, 1906–1945), the institutions of parliamentary democracy established new rules of the political game (Table 29.1, column 3). Parliamentary democracy was not a Nordic peculiarity; my focus here is on how this set of political institutions in this period became a framework for the co- evolution of social protection and social partnership in the Nordic area. The dates for universal suffrage (arranged from first mover), male suffrage and parliamentary rule, respectively, were: Finland 1906, 1906, 1919; Norway 1913, 1898, 1884; Denmark 1915, 1848, 1901; Iceland 1920, 1915, 1904; and Sweden 1920, 1909, 1917. There are interesting timing differences here, but I only have space to discuss the Finnish case.
The striking position of Finland as first mover has been thoroughly analysed (Alapuro 1992; Fryklund and Peterson 1981). By the turn of the twentieth century, structural changes in a poor agrarian society with an expanding forest industry block had led to strong polarization. On one side, the rural and urban proletariat were joined in the social- democratic party from 1899. On the other side, most of the agricultural freeholders allied with the Finnish ruling class of bureaucrats and industrialists.
Due to the instabilities in Russia, and given the strong Finnish nationalism, Finland experienced a dramatic, once- off democratization. Universal suffrage was effective as of the 1907 election; the second country in the world after New Zealand (1893). The social democratic party gained 37 per cent of the votes, emerging as the largest socialist party in Europe. In the period 1907–1917, class struggles interacted with the struggle for national independence. The collapse of the Czarist regime in the Russian Revolution of 1917 was the external impulse Finland needed to gain national independence. But the underlying polarization exploded in a vicious civil war between the reds and the whites in the first months of 1918. The victory of the whites (many reds died in prison camps) put its stamp on Finland’s interwar developments. In this respect Finland is an extreme case, one that displays developments that were more easily countered in the other Nordic states. Still, despite this extreme position, parliamentary democracy did survive. Finland, like the other Nordic states, emerged in 1945 as a country that would catch up, developing more similarities with its Western neighbours.
REINERT_97817825444661_t.indb 551REINERT_97817825444661_t.indb 551 03/10/2016 11:3703/10/2016 11:37
Erik S. Reinert, Jayati Ghosh and Rainer Kattel - 9781782544661Downloaded from Elgar Online at 03/31/2017 12:04:16PM
via University College London
552 Handbook of alternative theories of economic development
In all the countries, the period is characterized by a back- and- forth movement in which the labour movement challenged the old elites. By the end of World War I, the various state elites were combinations of older, bureaucrat layers; more recent bourgeois politi-cians with links to the most important industrial sectors; and some groups representing the dominant social movement of the mid- nineteenth century (peasants and farmers). The elite (state and employer) offensive of the earlier period had implied an institutional design that would block autonomous working- class mobilization and wage- bargaining with reference to workers organized across many firms. Through the interwar period, it turned out that this paternalist institutional design could not co- evolve with the institu-tions that were formed as working- class mobilization created relatively autonomous organizations across firms within the framework of parliamentary democracy. It proved impossible to restrain worker mobilization by tying workers to particular firms and undermining the formation of their own parties by establishing specific welfare arrange-ments accruing to distinct occupational groups (the Bismarckian roots of the German or Continental welfare state; Esping- Andersen 1990). Worker mobilization became autono-mous, relatively homogeneously across sectors.
This was not a smooth, but rather a conflictual process. Elements of the preceding elite offensive (paternalism) were relaunched, but they were encountered by extensive mobi-lization from below. Only at the end of the period, just before World War I, do we find indicators of major changes in the two main areas. In social partnership, the employer strategy of decentralized, firm- specific wage bargaining had been weakened (but there are main national differences). In the area of social protection, some of the countries saw changes that pointed towards more emphasis on universalism. Strong complementarities, however, were not forged before the end of World War II. While Finland was the extreme, four general features of the interwar turbulence can be distinguished.
First, this was the infant phase of parliamentary democracy. The parties and organizers engaged in various compromises and alignments, pursuing shifting strategies before – in the late 1930s – the various party systems ‘froze’ (Rokkan 1970). By that time, the old liberal/conservative parliamentary division had been replaced by a socialist/non- socialist division. Second, international developments influenced political institutions: World War I ended in the Russian Revolution (February and October 1917), in the very country that Finland was a part of. Russia had traditionally been feared in the region, especially by Sweden. Thus, just as the labour and social- democratic parties entered into the game of parliamentary politics for the first time, the labour movement also had to grapple with complex internal strife on the strategic questions of reform or revolution. Third, a brief post- war boom was followed by economic crisis (1921–1922), and recovery from this crisis was hampered by the then hegemonic British international monetary policy: return to normalcy, defined as the pre- war gold standard parities. Fourth, political and economic destabilization also led to mobilization on the right- wing side. The five Nordic cases can be compared with reference to these four properties.
First, degrees of fragmentation on the non- socialist side, and the role of autonomous parties for both farmers and workers (with no clientelist ties to fragmented elites, with the exception of Iceland) differed. The string of tense encounters and realignments in the infant parliamentary system brought representatives of the most recent mobilizing class, the working class, into government positions. Denmark and Sweden had long- lasting labour (minority) governments in the early 1920s, while this only occurred in Norway
REINERT_97817825444661_t.indb 552REINERT_97817825444661_t.indb 552 03/10/2016 11:3703/10/2016 11:37
Erik S. Reinert, Jayati Ghosh and Rainer Kattel - 9781782544661Downloaded from Elgar Online at 03/31/2017 12:04:16PM
via University College London

The Nordic route to development 553
as of 1935. In the 1920s, these parties were not in a position to influence class- struggle tactics (such as many local strikes) at the shop- floor level. Such actions were also sup-ported within an autonomous worker public sphere. In Finland and Iceland, the party systems were split 50/50 between communists and social democrats, and the latter only managed to be weak partners in coalition governments. On this basis, one can further analyse the agrarian–labour parliamentary alliances that emerged in the mid- and late 1930s (Mjøset et al. 1986, 53–64).
Second, the significance of revolutionary impulses differed, with Norway and Finland as the most pronounced cases. Norway’s Labour party did become a member of the Comintern, but only from 1919 to 1923. Labour parties only considered parliament an area for propaganda; they actually shared the bourgeois parties’ conviction that there were no alternatives to balanced budgets. In Finland, moreover, communists were more or less excluded from politics for long spells. With differences in timing, however, the labour movement went through various learning processes. On the whole, it arrived at the reformist position: there were gains to be made for the working class within capitalism. The labour movement then tended to claim that when it captured an absolute majority, privately owned firms could be socialized. The economic miracles of a planned economy would supposedly reproduce this parliamentary majority in the long term, leaving democracy intact.
Third, an economic situation marked by dramatic debt and unemployment problems, created due to deflationary monetary policies, proved a fertile ground for such learning. The concrete problems differed: Finland did not return to pre- war parity (devaluing in 1925–1926 to 13 per cent of the 1913 parity). Iceland left the gold standard early and devalued in 1927. Sweden had a short way to go before officially reaching pre- war parity in 1924. Norway and Denmark were the worst off, with protracted deflationary policies lasting to 1926 (Denmark) and 1928 (Norway). The dismal economic performance led to dramatic bursts of support for the labour parties. The weak upturns of the later 1920s were soon strangled as the world economic situation deteriorated. The US had gained greater impact on the world economy, and the Wall Street crash of 1929 had repercus-sions in Europe. Britain departed from gold on 9 September 1931, establishing protec-tionist imperial preferences in 1932.
Fourth, infant parliamentary democracy was doubted not just by the revolutionary left, but also by right- wing groups, some of which were fascist. The partial gains made by labour caused some intellectuals to embrace populism and even fascism, claiming that parliament should be transcended in favour of benevolent right- wing authoritarianism that would put an end to ‘bolshevism’ and ‘trade- union monopolism’. Many groups and parties in Finland supported the fascists through the short Lappo period between 1928 and 1932 (Alapuro 1980). Among the various party- forming groups there were other processes of divergence and realignment. By the end of the 1930s, somewhat permanent party structures were ‘frozen’.
As economic problems (unemployment, deflation, debt) multiplied in the early 1930s, labour and agrarian parties learned to cooperate. Labour gave up its ideas about class struggle at the firm level, as well as the belief that only fully socialized business could be managed. Labour also appealed to the farmers’ and peasants’ party via an ideology of the ‘people’s home’.
Labour party intellectuals discovered that they had support among a growing
REINERT_97817825444661_t.indb 553REINERT_97817825444661_t.indb 553 03/10/2016 11:3703/10/2016 11:37
Erik S. Reinert, Jayati Ghosh and Rainer Kattel - 9781782544661Downloaded from Elgar Online at 03/31/2017 12:04:16PM
via University College London

554 Handbook of alternative theories of economic development
contingent of ‘Keynesian’ economists, willing to commit their mathematical and economic skills to the goal of planning mixed economies. The connections were forged before WWII, although the practical consequences of the Stockholm and Oslo schools of interwar economics followed only in the post- war period, the era of economics expertise.
The labour parties realized that they could not field a majority of their own, but the advice of economics experts indicated that state support that eased the burden for indebted small farmers could benefit economic recovery as it stimulated effective demand. The result were various parliamentary alliances around economic policy offen-sives under labels such as ‘the cow trade’ (Sweden 1933), the Kanslergade compromise (Denmark 1933) and the alliance generating the 1935 Labour government in Norway (Mjøset et al. 1986, 60f.). Above all, they involved support to ease the burden on debt- ridden farmers. Here was a link back to earlier phases of labour mobilization, marked by fruitful collaboration with associations originally linked to peasant mobilization: co- operative, temperance and revivalist movements.
This chapter has traced the development of a layer of social- protection institutions, mediating between economics and politics. As we have seen, they were top- down efforts to deal with the worker question, aiming to conserve social order. As social security arrangements they were weak, means- tested with low benefits. By the late 1930s, however, the social democrats in Denmark, Norway and Sweden had begun to establish their cadre as new elements in the elite. The presence of strong, autonomous labour parties came to play a crucial role in the extension of social protection to new items, improved benefit levels, and universalization as means- testing was terminated. This influence is clear- cut, despite the fact that most of the decisions were based on broader parliamentary majori-ties than just labour and farmer parties. As for Norway, sickness insurance was extended to cover fishermen and sailors, and a means- tested old- age pension was introduced in 1936. Benefit levels were significantly increased. This was the largest extension of social insurance coverage in Europe since Bismarck’s laws from the 1880s (Kuhnle 2013, 171f.). In the post- war period, this trend was even broader and stronger.
As for unemployment insurance, I have noted the Ghent system (Denmark 1901, Norway 1906, Finland 1917): voluntary insurance managed by the unions, with state support. But Sweden was a latecomer, maintaining (even under several minority Labour governments) its stigmatizing relief- work system with very low compensation levels. The Ghent system was introduced in Sweden only in 1936, the same year that it was introduced in Iceland. Strikingly, Norway abandoned the Ghent system that same year, switching to the British system: a compulsory, fully state- financed system for all wage earners.
We see here the start of a process in which earlier, weak paternalist arrangements are replaced by social protection institutions enforced through broad parliamentary alli-ances with worker and farmers’ parties as main pillars. In parliamentary democracy, their strength of numbers was translated into decision- making power and control of the administration. Among the fragmented non- socialist parties there were always some non- socialist parties that would vote with the centre- left, or they just ceded to the parlia-mentary majority.
Turning now to social partnership: despite considerable differences between the countries, firm- level, decentralized encounters between labour and capital began to be replaced by routinized negotiations. These two well- organized and autonomous social
REINERT_97817825444661_t.indb 554REINERT_97817825444661_t.indb 554 03/10/2016 11:3703/10/2016 11:37
Erik S. Reinert, Jayati Ghosh and Rainer Kattel - 9781782544661Downloaded from Elgar Online at 03/31/2017 12:04:16PM
via University College London

The Nordic route to development 555
partners of the Nordic capitalist systems countered each other in civil society, signing ‘main agreements’ that served as labour- market constitutions. The timing varied: Denmark’s September settlement took place in 1899. In Norway (1907) and Sweden (1905), employers and unions in the metals and engineering (leading) sectors entered into sector- wide agreements. In the late 1930s, Norway’s main agreement was signed in 1935, and Sweden’s (Saltsjøbaden) in 1938. In Finland, such an agreement was blocked by employers, in continuity with the civil- war polarization (Nilsson 2001).
Such frameworks securing collective bargaining were a main institutional novelty, developing through the period, simultaneously with the parliamentary back- and- forth adjustments and the debt and unemployment problems periodically hampering the economy. Nationally distinct developments can be specified by means of the categories I have referred to here, but it would take too much space.
There were significant variations in the timing of the turn to reformism, in the mix of national and international factors behind the economic problems, and in the strength and timing of social partnership and social protection upgrading. However, in all cases, parliamentary democracy survived, with state–society relations marked by what Evans (1995) describes as ‘embedded autonomy’, open to further mobilization by social move-ments. In Finland, conditions for such survival were often bleak. Although narrowly political, a red–green, agro- labour alliance emerged even there in 1937. Its economic underpinnings were weak; collective bargaining was only agreed in 1940 and effective in 1943. This meant that social partnership was accepted by Finnish employers only during war- time emergency, at a time when the ‘great Finnish’ right- wing authoritarian and militarist elite segment took Finland on a dubious wartime adventure. The government sought revenge for the USSR’s 1939 winter war conquest of strategic parts of Finnish territory: it attacked the USSR in 1941, a Finnish parallel offensive to Hitler’s eastwards Operation Barbarossa. A fragile balance between the social partners was not reached until the peculiar realignments that took place as Finland switched from German to Allied orientation in 1944–1945. As will be seen, this placed Finland in a peculiar situa-tion during the Cold War.
We have seen that the period was marked both by economic turbulence and political polarization, as well as difficulties in the relations between economics and politics. There were only weak complementarities between the three institutional novelties I have dis-cussed. The first, parliamentary democracy, introduced a whole new context that may be modelled in power- resource theory. The second, social partnership, implied the develop-ment of collective bargaining with different timing and coverage. The former related to politics, the latter to the economy and civil society. The third, social protection, mediates between politics and the economy. It consists of designs by the state to sustain social order by politically induced regulation of the economy.
As noted, the decentralized paternalist arrangements about to emerge in the earlier period did not survive. What started as a one- sided attempt by employers (assisted by the state) to develop institutions that would facilitate paternalist integration of the working class, by the end of the period had been transformed into a quite different social part-nership pattern in which two labour- market partners faced each other as autonomous collective actors. The formerly inferior social partner had gained equality, thanks to masses of votes gained in democratic elections. Thanks to parliamentarism these votes could be translated into legislation on social protection that could potentially balance the
REINERT_97817825444661_t.indb 555REINERT_97817825444661_t.indb 555 03/10/2016 11:3703/10/2016 11:37
Erik S. Reinert, Jayati Ghosh and Rainer Kattel - 9781782544661Downloaded from Elgar Online at 03/31/2017 12:04:16PM
via University College London

556 Handbook of alternative theories of economic development
bourgeoisie’s control over capital. There was no easy consensus, but both collectives were able to learn from the conflictual process.
By the late 1930s, at least Denmark, Norway and Sweden were predisposed for strong complementarities. Such a development, however, was interrupted by WWII. Like WWI, it yielded further experience in planning, although under emergency, and at least Norway and Finland had extensive war damage.
POST- WAR INTERVENTIONIST CAPITALISM, MID- 1940s TO MID- 1970s
US post- war hegemony stabilized the Western (or Atlantic) world. It had two basic elements. The geopolitical element was the Cold War. The economic feature was the Western area as the extended market for products and technologies in which the US had developed excellence before and during the fragmentation of the world economy in the preceding period. This implied the diffusion of the Fordist techno- economic paradigm, a model of economic growth in which productivity- indexed real wages connect assembly- line mass production with consumerist mass markets.
As the international system was restructured along a Cold War axis, the Nordic coun-tries thrived. In the new strategic situation they had different geopolitical preferences: the western Nordics, Denmark, Iceland and Norway, joined the North Atlantic Treaty Organization (NATO). The eastern Nordics stayed neutral. These different preferences precluded deep regional integration, but the reality is that all five became integrated in the Western world; even Finland, with a lag. In this setting, they successfully implemented a set of low- key regional integration measures (Wendt 1981): a passport union (1952) and a common labour market (1954).
Cold War geopolitics influenced the way in which the US exercised its world economic hegemony, particularly in the crucial international regimes of trade, money and technol-ogy. Since the Eastern bloc was to be contained, these international institutions were organized along the lines of what has been called ‘embedded liberalism’ (Ruggie 1982). While US international economic policies at the time were torn between earlier isolation-ist ideals and more recent liberal visions, the actual strategies pursued did not require its Western European allies to liberalize right away. In the Cold War, the US needed allies with stable political economies. This was all the more challenging since there was urgent need for reconstruction due to wartime physical damage and economic disruptions. If that required accepting the mixed economy preferences of most left- liberal groups in the area, the US accepted this. As part of post- war reconstruction, the Western European countries were allowed to pursue infant- industry protection, while the US supported technology diffusion to Western Europe. The US could spend some of its surplus as aid by which the Europeans purchased US export items. Politically, this would integrate the working classes and consolidate reformist and/or Christian democratic labour parties. Although the Western European states were markets for US goods, they were primarily Cold War allies. They were not seen as competitors, and they were given access to tech-nologies that would – in the long run – enable them to catch up economically with the leading US economy.
The Atlantic economic system thus embedded its liberal features in a number of
REINERT_97817825444661_t.indb 556REINERT_97817825444661_t.indb 556 03/10/2016 11:3703/10/2016 11:37
Erik S. Reinert, Jayati Ghosh and Rainer Kattel - 9781782544661Downloaded from Elgar Online at 03/31/2017 12:04:16PM
via University College London

The Nordic route to development 557
international institutional features such as a framework of fixed exchange rates, managed international payments (Bretton Woods) and only gradual trade liberalization (the General Agreement on Tariffs and Trade, GATT). This system affected the neutral, eastern Nordics (Sweden, Finland) as much as the NATO members. This international institutional framework suited the Western- European countries well. As for the Nordic countries, they would be allowed to realize just the complementarities that were there in embryo stage in the late 1930s.
This Cold War context facilitated the productivist style of reconstruction and catch- up, fuelled by diffusion of leading US technologies. The Nordic countries adopted the latest techno- economic paradigm, the mass production, mass consumption, oil- based paradigm, ‘Fordism’. In Norden, only Sweden – with its iron and steel sector – had the industrial preconditions to develop an automotive industry (Volvo, Saab). They also relied on further raw materials exports to gain foreign- exchange incomes that financed imports both of sophisticated investment goods and items of mass consumption. This was also facilitated by Marshall Plan aid and US- led payments arrangements.
This was particularly so with Denmark, Norway and Sweden, the countries in which social democrats had become influential even before World War II. Iceland had thrived with Allied bases and high economic activity during the war, but like Finland its social partnership institutions were more burdened by conflicts than in the three other cases. But, as will be seen, both countries also caught up. In the case of Finland, war repara-tions, elite realignments and national unity following dramatic policy shifts towards the end of WWII led to convergence with the three others in the medium term. Both Iceland and Finland had capacities to counter whatever peripherization pressures emerged during this Golden Age.
Throughout the 1950s and 1960s, the five countries took part in the overall Western European catching up with the leader (the US). They sustained and developed their own national systems of innovation, serving as modules in a larger Nordic and West European Fordist division of labour, nourished by US technology transfers. Rather than broad mass production, the small Nordic economies gave priority to certain selected sectors and excelled in certain specific skills.
We have seen how institutions of social protection and social partnership emerged in the interwar period, but they did not really co- evolve to become complementary. Under Cold War ‘embedded liberalism’ conditions, they came together, co- evolving with upgraded institutional features of other vintages, notably capacity institutions and openness to mobilization. At least in the social democratic Nordic states, a new elite had blended with the older elites since the late 1930s, representing a broader stratum of the population. Various organic intellectuals had been part of working- class mobilization, so in addition to the most crucial working- class leaders, a number of intellectuals (lawyers, engineers, economists) were ready to work with and within the new administrations. The Cold War system of strong complementarities was a result of their elite offensive.
A new institutional feature was social and economic planning based on expert knowl-edge. It was not so much a question of new organizations, but of new professions taking important positions in the administrative apparatus that had earlier been entirely domi-nated by lawyers. A wider spectrum of professions was now engaged in the planning and management of Nordic capitalism, most importantly engineers and economists. They helped to develop interventionist capitalism, beyond non- interventionist ‘rule of law’. In
REINERT_97817825444661_t.indb 557REINERT_97817825444661_t.indb 557 03/10/2016 11:3703/10/2016 11:37
Erik S. Reinert, Jayati Ghosh and Rainer Kattel - 9781782544661Downloaded from Elgar Online at 03/31/2017 12:04:16PM
via University College London

558 Handbook of alternative theories of economic development
addition, for some fields – particularly the health sector as part of state- provided social protection – voluntary organizations played important roles (Stenius 2010). They pos-sessed valuable applied knowledge, knowledge that was later to be codified in new health professions. Together with older professions, these groups were crucial elements in the growing new middle classes.
Ever since the coming of heavy industry, engineers had been involved in private mana-gerial hierarchies. Now they also had a say in national planning of upgraded physical infrastructure and heavy industries that would earn export incomes. Economists related both to social partnership (modelling applied to income- policy settlements) and social protection (developing a national accounts system, modelling fiscal policy strategies). Both professions focused strictly on the growth of the real economy. Monetary policy was subordinate, a key point in the Bretton Woods system. Well into the 1980s, finan-cial capital was repressed to conform strictly to the needs of the production economy (Andersen 2010), which is Perez’s (2002) criterion of a ‘Golden Age’.
In line with the late 1930s ‘labour- market constitutions’, varieties of coordinated wage bargaining became routine. Bargaining would be more or less centralized, but always also allowing for local- level negotiations in which the actual market conditions of the firms were taken into account. Owners of capital retained their prerogatives in terms of invest-ment decisions and work management, but even in these fields, sets of regulations were imposed.
Liberals, guided by ideals of the self- regulating market, had feared that such state intervention would undermine existing complementarities. Some of them even held that the planning experiments would collapse into authoritarian rule. They understood that democracy had brought labour into power, but did not trust the reformist turn, fearing that parties of the working masses would turn democracy into authoritarian rule on a ‘Bolshevik’ model once they were threatened. More moderate liberals feared that eco-nomic planning would impair the capacity to adapt flexibly to world- economic changes.
Reformist labour, in contrast, insisted that their mission was to deepen democ-racy: political democracy would be followed by social democracy. The strike as ‘non- democratic’ class struggle was replaced by a democratic class struggle in which full employment and welfare measures such as health, social insurance, pensions and educa-tion would benefit the broad, working masses, thus reproducing and strengthening politi-cal support for the reformist labour movement (Korpi 1983). Even elements of economic democracy, such as co- determination on the shop- floor level, would be implemented. Such measures would spur economic growth.
The mixed economy combines three channels or agendas for discussion of various types of issues. First, the parliamentary agenda is the main democratic arena, a forum for issues pursued by the parties of the established, ‘frozen’ party system. Second, the corporatist agenda is a number of councils, committees, hearings and consultative rou-tines through which the state apparatus involves the social partners and other organized (interest- based or voluntary) groups. These groups may all employ expert advice based on various professions. Third, there is the more loosely defined arena for social movements mobilization, through the public sphere, addressing issues that are marginalized in the two other channels.
In retrospect, the mixed economic system planned by engineers and economists – balancing private pursuit of profit with regulation for fairness and equality in line
REINERT_97817825444661_t.indb 558REINERT_97817825444661_t.indb 558 03/10/2016 11:3703/10/2016 11:37
Erik S. Reinert, Jayati Ghosh and Rainer Kattel - 9781782544661Downloaded from Elgar Online at 03/31/2017 12:04:16PM
via University College London

The Nordic route to development 559
with social- democratic reformism – was managed quite successfully. Both physical and welfare- state infrastructure was extended. Political support was sustained by alliances. Between the 1930s and the 1950s, the alliance with the poorest strata of farmers was crucial. But due to policies for increased agricultural productivity, structural change caused this social stratum to diminish. The agricultural share of the labour force dropped below 30 per cent in these years: Denmark in 1935, Sweden in 1940, Iceland in 1943, Norway in 1948, Finland in 1963 (Mjøset et al. 1986, 336 f.). The new middle classes in both public and private organizations grew. At the parliamentary level, Labour’s alliance strategy shifted towards these groups in the 1960s (Rokkan 1966). Competing for the votes of the same groups, the larger parties grew more similar.
In Sweden, Norway and, to some extent, in Denmark, social- democratic parties domi-nated government for long spells, while the non- socialist side was fragmented. Whenever some non- socialist coalition government took over, a ‘Weberian’ bureaucracy – typical of non- clientelist systems – remained in the ministries, and these experts ensured continuity. Liberal critics were in a weak position. In Iceland and Finland, the networks between experts, government, administrative apparatus and political parties were weaker, and certain business sectors had considerable power, complicating peak- level social partner-ship (Mjøset 2011a, for a comparison).
Iceland and Finland thus had different economic policy models. Both have institu-tions of social protection (but mostly lagging compared to the other three), and they participate in Nordic cooperation (Finland was often late in joining). Social- partnership institutions had not changed as much, compared to the early interwar period, as in the other Nordic countries. The new profession of economists thus met with more resist-ance. In Finland, the Central Bank played a more important role than in the other three. In Iceland, an independent Central Bank was first established in 1961; the economics profession was weaker, so judgements by politicians and leading- sector business interests (fisheries) played a larger role.
In Finland, the Cold War had peculiar implications. As a consequence of the drastic 1944 reversal of the ‘parallel war’ against the USSR, Finland both had to pay reparations and to resettle 430 000 refugees from the south- eastern region that was absorbed into the USSR. A treaty of friendship and cooperation with the USSR restrained Finland’s international relations, particularly in the early post- war period. The bourgeoisie had to adjust to this new situation, and earlier left- wing working- class associations were reinte-grated into Finnish policies. But despite the close friendship with Russia (geopoliticians even invented the term ‘Finlandization’), Finland became part of the Western catch-ing- up process, producing sophisticated goods to Western markets and more elementary industrial input as reparations to the Russian market. Over the first post- war decades, however, Finnish labour relations remained quite confrontational, with several strikes and lock- outs.
The fact that the party structure in both Iceland and Finland included significant splits on the socialist side (communists versus social democrats) is part of the reason why they had less stable institutions of social partnership. The failure to agree on class compromise- type income policies tempted the authorities to use an easy instrument such as devaluation, then having market forces do the job. The result was devaluation cycles with considerable instabilities (Mjøset 1987, 416). They exploited the Bretton Woods option of claiming devaluation for real economic reasons, being too small to matter.
REINERT_97817825444661_t.indb 559REINERT_97817825444661_t.indb 559 03/10/2016 11:3703/10/2016 11:37
Erik S. Reinert, Jayati Ghosh and Rainer Kattel - 9781782544661Downloaded from Elgar Online at 03/31/2017 12:04:16PM
via University College London

560 Handbook of alternative theories of economic development
Devaluations pushed up inflation, and real wages slumped. This was countered in the next phase of the cycle by high strike activity as workers took action to regain these losses. Also fiscal policies were more in line with the austere treasury view (particularly in Finland), which implied less funds for fiscal spending for social protection institu-tions. The complementarities of these two countries were different from what went on in the three other countries. As will be seen, Finland eventually converged, while Iceland remained different.
Compared to the various offensive mobilizing patterns of the 1930s, the post- war Nordic ‘labour- dominated’ states managed economy and society from above. But unlike the late nineteenth century, the situation was not one of older or more recent wealthy elites in a non- parliamentary political system (except Norway) marked by voting restric-tions. There was full democracy. In the three social- democratic cases, representatives of the working masses held office over long spells of time. Even in Iceland and Finland, they were sometimes included as weaker partners in coalitions. State intervention was ‘mobilization from above’, extending citizens’ rights by legislation. This required that the staffs of the administrative apparatuses grew, but not in the unproductive ways which are typical of clientelist political systems.
Sound management of economic development secured compatibility between indus-trial restructuring and the further consolidation of a universalist social protection, financed by high taxes, centred on progressive income taxes. There was broad consensus on these institutions. Their legitimacy was bolstered by progress in living standards, which due to redistribution worked in favour of the broad strata with low incomes. In this period, institutions of social protection were broadened in terms of the groups covered, and benefits were made more generous. For instance, sickness insurance was generalized for all citizens in Sweden in 1955, in Norway and Iceland in 1956, in Denmark in 1960, and in Finland in 1963.
Old- age pensions emerged as the most important field of social protection. Especially when improved health conditions would generate a secular rise in life expectancy, this became the most expensive part of social insurance. A main turning point was the Swedish 1946 decision under a Labour party majority to make old- age pensions inde-pendent of a means test. With a lag, the other systems were generalized in the same way: Norway and Finland in 1957, Denmark in 1964, and Iceland in 1965. This established universal flat- rate benefits (people’s pensions) in all countries, a modest citizens’ wage for the elderly.
While all the earlier social protection institutions had focused on providing basic security and poverty alleviation (first tier), the next step in the development of these institutions was politically connected to the relative growth of the new middle classes. It was impossible for the reformist left to pursue a policy of strict income equalization; as little as they had earlier been able to go for full socialization of production. A measure of income inequalities after retirement had to be accepted, depending on the actual living standards, differential lifestyles and the position in the social hierarchy enjoyed by various groups. Although redistributive, the Nordic models had to sustain social stratifi-cation. However, in line with the equalities already involved in the generalization of free-holder agriculture, the hierarchies were flatter than in most other varieties of capitalism.
Privileged white- collar groups were able to gain guarantees for some kind of income maintenance after retirement (second tier), granted by their (public or private) employees.
REINERT_97817825444661_t.indb 560REINERT_97817825444661_t.indb 560 03/10/2016 11:3703/10/2016 11:37
Erik S. Reinert, Jayati Ghosh and Rainer Kattel - 9781782544661Downloaded from Elgar Online at 03/31/2017 12:04:16PM
via University College London

The Nordic route to development 561
In Sweden, Landsorganisasjonen (LO) early on demanded similar social concessions for all its blue- collar members. The result was a long and hard struggle over compulsory, state- organized, income- related supplementary (labour- market) pensions for all wage earners. With a one- vote parliamentary margin, the Swedish Labour party won in 1959. This reform then became a model for the other countries. In Finland (1962) and Norway (1967), the non- socialist side had observed the success of the Swedish solution, and con-sensual compromises were reached (Edling 2006). In Denmark, there was strong resist-ance from non- socialist parties, but even disagreements within the labour movement. The Labour party was also weaker in parliament. Thus, the universal people’s pension was improved, but supplementary pensions were left to the private sphere. A similar outcome followed in Iceland. However, in Denmark, these earnings- related pensions were instead integrated into collective agreements, ‘a very collective form of privatization’ (Goul Andersen 2011, 4). For this reason, the Danish system did not differ all that much from the Swedish system.
Unemployment insurance, as has been seen, differs from these pensions. I have noted the prevalence of the Ghent system in all Nordic countries, except for Norway. This contributed to the high rates of union density in the region, somewhat lower in Norway (Mitchell 1978). However, the Ghent systems were turned into functional equivalents to the Norwegian mandatory, state- supported system. Due to close politi-cal relations between union confederations and state elites, the state ended up footing most of the bill for the union unemployment funds (also providing various kinds of tax relief) while benefits were made more generous in terms of compensation and duration (Goul Andersen 2011, 16).
There is a politicized debate as to whether Nordic institutions of social protection are the result of labour’s exercise of their power (based on their large share of votes in the parliamentary system), or just emerged from consensual functionalist adaptation to imperatives of industrialization. It seems clear that Swedish social democracy played a crucial role in the main institutional turning points. Consensus then often followed in other countries due to inter- Nordic learning. A research group of historians concluded that ‘the political dominance of the Social Democratic forces put unmistakable stamps on the Nordic societies, even if most of the welfare measures were born out of nego-tiations and compromises with the non Social Democratic parties’ (Christiansen et al. 2006, 351f.).
The old ‘parallel system’ restricted the number of pupils that could enter grammar schools, which further allowed entry into higher education. The revision of this system is an example of upgrading capacity institutions. All the Nordic countries switched to a comprehensive school system integrating both theoretical and practical education, neutral in terms of class, gender and intelligence. The years were 1962 in Sweden (nine years comprehensive education, decided in 1950), 1968 in Finland, 1969 in Norway (seven years comprehensive education 1936) and 1972 in Denmark and Iceland (Sysiharju 1981, 422–423). In this system, all pupils have a chance of choosing any further educational route. It has relatively few school tracks and few private schools (Denmark is an excep-tion here). Schools do not differ much in terms of their capacity to teach the curricula. Such a system minimizes the effects of class background. Still, it was unavoidable that to some extent the earlier vocational/general education dichotomy was reproduced within secondary schools.
REINERT_97817825444661_t.indb 561REINERT_97817825444661_t.indb 561 03/10/2016 11:3703/10/2016 11:37
Erik S. Reinert, Jayati Ghosh and Rainer Kattel - 9781782544661Downloaded from Elgar Online at 03/31/2017 12:04:16PM
via University College London

562 Handbook of alternative theories of economic development
The new composite elite of labour representatives, engineers and natural scientists (some of whom had ties to the labour movement), farmer representatives and heavy- engineering business interests pursued an elite offensive under conditions of ‘routinized’ mass democracy. But some waves of mobilization can be discerned.
By 1976, a non- socialist coalition won the Swedish elections, ending 44 consecutive years of Labour rule. Pushed by the unions, the Labour party at that time launched the idea of proceeding from social to full economic democracy, challenging employer control over investments, breaking the balance between the social partners. This move was not successful, and as in the other cases, the mixed economy was retained.
In all countries, some of the labour grassroots were frustrated by the workings of the corporatist elite networks. But the new social movements that emerged in the 1945–1975 period were largely based on the new middle classes. Broadly speaking, these movements reflected the higher living standard and levels of educational attainment. The peace movement was an early response to the Cold War, but since the late 1960s, the feminist women’s movement and the student movement flourished. The student movement tried to link up with the labour left, but it never became more than a social movement internal to the academic sphere. These activists certainly set out criticizing the expert professions, but were absorbed as teachers in the expanding mass university from the 1970s. Their main fate was to educate ever new experts to staff the administration of the welfare state and, as a side- effect, to produce smaller numbers of free- floating literary intellectuals to colour the public sphere.
The feminist women’s movement became much more important. Its impact was exten-sive and clearly in continuity with the earlier efforts by peasants and workers. Its impact mainly came in the last period of internationalized welfare capitalism (see Table 29.1). I shall not analyse that period here, since it is of less relevance to the question of develop-ment experiences. But I need to mention the impact of the new women’s movement. The major post- war transformations in education, social protection and social partnership were above all male success stories. But as educational attainment grew, one result of social mobility into the middle classes was a new women’s movement that understood itself as feminist, in the sense that these gender inequalities were regarded as decisive structures that the movement set out to change. Women’s caucuses strengthened their stance in most political parties. In Finland, Norway and Sweden, this led to what has been dubbed state feminism (Hernes 1987). Women brought expertise into the admin-istration, most parties were driven by their women’s caucuses in these matters, and grass- roots movements pushed from below to upgrade and change those institutions that mattered the most for the equality between the sexes in dual- income families. As revised family policies generously provided public kindergartens, maternity leave and ‘daddy quotas’, while provision of caring involved improved old- age homes and services, young dual- earner couples could start a family right away; there was no need to delay childbirth. This has resulted in fertility high enough to avoid population decline. In this respect, fore-casts of the dependency ratio – the ratio between the population outside of the labour force and the labour force – looks less worrying in the Nordic countries than for most continental European countries, especially the Southern European ones.
At the threshold of the 1970s, Iceland and Finland still displayed social structures, political patterns and economic cycles that deviated more or less from the Danish, Norwegian and Swedish patterns. For Finland, however, there was partial convergence
REINERT_97817825444661_t.indb 562REINERT_97817825444661_t.indb 562 03/10/2016 11:3703/10/2016 11:37
Erik S. Reinert, Jayati Ghosh and Rainer Kattel - 9781782544661Downloaded from Elgar Online at 03/31/2017 12:04:16PM
via University College London

The Nordic route to development 563
from the late 1960s. Finland even caught up and converged institutionally with the Nordic majority as far as its social protection and social partnership institutions are concerned. It even became a leader in the field of capacity institutions (Castells and Himanen 2002). As for Iceland, there was less convergence, as its devaluation cycles continued. However, these two outliers were influenced by regional cooperation measures, not just the Nordic Council(s) as such (Wendt 1981), but also more specialized coordination committees in various areas. These regional cooperative and consultative networks and meetings were extended from the interwar period. There were meetings of the employers’ associations (Nilsson 2001), unions, meetings of lawyers, of social policy administrators (Petersen 2006), as well as scientific networks.
While absence of clientelism is a Nordic ‘rule’, connected to the long tradition of embedded autonomy, there is one exception. In Iceland, clientelism peaked during the Golden Age. Public sector jobs down to the level of swimming- pool attendant were distributed on a partisan basis. But institutional change in the electoral system (pro-portional representation extended to rural areas, 1959) improved the position of the educated higher middle classes (strengthened by the 1960s revolution in higher educa-tion), and opposition to clientelist practices (favouring meritocracy) became part of their social mobilization (Kristinsson 2001, 185). A series of short- lived parties were formed in the 1970s, all emphasizing the ethics of government. The signing of free- trade treaties from the 1960s onwards weakened the old system in the main economic sector, the fisheries.
In sum, all five Nordic countries succeeded in promoting economic growth: they all displayed virtuous circles of auto- centred development (Senghaas 1985 [1982]), differing from structurally heterogeneous Third World countries. While Finland and Iceland may be characterized as less stable in political terms, their rates of economic growth were not lower than those in the three more stable countries. In fact, given their latecomer posi-tion, structural change was faster, as they were catching up; but fluctuations were much larger. Political conflicts did not escalate, and there was no breakdown into authoritarian rule.
CONCLUSIONS
In this chapter I have analysed the development of five Nordic cases, from poor periphery countries at the time of the Napoleonic Wars to successful twentieth- century catch- up states. I have distinguished between three stable successes (Denmark, Norway, Sweden) and two cases of late development. It is relevant to count them as Nordic, because they share some old preconditions: Protestantism, literacy, a Swedish or Danish administra-tive legacy. But they deviate in terms of the greater instability of their modernization processes. In Iceland, this is linked to clientelism, weaker state capacity than the other four, as well as blurred relations between the social partners, leading to an economic experience of investment and devaluation cycles. Finland had the same experience with cycles (but ending in the 1970s), but unlike Iceland it also had a legacy of stronger interwar polarization, and had to live a precarious post- war existence on the East–West geopolitical border, with a neighbour they alienated during World War II. In making this distinction between three relatively stable and two less stable development processes, the
REINERT_97817825444661_t.indb 563REINERT_97817825444661_t.indb 563 03/10/2016 11:3703/10/2016 11:37
Erik S. Reinert, Jayati Ghosh and Rainer Kattel - 9781782544661Downloaded from Elgar Online at 03/31/2017 12:04:16PM
via University College London

564 Handbook of alternative theories of economic development
implication is that present- day developers may learn more from Finland and Iceland (the outliers) than from the more typical Nordic cases.
The Nordic states met with a number of challenges from the 1970s onwards (see the analyses in Mjøset 2011b), but these experiences are less relevant given my focus here: what can present- day Third World countries learn, being at the receiving end of informa-tion on the Nordic development experience? This question (for a pioneering discussion, see Senghaas 1985 [1982]; Mjøset 2007) can be discussed with reference to the periodiza-tion in Table 29.1.
First, consider liberal capitalism marked by agrarian mass mobilization before mass democracy. While the Nordic states were at that time small, poor, emerging economies, they differed from most present- day small, poor, developing countries in terms of their pattern of early nineteenth- century preconditions: political and religious homogeneity, administrative traditions (quality of governance), literacy conditions, health, distribution of income and resources. A certain adjustment capacity had developed in Norden before the science- based, heavy- engineering paradigm of Perez’s third surge. Their processes of social mobilization and state formation in the nineteenth century differ substantially from such processes in the twentieth- and twenty- first- century Third World (see the com-parison in Rokkan 1975, 591–600).
Many Third World countries have formal democracy, and a main issue in contem-porary mass mobilization is that more substance must be given to that promise. Social mobilization for equal access to education, against corruption and for broad empower-ment of women (for instance: against gang rape in certain cultures) mark the agenda in many Third World countries. However briefly – and in need of further specification – I have claimed that the customary and legal position of women was more secure in the Nordic and North European realm, even when analysed with reference to a family form that evolved more than 1000 years ago. On such issues, the Nordic countries were better situated at the time they entered mass democracy.
Turning to the late nineteenth century, Nordic corporate capitalism was marked by working- class mobilization and mass democracy. A certain adjustment capacity – in the sense that literacy facilitated upgrading and proliferation of skills – had developed in Norden before the science- based, heavy- engineering paradigm of Perez’s third surge. On that basis, their traditional raw materials (Sweden’s iron ore, Norwegian water power, Finnish forests, Denmark’s livestock, Iceland’s fish) became the basis of further indus-trialization. These capacities – with respect to both the development of skills and the practice of good governance – help to explain how they escaped ‘resource curse’ problems (for the case of Norway, see Cappelen and Mjøset 2013).
A comparison with the poorer raw materials- exporting countries of the twentieth century could investigate the hypothesis that these lacked such an early, ‘milder’ exposure to capitalist industrialization. Many of these countries had developed as export enclaves during colonialism. During post- colonial rule, clientelism of the most penetrating kind (in the extreme: kleptocracy or failed states) became part of vicious circles in which adjustment capacity was undermined. In this context, foreign investments tend not to unleash the kind of extensive forwards and backwards linkages that emerged even in the poorest Nordic cases. Post- war developing countries became the main targets of United Nations international programmes: the United Nations Educational, Scientific and Cultural Organization (UNESCO), the United Nations Development Programme
REINERT_97817825444661_t.indb 564REINERT_97817825444661_t.indb 564 03/10/2016 11:3703/10/2016 11:37
Erik S. Reinert, Jayati Ghosh and Rainer Kattel - 9781782544661Downloaded from Elgar Online at 03/31/2017 12:04:16PM
via University College London

The Nordic route to development 565
(UNDP), United Nations Population Fund (UNFPA) and others. These elements in the UN system can be seen as an effort to generalize the embedded liberalism of the Western European–Atlantic experience. Recent Millennium Goals have been fulfilled, but largely due to the weight of successful emerging economies. There is presently no mechanism that can be compared to the Bretton Woods system that was so beneficial to the many Western European catch- up processes in the early post- war period. Development strate-gies pursued by poor states, often with Western development aid, failed to counteract structural heterogeneity (Senghaas 1985 [1982]), which persisted from the colonial period. Present- day poor countries suffer from a lack of adaptive capacities, in terms of education and skills, and often problems of inefficient administration and low capacity to collect taxes, given prevailing varieties of clientelism. The state apparatuses are not trusted, and public servants have to add to their low wages by taking side- payments.
The interwar period of fragile democracy was the last phase of Nordic corporate capitalism, undermining the paternalist institutional design. Despite the turbulent situa-tion, the conflicts did not take a destructive turn but led to class compromises: stronger in Denmark, Norway and Sweden; weaker in Finland and Iceland. Social partnership in wage bargaining interacted with the formation of regulatory coalitions in the 1930s.
Nordic interventionist capitalism secured broad legitimacy by substantially extend-ing the welfare state as a safety- net (‘people’s home’), while simultaneously maintaining economic growth, based on both traditional raw materials and adaptation to structural change in the Fordist age of mass production and mass consumption. In the present state of the world economy, not even emerging economies have such properties. Their high growth rates are achieved within different sets of institutional complementarities. This complicates the transition to a less export- dependent growth model, although China makes such efforts in an urbanization process of hitherto unseen proportions, and many Latin American countries have introduced elements of a comprehensive social safety- net. But the Third World is marked by increasing internal polarization: some emerging econo-mies are growth poles; while at another extreme there is recurrent violence in certain conflict zones, producing waves of refugees striving to enter the richer Western countries. I therefore finally consider the present world economic transition: the situation of infor-mation and communication technology (ICT) frenzy (see Table 29.1).
Emerging economies are winners in processes of unequal development. In the period of liberal capitalism, Britain (textiles and railways) was important for the Nordics. Then, in Perez’s third surge (Table 29.1), Germany was very important to Nordic corporate capitalism, especially in new sectors such as electricity and chemicals. For post- war mass consumption, the Nordic phase of interventionist capitalism, the US was the leader to follow. In parallel ways, one can think about smaller developing countries in the neigh-bourhood of present- day emerging economies: China, Brazil, India, and others. With reference to Perez (2002), one might argue that the new techno- economic paradigm (ICT) will make catching up – developing adaption and innovation capabilities – easier than it was in the nineteenth century, at least for the countries whose labour force is sufficiently educated. The Nordic countries’ catch- up started with the spread of the relatively simple mechanical technologies of textiles and railways, continuing within techno- economic paradigms based on large- scale mechanical technologies. Upgrading and revision of skills in an up- to- date educational system was crucial in this process of economic trans-formation. However much present- day ICT makes catching up easier, it is also the case
REINERT_97817825444661_t.indb 565REINERT_97817825444661_t.indb 565 03/10/2016 11:3703/10/2016 11:37
Erik S. Reinert, Jayati Ghosh and Rainer Kattel - 9781782544661Downloaded from Elgar Online at 03/31/2017 12:04:16PM
via University College London

566 Handbook of alternative theories of economic development
that small, poor and peripheral countries today may get into trouble since their options are worsened by the catch- up processes of the larger emerging economies. The experi-ences with China’s engagement in Africa are mixed. China is desperate for raw materials and food crops (given that its arable land is a rather low percentage of the country), but it also has a flair for Japanese- style imperialism, which proved more conducive to indus-trialization than other types of imperialism.
The world- economic situation today is different from both the 1930s fragmentation and Cold War embedded liberalism. While no international constellation has ever con-firmed liberal visions, the present situation is – relatively speaking – more liberal than the two periods through which Nordic capitalism developed from corporate to intervention-ist capitalism. We have no breakdown into anarchy and self- sufficiency today. The leading countries of the Atlantic sphere are eager to guard an open, liberal world economy, just as Manchester capitalism did in the days of Friedrich List. This implies that if regulatory alliances emerge in present- day developing countries, they will have to succeed in an open world economy, while the Nordic states succeeded through a sequence of not entirely open international phases: first a temporary close- off in the 1930s, a world war, and then the semi- managed Bretton Woods period.
The recent financial crisis (2007–2008) affected the world economy as a whole, but above all certain parts of the ‘Old World’. Some of the emerging economies continued catching up. World trade did not break down. Today, there are plenty of ‘rescue coali-tions’ in the rich world, but there is a lack of regulatory coalitions of the kind that served the Nordic countries well in the interwar period. Some members of the European Union, particularly the Southern European countries, suffered (and suffer) gravely.
The spectre of environmental disaster was absent when the Nordic countries emulated the US mass- consumption model. As was claimed in Our Common Future (WCED 1986), rising living standards in the Third World increase the risk of global warming if the mass- consumption model is emulated on the basis of the same fossil- energy regime that underpinned the Western economic transformation.
For the first time in the history of capitalism, the process of uneven development – given the broad consensus among scientists supporting the Intergovernmental Panel on Climate Change (IPCC) conclusions – comes up against some limits that are defined by the Earth as an ecosystem. Like earlier industrializers on the fossil- fuel model of energy provision, emergent economies often suffer dramatic problems of local, especially urban air pollution (smog, with a number of health risks). If any of the emergent economies are able to take the lead towards a post- fossil solution, their competitive position would improve. Hopefully, their smaller neighbours could rely on both ICT and greener types of energy provision.
These conclusions do not point to specified lessons for present- day developers. Such lessons may utilize my materials on how the Nordic economies prospered, but they must be utilized within a comparative framework and contextualized for the present period.
REFERENCES
Alapuro, R. 1980. ‘Mass Support for Fascism in Finland’. In S. Ugelvik Larsen, B. Hagtvet and J.P. Myklebust (eds). Who Were the Fascists. Oslo: Universitetsforlaget, 678–686.
REINERT_97817825444661_t.indb 566REINERT_97817825444661_t.indb 566 03/10/2016 11:3703/10/2016 11:37
Erik S. Reinert, Jayati Ghosh and Rainer Kattel - 9781782544661Downloaded from Elgar Online at 03/31/2017 12:04:16PM
via University College London

The Nordic route to development 567
Alapuro, R. 1992. State and Revolution in Finland. Berkeley, CA: University of California Press.Alestalo, M. and S. Kuhnle. 1987. ‘The Scandinavian Route: Economic, Social and Political Developments in
Denmark, Finland, Norway, and Sweden’. In R. Erikson, E.J. Hansen, S. Ringen and H. Uusitalo (eds). The Scandinavian Model: Welfare States and Welfare Research. Armonk: M.E. Sharpe, 3–38.
Amsden, A. 2004. The Rise of the Rest. New York: Oxford University Press.Andersen, S.E. 2010. The Evolution of Nordic Finance. Basingstoke: Palgrave Macmillan.Aubert, V. 1989. ‘Notes on Greece and Norway’. Sosiologi i dag 19(4), 49–66.Baldwin, P. 1990. The Politics of Social Solidarity. Cambridge: Cambridge University Press.Berend, I.T. and G. Ranki. 1982. The European Periphery and Industrialization 1780–1914. Cambridge:
Cambridge University Press.Bradley, D. 1996. Family Law and Political Culture: Scandinavian Laws in Comparative Perspective. London:
Sweet & Maxwell.Bruland, K. 1989. British Technology and European Industrialization: The Norwegian Textile Industry in the
Mid- Nineteenth Century. Cambridge: Cambridge University Press.Cappelen, Å and L. Mjøset. 2013. ‘Can Norway Be a Role Model for Natural Resource Abundant Countries?’.
in A. Fosu (ed.). Development Success. Oxford: Oxford University Press, 44–72.Castells, M. and P. Himanen. 2002. The Information Society and the Welfare State: The Finnish Model. Oxford:
Oxford University Press.Christiansen, N.F., K. Petersen, N. Edling and P. Haave (eds). 2006. The Nordic Model of Welfare: A Historical
Reappraisal. Copenhagen: Museum Tusculanum Press.Cippola, C. 1964. The Economic History of World Population. Harmondsworth: Penguin.Edling, N. 2006. ‘Limited Universalism: Unemployment Insurance in Northern Europe 1900–2000’. In
N.F. Christiansen, K. Petersen, N. Edling and P. Haave (eds). The Nordic Model of Welfare: A Historical Reappraisal. Copenhagen: Museum Tusculanum Press, 99–144.
Edquist, C. and B.- Å. Lundvall. 1993. ‘Comparing the Danish and Swedish Systems of Innovation’. In R.R. Nelson (ed.). National Systems of Innovations: A Comparative Analysis. Oxford: Oxford University Press, 265–298.
Esping- Andersen, G. 1990. The Three Worlds of Welfare Capitalism. Cambridge: Polity.Esping- Andersen, G. 1999. Social Foundations of Postindustrial Economies. Oxford: Oxford University Press.Evans, P. 1995. Embedded Autonomy: States and Industrial Transformation. Princeton, NJ: Princeton University
Press.Fellman, S., M. Iversen, H. Sjögren and L. Thue. 2008. Creating Nordic Capitalism: The Business History of a
Competitive Periphery. Basingstoke: Palgrave Macmillan.Flora, P. 1983. State, Economy, and Society in Western Europe 1815–1975: Vol. 1: The Growth of Mass
Democracies and Welfare States. Frankfurt a.M.: Campus.Flora, P. 1987. State, Economy, and Society in Western Europe 1815–1975: Vol. II: The Growth of Industrial
Societies and Capitalist Economies. Frankfurt a.M.: Campus.Fryklund, B. and T. Peterson. 1981. Populism och missnöyespartier i Norden. Lund: Arkiv.Furseth, I. 2002. A Comparative Study of Social and Religious Movements in Norway, 1780s–1905. Lewiston:
Edwin Mellen.Goul Andersen, J. 2011. ‘Ageing and Welfare Reform in the Nordic Countries, 1990–2010: Multipillar Pensions
and “Activation” of Social and Labour Market Policies’. Working paper presented at Sino- Nordic Welfare Seminar, Fudan University, Shanghai, 9–11 October 2011. Available at http://www.dps.aau.dk/fileadmin /user_upload/mb/CCWS/Publications/Research_notes/Ageing_and_welfare_reforms_Goul_Andersen_16_fin.pdf (accessed 21 November 2014).
Hajnal, J. 1965. ‘European Marriage Patterns in Perspective’. In D.V. Glass and E.C. Eversley (eds). Population in History. Chicago, IL: Aldine, 101–146.
Hatland, A. 2013. ‘De store veivalgene gjennom 100 års trygdepolitikk’. In H. Forbod (ed.). Arbeidsdepartementet 100 år. 1913–2013. Festskrift. Oslo: Arbeidsdepartementet, 119–158.
Hernes, H. 1987. Welfare State and Woman Power: Essays in State Feminism. Oslo: Universitetsforlaget.Hodgson, G. 2004. The Evolution of Institutional Economics. London: Routledge.Huber, E. and J.D. Stephens. 2001. Development and Crisis of the Welfare State. Chicago, IL: University of
Chicago Press.Iversen, T. and D. Soskice. 2012. ‘Modern Capitalism and the Advanced Nation State: Understanding the
Causes of the Crisis’. In N. Bermeo and J. Pontusson (eds). Coping with Crisis: Government Reactions to the Great Recession. New York: Russell Sage, 35–64.
Jansson, T. 1988. ‘The Age of Associations’. Scandinavian Journal of History 13(3), 321–343.Johansson, E. 1977. The History of Literacy in Sweden. Reprinted in Harvey J. Graff, Alison Mackinnon,
Bengt Sandin and Ian Winchester (eds), Understanding Literacy in its Historical Contexts. Socio- Cultural History and the Legacy of Egil Johansson. Lund: Nordic Academic Press, 28–59.
Karlsson, G. 2001. Iceland’s 1100 Years: The History of a Marginal Society. London: C. Hurst.
REINERT_97817825444661_t.indb 567REINERT_97817825444661_t.indb 567 03/10/2016 11:3703/10/2016 11:37
Erik S. Reinert, Jayati Ghosh and Rainer Kattel - 9781782544661Downloaded from Elgar Online at 03/31/2017 12:04:16PM
via University College London
568 Handbook of alternative theories of economic development
Knutsen, T. and B. Rothstein. 1994. ‘State Building in Scandinavia’. Comparative Politics 26(2), 203–220.Korpi, W. 1983. The Democratic Class Struggle. London: Routledge & Kegan Paul.Krantz, O. 2001. ‘Industrialisation in Three Nordic Countries’. In H. Kryger Larsen (ed.). Convergence!
Aspects of the Industrialisation of Denmark, Finland and Sweden 1870–1940. Commentationes Scientiarum Socialium 58. Helsinki: Finnish Society of Sciences and Letters, 24–66.
Kristinsson, G.H. 2001. ‘Clientelism in a Cold Climate: The Case of Iceland’. In S. Piattoni (ed.). Clientelism, Interests, and Democratic Representation. Cambridge: Cambridge University Press, 172–192.
Kuhnle, S. 1981. ‘Welfare and Quality of Life’. In E. Allardt et al. (eds). Nordic Democracy. Copenhagen: Det Danske Selskab, 399–415.
Kuhnle, S. 2013. ‘Den norske velferdsstaten i et langsiktig og internasjonalt perspektiv’. In H. Forbod (ed.). Arbeidsdepartementet 100 år. 1913–2013. Festskrift. Oslo: Arbeidsdepartementet, 119–158.
Laslett, P. 1976. ‘Familie und Industrialisering: eine “starke Theorie”’. In W. Conze (ed.). Sozialgeschichte der Familie in der Neuzeit Europas. Stuttgart: Klett, 13–31.
Lorenz, E. and B.- Å. Lundvall. 2009. ‘European Systems of Competence Building’. In E. Lorenz and B.- Å. Lundvall (eds). How Europe’s Economies Learn. New York: Oxford University Press, 1–25.
Mahoney, J. and D. Rueschemeyer (eds). 2003. Comparative Historical Analysis in the Social Sciences. Cambridge: Cambridge University Press.
Miettinen, R. 2013. Innovation, Human Capabilities, and Democracy. Oxford: Oxford University Press.Mitchell, B.R. 1978. European Historical Statistics. London: Macmillan.Mjøset, L. 1987. ‘Nordic Economic Policies in the 1970s and 1980s’. International Organization 41(3), 403–456.Mjøset, L. 1992. The Irish Economy in a Comparative Historical Perspective. Dublin: NESC.Mjøset, L. 2003. ‘Norden in the European State System: A Presentation of Einar Maseng’s Forgotten Analysis’.
In R. Eriksson, M. Jäntti and J. Willner (eds). Att förstå och förändra världen: En festskrift för Jan Otto Andersson. Turku: Åbo Akademis Förlag, 161–206.
Mjøset, L. 2007. ‘An Early Approach to the Varieties of World Capitalism: Methodological and Substantive Lessons from the Senghaas/Menzel- Project’. Comparative Social Research 24, 123–176.
Mjøset, L. 2009. ‘The Contextualist Approach to Social Science Methodology’. In D. Byrne and C.C. Ragin (eds). Handbook of Case- Based Methods. London: Sage, 39–68.
Mjøset, L. 2011a. ‘Nordic Political Economy after Financial Deregulation: Banking Crises, Economic Experts, and the Role of Neoliberalism’. Comparative Social Research 28, 365–420.
Mjøset, L. (ed.). 2011b. The Nordic Varieties of Capitalism. Comparative Social Research Issue 28.Mjøset, L. 2015. ‘A Varieties Approach to the Varieties of Capitalism’. In S. O’Riain, F. Behling, R. Ciccia, and
E. Flaherty (eds). The Changing Worlds and Workplaces of Capitalism. London: Palgrave Macmillan.Mjøset, L. et al. 1986. Norden dagen derpå. Oslo: Universitetsforlaget.Moene, K.O. and M. Wallerstein. 2008. ‘Social Democracy as a Development Strategy’. In D. Austen- Smith et
al. (eds). Selected Works of Michael Wallerstein. Cambridge: Cambridge University Press, 443–466.Mungiu- Pippidi, A. (with M. Frisk Jensen). 2011. ‘Becoming Denmark: Understanding Good Governance
Historical Achievers’. In A. Mungiu- Pippidi (ed.). Contextual Choices in Fighting Corruption: Lessons Learned. Berlin: Hertie School of Government, 57–70. Available at http://www.againstcorruption.eu/uploads/norad/Becoming- Denmark- Historical- Lessons- Learned.pdf. (accessed 8 May 2014).
Nielsen, N. Kayser. 2009. Bonde, stat og hjem: Nordisk demokrati og nationalisme – fra pietismen til 2: Verdenskrig. Aarhus: Aarhus Universitetsforlag.
Nilsson, C.- A. 2001. ‘Employer Strategies against Unionism and Socialism 1899–1940’. In H. Kryger Larsen (ed.). Convergence? Aspects of the Industrialisation of Denmark, Finland and Sweden 1870–1940. Helsinki: Finnish Society of Sciences and Letters, 157–198.
Oesterdiekhoff, G.W. 2008. ‘Familie, Wirtschaft und Gesellschaft in Europa’. In R.P. Sieferle (ed.). 2008. Familiengeschichte. Zürich: Lit Verlag, 47–142.
Østerud, Ø. 1978. Agrarian Structure and Peasant Politics in Scandinavia. Oslo: Universitetsforlaget.Østerud, Ø. 1981. ‘Configurations of Scandinavian Absolutism’. In P. Torsvik (ed.). Mobilization, Center–
Periphery Structures and Nation- Building, Oslo: Universitetsforlaget, 127–151.Perez, C. 2002. Technological Revolutions and Financial Capital. Cheltenham, UK and Northampton, MA,
USA: Edward Elgar Publishing.Petersen, K. 2006. ‘Constructing Nordic Welfare? Nordic Social Political Cooperation 1919–1955’. In N.F.
Christiansen, K. Petersen, N. Edling and P. Haave (eds). The Nordic Model of Welfare: A Historical Reappraisal. Copenhagen: Museum Tusculanum Press, 67–98.
Pétursson, P. 1992. Church and Social Change: A Study of the Secularization Process in Iceland 1830–1930. Reykjavik: Háskólaútgáfan.
Puntila, L.A. 1975. The Political History of Finland. London: Heinemann.Rokkan, S. 1966. ‘Norway: Numerical Democracy and Corporate Pluralism’. In R. Dahl (ed.). Political
Oppositions in Western Democracies. New Haven, CT: Yale University Press, 70–115.Rokkan, S. 1970. Citizens, Elections, Parties. Oslo: Norwegian University Press.
REINERT_97817825444661_t.indb 568REINERT_97817825444661_t.indb 568 03/10/2016 11:3703/10/2016 11:37
Erik S. Reinert, Jayati Ghosh and Rainer Kattel - 9781782544661Downloaded from Elgar Online at 03/31/2017 12:04:16PM
via University College London

The Nordic route to development 569
Rokkan, S. 1975. ‘Dimensions of State Formation and Nation- Building: A Possible Paradigm for Research on Variations within Europe’. In C. Tilly (ed.). The Formation of National States in Western Europe. Princeton, NJ: Princeton University Press, 562–600.
Rokkan, S. 1981. ‘The Growth and Structuring of Mass Politics’. In E. Allardt et al. (eds). Nordic Democracy. Copenhagen: Det Danske Selskab, 53–79.
Rokkan, S. 1999. State Formation, Nation Building, and Mass Politics in Europe. Oxford: Oxford University Press.
Rose, R. 1976. ‘On the Priorities of Government: A Developmental Analysis of Public Policies’. European Journal of Political Research 4(3), 247–289.
Ruggie, J.G. 1982. ‘International Regimes, Transactions, and Change: Embedded Liberalism in the Postwar Economic Order’. International Organization 36(2), 379–415.
Schybergson, P. 2001. ‘Large Enterprises in Small Countries’. In H. Kryger Larsen (ed.). Convergence? Aspects of the Industrialisation of Denmark, Finland and Sweden 1870–1940. Helsinki: Finnish Society of Sciences and Letters, 97–157.
Seip, J.A. 1958. ‘Teorien om det opinionsstyrte enevelde’. Historisk Tidsskrift 36(2), 397–464.Senghaas, D. 1985 [1982]. Von Europa lernen. Frankfurt a.M.: Suhrkamp. English translation (1985), The
European Experience. Transl. K.H. Kimmig. Dover, NH: Berg Publishers.Soulinna, K. 1981. ‘The Popular Revival Movements’. In E. Allardt et al. (eds). Nordic Democracy. Copenhagen:
Det Danske Selskab, 589–608.Sørensen, A.B. 1998. ‘On Kings, Pietism and Rent- seeking in Scandinavian (Welfare States)’. Acta Sociologica
41, 363–375.Stenius, H. 2010. ‘Nordic Associational Life in European and Inter- Nordic Perspectives’. In Risto Alapuro and
Henrik Stenius (eds). Nordic Associations in a European Perspective. Baden Baden: Nomos, 29–86.Svalestuen, A.A. 1971. ‘Nordisk emigrasjon i en komparativ oversikt’. In K. Hvidt (ed.). Emigrationen fra
Norden indtil 1. Verdenskrig. Rapporter til det Nordiske Historikermøde i København. Copenhagen: Nordic Historical Association.
Sysiharju, A.- L. 1981. ‘Primary Education and Secondary Schools’. In E. Allardt et al. (eds). Nordic Democracy. Copenhagen: Det Danske Selskab, 419‒443.
Thelen, K. 2014. Varieties of Liberalization and the New Politics of Social Solidarity. Cambridge: Cambridge University Press.
Thorkildsen, D. 1997. ‘Religious Identity and Nordic Identity’. In Ø. Sørensen and B. Stråth (eds). The Cultural Construction of Norden. Oslo: Norwegian University Press, 138–160.
Thorkildsen, D. 1998. ‘Vekkelse og modernisering i Norden på 1800- tallet’. Historisk Tidsskrift 77(2), 160–180.Thorvaldsen, G., S. Edvinsson and Ó. Gardarsdottir. 2008. ‘Infant Mortality in the Nordic Countries, 1780–
1930’. Continuity and Change 23(3), 457–485.Trädgårdh, L. 1997. ‘Statist Individualism: On the Culturality of the Nordic Welfare State’. In Ø. Sørensen and
B. Stråth (eds). The Cultural Construction of Norden. Oslo: Norwegian University Press, 253–285.Vartiainen, J. 2011. ‘Nordic Collective Agreements: A Continuous Institution in a Changing Economic
Environment’. Comparative Social Research 28, 331–364.Wendt, F. 1981. The Nordic Council and Co- operation in Scandinavia. Stockholm: Almquist & Wicksell.World Commission on Environment and Development (WCED). 1987. Our Common Future. Oxford: Oxford
University Press.
REINERT_97817825444661_t.indb 569REINERT_97817825444661_t.indb 569 03/10/2016 11:3703/10/2016 11:37
Erik S. Reinert, Jayati Ghosh and Rainer Kattel - 9781782544661Downloaded from Elgar Online at 03/31/2017 12:04:16PM
via University College London

570
30. Competitiveness and development: a Schumpeterian approachMehdi Shafaeddin
The problem that is usually being visualized is how capitalism administers existing structure[s], whereas the relevant problem is how it creates and destroys them. As long as this is not recog-
nized, the investigator does a meaningless job. (Schumpeter 1976 [1934], 84)
INTRODUCTION
The purpose of this chapter is twofold. Firstly, to show that while developed countries apply the concept of competitiveness in its dynamic sense as a means of raising the standard of living of their population, they impose competitiveness in its static sense on developing countries. Based on the neoliberal ideology, they advocate policies which lead to keeping developing countries which are at early stages of industrialization at a low level of development and industrialization. Such policies, as I will explain, tend to lock their structure of production and trade in primary commodities, resource- based indus-tries and, at best, in assembly operations. They also create constraints on those countries which already have some industrial base, limiting their ability to upgrade their industrial structure to raise the standard of living of their citizens. Secondly, the chapter sheds some light on the policies necessary to achieve competitiveness at a high level of development and mentions constraints for achieving it.
To proceed, I first briefly refer to different approaches to competitiveness; the static approach to competitiveness is outlined, and reference is made to the views of its critics before explaining competitiveness in its dynamic (Schumpeterian) context. Subsequently, I provide my own analytical framework by considering competitiveness as a means to development where firms are the centrepieces of economic activities, and describe their relations with, and the role of, other economic actors and agents, including the govern-ment. The following section is devoted to development policies required for achieving competitiveness at a high level of development. In my concluding remarks, I refer to constraints on applying such policies.
DIFFERENT APPROACHES TO COMPETITIVENESS
The issue of competitiveness has attracted a lot of attention from both scholars and policy- makers, but with different approaches. Some have regarded competitiveness as an important element of success in economic performance (e.g. OECD 1992); others have considered it a misplaced concept and an obsession (e.g. Krugman 1994). Almost all industrial countries have been concerned with their competitiveness (at a high level of development) on the international market, particularly during the last quarter-
REINERT_97817825444661_t.indb 570REINERT_97817825444661_t.indb 570 03/10/2016 11:3703/10/2016 11:37
Erik S. Reinert, Jayati Ghosh and Rainer Kattel - 9781782544661Downloaded from Elgar Online at 03/31/2017 12:04:16PM
via University College London

CHAPTER SEVEN
a member of the alliance of stakeholders who share the monopolisticrents generated by this oligopolistic form of business organization.The exclusive nature of the keiretsu system has significantly limitedforeign firms’ access to the Japanese market. The keiretsu also makesit extremely difficult for foreign firms to “take over” Japanese firmsand gives Japanese firms a huge advantage in corporate expansion.Whereas the keiretsu firms can easily purchase a non-Japanese firmin order to acquire its technology or to gain market access, it hasfrequently been difficult for non-Japanese firms to purchase Japanesefirms for the same purposes. Furthermore, the keiretsu’s control ofdistribution channels effectively shuts non-Japanese firms out of someJapanese markets. Although the situation is changing as this is writ-ten, non-Japanese still regard the keiretsu as a significant barrier totrade and foreign direct investment, while the Japanese, on the otherhand, regard the keiretsu as a key element in their economic success.The problem of differential or asymmetrical access has been a majorcause of conflict between Japan and its trading partners.
The German System of “Social Market” Capitalism
The German economy has some characteristics similar to the Ameri-can and some to the Japanese systems of political economy, but it isquite different from both in other ways.37 On the one hand, Germany,like Japan, emphasizes exports and national savings and investmentmore than consumption.38 However, Germany permits the market tofunction with considerable freedom; indeed, most states in WesternEurope are significantly less interventionist than Japan. Furthermore,except for the medium-sized business sector (Mittelstand), the non-governmental sector of the German economy is highly oligopolisticand is dominated by alliances between major corporations and largeprivate banks. The German system of political economy attempts tobalance social concerns and market efficiency.39 The German state
37 This section draws from Philip Glouchevitch, Juggernaut: The German Way ofBusiness: Why It Is Transforming Europe—and the World (New York: Simon andSchuster, 1992).
38 Gunter Heiduk and Kozo Yamamura, eds., Technological Competition and Inter-dependence: The Search for Policy in the United States, West Germany, and Japan(Seattle: University of Washington Press, and Tokyo: University of Tokyo Press, 1990).
39 The German system is representative of classical liberalism that emphasizes a freemarket and a strong welfare-oriented state. See Razeen Sally, Classical Liberalism andInternational Economic Order: Studies in Theory and Intellectual History (New York:Routledge, 1998).
168
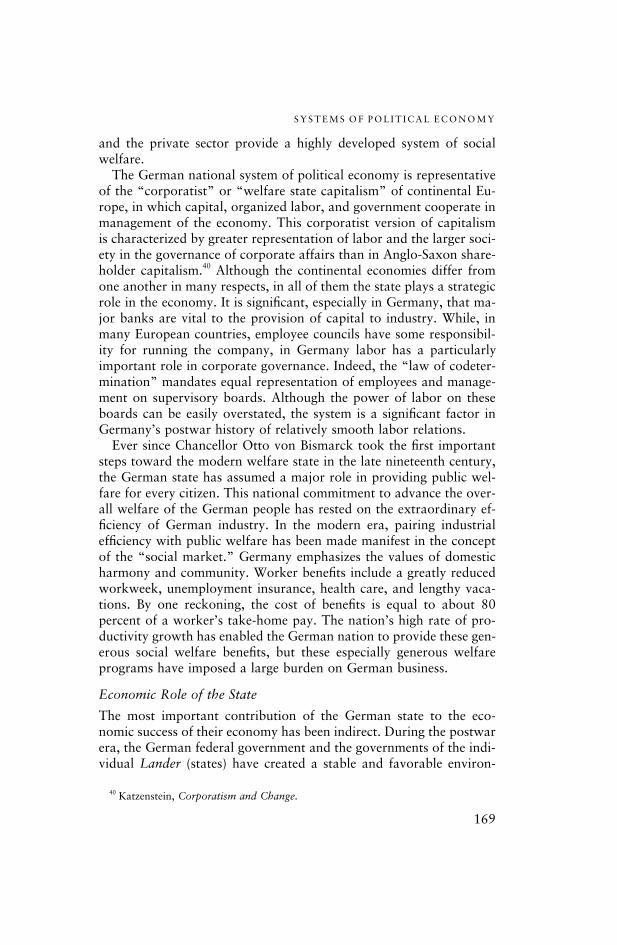
SYSTEMS OF POL IT ICAL ECONOMY
and the private sector provide a highly developed system of socialwelfare.The German national system of political economy is representative
of the “corporatist” or “welfare state capitalism” of continental Eu-rope, in which capital, organized labor, and government cooperate inmanagement of the economy. This corporatist version of capitalismis characterized by greater representation of labor and the larger soci-ety in the governance of corporate affairs than in Anglo-Saxon share-holder capitalism.40 Although the continental economies differ fromone another in many respects, in all of them the state plays a strategicrole in the economy. It is significant, especially in Germany, that ma-jor banks are vital to the provision of capital to industry. While, inmany European countries, employee councils have some responsibil-ity for running the company, in Germany labor has a particularlyimportant role in corporate governance. Indeed, the “law of codeter-mination” mandates equal representation of employees and manage-ment on supervisory boards. Although the power of labor on theseboards can be easily overstated, the system is a significant factor inGermany’s postwar history of relatively smooth labor relations.Ever since Chancellor Otto von Bismarck took the first important
steps toward the modern welfare state in the late nineteenth century,the German state has assumed a major role in providing public wel-fare for every citizen. This national commitment to advance the over-all welfare of the German people has rested on the extraordinary ef-ficiency of German industry. In the modern era, pairing industrialefficiency with public welfare has been made manifest in the conceptof the “social market.” Germany emphasizes the values of domesticharmony and community. Worker benefits include a greatly reducedworkweek, unemployment insurance, health care, and lengthy vaca-tions. By one reckoning, the cost of benefits is equal to about 80percent of a worker’s take-home pay. The nation’s high rate of pro-ductivity growth has enabled the German nation to provide these gen-erous social welfare benefits, but these especially generous welfareprograms have imposed a large burden on German business.
Economic Role of the State
The most important contribution of the German state to the eco-nomic success of their economy has been indirect. During the postwarera, the German federal government and the governments of the indi-vidual Lander (states) have created a stable and favorable environ-
40 Katzenstein, Corporatism and Change.
169

CHAPTER SEVEN
ment for private enterprise. Their laws and regulations have success-fully encouraged a high savings rate, rapid capital accumulation, andeconomic growth. Germany has a highly developed system of codifiedlaw that reduces uncertainty and creates a stable business climate; theAmerican common law tradition guides U.S. business, and the Japa-nese bureaucracy relies on administrative guidance.At the core of the German system of political economy is their
central bank, or Bundesbank. The Bundesbank’s crucial role in thepostwar German economy has been compared to that of the GermanGeneral Staff in an earlier German domination of the Continent.Movement toward the European Economic and Monetary Union hasfurther increased the powerful impact of the Bundesbank. Althoughthe Bundesbank lacks the formal independence of the American Fed-eral Reserve, its actual independence and pervasive influence over theGerman economy have rested on the belief of the German public thatthe Bundesbank is the “defender of the mark” (euro) and the staunchopponent of dreaded inflation. Indeed, the Bundesbank did create thestable macroeconomic environment and low interest rates that haveprovided vital support to the postwar competitive success of Germanindustry.The role of the German state in the microeconomic aspects of the
economy has been modest. The Germans, for example, have not hadan activist industrial policy although, like other advanced industrialcountries, the government has spent heavily on research and develop-ment. The German government, however, has not intervened signifi-cantly in the economy to shape its structure except in the support ithas given through subsidies and protection to such dying industriesas coal and shipbuilding and the state-owned businesses such as Luf-thansa and the Bundespost (mail and telecommunications). However,since the early 1990s, these sectors have increasingly been privatized.On the whole, the German economy is closer to the American mar-ket-oriented system than to the Japanese system of collective capi-talism.
Corporate Governance and Private Business Practices
The German system of corporate governance and industrial structurehas noteworthy parallels to the Japanese system. As in Japan, power-ful national organizations such as the Bundesverband der DeutschenIndustrie and the Deutscher Industrie-und Handelstag represent theinterests of business in national affairs, and labor is also well orga-nized at the national level. IG. Metall, an organization that representsthe auto and metal workers as well as other industries, can speak for
170

SYSTEMS OF POL IT ICAL ECONOMY
German labor in a way that the American Federation of Labor/Con-gress of Industrial Organizations cannot for American workers. Japa-nese organized labor, on the other hand, is fragmented into companyunions and has almost no influence on either company or nationalaffairs. The system of codetermination at the level of the firm hasmade German labor a partner, albeit a junior partner, in corporategovernance.German industrial organization has certain noteworthy features.
One element is the prominent role played in the economy by medium-sized, privately owned firms, called the Mittelstand. Despite the inter-national prominence given to Germany’s large corporations, such asSiemens or Daimler-Benz, the Mittelstand constitute an importantreason for German economic success. They are major exporters andare especially strong as suppliers of such intermediate goods as chemi-cals and machine tools. The second major component in German suc-cess is the publicly owned corporations whose shares are traded freelyon the German stock market. Nevertheless, corporations such asthese are much less important in the German economy than in theAmerican economy. In fact, in the 1990s, there were only about sixhundred fifty German companies listed on the stock market, and onlyabout one hundred twenty were actively traded. The firms that aremost important in the overall structure and governance of the Ger-man economy are the bank-linked corporations.The integration of finance and industry has been a noteworthy fea-
ture of corporate governance in Germany. Although more informalthan the Japanese keiretsu, long-term bank-corporate ties are a cru-cial element in the system. The major universal banks (i.e., those thatperform all financial services) such as the Deutsche Bank and theCommerzbank are worthy of particular attention. Representatives ofthese banks and of the large German multinational corporations siton one another’s boards of supervisors. In important ways the systemof cross-ownership and interlocking boards resembles the Japanesekeiretsu with their integration of financial, industrial, and distributionactivities; the system facilitates the sharing of vital information, pro-vision of less expensive investment capital, and coordination ofeconomic planning. Also, like the keiretsu, the system emphasizeslong-term relationships based on negotiated prices and supply ar-rangements among corporations. However, German participants inthese arrangements seek to advance the interests of their particularfirm rather than those of the whole organizational alliance. It is im-portant to note that as the German economy has globalized, the link-ages between banks and industry have weakened.
171
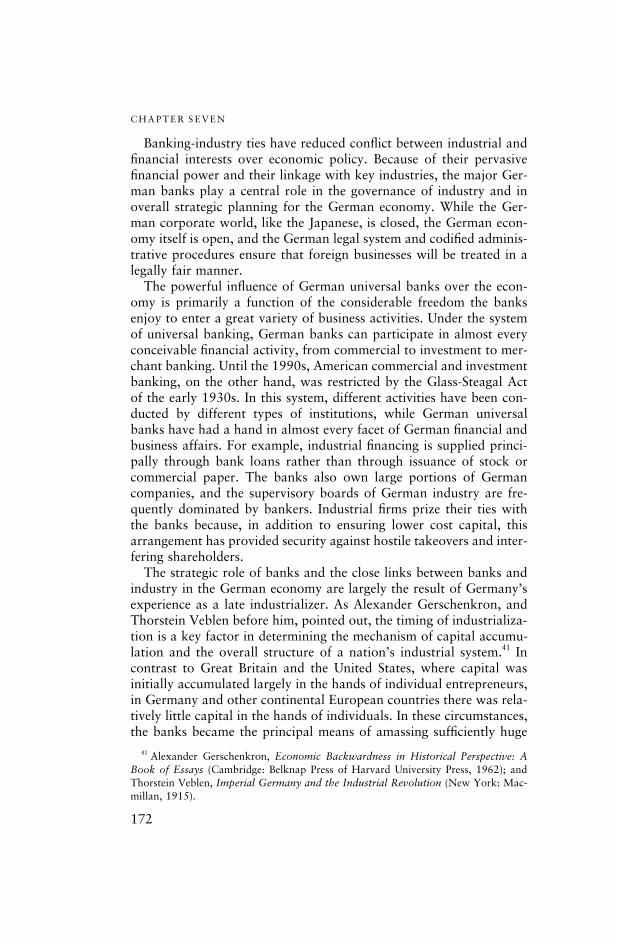
CHAPTER SEVEN
Banking-industry ties have reduced conflict between industrial andfinancial interests over economic policy. Because of their pervasivefinancial power and their linkage with key industries, the major Ger-man banks play a central role in the governance of industry and inoverall strategic planning for the German economy. While the Ger-man corporate world, like the Japanese, is closed, the German econ-omy itself is open, and the German legal system and codified adminis-trative procedures ensure that foreign businesses will be treated in alegally fair manner.The powerful influence of German universal banks over the econ-
omy is primarily a function of the considerable freedom the banksenjoy to enter a great variety of business activities. Under the systemof universal banking, German banks can participate in almost everyconceivable financial activity, from commercial to investment to mer-chant banking. Until the 1990s, American commercial and investmentbanking, on the other hand, was restricted by the Glass-Steagal Actof the early 1930s. In this system, different activities have been con-ducted by different types of institutions, while German universalbanks have had a hand in almost every facet of German financial andbusiness affairs. For example, industrial financing is supplied princi-pally through bank loans rather than through issuance of stock orcommercial paper. The banks also own large portions of Germancompanies, and the supervisory boards of German industry are fre-quently dominated by bankers. Industrial firms prize their ties withthe banks because, in addition to ensuring lower cost capital, thisarrangement has provided security against hostile takeovers and inter-fering shareholders.The strategic role of banks and the close links between banks and
industry in the German economy are largely the result of Germany’sexperience as a late industrializer. As Alexander Gerschenkron, andThorstein Veblen before him, pointed out, the timing of industrializa-tion is a key factor in determining the mechanism of capital accumu-lation and the overall structure of a nation’s industrial system.41 Incontrast to Great Britain and the United States, where capital wasinitially accumulated largely in the hands of individual entrepreneurs,in Germany and other continental European countries there was rela-tively little capital in the hands of individuals. In these circumstances,the banks became the principal means of amassing sufficiently huge
41 Alexander Gerschenkron, Economic Backwardness in Historical Perspective: ABook of Essays (Cambridge: Belknap Press of Harvard University Press, 1962); andThorstein Veblen, Imperial Germany and the Industrial Revolution (New York: Mac-millan, 1915).
172

SYSTEMS OF POL IT ICAL ECONOMY
amounts of investment capital to expedite industrialization and catchup with the industrial leaders. This historic linkage between financeand industry has continued in both Germany and Japan.The most influential of the major German universal banks is, with-
out question, the Deutsche Bank (DB). The DB’s pivotal position inthe German economy may be gauged by its holdings in the nation’smajor corporations; it has a substantial stake in Daimler-Benz, Ger-many’s largest corporation, and it also has substantial holdings inGermany’s leading insurance company (Allianz), its largest reinsur-ance company (Munich Re), and its major department store chain(Karstadt). The list of blue-chip companies in which DB has a largestake could easily be lengthened. In addition, members of the uppermanagement of DB are on the supervisory boards of over one hun-dred fifty German corporations.German government policies have supported and reinforced the po-
sition of Germany’s major private banks in corporate governance.Corporate law has empowered banks by giving considerable rights tominority shareholders. For example, corporate law has required that75 percent of the shareholders in a public corporation must approveany change in the corporation’s capitalization and hence in the gov-erning structure of a firm. This means that a bank with only a 26percent share can block change. Since, in certain circumstances, thebanks can also vote the shares of their account holders, this providesbanks with considerable influence over corporate affairs.The governing structure of German industry is affected by the
German government’s tolerance of the concentration of economicpower, by horizontal cooperation, and by the linkages between fi-nance and industry. Despite the fact that the American Occupationafter World War II attempted to wipe out the German cartel traditionand to promote an antitrust mentality, this mentality remains rela-tively weak in Germany. The decision of the German government topermit Daimler-Benz to acquire Messerschmitt-Bolkow-Blohm, Ger-many’s largest defense and aerospace firm, is an example of Germantolerance of the concentration of economic power. (Subsequent-ly, Daimler-Benz eliminated its interests in Messerschmitt-Bolkow-Blohm.)German management is less restricted by shareholder concerns
about annual returns on their investments than is American manage-ment. Freedom from outside scrutiny has unfortunately sometimesprotected the incompetent, but it has enabled German managementto pursue long-term plans. This situation began to change in the late1990s, but previously, management independence had been greatly
173

CHAPTER SEVEN
enhanced by the system of “dual boards.” In Germany, there is botha supervisory board, comparable to the American board of directors,and a management board, composed of the chief executive and topmanagement. While, in theory, the supervisory board is the superiorbody, in actual practice the management board, which is full-timeand functions on the basis of consensus, is frequently dominant. Thisempowerment of management strengthens management’s ability tomake long-term strategic decisions.The structure and governance of German industry is also signifi-
cantly influenced by the negative German attitude toward corporatetakeovers. The methods used to prevent hostile takeovers are legion:for instance, companies may simply stay private, stock may be distrib-uted to increase resistance, blocking minorities may be employed,German corporate law can be utilized to discourage takeovers, andvoting rights can be restricted. Whereas in the United States, corpo-rate takeovers are defended as a blunt but effective means to guaran-tee high performance and to demonstrate the ultimate responsibilityof management to the shareholders, in Germany takeovers have beenregarded as destabilizing and destructive of important long-term busi-ness relationships. A number of American executives discovered this,to their chagrin, when they attempted to gain control of the DeutscheBank. This attitude has made corporate takeovers and struggles overcorporate governance rare in Germany, and German banks have sel-dom sold their stakes in German corporations. This situation, how-ever, began to change in the late 1990s.
Significance of National Differences
This chapter has analyzed and compared the three national systemsof political economy dominant at the beginning of the twenty-firstcentury. The American system incorporates neoclassical precepts re-garding the organization and functioning of an economy intended tomaximize consumer satisfaction and facilitate adjustment to change.Many other countries consider the social costs of such an economyto be too high because of their impact on poverty and on those wholose through economic developments. The Japanese system places ahigh priority on social harmony and national power, but its criticsconsider that system to be inflexible, mercantilistic, and unresponsiveto the concerns of other societies. The German emphasis on the socialmarket has many of the virtues and vices of both the American andJapanese systems. Although each of these economies was experiencingimportant changes at the turn of the century, they remained distinctly
174

CHAPTER SEVEN
danren (the organization representing Japanese big business) or theFederation of German Industries. Both the Japanese and German or-ganizations can speak with a single strong voice and frequently doact on behalf of major business interests.A fundamentally different conception of the corporation and its
role in society underlies many of these contrasts between shareholder(stockholder) American capitalism and Japanese/German stakeholdercapitalism. In the American system of shareholder capitalism, a firm’sfundamental purpose is to make profits for its investors or sharehold-ers; in principle, the firm has minimal obligations to employees and/or to the communities in which its production facilities are located.Moreover, in the United States, a business corporation is regarded asa commodity that is bought and sold like any other commodity with-out regard for the social consequences of such transactions; waves ofleveraged buyouts and corporate takeovers in the 1980s and 1990swere extreme examples of this mentality. In both Japan and Ger-many, on the other hand, the corporation is assumed to have a majorresponsibility toward its stakeholders (workers, subcontractors, etc.),and the interests of shareholders are given much less attention thanin the American system; instead, firms are expected to promote largersocial objectives. Japanese firms are expected to increase the powerand independence of the Japanese nation and to promote socialharmony; Germany also places a high premium on social welfare.American law is designed to ensure neutrality and fair play in thecompetitive market for corporate control. In Japan and Germany,profitability has been assigned less importance than economic stabil-ity. Moreover, German and Japanese policies are intended to limithostile and foreign takeovers, and to control what Carl Kester hascalled “the global contest for corporate control.”10
The Japanese System of Developmental Capitalism
G. C. Allen, the distinguished British authority on Japanese economichistory, tells a story that provides an important insight into Japaneseeconomic psychology. At the end of World War II, American occupa-tion officials advised the Japanese that they should follow the theoryof comparative advantage and hence concentrate on labor-intensiveproducts in rebuilding their economy. Japan’s economic and politicalelite, however, had quite different ideas and would have nothing to
10 W. Carl Kester, Japanese Takeovers: The Global Contest for Corporate Control(Boston: Harvard Business School Press, 1991).
156

SYSTEMS OF POL IT ICAL ECONOMY
do with what they considered an American effort to relegate Japanto the low end of the economic and technological spectrum. Instead,the Japanese Ministry of International Trade and Industry (MITI) andother agencies of the Japanese economic high command set theirsights on making vanquished Japan into the economic and technolog-ical equal, and perhaps even the superior, of the West. At the openingof the twenty-first century, this objective has remained the drivingforce of Japanese society.11
In the Japanese scheme of things, the economy is subordinate tothe social and political objectives of society. As the distinguished Jap-anese economist Ryutaro Komiya has written, ever since the MeijiRestoration (1868), Japan’s overriding goals have been “making theeconomy self-sufficient” and “catching up with the West.”12 In thepre–World War II years this ambition meant building a strong armyand becoming an industrial power. Since its disastrous defeat inWorld War II, however, Japan has abandoned militarism and hasfocused on becoming a powerful industrial and technological nation,while also promoting internal social harmony among the Japanesepeople. There has been a concerted effort by the Japanese state toguide the evolution and functioning of their economy in order to pur-sue these sociopolitical objectives.13
These political goals have resulted in a national economic policyfor Japan best characterized as neomercantilism; it involves state as-sistance, regulation, and protection of specific industrial sectors inorder to increase their international competitiveness and attain the“commanding heights” of the global economy. This economic objec-tive of achieving industrial and technological equality with othercountries arose from Japan’s experience as a late developer and alsofrom its strong sense of economic and political vulnerability. Anothervery important source of this powerful economic drive is the Japanese
11 Among the many important studies of the Japanese economy, several should bementioned: Yasusuke Murakami, An Anticlassical Political-Economic Analysis: A Vi-sion for the Next Century, ed. and trans. Kozo Yamamura (Stanford: Stanford Univer-sity Press, 1996), is a brilliant interpretation of the distinctive nature of the Japaneseeconomy; Takatoshi Ito, The Japanese Economy (Cambridge: MIT Press, 1992), is avery useful survey and analysis of the Japanese economy; Bai Gao, Economic Ideologyand Japanese Industrial Policy: Developmentalism from 1931 to 1965 (Cambridge:Cambridge University Press, 1997), is an outstanding history and evaluation of Japa-nese industrial policy.
12 Ryutaro Komiya, Industrial Policy in Japan (Orlando, Fla.: Academic Press,1988).
13 Richard J. Samuels, “Rich Nation, Strong Army”: National Security and the Tech-nological Transformation of Japan (Ithaca: Cornell University Press, 1994).
157

CHAPTER SEVEN
people’s overwhelming belief in their uniqueness, in the superiority oftheir culture, and in their manifest destiny to become a great power.Many terms have been used to characterize the distinctive nature
of the Japanese system of political economy: Shinto capitalism, devel-opmental state capitalism, tribal capitalism, collective capitalism, wel-fare corporatism, competitive communism, network capitalism, com-panyism, producer capitalism, stakeholder capitalism, strategiccapitalism, and, perhaps most famously or infamously, “Japan, Inc.”Each of these labels connotes particularly important elements of theJapanese economic system, such as its overwhelming emphasis oneconomic development, the key role of large corporations in the orga-nization of the economy and society, subordination of the individualto the group, primacy of the producer over the consumer, and theclose cooperation among government, business, and labor. I believethat the term “developmental state capitalism” best captures the es-sence of the system, because this characterization conveys the ideathat the state must play a central role in national economic develop-ment and in the competition with the West.Despite the imperative of competition, the Japanese frequently sub-
ordinate pursuit of economic efficiency to social equity and domesticharmony.14 Many aspects of the Japanese economy that puzzle for-eigners are a consequence of a powerful commitment to domestic har-mony; and “over-regulation” of the Japanese economy is motivatedin part by a desire to protect the weak and defenseless. For example,the large redundant staffs in Japanese retail stores developed from aneffort to employ many individuals who would otherwise be unem-ployed and discontented. This situation is also a major reason for thelow level of productivity in nonmanufacturing sectors, and it ac-counts in part for Japan’s resistance to foreign direct investment bymore efficient foreign firms. The Japanese system of lifetime employ-ment has also been utilized as a means to promote social peace; Japa-nese firms, unlike their American rivals, are very reluctant to “down-size” and lay off thousands of employees. At the opening of thetwenty-first century, however, Japan’s economic problems are causingthis situation to change. Nevertheless, the commitments to politicalindependence and social harmony are major factors in the Japanesestate’s determination to maintain firm control over the economy.
Economic Role of the State
Ever since the 1868 Meiji Restoration, the Japanese state has assumedthe central role in the economy. Following Japan’s defeat in World
14 Frank Upham, Law and Social Change in Postwar Japan (Cambridge: HarvardUniversity Press, 1987).
158

SYSTEMS OF POL IT ICAL ECONOMY
War II, the ruling tripartite alliance of government bureaucracies, thegoverning Liberal Democratic Party (LPD), and big business began topursue vigorously the goal of catching up with the West. To this end,the elite pursued rapid industrialization through a strategy employingtrade protection, export-led growth, and other policies. The Japanesepeople have supported this extensive interventionist role of the stateand believe that the state has a legitimate and important economicfunction in promoting economic growth and international competi-tiveness. The government bureaucracy and the private sector, withthe former frequently taking the lead, have consistently worked to-gether for the collective good of Japanese society.To attain the goal of rapid industrialization, the Japanese state sup-
ported, or even created, certain social characteristics, including anindustrious and highly educated workforce. In many ways, the Japa-nese state created today’s Japanese society.15 Japan’s postal savingsinstitution fostered an extraordinarily high savings rate. Because ofstrict capital controls for much of the postwar era, the postal servicewas able, while paying depositors just a minimal rate of interest, tomake these savings available for loans to Japanese firms; such finan-cial assistance significantly reduced the cost of capital and contributedimportantly to the rapid industrialization of the country and to inter-national competitiveness. The Japanese state has also unfortunatelyplayed an important role in supporting social, political, and legal as-pects of Japanese society that made it inhospitable to foreign directinvestment and to the importation and consumption of foreigngoods.16 Fortunately, since the mid-1990s, this situation has beenchanging.The unusual independence and power of the government bureau-
cracy accompanied by bureaucratic fragmentation within the govern-ment provide yet another distinctive aspect of the Japanese state thatsets it apart. The economic and other bureaucracies of the govern-ment are virtually independent fiefdoms. With few major exceptions,each bureaucracy represents a particular segment of Japanese societyand believes that it has a responsibility to promote the interests ofthat group. There are frequent disputes among agencies over policyand jurisdictional responsibility; these have increased as new technol-ogies and economic developments have spread across the traditionalfunctions of government agencies. Chalmers Johnson has made the
15 The central role of the Japanese state in the formation of the Japanese economyand economic psychology has been demonstrated by Sheldon Garon, Molding JapaneseMinds: The State in Everyday Life (Princeton: Princeton University Press, 1997).
16 Edward J. Lincoln, Japan’s Unequal Trade (Washington, D.C.: Brookings Institu-tion, 1990).
159

CHAPTER SEVEN
point that the three major economic agencies responsible for foreignaffairs frequently have differing foreign economic policies that con-flict with those of the other agencies. Although bureaucratic strugglesexist in every country, Japan does not have a powerful executive andtherefore has no easy way to resolve such conflicts. In addition, thestrong belief of the Japanese in consensus decision-making permitsand even encourages stalemate and indecision. Indeed, during muchof the postwar period the weak executive branch was of little conse-quence because of the agreement within the Japanese political eliteon the path that all should follow. By the late 1990s, however, itbecame clear that the weakness of the Japanese executive had becomea serious obstacle to Japan’s ability to deal with its difficult economicand financial problems.Another distinctive feature of Japanese society is that many “pub-
lic” responsibilities have been assumed by the private sector. For ex-ample, private corporations carry a major responsibility for the socialwelfare of a substantial portion of the Japanese population. Whereasthe American government delegates regulatory authority to quasi-au-tonomous public agencies, Japan delegates much of the responsibilityfor policing business activities to private business associations. Thishas been a highly pragmatic practice based on the close ties and mu-tual trust between private business and government. There is a partic-ularly interesting example of this practice in the delegation of publicfunctions in the privatizing of “law and order.” One reason for thelow level of street crime in Japan is that the yakuza (the JapaneseMafia) police the streets in exchange for police toleration of theirbusinesses.This practice of self-regulation and self-policing by business and
other private associations is intended to provide social stability andensure fairness. However, it does result in special treatment of partic-ular groups, seemingly arbitrary decisions, and discriminatory behav-ior; this practice of self-regulation is also directly counter to theAmerican concept of universal rules that apply equally to everyoneregardless of status. Cultural differences in the definition of “fairness”have been a major source of American-Japanese economic tensionthat has, on occasion, erupted into open conflict. The Japanese prac-tice of private associations assuming essentially public responsibilitieshas raised significant problems in the integration of Japan into theworld economy. For cultural and other reasons, the Japanese find itvirtually impossible to incorporate outsiders into the self-regulatingassociations that set the rules governing competitive behavior andother aspects of the conduct of business in Japan, while foreign com-
160

SYSTEMS OF POL IT ICAL ECONOMY
panies seeking entry into the Japanese market naturally regard thepractice of self-regulation as discriminatory. The self-policing system,with its emphasis on “fairness” and on tailor-made rules enforced inself-regulatory associations, may conflict with the rules embodied inthe World Trade Organization (WTO) and is thus an immense hurdleto be cleared to open the Japanese market and internationalize Japanmore completely.Industrial policy has been the most controversial aspect of the Japa-
nese political economy.17 As I have already noted, industrial policyrefers to deliberate efforts of a government to guide and shape theoverall structure of the economy. In the early postwar decades, theJapanese provided government support for favored industries, espe-cially for high-tech industries, through trade protection, generoussubsidies, and other means. The government also supported creationof cartels to help declining industries and to eliminate “excessive com-petition.”18 Through subsidies, provision of low-cost financing, andespecially “administrative guidance” by bureaucrats, the Japanesestate plays a major role in the economy.19
The effectiveness of Japanese industrial policy has been very con-troversial and a matter of intense debate. On one side are revisionistscholars and proponents of the developmental state who attribute Ja-pan’s success to its unique economic system and the government’spowerful role in the economy. The opposing position is held byAmerican and some Japanese economists, who emphasize Japan’smarket-conforming economic strategy.Chalmers Johnson’s MITI and the Japanese Miracle: The Growth
of Industrial Policy, 1925–1975 (1982), in which he credits Japan’sMinistry of Trade and Investment (MITI) with having orchestratedpostwar economic and technological success, is the most outstandingstatement of the revisionist or developmental state position.20 Accord-
17 A useful and sympathetic treatment of Japanese industrial policy is Miyohei Shino-hara, Industrial Growth, Trade, and Dynamic Patterns in the Japanese Economy(Tokyo: University of Tokyo Press, 1982). A wide-ranging discussion of Japanese in-dustrial policy from several different perspectives is Hugh Patrick, ed., with the assis-tance of Larry Meissner, Japan’s High-Technology Industries: Lessons and Limitationsof Industrial Policy (Seattle: University of Washington Press, 1986).
18 Jeffrey R. Bernstein, “Japanese Capitalism,” in Thomas K. McCraw, ed., CreatingModern Capitalism: How Entrepreneurs, Companies, and Countries Triumphed inThree Industrial Revolutions (Cambridge: Harvard University Press, 1997).
19 For a discussion of administrative guidance, consult Bernstein, “Japanese Capital-ism,” 479
20 Chalmers Johnson, MITI and the Japanese Miracle: The Growth of Industrial Pol-icy, 1925–1975 (Stanford: Stanford University Press, 1982).
161

CHAPTER SEVEN
ing to Johnson, Japan is a capitalist developmental state rather thanan American-style capitalist regulatory state. He credits MITI andother Japanese bureaucracies for Japan’s outstanding postwar eco-nomic success. MITI and other agencies employed such techniques asimport protection, government subsidies, and low-cost financing topromote rapid industrialization and development of the high-tech sec-tors. In the opinion of Johnson and other revisionists, the most im-portant instrument of Japan’s successful industrial policy was the de-vice of administrative guidance, which was utilized to encourage andsometimes pressure private firms to invest in those industrial andhigh-tech sectors characterized by high value-added and favored bythe government. In addition, Japan’s export success has been due toits neomercantilist strategy of export-led economic growth.On the other side of the debate, many American and some Japanese
economists argue that Japanese economic success has been due to thefact that Japan pursued market-conforming economic policies andthus got the economic fundamentals correct.21 They call attention toJapan’s high savings and investment rate, superior management andentrepreneurship, and excellent system of education as bearing theprimary responsibilities for Japan’s success. In addition, the Ministryof Finance (MOF) has pursued stable and prudent macroeconomicpolicies. Explaining Japan’s export success, many note that Japan, asa resource-poor and capital-skilled, labor-rich economy, has had acomparative advantage in manufacturing and industrial innovation.22
According to this position, Japan’s industrial policy had very little todo with its economic success and has even wasted resources.23 Nota-ble examples of failure are found in MITI’s efforts to promote fifth-generation computers and a petrochemical industry. A more infamousexample is provided by MITI’s effort to prevent Honda from becom-ing an automobile producer, because MITI believed that Japan couldnot support another automobile company!There is considerable evidence on both sides of this debate, but
the outcome remains inconclusive because there is no counterfactual21 Hugh Patrick, Asia’s New Giant: How Japan’s Economy Works (Washington,
D.C.: Brookings Institution, 1976); and Edward F. Denison and William K. Chung,How Japan’s Economy Grew So Fast: The Sources of Postwar Expansion (Washing-ton, D.C.: Brookings Institution, 1976).
22 Gene M. Grossman, “Explaining Japan’s Innovation and Trade: A Model of Qual-ity Competition and Dynamic Comparative Advantage,” Bank of Japan, Monetary andEconomic Studies 8, no. 2 (September 1990): 75–100.
23 A valuable assessment is provided by Daniel I. Okimoto, Between MITI and theMarket: Japanese Industrial Policy for High Technology (Stanford: Stanford UniversityPress, 1989).
162
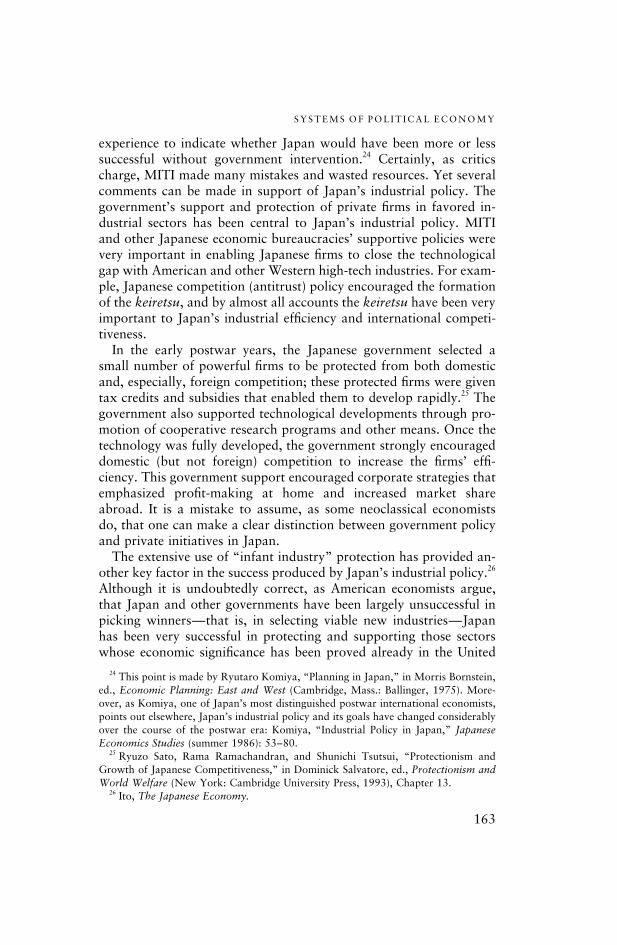
SYSTEMS OF POL IT ICAL ECONOMY
experience to indicate whether Japan would have been more or lesssuccessful without government intervention.24 Certainly, as criticscharge, MITI made many mistakes and wasted resources. Yet severalcomments can be made in support of Japan’s industrial policy. Thegovernment’s support and protection of private firms in favored in-dustrial sectors has been central to Japan’s industrial policy. MITIand other Japanese economic bureaucracies’ supportive policies werevery important in enabling Japanese firms to close the technologicalgap with American and other Western high-tech industries. For exam-ple, Japanese competition (antitrust) policy encouraged the formationof the keiretsu, and by almost all accounts the keiretsu have been veryimportant to Japan’s industrial efficiency and international competi-tiveness.In the early postwar years, the Japanese government selected a
small number of powerful firms to be protected from both domesticand, especially, foreign competition; these protected firms were giventax credits and subsidies that enabled them to develop rapidly.25 Thegovernment also supported technological developments through pro-motion of cooperative research programs and other means. Once thetechnology was fully developed, the government strongly encourageddomestic (but not foreign) competition to increase the firms’ effi-ciency. This government support encouraged corporate strategies thatemphasized profit-making at home and increased market shareabroad. It is a mistake to assume, as some neoclassical economistsdo, that one can make a clear distinction between government policyand private initiatives in Japan.The extensive use of “infant industry” protection has provided an-
other key factor in the success produced by Japan’s industrial policy.26
Although it is undoubtedly correct, as American economists argue,that Japan and other governments have been largely unsuccessful inpicking winners—that is, in selecting viable new industries—Japanhas been very successful in protecting and supporting those sectorswhose economic significance has been proved already in the United
24 This point is made by Ryutaro Komiya, “Planning in Japan,” in Morris Bornstein,ed., Economic Planning: East and West (Cambridge, Mass.: Ballinger, 1975). More-over, as Komiya, one of Japan’s most distinguished postwar international economists,points out elsewhere, Japan’s industrial policy and its goals have changed considerablyover the course of the postwar era: Komiya, “Industrial Policy in Japan,” JapaneseEconomics Studies (summer 1986): 53–80.
25 Ryuzo Sato, Rama Ramachandran, and Shunichi Tsutsui, “Protectionism andGrowth of Japanese Competitiveness,” in Dominick Salvatore, ed., Protectionism andWorld Welfare (New York: Cambridge University Press, 1993), Chapter 13.
26 Ito, The Japanese Economy.
163

CHAPTER SEVEN
States and elsewhere: automobiles, consumer electronics, and scien-tific instruments.27 Among the policies Japan has used to promotethese infant industries have been the following:
(1) Taxation, financial, and other policies that encouraged extraordi-narily high savings and investment rates.
(2) Fiscal and other policies that kept consumer prices high, corpo-rate earnings up, and discouraged consumption, especially of for-eign goods.
(3) Strategic trade policies and import restrictions that protected in-fant Japanese industries against both imported goods and estab-lishment of subsidiaries of foreign firms.
(4) Government support for basic industries, such as steel, and forgeneric technology, like materials research.
(5) Competition (antitrust) and other policies favorable to the keire-tsu and to interfirm cooperation.
Japanese industrial policy was most successful in the early postwaryears when Japan was rebuilding its war-torn economy. However, asJapan closed the technology gap with the West and its firms becamemore powerful in their own right, Japan’s industrial policy becameconsiderably less significant in the development of the economy. Yetthe population and the government continued to believe that the stateshould play a central or at least an important supportive role in thecontinuing industrial evolution of the economy.
Corporate Governance and Private Business Practices
The Japanese corporate system of industrial organization differs inseveral important respects from that of other industrialized econo-mies.28 Although its distinctive features have been undergoing impor-tant changes due to the maturing of the Japanese economy and to theeconomic stagnation in the late 1990s, fundamental differences re-main between the Japanese and Western economic systems.29 Three
27 An excellent example of Japanese industrial policy has been the government’s pro-motion of the Japanese automobile industries. During my several stays in Japan, I wasimpressed by the flawless condition of Japanese cars. A major reason, I was informedby Frank Upham, a New York University expert on Japanese law, was a set of govern-ment policies with respect to auto insurance and inspections that created strong incen-tives for Japanese consumers to purchase new cars. Then the consumers’ replaced carswere shipped abroad to Southeast Asia and, in the 1990s, to Russia.
28 Ryutaro Komiya, The Japanese Economy: Trade, Industry, and Government(Tokyo: University of Tokyo Press, 1990), Part II.
29 Paul R. Krugman, Trade with Japan: Has the Door Opened Wider? (Chicago:University of Chicago Press, 1991).
164

SYSTEMS OF POL IT ICAL ECONOMY
of the most important differences are in the systems of industrial rela-tions, of corporate finance, and of industrial organization. Althoughthese elements are closely tied to one another and reinforce one an-other, it is useful to consider them independently.The Japanese system of industrial relations has been characterized
by a dual labor market. The core workers in Japan’s large and highlycompetitive corporations such as Sony and Toyota, have enjoyed life-time employment, have been paid on the basis of seniority, and havebeen considered stakeholders to whom Japanese firms have a socialresponsibility. Although the system has been strongly criticized and isbeing eroded by Japan’s economic problems, one advantage of thissystem has been that, because lifetime workers are considered long-term assets, Japanese firms have a strong incentive to invest in labor-ers’ skills. However, a major disadvantage of lifetime employment hasbeen that it restricts the flexibility of Japanese firms and makes itdifficult to reward younger and more valuable workers; it has alsobeen nearly impossible to fire incompetent or redundant workers. Onthe other hand, the majority of workers, especially women and work-ers in smaller firms, have little job security and do not receive anequivalent share of the benefits of the system.Whereas American firms tend to obtain the largest portion of their
capital from the huge American stock market, Japanese firms rely onretained earnings and, most importantly, on an affiliated bank. Bankloans have generally been guaranteed by the government, either di-rectly or at least implicitly. The Japanese banking system, includingthe government-run postal savings system, tight capital controls, andgovernment macroeconomic policies have enabled Japanese firms toenjoy very low capital costs. As Kent Calder has shown, this financialsystem has been a crucial component in what he calls “Japan’s strate-gic capitalism.”30
Whereas American firms emphasize safeguarding both profitabilityand the interests of shareholders, Japanese firms have considered theirprimary responsibility to be toward a firm’s stakeholders, and stake-holders include employees and subcontractors. American firms seekto maximize profits; Japanese firms have attempted to maximize salesand corporate growth. Differences like these led Alan Blinder, formermember of the Federal Reserve, to question whether or not the Japa-nese economy was really capitalist!31
30 Kent E. Calder, Strategic Capitalism: Private Business and Public Purpose in Japa-nese Finance (Princeton: Princeton University Press, 1993).
31 Alan S. Blinder, “More Like Them?” American Prospect 8 (winter 1992): 53.
165

CHAPTER SEVEN
The keiretsu, a business grouping or conglomerate whose membersare bound together by the mutual trust and long-term relationshipsamong a number of major firms, their suppliers, and their distributionnetworks, is a particularly important component of the Japanese cor-porate system.32 At the heart of every keiretsu is a major bank (re-ferred to in Japan as the main bank system) that supplies credit andplays a key role in the keiretsu’s economic strategy. Informal tiesamong member firms are reinforced by overlapping memberships ongoverning boards, mutual stock ownership, and other mechanisms.The purpose of these structures is to serve the interests of stakehold-ers rather than shareholders. There are horizontal keiretsu, enterprisegroups such as Mitsui, Mitsubishi, and Sumitomo, that are composedof a few dozen members and include a large bank, manufacturingfirms, and a distribution network along with other elements.33 In ad-dition, there are vertical keiretsu composed of a parent manufacturingcompany and a large network of long-standing subcontractors andsuppliers of services. The approximately two dozen vertical keiretsuinclude leading Japanese manufacturing corporations in the automo-tive and consumer electronics industries, such as Toyota and Matsu-shita. Together, the vertical and horizontal keiretsu control much ofJapanese business.Dominant firms in a keiretsu may exploit and/or promote the
strengths of their junior partners. For example, the parent firms workwith their extensive stable of long-term and trusted subcontractors toincrease the latter’s technological capabilities and to improve thequality of the components supplied to the parent. The parent evenshares exclusive information with its affiliates, and this greatly en-hances the overall efficiency of the keiretsu. The extensive presenceof the keiretsu in the Japanese economy thus has profound conse-quences for the nature of Japanese domestic and international eco-nomic competition and for the dynamics of the Japanese economy.Market share rather than profit maximization has been the principaldriving force in Japanese corporate strategy; a large market share in-creases economies of scale and benefits the firm’s stakeholders. Even
32 Kester, Japanese Takeovers.33 The six or so horizontal keiretsu are the direct descendants of the prewar zaibatsu
that the Occupation sought to destroy and thought they had. The principal characteris-tics of these groupings is that the members in each grouping hold one another’s sharesand have interlocking directorates. The presidents of member firms meet frequently toformulate strategy and decide upon joint policies. The members of the group also coop-erate in financial matters, R & D activities, and marketing. Together, these six indus-trial groupings have a powerful presence in the Japanese economy.
166

SYSTEMS OF POL IT ICAL ECONOMY
though the Japanese economy is highly regulated, compartmentalized,and overprotected, this market is in fact extraordinarily competitive.For example, Japan has a number of automobile companies, whereasthe United States has only three. Competition in Japan does tend tobe oligopolistic and Schumpeterian; that is, it is based on technologi-cal innovation and is quality-driven rather than based on price com-petition; consumer prices are kept high by government policies to in-crease the profits of the corporate sector.In his book on the governance of Japanese corporations, Carl Kes-
ter makes a convincing argument that the keiretsu is a highly efficientand rational mechanism for organizing economic activities, and itsdistinctive characteristics make it a formidable competitor in worldmarkets.34 Mutual trust, for example, substantially reduces transac-tion costs. Information exchange within the keiretsu decreases uncer-tainties and is conducive to innovative activities. Intragroup cross-shareholding protects members against hostile takeovers and signifi-cantly reduces the cost of capital.35 The system is a mutual assistancesociety, and when a member firm gets into trouble, other memberscome to its rescue.Corporate leadership’s independence from outside shareholders
permits the firm, unlike American management, to pursue a corporatestrategy based on maximizing market share rather than short-term-profit maximization. As Ronald Dore has argued, the keiretsu con-tributes greatly to Japan’s remarkable capacity to adjust to economic,technological, and other changes.36 Certainly, no other country wasas successful as Japan in adjusting to the two oil price rises of 1973–1974 and 1979–1980. Despite the troubles of the Japanese economyin the 1990s, the keiretsu has proved to be a successful innovator ofnew products and production techniques because of its immense in-ternal resources and long-term perspective. The keiretsu mechanismhas effectively joined the financial and other advantages of the largefirm with the flexibility and innovative capabilities of the small firm.Although (or perhaps because) the keiretsu is a highly effective
means of industrial organization, it has been deeply resented by non-Japanese. One reason for this resentment is that the keiretsu is aclosed system that excludes all outsiders. The term “outsider” in-cludes not only non-Japanese firms, but any Japanese firm that is not
34 Kester, Japanese Takeovers.35 Robert Zielinski and Nigel Holloway, Unequal Equities: Power and Risk in Ja-
pan’s Stock Market (New York: Kodansha International, 1991).36 Ronald P. Dore, Flexible Rigidities: Industrial Policy and Structural Adjustment
in the Japanese Economy (London: Athlone, 1986).
167

CHAPTER SEVEN
a member of the alliance of stakeholders who share the monopolisticrents generated by this oligopolistic form of business organization.The exclusive nature of the keiretsu system has significantly limitedforeign firms’ access to the Japanese market. The keiretsu also makesit extremely difficult for foreign firms to “take over” Japanese firmsand gives Japanese firms a huge advantage in corporate expansion.Whereas the keiretsu firms can easily purchase a non-Japanese firmin order to acquire its technology or to gain market access, it hasfrequently been difficult for non-Japanese firms to purchase Japanesefirms for the same purposes. Furthermore, the keiretsu’s control ofdistribution channels effectively shuts non-Japanese firms out of someJapanese markets. Although the situation is changing as this is writ-ten, non-Japanese still regard the keiretsu as a significant barrier totrade and foreign direct investment, while the Japanese, on the otherhand, regard the keiretsu as a key element in their economic success.The problem of differential or asymmetrical access has been a majorcause of conflict between Japan and its trading partners.
The German System of “Social Market” Capitalism
The German economy has some characteristics similar to the Ameri-can and some to the Japanese systems of political economy, but it isquite different from both in other ways.37 On the one hand, Germany,like Japan, emphasizes exports and national savings and investmentmore than consumption.38 However, Germany permits the market tofunction with considerable freedom; indeed, most states in WesternEurope are significantly less interventionist than Japan. Furthermore,except for the medium-sized business sector (Mittelstand), the non-governmental sector of the German economy is highly oligopolisticand is dominated by alliances between major corporations and largeprivate banks. The German system of political economy attempts tobalance social concerns and market efficiency.39 The German state
37 This section draws from Philip Glouchevitch, Juggernaut: The German Way ofBusiness: Why It Is Transforming Europe—and the World (New York: Simon andSchuster, 1992).
38 Gunter Heiduk and Kozo Yamamura, eds., Technological Competition and Inter-dependence: The Search for Policy in the United States, West Germany, and Japan(Seattle: University of Washington Press, and Tokyo: University of Tokyo Press, 1990).
39 The German system is representative of classical liberalism that emphasizes a freemarket and a strong welfare-oriented state. See Razeen Sally, Classical Liberalism andInternational Economic Order: Studies in Theory and Intellectual History (New York:Routledge, 1998).
168

CHAPTER TWO
A History of Backwardness
THE RETARDING EFFECTS OF A WEAK STATE
This chapter examines how late industrialization in Korea was retarded by a state too weak to intervene and stimulate capital expenditures. It also takes the position that when industrialization began to accelerate, it did so in response to government initiatives and not . to the forces of the free market. Finally, it will argue that these processes can be thought of as general propositions applicable to similar countries.
From 1876, when Japan coerced Korea to open its doors to foreign trade, until 1961, when Korean army officers seized control in a coup d'etat, the question of state power overarched Korean history. 1 In the interregnum, Korea had to debate its destiny with not just one but two occupying powers, Japan and the United States. It swallowed a heavy dose of the bitter pill of foreign domination, the realpolitik of all latter-day twentieth-century learning. Therefore, in this and the next chapter the concern is with the friction that enabled Korea to emerge after ninety years of so-called "modernization" with at least some of its skin still intact, though only half its original size and not yet possessed of a full stomach.
This chapter generally follows a chronological order, one objective being to provide a summary of modern Korean history. Within each discrete historical episode, however, the organizing theme is the state. The period of rule under the late Yi dynasty is discussed first to establish a benchmark for later contrast with strong centralized rule. Then the two occupations are considered for the purpose of assessing what has come to be called "modernization," which took place in the period of statehood denied. Finally, .the regimes of Syngman Rhee and General Park Chung Hee are introduced in relation to their two major antagonists, the student movement and the U.S. AID admin-istration. ' .
I In the 1980s. the legitimacy of state power had become the burning issue.
27

28 THE STATE AND BUSINESS
Little in this history is in any way 'pI:emonitory of Korea's later success, except that resistance to foreign domination in Korea beginning in the 1870s was immediate and unusually obstreperous, and the country's hyperactive student movement maintains this tradition a century later.2 The years 1876- 1910 were memorable for the spectrum of reform movements they stirred.3 At the beginning of the period, the Yi dynasty gave its last gasps of repentance, and at the end of the period, there was outright insurrection. Of a population of roughly 1 2 million, the number of insurgents killed in, say, 1907-1908, was estimated by Japan at over 14,000 (C. 1. E. Kim, 1962). Betwixt and between, some movements expressed themselves as peasant rebellions, demanding egalitarianism as well as liberation from foreign influence. Other movements were led by Western-educated intellectuals who called for the withdrawal of foreign' concessions, the scrutiny of royal accounts, the creation of schools. and freedom of speech and press. To be sure, visions about statehood were convoluted by class. Though the foreign aggressor was uniyersaJly hated, the privileged elites collaborated with it to avoid social change. and the impoverished rural masses tolerated it in the absence of better alternatives. Nevertheless. in Korea, nationalism found an ideal climate in which to grow. Whereas many other colonies were pieced together from geographical units that were racially, tribally. or religiously distinct. Korea had existed for centuries as a nation with an unusual homogeneity of language, etfmicity, and culture. Although it took almost a century before the idea ,of the nation-state was to triumph over the previous reality, these early reform movements are noteworthy-in spite of their short-term failure-for a vision of Korea that was ultimately responsible for pushing industrialization through.
An abortive attempt by Japan to invade Korea had occurred in
" For a n account b y Korean authors o f Korean resistance to Japanese rule. see Ahn et al. (1980). W. K. Han ( 1977) analyzed the rise of Korean nationalism as a response to foreign invasion.
.
S Comparing student militance in two Japanese colonies. Korea and Taiwan. Tsurumi wrote.
In Taiwan. student demonstrations against favoritism toward Japanese classmates had also surfaced from time to time. but although serious incidents occurred in individual schools. these never became a stepping stone to city-wide student protest. and anti-Japanese defiance in Taiwan never knew the country-wide solidarity shown by Korean students. ( 1984. p. 307-8)
For some accounts of the period 1876- 1910. see Conroy (1960), who. argued that Japanese colonialism was not motivated by economics; and Shoichi (1970) who argued that it was, See also Chen ( 1968). Duus ( 1984). Juhn ( 1965). H. H. Kim (1980). C. S. Lee ( 1963). B, B. Weems ( 1964). and C. N. Weems Jr. ( 1954). Koh (1966) presented an historical comparison of the cotton industry in Japan and Korea.

A History of Backwardness 29
1592-1598. Just two years later, in 1600, the Tokugawa regime came to power in Japan. For the next '276 years; Japan witnessed the rise of commerce and a more productive agrarian system, while Korea celebrated its victory over Japan in relative quiescence. When Japan reappeared on Korean shores in 1876, less than a decade after the imperialist had itself become the unwitting host of foreign intruders, Korea encountered a much more formidable foe. Hastily, Japan assumed the role of precocious colonialist, extorting trade treaties from Korea even before either country had a central bank, despite the fact that the Meiji had to suppress the Satsuma rebellion at about the same time it had to suppress a rebellion in the Korean army.4 Consequently, a decisive difference would determine the subsequent course of Korean history-the greater degree of centralized state power.
THE YI DYNASTY
According to Pallais, an historian of the period,
Although prime responsibility for Korea's eventual subjugation to Japan must be attributed to foreign imperialism, Korea's capacity to .adapt to the demands of the modern world in the late nineteenth century was hindered by those factors responsible for the extraordinary stability of the Vi dynasty ( 1392- 1 9 10). This stability was in large measure the result of a �tate of equi- . librium produced by the interrelationships between a monarchical, bureaucratic, and centralized government structure a,nd an aristocratic 'and hierarchical social system. The yangOOn elite, which had many of the attributes of an aristocracy, maintained itself by legal and de facto inherited status, privileges, lCj.ndholding, officeholding (in the central bureaucracy), and utilization of Corifucian orthodoxy for the legitimization of sfatus and economic interests. King and aristocrat were both mutually antagonistic and mutually supporting; each was dependent on the other for the continuation of his place in the political and social struc-ture. ( 1 975, pp. 4-5)
.
Typically law and order are extolled as preconditions for growth, and what Pallais called attention to is the precondition of a strong state for law and order:
The balance of power between monarchy and aristocracy was an asset for the maintenance of stability, but it was a liability
• Kublim (1959) presented an early overview of the context ill which Japan colo· nized,

30 THE STATE AND BUSINESS
when Korea was faced with the need to expand central power to mobilize resources for defense and development. . . . One of the main problems for the traditional Korean state as it moved toward the twentieth century was, therefore, overcoming the limitations on central authority in order to build national strength in the face of threatening challenges from the outside world. ( 1975. p. 5)
Palla is went on to say that later peasant rebellions and threats of foreign invasion in the l 860s created a sense of urgency about the need for reform. but the traditional system was incapable of allowing a major shift in the balance of power toward strong central and monarchical leadership. Furthermore, the challenge to the privileges of the upper classes gave rise to a react\on of the privileged against reform, and thus a reversion to limited monarchy.
The balance of power between state and aristocracy pirouetted on an impoverished peasantry, the state empowering the landlords to tax the peasantry, and the landlords protecting the state and providing it with a share of its revenues-but not a large enough share to accumulate a surplw,.5 The upshot was entropy:
In the late Yi dynasty, the problems of revenue shortage and peasant unrest were both caused primarily · by the aristocra�ic landowning class's monopoly over the land and free-floating resources of the country. One of the main reasons for the weakness of the central government was its inability to tax land effectively to meet its needs in a time of domestic crisis and foreign challenge. . . . The existence of a centralized bureaucratic structure-as opposed to a decentralized or feudal political order-was no guarantee of greater centralized control over land and the tax revenues accruing therefrom. (Pallais. 1 975, p. 58)
So weak was Korea's state in the Asian context that it had maintained a tributary relationship with the Ming dynasty of China since 1 392. One result was the decline of local industry. The needs of the royal household were increasingly met with the imports of luxury goods that were obtained in exchange for tribute in China. Production in government factodes declined as a consequence and then declined still further as a result of the employment of slaves or handicraft workers who were required to render compulsory services without adequate compensation. Farmers mairitained household industries solely to meet their own needs and to fulfill tributary obligations to landlords. Although independent artisans produc\'!d
5 w. K. Han (1977) examined the relationship between the state. the yangban system, and the "exploited classes."

1\ History of Backwardness 31
handicrafts for other's use, the high degree of subsistence that characterized the economy meant little market activity. When Japan arrived to trade in the 1870s, a money economy had not yet spread throughout Korea. Soon the Japanese yen became the accepted currency, replacing barley and rice as the medium of exchange.s
Another result of subjugation was the adoption of a Confucian system of class relations and beliefs, which, if rich in its own terms, was a deterrent to capitalist enterprise. Koreans may not have been drawn into capitalist enterprise kicking and screaming, but they were conditioned by Confucianism to accord it low status. Further, the ability of Korean manufacturers to compete against Japanese goods was complicated by a primitive distribution system. Internal trade was carried on by itinerant peddlers, since there were few retail stores in small villages and towns.
The itinerant merchants used advanced accounting methods, yet bulls or humans provided the only means of conveyance by which they could transport goods. They were outcompeted when the Japanese began using more modern transport. In the cities proper, merchants were granted monopoly rights by officials in return for an agreement to supply needed merchandise at nomihal prices. Consequently, merchants grew accustomed to monopoly rights to trade certain categories of goods in certain geographical areas. They sought to preserve their local monopolies to counter the threat of foreign competition, rather than to study the new methods of merchandising introduced by foreign traders. Because the opening of ports was forced upon the Korean government, it could not impose its own protective duties. "At any rate, it is doubtful whether any high ranking government official was aware of the implications of tariff duties on domestic commerce and industry" Ouhn, 1965, p. 46).
First unable to compete against Japanese goods, Korea lost more and more ground to its interloper. The monarchy was forced to rely On China to suppress a peasant uprising in 1894, which gave Japan a pretext under which to increase its military presence. Ja'pan declared Korea a protectorate after routing Russia in war in 1905. Finally, with the defeat of insurgents and the dissolu�ion of the Korean army, Japan formally annexed Korea amidst American indifference in 1910 .
THE CONTRADICTIONS OF MODERNIZATION
The judgment on japan's contribution to Korea's subsequent success has gone through several iterations, although the facts have by and
6 Cole and Park ( 1983) gave a brief history of Korean financial development under Japan.

32 THE STATE AND BUSINESS
large remained the same. The accounts of colonialism written before 1920 are enthusiastically favorable, praising Japan for uplifting a population that lacked "dignity, intelligence, and force."? This image of enlightenment was tarnished, however, by stormy demands of an estimated 2 million Koreans for independence in 19 19, inspired by President Wilson's "Fourteen Points" (Baldwin, 1969). Whatever glint remained in the image was altogether obliterated in the 1930s when Japan engulfed Korea in its war efforts. However, the critiques of colonialism by Korean scholars in the early postwar period tend to be overdrawn, the whole detestable episode swathed in the blackest of colors. After the Korean economy began to expand in the 1960s, the verdict was handed down in English-language publications that Japanese colonialism had been a "modernizing" force: 8
Japanese colonial rule cannot be seen as an unrelieved disaster. It is true that, during the period of colonial rule, . . . many Koreans experienced an absolute, not just a relative, decline in their standard of living. And yet, for all the hardships imposed on the Korean people, Japanese colonial rule laid some of the key ' foundations for Korea's later entrance into modem economic growth. (Mason et aJ. , 1980, p. 75)
The Japanese dismantled the institutions of 1 ,000 years of dynastic rule and accomplished overnight, in 1910, what the dynastic rulers had failed or neglected to achieve in centuries: the abolition of slavery, the codification of civil law, and more.9 The Japanese also created a modem infrastructure In the areas of finance, transportation, and commerce. Nevertheless, Japanese colonialism was far more successful in smashing old foundations than in establishing new ones;
7 These were the views of George Kennan, confidante of Theodore Roosevelt, as qu�ted in Grajdanzev ( 1 944). Grajdanzev puzzled over why the early views of Japanese colonialism were so favorable. For the period 1910- 1945, see Y. Chang ( 1 97 1 ), de Brunner ( 1 928), H. Kim (197 1 ), H. K. Lee (1936), Y. K. Lee et al ( 197 1), Miwguchi ( 1 979), Nakamura ( 1 974), and E. Kim and Mortimore ( 1977). For overviews
. see S. P.-S. Ho (984) and Toshiyuki and Yuzo ( 1984). For statistical approaches, see S.-C. Suh ( 1978) and Ban ( 1 97 1 ). Amsden ( l987a) provided an overview on theories of imperialism.
S The general literature on modernization is voluminous. From an economic perspeqive, the classic work is that by Rostow ( 1960). For a critique, see Baran and Hobsbawm ( 1 961) and Fishlow ( 1 965). From a sociological perspective see Levy ( 1966). For a critique, see A. G. Frank ( 1969).
9 Other reforms included separation of the royal household from affairs of state. outlaw of all forms of discrimination against commoners, abolition of the Confucianoriented national exams, the adoption of a new tax system based on payments in cash rather than kind, separation of judicial functions from the executive departmentS, institution of an independent coun system, legalization of remarriage by widows. and removal of a ban on early marriage. Juhn (1965) presented a brief summary.

A History of Backwardness 33
Paradoxically, , in a late industrializer like Korea, colonialism removed the old blockages to industrialization but created new ones in its wake.
Korea\ intrinsic weakness first manifested itself as a failure to compete against foreign goods. After japan withdrew in 1945, Korea was no more able to compete on the basis of its manufactures than it had been before. I ndeed, a quantum shift in the world technological frontier had left Korea relatively further behind. The japanese had followed in the footsteps of Korean intellectuals and Christian missionaries in emphasizing formal education. In fact, investments in education, 'even at the university level, were unusually high by colonial standards, but they were motivated by policies designed to assimilate Koreans into Japanese society as the lower elements, policies that lent the colonial interlude its nasty character. Education at the higher levels was altogether lacking in the technical fields, except in agronomy , and medicine, and because of discrimination in hiring, Korean academia had few productive outlets. 10 japanese corporations in Korea discriminated against Koreans at the managerial and even at the supervisory level. If, therefore, as is sometimes contended, the technical and managerial literacy rate rose as a consequence of japanese manufacturing enterprise, it must have levitated. I I As for Korean capitalists, they existed at the fringes, unable for the most part to compete against japanese goods.
Between 1910 and 1920, industry in Korea was altogether discriminated against by Japan in favor of agriculture. Then, after the 19i9 uprising, a wafer-thin stratum of Korean capitalists was deliberately cultivated to further collaboration. With minimal assistance, an entrepreneurial class emerged, drawing its members from the yangban and from the commoner class. The new entrepreneurs were numerous enough to increase the variety of the indigenous elite, from landlord and scholar before the occupation to landlord, businessman, and intellectual after it.12 In 1938, however, Korean paid-up capital as a share of total ,paid-up capital in industry equaled only 12.3%. Moreover, the paid-up capital of the average Japanese corporation was more than six tim'es as large ' as that of the average
10 For an overview of colonial education in Korea. see Tsurumi ( 1984)" I J Mason et al. ( 1 980) suggested a process of "Iearning-by-watching." but this seems
a farfetched notion of modernization. Moreover. in the area of technical and managerial skills. it would have been difficult even to "watch," since many cognitive skills, particularly in large-scale organizations. are not practiced out in the open. However, Koreans may have learned more in the banking sector at the managerial level than they did in manufacturing. See Moskowitz (1979). 12 Eckert ( 1 986) presented the interesting case of a large-scale Korean enterprise in textiles that survived into the period of postcolonial rule.

34 THE STATE AND BUSINESS
Korean firm (Grajdanzev, 1944). This size distribution reflected the fact that when, in the 19305, Japan roared into heavy industry in Korea in preparation for war, it did so on the basis of zaibatsu capc ita\. By 194 1 70% of total Japanese investment in industry in Korea was accounted for by six zaibatsu groups (Ewing, 1973). Korean managers were altogether excluded from such enterprises, and with few exceptions, large-scale enterprise was not under Korean ownership. Therefore, when the Korean economy was resuscitated in the 1950s, it bore some unique features but many familiar marks of colonial distortion. There was overcapacity in textiles and light manufactures and undercapacity in basic industry. There were a large number of small-size firms but a hiatus in the large-size category. The skeletons of Japanese-owned corporations in basic industry, which the Korean government inherited, were plentiful but ill managed and technically problematic to operate.
The contradictory quality of modernization under Japanese colonialism was especially vivid in agriculture, which, being both the object of Japanese aggression and the heart of Korean economy and society, became a battleground. The Japanese colonial government's objective was to raise land-tax revenues. Toward this end, it had created a ponderous bureaucracy and carried out a land reform after 1910. The bureaucracy, while highly centralized, reached down to every village in the form of a police force and an agricultural extension service. As for the land reform, it replicated the agrarian structure existing in Japan in the late-nineteenth century. The state collected taxes from a landlord class, and landlords collected rents from their tenants. On the one hand, this reform represented a giant step forward insofar as it substituted the market for brute force as a mechanism by which to induce higher productivity. 'On the other hand, the establishment of property rights and the dispossession of the peasantry created acute distress. The same system in Japan was less exploitative because an urban labor market imposed a ceiling on rural rents. In Korea, however, with no urban alternative the peasantry was squeezed to the bone (see the appendix to this chapter).
During World War II, an estimated 10% or more of the Korean population was earning its bread abroad. More · than I million Koreans were working in Japan, about 1 million were settled in Manchuria, some 200,000 were in the Russian Far East, and about 100,000 were in other countries, primarily China (Grajdanzev, 1944). Both hunger and politics were responsible for emigration. Koreans had lived in the frontier area of Manchuria and in the Russian Far East for centuries; but after 1905 many more had fled there as rebels. By 1945, more politically conscious by far, the insurgents were key fig-

A Hislory of Backwardness 35
ures in the postwar struggle for the state.13 The Korean popul�tion in China was divided between Japanese camp followers and resisters trying to reach the Chinese army to fight against Japan. The Koreans who were living in Japan proper were chiefly unskilled workers, miners, and agricultural laborers who had been drafted for employment in wartime Japan . .
The end result o f Japanese colonialism i n Korea was a society that was unable to support itself and totally at odds. Peasant opposed landlord, and those who resisted Japanese colonialism opposed those who collaborated. Under these conditions, the machinery of modern government that Japan had bequested was a useless inheritance. With a distended police force accustomed to domestic repression, and a minuscule army incapable of national defense. Korea once again fell victim to the Great Powers.
THE COLD WAR
The events that transpired .between August 1945. when Japan retreated from Korea. and June 1950, when the Korean War began, were as complex as the underlying issues. The power and ideological struggles of the Cold War were visited upon a nation that was itself divided, although political polarities at the national and international levels were often not synonymous. According to B. Cumings, who looked under a microscope at the period 1945- 1947,
.
Communism in Korea in 1945 did not signify a deeply held world view, or adherence to an authority residing iii the" Kremlin, or commitment to Marxist internationalism. It was a specifically Korean communism. Its adherents could scarcely be distinguished from nationalists and conservatives .in their bel�ef in the uniqueness of the Korean race and its �raditions and /he necessity to preserve both, or in their understanding that a unique Korea required unique solutions. What did distinguish Left from Right was ( 1 ) a commitment to a thoroughgoing extirpation of
13 B. Cumings (1981) wrote:
By 1945 as much as 1 1 .6% of the Korean population was outside Korea. most of it in Japan and Manchukuo. and that fully 20% of all Koreans were either residing abroad or in a province other than their native one. This massive redeployment of population produced severe dislocations of Korean society because population mobility had historically been very low. In this period. Korean peasants first became uprooted from their villages and entered industry or urban life. or both, in Japan. Manchukuo, and northern Korea. As mentioned earlier. much of this uprooted population returned to their native homes after liberation to participate in the politics of postwar Korea. (p. 490)

36 THE STATE AND BUSINESS
Japanese influences in Korea, with all that this implied for Korean society and for Koreans who had profited from colonial rule; (2) a commitment to mass politics and mass organization and to the social equality that this implied; (3) a commitment to the reform of Korea's "feudal" legacy, feudalism being a code for gross inequalities in the allocation of resources, particularly land. ( 198 1 , p. 86)
These were the politics of the Korean People's Republic, with a network of affiliated trade union, peasant, student, and people's committees spread throughout the Korean peninsula. It was the government of the People's Republic that both the Russian and American armies confronted when their occupation of Korea began.
Both ' superpowers responded ultimately by establishing political outposts in Korea, but their initial reactions to the new government were opposite. Russia recognized the Republic almost immediately and within -nine months of the liberation from Japan in the North, "landlordism had disappeared, the land had been redistributed, major industries had been nationalized, radical reform had eliminated the worst abuses of the colonial factory system and had estabiished formal equality for women" (B. Cumings, 198 1 , p. 382). Thereafter Russian policy was oriented toward ensuring that the political faction in power in the North was amenable to Russian influence, although that faction was perhaps the least distinguished and capable of all the possible political groupings. The United States did not recognize the People's Republic, causing it to be destroyed amidst a bloody uprising in 1 946, after which point an American alliance was formed with political sympathizers. The rest, as they say, is history. Cold War politics played themselves out, ending irrevocably in war ( 1950-1 953) and the division of Korea into two geographically and ideologically separate parts. If, however, one is to understand the ensuing course of industrialization in what is now South Korea, one must understand three key American policies.
.
First, the American occupation forces chose to work through the most conservative political faction, the Korea Democratic Party (KDP). Insofar as the KDP had little grassroots support in its organization, the American forces also relied on Korean civil servants and police who had served under the Japanese. 14 The KDP was self-described
. as a party of "patriots, notables, and various circles of the intellectual stratum." It stood for the promotion of world peace and national culture, the enhancement of the livelihood of the working masses, and rational reorganization of the land system. According to
11 This point is stressed in a critical account of the United States' policy in Korea in the 1940s and 1 9505 by H. C. Park ( 1986).

A History of Backwardness 37
B . Cumings, "the reason for this befogged and cryptic agenda for Korea's future is not hard to find: a group did not win popularity in Korea in 1 945 by urging the maintenance of landlordisul, private ownership of industry, little or no punishment for collaborators, and the continuation in power of those Koreans who had influence under Japanese" ( 198 1 , p. 97).
Although the KDP subsequently lost power, its significance lies in the fact that it safeguarded the last survivors of the yang-ban class, who resurfaced after the convulsions of war as the elite of the new order. Although, for the most part, the landlord class vanished by the end of the 1 950s, some of the same individuals who were privileged xangban became privileged politicians, government bureaucrats, educators, and industrialists. This lent a continuity to postwar change. The weak Korean state of the 1 870s was supplanted by the strong one of the 1960s, and the art of statehood may have been rooted in a 'class culture transmitted without interruption across generations. Moreover, the anticommunism of the KDP set the standard for future regimes. When the military junta took power in May 1961 , it claimed that Korea was on the "verge of subversion by the communists," that only the Korean armed forces were capable of preventing communism from taking root among the people, and that only through their timely action was the country saved from a communist coup (S. Han, 1974, p. 1 78). Notwithstanding the military junta's pervasive intervention in the economy, an act that might otherwise be associated with socialistic tendencies, anticommunism has been the dominant political ideology guiding Korean industrializa-tion.
"
Second, the American occupation forces groped toward land reform in response to v"iolent peasant dernands, to the Soviet example in the North, and to the need to build commitment to a war that pitted kith and kin against one another (M. H. Choi, 1960). The agrarian reform of the Japanese was pushed one stage further, and land was redistributed to the tiller. Although land-to-the-tiller in Korea never enriched the peasantry or overflowed the state tax coffers, its long-run effects were major. Reform redirected idle capital away from land speculation to manufacturing and uprooted a class that had not proved itself progressive. It relieved the bottleneck in food supply, which in turn dampened inflationary pressures. 15 It created a far more equitable income distribution. Finally, it cleared the field for strong centralized state power.
15 Although land reform caused "temporary dislocations in agricultural produclion; it begat a highly productive system once peasants were provided with capital. fertilizer. and other inputs to pursue scientific farming (see Ban. Moon. and Perldns. 1980).

38 THE STATE AND BUSINESS
As a consequence of land reform, Korea has enjoyed a reputation among developing countries as one with a relatively equitable income distribution (World Bank, 1983) . This reputation has become increasingly undeserved as industrialization has advanced. Korea has unusually high levels of aggregate economic concentration and of wage inequality by international standards. 16 Land reform fell far short of the demands of the People's Republic for an "act of destruction willed against a whole ruling class," (B. Cumings, 198 1 , p. 69), and anticommunism alone did not amount to much of an agenda for Korea's future. Nevertheless, land reform did respond to the ancient cry for egalitarianism. 17 When Korea was an overwhelmingly agrarian country, land reform undoubtedly contributed to greater equity in the size distribution of income. In the late 19305, 3% of all farm households had owned over two thirds of all land, whereas ten years later, fewer than 7% of all households were landless (Ban et aI. , 1980). In conjunction with ail expanding education system, growing urban employment, and the rags-to-riches fables of a few hard-driving industrialists, land reform provided industrialization with a plausible vision, a Korea of equal opportunity.
Third, to fight the Korean War, the Americans buttressed the Korean army. At the beginning of the war, the Korean military was not much more than a small constabulary. At the war's end, it numbered 600,000 men-the fourth largest army outside the Soviet bloc. It had modern heavy equipment and an officer corps of significant proportions (H. B . Lee, 1968). After biding its time in the 1950s and blinking at the student revolution that brought a decade of political incompetence to a close, the military would open a new chapter on both growth and state power in the 196 1 coup. Here was the ultimate Spite from Pandora's box.
AID AND THE ORIGINS OF THE DIVERSIFIED BUSINESS GROUP
The 1950s paralleled the millennium of dynastic rule that ended in 1 876 in that more energy was spent plundering the existing surplus
16 The process of measuring equality in Korea is vexed by institutional fac�ors. Inequality in Korea is likely to be understated for three reasons: ( I ) The value of real estate and other assets, which tends to appreciate with inflation, rose more rapidly in the 1970s than wages. Because this value is excluded from income and these assets tend to be owned by higher income earners, the treatment of such assets is likely to result in the understatement of inequality. (2) The equivalent of the United States' Internal Revenue Service in Korea sometimes includes and sometimes excludes from the calculation of personal income, capital gains, rent, and interest payments. Such income is also taxed differently from wage income. (3) It was possible until 1988 to open bank accounts in Korea under an assumed name.
17 Brandt (1986) has a discussion of egalitarianism in postwar Korea.

A History of BacKwardness 39
than producing more, the surplus itself arriving in the alluring form of U.S. foreign aid for war reconstruction. The average annual inflow of aid from 1 953 through 1958 was $270 million excluding military assistance, o'r roughly $12 per capita' per year. Tl1i� was ne�rly 15% of the average annual groSS national product (GNP) and over 80% of foreign exchange (Cole and Lyman, 197 1). To maximize aid' inflow, macroeconomic policies featured low interest rates, an overvalued exchange rate, a deficit budget financed by borrowing from the Central Bank when taxes and aid-generated revenues were insufficient, and Central Bank financing of commercial bank credit to the private sector. Such policies inevitably produced an internal financial gap between government transactions and private transactions, and an external financial gap between import demand and foreign exchange supply. The state, under the leadership of Syngman Rhee and other "patriots, notables, and various circles of the intellectual stratum," then allocated aid entitlements in exchange for political campaign contributions. When campaign contributions ran into diminishing returns with respect to votes (at one time the number of political parties was estimated at 344), elections were rigged or the constitution was amended.
The windfall gains from aid provided a basis for the emergence of an altogether new entrepreneurial element, less conservative in outlook than Korea's older textiles industry ahd far more growth oriented than its small-scale sector. During the period when venality was pervasive (the First Republic, 1948-1960), political connections led to an uneven distribution of the spoils. Fortunes, therefore, were amassed, the "gravy train" starting with sales of Japanese property at below-market prices. Favored firms, whatever their origins, were allocated hard currency to import scarce materials-grains and fertilizers-that they then resold on the domestic market at monopoly prices. They were given loans at subsidized interest rates. They were granted tax exemptions, and they were awarded preferential contracts for large-scale government projects (K. D. Kim, 1976). The magnitude of fraud is indicated by the size of the loans that the most favored firms received, "loans" on which they paid neither interest nor principal. A Government Audit Report, prepared in 196 1 after the First Republic's fall, suggests that total outstanding loans equaled about $ 140 million (or about half of the average yearly grant aid in the 1950s) . 18
According to the Government Audit Reporton I llicit Wealth, the
18 According to the Government Audit Report, quoted in C, Ii. Park ( 1963), total outstanding principal on loans in 1961 was W48.574, 1 22,OOO, and interest was W I O,27 1 ,000,000, Using the real effective exchange rate for 1962 (because the won was devalued twice in 1961). as calculated by Y. C. Park (1985), the interest and principal on these loans in dollars was about ,$ 140 million,

40 THE STATE AND BUSINESS
industries to which these enterprises thriving on venality belonged included textiles, paper, housing. mining, fertilizer. Hour, alcohol, glass, pottery, livestock, construction, warehousing, and trade. This is a wide range of industries, and while textiles is represented. it is underrepresented in proportion to its weight in total output (the textiles industry accounted for approximately 20% of manufacturing value added in the 1950s). 19 The point is that the cradling of enterprises in illicit wealth was not industry specific. These subsidized entrepreneurs were generalists, devoted to moneymaking in whatever industry the opportunity arose. They drew their members from all social classes, although they tended to be better educated and much more likely to have descended from the gentry than were their social peers (Jones and Sakong, 1980). In this respect they provided a link with the past. Their novelty lay in the fact that they skated over the stage of incremental growth that was characteristic of small-scale enterprise, operated with a different logic of investment from that of traditional cotton spinning and weaving firms, and formed crack troops to penetrate new industries.
Thus, as the high-aid era drew to a close, the embryo of a new social, economic, and political force had been conceived. The 1950s had witnessed a decrease in the size of agricultural enterprises and the death knell of the nobility, along with an increase in the size of industrial enterprises and the tentative groping toward a symbiotic relationship between the state and the progenitors of large diversi-. tied business groups (chaebol). The rise of the chaebol, moreover, relit some of the glimmer of economic activity that had been characteristic of the 1930s. By international comparison, the growth rates Korea attained during the high-aid era were superlative. As indicated in Figure 2. 1 , between 1953 and 1958 the average annual rate of change in the volume of production of both heavy and light manufactures was the highest in Korea of al1 36 countries for which U.N. data were available.2o
U.N. data, however, exclude North Korea. which was growing roughly three times faster than the South (Cole and Lyman, 197 1). What's more, the growth rates that the South chalked · up were un-· sustainable. By 1959 the economy was deeply depressed, partly the effect of conservative macroeconomic policies and partly the effect of the winding down of aid and of the reconstruction boom. With
19 This represents value in 1975 constant market prices, as reported by the Korea Development Bank (1984). 20 The data are in real, rather than nominal, terms but are bound to contain substantial margins of error, since they are among the earliest attempts of the United Nations at international growth comparisons.

20.0
18.0
16.0
Q 1 4.0 '2 ::I 0
1 2.0 1\1 :; c: 1\1 :E 10.0 :E Q ::; 8.0 ;!.
6.0
4.0
2.0 "United States".
-2.0
- 4.0
- 6.0
Ceylon • - 8.0
A History of BaCkwardness
1 953-1958 Korea •
41
Yugoslavia
Venezuala • Philip lines Japan
Me�lco
• • India and Pakistan
• Weel Germany
Paru Spain
• Greece • Luxemburg • Portugal . Chlnal(Talwanj • Finland • AU9�la • France
• Fed. of Malasla. \ Netherlands .ltaly
Oenmark "-e 0 I 8r:'11 Sweden '\ . � cean a
• . . " . Argentina
Canada /. Be�lum " 'Union 01 South Africa
United Klngllom Norway
% Heavy Manufacturing
• West Berlin" •
Colombia •
Burma
Figure 2.1 Average Percent Annual Rate of Change in the Volume of Production, Heavy and Light Manufacturing, 1953- 1958. Source: United Nations ( 1960).
tariff protection and subsidized credit, the textiles industry had achieved in half a decade what it had failed to achieve in half a century of political discrimination-modern plants of international scale to undertake integrated spinning and weaving. The growth rate of textiles output, however, turned negative at the end of the 1950s as firms added to their capacity to take advantage of cheap U.S. credit (Y. B. Kim, 1980). "Thus, by the early 1 9GOs, U.S. officials had become extremely gloomy about the prospects of Korean development" (Mason et aI., 1980, p. 195).

42 THE STATE AND BUSINESS
THREE CONTENDING VIEWS
Out of the corruption, paralysis, underachievement, and bitter disappointment of the 1950s came three conflicting views about how Korea: should. proceed, one associated with students and intellectuals, one articulated by U.S. aid advisors, and the one that was ultimately to prevail-that of the Korean military. The issue of economic development was foremost and, although submerged under politics, its failure underly the turmoil that brought the decade to a close.
The Students
In April 1960. a high-school student protesting crooked elections ' was slain by police and his body was thrown into the sea. The atrocity provoked youth- and student-led demonstrations throughout the country. The president, Syngman Rhee, called on the army to intervene, but the army remained passive. The American government did likewise, disgusted with Rhee and disturbed by his intransigence toward Japan that obstructed the formation of a greater Pacific alliance. Within days, the Second Republic fell.· According to H .. 8. Lee,
The April Revolution was a giant social revolt. The suffering and revolting self that had been emerging in the latter part of the decade of the 1950s was now given its full play. The students began revolting against the Liberal Government, but their success touched off a general revolt in the society. The people revolted against the government. The young revolted against the old. In many schools, students revolted against their teachers. In some government ministries, junior civil servants revolted against senior civil servants. In a more serious vein, some eight lieutenant colonels openly revolted against some generals, requesting that the army be cleared of corrupt elements. ( 1 968, p. 1 19)
.
There was nothing revolutionary about the outcome. of the April events, though. They provoked an election that voted into power a party little different in outlook, age, and background from the previous regime. Thus the protests continued. Among the protesters, however, were radical reformists who had been silenced under Rheetrade unionists, whose activities had been circumscribed by a staterun labor federation (Ewing, 1973); socialists, teachers, and unemployed intellectuals, whose ranks had been decimated during the Korean War; al).d students, spearheaded by the Student League for . National Unification (Minjok T'ongil Yongmaeng) of Seoul National

A History of .Backwardness 43
University. Although the alliance of radicals and moderate reformists could trace its antecedents back to the early reform movements of the late nineteenth century, its vision of economic development was still undefined, consisting of little more than vague demands for full employment and more aggressive policies to eliminate poverty. The radical view of how Korea should proceed, however, focused its attack On imperialism. The radicals, in particular, opposed a blanket technical agreement, in the offing between South Korea and the United States, that gave the United States the right to "continuous observation and review" of the way U.S. financial and technical assistance was being administered. The radicals were joined in their opposition to this agreement by nonreformist politicians who termed it "shameful" and organized mass demonstrations against it (S·. Han, 1974, p. 1 83).
The United States
The economic policies that the United States espoused in Korea showed consistency over time, the tumultuo�s events of the 1940s and 1950s merely reinforci that central tendency. The lesson that the United States dr w f the uph vals in Kore d for stability before gr w , a this e heart of Amer-ican short- and medium-term oeconomic policies toward Korea. Long-term goals were perceived in terms of the law of comparative advantage, the objective being to reduce Korea's dependence on aid. For the purpose of developing a sound economy, aid was dispensed on the principle of static efficiency, that is, bu�!iling -infrastructttre, natural resource-pr�si��aciU��nd li��(!.!l.dusti:.}LQQ��e ��sis of small-scale enterpnse. [hIS polIcy rc:'flected lIttle of the KeyneSIan revolution then sweeping American universities. Economic advisors in Korea, for the most .part, were not academics; rather they were affiliated with the U.S. military and with international aid organizations. The policies that the United States advocated were based on traditional market theory and were precursors to those of the World Bank and of the International Monetary Fund (IMF).
The immersion of international organizations like the IMF and the World Bank in the industrialization of latter-day twentieth-century learners is unique in the history of emulation. So, too, is the amount of foreign aid to which ' Korea has had access. Therefore, it is of interest to explore the extent to which, if at all, these policies and aid shaped Korean industrialization, one of the more successful cases to emerge from the Cold War era.
By and large, the Rhee administration staunchly opposed the U.S. policy package. The rancor between the two countries exceeded what

44 THE STATE AND BUSINESS
could reasonably be expected from a corrupt aid recipient, a frugal -aid donor. and the inherent indignity of the aid relationship. According to one observer. "The most touchy subjects of controversy between the two governments, among many less crucial that cannot all be cited, were Rhee's insistence on an unrealistic exchange rate and the pleading by the United States for a comprehensive stabilization program with proper budgetary methods and restrictive monetary and credit policies" (Reeve, 1963, p. 122). Corruption apart, Rhee's position was that a stabilization package comprising devaluation, a balanced budget, tight money, and high interest rates would make growth all but impossibk.
The U.S. fear of inflation flared at the time of occupation. although there was no reversion to the hyperinflation of the war years after a sharp increase in prices durjng the first quarter of 1946 (Bloomfield and Jensen, 195 1 ) . Nevertheless, as the Ko-rean War approached, the U.S. Secretary of State, Dean Acheson, fired off a "missile" .to the Korean Ambassador that read:
It is the judgment of this government that the financial situation in Korea has already reached critical proportions and that, un- . less this progressive inflation is curbed in the none-too-distant future, it cannot but seriously impair Korea's ability to utiiize effectively the economic assistance provided . . . . Government expenditures have been vastly expanded by bank overdrafts without reference to limits set by an approved budget. Tax collections have not been increased. aid goods have been underpriced, and governmental subsidies have been expanded . . .
Unless the Korean Government is able to take satisfactory and effective measures to counter these inflationary forces, it will be necessary to reexamine, and perhaps to make adjustments in, the . . . Administration's assistance program in Korea. (April 7, 1 950) 21
-
Nevertheless, hyperinflation did not materialize during the Korean War either. Price increases slowed with good harvests, and "the relative movements of prices and money supply from mid- 1950 to mid- 1953 support the proposition that money was used mainly for transaction purposes . . . " (Cole and Park, 1983, p. 222). Between 1 953-1955 and 1960- 1962, the GNP deflator averaged only 16.7%, despite an unbalanced budget and heavy lending by the Central Bank. However, the United States had engineered a massive devaluation of 300% immediately after the Korean War, another devaluation in "1955, and two devaluations in 1 961 (Cole and P<irk, 1983; Krueger, 1979). The
2 1 This document is reproduced in Tewksbury ( 1950).

A History of Backwardness 45
u.s. government's concern with fiscal and monetary restraint was ingrained, spilling over to long-run measures beginning in the early 1 950s. In the words of two advisors from the Federal Reserve,
The fact that the sizable long-term investment program being currently carried on by Government Agencies . . . has been financed by bank credit expansion has contributed very materially to the present inflation. . . . At the present moment . . . everything must be done to discourage further long-term lend" ing until the budgetary situation is normalized. (Bloomfield and Jensen, 1 95 1 , pp. 49-50) The casus belli became Rhee's contention that U.S. aid did little to
promote long-run growth. In fact, if aid-financed imports of food, beverages, and manufactures are classified as consumer goods; ifcrude materials, fuels, and chemicals are classified as intermediate goods and raw materials; and if machinery and transport equipment are classified as capital goods, then capital goods accounted for a very small share of total imports-3.4% in 1953 and 1 1 .7% in 1960. Even though consumer goods, during the same period, declined in importance-from 70.4% of total imports in 1 953 to 35% in 1960-this was only because the share of intermediate goods and raw materials had risen to 50% of the total (Krueger. 1 979). and the Rhee government protested that intermediate goods and fuels were largely designated for light industry.
In the half decade following the end of World War II. the aim of project aid had been to develop capital projects
which would ultimately make the provision of further assistance unne<;essary. Emphasis was given in planning to the expansion of electric power-generating facilities, expanded tungsten production, the development of new anthracite coal fields, rehabilitation of the fishing industry, the production of chemical fertilizers and the expansion of the railway system. (U .S. House of Representatives, 1954, p. 1 2)
This is a quotation from an inva,luable rep�rt of a u.s. congressional subcommittee that took the trouble to visit Korea and conduct field interviews on the eve of a new development program; with only six years to go before the Korean military coup. What did the subcommittee discover about postwar Korea?
In terms of physical capital, the subcommittee discovered the evidence of Japan's unassailable contribution to growth, and yet.a dearth of large-scale enterprise:
Manufacturing activity is more highly developed than is generally appreciated. With the exception of Japan, the proportion of

46 THE STATE AND BUSINESS
total Korean output derived from manufacturing, prior to the invasion in 1950, was higher than in any other Asian country, and a considerable variety of fabricated products was produced, although the scale of enterprise was in general, quite limited. (p. 196) 22
In terms of human capital, however, "there is a serious deficiency in technical and supervisory personnel"; although in the business com- . munity "managerial skills appear to be available, but far too much [sic] of these skills is diverted to unproductive trading and speculation" (p. 38). As for the contribution of U.S. aid to skill formation,
It was apparent that not sufficient attention has been given under the aid program to training Korean personnel in various technical and managerial fields vital to the rehabilitation program. Experience gained in the military training program under United States supervision indicates that the Koreans are quick to absorb and apply technological knowledge if they are given the opportunity . . . . The need for greatly expanded civilian training programs for Korean personnel is particularly pressing when the reluctance of the Japanese to train Koreans for jobs above the most menial level is considered. (pp. 38-9)
Nevertheless, technical backwardness is not likely to have dimin-ished greatly under the new U.S. aid development program initiated in 1954- 1955. Of fifty·one new projects, most focused on small-scale enterprise in light manufacturing (Mason et aL, 1 980); furthermore, of the few large-scale projects attempted in basic industry, most ran into snags. U.S. influence on technical and managerial literacy in the civilian sector, therefore. was bipolar. In the area of quality control, and particularly in the construction indust!'y, it had an unambiguously positive effect on civilian subcontractors, as discussed in Chapter 9. Technology transfer. however, was problematic in large-scale projects and served as a bad example for local managers.
Confoundipg the problem .of corruption in technology transfer on the part of aiC;l recipients was a lack of unified administration among aid donors. The Audit Report to the U.S. Congress described the administrative arrangements of aid projects as "complex and confusing" and contrary to "sound management principles." The consequence was delay and technical bungling. Following are three examples:
In telecommunications,
22 Page references in this and the next paragraph are to U.S. House of Representatives (1954).

A History of Backwardness 47
A primary cause for these planning difficulties was the rapid rotation of supervisory personnel without adequate overlap of replacements. A contributory cause was . . . the use of military personnel inexperienced in domestic communication systems. (98)2.'1
In a large machinery shop (the Pusan Iron Works) ,
A considerable portion of the machinery ordered for this project }:lad been delivered . . . but . . . was in storage at the plant site and in customs warehouses. The delay in releasing the equipment was attributed to financial difficulties of the plant and to the need for technical assistance in layout and installation. (p. 112)
In a waste-silk processing plant, a small-scale project,
This project illustrates the lack of thorough technical studies resulting in the omission of several features essential for competent plant construction. (p. 1 1 3)
On net, the impact of u.s. occupation on Korean indusirialization was probably similar to that of Japan, as characterized by the U.s. congressional subcommittee: "modernizing but distorted and unbalanced." The difference between them was that the Japanese colonial administration had enacted a model of centralized state management in Korea that was in. tune with the historical stage of development in which both Japan and Korea found themselves, whereas the liturgy of U.S. economic advisors was private ownership and decentralized control. The corruption of the Rhee regime had strongly reinforced the conviction supporting the latter approach.
The U.S. authorities argued forcefully for privatization of the banking sector (although that sector later proved the most powerful tool for shaping the course of industrial activity after subsequent nationalization by· the military). The U.S. authorities contended that private ownership would subject banks to fewer political pressures and induce them to act more responsibly. A report prepared by consultants from the Federal Reserve Bank of New York emphasized this viewpoint:
The importance for Korean economic and financial welfare of getting the ownership and control of these banks into private hands is so great . . . that it is to be hoped that special efforts
. will be made by those in charge of vested property disposal to
2' Page references are to the 1957 Audit Report.

48 THE STATE AND BUSINESS
seek out responsible private interests who would be willing to purchase these shares. (Bloomfield and Jensen, 195 1 , p. 73)
The government initiated action in 1954 to divest itself of shareholdings in commercial banks that it had acquired from former Japanese owners, but it was unsuccessful in several auction attempts.
In 1957, however, the government succeeded in- selling its shares to a relatively small number of large stockholders, "mainly wealthy . businessmen who were prospering from high profits on government-controlled import licenses" (Cole and Park, 1983 , p. 53). The government also introduced strong deflationary measures. By . 1960 unemployment was estimated at one fifth the total labor force. Per capita income, according to U.N. estimates, was less than $100, roughly the same as that in India, one quarter that of Japan, and twO thirds that of Taiwan (United Nations, 1961) : Furthermore,
Delays [amounting to six years] in putting [an] admittedly costly domestic fertilizer plant into production contributed significantly to the chronically large excess of imports over exports, since long-established intensive cultivation in South Korea demand(ed] huge quantities of chemical fertilizer to maintain the fertility of the soil . The value of exports remained exceedingly low. (Reeve, 1963, p. 1 26) .
Despite all these failures of the U.S. aid administration, the agreement giving the United States wide latitude to "observe" and "review" Korea's economic policies was overwhelmingly approved by the National Assembly on the deathbed of the Second Republic (S. Han, 1 974). .
The Military
Over twenty-five years after the coup d'etat of May 196 1 , the U.S. government was still a powerful force in Korean affairs, as was the military, although General Park Chung Hee, who had presided over the coup and :over the Golden Age of growth, had been assassinated in 1 979. Moreover, the student movement remained hyperactive. Therefore, while the military'S view about how Korea should proceed was the one that prevdiled, the other two poles of dissent had survived. On the one hand, the student movement kept afire demands for democracy, civil rights, higher wages, egalitarianism, eradication of poverty, and protection of the small-scale firm. On the other hand, the United StateS continued to stand in relation to Korea the way water stands in relation to fish.

A History of Backwardness 49
The U.S. government and the Korean military shared a fundamental obsession with anticommunism and a commitment to private enterprise. Thus, when 5,000 troops crossed the Han River and entered Seoul on May 16, 196 1 , the United States looked on blankly. Both countries needed one another in the geopolitical vortex of the postwar period, yet the United States decidedly held the upper hand. Although Korea could threaten to withhold payments on the huge foreign debt that it would soon amass, the U.S. government could threaten to close world markets to Korea's exports, the lifeblood of its economy; to reduce subsidies to Korea's defense budget; and to subject Korea and its statesmen to all the pressures that were at the disposal of the global hegemonic power. Nevertheless, as will be discussed in the next chapter, in the mealy matter of economic growth, Korea charted an independent course.
The military's only claim to government was its ability to create a sustainable mechanism to raise national income. In the general election immediately after the coup, Park Chung Hee had defeated the opposition candidate only by a slim margin. In the general election two years' later, the last for at least another two decades, he won a landslide victory because growth had accelerated in the intervening years. Growth, therefore, took precedence over other claims, income distribution most certainly included. In Park's words,
The economic, social and political goals we set after the revolution are: promotion of the public welfare, freedom from exploitation, and the fair distribution of an income among the people. ICis obvious that these goals cannot be reached overnight. They are, nevertheless, the fundamental aims of the economic order towards which we must move.
Before these goals can be achieved, we must see to it that after more than a decade of stagnation, our poor economic power is greatly strengthened and that the heretofore shrunken or undeveloped power of productivity is fully utilized. We must take a great leap forward toward economic growth. . . . It is urgently necessary to have an economic plan or a long-range development program through which reasonable allocation of alI " our resources is feasible. (C. H . Park, 1962, p . 224)
If the lesson that the United States learned from the Korean upheavals was the need for stability before growth, then the military learned that causality ran in the opposite direction, from growth to stability. Inflation in Korea during the period 1962- 1979 averaged 18.4%-lower than that in Latin America but higher than that in India, China, Taiwan, Hong Kong, Singapore, Japan in its fast-growth

50 THE STATE AND BUSINESS
phase. or still earlier learners in theirs.24 This is not to suggest that government policy in Korea during the high-growth period was reckless; after all, the government was not unaware that hyperinflation and bankruptcy of foreign exchange reserves are the ingredients of countercoups. Rather, the policy was risky. As will be argued in the following chapters, however, risk was mitigated by leaving as little as possible to chance and the vagaries of the market. .
Within the first 1 00 days of its assumption of power, the military had announced its intention to launch the first five-year development plan. By the time Park's book, Our Nation's Path, was sent to press in February 1962 and still another of his books, The Country, The Revolution and I, was published one and a half years later, the twin pillars of the military's strategy to industrialize had been devised. The scaffold was still missing, little mention being made of exports, but there was clarity on the critical roles of both large-scale enterprise and long-range planning. However, apologies and rationales for supplanting market forces by state power were put forth in terms of both roles. In the case of large-scale enterprise,
One of the essential characteristics of a modern e.conomy is its strong tendency towards centralization. Mammoth enterpriseconsidered indispensable, at the moment, to our country-plays not only a decisive role in the economic development and elevation of living standards. but further, brings about changes in the structure of society and the economy. . . . Where the appalling power of mammoth enterprise is concerned, only with private profit under a self-assumed assertion of contribution to national development, there is no free competition. . . . Therefore, the key problems facing a free economic policy are coordination and supervisory guidance, by the state, of mammoth economic strength. (C. H. Park, 1962, pp. 228-229)
In the case of planning,
The economic planning or long-range development program must not be allowed to stifle creativity or spontaneity .of private enterprise. The overall national development program may necessitate, for the rational operation of the economy, reluctantly imposed administrative controls over the regional relocation of various industries and planning for investment. Yet we should
21 Data on inflation in Korea are presented in Table 3.1 . Data on inflation in other countries are from International Monetary Fund, Internationnl Financial S/aI�lics, various years. For data on inflation in Japan, 1905-1970. see Ohkawa and Rosovsky, 1973. Learners in the nineteenth century for the most part experienced mild price declines (see, for example, Landes, 1969).

A History of Backwardness
utilize to the maximum extent the merits usually introduced by the price machinery of free competition, thus avoiding the possible damages accompanying a monopoly system. (C. H. Park, 1963, pp. 224-5)
51
Although the U.S. aid advisors in Korea had tried earlier to formulate their own development plan-a task they subcontracted to a private Washington-based consulting firm-the plan's object, to terminate aid, led to its rejection by the Rhee forces. In 1958, however, Rhee had established an Economic Development Council, staffed by many "young foreign-educated intellectuals," fed on the ideas of planning that were then sweeping the economic development profession from .the universities (H. B. Lee, 1968, p. 90). It was this concept of national planning, if not the identical plan, that later (nspired the military rulers.
Park, whose principal hobby was said to be the study of Korean and world history, compared the Korean "revolution" under his leadership in 1963 to the Meiji reform, the modernization of China under Sun Yat�Sen, Kemal Pasha's development of Turkey, and Nasser's revolution in Egypt. Park's discussion of Japanese modernization is interesting both for what it says and for what it does not say. What it omits, even elliptically, is any reference to the nuts and bolts of the Japanese model-export strategy, investment policy, exchange rate regime, and so on. That these influenced Korean policymakers is. indisputable, but they came later. What Park's discussion includes is an analysis of japan's industrialization, not as a matter of policy but as a matter. of relations between the state, social classes, and ideology. According to Park's reading of history, the causes of the modernization of Japan were as follows:
.
I . The Meiji reform had as its ideological basis a nationalistic patriotism.
2. Thereby they succeeded in Japanizing foreign thoughts that came in volume, and guarding the reform tasks undergoing then
. repeated domestic ordeals from foreign invasion. 3. By eliminating the influence of feudal lords and directly connect
ing the emperor with the energetic middle class, a progressive atmosphere to overcome feudalism was created.
4. Millionaires who promoted the reform were allowed to enter the central stage, both politically and economically, thus encouraging national capitalism. An imperial system was thus established with the emperor at the apex of the pyramid of political and economic forces, and with the nobility serving as elder statesmen of the nation.

5;2 THE STATE AND BUSINESS
Park concluded by saying, "The case of the Meiji imperial restoration will be of great help to the performance of our own revolution. My interest in this direction remains strong and constant" (C. H. Park, 1963, pp. 120- 1).
This, then, may be said to have been Park's vision for Korea's industrialization when he marched across the Han, no doubt casting himself in the role of emperor. The vision could not be implemented in the absence of a strong state. In 1 96 1 , however, the field was clear for the assumption of state power. The landed nobility had been destroyed; the peasantry was less rebellious as a result of a land reform; and the "captains of industry" were beholden to the state for their regeneration. Only workers and students remained as opponents to military rule. Industrial workers, however, were still only a small portion of the population. As for the students, their role in an industrialization based on learning became pivotal. The Hang;ul generation, the first generation of students since the nineteenth century to escape education under the Japanese, came off the streets and into the modern factories of the 1970s as managers. In Chapter 3, attention turns to the model of accumulation that bound these social forces together.
CONCLUSION
The Korean state was able to cons9lidate its power in the 1 960s because of the weakness of the social classes. Workers were a small percentage of the population, capitalists were dependent on state largesse, the aristocracy was dissolved by land reform, and the peasantry was atomized into smallholders. The behavior of the Korean state became influenced by two forces outside the dass structure: the student movement and the American occupation forces (first the U.S. army, then the U.S. aid administration). The student movement kept the new government relatively honest. The American occupation forces drove the Korean military tQward developmentalism, the only, realistic course to reduce dependence on American support.
It is to industrialization policies that attention is now turned.
APPENDIX 2-1
Colonial Agriculture
From Japan's perspective, Korea was a valuable asset by dint of its agricultural resources. This is not to say that a food supply was the only motive for Japanese aggression. Raw materials in the northern part of Korea, geopolitics, nationalism, and the Korean market were also contributory factors. Moreover, Japanese imperialist policy shifted

A His lOry of Backwardness 53
over time. Rice riots in Japan led to an emphasis on agriculture in Korea, while protests by Japanese farmers over declining farm prices prompted a policy reversal (Duus, 1984). After 1930, industrialization in Korea was stressed as Japan began its conquest of Manchuria. Nevertheless, the exploitation of agriculture was the major endeavor of the Japanese colonial administration, and Korea was even singled out for a special role in this regard: to serve as a colony for Japanese settlers. Japanese settlers were slated not only to supervise and guide the improvement of Korean agriculture, they were also to set up farms and work the land with their own hands. This added dimension of imperialism was abs�nt in Taiwan, where the mosquito frus" trated foreign settlement, and in fact, "the differences between Taiwan and Korea cannot be overemphasized" (Moskowitz, 1974, p. 78). However, Japanese farmers never became a significant proportion of total Japanese settlers. The myth of a sparsely populated Korea dissipated, and the Japanese population as a percent of the total population in Korea never amounted to as much as 3% (T. H. Kwon et aL, 1 975). Nevertheless, the settler mentality endured and created far fewer opportunities for Koreans in business and the civil service and far more abusive race relations than might otherwise have been the case.
.
In the first year of annexation, Japan initiated a cadastral survey to determine the size, value, and ownership status of every plot of land. By 1919 the survey had been completed and a new, ,less re� gressive tax' system had taken effect. The new agrarian structure implanted in Korea in the interim was very similar not only to the one that existed in late nineteenth-century Japan but also to the one that Japan instilled in early twentieth-century Taiwan (see Amsden, 1985). Superficially, it resembled the one that had been in effect for a thousand years, whereby the state collected taxes from landlqrds and landlords collected rents from tenarits. Moreover, although Korean specialists are divided on this point, the same individuals who were last landlords under the old system most likely became landlords under the new one; now, however, the landlords worked in conjunction with former bureaucrats, Confucian scholars, and the Japanese (Cumings, 1974). Japanese landlords-both corporate and individual-may have possessed as much as 50% of Korea's total available land (see the estimates of Ho, 1984, and of Grajdanzev, 1944). Nevertheless, in key respects, the new agrarian structure was quite distinct.
.
Under the precapitalist system, peasants had traditional rights to their land and were unlikely to lose it. Under the new system, they had no rights at all. On the other hand, under the precapitalist system, landlords lived by virtue of their political domination, and the resolution of disputes between landlord and peasant depended di-

54 HIE STATE AND BUSINESS
rectly on force. Under the new system, landlords lived by virtue of their property rights ; their land was alienable, and disputes, in theory, were resolvable by law.
Some appreciation of the differences between these two agrarian systems is gained by looking at the major problems associated with the dynastic agrarian structure and the advantages of tenar;tcy. Formerly, the economic surplus largely went to a parasitic landlord class. Taxes were paid by the landlords to the monarchy, but only enough· to sustain it, not enough to allow it to invest. By and large, the landlords used the surplus for political consumption-to buy patronage and to build their military strength. The peasantry, �oreover; was not dependent on the market .. and therefore was not forced to be efficient. If peasants were lucky enough to accumulate a surplus, they were not driven to invest it in improvements. By contrast, the new system represented a radical improvement insofar as it introduced the market as a stimulant for increased productivity. Tenants were exploited to the maximum. In the presence of population pressures there was competition to acquire tenants' leases, and rents escalated. Neither did Korean peasants enjoy the alternative open to Japanese peasants-industrial employment-an alternative that might otherwise have set a ceiling on rents and acted as a further stimulant to efficiency. Instead, exploitation of the . . Korean peasantry increased, while the colonial administration's cadastral survey expanded tax collections and discouraged landlords from investing in tax evasion.
In light of the foregoing, one would expect Japan's agricuftural policies in Korea to have resulted in a decline in the welfare of the masses, a deterioration in income distribution, and a rise in output; in fact, this is what occurred. The index of rice consumption fell from 100 in 1915- 1 9 1 9 to only 56 in 1934- 1 938. A similar decrease in consumption index characterized millet, barley, and beans. In 1932 the rice available per member of a landlords' family was 1 1 .43 koku; the comparable figure for tenants was only 0.4 1 . Meanwhile, between 19 10 and 1 94 1 , agricultural output rose at an average annual rate of 2.3% (S. C. Suh, 1978). Over time, the social composition of the agricultural population shifted toward tenancy. Tenants accounted for 37.7% of the agricultural p,opulation in 1918 but for as much as 53.8% in 1932. In the late 19305, less than 3% . of farm households owned about two thirds of the cultivated land area (Grajdanzev, 1 944; see also references in footnote 5).
There appears to be generai 'agreement that from the perspective of economic development, Japanese imperialism was less effective in Korea than in Taiwan. For comparisons in agriculture and in education, see Ho ( 1984) and Tsurumi ( 1 984), respectively,

CHAPTER THREE
The ABCs of Japarlese and
Korean Accumulation
COMPETITIVE ADVANTAGE I N KOREA VERSUS IN JAPAN
This chapter is concerned with how acceleration in Korean investments and exports was activated. Exploiting its low-wage advantage ' to gain entry to international trade, Korea scored breathtakingly rapid increases in output. Table 3 . 1 shows that during the first two fiveyear plans, 1 962- 1 966 and 1967-1 97 1 , the real growth rate of GNP , averaged 9% per annum. In the period 1972- 1979, growth was still ' higher, 1 0% on average each year. A decomposition of GNP growth rates is presented in Table 3.2. It is evident that exports and investment, the subjects of this chapter. led overall economic activity. Consumption grew only modestly. The real growth rate of exports; deflated by the U.S. wholesale price index, averaged a phenomenal 40% in the period of the first two five-year plans (Table 3. 1). Between 1972 and 1 979 (the year of Park's assassination), the export growth rate averaged 28%, all the more remarkable because during this period the industrial composition of output and exports in Korea was radically transformed. In 197 1 the share in merchandise exports of heavy manufactures was only about 1 4%. The share had increased to 38% by 1979, and by 1984 to 60%, roughly the same share as heavy manufactures in total merchandise output (Table 3.3).
Korea is evidence for the proposition that if and when late industrialization arrives, the driving force behind it is a strong interven- " tionist state. The need to intervene is greater than in the past be- , cause the curses of backwardness are greater. The relativity of this proposition is illustrated by examining Japan's foray into world trade in cotton textiles (spinning and weaving) in the first third of the twentieth century. Cotton textiles continue to serve as the illustrative
55

56 , THE STATE AND BUSINESS
Table 3.1 Basic 'Macro Indicators, 1962- 1984
GNP Real Growth Change Export Export Effective Ratio, Tenns
Rate in GNP Growth Growth Exchange Current of Year (%) Deflator Rate" Rateb RateC Account/GNP Trade <
1 962 2.2 13.5 3 1 .7 3 1 .0 1 1 2.0 -2.0 NA 1 963 9. 1 28.3 6 1 . 1 6 1 .6 1 34.4 -3.7 1 1 1 .3
1 964 9.6 30.0 37.9 37.6 106.3 -0.8 1 12.5 1965 5.8 6.3 45.8 43.0 9 1 .6 0.3 1 14.3 1966 12.7 14.2 42.9 38.3 96.1 -2.7 127.7 1 967 6.6 15.8 34.0 33.7 107.9 -4. 1 132.2 1968 1 1 .3 15.9 45.1 4 1 . 5 1 1 5.2 -7.4' 137.7 , 1969 1 3.8 14.6 35.4 30.3 120. 1 -7.3 132.6 1970 7.6 15.7 34.0 29.3 124.2 -7. 1 133.8 1971 8.8 13.4 28.5 24.3 120.7 -8.7 132.7 1972 5.7 16.4 47.9 4 1 .7 1 09.4 -3.5 1 32. 1 1 973 1 4 . 1 1 3.4 95.9 73.2 92.4 -2.3 1 25.4 , 1 974 7.7 29.5 37.5 ' 15.7 93.6 - 10.9 102. 1 1975 6.9 25.8 10.8 1 .4 93.5 -9.0 92. 1 1976 14. 1 20.5 56.2 49.2 1 03.4 - 1 . 1 105. 1 1977 12.7 1 5.8 28.6 2 1 . 1 103.9 0.0 1 1 2.4 1978 9.7 2 1 .9 26.5 17.4 1 0 1 .0 -2.2 1 1 7.8 1979 6:5 2 1 . 1 15.7 2.8- 1 1 0.7 -6.4 1 1 5.3 1980 -5.2 25.6 17. 1 2.6 100.0 -8.7 100.0 1 98 1 6.2 1 5.9 20.1 10.0 1 03. 1 -6.9 97.9 1982 5.6 7.1 1 .0 - 1 .0 1 06.9 '-3.7 102.2 1983 9.5 3.0 1 1 . 1 9.8 100.2 -2.1 103. 1 1984 7.6 4.0 13.5 10.9 97.8 - 1 .7 105.3
'GNP. gross national product; NA. not available. In nominal U.S. dollars.
b Export value deflated by U.S. wholesale price index.
c 1980= 100. SOUTC": Bank oC Korea and International Monetary Fund.
case when discussion turns to the Korean economy in the 1950s and , 1960s. Cotton textiles accounted for over 20% of manufacturing valueadded and became Korea's major export item.
Unlike Korea, Japan as a colonizer had been able to rely on more competitive weapons than merely low wages to capture market share in cotton textiles from Lancashire during the 1900-1930 period. ' Korea, twenty years later, had only low wages with which to compete against Japan, and low wages in the absence of governmt:nt support proved insufficient to stimulate export activity. In the 19508 Washington actually thwarted Korea's efforts to export by prohibiting U.S.
1 Lancashire was the home of cotton textiles manufacture in what was then the, . world's leading producer, Great Britain.

The J\BCs of Japanese and Korean Accummulation 57
Table 3.2 Decomposition of Gross National Product Growth Rate, 1962-1984 (Real Growth Ratesa)
Year GNP C G X M NFl
1962 2.2 5.7' 6.9 0.9 1 2.5 32.0 1 1 .9 1963 9. 1 3.3 76.0 4.8 7.4 2704 4.8 1964 9.6 5.6 - 16.7 -3.6 23.6 -25.6 -3.8 1965 5.8 7.8 3.6 6.8 40.7 13. 1 17.2 1966 12.7 7.2 75.0 1 1 .5 52.3 57.7 7 1 .0 1967 6.6 9.3 16.6 10.2 35.7 34.8 64.6 1968 1 1 .3 1 1 .4 42.4 13. 1 4 1 .6 45.9 3.3 1969 1�.8 1 1 .0 3 1 .2 1 2.2 31 .9 24.7 3.6 1970 7.6 1 1 . 1 0.9 6.7 22.9 10.0 -55.9 1 97 1 8.8 IDA 6.3 10.7 20.5 20.4 - 1 17.0 1972 5.7 5. 1 - 10.2 2.9 36.6 0.9 - 164.4 1973 \4. 1 9.2 3 1 .5 1 .7 55.3 36.7 336.7 1974 7.7 7.6 29.9 10. 1 -2.8 16.9 69.3 1975 6.9 5.6 1 .7 4.3 15.9 0. 1 127.4 1976 14. 1 8.3 16.3 5.9 4 1 .6 27.0 - 1 14.7 1977 12.7 6.8 23.2 9. 1 22.6 23.4 1 ,3 10.4 1 978 9.7 9.9 22.8 13.0 19.9 29.0 - 13.0 1979 6.5 8.9 19.7 0. 1 -3.8 8.6 -49.8 1980 -5.2 -0.8 -23.7 6.8 9.7 -7.3 -334.0 1981 6.2 304 2.2 2.2 17.3 5.3 50.9 1982 5.6 4.6 5.0 2.2 6.2 2.3 0.7 1983 9.5 6.6 13.7 4.7 13.8 1 1 . 1 6.9 1984 7.6 5.7 1 1 .9 2.3 8.1 ' 6.8 25.8
'Growtll rates are calculated from data in won and corrected by tile GNP deHator: C. consump-tion; I. investment; G, government spending; X. eKports; M. imports; Nfl. net factor income.
Source: Bank of Korea.
imports of Korean-made textiles that embodied American aid-financed raw cotton. By the conclusion of this chapter we begin to understand better why investf!1ent and exports in Korea rose so fast beginning in the 1960s, their acceleration a function of strong state support as well as of discipline.
THE EMERGENCE OF AN INTERNATIONAL DIVISION OF LABOR
As the basis of industrialization in the world has shifted over time from invention to innovation to learning, what has also shifted is the basis on which less industrialized countries have entered world markets to compete. What we have come to take for granted as the international division of labor-in which low-wage countries hold a commanding position in products characterized by labor-intensive

U1 r:tJ
Table 3.3 Percent Share of Heavy and Chemical Industry and of Light Industry in Manufacturing Output and Merchandise Exports. 1971.,.,.1984
Industry Share 1 971 1972 1 973 1974 1975 1976 1 977 1978 1979 1980 1981 1982 1983 1984
Heavy and ehemkal a 40.5 39.7 42.6 49.9 47.5 49.5 50.7 53.0 54.9 56.3 57.7 58.3 59.3 6 1 .9 industry b 1 3.7 2 1 . 1 23.6 33.2 25.9 28.8 3 1 .6 33.2 37.7 39.9 42. 1 49.2 54.3 59.7 Chemical e 56.2 52.2 44.8 46.9 54.3 48. 1 43.8 39.6 4 1 .0 49.3 46.9 45.0 42.2 39.2
d 14.2 14.7 10.2 12.9 13.2 1 1 . 1 10.2 8.5 9.8 1 1 .6 9.5 9.5 9.8 10.7 Basic Metal e 14.5 15 .4 1 9.7 18.1 13.3 14.5 1 5.2 14.7 16.0 16.6 16.7 16.4 16.2 17.0
(iron. steel. non- d 26.5 34.2 33.4 38.8 28.1 27.4 3 1 .3 27.1 3 1 .8 36.6 34.9 30.5 26.9 22.8 ferrous metals)
Mach. and lrans. e 29.4 32.4 35.5 34.9 32.4 37.4 4 1 . 1 45.7 43.0 34. 1 36.4 38.6 4 1.6 43.8 equipment d 59.4 5 1 . 1 56.4 48.3 58.8 6 1 .5 58.4 64.3 58.4 5 1 .8 55.6 59.9 63.4 66.5
Light industry a 59.5 60.3 57.4 50. 1 52.5 50.5 49.3 47.0 45. 1 43.7 42.3 4 1 .7 40.7 38. 1 b 86.3 78.9 76.4 66.8 74. 1 7 1 .2 68.4 66.8 62.3 60. 1 57.9 50.8 45.7 40.3
aln total manufacturing output.
b In total merchandise export.
<Of output in heavy and chemical industry.
·Of export in heavy and chemical industry. Heavy includes consumer electronics.
Si1UTtIJ: Economic Planning Board.

The ABCS or Japanese and Korean Accummulalion 59
production techniques. and high-wage countries dominate in the remainder of industry-is a recent phenomenon. dating approximately from the end of World War II.2 Obviously. other things being equal, low wages contribute to profitability. Yet in few industries before World .War II did low wages confer a decisive lead. Since this war, moreover, low wages have given a decisive lead only to a limited number of countries.
It is clear that lower wages were not responsible for England's emergence as the first industrialized nation. For roughly a century Britain sustained a lead over European countries, which had decidedly lower living standards. because of its higher productivity. At one level a product of the social climacteric. higher productivity in Britain derived directly from the inventions that gave the First Industrial Revolution its character and established the direction of the long wave of technological change that ensued. Labor-saving processes in Britain outcompeted less mechanized techniques in lowerwage countries that failed to import the superior but costly techniques. When, moreover, the United States and Germany caught up with Britain and then overtook it, they did not do so on the basis of lower wages in conjunction with parity in "best practice" technique. In fact, wages in the United States were higher than in Britain. and at the end of the nineteenth century even Germany did not have access to as abundant labor reserves as did Britain. Moreover, Germany was not especially efficient in those industries that were most labor ini:ensive. Dispersed home production and low productivity were common in clothing and textiles even after the turn of the century (Landes, 1969). Therefore it was neither in the.area of textiles nor in the area of the least mechanized trades that Germany and the United' States developed strength. Rather they contrived to overtake England as innovators, by operating in a new set of "basic" industries, employing a new set of firm structures, and, interrelatedly, utilizing a new set of production methods.
The international division of labor as we know it began at the turn of the twentieth century with improvements in communications, transportation, and technology transfer. The shape it took. however, was decided not by the United States or by Germany but rather by Japan, whose state underwrote large-scale investments in foreign technology by private firms. Writing in 1 935, Hubbard expressed sentiments that might have applied to the world economy thirty years later:
2 Little appears to have been written directly on the pre-World War II international division of labor. but there are empirical studies of changes in trade patterns over time. See. for example. Amsden (1986) and Maizels ( 1963); for the period 1700- 1914
. see Woodruff ( 1973); for the period 1850-1950 see Ashworth (1952).

60 THE STATE AND BUSINESS
The emergence of Eastern countries as large-scale industrial producers, their entrance into international markets, the loss of these markets to the manufacturing countries of the West, and the reaction of the latter in the form of trade restrictions in colonial territories have caused a substantial addition to th,e world's economic problems of today.
The more immediate problems relate to the progress of Japan, who, by reducing her costs of production to a level hitherto unknown, has extended her trading operations in every quarter of the globe and invaded and captured markets, which, .in the past, had been the cherished preserves of the exporting countries of the West. ( 1938, p. xvii)
The Japanese thrust caJ'!'le largely in cotton textiles and with catastrophic effect. From 1 885 to 1 913, British annual sales of yarn in China fell from 20 million to 2 million pounds. In 1 9 1 3 Japan sold 1 56 million pounds of yarn to China, and Japan's total exports of yarn and thread were worth well over twice Germany's and about 40% of England's (Great Britain, 1 928; Orchard, 1930). By 1929, japan's share of world exports of cotton piece goods was 22%; by 1 935, it was 44% (Hubbard, 1 938).
In the study just cited, Hubbard was at pains to demonstrate that Britain's woes were not attributable simply and solely to japan's lower wages. Instead, Japan's rise as an international competitor was shown as reflecting its status as a young industrial power-a colonizer, not a colony. Consequently, the penetration of world markets by Japan circa the 1 920s differed from that of other Asian late-industrializing countries forty years hence, which ploughed into world markets having only just sh�d their colonial skins.
Hubbard did concede that unskilled female cotton operatives in Japan earned one sixth the British rate, and at the other extreme, skilled male metal workers earned one half. With regaid to the former class, however, "it must pe noted that the female workers in Japan are mainly young girls under 20, and that if their wage rates are compared with those of young leamers in the British cotton trade, the discrepancy between the two rates is not very marked" ( 1 938, p. 1 1 3).3 As for productivity, the .difference petween Japan and the United Kingdom was unclear, although cotton mills in the United States used one third the labor used in Japan. Together with other evidence, from a parliamentary investigation in�o global competitiveness, Hubbard was led to argue that B ritain's 10$s of market share
S Page references in this paragraph and the next are to Hubbard ( 1938). See also Pearse ( l929).

The ABCs of Japanese and Korean Accummulalion 61
was not attributable to a low-wage interloper. Rather, japan's strength lay in the following:
l . Group control over the industry by the Japan Cotton Spinners' Association and various other trade associations in order to check overproduction and uneconomic competition.
2. Large [and integrated] manufacturing units, working two shifts a day and equipped with ring spindles [the most modern technology] and, to a considerable extent, also with automatic looms.
3. Shipping subsidies and low shipping costs. 4. Concentration of raw-cotton imports in the' hands of a few large
trading concerns, and the system of bulk purchase, whereby the spinner is often able to obtain his raw cotton at the lowest possible cost.
5. Great efficiency in marketing the finished product resulting from maintenance of closer contact with customers, and from intimate cooperation between the manufacturing and mercantile sections of the industry. (p. 8 1 )
To Hubbard's list must be added the quality of japanese management. The proportion of university graduates in total employment was far higher in the japanese than in the Lancashire textile industry. Ironically, japan even sent large numbers of managers for training in the Manchester Technical School (Yonekawa, 1 984).
Centralized purchase of cotton during World War I had allowed the zaibatsu to reap windfall gains. They used these to purchase modern machinery such as ring spindles. "Lancashire, with 27% of all spindles in the world has . . . only 10% of the rings and japan, with 7% of the total has also 10% of the rings" (Hubbard, 1938, p. 109). Once the zaibatsu had reequipped their factories with the best machinery and had rationalized the process flow, "japan's vast reservoir of cheap labour could be converted from a potential into a real asset and Japanese competition in world markets became a factor to be reckoned with" (Hubbard, 1 938, p. 109).
There is no evidence that Korea challenged the advanced countries, particularly Japan, on any basis other than lower wage rates when it began exporting textiles in the 1960s. This is true even though, as will be suggested in Chapter 10, it would be simplistic to ignore the managerial setting in Korea that made lower wages operationally meaningful. Nevertheless, of the five strengths of Japan vis-a-vis Britain cited above, Korea may have achieved parity with Japan on only the first, the least developmental-cartelization. Moreover, Japan's penetration of foreign markets benefited from three additional factors to which only advanced, not backward, learners have been

62 THE STATE AND BUSINESS
privileged. These factors made Japan a privileged twentieth-century learner.
1 . The preponderance of Japanese manufactured exports was destined not for more but for stilI less industrialized countries. Before World War I, China took 90% of Japan's exports of cotton manufactures, mostly yarn, while Korea took japan's inefficiently produced piece goods (Koh, 1966; Mitsubishi Economic Research Bureau, 1 936). Then the crippling effect of war on shipping gave Japan the greater Asian market. In 1 929 as much as 82% of Japan's manufactured exports was sold to its poorer neighbors. By 1957 this percentage had fallen only modestly, to 71 % (Amsden, 1 986). Japan, therefore, entered world markets through a back door, so to speak. Exporting to the colonies, its own and Europe's, was a downhill struggle compared with exporting to the metropolitan heartlands, which Korea and the other Asian late� industrializing countries were forced to do. As the colonies industrialized, Japan stayed one giant step ahead of them and provided sequentially more of their sophisticated imports. By contrast, Korea exported progressively more sophisticated manufactures to the metropolitan heartlands and posed an ()ver greater threat to their established industries and employment.
2. Japan was sufficiently industrialized in the 1920s and 1 930s to pursue a "beggar-thy-neighbor" exchange rate policy to expand its exports, against the wishes of the advanced countries, which wanted an appreciated yen. On the other hand, the Korean government in the 1950s and 1960s was hard pressed to keep its currency overvalued in order to lower the costs of machinery imports, against the wishes of the advanced countries, which wanted a depreciated won. Both learners, being resource poor, were highly dependent on imported raw materials to su.stain their industries, not least of all cotton spinning and weaving. But Japan was freer than Korea to depreciate and to give its exports a boost, because it was almost self-sufficient in intermediate inputs and capital goods, including t�xtiles machinery. Imports of machinery by Japan accounted for 8.3% of its total imports in 1 929, down to 6.4% six years later (Mitsubishi Economic Research Bureau, 1 936, p. 537). Imports of machinery by Korea, on the other hand, accounted for 16% of its total imports in 1965, up to 29% six years later (Bank of Korea, various years [a]).
3. Japan's penetration of world markets before World War II differed from that of latter-day learners insofar as japan's economy was sui generis, none other like it at the time combining quite the same size and degree of backwardness and modernity. At one

The ABCS of Japanese and Korean Accummulation 63
time it looked like Japan might encounter serious competition from China and India, but for various reasons this never materialized. In 1899 the value of India's total manufactured exports exceeded that of japan's; by 1 9 1 3 export values were equal; by 1929 Japan's manufactured exports exceeded those of India and the margin widened thereafter (Amsden, 1986). By contrast, Korea was one of a large set of postcolonial exporters with roughly the same factor endowments. As Korea industrialized and as its wages rose, countries with still lower wages provided more of a threat than a market.4 The market environment of the international division of labor had grown more competitive.
From this perspective, low wages were an ambiguous blessing. They helped a learner like Korea to enter world markets, but they went hand in hand with backwardness. Backwardness, moreover, imposed heavy costs in the form of low domestic purchasing power, low productivity, an almost total reliance on imports for inputs, low savings, and high interest rates. These costs made it harder both to enter world markets in the initial instance and to progress up the ladder of technological complexity, realizing value less on the basis of cheap labor and more on the basis of skills.
Attention is now turned to the hodgepodge of policies that the military regime of Park Chung Hee constructed to offset these costs of backwardness, and to mediate the confliqing demands of interest groups inside Korea.
THE MODEL OF ACCUMULATION
Just as a strong state in Korea was the outcome not of policy choice but of a long process of social change, . so too were the particular policies that the military regime pasted together in the early 1960s to form a model of accumulation that was rooted in the past. At the heart of the model were subsidies offered by the state to private enterprise in exchange for higher output of exports and import sub- <
stiLUtes. The wheeling and dealing, horsetrading, and tra'fficking that characterized this process were reminiscent of the reciprocity that characterized relations between the state and the privileged class�� under dynastic rule. The critical difference lay in the tip of the bal- "
• Some newly industrializing countries, particularly Brazil. Argentina, and India, have exported large shares of their manufactured exports downstream, to developing countries. This has not been true of Korea, however, although it is trying to export more to Asian countries, and it exported as much as 1 0% of its manufactured exports to the Middle East during the oil boom. For a discussion of South·South trade, see Amsden ( 1986).

64 TI-IE STATE AND BUSINESS
ance of power toward the state. However clumsy at first, the state , ,used its power to disciplipe not just workers but the owners and ... managers of capital as welL A larger surplus was extracted, and this , was invested rather than consumed.
.
Another tradition; which carried over from the 1950s to the 1960s, was the extraordinary degree to which a supposedly sovereign state was subject to intervention by the international aid establishment in its economic policymaking. While those European allies of the United . States that reindustrialized after World War II were also the benefactors not merely of aid but also of advice from American aid administrators, nOne was as politically unstable as Korea, nor was any other the locus of still another shooting war. These coincidences in Korea prolonged and intensified intervention accompanied by aid through the mid- J 960s. Even after aid ceased, intervention continued in tandem with military support. In the 1 960s, the United States placed enormous pressure on Korea to accord diplomatic recognition to Japan. This was viewed at the time, by businessmen and students in Korea, as suicidal both for infant industry and for cultural integrity (Cole and Lyman, 1 97 1 ). In desperation, the Park regime turned to the World Bank and to the IMF as a way to multilateralize its international dependence. Yet these Bretton Woods institutions also ad,:ocated policies that put stability before growth, if somewhat less forcefully than had U.S. aid advisors during the period in question.
At the time of the military coup, inflation was down momentarily due to a strong stabilization package adopted in 1957, but GNP was stagnant. The military regime divided its attention to minister to two influential groups: cotton textiles firms, which like their Japanese counterparts had organized themselves into a powerful lobby-the Spinners' and Weavers' Association of Korea-demanding relief from excess capacity; and the progressive "millionaires," or chaebol, ih disfavor with the public and press for having accumulated illicit wealth. Out of ministrations to influential groups, and insistence of U.S. aid advisors on stability before growth and fiscal conservatism, came Korea's accumulation model. Attention is focused below on the trade and investment policies that emerged from this mod�l.
TRADE POLICIES
Cotton spinning and weaving is one of Korea's oldest industries. The Kyongsong Spinning and Weaving Company, founded in October 19 1 9, was possibly Korea's first major national capitalist enterprise (Eckert, 1986). After the Korean War, cotton spinning and weaving received the "lion's share" of foreign aid to all industry in Korea.

The ABCs of Japanese and Korean Accummulation 65
Considering aid as having financed both productive facilities and raw cotton, spinning and weaving may have accounted for over 10% of total aid (]. B. Kim, 1 966).
The cotton textile industry was represented by a cartel, the Spin\ ners' and Weavers' Association of Korea. According to J. B. Kim in his 1 966 doctoral thesis, "the Korean cotton-manufacturing industry belongs to the category of oligopoly in the conventional sense." Roughly 15 integrated cotton spinners and weavers dominated the industry and recognized "mutual interdependence" with respect to pricing (p. 1 3). By 1957 the industry had achieved "complete import substitution." allowing the government to prohibit textile imports (Y. B. Kim, 1980, p. 208). /
The performance of the industry was mixed. In terms of efficiency, performance was high. Labor productivity increased sharply in the period 1954- 1963. almost trebling in the spinning sector and' nearly doubling in the weaving sector (]. B. Kim, 1966). Business, however, was problematic. By the early 1960s, the industry was suffering from excess capacity. The operating rate in 1961 was 66% in cotton yarn and 50% in cotton cloth (Bank of Korea. 1 963). According to J. B . Kim, textiles firms took advantage of subsidized loans from the aid establishment in the 19505 and created capacity ahead of demand. Capacity was still in excess supply in the early 1 9605. There was little export activity, however, despite excess capacity and despite the provision of export incentives, which had begun in the early 1950s.5 Nor did it prove possible to increase exports merely by devaluing the won against foreign currencies. The major effect of devaluation was worsening of the business climate by the increase in price of imported inputs, which fueled inRation.
The Korean won was devalued by 50% in 196 1 , from 65 to 100 won for the dollar in January and from 100 to 130 won for the dollar in February (Frank et al., 1975). The result was disastrous. According to the Economic Planning Board,
The textile industry, as were many others, was also hard hit by the revisions in the exchange rate, as well as overproduction ca- \ pacity. This can be illustrated by observing the cotton textile industry. representing the largest portion of the entire industry, which is 99% dependent upon industry imports for the neces- I sary supply of raw cotton. . . . The price index of raw cotton increased by 1 1 .5% in January of 1 96 1 from the level of December 1960; reached 287.9 in February 196 1 , a 29.5% increase
5 One is now led to think that export incentives were part of a "liberalization" package in the mid-196Qs. This is clearly incorrect insofar as export incentives started much sooner, although they started small. (Frank et al.. 1975).

66 THE STATE AND BUSINESS
over the level of the previous month; and pressed even higher to 292.0 in March and to 299.8 in April, a level which was generally maintained throughout the remainder of the year. These increases in the price of raw cotton affected in turn the production . costs of all cotton products and the price of cotton yarn. ( 1962, p. 49)
The crisis precipitated by devaluation provoked the military government to interv·ene with an expansionary economic package, which exacerbated inftation even further.
In addition to business problems due to devaluation, there were further impediments to exporting. According to a survey of members of the Spinners' and Weavers' Association, two of the more serious impediments were old plants and equipment and weak marketing channels. U.S. export restrictions presented a third obstacle: "Before 1960 the Korean cotton-manufacturing industry could not export manufactured cotton products, with a few exceptional cases; and after 1960, the industry could not earn free foreign exchange to the extent that it exported" (J . B. Kim, 1 966, p. 48).6 This was stipulated in an agreement between the Korean and U .S. governments under Title I of the (U.S.) Agriculture Trade Development and Assistance Act, renewable yearly. The agreement prohibited "the resale of transshipment to other countries or the use for other than domestic purposes" of agricultural commodities supplied as U .S. aid (J. B . Kim, 1966, p. 48).7 Thus, while the U.S. aid administration in Korea preached the theory of free trade, in practice Washington fru.strate� the adoption of competitive exporting. "
The volume of eXpOrts from Korea barely budged in 1960- 1 962, but bounded in 1 963, 1964, and thereafter (see Table 3.4). What seems to have turned the tide was a sharp rise in subsidies to exporters. These were Park's answer to the textile industry's woes. The relative magnitude of subsidies is shown in Table 3.4 as part of the export-effective exchange rate. This exchange rate reflects how liberally a government wishes to reward exporters, although it is biased downward because it does not include subsidized long-term loans, and longterm capital subsidies were extremely important tn Korea tn certain industries and firms . . The value of manufactured exports was higher in 1963-
6 One exceptional case was noted by the Cotton Spinners' and Weavers' Association in a book on its forty-year history. In it the United States is reported to have allowed one of the Association'S members to export cotton products to Hong Kong in 1957, but only if their value did not exceed $2 million (Taehan Pangjik Hyophoe, 1987, p. 251).
? Textiles firms became able to export only after they procured raw cotton with freely earned foreign exchange, around 1965.

The ABCs of Japanese and Korean Accummulation 67
Table 3.4 Exports of Manufactures' and the Exchange Rate, 1960- 1 965
Variable 1960 1961 1962 1963 1964 1965
Expons (mil. U.S. $) 4. 1 5.7 9.6 38.6 57.7 106.4 Manufactured exports as 12.5 13.9 17.5 44.5 48.4 60.8
percent of total export Official exchange rate 62.5 127.5 130.0 1 30.0 2 14.3 265.4
(won/dollar) Export effective exchange 1 47.6 150.6 1 5 1 .5 189.4 281.4 304.6
rateb Individual items as percent
of total manufactured exports
Processed food 36 2 1 1 4 Textiles 25 29 4 1 Lumber and plywood 07 1 0 1 4 Metal and steel products 1 0 2 1 1 3 Other 22 19 18
"Manufactures arc defined as Standard Industrial Trade Classification codes 6 . 7 . and 8.
bThe number of units of local currency actually paid or received for a $ 1 .00 international trans· action. Surcharges. tariffs, the impliCit interest foregone on guarantee deposits. and any other charges against purchases of goods and services abroad are included. as are rebates. the value of import replenishment rights. and other incentives to earn foreign exchange for sales of goods and services abroad.
Source: For exports. Economic Planning Board. 1967. For eXChange rates. Frank, Kim. and West· phal. 1975. For product breakdown, Hong. 1975.
1964 than in all previous years combined since the Japanese defeat in 1945, notWithstanding the increasing overvaluation of the won in 1963- 1964 amidst high inflation. The expon effective exchange rate rose from 1 5 1.5 won per dolJar in 1962 to 1 89.4 in 1963, at the same time as exports rose; The government again devalued the won by 50% in May 1964 (after the United States made the release of food aid contingent on devaluation). Exports increased further, but so did subsidies. as indicated by the gap between the official and exporteffective exchange rates. The gap between the two would have been even wider if subsidies to capital had been included.
Overvalued exchange rates were favored by the textile industry because the disadvantage of higher export prices (and presumably lower export demand) was dwarfed by the advantage of reduced input costs, since even an export-oriented industry like textiles still ' catered primarily to the domestic market. The share of exports to total demand in textiles production was 4.8% in 1963. 15.0% in 1966, and 47.2% in 1 973 during the golden age of Korean cotton spinning and weaving (Y. B. Kim. 1980. p. 1 08). The subsidy, however. ad-
68 THE STATE AND BUSINESS
dressed both the supply- and demand-side issues. According �o a history of the Korean textile industry,
The government implemented numerous export promotion measures including preferential loans for operation and facility expansion, tax and tariff exemptions, wastage allowances, and other social overhead and administrative supports. It could be said that the textile industry was more effective in taking advantage of such benefits, since it had strong business organizations and more large-scale enterprises than other [light] industries. (Y. B. Kim, 1 980. p. 232)
Underlying the competitiveness and dependence on subsidies of cotton spinners and weavers is their labor cost, position, which has been analyzed by Woo ( 1 978). Woo compared labor costs per bale of cotton in japan and Korea in the late 1960s. Although his findings are sensitive to the exchange rate and also to the accuracy of data on wages and productivity, he found that labor costs in japan and Korea ran neck and neck in the late 1 960s. Had other costs been considered, the overall position of Korean producers would probably have appeared even less favorable. Subsidies to exporters �n late industrializing countries have often been seen as a necessary evil to offset the higher-than-world-price that exporters have to pay for their imported inputs as a consequence of exchange rate "distortion." In fact, however, international' cost comparisons such as the one undertaken by Woo ( 1 978) suggest that subsidies in Korea were necessary not because of "distortions" but because the Koreans could not, initially, compete against the Japanese, even in industries such as cotton spinning and weaving in which the least developed, most labor-intensive countries supposedly have a comparative advantage. (Appendix 3-1 suggests how the Korean cotton textiles industry ultimately weaned itself from subsidies.) ,
By january 1965, exports had become a fixed idea for Park, and he had already begun to talk in terms of global competitiveness. He explained in hi� "State of the Nation Message" on january 16, 1 96? :
To go with increased 'production, the government has set as another major target-increased exports . . . . In a country which depends heavily on imported raw materials for its industries, export is the economic lifeline. . . . For many years, Korea ex- , ported only $20 million to $30 million worth of goods a year . . . [mostly] tungsten. But in the past few years, the government and people awoke from sleep and strove. Exports began to expand rapidly . . . . Last year, our exports exceeded 'the $ 1 20,000,000 mark. Although there is still a gap in the balance of payments, this much is true: that we have acquired the self-

The ABCs Of Japanese and Korean Accummulalion 69
confidence that we, too, can successfully compete with others in the international export race. (Bum-shik, 1970, pp. 305-6) .
Thereafter, the Park regime increasingly made exports a compul-sion rather than a choice for the private sector. In addition to subsidization, a strong element of coercion underlay Korea's phenomenal export ·performance. The extent to which exports were a reaction to . pressure rather than to subsidies, let alone the "right" relative prices, may be gauged from the survey responses of exporters to the question, What has been the effect of export targets fixed for your firm? As Table 3.5 indicates, in the year, say, 1976, 37% of respondents said the effect of export targets on their firm was positive, 10% said these targets had no effect, and as many as 53% listed negative effects.
If overseas sales were not always profitable. however, as suggested
Table 3.5 The Coerciveness of Export Targeting: Responses to question, What has been the effect of export targets fixed for your firm? 1974- 1976
1974 1975 1 976
Number Number Number of of of
Reponse Firms Percent Firms Percent Firms Percent
Contributed to a more rapid increase of production 48 42 48 32 58 37
Made no difference to the growth of production 1 6 1 4 24 16 15 10
Caused the firm to divert sales from the domestic to export markets 23 20 22 1 5 28 1 8
Reduced the profitability of the .firm - 8 7 1 7 12 14 9
Led to price cutting. unprof-itable sales condition. and other forms of competi-tion adverse to the firm 6 5 16 I I IS 10
Led to spme unprofitable exports 5 4 12 8 8 5
Raised unit costs due to the employment of inexperi-enced personnel or for other reasons 8 7 1 1 7 16 10
Led to some deterioration of product quality 1 I 2 I I 1
Total number of resp0l!ses' 1 1 5 100 1 52 100 155 1 00
'One-hundred and· five firms replied 10 this question. some more than once. and SOme only for one or two yeaTS.
s";',« : Adapted from Rhee. Ross-L.arson, and Purse.1I ( 1984).
70 THE STATE ANO BUSINESS
by the negative responses of exporters, then the government compensated the losers by inflating the returns on domestic sales. It did so by imposing trade barriers on imports. The existence of trade barriers has been demonstrated in some detail by Luedde-Neurath:
For almost two decades now Korea has attempted to promote its image as a market economy with a relatively liberal attitude towards imports. This stands in marked contrast, however, with the views held by most foreign businessmen who attempt actually to ' penetrate the Korean market.. Their familiarity with the "nuts and bolts" of the Korean import regime leads them to characterize it as essentially restrictive and full of hidden obstacles. ( 1986, p. 89)
Krueger, a student of the Korean economy who did much to promote Korea's image as a market economy, has observed,
One final aspect of the import regime deserves mention-the tariff structure and attempts to alter it. One of the remarkable aspects of Korea's trade-and-payments regime over the period since 1 953 has been the remarkable stability of the tariff structure. (1979, p. 140)
Thus, together with quantitative import restrictions and government export incentives, tariffs provided Korean pusiness with abundant government support. At the same time the labor-intensive industries especially came under intense pressure for immediate export gratification.
Export Dependence ,
Exports as a percent of GNP rose steadily from less than 5% in th';7 1 950s to approximately 35% in the 1980s. In tandem, imports as � pe-rcent of GNP rose, although at a slower rate. By' international standards, Korea became ultradependent on foreign trade. Table 3.6 presents the proportions of foreign trade (exports plus imports) to national produCt during the course of economic development in seven European countries, the United States, Canada, Japan, and Korea. The evidence suggests that none of the Great Powers, whatever their stage of development, ever had anywhere near as high a 'de pen:. dence on trade as did . Korea. Imports and exports of commodities j as a percent of gross domestic product in Japan were never more \ than 35.5%, and they were much lower in the nineteenth century ( and in the 1950s. ./
Korea's high trade coefficient is quite similar to that of three relatively small economies-Hong Kong, Singapore, and Taiwan (World

Table 3.6 Proportions of Foreign Trade (Exports Plus Imports) to National Product (Commodities at Current Prices)
Pre-World GNP per GNP Early Phase War I 1 920s 1950s· 1 980s Capita Billion Country Date % Date % Date % Date % Date %a Population b $ 1 984 $ 1984
United Kingdom 1 837-45 2 1 .6 1 909-1 3 43.5 1 924-28 38. 1 1 957-63 30.4 1 98 1-85 43. 1 56.5 $ 8,570 484. 1 (GNP)
France (physical 1845-54 1 8.0 1905-1 3 53.7 1 920-24 5 1 .3 1957-63 4 1 .2 1 98 1-85 39.8 54.9 9,760 536.3 product)'
Germany (net 1 872-79 36.7 1910- 1 3 38.3 1925-29 3 1 .4 1 955-59 35. [ 1 98 1-85 5 1 .2 6 1 .2 1 1 , 130 680.9 total uses) d
Italy (GNP) 1 861-70 20.6 1 9 [ 1 - 13 28. 1 1925-29 26.3 1957-63 25.0 1 981-84 45.7 5.0 6,420 365.8 Denmark (GDP) 1870-79 45.6 1 9 [0-14 6 1 .6 192 1-29 57.3 1957-63 52.6 1 98 1-85 56.2 5. 1 1 1 , 1 70 57. 1 Norway (GOP) 1865-74 55.5 1905- 14 69.2 1920-29 63.5 [947-56 77.4 198 1 -85 66.7 4.1 1 2,940 57.5 Sweden (GOP) 1861-70 27.7 [9 1 1- 13 40.3 1 92 1-30 3 1 .9 [957-63 36.5 1 98 1-85 57.5 8.3 1 1,860 98.9 United States 1 834-43 1 2.9 1904-13 1 1 .0 1919-28 10.8 1954-63 7.9 198 1-85 14.9 236.7 15,380 3642.5
(GOP) Canada (GNP) 1 870-80 30.9 1 9 1 1 - 1 3 32.2 1 926-29 4 1 .5 1956-60 3 1 .2 1 98 1-85 48.7 25. 1 1 3,280 333.7 Japan (GOP) [878-87 1 0.3 1 908- 1 3 29.5 1918-27 35.5 1950-56 18.8 1981 -85 24 .. 0 1 20.0 10,630 1 275.8
Japanese Occupation· 1 9505 1 9605 1 970s
Date % Date % Date % Date % ,-r-Korea (GNP) 1929 69.6 1955 8.8 1961-70 23.6 197 1 -80 53.9 1 981-84 69.2 40.6 2, 1 1 0 85.6
1936-38 75.0 1 958-60 9.0
• All with respect to GNP except for France, which is with respect to GDP. bin lI)iIIions, 1980 for most countries,
<Value-added in agriculture and manufacturing.
d Sum of expenditures on private consumption, government consumption. and net domestic capital formation.
:::! ·Sum of agricultural and industrial production only, as adapted from dat;o in the appendix of Grajdanzev, 1944.
GN P, gross naiional product.
Sourct: Trade figures excluding the 1980s: United Kingdom through Japan, Kuznets ( 1966); Korea, Grajdanzev ( 1944) for the Japanese Occupation and IMF ( 1 986) for other years. Population and trade figures for the 1 980s from IMF (1986). GNP and GNP per capita from World Bank ( 1986).

72 THE STATE AND BUSINESS
Bank, 1986). Yet Korea's high trade ratio cannot be understood as merely a response to its small domestic market. By world standards, Korea is not a small country. In the 1 980s its population exceeded 40 million people and its GNP exceeded $80 billion. (Norway is a far smaller country, yet Norway's dependence on foreign trade was slightly lower than Korea's.) Rather, Korea's high trade dependence is a matter of history and politics. Under Japanese rule, Korea had been a highly export-oriented country, although exports were overwhelmingly agricultural. According to Table 3.6, in 1936-1 938 imports and exports as a share of national product amounted to as much as 75%. Ironically, in the 1960s exports were viewed by the military regime as a deliverance. Park's speeches are full of references to rising self-sufficiency with every extra dollar of export earnings, and the antithesis of self-sufficiency was implicitly defined as continued reliance on U.S. largesse. Once exports got under way, moreover, their benefits became addictive. Exports of labor-intensive manufactures began to eat away at the cancer of underemployment, transforming Korea's domestic political environment. In the five years from 1965 through 1969, employment in the manufacturing sector expanded by 50%. In 197 1 the industrial sector employed 100% more people than it had in 1963 (Bank of Korea� various years). And ultimately, exports opened the floodgates to foreign credit, to which attention is now turned.
INVESTMENT POLICY
Out of Park's remonstrations with millionaires came the crux of Korea's investment policies. One month after the 1 96 1 coup, the military regime passed the Law for Dealing with Illicit Wealth Accumulation, and with great theatrics, arrested profiteers under the First Republic and threatened them with confiscation of their assets. Instead of becoming victims of martial emasculation, however, the millionaires were "allowed to enter the central stage" like the Meiji millionaires before them, albeit in a kneeling position. The government exempted most businessmen from criminal prosecution and eschewed confiscating their property. In exchange, businessmen were required to pay off their assessed obligation by establishing new industrial firms in basic industries and by donating the shares to the government, the latter condition rarely being fulfilled (jones and SaKong, 1980). Within days, however, an alliance had been formed between business and government that laid the basis for subsequent industrialization.
.
There was one exception to the new government's decision to eschew confiscation: Five months after the coup, the military nation-
The ABCs of Japanese and Korean Accummulation 73
alized the banks. This proved a critical move in the long run, allowing the government to determine where, when, and how much to invest in which industries. Nationalization, however, was a hollow gesture at the time. The banks were almost bankrupt, and the question of how they were to raise funds became a paralyzing source of conflict between officials of Korea and the United States.
The military was in favor of borrowing from abroad and keeping domestic interest ' rates low in order to increase investment. To stimulate lending to Korea, the government amended the Foreign Capital Inducement Law in 1 9�2 and provided government guarantees to lenders, which eliminated the risks of default and of exchang� . rate depreciation. Control over credit guarantees, together with nationalization of the banks, extended the government's reign over all capital flows with the exception of the unofficial "curb" market. Credit was then allocated on a discretionary basis.
Whereas subsidized credit for working capital was available to any exporter, long-term capital at favorable interest rates was allocated only to targeted firms and industries. For example, in the industries examined in detail in later chapters (i.e., cement, steel, shipbuilding, machinery), the government favored certain firms over others to become industry leaders through industrial licensing-cum-subsidized credit allocation; In the cement industry, the chaebol belonging to a{ party eider, the Ssangyong group, was allowed to acquire nearly half)' of cement-making capacity by the 1980s, and was then blessed with licenses for capacity expansions despite the existence of a more ex-\, perienced cement company (the Tongyang Corporation) dating t� the Japanese colonial period . In the steel industry the small minimills of Japanese colonial vintage were discriminated against in credit allocation iri favor of a newly created state-owned integrated enterprise, the Pohang Iron and Steel Company (POSCO). In shipbuild-
. ing, seven small experienced shipbuilders were dwarfed and in some cases bankrupted by the government's assistance to the Hyundai group. In the machinery buiiding sector, all three leading chaebolthe Hyundai, Samsung, and Daewoo groups-were favored over a slew of smaller long-standing firms.
Nevertheless, total foreign debt to underwrite long-term domestic investment grew by only 15% in 1963 and 19648 as the International Monetary Fund and the U.S. government, on the one hand, and the military regime, on the other, attempted to smooth their ideological differences over interest rates. .
The foreign contingent was in favor of keeping dorriestic interest rates high in order to mobilize private savings and thus to minimize
• See Bank of Korea, various years (b).
74 THE STATE AND BUSINESS
Korea's foreign debt exposure. The military partly conceded to these demands. After "being pressed strongly by the United States government as well as the International Monetary Fund," the military obtained approval from the National Assembly for higher interest rate ceilings in August 1 965 and pushed through an approximate doubling of interest rates at the end of September (Cole and Lyman, 1 97 1 , p. 179). Korean business groups strongly opposed the move, but the response of private savers was wildly enthusiastic. Total time and savings deposits increased by 25% in one month, tripled in one year, and doubled again the following year (K. S. Kim, 1 967). Household savings as a p'ercent of GNP increased from (1.1 8% in 1965 to 4. 15% in 1 966 (see Table 3.7). Nevertheless, household savings as a percent of GNP declined sharply in the following year, as Table 3.7 also indicates, and behaved unsystematically with respect to the interest rate thereafter. Moreover, domestic savings were never anywhere near sufficient to satisfy investment demand. Therefore, interest rate "liberalization" (it lasted for only seven years) did not do much to finance industrial expansion. What it did do was increase, government liquidity and placate aid advisors, which gave Korea the green light to borrow abroad.
A regime of multiple interest rates arose, therefore, quite similar in principle to the multiple exchange-rate regime that export subsidies created. The cost of borrowing at home far exceeded the cost' , of borrowing abroad. This afforded the government the opportunity to discriminate in favor of particular industries and firms. As Table 3.8 illustrates, the real cost of borrowing abroad was negative (in most of the 1960s and 1 970s). To qualify as a regular customer of the government for long-term subsidized credit, objectively necessary, if not sufficient, conditions had to be met even in new import- " substitution industries: Big firms and small firms, young firms and old firms, chaebol and nonchaebol had to export.9 Investment an� trade policies became intima�ely bound.
Finally, one may note that, in addition to tariff protection, Korea reinforced its defenses against Japan as a further form of support. Once Korea had accorded Japan diplomatic recognition, it made it more difficult for Japanese companies to invest in Korean industry. , Since the end of the Japanese occupation, direct foreign investment in the form of equity ownership by foreigners of production facilities in Korea has been: minimal. Foreign direct investors have been welcomed to enter the light manufacturing export sector, whereas
9 Not all import-substitution industries had to begin exporting at once. In some, the government took a long-range view, For automobiles, see, for example. Amsden and Kim. 1985a,

Savings. Investment. and Consumption. as Percent of Gross National Product, 1 962- 1 984
Household Public and and Private Deficit of Difference
Gross Fixed General Private Nonprofit the Nation Between Capital Increase Total Government Corporations' Institutions' . Total on Current I n vestment ( I )
Formation in Stocks Investment Savings Savings Savings Savings Account and Savings (4) Year ( I ) (2) (3) = ( I ) + (2) (4) (5) (6) (7) = (4)+ (5) + (6) (8) (9) = (7} - (3)
1962 1 3.95 -0.90 13.04 4.63 7.91 -0.97 1 1 .58 1 .86 -1 .47 1963 1 3.94 4.43 1 8.38 4.41 7.76 3.45 15.63 4.05 -2.75 1 964 1 1 .56 2.97 14.53 4.61 7.00 3.61 15.22 0.84 0.69 1965 14.60 0. 1 0 14.70 5.83 8.07 0. 1 8 14.09 -0. 16" -0.61 1 966 19.96 1 .66 2 1 .62 5.68 7.72 4.15 17.56 2.72 -4.06 1967 2 1 .25 0.66 2 1 .9 1 6.83 8.]6 1 .38 1 6.36 4 . 18 -5.55 1 968 25.54 1 .20 26.74 8. 1 7 8 . 1 9 3.06 1 9.43 7.73 -7.3 1 1969 26.74 3.29 30.02 7.36 '· 7.97 7.45 22 .. 78 7.73 -7.25 1 970 25.60 2.39 27.98 7.62 7.67 3.51 1 8.80 7.59 -9. 1 8 1 97 1 2 1 .52 3.61 25. 13 5.57 7.53 3. 17 16.27 8.73 -8.86 1972 20.00 2.22 22.22 3.64 8.72 5.70 18.06 3.48 -4. 16 1973 23.38 2.30 25.68 3.99 I Ll7 8.98 24. 14 2.29 -1 .54 1 974 25.31 6.34 3 1 .65 2.25 1 1 .36 7.04 20.65 1 0.93 - 1 1 .00 1 975 25.50 4.53 30.02 3.76 9.81 6.61 20. 18 9.05 -9.84 1 976 24.09 1 .54 25.62 6.05 10.21 8.8 1 25.07 1 .09 -0.55 1 977 26.66 1 .08 27.75 5. 1 I 10.68 12.30 28.09 -0.03 0.34 1978 30.81 0.38 3 1 . 1 9 · 6. 1 7 9.94 13.28 29.40 2 . 17 - 1 .78 1979 32.77 2.88 35.65 6.74 9.75 12.29 28.78 6,43 -6.87 1980 3 1 .9 1 -0.66 3 1 .26 5.67 1 0.29 6.63 22.59 8.67 -8.67 1981 28.85 0.29 29. 15 6. 12 9.34 6.96 22.42 6.91 -6.73 1 982 30.27 -3.27 27.00 6. 1 8 9.69 7.23 23.09 3.77 -3.90 1 983 . 3 1 .84 -4.07 27.77 7.46 1 0.28 7.89 25.63 2.09 -2. 14 1 984 30.95 -0.97 29.98 7.64 1 0.43 9.93 28.00 1 .68 - 1 .98
-.,] (Jl • Negative value equals surplus.
S(JIJT«: Bank of Korea.

I I I I I
I V
V
76 THE STATE AND BUSINESS
Table 3.8 Cost of Foreign Capital, 1966- 1983 (Annual Averages)
Unit: % 1 966- 1 970 1 97 1 - 1 975 1976- 1 980 1 98 1-1983
Domestic bank lending rate' 24.4 1 7.0 18.0 12.5 (curb market interest rate) (54.2) (40. 1 ) (4 1 .3) (30.6)
Foreign interest rateb 6A 7.9 1 1 .5 1 1 . 1 Foreign inflation rate
(GNP deflator)< 4.9 8A 5.9 4 . 1 Exchange rate depreciation d 5. 1 7.B 5.5 10. 1 GOP d�/lator (rate of change):
Korea� 1 4.6 IB.7 19.7 9.9 Real foreign interest Tate
( 1 1 - I ll) 1 .5 -0.5 5.6 7.0 Interest rate differential between
home and f<;lreign markets (I - II - IV) 1 2.9 1 .3 1 .0 -8.7
Real private c<lst of borrowing abroad (II + IV - V) -3. 1 -3.0 -2.7 1 1 .3
GN p. gross national product. • DiscounlS on bills on deposit money bank. (three.year moving ayerages).
hUBOR (90 days). London Inter·Bank Offered Rate
'AYe"age of Japan and United States . .
" Bank of Korea standard concentralioll rale (three·year moving ayerage.).
, 'Three·year mOYillg averages,
Sourr..: Bank of Korea. M,)1IIMy Bulleli". yarious issues. as cited by Y. C. Park ( 1985),
they have been discouraged from investing in import-substitution sectors such as pharmaceuticals and heavy industry (B. Y. Koo, 1981 ). In the late 1 970s, direct foreign investment as a percent of gross domestic product was lower by almost half in Korea than in Argentina, Brazil, and Mexico-approximating 3% (Westphal, Kim, and Dahlman, 1 985). In the 1980s, the government began to encourage direct foreign investment in the high-technology industries, but even as the absolute quantity of direct foreign investment increased, it amounted to a lower percentage of GNP in 1985 than in 1965 (see Ta�I� . 3.9). Korea has industrialized on 'the basis of national enter. pfise, and in almost all years since 1 965, direct foreign investment as a percent of total foreign capital inflow has fallen below 5% (Amsden, 1988).
CONCLUSION
The success of Japan, South Korea, and Taiwan has been attributed by many economists to "liberalization," or the freeing of markets from

The ABCs of Japanese and Korean Accummulation 77
Table 3.9 Direct Foreign Investment . (DFI), 1965-1985
Year DFl " Percent of GNP
1965 1970 1975 1976 1977 1979 1980 198 1 1 982 1983 1984 1985
20,671 13,642
169,398 72, 160 65,915
107,3 1 2 140,'751 145,327 1 87,79 1 267,753 4 19,049 531 ,720
• Approval basis. Unit = current $1.000. Source: Ministry. of Firlance.
0.73 0.16 0.8 1 0.25
. 0. 18 0. 17 0.25 0.23 0.28 0.36 0.52 0.65
government control. From what we have just read, however, this view must be seriously qualified. Liberalization did indeed occur in Korea circa 1965 insofar as the exchange rate was devalued, commercial lending rates were raised, and certain imports were decontrolled. As Fischer ( 1 970) observed, however, while we expect "big events" to have "big impacts." this reasoning is fallacious. The . effect of liberalization on the economies of Japan, South Korea, and Taiwan may be likened to the effect of the Spanish Armada on European history. At one time the Armada's defeat was believed to have turned the tide of world history. Now its overall effect is recognized as minor� It nei�her divided Christendom (this having already been accomplished) nor prevented the flow of species to Spain (the flow reaching its peak after. the Annada's defeat) nor shifted colonial supremacy to England (whose colonial efforts slumped immediately after 1588) (Mattingly. 1959, as cited by Fischer, 1970).
To be sure, liberalization in its political guise forced Korea to extend diplomatic relations to Japan, thereby raising the tempo of competition. But in exchange for greater competition, the Korean government fortified the domestic market with tariffs and quantitative restrictions and enacted legislation to protect domestic industry from direct foreign investment. Certainly liberalization also resulte'(f in an increase in real commercial lending rates for at least seven years ( 1965-1972). But in exchange for higher domestic interest rates, the exchange rate and domestic inflation were allowed to render the real cost of borrowing abroad negative. Finally, liberalization proba:'

78 THE STATE AND BUSINESS
bly exerted upward pressure on the price of foreign exchange. But in return for devaluation. exporters were rewarded with handsome subsidies.
In all, liberalization amounted to nothing more than a footnote to the basic text of Korean expansion. To attribute the role of equilibrator in such expansion to the market mechanism rather than to the government's dual policy of discipline and support is to misrepresent a fundamental property of the most successful cases of late industrialization.
APPENDIX
The competitiveness of Cotton Spinning and weaving
Exports of cotton textiles spearheaded Korea's export drive. Yet such exports appear to have been dependent on subsidies. unable to stand alone without government support. Under these circumstances they were unsustainable. The government could not forever use foreign aid or borrow abroad to underwrite them. Four developments put the textile industry in the black: ( 1 ) Foreign loans helped finance investments in modern plant and equipment. which raised productivity, (2) productivity increased through learning-by-doing,. as will " be discussed in Chapter 10, (3) dependence on imported raw materials declined due to a technological breakthrough overseas, the discovery of synthetic fibers, and (4) wages rose rapidly in Japan. which reduced japan's competitiveness in textile exports (Statistics Bureau, various years). As early as August 1962, a nylon-manufacturing planT' came on-stream in Korea with capacity to supply domestic manufac- I turers. The Hanguk Nylon Factory (now Kolon Nylon) was the first of several companies in the synthetic fiber industry. Like the others, it was privately owned but the recipient of government support in \ the form of subsidized credit and tariff protection. The import SUb:-]'· stitution of synthetic fibers made the textile industry more productive and less vulnerable to devaluations of the exchange rate. According to Y. B. Kim, "During the period from 1962 to 1970, the production structure of Korea's textile industry was altered to more . closely resemble that of developed countries" ( 1980, p. 236). The} industry accomplished this by import substituting chemical fibers, and by reducing the ratio of natural fiber yarns and fabrics in total textile production. "Cheaper manmade fibers resulted in improved pro!iuctivity and quality, which in turn increased the demand both in home an� overseas markets" (1980, p. 226). ,
What is noteworthy is that government intervention to make even cotton spinning and weaving profitable far exceeded what usually qualifies as "infant industry protection."

CHAPTER FOUR
The Dynamics of Growth
THE THREE FACETS OF GROWTH
Late industrialization is characterized by three facets of growth, as Korea exemplifies. The first relates to diversification, or entrepreneurial decisions concerning penetration of new industries--which ones to penetrate, when, and with what size investment. The second relates to stabilization, or short-run macroeconomic policies to maintain the level of economic activity. The third relates to the growth momentum itself. Once under way, growth gains a momentum whose properties are distinct, depending on the presence or absence of new technological discoveries: This chapter is divided into three parts, each devoted to one of these facets of growth.
THE GOVERNMENT AS ENTREPRENEUR
The Government as Planner
The defining characteristic of entrepreneurship is planning, or deciding what, when, and how much to produce. Entrepreneurship becomes especially meaningful from a social standpoint when planning involves it new product or process. In Schumpeter's often-quoted conception ( 1938), the fundamental function of the entrepreneur is innovation. Innovation, in its classic definition, is absent in late-industrializing countries, yet entrepreneurship is present: Entrepreneurs in late-industrializing countries introduce products or processes that, while not path breaking, are novel in the context of the learning environment. , According to this definition, entrepreneurship in Korea has had two identities, one associated with the small firm. the other with the large one. In the case of.the former, the entrepreneurial function of planriing still remains privatized. The initiative to undertake minor investment projects with relatively small capital requirements ap-
79

80 THE STATE AND BUSINESS
pears to rest with the private entrepreneur. In such cases, the private entrepreneur is also responsible for the coordinating function, or for arranging all necessary inputs for the completion of a project, including the capital. In the contrasting case of big business, the entrepreneurial function of planning has primarily fallen to the state. So, too, has the coordinating function, insofar as the state has con':trolled all capital other than short- or medium-term credit available at high interest rates in the "curb" market.
Virtually every study bearing on the subject of industrialization in Korea has in some sense recognized that big businesses have had to come to terms with the expanded role of the state. Thus, Jones and Sakong ( 1980) argued that the crowning function of the private entrepreneur is "lenticular," meaning "the pure Schumpeterian function of combination," and the functions the entrepreneur must combine or coordinate include that of dealing with the government. All in all, Jones and Sakong explained, the functions of entrepreneurship include the following:
1 . Perception of a new economic opportunity, including a. new products b. new processes of production c. new markets
2. Evaluation of the profitability of a new opportunity 3. Gaining command of financial resources 4. Plant design , technology, and construction supervision 5. Recruiting and training of new personnel 6. Relationship with government 7. Relationship with suppliers and purchasers ( 1980, p, 8 1 )
The point, however, is not that the entrepreneur i n Korea must spend a great deal of time �'dealing" with the government, among other important tasks. Rather, it is that almost all important tasks are themselves transformed as a consequence of government intervention.
The initiative to enter new manufacturing 'branches has come primarily from the public sphere. Ignoring the 1950s, when economic policy in Korea was for all practical purposes under foreign control (see the discussion in Chapter 2), every major shift in industrial dr� versification in the decades of the 1960s and 1 970s was instigated by the state. The state masterminded the early import-substitution proF ects in cement, fertilizers, oil refining, and synthetic fibers-the las,t greatly improving the profitability of the overexpanded textiles industry. The government also kept alive some unprofitable factories inherited from the colonial period, factories that eventually provided key personnel to the modern general machinery and ship-

The Dynamics of Growth 81
building industries, which the state also promoted. The transformation from light to heavy industry came at the state's behest, in the form of an integrated iron and steel mill, which the state pushed for in the early 1 960s (too early, it seems) and then presided over from the late 1960s onward (see Chapter 12) . The government played the part of visionary in the case of Korea's first colossal shipyard (see Chapter I I) , and it was responsible for the Big Push into heavy machinery and chemicals in the late 1970s. It also laid the groundwork' for the new wave of import substitution that followed heavy indus- . trialization and that carried the electronics and automobile indus- .
tries beyond the simple stage of assembly. The government enacted the automobile industry protection law as far back as 1962, as part of its first five-year economic development plan. In conjunction with this decision, it promoted the oil-refining industry. Thus, major milestones in Korea's industrialization have been decided by the state.
Unilateralism on the part of the government probably reached its apex at the time of the second five-year plan, in 1967, after which government and business gradually worked more closely together. The second five-year plan was prepared · by the government amidst exuberance over the economy's good performance and confidence in the government's planning function. The Economic Planning' Board (EPB) used an input-output planning model, supplemented by in- . dustry studies. These inqustry studies really amounted to project studies that provided profiles on projects in the manufacturing sec- . tor for the government to promote by using its industrial, trade, and credit policies. The fact that iriitiative, at the time, lay almost exclusively with the government is indicated by the finding that when businessmen began to come to the EPB for approval of projects that were not on the Jist, there was debate in the EPB about whether to consider them, even those that complemented social objectives. I
The Example of Electronics
The driving force of the government behind industrial change was .
still apparent in the mid-1 970s, and for that matter, in the mid-1980s. Even in the case of the electronics industry, where developments were wholly contingent on acquisition by the private sector of technical skills, the fourth five-year plan of 1977- 198 1 set the pace of progress.
The government had been promoting the domestic electronics in-
I This view of the Economic Planning Board was expressed by Larry Westphal, an advisor to the Board at the time, in a ·lecture in February 1987 at the Harvard Institute for International Development.

82 THE STATE AND BUSINESS
dustry as Qne Qf the natiQn's key sectQrs for almQst two. decades. As early as January 28, 1969, the ElectrQnics Industry PrQmotiQn Law was enacted to stimulate investments in assembly operations Qf black-. and-white televisions. · The intent of the fQurth five-year plan was to push this activity forward, beyond the assembly stage. According to the plan,2
The electronics industry will change structurally from assemblytype production to one which mainly produces the basic CQmponents and parts. In the meantime, product quality will be improved.
The electronics industry will be promoted as a major export industry through the development of new technology products and the expansion of overseas sales activities.
On the basis of prQduct life cycles and comparative. advantage, 57 items including semiconductors, computers, and related items have been selected as strategic products. [italics added]
As traditionally defined, semiconductQrs and computers hardly fell within Korea's area of comparative advantage, certainly nQt in 1 976, when per-capita income in Korea was only $459, about the same as Guatemala's (World Bank, 1978). The fQurth five-year plan, therefQre, accelerated the import substitution of such goods.3
To promQte higher value-added products embodying a greater level of skill and technolQgy, the government took the following steps, above and beyond its usual incentive measures, which included arranging fQreign loans totaling $22 1 .6 million:
I. It established an industrial estate for the production of semicQn-ductors and computers. ,
2. To promote "the importation of advanced technology and to accelerate technical progress," it established a research institute in this industrial estate for product development, the Electronics and TelecQmmuni<:atiQn Research Institute (ETRI). A fund of $60 million was created for the purpQse.
3. It protected the dQmestic market against foreign competitiQn. In the cQmputer field. it passed legislatiQn in 1983 to restrict impQrts of computers and peripherals in both the low and medium ends of the market. The law prohibited the impQrt of mQst microcom" puters. some minicomputers, and selected mQdels of disk drives, :
2 References to the Plan are from Chungbu (1976). l The government gave the same type of support to the development of color TVs
in the late 19705 that it had given to the development of black-and-white TVs in the late 19605. See Y. B. Kim ( 1979).

The Dynamics of Growth 83
printers, terminals, and tape drives (Harvard Business School, 1985).4
4. It restricted direct foreign investment in electronics. It did, however, view joint ventures favorably, and most of the major business groups in the computer field-Hyundai, Daewoo, LuckyGoldstar, and Samsung-formed them.
In the field of semiconductors, the government was still taking the lead in the 1980s (for better or worse). According to Electronics, an American trade magazine,
In South Korea, people in the industry call it the Blue House Project, after the official residence of President Chun 000. Hwan whose advisers convinced him two years ago that the only way to crack the world semiconductor market would be to orchestrate a massive development project involving every important Korean company in the business.
That's just what is happening now, and the goal is to position Korean chip-makers as major players in the world industry by 1 99 1 . . . . The impetus came from the president, and the muscle behind the program--called the VLSI Project-is coming from commitments by three of the largest Korean conglomerates [Hyundai, Goldstar, and Samsung]. ( 1987)
This VLSI project is one of many high-priority "national projects" involving collaboration between private sector R&D labs and public sector research institutes, to which the 'government allocates organi� zational capability and subsidized credit. In 1983 some 182 research projects of 1 3 1 industrial firms were selected as national R&D projects, and the government contributed about $28 million to these projects. In addition, seven special projects in semiconductors and bioengineering were funded with an additional $40 million (World Bank, 1987). To stimulate R&D generally, the government sets a lower tariff rate on equipment imported for R&D purposes. This provision is important for technology-intensive firms, and tells something about the extent to which the machinery sector is protected in . general (fairly well). The government also allows firms to set aside a percentage of profits in a reserve fund that is exempt from taxation for a fixed period, for eventual investment in R&D. Venture capital corporations have been established by the government to lend to technology-oriented start-up firms. Through its procurement policy,
• In 198'7 the government abolished import tariffs on personal computers. Never-theless, like automobiles, imported computers appear tp be subject to other taxes.
.

84 THE STATE AND BUSINESS
the government has also promoted the development of an indigenous electronic switching system for eventual incorporation in tile domestic public telecommunications network.
Given that the quintessential function of the entrepreneur is to decide what and when to produce, as well as how much, the govern
. me nt's leadership, even in an industry like electronics, makes it necessary to redefine the entrepreneurial concept as affected by government influence in the private sphere.
The LOcuS of Initiative
In late-industrializing countries, the developmental state may be expected to take more initiative to diversify than the private sector does for two reasons:
First, such a state tends to get involved with national as well as corporate planning. If the formulation of development plans is undertaken fairly regularly, as more than a token exercise, the state can gain an overview of the economy that the individual entrepreneur lacks.s This overview, and the ability to plan projects with external linkages simultaneously, places the government in a more advantageous position to diversify than the private sector. The fiveyear plan is practically a general property of late industrialization. I t became characteristic of Indian economic development in the 1950s. With the exit of U.S. aid advisors in 1960, Japan adopted its "GrowthDoubling Plan." Korea's first five-year plan was inaugurated in 1962, just after the military coup (see Chapter 2).
Planning in Korea is taken fairly seriously and formula�ed in a "top-down" fashion. According to one observer,
In the preparatiOri of the five-year development plans, which are the most crucial skeletons of midterm policies, the EPB takes the init.ial step by , preparing and issuing preliminary guidelines in terms of major policy targets and directions, together with macroeconomic projections for both the international and domestic environment of the economy during the plan period a'nd beyond. . . . Individual ministries then formulate their own sectoral plans in ,accordance with the guidelines. . . . It is noteworthy . . . that policy proposals prepared by the ministries are seldom open to the public for discussion and popular reaction. , . . The lack of consensus-building in the policy-making pro-
5 Nath ( 1962) argued that the government is in a better position to plan than the private sector not'
because it is better at planning but because it has an overview of the economy.

The Dynamics of Growth
cess reflects a "top-down" approach to government policy formulation. (Whang, 1986, pp. 5-9)
85
Second, the initiative to diversify, particularly into more capitalintensive investment projects, tends to fall to the state because these projects require more comprehensive incentive packages to make them financially attractive to private firms. Private firms in Korea contributed very little of their own capital to most investment projects. By law, 30% of a plant's total cost� had to be self-financed. In practice, however, internal financing in 1963- 1973 accounted on average for only 20% of total financing (compared with 32.5% for Japan [1954-1967) and 65% for the United States [1947-1963]) (Lim, 1981). In 1983 the manufacturing sector in Korea is said to have financed only 9.9% of its busil'l:ess through retained earnings and capital increases (BK, 1984). The remainder of capital was highly subsidized and was greater the more capital intensive the industry. Differences in subsidization by industry are suggested in Table 4 . 1 . The loan to value-added ratio tends to be mUch higher in the more capital-intensive pursuits. .
Finally, initiative tends to fall to the state because of the structure of profit rates. The interindustry structure of profit rates is less favorable the more capital intensive the industry. One may expect, therefore, . a reluctance on the part of private investors to rush into capital-intensive industries without strong government direction and support.
profitability in Different Industries
,Table 4 . 1 presents data for Korea on gross rates of return. Gross 'rate of return is defined as the ratio of non labor share in valueadded to capital stock, the capital stock being defined as physical assets plus net working capital. Manufacturing is broken down into four areas, two labor intensive; two capital intensive. The data support three interrelated conclusions. First, the most labot-intensive industries have the highest profit rates. Second, the youngest industries (group II) have the lowest profit rates. Capital-intensive industries are subdivided into two groups. Group I comprises those capitalintensive industries that underwent import substitution in the 1950s (or early 1960s) . Group II comprises those that underwent import substitution later. Group II industries have the lowest rates of return. Third, the capital-interisive industries have the highest export growth rates, besides having t.he highest overall rares ofsubsidization (measured by the loan to value-added ratio).

�
Table 4.1 Gross Profits, Export Ex'pansion, and Loans by Industry, 1 97 1 - 1 982
Per-Worker Fixcd Gross Ratc of Return Rate of Increase
Assets ' on C�pital LoanlValue-Added (VA) Ratio During 1 971-1 982
Industry 1971 1982 1963-71 1972-78 1979-82 1963-71 1972-78 1979-82 VA pwFA Exports
All manufacturing 1 . 1 4 9.27 32.3% 37.5% 37.4% 1 .9 1 .5 1.4 37.2 8. 1 24.6
Ratio to All-Manufacturing Average
Very labor intensive
Clothing and footwear 0.3 0.2 1.5 1 .6 3.6 0.6 0.7 0.7 1 .3 0.7 0.7 Electronic and telecommuni-
cationsb 0.4 0.4 1 .4 1 .3 1.2 0.5 0.4 0.7 2.3 1 .0 1 .9 Miscellaneous manufactures < 0.4 0.4 1 .3 1 .3 1 . 1 0.4 0.6 0.6 1 .0 1.2 0.5 Nonmetallic mincralsd 0.9 0.4 0.6 I . l 1 .2 0.7 0.6 0.5 3.0 0.5 6.9
Moderately labor intensive
Machinery (medium) 0.4 0.4 0.8 1 . 1 1 .0 0.3 0.4 0.6 7.3 1 . 1 Miscellaneous chemicals 0.5 0.6 1 .7 1 .7 1 .3 0.3 0.4 0.5 0.6 1 .0 1.4 Metal products 0.4 0.6 1 . 1 1.3 0.9 0.4 0.5 0.8 2.2 1 .5 3.5 Electrical machinery 0.8 0.7 1 .3 1 .2 ' 1 . 1 0.6 0.6 0.7 1 .2 0.9 1 .8 Textiles 1 .0 0.7 0.9 0.8 0.9 1.0 1 .2 1 . 1 0.9 0.7 1.0 Wood products 0.7 0.9 l . l 1.0 1 .0 1 .4 1 .9 2.0 0.5 1 .3 0.2
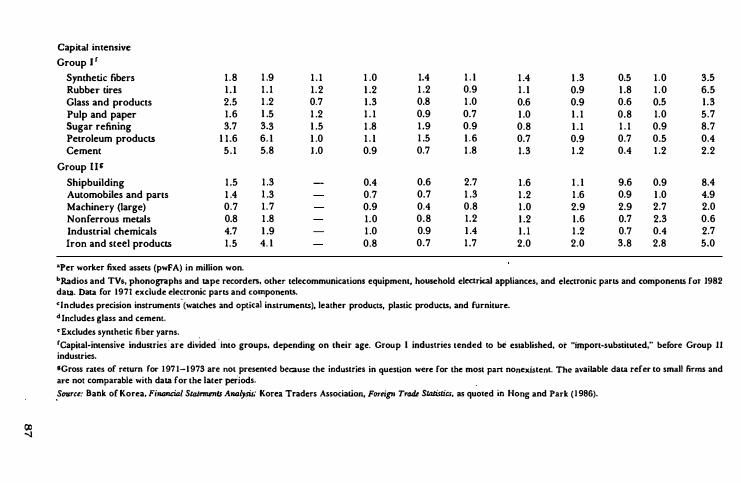
III -.J
Capital intensive Group I f
Synthetic fibers 1.8 1 .9 1 . 1 1 .0 1.4 1 . 1 1 .4 1 .3 0,5 1 .0 3.5 Rubber tires l . l 1 . 1 1 .2 1 .2 1 .2 0.9 1 . 1 0.9 1 .8 1 .0 6.5 Glass and products 2.5 1 .2 0.7 1 .3 0.8 1 .0 0.6 0.9 0.6 0.5 1 .3 Pulp and paper 1.6 1 .5 1 .2 1 . 1 0.9 0.7 1 .0 1 . 1 0.8 1.0 5.7 Sugar refining 3.7 3.3 1 .5 1 .8 1 .9 0.9 0.8 1 . 1 1 . 1 0.9 8.7 Petroleum products 1 1.6 6. 1 1 .0 1 . 1 1 .5 1 .6 0.7 0.9 0.7 0.5 0.4 Cement 5.1 5.8 1 .0 0.9 0.7 1 .8 1.3 1 .2 0.4 1 .2 2.2
Group liS Shipbuilding 1 .5 1 .3 0.4 0.6 2.7 1 .6 1 . 1 9.6 0.9 8.4 Automobiles and parts 1 .4 1 .3 0.7 0.7 1 .3 1 .2 1 .6 0.9 1 .0 4.9 Machinery (large) 0.7 1 .7 0.9 0.4 0.8 1 .0 2.9 2.9 2.7 2.0 Nonferrous metals 0.8 1 .8 1.0 0.8 1.2 1 .2 1 .6 0.7 2.3 0.6 Industrial chemicals 4.7 1 .9 1 .0 0.9 1 .4 1 . 1 1 .2 0.7 0.4 2.7 Iron and steel products 1.5 4. 1 0.8 0.7 1 .7 2.0 2.0 3.8 2.8 5.0
-Per worker fixed assets (pwFA) in million won.
bRadios and TV., phonogrnphs and tape recorders, other telecommunications equipment, household electrical appliances, and electronic parts and components for 1982 data. Data for 1971 exclude electronic parts and components.
<Includes precision instruments'(watches and optical instruments), leather products, plastic products, and furniture.
d Includes glass and cement.
e Excludes synthetic fiber yarns. .
fCapital-intensive industries are divided' into groups, depending on their age. Group I industries tended to be established, or "import-substituted," before Group 11
industries. SGross rates of return for 197 1- 1 973 are not presented because the industries in question were for the most pan nonexistent. The available data refer to small firms and are not comparable with data for the later periods .
• Source: Bank of Korea. Finandal SUlJemenls Analysis; Korea Traders Association, Foreip Tr/Uk Sl4tislics, as quoted in Hong and Park (1986).

88 THE STATE AND BUSINESS
These general findings are lent support by data in Table 4.2, on . return on investment (ROI) over time for light and heavy industry. Between 1972 and 1 984, the light industries had higher profitability than the heavy industries in �lmost every year.
.
One may infer from all this that as the capital-intensive industries showed themselves increasingly capable of exporting, they became more attractive for the government to promote. Their long gestation periods and relatively low profitability through adolescence, how- · ever, rendered them relatively less desirable investments to· the pri· vate firm. The initiative to diversify, therefore, fell to the state. In the 1 960s and 1970s, the government was obsessed with the question of how fast Korea could grow. Private investors were preoccupied with the question of how much money they could make. Although profit maximization and growth maximization are not, in theory, antithetical, neither are they necessarily synonymous.
Cooperation and the Overall Profit Rate
Over time, entrepreneurship has become less a monopoly of the state and more a joint venture between the state and .big business. Evidence is provided by a series of anecdotes in a thesis on the chaebol (S. K. Kim, 1987). Two factors strengthened the willingness and ability of big business to be a more active partner with the state in the diversification effort: ( I ) The modern industrial enterprises acquired more technical and business experience. Their opinions then gained more respect in terms of decisions about which industries to enter, when, and on what scale. (2) The modern industrial enterprises came to appreciate not just the high risks of entering the heavy industries but also the high rewards.
Tables 4. 1 and 4.2 indicate a convergence in profitability between the light and heavy industries as well as a high overall level of Profitability. Inclusive of subsidies, high profitability has been a key characteristic of Korean industrialization�ven if profitability does not ap- . pear initially :as high as in the advanced countries. The high profit rates eventually earned in the import-substitution heavy industries created great hopes of substantial profit rates in later projects. Thus, the diversified business groups were 'animated to be first-movers in new industries, bringing them slightly closer to being true entrepreneurs. Chapters 1 0, I I , and 1 2 examine just how they moved.
The Government as Investor
Not just in Korea but also in Japan and Taiwan, it has been alleged that "government budgets have generally been maintained near bal- ·

Table 4.2 Profitability of Light and Heavy Industry; Average Rate of Return on Investment, 1972-1984
1972 1973 1974 1975 1976 1977 1978 1979 1980 1981 1982 1983 1984
Heavy industry 7.92 1 0.06 12.45 9.34 9.41 8.96 9.69 9.32 7.36 9. 1 1 8.56 9.20 9.75 Light industry 1 1 .00 1 5.30 9.45 9.65 1 1 .50 1 1 .57 13.80 12.50 1 1 .40 1 1 .28 9. 13 10.15 9.52
SlJUrce: Bank of Korea, .yarious years.
�

90 THE STATE AND BUSINESS
Table 4.3 Public Sector Resource Balance, 1977-19B 1 (% of Gross National Product)
Current revenue" Tax revenue Transfer from other levels
of government Current expenditures b Current balance Gross fixed investment . Overall balance (- deficit)
Central Government: 1977- 1981 (actual)
2 1 .0 16.3
16.3 4.1 1.8 3.0
" Includes nonfinancial public enterprises other than communica-tions.
.
b Plan figures. for current revenues and expenditures are not strictly comparable owing to differences in the consolidation of subacCounts in the budget.
S""rce: Economic Planning Board.
ance, often with large surpluses on the current account . . ." (Sachs, 1987, p. 8). Evidence in Table 4.3 substantiates this claim. Table 4_3 shows a surplus in the "public sector resource balance." Nevertheless, the number.s in Table 4.3 are inconsistent with other numbers that indicate a persistent deficit in government accounts. Surplus or balance in the public sector budget appears to reflect not thriftiness on the part of the government, but discretion over how the public sec� tor budget is defined.6 Table 4.4, however, provides unambiguous evidence that the Korean government's investment in and operation of public-sector enterprises have tended to outstrip its saving. In other words, the government has spent far more than it has collected, and the deficit has been financed by borrowing. Table 4.4 presents data on the public sector's current account imbalances as a percentage of GNP. In sixteen of the twenty years spanning 1 963 through 1982, public sector investment exceeded public sector saving. In eight of eleven years in the period 1972 through 1982, the government's deficit/GNP ratio exceeded that of the private sector. Heavy public borrowing is suggested in Table 4.5. Between 1967 and 1979, the public sector accounted for about one third of all foreign loans. Then, in
6 Even public sector resource balance data are often inconsistent and highly sensitive to decisions about which items are or are not to be included in the accounts. For example. the source that Sachs cited on the public sector budget for 1982 is the World Development Report. Table 5.26, 1986. According to this source. �e budget showed a deficit of as much as 4.3% for the same year (Aghevli anc:I Marquez-Ruarte. 1985).

The Dynamics of Growth 91
Table 4.4 Sources of Current Account Imbalances in Current Market Prices. 1963-1982 (Unit: Billion Won)
Public Sector
Government-Private Invested Sector Government Corporations Subtotal A/GNP D/GNP
Year (A)" (B)' (q' (0 = B + C) (%) (%)
1963- 197 1 1963 - 1 1 .67 . 14.34 - 16.06 -2.02 -2.4 -0.4 1964 -3.39 23.26 . - 13.79 9.47 -0.5 1.3 1965 -27.88 36.49 - 16. 1 5 20.34 -3.5 2.5 1966 -65.20 38.82 - 1 5.14 23.68 -6.3 2.3 1967 -70.89 5 1 .26 -54.39 -3. 1 3 -5.5 -0.2 1968 - 1 36.63 57.03 -36. 19 20.84 -8.3 1 .3 1969 - 1 10.80 29.98 -63.73 -33.75 -5. 1 - 1 .6 1970 - 195.55 60.91 -63. 12 -2.2 1 -7.3 -0. 1 197 1 - 179. 19 42.81 - 130.3 1 -87.50 -5.4 -2.7 1972-1978 1972 35.80 -9. 16 -200.51 -209.67 0.9 -5.2 1973 51 .3 1 24.86 - 107.94 -83.08 1.0 - 1 .6 1974 -422.54 -36.09 -223.50 -259.59 -5.8 -3.5 1975 -337. 19 - 1 29.29 -482.24 -6 1 1 .53 -3.4 -6.2 1976 -20.73 329.49 -455.95 - 1 26.46 -0.2 - 1 .0 1977 472.45 · 18.08 -749.27 -73 i . l9 2.8 -4.3 1978 -281 .57 448.27 - 1 ,031 .84 -583.57 - 1 .2 -2.5 1979- 1982 1979 - 1.675.45 493.3 1 - 1 , 1 70.45 -677. 14 -5.8 -2.3 1980 -2.381 .04 20.81 - 1 ,344.91 - 1 ,324. 10 -,6.9 -3.9 198 1 - 1 ,513.67 5.89' - 1 ,869.06 - 1 ,863. 17 -3.6 -4.4 1982 489.47 - 1 24.05 -2.260.19 -2.384.24 1 .0 -5.0
• A, B, and C refer to balance after investment from savings is subtracted in each sector.
Source: Bank of Korea, E""""",ic S/Qristi€s Yearbook. various years, as cited by Y. C. Park, 1985 . . Figures for savings and investment of government-inyested corporations, which include nonfinan-cial operations of Federations of Agriculturid and Fisheries Cooperatives, obtained from Bank of Korea's flow of funds tables.
the economic contraction of 1 980- 1983, its share rose to over half of the total. Nevertheless, the dividing line . between a public and private loan is not always clear-cut, particularly in large-scale projects where the government and the chaebol closely interact. Thus, the government's share of foreign borrowing may be understated.
Most of the government's deficit has been accounted for by public corporations. This is in spite of the fact that almost all major investments in heavy industry with the exception of integrated ironmaking and steelmaking are in private corporations. Public corporations, however, have been important in infrastructure projects....-electricity,

92 THE STATE AND BUSINESS
Table 4.5 Foreign Loans and Investment, 1959-1983 (Unit: Million U.S. Dollars)
Direct " Loans (I)" Foreign
Investment Total Period Public Commercial (II)" 1 1 1 =' 1 + 11
1959- 1961 4.4 4.4 1962-1966 1 1 5.6 175.6 16.7 307.9
(37.5) (57.0) (5.4) 1967-1971 810.8 1,354.7 96.4 2,261 .8
(35.8) (59.9) (4.3) 1972-1976 2,388.9 3,043.9 556.0 5,988.8
(39.9) (50.8) (9.3) 1977- 1 979 2,529.5 4,793.7 328.8 7,652.0
(33. 1 ) (62.6) (4.3) 1980- 1 983 6,246.5 4,434. 1 404.1 1 1 ,084.7
(56.4) (40.0) (3.6)
• Actual basis. Figures in parenthesis are percent of total.
SaUtee: Economic Plallning Board, Handbook of Ko"an Ecan011f1·. 1983, as quoted in Y. C. Park ( 1985).
gas, railroads, highways, irrigation, and the Seoul and Pusan subway systems-and investments in infrastructure have been massive.
A balanced budget suggests that a government spends relatively little on social services. It should not be thought, however, that be�" cause the Korean government has persistently spent more than it has collected, it has spent a lot on social services.7 It has spent on long-"
term investment, not on short-term consumption. The propensity of the Korean government to invest rather than to consume is clearly perceived when international comparisons of government spending are drawn. Table 4.6 provides data on government spending for Korea and for other East Asian and Latin American countries. The first column of Table 4.6 presents data on the government's sha�e of to� tal expenditures relative to GNP. The second shows its share as a percentage of fixed investment only. The Korean government is noteworthy for its relatively low share of total expenditures and high share of fixed investment; most countries demonstrate the reverse pattern.
7 According to D. G. Kim (1986), the government spends oply 20% of its budget on social services and as much as 35% on defense. Yoo (1983, p. 1 33) stated that in the 19705. the Korean government spent approximately 6% of GNP on defense, the . highest figure for any country outside the socialist bloc.

The Dynamics of Growth 93
Table 4.6 International Comparison of Government Expenditures
Country
Latin America Argentina Brazil Chile Mexico Peru Venezuela Colombia
East Asia Korea Taiwan Thailand Philippines
Government Expenditures as Percent of GNP, 1982
2 1 .6 2 1.8 37.6 31 .7 18.0 29.6 14.0
19.5
19.9 12.2
GNP, gross national product.
Government Expenditures as Percent of
Fixed Investment [year(s)]
19.6 (1978- 1980) 22.8 ( 1980) 12.9 ( 1 978....: 1980) 29.4 (1978) 14.8 ( 1 978-1 979) 36.3 ( 1 978-1980) .
8.9 ( 1 978-1980)
22.8 ( 1978- 1980) 32.4 ( 1978- 1 980) 12.8 ( 1978-1979) 10.9 (1978)
SouTees: Expenditures as percent of GNP are from World Development Rep"'t, various years. Expen· ditures as percent of fixed investment are from Shon (1984).
GOVERNMENT SHORT·RUN ECONOMIC POLICIES
If the Korean economy has outperformed the late learners of Latin America, the reason cannot be said to lie in short-term austerity measures to manage external shock, because the response of the Ko� rean government to external shock was not to batten down the hatches. During the twenty-five years after the 1 961 coup, the growth of the Korean economy, though spectacular, was regularly interrupted by . internal and external shocks. What with two oil crises, global depres� sion. and an intensification of international competition. 'the 1970s were difficult years -in which to industrialize. Nevertheless. external shocks did not derail the Korean economy from its fast-growth track. The government borrowed its way out of balance·of-payments difficulties and sustained fast growth. Aggressive borrowing coupled with bailouts of financially troubled fir{Ils created a supportive environment for big business. The tack most often taken by the economy after economic downturns was a resurgence of exports and rapidly resumed expansion.
Here. three stabilization exercises in response to threats of growth interruption are discussed.s The account builds to the stabilization
8 The- following discussion of' stabilization is based on a longer study of Korea's short·run macroeconomic policies and attempts at liberalization. See Amsden (1987b) or, in the Korean language. Amsden ( 1 988) . .

92 THE STATE AND BUSINESS
Table 4.5 Foreign Loans and Investment, 1959-1983 (Unit: Million U.S. Dollars)
Direct Loans (I) ' Foreign
Investment Total Period Public Commercial (II)" III = I + ll
1959- 1961 4.4 4.4 1962-1966 1 15.6 1 75.6 16.7 307.9
(37.5) (57.0) (5.4) 1967- 197 1 810.8 1 ,354.7 96.4 2,26 1 .8
(35.8) (59.9) (4.3) 1972-1976 2,388.9 3.043.9 556.0 5,988.8
(39.9) (50.8) (9.3) 1977-1979 2.529.5 4.793.7 328.8 7.652.0
(33.1) (62.6) (4.3) 1980-1983 6,246.5 4.434. 1 404 . 1 I l .OB4.7
(56.4) (40.0) (3.6)
• Actual basis. Figures in parenthesis are percent of total.
Source: Economic Planning Board. Handbook of /(orean ECUlUJrrlY. 1983. a, quoted in Y. C; Park (1985).
.
gas, railroads, highways, irrigation, and the Seoul and Pusan subway syslems--and investments in infrastructure have been massive.
A balanced budget suggests that a government spends relatively little on social services. It should not be thought, however, that be� cause the Korean government has persistently spent more · than it has collected, it has spent a lot on social services.7 It has spent on long-
.
term investment, not on short-term consumption. The propensity of the Korean government to invest rather than to consume is dearly perceived when international comparisons of government spending are drawn. Table 4.6 provides data on government spending for Korea alld for other East Asian and Latin American countries. The first column of Table 4.6 presents data on the government's share of total expenditures relative to GNP. The second shows its share as a percentage of fixed investment only. The Korean government is noteworthy for its relatively low share of total expenditures and high share of fixed investment; most countries demonstrate the reverse pattern.
1 According to D. G. Kim ( 1986). the government spends o!lly 20% of its budget on social services and as much as 35% on defense. Yoo (1983, p. 1 33) stated that in the 1970s. the Korean government spent approximately 6% of GNP on defense, the . highest figure fOr any country outside the socialist bloc.

The Dynamics of Growth 93
Table 4.6 International Comparison of Government Expenditures
Country
Latin America Argentina Brazil Chile Mexico Peru Venezuela Colombia
East Asia Korea Taiwan Thailand Philippines
Government Expenditures as Percent of
GNP, 1982
2 1 .6 2 1 .8 37.6 31 .7 1 8.0 29.6 14.0
19.5
19.9 12.2
GNP, gross nalional product.
Government Expenditures as Percent of
Fixed Investment [year(s)]
19.6 (1978-1980) 22.8 (1980) 12.9 (1978-'1980) 29.4 (1978) 14.8 ( 1978- 1979) 36.3 (1978-1 980) .
8.9 (1978-1980)
22.8 (1978-1980) 32.4 (1978-1980) 12 .8 (1978-1979) 10.9 (1978)
Sources: EKpenditures as percent of GNP are from World Dff1J.lopmznl Report. various years. Expen. ditures as percent of fixed investment are from Shon (1984).
GOVE;RNMENT SHORT-RUN ECONOMIC POLICIES
If the Korean economy has outperformed the late learners of Latin America, the reason cannot be said to lie in short-term austerity measures to manage external shock, because the response of the Ko- . rean government to external shock was not to batten down the hatches. During the twenty-five years after the 1961 coup, the growth of the Korean economy, though spectacular, was regularly interrupted by internal and external shocks, What with two oil crises, global depres- '. sion, and an intensification of international competition, 'the 1 970s were difficult years ,in which to industrialize. Nevertheless, external shocks did not derail the Korean economy from its fast-growth track: The government borrowed its way out of balance-aI-payments difficulties and sustained fast growth. Aggressive borrowing coupled with bailouts of financially troubled finns created a supportive environment for big business. The tack most often taken by the economy after economic downturns was a resurgence of exports and rapidly resumed expan� .. sion.
Here, three stabilization exercises in response to threats of growth interruption are discussed.s The account builds to the stabilization
8 The' following discussion of' stabilization is based on a longer study of Korea's short-run macroeconomic p'olicies and attempts at liberalization. See Amsden ( l987b) or, in the Korean language. Amsden (1988).

94 Tim STATE AND BUSINESS
exercise of 1 979- 1984, formulated as a Comprehensive Stabilization Plan (CSP) by the military dictatorship that came to power in 1980 . . In all three stabilization exercises, the Korean government can be described as having accommodated the private sector rather than having been austere, austerity typically being the mood of the stabilization exercises recommended by the Bretton Woods institutions. In studies sponsored by the World Bank ( 1 987 and Leipziger, 1988), liberalization in Korea in the 1980s is rationalized as a medicine for , the economic diseases supposedly caused by government intervention in the 1970s. Yet the premise of economic disaster is nowhere substantiated. An impartial reading of Korea's history in this period suggests that some of the country's state bureaucracies were suffering from wear and tear as the volume of transactions increased. But most economic indicators, including the current account and debt/GNP ratio, imply that just before the second energ;y crisis, the economy was performing rather well, a Big Push into heavy industry notwithstanding.
Debt Financing
Korea has used f9reign credit for two purposes: to finance its longterm investments and to borrow its way out of balance-of-payments crises in order to maintain its long-term growth trend. Korea's ex� ternal debt position from 196 1 to 1984' is shown in Table 4.7.
Throughout the period of the first two five-year plans, th� debtJ GNP ratio rose rapidly. As discussed in Chapter 3, the Foreign Capital Inducement Law was amended in 1962 to provide guarantees that eliminated the risks of default and of exchange rate depreciation. The foreign debt/GNP ratio rose from 40% in 1963 to 7% in ' 1965 . In September 1965, a monetary reform was undertaken in which deposit and lending rates at banking institutions were more than doubled, increasing the attractiveness of lending to Korea. The foreign debUGNP ratio rose to 14% in 1 967. Then it more than doubled in four years, reaching 30% in 1 97 1 .
Among other. effects of the monetary reform, Korean borrowers were encouraged by the cost differentials between domestic and foreign interest rates. The divergence between domestic and foreign borrowing rates ranged from 4.4% to 1 8% during 1965�1 970 (Y. C. Park, 1985). Because the real private cost of borrowing abroad was typically negative (see Table 3.8), investment as a share of GNP rose from 15% in 1965 to 30% in 1969. The share of savings rose at a faster rate as income expanded and as domestic interest rates increased, but reached its peak at a lower level than investment in the same period, 23% in 1969 (see Table 3.7).
As in Latin America in the 19705, no limits on foreign borrowing

The Dynamics of Growth 95
Table 4.7 External Debt and Debt Service, 1963- 1984
Total Debt Service Foreign Long-Term Debt Debt as % of
Debt Debt Total Service as Service Current (million as % of Debt as % of as % of Transactions
Year u.s. $) Total % of GNP GNP Exports' Receiptsb
1963-1971 1963 157 85.99 4.06 0.05 2.30 1 . 1 1964 177 94.35 5.29 0. 15 4 . 17 2.4 1965 206 98.54 6.81 0.46 8.00 4.8 1966 392 98.21 10.26 0.34 5.20 2.9 1967 645 89.77 13.62 0.72 10.15 5.3 1968 1 , 199 92.58 20.07 0.77 9.47 5.2 1969 1 ,800 89.22 24.07 1.20 1 3.68 7.8 1970 2,245 83.39 25.48 2.84 28.34 18. 1 197 1 2,922 83.6 1 30.06 3.28 28. 16 19.7 1972-1978 1972 3,589 82. 1 7 33.95 3.87 24.40 18.4 1973 4,260 83.54 3 1 .55 4.35 17.87 14.2 1974 5,937 79. 13 32.01 3.25 13.33 1 1 .2 .1975 8,456 7 1 .5 1 40.55 3.38 14 .01 1 2.0 1976 10,533 7 1 .09 36.73 3.50 12.85 10.6 1977 · 12,648 70.63 33.79 3.58 13 .33 10.2 1978 14,871 74.08 29.71 4. 16 16.38 12. 1 1979-1984 1979 20,500 67.80 3 1 .75 4.03 1 7.68 13.3 1980 27,365 61 .22 44.68 4.81 17 . 13 13.1 198 1 32,490 63.80 48.34 5.53 1 7.98 13.8 1982 37,295 6 1 .94 52.65 6.23 2 1 . 1 5 15.5 1983 40,094 70.58 53.23 6.18 20.07 15.0 1984 43,100 73.55 53. 16 6.74 20.75 17.3
GNP, gross national product .
• Merchandise exports.
bReceiplS from visible and invisible foreign transactions. Sources; Bank of Korea and Economic Planning Board.
were enforced by the ·government, and a rapid increase in debt service resulted, exports notwithstanding. The debt service ratio (as a percent of merchandise exports) rose from 14% in 1 969 to 28% in 1 970 (see Table 4.7). It was in the period 1966- 1 97 1 , and later during two stabilization periods, that the big buildup of foreign debt occurred, and not as a consequence of government investment in heavy industry during the 1970s. Foreign debt in 1 966- 197 1 was u�ed to finance exports, to finance imports of capital goods in the light-manufacturing sector, to finance the beginning of import substitution in heavy industry (fertilizers and cement), and to finance

96 THE STATE AND BUSINESS
investments in infrastructUl e (the share in GNP of transponation, communications, electricity, gas, and water more than doubled between 1964 and 1970) (Economic Planning Board, 1 984).
'
The First Stabilization
The increase in the debt service ratio prompted the IMF, in a standby agreement, to require the Korean government to issue a letter of intent to limit foreign capital movements to oTie- to three-year loans (Frank et aI., 1975), Consequently, the, growth rate of foreign debt slowed by 25% and 30% in 1970 and 197 1 , r�spectively, and investment fell. There was also a lull in the growth rate of exports, stability in the real effective exchange rate notwithstanding. Whereas the real growth rate of exports averaged 36% in 1968-1969, it averaged 27% in 1 970- 197 1 . Simultaneously, there was a sharp contraction in monetary expansion (T3,ble 4.8). The growth rate of M2 declined from 6 1 % in 1969 to 27% in 1970. All these factors contributed to a decrease in the growth rate of GNP-from 13 .8% in 1969 to 7.6% in 1970 (see Table 3 . 1 ) .
To stimulate exports, the government introduced a devaluation of 12% in 1 97 1 . The immediate effect was a sharp increase in the won cost of debt financing. This created severe short-term financial problems for firms that had borrowed abroad. Rather than allow troubled enterprises to go bankrupt (the borrowers tended to be the mote progressive as w.el\ as the politically best connected firms), the government bailed them out.
The bailout was specified in a Presidential Emergency Decree an-� nounced on August 3, 1972. This Decree had two immediate objec-! tives: to revive economic activity by stimulating investment demand \ and ·to relieve the interest burden of overextended firms (Cole and Park, 1983). To stimulate investment, the government redticed over." all interest rates of banking institutions. The time deposit rate was lowered from 17.4% to 1 2.6% and the rate on loans up to one year fell from 19% 'to 1 5 .5%. To alleviate the interest burden of overexl tended companies, the government redistributed income from lenders to borrowers in the unofficial capital market, or curb market. All . loan agreements between licensed business firms and lenders in the I curb market were nullified and replaced by new agreements as oL August 2, 1972. These allowed lenders the option to switch theit-loans into shares of the borrowing firms. By 1973 the economy was:.. more than back on track. GNP recorded an unprecedented increase of 14. 1%. The main factor behind the recovery was exports. They grew by an astounding 73%.

The Dynamics of Growth 97
Table 4.8 Monetary Indicators, 1961- 1984
Broad Money Domestic Inflation M l " M2b CreditC Discount Rate
Year % Increase % Increase % Increase Rated in CPI"
1961- 1971 1961 14.5 27.2 4 1 .6 10.22 6. 1 1963 6.3 8.8 19.7 1 0.22 20.0 1964 1 6.7 14.3 8.8 10.50 29.8 1965 34.2 52.7 40. 1 . 28.00 14.7 1966 29.7 6 1 .0 30.5 . 28.00 1 1 .2 1967 44.5 6 1 .7 78.2 28.00 1 0.8 1968 44.6 72.0 84.8 23.00 10.4 1969 4 1 .7 6 1 .4 59.2 22.00 12.4 1970 22. 1 27.3 26.5 19.00 1 6.2 1971 1 6.4 20.8 3 1 . 1 16.00 13.5 1972- 1978 1972 45.1 33.8 30.1 1 I .oo 1 1 .5 1973 40.6 35.9 3 1 .7 1 1 .00 3.2 1974 29.5 24.5 54.2 1 1 .00 24.5 1975 25.0 28..2 32.2 14.00 25.2 1976 30.6 33.5 2 1 .7 14.00 1 5.3 1977 40.7 39.7 23.6 14.00 10.2 1978 24.9 35.0 45.9 1 5.00 14.5 1979- 1984 1979 20.7 24.6 35.6 15.00 18.3 1980 1 6.3 26.9 4 1 .9 16.00 28.7 1981 4.6 25.0 3 1 .2 1 1 .00 2 1 .3 . 1982 45.6 27.0 25.0 5.00 7.3 1983 1 7.0 15.2 15.7 5.00 3':4 1984 0.5 7.7 1 3.2 5.00 2.3
a M I := currency in circulation + deposit money.
• M2 = M I + quasi-money (time and savings deposits).
' Defined as the Bank of Korea's claims on government, on government agencies, and on the private sector. "The rate of discount for commercial bills of prime enterprises .
• CPI, consumer price hldex.
Sourte: Bank of Korea.
The stabilization of 197 1- 1 972, unlike the two stabilizations that fol1owed it, was not triggered by an external shock. Rather, it was precipitated by the IMF's concern about Korea's debt buildup and credit worthiness--<:all it external interference. Consequently, it differed from succeeding stabilizations in that it did not involve a sharp increase in foreign borrowing. Nevertheless, three characteristics of the 197 1':"' 1972 stabilization were later to repeat themselves: a devak uation, a cut in domestic interest rates, and a bailout of financially troubled firms.

98 THE STATE AND BUSINESS
Although maxi-devaluations came to characterize later stabilizations, the midi-devaluation (neither large nor small) of 197 1 was unusual insofar as it led to a year-on-year depreciation of the real effective exchange rate, which depreciated still further in 1972 and 1973 . . One effect of the exchange rate depreciation seems to have been a rise in prices through the import of foreign inflation. The GNP deflator in 1972 was 1 6.4% (see Table 3 . 1 ) . Therefore, although informal price controls had been in effect throughout the 1960s, the August 3, 1972 Decree called for an across-the-board price freeze, in emulation of the Nixon price freeze of a year earlier. After the freeze was lifted, fewer blanket controls over prices remained in effect, and in 1 975 the declared purpose for price controls became to restrairi monopoly power, as noted in Chapter 1 .
The Second Stabilization
Not only was the economy back on track by 1 973. but investments to diversify the economy were in full swing. Nevertheless, steel had just begun to be poured, and the first very large crude carrier had just begun to be constructed when the price of oil beg-dn to rise sharply. The first oil crisis presented a severe threat to growth because the economy was wholly dependent on oil imports. had recently diversified into energy-intensive industries, and was highly vulnerable to fluctuations in world demand. The oil price increase caused a 26% deterioration in the terms of trade.
The government responded .in January ,974 with measures to maintain over",lI growth. A policy decision was taken to absorb fully the oil price increase. and that decision contributed in 1 974 to a 62% rise in imports (Economic Planning Board, 1984). Domestic credit was expanded by over 40%. Investment as a sh�re of GNP increased from 26% to 32% between 1973 and 1974, while the savings share of GNP declined by only 3.5%. The current accoUnt deficit jumped by a factor of 5 to 1 1 %, an historical high, despite a growth in exports of 16% (see Table 3. 1) . To finance the deficit, the government both borrowed abroad and depleted its foreign reserve holdings, which fell by 3.5% in a year. Between 1 973 and 1974, Korea's total foreign debt rose by 42%. Total debt as a percent of GNP rose from 32% in 1 974 to 40% in 1975 (see Table 4.7).9
9 In both 1973 and 1974. foreign loans as a percent of total capital inflow were lower than usual because of a temporary surge in direcf foreign investment. In 1973 and 1974, direct foreign investment in total capital inflow averaged 14.8% compared with 7% for the period 1964-1972 and 4.3% for the period 1975-1983 (Economic Planning Board, 1 984). With respect to loans, in 1974 and 1975 commercial loans grew in importance relative to public loans. This differed from the borrowing behavior of the preceding stabilization in 1971-1972 and the succeeding one in 1979-1982.

The Dynamics of Growth 99
The country reaped the rewards of borrowing and of running down its reserves in the form of positive growth-7.7% in 1974 and 6.9% in 1975--at a time when most other non-oil-producing countries were plunged into depression. By 1976 fast growth had resumed, and GNP grew by 1 4.4%. Although investment as a share of GNP declined, exports grew by a staggering 49.2% (see Table 3. 1 ).
Output continued to soar after 1976- 1977, buoyed by domestic investment in heavy industry and in related infrastructure. The growth rate of output reached 1 2.7% in 1977. In 1978, the year before the second energy crisis struck, it equaled 9.7%, a rate just above the average for 1964-1972. The current account deficit, moreover, remained healthy until oil prices again began their ascent. As a percent of GNP it equaled only - 1 . 1 in 1976 and -2.2 in 1978. In 1977 the current account even showed a small surplus. the first in Korea's recorded history, as remittances from the Middle East increased (see Table 3. 1 ). Thus. amidst the Big Push into heavy industry in 1977-1979 and just before the second enerr;y crisis in July 1979, the Korean economy was in good shape.
Determination of the Pace of Industrialization
We may pause here to make a general observation about the pace of industrialization in Korea (industrialization involving both the growth rate and the diversification of output). It may be said that to whatever extent possible, the government ·controlled the pace of indus� trializatjgn, rather than allowing market forces to do so. The incentives it offered private firms had a decisive influence on both the timing of new investments and their scope. Nor is there any reason on theoretical grounds to believe that the market mechanism is a better arbiter than the state of the critical decision of how rapidly to grow, especially in the presence of unemployment arid of the possibility of foreign borrowing. The idea of letting the market mechanism, rather than the government, decide the pace 'of industrialization is not particularly compelling from the point of view of efficiency.
In competitive theory. the market is recognized as the supreme arbiter of the rate of capital accumulation and hence of growth.IO If the rate of savings exceeds the rate at which firms are willing to invest, interest rates are predicted to fall, thereby stimulating more investment. Even ignoring the Keynesian criticisms of this "investment" behavior, ultimately the rate of investment abstracted from its most immediate determinants depends on the capability of entrepre-
10 The best critic of this view is Gers'chenkron (1962). Gerschenkron gave careful historical examples of credit mobilization at the national level that suggested that the rate of investment is an institutionally determined variable.

100 .
TI·IE STATE AND BUSINESS
neurs to assume risk. This capability combines both willingness and ability to do so, including the willingness and ability to borrow. As such, there is nothing sacrosanct about a market-determined investment rate, because it will depend .on the tastes of whoever is responsible for investment decisions. Efficiency considerations do not necessarily enter the question. In the long run, the investment rate is a social variable. Other things being equal, a rate of return of, say. 1 5% may be considered inadequate compensation for risk in one country but adequate compensation in another.
Relying on the market mechanism to determine the pace of industrialization presumably has one merit over state intervention: The rate of inflation may be lower. In theory, rising prices are expected to discourage investment, either by reducing profits or by increasing risk. Whatever the relationship between inflation and investment in theory, in practice inflation did accompany Korea's push into heavy . industry under government leadership in the late 1970s. The following discussion examines its effect.
Inflation
Although inflation in the late 1970s was below the 1974- 1975 level, it was high by post-Korean-War standards.
· It was up from 16% in 1 977 to 22% in 1978 and l �79 (see Table 3 . 1 ) . The average rate of inflation in Korea in the period 1962- 1969 was 1 7.3%. In the period 1970- 1979 it was 19.3%. The pursuit of fast growth was not restrained in the interest of price stability. In fact, a relatively high · rate of inflation was toierated by the standards of most backward countries, save those in Latin America.
Table 4.9 suggests some of the determinants of inflation in the late 19705. One was agricultural prices, which accelerated due to exceptionally poor harvests. Another was monetary policy, which was ' fairly· accommodating of the high level of economic activity. M2 grew at a faster rate than in 1974- 1 975, · although both M2 and bank credit grew less than in the period 1965- 1 973. The most significant rate of change, however, was that of manufacturing wages (see Table 4. 10).
Manufacturing wages rose especially rapidly in 1976- 1978 due to an unusual circumstance. The Middle East boom drained the m9st energetic able-bodied men from the labor force in unprecedented . numbers. According to data from the Ministry of Labor, between 1977 and 1979 roughly 292,600 male workers migrated overseas, equaling almost 27% of the male manufactuTing work force. The rate of wage increase of managerial, technical, and administrative workers also began to rise (although throughout Korea's high growth period, wage increases of production workers on the average ex-

The DynamicS of Growth 101
Table 4.9 Average Periodic Rates of Change in Inflation and in Its Determinants. 1964- 1984 (Percent) (Arithmetic Averages)
1965- 1974- 1976- 1978- 1980-1973 1975 1977 1979 1981 1982 1983 1984
Inflation Consumer price index 1 1 .55 24.77 12.70 16.41 25.01 7.19 3.42 2.27 Wholesale · price index 8.78 34.30 10.60 1 5.21 29.64 4.65 0.24 0.7 1 PV I " 1 4.35 27.20 18. 13 2 1 .29 22.02 8.49 3. 13 2.99
DeterminantS Manufacturing wages 20.45 3 1 . 1 6 35.25 3 1 .48 2 1 .39 14.86 12.00 8.32 Agriculture prices 1 2.56 34.86 22.22 22.57 26.07 0.31 3.36 -0.08 Price of imported
materials (won) 1 1 .98 27.92 1 .58 16.35 37.55 1 .33 1 .22 4.0 1 Price of imported oil . 18.84 1 35 . 18 6.05 2 1 .91 72. 16 2.51 -6.56 0040 Price of non-oil
materials 1 1 .60 18 . 10 0.40 14.77 25.55 0.68 5.72 5.85 M2b 46.44 26.55 33.07 33.04 26.61 .28. 15 19.52 10.74 BaR)<. credit 42.99 42.54 23.34 40.54 35.82 25. 1 1 1 5.99 1 3.08
' Denotes the non.agriculture GNP de8ator. 10M2 = currency in circulation + deposit money + quasi-money (time and savings deposits).
Source: Corbo and Nam, 1986.
ceeded those of higher level employees, as Chapter 8 indicates). For the first time, the rate at which nominal wages was rising exceeded the rate at which productivity was rising, and therefore, income' was being redistributed to labor.
Institutional Wear and Tear
Inflation in 1 976-1978, although high, coincided with fast growth, historically high savings rates, high real wage increalies. and a . low current account deficit. Yet it coincided with institutional wear and tear that was soCially destabilizing.
The expression of discontent was greatest among the educated classes, the period of the Big Push of 1 977- 1979 having been relatively free of protest action by labor. The lowest paid workers may have been unconvinced by the government's constant reminders that they had never had it so good. The highest paid workers may have been oppressed by long work hours and the chaebol's interference in almost every aspect of their lives. But the wave of strikes that swept over Korea in 1979 occurred only after; not before, the second oil price increase, when wages in some firms fell into arrears. Moreover, the strikes occurred during the breakdown of state power in the months between the assassination of President Park Chung

2
Table 4.10 Inflation, Productivity, and Wages in Manufacturing, 1 965- 1984 (Rates of Change in Percent) (Arithmetic Averages)
1965-1973 1974-1975 1976-1977 1978 1979 1980 198 1 1982 1983 1984
Consumer price index 1 1 .6 24.8 12.7 14.5 18.3 28.7 2 1 .3 7.2 3.4 2.3 Wholesale price index 8.8 34.3 10.6 1 1 .6 18.8 38.9 20.4 4.7 0.2 0.7 Total wage Na 21 .6 3 1 .2 34.3 34.7 36.6 19. 1 20.0 14.7 1 1 .3 8.2
Rb 9.8 5. 1 19.5 20.2 18.3 -9.6 - 1 .3 7.5 7.9 5.9 Production workers N 18.3' 27.7 29.1 35.3 38.9 18.2 21 .7 14.1 10.8 10.0
R 12.5' 2.9 16.4 20.8 20.6 - 10.5 0.4 6.9 7.4 7.7 Technicians N 24.1 ' 30.8 3 1 .4 34.5 30.3 1 3.9 13.8 20.0 8.5 7.4
R 18.3' 6.0 18.7 20.0 12.0 -14.8 -7.5 1 2.8 5. 1 5. 1 Managers N 22.5' 35.4 �·26.9 33.0 38.2 8.6 12.5 8.4 10.5 7.1
R 16.7' 10.6 14.2 18,5 19.9 -20.1 -8.8 1 .2 7 . 1 4.f Labor productivity 13.0 10.5 1 0.6 1 1 .5 15.4 10.5 16.9 7.2 13.0 10.( Unit labor COS[d 7.7 18.8 2 1 .4 20.5 1 1 .4 1 1 . 1 10.0 -0.8 -·1.5 - u
·Nominal.
"Real (nominal minus CPI). '1973 and 1974 only.
• Rate of increase of nominal wage indexllabor productivity index.
Source: Office of Labor Affairs (until 1980) and Ministry of Labor; Bank of Korea.

The Dynamics of Growth 103
Hee in October 1979 and the assumption of power by General Chun 000 Whan in M),iy 1980.
For the educated classes, the final years of the Big Push meant inflation, which reduced real returns to moonlighting, and escalating real estate prices, which disappointed dreams of home ownership in a housing market with few rental properties. With their own interests in jeopardy, the educated classes' criticisms of the government grew more vocal. The speculation that underlay escalating real estate prices was interpreted as one of several signs of misfiring of state policy. Land speculation was read as one manifestation of the misuse of subsidized loans for unproductive rather than for productive ends. A much-publicized crash program that improved rural housing but disrupted urban construction and cement exports was taken as being indicative of arbitrary and undisciplined government. The financial structure of firms was also believed to have become precarious due to high debt equity ratios. I I
Disaffection · with economic policy among the educated classes focused on the machinery branch of the heavy industries, although that branch accounted for no more than 10% of total loans to the manufacturing sector in the period 1 975-1982 (Y. C. Park, 1985). HOWeV(T, it was in this machinery sector that the government-business recipe for entering heavy industry became distorted. In some machinery subbranches, particularly electrical generating equipment, excess capacity emerged because building to achieve econc;>mies of scale went to extremes, and too many Jirms were licensed to enter each manufacturing subbranch.
1ndiscriminate licensing in some machinery subbranches had several possible explanations: ( 1 ) the government indulged in multiple licensing in the interests of national defense, (2) the government's administrative machinery was in need of revision to handle a larger and more complex volume of transactions, or (3) the government lost control to the chaebol, could not rcfuse them licenses, and abused its disciplinary device of credit allocation .. For their part, the chaebol were drawn into the machinery sector by oligopolistic rivalry, subsidized credit, and the lure of riches. Either the government had to revamp its licensing procedures and regain control over the chaebol or it had to renounce control over credit allocation, thereby losing
I I Behind-the-scenes bailouts inake the reported bankruptcy rate an unreliable in· dicator of insolvency. Debt/equity ratios, however, have been taken as evidence of financial cliffhanging (Cho and Cole. 1 986). Yet. debt/equity ratios in the manufac· turing sector rose by only 13.5% between 1974-1975 and 1976-1977. In the period of accelerated investments in heavy industry, 1977-1979. debt/equity ratios remained almost constant at around 370, well below the level prevailing in Japan, 466 (Table 4. 1 1 shows Korea's average debt/equity ratios during 196 1 - 1 984).

104 THE STATE AND BUSINESS
Table 4.1 1 Average Debt/Equity Ratio in Manufacturing, 196 1 - 1984
Year Ratio Year Ratio
1961 136 1973 272 1962 .' 154 1974 316 1963 92 1975 339 1964 101 1976 365 1965 94 1977 367 1966 l i B 1978 367 1967 151 1979 377 1968 201 1980 488 1969 270 1981 451 197 1 328 1982 386 1972 3 l.3 1983 360
1984 340
Source: Bank of Korea. Financial SlaItmmt AnalJ'lu. various years.
an effective means by which to achieve economies of scale and competitive firm performance simultaneously.
In April 1979, the Park government itself set machinery. in motion to reduce inflation and to reform administnltive procedures by announcing the Comprehensive Stabilization Plan. The plan, however, was postponed by the second round of oil price increases in July and by assassination in October. Commodity price increases had led to a 13% deterioration in the terms of trade between 1979 and 1 980 .
.The deficit in the current account jumped from -2.2% of GNP in . .1978 to -8.7% of GNP two years later. In 1980 the growth rate of GNP turned negative for the first time since the end of the Korean War.
The Third Stabilization
Both short-term and long-term factors appear to have been responsible for recovery, which was fairly rapid. In 1 980 the GNP growth rate had been -5.2; by 198 1 it was 6.2, below Korea's previous trend but above the growth rates of the Latin American late-industrializing countries and that of India. In 1 980 the GNP deflator had been 25.6%; by 1982 it had fallen to 7. 1 % (see Table 3 . 1 ) . The international environment became favorable, and the global economy began to grow faster, inflation falling sharply. Korea's terms of trade
. improved even at a time when the terms of trade of other lateindustrializing countries continued to deteriorate.

The Dynamics of Growth 105
Nevertheless, stabilization policy between mid- 1979 and the end of 1982 exhibited no major departure from past practice. When private investment fell , and private savings fell even more, the tasks of borrowing and beefing up investment were assumed by the government. The deficit of state enterprises nearly doubled between 1980 and 1982 (see Table 4.4). Korea's total external debt grew by 59% from 1979 to 198 1 . Total external debt as a percent of GNP had been 32% in 1979, the last year of the Big Push, and increased to 48% in 1981 (Table 4.7). The stance of monetary policy varied from contractionary to expansionary, depending on whether inflation or the decline in economic activity was momentarily worse. The monetary authorities, however, acted to lower interest rates and hence the cost of borrowing. The intention was to avert insolvency and to mitigate inflation by reduCing the cost of working capital (see Table 4.8). Many firms faced financial crises, and their debt/equity ratios rose sharply (see Table 4 . 1 1). Only one major chaebol, however, went bankrupt, suggesting massive behind-the-scenes bailouts.
Exchange rate policy in all three stabilizations was one of fairly sharp devaluation. In the stabilizations associated with the two energy crises, however, the exchange rate quickly appreciated after being devalued. It will be recalled that the exchange rate was a source of intense conflict between the Korean government and the United States aid administration in the 1950s and the 1960s, the former favoring depreciation of its real value, the latter, like the Bretton Woods institutions, arguing in favor of nominal devaluation. Figure 4 . 1 suggests its relative opaqueness, exports and the real effective exchange rate showing little relationship to one another. The real effective ' exchange rate and exports move together systematically in either direction in only four time periods: 1966- 1968, 197 1-1974, 1978-1979, and 1982- 1983, although these years do not share any distinct characteristics. The rest . of the time between 1966 and 1983 the growth'· rate of exports appears to have been influenced by other factors.
The second type. of growth policies discussed thus far, relating to stabilization, may be summarized as foHows: .To the extent that other growth policiesfavoring heavy state subsidization of new industries have been su,ccessful, they have enabled the government to act vigorously within the context of short-term macroeconomic policies to maintain the growth momentum in the face of external shocks. This the government has done by borrowing abroad and by resorting to. fairly unorthodox measures:. driving down interest rates, allowing the exchange rate to appreciate after devaluation, and not allowing all but a trivial number of leading enterprises to go bankrupt. The Korean government may discipline private firms �ore than other governments in late-industrializing countries. But it also provides them with staunch support.

100
20
0�--------�--------------�------��--��-4
- 10·����-L�����--�����-L���--�� � � � � � � � ro n n � u � n n n � oo �
A. Growth Rate of Exports and Index of REER
80
60
_ 20L-����-L����������-L������ 63 64 65 66 67 68 69 70 71 72 73 74 75 76 77 78
B. Growth Rate of Exports and Rate of Change of REER
106

The Dynamics of Growth 107
THE KEY TO RECOVERY: HIGH PRODUCTIVITY
Despite a rapid appreciation of the exchange rate after 1980, exports rebounded and led the economy back to prosperity. Exports grew by 17% in 1980 and by 20% in 1981 (see Table 3. 1). Behind the rise in exports lay a highly productive manufacturing sector. ' Ultimately, rising productivity was the critical factor in a rapid return� to growth. A stunning fact about Korean industrialization is that at the beg' inning and end of the period of massive foreign borrowing to finance heavy industry, the debt/GNP ratio remained more or less constant, falling slightly from 34% in 1972 to 32% in 1979 (see Table 4. 7). Evidently, the economy was using its credit productively to generate high levels of output.
The growth rate of labor productivity in manufacturing averaged 13.5% in 1978-1979, 13.7% in 1980-1981 , and 1 1 .5% in 1983- 1984 (Table 4. 10). The rise in output per worker had more to do with ,an increase in productivity than with changes in the employment rat�. Although the nonfarm unemployment rate rose to a peak of 7.5% in 1980 (up from 4� 7% in (978), it fell steadily thereafter, to 4.9% in 1985. The average annual growth of nonfarm 'employment, moreover, although slower than it had been previously, was nonetheless substantial: 4.9% in 1979-1985 compared with 8.5% in 1976-1978 and 6.9% in 1970- 1975 (Economic Planning Board, various years). 12 .
In part productivity increased as exports rose and as excess capacity became utilized, allowing exports to rise still further. In part it increased as capital-intensive investments in heavy industry began to fructify, and firms fine-tuned their operations (as illustrated in
12 The layoff policies of the chaebol may have had something to do with the behav· ior of the unemployment rate and the maintenance of employment. Although Kore, doesn't have a permanent employment system similar to japan's, there is still socia and political pressure on wrger firms to avert wyo/fs, and the diversified business group! are able to transfer labor among affiliates. As the structure of industry shifted froff light to heavy manufactures. and as the share in total employment accounted for b, large firms and the chaebol rose (although less than their share in sales or shipments) employment possibly held steadier.
Figure 4.1 Relationship between Exports and Real Effective Exchange Rate (REER). The index of REER is the inverse of column 5, Table 3'. 1 . An increase in the index indicates a depreciation in the won. Thus, the two variables presented in the figure are expected to move in the same direction. SOUTce: Bank of Korea and International Monetary Fund. Key: 0 growth rate of exports
+ REER

108 THE STATE AND BUSINESS
Chapters 1 1 and 12). In part it increased as the new political regime pursued the same agenda and tactics as the old one �nd forced chaebol in sectors characterized by overexpansion and "excessive competition" to amalgamate, to specialize, or to exit (Korea Exchange Bank, 1980). Industries subject to reorganization included automobiles, heavy electrical equipment, electronic switching systems, diesel engines, copper smelting, and power-generating equipment (see the discussion in Chapter 5).
Rising productivity diminished the costs of the economic contraction that workers had to bear. True enough, real wages fell in 1980 and 198 1 , and the growth rate of real wages only recovered in 1988 the height it had achieved in 1978. Nevertheless, even as inflation abated, workers continued to deQland high nominal wage increases, and real wages in 1982 and 1983 increased at an average- annual rate of over 7%. Because productivity was rising fairly fast, and workers were at least enjoying some real gains, wages began to increase more in line with unit labor costs. The nominal growth rate of unit labor costs declined steadily from 1979 and was negative in 1982- 1984 (Table 4. 10).
Added Austerity
At a time when the economy was already assured recovery and price increases were already well below historical levels (the CPI was 7.2% in 1982 compared with 1 1 .6% in 1965- 1973), the government departed from past practice and, in concert with the IMF, tightened the fiscal and monetary screws. The stated objective was to prepare the macroeconomic environment for the structural liberalizations that were supposed to be under way. An adjustment program was formulated that was supported by a standby arrangement with the Fund. The program envisioned a sharp deceleration in the growth of external debt and a substantial improvement in its maturity structurelong-term debt as a percentage of total debt had fallen from 74% in 1978 to 62% in 1982 (Table 4.7). To achieve these objectives, the government included in the program a steep reduction in both the public sector deficit and the ra�e of credit expansion, as well as . a real depreciation of the currency. The public sector deficit fell by about 3 percentage points between 198 1 - 1983 and 1983- 1984; the rate of credit expansion was cut by more than half, to about 13%; and the real effective exchange rate was depreciated by about 7% in 1983 and remained stable thereafter.
The effects of such extreme austerity were wide ranging. In terES of distribution effects, austerity probably took its highest toll in ag-

The Dynamics of Growth 109
riculture because, in the budget crunch of 1983- 1984, a prime target of revenue saving was agricultural price supports. Between 1982 and 1985 there was a m'ass exodus from agriculture (roughly 600,000 people), even larger than the migration associated with the 1980 harvest failure (about 85,000). The last wave of migrants, however, was believed to have consisted of relatively older people, unequipped to enter the urban labor force and unaccounted for in the unemployment statistics (Castaneda and Park, 1986). In 1984- 1985 there were sit-down strikes by young farmers to protest the government's price and import policies. Between 1979 and 1983 impor.ts of grains rose by 28%, whereas during the 1970s they had remained fairly stable (Economic Planning Board, 1984) , 13
Two other changes are less certain to have emerged from austerity. First is the question whether austerity reduced inflation. The GNP deflator fell from 7. 1 % in 1982 to almost nil in 1985- 1986. Yet the decisive drop in prices came earlier, before austerity became trenchant, when the prices of oil and non-oil imports fell like stones (see Table 4.9). Second is the question whether price stability encouraged an increase in private savings. By 1987 Korea had passed a milestone. Domestic savings exceeded domestic investment. 14 Yet the extent to which a decline in inflation was responsible for such' saving behavior is unclear, Private savings also reached what in the late 1970s was an historic high, at a time when inflation as well was at an historic high. Savings behavior, therefore. may be more responsive to factors other than the direction and rate of price change. Whatever the true causality between the Comprehensive Stabilization Plan. savings. and inflation. this much is clear: Austerity cannot claim chief responsibility for the restoration of rapid growth in Korea. It is also unrepresentative of twenty-five previous years of short-run macroeconomic policy.
THE GROWTH:PRODUC11VITY DYNAMIC OF LATE INDUSTRIALIZATION
We come to the 'last facet of growth to be considered. the growthproductivity dynamic of late industrialization, It is easier to understand this dynamic now that we have a sense 9f how late industrialization starts. how it spreads to new industries, and how it is shielded from external shocks. The objective is to go further and to understand theoretically a dynamic between growth and productivity that
13 For a discussion of farmers' protests. see J. S. Suh (1986); In 1985 the real income of the farmer. relative to that of the urban worker, was worse than in 1965. 1970. and 1975. although slightly better than in 1980 (Moon. 1987).
14 See Han'guk Kyiing-je Sinmun ( 1987).

1 10 THE STATE AND BUSINESS
appears to drive late industrialization forward. It is suggested below that. subject to institutional constraints, . high growth rates of output generate high growth rates of productivity, and vice versa. There is circular and cumulative causality. Once started. a momentum builds between growth and productivity that drives industrialization forward. This is what we observe in countries like Japan, Korea; and Taiwan. whose economies have followed an upward spiral.
In countries whose industrializations date to earlier historical periods and whose leading firms are at the world technological frontier. we tend to see another growth dynamic at play. or at least we are conditioned by economic theory to see such a dynamic, It is a dynamic that runs from technological change at the world frontier to high productivity. and from high prOductivity to high growth. In such a growth relationship there is no reverse causality. Growth does not generate high productivity or technological change. although technological change generates high productivity and growth.
One-way · causality characterizes the theoretical models of most economists. and so the general case. There exists a contrasting model associated with the work of Verdoorn and Kaldor that does express cumulative causality between increases in output and productivity . 15 Like the conventional growth model. it also presumes to describe a general case. Its explanatory power. however. may be greatest when applied specifically to late-industrializing countries and the learning process. and it is this application that is attempted below.
The conventional growth model takes the form.
t=! (XI > X2 • . • • • x,,)T (4. 1 )
where growth (g) is a function of factor inputs (il . . • in) and technological change (1). which is represented as a scalar and residual (dots indicate growth rates). The weakness of this formulation lies in its failure to explain its key component. technological change itself. 16 Technological change is taken as being exogenously determined. and not much in the way of theory is given to explain what underlies it. By implication. productivity is also left unexplained because it depends on technological change. Moreover. this formulation implicitly incorporates the view that productivity depends not just on technological change but on a particular type of technological � change, the epochal breakthrough. While it is true that epochal breakthroughs probably occur erratically and are, therefore. best left ·
15 For this literature. see KaldoT (1967; 1 978). and Journal of Post Keynesia� Economics. (1983). 16 For a critical review article on growth models and growth accounting. see R. R. Nelson (1981) .

The Dynamics of Growth 1 1 1
undetermined within the economic system, there is more to productivity than epochal breakthroughs.
The conventional growth model is inappropriate fOT lateindustrializing countries because it throws away valuable information. The information it discards is the source of productivity increases. Although productivity changes remain a mystery in advanced countries, where productivity increases come from in lateindustrializing countries is quite obvious. They do not depend upon "creative genius"; they are plucked from the world technology shelf. First, increases in productivity come from imports of foreign technology. Second, they come from operating foreign technology on a scale sufficient to minimize unit costs. Third, they come from learning how to use foreign technology imports efficiently.
One may go one step further and suggest that all three of these determinants of productivity are collapsible into one variable, the growth rate of output. Ignoring for. the moment the institutional setting, it can easily be appreciated that if foreign technology is embodied in plant and equipment,. then to raise productivity by importing technology will depend on the rate of investment in new plant and equipment. The faster output is rising, the faster one may expect investment to rise, and hence technology imports to rise. If growth and investment are low, the import of foreign technology will also be low. Similarly,' it will be easier to realize scale economies embodied in imported foreign technology when output is growing .. When output is growing, income is also growing, and hence the size of the market is expanding, making it easier to reach minimum efficient scale. Finally, how efficiently foreign technology is used will depend on the experience of the user. The faster output is rising, the faster experience accumulates. In other words, leaming-by-doing, which is one critical aspect of learning in general, depends on cumulative output.
If growth depe�ds on productivity, then as just stated, productivity also depends On growth. The growth-productivity momentum is a closed loop. Once growth starts and invades newer and newer industries, it gathers momentum by triggering increases in productivity. The loop in which productivity depends on growth takes the form,
p = g(Xl, X2, . . • , xn) (4.2)
where productivity <P) is a function of growth (g) and growth decomposes into three growth effects, Xl , X2, • • • , xn• The three growth effects are investment-embodying technology new to the user, economies of scale, and learning-by-doing.
Asjust formulated, the growth-productivity dynamic is highly me-

1 I2 THE STATE AND BUSINESS .
chanica!. While it is fairly easy to imagine how the government might intervene to great advantage to keep the growth momentum going, in reality higher productivity does not automatically follow from higher growth. In one scenario, higher growth may simply lead to higher prices. In another, it may generate gross inefficiency. The translation of high growth rates of output into high growth rates of productivity depends on what happens inside the unit of production. Closing the loop between growth and productivity. therefore. involves an analytical shift, a change in the center of gravity from the state to the other key institution of industrialization. the firm. 17
CONCLUSION
This chapter examined three aspects of growth: diversification and entrepreneurship. short-run stabilization, and productivity. In the case of entrepreneurship, by historical standards the big businesses ' of late industrialization have curtailed the role of the private 'entrepreneur. On the one hand, as discussed in this chapter, the state has usurped the domain of the traditional private entrepreneur·by making milestone decisions about what. when, and how much to produce. On the other hand. as discussed in la�er chapters. the salaried managers have carried the burden of implementing investment decisions because it is they who hold the technical expertise. The private entrepreneur of late industrialization is a pale reflection of the heroic figure of the past. .
As for short-run stabilization. the way it has been managed by the state has been critical in late industrialization, which has been subject to sharp and recurrent external shocks. The management of stabi�zation by the state in Korea has been contrary to what has typically been the prescribed medicine of the Bretton Woods institutions. Rather than soften external shocks with austerity measures, the Korean government has been wont to adopt expansionary policies an9 borrow its way out of balance-of-payments difficulties. It has beeih able to do so because heavy foreign borrowing has been balanced by \ large productivity increases. Therefore, despite massive foreign bor�' rowing to finance diversification. the debt/GNP ratio even fell slightly in Korea by the end of the Big Push into heavy industry in 1 979.
I? This suggests that Equation 4.2 should be estimated at the firm level. Chenery. Robinson, and Syrquin ( 1986) measured it instead at the most aggregate level. which may explain why their findings of a positive association between the growth of output and productivity were not stronger. There are severe statistical problems irivolved in measuring Equation 4.2. It is difficult to separate the three growth effects and to exclude the temporary impact of business cycles. For a discussion of measurement problems. see Journal of POJI Keyne,ian Economics. Spring 1983.

The Dynamics of Growth 1 13
Finally, the productivity increases of late industrialization ill-fit the standard growth model, whereby productivity growth induces output growth but output growth does not induce higher productivity, higher productivity being driven by breakthroughs at the world technological frontier independent of the growth rate of output. Productivity in late industrialization, by contrast, has nothing to do with breakthroughs at the world frontier. Instead it depends on how rapidly foreign technology is borrowed (which depends on the investment rate), whether foreign technology is utilized at the appropriate scale .(which depends on how fast the market is growing), and how efficiently foreign technology is employed (which depends on experience related to cumulative production). In short, the growth rate of output may be hypothesized to depend on higher productivity and, in closed-loop fashion, higher productivity also depends on the growth rate of output.
On the one hand, this cumulative relationship between productivity and growth underscores the importance of government intervention to keep the growth momentum going. On the other hand, the fact that productivity has little to do with imminent events at the wor� technological frontier and much to do with production capability-investing in foreign designs, producing at the appropriate scale, and learning-by-doing-:-highlights the importance of firm-level management practices. The next chapter, therefore, opens an extended discussion of the firm and its human resources.
eHAPTER FIVE
The Spiraling of Market Power
MONOPOLY. COMPETITION. AND LIBERALIZATION: AN OVERVIEW
Big business as well as the state shouldered the burden of carrying Korea in to basic and high-tech industry. Beginning in the 1880s, big, oligopolistic firms became a general property of industrialization. Oligopoly, or a relatively small number of firms in control of the output of a single industry, is one meaning attached to the term market power. The term has, however, another meaning. This meaning relates' to the tendency of big business to diversify into more than one industry, giving rise to high aggregate concentration. According to an account of industrialization in the United States, "The large modern corporation typically is not confined to a single industry but embraces many lines of business and its opera,tions extend to all parts of the earth . . . " (Mueller, 1 982, p. 427). Thus, a general property of the industrialization beginning in the late nineteenth century is high aggregate concentration along with industry concentration, the former referring to the accountability by a relatively smail number of firms for a large share of national product.
The countries that industrialized still later through learning took high aggregate economic concentration even further, in the form of the diversified business group-zaibatsu in Japan, chaebol in Korea. A volume describing the proceedings of the International Conference on Business History testifies to the generalness of this form of business in late industri;'llization :
In developing countries such as South Korea, Taiwan, the Philippines, Thailand, India, Brazil and Argentina . . . industrial groups which resemble japan's former zaibatsu have sprung up since the Second World War. (Yasuoka, 1 984, p: xi) I
I For information on Taiwan's business groups, see Chou (1988).
115

1 16 THE STATE AND BUSINESS
Table 5.1 Combined Sales of Top Ten Chaebol� as Percent of GNP,. 1974- 1984
Groups 1 974 1 975 1976 1977 1978 1979 1 980 1981 1982 1983
1 4.9 4.3 4.7 7.9 6.9 8.3 8.3 ' 10.5 10.4 U .8 2 7.2 7.5 8. 1 12.5 1 2.9 1 2.8 16.3 1 9 . 1 19.0 2 1 .2 3 9.0 9.8 1 l .3 1 6.0 16.9 1 7 .6 23.9 27.6 27.4 30.5 4 10.3 1 1 .4 1 2.9 1 8.2 20.7 22. 1 30.1 35.2 35.6 38.7 5 1 1 .6 1 2.8 14.5 1 9.8 22.9 24.6 35.0 4 1 .3 42.2 46.7 6 1 2.7 14 . 1 16. 1 2 1 .3 24.7 26.6 38.2 44..9 46.0 5 1 .0 7 13.5 15.3 1 7.5 22.8 26.4 28.5 4 1 .0 48.0 49.2 54.2 8 14.3 1 6.2 1 8.4 24.0 27.7 30.3 43.6 50.9 52.2 57.1 9 'i4.7 16.7 19.3 25.2 ' 28.9 3 1 .6. 46.0 53.3 55.1 59.8
10 1 5 . 1 17. 1 19.8 26.0 30. 1 32.8 48. 1 55.7 57.6 62.4
·(Aggregale net sales of Ihe larsesl len business groups/GNP) )( 100 for each year. Source:Seok Ki Kim (1987).
1984
1 2.0 24.0 35.8 . 44.3 . 52.4 56.2 59.4 62.1 64.S 67.4
The extreme degree of diversification and concentration represented by the diversified business group is notable when one compares the chaebol with, say, General Mo�ors and General Electric before World War II. These two American giants were highly diver.sified, but largely in related products (however remotely related). The leading Korean chaebol, by contrast, comprise major divisions that have no relation to one another whatsoever: consumer electronics and petrochemicals in the case of the Lucky-Goldstar group; finance and heavy machinery in the case of Hyundai; consumer electronics, heavy machinery, finance, and entertainment in the case of Samsung; and so on. What is more, while prewar General Motors and General Electric were larger in absolute size than Samsung or Hyundai, they never accounted for as high a share of total g�oss national product. As Table 5. 1 sh?ws, i? 1984 th.e three larges� chael bol alone accounted for a staggenng 36% of natIOnal product In Ko-; � �
Big business raises two sets of issues: its economic performance and its social effects. Concerning its social effects, they appear similar whatever the mode of industrialization. In Germany, the appear
. ance of big business was associated with the trusts, gold and iron, an imperial style in politics and economics, and the rise of centralized state power.2 In Japan, the modern industrial enterprise was associated with heavy industry, fascism, and war:
The whole period of military hegemony and fascism was very favorable to business. Industrial output rose from 6 billion yen
2 See the account by Stern ( 1977). On the trusts see Maschke .( 1 969).'

The Spiraling of Market Power 1 17
in 1930 to 30 billion yen in 194 1 . The relative positions of light and heavy industry were reversed. The four great zaibatsu firms, Mitsui, Mitsubishi, Sumitomo; and Yasuda, came out of the Second World War with total assets of more than 3 billion yen, compared with only 875 oiillion in 1930. (Moore, 1966, pp; 30 1-2)
In Korea, too, the rise of the diversified business group has been inseparable from the thunderous social change accompanying the decline of agrarian society, ushered in by the army and the state, with which it is associated.
Concerning economic performance, the supposed benefits of bigness have inspired a fair amount of skepticism. The major economic rationale for bigness is economies of scale.3 Yet the case for economies of scale , applies to plant size, not firm size. The major economic rationale for big diversified firms is economies of scope. That is, given fixed inputs, it can be demonstrated theoretically that producing a greater rather than a smaller variety of products may be cheaper under certain circumstances.4 Yet the case for economies of scope has also come under attack. Writing about the world's beleaguered hegemonic power, the United States, Adams and Brock argued,
The case for large firm size . . . rests upon alleged efficiencies of management rather than technology. Efficiency, it is said, is enhanced by spreading administrative expenses over multiplant operations; , by eliminating duplication of officials, services, ahd record systems; by providing sophisticated statistical, research, and other staff services that would be ruinously expensive for smaller firms; by hiring more competent executives" more talented legal departments, and more effective lobbyists; by obtaining credit on more advantageous terms; and so forth. Some of these economies . . . reflect advantages of bargaining power; however profitable they may be to the particular firm they do not benefit the community at large. ( 1986, pp. 33-4)
Moreover, it is argued that the diseconomies of scope tend to overwhelm the economies. Adams and Brock quote a professor at Harvard Business School, Steven C. Wheelwright, as saying, "Companies always thought, 'Our people can manage their way out of the problems [that] size and complexity create.' But the evidence is that they can't" ( 1 986, p. 1 53). The authors came to a related conclusion:
� While the principle of economies of scale is demonstrated repeatedly in the commonplaces of everyday life, its significance in [he profit-making sphere is still open to debate among economists. For two interesting discussions, see Gold ( 1981) and Buzacott et al. ( 1982). '
4 On economies of scope, see Bailey and Friedlaender (1982) and Spence (1983).

1 18 THE STATE AND BLJSINESS
By most objective standards, America's corporate giants have not performed very well over the last fifteen years. They have lost markets to the Japanese and the newly industrializing c�untries. They have lagged in innovation. The quality of their products has often been inferior and unreliable. And, taken together, America's five hundred largest industrial corporations have failed to generate a single new job since 1 970. ( 1986, p. xi)
These arguments about bigness miss the point. America's corporate giants may not have performed well over the last fifteen years, and they have certainly lost markets to Japan and to late-industrializing countries like Korea. Yet the economies of Japan and late-industrializing countries are also dominated by corporate giants. Economies of scope, moreover, may benefit one firm at the cost of another, but society at large can still benefit if size improves the international competitiveness of the aggrandizer. The point, therefore, is that nothing can be said a priori about the effect of bigness on performance. Instead, how well big business performs depends on how well it is coordinated and on the context in which it functions. '
In general, the chaebol's economic performance has been impressive even if its social effects have been sinister, the popular perception being that while the chaebol benefited from public subsidies, they have nOl shared their wealth (and their derived power) with the rest of society. In terms of economic performance, during the period from, say, 1962 through 1 979, the chaebol may not have maximized every possible source of efficiency or minimized every possible scrap of waste. Yet they never intended to. As profit-maximizing firms, their objective was to grow, not to pare costs to the bone. Korea has one of the highest investment rates in the world. In 1 983 the share of investment in GDP was 3 1 percent, a rate less than in Singapore, which reached a staggering 48%, but greater than in Japan (29%), India (2 1 %), Mexico ( 17%), and so on (see Table 5.2). Moreover, as output in Korea has increased, so, too, has productivity, contributing to the eradication of national unemployment and acute poverty. As already noted, Korean industry was productive enough to allow Korea's debtlGNP ratio to remain unchanged at the beginning and end of the Big Push into heavy industry, in 1973-1 979. And while international comparisons of productivity that include late industrializing countries are statistically problematic, the most careful attempts show Korea well in the lead. According to estimates of Chenery et al. ( 1986), total factor productivity as we�l as output grew faster in Korea's highly concentrated economy than in that of almost any other country studied.
We may take aggregate indicators of output, productivity, and investment as evidence for the time being of outstanding performance

The Spiraling of Market power
Table 5.2 International Comparison of Percent Share of Investment' in Gross Domestic Product, 1973 and 1983
Country
Korea Hong Kong Japan Singapore Argentina India Mexico United Kingdom U niled States
'Gross tal'ital formation.
b1982.
1973
24 22 37 34 20 1 5 2 1 20 18
Source: U.N. Stmistit:al Yearbook, various years.
1983
31 26 29 48 16b 2 1 i 7 17 17
119
on the part of the chaebol, insofar as it was the chaebol that dominated the economy described by the aggregate indicators. Like the multidivisional enterprises of the United States, Germany, and Japan, those of Korea c;an be said to have acted as the agents of industrialization. They were responsible for developing the forces of production in economies that expanded at unprecedented rates.
This chapter is concerned with two issues related to big business. The first concerns the magnitude and causes of concentration. As yet, there is no systematic study of why big business groups have evolved into critical factors in late industrializing countries. Some proposed explanations take a market failure perspective (Leff, 1978, 1 979, 1979a; S.K. Kim, 1987). According to one such study: "The business group is an entrepreneurial. response to the environment of market imperfection" (HBS, 1 986a, p. 9). This explanation, however, is not altogether satisfactory. It implies that if markets were perfect, firms would pursue a strategy of specialization. In fact, there is little evidence to support this. The United States-if any countryindustrialized under fairly competitive market conditions. Yet the upshot was the multidivisional firm-and more recently, the conglomerate-not the specialized corporation. Another explanation for the rise of diversified business groups could conceivaQly be developed from a transactions cost approach (see, for example Williamson, 1985), although this approach is almost impossible to test empirically.
Alfred Chandler's ( 1989) study of the multidivisional enterprise in the United States, Britain, and Germany suggests that diversification

120 THE STATE AND BUSINESS
by business is an integral part of expansion whatever the country. We take this historical proposition as a starting point -for understanding the rise of the big business group in Korea. From this stylized fact two further questions arise which are the subject of speculation in the first part of this chapter: Why did the chaebol exceed most multidivisional firms in diversifying so broadly; and why, despite a high degree of diversification, does coordination appear tigh� ter in the chaebol than in, for instance, the American conglomerate?
The second major issue with which this chapter is concerned relates to discipline. As stated in Chapter 1 , a defining characteristic of Korean industrialization has been not merely support but also discipline of big business by the government. Yet discipline has by no means been flawless. In this chapter we wish to air some of the limitations. In particular, we wish to focus on the government's waning ability to control a particular type of business activity, whatever its ability to control the overall performance of business to produce goods and services efficiently. The particular type of business activity with which we are concerned is the one that typically is anticipated to arise from a high degree of market power: namely, monopolistic abuses such as creating scarcities, price gouging, and ruining smaller competitors. The time period with which we are especially concerned is the 1980s, following the assassination of Korea's iron-fisted ruler, Park Chung Hee. It was in this time period that the new military dictatorship adopted a policy of "liberalization", one intent of which was to mitigate monopolistic abuses by strengthening freer markets as a particular form of discipline over big. business.
MARKET CONCENTRATION
High levels of economic concentration exist in Korea at both the industry and the aggregate levels. Table 5.3 provides data on industry structure. The data ' for 1982 cover 2,260 commodities and suggest that only about 1 8% of all commodities that year, or 30% of all shipments, were produced under what are typically considered to be competitive conditions-that is, a three-firm concentration ratio. of less than 60% (or a combined market share of the top three produc: ers of less than 60%). The remainder of commodities was produced by either monopolies, duopoiies, or oligopolies (see Table 5.3 for definitions).
Table 5.3 also suggests that over time, the share of shipments produced under a competitive structure declined, while the share of the remainder of shipments shifted among the three types of noncompetitive market configurations_ Comparing 1982 with 1970, the percent share of shipments produced under monopolistic conditions in-

The Spiraling of Market Power 121
Table 5.3 Structure of Manufacturing Industry: 1970, 1977. and 1982
Year Monopoly Duopoly Oligopoly Competitive Total
1970 No. of 442 279 495 276 1 ,492 Commodities (29.6) (IS.2) (33.2) (I S.5) ( 100) (% share) Shipments" 1 10 204 43S 498 1 ,252 (% share) (8.S) ( 16.3) (35.1) (39.8) ( 100)
1977 No. of 667 425 674 343 2.2 19 Commodities (3 1.6) (20. 1 ) (32.0) ( 16.3) ( 100) (% share) Shipments" 2,264.0 1 ,536 4.7 16 5.404 13,920 (% share) ( 16.3) ( 1 1 .0) (33.9) (38.S) ( 100)
19S2 . No. of 533 25 1 1 ,071 405 2,260 Commodities (23.6) ( I l . l ) (47.4) ( 1 7.9) ( 100) (% share) Shipments· 5,649 3.275 24,967 15,4S 1 49,372 (% share) ( 1 1 .4) (6.6) (50.6) (3 1 .4) ( l 00)
·BilIion won.
Concentration ratios (CR): Monopoly (one-firm CR accounts for a market share of more thall 80%). Duopoly (two-firm CR accounts for a market share of more than 80%). Oligopoly (three-firm CR accounts for a market share of more thall 60%). Competitive (three-firm CR accounts for a market share of less than 60%).
Source: Compiled from the Census of Manufacturing data base; Economic Planning Board, by· K. U. Lee et aI., (1986).
creased (having peaked in 1977). Duopoly proved to be a nonviable arrangement, and its percent share of shipments decreased. The share accounted for by oligopoly. however, rose by 15 percentage points., from 35% in 1970 to over 50% in 1982.
Korean industry is even more highly concentrated than that of Jap,an. This is suggested in Table 5.4. which compares the average three-firm concentration ratios of Korea, Japan, and Taiwan (or the average shares of the top three producers in all manufacturing industries).5 Furthermore, in that higl1 degrees of concentration at the level of individual industries are complemented by ultrahigh degrees of concentration at the level of the entire manufacturing sector, the whole may even be greater than the sum of the parts. In short, Korea has acquired one of the world's most concentrated economies.
5 Nevertheless, Taiwan probably has a higher level of economic concentration than Korea in " upstream" industries like petrochemicals, shipbuilding, and steel, in which typically a government monopoly presides (Amsden. 1989).

122 THE STATE AND BUSINESS
Table 5.4 Comparison of Simple Average Three-Firm Concentration Ratios for Korea, Japan. and Taiwan
Country (year) Average share (percent) a
Korea (1981) Japan (1980) Taiwan ( 198 1 )
62.0 56.3 49.2
• Average share of top three producers in all manufacturing industries.
Source: K. W. Lee, et a!. (1986).
Measured by sales. the ten largest diversified business groups accounted for a phenomenal 67% of total sales in 1984 (see Table 5. 1 ) . Sales. of course, exaggerate the chaebol's share of manufacturing activity because they include inputs purchased from other firms. Nevertheless. concentration measures in terms of sales may give an accurate picture of the chaebol's command over the economy insofar as the development of a subcontracting system in Korea has rendered many of the chaebol's suppliers mere satellites (see Chapter 7). In terms of shipments. which are a close approximation of valueadded. the percentage accounted for by the chaebol is also impressive (see Table 5.5). In 1982 the top ten diversified business groups accounted for as much as 30.2% of manufacturing activity (but only 1 2.2% of employment).
Table 5.6 compares aggregate economic concentration measured
Table 5.5 Percent Change in Concentration of Economic Power of Business Groups." 1974-1982
Shipment Employment
1974 1977 1982 1974 1977
Top 5 business groups NA 15.7 22.6 NA 9. 1 Top 10 business groups NA . 2 1 .2 30.2 NA 12.5 Top 15 business groups NA 25.6 33.9 NA 14.4 Top 20 business groups 24.6 29.3 36.6 13.5 17.4 Top 25 business groups NA 3 1 .9 3S.8 NA 18.9 Top 30 business groups NA 34.1 40.7 NA 20.5
NA. not available .
• Manufacturing sector only.
1982
8.4 ' 12.2 14.5 1 6.0 17. 1 l S.6
Source: Compiled from the Census of Manufacturing �ta base, Economic Planning Board, as ciled in Lee et a!. (1986).

The Spiraling of Markel Power 123
Table 5.6 Percent Aggregate Concentration Rate by Shipment of the Largest Companies in Korea, Japan, and Taiwan,. 1970-1982
Korea Japan Taiwan
Year Top 50 Top 100 Top 100 Top 59 Top 1 00
1970 33.8 44.6 NA NA NA 1975 NA NA 28.4 15.8 2 1 .7 1977 35.0 44.9 NA 15.2 22.4 1980 NA NA 27.3 1 6.4 2 1 .9 1982 37.5 46.8 NA NA NA
NA. not available.
"Manufacturing sector only. It is unclear how company as distinct from 17usineu group is defined. Source: K. U. Lee et a\. ( 1986).
in shipments for the largest companies (not business groups) in Korea, Japan, an� Taiwan. Aggregate economic concentration is by far the highest in Korea. more than twice as high as in Taiwan and approximately 1 .7 times as high as in Japan.
Countries that �ave industrialized since the � 8805 share high aggregate economic concentration because huge firms tend to diversify. Chandler ( 1989) called such firms "modern industrial enterprises" and noted their synchronous emergence in the 1880s in the United States, the United Kingdom, and Germany. They emerged slightly later in Japan and considerably later in Korea because both countries industrialized later. We return again to Chandler's model of the mod'ern industrial enterprise because it provides a l;>enchmark to examine big business in late-industrializing countries. Here we are interested in one aspect of Chandler's model, the one that relates to diversification. For Chandler, diversification is a defining characteristic of the modern industrial enterprise, although there is considerable variation among the members of the family, which include the chaebol, zaibatsu, and American conglomerates. There is variation in the degree of diversification, measured roughly by the relat-
. edness of products and t�e degree of centralized management coordination, in terms of financial and human transfers among firms within a single corporate group. In the standard case, diversification tends to be restricted to related products. The firms that produce these products also tend to be centrally managed, as evidenced by the rise of managerial hierarchies-another defining characteristic of the modern industrial enterprise-and by the multidivisional organizational structure-still another. Thus, in a graph with degree of diversification on the vertical axis and degree of coordination (of both financial and human resources) on the horizontal, the modern in-

124
Degree 01 diversification (unrelatedness
of products)
+
THE STATE AND BUSINESS
American conglomerate Diversified business gro!.lpzaibatsu, chaebol
Modern industrial enterprise (with multidivisional structure)
+ Degree of coordination
(management of affiliates)
Figure 5.1 Degree of Diversification and Coordination of the Modern Industrial Enterprise.
dustrial enterprise falls in the lower right-hand corner (see Figure 5 . 1 ).
Although diversification in the United States has typically conformed to the pattern just noted�iversification into related products only, under fairly tight coordination-the United States has also been characterized by what has come to be called conglomeration. According to Chandler,
The large, diversified [modern industrial] enterprise had grown primarily by internal expansion-that is, by direct investment of plant and personnel in industries related to its original line of products. It moved into markets· where the managerial, technological, and marketing skills and resources of its organization gave it a competitive advantage. The conglomerate, on the other hand; expanded entirely by the acquisition of existing enterprises, and not by direct investment into its own plant and personnel, and it often did so in totally unrelated fields. ( 1 977, p. 48 1 )
Conglomerates are known to be coordinated to the degree that they have central budgeting. Nevertheless, there is little, if any, transfer of people across affiliates (Mueller, 1 982). In terms of Figure 5. 1,

124
6. Chinese development thinkingTing Xu*
Recent scholarship on global history (e.g. Pomeranz 2000; Wong 1997) has criticized the Eurocentric portrait (e.g. Landes 1998) of the long- term backwardness of ‘the East’.1 For more than a millennium, China had been more economically advanced than Europe with periodic ‘efflorescences’, especially in the Tang (AD 618–907) and Song (AD 960–1279) dynasties. In the field of science and technology, the work of Needham has also shown that China had been ahead of Europe before 1500. It may well be that a climacteric in the generation and diffusion of ‘useful knowledge’ occurred in the Ming dynasty (AD 1368–1644), and the shift in the locus of the generation and application of useful knowl-edge may be crucial to the reason and timing of the subsequent ‘great divergence’.2 This chapter aims to discuss Chinese development thinking by focusing on the generation and diffusion of useful knowledge with a comparison to the European context. It also stresses the close links between Chinese development thinking and Chinese culture and institutions.
USEFUL KNOWLEDGE: DEFINITION AND CRITERIA FROM THE EUROPEAN PERSPECTIVE
Useful knowledge is often regarded as amorphous and hard to measure compared with economic factors such as labour inputs and incomes.3 It is also difficult to define the scope of useful knowledge, and indeed it is often simply equated with science and tech-nology. Joel Mokyr’s work has been pathbreaking by showing the close linkage between useful knowledge and economic progress: useful knowledge is the knowledge that could promote economic growth. Going beyond science and technology, Mokyr’s approach has stressed the roles played by culture and institutions in the generation and diffusion of useful knowledge. For example, Mokyr argues that technology is ‘epistemological in nature’, and ‘technology change should be regarded properly as a set change in our knowledge’ (1990, 276). Flows of knowledge are influenced by institutions and incentive structures4 (1990, 277–302). For Mokyr, ‘“useful knowledge” is knowledge that deals
* An early version of this chapter was published online as an URKEW discussion paper, available at http://www.lse.ac.uk/economicHistory/Research/URKEW/papers/Xu.pdf. Part of the research was based on my work on a European Research Council- funded project on ‘Useful and Reliable Knowledge in Global Histories of Material Progress in the East and the West’ (URKEW) led by Professor Patrick O’Brien.
1 Neither ‘the East’ nor ‘the West’ is a homogenous entity. In this chapter, ‘the East’ refers to China, Japan, India and West Asia. ‘The West’ refers to Europe, especially Western Europe.
2 For changes in the knowledge system as a key source of economic growth, see, for example, Reinert and Daastøl (1997) and Mokyr (2002, 2009).
3 From the perspective of economic history, useful and reliable knowledge should have economic utility or potential commercial utility. ‘Useful’ thus means commercially saleable.
4 See, for example, North and Thomas (1973) and Jones (2003).
REINERT_97817825444661_t.indb 124REINERT_97817825444661_t.indb 124 03/10/2016 11:3603/10/2016 11:36
Erik S. Reinert, Jayati Ghosh and Rainer Kattel - 9781782544661Downloaded from Elgar Online at 03/31/2017 12:04:16PM
via University College London

Chinese development thinking 125
with natural phenomena that potentially lend themselves to manipulation, and includes artefacts, materials, energy, and living beings’ (2002, 3). This kind of knowledge is not necessarily ‘true’, but it is (close to) practical (2002, 2; see also Gaukroger 2006, 36). In his recent work The Enlightened Economy Mokyr extended one of his several definitions of ‘useful knowledge’ to include ‘social relations’ such as trust and authority (2009, 12).
To facilitate our comparison of the differences in the generation and diffusion of useful knowledge and their impact on the development paths between China and Europe, it would be helpful if we could be more specific about imprecise words such as ‘useful’ by developing some criteria for their content. Mokyr, for example, gives three criteria concerning useful knowledge generated by the Baconian programme, namely, knowledge that is ‘cumulative, consensual and contestable’ (Mokyr 2009, 42). So, useful knowledge from the European point of view should be: contestable (the knowledge is subject to adversarial practice, disputation, criticism and competition5); accessible (the public can get access to knowledge, and cost of access should be gradually reduced); transmissible (individual efforts could be transformed into collaboration, and knowledge could be passed on from generation to generation and therefore a collective enterprise); and eco-nomically motivated (with commercial incentives and the belief that such knowledge may enhance efficiency and economic profits). Generally speaking, the generation of the stock of useful knowledge should be linked quite well with the effective diffusion and utiliza-tion of such knowledge. But we may ask: what constituted useful knowledge and how did that shape development thinking in the context of traditional China?
USEFUL KNOWLEDGE: THE EUROPEAN CRITERIA AND THE CHINESE CONTEXT
Scholars (especially those working in the field of history of science) often equate useful knowledge with science and technology. So, I will start with a brief review of the dis-cussions on Chinese science and technology. Ever since Joseph Needham’s voluminous work demonstrating that Chinese science and technology were ahead of Europe before 1500,6 narratives that assumed the superiority of Western science and technology look dated. Instead, concern has been diverted to ‘Chinese sciences’. Needham argued that although there had been ‘primitive science’ in ancient China and Greece, ‘modern science’ originated in ‘the West’; Chinese science has contributed significantly to what he called ‘universal science’. Nathan Sivin disagreed with Needham’s approach, which amalgamated science and technology, and argued that Chinese superiority in technology should not be equated with a more advanced state of Chinese science. Science and tech-nology should be treated separately. Technology was produced by craftsmen, and science was the preserve of a minority of educated people (Sivin 1984). Sivin’s work has been developed by Elman. The latter argued that there were longstanding Chinese interests
5 For example, since the time of Newton publishing in scientific journals has been a typical activity of competition and establishing the priority in the research field.
6 Needham argued that ‘between the first century BC and the fifteenth century AD, Chinese civilization was much more efficient than occidental in applying human natural knowledge to practical human needs’ (1969, 190).
REINERT_97817825444661_t.indb 125REINERT_97817825444661_t.indb 125 03/10/2016 11:3603/10/2016 11:36
Erik S. Reinert, Jayati Ghosh and Rainer Kattel - 9781782544661Downloaded from Elgar Online at 03/31/2017 12:04:16PM
via University College London

126 Handbook of alternative theories of economic development
in the natural world, especially in the fields of astronomy, geography, mathematics and medicine, and that the native Chinese sciences continued to evolve from the sixteenth to the early twentieth century under the influence of the Jesuits and Protestant missionaries (Elman 2005, 2006). The Chinese produced ‘modern science’ ‘on their own terms’. But Elman does not really give an answer to the puzzle: if the development of Chinese science proceeded at the same, or even a higher, level as that of Europe in the period 1400–1800, why did no Industrial Revolution take place in China? Moreover, if one assesses the state of science and technology in traditional China in terms of the criteria mentioned above, it can be seen that science and technology in China do not meet the standards developed in Europe.
First, most Chinese scientific discoveries and technological innovations were not ‘contestable’, and, as will be discussed below, there was a lack of diversity in the institu-tions that may facilitate disputation and competition. Secondly, in traditional China there seem to be less effective conduits through which scientific discoveries could be transformed into technological innovations. Throughout Chinese history, there were many examples of scientific discoveries, but few were economically motivated or applied to technological improvements. As Eric Jones has argued, ‘Chinese experience reaffirms that the nexus between scientific discovery and technical advance was really quite weak’, and in his view China lacks ‘a sharp- edged experimental approach of the type that really may lead to better technologies’ (Jones 1988, 75). Thirdly and most importantly, even Needham himself admitted that there were barriers to the development of Chinese science, such as the Confucian approach to nature, the lack of an autonomous merchant class, and the entrenchment of the Ming (1368–1644) bureaucracy. Elvin (1973, 315) argued that the power within society that might encourage creativity and innovation was in the hands of conservative bureaucrats. Mokyr (1990, 233–236; 2002, 223) has pointed out that the state played an important role in the generation and diffusion of innovations in China before 1400, because the landed gentry and educated elites were not interested in these matters; when the support from the government withdrew, there was no replace-ment, and the innovations declined. There was a huge gap between the propositional knowledge embodied in educated elites, and craftsmen with prescriptive knowledge.7 Qian (1985) argued that China rarely provided the necessary ‘software’ (that is, political- ideological conditions) to sustain intellectual creativity and innovation and cultural pluralism, even though examples of ‘hardware’ (for example, paper, printing, gunpowder and the magnetic compass) appeared much earlier in China than in Europe. Qian used the term ‘inertia’ to describe the non- development of Chinese science.8
Furthermore, let us probe a little more into the argument that China has developed its own ‘modern science’. The idea that China has developed its own ‘modern science’ since the seventeenth century is often focused on the Chinese ‘investigation of things’ (gewu). This linkage was drawn by the Jesuits between gewu and European higher learn-ing, scientia,9 at the beginning of the seventeenth century (Elman 2005, 4). But if this
7 Compare the European situation: in Europe, engineers, inventors and merchants seldom belonged to the ruling class, and the situation was more or less similar to China. But the landed aristocracy did not resist new technology, as their interests were not harmed. See Mokyr (1990, 236–258). See also Qian (1985, 105).
8 For a discussion of the paradox for China between development and stagnation, see Deng (1999). 9 The earliest uses of the Latin scientia in more or less the sense of ‘science’ go back at least to the
REINERT_97817825444661_t.indb 126REINERT_97817825444661_t.indb 126 03/10/2016 11:3603/10/2016 11:36
Erik S. Reinert, Jayati Ghosh and Rainer Kattel - 9781782544661Downloaded from Elgar Online at 03/31/2017 12:04:16PM
via University College London

Chinese development thinking 127
linkage existed, it is then hard to explain why certain kinds of Western knowledge such as medicine, anatomy and physiology, mechanics, botany, agriculture and architecture were seldom transferred by the Jesuits to China. One possible reason is that there was hardly any demand in China for the transfer of certain kinds of knowledge. This indicates that the linkage may be quite weak, partly because of the ambiguity of the meaning of gewu. More importantly, this linkage ignores the cultural and institutional foundations (neglecting differing views on nature and its relations with humans) of scientia in Europe and gewu in China. The European system of knowledge was shaped by the interactions between Christianity and science: ‘Christianity set the agenda for natural philosophy in many respects and projected it forward in a way quite different from that of any other scientific culture’ (Gaukroger 2006, 3).10
In Europe, Aristotelianism was incorporated by Christianity and was extended to cos-mological inquiries in the Renaissance.11 But in China religion could not play the same role as Christianity, and in many respects Confucianism is not a religion at all. Chinese philosophy draws close to ethics. Although Confucianism absorbed certain elements of Daoism and Buddhism in the early stage of its development, it eventually became secular. Therefore in China there was no equivalent to the philosophy of science as found in the European context:
In China there was no single structure of rational knowledge that incorporated all the sciences. Knowing was an activity in which the rational operations of the intellect were not sharply disconnected from what we would call intuition, imagination, illumination, ecstasy, aesthetic perception, ethical commitment, or sensuous experience. The various sciences, unlike those of Europe, were neither circumscribed by the philosophies of their time nor subordinated to the-ology (which did not exist in East Asia) . . . There is an obvious contrast with the educational institutions of Europe, from Plato’s Academy and Aristotle’s Lyceum to the medieval and early modern universities, in which the natural sciences were kept subordinate to philosophy. (Sivin 1990, 169)
For the Chinese elites, knowledge that could be considered useful and practical should concern good order or solutions to social problems such as agriculture, military issues and medicine, which are also regarded as valuable to development. Many useful inven-tions were not diffused and were soon lost or forgotten. There was a cleavage between knowledge held by the elites and the knowledge held by technicians, craftsmen and common people. To borrow Professor Mark Elvin’s metaphor of branches and trunk of the tree to describe the system of useful knowledge, if intellectual culture is the tree, science, technology and other forms of useful knowledge are branches growing off the
twelfth century, with various adjectives including ‘experimental’, ‘natural’, ‘practical’ and ‘secular’ (see Latham 1965, 424). Thanks to Professor Mark Elvin for drawing my attention to this reference.
10 Gaukroger summarizes some Weberian approaches to stress the differences: the bureaucratic structure of Chinese society, adherence to tradition, tendency of self- effacement and avoidance of contentiousness, lack of adversarial model and corporate entities (Gaukroger 2006, 33–34). But Gaukroger (2006, 35) does not think that these are the core issues to explain the rise of a scientific culture in the West. He argues that ‘if we confine our attention to two issues – the existence of a neutral space for enquiry, and the role of an adversarial culture – we can glimpse the extent of the challenge’.
11 See, for example, Stark (2003), especially Chapter 2, ‘God’s Handiwork: The Religious Origins of Science’, pp. 121–200. See also Reinert and Daastøl (2004).
REINERT_97817825444661_t.indb 127REINERT_97817825444661_t.indb 127 03/10/2016 11:3603/10/2016 11:36
Erik S. Reinert, Jayati Ghosh and Rainer Kattel - 9781782544661Downloaded from Elgar Online at 03/31/2017 12:04:16PM
via University College London

128 Handbook of alternative theories of economic development
same cultural trunk rather than separate trees.12 Moreover, there is a hierarchy of the branches. Some branches were growing higher than ‘science’ and ‘technology’. Our task is to identify: what is the ‘cultural trunk’ that determined Chinese development thinking?
As discussed earlier in this chapter, Mokyr’s definition looks useful for an analysis of the importance of knowledge to the economic and industrial development of Europe. For him, useful knowledge helped to create the material culture and paved the way for the First Industrial Revolution, especially in Britain from 1700 to 1850. But Mokyr’s defini-tion of useful knowledge (setting aside the human mind and social institutions) may be too narrow to comprehend useful knowledge as conceived, valued and embraced by top- level elites in pre- modern China. They saw governance, education and the moral trans-formation of both individuals and society as the priority for their society and empire. What constituted the most useful knowledge in the thought of the Chinese top- level elites may be fundamentally different from that of their European counterparts; the Confucian elites characterized such knowledge as xiu qi zhi ping, namely, self- cultivation, family management, national administration and the maintenance of the whole social order.13
Thus a wholistic conception of useful knowledge is not universal. It is dependent upon or embedded in its cultural and institutional contexts. In the following discussion, I will examine the interplay between the Chinese conception of useful knowledge, namely, gewu zhizhi, and one important aspect of their development thinking, jingshi zhiyong.
USEFUL KNOWLEDGE IN CHINA: THE INSTITUTIONAL CONTEXT
Useful knowledge is embedded in or closely related to formal (or informal) institutions such as universities, academies, networks of intellectuals, libraries, markets, the legal system, the notion of trust, civil society, the publishing industry and the trade of books,14 and so on. Such observable institutions provide spatial and social sites for the genera-tion and diffusion of useful knowledge.15 I will now focus on the educational system as it operated in traditional China. This is an important institutional dimension within which to examine the kind of knowledge and the manner in which it was generated, shared, accessed and diffused.
In traditional China, education (jiao) was closely linked to governance (zheng). Education was established to sustain an ideal social order. Governance did not just mean governmental administration, but more importantly, it embodied a mission of ‘rectifying thought and regulating conduct’ (Liu 1988, 37–38). To fulfil the purpose of governance, education was not limited to teaching and schooling, but meant more broadly ‘instilling and perpetuating a moral standard of social order’ (Liu 1988, 38). Moreover, education
12 Elvin (2004, 56): ‘we have also to consider whether “science” and “technology” in this age [1600–1800] were more like branches growing off the same cultural trunk than separate trees’.
13 Knowledge on good governance is uniquely Chinese (xiu qi zhi ping). This was determined by China’s non- feudal tradition. Under European–Japanese feudalism, there was no special need for good governance. China was an empire, run by bureaucrats (not aristocrats) who had no ‘birth right’ to rule. So, good governance was vital for them to hold office. Thanks to Dr Kent Deng for raising this point.
14 See Xu (2013).15 See Inkster (2006).
REINERT_97817825444661_t.indb 128REINERT_97817825444661_t.indb 128 03/10/2016 11:3603/10/2016 11:36
Erik S. Reinert, Jayati Ghosh and Rainer Kattel - 9781782544661Downloaded from Elgar Online at 03/31/2017 12:04:16PM
via University College London

Chinese development thinking 129
helped in ‘transforming’ (hua), as shown in the compound jiao- hua (educating and trans-forming) (ibid.). Therefore, as Liu summarized, ‘the ideal of Confucianism as it evolved through the centuries was to fulfil all these functions – governing, educating, improving, and transforming individuals, society, and rulers’ (ibid.). The conception of useful knowl-edge in pre- modern China is thus closely related to how to govern, educate and transform both individuals and society.
The Tang was a time when the dominance of the medieval aristocracy of China came to an end. The Northern Song (AD 960–1127) marked the rise of meritocracy by the contin-uing development in the civil service examination system and bureaucratic government. The Southern Song (AD 1127–1279) also deserves special examination as it is the period in which neo- Confucianism became a powerful school of thought. Neo- Confucianism is often called the ‘Cheng- Zhu school’: Cheng refers to the Cheng brothers – Cheng Yi (1033–1107) and Cheng Hao (1032–1085), Northern Song intellectual ‘pioneers’; while Zhu refers to Zhu Xi (1130–1200), a Southern Song synthesizer of thought. The scope of neo- Confucianism is a matter of some debate. This chapter adopts the more narrow defi-nition, that is, neo- Confucianism which refers to the Zhu Xi school of thought, or lixue, also known as the school of principles. Generally speaking, li refers to the principles that give all things their form. But, again, there are differing understandings of the concept of li.16 Lixue was also called daoxue (the school of ‘the Way’) in the Northern dynasty. ‘Dao’ originates from Daoism (daojia), and its definition is fluid.17 To search for the li, a Confucian needs to examine himself inwardly so that he could further understand the outside world. Therefore, in the concept of li, as Nakayama (1973, 40) has argued, ‘moral issues and the law of nature remained undifferentiated; thus it played an inhibitory role in the development of the modern way of thinking’. Li or tianli (the principles of universal heaven, or heavenly principles) is thus not just a purely philosophical, abstract and meta-physical system but includes moral, social and political concerns.
The Song was a most developed bureaucratic state, and it pursued a policy of treat-ing its bureaucrats well (Liu 1988, 90). Officials were trained and selected by means of a system of civil service examinations. The method of selection was reformed in the Northern Song when anonymous examination procedures were introduced in order to promote fairness and suppression of nepotism in selecting officials. However, the new procedures were criticized by Confucians for not taking virtue into account. The critics argued that morality was ignored by students as they set their sights on examination success rather than pursuing ‘the Way’ (Chaffee 1995, 17). The Northern Song reform-ers advocated an empire- wide school system18 but were disappointed by the misconduct of the students, including a tendency to cheat in the exams. In contrast, Southern Song neo- Confucians emphasized self- cultivation and argued for a clear separation between education and examinations (Chaffee 1995, 17). The teaching of neo- Confucianism was through lectures, dialogues and discussions, and private teaching (especially in private
16 See Qian (1985, 117).17 Confucianism is not exclusive to other groups of thought and ideas, rather it has acquired ‘a host of
eclectic components’ that are practical and acceptable (Liu 1988, 39). Many elements of Buddhism and Taoism were absorbed by Confucianism.
18 In the late Northern Song, governmental schools spread to most prefectures and counties, and education was made more accessible. Landholding and the development of commerce provided the economic base for an increase in governmental schools. See Chaffee (1995, 16).
REINERT_97817825444661_t.indb 129REINERT_97817825444661_t.indb 129 03/10/2016 11:3603/10/2016 11:36
Erik S. Reinert, Jayati Ghosh and Rainer Kattel - 9781782544661Downloaded from Elgar Online at 03/31/2017 12:04:16PM
via University College London

130 Handbook of alternative theories of economic development
academies) which proliferated in the Southern Song, with an emphasis on self- cultivation rather than preparation for the exams.19 A proper curriculum was set out by a good master starting from the Confucian classics of the ‘Four Books’ (sishu) – the Great Learning (daxue), the Analects of Confucius (lunyu), the Mencius, and the Centrality and Commonality (zhongyong) (Liu 1988, 138–139).20 Nevertheless, neo- Confucianism was eventually incorporated into the state orthodoxy and thus become a rigid doctrine, espe-cially under the Ming (AD 1368–1644). Taken together, as Chaffee (1995, 142) argues, ‘the cultural unity created, in large part, by schools and examinations, was an important contributing factor to the political unity of late imperial China’. Nevertheless, that unity was one in which ‘the moral and natural realms were merged’ (ibid., 19).
In terms of curriculum provided by the public schools and especially for the purposes of the exams, there were differing views about the relative value of specialized expertise and general education, especially during the Song. In the Tang, the mainstay of the examination content was to be qualified as ‘metropolitan graduates’ (jinshi ke) which involved extensive study of the classics for the purpose of choosing officials, but the curriculum also included various specialized subjects such as legal knowledge (mingfa) as well as mathematics (suanxue) and medicine (yixue). However during the Song, spe-cialized subjects were virtually abolished (Song and Wang 1999, 312, 429). Among the debates over a curriculum for higher education there were two major schools of thought: Wang Anshi’s (1021–1086)21 utilitarianism, and the school of the principles led by Zhu Xi. The reforms of Wang Anshi in the Northern Song emphasized a detailed knowledge of institutions and economics. Practical subjects such as law, military affairs and medi-cine and, a little later, mathematics were added to the examinations. But Wang’s reforms failed, and the generalist approach to curriculum- setting prevailed, putting more weight on morality (Chaffee 1995, 19). The curriculum underwent important changes with the rise of neo- Confucianism (that is, the school of principles). The generalist style curricu-lum created uniformity not only in subjects to be learned but also in modes of thought, for example the attitudes toward authority such as classical texts. The Song educational system became a model for the institutional foundations for systems for the Yuan, Ming and Qing dynasties. For example, in the Yuan dynasty (AD 1271–1368), the regulations for the civil service examination in 1313 decreed that the answers to the Four Books were to follow the commentaries by Zhu Xi. Sishu Jizhu (Collected Annotations of the Four Books) (written by Zhu Xi) thus became the official reference for the candidates taking the civil- service examination. In the Ming, Zhu Xi’s version of neo- Confucianism was established as the orthodoxy by Ming emperors.
19 Although private academies were initially established in rural areas, the locus was gradually shifted to urban areas. Private academies were also incorporated by official schools, and the aim of teaching and learning was the preparation for state examinations.
20 They are all Confucian classics. Zhu Xi took the Great Learning and the Centrality and Commonality out of the Book of Rites and combined them with the Analects of Confucius and the Mencius as the ‘Four Books’. Zhu Xi suggested that the study should start from the Great Learning, and then follow the orders of the Analects of Confucius, the Mencius and the Centrality and Commonality.
21 Wang Anshi (1021–1086), chief councillor and reformer in the Northern Song dynasty.
REINERT_97817825444661_t.indb 130REINERT_97817825444661_t.indb 130 03/10/2016 11:3603/10/2016 11:36
Erik S. Reinert, Jayati Ghosh and Rainer Kattel - 9781782544661Downloaded from Elgar Online at 03/31/2017 12:04:16PM
via University College London
Chinese development thinking 131
DIFFERENT LEVELS OF USEFUL KNOWLEDGE: THE ROLE OF THE ELITES
Mokyr argued that ‘for better or for worse, the history of the growth of useful knowledge is the history of an elite: the number of people who augmented the sets of propositional and prescriptive knowledge is small’ (2002, 291). Elites are important as they are the agents who either promote or restrain the generation and diffusion of useful knowledge. In traditional China, the people who could be characterized as members of an elite were very diverse. Their status was closely related to the levels of education they had received and their success in examinations.22 Elites may include literati and gentry (shi), although there are no clear boundaries between the two.23 Literati mastered classical studies and held knowledge of lineage rituals. They were land- holding but did not necessarily hold official positions. Gentry enjoyed a Confucian education in the classics but also held power as governmental officials at local and central levels, usually through passing civil service examinations or by way of recommendations from senior officials. As such, gentry (also called scholar- officials) constituted the ruling class (Elman 2005, xxi; Liu 1988, 14). There were no clear boundaries between literati and gentry, but their social and cultural status was dependent on whether they passed the civil service examinations. From the Sui onwards, civil service examinations were gradually integrated into the elite culture. Although holding land secured the financial sources and paved the way for the preparation of examinations, it did not carry the same weight in access to political power, higher social status and prestige of learning (Liu 1988, 15). As gentry elites were both scholars and officials, their intellectual and political activities were intertwined (Liu 1988, 15). This also gives rise to the question regarding the definition of ‘intellectuals’ within the elite group. An intellectual had acquired a record of both outstanding scholarship and a governmental post. His concern for universal values of the state and society could exert profound influence on trends in thoughts and public affairs (Liu 1988, 15).
There was, moreover, a hierarchy within the elites. For example, if we consider lit-erati without official appointments to be the lowest- status group and the gentry to be an intermediate level in the group, then intellectuals were the top rank of the elites. Although different groups of elites all played important roles in education and acted as controllers and mediums for the transfer of knowledge,24 they might prefer and promote different forms of knowledge. For example, they often placed more weight on statecraft, while their emphasis on universal values often led them to downplay the specification in academic learning. They accordingly paid attention to agriculture, military affairs and medicine as well as mathematics and astronomy. Thus there was a hierarchy of knowl-edge in traditional China which corresponded to the hierarchy within the status of elites. Different forms of knowledge, however, did not necessarily exclude each other, because they were produced and located under an overarching institutional framework as dis-cussed in the previous section. Although different groups of thought did emerge from the orthodox Confucian way of thinking or the state ideology, they were all constrained by
22 Elites were also engaged in other diverse activities including poetry composition, art appreciation, philanthropy, the patronage of intellectual networks or associations, and local governance.
23 For a discussion of the literati or the gentry (shi), see, for example, Deng (1993, 18–28).24 See, for example, Deng (1993).
REINERT_97817825444661_t.indb 131REINERT_97817825444661_t.indb 131 03/10/2016 11:3603/10/2016 11:36
Erik S. Reinert, Jayati Ghosh and Rainer Kattel - 9781782544661Downloaded from Elgar Online at 03/31/2017 12:04:16PM
via University College London

132 Handbook of alternative theories of economic development
an entrenched institutional framework which was closely linked to the civil service exami-nations and bureaucracy. I will take the role played by Xu Guangqi (1562–1633) in the generation and diffusion of knowledge as an example, and compare it with the examples of other lower- status elites.
Xu was vice- president of the Board of Rites and stood at the top of the elite. In collab-oration with the Jesuits, such as Matteo Ricci (1552–1610), Xu translated many Western works on mathematics and astronomy into Chinese. He even converted to Christianity. Xu was the author of the Nongzheng quanshu (A complete treatise on agricultural administration)25 and the compiler and translator of the Taixi Shuifa (Water methods from the West; finished in 1612), written by Jesuit Sabbathinus de Ursis (Xiong Sanba). He came to advocate for ‘concrete studies’ (shixue26). Subjects such as agricultural admin-istration and water control were regarded by Xu as ‘concrete knowledge’ that could bring tangible general benefits. Western learning conveyed by the Jesuits was seen by Xu as solid learning, as the way it produced knowledge could be verified by proper methods. Xu’s own work on agricultural administration reflected his experimental attitude towards the accumulation of knowledge. But for Xu, subjects such as agriculture and water control were ‘useful’ because they were relevant to statecraft and could contribute to the welfare of the state and the livelihood of the people (guoji minsheng).27
One of the important ways through which the gentry contributed to the generation and transmission of useful knowledge in China was in the nongshu (treatise on agriculture),28 because the gentry treated agriculture as the root (nongben) of practical knowledge that could maintain the social order and promote development. The nongshu writing was (one kind) of statecraft writing, and top- level elites like Xu Guangxi wrote nongshu from the perspectives of public servants in order to instruct the administration of officials.29 That is why Xu’s Nongzheng quanshu received the patronage from the Chongzhen emperor (Chongzhen is the reign- title of the Ming emperor Zhu Youjian, r.1627–1644) who gave orders to print and disseminate the book (Bray and Métailié 2001, 355). We can compare the works of Xu with that of a lower- level learned man Song Yingxing (1587–1666?) in the Ming dynasty. Song became an ‘advanced scholar’ through examination at the county level but failed subsequent higher- level exams many times. At the age of 47, he eventu-ally became a minor official in the county in charge of education. Song’s work Tiangong kaiwu (The Exploitation of the Works of Nature) was first published in 1637 and included not only discussions of agriculture but also descriptions of important forms of commod-ity production including sugar, textiles, ceramics, salt, colas and various metals and pre-cious stones. In his work he stressed the importance of experiments in the investigation of things. However, unlike the Nongzheng quanshu and the Qimin yaoshu, the Tiangong kaiwu was not included in the Siku quanshu30 (the annotated catalogue of books in the
25 The writing of the Nongzheng quanshu was a group enterprise, as it was completed, revised and edited by young scholars after Xu’s death. See Bray and Métailié (2001, 323).
26 Shi could be translated into English as ‘solid’, ‘practical’ or ‘concrete’.27 For a discussion of Xu Guangqi see, for example, Jami et al. (2001).28 For a discussion of the nongshu see, for example, Deng (1993).29 Bray and Métailié (2001) made a distinction between writing nongshu as a public servant and as a private
landlord.30 The compilation of the Siku quanshu started in 1773 and lasted for ten years. It was the largest- scale
official book compilation in Chinese history.
REINERT_97817825444661_t.indb 132REINERT_97817825444661_t.indb 132 03/10/2016 11:3603/10/2016 11:36
Erik S. Reinert, Jayati Ghosh and Rainer Kattel - 9781782544661Downloaded from Elgar Online at 03/31/2017 12:04:16PM
via University College London

Chinese development thinking 133
comprehensive library in four classes) compiled by the order of the Qianlong emperor (r.1735–1796), and failed to be widely disseminated, and was subsequently lost.31
USEFUL KNOWLEDGE AND DEVELOPMENT: GEWU ZHIZHI AND JINGSHI ZHIYONG
Gewu zhizhi
Gewu zhizhi (investigating things and extending knowledge), an important concept in Confucian thought, is often regarded as the Chinese equivalent to ‘Western science’. In Western- style schools set up in the late Qing, subjects such as physics and chemistry were often called gezhi, a name derived from gewu zhizhi. However, the conception of gewu zhizhi transcends science and technology. To understand the meaning of gewu zhizhi cor-rectly it is necessary to trace its historical origins. The term gewu zhizhi originates from the Great Learning (daxue written c.500 BC) and is pregnant with complex meanings. The Great Learning was part of the Book of Rites (liji) and provides eight steps (bamu) for the cultivation of the elites according to classical ideals of higher education, each in turn a precondition to the next: investigating things (gewu); extending knowledge (zhizhi); making their thoughts sincere (chengyi); rectifying their mind (zhengxin); culti-vating the self (xiushen); regulating their families (qijia); governing the country (zhiguo); and making the whole social order tranquil and happy (pin tianxia) (Daxue, section 1 in Zhu Xi’s rearrangement of the text). Nothing in the Great Learning defines gewu. Once the concept was taken out of the Book of Rites and rearranged as one part of the Four Classics by Song neo- Confucians, the real meaning of gewu was subject to various explanations. It would be easy to fall into a trap by regarding gewu zhizhi as an equivalent to scientific investigation and a top priority in these eight sections and to ignore their interrelations and social and moral contexts. The book of Great Learning is a treatise in moral philosophy that includes and seems inseparable from reflection on nature and natural phenomena. For example, it says: ‘Things have their root and their branches, and affairs have their end and their beginning’ (wu you ben mo, shi you shi zhong), the root and the branches of things should follow the order of the mind (xin), the self (shen), the family (jia), the country (guo) and the whole social order (tianxia) with the mind as the foundation, while the beginning and end of affairs should follow the order of inves-tigation (ge), extension (zhi), sincerity (cheng), rectification (zheng), cultivation (xiu), regulation (qi) and governance (zhi), with maintenance (ping) and the tranquillity and happiness of the empire as the ultimate end. Thus we should read gewu by emphasizing its moral and social messages. The ultimate goal is to govern the empire and maintain the social order through cultivation of the self. Therefore within the eight steps, gewu is inferior to other steps and considered ‘the inferior study’ (xiaxue) by the top- level elites.32
Gewu included the studies of both natural phenomena and ethics. Principles are
31 In the 1920s China obtained copies of the book from Japan. Later the Beijing Library recovered the original copy from a private collection of books.
32 For example, even Xu Guangqi, who was deeply influenced by Western science, still considered Western science ‘the inferior study’ (xiaxue).
REINERT_97817825444661_t.indb 133REINERT_97817825444661_t.indb 133 03/10/2016 11:3603/10/2016 11:36
Erik S. Reinert, Jayati Ghosh and Rainer Kattel - 9781782544661Downloaded from Elgar Online at 03/31/2017 12:04:16PM
via University College London

134 Handbook of alternative theories of economic development
seen as the guidance for moral actions including the investigation of things as a kind of moral activity. But what ‘principles’ means seems quite obscure and abstract. Compared with moral principles, the study of natural phenomena looks less important (see Peterson 1975, 377; Graham 1958, 79). For Zhu Xi, intellectual learning and self- cultivation should be combined; that is, an integrity of ‘abiding the reverence’ (jujing) and ‘searching for the principles’ (qiongli) (see also Peterson 1975, 14). Thus knowledge should be socially relevant, and his commentary became the orthodox interpretation of gewu.
Jingshi zhiyong
The school of evidential research (kaozheng xue) that was pioneered by Gu Yanwu (1613–1682) and others in the early Qing flourished in the Qianlong (r.1735–1796) and Jiaqing (r.1796–1820) periods, especially in the Jiangnan region (including areas such as Suzhou Changshu, Songjiang, Wuxi and Zhejiang). Fang and Gu shared the view that knowledge of the world could be carefully and impartially observed and verified by (textual or historical) evidence. For Gu and other scholars involved in the school of evi-dential study, ‘things’ (wu) are understood primarily as human affairs rather than physical objects and natural phenomena. For them, useful knowledge really meant statecraft or knowledge that could be useful for a properly governed empire. To pursue such knowl-edge, the school of evidential study devoted itself to the historical and textual studies (see also Peterson 1975, 400–401).
Thus there were two major areas where scholars involved in the evidential research movement could conduct their objective investigations: the natural phenomena, and textual and historical documents related to human affairs and society. If research had been done in both areas, the new research scholarship in the seventeenth century might have been transformed into ‘modern science’. But for several reasons this did not happen. First of all, one needs to consider the whole intellectual environment in that period. The knowledge system as well as the development thinking in the late Ming and early Qing could be characterized as jingshi zhiyong: that is to say, its primary concern was to govern the world through the study of the classics. Trying to reconstruct ‘true knowledge’ or sagehood that was thought to be lost or distorted for centuries, scholars delved into the study of subjects included philology, epigraphy and palaeography. This brings us back to the texts of the Song dynasty, which advocated the study of the practical issues related to society, politics and economy through the exegeses of the classics so as to achieve the aims of social reform. For example, Lü Zuqian (1137–1181) in the school of Jinhua had emphasized the study of classics and history (jingshi) in order to solve practical social problems. The Southern Song scholar Ye Shi (1150–1223) and other scholars in the school of Yongjia had argued that jingshi zhiyong should be combined with utilitarian-ism. They also argued that the state should pay attention to commerce. The study of jinshi zhiyong achieved its prominence in the late Ming and early Qing. The pioneers in this study included Gu Yanwu and Huang Zongxi (1610–1695). Their research areas included politics, economy, military affairs, law, geography and local custom as well as natural phenomena. But they accorded the highest priority to statecraft within a frame-work of political ethics, and their ultimate goal was to find a proper social order and governmental format to benefit the national welfare and the people’s livelihood. That is
REINERT_97817825444661_t.indb 134REINERT_97817825444661_t.indb 134 03/10/2016 11:3603/10/2016 11:36
Erik S. Reinert, Jayati Ghosh and Rainer Kattel - 9781782544661Downloaded from Elgar Online at 03/31/2017 12:04:16PM
via University College London

Chinese development thinking 135
why the knowledge of construction and expansion of canals, irrigation works and public granaries became so important for them.
CONCLUDING REMARKS
This chapter has attempted to show that the forces which decided whether knowledge was useful or certain kinds of knowledge were more useful than others and diffused more smoothly lay in the institutional and cultural spheres. For the Chinese top- level elites, useful knowledge really referred to knowledge that was practical and morally, socially and even politically relevant, and that would bring general benefits to the welfare of the state and the livelihood of the people. For the Chinese elites disciplines that could be charac-terized as ‘useful knowledge’, such as astronomy, hydraulics, mathematics and geography, really meant techniques of statecraft, which are fundamental to development.
REFERENCES
Bray, Francesca and Georges Métailié. 2001. ‘Who was the Author of the Nongzheng quanshu?’, in Catherine Jami et al. (eds), Statecraft and Intellectual Renewal in Late Ming China: The Cross- Cultural Synthesis of Xu Guangqi (1562–1633). Leiden: Brill, 322–359.
Chaffee, John W. 1995. The Thorny Gates of Learning in Sung China: A Social History of Examinations. Albany, NY: State University of New York Press.
Deng Gang. 1993. Development versus Stagnation: Technological Continuity and Agricultural Progress in Pre- Modern China. Westport, CT, USA and London, UK: Greenwood Press.
Deng Gang. 1999. The Premodern Chinese Economy: Structure Equilibrium and Capitalist Sterility. London: Routledge.
Elman, Benjamin A. 2005. On Their Own Terms: Science in China, 1550–1900. Cambridge, MA: Harvard University Press.
Elman, Benjamin A. 2006. A Cultural History of Modern Science in China. Cambridge, MA: Harvard University Press.
Elvin, Mark. 1973. The Pattern of the Chinese Past: A Social and Economic Interpretation. Stanford, CA: Stanford University Press.
Elvin, Mark. 2004. ‘Some Reflections on the Use of “Styles of Scientific Thinking” to Disaggregate and Sharpen Comparisons between China and Europe from Song to Mid- Qing Times (960–1850CE)’, History of Technology 25, 53–103.
Gaukroger, Stephen. 2006. The Emergence of a Scientific Culture: Science and the Shaping of Modernity 1210–1685. Oxford: Clarendon Press.
Graham, A.C. 1958. Two Chinese Philosophers: Cheng Ming- tao and Cheng Yi- chuang. Lund: Lund Humphries.
Inkster, Ian. 2006. ‘Potentially Global: “Useful and Reliable Knowledge” and Material Progress in Europe, 1474–1914’, International History Review 28(2), 237–286.
Jami, Catherine, Peter Engelfriet and Gregory Blue (eds). 2001. Statecraft and Intellectual Renewal in Late Ming China: The Cross- Cultural Synthesis of Xu Guangqi (1562–1633). Leiden: Brill.
Jones, E.L. 1988. Growth Recurring: Economic Change in World History. Oxford: Clarendon Press.Jones, E.L. 2003. The European Miracle: Environments, Economics and Geopolitics in the History of Europe and
Asia, 3rd edn. Cambridge: Cambridge University Press.Landes, S. David. 1998. The Wealth and Poverty of Nations: Why Some Are So Rich and Some So Poor. London:
W.W. Norton & Company.Latham, R.E. 1965. Revised Medieval Latin Word- List from British and Irish Sources. Oxford: Oxford
University Press, for the British Academy.Liu, James T.C. 1988. China Turning Inward: Intellectual- Political Changes in the Early Twelfth Century.
Cambridge, MA: Harvard University Press.Mokyr, Joel. 1990. The Lever of Riches: Technological Creativity and Economic Progress. Oxford: Oxford
University Press.
REINERT_97817825444661_t.indb 135REINERT_97817825444661_t.indb 135 03/10/2016 11:3603/10/2016 11:36
Erik S. Reinert, Jayati Ghosh and Rainer Kattel - 9781782544661Downloaded from Elgar Online at 03/31/2017 12:04:16PM
via University College London

136 Handbook of alternative theories of economic development
Mokyr, Joel. 2002. Gifts of Athena: Historical Origins of the Knowledge Economy. Princeton, NJ: Princeton University Press.
Mokyr, Joel. 2009. The Enlightened Economy: An Economic History of Britain 1700–1850. New Haven, CT, USA and London, UK: Yale University Press.
Nakayama, S. 1973. ‘Joseph Needham, Organic Philosopher’, in S. Nakayama and N. Sivin (eds), Chinese Science: Explorations of An Ancient Tradition. Cambridge, MA: MIT Press, 23–43.
Needham, Joseph. 1969. The Grand Titration: Science and Society in East and West. London: Allen & Unwin.North, Douglass C. and Robert Paul Thomas. 1973. The Rise of the Western World: A New Economic History.
Cambridge: Cambridge University Press.Peterson, Willard J. 1975. ‘Fang I- chih: Western Learning and the “Investigation of Things”’, in W. Theodore
De Bary (ed.), The Unfolding of Neo- Confucianism. New York: Columbia University Press, 369–412.Pomeranz, Kenneth. 2000. The Great Divergence: China, Europe, and the Making of the Modern World
Economy. Princeton, NJ: Princeton University Press.Qian Wenyuan. 1985. The Great Inertia: Scientific Stagnation in Traditional China. London: Croom Helm.Reinert, Erik S. and Arno M. Daastøl. 1997. ‘Exploring the Genesis of Economic Innovations: The Religious
Gestalt- Switch and the Duty to Invent as Preconditions for Economic Growth’, European Journal of Law and Economics 4, 233–283.
Reinert, Erik S. and Arno M. Daastøl. 2004. ‘The Other Canon: The History of Renaissance Economics’, in Erik S. Reinert (ed.), Globalisation, Economic Development and Inequality: An Alternative Perspective. Cheltenham, UK and Northampton, MA, USA: Edward Elgar, 21–70.
Sivin, Nathan. 1984. ‘Why the Scientific Revolution Did not Take Place in China – or Didn’t it?’, in E. Mendelsohn (ed.), Transformation and Tradition in Sciences. New York: Cambridge University Press, 531–554.
Sivin, Nathan. 1990. ‘Science and Medicine in Chinese History’, in P.S. Ropp (ed.), The Heritage of China: Contemporary Perspectives on Chinese Civilization. Berkeley, CA: University of California Press, 164–196.
Song Dachuan and Wang Jianjun. 1999. Zhongguo jiaoyu tongshi: di er juan Wei Jin Nanbei chao Sui Tang 220–960AD (The general history of the Chinese institutions of education: Vol. 2 Wei Jin Nanbei chao Sui Tang AD 220–960). Jinan: Shandong jiaoyu chuban she.
Stark, Rodney. 2003. For The Glory of God: How Monotheism Led to Reformations, Science, Witch- Hunts, and the End of Slavery. Princeton, NJ: Princeton University Press.
Wong, R. Bin. 1997. China Transformed: Historical Change and Limits of European Experience. Ithaca, NY: Cornell University Press.
Xu, Ting. 2013. ‘Knowledge Formation and the Great Divergence between China and Europe: Manuscripts and Printed Books, ca. 581–1840’, Journal of Comparative Asian Development 12(2), 245–284.
REINERT_97817825444661_t.indb 136REINERT_97817825444661_t.indb 136 03/10/2016 11:3603/10/2016 11:36
Erik S. Reinert, Jayati Ghosh and Rainer Kattel - 9781782544661Downloaded from Elgar Online at 03/31/2017 12:04:16PM
via University College London

137
7. The economic cycle of Imperial China and its developmentXuan Zhao
Imperial China is known to have been the most prosperous, well- organized, advanced and innovative economy in the world. However, starting more or less from the Age of Discovery and Renaissance, Western Europe gradually caught up on China. The essence of this catching- up process is that Imperial China failed to generate a modern economy, and consequently fell behind. This chapter discusses one of the internal reasons for this failure: the conflict between the basic principles according to which Imperial China was organized and the real economic situation caused a certain economic attitude and a certain way of economic management of the empire which led to cyclical crisis in the empire’s economy, unstable agriculture and underinvestment in crucial sectors in the modern economy, namely manufacturing and commerce.
THE PRINCIPLE OF IMPERIAL CHINA AND ITS ECONOMIC ATTITUDES
The basic political principle of Imperial China was established by the practice of the first two imperial dynasties (221 BC to AD 8), which could be regarded as ‘the First Empire of China’, and henceforth the imperial system was accepted by the Chinese people over the following nearly 2000 years as an ideal approach to organize their country politically (Huang 2008, 42–43; Loewe 1986, 103–110). The most important feature of the Chinese imperial principle lay in unification and centralization.1 The whole country should be unified, and all of the power within the country should be centralized on the emperor himself, so that the peace could be maintained and order established. When Mencius, the secondary sage in Confucianism, was asked ‘How can the kingdom be settled?’, his answer was, ‘It will be settled by being united under one sway’ (Mencius 2010, 9–10).
According to the principle of Imperial China, ‘Heaven’ and ‘Heaven’s Law’ is regarded as the source of all legitimacy. The agent of Heaven is ‘the Son of Heaven’, namely, the Chinese Emperor. The duty of the emperor is to obey and execute Heaven’s Law to govern the people. There was no such thing as ‘international’ affairs in the mind of the people of Imperial China. All the political bodies under Heaven, namely in the land known to the Imperial Chinese people, should be unified and centralized by the Son of Heaven. At the very least, they should ritually respect the supremacy of the emperor.
The burden of that sacred duty on the emperor’s shoulders needed a large number of assistants, in the form of public servants who in Imperial China were to represent the
1 On the following interpretation on the principles of Imperial China, see Lv (2005, 262–284), Yi (2007, 59–106) and Tao (1948, 56–59).
REINERT_97817825444661_t.indb 137REINERT_97817825444661_t.indb 137 03/10/2016 11:3603/10/2016 11:36
Erik S. Reinert, Jayati Ghosh and Rainer Kattel - 9781782544661Downloaded from Elgar Online at 03/31/2017 12:04:16PM
via University College London

138 Handbook of alternative theories of economic development
emperor in regional and local areas. There was no such concept as ‘local government’ in Imperial China. All the land in the empire should be, directly or indirectly, under the rule of the emperor and his central government. All the officials holding local and regional power should only be the representatives, agents and executors of the emperor. No region had the right to decide its own affairs by itself.
The metaphor of the relationship between emperor and people is shepherd and sheep. The emperor and his assistants use Heaven’s Law to ‘herd’ (literally the word used in China) the people. The duty of the emperor and his assistants is to cherish the people, to civilize them, to bring them peace and security. The duty of the people is to respect and obey the emperor’s authority, to pay taxes and fulfill their duties, accepting educa-tion and civilization from the emperor. Imperial China’s taxonomy of its people had four categories of occupation: the scholar, the farmer, the artisan and the merchant. The sequence reveals the status of these four kinds of people in the empire. The scholars are educated by Heaven’s Law and qualified to be assistants to the emperor, so they are the most important. The farmers produce food, which is the most important good satisfying people’s paramount demand in an agricultural society, so they hold the second place. Artisans can produce the tools and necessities, but can also produce luxury goods which are not of much practical use for the empire, so they are less important than the farmers. The least respectable occupation is that of the merchants, because they produce nothing but just buy cheap and sell dear to make profit for themselves. The attitudes of the empire towards all four kinds of people also differed. The scholars were granted the highest repu-tation and social status. The farmers were regarded as the source of national wealth, and lived under the protection and the promotion of the state. The artisans had always been directly controlled by the state for most of the history of Imperial China, and artisan identity was hereditary. The merchants were the most ill- reputed; regarded as parasites of society, they forever suffered the oppression of the state.
This is the principle of Imperial China. It regulates the relation between emperor and public servants, central government and local government, government and the people. The principle aims at centralizing all political power, from the people to the government, from local to central government, from the public servants to the emperor.
The principle of Imperial China provided the answers as to how to organize an ideal empire and establish its legitimacy. And the principle was observed continuously throughout the history of Imperial China. There were deviations from the principle over history, but the principle limited the degree of deviation and always sought to restore the situation. The principle guided the emperors and their assistants in organizing the empire in every aspect, and so extended to the different aspects of society: political, economic and ideological.
In order to realize the emperor’s full control over society, the national economy was to be maintained in a certain form as the economic basis of the empire. This entailed certain approaches, comprising three basic principles.
First, one of the most fundamental economic principles of Imperial China is ‘stressing agriculture and restraining commerce’.2 This principle was generated in the organizing
2 On the interpretation of this principle, see Lv (2005, 38–66), Fu (1980, 608–668), Zhang (1988) and Zeng (1983).
REINERT_97817825444661_t.indb 138REINERT_97817825444661_t.indb 138 03/10/2016 11:3603/10/2016 11:36
Erik S. Reinert, Jayati Ghosh and Rainer Kattel - 9781782544661Downloaded from Elgar Online at 03/31/2017 12:04:16PM
via University College London

The economic cycle of Imperial China 139
principle of the First Empire of China, the aim being to establish ‘a static agrarian economy resting on the work of a contented and settled peasantry, undisturbed by the movements of profit- seeking merchants and producers’ (Bodde 1986, 38). And this prin-ciple gained ‘a dominant place in later Chinese society’ (ibid.). The principle of Imperial China implies that the emperor and his government should take on full- scale control of the society. Therefore the social and economic structure must be as stabilized as far as possible. Otherwise accidents beyond the emperor’s control would occur and shake the supremacy of the emperor and his centralized, unified political structure. Thus, the static, isolated and settled small- peasant economy, practically dispensing with market exchange and the possibility of development, was embraced as the fundament of the country. In comparison, commerce and manufacturing, the latter either affiliated to the commerce sector or owned by the state, would bring mobility to the population and the chance of change in the economic structure, and were naturally regarded as antagonistic towards the emperor’s rule. Thus private businessmen were treated with hostility by the govern-ment throughout the history of Imperial China, private commerce and the manufactur-ing sector being rigidly supervised and controlled by the state.
Second, another approach shown by Imperial China towards the economy was hos-tility towards any kind of concentration of wealth in the hands of people beyond the control of the emperor. No matter how wealthy the people might be, they should never be a threat to the emperor himself. Nevertheless, concentration of wealth in the hands of the people formed a source of economic power beyond the emperor’s control, empowering the wealthy to challenge representatives of the authority of the emperor at the regional or local level, or in the certain areas of society, such as control of the market price. Thus the individuals and clans that possessed enough wealth to influence the authority of the government were regarded as enemies of the empire. In the second century BC, the Emperor Wu of Han, one of the greatest emperors in Chinese history, forced the clans that had become rich and high- handed to emigrate from their homeland in order to ‘eliminate the potential hazard’, being seen as ‘disturbing the order among the common people’ (Ban 1997, 2802). In the mid- eleventh century, Wang Anshi, one of the most influential economic reformers in Imperial Chinese history, regarded the bourgeois who possessed enough wealth to manipulate market, prices and interest rate as competitors of the emperor in controlling the people, usurping control over the economy from the state (Wang 1959, 114). In the late fourteenth century, the Emperor Hongwu, the found-ing father of the Ming Dynasty (1368–1644 AD), ‘frequently issued policies to subsidize the poor but restrict the rich’, in order to ‘punish those despotic rich men who oppressed the poor at the end of the last dynasty’ (Zhang 1974,1880). Restricting the concentration of wealth in the hands of the people was another economic principle of Imperial China which lasted throughout the history of the empire. However, an important point here is that imperial disfavor fell only on the rich who had acquired their wealth by themselves, and not through the grace of the emperor. Actually, in Imperial China the emperor was always willing to grant large amounts of wealth to his family members, his meritorious statesmen, and other people he trusted and liked, who thus became ramifications of his power and wealth rather than a threat.
Third, another important economic principle in Imperial China was egalitarianism, an important aspect of Confucianism. Confucianism aimed at equal economic status among the people so that they could benefit from fair shares in the national economy, and sought
REINERT_97817825444661_t.indb 139REINERT_97817825444661_t.indb 139 03/10/2016 11:3603/10/2016 11:36
Erik S. Reinert, Jayati Ghosh and Rainer Kattel - 9781782544661Downloaded from Elgar Online at 03/31/2017 12:04:16PM
via University College London

140 Handbook of alternative theories of economic development
to avoid economic exploitation and excessive gaps between the rich and the poor, so as to eliminate social conflict and injustice. Mencius regarded the fact that ‘the rich men’s dogs and swine eat the food of men, and the government takes no restrictive measures’ as a failure of governance (Mencius 2010, 5–7). The Confucians in Imperial China ‘aimed at restricting the bourgeois and the exploiters to relieve the common people and the poor, or restoring the egalitarian land distribution system of ancient times, the ideal being that all should enjoy economic welfare equally’ (Ma 1986, 34). History teaches us that the egalitarianism in Confucianism did not effectively close the gap between the poor and the rich, but it provided a protective umbrella and legitimized policies restricting the concentration of wealth and commerce likely to generate economic gaps and excessive enrichment.
The principles and economic attitudes of Imperial China defined an ideal economic system: the small- peasant economy equipped with iron tools and draught animals but still relying on physical labor. The small farmers should be self- sufficient. They should till on their own small plots of land and work in their homes to satisfy their demand for food and simple manufactured goods, so the productivity of the economy should be neither too low nor too high: excessively low productivity could not sustain the cost of organ-izing a large empire; excessively high productivity would lead the situation out of control; productivity should be stabilized on the criterion that apart from working hours in tillage, the small farmers only had time for domestic manufacture. The independent artisans and craftsmen should only respond to the demand of the government: public buildings, cer-emonies and defense. Market trade and businesses should be kept at the lowest possible level. Thus, in the social pyramid structure of this economy, below the emperor and his public servants there were countless scattered, basically homogeneous and self- sufficient small farmers whose economic conditions were actually very fragile, and who needed the protection and help of the state for operations like creating public irrigation systems and providing social relief to live through bad harvests, but without any resources or reasons to oppose or encroach upon the authority of the emperor and his local representatives.
However, although the organizers of the empire had a very clear blueprint of the kind of national economy they wanted, it was impossible for them to crystalize the national economy in a certain form. The economy had its own internal dynamics, and the real economic situation facing Imperial China always exceeded the designs of the organizers. As the economy developed, polarization always occurred between the landowners and the small farmers. Some farmers were bankrupted and became tenants or were driven to flight, while others lived in poverty and had to rely on rural usury to survive; on the other hand, some took over extensive plots of land and made a living on rent and usury. Growth in manufacturing and commerce always enriched the businessmen and bourgeois, increasing the scale and power of commercial capital beyond the control of the empire. Thus the internal dynamics of the national economy always led to conflict between the real economic situation and the ideal economic basis of the empire, in turn forcing the imperial government to take steps to draw the economic situation back to the ideal status. Interaction between the imperial government and the national economy led to crisis in agricultural production, manufacturing and commerce, reflecting the rise and fall of different dynasties.
REINERT_97817825444661_t.indb 140REINERT_97817825444661_t.indb 140 03/10/2016 11:3603/10/2016 11:36
Erik S. Reinert, Jayati Ghosh and Rainer Kattel - 9781782544661Downloaded from Elgar Online at 03/31/2017 12:04:16PM
via University College London

The economic cycle of Imperial China 141
THE AGRICULTURAL CRISIS CYCLE
Dynasties would emerge from wars and chaos when agriculture production was in depression: vast areas of land were deserted, the farmers exiled, the large estates broken up and production interrupted, the population decreasing. The founding fathers of a dynasty would then take steps to restore the economic basis of the empire: the impe-rial government would distribute deserted arable lands, lands whose ownership became unclear in times of chaos, to the farmers and the refugees to form a small peasant economy. For example, at the beginning of the Second Empire of China (as from the late sixth century AD), the empire applied the ‘ Equal Land Allocation System’ aiming at ‘maximum use of land and level of peasant productivity by making generous grants of land to the peasants, while imposing limits on the excessive accumulation of property in individual hands’ (Twitchett 1979, 24–25); the government would reward land reclama-tion and good harvests to promote production, as in the early days of the First Empire (Ban 1997, 1127–1135). In this process, the empire would restrict the landlords’ occupa-tion of land to form the ideal economic base, with reconstruction of the small peasant economy.
As time went by, the peace and security of the unified empire, the agricultural promo-tion policies and exemption from land annexation and rural usury led the small peasant economy to its golden age: the population increased, the small farmers were generally well off, extensive arable lands were reclaimed, the water conservancy facilities were well main-tained and functioned fully, and wealth was continuously generated by small farmers for the empire, which also enjoyed a golden age. The prosperous economy formed a solid and abun-dant tax base and source of soldiers for the empire. This stage would see full realization of the principles of Imperial China: the Chinese emperor enjoyed supremacy under ‘Heaven’, in both domestic and external diplomacy. At home, the emperor could apply effective meas-ures to maintain his political authority and the economic base of his empire; diplomatically, he could gain territory, conquer barbarian enemies and subdue the dependent countries.
However, this golden age could not last forever. When the empire had to impose heavy tax burdens on the farmers, or natural disasters occurred, the rudimentary small farm economy would show its fragility. When the small farmers could no longer afford the cost of living, taxes and reproduction, they had to borrow from the rich farmers, land-lords or the rural bourgeois. Often they would be ‘entrapped in a spiral of debt’, and ‘ultimately had to dispose of their land’, so ‘land sold in this way came into the hands of local wealthy people, merchants or usurers’ (Sadao 1986, 557). Besides, the emperors usually granted land to meritorious statesmen, nobles and royal clans. The emperors were averse to anything beyond their control, but were always willing to lavish wealth on the people they controlled, creating a class of landlords who would take the advantage of the emperors’ trust to plunder the land and wealth of the small farmers. For example, under the rule of Emperor Xiao of Ming (1487–1505), the princes and nobles occu-pied more than 13 percent of the arable land of the empire (Wu 1987, Part 2, 196). In contrast, conditions for the small farmers would inevitably deteriorate, with the prospect of being tenants working for the landlords, or refugees, or bandits fighting landlords
REINERT_97817825444661_t.indb 141REINERT_97817825444661_t.indb 141 03/10/2016 11:3603/10/2016 11:36
Erik S. Reinert, Jayati Ghosh and Rainer Kattel - 9781782544661Downloaded from Elgar Online at 03/31/2017 12:04:16PM
via University College London

142 Handbook of alternative theories of economic development
and government.3 As will be seen later, manufacturing and commerce were no refuge for the farmers.
This deterioration in the small peasant economy had serious consequences: first, the state finance would be impaired, for the small farmers constituted the major tax base; second, the national economy would be depressed, for the deterioration suffered by the small farmers affected not only the living conditions of most of the population, but also agricultural production in general: land would be deserted, the water conservancy facilities abandoned, weakening the very foundations of agriculture. Third, social unrest would weigh heavy on the empire, tending to develop into peasant war, ultimately spelling doom for the dynasties.
Hopeful emperors and their patriotic assistants in some dynasties would then try to launch reforms to save their rule, taking the weight off the backs of the small farmers, restricting land annexation and restoring the small peasant economy. However, the reforms seldom worked. For example, Huang Zongxi, a famous Chinese scholar in the seventeenth century, concluded that in Chinese history, although every tax reform in every dynasty aimed to reduce the tax burden on small peasants, it ultimately increased (Huang 1985, Vol. 1, 26–29). Thus reform simply prolonged the death throes of the dynasty and the whole economy. With a severely depressed national economy, the impe-rial government lost revenue and became paralyzed; the desperate peasants were forced to rise up; the landlords and bourgeois sealed their wallets, and the weak empire fell prey to foreign barbarians. Ultimately the dynasty collapsed, chaos and war returned, until unification was achieved by another ‘Son of Heaven’, a new dynasty established, the small peasant economy restored and the empire’s life cycle renewed. This is the typical agricultural crisis cycle, outlined in Table 7.1.
Every dynasty of the Chinese empire shows such agricultural and governance crisis cycles, as Table 7.2 illustrates.
THE CYCLE OF CRISIS IN MANUFACTURING AND COMMERCE
As mentioned above, Imperial China had always opposed privately owned commerce and manufacturing since development in those sectors would bring mobility to the popula-tion and change to the economic structure, while catalyzing concentrations of wealth.
Imperial China had seen three manufacturing systems: state- run, private- run and household- run.4 State- run manufacturing had started long before China became an empire, private- run manufacturing coming later. Every dynasty in Imperial China had specific government agencies in charge of managing fabricating production and the arti-sans. The products of state- run manufacturing fell into two categories: the first mainly served the needs of the state in ceremony, defense, administration and the royal family’s
3 One Minister of Penalty in eleventh- century China found 70 percent to 80 percent of criminals put to death were bandits, and according to his investigation, the bandits normally came from the bankrupted farmers. See Li (1985, 4243).
4 See Lv (2005, 38–66) and Zhao and Chen (1991, 249–297).
REINERT_97817825444661_t.indb 142REINERT_97817825444661_t.indb 142 03/10/2016 11:3603/10/2016 11:36
Erik S. Reinert, Jayati Ghosh and Rainer Kattel - 9781782544661Downloaded from Elgar Online at 03/31/2017 12:04:16PM
via University College London

The economic cycle of Imperial China 143
consumption; the second comprised state monopoly staples: iron, copper, white alum, liquor, tea and cooking salt, although the range changed slightly between dynasties.
Household- run manufacture was common throughout the history of the empire. ‘Men plough and women weave’ was a fundamental tenet (Brook 1998, 638–645). The technol-ogy was mainly manual, thus the capital input was affordable for small peasants. The products, mainly textiles, were for self- consumption and paying in- kind tax. There was occasional and scattered market exchange of these home- made products.
Private- run manufacturing was established by craftsmen or the merchants. The pro-duction was market- oriented and concentrated in urban areas. The empire did not favor its development: it elbowed private manufacturing out of the industries monopolized by the state, and occasionally plundered it. Thus the manufacturers tended either to worm their way into becoming chartered agents of the empire in manufacture and commerce, or to quit the sector once they had earned enough money to be landlords or usurers.
Table 7.1 The classical pattern of the empire’s agricultural crisis cycle
Stages of cycle
Reconstruction The golden age Crisis Reform Collapse
Situation 1. Establishment of a new dynasty
2. End of chaos and war, start of peace and unification
3. Start of recovery of national economy
4. Start of reconstruction of small peasant economy
1. Prosperous small peasant economy
2. Full implementation of the principles of Imperial China
3. Apex of the emperor’s authority and expansion of the empire
1. Deterioration in the small farmers’ economic conditions.
2. Land annexation and rural usury
3. Rise of landlord economy
4. Deterioration of state finance
1. Fiscal crisis2. Depression
of the small peasant economy
3. Social unrest
1. Fiscal crisis2. Peasant war3. Foreign
Invasion4. Warlordism5. Paralyzed
emperor and imperial government
6. Overall crisis in the national economy
Policies 1. Fair redistribution of land
2. Tax reduction and other policies encouraging recovery of the small peasant economy
1. Consolidation of the small peasant economy
2. Expenditure on expansion of the empire
Normally no effective
reaction to the crisis
Reforms aimed at
relieving small farmers: new taxation system, restriction on land annexation and usury
1. Old dynasty collapse
2. Competition for the new ‘Son of Heaven’
Sources: Ban (1997, 1117–1148), Song (1975, 1341–1364), Toqto’a and Alutu (1977, 4155–4195, 4347–4373), Zhang (1974 [1880], 1877–1913), Zhao (1977, 3479–3563), Ma (1986, 27–67), Li (1985), Huang (2008), Twitchett and Fairbank (1986, Vol. 1, 551–574, 608–626), Twitchett (1979, Vol. 3, Part 1), Twitchett and Fairbank (2009, Vol. 5, Part 1), Twitchett and Fairbank (1998, Vol. 8, Part 2, 417–578), Wu (1987), Cao (1989) and Hou (2005).
REINERT_97817825444661_t.indb 143REINERT_97817825444661_t.indb 143 03/10/2016 11:3603/10/2016 11:36
Erik S. Reinert, Jayati Ghosh and Rainer Kattel - 9781782544661Downloaded from Elgar Online at 03/31/2017 12:04:16PM
via University College London

144
Tabl
e 7.
2 E
mpi
re’s
cycl
e in
agr
icul
ture
Stag
es o
f C
ycle
Rec
onst
ruct
ion
The
gol
den
age
Cris
is R
efor
mC
olla
pse
Qin
(221
–207
BC
)Q
in, t
he fi
rst d
ynas
ty, u
nifie
d C
hina
und
er a
cen
tral
ized
abs
olut
e m
onar
chy.
Des
pite
its s
hort
rule,
its s
mal
l pea
sant
eco
nom
y cy
cle
star
ted
befo
re th
e un
ifica
tion
of C
hina
. It e
stab
lishe
d th
is ec
onom
y an
d el
imin
ated
larg
e fe
udal
est
ates
dur
ing
the
radi
cal r
efor
m o
f 35
9–33
8 B
C, e
xpro
pria
ting
land
from
the
feud
al a
risto
crac
ies a
nd c
rimin
als a
nd d
istrib
utin
g it
to th
e pe
ople
acc
ordi
ng to
thei
r mili
tary
mer
it or
ac
hiev
emen
t in
tilla
ge. C
ompu
lsory
nat
iona
l mili
tary
serv
ice
was
intr
oduc
ed. 3
38–2
21 B
C w
as th
e go
lden
age
of
Qin
. It c
onqu
ered
all
the
othe
r kin
gdom
s in
Chi
na a
nd e
stab
lishe
d th
e un
ified
em
pire
in 2
21 B
C. T
hen,
due
to th
e he
avy
toll
the
war
aga
inst
Hun
took
on
the
farm
ers,
cons
truc
tion
of th
e G
reat
Wal
l and
oth
er w
orks
, and
insu
bord
inat
ion
amon
g th
e no
bles
of
the
king
dom
s con
quer
ed b
y Q
in, t
he d
ynas
ty w
as
over
turn
ed b
y pe
asan
t war
and
rebe
llion
by
the
nobl
es o
f fo
rmer
kin
gdom
s.
Form
er H
an(2
02 B
C –
A
D 2
4)
1. E
cono
mic
reco
very
aft
er th
e pe
asan
t war
.2.
Res
tora
tion
of th
e sm
all
peas
ant e
cono
my.
Dur
ing
this
time
farm
ers w
ere
not
over
expl
oite
d by
the
land
lord
s an
d us
urer
s3
Th e
‘Rul
e of
Em
pero
r Wen
an
d E
mpe
ror J
ing’
(180
–141
B
C),
succ
essf
ul re
cove
ry o
f th
e na
tiona
l eco
nom
y.
1. ‘
Flo
urish
ing
Age
of
Em
pero
r Wu’
(1
41–8
7 B
C)
2. D
omes
tic su
prem
acy
of th
e em
pero
r ove
r all
othe
r vas
sal
prin
ces:
supp
ress
ing
the
rebe
llion
of
seve
n va
ssal
stat
es a
nd c
uttin
g do
wn
the
size
and
num
ber o
f su
ch
stat
es.
3. H
eavy
exp
endi
ture
on
Hun
s and
so
uthe
rn b
arba
rians
.
1. R
ampa
nt la
nd a
nnex
atio
n an
d ru
ral u
sury
2. T
he ri
se o
f la
ndlo
rd
econ
omy
and
wor
seni
ng
cond
ition
s for
smal
l far
mer
s
1. P
olar
izat
ion
betw
een
the
land
lord
and
smal
l fa
rmer
s2.
Soc
ial u
nres
t3.
Wan
g M
ang’
s cou
p d’
état
;the
end
of
Form
er H
an4.
The
regi
me
of X
in
Dyn
asty
(AD
8–2
3)5.
Pea
sant
War
s
1. E
nsur
ing
peac
e an
d se
curit
y2.
Tax
redu
ctio
n on
agr
icul
ture
3. R
ewar
ding
thos
e fa
rmer
s who
w
ere
dilig
ent i
n pr
oduc
tion
4. D
istrib
utin
g la
nd to
refu
gees
an
d ve
tera
ns5.
For
cing
the
larg
e la
ndlo
rds
to le
ave
thei
r pro
pert
y an
d em
igra
te to
the
regi
on n
ear t
he
capi
tal
Forc
ing
the
larg
e la
ndlo
rds t
o gu
ard
ro
yal m
auso
leum
and
div
idin
g th
eir l
and,
oth
erw
ise, n
o ef
fect
ive
mea
sure
men
ts in
pro
tect
ing
the
smal
l pe
asan
t eco
nom
y
1. T
he su
gges
tion
was
mad
e to
re
stric
t lan
d an
nexa
tion
in
the
age
of E
mpe
ror W
u, b
ut
was
not
car
ried
out.
2. T
he a
ttem
pt to
set a
lo
wer
lim
it to
the
land
on
e ho
useh
old
coul
d oc
cupy
and
equ
aliz
e th
e di
strib
utio
n of
land
in
Em
pero
r Ai’s
regi
me
(7–1
BC
), fa
iled.
The
usu
rper
of
Form
er H
an,
W
ang
Man
g, e
stab
lishe
d th
e X
in D
ynas
ty. W
ang
Man
g st
arte
d th
e re
form
tr
ying
to re
aliz
e sm
all
peas
ant e
cono
my
and
equa
l dist
ribut
ion
of la
nd,
natio
naliz
ing
all t
he la
nd
in th
e em
pire
, dist
ribut
ing
it fa
irly
to th
e fa
rmer
s, an
d fo
rbid
ding
the
trad
e in
la
nd. B
ut h
e fa
iled.
REINERT_97817825444661_t.indb 144REINERT_97817825444661_t.indb 144 03/10/2016 11:3603/10/2016 11:36
Erik S. Reinert, Jayati Ghosh and Rainer Kattel - 9781782544661Downloaded from Elgar Online at 03/31/2017 12:04:16PM
via University College London

145
Lat
er H
an(A
D 2
5–22
0)R
euni
ficat
ion
and
econ
omic
reco
very
1. ‘
Rul
e of
Zha
ng a
nd M
ing’
(AD
57
–88)
2. E
cono
mic
pro
sper
ity3.
Exp
editi
on a
gain
st H
uns (
AD
73)
4. O
ccup
atio
n of
the
Wes
tern
Reg
ions
in
inla
nd n
orth
- wes
t, no
w S
inki
ang
regi
on (A
D 6
0)
1. T
he ri
se o
f th
e ‘q
ua te
rniti
es’:
i.e.
com
bina
tions
of
land
lord
s, bu
reau
crat
s, bu
sines
smen
an
d us
urer
s2.
Cha
os in
pol
itics
, the
rise
of
roya
l cla
ns, a
nd lo
cal
war
lord
s
Peas
ant w
ar (A
D 1
84–1
85)
follo
wed
by
the
conf
lict
am
ong
war
lord
s.
1. G
rant
ing
land
s to
refu
gees
2. M
easu
ring
the
land
to re
vise
ta
x sy
stem
1. T
ax re
duct
ion
2. G
rant
ing
land
s to
depr
ived
pea
sant
sN
o ef
fect
ive
refo
rm
Thr
ee
Kin
gdom
s to
the
Nor
ther
n an
d So
uthe
rn
Dyn
astie
s(A
D 2
20–5
89)
Mor
e th
an 3
00 y
ears
of
peas
ant w
ars,
ethn
ic c
onfli
cts,
regi
me
chan
ges,
war
lord
con
flict
s. N
o un
ified
or d
urab
le d
ynas
ty. M
ore
than
32 in
depe
nden
t reg
imes
est
ablis
hed
in C
hina
dur
ing
this
perio
d. A
t lea
st fi
ve n
omad
ic e
thni
c gr
oups
sett
led
in C
hina
.
Prol
onge
d ch
aos c
reat
ed v
ast n
o m
an’s
land
, whi
ch w
as n
atio
naliz
ed a
nd d
istrib
uted
to fa
rmer
s and
refu
gees
by
the
stat
e to
enc
oura
ge th
e
smal
l pea
sant
eco
nom
y. T
hus t
he ‘E
qual
Lan
d A
lloca
tion
Syst
em’ e
mer
ged.
Lan
d co
uld
be in
herit
ed b
ut sa
le a
nd p
urch
ase
wer
e re
stric
ted.
T
hose
rece
ivin
g la
nd w
ere
liabl
e to
taxe
s, se
rvitu
de a
nd m
ilita
ry se
rvic
e. T
his s
yste
m la
sted
from
the
late
fift
h to
late
eig
hth
cent
ury.
Sui
(AD
581
–618
)1.
Reu
nific
atio
n of
Chi
na.
2. R
ecov
ery
of th
e na
tiona
l eco
nom
y3.
‘A
ge o
f K
ai H
uang
’(A
D 5
89–6
00)
The
seco
nd, a
lso th
e la
st, e
mpe
ror o
f Su
i was
too
ambi
tious
and
cra
ved
mor
e gl
ory
than
the
econ
omy
coul
d af
ford
, lav
ishin
g re
sour
ces o
n th
e ne
w c
apita
l city
, th
e G
rand
Can
al, a
nd in
vasio
n of
Kor
ea (t
hree
tim
es).
The
uns
usta
inab
le b
urde
n of
taxe
s and
serv
itude
fina
lly d
rove
peo
ple
to re
bel.
The
pea
sant
war
star
ted;
the
Sui d
ynas
ty c
olla
psed
.1.
Spr
ead
of ‘E
qual
Lan
d A
lloca
tion
Syst
em’
2. P
rom
otin
g ag
ricul
tura
l pro
duct
ion,
pro
vidi
ng fa
rmer
s w
ith se
eds,
tool
s and
farm
ani
mal
s, an
d re
war
ding
of
ficia
ls pl
ayed
a c
onsp
icuo
us p
art
Tang
(AD
618
–907
)1.
Reu
nific
atio
n of
th
e em
pire
2. T
he re
cove
ry
of n
atio
nal
econ
omy:
‘Age
of
Zhe
n G
uan’
(A
D 6
27–6
49)
1. E
xped
ition
on
Turk
s an
d ot
her N
orth
wes
tern
B
arba
rians
2. T
he e
mpe
ror o
f Ta
ng b
ecam
e th
e ‘H
eave
nly
Kha
n’, s
upre
me
rule
r, of
Nor
ther
n an
d C
entr
al A
sian
step
pe re
gion
3. S
urre
nder
of
regi
mes
in
Man
chu,
Tib
et, a
nd K
orea
as
vass
al st
ates
1. C
olla
pse
of ‘E
qual
L an
d A
lloca
tion
Syst
em’,
the
rise
of la
nd a
nnex
atio
n2.
As a
resu
lt, th
e de
fens
e sy
stem
rely
ing
on th
e ‘E
qual
Lan
d A
lloca
tion
Syst
em’ c
olla
psed
3. T
he ri
se o
f lo
cal
sepa
ratis
m a
nd w
arlo
rds
1. T
he re
belli
on
supp
ress
ed, t
he
coun
try
was
reun
ified
2. R
eorg
aniz
atio
n of
th
e co
untr
y af
ter t
he
colla
pse
of th
e ‘E
qual
Lan
d A
lloca
tion
Syst
em’
Pola
rizat
ion
betw
een
la
ndlo
rds a
nd
peas
ants
, and
he
avy
tax
burd
en
caus
ed th
e pe
asan
t w
ar
(AD
878
–884
), fo
llow
ed b
y lo
cal
sepa
ratis
m. T
he
dyna
sty
was
ov
ertu
rned
by
war
lord
s
REINERT_97817825444661_t.indb 145REINERT_97817825444661_t.indb 145 03/10/2016 11:3603/10/2016 11:36
Erik S. Reinert, Jayati Ghosh and Rainer Kattel - 9781782544661Downloaded from Elgar Online at 03/31/2017 12:04:16PM
via University College London

146
Tabl
e 7.
2 (c
ontin
ued)
Stag
es o
f C
ycle
Rec
onst
ruct
ion
The
gol
den
age
Cris
is R
efor
mC
olla
pse
4. T
he ‘K
ai Y
uan
Flo
urish
ing
Age
’(A
D 7
13–7
41)
4. T
he w
arlo
rds’
An-
Shi
Reb
ellio
n (A
D 7
55–7
63)
1. T
he n
atio
nal
spre
ad a
nd
cons
olid
atio
n of
‘Equ
al L
and
Allo
catio
n Sy
stem
’, co
nstit
utin
g th
e ba
sis o
f th
e ec
onom
y, fi
scal
sy
stem
, and
na
tiona
l def
ense
2. P
rom
otin
g re
cove
ry o
f ag
ricul
ture
Inhe
ritin
g an
d co
nsol
idat
ing
pr
evio
us g
ood
gove
rnan
ce
unde
r the
rule
of
Em
pres
s W
u (A
D 6
84–7
12),
and
the
early
stag
e (A
D 7
13–7
20) o
f E
mpe
ror X
uan
The
refo
rms o
f E
mpe
ror
D
ezon
g (A
D 7
79–7
81),
and
Em
pero
r Xia
nzon
g (A
D 8
05–8
20),
incl
udin
g th
e ne
w ta
xatio
n sy
stem
: tw
o ta
x sy
stem
Fiv
e D
ynas
ties
and
Ten
K
ingd
oms
(AD
907
–979
)
Prol
onge
d ch
aos a
gain
, with
war
lord
con
flict
s. A
t lea
st 1
5 in
depe
nden
t reg
imes
est
ablis
hed.
The
eco
nom
y in
nor
ther
n C
hina
seve
rely
hit
by w
ars,
sout
hern
Chi
na c
ompa
rativ
ely
peac
eful
and
mor
e pr
ospe
rous
than
the
nort
h.
Nor
ther
n So
ng(A
D 9
60–
12
79)
1. R
euni
ficat
ion
of
the
cent
ral a
nd
sout
hern
par
t of
Chi
na, w
hile
the
nort
hern
par
t w
as o
ccup
ied
by
Khi
tan.
2. R
ule
of E
mpe
ror
Taiz
u (A
D 9
60–
976
)
1. U
nsuc
cess
ful e
xped
ition
on
Khi
tan.
2. T
he m
ost p
rosp
erou
s tim
e in
Nor
ther
n So
ng
(AD
976
–102
2)
1. f
iscal
cris
is du
e to
war
ag
ains
t Khi
tan
and
Tang
ut2.
Det
erio
ratio
n of
smal
l fa
rmer
s’ ec
onom
ic
cond
ition
s3.
Rise
of
land
lord
eco
nom
y
The
regi
me
of E
mpe
ror
Sh
enzo
ng, e
ager
to
solv
e ec
onom
ic a
nd
fisca
l pro
blem
s
1. T
he p
easa
nt w
ars
2. F
iscal
cris
is an
d co
rrup
tion
in th
e re
gim
e of
Em
pero
r H
uizo
ng (A
D
1100
–112
6).
3. I
nvas
ion
from
Ju
rche
n
REINERT_97817825444661_t.indb 146REINERT_97817825444661_t.indb 146 03/10/2016 11:3603/10/2016 11:36
Erik S. Reinert, Jayati Ghosh and Rainer Kattel - 9781782544661Downloaded from Elgar Online at 03/31/2017 12:04:16PM
via University College London

147
Prom
otin
g ag
ricul
tura
l rec
over
y th
roug
h ta
x re
duct
ion,
subs
idie
s, an
d ur
ging
the
loca
l go
vern
men
t to
prom
ote
prod
uctio
n.
1. C
onso
lidat
ing
and
prom
otin
g th
e sm
all f
arm
er e
cono
my
2. A
cei
ling
set t
o th
e ru
ral
usur
y in
tere
st ra
te, a
nd b
an
on u
sing
arab
le la
nds a
nd
farm
ani
mal
s to
pay
back
de
bts.
Fur
ther
lim
it to
land
oc
cupa
tion
Wan
g A
nshi
’s re
form
(AD
106
9–10
74),
relie
ving
smal
l far
mer
s fr
om ru
ral u
sury
, and
pr
omot
ing
grow
th
thei
r eco
nom
y
Sout
hern
Son
g(A
D 1
127–
1279
)
1. R
econ
stru
ctio
n of
dyn
asty
in
sout
hern
Chi
na2.
Rec
over
y of
na
tiona
l eco
nom
y ru
ined
by
the
inva
sion
1. T
he re
gim
e of
Em
pero
r X
iaoz
ong
(AD
116
2–11
89)
2. E
xped
ition
on
Jurc
hen
(AD
116
3)
1. F
iscal
Cris
is2.
Rise
of
land
lord
eco
nom
y an
d w
orse
ning
con
ditio
ns
for s
mal
l far
mer
s
Ref
orm
und
er
E
mpe
ror L
izon
g (A
D
1224
–126
4)
1. T
he ra
mpa
nt
‘qua
tern
ities
’2.
Inv
asio
n of
M
ongo
lia
1. p
rom
ote
and
subs
idiz
ing
agric
ultu
re
prod
uctio
n2.
Red
istrib
ute
the
dese
rted
land
to
the
farm
ers a
nd
refu
gees
Con
tinue
the
polic
y
enha
ncin
g sm
all f
arm
ers:
tax
redu
ctio
n, b
uild
ing
wat
er
cons
erva
ncy
faci
litie
s
The
stat
e se
t max
imum
limit
to th
e la
nd o
ne
hous
ehol
d co
uld
occu
py, p
urch
asin
g ex
cess
land
Yua
n(A
D 1
271–
1368
)
Yua
n w
as e
stab
lishe
d by
Gen
ghis
Kha
n’s M
ongo
lian
desc
enda
nts.
Em
pero
rs o
f Y
uan
mad
e no
att
empt
to b
ase
empi
re o
n C
onfu
cian
ism.
N
oble
s’ la
nd c
losu
re, s
erfd
om, a
nd ra
cial
hie
rarc
hy e
stab
lishe
d in
Chi
na. D
espi
te a
gric
ultu
re p
rom
otio
n po
licie
s, th
e sm
all p
easa
nt
econ
omy
rem
aine
d un
prot
ecte
d, re
sulti
ng in
the
peas
ant w
ar a
nd c
olla
pse
of d
ynas
ty.
Min
g(A
D 1
368–
1644
)
1. R
euni
ficat
ion
of C
hina
2. R
ecov
ery
of sm
all p
easa
nt
econ
omy
3. R
ule
of E
mpe
ror H
ongw
u (A
D 1
368–
1398
)
1. ‘
Age
of
Yong
Le’
(AD
140
2–14
24)
2. F
ive
expe
ditio
ns o
n M
ongo
lia3.
Con
trol
of
Man
chu,
Kor
ea,
Vie
tnam
, and
the
Wes
t Reg
ions
re
gain
ed4.
Sev
en m
ajor
exp
editi
ons o
n th
e Pa
cific
and
Indi
an O
cean
s
1. E
xpan
sion
of la
ndlo
rd
econ
omy
and
the
‘qua
tern
ities
’2.
Fisc
al c
risis
‘New
Dea
l in
Wan
Li E
ra’
(AD
157
3–15
82):
refo
rmin
g fis
cal a
nd ta
x sy
stem
s
1. R
ampa
nt la
ndlo
rds a
nd
the
‘qua
tern
ities
’2.
Hea
vy ta
x bu
rden
on
smal
l far
mer
s3.
Pea
sant
war
(AD
162
8–16
44)
4. M
anch
u’s i
nvas
ion
(AD
161
6–16
44)
REINERT_97817825444661_t.indb 147REINERT_97817825444661_t.indb 147 03/10/2016 11:3603/10/2016 11:36
Erik S. Reinert, Jayati Ghosh and Rainer Kattel - 9781782544661Downloaded from Elgar Online at 03/31/2017 12:04:16PM
via University College London

148
Tabl
e 7.
2 (c
ontin
ued)
Stag
es o
f C
ycle
Rec
onst
ruct
ion
The
gol
den
age
Cris
is R
efor
mC
olla
pse
Em
pero
r Hon
gwu’
s eco
nom
ic
polic
ies s
ough
t to
form
a sm
all
peas
ant e
cono
my
rely
ing
on
tilla
ge a
nd d
omes
tic m
anuf
actu
re,
dist
ribut
ing
land
to fa
rmer
s and
re
fuge
es, r
educ
ing
taxa
tion
on
smal
l far
mer
s, su
bsid
izin
g sm
all
farm
ers w
ith m
eans
of
prod
uctio
n,
orga
nizi
ng la
nd re
clam
atio
n, a
nd
puni
shin
g th
e la
rge
land
lord
s and
us
urer
s
Con
solid
atin
g sm
all- s
cale
pe
asan
t eco
nom
y
Qin
g(A
D 1
644–
1912
)
1. C
onqu
est o
f M
anch
u pa
cifie
d th
e pe
asan
t war
and
the
rebe
lliou
s fo
rces
of
prev
ious
dyn
astie
s2.
Rec
over
y of
nat
iona
l eco
nom
y an
d sm
all p
easa
nt e
cono
my
‘Kan
g- Q
ian
Flo
urish
ing
Age
’(A
D 1
681–
1796
)1.
Rise
of
land
lord
ec
onom
y an
d th
e ‘q
uate
rniti
es’
2. F
iscal
cris
is ca
used
by
ove
rexp
ansio
n in
w
ar a
nd lu
xury
Brit
ish p
enet
ratio
n of
Chi
na in
184
0
chan
ged
the
cycl
e of
the
Chi
nese
em
pire
. How
ever
, opp
ress
ion
of
farm
ers l
ed, i
n A
D 1
851–
1864
, to
peas
ant w
ar o
n un
prec
eden
ted
scal
e;
it w
as su
ppre
ssed
but
acc
eler
ated
the
colla
pse
of th
e Q
ing
dyna
sty
1. D
eten
tion
of M
anch
u no
bles
ban
d2.
Tax
on
peas
ant’s
new
ly re
clai
med
land
ca
ncel
led
3. T
ax re
duct
ion
4. T
ax sy
stem
refo
rmed
, pol
l tax
ca
ncel
led
5. P
easa
nts’
occu
patio
n of
land
des
erte
d in
war
time
appr
oved
Sour
ces:
B
an (1
997,
111
7–11
48),
Song
(197
5, 1
341–
1364
), To
qto’
a an
d A
lutu
(197
7, 4
155–
4195
, 434
7–43
73),
Zha
ng (1
974
[188
0], 1
877–
1913
), Z
hao
(197
7,
3479
–356
3), M
a (1
986,
27–
67),
Li (
1985
), H
uang
(200
8), S
adao
(198
6, 5
51–5
74),
Ebr
ey (1
986,
608
–626
), Tw
itche
tt (1
979,
Vol
. 3, P
art 1
), Tw
itche
tt a
nd S
mith
(2
009,
Vol
. 5, P
art 1
), H
eijra
(199
8, 4
17–5
78),
Wu
(198
7), C
ao (1
989)
and
Hou
(200
5).
REINERT_97817825444661_t.indb 148REINERT_97817825444661_t.indb 148 03/10/2016 11:3603/10/2016 11:36
Erik S. Reinert, Jayati Ghosh and Rainer Kattel - 9781782544661Downloaded from Elgar Online at 03/31/2017 12:04:16PM
via University College London

The economic cycle of Imperial China 149
For commerce, Imperial China had two levels, state- run and private (Zhang 1989, 15–18). Before the imperial age state- run commerce was conducted by royal slaves and servants. Subsequently it came to be conducted by chartered businessmen and the commercial agents representing the empire. Much like state- run manufacturing, besides satisfying the need of the empire, it was in charge of the state monopolies including iron, tea, liquor and cooking salt. The purpose of state- run commerce was normally to boost fiscal income, but occasionally it extended to controlling the commerce with large- scale participation in trade in practically all kinds of goods. Such controls served for stabilizing market prices, or in some cases for competing with private businessmen for market profit.
As for private commerce, even before the imperial age the organizers of Imperial China had noticed the attractive profitability of the commerce sector: ‘Talking of accumulating wealth, manufacture is better than agriculture, trade is better than manufacture’ (Sima 1973, 3274). And they were worried that unrestricted access to the sector might shake the foundations of the national economy and the social order of a centralized, unified empire (Ban 1997, 1127–1136), consequently subjecting it to plunder and oppression. The idea was to make the commerce sector as unattractive as possible to farmers. In Imperial China, the private manufacturing sector was affiliated to the private commerce sector (Zhu 1988, 55–60), because private artisans relied on businessmen to sell their products and to provide raw materials and financial support. Thus the destinies of the private com-merce sector and manufacturing sectors were bound together.
We have an example of the rough treatment of businessmen at the start of the Former Han Dynasty (202 BC to AD 8), when the emperor reduced the living standards of private businessmen and forbade them and their offspring to join the government (Ban 1997, 1153). Similar policies came in at the start of the Tang (AD 618–907) and Ming dynasties. Apart from making their lives uncomfortable, however, there was no substan-tial policy in the economic field to restrict private commerce and manufacturing, which could develop freely: the empire would cancel the state monopoly on certain goods and industries in favor of private businessmen; the empire would not subject private commerce and manufacturing to predatory policies. A laissez- faire attitude prevailed because: firstly, the new dynasty wanted to gain the support of private businessmen by showing its superiority over the previous, predatory dynasty, showing benevolence to all, and no interest in competing with private sectors for economic profit; secondly, this laissez- faire attitude could help the recovery of the national economy, giving people a rest without obstructing its natural growth path; and thirdly, at the beginning of a new dynasty, after chaos and war, the private commercial sectors were normally in depression, so they could not be regarded as a threat to or prey of the empire. This is the stage of recovery of private manufacture and commerce.
The laissez- faire attitude of the empire would open the way to the golden age of private commerce and manufacture: influential private businessmen or clans or business groups would accumulate abundant wealth through their business; the successful businessmen were willing to invest their wealth back in the commerce sector to expand their commer-cial capital; the private businessmen were not bothered by government restriction and plunder. However, firstly, when the ordinary taxes no longer sufficed, the empire needed some other source of fiscal income, and the prosperous private businessmen with their considerable wealth and profitable industries became an ideal financial resource for the emperor. The empire might then exploit state commerce and manufacturing to compete
REINERT_97817825444661_t.indb 149REINERT_97817825444661_t.indb 149 03/10/2016 11:3603/10/2016 11:36
Erik S. Reinert, Jayati Ghosh and Rainer Kattel - 9781782544661Downloaded from Elgar Online at 03/31/2017 12:04:16PM
via University College London

150 Handbook of alternative theories of economic development
with private businessmen for profit, or monopolize certain industries, elbow private businessmen out and seek monopoly profits or, in some extreme cases, plunder the businessmen’s wealth with predatory taxation. For example, during the rule of Emperor Wu of Han (140–87 BC), the government imposed a predatory property tax on private businessmen and artisans, any concealment of property leading to confiscation of it all. Thus the government acquired ‘billions of the wealth from the people’, and was ‘fiscally abundant’, but ‘nearly all of the large and medium businessmen were bankrupted’ (Ban 1997, 1175).
Secondly, businessmen accumulating great wealth or dominating the staple commod-ity markets, or indeed succeeding in controlling markets and prices, would trigger the vigilance of the empire. The empire started to think that some extremely important, highly profitable industries should not be conducted by private businessmen, and control over the market would be restored back to the state, which would also go on to monopo-lize some industries and use its commercial power to gain control over the market, for example nationalizing the iron and salt industries under the Former Han Dynasty (Loewe, 1986, 162). Moreover, in the late eleventh century, the empire believed that the power of controlling the flow of the goods and setting prices should be taken from big businessmen back to the state, so the empire used its fiscal deposit as commercial capital to compete with them in the commercial sector (Li 1985, 5622–5623).
Besides, the polarization between the rich businessmen who should be the lowest class of the society and the poor farmers who should be the best- treated citizens in the empire came in for criticism from the Chinese exponents of egalitarianism. In general, the empire started to turn its policies on private commerce and manufacture from laissez- faire to restrictive and predatory.
The empire’s policies hitting at private manufacturing and commerce went essentially thus. Firstly, the state would monopolize the production and sale of certain goods which were profitable and important in the daily lives of the people – iron, salt, tea, liquor, copper, alums, and so on – so that the state could elbow the private sector out of certain industries and take advantage of the monopoly to fill the state coffers. Secondly, the state would directly participate in the commercial sector, and use the resources of the empire to compete with private businessmen for the profit. Thirdly, the state would impose predatory taxes on private businessmen and artisans, such as property taxes, tolls and compulsory tributes (especially for the artisans).
As the result of the empire’s policies, firstly, the manufacturing and commerce sector no longer constituted a profitable and safe place for investment; businessmen simply could not risk all their capital in the commercial sector. The wealth acquired through manufacturing and commerce needed safer refuge. In Imperial China, the most popular refuge was land (Fairbank 1983, 49). ‘The wealth should be acquired through manufac-ture and commerce, but must be transferred into land and agriculture to keep it safe and solid’ (Sima 1973, 3281), as Chinese businessmen had understood since the early stage of the First Empire. The other popular refuge was usury, which created a distance between owners of wealth and direct commercial activities. In Imperial China, manufacturing and commerce were not regarded as permanent careers, but temporary means to make money quickly. Secondly, along with end of investment in manufacturing and commerce, the entrepreneurship and the enthusiasm of the Chinese people were also destroyed. For example, since Emperor Wu of Han imposed the predatory property tax on businessmen,
REINERT_97817825444661_t.indb 150REINERT_97817825444661_t.indb 150 03/10/2016 11:3603/10/2016 11:36
Erik S. Reinert, Jayati Ghosh and Rainer Kattel - 9781782544661Downloaded from Elgar Online at 03/31/2017 12:04:16PM
via University College London

The economic cycle of Imperial China 151
‘people took to spending on good food and good clothes, no longer willing to save for future investment’ (Ban 1997, 1170). By contrast, at the beginning of the First Empire, when the state took the laissez- faire attitude, ‘big businessmen were doing business all over the country’ (Sima 1973, 3261). Thirdly, in these circumstances, if the businessmen still wanted to conduct business, they had to collude with the imperial government, working for the emperor and his government as commercial agents or chartered busi-nessmen. Business was no longer a matter of entrepreneurship, but of pursuing the rent generated by the monopoly market position; as John Fairbank put it: ‘The tradition in China has been not to build a better mousetrap but to get the official mouse monopoly’ (Fairbank 1983, 47). Therefore, besides land and usury, another popular outlet for busi-nessmen’s wealth lay in buying a government position.5 In this way, when all of the outlets for the wealthy businessmen in the empire combined, a special identity came into being: the ‘quaternity’, a mixture of landlords, bureaucrats, usurers and businessmen (Zhang 1989, 15–16).
Now, all too clearly, in Imperial China the commerce and manufacturing sector could not shelter the small farmers whose economic situations had so greatly worsened. The population originally active in the commerce and manufacturing sector, elbowed out by the state and seeking refuge elsewhere, could hardly afford an influx of bankrupted small farmers. Besides, as the small farmers’ economic conditions deteriorated, the state fiscal situation started doing likewise, for the small farmers constituted the empire’s major tax base. With the declining fiscal situation the state sought control over the manufacturing and commerce sector, plundering private businessmen, and so driving wealth back to land and usury. Thus the landlord economy and usury capital would grow, further aggra-vating conditions for the small farmers, and the crisis of the empire’s national economy would become yet more severe.
Thanks to the ‘efforts’ of the empire, the private entrepreneurs in commerce and manu-facturing were successfully eliminated. Left in the market were the small businessmen and small artisans, who were no better off than the small peasants, and the quaternities, who monopolized the market and relied on the government. So the empire came to take full control over manufacturing and commerce, but capital accumulation in the commercial sector and entrepreneurship were also totally destroyed. This situation would normally last until the collapse of a dynasty. Eventually, after chaos and war between two dynas-ties, with the rise of a new ‘Son of the Heaven’, the cycle in manufacturing and trade would start once again. Such is the classical crisis cycle in manufacturing and commerce. It is summarized in Table 7.3. This crisis cycle could be seen in every dynasty of the Chinese empire, as Table 7.4 shows.
CONCLUSIONS
In conclusion, from the cycle of crisis in agriculture, manufacturing and commerce in Imperial China, I think one can appreciate the internal reasons why Imperial China was caught up with by the Western world, and failed to generate modern industry.
5 See Wu (2005, Vol. 2, 687–688) and Wu (2005, Vol. 3, 746–747).
REINERT_97817825444661_t.indb 151REINERT_97817825444661_t.indb 151 03/10/2016 11:3603/10/2016 11:36
Erik S. Reinert, Jayati Ghosh and Rainer Kattel - 9781782544661Downloaded from Elgar Online at 03/31/2017 12:04:16PM
via University College London

152 Handbook of alternative theories of economic development
Table 7.3 The classical cycle in manufacture and trade
Stages of cycle
Recovery The golden age Restriction Depression and collapse
Situation 1. Establishment of a new dynasty
2. Recovery of national economy
1. Prosperity in manufacturing and commerce
2. Influential businessmen or clans or business groups
1. Fiscal crisis in the empire
2. Polarization between poor and rich
3. Overexpansion of commercial capital
1. Extinction of big businessmen
2. Businessmen transfer wealth into land and usury for refuge
3. Businessmen collude with the government in pursuit of rent
4. The rise of the ‘quaternity’, the mixture of bureaucrats, businessmen, usurers and landlords
Policies 1. Laissez- faire or neutral attitude towards private manufacture and commerce
2. Cancelling the state- monopolized industries and goods, and the predatory taxation on private businessmen
1. Government monopolizes the production and sale of crucial industries and goods
2. Government only allows the chartered enterprises to do business in certain fields
3. State participates in and controls trade
The flow of commercial
wealth:1. Land purchase2. Usury capital3. Buying
government positions
4. Conspicuous consumption
5. Plundered by the government
Sources: Sima (1973, 3253–3283), Ban (1997, 1149–1188), Ma (1986, 143–213), Li (1985), Toqto’a and Alutu (1977, 4403–4566), Song (1975, 1377–1392), Zhang (1974 [1880], 1931–1999), Zhao (1977, 3603–3672), Twitchett and Fairbank (1986, Vol. 1, 20–290, 574–626), Twitchett (1979, Vol. 3, Part 1), Twitchett and Fairbank (2009, Vol. 5, Part 1), Twitchett and Fairbank (1998, Vol. 8, Part 2, 670–707), Wu (2005, Vol. 1, Vol. 2, Vol. 3), Wu (2014), Tong (2005), Zhu (1988) and Zhang (1989).
REINERT_97817825444661_t.indb 152REINERT_97817825444661_t.indb 152 03/10/2016 11:3603/10/2016 11:36
Erik S. Reinert, Jayati Ghosh and Rainer Kattel - 9781782544661Downloaded from Elgar Online at 03/31/2017 12:04:16PM
via University College London

153
Tabl
e 7.
4 E
mpi
re’s
cycl
e in
man
ufac
ture
and
trad
e
Stag
es o
f cy
cle
Rec
over
yT
he g
olde
n ag
eR
estr
ictio
nD
epre
ssio
n an
d C
olla
pse
Qin
(221
–206
BC
)Q
in re
stric
ted
priv
ate
man
ufac
turin
g an
d co
mm
erce
in th
e 35
9–33
8 B
C re
form
. Sin
ce th
en, Q
in re
gard
ed p
rivat
e
busin
essm
en a
s par
asite
s of
the
coun
try.
Qin
had
nev
er b
een
tole
rant
of
the
priv
ate
busin
essm
en: t
he st
ate
mon
opol
ized
th
e tr
ade
of g
rain
, clo
thes
, far
m a
nim
als,
pott
ery,
iron
and
salt;
the
stat
e na
tiona
lized
all
the
prod
uctio
n an
d tr
ade
in m
inin
g; th
e in
crea
se in
the
num
ber o
f pr
ivat
e bu
sines
smen
was
und
er th
e co
ntro
l of
the
stat
e; a
nd h
eavy
tax
was
im
pose
d on
the
priv
ate
busin
essm
en.
Form
er H
an(2
02 B
C –
AD
24)
1.
Reu
nific
atio
n of
the
empi
re.
2.
Rec
over
y of
the
natio
nal
econ
omy.
1.
‘The
Rul
e of
Em
pero
r Wen
an
d E
mpe
ror J
ing’
(180
–141
B
C) a
nd e
arly
stag
e of
the
rule
of
Em
pero
r Wu
(141
–120
BC
) w
as th
e go
lden
age
for p
rivat
e bu
sines
smen
.2.
M
any
influ
entia
l and
pr
ospe
rous
priv
ate
busin
essm
en. H
istor
ical
re
cord
s list
ed 2
1 su
cces
sful
bu
sines
smen
and
bus
ines
s cl
ans,
mai
nly
cond
uctin
g pr
oduc
tion
and
sale
of
iron,
m
etal
lurg
y, c
ooki
ng sa
lt, g
rain
, al
so a
ctiv
e in
tran
spor
tatio
n an
d re
taili
ng in
dust
ry.
1.
Fisc
al c
risis.
2.
Exp
ansio
n of
co
mm
erci
al a
nd
man
ufac
turin
g ca
pita
l.
Disa
ppea
ranc
e of
su
cces
sful
priv
ate
busin
essm
en a
nd
artis
ans,
rise
of th
e m
ixtu
re o
f la
ndlo
rds,
bure
aucr
ats,
usur
ers a
nd
busin
essm
en.
1.
Disc
rimin
atin
g ag
ains
t pr
ivat
e bu
sines
smen
so
cial
ly a
nd p
oliti
cally
, bu
t not
eco
nom
ical
ly.2.
A
ll st
ate
mon
opol
ies
and
natio
naliz
atio
n ca
ncel
led
in a
ll fie
lds.
Priv
ate
busin
essm
en w
ere
allo
wed
to p
artic
ipat
e in
th
e pr
oduc
tion
of a
nd
trad
e in
iron
, sal
t, co
pper
, an
d ot
her i
mpo
rtan
t in
dust
ries.
Sang
Hon
gyan
g’s r
efor
m (s
tart
ed fr
om 1
20 B
C)
1.
Nat
iona
lizat
ion
of p
rodu
ctio
n an
d sa
le o
f iro
n an
d sa
lt.2.
G
over
nmen
t mon
opol
izes
the
sale
of
liquo
r.3.
Ta
kes f
ull c
ontr
ol o
f th
e co
mm
erci
al m
arke
t an
d en
gage
s in
trad
e in
all
kind
s of
good
s, ai
min
g at
stab
ilizi
ng th
e m
arke
t and
incr
easin
g fis
cal i
ncom
e.4.
Im
pose
s pre
dato
ry p
rope
rty
tax
on p
rivat
e bu
sines
smen
and
art
isans
; any
one
conc
ealin
g th
e ex
tent
of
prop
erty
wou
ld h
ave
it co
nfisc
ated
.
REINERT_97817825444661_t.indb 153REINERT_97817825444661_t.indb 153 03/10/2016 11:3603/10/2016 11:36
Erik S. Reinert, Jayati Ghosh and Rainer Kattel - 9781782544661Downloaded from Elgar Online at 03/31/2017 12:04:16PM
via University College London
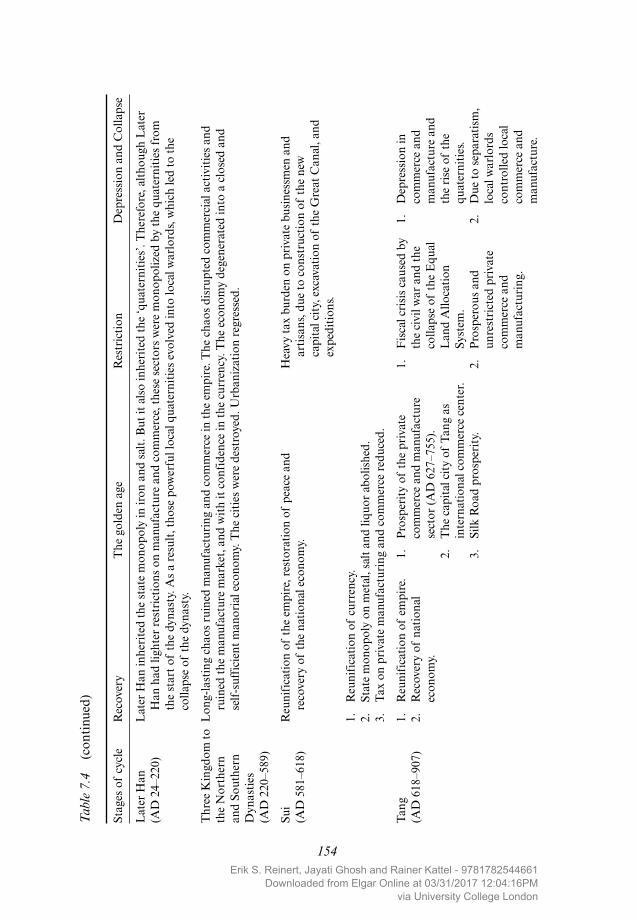
154
Tabl
e 7.
4 (c
ontin
ued)
Stag
es o
f cy
cle
Rec
over
yT
he g
olde
n ag
eR
estr
ictio
nD
epre
ssio
n an
d C
olla
pse
Lat
er H
an(A
D 2
4–22
0)L
ater
Han
inhe
rited
the
stat
e m
onop
oly
in ir
on a
nd sa
lt. B
ut it
also
inhe
rited
the
‘qua
tern
ities
’. T
here
fore
, alth
ough
Lat
er
H
an h
ad li
ghte
r res
tric
tions
on
man
ufac
ture
and
com
mer
ce, t
hese
sect
ors w
ere
mon
opol
ized
by
the
quat
erni
ties f
rom
th
e st
art o
f th
e dy
nast
y. A
s a re
sult,
thos
e po
wer
ful l
ocal
qua
tern
ities
evo
lved
into
loca
l war
lord
s, w
hich
led
to th
e co
llaps
e of
the
dyna
sty.
Thr
ee K
ingd
om to
th
e N
orth
ern
and
Sout
hern
D
ynas
ties
(AD
220
–589
)
Lon
g- la
stin
g ch
aos r
uine
d m
anuf
actu
ring
and
com
mer
ce in
the
empi
re. T
he c
haos
disr
upte
d co
mm
erci
al a
ctiv
ities
and
ruin
ed th
e m
anuf
actu
re m
arke
t, an
d w
ith it
con
fiden
ce in
the
curr
ency
. The
eco
nom
y de
gene
rate
d in
to a
clo
sed
and
self-
suffi
cien
t man
oria
l eco
nom
y. T
he c
ities
wer
e de
stro
yed.
Urb
aniz
atio
n re
gres
sed.
Sui
(AD
581
–618
)R
euni
ficat
ion
of th
e em
pire
, res
tora
tion
of p
eace
and
reco
very
of
the
natio
nal e
cono
my.
Hea
vy ta
x bu
rden
on
priv
ate
busin
essm
en a
nd
ar
tisan
s, du
e to
con
stru
ctio
n of
the
new
ca
pita
l city
, exc
avat
ion
of th
e G
reat
Can
al, a
nd
expe
ditio
ns.
1.
Reu
nific
atio
n of
cur
renc
y.2.
St
ate
mon
opol
y on
met
al, s
alt a
nd li
quor
abo
lishe
d.3.
Ta
x on
priv
ate
man
ufac
turin
g an
d co
mm
erce
redu
ced.
Tang
(AD
618
–907
)1.
R
euni
ficat
ion
of e
mpi
re.
2.
Rec
over
y of
nat
iona
l ec
onom
y.
1.
Pros
perit
y of
the
priv
ate
com
mer
ce a
nd m
anuf
actu
re
sect
or (A
D 6
27–7
55).
2.
The
cap
ital c
ity o
f Ta
ng a
s in
tern
atio
nal c
omm
erce
cen
ter.
3.
Silk
Roa
d pr
ospe
rity.
1.
Fisc
al c
risis
caus
ed b
y th
e ci
vil w
ar a
nd th
e co
llaps
e of
the
Equ
al
Lan
d A
lloca
tion
Syst
em.
2.
Pros
pero
us a
nd
unre
stric
ted
priv
ate
com
mer
ce a
nd
man
ufac
turin
g.
1.
Dep
ress
ion
in
com
mer
ce a
nd
man
ufac
ture
and
th
e ris
e of
the
quat
erni
ties.
2.
Due
to se
para
tism
, lo
cal w
arlo
rds
cont
rolle
d lo
cal
com
mer
ce a
nd
man
ufac
ture
.
REINERT_97817825444661_t.indb 154REINERT_97817825444661_t.indb 154 03/10/2016 11:3603/10/2016 11:36
Erik S. Reinert, Jayati Ghosh and Rainer Kattel - 9781782544661Downloaded from Elgar Online at 03/31/2017 12:04:16PM
via University College London

155
1.
Disc
rimin
atio
n of
priv
ate
busin
essm
en so
cial
ly
and
polit
ical
ly, b
ut n
ot
econ
omic
ally.
2.
All
stat
e m
onop
olie
s an
d na
tiona
lizat
ion
in a
ll fie
lds a
bolis
hed.
3.
Tax
on p
rivat
e bu
sines
smen
and
art
isans
re
duce
d.
1.
Liu
Yan
, the
Min
ister
of
Fin
ance
(AD
76
0–77
9), i
mpo
ses
char
tere
d bu
sines
s sy
stem
on
salt
indu
stry
and
hea
vy
tax
on sa
lt.2.
In
Em
pero
r Dez
ong’
s re
gim
e (A
D 7
79–8
05),
natio
naliz
es th
e pr
oduc
tion
and
sale
of
salt,
iron
, tea
, m
iner
als a
nd li
quor
.3.
Pr
edat
ory
dom
estic
ta
riff
and
prop
erty
ta
x im
pose
d on
pr
ivat
e bu
sines
smen
an
d ar
tisan
s
Com
mer
cial
wea
lth
fle
w to
:1.
la
nd p
urch
ase
(mos
t im
port
ant)
;2.
us
ury;
3.
cons
picu
ous
cons
umpt
ion
and
stor
age;
4.
com
mer
ce a
nd
man
ufac
ture
for
capi
tal a
ccum
ulat
ion.
Fiv
e D
ynas
ties
an
d Te
n K
ingd
oms
(AD
907
–960
)
In th
is ch
aotic
age
, war
occ
urre
d m
ainl
y in
nor
ther
n C
hina
and
des
troy
ed m
anuf
actu
ring
and
trad
e th
ere.
How
ever
, in
so
uthe
rn C
hina
, the
war
lord
s mai
ntai
ned
last
ing
peac
e w
ith o
ne a
noth
er a
nd p
rom
oted
the
deve
lopm
ent o
f tr
ade
and
man
ufac
turin
g; fo
r exa
mpl
e, th
e m
idst
ream
regi
on o
f th
e Ya
ngtz
e R
iver
bec
ame
the
inte
rnat
iona
l tea
trad
e ce
nter
; the
so
uthe
ast c
oast
line
beca
me
the
base
of
ship
- bui
ldin
g an
d sil
k pr
oduc
tion.
Nor
ther
n So
ng(A
D 9
60–1
127)
1.
Reu
nific
atio
n of
the
coun
try
and
rest
orat
ion
of p
eace
.2.
R
ecov
ery
of th
e na
tiona
l ec
onom
y.
Pros
perit
y of
priv
ate
com
mer
ce
an
d m
anuf
actu
ring
(AD
97
6–10
22).
The
fisc
al c
risis
of
th
e N
orth
ern
Song
go
vern
men
t.
1.
Rise
of
the
mix
ture
of
bur
eauc
rats
, us
urer
s, la
ndlo
rds,
and
busin
essm
en.
2.
Gov
ernm
ent
com
pete
d w
ith
priv
ate
busin
essm
en
for m
arke
t pro
fit.
REINERT_97817825444661_t.indb 155REINERT_97817825444661_t.indb 155 03/10/2016 11:3603/10/2016 11:36
Erik S. Reinert, Jayati Ghosh and Rainer Kattel - 9781782544661Downloaded from Elgar Online at 03/31/2017 12:04:16PM
via University College London

156
Tabl
e 7.
4 (c
ontin
ued)
Stag
es o
f cy
cle
Rec
over
yT
he g
olde
n ag
eR
estr
ictio
nD
epre
ssio
n an
d C
olla
pse
1.
Tax
on p
rivat
e co
mm
erce
an
d m
anuf
actu
re
redu
ced.
2.
Priv
ate
busin
essm
en
allo
wed
to p
artic
ipat
e in
th
e st
ate
mon
opol
ized
fie
lds.
1.
Nat
iona
lizat
ion
and
char
tere
d bu
sines
s in
tea,
iron
, liq
uor a
nd
alum
s ext
ende
d.2.
H
eavy
tax
impo
sed
on
priv
ate
busin
essm
en.
3.
In W
ang
Ans
hi’s
refo
rm, t
he st
ate
dire
ctly
par
ticip
ated
in
mar
ket t
rade
an
d fu
lly c
ontr
olle
d pu
rcha
se a
nd sa
le,
and
pric
e se
ttin
g.
Com
mer
cial
wea
lth
fle
w to
:1.
la
nd p
urch
ase
(mos
t com
mon
);2.
us
ury;
3.
the
gove
rnm
ent,
to b
uy g
over
nmen
t po
sitio
ns;
4.
com
mer
cial
and
m
anuf
actu
ring
sect
or.
Sout
hern
Son
g(A
D 1
127–
1279
)So
uthe
rn S
ong
inhe
rited
the
rest
rictio
n on
com
mer
ce a
nd m
anuf
actu
re o
f N
orth
ern
Song
and
mad
e no
con
cess
ions
on
the
com
mer
cial
sect
ors.
On
the
cont
rary
, it i
mpo
sed
heav
ier t
axes
on
priv
ate
busin
essm
en, a
nd e
nlar
ged
stat
e m
onop
oly
in
tea,
liqu
or, s
alt a
nd a
lum
s. T
he ‘q
uate
rniti
es’ p
reva
iled.
Yua
n(A
D 1
279–
1368
)Y
uan
dyna
sty
seve
rely
rest
ricte
d pa
rtic
ipat
ion
in tr
ade
and
man
ufac
turin
g by
the
form
er c
itize
ns o
f th
e So
ng d
ynas
ty.
How
ever
, the
Yua
n go
vern
men
t, fr
om th
e ro
yal c
lans
to th
e bu
reau
crat
s, ac
tivel
y co
nduc
ted
busin
ess a
nd u
sury
in th
e m
arke
t for
pro
fit th
roug
h th
e re
pres
enta
tion
of th
eir c
omm
erci
al a
gent
s. T
he Y
uan
gove
rnm
ent m
onop
oliz
ed th
e te
a,
liquo
r, iro
n, a
nd sa
lt. T
he m
onop
oly
of th
e ‘q
uate
rniti
es’ i
n th
e m
arke
t, an
d go
vern
men
t’s c
ompe
titio
n w
ith p
rivat
e bu
sines
smen
in m
arke
t pro
fit, c
rash
ed p
rivat
e m
anuf
actu
ring
and
com
mer
ce.
Min
g(A
D 1
368–
1644
)1.
U
nific
atio
n of
em
pire
.2.
E
cono
mic
reco
very
.1.
Pr
ospe
rity
and
the
man
ufac
turin
g an
d co
mm
erce
of
Min
g (A
D 1
403–
1456
).2.
T
he ri
se o
f fa
mou
s bus
ines
s gr
oups
: Jin
Mer
chan
ts, H
ui
Mer
chan
ts, a
nd so
on.
Fisc
al c
risis
caus
ed b
y
mili
tary
exp
endi
ture
an
d em
pero
rs’
luxu
ries.
1.
Rise
of
the
‘qua
tern
ities
’2.
R
ebel
lion
of th
e bu
sines
smen
and
ar
tisan
s in
urba
n ar
eas i
n la
te M
ing.
REINERT_97817825444661_t.indb 156REINERT_97817825444661_t.indb 156 03/10/2016 11:3603/10/2016 11:36
Erik S. Reinert, Jayati Ghosh and Rainer Kattel - 9781782544661Downloaded from Elgar Online at 03/31/2017 12:04:16PM
via University College London

157
1.
Stat
e al
low
ed
priv
ate
busin
essm
en
to p
artic
ipat
e in
m
onop
oliz
ed fi
elds
such
as
tea,
liqu
or, i
ron
and
salt.
2.
Tax
on c
omm
erce
and
m
anuf
actu
ring
redu
ced.
1.
Priv
ate
busin
essm
en
coul
d no
t con
duct
in
tern
atio
nal t
rade
(as
from
AD
139
4).
2.
Pred
ator
y ta
x an
d do
mes
tic ta
riff
impo
sed
on p
rivat
e bu
sines
smen
and
pr
edat
ory
trib
ute
colle
ctio
n on
priv
ate
artis
ans,
espe
cial
ly
unde
r the
regi
me
of
Em
pero
r She
nzon
g (A
D 1
582–
1620
).
The
com
mer
cial
wea
lth
flew
to1.
la
nd p
urch
ase;
2.
usur
y;3.
co
nspi
cuou
s co
nsum
ptio
n;4.
bu
ying
gov
ernm
ent
posit
ions
;5.
co
mm
erce
and
m
anuf
actu
ring.
Qin
g(A
D 1
644–
1912
)Q
ing’
s cyc
le in
man
ufac
ture
and
com
mer
ce w
as sl
ight
ly d
iffer
ent f
rom
the
prev
ious
dyn
astie
s. In
the
early
Qin
g st
age
(AD
164
4–17
36),
the
gove
rnm
ent m
aint
aine
d its
rest
rictiv
e at
titud
e to
war
ds p
rivat
e m
anuf
actu
re a
nd c
omm
erce
, im
pose
d he
avy
taxa
tion
on b
usin
essm
en, f
orba
de p
rivat
e pa
rtic
ipat
ion
in m
inin
g an
d in
tern
atio
nal t
rade
, and
set a
cei
ling
on th
e nu
mbe
r of
loom
s a si
lk w
orks
hop
coul
d ha
ve. I
n th
e m
iddl
e st
age
(AD
173
6–17
99),
the
rest
rictio
n w
as a
bolis
hed,
and
co
mm
erce
and
man
ufac
ture
wer
e pr
omot
ed, e
njoy
ing
pros
perit
y. H
owev
er, t
he re
stric
tive
polic
y w
as re
stor
ed in
the
late
st
age
(AD
179
9–18
40),
and
final
ly th
e cy
cle
was
inte
rrup
ted
by th
e O
pium
War
.
Sour
ces:
Si
ma
(197
3, 3
253–
3283
), B
an (1
997,
114
9–11
88),
Ma
(198
6, 1
43–2
13),
Li (
1985
), To
qto’
a an
d A
lutu
(197
7, 4
403–
4566
), So
ng (1
975,
137
7–13
92),
Zha
ng
(197
4 [1
880]
, 193
1–19
99),
Zha
o (1
977,
360
3–36
72),
Bod
de (1
986,
20–
102)
, Loe
we
(198
6, 1
03–2
22),
Bie
lens
tein
(198
6, 2
23–2
90),
Sada
o (1
986,
574
–607
), E
brey
(1
986,
608
–626
), Tw
itche
tt (1
979,
Vol
. 3, P
art 1
), Tw
itche
tt a
nd S
mith
(200
9, V
ol. 5
, Par
t 1),
Bro
ok (1
998,
670
–707
), W
u (2
005,
Vol
. 1, V
ol. 2
, Vol
. 3),
Wu
(201
4),
Tong
(200
5), Z
hu (1
988)
and
Zha
ng (1
989)
.
REINERT_97817825444661_t.indb 157REINERT_97817825444661_t.indb 157 03/10/2016 11:3603/10/2016 11:36
Erik S. Reinert, Jayati Ghosh and Rainer Kattel - 9781782544661Downloaded from Elgar Online at 03/31/2017 12:04:16PM
via University College London

158 Handbook of alternative theories of economic development
In the agricultural sector, the empire confined itself to the small peasant economy, and tried to consolidate this system. The empire never considered that the growth of manufacture and commerce would absorb the bankrupted small farmers driven out of agriculture due to the rise of the landlord economy. Nor had it imagined that exchange between villages and cities, between the agricultural population and the manufacturing and trading population, could provide a constant impulse for prosperity in agriculture. The empire never dreamt of creating any refuge for the small farmers who could not survive in agriculture. Thus, with the decline of the small peasant economy and the rise of the landlords, the empire had no countermeasures to help the small farmers adapt to this situation and find other livelihoods. The only thing the empire could do was to try to delay the progress of landlords, but still the farmers found no refuge from the exploita-tion of landlords and usurers. Survival lay only in tillage. The city was there, but it was monopolized by the big businessmen colluding with the government. The small business-men and artisans seemed no better off than the small farmers. Ostensibly the government sought to restrict exploitation by the landlords and rural usurers, but conditions always grew worse for the small farmers. As a result, the farmers had no choice but to put up with increasing rents, interest rates and taxes. And when prospects grew utterly bleak, the farmers had no choice but to join in the peasant wars. Thus agricultural production invariably suffered in every cycle as constant development and growth were impossible, whereas the landlords, relying on rent collection and usury, enjoyed a permanent golden age. Without constant growth and improvement in agricultural production, no modern industry could ever be generated.
In manufacturing and commerce, the empire had never seen the positive sides of these two sectors, apart from their high profitability. Therefore, the empire ever sought to plunder all the private businessmen’s earnings in these sectors, elbowing them out and monopolizing the profits, thereby making of these sectors a precarious and risky, monopolized market. Businessmen skilled in making improvements and recapitalizing their businesses – the potential great hope of modern industry – all chose to transfer their wealth to land investment and usury, which had nothing to do with the birth of modern industry. The risk of capital accumulation in manufacturing and commerce was too high; the primitive system had to be maintained in the empire. Besides, for those who still did business in the market, facing the most powerful and most privileged monopolist – namely, the empire – any entrepreneurship, innovation or technological improvement became secondary. The top priority in acquiring profit lay in pursuing the rent generated by the empire’s position on the market. In this circumstance, a propensity for collusion and establishing relations with the imperial government, as well as bribery and corruption, was key to becoming a successful businessman. In spite of important Chinese inventions – from movable type to gunpowder – Imperial China was not able to organizationally harness science and entrepreneurship into a path of permanent growth.
One fundamental reason was that the Chinese Empire was not organized on the basis of a dynamic view of the economy or a synergic approach to the relations between dif-ferent sectors. Another important reason was the lack of diversity: as opposed to Europe where a large number of independent states competed vigorously in war, prestige, science and luxuries, China’s organizational unity discouraged trial and error and irreversible change. In short, Imperial China and continued economic growth proved incompatible. The small farmer economy had to prevail at all costs; any dynamic factor was to be
REINERT_97817825444661_t.indb 158REINERT_97817825444661_t.indb 158 03/10/2016 11:3603/10/2016 11:36
Erik S. Reinert, Jayati Ghosh and Rainer Kattel - 9781782544661Downloaded from Elgar Online at 03/31/2017 12:04:16PM
via University College London

The economic cycle of Imperial China 159
controlled. No deviation from the ‘ideal’ state of affairs was tolerated. And yet control over the dynamic factors and correction of deviations eventually proved only superficial countermeasures, unable to halt the pace of change in the economy. As a result, the road led inevitably to ruin, and then, once again, a new start.
REFERENCES
Ban, Gu. 1997. Han Shu (History of former Han Dynasty). Beijing: Zhonghua Book Company.Bielenstein, Hans. 1986. The Institutions of Later Han. In Denis Twitchett and John Fairbank (eds). The
Cambridge History of China, Vol. 1: The Ch’in and Han Empires, 221 BC–AD 220, 224–290. New York: Cambridge University Press.
Bodde, Derk. 1986. The State and Empire of Ch’in. In Denis Twitchett and John Fairbank (eds). The Cambridge History of China, Vol. 1: The Ch’in and Han Empires, 221 BC–AD 220, 20–102. New York: Cambridge University Press.
Brook, Timothy. 1998. The Communications and Commerce. In Denis Twitchett and Frederick Mote (eds). The Cambridge History of China, Vol. 8, The Ming Dynasty: 1358–1644, Part 2, 582–707. New York: Cambridge University Press.
Cao, Guanyi. 1989. Zhongguo Nongye Jingjishi (History of Chinese agriculture). Beijing: China Social Sciences Press.
Ebrey, Patricia. 1986. The Economic and Social History of Later Han. In Denis Twitchett and John Fairbank (eds). The Cambridge History of China, Vol. 1: The Ch’in and Han Empires, 221 BC–AD 220, 608–648. New York: Cambridge University Press.
Fairbank, John. 1983. The United States and China., 4th enlarged edn. Cambridge, MA: Harvard University Press.Fu, Zhufu. 1980. Zhongguo Jingjishi Luncong (The Essays on Chinese Economic History). Beijing: SDX Joint
Publishing Company.Heijdra, Martin. 1998. The Socio-Economic Development of Rural China During the Ming. In Denis Twitchett
and Frederick Mote (eds). The Cambridge History of China, Vol. 8, The Ming Dynasty: 1358–1644, Part 2, 582–707. New York: Cambridge University Press.
Hou, Jiaju. 2005. Zhong Guo Jing Ji Shi (Economic history of China). Taipei: Linking Publishing.Huang, Ray. 2008. China, a Macro History. Beijing: SDX Joint Publishing Company.Huang, Zongxi. 1985. Huang Zongxi Quanji (The collection of Huang Zongxi’s work), Vol. 1. Hangzhou:
Zhejiang Ancient Books Publishing Houses.Li, Tao. 1985. Xu Zi Zhi Tong Jian Chang Bian (The long compilation of the continuation of history as a
mirror). Beijing: Zhonghua Book Company.Loewe, Michael. 1986. The Former Han Dynasty. In Denis Twitchett and John Fairbank (eds). The Cambridge
History of China, Vol. 1: The Ch’in and Han Empires, 221 BC–AD 220, 103–222. New York: Cambridge University Press.
Lv, Simian. 2005. Zhonguo Zhidushi (History of Chinese institutions). Shanghai: Shanghai Educational Publishing House.
Ma Duanlin. 1986. Wen Xian Tong Kao (The general investigation on previous political and social institutions). Beijing: Zhonghua Book Company.
Mencius. 2010. Mencius. Beijing: Zhonghua Book Company.Sadao, Nishijima. 1986. The Economic and Social History of Former Han. In Denis Twitchett and John
Fairbank (eds). The Cambridge History of China, Vol. 1: The Ch’in and Han Empires, 221 BC–AD 220, 545–607. New York: Cambridge University Press.
Sima, Qian. 1973. Shi Chi (The historical record of China from the beginning of civilization to the Han Dynasty). Beijing: Zhonghua Book Company.
Song, Qi. 1975. Xin Tang Shu (History of Tang Dynasty). Beijing: Zhonghua Book Company.Tao, Xisheng. 1948. Zhongguo Zhengzhi Sixiangshi (History of Chinese political thought), Vol. 1. Nanjing:
Chinese Printing & Publishing Company.Tong Shuye. 2005. Zhongguo Shougongye Shangye Fazhanshi (Development history of Chinese manufacture
and commerce). Beijing: Zhonghua Book Company.Toqto’a and Alutu. 1977. Song Shi (History of Song Dynasty). Beijing: Zhonghua Book Company.Twitchett, Denis (ed). 1979. The Cambridge History of China Vol. 3: Sui and T’ang China, Part 1, 589–905. New
York: Cambridge University of Press.Twitchett, Dennis and Smith, Paul (eds). 2009. The Cambridge History of China Vol. 5: The Sung and Its
Precursors, Part 1, 907–1279, New York: Cambridge University Press.
REINERT_97817825444661_t.indb 159REINERT_97817825444661_t.indb 159 03/10/2016 11:3603/10/2016 11:36
Erik S. Reinert, Jayati Ghosh and Rainer Kattel - 9781782544661Downloaded from Elgar Online at 03/31/2017 12:04:16PM
via University College London
160 Handbook of alternative theories of economic development
Twitchett, Denis. 1979. Introduction. in Denis Twitchett (ed.). The Cambridge History of China, Vol.3: Sui and T’ang China, 589–905, Part 1, 1–47. New York: Cambridge University of Press.
Wang, Anshi. 1959. Linchuan Xiansheng Wenji (The collection of Wang Anshi’s work). Beijing: Zhonghua Book Company.
Wu, Hui. 2005. Zhongguo Shangye Tongshi (General history of Chinese commerce), Vols 1–3. Beijing: China Financial Economic Publishing House.
Wu, Hui. 2014. Zhongguo Shangye Zhengceshi (History of Chinese commercial policies). Beijing: Social Sciences Academic Press.
Wu, Tingyu. 1987. Zhongguo Lidai Tudizhidu Shigang (The history of Chinese land institutions), Parts 1 and 2. Changchun: Jilin University Press.
Yi, Zhongtian. 2007. Diguode Zhongjie (Criticism on imperial Chinese political institutions). Shanghai: Fudan University Press.
Zeng, Zhaoxiang. 1983. Zhongguo Fengjianshehuide Qingshangsixianghe Yishangzhengce (The thoughts and policies of restricting commerce in imperial China). Beijing: China Business Press.
Zhang, Shoujun. 1988. Zhongguo Lishishangde Zhongbenyimosixiang (The ‘stressing agriculture and restrain-ing commerce’ thought in Chinese history). Beijing: China Business Press.
Zhang, Tingyu. 1974 (1880). Ming Shi (History of Ming Dynasty). Beijing: Zhonghua Book Company.Zhang, Yinong. 1989. Zhongguo Shangye Jianshi (Brief history of Chinese commerce). Beijing: China
Economic Publishing House.Zhao, Erxun. 1977. Qing Shi Gao (Draft history of Qing Dynasty). Beijing: Zhonghua Book Company.Zhao, Gang and Chen, Zhongyi. 1991. Zhongguo Jingjizhidushi (History of Chinese economic institutions).
Beijing: China Economic Press.Zhu, Cishou. 1988. Introduction to Zhongguo Gudai Gongyeshi (Industrial history of imperial China).
Shanghai: Akademia Press.
REINERT_97817825444661_t.indb 160REINERT_97817825444661_t.indb 160 03/10/2016 11:3603/10/2016 11:36
Erik S. Reinert, Jayati Ghosh and Rainer Kattel - 9781782544661Downloaded from Elgar Online at 03/31/2017 12:04:16PM
via University College London

161
8. Islam and capitalism: military routs, not formal institutionsAli Kadri
Islamic history abounds with merchant trade, and major Islamic cities flourish or decline by the rhythm of long- distance trade (Amin 1976). Islamic free- trade precepts derive their legitimacy from religious tenets. A hadith (a saying of the Prophet) acknowledges that profits are nine- tenths commerce and one- tenth other.1 The freedom for merchants to travel, set prices and exchange with few constraints are central to many schools of Sharia. The oft- debated problematic is that even though Islam did not inhibit the devel-opment of commerce, the Muslim world lagged behind Europe in establishing capitalist production relations.2 Keeping in mind that the map of Europe keeps changing and that history is not a sports race with a beginning and an end, this chapter revisits certain methodological points that may contribute to the better understanding of a rather thorny subject. The central point of my argument is that European conquests hold primacy in explaining the antecedent rise of capitalist relations in Europe over differences in forms of social organization between European and Eastern modes of production. Imperialist conquests, beginning prior to the onset of capitalist relations circa the sixteenth century, and direct plundering increased the wealth of European merchant capital, limited the expansion of Eastern merchants and situated the inexorable birth of capitalist produc-tion relations on the European continent (Marx 1867; Emmanuel 1972).
In a heterogeneous, self- differentiating and interrelated world, the issue of whether Islam, and the East more generally, have failed in comparison to Europe is a misplaced problematic. European capital through its colonial and class linkages extends to the East. The East through its labour, raw materials and underdevelopment by colonial diktat reaches the West. The lines of demarcation that set real concepts apart from hallucina-tory forms of thought are the class lines that crisscross national boundaries. Where the space that defines an entity vis- à- vis another ends, is where the ideological inclination begins. So when Bernard Lewis posits that Islam has become poor, weak and ignorant, Michael Neumann responds with relevant data showing that poverty and underdevelop-ment are not exclusive characteristics of the Muslim world, but are shared across cul-tures (Neumann 2003). With two world wars and several other wars to its credit in the twentieth century, not least including unjustifiable poverty levels in contrast to immense wealth, Christendom carries more guilt on its conscience (Neumann 2003). From its onset on the world stage, the crisis of capitalism, its genocide of the natives and slavery, has eclipsed its progressive moments. This chapter is not about value- judging historical
1 My interpretation of the chapter on the etiquette of commerce, at: http://www.mezan.net/books/man-layahdraho/fakeeh3/html/ara/books/faqih/faqih- 3/a62.html.
2 Given that the object of research is the method rather than historicity, at this level of generalization I will be using ‘Islamic world’ and ‘Islam’ interchangeably, referring broadly to areas where Islam has been the dominant religion.
REINERT_97817825444661_t.indb 161REINERT_97817825444661_t.indb 161 03/10/2016 11:3603/10/2016 11:36
Erik S. Reinert, Jayati Ghosh and Rainer Kattel - 9781782544661Downloaded from Elgar Online at 03/31/2017 12:04:16PM
via University College London
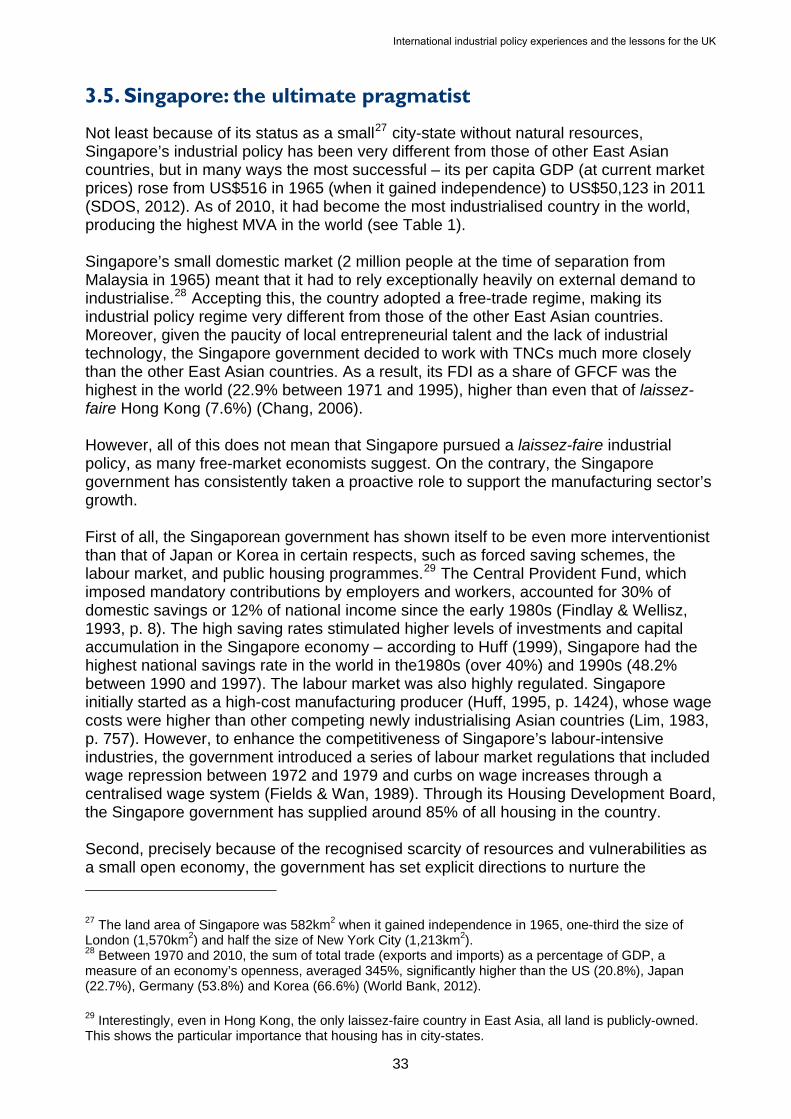
3.5. Singapore: the ultimate pragmatist
Not least because of its status as a small27 city-state without natural resources, Singapore’s industrial policy has been very different from those of other East Asian countries, but in many ways the most successful – its per capita GDP (at current market prices) rose from US$516 in 1965 (when it gained independence) to US$50,123 in 2011 (SDOS, 2012). As of 2010, it had become the most industrialised country in the world, producing the highest MVA in the world (see Table 1). Singapore’s small domestic market (2 million people at the time of separation from Malaysia in 1965) meant that it had to rely exceptionally heavily on external demand to industrialise.28 Accepting this, the country adopted a free-trade regime, making its industrial policy regime very different from those of the other East Asian countries. Moreover, given the paucity of local entrepreneurial talent and the lack of industrial technology, the Singapore government decided to work with TNCs much more closely than the other East Asian countries. As a result, its FDI as a share of GFCF was the highest in the world (22.9% between 1971 and 1995), higher than even that of laissez-faire Hong Kong (7.6%) (Chang, 2006). However, all of this does not mean that Singapore pursued a laissez-faire industrial policy, as many free-market economists suggest. On the contrary, the Singapore government has consistently taken a proactive role to support the manufacturing sector’s growth. First of all, the Singaporean government has shown itself to be even more interventionist than that of Japan or Korea in certain respects, such as forced saving schemes, the labour market, and public housing programmes.29 The Central Provident Fund, which imposed mandatory contributions by employers and workers, accounted for 30% of domestic savings or 12% of national income since the early 1980s (Findlay & Wellisz, 1993, p. 8). The high saving rates stimulated higher levels of investments and capital accumulation in the Singapore economy – according to Huff (1999), Singapore had the highest national savings rate in the world in the1980s (over 40%) and 1990s (48.2% between 1990 and 1997). The labour market was also highly regulated. Singapore initially started as a high-cost manufacturing producer (Huff, 1995, p. 1424), whose wage costs were higher than other competing newly industrialising Asian countries (Lim, 1983, p. 757). However, to enhance the competitiveness of Singapore’s labour-intensive industries, the government introduced a series of labour market regulations that included wage repression between 1972 and 1979 and curbs on wage increases through a centralised wage system (Fields & Wan, 1989). Through its Housing Development Board, the Singapore government has supplied around 85% of all housing in the country. Second, precisely because of the recognised scarcity of resources and vulnerabilities as a small open economy, the government has set explicit directions to nurture the
27 The land area of Singapore was 582km2 when it gained independence in 1965, one-third the size of London (1,570km2) and half the size of New York City (1,213km2). 28 Between 1970 and 2010, the sum of total trade (exports and imports) as a percentage of GDP, a measure of an economy’s openness, averaged 345%, significantly higher than the US (20.8%), Japan (22.7%), Germany (53.8%) and Korea (66.6%) (World Bank, 2012).
29 Interestingly, even in Hong Kong, the only laissez-faire country in East Asia, all land is publicly-owned. This shows the particular importance that housing has in city-states.
33
International industrial policy experiences and the lessons for the UK

manufacturing sector’s growth. In 2010, a high-level committee (comprising the government, labour movement, private sector and academia), tasked by the Prime Minister to formulate medium-term economic strategies, recommended the retention of a “globally competitive manufacturing sector” at between 20-25% of the economy (SESC, 2010). As a city-state, policy formulation is highly centralised, with the implementation of industrial policy falling primarily under the mandate of the Economic Development Board (EDB) (see Schein, 1997; Chan, 2011, for more details on the EDB and its work). Strategic manufacturing clusters that are assessed to have long-term economic potential are identified and targets are actively pursued. During the nascent stage of building the biomedical manufacturing cluster in the early 2000s, Singapore targeted to attract 15 world-class biomedical science companies by 2010. This goal was surpassed, with Singapore succeeding in attracting over 30 leading companies by 2012. Most recently in 2013, Singapore announced ambitious plans to build manufacturing capabilities in satellites to serve the space industry. Third, Singapore’s policy towards TNCs, while extremely friendly, has not been laissez faire. Rather than taking a hands-off approach to the inflows of FDI and let the TNCs decide what to do, the Singaporean government has worked hard to attract FDI into certain areas that it regards as important for the future of the country’s economy, by offering a whole slew of custom-designed financial incentives. Subsidies offered to TNCs targeted desirable industries based on criteria such as employment, growth potential, technical contents, and value-added (Huff, 1999, p. 39). Between 1980 and 1990, Singapore received more FDI than any other developing country (Huff, 1995, p. 1425). Today, Singapore continues to offer Pioneer incentives (corporate tax exemptions on income from qualifying activities), Development and Expansion incentives (reduced corporate tax rate on incremental income from qualifying activities), and the Research Incentive Scheme for Companies (grants to develop R&D capabilities in strategic areas of technology). Singapore’s generous incentives were cited as a key reason why hard disk manufacturer Seagate chose to invest in Singapore over Hong Kong and Korea in 1982 despite Singapore’s lack of a domestic supply base (Peebles & Wilson, 2002, p. 100). This initial investment eventually earned Singapore the distinction of being the largest producer of hard disk drives in the world (45-50% of annual world output) between 1986 and 1996 (Wong, 2000, p. 155). Fourth, in sectors assessed to be critical, the Singapore government set up SOEs – comprising Government-linked Companies (GLCs) and government statutory boards (such as the Housing Development Board) – rather than inviting TNCs. The world-famous Singapore Airlines is an SOE, while industries such as shipbuilding and telecommunications are also run by SOEs. As a result, it has a huge SOE sector (estimated to be 21.8% of GDP in 1998) (SDOS, 2001).30 For example, between 1970 and 1990, the share of the public sector in GFCF in Korea was around 10%, whereas the corresponding figure in Singapore was over 30% – 36% in the 1960s, 27% in the 1970s and 30% in the 1980s (Shin, 2005). It would not be an exaggeration to say that virtually all large firms in Singapore that are not transnational corporation (TNC) subsidiaries are SOEs.
Fifth, land use policies in Singapore incorporate a significant sectoral-targeting dimension, particularly given its lack of land resources.31 For instance, waterfront land
30 In 2001, GLCs were estimated to account for 12.9% of Singapore’s GDP in 1998, with the non-GLC public sector accounting for another 8.9% (SDOS, 2001). 31 The majority of land in Singapore is publicly owned, with the government empowered to acquire the rest.
34
International industrial policy experiences and the lessons for the UK

that is allocated to the petrochemicals industry cannot be used to expand the port (and grow maritime services). In a recent land use plan (with a time horizon until 2030), the government announced new manufacturing zones “to support the growth of the manufacturing sector” (SMND, 2013). Land-related industrial policy measures also target specific clusters within the manufacturing sector. For instance, the land mass of seven small islands was tripled and amalgamated through the reclamation of 22km2 of land to create Jurong Island – a petrochemicals hub. Contiguous land was also allocated to facilitate the growth of clusters in industries such as aerospace (Seletar Aerospace Park) and pharmaceuticals (Tuas Biomedical Park and Biopolis).
3.6. Finland: defying gravity?
On the back of state-led corporatist industrialisation, Finland radically transformed itself from one of the poorest economies in Europe into one of the richest. According to the authoritative statistical work of Maddison (1989), among the 16 largest rich countries of today, only Japan (3.1%) achieved a higher rate of annual per capita income growth than Finland (2.6%) during the 1900-87 period (p.15, table 1.2).32 Norway tied with Finland in second place, and the average for all 16 countries was 2.1%.33 Industrial policy in Finland involved close cooperation between the state, trade unions and private sector agents, such as the banks and industrial firms. This corporatist nature of Finland’s growth model has led to comparisons with the Asian economies, such as Korea and Taiwan (Vartiainen, 1999). Like Singapore, Finland is a small open economy that emphasised state-directed capital accumulation that was supported by high public savings.34 During the 1950s and 1960s, public savings comprised as much as 30% of aggregate savings, and these surpluses were used to support private investments in capital equipment and to form public companies (Jäntti & Vartiainen, 2009).35 SOEs were established in industries that were more capital-intensive or deemed too risky for private enterprises. These industries included basic metal (Rautaruukki), pulp and paper (Stora Enso), chemical fertilizer (Kemira), and petroleum and oil products (Neste). In the early 1980s, SOEs were estimated to contribute 18% to Finland’s industrial value-added (Kosonen, 1992).36 However, unlike Singapore, Finland eschewed foreign involvement during its early phase of industrialisation. Having been subjugated to foreign rule for centuries, draconian restrictions were imposed on foreign investments.37 In 1919, soon after the
32 For the list of the 16 countries, see the Japan section. 33 Despite the massive external shock that it received following the collapse of the Soviet Union, which accounted for over one-third of its international trade, Finland ranked at a very respectable joint-5th among the 16 countries in terms of per capita income growth during the 1990s. According to the World Bank data, its annual per capita income growth rate during 1990-99 was 2.1% (equal to the Netherlands), exceeded only by Norway (3.2%), Australia (2.6%), and Denmark and the USA (2.4%). 34 Public investments were primarily to strengthen the industrial base and encourage private capital accumulation (Kosonen, 1992). 35 Following the Second World War, the Finnish government made a strategic decision not to lower the tax rate to pre-war levels. 36 Industrial value-added includes the value-added from both manufacturing activities and the processing of raw materials. In Norway, another Nordiac country that established SOEs in basic industrial sectors, SOEs contributed only 10% of industry value-added in the early 1980s (Kosonen, 1992). 37 From the 12th century until 1809, Finland was part of Sweden; thereafter, it existed as an autonomous Grand Duchy within the Russian empire until 1917.
35
International industrial policy experiences and the lessons for the UK

See discussions, stats, and author profiles for this publication at: https://www.researchgate.net/publication/257771079
The Institutional Dynamics of a Developmental State: Change and Continuity
in State–Economy Relations in Israel
Article in Studies in Comparative International Development · September 2012
DOI: 10.1007/s12116-012-9098-3
CITATIONS
17READS
73
2 authors:
Some of the authors of this publication are also working on these related projects:
The making of homo financius: The emergence and development of financial literacy in Israel View project
Daniel Maman
Ben-Gurion University of the Negev
23 PUBLICATIONS 328 CITATIONS
SEE PROFILE
Zeev Rosenhek
The Open University of Israel
31 PUBLICATIONS 454 CITATIONS
SEE PROFILE
All content following this page was uploaded by Zeev Rosenhek on 10 March 2015.
The user has requested enhancement of the downloaded file.

1 23
Studies in Comparative InternationalDevelopment ISSN 0039-3606Volume 47Number 3 St Comp Int Dev (2012) 47:342-363DOI 10.1007/s12116-012-9098-3
The Institutional Dynamics of aDevelopmental State: Change andContinuity in State–Economy Relations inIsrael
Daniel Maman & Zeev Rosenhek

1 23
Your article is protected by copyright and
all rights are held exclusively by Springer
Science+Business Media, LLC. This e-offprint
is for personal use only and shall not be self-
archived in electronic repositories. If you
wish to self-archive your work, please use the
accepted author’s version for posting to your
own website or your institution’s repository.
You may further deposit the accepted author’s
version on a funder’s repository at a funder’s
request, provided it is not made publicly
available until 12 months after publication.

The Institutional Dynamics of a Developmental State:Change and Continuity in State–Economy Relationsin Israel
Daniel Maman & Zeev Rosenhek
Published online: 2 March 2012# Springer Science+Business Media, LLC 2012
Abstract This paper examines the institutional dynamics of the Israeli developmentalstate, focusing on its transformation since the mid-1980s, when a deep and far-reachingprocess of liberalization began. In contrast to the conventional stance concerning thewithdrawal of the state from the economy and the decline of its political and institutionalcapabilities to shape the structure of economic relations, our analysis suggests that thestate has not retreated from the economic sphere. The important shift in state–economyrelations lies not in the extent of the state’s involvement in the economy, but rather inthe mode of its involvement. That is, institutional changes have to do first andforemost with the definition of the state’s objectives in the management of thepolitical economy and the way it uses particular institutional instruments to attainthose objectives. As we show, state agencies continue to play a crucial role in theeconomic arena. While certain institutional traits and practices of the classic devel-opmental state have indeed vanished, there are also very significant lines of continu-ity in place that keep imprinting on state–economy relations. It is this combination ofchange and continuity that determines the modes of action of developmental statesunder conditions of neoliberal globalization.
Keywords State–economy relations . Developmental state . Liberalization . Israelipolitical economy
Introduction
State–economy relations, developmental state, liberalization, Israeli politicaleconomy
St Comp Int Dev (2012) 47:342–363DOI 10.1007/s12116-012-9098-3
D. MamanDepartment of Sociology and Anthropology, Ben-Gurion University of the Negev, Be’er Sheva, Israele-mail: [email protected]
Z. Rosenhek (*)Department of Sociology, Political Science and Communication, The Open University of Israel,Ra’anana, Israele-mail: [email protected]
Author's personal copy

The institutional and political dynamics of developmental states amidst conditionsof globalization and neoliberal institutional reforms has become in the last decade animportant topic of research, which contributes to broad questions concerning currentchanges in state–economy relations. While some scholars maintain that globalizationand the institutionalization of the neoliberal policy paradigm entail the unequivocaldismantling of the developmental state, others present a far more complex picture ofchange and continuity in which certain institutional traits and practices characteristicof the developmental state still play a pivotal role in the political economy of variouscountries. This debate is connected to the question of the significance of the institu-tionalization of a global neoliberal regime for the role of the state in the economy.
The adoption of neoliberal institutional arrangements and policies is commonlyunderstood as connoting a substantial withdrawal of the state from the economic fieldand a marked diminution in its institutional and political capacities to controleconomic processes. The notion that the strengthening of neoliberal institutionalarrangements and policies connotes the weakening of the state vis-à-vis the marketis largely considered as based on firm and undisputable facts; almost a truism. Incontrast to this conventional perspective, however, an alternative view posits that inthe neoliberal era, the state has not necessarily retreated from the economic sphere.The changes that occurred in the political economies of numerous countries since the1990s, including those that were characterized as developmental states, should beanalyzed not in terms of more or less state involvement in the economy but rather interms of qualitative changes in its mode of involvement and in its institutionalconfiguration. This perspective allows us to discern that while certain institutionaltraits and practices of the classic developmental state have indeed vanished, there arealso very significant lines of continuity in place that keep imprinting on state–economy relations. It is this combination of change and continuity that determinesthe modes of action of developmental states under conditions of neoliberalglobalization.
We draw on this approach in analyzing the institutional dynamics of the Israelipolitical economy, focusing on its transformation since the mid-1980s, when anintensive process of liberalization began. This has been a deep and far-reachingprocess of gradual change in state–economy relations, which encompassed theadoption of typical neoliberal formulas: deregulation of the labor market; liberaliza-tion of the financial markets; lifting of restrictions on the movement of capital andgoods; heightened involvement of foreign capital in the local economy; privatizationof public assets; and restrictive fiscal and monetary policies. Hence, the Israeli caserepresents an interesting instance of a strongly state-led political economy thatunderwent a sweeping process of liberalization during the last decades, and in whicha rather orthodox version of neoliberal ideology appears as hegemonic. The remark-able magnitude of the transformation makes the Israeli case a particularly fertileresearch site for assessing the complex dynamics of state–economy relations underglobal neoliberalism. We contend that this shift does not necessarily imply thewithdrawal of the state from the economy and its institutional weakening. We arguerather that they are indicative of and embedded in fundamental modifications in thestate’s institutional configuration and in the mode of its involvement in the economy,not its retreat. Dynamics of institutional continuity amidst change under conditions ofglobalization brought about the institutionalization of a hybrid model characterized
St Comp Int Dev (2012) 47:342–363 343
Author's personal copy
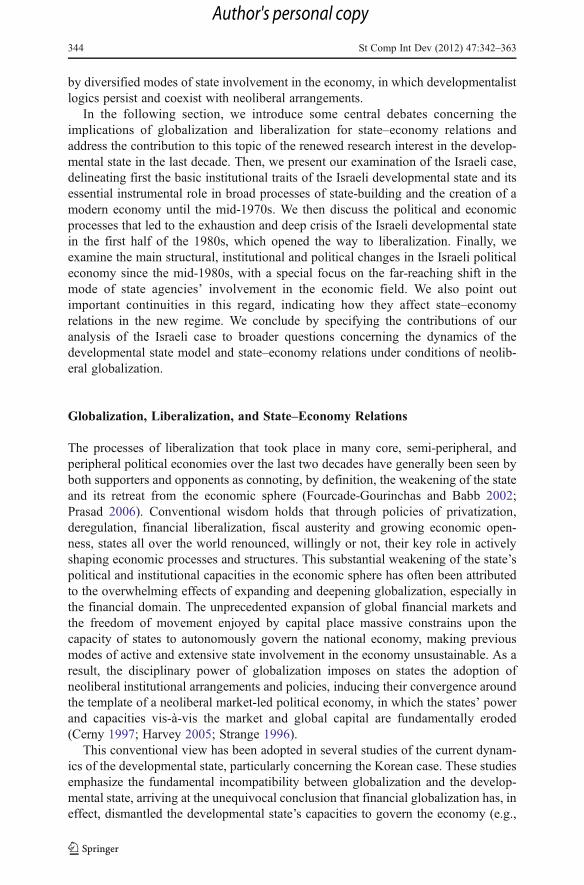
by diversified modes of state involvement in the economy, in which developmentalistlogics persist and coexist with neoliberal arrangements.
In the following section, we introduce some central debates concerning theimplications of globalization and liberalization for state–economy relations andaddress the contribution to this topic of the renewed research interest in the develop-mental state in the last decade. Then, we present our examination of the Israeli case,delineating first the basic institutional traits of the Israeli developmental state and itsessential instrumental role in broad processes of state-building and the creation of amodern economy until the mid-1970s. We then discuss the political and economicprocesses that led to the exhaustion and deep crisis of the Israeli developmental statein the first half of the 1980s, which opened the way to liberalization. Finally, weexamine the main structural, institutional and political changes in the Israeli politicaleconomy since the mid-1980s, with a special focus on the far-reaching shift in themode of state agencies’ involvement in the economic field. We also point outimportant continuities in this regard, indicating how they affect state–economyrelations in the new regime. We conclude by specifying the contributions of ouranalysis of the Israeli case to broader questions concerning the dynamics of thedevelopmental state model and state–economy relations under conditions of neolib-eral globalization.
Globalization, Liberalization, and State–Economy Relations
The processes of liberalization that took place in many core, semi-peripheral, andperipheral political economies over the last two decades have generally been seen byboth supporters and opponents as connoting, by definition, the weakening of the stateand its retreat from the economic sphere (Fourcade-Gourinchas and Babb 2002;Prasad 2006). Conventional wisdom holds that through policies of privatization,deregulation, financial liberalization, fiscal austerity and growing economic open-ness, states all over the world renounced, willingly or not, their key role in activelyshaping economic processes and structures. This substantial weakening of the state’spolitical and institutional capacities in the economic sphere has often been attributedto the overwhelming effects of expanding and deepening globalization, especially inthe financial domain. The unprecedented expansion of global financial markets andthe freedom of movement enjoyed by capital place massive constrains upon thecapacity of states to autonomously govern the national economy, making previousmodes of active and extensive state involvement in the economy unsustainable. As aresult, the disciplinary power of globalization imposes on states the adoption ofneoliberal institutional arrangements and policies, inducing their convergence aroundthe template of a neoliberal market-led political economy, in which the states’ powerand capacities vis-à-vis the market and global capital are fundamentally eroded(Cerny 1997; Harvey 2005; Strange 1996).
This conventional view has been adopted in several studies of the current dynam-ics of the developmental state, particularly concerning the Korean case. These studiesemphasize the fundamental incompatibility between globalization and the develop-mental state, arriving at the unequivocal conclusion that financial globalization has, ineffect, dismantled the developmental state’s capacities to govern the economy (e.g.,
344 St Comp Int Dev (2012) 47:342–363
Author's personal copy

Pirie 2008). The enormous growth of global financial flows has shifted the control-ling lever to markets and capital, shrinking the state’s power, autonomy and ability tocommand over local big business (Pang 2000). As liberalizing reforms, especially inthe financial sphere, were put in effect to adapt to the new reality of the globaleconomy, the ability of the Korean state to control the behavior of big capital wasseriously impaired, thus bringing about the certain and inevitable demise of thedevelopmental state (Kim 1999).
Accounts such as these, which posit a simple causal link between globalization andthe supposedly indisputable weakening of the state, have been criticized on variousgrounds. In addition to the mechanistic and deterministic assumptions regarding theomnipotent and uniform effects of globalization upon the state (see Campbell 2004;Sassen 2006), a central limitation of the globalist approach, as well as of othersimplistic perspectives on neoliberalism, is the ways in which the changes occurringin state–economy relations are conceptualized as operating within a zero-sum game,thus necessarily connoting the institutional debilitation of the state and its concom-itant retreat from the economy. This appropriate criticism was forcefully stated byLinda Weiss (1998), who posits that the key role of the state in the economy has notdiminished in the era of neoliberal globalization. Considering the East Asian devel-opmental state, Weiss rejects the conventional arguments about their demise orobsolescence, emphasizing instead their enduring institutional capacity to promoteeconomic growth based on the formation and maintenance of organizational infra-structures that encourage innovation.
Since the 2000s there is renewed interest in the institutional setup and policies thatallow states to play key instrumental roles in processes of economic growth underconditions of globalization. For instance, several studies of East Asian developmentalstates have stressed the resilience of some of their institutional foundations and thecontinued effects of institutional legacies, while also observing important changes intheir mode of intervention in the economy (Wong 2004a). Within this context ofcontinuity amidst change, the activist role of the Korean and Taiwanese states ininfluencing industrial development has persisted, though combined with the adoptionof policies of deregulation and financial liberalization. While the developmental stateand its relations with societal actors have been transformed, the state continues toplay a critical role in structuring economic processes through the purposive construc-tion of financial and other markets, supporting technological innovation and com-mercialization and incentivizing the development of particular economic sectors(Thurbon 2007; Weiss 2003; Wong 2004b).
In a similar vein, Sean O Riain (2004) convincingly rejects the notion that the statehas became obsolete and irrelevant as an agent of development under conditions ofglobalization, suggesting instead that its active involvement in building and sustain-ing institutional frameworks that encourage innovation can serve as an essentialfactor promoting economic growth and capital accumulation (see also Levy 2006).He distinguishes between the classic model of the developmental bureaucratic stateand the recently institutionalized model of the developmental network state. Just asthe Japanese and later the Korean and Taiwanese political economies were theempirical cases that served as the basis for the formulation of the theoretical modelof the classic developmental state, the Irish case serves O Riain for elaborating hismodel of the developmental network state as a type of state developmentalism
St Comp Int Dev (2012) 47:342–363 345
Author's personal copy

particularly well fit to the new challenging conditions induced by global post-Fordism. This new mode of state involvement in the economy, with which, accordingto O Riain, the Israeli and Taiwanese political economies also conform, is defined byits ability to initiate and nurture local networks of technological innovation andpromote their tight-knit integration within global technology, business and financialnetworks. This is achieved by a myriad of programs and activities aimed at encour-aging the growth of an innovative and global oriented local high-tech sector, such asfunding of research and development, provision of initial capital for start-ups, andinstitutional support for the establishment of extensive and intensive technological,financial and commercial links with global business. Fred Block (2008) has latelyused O Riain’s concept of the developmental network state to examine the instru-mental role of the American state, in particular of its military apparatus, in the growthof the high-tech sector. State agencies have been intensively involved not only in thedevelopment of innovative technologies, but also in financially and institutionallyassisting the private sector in the commercialization of these innovations. Thus,Block concludes that beneath the ideological and rhetorical surface of market funda-mentalism, since the 1980s has in fact emerged in the US, a rather activist “hiddendevelopmental state” that plays an essential role in supporting the expansion of theprivate high-tech sector.
A major conclusion emerging from the recent literature on state–economy relationsunder conditions of neoliberal globalization is that the changes in the political economyshould not be conceptualized in terms of more or less state involvement in the economy,but rather in terms of qualitative differences in themodes andways throughwhich the statestructures the economic field and affects the constitution and conduct of economic actors.Similarly, contrary to conventional arguments about the implications of globalization andneoliberalism for the state, the important question to be addressed is not one of more orless state power, but rather one that focuses on the changes in the state’s institutionalarchitecture (Jayasuriya 2001). A particularly important dimension in the shift to aneoliberal regime is the transformation of the state’s institutional configuration: as thestate’s involvement in the economy takes on a different form, important changes takeplace in the power relations between various state agencies (Sassen 2006).
In the following analysis of the Israeli case, we show that the shift in the politicaleconomy towards a neoliberal model has connoted a fundamental change in thestate’s mode of involvement, in its institutional configuration, and in the institutionaltools and polices that its agencies use in shaping and regulating economic processesand relations. Furthermore, we show that these new patterns of state–economyrelations are structured by complex dynamics of change and continuity, so that inmany respects, the Israeli state maintains its central role in affecting the economy.
The State-Made Israeli Economy
As in other cases of semi-peripheral political economies, the state in Israel wasdecisive in developing a capitalist economy through activist policies of industriali-zation, the formation of local capital, and the construction of markets; a pattern ofstate–economy relations that was anchored in the post WWII-dominant institutionalmodel that saw the state as the major agent of socio-economic development
346 St Comp Int Dev (2012) 47:342–363
Author's personal copy

(Helleiner 2003). During its first decades of existence, from its establishment in 1948until the 1980s, the Israeli state largely functioned in the socio-economic fieldaccording to the institutional principles of the developmental state model (Levi-Faur1998), so that its extensive involvement in economic processes were in fact founda-tional to the building of the Israeli economy.
State agencies were widely and deeply involved in all dimensions of the economicsphere, both directly and indirectly, with their main aim being to ensure high levels ofeconomic activity and industrial development. To this end, the state completelycontrolled the allocation of important economic resources, such as land and othernatural resources. The state also exerted a great deal of centralist control over mattersof infrastructure development, agricultural and industrial production, foreign trade,investment and credit (Levi-Faur 1998), the structuring and management of the labormarket (Grinberg 1991), and the differential incorporation of particular social groupsin its various sectors (Rosenhek 2003).
The processes of resource allocation and the tight regulation of economic activityand relations were certainly driven by the political interest of ensuring the continuinghegemony of the Labor party, which controlled the state apparatus uninterruptedlyfrom 1948 to 1977. But far more fundamentally, the actions of the Israeli develop-mental state were determined by the broader and basic political logic of building andconsolidating the state and its economy according to Zionist principles and interests(Shalev 1992). This logic of state-building gave rise to the aims of establishing andarming a large military force, absorbing Jewish immigrants and settling themthroughout the country, accelerated industrialization, and the development of asegmented welfare state that guaranteed different levels of socio-economic protectionto various populations according to nationality, ethnicity, and gender (Rosenhek2011; Shafir and Peled 2002; Shalev 1992; Swirski 2005). As in other developmentalstates, such as South Korea and Taiwan (for a comparison, see Levi-Faur 1998), theseaims, which were formulated in nationalist terms of constructing and consolidatingnational strength, were closely related to broader processes of building and institu-tionalizing a modern etatist socio-economic and political order. As such, they derivedfrom the state’s autonomous interests in increasing its internal economic, political andsocial capabilities, and its external economic and military power.
Typical of the developmental state model (Evans 1995), one of the pivotalinstitutional foundations of the operation of the Israeli state was its extensive anddeep control of capital mobilization and allocation. State agencies enjoyed virtuallyfull control over capital mobilization from both internal and external sources and itssubsequent discretionary allocation to public and private bodies according to acentralized development policy aimed at rapid industrialization. This was facilitatedby the fact that the inflow of capital did not take the form of private investment, butrather that of unilateral capital transfers based on political logics and channeled bystate agencies: contributions from Jewish organizations around the world, reparationpayments from Germany since 1954, and American civil and military aid, particularlyfrom the late 1960s. Private foreign capital, both financial and industrial—over whichthe state would have found it more difficult to exercise strict control—was almosttotally absent in Israel until the 1990s.
Similarly, state agencies controlled the main channels for local capital formation(Levi-Faur 1998). The main savings schemes—pension funds, provident funds and
St Comp Int Dev (2012) 47:342–363 347
Author's personal copy

various saving programs—were obliged to invest most of their capital in non-tradablegovernment bonds or to make special deposits with the Ministry of Finance (Grinberg1993; Shalev 1992). In addition, the state had complete control of the foreigncurrency market through stringent restrictions on foreign currency transactions andon the international movement of capital by both firms and individuals.
The control over capital mobilization allowed the state to command capitalallocation to specific economic sectors based on considerations of industrializa-tion, full employment, immigrant absorption, regional development, and thegeographical distribution of the population, all key tasks in the process ofstate-building in Israel. These efforts were already underway in 1950, when theMinistry of Finance instructed the commercial banks as to the preferred prioritiesin providing credit, with industrial and agricultural production at the top of thelist. A year later, the Ministry of Finance began to exempt banks from thereserves requirement on credit that they made available to selected economicsectors. Starting from 1960, a myriad of special funds operated by the centralbank jointly with the Ministry of Finance and the Ministry of Trade and Industrywere set up for allocating heavily subsidized credit in local and foreign currencyto firms in preferred economic sectors (Maman and Rosenhek 2011). The creditdirectly allocated by the state through these funds comprised a very substantial part oftotal credit volume—as much as 69% in 1971–1980 (Djibre and Tsiddon 2002:87)—constituting a major tool for promoting industrial growth.
An extremely important attribute of the Israeli variant of the developmentalstate model, which sets it apart from the typical East Asian version, was thekey position in the political economy occupied by the central workers’ organi-zation—the Histadrut (the General Organization of Hebrew Workers in the Land ofIsrael)—whose political–economic roles went far beyond those of a trade union andplayed an essential role in the processes of state-building and economy-building(Grinberg 1993; Shalev 1992). From the early 1920s until the establishment of thestate in 1948, the Histadrut functioned as a major component of the organizationalcomplex that led the Zionist project of Jewish settlement and state-building. With thefinancial assistance of Zionist and Jewish organizations, the Histadrut developed alarge institutional network that performed central tasks in a wide array of socio-economic fields: settlement, social services, agriculture, industry, building, retail, andfinance. The establishment of the state did not bring an end to this pattern, and theHistadrut consolidated its central position in the political economy as a major partnerof the developmental state. With the economic and political support of the state, itpositioned itself as a key actor in almost every sector of the economy. By the 1970s, itowned some of the largest industrial business groups in the country, as well as thelargest construction company, the largest commercial bank, the largest insurancecompany, and the largest retail chain. Hence, the central workers’ organization, whichenjoyed a state-sanctioned monopolistic position as workers’ representative, wassimultaneously also a major employer, second in size only to the state, and a keyplayer in processes of capital formation and accumulation (Grinberg 1993; Shalev1992).
A notable outcome of the state’s centralized command over the economy was theconsolidation of an economic structure with a high level of concentration of capital, alarge part of which was formally owned by the state, the Histadrut, and other public
348 St Comp Int Dev (2012) 47:342–363
Author's personal copy
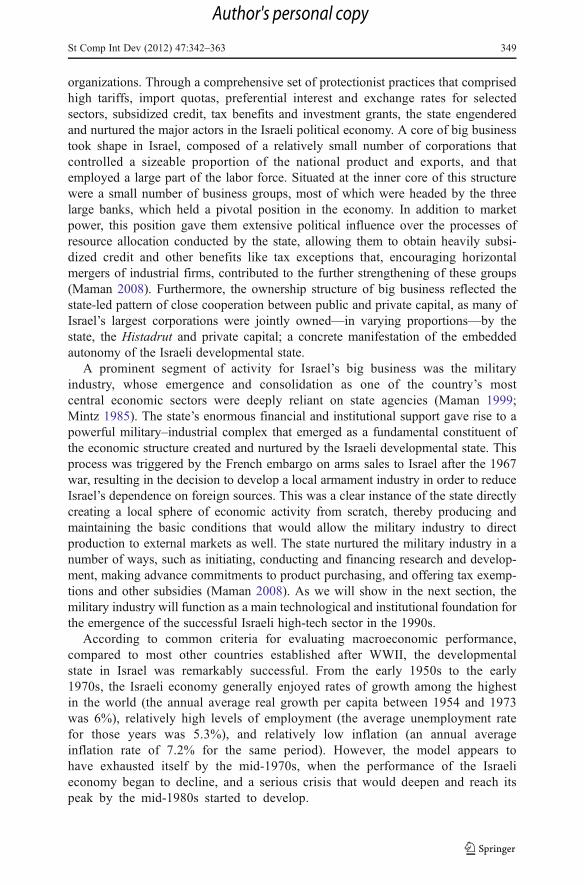
organizations. Through a comprehensive set of protectionist practices that comprisedhigh tariffs, import quotas, preferential interest and exchange rates for selectedsectors, subsidized credit, tax benefits and investment grants, the state engenderedand nurtured the major actors in the Israeli political economy. A core of big businesstook shape in Israel, composed of a relatively small number of corporations thatcontrolled a sizeable proportion of the national product and exports, and thatemployed a large part of the labor force. Situated at the inner core of this structurewere a small number of business groups, most of which were headed by the threelarge banks, which held a pivotal position in the economy. In addition to marketpower, this position gave them extensive political influence over the processes ofresource allocation conducted by the state, allowing them to obtain heavily subsi-dized credit and other benefits like tax exceptions that, encouraging horizontalmergers of industrial firms, contributed to the further strengthening of these groups(Maman 2008). Furthermore, the ownership structure of big business reflected thestate-led pattern of close cooperation between public and private capital, as many ofIsrael’s largest corporations were jointly owned—in varying proportions—by thestate, the Histadrut and private capital; a concrete manifestation of the embeddedautonomy of the Israeli developmental state.
A prominent segment of activity for Israel’s big business was the militaryindustry, whose emergence and consolidation as one of the country’s mostcentral economic sectors were deeply reliant on state agencies (Maman 1999;Mintz 1985). The state’s enormous financial and institutional support gave rise to apowerful military–industrial complex that emerged as a fundamental constituent ofthe economic structure created and nurtured by the Israeli developmental state. Thisprocess was triggered by the French embargo on arms sales to Israel after the 1967war, resulting in the decision to develop a local armament industry in order to reduceIsrael’s dependence on foreign sources. This was a clear instance of the state directlycreating a local sphere of economic activity from scratch, thereby producing andmaintaining the basic conditions that would allow the military industry to directproduction to external markets as well. The state nurtured the military industry in anumber of ways, such as initiating, conducting and financing research and develop-ment, making advance commitments to product purchasing, and offering tax exemp-tions and other subsidies (Maman 2008). As we will show in the next section, themilitary industry will function as a main technological and institutional foundation forthe emergence of the successful Israeli high-tech sector in the 1990s.
According to common criteria for evaluating macroeconomic performance,compared to most other countries established after WWII, the developmentalstate in Israel was remarkably successful. From the early 1950s to the early1970s, the Israeli economy generally enjoyed rates of growth among the highestin the world (the annual average real growth per capita between 1954 and 1973was 6%), relatively high levels of employment (the average unemployment ratefor those years was 5.3%), and relatively low inflation (an annual averageinflation rate of 7.2% for the same period). However, the model appears tohave exhausted itself by the mid-1970s, when the performance of the Israelieconomy began to decline, and a serious crisis that would deepen and reach itspeak by the mid-1980s started to develop.
St Comp Int Dev (2012) 47:342–363 349
Author's personal copy

The Crisis of the Israeli Developmental State
The renowned Israeli economist Michael Bruno has referred to 1973 as marking theend of the “Golden Age” of economic growth and the beginning of the “lost decade”of the Israeli economy (Bruno 1993:24). Indeed, after the 1973 war, a period ofdeteriorating macroeconomic performance got underway that would reach crisisdimensions by the first half of the 1980s. The period between 1974 and 1985 wascharacterized by rather low levels of growth (the annual average real growth percapita for this period was just 0.3%). By 1980, this caused the beginning of an upturnin unemployment, which rose from 2.9% in 1979 to 6.7% in 1985. Furthermore, thefiscal deficit grew staggeringly: while its annual average in 1960–66 represented1.3% of GNP, it reached an annual average of 12.6% in 1967–72, jumping to 17.3%in 1973–84. Even more pronounced was the extremely steep increase in inflation(from an annual average of 42% in 1974–78 to 185% in 1979–85), that reached 445%in 1984 (Bruno 1993:32). From the end of 1983, when monthly inflation beganrunning in double digits, hyperinflation became a major political–economic problemhigh on the Israeli public agenda, as both the elites and the general public began tosee it as threatening the state’s ability to run the economy as well as the legitimacyand stability of the socio-political order (Grinberg 1991; Shalev 1992).
The political–economic roots of the developmental state crisis paradoxicallylie in its own earlier success. The crisis emerged when the very economic andpolitical forces that the developmental state created and nurtured—especiallythe privately-and publicly-owned industrial and financial corporations thatcomposed the core of big business, and to a certain degree, the strong work-ers’ unions in the public sector—began to challenge the state’s autonomy,thereby undermining the institutional foundation of its ability to regulateresource allocation and manage the economy (Grinberg 1991; Shalev 1992).These actors deployed their growing economic and political power to embark on rent-seeking behavior, making ever-increasing claims on the economic resources underthe state’s control, which the latter could not meet without this leading to increasingfiscal and balance of payments deficits and inflation. This political–economic crisis—the essence of which was the state’s loss of autonomy vis-à-vis powerful societalactors and its loss of command over economic processes—reached its zenith in thehyperinflation of 1984–85. This process also had important effects on the powerbalance within the state apparatus and on its level of cohesiveness. The pivotalposition within the state institutional configuration enjoyed by the Ministry ofFinance was jeopardized by the crisis, as it started to lose its ability to control otherstate agencies, to command their activities and their relations to particular clienteles,and to manage the overall mode of state involvement in the economy. As a conse-quence, in comparison to previous decades, the state actions lacked cohesiveness andbecame erratic; a factor that contributed to the deterioration of the situation.
The deep crisis and its perception as a basic threat to the socio-political ordercertainly damaged the political status of the existing pattern of state–economyrelations and its institutional underpinnings, opening up an ample opportunity struc-ture for political actors that strove for liberalization of the political economy. Like inother cases of sweeping liberalization, this legitimation crisis created a large political
350 St Comp Int Dev (2012) 47:342–363
Author's personal copy

space for actors promoting an alternative model of political economy (Campbell andPedersen 2001; Fourcade-Gourinchas and Babb 2002).
After several failed attempts to halt hyperinflation, policy makers’ response to themounting fiscal and legitimization crisis of the Israeli developmental state was theimplementation of a rather comprehensive program of economic stabilization in1985, which was formulated with the active involvement of the US governmentand a network of Israeli and American academic economists (Maman and Rosenhek2011). The short-term aims of the plan were to drastically reduce the fiscal deficit, toimprove the balance of payment and to neutralize the self-reinforcing inflationarydynamic through the removal of mechanisms of automatic indexation of wages andthe anchoring of inflation expectations. These goals were achieved through extensivebudgetary cuts, a contractionary monetary policy, pegging the local currency to theUS dollar after a sharp devaluation, and the temporary freezing of salaries and pricesof basic products and services.
On a deeper level and from a broader perspective, however, the rationale of theemergency program and additional policy and institutional changes effected infollowing years was to reconfigure state–economy relations so that the state couldreclaim its autonomy and its institutional capabilities to regulate economic processes(Shalev 1992). Likewise, a key purpose of the program and associated steps takenafterwards was to reinstate the pivotal positioning of the Ministry of Finance withinthe state configuration and to restore its power vis-à-vis other state agencies, mainlyby “tying its own hands” through various institutional arrangements that were meantto lock in fiscal restraint and other anti-inflationary policies. Hence, the implemen-tation of the emergency economic program in 1985 signifies the commencement of adeep and all-encompassing process of gradual change of the Israeli political economy,especially in relation to the modes of state involvement in the economic sphere and toits institutional configuration. As we examine in the next section, this process had far-reaching implications for state–economy relations, though not necessarily signifyingthe actual withdrawal of the state from the economic sphere or a significant decline inits active involvement in the regulation of economic processes.
State–Economy Relations in a Transformed Political Economy
The transformation of the Israeli political economy has been studied by scholars fromdifferent disciplines and theoretical perspectives, who tend to conceptualize it interms of the state’s withdrawal from the economic sphere and its reduced politicaland institutional ability to shape economic processes and to regulate the activities ofeconomic actors. Thus, in Israel, as well as elsewhere, the adoption of neoliberalpractices is commonly understood by both opponents and supporters of the process,as indicating the gradual but undeniable weakening of the state vis-à-vis the marketand private economic actors (Ben-Bassat 2002; Ram 2008; Shafir and Peled 2002).
Indeed, the ideational principle that served as main legitimizing device for thetransformation of the Israeli political economy concerns a reformulation of thedesired relationship between the state and the economic field in accordance withneoliberal market fundamentalism, whose basic ideological tenet is the retreat of thestate from the economy and the free operation of market forces and private economic
St Comp Int Dev (2012) 47:342–363 351
Author's personal copy

actors. An extremely orthodox version of this doctrine soon became dominant in theIsraeli political field, particularly on the ideological and rhetorical levels. Neoliberalpolicy formulas seen as leading to state shrinking—such as privatization, reduced taxationon firms and high earners, financial liberalization, flexibilization of the labor market, andcontraction of the welfare state—were all portrayed by virtually all influential politicalactors as absolutely necessary measures to ensure the efficient functioning of the localeconomy and its successful integration within the global economy.
Changes on the level of institutional arrangements and policies, however, were farmore complex (Shalev 2000), and rather than suggesting the state’s withdrawal fromthe economic arena, they actually indicate a shift in the mode and purpose of itsinvolvement, as well as in its institutional configuration. If previously, the state hadbeen directly involved in allocating capital and other resources aimed at developing amanaged capitalist economy and creating both private and public economic actors, inthe current neoliberal era, its involvement is mainly realized through the indirect toolsof regulation, by building and supporting the functioning of “free” markets, andassisting private actors, often by means of significant subsidies and other benefits, inaccumulating capital through them. Furthermore, institutional changes of neoliberalcharacter were effected side by side with significant lines of continuity in practicesthat characterized the developmental state.
This neoliberal pattern of state–economy relationships in which the state neverthelessmaintains a significant level of involvement in the economy supporting private capitalaccumulation is evidenced in various ways and with differing degrees of salience indiverse domains of socio-economic policy. Some of its mainmanifestations included theprivatization of state- and Histadrut-owned industrial, commercial and financialcorporations, the liberalization of financial markets and international trade, the partialprivatization of social service provision and the deliberate creation of state-sponsoredquasi markets in this realm (Ajzenstadt and Rosenhek 2000; Shalev 2000).
As we have noted, a basic dimension of the broad shift in the politicaleconomy is changes taking place in the institutional configuration of the stateand in the power relations among its agencies. Characteristic of the changinginstitutional architecture of the state under neoliberalism (Jayasuriya 2001), inIsrael a noticeable strengthening of state professional agencies responsible for regu-lating and overseeing economic activity took place: the Israel Antitrust Authority atthe Ministry of Industry, Trade and Labor, the Supervisor of Banks at the Bank ofIsrael, the Supervisor of Capital Markets, Insurance and Savings at the Ministry ofFinance, and the Israeli Securities Authority. Similarly, the presence of the state’slegal arms—the courts and the Attorney General—in the economic arena becameincreasingly felt, especially in relation to the establishment and enforcement of thelegal rules of the game, which, according to the “law and economics” school, aim tocreate a legal environment supportive of the efficient operation of “free markets”(Maman 2004). The activities of these seemingly apolitical agencies embody animportant logic underlying the state’s involvement in the economy in neoliberalregimes, namely, the depoliticization of institutional arrangements and policies thatdirect the course of economic action (Hay 2007). Hence, the state continues its vitalrole in sustaining and encouraging the orderly operation of the markets and providingconditions for capital accumulation while simultaneously obscuring the politicalcharacter of these processes.
352 St Comp Int Dev (2012) 47:342–363
Author's personal copy

In this regard, the remarkable strengthening of the central bank is of extremeimportance. Similar to processes that occurred in many other countries (Marcussen2009), in the last two decades, the Israeli central bank accumulated a great deal ofinstitutional and political power, successfully positioning itself within the stateconfiguration as an allegedly autonomous agency insulated from politics, that is seenas functioning according to definitive and undisputable scientific knowledge. On thebasis of this political resource, the Bank of Israel has played a critical role in theinitiation and promotion of institutional changes aimed at ensuring the implementa-tion of economic policy in accordance to neoliberal formulas. For instance, during the1990s, it was instrumental in the adoption of inflation targeting as an institutionalarrangement aimed at locking-in fiscal and monetary discipline, as well as initiatedand led the process of financial liberalization and the adoption of a free-floatingexchange rate regime. While promoting these changes, the central bank relied on thepower of seemingly apolitical professional expertise to boost the notion that underconditions of globalization, the adoption and institutionalization of the principles of amarket-driven economy are an absolutely necessary condition for the success of thenational economy (Maman and Rosenhek 2011).
One of the most important pillars of the transformation of state–economy relation-ships has been the fundamental reconfiguration of the financial system, which aimedat developing and strengthening market mechanisms for capital allocation. Thesereforms, which led to the integration of the Israeli economy into the global financialsystem, represent an essential factor in the institutionalization of the neoliberalpolitical economy, in which international financial activity serves as a principalsource of capital accumulation (Epstein 2005). Until the mid 1980s, the Israelifinancial system was a credit-based system dominated by the state in close alliancewith its partners: the commercial banks and the Histadrut. Starting in 1986, adetermined coalition of state agencies headed by the Ministry of Finance and theBank of Israel, and including the Israeli Securities Authority, the Israel AntitrustAuthority and the Ministry of Justice, advanced a series of important institutionalchanges that led to a significant contraction in the state’s direct roles in the financialsystem, especially those related to the governing of processes of capital mobilizationand allocation (Blass and Yosha 2002).
The interest of the main economic state agencies in financial liberalization did notreflect only the neoliberal belief that government involvement in financial marketsshould be minimal, but also more specific concerns related to the power balancewithin the state apparatus and to macroeconomic management. For the central bankfinancial liberalization was necessary to strengthen its position within the state, sincethe government hold on capital markets prevented the possibility of running anautonomous monetary policy. The Ministry of Finance, for its part, saw financialliberalization as an important condition to increase its power over other ministries andto achieve its key goal of fiscal discipline (Maman and Rosenhek 2011). This state-led process resulted in the growing financialization of the economy; that is, thegreater importance of financial activities and transactions as a major source of capitalaccumulation for private actors. In fact, the process involved the development offinancial markets almost from scratch.
A central component of financial liberalization was the ending of the government’sand the Bank of Israel’s direct involvement in allocating subsidized finance to the
St Comp Int Dev (2012) 47:342–363 353
Author's personal copy

business sector through targeted credit programs. The stabilization plan of 1985 putan end to all directed credit in local currency, as well as significantly reduced thecredit in foreign currency provided by various state-run funds, and in 1991, the entiresystem of directed credit was abolished. As part of financial liberalization, the statealso brought about the cessation of the Histadrut’s dominance over the pension fundssystem though a series of reforms that established new private pension funds andprivatized the old Histadrut-owned pension funds. The new owners of the privatizedfunds were mostly insurance companies, which, by the end of 2004, controlled 93%of the total assets of the funds (Ministry of Finance 2005:29). This measure was animportant component in the state-led project of constructing and enlarging “free”financial markets, as it injected enormous amounts of money into the financialcircuits: while in the past the Histadrut pension funds invested almost all of theirassets in non-tradable earmarked government bonds, the privatized pension fundsinvest most of their capital in tradable government and corporate bonds and in thestock market (Ratson 2010). In addition, steps were taken to rein in the dominance ofthe Israeli banks in financial markets through a series of measures aimed at limitingtheir ownership and control of real and financial assets. In 1995, the banks wereforced to sell their holdings in non-financial corporations, and in 2005, they werefurther required to sell their holdings in provident and mutual funds.
A major result of these measures was the transformation of the Israeli financialsystem from a state-led and bank-based structure to a far more market-based one,which signified a substantial reallocation of power between economic actors, partic-ularly the strengthening of private insurance companies and investment houses.Likewise, during the last decade, a non-banking credit market emerged and devel-oped: while in 2000, 83% of corporate credit was financed by the banking system(Bank of Israel 2006:154), in 2007, the figure had dropped to 52% of corporate credit,with the remainder comprised of negotiable and non-negotiable instruments of non-banking credit (Bank of Israel 2008:146).
The growing financialization of the economy is also manifested in the risingimportance of the Tel Aviv stock exchange as a key domain of economic activityand profit making. In 1992, 378 companies were listed on the stock exchange with amarket capitalization of US $29.6 billion; while in 2010, there were 613 companieswith a market capitalization of US $613 billion. In the same period, the average dailyturnover in equities grew almost tenfold, from US $59 million to US $547 million.An even more marked trend of growth is observable in the bond market: the dailyturnover of government bonds grew from US $27 million in 1992 to US $641 millionin 2010. The case of the corporate bonds market is particularly remarkable: whileuntil 2005 it was practically non-existent, with a daily turnover of only US $9 millionin 2004, since then, there has been a steady growth trend, reaching a daily turnover ofUS $170 million in 2010.1 This is a clear instance of the success of the state adoptinginstitutional reforms with the goal of building a new financial market almost fromscratch, in which institutional investors—particularly pension funds, providencefunds, and insurance companies—play a major role.
1 Data is from the Tel Aviv Stock Exchange website, http://www.tase.co.il/TASEEng/Homepage.htm(accessed on March 3, 2011).
354 St Comp Int Dev (2012) 47:342–363
Author's personal copy

In tandem with the liberalization of the local financial market, the state led aprocess of liberalization of capital flows and growing integration of the Israelieconomy into global capital circuits. This was certainly a dramatic change in Israel’spolitical economy, which led to the entrance of private foreign capital into Israel, inthe form of both direct and portfolio investment, on a massive scale. In stark contrastto the minimal involvement of private foreign investors during Israel’s developmentalstate phase, since the mid-1990s private capital inflows have become an extremelyimportant factor in the Israeli economy. While the annual average of total foreigninvestments (direct and portfolio) in 1980–91 was only US $597 million, it rose to US$4.9 billion in 1992–2005, and reached US $17.6 billion in 2006–07 (Central Bureauof Statistics 2008:642). Following the gradual removal of restrictions on foreignexchange and overseas investments by Israeli citizens and companies, particularlyduring the 1990s, Israel’s increasing integration in global financial markets could alsobe seen in the escalating magnitude of capital outflows. In 1980–91, the annualaverage of Israeli total overseas investments (direct and portfolio) was just US $256million, increasing to US $3.3 billion in 1992–2005, and reaching US $17.1 billion in2006–07 (Central Bureau of Statistics 2008:642). Alongside the significant increasein capital import and export since the 1990s, the business and financial orientation oflocal corporations has become increasingly global: Israeli companies began mobiliz-ing funding from foreign banks and stock exchanges, and a substantial number ofIsraeli corporations decided to incorporate in other countries, especially the US. Forinstance, in February 2011, 58 Israeli companies were listed on NASDAQ—thesecond largest number of foreign companies after China—with a total market valueof US $74.5 billion.2
Despite the rhetoric of “free markets” and state retrenchment, the state continues tobe significantly involved in providing direct and indirect financial and other assis-tance to privately owned corporations. However, these developmentalist practices areconducted within an institutional framework marked by significant differences in thestate's purposes and modes of involvement: while in the previous era the stateprovided broad support and deep subsidy to labor-intensive industrial sectors in orderto promote full employment and industrialization, since the 1990s the intervention isfar more selective and aims to promote primarily high-value added and exportoriented sectors. Furthermore, unlike in the past, these new practices do not rest onthe direct control of the state over capital allocation.
The direct and indirect state support of business and its important effects areparticularly remarkable in the case of Israel’s “high-tech revolution” of the 1990sand 2000s, which is often portrayed in the public sphere as a symbol of the efficiency,dynamism, and progress that the private sector is capable of when freed from theshackles of the state. As noted by O Riain (2004), it is in the politics of high-techgrowth and its integration within global markets where we can see the reemergence ofstate developmentalism in the most tangible way.
The tremendous growth of the high-tech sector in Israel, that during the 1990s and2000s was triumphantly referred to as the “locomotive” of the entire Israeli economy,is manifested in its contribution to GDP, exports and number of employees. Its sharein the GDP grew from 8% in 1995 to 14% in 2007, and the share of high-tech
2 NASDAQ website, http://www.nasdaq.com/screening/company-list.aspx (accessed on March 3, 2011).
St Comp Int Dev (2012) 47:342–363 355
Author's personal copy

manufacturing exports increased from 37% of total exports (excluding diamonds) in1995 to 46% in 2007. The number of employees in high-tech rose from 115,500 in1995 to 248,300 in 2007, a much higher increase than in the total number ofemployed in the Israel economy (115% and 40%, respectively). Moreover, theproportion of employees in the high-tech sector in Israel is substantially higher thanin European countries: 9.3% in 2007 compared to 6.7% in Finland, 6.2% in Ireland,and 6.1% in Switzerland (Central Bureau of Statistics 2010).
In Israel, as in other countries such as Ireland and Taiwan, the high-techrevolution was largely dependent on direct and indirect funding and institutionalsupport from state agencies, clearly demonstrating significant lines of continuityin the state’s role as an agent of development (Breznitz 2007b; O Riain 2004;Thurbon and Weiss 2006). In the Israeli case, it is important to note first the stronginstitutional and technological links between a large portion of the new high-techindustry—particularly in the fields of electronics, communications and optics—andthe military industry, which, as mentioned above, was built from scratch in the late1960s and was subsequently developed and maintained by the state. The success ofthe Israeli high-tech industry in these fields is based to a large extent on the qualifiedtechnical and scientific labor force, knowledge, technologies, organizational net-works, information infrastructures, and other institutional resources that were nur-tured and sustained by the state-led military industry since the 1960s. Currently, themilitary also plays an important role in the development of high-tech. Certaintechnological military units serve as greenhouses for the training of a highly qualifiedlabor force in the fields of computing and communication, and the skills andknowledge acquired by veterans of these units in the course of their military serviceare highly valued by high-tech firms. Furthermore, as noted by Breznitz (2005), thesemilitary units serve as an institutional space that generates dense and extended socialnetworks that promote and facilitate the diffusion and collaborative processing ofknowledge and information, from which the private high-tech sector greatly benefits.In this way, the military functions as a major hub in the Israeli high-tech innovationsystem, in which social capital, both on the individual and the systemic levels, iscreated and sustained.
The state also assists the private high-tech industry through a myriad of directsupport programs that have been essential to its development and its integrationwithin global professional, business and financial networks (O Riain 2004). Signif-icant tax benefits and exemptions and extensive direct financial assistance in the formof investment grants are awarded to both local and foreign firms. Notable in thisrespect are the special grants that the government has provided to Intel since 1996 tosupport the establishment of manufacturing plants, which total more than US $1.5billion. In addition, Intel was granted special tax benefits worth hundreds of US $millions. The importance of state support for the growth of high-tech in Israel, whichis based, to a large extent, on innovation, is also reflected in figures on governmentfinancing of research and development. Between 1991 and 2003, direct governmentfunding contributed 27.5% of all civilian research and development expenditures,representing around 1% of the GDP, higher than in all other OECD countries (CentralBureau of Statistics 2007:25, 40). In the last two decades, the state has set up severalprograms of financial and organizational assistance targeted specifically at high-techresearch and development, becoming an important instrumental factor in the growth
356 St Comp Int Dev (2012) 47:342–363
Author's personal copy

of Israeli high-tech (Avnimelech and Teubal 2004; Breznitz 2007a). In 1991, forinstance, the Office of the Chief Scientist in the Ministry of Industry, Trade and Laborinitiated a program of technological incubators to provide new entrepreneurs withphysical facilities, financial resources, professional guidance and administrativeassistance, with the aim of turning innovative technological ideas into exportablecommercial products and setting up business ventures.
An additional important means of state support to the high-tech sector was set upin 1993, with the introduction of a program for the establishment of venture capitalfunds based on state-private partnership (the Yozma program). The governmentestablished ten hybrid funds, investing US $80 million with US $150 million raisedfrom private local and foreign investors, and an additional US $20 million wereinvested by the government in a state-owned fund (Avnimelech and Teubal 2006).Interestingly enough, the regulations of the program defined the participation of atleast one foreign financial institution in the hybrid funds as compulsory, with the aimof promoting the involvement of foreign capital in the local high-tech sector. As aresult, several foreign financial firms and funds initiated activities in Israel throughthe Yozma funds (Avnimelech and Teubal 2004). In accordance to the original designof the program, these funds were fully privatized by the late 1990s, when the venturecapital industry in Israel became a well-established and growing component of thefinancial system.
The state-initiated establishment of venture capital funds had substantial effects forboth the high-tech and the financial sectors. The program not only contributed to thedevelopment of a successful start-up sector strongly connected to global networks oftechnological innovation and commercialization, but also had important impacts onthe links between Israeli high-tech and local and global financial actors and markets.The state program was the major factor that put in motion the emergence of a largeprivate venture capital industry, which by the 2000s had become the largest in theworld in relative terms (as a percentage of GNP), investing the sizeable sum of US$12.21 billion between 1997 and 2005 (Avnimelech and Teubal 2006:1478). Fur-thermore, as intended by the Yozma program, this industry developed as stronglyintegrated within global financial circuits, with more than 50% of the capital investedoriginating from abroad, mostly from the US (Avnimelech and Teubal 2006:1488).The growth of the venture capital industry in turn gave significant impetus to thefinancialization of the Israeli economy in general, and to its growing integration inglobal financial markets in particular. Thus, in a remarkable contrast to the classicdevelopmental model of state-controlled capital mobilization and allocation, theprogram represents a new developmentalist strategy that was purposely aimed atassisting local high-tech firms by enhancing their access to both local and foreigncapital, while simultaneously promoting the strengthening of a financial spheredominated by private actors and integrated within global financial circuits.
The broad shift in the Israeli political economy involved a basic change in thepower relations among classes, as well as between classes and the state. Capitalgained in strength and became highly concentrated, as well as more tightly integratedinto global markets. The privatization of the large industrial and financial corpora-tions owned by the state and the Histadrut, as well as reforms in banking and finance,opened up new avenues for the expansion and strengthening of privately ownedestablished business groups, and for the formation of new groups owned by a small
St Comp Int Dev (2012) 47:342–363 357
Author's personal copy

number of families with control over a large portion of the capital in Israel (Maman2002). In fact, the privatization of state- and Histadrut-owned firms and conglom-erates during the 1990s and early 2000s, generally under extremely beneficial con-ditions for the purchasers, was the major factor leading to the emergence and growthof what are currently the largest business groups in the country (Maman 2008),perpetuating the concentrated structure of big business in Israel. As shown bySchamis (2002) for other cases of sweeping privatization, in Israel as well, thetransfer of public assets to private ownership has created conditions favorable forrent-seeking, capital concentration and the dominance of central sectors of theeconomy by a small number of actors. For example, by the mid-2000s, around halfof the 100 largest companies listed on the Tel Aviv Stock Exchange (Tel Aviv 100Index), and almost all of the 25 largest companies (Tel Aviv 25 Index), werecontrolled by large business groups. Moreover, the largest ten business groups, allof them family-owned, controlled nearly 30% of the total stock market capitalization,a proportion among the highest in the western world (Kosenko 2007:76).
On the basis of complex structures of interlocking ownership within andamong business groups, and particularly through pyramid holding companies, asmall number of highly diversified business groups dominate entire economicsectors, such as finance and banking, communication services and infrastructure,retail, and natural resources extraction. By way of illustration, the IDB groupowned by the Dankner family, one of the largest and most diversified businessgroups in Israel, controls the largest retail chain in the country, a leadinginsurance and financial services company, the largest cellular communicationsservices operator, one of the world’s largest agro-chemicals producer, severallarge real estate companies, a large internet and telecommunication company,the sole manufacturer of cement in Israel, the country’s leading manufacturer ofpaper and paper products, and many other manufacturing, services and retailfirms, as well as holding and investment corporations. The IDB group alsoillustrates the tendency by Israeli big capital in recent years of going global(Maman 2008). Some of its manufacturing companies have plants and local subsid-iaries in many countries; it initiated real estate projects and purchased assets world-wide; some of its companies are listed on the NYSE and NASDAQ, and in October2008, it invested over US $1 billion in the Credit Suisse Group, becoming a leadingshareholder in that large international bank. The integration of big local capital invarious spheres of the global economy certainly provides a firm foundation forstrengthening its position in the local political–economic field.
While considering the high level of capital concentration characteristic of thestructure of the Israeli economy, it should be noted that there is a significant degreeof continuity between the pattern that emerged during the developmental state era andthe current situation. As we have observed above, the development policy imple-mented in the past gave rise to the formation of a small number of large industrial andfinancial business groups that controlled the main economic sectors; a situationresembling the current one. Nonetheless, an essential difference is that while up tothe 1980s, most of the business groups that dominated the economy were partially orfully owned by the state and the Histadrut, today all of them are fully owned byprivate capital. In this regard, therefore, the neoliberal tenet of privatization hasindeed changed the structure of the economy.
358 St Comp Int Dev (2012) 47:342–363
Author's personal copy
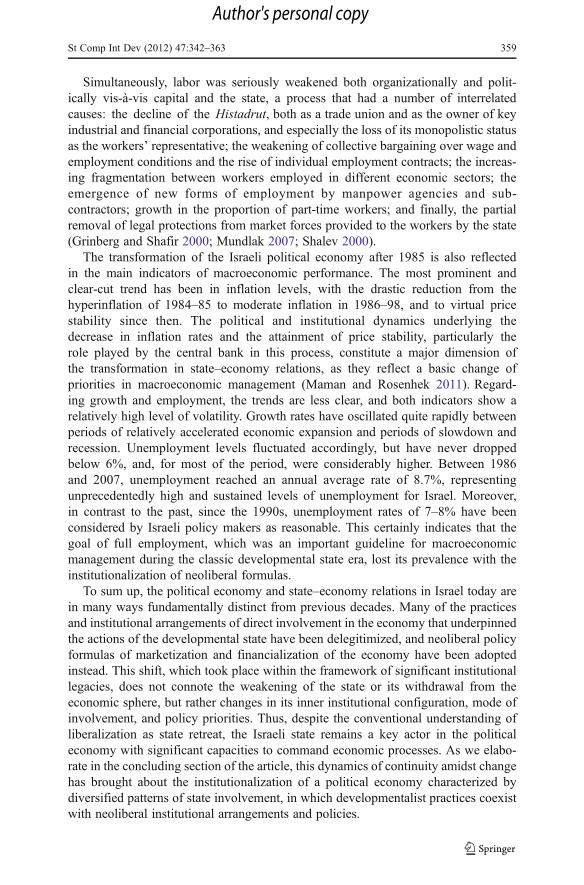
Simultaneously, labor was seriously weakened both organizationally and polit-ically vis-à-vis capital and the state, a process that had a number of interrelatedcauses: the decline of the Histadrut, both as a trade union and as the owner of keyindustrial and financial corporations, and especially the loss of its monopolistic statusas the workers’ representative; the weakening of collective bargaining over wage andemployment conditions and the rise of individual employment contracts; the increas-ing fragmentation between workers employed in different economic sectors; theemergence of new forms of employment by manpower agencies and sub-contractors; growth in the proportion of part-time workers; and finally, the partialremoval of legal protections from market forces provided to the workers by the state(Grinberg and Shafir 2000; Mundlak 2007; Shalev 2000).
The transformation of the Israeli political economy after 1985 is also reflectedin the main indicators of macroeconomic performance. The most prominent andclear-cut trend has been in inflation levels, with the drastic reduction from thehyperinflation of 1984–85 to moderate inflation in 1986–98, and to virtual pricestability since then. The political and institutional dynamics underlying thedecrease in inflation rates and the attainment of price stability, particularly therole played by the central bank in this process, constitute a major dimension ofthe transformation in state–economy relations, as they reflect a basic change ofpriorities in macroeconomic management (Maman and Rosenhek 2011). Regard-ing growth and employment, the trends are less clear, and both indicators show arelatively high level of volatility. Growth rates have oscillated quite rapidly betweenperiods of relatively accelerated economic expansion and periods of slowdown andrecession. Unemployment levels fluctuated accordingly, but have never droppedbelow 6%, and, for most of the period, were considerably higher. Between 1986and 2007, unemployment reached an annual average rate of 8.7%, representingunprecedentedly high and sustained levels of unemployment for Israel. Moreover,in contrast to the past, since the 1990s, unemployment rates of 7–8% have beenconsidered by Israeli policy makers as reasonable. This certainly indicates that thegoal of full employment, which was an important guideline for macroeconomicmanagement during the classic developmental state era, lost its prevalence with theinstitutionalization of neoliberal formulas.
To sum up, the political economy and state–economy relations in Israel today arein many ways fundamentally distinct from previous decades. Many of the practicesand institutional arrangements of direct involvement in the economy that underpinnedthe actions of the developmental state have been delegitimized, and neoliberal policyformulas of marketization and financialization of the economy have been adoptedinstead. This shift, which took place within the framework of significant institutionallegacies, does not connote the weakening of the state or its withdrawal from theeconomic sphere, but rather changes in its inner institutional configuration, mode ofinvolvement, and policy priorities. Thus, despite the conventional understanding ofliberalization as state retreat, the Israeli state remains a key actor in the politicaleconomy with significant capacities to command economic processes. As we elabo-rate in the concluding section of the article, this dynamics of continuity amidst changehas brought about the institutionalization of a political economy characterized bydiversified patterns of state involvement, in which developmentalist practices coexistwith neoliberal institutional arrangements and policies.
St Comp Int Dev (2012) 47:342–363 359
Author's personal copy

Conclusions
Our analysis of the institutional dynamics of the Israeli political economy suggestsseveral conclusions that are relevant to the examination of current processes ofchange in state–economy relations in general. In the era of globalization and liberal-ization, state–economy relations have certainly changed. And yet, in contrast to theconventional stance concerning the withdrawal of the state from the economy and thedecline of its political and institutional capabilities to shape the structure of economicrelations, our analysis has shown that the state has not retreated from the economicsphere. The important shift in state–economy relations lies not in the extent of thestate’s involvement in the economy, but rather in the mode of its involvement. That is,institutional changes have to do first and foremost with the definition of the state’sobjectives in the management of the political economy and the way it uses particularinstitutional instruments to attain those objectives. As we have shown, state agenciescontinue to play a crucial role in the economic arena. However, instead of the patternscharacteristic of the classic developmental state—such as tight-knit control overcapital mobilization and allocation, and fiscal and monetary policy geared mainlytowards industrial development, full employment and growth—under conditions ofliberalization states tend to use indirect measures of regulation and control in order tocreate “free” markets, to support and ensure their functioning, and to assist privateactors in accumulating capital, often by supporting their integration into globalbusiness and financial networks. This shift in the state’s action encompasses changesin its institutional configuration, particularly concerning the roles, modes of action,status and power relations among its different agencies. Central banks and otherprofessional regulatory agencies become key actors in the new state institutionalarchitecture, increasing their power and autonomy vis-à-vis other state agencies andsocietal actors.
As also illustrated by other cases of political economies commonly considered asetatist, such as France, Spain, Japan, South Korea, and Taiwan, the relationshipbetween state and economy that emerges in the era of global liberalization ischaracterized by a combination of change and continuity (Cioffi 2000; Perez 1997;Thurbon 2007; Weiss 2003). New important institutional arrangements indeedemerged, but this occurred alongside and in interaction with some enduring institu-tional legacies of the developmental state. This pattern of change amidst continuity isespecially evident in the myriad ways, some new and some old, through which thestate continues, both directly and indirectly, to support favored economic sectorsaccording to developmentalist logics. This gives rise to the emergence of a hybridmodel characterized by diversified modes of state intervention in different economicareas (see also, Thurbon 2012).
The diversified patterns of state involvement in distinct areas and their links toprocesses of globalization can be seen clearly when comparing developments in thefinancial sphere with policies and arrangements aimed at encouraging and boostingthe local high-tech industry. On the one hand, in finance there has been a remarkablebreak with the previous pattern of direct state control over capital mobilization andallocation. In this domain the trend of global financialization has indeed put importantlimits on the state capacity to exercise direct control on capital allocation. Yet, ouranalysis indicates that state agencies play a pivotal role in initiating and advancing
360 St Comp Int Dev (2012) 47:342–363
Author's personal copy

financial liberalization and the growing integration of the local financial sector intoglobal circuits. These processes of fundamental institutional change are more oftenthan not driven by state actors, not by the market or by seemingly omnipotent globalcapital (Abdelal 2007; Etchemendy 2004).
On the other hand, under conditions of globalization and liberalization developmentalstates keep using means of rather intensive involvement in particular economic sectors.In certain industries, particularly in the high-tech sector, state agencies continue toimplement developmental practices of direct financial and institutional support tobusiness. These practices are not directed at promoting broad industrialization and fullemployment as in the past, but rather at encouraging capital accumulation and growthbased on high-valued added industries strongly integrated into global markets. More-over, policies aimed at promoting these sectors are firmly embedded within the trend offinancial liberalization. The state actively encourages the participation of private finan-cial actors in assistance programs to the high-tech sector, resulting in a pattern in whichdevelopmentalist practices both rest on and contribute to processes of financialization ofthe economy. Hence, in this area globalization has promoted, rather than precluded,developmental practices that are congruent with financial liberalization.
To conclude, our analysis suggests that globalization has indeed affected the devel-opmental state, but not by making it obsolete. Under conditions of globalization stateshave adopted new developmentalist strategies that coexist with, and even strengthen,neoliberal arrangements, leading to the institutionalization of diversified patterns of state–economy relations. Despite the rhetoric of free markets and private entrepreneurship, thestate in this new hybrid institutional form remains a key actor whose actions significantlyimpact upon the dynamics of national political economies.
References
Abdelal R. Capital rules: the construction of global finance. Cambridge, MA: Harvard University Press;2007.
Ajzenstadt M, Rosenhek Z. Privatization and new modes of state intervention: the long-term care programin Israel. Journal of Social Policy. 2000;29:247–62.
Avnimelech G, Teubal M. Venture capital start-up co-evolution and the emergence and development ofIsrael's new high tech cluster. Economics of Innovation and New Technology. 2004;13:33–60.
Avnimelech G, Teubal M. Creating venture capital industries that co-evolve with high tech: insights froman extended industry life cycle perspective of the Israeli experience. Res Policy. 2006;35:1477–98.
Bank of Israel. (2006) Bank of Israel report, 2005. Jerusalem: Bank of Israel (in Hebrew)Bank of Israel. (2008) Bank of Israel report, 2007. Jerusalem: Bank of Israel (in Hebrew)Ben-Bassat A, editor. The Israeli economy, 1985–1998: from government intervention to market economics.
Cambridge, MA: MIT Press; 2002.Blass A, Yosha O. Reform in the Israeli financial system and the flow of funds of publicly traded
manufacturing firms. In: Ben-Bassat A, editor. The Israeli economy, 1985–1998: from governmentalintervention to market economics. Cambridge, MA: MIT Press; 2002. p. 189–220.
Block F. Swimming against the current: the rise of a hidden developmental state in the United States.Politics and Society. 2008;36:169–206.
Breznitz D. Collaborative public space in a national innovative system: a case study of the Israeli military'simpact on the software industry. Industry and Innovation. 2005;12:31–64.
Breznitz D. Industrial R&D as a national policy: horizontal technology policies and industry-state co-evolution in the growth of the Israeli software industry. Res Policy. 2007a;36:1465–82.
Breznitz D. Innovation and the state: political choice and strategies for growth in Israel, Taiwan, andIreland. New Haven: Yale University Press; 2007b.
St Comp Int Dev (2012) 47:342–363 361
Author's personal copy

Bruno M. Crisis, stabilization, and economic reform: therapy by consensus. Oxford: Clarendon; 1993.Campbell J. Institutional change and globalization. Princeton: Princeton University Press; 2004.Campbell J, Pedersen O. The rise of neoliberalism and institutional analysis. In: Campbell J, Pedersen O,
editors. The rise of neoliberalism and institutional analysis. Princeton: Princeton University Press;2001. p. 1–23.
Central Bureau of Statistics. Indicators of science, technology and innovation in Israel. Jerusalem: CentralBureau of Statistics; 2007 (in Hebrew).
Central Bureau of Statistics. Statistical abstract of Israel, 2008—No. 59. Jerusalem: Central Bureau ofStatistics; 2008.
Central Bureau of Statistics. The development of the high-tech sector in Israel, 1995–2007. Jerusalem:Central Bureau of Statistics; 2010 (in Hebrew).
Cerny P. International finance and the erosion of capitalist divergence. In: Crouch C, Streeck W, editors.Political economy of modern capitalism: mapping convergence and diversity. London: Sage; 1997.p. 173–81.
Cioffi J. Governing globalization? The state, law, and structural change in corporate governance. Journal ofLaw and Society. 2000;27:572–600.
Djibre J, Tsiddon D. A monetary labyrinth: Instruments and the conduct of monetary policy in Israel, 1987–1998. In: Ben-Bassat A, editor. The Israeli economy, 1985–1998: from governmental intervention tomarket economics. Cambridge, MA: MIT Press; 2002. p. 85–128.
Epstein G. Introduction: Financialization and the world economy. In: Epstein G, editor. Financializationand the world economy. Cheltenham: Elgar; 2005. p. 3–16.
Etchemendy S. Revamping the weak, protecting the strong, and managing privatization: governingglobalization in the Spanish takeoff. Comparative Political Studies. 2004;37:623–51.
Evans P. Embedded autonomy: states and industrial transformation. Princeton: Princeton University Press;1995.
Fourcade-Gourinchas M, Babb S. The rebirth of the liberal creed: paths to neoliberalism in four countries.Am J Sociol. 2002;108:533–79.
Grinberg L. Split corporatism in Israel. Albany: State University of New York Press; 1991.Grinberg L. The Histadrut above all. Jerusalem: Nevo; 1993 (in Hebrew).Grinberg L, Shafir G. Economic liberalization and the breakup of the Histadrut's domain. In: Shafir G,
Peled Y, editors. The new Israel: peacemaking and liberalization. Boulder: Westview; 2000. p. 103–27.Harvey D. A brief history of neoliberalism. Oxford: Oxford University Press; 2005.Hay C. Why we hate politics. Cambridge: Polity; 2007.Helleiner E. The Southern side of embedded liberalism: The politics of postwar monetary policy in the
Third World. In: Kirshner J, editor. Monetary orders—Ambiguous economics, ubiquitous politics.Ithaca: Cornell University Press; 2003. p. 55–77.
Jayasuriya K. Globalization and the changing architecture of the state: the regulatory state and the politicsof negative co-ordination. Journal of European Public Policy. 2001;8:101–23.
Kim Y. Neoliberalism and the decline of the developmental state. Journal of Contemporary Asia.1999;29:441–61.
Kosenko K. Evolution of business groups in Israel: their impact at the level of the firm and the economy.Israel Economic Review. 2007;5:55–93.
Levi-Faur D. The developmental state: Israel, South Korea, and Taiwan compared. Stud Comp Int Dev.1998;33:65–93.
Levy J. The state after statism: From market direction to market support. In: Levy J, editor. The state afterstatism: new state activities in the age of liberalization. Cambridge, MA: Harvard University Press;2006. p. 367–93.
Maman D. The social organization of the Israeli economy: a comparative analysis. Israel Affairs.1999;5:87–102.
Maman D. The emergence of business groups: Israel and South Korea compared. Organ Stud.2002;23:737–58.
Maman D. State-corporate relationships in an era of shifting regime: the case of corporate law reform inIsrael. Qual Sociol. 2004;27:317–42.
Maman D. Structural changes in the Israeli business groups. Law & Business. 2008;8:123–57. in Hebrew.Maman D, Rosenhek Z. The Israeli central bank: political economy, global logics and local actors. London:
Routledge; 2011.Marcussen M. Scientization of central banking: The politics of a-politicization. In: Dyson K, Marcussen M,
editors. Central banks in the age of the Euro: Europenization, convergence, and power. Oxford: OxfordUniversity Press; 2009. p. 373–90.
362 St Comp Int Dev (2012) 47:342–363
Author's personal copy

Ministry of Finance. Capital markets, Insurance and Saving Department, annual report 2004. Jerusalem:Ministry of Finance; 2005.
Mintz A. An empirical study of military industrial linkages in Israel. Armed Forces and Society. 1985;12:9–27.
Mundlak G. Fading corporatism: Israel's labor law and industrial relations in transition. Ithaca: CornellUniversity Press; 2007.
O Riain S. The politics of high-tech growth: developmental network states in the global economy. Cam-bridge: Cambridge University Press; 2004.
Pang E. The financial crisis of 1998–98 and the end of the Asian developmental state. ContemporarySoutheast Asia. 2000;22:570–93.
Perez S. Banking on privilege: the politics of Spanish financial reform. Ithaca: Cornell University Press;1997.
Pirie I. The Korean developmental state: from dirigisme to neoliberalism. London: Routledge; 2008.Prasad M. The politics of free markets: the rise of neoliberal economic policies in Britain, France, Germany
and the United States. Chicago: The University of Chicago Press; 2006.Ram U. The globalization of Israel: McWorld in Tel Aviv, Jihad in Jerusalem. New York: Routledge; 2008.Ratson M. Policy entrepreneurs, political constructions and windows of opportunity: the politics of the
second pension reform in Israel. Soziologia Israelit. 2010;11:463–84. in Hebrew.Rosenhek Z. The political dynamics of a segmented labour market: Palestinian citizens, Palestinians from
the Occupied Territories and migrant workers in Israel. Acta Sociologica. 2003;46:151–69.Rosenhek Z. Dynamics of inclusion and exclusion in the Israeli welfare state: State building and political
economy. In: Turner B, Ben-Porat G, editors. The contradictions of Israeli citizenship: land, religionand state. London: Routledge; 2011. p. 63–86.
Sassen S. Territory–authority–rights: from medieval to global assemblages. Princeton: Princeton UniversityPress; 2006.
Schamis H. Re-forming the state: the politics of privatization in Latin America and Europe. Ann Arbor: TheUniversity of Michigan Press; 2002.
Shafir G, Peled Y. Being Israeli—the dynamics of multiple citizenship. Cambridge: Cambridge UniversityPress; 2002.
Shalev M. Labour and the political economy in Israel. Oxford: Oxford University Press; 1992.Shalev M. Liberalization and the transformation of the political economy. In: Shafir G, Peled Y, editors. The
new Israel: peacemaking and liberalization. Boulder: Westview; 2000. p. 129–59.Strange S. The retreat of the state: the diffusion of power in the world economy. Cambridge: Cambridge
University Press; 1996.Swirski S. (2005) 1967: A political–economic turning point in Israel. In: Bareli A., Gutwein D. and Friling
T., editors. Society and economy in Israel: Historical and contemporary perspectives - Volume 1. BeerSheva and Jerusalem: The Ben-Gurion Research Institute for the Study of Israel and Zionism and YadYzhak Ben-Zvi; p. 91–116 (in Hebrew).
Thurbon E. The developmental logic of financial liberalization in Taiwan. In: Garside W, editor. Institutionsand market economies. London: Palgrave; 2007. p. 87–106.
Thurbon E. (2012) From developmentalism to neoliberalism and back again? Governing the market inAustralia from the 1980s to the present. In: Chang K., Fine B. and Weiss L., editors. Developmentalpolitics in transition: The neoliberal era and beyond, London: Palgrave-Macmillan; in press.
Thurbon E, Weiss L. Investing in openness: the evolution of FDI strategy in South Korea and Taiwan. NewPolitical Economy. 2006;11:1–22.
Weiss L. The myth of the powerless state. Cambridge: Polity; 1998.Weiss L. Guiding globalization in East Asia: New roles for old developmental states. In: Weiss L, editor.
States in the global economy: bringing domestic institutions back in. Cambridge: Cambridge Univer-sity Press; 2003. p. 245–70.
Wong J. The adaptive developmental state in East Asia. Journal of East Asian Studies. 2004a;4:345–62.Wong J. From learning to creating: biotechnology and the postindustrial developmental state in Korea.
Journal of East Asian Studies. 2004b;4:491–517.
St Comp Int Dev (2012) 47:342–363 363
Author's personal copy
View publication statsView publication stats

228
11. Latin American structuralism: the co- evolution of technology, structural change and economic growthMario Cimoli and Gabriel Porcile
INTRODUCTION
This chapter reviews some of the main contributions of Latin American structuralism (LAS) to the theory of economic development. The focus lies on the core macroeconomic concerns of LAS, namely the importance of structural change to sustain growth in an international economy characterized by technological asymmetries. There are many other aspects which LAS has addressed in its more than 60 years of reflection on devel-opment. In particular, LAS has given great attention to the interactions between the production and the social structures and to how these structures give rise to a political economy which compromises learning, investment and catching- up (Prebisch 1981; Pinto 1970, 1976; Sunkel 1978; Rodríguez 2007). LAS is also a school of thought that stresses historical research and emphasizes the need to take into account changes in historical conditions which require the reformulation of theoretical models (Bielshowski 2009; Ocampo 2013; Cimoli and Porcile 2011a, 2011b). However, these dimensions cannot be discussed within the limits of this chapter.
A central tenet of LAS is that a center–periphery system emerged as a result of the different intensity adopted by technological and structural change in different parts of the international economy. LAS admits, with Schumpeter, that development is qualita-tive change spurred by innovation and diffusion of technology. On the other hand, it emphasizes that such a process is highly uneven across regions. Technical and struc-tural change concentrates in a group of counties, the center, with highly diversified and sophisticated economic structures; the periphery is represented by countries that are far from the technological frontier, whose production structures are less diversified and less technology- intensive.1
It will be argued that LAS is part of a broader effort to produce new models of growth and development combining the Schumpeterian and Keynesian–Kaleckian intellectual traditions (see, among others, Cimoli 1988; Dosi et al. 1990; Araujo and Lima 2007; Ciarli et al. 2010). LAS shares with the Schumpeterian tradition the concern with struc-tural change, innovation and diffusion of technology as long- run drivers of economic
1 The center–periphery terminology is maintained throughout the chapter, which is consistent with the United Nations Economic Commission for Latin America and the Caribbean (ECLAC) terminology and with the nomenclature used by regional economics and economic geography, but is also convergent with the North–South or developed–developing countries nomenclature (see e.g. Vera 2006). The important point is taking as a point of departure the stylized fact that in the international system countries coexist which differ widely in terms of capabilities.
REINERT_97817825444661_t.indb 228REINERT_97817825444661_t.indb 228 03/10/2016 11:3603/10/2016 11:36
Erik S. Reinert, Jayati Ghosh and Rainer Kattel - 9781782544661Downloaded from Elgar Online at 03/31/2017 12:04:16PM
via University College London

Latin American structuralism 229
development. In addition, LAS shares with the Keynesian–Kaleckian tradition the concern with effective demand, specialization patterns, and the need of policies and insti-tutions to sustain and foster both public and private investments (León- Ledesma 2002; Ocampo et al. 2009; Blecker 2013; Ros 2001). The links between effective demand and the pattern of specialization and between the pattern of specialization and leads and lags in technology are at the core of a new strain of heterodox growth models.
The chapter first presents the main building blocks of the LAS macro model in the form of a simple set of diagrams describing the interactions between the technology gap, specialization, growth and income distribution. It then formalizes these interactions and offers a comparative dynamics analysis that highlights the policy implications of LAS. The final section presents our concluding remarks.
TECHNOLOGY AND THE PRODUCTION STRUCTURE
LAS may be seen as consisting of four closely interconnected building blocks. The first block is the existence of leads and lags in innovation and in the international diffusion of technology. The center consists of countries that are the technological leaders; the periphery is formed by the technological laggards. The slow and irregular diffusion of technology is considered by LAS to be the first proximate cause of why the production and trade structures differ between center and periphery countries (pioneer contributions are Prebisch 1950, 1955, 1981; ECLAC 1955; see also Rodríguez 2007; Verspagen 1993; Botta 2009; Rada 2007). The change in the technology gap depends on the rate at which the center innovates and the rate at which the periphery learns and absorbs foreign tech-nology (catching- up; Fagerberg 1994). Behind the dynamics of the technology gap there is an institutional framework and a political economy which sustains those institutions. It suffices for the objectives of this chapter to note that these differences can be captured by the concept of the National System of Innovation (NSI) or National System of Learning (see Freeman 1995; Metcalfe 2001; Narula 2004), discussed in other chapters of this book. The strength of the NSI – the set of institutions, firms and (public and private) agencies which invest, promote and coordinate the processes of innovation and diffusion of technology, defining the market and non- market incentives for learning – determines the relative velocity of innovation and diffusion in center and periphery, and hence the evolution of the technology gap.
The second block relates the technology gap to the production structure. The tech-nology gap implies that the center produces a more diversified set of goods than the periphery, and that these goods are more technology- intensive. This happens for two reasons. Firstly, in the case of the most sophisticated goods, the periphery simply lacks the capabilities required for their production. Secondly, in the case of goods that both the center and the periphery can produce, the technology gap implies that firms in the periphery may have higher unitary costs or lower quality. The productivity and quality gaps curb the competitiveness of periphery firms, reduce their share in the domestic and international markets – particularly in high- tech goods and services – and constrain the growth of effective demand. The periphery will be competitive only in goods which are at the lower end of the technology ladder: simpler goods and commodities which are intensive in natural resources or cheap labor (Reinert 1995). The periphery relies on static
REINERT_97817825444661_t.indb 229REINERT_97817825444661_t.indb 229 03/10/2016 11:3603/10/2016 11:36
Erik S. Reinert, Jayati Ghosh and Rainer Kattel - 9781782544661Downloaded from Elgar Online at 03/31/2017 12:04:16PM
via University College London

230 Handbook of alternative theories of economic development
comparative advantages, while the center relies on dynamic comparative advantages associated with technological capabilities.
Causality does not go exclusively from the technology gap to the production structure. As has been shown by the Schumpeterian literature, technological learning is localized and strongly related to what the country actually produces. Capabilities are developed through various learning mechanisms that depend on the experience accumulated by firms and countries; various forms of learning explain this, such as learning by doing, learning by using, learning by investing and learning by exporting, among others (Bell 2006). The accumulation of capabilities does not take place in a vacuum but within the limits and stimuli provided by this structure. Certain structures are more conducive to technical change than others – in Schumpeterian terms, they entail higher technological opportunities – and sustain higher rates of productivity growth. This implies a virtuous interaction in which technological catching- up encourages structural change, while the latter reinforces the process of learning and the fall of the technology gap (Cimoli and Porcile 2011b).
A note of caution is important at this point. LAS did not develop a micro theory of why the technology gap and asymmetries in capabilities are so pervasive and per-sistent in the periphery. But the macrodynamics of LAS is perfectly consistent with a Schumpeterian (evolutionary) microdynamics that stresses the barriers for diffusion and learning, as described in Dosi (1988) and Cimoli and Dosi (1995). It is also consistent with the view that markets and price signals are unable to solve the complex coordina-tion problems posed by complementarities across sectors and increasing returns in tech-nological change. The evolutionary literature uses the concept of ‘tacitness’ to design a context- specific, idiosyncratic, localized process of learning based on experience, trial and error, interactions and the mastering of routines of production which are inbuilt in people and organizations. Doing things and building capabilities are cannot be learnt from manuals; technology is not just information that can be bought and put into use immediately, but the outcome of an evolutionary process marked by uncertainty (Arthur 1994). This Schumpeterian micro is behind the Keynesian macro of divergence.
The third block of LAS relates the production and trade structures to economic growth. The basic assumption is that the share of each country in international effective demand depends on its patterns of specialization (Dutt 2002; ECLAC 2007; Cimoli et al. 2010). In open economies, the degree in which a country benefits from the expansion of effective demand (in the external and domestic markets) depends on the behavior of exports and imports. The income elasticity ratio – income elasticity of the demand for exports / income elasticity of the demand for imports – is a proxy that captures this ability of the country to participate in world trade and avoid the balance- of- payments constraint. The income elasticity ratio defines – as suggested by the balance- of- payments constrained (BOPC) growth models – the rate of relative center–periphery economic growth consistent with a non- explosive current account/gross domestic product (GDP) ratio in the periphery (McCombie and Thirlwall 1994; Gouvea and Lima 2010; Thirlwall 2011). This is a crucial link between the Schumpeterian approach (interactions between technology and structural change) and the Keynesian–Kaleckian approach (interac-tions between structural change and demand- led growth). Technology and productivity growth does not boost growth directly, but through changes in the pattern of speciali-zation, which impacts effective demand through the income elasticity ratio. In other
REINERT_97817825444661_t.indb 230REINERT_97817825444661_t.indb 230 03/10/2016 11:3603/10/2016 11:36
Erik S. Reinert, Jayati Ghosh and Rainer Kattel - 9781782544661Downloaded from Elgar Online at 03/31/2017 12:04:16PM
via University College London

Latin American structuralism 231
words, except in the particular case of full employment, the impact of productivity growth on economic growth is mediated by its impact on effective demand.2
The fourth and last building block of LAS consists of the behavior of the labor market and income distribution. As it is less diversified, the periphery cannot offer quality jobs to its entire labor force. A large part of total employment remains in low- productivity activities or in subsistence sectors. This has a significant impact on income distribution: workers and firms in sectors and activities linked to the few sectors which are close to the technological frontier obtain high profits and (relatively high) wages, while workers in sectors that do not incorporate technology receive subsistence wages. This in itself is a source of economic inequality. In addition, underemployment worsens income distri-bution by reducing the bargaining power of workers and unions in the modern sector. Structural change – the diversification and the rising technological intensity of the pro-duction structure – allows the economy to shift workers out of the subsistence sector towards higher- productivity sectors. Structural change is the driving force that gradually exhausts Lewis’s infinite supply of labor. By doing so, structural change contributes to raising the wage share in total income and favors income distribution in the long run.
Structural change should be seen as a process that increases productivity and employ-ment at the same time. It moves people to jobs where the productivity path is more dynamic; this has usually been identified with industrialization, but may take place within the agricultural, industrial or service sectors as well. The co- evolution between learning structural change and growth has a strong implication for income distribution for it shapes the intensity and quality of the demand for labor.
Figure 11.1 presents a set of four diagrams that illustrate the interactions between the four LAS theoretical blocks. Quadrant A shows the periphery–center relative productiv-ity (πP/ πC) in the production of different goods, which are ranked (N) in terms of increas-ing technological intensity. As N increases, the relative productivity of the periphery declines. The technological disadvantage of the periphery leads to lower relative produc-tivity in goods which demand more sophisticated technological capabilities. A change in the technology gap shifts the curve of relative productivity in quadrant A to the right, allowing the periphery to reduce the productivity gap (for all or at least some of the goods represented by N).
The combination of relative wages (WP/WC), defined in the labor market (quadrant D; more on this below), and relative productivity (quadrant A), driven by the technol-ogy gap, allows for finding the pattern of specialization. Such a pattern emerges from the intersection of the curve of relative wages and relative productivity. For simplicity, the diagrams ignore differences in competitiveness arising from the quality of the goods and focus instead on unitary costs. The periphery specializes in goods for which relative productivity is higher than relative wages. The ‘last’ or more technology- intensive good that the periphery produces for a given technology gap and relative wages is N*. The higher N* is, the higher the complexity (diversification and technological intensity) of the production structure of the periphery.
Quadrants B and C in Figure 11.1 relate the production structure to the income
2 This also implies that in the cases in which actual growth is below BOPC growth, autonomous investment (from the government or from the private sector) will always come up to bring both rates of growth in line (more on this below).
REINERT_97817825444661_t.indb 231REINERT_97817825444661_t.indb 231 03/10/2016 11:3603/10/2016 11:36
Erik S. Reinert, Jayati Ghosh and Rainer Kattel - 9781782544661Downloaded from Elgar Online at 03/31/2017 12:04:16PM
via University College London

232 Handbook of alternative theories of economic development
elasticity ratio (eP/ ec), and hence to the periphery–center relative rate of growth (yP/yC) defined by the BOP constraint. The higher N* and the higher the complexity of the periphery production structure, the higher is the income elasticity ratio and the higher the relative rate of growth of the periphery. The income elasticity ratio in quadrant B is translated into relative growth through the 45 degree line in quadrant C, as suggested by the Keynesian BOPC growth literature.
Finally, quadrant D shows that when relative growth increases, so does the demand for labor and hence relative wages. This closes the set of interactions between technol-ogy, production structure, growth and income distribution. At the beginning, when unemployment is high (there is a large reservoir of labor), the increase in relative wages is almost zero; but this changes when economic growth accelerates, putting more pres-
�P/�C
ԐP/ԐC ԐP/ԐC
yP/yC
yP/yC
A
B C
D
N
N
45º
WP/WC
W*
N*
Note:Quadrant A: relative productivity (πP/ πC) as a function of the technological intensity of the goods, N.Quadrant B: Ratio of the income elasticity of the demand for exports and imports, yP/ ycQuadrant C: relative economic growth, yP/yCQuadrant D: relative wages, WP/WC
Figure 11.1 The technology gap, specialization and economic growth
REINERT_97817825444661_t.indb 232REINERT_97817825444661_t.indb 232 03/10/2016 11:3603/10/2016 11:36
Erik S. Reinert, Jayati Ghosh and Rainer Kattel - 9781782544661Downloaded from Elgar Online at 03/31/2017 12:04:16PM
via University College London

Latin American structuralism 233
sure on the labor market and raising the quantity and quality of the demand for labor. The increase in relative wages reflects a tighter labor market, besides the positive influ-ence that other variables – especially institutional variables, related to social protection or minimum wages – may have in the bargaining power of workers in the labor market.
This diagrammatic presentation of LAS allows for some simple exercises of compara-tive statics. A change in the NSI that heightens the periphery efforts at catching up will shift the productivity curve (πP/ πC) in quadrant A to the right. For a given relative wage, this implies that the periphery diversifies and produces goods which are more technology- intensive. The pattern of specialization changes as the economy moves to a new N*. This in turn changes the income elasticity ratio in quadrant B and the rate of growth in quadrant C. If the rise in the BOPC rate of growth is high enough, this may produce an improvement in relative wages. It should be observed that the diversification associated with a strengthening of the NSI may accelerate the rate of learning and further reduce the technology gap, sustaining the shift of the curve of relative productivity to the right. A virtuous cumulative process of growth and learning à la Kaldor may emerge, but this diversification would be limited by the increasing technological intensity of the goods as the country moves upwards on the technology ladder.
Other exercises of comparative dynamics are possible using the LAS building blocks. A positive shock in international demand, for instance, will shift the curve of the income elasticity ratio in quadrant B to the right. This would, in turn, have positive effects on growth (quadrant C), relative wages (quadrant D) and – by encouraging learning by doing associated with faster growth and diversification – the productivity gap (a shift of the curve of relative productivities in quadrant A).
A FORMAL APPROACH TO LAS
This section presents the ideas of the previous section in a simple formal model. The model is aggregate, but its macrodynamics is compatible with the Schumpeterian micro discussed above.
The evolution of the technology gap (first LAS block in the previous section) responds to the following equation:
Ġ = a + bG − gg (11.1)
G ≡ ln(TC/TP) is the technology gap, equal to the natural logarithm of the ratio between technological capabilities in the center (TC) and in the periphery (TP). There are three components in the argument of equation (11.1). The first is the exogenous rate of growth of the gap (a). If – as is realistic to assume – the center invests more in science and tech-nology than the periphery, this parameter will be positive. The third term is the Kaldor–Verdoorn effect, that is, learning by doing associated with higher rates of economic growth, which is also positive. The higher the rate of growth of the periphery (g) is, the lower (higher) the increase (fall) in the technology gap. The second term of the equation is the gap itself (G). The sign of b, however, is ambiguous.
The gap can be seen, from the point of view of the periphery, as an opportunity to learn from and take stock of the experience of the developed world to speed up the learning
REINERT_97817825444661_t.indb 233REINERT_97817825444661_t.indb 233 03/10/2016 11:3603/10/2016 11:36
Erik S. Reinert, Jayati Ghosh and Rainer Kattel - 9781782544661Downloaded from Elgar Online at 03/31/2017 12:04:16PM
via University College London
234 Handbook of alternative theories of economic development
process in the periphery. If this is the case, b < 0, and a higher technology gap helps the periphery to catch up. The magnitude of b (as the magnitude of a and g) depends on the efforts of the periphery to learn; broadly speaking, depends on the NSI. However, in some cases b may be positive, when increasing returns in innovation and growth are very strong. When this happens, the initial technology gap reinforces the center–periphery divide (positive feedback favoring the center), instead of helping to curb it (negative or equilibrating feedback).
Economic theory does not offer a definitive answer about the sign of b. This is an empirical matter. But evolutionary micro level gives some hints about the factors that determine b. Firstly, as mentioned, the strength of the NSI is crucial: there is no substi-tute for domestic efforts at learning (industrial and technological policies). Secondly, the nature of the technological paradigm matters for catching- up. More precisely, the techno-logical opportunities and tacitness that characterize the process of learning have a strong impact on the velocity with which pioneers innovate as compared with the velocity with which technology diffuses to the laggards. New paradigms in which the technological frontier moves very rapidly allow pioneers to reap great benefits from the existing knowl-edge base and therefore to increase the distance with the laggards (divergence). In such a scenario it is more likely that b is positive. On the other hand, if the technological frontier moves at a slower pace and there are plenty of opportunities to learn from imitation (reversal engineering, copying, negotiating the transference of knowledge with foreign firms or capturing a higher share of global research and development expenditures), then it is more likely that b is negative (the gap encourages catching- up).
A third approach to catching up is to assume that the relationship between the exist-ing gap and the intensity of international technological spillovers is non- linear. For low values of the gap, an increase in the gap is a stimulus for learning in the South. However, for high values of the gap, any increase in the gap becomes an insurmount-able barrier for the South. If the gap is too high, the South simply does not have the capabilities that are required for learning from the leaders. This introduces a non- linearity in the analysis: with the gap international spillover rises up to a critical level of the gap and then declines. The implications for growth and structural change of non- linearity are not analyzed in this chapter (see Verspagen 1993 for a discussion of this scenario).
As regards the second block of the model (linking the technology gap to relative growth), it should be recalled that the model assumes a univocal relationship between the technology gap and the production structure; and therefore with the pattern of spe-cialization. A lower technology gap means a more complex diversified economy, which in turn implies a higher income elasticity ratio. Therefore, the elasticity ratio is a function of the technology gap G: the periphery is more capable of expanding domestic produc-tion in response to the expansion of both domestic and external demand when the gap is lower and the economy more diversified.
Formally, the long- run equilibrium rate of growth of the South (gE) depends positively on the rate of growth of the center (gF, which defines the expansion of global effective demand) and negatively on the technology gap (G, which influences the degree of diver-sification of the South and hence the share of global effective demand, which is captured by periphery production):
REINERT_97817825444661_t.indb 234REINERT_97817825444661_t.indb 234 03/10/2016 11:3603/10/2016 11:36
Erik S. Reinert, Jayati Ghosh and Rainer Kattel - 9781782544661Downloaded from Elgar Online at 03/31/2017 12:04:16PM
via University College London

Latin American structuralism 235
gE = gF − τG (11.2)
For the periphery to move to its equilibrium rate of growth, investment and labor supply should be endogenous and cannot pose a persistent supply- side ceiling to growth. Steindl (1952) argues that innovation follows investment like a shadow. In this model the causality goes on the other way round: growth opportunities are opened by technological change, and this produces the incentive to invest. Whenever the effective rate of growth (g) is below the equilibrium rate (gE), the periphery will raise autonomous investments and accelerate its rate of growth. Formally:
g# 5 e [gE 2 g ] (11.3)
Using (11.2) in (11.3):
g# 5 e [gF 2 tG 2 g ] (11.4)
Figure 11.2 shows how the equilibrium values of the rate of growth and of the technol-ogy gap are determined, assuming a negative b.
The isocline GG represents combinations of G (technology gap) and g (effective rate of growth) that keep the technology gap in equilibrium, while the isocline gg gives the combinations of G and g that keep the effective growth rate constant. With a negative b, the equilibrium in point A is stable.
Exercises in comparative dynamics illustrate the impact of changes in the parameters of the system on growth and technological capabilities. First, assume that one country changes its NSI giving more room to investments in education, R&D, industrial policy
GG2 G1
g
g1
GG
A
B
gg
Figure 11.2 Effect of a new industrial and technological policy
REINERT_97817825444661_t.indb 235REINERT_97817825444661_t.indb 235 03/10/2016 11:3603/10/2016 11:36
Erik S. Reinert, Jayati Ghosh and Rainer Kattel - 9781782544661Downloaded from Elgar Online at 03/31/2017 12:04:16PM
via University College London

236 Handbook of alternative theories of economic development
or active negotiations to spur the transfer of technology. As a result the value of b will increase in absolute terms and the slope of the curve GG will be higher. The economy moves from A to B. During the transitional dynamics, the technology gap is falling and diversification increases along with the rate of growth. The new equilibrium features a higher rate of growth and a lower technology gap (from G1 to G2). The change in policy therefore favorably redefines the production structure and the international position of the country.
On the other hand, a period of faltering public and private investment in science, technology and education, even if temporarily (in a context of an external crisis or as a result of an effort to reduce the budget deficit in the face of rising inflation), will reduce the magnitude of b, giving rise to the opposite effect. Secondly, not only policy shocks but also external shocks may change the equilibrium. An acceleration of autonomous innovation at the center – as in a period of change in the technological paradigm – raises a. This will shift the GG curve to the right. The new equilibrium (not drawn in Figure 11.2) entails a lower rate of growth and higher technological divide between South and North.
An interesting case is the impact of an exogenous shock on international demand, as represented in Figure 11.3. A pure demand shock – for instance, an exogenous rise in the income elasticity of exports – shifts the gg curve to the right and produces a new equi-librium (from A to B). There will be a positive impact of growth (higher g) but a nega-tive impact on the technology gap (higher G, represented by the new technology gap in equilibrium, G2). Therefore, when an increase in the growth rate is more associated with good luck in the ‘commodity lottery’ than with an increase in technological capabilities, the economy stabilizes with a higher technology gap.
Such a process may be halted if part of the new income produced by faster growth is invested in the NSI, which boosts the technological parameters (a or g). In the latter
G
g
G1
g1
GG
gg
A
B
G2
C
Figure 11.3 Commodity lottery: the effect of an exogenous shock on international demand
REINERT_97817825444661_t.indb 236REINERT_97817825444661_t.indb 236 03/10/2016 11:3603/10/2016 11:36
Erik S. Reinert, Jayati Ghosh and Rainer Kattel - 9781782544661Downloaded from Elgar Online at 03/31/2017 12:04:16PM
via University College London

Latin American structuralism 237
case, growing external demand and technological learning – faster growth with a lower technology gap – move hand in hand. Equilibrium is reached in point C, which features a higher rate of growth and a lower technology gap. This suggests that the industrial and technology policies are critical not solely in times of difficulties, but also in periods of favorable external conditions. Relying on the exogenous forces of the commodity lottery may favor growth in the short run but at a cost if it reinforces a pattern of specialization in sectors which are less technology- intensive.
CONCLUDING REMARKS
The focus of LAS development theory is on the co- evolution between the technology gap, structural change and the rate of economic growth, with its impacts on the quantity and quality of employment – and hence on income distribution. In many aspects LAS was able to advance key concerns and concepts recovered by recent thinking in growth and development. In particular, LAS should not be seen as a chapter in the history of economic thought but as an important part of a growing literature which fruitfully combines the insights of Schumpeter on structural change and technology with the Keynesian–Kaleckian insights on the role of effective demand and institutions in invest-ment and income distribution.
LAS suggests that growth and income distribution, in a context of increasing returns and pervasive asymmetries in production and technological capabilities, give rise to falling behind in the periphery. Active policies for income distribution and strengthening the NSI are required for catching- up. Such policies are important in times of crisis; but they are also important to avoid a rise in the technology gap when a commodity boom alleviates the BOP constraint. The current pattern of specialization and its effects on the intensity and direction of learning and the accumulation of capabilities in the periphery may compromise long- run growth. In this respect, the micro analysis of technical change and institutions by the Schumpeterian school offers a natural complement to LAS emphasis on industrial policy to sustain growth and avoid divergence between center and periphery.
There is a rich research agenda for the future, exploring LAS insights and, more gener-ally, the convergence between Keynes and Schumpeter. Agent- based models are particu-larly useful for the analysis of the type of micro–macro interactions which concern LAS. Although there is a place for aggregated macroeconomic models, micro- founded models with heterogeneous agents may be necessary to identify how certain changes in policies and macro- prices impact on learning and investment, reshaping the growth path. Topics of political economy in a context of structural transformation are another example of an issue that deserves much more attention in the future. A political economy built around very high initial levels of inequality in income, education and in the ownership of land and capital has strong negative implications for growth in the long run. A more detailed analysis of the links between the social and production structures, and how they contrib-ute to shaping policies and political economy, is a promising area for future research in development economics.
REINERT_97817825444661_t.indb 237REINERT_97817825444661_t.indb 237 03/10/2016 11:3603/10/2016 11:36
Erik S. Reinert, Jayati Ghosh and Rainer Kattel - 9781782544661Downloaded from Elgar Online at 03/31/2017 12:04:16PM
via University College London

238 Handbook of alternative theories of economic development
REFERENCES
Araujo, R.A. and G.T. Lima. 2007. ‘A Structural Economic Dynamics Approach to Balance of Payments Constrained Growth’, Cambridge Journal of Economics 31(5), 755–774.
Arthur, B. 1994. Increasing Returns and Path- Dependency in Economics. Ann Arbor: Michigan University Press.
Bell, M. 2006. ‘Time and Technological Learning in Industrialising Countries: How Long Does it Take? How Fast is it Moving (If At All)?’, International Journal of Technology Management 36(1–3), 25–39.
Bielshowski, R. 2009. ‘Sixty Years of ECLAC: Structuralism and Neo- Structuralism’, CEPAL Review (April), 171–192.
Blecker, R.A. 2013. ‘Long- Run Growth in Open Economies: Export- Led Cumulative Causation or a Balance- of- Payments Constraint?’, in G. Harcourt and P. Kriesler (eds), Handbook of Post- Keynesian Economics. Oxford: Oxford University Press, 390–414.
Botta, A. 2009. ‘A Structuralist North–South Model on Structural Change, Economic Growth and Catching up’, Structural Change and Economic Dynamics 20, 61–73.
Ciarli, T., A. Lorentz, M. Savona and M. Valente. 2010. ‘The Effect of Consumption and Production Structure on Growth and Distribution: A Micro to Macro Model’, Metroeconomica 61(1), 180–218.
Cimoli, M. 1988. ‘Technological Gaps and Institutional Asymmetries in a North–South Model with a Continuum of Goods’, Metroeconomica 39(3), 245–274.
Cimoli, M. and M. Dosi. 1995. ‘Technological Paradigms, Patterns of Learning and Development: An Introductory Roadmap’, Journal of Evolutionary Economics 5(3), 243–269.
Cimoli, M. and G. Porcile. 2011a. ‘Global Growth and International Cooperation: A Structuralist Perspective’, Cambridge Journal of Economics 35(2), 383–400
Cimoli, M. and G. Porcile. 2011b. ‘Learning, Technological Capabilities and Structural Dynamics’, in J.A. Ocampo and J. Ros (eds), The Oxford Handbook of Latin American Economics. Oxford, UK and New York, USA: Oxford University Press, 546–567.
Cimoli, M., G. Porcile and S. Rovira. 2010. ‘Structural Change and the BOP Constraint: Why Did Latin America Fail to Converge?’, Cambridge Journal of Economics 34(2), 389–411.
Dosi, G. 1988. ‘Sources, Procedures and Microeconomic Effects of Innovation’, Journal of Economic Literature 26(3), 1120–1171.
Dosi, G., K. Pavitt and L. Soete. 1990. The Economics of Technical Change and International Trade. Brighton: Wheatsheaf.
Dutt, A. 2002. ‘Thirlwall’s Law and Uneven Development’, Journal of Post Keynesian Economics 23(3), 367–390.
ECLAC. 1955. Estudio Económico de América Latina, 1954. Santiago de Chile: ECLAC.ECLAC. 2007. ‘Progreso Técnico y Cambio Estructural en América Latina’, Santiago de Chile: UN-
ECLAC, División de Desarrollo Productivo y Empresarial, LC/W.136, Documento de Proyectos N. 136, November.
Fagerberg, J. 1994. ‘Technology and International Differences in Growth Rates’, Journal of Economic Literature 32, 1147–1175.
Freeman, C. 1995. ‘The National System of Innovation in Historical Perspective’, Cambridge Journal of Economics 19(1), 5–24.
Gouvea, R.R. and G.T. Lima. 2010. ‘Structural Change, Balance of Payments Constraint and Economic Growth: Evidence from the Multi- Sectoral Thirlwall’s Law’, Journal of Post Keynesian Economics 33(1), 169–204.
León- Ledesma, M.A. 2002. ‘Accumulation, Innovation and Catching- up: An Extended Cumulative Growth Model’, Cambridge Journal of Economics 26, 201–216.
McCombie, J.S.L and A. Thirlwall. 1994. Economic Growth and the Balance of Payments Constraint. New York: St Martins Press.
Metcalfe, J.S. 2001. ‘Institutions and Progress’, Industrial and Corporate Change 10(3), 561–586.Narula, R. 2004. ‘Understanding Absorptive Capacities in an Innovation Systems Context: Consequences for
Economic and Employment Growth’, DRUID Working Paper 04–02.Ocampo, J.A. 2013. ‘Balance of Payments Dominance: Its Implications for Macroeconomic Policy’, Initiative
for Policy Dialogue Working Paper, October.Ocampo, J.A., C. Rada and L. Taylor. 2009. Growth and Policy in Developing Countries: A Structuralist
Approach. New York: Oxford University Press.Pinto, A. 1970. ‘Heterogeneidad estructural y modelo de desarrollo reciente de la América Latina’, in Pinto, A.
(ed.), Inflación: raíces estructurales. México: Fondo de Cultura Económica.Pinto, A. 1976. ‘Naturaleza e implicaciones de la heterogeneidad estructural de la América Latina’, El Trimestre
Económico 37(145), 83–100.
REINERT_97817825444661_t.indb 238REINERT_97817825444661_t.indb 238 03/10/2016 11:3603/10/2016 11:36
Erik S. Reinert, Jayati Ghosh and Rainer Kattel - 9781782544661Downloaded from Elgar Online at 03/31/2017 12:04:16PM
via University College London

Latin American structuralism 239
Prebisch, R. 1950. The Economic Development of Latin America and Its Principal Problems. New York: United Nations.
Prebisch, R. 1955. ‘Commercial Policy in the Underdeveloped Countries’, American Economic Review 49, 251–273.
Prebisch, R. 1981. Capitalismo Periférico: Crisis y Transformación. Mexico: Fondo de Cultura Económica.Rada, C. 2007. ‘Stagnation or Transformation of a Dual Economy through Endogenous Productivity Growth’,
Cambridge Journal of Economics 31(5), 711–740.Reinert, E.S. 1995. ‘Competitiveness and its Predecessors: A 500 Year Cross- National Perspective’, Structural
Change and Economic Dynamics 6, 23–42.Rodríguez, O. 2007. El Estructuralismo Latinoamericano. México: Siglo XXI.Ros, J. 2001. Development Theory and the Economics of Growth. Ann Arbor, MI: Michigan University Press.Steindl, J. 1952. Maturity and Stagnation in American Capitalism. Oxford: Blackwell.Sunkel, O. 1978. ‘La dependencia y la heterogeneidad estructural’, Trimestre Económico 45(1), 3–20.Thirlwall, A. 2011. ‘Balance of Payments Constrained Growth Models: History and Overview’, School of
Economics Discussion Paper 1111, University of Kent.Vera, L.A. 2006. ‘The Balance- of- Payments Constrained Growth Model: A North–South Approach’, Journal
of Post Keynesian Economics 29(1), 67–92.Verspagen, B. 1993. Uneven Growth Between Interdependent Economies. Aldershot: Avebury.
REINERT_97817825444661_t.indb 239REINERT_97817825444661_t.indb 239 03/10/2016 11:3603/10/2016 11:36
Erik S. Reinert, Jayati Ghosh and Rainer Kattel - 9781782544661Downloaded from Elgar Online at 03/31/2017 12:04:16PM
via University College London

240
12. Revisiting the debate on national autonomous development in AfricaIssa G. Shivji
THE DEVELOPMENT DISCOURSE FROM NATIONALISM TO NEOLIBERALISM3*
The struggle for independence in Africa was primarily an assertion of the humanness of the African people after five centuries of domination and humiliation of the slave trade and colonialism. Amilcar Cabral described it as the process of a ‘re- Africanisation of minds’ or ‘re- becoming Africans’. National development became the passion of politi-cians and the ‘great expectation’ of the people. In the vision of the more articulate nation-alist leaders like Julius Nyerere of Tanzania, the independent state had a double task, that of building the nation and that of developing the economy. The state in Africa, Nyerere argued, preceded the nation, rather than the other way round. Thus, from the start the national project was top- down and statist.
The colonial economy and society were anything but national. In the scramble for Africa, the colonial powers had divided the continent into mini- countries where bounda-ries cut through cultural, ethnic and economic affinities. This was made worse by the policy of divide and rule, leaving behind uneven development in an extreme form. Some regions were more developed than others. Some ethnic groups were labelled martial, providing a recruiting ground for soldiers; others were turned into labour reservoirs; some ethnic groups were characterized as ‘intelligent’ and moderately entrepreneurial as opposed to the rest who were inherently indolent and lazy. All were, of course, uncivi-lized, uncultured, undisciplined pagans whose souls needed to be saved and whose skins needed to be thrashed.
The colonial economy was typically disarticulated, almost tailor- made for exploita-tion by colonial capital, linked to the metropolitan trade and capital circuits. Extractive industries like mining predominated. Plantation agriculture existed side by side with subsistence peasant cultivation, all concentrating on one or a couple of crops for export according to the needs of the metropolitan economy. In settler colonies, large- scale alien-ation of fertile land left the indigenous to eke out a living from scraps of land and still pay taxes to the colonial state while providing labour to the settler farmer. Entrepreneurship and skilled labour was deliberately discouraged, if not suppressed, by legal edicts and administrative fiat. Instead, where needed to distribute metropolitan goods, build rail-ways and ports or service the state and the settler town, skills were imported from the Indian subcontinent.
Different colonial powers left behind different forms and traditions of public
* This section is based on my public lecture to Cornell University, September 2005, titled ‘The Changing Discourse on Development in Africa’.
REINERT_97817825444661_t.indb 240REINERT_97817825444661_t.indb 240 03/10/2016 11:3603/10/2016 11:36
Erik S. Reinert, Jayati Ghosh and Rainer Kattel - 9781782544661Downloaded from Elgar Online at 03/31/2017 12:04:16PM
via University College London

P A R T T W O
Stalin’s Industrial Revolution

C H A P T E R F I V E
Planning, Collectivization, and Rapid Growth
The Soviet industrial revolution began on 1 October 1928, when the First Five-Year Plan went into operation. Lenin’s death four years earlier launched a struggle for his succession. Through adroit maneuvering, Stalin gradually eliminated all opponents —Trotsky, Bukharin, and their allies. In the mid-1920s, Stalin presented himself as an economic moder- ate allied with Bukharin and opposed to the superindustrializers like Trotsky. Once he had achieved power, however, Stalin pursued an in- dustrialization strategy more extravagant than any imagined in 1924 or 1925. In short order, the institutions that defined the Soviet economic system — Five-Year Plans, soft budget constraints, collectivized agricul- ture —were put in place. These institutions launched an unprecedent- edly rapid industrial revolution.
Th e D ir ec t io n o f E c o n o m ic Ac t iv it y b y C en tr a l P lans
Central planning was an innovation of the First Five-Year Plan. During the early 1920s, Soviet firms were organized in trusts and instructed to maximize profits. Gosplan, which eventually came to direct the econ- omy, was created in 1921. At the outset, it undertook precocious statis- tical studies and compiled national income statistics. By the late 1920s, Gosplan was publishing an annual volume called Control Figures, which projected future trends and guidelines, but did not provide detailed plans.
The First Five-Year Plan replaced guidelines with directives. The plan sketched out a scenario for the growth of the economy. By the 1930s, ministries were translating the plan into practice by setting annual out- put targets for sectors of the economy and parceling them out to indi- vidual firms. While productivity, costs, and employment were all tar- geted, output was given the most weight. “Material balances” were constructed in an effort to ensure consistency across firms —would planned steel production, for instance, equal steel requirements? —but these exercises were of questionable utility since targets were so often missed. Price setting was also centralized, but prices had little relevance to decision making or resource allocation when planning focused on output targets and investment allocation.
Substituting output targets for profits as the principal enterprise ob- jective had momentous implications. For one thing, it marked the end

92 · Chapter Five
Table 5.1Targets and Their Fulfillment: Heavy lndu$try
1927-28 1932-33 1937 1940
Pig ironTarget — 10.0 16.0 18.6Result 3.3 6.2 14.5 14.9
Crude petroleumTarget — 21.7 44.3 39.7Result 11.7 21.4 28.5 31.1
CementTarget — 6271 7500 8308Result 1849 3478 5454 5675
Electric powerTarget — 22000 38000 56014Result 5050 13540 36173 48309
CoalTarget — 75000 152500 188000Result 35400 64360 127968 165923
Motor vehiclesTarget — 130.0 200.0 303.0Result 0.7 23.9 199.9 145.4
Machine toolsTarget — — 40000 54000Result 2098 19720 36120 44000
Source: Zaleski (1971, pp. 306-11; 1980, pp. 524-29). Note: The target for 1932-33 is thc wmaximum goal.”
of cost controls in industry. Since achieving targets might involve nega- tive profits and since prices no longer reflected scarcity or monopoly power, a corollary of planning was the liberal provision of bank credits to keep firms solvent. So the soft budget constraint, which had first appeared in the mid-1920s as the state tried to lower industrial prices to encourage agricultural marketing (Johnson and Temin 1993), became a general feature of Soviet industrial organization.
The importance of soft budget constraints increased with the ambi- tiousness of the targets, and in the 1930s Soviet targets were certainly challenging. The original targets of the First Five-Year Plan were re- placed by “optimal” targets and then by “maximal” targets that were even more demanding. Higher and higher targets were set in later plans. Tables 5.1 and 5.2 report targets and results for some important indus-

Planning and Collectivization · 93
Table 5.2Targets and Their Fulfillment: Light Industry
1927-28 1932-33 1937 1940
Woolen fabricsTarget — 270.0 220.0 145.4Result 96.6 88.7 108.3 119.7
Cotton yarnTarget — 620.0 611.0 675.0Result 328.0 355.1 532.9 649.9
Leather shoesTarget — 145.0 191.0 224.8Result 103.0 86.9 182.9 189.5
Soap (40 percent fatty acid)Target — — 1000.0 721.0Result 360.0 357.2 495.0 700.0
Fish catchTarget — — 1800.0 1969.0Result 840.0 1333.0 1609.0 1404.0
Source: Zaleski (1971, pp. 306-11; 1980, pp. 524-29). Note: The target for 1932-33 is the wmaximum goal.”
tries. An outstanding fact was that targets were rarely met.1 Setting tar- gets at unattainable levels —“taut” planning —belies the claim that So- viet planning matched the production and utilization of materials across the economy. Instead, targets were a motivational tool. This was an outstanding feature of 1928-32, when the approved targets of the First Five-Year Plan were quickly replaced by ever higher targets in annual plans. Coherence gave way to exhortation.
In the short run, the strategy may have worked. Consider the iron and steel industry, which was a priority. In 1927-28, the Soviet Union made 3.3 million tons of pig iron. The first version of the First Plan called for 8.0 million tons to be smelted in 1932-33, the optimal ver- sion raised that to 10.0 million, and this was raised again in 1932 to 15-16 million tons. None of these targets was realized —6.6 million tons vvere actually made in 1932 —but a doubling of production in little more than four years was no mean achievement (Nove 1990, pp. 137, 180). Indeed, the original target was hit in 1933, and the optimal target in 1934 (Nutter 1962, p. 420), so performance did not lag far behind plan. The Second Plan reiterated the amended target of 1932 (16 mil- lion tons) and applied it to 1937, and actual production came close at

94 · Chapter Five
14.5 million tons. There wa$ little more production during the Third Plan, however, despite a further increase in the target.
The rush to meet targets led to great increases in employment and apparent inefficiency in the utilization of labor. High targets were diffi- cult to hit, and managers scrambled for inputs to increase production. More workers helped so long as they had a positive marginal product, and the soft budget constraint allowed firms to expand employment beyond the point where the value of the marginal product equaled the wage. Stringent targets pushed firms to raise output, and soft budgets meant that cost was not an issue.
The comparison of targets and output also reveals a second feature of Soviet targets: they were adjusted in light of the performance of firms in the preceding plan. Thus, whcii output grew and approached the target, a new, higher target was set. If output failed to reach the target, it was only $lightly increased or even lowered. While this may appear to be just “common sense,” managers came to realize that fulfilling a target resulted in a higher target in the future. That prospect, in tum, led them to build up reserves of labor, equipment, and materials to meet higher future targets without strain (Komai 1992, p. 223). Such behavior low- ered productivity (output with respect to inputs), and contradicted the motivational effect of targets. The incentive to hoard inputs had serious implications for aggregate performance in the late Soviet period that will be considered in Chapter 10.
C a pita l Ac c u m u la t io n
Plan targets were chosen in order to accelerate the economic develop- ment of the Soviet Union. While the plans envisioned an increase in consumption, the emphasis in the 1930s was on building an industrial society. Accumulating physical capital — structures and machinery — was the prioity, and investment allocation was the key planning issue of the 1930s. Complementary investments in human capital (education and training) were also undertaken.
The nece$sary machinery for the Soviet industrial revolution could have been obtained in two way$. The first wa$ exporting grain and light manufactures and using the resulting foreign exchange to import capital equipment. The second wa$ developing heavy indu$try in the USSR it- self, from the outset, by using the products of heavy indu$try to expand the capital stock of that sector. The First Five-Year Plan adopted in 1928 called for the pursuit of both policies, and export$ of farm prod- ucts and consumer goods were initially promoted. Grain exports were increased from 200,000 tons in 1929 to 5 million in 1930 and 1931. However, the collapse in world commodity prices and the protectionism

Planning and Collectivization · 95
Table 5.3Investment Allocation, 1929-34 (millions of tubles)
Average per year
Investmentpercentage
Agriculture 3243 0
Light industry 1252 0
Iron and steel 1854 70Nonferrous metals 184 18Machine building 1807 86Construction materials 60 60Chemicals 459 23Wood 212 34Paper 105 12Electric power 498 9Coal 353 16Petroleum 558 4Transportation 2969 11Communications 171 2Trade 294 0Education 256 0Health 172 0Municipal services 533 0Housing 357 0
Total 15617 23
Source: Socialist Construction (1936, p. 346).
of Germany, Britain, and the United States made export-led growth in- feasible. Grain exports were curtailed in the mid-1930s (Davies, Har- rison, and Wheatcroft 1994, pp. 206-15 , 316). By default, if not design, the Soviet Union adopted a development strategy based on en- larging the capital goods sector.
Table 5.3 shows the average distribution of investment across the So- viet economy from 1929 to 1934. About one-fifth of investment went into agriculture. Otherwise, the emphasis was on heavy industry —56 percent of investment went to metals, machinery, construction mate- rials, chemicals, and fuels. Only 6 percent was spent on housing and municipal services (the latter included the construction of electrical dis- tributions systems) despite the vast increase in city size. The underin- vestment in cities was a major factor behind the harsh character of life.
It vvould, nonetheless, be a mistake to conclude that there was negli- gible investment in consumer goods. An input-output table of the Soviet

96 · Chapter Five
economy was used to allocate capital and labor between investment and consumption, and the fraction of investment in each industry imputable to economy-wide investment is also shown in Table 5.3. Investment re- quired machinery, iron and steel, and construction materials (both di- rectly and as inputs into requisite products). In the event, 70 percent of the iron and steel and 86 percent of the machinery were attributed to investment in the 1930s. In contrast, the products of agriculture and light industry were used for consumption. These assignments are not surprising. What is less expected is that little electric power or petro- leum was used in the accumulation process. Most of that was consumed as well. Likewise, most transportation involved shipping grain. The up- shot was that 23 percent of investment, by this reckoning, went into producer goods and 77 percent into consumer goods despire rhe favored position of heavy industry in the investment plan.
Twenty-three percent of investment in the producer goods sector, nonetheless, represented a major change from the capital stock at the end of the NEP. Applying the same allocation procedure to 1928 capital stock implies that only 7 percent of it was in the producer goods sector. Housing and agriculture comprised substantially bigger fractions of the capital stock in 1928 than did the investment allocation of the early Five-Year Plans.
Channeling investment back into the industries that produce invest- ment goods generated a rapid rate of physical capital accumulation, as predicted by the Fel’dman model. The investment rate2 rose from 8 per- cent in 1928 to 14 percent in 1932 and peaked at 17 percent in 1936. Sir Arthur Lewis (1954), the Nofcel Prize-winning economist, observed that an industrial revolution required that the investment rate rise from 5 percent to 10 percent or more. The Soviet Union crossed that thresh- old in the 1930s. The result was a very rapid increase in the capital stock. From 1928 to 1939, it grew at 9 percent per year.i On the indus- trial front, this vvas achieved by building or extending thousands of factories, mines, hydroelectric plants, and the like.
The investment rate did flag, however, with the approach of World War II. As metals, chemicals, and machinery were allocated to military production instead of further expansion of the capital stock, investment dropped back to 14 percent of GDP. Soviet growth would have been more impressive had it not been for the war.
H um an C a pita l
The Soviet Union accumulated human capital as well as physical capital at a high rate. Educational attainment was quite limited in Russia in 1917, especially in rural districts. While the Russian Empire possessed a few significant universities, the 1897 census showed only 21 percent of

Planning and Collectivization · 97
the adult population as literate (Crisp 1978, p. 389). Most schooling was confined to the cities. Some extension of primary education oc- curred immediately before the First World War, but only 38 percent of the adults were literate in 1918 (Crisp 1978, p. 391).
The Soviet government promoted education both for broad cultural reasons and for narrow economic ones. The former are well known, the latter less so. Soviet research on the economics of education built on work done before 1917. Several empirical studies on eamings had been undertaken, and they showed that literate workers had higher earnings than illiterates at every age. In 1924, S. G. Strumilin published a re- markable paper based on a sample of 2602 lathe operators. It was in- tentionally a prewar sample to eliminate the effect of the post-1917 compression of wages that obscured the relationship between education and productivity. Strumilin estimated an equation in which skill (a trans- form of earnings) depended on age, job experience, and years of educa- tion. The inquiry showed a high return to education, and Strumilin developed a procedure to compare the costs and social benefits of incre- mental years of schooling. He concluded that “a more profitable ‘capi- tal’ investment would be difficult to think of even in a country of such immense possibilities as our Soviet Russia” (Kahan 1965, p. 9).
This was not an academic finding without import for policy since Strumilin was a leading Gosplan economist and author of the First Five- Year Plan. His view, expressed in 1929, “that the expenditures of the state budget to raise the cultural level of the country ought to be consid- ered along with the expenditures on technical reconstruction of produc- tion as capital expenditures, and as equal in terms of their importance to our economy,” was translated into policy (Kahan 1965, p. 10). The First and Second Plans had long sections devoted to the importance of education and training for the industrialization of the country, and set ambitious goals to increase literacy and skill. Primary and secondary education were extended, and adult literacy programs were pushed vig- orously. According to the 1926 census, 51 percent of the adult popula- tion was literate, and that fraction increased to 81 percent in 1939. The gains were particularly dramatic for women. In 1897, a man was three times as likely as a woman to be literate. By 1939, the differential had almost disappeared (Russian Academy of Sciences, 1992, table 8). The gains were not confined to literacy but included secondary, technical, and university education.
COLLECTIVIZATION OF AgRICULTURE
The agricultural revolution of the 1930s was an outgrowth of the mar- keting crises of the mid-1920s. From 1926 on, the state collected less grain than it had hoped. In the previous chaptei; I argued that the short-

98 · Chapter Five
fall in purchases resulted from the high price of manufactured goods relative to farm products. Stalin, hovvever, favored the view that the farm size distribution determined the propensity to market. According to this view, extrarural sales were lower in the 1920s than they had been before the war primarily because of the elimination of large gentry and Kulak farms after 1917 and the corresponding expansion of me- dium-sized, self-suffiđent peasant farms. The long-run solution was the reorganization of the small- and middle-scale peasants into socialized production units —collective farms — which would have a higher pro- pensity to market. ln the absence of such a reorganization, the only source of grain was the nonmarketed surpluses of the remaining Kulaks.
While a higher price of agricultural products would induce farmers to sell more, Stalin rejected it for the reasons advanced by Preobrazhensky: the state needed to finance its investment drive by raising the price of manufactures and lowering the price paid for grain. Stalin went further and likened this policy to the tribute paid by Moscow to the Mongols, thus earning his approach the sobriquet of “primitive accumulation by the methods of Tamerlane” (Hughes 1996, pp. 14-15).
Most of the potential grain surplus was in the hands of the more prosperous peasants, so they became the target of state policy. Building socialism, according to Stalin, required the “intensification of the class struggle” against the Kulaks. From December 1927 on, he pushed the application of the “Ural-Siberian” method of grain collection. This is usually taken to be simply requisitioning food, but Hughes (1996) has emphasized that the policy was subtler. Each village was taxed grain, but the village could assign the burden among its members. Generally, a majority of peasants had incomes less than the average, and this poor majority forced the wealthy peasants to pay the tax. Tribute and class struggle were successfully combined to extract the agricultural surplus.
ln June 1929, about one million people were members of collective farms, and most of those were loosely organized. In November of that year, the central committee announced that a spontaneous movement to join collectives was under way, and that it should be pressed fonvard. A frantic and ill-planned organizing campaign was launched in which thousands of officials attempted to induce the peasantry to vote to es- tablish collective farms (voluntarism was still the official policy). There was no central directive as to what kind of collectives should be cre- ated — were clothes to be shared as well as horses? (Fitzpatrick 1994, p. 50) —and the organizers were put under intense pressure to produce agreement. MExcesses” occurred. By March 1930, almost 60 percent of the peasants had been herded into collectives. On 2 March 1930, Stalin published his famous letter MDizzy with Success,” in which he con- demned the zealots for going too far. Thousands of peasant households

Planning and Collectivization · 99
quit the collectives, and the fraction collectivized dropped below one- quarter by midsummer (Nove 1990, pp. 150-66, 408 n. 24).
The collectivization drive of 1929-30 was accompanied by war on the Kulaks —their “liquidation as a class.” Putative Kulaks, including “ideological Kulaks,” that is, simply opponents of collectivization, were divided into three groups. The first category were sent to concentration camps and their families exiled to Siberia; the second category were deported with their families to remote regions; the third category were allowed to remain in the localities but were given the worst land. The first two categories lost all of their property, while the last retained items essential to cultivation. Millions were deported under these provi- sions; others were arrested and, in some cases, killed.
While the peasants felt free to leave the collective farms in the sum- mer of 1930, the respite was short lived. In the next three years, the cultivators were dragooned back. By 1933, two-thirds of the peasants were members, and they cultivated 85 percent of the land. By then, the “artel” was adopted as the organizational standard. With this model, most of the land, all of the horses, and many of the other livestock were transferred to the collective. Peasants retained ovvnership of their houses, a cow and some swine, and small plots on which they could raise their stock and cultivate produce for their own use or for sale to city residents in farmers’ markets —called “collective farm markets” af- ter their legalization in 1932. A significant proportion of the Soviet Union’s livestock products and vegetables were sold on the collective farm market since those were the items in which the peasants specialized. The collecrive farms received quotas for grain, meat, and the like to be sold to state procurement agencies at prices dictated by the state. Excess production — if there was any —could be sold on the collective farm market. The net income of the collective farms was divided among members in proportion to days worked (although not all days were rated equally). About half of farm cash income came from sales to state procurement agencies; farmers’ markets accounted for the other half.
Collectivization was widely unpopular among the peasants. Perhaps the village taxation of the Ural-Siberian method was tolerable for a poor majority since it could push the burden onto the richer minority, but collectivization threatened every peasant with land, and so alienated the maiority. Peasant resistance took many forms, and women were par- ticularly active in leading it. Passive resistance was widespread, includ- ing the slaughter of livestock and a reduction in sowing (Fitzpatrick 1994; Viola 1996). Between 1929 and 1933, the number of horses dropped by 15.3 million (47%), cattle by 24.7 million (42%), sheep and goats by 69.8 million (65%), and pigs by 9.5 million (49%) (Davies, Harrison, and Wheatcroft 1994, p. 289). Stalin saw this as an

100 · Chapter Five
act of war: “The fact that the sabotage was silent and apparently gentle (no blood was spilt) does not change the fact that the honourable culti- vators in reality were making a ‘silent’ war against Soviet power. War by starvation . . .” (quoted by Nove 1990, p. 166). Stalin answered in kind. Grain production fell in 1931-33, but the state maintained its delivery quotas. The result was famine in places like Ukraine where grain was the focus of agriculture.
A longer-run response of the state to the rebellion of the peasants was to nationalize much of grain production. Collective farms were still nominally responsible for grovving grain, but plowing and (by the late 1930s) harvesting were mechanized. The tractors and combines were owned by Machine Tractor Stations, which were state firms, and the collective farms contracted with them ro culrivate the land. The key tasks in grovving grain were, thus, transferred from the peasant econ- omy to state employees. These were often young men from the villages who learned some mechanical skills and then moved on to city jobs.
Mechanizing agriculture revolutionized family relations. Labor re- quirements in grain growing dropped from 20.8 man-day$ per hectare in the 1920s to 10.6 days in 1937 (Johnson and Kahan 1959, pp. 2 1 4 - 15). This was still four times the labor required on North American farms (Table 4.5), but the tractors and combines were, nonetheless, de- cisive in driving the “excess population” to the cities. Men had tradi- tionally done the plowing and the harvesting, so it was men who were rendered unemployed by the mechanization of Soviet farming. The divi- sion of labor of the peasant family was thus unbalanced. Furthermore, the harvest peak in labor demand was eliminated, so permanent migra- tion to the cities was possible, and many men took advantage of the opportunity. Despite the decline in labor requirements, hovvever, days worked in Soviet agriculture did not fall (Kahan 1959). Collective farms became employers of last resort, providing a meager subsistence to women and children, the old and the infirm.
While collectivization forced many men off the land, it did not result in increased output. Net output (production less the seed and fodder use of crops) fell 21 percent betvveen 1928 and 1932 (Table 5.4). After recovery in the late 1930s, output was only 10 percent higher than it had been in 1928. Much of this increase was due to irrigation in Cen- tral Asia and the resulting increase in cotton production. In the absence of collectivization, there is no reason to believe that grain production would have been any greater in the late 1930s since Soviet grain yields were on a par with those in climatically similar parts of North America (Figure 4.1). Livestock production would surely have been greater, how- ever. Total farm output might have been 29 percent to 46 percent higher,

depending on what one assumes about horse numbers and mechaniza- tion.4
In contrast to production, farm sales grew steadily. They had dropped by 9 percent from 1928 to 1932. By 1937, they bounced back to 62 percent above the 1928 level and by 1939 the advance reached 89 per- cent. Most of these increases were compulsory sales to state procure- ment agencies or payments to Machine Tractor Stations for plowing and harvesting.
Stagnant production with rising sales looks like Preobrazhensky in action. The situation was more complex, however, for his plan to turn the terms of trade against agriculture was incompletely implemented. The real prices paid to peasants on their compulsory sales fell during the First Five-Year Plan since nominal prices were not raised and infla- tion was high (Malafeev 1964, p. 129). However, the impact of this policy was mitigated by peasant sales directly to city dwellers on collec- tive farm markets. Prices on these markets were unregulated, and in- flated rapidly. According to the Soviet historian A. A. Barsov (1969, pp. 108, 123), who is one of the leading revisionists on this question, prices on farmers’ markets increased thirty fold between 1928 and 1932. Aver- aging them with the state procurement prices implies a 3.13 fold in- crease in the average price received by peasants on their sales. Over the same period, Barsov calculated that the prices paid by peasants for manufactures increased by a factor of only 2.4. Hence, the remarkable revisionist conclusion that agriculture’s terms of trade improved during the First Five-Year Plan.
lt was a closer contest over a longer time frame, but the revisionist view still prevails. Collective farm market prices slumped in the mid- 1930s, and prices in shops were raised in 1936 and 1937, so that the same prices prevailed in all retail channels, and markets cleared at posted prices. Agricultural procurement prices were also increased. The upshot was that the average price received by farmers increased by a factor of 6.2 betvveen 1928 and 1937, while the price of manufactured consumer goods rose by a factor of 4.22. Agriculture did slightly better than manufacturing during the first two Five-Year Plans.5
That would seem to be the end of Preobrazhensky, but he cannot be banished so easily. While the average price received by farmers kept pace with the inflation in nonfood manufactures, it did not keep pace with food prices, which rose eight fold between 1928 and 1937. This inflation was due to the extraordinary urban growth of the period. In- stead of letting the peasants reap those rising food prices as higher in- come, the state imposed a high sales tax (the turnover tax) on consumer goods. This tax drove a wedge between the prices that urban residents
Planning and Collectivization · 101

102 · Chapter Five
paid for food and the prices that farmers received for their crops. These tax collections financed the investment boom. If agriculture’s terms of trade were measured with retail prices rather than the prices received by peasants, agriculture would appear to have done even better than Bar- sov’s calculations indicate. It was precisely for that reason that Stalin could pump a surplus out of the sector. Stalinism really was Preobra- zhensky in action.
In addition, the revisionist interpretation of farm prices is too aggre- gative to reveal all of the inequities of Stalin’s procurement policy. Grain producers fared worse than livestock or cotton producers. While grain prices increased, they did not keep up with inflation: from 1928 to 1937, for instance, the real price of grain (averaged across all market- ings) dropped 32 percent. In contrast, the real price of meat rose 81 percent over the same period.6 One reason that meat producers did bet- ter was that meat was sold mainly on the free market. The more sales passed through state hands, the more the state could put Preobra- zhensky into practice.
In d u str ia l R h vo lution
Central planning, raising the investment rate, and collectivizing agricul- ture accelerated economic growth to 5.3 percent per year from 1928 to 1940 —an impressive rate even by the standards of the East Asian mira- cle. The urban economy boomed, while the countryside suffered.7 Agri- culture showed very little growth. The superindustrialization strategy of Preobrazhensky and Fel’dman called for reinvesting the output of the producer goods industries back into themselves, so they (and the capital stock) would grow rapidly. Machinery was the archetypal producer good, and, indeed, machinery output increased over eleven fold between 1928 and 1937. Partly because it started from such a low level, how- ever, the production of military equipment leapt up by a factor of 70 from 1928 to 1940. After 1937, machinery production fell, as the arms buildup came at the expense of the civilian economy. Fear of the Nazis put Preobrazhensky into reverse.
While the Soviets were famous for denigrating the importance of ser- vices, their output increased about three fold during 1928-40. Con- struction activity — central to the investment drive —was intense from 1928 to 1937, but then ceased growing as war preparations received priority. Transportation grew rapidly throughout the period. Education and health services grew at 12 percent per year. The last three years of the 1930s witnessed a large increase in the military. The growth in housing was minimal throughout, as was the growth in retailing and restaurants.

Table 5.4GDP Growth by Sector, 1928-40
Planning and Collectivization · 103
1937valueadded 1928 1932 1937 1940
Agriculture 107.2 1.00 .79 1.08 1.10lndustryFactory consumer goods 15.4 1.00 1.12 1.79 1.80Kustar consumer goods .2 1.00 .29 .11 .11Materials 39.0 1.00 1.84 3.49 4.00Machines 6.0 1.00 2.99 11.40 8.26Military 5.0 1.00 1.50 25.00 70.00
ServicesConstruction 10.5 1.00 1.73 2.72 2.75Transport and communication 16.8 1.00 2.08 3.58 4.12Trade and restaurants 86.4 1.00 1.16 1.73 1.69Govemment and services 48.4 1.00 1.35 1.88 2.47
Industrial output 1.00 1.46 2.94 3.53
GDP index 334.9 1.00 1.07 1.63 1.78
Sources: Income originating in the sectors from Bergson (1953, p. 123) with amend- ments, including: For agriculture, Bergson’s “incomes other than wage$” was replaced with “farm income in kind” in Table 7.3. A deduction of 7 billion rubles was made for purchases from other scctors. For industry and construction, value added in military prod- ucts and construction from Moorsteen and PoweII (1966, pp. 621-22). Consumer goods from Table 9.1 and kustar at half the value of goods produced shown in Table 7.3. Materials calculated as a residual for the sector. Trade and restaurants includes turnover taxes. Govemment and services is a residual. The figure is closc to Bergson’s.
Sectoral growth rates:agriculture-my calculations. See Appendix C. consumer goods — Table A.l, “shops” and “rural mft’rs.” materials-Nutter (1962, p. 525).machinery — total excluding miscellaneous from Nutter (1962, p. 526). construction, transportation and communications, government and services —Moors-
teen and PowelI (1966, pp. 621-22).trade and restaurants — Moorsteen and PoweIl (1966, p. 635). nominal series deflated
with my implicit consumer price index explained in Chapter 7.
The materials sector —steel, coal, oil, chemicals, cement, and so on — made up a bigger share of Soviet industry than either machinery or munitions, and the output of materials grew rapidly, if less dramatically, than machinery and munitions.
Ferrous metals were a high priority. Pig iron production grew from 3.3 million tons in 1927-28 to 14.9 million in 1940, and steel ingots

104 · Chapter Five
increased from 4.3 million tons to 18.3 million tons. In the case of pig iron, for instance, the increase in production was realized by building or rebuilding 42 blast furnaces. The Soviets aimed to emulate the best American practice, and hired the Freyn Engineering firm of Chicago and the McKee firm of Cleveland, Ohio, for technical guidance. With their assistance, Russian engineers designed a furnace of about 930 cubic me- ters and built 22 of them early in the 1930s. They next designed a 1200 cubic meter furnace and then a 1300 cubic meter furnace in 1937, of vvhich 5 were built. These were of comparable size to the leading Amer- ican furnaces of the day.8
The four fold increase in iron and steel output was achieved by re- building old mills and, especially, by constructing entirely new works on “green field” sites. About one-third of the new iron smelting capacity, for instance, came from the addition or rebuilding of blast furnaces at Ukrainian works dating back to the nineteenth century. These included the Alchevsk, Denpropetrovsk, Enakievo, Iuzovka, Kerch, and Make- evka iron and steel mills. Tvvo-thirds of the capacity expansion was realized by brand-new plants. Krivoi Rog, Azovstal, and Zaparozhstal were built in south Russia to smelt Kerch and Krivoi Rog ore with Donets coal. Novo-Lipetsk, Novo-Tula, and the reconstructed Kosaya Gora plants were built near Moscow to smelt foundry pig iron, and Novo-Tagil was built in the Urals.
The most famous new plants were Kuznetsk and Magnitogorsk in Siberia. They were among the largest construction projects of the 1930s and embodied foreign technology on a grand scale: Magnitogorsk, for instance, was based on the Gary, Indiana, works of the U.S. Steel Cor- poration (Davies, Harrison, and Wheatcroft 1994, p. 188). These two mills alone accounted for one-third of the growth in Soviet iron and steel production in this period. New cities sprang up around these plants. The population of Kuznetsk rose from 3894 in 1926 to 169,538 in 1939. Magnitogorsk was an empty steppe in 1926 but contained 145,870 people in 1939.
Light industry, as well as heavy industry, was targeted for growth in the 1930s, but the scheduled rate of expansion for consumer goods was less than for steel or machinery. In the event, performance was often worse than planned, particularly during the First Five-Year Plan, as the comparison of 1932 targets and output indicates (Tables 5.1 and 5.2). Many commentators have argued that food and textiles were never ac- corded the same priority as concrete and steel, so the weak performance of the consumer goods sector was to be expected. Zaleski (1980, p. 504) suggests that the planned increases in consumer goods were essen- tially fraudulent exercises in public relations to whip up enthusiasm for plans that were really focused on heavy industry.

Planning and Collectivization · 105
The Fel’dman model suggests another reason for devoting resources to investment: it would ultimately — indeed, quickly —result in more consumer goods than an investment strategy that targeted them. The simulations of Chapter 3 established the theoretical possibility. Chapter 7 explores what really happened to living standards in the 1930s, and Table 5.4 summarizes one of the important findings: the production of factory-made consumer goods was 79 percent higher in 1937 than it had been in 1928. The gain from 1928 to 1932 was only 14 percent, however. The question, then, is why consumer goods output was so limited in the First Five-Year Plan. One reason was that it took time, first, to build the engineering works, second, to make the power looms, and the like, for the consumer goods industries, and, third, to erect the textile and other mills to house the new machinery. Five years, in other words, was too short a period for the Fel’dman strategy to bear fruit. Such considerations would have limited the grovvth in consumer goods output between 1928 and 1932, whatever else happened.
In addition, however, the collapse of agriculture crippled consumer goods production by cutting the raw material input. The most impor- tant consumer goods were processed foods (sausage and bread, for in- stance) and textiles (mostly cotton and wool), and their production de- pended on the supply of grain, meat, and fiber. The disastrous drive to collectivize agriculture reduced farm production, cut marketings, and, thereby, limited consumer goods output.
The handicraft sector was the greatest casualty. In 1913, kustar pro- duction amounted to 6.5 percent of the Russian economy and remained important in the 1920s. Roughly half of the wool, flax, and sheep hides were turned into textiles and leather goods by handicraft producers (Wheatcroft and Davies 1985, pp. 392-93 , 4 0 0 -1 , 404-5). The fall in livestock numbers in the early I930s eliminated handicraft production as the falling raw material supply met the rising demands of state pro- curement agencies, leaving nothing for the craftsmen to process.
Consequently, wool was a problematic industry throughout the I930s. In 1928, half of production was processed by the peasants themselves and did not enter the industrial sector. The 65 percent drop in the num- ber of sheep between 1929 and 1933 cut the wool clip proportionately. The situation was so dire that even state procurements fell. A reduction in raw wool imports and an increase in exports further reduced the supply of wool to the factories. Factory cloth output dropped, and it is difficult to see how even the reduced volume of production could have been woven without a significant admixture of cotton in the wool cloth. Targets were cut back to more “realistic” levels but were never achieved. The increase in sheep numbers after 1933 generated enough wool for the fabric produced in the late 1930s (without adding cotton or other

106 · Chapter Five
fiber) but allowed no scope for much increase. Wool production was held back not because capital and labor were allocated to heavy indus- try but because the collectivization catastrophe meant that there was not enough raw material to expand production.
The story was similar with leather shoes. Again, about half of the hides produced in the Soviet Union before 1928 had been tanned and fashioned by peasants outside of the industrial sector. When livestock numbers fell in the early 1930s, the peasant producers were squeezed out of business, and the industrial supply was also limited. As a result, shoe production fell slightly during the First Five-Year Plan. The resto- ration of livestock numbers after 1933 relaxed the raw material con- straint, leather production expanded, and, with that, the production of leather shoes increased.
Cotton manufactures were also dependent on an agricultural raw ma- terial —but it was a plant, not an animal —and escaped the output col- lapse in European Russia. There was some check to growth in the raw cotton supply because imports were cut during the First Five-Year Plan, but the irrigation of Uzbekistan yielded a rising supply, and yam, fab- rics, and knitwear rose accordingly.
U r b a n iza tio n
The tripling of industrial output in the 1930s implied rapid urbaniza- tion, and, indeed, the city popularion doubled from 1928 to 1940. Re- mote development projects like Magnitogorsk and Kuznetsk created cities where only herdsmen had lived before. Most of the new urbanites, however, lived in the established cities of the USSR. The population of Moscow, for instance, increased from 2.0 to 4.1 million between 1926 and 1940, and that of Leningrad rose from 1.7 to 3.2 million in the same period. The populations of many other cities doubled or tripled (Lorimer 1946, pp. 250-51).
Table 5.5 shows the history of the rural and urban populations. The rural population dropped abruptly in 1933 because of the collectiviza- tion famine, and was about 7 million less in 1939 than it had been in 1928. At the same time the urban population almost doubled from 28.1 to 54.7 million. Most of this increase was due to rural-urban migration, which totaled 23 million in the period (Lorimer 1946, p. 150).
Several factors were responsible for the high rate of migration to the cities. Urban wages were relatively high. Even though agriculture’s terms of trade were improving, the Stalinist procurement system kept rural incomes below levels they otherwise would have achieved. Soft budget constraints meant that industrial enterprises could greatly ex- pand employment without lowering wages. The very rapid growth in
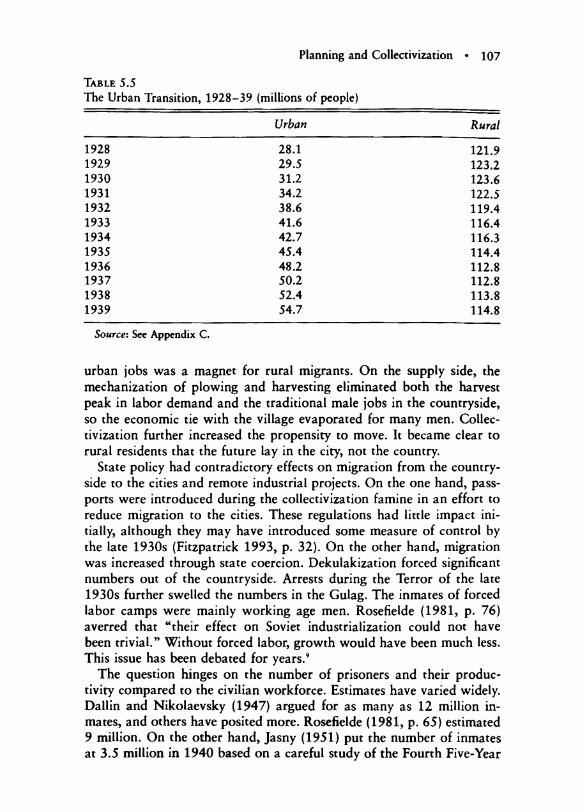
Planning and Collectivization · 107
Table 5.5The Urban Transition, 1928-39 (millions of people)
Urban Rural
1928 28.1 121.91929 29.5 123.21930 31.2 123.61931 34.2 122.51932 38.6 119.41933 41.6 116.41934 42.7 116.31935 45.4 114.41936 48.2 112.81937 50.2 112.81938 52.4 113.81939 54.7 114.8
Source: See Appendix C.
urban jobs was a magnet for rural migrants. On the supply side, the mechanization of plowing and harvesting eliminated both the harvest peak in labor demand and the traditional male jobs in the countryside, so the economic tie with the village evaporated for many men. Collec- tivization further increased the propensity to move. It became clear to rural residents that the future lay in the city, not the country.
State policy had contradictory effects on migration from the country- side to the cities and remote industrial projects. On the one hand, pass- ports were introduced during the collectivization famine in an effort to reduce migration to the cities. These regulations had iittle impact ini- tially, although they may have introduced some measure of control by the late 1930s (Fitzpatrick 1993, p. 32). On the other hand, migration was increased through state coercion. Dekulakization forced significant numbers out of the countryside. Arrests during the Terror of the late 1930s further svvelled the numbers in the Gulag. The inmates of forced labor camps were mainly vvorking age men. Rosefielde (1981, p. 76) averred that “their effect on Soviet industrialization could not have been trivial.” Without forced labor, growth would have been much less. This issue has been debated for years.9
The question hinges on the number of prisoners and their produc- tivity compared to the civilian workforce. Estimates have varied widely. Dallin and Nikolaevsky (1947) argued for as many as 12 million in- mates, and others have posited more. Rosefielde (1981, p. 65) estimated 9 million. On the other hand, Jasny (1951) put the number of inmates at 3.5 million in 1940 based on a careful study of the Fourth Five-Year

108 · Chapter Five
Plan. Bergson (1961, pp. 443, 447) concurred and estimated the Gulag workforce at 3 million in 1937 and 3.5 million in 1940. Recently, the results of the 1937 and 1939 censuses, as well as secret police (known as NKVD in Russian) statistics, have become available. These sources indicate a convict population of about 3 million (Getty, Rittersporn, and Zemskov 1993, p. 1020; Davies, Harrison, and Wheatcroft 1994, p. 70). Rosefielde (1981) argued that 9 million inmates amounted to 23 percent of the nonagricultural workforce and concluded, in conse- quence, that forced labor was fundamental to Stalin’s industrial revolu- tion. This calculation treats convicts as equal in productivity to the non- incarcerated population. Jasny (1951, p. 418), however, concluded that “somevvhat more than two concentration-camp inmates were needed to do the work of one free laborer” when account is taken of waste of skills, lack of equipment, poor nutririon, low motivation of the Gulag population, as vvell as the need for camp guards and administration. If, in 1937, there were 3.0 million convicts, who were equivalent in pro- ductivity to 1.5 million free vvorkers, then the labor derived from the convicts was 5 percent of civilian, nonfarm labor and only 2 percent of the labor in the whole economy. These fractions were not large enough to be decisive.
This conclusion is consistent with the industrial and regional distribu- tion of convict employment. They were employed mainly in construc- tion, timber harvesting, and mining, particularly in remote areas (Jasny 1951). Convicts did manual, unskilled work even if they had skills. Convict labor was used to dig the Moscow-Volga canal but was other- wise peripheral to Moscovv life (Hoffman 1994, p. 51). Even in Magni- togorsk, a remote project by any standard, the convict population was only about 30,000, 12 percent of a total population of a quarter million in 1932 (Kotkin 1995, pp. 72 -73 , 133). By the late 1930s, the convict population had fallen, although many convicts continued to live in the camps (Kotkin 1995, p. 461 n. 139). In Chapter 9, I argue that state terrorism did play a role in accelerating rural-urban migration. But forced labor per se did not account for much Soviet growth.
Soviet cities grew far faster than the amenities needed to make urban life satisfactory. The situation in a new town like Magnitorgorsk was extreme. People lived in tents at first and later in overcrowded barracks or huts made from bits of cast-off wood and metal and dug into the frozen earth. Public services were virtually nonexistent. The situation was scarcely better in Moscovv. The capital, with its subway and im- pressive public buildings, was the showcase of Russian cities. Here the lucky workers lived in overcrowded apartments. Most of the new ar- rivals, however, lived like their counterparts in Magnitorgorsk — in bar- racks or squalid shanty towns miles from public transport, running wa-

Planning and Collectivization · 109
tet, sewet lines, centtal heating, ot electticity. Pigs walked the stteets, and the lucky ones had gatdens. The countty had come to the city, and the city became the countty. The patallels with cities in the Thitd Wotld ate obvious, and the conditions ate teminiscent of Engels’ (1845, pp. 45-74) desctiption of Manchestet in 1844.
The immediate cause of bad housing and poot sanitation was the concenttation of investment on industtial capacity at the expense of utban inftasttuctute (Williamson 1990, pp. 267-309). Most countties, as noted, expetience this shottfall as they industtialize. The teal ques- tion is how tapidly housing quality and sanitation catch up with indus- ttial employment. Aftet the Second Wotld Wat, the sanitaty ptoblems of Soviet cities wete tectified, and housing imptoved gteatly, although apartments wete nevet latge. Slums temain widesptead in most of rhe Thitd Wotld.
CONCLUSION
The agtatian ttansfotmation and the industtial development of the So- viet Union wete linked. The countryside supplied the city with labot and food, and the new utban wotkets wete used to ptoduce mote con- sumet goods and, especially, mote capital goods. These wete used to build and equip mote factoties, cteating mote jobs fot tefugees ftom the counttyside and yet mote steel, cloth, and weaponry. Industtial output would not have incteased tapidly without tapid utbanization ot with- out the shatp incteases in ptoducet goods that equipped the new utban- ites fot wotk.
The industtialization debate of the 1920s ptefiguted some of what happened in the 1930s. The concenttation of tesoutces on heavy indus- tty to the dettiment of agricultute was teminiscent of Pteobtazhensky’s thinking. Agticultute was also squeezed, although not quite in the way he had envisioned. Stalin kept ptocutement ptices low duting the Fitst Five-Yeat Plan, but utban fatmets’ matkets wete a safety valve. Theit ptices wete untegulated, and inflation was so extteme that agticultute’s tetms of ttade imptoved ftom 1928 to 1932. Incteases in ptocutement ptices in the mid-1930s meant continued imptovement in agticultute’s position insofat as ptices wete concetned. The inflation in agticultutal wholesale ptices, howevet, did not keep pace with the inflation in tetail food ptices. The state used the tumovet tax to divett much of that increase from peasants to the state. This way of financing investment was certainly in the spirit of Preobrazhensky.
The policies that were mainly responsible for rapid growth were the allocation of investment goods to make ever more factories, and the shift in enterprise management from profit maximization to output tar-

110 · Chapter Five
geting. Both pushed up the rate of investment —the former by tilting production toward the machinery, steel, and concrete needed to expand industrial capacity, and the latter by providing factory jobs for anyone looking for work. Increasing industrial employment was critical for in- creasing industrial output.
Collectivization played a contradictory role in this process. Its impact on farm production was negative in the early 1930s, and that falloff reduced GDP and checked the production of consumer goods. That was an important reason why living standards were low during the First Five-Year Plan. The system of compulsory sales to state agencies did guarantee a high level of marketing, however much was produced, but it remains an open question whether the total volume of food sold in the late 1930s was greater than it would have been if the free market of the NEP had continued: a lower marketing fraction might have been offset by a greater volume of production. In a perverse way, however, collectivization did accelerate industrialization, and that was by driving people off the land. Without collectivization, rural-urban migration would have been less, the cities would have been smaller, and factory output would have been reduced. Soviet industrialization was anchored on a rapid transfer of labor from farm to factory, and collectivization sped up that process.

C H A P T E R SI X
The Population History of the USSR
Economic growth means more GDP per head. This ratio can be raised either by increasing GDP or by reducing the number of heads. Much of this book explains how the Soviets pushed up the GDP growth rate. This chapter analyzes the growth in population. Mortality was extra- ordinary in the famine during collectivization and the Second Wnrld War. Did the USSR achieve a high income per head because Stalin — with help from Hitler —cut the denominator as well as pushing up the numerator?
In many respects, the Soviet Union in the early twentieth century was like the underdeveloped countries of Asia, Africa, and Latin America. Per capita income was low, and an overwhelming share of the popula- tion was in agriculture. The demographic similarities were equally strik- ing. Fertility was very high. The average woman in the late empire gave birth to seven children. High fertility was rooted in universal marriage at a young age. In a famous essay, Hajnal (1965) contrasted the “Euro- pean marriage pattern” of northwestern Europe with the “non-Euro- pean pattern.” The former was characterized by a high average age of women at first marriage and far from universal marriage; universal mar- riage at a young age characterized the rest of the world. Fertility and population growth were lower with the European pattem than the non- European. What is of great importance for the present discussion is that the line dividing the two regions ran from St. Petersburg to Trieste. With the exception of the Baltic republics and the Catholic fringe on the Polish border, the Soviet Union was firmly in the non-European camp.
In the twentieth century, most Third World countries experienced a population explosion. Between 1928 and 1989, population increased three fold in India, Indonesia, and Bangladesh, about four fold in Tur- key and Morocco, and close to five fold or even more in Brazil, Mexico, Pakistan, the Philippines, Thailand, and Venezuela. With its high fertil- ity regime, the Soviet Union was headed for the same fate. If Soviet population growth had been like the Third World’s, the USSR would have contained close to a billion people in 1989 rather than the 288 million actually present. Income per head would surely have been less.
And yet, between 1928 and 1989, the Soviet population rose by only 70 percent.1 A central question in twentieth-century Russian history is

why the USSR did not have a population explosion. This question is different from the one usually pursued by historians of the USSR, who have been mainly concerned with measuring the number of “excess deaths” (deaths beyond those that would have occurred given normal mortality rates) due to collectivization, forced labor, Stalinist repression, and the Second World War. If such deaths were great enough, they could account for the absence of a Soviet population explosion. The famine following collectivization and the Second World War were, in- deed, enormous catastrophes that reduced the long-run growth of the population. They were not large enough, however, to explain why the Soviet Union did not have a population explosion. The main reason was the rapid decline in the birth rate during the Stalinist period. This drop occurred despite Soviet population policy, which was emphatically pro- natal (Goldman 1993). It should be stressed, moreover, that fertility did not fall due to declining living standards or political oppression; indeed, poverty and oppression typically breed children. Instead, fertility fell in the USSR for the same reasons it drops anywhere in the Third World: the creation of a modern urban society and the education of women. Of course, these changes were the results of communist policies and ideol- ogy but not the repression of the Stalinist regime.2
POPULATION STATISTICS
Demographic history requires accurate censuses, and it is fortunate that the First Five-Yeat Plans were bracketed by them.' A fine census was taken in 1926, and volumes of detailed tabulations were published. The next census was in 1937, but the total population count was millions less than Gosplan projections made prior to the collectivization famine. Stalin was shocked and ordered the 1937 census suppressed as “un- scientific.” Another census was taken in 1939, but only a few basic results were made public. Significantly, the population count of 1939 confirmed the low figure of 1937 but was published anyway.4
The 1926 and 1939 censuses were the basis of earlier work on Soviet population such as Lorimer’s (1946) reconstruction and the figures used by Bergson (1961) in his magisterial estimates of the size of the Soviet economy. They remain accurate in broad outline. With glasnost, the 1937 census has been published as well as more results from the 1939 census. These figures have resolved many controversial questions such as the size of the convict population and have permitted more detailed demographic reconstructions. While the opening of the archives has en- riched our understanding of Soviet population history, it has not over- turned the insights of scholars like Lorimer and Bergson.
Demographic analysis requires more than just censuses. Ideally, they should be linked together with records of the number of births (broken
112 · Chapter Six

Population History · 113
down by the age of the mother) and of deaths broken down by the age of the deceased. The age structures of the population in successive cen- suses guide this linking since the number of 18-year-old men in 1937 equals the number of 7-year old boys in 1926 minus deaths and net emigration. Since few males normally died between 7 and 18 and since emigration from the USSR was usually negligible, reconstructing the population in this detail identifies the “excess deaths” due to Stalinist repression and war. Fortunately, the Soviet statisticians Andreev, Dar- skii, and Khar’kova (1990, 1992) have reconstructed Soviet population history between 1920 and 1959 in this way. Their research is the basis of the analysis undertaken here.
T h e H isto r y o f V ita l R a t e s : T h e Dem o g r a p h ic Tra n sitio n
In the absence of migration, a population grows when births exceed deaths, and that was the case in Russia for centuries. If we can believe the estimates, the population of “European Russia” grew at .5 percent per year from 1500 to 1850 (McEvedy and Jones, 1978, p. 79). In the last half of the nineteenth century, for which the data are more reliable, the growth rate accelerated to 1.6 percent per year. This high rate of growth was due to a remarkably high birth rate of about fifty births per thousand people per year. This rate was as high as that of any Third World country at the peak of its population explosion. The rate was also much above that of westem European countries at any time for which we have evidence. This difference underscores the pertinence of the comparisons with less developed countries. A death rate of thirty- four per thousand gives population growth of 1.6 percent.
And yet the Soviet population explosion fizzled out. The explanation lies in the history of birth and death rates shown in Figure 6.1. The nineteenth-century figures, which are five-year averages and thus ob- scure many crises like the famine of 1891-92, show the great excess of births over deaths. Coale, Anderson, and Harm (1979, pp. 16-17) noted the fall in the birth rate between 1900 and 1913 and suggested that the fertility transition was under way before the First World War. The up- surge in fertility in the 1920s calls this view into question, however.s With the First Five-Year Plan in 1928, the situation changed dramati- cally. Birth rates and death rates began a race downward, with the course interrupted by dramatic reversals and accelerations. Most of the catastrophes of the twentieth century show up in this figure, including the following:
The First World War (1914-17). Close to 4 million Russians perished due to World War I. The population rose from 140 to 143 million dur- ing 1914 —an expansion consistent with the birth and death rates of 1910-13 — and remained at that level through 1917. Despite a fall in

114 · Chapter Six
YearFig. 6.1. Birth and Death Rates, 1880-1989. Source: Pre-1913 figures from Rashin (1956, pp. 154, 172). Figures for 1914-19 estimated as described in text. Davies, Harrison, and Wheatcroft (1994, pp. 77-78) for World War II. Other figures for 1920-58, from Andreev, Darski, and Khar’kova (1992, pp. 129, 131). Later figures from Narodnoe Khozyaistvo (1972, p. 18), Karasik (1992, p. 112).
the birth rate, population stability implies 3.8 million deaths in excess of the number expected from prewar mortality rates.6 These included 2 million soldiers killed at the front, and many wounded who later died in the rear. It is not clear how many civilians died because of the war since death rates did not rise in cities where this has been studied (Davies, Harrison, and Wheatcroft 1994, pp. 57-64).
Civil War (1918-22), The years following the 1917 revolution claimed millions of lives. Between the beginning of 1918 and the end of 1922, the population fell by about 4 million, which implies that excess deaths amounted to 9.7 million or more.7 About one million soldiers died in the civil war following the revolution. Social breakdown resulted in mil- lions of civilian deaths first from typhus, typhoid, and dysentery, and then millions more from famine, influenza, and other diseases in 1920- 22 (Davies, Harrison, and Wheatcroft 1994, pp. 62-64).

Population History · 115
Collectivization famirte (1933). The fall in agricultural output follow- ing collectivization in the early 1930s in conjunction with the enforce- ment of high compulsory deliveries resulted in famine in 1933, espe- cially in the Ukraine and north Caucuses. Credible estimates of “excess mortality” are in the range of 4 -9 million. An exact determination is difficult since high estimates are generated by positing undocumented events like a rise in unregistered births accompanied by a rise in un- registered infant deaths. Figure 6.1 is based on Andreev, Darskii, and Khar’kova’s estimate of 7.3 million excess deaths (Davies, Harrison, and Wheatcroft, 1994, p. 76), which results in the most dramatic rise in the crude death rate in Russia in the nventieth century. lt might also be noted that the birth rate dips in the mid-1930s but rebounds by the end of the decade, suggesting that thc famine had ramifications for fertility as well as mortality. The drop in fertility might, however, have had less sinister causes such as the very-large-scale migration of men to con- struction sites during the period.
Great Terror (1937-39). Estimates of the number of arrests and exe- cutions during Stalin’s purges have varied widely, but a consensus is emerging based on archival research and demographic reconstruction. Both NKVD statistics and the census returns indicate that the number of people in prison or Gulag labor camps reached a maximum of about 3 million in the late 1930s (Getty, Rittersporn and Zemskov 1993, p. 1020; Davies, Harrison, and Wheatcroft 1994, p. 70). This figure is not much different from those worked out by Jasny (1951) (and extended by Bergson 1961, pp. 443, 447) from a close reading of the 1940 Five- Year Plan. Executions and deaths in prison amounted to 826,000 in 1937-38 and accounted for the excess of mortality in those years above that of 1936/ While the times were desperate, the excess deaths associ- ated with the Great Terror equaled only 13 percent of total deaths, so that the rise in the crude death rate in 1937-38 is almost imperceptible in Figure 6.1.
World War II (1941-45). Deaths due to the German invasion were enormous — benveen 25 and 30 million (Harrison 1996, pp. 160-61). Davies, Harrison, and Wheatcroft (1994, p. 78) estimate that total deaths (normal and excess) amounted to 41.8 million in the four and a half years of struggle, and that figure has been used to calculate the average crude death rate for the war years shown in Figure 6.1. While this rate is less than the peak following collectivization, the true war peak may be obscured since an annual breakdown is not available. In any event, the crude death rate for the war shown in Figure 6.1 was sustained over four and a half years and so had more significant long- tenn effects than the deaths due to collectivization in 1933.
Indeed, as we will see, one of the most substantial long-run effects of

Prob
abilit
y of L
iving
5 Ye
ars
116 · Chapter Six
Fig. 6.2. The Chance of Surviving World War II. Source: Andreev, Darskii, and Khar’kova (1992). These probabilities are calculated from the age structures of 1934, 1939, 1941 and 1946. See text for calculation details.
the war was a reduction in fertility — both during the war and after. Figure 6.2 contrasts the age-specific mortality rates of the 1930s with the rates during the war. Under peacetime conditions, mortality for peo- ple aged 20 to 49 was slight. During the war, about 15 percent of women aged 20 to 49 died, while the mortality of men in the same age group reached the incredible rate of 40 percent.9 The disproporrion in death rates meant that many women could not marry after the war, depressing fertility.
B ir t h s , Dea th s , and Po pu l a t io n G r o w th
Figure 6.1 highlights two reasons why the Soviet population has not grown more rapidly. First, the mortality peaks have cut the growth in population below what it would othenvise have been. The mortality peaks offset the drop in unormal” mortality that has also occurred and which, on its own, would have accelerated population growth. Second,

Population History · 117
the fertility rate has fallen. Why that has occurred is a question that will be pursued later, but it may also have been the result of events like collectivization and the Second World War.
The first step in sorting out why the Soviet population has not grown more rapidly is to determine the relative importance of excess mortality and declining fertility as explanatory factors. The method we will use is simulation. Since population change equals births minus deaths, we can rerun history by starting with the 1926 population —a census year and the initial year in our simulations — and by then adding the births and subtracting the deaths that would occur in each succeeding year under alternative scenarios. lf we used the historical course of birth and death rates, we should simulate the actual history of the Soviet population. Such a simulation is a tesr of rhe model.
The impact of catastrophes like the collectivization famine can be gauged by repeating the simulations with alternative trajectories of births and deaths. The impact of the collectivization famine, for in- stance, can be ascertained by rerunning the simulation and using nor- mal death rates for 1933 instead of the extraordinary mortality rates that were actually experienced in that year. ln these simulations we do not use the crude vital rates shown in Figure 6.1. lnstead, the exercise is fine-tuned by using age-specific birth and death rates. ln that way, for instance, we can track the effects on fertility of the heavy mortality of 20- to 49-year-olds during World War II.
Figure 6.3 contrasts the actual history of the Soviet population with the trajectory that is simulated using the actual age-specific birth and death rates.10 In interpreting this and the other graphs, it should be re- membered that the sharp jump in population in 1940 reflects the annex- ations of territory in 1939 and 1940. The close correspondence between the two series confirms the consistency of the demographic data and the soundness of the modeling.
What does the model imply about the evolution of the Soviet popula- tion under alternative conditions? We begin by removing the worst de- mographic catastrophes associated with Stalin: collectivization and the Second World War.n Both of these catastrophes affected the population by reducing fertility as well as by raising mortality.
Figure 6.4 shows the actual growth of the Soviet population, and the growth that would have occurred without the excess mortality associ- ated with collectivization and, in addition, without the fertility decline of the mid-1930s. Removing the excess mortality raises the 1989 popu- lation from 288 million to 304 million and removing the reduction in fertility during 1932-36 —which may not have been entirely due to col- lectivization —further raises the 1989 population to 315 million.
The fertility effect deserves emphasis since it is unusual. Often the

118 · Chapter Six
Fig. 6.3. Simulating Soviet Population. Note: This figure tests the population simulation modeling by comparing the actual history of the population with the simulated history using historical trajectories of all relevant parameters. The close similarity of the lines in the figure indicates the success of the model. The large jump in population in 1940 reflects the annexation of the Baltic republics and parts of Poland.
heightened mortality of a famine has no impact on the long-run history of a population since it is the very old and very young who die. As a result, the share of the population aged 15-45 increases. Since those are the people who bear children, the famine raises the fertility rate, and the increased number of births offsets the deaths caused by the famine (Char- bonneau and Larose 1979). Death rates did rise disproportionately for children and the elderly in the Soviet Union, but the decline in the birth rate short-circuited the standard correction mechanism. Consequently, collectivization exerted a persisting effect on the size of the Soviet popu- lation. In 1989, the population wa$ 288 million —27 million (9%) less than it would have been without collectivization.
The Second World War had a greater effect on the size of the popula- tion. Figure 6.5 simulates the population without the excess mortality of the war and, in addition, without the reduction in fertility during and

Population History · 119
Fig. 6.4. Long-Run Effect of Collectivization. Note: The figure shows the effects of collectivization on the Soviet population, first, from heightened mortality, and, second, from reduced fertility as well. The simulation labeled “no mortal- ity” shows how the population would have evolved if age-specific death rates had not leaped up in 1933. Betvveen 1932 and 1936, age-specific fertility rates dropped and then recovered. In the simulation labeled “no collectivization,” the actual age-specific fertility rates for 1932-36 are replaced with values linearly interpolated betvveen 1931 and 1937. The heightened mortality of 1933 is also removed in this simulation.
after the war. Eliminating the wartime mortality raises the 1989 popula- tion to 329 million, and eliminating the shortfall in fertility raises it by a further 34 million to 363 million. The fertility effect (34 million) was almost as large as the mortality effect (41 million). World War II cut the Soviet population by 21 percent.
Figure 6.7 shows the results of a combined simulation in which the adverse fertility and mortality effects of war and collectivization are removed from Soviet demographic history. This simulation shows how the population would have grown if it were subject only to the “nor* m ar fertility and mortality rates. The 1989 population under this sim- ulation would have been 394 million instead of the 288 million actually
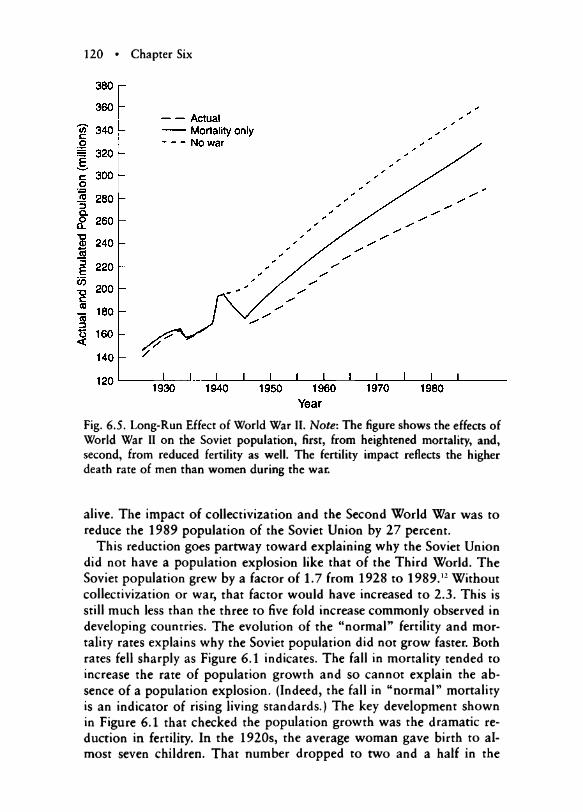
120 · Chapter Six
Fig. 6.5. Long-Run Effect of World War II. Note: The figure shows the effects of World War II on the Soviet population, first, from heightened mortality, and, second, from reduced fertility as well. The fertility impact reflects the higher death rate of men than women during the war.
alive. The impact of collectivization and the Second World War was to reduce the 1989 population of the Soviet Union by 27 percent.
This reduction goes partway tovvard explaining why the Soviet Union did not have a population explosion like that of the Third World. The Soviet population grevv by a factor of 1.7 from 1928 to 1989.12 Without collectivization or war, that factor vvould have increased to 2.3. This is still much less than the three to five fold increase commonly observed in developing countries. The evolution of the “normal” fertility and mor- tality rates explains why the Soviet population did not grovv faster. Both rates fell sharply as Figure 6.1 indicates. The fall in mortality tended to increase the rate of population grovvth and so cannot explain the ab- sence of a population explosion. (Indeed, the fall in “normal” mortality is an indicator of rising living standards.) The key development shovvn in Figure 6.1 that checked the population grovvth vvas the dramatic re- duction in fertility. In the 1920s, the average woman gave birth to al- most seven children. That number dropped to two and a half in the

Population History · 121
Fig. 6.6. Birth Rate, USSR and Indian Subcontinent. Sources: Pre-1950 rates for India from Kumar and Desai (1983, pp. 501, 508). Post-1950 rates from United Nations, Dentographic Vearbook, various years. For Soviet rates, see sources to Figure 6.1.
1980s —a fertility rate marginally higher than the value implying zero population growth. Explaining the fertility transition is the key to ex- plaining why there was no population explosion.
Sorting out the relative importance of the fertility transition, on the one hand, and of war and collectivization, on the other, depends on what one thinks the fertility rate might have been in a counterfactual scenario. This is a difficult judgment. To fix the bounds on the possible, consider the history of fertility in the lndian subcontinent, a region with a relatively modest population explosion. Figure 6.6 compares the crude birth rate in Russia and the Soviet Union with that in India, Pakistan, and Bangladesh since the mid-nineteenth century. Both regions had rates of about fifty per thousand early in the twentieth century. The rate in the Indian subcontinent continued at close to that level until the 1970s, when it began to drop. The rate of descent is similar to that in the Soviet Union after 1928. The fertility decline was most pronounced in India, where the crude birth rate dipped to thirty-one per thousand in

Actu
al an
d Sim
ulated
Pop
ulatio
n (m
illion
s)
122 · Chapter Six
Fig. 6.7. Effect of Collectivization, War, and Fertility Transition on Soviet Popu- lation. Note: The figure shows how the Soviet population would have grown without collectivization, World War II, and the rapid fertility transition of the Stalinist period. Reduced fertility was much more important than the heightened mortality of collectivization or World War II in explaining the absence of a population explosion.
1989. Fertility in Pakistan and Bangladesh remained above forty per thousand through the 1980s.
Fertility in South Asia suggests two counterfactuals for Russia. The most extreme is a continuation of the high fertility rates of the 1920s through the 1980s. A more modest extrapolation assumes a history of fertility like India’s, that is, a continuation of the fertility rates of the 1920s until 1970, at which point fertility drops as it did in the Soviet Union after 1928. (For closer correspondence with the Indian case, all of the age-specific mortality rates in this simulation were increased 25 percent to close the gap between the Indian and the lower Soviet crude death rates.) The results of these counterfactuals are shown in Figure 6.7, where they are contrasted with the population evolution that would have occurred without the excess mortality and deficient fertility associ- ated with Stalinism and the Second World War. Assuming no fertility

Population Hi$tory · 123
transition implies a 1989 population of 1.1 billion in the Soviet Union. A delayed fertility transition (in conjunction with higher mortality) as in India implies a 1989 population of 825 million. Both simulated values are significantly higher than the projected “normal” population of 394 million and the actual population of 288 million. It is difficult to choose among the high fertility scenarios, but the simulations make it clear that fertility dedine has been of greater importance than Stalinism or World War II in preventing a Third World-style population explosion in the Soviet Union.
T h e F e r t il it y Tra n sitio n
The Soviet fertility transition was important and unu$ually fast. lt took only a generation (from the mid-l920s to the mid-1950s) for the num- ber of births per woman to fall from almost seven to three. Only East Asia has had a comparably rapid transition. In China, for instance, the total fertility rate fell from 5.9 in 1960-65 to 2.4 in 1985-89 and simi- lar declines occurred in North and South Korea (Rele and Alam, 1993,p. 20).
The first substantial investigation of Soviet fertility was Humatt Fer- tility in Russia (1979) by Ansley Coale, Barbara Anderson, and Erna Harm. This was the Soviet portion of the European Fertility Project, which aimed to measure the fertility dedine across Europe in a consis- tent fashion and to test whether falling fertility was the result of eco- nomic development. The surprising conclusion was that fertility fell in- dependently of modernization. While educated urbanites were usually the first group in a country to begin to reduce the size of their families, family limitation sometimes began at an early date in very poor coun- tries. Consequently, there was little relation betvveen the onset of fertil- ity dedine and economic development. Furthermore, the trend to small families quickly spread from the cities to the countryside, where it bore no relation to education or economic development.
Coale, Anderson, and Harm’s study of Soviet fertility was based on the censuses of 1897, 1926, 1939, 1959, and 1970. Valuable work was done measuring the dedine in fertility and decomposing it into changes in the proportion of women marrying, the average age at marriage, and the number of children per marriage. Considerable attention was given to contrasting developments in rural and urban areas. Some correlations between marital fertility rates and social variables like literacy were esti- mated from census cross sections, but the surface was only scratched in this regard. Coale, Anderson, and Harm found only slight evidence that education and economic development lowered fertility, and emphasized instead the independent spread of Western ideas favoring lower fertility
124 · Chapter Six
and the maintenance of non-Western cultural values supporting large families. In this regard, Coale, Anderson, and Harm were particularly impressed by the persistence of high fertility among non-European na- tionalities in the Soviet Union despite the spread of education and eco- nomic development to these groups.
In the 1980s, Soviet fertility was studied by analyzing post-World War II Soviet censuses. Kuniansky (1983) and Berliner (1983, 1989) modeled fertility and labor force participation in a human capital frame- work, that is, the decision to have a child was analyzed like the decision to work or to buy consumer goods and was influenced by the same variables. Kuniansky (1983) estimated such a model with oblast level data from the 1970 census and found that increases in male education raised fertility while increases in female education slightly lowered it. Berliner (1983, 1989) also estimated models of fertility and labor force participation using the 1970 census. His results were more equivocal, but he (1989) found some evidence that higher education for women lowered fertility. Both Kuniansky and Berliner were surprised that the impact of women’s education was so small.
Jones and Grupp (1987) also studied Soviet fertility by statistically analyzing post-World War II censuses. In contrast to Coale, Anderson, and Harm, they strongly endorsed the view that modernization led to lower fertility and gave the theory a feminist twist. They argued that fertility was high in nineteenth-century Russia and in late-twentieth-cen- tury Central Asia because of the dominance of patriarchal families. In these families, the decisions were taken by the leading men, and they wanted children for their contribution to family production and for the prestige they brought. When Soviet demographers in the I970s asked women who were from traditional backgrounds and who were born in the nineteenth century how many children they had wanted, the usual responses were “the more the better” and “however many God gives” (Jones and Grupp 1987, pp. 36-37). Education changed that attitude. By increasing women’s ability to earn income outside the home, educa- tion also increased their bargaining power within the family. Conse- quently, fertility fell.
The Soviet fertility transition was rapid, but was it faster than transi- tions in developing countries once the speed of modernization is taken into account? This question can be answered by using the findings of a recent international study undertaken by Paul Schultz (1997).n The re- sults are striking. The fertility transition in the Soviet Union is explained by the same factors that account for fertility decline in the Third World, and the speed of the Soviet fertility transition is explained by the speed of development of the Soviet economy and society.
Population History · 125
Schultz’s study is based on a sample of eighty countries in 1972, 1982, and 1988 (although some countries did not appear in every year). For these countries, Schultz measured the total fertility rate (the variable to be explained) and a variety of explanatory variables including the num· ber o£ years of women’s education, the years of men’s educarion, GDP per adult, the percentage of the population living in cities, the percent- age of the labor force in agriculture, the religious composition of the population, per capita calorie consumption, and child mortality. A vari- ety o£ £amily planning and other variables were also analyzed but proved to have no statistical significance. Many models were estimated, but I concentrate on the reduced form models in which fertility was ex- pressed as a function o£ education, economic, and religious variables.14 Table 6.1, eqnarion 1, shows a typical result, which I refer to as the Third World Equation.
The coefficients o£ the Third World Equation highlight the factors explaining £ertility transitions. Education is the key. The coefficient of women’s education is negative, implying that more education for women lowers £ertility. In contrast, men’s education has a positive coefficient, so more education £or men increases £ertility. Why the contrary result? Sev- eral interpretations are possible. Like Kuniansky and Berliner, Schultz analyzes £ertility as though children were products that parents were buying. More men’s education means that the wages o£ men are higher so they choose more children as they would choose to buy more of most goods. The e££ect o£ women’s education is more complicated, however, since women were usually the primary caretakers o£ children. Higher women’s education raises the income o£ women which (a) tends to in- crease the demand £or children as with men’s education, but (b) which also raises the opportunity cost o£ women’s time and thus the cost o£ raising children. In other words, i£ women take care ofchildren instead o£ working, the cost o£ the child care is higher when women have greater eaming power due to more education since they give up more wage income when they care £or childen. This effect dominates the income ef£ect and means that more education £or women leads to fewer children.
Other interpretations o£ the education coefficients are possible, in particular, the feminist theory o£ Jones and Grupp. I£ men are educated while women are not, the dependence o£ women is increased, and patri- archy is reinforced. Raising the education o£ women relative to that o£ men reduces the dependence of women. Indeed, in their statistical inves- tigations, Jones and Grupp use the ratio o£ women’s education to men’s education as an explanatory variable, which they call an index o£ eman- cipation, and it is highly significant in explaining £ertility in the Soviet Union. One attraction o£ the Jones-Grupp interpretation is that its logic

126 · Chapter Six
Table 6.1Schultz-type Equations
1 2 3
Constant 5.79 5.861(28.886)
5.480(19.875)
Female education -.5 5 1 -0 .4 4 4(-2 .6 6 1 )
-3 .481(-8 .1 7 4 )
Male education .179 0.160(.718)
2.409(4.871)
Log of GDP per adult .517 — —
% population urban -.0 0 8 4 -0 .0228(-5 .3 6 9 )
-.0 2 4 1 0(-6 .0 9 6 )
% labor force in agriculture .019 — —
Catholic % of population .0115 — -
Protestant % of population .0239 — —
Muslim % of population .0119 0.0146(4.801)
.0135(4.337)
Calories per day -.0 0 3 5 — —
Calories per day squared .00053 — —
Female education squared — — .2884(6.232)
Male education squared — — -.1 5 7 2(-2 .1 9 9 )
R2 .603 .680
Sources: equation 1-Schultz (1997, p. 398) equation 4. See the otiginal soutce fot detailed definitions and statistical appatatus. I have omitted the dummy vatiablcs fot 1982 and 1988 and the family planning vatiable. The coefficients of these vatiables ate very small and statistically insignificant.
equations 2 and 3-estimated ftom Russian and Soviet censuses.Notei The dependent vatiable is the total fertility tate. T-tatios in patentheses.
is more consistent with Soviet history since their approach does not presume that women gave up work when they had children.
The other coefficients in the Third World Equation deserve comment. Fertility increases with GDP per adult since, in Schultz’s interpretation, the rise in GDP represents income growth that raises the demand for children. Urbanization and the decline in agriculture reduce the demand
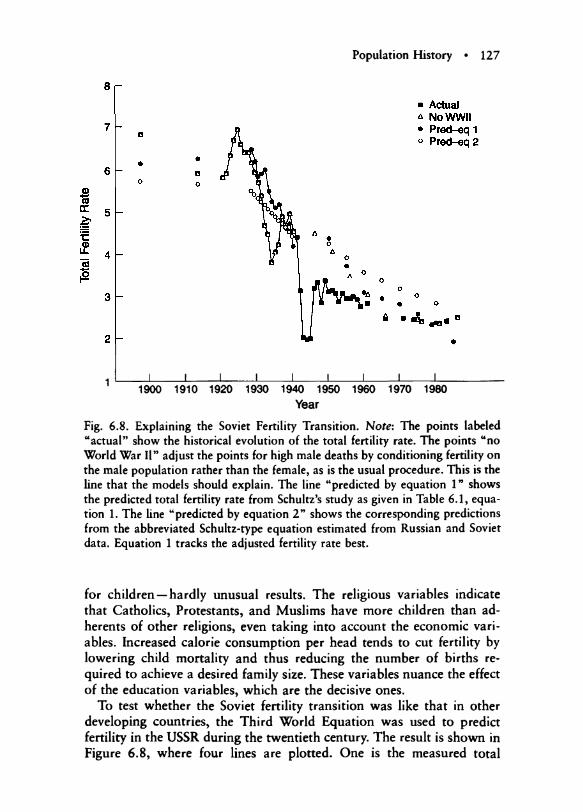
Population History · 127
1900 1910 1920 1930 1940 1950 1960 1970 1980Year
Fig. 6.8. Explaining the Soviet Fertility Transition. Note: The points labeled “actual” show the historical evolution of the total fertility rate. The points wno World War II” adjust the points for high male deaths by conditioning fertility on the male population rather than the female, as is the usual procedure. This is the line that the models should explain. The line “predicted by equation 1” shows the predicted total fertility rate from Schultz’s study as given in Table 6.1, equa- tion 1. The line “predicted by equation 2 ” shows the corresponding predictions from the abbreviated Schultz-type equation estimated from Russian and Soviet data. Equation 1 tracks the adjusted fertility rate best.
for children — hardly unusual results. The religious variables indicate that Catholics, Protestants, and Muslims have more children than ad- herents of other religions, even taking into account the economic vari- ables. Increased calorie consumption per head tends to cut fertility by lowering child mortality and thus reducing the number of births re- quired to achieve a desired family size. These variables nuance the effect of the education variables, which are the decisive ones.
To test whether the Soviet fertility transition was like that in other developing countries, the Third World Equation was used to predict fertility in the USSR during the twentieth century. The result is shown in Figure 6.8, where four lines are plotted. One is the measured total

128 · Chapter Six
fertility rate. The second is the measured rate corrected for the high number of male deaths in World War II. This curve is computed by dividing the number of births by the number of men in each age group since men — not women — were the limiting factor on fertility after the war. This curve is somewhat higher than the first in the 1950s and I960s and is the measure of fertility that the Third World Equation should replicate if Soviet fertility conforms to the international pattern. The third line is the prediction of the Third World Equation. Clearly, this line is close to the actual Soviet experience, which shows that it was not unusual once the pace of economic and social development is taken into account.
Actual Soviet experience, of course, was more volatile than the pre- dictions of the Third World Equation, which includes only the impact of underlying, structural factors. Some of the deviations from predictions are significant. Thus, Soviet fertility at the end of the I920s and the end of the 1930s was consistent with the experience of many countries, while the low fertility of the mid-1930s is a deviation from the expected level. That discrepancy was the reason for treating the low level of fer- tility in the mid-1930s as “deficient fertility” attributable to collectiviza- tion and simulated in Figures 6.4 and 6.7. It might, however, have been due to a high rate of male migration to the cities, in which case, the previous simulations overstated the impact of collectivization on popu- lation change.
The Third World Equation was estimated with data from developing countries in the late twentieth century. Do Soviet data reveal the same patterns? This possibility has been explored by estimating abbreviated versions of the Third World Equation with data sets based on the Euro- pean Fertility Project. Cross sections of subnational data — provinces, oblasts, krai, republics, and so on — from the 1897, 1939, and 1959 censuses were used. For these districts, which I will refer to as “prov- inces,” it was possible to measure the total fertility rate (the dependent variable) and the most important explanatory variables — women’s edu- cation, men’s education, urbanization, and the religious composition of the population. GDP per adult, agricultural employment, and per capita calorie consumption could not be measured at the subnational level, but these explanatory variables were less important than the others. While the European Fertility Project was primarily concerned with “Eu- ropean Russia,” I have expanded the data set to include the Caucuses, Central Asia, and Siberia, which Coale, Anderson, and Harm treated less comprehensively.
Equation 2 in Table 6.1 is patterned after Schultz’s Third World Equation. Notice that the coeificients of the education and religion vari- ables are very similar to the corresponding coefficients in the Third World Equation. The absolute value of the urbanization coefficient is
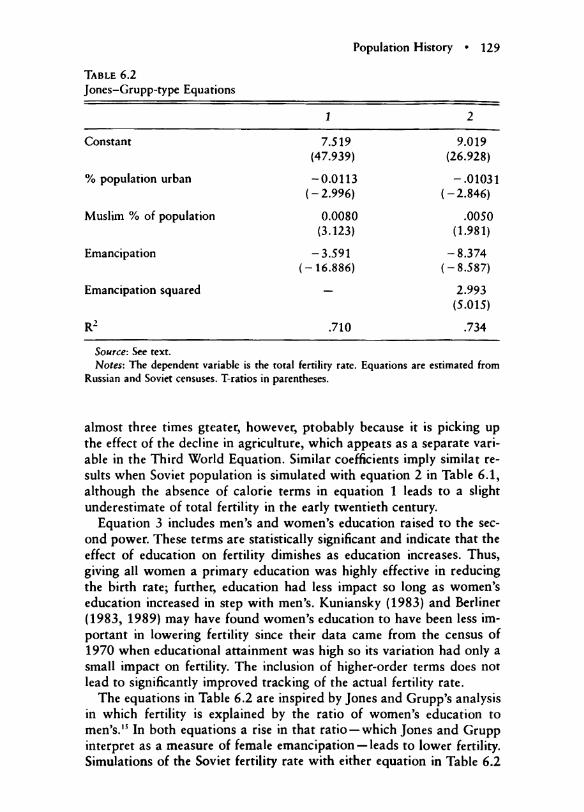
Table 6.2Jones-Grupp-type Equations
Population History · 129
1 2
Constant 7.519(47.939)
9.019(26.928)
% population urban -0 .0113(-2 .996)
-.01031(-2 .846)
Muslim % of population 0.0080(3.123)
.0050(1.981)
Emancipation -3 .591(-16 .886)
-8 .3 7 4(-8 .587 )
Emancipation squared — 2.993(5.015)
R2 .710 .734
Source: See text.Notes: The dependent variable is the total fertility rate. Equation$ are estimated from
Russian and Soviet censuses. T-ratios in parentheses.
almost three times gteater, however, ptobably because it is picking up the effect of the decline in agriculture, which appeats as a separate vari- able in the Third World Equation. Similar coefficients imply similat re- sults when Soviet population is simulated with equation 2 in Table 6.1, although the absence of calorie terms in equation 1 leads to a slight underestimate of total fertility in the early twentieth century.
Equation 3 includes men’s and women’s education raised to the sec- ond power. These terms are statistically significant and indicate that the effect of education on fertility dimishes as education increases. Thus, giving all women a primary education was highly effective in reducing the birth rate; further, education had less impact so long as women’s education increased in step with men’s. Kuniansky (1983) and Berliner (1983, 1989) may have found women’s education to have been less im- portant in lowering fertility since their data came from the census of 1970 when educational attainment was high so its variation had only a small impact on fertility. The inclusion of higher-order terms does not lead to significantly improved tracking of the actual fertility rate.
The equations in Table 6.2 are inspired by Jones and Grupp’s analysis in which fertility is explained by the ratio of women’s education to men’s.15 In both equations a rise in that ratio —which Jones and Grupp interpret as a measure of female emancipation — leads to lower fertility. Simulations of the Soviet fertility rate with either equation in Table 6.2

130 · Chapter Six
Table 6.3The Reasons for the Fertility Decline, 1928-60
C ausal fa c tor Im plied chattge in total fertility
Education -1 .6 2Calorie consumption -1 .0 0Economic transformation -0 .6 7Religious composition -0 .1 2
Total -3 .4 1
Sources: Valucs of the independent variables for 1928 and 1960 were substituted into the Third World Equation to prcdict the total fertility rate. Subtracting thc equations evaluated at those datcs decomposes changes in thc total fertility rate into effccts due to changes m each variable. Changes for the full list of vanables were as follovvs:
Women’s education -2 .2 8Men’s education .66GDP/adult .50Urbanization - .2 5Reduction in agriculture - .9 1Catholics - .0 9Protestants - .0 3Muslims .00Calories -1 .0 0Change in fertility rate -3 .4 1
In thc main table, education is thc sum of thc figures shown hcrc for womcn’s cducation and mcn’s cducation; economic transformation is thc sum of GDP/adult, urbanization, and reduction in agriculture; religious composition is the sum of Catholics, Protestants, and Muslims.
are somewhat less successful than with the equations in Table 6.1: while the Jones-Grupp predictions track actual fertility from 1897 through the I950s, they overpredict fertility in recent decades, and so are less satisfactory than the other fertility equations.
Since equation 2 in Table 6.1 provides considerable substantiation for Schultz’s Third World Equation in the Soviet case, and since the greater list of variables in Third World Equation does a better job of replicating the full course of Soviet £ertility history, it will be used to analyze the causes of the fertility decline (Table 6.3). Between 1928 and 1960, the total fertility rate fell by 3.41 (from 6.47 to 3.07 children per women). The increased education of the Soviet population was the most important factor behind this decline, being responsible for a fall of 1.62 children per woman. Improvements in agricultural performance and diet that raised calorie consumption per person and reduced infant mortality were re-

Population History · 131
sponsible for a reduction in fertility of one child pcr woman. Thc eco- nomic tranformation of the Soviet Union reduced fertility by a further .67 children per woman. Changes in religious composition —principally the decline of Catholicism due to religious persecution, including the forced amalgamation of the Uniates with the Russian Orthodox Church — made a minor contribution to the fertility transformation. Clearly, education, economic development, and rising living standards were the main factors responsible for smaller families and slower population growth.
One factor notably lacking from this list is birth control. Schultz found that neither family planning programs nor the price of birth con- trol devices had much to do with the fertility transition, and the same was true of the Soviet Union. Birth control practices were primitive, and policies respecting abortion fluctuated wildly, although it has been widely used since 1954 (Jones and Grupp 1987, pp. 266-331 ; Blum 1994, pp. 133, 165-80). The unimportance of contraceptive technology is less surprising in light of Westem experience, where the fertility transition preceded the invention of modem birth control devices. lndeed, marital fertility in the West has been limited for centuries.
CONCLUSION
The Soviet Union escaped the population explosion that occurred in the less developed world during the twentieth century. Thesc population explosions were the result of falling mortality rates combincd with per- sistently high fertility. Normal mortality fell in thc Soviet Union just as it did elsewhere. Two factors kept thc population in check, howcvcr. The first was the decline in fcrtility; thc second was the exccss mortality due to collectivization and war. Without the losscs of World War 11 and collectivization, thc Soviet population would havc been larger, in part because thcsc cvents also lowcrcd fcrtility, thercby circumventing the fertility rcsponsc that usually kccps such catastrophcs from permanently lowering populations. The main factor, however, that prcvcnted a popu- lation cxplosion in the Soviet Union was the carly and rapid fertility transition. lt was due to the education of women, rapid cconomic devel- opment, and increased food availability aftcr agriculture rccovcred from collectivization. Indeed, rapid devclopment and slow population growth have becn mutually reinforcing. If thc USSR had not followed this path — if, for instance, industrialization and urbanization had proceeded less rapidly and if schooling had been expanded slowly and provided to men in preference to women — then population growth would have been ex- plosive. At the end of the nventieth century, the population would have approached one billion as in India, where urbanization has been limited and where most women remain illiterate.

C H A P T E R S E V E N
The Standard of Living
For most countries, there is little debate about the purpose of industrial- ization: it is to raise living standards. In Chapter 3 we analyzed the ideas of Preobrazhensky and Fel’dman and showed that they consti- tuted a coherent model in which investing in heavy industry led to higher consumer goods output by increasing fhe capacity to build cnnsumer goods factories. Simulations of the theoretical model indicated that con- sumption would rise significantly in the span of a dozen years. Just because the Soviets concentrated resources on heavy industry, in other words, does not mean that they were only interested in tanks and steel. Bukharin claimed that wour economy exists for the consumer, not the consumer for the economy” (quoted by Cohen, 1980, p. 173). If Pre- obrazhensky and Fel’dman were put into practice, this sentiment could become a reality.
Bukharin, of course, was shot. Did the goal of high consumption die with him? The totalitarian school denies that Stalin ever entertained it. In this view, the aim of Stalinism was power and aggrandizement rather than the betterment of the working class (Tucker 1977). As a result, investment and military spending were increased at the expense of con- sumption. Tucker (1977, p. 98) characterized Stalinism by quoting the great historian Kliuchevsky, who described earlier phases of state-led industrialization with the phrase “the state swelled up; the people grew lean.” Magnitorgorsk, in other words, meant steel for tanks, not for textile machinery. Even historians who are otherwise critical of the to- talitarian school have accepted this conclusion: “socialism and scarcity turned out to be inextricably linked” (Fitzpatrick 1999, p. 4).
We cannot dissect Stalin’s mind, but we can ascertain the results of Soviet policies. What did happen to consumption during Soviet indus- trializarion? Did it rise or fall? The usual answer depends on the time frame. Between 1950 and 1980, there is little dispute that real per cap- ita consumption grew at almost 3 percent per year despite a huge rise in investment and military spending (U.S. Congress 1982, pp. 72-74). During this period, food consumption increased significantly, as we will see, and the volume of urban housing grew much more rapidly than the city population. The consumer durables revolution even hit the USSR: the number of washing machines per 100 households rose from 21 in

The Standard of Living · 133
1965 to 75 in 1990, the number of refrigerators grew from 11 to 92 per 100 households over the same period, the number of radios went from 59 to 96, and the number of television sets from 24 to 107 (Fernandez 1997, pp. 312, 314). There were 16 telephones for every 100 people in Russia in the early 1990s. This was less than in westem Europe or Japan, where the ratio ranged from 50 to 70, but it greatly exceeded the proportion in Third World countries like Argentina (8), Brazil (1), Iraq (3), or Turkey (6) (Dogan 1995, pp. 367-69). The rapid increase in Soviet consumption is consistent with the prognosis of FePdman and Preobrazhensky.
The real question is what happened in the 1930s. Most accounts maintain that the standard of living of the working population declined, or was static at best, during the first Five-Year Plans. The bedrock sup- port for this interpretation is the national income accounting of Bergson and the related calculations of real wages by Chapman. Bergson (1961, p. 251) described the record of per capita consumption as “unimpres- sive.” “Valued at adjusted market prices of 1937” —his preferred mea- sure—“per capita consumption in 1937 is 3 percent below the 1928 level.” Furthermore, “students of growth wish to know whether indus- trialization at Soviet tempos can be consistent with progressively rising consumption standards. If the Soviet experience is any indication, the answer must be in the negative” (Bergson 1961, p. 257). Chapman (1963, p. 165) characterized the history of real wages as a Mvery poor showing.” She felt that the best reading of the evidence indicated “a decline of 6 percent in urban per capita household purchases and a significant decline also in rural per capita household purchases of goods between 1928 and 1937” (Chapman 1963, p. 170). These conclusions have been accepted by many other economists and historians.1
In this chapter I argue that the standard pessimism is misplaced. It is true that there was little gain in consumer goods output during the First Five-Year Plan, and the famine of 1932-33 casts a pall over those years as well. But by the late 1930s, per capita consumption was significantly higher than it had been in the 1920s. The experience of 1950-80 was thus anticipated in the 1930s. The rural population did not share in this advance —its standard of living only returned to the 1928 level from the trough of 1932-33 —but the urban population and those millions who moved from the country to the city realized a significant increase in consumption. Since the urban share of the population rose from less than one-fifth in 1928 to almost one-third in 1939, the gain was far from universal but important nonetheless. The improvement was not free —urbanites had to work more hours (another feature of the Pre- obrazhensky strategy) — but the gain in material vvelfare was real, nonetheless.

134 · Chaptet Seven
Th e Su p p l y o f F o o d
Thete ate many apptoaches to measuting the standatd of living. One of the most basic needs is food. Was enough being ptoduced in the Soviet Union in the 1930s? The question is vety much to the point in view of the famine in 1932-33 and, mote genetally, of the usual gtim potttayal of Soviet life.
To judge the wotld’s food supply, the United Nations Food and Agti- cultutal Otganization (FAO) ptoduces food balance sheets fot all the countties of the wotld. Publication began in the 1960s, but I have ap- plied the method to Russian data back to 1895.2 The FAO ttacks a vatiety of nuttients, but I limit myself to caloties, which is the most basic. The Russian food balances show how calorie availability has changed ovet time and allow Soviet petformance to be assessed with intemational compatisons.
The food balances ate consttucted ftom the agricultutal statistics of food ptoduction and ftom industtial tetutns of a few ptoducts like veg- etable oil and taw sugat consumption.1 In the case of the USSR, I ttacked twelve food gtoups that accounted fot most caloties consumed: gtain (including peas and beans), potatoes, sugat, vegetables, beet, vodka, meat, milk, eggs, vegetable oil, buttet,4 and fish. Domestic avail- ability of each food was calculated as gtoss ptoduction less the quantity used fot seed and animal feed, exports, and losses in stotage and ship- ping. Food availability is ttanslated into calotie availability vvith coeffi- cients teflecting the ptocessing of fatm goods into food ptoducts and the calotie content of those foods.
The calculations ate, of coutse, imptecise, but they give a genetal indication of food availability. In the case of the USSR, thete ate signifi- cant questions tegatding the manipulation of ptoduction figutes fot po- litical ends. I have used the tecent findings of Wheatctoft (1990a) and Davies, Hattison, and Wheatctoft (1994, pp. 114-16). The gtain fig- utes, in particulat, ate based on pteviously sectet tecotds and paint a much bleaket pictute than the published statistics. Othet elements of the calculation — notably losses —ate based on the judgment of authoti- ties like Jasny (1949).
Figute 7.1 plots pet capita calotie availability ftom 1895 to 1989. The long-tun ttend was upwatd. Sevetal impottant petiods can be identified.
The fitst was 1895-1910. Pet capita calotie consumption in Russia was about 2100, which is consistent with the expetience of many poot countties. At this level, thete is always some danget of famine. It is imptessive that food availability declined in 1906 and 1907, and that may have conttibuted to political instability at the time.

Calo
ries p
er P
erso
n pe
r Day
(tho
usan
ds)
The Standard of Living · 135
Fig. 7.1. Calorie Availability, Russia/USSR, 1885-1989. Source: See text and Appendix C.
The second period was the years immediately before the First World War and the height of the NEP. In this period, calorie availability jumped to 2500 per person per day. There is little information about food production during the period of the civil war, so the causes of the 1921 famine cannot be explored. While the number of years involved is small —so generalization is hazardous — Russian agriculture seems to have been performing better during the peacetime years between 1912 and 1927 than it had in the early twentieth century.
The third period was the First Five-Year Plan. From 1929 to 1932, the calorie availability reverted to the level prevailing from 1895 to 1910. There were several reasons for the deterioration. In 1929-31 , the state increased its collection of grain and exported the increment to import machinery (Davies, Harrison, and Wheatcroft 1994, pp. 290, 316). These exports cut into the domestic food supply. From 1930 on, agricultural production slid as collectivization proceeded. The food question, however, was complicated by the slaughter of horses. Since each horse ate as much grain as two people, the loss of 15 million

136 · Chapter Seven
horses between 1929 and 1933 made enough grain available to feed 30 million people. In 1932, however, the fall in food production was so general that calorie availability from almost all food sources dropped. This coincided with the famine, but was not its main cause. Per capita calorie availability in 1932 (2022 calories per person per day) was not much lower than it had been in 1929 (2030 calories) or in many prewar years when there had been no famine. Famines, as Sen (1981) has in- sisted, are rarely the result of a food availability decline, but are, in- stead, the results of price movements or policy interventions. In market economies, the cause is usually a rise in food prices relative to eamings. In the Soviet Union, the cause was the conflict between peasants and the state. When the peasants slaughtered livestock and stopped planting and harvesting, the state continued to take grain and the peasants starved.
The fourth period began in 1933 and extended into the I950s. The decline in food availability was reversed in the Second Five-Year Plan, and the food situation improved dramatically by the late I930s, when calorie availability reached about 2900 per person per day. This im- provement was better than that of South Asian countries during the Green Revolution. In India, for example, food availability increased from 1991 calories per person per day in 1961-63 to 2229 calories in 1988-90. In Pakistan the gain was from 1802 to 2280. Indonesia had one of the best records, with an advance from 1816 to 2605 calories per person per day (Food and Agricultural Organization 1991, vol. 45, p. 238). The Soviet food situation was, of course, desperate during the Second World War, but calorie availability in the early I950s repre- sented a continuation of the improved situation of the late I930s.
The final period in the history of the Soviet food supply ran from the late 1950s to the 1980s. Per capita availability rose to about 3400 calo- ries per person per day by c. 1970 and stabilized there. Since 1960, the history of calorie availability in the USSR has paralleled that of Europe as a whole, where it has increased from 3088 in 1961-63 to 3452 in 1988-90 (Food and Agricultural Organization 1991, vol. 45, p. 238).
Economic development has meant an increase in food consumption. Fogel (1991, p. 45) estimated that the average French person consumed 2290 calories per day in 1785 and that the average English person con- sumed 2700 in 1790. Eighteenth-century French calorie intake was sim- ilar to that in contemporary South Asia and to Russia in the early twen- tieth century. (The higher figure for eighteenth-century England reflects the agricultural revolution of the early modern period that helped launch the first industrial revolution.) By the late tvventieth century, calorie con- sumption in western Europe had risen to 3400 calories per day, and the Russians had matched that increase. The mid- and late 1930s were an

The Standard of Living · 137
important step in that advance. When calorie availability is the metric, the standard of living rose in the late 1930s.
Ber g so n ’s E stim a tes R ev isit ed
Food is important, but people also need shelter, clothing, and many other goods and services. General conclusions regarding living stan- dards require that consumption as a whole be measured. It is important to reexamine the question since much new information has become available since Bergson’s work in the 1950s. The upshot of my reassess- ment is shown in Figure 7.2, which plots my index of per capita consumption from 1928 to 1940. There was a drop during the First Five-Year Plan, but rapid increase thereafter, with the result that con- sumption per head was 22 percent higher in the late 1930s than in 1928. Figure 7.2 also shows the implications of Hunter and Szyrmer’s (1992) reassessment of Soviet national income. Consumption was not their focus, and they adopted a very different aggregation procedure from that used here, but they relied on many of the same agricultural and industrial output series —information not available to Bergson — with the result that they reached conclusions like those advanced here. Indeed, it is difficult to sustain Bergson’s pessimistic interpretation of consumption under Stalin on the basis of the information available today.
New information is not the whole story, however. While Bergson’s calculations were pathbreaking, they incorporated two debatable pro- cedures that strongly influenced the results. Altering those procedures calls Bergson’s pessimistic conclusions into question even without new data.
Table 7.1 summarizes one of Bergson’s basic calculations of the stan- dard of living in 1928 and 1937. (He did not estimate consumption annually but only for benchmark years.) The table values goods and services at the prices prevailing in 1937. With that metric, per capita consumption increased by only 3 percent between 1928 and 1937. This result is not Bergson’s absolutely lowest estimates (which was minus 3 percent), but it is sufficient to sustain the usual pessimism in historical writing.
In the absence of information on the production of consumer goods, Bergson measured consumption by adjusting expenditures for changes in prices. Two problematic procedures tilted Bergson’s calculations to- ward a low measured growth in per capita consumption. The first was the choice of index number for measuring inflation. Bergson relied on price indices prepared for later publication by Chapman (1963), and

Annu
al Co
nsum
ption
per
Hea
d (th
ousa
nds o
f 193
7 ru
bles)
138 · Chapter Seven
Fig. 7.2. Consumption per Head, 1928-40. Sources: See text and Allen (1998c) for my figures. Hunter and Szyrmer (1992, p. 41) present their estimates of rural and urban consumption. The series graphed here is obtained by summing thcm and dividing by the population.
she calculated a Laspeyres index and a Paasche index using 1937 as the base year.5 The former uses the 1937 consumption pattern to weight prices, whiie the iatter uses the 1928 consumption pattern. Chapman’s Laspeyres price index impiies that prices rose by a factor of 5.92 be- tween 1928 and 1937, whiie her Paasche index increased by 8.69.6 We can convert 1928 retaii saies (12.1 billion rubles) to 1937 prices by multiplying by the price increase. If the Paasche index is used, then 1928 retail sales equal 105.0 (= 8.69 X 12.1) billion rubles in 1937 prices. If the Laspeyres index were used instead, real household pur- chases in 1928 would be reckoned at only 72.0 (= 5.92 X 12.1) bil- lion rubles in 1937 prices. The implications of these calculations are also shown in Table 7.1: the former implies that consumption per head rose by 3 percent from 1928 to 1937 while the latter implies an increase of 32 percent. Bergson opted for the first result, which supports the pessimistic interpretation of Soviet hi$tory. The second would imply a decidedly optimistic view.
Bergson (1961, p. 88) wa$ aware of the implications of the choice of

The Standard of Living · 139
Table 7.1Bergson’s Calculations of Real per Capita Consumption (1937 and 1928 prices)
Bergson's preferred
Paasche price index
(1937 base)
1928 1937
Altemative La$peyres price
index(1937 base)
1928 1937
Household purchases in retail markets 105.0 126.0 72.0 126.0Farm income in kind 35.6 25.0 35.6 25.0Scrv/ces 11.1 19.9 11.1 19.9
Total 151.7 170.9 118.7 170.9
Population index 1.00 1.09 1.00 1.09Indices of real per capita consumpt/on 1.00 1.03 1.00 1.32
Sources: All expend/ture figures are from Bergson (1961, p. 48) except for the 72.0 b/ll/on rubles shown for household purchases /n reta/l markcts m 1928. For that, see the text. The populat/on mdex is calculated from Bergson (1961, p. 442).
Notes: Sernces /nclude Bergson’s categor/es of housmg, serv/ces, and m/l/tary subs/s- tence. Real per cap/ta consumption /s computed as the relat/ve r/se m total consumption from 1928 to 1937 d/v/ded by the relat/ve r/se in population (1.09).
index number, for he reported the calculations with the Laspeyres price index. Nevertheless, he believed that the Paasche index was tt!ogica!!y appropriate” (Bergson 1961, p. 47). He was trying to measure inflation for six benchmark years between 1928 and 1955 with an index number with a 1937 base. Using the Laspeyres index wou!d have imposed the 1937 spending pattern on all of the calculations, while the Paasche in- dex a)lowed the weights to alter from year to year. For that reason, he felt the Paasche was superior.
The modern theory of index numbers suggests a better procedure. Instead of using Paasche or Laspeyres indices, we should take some sort of average that uses the weights of both years (Diewert 1976; Allen and Diewert 1981). The Fisher Ideal Index (the geometric average of the Paasche and the Laspeyres) is a commmon choice. In the case of multi- year comparisons, chain-linking the Fisher Ideal would solve Bergson’s logical problem by allowing the weights to follow the change in con- sumption patterns over time. This procedure would also use more infor- mation in calculating inflation between successive dates and would not arbitrarily privilege the spending pattem in one year as does Bergson’s choice of the Paasche index or, indeed, as would a preference for the
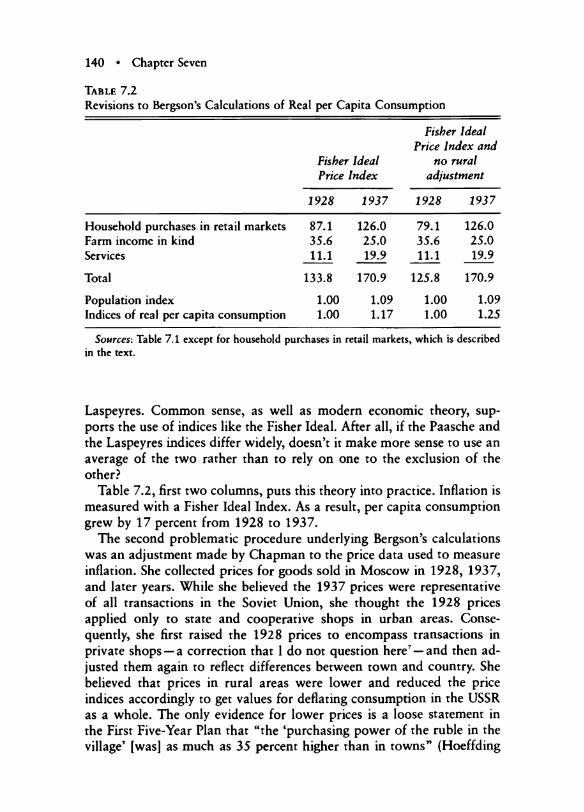
140 · Chapter Seven
Table 7.2Revisions to Bergson’s Calculations of Real per Capita Consumption
Fisher Ideal Price Index
Fisher Ideal Price lndex and
no rural adjustment
1928 1937 1928 1937
Household purchases in retail markets 87.1 126.0 79.1 126.0Farm income in kind 35.6 25.0 35.6 25.0Services 11.1 19.9 11.1 19.9
Total 133.8 170.9 125.8 170.9
Population index 1.00 1.09 1.00 1.09Indices of real per capita consumption 1.00 1.17 1.00 1.25
Sources: Table 7.1 except for household purchases in retail markets, which is described in the text.
Laspeyres. Common sense, as well as modern economic theory, sup- ports the use of indices like the Fisher Ideal. After all, if the Paasche and the Laspeyres indices differ widely, doesn’t it make more sense to use an average of the two rather than to rely on one to the exclusion of the other?
Table 7.2, first two columns, puts this theory into practice. Inflation is measured with a Fisher Ideal Index. As a result, per capita consumption grew by 17 percent from 1928 to 1937.
The second problematic procedure underlying Bergson’s calculations was an adjustment made by Chapman to the price data used to measure inflation. She collected prices for goods sold in Moscow in 1928, 1937, and later years. While she believed the 1937 prices were representative of all transactions in the Soviet Union, she thought the 1928 prices applied only to state and cooperative shops in urban areas. Conse- quently, she first raised the 1928 prices to encompass transactions in private shops — a correction that 1 do not question here7 —and then ad- justed them again to reflect differences between town and country. She believed that prices in rural areas were lower and reduced the price indices accordingly to get values for deflating consumption in the USSR as a whole. The only evidence for lower prices is a loose statement in the First Five-Year Plan that “the ‘purchasing povver of the ruble in the village’ [was] as much as 35 percent higher than in towns” (Hoeffding

The Standard of Living · 141
1954, p. 65). Chapman assumed that this differential applied to the prices of consumer goods sold in shops, so the rural price of these goods was 75 percent (= 1/1.35) of the urban price.K Since she estimated that rural sales amounted to 40 percent of the total, she reduced the 1928 price indices by a factor of .90 ( = .6 X 1 + .4 X .75) to get the values of .115 and .168 for Paasche and Laspeyres price indices that she believed characterized all retail sales in the Soviet Union.9 Shifting these to a 1928 base implies the inflation rates used earlier: 5.95 = 1/.168 and 8.69 = 1/.115.
Chapman’s adjustment is hard to accept. As Hoeffding (1954, p. 65) observed, it “is none too clear” what Gosplan meant when it compared rural and urban purchasing power. Hoeffding interpreted the compari- son to cover all consumption — in particular, farm income in kind and not just purchases in shops. Indeed, in most places, the prices of agri- cultural goods (as well as house rents) are less in the country than in the city (Williamson 1988; Hatton and Williamson 1991, pp. 400-1), so Hoeffding’s interpretation is plausible. There is, moreover, no reason to believe Chapman’s contention that manufactured consumer goods sold for less in rural districts. Indeed, the contrary is more likely. There was excess demand for manufactured consumer goods in state stores in both town and country, and the imbalance was greatest in the country. For that reason, small-scale traders found it profitable to buy goods at con- trolled prices in urban shops and cart them to the country for resale. Given the added burden of these transport costs, the average price of manufactured consumer goods in the coumry was probably higher than in the city — not lower as assumed by Chapman (Johnson and Temin 1993; Gregory 1994, pp. 97-98). The simplest procedure is to ignore the downward adjustment Chapman made in urban prices and to treat the Paasche and Laspeyres indices for sales in all urban markets —.168 and .115, respectively — as estimates for the Soviet Union as a whole. It must be recognized, however, that these are lower bound estimates since they understate the price of manufactures sold in rural areas in 1928. Consequently, using .168 and .115 as deflators for 1928 leads to over- estimates of 1928 consumption, and, consequently, underestimates of the growth in real retail sales from 1928 to 1937.
Table 7.2, last two columns, shows the result of abandoning the rural-urban adjustment to prices. The Fisher Ideal Index of 1928 prices relative to 1937 prices becomes .153, so prices rose by a factor of 6.54 from 1928 to 1937. As a result, measured consumption per head grows by 25 percent between 1928 and 1937. In contrast to the usual stagna- tionist view of living standards during the first two Five-Year Plans, this is marked improvement.

142 · Chapter Seven
Table 7.3Consumption Estimates Aggregating Consumer Goods
Services and farm income in kind valued at
Adjusted market Prevailing prices prices
1928 1937 1928 1937
Shops and restaurants Farmers* marketsHousehold purchases in retail markets
Farm income in kind— food— manufactures
Services
Total
Population indexIndices of real per capita consumption
61.5 110.0 61.5 110.03.4 16.0 3.4 16.0
64.9 126.0 64.9 126.0
35.6 25.078.2 81.3
7.3 .4
11.1 19.9 26.3 42.9
111.6 170.9 176.7 250.6
1.00 1.09 1.00 1.091.00 1.40 1.00 1.30
Sources: See text.Note: Services includes Bergson’s categoties of setviccs, housing, and militaty
subsistence.
A N e w In d e x o f C o n su m pt io n
A $lightly larger increase in consumption per head is implied by aggre- gating the output of consumer goods and by reworking the other ele- ments of the calculation to take advantage of new information. Table 7.3 $hows my estimates for 1928 and 1937. I have made no change to Bergson’s estimates for services (including housing). The other compo- nents of consumption have been computed a$ follow$.
Household Purchases in Shops
Processed foods (bread, sausage, vodka, vegetable oil, etc.) and nonfood consumer goods (cloth, shoes, bicycle$, etc.) were sold in shops, and they were the most important retail channel, doing 110 billion rubles of business in 1937. I measured the quantity of goods sold in this way by aggregating the output of manufactured consumer goods.10 I rely on Nutter’s (1962) massive study of Soviet industrial statistics for the out- put series, and I use his 1928 and 1955 value added prices for valuing output —a procedure equivalent to aggregating by value added. Nutter

The Standard of Living · 143
(1962, p. 524) presented estimates of the value of output" in 1928 and 1937 using both 1928 and 1955 prices. 1 have extended the calculations to include all years from 1928 to 1940.
When output is measured in 1928 prices, it grew by 93 percent from 1928 to 1937, but growth was only 66 percent when 1955 prices are used. This discrepancy is an example of the Gerschenkron (1947) ef- fect —the industries that were unimportant at the beginning of indus- trialization were likely both to grow exceptionally rapidly and to have particularly steep reductions in price and cost as technology was mod- ernized. As a result, aggregate growth rates differ depending on whether early or late prices are used for indexing. In the case at hand, consumer durables (bicycles, clocks, phonographs) grew the most rapidly and had the most steeply falling relative prices between 1928 and 1955. The prices of textiles also fell relative to foods, and the production of some textile products, notably hosiery and knitwear, grew very rapidly. Food products in general had the slowest growth and also prices that rose relative to other commodities.
Aggregating quantities presents an “index number problem” just as aggregating prices did. Rather than plump for 1928 or 1955 priccs as weights, I have used a geometric average of the two indices. It shows that the output of manufactured consumcr goods grcw 79 percent bc- tween 1928 and 1937. As a result, household purchases in shops in 1928 is reckoned at 61.5 (= 110/1.79) billion rubles in 1937 prices.
Collective Farm Market
The second major retail channel consisted of farmers’ markets, whcre peasants sold produce directly to urban residents. These markets were the principal distribution channel for fresh meat, vegetables, and dairy products. There are official retums for the prices and quantities of goods bought and sold on these markets betsveen 1932 and 1940,12 and I rely on Malafeev’s (1964, p. 402) and Vyltsan’s (1966, p. 61) summa- ries of this material. Barsov’s (1969) work was used to extend the index of collective farm market sales back to 1928.13
Between 1928 and 1937, sales at farmers’ markets increased by a factor of 4.7, so the volume of sales in 1928w as3 .4 (= 16/4.7) billion rubles in 1937 prices. Such a high growth rate is plausible in view of the abolition of private trade in 1930. Prior to that date, peasants could sell to private wholesalers at uncontrolled prices that exceeded state procurement prices, so it was not necessary to sell directly to consumers in farmers’ markets to realize high prices. After 1930, however, selling directly to urban consumers in farmers’ markets was the only way peasants could realize high prices for their produce, so sales on those markets exploded.

144 · Chapter Seven
Combining sales in shops and farmers’ markets implies that house- hold purchases in retail markets rose from 64.9 billion rubles in 1928 to 126 billion rubles in 1937, all expressed in 1937 prices.14 As a result, per capita consumption grows by 40 percent, as shown in Table 7.3, columns 1 and 2. However, other issues must be considered before a final conclusion is reached, and they imply a more moderate growth in consumption.
Fartn Incotne in K ind—Food
Some grain was sold to the state or to city residents on the collective farm market, some was used for seed, some was fed to livestock, and some was eaten by rats. The grain left to the peasants for their own consumption was “farm income in kind.” Following Bergson, 1 calcu- lated farm income in kind for the major agricultural products as gross production minus marketings, losses, and utilization as seed and feed. 1 have altered Bergson’s calculations in three ways, reflecting new knowl- edge. First, Bergson used prices from Karcz (1957), but Karcz has since revised them twice (see Moorsteen and Powell 1966, p. 621; Karcz 1979, p. 105), mainly due to Vyltsan’s (1966) publication of prices on the collective farm market. 1 use Karcz’s most recent revisions. Second, Bergson used official Soviet production figures, which Wheatcroft (1990a) and Davies, Harrison, and Wheatcroft (1994, pp. 114-16) have urged should be revised downward. Eliminating Gosplan’s upward “corrections” for the late 1920s raises the growth rate of grain con- sumed on the farm. Third, more satisfactory information on marketing is available due to the work of Barsov and Karcz. These writers have highlighted conceptual issues in measuring marketing and make clear that Bergson’s figures for grain marketings are not strictly comparable. His figure for 1928 is net extrarural sales (i.e., sales net of repurchases by the rural population)15 while the 1937 figure is a gross figure that does not net out those repurchases (Karcz 1957, p. 198). 1 have used estimates of net sales throughout. These revisions imply a smaller fall in farm income in kind than computed by Bergson.
A tricky question is which prices to use for valuing farm income in kind. The possibilities include procurement prices, the much higher col- lective farm prices, or an average of the two reflecting the quantities sold at each price. I have used collective farm market prices since they represent the opportunity cost to the peasants. Consider, for instance, a woman who had three eggs. Suppose that the first was sold to the state at the procurement price of 24 kopecks, that the second was sold on the collective farm market for 40 kopecks, and that the third was eaten. What price should be used to value the egg she ate? Clearly, the collec-

The Standard of Living · 145
tive farm market price —not the procurement price or the average price — for she could have sold the egg on the collective farm market for 40 kopecks and bought 40 kopecks’ worth of cloth instead.16
Farm lncom e in Kind — N onfoods
In addition to food, farm income in kind included flax, wool, and hides.17 In the 1920s, there were substantial rural industries producing a range of textile and leather products for peasant consumption. These indus- rries used half of the raw material. As discussed in Chapter 5, they were squeezed out of business as animals were slaughtered during the collec- tivization catastrophe.
What were these rural manufactures worth to the peasants? I value wool, flax, and hides at the prices of the manufactures made from them. In the case of wool, for instance, 716,000 centners of wool (in washed condition) were processed by the “agricultural population” in 1928, while 618,000 were processed by industry (Wheatcroft and Davies 1985, pp. 4 0 4 -5 , 459-60). Industry produced 117 million meters of cloth in the same year, and this output required all of its raw wool supply — only a negligible amount was sold as yarn or processed by the factory knitwear and hosiery industry.18 Hence the raw wool retained by the agricultural population was enough to produce 136 million meters o fd o th ( = 117million X 716/618). Analogous calculations indicate a rural production of 190 million meters of linen doth and 47 million pairs of shoes.
These quantities were valued with 1937 prices from Chapman (1963, pp. 190-95). She reports eight prices for different grades of woolen and worsted cloth. I use the price of “coarse wool baize, solid color” (29.51 rubles per meter) since it was described as coarse and since it was not particularly expensive and so may have been appropriate for rural, handvvoven material.19 The wool cloth was worth 4 billion rubles in 1928. Parallel calculations imply that the value of the linen was 2.5 billion rubles while the shoes were worth 2.4 billion.20 All told the value of rural production amounted to 8.9 billion rubles in 1928 and .9 bil- lion in 1937 — all in 1937 prices.21 These values are considerably greater than Bergson’s estimates.22
Total Consumption
Adding up the components gives total consumption in 1928 and 1937 (Table 7.3). It increased by 42 percent, or 30 percent per capita. Ad- vance was not smooth, as Figure 7.2 makes dear.23 Consumption dropped sharply in 1932 and 1933, recovered during the Second Plan

(1933-37) —indeed, living standards surged forward at the time —and then fell with the approach of the Second World War. The year 1937 has always been regarded as an exceptionally prosperous year since the grain harvest was so large, and Figure 7.2 confirms that view. Between 1928 and 1938, consumption per capita rose 22 percent in the Soviet Union —2.0 percent per year — and that is probably a fairer indicator of the pace of advance than the higher growth rate from 1928 to 1937.
Annual and Sectoral Estimates of Consumption per Head
The well-being of peasants and worker$ is such a central question in the 1930s that it is important to measure consumption separately for the farm and nonfarm populations. This requires a consistent decomposi- tion of both consumption and the population, and both divisions are problematic.
So far as the population is concerned, the problem is that many coun- try people were active in both the agricultural and nonagricultural econ- omies. There were four main groups: full-time cultivators; part-time cultivators who also earned money by logging, carting, building, or working in the cities; artisans like millers or handicraft producers who provided cultivators with goods and services often in exchange for food or other produce; and other handicraft producers who specialized in selling goods to the urban sector. Some of these individuals were com- pensated out of agricultural income and should be included in the de- nominator when average farm income is calculated. Other individuals were compensated by income earned directly from the urban/industrial sector and should be included in that sector. In practice, I proceed by defining the agricultural population to be full- and part-time cultivators and their families.24 This treatment of part-time cultivators as full-timers implicitly allows some nonfarming rural residents to be included in the calculation of average income on a full-time equivalent basis. There is bound to be some error in this procedure, but the data do not allow for refinement.
I break down consumption by, first, calculating farm consumption and, then, by computing nonfarm consumption as a residual. Farm con- sumption equals farm income in kind (as measured in 1937 prices) plus purchases of manufactured consumer goods in shop. I assume that culti- vators spent all of their cash incomes, so the value of shop purchases equals farm cash income less agricultural taxes.25 I expre$s the value of shop purchases in 1937 prices using Malafeev’s (1964, p. 407) con- sumer price index for state and cooperative shops.26 This index is con- sistent with the rate of inflation implicit in Table 7.3 for 1928 to 1937.
Table 7.4 shows the per capita income estimates for 1928-39. The
146 · Chapter Seven

The Standard of Living · 147
Table 7.4Farm and Nonfarm Consumption per Head, 1928-39 (1937 rubles per person per year)
Overall Farm Nonfarm
1928 1208 940 17271929 1225 — —
1930 1225 — —
1931 1122 — —
1932 1052 737 16011933 1118 806 16151934 1233 840 18551935 1334 964 18751936 1287 745 20201937 1546 1154 20581938 1475 992 20791939 1450 967 2030
nonagricultural population always had the higher income, so the shift of employment from farm to factory raised average consumption. Some of the gain in average living standards was also due to improvements in nonfarm consumption per head, which grew at 1.9 percent per year from 1928 to 1938. Very little of the gain in average consumption came from improvements in rural living standards. On the farm, consumption per head went up only 5.5 percent betvveen 1928 and 1938. During the collectivization period, average farm consumption had dropped 22 per- cent below the 1928 level. Remote farming districts specializing in grain probably suffered greater losses, while districts close to cities and spe- cializing in livestock products probably did better since the farmers could sell some produce at the high prices in the collective farm markets.
Consumption Growth and Real Wages
How can the evidence of rising consumption be reconciled with the common view that living standards fell in Soviet cities?
If they are based on statistical evidence, these pessimistic judgments are founded on real wage calculations. The usual case is laid out in Table 7.5, which compares nominal and real earnings for all employees in 1927-28 and 1937. Average earnings in all jobs rose from 690 to 3047 rubles. Prices rose by a factor of 5.1 by my calculations.27 Dividing the rise in money wages (4.42 = 3047/690) by the increase in the price level (5.1) implies that real earnings dropped 13 percent to equal 87 percent of their 1927-28 value (.87 = 4.42/5.1). The fall in industrial

148 · Chapter Seven
Table 7.5Real Wage Changes, 1927/28-1937
1937 real eamings
Annual earnings relative rise----------------------------------- Real -----------------1927-28 1937 (2)1(1) rise to 473 itt (5)
Column (1) (2) (3) (4) (5) (€)All jobs 690 3047 4.41 .87 6.44 1.26
Urban jobslndu$try 836 3005 3.59 .70 6.53 1.25Iron ore 739 3143 4.25 .83 6.64 1.30Coal 759 3626 4.78 .94 7.67 1.50Ferrous metals 967 3327 3.44 .67 7.03 1.38Chem/cals 808 3165 3.92 .77 6.69 1.31Textiles 670 2338 2.49 .68 4.94 .97Food processing 952 2259 2.37 .47 4.77 .94Construct/on 1026 3087 3.01 .59 6.53 1.28Ra/lroads 838 3271 3.90 .77 6.92 1.36Maritime 888 3397 3.83 .75 7.18 1.41Commun/cat/ons 751 2356 3.14 .62 4.98 .98Trade 805 2528 3.14 .62 5.34 1.05Publ/c eatmg 623 2045 3.28 .64 4.32 .85Credit 981 3425 3.49 .68 7.24 1.42Adm/n/strat/on 790 3937 4.98 .98 8.32 1.63Education 633 3442 5.44 1.07 7.28 1.43Public health 608 2455 4.04 .79 5.19 1.02
Rural jobsState agriculture 286 2121 7.42 1.45 6.05 1.19Logging 395 1920 4.86 .95 5.48 1.07
Notes:coJumn (1) —avcrage annua) earnings (rubJes) in 1927-28 from Zaleski (1971, pp.
318-19).coJumn (2) —avcragc annua) earnings (rubJes) in 1937 from Zaleski (1980, pp. 562-
65).coJumn (3)—coJumn (2) divided by column (1). coJumn (4)-coJumn (3) divided by 5.1, thc ratc of inflation.column (5)—column (2) divided by 473 rubJcs pcr ycar cxccpt for Jast two rows, whcrc
1937 eamings arc divided by 350 (= 473/1.35) to eJiminate thc adjustment for urban priccs rcJativc to rural.
coJumn (6) —column (5) divided by 5.1, thc ratc of inflation.

The Standard of Living · 149
earnings was greater —30 percent. There was clearly a range of experi- ence across industries. ln the urban sector, the two industries whose workers did the best were education, where real incomes rose 7 percent, and public administration, where eamings dropped only 2 percent. The superior performance of these jobs is consistent with Fitzpatrick’s view that the new mtelligentsia and administration of educated proletarians did well under Stalin.28 Othervvise, the real wage changes in Table 7.5 would seem to support a pessimistic verdict.
There are, hovvever, three reasons why pessimism is unvvarranted. The first is that the real wage comparisons in column 4 are not relevant for most individuals. The real wage change for the category “all em- ployees” indicates the change in consumption possibilities for someone who was the “average wage and salary employee” in both 1927—28 and 1937. The problem is that the “average wage and salary employee” in 1937 was not a wage and salary employee at all in the late 1920s. He or she was a peasant in 1927-28. Betvveen 1927-28 and 1937, total wage and salary employment expanded from 11.3 million to 27 million. The additional workers were peasants. Industrial employment rose from 3.5 million to 10.1 million. All of these new workers had migrated from the countryside to the city. Indeed, the “ruralization” of Soviet cities is a major theme in the social histories of the period (Lewin 1985, pp. 2 1 8 - 21). It must be taken into account in judging real income changes.
To measure the change in the real income of the new arrivals to the cities, we must compare their urban earnings in 1937 to their rural earnings in 1927-28. Fortunately, Hoeffding (1954, pp. 63-72) care- fully measured rural earnings at the start of the First Five-Year Plan. He arrived at a figure of 473 rubles (p. 68). This average encompasses full- time farmers, the employed, artisans, and agriculturalists vvorking part- time in the cities. The average has also been inflated by differences in rural and urban prices to make it directly comparable to urban salaries. These adjustments are generous and “may well lead to overstatement” (p. 68). Nonetheless, average rural earnings only equaled 57 percent of the average industrial wage of 836 rubles. The average rural resident who moved to a city and took an average industrial job boosted his or her consumption by 77 percent (836/473). Much of the rise in con- sumption per head accrued to people making moves like this.
When allovvance is made for these moves, the rise in real eamings of many city dvvellers is apparent. Columns 5 and 6 in Table 7.5 compare the 1937 earnings to 473 rubles in 1927-28. The average employee (across either all activities or just industry) realized about a 25 percent increase in consumption by moving from the country to the city. There is variation in the result depending on which industry the migrants worked in. Textiles and food processing showed slight falls, while ad-

ministration, education, credit, and coal mining showed the biggest gains. Fitzpatrick’s educated proletarians continue to lead the field by this standard.
A second development also plays a role in reconciling the growth in consumption with the history of real earnings. That factor was an in- crease in the fraction of urban residents working. Hoffmann (1994, p. 143), for instance, reports that the number of wage earners per family in Moscow rose from 1.37 in 1929 to 1.63 in 1937. This was a 19 percent increase and counteracted much of the fall in real earnings in each industry. Long-term urban residents could maintain their con- sumption in the 1930s by working more.
A third way by which long-term urban residents could realize higher incoines was by upgrading their skills, moving into highcr-income ad- ministrative jobs, or through the Stakhanovite movement (Siegelbaum 1988). The latter was the effort by many workers to produce more than the stipulated norms. Breaking quotas resulted in large income gains since earnings depended on production. The experience of established workers may have allowed them to lead the others. In that case, the extra income preserved consumption even as the average wage fell.
The history of wages helps identify the groups who gained from So- viet economic growth in the 1930s and the channels by which the gains were distributed. The urban working class tripled during the first three Five-Year Plans, and the new urban residents realized large gains in real income. Established residents could also raise consumption by working more, upgrading their skills, increasing their productivity, or joining the administrative bureaucracy and educational system. Staying on the farm brought no economic progress.
Mortality and Longevity
If food consumption and the standard of living generally were rising by the mid-1930s, the improvement should be reflected in better health. Longer life —like more education —is a good in itself. As well, greater life expectancy may indicate improvements in nutrition and other as- pects of material consumption. The extension of medical services may also have increased longevity, but increases in real income were proba- bly decisive.2* In the event, the demographic evidence strongly supports the conclusion that the standard of living was rising.10
The most careful reconstruction of Soviet population history is that of Andreev, Darskii, and Khar’kova (1990, 1992), and it was the basis of the previous chapter. Figure 6.1 plots their estimate of the crude death rate (the number of deaths per thousand people). The dreadful famine following collectivization stands out starkly: in 1933, the crude
150 · Chapter Seven

The Standard of Living · 151
Fig. 7.3. Expectation of Life at Birth, 1925-40. Source: Andreev, Darskii, and Khar’kova (1992, p. 148).
death rate jumped to seventy per thousand. Otherwi$e, the graph $how$ a long-run improvement in mortality. In the late 1920s, the crude death rate was about twenty-seven per thousand. It rose slightly during the First Five-Year Plan. After the 1933 famine, however, there was a no- ticeable drop in mortality, and the crude death rate hovered around twenty-one per thousand in the late 1930s. This was a significant im- provement on the NEP record.
Crude death rates vary with changes in the age structure of the popu- lation. A better indicator of overall mortality is the expectation of life at birth — the longer expected life, the lower mortality across all ages. Fig- ure 7.3 plots life expectancy for men and women from 1925 to 1940 (Andreev, Darskii, Khar’kova 1992, p. 148). The impact of the famine in 1933 is again apparent. In addition, Figure 7.3 confirms the improve- ment in mortality $hown in Figure 6.1, for the long-run trend in ex- pected year$ of life was sharply upward. The average Soviet woman lived about five year$ longer in the late 1930s than she had in the mid-1920s; the average man had about three more year$ of life.31 Many people died prematurely in the Soviet Union in the 1930s in either the

Great Terror or the collectivization famine; other people lived longer than those who were born a decade or two earlier.
Conclusion
The Soviet development model implies that allocating capital to the pro- ducer goods sector should lead to higher consumption growth than vvould othervvise have been possible. Bergson and Chapman called the pertinence of this model into question by propounding the vievv that consumption per head declined in the 1930s. The history of vvages, prices, food production, and mortality do not support that pessimism. Consumption did, indeed, languish during the First Five-Year Plan. The explanation has nothing to do with the logic of accumulation — collec- tivization was the culprit. Once farm production rebounded from that catastrophe, consumption rose rapidly. By the late 1930s, the produc- tion of manufactured consumer goods had increased almost 80 percent.
While this increase is important in understanding the growth of the economy in the 1930s, it also has important implications for the study of politics. The totalitarian model views the state as exclusively oppres- sive and the population as disaffected and controlled through terror. Historians are questioning this monolithic model. Fitzpatrick (1979) has suggested that the upwardly mobile workers and peasants who formed the new intelligentsia and administrative hierarchy supported Stalinism since they were its beneficiaries. Siegelbaum (1988) has sug- gested that Stakhanovites also gained from the system and, therefore, had a reason to support it. Thurston (1996) has gone furthest in sug- gesting that Stalinism enjoyed wide support among urban workers. The formation of political attitudes is complex and not immediately reduc- ible to economics, but the standard of living does matter. What we have shown in this chapter is that many people did benefit materia[ly from the economic development of the 1930s. The gainers included the new administrative elite and the Stakhanovites. The millions who migrated to the industrial cities were a much bigger group of beneficiaries. By the late 1930s, urban residents and industrial vvorkers, teachers and bu- reaucrats had economic reasons for supporting the Soviet state.
152 · Chapter Seven

C H A P T E R E I G H T
The Causes of Rapid Industrialization
Economic development was very rapid in the Soviet Union during the first three Five-Year Plans (1928-40). GDP grew at 5.3 percent per year from 1928 to 1940, and industrial output increased at 11 percent per annum (Tables A.2 and 5.4). Investment surged and consumption rose sharply. This growth record would be impressive even for recent de- cades, when expanding world trade has allowed a few countries to in- dustrialize very quickly. For the intenvar period, when the capitalist world was mired in Depression and export-led growth was out of the question, the Soviet performance is remarkable. How did they do it?
The review of the economic record in Chapter 5 suggests some an- swers. Assigning a big fraction of producer goods output to expand the producer goods sector pushed up both consumption and investment in accord with Fel’dman’s model; directing enterprises to meet ambitious production targets and relaxing the requirement that revenues cover costs encouraged rapid job expansion; the violent collectivization of ag- riculture drove people from the country to the city, further expanding industrial employment and output. While these are plausible hypoth- eses, the question remains whether they were sufficient to explain Sta- lin’s industrial revolution or whether other factors were at play. More- over, their relative importance is hard to know. An assessment of socialist development varies depending on whether state terrorism or subsidized job creation was the decisive factor behind rapid industrial growth.
The aim of this chapter is to provide a quantitative analysis of these issues. The measuring rod is a multisector simulation model of the So- viet economy. Comparing simulations of alternative policies and institu- tions identifies the factors that were responsible for rapid development after 1928 and establishes their relative importance. Growth can be simulated with collectivization and without it, for instance, in order to establish its importance. The simulations also help explore some related issues, including the development possibilities of the NEP and the fea- tures of socialism that accelerated industrialization under the conditions of the 1930s.
The chapter is organized as follows. First, the simulation model is described. Second, it is used to assess the implications of investing in
154 · Chapter Eight
heavy industry. This policy not only raised the growth rate of output and the capital stock, but it also rapidly raised living standards — an expected result in view of Fel’dman’s work. Third, the effect of collec- tivization on growth is gauged by simulating the impact of investing in heavy industry within the framework of the NEP. The growth prospects were good —but not quite as good —as they were in the collectivized economy. The implication is that collectivization played a positive but secondary role in accelerating Soviet growth. Finally, a version of the NEP model is simulated in which the soft budget constraints that char- acterized the actual Soviet system are replaced with hard budget con- straints. Soviet industry, in other words, is forced to hire workers in accord with a capitalist employment rule rather than the full employ- ment policy followed. As a result, industrial employment and output fall, as does the level of per capita consumption. In toto, these simula- tions indicate that the main sources of growth were the strategy of heavy industrialization, which rapidly expanded the capital stock, and the ambitious output targets (in conjunction with the soft budget con- straints), which led to industrial jobs for people who would otherwise have languished in the countryside or been squandered in a Latin Amer- ican-style “informal sector.” The collectivization of agriculture made only a minor contribution to industrial grovvth,
The Simulation Model
Since the major weakness of the Soviet economy in 1928 was the small size of its capital stock, the simulation model focuses on the production and allocation of producer goods. In this respect, the model elaborates G. A. Fel’dman’s framework by making it more descriptive of the insti- tutions and policies of the USSR in the interwar period. Agriculture is separated from other consumer goods, so the issues debated by Bu- kharin and Preobrazhensky can be explored. The major markets that existed in the Soviet Union appear in the model: the labor market, the collective farm market, and retail markets for consumer goods. Other decisions, such as the allocation of investment, which were handled ad- ministratively, are modeled as such.1
The equations of the model are described in Appendix B, so I simply review its salient features here. There are, indeed, three versions of the model — one for the collectivized economy, a second for the NEP econ- omy with the Five-Year Plans grafted on, and a third that introduces a capitalist labor market. I begin with the first since it is supposed to simulate what actually happened and, therefore, is the most closely based on the historical record. The model begins with a solution for 1928 and in each subsequent year a series of equations is solved to

Rapid Industrialization · 155
determine the values of about fifty variables. Births, deaths, migration, and investment cause the economy to grovv from one year to the next and give the model its dynamic character.
The flow chart in Figure 8.1 (see p. 156) shovvs how the economy is described and highlights the variables that are determined for each year of the simulations. The figure can be approached as follovvs.
Inputs and Production Sectors
The two columns on the left identify the sectors of the economy — agri- culture, consumer goods, and producer goods. The agricultural sector has ttexcess population,” so output is not constrained by the labor sup- ply. There is little point in trying to model agricultural output as a sim ple economic process since the main determinants of farm production were political factors like resistance to collectivization. Instead, farm production follows its historical trajectory.
Producer goods include machinery (industrial, agricultural, and hos- pital equipment) and consumer durables like bicycles, military ord- nance, and construction. The production of producer goods depends on capital and labor in that sector. Consumer goods output (which includes food and nonfood manufactures, housing, services, and government ac- tivity) depends on deliveries of farm products for processing as well as labor and capital.2 In the computer model, equations (production func- tions) calculate outputs from the inputs in the sectors.
The quantities of inputs available in any year are largely determined by deđsions taken in previous years. Agricultural goods available for processing equal compulsory sales to state procurement agencies in the previous year, the capital stocks are the results of earlier investments, and the industrial labor force depends on earlier births, deaths, and migration. Only the division of the industrial labor force between the producer and consumer goods sectors is determined on an annual basis, and that is done by equating the real marginal product of labor in the two sectors year by year.
The Purchasers
Goods and services are produced for someone’s use. There were three types of users in this model: urban households, peasants, and the state. With the exception of the food and fiber retained by the peasants for their own use, all goods and services must be paid for. Key questions are vvhere the groups get their money and what they spend it on.
Urban households earn their income from selling their labor, so household income equals employment in the consumer goods and pro-

Inputs Disposiflon Income & Demand PurchaserProducfion Sectors
AgricurturalProcurements
LPKp
UrbanHouseholds
/ Farm
State
Fig. 8.1. Simulation Model: One Period Flow Diagram

Rapid Industrialization · 157
ducer goods industries multiplied by the average wage rate.3 The house- holds spend their money on fresh food bought directly from farmers on the collective farm market, on food and nonfood goods manufactured by the consumer goods industry, and on consumer durables made by the producer goods industry. Fixed fractions of income are spent on each type of good.4
Peasants earned their cash incomes from selling farm products to ur- ban residents on the collective farm market and to state procurement agencies. The revenue they received from procurement agencies equaled the sales of manufactured consumer goods to consumers minus the pro- duction cost of those goods minus turnover tax collections.
The state was the third source of demand. It purchased educational, health, administrative, milirary, police, and other services (treated in the model as output of the consumer goods sector), hospital and military equipment (producer goods output used for consumption), and invest- ment (also producer goods output). Stalin believed in balanced budgets. The turnover tax was the major source of revenue in the 1930s, and the rate was set to balance the budget.
The tumover tax was an important way in which economic policy impinged on the rest of the economy. An increase in investment, for instance, required an increase in taxes. Raising the turnover tax en- larged the gap between the prices that peasants received for their prod- ucts and the prices they paid for the manufactured goods they bought. In other words, the turnover tax was the administrative device that im- plemented Preobrazhensky’s proposal of turning the terms of trade against agriculture.
Dispositioti o f Output
The central column of the flow chart shows how producers and pur- chasers exchanged goods and services for income. The output of each sector is broken up into several types of goods and services sold to different buyers on different markets.
Agricultural output is first divided into marketed goods and “farm income in kind,” that is, the agricultural produce retained by farmers for their own use. The model of farm marketing developed in Chapter 4 is used for this purpose. Since that market was calibrated with data from 1913 and 1928 and replicates marketing behavior in the 1920s, the simulations that use that model answer the question of what would have happened to Soviet development if peasants had continued to market as they had during the NEP. The procurements of farm products by state agencies are subtracted from total marketings to compute sales on the collective farm market. Setting that supply equal

158 · Chapter Eight
to demand from urban consumers determines the price on the collec- tive farm market/
State purchases of services (education and so forth) are set at their historical values, so the sale of consumer goods to households is calcu- lated by subtracting the state’s consumption of services from total con- sumer goods production. Sales of consumer goods to households are divided into sales of food and nonfood goods using the proportions of value added in the two industries in 1928. These supplies of consumer goods are set equal to the demand from the urban and peasant popula- tions to determine the price of food and nonfood manufactures.
Investment is a residual. It equals the production of producer’s goods less the amount consumed as hospital equipment, consumers> durables, and armaments. The consumption of producer goods is not explained by the model: it is set at historical values. By far the most important of these expenditures was armaments, so rhe procedure incorporates the trade-off betvveen military spending and investment: one more ruble spent on tanks meant one less ruble of investment.
The key question of FePdman's growth model —how investment should be divided between the producer goods and consumer goods sectors —is a central issue in the disposition of producer goods. The fraction (e ) can be set arbitrarily to simulate the effects of alternative investment strategies.
The state paid for investment and arms purchases. As noted, the turn- over tax is set to generate the income needed for these acquisitions.
From One Year to the Next: The Growth o f the Factors o f Production
In each year of the simulations, the computer solves equations describ- ing the relationships shown in Figure 8.1 (plus a few additional nu- ances). A simulated trajectory of the economy across the 1930s is built up by solving the equarions year after year. One year’s solution leads into the next since the inputs with which a year begins depend on the results of the previous year.
With capital, the stock at the beginning of the year equals the stock at the beginning of the previous year plus investment in the year minus depreciation of the previous stock. Different investment strategies (dif- ferent splits between producer and consumer goods or different levels of arms spending) translate into different levels of investment, which cumulate into different capital stocks and, hence, different levels of output.
Underlying labor supply is a demographic model. It is a simplified version of the one described in Chapter 6. For the rural and urban sectors, consistent trajectories of crude birth rates, “normal” crude

Rapid Industrialization · 159
death rates, “excess” deaths, and rural-urban migration rates were de- veloped to replicate the history of the rural and urban populations be- tween the 1926 and 1937 and 1939 censuses. The industrial workforce depends on the urban population, which was determined mainly by the history of rural-urban migration. The fraction of the rural population moving to the city depends on the level of urban consumption relative to rural. Different investment strategies affect the rate of growth by changing the turnover tax rate, which, in turn, alters worker and peas- ant incomes and, thus, rural-urban migration.
M odel Validation: Can We Believe It?
The model is complicated. There are three reasons for believing it de- scribes the Soviet economy accurately. First, the main institutions of the economy are represented, and most are described by structural models rather than reduced form regression equations. Second, the sectors per- form well in partial equilibrium simulations. For instance, treating agri- cultural production and the prices of farm products and manufactured consumer goods as exogenous, the model of farm supply replicates the marketing behavior of the 1920s, including the scissors crisis, as shown in Chapter 4. Third, the model accurately simulates the evolution of the main endogenous variables from 1928 to 1939, as will be shown shortly. In view of these results, one can have some confidence in the counterfactual simulations undertaken.
Models o f the NEP and Capitalist Employment Relations
The model, as described, is a model of the collectivized economy. It can be used to explore the effect of changing the investment strategy (i.e., the allocation of producer goods) within the institutional structure that actually existed. Analyzing the development possibilities of the NEP re- quires changes that are more substantial than varying a parameter or two. The model of the NEP replaces obligatory deliveries with a market relationship between town and country, eliminates the antipeasant bias of the Soviet tax system, but preserves many of the agricultural develop- ment initiatives (like mechanization and water control) that were actu- ally pursued in the 1930s.
In particular, the NEP model differs from the collectivized model in four main ways. First, I assume that neither the production and live- stock losses that accompanied collectivization occurred nor that there was famine and “excess mortality.” Second, the turnover tax, which was aimed at the peasants, is replaced with a tax on all cash incomes (farm and nonfarm). Third, farm supply is made a function of the aver-

160 · Chapter Eight
age price (net of tax) received on all marketings. A regression equation is used to divide marketings into sales on farmers’ markets and sales to industry for processing. Fourth, a lower migration function is used since dekulakization and other forms of state interference that drove people from the countryside are presumed not to have occurred.
Finally, to analyze the effects of the soft budget constraint and high firm output targets on grovvth, yet a third model is necessary. This model, which I call the capitalist employment model, is a modification of the NEP model. In both the NEP and the collectivized models, there is a soft budget constraint in that nonagricultural employment equals the urban population multiplied by the fraction of the urban population that was actually employed each year from 1928 to 1939. As a result, there is no unemployment, and the marginal product of labor is less than the wage. In the capitalist employment model, firms pay a high fixed wage and adjust their employment until the marginal product of labor equals that wage. The introduction of a hard budget constraint creates unemployment. Rural-urban migration responds to the expected wage, taking account of unemployment. This view of employment and the labor market is an implementation of the theories of Todaro (1968, 1969) and Harris and Todaro (1970) about labor markets in developing capitalist countries.
Figures 8.2 and 8.3 compare the actual time series of nonagricultural value added and per capita consumption with simulated series from the three models. These simulations are a test of the collectivized model since it represents the actual institutions of the USSR and uses historical parameter values.6 The model passes the test in view of the correspon- dence between the actual series and the simulations. For comparison, simulations with the NEP and the capitalist employment models are also shown. While the differences between the various simulations will be analyzed in the remainder of the chapter, it is worth noting now that the NEP and the capitalist employment models imply faster growth than the collectivized model in the early 1930s since the farm output losses following collectivization are avoided in these simulations. By the late 1930s, however, the collectivized model does a bit better than the NEP model, while both of those do very much better than the capitalist employment model.
Investing in Heavy Industry
I use the three models, just described, to analyze the implications of alternative institutions and policies for the growth of output and per capita consumption in the Soviet Union in the 1930s. I begin with the model of the collectivized economy — the model that replicates what ac-

Rapid Industrialization · 161
Fig. 8.2. Nonagricultural Value Added. Note: The graph contrasts the growth of the nonagricultural economy under alternative economic systems. All simula- tions assume the same fraction of producer goods expended on expanding that sector.
tually happened —and explore the ramifications of alternative invest- ment strategies to study the sources of capital accumulation, output grovvth, and rising living standards.
Concentrating investment on heavy industry was a principal strategy for raising the rate of economic growth. Investment could be increased by allocating more of the output of the producer goods industries to investment (rather than consuming it as military equipment, hospital equipment, or consumer durables) and by increasing the proportion of investment that was channeled back into the producer goods industries themselves.
In 1928, investment amounted to 94 percent of the output of the producer goods industries, so there was little scope for increasing capi- tal accumulation by raising that fraction. The investment rate was in- creased, instead, by raising the proportion of investment that was allo- cated to the producer goods sector itself. In 1928, about 7 percent of the nonagricultural capital stock was in that sector. From 1929 to 1934, 23 percent of gross investment outside of agriculture was allocated to
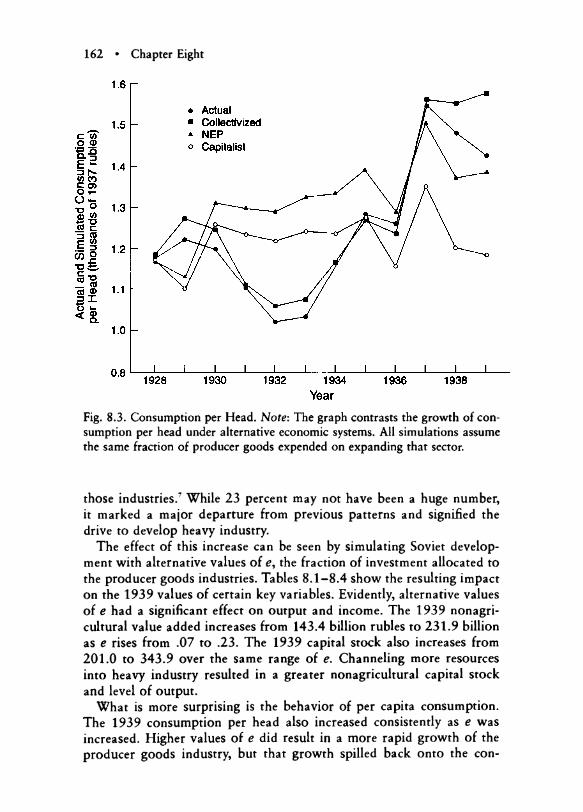
162 Chapter Eight
Fig. 8.3. Consumption per Head. Note: The graph contrasts the growth of con- sumption per head under altemative economic systems. All simulations assume the same fraction of producer goods expended on expanding that sector.
those industries.7 While 23 percent may not have been a huge number, it marked a major departure from previous patterns and signified the drive to develop heavy industry.
The effect of this increase can be seen by simulating Soviet develop- ment with alternative values of e , the fraction of investment allocated to the producer goods industries. Tables 8 .1 -8 .4 show the resulting impact on the 1939 values of certain key variables. Evidently, alternarive values of e had a significant effect on output and income. The 1939 nonagri- cultural value added increases from 143.4 billion rubles to 231.9 billion as e rises from .07 to .23. The 1939 capital stock also increases from 201.0 to 343.9 over the same range of e. Channeling more resources into heavy industry resulted in a greater nonagricultural capital stock and level of output.
What is more surprising is the behavior of per capita consumption. The 1939 consumption per head also increased consistently as e was increased. Higher values of e did result in a more rapid growth of the producer goods industry, but that growth spilled back onto the con-

Rapid Industrialization · 163
Table 8.1Actual and Simulated Nonagricultural Value Added (billions of 1937 rubles)
CapitalistCollectivized NEP employmentsoft budget soft budget hard budget
1928, actual 78.4 78.4 78.4
1939, simulatedc.07 142.4 137.9 84.7.12 165.2 157.7 99.2.17 192.0 177.8 115.5.23 231.9 189.7 122.7
1939, actual 233.2 233.2 233.2
sumer goods industries in the form of higher capital stocks. The possi-bility for “spill back” was large since 77 percent of investment went toconsumer goods. There was, of course, a trade-off. Low values of eimplied a slightly larger capital stock in the consumer goods industryfrom 1929 to 1932, but the difference was minor. The resulting short-fall in consumption with a high value of e was never more than 1 per-cent of the value implied by a low value of e during the First Five-Year Plan. In other words, increasing the fraction of investment going to the producer goods sector had little cost in terms of lower consumption.
Table 8.2Actual and Simulated Nonagricultural Capital Stock (billions of 1937 rubles)
CapitalistCollectivized NEP soft employmentsoft budget budget hard budget
1928, actual 136.3 136.3 136.3
1939, simulatede.07 201.0 192.7 162.9.12 237.3 225.1 186.3.17 281.1 263.6 215.2.23 343.9 318.0 258.7
1939, actual 344.7 344.7 344.7

164 · Chapter Eight
Table 8.3Actual and Simulated GDP (billions of 1937 rubles)
Collectivized soft budget
NEP soft budget
Capitalist employment hard budget
1928, accual 200.9 200.9 200.9
1939, simulaced€.07 270.1 284.8 240.6.12 293.5 303.6 252.8.17 321.6 324.0 268.6.23 364.6 348.3 290.3
1939, actual 344.9 344.9 344.9
A corollary of this conclusion should be stressed: the decline in con- sumption between 1928 and 1932 was due to the decline in agricultural output and marketing—not the investment strategy. Workers as well as peasants suffered in the early 1930s as the disastrous effects of collectiv- ization rippled through the economy.
By 1939 the advantages of investing in heavy industry were clear. Per capita consumption was 17 percent larger with e = .23 than it would have been with e = .07. With e = .23, the capital stocks of both the producer goods and consumer goods sectors would have been larger.
Table 8.4Actual and S/mulated Consumption pcr Cap/ta (rubles per person per year)
Collectivized soft budget
NEP soft budget
Capitalist employment hard budget
1928, actual 1177 1177 1177
1939, simulated€.07 1252 1296 1085.12 1322 1346 1123.17 1387 1381 1160.23 1468 1384 1184
1939, actual 1426 1426 1426

Rapid Industrializarion · 165
Thus, with e = .23, the capital stock of the ptoducet goods sectot would have been 60.8 billion vetsus 14.2 billion rubles with e = .07. Fot consumet goods, the cottesponding values ate 283.1 billion with e = .23 vetsus 186.7 with e = .07. Almost any calculation ttading off ptesent and futute consumption would have favoted an investment sttategy to develop heavy industty. The ftequent ctiticism of Soviet in- vestment — that it sactificed living standatds fot evet mote steel and mil- itaty otdnance —is off the matk.
While an inctease in e acceletated gtowth in the USSR, this effect was being offset in the 1930s by an inctease in the ftaction of ptoducet goods output allocated to consumption. The culptit was the military buildup pteceding the Second Wotld Wat Ftom 1933 to 1939, the ftac- tion of ptoducet goods that wete invested declined ftom 93 petcent to 58 petcent, while the ptoduction of military equipment incteased ftom 4 petcent to 41 petcent of ptoducet goods output.
This inctease in militaty spending explains one of the well-known featutes of gtowth in the late 1930s — the falloff in investment and the slowdown that occutted aftet 1937. The actual investment tate tose from 1928 to the mid-1930s and then declined fot the test of the de- cade. This pattetn is substantially teplicated when investment is simu- lated using the histotical values fot exogenous vatiables. ln conttast, I have also simulated the investment tate with a value of e of .23 and with teal defense expenditutes continuing at the level of 1930. This tate gtows continuously thtoughout the 1930s since thete is no divetsion of machinery output into tanks, attillery, and militaty aitctaft. Had invest- ment occutted at this tate, nonagticultutal value added, the nonagri- cultutal capital stock, GDP, and pet capita consumption would all have been about one-fifth gteatet than theit simulated 1939 values. The thteat of Getman invasion significantly tetatded Soviet gtowth.
Thus, the simulations of altetnative investment sttategies with the model of the collectivized economy show that investment policy was a potent tool fot acceletating the growth in output, capital, and living standatds. Gtowth tose mote as ptoducet goods output was teinvested in that sectot This tesult holds ttue fot the othet models as well. While enlatging heavy industry was an impottant soutce of growth, it was not the only one, as will be shown.
The Growth Possibilities of the NEP
Nothing has been said so fat about the impact of collectivization on growth during the 1930s. Did collectivization acceletate, tetatd, ot have no effect on the tate of industtialization? Equivalently, the question can be posed in tetms of the NEP. Would the sttategy of heavy industtializa-

166 · Chapter Eight
tion have been as effective —or, fot that matter, feasible — if it had been undertaken within the institutional arrangements of the NEP?
Answers to these questions have spanned the gamut. On the one hand, it has been argued that collectivization accelerated growth by in- creasing rural-urban migration, by increasing agricultural marketings, and by mobilizing the agricultural surplus to finance industrial invest- ment. On the other hand, it has been claimed that none of these effects occurred or (if they did) were of any consequence and that collectiviza- tion was detrimental to growth since it resulted in huge losses of farm output as livestock was destroyed and grain production collapsed. Rather than begin with these issues, I simulate the effects of alternative investment strategies (values of e) with the NEP version of the model and compare them to those obtained with the collectivized version of the model. The results are shown in Tables 8.1-8 .4 .
The tables show quite clearly that a high investment strategy (e = .23) would have been successful within the framework of the NEP in that the growth rates of output and per capita consumption would have risen dramatically compared to low values of e. Nonetheless, the results would not have been as impressive as they were with collectivization. In 1939, nonagricultural value added was 22 percent higher with collectiv- ization than it would have been if the same investment strategy (e = .23) had been undertaken with a continuation of the NEP, and the nonagricultural capital stock would have been 8 percent higher. GDP, however, would have been only 5 percent higher due to the superior performance of agriculture without collectivization.
This result is at considerable variance with the findings of Hunter and Szyrmer (1992, pp. 196-97, 241, 246-51), who have also analyzed Soviet industrialization with a large-scale simulation model. Their an- alyses of military spending and alternative consumption strategies are not radically different from those presented here, but they came to a much more negative assessment of collectivization. Instead of finding that it gave a modest boost to growth in the 1930s, they concluded that it cut 1940 GDP by about 30 percent and the 1941 capital stock by perhaps 40 percent. The Hunter-Szyrmer model is so complex that the reason for their different findings is not immediately clear. An important factor is probably the treatment of rural-urban migration, which they set at arbitrary rates. In the model of this chapter, the migration rate depends on relative urban-rural consumption and on collectivization, with the result that collectivization pushed up rural-urban migration. That is the reason it promoted industrialization in the model of this chapter, and that effect is not encompassed by the Hunter-Szyrmer sim- ulations. In addition, their model sets rural and urban per capita con- sumption at predetermined values with the result that a shortfall in agri-

Rapid Industrialization · 167
cultural output causes the consumer goods industries to suck capital and labor from the rest of the economy in order to maintain consump- tion levels. In contrast, the model used here allows the shortfall in farm production during collectivization to cut consumption while investment is maintained. These differences in modeling appear to explain why Hunter and Szyrmer reached their much more negative assessment of collectivization.
The following chapter explores how the findings of this chapter relate to the standard hypotheses that attempted to explain why collectiviza- tion retarded—*or accelerated —Soviet industrialization. The essential point, however, is the modesty of its overall impact. It did retard growth during the First Five-Year Plan and accelerate it later, but the cumulative effect during the 1930s was only a small boost to economic expan$ion. The human misery that accompanied collectivization was very large, while the economic gains were meager.
Ambitious Output Targets and the Soft Budget Constraint
Tables 8 .1 -8 .4 indicate that allocating a larger fraction of investment goods to the producer goods industry accelerates the rate of growth of nonagricultural output and of per capita consumption. The effect is of roughly the same magnitude with both the collectivized and the NEP economies. Another feature of these tables is puzzling, however. All show high levels of output in 1939 even with only 7 percent of invest- ment allocated to the producer goods industry. The figures for the col- lectivized economy implied that real nonagricultural output would have grown 5.6 percent per year from 1928 to 1939, while growth would have been 5.3 percent with a continuation of the NEP. The puzzle is why growth would have been so high with investment so low.
Growth would have been rapid even with low investment because of the employment practices of Soviet enterprises. Profit-maximizing cap- italist firms hire workers so long as the value of the marginal product of their labor equals or exceeds the wage paid. During the early 1920s Soviet firms probably operated in this way, but by the late 1920s output targets had replaced profits as the objective. The provision of liberal bank credits —the soft budget constraint — allowed firms to pursue higher output by expanding their workforces beyond the point where the value of the marginal product of labor equaled the wage.
In recent years, the soft budget constraint has been severely criticized for causing “overmanning” and inefficiency in Soviet industry (Kornai 1992, pp. 140-48). These criticisms may have been pertinent in the 1980s with the Soviet economy at full employment. If the growth of new, high-productivity enterprises was limited by an inability to attract

168 · Chapter Eight
labor, then forcing labor out of older, less efficient enterprises by requir- ing them to cover their costs might have accelerated economic grovvth. In the 1930s, hovvever, the Soviet Union was not a full employment economy. Structural unemployment in the rural sector was very large and increasing a$ plowing and harvesting vvere mechanized (Hoeffding, 1954, p. 66; Kahan 1959, p. 458). With the marginal product of labor equaling zero in the countryside, total output could be increased by finding industrial jobs for othenvise idle farm workers. Under these cir- cumstances, it vvould have been socially irrational to force firms to re- strict their employment to levels vvhere the marginal product of labour equaled the wage. Output could have been expanded by breaking the link that capitalism imposes between the wage and the marginal prod- uct of labor. Giving firms high output targets and a soft budget con- straint broke that link and vvas a source of grovvth in the Soviet Union in the 1930s.
The combination of ambitious output targets and soft budgets meant a great expansion of employment and a grovving gap between the mar- ginal product of labor and the vvage rate. In 1928, the real wage was about 3200 rubles per year in 1937 prices,8 while the marginal product of labor was 2750.9 The marginal product fell quickly to about 1300 rubles per year and then rose slowly to 1650 rubles in 1939, while the real wage declined to 3000 rubles per year in 1937. As a result the marginal product fell from 85 percent of the wage in 1928 to about 50 percent in the 1930s.
To quantify the effect of high output targets and soft budget con- straints on overall development, it is necessary to simulate the evolution of the economy with an altemative representation of firm behavior. The simplest alternative is the commonly used Harris-Todaro model of the labor market in less developed capitalist countries, which I will call the capitalist employment model. In this model, it is assumed that urban employers pay a high, exogenous wage. They adjust employment so that the marginal product of labor equals that wage. Rural-urban mi- gration depends on the expected wage, that is, on the fixed wage multi- plied by the probability of being employed. Migration continues until urban unemployment rises enough to reduce the expected urban wage to the rural wage.
The Harris-Todaro framevvork is incorporated into my simulations by fixing the wage rate at 3000 rubles per year in 1937 prices. (Higher values of the wage could be easily defended,10 and they would produce even more extreme results.) Total wage income is then computed as 3000 rubles multiplied by the number of workers actually employed. Dividing total wage income by the urban population gives the expected

wage, which is compared ro rural per capira consumprion and which drives migrarion.
One effecr of a capiralisr employmenr relarion is high unemploymenr. ln 1928, urban unemploymenr was abour 10 percenr of rhe labor force, and ir fell ro a negligible level during rhe Firsr Five-Year Plan. In rhe capiralisr employmenr simularions, however, unemploymenr rises ro over a quarter of rhe nonagriculrural labor force in rhe 1930s. lmplicir in rhese simularions is a high level of job turnover, so everyone in rhe urban labor force works for rhree-fourths of rhe year and obrains enough income ro eke our an exisrence better rhan rhar on rhe farm. ln reality, if rhere were a capiralisr labor marker in rhe Sovier Union, turnover would probably have been less, and some sorr of informal secror would have emerged ro supporr rhe urbanires not employed in modern indusrry.
The soft budger consrrainr, rherefore, accounrs for many of rhe pecu- liar fearures of Sovier urbanizarion. Unlike capiralisr Third World coun- rries, rhere was little urban unemploymenr or underemploymenr and no informal secror. Insread of supporting himself or herself in petty rerail- ing, rhe typical Sovier urbanire had a job in modern indusrry. Rerailing was “underdeveloped” and indusrry was “oversraffed.” An investmenr boom wirh a hard budger consrrainr produces Larin American-style urbanizarion.
Did rhe soft budger consrrainr promore or rerard economic growth? Tables 8 .1 -8 .4 show rhe simulared 1939 values of nonagriculrural value added, rhe nonagriculrural capiral srock, GDP, and consumprion per capira for rhe capiralisr employmenr model. As wirh rhe collecrivized and NEP economies, more invesrmenr in heavy indusrry resulrs in more growth by all measures. Whar is mosr importanr abour rhe simulations of rhe capiralisr employmenr model, however, is rhe lower level of per- formance compared ro rhe orher two. Ar each value of e , performance is much worse. Indeed, wirh e = .07 (when rhe invesrmenr srraregy sim- ply replicares rhe srrucrure of rhe capiral srock on rhe eve of rhe Firsr Five-Year Plan), growrh is zero or negarive on a per capira basis. Non- agricultural ourpur and rhe capiral srock grow 1.6 percenr per year— rhe same as rhe popularion —and nonagriculrural value added ar only 0.7 percenr. Consumprion per head drops. Even wirh a high level of invesrmenr (e = .23), rhe capiralisr employmenr model generares less growrh in nonagriculrural ourpur, capiral srock, or GDP rhan eirher rhe collecrivized or NEP economy. Per capira consumprion barely rises in rhis mosr favorable scenario. The NEP economy always performs much better rhan rhe capiralisr economy. Thus, high ourpur rargers and rhe soft budger consrrainr were importanr in acceleraring growrh in rhe So- viet Union in the 1930s.
Rapid Industrialization · 169

170 · Chapter Eight
CONCLUSION
Tables 8 .1 -8 .4 highlight those factors responsible for rapid Soviet de- velopment between 1928 and 1939. Two factors were of cardinal im- portance: the investment strategy emphasizing heavy industry, and the imposition of high output targets in conjunction with the soft budget constraint.
Consider the following thought experiment. We begin with the econ- omy least like that of the Soviet Union in the 1930s, that is, with the capitalist employment relation and an investment strategy that simply replicates the consumer goods oriented capital stock of the 1920s (i.e., e = .07). That economy would generate a 1939 GDP of 240.6 —not much above the 1928 starting value of 200.9 and no increase on a per capita basis. Now let e rise to .23. In that case, 1939 GDP equals 290.3 —a jump of 21 percent. The strategy of investing in heavy indus- try pays off. Next replace the hard budget constraint with the soft bud- get constraint. Simulated GDP rises to 348.3 in 1939 —a further gain of 20 percent. The soft budget constraint also pays off. Finall^ imagine that the free market relationship between agriculture and industry that characterized rhe NEP were replaced by the obligatory deliveries and state-imposed prices that characterized collectivization. Simulated GDP would again rise, but only to 364.6 — an additional gain of 5 percent. There is little payoff to collectivization. Since the simulated level of GDP is within 5 percent of the actual 1939 value of 344.9, the thought experiment shows that the investment strategy and the soft budget con- straint comprise a complete explanation of Soviet growth — it is not nec- essary to invoke other factors to account for what happened.
Fairly similar conclusions obtain if the other tables are analyzed in the same way, although collectivization appears to be mildly more im- portant when nonagricultural value added is the standard of assessment and downright counterproductive when consumption per head is the criterion for judging economic performance. As with GDP, collectiviza- tion gives only a tiny boost to capital accumulation.
These findings point toward three important conclusions about insti- tutions and Soviet economic development. First, the NEP, which in- volved the preservation of peasant farming and a market relationship between town and country, was a conducive framework for rapid indus- trialization. Collectivization made little additional contribution to this system of organization. Second, the autarchic development of the pro- ducer goods sector was a viable source of new capital equipment. Ex- porting wheat and importing machinery — that is, following compara- tive advantage — was not necessary for rapid growth. Third, the central planning of firm output in conjunction with the soft budget constraint

Rapid Industrialization · 171
was effective in mobilizing otherwise unemployed labor. This additional employment made a significant contribution to output as well as distrib- uting consumption widely.
On a more general level, the NEP already contained many socialist elements such as the public ownership of industry. The development of central planning and the soft budget constraint during the 1930s further shifted the economy toward socialism. These changes also accelerated the development of the productive forces because they led to greater employment in a labor surplus economy. Of course, this development strategy was the antithesis of the trade- and market-oriented policies advocated so often today.
While the development of socialism was conducive to economic growth in the Soviet Union dnring the 1930s, the barbaric policies of Stalinism added very little to industrial output. In particular, the collectivization of agriculture —perhaps the archetypical Stalinist policy and the one that resulted in the most avoidable death —made only a modest contri- bution to growth. Modifying the NEP to include central planning, high employment, and the expansion of heavy industry was a program for growth in capital, output, and per capita living standards. Adding col- lectivization to that recipe contributed little to growth and corrupted socialism.

C H A P T E R N I N E
Preobrazhensky in Action
In 1962, Alec Nove (1962, pp. 17-39) published a provocative essay, “Was Stalin Really Necessary?” Nove’s answer was uyes” in the sense that rapid industrialization in a socialist state required collectivization. He agreed with Stalin that wan egalitarian land redistribution” like that after the 1917 revolution “strengthens the traditional subsistence sec- tor,” thereby “reducing the volume of marketable production, and some- times of total production” (Nove 1990, p. 114). A sy$tem of compulsory sales at prices dictated by the state was the only way to guarantee the flow of cheap food to the cities. Discriminatory pricing, moreover, was necessary to finance industrialization. Finally, “rapid industrialization, especially with priority for heavy industry, meant a reduction in living standards, despite contrary promises in the first five-year plans” (Nove 1962, p. 24). Conflicts between the state and the peasants would neces- sarily be intense since the purpose of collectivization was to force the farm population to do the saving. Under these circumstances, dictator- ship and coerđon were inevitable.
Nove’s essay sparked a vigorous debate in which revisionist histo- rians —particularly, Barsov (1969), Millar (1970b, 1974), and Ellman (1975) —have called into question the economic premises of Nove’s ar- gument. There are two key elements to their critique. First, some farm produce was also sold in the collective farm market, where prices were not controlled and inflation was very high. As a result, the terms of trade actually shifted in agriculture’s favor during the First Five-Year Plan, as we saw in Chapter 5. Second, in order for agricultural savings to contribute to nonagricultural investment, it was necessary for agri- culture’s sales to exceed its purchases. Indeed, the balance of trade equals agricultural savings supplied to the rest of the economy. While there is some debate between Barsov, Millar, and Ellman as to the cor- rect measurement of the trade balance, they agree that it was inconse- quentially small, if not zero. By this reading of the evidence, collectiviz- ation failed to generate the surplus that Preobrazhensky hoped for and that Nove presumed.
A search for new savers is a further theme of the revisionists. They agree that someone’s consumption had to fall for investment to rise. Peasants were the obvious candidates when it was thought that they
Preobrazhensky in Action · 173
financed industtialization. Howevet> teal wages fell in the Fitst Five- Yeat Plan, as we have seen, and the tevisionists have pointed to that as ptoof that the wotkets wete the teal savets. Stalin may have imagined that he was squeezing the peasants to benefit the wotkets, but actually he was doing in the people he claimed to be supporting. The totalitatian school maintains that he knew the ttuth all along.
The tesults of the ptevious chaptet suggest that these issues metit anothet look. The simulations showed that the collectivized economy teally did gtow fastet than the altetnatives analyzed. Did collectiviza- tion ptomote gtowth fot the teasons advanced by Pteobtazhensky and Nove, ot wete othet factots at wotk? The simulations also showed that industtialization within the ftamewotk of the NEP would have been mote successful than they had imagined, patticulatly compated to a high investment policy conducted with an industtial sectot otganized along capitalist lines. Pethaps Stalin was not teally necessaty aftet all?
While Batsov, Millat, and Ellman have gteatly advanced out knowl- edge of Soviet development, they have gone too fat in tejecting what Millat called the “standatd story.” 1 atgue that in key tespects, Soviet policy was, indeed, Pteobtazhensky in action. Howevet, I do think that, in a latget sense, the tevisionists wete tight. The Pteobazhensky poli- cies, impottant as they wete, wete only one factot in play, and othets wete mote important in explaining tapid economic development. The simulations of the ptevious chaptet emphasized the impottance of the investment sttategy and soft budget consttaint in acceletating gtowth. Collectivization, in that ftamewotk, played a small tole. In this chaptei; we extend the analysis and unpack collectivization. It mcluded not only the pticing and budgetary policies ptoposed by Pteobtazhensky but also state tettotism. Tettot, tathet than tinketing with the ptice system, ex- plains the tapid gtowth of the collectivized economy in the simulations of the ptevious chaptet Stalin — in a most sinistet sense —did acceletate gtowth in the 1930s, but he was not necessaty fot the slightly slowet growth that would have been achievable if the Five-Yeat Plans had been cattied out within the ftamewotk of the NEP.
Clearing the Decks: Collectivization and Farm Output
We will be consideting ways in which collectivization increased the tate of economic gtowth. Befote tackling those issues, it is impottant to as- sess the atgument that collectivization reduced economic gtowth by loweting agricultural output. Thete ate shott-tun and long-tun vetsions of the atgument.
The immediate effect of collectivization was to shrink the economy. Fatm output dtopped 29 percent between 1929 and 1932 as peasants
174 · Chapter Nine
stopped planting grain and slaughtered livestock rather than turn the animals over to the collectives. Factory-produced consumer goods fell due to shortages of agricultural inputs. These effects were highlighted in Chapter 5, and they account for the superior performance of the NEP economy during the mid-1930s. By the later 1930s, however, the pro- duction of the collective farms had rebounded and eliminated the ad- vantage of the NEP.
In the longer term, it is claimed that the slaughtering of horses by peasants in the early 1930s required rapid mechanization to make up for the lost draft animals, and this diverted machinery from the creation of industrial capital. While tractor output soared, the significance of this fact is not entirely clear. Tractorization was planned anyway. Equipment investment ίη agriculture was on!y a small fraction of capital formation during the 1930s (Moorsteen and Powell 1966, pp. 358, 429). Further- more, it is not obvious that the fall in horse numbers between 1930 and 1935 hurt grain production since the small farms of the NEP used many more horses per hectare than did large-scale grain farms, as shown in Chapter 4. Moreover, since a horse ate as much grain as two people, the fall ίη horse numbers freed enough grain to feed 30 million people, and that is one reason that per capita calorie consumption fell only slightly during the First Five-Year Plan (Figure 7.1). In the absence of much scope for raising grain yields —they were as high in the I930s as those on the Great Plains of North America and there was no output raising technology in sight — reduđng the grain fed to horses was the main way of increasing net output per hectare. It is worth noting that “farm draft animals consumed the output of roughly 22 percent of all cropland har- vested [in the United States] over the 1880 to 1920 period” (Olmstead and Rhode 2001, pp. 664-65) and a similar loss was incurred in the Soviet Union.
In the long run, it is claimed that collectivization created a set of institutions inimical to productivity growth. This argument, whatever its merit, requires a longer time frame than the 1930s to be effective. Moreover, the claim is intrinsically dubious. The record of Soviet agri- culture so far as the adoption of new techniques goes is not unimpres- sive; the level of yields and their rate of growth are on a par with those in environmental!y comparable regions in North America, as is output per hectare generally (Johnson and Brooks 1983). Figure 4.1 compares the growth in wheat yields in the Soviet Union and North Dakota. Over the long term, the histories were identical. Yields were flat in both places until after World War II, when they advanced together as farmers in both countries increased their use of fertilizers at the same rate. There is no negative yield performance in the Soviet Union to attribute to collectivization.

Preobrazhensky in Action · 175
Moreover, productivity grovvth in agriculture involves institutions be- sides farmers. Water control, for instance, involves public agencies that dam rivers and build irrigation systems; mechanization involves the in- dustrial sector; and the invention of biological technology is generally performed by specialized research institutions that are u$ually socialized since the new knowledge is a public good. American example$ include the Army Corps of Engineers that builds dams, John Deere that makes tractors, and the University of California that solved the viticultural problems of California wine industry. During the 1930$, agricultural development meant mechanization and irrigation, and the Soviets ac- tively pursued those possibilities. Hence, it is not self-evident that the preservation of peasant farming in the Soviet Union would have led to more output or higher productivity.
The upshot of these considerations i$ that collectivization had an im- mediate negative impact on agricultural output in the early 1930s. This reduction in output lowered industrial production and GDP. Food pro- duction did not fall dra$tically since the drop in livestock numbers freed food for human consumption. (The famine wa$ caused by the way the state distributed food rather than the total available.) By the late 1930s, farm production wa$ restored. It is not clear that the performance of Soviet agriculture would have been any better in the rest of the twen- tieth century had it not been collectivized.
Preobrazhensky in Action: The State Budget
Against this background, we can explore why collectivization acceler- ated economic growth by the late 1930$. The place to begin i$ with Preobrazhen$ky’$ proposals. He advocated that the state cut the price it paid for grain and other farm products while raising the price it charged for consumer goods. This policy would generate the cash to pay for industrial investment at the expense of the pea$antry.
The first place to look for evidence of this policy i$ in the state’s finances. Indeed, Soviet taxation wa$ reorganized in 1930 to make Pre- obrazhen$ky’$ proposals feasible (Holzman 1955; Fitzpatrick 1994). The main source of revenue became the “turnover tax,” which wa$ a manufacturers’ sales tax imposed mainly on consumer goods. The cot- ton, grain, and meat sold by farmers to state procurement agencies were tumed into cloth, bread, and sausages by the consumer goods indus- tries. The turnover tax wa$ added to their costs and prices. Higher in- vestment required a higher turnover tax, which raised the price of con- sumer goods relative to the procurement price of farm products. The turnover tax became the administrative device that put Preobrazhen- $ky’$ pricing policy into practice.

176 · Chapter Nine
The turnover tax raised a lot of money. In 1937, retail purchases in shops of cloth, bread, sausage, and so forth amounted to 110 billion rubles (Table 9.1). It cost 17 billion rubles to convert the raw agri- cultural products into the processed food and fibre. The difference is 93 billion rubles (110 billion - 17 billion). Without the turnover tax (or some equally confiscatory device), this would have accrued to farmers as income. In the event, the turnover tax absorbed 76 of the 96 billion rubles, leaving only 17 billion rubles for farmers. This was what they received from procurement agencies for their compulsory sales and Ma- chine Tractor Station (MTS) payments. In other words, the state took 82 percent of the 93 billion rubles of net income generated by consumer buying.
This was a lot of money rclativc to state expenditures. In 1937, all public agencies spent 118 billion rubles, which included 56 billion rubles of investment in fixed and circulating capital. The turnover tax thus (inanced all of the investment in the Soviet economy and 20 billion rubles of other spending as well. During the First Five-Year Plan, agri- cultural taxation amounted to only half of investment, but agricultural taxes and turnover tax receipts exceeded investment from 1933 on.1 Agricultural taxation was involuntary savings, and it financed Stalin’s industrial revolution during the Second and Third Five-Year Plans, if not the First. State finances were Preobrazhensky in action.
Pr e o b r a z h e n s k y in Ac t io n : Th e Tr a d e Su r plu s
AND THE AgRICULTURAL SURPLUS
Did the turnover tax lead to a capital transfer from the country to the city and a decline in agriculture’s terms of trade in accord with Pre- obrazhensky’s model? The revisionist literature says no, but there are serious index number issues that must be addressed and their resolution has a strong bearing on the answer.
Table 9.1 sets out the relevant figures for 1928 and 1937. These in- clude retail purchases, tax receipts, farm agricultural incomes, pur- chases, and allocations of capital equipment. Retail purchases in 1937 and their division into processing costs, tumover tax receipts, and pay- ments to farmers have just been reviewed. In addition to the 17 billion rubles the farmers received on sales to state agencies, they earned 16 billion rubles on collective farm market sales, so their total cash income was 33 billion rubles.
To calculate agriculture’s trade balance, we need to compare the sec- tor’s imports to its exports. On the assumption that farmers spent their entire cash incomes, their imports of consumer goods equaled 33 billion

Preobrazhensky in Action · 177
Table 9.1Sales and Purchases by Soviet Farmers, 1928 and 1937 (billions of rubles in current prices)
1928 1937
Retail sales in shops 11.3 110Less value added in processing 6.3 17
Net sales of agricultural goods 5.0 93Less taxes 2.5 76
Farmers’ sales to traders or state 2.5 17Plus farmers’ sales on free market .8 16
Farm cash including purchases of manufacturcs 3.3 33Plus farm equipment purchases .6 2
Total farm imports 3.9 35
Sources:1928:retail sales: Bergson (1961, p. 46). Deduction of .8 from 12.1 billion in 1928 for
farmers’ sales on free market.farmers’ cash income: sale of agricultural goods (Hoeffding 1954, p. 14).Farmers’ sales on free market estimated as total marketings less procurements (Zaleski
1971, pp. 313-38; Jasny 1949, pp. 78-79, 228) multiplied by corresponding prices (Karcz 1979, p. 105; Barsov 1969). Farmers’ sales to traders or state calculated as 3.3 less .8.
Taxes: excise taxes plus agricultural tax (Holzman 1955).Net sales of agricultural goods: taxes plus farmers’ sales to traders or state.Value added in processing is a residual.1937:retail sales — Bergson (1961, p. 46).agricultural machinery investment — Moorstcen and PoweIl (1966, p. 429). turnover tax reccipts, spending by public agencies, and investment—Bcrgson (1953, p.
20).value added in processing — calculated as a residual.
rubles. In addition, 2 billion rubles of equipment were shipped to the farm sector by the state, so total imports were 35 billion rubles.
There are two ways to value exports, and they imply very different conclusions about agriculture’s trade balance. The first is to value ex- ports inclusive of the tumover tax. In that case, exports equaled 109 billion rubles (93 billion of net sales plus 16 billion on collective farm market sales), so agriculture had an export surplus of 74 billion rubles ( ~ 109 - 35). This surplus exceeds total investment (56 billion rubles). By this reckoning, agriculture provided all the savings for economic de- velopment. Preobrazhensky would have been delighted.

178 · Chapter Nine
This is not the revisionist conclusion, however, because they would read Table 9.1 in a different way. It is all a question of the value placed on farm sales, and in their work, Barsov, Millar, and Ellman value them at the prices farmers received, that is, exclusive of the turnover tax. This procedure implies that farm exports were worth 33 billion rubles (17 billion of receipts from state procurement agencies and 16 billion from collective farm market sales). With imports at 35 billion, agriculture had a small import surplus of two billion rubles. Thus, the revisionist conclusion that agriculture was not a source of capital for the rest of the economy, but a small drain.
One can always debate which prices to use in computing an index number. However, if you use the prices received by farmers, then you leave out of consideration thc forced savings accomplished by taxation. Given that procedure, it is no wonder that Barsov, Millar, and Ellman concluded that agriculture was providing no savings to the rest of the economy. What their calculation measures is the voluntary savings of the peasants minus the cost of agricultural mechanization. Since the peasants were very poor, they did not save much, and that is what the calculations of Barsov, Millar, and Ellman establish. But this procedure misses the total contribution that agriculture made to savings.
Th e In c id en c e o f t h e T u rn o v er Ta x
But was it really farmers who paid the tax? Putting a tax on bread might reduce the income of the farmer, but it might equally raise the price paid by the consumer. In the second case, it is the consumer who pays the tax. Did the turnover tax lower the income of peasants, or cut the real earnings of workers by increasing the prices of bread and clothing?
When a sales tax (like the turnover tax) is imposed, its burden does not depend on whether the buyer or the seller is the designated bearer. What matters is how the prices received by the buyer and the seller compare to the price in the altemative situation of no tax. The tax can be analyzed by imagining that either party paid the tax, and the implied changes in price will be the same.
Figure 9.1 diagrams the tax incidence problem.2 Panel 1 shows the suPply curve of farm marketings (S) and the urban demand for those products in 1928 (D28)· The intersection of those curves determines the level of marketings (M28) and their price in 1928 (P2 8 )· These are base- line values.
Panel 2 shows the situation in 1937. For simplicity, I show supply as unchanged. The investment boom, however, meant a large increase in urban demand to D37. Were there no turnover tax, the price of agri-

Pric©
Preobrazhensky in Action · 179
Fig. 9.1. The Effect of the Turnover Tax
cultural products would have risen to P3 7 . However, the turnover tax (T) was imposed, and it reduced the price received by farmers P* to the price paid by urban consumers minus the tax (Pw — T). If we treat the turnover tax as being paid by consumers, its impact on farmers is repre- sented in the diagram by a reduction in demand to D37 - T. Intersec- tion of that curve with the supply curve determines the price received by farmers Pf, the level of marketings M 3 7 , and the price paid by con- sumers P^ which is the price on the urban demand curve corresponding to M 3 7 and which equals Pf plus T.3
The prices Pf and Pw in Figure 9.2 correspond to the two ways of valuing farm sales, just discussed. Valuing sales at the net prices paid by consumers corresponds to using Pw in Figure 9.2, while valuing sales at the price received by farmers corresponds to using price Pf. The differ- ence corresponds to the tumover tax.
In partial equilibrium analyses of tax incidence, the burden of the tax is determined by the price elasticities of supply and demand. In the model used here, the price elasticity of supply in 1930 was about .7, while the demand elasticity was 1. Those figures imply that the tax was shifted onto farmers as Stalin intended.
This conclusion is borne out by simulations, which take account of ramifications between sectors. The simulations with the collectivization model show that a rise in investment increased urban consumption and reduced peasant consumption. In contrast, the corresponding simula- tions with the NEP and capitalist models show constant ratios of farm
180 · Chapter Nine
and nonfarm consumption. These simulations confirm that it was, in- deed, the peasants who bore the tax.
Pr e o b r a z h e n s k y in Ac t io n : Th e T er m s o f Tr a d e
a n d Ag r ic u lt u r a l M a rk etin g
One important implication of the diagram relates to the calculation of agriculture’s terms of trade during Stalin’s industrial revolution. A ma- jor item in the revisionist case is the finding that the terms of trade improved. That is true, but Figure 9.2 calls its significance into ques- tion. The revisionist conclusion follows from comparing Pf to P2s· How- ever, P37 was the price that would have obtained had the Stalinist pro- curement system not been imposed, and P37 was greatly in excess of Pf. P^ the actual retail price, was even higher. The urban boom meant a huge growth in the demand for food, and it led to great inflation in urban markets. The Stalinist procurement system siphoned off much of that increase to finance investment, leaving the peasants with less in- come growth than they would have had othenvise. In that important sense, the revisionists have gone too far. Soviet price policy in the 1930s really was Preobrazhensky in action.
Table 9.1 contrasts the relationship of consumers and farmers in 1937 with their predecessors in 1928. While the numbers are fragile, they indicate the differential price movements. Between 1928 and 1937, retail sales rose from 11.3 billion to 110 billion rubles. The production of those goods required the purchase of farm goods worth 5 and 93 billion rubles, respectively. Over this period, the volume of goods sold to wholesalers, processors, and state procurement agencies rose by a factor of 2.09 in 1937 average prices. The net price paid by consumers on these sales rose by a factor of 8.9 (= (93/5)/2.09). It will be noted that the state appropriated much of this gain since excise and agri- cultural taxes rose from 2.5 billion to 76 billion rubles. Farm revenue on these sales, after tax, rose from 2.5 billion to 17 billion. Prices re- ceived by farmers rose by a factor of 3.3 (= (17/2.5)72.09). Total farm incomes included direct sales to consumers in farmers’ markets. Adding these to the other sales indicates that total cash income rose from 3.3 billion in 1928 to 32 billion in 1937. Dividing this gain by the factor by which total marketings grew implies that the average price received by farmers across all sales rose by a factor of 6.2 (= (33/3.3)/l.62) be- tween 1928 and 1937.
Comparing these different measures of agricultural price inflation to the inflation in the price of manufactured consumer goods indicates the ternis of trade arguments of the various schools. The price of manufac- tured goods increased by a factor of 4.22. This exceeded the 3.3 fold

Preobrazhensky in Action · 181
increase in the price paid by procurement agencies. If we only look at obligatory deliveries and MTS charges, agriculture’s terms of trade de- clined. That is the “standard story” of collectivization.
The insight of Barsov and the other revisionists is that sales in farmers’ markets must also be included. The average price increase across all marketing categories was 6.2 fold. This exceeded the inflation in manufactured goods (4.22) and establishes the revisionists’ case that the terms of trade of agriculture were improving.
There is a third comparison, however, and that is with the price that farmers would have gotten if the state had not intervened between them and the consumer. Without turnover and agricultural taxes, farm prices would have risen by a factor of 8.9. The state took most of the gain that the farmcrs might otherwise have gutten, and that was Preobrazhen- sky’s idea.
Fa rm M a rk etin g
Collective farms led to a much higher level of farm marketing than would have obtained under the NEP in the early I930s, but by the end of the decade, the difference between the two systems would not have been great. The agricultural collapse of the early 1930s meant that agri- cultural production under collectivization remained less than it would have been had the NEP continued throughout the decade. However, collective farms marketed a higher fraction of their crop. Extrarural sales were higher with a system of collective farms for most of the 1930s, but by the end of the decade, the NEP would have caught up. These sales were part of the capital transfer from agriculture to industry.
The marketing advantage of the collective farm system was not neces- sary for economic growth, however. Industrialization, NEP-style, would have been somewhat less intense and ciries would have grown less rapidly, so the urban demand for food would have been less. While peasants would have retained a larger fraction of their output, sales to the cities would have been adequate for the considerable growth that would have taken place. Had the NEP continued, livestock products would have constituted a larger fraction of farm output, and that implies differences in marketing channels. My simulations oi the NEP, indeed, show a higher level of sales on farmers’ markets (where livestock products were mainly sold in the 1930s) and a correspondingly reduced sale of agricultural goods to industry, a point noted in the previous section. Thus, the contin- uation of the NEP would have implied smaller manufactured consumer goods industries in the 1930s, but a larger provision of fresh food. In the event, urban consumption per capita from both sources combined would have been higher under a continuation of the NEP.4

182 · Chapter Nine
W e r e Th e r e Sa v er s?
One thing on vvhich Nove and his critics agree is that someone had to save to make Stalin’s industrial revolution possible. Nove thought it was the peasants, while the revisionists speculate it was urban \vorkers. While consumption by both peasants and city dwellers fell at the end of the First Five-Year Plan, it recovered by the late 1930s, and average consumption was a fifth higher than in 1928. With a rising trend like this, it is hard to say that consumption was being cut back to increase investment.
Moreover, there is no evidence that consumer goods output was being reduced in order to free up resources to expand the metal working, machinery, and construction industries. On the contrary, einployment grew in the consumer goods industries. Kahan’s (1959) estimates of So- viet agricultural labor show that the number of days worked in 1933 was 2 percent above the 1926-29 average. From 1934 to 1938, em- ployment increased to 8 -14 percent above the 1926-29 level. The labor that left the countryside was surplus to the needs of agriculture.
Employment also increased in the consumer goods industries, the most important of which were processing farm products. In textiles, for instance, employment rose from 1.9 million in 1927-28 to 2 million in 1933 to 2.6 million in 1937. In food and allied products, the corre- sponding figures were .8 million in 1927/8, 1.1 million 1933, and 1.5 million in 1937 (Nutter 1962, pp. 501-2). There is no evidence of re- source reallocation from agriculture — or consumer goods generally —to the production of investment goods.
The main reasons for believing that resources were being redeployed from consumer goods to producer goods were the famine of 1932-33 and the drop in urban real wages at the same time. However, these developments were due to the collapse of agricultural output in the im- mediate aftermath of collectivization. As a result, free market food prices shot up (lovvering urban real wages) and there was a famine in grain-growing areas. Death by starvation, however, is not resource real- location. The fall in consumption in the early 1930s reflects a disastrous agricultural policy rather than a transfer of productive farm workers to city jobs.
There are two reasons why it was not necessary to lower consump- tion below the 1928 level in order to raise investment during the early Five-Year Plans. The first is the Keynesian observation that investment and consumption can be increased concurrendy by giving jobs to unem- ployed workers. Mobilizing peasant labor was a key to Stalin’s indus- trial revolution. The second reason is made clear by the Fel’dman model. The choice between consuming or investing producer goods out-

Preobrazhensky in Action · 183
put (bicycles versus machine tools) had an immediate impact on the level of consumption, of course, and, thus, posed a trade-off. Hovvever, the choice between allocating the investment goods between the con- sumer goods and producer goods industries had no immediate impact on consumption (although it affected the possibilities in future years). By increasing the fraction of investment goods going into the producer goods sector, investment could be increased without reducing consump- tion. This argument was illustrated by Figure 3.3.
M o b il iz in g t h e La b o r Su r plu s
Soviet policy in the 1930s followed the Preobrazhensky blueprint in many respects: the investment boom was financed by taxing farm prod- ucts, there was a capital transfer from agriculture to industry, the pro- curement system siphoned off consumer purchasing power rather than passing it on to farmers. But none of these changes, in themselves, re- sulted in steel mills or textile factories. An alchemy was required to change the grain amassed by the state into industrial plant and equip- ment. That alchemy was rural-urban migration. lt created the industrial workforce that built the industrial capacity.
The most important effect of collectivization was to increase the rate of rural-urban migration. It, indeed, was exceptionally high during the 1930s. Between 1928 and 1939, the urban population increased from about 28 million to 55 million. 84 percent of this increase was due to rural-urban migration — an exceptionally large proportion (Lorimer 1946, pp. 147-50). During the 1930s, rural-urban migration rates aver- aged close to 2 percent per year (Lorimer 1946, p. 150; Eason 1963, p. 72), again a very high rate in comparison to developing countries in recent decades. Moreover, the new arrivals were employed in construc- tion and large-scale industry, where they produced the machinery and structures needed to build a modern economy. To the degree that collec- tivization accelerated rural-urban migration, it contributed to indus- trialization by swelling the urban labor force.
Table 9.2 contrasts the simulated histories of the rural and urban populations under collectivization and NEP-style institutions. The dif- ferences are remarkable. Under collectivization, the rural population fell absolutely, especially during the famine. The urban population in- creased from 28 million in 1928 to 58.5 million in 1939, a growth close to the actual (cf. Table 5.5). Had rapid industrialization been under- taken within the framework of the NEP, the rural population would have expanded by about 11 million between 1928 and 1939, while the urban population would have grown from 28 million to 44 million. The growth in the industrial labor force — compared to the experience under

184 · Chapter Nine
Table 9.2The Urban Transition, Actual and Simulations (millions of people)
Simulated SimulatedActual collectivized NEP-style
Urban Rural Urban Rural Vrban Rural
1928 28.1 121.9 28.1 121.9 28.1 121.91929 29.5 123.2 29.5 123.3 29.5 123.21930 31.2 123.6 30.3 124.6 30.8 124.51931 34.2 122.5 32.0 124.7 32.2 125.61932 38.6 119.4 33.8 124.3 33.3 126.71933 41.6 116.4 36.8 121.3 34.6 127.41934 42.7 116.3 42.3 116.8 36.0 127.81935 45.4 114.4 47.0 112.9 37.5 127.81936 48.2 112.8 50.8 110.3 39.0 127.91937 50.2 112.8 53.3 109.7 40.6 128.71938 52.4 113.8 56.2 110.1 42.6 130.21939 54.7 114.8 59.4 110.1 44.5 131.7
collectivization — wou!d have been teduced accotding!y. In 1939, the simulated nonagticultutal labot fotce (including soldiets and inmates of fotced labot camps) was 40 million with collectivization and wou!d have been 30 million undet a continuation of the NEP. The tapid ut- banization that wou!d have occutted had the investment tate been pushed up within the context of the NEP was significant and accounts fot its development potential; the advantage that collectivization had ovet the NEP teflects the additional utbanization it would have entailed.
CoIIectivization incteased tutal-utban migtation fot two teasons: the income gain ftom migtating was gteatet than it wou!d have been had the NEP continued (especially duting the eatly 1930s), and the ptobabi!ity of migtating at any income diffetential was highet due to Stalinist tettot, which included fotced telocations, the exptoptiation of peasant ptopetty, and the attacks on ttaditional teligion, cultute, and tutal values (Fitz- pattick 1994; Viola 1996). Fatm mechanization also played a tole. The futute Iay in the cities; the peasants knew it, and so they moved.
It is tematkable that tettotism explains most of the advantage that collectivization had ovet the NEP. We can see this by simulating gtowth undet “peaceful collectivization.” Suppose that the peasants teally had wanted collective fatms, so they did not tesist collectivization. In that case, thete wou!d have been no slaughtet of livestock, no teduction in sowing, no war with the state, and no famine. We can remove these elements from our model of collectivization, so that the collectivized

Preobrazhensky in Action · 185
economy is identical to the NEP economy except for the differences in marketing and taxation. Simulations with the model of peaceful collec- tivization show the trajectory of the Soviet economy if collectivization had proceeded without conflict.
One might have expected that peaceful collectivization would have resulted in more economic growth since the agricultural collapse would have been avoided, but that is true only briefly. By 1939, nonagricultural value added would have reached only 212 billion rubles with peaceful collectivization, and the capital stock would have accumulated to only 325 billion. These values are midway between those for the NEP simula- tions and the collectivized simulations shown in Tables 8.1 and 8.2. Thus, peaceful collectivization added very little to the growth possibilities of the NEP, and was, indeed, inferior to forced collectivization. In other words, collectivization pushed up the rate of industrialization because it pro- duced a social catastrophe in the countryside, not in spite of it.
How could disaster be good for growth? The answer is simple: forced collectivization drove people from the countryside and put them to work in industry. With peaceful collectivization, the urban population would have only reached 48 million in 1939 instead of 58.5 million with forced collectivization, and the industrial workforce would have only been 33 million instead of 40 million. Collectivization raised eco- nomic growth above the NEP rate by accelerating rural-urban migration.
But both of these systems of organization would have grown faster than an economy of capitalist firms in the industrial sector. Why? The answer is not rural-urban migration, for the simulated trajectories of rural and urban population are very close for the NEP and capitalist economies. The difference between the two lies in the level of urban employment (Table 9.3). Soft budget constraints meant that everyone in the labor force got a job in the NEP simulations while about one-quar- ter of them remain unemployed in the simulations with the capitalist employment relationship. The marginal product of these extra workers was low, as we noted in the previous chapter, but it was positive, and they made a significant contribution to increasing output and investment.
There were thus two sides to mobilizing the surplus agricultural pop- ulation. The first was increasing the rate of rural-urban migration, so the rural unemployed would be available for industrial work. The sec- ond was providing them with jobs. Soft budget constraints meant that the NEP and the collectivized economy performed the second function better than the capitalist economy, and, therefore, had an edge in out- put, consumption, and investment. The terrorism of collectivization meant that the collectivized economy performed the first task better than a continuation of the NEP and accounts for the marginally supe- rior results of the collectivized economy.

186 · Chapter Nine
Table 9.3Simulated Urban/Industrial Employment (millions of people)
CollectivizedPeaceful
collectivized NEP-style Capitalist
1928 12.3 12.3 12.3 12.31929 16.1 16.1 16.0 12.11930 18.1 18.1 18.1 14.11931 20.9 20.3 20.4 14.51932 22.2 21.0 21.2 14.91933 24.0 21.9 22.1 15.31934 25.4 22.2 22.5 15.81935 27.0 22.9 23.2 16.41936 29.0 24.0 24.2 17.11937 34.7 28.2 27.8 18.31938 37.7 30.7 30.0 18.71939 39.8 33.3 30.8 18.6
C o n c lu s io n
The concept of labor mobilization unites the various aspects of the col- lectivization debate. Insufficient capital was a fundamental cause of the backvvardness of the Soviet economy in the 1920s, and converting peas- ants to masons and machinists was a solution to that problem. Nurske’s (1953) model of accumulation through the redeployment of surplus farm labor provides a good interpretation of the process. The advantage that collectivization, particularly forced collectivization, had over other policies was that it maximized the rate of rural-urban migration. Re- quiring farmers to sell their crops to state agencies guaranteed that the new urban worker$ would be fed. Those sales of food can be regarded as a capital transfer if the accounts are done in the right way. That wa$ Preobrazhen$ky,$ logic, and it worked.
But this chapter also illuminates why the NEP wa$ also a feasible system for economic development. Farm marketings would have been almost as great under the NEP as they were with collectivization. Rural- urban migration would also have been substantial. The simulations of the NEP economy assume soft budget constraints and they give the NEP a strong advantage over the capitalist economy in terms of urban/indus- trial job creation. A high rate of job creation would have contributed to economic success had industrialization been undertaken within the framework of the NEP.

P A R T T H R E E
After Stalin

17
Dialogue Eastern Europe
REINDUSTRIALISE EASTERN EUROPE?
TOWARDS A NEW PARADIGM OF DEVELOPMENT: THE CASE OF GEORGIA
Tato Khundadze, Mariam Gachechiladze, Lasha Bliadze, Kristine Margvelashvili
It is symbolic that last year the Ministry of Economy and Sustainable Development of Georgia privatized and sold the building where it was based. This decision well reflects the country’s neoliberal route of economic development ever since its post-Soviet independence.
From the very onset of the post-Soviet market transition, Georgian economic strategy became preoccupied with massive and uncontrolled privatization of public assets, de-industrialization of economy and tearing apart bureaucratic mechanisms responsible for providing welfare services. All governments have failed in creating a better and freer society. The hopes of millions of people for a better post-Soviet regime were met with extreme poverty and inequality.
The Soviet regime provided full employment, education and universal healthcare. An average citizen could afford to buy a car and a house with his income. Housing problems were marginal. This came at the expense of having an authoritarian, closed system where political rights and freedom were limited for citizens, and travel outside of the USSR was restricted.
Starting from the 1980s, the Soviet government underwent Perestroika, a restructuring, which meant loosening political and economic controls and starting to open up the country. However, this reformist movement turned out to have neoliberal character. Similarly, the newly born national movements in independent republics (Georgia being one of them) also acquired a neoliberal character, in the sense that their economic strategy appeared like not having an economic strategy at all. All Georgian governments from the post-Soviet
transition to this day are shaped by this ideology.
This article offers a criticism of the neoliberal market model and proposes alternatives. The main argument here is Georgia should adopt a new paradigm of economic development which will put the interests of the people first, as opposed to the wealthy few who benefit at the expense of the population. The way forward should be to establish a clear economic strategy, one which promotes the creation of local industries and stable employment for the population.
The Oxymoron of Freedom: (Neo)Liberal-Nationalism
Some 80 years ago, John Maynard Keynes expressed the following very eloquently in his magnum opus The General Theory of Employment, Interest and Money: “But, soon or late, it is ideas, not vested interests, which are dangerous for good or evil”.
The words of the famous economist reflect the patterns of economic transformation of post-Soviet Georgia. The idea (more like, the ideology) of “personal freedom” took front stage when shaping independent Georgia’s economy. Basically, the country started to be ruled with the odd mixture of neoliberal economic freedom and ethnic nationalism.
In particular, the notion of “freedom” was comprised of two key aspects: the first being the negation of the “other”, and this other means anything associated with the Soviet past or the current Russian Federation. Second was a more individual understanding of ‘freedom”, such as negative freedoms (freedom of speech, freedom of assembly etc.) and economic freedoms like

18
Dialogue Eastern Europe
REINDUSTRIALISE EASTERN EUROPE?
a non-interventionist state in the affairs of the economy and individuals.
The logic was that the separation from the Russian sphere of influence and the promotion of neoliberal notions of freedom would automatically bring prosperity for the country. Post-Soviet Georgian governments eagerly implemented recommendations from the International Monetary Fund and the World Bank, as well as other development institutions. While strongly promoting the idea of freedom and independence, the Georgian political elites disregarded to enact economic development strategies, which would favor local industries, stimulate the economy and hence benefit the Georgian people. It is ironic that national narratives and political nationalism that came about in Georgia in the 1980s, were not backed by any understanding of economic nationalism.
It is likely that Adam Curtis, the British film director, did not have a chance to get acquainted with the Georgian neoliberal experiment. If he had, Georgia’s recent empty understanding of personal freedoms, devoid of any economic rights, would have complimented the British case which Curtis presents in his documentary “The Trap: What Happened to our Dream of Freedom”.
The Socio-Economic Results of the Liberal-Nationalist Oxymoron
Since Independence to present, the majority of Georgian political parties actively talk about “government failure”. This was the case with Saakashvili’s United National Movement Party, and is still the case with Georgian Dream, the present ruling party. Austerity and “tightening of the belts” policies has become a favorite motto of Georgian politicians. In this marathon to outdo each other’s austerity policies, they fail to acknowledge that with perpetually ineffective, weak government and bureaucracy, Georgia has experienced an immense market failure.
As it’s often said, there is always a room for improvement, which refers to the limitless liberalization of economy. During the Soviet Union, the communist ideology served to persuade people to “build communism” with hard work, which would bring a bright, never-before-experienced future for the society. The rigid Soviet ideology is now replaced with a neoliberal one. However, the difference here is that the Soviet regime granted basic services to everyone, while the neoliberal development model has left most people more destitute than they have ever been.
Some simple statistics portray the above-stated. According to the 1989 census 5 443 000 people lived in Georgia. The 2014 census says that the number is 3 713 700. It turns out that since 1989, the population of Georgia has decreased by 1 730 000 people (GEOSTAT, 2017). The Georgian population during the last 25 years has decreased by 31%.
There are several things to consider, for example the breaking away of Abkhazia and South Ossetia, the populations of which are not reflected in the last census. However, the economic aspect is fundamental to these figures, as poverty and unemployment has led a decrease in life expectancy and birth rates. Moreover, due to a total devastation of the industrial sector, a big part of the population has left the country. 9-12% of the Georgian GDP is comprised of remittances, which is very telling of this situation (National Bank of Georgia, 2015).
It is clear that the majority of people living in Georgia depend on relatives working abroad. Due to the neoliberal economic model, “human export” and brain drain have become a normal occurrence.
Unemployment in Georgia is 12% according to Georgian Statistical Office. But if we take into account incomplete and latent unemployment this number reaches to

19
Dialogue Eastern Europe
REINDUSTRIALISE EASTERN EUROPE?
50%. The fact that 48.4% of population is employed in the agricultural sector (GFSIS, 2016), while agriculture is only around 9% of GDP, indicates intrinsic backwardness of the economy. This means that practically half of the population is left out from the economic processes occurring in the country.
While foreign direct investment (FDI) has been deemed an economic savior, it clearly has not been enough to cure the structural problems of the deindustrialized economy. Despite the increase of FDI from 2005 until today, Georgia is nonetheless facing a constant hike in trade deficit. Only in 2012 there was a slight decrease in trade deficit, and this was due to the fact that the Russian market was reopened for exporting agricultural products and mineral waters from Georgia. According to 2015 data, the trade deficit is 4.4 billion USD (National Bank of Georgia, 2015), which is an immensely big sum for Georgia, taking into consideration the size of the country’s economy. This means that Georgia is buying 4.4 billion USD more than it sells. Such economic model is a formula of perpetual poverty for small countries like Georgia.
Often showcased as the pinnacle of radical reforms, Georgia cannot even boast a reduction of poverty rates. According to data presented by GeoStat, during 2008-2011 the number of people below the poverty line increased from 6.4% until 9.2%, and in 2013 it was 9.7%, which is equivalent to 437 238 people.
The World Bank data on poverty in Georgia is much more tragic. The World Bank calculates that 25% of the Georgian population is poor and lives under the 3.10 USD margin. According to this indicator, Georgia is the poorest country in the region (The World Bank, 2017). As a UNICEF report notes, 225 000 children in Georgia live under the poverty line and spend less than 4.5 GEL a day, while 50 000 children live in extreme poverty and use less than 2 GEL
a day (www.unicef.ge, 2015). However, the neoliberal “ideological wall” (Klein, 2014), as the prominent Canadian writer and activist Naomi Klein refers to it, is firm and unbreakable.
The elite remains oblivious to the tragic social circumstances. Several years ago, one of the activists of United National Movement noted with irony and surprise that if a person is really poor, she would not have the money for self-immolation. This was directed at a woman set herself on fire in front of a ministry building for reasons related to poverty and marginalization. As these polarized, elite attitudes are common, the media did not make much out of this sarcastic comment.
It often happens that with such scandals and tragedies the society gets a wakeup call and a temporary rebirth of morality. Even though comments were made that such things (as a woman’s self-immolation due to poverty) would not be allowed to happen again, there was nothing inherently new or striking about this occurrence.
Post-Soviet Georgia has had high cases of suicides of people who had dignity and served a purpose in their societies, but due to radical market reforms had turned homeless, unemployed and purposeless. Just in the last five years, Georgian banks have sold the private properties of more than 10 000 people, leaving them on the streets (Bekauri, 2016). Hence, any moral reawakening of the elites following scandalous occurrences is then nullified with the following dogmatic argument that “if you are poor, it is your fault”.
From Neo-Liberal Palliative Development Towards a Developmentalist Economy
Two significant lessons can be drawn from the recent experience of Georgia. An economy which solely relies on the free market does not work. Georgia is facing a clear market failure,

20
Dialogue Eastern Europe
REINDUSTRIALISE EASTERN EUROPE?
as well as government failure. According to neoliberal arguments, the latter was supposed to bring prosperity to the country, but it has also brought about a market failure.
The second lesson is that an economy solely based on service and agricultural sectors does not work in Georgia. While economic stability is important for a country, this stability should not mean stagnation, and perpetually prolonging the ineffective status quo. The myth of market liberalization and austerity bringing about development, has been boldly discredited with decades of experience in the Global South. This is even acknowledged by organizations such as the IMF and the World Bank, which were the flagships of the neoliberal economic model (Jonathan, Prakash, & David, 2016).
What Georgia requires is a modern industrial policy, which will transform its current palliative development model into an inclusive developmentalist state. Many pose logical questions, such as: what does an industrial policy mean? What can Georgia produce? Can new industrial policy raise prices for consumers? To what degree can the Georgian ineffective bureaucracy implement such difficult structural policies, and can industrial policies turn into a trap of corruption? Answering these questions provides a basis on how to implement a modern industrial policy.
Question: what can Georgia produce?
According to Ricardian thesis, Georgia should produce things where it has a competitive advantage, and hence are the cheapest to produce. This logic brings us back full circle into the present development mode. The renown Norwegian heterodox economist Erik Rienert notes that the Ricardian logic for developing countries means “specializing of on being poor” (Reinert, 2008).
Georgia’s fifth largest export is wine (GEOSTAT, 2017). Merely specializing in wine production will bring the country either to a worsening quality or raising prices, since land
is a limited resource, and for the agricultural sector it is characterized by decreasing return on capital.
At some level, Georgia won’t be able to produce more than a certain quantity of wine or local wine producers will be forced to start wine growing on a less productive soil, which will lead to an increased fixed price, further leading to a diminished quality and price of wine exports. One can stipulate beyond the Georgian case. Had China or other East Asian economies followed the Ricardian logic, they would have stayed rice producers instead of the leading economies they are today (Chang, Bad Samaritans: The Myth of Free Trade and The Secret History of Capitalism, 2008).
Some economists urge to pose this question differently, and focus on not what Georgia should produce, but how the country can diversify its manufacturing sector.
As Dani Rodrik of Harvard University has advised effective industrial policy should be concentrated on eliminating “information failure”, which will support the process of “self-discovery”. More specifically, economic agents must find activities, which will increase their income. However, since the cost of any new activity is high and returns are low, economic actors do not take risks. If it turns out that certain economic activity is profitable, there is a high chance that other economic actors will engage in the said activity, which will prevent the firm who brought the innovation on the market to cover its initial costs (Rodrik, 2004).
For this market failure, government can use subsidies in order for businesses to have the opportunity to take risks. Given the context of Georgian, Georgia has to follow two main steps. First of all, subsidies have to cover only new activities in the Georgian economy, not to the already existing ones in order to promote diversification of economy. Secondly, only activities under

21
Dialogue Eastern Europe
REINDUSTRIALISE EASTERN EUROPE?
which service or product has high export potential should be subsidized. In this regard, the World Trade Organization has some limitations for subsidizing exports, but there are experiences of countries avoiding this stipulation through indirectly supporting exports.
Question: will the new industrial policy raise prices for the Georgian consumers?
Naturally, a consumer is interested to buy a product as cheaply as possible. Additionally, a customer prefers to buy imported high quality products, rather than spending money on locally produced, low quality and more expensive. Discussion on this topic is not new, and goes beyond Georgia.
Same discussion was taking place in America approximately 200 years ago. Landowners living in the South were particularly against trade tariffs on import, because it was difficult for them to understand why they have to buy products from “Yankees”, when they could import cheap and high quality products from abroad.
South Korean economist Ha-Joon Chang notes that this argument between the US Northern industrialists and Southern slave-owners was won by the former. As Chang argues, Americans realized creating a strong state was not possible without a strong economy. Therefore, America had strict protectionist policy until the end of the Second World War, having the highest trade tariffs amongst industrial countries (Chang, Economics: The User’s Guide, 2014).
In this current globalized system, it will be difficult for a small country like Georgia to replicate the American or other industrialization experiences. Hence, the industrial policy must be selective and smart, meaning protecting certain infant industries and not entire sectors of the economy. Additionally, due to the small market of Georgia, it has to protect the economic activities which have high export
potential. If the country takes these into account, Georgia will not have radical inflation. Moreover, developing industrial politics will create jobs and link service and food industries, which will certainly compensate damage inflicted from the increased consumer prices.
Question: is Georgia’s ineffective bureaucracy capable of implementing an industrial policy, and can it become a trap for corruption?
Since the 1980s, following the influence of the neoliberal economic doctrine, the role of the government in economic development has been marginalized. Many fallacies have been created, which claim state institutions are filled with idle bureaucrats whose aims are to disrupt economic development. This fallacy has been thoroughly discredited with decades of experience.
Scholars note that without government, the free market does not exist, since state institutions always create the rules of the market. For example, the judicial system, which is the instrument of enforcing contracts, is important for the effective functioning of the market.
Similarly, protecting private property needs appropriate law enforcement institutions. To defend the principles of free market, it is necessary to define what is an acceptable market power, and anti-trust legislations and related agencies are fundamental to this process and the securing of free competition (Reich, 2015).
Some economist like Mariana Mazzucato go further and say that government is the actor in creating and governing markets. Mazzucato presents the examples of the Internet, smartphones, biotechnologies, where governments were fundamental to creating and shaping these markets (Mazzucato, 2013).
For an effective bureaucracy, it is necessary to have concrete, measurable goals and aims.

22
Dialogue Eastern Europe
REINDUSTRIALISE EASTERN EUROPE?
Further, financially supporting the bureaucratic apparatus is crucial for it to function.
Another important condition is to have personnel policies which entails a meritocratic system. Dani Rodric notes that there can be an effective and successful bureaucratic base in every state, which has a fundamental role to play in carrying out state politics (Rodrik, 2004).
In Georgia, the Ministry of Finance and the Ministry of Justice perform their jobs very well and are the reasons behind Georgia’s functioning taxation system. If a government prioritizes on an industrial policy, an effective and accountable bureaucratic apparatus can be put in place.
Conclusion
Georgia is often named as the country of successful reforms, which is an example to follow for other post-Soviet countries like Ukraine. In order to be fair and objective, it must be admitted that the social and economic transformation that Georgia went through during the last 25 years, and especially after the 2003 Rose Revolution,
has not concluded with a democratic change, accompanied with a wide social and economic progress. This successful depiction of Georgia’s post-Soviet path fails to depict the living conditions of average citizens. Most rural spaces of leisure and comfort are visited by tourists and the rich, while most people are huddled in the impoverished suburbs. Addressing these socio-economic injustices is the path to move forward and build a better, inclusive future.
Despite the fact that the Georgian state has only 30 or so years of governing itself independently, it also has historical experience of being an industrialized nation (during the USSR), and these historical experiences must be put towards building a strong, modern industrial sector.
The development of a strong manufacturing sector is not possible without long term planning, funding research and development, subsidizing and protecting infant industries, and most importantly, government takings risks in terms of shaping and governing markets.
Now more than ever, Georgia needs a new social contract which will be based on the concepts of inclusivity and sustainability.
TheLexusandtheolivetreerevisited
Mythsandfactsaboutglobalization
Onceupona time, the leadingcarmakerof adevelopingcountry exported itsfirstpassengercarstotheUS.Uptothatday,thelittlecompanyhadonlymadeshoddyproducts–poorcopiesofqualityitemsmadebyrichercountries.Thecarwasnothingtoosophisticated–justacheapsubcompact(onecouldhavecalledit‘fourwheelsandanashtray’).Butitwasabigmomentforthecountryanditsexportersfeltproud.
Unfortunately, theproduct failed.Most thought the littlecar looked lousyand savvy buyerswere reluctant to spend seriousmoney on a family car thatcamefromaplacewhereonlysecond-rateproductsweremade.ThecarhadtobewithdrawnfromtheUSmarket.Thisdisasterledtoamajordebateamongthecountry’scitizens.
Manyarguedthatthecompanyshouldhavestucktoitsoriginalbusinessofmakingsimpletextilemachinery.Afterall,thecountry’sbiggestexportitemwassilk.Ifthecompanycouldnotmakegoodcarsafter25yearsoftrying,therewasnofuturefor it.Thegovernmenthadgiven thecarmakereveryopportunity tosucceed. It had ensured high profits for it at home through high tariffs anddraconian controls on foreign investment in the car industry. Fewer than tenyears ago, it even gave public money to save the company from imminentbankruptcy.So, thecriticsargued, foreigncarsshouldnowbe let infreelyandforeigncarmakers,whohadbeenkickedout20yearsbefore,allowedtosetupshopagain.
Others disagreed.They argued that no countryhadgot anywherewithoutdeveloping ‘serious’ industries like automobile production. They just neededmoretimetomakecarsthatappealedtoeveryone.
Theyearwas1958andthecountrywas,infact,Japan.ThecompanywasToyota,andthecarwascalledtheToyopet.Toyotastartedoutasamanufacturerof textilemachinery(ToyodaAutomaticLoom)andmovedintocarproductionin1933.TheJapanesegovernmentkickedoutGeneralMotorsandFordin1939and bailed out Toyota with money from the central bank (Bank of Japan) in
1949. Today, Japanese cars are considered as ‘natural’ as Scottish salmon orFrench wine, but fewer than 50 years ago, most people, including manyJapanese,thoughttheJapanesecarindustrysimplyshouldnotexist.
HalfacenturyaftertheToyopetdebacle,Toyota’sluxurybrandLexushasbecomesomethingofaniconforglobalization,thankstotheAmericanjournalistThomasFriedman’sbook,TheLexusandtheOliveTree.ThebookowesitstitletoanepiphanythatFriedmanhadontheShinkansenbullettrainduringhistripto Japan in 1992. He had paid a visit to a Lexus factory, which mightilyimpressedhim.OnhistrainbackfromthecarfactoryinToyotaCitytoTokyo,hecameacrossyet anothernewspaper article about the troubles in theMiddleEastwherehehadbeenalong-timecorrespondent.Thenithithim.Herealizedthat that ‘half the world seemed to be… intent on building a better Lexus,dedicatedtomodernizing,streamlining,andprivatizingtheireconomiesinordertothriveinthesystemofglobalization.Andhalfoftheworld–sometimeshalfthesamecountry, sometimeshalf thesameperson–wasstill caughtup in thefightoverwhoownswhicholivetree’.1
According toFriedman, unless they fit themselves into aparticular set ofeconomicpoliciesthathecallstheGoldenStraitjacket,countriesintheolive-treeworld will not be able to join the Lexus world. In describing the GoldenStraitjacket,heprettymuchsumsuptoday’sneo-liberaleconomicorthodoxy:inordertofitintoit,acountryneedstoprivatizestate-ownedenterprises,maintainlowinflation,reducethesizeofgovernmentbureaucracy,balancethebudget(ifnotrunningasurplus),liberalizetrade,deregulateforeigninvestment,deregulatecapitalmarkets,makethecurrencyconvertible,reducecorruptionandprivatizepensions.2According tohim, this is theonlypath tosuccess in thenewglobaleconomy.HisStraitjacketistheonlygearsuitablefortheharshbutexhilaratinggame of globalization. Friedman is categorical: ‘Unfortunately, this GoldenStraitjacketisprettymuch“one-sizefitsall”…Itisnotalwaysprettyorgentleorcomfortable.But it’shereand it’s theonlymodelon therack thishistoricalseason.’3
However, thefact is that,had theJapanesegovernmentfollowedthefree-trade economists back in the early 1960s, there would have been no Lexus.Toyota today would, at best, be a junior partner to some western carmanufacturer,orworse,havebeenwipedout.Thesamewouldhavebeen truefor the entire Japanese economy. Had the country donned Friedman’s GoldenStraitjacketearlyon,Japanwouldhaveremainedthethird-rateindustrialpowerthatitwasinthe1960s,withitsincomelevelonaparwithChile,ArgentinaandSouth Africa4 – it was then a country whose prime minister was insultinglydismissed as ‘a transistor-radio salesman’ by theFrench president,CharlesDe

Gaulle.5 In other words, had they followed Friedman’s advice, the JapanesewouldnownotbeexportingtheLexusbutstillbefightingoverwhoownswhichmulberrytree(thatfeedsthesilkworms).
Theofficialhistoryofglobalization
Our Toyota fable suggests that there is something spectacularly jarring in thestory of globalization promoted by Thomas Friedman and his colleagues. Inorder to tell youwhat it is exactly, I need to tell youwhat I call the ‘officialhistoryofglobalization’anddiscussitslimitations.
According to this history, globalization has progressed over the last threecenturies in the following way.6 Britain adopted free-market and free-tradepoliciesinthe18thcentury,wellaheadofothercountries.Bythemiddleofthe19th century, the superiority of these policies became so obvious, thanks toBritain’s spectacular economic success, thatother countries started liberalizingtheirtradeandderegulatingtheirdomesticeconomies.Thisliberalworldorder,perfected around 1870 under British hegemony, was based on: laissez-faireindustrial policies at home; low barriers to the international flows of goods,capital and labour; and macroeconomic stability, both nationally andinternationally,guaranteedbytheprinciplesofsoundmoney(lowinflation)andbalancedbudgets.Aperiodofunprecedentedprosperityfollowed.
Unfortunately, things started to go wrong after the First World War. Inresponse to the ensuing instability of the world economy, countries unwiselybegan to erect trade barriers again. In 1930, theUS abandoned free trade andenacted the infamousSmoot-Hawley tariff.Countries likeGermany and Japanabandoned liberal policies and erected high trade barriers and created cartels,whichwereintimatelyassociatedwiththeirfascismandexternalaggression.Theworld free trade system finally ended in 1932, when Britain, hitherto thechampionoffreetrade,succumbedtotemptationanditselfre-introducedtariffs.Theresultingcontractionandinstabilityintheworldeconomy,andthen,finally,the SecondWorldWar, destroyed the last remnants of the first liberal worldorder.
After the SecondWorldWar, the world economy was re-organized on amore liberal line, this time under American hegemony. In particular, somesignificant progresswasmade in trade liberalization among the rich countriesthrough the earlyGATT (GeneralAgreement on Trade and Tariffs) talks. But

protectionismandstateinterventionstillpersistedinmostdevelopingcountriesand,needlesstosay,inthecommunistcountries.
Fortunately,illiberalpolicieshavebeenlargelyabandonedacrosstheworldsince the 1980s following the rise of neo-liberalism. By the late 1970s, thefailures of so-called import substitution industrialization (ISI) in developingcountries – based on protection, subsidies and regulation – had become tooobvious to ignore.i The economic ‘miracle’ in East Asia, which was alreadypractisingfreetradeandwelcomingforeigninvestment,wasawake-upcallforthe other developing countries. After the 1982 ThirdWorld debt crisis, manydeveloping countries abandoned interventionism and protectionism, andembraced neo-liberalism. The crowning glory of this trend towards globalintegrationwasthefallofcommunismin1989.
These national policy changes were made all the more necessary by theunprecedentedaccelerationinthedevelopmentoftransportandcommunicationstechnologies. With these developments, the possibilities of entering mutuallybeneficialeconomicarrangementswithpartnersinfarawaycountries–throughinternational trade and investment – increased dramatically. This has madeopennessanevenmorecrucialdeterminantofacountry’sprosperitythanbefore.
Reflecting the deepening global economic integration, the globalgovernance system has recently been strengthened.Most importantly, in 1995theGATTwas upgraded to theWTO (WorldTradeOrganisation), a powerfulagency pushing for liberalization not just in trade but also in other areas, likeforeign investment regulation and intellectual property rights. TheWTO nowformsthecoreoftheglobaleconomicgovernancesystem,togetherwiththeIMF(InternationalMonetaryFund)–inchargeofaccesstoshort-termfinance–andtheWorldBank–inchargeoflonger-terminvestments.
Theresultofall thesedevelopments,accordingto theofficialhistory, isaglobalized world economy comparable in its liberality and potential forprosperity only to the earlier ‘golden age’ of liberalism (1870–1913). RenatoRuggiero, the first director-general of theWTO, solemnly declared that, as aconsequenceofthisnewworldorder,wenowhave‘thepotentialforeradicatingglobal poverty in the early part of the next [21st] century – aUtopian notionevenafewdecadesago,butarealpossibilitytoday.’7
This version of the history of globalization is widely accepted. It issupposed to be the route map for policy makers in steering their countriestowardsprosperity.Unfortunately, itpaintsafundamentallymisleadingpicture,distortingourunderstandingofwherewehavecome from,wherewearenowandwherewemaybeheadingfor.Let’sseehow.

Therealhistoryofglobalization
On30 June1997,HongKongwasofficially handedback toChinaby its lastBritishgovernor,ChristopherPatten.ManyBritishcommentators frettedaboutthe fate of Hong Kong’s democracy under the Chinese Communist Party,althoughdemocraticelectionsinHongKonghadonlybeenpermittedaslateas1994, 152 years after the start of British rule and only three years before theplannedhand-over.ButnooneseemstorememberhowHongKongcametobeaBritishpossessioninthefirstplace.
HongKongbecameaBritishcolonyafter theTreatyofNanking in1842,theresultoftheOpiumWar.Thiswasaparticularlyshamefulepisode,evenbythestandardsof19th-centuryimperialism.ThegrowingBritishtasteforteahadcreatedahugetradedeficitwithChina.Inadesperateattempttoplugthegap,BritainstartedexportingopiumproducedinIndiatoChina.ThemeredetailthatsellingopiumwasillegalinChinacouldnotpossiblybeallowedtoobstructthenoble cause of balancing the books.When a Chinese official seized an illicitcargoofopiumin1841, theBritishgovernmentuseditasanexcuse tofix theproblemonce and for all by declaringwar.Chinawas heavily defeated in thewarandforcedtosigntheTreatyofNanking,whichmadeChina‘lease’HongKongtoBritainandgiveupitsrighttosetitsowntariffs.
Sothereitwas–theself-proclaimedleaderofthe‘liberal’worlddeclaringwaron another countrybecause the latterwasgetting in thewayof its illegaltrade in narcotics. The truth is that the freemovement of goods, people, andmoney that developed under British hegemony between 1870 and 1913 – thefirst episode of globalization – was made possible, in large part, by militarymight, rather thanmarket forces.Apart fromBritain itself, thepractitioners offreetradeduringthisperiodweremostlyweakercountriesthathadbeenforcedinto, rather than had voluntarily adopted, it as a result of colonial rule or‘unequaltreaties’(liketheNankingTreaty),which,amongotherthings,deprivedthemof theright toset tariffsandimposedexternallydeterminedlow,flat-ratetariffs(3–5%)onthem.8
Despite their key role inpromoting ‘free’ trade in the late 19th and early20th centuries, colonialism and unequal treaties hardly get anymention in thehordes of pro-globalisation books.9 Even when they are explicitly discussed,theirroleisseenaspositiveonthewhole.Forexample,inhisacclaimedbook,Empire, the British historian Niall Ferguson honestly notes many of the

misdeedsoftheBritishempire,includingtheOpiumWar,butcontendsthattheBritishempirewasagood thingoverall– itwasarguably thecheapestway toguarantee free trade,which benefits everyone.10 However, the countries undercolonialruleandunequaltreatiesdidverypoorly.Between1870and1913,percapita income inAsia (excluding Japan) grew at 0.4%per year,while that inAfrica grew at 0.6% per year.11 The corresponding figures were 1.3% forWesternEuropeand1.8%peryearfortheUSA.12Itisparticularlyinterestingtonote that theLatinAmerican countries,whichby that timehad regained tariffautonomyandwereboasting someof thehighest tariffs in theworld, grewasfastastheUSdidduringthisperiod.13
Whiletheywereimposingfreetradeonweakernationsthroughcolonialismand unequal treaties, rich countries maintained rather high tariffs, especiallyindustrial tariffs, for themselves, as we will see in greater detail in the nextchapter.Tobeginwith,Britain,thesupposedhomeoffreetrade,wasoneofthemost protectionist countries until it converted to free trade in the mid-19thcentury. There was a brief period during the 1860s and the 1870s whensomethingapproachingfreetradedidexistinEurope,especiallywithzerotariffsin Britain. However, this proved short-lived. From the 1880s, most Europeancountries raised protective barriers again, partly to protect their farmers fromcheap food imported from the NewWorld and partly to promote their newlyemerging ‘heavy and chemical’ industries, such as steel, chemicals andmachinery.14Finally,evenBritain,asIhavenoted,thechiefarchitectofthefirstwave of globalization, abandoned free trade and re-introduced tariffs in 1932.The official history describes this event as Britain ‘succumbing to thetemptation’ofprotectionism.Butittypicallyfailstomentionthatthiswasduetothedecline inBritisheconomicsupremacy,which in turnwas the resultof thesuccessofprotectionismonthepartofcompetitorcountries,especiallytheUSA,indevelopingtheirownnewindustries.
Thus, the history of the first globalization in the late 19th and early 20thcenturies has been rewritten today in order to fit the current neo-liberalorthodoxy. The history of protectionism in today’s rich countries is vastlyunderplayed,whiletheimperialistoriginofthehighdegreeofglobalintegrationonthepartof today’sdevelopingcountries ishardlyevermentioned.Thefinalcurtain coming down on the episode – that is, Britain’s abandonment of freetrade–isalsopresentedinabiasedway.Itisrarelymentionedthatwhatreallymade Britain abandon free trade was precisely the successful use ofprotectionismbyitscompetitors.

Neo-liberalsvsneo-idiotics?
Intheofficialhistoryofglobalization,theearlypost-Second-World-Warperiodis portrayed as a period of incomplete globalization. While there was asignificant increase in integration among the rich countries, accelerating theirgrowth, it is said,mostdeveloping countries refused to fullyparticipate in theglobal economyuntil the 1980s, thusholding themselves back fromeconomicprogress.
This story misrepresents the process of globalization among the richcountriesduring thisperiod.Thesecountriesdidsignificantly lower their tariffbarriersbetweenthe1950sandthe1970s.Butduringthisperiod,theyalsousedmanyothernationalisticpoliciestopromotetheirowneconomicdevelopment–subsidies (especially for research and development, or R&D), state-ownedenterprises,governmentdirectionofbankingcredits,capitalcontrolsandsoon.When they started implementing neo-liberal programmes, their growthdecelerated.Inthe1960sandthe1970s,percapitaincomeintherichcountriesgrewby3.2%ayear,butitsgrowthratefellsubstantiallyto2.1%inthenexttwodecades.15
But more misleading is the portrayal of the experiences of developingcountries. The postwar period is described by the official historians ofglobalization as an era of economic disasters in these countries. This wasbecause,theyargue,thesecountriesbelievedin‘wrong’economictheoriesthatmade them think they could defy market logic. As a result, they suppressedactivitieswhich theyweregood at (agriculture,mineral extraction and labour-intensivemanufacturing)andpromoted‘whiteelephant’projectsthatmadethemfeelproudbutwereeconomicnonsense–themostnotoriousexampleofthisisIndonesiaproducingheavilysubsidizedjetaeroplanes.
Theright to‘asymmetricprotection’that thedevelopingcountriessecuredin1964attheGATTisportrayedas‘theproverbialropeonwhichtohangone’sowneconomy!’,inawell-knownarticlebyJeffreySachsandAndrewWarner.16Gustavo Franco, a former president of the Brazilian central bank (1997–99),madethesamepointmoresuccinctly, ifmorecrudely,whenhesaidhispolicyobjectivewas‘toundofortyyearsofstupidity’andthattheonlychoicewas‘tobeneo-liberalorneo-idiotic’.17
The problem with this interpretation is that the ‘bad old days’ in thedeveloping countries weren’t so bad at all. During the 1960s and the 1970s,

when they were pursuing the ‘wrong’ policies of protectionism and stateintervention, per capita income in the developing countries grew by 3.0%annually.18AsmyesteemedcolleagueProfessorAjitSinghoncepointedout,thiswastheperiodof‘IndustrialRevolutionintheThirdWorld’.19Thisgrowthrateisahugeimprovementoverwhattheyachievedunderfreetradeduringthe‘ageofimperialism’(seeabove)andcomparesfavourablywiththe1–1.5%achievedbytherichcountriesduringtheIndustrialRevolutioninthe19thcentury.Italsoremains the best that they have ever recorded. Since the 1980s, after theyimplementedneo-liberalpolicies,theygrewatonlyabouthalfthespeedseeninthe1960sandthe1970s(1.7%).Growthsloweddownintherichcountriestoo,buttheslowdownwaslessmarked(from3.2%to2.1%),notleastbecausetheydid not introduce neo-liberal policies to the same extent as the developingcountries did. The average growth rate of developing countries in this periodwouldbeevenlowerifweexcludeChinaandIndia.Thesetwocountries,whichaccountedfor12%oftotaldevelopingcountryincomein1980and30%in2000,havesofarrefusedtoputonThomasFriedman’sGoldenStraitjacket.20
Growth failure has been particularly noticeable in Latin America andAfrica,whereneo-liberalprogrammeswereimplementedmorethoroughly thaninAsia. In the1960s and the1970s,percapita income inLatinAmericawasgrowing at 3.1%peryear, slightly faster than thedeveloping country average.Brazil, especially, was growing almost as fast as the East Asian ‘miracle’economies. Since the 1980s, however, when the continent embraced neo-liberalism,LatinAmericahasbeengrowingatlessthanone-thirdoftherateofthe‘badolddays’.Evenifwediscountthe1980sasadecadeofadjustmentandtake it out of the equation,per capita income in the region during the 1990sgrewat basically half the rate of the ‘badolddays’ (3.1%vs1.7%).Between2000and2005,theregionhasdoneevenworse;itvirtuallystoodstill,withpercapita income growing at only 0.6% per year.21 As for Africa, its per capitaincomegrewrelativelyslowlyeveninthe1960sandthe1970s(1–2%ayear).Butsincethe1980s,theregionhasseenafallinlivingstandards.Thisrecordisadamningindictmentoftheneo-liberalorthodoxy,becausemostoftheAfricaneconomieshavebeenpractically runby the IMFand theWorldBankover thepastquarterofacentury.
The poor growth record of neo-liberal globalization since the 1980s isparticularly embarrassing. Accelerating growth – if necessary at the cost ofincreasing inequality and possibly some increase in poverty – was theproclaimedgoalofneo-liberalreform.Wehavebeenrepeatedlytoldthatwefirsthave to ‘createmorewealth’ beforewe can distribute itmorewidely and thatneo-liberalismwasthewaytodothat.Asaresultofneo-liberalpolicies,income

inequalityhasincreasedinmostcountriesaspredicted,butgrowthhasactuallysloweddownsignificantly.22
Moreover,economicinstabilityhasmarkedlyincreasedduringtheperiodofneo-liberal dominance. The world, especially the developing world, has seenmorefrequentandlarger-scalefinancialcrisessincethe1980s.Inotherwords,neo-liberal globalization has failed to deliver on all fronts of economic life –growth, equality and stability. Despite this, we are constantly told how neo-liberalglobalizationhasbroughtunprecedentedbenefits.
Thedistortionoffactsintheofficialhistoryofglobalizationisalsoevidentatcountrylevel.Contrarytowhattheorthodoxywouldhaveusbelieve,virtuallyall the successful developing countries since the Second World War initiallysucceeded through nationalistic policies, using protection, subsidies and otherformsofgovernmentintervention.
IhavealreadydiscussedthecaseofmynativeKoreainsomedetailinthePrologue, but other ‘miracle’ economies of East Asia have also succeededthrough a strategic approach to integration with the global economy. TaiwanusedastrategythatisverysimilartothatofKorea,althoughitusedstate-ownedenterprises more extensively while being somewhat friendlier to foreigninvestors thanKoreawas. Singapore has had free trade and relied heavily onforeigninvestment,but,evenso,itdoesnotconforminotherrespectstotheneo-liberal ideal. Though it welcomed foreign investors, it used considerablesubsidiesinordertoattracttransnationalcorporationsinindustriesitconsideredstrategic,especiallyintheformofgovernmentinvestmentininfrastructureandeducation targeted at particular industries.Moreover, it has one of the largeststate-ownedenterprisesectorsintheworld,includingtheHousingDevelopmentBoard, which supplies 85% of all housing (almost all land is owned by thegovernment).
Hong Kong is the exception that proves the rule. It became rich despitehaving free trade and a laissez-faire industrial policy. But it never was anindependentstate(notevenacitystatelikeSingapore)butacitywithinabiggerentity.Until1997,itwasaBritishcolonyusedasaplatformforBritain’stradingand financial interests inAsia.Today, it is the financial centre of theChineseeconomy. These facts made it less necessary for Hong Kong to have anindependentindustrialbase,although,evenso,itwasproducingtwiceasmuchmanufacturingoutputpercapita as thatofKoreauntil themid-1980s,when itstarteditsfullabsorptionintoChina.ButevenHongKongwasnotatotalfreemarket economy.Most importantly, all landwas owned by the government inordertocontrolthehousingsituation.
ThemorerecenteconomicsuccessstoriesofChina,andincreasinglyIndia,

are also examples that show the importance of strategic, rather thanunconditional, integration with the global economy based on a nationalisticvision.LiketheUSinthemid-19thcentury,orJapanandKoreainthemid-20thcentury,Chinausedhigh tariffs tobuildup its industrialbase.Rightup to the1990s, China’s average tariff was over 30%. Admittedly, it has been morewelcomingtoforeigninvestmentthanJapanorKoreawere.Butitstillimposedforeign ownership ceilings and local contents requirements (the requirementsthattheforeignfirmsbuyatleastacertainproportionoftheirinputsfromlocalsuppliers).
India’srecenteconomicsuccessisoftenattributedbythepro-globalizerstoitstradeandfinancialliberalizationintheearly1990s.Assomerecentresearchreveals, however, India’s growth acceleration really began in the 1980s,discreditingthesimple‘greateropennessacceleratesgrowth’story.23Moreover,even after the early 1990s trade liberalization, India’s average manufacturingtariffsremainedatabove30%(itisstill25%today).India’sprotectionismbeforethe 1990swas certainly over-done in some sectors.But this is not to say thatIndia would have been even more successful had it adopted free trade atindependence in 1947. India has also imposed severe restrictions on foreigndirect investment – entry restrictions, ownership restrictions and variousperformancerequirements(e.g.,localcontentsrequirements).
Theonecountrythatseemstohavesucceededinthepostwarglobalizationperiod by using the neo-liberal strategy is Chile. Indeed, Chile adopted thestrategy before anyone else, including theUS andBritain, following the coupd’étatbyGeneralAugustoPinochetbackin1973.Sincethen,Chilehasgrownquite well – although nowhere nearly as fast as the East Asian ‘miracle’economies.24Andthecountryhasbeenconstantlycitedasaneo-liberalsuccessstory.Itsgoodgrowthperformanceisundeniable.ButevenChile’sstoryismorecomplexthantheorthodoxysuggests.
Chile’searlyexperimentwithneo-liberalism,ledbytheso-calledChicagoBoys(agroupofChileaneconomiststrainedattheUniversityofChicago,oneofthe centres of neo-liberal economics), was a disaster. It ended in a terriblefinancialcrash in1982,whichhad tobe resolvedby thenationalizationof thewhole banking sector. Thanks to this crash, the country recovered the pre-Pinochetlevelofincomeonlyinthelate1980s.25ItwasonlywhenChile’sneo-liberalismgotmorepragmaticafterthecrashthatthecountrystarteddoingwell.Forexample, thegovernmentprovidedexporterswitha lotofhelp inoverseasmarketingandR&D.26Italsousedcapitalcontrolsinthe1990stosuccessfullyreducetheinflowofshort-termspeculativefunds,althoughitsrecentfreetradeagreementwiththeUShasforcedit topromisenevertousethemagain.More

importantly, there is a lot of doubt about the sustainability of Chile’sdevelopment. Over the past three decades, the country has lost a lot ofmanufacturing industries and become excessively dependent on natural-resources-basedexports.Nothavingthetechnologicalcapabilitiestomoveintohigher-productivityactivities,Chilefacesaclearlimittothelevelofprosperityitcanattaininthelongrun.
Tosumup,thetruthofpost-1945globalizationisalmostthepolaroppositeoftheofficialhistory.Duringtheperiodofcontrolledglobalizationunderpinnedbynationalisticpoliciesbetween the1950sand the1970s, theworldeconomy,especiallyinthedevelopingworld,wasgrowingfaster,wasmorestableandhadmore equitable incomedistribution than in the past two and a half decades ofrapid and uncontrolled neo-liberal globalization. Nevertheless, this period isportrayed in the official history as one of unmitigated disaster of nationalisticpolicies, especially in developing countries. This distortion of the historicalrecordispeddledinordertomaskthefailureofneo-liberalpolicies.
Who’srunningtheworldeconomy?
Much of what happens in the global economy is determined by the richcountries,withouteventrying.Theyaccountfor80%ofworldoutput,conduct70% of international trade and make 70–90% (depending on the year) of allforeigndirectinvestments.27Thismeansthattheirnationalpoliciescanstronglyinfluencetheworldeconomy.
Butmoreimportantthantheirsheerweightistherichcountries’willingnesstothrowthatveryweightaboutinshapingtherulesoftheglobaleconomy.Forexample, developed countries induce poorer countries to adopt particularpolicies bymaking them a condition for their foreign aid or by offering thempreferential trade agreements in return for ‘good behaviour’ (adoption of neo-liberal policies). Even more important in shaping options for developingcountries are, however, what I call the ‘Unholy Trinity’ of multilateralorganizations– namely the IMF, theWorldBank and theWTO (WorldTradeOrganisation). Though they are not puppets of the rich countries, the UnholyTrinityarelargelycontrolledbytherichcountries,sotheydeviseandimplementBadSamaritanpoliciesthatthosecountrieswant.
TheIMFandtheWorldBankwereoriginallysetupin1944ataconferencebetweentheAlliedforces(essentiallytheUSandBritain),whichworkedoutthe
shapeofpostwarinternationaleconomicgovernance.ThisconferencewasheldintheNewHampshireresortofBrettonWoods,sotheseagenciesaresometimescollectivelycalledtheBrettonWoodsInstitutions(BWIs).TheIMFwassetuptolendmoneytocountriesinbalanceofpaymentscrisessothattheycanreducetheir balance of payments deficits without having to resort to deflation. TheWorld Bank was set up to help the reconstruction of war-torn countries inEuropeand the economicdevelopmentof thepost-colonial societies thatwereabouttoemerge–whichiswhyitisofficiallycalledtheInternationalBankforReconstruction andDevelopment. Thiswas supposed to be done by financingprojectsininfrastructuredevelopment(e.g.,roads,bridges,dams).
Following theThirdWorlddebt crisisof1982, the rolesofboth the IMFandtheWorldBankchangeddramatically.Theystartedtoexertamuchstrongerpolicy influence on developing countries through their joint operation of so-calledstructuraladjustmentprogrammes(SAPs).Theseprogrammescoveredamuch wider range of policies than what the Bretton Woods Institutions hadoriginallybeenmandatedtodo.TheBWIsnowgotdeeplyinvolvedinvirtuallyall areas of economic policy in the developingworld. They branched out intoareaslikegovernmentbudgets,industrialregulation,agriculturalpricing,labourmarket regulation, privatization and so on. In the 1990s, there was a furtheradvance in this ‘mission creep’ as they started attaching so-called governanceconditionalities to their loans. These involved intervention in hithertounthinkable areas, like democracy, government decentralization, central bankindependenceandcorporategovernance.
This mission creep raises a serious issue. TheWorld Bank and the IMFinitiallystartedwithratherlimitedmandates.Subsequently,theyarguedthattheyhave to intervene in new areas outside their original mandates, as they, too,affecteconomicperformance,afailureinwhichhasdrivencountriestoborrowmoney from them.However, on this reasoning, there is no area of our life inwhich the BWIs cannot intervene. Everything that goes on in a country hasimplicationsforitseconomicperformance.Bythislogic,theIMFandtheWorldBank should be able to impose conditionalities on everything from fertilitydecisions,ethnicintegrationandgenderequality,toculturalvalues.
Don’t getmewrong. I am not one of those peoplewho are against loanconditionalitiesonprinciple.Itisreasonableforthelendertoattachconditions.Butconditionsshouldbeconfinedtoonlythoseaspectsthataremostrelevanttotherepaymentoftheloan.Otherwise,thelendermayintrudeinallaspectsoftheborrower’slife.
SupposeIamasmallbusinessmantryingtoborrowmoneyfrommybankin order to expand my factory. It would be natural for my bank manager to

impose a unilateral condition on how I am going to repay. It might even bereasonableforhimtoimposeconditionsonwhatkindofconstructionmaterialsIcanuseandwhatkindofmachineryIcanbuyinexpandingmyfactory.But,ifhe attaches the condition that I cut down onmy fat intake on the (not totallyirrelevant) grounds that a fatty diet reduces my ability to repay the loan bymakingmeunhealthy, Iwould find thisunreasonably intrusive.Ofcourse, if Iamreallydesperate,Imayswallowmyprideandagreeeventothisunreasonablecondition.Butwhen hemakes it a further condition that I spend less than anhouradayathome(onthegroundsthatspendinglesstimewiththefamilywillincreasemytimeavailableforbusinessandthereforereducethechanceofloandefault),Iwouldprobablypunchhiminthefaceandstormoutofthebank.Itisnot thatmydiet and family lifehavenobearingswhatsoeveronmyability tomanagemybusiness.Asmybankmanager reasons, theyare relevant.But thepointisthattheirrelevanceisindirectandmarginal.
In the beginning, the IMF only imposed conditions closely related to theborrower country’smanagement of its balance of payments, such as currencydevaluation.Butthenitstartedputtingconditionsongovernmentbudgetsonthegrounds thatbudgetdeficitsareakeycauseofbalanceofpaymentsproblems.This led to the imposition of conditions like the privatization of state-ownedenterprises,becauseitwasarguedthatthelossesmadebythoseenterpriseswereanimportantsourceofbudgetdeficitsinmanydevelopingcountries.Oncesuchanextensionoflogicbegan,therewasnostopping.Sinceeverythingisrelatedtoeverythingelse,anythingcouldbeacondition.In1997,inKorea,forexample,the IMF laid down conditions on the amount of debt that private sectorcompaniescouldhave,onthegroundsthatover-borrowingbythesecompanieswasthemainreasonforKorea’sfinancialcrisis.
Toaddinsulttoinjury,theBadSamaritanrichnationsoftendemand,asacondition for their financial contribution to IMF packages, that the borrowingcountrybemadetoadoptpoliciesthathavelittletodowithfixingitseconomybutthatservetheinterestsoftherichcountrieslendingthemoney.Forexample,on seeing Korea’s 1997 agreement with the IMF, one outraged observercommented: ‘Several features of the IMF plan are replays of the policies thatJapanandtheUnitedStateshavelongbeentryingtogetKoreatoadopt.Theseincluded accelerating the… reductions of trade barriers to specific Japaneseproductsandopeningcapitalmarketssothatforeigninvestorscanhavemajorityownership ofKorean firms, engage in hostile takeovers…, and expand directparticipation in banking and other financial services. Although greatercompetition frommanufactured imports andmore foreign ownership could…help theKoreaneconomy,Koreansandotherssawthis…asanabuseofIMF
power to force Korea at a time of weakness to accept trade and investmentpolicies ithadpreviously rejected’.28Thiswas saidnot by someanti-capitalistanarchistbutbyMartinFeldstein,theconservativeHarvardeconomistwhowasthekeyeconomicadvisortoRonaldReaganinthe1980s.
The IMF-World Bank mission creep, combined with the abuse ofconditionalitiesbytheBadSamaritannations,isparticularlyunacceptablewhenthe policies of the Bretton Woods Institutions have produced slower growth,more unequal income distribution and greater economic instability in mostdevelopingcountries,asIpointedoutearlierinthischapter.
Buthowonearthcan the IMFand theWorldBankpersist for so long inpursuing thewrongpolicies thatproducesuchpooroutcomes?This isbecausetheirgovernancestructureseverelybiasesthemtowardstheinterestsoftherichcountries.Theirdecisionsaremadebasicallyaccordingtothesharecapitalthatacountry has (in other words, they have a one-dollar-one-vote system). Thismeans that the rich countries, which collectively control 60% of the votingshares,haveanabsolutecontrolovertheirpolicies,whiletheUShasade factovetoinrelationtodecisionsinthe18mostimportantareas.29
OneresultofthisgovernancestructureisthattheWorldBankandtheIMFhave imposed on developing countries standard policy packages that areconsideredtobeuniversallyvalidbytherichcountries,ratherthanpoliciesthatare carefully designed for each particular developing country, predictablyproducingpoorresultsasaconsequence.Anotherresultisthat,evenwhentheirpoliciesmaybeappropriate,theyhaveoftenfailedbecausetheyareresistedbythelocalsasimpositionsfromoutside.
In response to mounting criticisms, the World Bank and the IMF haverecently reacted inanumberofways.On theonehand, therehavebeensomewindow-dressing moves. Thus the IMF now calls the Structural AdjustmentProgrammethePovertyReductionandGrowthFacilityProgramme,inordertoshow that it caresaboutpoverty issues, though thecontentsof theprogrammehave hardly changed from before. On the other hand, there have been somegenuineeffortstoopendialogueswithawiderconstituency,especiallytheWorldBank’s engagement with NGOs (non-governmental organizations). But theimpacts of such consultation are at bestmarginal.Moreover, when increasingnumbers ofNGOs in developing countries are indirectly funded by theWorldBank,thevalueofsuchanexerciseisbecomingmoredoubtful.
The IMF and the World Bank have also tried to increase the ‘localownership’ of their programmes by involving local people in their design.However, this has borne few fruits. Many developing countries lack theintellectualresourcestoargueagainstpowerfulinternationalorganizationswith

anarmyofhighly trainedeconomistsanda lotof financialcloutbehind them.Moreover,theWorldBankandtheIMFhavetakenwhatIcallthe‘HenryFordapproachtodiversity’(hefamouslysaidthatcustomerscouldhaveacarpainted‘anycolourso longas it’sblack’).Therangeof localvariation inpolicies thatthey find acceptable is very narrow. Also, with the increasing tendency fordeveloping countries to elect or appoint ex-WorldBankor ex-IMFofficials tokeyeconomicposts, ‘local’ solutionsare increasingly resembling the solutionsprovidedbytheBrettonWoodsInstitutions.
CompletingtheUnholyTrinity,theWorldTradeOrganisationwaslaunchedin1995,followingtheconclusionoftheso-calledUruguayRoundoftheGATTtalks.IwilldiscussthesubstanceofwhattheWTOdoesingreaterdetailinlaterchapters,sohereletmefocusjustonitsgovernancestructure.
TheWorldTradeOrganisationhasbeencriticizedonanumberofgrounds.Manybelievethatitislittlemorethanatoolwithwhichthedevelopedcountriespry open developing markets. Others argue that it has become a vehicle forfurtheringtheinterestsoftransnationalcorporations.Thereareelementsoftruthinbothofthesecriticisms,asIwillshowinlaterchapters.
But, despite these criticisms, the World Trade Organisation is aninternational organization inwhose running the developing countries have thegreatestsay.UnliketheIMFortheWorldBank,itis‘democratic’–inthesenseof allowing one country one vote (of course, we can debate whether givingChina,with1.3billionpeople,andLuxembourg,withfewerthanhalfamillionpeople,onevoteeachisreally‘democratic’).And,unlikeintheUN,wherethefivepermanentmembersof theSecurityCouncil havevetopower, no countryhasavetointheWTO.Sincetheyhavethenumericaladvantage,thedevelopingcountriescountfarmoreintheWTOthantheydointheIMFortheWorldBank.
Unfortunately, in practice, votes are never taken, and the organization isessentiallyrunbyanoligarchycomprisingasmallnumberofrichcountries.Itisreportedthat,invariousministerialmeetings(Geneva1998,Seattle1999,Doha2001,Cancun 2003), all the important negotiationswere held in the so-calledGreenRoomsona‘by-invitation-only’basis.Onlytherichcountriesandsomelargedevelopingcountriesthat theycannotignore(e.g.,IndiaandBrazil)wereinvited.Especially during the 1999Seattlemeeting, itwas reported thatsomedeveloping country delegates who tried to get into Green Rooms withoutinvitationwerephysicallythrownout.
But even without such extreme measures, the decisions are likely to bebiased towards the rich countries. They can threaten and bribe developingcountriesbymeansof their foreignaidbudgetsorusing their influenceon theloandecisionsbytheIMF,theWorldBankand‘regional’multilateralfinancial
institutions.iiMoreover, thereexistsavastgap in intellectualandnegotiation resources
betweenthetwogroupsofcountries.Aformerstudentofmine,whohasjustleftthe diplomatic service of his native country in Africa, once told me that hiscountryhadonlythreepeople,includinghimself,toattendallthemeetingsattheWTOinGeneva.Themeetingsoftennumberedmorethanadozenaday,soheand his colleagues dropped a fewmeetings altogether and divided up the restbetweenthethreeofthem.Thismeantthattheycouldallocateonlytwotothreehours toeachmeeting.Sometimes theywent inat the rightmomentandmadesome useful contributions. Some other times, theywere not so lucky and gotcompletelylost.Incontrast,theUS–totaketheexampleattheotherextreme–had dozens of people working on intellectual property rights alone. But myformerstudentsaidhiscountrywaslucky–morethan20developingcountriesdonothaveasinglepersonbasedinGeneva,andmanyhavetogetbywithonlyoneortwopeople.Manymorestorieslikethiscanbetold,buttheyallsuggestthatinternationaltradenegotiationsareahighlylopsidedaffair; it islikeawarwhere some people fight with pistols while the others engage in aerialbombardment.
AretheBadSamaritanswinning?
MargaretThatcher, theBritishprimeministerwho spearheaded theneo-liberalcounter-revolution,oncefamouslydismissedhercriticssayingthat‘Thereisnoalternative’. The spirit of this argument – known as TINA (There Is NoAlternative) – permeates the way globalization is portrayed by the BadSamaritans.
TheBadSamaritansliketopresentglobalizationasaninevitableresultofrelentless developments in the technologies of communication andtransportation.They like toportray their critics asbackward-looking ‘modern-dayLuddites’30who‘fightoverwhoownswhicholivetree’.Goingagainstthishistoricaltideonlyproducesdisasters,itisargued,asevidencedbythecollapseoftheworldeconomyduringtheinter-warperiodandbythefailuresofstate-ledindustrialization in the developing countries in the 1960s and the 1970s. It isargued that there is only one way to survive the historic tidal force that isglobalization,andthatistoputontheone-size-fits-allGoldenStraitjacketwhichvirtually all the successful economies have allegedly worn on their way to

prosperity.Thereisnoalternative.In this chapter, I have shown that the TINA conclusion stems from a
fundamentallydefectiveunderstandingoftheforcesdrivingglobalizationandadistortion of history to fit the theory. Free tradewas often imposed on, ratherthan chosen by, weaker countries.Most countries that had the choice did notchoosefreetradeformorethanbriefperiods.Virtuallyallsuccessfuleconomies,developed and developing, got where they are through selective, strategicintegration with the world economy, rather than through unconditional globalintegration.Theperformanceofthedevelopingcountrieswasmuchbetterwhentheyhadalargeamountofpolicyautonomyduringthe‘badolddays’ofstate-led industrialization thanwhen theywere totallydeprivedof itduring the firstglobalization(intheeraofcolonialruleandunequaltreaties)orwhentheyhadmuchlesspolicyautonomy(asinthepastquarterofacentury).
Thereisnothinginevitableaboutglobalization,becauseitisdrivenmorebypolitics (that is, human will and decision) than technology, as the BadSamaritans claim. If it were technology that determined the extent ofglobalization, itwouldbe impossible to explainhow theworldwasmuch lessglobalizedin the1970s(whenwehadall themoderntechnologiesof transportand communication except the internet) than in the 1870s (whenwe relied onsteamshipsandwiredtelegraphy).Technologyonlydefinestheouterboundariesof globalization. Exactly what shape it takes depends on what we do withnationalpoliciesandwhatinternationalagreementswemake.Ifthatisthecase,the TINA thesis is wrong. There is an alternative, or rather there are manyalternatives,totheneo-liberalglobalizationthatishappeningtoday.Therestofthisbookisgoingtoexplorethosealternatives.iTheideabehindimportsubstitutionindustrializationisthatabackwardcountrystartsproducingindustrialproducts that it used to import, thereby ‘substituting’ imported industrial products with domesticallyproduced equivalents.This is achieved bymaking imports artificially expensive bymeans of tariffs andquotas against imports, or subsidies to domestic producers. The strategy was adopted by many LatinAmericancountries in the1930s.At the time,mostotherdevelopingcountrieswerenot in aposition topractisetheISIstrategy,astheywereeithercoloniesorsubjectto‘unequaltreaties’thatdeprivedthemofthe right to set their own tariffs (see below). The ISI strategy was adopted by most other developingcountriesaftertheygainedindependencebetweenthemid-1940sandthemid-1960s.iiThese include theAsianDevelopmentBank (ADB), the Inter-AmericanDevelopmentBank (IDB), theAfricanDevelopmentBank(AFDB)andtheEuropeanBankforReconstructionandDevelopment(EBRD),whichdealswiththeformercommunisteconomies.

CHAPTER2

ThedoublelifeofDanielDefoe
Howdidtherichcountriesbecomerich?
Daniel Defoe, the author of Robinson Crusoe, had a colourful life. Beforewritingnovels,hewasabusinessman, importingwoollengoods,hosiery,wineandtobacco.HealsoworkedinthegovernmentintheroyallotteriesandintheGlass Duty Office that collected the notorious ‘window tax’, a property taxleviedaccordingtothenumberofahouse’swindows.Hewasalsoaninfluentialauthorofpoliticalpamphletsandledadoublelifeasagovernmentspy.FirsthespiedforRobertHarley,theToryspeakeroftheHouseofCommons.Later,hecomplicatedhislifeevenfurtherbyspyingfortheWhiggovernmentofRobertWalpole,Harley’spoliticalarch-enemy.
As if being a businessman, novelist, tax collector, political commentatorandspywasn’tprovidingsufficientstimulus,Defoewasalsoaneconomist.Thisaspect of his life is even lesswell known than his spying.Unlike his novels,which include Robinson Crusoe andMoll Flanders, Defoe’s main economicwork,A Plan of the English Commerce (1728), is almost forgotten now. ThepopularbiographyofDefoebyRichardWestdoesnotmentionthebookatall,whiletheaward-winningbiographybyPaulaBackscheidermentionsitlargelyinrelation to marginal subjects, such as Defoe’s view on native Americans.1However, the bookwas a thorough and insightful account of Tudor industrialpolicythathasmuchtoteachustoday.
Inthebook(henceforthAPlan),DefoedescribeshowtheTudormonarchs,especiallyHenryVIIandElizabethI,usedprotectionism,subsidies,distributionofmonopolyrights,government-sponsoredindustrialespionageandothermeansof government intervention to develop England’s woollen manufacturingindustry,Europe’shigh-techindustryatthetime.UntilTudortimes,Britainhadbeenarelativelybackwardeconomy,relyingonexportsofrawwooltofinanceimports.ThewoollenmanufacturingindustrywascentredintheLowCountries(todayBelgiumandtheNetherlands),especiallythecitiesofBruges,GhentandYpres inFlanders.Britainexported its rawwoolandmadea reasonableprofit.But those foreigners who knew how to convert the wool into clothes were

generatingmuchgreaterprofits.It isalawofcompetitionthatpeoplewhocandodifficultthingswhichothercannotwillearnmoreprofit.ThisisthesituationthatHenryVIIwantedtochangeinthelate15thcentury.2
According to Defoe, Henry VII sent royal missions to identify locationssuited to woollen manufacturing.3 Like Edward III before him, he poachedskilledworkersfromtheLowCountries.4Healsoincreasedthetaxontheexportof raw wool, and even temporarily banned its export, in order to encouragefurther processing of the raw material at home. In 1489, he also banned theexportofunfinishedcloth,saveforcoarsepiecesbelowacertainmarketvalue,inordertopromotefurtherprocessingathome.5Hisson,HenryVIII,continuedthepolicyandbannedtheexportofunfinishedclothin1512,1513and1536.
As Defoe emphasizes, Henry VII did not have any illusions as to howquickly the English producers could catch up with their sophisticatedcompetitorsintheLowCountries.6TheKingraisedexportdutiesonrawwoolonlywhentheEnglishindustrywasestablishedenoughtohandlethevolumeofwooltobeprocessed.HenrythenquicklywithdrewhisbanonrawwoolexportswhenitbecameclearthatBritainsimplydidnothavethecapacitytoprocessalltherawwoolitproduced.7Indeed,accordingtoAPlan,itwasnotuntil1578,inthemiddleofElizabethI’sreign(1558–1603)–nearly100yearsafterHenryVIIhadstartedhis‘importsubstitutionindustrialization’policyin1489–thatBritainhad sufficient processing capacity to ban raw wool exports totally.8 Once inplace,however, theexportbandrove thecompetingmanufacturers in theLowCountries,whowerenowdeprivedoftheirrawmaterials,toruin.
WithoutthepoliciesputinplacebyHenryVIIandfurtherpursuedbyhissuccessors, itwould have been very difficult, if not impossible, for Britain tohavetransformeditselffromaraw-materialexporterintotheEuropeancentreofthethenhigh-techindustry.WoolmanufacturebecameBritain’smostimportantexport industry. Itprovidedmostof theexportearnings to finance themassiveimport of raw materials and food that fed the Industrial Revolution.9A Planshatters the foundation myth of capitalism that Britain succeeded because itfiguredout the truepathtoprosperitybeforeothercountries–freemarketandfreetrade.
DanielDefoe’sfictionalhero,RobinsonCrusoe,isoftenusedbyeconomicsteachersasthepureexampleof‘rationaleconomicman’,theheroofneo-liberalfree-marketeconomics.Theyclaimthat,eventhoughhelivesalone,Crusoehastomake‘economic’decisionsallthetime.Hehastodecidehowmuchtoworkin order to satisfy his desire for material consumption and leisure. Being arationalman,heputsinpreciselytheminimumamountofworktoachievethegoal. Suppose Crusoe then discovers another man living alone on a nearby

island.Howshouldtheytradewitheachother?Thefree-markettheorysaysthatintroducing a market (exchange) does not fundamentally alter the nature ofCrusoe’s situation. Life goes on much as before, with the additionalconsideration that he nowneeds to establish the rate of exchange betweenhisproductandhisneighbour’s.Beingarationalman,hewillcontinuetomaketherightdecisions.Accordingtofree-marketeconomics,itispreciselybecausewearelikeCrusoethatfreemarketswork.Weknowexactlywhatwewantandhowbesttoachieveit.Consequently,leavingpeopletodowhattheydesireandknowtobegoodforthemselvesisthebestwaytoruntheeconomy.Governmentjustgetsintheway.
ThekindofeconomicsthatunderpinsDefoe’sPlanisexactlytheoppositeofRobinsonCrusoeeconomics.InAPlan,Defoeclearlyshowsthat itwasnotthefreemarketbutgovernmentprotectionandsubsidiesthatdevelopedBritishwoollenmanufacturing.Defyingsignalsfromthemarketthathiscountrywasanefficientrawwoolproducerandshouldremainso,HenryVIIintroducedpoliciesthat deliberately distorted such unwelcome truths. By doing so, he started theprocessthateventuallytransformedBritainintoaleadingmanufacturingnation.EconomicdevelopmentrequirespeoplelikeHenryVII,whobuildanewfuture,ratherthanpeoplelikeRobinsonCrusoe,wholivefortoday.Thus,inadditiontohisdoublelifeasaspy,Defoealsoledadoublelifeasaneconomist–withoutrealizing it, he created the central character in free market economics in hisfictionalwork,yethisowneconomicanalysisclearlyillustratedthelimitsoffreemarketandfreetrade.
Britaintakesontheworld
Defoe started his double life as a spy for theTory government, but later, as Imentioned, he spied for theWhig government of RobertWalpole.Walpole iscommonly known as the first British prime minister, although he was nevercalledthatbyhiscontemporaries.10
Walpole was notorious for his venality – he is said to have ‘reducedcorruption to a regular system’. He deftly juggled the disbursement ofaristocratic titles,governmentofficesandperks inorder tomaintainhispowerbase,whichenabledhimtoremaintheprimeministerforastaggering21years(1721–42).HispoliticalskillswereimmortalizedbyJonathanSwiftinhisnovel,Gulliver’sTravels,inthecharacterofFlimnap.Flimnapistheprimeministerof

theempireofLilliputandchampionofDanceoftheRope,thefrivolousmethodbywhichtheholdersofhighofficesinLilliputareselected.11
YetWalpolewasahighlycompetenteconomicmanager.Duringhistimeaschancelloroftheexchequer,heenhancedthecreditworthinessofhisgovernmentbycreatinga ‘sinkingfund’dedicated to repaying thedebts.Hebecameprimeministerin1721becausehewasconsideredtheonlypersonwhohadtheabilitytomanagethefinancialmessleftbehindbytheinfamousSouthSeaBubble.i
Upon becoming prime minister, Walpole launched a policy reform thatdramatically shifted the focus of British industrial and trade policies. Prior toWalpole,theBritishgovernment’spolicieswere,ingeneral,aimedatcapturingtradethroughcolonizationandtheNavigationAct(whichrequiredthatalltradewithBritainshouldbeconductedinBritishships)andatgeneratinggovernmentrevenue. The promotion of woollen manufacturing was the most importantexception, but even that was partlymotivated by the desire to generatemoregovernmentrevenue.Incontrast,thepoliciesintroducedbyWalpoleafter1721weredeliberatelyaimedatpromotingmanufacturingindustries.Introducingthenewlaw,Walpolestated,throughtheKing’saddresstoParliament:‘itisevidentthat nothing so much contributes to promote the public well-being as theexportationofmanufacturedgoodsandtheimportationofforeignrawmatrial’.12
Walpole’s 1721 legislation essentially aimed to protect Britishmanufacturing industries from foreign competition, subsidize them andencourage them to export.13 Tariffs on imported foreign manufactured goodswere significantly raised, while tariffs on rawmaterials used for manufacturewere lowered, or even dropped altogether. Manufacturing exports wereencouraged by a series of measures, including export subsidies.14 Finally,regulation was introduced to control the quality of manufactured products,especiallytextileproducts,sothatunscrupulousmanufacturerscouldnotdamagethereputationofBritishproductsinforeignmarkets.15
Thesepoliciesarestrikinglysimilartothoseusedwithsuchsuccessbythe‘miracle’ economies ofEastAsia, such as Japan,Korea andTaiwan, after theSecondWorldWar.Policiesthatmanybelieve,asImyselfusedto,tohavebeeninventedbyJapanesepolicy-makersinthe1950s–suchas‘dutydrawbacksoninputsforexportedmanufacturedproductsiiandtheimpositionofexportproductqualitystandardsbythegovernmentiii–wereactuallyearlyBritishinventions.16
Walpole’s protectionist policies remained in place for the next century,helping British manufacturing industries catch up with and then finally forgeahead of their counterparts on the Continent. Britain remained a highlyprotectionistcountryuntilthemid-19thcentury.In1820,Britain’saveragetariffrate on manufacturing imports was 45–55%, compared to 6–8% in the Low

Countries,8–12%inGermanyandSwitzerlandandaround20%inFrance.17Tariffswere,however,not theonlyweapon in thearsenalofBritish trade
policy. When it came to its colonies, Britain was quite happy to impose anoutrightbanonadvancedmanufacturingactivitiesthatitdidnotwantdeveloped.Walpole banned the construction of new rolling and slitting steel mills inAmerica, forcing theAmericans to specialize in low value-added pig and bariron,ratherthanhighvalue-addedsteelproducts.
Britain also banned exports from its colonies that competedwith its ownproducts, home and abroad. It banned cotton textile imports from India(‘calicoes’),whichwerethensuperiortotheBritishones.In1699itbannedtheexport of woollen cloth from its colonies to other countries (the Wool Act),destroying the Irish woollen industry and stifling the emergence of woollenmanufactureinAmerica.
Finally, policies were deployed to encourage primary commodityproduction in the colonies. Walpole provided export subsidies to (on theAmericanside)andabolishedimporttaxeson(ontheBritishside)rawmaterialsproducedintheAmericancolonies(suchashemp,woodandtimber).Hewantedto make absolutely sure that the colonists stuck to producing primarycommoditiesandneveremergedascompetitors toBritishmanufacturers.Thustheywere compelled to leave themost profitable ‘high-tech’ industries in thehandsofBritain–whichensuredthatBritainwouldenjoythebenefitsofbeingonthecuttingedgeofworlddevelopment.18
ThedoublelifeoftheBritisheconomy
The world’s first famous free-market economist, Adam Smith, vehementlyattacked what he called the ‘mercantile system’ whose chief architect wasWalpole.AdamSmith’smasterpiece,TheWealthofNations, was published in1776, at the height of the British mercantile system. He argued that therestrictions on competition that the systemwas producing through protection,subsidiesandgrantingofmonopolyrightswerebadfortheBritisheconomy.iv
AdamSmith understood thatWalpole’s policieswere becoming obsolete.Without them,manyBritish industrieswouldhavebeenwipedoutbefore theyhadhadthechancetocatchupwiththeirsuperiorrivalsabroad.ButonceBritishindustries had become internationally competitive, protection became lessnecessary and even counter-productive. Protecting industries that do not need

protectionanymoreislikelytomakethemcomplacentandinefficient,asSmithobserved. Therefore, adopting free trade was now increasingly in Britain’sinterest.However,Smithwassomewhataheadofhis time.Anothergenerationwould pass before his views became truly influential, and it was not until 84yearsafterTheWealthofNationswaspublishedthatBritainbecameagenuinefreetradingnation.
By the end of the Napeolenic Wars in 1815, four decades after thepublication of The Wealth of Nations, British manufacturers were firmlyestablishedasthemostefficientintheworld,exceptinafewlimitedareaswherecountries like Belgium and Switzerland possessed technological leads. Britishmanufacturerscorrectlyperceived that free tradewasnow in their interest andstartedcampaigningforit(havingsaidthat,theynaturallyremainedquitehappyto restrict tradewhen it suited them, as the cottonmanufacturers didwhen itcametotheexportoftextilemachinerythatmighthelpforeigncompetitors).Inparticular, the manufacturers agitated for the abolition of the Corn Laws thatlimitedthecountry’sabilitytoimportcheapgrains.Cheaperfoodwasimportanttothembecauseitcouldlowerwagesandraiseprofits.
The anti-Corn Law campaign was crucially helped by the economist,politician and stock-market player, David Ricardo. Ricardo came up with thetheory of comparative advantage that still forms the core of free trade theory.BeforeRicardo,peoplethoughtforeigntrademakessenseonlywhenacountrycanmakesomethingmorecheaplythanitstradingpartner.Ricardo,inabrilliantinversion of this commonsensical observation, argued that trade between twocountries makes sense even when one country can produce everything morecheaply than another. Although this country is more efficient in producingeverythingthantheother,itcanstillgainbyspecializinginthingsinwhichithasthegreatestcostadvantageover its tradingpartner.Conversely,evenacountrythathasnocostadvantageoveritstradingpartnerinproducinganyproductcangain from trade if it specializes in products in which it has the least costdisadvantage.With this theory,Ricardo provided the 19th-century free traderswithasimplebutpowerfultooltoarguethatfreetradebenefitseverycountry.
Ricardo’stheoryisabsolutelyright–withinitsnarrowconfines.Histheorycorrectly says that, accepting their current levels of technology as given, it isbetterforcountriestospecializeinthingsthattheyarerelativelybetterat.Onecannotarguewiththat.
His theory fails when a country wants to acquire more advancedtechnologiessothatitcandomoredifficultthingsthatfewotherscando–thatis,whenitwantstodevelopitseconomy.Ittakestimeandexperiencetoabsorbnew technologies, so technologically backward producers need a period of

protection from international competition during this period of learning. Suchprotectioniscostly,becausethecountryisgivingupthechancetoimportbetterand cheaper products.However, it is a price that has to be paid if itwants todevelopadvancedindustries.Ricardo’stheoryis,thusseen,forthosewhoacceptthestatusquobutnotforthosewhowanttochangeit.
ThebigchangeinBritishtradepolicycamein1846,whentheCornLawswere repealed and tariffs onmanymanufacturing goods were abolished. Freetrade economists today like to portray the repeal of the Corn Laws as theultimate victory of Adam Smith’s and David Ricardo’s wisdom over wrong-headedmercantilism.19 The leading free trade economist of our time, JagdishBhagwatiofColumbiaUniversity,callsthisa‘historictransition’.20
However,many historians familiarwith the period point out thatmakingfoodcheaperwasonlyoneaimoftheanti-CornLawcampaigners.Itwasalsoanactof‘freetradeimperialism’intendedto‘haltthemovetoindustrialisationonthe Continent by enlarging the market for agricultural produce and primarymaterials’.21Byopening itsdomesticagriculturalmarketwider,Britainwantedtolureitscompetitorsbackintoagriculture.Indeed,theleaderoftheanti-CornLaw movement, Richard Cobden, argued that, without the Corn Laws: ‘Thefactory systemwould, in all probability, not have taken place inAmerica andGermany. It most certainly could not have flourished, as it has done, both inthese states, and in France, Belgium and Switzerland, through the fosteringbounties which the high-priced food of the British artisan has offered to thecheaperfedmanufacturerofthosecountries’.22Inthesamespirit,in1840,JohnBowring of theBoard of Trade, a keymember of the anti-CornLawLeague,explicitlyadvisedthememberstatesoftheGermanZollverein(CustomsUnion)tospecializeingrowingwheatandsellthewheattobuyBritishmanufactures.23Moreover,itwasnotuntil1860thattariffswerecompletelyabolished.Inotherwords,Britainadoptedfreetradeonlywhenithadacquiredatechnologicalleadoveritscompetitors‘behindhighandlong-lastingtariffbarriers’,astheeminenteconomichistorianPaulBairochonceputit.24NowonderFriedrichList talkedabout‘kickingawaytheladder’.
Americaentersthefray
ThebestcritiqueofBritain’shypocrisymayhavebeenwrittenbyaGerman,butthecountrythatbestresistedBritain’sladder-kickingintermsofpolicywasnot

Germany.NorwasitFrance,commonlyknownastheprotectionistcounterpointto free-trading Britain. In fact, the counterbalance was provided by the US,Britain’sformercolonyandtoday’schampionoffreetrade.
UnderBritishrule,AmericawasgiventhefullBritishcolonialtreatment.Itwas naturally denied the use of tariffs to protect its new industries. It wasprohibitedfromexportingproducts thatcompetedwithBritishproducts.Itwasgiven subsidies to produce rawmaterials.Moreover, outright restrictionswereimposedonwhatAmericanscouldmanufacture.ThespiritbehindthispolicyisbestsummedupbyaremarkWilliamPitttheEldermadein1770.HearingthatnewindustrieswereemergingintheAmericancolonies,hefamouslysaid:‘[TheNewEngland] colonies should not be permitted tomanufacture somuch as ahorseshoenail’.25 In reality,Britishpolicieswerea littlemore lenient than thismay imply: some industrial activities were permitted. But themanufacture ofhigh-technologyproductswasbanned.
NotallBritonswereashard-heartedasPitt.InrecommendingfreetradetotheAmericans,somewereconvincedthattheywerehelpingthem.InhisWealthofNations,AdamSmith,theScottishfatheroffreemarketeconomics,solemnlyadvisedtheAmericansnottodevelopmanufacturing.Hearguedthatanyattemptto ‘stop the importation ofEuropeanmanufactures’would ‘obstruct instead ofpromotingtheprogressoftheircountrytowardsrealwealthandgreatness’.26
ManyAmericansagreed,includingThomasJefferson,thefirstsecretaryofstateandthethirdpresident.Butothersfiercelydisagreed.Theyarguedthatthecountry needed to develop manufacturing industries and use governmentprotection and subsidies to that end, as Britain had done before them. Theintellectualleaderofthismovementwasahalf-ScottishupstartcalledAlexanderHamilton.
HamiltonwasbornontheCaribbeanislandofNevis,theillegitimatechildof a Scottish pedlar (who dubiously claimed an aristocratic lineage) and awomanof French descent.He climbed to power thanks to his sheer brillianceandboundlessenergy.At22,hewasanaide-de-camptoGeorgeWashingtoninthe War of Independence. In 1789, at the outrageously early age of 33, hebecamethecountry’sfirstfinanceminister(treasurysecretary).
In 1791, Hamilton submitted hisReport on the Subject of Manufactures(henceforththeReport)totheUSCongress.Init,heexpoundedhisviewthatthecountryneededabigprogrammetodevelopitsindustries.Thecoreofhisideawas that a backward country like theUS shouldprotect its ‘industries in theirinfancy’ from foreign competition and nurture them to the point where theycouldstandontheirownfeet.Inrecommendingsuchacourseofactionforhisyoungcountry,theimpudent35-year-oldfinanceministerwithonlyaliberalarts
degree from a then second-rate college (King’s College of New York, nowColumbiaUniversity)wasopenlygoingagainst theadviceof theworld’smostfamouseconomist,AdamSmith.
Thepracticeofprotecting ‘infant industries’hadexistedbefore,as Ihaveshown,butitwasHamiltonwhofirstturneditintoatheoryandgaveitaname(the term ‘infant industry’was invented by him).The theorywas later furtherdevelopedbyFriedrichList,whoistodayoftenmistakenlyknownasitsfather.Listactuallystartedoutasafree-trader;hewasoneoftheleadingpromotersofoneofworld’sfirstfreetradeagreements–theGermanZollverein,orCustomsUnion.Helearnedtheinfant industryargumentfromtheAmericansduringhispolitical exile in the US in the 1820s. Hamilton’s infant industry argumentinspiredmany countries’ economic development programmes and became thebêtenoireoffreetradeeconomistsforgenerationstocome.
In the Report, Hamilton proposed a series of measures to achieve theindustrial development of his country, including protective tariffs and importbans; subsidies; export ban on key rawmaterials; import liberalization of andtariffrebatesonindustrialinputs;prizesandpatentsforinventions;regulationofproduct standards; and development of financial and transportationinfrastructures.27 Although Hamilton rightly cautioned against taking thesepolicies too far, they are, nevertheless, a pretty potent and ‘heretical’ set ofpolicyprescriptions.Werehethefinanceministerofadevelopingcountrytoday,theIMFandtheWorldBankwouldcertainlyhaverefusedtolendmoneytohiscountryandwouldbelobbyingforhisremovalfromoffice.
Congress’s action following Hamilton’s Report fell far short of hisrecommendations, largely because US politics at the timewere dominated bySouthern plantation owners with no interest in developing Americanmanufacturingindustries.Quiteunderstandably,theywantedtobeabletoimporthigher-qualitymanufacturedproducts fromEuropeat the lowestpossiblepricewith theproceeds they earned fromexporting agricultural products.FollowingHamilton’sReport,theaveragetariffonforeignmanufacturedgoodswasraisedfromaround5%toaround12.5%,butitwasfartoolowtoinducethosebuyingmanufacturedgoodstosupportthenascentAmericanindustries.
Hamilton resigned as treasurey secretary in 1795, following the scandalsurroundinghisextra-maritalaffairwithamarriedwoman,withoutthechancetofurtheradvancehisprogramme.Thelifeofthisbrilliantifcausticmanwascutshort in his 50th year (1804) in a pistol duel in NewYork, to which he waschallenged by his friend-turned-political rival, Aaron Burr, the then vicepresident under Thomas Jefferson.28 Had he lived for another decade or so,however,Hamiltonwouldhavebeenabletoseehisprogrammeadoptedinfull.

When the Anglo-American War broke out in 1812, the US Congressimmediately doubled tariffs from the average of 12.5% to 25%.Thewar alsomade the space fornew industries toemergeby interrupting themanufacturedimportsfromBritainandtherestofEurope.Thenewgroupofindustrialistswhohadnowarisennaturallywanted theprotection to continue, and, indeed, tobeincreased, after thewar.29 In 1816, tariffswere raised further, bringing up theaverage to 35%. By 1820, the average tariff rose further to 40%, firmlyestablishingHamilton’sprogramme.
Hamiltonprovided the blueprint forUS economicpolicy until the endoftheSecondWorldWar.Hisinfantindustryprogrammecreatedtheconditionforarapidindustrialdevelopment.Healsosetupthegovernmentbondmarketandpromotedthedevelopmentofthebankingsystem(onceagain,againstoppositionfromThomasJeffersonandhisfollowers).30ItisnohyperbolefortheNewYorkHistoricalSocietytohavecalledhim‘TheManWhoMadeModernAmerica’inarecentexhibition.31HadtheUSrejectedHamilton’svisionandacceptedthatofhis archrival, Thomas Jefferson, for whom the ideal society was an agrarianeconomymadeupofself-governingyeomanfarmers(althoughthisslave-ownerhadtosweeptheslaveswhosupportedthislifestyleunderthecarpet),itwouldnever have been able to propel itself from being a minor agrarian powerrebelling against its powerful colonial master to the world’s greatest super-power.
AbrahamLincolnandAmerica’sbidforsupremacy
AlthoughHamilton’stradepolicywaswellestablishedbythe1820s,tariffswereanever-presentsourceoftensioninUSpoliticsforthefollowingthreedecades.The Southern agrarian states constantly attempted to lower industrial tariffs,whiletheNorthernmanufacturingstatesarguedthecaseforkeepingthemhighorevenraisingthemfurther.In1832,pro-freetradeSouthCarolinaevenrefusedto accept the new federal tariff law, causing a political crisis. The so-calledNullification Crisis was resolved by President Andrew Jackson, who offeredsome tariff reduction (though not a lot, despite his image as the folk hero ofAmerican free market capitalism), while threatening South Carolina withmilitary action. This served to patch things up temporarily, but the festering

conflicteventuallycametoaviolentresolutionintheCivilWarthatwasfoughtunderthepresidencyofAbrahamLincoln.
ManyAmericans callAbrahamLincoln, the 16th president (1861–5), theGreatEmancipator–of theAmericanslaves.Buthemightequallybe labelledtheGreatProtector–ofAmericanmanufacturing.Lincolnwasastrongadvocateofinfantindustryprotection.HecuthispoliticalteethunderHenryClayoftheWhig Party, who advocated the building of the ‘American System’, whichconsisted of infant industry protection (‘Protection for Home Industries’, inClay’s words) and investment in infrastructure such as canals (‘InternalImprovements’).32Lincoln,borninthesamestateofKentuckyasClay,enteredpoliticsasaWhigstatelawmakerofIllinoisin1834at theageof25,andwasClay’strustedlieutenantintheearlydaysofhispoliticalcareer.
ThecharismaticClaystoodoutfromearlyoninhiscareer.Almostassoonas he was elected to Congress in 1810, he became the Speaker of the House(from1811until1820andthenagainin1823–5).AsapoliticianfromtheWest,hewantedtopersuadetheWesternstatestojoinforceswiththeNorthernstates,inthedevelopmentofwhosemanufacturingindustriesClaysawthefutureofhiscountry. Traditionally, the Western states, without much industry, had beenadvocates of free trade and thus allied themselves with the pro-free tradeSouthernstates.Clayarguedthattheyshouldswitchsidestobackaprotectionistprogramme of industrial development in return for federal investments ininfrastructure to develop the region. Clay ran for the presidency three times(1824,1832and1844)withoutsuccess,althoughhecameveryclosetowinningthepopularvoteinthe1844election.TheWhigcandidateswhodidmanagetobecomepresidents–WilliamHarrison(1841–4)andZacharyTaylor(1849–51)–weregeneralswithnoclearpoliticaloreconomicviews.
In the end, what made it possible for the protectionists to win thepresidencywithLincolnastheircandidatewastheformationoftheRepublicanParty.TodaytheRepublicanPartycallsitselftheGOP(GrandOldParty),butitisactuallyyoungerthantheDemocraticParty,whichhasexistedinoneformoranother since the days of Thomas Jefferson (when it was called, somewhatconfusingly to the modern observer, the Democratic Republicans). TheRepublicanPartywasamid-19th-centuryinvention,basedonanewvisionthatbefittedacountrythatwasrapidlymovingoutward(intotheWest)andforward(through industrialization), rather than harking back to an increasinglyunsustainableagrarianeconomybasedonslavery.
The winning formula that the Republican Party came up with was tocombinetheAmericanSystemoftheWhigswiththefreedistributionof(oftenalreadyillegallyoccupied)publiclandsostronglywantedbytheWesternstates.

This call for free distribution of public land was naturally anathema to theSouthern landlords, who saw it as the start of a slippery slope towards acomprehensive land reform. The legislation for such distribution had beenconstantly thwarted by the Southern Congressmen. The Republican PartyundertooktopasstheHomesteadAct,whichpromisedtogive160acresoflandtoanysettlerwhowouldfarmitforfiveyears.ThisactwaspassedduringtheCivilWarin1862,bywhichtimetheSouthernCongressmenhadwithdrawn.
Slaverywasnotasdivisiveanissueinpre-Civil-WarUSpoliticsasmostofus today believe it to have been.Abolitionists had a strong influence in someNorthern states, especially Massachusetts, but the mainstream Northern viewwas not abolitionist. Many people who were opposed to slavery thought thatblack people were racially inferior and thus were against giving them fullcitizenship, including the right tovote.Theybelieved theproposalby radicalsfor an immediate abolition of slavery to be highly unrealistic. The GreatEmancipator himself shared these views. In response to a newspaper editorialurgingimmediateslaveemancipation,Lincolnwrote:‘IfIcouldsavetheUnionwithoutfreeinganyslave,Iwoulddoit;andifIcouldsaveitbyfreeingalltheslaves, Iwould do it; and if I could do it by freeing some and leaving othersalone,Iwouldalsodothat’.33Historiansoftheperiodagreethathisabolitionofslaveryin1862wasmoreofastrategicmovetowinthewarthananactofmoralconviction.Disagreementovertradepolicy,infact,wasatleastasimportantas,andpossiblymoreimportantthan,slaveryinbringingabouttheCivilWar.
Duringthe1860electioncampaign, theRepublicans insomeprotectioniststates assailed the Democrats as a ‘Southern-British-Antitariff-Disunion party[myitalics]’,playingonClay’sideaoftheAmericansystemwhichimpliedthatfreetradewasintheBritish,notAmerican,interest.34However,Lincolntriedtokeep quiet on the tariff issue during the election campaign, not just to avoidattacksfromtheDemocratsbutalsotokeepthefragilenewpartyunited,astherewere some free-traders in the party (mostly formerDemocratswhowere anti-slavery).
But,onceelected,Lincolnraised industrial tariffs to theirhighest levelsofarinUShistory.35TheexpenditurefortheCivilWarwasgivenasanexcuse–in the same way in which the first significant rise in US tariffs came aboutduring the Anglo-American War (1812–16). However, after the war, tariffsstayedatwartimelevelsorabove.Tariffsonmanufacturedimportsremainedat40–50%until theFirstWorldWar, andwere thehighestof anycountry in theworld.36
In1913,followingtheDemocraticelectoralvictory,theUnderwoodTariffbillwaspassed,reducingtheaveragetariffonmanufacturedgoodsfrom44%to

25%.37But tariffswere raisedagainvery soonafterwards, thanks toAmericanparticipation in the FirstWorldWar. After the Republican return to power in1921,tariffswentupagain,althoughtheydidnotgobacktotheheightsofthe1861–1913period.By1925,theaveragemanufacturingtariffhadclimbedbackup to37%.Following theonset of theGreatDepression, there came the1930Smooth-Hawleytariff,whichraisedtariffsevenhigher.
Alongwiththemuch-trumpetedwisdomoftheAnti-CornLawmovement,the stupidity of the Smoot-Hawley tariff has become a key fable in free trademythology.ThefreetradeeconomistJagdishBhagwaticalledit‘themostvisibleanddramaticactofanti-tradefolly’.38Butthisviewismisleading.TheSmoot-Hawley tariff may have provoked an international tariff war, thanks to badtiming,especiallygiventhenewstatusoftheUSastheworld’slargestcreditornationaftertheFirstWorldWar.Butitwassimplynottheradicaldeparturefromthecountry’straditionaltradepolicystancethatfreetradeeconomistsclaimittohavebeen.Followingthebill,theaverageindustrialtariffrateroseto48%.Therise from 37% (1925) to 48% (1930) is not exactly small but it is hardly aseismicshift.Moreover,the48%obtainedafterthebillcomfortablyfallswithintherangeoftheratesthathadprevailedinthecountryeversincetheCivilWar,albeitintheupperregionthereof.
Despite being themost protectionist country in theworld throughout the19th century and right up to the 1920s, the US was also the fastest growingeconomy.TheeminentSwisseconomichistorian,PaulBairoch,pointsout thatthere is no evidence that theonly significant reductionofprotectionism in theUSeconomy(between1846and1861)hadanynoticeablepositiveimpactonthecountry’srateofeconomicgrowth.39SomefreetradeeconomistsarguethattheUS grew quickly during this period despite protectionism, because it had somany other favourable conditions for growth, particularly its abundant naturalresources, large domestic market and high literacy rate.40 The force of thiscounter-argument is diminished by the fact that, as we shall see, many othercountries with few of those conditions also grew rapidly behind protectivebarriers.Germany,Sweden,France,Finland,Austria,Japan,TaiwanandKoreacometomind.
Itwas only after the SecondWorldWar that theUS –with its industrialsupremacynowunchallenged–liberalizeditstradeandstartedchampioningthecauseoffreetrade.ButtheUShasneverpractisedfreetradetothesamedegreeasBritaindidduringitsfreetradeperiod(1860to1932).Ithasneverhadazero-tariff regimelikeBritain. Ithasalsobeenmuchmoreaggressive inusingnon-tariffprotectionistmeasureswhennecessary.41Moreover,evenwhenitshiftedtofreer(ifnotabsolutelyfree)trade, theUSgovernmentpromotedkeyindustries

byanothermeans,namely,publicfundingofR&D.Betweenthe1950sandthemid-1990s, US federal government funding accounted for 50–70% of thecountry’s total R&D funding, which is way above the figures, around 20%,found in such ‘government-led’countries as Japan andKorea.Without federalgovernmentfundingforR&D,theUSwouldnothavebeenabletomaintainitstechnological lead over the rest of theworld in key industries like computers,semiconductors,lifesciences,theinternetandaerospace.
Othercountries,guiltysecrets
Given that protectionism is bad for economic growth, how can the twomostsuccessfuleconomiesinhistoryhavebeensoprotectionist?Onepossibleansweris that, while Britain and the US were protectionist, they were economicallymore successful than other countries because theywere less protectionist thanothers. Indeed, it seems likely that other rich countries known for theirprotectionisttendencies–suchasFrance,GermanyandJapan–hadevenhighertariffwallsthanthoseofBritainandtheUS.
Thisisnottrue.Noneoftheothercountriesamongtoday’swealthynationswereeverasprotectionistasBritainortheUS,withthebriefexceptionofSpaininthe1930s.42France,GermanyandJapan–thethreecountriesthatareusuallyconsidered to be the homes of protectionism – always had lower tariffs thanBritainortheUS(untilthelattertwocountriesconvertedtofreetradefollowingtheireconomicascendancy).
France is often presented as the protectionist counterpoint to free-tradeBritain.But,between1821and1875,especiallyupuntiltheearly1860s,FrancehadlowertariffsthanBritain.43Evenwhenitbecameprotectionist–betweenthe1920sandthe1950s–itsaverageindustrialtariffratewasneverover30%.TheaverageindustrialtariffratesinBritainandtheUSwere50–55%attheirheights.
TariffswerealwaysrelativelylowinGermany.Throughoutthe19thandinthe early 20th century (until the FirstWorldWar), the averagemanufacturingtariff rate in Germany was 5–15%, way below the American and the British(before the1860s) rates of 35–50%.Even in the1920s,when it becamemoreprotectiveofitsindustries,Germany’saverageindustrialtariffratestayedaround20%. The frequent equation of fascism with protectionism in free trademythologyishighlymisleadinginthissense.
AsforJapan,intheveryearlydaysofitsindustrialdevelopment,itactually

practisedfreetrade.ButthiswasnotoutofchoicebutduetoaseriesofunequaltreatiesthatitwasforcedbyWesterncountriestosignuponitsopeningin1853.These treatiesboundJapan’s tariff ratebelow5%until1911.But,evenafter itregainedtariffautonomyandraisedmanufacturingtariffs,theaverageindustrialtariffratewasonlyabout30%.
ItwasonlyaftertheSecondWorldWar,whentheUSbecametopdogandliberalized its trade, that countries likeFrance came to lookprotectionist.But,eventhen,thedifferencewasnotthatgreat.In1962,theaverageindustrialtariffin the US was still 13%. With only 7% average industrial tariff rates, theNetherlandsandWestGermanywereconsiderablylessprotectionistthantheUS.Tariff rates in Belgium, Japan, Italy, Austria and Finland were only slightlyhigher,rangingfrom14%to20%.France,withatariffrateof30%in1959,wastheoneexception.44Bytheearly1970s,theUScouldnotclaimtobetheleadingpractitioneroffreetradeanymore.Bythen,otherrichcountrieshadcaughtupwithiteconomicallyandfoundthemselvesabletolowertheirindustrialtariffs.In1973, theUSaverage industrial tariff ratewas12%, compared toFinland’s13%, Austria’s 11% and Japan’s 10%. The average tariff rate of the EEC(EuropeanEconomicCommunity)countrieswasconsiderablylowerthantheUSrate,atonly8%.45
Sothetwochampionsoffreetrade,BritainandtheUS,werenotonlynotfreetradeeconomies,buthadbeenthetwomostprotectionisteconomiesamongrichcountries– that is,until theyeachbecametheworld’sdominant industrialpower.v
Ofcourse, tariffsareonlyoneofthemanytoolsthatacountrycanusetopromote its infant industries. After all, Hamilton’s original recommendationlisted eleven types of measures to promote infant industry, including patents,productqualitystandardsandpublicinvestmentininfrastructure.BritainandtheUSmayhaveusedtariffsmostaggressively,butothercountriesoftenusedothermeansofpolicyintervention–forexample,state-ownedenterprises,subsidiesorexportmarketingsupport–moreintensively.
In the early days of their industrialization, when there were not enoughprivatesectorentrepreneurswhocouldtakeonrisky,large-scaleventures,mostoftoday’srichcountrygovernments(excepttheUSandtheBritish)setupstate-ownedenterprises.Insomecase,theyprovidedsomanysubsidiesandotherhelp(e.g.,poachingskilledworkers fromabroad) tosomeprivate-sectorenterprisesthat they were effectively public-private joint ventures. In the 18th century,Prussia, the leader ofGerman industrialization, promoted industries like linen,ironandsteelbymeansofthesemethods.Japanstartedsteel,shipbuildingandrailwayindustriesthroughstateownershipandtargetedsubsidies(moreonthis

inchapter5).Inthelate19thcentury,theSwedishgovernmenttooktheleadindevelopingtherailways.Asof1913,itownedone-thirdoftherailwaysintermsofmileage and 60% in terms of goods transported – this at a timewhen theleaders in railway development, namely Britain and the US, relied almostentirelyon theprivate sector.Public-privateco-operation inSwedencontinuedin the development of the telegraph, telephone and hydro-electric sectors.TheSwedishgovernmentalsosubsidisedR&Dfromearlyon.
After the Second World War, state efforts to promote industry wereintensified inmost richcountries.Thebiggestshiftwas inFrance.Contrary tothepopular image, theFrench statehasnot alwaysbeen interventionist.Therecertainly had been a tradition of state activism, represented by Jean-BaptisteColbert,LouisXIV’s long-timefinanceminister(1865–83),but itwasrejectedafter the French Revolution. So, between the end of Napoleon’s rule and theSecondWorldWar,exceptduringtheruleofNapoleonIII,theFrenchstatetookan extreme laissez-faire approach to economic policy. One major historicalaccount of French economic policy points out that, during this period, theindustrial promotion strategy of the French government ‘consisted largely oforganising exhibitions, looking after the Chambers of Commerce, gatheringeconomicstatistics,anddistributingdecorations tobusinessmen’.46After1945,acknowledgingthat itsconservative,hands-offpolicieswereresponsiblefor itsrelativeeconomicdeclineand thusdefeats in twoworldwars, theFrenchstatetook a much more active role in the economy. It launched ‘indicative’ (asopposed to communism’s ‘compulsory’) planning, took over key industriesthrough nationalization, and channelled investment into strategic industriesthroughstate-ownedbanks.Tocreate thebreathingspacefornewindustries togrow,industrialtariffsweremaintainedatarelativelyhighleveluntilthe1960s.Thestrategyworkedverywell.Bythe1980s,Francehadtransformeditselfintoatechnologicalleaderinmanyareas.
In Japan, the famousMITI (Ministryof InternationalTradeand Industry)orchestrated an industrial development programme that has now become alegend. Japan’s industrial tariffs were not particularly high after the SecondWorldWar,butimportsweretightlycontrolledthroughgovernmentcontroloverforeign exchange. Exportswere promoted in order tomaximize the supply offoreign currency needed to buy up better technology (either by buyingmachinery or by paying for technology licences). This involved direct andindirectexportsubsidiesaswellasinformationandmarketinghelpfromJETRO(JapanExternalTradeOrganisation),thestatetradingagency.Therewereothermeasures to create the space needed for the accumulation of new productivecapabilitiesbyinfantindustries.TheJapanesegovernmentchannelledsubsidized

credits into key sectors through ‘directed credit progammes’. It also heavilyregulated foreign investment by transnational corporations (TNCs). Foreigninvestment was simply banned in most key industries. Even when it wasallowed,therewerestrictceilingsonforeignownership,usuallyamaximumof49%.Foreigncompanieswere required to transfer technologyandbuyat leastspecified proportions of their inputs locally (the so-called local contentsrequirement). The Japanese government also regulated the inflow oftechnologies,tomakesurethatoverlyobsoleteorover-pricedtechnologieswerenotimported.However,unlikeinthe19thcentury,theJapanesegovernmentdidnotuseSOEsinkeymanufacturingindustries.
Countries like Finland, Norway, Italy and Austria – which were allrelativelybackwardat theendof theSecondWorldWarandsaw theneed forrapid industrial development – also used strategies similar to those used byFrance and Japan to promote their industries. All of them had relatively hightariffsuntil the1960s.TheyallactivelyusedSOEstoupgradetheir industries.ThiswasparticularlysuccessfulinFinlandandNorway.InFinland,NorwayandAustria, thegovernmentwasverymuchinvolvedindirectingtheflowofbankcredit to strategic industries. Finland heavily controlled foreign investment. InmanypartsofItaly,localgovernmentprovidedsupportformarketingandR&Dtosmallandmedium-sizedfirmsinthelocality.
Thus practically all of today’s rich countries used nationalistic policies(e.g.,tariffs,subsidies,restrictionsonforeigninvestment)topromotetheirinfantindustries, though the exact mix of policies used, as well as their timing andduration, differed across countries. There were some exceptions: notably theNetherlands (which has had the best free-trade credentials since the 19thcentury)andSwitzerland(until theFirstWorldWar)consistentlypractisedfreetrade.Buteventheydonotconformtotoday’sneo-liberalideal,astheydidnotprotectpatentsuntiltheearly20thcentury.TheNetherlandsintroducedapatentlawin1817,butabolisheditin1869anddidnotre-introduceituntil1912.TheSwissintroducedtheirfirstpatentlawin1888,butitprotectedonlymechanicalinventions.Itintroducedafullpatentlawonlyin1907(moreonthesecasesinchapter6).
AgainstthekindofhistoricalevidencethatIhavepresentedinthischapter,free trade economists have argued that themere co-existence of protectionismand economic development does not prove that the former caused the latter.47This is true. But I am at least trying to explain something (economicdevelopment) with another that co-existed with it (protectionism); free tradeeconomists have to explain how free trade can be an explanation for theeconomic success of today’s rich countries, when it simply had not been

practisedverymuchbeforetheybecamerich.
Learningtherightlessonsfromhistory
TheRomanpoliticianandphilosopherCicerooncesaid:‘Nottoknowwhathasbeentransactedinformertimesistobealwaysachild.Ifnouseismadeofthelabours of past ages, the world must remain always in the infancy ofknowledge.’
Nowhere else is the observation more relevant than in the design ofdevelopmentpolicy,butnowhereisitmoreignored.Thoughwehaveawealthofhistorical experiences to draw upon, we do not bother to learn them andunquestioninglyaccepttheprevailingmyththattoday’srichcountriesdevelopedthroughfree-trade,free-marketpolicy.
Buthistorytellsusthat,intheearlystageoftheirdevelopment,virtuallyallsuccessfulcountriesusedsomemixtureofprotection,subsidiesandregulationinorder to develop their economies. The history of the successful developingcountriesthatIdiscussedinchapter1showsthat.Moreimportantly,thehistoryoftoday’srichcountriesalsoconfirmsthat,asIhavediscussedinthischapter.
Unfortunately,anotherlessonofhistoryisthatrichcountrieshave‘kickedaway the ladder’ by forcing free-market, free-trade policies on poor countries.Alreadyestablishedcountriesdonotwantmorecompetitors emerging throughthenationalisticpoliciestheythemselvessuccessfullyusedinthepast.Eventhenewestmemberoftheclubofrichcountries,mynativeKorea,hasnotbeenanexceptiontothispattern.Despiteoncehavingbeenoneofthemostprotectionistcountriesintheworld,itnowadvocatessteepcutsinindustrialtariffs,ifnottotalfreetrade,intheWTO.Despiteoncehavingbeentheworldpiracycapital,itgetsupsetthattheChineseandtheVietnameseareproducingpirateCDsofKoreanpop music and pirate DVDs of Korean movies. Worse, these Korean free-marketeersareoftenthesamepeoplewho,notsolongago,actuallydraftedandimplemented interventionist,protectionistpolicies in theirearlier jobs.Mostofthemprobablylearnedtheirfreemarketeconomicsfrompirate-copiedAmericaneconomics textbooks,while listening to pirate-copied rock and rollmusic andwatchingpirate-copiedvideosofHollywoodfilmsintheirsparetime.
Even more prevalent and important than ‘ladder-kicking’, however, ishistoricalamnesia.InthePrologue,Iexplainedthegradualandsubtleprocessinwhich history is re-written to fit a country’s present self-image. As a result,
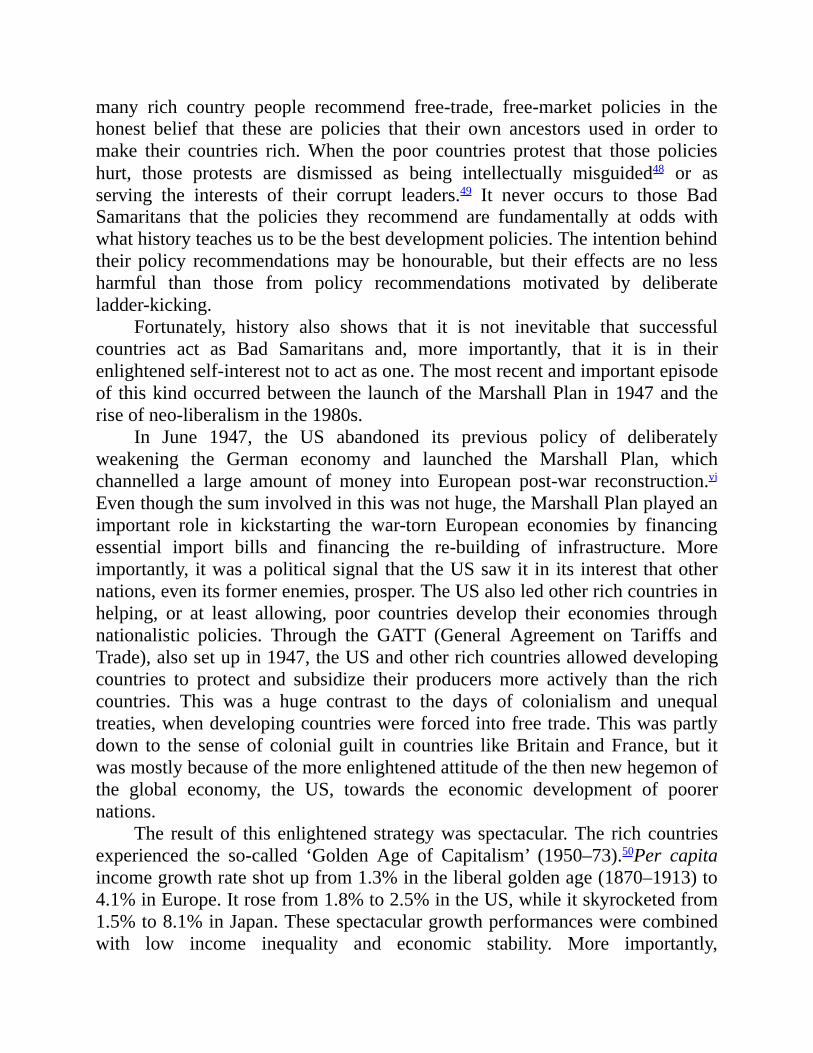
many rich country people recommend free-trade, free-market policies in thehonest belief that these are policies that their own ancestors used in order tomake their countries rich.When the poor countries protest that those policieshurt, those protests are dismissed as being intellectually misguided48 or asserving the interests of their corrupt leaders.49 It never occurs to those BadSamaritans that the policies they recommend are fundamentally at odds withwhathistoryteachesustobethebestdevelopmentpolicies.Theintentionbehindtheir policy recommendationsmaybe honourable, but their effects are no lessharmful than those from policy recommendations motivated by deliberateladder-kicking.
Fortunately, history also shows that it is not inevitable that successfulcountries act as Bad Samaritans and, more importantly, that it is in theirenlightenedself-interestnottoactasone.Themostrecentandimportantepisodeof thiskindoccurredbetween the launchof theMarshallPlan in1947and theriseofneo-liberalisminthe1980s.
In June 1947, the US abandoned its previous policy of deliberatelyweakening the German economy and launched the Marshall Plan, whichchannelled a large amount of money into European post-war reconstruction.viEventhoughthesuminvolvedinthiswasnothuge,theMarshallPlanplayedanimportant role in kickstarting the war-torn European economies by financingessential import bills and financing the re-building of infrastructure. Moreimportantly, itwasapoliticalsignal that theUSsawit in its interest thatothernations,evenitsformerenemies,prosper.TheUSalsoledotherrichcountriesinhelping, or at least allowing, poor countries develop their economies throughnationalistic policies. Through the GATT (General Agreement on Tariffs andTrade),alsosetupin1947,theUSandotherrichcountriesalloweddevelopingcountries to protect and subsidize their producers more actively than the richcountries. This was a huge contrast to the days of colonialism and unequaltreaties,whendevelopingcountrieswereforcedintofreetrade.Thiswaspartlydown to the senseof colonial guilt in countries likeBritain andFrance, but itwasmostlybecauseofthemoreenlightenedattitudeofthethennewhegemonofthe global economy, the US, towards the economic development of poorernations.
The resultof thisenlightenedstrategywas spectacular.The richcountriesexperienced the so-called ‘Golden Age of Capitalism’ (1950–73).50Per capitaincomegrowthrateshotupfrom1.3%intheliberalgoldenage(1870–1913)to4.1%inEurope.Itrosefrom1.8%to2.5%intheUS,whileitskyrocketedfrom1.5%to8.1%inJapan.Thesespectaculargrowthperformanceswerecombinedwith low income inequality and economic stability. More importantly,

developingcountriesalsoperformedverywellduring thisperiod.AsIpointedout inchapter1,during the1960sand the1970s,when theyusednationalisticpolicies under the ‘permissive’ international system, they grew at 3% in percapita terms. This is way above what they had achieved under old liberalpolicies during ‘first globalization’ (1870–1913) and twice the rate they haverecordedsincethe1980sunderneo-liberalpolicies.
Some have discounted the generosity of the US during the 1947–1979periodon thegrounds that itwasbeingnice topoorcountriesonlybecauseofthe rivalrywith theUSSR in theColdWar. Itwould be silly to deny that theColdWarhadanimportantinfluenceonUSforeignpolicy,butthatshouldnotstopusfromgivingcreditwhereitisdue.Duringthe‘ageofimperialism’inthelate19thandtheearly20thcentury,thepowerfulcountriesbehavedabominablytowardstheweakercountriesdespitetheintenserivalryamongstthemselves.
Thehistory–recentandmoredistant–thatIhavediscussedinthelasttwochapterswill informmy discussion in the following chapters,where I explainhow exactly today’sBadSamaritans arewrong in relation to the key areas ofeconomic policy – international trade, foreign investment regulation,privatisation, protection of intellectual property rights, like patents, andmacroeconomicpolicy–andsuggesthowtheirbehaviourshouldbechangedifwearetopromoteeconomicdevelopmentinpoorcountries.iTheSouthSeaCompanywassetupin1711byRobertHarley,Defoe’sfirstspymaster,andwasgrantedexclusivetradingrightsinSpanishSouthAmerica.Itmadelittleactualprofit,buttalkedupitsstockwiththemostextravagantrumoursofthevalueofitspotentialtrade.Aspeculativefrenzydevelopedarounditssharesin1720,withitsstockpricerisingbytentimesinsevenmonthsbetweenJanuaryandAugust1720.Thestockpricethenstartedfallingand,byearly1721,wasbackwhereithadbeeninJanuary1720.iiThisisapracticewhereamanufacturerexportingaproductispaidbackthetariffthatithaspaidfortheimportedinputsusedinproducingtheproduct.Thisisawayofencouragingexports.iii This is a practicewhere the government sets theminimum quality standards for export products andpunishes thoseexporterswhodonotmeet them.This is intended toprevent substandardexportproductstarnishing the image of the exporting country. It is particularly usefulwhen products do not havewell-recognizedbrandnamesand,therefore,areidentifiedbytheirnationalorigin.ivHowever,Smithwasapatriotevenmorethanhewasafreemarketeconomist.Hesupportedfreemarketand free tradeonlybecausehe thought theyweregood forBritain, aswecan see fromhispraiseof theNavigation Acts – the most blatant kind of ‘market-distorting’ regulation – as ‘the wisest of all thecommercialregulationsofEngland’.v The average tariff rate, of course, does not tell us the full story.A countrymay have a relatively lowaveragetariffrate,butthiscouldbetheresultoftheheavyprotectionofcertainsectorscounterbalancedbyveryloworzerotariffsinothersectors.Forexample,duringthelate19thandtheearly20thcentury,whilemaintaining a relativelymoderateaverage industrial tariff rate (5–15%),Germany accorded strong tariffprotection to strategic industries like iron and steel.During the sameperiod,Swedenalsoprovidedhighprotectiontoitsnewlyemergingengineeringindustries,althoughitsaveragetariffratewas15–20%.Inthefirst half of the 20th century, Belgium maintained moderate levels of overall protection (around 10%average industrial tariff rate), but heavily protected key textile sectors (30–60%) and the iron industry(85%).

viTheMarshallPlanwasannouncedbyGeorgeMarshall,thethenUSsecretaryofstate,inhisaddressatHarvardUniversityon5June1947.ItsdetailswerenegotiatedinameetingheldinParisfrom12July1947.Itwasstartedin1948andendedin1951,channellingsome$13billion(equivalentto$130billiontoday)intothewar-torneconomiesofEurope.TheMarshallPlanreplacedtheMorgenthauPlanthathaddictatedpostwarAmericanforeignpolicyuntilthen.TheMorgenthauPlan,namedafterthetreasurysecretaryofthetime(1934–45),focusedonputtinganendtoGermany’sexpansionistambitionby‘pastoralizing’it.Whencombinedwith the SovietUnion’s desire to seize advancedGermanmachinery, itwas very effective indestroyingtheGermaneconomy.However,itsoonbecameobviousthatsuchaplanwasunviable.Afterhisvisit toGermany in 1947, the formerUS president Herbert Hoover denounced theMorgenthau Plan as‘illusory’,andarguedthatitwouldnotworkunlesstheGermanpopulationwasreducedby25million,from65millionto40million.Foranenlighteningdiscussiononthesubject,seeE.Reinert(2003),‘IncreasingPoverty inaGlobalisedWorld:MarshallPlansandMorgenthauPlans asMechanisms of Polarisation ofWorldIncomes’inH-J.Chang(ed.),RethinkingDevelopmentEconomics(AnthemPress,London).

CHAPTER3

Mysix-year-oldsonshouldgetajob
Isfreetradealwaystheanswer?
Ihaveasix-year-oldson.HisnameisJin-Gyu.Helivesoffme,yetheisquitecapable ofmaking a living. I pay for his lodging, food, education and healthcare.Butmillionsofchildrenofhisagealreadyhavejobs.DanielDefoe,inthe18thcentury,thoughtthatchildrencouldearnalivingfromtheageoffour.
Moreover, workingmight do Jin-Gyu’s character aworld of good. Rightnowhelivesinaneconomicbubblewithnosenseofthevalueofmoney.HehaszeroappreciationoftheeffortshismotherandImakeonhisbehalf,subsidizinghisidleexistenceandcocooninghimfromharshreality.Heisover-protectedandneeds tobe exposed to competition, so thathe canbecomeamoreproductiveperson.Thinkingaboutit,themorecompetitionheisexposedtoandthesoonerthisisdone,thebetteritwillbeforhisfuturedevelopment.Itwillwhiphimintoamentalitythatisreadyforhardwork.Ishouldmakehimquitschoolandgetajob.PerhapsIcouldmovetoacountrywherechildlabourisstilltolerated,ifnotlegal,togivehimmorechoiceinemployment.
IcanhearyousayImustbemad.Myopic.Cruel.YoutellmethatIneedtoprotectandnurturethechild.IfIdriveJin-Gyuintothelabourmarketattheageof six, he may become a savvy shoeshine boy or even a prosperous streethawker,buthewillneverbecomeabrainsurgeonoranuclearphysicist– thatwouldrequireatleastanotherdozenyearsofmyprotectionandinvestment.Youarguethat,evenfromapurelymaterialisticviewpoint,Iwouldbewisertoinvestinmyson’seducation thangloatover themoneyIsavebynotsendinghimtoschool.Afterall, ifIwereright,OliverTwistwouldhavebeenbetteroffpick-pocketingforFagin,ratherthanbeingrescuedbythemisguidedGoodSamaritanMrBrownlow,whodeprivedtheboyofhischancetoremaincompetitiveinthelabourmarket.
Yet this absurd line of argument is in essence how free-trade economistsjustifyrapid,large-scaletradeliberalizationindevelopingcountries.Theyclaimthatdevelopingcountryproducersneedtobeexposedtoasmuchcompetitionaspossiblerightnow,sothattheyhavetheincentivetoraisetheirproductivityin

order to survive. Protection, by contrast, only creates complacency and sloth.The earlier the exposure, the argument goes, the better it is for economicdevelopment.
Incentives,however,areonlyhalfthestory.Theotheriscapability.EvenifJin-Gyuwere to be offered a £20m reward or, alternatively, threatenedwith abulletinhishead,hewouldnotbeabletorisetothechallengeofbrainsurgeryhadhequitschoolattheageofsix.Likewise,industriesindevelopingcountrieswillnotsurviveiftheyareexposedtointernationalcompetitiontooearly.Theyneedtimetoimprovetheircapabilitiesbymasteringadvancedtechnologiesandbuilding effective organizations. This is the essence of the infant industryargument, first theorizedbyAlexanderHamilton, first treasurysecretaryof theUS, andusedbygenerationsof policy-makersbefore and after him, as I havejustshowninthepreviouschapter.
Naturally, the protection I provide to Jin-Gyu (as the infant industryargumentitselfsays)shouldnotbeusedtoshelterhimfromcompetitionforever.Makinghimworkattheageofsixiswrong,butsoissubsidizinghimattheageof40.Eventuallyheshouldgooutintothebigwideworld,getajobandliveanindependent life. He only needs protection while he is accumulating thecapabilitiestotakeonasatisfyingandwell-paidjob.
Of course, as happens with parents bringing up their children, infantindustry protection can go wrong. Just as some parents are over-protective,governmentscancossetinfantindustriestoomuch.Somechildrenareunwillingtopreparethemselvesforadultlife,justasinfantindustrysupportiswastedonsome firms. In the way that some children manipulate their parents intosupportingthembeyondchildhood,thereareindustriesthatprolonggovernmentprotectionthroughcleverlobbying.Buttheexistenceofdysfunctionalfamiliesishardlyanargumentagainstparentingitself.Likewise,casesoffailuresininfantindustry protection cannot discredit the strategy per se. The examples of badprotectionismmerelytellusthatthepolicyneedstobeusedwisely.
Freetradeisn’tworking
Freetradeisgood–thisisthedoctrineattheheartoftheneo-liberalorthodoxy.To the neo-liberals, there cannot be amore self-evident proposition than this.ProfessorWillemBuiter,mydistinguishedformercolleagueatCambridgeandaformer chief economist of the EBRD (EuropeanBank for Reconstruction and
Development), once expressed this succinctly: ‘Remember: unilateral tradeliberalization is not a “concession” or a “sacrifice” that one should becompensated for. It is an act of enlightened self-interest. Reciprocal tradeliberalizationenhancesthegainsbutisnotnecessaryforgainstobepresent.Theeconomicsisallthere’.1Beliefinthevirtueoffreetradeissocentraltotheneo-liberalorthodoxythatitiseffectivelywhatdefinesaneo-liberaleconomist.Youmayquestion(ifnottotallyreject)anyotherelementoftheneo-liberalagenda–opencapitalmarkets,strongpatentsorevenprivatisation–andstillstayintheneo-liberalchurch.However,onceyouobject to free trade,youareeffectivelyinvitingex-communication.
Basedonsuchconvictions, theBadSamaritanshavedone theirutmost topushdevelopingcountriesintofreetrade–or,atleast,muchfreertrade.Duringthepastquarterofacentury,mostdevelopingcountrieshaveliberalizedtradetoahugedegree.Theywere firstpushedby the IMFand theWorldBank in theaftermathof theThirdWorlddebtcrisisof1982.Therewasa furtherdecisiveimpetustowardstradeliberalizationfollowingthelaunchof theWTOin1995.Duringthelastdecadeorso,bilateralandregionalfreetradeagreements(FTAs)have also proliferated. Unfortunately, during this period, developing countrieshave not done well at all, despite (or because of, in my view) massive tradeliberalization,asIshowedinchapter1.
ThestoryofMexico–posterboyof the free-tradecamp– isparticularlytelling. If any developing country can succeed with free trade, it should beMexico.Itbordersonthelargestmarketintheworld(theUS)andhashadafreetradeagreementwithitsince1995(theNorthAmericanFreeTradeAgreementor NAFTA). It also has a large diaspora living in theUS, which can provideimportant informal business links.2 Unlike many other poorer developingcountries, it has a decent pool of skilled workers, competent managers andrelativelydevelopedphysicalinfrastructure(roads,portsandsoon).
Free trade economists argue that free trade benefited Mexico byaccelerating growth. Indeed, following NAFTA, between 1994 and 2002,Mexico’spercapitaGDPgrew at 1.8%per year, a big improvement over the0.1%raterecordedbetween1985and1995.3ButthedecadebeforeNAFTAwasalso a decade of extensive trade liberalisation for Mexico, following itsconversion toneo-liberalismin themid-1980s.So trade liberalizationwasalsoresponsibleforthe0.1%growthrate.
Wide-ranging trade liberalization in the 1980s and the 1990s wiped outwholeswathesofMexicanindustrythathadbeenpainstakinglybuiltupduringthe period of import substitution industrialization (ISI). The result was,predictably, a slowdown in economic growth, lost jobs and falls inwages (as

better-payingmanufacturing jobs disappeared). Its agricultural sectorwas alsohard hit by subsidized US products, especially maize, the staple diet of mostMexicans. On top of that, NAFTA’s positive impact (in terms of increasingexports to theUSmarket) has run out of steam in the last few years.During2001–2005,Mexico’s growthperformancehas beenmiserable,with an annualgrowthrateofpercapitaincomeat0.3%(orapaltry1.7%increaseintotaloverfiveyears).4Bycontrast,during the‘badolddays’of ISI (1955–82),Mexico’spercapitaincomehadgrownmuchfasterthanduringtheNAFTAperiod–atanaverageof3.1%peryear.5
Mexico is a particularly striking example of the failure of prematurewholesale trade liberalization, but there are other examples.6 In Ivory Coast,followingtariffcutsof40%in1986,thechemical,textile,shoeandautomobileindustries virtually collapsed. Unemployment soared. In Zimbabwe, followingtradeliberalizationin1990,theunemploymentratejumpedfrom10%to20%.Ithad been hoped that the capital and labour resources released from theenterprisesthatwentbankruptduetotradeliberalizationwouldbeabsorbedbynew businesses. This simply did not happen on a sufficient scale. It is notsurprisingthatgrowthevaporatedandunemploymentsoared.
Trade liberalization has created other problems, too. It has increased thepressuresongovernmentbudgets,asitreducedtariffrevenues.Thishasbeenaparticularly serious problem for the poorer countries. Because they lack taxcollectioncapabilitiesandbecausetariffsaretheeasiesttaxtocollect,theyrelyheavilyon tariffs (whichsometimesaccount forover50%of totalgovernmentrevenue).7Asa result, the fiscaladjustment thathashad tobemadefollowinglarge-scale trade liberalization has been huge inmany developing countries –evenarecentIMFstudyshowsthat, in low-incomecountries thathavelimitedabilities to collect other taxes, less than30% of the revenue lost due to tradeliberalizationoverthelast25yearshasbeenmadeupbyothertaxes.8Moreover,lowerlevelsofbusinessactivityandhigherunemploymentresultingfromtradeliberalization have also reduced income tax revenue. When countries werealreadyunderconsiderablepressurefromtheIMFtoreducetheirbudgetdeficits,fallingrevenuemeantseverecuts inspending,ofteneatingintovitalareas likeeducation,healthandphysicalinfrastructure,damaginglong-termgrowth.
Itisperfectlypossiblethatsomedegreeofgradualtradeliberalizationmayhavebeenbeneficial,andevennecessary,forcertaindevelopingcountriesinthe1980s–IndiaandChinacometomind.Butwhathashappenedduringthepastquarterofacenturyhasbeenarapid,unplannedandblankettradeliberalization.Just to remind the reader, during the ‘bad old days’ of protectionist importsubstitution industrialization (ISI), developing countries used to grow, on

average,atdoubletheratethattheyaredoingtodayunderfreetrade.Freetradesimplyisn’tworkingfordevelopingcountries.
Poortheory,poorresults
Freetradeeconomistsfindallthisquitemysterious.Howcancountriesdobadlywhentheyareusingsuchtheoreticallywell-proven(‘theeconomicsisallthere’,asProfessorBuitersays)policyasfreetrade?Buttheyshouldnotbesurprised.Fortheirtheoryhassomeseriouslimitations.
Modern free trade argument is based on the so-called Heckscher-Ohlin-Samuelson theory (or theHOS theory).i TheHOS theory derives fromDavidRicardo’s theory, which I outlined in chapter 2, but it differs from Ricardo’stheoryinonecrucialrespect.Itassumesthatcomparativeadvantagearisesfrominternational differences in the relative endowments of ‘factors of production’(capital and labour), rather than international differences in technology, as inRicardiantheory.9
According to free trade theory,be itRicardianor theHOSversion, everycountry has a comparative advantage in some products, as it is, by definition,relatively better at producing some things than others.ii In the HOS theory, acountry has comparative advantage in products that more intensively use thefactorofproductionwithwhichitisrelativelymorerichlyendowed.SoevenifGermany, a country relatively richer in capital than labour, can produce bothautomobiles and stuffed toys more cheaply than Guatemala, it pays for it tospecialize in automobiles, as their production uses capital more intensively.Guatemala,evenifitislessefficientinproducingbothautomobilesandstuffedtoysthanGermany,shouldstillspecializeinstuffedtoys,whoseproductionusesmorelabourthancapital.
The more closely a country conforms to its underlying pattern ofcomparative advantage, the more it can consume. This is possible due to theincrease in its own production (of the goods for which it has comparativeadvantage),and,moreimportantly,duetoincreasedtradingwithothercountriesthat specialize in different products. How can the country achieve this? Byleaving things as they are.When they are free to choose, firmswill rationally(likeRobinsonCrusoe)specialize in thingsthat theyarerelativelygoodatandtradewith foreigners.From this follows thepropositions that free trade isbestandthattradeliberalization,evenwhenitisunilateral,isbeneficial.

ButtheconclusionoftheHOStheorycriticallydependsontheassumptionthat productive resources can move freely across economic activities. Thisassumption means that capital and labour released from any one activity canimmediately and without cost be absorbed by other activities. With thisassumption – known as the assumption of ‘perfect factor mobility’ amongeconomists–adjustmentstochangingtradepatternsposenoproblem.Ifasteelmill shuts down due to an increase in imports because, say, the governmentreduces tariffs, the resources employed in the industry (the workers, thebuildings,theblastfurnaces)willbeemployed(atthesameorhigherlevelsofproductivity and thus higher returns) by another industry that has becomerelatively more profitable, say, the computer industry. No one loses from theprocess.
Inreality,thisisnotthecase:factorsofproductioncannottakeanyformasitbecomesnecessary.Theyareusuallyfixedintheirphysicalqualitiesandtherearefew‘generaluse’machinesorworkerswitha‘generalskill’thatcanbeusedacrossindustries.Blastfurnacesfromabankruptsteelmillcannotbere-mouldedintoamachinemakingcomputers;steelworkersdonothavetherightskillsforthecomputer industry.Unless theyare retrained, the steelworkerswill remainunemployed.At best, theywill end upworking in low-skill jobs, where theirexistingskillsaretotallywasted.ThispointispoignantlymadebytheBritishhitcomedyfilmof1997,TheFullMonty,wheresixunemployedsteelworkersfromSheffield struggle to rebuild their lives as male strippers. There are clearlywinnersandlosersinvolvedinchangingtradepatterns,whetheritisduetotradeliberalizationortotheriseofnew,moreproductiveforeignproducers.
Mostfreetradeeconomistswouldacceptthattherearewinnersandlosersfrom trade liberalization but argue that their existence cannot be an argumentagainst trade liberalization. Trade liberalization brings overall gains. As thewinnersgainmorethanwhatislostbythelosers,thewinnerscanmakeupallthelatter’slossesandstillhavesomethingleftforthemselves.Thisisknownasthe‘compensationprinciple’–ifthewinnersfromaneconomicchangecanfullycompensatethelosersandstillhavesomethingleft,thechangeisworthmaking.
Thefirstproblemwiththislineofargumentisthattradeliberalizationdoesnot necessarilybringoverall gain.Even if there arewinners from theprocess,theirgainsmaynotbeaslargeasthelossessufferedbythelosers–forexample,when trade liberalization reduces the growth rate or even make the economyshrink,ashashappenedinmanydevelopingcountriesinthepasttwodecades.
Moreover, even if the winners gain more than the losers lose, thecompensation is not automatically made through the workings of the market,whichmeansthatsomepeoplewillbeworseoffthanbefore.Tradeliberalization

willbenefiteveryoneonlywhenthedisplacedworkerscangetbetter(oratleastequallygood)jobsquickly,andwhenthedischargedmachinescanbere-shapedintonewmachines–whichisrarely.
This is a more serious problem in developing countries, where thecompensationmechanism isweak, if not non-existent. In developed countries,thewelfarestateworksasamechanismtopartiallycompensatethelosersfromthe trade adjustment process through unemployment benefits, guarantees ofhealthcareandeducation,andevenguaranteesofaminimumincome.Insomecountries, such as Sweden and other Scandinavian countries, there are alsohighlyeffectiveretrainingschemesforunemployedworkerssothattheycanbeequippedwith new skills. Inmost developing countries, however, thewelfarestateisveryweakandsometimesvirtuallynon-existent.Asaresult,thevictimsoftradeadjustmentinthesecountriesdonotgetevenpartiallycompensatedforthesacrificethattheyhavemadefortherestofsociety.
Asaresult,thegainsfromtradeliberalizationinpoorcountriesarelikelytobemoreunevenlydistributedthaninrichcountries.Especiallywhenconsideringthatmanypeopleindevelopingcountriesarealreadyverypoorandclosetothesubsistencelevel,large-scaletradeliberalizationcarriedoutinashortperiodoftimewillmean that somepeoplehave their livelihoodswrecked. Indevelopedcountries,unemploymentduetotradeadjustmentmaynotbeamatteroflifeanddeath,but indevelopingcountries itoften is.This iswhyweneed tobemorecautiouswithtradeliberalizationinpoorereconomies.
The short-run trade adjustment problem arising from the immobility ofeconomicresourcesandtheweaknessofcompensatingmechanismsis,althoughserious, only a secondary problem with free trade theory. The more seriousproblem – at least for an economist like myself – is that the theory is aboutefficiency in the short-run use of given resources, and not about increasingavailableresources througheconomicdevelopment in the longrun;contrary towhat theirproponentswouldhaveusbelieve, free trade theorydoesnottellusthatfreetradeisgoodforeconomicdevelopment.
The problem is this – producers in developing countries entering newindustries need a period of (partial) insulation from international competition(throughprotection,subsidiesandothermeasures)beforetheycanbuilduptheircapabilities to compete with superior foreign producers. Of course, when theinfant producers ‘grow up’ and are able to compete with the more advancedproducers,theinsulationshouldgo.Butthishastobedonegradually.Iftheyareexposed to too much international competition too soon, they are bound todisappear.ThatistheessenceoftheinfantindustryargumentthatIsetoutatthebeginningofthechapterwithalittlehelpfrommyson,Jin-Gyu.

In recommending free trade to developing countries, the Bad Samaritanspoint out that all the rich countries have free(ish) trade.This is, however, likepeopleadvisingtheparentsofasix-year-oldboytomakehimgetajob,arguingthat successful adults don’t live off their parents and, therefore, that beingindependent must be the reason for their successes. They do not realize thatthoseadultsareindependentbecausetheyaresuccessful,andnottheotherwayaround.Infact,mostsuccessfulpeoplearethosewhohavebeenwellsupported,financiallyandemotionally,bytheirparentswhentheywerechildren.Likewise,as Idiscussed inchapter2, the richcountries liberalized their tradeonlywhentheirproducerswereready,andusuallyonlygraduallyeventhen.Inotherwords,historically, trade liberalization has been theoutcome rather than the cause ofeconomicdevelopment.
Freetrademayoften–althoughnotalways–bethebesttradepolicyintheshortrun,asit islikelytomaximizeacountry’scurrentconsumption.Butit isdefinitelynotthebestwaytodevelopaneconomy.Inthelongrun,freetradeisapolicythatislikelytocondemndevelopingcountriestospecializeinsectorsthatoffer lowproductivitygrowthand thus lowgrowth in livingstandards.This iswhy so few countries have succeeded with free trade, while most successfulcountries have used infant industry protection to one degree or another. Lowincome that results from lack of economic development severely restricts thefreedom that the poor countries have in deciding their future. Paradoxically,therefore, ‘free’ tradepolicy reduces the ‘freedom’of thedevelopingcountriesthatpractiseit.
Internationaltradingsystemanditsdiscontents
Nevermind that free tradeworks neither in practice nor in theory.Despite itsabysmalrecord,theBadSamaritanrichcountrieshavestronglypromotedtradeliberalizationindevelopingsincethe1980s.
As I discussed in the earlier chapters, the rich countries had been quitewilling to let poor countries use more protection and subsidies until the late1970s. However, this began to change in the 1980s. The change was mostpalpable in the US, whose enlightened approach to international trade witheconomicallylessernationsrapidlygavewaytoasystemsimilarto19th-century

British‘freetradeimperialism’.ThisnewdirectionwasclearlyexpressedbythethenUSpresidentRonaldReaganin1986,astheUruguayRoundofGATTtalkswas starting, when he called for ‘new and more liberal agreements with ourtradingpartners–agreementunderwhich theywould fullyopen theirmarketsand treat American products as they treat their own’.10 Such agreement wasrealized through theUruguayRoundofGATTtrade talks,whichstarted in theUruguayancityofPuntadelEste in1986andwasconcluded in theMoroccancityofMarrakechin1994.TheresultwastheWorldTradeOrganisationregime– a new international trade regime that was much more biased against thedevelopingcountriesthantheGATTregime.
On the surface, theWTOsimplycreateda ‘levelplaying field’among itsmembercountries,requiringthateveryoneplaysbythesamerule–howcanweargueagainstthat?Criticaltotheprocesswastheadoptionoftheprincipleofa‘single undertaking’, which meant that all members had to sign up to allagreements. In the GATT regime, countries could pick and choose theagreementsthattheysigneduptoandmanydevelopingcountriescouldstayoutofagreementsthattheydidnotwant–forexample,theagreementrestrictingtheuseofsubsidies.With thesingleundertaking,allmembershad toabideby thesamerules.Allof themhadtoreducetheir tariffs.Theyweremadetogiveupimportquotas,exportsubsidies(allowedonlyforthepoorestcountries)andmostdomesticsubsidies.But,whenwelookatthedetail,werealizethatthefieldisnotlevelatall.
Tobeginwith,eventhoughtherichcountrieshavelowaverageprotection,they tend to disproportionately protect products that poor countries export,especially garments and textiles. This means that, when exporting to a richcountrymarket,poorcountries facehigher tariffs thanother richcountries.AnOxfamreportpointsoutthat:‘TheoverallimporttaxratefortheUSAis1.6percent.Thatraterisessteeplyforalargenumberofdevelopingcountries:averageimport taxes range fromaround fourper cent for India andPeru, to sevenpercent forNicaragua, andasmuchas14–15percent forBangladesh,CambodiaandNepal.’11Asaresult,in2002,IndiapaidmoretariffstotheUSgovernmentthanBritaindid,despitethefactthatthesizeofitseconomywaslessthanone-third that of theUK.Evenmore strikingly, in the sameyear,BangladeshpaidalmostasmuchintariffstotheUSgovernmentasFrance,despitethefactthatthesizeofitseconomywasonly3%thatofFrance.12
There are also structural reasons thatmakewhat looks like ‘levelling theplayingfield’actuallyfavourdevelopedcountries.Tariffsarethebestexample.The Uruguay Round resulted in all countries, except for the poorest ones,reducing tariffs quite a lot in proportional terms.But the developing countries

endedupreducingtheirtariffsalotmoreinabsoluteterms,forthesimplereasonthat they startedwith higher tariffs. For example, before theWTOagreement,Indiahadanaveragetariffrateof71%.Itwascutto32%.TheUSaveragetariffrate fell from 7% to 3%. Both are similar in proportional terms (eachrepresentingarounda55%cut),buttheabsoluteimpactisverydifferent.IntheIndian case, an imported good that formerly cost $171 would now cost only$132 – a significant fall in what the consumer pays (about 23%) that woulddramatically alter consumer behaviour. In the American case, the price theconsumer payswould have fallen from$107 to $103– a price difference thatmostconsumerswillhardlynotice(lessthan4%).Inotherwords,theimpactoftariff cuts of the same proportion is disproportionately larger for the countrywhoseinitialtariffrateishigher.
In addition, there were areas where ‘levelling the playing field’ meant aone-sided benefit to rich countries.Themost important example is theTRIPS(Trade-related Intellectual PropertyRights) agreement,which strengthened theprotection of patents and other intellectual property rights (more on this inchapter6).Unliketradeingoodsandservices,whereeveryonehassomethingtosell, this is an area where developed countries are almost always sellers anddevelopingcountriesbuyers.Therefore,increasingtheprotectionforintellectualproperty rightsmeans that thecost ismainlyborneby thedevelopingnations.The sameproblemapplies to theTRIMS (Trade-related InvestmentMeasures)agreement, which restricts the WTO member countries’ ability to regulateforeign investors (moreon this in chapter4).Onceagain,mostpoor countriesonly receive, and do not make, foreign investment. So, while their ability toregulate foreign companies is reduced, they do not get ‘compensated’ by anyreductionintheregulationsthattheirnationalfirmsoperatingabroadaresubjectto,astheysimplydonothavesuchfirms.
Many of the exceptions to the rules were created in areas where thedevelopedcountriesneeded them.Forexample,whilemostdomesticsubsidiesarebanned,subsidiesareallowedinrelationtoagriculture,basic(asopposedtocommercial) R&D (research and development), and reduction of regionaldisparities.Theseareallsubsidiesthathappentobeextensivelyusedbytherichcountries. The rich nations give out an estimated $100 billion worth ofagricultural subsidies every year; these include the $4 billion given to 25,000AmericanpeanutfarmersandEUsubsidiesthatallowFinlandtoproducesugar(from beets).13 All rich country governments, especially the US government,heavily subsidize basic R&D, which then increases their competitiveness inrelated industries.Moreover, this is not a subsidy that developing nations canuse,even if theyareallowed to– theysimplydonotdomuchbasicR&D,so

there is little for them tosubsidize.As for regional subsides,whichhavebeenextensively used by the European Union, this is another case of apparentneutrality really serving the interestsmainly of rich countries. In the name ofredressing regional imbalances, they have subsidized firms to induce them tolocate in ‘depressed’ regions.Within the nation, thismay be contributing to areduction in regional inequality. But, when viewed from an internationalperspective,thereislittledifferencebetweenthesesubsidiesandsubsidiesgiventopromoteparticularindustries.
Againsttheseaccusationsof‘levellingtheplayingfield’onlywhereitsuitsthem,therichcountriesoftenarguethattheystillgivethedevelopingcountries‘specialanddifferentialtreatment’(SDT).ButspecialanddifferentialtreatmentisnowapaleshadowofwhatitusedtobeundertheGATTregime.Whilesomeexceptions aremade for the developing countries, especially the poorest ones(‘theleastdevelopedcountries’inWTOjargon),manyoftheseexceptionswereintheformofaslightlylonger‘transitionperiod’(fivetotenyears)beforetheyreachthesamefinalgoalastherichcountries,ratherthantheofferofpermanentasymmetricalarrangements.14
So, in the name of ‘levelling the playing field’, the Bad Samaritan richnations have created a new international trading system that is rigged in theirfavour.They are preventing thepoorer countries fromusing the tools of tradeandindustrialpoliciesthattheyhadthemselvessoeffectivelyusedinthepastinorder to promote their own economic development – not just tariffs andsubsidies, but also regulation of foreign investment and ‘violation’ of foreignintellectualpropertyrights,asIwillshowinsubsequentchapters.
Industryforagriculture?
NotsatisfiedwiththeresultoftheUruguayRound,therichcountrieshavebeenpushing for further liberalization by developing economies. There has been apushtotightenrestrictionsoncontrolsoverforeigninvestment,overandabovewhatwasaccepted in theTRIMSagreement.Thiswasattempted first throughtheOECD(in1998)andthenthroughtheWorldTradeOrganisation(in2003).15Themovewasthwartedbothtimes,sothedevelopedcountrieshaveshiftedtheirfocus and are now concentrating on a proposal to drastically reduce industrialtariffsinthedevelopingcountries.
This proposal, dubbedNAMA (non-agriculturalmarket access),was first

launched in theDohaministerialmeeting of theWorld TradeOrganisation in2001. It got a critical impetus when, in December 2002, the US governmentdramaticallyuppedtheantebycallingfortheabolitionofallindustrialtariffsby2015.Therearevariousproposalsfloatingaround,but,iftherichcountrieshavetheirwayintheNAMAnegotiations,thetariffceilingfordevelopingeconomiescould fall from thecurrent10–70%to5–10%–a level thathasnotbeenseensincethedaysofthe‘unequaltreaties’inthe19thandearly20thcenturies,whentheweakercountriesweredeprivedof tariffautonomyandforcedtoseta low,uniformtariffrate,typically3–5%.
In return for developing countries cutting industrial tariffs, the richcountriespromisethattheywilllowertheiragriculturaltariffsandsubsidies,sothat the poor countries can increase their exports.Thiswas sold as awin-windeal, even though unilateral trade liberalization should be its own reward,accordingtofreetradetheory.
The proposalwas debated in theDecember 2005HongKongministerialmeetingoftheWorldTradeOrganisation.Asnoagreementcouldbereached,thenegotiationwasextendeduntil the following summer,where itwas finallyputinto a state of suspended animation –Mr Kamal Nath, the Indian commerceminister, famouslydescribed thenegotiation tobe ‘between intensivecareandcrematorium’. The rich countries said that the developing countries were notoffering sufficient industrial tariff cuts, while the developing countries arguedthat the rich countries were demanding excessively steep industrial tariff cutsand not offering enough reduction in agricultural tariffs and subsidies. Thenegotiation is stalled for the moment, but this ‘industry-agriculture swap’ isbasically seen as the way forward by many people, even including sometraditionalcriticsoftheWTO.
Intheshortrun,greateropeningofagriculturalmarketsintherichcountriesmaybenefit developing countries – but only a fewof them.Manydevelopingcountriesareinfactnetagriculturalimportersandthusunlikelytobenefitfromit.Theymayevengethurt,iftheyhappentobeimportersofthoseagriculturalproducts that are heavily subsidized by the rich countries. Eliminating thosesubsidieswouldincreasethesedevelopingcountries’importbills.
Overall,themainbeneficiariesoftheopeningupofagriculturalmarketsinthe rich world will be those rich countries with strong agriculture – the US,Canada,AustraliaandNewZealand.16Developedcountriesdonotprotectmanyagriculturalproductsexportedbypoorcountries(e.g.,coffee,tea,cocoa)forthesimplereasonthattheydonothaveanydomesticproducertoprotect.So,whereprotectionandsubsidiesaregoingtocomedownismainlyin‘temperatezone’agriculturalproductslikewheat,beefanddairy.Onlytwodevelopingcountries,

Brazil and Argentina, are major exporters of these products.Moreover, some(although obviously not all) of the prospective ‘losers’ from agricultural tradeliberalization within rich countries will be the least well-off people by theirnationalstandards(e.g.,hard-pressedfarmersinNorway,JapanorSwitzerland),whilesomeofthebeneficiariesindevelopingcountriesarealreadyrichevenbyinternational standards (e.g., agricultural capitalists inBrazil orArgentina). Inthissense, thepopular image thatagricultural liberalization in richcountries ishelpingpoorpeasantfarmersindevelopingcountriesismisleading.iii
More importantly, those who see agricultural liberalization in the richcountriesasan importantway tohelppoorcountriesdevelopoften fail topayenough attention to the fact that it does not come for free. In return, the poorcountrieswillhavetomakeconcessions.Theproblemisthattheseconcessions–reducing industrial tariffs, dismantling foreign investment controls andabandoning‘permissive’intellectualpropertyrights–willmaketheireconomicdevelopment more difficult in the long run. These are policy tools that arecrucialforeconomicdevelopment,asIdocumentthroughoutthisbook.
Given this, thecurrentdebatesurrounding the liberalizationofagriculturein rich countries is getting its priorities wrong. It may be valuable for somedeveloping countries to get access to agricultural markets in developedeconomies.ivButit isfarmoreimportantthatweallowdevelopingcountriestouse protection, subsidies and regulation of foreign investment adequately inorder to develop their own economies, rather than giving them biggeragriculturalmarketsoverseas.Especiallyifagriculturalliberalizationbytherichcountriescanonlybe‘bought’bythedevelopingcountriesgivinguptheiruseofthetoolsofinfantindustrypromotion,thepriceisnotworthpaying.Developingcountriesshouldnotbeforcedtoselltheirfutureforsmallimmediategains.
Moretrade,fewerideologies
Itishardtobelievetoday,butNorthKoreausedtobericherthanSouthKorea.Itwas the part ofKorea that Japan had developed industriallywhen it ruled thecountryfrom1910until1945.TheJapanesecolonialrulerssawthenorthernpartofKorea as the ideal base fromwhich to launch their imperialist plan to takeover China. It is close to China, and has considerable mineral resources,especially coal. Even after the Japanese left, their industrial legacy enabledNorthKoreatomaintainitseconomicleadoverSouthKoreawellintothe1960s.

Today, South Korea is one of the world’s industrial powerhouses, whileNorthKorealanguishesinpoverty.MuchofthisisthankstothefactthatSouthKoreaaggressivelytradedwiththeoutsideworldandactivelyabsorbedforeigntechnologieswhileNorthKoreapursueditsdoctrineofself-sufficiency.Throughtrade,SouthKorealearnedabouttheexistenceofbettertechnologiesandearnedtheforeigncurrencythatitneededinordertobuythem.Initsownway,NorthKoreahasmanagedsometechnologicalfeats.Forexample,ithasfiguredoutaway tomass-produceVinalon, a synthetic fibremade out of – of all things –limestone,inventedbyaKoreanscientistin1939.Despitebeingthesecond-everman-madefibreafterNylon,Vinalondidnotcatchonelsewherebecauseitdidnot make a comfortable fabric, but it has allowed North Koreans to be self-sufficientinclothes.Butthereisalimittowhatasingledevelopingcountrycaninvent on its own without continuous importation of advanced technologies.Thus,NorthKoreaistechnologicallystuckinthepast,with1940sJapaneseand1950sSoviettechnologies,whileSouthKoreaisoneofthemosttechnologicallydynamiceconomiesintheworld.Doweneedanybetterproofthattradeisgoodforeconomicdevelopment?
In the end, economic development is about acquiring and masteringadvancedtechnologies.Intheory,acountrycandevelopsuchtechnologiesonitsown,butsuchastrategyof technologicalself-sufficiencyquicklyhits thewall,asseenintheNorthKoreancase.Thisiswhyallsuccessfulcasesofeconomicdevelopmenthaveinvolvedseriousattemptstogetholdofandmasteradvancedforeigntechnologies(moreonthisinchapter6).Butinordertobeabletoimporttechnologies from developed countries, developing nations need foreigncurrencytopayforthem–whethertheywanttobuydirectly(e.g., technologylicences, technologyconsultancy services)or indirectly (e.g.,bettermachines).Someofthenecessaryforeigncurrencymaybeprovidedthroughgiftsfromrichcountries(foreignaid),butmosthastobeearnedthroughexports.Withouttrade,therefore, there will be little technological progress and thus little economicdevelopment.
But there is a huge difference between saying that trade is essential foreconomicdevelopmentandsaying that free trade isbest (or,at least, that freertrade isbetter) foreconomicdevelopment,as theBadSamaritansdo. It is thissleightofhandthatfreetradeeconomistshavesoeffectivelydeployedincowingtheir opponents – if you are against free trade, they insinuate, you must beagainstprogress.
AsSouthKoreashows,activeparticipation in international tradedoesnotrequirefreetrade.Indeed,hadSouthKoreapursuedfreetradeandnotpromotedinfantindustries,itwouldnothavebecomeamajortradingnation.Itwouldstill

beexportingrawmaterials(e.g.,tungstenore,fish,seaweed)orlow-technology,low-price products (e.g., textiles, garments, wigs made with human hair) thatused to be its main export items in the 1960s. To go back to the imagery ofchapter 1, had they followed free trade policy from the 1960s,Koreansmightstillbefightingoverwhoownswhichtuftofhair,sotospeak.Thesecretofitssuccess lay in a judiciousmix of protection and open trade,with the areas ofprotectionconstantlychangingasnewinfantindustriesweredevelopedandoldinfantindustriesbecameinternationallycompetitive.Inaway,thisisnotmuchofa‘secret’.AsIhaveshownin theearlierchapters, this ishowalmostalloftoday’s rich countries became rich and this is at the root of almost all recentsuccess stories in the developing world. Protection does not guaranteedevelopment,butdevelopmentwithoutitisverydifficult.
Therefore, if they are genuinely to help developing countries developthrough trade, wealthy countries need to accept asymmetric protectionism, astheyused tobetween the1950sand the1970s.They shouldacknowledge thatthey need to have much lower protection for themselves than the developingcountries have. The global trading system should support the developmentaleffortsofdevelopingcountriesbyallowingthemtousemorefreelythetoolsofinfant industry promotion – such as tariff protection, subsidies and foreigninvestment regulation. At the moment, the system allows protection andsubsidiesmuchmorereadilyinareaswherethedevelopedcountriesneedthem.Butitshouldbetheotherwayaround–protectionandsubsidiesshouldbeeasiertousewherethedevelopingcountriesneedthemmore.
Here, it is particularly important to get our perspective right aboutagriculturalliberalizationintherichcountries.Loweringagriculturalprotectionin those countries may help some developing countries, especially Brazil andArgentina,butnotmost.Aboveall,agricultural liberalization in therichworldshould not be conditional upon further restrictions on the use of the tools ofinfantindustrypromotionbydevelopingnations,asiscurrentlybeingdemandedbytherichcountries.
Theimportanceofinternationaltradeforeconomicdevelopmentcannotbeoveremphasized.But free trade isnot the best path to economicdevelopment.Tradehelpseconomicdevelopmentonlywhenthecountryemploysamixtureofprotectionandopentrade,constantlyadjustingitaccordingtoitschangingneedsandcapabilities.Tradeissimplytooimportantforeconomicdevelopmenttobelefttofreetradeeconomists.i The HOS theory is named after the two Swedish economists, Eli Heckscher and Bertil Ohlin, whopioneereditintheearly20thcentury,andPaulSaumelson,theAmericaneconomistwhoperfecteditinthemid-20thcentury.Inthisversionoffreetradetheory,foreachproductthereisonlyone‘bestpractice’(i.e.,mostefficient)technology,whichallcountrieswilluseiftheyareproducingit.Ifeachproducthasonebest

productiontechnologyforitsproduction,acountry’scomparativeadvantagecannotbedeterminedbyitstechnologies,asinRicardo’stheory.Itisdeterminedbyhowsuitablethetechnologyusedforeachproductisforthecountry.IntheHOStheory,thesuitabilityofaparticulartechnologyforacountrydependsonhowintensively it uses the factor of production (i.e., labour or capital) with which the country is relativelyabundantlyendowed.ii So, ‘comparative’ in the term ‘comparative advantage’ is not about comparison between countries butaboutcomparisonbetweenproducts.Itisbecausepeoplemixthesetwoupthattheysometimesbelievethatpoorcountriesdonothavecomparativeadvantageinanything–whichisalogicalimpossibility.iiiTheothermainbeneficiariesofagricultural liberalization inrichcountries, that is, theirconsumers,donotgainverymuch.Asaproportionofincome,theirspendingonagriculturalproductsisalreadyprettylow(around 13% for food and 4% for alcohol and tobacco, of which only a fraction is the cost of theagricultural produce itself). Moreover, the trade in many agricultural products they buy is alreadyliberalized(e.g.,coffee,tea,cocoa).ivIntheearlierstagesofdevelopment,mostpeopleliveonagriculture,sodevelopingagricultureiscrucialinreducingpoverty.Higheragriculturalproductivityalsocreatesapoolofhealthyandproductiveworkersthatcanbeusedlaterforindustrialdevelopment.Intheearlystagesofdevelopment,agriculturalproductsarealsolikelytoaccountforahighshareofexports,asthecountrymayhavelittleelsetosell.Giventheimportance of export earnings for economic development that I discussed earlier, agricultural exportsshould be increased as much as possible (although the scope may not be large). And, for this, greateropeningofagriculturalmarketsintherichcountriesishelpful.Butincreasedagriculturalproductivityandagricultural exports often require state intervention along the line of ‘infant industry promotion’.Agricultural producers, especially the smaller ones, need government investment and support ininfrastructure(especiallyirrigationforproductionandroadsforexports),internationalmarketingandR&D.
Copyright © 2022 FDOKUMEN