Validation of an updated Associative Transcriptomics platform ...
47
This is a repository copy of Validation of an updated Associative Transcriptomics platform for the polyploid crop species Brassica napus by dissection of the genetic architecture of erucic acid and tocopherol isoform variation in seeds. White Rose Research Online URL for this paper: https://eprints.whiterose.ac.uk/124762/ Version: Accepted Version Article: Havlickova, Lenka orcid.org/0000-0002-5874-8615, He, Zhesi orcid.org/0000-0001-8335- 9876, Wang, Lihong et al. (6 more authors) (2018) Validation of an updated Associative Transcriptomics platform for the polyploid crop species Brassica napus by dissection of the genetic architecture of erucic acid and tocopherol isoform variation in seeds. The Plant journal. ISSN 1365-313X https://doi.org/10.1111/tpj.13767 [email protected] https://eprints.whiterose.ac.uk/ Reuse Items deposited in White Rose Research Online are protected by copyright, with all rights reserved unless indicated otherwise. They may be downloaded and/or printed for private study, or other acts as permitted by national copyright laws. The publisher or other rights holders may allow further reproduction and re-use of the full text version. This is indicated by the licence information on the White Rose Research Online record for the item. Takedown If you consider content in White Rose Research Online to be in breach of UK law, please notify us by emailing [email protected] including the URL of the record and the reason for the withdrawal request.
-
Upload
khangminh22 -
Category
Documents
-
view
4 -
download
0
Transcript of Validation of an updated Associative Transcriptomics platform ...

This is a repository copy of Validation of an updated Associative Transcriptomics platform for the polyploid crop species Brassica napus by dissection of the genetic architecture of erucic acid and tocopherol isoform variation in seeds.
White Rose Research Online URL for this paper:https://eprints.whiterose.ac.uk/124762/
Version: Accepted Version
Article:
Havlickova, Lenka orcid.org/0000-0002-5874-8615, He, Zhesi orcid.org/0000-0001-8335-9876, Wang, Lihong et al. (6 more authors) (2018) Validation of an updated Associative Transcriptomics platform for the polyploid crop species Brassica napus by dissection of thegenetic architecture of erucic acid and tocopherol isoform variation in seeds. The Plant journal. ISSN 1365-313X
https://doi.org/10.1111/tpj.13767
[email protected]://eprints.whiterose.ac.uk/
Reuse
Items deposited in White Rose Research Online are protected by copyright, with all rights reserved unless indicated otherwise. They may be downloaded and/or printed for private study, or other acts as permitted by national copyright laws. The publisher or other rights holders may allow further reproduction and re-use of the full text version. This is indicated by the licence information on the White Rose Research Online record for the item.
Takedown
If you consider content in White Rose Research Online to be in breach of UK law, please notify us by emailing [email protected] including the URL of the record and the reason for the withdrawal request.
1
Validation of an updated Associative Transcriptomics platform for the1
polyploid crop species Brassica napus by dissection of the genetic2
architecture of erucic acid and tocopherol isoform variation in seeds3
4
Lenka Havlickova1, Zhesi He1, Lihong Wang1, Swen Langer1, Andrea L. Harper1,5
Harjeevan Kaur1, Martin R. Broadley3, Vasilis Gegas2 and Ian Bancroft1*6
7
1 Department of Biology, University of York, Heslington, York, YO10 5DD, UK8
2 Limagrain, Joseph Nickerson Research Centre, Rothwell, LN7 6DT, UK9
3 Plant and Crop Sciences Division, School of Biosciences, University of10
Nottingham, Sutton Bonington Campus, Loughborough LE12 5RD, UK11
12
*Correspondence to:13
Prof. Ian Bancroft, Department of Biology, University of York, Heslington, York,14
YO10 5DD, UK. Email: [email protected] Tel: +44 (0)1904 32877815
16
Author email addresses:17
Lenka Havlickova [email protected]
Zhesi He [email protected]
Lihong Wang [email protected]
Swen Langer [email protected]
Andrea L. Harper [email protected]
Harjeevan Kaur [email protected]
Martin R. Broadley [email protected]

2
Vasilis Gegas [email protected]
26
Running title: Associative Transcriptomics platform for B. napus27
28
Key words: Association genetics, transcriptomics, Brassica napus, tocopherol,29
erucic acid30
31
Accession numbers: PRJNA30936732
33
Word count: 6108 (excluding references)34

3
Summary35
An updated platform was developed to underpin association genetics studies in36
the polyploid crop species Brassica napus. Based on 1.92 x 10¹² bases of leaf37
mRNAseq data, functional genotypes, comprising 355,536 single nucleotide38
polymorphism markers and transcript abundance were scored across a 383-39
accession genetic diversity panel using a transcriptome reference comprising40
116,098 ordered CDS gene models. The use of the platform for Associative41
Transcriptomics was first tested by analysing the genetic architecture of variation42
for seed erucic acid content, as high erucic rapeseed oil is highly valued for a43
variety of applications in industry. Known loci were identified, along with a44
previously undetected minor effect locus. The platform was then used to analyse45
variation for the relative proportions of tocopherol (Vitamin E) forms in seeds and46
the validity of the most significant markers assessed using a take-one-out47
approach. Furthermore, the analysis implicated expression variation of the gene48
Bo2g050970.1, an orthologue of VTE4 (which encodes a γ-tocopherol methyl 49
transferase converting γ-tocopherol into α-tocopherol), associated with the 50
observed trait variation. The establishment of the first full-scale Associative51
Transcriptomics platform for B. napus enables rapid progress to be made towards52
an understanding of the genetic architecture of trait variation in this important53
species and provides an exemplar for other crops.54
55
56
Significance statement57

4
The availability of a full-scale association genetics platform for Brassica napus,58
based on functional genotypes, enables the genetic architecture of essentially59
any trait to be addressed in this important crop species.60
61
62
Introduction63
As the demand for ever increasing crop productivity continues against the64
backdrop of changing climate and diminishing resources, crop improvement has65
become an important driver for advances in genomic technologies in plants. A66
broad aim of crop science is the identification of the genetic bases for trait67
variation, including both the identification of beneficial alleles and the68
development of molecular markers to accelerate introduction into elite69
germplasm. Genetic diversity panels, typically comprising past and current70
cultivars along with wild relatives, are usually available for crop species. Such71
panels represent ideal resources for genome-wide association studies (GWAS),72
which exploit historical recombination between molecular markers and loci73
associated with trait variation. Where recombination between loci is observed74
proportionately less frequently than expected for unlinked loci (i.e. < 0.5), those75
loci are said to be in Linkage Disequilibrium (LD). The approach of identifying76
molecular markers in LD with loci associated with trait variation is an important77
tool in human genetics studies and has been applied successfully in several plant78
species (Garrigan and Hammer, 2006; Li et al., 2008; Atwell et al., 2010; Cockram79
et al., 2010; Tian et al., 2011; Zhao et al., 2011).The recent development of80
transcriptome-based GWAS, including the technology termed Associative81

5
Transcriptomics (AT), in which both gene sequence variation and transcript82
abundance variation are used to identify associations with trait variation (Harper83
et al., 2012) greatly increases the range of crops to which GWAS approaches84
can be applied.85
86
The Brassicaceae family includes Arabidopsis thaliana, the first plant for which a87
high quality genome sequence was available (AGI, 2000), and the Brassica88
crops. The diploid species Brassica rapa and Brassica oleracea, which contain89
the Brassica A and C genomes, respectively, are closely related, having shared90
a common ancestor only ca. 3.7 Mya (Inaba and Nishio, 2002). Brassica napus91
is an allopolyploid, arising from the hybridization of these species (U, 1935) and92
the related (homoeologous) regions of the genomes are clearly discernible93
(Bancroft et al., 2015). A diverse range of B. napus crop types have been94
developed, including oilseed rape, fodders, leafy vegetables and root vegetables.95
Brassica species have been used extensively in genomics studies, due to their96
utility in studying the evolution of polyploid genomes (Song et al., 1995; O’Neill97
and Bancroft, 2000; Pires et al., 2004; Yang et al., 2006; Town et al., 2006;98
Cheung et al., 2009). A draft genome sequence has been obtained for B. napus99
(Chalhoub et al., 2014). However, at ca. 1.2 Gb, the genome of B. napus is100
relatively large. To address this problem, rapid and cost-effective transcriptome-101
based technologies, using mRNAseq, have been developed and applied for SNP102
discovery (Trick et al., 2009), linkage mapping and genome characterization103
(Bancroft et al., 2011) and transcript quantification (Higgins et al., 2012). Indeed,104
AT was first developed in B. napus with a very small genetic diversity panel,105

6
enabling the implication of orthologues of HAG1 in the control of seed106
glucosinolate content (Harper et al., 2012).107
108
Vegetable oils are a major source of dietary vitamin E (Goffman and Becker,109
2002). Vitamin E occurs in the form of tocopherols, which are lipid-soluble110
antioxidants that accumulate in the chloroplast. Their function is to protect111
photosystem II from oxidative damage under the influence of free/released lipid112
peroxyl radicals and singlet oxygen (Quadrana et al., 2013) and in seeds they113
play role in preventing oxidation of polyunsaturated fatty acids (PUFAs). The four114
forms of tocopherol (α-, β-, γ- and δ-), vary in the number and position of methyl 115
substituents attached to the chromanol ring (Munné-Bosh and Alegre, 2002). The116
most abundant forms of vitamin E in rapeseed oil are γ- and α-tocopherol, with a 117
small proportion of δ-tocopherol (Fritsche et al., 2012, Wang et al., 2012). 118
Besides its nutritional value, α-tocopherol is the most potent vitamin E, whereas 119
the γ- and δ-tocopherol forms are valued for their oil-stabilizing properties 120
(Munné-Bosh and Alegre, 2002), which is particularly relevant for PUFA-rich oils,121
such as rapeseed. Tocopherol content and composition in rapeseed varies122
widely; values for total tocopherol content (TTC) have been reported ranging123
between 166 and 687 mg.kg-1, α-tocopherol content between 59 and 286 mg.kg-124
1, and γ-tocopherol content from 107 to 280 mg.kg-1. The ratio between α- and γ-125
tocopherol has also been reported to range between 0.33 and 2.14 (Dolde et al.,126
1999; Goffman and Becker, 2002;Wang et al., 2012; Fritsche et al., 2012). Genes127
involved in the tocopherol biosynthetic pathway have been identified in128
Arabidopsis thaliana and other model plants (Valentin et al., 2006; Endrigkeit et129

7
al., 2009; Li et al., 2012), (Figure 1). QTL affecting seed tocopherol content and130
composition have also been reported (Gilliand et al., 2006), but the control of131
biosynthesis is poorly understood.132
133
The first AT panel reported for B. napus (Harper et al., 2012) comprised only 84134
accessions and was smaller than is usually required for association studies135
(Spencer et al., 2009), meaning that it could be used successfully only for traits136
with a simple genetic basis. In this study, we report the establishment of a full AT137
platform for the crop species B. napus, based on a widely-shared genetic diversity138
panel of 383 accessions, which can be used to address the genetic architecture139
of a broad range of traits. We validated the resource by analysing with the new140
platform a trait that had been analysed using the original panel (erucic acid141
content of seed oil), and a new trait (the relative content of γ and α forms of 142
tocopherol in seeds).143
144
145
Results146
147
The RIPR genetic diversity panel148
A diversity panel of 383 B. napus doubled haploid (DH) or inbred accessions was149
assembled, with the aim of covering the breadth of genetic variation available in150
the species. This panel included the breadth of crop types of B. napus and151
comprised 362 inbred lines previously used by Bus et al. (2011) and Harper et al.152
(2012) plus 21 further accessions as used by Thomas et al. (2016). The list of153

8
accessions is shown in Data S1. The panel is named RIPR after the research154
project “BBSRC Renewable Industrial Products from Rapeseed (RIPR)155
Programme” that funded its development and genotyping.156
157
Functional genotypes158
Functional genotypes were produced for the panel based on leaf RNA, with 100-159
base read length mRNAseq data produced using the Illumina HiSeq 2000160
platform. A total of 1.92 x 10¹² bases of sequence data were produced. The161
sequence reads were mapped to the CDS gene model-based Brassica AC pan162
transcriptome reference (He et al., 2015), which comprised 116,098 gene163
models, has an aggregate length of 118,657,829 bases and for which we provide164
an updated gene order based on a high density SNP linkage map as shown in165
Data S2. Sequence read mapping statistics are summarised in Data S1. Mean166
figures of 50,165,125 reads were generated per accession, with 32,275,718167
being mapped across 61,620,266 bases of the reference sequence, representing168
52.1-fold coverage of the 51.9% of the predicted transcriptome to which169
mRNAseq reads were mapped. SNPs were identified and gene expression170
quantified. Across the panel of 383 lines, 355,536 SNPs were scored, of which171
the majority (87.0%) were hemi-SNPs, as found in previous B. napus studies172
(Trick et al., 2009). A total of 127,153,561 allele calls were made, with 9,017,727173
(6.6%) missing values. Significant expression (>0.4 RPKM) was detected for174
53,889 CDS models (46.4% of all CDS models in the AC pan transcriptome175
reference), of which 25,834 belong to the A genome and 28,055 to the C genome.176
9
The functional genotypes are available from the York Oilseed Rape177
Knowledgebase (http://www.yorknowledgebase.info/).178
179
Genetic architecture of the Population180
The 355,536 SNP markers scored across the RIPR panel were used to analyse181
the relatedness of members of the panel. First, a distance matrix was generated182
and visualised by the dendrogram shown in Figure 2a. The assigned crop types183
(Data S1) show the expected clustering, as shown in Figure 2b. Next, the184
population structure of the panel was analysed using PSIKO (Popescu et al.,185
2014). The highest likelihood is a subpopulation K=2, with mixture across the186
panel as illustrated in Figure 2c. Finally, LD was calculated across the genome,187
as summarised in Figure S1, producing a mean value of 0.031 for the population.188
189
Seed erucic acid analysis190
Erucic acid is a 22-carbon monounsaturated fatty acid. Its content in rapeseed oil191
is one of the key determinants of suitability for use as an edible or industrial oil.192
Detection of the known loci controlling the biosynthesis of erucic acid in seeds193
was used as a validation study for the first report of AT (Harper et al., 2012). We194
re-analysed this trait to compare the performance of the original panel with the195
new RIPR panel. The fatty acid composition of seeds was determined for 376196
lines of the RIPR diversity panel (summarised in Data S3). The erucic acid197
content of seeds varied between 0 and 51%, reflecting the range of crop types198
represented in the panel, which included modern Canola quality rapeseed199
varieties as well as crop types for which seed composition was not the subject of200

10
active domesticated selection process (hence representative of “unimproved”201
seed composition).202
203
Associative Transcriptomics of erucic acid content204
The first stage of validation of the new AT platform for B. napus involved analysis205
of seed erucic acid content, a trait for which the two main control loci are known206
and were confirmed previously by AT (Harper et al., 2012). The estimated narrow-207
sense heritability (h2) for the erucic acid trait was estimated from the SNP analysis208
as 0.794. 318 genome-assigned SNP markers above the Bonferroni-corrected209
significance threshold of P = 0.05 (i.e. – log10P value of 6.7) were detected across210
association signals on chromosomes A5, A8, A9, A10 and C3 (Data S4, Figure211
S3), as illustrated in Figure 3a. The main loci controlling erucic content (on212
chromosomes A8 and C3) provide association signals with a significance eight213
orders of magnitude greater: -log10P >16, compared with <8 in the previous study.214
The known control genes, orthologues of FAE1 (AT4G34520), represented by215
gene models Cab035983.1 and Bo3g168810.1, are near the centres of these216
SNP association peaks, in the distance of 6 genes (~42 kb) and 9 genes (~56 kb)217
from the closest significantly associated gene, respectively, according of the218
reference sequence (Data S4). In addition, SNP associations were found for a219
region of the genome, on chromosome A5, which were not previously detected.220
This indicates the position of a novel locus with minor effect on the trait. A221
candidate for the trait control gene in this region is Cab033920.1. This gene is an222
orthologue of AT2G34770.1, which is annotated as fatty acid hydroxylase 1 which223
has a potential role in very long chain fatty acid biosynthesis. An association224

11
signal was also detected for a relatively large region of chromosome A9, which225
we interpret as corresponding to a seed glucosinolate-controlling locus, which226
was co-selected in modern low erucic rapeseed cultivars to produce Canola227
quality seed.228
229
In addition to association analysis using SNP markers, AT also reveals230
associations between gene expression markers (in the tissue of second true231
leaves used for the development of functional genotypes) and trait variation. In232
the case of seed erucic acid content, the main control genes (orthologues of233
FAE1) are transcriptionally inactive in the tissue (leaves) sampled for production234
of the functional genotypes. However, we are still able to detect both SNP and235
GEM association peaks through markers in linkage disequilibrium (LD) with FAE1236
on A8 and C3 as illustrated in Figure 3b. The lower resolution observed for the237
A8 peaks may reflect the influence of two strong bottlenecks during the breeding238
selection (Hasan et al., 2008) for low glucosinolate content (controlling loci on239
chromosome A2, A9, C2 and C9) and zero seed erucic acid (controlling loci on240
chromosome A8 and C3), or perhaps the presence of additional minor effect241
genes located on A8 that are also contributing to the erucic trait. Indeed there are242
many potential candidate genes in the region which could have an effect,243
including an orthologue of FAD6 (AT4G30950) which could act to reduce the pool244
of oleic acid available for elongation to erucic acid. In addition, there is a signature245
of slightly inflated LD on the first half of A8, which may further contribute to246
reducing the resolution of association peaks in this region (Figure S1).247
248
12
The clear signals in the transcript abundance-based association analysis249
confirms the stability of differential gene expression across the panel and its utility250
for the identification of association signals. Regions of the genome previously251
associated with seed glucosinolate content (selected alongside erucic content in252
Canola quality rapeseed) show particularly strong transcript abundance253
associations, which we interpret as consequences of the extensive structural254
variation in these regions of the genome (He et al, 2016). The new AT platform255
generates strong signals due to the large, diverse panel and superior number of256
markers assigned to homoeologues, properties lacking in the platform reported257
previously (Harper et al, 2012).258
259
Tocopherol phenotype analysis260
We selected tocopherols in seeds as test traits of unknown genetic basis,261
quantifying α, γ and δ forms. Tocopherols were purified from seeds and quantified 262
for 377 accessions of the RIPR panel. The results are summarised in Data S5263
and Figure S2. Total tocopherol in seeds varied from 197 to 445 mg.kg-1, with the264
main types being γ-tocopherol (78 to 347 mg.kg-1) and α-tocopherol (51 to 229 265
mg.kg-1), the relative proportions of which (measured as the γ/α-tocopherol ratio) 266
varied greatly, ranging from 0.485 to 5.00, δ-tocopherol was a minor component 267
(1.8 to 9.9 mg.kg-1). Analysis of tocopherol characteristics by crop type showed268
that γ-tocopherol content tended to be higher in spring crop types and α-269
tocopherol content tended to be higher in winter crop types, as illustrated in270
Figure 2d.271
272

13
Given that the purpose of tocopherols in seed oil is to protect against oxidation,273
we assessed the diversity panel for correlation of tocopherol traits with the274
proportions of the fatty acids found in seed oil that are most susceptible to275
oxidation, the polyunsaturated fatty acids (PUFAs) linoleic and linolenic. The276
content of these fatty acids had been determined alongside that of erucic acid277
(Data S3). A weak positive correlation between total tocopherol and PUFA278
content was, indeed, identified (R2 = 0.13; p<0.001)..279
280
Associative Transcriptomics of tocopherol composition281
To undertake AT for tocopherol traits, we analysed the population for loci282
controlling the proportion of tocopherol occurring in the γ form rather than the α 283
form by using γ/α ratio as the trait. The SNP-based association analysis, as 284
illustrated in Figure 4a, revealed exceptionally strong associations with markers285
in a very small regions of chromosome C2, along with weaker associations with286
a few markers in regions of chromosomes A2 and A10. Unlike seed erucic acid,287
tocopherol composition has not been selected by B. napus breeders. We interpret288
the very sharp association signal as indicative of this lack of selection and to be289
consistent with LD across most of the genome. The association peak on290
chromosome C2 includes 33 genome-assigned markers above the Bonferroni-291
corrected significance threshold (alpha = 0.05 ; – log10P value of 6.7) (Data S6,292
Figure S3). These delineated a genomic region containing 39 genes, including293
an orthologue of VTE4, which encodes a γ-tocopherol methyl transferase (γ-294
TMT), an enzyme that converts γ-tocopherol into α-tocopherol (Figure 1). A 295
homoeologous region including a duplicate copy of VTE4 gene within association296

14
peak on chromosome A2 was observed, while there was no obvious candidate297
gene in the region of chromosome A10 showing associations. Four transcript298
abundance-based markers above the Bonferroni-corrected significance299
threshold (– log10P value of 6.03 for GEMs) were identified on chromosome C2,300
C5 and C7 (Figure 4b).The identification of the gene VTE4 as the most highly301
associated GEM on chromosome C2 demonstrated the ability for AT to efficiently302
provide candidate genes associated with traits of interest.303
To investigate whether the top selected markers are predictive for γ/α ratio, we 304
performed a set of “take-one-out” permutations for the SNP and GEM markers305
identified from association analysis of 377 accessions adapted from Harper et al306
(2016). Markers above the Bonferroni line (Data S6 and S7) were selected for307
each round of permutations. For SNP data, the allelic effects of each of these308
markers was used to predict trait values for the missing accessions based on309
their scored genotypes. For GEM data, RPKM values were fitted to the regression310
line to predict trait values. The predicted trait values against the observed trait311
are illustrated, as scatter plots, in Figure 5 and confirmed excellent predictive312
ability (R2 = 0.59 for SNPs and R2 =0.47 for GEMs between predicted and313
observed values; p<0.001), which reflect the estimated narrow-sense heritability314
(h2) of 0.452 for γ/α ratio. These SNPs and GEMs can therefore be used as 315
promising markers in marker assisted breeding.316
317
318
319

15
In order to confirm the role of the VTE4 orthologue in the associated region of C2320
(Bo2g050970.1), we used the transcript quantification data that were obtained321
alongside the transcriptome SNP data as part of the functional genotypes. As322
illustrated in Figure 6, these show that the expression level of Bo2g050970.1 in323
the tissue sampled to produce the functional genotypes (leaves) is negatively324
correlated with the γ/α ratio (R2 = 0.41, p<0.001). This is consistent with the325
predicted γ-TMT activity of the gene encoded by Bo2g050970.1 (i.e. lower326
expression leading to less conversion of γ-tocopherol to α-tocopherol). There had 327
been no significant associations between SNPs within Bo2g050970.1 and the γ/α 328
ratio, consistent with the basis of the allelic variation being variation in gene329
expression rather than variation in gene sequence.330
331
332
Discussion333
334
Association studies are becoming increasingly widely-used in crops for identifying335
molecular markers linked to trait-controlling loci (Rafalski, 2010). However,336
polyploid crops present additional difficulties that must be overcome, including337
the intrinsic genome complexity and increased genome structural instability, such338
as the copy-number variations (CNV) which affect gene families (Zhang et al.,339
2013; Renny-Byfield and Wendel, 2014). Such difficulties occur in B. napus, as340
was recently shown by Chalhoub et al. (2014) and He et al. (2016). Association341
studies have to meet many demands to maximize the probability of identifying342
marker-trait associations. In addition to good planning of experimental design,343

16
along with access to all the necessary equipment and available funds, there is344
also the need to choose a permanent and sufficiently large set of diverse and345
preferably homozygous individuals, the larger size and higher genetic diversity of346
which providing sufficient power for association analysis (Spencer et al., 2009;347
Huang and Han, 2014). Once assembled, association panels need to be348
genotyped with molecular markers in a sufficiently high density to identify349
polymorphisms in linkage disequilibrium with trait-controlling loci. The350
development of suitable association panels is challenging for individual research351
groups, providing a driver for the development of community resources.352
353
In this study, we introduce a new genetically diverse AT panel of 383 rapeseed354
accessions, together with a mapping platform that comprises complete genotype355
information for this panel, which may be used for a broad range of association356
studies suitable for re-phenotyping any trait, without the need of additional357
genotyping. This panel, being made available with all transcriptomic data, offers358
a large range of potential applications: identifying causative genes, uncovering359
unknown pathways, identifying regulatory genes or transcription factors, and360
screening of available germplasm for allelic variants and to support the361
development of molecular markers for marker-assisted breeding. Our resource362
provides 355,536 SNP markers, equivalent to one SNPevery 0.33 kb across our363
Brassica napus AC pan-transcriptome reference. The SNP density is much364
higher than the density of the commercially available 60K Brassica Infinium®365
SNP array, which only provided 26,841 or 21,117 SNPs for recent B. napus366
GWAS studies (Li et al., 2014, Xu et al., 2016). Although the number of SNPs367
17
can even be greater when using whole genome re-sequencing, as shown by368
Huang et al. (2013), the advantage of transcriptome re-sequencing using369
mRNAseq is the availability of transcript abundance data; in our case for 46% of370
the genes present in the AC pan-transcriptome reference sequence. In this study,371
we demonstrate a significant step-change in resolution from our original AT372
platform based on a panel of 84 accessions, as reported in Harper et al. (2012).373
The unigene-based transcriptome reference sequence used by that platform had374
relatively poor capability to resolve homoeologous loci, due to its construction375
based on a Brassica-wide transcriptome assembly and subsequent “curing” to376
more closely match the progenitor genomes. In the absence of the ability to map377
sequence reads unambiguously to the correct homoeologue, most SNPs appear,378
due to cross-mapping, as “hemi-SNPs”, i.e. where one allele comprises a mixture379
of two bases (Trick et al., 2009). In the original platform only a small proportion380
of markers could be assigned with high confidence to a genome, the majority381
being assigned to both homoeologous positions. The new platform is based382
mainly on gene models originating from the genome sequences of the progenitor383
species permits more discriminating read mapping, resulting in a greater384
proportion of “simple SNPs” (i.e. where the polymorphism is between resolved385
single bases only), which can be assigned with confidence to a genome. Where386
there are association peaks comprising pale points in homoeologous positions to387
the associations identified, such as those observed in regions of A2 depicted in388
Figure 4a, these can be disregarded as homoeologous “shadows” of the regions389
genuinely containing causative variation. SNP discovery for particular genes from390
juvenile leaves can be limited by their transcription in different phenological stage391

18
or tissue, but candidate loci/genes associated with trait manifesting in different392
time or place can be still identified, as demonstrated here in case of FAE1 and in393
previous AT studies (Lu et al., 2014; Wood et al., 2017). This is possible due to394
the presence of variation in genes in LD with the causative gene, resulting in an395
associated region including the control gene. In addition, the new platform396
provides much greater resolution of the contributions to the transcriptome of pairs397
of homoeologous genes. This permitted efficient detection of association peaks398
based solely on transcript abundance variation, as illustrated in Figure 3.399
Moreover, the current platform also allows deeper insight of the structural400
changes and functional interactions between B. napus AC genomes. Information401
about respective homologous genes including their copy number, sequence402
variation and transcript prevalence provides important information in polyploid403
research.404
405
In addition to extending previous association studies of the control of seed erucic406
acid content, a trait selected recently by rapeseed breeders, we applied the407
platform to a trait not previously selected by breeders, or studied extensively: the408
control of tocopherol (Vitamin E) forms accumulated in seeds. We analysed seed409
tocopherols in 377 rapeseed accessions for their type and content. The profiles410
presented here showed a high degree of variability for the γ-/α-tocopherol ratio 411
(CV=53%), displaying distinct patterns for different crop types, which allowed us412
to identify gene Bo2g050970.1 (an orthologue of the Arabidopsis gene VTE4) on413
chromosome C2 as a candidate gene, based on inference of gene function based414
on studies of its orthologue in A. thaliana. Although there was no evidence of the415

19
presence any specific allelic form of the VTE4 orthologue associated with γ-/α-416
tocopherol ratio, this gene has been easily identifiable by the presence of SNPs417
in surrounding genes. This set of tightly linked markers exhibited excellent418
predictive ability (Figure 5), which we attribute to the broad (species-wide) range419
of genetic variation represented by the RIPR diversity panel, overcoming the lack420
of predictive capability that can be encountered when applying markers to test421
material (Bush and Moore, 2012). The association we observed between422
transcript abundance of Bo2g050970.1 in leaves and the tocopherol γ/α ratio in 423
seed is consistent with our understanding that tocopherols are synthesized and424
localized in plastids and accumulate in all tissues with generally highest content425
in seeds (Sattler et al., 2004). In Arabidopsis, γ-TMT (VTE4, AT1G64970) is426
known to use δ- and γ-tocopherols as substrates to produce β- and α-tocopherols 427
respectively (Shitani and DellaPenna, 1998) and the effect of VTE4 gene from B.428
napus on α-tocopherol content has been also proved by overexpression in 429
soybean and Arabidopsis (Chen et al., 2012, Endrigkeit et al., 2009).430
431
By assembling and developing functional genotypes (i.e. comprising both gene432
sequence variation and gene expression variation) for a diversity panel433
representing species-wide genetic diversity, we have established a resource for434
the whole rapeseed research community to use. Furthermore, the success of the435
approach of Associative Transcriptomics for the identification not only of linked436
markers, but of candidates for causative genes, serves as an exemplar for plant437
and crop science more broadly.438
439

20
440
Experimental procedures441
442
Growth of the genetic diversity panel443
The panel of 383 B. napus accessions is available from the John Innes Centre,444
Norwich, UK. It was planted in a randomized block design of five biological445
replicates under controlled conditions of two polytunnels at University of446
Nottingham as described by Thomas et al. (2016). The accessions comprise447
inbred derivatives of both recent and historic varieties and some research lines.448
Plants were bagged before flowering to prevent cross-pollination. Seeds were449
collected from individual plants at maturity. Seeds from 377 and 376 accessions450
were used for the tocopherol and erucic acid measurement, respectively. Based451
on descriptors originally received with the material and analysis of relatedness,452
they were attributed to one of seven different groups, namely spring oilseed rape453
(123), semi-winter oilseed rape (11), swede (27), kale (3), fodder (6), winter454
oilseed rape (169) or crop type not assigned (44), as listed in Data S1.455
456
Measurement of fatty acid content and composition457
For fatty acid methyl esters (FAME) analysis, 30 mg of seeds were homogenized458
in a glass vial with 5 ml of heptane. To the homogenate, 500 µl of 2 M potassium459
hydroxide was added, left for one hour and neutralised with sodium hydrogen460
sulphate monohydrate. The upper phase was transferred into a crimp cap461
Chromacol 0.8 ml vials for analysis using a DANI Master GC fitted with an SGE-462
BPX70 double column.463
21
464
Measurement of tocopherol content and composition465
The α-, γ- and δ-tocopherol (the sum of which formed total tocopherol, TTC) were 466
extracted from a homogenous mixture of 80 mg rapeseed seeds and analyzed467
by normal-phase HPLC as described previously (Fritsche et al., 2012). Modified468
mobile phase A was heptane (Rathburn, Walkerburn, UK), phase B469
heptane:dioxane (Sigma-Aldrich, Gillingham, UK) (90:10, v/v). Internal standard,470
α-tocopherol acetate (Sigma-Aldrich), was added to each sample at a 471
concentration of 25.4 µM (12 µg·mL-1).472
473
SNP identification and Transcript quantification for RNA-seq data474
The growth conditions, sampling of plant material, RNA extraction and475
transcriptome sequencing was carried out as described by He et al. (2016). The476
RNA-seq data from each accession line were mapped on to recently-developed477
ordered Brassica A and C pan-transcriptomes (He et al., 2015) as reference478
sequences Maq v0.7.1 (Li et al., 2008). SNPs were called by the meta-analysis479
of alignments as described in Bancroft et al. (2011) of mRNAseq reads obtained480
from each of the B. napus accessions. SNP positions were excluded if they did481
not have a read depth in excess of 10, a base call quality above Q20, missing482
data below 0.25, and 3 alleles or fewer. An additional noise threshold was483
employed to reduce the effect of sequencing errors, whereby ambiguous bases484
were only allowed to be called if both bases were present at a frequency of 0.2485
or above. This resulted in a set of 355,536 SNPs, of which 256,397 had the486
second most frequent allele in the population, so called here as a minor allele487

22
frequency (MAF) > 0.01. The markers were also classified as those that can be488
assigned with confidence to the genomic position of the CDS model in which they489
are scored (simple SNPs and hemi-SNPs genetically mapped into the490
appropriate genome using the TNDHmapping population), and those that cannot491
as the polymorphism may be in either homoeologue of the CDS model in which492
they are scored (hemi-SNPs not genetically mapped into the appropriate genome493
using the TNDH mapping population). Transcript abundance was quantified and494
normalized as reads per kb per million aligned reads (RPKM) for each sample for495
116,098 CDS models of the pan-transcriptome reference. Significant expression496
(>0.4 RPKM) was detected for 53,889 CDS models.497
498
Clustering based on SNP genotypes499
Clustering and dendrogram visualisation on SNP data was performed by in-500
house R script. R package “phangorn” was used for generating distance matrix501
with JC69 model (Schliep, 2011).502
503
Assessment of LD504
Pairwise linkage disequilibrium was calculated and heatmaps produced for each505
individual chromosome, and these values used to calculate the mean LD across506
the genome. SNPs were removed from the analysis if they were not confirmed507
by TNDH population (Qiu et al., 2006) that assigned to the A or C genome and if508
their minor allele frequency was below 0.01. A single SNP was selected at509
random from each CDS model to reduce the effect of many linked SNPs in the510

23
same gene. Pairwise r2 LD matrices and heatmaps were calculated for each511
chromosome using the R package LDheatmap (version 0.99-2; Shin et al., 2006).512
513
Associative Transcriptomic analysis514
SNPs and gene expression markers (GEMs) association analysis was performed515
using R as previously described by (Harper et al., 2012,Sollars et al., 2017), with516
modifications: to deal with the greatly increased sizes of the datasets, PSIKO517
(Popescu et al., 2014) was used for Q-matrix generation and GAPIT R package518
with a mixed linear model (Lipka et al., 2012) was used for GWAS analysis. For519
SNP association Manhattan plots, SNP markers were filtered to include only520
those with minor allele frequency > 0.01, markers that could be assigned with521
confidence to the genomic position of the CDS model are rendered as dark points522
and markers that could not be assigned with confidence were rendered as pale523
points. For GEM association, CDS models were filtered prior to regression to524
include only those with mean expression across the panel > 0.4 RPKM. The525
association between gene expression and traits was calculated by fixed effect526
linear model in R with RPKM values and the Q matrix inferred by PSIKO as the527
explanatory variables and trait score the response variable. R2 regression528
coefficients, constants and significance values were outputted for each529
regression. Genomic control (Devlin and Roeder, 1999) was applied to the GEM530
analysis to correct for spurious associations, with p-value adjustment applied531
when the genomic inflation factor (λ) was observed to be greater than 1. 532
533
Validation of marker association by trait prediction534

24
The predictive power of the best GEMs and SNPs were assessed using a “take535
one out” approach (Harper et al. 2016) whereby each accession is removed from536
the SNP or GEM analysis in turn. An in-house R script was performed with537
adaptation from Harper 2016, with a modification of incorporating all SNPs and538
GEMs above bonferroni lines. When permutations finishes, an r square value is539
calculated from predicted trait values regressed against the observed trait values540
which indicates the predictive power of the top selected GEMs and SNPs.541
542
Accession numbers543
Sequence data from this article can be found in the SRA data library under544
accession number PRJNA309367.545
546
547
Acknowledgements548
We thank Neil Graham and Rory Hayden at the University of Nottingham for549
growing plants and seed collection. Next-generation sequencing and library550
construction was delivered via the BBSRC National Capability in Genomics551
(BB/J010375/1) at The Genome Analysis Centre by members of the Platforms552
and Pipelines Group. This work was supported by UK Biotechnology and553
Biological Sciences Research Council (BB/L002124/1), including work carried out554
within the ERA-CAPS Research Program (BB/L027844/1).555
556
557
Supporting Information558

25
Supporting data are provided. The largest datasets, representing the functional559
genotypes of the RIPR panel, are accessible via a data distribution website:560
http://www.yorknowledgebase.info/.The smaller datasets accompany the561
manuscript, as MS Excel files:562
563
Supporting figures:564
Figure S1. Genome-wide Linkage Disequilibrium analysis for the RIPR diversity565
panel: Figure S1_LD_SAF_1perc_26-9-17.pdf566
567
Figure S2. Histograms of seed tocopherol composition of the RIPR diversity568
panel in different crop types: Figure S2_histograms of seed tocopherol569
composition.pdf570
571
Figure S3. QQ plots from GEM and SNP association analysis for erucic acid572
and γ/α tocopherol ratio: Figure S3_QQ_plots.pdf 573
574
Supporting data:575
Data S1. List of cultivars, crop type classifications and Illumina read mapping576
statistics: Data S1_cultivars and read mapping_20-12-16.xlsx.577
578
Data S2. Ordered list of CDS gene model-based Brassica AC pan579
transcriptome: Data S2_v11 pan-tanscriptome_20-12-16.xlsx.580
581

26
Data S3. Seed fatty acid composition of the RIPR diversity panel: Data S3_fatty582
acids_10-04-17.xlsx.583
584
Data S4. Markers and genomic regions showing association with variation for585
erucic acid content: Data S4_erucic-associated regions_30-3-17.xlsx.586
587
Data S5. Seed tocopherol composition of the RIPR diversity panel: Data588
S5_tocopherols_14-10-16.xlsx.589
590
Data S6. Markers and genomic regions showing association with variation for591
γ/α tocopherol ratio: Data S6_tocopherol-associated regions_SNPs.xlsx. 592
593
Data S7. Gene expression markers showing association with variation for γ/α 594
tocopherol ratio: Data S7_tocopherol-associated regions_GEMs.xlsx595
596
597
References598
599
Arabidopsis Genome Initiative (2000) Analysis of the genome sequence of the600
flowering plant Arabidopsis thaliana. Nature, 408:796-815.601
602
Atwell, S., Huang, Y.S., Vilhjálmsson, B.J et al. (2010) Genome-wide603
association study of 107 phenotypes in a common set of Arabidopsis thaliana604
inbred lines. Nature, 465(7298), 627-631.605

27
606
Bancroft, I., Morgan, C., Fraser, F., Higgins, J., Wells, R., Clissold, L., Baker,607
D., Long, Y., Meng, J., Wang, X., Liu, S. and Trick, M. (2011) Dissecting the608
genome of the polyploid crop oilseed rape by transcriptome sequencing. Nat.609
Biotechnol. 29:762-766.610
611
Bancroft, I., Fraser, F., Morgan, C. and Trick, M. (2015) Collinearity analysis of612
Brassica A and C genomes based on an updated inferred unigene order. Data in613
Brief, 3:51-55.614
615
Bus, A., Körber, N., Snowdon, R.J. and Stich, B. (2011) Patterns of molecular616
variation in a species-wide germplasm set of Brassica napus. Theor. Appl. Genet.617
123(8):1413-1423.618
619
Bush, W.S. and Moore, J.H. (2012) Chapter 11: Genome-Wide Association620
studies. PLoS Comput. Biol. 8(12):e1002822621
622
Chalhoub, B., Denoeud, F., Liu, S. et al. (2014) Early allopolyploid evolution in623
the post-Neolithic Brassica napus oilseed genome. Science, 345(6199):950-953.624
625
Chen, D.F., Zhang, M., Wang, Y.O. and Chen, X.W. (2012) Expression of γ-626
tocopherol methyltransferase gene from Brassica napus increased α-tocopherol 627
content in soybean seed. Biologia Plantarum 56(1):131-134628
629
28
Cheung, F., Trick, M., Drou, N., Lim, Y.P., Park, J-Y., Kwon, S-J., Kim, J-A.,630
Scott, R., Pires, J.C., Paterson, A.H., Town, C. and Bancroft, I. (2009)631
Comparative analysis between homoeologous genome segments of Brassica632
napus and its progenitor species reveals extensive sequence-level divergence.633
Plant Cell. 21(7), 1912-1928.634
Cockram, J., White, J., Zuluaga, D.L. et al. (2010) Genome-wide association635
mapping to candidate polymorphism resolution in the unsequenced barley636
genome. Proc. Natl. Acad. Sci. USA, 107 (50), 21611-21616.637
638
Devlin, B and Roeder, K. (1999) Genomic control for association studies.639
Biometrics. 55(4), 997-1004.640
641
Dolde, D., Vlahakis, C. and Hazebroek, J. (1999) Tocopherols in Breeding642
Lines and Effects of Planting Location, Fatty Acid Composition, and Temperature643
During Development. J. Am. Oil Chem. Soc. 76(3), 349-355.644
645
Endrigkeit, J., Wang, X., Cai, D., Zhang, C., Long, Y., Meng, J., Jung, C.646
(2009) Genetic mapping, cloning, and functional characterization of the647
BnaX.VTE4 gene encoding α-tocopherol methyltransferase from oilseed rape. 648
Theor. Appl. Genet. 119(3), 567-575.649
650
Fritsche, S., Wang, X., Li, J., Stich, B., Kopisch-Obuch, F.J., Endrigkeit, J.,651
Leckband, G., Dreyer, F., Friedt, W., Meng, J. and Jung, C. (2012) A candidate652

29
gene-based association study of tocopherol content and composition in rapeseed653
(Brassica napus). Front. Plant Sci. 3(129),1-24.654
655
Garrigan, D. and Hammer, M.F. (2006) Reconstructing human origins in the656
genomic era. Nat. Rev. Genet. 7, 669-680.657
658
Gilliland, L.U., Magallanes-Lundback, M., Hemming, C., Supplee, A.,659
Koorneef, M., Bentsink, L., DellaPenna, D. (2006) Genetic basis for natural660
variation in seed vitamin E levels in Arabidopsis thaliana. Proc. Natl. Acad. Sci.661
USA, 103(49), 18834-18841.662
663
Goffman, F.D. and Becker, H. C. (2002) Genetic variation of tocopherol content664
in a germplasm collection of Brasscia napus L. Euphytica, 125(2), 189-196.665
666
Harper, A.L., Trick, M., Higgins, J., Fraser, F., Clissold, L., Wells, R., Hattori,667
C., Werner, P. and Bancroft, I. (2012) Associative transcriptomics of traits in the668
polyploid crop species Brassica napus. Nat. Biotechnol. 30,798-802.669
670
Harper, A.L., McKinney, L.V., Nielsen, L.R., Havlickova, L., Li, Y., Trick, M.,671
Fraser, F., Wang, L., Fellgett, A., Sollars, E.S.A., Janacek, S.H., Downie, J.A.,672
Buggs, R.J.A., Kjaer, E.D., Bancroft, I. (2016) Molecular markers for tolerance673
of European ash (Fraxinus excelsior) to dieback disease identified using674
Associative Transcriptomics. Sci. Rep-UK. 6,19335.675
676

30
Hasan, M., Friedt, W., Pons-Kühnemann, J., Freitag, N.M., Link, K. and677
Snowdon, R.J. (2008) Association of gene-linked SSR markers to seed678
glucosynolate content in oilseed rape (Brassica napus ssp. napus). Theor. Appl.679
Genet 116:1035-1049.680
681
He, Z., Cheng, F., Li, Y., Wang, X., Parkin, I.A., Chalhoub, B., Liu, S. and682
Bancroft, I. (2015) Construction of Brassica A and C genome-based ordered683
pan-transcriptomes for use in rapeseed genomic research. Data Brief. 4:357-362.684
685
He, Z., Wang, L., Harper, A.L., Havlickova, L., Pradhan, A.K., Parkin, I.A.P.686
and Bancroft, I. (2016) Extensive homoeologous genome exchanges in687
allopolyploid crops revealed by mRNAseq-based visualization. Plant Biotechnol.688
J. 15, 594-604689
690
Higgins, J., Magusin, A., Trick, M., Fraser, F. and Bancroft, I. (2012) Use of691
mRNA-seq to discriminate contributions to the transcriptome from the constituent692
genomes of the polyploid crop species Brassica napus. BMC Genomics, 13, 247.693
694
Huang, X. and Han, B. (2014) Natural variations and genome-wide association695
studies in crop plants. Annu. Rev. Plant Biol. 65, 531–551.696
697
Huang, S., Deng, L., Guan, M., Li, J., Lu, K., Wang, H., Fu, D., Mason, A.S.,698
Liu, S. and Hua, W. (2013) Identification of genome-wide single nucleotide699
polymorphisms in allopolyploid crop Brassica napus. BMC Genomics, 14, 717.700
31
701
Inaba, R. and Nishio, T. (2002) Phylogenetic analysis of Brassiceae based on702
the nucleotide sequences of the S-locus related gene, SLR1. Theoretical and703
Applied Genetics, 105:1159-1165.704
705
Li, F., Chen, B., Xu, K., Wu, J., Song, W., Bancroft, I., Harper, A., Trick, M.,706
Liu, S., Gao, G., Wang, N., Yan, G., Qiao, J., Li, J., Li, H., Xiao, X., Zhang, T707
and Wu, X. (2014) Genome-wide association study dissects the genetic708
architecture of seed weight and seed quality in rapeseed (Brassica napus L.).709
DNA Res. 21, 355–367.710
711
Li, J.Z., Absher, D.M., Tang, H., Southwick, A.M., Casto, A.M.,712
Ramachandran, S., Cann, H.M., Barsh, G.S., Feldman, M., Cavalli-Sforza,713
L.L. and Myers, R.M. (2008) Worldwide human relationships inferred from714
genome-wide patterns of variation. Science, 319, 1100-1104.715
716
Li, Q., Yang, X., Xu, S., Cai, Y., Zhang, D., Han, Y., Li, L., Zhang, Z., Gao, S.,717
Li, J. and Yan, J. (2012) Genome-Wide Association Studies Identified Three718
Independent polymorphisms Associated with α-Tocopherol Content in Maize 719
Kernels. PLOS ONE, 7(5), e36807.720
721
Lipka, A.E., Tian, F., Wang, Q., Peiffer, J., Li, M., Bradbury, P.J., Gore, M.A.,722
Buckler, E.S. and Zhang, Z. (2012) GAPIT: genome association and prediction723
integrated tool. Bioinformatics, 28(18), 2397-2399.724

32
725
Lu, G., Harper, A. L., Trick, M., Morgan, C., Fraser, F., O’Neill, C. and726
Bancroft, I. (2014) Associative transcriptomics study dissects the genetic727
architecture of seed glucosinolate content in Brassica napus. DNA Res. 21(6),728
613–625.729
730
Munné-Bosch, S. and Alegre, L. (2002) The function of tocopherols in plants.731
Crit. Rev. Plant Sci. 21(1), 31-57.732
733
O'Neill, C. M. and Bancroft, I. (2000) Comparative physical mapping of734
segments of the genome of Brassica oleracea var. alboglabra that are735
homoeologous to sequenced regions of chromosomes 4 and 5 of Arabidopsis736
thaliana. Plant J. 23(2), 233-243.737
738
Pires, C. J., Zhao, J., Schranz, M.E., Leon, E.J., Quijada, P.A., Lukens, L.N.739
and Osborn, T.C. (2004) Flowering time divergence and genomic740
rearrangements in resynthesized Brassica polyploids (Brassicaceae). Biol J.741
Linn. Soc. 82, 675-688.742
743
Popescu, A-A., Harper, A.L., Trick, M., Bancroft, I., Huber, K.T. (2014) A novel744
and fast approach for population structure inference using kernel-PCA and745
optimization. Genetics, 198(4), 1421-1431.746
747

33
Qiu, D., Morgan, C., Shi, J., Long, Y., Liu, J., Li, R., Zhuang, X., Wang, Y.,748
Tan, X., Dietrich, E., Weihmann, T., Everett, C., Vanstraelen, S., Beckett, P749
and Fraser, F. (2006) A comparative linkage map of oilseed rape and its use for750
QTL analysis of seed oil and erucic acid content. Theor. Appl. Genet. 114(1), 67-751
80.752
753
Quadrana, L., Almeida, J., Otaiza, S.N., Duffy, T., Correa da Silva, J.V., de754
Godoy, F., Asís, R., Bermúndez, L., Fernie, A.R., Carrari, F. and Rossi, M.755
(2013) Transcriptional regulation of tocopherol biosynthesis in tomato. Plant Mol.756
Biol. 81(3), 309-325.757
758
Rafalski, J. A. (2010) Association genetics in crop improvement. Curr. Opin.759
Plant Biol. 13(2), 174–180.760
761
Renny-Byfield, S. and Wendel, J. F. (2014) Doubling down on genomes:762
Polyploidy and crop plants. Am. J. Bot. 101(10), 1711–1725.763
764
Sattler, S.E., Gilliland, L.U., Magallanes-Lundback, M., Pollard, M.,765
DellaPenna, D. (2004) Vitamin E is essential for seed longevity and for766
preventing lipid peroxidation during germination. Plant Cell, 16(6):1419-1432.767
768
Schliep, K.P. (2011) phangorn: Phylogenetic analysis in R. Bioinformatics, 27(4),769
592-593.770
771

34
Shin, J-H., Blay, S., McNeney, B. and Graham, J. (2006) LDheatmap: An R772
function for graphical display of pairwise linkage disequilibria between single773
nucleotide polymorphisms. J. Stat. Softw. 16, Code Snippet 3, 1-9.774
775
Shintani, D. and DellaPenna, D. (1998) Elevating the vitamin E content of plants776
through metabolic engineering. Science. 282:2098-2100.777
778
Sollars, E.S.S., Harper, A.L., Kelly, L.J., Sambles, C.M. et al. (2017) Genome779
sequence and genetic diversity of European ash trees. Nature. 541780
781
Song, K., Lu, P., Tang, K. and Osborn, T.C. (1995) Rapid genome change in782
synthetic polyploids of Brassica and its implications for polyploid evolution. Proc.783
Natl. Acad. Sci. USA, 92(17), 7719-7723.784
785
Spencer, C.C.A., Su, Z, Donnelly, P. and Marchini, J. (2009) Designing786
Genome-Wide Association Studies: Sample Size, Power, Imputation, and the787
Choice of Genotyping Chip. PLoS Genet. 5(5): e1000477.788
789
Thomas, C.L., Alcock, T.D., Graham, N.S., Hayden, R., Matterson, S., Wilson,790
L., Young, S.D., Dupuy, L.X., White, P.J., Hammond, J.P., Danku, J.M., Salt,791
D.E., Sweeney, A., Bancroft, I. and Broadley, M.R. (2016) Root morphology792
and seed and leaf ionomic traits in a Brassica napus L. diversity panel show wide793
phenotypic variation and are characteristic of crop habit. BMC Plant Biol. 16,214.794
795

35
Tian, F., Bradbury, P.J., Brown, P.J., Hung, H., Sun, Q., Flint-Garcia, S.,796
Rocheford, T.R., McMullen, M.D., Holland, J.B. and Buckler, E.S. (2011)797
Genome-wide association study of leaf architecture in the maize nested798
association mapping population. Nat. Genet. 43, 159-162.799
800
Town, C. D., Cheung, F., Maiti, R., Crabtree, J., Haas, B.J., Wortman, J.R.,801
Hine, E.E., Althoff, R., Arbogast, T.S., Tallon, L.J., Viqouroux, M., Trick, M.,802
Bancroft, I. (2006) Comparative genomics of Brassica oleracea and Arabidopsis803
thaliana reveal gene loss, fragmentation, and dispersal after polyploidy. Plant804
Cell, 18(6), 1348-1359.805
806
Trick, M., Long, Y., Meng, J. and Bancroft, I. (2009) Single nucleotide807
polymorphism (SNP) discovery in the polyploid Brassica napus using Solexa808
transcriptome sequencing. Plant Biotechnol. J. 7(4), 334-346.809
810
U, N. (1935) Genome analysis in Brassica with special reference to the811
experimental formation of B. napus and peculiar mode of fertilization. Jap. J. Bot.812
7, 389-452.813
814
Valentin, H.E., Lincoln, K., Moshiri, F., Jensen, P.K., Qi, Q., Venkatesh, T.V.,815
Karunanandaa, B., Baszis, S.R., Norris, S.R., Savidge, B., Gruys, K.J., Last,816
R.L. (2006) The Arabidopsis vitamin E pathway gene5-1 Mutant Reveals a817
Critical Role for Phytol Kinase in Seed Tocopherol Biosynthesis. Plant Cell, 18(1),818
212-224.819

36
820
Wang, X., Zhang, C., Li, L., Fritsche, S., Enderigkeit, J., Zhang, W., Long, Y.,821
Jung, C. and Meng, J. (2012) Unraveling the genetic basis of seed tocopherol822
content and composition in rapeseed (Brassica napus L.). PLOS ONE, 7(11),823
e50038.824
825
Wood, I.P., Pearson, B.M., Garcia-Gutierrez, E.G., Havlickova, L., He, Z.,826
Harper, A.L., Bancroft, I. and Waldron, K.W. (2017) Carbohydrate microarrays827
and their use for the identification of molecular markers dor plant cell wall828
composition. Proc. Natl. Acad. Sci. USA, 114(26), 6860–6865.829
830
Yang, T-J., Kim, J.S., Kwon, S-J., Lim, K-B., Choi, B-S., Kim, J-A., Jin, M.,831
Park, J.Y., Lim, M-H., Kim, H-I., Lim, Y.P., Kang, J.J., Hong, J-H., Kim, C-B.,832
Bhak, J., Bancroft, I. and Park, S. (2006) Sequence-level analysis of the833
diploidization process in the triplicated FLOWERING LOCUS C region of834
Brassica rapa. Plant Cell, 18(6), 1339-1347.835
836
Zhang, H., Bian, Y., Gou, X., Dong, Y., Rustgi, S., Zhang, B., Xu, C., Li, N.,837
Qi, B., Han, F., Wettstein, D. and Liu, B. (2013) Intrinsic karyotype stability and838
gene copy number variations may have laid the foundation for tetraploid wheat839
formation. Proc. Natl. Acad. Sci. USA, 110(48), 19466–19471.840
841
Zhao, K., Tung, C-W., Eizenga, G.C., Wright, M.H., Ali, M.L., Price, A.H.,842
Norton, G.J., Islam, M.R., Reynolds, A., Mezey, J., McClung, A.M.,843
37
Bustamante, C.D. and McCouch, S.R. (2011) Genome-wide association844
mapping reveals a rich genetic architecture of complex traits in Oryza sativa. Nat.845
Commun. 2, 467.846
847
Xu, L., Hu, K., Zhang, Z., Guan, C., Chen, S., Hua, W., Li, J., Wen, J., Yi, B.,848
Shen, J., Ma, C., Tu, J. and Fu, T. (2016) Genome-wide association study849
reveals the genetic architecture of flowering time in rapeseed (Brassica napus850
L.). DNA Res. 23(1), 43–52.851
852
Figure legends853
Figure 1. Simplified tocopherol biosynthesis pathway in plants. HPP, p-854
hydroxyphenylpyruvate; HGA, homogentisic acid; MPBQ, 2-methyl-6-phytyl-1,4-855
benzoquinone; DMPBQ, 2,3-dimethyl-5-phytyl-1,4-benzoquinone; PDP, phytyl-856
diphosphate; HPPD, HPP dioxygenase; VTE1, tocopherol cyclase; VTE2,857
homogentisate phytyltransferase; VTE3, MPBQ methyltransferase; VTE4, γ-858
tocopherol methyltransferase; VTE5, phytol kinase.859
860
Figure 2. Population structure and trait variation across the RIPR panel. A.861
Relatedness of accessions in the panel based on 355,536 scored SNPs. B. Main862
crop types in the panel, colour-coded: orange for spring oilseed rape, green for863
semi-winter oilseed rape, light blue for swede, dark blue for kale, black for fodder864
and red for winter oilseed rape, grey for crop type not assigned. C. Population865
structure for highest likelihood K = 2. D. Variation for seed content of α- tocopherol 866
(light blue), γ-tocopherol (dark blue) and δ-tocopherol (magenta). 867

38
868
Figure 3. Association analysis. A. Transcriptome SNP markers with seed erucic869
acid content. The SNPmarkers are positioned on the x-axis based in the genomic870
order of the gene models in which the polymorphism was scored, with the871
significance of the trait association, as –log10P, on the y-axis. A1 to A10 and C1872
to C9 are the chromosomes of B. napus, shown in alternating black and red873
colours to permit boundaries to be distinguished. Hemi-SNP markers (i.e.874
polymorphisms involving multiple bases called at the SNP position in one allele875
of the polymorphism) for which the genome of the polymorphism cannot be876
assigned are shown as light points whereas simple SNP markers (i.e.877
polymorphisms between resolved bases) and hemi-SNPs that have been directly878
linkage mapped, both of which can be assigned to a genome, are shown as dark879
points. The broken light blue horizontal line marks the Bonferroni-corrected880
significance threshold of 0.05.881
B. Transcript abundance with seed erucic acid content. The gene models are882
positioned on the x-axis based in their genomic order, with the significance of the883
trait association, as –log10P, on the y-axis. The broken dark blue horizontal line884
marks the 5% false discovery rate.885
886
Figure 4. Association analysis. A. Transcriptome SNP association analysis for887
seed γ/α tocopherol ratio. The SNP markers are positioned on the x-axis based 888
in the genomic order of the gene models in which the polymorphism was scored,889
with the significance of the trait association, as –log10P, on the y-axis. A1 to A10890
and C1 to C9 are the chromosomes of B. napus, shown in alternating black and891

39
red colours to permit boundaries to be distinguished. Hemi-SNP markers (i.e.892
polymorphisms involving multiple bases called at the SNP position in one allele893
of the polymorphism) for which the genome of the polymorphism cannot be894
assigned are shown as light points whereas simple SNP markers (i.e.895
polymorphisms between resolved bases) and hemi-SNPs that have been directly896
linkage mapped, both of which can be assigned to a genome, are shown as dark897
points. The broken light blue horizontal line marks the Bonferroni-corrected898
significance threshold of 0.05.899
B. Association analysis of transcript abundance with seed γ/α tocopherol ratio. 900
The gene models are positioned on the x-axis based in their genomic order, with901
the significance of the trait association, as –log10P, on the y-axis. The broken902
dark blue horizontal line marks the 5% false discovery rate.903
904
Figure 5. Test of the predictive ability of SNP and GEM markers associated with905
γ/α tocopherol ratio by using ”take-one-out” permutation. The allelic effects of 906
each of 36 SNP markers associated with γ/α tocopherol ratio was used to predict 907
the γ/α tocopherol ratio for the missing accessions. For GEM data, RPKM values 908
for each of 4 GEMs were fitted to the regression line to predict γ/α tocopherol 909
ratio. The strong correlation between predicted and observed γ/α tocopherol ratio 910
values (R2 = 0.59; p<0.001 for SNPs and R2 = 0.47; p<0.001 for GEMs)911
demonstrates excellent predictive ability.912
913
Figure 6. Relationship between expression in leaves of Bo2g050970.1 and the914
tocopherol γ/α ratio in seed. The ratio of γ-tocopherol / α-tocopherol measured in 915

40
seeds was regressed against the transcript abundance in leaves of the VTE4916
orthologue Bo2g050970.1 (R2=0.26; p<0.001), measured as reads per kilobase917
per million aligned reads (RPKM).918
919

Tyrosine Phytol HPP Phytylphosphate HGA PDP MPBQ DMPBQ δ-tocopherol γ-tocopherol
β-tocopherol α-tocopherol
HPPD
VTE2
VTE3
VTE1
VTE4
VTE1
VTE4
VTE5
Figure 1. Simplified tocopherol biosynthesis pathway in plants.
HPP, p-hydroxyphenylpyruvate; HGA, homogentisic acid; MPBQ, 2-
methyl-6-phytyl-1,4-benzoquinone; DMPBQ, 2,3-dimethyl-5-phytyl-
1,4-benzoquinone; PDP, phytyl-diphosphate; HPPD, HPP
dioxygenase; VTE1, tocopherol cyclase; VTE2, homogentisate
phytyltransferase; VTE3, MPBQ methyltransferase; VTE4, γ-
tocopherol methyltransferase; VTE5, phytol kinase.

a
b
c
d
Figure 2. Population structure and trait variation across the RIPR panel. A. Relatedness of accessions in the
panel based on 355,536 scored SNPs. B. Main crop types in the panel, colour-coded: orange for spring oilseed
rape, green for semi-winter oilseed rape, light blue for swede, dark blue for kale, black for fodder and red for
winter oilseed rape, grey for crop type not assigned. C. Population structure for highest likelihood K = 2. D.
Variation for seed content of α- tocopherol (light blue), γ-tocopherol (dark blue) and δ-tocopherol (magenta).

A1 A2 A3 A4 A5 A6 A7 A8 A9 A10 C1 C2 C3 C4 C5 C6 C7 C8 C9
A1 A2 A3 A4 A5 A6 A7 A8 A9 A10 C1 C2 C3 C4 C5 C6 C7 C8 C9
Figure 3. Association analysis. A. Transcriptome SNP markers with seed erucic acid content. The SNP markers are positioned on the x-axis based in the genomic order of the gene models in which the polymorphism was scored, with the significance of the trait association, as –log10P, on the y-axis. A1 to A10 and C1 to C9 are the chromosomes of B. napus, shown in alternating black and red colours to permit boundaries to be distinguished. Hemi-SNP markers (i.e. polymorphisms involving multiple bases called at the SNP position in one allele of the polymorphism) for which the genome of the polymorphism cannot be assigned are shown as light points whereas simple SNP markers (i.e. polymorphisms between resolved bases) and hemi-SNPs that have been directly linkage mapped, both of which can be assigned to a genome, are shown as dark points. The broken light blue horizontal line marks the Bonferroni-corrected significance threshold of 0.05.
B. Transcript abundance with seed erucic acid content. The gene models are positioned on the x-axis based in their genomic order, with the significance of the trait association, as –log10P, on the y-axis. The broken dark blue horizontal line marks the 5% false discovery rate.
a
b

A1 A2 A3 A4 A5 A6 A7 A8 A9 A10 C1 C2 C3 C4 C5 C6 C7 C8 C9
Figure 4. Association analysis. A. Transcriptome SNP association analysis for seed γ/α tocopherol ratio. The SNP markers are positioned on the x-axis based in the genomic order of the gene models in which the polymorphism was scored, with the significance of the trait association, as –log10P, on the y-axis. A1 to A10 and C1 to C9 are the chromosomes of B. napus, shown in alternating black and red colours to permit boundaries to be distinguished. Hemi-SNP markers (i.e. polymorphisms involving multiple bases called at the SNP position in one allele of the polymorphism) for which the genome of the polymorphism cannot be assigned are shown as light points whereas simple SNP markers (i.e. polymorphisms between resolved bases) and hemi-SNPs that have been directly linkage mapped, both of which can be assigned to a genome, are shown as dark points. The broken light blue horizontal line marks the Bonferroni-corrected significance threshold of 0.05. B. Association analysis of transcript abundance with seed γ/α tocopherol ratio. The gene models are positioned on the x-axis based in their genomic order, with the significance of the trait association, as –log10P, on the y-axis. The broken dark blue horizontal line marks the 5% false discovery rate.
A1 A2 A3 A4 A5 A6 A7 A8 A9 A10 C1 C2 C3 C4 C5 C6 C7 C8 C9
a
b
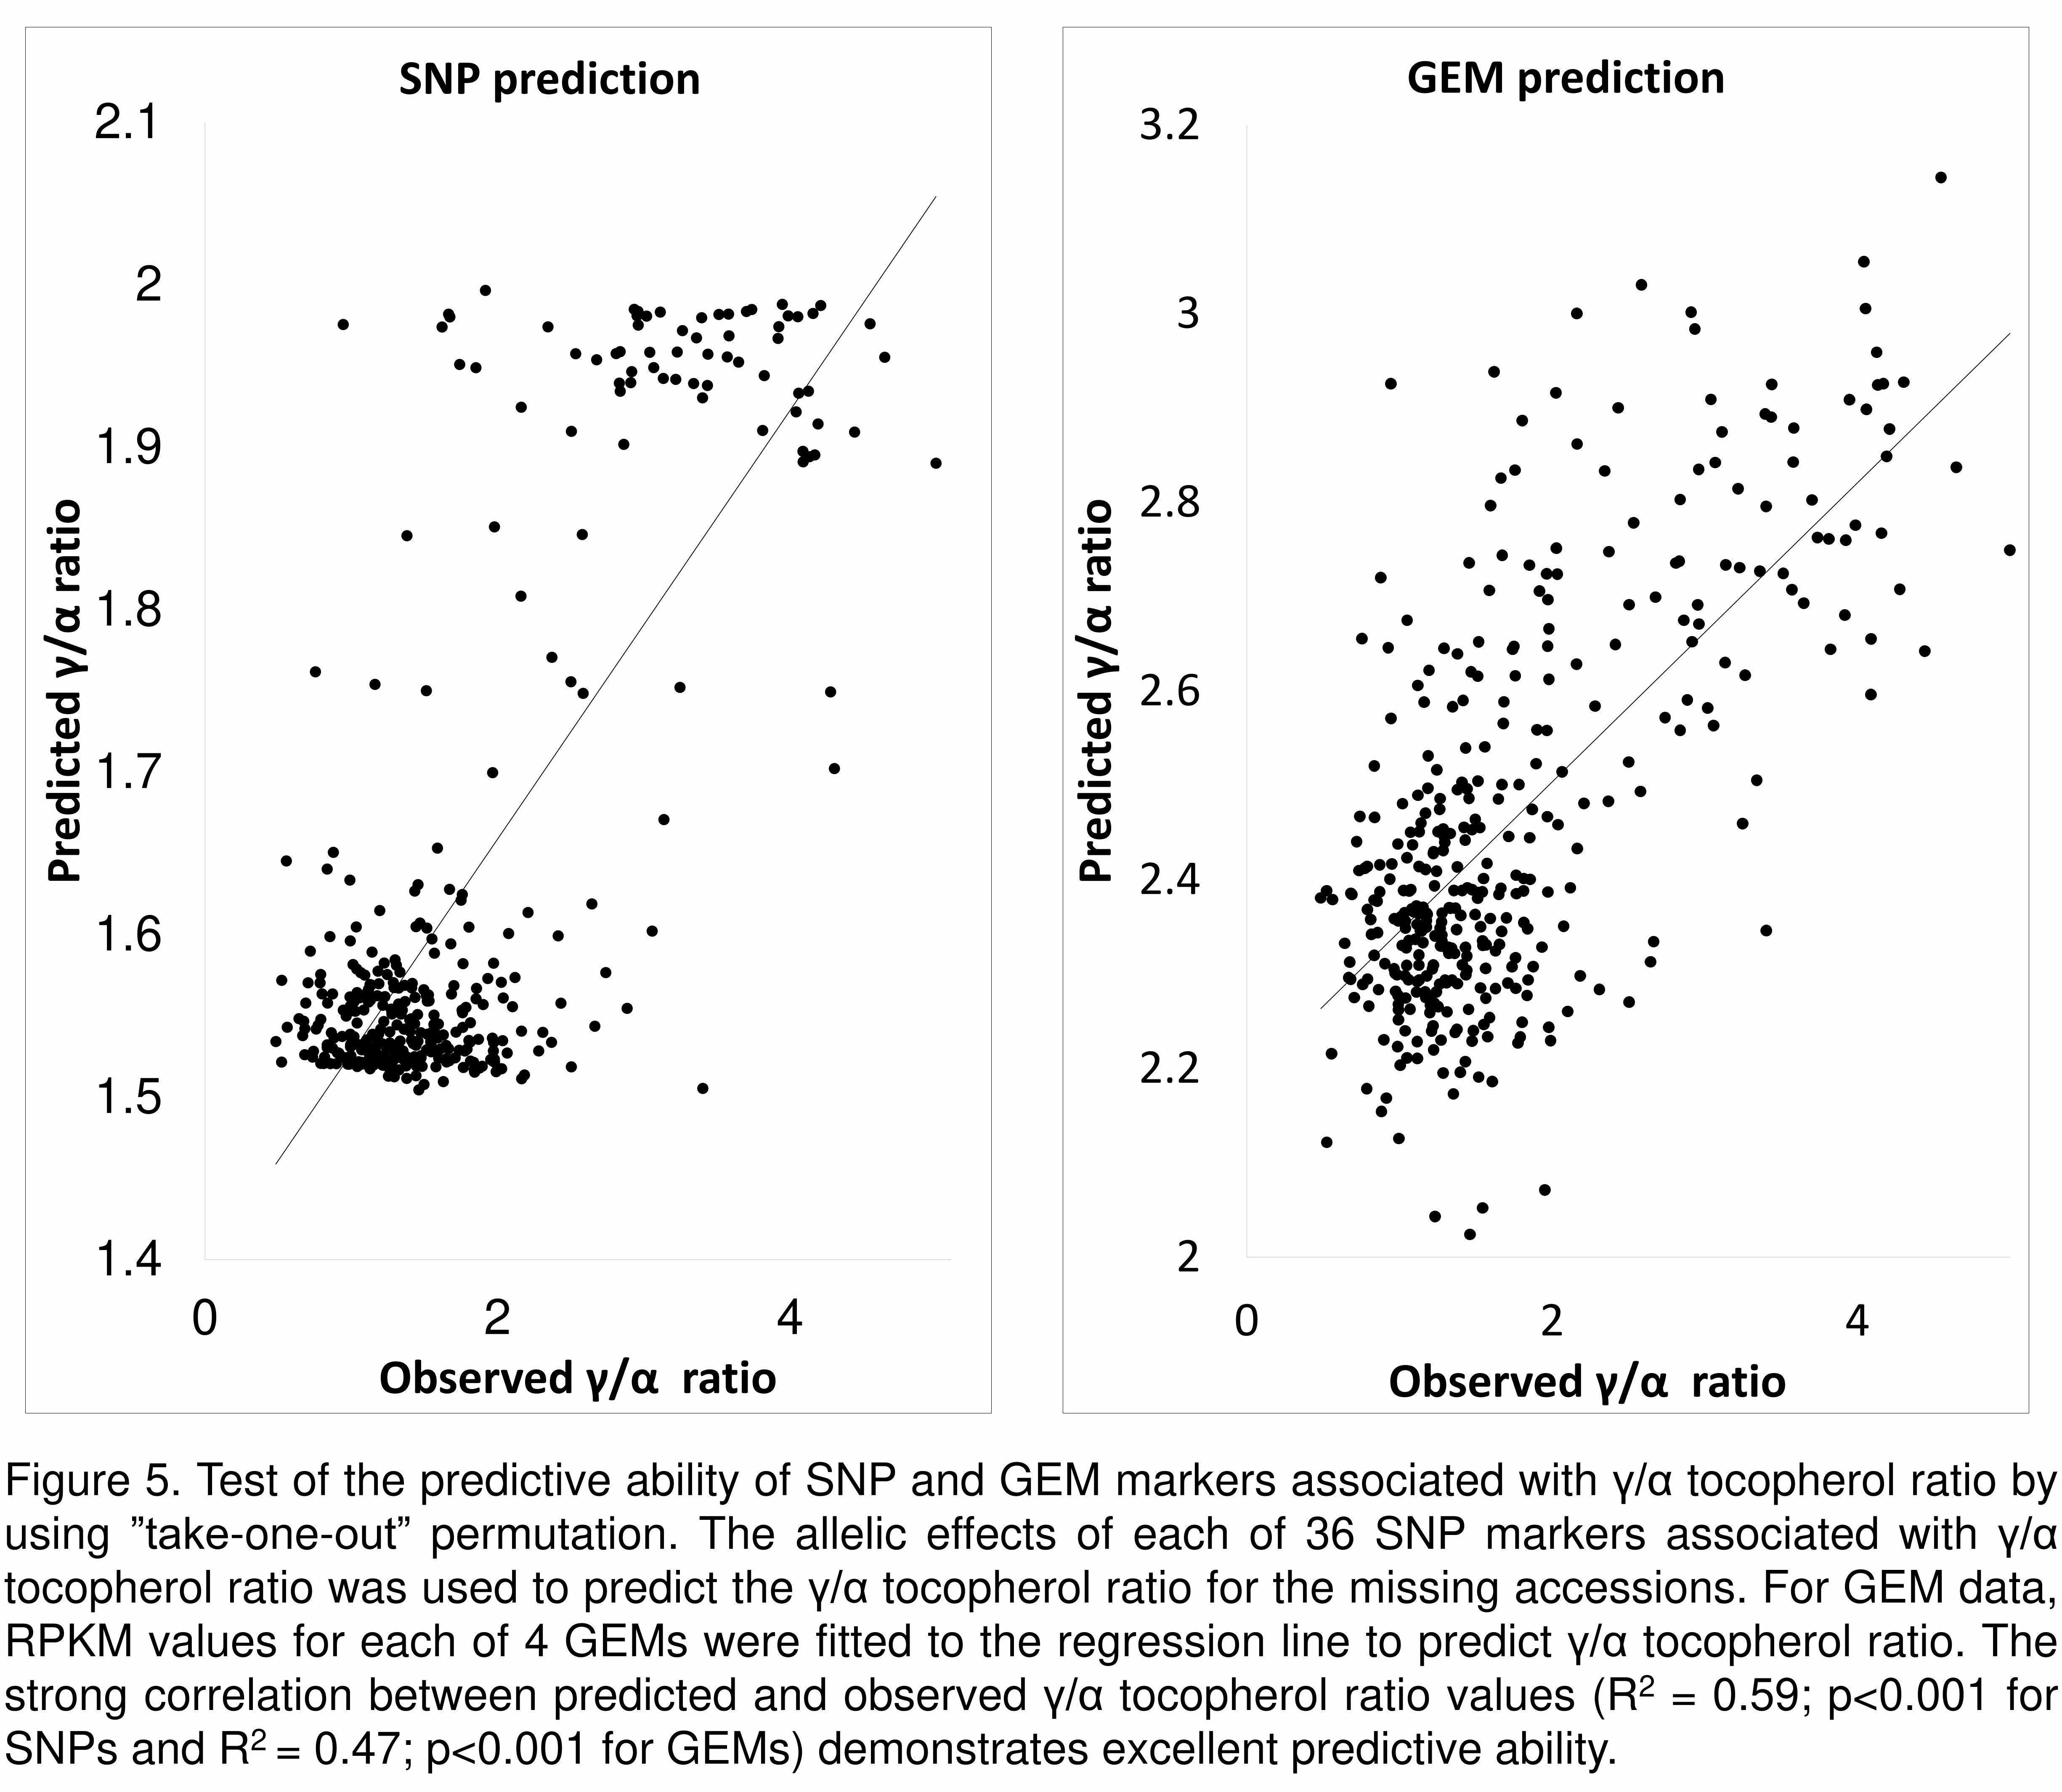
Figure 5. Test of the predictive ability of SNP and GEM markers associated with γ/α tocopherol ratio by
using ”take-one-out” permutation. The allelic effects of each of 36 SNP markers associated with γ/α
tocopherol ratio was used to predict the γ/α tocopherol ratio for the missing accessions. For GEM data,
RPKM values for each of 4 GEMs were fitted to the regression line to predict γ/α tocopherol ratio. The
strong correlation between predicted and observed γ/α tocopherol ratio values (R2 = 0.59; p<0.001 for
SNPs and R2 = 0.47; p<0.001 for GEMs) demonstrates excellent predictive ability.
1.4
1.5
1.6
1.7
1.8
1.9
2
2.1
0 2 4
Pre
dic
ted
γ/α
ratio
Observed γ/α ratio
SNP prediction
2
2.2
2.4
2.6
2.8
3
3.2
0 2 4
Pre
dic
ted
γ/α
ratio
Observed γ/α ratio
GEM prediction

0
0.5
1
1.5
2
2.5
3
3.5
4
4.5
5
0 10 20 30 40 50 60 70 80
Obs
erve
d γ/
α ra
tio
Expression of Bo2g050970.1 / RPKM
Figure 6. Relationship between expression in leaves of Bo2g050970.1 and the tocopherol γ/α ratio in seed.
The ratio of γ-tocopherol / α-tocopherol measured in seeds was regressed against the transcript abundance
in leaves of the VTE4 orthologue Bo2g050970.1 (R2=0.41; p<0.001), measured as reads per kilobase per
million aligned reads (RPKM).