Genome adaptation to chemical stress: clues from comparative transcriptomics in Saccharomyces...
15
Genome Biology 2008, 9:R164 Open Access 2008 Lelandais et al. Volume 9, Issue 11, Article R164 Research Genome adaptation to chemical stress: clues from comparative transcriptomics in Saccharomyces cerevisiae and Candida glabrata Gaëlle Lelandais *† , Véronique Tanty ‡ , Colette Geneix *§ , Catherine Etchebest * , Claude Jacq †‡ and Frédéric Devaux † Addresses: * Equipe de Bioinformatique Génomique et Moléculaire, INSERM UMR S726, Université Paris 7, INTS, 6 rue Alexandre Cabanel, 75015 Paris, France. † Laboratoire de Génétique Moléculaire, CNRS UMR 8541, Ecole Normale Supérieure, 46 rue d'Ulm, 75230 Paris cedex 05, France. ‡ Plate-forme transcriptome IFR 36, Ecole Normale Supérieure, 46 rue d'Ulm, 75230 Paris cedex 05, France. § Current address: MTI, Bât. Lamarck, 35 rue Hélène Brion, 75205 Paris Cedex 13, France. Correspondence: Gaëlle Lelandais. Email: [email protected] © 2008 Lelandais et al.; licensee BioMed Central Ltd. This is an open access article distributed under the terms of the Creative Commons Attribution License (http://creativecommons.org/licenses/by/2.0), which permits unrestricted use, distribution, and reproduction in any medium, provided the original work is properly cited. Yeast transcriptional network evolution <p>Comparative transcriptomics of <it>Saccharomyces cerevisiae</it> and <it>Candida glabrata</it> revealed a remarkable conserva- tion of response to drug-induced stress, despite underlying differences in the regulatory networks.</p> Abstract Background: Recent technical and methodological advances have placed microbial models at the forefront of evolutionary and environmental genomics. To better understand the logic of genetic network evolution, we combined comparative transcriptomics, a differential clustering algorithm and promoter analyses in a study of the evolution of transcriptional networks responding to an antifungal agent in two yeast species: the free-living model organism Saccharomyces cerevisiae and the human pathogen Candida glabrata. Results: We found that although the gene expression patterns characterizing the response to drugs were remarkably conserved between the two species, part of the underlying regulatory networks differed. In particular, the roles of the oxidative stress response transcription factors ScYap1p (in S. cerevisiae) and Cgap1p (in C. glabrata) had diverged. The sets of genes whose benomyl response depends on these factors are significantly different. Also, the DNA motifs targeted by ScYap1p and Cgap1p are differently represented in the promoters of these genes, suggesting that the DNA binding properties of the two proteins are slightly different. Experimental assays of ScYap1p and Cgap1p activities in vivo were in accordance with this last observation. Conclusions: Based on these results and recently published data, we suggest that the robustness of environmental stress responses among related species contrasts with the rapid evolution of regulatory sequences, and depends on both the coevolution of transcription factor binding properties and the versatility of regulatory associations within transcriptional networks. Background As evolutionary changes frequently involve modifications to transcriptional regulatory programs, the integration of gene expression data into classic cross-species comparisons based on protein or DNA sequence similarity is a powerful approach likely to improve our understanding of phenotypic diversity among organisms. Sequence similarity between genes or pro- teins is not always proportional to the conservation of func- Published: 24 November 2008 Genome Biology 2008, 9:R164 (doi:10.1186/gb-2008-9-11-r164) Received: 6 October 2008 Accepted: 24 November 2008 The electronic version of this article is the complete one and can be found online at http://genomebiology.com/2008/9/11/R164
-
Upload
univ-paris-diderot -
Category
Documents
-
view
0 -
download
0
Transcript of Genome adaptation to chemical stress: clues from comparative transcriptomics in Saccharomyces...

Open Access2008Lelandaiset al.Volume 9, Issue 11, Article R164ResearchGenome adaptation to chemical stress: clues from comparative transcriptomics in Saccharomyces cerevisiae and Candida glabrataGaëlle Lelandais*†, Véronique Tanty‡, Colette Geneix*§, Catherine Etchebest*, Claude Jacq†‡ and Frédéric Devaux†
Addresses: *Equipe de Bioinformatique Génomique et Moléculaire, INSERM UMR S726, Université Paris 7, INTS, 6 rue Alexandre Cabanel, 75015 Paris, France. †Laboratoire de Génétique Moléculaire, CNRS UMR 8541, Ecole Normale Supérieure, 46 rue d'Ulm, 75230 Paris cedex 05, France. ‡Plate-forme transcriptome IFR 36, Ecole Normale Supérieure, 46 rue d'Ulm, 75230 Paris cedex 05, France. §Current address: MTI, Bât. Lamarck, 35 rue Hélène Brion, 75205 Paris Cedex 13, France.
Correspondence: Gaëlle Lelandais. Email: [email protected]
© 2008 Lelandais et al.; licensee BioMed Central Ltd. This is an open access article distributed under the terms of the Creative Commons Attribution License (http://creativecommons.org/licenses/by/2.0), which permits unrestricted use, distribution, and reproduction in any medium, provided the original work is properly cited.Yeast transcriptional network evolution<p>Comparative transcriptomics of <it>Saccharomyces cerevisiae</it> and <it>Candida glabrata</it> revealed a remarkable conserva-tion of response to drug-induced stress, despite underlying differences in the regulatory networks.</p>
Abstract
Background: Recent technical and methodological advances have placed microbial models at theforefront of evolutionary and environmental genomics. To better understand the logic of geneticnetwork evolution, we combined comparative transcriptomics, a differential clustering algorithmand promoter analyses in a study of the evolution of transcriptional networks responding to anantifungal agent in two yeast species: the free-living model organism Saccharomyces cerevisiae andthe human pathogen Candida glabrata.
Results: We found that although the gene expression patterns characterizing the response todrugs were remarkably conserved between the two species, part of the underlying regulatorynetworks differed. In particular, the roles of the oxidative stress response transcription factorsScYap1p (in S. cerevisiae) and Cgap1p (in C. glabrata) had diverged. The sets of genes whose benomylresponse depends on these factors are significantly different. Also, the DNA motifs targeted byScYap1p and Cgap1p are differently represented in the promoters of these genes, suggesting thatthe DNA binding properties of the two proteins are slightly different. Experimental assays ofScYap1p and Cgap1p activities in vivo were in accordance with this last observation.
Conclusions: Based on these results and recently published data, we suggest that the robustnessof environmental stress responses among related species contrasts with the rapid evolution ofregulatory sequences, and depends on both the coevolution of transcription factor bindingproperties and the versatility of regulatory associations within transcriptional networks.
BackgroundAs evolutionary changes frequently involve modifications totranscriptional regulatory programs, the integration of geneexpression data into classic cross-species comparisons based
on protein or DNA sequence similarity is a powerful approachlikely to improve our understanding of phenotypic diversityamong organisms. Sequence similarity between genes or pro-teins is not always proportional to the conservation of func-
Published: 24 November 2008
Genome Biology 2008, 9:R164 (doi:10.1186/gb-2008-9-11-r164)
Received: 6 October 2008Accepted: 24 November 2008
The electronic version of this article is the complete one and can be found online at http://genomebiology.com/2008/9/11/R164
Genome Biology 2008, 9:R164

http://genomebiology.com/2008/9/11/R164 Genome Biology 2008, Volume 9, Issue 11, Article R164 Lelandais et al. R164.2
tion during evolution [1,2] and investigations of theconservation of gene expression patterns are, therefore, use-ful for precise determinations of function [3-5]. Comparativefunctional analyses have been made possible by the accumu-lation of large-scale gene expression datasets for a largenumber of organisms, due directly to the exponential increasein the number of species for which whole genome sequencesare available [6,7]. The development of methodologies forcomparing genome-wide gene expression data between spe-cies has been challenging, and several computationalapproaches have been proposed in the past five years for theintegration of cross-species expression and sequence com-parisons [2,8-12]. Combining sequence and expression dataappeared to be useful for improving functional annotation ofgenes [13,14], for refining modules of homologous genes indifferent organisms [15,16] or for increasing our understand-ing of the regulatory relationships between genes among spe-cies [17,18].
Pioneering studies focused on evolutionarily distant modelorganisms, for which all the publicly available microarraydata were combined into a single dataset [8,9]. These studiesgave interesting results, demonstrating the potential of cross-species comparisons based on expression data. However, theevolutionary distance between the compared species and thecombination of unrelated expression data limited the conclu-sions to the characterization of transcriptional modules con-sisting of large numbers of genes with very high levels ofsequence conservation and very highly correlated expressionpatterns. To increase the accuracy of investigations of theevolution of genetic networks, we would like, in an ideal case,to: compare selected microarray experiments that are as sim-ilar as possible for all species considered; and compare spe-cies separated by an optimal evolutionary distance, that is,species sharing a high level of orthology but with differentlifestyles and physiological properties [11]. In this respect, thehemiascomycete phylum constitutes a valuable model. Yeastspecies have evolved in niches with constantly varying nutri-ent availability and growth conditions, and have thus had todevelop sophisticated mechanisms for controlling genomeexpression. More than ten yeast species have now been fullysequenced [19,20], opening up new possibilities for studyingthe adaptation of transcriptional networks to environmentalconstraints over a progressive evolutionary scale spanning400 million years [11,21].
We present here a comparative analysis of the transcriptionalprograms driving the chemical stress response in two evolu-tionarily close yeast species, Saccharomyces cerevisiae andCandida glabrata [20]. C. glabrata is a pathogenic yeast andthe frequency of systemic infections with this yeast is increas-ing, perhaps due to the extensive use of azole antifungalagents, to which C. glabrata may be resistant [22,23]. In con-trast to S. cerevisiae, in which genome expression has beenextensively studied, very few functional genomic studies haveyet been carried out for C. glabrata, and very little is known
about its drug resistance pathways [24,25]. Most functionalannotations of C. glabrata genes are currently based onsequence similarity with genes of S. cerevisiae that have beenwell characterized functionally. One clear challenge for com-parative functional genomics concerns the extension of ourconsiderable knowledge of S. cerevisiae genetic networks toother yeasts, such as C. glabrata. With this goal in mind, wefocused on the early genomic events characterizing the stressresponse induced by benomyl, an antifungal agent that inhib-its cell growth during mitosis.
In S. cerevisiae, benomyl has been shown to activate an oxi-dative stress response primarily dependent on the transcrip-tion factor ScYap1p [26]. Our global analyses showed that thisdrug induces the expression of orthologous gene pairsinvolved in oxidative stress responses similarly in both spe-cies, suggesting a high degree of conservation of the corre-sponding pathways in these two species. Combining thedifferential clustering algorithm (DCA) [10] with promotersequence analyses, we observed that, despite the highly con-served patterns of expression of genes regulated by benomylin the two species, the transcriptional pathway related to thetranscription factor Yap1p appeared to have substantiallychanged. Experimental assessment of the genes actually con-trolled by Cgap1p, the functional homolog of ScYap1p in C.glabrata, indicated that even if Cgap1p retained an importantrole in the benomyl response, this function was less impor-tant than that of ScYap1p in the S. cerevisiae benomylresponse. Interestingly, the Yap1 response element (YRE),which is the most enriched in the promoters of Cgap1p targetgenes, is only marginally present in the promoters of Yap1p-dependent genes. Finally, our data are consistent with adivergence of the Cgap1p recognition sites from the preferredbinding sequences for ScYap1p. In terms of the oxidativestress response, this divergence of the promoter regionsbetween S. cerevisiae and C. galabrata is counterbalanced bycoevolution of the DNA binding sites of transcription factorsand by the flexibility of transcriptional networks, ensuring therobustness of the genomic response of cells to hostile chemi-cal environments.
ResultsTranscript profiling with identical experimental conditions in both yeast speciesBenomyl dose and measurement timesWe carried out microarray analyses of the transcriptomeresponses of S. cerevisiae and C. glabrata following identicaltreatments with the antifungal agent benomyl [27]. Bothyeast strains were subjected, in parallel, to the growth condi-tions defined in our previous study [26]: 20 μg/ml benomylfor 2, 4, 10, 20, 40 and 80 minutes. Labeled cDNA fromtreated cells was hybridized with S. cerevisiae or C. glabratamicroarrays in the presence of cDNA from mock-treated cellsas a competitor.
Genome Biology 2008, 9:R164
http://genomebiology.com/2008/9/11/R164 Genome Biology 2008, Volume 9, Issue 11, Article R164 Lelandais et al. R164.3
Global analysis of changes in gene expression shows quantitatively similar transcriptional responsesWe used principal component analysis (PCA) to obtain a glo-bal view of the changes in gene expression occurring inresponse to the addition of benomyl. This multivariate statis-tical technique allowed us to identify new variables - the prin-cipal components (PCs) - that are linear combinations of theoriginal time vectors and account for the largest proportion ofthe variance of the data. A complete description of PCA can befound in [28]. The results of independent PCAs for S. cerevi-siae and C. glabrata benomyl expression data are presentedin Figure 1a, b. In both yeasts, more than 90% of the observedvariability was accounted for by the first two principal compo-nents (Figure 1a, b, right panels). These were used for thesimultaneous representation of all the microarray results(Figure 1a, b, left panels). The resulting PCA diagrams werevery similar, suggesting that benomyl had a similar impact onthe transcriptomes of S. cerevisiae and C. glabrata. Interest-ingly, the dominant component PC1 consisted primarily oftime vectors 80 and 40 minutes in S. cerevisiae (loadingswere 43% and 34%, respectively), whereas in C. glabrata, PC1
consisted primarily of the earlier time vectors 40 and 20 min-utes (loadings were 30% and 31%, respectively). Such a resultmeant that the maximal expression variability in S. cerevisiaewas reached at later times compared with that of C. glabrata,and was in agreement with pair-wise correlation values calcu-lated between different time points in different species (Fig-ure 1c; Additional data file 1). In summary, our PCA andcross-species correlation analyses stated that the two beno-myl responses were quantitatively similar, although the C.glabrata response was faster than that of S. cerevisiae.
Definition of lists of genes displaying significant changes in expression in response to benomylFrom all the genes for which expression data were available,we identified genes whose expression was significantly modi-fied after benomyl addition, using the significance analysis ofmicroarrays (SAM) procedure [29]. In total, 228 genes in S.cerevisiae and 272 genes in C. glabrata were found to be up-regulated, whereas 379 genes in S. cerevisiae and 298 genesin C. glabrata were found to be down-regulated (Additionaldata file 2).
Construction of an orthology table for expression comparisonsTo address the evolution of transcriptional programsinvolved in chemical stress responses, it was important todetermine whether 'orthologous' genes in the two yeasts weresimilarly involved in the biological processes comprising thebenomyl stress response. We inferred orthology relationshipsbetween the complete genomes of S. cerevisiae and C. gla-brata, using the INPARANOID algorithm [30]. We foundorthology links in S. cerevisiae for almost 90% of the C. gla-brata genes. Such a result pointed out the high codingsequence similarity between the two genomes [21]. Ortholo-gous gene pairs for which at least one gene (in one species)displayed a change in expression in response to benomyl
stress were then identified. In total, 718 orthologous genepairs were selected and used as the kernel for cross-speciescomparisons.
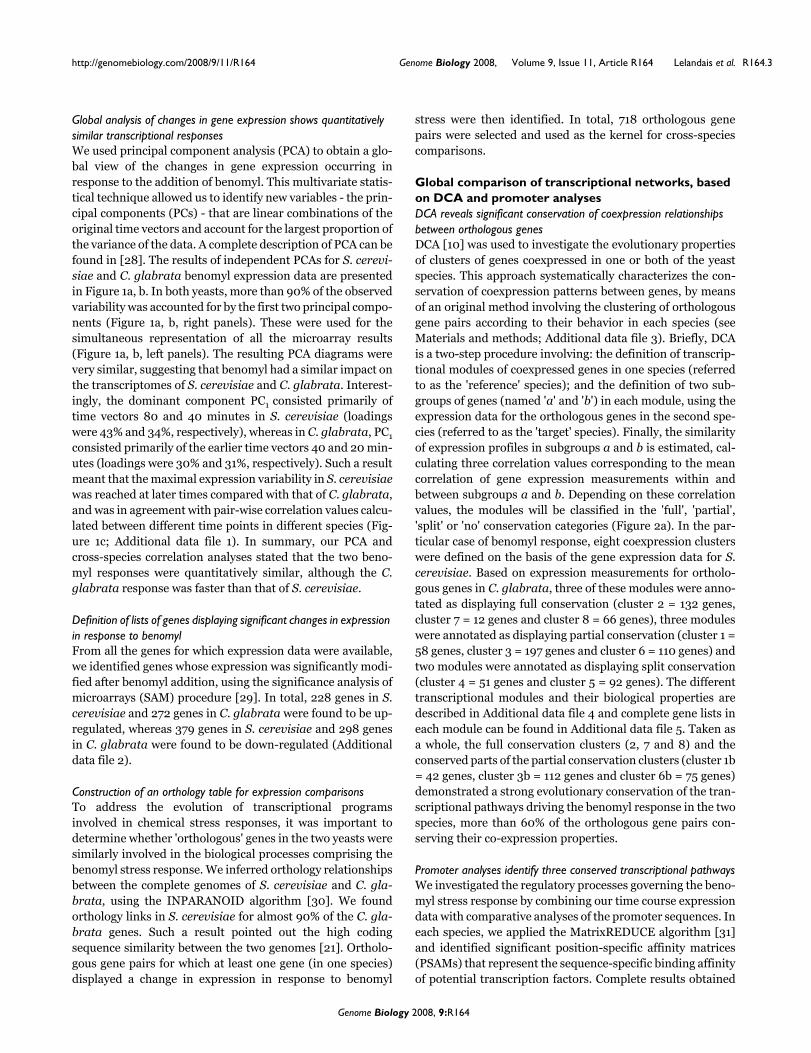
Global comparison of transcriptional networks, based on DCA and promoter analysesDCA reveals significant conservation of coexpression relationships between orthologous genesDCA [10] was used to investigate the evolutionary propertiesof clusters of genes coexpressed in one or both of the yeastspecies. This approach systematically characterizes the con-servation of coexpression patterns between genes, by meansof an original method involving the clustering of orthologousgene pairs according to their behavior in each species (seeMaterials and methods; Additional data file 3). Briefly, DCAis a two-step procedure involving: the definition of transcrip-tional modules of coexpressed genes in one species (referredto as the 'reference' species); and the definition of two sub-groups of genes (named 'a' and 'b') in each module, using theexpression data for the orthologous genes in the second spe-cies (referred to as the 'target' species). Finally, the similarityof expression profiles in subgroups a and b is estimated, cal-culating three correlation values corresponding to the meancorrelation of gene expression measurements within andbetween subgroups a and b. Depending on these correlationvalues, the modules will be classified in the 'full', 'partial','split' or 'no' conservation categories (Figure 2a). In the par-ticular case of benomyl response, eight coexpression clusterswere defined on the basis of the gene expression data for S.cerevisiae. Based on expression measurements for ortholo-gous genes in C. glabrata, three of these modules were anno-tated as displaying full conservation (cluster 2 = 132 genes,cluster 7 = 12 genes and cluster 8 = 66 genes), three moduleswere annotated as displaying partial conservation (cluster 1 =58 genes, cluster 3 = 197 genes and cluster 6 = 110 genes) andtwo modules were annotated as displaying split conservation(cluster 4 = 51 genes and cluster 5 = 92 genes). The differenttranscriptional modules and their biological properties aredescribed in Additional data file 4 and complete gene lists ineach module can be found in Additional data file 5. Taken asa whole, the full conservation clusters (2, 7 and 8) and theconserved parts of the partial conservation clusters (cluster 1b= 42 genes, cluster 3b = 112 genes and cluster 6b = 75 genes)demonstrated a strong evolutionary conservation of the tran-scriptional pathways driving the benomyl response in the twospecies, more than 60% of the orthologous gene pairs con-serving their co-expression properties.
Promoter analyses identify three conserved transcriptional pathwaysWe investigated the regulatory processes governing the beno-myl stress response by combining our time course expressiondata with comparative analyses of the promoter sequences. Ineach species, we applied the MatrixREDUCE algorithm [31]and identified significant position-specific affinity matrices(PSAMs) that represent the sequence-specific binding affinityof potential transcription factors. Complete results obtained
Genome Biology 2008, 9:R164

http://genomebiology.com/2008/9/11/R164 Genome Biology 2008, Volume 9, Issue 11, Article R164 Lelandais et al. R164.4
Genome Biology 2008, 9:R164
Figure 1 (see legend on next page)
(a) Saccharomyces cerevisiae
(b) Candida glabrata
Up-regulated genes Down-regulated genes
0
20
40
60
80
0
20
40
60
Loadings (%)
80 min 43
40 min 34
20 min 15
10 min 6
4 min 1
2 min 1
Loadings (%)
80 min 43
40 min 34
20 min 15
10 min 6
4 min 1
2 min 1
Loadings (%)
80 min 10
40 min 30
20 min 31
10 min 21
4 min 6
2 min 2
Loadings (%)
80 min 10
40 min 30
20 min 31
10 min 21
4 min 6
2 min 2
(c)2’ 4’ 10’ 20’ 40’ 80’S. cerevisiae
C. glabrata 2’ 4’ 10’ 20’ 40’ 80’

http://genomebiology.com/2008/9/11/R164 Genome Biology 2008, Volume 9, Issue 11, Article R164 Lelandais et al. R164.5
with MatrixREDUCE are shown in Additional data file 6.Most notably, we could identify three pairs of PSAMs betweenS. cerevisiae and C. glabrata that exhibited significant Pear-son correlations (r > 0.6); these are shown in Figure 2b (leftpanel) and correspond to specific regulatory sequences thatare evolutionary conserved. The AAAATTT (PSAM 1 in S. cer-evisiae and PSAM 1 in C. glabrata) and CGATGAG (PSAM 3in S. cerevisiae and PSAM 4 in C. glabrata) motifs corre-spond to motifs named rRPE and PAC, respectively [32,33].They have been identified in the promoters of genes repressedduring the environmental stress response, most of whichencode ribosomal proteins or proteins involved in ribosomebiogenesis and rRNA processing [34]. The AGGGG motif(PSAM 2 in S. cerevisiae and PSAM 2 in C. glabrata) corre-spond to the stress response element (STRE) identified in thepromoters recognized by the environmental stress responsefactors Msn2p and Msn4p [35]. This inter-species conserva-tion of DNA motifs involved in both down- and up-regulationof genes responding to benomyl indicate that at least threeidentical transcriptional pathways were involved in the chem-ical stress response in S. cerevisiae and C. glabrata. Toexpand on this observation, we examined in more detail theappearance of these three motifs in the promoters of theorthologous genes that we analyzed with DCA (Figure 2a),making a distinction between orthologous pairs that belongto the conserved and the non-conserved parts of the DCAclusters (Figure 2b, right panel). For each motif, we couldobserved that its position relative to that of the open readingframe (ORF) start codon was highly conserved between thetwo yeasts and that its frequency was systematically higher inthe conserved DCA clusters than in the non-conserved parts.In summary, the combination of DCA and MatrixREDUCEefficiently extracted a set of orthologous genes whose expres-sion and regulation is conserved between the two speciesexamined here.
Comparative analysis of the Yap1p-mediated transcriptional modules controlling the benomyl stress response in S. cerevisiae and C. glabrataScYap1p and Cgap1p have different impacts on benomyl responseThe transcription factor ScYap1p has been extensively stud-ied in S. cerevisiae as a major regulator of the oxidative stressresponse [36]. It is one of the main coordinators of the earlytranscriptional response to benomyl stress [26]. In agree-
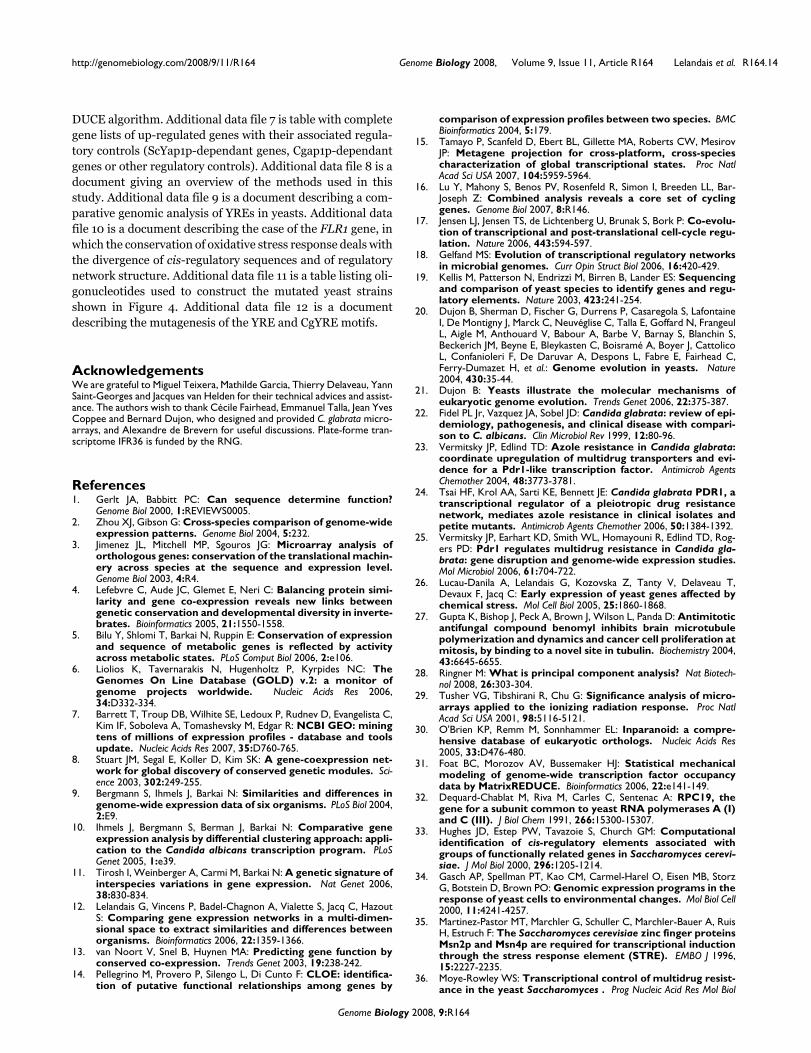
ment with these previous reports, our promoter analysis ofthe S. cerevisiae benomyl response identified a PSAM whoseconsensus sequence (T(G/T)ACTAA) is compatible with theYRE, that is, the binding site of ScYap1p (S. cerevisiae PSAM4; Additional data file 6). A homolog of ScYap1p was recentlyidentified in C. glabrata [37]. This homolog, named Cgap1p,restores drug resistance in a S. cerevisiae yap1Δ mutant [37]and regulates the expression of CgFLR1 in response to beno-myl [37]. In S. cerevisiae, the ScFLR1 gene encodes a trans-porter of the major facilitator superfamily (MFS) involved inmultidrug resistance and is a well known transcriptional tar-get of ScYap1p [38]. The observation that the orthologousgenes CgFLR1 (in C. glabrata) and ScFLR1 (in S. cerevisiae)may be similarly regulated by Cgap1p and ScYap1p suggestedthat the Yap1p-mediated transcriptional modules were atleast partly conserved between S. cerevisiae and C. glabrata.However, none of the PSAMs identified in C. glabrata exhib-ited significant Pearson correlation with the S. cerevisiaeYRE-PSAM (Additional data file 6). To highlight the roleplayed by Cgap1p in the benomyl response of C. glabrata, wecarried out a series of transcriptome analyses, directly com-paring gene expression in the C. glabrata wild-type strainand a CgAP1Δ strain 20 minutes after benomyl addition. Dif-ferential gene expression analysis showed that CgAP1 dele-tion affected the benomyl-mediated induction of 66 of the 272up-regulated genes (Figure 3a). Therefore, Cgap1p played akey role in the benomyl response by controlling the expres-sion of almost 25% of the genes induced in our experiments.Nevertheless, this contribution was smaller than in S. cerevi-siae, in which more than 40% of the genes up-regulated bybenomyl in this study are regulated by ScYap1p (Figure 3a).Moreover, we could observe that the sets of genes whose ben-omyl response depends on Cgap1p or ScYap1p are signifi-cantly different since only 14 orthologous genes wereidentified between them. Complete lists of Cgap1p andScYap1p target genes are supplied in Additional data file 7.
Differences in the benomyl response element between S. cerevisiae and C. glabrataThe observation that a quarter of the C. glabrata genes sensi-tive to benomyl depend on the transcription factor Cgap1p fortheir upregulation apparently conflicts with the lack of inter-species correlation between YRE-PSAMs. To extend theMatrixREDUCE results, we searched for all published data
PCA analysis of the time-course responses of S. cerevisiae and C. glabrata transcriptomes to chemical stressFigure 1 (see previous page)PCA analysis of the time-course responses of S. cerevisiae and C. glabrata transcriptomes to chemical stress. Microarray results were analyzed by PCA. The (a) S. cerevisiae and (b) C. glabrata datasets were examined independently. The panels on the left show biplots of the PCA results. Points represent genes. The horizontal axes correspond to the first principal component (PC1), accounting for 78% of the total variance in S. cerevisiae and 82% in C. glabrata. Vertical axes correspond to the second principal component (PC2), accounting for 13% of the total variance in S. cerevisiae and 8% in C. glabrata. Initial time vectors are shown in blue and genes significantly up- and down-regulated are shown in red and green, respectively. The panels on the right show the variability accounted for by each component. Each panel also shows the loadings of initial time vectors on the first principal component (PC1). In both species, the first two principal components account for more than 90% of the global variance in the microarray datasets. (c) Graphical representation of the relationships between the time points in the two species studied here. In each species, the time point expression measurements are represented by nodes and arrows connect experiments with the highest correlation values (Additional data file 1) for cross-species correlation values between different time points).
Genome Biology 2008, 9:R164

http://genomebiology.com/2008/9/11/R164 Genome Biology 2008, Volume 9, Issue 11, Article R164 Lelandais et al. R164.6
Genome Biology 2008, 9:R164
Figure 2 (see legend on next page)
Partial
conservation
Full
conservation
Partial
conservation
Split
conservation
Split
conservation
Partial
conservation
Full
conservation
Full
conservation
Up-r
eg
ula
ted
ge
ne
sD
ow
n-r
eg
ula
ted
ge
ne
s
Sac
char
omyc
es c
erev
isia
eOrthologous genes in Candida glabrata
(b)
(a)
1
2
3
4
5
6
8
7
1 2 3 4 5 6 7 8
a
b
a
b
a
b
a b
ab

http://genomebiology.com/2008/9/11/R164 Genome Biology 2008, Volume 9, Issue 11, Article R164 Lelandais et al. R164.7
concerning YRE that had been experimentally characterized.Seven versions of the YRE were found in S. cerevisiae:TGACTCA [39], TGACTAA[38], TTACTAA[38],TTAGTCA[38], TGACAAA[40], TGAGTAA [40]and TTA-CAAA [40]. Little is known about the Cgap1p DNA bindingelements in C. glabrata. The TTAGTAA motif was recentlyidentified as a potential Cgap1p-binding site, based on its
presence in the promoter of the CgFLR1 gene [37]. We ana-lyzed the proportion of YREs in the promoter of genes withbenomyl stress responses dependent on ScYap1p or Cgap1p(Figure 3b). In S. cerevisiae, the ScYap1p-dependent genesmainly contained the TTACTAA motif (28%), and its comple-mentary form, TTAGTAA (22%). This finding is consistentwith published reports identifying TTA(C/G)TAA as the
Global comparison of the S. cerevisiae and C. glabrata chemical stress responses based on DCA and MatrixREDUCE analysesFigure 2 (see previous page)Global comparison of the S. cerevisiae and C. glabrata chemical stress responses based on DCA and MatrixREDUCE analyses. (a) We analyzed 718 orthologous gene pairs for which at least one gene displayed a change in expression in response to benomyl stress using the DCA method [10]. The DCA cluster pairs of orthologous genes according to their expression in each species (see Additional data file 3 for a complete description of the DCA method). S. cerevisiae was used as the 'reference' yeast whereas C. glabrata was used as the 'target' yeast. Eight clusters were obtained after primary hierarchical clustering using the S. cerevisiae expression profiles. Each cluster was then split into two subclusters (labeled 'a' and 'b') after secondary hierarchical clustering using the C. glabrata expression profiles. Gene expression profiles are indicated with a color code [80]: green for down-regulated genes and red for up-regulated genes. Based on the mean correlations between gene expression levels within and between 'a' and 'b' subgroups, eight conservation clusters were defined: three clusters displaying 'full conservation' (clusters 2, 7 and 8); three clusters displaying 'partial conservation' (clusters 1, 3 and 6); and two clusters displaying 'split conservation' (clusters 4 and 5). The biological relevance of these clusters is discussed in Additional data file 4. (b) Three pairs of PSAMs identified with the MatrixREDUCE algorithm [31] and that exhibited significant Pearson correlations (r > 0.6) are shown in the panel on the left. They correspond to specific regulatory sequences that are evolutionarily conserved between S. cerevisiae and C. glabrata. The panel on the right shows the frequency of occurrence of PSAM in 50 bp windows of the gene clusters identified with the DCA. Background genomic frequency is indicated in black (dashed line); the frequency in conserved parts of DCA clusters is indicated in red (clusters 1b, 2 and 3b for down-regulated genes, and clusters 6b, 7 and 8 for up-regulated clusters); and the frequency in non-conserved parts of DCA clusters is indicated in yellow (clusters 1a, 3a and 4 for down-regulated genes, and clusters 5 and 6a for up-regulated clusters). Together, the DCA and MatrixREDUCE results allowed the identification of a set of orthologous genes whose expression and regulation is conserved between the two species examined here.
Comparative analysis of Yap1-mediated transcriptional modulesFigure 3Comparative analysis of Yap1-mediated transcriptional modules. (a) Genes up-regulated during the time course of benomyl treatment were assigned to two groups as a function of their regulation by the transcription factors ScYap1p in S. cerevisiae (ScYap1p-dependent genes) and Cgap1p in C. glabrata (Cgap1p-dependent genes). In S. cerevisiae, the ScYap1p transcription factor accounts for 41% of the genes induced during benomyl stress, whereas, in C. glabrata, the transcription factor Cgap1p accounts for 24% of the genes induced during the benomyl stress response. (b) Eight versions of the YRE have been described in previous studies (TGACTCA [39], TGACTAA[38], TTACTAA[38], TTAGTAA [37], TTAGTCA[38], TGACAAA[40], TGAGTAA [40]and TTACAAA [40]). We looked for these motifs in the upstream regions (from nucleotides -600 to -1, direct strand) of up-regulated genes during the benomyl stress response. The percentages of genes with a YRE in their promoter are shown here. In S. cerevisiae, the motifs TTACTAA and TTAGTAA appeared to be the more frequent in the promoters of genes regulated by ScYap1p, whereas in C. glabrata, the motifs TTAGTAA and TTACAAA appeared to be the more frequent in Cgap1p-dependant genes.
Up-regulated genes
in C. glabrata
Cgap1p dependent
genes
272 genes
66 genes (24%)
Up-regulated genes
in S. cerevisiae
ScYap1p dependent
genes
229 genes
94 genes (41%)
1480 52
Orthologous genes
1480 52
Orthologous genes
TGACTC
A
TGACTA
A
TTACTA
A
TTAG
TAA
TTACAAA
TGAG
TAA
TGACAAA
TTAG
TCA
TTACTAA TTACAAA
0
5
10
15
0
5
10
15
20
25
30
Perc
en
tag
e
Perc
en
tag
e
ScYap1p-dependent genes
(S. cerevisiae)
Cgap1p-dependent genes
(C. glabrata)
(a) (b)
TTAGTAA
Genome Biology 2008, 9:R164

http://genomebiology.com/2008/9/11/R164 Genome Biology 2008, Volume 9, Issue 11, Article R164 Lelandais et al. R164.8
major benomyl response element (BRE) for ScYap1p [38].Different results were obtained for C. glabrata. Indeed, theCgap1p-dependant genes still mainly contained TTAGTAAmotifs (15%) but they also contained TTACAAA motifs (15%).By contrast, the TTACTAA motif - the major BRE in S. cerevi-siae - was present in a relatively low number of the promotersof genes that are regulated by Cgap1p (7%). Finally, a blindsearch for DNA motifs overrepresented in the promotersequences of Cgap1p-dependent genes based on the oligomeranalysis tool of Regulatory Sequence Analysis Tool (RSAT)[41] also identified TTACAA as the most abundant motif inCgap1p targets (data not shown). Together, these observa-tions suggest that, in C. glabrata, the major BRE is TTACAAArather than TTA(C/G)TAA. To experimentally verify thishypothesis, we constructed yeast strains expressing eitherScYap1p (BY4742) or Cgap1p (BYCgAP1) (see Materials andmethods). These strains were transformed with plasmidscontaining LacZ as a reporter gene under the control of wild-type or mutated versions of the CgFLR1 promoter (Figure 4a;and Materials and methods). LacZ expression was measuredby real-time quantitative RT-PCR, before and after benomyltreatment (20 μg/ml, 40 minutes; Figure 4a). We choseCgFLR1 as a model target because its induction by benomyl isentirely dependent on Cgap1p in C. glabrata [37] and becauseits promoter contains the two YREs, TTAGTAA (from -373 to-367) and TTACAAA (from -172 to -166), that are the mostfrequent in the promoters of Cgap1p-dependant genes (Fig-ure 3b). We observed that the inactivation of the TTACAAAmotif was sufficient to significantly decrease the benomylresponse of CgFLR1 in the presence of Cgap1p or ScYap1p(Figure 4a). On the other hand, the inactivation of the motifTTAGTAA had no effect. Such an observation demonstratedthat, in the context of a C. glabrata promoter (in this case,CgFLR1), the TTACAAA acts as the major BRE.
Cgap1p and ScYap1p differently 'read' cis-regulatory signals in their target promotersThe observation that the major BRE has changed between S.cerevisiae and C. glabrata opened new questions concerningthe binding properties of ScYap1p and Cgap1p. The resultspresented in Figure 4a suggest that the TTACAAA motif,when placed in the natural context of the CgFLR1 promoter,was interpreted as a BRE by both proteins. We then decidedto test the effect of this sequence on Cgap1p and ScYap1pactivities in the 'heterologous' context of a S. cerevisiae pro-moter. The BY4742 and BYCgAP1 strains were transformedwith plasmids containing LacZ as a reporter gene under thecontrol of wild-type or mutated versions of the ScFLR1 pro-moter. Briefly, three YREs are present in the ScFLR1 pro-moter, named YRE1-3 (Figure 4b). YRE3 has been shown tobe responsible for most of the benomyl response of ScFLR1,whereas YRE2 has a minor role and YRE1 no role in thisresponse [38]. As stated above, only two YREs have beendescribed in the CgFLR1 promoter. Considering their posi-tion from the ATG of the CgFLR1 gene, we called themCgYRE3 and CgYRE2 (Figure 4a). The sequence of CgYRE3
(TTAGTAA) is very similar to YRE3 (TTACTAA), whereasCgYRE2 (TTACAAA) is significantly different from bothYRE2 (TGACTAA) and YRE1 (TTAGTCA). We first put LacZunder the control of a wild-type version of the ScFLR1 pro-moter, in which we then inactivated all three YREs (see Mate-rials and methods). We then introduced the CgYRE3 andCgYRE2 sequences in place of the YRE3 and YRE2 sequences,respectively, and measured the LacZ expression. Weobserved two main differences between the activities of thetwo transcription factors. First, ScYap1p appeared to be asefficient at the ScFLR1 as at the CgFLR1 wild-type promoters,whereas Cgap1p was more efficient at the CgFLR1 promoter(Figure 4a, b). Second, only the introduction of CgYRE2 wasable to restore the full activity of Cgap1p at the ScFLR1mutated promoter, whereas the sole introduction of theCgYRE3 sequence restored half of the ScYap1p activity, andthe addition of the CgYRE2 sequence did not increase thisactivity (Figure 4b). In conclusion, in the heterologous con-text of the ScFLR1 promoter, CgYRE2 is still the main BRE forCgap1p, but not for ScYap1p, which prefers CgYRE3, that is,the reverse complement of YRE3. This may be due to asequence or a position effect but, in both cases, it implies thatCgap1p and ScYap1p, although sharing an affinity for theYREs of the ScFLR1 and CgFLR1 promoters, exhibited cleardifferences in the way they 'read' the cis-regulatory elementspresent in their target promoters.
DiscussionA general protocol for comparing gene expression networksComparative analyses of gene expression networks in differ-ent organisms are promising for understanding both themolecular basis of phenotypic diversity and the evolution ofthe interactions between genomes and their environment.One of the main obstacles is the difficulty of comparing dataobtained in different experimental conditions between organ-isms separated by large evolutionary distances. We propose ageneral protocol for studies of the evolution of genetic net-works involved in similar biological processes. We optimizedconditions for the integration of expression data into a cross-species comparison by: choosing species from the same phy-lum and with a high rate of functional orthologous genes; pro-ducing experimental data as comparable as possible betweenspecies; and sequentially applying a set of complementarybioinformatic approaches to assess the validity of the results(Additional data file 8). We first performed independentanalyses of the two sets of microarray data obtained for eachspecies. We carried out PCA to check that the two yeasts dis-played comparable transcriptome responses to the benomyldose used in this study (Figure 1a, b). We then used DCA [10]to compare the transcriptional responses in the two yeast spe-cies, based on orthology relationships between genes (Figure2a). It is important to mention that the method used here toassign orthology links does not really distinguish the 'real'orthologs from the paralog lists. Therefore, what are called,
Genome Biology 2008, 9:R164

http://genomebiology.com/2008/9/11/R164 Genome Biology 2008, Volume 9, Issue 11, Article R164 Lelandais et al. R164.9
Genome Biology 2008, 9:R164
Figure 4 (see legend on next page)
CgFLR1 promoter
3 2
TTACAAA
-172 to -166
TTAGTAA
-373 to -367
CgYRE2CgYRE3
Wild type CgYREnull CgYRE2mut
3
CgYRE3mut
2
ScYap1p Cgap1p
TTAGTCA
-149 to -143
TGACTAA
-168 to -162
TTACTAA
-365 to -359
YRE3 YRE1YRE2
ScFLR1 promoter
3 1
Wild type YREnull
2
YREnull
YRE3::CgYRE3
3
CgYRE3
YREnull
YRE3::CgYRE3
YRE2::CgYRE2
3
CgYRE3
2
CgYRE2
(b)
(a)
0
1
2
3
4
5
6
7
La
cZ
expre
ssio
nL
acZ
expre
ssio
n
0
1
2
3
4
5
6
7
ScYap1p Cgap1p

http://genomebiology.com/2008/9/11/R164 Genome Biology 2008, Volume 9, Issue 11, Article R164 Lelandais et al. R164.10
for the sake of simplicity, 'orthologs' in this work, should beunderstood as 'likely functional orthologs'. DCA was origi-nally applied to large sets of unrelated microarray data, usingGene Ontology as a reference for the definition of groups ofgenes [10]. We used DCA in a different context; it was appliedto a limited set of experimental conditions, with no functionalassumptions concerning the relationships between genes.DCA efficiently revealed the structure of the transcriptionalmodules involved in the stress response. We therefore aimedto decipher the underlying regulatory mechanisms, identify-ing both transcription factors and the associated regulatorymotifs in the promoter sequences of regulated genes. In thatrespect, the benefit of the MatrixREDUCE algorithm [42]relied on possibilities to identify, from a large pool of poten-tial motifs, those best correlated with the expression data, andmotifs common to both yeasts (Figure 2b). Finally, our com-parative analysis of Yap1-mediated transcriptional modules(Figures 3 and 4) allowed us to identify interesting propertiesconcerning the evolution of the DNA motifs targeted byScYap1p (in S. cerevisiae) and Cgap1p (in C. glabrata), andthe DNA binding properties of these two proteins.
Interplay between the conservation of gene expression patterns and the divergence of regulatory networksAs a case study, we investigated the evolution of the geneticnetworks controlling the chemical stress responses of the twoyeast species S. cerevisiae and C. glabrata. Unlike previousstudies of drug responses in pathogenic Candida species [43],this study focused on C. glabrata rather than Candida albi-cans, for two reasons: C. glabrata is the second leading causalagent of candidiasis in humans; and C. glabrata is phyloge-netically more closely related to S. cerevisiae than it is to Can-dida albicans [20]. The use of C. glabrata therefore ensuredclear and extensive sequence homology with the model yeastS. cerevisiae. Despite a short time delay, our PCA and DCAanalyses indicated that transcriptional responses were quan-titatively similar in the two yeasts, with the set of genesinduced or repressed in both species including more than 400orthologous gene pairs (60% of the entire set of genesresponding to benomyl stress in one or both species). Thetranscriptional pathways related to the regulatory motifsrRPE, PAC and STRE were found to be conserved, whereasthe transcriptional pathway related to the transcription factor
Yap1p appeared to have substantially changed. In S. cerevi-siae, the transcription factor ScYap1p controls the expressionof more than 40% of genes up-regulated in the presence ofbenomyl and a single deletion of the ScYAP1 gene is sufficientto abolish this response [26]. In our study, the C. glabrataortholog of ScYap1p, Cgap1p, controlled 'only' 25% of the pos-itive response to benomyl. Reconstructing the evolutionarypath of the promoters that 'escaped' the Yap1p regulation inC. glabrata, we observed a progressive decrease in thenumber of these promoters that contained YREs along theSaccharomyces sensu stricto evolutionary tree, from 100% inS. cerevisiae down to 50% in S. bayanus (Additional data file9). Still, 60% of these promoters have one or more YREs andare actually controlled by the ScYap1p ortholog in the distantyeast species C. albicans [44]. These observations suggestthat the ancestral regulation of these promoters was depend-ent on Yap1p. In C. glabrata, other combinations of tran-scription factors may be involved in the oxidative stressresponse of these genes. The Msn2p/Msn4p transcriptionfactors are good candidates, since a large number of STREregulatory motifs were observed in the C. glabrata genes forwhich the orthologous genes in S. cerevisiae were ScYap1ptarget genes (data not shown). A different sharing of the workbetween the seven ScYap1p paralogs, six of which have clearorthologs in C. glabrata, could also be investigated.
Together with this quantitative decrease of the regulatory roleof Cgap1p, we observed a modification of the Yap1 binding-site sequences present in the promoters of C. glabrata genes.Comparative genomics analysis of the YRE in five yeast spe-cies (Additional data file 9) showed that the proportions ofmost of the S. cerevisiae YRE motifs are gradually decreasingalong the yeast phylogenetic tree, except the TTACAAA andTGACAAA motifs, whose frequencies were significantlyhigher in Candida species (C. glabrata and C. albicans) thanin S. cerevisiae. Our functional analyses confirmed that TTA-CAAA acts as the major BRE in C. glabrata promoters (Figure4). Of note, although the alanine spacer and the second basiccluster of the bZip domain are identical in ScYap1p andCgap1p, 50% of amino acids in the first basic cluster are sub-stitutions, some of which may account for differences in theDNA recognition properties of the two proteins [37].
Functional comparative analyses of ScYap1p and Cgap1p activities in vivoFigure 4 (see previous page)Functional comparative analyses of ScYap1p and Cgap1p activities in vivo. In vivo assays of ScYap1p and Cgap1p properties were conducted, using S. cerevisiae strains expressing either ScYap1p (purple histograms) or Cgap1p (orange histograms). LacZ was used as a reporter gene and was placed under the control of wild-type or mutated versions of (a) the CgFLR1 or (b) ScFLR1 promoter regions (see Materials and methods). Descriptions of the mutations performed in YREs are shown in Additional data file 12. LacZ expression was measured by real-time quantitative RT-PCR, before and after benomyl treatment (20 μg/ml) for 40 minutes. (a) Only the inactivation of CgYRE2 (TTACAAA) dramatically decreased the benomyl response of CgFLR1. In the context of a C. glabrata promoter (in this case, CgFLR1) TTACAAA acts as the major BRE. (b) The LacZ reporter gene was placed under the control of the ScFLR1 promoter, in which all three YREs were inactivated and replaced with CgYRE3 and CgYRE2 sequences. To summarize, ScYap1p appeared to be as efficient at the ScFLR1 and at the CgFLR1 wild-type promoters, whereas Cgap1p was more efficient at the CgFLR1 promoter (a, b). Moreover, only the introduction of CgYRE2 was able to restore the full activity of Cgap1p at the ScFLR1 mutated promoter, whereas the sole introduction of CgYRE3 sequence restored half of the ScYap1p activity, and the addition of the CgYRE2 sequence did not increase this activity. In the heterologous context of the ScFLR1 promoter, CgYRE2 is still the main BRE for Cgap1p, but not for ScYap1p, which prefers CgYRE3.
Genome Biology 2008, 9:R164

http://genomebiology.com/2008/9/11/R164 Genome Biology 2008, Volume 9, Issue 11, Article R164 Lelandais et al. R164.11
The complexity of the evolution of the promoters respondingto oxidative stress is nicely exemplified by the ScFLR1 geneand its orthologs, CgFLR1 in C. glabrata and CaMDR1 in C.Albicans. Indeed, the FLR1 response to various sources ofoxidative stress, although conserved all along the hemiasco-mycete tree, relies on different regulatory systems from S.cerevisiae and C. glabrata, in which the discriminationbetween H2O2 and benomyl is based on different cis-regula-tory elements used by the same transcription factor (thisstudy and [38]), to C. albicans, in which the BRE activity hasbeen transferred to a different regulatory pathway (Addi-tional data file 10) [45,46].
ConclusionThe evolution of transcriptional regulatory networks hasmade a major contribution to the diversity of life [47-49].Work in this field was long restricted to analyses of the regu-latory networks controlling development in higher eukaryo-tes, but the recent sequencing of the genomes of more thanten yeast species has placed yeasts at the forefront of evolu-tionary studies [50]. A phylogeny of functionally importantcis-regulatory motifs can be established among closelyrelated yeast species [19], but the intimate structure of thepromoters and the DNA-binding properties of transcriptionfactors rapidly diverge. A recent study of the genome-widelocation of binding sites for the transcription factors Ste12and Tec1 was carried out in three closely related Saccharomy-ces species and showed that, in this case, the divergence oftranscription factor binding sites was associated with a mod-ification in target gene selection, depending on the physiolog-ical conditions (pseudohyphal growth versus mating) [51,52].Progressive divergence of regulatory networks, together withmajor genome rearrangements, such as entire genome dupli-cation events, led, in hemiascomycetes, to considerablechanges in gene expression patterns [53]. However, the diver-gence of the structure of the regulatory networks is, in manycases, not accompanied by changes in gene expression. Forexample, the logic underlying mating-type (MAT) target generegulation is conserved in all hemiascomycetes species exam-ined to date, despite major changes to the regulatory net-works controlling MAT gene expression [54]. The control ofproteasome expression illustrates another case in which highconservation of gene regulation is connected to a high conser-vation of the regulatory system, with only a subtle divergenceof the corresponding cis-regulatory motifs, which co-evolvedwith the Rpn4p transcription factor DNA binding properties[55]. The case of the oxidative stress response described hereturned out to be intermediate. As for the MAT locus, littlephenotypic divergence was observed in terms of gene expres-sion patterns or gene co-regulation properties. This high con-servation deals with a fast divergence of the promotersequences, which seems to have been counterbalanced by twophenomena: the co-evolution of transcription factor bindingproperties (for example, differences in the YRE preferred byScYap1p and Cgap1p); and the versatility and the fast evolu-
tion of the structure of the transcription regulation networks(for example, the apparent sharing of Yap1p function betweenother transcription factors in C. glabrata). This model wasrecently supported by a similar study conducted on the mat-ing/pseudohyphal growth regulation system in yeasts [56]and by an experimental analysis of Mcm1p genomic bindingloci over three distant yeast species [57]. All these works con-cluded the occurrence of a very fast divergence of promoterstructure and regulatory network combinatorial circuits,which created a complex equilibrium between the conserva-tion of essential functions and the emergence of new proper-ties. These observations address the role of the evolution oftranscriptional networks in the adaptation of yeast species tospecific ecological niches. These features could not have beenpredicted from genome sequences alone and demonstrate theneed to combine accurate functional genomic analyses andsequence resources for a larger set of evolutionarily differentorganisms.
Materials and methodsYeast strains, growth conditions and YRE mutagenesisThe S. cerevisiae strain is BY4742 from the Euroscarf collec-tion. The wild-type C. glabrata strain used in the kineticexperiments was the sequenced strain CBS418. The C. gla-brata CgAP1Δ strain and its isogenic wild type were a giftfrom J Bennett [37]. The S. cerevisiae strain expressingCgap1p in place of ScYap1p was derived from the BY4742YAP1::KanMX strain (Euroscarf). This strain was trans-formed with a DNA fragment containing the CgAP1 ORFfused to the selective marker gene his5 from Schizosaccharo-myces pombe, flanked by about 40 bp corresponding to theregions immediately upstream and downstream of the YAP1ORF, as described previously [58]. The clones having inte-grated this fragment in place of KanMX were selected onCSM-HIS plates and controlled by PCR and sequencing. TheCgAP1-his5 fusion was obtained as follows: CgAP1 was ampli-fied by PCR from C. glabrata CBS418 genomic DNA, usingoligonucleotides so that a SacII restriction site was intro-duced 3'. His5 was amplified by PCR from a plasmid previ-ously described [58], with oligonucleotides so that a SacIIrestriction site was introduced 5'. After SacII digestion, thetwo PCR fragments were ligated using the Quick Ligation kit(New England Biolabs, Ipswich, MA, USA). The cassette forthe chromosomic insertion of CgAP1-his5 was obtained byPCR using oligonucleotides containing sequences flankingthe YAP1 ORF. The ScFLR1 and CgFLR1 were amplified fromgenomic DNA by PCR, using oligonucleotides designed tointroduce Not1 and SacII restriction sites 3' and 5' of the PCRproduct, respectively. After Not1 and SacII digestions, thesePCR fragments were cloned in the plasmid pZLG (Garcia etal., in preparation), which contained lacZ cloned downstreamof the SacII and Not1 sites in the polylinker and the URA3selective marker gene. The mutagenesis of YRE and CgYRE inthese promoters were conducted using specific oligonucle-otides and the QuickChange II Multisite-directed Mutagene-
Genome Biology 2008, 9:R164

http://genomebiology.com/2008/9/11/R164 Genome Biology 2008, Volume 9, Issue 11, Article R164 Lelandais et al. R164.12
sis kit (Stratagene, La Jolla, CA, USA). All constructs werecontrolled by sequencing. All the oligonucleotides used aredescribed in Additional data file 11. All PCR amplificationswere conducted using the Pfx platinium (Invitrogen,Carlsbad, CA, USA) enzyme and the corresponding protocol.Cells were grown in YPD rich media (2% glucose, 1% bac-topeptone, 1% yeast extract).
Transcriptome analysesTime-course experiments and microarray hybridizationsCells were grown to an OD600nm of 0.6 and treated with beno-myl (Sigma-Aldrich, St. Louis, MO, USA) to a final concentra-tion of 20 μg/ml (stock solution: 10 mg/ml in DMSO). Formock treatment, cells were incubated with a similar volumeof DMSO. The cells were snap-frozen in cold ethanol (finalconcentration 70% at -80°C) after 2, 4, 10, 20, 40 and 80 min-utes of benomyl or mock treatment. RNA was extracted aspreviously described [26]. Total RNA (10 μg) was used for flu-orescent cDNA synthesis according to the amino-allyl proto-col. The labeled cDNA was purified and hybridization carriedout according to the protocol available from [59]. At leastthree independent experiments were performed for each timepoint, using dye switching techniques. The budding yeastarrays were custom-made and contained probes for all yeastORFs, spotted in duplicate onto Corning Ultragapslides(Corning, NY, USA). The Candida arrays were obtainedfrom the Pasteur Institute and contained probes for most ofthe ORFs from C. glabrata, spotted singly onto CorningUltragap slides at the transcriptome platform [60]. Note thatall the microarray data have also been submitted to the GeneExpression Omnibus (GEO) database [61]. The accessionnumber is GSE10244.
Image analyses and data processingThe microarrays were read with a Genepix 4000B scanner(Axon. Downingtown, PA, USA) and analyzed with Genepix6.0 software. Artifactual and saturated signal spots wereeliminated. After image quantification, data were normalizedover all features with print-tip lowess, using the R/BioCon-ductor packages 'limma' and 'marray' available from [62].Expression values for replicated spots on the array were aver-aged. The SAM algorithm [29] in the 'samr' package of R [63]was used to identify genes displaying a change in expressionover time, using an equivalent false discovery rate (less than5%) for all time points. As an additional filter, only genes withsmooth expression profiles were retained. These genes dis-played a significant change in expression over at least twosuccessive time points. Gene expression patterns with morethan two missing values (33%) were also excluded from sub-sequent analysis. The remaining missing values werereplaced by the KNN-imputation [64] method, with the Kparameter fixed at 30, as recommended by de Brevern et al.[65].
Real-time, quantitative RT-PCR analysesReal-time, quantitative RT-PCR analyses were carried outexactly as described previously [66], using a Light Cycler 480(Roche, Basel, Switzerland). All the experiments were dupli-cated, using independent clones to average clone-specificeffects. ACT1 was used as a reference. The sequences of theoligonucleotides used are available in Additional data file 11.
Bioinformatic analysesSource of sequence dataComplete genome sequences for S. cerevisiae and C. glabratawere downloaded from the Saccharomyces Genome Data-base [67,68] and Génolevures [69,70] websites, respectively.Promoter sequences located upstream from the ORF wereobtained with RSA tools [71] available from [72]. Upstreamregions from -600 bases to -1 base were used for regulatorymotif searches, by analysis of the direct strand of DNA.
Orthology assignmentsOrthology relationships were inferred between S. cerevisiaeand C. glabrata genes using the INPARANOID algorithm[30,73] with the default parameters. This algorithm begins bycalculating all pairwise similarity scores between the com-plete sets of protein sequences from the two genomes, usingBLAST [74]. The sequence pairs with the best mutual hits arethen detected and serve as central points around which addi-tional orthologs from both species are clustered. Finally,overlapping groups are resolved.
MatrixREDUCE algorithmWe used the MatrixREDUCE algorithm [31,42] to detect sig-nificant PSAMs in promoter sequences. MatrixREDUCEinfers the sequence specificity of a transcription factordirectly from genome-wide transcription factor occupancydata by fitting a statistical mechanical model for transcriptionfactor-DNA interaction. The source code is freely availableonline from [75] and was used for analyses of upstreamsequences from positions -600 to -1, searching for 1-7 bpmotifs (see the documentation available online for moreinformation).
Principal component analysisPCA is a multivariate statistical method allowing a largenumber of sample datasets to be described in terms of muchsmaller numbers of principal components, each of whichaccounts for significant variability in the data but is not cor-related with any other component. A complete interpretationof the biplots, given different transformations of the dataexpression matrix, can be found elsewhere [76]. The analysiswas carried out in the statistical computing and graphicsenvironment R [77].
Measurement of similarity between gene expression profilesMethods for analyzing expression data are often based on theimplicit hypothesis that genes with similar functions havesimilar expression profiles across a set of conditions [78]. For
Genome Biology 2008, 9:R164

http://genomebiology.com/2008/9/11/R164 Genome Biology 2008, Volume 9, Issue 11, Article R164 Lelandais et al. R164.13
computational analysis, it is necessary to transform the intu-itive notion of 'similarity' into quantitative measures. Classi-cally, a distance measured between gene expression profilesis applied [79]. In this study, we used 'Euclidian distance' toassess the relationship between two gene expression profiles.If we denote two sets of measurements xi and yi, where i is anindex from microarray experiment 1 to n, the Euclidean dis-tance between the two profiles X and Y is given by the follow-ing equation:
The Euclidean distance takes a value between 0 and + ∞;. Avalue of 0 means that the two profiles are perfectly superim-posed.
Hierarchical clusteringThe hierarchical clustering procedure has been described indetail elsewhere [79]. It can be summarized by the followingfive steps: step 1, distances between all genes pairs are calcu-lated, using Euclidean distance, for example (see the previousparagraph); step 2, the resulting distance matrix is thor-oughly inspected to find the smallest distance betweenexpression profiles; step 3, the corresponding genes arejoined together in the tree and form a new cluster; step 4, thedistances between the newly formed cluster and the othergenes are recalculated; step 5, steps 2, 3 and 4 are repeateduntil all genes and clusters are linked in a final tree. We usedthe 'hclust' function, available in the R programming lan-guage, with the 'ward' method for gene agglomeration. Hier-archical clustering results were visualized by representing theordered expression profiles with a color code [80]: green fornegative expression measurements (down-regulated genes)and red for positive expression values (up-regulated genes).
Differential clustering algorithmThe DCA was first described by Ihmels et al. [10] and theunderlying principle is illustrated in Additional data file 3. Weapplied the DCA to orthologous gene pairs defined by INPAR-ANOID. Genes belonging to one of the two species (the 'refer-ence' yeast) were first classified using the hierarchicalclustering method described above. This generated clusters ofgenes coexpressed in the reference yeast but not necessarilyin the other yeast (the 'target' yeast). We then reordered theorthologous counterparts of the genes within each coex-pressed cluster in the target yeast using a secondary hierar-chical clustering step. DCA results are presented asrearranged distance matrices for each yeast species, withlines and columns ordered according to primary and second-ary clustering results. These matrices are of the same dimen-sion (that is, the number of orthologous genes) and arecomposed of all pairwise distances between gene expressionprofiles, represented using the following color code: red forsmall distances (that is, gene pairs strongly coexpressed) and
yellow for large distances (that is, gene pairs weakly coex-pressed). Finally, the distance matrices were combined into asingle matrix, in which each triangle corresponded to one ofthe distance matrices. This ingenious graphical representa-tion facilitates the intuitive extraction of differences and sim-ilarities in the coexpression patterns of the two yeasts,resulting in the definition of four categories of gene clusters:full, partial, split or no conservation of expression. Labels forcluster conservation are based on three correlation measures(Ca, Cb, and Cab), corresponding to the mean correlations ofgenes within secondary clusters 'a' (Ca) and 'b' (Cb) in the tar-get yeast (see main text) and between these clusters (Cab). IfCa, Cb and Cab are higher than a threshold T chosen heuris-tically (T = 0.3 in this study), the cluster is considered to dis-play full conservation; if (Ca and Cb) > T and Cab < T, thecluster is considered to display split conservation; if (Ca or Cb)> T, the cluster is considered to display partial conservation;and, if (Ca and Cb) < T, the cluster is considered to display noconservation. The R programming language [77] was used forthe DCA approach and graphical representation.
AbbreviationsBRE: benomyl response element; DCA: differential clusteringalgorithm; DMSO: dimethylsulfoxide; ORF: open readingframe; PC: principal component; PCA: principal componentanalysis; PSAM: position apecific affinity matrix; SAM: sig-nificance analysis of microarrays; STRE: stress response ele-ment; YRE: Yap1 response element.
Authors' contributionsGL conceived and performed all the bioinformatic analysesand drafted the manuscript, VT performed microarray exper-iments, CG participated in microarray analyses, CE and CJcontributed to discussions, and FD supervised microarrayexperiments, performed experimental assays of ScYap1p andCgap1p activities in vivo and drafted the manuscript. Allauthors read and approved the final manuscript.
Additional data filesThe following additional data are available with the onlineversion of this paper. Additional data file 1 is a document giv-ing the Pearson correlation values between expression meas-urements obtained for different time points, using orthologyrelationships between all genes in S. cerevisiae and C. gla-brata. Additional data file 2 is a table listing the genes signif-icantly up- and down-regulated in S. cerevisiae and C.glabrata, with expression measurements. Additional data file3 is a document describing the principle of the differentialclustering algorithm. Additional data file 4 is a documentdescribing the different transcriptional modules identifiedwith DCA. Additional data file 5 is a table with complete listsof genes in each DCA cluster. Additional data file 6 is docu-ment giving the detailed results obtained with the MatrixRE-
d X Y x yi i
i
n
( , ) = −( )=∑ 2
1
Genome Biology 2008, 9:R164
http://genomebiology.com/2008/9/11/R164 Genome Biology 2008, Volume 9, Issue 11, Article R164 Lelandais et al. R164.14
DUCE algorithm. Additional data file 7 is table with completegene lists of up-regulated genes with their associated regula-tory controls (ScYap1p-dependant genes, Cgap1p-dependantgenes or other regulatory controls). Additional data file 8 is adocument giving an overview of the methods used in thisstudy. Additional data file 9 is a document describing a com-parative genomic analysis of YREs in yeasts. Additional datafile 10 is a document describing the case of the FLR1 gene, inwhich the conservation of oxidative stress response deals withthe divergence of cis-regulatory sequences and of regulatorynetwork structure. Additional data file 11 is a table listing oli-gonucleotides used to construct the mutated yeast strainsshown in Figure 4. Additional data file 12 is a documentdescribing the mutagenesis of the YRE and CgYRE motifs.Additional data file 1Pearson correlation values between expression measurements obtained for different time points, using orthology relationships between all genes in S. cerevisiae and C. glabrataPearson correlation values between expression measurements obtained for different time points, using orthology relationships between all genes in S. cerevisiae and C. glabrata.Click here for fileAdditional data file 2Genes significantly up- and down-regulated in S. cerevisiae and C. glabrata, with expression measurementsGenes significantly up- and down-regulated in S. cerevisiae and C. glabrata, with expression measurements.Click here for fileAdditional data file 3Principle of the differential clustering algorithmPrinciple of the differential clustering algorithm.Click here for fileAdditional data file 4Different transcriptional modules identified with DCADifferent transcriptional modules identified with DCA.Click here for fileAdditional data file 5Genes in each DCA clusterGenes in each DCA cluster.Click here for fileAdditional data file 6Results obtained with the MatrixREDUCE algorithmResults obtained with the MatrixREDUCE algorithm.Click here for fileAdditional data file 7Up-regulated genes with their associated regulatory controls (ScYap1p-dependant genes, Cgap1p-dependant genes or other reg-ulatory controls)Up-regulated genes with their associated regulatory controls (ScYap1p-dependant genes, Cgap1p-dependant genes or other reg-ulatory controls).Click here for fileAdditional data file 8Overview of the methods used in this studyOverview of the methods used in this study.Click here for fileAdditional data file 9Comparative genomic analysis of YREs in yeastsComparative genomic analysis of YREs in yeasts.Click here for fileAdditional data file 10Description of the FLR1 gene, in which the conservation of oxida-tive stress response deals with the divergence of cis-regulatory sequences and of regulatory network structureDescription of the FLR1 gene, in which the conservation of oxida-tive stress response deals with the divergence of cis-regulatory sequences and of regulatory network structure.Click here for fileAdditional data file 11Oligonucleotides used to construct the mutated yeast strains shown in Figure 4Oligonucleotides used to construct the mutated yeast strains shown in Figure 4.Click here for fileAdditional data file 12Mutagenesis of the YRE and CgYRE motifsMutagenesis of the YRE and CgYRE motifs.Click here for file
AcknowledgementsWe are grateful to Miguel Teixera, Mathilde Garcia, Thierry Delaveau, YannSaint-Georges and Jacques van Helden for their technical advices and assist-ance. The authors wish to thank Cécile Fairhead, Emmanuel Talla, Jean YvesCoppee and Bernard Dujon, who designed and provided C. glabrata micro-arrays, and Alexandre de Brevern for useful discussions. Plate-forme tran-scriptome IFR36 is funded by the RNG.
References1. Gerlt JA, Babbitt PC: Can sequence determine function?
Genome Biol 2000, 1:REVIEWS0005.2. Zhou XJ, Gibson G: Cross-species comparison of genome-wide
expression patterns. Genome Biol 2004, 5:232.3. Jimenez JL, Mitchell MP, Sgouros JG: Microarray analysis of
orthologous genes: conservation of the translational machin-ery across species at the sequence and expression level.Genome Biol 2003, 4:R4.
4. Lefebvre C, Aude JC, Glemet E, Neri C: Balancing protein simi-larity and gene co-expression reveals new links betweengenetic conservation and developmental diversity in inverte-brates. Bioinformatics 2005, 21:1550-1558.
5. Bilu Y, Shlomi T, Barkai N, Ruppin E: Conservation of expressionand sequence of metabolic genes is reflected by activityacross metabolic states. PLoS Comput Biol 2006, 2:e106.
6. Liolios K, Tavernarakis N, Hugenholtz P, Kyrpides NC: TheGenomes On Line Database (GOLD) v.2: a monitor ofgenome projects worldwide. Nucleic Acids Res 2006,34:D332-334.
7. Barrett T, Troup DB, Wilhite SE, Ledoux P, Rudnev D, Evangelista C,Kim IF, Soboleva A, Tomashevsky M, Edgar R: NCBI GEO: miningtens of millions of expression profiles - database and toolsupdate. Nucleic Acids Res 2007, 35:D760-765.
8. Stuart JM, Segal E, Koller D, Kim SK: A gene-coexpression net-work for global discovery of conserved genetic modules. Sci-ence 2003, 302:249-255.
9. Bergmann S, Ihmels J, Barkai N: Similarities and differences ingenome-wide expression data of six organisms. PLoS Biol 2004,2:E9.
10. Ihmels J, Bergmann S, Berman J, Barkai N: Comparative geneexpression analysis by differential clustering approach: appli-cation to the Candida albicans transcription program. PLoSGenet 2005, 1:e39.
11. Tirosh I, Weinberger A, Carmi M, Barkai N: A genetic signature ofinterspecies variations in gene expression. Nat Genet 2006,38:830-834.
12. Lelandais G, Vincens P, Badel-Chagnon A, Vialette S, Jacq C, HazoutS: Comparing gene expression networks in a multi-dimen-sional space to extract similarities and differences betweenorganisms. Bioinformatics 2006, 22:1359-1366.
13. van Noort V, Snel B, Huynen MA: Predicting gene function byconserved co-expression. Trends Genet 2003, 19:238-242.
14. Pellegrino M, Provero P, Silengo L, Di Cunto F: CLOE: identifica-tion of putative functional relationships among genes by
comparison of expression profiles between two species. BMCBioinformatics 2004, 5:179.
15. Tamayo P, Scanfeld D, Ebert BL, Gillette MA, Roberts CW, MesirovJP: Metagene projection for cross-platform, cross-speciescharacterization of global transcriptional states. Proc NatlAcad Sci USA 2007, 104:5959-5964.
16. Lu Y, Mahony S, Benos PV, Rosenfeld R, Simon I, Breeden LL, Bar-Joseph Z: Combined analysis reveals a core set of cyclinggenes. Genome Biol 2007, 8:R146.
17. Jensen LJ, Jensen TS, de Lichtenberg U, Brunak S, Bork P: Co-evolu-tion of transcriptional and post-translational cell-cycle regu-lation. Nature 2006, 443:594-597.
18. Gelfand MS: Evolution of transcriptional regulatory networksin microbial genomes. Curr Opin Struct Biol 2006, 16:420-429.
19. Kellis M, Patterson N, Endrizzi M, Birren B, Lander ES: Sequencingand comparison of yeast species to identify genes and regu-latory elements. Nature 2003, 423:241-254.
20. Dujon B, Sherman D, Fischer G, Durrens P, Casaregola S, LafontaineI, De Montigny J, Marck C, Neuvéglise C, Talla E, Goffard N, FrangeulL, Aigle M, Anthouard V, Babour A, Barbe V, Barnay S, Blanchin S,Beckerich JM, Beyne E, Bleykasten C, Boisramé A, Boyer J, CattolicoL, Confanioleri F, De Daruvar A, Despons L, Fabre E, Fairhead C,Ferry-Dumazet H, et al.: Genome evolution in yeasts. Nature2004, 430:35-44.
21. Dujon B: Yeasts illustrate the molecular mechanisms ofeukaryotic genome evolution. Trends Genet 2006, 22:375-387.
22. Fidel PL Jr, Vazquez JA, Sobel JD: Candida glabrata: review of epi-demiology, pathogenesis, and clinical disease with compari-son to C. albicans. Clin Microbiol Rev 1999, 12:80-96.
23. Vermitsky JP, Edlind TD: Azole resistance in Candida glabrata:coordinate upregulation of multidrug transporters and evi-dence for a Pdr1-like transcription factor. Antimicrob AgentsChemother 2004, 48:3773-3781.
24. Tsai HF, Krol AA, Sarti KE, Bennett JE: Candida glabrata PDR1, atranscriptional regulator of a pleiotropic drug resistancenetwork, mediates azole resistance in clinical isolates andpetite mutants. Antimicrob Agents Chemother 2006, 50:1384-1392.
25. Vermitsky JP, Earhart KD, Smith WL, Homayouni R, Edlind TD, Rog-ers PD: Pdr1 regulates multidrug resistance in Candida gla-brata: gene disruption and genome-wide expression studies.Mol Microbiol 2006, 61:704-722.
26. Lucau-Danila A, Lelandais G, Kozovska Z, Tanty V, Delaveau T,Devaux F, Jacq C: Early expression of yeast genes affected bychemical stress. Mol Cell Biol 2005, 25:1860-1868.
27. Gupta K, Bishop J, Peck A, Brown J, Wilson L, Panda D: Antimitoticantifungal compound benomyl inhibits brain microtubulepolymerization and dynamics and cancer cell proliferation atmitosis, by binding to a novel site in tubulin. Biochemistry 2004,43:6645-6655.
28. Ringner M: What is principal component analysis? Nat Biotech-nol 2008, 26:303-304.
29. Tusher VG, Tibshirani R, Chu G: Significance analysis of micro-arrays applied to the ionizing radiation response. Proc NatlAcad Sci USA 2001, 98:5116-5121.
30. O'Brien KP, Remm M, Sonnhammer EL: Inparanoid: a compre-hensive database of eukaryotic orthologs. Nucleic Acids Res2005, 33:D476-480.
31. Foat BC, Morozov AV, Bussemaker HJ: Statistical mechanicalmodeling of genome-wide transcription factor occupancydata by MatrixREDUCE. Bioinformatics 2006, 22:e141-149.
32. Dequard-Chablat M, Riva M, Carles C, Sentenac A: RPC19, thegene for a subunit common to yeast RNA polymerases A (I)and C (III). J Biol Chem 1991, 266:15300-15307.
33. Hughes JD, Estep PW, Tavazoie S, Church GM: Computationalidentification of cis-regulatory elements associated withgroups of functionally related genes in Saccharomyces cerevi-siae. J Mol Biol 2000, 296:1205-1214.
34. Gasch AP, Spellman PT, Kao CM, Carmel-Harel O, Eisen MB, StorzG, Botstein D, Brown PO: Genomic expression programs in theresponse of yeast cells to environmental changes. Mol Biol Cell2000, 11:4241-4257.
35. Martinez-Pastor MT, Marchler G, Schuller C, Marchler-Bauer A, RuisH, Estruch F: The Saccharomyces cerevisiae zinc finger proteinsMsn2p and Msn4p are required for transcriptional inductionthrough the stress response element (STRE). EMBO J 1996,15:2227-2235.
36. Moye-Rowley WS: Transcriptional control of multidrug resist-ance in the yeast Saccharomyces . Prog Nucleic Acid Res Mol Biol
Genome Biology 2008, 9:R164
http://www.ncbi.nlm.nih.gov/entrez/query.fcgi?cmd=Retrieve&db=PubMed&dopt=Abstract&list_uids=9880475
http://www.ncbi.nlm.nih.gov/entrez/query.fcgi?cmd=Retrieve&db=PubMed&dopt=Abstract&list_uids=1869554
http://www.ncbi.nlm.nih.gov/entrez/query.fcgi?cmd=Retrieve&db=PubMed&dopt=Abstract&list_uids=1869554
http://www.ncbi.nlm.nih.gov/entrez/query.fcgi?cmd=Retrieve&db=PubMed&dopt=Abstract&list_uids=1869554
http://www.ncbi.nlm.nih.gov/entrez/query.fcgi?cmd=Retrieve&db=PubMed&dopt=Abstract&list_uids=8641288
http://www.ncbi.nlm.nih.gov/entrez/query.fcgi?cmd=Retrieve&db=PubMed&dopt=Abstract&list_uids=8641288

http://genomebiology.com/2008/9/11/R164 Genome Biology 2008, Volume 9, Issue 11, Article R164 Lelandais et al. R164.15
2003, 73:251-279.37. Chen KH, Miyazaki T, Tsai HF, Bennett JE: The bZip transcription
factor Cgap1p is involved in multidrug resistance andrequired for activation of multidrug transporter geneCgFLR1 in Candida glabrata . Gene 2007, 386:63-72.
38. Nguyen DT, Alarco AM, Raymond M: Multiple Yap1p-bindingsites mediate induction of the yeast major facilitator FLR1gene in response to drugs, oxidants, and alkylating agents. JBiol Chem 2001, 276:1138-1145.
39. Fernandes L, Rodrigues-Pousada C, Struhl K: Yap, a novel family ofeight bZIP proteins in Saccharomyces cerevisiae with distinctbiological functions. Mol Cell Biol 1997, 17:6982-6993.
40. He XJ, Fassler JS: Identification of novel Yap1p and Skn7p bind-ing sites involved in the oxidative stress response of Saccha-romyces cerevisiae . Mol Microbiol 2005, 58:1454-1467.
41. van Helden J, Andre B, Collado-Vides J: A web site for the compu-tational analysis of yeast regulatory sequences. Yeast 2000,16:177-187.
42. Roven C, Bussemaker HJ: REDUCE: An online tool for inferringcis-regulatory elements and transcriptional module activi-ties from microarray data. Nucleic Acids Res 2003, 31:3487-3490.
43. Banerjee D, Lelandais G, Shukla S, Mukhopadhyay G, Jacq C, DevauxF, Prasad R: Responses of pathogenic and nonpathogenic yeastspecies to steroids reveal the functioning and evolution ofmultidrug resistance transcriptional networks. Eukaryot Cell2008, 7:68-77.
44. Enjalbert B, Smith DA, Cornell MJ, Alam I, Nicholls S, Brown AJ,Quinn J: Role of the Hog1 stress-activated protein kinase inthe global transcriptional response to stress in the fungalpathogen Candida albicans . Mol Biol Cell 2006, 17:1018-1032.
45. Rognon B, Kozovska Z, Coste AT, Pardini G, Sanglard D: Identifica-tion of promoter elements responsible for the regulation ofMDR1 from Candida albicans, a major facilitator transporterinvolved in azole resistance. Microbiology 2006, 152:3701-3722.
46. Riggle PJ, Kumamoto CA: Transcriptional regulation of MDR1,encoding a drug efflux determinant, in fluconazole-resistantCandida albicans strains through an Mcm1p binding site.Eukaryot Cell 2006, 5:1957-1968.
47. Levine M, Tjian R: Transcription regulation and animal diver-sity. Nature 2003, 424:147-151.
48. Doebley J, Lukens L: Transcriptional regulators and the evolu-tion of plant form. Plant Cell 1998, 10:1075-1082.
49. Galant R, Carroll SB: Evolution of a transcriptional repressiondomain in an insect Hox protein. Nature 2002, 415:910-913.
50. Dujon B: Hemiascomycetous yeasts at the forefront of com-parative genomics. Curr Opin Genet Dev 2005, 15:614-620.
51. Borneman AR, Gianoulis TA, Zhang ZD, Yu H, Rozowsky J, Sering-haus MR, Wang LY, Gerstein M, Snyder M: Divergence of tran-scription factor binding sites across related yeast species.Science 2007, 317:815-819.
52. Zeitlinger J, Simon I, Harbison CT, Hannett NM, Volkert TL, Fink GR,Young RA: Program-specific distribution of a transcriptionfactor dependent on partner transcription factor and MAPKsignaling. Cell 2003, 113:395-404.
53. Ihmels J, Bergmann S, Gerami-Nejad M, Yanai I, McClellan M, BermanJ, Barkai N: Rewiring of the yeast transcriptional networkthrough the evolution of motif usage. Science 2005,309:938-940.
54. Tsong AE, Tuch BB, Li H, Johnson AD: Evolution of alternativetranscriptional circuits with identical logic. Nature 2006,443:415-420.
55. Gasch AP, Moses AM, Chiang DY, Fraser HB, Berardini M, Eisen MB:Conservation and evolution of cis-regulatory systems inascomycete fungi. PLoS Biol 2004, 2:e398.
56. Tirosh I, Weinberger A, Bezalel D, Kaganovich M, Barkai N: On therelation between promoter divergence and gene expressionevolution. Mol Syst Biol 2008, 4:159.
57. Tuch BB, Galgoczy DJ, Hernday AD, Li H, Johnson AD: The evolu-tion of combinatorial gene regulation in fungi. PLoS Biol 2008,6:e38.
58. Longtine MS, McKenzie A 3rd, Demarini DJ, Shah NG, Wach A, Bra-chat A, Philippsen P, Pringle JR: Additional modules for versatileand economical PCR-based gene deletion and modificationin Saccharomyces cerevisiae . Yeast 1998, 14:953-961.
59. ENS Transcriptome Platform [http://www.transcriptome.ens.fr/sgdb/]
60. Pasteur Institute [http://www.pasteur.fr/ip/easysite/go/03b-00002j-000/en]
61. GEO Database [http://www.ncbi.nlm.nih.gov/geo/]62. Bioconductor [http://www.bioconductor.org/]63. SAM Library [http://www-stat.stanford.edu/~tibs/SAM/]64. Troyanskaya O, Cantor M, Sherlock G, Brown P, Hastie T, Tibshirani
R, Botstein D, Altman RB: Missing value estimation methods forDNA microarrays. Bioinformatics 2001, 17:520-525.
65. de Brevern AG, Hazout S, Malpertuy A: Influence of microarraysexperiments missing values on the stability of gene groupsby hierarchical clustering. BMC Bioinformatics 2004, 5:114.
66. Garcia M, Darzacq X, Delaveau T, Jourdren L, Singer RH, Jacq C:Mitochondria-associated yeast mRNAs and the biogenesis ofmolecular complexes. Mol Biol Cell 2007, 18:362-368.
67. Christie KR, Weng S, Balakrishnan R, Costanzo MC, Dolinski K,Dwight SS, Engel SR, Feierbach B, Fisk DG, Hirschman JE, Hong EL,Issel-Tarver L, Nash R, Sethuraman A, Starr B, Theesfeld CL, AndradaR, Binkley G, Dong Q, Lane C, Schroeder M, Botstein D, Cherry JM:Saccharomyces Genome Database (SGD) provides tools toidentify and analyze sequences from Saccharomyces cerevi-siae and related sequences from other organisms. NucleicAcids Res 2004, 32:D311-314.
68. SGD database [http://www.yeastgenome.org/]69. Sherman D, Durrens P, Iragne F, Beyne E, Nikolski M, Souciet JL:
Genolevures complete genomes provide data and tools forcomparative genomics of hemiascomycetous yeasts. NucleicAcids Res 2006, 34:D432-435.
70. Genolevures [http://cbi.labri.fr/Genolevures/]71. van Helden J: Regulatory sequence analysis tools. Nucleic Acids
Res 2003, 31:3593-3596.72. RSA tools [http://rsat.ulb.ac.be/rsat/]73. Remm M, Storm CE, Sonnhammer EL: Automatic clustering of
orthologs and in-paralogs from pairwise species compari-sons. J Mol Biol 2001, 314:1041-1052.
74. Altschul SF, Gish W, Miller W, Myers EW, Lipman DJ: Basic localalignment search tool. J Mol Biol 1990, 215:403-410.
75. MatrixREDUCE [http://bussemaker.bio.columbia.edu/software/MatrixREDUCE/]
76. Gabriel KR, Odoroff CL: Biplots in biomedical research. StatMed 1990, 9:469-485.
77. R Software [http://cran.r-project.org/]78. Quackenbush J: Genomics. Microarrays - guilt by association.
Science 2003, 302:240-241.79. Stekel D: Microarray Bioinformatics Cambridge: Cambridge University
Press; 2003. 80. Eisen MB, Spellman PT, Brown PO, Botstein D: Cluster analysis
and display of genome-wide expression patterns. Proc NatlAcad Sci USA 1998, 95:14863-14868.
Genome Biology 2008, 9:R164
http://www.ncbi.nlm.nih.gov/entrez/query.fcgi?cmd=Retrieve&db=PubMed&dopt=Abstract&list_uids=9372930
http://www.ncbi.nlm.nih.gov/entrez/query.fcgi?cmd=Retrieve&db=PubMed&dopt=Abstract&list_uids=9372930
http://www.ncbi.nlm.nih.gov/entrez/query.fcgi?cmd=Retrieve&db=PubMed&dopt=Abstract&list_uids=9668128
http://www.ncbi.nlm.nih.gov/entrez/query.fcgi?cmd=Retrieve&db=PubMed&dopt=Abstract&list_uids=9668128
http://www.ncbi.nlm.nih.gov/entrez/query.fcgi?cmd=Retrieve&db=PubMed&dopt=Abstract&list_uids=9717241
http://www.ncbi.nlm.nih.gov/entrez/query.fcgi?cmd=Retrieve&db=PubMed&dopt=Abstract&list_uids=2231712
http://www.ncbi.nlm.nih.gov/entrez/query.fcgi?cmd=Retrieve&db=PubMed&dopt=Abstract&list_uids=2231712
http://www.ncbi.nlm.nih.gov/entrez/query.fcgi?cmd=Retrieve&db=PubMed&dopt=Abstract&list_uids=2349401