Assessing Lead Time of Selected Ovarian Cancer Biomarkers: A Nested Case - Control Study
13
26 Articles | JNCI Vol. 102, Issue 1 | January 6, 2010 DOI: 10.1093/jnci/djp438 © The Author 2009. Published by Oxford University Press. Advance Access publication on December 30, 2009. This is an Open Access article distributed under the terms of the Creative Commons Attribution Non-Commercial License (http://creativecommons.org/licenses/by-nc/2.5), which permits unrestricted non-commercial use, distribution, and reproduction in any medium, provided the original work is properly cited. Ovarian cancer is often a lethal disease, and stage at diagnosis remains one of the strongest prognostic factors. The high cure rate associated with local-stage disease has motivated diverse efforts to advance early detection (1,2). This growing interest in early detec- tion has paralleled the development of high-dimensional molec- ular technologies for biomarker discovery (3,4); these technologies have been used to identify several biomarkers for ovarian cancer. Except for a few studies (5–8) in which CA125 has been measured before diagnosis, to our knowledge, no systematic evaluation of prediagnostic marker levels for ovarian cancer has been conducted. Candidate markers have typically been characterized in cross- sectional studies of samples collected at the time of diagnosis when contrasts in marker concentrations between women with and without cancer are expected to be greatest. Biomarkers of risk or early detection, however, must be able to identify women with no or few nonspecific symptoms but who are destined to have a future clinical diagnosis from women with similar characteristics who will remain disease free for the foreseeable future. The length of the interval during which this distinction can be made remains unknown. Assessment of a biomarker’s potential for early detection or risk assessment requires measurements in specimens that were collected before diagnosis, typically available only from specimen reposi- tories of large prospective cohort studies (9). In this article, we describe the longitudinal behavior and classification performance of six markers —CA125, human epididymis protein 4 (HE4), mesothe- lin, B7-H4, decoy receptor 3 (DcR3), and spondin-2 —in prediag- nostic serum samples from 34 women who were later diagnosed ARTICLE Assessing Lead Time of Selected Ovarian Cancer Biomarkers: A Nested Case–Control Study Garnet L. Anderson, Martin McIntosh, Lieling Wu, Matt Barnett, Gary Goodman, Jason D. Thorpe, Lindsay Bergan, Mark D. Thornquist, Nathalie Scholler, Nam Kim, Kathy O’Briant, Charles Drescher, Nicole Urban Manuscript received December 31, 2008; revised October 12, 2009; accepted October 30, 2009. Correspondence to: Garnet L. Anderson, PhD, Division of Public Health Sciences, Fred Hutchinson Cancer Research Center, PO Box 19024, M3-A410, Seattle, WA 98109-1024 (e-mail: [email protected]). Background CA125, human epididymis protein 4 (HE4), mesothelin, B7-H4, decoy receptor 3 (DcR3), and spondin-2 have been identified as potential ovarian cancer biomarkers. Except for CA125, their behavior in the pre- diagnostic period has not been evaluated. Methods Immunoassays were used to determine concentrations of CA125, HE4, mesothelin, B7-H4, DcR3, and spondin-2 proteins in prediagnostic serum specimens (1–11 samples per participant) that were contributed 0–18 years before ovarian cancer diagnosis from 34 patients with ovarian cancer (15 with advanced-stage serous carcinoma) and during a comparable time interval before the reference date from 70 matched con- trol subjects who were participating in the Carotene and Retinol Efficacy Trial. Lowess curves were fit to biomarker levels in cancer patients and control subjects separately to summarize mean levels over time. Receiver operating characteristic curves were plotted, and area-under-the curve (AUC) statistics were com- puted to summarize the discrimination ability of these biomarkers by time before diagnosis. Results Smoothed mean concentrations of CA125, HE4, and mesothelin (but not of B7-H4, DcR3, and spondin-2) began to increase (visually) in cancer patients relative to control subjects approximately 3 years before diagnosis but reached detectable elevations only within the final year before diagnosis. In descriptive receiver operating characteristic analyses, the discriminatory power of these biomarkers was limited (AUC statistics range = 0.56–0.75) but showed increasing accuracy with time approaching diagnosis (eg, AUC statistics for CA125 were 0.57, 0.68, and 0.74 for ≥4, 2–4, and <2 years before diagnosis, respectively). Conclusion Serum concentrations of CA125, HE4, and mesothelin may provide evidence of ovarian cancer 3 years before clinical diagnosis, but the likely lead time associated with these markers appears to be less than 1 year. J Natl Cancer Inst 2010;102:26–38 by guest on December 16, 2014 http://jnci.oxfordjournals.org/ Downloaded from
Transcript of Assessing Lead Time of Selected Ovarian Cancer Biomarkers: A Nested Case - Control Study
26 Articles | JNCI Vol. 102, Issue 1 | January 6, 2010
DOI: 10.1093/jnci/djp438 © The Author 2009. Published by Oxford University Press. Advance Access publication on December 30, 2009. This is an Open Access article distributed under the terms of the Creative Com mons Attribution Non-Commercial License (http://creativecommons.org/licenses/by-nc/2.5), which permits unrestricted non-commercial use, distribution, and reproduction in any medium, provided the original work is properly cited.
Ovarian cancer is often a lethal disease, and stage at diagnosis remains one of the strongest prognostic factors. The high cure rate associated with local-stage disease has motivated diverse efforts to advance early detection ( 1 , 2 ). This growing interest in early detec-tion has paralleled the development of high-dimensional molec-ular technologies for biomarker discovery ( 3 , 4 ); these technologies have been used to identify several biomarkers for ovarian cancer. Except for a few studies ( 5 – 8 ) in which CA125 has been measured before diagnosis, to our knowledge, no systematic evaluation of prediagnostic marker levels for ovarian cancer has been conducted. Candidate markers have typically been characterized in cross-sectional studies of samples collected at the time of diagnosis when contrasts in marker concentrations between women with and without cancer are expected to be greatest. Biomarkers of risk
or early detection, however, must be able to identify women with no or few nonspecific symptoms but who are destined to have a future clinical diagnosis from women with similar characteristics who will remain disease free for the foreseeable future. The length of the interval during which this distinction can be made remains unknown.
Assessment of a biomarker’s potential for early detection or risk assessment requires measurements in specimens that were collected before diagnosis, typically available only from specimen reposi-tories of large prospective cohort studies ( 9 ). In this article, we describe the longitudinal behavior and classifi cation performance of six markers — CA125, human epididymis protein 4 (HE4), mesothe-lin, B7-H4, decoy receptor 3 (DcR3), and spondin-2 — in prediag-nostic serum samples from 34 women who were later diagnosed
ARTICLE
Assessing Lead Time of Selected Ovarian Cancer Biomarkers: A Nested Case – Control Study Garnet L. Anderson , Martin McIntosh , Lieling Wu , Matt Barnett , Gary Goodman , Jason D. Thorpe , Lindsay Bergan , Mark D. Thornquist , Nathalie Scholler , Nam Kim , Kathy O ’ Briant , Charles Drescher , Nicole Urban
Manuscript received December 31 , 2008 ; revised October 12 , 2009 ; accepted October 30 , 2009 .
Correspondence to: Garnet L. Anderson, PhD, Division of Public Health Sciences, Fred Hutchinson Cancer Research Center,
PO Box 19024, M3-A410, Seattle, WA 98109-1024 (e-mail: [email protected] ).
Background CA125, human epididymis protein 4 (HE4), mesothelin, B7-H4, decoy receptor 3 (DcR3), and spondin-2 have been identified as potential ovarian cancer biomarkers. Except for CA125, their behavior in the pre-diagnostic period has not been evaluated.
Methods Immunoassays were used to determine concentrations of CA125, HE4, mesothelin, B7-H4, DcR3, and spondin-2 proteins in prediagnostic serum specimens (1 – 11 samples per participant) that were contributed 0 – 18 years before ovarian cancer diagnosis from 34 patients with ovarian cancer (15 with advanced-stage serous carcinoma) and during a comparable time interval before the reference date from 70 matched con-trol subjects who were participating in the Carotene and Retinol Efficacy Trial. Lowess curves were fit to biomarker levels in cancer patients and control subjects separately to summarize mean levels over time. Receiver operating characteristic curves were plotted, and area-under-the curve (AUC) statistics were com-puted to summarize the discrimination ability of these biomarkers by time before diagnosis.
Results Smoothed mean concentrations of CA125, HE4, and mesothelin (but not of B7-H4, DcR3, and spondin-2) began to increase (visually) in cancer patients relative to control subjects approximately 3 years before diagnosis but reached detectable elevations only within the final year before diagnosis. In descriptive receiver operating characteristic analyses, the discriminatory power of these biomarkers was limited (AUC statistics range = 0.56 – 0.75) but showed increasing accuracy with time approaching diagnosis (eg, AUC statistics for CA125 were 0.57, 0.68, and 0.74 for ≥ 4, 2 – 4, and <2 years before diagnosis, respectively).
Conclusion Serum concentrations of CA125, HE4, and mesothelin may provide evidence of ovarian cancer 3 years before clinical diagnosis, but the likely lead time associated with these markers appears to be less than 1 year.
J Natl Cancer Inst 2010;102:26–38
by guest on Decem
ber 16, 2014http://jnci.oxfordjournals.org/
Dow
nloaded from

jnci.oxfordjournals.org JNCI | Articles 27
with ovarian, fallopian tube, or primary peritoneal cancer and from 70 matched control subjects. These women were participants in the Carotene and Retinol Effi cacy Trial (CARET), a National Cancer Institute – sponsored randomized, double-blind, placebo-controlled chemoprevention trial testing the effects of beta-carotene and retinol on the incidence of lung cancer among individuals at high risk for lung cancer ( 10 ). The behavior of these markers in the preclinical period is assessed by describing their discriminatory performance of the biomarkers when used individually or in com-bination and when used in both cross-sectional and longitudinal algorithms ( 11 , 12 ).
CA125, the current benchmark biomarker for ovarian cancer detection, is a high-molecular-weight mucin-type glycoprotein that is aberrantly expressed by ovarian cancer and other cancers, such as breast cancer ( 13 , 14 ), mesothelioma ( 15 ), non-Hodgkin lymphoma ( 16 – 19 ), leukemia ( 20 ), gastric cancer ( 21 ), and leio-myoma and leiomyosarcoma of gastrointestinal origin ( 22 ). CA125 levels have also been found to be elevated in benign conditions, such as cirrhosis, benign gynecological conditions, pregnancy, ovulation, liver diseases, and congestive heart failure. The role of CA125 in health and in disease remains poorly understood. The unusual features of the oligosaccharides such as the expression of branched-core 1 antennae in the core type 2 O -glycans, as well as robust N -glycosylation, primarily in high mannose and bisecting type N-linked glycans linked to CA125, suggest a role for CA125 in cell-mediated immune response ( 23 ). Belisle et al. ( 24 ) suggested that CA125 could play a role in altering the phenotype of natural killer cells, perhaps by binding directly to these or other immune cells [for a more comprehensive review, see Scholler and Urban ( 25 )]. Although the level of CA125 has been shown to be a useful marker for monitoring treatment response and disease recurrence ( 26 , 27 ), CA125 has not been approved for early detection. Elevated CA125 concentrations in serum have been documented 5 years or more before diagnosis of ovarian cancer ( 5 – 8 ). Studies examining the discriminatory performance at the time of diagnosis have found that a single threshold rule provides reasonable sensitivity and specifi city overall, with more limited sensitivity for early-stage disease ( 28 , 29 ). The reported accuracy for CA125 is not suffi cient, however, to use in population-based screening.
We evaluated fi ve other markers, selected on the basis of their classifi cation performance in cross-sectional studies in a common set of specimens from women with ovarian cancer and control women with no evidence of cancer ( 30 ). The WFDC2 gene that encodes HE4, a member of the family of stable 4-disulfi de core proteins, is overexpressed in ovarian tumors, especially in serous and endometrioid carcinomas ( 31 , 32 ), lung adenocarcinoma ( 33 ), and normal endometrial glands and endometrial cancer ( 32 , 33 ), but its function has not been determined. Elevated HE4 protein levels have been found in serum from patients with ovarian cancer ( 31 , 34 ). Mesothelin is a cell surface molecule that binds CA125 and may contribute to the metastasis through cell adhesion mechanisms ( 35 – 37 ). Mesothelin is displayed at the cell surface via a glyco-sylphosphatidylinositol anchor ( 38 ). Proteins with a glycosylphos-phatidylinositol anchor are structurally and functionally diverse and play vital roles in many biological processes ( 39 ). The physio-logical role of mesothelin is not currently understood, and the lack of a phenotype change in mesothelin knockout mice led Bera and
CONTEXT AND CAVEATS
Prior knowledge
CA125, human epididymis protein 4, mesothelin, B7-H4, decoy re-ceptor 3, and spondin-2 have been identified as potential ovarian cancer biomarkers.
Study design
Analysis of prediagnostic serum samples and patient data from the Carotene and Retinol Efficacy Trial, a randomized, double-blind, placebo-controlled chemoprevention trial testing the effects of be-ta-carotene and retinol on lung cancer incidence among individ-uals at high risk for lung cancer. Serum was contributed 0 – 18 years before ovarian cancer diagnosis from 34 patients with ovarian can-cer and 70 matched control subjects. Changes in the levels of these biomarkers by time before diagnosis were analyzed.
Contribution
Concentrations of CA125, human epididymis protein 4, and meso-thelin (but not of B7-H4, decoy receptor 3, and spondin-2) began to increase slightly in cancer patients relative to control subjects ap-proximately 3 years before diagnosis but became substantially el-evated only about a year before diagnosis. The discriminatory power of these biomarkers was limited, and accuracy only increased shortly before diagnosis.
Implications
The likely lead time associated with these markers was short (<1 year).
Limitations
The sample size was small. All women had a history of heavy smoking and so results may not apply to other groups. Blood was collected at different times across all women, and few samples were collected during the last 2 – 3 years before diagnosis.
From the Editors
Pastan ( 40 ) to conclude that mesothelin is a nonessential protein. Soluble forms of mesothelin have been found in serum from cancer patients ( 41 ), and use of information on both mesothelin and CA125 levels may improve diagnostic accuracy over either marker alone ( 42 ). We also evaluated three other markers that may have diagnostic potential: B7-H4, a newly described member of the B7 family of proteins that is expressed on tumor-associated macro-phages and appears to be a negative regulator of T-cell response ( 43 ); spondin-2, a protein of unknown function that may be associ-ated with the extracellular membrane; and DcR3, a soluble decoy receptor member of the tumor necrosis factor receptor family that blocks FasL-induced cell death ( 44 ). Each of these markers has been shown to be elevated in patients with ovarian cancer ( 45 ).
Participants and Methods Study Population, Blood Collection, and Cancer
Ascertainment
Between January 1, 1983, and December 31, 1994, 18 314 partic-ipants, including 6289 postmenopausal women between the ages of 50 and 69 years, were recruited into CARET at six study cen-ters, primarily by use of mass mailings to individuals on insurance lists. For women, only current or former smokers with at least 20
by guest on Decem
ber 16, 2014http://jnci.oxfordjournals.org/
Dow
nloaded from

28 Articles | JNCI Vol. 102, Issue 1 | January 6, 2010
pack-years of exposure were eligible. Height and weight were measured at a baseline study center visit. Other risk factor infor-mation was provided at baseline by self-report. Study participants were queried routinely (at least annually) through 2005 for new health events. Blood specimens were collected according to stan-dardized procedures every year from the 490 women in the pilot phase and every 2 years from the 5799 full-scale trial participants through 1996. Briefly, blood was collected in foil-covered vacu-tainers, centrifuged to separate serum, separated into aliquots in 2- and 0.5-mL amber vials, and stored locally at � 25°C for a maximum of 2 weeks before being placed in long-term centralized storage at � 70°C.
Until 2003, all self-reports of cancers were documented with pathology reports and centrally reviewed. Subsequently, cancer ascertainment was limited to self-report. The agreement rate between self-report and central review was 80%. All women pro-vided written informed consent to participate in CARET. Details of the study design for CARET have been published ( 10 ).
We identifi ed 35 CARET participants who reported receiving a diagnosis of ovarian, fallopian tube, or primary peritoneal cancer and who had stored serum specimens available. Each cancer patient was matched to two disease-free participants on the basis of age, date and study center of enrollment, race or ethnicity, and serum specimen availability. In selecting control subjects, the win-dow allowed for matching on date resulted in a few control sub-jects whose blood was drawn after the reference date (ie, the date of diagnosis for the matched cancer patient). Medical records of the 35 cancer patients were centrally reviewed by one of us (G. Goodman) for detailed tumor characteristics. One reported cancer was found to be a leiomyosarcoma of the fallopian tube and that patient was excluded. The corresponding matched control subjects for the excluded cancer patient were retained in this analysis. Six cancers were identifi ed only by self-report because neither pa-thology nor surgery reports were available. This study was ap-proved by the internal review board of the Fred Hutchinson Cancer Research Center.
Additional Blood Processing and Quality Assurance
Specimen vials were identified by a unique specimen identification number and provided by the CARET staff without thawing. All specimens for this study were thawed, separated into additional aliquots, and refrozen until assayed. To reduce potential bias asso-ciated with plate-to-plate and positional variation in the bead-based assays for CA125, HE4, and mesothelin, CARET staff defined plate positions for each specimen, assuring that all speci-mens from matched case – control sets were on the same plate in random order. Four replicates of a pooled serum sample were measured on each plate for quality control. Laboratory staff were blinded to all participant-level information throughout the study.
Determination of Marker Concentrations in Serum
Samples
Concentrations of CA125, HE4, mesothelin, B7-H4, DcR3, and spondin-2 were determined by use of immunoassays. Anti-CA125 mouse monoclonal antibodies, X306 and X52, were purchased from Research Diagnostics, Inc (Flanders, NJ). Anti -HE4 poly-clonal antibodies were developed as described previously ( 32 ) and
were kindly provided by Dr Ronny Drapkin (Dana-Farber Cancer Institute). Briefly, HE4-specific polyclonal antibodies were raised by immunizing rabbits with a fusion protein composed of the mature form of HE4 (amino acids 31 – 125) and glutathione S -transferase (GST). Affinity-purified antibodies were generated by absorption of the crude antiserum to a GST affinity column (Pierce Biotechnology, Inc, Rockford, IL) to remove all the GST antibodies. The GST antibody – depleted serum was then affinity-purified by passing it over a GST-HE4 column generated by use of an AminoLink Coupling Gel column (Pierce Biotechnology, Inc). Anti-mesothelin goat polyclonal antibodies were purchased from R&D Systems (Minneapolis, MN). Recombinant antibodies (single-chain variable fragment) secreted by yeast with a biotin attached to a biotin-accepting site fused to the carboxyl-terminal end of the binding site after an IgA linker [referred to hereafter as biobodies ( 46 )] were used in HE4 ( 46 ) and mesothelin ( 47 ) assays. Biobodies have a six-histidine (HIS 6 ) tag in the carboxyl terminus of the binding site that permits their purification from yeast cul-ture supernatants with HIS-Select-Nickel Affinity Gel (Sigma-Aldrich, St Louis, MO) via the biobody’s HIS 6 tag, pelleting the gel – biobody complexes, washing away other supernatant compo-nents, then eluting the biobodies from the gel by competition with imidazole buffer (0.3 M imidazole; 0.3 M NaCl; 0.05 M NaP, pH 8) (Fisher Scientific, Pittsburgh, PA). Centrifugal concentrators with a molecular weight cutoff of 30 000 kDa (VWR, West Chester, PA) were used to concentrate biobodies from a volume of 2 mL to 0.5 mL and exchange imidazole buffer with 1X phosphate-buffered saline (PBS; Fisher Scientific).
Serum levels of CA125, HE4, and mesothelin were measured by use of bead-based enzyme-linked immunosorbent assays (ELISAs) as described previously ( 48 ). Briefl y, all incubations were performed at room temperature in the dark. Capture anti-bodies against CA125 (X306 monoclonal antibodies at 5 µ g/mL), against HE4 (anti-HE4 polyclonal antibodies at 40 µ g/mL), or against mesothelin (anti-mesothelin polyclonal antibodies at 50 µ g/mL) were covalently coupled to carboxylated polystyrene beads (Bio-Rad Laboratories, Inc, Hercules, CA) by activating the beads with the fi rst bead activation buffer (0.1 M sodium phosphate, pH 6.2; Sigma, St Louis, MO) containing 1-ethyl-3-(3-dimethylaminopropyl) carbodiimide hydro chloride (Pierce, Rockford, IL) and N -hydroxysulfosuccinimide (Pierce) diluted, respectively, to 38 mg/mL and 109 mg/mL in activation buffer . The coupling buffer was made with 0.05 M 2-( N -morpholino)ethanesulfonic acid, pH 5.0 (Sigma-Aldrich). Washes were per-formed with PBS supplemented with 0.05% Tween 20; assays, blocking of nonspecifi c sites on beads, and storage were per-formed in PBS containing 1% bovine serum albumin (Sigma-Aldrich). The capture antibody was then added to the reaction mixture to allow the amines in the protein to react with the acti-vated intermediate to form an amide bond, through which the antibody was attached to the bead.
For CA125 assays, X306-coupled beads were incubated with serum diluted 1:4 in Bio-Rad Human Serum Diluent for 30 minutes in 96-well Multiscreen HTS, GV plates (Millipore, Billerica, MA). Captured antigen was detected by incubation with 25 µ L of biotinylated X52 monoclonal antibody diluted to 2 µ L/mL in Bio-Rad Cytokine Detection Antibody Diluent 1:100 for 30
by guest on Decem
ber 16, 2014http://jnci.oxfordjournals.org/
Dow
nloaded from
jnci.oxfordjournals.org JNCI | Articles 29
minutes, followed by incubation with 50 µ L of phycoerythrin-conjugated streptavidin (Bio-Rad) diluted 1:100 in Bio-Rad Assay Buffer for 10 minutes. Serum was diluted 1:10 for HE4 assays and 1:5 for mesothelin assays in PBS containing 1% bovine serum albumin (Sigma), and 50 µ L of diluted serum was added to anti-HE4 – coupled beads or to anti-mesothelin – coupled beads in 96-well Multiscreen HTS, GV plates and incubated for 30 mi-nutes. Captured antigen was detected with 25 µ L of the respective biobodies against HE4 at 5 µ g/ µ L and against mesothelin at 1 µ g/mL that had been preincubated with PhycoLink Streptavidin-R-Phycoerythrins PJ31S (Prozyme, San Leandro, CA) in PBS containing 1% bovine serum albumin for 30 minutes. All plates were analyzed with the Bio-Plex Array Reader (Bio-Rad).
For B7-H4, DcR3, and spondin-2 immunoassays, generation of monoclonal antibodies and ELISA protocols have been published ( 45 ). Briefl y, all monoclonal antibodies used in this study were generated by immunizing BALB/c mice with the corresponding recombinant human protein (B7-H4, DcR3, or spondin-2) that had been expressed in either a baculovirus or mammalian expres-sion system (diaDexus, Inc, South San Francisco, CA). For each antigen (B7-H4, DcR3, or spondin-2), a pair of mouse monoclonal antibodies, each binding to different epitopes on the antigen, were used as capture or detection antibodies in the ELISA. For each ELISA, 20 – 25 µ L of undiluted serum was added to high-binding polystyrene plates (Corning Life Sciences, Bedford, MA) that had been coated overnight at 4°C with the corresponding capture monoclonal antibody at a concentration of 5 µ g/mL in 1X Tris-buffered saline. Immobilized antigen was then detected by incuba-tion with a biotinylated secondary monoclonal antibody at a concentration of 3 µ g/mL in assay buffer (Tris-buffered saline, 1% bovine serum albumin, 1% mouse serum, 1% calf serum, and 0.1% Tween-20) for 1 hour at room temperature, followed by incuba-tion with horseradish peroxidase – conjugated streptavidin or alka-line phosphatase – conjugated streptavidin diluted 1:10 000 in assay buffer for 30 minutes at room temperature. For quantifi cation of antigens in the serum samples, standards of recombinant protein and serum from two control subjects were added to each plate and tested together with the samples.
Statistical Methods
Associations between baseline characteristics and ovarian cancer status were evaluated by use of t tests for continuous variables or � 2 tests for categorical variables. Percentages may not add to 100% because of missing values. Baseline blood values refer to the blood specimen obtained at enrollment or first blood draw thereafter.
To further control for potential plate-to-plate variability in the bead-based assays, CA125, HE4, and mesothelin concentrations were normalized by dividing each value by the mean of the four replicates of pooled serum on the corresponding plate. All six marker levels were log-transformed and rescaled by subtracting the mean of baseline values in the control group and dividing the result by the SD of the baseline control group values. The rescaled levels, referred to as “standardized” levels and reported without units, allowed direct comparison of results across markers.
Descriptive statistics of baseline marker levels were calculated for cancer patients and control subjects separately. The mean and
SD of baseline values in the control group may have deviated slightly from 0 and 1, respectively, because of rounding error. For visual displays, standardized biomarker levels are presented by time before diagnosis for the cancer patients and by time before the corresponding reference date (ie, the date of diagnosis for the matched cancer patient) for control subjects. To summarize trends over time, lowess curves ( 49 ) were fi t to biomarker levels in cancer patients and control subjects separately by time before diagnosis or reference date. Correlations among biomarkers were assessed on standardized baseline values within cancer patients and control subjects separately by use of Pearson correlation coeffi cients.
Receiver operating characteristic (ROC) curves were plotted, and area-under-the curve (AUC) statistics were computed to sum-marize the discrimination ability of these markers ( 50 ). All avail-able marker levels from cancer patients were divided into the following three periods: less than 2 years, 2 – 4 years, and 4 years or more before diagnosis. The intervals were selected to allow closer examination of the time approaching diagnosis while assuring a reasonable number of cancer diagnoses. For control subjects, all available marker levels from all time periods were used because time before reference date has no particular relevance to their distribution. Multiple values per individual were included to increase the precision of the estimates of sensitivity and specifi city. Traditional estimates of variability are not accurate in this setting and so these curves should be viewed as descriptive only. In explor-atory analyses, composite markers that were based on the sum or the maximum of marker levels for each woman at each time point were similarly assessed.
Multivariable Cox regression models ( 51 ) were used to evaluate the risk of ovarian cancer associated with these serum markers and to assess their relative contribution to estimated risk after control-ling for age, family history of breast and ovarian cancer, and, where feasible, self-reported race. Education was not included because it was not strongly associated with the ovarian cancer risk in this study population, and its use caused participants to be excluded for missing data. Each biomarker and each composite marker were modeled individually as a time-varying covariate to refl ect changing levels over time, similar to what would be observed in a clinical setting. For cancer patients, the time to ovarian cancer diagnosis was calculated from the date of baseline blood collection. For con-trol subjects, censoring occurred at the earlier of death from other causes or date of last follow-up. To examine the potential value of multiple markers for risk prediction, we used forward selection methods to obtain a fi nal risk model.
Analyses were performed with SAS version 9.1 (SAS Institute, Cary, NC) with graphical displays generated in R version 2.7.2. All statistical tests are two-sided, and P values of less than .05 were con-sidered to be statistically signifi cant. Using a Bonferroni correction to account for testing six markers would imply that only P values of less than .008 would be considered statistically signifi cant.
Results Cancer patients and matched control subjects from CARET were all postmenopausal women who were current or former smokers and who had a mean age of 59 years (SD = 5.7 years). All were white, except for one matched case – control pair of African
by guest on Decem
ber 16, 2014http://jnci.oxfordjournals.org/
Dow
nloaded from
30 Articles | JNCI Vol. 102, Issue 1 | January 6, 2010
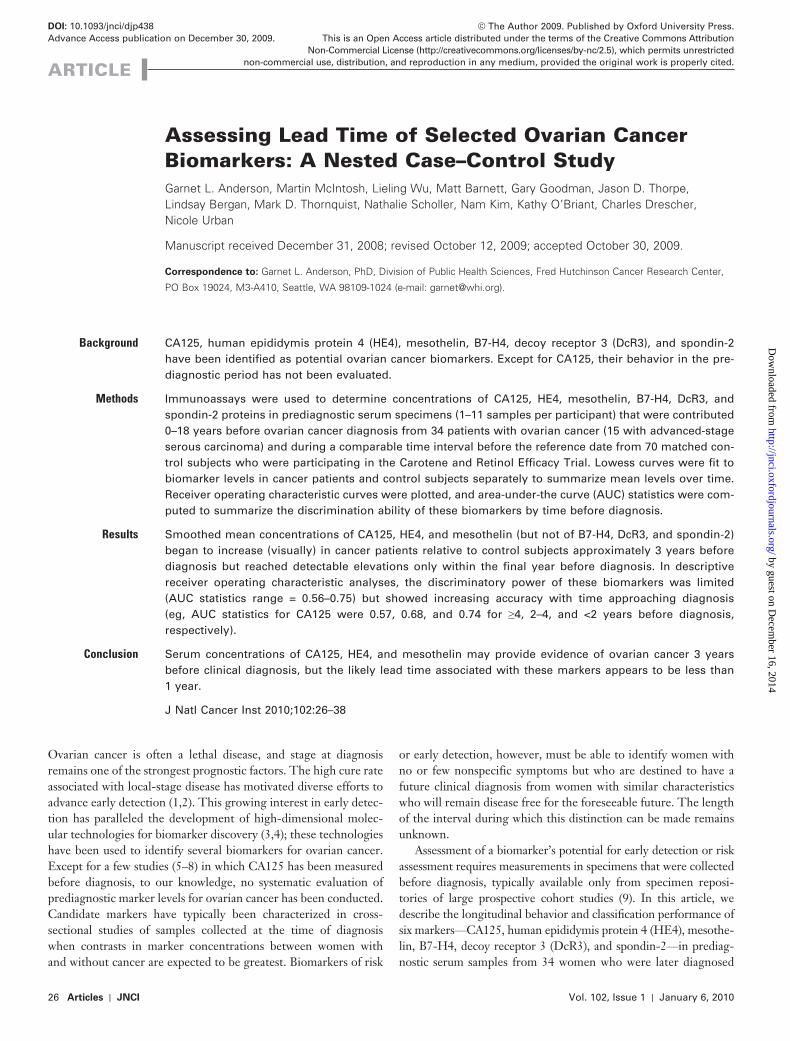
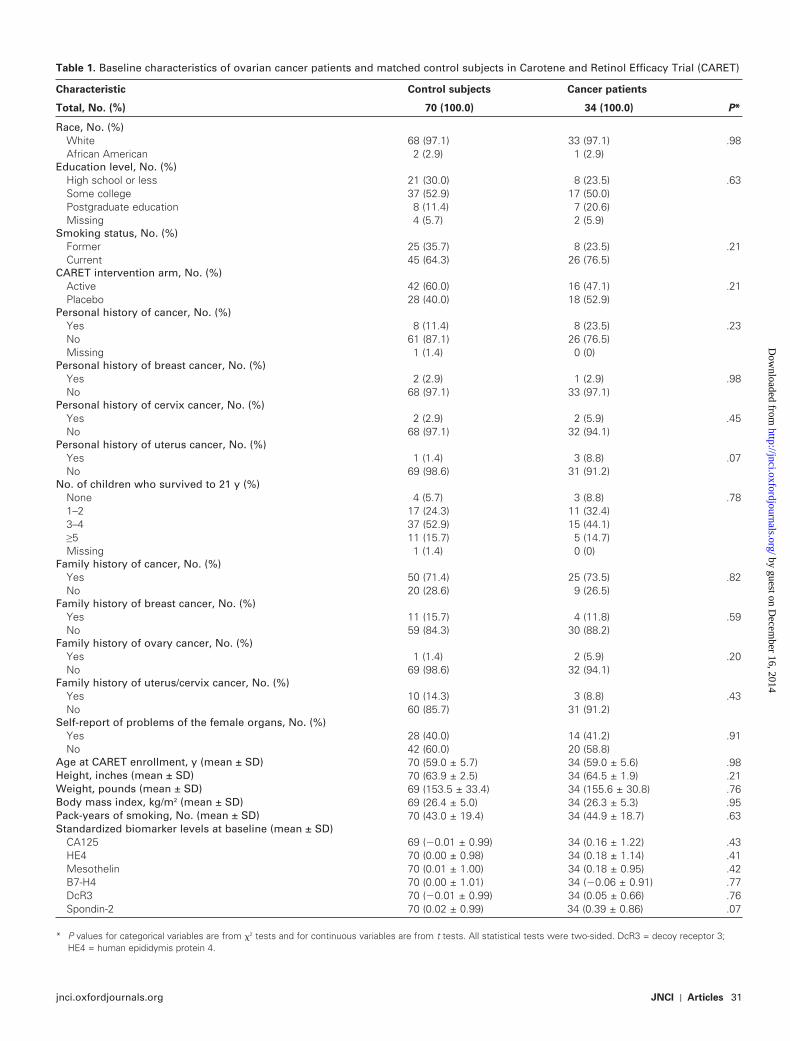
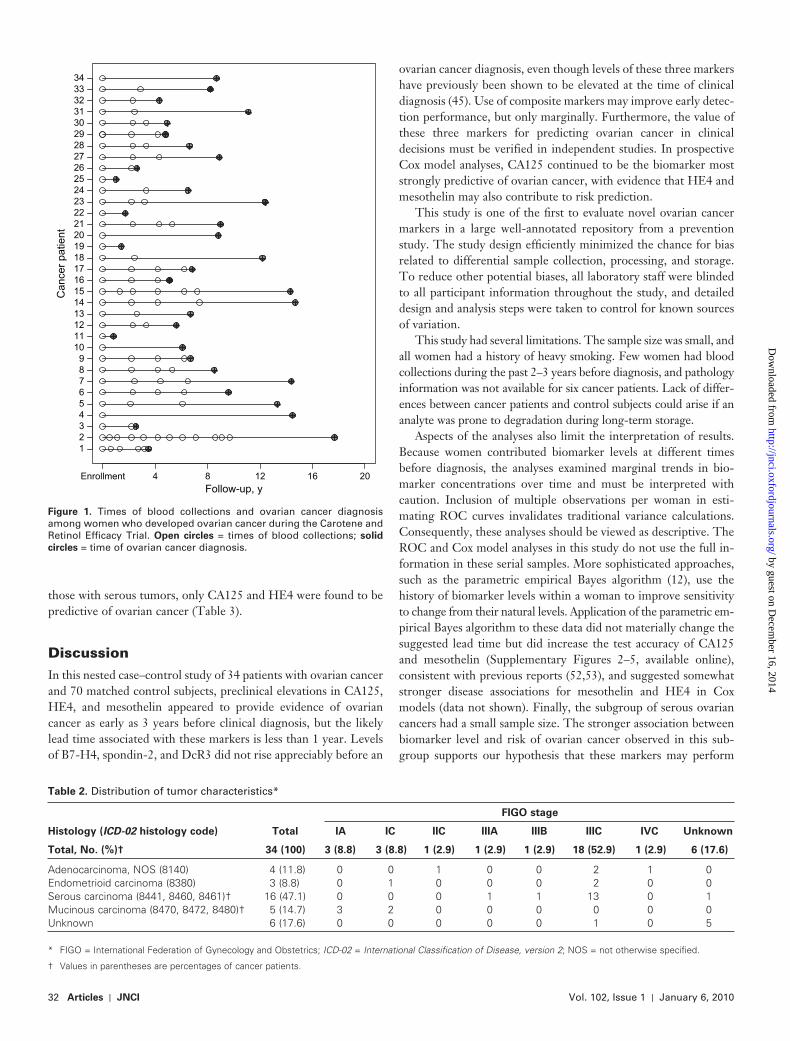
American women. The available information indicated that this population was at average risk for ovarian cancer. The distributions of most risk factors are generally comparable between cancer patients and control subjects ( Table 1 ). Mean standardized base-line serum levels of all six markers were slightly higher in cancer patients than in control subjects, but the only marker with a differ-ence that approached statistical significance was spondin-2. The mean (±SD) CA125 level at baseline was 16.7 U/mL (±36.6 U/mL) among control subjects and 22.4 U/mL (±52.3 U/mL) among cancer patients. Most women provided blood specimens on two or more occasions (range = 1 – 11 occasions) between 0 and 18 years before diagnosis among cancer patients ( Figure 1 ) and during a comparable time interval before the reference date among control subjects.
Among control subjects, modest pairwise Pearson correlations were found between levels of spondin-2 and B7-H4 ( r = .41, P = .003), DcR3 ( r = .44, P < .001), and CA125 ( r = .37, P = .002). Among cancer patients, the only correlation that reached statistical signifi cance at the P ≤ .008 level was between spondin-2 and DcR3 ( r = .59, P < .001) ( Supplementary Table 1 , available online).
Available tumor characteristics indicate that 16 of the 34 cancer patients were diagnosed with serous carcinoma, including 15 known to be at advanced stage ( Table 2 ). The other histologies observed included mucinous (n = 5), adenocarcinoma not other-wise specifi ed (n = 4), and endometrioid (n = 3). Early-stage tumors were primarily mucinous. Of the 23 cancers with available tumor grade information, 13 (57%) were anaplastic, seven (30%) were poorly differentiated, and three (13%) were moderately differentiated.
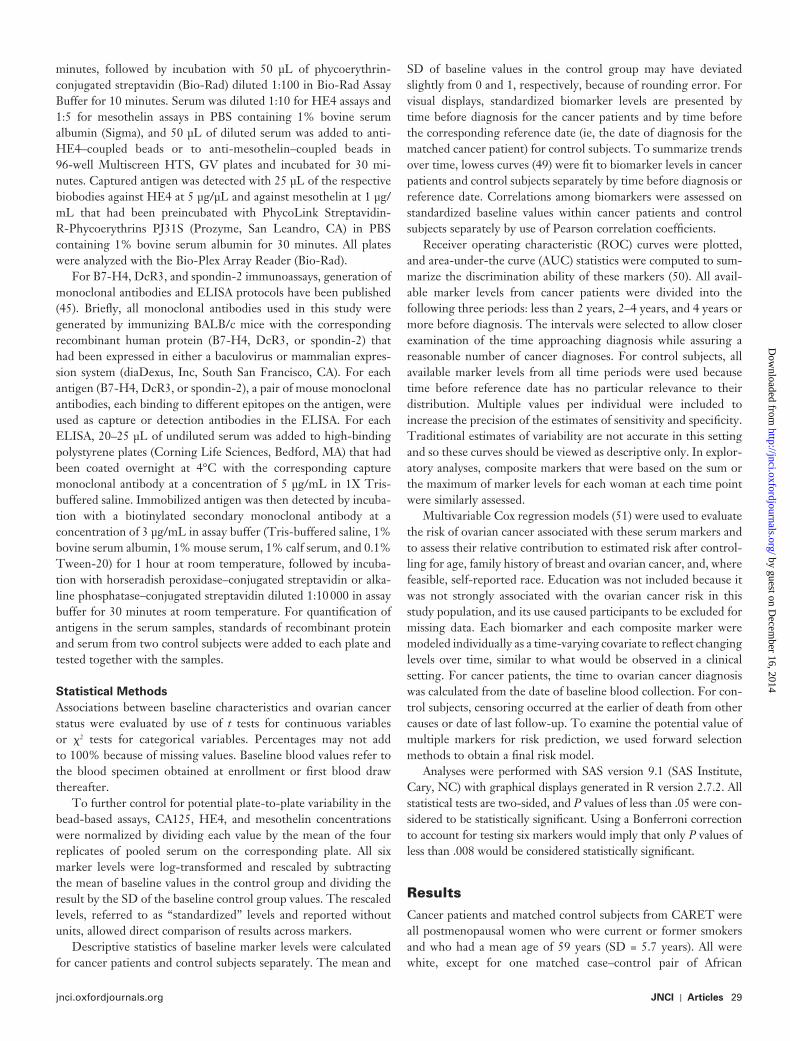
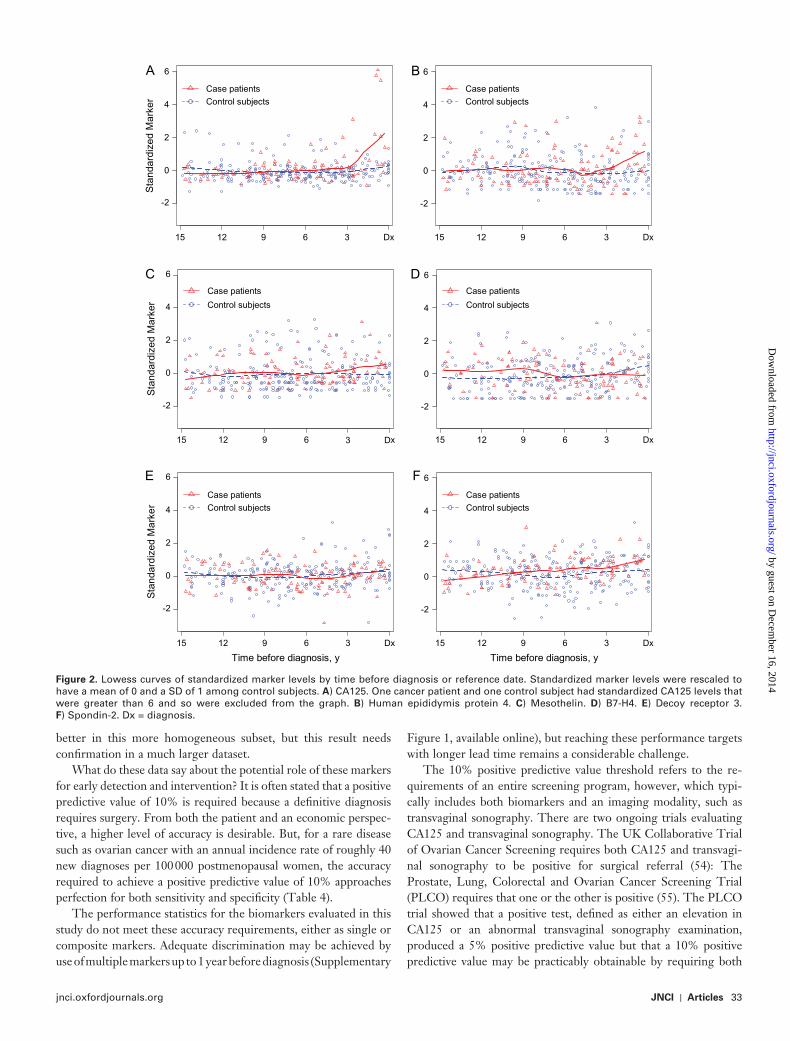
Similar CA125 protein levels were observed between cancer patients and control subjects until approximately 3 years before diagnosis of ovarian cancer, at which point (by visual inspection), the mean marker level among cancer patients began to rise ( Figure 2 , A). A similar pattern, though less pronounced, was observed for HE4 protein levels and to a lesser extent, for meso-thelin protein levels ( Figure 2 , B and C). Levels of B7-H4 and DcR3 in cancer patients and control subjects were indistinguish-able throughout the study ( Figure 2 , D and E). Spondin-2 levels showed a slight increase over time among cancer patients result-ing in a small separation during the fi nal year before diagnosis ( Figure 2 , F).
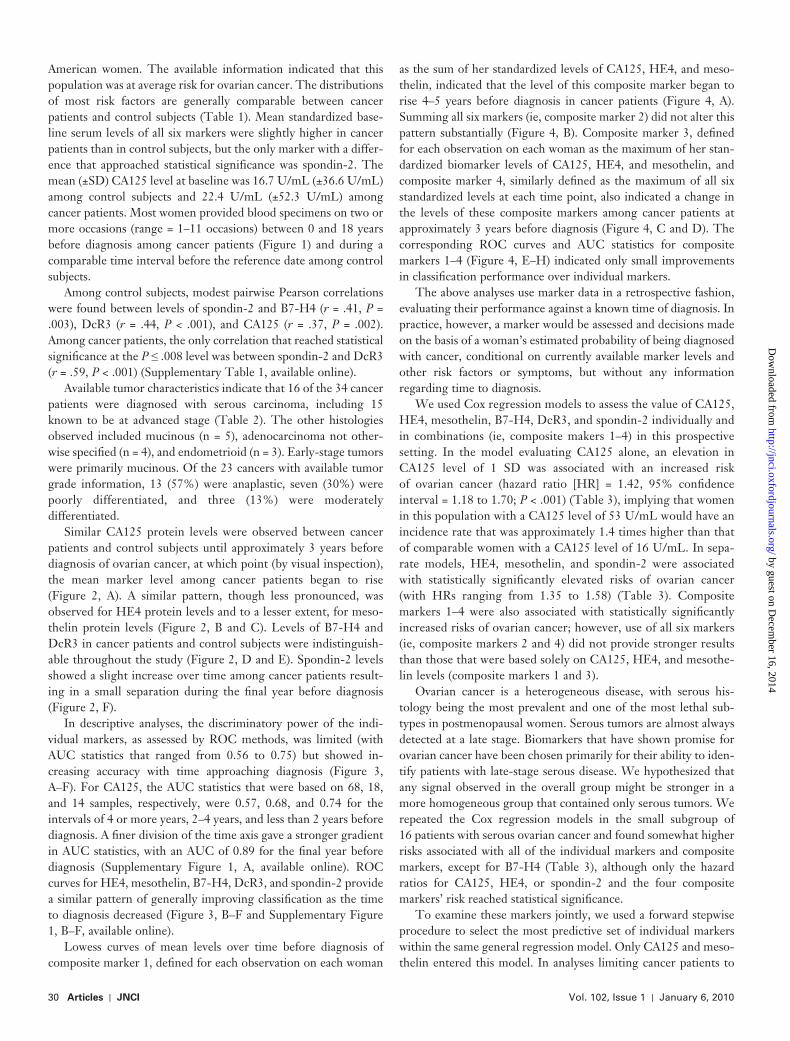
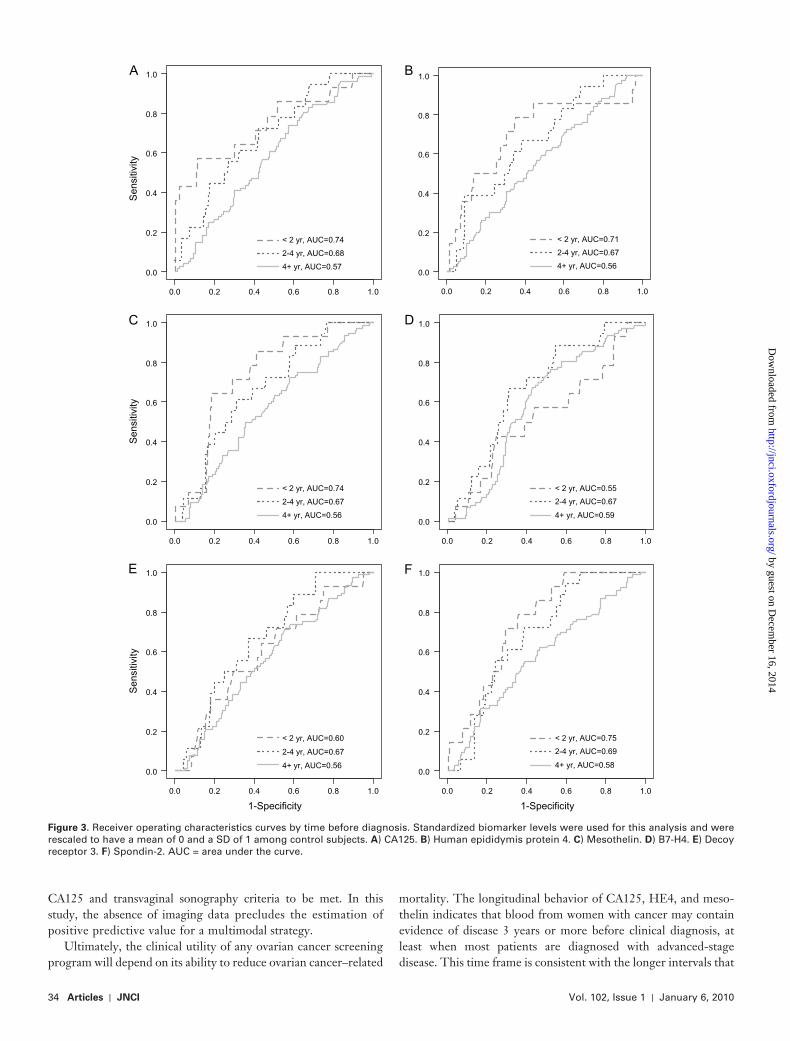
In descriptive analyses, the discriminatory power of the indi-vidual markers, as assessed by ROC methods, was limited (with AUC statistics that ranged from 0.56 to 0.75) but showed in-creasing accuracy with time approaching diagnosis ( Figure 3 , A – F). For CA125, the AUC statistics that were based on 68, 18, and 14 samples, respectively, were 0.57, 0.68, and 0.74 for the intervals of 4 or more years, 2 – 4 years, and less than 2 years before diagnosis. A fi ner division of the time axis gave a stronger gradient in AUC statistics, with an AUC of 0.89 for the fi nal year before diagnosis ( Supplementary Figure 1 , A , available online). ROC curves for HE4, mesothelin, B7-H4, DcR3, and spondin-2 provide a similar pattern of generally improving classifi cation as the time to diagnosis decreased ( Figure 3 , B – F and Supplementary Figure 1 , B – F, available online).
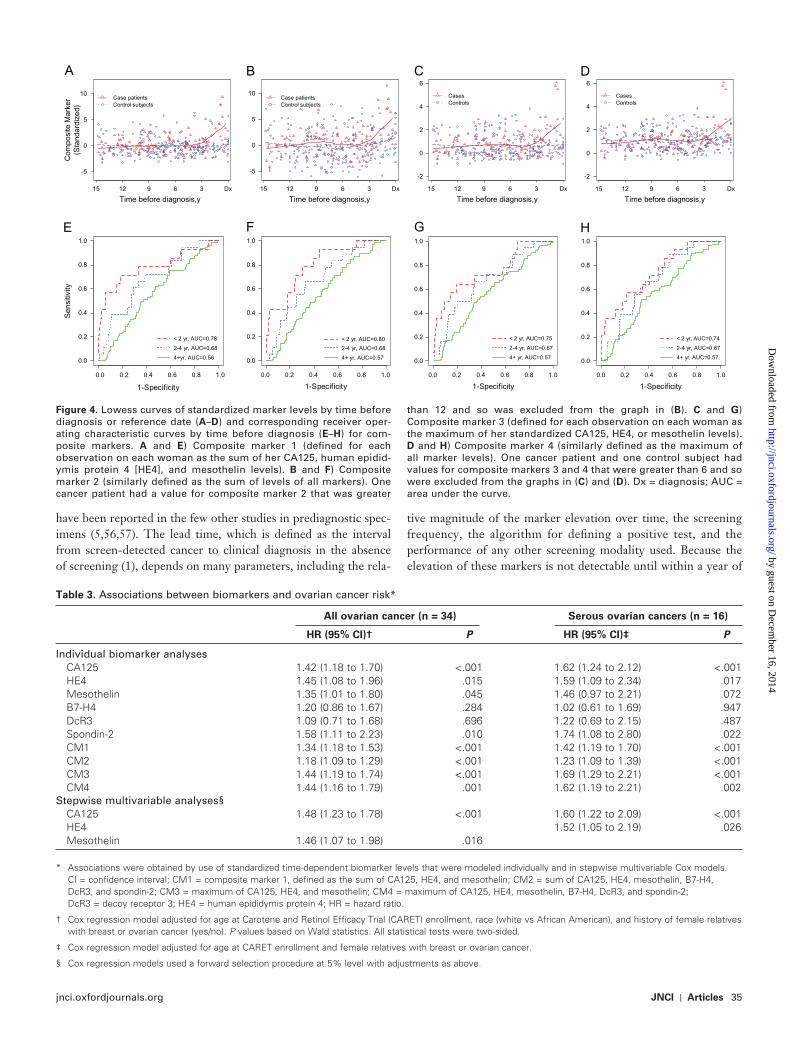
Lowess curves of mean levels over time before diagnosis of composite marker 1, defi ned for each observation on each woman
as the sum of her standardized levels of CA125, HE4, and meso-thelin, indicated that the level of this composite marker began to rise 4 – 5 years before diagnosis in cancer patients ( Figure 4 , A). Summing all six markers (ie, composite marker 2) did not alter this pattern substantially ( Figure 4 , B). Composite marker 3, defi ned for each observation on each woman as the maximum of her stan-dardized biomarker levels of CA125, HE4, and mesothelin, and composite marker 4, similarly defi ned as the maximum of all six standardized levels at each time point, also indicated a change in the levels of these composite markers among cancer patients at approximately 3 years before diagnosis ( Figure 4 , C and D). The corresponding ROC curves and AUC statistics for composite markers 1 – 4 ( Figure 4 , E – H) indicated only small improvements in classifi cation performance over individual markers.
The above analyses use marker data in a retrospective fashion, evaluating their performance against a known time of diagnosis. In practice, however, a marker would be assessed and decisions made on the basis of a woman’s estimated probability of being diagnosed with cancer, conditional on currently available marker levels and other risk factors or symptoms, but without any information regarding time to diagnosis.
We used Cox regression models to assess the value of CA125, HE4, mesothelin, B7-H4, DcR3, and spondin-2 individually and in combinations (ie, composite makers 1 – 4) in this prospective setting. In the model evaluating CA125 alone, an elevation in CA125 level of 1 SD was associated with an increased risk of ovarian cancer (hazard ratio [HR] = 1.42, 95% confi dence interval = 1.18 to 1.70; P < .001) ( Table 3 ), implying that women in this population with a CA125 level of 53 U/mL would have an incidence rate that was approximately 1.4 times higher than that of comparable women with a CA125 level of 16 U/mL. In sepa-rate models, HE4, mesothelin, and spondin-2 were associated with statistically signifi cantly elevated risks of ovarian cancer (with HRs ranging from 1.35 to 1.58) ( Table 3 ). Composite markers 1 – 4 were also associated with statistically signifi cantly increased risks of ovarian cancer; however, use of all six markers (ie, composite markers 2 and 4) did not provide stronger results than those that were based solely on CA125, HE4, and mesothe-lin levels (composite markers 1 and 3).
Ovarian cancer is a heterogeneous disease, with serous his-tology being the most prevalent and one of the most lethal sub-types in postmenopausal women. Serous tumors are almost always detected at a late stage. Biomarkers that have shown promise for ovarian cancer have been chosen primarily for their ability to iden-tify patients with late-stage serous disease. We hypothesized that any signal observed in the overall group might be stronger in a more homogeneous group that contained only serous tumors. We repeated the Cox regression models in the small subgroup of 16 patients with serous ovarian cancer and found somewhat higher risks associated with all of the individual markers and composite markers, except for B7-H4 ( Table 3 ), although only the hazard ratios for CA125, HE4, or spondin-2 and the four composite markers ’ risk reached statistical signifi cance.
To examine these markers jointly, we used a forward stepwise procedure to select the most predictive set of individual markers within the same general regression model. Only CA125 and meso-thelin entered this model. In analyses limiting cancer patients to
by guest on Decem
ber 16, 2014http://jnci.oxfordjournals.org/
Dow
nloaded from
jnci.oxfordjournals.org JNCI | Articles 31
Table 1 . Baseline characteristics of ovarian cancer patients and matched control subjects in Carotene and Retinol Efficacy Trial (CARET)
Characteristic Control subjects Cancer patients
P * Total, No. (%) 70 (100.0) 34 (100.0)
Race, No. (%) White 68 (97.1) 33 (97.1) .98 African American 2 (2.9) 1 (2.9) Education level, No. (%) High school or less 21 (30.0) 8 (23.5) .63 Some college 37 (52.9) 17 (50.0) Postgraduate education 8 (11.4) 7 (20.6) Missing 4 (5.7) 2 (5.9) Smoking status, No. (%) Former 25 (35.7) 8 (23.5) .21 Current 45 (64.3) 26 (76.5) CARET intervention arm, No. (%) Active 42 (60.0) 16 (47.1) .21 Placebo 28 (40.0) 18 (52.9) Personal history of cancer, No. (%) Yes 8 (11.4) 8 (23.5) .23 No 61 (87.1) 26 (76.5) Missing 1 (1.4) 0 (0) Personal history of breast cancer, No. (%) Yes 2 (2.9) 1 (2.9) .98 No 68 (97.1) 33 (97.1) Personal history of cervix cancer, No. (%) Yes 2 (2.9) 2 (5.9) .45 No 68 (97.1) 32 (94.1) Personal history of uterus cancer, No. (%) Yes 1 (1.4) 3 (8.8) .07 No 69 (98.6) 31 (91.2) No. of children who survived to 21 y (%) None 4 (5.7) 3 (8.8) .78 1 – 2 17 (24.3) 11 (32.4) 3 – 4 37 (52.9) 15 (44.1) ≥ 5 11 (15.7) 5 (14.7) Missing 1 (1.4) 0 (0) Family history of cancer, No. (%) Yes 50 (71.4) 25 (73.5) .82 No 20 (28.6) 9 (26.5) Family history of breast cancer, No. (%) Yes 11 (15.7) 4 (11.8) .59 No 59 (84.3) 30 (88.2) Family history of ovary cancer, No. (%) Yes 1 (1.4) 2 (5.9) .20 No 69 (98.6) 32 (94.1) Family history of uterus/cervix cancer, No. (%) Yes 10 (14.3) 3 (8.8) .43 No 60 (85.7) 31 (91.2) Self-report of problems of the female organs, No. (%) Yes 28 (40.0) 14 (41.2) .91 No 42 (60.0) 20 (58.8) Age at CARET enrollment, y (mean ± SD) 70 (59.0 ± 5.7) 34 (59.0 ± 5.6) .98 Height, inches (mean ± SD) 70 (63.9 ± 2.5) 34 (64.5 ± 1.9) .21 Weight, pounds (mean ± SD) 69 (153.5 ± 33.4) 34 (155.6 ± 30.8) .76 Body mass index, kg/m 2 (mean ± SD) 69 (26.4 ± 5.0) 34 (26.3 ± 5.3) .95 Pack-years of smoking, No. (mean ± SD) 70 (43.0 ± 19.4) 34 (44.9 ± 18.7) .63 Standardized biomarker levels at baseline (mean ± SD) CA125 69 ( � 0.01 ± 0.99) 34 (0.16 ± 1.22) .43 HE4 70 (0.00 ± 0.98) 34 (0.18 ± 1.14) .41 Mesothelin 70 (0.01 ± 1.00) 34 (0.18 ± 0.95) .42 B7-H4 70 (0.00 ± 1.01) 34 ( � 0.06 ± 0.91) .77 DcR3 70 ( � 0.01 ± 0.99) 34 (0.05 ± 0.66) .76 Spondin-2 70 (0.02 ± 0.99) 34 (0.39 ± 0.86) .07
* P values for categorical variables are from � 2 tests and for continuous variables are from t tests. All statistical tests were two-sided. DcR3 = decoy receptor 3; HE4 = human epididymis protein 4.
by guest on Decem
ber 16, 2014http://jnci.oxfordjournals.org/
Dow
nloaded from
32 Articles | JNCI Vol. 102, Issue 1 | January 6, 2010
those with serous tumors, only CA125 and HE4 were found to be predictive of ovarian cancer ( Table 3 ).
Discussion In this nested case – control study of 34 patients with ovarian cancer and 70 matched control subjects, preclinical elevations in CA125, HE4, and mesothelin appeared to provide evidence of ovarian cancer as early as 3 years before clinical diagnosis, but the likely lead time associated with these markers is less than 1 year. Levels of B7-H4, spondin-2, and DcR3 did not rise appreciably before an
Follow-up, y
Can
cer p
atie
nt
123456789
10111213141516171819202122232425262728293031323334
Enrollment 4 8 12 16 20
Figure 1 . Times of blood collections and ovarian cancer diagnosis among women who developed ovarian cancer during the Carotene and Retinol Effi cacy Trial. Open circles = times of blood collections; solid
circles = time of ovarian cancer diagnosis.
Table 2 . Distribution of tumor characteristics *
Histology ( ICD-02 histology code) Total
FIGO stage
IA IC IIC IIIA IIIB IIIC IVC Unknown
Total, No. (%) † 34 (100) 3 (8.8) 3 (8.8) 1 (2.9) 1 (2.9) 1 (2.9) 18 (52.9) 1 (2.9) 6 (17.6)
Adenocarcinoma, NOS (8140) 4 (11.8) 0 0 1 0 0 2 1 0 Endometrioid carcinoma (8380) 3 (8.8) 0 1 0 0 0 2 0 0 Serous carcinoma (8441, 8460, 8461) † 16 (47.1) 0 0 0 1 1 13 0 1 Mucinous carcinoma (8470, 8472, 8480) † 5 (14.7) 3 2 0 0 0 0 0 0 Unknown 6 (17.6) 0 0 0 0 0 1 0 5
* FIGO = International Federation of Gynecology and Obstetrics; ICD-02 = International Classification of Disease, version 2 ; NOS = not otherwise specified.
† Values in parentheses are percentages of cancer patients.
ovarian cancer diagnosis, even though levels of these three markers have previously been shown to be elevated at the time of clinical diagnosis ( 45 ). Use of composite markers may improve early detec-tion performance, but only marginally. Furthermore, the value of these three markers for predicting ovarian cancer in clinical decisions must be verified in independent studies. In prospective Cox model analyses, CA125 continued to be the biomarker most strongly predictive of ovarian cancer, with evidence that HE4 and mesothelin may also contribute to risk prediction.
This study is one of the fi rst to evaluate novel ovarian cancer markers in a large well-annotated repository from a prevention study. The study design effi ciently minimized the chance for bias related to differential sample collection, processing, and storage. To reduce other potential biases, all laboratory staff were blinded to all participant information throughout the study, and detailed design and analysis steps were taken to control for known sources of variation.
This study had several limitations. The sample size was small, and all women had a history of heavy smoking. Few women had blood collections during the past 2 – 3 years before diagnosis, and pathology information was not available for six cancer patients. Lack of differ-ences between cancer patients and control subjects could arise if an analyte was prone to degradation during long-term storage.
Aspects of the analyses also limit the interpretation of results. Because women contributed biomarker levels at different times before diagnosis, the analyses examined marginal trends in bio-marker concentrations over time and must be interpreted with caution. Inclusion of multiple observations per woman in esti-mating ROC curves invalidates traditional variance calculations. Consequently, these analyses should be viewed as descriptive. The ROC and Cox model analyses in this study do not use the full in-formation in these serial samples. More sophisticated approaches, such as the parametric empirical Bayes algorithm ( 12 ), use the history of biomarker levels within a woman to improve sensitivity to change from their natural levels. Application of the parametric em -pirical Bayes algorithm to these data did not materially change the suggested lead time but did increase the test accuracy of CA125 and mesothelin ( Supplementary Figures 2 – 5 , available online), consistent with previous reports ( 52 , 53 ), and suggested somewhat stronger disease associations for mesothelin and HE4 in Cox models (data not shown). Finally, the subgroup of serous ovarian cancers had a small sample size. The stronger association between biomarker level and risk of ovarian cancer observed in this sub-group supports our hypothesis that these markers may perform
by guest on Decem
ber 16, 2014http://jnci.oxfordjournals.org/
Dow
nloaded from
jnci.oxfordjournals.org JNCI | Articles 33
better in this more homogeneous subset, but this result needs confi rmation in a much larger dataset.
What do these data say about the potential role of these markers for early detection and intervention? It is often stated that a positive predictive value of 10% is required because a defi nitive diagnosis requires surgery. From both the patient and an economic perspec-tive, a higher level of accuracy is desirable. But, for a rare disease such as ovarian cancer with an annual incidence rate of roughly 40 new diagnoses per 100 000 postmenopausal women, the accuracy required to achieve a positive predictive value of 10% approaches perfection for both sensitivity and specifi city ( Table 4 ).
The performance statistics for the biomarkers evaluated in this study do not meet these accuracy requirements, either as single or composite markers. Adequate discrimination may be achieved by use of multiple markers up to 1 year before diagnosis ( Supplementary
Figure 1 , available online), but reaching these performance targets with longer lead time remains a considerable challenge.
The 10% positive predictive value threshold refers to the re-quirements of an entire screening program, however, which typi-cally includes both biomarkers and an imaging modality, such as transvaginal sonography. There are two ongoing trials evaluating CA125 and transvaginal sonography. The UK Collaborative Trial of Ovarian Cancer Screening requires both CA125 and transvagi-nal sonography to be positive for surgical referral ( 54 ): The Prostate, Lung, Colorectal and Ovarian Cancer Screening Trial (PLCO) requires that one or the other is positive ( 55 ). The PLCO trial showed that a positive test, defi ned as either an elevation in CA125 or an abnormal transvaginal sonography examination, produced a 5% positive predictive value but that a 10% positive predictive value may be practicably obtainable by requiring both
-2
0
2
4
6
Sta
ndar
dize
d M
arke
r
15 12 9 6 3 Dx
ACase patientsControl subjects
-2
0
2
4
6
Sta
ndar
dize
d M
arke
r
15 12 9 6 3 Dx
CCase patients
Control subjects
-2
0
2
4
6
Time before diagnosis, y
Sta
ndar
dize
d M
arke
r
15 12 9 6 x
ECase patientsControl subjects
3 D
-2
0
2
4
6
15 12 9 6 x
BCase patientsControl subjects
-2
0
2
4
6
15 12 9 6
3 D
3 Dx
DCase patients
Control subjects
-2
0
2
4
6
Time before diagnosis, y
15 12 9 6 3 Dx
FCase patientsControl subjects
Figure 2 . Lowess curves of standardized marker levels by time before diagnosis or reference date. Standardized marker levels were rescaled to have a mean of 0 and a SD of 1 among control subjects. A ) CA125. One cancer patient and one control subject had standardized CA125 levels that were greater than 6 and so were excluded from the graph. B ) Human epididymis protein 4. C ) Mesothelin. D ) B7-H4. E ) Decoy receptor 3. F ) Spondin-2. Dx = diagnosis.
by guest on Decem
ber 16, 2014http://jnci.oxfordjournals.org/
Dow
nloaded from
34 Articles | JNCI Vol. 102, Issue 1 | January 6, 2010
CA125 and transvaginal sonography criteria to be met. In this study, the absence of imaging data precludes the estimation of positive predictive value for a multimodal strategy.
Ultimately, the clinical utility of any ovarian cancer screening program will depend on its ability to reduce ovarian cancer – related
mortality. The longitudinal behavior of CA125, HE4, and meso-thelin indicates that blood from women with cancer may contain evidence of disease 3 years or more before clinical diagnosis, at least when most patients are diagnosed with advanced-stage disease. This time frame is consistent with the longer intervals that
Sen
sitiv
ity
0.0
0.2
0.4
0.6
0.8
1.0
< 2 yr, AUC=0.74
2-4 yr, AUC=0.68
4+ yr, AUC=0.57
A
0.0 0.2 0.4 0.6 0.8 1.0
Sen
sitiv
ity
0.0
0.2
0.4
0.6
0.8
1.0
< 2 yr, AUC=0.74
2-4 yr, AUC=0.67
4+ yr, AUC=0.56
C
0.0 0.2 0.4 0.6 0.8 1.0
1-Specificity
Sen
sitiv
ity
0.0
0.2
0.4
0.6
0.8
1.0
< 2 yr, AUC=0.60
2-4 yr, AUC=0.67
4+ yr, AUC=0.56
E
0.0 0.2 0.4 0.6 0.8 1.0
0.0 0.2 0.4 0.6 0.8 1.0
0.0
0.2
0.4
0.6
0.8
1.0
< 2 yr, AUC=0.71
2-4 yr, AUC=0.67
4+ yr, AUC=0.56
B
0.0 0.2 0.4 0.6 0.8 1.0
0.0
0.2
0.4
0.6
0.8
1.0
< 2 yr, AUC=0.55
2-4 yr, AUC=0.67
4+ yr, AUC=0.59
D
1-Specificity
0.0 0.2 0.4 0.6 0.8 1.0
0.0
0.2
0.4
0.6
0.8
1.0
< 2 yr, AUC=0.75
2-4 yr, AUC=0.69
4+ yr, AUC=0.58
F
Figure 3 . Receiver operating characteristics curves by time before diagnosis. Standardized biomarker levels were used for this analysis and were rescaled to have a mean of 0 and a SD of 1 among control subjects. A ) CA125. B ) Human epididymis protein 4. C ) Mesothelin. D ) B7-H4. E ) Decoy receptor 3. F ) Spondin-2. AUC = area under the curve.
by guest on Decem
ber 16, 2014http://jnci.oxfordjournals.org/
Dow
nloaded from
jnci.oxfordjournals.org JNCI | Articles 35
have been reported in the few other studies in prediagnostic spec-imens ( 5 , 56 , 57 ). The lead time, which is defi ned as the interval from screen-detected cancer to clinical diagnosis in the absence of screening ( 1 ), depends on many parameters, including the rela-
tive magnitude of the marker elevation over time, the screening frequency, the algorithm for defi ning a positive test, and the performance of any other screening modality used. Because the elevation of these markers is not detectable until within a year of
-5
0
5
10
Time before diagnosis,y
Com
posi
te M
arke
r(S
tand
ardi
zed)
A
Case patientsControl subjects
-5
0
5
10
Time before diagnosis,y
B
Case patientsControl subjects
Time before diagnosis,y
C
CasesControls
Time before diagnosis,y15 12 9 6 3 Dx15 12 9 6 3 Dx15 12 9 6 3 Dx15 12 9 6 3 Dx
D
CasesControls
-2
0
2
4
6
-2
0
2
4
6
1-Specificity
Sen
sitiv
ity
0.0 0.2 0.4 0.6 0.8 1.0 0.0 0.2 0.4 0.6 0.8 1.0 0.0 0.2 0.4 0.6 0.8 1.0 0.0 0.2 0.4 0.6 0.8 1.0
< 2 yr, AUC=0.78
2-4 yr, AUC=0.68
4+yr, AUC=0.56
E
1-Specificity
0.0
0.2
0.4
0.6
0.8
1.0
0.0
0.2
0.4
0.6
0.8
1.0
0.0
0.2
0.4
0.6
0.8
1.0
0.0
0.2
0.4
0.6
0.8
1.0
< 2 yr, AUC=0.80
2-4 yr, AUC=0.68
4+ yr, AUC=0.57
F
1-Specificity
< 2 yr, AUC=0.75
2-4 yr, AUC=0.67
4+ yr, AUC=0.57
G
1-Specificity
< 2 yr, AUC=0.74
2-4 yr, AUC=0.67
4+ yr, AUC=0.57
H
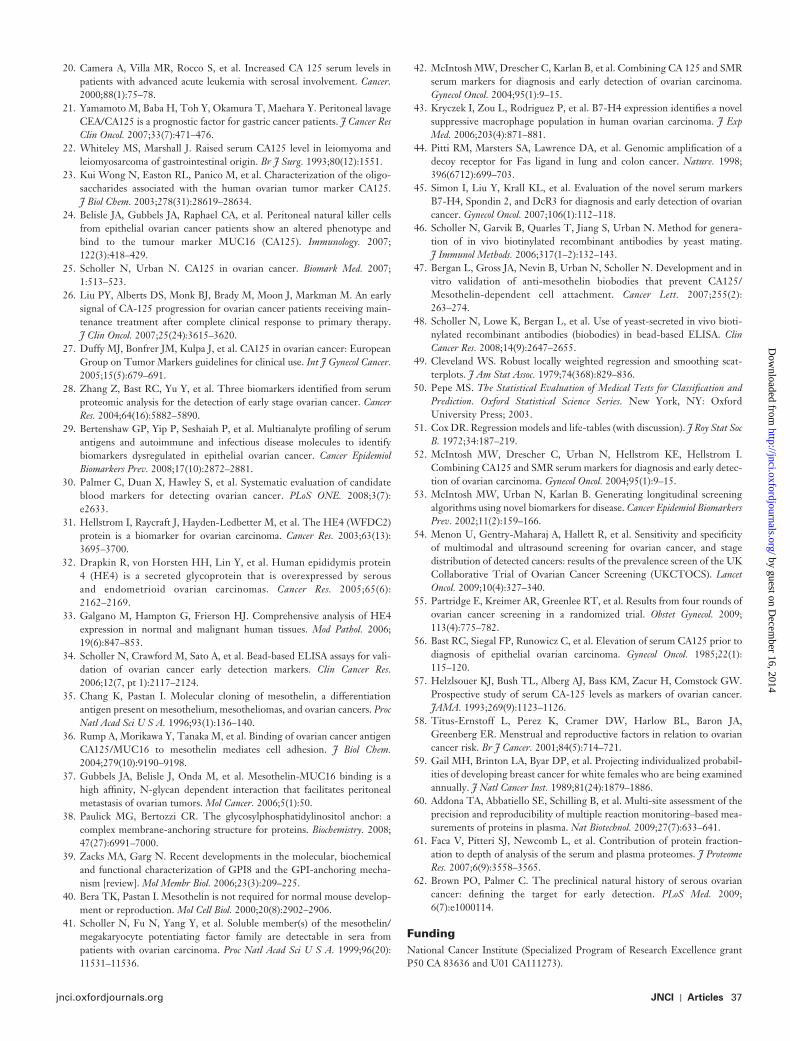
Table 3 . Associations between biomarkers and ovarian cancer risk *
All ovarian cancer (n = 34) Serous ovarian cancers (n = 16)
HR (95% CI) † P HR (95% CI) ‡ P
Individual biomarker analyses CA125 1.42 (1.18 to 1.70) <.001 1.62 (1.24 to 2.12) <.001 HE4 1.45 (1.08 to 1.96) .015 1.59 (1.09 to 2.34) .017 Mesothelin 1.35 (1.01 to 1.80) .045 1.46 (0.97 to 2.21) .072 B7-H4 1.20 (0.86 to 1.67) .284 1.02 (0.61 to 1.69) .947 DcR3 1.09 (0.71 to 1.68) .696 1.22 (0.69 to 2.15) .487 Spondin-2 1.58 (1.11 to 2.23) .010 1.74 (1.08 to 2.80) .022 CM1 1.34 (1.18 to 1.53) <.001 1.42 (1.19 to 1.70) <.001 CM2 1.18 (1.09 to 1.29) <.001 1.23 (1.09 to 1.39) <.001 CM3 1.44 (1.19 to 1.74) <.001 1.69 (1.29 to 2.21) <.001 CM4 1.44 (1.16 to 1.79) .001 1.62 (1.19 to 2.21) .002 Stepwise multivariable analyses § CA125 1.48 (1.23 to 1.78) <.001 1.60 (1.22 to 2.09) <.001 HE4 1.52 (1.05 to 2.19) .026 Mesothelin 1.46 (1.07 to 1.98) .016
* Associations were obtained by use of standardized time-dependent biomarker levels that were modeled individually and in stepwise multivariable Cox models. CI = confidence interval; CM1 = composite marker 1, defined as the sum of CA125, HE4, and mesothelin; CM2 = sum of CA125, HE4, mesothelin, B7-H4, DcR3, and spondin-2; CM3 = maximum of CA125, HE4, and mesothelin; CM4 = maximum of CA125, HE4, mesothelin, B7-H4, DcR3, and spondin-2; DcR3 = decoy receptor 3; HE4 = human epididymis protein 4; HR = hazard ratio.
† Cox regression model adjusted for age at Carotene and Retinol Efficacy Trial (CARET) enrollment, race (white vs African American), and history of female relatives with breast or ovarian cancer (yes/no). P values based on Wald statistics. All statistical tests were two-sided.
‡ Cox regression model adjusted for age at CARET enrollment and female relatives with breast or ovarian cancer.
§ Cox regression models used a forward selection procedure at 5% level with adjustments as above.
Figure 4 . Lowess curves of standardized marker levels by time before diagnosis or reference date ( A – D ) and corresponding receiver oper-ating characteristic curves by time before diagnosis ( E – H ) for com-posite markers. A and E ) Composite marker 1 (defi ned for each observation on each woman as the sum of her CA125, human epidid-ymis protein 4 [HE4], and mesothelin levels). B and F ) Composite marker 2 (similarly defi ned as the sum of levels of all markers). One cancer patient had a value for composite marker 2 that was greater
than 12 and so was excluded from the graph in ( B ). C and G ) Composite marker 3 (defi ned for each observation on each woman as the maximum of her standardized CA125, HE4, or mesothelin levels). D and H ) Composite marker 4 (similarly defi ned as the maximum of all marker levels). One cancer patient and one control subject had values for composite markers 3 and 4 that were greater than 6 and so were excluded from the graphs in ( C ) and ( D ). Dx = diagnosis; AUC = area under the curve.
by guest on Decem
ber 16, 2014http://jnci.oxfordjournals.org/
Dow
nloaded from

36 Articles | JNCI Vol. 102, Issue 1 | January 6, 2010
diagnosis, one cannot expect these markers to routinely detect cancer more than a year earlier than it would be diagnosed clini-cally, regardless of the screening interval. It is not known whether a 1-year lead time is adequate to impact mortality.
Although these markers are not accurate enough to prompt early intervention in existing screening protocols, the multivari-able regression analyses identifi ed modest but statistically signif-icant increases in risk associated with CA125, HE4, and mesothelin, which are consistent with many of the established epidemiological risk factors for ovarian cancer. For example, the risk of ovarian cancer associated with an elevation of 1 or 2 SDs in CA125 levels is as strong as that for most menstrual and repro-ductive risk factors ( 58 ) and similar in magnitude with several of the factors used in the Gail model for estimating breast cancer risk ( 59 ). As such, these markers should be considered, in con-junction with other epidemiological risk factors when developing ovarian cancer risk models.
To have the greatest impact, new efforts should focus on iden-tifying markers that extend lead time rather than those that simply add sensitivity near the time of clinical diagnosis. The length of the preclinical period observed in this study provides some hope that lead times approaching 3 years or more could be obtained if the right circulating proteins are identifi ed. The approach to dis-covering these proteins is less clear. Other existing candidates could be evaluated in preclinical specimens, as we did in this study. The markers that we selected for evaluation had the highest sensi-tivity and specifi city in clinically advanced samples, yet half of them were not predictive of disease prospectively. Thus, one should not expect many of the other existing markers to substan-tially improve performance. Use of proteomics technologies to discover markers in prediagnostic samples is still a largely untested approach. Although appealing in principle, even the most sensitive technologies can rarely measure plasma proteins at concentrations that are lower than 10 ng/mL ( 60 , 61 ), which may be far above the concentrations that exist in early preclinical ovarian cancer
Table 4 . Examples of test accuracy required to achieve a 10% positive predictive value in populations with incidence rates of ovarian cancer ranging from that of the general US population of postmenopausal women to a population with a 10-fold increase in risk
Incidence per 100 000
persons per y Sensitivity, % Specificity, %
40 100 99.6 80 99.7 60 99.8
80 100 99.3 80 99.4 60 99.6
160 100 98.6 80 98.8 60 99.1
200 100 98.2 80 98.6 60 98.9
400 100 96.4 80 97.1 60 97.8
samples ( 62 ). Moreover, the results of the PLCO trial, which showed that CA125 alone performed better than transvaginal sonography alone ( 55 ), suggest that improvements in imaging are needed and may have considerable impact on achieving early detection goals. Additional studies describing these and other novel marker levels over the prediagnostic interval would help to improve the precision of these classifi cation estimates over time, to develop optimal composite markers and screening algorithms, and to develop risk models that incorporate biomarker information.
References 1. Etzioni R , Urban N , Ramsey S , et al. The case for early detection . Nat Rev
Cancer . 2003 ; 3 ( 4 ): 243 – 252 . 2. Jacobs IJ , Menon U . Progress and challenges in screening for early detec-
tion of ovarian cancer . Mol Cell Proteomics . 2004 ; 3 ( 4 ): 355 – 366 . 3. Bast RC , Urban N , Shridhar V , et al . Early detection of ovarian cancer:
promise and reality . Cancer Treat Res. 2002 ; 107 : 61 – 97 . 4. Bast RC . Early detection of ovarian cancer: new technologies in pursuit of
a disease that is neither common nor rare . Trans Am Clin Climatol Assoc. 2004 ; 155 : 233 – 248 .
5. Zurawski VR , Orjaseter H , Anderson A , Jellum E . Elevated serum CA 125 levels prior to diagnosis of ovarian neoplasia: relevance to early detection of ovarian cancer . Int J Cancer . 1988 ; 42 ( 5 ): 667 – 680 .
6. Einhorn N , Sjovall K , Knapp RC , et al . Prospective evaluation of serum CA 125 levels for early detection of ovarian cancer . Obstet Gynecol . 1992 ; 80 ( 1 ): 14 – 18 .
7. Woolas RP , Xu F , Jacobs IJ , et al . Elevated serum levels of macrophage colony-stimulating factor and OVX1, 11 months prior to the diagnosis of stage IC ovarian cancer . Int J Gynecol Cancer . 1996 ; 6 ( 2 ): 156 – 158 .
8. Skates SJ , Menon U , MacDonald N , et al . Calculation of the risk of ovarian cancer from serial CA-125 values for preclinical detection in post-menopausal women . J Clin Oncol . 2003 ; 21 ( suppl 10 ): 206S – 210S .
9. Pepe MS , Etzioni R , Feng Z , et al . Phases of biomarker development for early detection of cancer . J Natl Cancer Inst . 2001 ; 93 ( 14 ): 1054 – 1061 .
10. Thornquist MD , Omenn GS , Goodman GE , et al . Statistical design and monitoring of the Carotene and Retinol Effi cacy Trial (CARET) . Control Clin Trials . 1993 ; 14 ( 4 ): 308 – 324 .
11. McIntosh MW , Pepe MS . Combining several screening tests: optimality of the risk score . Biometrics . 2002 ; 58 ( 3 ): 657 – 664 .
12. McIntosh MW , Urban N . A parametric empirical Bayes method for can-cer screening using longitudinal observations of a biomarker . Biostatistics . 2003 ; 4 ( 1 ): 27 – 40 .
13. Berruti A , Tampellini M , Torta M , Buniva T , Gorzegno G , Dogliotti L . Prognostic value in predicting overall survival of two mucinous markers: CA 15-3 and CA 125 in breast cancer patients at fi rst relapse of disease . Eur J Cancer . 1994 ; 30A ( 14 ): 2082 – 2084 .
14. Norum LF , Erikstein B , Nustad K . Elevated CA125 in breast cancer — a sign of advanced disease . Tumour Biol. 2001 ; 22 ( 4 ): 223 – 228 .
15. Hedman M , Arnberg H , Wernlund J , Riska H , Brodin O . Tissue polypep-tide antigen (TPA), hyaluronan and CA 125 as serum markers in malig-nant mesothelioma . Anticancer Res. 2003 ; 23 ( 18 ): 531 – 536 .
16. Bairey O , Blickstein D , Stark P , et al . Serum CA 125 as a prognostic factor in non-Hodgkin’s lymphoma . Leuk Lymphoma . 2003 ; 44 ( 10 ): 1733 – 1738 .
17. Burney IA , Siddiqui T , Siddiqui I . Serum CA 125 is of clinical value in the staging and follow-up of patients with non-Hodgkin’s lymphoma: correla-tion with tumor parameters and disease activity . Cancer . 1999 ; 85 ( 3 ): 755 – 756 .
18. Kutluk T , Varan A , Erbas B , Buyukpamukcu M . Serum CA 125 levels in children with non-Hodgkin’s lymphoma . Pediatr Hematol Oncol . 1999 ; 16 ( 4 ): 311 – 319 .
19. Zidan J , Hussein O , Basher W , Zohar S . Serum CA125: a tumor marker for monitoring response to treatment and follow-up in patients with non-Hodgkin’s lymphoma . Oncologist . 2004 ; 9 ( 4 ): 417 – 421 .
by guest on Decem
ber 16, 2014http://jnci.oxfordjournals.org/
Dow
nloaded from
jnci.oxfordjournals.org JNCI | Articles 37
20. Camera A , Villa MR , Rocco S , et al . Increased CA 125 serum levels in patients with advanced acute leukemia with serosal involvement . Cancer . 2000 ; 88 ( 1 ): 75 – 78 .
21. Yamamoto M , Baba H , Toh Y , Okamura T , Maehara Y . Peritoneal lavage CEA/CA125 is a prognostic factor for gastric cancer patients . J Cancer Res Clin Oncol . 2007 ; 33 ( 7 ): 471 – 476 .
22. Whiteley MS , Marshall J . Raised serum CA125 level in leiomyoma and leiomyosarcoma of gastrointestinal origin . Br J Surg . 1993 ; 80 ( 12 ): 1551 .
23. Kui Wong N , Easton RL , Panico M , et al . Characterization of the oligo-saccharides associated with the human ovarian tumor marker CA125 . J Biol Chem. 2003 ; 278 ( 31 ): 28619 – 28634 .
24. Belisle JA , Gubbels JA , Raphael CA , et al . Peritoneal natural killer cells from epithelial ovarian cancer patients show an altered phenotype and bind to the tumour marker MUC16 (CA125) . Immunology . 2007 ; 122 ( 3 ): 418 – 429 .
25. Scholler N , Urban N . CA125 in ovarian cancer . Biomark Med . 2007 ; 1 : 513 – 523 .
26. Liu PY , Alberts DS , Monk BJ , Brady M , Moon J , Markman M . An early signal of CA-125 progression for ovarian cancer patients receiving main-tenance treatment after complete clinical response to primary therapy . J Clin Oncol . 2007 ; 25 ( 24 ): 3615 – 3620 .
27. Duffy MJ , Bonfrer JM , Kulpa J , et al . CA125 in ovarian cancer: European Group on Tumor Markers guidelines for clinical use . Int J Gynecol Cancer . 2005 ; 15 ( 5 ): 679 – 691 .
28. Zhang Z , Bast RC , Yu Y , et al . Three biomarkers identifi ed from serum proteomic analysis for the detection of early stage ovarian cancer . Cancer Res. 2004 ; 64 ( 16 ): 5882 – 5890 .
29. Bertenshaw GP , Yip P , Seshaiah P , et al . Multianalyte profi ling of serum antigens and autoimmune and infectious disease molecules to identify biomarkers dysregulated in epithelial ovarian cancer . Cancer Epidemiol Biomarkers Prev . 2008 ; 17 ( 10 ): 2872 – 2881 .
30. Palmer C , Duan X , Hawley S , et al . Systematic evaluation of candidate blood markers for detecting ovarian cancer . PLoS ONE . 2008 ; 3 ( 7 ): e2633 .
31. Hellstrom I , Raycraft J , Hayden-Ledbetter M , et al . The HE4 (WFDC2) protein is a biomarker for ovarian carcinoma . Cancer Res. 2003 ; 63 ( 13 ): 3695 – 3700 .
32. Drapkin R , von Horsten HH , Lin Y , et al . Human epididymis protein 4 (HE4) is a secreted glycoprotein that is overexpressed by serous and endometrioid ovarian carcinomas . Cancer Res. 2005 ; 65 ( 6 ): 2162 – 2169 .
33. Galgano M , Hampton G , Frierson HJ . Comprehensive analysis of HE4 expression in normal and malignant human tissues . Mod Pathol . 2006 ; 19 ( 6 ): 847 – 853 .
34. Scholler N , Crawford M , Sato A , et al . Bead-based ELISA assays for vali-dation of ovarian cancer early detection markers . Clin Cancer Res. 2006 ; 12 ( 7, pt 1 ): 2117 – 2124 .
35. Chang K , Pastan I . Molecular cloning of mesothelin, a differentiation antigen present on mesothelium, mesotheliomas, and ovarian cancers . Proc Natl Acad Sci U S A . 1996 ; 93 ( 1 ): 136 – 140 .
36. Rump A , Morikawa Y , Tanaka M , et al . Binding of ovarian cancer antigen CA125/MUC16 to mesothelin mediates cell adhesion . J Biol Chem. 2004 ; 279 ( 10 ): 9190 – 9198 .
37. Gubbels JA , Belisle J , Onda M , et al . Mesothelin-MUC16 binding is a high affi nity, N-glycan dependent interaction that facilitates peritoneal metastasis of ovarian tumors . Mol Cancer . 2006 ; 5 ( 1 ): 50 .
38. Paulick MG , Bertozzi CR . The glycosylphosphatidylinositol anchor: a complex membrane-anchoring structure for proteins . Biochemistry . 2008 ; 47 ( 27 ): 6991 – 7000 .
39. Zacks MA , Garg N . Recent developments in the molecular, biochemical and functional characterization of GPI8 and the GPI-anchoring mecha-nism [review] . Mol Membr Biol. 2006 ; 23 ( 3 ): 209 – 225 .
40. Bera TK , Pastan I . Mesothelin is not required for normal mouse develop-ment or reproduction . Mol Cell Biol. 2000 ; 20 ( 8 ): 2902 – 2906 .
41. Scholler N , Fu N , Yang Y , et al . Soluble member(s) of the mesothelin/megakaryocyte potentiating factor family are detectable in sera from patients with ovarian carcinoma . Proc Natl Acad Sci U S A . 1999 ; 96 ( 20 ): 11531 – 11536 .
42. McIntosh MW , Drescher C , Karlan B , et al . Combining CA 125 and SMR serum markers for diagnosis and early detection of ovarian carcinoma . Gynecol Oncol . 2004 ; 95 ( 1 ): 9 – 15 .
43. Kryczek I , Zou L , Rodriguez P , et al . B7-H4 expression identifi es a novel suppressive macrophage population in human ovarian carcinoma . J Exp Med . 2006 ; 203 ( 4 ): 871 – 881 .
44. Pitti RM , Marsters SA , Lawrence DA , et al . Genomic amplifi cation of a decoy receptor for Fas ligand in lung and colon cancer . Nature . 1998 ; 396 ( 6712 ): 699 – 703 .
45. Simon I , Liu Y , Krall KL , et al . Evaluation of the novel serum markers B7-H4, Spondin 2, and DcR3 for diagnosis and early detection of ovarian cancer . Gynecol Oncol . 2007 ; 106 ( 1 ): 112 – 118 .
46. Scholler N , Garvik B , Quarles T , Jiang S , Urban N . Method for genera-tion of in vivo biotinylated recombinant antibodies by yeast mating . J Immunol Methods . 2006 ; 317 ( 1 – 2 ): 132 – 143 .
47. Bergan L , Gross JA , Nevin B , Urban N , Scholler N . Development and in vitro validation of anti-mesothelin biobodies that prevent CA125/Mesothelin-dependent cell attachment . Cancer Lett. 2007 ; 255 ( 2 ): 263 – 274 .
48. Scholler N , Lowe K , Bergan L , et al . Use of yeast-secreted in vivo bioti-nylated recombinant antibodies (biobodies) in bead-based ELISA . Clin Cancer Res. 2008 ; 14 ( 9 ): 2647 – 2655 .
49. Cleveland WS . Robust locally weighted regression and smoothing scat-terplots . J Am Stat Assoc. 1979 ; 74 ( 368 ): 829 – 836 .
50. Pepe MS . The Statistical Evaluation of Medical Tests for Classifi cation and Prediction. Oxford Statistical Science Series . New York, NY : Oxford University Press ; 2003 .
51. Cox DR . Regression models and life-tables (with discussion) . J Roy Stat Soc B . 1972 ; 34 : 187 – 219 .
52. McIntosh MW , Drescher C , Urban N , Hellstrom KE , Hellstrom I . Combining CA125 and SMR serum markers for diagnosis and early detec-tion of ovarian carcinoma . Gynecol Oncol . 2004 ; 95 ( 1 ): 9 – 15 .
53. McIntosh MW , Urban N , Karlan B . Generating longitudinal screening algorithms using novel biomarkers for disease . Cancer Epidemiol Biomarkers Prev . 2002 ; 11 ( 2 ): 159 – 166 .
54. Menon U , Gentry-Maharaj A , Hallett R , et al . Sensitivity and specifi city of multimodal and ultrasound screening for ovarian cancer, and stage distribution of detected cancers: results of the prevalence screen of the UK Collaborative Trial of Ovarian Cancer Screening (UKCTOCS) . Lancet Oncol . 2009 ; 10 ( 4 ): 327 – 340 .
55. Partridge E , Kreimer AR , Greenlee RT , et al . Results from four rounds of ovarian cancer screening in a randomized trial . Obstet Gynecol . 2009 ; 113 ( 4 ): 775 – 782 .
56. Bast RC , Siegal FP , Runowicz C , et al . Elevation of serum CA125 prior to diagnosis of epithelial ovarian carcinoma . Gynecol Oncol . 1985 ; 22 ( 1 ): 115 – 120 .
57. Helzlsouer KJ , Bush TL , Alberg AJ , Bass KM , Zacur H , Comstock GW . Prospective study of serum CA-125 levels as markers of ovarian cancer . JAMA . 1993 ; 269 ( 9 ): 1123 – 1126 .
58. Titus-Ernstoff L , Perez K , Cramer DW , Harlow BL , Baron JA , Greenberg ER . Menstrual and reproductive factors in relation to ovarian cancer risk . Br J Cancer . 2001 ; 84 ( 5 ): 714 – 721 .
59. Gail MH , Brinton LA , Byar DP , et al . Projecting individualized probabil-ities of developing breast cancer for white females who are being examined annually . J Natl Cancer Inst . 1989 ; 81 ( 24 ): 1879 – 1886 .
60. Addona TA , Abbatiello SE , Schilling B , et al . Multi-site assessment of the precision and reproducibility of multiple reaction monitoring – based mea-surements of proteins in plasma . Nat Biotechnol . 2009 ; 27 ( 7 ): 633 – 641 .
61. Faca V , Pitteri SJ , Newcomb L , et al . Contribution of protein fraction-ation to depth of analysis of the serum and plasma proteomes . J Proteome Res. 2007 ; 6 ( 9 ): 3558 – 3565 .
62. Brown PO , Palmer C . The preclinical natural history of serous ovarian cancer: defi ning the target for early detection . PLoS Med . 2009 ; 6 ( 7) : e1000114 .
Funding National Cancer Institute (Specialized Program of Research Excellence grant P50 CA 83636 and U01 CA111273).
by guest on Decem
ber 16, 2014http://jnci.oxfordjournals.org/
Dow
nloaded from

38 Articles | JNCI Vol. 102, Issue 1 | January 6, 2010
Notes The authors had full responsibility for the design of the study, the collection of the data, the analysis and interpretation of the data, the decision to submit the manuscript for publication, and the writing of the manuscript.
L. Wu is currently employed by Baxter Healthcare, Inc, and holds stock in this company but is not involved in projects related to ovarian cancer. diaDeXus conducted the blinded assays of B7-H4, DcR3, and spondin-2 and through N. Kim, participated in the review of the manuscript.
The authors thank the CARET investigators and staff for their support for this study; Mary Pettinger for assistance with graphical displays; Robin Forrest and
Archana Kampani for their superb efforts in the laboratory; Dr Ronny Drapkin for provision of the anti-HE4 polyclonal antibodies; diaDexus for providing the assays for B7-H4, spondin-2, and DcR3; Caitlin Anderson for her critical review of the manuscript; and Sheri Greaves for her assistance in manuscript preparation.
Affiliations of authors: Division of Public Health Sciences, Fred Hutchinson Cancer Research Center, Seattle, WA (GLA, MM, LW, MB, GG, JDT, LB, MDT, KO, CD, NU); Ovarian Cancer Research Center, Department of Obstetrics and Gynecology, University of Pennsylvania School of Medicine, Philadelphia, PA (NS); diaDeXus, South San Francisco, CA (NK) .
by guest on Decem
ber 16, 2014http://jnci.oxfordjournals.org/
Dow
nloaded from